Pioneer International
Equity Fund
Semiannual Report | May 31, 2020
| | |
| Ticker Symbols: |
Class A | PIIFX |
Class C | PCITX |
Class Y | INVYX |
Beginning in February 2021, as permitted by regulations adopted by the Securities and Exchange Commission, paper copies of the Fund’s shareholder reports like this one will no longer be sent by mail, unless you specifically request paper copies of the reports from the Fund or from your financial intermediary, such as a broker-dealer, bank or insurance company. Instead, the reports will be made available on the Fund’s website, and you will be notified by mail each time a report is posted and provided with a website link to access the report.
If you already elected to receive shareholder reports electronically, you will not be affected by this change and you need not take any action. You may elect to receive shareholder reports and other communications electronically by contacting your financial intermediary or, if you invest directly with the Fund, by calling 1-800-225-6292.
You may elect to receive all future reports in paper free of charge. If you invest directly with the Fund, you can inform the Fund that you wish to continue receiving paper copies of your shareholder reports by calling 1-800-225-6292. If you invest through a financial intermediary, you can contact your financial intermediary to request that you continue to receive paper copies of your shareholder reports. Your election to receive reports in paper will apply to all funds held in your account if you invest through your financial intermediary or all funds held within the Pioneer Fund complex if you invest directly.
visit us: www.amundipioneer.com/us
Pioneer International Equity Fund | Semiannual Report | 5/31/20 1
Dear Shareholders,
The new decade has arrived delivering a half-year that will go down in the history books. The beginning of 2020 seemed to extend the positive market environment of 2019. Then, March roared in like a lion and the COVID-19 pandemic became a global crisis impacting lives and life as we know it. The long-term impact on the global economy from the COVID-19 virus pandemic, while currently unknown, is likely to be considerable. It is clear that several industries have already felt greater effects than others. And the markets, which do not thrive on uncertainty, have been volatile, delivering significantly negative performance in the first quarter, and then staging a strong rally in the opening weeks of the second quarter. Our business continuity plan was implemented given the new COVID-19 guidelines, and most of our employees are working remotely. To date, our operating environment has faced no interruption. I am proud of the careful planning that has taken place and confident we can maintain this environment for as long as is prudent. History in the making for a company that first opened its doors way back in 1928.
Since 1928, Amundi Pioneer’s investment process has been built on a foundation of fundamental research and active management, principles which have guided our investment decisions for more than 90 years. We believe active management – that is, making active investment decisions – can help mitigate the potential risks during periods of market volatility. As the first several months of 2020 have reminded us, investment risk can arise from a number of factors in today’s global economy, including slower or stagnating growth, changing U.S. Federal Reserve policy, oil price shocks, political and geopolitical factors and, unfortunately, major public health concerns such as a viral pandemic.
At Amundi Pioneer, active management begins with our own fundamental, bottom-up research process. Our team of dedicated research analysts and portfolio managers analyzes each security under consideration, communicating directly with the management teams of the companies issuing the securities and working together to identify those securities that best meet our investment criteria for our family of funds. Our risk management approach begins with each and every security, as we strive to carefully understand the potential opportunity, while considering any and all risk factors.
2 Pioneer International Equity Fund | Semiannual Report | 5/31/20
Today, as investors, we have many options. It is our view that active management can serve shareholders well, not only when markets are thriving, but also during periods of market stress. As you consider your long-term investment goals, we encourage you to work with your financial advisor to develop an investment plan that paves the way for you to pursue both your short-term and long-term goals.
We remain confident that the current crisis, like others in human history, will pass, and we greatly appreciate the trust you have placed in us and look forward to continuing to serve you in the future.
Sincerely,
Lisa M. Jones
Head of the Americas, President and CEO of U.S.
Amundi Pioneer Asset Management USA, Inc.
May 31, 2020
Any information in this shareowner report regarding market or economic trends or the factors influencing the Fund’s historical or future performance are statements of opinion as of the date of this report. Past performance is no guarantee of future results.
Pioneer International Equity Fund | Semiannual Report | 5/31/20 3
Portfolio Management Discussion |
5/31/20 In the following interview, Marco Pirondini, Lead Portfolio Manager of Pioneer International Equity Fund, discusses the market environment for international equities and the factors that influenced the performance of Pioneer International Equity Fund during the six-month period ended May 31, 2020. Mr. Pirondini, Senior Managing Director, Head of Equities, U.S., and a portfolio manager at Amundi Pioneer Asset Management, Inc.(Amundi Pioneer), and Brian Chen, a vice president and a portfolio manager at Amundi Pioneer, are responsible for the day-to-day management of the Fund.
Q How did the Fund perform during the six-month period ended May 31, 2020?
A Pioneer International Equity Fund’s Class A shares returned -11.43% at net asset value during the six-month period ended May 31, 2020, while the Fund’s benchmark, the Morgan Stanley Capital International (MSCI) Europe, Australasia, Far East (EAFE) NR Index (the MSCI Index)1, returned -11.48%. During the same 12-month period, the average return for the 780 mutual funds in Morningstar’s Foreign Large Blend Funds category was -11.02%.
Q How would you characterize the investment environment for international equities during the six-month period ended May 31, 2020?
A The period began on a positive note towards the end of the 2019 calendar year, with a thawing in U.S.-China trade relations and a favorable outlook for the gradual reacceleration of the U.S. economy. In addition, the risk of the United Kingdom’s “no-deal” departure from the European Union, known as Brexit, had declined considerably, which also boosted investors’ confidence. Signs of economic improvement in the emerging markets and Japan were other contributing factors in the renewed market optimism about global growth.
1 The MSCI information may only be used for your internal use, may not be reproduced or re-disseminated in any form and may not be used as a basis for or a component of any financial instruments or products or indices. None of the MSCI information is intended to constitute investment advice or a recommendation to make (or refrain from making) any kind of investment decision and may not be relied on as such. Historical data and analysis should not be taken as an indication or guarantee of any future performance analysis, forecast or prediction. The MSCI information is provided on an “as is” basis and the user of this information assumes the entire risk of any use made of this information. MSCI, each of its affiliates and each other person involved in or related to compiling, computing or creating any MSCI information (collectively, the “MSCI Parties”) expressly disclaim all warranties (including, without limitation, any warranties of originality, accuracy, completeness, timeliness, non-infringement, merchantability and fitness for a particular purpose) with respect to this information. Without limiting any of the foregoing, in no event shall any MSCI Party have any liability for any direct, indirect, special, incidental, punitive, consequential (including, without limitation, lost profits) or any other damages.
4 Pioneer International Equity Fund | Semiannual Report | 5/31/20
By March, however, the COVID-19 virus – which first emerged in China in December 2019 and then rapidly spread to Europe and the United States, eventually becoming a full-blown pandemic during the first quarter of 2020 – had completely disrupted global economic activity. In an attempt to stem the spread of the virus, various governments around the world issued lockdown and shelter-in-place orders. With those edicts in effect, most companies with the ability to continue operations did so by having their employees work from home, but numerous businesses, such as retail stores, bars, and restaurants, were forced to close their doors and lay-off workers.
With all the uncertainty created by COVID-19, investors sold-off higher-risk assets and moved into so-called “safe haven” securities in March. The sell-off included an exodus from equities as stock-market investors absorbed some of the worst economic data since the Great Depression in the 1930s. By the end of the first quarter (March 31, 2020), the global economy had shifted from a scenario of a gradual recovery to one of deep recession.
In response, policy makers in many countries introduced massive fiscal stimulus programs and aid packages to help cushion their economies from the fallout created by the pandemic. Central banks cut interest rates where applicable, and announced initiatives to inject liquidity into financial systems through various channels in the hopes of re-establishing some order within the fixed-income and currency markets. For the most part, we believe those aggressive policies eased investors’ fears as riskier assets staged a dramatic comeback during April and May. In addition, the staggered nature of the spread of the COVID-19 virus meant that while the United States and Europe were still battling the pandemic as winter turned to spring, China was beginning to see signs of a recovery, both in terms of a decline in new infections as well as in the country’s economic outlook. The situation in China presented a possible roadmap for what a potential recovery might look like in the rest of the world.
Over the six-month period, international equities underperformed U.S. equities. From a regional perspective, stocks in the emerging markets and Japan held up better than European stocks. Within the Fund’s benchmark,
Pioneer International Equity Fund | Semiannual Report | 5/31/20 5
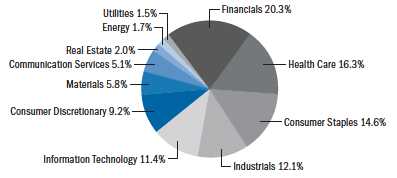
the MSCI Index, 10 out of the 11 market sectors turned in negative results over the six-month period, with only health care delivering positive returns. The energy and financials sectors fared the worst during the period, while growth stocks continued to outperform value stocks.
Q The Fund delivered performance that was in line with the benchmark MSCI Index during the six-month period ended May 31, 2020. Which of your investment strategies or individual portfolio holdings contributed positively to that result?
A Asset allocation was the primary positive factor in the Fund’s benchmark-relative performance during the six-month period. In managing the portfolio during the period, we never strayed far from the benchmark’s sector weightings, but we did make a concerted effort to increase the Fund’s exposure to Asia versus Europe.
On a country basis, we increased the Fund’s allocations to South Korea, Taiwan, and China, and reduced exposures to France, Germany, and the United Kingdom. The move was both tactical and strategic, as it seemed likely to us that Asia would be the first to emerge from the COVID-19 crisis. More importantly, Asia features some of the best long-term investment stories in the world, in our opinion, particularly technology companies that are focused on the manufacturing of semiconductors and batteries for electric vehicles.
With regard to individual holdings, the top positive contributor to the Fund’s benchmark-relative performance during the six-month period was Accton. The main focus of the Taiwanese electronics company is the development and manufacturing of networking systems and communications solutions, primarily those with large-capacity switches. With increasing numbers of people working from home during the pandemic, demand for Accton’s cloud data-center solution products has remained robust.
The portfolio’s second-best performing holding during the six-month period was Lonza Group, a manufacturing partner for pharmaceutical companies, both large and small. In our view, the company has little pipeline risk due to the diversified nature of its business and best-in-class manufacturing facilities, which makes Lonza a natural ally for companies with tight manufacturing capacity or capital.
6 Pioneer International Equity Fund | Semiannual Report | 5/31/20
With stock prices in deep correction territory in March, we added several new holdings that aided the Fund’s performance during the six-month period, including Adidas, which turned out to be one of the key positive contributors to relative returns. Adidas is one of the world’s largest sportswear brands. With global consumption falling precipitously as the COVID-19 situation worsened, the stock price had declined by 50% from its January highs. We believe the company’s brand remains iconic. Furthermore, with a management team that has improved investor returns over the last several years, we viewed the sell-off as a timely opportunity for us to add Adidas to the portfolio, and the decision benefited the Fund’s benchmark-relative results.
All of the stocks mentioned here remained in the portfolio at period-end, as we believe they continue to offer longer-term upside potential.
Q Which strategies or individual portfolio holdings detracted from the Fund’s benchmark-relative performance during the six-month period ended May 31, 2020?
A Stock selection in the consumer staples and consumer discretionary sectors weighed on the Fund’s benchmark-relative returns during the six-month period.
The individual portfolio position that detracted the most from the Fund’s benchmark-relative performance over the six-month period was Dometic Group. Based in Sweden, Dometic manufactures and sells a broad range of products used in recreational vehicles, boats, campers, and trucks — such as refrigerator consoles and air conditioning systems. A combination of our concerns over the uncertainty of demand for travel during and after the pandemic crisis and, more importantly, over the company’s leveraged balance sheet, convinced us that it was best to exit the Fund’s position.
The second-biggest detractor from the Fund’s relative performance during the period was Covivio. Listed in Paris, the company is a diversified property developer with the majority of its portfolio in the office markets within France, Italy, and Germany. The office segment appears particularly vulnerable in a post-COVID-19 world, given the likelihood of more employees continuing to work from home and not going back to an office
Pioneer International Equity Fund | Semiannual Report | 5/31/20 7
setting, which could reduce demand for space, in our view. In addition, we were not comfortable with Covivio’s leveraged balance sheet. Those factors drove our decision to sell the Fund’s position.
ITV, a media company that operates a family of free-to-air channels based in London, was the third-largest detractor from the Fund’s benchmark-relative performance during the six-month period. With lockdown measures in place, the company’s advertisers were not spending any money. Additionally, ITV’s ability to film new shows was put on hold during the pandemic. However, we believe those setbacks to be temporary. We also feel that the company’s prospects have remained strong, driven by ITV’s very good content library and efforts to monetize its vast catalogue globally. Therefore, we have retained the Fund’s position.
Q Did the Fund have any derivatives exposure during the six-month period ended May 31, 2020?
A Yes, we temporarily employed Euro Stoxx 50 futures during the market correction in March, as the Fund had built up too much cash and we wanted to reposition the portfolio for a market rebound. Ultimately, we replaced the futures with individual stocks. The strategy contributed positively to the Fund’s performance during the six-month period.
Q What is your outlook as the Fund moves into the second half of its fiscal year, and how is the portfolio positioned?
A Global economies are slowly beginning to open, and equity markets are trying to find a new equilibrium in the wake of the dramatic sell-off in March, and the sharp bounce-back that followed. With the news flows surrounding the COVID-19 crisis still fluid and uncertain with respect to the number and severity of cases as well as the efficacy of potential treatments and vaccines, we believe market volatility will persist. Furthermore, we expect that corporate earnings will experience material, downward revisions due to economic activity essentially ceasing for 45 to 60 days. With companies reassessing their growth and spending plans over the coming quarters, we do not believe any potential economic recovery will be V-shaped (that is, not a sharp, dramatic recovery).
8 Pioneer International Equity Fund | Semiannual Report | 5/31/20
With regard to the Fund’s positioning, we have continued to favor owning stocks of companies that we believe have strong underlying business models and that can potentially hold up well even if the economic outlook deteriorates. As of May 31, 2020, the portfolio was overweight relative to the MSCI Index in health care and information technology. We believe those sectors have continued to benefit from positive secular trends.
Included among the portfolio’s underweight sector allocations versus the MSCI Index were financials and industrials. In financials, European banks in particular have been struggling from earnings headwinds driven by a low-interest-rate environment as well as very heavy regulatory regimes. However, valuations do appear attractive, in our view. As for industrials, we have preferred to underweight the Fund in the sector until we have a better idea of how the global economic picture might look given the challenges posed by COVID-19.
Please refer to the Schedule of Investments on pages 18–24 for a full listing of Fund securities.
All investments are subject to risk, including the possible loss of principal. In the past several years, financial markets have experienced increased volatility and heightened uncertainty. The market prices of securities may go up or down, sometimes rapidly or unpredictably, due to general market conditions, such as real or perceived adverse economic, political, or regulatory conditions, recessions, inflation, changes in interest or currency rates, lack of liquidity in the bond markets, the spread of infectious illness or other public health issues or adverse investor sentiment. These conditions may continue, recur, worsen or spread.
Investing in foreign and/or emerging markets securities involves risks relating to interest rates, currency exchange rates, economic, and political conditions.
Pioneer International Equity Fund | Semiannual Report | 5/31/20 9
To the extent the Fund invests in issuers located within specific countries or regions, the Fund may be particularly affected by adverse markets, rates, and events, which may occur in those countries and regions.
When interest rates rise, the prices of fixed-income securities in the Fund will generally fall. Conversely, when interest rates fall, the prices of fixed-income securities in the Fund will generally rise.
At times, the Fund’s investments may represent industries or industry sectors that are interrelated or have common risks, making the Fund more susceptible to any economic, political, or regulatory developments or other risks affecting those industries or sectors.
These risks may increase share price volatility.
Before investing, consider the product’s investment objectives, risks, charges and expenses. Contact your financial professional or Amundi Pioneer Asset Management, Inc., for a prospectus or summary prospectus containing this information. Read it carefully.
Any information in this shareholder report regarding market or economic trends or the factors influencing the Fund’s historical or future performance are statements of opinion as of the date of this report. Past performance is no guarantee of future results.
10 Pioneer International Equity Fund | Semiannual Report | 5/31/20
Portfolio Summary |
5/31/20Sector Distribution
(As a percentage of total investments)*
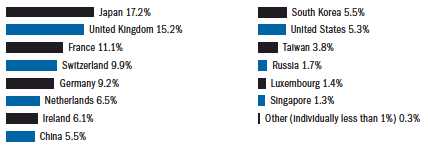
Geographical Distribution
(As a percentage of total investments based on country of domicile)*
| | | |
| 10 Largest Holdings | |
(As a percentage of total investments)* | |
| | | |
| 1. | Roche Holding AG | 3.30% |
| 2. | Schneider Electric SE | 2.89 |
| 3. | Koninklijke Philips NV | 2.67 |
| 4. | Unilever NV | 2.64 |
| 5. | Accton Technology Corp. | 2.61 |
| 6. | Hoya Corp. | 2.60 |
| 7. | Kerry Group Plc | 2.51 |
| 8. | KDDI Corp. | 2.23 |
| 9. | U.S. Treasury Bills, 8/13/20 | 2.15 |
| 10. | Daikin Industries, Ltd. | 2.14 |
* Excludes temporary cash investments and all derivative contracts except for options purchased. The Fund is actively managed, and current holdings may be different. The holdings listed should not be considered recommendations to buy or sell any securities.
Pioneer International Equity Fund | Semiannual Report | 5/31/20 11
Prices and Distributions |
5/31/20Net Asset Value per Share
| | | |
| Class | 5/31/20 | 11/30/19 |
| A | $19.46 | $22.38 |
| C | $16.85 | $19.35 |
| Y | $19.46 | $22.44 |
Distributions per Share: 12/1/19–5/31/20
| | | | |
| Net | | |
| Investment | Short-Term | Long-Term |
| Class | Income | Capital Gains | Capital Gains |
| A | $0.4204 | $ — | $ — |
| C | $0.2475 | $ — | $ — |
| Y | $0.5194 | $ — | $ — |
Index Definition
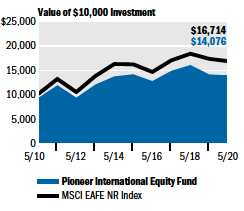
The MSCI EAFE NR Index is an unmanaged, commonly used measure of international stocks. Index returns are calculated monthly, assume reinvestment of dividends and, unlike Fund returns, do not reflect any fees, expenses or sales charges. It is not possible to invest directly in an index.
The index defined here pertains to the “Value of $10,000 Investment” and “Value of $5 Million Investment” charts on pages 13–15.
12 Pioneer International Equity Fund | Semiannual Report | 5/31/20
| Performance Update | 5/31/20 | Class A Shares |
Investment Returns
The mountain chart on the right shows the change in value of a $10,000 investment made in Class A shares of Pioneer International Equity Fund at public offering price during the periods shown, compared to that of the Morgan Stanley Capital International (MSCI) Europe, Australasia and Far East (EAFE) NR Index.
| | | | |
| Average Annual Total Returns | |
(As of May 31, 2020) | | |
| Net | Public | MSCI |
| Asset | Offering | EAFE |
| Value | Price | NR |
| Period | (NAV) | (POP) | Index |
10 Years | 4.09% | 3.48% | 5.27% |
5 Years | -0.27 | -1.44 | 0.79 |
1 Year | -1.04 | -6.73 | -2.81 |
|
|
| Expense Ratio | | |
(Per prospectus dated April 1, 2020) |
| Gross | Net | | |
1.50% | 1.15% | | |
Call 1-800-225-6292 or visit www.amundipioneer.com/us for the most recent month-end performance results. Current performance may be lower or higher than the performance data quoted.
The performance data quoted represents past performance, which is no guarantee of future results. Investment return and principal value will fluctuate, and shares, when redeemed, may be worth more or less than their original cost.
NAV results represent the percent change in net asset value per share. POP returns reflect deduction of maximum 5.75% sales charge. NAV returns would have been lower had sales charges been reflected. All results are historical and assume the reinvestment of dividends and capital gains. Other share classes are available for which performance and expenses will differ.
Performance results reflect any applicable expense waivers in effect during the periods shown. Without such waivers Fund performance would be lower. Waivers may not be in effect for all funds. Certain fee waivers are contractual through a specified period. Otherwise, fee waivers can be rescinded at any time. See the prospectus and financial statements for more information.
The net expense ratio reflects the contractual expense limitation currently in effect through April 1, 2021 for Class A shares. There can be no assurance that Amundi Pioneer will extend the expense limitation beyond such time. Please see the prospectus and financial statements for more information.
The performance table and graph do not reflect the deduction of fees and taxes that a shareowner would pay on Fund distributions or the redemption of Fund shares.
Please refer to the financial highlights for more current expense ratios.
Pioneer International Equity Fund | Semiannual Report | 5/31/20 13
| Performance Update | 5/31/20 | Class C Shares |
Investment Returns
The mountain chart on the right shows the change in value of a $10,000 investment made in Class C shares of Pioneer International Equity Fund during the periods shown, compared to that of the Morgan Stanley Capital International (MSCI) Europe, Australasia and Far East (EAFE) NR Index.
| | | | |
| Average Annual Total Returns | |
(As of May 31, 2020) | | |
| | | MSCI |
| | | EAFE |
| If | If | NR |
| Period | Held | Redeemed | Index |
10 Years | 3.18% | 3.18% | 5.27% |
5 Years | -1.13 | -1.13 | 0.79 |
1 Year | -1.89 | -1.89 | -2.81 |
|
|
| Expense Ratio | | |
(Per prospectus dated April 1, 2020) |
| Gross | Net | | |
2.21% | 2.15% | |
Call 1-800-225-6292 or visit www.amundipioneer.com/us for the most recent month-end performance results. Current performance may be lower or higher than the performance data quoted.
The performance data quoted represents past performance, which is no guarantee of future results. Investment return and principal value will fluctuate, and shares, when redeemed, may be worth more or less than their original cost.
Class C shares held for less than one year are also subject to a 1% contingent deferred sales charge (CDSC). “If Held” results represent the percent change in net asset value per share. NAV returns would have been lower had sales charges been reflected. All results are historical and assume the reinvestment of dividends and capital gains. Other share classes are available for which performance and expenses will differ.
Performance results reflect any applicable expense waivers in effect during the periods shown. Without such waivers Fund performance would be lower. Waivers may not be in effect for all funds. Certain fee waivers are contractual through a specified period. Otherwise, fee waivers can be rescinded at any time. See the prospectus and financial statements for more information.
The net expense ratio reflects the contractual expense limitation currently in effect through April 1, 2021 for Class C shares. There can be no assurance that Amundi Pioneer will extend the expense limitation beyond such time. Please see the prospectus and financial statements for more information.
The performance table and graph do not reflect the deduction of fees and taxes that a shareowner would pay on Fund distributions or the redemption of Fund shares.
Please refer to the financial highlights for a more current expense ratio.
14 Pioneer International Equity Fund | Semiannual Report | 5/31/20
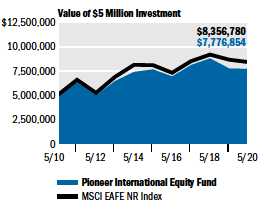
| Performance Update | 5/31/20 | Class Y Shares |
Investment Returns
The mountain chart on the right shows the change in value of a $5 million investment made in Class Y shares of Pioneer International Equity Fund during the periods shown, compared to that of the Morgan Stanley Capital International (MSCI) Europe, Australasia and Far East (EAFE) NR Index.
| | | |
| Average Annual Total Returns | |
(As of May 31, 2020) | |
| Net | MSCI |
| Asset | EAFE |
| Value | NR |
| Period | (NAV) | Index |
10 Years | 4.52% | 5.27% |
5 Years | 0.12 | 0.79 |
1 Year | -0.61 | -2.81 |
|
|
| Expense Ratio | | |
(Per prospectus dated April 1, 2020) |
| Gross | Net | |
0.93% | 0.70% | |
Call 1-800-225-6292 or visit www.amundipioneer.com/us for the most recent month-end performance results. Current performance may be lower or higher than the performance data quoted.
The performance data quoted represents past performance, which is no guarantee of future results. Investment return and principal value will fluctuate, and shares, when redeemed, may be worth more or less than their original cost.
Class Y shares are not subject to sales charges and are available for limited groups of eligible investors, including institutional investors. All results are historical and assume the reinvestment of dividends and capital gains. Other share classes are available for which performance and expenses will differ.
Performance results reflect any applicable expense waivers in effect during the periods shown. Without such waivers Fund performance would be lower. Waivers may not be in effect for all funds. Certain fee waivers are contractual through a specified period. Otherwise, fee waivers can be rescinded at any time. See the prospectus and financial statements for more information.
The net expense ratio reflects the contractual expense limitation currently in effect through April 1, 2021 for Class Y shares. There can be no assurance that Amundi Pioneer will extend the expense limitation beyond such time. Please see the prospectus and financial statements for more information.
The performance table and graph do not reflect the deduction of fees and taxes that a shareowner would pay on Fund distributions or the redemption of Fund shares.
Please refer to the financial highlights for more current expense ratios.
Pioneer International Equity Fund | Semiannual Report | 5/31/20 15
Comparing Ongoing Fund Expenses
As a shareowner in the Fund, you incur two types of costs:
(1) ongoing costs, including management fees, distribution and/or service (12b-1) fees, and other Fund expenses; and
(2) transaction costs, including sales charges (loads) on purchase payments.
This example is intended to help you understand your ongoing expenses (in dollars) of investing in the Fund and to compare these costs with the ongoing costs of investing in other mutual funds. The example is based on an investment of $1,000 at the beginning of the Fund’s latest six-month period and held throughout the six months.
Using the Tables
Actual Expenses
The first table below provides information about actual account values and actual expenses. You may use the information in this table, together with the amount you invested, to estimate the expenses that you paid over the period as follows:
(1) Divide your account value by $1,000
Example: an $8,600 account value ÷ $1,000 = 8.6
(2) Multiply the result in (1) above by the corresponding share class’s number in the third row under the heading entitled “Expenses Paid During Period” to estimate the expenses you paid on your account during this period.
Expenses Paid on a $1,000 Investment in Pioneer International Equity Fund
Based on actual returns from December 1, 2019 through May 31, 2020.
| | | | |
| Share Class | A | C | Y |
Beginning Account | $1,000.00 | $1,000.00 | $1,000.00 |
Value on 12/1/19 | | | |
Ending Account | $885.70 | $881.80 | $887.10 |
Value (after expenses) | | | |
on 5/31/20 | | | |
Expenses Paid | $5.42 | $9.60 | $3.30 |
During Period* | | | |
* Expenses are equal to the Fund’s annualized expense ratio of 1.15%, 2.04%, and 0.70% for Class A, Class C and Class Y shares, respectively, multiplied by the average account value over the period, multiplied by 183/366 (to reflect the partial year period).
16 Pioneer International Equity Fund | Semiannual Report | 5/31/20
Hypothetical Example for Comparison Purposes
The table below provides information about hypothetical account values and hypothetical expenses based on the Fund’s actual expense ratio and an assumed rate of return of 5% per year before expenses, which is not the Fund’s actual return. The hypothetical account values and expenses may not be used to estimate the actual ending account balance or expenses you paid for the period.
You may use this information to compare the ongoing costs of investing in the Fund and other funds. To do so, compare this 5% hypothetical example with the 5% hypothetical examples that appear in the shareholder reports of the other funds.
Please note that the expenses shown in the tables are meant to highlight your ongoing costs only and do not reflect any transaction costs, such as sales charges (loads), or redemption fees that are charged at the time of the transaction. Therefore, the table below is useful in comparing ongoing costs only and will not help you determine the relative total costs of owning different funds. In addition, if these transaction costs were included, your costs would have been higher.
Expenses Paid on a $1,000 Investment in Pioneer International Equity Fund
Based on a hypothetical 5% return per year before expenses, reflecting the period from December 1, 2019 through May 31, 2020.
| | | | |
| Share Class | A | C | Y |
Beginning Account | $1,000.00 | $1,000.00 | $1,000.00 |
Value on 12/1/19 | | | |
Ending Account | $1,019.25 | $1,014.80 | $1,021.50 |
Value (after expenses) | | | |
on 5/31/20 | | | |
Expenses Paid | $5.81 | $10.28 | $3.54 |
During Period* | | | |
* Expenses are equal to the Fund’s annualized expense ratio of 1.15%, 2.04%, and 0.70% for Class A, Class C and Class Y shares, respectively, multiplied by the average account value over the period, multiplied by 183/366 (to reflect the partial year period).
Pioneer International Equity Fund | Semiannual Report | 5/31/20 17
Schedule of Investments |
5/31/20 (unaudited) | | | | |
| Shares | | | Value |
| | UNAFFILIATED ISSUERS — 99.9% | |
| | COMMON STOCKS — 97.1% of Net Assets | |
| | Aerospace & Defense — 1.3% | |
| 668,400 | | Singapore Technologies Engineering Ltd. | $ 1,515,048 |
| | Total Aerospace & Defense | $ 1,515,048 |
| | Automobiles — 1.8% | |
| 33,500 | | Toyota Motor Corp. | $ 2,103,073 |
| | Total Automobiles | $ 2,103,073 |
| | Banks — 6.3% | |
| 108,962 | | ABN Amro Bank NV (144A) | $ 877,907 |
| 493,141 | | Barclays Plc | 705,590 |
| 60,267 | | BNP Paribas S.A. | 2,174,704 |
| 201,500 | | ING Groep NV | 1,308,925 |
| 81,756 | | KB Financial Group, Inc. | 2,257,276 |
| | Total Banks | $ 7,324,402 |
| | Beverages — 1.1% | |
| 33,000 | | Asahi Group Holdings, Ltd. | $ 1,245,120 |
| | Total Beverages | $ 1,245,120 |
| | Building Products — 2.1% | |
| 16,900 | | Daikin Industries, Ltd. | $ 2,489,784 |
| | Total Building Products | $ 2,489,784 |
| | Capital Markets — 4.0% | |
| 24,500 | | Euronext NV (144A) | $ 2,264,602 |
| 215,481 | | UBS Group AG | 2,322,648 |
| | Total Capital Markets | $ 4,587,250 |
| | Chemicals — 1.6% | |
| 5,836 | | LG Chem, Ltd. | $ 1,850,947 |
| | Total Chemicals | $ 1,850,947 |
| | Communications Equipment — 2.6% | |
| 376,000 | | Accton Technology Corp. | $ 3,030,406 |
| | Total Communications Equipment | $ 3,030,406 |
| | Construction Materials — 1.7% | |
| 59,171 | | CRH Plc | $ 1,923,342 |
| | Total Construction Materials | $ 1,923,342 |
| | Consumer Discretionary — 0.7% | |
| 464(a) | | Booking Holdings, Inc. | $ 760,691 |
| | Total Consumer Discretionary | $ 760,691 |
| | Containers & Packaging — 1.0% | |
| 34,685 | | Smurfit Kappa Group Plc | $ 1,134,718 |
| | Total Containers & Packaging | $ 1,134,718 |
| | Diversified Telecommunication Services — 1.1% | |
| 108,660 | | Orange S.A. | $ 1,313,493 |
| | Total Diversified Telecommunication Services | $ 1,313,493 |
The accompanying notes are an integral part of these financial statements.
18 Pioneer International Equity Fund | Semiannual Report | 5/31/20
| | | | |
| Shares | | | Value |
| | Electrical Equipment — 2.9% | |
| 33,618 | | Schneider Electric SE | $ 3,355,159 |
| | Total Electrical Equipment | $ 3,355,159 |
| | Electronic Equipment, Instruments & Components — 5.6% | |
| 69,100 | | Hitachi, Ltd. | $ 2,219,140 |
| 3,700 | | Keyence Corp. | 1,524,610 |
| 14,300 | | Murata Manufacturing Co., Ltd. | 799,736 |
| 25,594 | | Samsung Electronics Co., Ltd. | 1,052,904 |
| 67,300 | | Sunny Optical Technology Group Co., Ltd. | 899,264 |
| | Total Electronic Equipment, Instruments & Components | $ 6,495,654 |
| | Energy — 1.2% | |
| 268,558 | | Rosneft Oil Co. PJSC (G.D.R.) | $ 1,409,207 |
| | Total Energy | $ 1,409,207 |
| | Food & Staples Retailing — 2.5% | |
| 71,000 | | Seven & i Holdings Co., Ltd. | $ 2,431,785 |
| 13,500 | | Sundrug Co., Ltd. | 455,097 |
| | Total Food & Staples Retailing | $ 2,886,882 |
| | Food Products — 4.9% | |
| 55,250 | | Associated British Foods Plc | $ 1,245,971 |
| 5,519 | | Bakkafrost P/F | 345,071 |
| 17,490 | | Danone S.A. | 1,199,386 |
| 23,857 | | Kerry Group Plc | 2,915,308 |
| | Total Food Products | $ 5,705,736 |
| | Health Care Equipment & Supplies — 6.2% | |
| 32,100 | | Hoya Corp. | $ 3,014,668 |
| 68,000 | | Koninklijke Philips NV | 3,099,039 |
| 11,396 | | Medtronic Plc | 1,123,418 |
| | Total Health Care Equipment & Supplies | $ 7,237,125 |
| | Health Care Providers & Services — 1.7% | |
| 42,355 | | Fresenius SE & Co. KGaA | $ 2,021,354 |
| | Total Health Care Providers & Services | $ 2,021,354 |
| | Hotels, Restaurants & Leisure — 1.7% | |
| 135,555 | | Compass Group Plc | $ 1,989,465 |
| | Total Hotels, Restaurants & Leisure | $ 1,989,465 |
| | Household Durables — 1.3% | |
| 54,658 | | Persimmon Plc | $ 1,553,891 |
| | Total Household Durables | $ 1,553,891 |
| | Household Products — 2.0% | |
| 29,600(a) | | Henkel AG & Co. KGaA | $ 2,355,329 |
| | Total Household Products | $ 2,355,329 |
The accompanying notes are an integral part of these financial statements.
Pioneer International Equity Fund | Semiannual Report | 5/31/20 19
Schedule of Investments | 5/31/20 (unaudited) (continued)
| | | | |
| Shares | | | Value |
| | Industrial Conglomerates — 1.3% | |
| 13,393 | | Siemens AG | $ 1,462,493 |
| | Total Industrial Conglomerates | $ 1,462,493 |
| | Industrials — 0.8% | |
| 6,031 | | Kansas City Southern | $ 907,786 |
| | Total Industrials | $ 907,786 |
| | Insurance — 7.2% | |
| 11,582 | | Allianz SE | $ 2,102,436 |
| 113,300 | | AXA S.A. | 2,074,256 |
| 212,000 | | Ping An Insurance Group Co. of China, Ltd., Class H | 2,104,634 |
| 6,340 | | Zurich Insurance Group AG | 2,051,895 |
| | Total Insurance | $ 8,333,221 |
| | Interactive Media & Services — 1.0% | |
| 21,300 | | Tencent Holdings, Ltd. | $ 1,135,240 |
| | Total Interactive Media & Services | $ 1,135,240 |
| | Internet & Direct Marketing Retail — 1.9% | |
| 86,100(a) | | Alibaba Group Holding, Ltd. | $ 2,219,438 |
| | Total Internet & Direct Marketing Retail | $ 2,219,438 |
| | IT Services — 1.0% | |
| 21,592 | | Cognizant Technology Solutions Corp. | $ 1,144,376 |
| | Total IT Services | $ 1,144,376 |
| | Life Sciences Tools & Services — 2.0% | |
| 4,685 | | Lonza Group AG | $ 2,307,654 |
| | Total Life Sciences Tools & Services | $ 2,307,654 |
| | Media — 0.8% | |
| 909,178 | | ITV Plc | $ 904,098 |
| | Total Media | $ 904,098 |
| | Metals & Mining — 1.5% | |
| 32,958 | | Rio Tinto Plc | $ 1,763,788 |
| | Total Metals & Mining | $ 1,763,788 |
| | Multi-Utilities — 1.5% | |
| 53,322 | | RWE AG | $ 1,757,443 |
| | Total Multi-Utilities | $ 1,757,443 |
| | Oil, Gas & Consumable Fuels — 0.5% | |
| 7,656 | | Lukoil PJSC (A.D.R.) | $ 576,420 |
| | Total Oil, Gas & Consumable Fuels | $ 576,420 |
| | Personal Products — 4.1% | |
| 5,885 | | L’Oreal S.A. | $ 1,719,054 |
| 59,063 | | Unilever NV | 3,059,255 |
| | Total Personal Products | $ 4,778,309 |
The accompanying notes are an integral part of these financial statements.
20 Pioneer International Equity Fund | Semiannual Report | 5/31/20
| | | | |
| Shares | | | Value |
| | Pharmaceuticals — 6.4% | |
| 20,592 | | AstraZeneca Plc | $ 2,185,974 |
| 4,900 | | Eisai Co., Ltd. | 384,325 |
| 11,562 | | Novartis AG | 1,002,618 |
| 11,050 | | Roche Holding AG | 3,836,916 |
| | Total Pharmaceuticals | $ 7,409,833 |
| | Real Estate Management & Development — 2.0% | |
| 72,391 | | Grand City Properties S.A. | $ 1,641,521 |
| 237,900 | | Ichigo, Inc. | 679,550 |
| | Total Real Estate Management & Development | $ 2,321,071 |
| | Semiconductors & Semiconductor Equipment — 2.2% | |
| 17,872 | | SK Hynix, Inc. | $ 1,182,364 |
| 144,000 | | Taiwan Semiconductor Manufacturing Co., Ltd. | 1,403,148 |
| | Total Semiconductors & Semiconductor Equipment | $ 2,585,512 |
| | Textiles, Apparel & Luxury Goods — 1.7% | |
| 3,744(a) | | adidas AG | $ 982,196 |
| 2,488 | | LVMH Moet Hennessy Louis Vuitton SE | 1,042,297 |
| | Total Textiles, Apparel & Luxury Goods | $ 2,024,493 |
| | Trading Companies & Distributors — 3.7% | |
| 71,273 | | Ashtead Group Plc | $ 2,117,879 |
| 27,602 | | Ferguson Plc | 2,176,738 |
| | Total Trading Companies & Distributors | $ 4,294,617 |
| | Wireless Telecommunication Services — 2.2% | |
| 88,700 | | KDDI Corp. | $ 2,584,341 |
| | Total Wireless Telecommunication Services | $ 2,584,341 |
| | TOTAL COMMON STOCKS | |
| | (Cost $104,853,918) | $ 112,798,209 |
| Principal | | | |
| Amount | | | |
| USD ($) | | | |
| | U.S. GOVERNMENT AND AGENCY OBLIGATIONS — | |
| | 2.8% of Net Assets | |
| 800,000(b) | | U.S. Treasury Bills, 6/23/20 | $ 799,940 |
| 2,500,000(b) | | U.S. Treasury Bills, 8/13/20 | 2,499,322 |
| | TOTAL U.S. GOVERNMENT AND AGENCY OBLIGATIONS | |
| | (Cost $3,299,388) | $ 3,299,262 |
| | TOTAL INVESTMENTS IN UNAFFILIATED ISSUERS — 99.9% | |
| | (Cost $108,153,306) (c) | $ 116,097,471 |
| | OTHER ASSETS AND LIABILITIES — 0.1% | $ 74,216 |
| | NET ASSETS — 100.0% | $ 116,171,687 |
The accompanying notes are an integral part of these financial statements.
Pioneer International Equity Fund | Semiannual Report | 5/31/20 21
Schedule of Investments | 5/31/20 (unaudited) (continued)
| | | |
(144A) | Security is exempt from registration under Rule 144A of the Securities Act of 1933. Such securities may be resold normally to qualified institutional buyers in a transaction exempt from registration. At May 31, 2020, the value of these securities amounted to $3,142,509, or 2.7% of net assets. |
(A.D.R.) | American Depositary Receipts. | |
(G.D.R.) | Global Depositary Receipts. | |
(a) | Non-income producing security. | |
(b) | Security issued with a zero coupon. Income is recognized through accretion of discount. |
(c) | Distribution of Investments by country of domicile (excluding temporary cash investments) as a percentage of total investments in securities, is as follows: |
| Japan | 17.2% |
| United Kingdom | 15.2 |
| France | 11.1 |
| Switzerland | 9.9 |
| Germany | 9.2 |
| Netherlands | 6.5 |
| Ireland | 6.1 |
| China | 5.5 |
| South Korea | 5.5 |
| United States | 5.3 |
| Taiwan | 3.8 |
| Russia | 1.7 |
| Luxembourg | 1.4 |
| Singapore | 1.3 |
| Other (individually less than 1%) | 0.3 |
| | 100.0% |
| | | | | | | | | | | | | |
FORWARD FOREIGN CURRENCY EXCHANGE CONTRACTS
| |
| | | | | | | | | | | | | |
| | In | | | | | | | | | Unrealized | |
| Currency | | Exchange | | Currency | | | | | Settlement | | Appreciation | |
| Purchased | | for | | Sold | | Deliver | | Counterparty | Date | | (Depreciation) | |
| JPY | | | 357,236,250 | | USD | | | (3,284,200 | ) | Citibank NA | 8/24/20 | | $ | 34,405 | |
| USD | | | 3,298,200 | | JPY | | | (357,236,250 | ) | Citibank NA | 8/24/20 | | | (20,406 | ) |
| KRW | | | 4,185,930,000 | | USD | | | (3,448,048 | ) | JPMorgan | | | | | |
| | | | | | | | | | Chase | | | | | |
| | | | | | | | | | Bank NA | 8/24/20 | | | (61,076 | ) |
| USD | | | 3,348,744 | | KRW | | | (4,185,930,000 | ) | JPMorgan | | | | | |
| | | | | | | | | | Chase | | | | | |
| | | | | | | | | | Bank NA | 8/24/20 | | | (38,227 | ) |
| TOTAL FORWARD FOREIGN CURRENCY EXCHANGE CONTRACTS | | | $ | (85,304 | ) |
Principal amounts are denominated in U.S. dollars (“USD”) unless otherwise noted.
JPY — Japanese Yen
KRW — Korean Won
Purchases and sales of securities (excluding temporary cash investments) for the six months ended May 31, 2020, aggregated $41,876,121 and $42,740,245, respectively.
The Fund is permitted to engage in purchase and sale transactions (“cross trades”) with certain funds and accounts for which Amundi Pioneer Asset Management, Inc. (the “Adviser”) serves as the Fund’s investment adviser, as set forth in Rule 17a-7 under the Investment Company Act of 1940, pursuant to procedures adopted by the Board of Trustees. Under these procedures, cross trades are effected at current market prices. During the six months ended May 31, 2020, the Fund did not engage in any cross trade activity.
The accompanying notes are an integral part of these financial statements.
22 Pioneer International Equity Fund | Semiannual Report | 5/31/20
At May 31, 2020, the net unrealized appreciation on investments based on cost for federal tax purposes of $109,138,835 was as follows:
| | | | |
| Aggregate gross unrealized appreciation for all investments in which | | | |
| there is an excess of value over tax cost | | $ | 19,075,469 | |
| Aggregate gross unrealized depreciation for all investments in which | | | | |
| there is an excess of tax cost over value | | | (12,202,137 | ) |
| Net unrealized appreciation | | $ | 6,873,332 | |
Various inputs are used in determining the value of the Fund’s investments. These inputs are summarized in the three broad levels below.
Level 1 – quoted prices in active markets for identical securities.
Level 2 – other significant observable inputs (including quoted prices for similar securities, interest rates, prepayment speeds, credit risks, etc.). See Notes to Financial Statements — Note 1A.
Level 3 – significant unobservable inputs (including the Fund’s own assumptions in determining fair value of investments). See Notes to Financial Statements — Note 1A.
The following is a summary of the inputs used as of May 31, 2020, in valuing the Fund’s investments:
| | | | | | | | | | | | | |
| | Level 1 | | | Level 2 | | | Level 3 | | | Total | |
Common Stocks* | | | | | | | | | | | | |
| Consumer Discretionary | | $ | 760,691 | | | $ | — | | | $ | — | | | $ | 760,691 | |
| Health Care Equipment & | | | | | | | | | | | | | | | | |
| Supplies | | | 1,123,418 | | | | 6,113,707 | | | | — | | | | 7,237,125 | |
| Industrials | | | 907,786 | | | | — | | | | — | | | | 907,786 | |
| IT Services | | | 1,144,376 | | | | — | | | | — | | | | 1,144,376 | |
| Oil, Gas & Consumable Fuels | | | 576,420 | | | | — | | | | — | | | | 576,420 | |
| All Other Common Stocks | | | — | | | | 102,171,811 | | | | — | | | | 102,171,811 | |
U.S. Government and | | | | | | | | | | | | | | | | |
| Agency Obligations | | | — | | | | 3,299,262 | | | | — | | | | 3,299,262 | |
| Total Investments | | | | | | | | | | | | | | | | |
| in Securities | | $ | 4,512,691 | | | $ | 111,584,780 | | | $ | — | | | $ | 116,097,471 | |
| Other Financial Instruments | | | | | | | | | | | | | | | | |
| Net unrealized depreciation | | | | | | | | | | | | | | | | |
| on forward foreign currency | | | | | | | | | | | | | | | | |
| exchange contracts | | $ | — | | | $ | (85,304 | ) | | $ | — | | | $ | (85,304 | ) |
| Total Other Financial | | | | | | | | | | | | | | | | |
| Instruments | | $ | — | | | $ | (85,304 | ) | | $ | — | | | $ | (85,304 | ) |
* Securities are valued using inputs/data furnished by independent pricing services using fair value factors.
During the six months ended May 31, 2020, there were no transfers between Levels 1, 2 and 3.
The accompanying notes are an integral part of these financial statements.
Pioneer International Equity Fund | Semiannual Report | 5/31/20 23
| | |
Statement of Assets and Liabilities | 5/31/20 (unaudited) | |
|
| | |
| ASSETS: | | | |
| Investments in unaffiliated issuers, at value (cost $108,153,306) | | $ | 116,097,471 | |
| Cash | | | 1,678,708 | |
| Foreign currencies, at value (cost $149,607) | | | 149,814 | |
| Receivables — | | | | |
| Investment securities sold | | | 1,650,082 | |
| Fund shares sold | | | 9,484 | |
| Dividends | | | 809,638 | |
| Interest | | | 416 | |
| Due from the Adviser | | | 36,079 | |
| Other assets | | | 34,435 | |
| Total assets | | $ | 120,466,127 | |
| LIABILITIES: | | | | |
| Payables — | | | | |
| Investment securities purchased | | $ | 3,975,375 | |
| Fund shares repurchased | | | 26,852 | |
| Trustees’ fees | | | 3,934 | |
| Net unrealized depreciation on forward foreign currency | | | | |
| exchange contracts | | | 85,304 | |
| Due to affiliates | | | 36,013 | |
| Accrued expenses | | | 166,962 | |
| Total liabilities | | $ | 4,294,440 | |
| NET ASSETS: | | | | |
| Paid-in capital | | $ | 118,709,853 | |
| Distributable earnings (loss) | | | (2,538,166 | ) |
| Net assets | | $ | 116,171,687 | |
| NET ASSET VALUE PER SHARE: | | | | |
No par value (unlimited number of shares authorized) | | | | |
| Class A (based on $61,474,205/3,159,317 shares) | | $ | 19.46 | |
| Class C (based on $4,606,619/273,465 shares) | | $ | 16.85 | |
| Class Y (based on $50,090,863/2,573,525 shares) | | $ | 19.46 | |
| MAXIMUM OFFERING PRICE PER SHARE: | | | | |
| Class A (based on $19.46 net asset value per share/100%-5.75% | | | | |
| maximum sales charge) | | $ | 20.65 | |
The accompanying notes are an integral part of these financial statements.
24 Pioneer International Equity Fund | Semiannual Report | 5/31/20
| |
Statement of Operations (unaudited) |
| FOR THE SIX MONTHS ENDED 5/31/20 |
| | |
| INVESTMENT INCOME: | | | | | | |
| Dividends from unaffiliated issuers (net of foreign taxes | | | | | | |
| withheld $191,339) | | $ | 1,268,834 | | | | |
| Interest from unaffiliated issuers | | | 15,643 | | | | |
| Total investment income | | | | | | $ | 1,284,477 | |
| EXPENSES: | | | | | | | | |
| Management fees | | $ | 397,102 | | | | | |
| Administrative expense | | | 56,222 | | | | | |
| Transfer agent fees | | | | | | | | |
| Class A | | | 58,968 | | | | | |
| Class C | | | 5,544 | | | | | |
| Class Y | | | 2,427 | | | | | |
| Distribution fees | | | | | | | | |
| Class A | | | 81,956 | | | | | |
| Class C | | | 25,101 | | | | | |
| Shareowner communications expense | | | 39,942 | | | | | |
| Custodian fees | | | 13,131 | | | | | |
| Registration fees | | | 27,360 | | | | | |
| Professional fees | | | 29,435 | | | | | |
| Printing expense | | | 36,234 | | | | | |
| Pricing fees | | | 5,236 | | | | | |
| Trustees’ fees | | | 4,926 | | | | | |
| Miscellaneous | | | 5,158 | | | | | |
| Total expenses | | | | | | $ | 788,742 | |
| Less fees waived and expenses reimbursed by the Adviser | | | | | | | (179,856 | ) |
| Net expenses | | | | | | $ | 608,886 | |
| Net investment income | | | | | | $ | 675,591 | |
| REALIZED AND UNREALIZED GAIN (LOSS) ON INVESTMENTS: | | | | | | | | |
| Net realized gain (loss) on: | | | | | | | | |
| Investments in unaffiliated issuers | | $ | (4,298,709 | ) | | | | |
| Futures contracts | | | 360,869 | | | | | |
| Other assets and liabilities denominated in | | | | | | | | |
| foreign currencies | | | (45,689 | ) | | $ | (3,983,529 | ) |
| Change in net unrealized appreciation (depreciation) on: | | | | | | | | |
Investments in unaffiliated issuers
| | $ | (12,114,576 | ) | | | | |
| Forward foreign currency exchange contracts | | | (85,304 | ) | | | | |
| Other assets and liabilities denominated in | | | | | | | | |
| foreign currencies | | | 16,853 | | | $ | (12,183,027 | ) |
| Net realized and unrealized gain (loss) on investments | | | | | | $ | (16,166,556 | ) |
| Net decrease in net assets resulting from operations | | | | | | $ | (15,490,965 | ) |
The accompanying notes are an integral part of these financial statements.
Pioneer International Equity Fund | Semiannual Report | 5/31/20 25
Statements of Changes in Net Assets
| | | | | | | |
| | Six Months | | | | |
| | Ended | | | | |
| | 5/31/20 | | | Year Ended | |
| | (unaudited) | | | 11/30/19 | |
| FROM OPERATIONS: | | | | | | |
Net investment income (loss) | | $ | 675,591 | | | $ | 2,384,714 | |
Net realized gain (loss) on investments | | | (3,983,529 | ) | | | (4,487,219 | ) |
Change in net unrealized appreciation (depreciation) | | | | | | | | |
| on investments | | | (12,183,027 | ) | | | 14,275,785 | |
| Net increase (decrease) in net assets resulting | | | | | | | | |
| from operations | | $ | (15,490,965 | ) | | $ | 12,173,280 | |
| DISTRIBUTIONS TO SHAREOWNERS: | | | | | | | | |
| Class A ($0.42 and $0.57 per share, respectively) | | $ | (1,363,374 | ) | | $ | (1,900,257 | ) |
| Class C ($0.25 and $0.31 per share, respectively) | | | (71,663 | ) | | | (106,253 | ) |
| Class Y ($0.52 and $0.66 per share, respectively) | | | (1,272,588 | ) | | | (1,788,533 | ) |
| Total distributions to shareowners | | $ | (2,707,625 | ) | | $ | (3,795,043 | ) |
| FROM FUND SHARE TRANSACTIONS: | | | | | | | | |
Net proceeds from sales of shares | | $ | 6,790,206 | | | $ | 7,426,290 | |
Reinvestment of distributions | | | 2,604,503 | | | | 3,656,352 | |
Cost of shares repurchased | | | (8,773,748 | ) | | | (22,807,905 | ) |
| Net increase (decrease) in net assets resulting from | | | | | | | | |
| Fund share transactions | | $ | 620,961 | | | $ | (11,725,263 | ) |
| Net decrease in net assets | | $ | (17,577,629 | ) | | $ | (3,347,026 | ) |
| NET ASSETS: | | | | | | | | |
Beginning of period | | $ | 133,749,316 | | | $ | 137,096,342 | |
End of period | | $ | 116,171,687 | | | $ | 133,749,316 | |
The accompanying notes are an integral part of these financial statements.
26 Pioneer International Equity Fund | Semiannual Report | 5/31/20
| | | | | | | | | | | | | |
| | Six Months | | | Six Months | | | | | | | |
| | Ended | | | Ended | | | | | | | |
| | 5/31/20 | | | 5/31/20 | | | Year Ended | | | Year Ended | |
| | Shares | | | Amount | | | 11/30/19 | | | 11/30/19 | |
| | (unaudited) | | | (unaudited) | | | Shares | | | Amount | |
| Class A | | | | | | | | | | | | |
Shares sold | | | 126,115 | | | $ | 2,594,646 | | | | 251,835 | | | $ | 5,178,835 | |
Reinvestment of distributions | | | 58,183 | | | | 1,316,098 | | | | 94,701 | | | | 1,822,159 | |
Less shares repurchased | | | (285,276 | ) | | | (5,719,831 | ) | | | (514,792 | ) | | | (10,582,808 | ) |
| Net decrease | | | (100,978 | ) | | $ | (1,809,087 | ) | | | (168,256 | ) | | $ | (3,581,814 | ) |
| Class C | | | | | | | | | | | | | | | | |
Shares sold | | | 29,096 | | | $ | 509,352 | | | | 69,291 | | | $ | 1,234,965 | |
Reinvestment of distributions | | | 3,650 | | | | 71,663 | | | | 6,283 | | | | 106,253 | |
Less shares repurchased | | | (49,356 | ) | | | (843,180 | ) | | | (148,489 | ) | | | (2,679,182 | ) |
| Net decrease | | | (16,610 | ) | | $ | (262,165 | ) | | | (72,915 | ) | | $ | (1,337,964 | ) |
| Class Y | | | | | | | | | | | | | | | | |
Shares sold | | | 178,170 | | | $ | 3,686,208 | | | | 49,762 | | | $ | 1,012,490 | |
Reinvestment of distributions | | | 53,885 | | | | 1,216,742 | | | | 90,293 | | | | 1,727,940 | |
Less shares repurchased | | | (116,749 | ) | | | (2,210,737 | ) | | | (471,083 | ) | | | (9,545,915 | ) |
| Net increase/ (decrease) | | | 115,306 | | | $ | 2,692,213 | | | | (331,028 | ) | | $ | (6,805,485 | ) |
The accompanying notes are an integral part of these financial statements.
Pioneer International Equity Fund | Semiannual Report | 5/31/20 27
Financial Highlights
| | | | | | | | | | | | | | | | | | | |
| | Six Months | | | | | | | | | | | | | | | | |
| | Ended | | | Year | | | Year | | | Year | | | Year | | | Year | |
| | 5/31/20 | | | Ended | | | Ended | | | Ended | | | Ended | | | Ended | |
| | (unaudited) | | | 11/30/19 | | | 11/30/18 | | | 11/30/17 | | | 11/30/16* | | | 11/30/15* | |
| Class A | | | | | | | | | | | | | | | | | | |
Net asset value, beginning of period | | $ | 22.38 | | | $ | 20.97 | | | $ | 24.72 | | | $ | 19.45 | | | $ | 20.74 | | | $ | 22.34 | |
Increase (decrease) from investment operations: | | | | | | | | | | | | | | | | | | | | | | | | |
| Net investment income (loss) (a) | | $ | 0.10 | | | $ | 0.35 | | | $ | 0.37 | | | $ | 0.24 | | | $ | 0.21 | | | $ | 0.16 | |
| Net realized and unrealized gain (loss) on investments | | | (2.60 | ) | | | 1.63 | | | | (2.90 | ) | | | 5.21 | | | | (1.17 | ) | | | (0.53 | ) |
| Net increase (decrease) from investment operations | | $ | (2.50 | ) | | $ | 1.98 | | | $ | (2.53 | ) | | $ | 5.45 | | | $ | (0.96 | ) | | $ | (0.37 | ) |
Distributions to shareowners: | | | | | | | | | | | | | | | | | | | | | | | | |
| Net investment income | | $ | (0.42 | ) | | $ | (0.50 | ) | | $ | (0.45 | ) | | $ | (0.18 | ) | | $ | (0.33 | ) | | $ | (1.23 | ) |
| Net realized gain | | | — | | | | (0.07 | ) | | | (0.77 | ) | | | — | | | | — | | | | — | |
| Total distributions | | $ | (0.42 | ) | | $ | (0.57 | ) | | $ | (1.22 | ) | | $ | (0.18 | ) | | $ | (0.33 | ) | | $ | (1.23 | ) |
| Net increase (decrease) in net asset value | | $ | (2.92 | ) | | $ | 1.41 | | | $ | (3.75 | ) | | $ | 5.27 | | | $ | (1.29 | ) | | $ | (1.60 | ) |
Net asset value, end of period | | $ | 19.46 | | | $ | 22.38 | | | $ | 20.97 | | | $ | 24.72 | | | $ | 19.45 | | | $ | 20.74 | |
| Total return (b) | | | (11.43 | )%(c) | | | 9.85 | % | | | (10.46 | )% | | | 28.24 | % | | | (4.70 | )% | | | (1.69 | )% |
Ratio of net expenses to average net assets | | | 1.15 | %(d) | | | 1.15 | % | | | 1.23 | % | | | 1.38 | % | | | 1.45 | % | | | 1.45 | % |
Ratio of net investment income (loss) to average net assets | | | 0.94 | %(d) | | | 1.68 | % | | | 1.53 | % | | | 1.09 | % | | | 1.10 | % | | | 0.73 | % |
Portfolio turnover rate | | | 35 | %(c) | | | 28 | % | | | 41 | % | | | 36 | % | | | 41 | % | | | 49 | % |
Net assets, end of period (in thousands) | | $ | 61,474 | | | $ | 72,979 | | | $ | 71,885 | | | $ | 80,688 | | | $ | 65,844 | | | $ | 77,173 | |
Ratios with no waiver of fees and assumption of expenses by | | | | | | | | | | | | | | | | | | | | | | | | |
| the Adviser and no reduction for fees paid indirectly: | | | | | | | | | | | | | | | | | | | | | | | | |
| Total expenses to average net assets | | | 1.48 | %(d) | | | 1.50 | % | | | 1.54 | % | | | 1.59 | % | | | 1.68 | % | | | 1.71 | % |
| Net investment income (loss) to average net assets | | | 0.61 | %(d) | | | 1.33 | % | | | 1.22 | % | | | 0.88 | % | | | 0.87 | % | | | 0.47 | % |
* The Fund was audited by an independent registered public accounting firm other than Ernst & Young LLP.
(a) The per-share data presented above is based on the average shares outstanding for the period presented.
(b) Assumes initial investment at net asset value at the beginning of each period, reinvestment of all distributions, the complete redemption of the investment at net asset value at the end of each period and no sales charges. Total return would be reduced if sales charges were taken into account.
(c) Not annualized.
(d) Annualized.
The accompanying notes are an integral part of these financial statements.
28 Pioneer International Equity Fund | Semiannual Report | 5/31/20
| | | | | | | | | | | | | | | | | | | |
| | Six Months | | | | | | | | | | | | | | | | |
| | Ended | | | Year | | | Year | | | Year | | | Year | | | Year | |
| | 5/31/20 | | | Ended | | | Ended | | | Ended | | | Ended | | | Ended | |
| | (unaudited) | | | 11/30/19 | | | 11/30/18 | | | 11/30/17 | | | 11/30/16* | | | 11/30/15* | |
| Class C | | | | | | | | | | | | | | | | | | |
Net asset value, beginning of period | | $ | 19.35 | | | $ | 18.09 | | | $ | 21.52 | | | $ | 16.95 | | | $ | 18.13 | | | $ | 19.69 | |
Increase (decrease) from investment operations: | | | | | | | | | | | | | | | | | | | | | | | | |
| Net investment income (loss) (a) | | $ | 0.00(b | ) | | $ | 0.16 | | | $ | 0.15 | | | $ | 0.04 | | | $ | 0.03 | | | $ | (0.04 | ) |
| Net realized and unrealized gain (loss) on investments | | | (2.25 | ) | | | 1.41 | | | | (2.53 | ) | | | 4.55 | | | | (1.02 | ) | | | (0.46 | ) |
| Net increase (decrease) from investment operations | | $ | (2.25 | ) | | $ | 1.57 | | | $ | (2.38 | ) | | $ | 4.59 | | | $ | (0.99 | ) | | $ | (0.50 | ) |
Distributions to shareowners: | | | | | | | | | | | | | | | | | | | | | | | | |
| Net investment income | | $ | (0.25 | ) | | $ | (0.24 | ) | | $ | (0.28 | ) | | $ | (0.02 | ) | | $ | (0.19 | ) | | $ | (1.06 | ) |
| Net realized gain | | | — | | | | (0.07 | ) | | | (0.77 | ) | | | — | | | | — | | | | — | |
| Total distributions | | $ | (0.25 | ) | | $ | (0.31 | ) | | $ | (1.05 | ) | | $ | (0.02 | ) | | $ | (0.19 | ) | | $ | (1.06 | ) |
| Net increase (decrease) in net asset value | | $ | (2.50 | ) | | $ | 1.26 | | | $ | (3.34 | ) | | $ | 4.57 | | | $ | (1.18 | ) | | $ | (1.56 | ) |
Net asset value, end of period | | $ | 16.85 | | | $ | 19.35 | | | $ | 18.09 | | | $ | 21.52 | | | $ | 16.95 | | | $ | 18.13 | |
| Total return (c) | | | (11.82 | )%(d) | | | 8.93 | % | | | (11.22 | )% | | | 27.09 | % | | | (5.50 | )% | | | (2.58 | )% |
Ratio of net expenses to average net assets | | | 2.04 | %(e) | | | 1.99 | % | | | 2.09 | % | | | 2.26 | % | | | 2.35 | % | | | 2.35 | % |
Ratio of net investment income (loss) to average net assets | | | 0.03 | %(e) | | | 0.87 | % | | | 0.73 | % | | | 0.22 | % | | | 0.20 | % | | | (0.20 | )% |
Portfolio turnover rate | | | 35 | %(d) | | | 28 | % | | | 41 | % | | | 36 | % | | | 41 | % | | | 49 | % |
Net assets, end of period (in thousands) | | $ | 4,607 | | | $ | 5,614 | | | $ | 6,565 | | | $ | 11,072 | | | $ | 9,829 | | | $ | 11,981 | |
Ratios with no waiver of fees and assumption of expenses by | | | | | | | | | | | | | | | | | | | | | | | | |
| the Adviser and no reduction for fees paid indirectly: | | | | | | | | | | | | | | | | | | | | | | | | |
| Total expenses to average net assets | | | 2.28 | %(e) | | | 2.21 | % | | | 2.27 | % | | | 2.32 | % | | | 2.37 | % | | | 2.42 | % |
| Net investment income (loss) to average net assets | | | (0.21 | )%(e) | | | 0.65 | % | | | 0.55 | % | | | 0.16 | % | | | 0.18 | % | | | (0.27 | )% |
* The Fund was audited by an independent registered public accounting firm other than Ernst & Young LLP.
(a) The per-share data presented above is based on the average shares outstanding for the period presented.
(b) Amount rounds to less than $0.01 or ($0.01) per share.
(c) Assumes initial investment at net asset value at the beginning of each period, reinvestment of all distributions, the complete redemption of the investment at net asset value at the end of each period and no sales charges. Total return would be reduced if sales charges were taken into account.
(d) Not annualized.
(e) Annualized.
The accompanying notes are an integral part of these financial statements.
Pioneer International Equity Fund | Semiannual Report | 5/31/20 29
Financial Highlights (continued)
| | | | | | | | | | | | | | | | | | | |
| | Six Months | | | | | | | | | | | | | | | | |
| | Ended | | | Year | | | Year | | | Year | | | Year | | | Year | |
| | 5/31/20 | | | Ended | | | Ended | | | Ended | | | Ended | | | Ended | |
| | (unaudited) | | | 11/30/19 | | | 11/30/18 | | | 11/30/17 | | | 11/30/16* | | | 11/30/15* | |
| Class Y | | | | | | | | | | | | | | | | | | |
Net asset value, beginning of period | | $ | 22.44 | | | $ | 21.03 | | | $ | 24.79 | | | $ | 19.50 | | | $ | 20.81 | | | $ | 22.41 | |
Increase (decrease) from investment operations: | | | | | | | | | | | | | | | | | | | | | | | | |
| Net investment income (loss) (a) | | $ | 0.14 | | | $ | 0.44 | | | $ | 0.46 | | | $ | 0.33 | | | $ | 0.28 | | | $ | 0.25 | |
| Net realized and unrealized gain (loss) on investments | | | (2.60 | ) | | | 1.63 | | | | (2.91 | ) | | | 5.21 | | | | (1.17 | ) | | | (0.54 | ) |
| Net increase (decrease) from investment operations | | $ | (2.46 | ) | | $ | 2.07 | | | $ | (2.45 | ) | | $ | 5.54 | | | $ | (0.89 | ) | | $ | (0.29 | ) |
Distributions to shareowners: | | | | | | | | | | | | | | | | | | | | | | | | |
| Net investment income | | $ | (0.52 | ) | | $ | (0.59 | ) | | $ | (0.54 | ) | | $ | (0.25 | ) | | $ | (0.42 | ) | | $ | (1.31 | ) |
| Net realized gain | | | — | | | | (0.07 | ) | | | (0.77 | ) | | | — | | | | — | | | | — | |
| Total distributions | | $ | (0.52 | ) | | $ | (0.66 | ) | | $ | (1.31 | ) | | $ | (0.25 | ) | | $ | (0.42 | ) | | $ | (1.31 | ) |
| Net increase (decrease) in net asset value | | $ | (2.98 | ) | | $ | 1.41 | | | $ | (3.76 | ) | | $ | 5.29 | | | $ | (1.31 | ) | | $ | (1.60 | ) |
Net asset value, end of period | | $ | 19.46 | | | $ | 22.44 | | | $ | 21.03 | | | $ | 24.79 | | | $ | 19.50 | | | $ | 20.81 | |
| Total return (b) | | | (11.29 | )%(c) | | | 10.37 | % | | | (10.15 | )% | | | 28.76 | % | | | (4.34 | )% | | | (1.29 | )% |
Ratio of net expenses to average net assets | | | 0.70 | %(d) | | | 0.70 | % | | | 0.87 | % | | | 0.99 | % | | | 1.09 | % | | | 1.04 | % |
Ratio of net investment income (loss) to average net assets | | | 1.42 | %(d) | | | 2.14 | % | | | 1.91 | % | | | 1.48 | % | | | 1.45 | % | | | 1.16 | % |
Portfolio turnover rate | | | 35 | %(c) | | | 28 | % | | | 41 | % | | | 36 | % | | | 41 | % | | | 49 | % |
Net assets, end of period (in thousands) | | $ | 50,091 | | | $ | 55,156 | | | $ | 58,647 | | | $ | 93,627 | | | $ | 74,448 | | | $ | 84,957 | |
Ratios with no waiver of fees and assumption of expenses by | | | | | | | | | | | | | | | | | | | | | | | | |
| the Adviser and no reduction for fees paid indirectly: | | | | | | | | | | | | | | | | | | | | | | | | |
| Total expenses to average net assets | | | 0.95 | %(d) | | | 0.93 | % | | | 1.06 | % | | | 1.06 | % | | | 1.09 | % | | | 1.04 | % |
| Net investment income (loss) to average net assets | | | 1.17 | %(d) | | | 1.91 | % | | | 1.72 | % | | | 1.41 | % | | | 1.45 | % | | | 1.16 | % |
* The Fund was audited by an independent registered public accounting firm other than Ernst & Young LLP.
(a) The per-share data presented above is based on the average shares outstanding for the period presented.
(b) Assumes initial investment at net asset value at the beginning of each period, reinvestment of all distributions and the complete redemption of the investment at net asset value at the end of each period.
(c) Not annualized.
(d) Annualized.
The accompanying notes are an integral part of these financial statements.
30 Pioneer International Equity Fund | Semiannual Report | 5/31/20
Notes to Financial Statements |
5/31/20 (unaudited) 1. Organization and Significant Accounting Policies
Pioneer International Equity Fund (the “Fund”) is the sole portfolio comprising Pioneer Series Trust VIII, a Delaware statutory trust. The Fund is registered under the Investment Company Act of 1940 as a diversified, open-end management investment company. The investment objective of the Fund is long-term growth of capital.
The Fund offers four classes of shares designated as Class A, Class C, Class K and Class Y shares. Class K had not commenced operations as of May 31, 2020. Each class of shares represents an interest in the same portfolio of investments of the Fund and has identical rights (based on relative net asset values) to assets and liquidation proceeds. Share classes can bear different rates of class-specific fees and expenses such as transfer agent and distribution fees. Differences in class-specific fees and expenses will result in differences in net investment income and, therefore, the payment of different dividends from net investment income earned by each class. The Amended and Restated Declaration of Trust of the Fund gives the Board of Trustees the flexibility to specify either per-share voting or dollar-weighted voting when submitting matters for shareowner approval. Under per-share voting, each share of a class of the Fund is entitled to one vote. Under dollar-weighted voting, a shareowner’s voting power is determined not by the number of shares owned, but by the dollar value of the shares on the record date. Each share class has exclusive voting rights with respect to matters affecting only that class, including with respect to the distribution plan for that class. There is no distribution plan for Class Y shares.
Amundi Pioneer Asset Management, Inc., an indirect, wholly owned subsidiary of Amundi and Amundi’s wholly owned subsidiary, Amundi USA, Inc., serves as the Fund’s investment adviser (the “Adviser”). Amundi Pioneer Distributor, Inc., an affiliate of Amundi Pioneer Asset Management, Inc., serves as the Fund’s distributor (the “Distributor”).
In August 2018, the Securities and Exchange Commission (“SEC”) released a Disclosure Update and Simplification Final Rule. The Final Rule amends Regulation S-X disclosures requirements to conform them to U.S. Generally Accepted Accounting Principles (“U.S. GAAP”) for investment companies. The Fund’s financial statements were prepared in compliance with the new amendments to Regulation S-X.
The Fund is an investment company and follows investment company accounting and reporting guidance under U.S. GAAP. U.S. GAAP requires the management of the Fund to make estimates and assumptions that affect the
Pioneer International Equity Fund | Semiannual Report | 5/31/20 31
reported amounts of assets and liabilities, the disclosure of contingent assets and liabilities at the date of the financial statements, and the reported amounts of income, expenses and gain or loss on investments during the reporting period. Actual results could differ from those estimates.
The following is a summary of significant accounting policies followed by the Fund in the preparation of its financial statements:
A. Security Valuation
The net asset value of the Fund is computed once daily, on each day the New York Stock Exchange (“NYSE”) is open, as of the close of regular trading on the NYSE.
Equity securities that have traded on an exchange are valued by using the last sale price on the principal exchange where they are traded. Equity securities that have not traded on the date of valuation, or securities for which sale prices are not available, generally are valued using the mean between the last bid and asked prices or, if both last bid and asked prices are not available, at the last quoted bid price. Last sale and bid and asked prices are provided by independent third party pricing services. In the case of equity securities not traded on an exchange, prices are typically determined by independent third party pricing services using a variety of techniques and methods.
The principal exchanges and markets for non-U.S. equity securities have closing times prior to the close of the NYSE. However, the value of these securities may be influenced by changes in global markets occurring after the closing times of the local exchanges and markets up to the time the Fund determines its net asset value. Consequently, the Fund uses a fair value model developed by an independent pricing service to value non-U.S. equity securities. On a daily basis, the pricing service recommends changes, based on a proprietary model, to the closing market prices of each non-U.S. security held by the Fund to reflect the security’s fair value at the time the Fund determines its net asset value. The Fund applies these recommendations in accordance with procedures approved by the Board of Trustees.
Fixed-income securities are valued by using prices supplied by independent pricing services, which consider such factors as market prices, market events, quotations from one or more brokers, Treasury spreads, yields, maturities and ratings, or may use a pricing matrix or other fair value methods or techniques to provide an estimated value of the security or instrument. A pricing matrix is a means of valuing a debt security on the basis of current market prices for other debt securities, historical trading patterns in the market for fixed-income securities and/or other factors. Non-U.S. debt securities that are listed on an
32 Pioneer International Equity Fund | Semiannual Report | 5/31/20
exchange will be valued at the bid price obtained from an independent third party pricing service. When independent third party pricing services are unable to supply prices, or when prices or market quotations are considered to be unreliable, the value of that security may be determined using quotations from one or more broker-dealers.
Forward foreign currency exchange contracts are valued daily using the foreign exchange rate or, for longer term forward contract positions, the spot currency rate and the forward points on a daily basis, in each case provided by a third party pricing service. Contracts whose forward settlement date falls between two quoted days are valued by interpolation.
Futures contracts are generally valued at the closing settlement price established by the exchange on which they are traded.
Securities for which independent pricing services or broker-dealers are unable to supply prices or for which market prices and/or quotations are not readily available or are considered to be unreliable are valued by a fair valuation team comprised of certain personnel of the Adviser pursuant to procedures adopted by the Fund’s Board of Trustees. The Adviser’s fair valuation team uses fair value methods approved by the Valuation Committee of the Board of Trustees. The Adviser’s fair valuation team is responsible for monitoring developments that may impact fair valued securities and for discussing and assessing fair values on an ongoing basis, and at least quarterly, with the Valuation Committee of the Board of Trustees.
Inputs used when applying fair value methods to value a security may include credit ratings, the financial condition of the company, current market conditions and comparable securities. The Fund may use fair value methods if it is determined that a significant event has occurred after the close of the exchange or market on which the security trades and prior to the determination of the Fund’s net asset value. Examples of a significant event might include political or economic news, corporate restructurings, natural disasters, terrorist activity or trading halts. Thus, the valuation of the Fund’s securities may differ significantly from exchange prices, and such differences could be material.
At May 31, 2020, no securities were valued using fair value methods (other than securities valued using prices supplied by independent pricing services, broker-dealers or using a third party insurance industry pricing model).
Pioneer International Equity Fund | Semiannual Report | 5/31/20 33
B. Investment Income and Transactions
Dividend income is recorded on the ex-dividend date, except that certain dividends from foreign securities where the ex-dividend date may have passed are recorded as soon as the Fund becomes aware of the ex-dividend data in the exercise of reasonable diligence.
Interest income, including interest on income-bearing cash accounts, is recorded on the accrual basis. Dividend and interest income are reported net of unrecoverable foreign taxes withheld at the applicable country rates and net of income accrued on defaulted securities.
Interest and dividend income payable by delivery of additional shares is reclassified as PIK (payment-in-kind) income upon receipt and is included in interest and dividend income, respectively.
Security transactions are recorded as of trade date. Gains and losses on sales of investments are calculated on the identified cost method for both financial reporting and federal income tax purposes.
C. Foreign Currency Translation
The books and records of the Fund are maintained in U.S. dollars. Amounts denominated in foreign currencies are translated into U.S. dollars using current exchange rates.
Net realized gains and losses on foreign currency transactions, if any, represent, among other things, the net realized gains and losses on foreign currency exchange contracts, disposition of foreign currencies and the difference between the amount of income accrued and the U.S. dollars actually received. Further, the effects of changes in foreign currency exchange rates on investments are not segregated on the Statement of Operations from the effects of changes in the market prices of those securities, but are included with the net realized and unrealized gain or loss on investments.
D. Federal Income Taxes
It is the Fund’s policy to comply with the requirements of the Internal Revenue Code applicable to regulated investment companies and to distribute all of its net taxable income and net realized capital gains, if any, to its shareowners. Therefore, no provision for federal income taxes is required. As of November 30, 2019, the Fund did not accrue any interest or penalties with respect to uncertain tax positions, which, if applicable, would be recorded as an income tax expense on the Statement of Operations. Tax returns filed within the prior three years remain subject to examination by federal and state tax authorities.
34 Pioneer International Equity Fund | Semiannual Report | 5/31/20
The amount and character of income and capital gain distributions to shareowners are determined in accordance with federal income tax rules, which may differ from U.S. GAAP. Distributions in excess of net investment income or net realized gains are temporary over distributions for financial statement purposes resulting from differences in the recognition or classification of income or distributions for financial statement and tax purposes. Capital accounts within the financial statements are adjusted for permanent book/tax differences to reflect tax character, but are not adjusted for temporary differences.
The tax character of current year distributions payable will be determined at the end of the current taxable year. The tax character of distributions paid during the year ended November 30, 2019 was as follows:
| | | | |
| | 2019 | |
| Distributions paid from: | | | |
Ordinary income | | $ | 3,392,583 | |
Long-term capital gain | | | 402,460 | |
| Total | | $ | 3,795,043 | |
The following shows the components of distributable earnings (losses) on a federal income tax basis at November 30, 2019:
| | | | |
| | 2019 | |
| Distributable earnings: | | | |
Undistributed ordinary income | | $ | 2,317,645 | |
Capital loss carryforward | | | (5,694,979 | ) |
Net unrealized appreciation | | | 19,037,758 | |
| Total | | $ | 15,660,424 | |
The difference between book-basis and tax-basis net unrealized appreciation is attributable to the tax deferral of losses on wash sales and adjustments relating to Passive Foreign Investment Companies (“PFICs”).
E. Fund Shares
The Fund records sales and repurchases of its shares as of trade date. The Distributor earned $4,211 in underwriting commissions on the sale of Class A shares during the six months ended May 31, 2020.
F. Class Allocations
Income, common expenses and realized and unrealized gains and losses are calculated at the Fund level and allocated daily to each class of shares based on its respective percentage of adjusted net assets at the beginning of the day.
Pioneer International Equity Fund | Semiannual Report | 5/31/20 35
Distribution fees are calculated based on the average daily net asset value attributable to Class A and Class C shares of the Fund, respectively (see Note 4). Class Y shares do not pay distribution fees. All expenses and fees paid to the Fund’s transfer agent for its services are allocated among the classes of shares based on the number of accounts in each class and the ratable allocation of related out-of-pocket expenses (see Note 3).
Distributions to shareowners are recorded as of the ex-dividend date. Distributions paid by the Fund with respect to each class of shares are calculated in the same manner and at the same time, except that net investment income dividends to Class A, Class C and Class Y shares can reflect different transfer agent and distribution expense rates.
G. Risks
The value of securities held by the Fund may go up or down, sometimes rapidly or unpredictably, due to general market conditions, such as real or perceived adverse economic, political or regulatory conditions, recessions, the spread of infectious illness or other public health issues, inflation, changes in interest rates, lack of liquidity in the bond markets or adverse investor sentiment. In the past several years, financial markets have experienced increased volatility, depressed valuations, decreased liquidity and heightened uncertainty. These conditions may continue, recur, worsen or spread. A general rise in interest rates could adversely affect the price and liquidity of fixed-income securities and could also result in increased redemptions from the Fund.
At times, the Fund’s investments may represent industries or industry sectors that are interrelated or have common risks, making the Fund more susceptible to any economic, political, or regulatory developments or other risks affecting those industries and sectors. The Fund’s investments in foreign markets and countries with limited developing markets may subject the Fund to a greater degree of risk than investments in a developed market. These risks include disruptive political or economic conditions and the imposition of adverse governmental laws or currency exchange restrictions. Lack of information and less market regulation also may affect the value of these securities. Withholding and other non-U.S. taxes may decrease the Fund’s return. Non-U.S. issuers may be located in parts of the world that have historically been prone to natural disasters. Investing in depositary receipts is subject to many of the same risks as investing directly in non-U.S. issuers. Depositary receipts may involve higher expenses and may trade at a discount (or premium) to the underlying security. A number of countries in the European Union (EU) have experienced, and may continue to experience, severe economic and financial difficulties. In addition, voters in the United Kingdom have approved withdrawal from the EU. Other countries may seek
36 Pioneer International Equity Fund | Semiannual Report | 5/31/20
to withdraw from the EU and/or abandon the euro, the common currency of the EU. The Fund may invest a substantial amount of its assets in issuers located in a limited number of countries and therefore is susceptible to adverse economic, political or regulatory developments affecting those countries.
With the increased use of technologies such as the Internet to conduct business, the Fund is susceptible to operational, information security and related risks. While the Fund’s Adviser has established business continuity plans in the event of, and risk management systems to prevent, limit or mitigate, such cyber-attacks, there are inherent limitations in such plans and systems, including the possibility that certain risks have not been identified. Furthermore, the Fund cannot control the cybersecurity plans and systems put in place by service providers to the Fund such as Brown Brothers Harriman & Co., the Fund’s custodian and accounting agent, and DST Asset Manager Solutions, Inc., the Fund’s transfer agent. In addition, many beneficial owners of Fund shares hold them through accounts at broker-dealers, retirement platforms and other financial market participants over which neither the Fund nor Amundi Pioneer exercises control. Each of these may in turn rely on service providers to them, which are also subject to the risk of cyber-attacks. Cybersecurity failures or breaches at Amundi Pioneer or the Fund’s service providers or intermediaries have the ability to cause disruptions and impact business operations, potentially resulting in financial losses, interference with the Fund’s ability to calculate its net asset value, impediments to trading, the inability of Fund shareowners to effect share purchases, redemptions or exchanges or receive distributions, loss of or unauthorized access to private shareowner information and violations of applicable privacy and other laws, regulatory fines, penalties, reputational damage, or additional compliance costs. Such costs and losses may not be covered under any insurance. In addition, maintaining vigilance against cyber-attacks may involve substantial costs over time, and system enhancements may themselves be subject to cyber-attacks.
COVID-19
The respiratory illness COVID-19 caused by a novel coronavirus has resulted in a global pandemic and major disruption to economies and markets around the world, including the United States. Global financial markets have experienced extreme volatility and severe losses, and trading in many instruments has been disrupted. Liquidity for many instruments has been greatly reduced for periods of time. Some interest rates are very low and in some cases yields are negative. Some sectors of the economy and individual issuers have experienced particularly large losses. These circumstances may continue for an extended period of time, and may continue to affect adversely
Pioneer International Equity Fund | Semiannual Report | 5/31/20 37
the value and liquidity of the Fund’s investments. The ultimate economic fallout from the pandemic, and the long-term impact on economies, markets, industries and individual issuers, are not known. Governments and central banks, including the Federal Reserve in the U.S., have taken extraordinary and unprecedented actions to support local and global economies and the financial markets. These actions have resulted in significant expansion of public debt, including in the U.S. The impact of these measures, and whether they will be effective to mitigate the economic and market disruption, will not be known for some time. The consequences of high public debt, including its future impact on the economy and securities markets, likewise may not be known for some time.
The Fund’s prospectus contains unaudited information regarding the Fund’s principal risks. Please refer to that document when considering the Fund’s principal risks.
H. Forward Foreign Currency Exchange Contracts
The Fund may enter into forward foreign currency exchange contracts (“contracts”) for the purchase or sale of a specific foreign currency at a fixed price on a future date. All contracts are marked-to-market daily at the applicable exchange rates, and any resulting unrealized appreciation or depreciation is recorded in the Fund’s financial statements. The Fund records realized gains and losses at the time a contract is offset by entry into a closing transaction or extinguished by delivery of the currency. Risks may arise upon entering into these contracts from the potential inability of counterparties to meet the terms of the contract and from unanticipated movements in the value of foreign currencies relative to the U.S. dollar (see Note 7).
During the six months ended May 31, 2020, the Fund had entered into various forward foreign currency exchange contracts that obligated the Fund to deliver or take delivery of currencies at specified future maturity dates. Alternatively, prior to the settlement date of a forward foreign currency exchange contract, the Fund may close out such contract by entering into an offsetting contract.
The average market value of forward foreign currency exchange contracts open during the six months ended May 31, 2020, was $(17,141). Open forward foreign currency exchange contracts outstanding at May 31, 2020, are listed in the Schedule of Investments.
I. Futures Contracts
The Fund may enter into futures transactions in order to attempt to hedge against changes in interest rates, securities prices and currency exchange rates or to seek to increase total return. Futures contracts are types of derivatives.
38 Pioneer International Equity Fund | Semiannual Report | 5/31/20
All futures contracts entered into by the Fund are traded on a futures exchange. Upon entering into a futures contract, the Fund is required to deposit with a broker an amount of cash or securities equal to the minimum “initial margin” requirements of the associated futures exchange. The amount of cash deposited with the broker as collateral at May 31, 2020, is recorded as “Futures collateral” on the Statement of Assets and Liabilities.
Subsequent payments for futures contracts (“variation margin”) are paid or received by the Fund, depending on the daily fluctuation in the value of the contracts, and are recorded by the Fund as unrealized appreciation or depreciation. Cash received from or paid to the broker related to previous margin movement is held in a segregated account at the broker and is recorded as either “Due from broker for futures” or “Due to broker for futures” on the Statement of Assets and Liabilities. When the contract is closed, the Fund realizes a gain or loss equal to the difference between the opening and closing value of the contract as well as any fluctuation in foreign currency exchange rates where applicable. Futures contracts are subject to market risk, interest rate risk and currency exchange rate risk. Changes in value of the contracts may not directly correlate to the changes in value of the underlying securities. With futures, there is reduced counterparty credit risk to the Fund since futures are exchange-traded and the exchange’s clearinghouse, as counterparty to all exchange-traded futures, guarantees the futures against default.
There were no open futures contracts outstanding at May 31, 2020.
2. Management Agreement
The Adviser manages the Fund’s portfolio. Effective October 1, 2018, management fees are calculated daily and paid monthly at the annual rate of 0.65% of the Fund’s average daily net assets up to $1 billion and 0.60% of the Fund’s average daily net assets over $1 billion. For the six months ended May 31, 2020, the effective management fee (excluding waivers and/or assumptions of expenses) was equivalent to 0.65% (annualized) of the Fund’s average daily net assets.
The Adviser has contractually agreed to limit ordinary operating expenses (ordinary operating expenses means all fund expenses other than extraordinary expenses, such as litigation, taxes, brokerage commissions and acquired fund fees and expenses) to the extent required to reduce Fund expenses to 1.15%, 2.15% and 0.70%, of the average daily net assets attributable to Class A, Class C and Class Y shares, respectively. These expense limitations will be in effect through April 1, 2021. There can be no assurance that the Adviser will extend the expense limitation agreement for a class of shares beyond the date referred to above.
Pioneer International Equity Fund | Semiannual Report | 5/31/20 39
Fees waived and expenses reimbursed during the six months ended May 31, 2020, are reflected on the Statement of Operations. In addition, under the management and administration agreements, certain other services and costs, including accounting, regulatory reporting and insurance premiums, are paid by the Fund as administrative reimbursements. Included in “Due to affiliates” reflected on the Statement of Assets and Liabilities is $33,284 in management fees, administrative costs and certain other reimbursements payable to the Adviser at May 31, 2020.
3. Transfer Agent
DST Asset Manager Solutions, Inc. serves as the transfer agent to the Fund at negotiated rates. Transfer agent fees and payables shown on the Statement of Operations and the Statement of Assets and Liabilities, respectively, include sub-transfer agent expenses incurred through the Fund’s omnibus relationship contracts.
In addition, the Fund reimbursed the transfer agent for out-of-pocket expenses incurred by the transfer agent related to shareowner communications activities such as proxy and statement mailings, and outgoing phone calls. For the six months ended May 31, 2020, such out-of-pocket expenses by class of shares were as follows:
| | | | |
| Shareowner Communications: | | | |
Class A | | $ | 36,819 | |
Class C | | | 3,123 | |
| Total | | $ | 39,942 | |
4. Distribution and Service Plans
The Fund has adopted a distribution plan (the “Plan”) pursuant to Rule 12b-1 of the Investment Company Act of 1940 with respect to its Class A and Class C shares. Pursuant to the Plan, the Fund pays the Distributor 0.25% of the average daily net assets attributable to Class A shares as compensation for personal services and/or account maintenance services or distribution services with regard to Class A shares. Pursuant to the Plan, the Fund also pays the Distributor 1.00% of the average daily net assets attributable to Class C shares. The fee for Class C shares consists of a 0.25% service fee and a 0.75% distribution fee paid as compensation for personal services and/or account maintenance services or distribution services with regard to Class C shares. Included in “Due to affiliates” reflected on the Statement of Assets and Liabilities is $2,729 in distribution fees payable to the Distributor at May 31, 2020.
In addition, redemptions of Class A and Class C shares may be subject to a contingent deferred sales charge (“CDSC”). A CDSC of 1.00% may be imposed on redemptions of certain net asset value purchases of Class A
40 Pioneer International Equity Fund | Semiannual Report | 5/31/20
shares within 12 months of purchase. Redemptions of Class C shares within 12 months of purchase are subject to a CDSC of 1.00%, based on the lower of cost or market value of shares being redeemed. Shares purchased as part of an exchange remain subject to any CDSC that applied to the original purchase of those shares. There is no CDSC for Class Y shares. Proceeds from the CDSCs are paid to the Distributor. For the six months ended May 31, 2020, CDSCs in the amount of $481 were paid to the Distributor.
5. Line of Credit Facility
The Fund, along with certain other funds in the Pioneer Family of Funds (the “Funds”), participates in a committed, unsecured revolving line of credit facility. Borrowings are used solely for temporary or emergency purposes. The Fund may borrow up to the lesser of the amount available under the credit facility or the limits set for borrowing by the Fund’s prospectus and the 1940 Act. Effective March 11, 2020, the Fund participates in a facility in the amount of $300 million. Prior to March 11, 2020, the Fund participated in a facility in the amount of $25 million. Under such facility, depending on the type of loan, interest on borrowings is payable at the London Interbank Offered Rate (“LIBOR”) plus a credit spread. The Fund pays an annual commitment fee to participate in a credit facility.The commitment fee is allocated among participating Funds based on an allocation schedule set forth in the credit agreement. For the six months ended May 31, 2020, the Fund had no borrowings under the credit facility.
6. Master Netting Agreements
The Fund has entered into an International Swaps and Derivatives Association, Inc. Master Agreement (“ISDA Master Agreement”) or similar agreement with substantially all of its derivative counterparties. An ISDA Master Agreement is a bilateral agreement between the Fund and a counterparty that governs the trading of certain Over the Counter (“OTC”) derivatives and typically contains, among other things, close-out and set-off provisions which apply upon the occurrence of an event of default and/or a termination event as defined under the relevant ISDA Master Agreement. The ISDA Master Agreement may also give a party the right to terminate all transactions traded under such agreement if, among other things, there is deterioration in the credit quality of the other party.
Upon an event of default or a termination of the ISDA Master Agreement, the non-defaulting party has the right to close-out all transactions under such agreement and to net amounts owed under each transaction to determine one net amount payable by one party to the other. The right to close out and net payments across all transactions under the ISDA Master Agreement could result in a reduction of the Fund’s credit risk to its counterparty equal to any
Pioneer International Equity Fund | Semiannual Report | 5/31/20 41
amounts payable by the Fund under the applicable transactions, if any. However, the Fund’s right to set-off may be restricted or prohibited by the bankruptcy or insolvency laws of the particular jurisdiction to which each specific ISDA Master Agreement of each counterparty is subject.
The collateral requirements for derivatives transactions under an ISDA Master Agreement are governed by a credit support annex to the ISDA Master Agreement. Collateral requirements are generally determined at the close of business each day and are typically based on changes in market values for each transaction under an ISDA Master Agreement and netted into one amount for such agreement. Generally, the amount of collateral due from or to a counterparty is subject to threshold (a “minimum transfer amount”) before a transfer is required, which may vary by counterparty. Collateral pledged for the benefit of the Fund and/or counterparty is held in segregated accounts by the Fund’s custodian and cannot be sold, re-pledged, assigned or otherwise used while pledged. Cash that has been segregated to cover the Fund’s collateral obligations, if any, will be reported separately on the Statement of Assets and Liabilities as “Swaps collateral”. Securities pledged by the Fund as collateral, if any, are identified as such in the Schedule of Investments.
Financial instruments subject to an enforceable master netting agreement, such as an ISDA Master Agreement, have been offset on the Statement of Assets and Liabilities. The following charts show gross assets and liabilities of the Fund as of May 31, 2020.
| | | | | | | | | | | | | | | | |
| | Derivative | | | | | | | | | | | | | |
| | Assets | | | | | | | | | | | | | |
| | Subject to | | | Derivatives | | | Non-Cash | | | Cash | | | Net Amount | |
| | Master Netting | | | Available | | | Collateral | | | Collateral | | | of Derivative | |
| Counterparty | | Agreement | | | for Offset | | | Received (a) | | | Received (a) | | | Assets (b) | |
Citibank NA | | $ | 34,405 | | | $ | (20,406 | ) | | $ | — | | | $ | — | | | $ | 13,999 | |
JPMorgan Chase | | | | | | | | | | | | | | | | | | | | |
| Bank NA | | | — | | | | — | | | | — | | | | — | | | | — | |
| Total | | $ | 34,405 | | | $ | (20,406 | ) | | $ | — | | | $ | — | | | $ | 13,999 | |
| | |
| | Derivative | | | | | | | | | | | | | | | | | |
| | Liabilities | | | | | | | | | | | | | | | | | |
| | Subject to | | | Derivatives | | | Non-Cash | | | Cash | | | Net Amount | |
| | Master Netting | | | Available | | | Collateral | | | Collateral | | | of Derivative | |
| Counterparty | | Agreement | | | for Offset | | | Pledged (a) | | | Pledged (a) | | | Liabilities (c) | |
Citibank NA | | $ | 20,406 | | | $ | (20,406 | ) | | $ | — | | | $ | — | | | $ | — | |
JPMorgan Chase | | | | | | | | | | | | | | | | | | | | |
| Bank NA | | | 99,303 | | | | — | | | | — | | | | — | | | | 99,303 | |
| Total | | $ | 119,709 | | | $ | (20,406 | ) | | $ | — | | | $ | — | | | $ | 99,303 | |
(a) The amount presented here may be less than the total amount of collateral received/pledged as the net amount of derivative assets cannot be less than $0.
(b) Represents the net amount due from the counterparty in the event of default.
(c) Represents the net amount payable to the counterparty in the event of default.
42 Pioneer International Equity Fund | Semiannual Report | 5/31/20
7. Additional Disclosures about Derivative Instruments and Hedging Activities
The Fund’s use of derivatives may enhance or mitigate the Fund’s exposure to the following risks:
Interest rate risk relates to the fluctuations in the value of interest-bearing securities due to changes in the prevailing levels of market interest rates.
Credit risk relates to the ability of the issuer of a financial instrument to make further principal or interest payments on an obligation or commitment that it has to the Fund.
Foreign exchange rate risk relates to fluctuations in the value of an asset or liability due to changes in currency exchange rates.
Equity risk relates to the fluctuations in the value of financial instruments as a result of changes in market prices (other than those arising from interest rate risk or foreign exchange rate risk), whether caused by factors specific to an individual investment, its issuer, or all factors affecting all instruments traded in a market or market segment.
Commodity risk relates to the risk that the value of a commodity or commodity index will fluctuate based on increases or decreases in the commodities market and factors specific to a particular industry or commodity.
The fair value of open derivative instruments (not considered to be hedging instruments for accounting disclosure purposes) by risk exposure at May 31, 2020, was as follows:
| | | | | | | | | | | | | | | | |
| | | | | | | | Foreign | | | | | | | |
| Statement of Assets | | Interest | | | Credit | | | Exchange | | | Equity | | | Commodity | |
| and Liabilities | | Rate Risk | | | Risk | | | Rate Risk | | | Risk | | | Risk | |
| Liabilities | | | | | | | | | | | | | | | |
| Net unrealized appreciation | | | | | | | | | | | | | | | |
| on forward foreign currency | | | | | | | | | | | | | | | |
| exchange contracts | | $ | — | | | $ | — | | | $ | 85,304 | | | $ | — | | | $ | — | |
| Total Value | | $ | — | | | $ | — | | | $ | 85,304 | | | $ | — | | | $ | — | |
Pioneer International Equity Fund | Semiannual Report | 5/31/20 43
The effect of derivative instruments (not considered to be hedging instruments for accounting disclosure purposes) on the Statement of Operations by risk exposure at May 31, 2020, was as follows:
| | | | | | | | | | | | | | | | |
| | | | | | | | Foreign | | | | | | | |
| Statement of | | Interest | | | Credit | | | Exchange | | | Equity | | | Commodity | |
| Operations | | Rate Risk | | | Risk | | | Rate Risk | | | Risk | | | Risk | |
| Net realized gain (loss) on: | | | | | | | | | | | | | | | |
| Futures contracts | | $ | — | | | $ | — | | | $ | — | | | $ | 360,869 | | | $ | — | |
| Total Value | | $ | — | | | $ | — | | | $ | — | | | $ | 360,869 | | | $ | — | |
| Change in net unrealized | | | | | | | | | | | | | | | | | | | | |
| appreciation (depreciation) on: | | | | | | | | | | | | | | | | | | | | |
| Forward foreign currency | | | | | | | | | | | | | | | | | | | | |
| exchange contracts | | $ | — | | | $ | — | | | $ | (85,304 | ) | | $ | — | | | $ | — | |
| Total Value | | $ | — | | | $ | — | | | $ | (85,304 | ) | | $ | — | | | $ | — | |
44 Pioneer International Equity Fund | Semiannual Report | 5/31/20
Trustees, Officers and Service Providers
| | |
| Trustees | Officers |
Thomas J. Perna, Chairman | Lisa M. Jones, President and |
John E. Baumgardner, Jr. | Chief Executive Officer |
Diane Durnin | Mark E. Bradley, Treasurer and |
Benjamin M. Friedman | Chief Financial and |
Lisa M. Jones | Accounting Officer |
Lorraine H. Monchak | Christopher J. Kelley, Secretary and |
Marguerite A. Piret | Chief Legal Officer |
Fred J. Ricciardi | |
Kenneth J. Taubes | |
Investment Adviser and Administrator
Amundi Pioneer Asset Management, Inc.
Custodian and Sub-Administrator
Brown Brothers Harriman & Co.
Principal Underwriter
Amundi Pioneer Distributor, Inc.
Legal Counsel
Morgan, Lewis & Bockius LLP
Transfer Agent
DST Asset Manager Solutions, Inc.
Proxy Voting Policies and Procedures of the Fund are available without charge, upon request, by calling our toll free number (1-800-225-6292). Information regarding how the Fund voted proxies relating to portfolio securities during the most recent 12-month period ended June 30 is publicly available to shareowners at www.amundipioneer.com/us. This information is also available on the Securities and Exchange Commission’s web site at www.sec.gov.
Pioneer International Equity Fund | Semiannual Report | 5/31/20 45
This page was intentionally left blank.
46 Pioneer International Equity Fund | Semiannual Report | 5/31/20
This page was intentionally left blank.
Pioneer International Equity Fund | Semiannual Report | 5/31/20 47
This page was intentionally left blank.
48 Pioneer International Equity Fund | Semiannual Report | 5/31/20
This page was intentionally left blank.
Pioneer International Equity Fund | Semiannual Report | 5/31/20 49
This page was intentionally left blank.
50 Pioneer International Equity Fund | Semiannual Report | 5/31/20
This page was intentionally left blank.
Pioneer International Equity Fund | Semiannual Report | 5/31/20 51
This page was intentionally left blank.
52 Pioneer International Equity Fund | Semiannual Report | 5/31/20
How to Contact Amundi Pioneer
We are pleased to offer a variety of convenient ways for you to contact us for assistance or information.
| | |
| Call us for: | |
Account Information, including existing accounts, | |
new accounts, prospectuses, applications | |
and service forms | 1-800-225-6292 |
| | |
FactFoneSM for automated fund yields, prices, | |
account information and transactions | 1-800-225-4321 |
| | |
| Retirement plans information | 1-800-622-0176 |
|
| Write to us: | |
Amundi Pioneer | |
P.O. Box 219427 | |
Kansas City, MO 64121-9427 | |
| | |
| Our toll-free fax | 1-800-225-4240 |
| | |
| Our internet e-mail address | us.askamundipioneer@amundipioneer.com
|
(for general questions about Amundi Pioneer only) | |
|
| Visit our web site: www.amundipioneer.com/us | |
This report must be preceded or accompanied by a prospectus.
The Fund files a complete schedule of portfolio holdings with the Securities and Exchange Commission for the first and third quarters of each fiscal year as an exhibit to its reports on Form N-PORT. Shareholders may view the filed Form N-PORT by visiting the Commission’s web site at https://www.sec.gov.
Amundi Pioneer Asset Management Inc.
60 State Street
Boston, MA 02109
www.amundipioneer.com/us
Securities offered through Amundi Pioneer Distributor, Inc.
60 State Street, Boston, MA 02109
Underwriter of Pioneer Mutual Funds, Member SIPC
© 2020 Amundi Pioneer Asset Management 19390-14-0720
ITEM 2. CODE OF ETHICS.
(a) Disclose whether, as of the end of the period covered by the report, the registrant has adopted a code of ethics that applies to the registrant’s principal executive officer, principal financial officer, principal accounting officer or controller, or persons performing similar functions, regardless of whether these individuals are employed by the registrant or a third party. If the registrant has not adopted such a code of ethics, explain why it has not done so.
The registrant has adopted, as of the end of the period covered by this report, a code of ethics that applies to the registrant’s principal executive officer, principal financial officer, principal accounting officer and controller.
(b) For purposes of this Item, the term “code of ethics” means written standards that are reasonably designed to deter wrongdoing and to promote:
(1) Honest and ethical conduct, including the ethical handling of actual or apparent conflicts of interest between personal and professional relationships;
(2) Full, fair, accurate, timely, and understandable disclosure in reports and documents that a registrant files with, or submits to, the Commission and in other public communications made by the registrant;
(3) Compliance with applicable governmental laws, rules, and regulations;
(4) The prompt internal reporting of violations of the code to an appropriate person or persons identified in the code; and
(5) Accountability for adherence to the code.
(c) The registrant must briefly describe the nature of any amendment, during the period covered by the report, to a provision of its code of ethics that applies to the registrant’s principal executive officer, principal financial officer, principal accounting officer or controller, or persons performing similar functions, regardless of whether these individuals are employed by the registrant or a third party, and that relates to any element of the code of ethics definition enumerated in paragraph (b) of this Item. The registrant must file a copy of any such amendment as an exhibit pursuant to Item 10(a), unless the registrant has elected to satisfy paragraph (f) of this Item by posting its code of ethics on its website pursuant to paragraph (f)(2) of this Item, or by undertaking to provide its code of ethics to any person without charge, upon request, pursuant to paragraph (f)(3) of this Item.
The registrant has made no amendments to the code of ethics during the period covered by this report.
(d) If the registrant has, during the period covered by the report, granted a waiver, including an implicit waiver, from a provision of the code of ethics to the registrant’s principal executive officer, principal financial officer, principal accounting officer or controller, or persons performing similar functions, regardless of whether these individuals are employed by the registrant or a third party, that relates to one or more of the items set forth in paragraph (b) of this Item, the registrant must briefly describe the nature of the waiver, the name of the person to whom the waiver was granted, and the date of the waiver.
Not applicable.
(e) If the registrant intends to satisfy the disclosure requirement under paragraph (c) or (d) of this Item regarding an amendment to, or a waiver from, a provision of its code of ethics that applies to the registrant’s principal executive officer, principal financial officer, principal accounting officer or controller, or persons performing similar functions and that relates to any element of the code of ethics definition enumerated in paragraph (b) of this Item by posting such information on its Internet website, disclose the registrant’s Internet address and such intention.
Not applicable.
(f) The registrant must:
(1) File with the Commission, pursuant to Item 12(a)(1), a copy of its code of ethics that applies to the registrant’s principal executive officer, principal financial officer, principal accounting officer or controller, or persons performing similar functions, as an exhibit to its annual report on this Form N-CSR (see attachment);
(2) Post the text of such code of ethics on its Internet website and disclose, in its most recent report on this Form N-CSR, its Internet address and the fact that it has posted such code of ethics on its Internet website; or
(3) Undertake in its most recent report on this Form N-CSR to provide to any person without charge, upon request, a copy of such code of ethics and explain the manner in which such request may be made. See Item 10(2)
ITEM 3. AUDIT COMMITTEE FINANCIAL EXPERT.
(a) (1) Disclose that the registrant’s board of trustees has determined that the registrant either:
(i) Has at least one audit committee financial expert serving on its audit committee; or
(ii) Does not have an audit committee financial expert serving on its audit committee.
The registrant’s Board of Trustees has determined that the registrant has at least one audit committee financial expert.
(2) If the registrant provides the disclosure required by paragraph (a)(1)(i) of this Item, it must disclose the name of the audit committee financial expert and whether that person is “independent.” In order to be considered “independent” for purposes of this Item, a member of an audit committee may not, other than in his or her capacity as a member of the audit committee, the board of trustees, or any other board committee:
(i) Accept directly or indirectly any consulting, advisory, or other compensatory fee from the issuer; or
(ii) Be an “interested person” of the investment company as defined in Section 2(a)(19) of the Act (15 U.S.C. 80a-2(a)(19)).
Mr. Fred J. Ricciardi, an independent trustee, is such an audit committee financial expert.
(3) If the registrant provides the disclosure required by paragraph (a)(1) (ii) of this Item, it must explain why it does not have an audit committee financial expert.
Not applicable.
ITEM 4. PRINCIPAL ACCOUNTANT FEES AND SERVICES.
(a) Disclose, under the caption AUDIT FEES, the aggregate fees billed for each of the last two fiscal years for professional services rendered by the principal accountant for the audit of the registrant’s annual financial statements or services that are normally provided by the accountant in connection with statutory and regulatory filings or engagements for those fiscal years.
N/A
(b) Disclose, under the caption AUDIT-RELATED FEES, the aggregate fees billed in each of the last two fiscal years for assurance and related services by the principal accountant that are reasonably related to the performance of the audit of the registrant’s financial statements and are not reported under paragraph (a) of this Item. Registrants shall describe the nature of the services comprising the fees disclosed under this category.
N/A
(c) Disclose, under the caption TAX FEES, the aggregate fees billed in each of the last two fiscal years for professional services rendered by the principal accountant for tax compliance, tax advice, and tax planning. Registrants shall describe the nature of the services comprising the fees disclosed under this category.
N/A
(d) Disclose, under the caption ALL OTHER FEES, the aggregate fees billed in each of the last two fiscal years for products and services provided by the principal accountant, other than the services reported in paragraphs (a) through (c) of this Item. Registrants shall describe the nature of the services comprising the fees disclosed under this category.
N/A
(e) (1) Disclose the audit committee’s pre-approval policies and procedures described in paragraph (c)(7) of Rule 2-01 of Regulation S-X.
PIONEER FUNDS
APPROVAL OF AUDIT, AUDIT-RELATED, TAX AND OTHER SERVICES
PROVIDED BY THE INDEPENDENT AUDITOR
SECTION I - POLICY PURPOSE AND APPLICABILITY
The Pioneer Funds recognize the importance of maintaining the independence of their outside auditors. Maintaining independence is a shared responsibility involving Amundi Pioneer Asset Management, Inc, the audit committee and the independent auditors.
The Funds recognize that a Fund’s independent auditors: 1) possess knowledge of the Funds, 2) are able to incorporate certain services into the scope of the audit, thereby avoiding redundant work, cost and disruption of Fund personnel and processes, and 3) have expertise that has value to the Funds. As a result, there are situations where it is desirable to use the Fund’s independent auditors for services in addition to the annual audit and where the potential for conflicts of interests are minimal. Consequently, this policy, which is intended to comply with Rule 210.2-01(C)(7), sets forth guidelines and procedures to be followed by the Funds when retaining the independent audit firm to perform audit, audit-related tax and other services under those circumstances, while also maintaining independence.
Approval of a service in accordance with this policy for a Fund shall also constitute approval for any other Fund whose pre-approval is required pursuant to Rule 210.2-01(c)(7)(ii).
In addition to the procedures set forth in this policy, any non-audit services that may be provided consistently with Rule 210.2-01 may be approved by the Audit Committee itself and any pre-approval that may be waived in accordance with Rule 210.2-01(c)(7)(i)(C) is hereby waived.
Selection of a Fund’s independent auditors and their compensation shall be determined by the Audit Committee and shall not be subject to this policy.
| | | |
| SECTION II - POLICY |
| |
SERVICE CATEGORY | SERVICE CATEGORY DESCRIPTION | SPECIFIC PRE-APPROVED SERVICE SUBCATEGORIES |
| | | |
I. AUDIT SERVICES | Services that are directly | o Accounting research assistance |
| | related to performing the | o SEC consultation, registration |
| | independent audit of the Funds | statements, and reporting |
| | | o Tax accrual related matters |
| | | o Implementation of new accounting standards |
| | | o Compliance letters (e.g. rating agency letters) |
| | | o Regulatory reviews and assistance |
| | | regarding financial matters |
| | | o Semi-annual reviews (if requested) |
| | | o Comfort letters for closed end offerings |
II. AUDIT-RELATED | Services which are not | o AICPA attest and agreed-upon procedures |
SERVICES | prohibited under Rule | o Technology control assessments |
| | 210.2-01(C)(4) (the “Rule”) | o Financial reporting control assessments |
| | and are related extensions of | o Enterprise security architecture |
| | the audit services support the | assessment |
| | audit, or use the knowledge/expertise | |
| | gained from the audit procedures as a | |
| | foundation to complete the project. | |
| | In most cases, if the Audit-Related | |
| | Services are not performed by the | |
| | Audit firm, the scope of the Audit | |
| | Services would likely increase. | |
| | The Services are typically well-defined | |
| | and governed by accounting | |
| | professional standards (AICPA, | |
| | SEC, etc.) | |
| | |
AUDIT COMMITTEE APPROVAL POLICY | AUDIT COMMITTEE REPORTING POLICY |
| o “One-time” pre-approval | o A summary of all such |
| for the audit period for all | services and related fees |
| pre-approved specific service | reported at each regularly |
| subcategories. Approval of the | scheduled Audit Committee |
| independent auditors as | meeting. |
| auditors for a Fund shall | |
| constitute pre approval for | |
| these services. | |
| |
| o “One-time” pre-approval | o A summary of all such |
| for the fund fiscal year within | services and related fees |
| a specified dollar limit | (including comparison to |
| for all pre-approved | specified dollar limits) |
| specific service subcategories | reported quarterly. |
| |
| o Specific approval is | |
| needed to exceed the | |
| pre-approved dollar limit for | |
| these services (see general | |
Audit Committee approval policy | |
| below for details on obtaining | |
| specific approvals) | |
| |
| o Specific approval is | |
| needed to use the Fund’s | |
| auditors for Audit-Related | |
| Services not denoted as | |
| “pre-approved”, or | |
| to add a specific service | |
| subcategory as “pre-approved” | |
SECTION III - POLICY DETAIL, CONTINUED
| | |
SERVICE CATEGORY | SERVICE CATEGORY DESCRIPTION | SPECIFIC PRE-APPROVED SERVICE |
| | | SUBCATEGORIES |
III. TAX SERVICES | Services which are not | o Tax planning and support |
| | prohibited by the Rule, | o Tax controversy assistance |
| | if an officer of the Fund | o Tax compliance, tax returns, excise |
| | determines that using the | tax returns and support |
| | Fund’s auditor to provide | o Tax opinions |
| | these services creates | |
| | significant synergy in | |
| | the form of efficiency, | |
| | minimized disruption, or | |
| | the ability to maintain a | |
| | desired level of | |
| | confidentiality. | |
| | |
| AUDIT COMMITTEE APPROVAL POLICY | AUDIT COMMITTEE REPORTING POLICY |
o “One-time” pre-approval | o A summary of |
for the fund fiscal year | all such services and |
within a specified dollar limit | related fees |
| | (including comparison |
| | to specified dollar |
| | limits) reported |
| | quarterly. |
| |
o Specific approval is | |
| needed to exceed the | |
| pre-approved dollar limits for | |
| these services (see general | |
| Audit Committee approval policy | |
| below for details on obtaining | |
| specific approvals) | |
| |
o Specific approval is | |
| needed to use the Fund’s | |
| auditors for tax services not | |
| denoted as pre-approved, or to | |
add a specific service subcategory as | |
| “pre-approved” | |
SECTION III - POLICY DETAIL, CONTINUED
| |
SERVICE CATEGORY | SERVICE CATEGORY DESCRIPTION | SPECIFIC PRE-APPROVED SERVICE |
| | | SUBCATEGORIES |
IV. OTHER SERVICES | Services which are not | o Business Risk Management support |
| | prohibited by the Rule, | o Other control and regulatory |
A. SYNERGISTIC, | if an officer of the Fund | compliance projects |
UNIQUE QUALIFICATIONS | determines that using the | |
| | Fund’s auditor to provide | |
| | these services creates | |
| | significant synergy in | |
| | the form of efficiency, | |
| | minimized disruption, | |
| | the ability to maintain a | |
| | desired level of | |
| | confidentiality, or where | |
| | the Fund’s auditors | |
| | posses unique or superior | |
| | qualifications to provide | |
| | these services, resulting | |
| | in superior value and | |
| | results for the Fund. | |
| | |
AUDIT COMMITTEE APPROVAL POLICY | AUDIT COMMITTEE REPORTING POLICY |
o “One-time” pre-approval | o A summary of |
| for the fund fiscal year within | all such services and |
| a specified dollar limit | related fees |
| | (including comparison |
| | to specified dollar |
| | limits) reported |
| | quarterly. |
o Specific approval is | |
| needed to exceed the | |
| pre-approved dollar limits for | |
| these services (see general | |
| Audit Committee approval policy | |
| below for details on obtaining | |
| specific approvals) | |
| |
o Specific approval is | |
| needed to use the Fund’s | |
| auditors for “Synergistic” or | |
| “Unique Qualifications” Other | |
| Services not denoted as | |
| pre-approved to the left, or to | |
| add a specific service | |
| subcategory as “pre-approved” | |
SECTION III - POLICY DETAIL, CONTINUED
| |
SERVICE CATEGORY | SERVICE CATEGORY DESCRIPTION | SPECIFIC PROHIBITED SERVICE |
| | | SUBCATEGORIES |
PROHIBITED SERVICES | Services which result | 1. Bookkeeping or other services |
| | in the auditors losing | related to the accounting records or |
| | independence status | financial statements of the audit |
| | under the Rule. | client* |
| | | 2. Financial information systems design |
| | | and implementation* |
| | | 3. Appraisal or valuation services, |
| | | fairness* opinions, or |
| | | contribution-in-kind reports |
| | | 4. Actuarial services (i.e., setting |
| | | actuarial reserves versus actuarial |
| | | audit work)* |
| | | 5. Internal audit outsourcing services* |
| | | 6. Management functions or human |
| | | resources |
| | | 7. Broker or dealer, investment |
| | | advisor, or investment banking services |
| | | 8. Legal services and expert services |
| | | unrelated to the audit |
| | | 9. Any other service that the Public |
| | | Company Accounting Oversight Board |
| | | determines, by regulation, is |
| | | impermissible |
| | |
AUDIT COMMITTEE APPROVAL POLICY | AUDIT COMMITTEE REPORTING POLICY |
o These services are not to be | o A summary of all |
| performed with the exception of the(*) | services and related |
| services that may be permitted | fees reported at each |
| if they would not be subject to audit | regularly scheduled |
| procedures at the audit client (as | Audit Committee meeting |
| defined in rule 2-01(f)(4)) level | will serve as continual |
| the firm providing the service. | confirmation that has |
| | not provided any |
| | restricted services. |
GENERAL AUDIT COMMITTEE APPROVAL POLICY:
o For all projects, the officers of the Funds and the Fund’s auditors will each make an assessment to determine that any proposed projects will not impair independence.
o Potential services will be classified into the four non-restricted service categories and the “Approval of Audit, Audit-Related, Tax and Other Services” Policy above will be applied. Any services outside the specific pre-approved service subcategories set forth above must be specifically approved by the Audit Committee.
o At least quarterly, the Audit Committee shall review a report summarizing the services by service category, including fees, provided by the Audit firm as set forth in the above policy.
(2) Disclose the percentage of services described in each of paragraphs (b) through (d) of this Item that were approved by the audit committee pursuant to paragraph (c)(7)(i)(C) of Rule 2-01 of Regulation S-X.
N/A
(f) If greater than 50 percent, disclose the percentage of hours expended on the principal accountants engagement to audit the registrant’s financial statements for the most recent fiscal year that were attributed to work performed by persons other than the principal accountant’s full-time, permanent employees.
N/A
(g) Disclose the aggregate non-audit fees billed by the registrants accountant for services rendered to the registrant, and rendered to the registrants investment adviser (not including any sub-adviser whose role is primarily portfolio management and is subcontracted with or overseen by another investment adviser), and any entity controlling, controlled by, or under common control with the adviser that provides ongoing services to the registrant for each of the last two fiscal years of the registrant.
N/A
(h) Disclose whether the registrants audit committee of the board of trustees has considered whether the provision of non-audit services that were rendered to the registrants investment adviser (not including any subadviser whose role is primarily portfolio management and is subcontracted with or overseen by another investment adviser), and any entity controlling, controlled by, or under common control with the investment adviser that provides ongoing services to the registrant that were not pre-approved pursuant to paragraph (c)(7)(ii) of Rule 2-01 of Regulation S-X is compatible with maintaining the principal accountant’s independence.
The Fund’s audit committee of the Board of Trustees has considered whether the provision of non-audit services that were rendered to the Affiliates (as defined) that were not pre- approved pursuant to paragraph (c)(7)(ii) of Rule 2-01 of Regulation S-X is compatible with maintaining the principal accountant’s independence.
ITEM 5. AUDIT COMMITTEE OF LISTED REGISTRANTS
(a) If the registrant is a listed issuer as defined in Rule 10A-3 under the Exchange Act (17 CFR 240.10A-3), state whether or not the registrant has a separately-designated standing audit committee established in accordance with Section 3(a)(58)(A) of the Exchange Act (15 U.S.C. 78c(a)(58)(A)). If the registrant has such a committee, however designated, identify each committee member. If the entire board of directors is acting as the registrant’s audit committee as specified in Section 3(a)(58)(B) of the Exchange Act (15 U.S.C. 78c(a)(58)(B)), so state.
N/A
(b) If applicable, provide the disclosure required by Rule 10A-3(d) under the Exchange Act (17 CFR 240.10A-3(d)) regarding an exemption from the listing standards for audit committees.
N/A
ITEM 6. SCHEDULE OF INVESTMENTS.
File Schedule of Investments in securities of unaffiliated issuers as of the close of the reporting period as set forth in 210.1212 of Regulation S-X [17 CFR 210.12-12], unless the schedule is included as part of the report to shareholders filed under Item 1 of this Form.
Included in Item 1
ITEM 7. DISCLOSURE OF PROXY VOTING POLICIES AND PROCEDURES FOR CLOSED-END MANAGEMENT INVESTMENT COMPANIES.
A closed-end management investment company that is filing an annual report on this Form N-CSR must, unless it invests exclusively in non-voting securities, describe the policies and procedures that it uses to determine how to vote proxies relating to portfolio securities, including the procedures that the company uses when a vote presents a conflict between the interests of its shareholders, on the one hand, and those of the company’s investment adviser; principal underwriter; or any affiliated person (as defined in Section 2(a)(3) of the Investment Company Act of 1940 (15 U.S.C. 80a-2(a)(3)) and the rules thereunder) of the company, its investment adviser, or its principal underwriter, on the other. Include any policies and procedures of the company’s investment adviser, or any other third party, that the company uses, or that are used on the company’s behalf, to determine how to vote proxies relating to portfolio securities.
N/A
ITEM 8. PORTFOLIO MANAGERS OF CLOSED-END MANAGEMENT INVESTMENT COMPANIES.
(a) If the registrant is a closed-end management investment company that is filing an annual report on this Form N-CSR, provide the following information:
(1) State the name, title, and length of service of the person or persons employed by or associated with the registrant or an investment adviser of the registrant who are primarily responsible for the day-to-day management of the registrant’s portfolio (“Portfolio Manager”). Also state each Portfolio Manager’s business experience during the past 5 years.
N/A
ITEM 9. PURCHASES OF EQUITY SECURITIES BY CLOSED-END MANAGEMENT INVESTMENT COMPANY AND AFFILIATED PURCHASERS.
(a) If the registrant is a closed-end management investment company, in the following tabular format, provide the information specified in paragraph (b) of this Item with respect to any purchase made by or on behalf of the registrant or any affiliated purchaser, as defined in Rule 10b-18(a)(3) under the Exchange Act (17 CFR 240.10b-18(a)(3)), of shares or other units of any class of the registrant’s equity securities that is registered by the registrant pursuant to Section 12 of the Exchange Act (15 U.S.C. 781).
N/A
ITEM 10. SUBMISSION OF MATTERS TO A VOTE OF SECURITY HOLDERS.
Describe any material changes to the procedures by which shareholders may recommend nominees to the registrant’s board of directors, where those changes were implemented after the registrant last provided disclosure in response to the requirements of Item 407(c)(2)(iv) of Regulation S-R(17 CFR 229.407)(as required by Item 22(b)(15)) of Schedule 14A (17 CFR 240.14a-101), or this Item.
There have been no material changes to the procedures by which the shareholders may recommend nominees to the registrant’s board of directors since the registrant last provided disclosure in response to the requirements of Item 407(c)(2)(iv) of Regulation S-R of Schedule 14(A) in its definitive proxy statement, or this item.
ITEM 11. CONTROLS AND PROCEDURES.
(a) Disclose the conclusions of the registrant’s principal executive and principal financials officers, or persons performing similar functions, regarding the effectiveness of the registrant’s disclosure controls and procedures (as defined in Rule 30a-3(c) under the Act (17 CFR 270.30a-3(c))) as of a date within 90 days of the filing date of the report that includes the disclosure required by this paragraph, based on the evaluation of these controls and procedures required by Rule 30a-3(b) under the Act (17 CFR 270.30(a)-3(b) and Rules 13a-15(b) or 15d-15(b) under the Exchange Act (17 CFR 240.13a-15(b) or 240.15d-15(b)).
The registrant’s principal executive officer and principal financial officer have concluded that the registrant’s disclosure controls and procedures are effective based on the evaluation of these controls and procedures as of a date within 90 days of the filing date of this report.
(b) Disclose any change in the registrant’s internal control over financial reporting (as defined in Rule 30a-3(d) under the Act (17CFR 270.30a-3(d)) that occured during the second fiscal quarter of the period covered by this report that has materially affected, or is reasonably likely to materially affect, the registrant’s internal control over financial reporting.
There were no significant changes in the registrant’s internal control over financial reporting that occurred during the second fiscal quarter of the period covered by this report that have materially affected, or are reasonably likely to materially affect, the registrant’s internal control over financial reporting.
Item 12. Disclosure of Securities Lending Activities for Closed-End Management Investment Companies.
(a) If the registrant is a closed-end management investment company, provide the following dollar amounts of income and compensation related to the securities lending activities of the registrant during its most recent fiscal year:
N/A
(1) Gross income from securities lending activities;
N/A
(2) All fees and/or compensation for each of the following securities lending activities and related services: any share of revenue generated by the securities lending program paid to the securities lending agent(s) (revenue split); fees paid for cash collateral management services (including fees deducted from a pooled cash collateral reinvestment vehicle) that are not included in the revenue split; administrative fees that are not included in the revenue split; fees for indemnification that are not included in the revenue split; rebates paid to borrowers; and any other fees relating to the securities lending program that are not included in the revenue split, including a description of those other fees;
N/A
(3) The aggregate fees/compensation disclosed pursuant to paragraph (2); and
N/A
(4) Net income from securities lending activities (i.e., the dollar amount in paragraph (1) minus the dollar amount in paragraph (3)).
If a fee for a service is included in the revenue split, state that the fee is included in the revenue split.
N/A
(b) If the registrant is a closed-end management investment company, describe the services provided to the registrant by the securities lending agent in the registrants most recent fiscal year.
N/A
ITEM 13. EXHIBITS.
(a) File the exhibits listed below as part of this Form. Letter or number the exhibits in the sequence indicated.
SIGNATURES
[See General Instruction F]
Pursuant to the requirements of the Securities Exchange Act of 1934 and the Investment Company Act of 1940, the registrant has duly caused this report to be signed on its behalf by the undersigned, thereunto duly authorized.
(Registrant) Pioneer Series Trust VIII
By (Signature and Title)* /s/ Lisa M. Jones
Lisa M. Jones, President & Chief Executive Officer
Date July 31, 2020
Pursuant to the requirements of the Securities Exchange Act of 1934 and the Investment Company Act of 1940, this report has been signed below by the following persons on behalf of the registrant and in the capacities and on the dates indicated.
By (Signature and Title)* /s/ Lisa M. Jones
Lisa M. Jones, President & Chief Executive Officer
Date July 31, 2020
By (Signature and Title)* /s/ Mark E. Bradley
Mark E. Bradley, Treasurer & Chief Accounting & Financial Officer
Date July 31, 2020
* Print the name and title of each signing officer under his or her signature.