| OMB APPROVAL | |
OMB Number: 3235-0570
Expires: July 31, 2022
Estimated average burden hours per response: 20.6 |
UNITED STATES
SECURITIES AND EXCHANGE COMMISSION
Washington, D.C. 20549
FORM N-CSR
CERTIFIED SHAREHOLDER REPORT OF REGISTERED
MANAGEMENT INVESTMENT COMPANIES
| Investment Company Act file number | 811-07324 |
Chesapeake Investment Trust
(Exact name of registrant as specified in charter)
| 285 Wilmington-West Chester Pike Chadds Ford, Pennsylvania | 19317 |
| (Address of principal executive offices) | (Zip code) |
| Capitol Services Inc. |
| 1675 S State Street, Suite B, Dover, DE 19901 |
| (Name and address of agent for service) |
With a copy to:
Jesse D. Hallee, Esq.
Ultimus Fund Solutions, LLC
225 Pictoria Drive, Suite 450
Cincinnati, Ohio 45246
and
John H. Lively, Esq.
Practus, LLP
11300 Tomahawk Creek Parkway, Suite 310
Leawood, KS 66211
| Registrant's telephone number, including area code: | (610) 558-2800 |
| Date of fiscal year end: | October 31, 2021 | |
| Date of reporting period: | October 31 |
Form N-CSR is to be used by management investment companies to file reports with the Commission not later than 10 days after the transmission to stockholders of any report that is required to be transmitted to stockholders under Rule 30e-1 under the Investment Company Act of 1940 (17 CFR 270.30e-1). The Commission may use the information provided on Form N-CSR in its regulatory, disclosure review, inspection, and policymaking roles.
A registrant is required to disclose the information specified by Form N-CSR, and the Commission will make this information public. A registrant is not required to respond to the collection of information contained in Form N-CSR unless the Form displays a currently valid Office of Management and Budget ("OMB") control number. Please direct comments concerning the accuracy of the information collection burden estimate and any suggestions for reducing the burden to the Secretary, Securities and Exchange Commission, 450 Fifth Street, NW, Washington, DC 20549-0609. The OMB has reviewed this collection of information under the clearance requirements of 44 U.S.C. § 3507.
| Item 1. | Reports to Stockholders. |
| (a) |
| The Chesapeake Growth Fund | |||||
| Annual Report | |||||
| October 31, 2021 | |||||
| Investment Advisor | Administrator | ||||
| Gardner Lewis Asset Management, L.P. | Ultimus Fund Solutions, LLC | ||||
| 285 Wilmington-West Chester Pike | P.O. Box 46707 | ||||
| Chadds Ford, Pennsylvania 19317 | Cincinnati, Ohio 45246-0707 | ||||
| www.chesapeakefunds.com | 1-800-430-3863 | ||||
| The Chesapeake Growth Fund | |
| Management Discussion of | |
| Fund Performance (Unaudited) | December 10, 2021 |
Market Environment: The year began strongly as tailwinds such as accommodating fiscal policy, historically low interest rates, improving employment trends, and rebounding corporate earnings propelled the market higher. These trends continued throughout the winter as the new administration quickly passed a $1.9 trillion dollar stimulus plan and COVID concerns waned (temporarily) as vaccines were approved, leading to increased consumer confidence and a surprisingly strong 8% increase in holiday spending. Conditions improved further into the spring as vaccination rates climbed and COVID cases fell, driving robust economic activity and leading the S&P 500 Index to a record fifth straight quarterly gain of more than 5%. The market’s advance began to slow into year-end as worries started to emerge, both new and old. Rising inflation, spurred by higher wages and commodity costs, caused the Federal Reserve (the “Fed”) to signal a shift in focus from solely fighting the negative effects of the pandemic to a more balanced approach, spurring concerns of increasing interest rates. Higher costs, along with emerging supply chain disruptions raised concerns that corporate earnings growth would slow. COVID also re-emerged as the Delta variant spread from India to the rest of the world while vaccination rates waned.
Outlook: As we enter the new year, the environment for equities is changing. Inflation is increasing and it is unclear whether such an increase is truly “transitory.” Moreover, the labor market is improving. These developments should allow the Fed to pivot from a purely accommodative policy, first by tapering open market bond purchases and, eventually, raising interest rates. COVID outbreaks and new variants such as Delta and Omicron also continue to periodically plague the markets. Partisan politics and regulatory changes are also on our radar. While Congress finally passed the bipartisan infrastructure bill it seems unlikely Washington will pass further stimulus. Higher taxes are also on the horizon under the new administration. Finally, but not new, our relationship with China remains volatile.
We continue to monitor these developments and adjust our portfolio accordingly. We believe stock selection will be key to outperformance going forward and will continue to concentrate our attention on those companies that should perform well regardless of current macroeconomic or geopolitical concerns. We are also focusing on companies that have modest direct exposure to inflationary pressures and maintain pricing power to accommodate rising costs. Most importantly, however, our team remains committed to identifying strong and durable businesses with underappreciated future growth prospects and compelling catalysts.
Portfolio Review: The total return for The Chesapeake Growth Fund (the “Fund”) for the fiscal year ended October 31, 2021 was 33.89%, versus 42.91% for the S&P 500 Total Return Index.
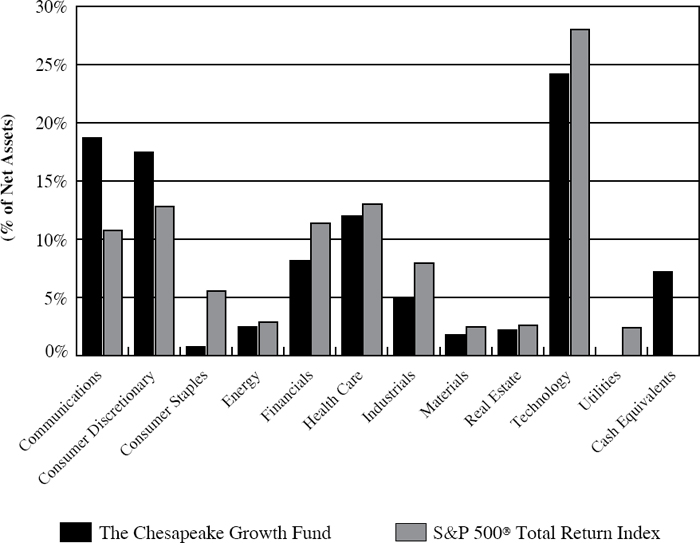
The following table breaks out the holdings of the Fund by economic sector and compares 2020 and 2021 fiscal year-end holdings to those of the Fund’s benchmark, the S&P 500 Total Return Index (the “S&P 500”).
| 10/31/2020 | 10/31/2021 | |||
| Economic Sector | S&P 500 | Fund | S&P 500 | Fund |
| Communications | 11% | 19% | 11% | 19% |
| Consumer Discretionary | 12% | 21% | 13% | 17% |
| Consumer Staples | 7% | 1% | 6% | 1% |
| Energy | 2% | 1% | 3% | 3% |
| Financials | 10% | 5% | 11% | 8% |
| Health Care | 14% | 14% | 13% | 12% |
| Industrials | 8% | 8% | 8% | 5% |
| Materials | 3% | 2% | 2% | 2% |
| Real Estate | 3% | 0% | 3% | 2% |
| Technology | 27% | 21% | 28% | 24% |
| Utilities | 3% | 0% | 2% | 0% |
The most significant sector shifts in the Fund during the fiscal year included a decrease in Consumer Discretionary, Health Care and Industrials and an increase in Energy, Financials, Technology and Real Estate.
During the Fund’s fiscal year, Technology, Communications, Financials, Health Care and Consumer Discretionary provided the largest positive contributions to overall returns. Consumer Staples provided negative contributions to overall returns.
The Fund’s most significant contributors to gains this fiscal year were Alphabet, Inc. (Communications), Bank of America Corp. (Financials), Goldman Sachs Group, Inc. (Financials), Apple, Inc. (Technology), and Pioneer Natural Resources Company (Energy).
The principal detractors were Alibaba Group Holdings, Ltd. (Consumer Discretionary), Las Vegas Sands Corp. (Consumer Discretionary), Boston Beer Company, Inc. (Consumer Staples), Spotify Technology S.A. (Communications), and TJX Company, Inc. (Consumer Discretionary).
Sincerely,

W. Whitfield Gardner
| The Chesapeake Growth Fund |
Comparison of the Change in Value of a $10,000 Investment
in The Chesapeake Growth Fund and the S&P 500® Total Return Index*
(Unaudited)
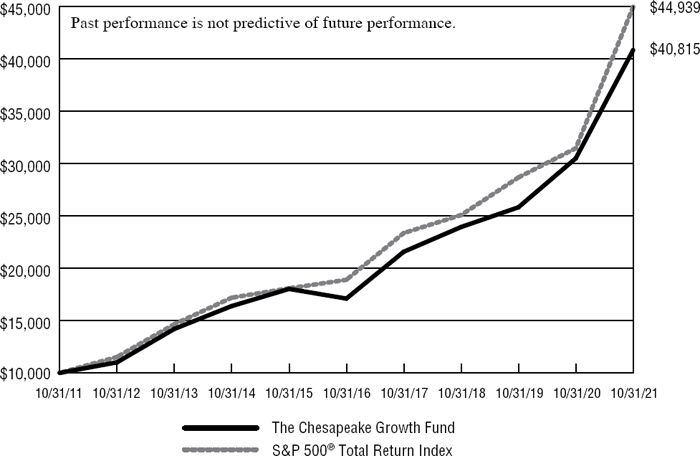
| Average Annual Total Returns (for years ended October 31, 2021) | ||||||||
| 1 Year | 5 Years | 10 Years | ||||||
| The Chesapeake Growth Fund(a) | 33.89% | 19.01% | 15.10% | |||||
| S&P 500® Total Return Index | 42.91% | 18.93% | 16.21% | |||||
| * | The S&P 500® Total Return Index is a market capitalization weighted index that is widely used as a barometer of U.S. stock market performance. The S&P 500® Total Return Index provides investors with a price-plus gross cash dividend return of the companies represented in the S&P 500® Index. The Index is unmanaged and shown for illustration purposes only. An investor cannot invest in an index and its returns are not indicative of the performance of any specific investment. |
| (a) | Total return is a measure of the change in value of an investment in the Fund over the periods covered, which assumes dividends or distributions, if any, are reinvested in shares of the Fund. The total returns in the table and graph above do not reflect the deduction of taxes a shareholder would pay on Fund distributions, if any, or the redemption of Fund shares. The expense ratio as disclosed in the February 28, 2021 prospectus was 1.83%. |
| The Chesapeake Growth Fund |
The Chesapeake Growth Fund vs S&P 500® Total Return Index
Sector Diversification
October 31, 2021 (Unaudited)
| Top Ten Equity Holdings October 31, 2021 (Unaudited) | |
| % of | |
| Security Description | Net Assets |
| Alphabet, Inc. - Class C | 6.4% |
| Apple, Inc. | 5.8% |
| Bank of America Corporation | 5.5% |
| Amazon.com, Inc. | 5.1% |
| NIKE, Inc. - Class B | 4.7% |
| Mastercard, Inc. - Class A | 4.6% |
| Humana, Inc. | 4.5% |
| Microsoft Corporation | 4.3% |
| salesforce.com, inc. | 4.0% |
| Take-Two Interactive Software, Inc. | 3.4% |
| The Chesapeake Growth Fund |
| Schedule of Investments |
| October 31, 2021 |
| Common Stocks — 92.8% | Shares | Value | ||||||
| Communications — 18.7% | ||||||||
| Entertainment Content — 5.5% | ||||||||
| Take-Two Interactive Software, Inc. * | 9,658 | $ | 1,748,098 | |||||
| Walt Disney Company (The) * | 6,050 | 1,022,874 | ||||||
| 2,770,972 | ||||||||
| Internet Media & Services — 13.2% | ||||||||
| Airbnb, Inc. - Class A * | 2,075 | 354,119 | ||||||
| Alphabet, Inc. - Class C * | 1,093 | 3,241,193 | ||||||
| Meta Platforms, Inc. - Class A * | 4,810 | 1,556,372 | ||||||
| Shopify, Inc. - Class A * | 1,055 | 1,547,400 | ||||||
| 6,699,084 | ||||||||
| Consumer Discretionary — 17.5% | ||||||||
| Apparel & Textile Products — 4.7% | ||||||||
| NIKE, Inc. - Class B | 14,298 | 2,391,912 | ||||||
| E-Commerce Discretionary — 5.5% | ||||||||
| Amazon.com, Inc. * | 761 | 2,566,419 | ||||||
| MercadoLibre, Inc. * | 145 | 214,748 | ||||||
| 2,781,167 | ||||||||
| Leisure Facilities & Services — 2.9% | ||||||||
| Chipotle Mexican Grill, Inc. * | 675 | 1,200,845 | ||||||
| McDonald’s Corporation | 1,045 | 256,600 | ||||||
| 1,457,445 | ||||||||
| Retail - Discretionary — 4.4% | ||||||||
| lululemon athletica, inc. * | 3,727 | 1,736,820 | ||||||
| TJX Companies, Inc. (The) | 7,580 | 496,414 | ||||||
| 2,233,234 | ||||||||
| Consumer Staples — 0.8% | ||||||||
| Household Products — 0.8% | ||||||||
| Estée Lauder Companies, Inc. (The) - Class A | 1,315 | 426,494 | ||||||
| Energy — 2.5% | ||||||||
| Oil & Gas Producers — 2.5% | ||||||||
| Pioneer Natural Resources Company | 6,819 | 1,275,017 | ||||||
| Financials — 8.2% | ||||||||
| Banking — 5.5% | ||||||||
| Bank of America Corporation | 58,482 | 2,794,270 | ||||||
| Institutional Financial Services — 2.7% | ||||||||
| Goldman Sachs Group, Inc. (The) | 3,285 | 1,357,855 | ||||||
| The Chesapeake Growth Fund |
| Schedule of Investments (Continued) |
| Common Stocks — 92.8% (Continued) | Shares | Value | ||||||
| Health Care — 12.0% | ||||||||
| Health Care Facilities & Services — 4.5% | ||||||||
| Humana, Inc. | 4,955 | $ | 2,294,958 | |||||
| Medical Equipment & Devices — 7.5% | ||||||||
| Agilent Technologies, Inc. | 1,930 | 303,956 | ||||||
| DexCom, Inc. * | 2,277 | 1,419,049 | ||||||
| Illumina, Inc. * | 1,853 | 769,106 | ||||||
| Intuitive Surgical, Inc. * | 3,582 | 1,293,567 | ||||||
| 3,785,678 | ||||||||
| Industrials — 4.9% | ||||||||
| Aerospace & Defense — 2.3% | ||||||||
| Boeing Company (The) * | 2,753 | 569,954 | ||||||
| TransDigm Group, Inc. * | 970 | 605,105 | ||||||
| 1,175,059 | ||||||||
| Commercial Support Services — 1.0% | ||||||||
| Republic Services, Inc. | 3,755 | 505,423 | ||||||
| Electrical Equipment — 0.6% | ||||||||
| AMETEK, Inc. | 2,265 | 299,886 | ||||||
| Transportation Equipment — 1.0% | ||||||||
| PACCAR, Inc. | 5,590 | 500,976 | ||||||
| Materials — 1.8% | ||||||||
| Chemicals — 1.8% | ||||||||
| Sherwin-Williams Company (The) | 2,853 | 903,288 | ||||||
| Real Estate — 2.2% | ||||||||
| REITs — 2.2% | ||||||||
| Simon Property Group, Inc. | 7,440 | 1,090,555 | ||||||
| Technology — 24.2% | ||||||||
| Semiconductors — 2.3% | ||||||||
| NXP Semiconductors N.V. | 5,921 | 1,189,292 | ||||||
| Software — 9.2% | ||||||||
| Microsoft Corporation | 6,540 | 2,168,795 | ||||||
| salesforce.com, inc. * | 6,778 | 2,031,299 | ||||||
| Unity Software, Inc. * | 3,030 | 458,469 | ||||||
| 4,658,563 | ||||||||
| Technology Hardware — 5.8% | ||||||||
| Apple, Inc. | 19,560 | 2,930,088 | ||||||
| The Chesapeake Growth Fund |
| Schedule of Investments (Continued) |
| Common Stocks — 92.8% (Continued) | Shares | Value | ||||||
| Technology — 24.2% (Continued) | ||||||||
| Technology Services — 6.9% | ||||||||
| Mastercard, Inc. - Class A | 6,891 | $ | 2,312,068 | |||||
| PayPal Holdings, Inc. * | 3,866 | 899,193 | ||||||
| Toast, Inc. - Class A * | 5,545 | 295,105 | ||||||
| 3,506,366 | ||||||||
| Total Common Stocks (Cost $29,533,072) | $ | 47,027,582 | ||||||
| Money Market Funds — 6.6% | Shares | Value | ||||||
| Fidelity Institutional Money Market Government Portfolio - Class I, 0.01% (a) (Cost $3,367,835) | 3,367,835 | $ | 3,367,835 | |||||
| Total Investments at Value — 99.4% (Cost $32,900,907) | $ | 50,395,417 | ||||||
| Other Assets in Excess of Liabilities — 0.6% | 295,007 | |||||||
| Total Net Assets — 100.0% | $ | 50,690,424 | ||||||
| * | Non-income producing security. |
| (a) | The rate shown is the 7-day effective yield as of October 31, 2021. |
See accompanying notes to financial statements.
| The Chesapeake Growth Fund |
| Statement of Assets and Liabilities |
| October 31, 2021 |
| ASSETS | ||||
| Investments in securities: | ||||
| At cost | $ | 32,900,907 | ||
| At value (Note 2) | $ | 50,395,417 | ||
| Receivable for capital shares sold | 3,265 | |||
| Receivable for investment securities sold | 910,338 | |||
| Dividends receivable | 3,064 | |||
| Other assets | 14,978 | |||
| TOTAL ASSETS | 51,327,062 | |||
| LIABILITIES | ||||
| Payable for investment securities purchased | 555,802 | |||
| Payable to Advisor (Note 5) | 41,701 | |||
| Payable to administrator (Note 5) | 5,000 | |||
| Accrued distribution and service plan fees (Note 5) | 3,890 | |||
| Accrued Trustees’ fees (Note 4) | 9,135 | |||
| Other accrued expenses | 21,110 | |||
| TOTAL LIABILITIES | 636,638 | |||
| NET ASSETS | $ | 50,690,424 | ||
| Net Assets consist of: | ||||
| Paid-in capital | $ | 31,184,199 | ||
| Accumulated earnings | 19,506,225 | |||
| NET ASSETS | $ | 50,690,424 | ||
| Shares of beneficial interest outstanding (unlimited number of shares authorized, no par value) | 872,832 | |||
| Net asset value, offering price and redemption price per share (Note 2) | $ | 58.08 | ||
See accompanying notes to financial statements.
| The Chesapeake Growth Fund |
| Statement of Operations |
| For the Year Ended October 31, 2021 |
| INVESTMENT INCOME | ||||
| Dividends (net of foreign withholding taxes of $1,924) | $ | 262,286 | ||
| EXPENSES | ||||
| Investment advisory fees (Note 5) | 468,260 | |||
| Administration fees (Note 5) | 60,058 | |||
| Compliance service fees (Note 5) | 60,000 | |||
| Distribution and service plan fees (Note 5) | 41,782 | |||
| Registration and filing fees | 30,098 | |||
| Legal fees | 26,056 | |||
| Trustees’ fees (Note 4) | 25,200 | |||
| Audit and tax services fees | 17,710 | |||
| Shareholder account maintenance fees | 16,451 | |||
| Custodian and bank service fees | 8,499 | |||
| Insurance expense | 8,037 | |||
| Postage and supplies | 5,242 | |||
| Printing of shareholder reports | 3,401 | |||
| Other expenses | 8,027 | |||
| TOTAL EXPENSES | 778,821 | |||
| NET INVESTMENT LOSS | (516,535 | ) | ||
| REALIZED AND UNREALIZED GAINS ON INVESTMENTS | ||||
| Net realized gains from investment transactions | 3,750,575 | |||
| Net change in unrealized appreciation (depreciation) on investments | 9,976,405 | |||
| NET REALIZED AND UNREALIZED GAINS ON INVESTMENTS | 13,726,980 | |||
| NET INCREASE IN NET ASSETS RESULTING FROM OPERATIONS | $ | 13,210,445 | ||
See accompanying notes to financial statements.
| The Chesapeake Growth Fund |
| Statements of Changes in Net Assets |
| Year | Year | |||||||
| Ended | Ended | |||||||
| October 31, | October 31, | |||||||
| 2021 | 2020 | |||||||
| FROM OPERATIONS | ||||||||
| Net investment loss | $ | (516,535 | ) | $ | (445,034 | ) | ||
| Net realized gains from investment transactions | 3,750,575 | 595,714 | ||||||
| Net change in unrealized appreciation (depreciation) on investments | 9,976,405 | 6,384,183 | ||||||
| Net increase in net assets resulting from operations | 13,210,445 | 6,534,863 | ||||||
| FROM CAPITAL SHARE TRANSACTIONS | ||||||||
| Proceeds from shares sold | 245,992 | 2,041,396 | ||||||
| Payments for shares redeemed | (2,561,607 | ) | (5,490,893 | ) | ||||
| Net decrease in net assets from capital share transactions | (2,315,615 | ) | (3,449,497 | ) | ||||
| TOTAL INCREASE IN NET ASSETS | 10,894,830 | 3,085,366 | ||||||
| NET ASSETS | ||||||||
| Beginning of year | 39,795,594 | 36,710,228 | ||||||
| End of year | $ | 50,690,424 | $ | 39,795,594 | ||||
| SUMMARY OF CAPITAL SHARE ACTIVITY | ||||||||
| Shares sold | 4,742 | 51,193 | ||||||
| Shares redeemed | (49,260 | ) | (133,376 | ) | ||||
| Net decrease in shares outstanding | (44,518 | ) | (82,183 | ) | ||||
| Shares outstanding, beginning of year | 917,350 | 999,533 | ||||||
| Shares outstanding, end of year | 872,832 | 917,350 | ||||||
See accompanying notes to financial statements.
| The Chesapeake Growth Fund |
| Financial Highlights |
| Per share data for a share outstanding throughout each year: |
| For the Years Ended October 31, | ||||||||||||||||||||
| 2021 | 2020 | 2019 | 2018 | 2017 | ||||||||||||||||
| Net asset value at beginning of year | $ | 43.38 | $ | 36.73 | $ | 34.05 | $ | 30.69 | $ | 24.33 | ||||||||||
| Income (loss) from investment operations: | ||||||||||||||||||||
| Net investment loss | (0.61 | ) | (0.51 | ) | (0.38 | ) | (0.46 | ) | (0.38 | ) | ||||||||||
| Net realized and unrealized gains on investments | 15.31 | 7.16 | 3.06 | 3.82 | 6.74 | |||||||||||||||
| Total from investment operations | 14.70 | 6.65 | 2.68 | 3.36 | 6.36 | |||||||||||||||
| Net asset value at end of year | $ | 58.08 | $ | 43.38 | $ | 36.73 | $ | 34.05 | $ | 30.69 | ||||||||||
| Total return(a) | 33.89 | % | 18.11 | % | 7.87 | % | 10.95 | % | 26.14 | % | ||||||||||
| Net assets at end of year (000’s) | $ | 50,690 | $ | 39,796 | $ | 36,710 | $ | 35,405 | $ | 33,106 | ||||||||||
| Ratio of total expenses to average net assets | 1.66 | % | 1.82 | % | 1.85 | % | 1.86 | % | 1.98 | % | ||||||||||
| Ratio of net investment loss to average net assets | (1.10 | %) | (1.16 | %) | (1.01 | %) | (1.29 | %) | (1.17 | %) | ||||||||||
| Portfolio turnover rate | 42 | % | 42 | % | 65 | % | 122 | % | 215 | % | ||||||||||
| (a) | Total return is a measure of the change in value of an investment in the Fund over the periods covered, which assumes any dividends or capital gains distributions are reinvested in shares of the Fund. Returns shown do not reflect the deduction of taxes a shareholder would pay on Fund distributions or the redemption of Fund shares. |
See accompanying notes to financial statements.
The Chesapeake Growth Fund
Notes to Financial Statements
October 31, 2021
1. Organization
The Chesapeake Growth Fund (the “Fund”) is a diversified series of The Chesapeake Investment Trust (the “Trust”), an open-end management investment company organized as a Delaware statutory trust and registered under the Investment Company Act of 1940, as amended (the “1940 Act”).
The investment objective of the Fund is to seek capital appreciation.
2. Significant Accounting Policies
The Fund follows accounting and reporting guidance under Financial Accounting Standards Board Accounting Standards Codification Topic 946, “Financial Services– Investment Companies.” The following is a summary of the Fund’s significant accounting policies used in the preparation of its financial statements. These policies are in conformity with accounting principles generally accepted in the United States of America (“GAAP”).
Securities valuation – Securities that are traded on any stock exchange, including common stocks, are generally valued at the last quoted sale price. Lacking a last sale price, an exchange traded security is generally valued at its last bid price. Securities traded on NASDAQ are valued at the NASDAQ Official Closing Price. Investments representing shares of money market funds and other open-end investment companies are valued at their net asset value (“NAV”) as reported by such companies.
When using a quoted price and when the market for the security is considered active, the security will be classified as Level 1 within the fair value hierarchy (see below). Securities and assets for which representative market quotations are not readily available or which cannot be accurately valued using the Fund’s normal pricing procedures are valued at fair value as determined in good faith under policies adopted by the Board of Trustees of the Trust and will be classified as Level 2 or 3 within the fair value hierarchy, depending on the inputs used. Fair value pricing may be used, for example, in situations where (i) a portfolio security is so thinly traded that there have been no transactions for that security over an extended period of time; (ii) the exchange on which the portfolio security is principally traded closes early; or (iii) trading of the portfolio security is halted during the day and does not resume prior to the Fund’s NAV calculation. A portfolio security’s “fair value” price may differ from the price next available for that portfolio security using the Fund’s normal pricing procedures.
GAAP establishes a single authoritative definition of fair value, sets out a framework for measuring fair value and requires additional disclosures about fair value measurements.
The Chesapeake Growth Fund
Notes to Financial Statements (Continued)
Various inputs are used in determining the value of the Fund’s investments. These inputs are summarized in the three broad levels listed below:
| ● | Level 1 – quoted prices in active markets for identical securities |
| ● | Level 2 – other significant observable inputs |
| ● | Level 3 – significant unobservable inputs |
The inputs or methodology used for valuing securities are not necessarily an indication of the risks associated with investing in those securities. For disclosure purposes, the level in the fair value hierarchy within which the fair value measurement falls in its entirety is determined based on the lowest level input that is significant to the fair value measurement.
The following is a summary of the Fund’s investments based on the inputs used to value the investments as of October 31, 2021:
| Level 1 | Level 2 | Level 3 | Total | |||||||||||||
| Common Stocks | $ | 47,027,582 | $ | — | $ | — | $ | 47,027,582 | ||||||||
| Money Market Funds | 3,367,835 | — | — | 3,367,835 | ||||||||||||
| Total | $ | 50,395,417 | $ | — | $ | — | $ | 50,395,417 | ||||||||
Refer to the Fund’s Schedule of Investments for a listing of the securities by sector and industry type. The Fund did not hold derivative instruments or any assets or liabilities that were measured at fair value on a recurring basis using significant unobservable inputs (Level 3) as of or during the year ended October 31, 2021.
Share valuation – The NAV per share of the Fund is calculated as of the close of trading on the New York Stock Exchange (the “Exchange”) (normally 4:00 p.m., Eastern Time) on each day that the Exchange is open for business. The NAV per share of the Fund is calculated by dividing the total value of the Fund’s assets, minus liabilities, by the number of shares outstanding. The offering price and redemption price per share is equal to the NAV per share.
Investment transactions and investment income – Investment transactions are accounted for on trade date. Cost of investments sold is determined on a specific identification basis. Dividend income is recorded on the ex-dividend date. Non-cash dividends included in dividend income, if any, are recorded at the fair market value of the security received. Interest income, if any, is accrued as earned and includes amortization of discounts and premiums. Withholding taxes on foreign dividends, if any, have been recorded in accordance with the Fund’s understanding of the applicable country’s rules and tax rates.
The Chesapeake Growth Fund
Notes to Financial Statements (Continued)
Distributions to shareholders – Distributions arising from net investment income and net realized capital gains, if any, are declared and paid at least annually. The amount of distributions from net investment income and net realized capital gains are determined in accordance with income tax regulations, which may differ from GAAP, and are recorded on the ex-dividend date. There were no distributions paid to shareholders during the years ended October 31, 2021 and 2020.
Estimates – The preparation of financial statements in conformity with GAAP requires management to make estimates and assumptions that affect the reported amounts of assets and liabilities and the disclosure of contingent assets and liabilities as of the date of the financial statements and the reported amounts of increase (decrease) in net assets from operations during the reporting period. Actual results could differ from those estimates.
Federal income tax – The Fund has qualified and intends to continue to qualify as a regulated investment company under the Internal Revenue Code of 1986, as amended (the “Code”). Qualification generally will relieve the Fund of liability for federal income taxes to the extent 100% of its net investment income and net realized capital gains are distributed in accordance with the Code.
In order to avoid imposition of the excise tax applicable to regulated investment companies, it is also the Fund’s intention to declare as dividends in each calendar year at least 98% of its net investment income (earned during the calendar year) and 98.2% of its net realized capital gains (earned during the twelve months ended October 31) plus undistributed amounts from prior years.
The following information is computed on a tax basis for each item as of October 31, 2021:
| Tax cost of portfolio investments | $ | 32,979,980 | ||
| Gross unrealized appreciation | $ | 17,803,714 | ||
| Gross unrealized depreciation | (388,277 | ) | ||
| Net unrealized appreciation | 17,415,437 | |||
| Undistributed long-term capital gains | 2,552,826 | |||
| Accumulated capital and other losses | (462,038 | ) | ||
| Accumulated earnings | $ | 19,506,225 | ||
The difference between the federal income tax cost of portfolio investments and the financial statement cost of portfolio investments is due to certain timing differences in the recognition of capital gains or losses under income tax regulations and GAAP. These “book/tax” differences are temporary in nature and are due to the tax deferral of losses on wash sales.
The Chesapeake Growth Fund
Notes to Financial Statements (Continued)
Net qualified late year losses, incurred after December 31, 2020 and within the taxable year, are deemed to arise on the first day of the Fund’s next taxable year. For the year ended October 31, 2021, the Fund deferred $462,038 of late year ordinary losses to November 1, 2021 for federal tax purposes.
During the year ended October 31, 2021, the Fund utilized $1,026,525 of short-term capital loss carryforwards and $126,326 of long-term capital loss carryforwards.
For the year ended October 31, 2021, the Fund reclassified $451,026 of accumulated earnings against paid-in capital on the Statement of Assets and Liabilities. Such reclassification, the result of permanent differences between the financial statement and income tax reporting requirements, had no effect on the Fund’s net assets or NAV per share.
The Fund recognizes the tax benefits or expenses of uncertain tax positions only when the position is “more-likely-than-not” to be sustained assuming examination by tax authorities. Management has reviewed the tax positions taken on federal income tax returns for all open tax years (generally, three years) and has concluded that no provision for unrecognized tax benefits or expenses is required in these financial statements and does not expect this to change over the next twelve months. The Fund identifies its major tax jurisdiction as U.S. Federal.
3. Investment Transactions
During the year ended October 31, 2021, cost of purchases and proceeds from sales of investment securities, other than short-term investments, amounted to $17,993,771 and $21,301,364, respectively.
4. Trustees and Officers
A Trustee and certain officers of the Trust are affiliated with Gardner Lewis Asset Management, L.P. (the “Advisor”), the investment advisor to the Fund, and certain officers are affiliated with Ultimus Fund Solutions, LLC (“Ultimus”), the Fund’s administrator, transfer agent and fund accounting agent, and Ultimus Fund Distributors, LLC (“UFD”), the Fund’s principal underwriter.
Each Trustee of the Trust who is not affiliated with the Advisor (“Independent Trustee”) receives an annual retainer of $10,000. In addition, the Fund pays each Independent Trustee $600 for attendance at each Board meeting, either in person or by telephone, plus reimbursement of any travel and other expenses incurred in attending meetings.
The Chesapeake Growth Fund
Notes to Financial Statements (Continued)
5. Transactions with Related Parties
INVESTMENT ADVISORY AGREEMENT
Under the terms of the Investment Advisory Agreement between the Trust and the Advisor, the Advisor serves as the investment advisor to the Fund. For its services, the Fund pays the Advisor an investment advisory fee, which is computed and accrued daily and paid monthly, at the annual rate of 1.00% of the Fund’s average daily net assets.
The Chief Compliance Officer of the Trust is an employee of the Advisor. The Fund reimburses the Advisor $60,000 annually for the services provided by the Chief Compliance Officer to the Trust.
ADMINISTRATOR
Pursuant to servicing agreements between the Trust and Ultimus, Ultimus provides administrative, pricing, accounting, dividend disbursing, shareholder servicing and transfer agent services for the Fund. The Fund pays Ultimus fees in accordance with the agreements for such services. In addition, the Fund pays out-of-pocket expenses including, but not limited to, postage, supplies and certain costs related to the pricing of the Fund’s portfolio securities.
DISTRIBUTION AND SERVICE FEES
The Trust has adopted a distribution plan, pursuant to Rule 12b-1 under the 1940 Act (the “Rule 12b-1 Plan”), pursuant to which the Fund may incur certain costs for distribution and/or shareholder servicing expenses not to exceed 0.25% per annum of the Fund’s average daily net assets. During the year ended October 31, 2021, the Fund incurred $41,782 in distribution and service plan fees under the Rule 12b-1 Plan.
DISTRIBUTION AGREEMENT
Under the terms of a Distribution Agreement with the Trust, UFD provides distribution services to the Trust and serves as principal underwriter to the Fund. UFD is a wholly-owned subsidiary of Ultimus. UFD receives compensation from the Fund for such services, which is paid pursuant to the Rule 12b-1 Plan discussed above.
PRINCIPAL HOLDER OF FUND SHARES
As of October 31, 2021, the following shareholder owned of record 25% or more of the outstanding shares of the Fund:
| Name of Record Owner | % Ownership | |
| J.P. Morgan Securities, LLC (for the benefit of its customers) | 43% |
A beneficial owner of 25% or more of the Fund’s outstanding shares may be considered a controlling person. That shareholder’s vote could have a more significant effect on matters presented at a shareholders’ meeting.
The Chesapeake Growth Fund
Notes to Financial Statements (Continued)
6. Contingencies and Commitments
The Fund indemnifies the Trust’s officers and Trustees for certain liabilities that might arise from their performance of their duties to the Fund. Additionally, in the normal course of business, the Trust enters into contracts that contain a variety of representations and warranties and which provide general indemnifications. The Fund’s maximum exposure under these arrangements is unknown, as this would involve future claims that may be made against the Fund that have not yet occurred. However, based on experience, the Trust expects the risk of loss to be remote.
7. Coronavirus (COVID-19) Pandemic
The COVID-19 pandemic has caused financial markets to experience significant volatility and uncertainty exists as to its long-term impact. COVID-19 has resulted in closing borders, quarantines, disruptions to supply chains and customer activity, as well as general concern and economic uncertainty. The impact of the outbreak may be short term or may last for an extended period of time. The impact of epidemics and pandemics such as COVID-19 could affect the economies of many nations, individual companies and the market in general in ways that cannot necessarily be foreseen at the present time. As a result, the Fund’s performance and the ability to achieve its investment objective may be adversely impacted. Management is monitoring the development of the pandemic and evaluating its impact on the financial position and operating results of the Fund.
8. Subsequent Events
The Fund is required to recognize in the financial statements the effects of all subsequent events that provide additional evidence about conditions that existed as of the date of the Statement of Assets and Liabilities. For non-recognized subsequent events that must be disclosed to keep the financial statements from being misleading, the Fund is required to disclose the nature of the event as well as an estimate of its financial effect, or a statement that such an estimate cannot be made. Management has evaluated subsequent events through the issuance of these financial statements and has noted no such events except for the following:
On December 3, 2021, the Fund paid a long-term capital gain distribution of $2.9318 per share to shareholders of record on December 2, 2021.
The Chesapeake Growth Fund
Report of Independent Registered Public Accounting Firm
To the Board of Trustees of Chesapeake Investment Trust
and the Shareholders of The Chesapeake Growth Fund
Opinion on the Financial Statements
We have audited the accompanying statement of assets and liabilities of The Chesapeake Growth Fund, a series of shares of beneficial interest in Chesapeake Investment Trust (the “Fund”), including the schedule of investments, as of October 31, 2021, and the related statement of operations for the year then ended, the statements of changes in net assets for each of the years in the two-year period then ended and the financial highlights for each of the years in the five-year period then ended, and the related notes (collectively referred to as the “financial statements”). In our opinion, the financial statements present fairly, in all material respects, the financial position of the Fund as of October 31, 2021, and the results of its operations for the year then ended, the changes in its net assets for each of the years in the two-year period then ended and its financial highlights for each of the years in the five-year period then ended, in conformity with accounting principles generally accepted in the United States of America.
Basis for Opinion
These financial statements are the responsibility of the Fund’s management. Our responsibility is to express an opinion on the Fund’s financial statements based on our audits. We are a public accounting firm registered with the Public Company Accounting Oversight Board (United States) (“PCAOB”) and are required to be independent with respect to the Fund in accordance with the U.S. federal securities law and the applicable rules and regulations of the Securities and Exchange Commission and the PCAOB.
We conducted our audits in accordance with the standards of the PCAOB. Those standards require that we plan and perform the audits to obtain reasonable assurance about whether the financial statements are free of material misstatement, whether due to error or fraud. The Fund is not required to have, nor were we engaged to perform, an audit of its internal control over financial reporting. As part of our audits we are required to obtain an understanding of internal control over financial reporting but not for the purpose of expressing an opinion on the effectiveness of the Fund’s internal control over financial reporting. Accordingly, we express no such opinion.
Our audits included performing procedures to assess the risk of material misstatement of the financial statements, whether due to error or fraud, and performing procedures that respond to those risks. Such procedures included examining, on a test basis, evidence regarding the amounts and disclosures in the financial statements. Our procedures included confirmation of securities owned as of October 31, 2021 by correspondence with the custodian and brokers. Our audits also included evaluating the accounting
The Chesapeake Growth Fund
Report of Independent Registered Public Accounting Firm
(Continued)
principles used and significant estimates made by management, as well as evaluating the overall presentation of the financial statements. We believe that our audits provide a reasonable basis for our opinion.

BBD, LLP
We have served as the auditor of one or more of the Funds in the Chesapeake Investment Trust since 2006.
Philadelphia, Pennsylvania
December 21, 2021
The Chesapeake Growth Fund
About Your Fund’s Expenses (Unaudited)
We believe it is important for you to understand the impact of costs on your investment. All mutual funds have operating expenses. As a shareholder of the Fund, you incur ongoing costs, including management fees, Rule 12b-1 distribution fees and other Fund expenses. The following examples are intended to help you understand your ongoing costs (in dollars) of investing in the Fund and to compare these costs with the ongoing costs of investing in other mutual funds.
A mutual fund’s ongoing costs are expressed as a percentage of its average net assets. This figure is known as the expense ratio. The expenses in the table that follows are based on an investment of $1,000 made at the beginning of the most recent semi-annual period (May 1, 2021) and held until the end of the period (October 31, 2021).
The table that follows illustrates the Fund’s ongoing costs in two ways:
Actual fund return – This section helps you to estimate the actual expenses that you paid over the period. The “Ending Account Value” shown is derived from the Fund’s actual return, and the third column shows the dollar amount of operating expenses that would have been paid by an investor who started with $1,000 in the Fund. You may use the information here, together with the amount you invested, to estimate the expenses that you paid over the period.
To do so, simply divide your account value by $1,000 (for example, an $8,600 account value divided by $1,000 = 8.6), then multiply the result by the number given for the Fund under the heading “Expenses Paid During Period.”
Hypothetical 5% return – This section is intended to help you compare the Fund’s ongoing costs with those of other mutual funds. It assumes that the Fund had an annual return of 5% before expenses during the period shown, but that the expense ratio is unchanged. In this case, because the return used is not the Fund’s actual return, the results do not apply to your investment. The example is useful in making comparisons because the U.S. Securities and Exchange Commission (the “SEC”) requires all mutual funds to calculate expenses based on a 5% return. You can assess the Fund’s ongoing costs by comparing this hypothetical example with the hypothetical examples that appear in shareholder reports of other funds.
Note that expenses shown in the table are meant to highlight and help you compare ongoing costs only.
The calculations assume no shares were bought or sold during the period. Your actual costs may have been higher or lower, depending on the amount of your investment and the timing of any purchases or redemptions.
The Chesapeake Growth Fund
About Your Fund’s Expenses (Unaudited) (Continued)
More information about the Fund’s expenses, including historical expense ratios, can be found in this report. For additional information on operating expenses and other shareholder costs, please refer to the Fund’s prospectus.
| Beginning | Ending | ||
| Account Value | Account Value | Expenses Paid | |
| May 1, 2021 | October 31, 2021 | During Period * | |
| Based on Actual Fund Return | $1,000.00 | $1,088.50 | $8.53 |
| Based on Hypothetical 5% Return (before expenses) | $1,000.00 | $1,017.04 | $8.24 |
| * | Expenses are equal to the Fund’s annualized net expense ratio of 1.62% for the period, multiplied by the average account value over the period, multiplied by 184/365 (to reflect the one-half year period). |
Other Information (Unaudited)
The Trust files a complete listing of the Fund’s portfolio holdings with the SEC as of the end of the first and third quarters of each fiscal year as an exhibit to its reports on Form N-PORT. The filings are available free of charge, upon request, by calling the Trust toll-free at 1-800-430-3863. Furthermore, you may obtain a copy of these filings on the SEC’s website at www.sec.gov.
A description of the policies and procedures that the Fund uses to determine how to vote proxies relating to portfolio securities is available without charge upon request by calling the Trust toll-free at 1-800-430-3863, or on the SEC’s website at www.sec.gov. Information regarding how the Fund voted proxies relating to portfolio securities during the most recent 12-month period ended June 30 is also available without charge upon request by calling the Trust toll-free at 1-800-430-3863, or on the SEC’s website at www.sec.gov.
| The Chesapeake Growth Fund |
| Board of Trustees and Executive Officers (Unaudited) |
The Board of Trustees has overall responsibility for management of the Trust’s affairs. The Trustees serve during the lifetime of the Trust and until its termination, or until death, resignation, retirement, or removal. The Trustees, in turn, elect the officers of the Trust to actively supervise its day-to-day operations. The officers have been elected for an annual term. The following are the Trustees and executive officers of the Trust:
| Name, Age, and Address | Position(s) held with Trust | Length of Time Served | Principal Occupation(s) During Past 5 Years | Number of Portfolios in Fund Complex Overseen by Trustee | Other Directorships Held by Trustee |
| Independent Trustees | |||||
| Theo H. Pitt, Jr. (age 85) 285 Wilmington- West Chester Pike Chadds Ford, Pennsylvania 19317 | Trustee | Since April 2002 | Senior Partner of Community Financial Institutions Consulting (bank consulting). | 1 | Mr. Pitt serves as an Independent Trustee of World Funds Trust for the thirty series of that Trust; Starboard Investment Trust for the twelve series of that Trust; ETF Opportunities Trust for the two series of that Trust; and Chairman and Independent Trustee of Leeward Investment Trust (formerly known as Vertical Capital Investors Trust) for its one series of that Trust (all registered investment companies). Mr. Pitt served as an Independent Trustee of Hillman Capital Management Investment Trust for the one series of that Trust until March 2021. |
| The Chesapeake Growth Fund |
| Board of Trustees and Executive Officers (Unaudited) (Continued) |
| Name, Age, and Address | Position(s) held with Trust | Length of Time Served | Principal Occupation(s) During Past 5 Years | Number of Portfolios in Fund Complex Overseen by Trustee | Other Directorships Held by Trustee |
| Independent Trustees (Continued) | |||||
| James H. Speed, Jr. (age 68) 285 Wilmington- West Chester Pike Chadds Ford, Pennsylvania 19317 | Trustee | Since May 2016 | Retired; formerly President and CEO of NC Mutual Insurance Company (insurance company). | 1 | Mr. Speed is an Independent Trustee of Centaur Mutual Funds Trust for its two series; Brown Capital Management Mutual Funds for its four series; Starboard Investment Trust for its twelve series; and WST Investment Trust for the one series of that Trust (all registered investment companies); and Director of Investors Title Company. Mr. Speed served as an Independent Trustee of Hillman Capital Management Investment Trust for the one series of that Trust until March 2021. |
| Interested Trustee* | |||||
| W. Whitfield Gardner (age 58) 285 Wilmington- West Chester Pike Chadds Ford, Pennsylvania 19317 | Chairman and Principal Executive Officer | Since June 1996
| Managing Partner and Portfolio Manager of the Advisor. | 1 | None. |
| * | W. Whitfield Gardner is an Interested Trustee because he is an officer and principal owner of Gardner Lewis Asset Management, L.P., the investment advisor to the Fund. |
| The Chesapeake Growth Fund |
| Board of Trustees and Executive Officers (Unaudited) (Continued) |
| Name, Age, and Address | Position(s) held with Trust | Length of Time Served | Principal Occupation(s) During Past 5 Years |
| Executive Officers | |||
| Leonard M. Sorgini, CPA (age 63) 285 Wilmington-West Chester Pike Chadds Ford, Pennsylvania 19317 | Chief Compliance Officer | Since October 2013 | Chief Compliance Officer and Client Accountant of the Advisor. |
| Jesse D. Hallee (age 45) 225 Pictoria Drive, Suite 450 Cincinnati, Ohio 45246 | Secretary | Since June 2021 | Vice President and Senior Managing Counsel, Ultimus Fund Solutions, LLC (2019-present); Vice President and Managing Counsel, State Street Bank and Trust Company (2013- 2019). |
| Theresa M. Bridge (age 51) 225 Pictoria Drive, Suite 450 Cincinnati, Ohio 45246 | Treasurer and Principal Financial Officer | Since September 2013 | Senior Vice President, Financial Administration of Ultimus Fund Solutions, LLC. |
Additional information about members of the Board of Trustees and executive officers is available in the Fund’s Statement of Additional Information (“SAI”). To obtain a free copy of the SAI, please call 1-800-430-3863.
| The Chesapeake Growth Fund |
| Renewal of the Investment Advisory Agreement (Unaudited) |
The Adviser supervises the investments of the Fund pursuant to an Investment Advisory Agreement (the “Advisory Agreement”) between the Adviser and the Trust. At the quarterly meeting of the Board of Trustees of the Trust that was held on September 14, 2021, the Trustees unanimously approved the continuance of the Advisory Agreement for an additional annual term. In considering whether to approve the renewal of the Advisory Agreement, the Trustees reviewed and considered such information as they deemed reasonably necessary, including the following material factors: (1) the nature, extent and quality of the services provided by the Adviser; (2) the investment performance of the Fund and the Adviser; (3) the costs of the services provided and profits realized by the Adviser from its relationship with the Fund; (4) the extent to which economies of scale would be realized as the Fund grows and whether advisory fee levels reflect those economies of scale for the benefit of the Fund’s investors; (5) the Adviser’s practices regarding brokerage and portfolio transactions; and (6) the Adviser’s practices regarding possible conflicts of interest.
At the meeting, the Trustees reviewed various informational materials including, without limitation: (1) the Advisory Agreement; (2) financial statements of the Adviser; (3) a description of the Adviser’s key personnel and the services provided by the Adviser to the Fund; (4) information regarding the Adviser’s investment approach and investment performance and comparative performance information for other mutual funds with strategies similar to the Fund; (5) information regarding the Adviser’s brokerage practices, compliance program and affiliations, including potential conflicts of interest; (6) analyses of Fund expenses and comparative expense information for other mutual funds with strategies similar to the Fund; and (7) a memorandum from the Trust’s outside legal counsel that summarized the fiduciary duties and responsibilities of the Board of Trustees in reviewing and approving the Advisory Agreement, including the material factors set forth above and the types of information included in each factor that should be considered by the Board of Trustees in order to make an informed decision.
| 1. | Nature, Extent, and Quality of the Services Provided by the Adviser |
In considering the nature, extent, and quality of the services provided by the Adviser, the Trustees reviewed the responsibilities of the Adviser under the Advisory Agreement. The Trustees reviewed the services being provided by the Adviser to the Fund including, without limitation: the quality of its investment advisory services since the Fund’s commencement of operations (including research and recommendations with respect to portfolio securities); its process for formulating investment decisions and assuring compliance with the Fund’s investment objectives and limitations; its efforts to negotiate arrangements with other service providers for the benefit of shareholders; and its efforts to promote and market the Fund and grow the Fund’s assets. The Trustees also evaluated the Adviser’s personnel, including their education and experience. The Trustees noted
| The Chesapeake Growth Fund |
| Renewal of the Investment Advisory Agreement (Unaudited) |
| (Continued) |
that the principal executive officer and president of the Trust is an employee of the Adviser and serves the Trust without additional compensation. After reviewing the information in the materials provided by the Adviser, the Board concluded, in light of all the facts and circumstances, that the nature, extent, and quality of the services provided by the Adviser to the Fund were satisfactory and adequate.
| 2. | Investment Performance of the Fund and the Adviser |
In considering the investment performance of the Fund and the Adviser, the Trustees compared the short-term and long-term performance of the Fund with the historical returns of comparable funds with similar structures, investment objectives, and strategies (i.e., the Morningstar peer group data). The Trustees also considered the consistency of the Adviser’s management of the Fund with its investment objective and policies. The Trustees reviewed the Fund’s performance over the one-, three-and five-year periods ended June 30, 2021, and noted that the Fund underperformed the S&P 500 and Morningstar US Fund Large Growth Category for the one- and three-year periods ended June 30, 2021, but outperformed the S&P 500 for the five-year period ended June 30, 2021. The Trustees considered the Adviser’s representation that the performance of the Fund in comparison to other advisory accounts managed by the Adviser that use investment objectives similar to that of the Fund are not significantly different. After reviewing and discussing the short-term and long-term investment performance of the Fund, the Adviser’s experience managing the Fund and other advisory accounts, the Adviser’s historical investment performance and other factors, the Board concluded, in light of all the facts and circumstances, that the investment performance of the Fund and the Adviser was satisfactory.
| 3. | Costs of the Services Provided and Profits Realized by the Adviser |
In considering the costs of the services provided and profits realized by the Adviser from its relationship with the Fund, the Trustees considered, among other things: (i) the Adviser’s financial condition and the level of commitment to the Fund; (ii) the asset levels of the Fund; (iii) the overall expenses of the Fund; (iv) the nature and frequency of advisory fee payments; (v) the Adviser’s staffing, personnel, and methods of operating; and (vi) the Adviser’s compliance policies and procedures. The Trustees reviewed financial statements and other information communicated by the Adviser regarding its profits associated with managing the Fund. The Trustees also considered potential benefits for the Adviser in managing the Fund, including the ability for the Adviser to place small accounts into the Fund and the potential for the Adviser to generate “soft dollar” research from certain of the Fund’s trades that may benefit the Adviser’s other clients as well.
| The Chesapeake Growth Fund |
| Renewal of the Investment Advisory Agreement (Unaudited) |
| (Continued) |
The Trustees then compared the fees and expenses of the Fund (including the management fee) to other specifically identifiable funds with similar investment objectives managed by other investment advisers. The Trustees considered the Adviser’s representation that a comparison of fees the Adviser charges its separately managed accounts vis-à-vis the Fund are not necessarily an appropriate comparison because the services rendered to the two types of accounts are sufficiently different with, in the Adviser’s view, the Fund requiring more man-hours of servicing than separate accounts, and the management of the Fund involving higher levels of risk and administration in fund management. The Trustees noted that the Fund’s management fee is higher than the average and median of comparable funds in the Fund’s category, but the management fee is consistent with the average and median in the Fund’s peer group and other funds of similar size. Further, the Trustees noted that the Fund’s net expense ratio was higher than the average and median in its category. After further discussion on the Fund’s fee structure, the Board concluded that the fees paid to the Adviser by the Fund, in light of all the facts and circumstances, were fair, reasonable, and consistent with terms under an arm’s length negotiation.
| 4. | Economies of Scale |
In considering the extent to which the Fund would realize economies of scale as the assets increase and whether advisory fee levels reflect those economies of scale for the benefit of the Fund’s investors, the Trustees determined that while the management fee for the Fund is the same at all asset levels, the Fund’s shareholders would benefit from economies of scale under the Fund’s agreements with service providers other than the Adviser. The Trustees agreed that it was not appropriate to introduce fee breakpoints at present. The Trustees noted, however, that if the Fund grows significantly in assets, it may become necessary for the Adviser to consider adding breakpoints to the management fees. Following further discussion of the Fund’s asset levels, expectations for growth, and fee levels, the Board determined that the Fund’s fee arrangements, in light of all the facts and circumstances, were fair, reasonable, and consistent with the nature and quality of the services provided by the Adviser.
| 5. | The Adviser’s Practices Regarding Brokerage and Portfolio Transactions |
In considering the Adviser’s practices regarding brokerage and portfolio transactions, the Trustees reviewed the Adviser’s practices for seeking best execution for the Fund’s portfolio transactions. The Trustees also considered the extent to which the Fund allocates portfolio business to broker-dealers who provide research, statistical, or other services, and whether the higher rates are reasonable given
| The Chesapeake Growth Fund |
| Renewal of the Investment Advisory Agreement (Unaudited) |
| (Continued) |
the services provided to the Adviser and the Fund. The Trustees considered the process by which the Adviser evaluates its best execution duties. The Trustees noted that in selecting broker-dealers to execute portfolio transactions, the Adviser considers a variety of factors including, among others: order flow, liquidity of the security traded, ability of a broker-dealer to maintain the confidentiality of trading intentions, ability of a broker-dealer to place trades in difficult market environments, research services provided, execution facilitation services provided, timeliness of execution, timeliness and accuracy of trade confirmations, willingness to commit capital, allocation of limited investment opportunities, client direction, record-keeping services provided, custody services provided, frequency and correction of trading errors, ability to access a variety of market venues, expertise as it relates to specific securities, intermediary compensation (commissions and spreads), financial condition, and business reputation. The Trustees also considered the process for aggregating or “blocking” trades for client accounts, including the Fund. After further review and discussion, the Board determined that the Adviser’s practices regarding brokerage and portfolio transactions were satisfactory.
| 6. | The Adviser’s Practices Regarding Possible Conflicts of Interest |
In considering the Adviser’s practices regarding conflicts of interest, the Trustees evaluated the potential for conflicts of interest and considered such matters as the experience and ability of the advisory personnel assigned to the Fund; the basis for “soft dollar” arrangements with broker-dealers; the basis of decisions to buy or sell securities for the Fund and/or the Adviser’s other accounts; the method for bunching of portfolio securities transactions; the substance and administration of the Adviser’s code of ethics; and the compensation paid to the chief compliance officer by the Fund. Following further consideration and discussion, the Board indicated that the Adviser’s standards and practices relating to the identification and mitigation of possible conflicts of interest were satisfactory.
Based upon all of the foregoing considerations, the Board of Trustees, including a majority of the Trustees who are not parties to the Advisory Agreement or “interested persons” of any such party (as such term is defined by the Investment Company Act of 1940), approved the renewal of the Advisory Agreement.
| The Chesapeake Growth Fund |
| Liquidity Risk Management Program (Unaudited) |
The Fund has adopted and implemented a written liquidity risk management program as required by Rule 22e-4 (the “Liquidity Rule”) under the Investment Company Act of 1940. The program is reasonably designed to assess and manage the Fund’s liquidity risk, taking into consideration, among other factors, the Fund’s investment strategy and the liquidity of its portfolio investments during normal and reasonably foreseeable stressed conditions; its short and long-term cash flow projections; and its cash holdings and access to other funding sources. The Funds’ Board of Trustees approved the appointment of a committee to serve as Liquidity Program Administrator (“LPA”), which committee includes representatives from the Fund’s Adviser. The LPA is responsible for the program’s administration and oversight and for reporting to the Board on at least an annual basis regarding the program’s operation and effectiveness. The Liquidity Assessment written report that was presented to the Board of Trustees at the September 14, 2021 Board meeting covered the period from July 1, 2020 to June 30, 2021 (the “Review Period”).
During the Review Period, the Fund did not experience unusual stress or disruption to its operations related to purchase and redemption activity. Also, during the Review Period, the Fund held adequate levels of cash and highly liquid investments to meet shareholder redemption activities in accordance with applicable requirements. During the Review Period, the Fund did not hold illiquid securities and the Fund was not required to establish a highly liquid investment minimum. The Report concluded that the Fund takes many factors into consideration when determining the best methods for managing the liquidity of the portfolio and that the Fund’s liquidity risk management program operated appropriately during the Review Period.
| The Chesapeake Growth Fund |
| is a series of |
| Chesapeake Investment Trust |
| For Shareholder Service Inquiries: | For Investment Advisor Inquiries: |
| The Chesapeake Growth Fund | Gardner Lewis Asset Management |
| c/o Ultimus Fund Solutions, LLC | 285 Wilmington-West Chester Pike |
| P.O. Box 46707 | Chadds Ford, Pennsylvania 19317 |
| Cincinnati, Ohio 45246-0707 | |
| Toll-Free Telephone: | |
| 1-800-430-3863 | |
| World Wide Web @: | |
| www.chesapeakefunds.com |
Chesapeake-AR-21
| (b) | Not applicable. |
| Item 2. | Code of Ethics. |
As of the end of the period covered by this report, the registrant has adopted a code of ethics that applies to the registrant’s principal executive officer, principal financial officer, principal accounting officer or controller, or persons performing similar functions, regardless of whether these individuals are employed by the registrant or a third party. Pursuant to Item 13(a)(1), a copy of registrant’s code of ethics is filed as an exhibit to this Form N-CSR. During the period covered by this report, the code of ethics has not been amended, and the registrant has not granted any waivers, including implicit waivers, from the provisions of the code of ethics.
| Item 3. | Audit Committee Financial Expert. |
The registrant’s board of trustees has determined that the registrant has at least one audit committee financial expert serving on its audit committee. The name of the audit committee financial expert is James H. Speed, Jr. Mr. Speed is “independent” for purposes of this Item.
| Item 4. | Principal Accountant Fees and Services. |
| (a) | Audit Fees. The aggregate fees billed for professional services rendered by the principal accountant for the audit of the registrant’s annual financial statements or for services that are normally provided by the accountant in connection with statutory and regulatory filings or engagements were $14,250 and $14,250 with respect to the registrant’s fiscal years ended October 31, 2021 and 2020, respectively. |
| (b) | Audit-Related Fees. No fees were billed in either of the last two fiscal years for assurance and related services by the principal accountant that are reasonably related to the performance of the audit of the registrant’s financial statements and are not reported under paragraph (a) of this Item. |
| (c) | Tax Fees. The aggregate fees billed for professional services rendered by the principal accountant for tax compliance, tax advice, and tax planning were $2,500 and $2,500 with respect to the registrant’s fiscal years ended October 31, 2021 and 2020, respectively. The services comprising these fees are the preparation of the registrant’s federal income and excise tax returns. |
| (d) | All Other Fees. No fees were billed in either of the last two fiscal years for products and services provided by the principal accountant, other than the services reported in paragraphs (a) through (c) of this Item. |
(e)(1) The audit committee has not adopted pre-approval policies and procedures described in paragraph (c)(7) of Rule 2-01 of Regulation S-X.
| (e)(2) | None of the services described in paragraph (b) through (d) of this Item were approved by the audit committee pursuant to paragraph (c)(7)(i)(C) of Rule 2-01 of Regulation S-X. |
| (f) | Less than 50% of hours expended on the principal accountant’s engagement to audit the registrant’s financial statements for the most recent fiscal year were attributed to work performed by persons other than the principal accountant’s full-time, permanent employees. |
(g) During the fiscal years ended October 31, 2021 and 2020, aggregate non-audit fees of $2,500 and $2,500, respectively, were billed by the registrant’s accountant for services rendered to the registrant. No non-audit fees were billed in either of the last two fiscal years by the registrant’s accountant for services rendered to the registrant’s investment adviser (not including any sub-adviser whose role is primarily portfolio management and is subcontracted with or overseen by another investment adviser), and any entity controlling, controlled by, or under common control with the adviser that provides ongoing services to the registrant.
| (h) | The principal accountant has not provided any non-audit services that were not previously approved to the registrant’s investment adviser (not including any sub-adviser whose role is primarily portfolio management and is subcontracted with or overseen by another investment adviser), and any entity controlling, controlled by, or under common control with the investment adviser that provides ongoing services to the registrant. |
| Item 5. | Audit Committee of Listed Registrants. |
Not applicable
| Item 6. | Investments. |
| (a) | Not applicable [schedule filed with Item 1] |
| (b) | Not applicable |
| Item 7. | Disclosure of Proxy Voting Policies and Procedures for Closed-End Management Investment Companies. |
Not applicable
| Item 8. | Portfolio Managers of Closed-End Management Investment Companies. |
Not applicable
| Item 9. | Purchases of Equity Securities by Closed-End Management Investment Company and Affiliated Purchasers. |
Not applicable
| Item 10. | Submission of Matters to a Vote of Security Holders. |
The registrant has not adopted procedures by which shareholders may recommend nominees to the registrant’s board of trustees.
| Item 11. | Controls and Procedures. |
(a) Based on their evaluation of the registrant’s disclosure controls and procedures (as defined in Rule 30a-3(c) under the Investment Company Act of 1940, as amended (the “Act”)) as of a date within 90 days of the filing date of this report, the registrant’s principal executive officer and principal financial officer have concluded that such disclosure controls and procedures are reasonably designed and are operating effectively to ensure that material information relating to the registrant is made known to them by others within those entities, particularly during the period in which this report is being prepared, and that the information required in filings on Form N-CSR is recorded, processed, summarized, and reported on a timely basis.
(b) There were no changes in the registrant’s internal control over financial reporting (as defined in Rule 30a-3(d) under the Investment Company Act of 1940) that occurred during the period covered by this report that have materially affected, or are reasonably likely to materially affect, the registrant’s internal control over financial reporting.
Item 12. Disclosure of Securities Lending Activities for Closed-End Management Investment Companies.
Not applicable
| Item 13. | Exhibits. |
File the exhibits listed below as part of this Form. Letter or number the exhibits in the sequence indicated.
(a)(1) Any code of ethics, or amendment thereto, that is the subject of the disclosure required by Item 2, to the extent that the registrant intends to satisfy the Item 2 requirements through filing of an exhibit: Attached hereto
(a)(2) A separate certification for each principal executive officer and principal financial officer of the registrant as required by Rule 30a-2(a) under the Act (17 CFR 270.30a-2(a)): Attached hereto
(a)(3) Any written solicitation to purchase securities under Rule 23c-1 under the Act (17 CFR 270.23c-1) sent or given during the period covered by the report by or on behalf of the registrant to 10 or more persons: Not applicable
(a)(4) Change in the registrant’s independent public accountants: Not applicable
(b) Certifications required by Rule 30a-2(b) under the Act (17 CFR 270.30a-2(b)): Attached hereto
| Exhibit 99.CODE ETH | Code of Ethics
|
| Exhibit 99.CERT | Certifications required by Rule 30a-2(a) under the Act
|
| Exhibit 99.906CERT | Certifications required by Rule 30a-2(b) under the Act
|
.
SIGNATURES
Pursuant to the requirements of the Securities Exchange Act of 1934 and the Investment Company Act of 1940, the registrant has duly caused this report to be signed on its behalf by the undersigned, thereunto duly authorized.
| (Registrant) | Chesapeake Investment Trust | ||
| By (Signature and Title)* | /s/ W. Whitfield Gardner | ||
| W. Whitfield Gardner, Chairman and Chief Executive Officer (Principal Executive Officer) | |||
| Date | January 3, 2022 | ||
| Pursuant to the requirements of the Securities Exchange Act of 1934 and the Investment Company Act of 1940, this report has been signed below by the following persons on behalf of the registrant and in the capacities and on the dates indicated. | |||
| By (Signature and Title)* | /s/ W. Whitfield Gardner | ||
| W. Whitfield Gardner, Chairman and Chief Executive Officer (Principal Executive Officer) | |||
| Date | January 3, 2022 | ||
| By (Signature and Title)* | /s/ Theresa M. Bridge | ||
| Theresa M. Bridge, Treasurer (Principal Financial Officer) | |||
| Date | January 3, 2022 | ||
* Print the name and title of each signing officer under his or her signature.