UNITED STATES
SECURITIES AND EXCHANGE COMMISSION
Washington, D.C. 20549
FORM N-CSR
Certified Shareholder Report of
Registered Management Investment Companies
Investment Company Act File Number: 811-07338
Capital World Growth and Income Fund
(Exact Name of Registrant as Specified in Charter)
333 South Hope Street
Los Angeles, California 90071
(Address of Principal Executive Offices)
Registrant's telephone number, including area code: (213) 486-9200
Date of fiscal year end: November 30
Date of reporting period: May 31, 2013
Vincent P. Corti
Capital World Growth and Income Fund
333 South Hope Street
Los Angeles, California 90071
(Name and Address of Agent for Service)
Copies to:
Kathryn A. Sanders
O’Melveny & Myers LLP
400 South Hope Street, 10th Floor
Los Angeles, California 90071
(Counsel for the Registrant)
ITEM 1 – Reports to Stockholders

Capital World Growth
and Income Fund®
Semi-annual report for the six months ended May 31, 2013
Capital World Growth and Income Fund seeks long-term growth of capital while providing current income. It invests on a global basis in a diversified portfolio consisting primarily of common stocks and other equity securities.
This fund is one of more than 40 offered by one of the nation’s largest mutual fund families, American Funds, from Capital Group. For more than 80 years, Capital has invested with a long-term focus based on thorough research and attention to risk.
Fund results shown in this report, unless otherwise indicated, are for Class A shares at net asset value. If a sales charge (maximum 5.75%) had been deducted, the results would have been lower. Results are for past periods and are not predictive of results for future periods. Current and future results may be lower or higher than those shown. Share prices and returns will vary, so investors may lose money. Investing for short periods makes losses more likely. Investments are not FDIC-insured, nor are they deposits of or guaranteed by a bank or any other entity, so they may lose value. For current information and month-end results, visit americanfunds.com.
Here are the average annual total returns on a $1,000 investment with all distributions reinvested for periods ended June 30, 2013 (the most recent calendar quarter-end):
| Class A shares | | 1 year | | | 5 years | | | 10 years | |
| | | | | | | | | | | | |
| Reflecting 5.75% maximum sales charge | | | 12.44% | | | | 1.69% | | | | 9.18% | |
For other share class results, see americanfunds.com and americanfundsretirement.com.
The total annual fund operating expense ratio was 0.82% for Class A shares as of the prospectus dated February 1, 2013.
Investment results assume all distributions are reinvested and reflect applicable fees and expenses. When applicable, investment results reflect fee waivers, without which results would have been lower. Visit americanfunds.com for more information.
The fund’s 30-day yield for Class A shares as of June 30, 2013, reflecting the 5.75% maximum sales charge and calculated in accordance with the U.S. Securities and Exchange Commission formula, was 2.12%.
Investing outside the United States may be subject to risks, such as currency fluctuations, periods of illiquidity and price volatility. These risks may be heightened in connection with investments in developing countries. Refer to the fund prospectus and the Risk Factors section of this report for more information on these and other risks associated with investing in the fund.

Fellow investors:
Global stock markets surged during the first half of the fiscal year, supported by continued strength in the U.S. economy and aggressive monetary easing by Japan’s central bank.
For the six months ended May 31, 2013, Capital World Growth and Income Fund delivered a strong gain of 12.04%. That result assumes the reinvestment of quarterly dividends totaling 44 cents a share, reflecting an income return of 1.20%. Investors who took dividends in cash recorded the same return.
The fund finished the period ahead of its primary benchmark, the unmanaged MSCI All Country World Index. The index, which measures a broad range of developed- and developing-country stock markets, recorded an 11.72% total return for the six months ended May 31, 2013. However, the fund trailed the 14.46% gain of the Lipper Global Funds Index, a peer group measure.
The fund takes a long-term approach to global investing. As you can see in the table below, the fund compares favorably to its benchmarks over longer time frames.
Results at a glance
For periods ended May 31, 2013, with all distributions reinvested
| | | Total returns | | Average annual total returns |
| | | 1 year | | 5 years | | 10 years | | Lifetime
(since 3/26/93) |
| | | | | | | | | | | | | | | | |
| Capital World Growth and Income Fund (Class A shares) | | | 28.66 | % | | | 1.65 | % | | | 10.37 | % | | | 11.05 | % |
| MSCI All Country World Index* | | | 26.01 | | | | 1.16 | | | | 8.11 | | | | 7.14 | |
| Lipper Global Funds Index | | | 27.83 | | | | 1.68 | | | | 7.97 | | | | 7.27 | |
| * | The market index is unmanaged and, therefore, has no expenses. Results reflect dividends gross of withholding taxes through December 31, 2000, and dividends net of withholding taxes thereafter. |
| Capital World Growth and Income Fund | 1 |
The global investing environment
Most of the world’s equity markets advanced during the fiscal first half, with developed-country stocks generally exceeding developing-country stocks. Japan and the United States led most markets higher. Consumer discretionary companies, financials and industrials outpaced the broader market. More defensive areas of the market tended to lag, but the health care sector recorded the strongest returns of the period.
The U.S. budget picture has improved somewhat due primarily to stronger economic growth but also to automatic spending cuts resulting from Congress’s inability to agree on longer term budget reform. A number of indicators pointed to a strengthening U.S. economy. Both construction activity and home prices rose to multiyear highs during the period, signaling a turnaround in the housing market. Labor market conditions also improved somewhat, and in May consumer confidence rose to its highest level in five years. While the Federal Reserve held interest rates near zero, toward the end of the period Fed Chairman Ben Bernanke suggested that the central bank may begin to reduce the scope of its bond-buying programs.
Returns for most markets outside the U.S. were dampened slightly for U.S. investors by a strengthening dollar. Most notably, the dollar rose 22.4% versus the Japanese yen.
Japan’s stock market rose sharply as the country’s central bank announced aggressive monetary easing to help stave off deflation. In early 2013, newly elected Prime Minister Shinzo Abe proposed a number of economic reforms aimed at stimulating growth, and in April the country’s central bank pledged to double the monetary base over two years to achieve a 2% inflation target by 2015. Despite the weakening yen, the Japanese equity market gained 20.6%* on a dollar-adjusted basis.
In the 17-nation euro zone, economic activity declined at an annualized rate of 0.9% in the first quarter, and unemployment rose to a record 12.2% in April. In May, the European Central Bank (ECB) slashed its benchmark interest rate and ECB President Mario Draghi said the bank “stands ready to act if needed,” providing a further boost to investor confidence. Therefore, despite lackluster growth, European equities recorded solid gains. Stock markets in Germany and France, the euro zone’s two largest economies, rose 11.6% and 12.4%, respectively, in U.S. dollar terms. Likewise, struggling nations Portugal (14.2%), Greece (7.8%), Italy (6.0%) and Spain (5.8%) all advanced during the period.
In the developing markets, equity returns were mixed. China’s GDP growth decelerated during the period, raising concerns that the economy might be losing momentum. Leaders in Beijing are seeking a shift toward a more balanced economy driven more by domestic consumption. For the six months, China’s stock market rose 0.3%. Elsewhere, Brazil rose 1.0%, while India (–1.5%) and Russia (–1.9%) declined in U.S. dollar terms.
| * | Country returns are based on MSCI indexes, expressed in U.S. dollars (except where noted), and assume the reinvestment of dividends. Results reflect dividends net of withholding taxes. |
| 2 | Capital World Growth and Income Fund |
Where the fund’s assets were invested
Percent of net assets by country as of May 31, 2013
| | | Capital World Growth
and Income Fund | | MSCI All Country
World Index* |
| | | | | | | | | |
| Europe | | | 38.0 | % | | | 24.8 | % |
| Euro zone† | | | 15.9 | | | | 10.4 | |
| United Kingdom | | | 11.0 | | | | 8.0 | |
| Switzerland | | | 6.5 | | | | 3.3 | |
| Sweden | | | 3.2 | | | | 1.2 | |
| Russia | | | .8 | | | | .7 | |
| Other Europe | | | .6 | | | | 1.2 | |
| | | | | | | | | |
| The Americas | | | 37.5 | | | | 54.3 | |
| United States | | | 36.5 | | | | 48.1 | |
| Canada | | | .6 | | | | 3.8 | |
| Other Americas | | | .4 | | | | 2.4 | |
| | | | | | | | | |
| Asia/Pacific | | | 16.0 | | | | 19.9 | |
| Hong Kong | | | 3.8 | | | | 1.1 | |
| China | | | 2.2 | | | | 2.2 | |
| Japan | | | 2.1 | | | | 7.8 | |
| Australia | | | 2.0 | | | | 3.0 | |
| South Korea | | | 1.4 | | | | 1.7 | |
| Singapore | | | 1.4 | | | | .6 | |
| Thailand | | | 1.2 | | | | .3 | |
| Taiwan | | | 1.0 | | | | 1.4 | |
| Other Asia/Pacific | | | .9 | | | | 1.8 | |
| | | | | | | | | |
| Other | | | 1.2 | | | | 1.0 | |
| | | | | | | | | |
| Bonds, notes & other debt instruments, short-term securities & other assets less liabilities | | | 7.3 | | | | — | |
| | | | | | | | | |
| Total | | | 100.0 | % | | | 100.0 | % |
| * | The MSCI All Country World Index is weighted by market capitalization. |
| † | Countries using the euro as a common currency: Austria, Belgium, Cyprus, Estonia, Finland, France, Germany, Greece, Ireland, Italy, Luxembourg, Malta, the Netherlands, Portugal, Slovakia, Slovenia and Spain. |
| Capital World Growth and Income Fund | 3 |
Inside the portfolio
Despite having a relatively light exposure to U.S. and Japanese equities — two standout markets during the period — the fund delivered a strong gain partly due to favorable stock selection across a variety of areas. As we have often pointed out, the fund’s managers choose investments from the bottom up, focusing on individual businesses they believe represent superior value and have good long-term prospects.
Favorable stock selection among health care companies helped the fund’s investments in this area outpace the sector and the overall market. Medical device maker Boston Scientific Corp. (66.8%) and biotech company Gilead Sciences (45.3%), the fund’s No. 8 holding, registered exceptional gains. Other contributors were No. 4 holding Bayer (18.9%) and Novartis (15.8%), the fund’s top holding. (You can find a list of the fund’s top-10 holdings below.) One exception to this positive trend was Israel-based Teva Pharmaceutical Industries (–5.3%), which declined after investors grew concerned over the company’s strategy to repurpose existing drugs for new uses.
Elsewhere in the portfolio, select holdings in the consumer discretionary and information technology sectors also supported the fund’s solid return. Top contributors in the consumer discretionary area included specialty retailer Home Depot (20.9%), satellite television broadcaster DIRECTV (23.0%), and auto makers Renault (54.2%), General Motors (31.0%) and Daimler (29.8%). Information technology companies that had strong showings included Yahoo (40.1%), No. 7 holding Microsoft (31.0%) and electronic components maker Murata Manufacturing (33.9%).
Largest equity holdings
(as of May 31, 2013)
| Company | | Country | | Percent of
net assets | | 6-month
return |
| | | | | | | | | | | |
| Novartis | | Switzerland | | | 3.18 | % | | | 15.79 | % |
| Philip Morris International | | United States | | | 2.33 | | | | 1.15 | |
| Amgen | | United States | | | 2.03 | | | | 13.21 | |
| Bayer | | Germany | | | 1.94 | | | | 18.92 | |
| BP | | United Kingdom | | | 1.79 | | | | 3.51 | |
| Altria | | United States | | | 1.78 | | | | 6.77 | |
| Microsoft | | United States | | | 1.65 | | | | 31.03 | |
| Gilead Sciences | | United States | | | 1.34 | | | | 45.28 | |
| AbbVie | | United States | | | 1.18 | | | | — | * |
| ASSA ABLOY | | Sweden | | | 1.14 | | | | 10.20 | |
| * | Six-month return data unavailable for AbbVie, since the company was formed in January 2013 from a spinoff of Abbott Laboratories. |
| 4 | Capital World Growth and Income Fund |
Among the holdings detracting from results were Brazilian steel maker Usinas Sider Minas (–29.0%), Light SA (–26.9%) and U.K. power generator Aggreko (–24.5%). Tobacco maker Philip Morris International (1.2%), the fund’s second-largest holding, and oil company BP (3.5%) also held back the fund’s overall result on a relative basis.
A look ahead
Looking forward, we see reasons for optimism. The U.S. economy continues to make progress, and the changes in policy direction in Japan could benefit both Japan and the overall global economy. It remains to be seen, however, whether Japanese lawmakers will follow through with proposed structural reforms. Likewise, there have been some early indications that the euro zone is on the mend. However, a number of European economies remain in recession and further fiscal and economic adjustments must be made.
As always, we will rely on a research-driven approach to seek out companies that we believe have the potential to contribute to the fund’s growth-and-income objectives over the long term.
We are grateful for your support and look forward to reporting back to you at the end of the fiscal year.
Cordially,
 |  |
| Michael Thawley | Mark E. Denning |
| Vice Chairman of the Board | President |
July 11, 2013
For current information about the fund, visit americanfunds.com.
| Capital World Growth and Income Fund | 5 |
| Summary investment portfolio May 31, 2013 | unaudited |
The following summary investment portfolio is designed to streamline the report and help investors better focus on the fund’s principal holdings. See the inside back cover for details on how to obtain a complete schedule of portfolio holdings.
| Industry sector diversification | Percent of net assets |
| Country diversification | | Percent of
net assets |
| United States | | | 36.5 | % |
| Euro zone* | | | 15.9 | |
| United Kingdom | | | 11.0 | |
| Switzerland | | | 6.5 | |
| Hong Kong | | | 3.8 | |
| Sweden | | | 3.2 | |
| China | | | 2.2 | |
| Japan | | | 2.1 | |
| Australia | | | 2.0 | |
| South Korea | | | 1.4 | |
| Other countries | | | 8.1 | |
| Bonds, notes & other debt instruments, short-term securities & other assets less liabilities | | | 7.3 | |
| * | Countries using the euro as a common currency; those represented in the fund’s portfolio are Austria, Belgium, Finland, France, Germany, Ireland, Italy, Luxembourg, the Netherlands, Portugal and Spain. |
| 6 | Capital World Growth and Income Fund |
| Common stocks — 92.31% | | Shares | | | Value
(000) | | | Percent of
net assets | |
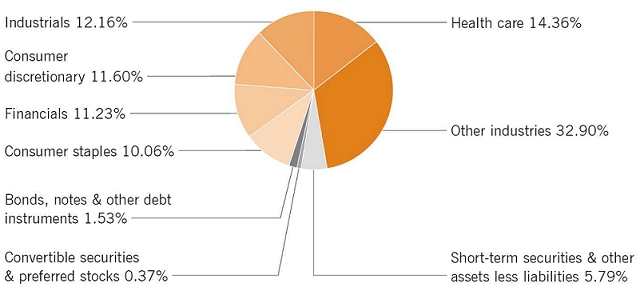
| Health care — 14.36% | | | | | | | | | | | | |
| Novartis AG1 | | | 33,907,063 | | | $ | 2,429,635 | | | | 3.18 | % |
| Amgen Inc. | | | 15,435,458 | | | | 1,551,727 | | | | 2.03 | |
| Bayer AG1 | | | 13,831,026 | | | | 1,487,797 | | | | 1.94 | |
| Gilead Sciences, Inc.2 | | | 18,860,000 | | | | 1,027,493 | | | | 1.34 | |
| AbbVie Inc. | | | 21,085,700 | | | | 900,148 | | | | 1.18 | |
| Teva Pharmaceutical Industries Ltd. (ADR) | | | 16,498,000 | | | | 630,224 | | | | .82 | |
| Roche Holding AG1 | | | 2,014,000 | | | | 498,345 | | | | .65 | |
| Other securities | | | | | | | 2,460,627 | | | | 3.22 | |
| | | | | | | | 10,985,996 | | | | 14.36 | |
| | | | | | | | | | | | | |
| Industrials — 12.16% | | | | | | | | | | | | |
| ASSA ABLOY AB, Class B1 | | | 21,821,007 | | | | 869,911 | | | | 1.14 | |
| KONE Oyj, Class B1 | | | 6,185,000 | | | | 543,725 | | | | .71 | |
| AB Volvo, Class B1 | | | 34,899,080 | | | | 509,143 | | | | .67 | |
| Jardine Matheson Holdings Ltd.1 | | | 7,748,000 | | | | 507,958 | | | | .66 | |
| United Parcel Service, Inc., Class B | | | 5,200,000 | | | | 446,680 | | | | .58 | |
| General Electric Co. | | | 17,500,000 | | | | 408,100 | | | | .53 | |
| Other securities | | | | | | | 6,017,099 | | | | 7.87 | |
| | | | | | | | 9,302,616 | | | | 12.16 | |
| | | | | | | | | | | | | |
| Consumer discretionary — 11.60% | | | | | | | | | | | | |
| Home Depot, Inc. | | | 11,038,800 | | | | 868,312 | | | | 1.14 | |
| General Motors Co.2 | | | 17,711,450 | | | | 600,241 | | | | .78 | |
| DIRECTV2 | | | 8,313,000 | | | | 508,174 | | | | .66 | |
| Renault SA1 | | | 6,291,861 | | | | 485,136 | | | | .63 | |
| Amazon.com, Inc.2 | | | 1,762,600 | | | | 474,192 | | | | .62 | |
| SJM Holdings Ltd.1 | | | 157,031,000 | | | | 427,248 | | | | .56 | |
| Other securities | | | | | | | 5,507,365 | | | | 7.21 | |
| | | | | | | | 8,870,668 | | | | 11.60 | |
| | | | | | | | | | | | | |
| Financials — 11.23% | | | | | | | | | | | | |
| Société Générale1 | | | 14,946,365 | | | | 592,533 | | | | .77 | |
| AIA Group Ltd.1 | | | 112,663,396 | | | | 497,189 | | | | .65 | |
| Prudential PLC1 | | | 29,306,500 | | | | 493,922 | | | | .65 | |
| Other securities | | | | | | | 7,003,507 | | | | 9.16 | |
| | | | | | | | 8,587,151 | | | | 11.23 | |
| Capital World Growth and Income Fund | 7 |
| Common stocks | | Shares | | | Value
(000) | | | Percent of
net assets | |
| Consumer staples — 10.06% | | | | | | | | | | | | |
| Philip Morris International Inc. | | | 19,606,300 | | | $ | 1,782,409 | | | | 2.33 | % |
| Altria Group, Inc. | | | 37,619,300 | | | | 1,358,057 | | | | 1.78 | |
| Pernod Ricard SA1 | | | 5,085,210 | | | | 610,663 | | | | .80 | |
| Wesfarmers Ltd.1 | | | 16,071,520 | | | | 601,344 | | | | .79 | |
| Nestlé SA1 | | | 7,310,030 | | | | 482,366 | | | | .63 | |
| Anheuser-Busch InBev NV1 | | | 5,223,383 | | | | 481,490 | | | | .63 | |
| Lorillard, Inc. | | | 11,049,353 | | | | 468,935 | | | | .61 | |
| Other securities | | | | | | | 1,914,049 | | | | 2.49 | |
| | | | | | | | 7,699,313 | | | | 10.06 | |
| | | | | | | | | | | | | |
| Information technology — 7.19% | | | | | | | | | | | | |
| Microsoft Corp. | | | 36,085,019 | | | | 1,258,645 | | | | 1.65 | |
| Samsung Electronics Co. Ltd.1 | | | 515,800 | | | | 695,595 | | | | .91 | |
| Oracle Corp. | | | 13,337,000 | | | | 450,257 | | | | .59 | |
| Google Inc., Class A2 | | | 490,829 | | | | 427,222 | | | | .56 | |
| Automatic Data Processing, Inc. | | | 6,040,000 | | | | 415,069 | | | | .54 | |
| Other securities | | | | | | | 2,253,171 | | | | 2.94 | |
| | | | | | | | 5,499,959 | | | | 7.19 | |
| | | | | | | | | | | | | |
| Telecommunication services — 6.67% | | | | | | | | | | | | |
| SOFTBANK CORP.1 | | | 14,920,000 | | | | 746,256 | | | | .98 | |
| Verizon Communications Inc. | | | 15,119,500 | | | | 732,993 | | | | .96 | |
| Vodafone Group PLC1 | | | 216,977,500 | | | | 628,792 | | | | | |
| Vodafone Group PLC (ADR) | | | 1,120,000 | | | | 32,424 | | | | .86 | |
| AT&T Inc. | | | 15,110,000 | | | | 528,699 | | | | .69 | |
| TeliaSonera AB1 | | | 70,557,215 | | | | 469,916 | | | | .61 | |
| CenturyLink, Inc. | | | 13,456,000 | | | | 459,523 | | | | .60 | |
| Other securities | | | | | | | 1,504,443 | | | | 1.97 | |
| | | | | | | | 5,103,046 | | | | 6.67 | |
| | | | | | | | | | | | | |
| Energy — 5.17% | | | | | | | | | | | | |
| BP PLC1 | | | 191,653,213 | | | | 1,371,822 | | | | 1.79 | |
| Eni SpA1 | | | 18,245,300 | | | | 412,571 | | | | | |
| Eni SpA (ADR) | | | 253,148 | | | | 11,470 | | | | .55 | |
| Other securities | | | | | | | 2,157,458 | | | | 2.83 | |
| | | | | | | | 3,953,321 | | | | 5.17 | |
| 8 | Capital World Growth and Income Fund |
| Common stocks | | Shares | | | Value
(000) | | | Percent of
net assets | |
| Utilities — 4.78% | | | | | | | | | | | | |
| National Grid PLC1 | | | 62,148,492 | | | $ | 735,297 | | | | .96 | % |
| PT Perusahaan Gas Negara (Persero) Tbk1 | | | 836,821,500 | | | | 468,993 | | | | .61 | |
| SSE PLC1 | | | 18,545,336 | | | | 433,651 | | | | .57 | |
| Other securities | | | | | | | 2,015,880 | | | | 2.64 | |
| | | | | | | | 3,653,821 | | | | 4.78 | |
| | | | | | | | | | | | | |
| Materials — 4.30% | | | | | | | | | | | | |
| Dow Chemical Co. | | | 16,047,000 | | | | 552,980 | | | | .72 | |
| BASF SE1 | | | 4,429,000 | | | | 432,773 | | | | .57 | |
| Other securities | | | | | | | 2,301,069 | | | | 3.01 | |
| | | | | | | | 3,286,822 | | | | 4.30 | |
| | | | | | | | | | | | | |
| Miscellaneous — 4.79% | | | | | | | | | | | | |
| Other common stocks in initial period of acquisition | | | | | | | 3,667,692 | | | | 4.79 | |
| | | | | | | | | | | | | |
| Total common stocks (cost: $53,131,151,000) | | | | | | | 70,610,405 | | | | 92.31 | |
| | | | | | | | | | | | | |
| Preferred stocks — 0.01% | | | | | | | | | | | | |
| Financials — 0.01% | | | | | | | | | | | | |
| Other securities | | | | | | | 10,274 | | | | .01 | |
| | | | | | | | | | | | | |
| Total preferred stocks (cost: $9,150,000) | | | | | | | 10,274 | | | | .01 | |
| | | | | | | | | | | | | |
| Convertible securities — 0.36% | | | | | | | | | | | | |
| Other — 0.32% | | | | | | | | | | | | |
| Other securities | | | | | | | 245,853 | | | | .32 | |
| | | | | | | | | | | | | |
| Miscellaneous — 0.04% | | | | | | | | | | | | |
| Other convertible securities in initial period of acquisition | | | | | | | 31,423 | | | | .04 | |
| | | | | | | | | | | | | |
| Total convertible securities (cost: $232,941,000) | | | | | | | 277,276 | | | | .36 | |
| Capital World Growth and Income Fund | 9 |
Bonds, notes & other debt
instruments — 1.53% | | Principal amount
(000) | | | Value
(000) | | | Percent of
net assets | |
| Energy — 0.02% | | | | | | | | | | | | |
| BP Capital Markets PLC 3.875%–5.25% 2013–2015 | | $ | 10,655 | | | $ | 11,127 | | | | .02 | % |
| | | | | | | | | | | | | |
| Other — 1.51% | | | | | | | | | | | | |
| Other securities | | | | | | | 1,158,015 | | | | 1.51 | |
| | | | | | | | | | | | | |
Total bonds, notes & other debt instruments
(cost: $1,018,898,000) | | | | | | | 1,169,142 | | | | 1.53 | |
| | | | | | | | | | | | | |
| Short-term securities — 5.36% | | | | | | | | | | | | |
| Freddie Mac 0.075%–0.17% due 7/15/2013–4/9/2014 | | | 1,185,175 | | | | 1,184,607 | | | | 1.55 | |
| Fannie Mae 0.11%–0.15% due 7/24/2013–3/3/2014 | | | 665,900 | | | | 665,611 | | | | .87 | |
| Federal Home Loan Bank 0.075%–0.155% due 6/7/2013–1/6/2014 | | | 434,600 | | | | 434,489 | | | | .57 | |
| Other securities | | | | | | | 1,818,444 | | | | 2.37 | |
| | | | | | | | | | | | | |
| Total short-term securities (cost: $4,102,755,000) | | | | | | | 4,103,151 | | | | 5.36 | |
| Total investment securities (cost: $58,494,895,000) | | | | | | | 76,170,248 | | | | 99.57 | |
| Other assets less liabilities | | | | | | | 325,089 | | | | .43 | |
| | | | | | | | | | | | | |
| Net assets | | | | | | $ | 76,495,337 | | | | 100.00 | % |
“As permitted by U.S. Securities and Exchange Commission regulations, “Miscellaneous” securities include holdings in their first year of acquisition that have not previously been publicly disclosed.
“Other securities” includes all issues that are not disclosed separately in the summary investment portfolio. Some of these securities (with an aggregate value of $1,395,945,000, which represented 1.82% of the net assets of the fund) were acquired in transactions exempt from registration under Rule 144A or section 4(2) of the Securities Act of 1933 and may be resold in the U.S. in transactions exempt from registration, normally to qualified institutional buyers.
Forward currency contracts
The fund has entered into forward currency contracts to sell currencies as shown in the following table. The open forward currency contracts shown are generally indicative of the level of activity over the prior 12-month period.
| | | | | | | Contract amount | | Unrealized
appreciation
(depreciation) | |
| | | Settlement date | | Counterparty | | Receive
(000) | | Deliver
(000) | | at 5/31/2013
(000) | |
| Sales: | | | | | | | | | | | | |
| Australian dollars | | 6/18/2013 | | Barclays Bank PLC | | $75,796 | | A$78,000 | | | $1,246 | |
| Australian dollars | | 6/18/2013 | | Barclays Bank PLC | | $141,224 | | A$139,000 | | | 8,373 | |
| British pounds | | 6/28/2013 | | UBS AG | | $105,780 | | £69,924 | | | (441 | ) |
| Euros | | 6/28/2013 | | Bank of America, N.A. | | $109,515 | | €84,800 | | | (720 | ) |
| Japanese yen | | 7/3/2013 | | Bank of New York Mellon | | $101,655 | | ¥10,242,554 | | | (321 | ) |
| | | | | | | | | | | | $8,137 | |
| 10 | Capital World Growth and Income Fund |
Investments in affiliates
A company is considered to be an affiliate of the fund under the Investment Company Act of 1940 if the fund’s holdings in that company represent 5% or more of the outstanding voting shares. The value of the fund’s holdings in affiliated companies is included in “Other securities” under the respective industry sectors in the summary investment portfolio. Further details on these holdings and related transactions during the six months ended May 31, 2013, appear below.
| | | Beginning
shares | | | Additions | | | Reductions | | | Ending
shares | | | Dividend
income
(000) | | | Value of
affiliates at
5/31/2013
(000) | |
| ComfortDelGro Corp. Ltd.1 | | | 135,100,000 | | | | — | | | | — | | | | 135,100,000 | | | $ | 3,828 | | | $ | 199,151 | |
| Qantas Airways Ltd.1,2 | | | 125,158,600 | | | | — | | | | — | | | | 125,158,600 | | | | — | | | | 189,437 | |
| | | | | | | | | | | | | | | | | | | $ | 3,828 | | | $ | 388,588 | |
The following footnotes apply to either the individual securities noted or one or more of the securities aggregated and listed as a single line item.
| 1 | Valued under fair value procedures adopted by authority of the board of trustees. The total value of all such securities, including those in “Miscellaneous” and “Other securities,” was $40,678,782,000, which represented 53.18% of the net assets of the fund. This entire amount relates to certain securities trading outside the U.S. whose values were adjusted as a result of significant market movements following the close of local trading. |
| 2 | Security did not produce income during the last 12 months. |
Key to abbreviation and symbols
ADR = American Depositary Receipts
A$ = Australian dollars
€ = Euros
£ = British pounds
¥ = Japanese yen
See Notes to Financial Statements
| Capital World Growth and Income Fund | 11 |
Financial statements
| Statement of assets and liabilities | | unaudited | |
| at May 31, 2013 | | (dollars in thousands) | |
| | | | |
| Assets: | | | | | | | | |
| Investment securities, at value: | | | | | | | | |
| Unaffiliated issuers (cost: $58,073,177) | | $ | 75,781,660 | | | | | |
| Affiliated issuers (cost: $421,718) | | | 388,588 | | | $ | 76,170,248 | |
| Cash denominated in currencies other than U.S. dollars (cost: $16,399) | | | | | | | 16,399 | |
| Unrealized appreciation on open forward currency contracts | | | | | | | 9,619 | |
| Receivables for: | | | | | | | | |
| Sales of investments | | | 194,248 | | | | | |
| Sales of fund’s shares | | | 74,503 | | | | | |
| Closed forward currency contracts | | | 3,348 | | | | | |
| Dividends and interest | | | 314,183 | | | | 586,282 | |
| | | | | | | | 76,782,548 | |
| Liabilities: | | | | | | | | |
| Unrealized depreciation on open forward currency contracts | | | | | | | 1,482 | |
| Payables for: | | | | | | | | |
| Purchases of investments | | | 128,665 | | | | | |
| Repurchases of fund’s shares | | | 78,992 | | | | | |
| Investment advisory services | | | 24,960 | | | | | |
| Services provided by related parties | | | 47,106 | | | | | |
| Trustees’ deferred compensation | | | 1,225 | | | | | |
| Bank overdraft | | | 4,022 | | | | | |
| Other | | | 759 | | | | 285,729 | |
| Net assets at May 31, 2013 | | | | | | $ | 76,495,337 | |
| | | | | | | | | |
| Net assets consist of: | | | | | | | | |
| Capital paid in on shares of beneficial interest | | | | | | $ | 69,947,839 | |
| Undistributed net investment income | | | | | | | 738,951 | |
| Accumulated net realized loss | | | | | | | (11,872,889 | ) |
| Net unrealized appreciation | | | | | | | 17,681,436 | |
| Net assets at May 31, 2013 | | | | | | $ | 76,495,337 | |
(dollars and shares in thousands, except per-share amounts)
Shares of beneficial interest issued and outstanding (no stated par value) —
unlimited shares authorized (1,882,334 total shares outstanding)
| | | | | | Shares | | | Net asset | |
| | | Net assets | | | outstanding | | | value per share | |
| Class A | | $ | 50,067,042 | | | | 1,230,224 | | | $ | 40.70 | |
| Class B | | | 1,282,393 | | | | 31,699 | | | | 40.46 | |
| Class C | | | 4,583,462 | | | | 113,839 | | | | 40.26 | |
| Class F-1 | | | 3,587,781 | | | | 88,317 | | | | 40.62 | |
| Class F-2 | | | 2,165,020 | | | | 53,207 | | | | 40.69 | |
| Class 529-A | | | 2,571,919 | | | | 63,371 | | | | 40.58 | |
| Class 529-B | | | 109,576 | | | | 2,709 | | | | 40.45 | |
| Class 529-C | | | 647,238 | | | | 16,025 | | | | 40.39 | |
| Class 529-E | | | 110,294 | | | | 2,722 | | | | 40.52 | |
| Class 529-F-1 | | | 89,285 | | | | 2,198 | | | | 40.62 | |
| Class R-1 | | | 281,555 | | | | 6,981 | | | | 40.33 | |
| Class R-2 | | | 1,217,170 | | | | 30,245 | | | | 40.24 | |
| Class R-3 | | | 2,498,920 | | | | 61,774 | | | | 40.45 | |
| Class R-4 | | | 2,315,817 | | | | 57,024 | | | | 40.61 | |
| Class R-5 | | | 1,500,956 | | | | 36,860 | | | | 40.72 | |
| Class R-6 | | | 3,466,909 | | | | 85,139 | | | | 40.72 | |
See Notes to Financial Statements
| 12 | Capital World Growth and Income Fund |
| Statement of operations | | unaudited | |
| for the six months ended May 31, 2013 | | (dollars in thousands) | |
| | | | | | | |
| Investment income: | | | | | | | | |
| Income: | | | | | | | | |
| Dividends (net of non-U.S. taxes of $89,405; also includes $3,828 from affiliates) | | $ | 1,208,606 | | | | | |
| Interest (net of non-U.S. taxes of $19) | | | 40,450 | | | $ | 1,249,056 | |
| Fees and expenses*: | | | | | | | | |
| Investment advisory services | | | 139,121 | | | | | |
| Distribution services | | | 113,352 | | | | | |
| Transfer agent services | | | 54,683 | | | | | |
| Administrative services | | | 8,395 | | | | | |
| Reports to shareholders | | | 2,212 | | | | | |
| Registration statement and prospectus | | | 410 | | | | | |
| Trustees’ compensation | | | 357 | | | | | |
| Auditing and legal | | | 101 | | | | | |
| Custodian | | | 3,755 | | | | | |
| State and local taxes | | | 257 | | | | | |
| Other | | | 1,878 | | | | 324,521 | |
| Net investment income | | | | | | | 924,535 | |
| | | | | | | | | |
| Net realized gain and unrealized appreciation on investments, forward currency contracts and currency: | | | | | | | | |
| Net realized gain (loss) on: | | | | | | | | |
| Investments (net of non-U.S. taxes of $62) | | | 2,736,329 | | | | | |
| Forward currency contracts | | | (11,638 | ) | | | | |
| Currency transactions | | | (9,790 | ) | | | 2,714,901 | |
| Net unrealized appreciation (depreciation) on: | | | | | | | | |
| Investments | | | 4,635,427 | | | | | |
| Forward currency contracts | | | 23,124 | | | | | |
| Currency translations | | | (428 | ) | | | 4,658,123 | |
| Net realized gain and unrealized appreciation on investments, forward currency contracts and currency | | | | | | | 7,373,024 | |
| | | | | | | | | |
| Net increase in net assets resulting from operations | | | | | | $ | 8,297,559 | |
*Additional information related to class-specific fees and expenses is included in the Notes to Financial Statements.
See Notes to Financial Statements
| Capital World Growth and Income Fund | 13 |
Statements of changes in net assets
(dollars in thousands)
| | | Six months ended | | | Year ended | |
| | | May 31, 2013* | | | November 30, 2012 | |
| | | | | | | |
| Operations: | | | | | | | | |
| Net investment income | | $ | 924,535 | | | $ | 1,677,355 | |
| Net realized gain on investments, forward currency contracts and currency transactions | | | 2,714,901 | | | | 278,665 | |
| Net unrealized appreciation on investments, forward currency contracts and currency translations | | | 4,658,123 | | | | 8,262,865 | |
| Net increase in net assets resulting from operations | | | 8,297,559 | | | | 10,218,885 | |
| | | | | | | | | |
| Dividends paid to shareholders from net investment income | | | (809,995 | ) | | | (1,889,680 | ) |
| | | | | | | | | |
| Net capital share transactions | | | (1,147,701 | ) | | | (6,354,159 | ) |
| | | | | | | | | |
| Total increase in net assets | | | 6,339,863 | | | | 1,975,046 | |
| | | | | | | | | |
| Net assets: | | | | | | | | |
| Beginning of period | | | 70,155,474 | | | | 68,180,428 | |
| End of period (including undistributed net investment income: $738,951 and $624,411, respectively) | | $ | 76,495,337 | | | $ | 70,155,474 | |
|
*Unaudited.
See Notes to Financial Statements
| 14 | Capital World Growth and Income Fund |
| Notes to financial statements | unaudited |
1. Organization
Capital World Growth and Income Fund (the “fund”) is registered under the Investment Company Act of 1940 as an open-end, diversified management investment company. The fund seeks long-term growth of capital while providing current income. It invests on a global basis in a diversified portfolio consisting primarily of common stocks and other equity securities. Effective February 1, 2013, the fund reorganized from a Maryland corporation to a Delaware statutory trust in accordance with a proposal approved by shareholders on November 24, 2009.
The fund has 16 share classes consisting of five retail share classes (Classes A, B and C, as well as two F share classes, F-1 and F-2), five 529 college savings plan share classes (Classes 529-A, 529-B, 529-C, 529-E and 529-F-1) and six retirement plan share classes (Classes R-1, R-2, R-3, R-4, R-5 and R-6). The 529 college savings plan share classes can be used to save for college education. The retirement plan share classes are generally offered only through eligible employer-sponsored retirement plans. The fund’s share classes are further described below:
| Share class | | Initial sales
charge | | Contingent deferred sales
charge upon redemption | | Conversion feature | |
| Classes A and 529-A | | Up to 5.75% | | None (except 1% for certain redemptions within one year of purchase without an initial sales charge) | | None | |
| Classes B and 529-B* | | None | | Declines from 5% to 0% for redemptions within six years of purchase | | Classes B and 529-B convert to Classes A and 529-A, respectively, after eight years | |
| Class C | | None | | 1% for redemptions within one year of purchase | | Class C converts to Class F-1 after 10 years | |
| Class 529-C | | None | | 1% for redemptions within one year of purchase | | None | |
| Class 529-E | | None | | None | | None | |
| Classes F-1, F-2 and 529-F-1 | | None | | None | | None | |
| Classes R-1, R-2, R-3, R-4, R-5 and R-6 | | None | | None | | None | |
* Class B and 529-B shares of the fund are not available for purchase.
Holders of all share classes have equal pro rata rights to assets, dividends and liquidation proceeds. Each share class has identical voting rights, except for the exclusive right to vote on matters affecting only its class. Share classes have different fees and expenses (“class-specific fees and expenses”), primarily due to different arrangements for distribution, administrative and shareholder services. Differences in class-specific fees and expenses will result in differences in net investment income and, therefore, the payment of different per-share dividends by each share class.
| Capital World Growth and Income Fund | 15 |
2. Significant accounting policies
The financial statements have been prepared to comply with accounting principles generally accepted in the United States of America. These principles require management to make estimates and assumptions that affect reported amounts and disclosures. Actual results could differ from those estimates. The fund follows the significant accounting policies described below, as well as the valuation policies described in the next section on valuation.
Security transactions and related investment income — Security transactions are recorded by the fund as of the date the trades are executed with brokers. Realized gains and losses from security transactions are determined based on the specific identified cost of the securities. In the event a security is purchased with a delayed payment date, the fund will segregate liquid assets sufficient to meet its payment obligations. Dividend income is recognized on the ex-dividend date and interest income is recognized on an accrual basis. Market discounts, premiums and original issue discounts on fixed-income securities are amortized daily over the expected life of the security.
Class allocations — Income, fees and expenses (other than class-specific fees and expenses) and realized and unrealized gains and losses are allocated daily among the various share classes based on their relative net assets. Class-specific fees and expenses, such as distribution, administrative and shareholder services, are charged directly to the respective share class.
Dividends and distributions to shareholders — Dividends and distributions to shareholders are recorded on the ex-dividend date.
Currency translation — Assets and liabilities, including investment securities, denominated in currencies other than U.S. dollars are translated into U.S. dollars at the exchange rates supplied by one or more pricing vendors on the valuation date. Purchases and sales of investment securities and income and expenses are translated into U.S. dollars at the exchange rates on the dates of such transactions. On the accompanying financial statements, the effects of changes in exchange rates on investment securities are included with the net realized gain or loss and net unrealized appreciation or depreciation on investments. The realized gain or loss and unrealized appreciation or depreciation resulting from all other transactions denominated in currencies other than U.S. dollars are disclosed separately.
3. Valuation
Capital Research and Management Company (“CRMC”), the fund’s investment adviser, values the fund’s investments at fair value as defined by accounting principles generally accepted in the United States of America. The net asset value of each share class of the fund is generally determined as of approximately 4:00 p.m. New York time each day the New York Stock Exchange is open.
| 16 | Capital World Growth and Income Fund |
Methods and inputs — The fund’s investment adviser uses the following methods and inputs to establish the fair value of the fund’s assets and liabilities. Use of particular methods and inputs may vary over time based on availability and relevance as market and economic conditions evolve.
Equity securities are generally valued at the official closing price of, or the last reported sale price on, the exchange or market on which such securities are traded, as of the close of business on the day the securities are being valued or, lacking any sales, at the last available bid price. Prices for each security are taken from the principal exchange or market on which the security trades.
Fixed-income securities, including short-term securities purchased with more than 60 days left to maturity, are generally valued at prices obtained from one or more pricing vendors. Vendors value such securities based on one or more of the inputs described in the following table. The table provides examples of inputs that are commonly relevant for valuing particular classes of fixed-income securities in which the fund is authorized to invest. However, these classifications are not exclusive, and any of the inputs may be used to value any other class of fixed-income security.
| Fixed-income class | Examples of standard inputs |
| All | Benchmark yields, transactions, bids, offers, quotations from dealers and trading systems, new issues, spreads and other relationships observed in the markets among comparable securities; and proprietary pricing models such as yield measures calculated using factors such as cash flows, financial or collateral performance and other reference data (collectively referred to as “standard inputs”) |
Corporate bonds & notes;
convertible securities | Standard inputs and underlying equity of the issuer
|
Bonds & notes of governments &
government agencies | Standard inputs and interest rate volatilities
|
| Mortgage-backed; asset-backed obligations | Standard inputs and cash flows, prepayment information, default rates, delinquency and loss assumptions, collateral characteristics, credit enhancements and specific deal information |
When the fund’s investment adviser deems it appropriate to do so (such as when vendor prices are unavailable or not deemed to be representative), fixed-income securities will be valued in good faith at the mean quoted bid and ask prices that are reasonably and timely available (or bid prices, if ask prices are not available) or at prices for securities of comparable maturity, quality and type.
Securities with both fixed-income and equity characteristics, or equity securities traded principally among fixed-income dealers, are generally valued in the manner described above for either equity or fixed-income securities, depending on which method is deemed most appropriate by the fund’s investment adviser. Short-term securities purchased within
| Capital World Growth and Income Fund | 17 |
60 days to maturity are valued at amortized cost, which approximates fair value. The value of short-term securities originally purchased with maturities greater than 60 days is determined based on an amortized value to par when they reach 60 days. Forward currency contracts are valued at the mean of representative quoted bid and ask prices, generally based on prices supplied by one or more pricing vendors.
Securities and other assets for which representative market quotations are not readily available or are considered unreliable by the fund’s investment adviser are fair valued as determined in good faith under fair valuation guidelines adopted by authority of the fund’s board of trustees as further described below. The investment adviser follows fair valuation guidelines, consistent with U.S. Securities and Exchange Commission rules and guidance, to consider relevant principles and factors when making fair value determinations. The investment adviser considers relevant indications of value that are reasonably and timely available to it in determining the fair value to be assigned to a particular security, such as the type and cost of the security; contractual or legal restrictions on resale of the security; relevant financial or business developments of the issuer; actively traded similar or related securities; conversion or exchange rights on the security; related corporate actions; significant events occurring after the close of trading in the security; and changes in overall market conditions. In addition, the closing prices of equity securities that trade in markets outside U.S. time zones may be adjusted to reflect significant events that occur after the close of local trading but before the net asset value of each share class of the fund is determined. Fair valuations and valuations of investments that are not actively trading involve judgment and may differ materially from valuations that would have been used had greater market activity occurred.
Processes and structure — The fund’s board of trustees has delegated authority to the fund’s investment adviser to make fair value determinations, subject to board oversight. The investment adviser has established a Joint Fair Valuation Committee (the “Fair Valuation Committee”) to administer, implement and oversee the fair valuation process, and to make fair value decisions. The Fair Valuation Committee regularly reviews its own fair value decisions, as well as decisions made under its standing instructions to the investment adviser’s valuation teams. The Fair Valuation Committee reviews changes in fair value measurements from period to period and may, as deemed appropriate, update the fair valuation guidelines to better reflect the results of back testing and address new or evolving issues. The Fair Valuation Committee reports any changes to the fair valuation guidelines to the board of trustees with supplemental information to support the changes. The fund’s board and audit committee also regularly review reports that describe fair value determinations and methods.
The fund’s investment adviser has also established a Fixed-Income Pricing Review Group to administer and oversee the fixed-income valuation process, including the use of fixed-income pricing vendors. This group regularly reviews pricing vendor information and market data. Pricing decisions, processes and controls over security valuation are also subject to additional internal reviews, including an annual control self-evaluation program facilitated by the investment adviser’s compliance group.
| 18 | Capital World Growth and Income Fund |
Classifications — The fund’s investment adviser classifies the fund’s assets and liabilities into three levels based on the inputs used to value the assets or liabilities. Level 1 values are based on quoted prices in active markets for identical securities. Level 2 values are based on significant observable market inputs, such as quoted prices for similar securities and quoted prices in inactive markets. Certain securities trading outside the U.S. may transfer between Level 1 and Level 2 due to valuation adjustments resulting from significant market movements following the close of local trading. Level 3 values are based on significant unobservable inputs that reflect the investment adviser’s determination of assumptions that market participants might reasonably use in valuing the securities. The valuation levels are not necessarily an indication of the risk or liquidity associated with the underlying investment. For example, U.S. government securities are reflected as Level 2 because the inputs used to determine fair value may not always be quoted prices in an active market. The following tables present the fund’s valuation levels as of May 31, 2013 (dollars in thousands):
| | | Investment securities | |
| | | Level 1 | | | Level 2* | | | Level 3 | | | Total | |
| Assets: | | | | | | | | | | | | | | | | |
| Common stocks: | | | | | | | | | | | | | | | | |
| Health care | | $ | 5,777,905 | | | $ | 5,208,091 | | | $ | — | | | $ | 10,985,996 | |
| Industrials | | | 3,815,600 | | | | 5,487,016 | | | | — | | | | 9,302,616 | |
| Consumer discretionary | | | 4,163,551 | | | | 4,707,117 | | | | — | | | | 8,870,668 | |
| Financials | | | 1,461,183 | | | | 7,125,968 | | | | — | | | | 8,587,151 | |
| Consumer staples | | | 4,368,852 | | | | 3,330,461 | | | | — | | | | 7,699,313 | |
| Information technology | | | 3,670,018 | | | | 1,829,941 | | | | — | | | | 5,499,959 | |
| Telecommunication services | | | 2,289,817 | | | | 2,813,229 | | | | — | | | | 5,103,046 | |
| Energy | | | 1,279,345 | | | | 2,673,976 | | | | — | | | | 3,953,321 | |
| Utilities | | | 835,847 | | | | 2,817,974 | | | | — | | | | 3,653,821 | |
| Materials | | | 931,106 | | | | 2,355,716 | | | | — | | | | 3,286,822 | |
| Miscellaneous | | | 1,336,649 | | | | 2,331,043 | | | | — | | | | 3,667,692 | |
| Preferred stocks | | | — | | | | 10,274 | | | | — | | | | 10,274 | |
| Convertible securities | | | 91,520 | | | | 185,756 | | | | — | | | | 277,276 | |
| Bonds, notes & other debt instruments | | | — | | | | 1,169,142 | | | | — | | | | 1,169,142 | |
| Short-term securities | | | — | | | | 4,103,151 | | | | — | | | | 4,103,151 | |
| Total | | $ | 30,021,393 | | | $ | 46,148,855 | | | $ | — | | | $ | 76,170,248 | |
| | | Other investments† | |
| | | Level 1 | | | Level 2 | | | Level 3 | | | Total | |
| Assets: | | | | | | | | | | | | | | | | |
| Unrealized appreciation on open forward currency contracts | | $ | — | | | $ | 9,619 | | | $ | — | | | $ | 9,619 | |
| Liabilities: | | | | | | | | | | | | | | | | |
| Unrealized depreciation on open forward currency contracts | | | — | | | | (1,482 | ) | | | — | | | | (1,482 | ) |
| Total | | $ | — | | | $ | 8,137 | | | $ | — | | | $ | 8,137 | |
| * | Securities with a market value of $37,813,082,000, which represented 49.43% of the net assets of the fund, transferred from Level 1 to Level 2 since the prior fiscal year-end, primarily due to significant market movements following the close of local trading. |
| † | Forward currency contracts are not included in the investment portfolio. |
| Capital World Growth and Income Fund | 19 |
4. Risk factors
Investing in the fund may involve certain risks including, but not limited to, those described below.
Market conditions — The prices of, and the income generated by, the common stocks and other securities held by the fund may decline due to market conditions and other factors, including those directly involving the issuers of securities held by the fund.
Investing outside the U.S. — Securities of issuers domiciled outside the U.S., or with significant operations outside the U.S., may lose value because of adverse political, social, economic or market developments in the countries or regions in which the issuer operates. These securities may also lose value due to changes in foreign currency exchange rates against the U.S. dollar and/or currencies of other countries. Securities markets in certain countries may be more volatile and/or less liquid than those in the U.S. Investments outside the U.S. may also be subject to different settlement and accounting practices and different regulatory, legal and reporting standards, and may be more difficult to value, than those in the U.S. The risks of investing outside the U.S. may be heightened in connection with investments in emerging markets.
Investing in emerging markets — Investing in emerging markets may involve risks in addition to and greater than those generally associated with investing in developed countries. For instance, developing countries may have less developed legal and accounting systems than those in developed countries. The governments of these countries may be less stable and more likely to impose capital controls, nationalize a company or industry, place restrictions on foreign ownership and on withdrawing sale proceeds of securities from the country, and/or impose punitive taxes that could adversely affect the prices of securities. In addition, the economies of these countries may be dependent on relatively few industries that are more susceptible to local and global changes. Securities markets in these countries can also be relatively small and have substantially lower trading volumes. As a result, securities issued in these countries may be more volatile and less liquid, and may be more difficult to value, than securities issued in countries with more developed economies and/or markets. Additionally, there may be increased settlement risks for transactions in local securities.
Investing in growth-oriented stocks — Growth-oriented stocks may involve larger price swings and greater potential for loss than other types of investments.
Investing in income-oriented stocks — Income provided by the fund may be reduced by changes in the dividend policies of, and the capital resources available at, the companies in which the fund invests.
Management — The investment adviser to the fund actively manages the fund’s investments. Consequently, the fund is subject to the risk that the methods and analyses employed by the investment adviser in this process may not produce the desired results. This could cause the fund to lose value or its investment results to lag relevant benchmarks or other funds with similar objectives.
| 20 | Capital World Growth and Income Fund |
5. Certain investment techniques
Forward currency contracts — The fund has entered into forward currency contracts, which represent agreements to exchange currencies on specific future dates at predetermined rates. The fund’s investment adviser uses forward currency contracts to manage the fund’s exposure to changes in exchange rates. Upon entering into these contracts, risks may arise from the potential inability of counterparties to meet the terms of their contracts and from possible movements in exchange rates.
On a daily basis, the fund’s investment adviser values forward currency contracts based on the applicable exchange rates and records unrealized appreciation or depreciation for open forward currency contracts in the fund’s statement of assets and liabilities. Realized gains or losses are recorded at the time the forward currency contract is closed or offset by another contract with the same broker for the same settlement date and currency. Closed forward currency contracts that have not reached their settlement date are included in the respective receivables or payables for closed forward currency contracts in the fund’s statement of assets and liabilities. Net realized gains or losses from closed forward currency contracts and net unrealized appreciation or depreciation from open forward currency contracts are recorded in the fund’s statement of operations.
Collateral — To reduce the risk to counterparties of forward currency contracts, the fund has entered into a collateral program with certain counterparties. The program calls for the fund to either receive or pledge collateral based on the net gain or loss on unsettled forward currency contracts by counterparty. The purpose of the collateral is to cover potential losses that could occur in the event that either party cannot meet its contractual obligations.
6. Taxation and distributions
Federal income taxation — The fund complies with the requirements under Subchapter M of the Internal Revenue Code applicable to mutual funds and intends to distribute substantially all of its net taxable income and net capital gains each year. The fund is not subject to income taxes to the extent such distributions are made. Therefore, no federal income tax provision is required.
As of and during the period ended May 31, 2013, the fund did not have a liability for any unrecognized tax benefits. The fund recognizes interest and penalties, if any, related to unrecognized tax benefits as income tax expense in the statement of operations. During the period, the fund did not incur any interest or penalties.
The fund is not subject to examination by U.S. federal tax authorities for tax years before 2008, by state tax authorities for tax years before 2007 and by tax authorities outside the U.S. for tax years before 2006.
| Capital World Growth and Income Fund | 21 |
Non-U.S. taxation — Dividend and interest income are recorded net of non-U.S. taxes paid. Gains realized by the fund on the sale of securities in certain countries are subject to non-U.S. taxes. The fund records a liability based on unrealized gains to provide for potential non-U.S. taxes payable upon the sale of these securities.
Distributions — Distributions paid to shareholders are based on net investment income and net realized gains determined on a tax basis, which may differ from net investment income and net realized gains for financial reporting purposes. These differences are due primarily to different treatment for items such as currency gains and losses; short-term capital gains and losses; unrealized appreciation of certain investments in securities outside the U.S.; and net capital losses. The fiscal year in which amounts are distributed may differ from the year in which the net investment income and net realized gains are recorded by the fund for financial reporting purposes.
The components of distributable earnings on a tax basis are reported as of the fund’s most recent year-end. As of November 30, 2012, the components of distributable earnings on a tax basis were as follows (dollars in thousands):
| Undistributed ordinary income | | | | | | $ | 857,091 | |
| Capital loss carryforward*: | | | | | | | | |
| No expiration | | $ | (66,897 | ) | | | | |
| Expiring 2016 | | | (1,291,317 | ) | | | | |
| Expiring 2017 | | | (13,178,426 | ) | | | (14,536,640 | ) |
| * | The capital loss carryforward will be used to offset any capital gains realized by the fund in the current year or in subsequent years through the expiration dates. The fund will not make distributions from capital gains while a capital loss carryforward remains. |
Under the Regulated Investment Company Modernization Act of 2010 (the “Act”), net capital losses recognized after November 30, 2011, may be carried forward indefinitely, and their character is retained as short-term and/or long-term losses. Previously, net capital losses were carried forward for eight years and treated as short-term losses. As a transition rule, the Act requires that post-enactment net capital losses be used before pre-enactment net capital losses.
As of May 31, 2013, the tax basis unrealized appreciation (depreciation) and cost of investment securities were as follows (dollars in thousands):
| Gross unrealized appreciation on investment securities | | $ | 20,087,737 | |
| Gross unrealized depreciation on investment securities | | | (2,704,529 | ) |
| Net unrealized appreciation on investment securities | | | 17,383,208 | |
| Cost of investment securities | | | 58,787,040 | |
| 22 | Capital World Growth and Income Fund |
Tax-basis distributions paid to shareholders from ordinary income were as follows (dollars in thousands):
| | | Six months ended | | | Year ended | |
| Share class | | May 31, 2013 | | | November 30, 2012 | |
| Class A | | $ | 549,628 | | | $ | 1,295,073 | |
| Class B | | | 10,725 | | | | 33,659 | |
| Class C | | | 34,360 | | | | 93,351 | |
| Class F-1 | | | 37,996 | | | | 95,614 | |
| Class F-2 | | | 25,198 | | | | 44,923 | |
| Class 529-A | | | 26,819 | | | | 59,493 | |
| Class 529-B | | | 813 | | | | 2,434 | |
| Class 529-C | | | 4,482 | | | | 11,059 | |
| Class 529-E | | | 1,037 | | | | 2,364 | |
| Class 529-F-1 | | | 1,011 | | | | 2,111 | |
| Class R-1 | | | 2,206 | | | | 6,013 | |
| Class R-2 | | | 9,695 | | | | 24,066 | |
| Class R-3 | | | 24,574 | | | | 57,429 | |
| Class R-4 | | | 25,644 | | | | 57,655 | |
| Class R-5 | | | 18,738 | | | | 41,232 | |
| Class R-6 | | | 37,069 | | | | 63,204 | |
| Total | | $ | 809,995 | | | $ | 1,889,680 | |
7. Fees and transactions with related parties
CRMC, the fund’s investment adviser, is the parent company of American Funds Distributors,® Inc. (“AFD”), the principal underwriter of the fund’s shares, and American Funds Service Company® (“AFS”), the fund’s transfer agent. CRMC, AFD and AFS are considered related parties to the fund.
Investment advisory services — The fund has an investment advisory and service agreement with CRMC that provides for monthly fees accrued daily. These fees are based on a series of decreasing annual rates beginning with 0.600% on the first $500 million of daily net assets and decreasing to 0.350% on such assets in excess of $115 billion. For the six months ended May 31, 2013, the investment advisory services fee was $139,121,000, which was equivalent to an annualized rate of 0.377% of average daily net assets.
Class-specific fees and expenses — Expenses that are specific to individual share classes are accrued directly to the respective share class. The principal class-specific fees and expenses are described below:
Distribution services — The fund has plans of distribution for all share classes, except Class F-2, R-5 and R-6 shares. Under the plans, the board of trustees approves
| Capital World Growth and Income Fund | 23 |
certain categories of expenses that are used to finance activities primarily intended to sell fund shares and service existing accounts. The plans provide for payments, based on an annualized percentage of average daily net assets, ranging from 0.30% to 1.00% as noted below. In some cases, the board of trustees has limited the amounts that may be paid to less than the maximum allowed by the plans. All share classes with a plan may use up to 0.25% of average daily net assets to pay service fees, or to compensate AFD for paying service fees, to firms that have entered into agreements with AFD to provide certain shareholder services. The remaining amounts available to be paid under each plan are paid to dealers to compensate them for their sales activities.
For Class A and 529-A shares, distribution-related expenses include the reimbursement of dealer and wholesaler commissions paid by AFD for certain shares sold without a sales charge. These share classes reimburse AFD for amounts billed within the prior 15 months but only to the extent that the overall annual expense limit of 0.30% is not exceeded. As of May 31, 2013, there were no unreimbursed expenses subject to reimbursement for Class A or 529-A shares.
| | Share class | | Currently approved limits | | Plan limits | |
| | Class A | | 0.30% | | 0.30% | |
| | Class 529-A | | | 0.30 | | | | 0.50 | | |
| | Classes B and 529-B | | | 1.00 | | | | 1.00 | | |
| | Classes C, 529-C and R-1 | | | 1.00 | | | | 1.00 | | |
| | Class R-2 | | | 0.75 | | | | 1.00 | | |
| | Classes 529-E and R-3 | | | 0.50 | | | | 0.75 | | |
| | Classes F-1, 529-F-1 and R-4 | | | 0.25 | | | | 0.50 | | |
| | Transfer agent services — The fund has a shareholder services agreement with AFS under which the fund compensates AFS for providing transfer agent services to each of the fund’s share classes. These services include recordkeeping, shareholder communications and transaction processing. In addition, the fund reimburses AFS for amounts paid to third parties for performing transfer agent services on behalf of fund shareholders. |
| | |
| | Administrative services — The fund has an administrative services agreement with CRMC under which the fund compensates CRMC for providing administrative services to Class A, C, F, 529 and R shares. These services include, but are not limited to, coordinating, monitoring, assisting and overseeing third parties that provide services to fund shareholders. Under the agreement, Class A shares pay an annual fee of 0.01% and Class C, F, 529 and R shares pay an annual fee of 0.05% of their respective average daily net assets. |
| | |
| | 529 plan services — Each 529 share class is subject to service fees to compensate |
| 24 | Capital World Growth and Income Fund |
| | the Commonwealth of Virginia for the maintenance of the 529 college savings plan. The quarterly fee is based on a series of decreasing annual rates beginning with 0.10% on the first $30 billion of the net assets invested in Class 529 shares of the American Funds and decreasing to 0.06% on such assets between $120 billion and $150 billion. The fee for any given calendar quarter is accrued and calculated on the basis of the average net assets of Class 529 shares of the American Funds for the last month of the prior calendar quarter. The fee is included in other expenses on the accompanying financial statements. The Commonwealth of Virginia is not considered a related party. |
| | |
| | Class-specific expenses under the agreements described above for the six months ended May 31, 2013, were as follows (dollars in thousands): |
| | Share class | | Distribution
services | | Transfer agent
services | | Administrative
services | | 529 plan
services |
| | Class A | | | $58,540 | | | | $39,294 | | | | $2,423 | | | Not applicable |
| | Class B | | | 6,828 | | | | 1,193 | | | | Not applicable | | | Not applicable |
| | Class C | | | 22,484 | | | | 3,702 | | | | 1,127 | | | Not applicable |
| | Class F-1 | | | 4,230 | | | | 2,136 | | | | 851 | | | Not applicable |
| | Class F-2 | | | Not applicable | | | | 860 | | | | 505 | | | Not applicable |
| | Class 529-A | | | 2,687 | | | | 1,531 | | | | 613 | | | $1,206 |
| | Class 529-B | | | 559 | | | | 80 | | | | 28 | | | 55 |
| | Class 529-C | | | 3,074 | | | | 412 | | | | 155 | | | 304 |
| | Class 529-E | | | 262 | | | | 41 | | | | 26 | | | 52 |
| | Class 529-F-1 | | | — | | | | 53 | | | | 21 | | | 42 |
| | Class R-1 | | | 1,384 | | | | 149 | | | | 69 | | | Not applicable |
| | Class R-2 | | | 4,424 | | | | 1,924 | | | | 298 | | | Not applicable |
| | Class R-3 | | | 6,076 | | | | 1,811 | | | | 608 | | | Not applicable |
| | Class R-4 | | | 2,804 | | | | 1,134 | | | | 562 | | | Not applicable |
| | Class R-5 | | | Not applicable | | | | 355 | | | | 363 | | | Not applicable |
| | Class R-6 | | | Not applicable | | | | 8 | | | | 746 | | | Not applicable |
| | Total class-specific expenses | | | $113,352 | | | | $54,683 | | | | $8,395 | | | $1,659 |
Trustees’ deferred compensation — Trustees who are unaffiliated with CRMC may elect to defer the cash payment of part or all of their compensation. These deferred amounts, which remain as liabilities of the fund, are treated as if invested in shares of the fund or other American Funds. These amounts represent general, unsecured liabilities of the fund and vary according to the total returns of the selected funds. Trustees’ compensation of $357,000, shown on the accompanying financial statements, includes $205,000 in current fees (either paid in cash or deferred) and a net increase of $152,000 in the value of the deferred amounts.
Affiliated officers and trustees — Officers and certain trustees of the fund are or may be considered to be affiliated with CRMC, AFD and AFS. No affiliated officers or trustees received any compensation directly from the fund.
| Capital World Growth and Income Fund | 25 |
8. Capital share transactions
Capital share transactions in the fund were as follows (dollars and shares in thousands):
| | | | | | | | | Reinvestments | | | | | | | | | Net (decrease) | |
| | | Sales* | | | of dividends | | | Repurchases* | | | increase | |
| Share class | | Amount | | | Shares | | | Amount | | | Shares | | | Amount | | | Shares | | | Amount | | | Shares | |
| | | | | | | | | | | | | | | | | | | | | | | | | |
| Six months ended May 31, 2013 | | | | | | | | | | | | | | | | | | |
| | | | | | | | | | | | | | | | | | | |
| Class A | | $ | 1,869,164 | | | | 47,929 | | | $ | 537,181 | | | | 14,194 | | | $ | (3,590,772 | ) | | | (92,455 | ) | | $ | (1,184,427 | ) | | | (30,332 | ) |
| Class B | | | 4,769 | | | | 123 | | | | 10,589 | | | | 283 | | | | (307,971 | ) | | | (7,933 | ) | | | (292,613 | ) | | | (7,527 | ) |
| Class C | | | 170,098 | | | | 4,400 | | | | 33,375 | | | | 893 | | | | (452,085 | ) | | | (11,725 | ) | | | (248,612 | ) | | | (6,432 | ) |
| Class F-1 | | | 400,086 | | | | 10,261 | | | | 37,405 | | | | 989 | | | | (371,447 | ) | | | (9,557 | ) | | | 66,044 | | | | 1,693 | |
| Class F-2 | | | 301,736 | | | | 7,746 | | | | 22,334 | | | | 589 | | | | (219,261 | ) | | | (5,658 | ) | | | 104,809 | | | | 2,677 | |
| Class 529-A | | | 153,521 | | | | 3,967 | | | | 26,811 | | | | 710 | | | | (155,603 | ) | | | (4,024 | ) | | | 24,729 | | | | 653 | |
| Class 529-B | | | 779 | | | | 20 | | | | 813 | | | | 22 | | | | (18,589 | ) | | | (481 | ) | | | (16,997 | ) | | | (439 | ) |
| Class 529-C | | | 41,229 | | | | 1,069 | | | | 4,480 | | | | 120 | | | | (43,112 | ) | | | (1,121 | ) | | | 2,597 | | | | 68 | |
| Class 529-E | | | 6,570 | | | | 170 | | | | 1,037 | | | | 27 | | | | (7,098 | ) | | | (184 | ) | | | 509 | | | | 13 | |
| Class 529-F-1 | | | 9,675 | | | | 249 | | | | 1,011 | | | | 27 | | | | (8,175 | ) | | | (209 | ) | | | 2,511 | | | | 67 | |
| Class R-1 | | | 14,520 | | | | 375 | | | | 2,200 | | | | 59 | | | | (39,477 | ) | | | (1,034 | ) | | | (22,757 | ) | | | (600 | ) |
| Class R-2 | | | 131,374 | | | | 3,409 | | | | 9,680 | | | | 259 | | | | (194,759 | ) | | | (5,060 | ) | | | (53,705 | ) | | | (1,392 | ) |
| Class R-3 | | | 295,817 | | | | 7,646 | | | | 24,540 | | | | 653 | | | | (403,688 | ) | | | (10,450 | ) | | | (83,331 | ) | | | (2,151 | ) |
| Class R-4 | | | 291,647 | | | | 7,497 | | | | 25,637 | | | | 679 | | | | (387,804 | ) | | | (10,017 | ) | | | (70,520 | ) | | | (1,841 | ) |
| Class R-5 | | | 188,473 | | | | 4,842 | | | | 18,724 | | | | 495 | | | | (236,731 | ) | | | (6,036 | ) | | | (29,534 | ) | | | (699 | ) |
| Class R-6 | | | 816,120 | | | | 20,877 | | | | 34,557 | | | | 911 | | | | (197,081 | ) | | | (5,137 | ) | | | 653,596 | | | | 16,651 | |
| Total net increase (decrease) | | $ | 4,695,578 | | | | 120,580 | | | $ | 790,374 | | | | 20,910 | | | $ | (6,633,653 | ) | | | (171,081 | ) | | $ | (1,147,701 | ) | | | (29,591 | ) |
| | | | | | | | | | | | | | | | | | | | | | | | | | | | | | | | | |
| Year ended November 30, 2012 | | | | | | | | | | | | | | | | | | | | | | | | | |
| Class A | | $ | 2,626,636 | | | | 76,391 | | | $ | 1,262,109 | | | | 37,759 | | | | $(8,702,758 | ) | | | (253,570 | ) | | | $(4,814,013 | ) | | | (139,420 | ) |
| Class B | | | 9,241 | | | | 270 | | | | 33,137 | | | | 1,005 | | | | (632,184 | ) | | | (18,561 | ) | | | (589,806 | ) | | | (17,286 | ) |
| Class C | | | 229,803 | | | | 6,736 | | | | 90,255 | | | | 2,747 | | | | (1,171,467 | ) | | | (34,497 | ) | | | (851,409 | ) | | | (25,014 | ) |
| Class F-1 | | | 966,663 | | | | 28,595 | | | | 93,738 | | | | 2,809 | | | | (1,581,212 | ) | | | (46,262 | ) | | | (520,811 | ) | | | (14,858 | ) |
| Class F-2 | | | 727,890 | | | | 20,760 | | | | 38,704 | | | | 1,157 | | | | (495,180 | ) | | | (14,407 | ) | | | 271,414 | | | | 7,510 | |
| Class 529-A | | | 256,259 | | | | 7,491 | | | | 59,473 | | | | 1,783 | | | | (303,115 | ) | | | (8,839 | ) | | | 12,617 | | | | 435 | |
| Class 529-B | | | 2,045 | | | | 59 | | | | 2,433 | | | | 74 | | | | (38,180 | ) | | | (1,123 | ) | | | (33,702 | ) | | | (990 | ) |
| Class 529-C | | | 74,097 | | | | 2,174 | | | | 11,055 | | | | 335 | | | | (97,169 | ) | | | (2,855 | ) | | | (12,017 | ) | | | (346 | ) |
| Class 529-E | | | 12,233 | | | | 358 | | | | 2,362 | | | | 71 | | | | (16,051 | ) | | | (471 | ) | | | (1,456 | ) | | | (42 | ) |
| Class 529-F-1 | | | 16,246 | | | | 473 | | | | 2,110 | | | | 63 | | | | (15,169 | ) | | | (443 | ) | | | 3,187 | | | | 93 | |
| Class R-1 | | | 30,699 | | | | 903 | | | | 5,992 | | | | 182 | | | | (69,691 | ) | | | (2,030 | ) | | | (33,000 | ) | | | (945 | ) |
| Class R-2 | | | 238,510 | | | | 6,997 | | | | 24,035 | | | | 730 | | | | (373,175 | ) | | | (10,976 | ) | | | (110,630 | ) | | | (3,249 | ) |
| Class R-3 | | | 518,783 | | | | 15,146 | | | | 57,318 | | | | 1,726 | | | | (673,549 | ) | | | (19,624 | ) | | | (97,448 | ) | | | (2,752 | ) |
| Class R-4 | | | 479,903 | | | | 13,902 | | | | 57,635 | | | | 1,726 | | | | (595,861 | ) | | | (17,419 | ) | | | (58,323 | ) | | | (1,791 | ) |
| Class R-5 | | | 301,418 | | | | 8,702 | | | | 41,168 | | | | 1,229 | | | | (394,640 | ) | | | (11,440 | ) | | | (52,054 | ) | | | (1,509 | ) |
| Class R-6 | | | 738,967 | | | | 21,376 | | | | 57,556 | | | | 1,712 | | | | (263,231 | ) | | | (7,702 | ) | | | 533,292 | | | | 15,386 | |
| Total net increase (decrease) | | | $7,229,393 | | | | 210,333 | | | $ | 1,839,080 | | | | 55,108 | | | | $(15,422,632 | ) | | | (450,219 | ) | | $ | (6,354,159 | ) | | | (184,778 | ) |
*Includes exchanges between share classes of the fund.
| 26 | Capital World Growth and Income Fund |
9. Investment transactions
The fund made purchases and sales of investment securities, excluding short-term securities and U.S. government obligations, if any, of $7,367,564,000 and $9,360,455,000, respectively, during the six months ended May 31, 2013.
| Capital World Growth and Income Fund | 27 |
Financial highlights
| | | | | | | | Income (loss) from investment operations1 | |
| | | | | Net asset
value,
beginning
of period | | | Net
investment
income | | | Net gains
(losses) on
securities (both
realized and
unrealized) | | | Total from
investment
operations | |
| Class A: | | Six months ended 5/31/20134,5 | | $ | 36.75 | | | $ | .50 | | | $ | 3.89 | | | $ | 4.39 | |
| | | Year ended 11/30/2012 | | | 32.57 | | | | .87 | | | | 4.28 | | | | 5.15 | |
| | | Year ended 11/30/2011 | | | 33.75 | | | | .94 | | | | (1.22 | ) | | | (.28 | ) |
| | | Year ended 11/30/2010 | | | 33.80 | | | | .86 | | | | (.03 | ) | | | .83 | |
| | | Year ended 11/30/2009 | | | 25.50 | | | | .78 | | | | 8.52 | | | | 9.30 | |
| | | Year ended 11/30/2008 | | | 48.56 | | | | 1.27 | | | | (19.81 | ) | | | (18.54 | ) |
| Class B: | | Six months ended 5/31/20134,5 | | | 36.53 | | | | .34 | | | | 3.88 | | | | 4.22 | |
| | | Year ended 11/30/2012 | | | 32.37 | | | | .60 | | | | 4.26 | | | | 4.86 | |
| | | Year ended 11/30/2011 | | | 33.53 | | | | .67 | | | | (1.21 | ) | | | (.54 | ) |
| | | Year ended 11/30/2010 | | | 33.58 | | | | .60 | | | | (.03 | ) | | | .57 | |
| | | Year ended 11/30/2009 | | | 25.34 | | | | .57 | | | | 8.46 | | | | 9.03 | |
| | | Year ended 11/30/2008 | | | 48.27 | | | | .96 | | | | (19.69 | ) | | | (18.73 | ) |
| Class C: | | Six months ended 5/31/20134,5 | | | 36.36 | | | | .34 | | | | 3.85 | | | | 4.19 | |
| | | Year ended 11/30/2012 | | | 32.23 | | | | .59 | | | | 4.24 | | | | 4.83 | |
| | | Year ended 11/30/2011 | | | 33.40 | | | | .65 | | | | (1.21 | ) | | | (.56 | ) |
| | | Year ended 11/30/2010 | | | 33.45 | | | | .59 | | | | (.02 | ) | | | .57 | |
| | | Year ended 11/30/2009 | | | 25.25 | | | | .56 | | | | 8.43 | | | | 8.99 | |
| | | Year ended 11/30/2008 | | | 48.11 | | | | .95 | | | | (19.63 | ) | | | (18.68 | ) |
| Class F-1: | | Six months ended 5/31/20134,5 | | | 36.68 | | | | .50 | | | | 3.88 | | | | 4.38 | |
| | | Year ended 11/30/2012 | | | 32.51 | | | | .87 | | | | 4.28 | | | | 5.15 | |
| | | Year ended 11/30/2011 | | | 33.69 | | | | .93 | | | | (1.22 | ) | | | (.29 | ) |
| | | Year ended 11/30/2010 | | | 33.74 | | | | .86 | | | | (.03 | ) | | | .83 | |
| | | Year ended 11/30/2009 | | | 25.46 | | | | .79 | | | | 8.50 | | | | 9.29 | |
| | | Year ended 11/30/2008 | | | 48.48 | | | | 1.27 | | | | (19.78 | ) | | | (18.51 | ) |
| Class F-2: | | Six months ended 5/31/20134,5 | | | 36.74 | | | | .56 | | | | 3.88 | | | | 4.44 | |
| | | Year ended 11/30/2012 | | | 32.56 | | | | .97 | | | | 4.28 | | | | 5.25 | |
| | | Year ended 11/30/2011 | | | 33.75 | | | | 1.02 | | | | (1.22 | ) | | | (.20 | ) |
| | | Year ended 11/30/2010 | | | 33.79 | | | | .94 | | | | (.02 | ) | | | .92 | |
| | | Year ended 11/30/2009 | | | 25.51 | | | | .72 | | | | 8.64 | | | | 9.36 | |
| | | Period from 8/1/2008 to 11/30/20084 | | | 38.34 | | | | .23 | | | | (12.79 | ) | | | (12.56 | ) |
| 28 | Capital World Growth and Income Fund |
| Dividends and distributions | | | | | | | | | | | | | | | | | | | |
Dividends
(from net
investment
income) | | | Distributions
(from capital
gains) | | | Total
dividends
and
distributions | | | Net asset
value, end
of period | | | Total
return2,3 | | | Net assets,
end of period
(in millions) | | | Ratio of
expenses
to average net
assets before
reimbursements/
waivers | | | Ratio of
expenses
to average net
assets after
reimbursements/
waivers3 | | | Ratio of net
income to
average net
assets3 | |
| $ | (.44 | ) | | $ | — | | | $ | (.44 | ) | | $ | 40.70 | | | | 12.04 | % | | $ | 50,067 | | | | .81 | %6 | | | .81 | %6 | | | 2.57 | %6 |
| | (.97 | ) | | | — | | | | (.97 | ) | | | 36.75 | | | | 16.14 | | | | 46,323 | | | | .82 | | | | .82 | | | | 2.52 | |
| | (.90 | ) | | | — | | | | (.90 | ) | | | 32.57 | | | | (.99 | ) | | | 45,595 | | | | .79 | | | | .79 | | | | 2.67 | |
| | (.88 | ) | | | — | | | | (.88 | ) | | | 33.75 | | | | 2.57 | | | | 52,156 | | | | .79 | | | | .79 | | | | 2.59 | |
| | (1.00 | ) | | | — | | | | (1.00 | ) | | | 33.80 | | | | 37.48 | | | | 56,058 | | | | .83 | | | | .83 | | | | 2.80 | |
| | (1.18 | ) | | | (3.34 | ) | | | (4.52 | ) | | | 25.50 | | | | (41.75 | ) | | | 46,011 | | | | .75 | | | | .71 | | | | 3.28 | |
| | (.29 | ) | | | — | | | | (.29 | ) | | | 40.46 | | | | 11.59 | | | | 1,282 | | | | 1.57 | 6 | | | 1.57 | 6 | | | 1.73 | 6 |
| | (.70 | ) | | | — | | | | (.70 | ) | | | 36.53 | | | | 15.27 | | | | 1,433 | | | | 1.57 | | | | 1.57 | | | | 1.76 | |
| | (.62 | ) | | | — | | | | (.62 | ) | | | 32.37 | | | | (1.74 | ) | | | 1,829 | | | | 1.56 | | | | 1.56 | | | | 1.90 | |
| | (.62 | ) | | | — | | | | (.62 | ) | | | 33.53 | | | | 1.80 | | | | 2,459 | | | | 1.56 | | | | 1.56 | | | | 1.82 | |
| | (.79 | ) | | | — | | | | (.79 | ) | | | 33.58 | | | | 36.43 | | | | 2,999 | | | | 1.61 | | | | 1.61 | | | | 2.04 | |
| | (.86 | ) | | | (3.34 | ) | | | (4.20 | ) | | | 25.34 | | | | (42.21 | ) | | | 2,598 | | | | 1.52 | | | | 1.48 | | | | 2.51 | |
| | (.29 | ) | | | — | | | | (.29 | ) | | | 40.26 | | | | 11.59 | | | | 4,583 | | | | 1.61 | 6 | | | 1.61 | 6 | | | 1.76 | 6 |
| | (.70 | ) | | | — | | | | (.70 | ) | | | 36.36 | | | | 15.19 | | | | 4,373 | | | | 1.61 | | | | 1.61 | | | | 1.73 | |
| | (.61 | ) | | | — | | | | (.61 | ) | | | 32.23 | | | | (1.77 | ) | | | 4,683 | | | | 1.58 | | | | 1.58 | | | | 1.87 | |
| | (.62 | ) | | | — | | | | (.62 | ) | | | 33.40 | | | | 1.78 | | | | 5,775 | | | | 1.59 | | | | 1.59 | | | | 1.80 | |
| | (.79 | ) | | | — | | | | (.79 | ) | | | 33.45 | | | | 36.42 | | | | 6,428 | | | | 1.61 | | | | 1.61 | | | | 2.01 | |
| | (.84 | ) | | | (3.34 | ) | | | (4.18 | ) | | | 25.25 | | | | (42.23 | ) | | | 5,405 | | | | 1.56 | | | | 1.52 | | | | 2.47 | |
| | (.44 | ) | | | — | | | | (.44 | ) | | | 40.62 | | | | 12.03 | | | | 3,588 | | | | .82 | 6 | | | .82 | 6 | | | 2.58 | 6 |
| | (.98 | ) | | | — | | | | (.98 | ) | | | 36.68 | | | | 16.16 | | | | 3,177 | | | | .80 | | | | .80 | | | | 2.52 | |
| | (.89 | ) | | | — | | | | (.89 | ) | | | 32.51 | | | | (1.02 | ) | | | 3,299 | | | | .80 | | | | .80 | | | | 2.66 | |
| | (.88 | ) | | | — | | | | (.88 | ) | | | 33.69 | | | | 2.58 | | | | 3,827 | | | | .80 | | | | .80 | | | | 2.60 | |
| | (1.01 | ) | | | — | | | | (1.01 | ) | | | 33.74 | | | | 37.49 | | | | 4,152 | | | | .82 | | | | .81 | | | | 2.83 | |
| | (1.17 | ) | | | (3.34 | ) | | | (4.51 | ) | | | 25.46 | | | | (41.76 | ) | | | 3,677 | | | | .76 | | | | .72 | | | | 3.30 | |
| | (.49 | ) | | | — | | | | (.49 | ) | | | 40.69 | | | | 12.20 | | | | 2,165 | | | | .53 | 6 | | | .53 | 6 | | | 2.88 | 6 |
| | (1.07 | ) | | | — | | | | (1.07 | ) | | | 36.74 | | | | 16.43 | | | | 1,857 | | | | .54 | | | | .54 | | | | 2.80 | |
| | (.99 | ) | | | — | | | | (.99 | ) | | | 32.56 | | | | (.75 | ) | | | 1,401 | | | | .54 | | | | .54 | | | | 2.91 | |
| | (.96 | ) | | | — | | | | (.96 | ) | | | 33.75 | | | | 2.86 | | | | 1,464 | | | | .54 | | | | .54 | | | | 2.84 | |
| | (1.08 | ) | | | — | | | | (1.08 | ) | | | 33.79 | | | | 37.80 | | | | 1,165 | | | | .58 | | | | .58 | | | | 2.42 | |
| | (.27 | ) | | | — | | | | (.27 | ) | | | 25.51 | | | | (32.95 | ) | | | 127 | | | | .18 | | | | .17 | | | | .83 | |
See page 33 for footnotes.
| Capital World Growth and Income Fund | 29 |
Financial highlights (continued)
| | | | | | | | Income (loss) from investment operations1 | |
| | | | | Net asset
value,
beginning
of period | | | Net
investment
income | | | Net gains (losses) on
securities (both
realized and
unrealized) | | | Total from
investment
operations | |
| Class 529-A: | | Six months ended 5/31/20134,5 | | $ | 36.65 | | | $ | .49 | | | $ | 3.87 | | | $ | 4.36 | |
| | | Year ended 11/30/2012 | | | 32.49 | | | | .84 | | | | 4.27 | | | | 5.11 | |
| | | Year ended 11/30/2011 | | | 33.67 | | | | .91 | | | | (1.21 | ) | | | (.30 | ) |
| | | Year ended 11/30/2010 | | | 33.72 | | | | .84 | | | | (.02 | ) | | | .82 | |
| | | Year ended 11/30/2009 | | | 25.45 | | | | .77 | | | | 8.49 | | | | 9.26 | |
| | | Year ended 11/30/2008 | | | 48.46 | | | | 1.24 | | | | (19.76 | ) | | | (18.52 | ) |
| Class 529-B: | | Six months ended 5/31/20134,5 | | | 36.52 | | | | .32 | | | | 3.88 | | | | 4.20 | |
| | | Year ended 11/30/2012 | | | 32.36 | | | | .57 | | | | 4.26 | | | | 4.83 | |
| | | Year ended 11/30/2011 | | | 33.53 | | | | .63 | | | | (1.21 | ) | | | (.58 | ) |
| | | Year ended 11/30/2010 | | | 33.58 | | | | .57 | | | | (.02 | ) | | | .55 | |
| | | Year ended 11/30/2009 | | | 25.35 | | | | .54 | | | | 8.46 | | | | 9.00 | |
| | | Year ended 11/30/2008 | | | 48.28 | | | | .92 | | | | (19.70 | ) | | | (18.78 | ) |
| Class 529-C: | | Six months ended 5/31/20134,5 | | | 36.48 | | | | .33 | | | | 3.86 | | | | 4.19 | |
| | | Year ended 11/30/2012 | | | 32.34 | | | | .57 | | | | 4.25 | | | | 4.82 | |
| | | Year ended 11/30/2011 | | | 33.51 | | | | .63 | | | | (1.20 | ) | | | (.57 | ) |
| | | Year ended 11/30/2010 | | | 33.57 | | | | .58 | | | | (.03 | ) | | | .55 | |
| | | Year ended 11/30/2009 | | | 25.34 | | | | .54 | | | | 8.47 | | | | 9.01 | |
| | | Year ended 11/30/2008 | | | 48.27 | | | | .92 | | | | (19.69 | ) | | | (18.77 | ) |
| Class 529-E: | | Six months ended 5/31/20134,5 | | | 36.59 | | | | .44 | | | | 3.87 | | | | 4.31 | |
| | | Year ended 11/30/2012 | | | 32.44 | | | | .76 | | | | 4.26 | | | | 5.02 | |
| | | Year ended 11/30/2011 | | | 33.61 | | | | .82 | | | | (1.21 | ) | | | (.39 | ) |
| | | Year ended 11/30/2010 | | | 33.67 | | | | .74 | | | | (.03 | ) | | | .71 | |
| | | Year ended 11/30/2009 | | | 25.41 | | | | .68 | | | | 8.49 | | | | 9.17 | |
| | | Year ended 11/30/2008 | | | 48.40 | | | | 1.12 | | | | (19.74 | ) | | | (18.62 | ) |
| Class 529-F-1: | | Six months ended 5/31/20134,5 | | | 36.68 | | | | .53 | | | | 3.88 | | | | 4.41 | |
| | | Year ended 11/30/2012 | | | 32.51 | | | | .91 | | | | 4.28 | | | | 5.19 | |
| | | Year ended 11/30/2011 | | | 33.70 | | | | .98 | | | | (1.21 | ) | | | (.23 | ) |
| | | Year ended 11/30/2010 | | | 33.75 | | | | .91 | | | | (.02 | ) | | | .89 | |
| | | Year ended 11/30/2009 | | | 25.47 | | | | .82 | | | | 8.50 | | | | 9.32 | |
| | | Year ended 11/30/2008 | | | 48.50 | | | | 1.31 | | | | (19.76 | ) | | | (18.45 | ) |
| 30 | Capital World Growth and Income Fund |
| Dividends and distributions | | | | | | | | | | | | | | | | | | | |
Dividends
(from net
investment
income) | | | Distributions
(from capital
gains) | | | Total
dividends
and
distributions | | | Net asset
value, end
of period | | | Total
return2,3 | | | Net assets,
end of period
(in millions) | | | Ratio of
expenses
to average net
assets before
reimbursements/
waivers | | | Ratio of
expenses
to average net
assets after
reimbursements/
waivers3 | | | Ratio of
net income
to average
net assets3 | |
| $ | (.43 | ) | | $ | — | | | $ | (.43 | ) | | $ | 40.58 | | | | 11.98 | % | | $ | 2,572 | | | | .89 | %6 | | | .89 | %6 | | | 2.51 | %6 |
| | (.95 | ) | | | — | | | | (.95 | ) | | | 36.65 | | | | 16.04 | | | | 2,299 | | | | .89 | | | | .89 | | | | 2.45 | |
| | (.88 | ) | | | — | | | | (.88 | ) | | | 32.49 | | | | (1.06 | ) | | | 2,023 | | | | .85 | | | | .85 | | | | 2.61 | |
| | (.87 | ) | | | — | | | | (.87 | ) | | | 33.67 | | | | 2.54 | | | | 1,972 | | | | .84 | | | | .84 | | | | 2.54 | |
| | (.99 | ) | | | — | | | | (.99 | ) | | | 33.72 | | | | 37.41 | | | | 1,796 | | | | .87 | | | | .86 | | | | 2.75 | |
| | (1.15 | ) | | | (3.34 | ) | | | (4.49 | ) | | | 25.45 | | | | (41.77 | ) | | | 1,235 | | | | .80 | | | | .77 | | | | 3.23 | |
| | (.27 | ) | | | — | | | | (.27 | ) | | | 40.45 | | | | 11.54 | | | | 110 | | | | 1.68 | 6 | | | 1.68 | 6 | | | 1.65 | 6 |
| | (.67 | ) | | | — | | | | (.67 | ) | | | 36.52 | | | | 15.11 | | | | 115 | | | | 1.69 | | | | 1.69 | | | | 1.65 | |
| | (.59 | ) | | | — | | | | (.59 | ) | | | 32.36 | | | | (1.84 | ) | | | 134 | | | | 1.65 | | | | 1.65 | | | | 1.80 | |
| | (.60 | ) | | | — | | | | (.60 | ) | | | 33.53 | | | | 1.72 | | | | 167 | | | | 1.65 | | | | 1.65 | | | | 1.74 | |
| | (.77 | ) | | | — | | | | (.77 | ) | | | 33.58 | | | | 36.29 | | | | 188 | | | | 1.70 | | | | 1.69 | | | | 1.95 | |
| | (.81 | ) | | | (3.34 | ) | | | (4.15 | ) | | | 25.35 | | | | (42.26 | ) | | | 140 | | | | 1.62 | | | | 1.58 | | | | 2.41 | |
| | (.28 | ) | | | — | | | | (.28 | ) | | | 40.39 | | | | 11.55 | | | | 647 | | | | 1.67 | 6 | | | 1.67 | 6 | | | 1.72 | 6 |
| | (.68 | ) | | | — | | | | (.68 | ) | | | 36.48 | | | | 15.14 | | | | 582 | | | | 1.68 | | | | 1.68 | | | | 1.66 | |
| | (.60 | ) | | | — | | | | (.60 | ) | | | 32.34 | | | | (1.84 | ) | | | 527 | | | | 1.65 | | | | 1.65 | | | | 1.81 | |
| | (.61 | ) | | | — | | | | (.61 | ) | | | 33.51 | | | | 1.71 | | | | 526 | | | | 1.64 | | | | 1.64 | | | | 1.75 | |
| | (.78 | ) | | | — | | | | (.78 | ) | | | 33.57 | | | | 36.32 | | | | 491 | | | | 1.69 | | | | 1.68 | | | | 1.93 | |
| | (.82 | ) | | | (3.34 | ) | | | (4.16 | ) | | | 25.34 | | | | (42.27 | ) | | | 342 | | | | 1.61 | | | | 1.58 | | | | 2.42 | |
| | (.38 | ) | | | — | | | | (.38 | ) | | | 40.52 | | | | 11.84 | | | | 110 | | | | 1.12 | 6 | | | 1.12 | 6 | | | 2.27 | 6 |
| | (.87 | ) | | | — | | | | (.87 | ) | | | 36.59 | | | | 15.78 | | | | 99 | | | | 1.13 | | | | 1.13 | | | | 2.20 | |
| | (.78 | ) | | | — | | | | (.78 | ) | | | 32.44 | | | | (1.31 | ) | | | 89 | | | | 1.12 | | | | 1.12 | | | | 2.33 | |
| | (.77 | ) | | | — | | | | (.77 | ) | | | 33.61 | | | | 2.21 | | | | 87 | | | | 1.13 | | | | 1.13 | | | | 2.25 | |
| | (.91 | ) | | | — | | | | (.91 | ) | | | 33.67 | | | | 37.03 | | | | 80 | | | | 1.18 | | | | 1.17 | | | | 2.43 | |
| | (1.03 | ) | | | (3.34 | ) | | | (4.37 | ) | | | 25.41 | | | | (41.97 | ) | | | 55 | | | | 1.11 | | | | 1.07 | | | | 2.92 | |
| | (.47 | ) | | | — | | | | (.47 | ) | | | 40.62 | | | | 12.12 | | | | 89 | | | | .67 | 6 | | | .67 | 6 | | | 2.74 | 6 |
| | (1.02 | ) | | | — | | | | (1.02 | ) | | | 36.68 | | | | 16.27 | | | | 78 | | | | .67 | | | | .67 | | | | 2.65 | |
| | (.96 | ) | | | — | | | | (.96 | ) | | | 32.51 | | | | (.84 | ) | | | 66 | | | | .64 | | | | .64 | | | | 2.81 | |
| | (.94 | ) | | | — | | | | (.94 | ) | | | 33.70 | | | | 2.74 | | | | 59 | | | | .63 | | | | .63 | | | | 2.75 | |
| | (1.04 | ) | | | — | | | | (1.04 | ) | | | 33.75 | | | | 37.68 | | | | 49 | | | | .68 | | | | .67 | | | | 2.93 | |
| | (1.24 | ) | | | (3.34 | ) | | | (4.58 | ) | | | 25.47 | | | | (41.66 | ) | | | 31 | | | | .61 | | | | .57 | | | | 3.44 | |
See page 33 for footnotes.
| Capital World Growth and Income Fund | 31 |
Financial highlights (continued)
| | | | | | Income (loss) from investment operations1 |
| | | | | | Net asset
value,
beginning
of period | | | Net
investment
income | | | Net gains (losses)
on securities
(both realized
and unrealized) | | | Total from
investment
operations | |
| Class R-1: | | | Six months ended 5/31/20134,5 | | | $ | 36.42 | | | $ | .35 | | | $ | 3.86 | | | $ | 4.21 | |
| | | | Year ended 11/30/2012 | | | | 32.29 | | | | .61 | | | | 4.24 | | | | 4.85 | |
| | | | Year ended 11/30/2011 | | | | 33.46 | | | | .66 | | | | (1.20 | ) | | | (.54 | ) |
| | | | Year ended 11/30/2010 | | | | 33.52 | | | | .60 | | | | (.02 | ) | | | .58 | |
| | | | Year ended 11/30/2009 | | | | 25.31 | | | | .57 | | | | 8.45 | | | | 9.02 | |
| | | | Year ended 11/30/2008 | | | | 48.22 | | | | .96 | | | | (19.67 | ) | | | (18.71 | ) |
| Class R-2: | | | Six months ended 5/31/20134,5 | | | | 36.35 | | | | .36 | | | | 3.84 | | | | 4.20 | |
| | | | Year ended 11/30/2012 | | | | 32.22 | | | | .61 | | | | 4.24 | | | | 4.85 | |
| | | | Year ended 11/30/2011 | | | | 33.39 | | | | .66 | | | | (1.20 | ) | | | (.54 | ) |
| | | | Year ended 11/30/2010 | | | | 33.45 | | | | .59 | | | | (.03 | ) | | | .56 | |
| | | | Year ended 11/30/2009 | | | | 25.25 | | | | .55 | | | | 8.43 | | | | 8.98 | |
| | | | Year ended 11/30/2008 | | | | 48.11 | | | | .93 | | | | (19.62 | ) | | | (18.69 | ) |
| Class R-3: | | | Six months ended 5/31/20134,5 | | | | 36.53 | | | | .44 | | | | 3.87 | | | | 4.31 | |
| | | | Year ended 11/30/2012 | | | | 32.38 | | | | .77 | | | | 4.25 | | | | 5.02 | |
| | | | Year ended 11/30/2011 | | | | 33.56 | | | | .82 | | | | (1.21 | ) | | | (.39 | ) |
| | | | Year ended 11/30/2010 | | | | 33.61 | | | | .75 | | | | (.02 | ) | | | .73 | |
| | | | Year ended 11/30/2009 | | | | 25.37 | | | | .69 | | | | 8.48 | | | | 9.17 | |
| | | | Year ended 11/30/2008 | | | | 48.32 | | | | 1.12 | | | | (19.70 | ) | | | (18.58 | ) |
| Class R-4: | | | Six months ended 5/31/20134,5 | | | | 36.67 | | | | .50 | | | | 3.88 | | | | 4.38 | |
| | | | Year ended 11/30/2012 | | | | 32.50 | | | | .87 | | | | 4.28 | | | | 5.15 | |
| | | | Year ended 11/30/2011 | | | | 33.68 | | | | .93 | | | | (1.22 | ) | | | (.29 | ) |
| | | | Year ended 11/30/2010 | | | | 33.73 | | | | .85 | | | | (.02 | ) | | | .83 | |
| | | | Year ended 11/30/2009 | | | | 25.46 | | | | .78 | | | | 8.50 | | | | 9.28 | |
| | | | Year ended 11/30/2008 | | | | 48.48 | | | | 1.23 | | | | (19.75 | ) | | | (18.52 | ) |
| Class R-5: | | | Six months ended 5/31/20134,5 | | | | 36.77 | | | | .57 | | | | 3.88 | | | | 4.45 | |
| | | | Year ended 11/30/2012 | | | | 32.59 | | | | .98 | | | | 4.28 | | | | 5.26 | |
| | | | Year ended 11/30/2011 | | | | 33.77 | | | | 1.04 | | | | (1.22 | ) | | | (.18 | ) |
| | | | Year ended 11/30/2010 | | | | 33.81 | | | | .95 | | | | (.02 | ) | | | .93 | |
| | | | Year ended 11/30/2009 | | | | 25.51 | | | | .88 | | | | 8.51 | | | | 9.39 | |
| | | | Year ended 11/30/2008 | | | | 48.58 | | | | 1.35 | | | | (19.80 | ) | | | (18.45 | ) |
| Class R-6: | | | Six months ended 5/31/20134,5 | | | | 36.77 | | | | .59 | | | | 3.87 | | | | 4.46 | |
| | | | Year ended 11/30/2012 | | | | 32.59 | | | | .99 | | | | 4.29 | | | | 5.28 | |
| | | | Year ended 11/30/2011 | | | | 33.77 | | | | 1.03 | | | | (1.19 | ) | | | (.16 | ) |
| | | | Year ended 11/30/2010 | | | | 33.82 | | | | .98 | | | | (.04 | ) | | | .94 | |
| | | | Period from 5/1/2009 to 11/30/20094 | | | | 26.05 | | | | .51 | | | | 7.85 | | | | 8.36 | |
| | | Six months ended | | Year ended November 30 |
| | | May 31, 20134,5 | | 2012 | | 2011 | | 2010 | | 2009 | | 2008 |
| Portfolio turnover rate for all share classes | | | 11 | % | | | 23 | % | | | 27 | % | | | 25 | % | | | 44 | % | | | 37 | % |
| 32 | Capital World Growth and Income Fund |
| Dividends and distributions | | | | | | | | | | | | | | |
Dividends
(from net
investment
income) |
|
|
Distributions
(from capital
gains) |
|
|
Total
dividends
and
distributions |
|
|
Net asset
value, end
of period |
|
|
Total
return3 |
|
|
Net assets,
end of period
(in millions) |
|
| Ratio of
expenses to
average net
assets before
reimbursements/
waivers |
|
| Ratio of
expenses to
average net
assets after
reimbursements/
waivers3 |
|
|
Ratio of
net income
to average
net assets3 |
|
| $ | (.30 | ) | | $ | — | | | $ | (.30 | ) | | $ | 40.33 | | | | 11.63 | % | | $ | 282 | | | | 1.55 | %6 | | | 1.55 | %6 | | | 1.81 | %6 |
| | (.72 | ) | | | — | | | | (.72 | ) | | | 36.42 | | | | 15.27 | | | | 276 | | | | 1.56 | | | | 1.56 | | | | 1.79 | |
| | (.63 | ) | | | — | | | | (.63 | ) | | | 32.29 | | | | (1.75 | ) | | | 275 | | | | 1.56 | | | | 1.56 | | | | 1.90 | |
| | (.64 | ) | | | — | | | | (.64 | ) | | | 33.46 | | | | 1.80 | | | | 269 | | | | 1.56 | | | | 1.56 | | | | 1.84 | |
| | (.81 | ) | | | — | | | | (.81 | ) | | | 33.52 | | | | 36.45 | | | | 217 | | | | 1.58 | | | | 1.58 | | | | 2.02 | |
| | (.86 | ) | | | (3.34 | ) | | | (4.20 | ) | | | 25.31 | | | | (42.21 | ) | | | 124 | | | | 1.52 | | | | 1.48 | | | | 2.54 | |
| | (.31 | ) | | | — | | | | (.31 | ) | | | 40.24 | | | | 11.62 | | | | 1,217 | | | | 1.51 | 6 | | | 1.51 | 6 | | | 1.86 | 6 |
| | (.72 | ) | | | — | | | | (.72 | ) | | | 36.35 | | | | 15.30 | | | | 1,150 | | | | 1.55 | | | | 1.55 | | | | 1.78 | |
| | (.63 | ) | | | — | | | | (.63 | ) | | | 32.22 | | | | (1.75 | ) | | | 1,124 | | | | 1.56 | | | | 1.56 | | | | 1.90 | |
| | (.62 | ) | | | — | | | | (.62 | ) | | | 33.39 | | | | 1.77 | | | | 1,259 | | | | 1.57 | | | | 1.57 | | | | 1.81 | |
| | (.78 | ) | | | — | | | | (.78 | ) | | | 33.45 | | | | 36.34 | | | | 1,270 | | | | 1.66 | | | | 1.66 | | | | 1.95 | |
| | (.83 | ) | | | (3.34 | ) | | | (4.17 | ) | | | 25.25 | | | | (42.24 | ) | | | 836 | | | | 1.59 | | | | 1.55 | | | | 2.45 | |
| | (.39 | ) | | | — | | | | (.39 | ) | | | 40.45 | | | | 11.88 | | | | 2,499 | | | | 1.10 | 6 | | | 1.10 | 6 | | | 2.29 | 6 |
| | (.87 | ) | | | — | | | | (.87 | ) | | | 36.53 | | | | 15.81 | | | | 2,335 | | | | 1.10 | | | | 1.10 | | | | 2.23 | |
| | (.79 | ) | | | — | | | | (.79 | ) | | | 32.38 | | | | (1.32 | ) | | | 2,159 | | | | 1.10 | | | | 1.10 | | | | 2.36 | |
| | (.78 | ) | | | — | | | | (.78 | ) | | | 33.56 | | | | 2.27 | | | | 2,311 | | | | 1.10 | | | | 1.10 | | | | 2.29 | |
| | (.93 | ) | | | — | | | | (.93 | ) | | | 33.61 | | | | 37.07 | | | | 2,208 | | | | 1.13 | | | | 1.13 | | | | 2.47 | |
| | (1.03 | ) | | | (3.34 | ) | | | (4.37 | ) | | | 25.37 | | | | (41.95 | ) | | | 1,397 | | | | 1.09 | | | | 1.05 | | | | 2.95 | |
| | (.44 | ) | | | — | | | | (.44 | ) | | | 40.61 | | | | 12.05 | | | | 2,316 | | | | .80 | 6 | | | .80 | 6 | | | 2.58 | 6 |
| | (.98 | ) | | | — | | | | (.98 | ) | | | 36.67 | | | | 16.13 | | | | 2,159 | | | | .80 | | | | .80 | | | | 2.53 | |
| | (.89 | ) | | | — | | | | (.89 | ) | | | 32.50 | | | | (.98 | ) | | | 1,972 | | | | .80 | | | | .80 | | | | 2.66 | |
| | (.88 | ) | | | — | | | | (.88 | ) | | | 33.68 | | | | 2.56 | | | | 2,062 | | | | .81 | | | | .81 | | | | 2.58 | |
| | (1.01 | ) | | | — | | | | (1.01 | ) | | | 33.73 | | | | 37.46 | | | | 1,840 | | | | .83 | | | | .83 | | | | 2.76 | |
| | (1.16 | ) | | | (3.34 | ) | | | (4.50 | ) | | | 25.46 | | | | (41.77 | ) | | | 1,159 | | | | .79 | | | | .76 | | | | 3.25 | |
| | (.50 | ) | | | — | | | | (.50 | ) | | | 40.72 | | | | 12.21 | | | | 1,501 | | | | .50 | 6 | | | .50 | 6 | | | 2.91 | 6 |
| | (1.08 | ) | | | — | | | | (1.08 | ) | | | 36.77 | | | | 16.49 | | | | 1,381 | | | | .50 | | | | .50 | | | | 2.84 | |
| | (1.00 | ) | | | — | | | | (1.00 | ) | | | 32.59 | | | | (.71 | ) | | | 1,273 | | | | .50 | | | | .50 | | | | 2.95 | |
| | (.97 | ) | | | — | | | | (.97 | ) | | | 33.77 | | | | 2.89 | | | | 1,371 | | | | .50 | | | | .50 | | | | 2.85 | |
| | (1.09 | ) | | | — | | | | (1.09 | ) | | | 33.81 | | | | 37.89 | | | | 1,598 | | | | .53 | | | | .53 | | | | 3.18 | |
| | (1.28 | ) | | | (3.34 | ) | | | (4.62 | ) | | | 25.51 | | | | (41.61 | ) | | | 1,399 | | | | .50 | | | | .46 | | | | 3.54 | |
| | (.51 | ) | | | — | | | | (.51 | ) | | | 40.72 | | | | 12.24 | | | | 3,467 | | | | .45 | 6 | | | .45 | 6 | | | 3.04 | 6 |
| | (1.10 | ) | | | — | | | | (1.10 | ) | | | 36.77 | | | | 16.55 | | | | 2,518 | | | | .45 | | | | .45 | | | | 2.86 | |
| | (1.02 | ) | | | — | | | | (1.02 | ) | | | 32.59 | | | | (.65 | ) | | | 1,731 | | | | .45 | | | | .45 | | | | 2.97 | |
| | (.99 | ) | | | — | | | | (.99 | ) | | | 33.77 | | | | 2.92 | | | | 1,158 | | | | .46 | | | | .46 | | | | 2.97 | |
| | (.59 | ) | | | — | | | | (.59 | ) | | | 33.82 | | | | 32.50 | | | | 517 | | | | .49 | 6 | | | .49 | 6 | | | 2.84 | 6 |
| 1 | | Based on average shares outstanding. |
| 2 | | Total returns exclude any applicable sales charges, including contingent deferred sales charges. |
| 3 | | This column reflects the impact, if any, of certain reimbursements/waivers from CRMC. During some of the periods shown, CRMC reduced fees for investment advisory services. In addition, during some of the periods shown, CRMC paid a portion of the fund’s transfer agent fees for certain retirement plan share classes. |
| 4 | | Based on operations for the period shown and, accordingly, is not representative of a full year. |
| 5 | | Unaudited. |
| 6 | | Annualized. |
See Notes to Financial Statements
| Capital World Growth and Income Fund | 33 |
As a shareholder of the fund, you incur two types of costs: (1) transaction costs, such as initial sales charges on purchase payments and contingent deferred sales charges on redemptions (loads), and (2) ongoing costs, including management fees, distribution and service (12b-1) fees, and other expenses. This example is intended to help you understand your ongoing costs (in dollars) of investing in the fund so you can compare these costs with the ongoing costs of investing in other mutual funds. The example is based on an investment of $1,000 invested at the beginning of the period and held for the entire six-month period (December 1, 2012, through May 31, 2013).
Actual expenses:
The first line of each share class in the table on the next page provides information about actual account values and actual expenses. You may use the information in this line, together with the amount you invested, to estimate the expenses that you paid over the period. Simply divide your account value by $1,000 (for example, an $8,600 account value divided by $1,000 = 8.6), then multiply the result by the number in the first line under the heading entitled “Expenses paid during period” to estimate the expenses you paid on your account during this period.
Hypothetical example for comparison purposes:
The second line of each share class in the table on the next page provides information about hypothetical account values and hypothetical expenses based on the actual expense ratio for the share class and an assumed rate of return of 5.00% per year before expenses, which is not the actual return of the share class. The hypothetical account values and expenses may not be used to estimate the actual ending account balance or expenses you paid for the period. You may use this information to compare the ongoing costs of investing in the fund and other funds. To do so, compare this 5.00% hypothetical example with the 5.00% hypothetical examples that appear in the shareholder reports of the other funds.
Notes:
There are some account fees that are charged to certain types of accounts, such as individual retirement accounts and 529 college savings plan accounts (generally, a $10 fee is charged to set up the account and an additional $10 fee is charged to the account annually), that would increase the amount of expenses paid on your account. In addition, retirement plan participants may be subject to certain fees charged by the plan sponsor, and Class F-1, F-2 and 529-F-1 shareholders may be subject to fees charged by financial intermediaries, typically ranging from 0.75% to 1.50% of assets annually depending on services offered. You can estimate the impact of these fees by adding the amount of the fees to the total estimated expenses you paid on your account during the period as calculated above. In addition, your ending account value would be lower by the amount of these fees.
Note that the expenses shown in the table are meant to highlight your ongoing costs only and do not reflect any transactional costs, such as sales charges (loads). Therefore, the second line of each share class in the table is useful in comparing ongoing costs only and will not help you determine the relative total costs of owning different funds. In addition, if these transactional costs were included, your costs would have been higher.
| 34 | Capital World Growth and Income Fund |
| | | Beginning
account value
12/1/2012 | | | Ending
account value
5/31/2013 | | | Expenses paid
during period* | | | Annualized
expense ratio | |
| Class A — actual return | | $ | 1,000.00 | | | $ | 1,120.39 | | | $ | 4.28 | | | | .81 | % |
| Class A — assumed 5% return | | | 1,000.00 | | | | 1,020.89 | | | | 4.08 | | | | .81 | |
| Class B — actual return | | | 1,000.00 | | | | 1,115.89 | | | | 8.28 | | | | 1.57 | |
| Class B — assumed 5% return | | | 1,000.00 | | | | 1,017.10 | | | | 7.90 | | | | 1.57 | |
| Class C — actual return | | | 1,000.00 | | | | 1,115.89 | | | | 8.49 | | | | 1.61 | |
| Class C — assumed 5% return | | | 1,000.00 | | | | 1,016.90 | | | | 8.10 | | | | 1.61 | |
| Class F-1 — actual return | | | 1,000.00 | | | | 1,120.26 | | | | 4.33 | | | | .82 | |
| Class F-1 — assumed 5% return | | | 1,000.00 | | | | 1,020.84 | | | | 4.13 | | | | .82 | |
| Class F-2 — actual return | | | 1,000.00 | | | | 1,122.03 | | | | 2.80 | | | | .53 | |
| Class F-2 — assumed 5% return | | | 1,000.00 | | | | 1,022.29 | | | | 2.67 | | | | .53 | |
| Class 529-A — actual return | | | 1,000.00 | | | | 1,119.76 | | | | 4.70 | | | | .89 | |
| Class 529-A — assumed 5% return | | | 1,000.00 | | | | 1,020.49 | | | | 4.48 | | | | .89 | |
| Class 529-B — actual return | | | 1,000.00 | | | | 1,115.38 | | | | 8.86 | | | | 1.68 | |
| Class 529-B — assumed 5% return | | | 1,000.00 | | | | 1,016.55 | | | | 8.45 | | | | 1.68 | |
| Class 529-C — actual return | | | 1,000.00 | | | | 1,115.49 | | | | 8.81 | | | | 1.67 | |
| Class 529-C — assumed 5% return | | | 1,000.00 | | | | 1,016.60 | | | | 8.40 | | | | 1.67 | |
| Class 529-E — actual return | | | 1,000.00 | | | | 1,118.35 | | | | 5.92 | | | | 1.12 | |
| Class 529-E — assumed 5% return | | | 1,000.00 | | | | 1,019.35 | | | | 5.64 | | | | 1.12 | |
| Class 529-F-1 — actual return | | | 1,000.00 | | | | 1,121.19 | | | | 3.54 | | | | .67 | |
| Class 529-F-1 — assumed 5% return | | | 1,000.00 | | | | 1,021.59 | | | | 3.38 | | | | .67 | |
| Class R-1 — actual return | | | 1,000.00 | | | | 1,116.25 | | | | 8.18 | | | | 1.55 | |
| Class R-1 — assumed 5% return | | | 1,000.00 | | | | 1,017.20 | | | | 7.80 | | | | 1.55 | |
| Class R-2 — actual return | | | 1,000.00 | | | | 1,116.18 | | | | 7.97 | | | | 1.51 | |
| Class R-2 — assumed 5% return | | | 1,000.00 | | | | 1,017.40 | | | | 7.59 | | | | 1.51 | |
| Class R-3 — actual return | | | 1,000.00 | | | | 1,118.77 | | | | 5.81 | | | | 1.10 | |
| Class R-3 — assumed 5% return | | | 1,000.00 | | | | 1,019.45 | | | | 5.54 | | | | 1.10 | |
|
| Class R-4 — actual return | | | 1,000.00 | | | | 1,120.47 | | | | 4.23 | | | | .80 | |
| Class R-4 — assumed 5% return | | | 1,000.00 | | | | 1,020.94 | | | | 4.03 | | | | .80 | |
| Class R-5 — actual return | | | 1,000.00 | | | | 1,122.08 | | | | 2.65 | | | | .50 | |
| Class R-5 — assumed 5% return | | | 1,000.00 | | | | 1,022.44 | | | | 2.52 | | | | .50 | |
| Class R-6 — actual return | | | 1,000.00 | | | | 1,122.37 | | | | 2.38 | | | | .45 | |
| Class R-6 — assumed 5% return | | | 1,000.00 | | | | 1,022.69 | | | | 2.27 | | | | .45 | |
| * | The “expenses paid during period” are equal to the “annualized expense ratio,” multiplied by the average account value over the period, multiplied by the number of days in the period, and divided by 365 (to reflect the one-half year period). |
| Capital World Growth and Income Fund | 35 |
Offices of the fund and of the investment adviser
Capital Research and Management Company
333 South Hope Street
Los Angeles, CA 90071-1406
6455 Irvine Center Drive
Irvine, CA 92618
Custodian of assets
JPMorgan Chase Bank
270 Park Avenue
New York, NY 10017-2070
Counsel
O’Melveny & Myers LLP
400 South Hope Street
Los Angeles, CA 90071-2899
Transfer agent for shareholder accounts
American Funds Service Company
(Write to the address near you.)
P.O. Box 6007
Indianapolis, IN 46206-6007
P.O. Box 2280
Norfolk, VA 23501-2280
Independent registered public accounting firm
PricewaterhouseCoopers LLP
601 South Figueroa Street
Los Angeles, CA 90017-3874
Principal underwriter
American Funds Distributors, Inc.
333 South Hope Street
Los Angeles, CA 90071-1406
| 36 | Capital World Growth and Income Fund |
Investors should carefully consider investment objectives, risks, charges and expenses. This and other important information is contained in the fund prospectus and summary prospectus, which can be obtained from your financial professional and should be read carefully before investing. You may also call American Funds Service Company (AFS) at (800) 421-4225 or visit the American Funds website at americanfunds.com.
“American Funds Proxy Voting Procedures and Principles” — which describes how we vote proxies relating to portfolio securities — is available on the American Funds website or upon request by calling AFS. The fund files its proxy voting record with the U.S. Securities and Exchange Commission (SEC) for the 12 months ended June 30 by August 31. The proxy voting record is available free of charge on the SEC website at sec.gov and on the American Funds website.
A complete May 31, 2013, portfolio of Capital World Growth and Income Fund’s investments is available free of charge by calling AFS or visiting the SEC website (where it is part of Form N-CSR).
Capital World Growth and Income Fund files a complete list of its portfolio holdings with the SEC for the first and third quarters of each fiscal year on Form N-Q. This filing is available free of charge on the SEC website. You may also review or, for a fee, copy this filing at the SEC’s Public Reference Room in Washington, D.C. Additional information regarding the operation of the Public Reference Room may be obtained by calling the SEC’s Office of Investor Education and Advocacy at (800) SEC-0330. Additionally, the list of portfolio holdings is available by calling AFS.
This report is for the information of shareholders of Capital World Growth and Income Fund, but it also may be used as sales literature when preceded or accompanied by the current prospectus or summary prospectus, which gives details about charges, expenses, investment objectives and operating policies of the fund. If used as sales material after September 30, 2013, this report must be accompanied by an American Funds statistical update for the most recently completed calendar quarter.
The American Funds Advantage
Since 1931, American Funds, part of Capital Group, has helped investors pursue long-term investment success. Our consistent approach — in combination with The Capital SystemSM — has resulted in a superior long-term track record.
| | Aligned with investor success |
| | We base our decisions on a long-term perspective, which we believe aligns our goals with the interests of our clients. Our portfolio managers average 25 years of investment experience, including 20 years at our company, reflecting a career commitment to our long-term approach.1 |
| | |
| | The Capital SystemSM |
| | Our investment process, The Capital System, combines individual accountability with teamwork. Each fund is divided into portions that are managed independently by investment professionals with diverse backgrounds, ages and investment approaches. An extensive global research effort is the backbone of our system. |
| | |
| | Superior long-term track record |
| | Our equity funds have beaten their Lipper peer indexes in 90% of 10-year periods and 96% of 20-year periods. Our fixed-income funds have beaten their Lipper indexes in 58% of 10-year periods and 63% of 20-year periods.2 Our fund management fees have been among the lowest in the industry.3 |
| | 1 | Portfolio manager experience as of December 31, 2012. |
| | 2 | Based on Class A share results for rolling periods through December 31, 2012. Periods covered are the shorter of the fund’s lifetime or since the comparable Lipper index inception date. |
| | 3 | Based on management fees for the 20-year period ended December 31, 2012, versus comparable Lipper categories, excluding funds of funds. |
| | American Funds span a range of investment objectives |
| ¢ | Growth funds |
| | AMCAP Fund® |
| | EuroPacific Growth Fund® |
| | The Growth Fund of America® |
| | The New Economy Fund® |
| | New Perspective Fund® |
| | New World Fund® |
| | SMALLCAP World Fund® |
| ¢ | Growth-and-income funds |
| | American Mutual Fund® |
| | Capital World Growth and Income Fund® |
| | Fundamental Investors® |
| | International Growth and Income FundSM |
| | The Investment Company of America® |
| | Washington Mutual Investors FundSM |
| ¢ | Equity-income funds |
| | Capital Income Builder® |
| | The Income Fund of America® |
| ¢ | Balanced funds |
| | American Balanced Fund® |
| | American Funds Global Balanced FundSM |
| ¢ | Bond funds |
| | American Funds Mortgage Fund® |
| | American High-Income Trust® |
| | The Bond Fund of America® |
| | Capital World Bond Fund® |
| | Intermediate Bond Fund of America® |
| | Short-Term Bond Fund of America® |
| | U.S. Government Securities Fund® |
| ¢ | Tax-exempt bond funds |
| | American Funds Short-Term Tax-Exempt Bond Fund® |
| | American High-Income Municipal Bond Fund® |
| | Limited Term Tax-Exempt Bond Fund of America® |
| | The Tax-Exempt Bond Fund of America® |
| | State-specific tax-exempt funds |
| | American Funds Tax-Exempt Fund of New York® |
| | The Tax-Exempt Fund of California® |
| | The Tax-Exempt Fund of Maryland® |
| | The Tax-Exempt Fund of Virginia® |
| ¢ | Money market fund |
| | American Funds Money Market Fund® |
| ¢ | American Funds Portfolio SeriesSM |
| | American Funds Global Growth PortfolioSM |
| | American Funds Growth PortfolioSM |
| | American Funds Growth and Income PortfolioSM |
| | American Funds Balanced PortfolioSM |
| | American Funds Income PortfolioSM |
| | American Funds Tax-Advantaged Income PortfolioSM |
| | American Funds Preservation PortfolioSM |
| | American Funds Tax-Exempt Preservation PortfolioSM |
| ¢ | American Funds Target Date Retirement Series® |
| ¢ | American Funds College Target Date SeriesSM |

ITEM 2 – Code of Ethics
Not applicable for filing of semi-annual reports to shareholders.
ITEM 3 – Audit Committee Financial Expert
Not applicable for filing of semi-annual reports to shareholders.
ITEM 4 – Principal Accountant Fees and Services
Not applicable for filing of semi-annual reports to shareholders.
ITEM 5 – Audit Committee of Listed Registrants
Not applicable to this Registrant, insofar as the Registrant is not a listed issuer as defined in Rule 10A-3 under the Securities Exchange Act of 1934.
ITEM 6 – Schedule of Investments
 | Capital World Growth and Income Fund Investment Portfolio May 31, 2013 unaudited |
| Common stocks 92.31% | | |
| | | Value |
| Health care 14.36% | Shares | (000) |
| | | |
| Novartis AG1 | 33,907,063 | $ 2,429,635 |
| Amgen Inc. | 15,435,458 | 1,551,727 |
| Bayer AG1 | 13,831,026 | 1,487,797 |
| Gilead Sciences, Inc.2 | 18,860,000 | 1,027,493 |
| AbbVie Inc. | 21,085,700 | 900,148 |
| Teva Pharmaceutical Industries Ltd. (ADR) | 16,498,000 | 630,224 |
| Roche Holding AG1 | 2,014,000 | 498,345 |
| Zimmer Holdings, Inc. | 3,334,000 | 261,752 |
| Aetna Inc. | 4,199,500 | 253,566 |
| St. Jude Medical, Inc. | 5,648,800 | 244,198 |
| UnitedHealth Group Inc. | 3,887,900 | 243,499 |
| Allergan, Inc. | 2,130,000 | 211,914 |
| Alexion Pharmaceuticals, Inc.2 | 1,999,900 | 195,070 |
| UCB SA1 | 3,510,000 | 192,386 |
| GlaxoSmithKline PLC1 | 5,981,100 | 155,032 |
| Novo Nordisk A/S, Class B1 | 870,000 | 139,670 |
| Stryker Corp. | 1,468,000 | 97,460 |
| Boston Scientific Corp.2 | 10,000,000 | 92,400 |
| Sonic Healthcare Ltd.1 | 6,042,323 | 81,440 |
| Fresenius SE & Co. KGaA1 | 590,924 | 69,949 |
| Edwards Lifesciences Corp.2 | 1,030,000 | 68,454 |
| Fisher & Paykel Healthcare Corp. Ltd.1 | 23,339,600 | 57,636 |
| Orion Oyj, Class B1 | 2,024,201 | 49,775 |
| Grifols, SA, Class B1 | 1,728,090 | 46,426 |
| | | 10,985,996 |
| Industrials 12.16% | | |
| | | |
| ASSA ABLOY AB, Class B1 | 21,821,007 | 869,911 |
| KONE Oyj, Class B1 | 6,185,000 | 543,725 |
| AB Volvo, Class B1 | 34,899,080 | 509,143 |
| Jardine Matheson Holdings Ltd.1 | 7,748,000 | 507,958 |
| United Parcel Service, Inc., Class B | 5,200,000 | 446,680 |
| General Electric Co. | 17,500,000 | 408,100 |
| Schneider Electric SA1 | 5,031,123 | 393,725 |
| VINCI SA1 | 6,661,441 | 337,397 |
| Lockheed Martin Corp. | 2,905,000 | 307,436 |
| PACCAR Inc | 5,720,000 | 306,592 |
| Union Pacific Corp. | 1,844,700 | 285,227 |
| Singapore Technologies Engineering Ltd1 | 76,260,000 | 242,853 |
| Komatsu Ltd.1 | 9,500,000 | 239,670 |
| Ryanair Holdings PLC (ADR) | 4,900,000 | 239,316 |
| CSX Corp. | 9,485,865 | 239,139 |
| Atlas Copco AB, Class A1 | 9,000,000 | 236,535 |
| Nielsen Holdings NV | 6,973,391 | 236,468 |
| Common stocks | | |
| | | Value |
| Industrials (continued) | Shares | (000) |
| | | |
| Hutchison Port Holdings Trust1 | 293,882,000 | $ 232,112 |
| Emerson Electric Co. | 3,960,000 | 227,542 |
| United Continental Holdings, Inc.2 | 6,900,300 | 223,984 |
| ComfortDelGro Corp. Ltd.1,3 | 135,100,000 | 199,151 |
| General Dynamics Corp. | 2,535,000 | 195,448 |
| Qantas Airways Ltd.1,2,3 | 125,158,600 | 189,437 |
| Bureau Veritas SA1 | 1,596,369 | 185,066 |
| Waste Management, Inc. | 4,200,000 | 176,106 |
| Bunzl PLC1 | 8,246,985 | 160,422 |
| Danaher Corp. | 2,500,000 | 154,550 |
| Siemens AG1 | 1,387,000 | 147,413 |
| Kühne + Nagel International AG1 | 1,174,050 | 131,646 |
| Southwest Airlines Co. | 7,533,300 | 106,747 |
| Republic Services, Inc. | 3,000,000 | 102,300 |
| BAE Systems PLC1 | 13,675,000 | 83,894 |
| SGS SA1 | 36,826 | 82,363 |
| Hutchison Whampoa Ltd.1 | 7,480,000 | 79,412 |
| Capita PLC1 | 5,376,951 | 78,336 |
| United Technologies Corp. | 804,400 | 76,338 |
| Norfolk Southern Corp. | 712,000 | 54,532 |
| Aggreko PLC1 | 1,185,000 | 32,016 |
| FedEx Corp. | 302,001 | 29,095 |
| Serco Group PLC1 | 521,698 | 4,831 |
| | | 9,302,616 |
| Consumer discretionary 11.60% | | |
| | | |
| Home Depot, Inc. | 11,038,800 | 868,312 |
| General Motors Co.2 | 17,711,450 | 600,241 |
| DIRECTV2 | 8,313,000 | 508,174 |
| Renault SA1 | 6,291,861 | 485,136 |
| Amazon.com, Inc.2 | 1,762,600 | 474,192 |
| SJM Holdings Ltd.1 | 157,031,000 | 427,248 |
| Bayerische Motoren Werke AG1 | 2,463,100 | 235,481 |
| Bayerische Motoren Werke AG, nonvoting preferred1 | 2,500,652 | 174,021 |
| Kingfisher PLC1 | 70,500,438 | 368,926 |
| Cie. Générale des Établissements Michelin1 | 4,000,000 | 347,473 |
| Comcast Corp., Class A | 8,272,900 | 332,157 |
| News Corp., Class A | 10,240,458 | 328,821 |
| YUM! Brands, Inc. | 4,131,486 | 279,908 |
| Daimler AG1 | 3,942,000 | 252,760 |
| adidas AG1 | 2,031,300 | 220,564 |
| ProSiebenSAT.1 Media AG, nonvoting preferred1,2 | 5,437,000 | 217,811 |
| Whitbread PLC1 | 4,774,096 | 206,938 |
| H & M Hennes & Mauritz AB, Class B1 | 5,607,300 | 191,613 |
| British Sky Broadcasting Group PLC1 | 15,422,000 | 182,659 |
| Time Warner Cable Inc. | 1,900,000 | 181,469 |
| Ford Motor Co. | 10,568,000 | 165,706 |
| Daily Mail and General Trust PLC, Class A, nonvoting1 | 12,454,000 | 144,423 |
| Galaxy Entertainment Group Ltd.1,2 | 27,250,000 | 141,881 |
| Wynn Macau, Ltd.1 | 42,368,000 | 124,742 |
| NIKE, Inc., Class B | 2,000,000 | 123,320 |
| Li & Fung Ltd.1 | 82,988,000 | 115,370 |
| Intercontinental Hotels Group PLC1 | 3,924,560 | 113,096 |
| Swatch Group Ltd, non-registered shares1 | 196,000 | 111,267 |
| Common stocks | | |
| | | Value |
| Consumer discretionary (continued) | Shares | (000) |
| | | |
| William Hill PLC1 | 15,971,511 | $ 106,226 |
| Cie. Financière Richemont SA, Class A, non-registered shares1 | 1,190,000 | 104,596 |
| WPP PLC1 | 6,120,000 | 104,531 |
| Johnson Controls, Inc. | 2,772,325 | 103,574 |
| Hyundai Motor Co.1 | 464,272 | 86,619 |
| Sands China Ltd.1 | 14,323,500 | 75,988 |
| Melco Crown Entertainment Ltd. (ADR)2 | 2,790,084 | 66,348 |
| MGM China Holdings Ltd.1 | 24,670,000 | 65,766 |
| Nordstrom, Inc. | 1,000,000 | 58,820 |
| Reed Elsevier PLC1 | 4,703,000 | 52,693 |
| Darden Restaurants, Inc. | 741,400 | 38,405 |
| D.R. Horton, Inc. | 1,400,000 | 34,104 |
| Darty PLC1 | 16,230,500 | 17,504 |
| Stella International Holdings Ltd.1 | 6,238,500 | 17,413 |
| Dixons Retail PLC1,2 | 23,103,600 | 14,372 |
| | | 8,870,668 |
| Financials 11.23% | | |
| | | |
| HSBC Holdings PLC (Hong Kong)1 | 35,776,561 | 392,210 |
| HSBC Holdings PLC (United Kingdom)1 | 30,718,231 | 336,487 |
| Société Générale1 | 14,946,365 | 592,533 |
| AIA Group Ltd.1 | 112,663,396 | 497,189 |
| Prudential PLC1 | 29,306,500 | 493,922 |
| Wells Fargo & Co. | 10,000,000 | 405,500 |
| Industrial and Commercial Bank of China Ltd., Class H1 | 547,900,470 | 383,251 |
| Siam Commercial Bank PCL1 | 66,634,100 | 381,846 |
| Barclays PLC1 | 79,590,000 | 380,830 |
| Credit Suisse Group AG1 | 12,833,898 | 380,631 |
| China Construction Bank Corp., Class H1 | 464,505,735 | 375,461 |
| UBS AG1 | 20,660,786 | 359,353 |
| Bank of China Ltd., Class H1 | 626,129,000 | 295,149 |
| Westfield Group1 | 26,688,000 | 292,209 |
| Link Real Estate Investment Trust1 | 55,340,000 | 285,197 |
| Agricultural Bank of China, Class H1 | 599,521,000 | 276,575 |
| BNP Paribas SA1 | 4,035,063 | 235,199 |
| Citigroup Inc. | 4,407,500 | 229,146 |
| Woori Finance Holdings Co., Ltd.1 | 20,047,350 | 210,233 |
| Sampo Oyj, Class A1 | 4,225,974 | 170,918 |
| Willis Group Holdings PLC | 4,286,445 | 167,429 |
| JPMorgan Chase & Co. | 2,700,000 | 147,393 |
| Banco Santander, SA1,2 | 18,640,047 | 133,905 |
| Deutsche Börse AG1 | 2,049,600 | 132,661 |
| Hang Seng Bank Ltd.1 | 7,000,000 | 112,464 |
| Weyerhaeuser Co. | 3,359,686 | 100,186 |
| Kimco Realty Corp. | 4,132,329 | 91,531 |
| CapitaMall Trust1 | 47,611,000 | 79,775 |
| Samsung Card Co., Ltd.1 | 2,349,900 | 77,734 |
| Sun Hung Kai Properties Ltd.1 | 5,158,000 | 67,660 |
| Canadian Imperial Bank of Commerce (CIBC) | 889,318 | 67,208 |
| Starwood Property Trust, Inc. | 2,250,000 | 57,082 |
| PNC Financial Services Group, Inc. | 770,000 | 55,163 |
| UniCredit SpA1 | 9,629,006 | 54,443 |
| State Street Corp. | 761,105 | 50,370 |
| Sberbank of Russia (GDR)1,4 | 2,865,801 | 34,543 |
| Common stocks | | |
| | | Value |
| Financials (continued) | Shares | (000) |
| | | |
| Sberbank of Russia (ADR)1 | 1,263,000 | $ 15,224 |
| Public Storage | 327,200 | 49,669 |
| Toronto-Dominion Bank | 500,000 | 40,506 |
| Ascendas Real Estate Investment Trust1 | 20,389,000 | 37,302 |
| China Overseas Land & Investment Ltd.1 | 10,758,000 | 31,542 |
| CapitaCommercial Trust1 | 7,940,000 | 9,522 |
| | | 8,587,151 |
| Consumer staples 10.06% | | |
| | | |
| Philip Morris International Inc. | 19,606,300 | 1,782,409 |
| Altria Group, Inc. | 37,619,300 | 1,358,057 |
| Pernod Ricard SA1 | 5,085,210 | 610,663 |
| Wesfarmers Ltd.1 | 16,071,520 | 601,344 |
| Nestlé SA1 | 7,310,030 | 482,366 |
| Anheuser-Busch InBev NV1 | 5,223,383 | 481,490 |
| Lorillard, Inc. | 11,049,353 | 468,935 |
| Kraft Foods Group, Inc. | 5,772,166 | 318,219 |
| British American Tobacco PLC1 | 4,644,000 | 255,054 |
| Tingyi (Cayman Islands) Holding Corp.1 | 86,020,000 | 220,098 |
| SABMiller PLC1 | 3,580,000 | 180,073 |
| Mondelez International, Inc. | 6,000,000 | 176,760 |
| Coca-Cola Co. | 4,338,800 | 173,509 |
| Danone SA1 | 2,070,123 | 152,067 |
| L’Oréal SA, non-registered shares1 | 637,100 | 106,803 |
| Diageo PLC1 | 3,100,000 | 91,774 |
| ConAgra Foods, Inc. | 2,700,000 | 90,963 |
| Koninklijke Ahold NV1 | 3,400,597 | 54,941 |
| Imperial Tobacco Group PLC1 | 1,455,000 | 52,106 |
| Treasury Wine Estates Ltd.1 | 7,212,137 | 41,682 |
| | | 7,699,313 |
| Information technology 7.19% | | |
| | | |
| Microsoft Corp. | 36,085,019 | 1,258,645 |
| Samsung Electronics Co. Ltd.1 | 515,800 | 695,595 |
| Oracle Corp. | 13,337,000 | 450,257 |
| Google Inc., Class A2 | 490,829 | 427,222 |
| Automatic Data Processing, Inc. | 6,040,000 | 415,069 |
| Delta Electronics, Inc.1 | 59,003,873 | 281,830 |
| Accenture PLC, Class A | 2,825,000 | 231,961 |
| Hewlett-Packard Co. | 8,125,000 | 198,413 |
| Amadeus IT Holding, SA, Class A, non-registered shares1 | 5,815,000 | 177,277 |
| Maxim Integrated Products, Inc. | 5,723,000 | 168,771 |
| Telefonaktiebolaget LM Ericsson, Class B1 | 11,877,220 | 138,914 |
| Analog Devices, Inc. | 2,970,186 | 136,421 |
| Intel Corp. | 5,000,000 | 121,400 |
| Quanta Computer Inc.1 | 50,388,595 | 108,100 |
| Texas Instruments Inc. | 3,000,000 | 107,670 |
| Murata Manufacturing Co., Ltd.1 | 1,274,000 | 96,632 |
| Yahoo! Inc.2 | 3,423,798 | 90,046 |
| HTC Corp.1 | 9,707,000 | 88,928 |
| Siliconware Precision Industries Co., Ltd.1 | 66,700,000 | 77,862 |
| Compal Electronics, Inc.1 | 117,239,420 | 71,647 |
| HOYA Corp.1 | 2,763,000 | 55,450 |
| Common stocks | | |
| | | Value |
| Information technology (continued) | Shares | (000) |
| | | |
| Nokia Corp.1 | 10,971,000 | $ 37,706 |
| Nokia Corp. (ADR) | 4,169,800 | 14,344 |
| Baidu, Inc., Class A (ADR)2 | 515,300 | 49,799 |
| | | 5,499,959 |
| Telecommunication services 6.67% | | |
| | | |
| SOFTBANK CORP.1 | 14,920,000 | 746,256 |
| Verizon Communications Inc. | 15,119,500 | 732,993 |
| Vodafone Group PLC1 | 216,977,500 | 628,792 |
| Vodafone Group PLC (ADR) | 1,120,000 | 32,424 |
| AT&T Inc. | 15,110,000 | 528,699 |
| TeliaSonera AB1 | 70,557,215 | 469,916 |
| CenturyLink, Inc. | 13,456,000 | 459,523 |
| OJSC Mobile TeleSystems (ADR) | 15,210,307 | 293,103 |
| Singapore Telecommunications Ltd.1 | 89,868,810 | 265,942 |
| MTN Group Ltd.1 | 12,842,375 | 232,885 |
| Türk Telekomünikasyon AS, Class D1 | 39,150,000 | 151,061 |
| Advanced Info Service PCL1 | 15,801,800 | 136,910 |
| Sprint Nextel Corp., Series 12 | 16,429,086 | 119,932 |
| Philippine Long Distance Telephone Co. (ADR) | 877,673 | 63,175 |
| Philippine Long Distance Telephone Co.1 | 693,790 | 50,665 |
| Taiwan Mobile Co., Ltd.1 | 18,940,000 | 68,954 |
| OJSC MegaFon (GDR)1,4 | 2,000,000 | 61,848 |
| América Móvil, SAB de CV, Series L (ADR) | 1,855,198 | 36,937 |
| BCE Inc. | 512,500 | 23,031 |
| | | 5,103,046 |
| Energy 5.17% | | |
| | | |
| BP PLC1 | 191,653,213 | 1,371,822 |
| Royal Dutch Shell PLC, Class B1 | 10,003,585 | 345,610 |
| Royal Dutch Shell PLC, Class A (ADR) | 1,127,500 | 74,832 |
| Royal Dutch Shell PLC, Class A1 | 1,686,000 | 56,147 |
| Royal Dutch Shell PLC, Class B (ADR) | 344,800 | 23,733 |
| Eni SpA1 | 18,245,300 | 412,571 |
| Eni SpA (ADR) | 253,148 | 11,470 |
| BG Group PLC1 | 12,035,000 | 219,035 |
| OJSC Gazprom (ADR)1 | 27,399,000 | 206,120 |
| Devon Energy Corp. | 3,600,000 | 204,660 |
| EOG Resources, Inc. | 1,393,000 | 179,836 |
| Schlumberger Ltd. | 2,200,000 | 160,666 |
| Chevron Corp. | 1,295,000 | 158,961 |
| Apache Corp. | 1,592,036 | 130,754 |
| ConocoPhillips | 1,650,000 | 101,211 |
| Canadian Natural Resources, Ltd. | 3,325,000 | 99,101 |
| Husky Energy Inc. | 3,456,000 | 97,638 |
| Woodside Petroleum Ltd.1 | 1,154,000 | 39,326 |
| EnCana Corp. (CAD denominated) | 1,035,000 | 19,737 |
| EnCana Corp. | 880,000 | 16,746 |
| CNOOC Ltd.1 | 13,276,900 | 23,345 |
| | | 3,953,321 |
| Utilities 4.78% | | |
| | | |
| National Grid PLC1 | 62,148,492 | 735,297 |
| PT Perusahaan Gas Negara (Persero) Tbk1 | 836,821,500 | 468,993 |
| SSE PLC1 | 18,545,336 | 433,651 |
| Common stocks | | |
| | | Value |
| Utilities (continued) | Shares | (000) |
| | | |
| GDF SUEZ1 | 15,243,555 | $ 307,456 |
| Power Assets Holdings Ltd.1 | 32,244,000 | 282,155 |
| Dominion Resources, Inc. | 4,456,422 | 252,011 |
| RWE AG1 | 5,726,000 | 196,612 |
| EDP — Energias de Portugal, SA1 | 58,920,566 | 189,147 |
| FirstEnergy Corp. | 4,495,000 | 175,350 |
| Public Service Enterprise Group Inc. | 5,000,000 | 165,200 |
| CEZ, a s1 | 4,814,562 | 133,603 |
| Exelon Corp. | 3,800,000 | 119,092 |
| E.ON SE1 | 4,200,000 | 71,060 |
| PG&E Corp. | 1,401,000 | 62,919 |
| Cia. Energética de Minas Gerais — CEMIG, preferred nominative (ADR) | 4,471,294 | 46,591 |
| LIGHT SA, ordinary nominative | 1,810,600 | 14,684 |
| | | 3,653,821 |
| Materials 4.30% | | |
| | | |
| Dow Chemical Co. | 16,047,000 | 552,980 |
| BASF SE1 | 4,429,000 | 432,773 |
| Amcor Ltd.1 | 30,684,007 | 288,288 |
| Akzo Nobel NV1 | 4,238,000 | 270,578 |
| Syngenta AG1 | 613,000 | 240,544 |
| Praxair, Inc. | 1,763,120 | 201,576 |
| Koninklijke DSM NV1 | 3,054,000 | 198,824 |
| Linde AG1 | 959,000 | 184,054 |
| ArcelorMittal1 | 11,679,654 | 147,083 |
| CRH PLC1 | 6,497,177 | 137,177 |
| Holcim Ltd1 | 1,240,908 | 96,308 |
| Sherwin-Williams Co. | 500,000 | 94,265 |
| Vicat S.A.1 | 1,025,000 | 65,166 |
| Celanese Corp., Series A | 1,320,000 | 65,142 |
| Israel Chemicals Ltd.1 | 5,090,000 | 56,688 |
| Nitto Denko Corp.1 | 893,000 | 53,315 |
| Ube Industries, Ltd.1 | 25,200,000 | 48,873 |
| Formosa Plastics Corp.1 | 20,000,000 | 46,188 |
| voestalpine AG1 | 1,397,000 | 45,875 |
| Rautaruukki Oyj1 | 3,396,570 | 22,239 |
| K+S AG1 | 515,000 | 21,743 |
| Usinas Siderúrgicas de Minas Gerais SA — USIMINAS, Class A, preferred nominative | 4,125,500 | 17,143 |
| | | 3,286,822 |
| Miscellaneous 4.79% | | |
| | | |
| Other common stocks in initial period of acquisition | | 3,667,692 |
| Total common stocks (cost: $53,131,151,000) | | 70,610,405 |
| Preferred stocks 0.01% | | |
| | | |
| Financials 0.01% | | |
| | | |
| Citigroup Inc. 7.875% preferred | 366,000 | 10,274 |
| Total preferred stocks (cost: $9,150,000) | | 10,274 |
| Convertible securities 0.36% | | |
| | Shares or | Value |
| Industrials 0.13% | principal amount | (000) |
| | | |
| United Continental Holdings, Inc. 6.00% convertible notes 2029 | $15,000,000 | $ 56,906 |
| United Continental Holdings, Inc. 4.50% convertible debentures 2015 | $4,700,000 | 8,534 |
| United Continental Holdings, Inc. 6.00% convertible preferred 2030 | 397,000 | 19,381 |
| JetBlue Airways Corp., Series B, 6.75% convertible notes 2039 | $3,925,000 | 5,880 |
| JetBlue Airways Corp., Series A, convertible notes 5.50% 2038 | $3,250,000 | 4,528 |
| JetBlue Airways Corp., Series B, convertible notes 5.50% 2038 | $3,240,000 | 4,953 |
| | | 100,182 |
| Consumer discretionary 0.10% | | |
| | | |
| General Motors Co., Series B, 4.75% convertible preferred 2013 | 1,558,603 | 76,076 |
| Financials 0.02% | | |
| | | |
| Bank of America Corp., Series L, 7.25% convertible preferred | 13,000 | 15,444 |
| Telecommunication services 0.06% | | |
| | | |
| Clearwire Corp. 8.25% convertible notes 20404 | $38,630,000 | 43,048 |
| Consumer staples 0.01% | | |
| | | |
| Alliance One International, Inc. 5.50% convertible notes 2014 | $11,000,000 | 11,103 |
| Miscellaneous 0.04% | | |
| | | |
| Other convertible securities in initial period of acquisition | | 31,423 |
| Total convertible securities (cost: $232,941,000) | | 277,276 |
| Bonds, notes & other debt instruments 1.53% | | |
| | Principal amount | |
| U.S. Treasury bonds & notes 0.52% | (000) | |
| | | |
| U.S. Treasury 0.25% 2014 | $ 92,000 | 92,086 |
| U.S. Treasury 1.875% 2014 | 301,000 | 304,898 |
| | | 396,984 |
| Financials 0.38% | | |
| | | |
| HBOS PLC 6.75% 20184 | 36,490 | 41,168 |
| Lloyds Banking Group PLC, junior subordinated 6.657% preference shares (undated)4,5 | 30,300 | 29,164 |
| Mizuho Capital Investment (USD) 2 Ltd, junior subordinated 14.95% (undated)4,5 | 60,000 | 67,950 |
| JPMorgan Chase & Co., Series I, junior subordinated 7.90% (undated)5 | 41,090 | 48,022 |
| Prologis, Inc. 6.625% 2019 | 1,600 | 1,927 |
| Prologis, Inc. 7.375% 2019 | 11,933 | 14,763 |
| Prologis, Inc. 6.875% 2020 | 20,380 | 24,701 |
| Simon Property Group, LP 5.25% 2016 | 3,540 | 4,001 |
| Simon Property Group, LP 6.10% 2016 | 860 | 975 |
| Simon Property Group, LP 5.875% 2017 | 165 | 190 |
| Simon Property Group, LP 6.125% 2018 | 890 | 1,075 |
| Simon Property Group, LP 10.35% 2019 | 5,170 | 7,428 |
| AXA SA 8.60% 2030 | 8,000 | 10,358 |
| Developers Diversified Realty Corp. 7.875% 2020 | 8,075 | 10,307 |
| Standard Chartered Bank 6.40% 20174 | 8,451 | 9,857 |
| Barclays Bank PLC, Series RCI, junior subordinated 14.00% (undated)5 | £4,520 | 9,305 |
| Bonds, notes & other debt instruments | | |
| | Principal amount | Value |
| Financials (continued) | (000) | (000) |
| | | |
| Discover Financial Services 10.25% 2019 | $ 4,334 | $ 5,678 |
| ERP Operating LP 5.125% 2016 | 2,886 | 3,201 |
| ERP Operating LP 5.75% 2017 | 2,055 | 2,378 |
| | | 292,448 |
| Telecommunication services 0.26% | | |
| | | |
| Sprint Nextel Corp. 9.125% 2017 | 35,000 | 41,125 |
| Sprint Nextel Corp. 11.50% 2021 | 49,375 | 68,384 |
| MTS International Funding Ltd. 8.625% 2020 | 29,630 | 36,362 |
| MTS International Funding Ltd. 8.625% 20204 | 9,162 | 11,244 |
| América Móvil, SAB de CV 6.45% 2022 | MXN155,000 | 12,450 |
| América Móvil, SAB de CV 8.46% 2036 | 341,400 | 29,755 |
| | | 199,320 |
| Materials 0.13% | | |
| | | |
| ArcelorMittal 4.25% 20155 | $16,500 | 17,078 |
| ArcelorMittal 4.25% 20155 | 8,200 | 8,446 |
| ArcelorMittal 10.35% 20195 | 20,000 | 24,850 |
| ArcelorMittal 6.75% 20225 | 24,365 | 26,192 |
| CRH America, Inc. 6.00% 2016 | | 1,260 |
| 1,431 | | |
| CRH America, Inc. 8.125% 2018 | 15,540 | 19,376 |
| | | 97,373 |
| Bonds & notes of governments outside the U.S. 0.11% | | |
| | | |
| United Mexican States Government, Series M30, 10.00% 2036 | MXN738,400 | 82,771 |
| Energy 0.10% | | |
| | | |
| Gazprom OJSC 8.146% 2018 | $ 4,415 | 5,298 |
| Gazprom OJSC, Series 9, 6.51% 2022 | 30,710 | 34,702 |
| Gazprom OJSC, Series 2, 8.625% 2034 | 1,015 | 1,332 |
| Gazprom OJSC 7.288% 2037 | 18,425 | 21,696 |
| Gazprom OJSC 7.288% 20374 | 365 | 430 |
| BP Capital Markets PLC 5.25% 2013 | 3,335 | 3,404 |
| BP Capital Markets PLC 3.875% 2015 | 7,320 | 7,723 |
| | | 74,585 |
| Consumer discretionary 0.02% | | |
| | | |
| Marks and Spencer Group PLC 6.25% 20174 | 100 | 111 |
| Marks and Spencer Group PLC 7.125% 20374 | 15,550 | 16,267 |
| | | 16,378 |
| Consumer staples 0.01% | | |
| | | |
| British American Tobacco International Finance PLC 8.125% 20134 | 9,000 | 9,283 |
| Total bonds, notes & other debt instruments (cost: $1,018,898,000) | | 1,169,142 |
| Short-term securities 5.36% | | |
| | | |
| Freddie Mac 0.075%–0.17% due 7/15/2013–4/9/2014 | 1,185,175 | 1,184,607 |
| Fannie Mae 0.11%–0.15% due 7/24/2013–3/3/2014 | 665,900 | 665,611 |
| Federal Home Loan Bank 0.075%–0.155% due 6/7/2013–1/6/2014 | 434,600 | 434,489 |
| U.S. Treasury Bills 0.163%–0.195% due 6/27–7/25/2013 | 200,000 | 199,998 |
| | Principal amount | Value |
| Short-term securities | (000) | (000) |
| | | |
| Australia & New Zealand Banking Group, Ltd. 0.165%–0.19% due 6/4–8/15/20134 | $138,300 | $ 138,277 |
| ANZ National (International) Ltd. 0.21% due 8/9/20134 | 30,000 | 29,993 |
| Nordea Bank Finland PLC 0.20% due 9/12/20134 | 40,000 | 39,972 |
| Nordea North America, Inc. 0.165%–0.195% due 6/4–8/1/2013 | 124,100 | 124,084 |
| Gotham Funding Corp. CP 0.19% due 6/3/20134 | 60,000 | 59,999 |
| Mitsubishi UFJ Trust and Banking Corp 0.185% due 7/16/20134 | 51,700 | 51,685 |
| Bank of Tokyo-Mitsubishi UFJ, Ltd. 0.15% due 6/7/2013 | 32,900 | 32,899 |
| Sumitomo Mitsui Banking Corp. 0.15%–0.22% due 6/14–8/16/20134 | 137,300 | 137,273 |
| Toronto-Dominion Holdings USA Inc. 0.17% due 6/10–7/17/20134 | 123,500 | 123,488 |
| Commonwealth Bank of Australia CP 0.17% due 8/13/20134 | 95,500 | 95,474 |
| Thunder Bay Funding, LLC 0.22%–0.24% due 9/5–9/16/20134 | 41,400 | 41,378 |
| Old Line Funding, LLC 0.17%–0.20% due 8/8–9/20/20134 | 44,339 | 44,329 |
| American Honda Finance Corp. 0.15% due 6/18–6/19/2013 | 80,000 | 79,991 |
| Toyota Motor Credit Corp. 0.17% due 7/31/2013 | 46,000 | 45,992 |
| Toyota Credit Canada Inc. 0.18% due 6/17/2013 | 30,200 | 30,199 |
| BASF AG 0.14% due 6/27–6/28/20134 | 65,500 | 65,493 |
| Svenska Handelsbanken Inc. 0.20%–0.24% due 7/2–10/22/20134 | 59,400 | 59,363 |
| GlaxoSmithKline Finance PLC 0.14% due 6/17/20134 | 54,700 | 54,696 |
| Province of Ontario 0.15% due 6/25/2013 | 50,000 | 49,993 |
| National Australia Funding (Delaware) Inc. 0.175% due 7/15/20134 | 50,000 | 49,991 |
| Québec (Province of) 0.13% due 6/26/20134 | 48,250 | 48,242 |
| Federal Farm Credit Banks 0.18%–0.20% due 6/21–8/2/2013 | 46,900 | 46,897 |
| Bank of Nova Scotia 0.165% due 8/13/2013 | 40,000 | 39,987 |
| Nestlé Finance International Ltd. 0.20% due 10/8/2013 | 35,490 | 35,476 |
| International Bank for Reconstruction and Development 0.11% due 7/1/2013 | 31,900 | 31,898 |
| Reckitt Benckiser Treasury Services PLC 0.15% due 9/17/20134 | 31,400 | 31,379 |
| Wells Fargo & Co. 0.17% due 6/11/2013 | 30,000 | 29,998 |
| Total short-term securities (cost: $4,102,755,000) | | 4,103,151 |
| Total investment securities (cost: $58,494,895,000) | | 76,170,248 |
| Other assets less liabilities | | 325,089 |
| Net assets | | $76,495,337 |
As permitted by U.S. Securities and Exchange Commission regulations, “Miscellaneous” securities include holdings in their first year of acquisition that have not previously been publicly disclosed.
| 1 | Valued under fair value procedures adopted by authority of the board of trustees. The total value of all such securities, including those in “Miscellaneous,” was $40,678,782,000, which represented 53.18% of the net assets of the fund. This entire amount relates to certain securities trading outside the U.S. whose values were adjusted as a result of significant market movements following the close of local trading. |
| 2 | Security did not produce income during the last 12 months. |
| 3 | Represents an affiliated company as defined under the Investment Company Act of 1940. |
| 4 | Acquired in a transaction exempt from registration under Rule 144A or section 4(2) of the Securities Act of 1933. May be resold in the U.S. in transactions exempt from registration, normally to qualified institutional buyers. The total value of all such securities was $1,395,945,000, which represented 1.82% of the net assets of the fund. |
| 5 | Coupon rate may change periodically. |
Key to abbreviations and symbols
ADR = American Depositary Receipts
GDR = Global Depositary Receipts
CAD = Canadian dollars
£ = British pounds
MXN = Mexican pesos
Investments are not FDIC-insured, nor are they deposits of or guaranteed by a bank or any other entity, so they may lose value.
Investors should carefully consider investment objectives, risks, charges and expenses. This and other important information is contained in the fund prospectus and summary prospectus, which can be obtained from your financial professional and should be read carefully before investing. You may also call American Funds Service Company (AFS) at (800) 421-4225 or visit the American Funds website at americanfunds.com.
MFGEFPX-033-0713O-S37732
ITEM 7 – Disclosure of Proxy Voting Policies and Procedures for Closed-End Management Investment Companies
Not applicable to this Registrant, insofar as the Registrant is not a closed-end management investment company.
ITEM 8 – Portfolio Managers of Closed-End Management Investment Companies
Not applicable to this Registrant, insofar as the Registrant is not a closed-end management investment company.
ITEM 9 – Purchases of Equity Securities by Closed-End Management Investment Company and Affiliated Purchasers
Not applicable to this Registrant, insofar as the Registrant is not a closed-end management investment company.
ITEM 10 – Submission of Matters to a Vote of Security Holders
There have been no material changes to the procedures by which shareholders may recommend nominees to the Registrant’s board of trustees since the Registrant last submitted a proxy statement to its shareholders. The procedures are as follows. The Registrant has a nominating and governance committee comprised solely of persons who are not considered ‘‘interested persons’’ of the Registrant within the meaning of the Investment Company Act of 1940, as amended. The committee periodically reviews such issues as the board’s composition, responsibilities, committees, compensation and other relevant issues, and recommends any appropriate changes to the full board of trustees. While the committee normally is able to identify from its own resources an ample number of qualified candidates, it will consider shareholder suggestions of persons to be considered as nominees to fill future vacancies on the board. Such suggestions must be sent in writing to the nominating and governance committee of the Registrant, c/o the Registrant’s Secretary, and must be accompanied by complete biographical and occupational data on the prospective nominee, along with a written consent of the prospective nominee for consideration of his or her name by the nominating and governance committee.
ITEM 11 – Controls and Procedures
| (a) | The Registrant’s Principal Executive Officer and Principal Financial Officer have concluded, based on their evaluation of the Registrant’s disclosure controls and procedures (as such term is defined in Rule 30a-3 under the Investment Company Act of 1940), that such controls and procedures are adequate and reasonably designed to achieve the purposes described in paragraph (c) of such rule. |
| | |
| (b) | There were no changes in the Registrant’s internal controls over financial reporting (as defined in Rule 30a-3(d) under the Investment Company Act of 1940) that occurred during the Registrant’s second fiscal quarter of the period covered by this report that has materially affected, or is reasonably likely to materially affect, the Registrant’s internal control over financial reporting. |
ITEM 12 – Exhibits
| (a)(1) | Not applicable for filing of semi-annual reports to shareholders. |
| | |
| (a)(2) | The certifications required by Rule 30a-2 of the Investment Company Act of 1940 and Sections 302 and 906 of the Sarbanes-Oxley Act of 2002 are attached as exhibits hereto. |
SIGNATURES
Pursuant to the requirements of the Securities Exchange Act of 1934 and the Investment Company Act of 1940, the Registrant has duly caused this report to be signed on its behalf by the undersigned, thereunto duly authorized.
| | CAPITAL WORLD GROWTH AND INCOME FUND |
| | |
| | By /s/ Michael J. Thawley |
| | Michael J. Thawley, Vice Chairman and Principal Executive Officer |
| | |
| | Date: July 31, 2013 |
Pursuant to the requirements of the Securities Exchange Act of 1934 and the Investment Company Act of 1940, this report has been signed below by the following persons on behalf of the Registrant and in the capacities and on the dates indicated.
| By /s/ Michael J. Thawley |
Michael J. Thawley, Vice Chairman and Principal Executive Officer |
| |
| Date: July 31, 2013 |
| By /s/ Neal F. Wellons |
Neal F. Wellons, Treasurer and Principal Financial Officer |
| |
| Date: July 31, 2013 |