UNITED STATES
SECURITIES AND EXCHANGE COMMISSION
Washington, D.C. 20549
FORM N-CSR
Certified Shareholder Report of
Registered Management Investment Companies
Investment Company Act File Number: 811-07338
Capital World Growth and Income Fund
(Exact Name of Registrant as Specified in Charter)
333 South Hope Street
Los Angeles, California 90071
(Address of Principal Executive Offices)
Registrant's telephone number, including area code: (213) 486-9200
Date of fiscal year end: November 30
Date of reporting period: May 31, 2014
Michael W. Stockton
Capital World Growth and Income Fund
333 South Hope Street
Los Angeles, California 90071
(Name and Address of Agent for Service)
Copies to:
Kathryn A. Sanders
O’Melveny & Myers LLP
400 South Hope Street, 10th Floor
Los Angeles, California 90071
(Counsel for the Registrant)
ITEM 1 – Reports to Stockholders

| | | |
 | | Capital World Growth
and Income Fund®
Semi-annual report
for the six months ended
May 31, 2014 |
Capital World Growth and Income Fund seeks long-term growth of capital while providing current income. It invests on a global basis in a diversified portfolio consisting primarily of common stocks and other equity securities.
This fund is one of more than 40 offered by one of the nation’s largest mutual fund families, American Funds, from Capital Group. For more than 80 years, Capital has invested with a long-term focus based on thorough research and attention to risk.
Fund results shown in this report, unless otherwise indicated, are for Class A shares at net asset value. If a sales charge (maximum 5.75%) had been deducted, the results would have been lower. Results are for past periods and are not predictive of results for future periods. Current and future results may be lower or higher than those shown. Share prices and returns will vary, so investors may lose money. Investing for short periods makes losses more likely. Investments are not FDIC-insured, nor are they deposits of or guaranteed by a bank or any other entity, so they may lose value. For current information and month-end results, visit americanfunds.com.
Here are the average annual total returns on a $1,000 investment with all distributions reinvested for periods ended June 30, 2014 (the most recent calendar quarter-end):
| Class A shares | | | 1 year | | | | 5 years | | | | 10 years | |
| | | | | | | | | | | | | |
| Reflecting 5.75% maximum sales charge | | | 16.33% | | | | 12.86% | | | | 8.69% | |
For other share class results, visit americanfunds.com and americanfundsretirement.com.
The total annual fund operating expense ratio was 0.80% for Class A shares as of the prospectus dated February 1, 2014.
Investment results assume all distributions are reinvested and reflect applicable fees and expenses. When applicable, investment results reflect fee waivers, without which results would have been lower. Visit americanfunds.com for more information.
The fund’s 30-day yield for Class A shares as of June 30, 2014, reflecting the 5.75% maximum sales charge and calculated in accordance with the U.S. Securities and Exchange Commission formula, was 1.69%.
Investing outside the United States may be subject to risks, such as currency fluctuations, periods of illiquidity and price volatility. These risks may be heightened in connection with investments in developing countries. Refer to the fund prospectus and the Risk Factors section of this report for more information on these and other risks associated with investing in the fund.
Fellow investors:
The broad rally in global stock markets continued through the first half of the fiscal year, despite political unrest in a number of developing nations and mixed economic data in the U.S., Japan and China.
For the six months ended May 31, 2014, Capital World Growth and Income Fund produced a solid 7.46% total return, assuming reinvestment of quarterly dividends totaling 42 cents a share. Dividend payments include a special dividend of 13 cents paid in December 2013.
The fund outpaced its primary benchmark, the unmanaged MSCI All Country World Index (ACWI),* which recorded a 6.02% total return. The fund’s peer group, as measured by the Lipper Global Funds Index, returned 6.19%. As you can see in the table below, the fund has fared better than both benchmarks over longer time frames.
Strength in the developed world
On the whole, global equities ended the period with strong gains, driven largely by positive signs in a number of the world’s advanced markets.† European shares rose, supported by modest economic growth across the euro zone and a wave of mergers and acquisitions. Mounting concerns about Japan-style deflation prompted European Central Bank (ECB) officials to declare in May that further economic stimulus might be forthcoming. After the close of the fiscal period, the ECB instituted a number of new stimulus measures, including a negative interest rate for its overnight depositors and special funding arrangements, known as TLTRO (targeted long-term refinancing operation), that would benefit banks in peripheral countries, among others.
| † | Country returns are based on MSCI indexes, expressed in U.S. dollars, and assume the reinvestment of dividends. Results reflect dividends net of withholding taxes. |
Results at a glance
For periods ended May 31, 2014, with all distributions reinvested
| | | Cumulative
total returns | | Average annual total returns |
| | | 6 months | | 1 year | | 5 years | | 10 years | | Lifetime
(since 3/26/93) |
| | | | | | | | | | | |
| Capital World Growth and Income Fund (Class A shares) | | | 7.46 | % | | | 19.68 | % | | | 13.85 | % | | | 9.43 | % | | | 11.45 | % |
| MSCI ACWI* | | | 6.02 | | | | 17.15 | | | | 13.73 | | | | 7.47 | | | | 7.60 | |
| Lipper Global Funds Index | | | 6.19 | | | | 18.26 | | | | 13.56 | | | | 7.43 | | | | 7.76 | |
| * | Results for MSCI ACWI reflect dividends gross of withholding taxes through December 31, 2000, and dividends net of withholding taxes thereafter. This index is a free float-adjusted market capitalization weighted index that is designed to measure results of more than 40 developed and emerging equity markets. It is unmanaged and, therefore, has no expenses. Investors cannot invest directly in an index. |
| Capital World Growth and Income Fund | 1 |
Italy (+15.96%), Spain (+12.99%) and Ireland (+9.72%), among Europe’s weaker economies, advanced amid signs of improving conditions. France and Germany, the euro zone’s two largest economies, rose 7.95% and 4.82%, respectively.
Solid corporate earnings and investor optimism helped lift U.S. equities. In the first quarter of 2014, the U.S. economy experienced its first contraction in three years, as harsh winter weather slowed construction activity and retail sales. Nevertheless, the Federal Reserve in April said it would continue to reduce its bond purchase program, signaling confidence in the recovery. What’s more, employment figures in April exceeded expectations. U.S. stocks finished the period with four straight months of gains, reaching fresh all-time highs in May.
Japan shares slip
While developed markets generally rose, Japan proved to be an exception. After climbing sharply in 2013, Japanese stocks declined through much of the fiscal period, hurt in part by a slowing Chinese economy, a strengthening yen and worries over the potential impact of a sales tax increase that took effect in April. Stock prices rebounded in May, however, amid signs that the tax hike might not be as detrimental as feared. Overall, the Japanese equity market slid -3.56% for the six months on a dollar-adjusted basis. Prime Minister Shinzo Abe continues to pursue reforms to bolster the Japanese economy over the long term.
Volatility in emerging markets
Developing markets were mixed as political conflicts, economic malaise in China and reduced liquidity in the U.S. weighed on certain countries. China’s stock market fell -7.02% as growth decelerated in the first quarter and investors became increasingly concerned about the health of the country’s banking system and property market. Russian shares dropped -8.72% as political tensions with Ukraine mounted. However, there were some bright spots. India rose 21.08% as investors welcomed the election of reform-minded Narendra Modi. Indonesian stocks advanced 21.98% amid investor optimism over an improving trade surplus and the implementation of reforms.
All 10 sectors comprising the MSCI ACWI registered positive results. Utilities (+12.31%) led the way as lower interest rates in a number of markets spurred interest in dividend-paying stocks. Energy stocks climbed 9.74% on fears of a possible gas shortage if the Ukraine crisis deepens.
Sizable holdings in health care support results
While macroeconomic factors offer valuable context, stock selection plays a primary role in the fund’s results. The fund’s investments in health care companies, which include some of its largest positions, were among the strongest contributors.
| 2 | Capital World Growth and Income Fund |
Where the fund’s assets were invested
Percent of net assets by country as of May 31, 2014
| | | Capital World Growth
and Income Fund | | MSCI All Country
World Index* |
| | | | | |
| The Americas | | | 40.1 | % | | | 54.8 | % |
| United States | | | 39.5 | | | | 49.0 | |
| Other Americas | | | 0.6 | | | | 5.8 | |
| | | | | | | | | |
| Europe | | | 37.5 | | | | 25.8 | |
| United Kingdom | | | 13.2 | | | | 7.9 | |
| Switzerland | | | 6.1 | | | | 3.4 | |
| France | | | 5.0 | | | | 3.8 | |
| Germany | | | 5.0 | | | | 3.4 | |
| Sweden | | | 2.2 | | | | 1.2 | |
| Finland | | | 1.5 | | | | 0.3 | |
| Other Europe | | | 4.5 | | | | 5.8 | |
| | | | | | | | | |
| Asia/Pacific | | | 14.9 | | | | 18.4 | |
| Hong Kong | | | 3.4 | | | | 1.0 | |
| Japan | | | 2.9 | | | | 7.2 | |
| China | | | 2.1 | | | | 2.0 | |
| South Korea | | | 1.6 | | | | 1.7 | |
| Thailand | | | 1.3 | | | | 0.2 | |
| Other Asia/Pacific | | | 3.6 | | | | 6.3 | |
| | | | | | | | | |
| Other | | | 1.0 | | | | 1.0 | |
| | | | | | | | | |
| Bonds, notes & other debt instruments, short-term securities & other assets less liabilities | | | 6.5 | | | | — | |
| | | | | | | | | |
| Total | | | 100.0 | % | | | 100.0 | % |
| * | The MSCI All Country World Index is weighted by market capitalization. |
| Capital World Growth and Income Fund | 3 |
Top holding Novartis rose 13.44% following its announcement of a stop to pivotal trials for a blood pressure drug that it found benefits patients with chronic heart failure. Other health care holdings that outpaced the broader market include AbbVie (+12.14%), Gilead Sciences (+8.56%) and Bayer (+8.41%). U.S. biotechnology firm Amgen (+1.67%), the fund’s second-largest holding, advanced slightly but lagged the market overall.
Investments in utilities also delivered excellent results. National Grid climbed 17.6% on healthy profits and said it would boost its full-year dividend payment. U.S. nuclear power plant operator Exelon (+36.86%) and Portuguese utility EDP (+25.02%) also notched substantial gains.
The industrials sector proved to be another area of strength, as several of the fund’s holdings benefitted from global economic expansion and an increase in corporate spending. U.S. firms General Dynamics (+28.87%) and United Continental (+13.04%), French construction company VINCI (+15.13%) and Hong Kong-based conglomerate Jardine Matheson (+21.73%) all exceeded the MSCI ACWI.
Telecommunications holdings lag
As a group, the fund’s telecommunications holdings trailed the broader market. Japan-based SoftBank (-10.86%), which took a controlling interest in U.S. carrier Sprint in 2013, reported that profits would drop this year.
Largest equity holdings
(as of May 31, 2014)
| Company | | Country | | Percent of
net assets | | 6-month
return |
| | | | | | | |
| Novartis | | Switzerland | | | 2.95 | % | | | 13.44 | % |
| Amgen | | United States | | | 2.62 | | | | 1.67 | |
| Gilead Sciences | | United States | | | 2.07 | | | | 8.56 | |
| Bayer | | Germany | | | 2.03 | | | | 8.41 | |
| Altria | | United States | | | 1.95 | | | | 12.39 | |
| BP | | United Kingdom | | | 1.83 | | | | 6.87 | |
| Verizon | | United States | | | 1.66 | | | | 0.69 | |
| Philip Morris International | | United States | | | 1.64 | | | | 3.51 | |
| Google* | | United States | | | 1.32 | | | | 7.80 | |
| Samsung Electronics | | South Korea | | | 1.29 | | | | 0.19 | |
| * | Six-month return for Google represents Class A shares only. |
| 4 | Capital World Growth and Income Fund |
Elsewhere in the portfolio, Amazon (-20.60%), HSBC Holdings (-5.57%) and General Motors (-10.72%) all declined. In recent months, GM has recalled more than 8.4 million cars worldwide for defects.
A look ahead
The overall global economic picture continues to improve, but a number of challenges remain. Europe appears to have stabilized but unemployment remains high and growth is tepid. We continue to watch closely as the ECB completes asset quality reviews and stress testing of major European banks.
The near-term outlook for emerging markets remains mixed. As China’s leaders work toward a more consumption-driven economy, we expect growth there to decelerate further. While we remain guardedly optimistic about the country’s prospects over the longer term, it continues to face a number of headwinds. Political events in other developing nations could fuel further market turbulence in the short term. Among these are the government standoff in Thailand, presidential elections in Indonesia, ongoing uncertainties in Ukraine, and the effect of sectarian conflict in Iraq on oil prices and supply over the long term.
There has been some positive news — most notably India’s election of Modi, who will pursue policies to open India to foreign investments and seek to streamline infrastructure improvements.
Regardless of the macroeconomic backdrop, we will continue to seek out and comprehensively research attractively valued investment opportunities with the potential to contribute to the fund’s objectives.
We thank you for your commitment to Capital World Growth and Income Fund.
Cordially,
 |  |
| Michael J. Thawley | Mark E. Denning |
| Vice Chairman of the Board | President |
July 11, 2014
For current information about the fund, visit americanfunds.com.
| Capital World Growth and Income Fund | 5 |
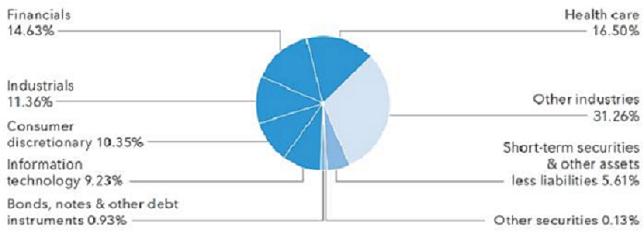
| Summary investment portfolio May 31, 2014 | unaudited |
| Industry sector diversification | Percent of net assets |
| Country diversification | | Percent of
net assets |
| United States | | | 39.5 | % |
| Euro zone* | | | 15.3 | |
| United Kingdom | | | 13.2 | |
| Switzerland | | | 6.1 | |
| Hong Kong | | | 3.4 | |
| Japan | | | 2.9 | |
| Sweden | | | 2.2 | |
| China | | | 2.1 | |
| South Korea | | | 1.6 | |
| Thailand | | | 1.3 | |
| Other countries | | | 5.9 | |
| Bonds, notes & other debt instruments, short-term securities & other assets less liabilities | | | 6.5 | |
| * | Countries using the euro as a common currency; those represented in the fund’s portfolio are Austria, Belgium, Finland, France, Germany, Greece, Ireland, Italy, the Netherlands, Portugal and Spain. |
| 6 | Capital World Growth and Income Fund |
| Common stocks 93.33% | | Shares | | | Value
(000) | | | Percent of
net assets | |
| Health care 16.50% | | | | | | | | | | | | |
| Novartis AG | | | 29,311,025 | | | $ | 2,628,337 | | | | 2.95 | % |
| Amgen Inc. | | | 20,084,932 | | | | 2,329,651 | | | | 2.62 | |
| Gilead Sciences, Inc.1 | | | 22,733,525 | | | | 1,846,190 | | | | 2.07 | |
| Bayer AG | | | 12,457,929 | | | | 1,801,793 | | | | 2.03 | |
| AbbVie Inc. | | | 20,085,700 | | | | 1,091,256 | | | | 1.23 | |
| St. Jude Medical, Inc. | | | 8,586,800 | | | | 557,283 | | | | .63 | |
| Teva Pharmaceutical Industries Ltd. (ADR) | | | 10,457,486 | | | | 527,999 | | | | .59 | |
| Thermo Fisher Scientific Inc. | | | 4,333,200 | | | | 506,594 | | | | .57 | |
| Other securities | | | | | | | 3,388,488 | | | | 3.81 | |
| | | | | | | | 14,677,591 | | | | 16.50 | |
| | | | | | | | | | | | | |
| Financials 14.63% | | | | | | | | | | | | |
| Prudential PLC | | | 42,379,500 | | | | 984,211 | | | | 1.11 | |
| HSBC Holdings PLC (Hong Kong) | | | 49,862,976 | | | | 525,774 | | | | | |
| HSBC Holdings PLC (United Kingdom) | | | 30,718,231 | | | | 323,974 | | | | .96 | |
| UBS AG | | | 41,262,786 | | | | 828,481 | | | | .93 | |
| Barclays PLC | | | 182,887,500 | | | | 757,193 | | | | .85 | |
| Société Générale | | | 12,791,989 | | | | 736,992 | | | | .83 | |
| AIA Group Ltd. | | | 117,195,396 | | | | 587,266 | | | | .66 | |
| Link Real Estate Investment Trust | | | 109,299,002 | | | | 582,236 | | | | .65 | |
| Aviva PLC | | | 62,639,200 | | | | 550,178 | | | | .62 | |
| Other securities | | | | | | | 7,133,348 | | | | 8.02 | |
| | | | | | | | 13,009,653 | | | | 14.63 | |
| | | | | | | | | | | | | |
| Industrials 11.36% | | | | | | | | | | | | |
| ASSA ABLOY AB, Class B | | | 16,312,507 | | | | 823,669 | | | | .93 | |
| VINCI SA | | | 10,913,941 | | | | 807,840 | | | | .91 | |
| Lockheed Martin Corp. | | | 3,988,400 | | | | 652,702 | | | | .73 | |
| Schneider Electric SA | | | 6,086,719 | | | | 573,164 | | | | .65 | |
| General Dynamics Corp. | | | 4,677,300 | | | | 552,483 | | | | .62 | |
| Other securities | | | | | | | 6,690,918 | | | | 7.52 | |
| | | | | | | | 10,100,776 | | | | 11.36 | |
| | | | | | | | | | | | | |
| Consumer discretionary 10.35% | | | | | | | | | | | | |
| DIRECTV1 | | | 9,872,686 | | | | 813,904 | | | | .92 | |
| Amazon.com, Inc.1 | | | 2,538,400 | | | | 793,377 | | | | .89 | |
| Kingfisher PLC | | | 84,568,999 | | | | 555,678 | | | | .62 | |
| Volkswagen AG, nonvoting preferred | | | 2,051,602 | | | | 545,345 | | | | .61 | |
| Home Depot, Inc. | | | 6,627,800 | | | | 531,748 | | | | .60 | |
| General Motors Co. | | | 14,652,347 | | | | 506,678 | | | | .57 | |
| Other securities | | | | | | | 5,457,098 | | | | 6.14 | |
| | | | | | | | 9,203,828 | | | | 10.35 | |
| Capital World Growth and Income Fund | 7 |
| Common stocks (continued) | | Shares | | | Value
(000) | | | Percent of
net assets | |
| Information technology 9.23% | | | | | | | | | | | | |
| Google Inc., Class A1 | | | 1,037,629 | | | $ | 593,161 | | | | | |
| Google Inc., Class C1 | | | 1,037,629 | | | | 582,089 | | | | 1.32 | % |
| Samsung Electronics Co. Ltd. | | | 812,850 | | | | 1,149,718 | | | | 1.29 | |
| Oracle Corp. | | | 20,422,000 | | | | 858,132 | | | | .97 | |
| Texas Instruments Inc. | | | 16,070,000 | | | | 754,969 | | | | .85 | |
| Motorola Solutions, Inc. | | | 7,780,062 | | | | 524,532 | | | | .59 | |
| Other securities | | | | | | | 3,745,626 | | | | 4.21 | |
| | | | | | | | 8,208,227 | | | | 9.23 | |
| Consumer staples 7.18% | | | | | | | | | | | | |
| Altria Group, Inc. | | | 41,743,300 | | | | 1,734,852 | | | | 1.95 | |
| Philip Morris International Inc. | | | 16,440,200 | | | | 1,455,615 | | | | 1.64 | |
| Nestlé SA | | | 8,454,443 | | | | 663,232 | | | | .74 | |
| Other securities | | | | | | | 2,531,683 | | | | 2.85 | |
| | | | | | | | 6,385,382 | | | | 7.18 | |
| | | | | | | | | | | | | |
| Energy 6.11% | | | | | | | | | | | | |
| BP PLC | | | 193,063,649 | | | | 1,627,775 | | | | 1.83 | |
| Royal Dutch Shell PLC, Class A | | | 10,010,000 | | | | 393,462 | | | | | |
| Royal Dutch Shell PLC, Class B | | | 9,203,685 | | | | 375,653 | | | | | |
| Royal Dutch Shell PLC, Class A (ADR) | | | 897,500 | | | | 70,543 | | | | 1.05 | |
| Royal Dutch Shell PLC, Class A (EUR denominated) | | | 1,686,000 | | | | 66,294 | | | | | |
| Royal Dutch Shell PLC, Class B (ADR) | | | 344,800 | | | | 28,218 | | | | | |
| Eni SpA | | | 22,965,300 | | | | 585,093 | | | | | |
| Eni SpA (ADR) | | | 253,148 | | | | 12,867 | | | | .67 | |
| Other securities | | | | | | | 2,279,329 | | | | 2.56 | |
| | | | | | | | 5,439,234 | | | | 6.11 | |
| | | | | | | | | | | | | |
| Telecommunication services 5.34% | | | | | | | | | | | | |
| Verizon Communications Inc. | | | 29,517,339 | | | | 1,474,686 | | | | 1.66 | |
| SoftBank Corp. | | | 8,127,700 | | | | 586,424 | | | | .66 | |
| TeliaSonera AB | | | 74,332,564 | | | | 550,608 | | | | .62 | |
| CenturyLink, Inc. | | | 13,456,000 | | | | 506,888 | | | | .57 | |
| Other securities | | | | | | | 1,627,283 | | | | 1.83 | |
| | | | | | | | 4,745,889 | | | | 5.34 | |
| | | | | | | | | | | | | |
| Utilities 4.41% | | | | | | | | | | | | |
| National Grid PLC | | | 70,136,919 | | | | 1,046,315 | | | | 1.18 | |
| Fortum Oyj | | | 32,911,777 | | | | 802,611 | | | | .90 | |
| Other securities | | | | | | | 2,073,960 | | | | 2.33 | |
| | | | | | | | 3,922,886 | | | | 4.41 | |
| | | | | | | | | | | | | |
| Materials 3.31% | | | | | | | | | | | | |
| BASF SE | | | 4,610,000 | | | | 530,820 | | | | .60 | |
| Other securities | | | | | | | 2,414,883 | | | | 2.71 | |
| | | | | | | | 2,945,703 | | | | 3.31 | |
| 8 | Capital World Growth and Income Fund |
| | Value
(000) | | | Percent of
net assets | |
| Miscellaneous 4.91% | | | | | | | | |
| Other common stocks in initial period of acquisition | | $ | 4,367,960 | | | | 4.91 | % |
| | | | | | | | | |
| Total common stocks (cost: $59,193,383,000) | | | 83,007,129 | | | | 93.33 | |
| | | | | | | | | |
| Preferred securities 0.00% | | | | | | |
| Financials 0.00% | | | | | | | | |
| Other securities | | | 3,352 | | | | .00 | |
| | | | | | | | | |
| Total preferred securities (cost: $3,050,000) | | | 3,352 | | | | .00 | |
| | | | | | | | | |
| Rights & warrants 0.00% | | | | | | | | |
| Miscellaneous 0.00% | | | | | | | | |
| Other rights & warrants in initial period of acquisition | | | 1,020 | | | | .00 | |
| | | | | | | | | |
| Total rights & warrants (cost: $0) | | | 1,020 | | | | .00 | |
| | | | | | | | | |
| Convertible securities 0.13% | | | | | | | | |
| Other 0.13% | | | | | | | | |
| Other securities | | | 115,878 | | | | .13 | |
| | | | | | | | | |
| Total convertible securities (cost: $90,281,000) | | | 115,878 | | | | .13 | |
Bonds, notes & other
debt instruments 0.93% | | Principal amount
(000) | | | | | | | |
| Corporate bonds & notes 0.64% | | | | | | | | | | | | |
| Energy 0.05% | | | | | | | | | | | | |
| BP Capital Markets PLC 3.875% 2015 | | $ | 7,320 | | | | 7,522 | | | | .01 | |
| Other securities | | | | | | | 42,441 | | | | .04 | |
| | | | | | | | 49,963 | | | | .05 | |
| Other corporate bonds & notes 0.59% | | | | | | | | | | | | |
| Other securities | | | | | | | 523,311 | | | | .59 | |
| | | | | | | | | | | | | |
| Total corporate bonds & notes | | | | | | | 573,274 | | | | .64 | |
| | | | | | | | | | | | | |
| Other bonds & notes 0.29% | | | | | | | | | | | | |
| Other securities | | | | | | | 256,664 | | | | .29 | |
| | | | | | | | | | | | | |
Total bonds, notes & other debt instruments
(cost: $720,852,000) | | | | | | | 829,938 | | | | .93 | |
| Capital World Growth and Income Fund | 9 |
| Short-term securities 4.99% | | Principal amount
(000) | | | Value
(000) | | | Percent of
net assets | |
| Fannie Mae 0.055%–0.15% due 7/2–10/27/2014 | | $ | 935,103 | | | $ | 934,998 | | | | 1.05 | % |
| Freddie Mac 0.05%–0.15% due 6/2/2014–1/16/2015 | | | 879,800 | | | | 879,615 | | | | .99 | |
| Federal Home Loan Bank 0.045%–0.18% due 6/4/2014–1/30/2015 | | | 864,734 | | | | 864,607 | | | | .97 | |
| Other securities | | | | | | | 1,754,066 | | | | 1.98 | |
| | | | | | | | | | | | | |
| Total short-term securities (cost: $4,432,924,000) | | | | | | | 4,433,286 | | | | 4.99 | |
| | | | | | | | | | | | | |
| Total investment securities (cost: $64,440,490,000) | | | | | | | 88,390,603 | | | | 99.38 | |
| Other assets less liabilities | | | | | | | 548,992 | | | | .62 | |
| | | | | | | | | | | | | |
| Net assets | | | | | | $ | 88,939,595 | | | | 100.00 | % |
This summary investment portfolio is designed to streamline the report and help investors better focus on the fund’s principal holdings. See the inside back cover for details on how to obtain a complete schedule of portfolio holdings.
As permitted by U.S. Securities and Exchange Commission regulations, “Miscellaneous” securities include holdings in their first year of acquisition that have not previously been publicly disclosed.
“Other securities” includes all issues that are not disclosed separately in the summary investment portfolio. Some of these securities (with an aggregate value of $1,436,017,000, which represented 1.61% of the net assets of the fund) were acquired in transactions exempt from registration under Rule 144A or section 4(2) of the Securities Act of 1933 and may be resold in the U.S. in transactions exempt from registration, normally to qualified institutional buyers. “Other securities” also includes a portion of a security which was pledged as collateral. The total value of pledged collateral was $588,000, which represented less than .01% of the net assets of the fund.
| 10 | Capital World Growth and Income Fund |
Forward currency contracts
The fund has entered into forward currency contracts to sell currencies as shown in the following table. The average notional amount of open forward currency contracts was $625,363,000 over the prior 12-month period.
| | | | | | | Contract amount | | Unrealized (depreciation)
appreciation | |
| | | Settlement date | | Counterparty | | Receive
(000) | | Deliver
(000) | | at 5/31/2014
(000) | |
| Sales: | | | | | | | | | | | | |
| Australian dollars | | 6/5/2014 | | UBS AG | | $17,594 | | A$19,000 | | | $ (80 | ) |
| Australian dollars | | 7/11/2014 | | Barclays Bank PLC | | $75,971 | | A$82,000 | | | (115 | ) |
| Euros | | 6/16/2014 | | Bank of America, N.A. | | $116,134 | | €84,800 | | | 543 | |
| Japanese yen | | 6/30/2014 | | Bank of America, N.A. | | $56,019 | | ¥5,700,000 | | | 16 | |
| Japanese yen | | 7/14/2014 | | Bank of New York Mellon | | $100,664 | | ¥10,242,554 | | | 20 | |
| Swiss francs | | 7/14/2014 | | Citibank | | $159,520 | | CHF142,650 | | | 148 | |
| | | | | | | | | | | | $ 532 | |
Investments in affiliates
A company is an affiliate of the fund under the Investment Company Act of 1940 if the fund’s holdings in that company represent 5% or more of the outstanding voting shares. The value of the fund’s holdings in affiliated companies is included in “Other securities” under the respective industry sectors in the summary investment portfolio. Further details on these holdings and related transactions during the six months ended May 31, 2014, appear below.
| | | Beginning shares | | | Additions | | | Reductions | | | Ending shares | | | Dividend income (000) | | | Value of
Affiliates at
5/31/2014
(000) | |
| ComfortDelGro Corp. Ltd. | | | 135,100,000 | | | | — | | | | — | | | | 135,100,000 | | | $ | 4,314 | | | $ | 250,963 | |
| Qantas Airways Ltd.1 | | | 125,158,600 | | | | — | | | | — | | | | 125,158,600 | | | | — | | | | 163,653 | |
| | | | | | | | | | | | | | | | | | | $ | 4,314 | | | $ | 414,616 | |
The following footnote applies to either the individual securities noted or one or more of the securities aggregated and listed as a single line item.
| 1 | Security did not produce income during the last 12 months. |
Key to abbreviations and symbols
ADR = American Depositary Receipts
A$ = Australian dollars
CHF = Swiss francs
EUR/€ = Euros
¥ = Japanese yen
See Notes to Financial Statements
| Capital World Growth and Income Fund | 11 |
Financial statements
| Statement of assets and liabilities | | unaudited | |
| at May 31, 2014 | | (dollars in thousands) | |
| | | | | | | |
| Assets: | | | | | | | | |
| Investment securities, at value: | | | | | | | | |
| Unaffiliated issuers (cost: $64,018,772) | | $ | 87,975,987 | | | | | |
| Affiliated issuers (cost: $421,718) | | | 414,616 | | | $ | 88,390,603 | |
| Cash | | | | | | | 8,747 | |
| Unrealized appreciation on open forward currency contracts | | | | | | | 727 | |
| Receivables for: | | | | | | | | |
| Sales of investments | | | 676,769 | | | | | |
| Sales of fund’s shares | | | 72,765 | | | | | |
| Closed forward currency contracts | | | 2,337 | | | | | |
| Dividends and interest | | | 292,322 | | | | | |
| Other | | | 8 | | | | 1,044,201 | |
| | | | | | | | 89,444,278 | |
| Liabilities: | | | | | | | | |
| Unrealized depreciation on open forward currency contracts | | | | | | | 195 | |
| Payables for: | | | | | | | | |
| Purchases of investments | | | 335,773 | | | | | |
| Repurchases of fund’s shares | | | 79,890 | | | �� | | |
| Closed forward currency contracts | | | 1,062 | | | | | |
| Investment advisory services | | | 27,864 | | | | | |
| Services provided by related parties | | | 46,253 | | | | | |
| Trustees’ deferred compensation | | | 1,414 | | | | | |
| Non-U.S. taxes | | | 11,475 | | | | | |
| Other | | | 757 | | | | 504,488 | |
| Net assets at May 31, 2014 | | | | | | $ | 88,939,595 | |
| | | | | | | | | |
| Net assets consist of: | | | | | | | | |
| Capital paid in on shares of beneficial interest | | | | | | $ | 69,498,297 | |
| Undistributed net investment income | | | | | | | 1,121,022 | |
| Accumulated net realized loss | | | | | | | (5,620,252 | ) |
| Net unrealized appreciation | | | | | | | 23,940,528 | |
| Net assets at May 31, 2014 | | | | | | $ | 88,939,595 | |
(dollars and shares in thousands, except per-share amounts)
Shares of beneficial interest issued and outstanding (no stated par value) —
unlimited shares authorized (1,872,752 total shares outstanding)
| | | Net assets | | | Shares
outstanding | | | Net asset
value per share | |
| Class A | | $ | 57,842,337 | | | | 1,216,317 | | | $ | 47.56 | |
| Class B | | | 974,753 | | | | 20,614 | | | | 47.29 | |
| Class C | | | 4,824,346 | | | | 102,563 | | | | 47.04 | |
| Class F-1 | | | 4,110,698 | | | | 86,609 | | | | 47.46 | |
| Class F-2 | | | 3,314,079 | | | | 69,708 | | | | 47.54 | |
| Class 529-A | | | 3,081,994 | | | | 64,994 | | | | 47.42 | |
| Class 529-B | | | 92,133 | | | | 1,949 | | | | 47.27 | |
| Class 529-C | | | 758,298 | | | | 16,070 | | | | 47.19 | |
| Class 529-E | | | 130,271 | | | | 2,751 | | | | 47.35 | |
| Class 529-F-1 | | | 110,008 | | | | 2,318 | | | | 47.47 | |
| Class R-1 | | | 313,384 | | | | 6,652 | | | | 47.11 | |
| Class R-2 | | | 1,288,063 | | | | 27,401 | | | | 47.01 | |
| Class R-3 | | | 2,678,873 | | | | 56,682 | | | | 47.26 | |
| Class R-4 | | | 2,405,250 | | | | 50,688 | | | | 47.45 | |
| Class R-5 | | | 1,522,255 | | | | 31,993 | | | | 47.58 | |
| Class R-6 | | | 5,492,853 | | | | 115,443 | | | | 47.58 | |
See Notes to Financial Statements
| 12 | Capital World Growth and Income Fund |
| Statement of operations | | | unaudited | |
| for the six months ended May 31, 2014 | | | (dollars in thousands) | |
| | | | | | | | | |
| Investment income: | | | | | | | | |
| Income: | | | | | | | | |
| Dividends (net of non-U.S. taxes of $92,490; also includes $4,314 from affiliates) | | $ | 1,907,668 | | | | | |
| Interest (net of non-U.S. taxes of $308) | | | 33,716 | | | $ | 1,941,384 | |
| Fees and expenses*: | | | | | | | | |
| Investment advisory services | | | 159,092 | | | | | |
| Distribution services | | | 123,668 | | | | | |
| Transfer agent services | | | 53,242 | | | | | |
| Administrative services | | | 9,895 | | | | | |
| Reports to shareholders | | | 2,169 | | | | | |
| Registration statement and prospectus | | | 475 | | | | | |
| Trustees’ compensation | | | 299 | | | | | |
| Auditing and legal | | | 79 | | | | | |
| Custodian | | | 3,318 | | | | | |
| Other | | | 2,100 | | | | 354,337 | |
| Net investment income | | | | | | | 1,587,047 | |
| | | | | | | | | |
| Net realized gain and unrealized appreciation on investments, forward currency contracts and currency: | | | | | | | | |
| Net realized gain (loss) on: | | | | | | | | |
| Investments | | | 3,400,121 | | | | | |
| Forward currency contracts | | | 3,921 | | | | | |
| Currency transactions | | | (1,870 | ) | | | 3,402,172 | |
| Net unrealized appreciation (depreciation) on: | | | | | | | | |
| Investments (net of non-U.S. taxes of $11,475) | | | 1,188,117 | | | | | |
| Forward currency contracts | | | (9,306 | ) | | | | |
| Currency translations | | | (545 | ) | | | 1,178,266 | |
| Net realized gain and unrealized appreciation on investments, forward currency contracts and currency | | | | | | | 4,580,438 | |
| Net increase in net assets resulting from operations | | | | | | $ | 6,167,485 | |
* Additional information related to class-specific fees and expenses is included in the Notes to Financial Statements.
See Notes to Financial Statements
| Capital World Growth and Income Fund | 13 |
| Statements of changes in net assets | | | | | | |
| | | (dollars in thousands) | |
| | | | | | | |
| | | Six months ended
May 31, 2014* | | | Year ended
November 30, 2013 | |
| Operations: | | | | | | | | |
| Net investment income | | $ | 1,587,047 | | | $ | 1,517,206 | |
| Net realized gain on investments, forward currency contracts and currency transactions | | | 3,402,172 | | | | 5,614,182 | |
| Net unrealized appreciation on investments, forward currency contracts and currency translations | | | 1,178,266 | | | | 9,738,949 | |
| Net increase in net assets resulting from operations | | | 6,167,485 | | | | 16,870,337 | |
| | | | | | | | | |
| Dividends paid to shareholders from net investment income | | | (761,661 | ) | | | (1,894,727 | ) |
| | | | | | | | | |
| Net capital share transactions | | | (204,552 | ) | | | (1,392,761 | ) |
| | | | | | | | | |
| Total increase in net assets | | | 5,201,272 | | | | 13,582,849 | |
| | | | | | | | | |
| Net assets: | | | | | | | | |
| Beginning of period | | | 83,738,323 | | | | 70,155,474 | |
| End of period (including undistributed net investment income: $1,121,022 and $295,636, respectively) | | $ | 88,939,595 | | | $ | 83,738,323 | |
* Unaudited.
See Notes to Financial Statements
| 14 | Capital World Growth and Income Fund |
| Notes to financial statements | unaudited |
1. Organization
Capital World Growth and Income Fund (the “fund”) is registered under the Investment Company Act of 1940 as an open-end, diversified management investment company. The fund seeks long-term growth of capital while providing current income. It invests on a global basis in a diversified portfolio consisting primarily of common stocks and other equity securities.
The fund has 16 share classes consisting of five retail share classes (Classes A, B and C, as well as two F share classes, F-1 and F-2), five 529 college savings plan share classes (Classes 529-A, 529-B, 529-C, 529-E and 529-F-1) and six retirement plan share classes (Classes R-1, R-2, R-3, R-4, R-5 and R-6). The 529 college savings plan share classes can be used to save for college education. The retirement plan share classes are generally offered only through eligible employer-sponsored retirement plans. The fund’s share classes are described further in the following table:
| Share class | | Initial sales
charge | | Contingent deferred sales
charge upon redemption | | Conversion feature | |
| Classes A and 529-A | | Up to 5.75% | | None (except 1% for certain redemptions within one year of purchase without an initial sales charge) | | None | |
| Classes B and 529-B* | | None | | Declines from 5% to 0% for redemptions within six years of purchase | | Classes B and 529-B convert to Classes A and 529-A, respectively, after eight years | |
| Class C | | None | | 1% for redemptions within one year of purchase | | Class C converts to Class F-1 after 10 years | |
| Class 529-C | | None | | 1% for redemptions within one year of purchase | | None | |
| Class 529-E | | None | | None | | None | |
| Classes F-1, F-2 and 529-F-1 | | None | | None | | None | |
| Classes R-1, R-2, R-3, R-4, R-5 and R-6 | | None | | None | | None | |
* Class B and 529-B shares of the fund are not available for purchase.
Holders of all share classes have equal pro rata rights to assets, dividends and liquidation proceeds. Each share class has identical voting rights, except for the exclusive right to vote on matters affecting only its class. Share classes have different fees and expenses (“class-specific fees and expenses”), primarily due to different arrangements for distribution, administrative and shareholder services. Differences in class-specific fees and expenses will result in differences in net investment income and, therefore, the payment of different per-share dividends by each share class.
| Capital World Growth and Income Fund | 15 |
2. Significant accounting policies
The financial statements have been prepared to comply with accounting principles generally accepted in the United States of America. These principles require management to make estimates and assumptions that affect reported amounts and disclosures. Actual results could differ from those estimates. The fund follows the significant accounting policies described in this section, as well as the valuation policies described in the next section on valuation.
Security transactions and related investment income — Security transactions are recorded by the fund as of the date the trades are executed with brokers. Realized gains and losses from security transactions are determined based on the specific identified cost of the securities. In the event a security is purchased with a delayed payment date, the fund will segregate liquid assets sufficient to meet its payment obligations. Dividend income is recognized on the ex-dividend date and interest income is recognized on an accrual basis. Market discounts, premiums and original issue discounts on fixed-income securities are amortized daily over the expected life of the security.
Class allocations — Income, fees and expenses (other than class-specific fees and expenses) and realized and unrealized gains and losses are allocated daily among the various share classes based on their relative net assets. Class-specific fees and expenses, such as distribution, administrative and shareholder services, are charged directly to the respective share class.
Dividends and distributions to shareholders — Dividends and distributions to shareholders are recorded on the ex-dividend date.
Currency translation — Assets and liabilities, including investment securities, denominated in currencies other than U.S. dollars are translated into U.S. dollars at the exchange rates supplied by one or more pricing vendors on the valuation date. Purchases and sales of investment securities and income and expenses are translated into U.S. dollars at the exchange rates on the dates of such transactions. The effects of changes in exchange rates on investment securities are included with the net realized gain or loss and net unrealized appreciation or depreciation on investments in the fund’s statement of operations. The realized gain or loss and unrealized appreciation or depreciation resulting from all other transactions denominated in currencies other than U.S. dollars are disclosed separately.
3. Valuation
Capital Research and Management Company (“CRMC”), the fund’s investment adviser, values the fund’s investments at fair value as defined by accounting principles generally accepted in the United States of America. The net asset value of each share class of the fund is generally determined as of approximately 4:00 p.m. New York time each day the New York Stock Exchange is open.
| 16 | Capital World Growth and Income Fund |
Methods and inputs — The fund’s investment adviser uses the following methods and inputs to establish the fair value of the fund’s assets and liabilities. Use of particular methods and inputs may vary over time based on availability and relevance as market and economic conditions evolve.
Equity securities are generally valued at the official closing price of, or the last reported sale price on, the exchange or market on which such securities are traded, as of the close of business on the day the securities are being valued or, lacking any sales, at the last available bid price. Prices for each security are taken from the principal exchange or market on which the security trades.
Fixed-income securities, including short-term securities purchased with more than 60 days left to maturity, are generally valued at prices obtained from one or more pricing vendors. Vendors value such securities based on one or more of the inputs described in the following table. The table provides examples of inputs that are commonly relevant for valuing particular classes of fixed-income securities in which the fund is authorized to invest. However, these classifications are not exclusive, and any of the inputs may be used to value any other class of fixed-income security.
| Fixed-income class | Examples of standard inputs |
| All | Benchmark yields, transactions, bids, offers, quotations from dealers and trading systems, new issues, spreads and other relationships observed in the markets among comparable securities; and proprietary pricing models such as yield measures calculated using factors such as cash flows, financial or collateral performance and other reference data (collectively referred to as “standard inputs”) |
| Corporate bonds & notes; convertible securities | Standard inputs and underlying equity of the issuer |
| Bonds & notes of governments & government agencies | Standard inputs and interest rate volatilities |
| Mortgage-backed; asset-backed obligations | Standard inputs and cash flows, prepayment information, default rates, delinquency and loss assumptions, collateral characteristics, credit enhancements and specific deal information |
When the fund’s investment adviser deems it appropriate to do so (such as when vendor prices are unavailable or not deemed to be representative), fixed-income securities will be valued in good faith at the mean quoted bid and ask prices that are reasonably and timely available (or bid prices, if ask prices are not available) or at prices for securities of comparable maturity, quality and type.
Securities with both fixed-income and equity characteristics, or equity securities traded principally among fixed-income dealers, are generally valued in the manner described for either equity or fixed-income securities, depending on which method is deemed most appropriate by the fund’s investment adviser. Short-term
| Capital World Growth and Income Fund | 17 |
securities purchased within 60 days to maturity are valued at amortized cost, which approximates fair value. The value of short-term securities originally purchased with maturities greater than 60 days is determined based on an amortized value to par when they reach 60 days. Forward currency contracts are valued at the mean of representative quoted bid and ask prices, generally based on prices supplied by one or more pricing vendors.
Securities and other assets for which representative market quotations are not readily available or are considered unreliable by the fund’s investment adviser are fair valued as determined in good faith under fair valuation guidelines adopted by authority of the fund’s board of trustees as further described. The investment adviser follows fair valuation guidelines, consistent with U.S. Securities and Exchange Commission rules and guidance, to consider relevant principles and factors when making fair value determinations. The investment adviser considers relevant indications of value that are reasonably and timely available to it in determining the fair value to be assigned to a particular security, such as the type and cost of the security; contractual or legal restrictions on resale of the security; relevant financial or business developments of the issuer; actively traded similar or related securities; conversion or exchange rights on the security; related corporate actions; significant events occurring after the close of trading in the security; and changes in overall market conditions. In addition, the closing prices of equity securities that trade in markets outside U.S. time zones may be adjusted to reflect significant events that occur after the close of local trading but before the net asset value of each share class of the fund is determined. Fair valuations and valuations of investments that are not actively trading involve judgment and may differ materially from valuations that would have been used had greater market activity occurred.
Processes and structure — The fund’s board of trustees has delegated authority to the fund’s investment adviser to make fair value determinations, subject to board oversight. The investment adviser has established a Joint Fair Valuation Committee (the “Fair Valuation Committee”) to administer, implement and oversee the fair valuation process, and to make fair value decisions. The Fair Valuation Committee regularly reviews its own fair value decisions, as well as decisions made under its standing instructions to the investment adviser’s valuation teams. The Fair Valuation Committee reviews changes in fair value measurements from period to period and may, as deemed appropriate, update the fair valuation guidelines to better reflect the results of back testing and address new or evolving issues. The Fair Valuation Committee reports any changes to the fair valuation guidelines to the board of trustees with supplemental information to support the changes. The fund’s board and audit committee also regularly review reports that describe fair value determinations and methods.
The fund’s investment adviser has also established a Fixed-Income Pricing Review Group to administer and oversee the fixed-income valuation process, including the use of fixed-income pricing vendors. This group regularly reviews pricing vendor information and market data. Pricing decisions, processes and controls over security valuation are also subject to additional internal reviews, including an annual control self-evaluation program facilitated by the investment adviser’s compliance group.
| 18 | Capital World Growth and Income Fund |
Classifications — The fund’s investment adviser classifies the fund’s assets and liabilities into three levels based on the inputs used to value the assets or liabilities. Level 1 values are based on quoted prices in active markets for identical securities. Level 2 values are based on significant observable market inputs, such as quoted prices for similar securities and quoted prices in inactive markets. Certain securities trading outside the U.S. may transfer between Level 1 and Level 2 due to valuation adjustments resulting from significant market movements following the close of local trading. Level 3 values are based on significant unobservable inputs that reflect the investment adviser’s determination of assumptions that market participants might reasonably use in valuing the securities. The valuation levels are not necessarily an indication of the risk or liquidity associated with the underlying investment. For example, U.S. government securities are reflected as Level 2 because the inputs used to determine fair value may not always be quoted prices in an active market. The following tables present the fund’s valuation levels as of May 31, 2014 (dollars in thousands):
| | | Investment securities | |
| | | Level 1 | | | Level 2 | | | Level 3 | | | Total | |
| Assets: | | | | | | | | | | | | | | | | |
| Common stocks: | | | | | | | | | | | | | | | | |
| Health care | | $ | 14,677,591 | | | $ | — | | | $ | — | | | $ | 14,677,591 | |
| Financials | | | 13,009,653 | | | | — | | | | — | | | | 13,009,653 | |
| Industrials | | | 10,100,776 | | | | — | | | | — | | | | 10,100,776 | |
| Consumer discretionary | | | 9,203,828 | | | | — | | | | — | | | | 9,203,828 | |
| Information technology | | | 8,208,227 | | | | — | | | | — | | | | 8,208,227 | |
| Consumer staples | | | 6,385,382 | | | | — | | | | — | | | | 6,385,382 | |
| Energy | | | 5,439,234 | | | | — | | | | — | | | | 5,439,234 | |
| Telecommunication services | | | 4,745,889 | | | | — | | | | — | | | | 4,745,889 | |
| Utilities | | | 3,922,886 | | | | — | | | | — | | | | 3,922,886 | |
| Materials | | | 2,945,703 | | | | — | | | | — | | | | 2,945,703 | |
| Miscellaneous | | | 4,367,960 | | | | — | | | | — | | | | 4,367,960 | |
| Preferred securities | | | — | | | | 3,352 | | | | — | | | | 3,352 | |
| Rights & warrants | | | 1,020 | | | | — | | | | — | | | | 1,020 | |
| Convertible securities | | | 15,471 | | | | 100,407 | | | | — | | | | 115,878 | |
| Bonds, notes & other debt instruments | | | — | | | | 829,938 | | | | — | | | | 829,938 | |
| Short-term securities | | | — | | | | 4,433,286 | | | | — | | | | 4,433,286 | |
| Total | | $ | 83,023,620 | | | $ | 5,366,983 | | | $ | — | | | $ | 88,390,603 | |
| | | Other investments* | |
| | | Level 1 | | | Level 2 | | | Level 3 | | | Total | |
| Assets: | | | | | | | | | | | | | | | | |
| Unrealized appreciation on open forward currency contracts | | $ | — | | | $ | 727 | | | $ | — | | | $ | 727 | |
| Liabilities: | | | | | | | | | | | | | | | | |
| Unrealized depreciation on open forward currency contracts | | | — | | | | (195 | ) | | | — | | | | (195 | ) |
| Total | | $ | — | | | $ | 532 | | | $ | — | | | $ | 532 | |
| * | Forward currency contracts are not included in the investment portfolio. |
| Capital World Growth and Income Fund | 19 |
4. Risk factors
Investing in the fund may involve certain risks including, but not limited to, those described below.
Market conditions — The prices of, and the income generated by, the common stocks and other securities held by the fund may decline due to market conditions and other factors, including those directly involving the issuers of securities held by the fund.
Investing outside the U.S. — Securities of issuers domiciled outside the U.S., or with significant operations outside the U.S., may lose value because of adverse political, social, economic or market developments in the countries or regions in which the issuers operate. These securities may also lose value due to changes in foreign currency exchange rates against the U.S. dollar and/or currencies of other countries. Securities markets in certain countries may be more volatile and/or less liquid than those in the U.S. Investments outside the U.S. may also be subject to different settlement and accounting practices and different regulatory, legal and reporting standards, and may be more difficult to value, than those in the U.S. The risks of investing outside the U.S. may be heightened in connection with investments in emerging markets.
Investing in emerging markets — Investing in emerging markets may involve risks in addition to and greater than those generally associated with investing in the securities markets of developed countries. For instance, developing countries may have less developed legal and accounting systems than those in developed countries. The governments of these countries may be less stable and more likely to impose capital controls, nationalize a company or industry, place restrictions on foreign ownership and on withdrawing sale proceeds of securities from the country, and/or impose punitive taxes that could adversely affect the prices of securities. In addition, the economies of these countries may be dependent on relatively few industries that are more susceptible to local and global changes. Securities markets in these countries can also be relatively small and have substantially lower trading volumes. As a result, securities issued in these countries may be more volatile and less liquid, and may be more difficult to value, than securities issued in countries with more developed economies and/or markets. Additionally, there may be increased settlement risks for transactions in local securities.
Investing in growth-oriented stocks — Growth-oriented stocks may involve larger price swings and greater potential for loss than other types of investments.
Investing in income-oriented stocks — Income provided by the fund may be reduced by changes in the dividend policies of, and the capital resources available at, the companies in which the fund invests.
Management — The investment adviser to the fund actively manages the fund’s investments. Consequently, the fund is subject to the risk that the methods and analyses employed by the investment adviser in this process may not produce the desired results. This could cause the fund to lose value or its investment results to lag relevant benchmarks or other funds with similar objectives.
| 20 | Capital World Growth and Income Fund |
5. Certain investment techniques
Forward currency contracts — The fund has entered into forward currency contracts, which represent agreements to exchange currencies on specific future dates at predetermined rates. The fund’s investment adviser uses forward currency contracts to manage the fund’s exposure to changes in exchange rates. Upon entering into these contracts, risks may arise from the potential inability of counterparties to meet the terms of their contracts and from possible movements in exchange rates.
On a daily basis, the fund’s investment adviser values forward currency contracts and records unrealized appreciation or depreciation for open forward currency contracts in the fund’s statement of assets and liabilities. Realized gains or losses are recorded at the time the forward currency contract is closed or offset by another contract with the same broker for the same settlement date and currency.
Closed forward currency contracts that have not reached their settlement date are included in the respective receivables or payables for closed forward currency contracts in the fund’s statement of assets and liabilities. Net realized gains or losses from closed forward currency contracts and net unrealized appreciation or depreciation from open forward currency contracts are recorded in the fund’s statement of operations.
The following tables present the financial statement impacts resulting from the fund’s use of forward currency contracts as of May 31, 2014 (dollars in thousands):
| | | Asset | | | Liability | |
| Contract | | Location on statement
of assets and liabilities | | Value | | | Location on statement
of assets and liabilities | | Value | |
| Forward currency | | Unrealized appreciation on open forward currency contracts | | $ | 727 | | | Unrealized depreciation on open forward currency contracts | | $ | 195 | |
| Forward currency | | Receivables for closed forward currency contracts | | | 2,337 | | | Payables for closed forward currency contracts | | | 1,062 | |
| | | | | $ | 3,064 | | | | | $ | 1,257 | |
| | | Net realized gain | | | Net unrealized depreciation | |
| Contract | | Location on statement
of operations | | Value | | | Location on statement
of operations | | Value | |
| Forward currency | | Net realized gain on forward currency contracts | | $ | 3,921 | | | Net unrealized depreciation on forward currency contracts | | $ | (9,306 | ) |
Collateral — The fund has entered into a collateral program due to its use of forward currency contracts. The program calls for the fund to either receive or pledge collateral based on the net gain or loss on unsettled forward currency contracts by counterparty. The purpose of the collateral is to cover potential losses that could occur in the event that either party cannot meet its contractual obligations.
| Capital World Growth and Income Fund | 21 |
6. Taxation and distributions
Federal income taxation — The fund complies with the requirements under Subchapter M of the Internal Revenue Code applicable to mutual funds and intends to distribute substantially all of its net taxable income and net capital gains each year. The fund is not subject to income taxes to the extent such distributions are made. Therefore, no federal income tax provision is required.
As of and during the period ended May 31, 2014, the fund did not have a liability for any unrecognized tax benefits. The fund recognizes interest and penalties, if any, related to unrecognized tax benefits as income tax expense in the statement of operations. During the period, the fund did not incur any interest or penalties.
The fund is not subject to examination by U.S. federal tax authorities for tax years before 2009, by state tax authorities for tax years before 2008 and by tax authorities outside the U.S. for tax years before 2007.
Non-U.S. taxation — Dividend and interest income are recorded net of non-U.S. taxes paid. Gains realized by the fund on the sale of securities in certain countries are subject to non-U.S. taxes. The fund records a liability based on unrealized gains to provide for potential non-U.S. taxes payable upon the sale of these securities.
Distributions — Distributions paid to shareholders are based on net investment income and net realized gains determined on a tax basis, which may differ from net investment income and net realized gains for financial reporting purposes. These differences are due primarily to different treatment for items such as currency gains and losses; short-term capital gains and losses; capital losses related to sales of certain securities within 30 days of purchase; unrealized appreciation of certain investments in securities outside the U.S.; cost of investments sold; and net capital losses. The fiscal year in which amounts are distributed may differ from the year in which the net investment income and net realized gains are recorded by the fund for financial reporting purposes.
The components of distributable earnings on a tax basis are reported as of the fund’s most recent year-end. As of November 30, 2013, the components of distributable earnings on a tax basis were as follows (dollars in thousands):
| Undistributed ordinary income | | $ | 438,720 | |
| Capital loss carryforward expiring 2017* | | | (8,951,624 | ) |
| * | The capital loss carryforward will be used to offset any capital gains realized by the fund in the current year or in subsequent years through the expiration date. The fund will not make distributions from capital gains while a capital loss carryforward remains. |
Under the Regulated Investment Company Modernization Act of 2010 (the “Act”), net capital losses recognized after November 30, 2011, may be carried forward indefinitely, and their character is retained as short-term and/or long-term losses.
| 22 | Capital World Growth and Income Fund |
Previously, net capital losses were carried forward for eight years and treated as short-term losses. As a transition rule, the Act requires that post-enactment net capital losses be used before pre-enactment net capital losses.
As of May 31, 2014, the tax basis unrealized appreciation (depreciation) and cost of investment securities were as follows (dollars in thousands):
| Gross unrealized appreciation on investment securities | | $ | 24,765,092 | |
| Gross unrealized depreciation on investment securities | | | (1,011,392 | ) |
| Net unrealized appreciation on investment securities | | | 23,753,700 | |
| Cost of investment securities | | | 64,636,903 | |
Tax-basis distributions paid to shareholders from ordinary income were as follows (dollars in thousands):
| | | Six months ended | | | Year ended | |
| Share class | | May 31, 2014 | | | November 30, 2013 | |
| Class A | | $ | 513,172 | | | $ | 1,274,323 | |
| Class B | | | 6,069 | | | | 23,731 | |
| Class C | | | 25,798 | | | | 82,518 | |
| Class F-1 | | | 37,638 | | | | 90,167 | |
| Class F-2 | | | 27,700 | | | | 59,671 | |
| Class 529-A | | | 25,713 | | | | 63,301 | |
| Class 529-B | | | 477 | | | | 1,877 | |
| Class 529-C | | | 3,648 | | | | 11,115 | |
| Class 529-E | | | 950 | | | | 2,471 | |
| Class 529-F-1 | | | 1,017 | | | | 2,346 | |
| Class R-1 | | | 1,690 | | | | 5,257 | |
| Class R-2 | | | 7,331 | | | | 23,130 | |
| Class R-3 | | | 20,387 | | | | 57,132 | |
| Class R-4 | | | 21,882 | | | | 58,161 | |
| Class R-5 | | | 17,422 | | | | 42,998 | |
| Class R-6 | | | 50,767 | | | | 96,529 | |
| Total | | $ | 761,661 | | | $ | 1,894,727 | |
7. Fees and transactions with related parties
CRMC, the fund’s investment adviser, is the parent company of American Funds Distributors,® Inc. (“AFD”), the principal underwriter of the fund’s shares, and American Funds Service Company® (“AFS”), the fund’s transfer agent. CRMC, AFD and AFS are considered related parties to the fund.
Investment advisory services — The fund has an investment advisory and service agreement with CRMC that provides for monthly fees accrued daily. These fees are based on a series of decreasing annual rates beginning with 0.600% on the first $500 million of daily net assets and decreasing to 0.350% on such assets in excess of $115 billion. For the six months ended May 31, 2014, the investment advisory services fee was $159,092,000, which was equivalent to an annualized rate of 0.375% of average daily net assets.
| Capital World Growth and Income Fund | 23 |
Class-specific fees and expenses — Expenses that are specific to individual share classes are accrued directly to the respective share class. The principal class-specific fees and expenses are further described below:
| Distribution services — The fund has plans of distribution for all share classes, except Class F-2, R-5 and R-6 shares. Under the plans, the board of trustees approves certain categories of expenses that are used to finance activities primarily intended to sell fund shares and service existing accounts. The plans provide for payments, based on an annualized percentage of average daily net assets, ranging from 0.30% to 1.00% as noted in this section. In some cases, the board of trustees has limited the amounts that may be paid to less than the maximum allowed by the plans. All share classes with a plan may use up to 0.25% of average daily net assets to pay service fees, or to compensate AFD for paying service fees, to firms that have entered into agreements with AFD to provide certain shareholder services. The remaining amounts available to be paid under each plan are paid to dealers to compensate them for their sales activities. |
| | |
| | For Class A and 529-A shares, distribution-related expenses include the reimbursement of dealer and wholesaler commissions paid by AFD for certain shares sold without a sales charge. These share classes reimburse AFD for amounts billed within the prior 15 months but only to the extent that the overall annual expense limit of 0.30% is not exceeded. As of May 31, 2014, there were no unreimbursed expenses subject to reimbursement for Class A or 529-A shares. |
| Share class | | Currently approved limits | | Plan limits | |
| Class A | | | 0.30 | % | | 0.30% | |
| Class 529-A | | | 0.30 | | | | 0.50 | | |
| Classes B and 529-B | | | 1.00 | | | | 1.00 | | |
| Classes C, 529-C and R-1 | | | 1.00 | | | | 1.00 | | |
| Class R-2 | | | 0.75 | | | | 1.00 | | |
| Classes 529-E and R-3 | | | 0.50 | | | | 0.75 | | |
| Classes F-1, 529-F-1 and R-4 | | | 0.25 | | | | 0.50 | | |
| Transfer agent services — The fund has a shareholder services agreement with AFS under which the fund compensates AFS for providing transfer agent services to each of the fund’s share classes. These services include recordkeeping, shareholder communications and transaction processing. In addition, the fund reimburses AFS for amounts paid to third parties for performing transfer agent services on behalf of fund shareholders. |
| | |
| | Administrative services — The fund has an administrative services agreement with CRMC under which the fund compensates CRMC for providing administrative services to Class A, C, F, 529 and R shares. These services include, but are not limited to, coordinating, monitoring, assisting and overseeing third parties that provide services to fund shareholders. Under the agreement, Class A shares pay an annual fee of 0.01% and Class C, F, 529 and R shares pay an annual fee of 0.05% of their respective average daily net assets. |
| 24 | Capital World Growth and Income Fund |
| 529 plan services — Each 529 share class is subject to service fees to compensate the Commonwealth of Virginia for the maintenance of the 529 college savings plan. During the period December 1, 2013, to March 31, 2014, the quarterly fee was based on a series of decreasing annual rates beginning with 0.10% on the first $30 billion of the net assets invested in Class 529 shares of the American Funds and decreasing to 0.06% on such assets between $120 billion and $150 billion. Effective April 1, 2014, the quarterly fee was amended to provide for reduced annual rates of 0.07%, 0.06% and 0.05% over $30 billion, $50 billion and $70 billion, respectively, of the net assets invested in Class 529 shares of the American Funds. The fee for any given calendar quarter is accrued and calculated on the basis of the average net assets of Class 529 shares of the American Funds for the last month of the prior calendar quarter. The fee is included in other expenses in the fund’s statement of operations. The Commonwealth of Virginia is not considered a related party. |
| | |
| | For the six months ended May 31, 2014, class-specific expenses under the agreements were as follows (dollars in thousands): |
| | Share class | | Distribution
services | | Transfer agent
services | | Administrative
services | | 529 plan
services |
| | Class A | | | $66,381 | | | | $37,558 | | | | $2,768 | | | Not applicable |
| | Class B | | | 5,342 | | | | 770 | | | | Not applicable | | | Not applicable |
| | Class C | | | 23,602 | | | | 3,237 | | | | 1,183 | | | Not applicable |
| | Class F-1 | | | 5,182 | | | | 2,504 | | | | 1,039 | | | Not applicable |
| | Class F-2 | | | Not applicable | | | | 1,183 | | | | 676 | | | Not applicable |
| | Class 529-A | | | 3,209 | | | | 1,544 | | | | 730 | | | $1,380 |
| | Class 529-B | | | 478 | | | | 59 | | | | 24 | | | 46 |
| | Class 529-C | | | 3,584 | | | | 407 | | | | 180 | | | 341 |
| | Class 529-E | | | 308 | | | | 40 | | | | 31 | | | 58 |
| | Class 529-F-1 | | | — | | | | 55 | | | | 26 | | | 49 |
| | Class R-1 | | | 1,505 | | | | 158 | | | | 75 | | | Not applicable |
| | Class R-2 | | | 4,669 | | | | 2,126 | | | | 314 | | | Not applicable |
| | Class R-3 | | | 6,479 | | | | 1,992 | | | | 650 | | | Not applicable |
| | Class R-4 | | | 2,929 | | | | 1,197 | | | | 588 | | | Not applicable |
| | Class R-5 | | | Not applicable | | | | 402 | | | | 407 | | | Not applicable |
| | Class R-6 | | | Not applicable | | | | 10 | | | | 1,204 | | | Not applicable |
| | Total class-specific expenses | | | $123,668 | | | | $53,242 | | | | $9,895 | | | $1,874 |
Trustees’ deferred compensation — Trustees who are unaffiliated with CRMC may elect to defer the cash payment of part or all of their compensation. These deferred amounts, which remain as liabilities of the fund, are treated as if invested in shares of the fund or other American Funds. These amounts represent general, unsecured liabilities of the fund and vary according to the total returns of the selected funds. Trustees’ compensation of $299,000 in the fund’s statement of operations includes $219,000 in current fees (either paid in cash or deferred) and a net increase of $80,000 in the value of the deferred amounts.
| Capital World Growth and Income Fund | 25 |
Affiliated officers and trustees — Officers and certain trustees of the fund are or may be considered to be affiliated with CRMC, AFD and AFS. No affiliated officers or trustees received any compensation directly from the fund.
8. Capital share transactions
Capital share transactions in the fund were as follows (dollars and shares in thousands):
| | | Sales* | | | Reinvestments
of dividends | | | Repurchases* | | | Net (decrease) increase | |
| Share class | | Amount | | | Shares | | | Amount | | | Shares | | | Amount | | | Shares | | | Amount | | | Shares | |
| | | | | | | | | | | | | | | | | | | | | | | | | | | | | | | | | |
| Six months ended May 31, 2014 | | | | | | | | | | | | | | | | | | | | | | | |
| | | | | | | | | | | | | | | | | | | | | | | | | | | | | | | | | |
| Class A | | $ | 2,070,657 | | | | 45,676 | | | $ | 502,594 | | | | 11,399 | | | $ | (2,926,293 | ) | | | (64,500 | ) | | $ | (353,042 | ) | | | (7,425 | ) |
| Class B | | | 3,705 | | | | 82 | | | | 6,002 | | | | 138 | | | | (293,150 | ) | | | (6,494 | ) | | | (283,443 | ) | | | (6,274 | ) |
| Class C | | | 217,904 | | | | 4,856 | | | | 25,123 | | | | 576 | | | | (533,896 | ) | | | (11,907 | ) | | | (290,869 | ) | | | (6,475 | ) |
| Class F-1 | | | 575,183 | | | | 12,717 | | | | 37,068 | | | | 842 | | | | (745,186 | ) | | | (16,114 | ) | | | (132,935 | ) | | | (2,555 | ) |
| Class F-2 | | | 784,247 | | | | 16,936 | | | | 24,781 | | | | 562 | | | | (211,523 | ) | | | (4,677 | ) | | | 597,505 | | | | 12,821 | |
| Class 529-A | | | 159,952 | | | | 3,544 | | | | 25,708 | | | | 585 | | | | (143,272 | ) | | | (3,175 | ) | | | 42,388 | | | | 954 | |
| Class 529-B | | | 797 | | | | 18 | | | | 477 | | | | 11 | | | | (20,218 | ) | | | (449 | ) | | | (18,944 | ) | | | (420 | ) |
| Class 529-C | | | 42,190 | | | | 938 | | | | 3,647 | | | | 83 | | | | (42,623 | ) | | | (949 | ) | | | 3,214 | | | | 72 | |
| Class 529-E | | | 6,486 | | | | 144 | | | | 950 | | | | 21 | | | | (6,681 | ) | | | (149 | ) | | | 755 | | | | 16 | |
| Class 529-F-1 | | | 9,751 | | | | 216 | | | | 1,016 | | | | 23 | | | | (7,448 | ) | | | (165 | ) | | | 3,319 | | | | 74 | |
| Class R-1 | | | 16,020 | | | | 356 | | | | 1,684 | | | | 39 | | | | (25,592 | ) | | | (569 | ) | | | (7,888 | ) | | | (174 | ) |
| Class R-2 | | | 111,785 | | | | 2,492 | | | | 7,322 | | | | 168 | | | | (187,118 | ) | | | (4,170 | ) | | | (68,011 | ) | | | (1,510 | ) |
| Class R-3 | | | 266,713 | | | | 5,911 | | | | 20,360 | | | | 465 | | | | (422,208 | ) | | | (9,386 | ) | | | (135,135 | ) | | | (3,010 | ) |
| Class R-4 | | | 210,664 | | | | 4,654 | | | | 21,872 | | | | 497 | | | | (354,680 | ) | | | (7,847 | ) | | | (122,144 | ) | | | (2,696 | ) |
| Class R-5 | | | 196,278 | | | | 4,333 | | | | 17,406 | | | | 395 | | | | (408,089 | ) | | | (8,864 | ) | | | (194,405 | ) | | | (4,136 | ) |
| Class R-6 | | | 923,387 | | | | 20,285 | | | | 48,425 | | | | 1,098 | | | | (216,729 | ) | | | (4,779 | ) | | | 755,083 | | | | 16,604 | |
| Total net increase (decrease) | | $ | 5,595,719 | | | | 123,158 | | | $ | 744,435 | | | | 16,902 | | | $ | (6,544,706 | ) | | | (144,194 | ) | | $ | (204,552 | ) | | | (4,134 | ) |
| 26 | Capital World Growth and Income Fund |
| | | Sales* | | | Reinvestments
of dividends | | | Repurchases* | | | Net (decrease) increase | |
| Share class | | Amount | | | Shares | | | Amount | | | Shares | | | Amount | | | Shares | | | Amount | | | Shares | |
| | | | | | | | | | | | | | | | | | | | | | | | | | | | | | | | | |
| Year ended November 30, 2013 | | | | | | | | | | | | | | | | | | | | | | | |
| | | | | | | | | | | | | | | | | | | | | | | | | | | | | | | | | |
| Class A | | $ | 3,607,561 | | | | 89,374 | | | $ | 1,246,185 | | | | 31,546 | | | $ | (6,323,389 | ) | | | (157,734 | ) | | $ | (1,469,643 | ) | | | (36,814 | ) |
| Class B | | | 13,182 | | | | 319 | | | | 23,434 | | | | 600 | | | | (529,770 | ) | | | (13,257 | ) | | | (493,154 | ) | | | (12,338 | ) |
| Class C | | | 343,943 | | | | 8,582 | | | | 80,216 | | | | 2,057 | | | | (873,849 | ) | | | (21,872 | ) | | | (449,690 | ) | | | (11,233 | ) |
| Class F-1 | | | 835,729 | | | | 20,643 | | | | 88,796 | | | | 2,250 | | | | (828,525 | ) | | | (20,353 | ) | | | 96,000 | | | | 2,540 | |
| Class F-2 | | | 688,961 | | | | 16,836 | | | | 52,747 | | | | 1,334 | | | | (476,171 | ) | | | (11,813 | ) | | | 265,537 | | | | 6,357 | |
| Class 529-A | | | 277,930 | | | | 6,947 | | | | 63,284 | | | | 1,605 | | | | (289,080 | ) | | | (7,230 | ) | | | 52,134 | | | | 1,322 | |
| Class 529-B | | | 1,641 | | | | 41 | | | | 1,877 | | | | 48 | | | | (34,666 | ) | | | (868 | ) | | | (31,148 | ) | | | (779 | ) |
| Class 529-C | | | 76,422 | | | | 1,914 | | | | 11,110 | | | | 284 | | | | (85,963 | ) | | | (2,157 | ) | | | 1,569 | | | | 41 | |
| Class 529-E | | | 12,630 | | | | 315 | | | | 2,471 | | | | 63 | | | | (14,094 | ) | | | (352 | ) | | | 1,007 | | | | 26 | |
| Class 529-F-1 | | | 18,779 | | | | 468 | | | | 2,345 | | | | 59 | | | | (16,628 | ) | | | (414 | ) | | | 4,496 | | | | 113 | |
| Class R-1 | | | 28,368 | | | | 710 | | | | 5,242 | | | | 134 | | | | (63,044 | ) | | | (1,599 | ) | | | (29,434 | ) | | | (755 | ) |
| Class R-2 | | | 226,756 | | | | 5,714 | | | | 23,105 | | | | 593 | | | | (358,963 | ) | | | (9,033 | ) | | | (109,102 | ) | | | (2,726 | ) |
| Class R-3 | | | 539,323 | | | | 13,510 | | | | 57,062 | | | | 1,454 | | | | (767,051 | ) | | | (19,197 | ) | | | (170,666 | ) | | | (4,233 | ) |
| Class R-4 | | | 525,318 | | | | 13,098 | | | | 58,144 | | | | 1,476 | | | | (805,854 | ) | | | (20,055 | ) | | | (222,392 | ) | | | (5,481 | ) |
| Class R-5 | | | 319,642 | | | | 7,981 | | | | 42,971 | | | | 1,087 | | | | (424,288 | ) | | | (10,498 | ) | | | (61,675 | ) | | | (1,430 | ) |
| Class R-6 | | | 1,496,481 | | | | 37,201 | | | | 90,400 | | | | 2,274 | | | | (363,481 | ) | | | (9,124 | ) | | | 1,223,400 | | | | 30,351 | |
| Total net increase (decrease) | | $ | 9,012,666 | | | | 223,653 | | | $ | 1,849,389 | | | | 46,864 | | | $ | (12,254,816 | ) | | | (305,556 | ) | | $ | (1,392,761 | ) | | | (35,039 | ) |
| * | Includes exchanges between share classes of the fund. |
9. Investment transactions
The fund made purchases and sales of investment securities, excluding short-term securities and U.S. government obligations, if any, of $14,286,387,000 and $13,271,069,000, respectively, during the six months ended May 31, 2014.
| Capital World Growth and Income Fund | 27 |
Financial highlights
| | | | | | | | Income (loss) from investment operations1 | |
| | | | | Net asset
value,
beginning
of period | | | Net
investment
income2 | | | Net gains (losses)
on securities
(both realized
and unrealized) | | | Total from
Investment
operations | |
| Class A: | | Six months ended 5/31/20145,6 | | $ | 44.68 | | | $ | .86 | | | $ | 2.44 | | | $ | 3.30 | |
| | | Year ended 11/30/2013 | | | 36.75 | | | | .83 | | | | 8.13 | | | | 8.96 | |
| | | Year ended 11/30/2012 | | | 32.57 | | | | .87 | | | | 4.28 | | | | 5.15 | |
| | | Year ended 11/30/2011 | | | 33.75 | | | | .94 | | | | (1.22 | ) | | | (.28 | ) |
| | | Year ended 11/30/2010 | | | 33.80 | | | | .86 | | | | (.03 | ) | | | .83 | |
| | | Year ended 11/30/2009 | | | 25.50 | | | | .78 | | | | 8.52 | | | | 9.30 | |
| Class B: | | Six months ended 5/31/20145,6 | | | 44.42 | | | | .67 | | | | 2.44 | | | | 3.11 | |
| | | Year ended 11/30/2013 | | | 36.53 | | | | .53 | | | | 8.08 | | | | 8.61 | |
| | | Year ended 11/30/2012 | | | 32.37 | | | | .60 | | | | 4.26 | | | | 4.86 | |
| | | Year ended 11/30/2011 | | | 33.53 | | | | .67 | | | | (1.21 | ) | | | (.54 | ) |
| | | Year ended 11/30/2010 | | | 33.58 | | | | .60 | | | | (.03 | ) | | | .57 | |
| | | Year ended 11/30/2009 | | | 25.34 | | | | .57 | | | | 8.46 | | | | 9.03 | |
| Class C: | | Six months ended 5/31/20145,6 | | | 44.19 | | | | .67 | | | | 2.42 | | | | 3.09 | |
| | | Year ended 11/30/2013 | | | 36.36 | | | | .50 | | | | 8.05 | | | | 8.55 | |
| | | Year ended 11/30/2012 | | | 32.23 | | | | .59 | | | | 4.24 | | | | 4.83 | |
| | | Year ended 11/30/2011 | | | 33.40 | | | | .65 | | | | (1.21 | ) | | | (.56 | ) |
| | | Year ended 11/30/2010 | | | 33.45 | | | | .59 | | | | (.02 | ) | | | .57 | |
| | | Year ended 11/30/2009 | | | 25.25 | | | | .56 | | | | 8.43 | | | | 8.99 | |
| Class F-1: | | Six months ended 5/31/20145,6 | | | 44.59 | | | | .85 | | | | 2.43 | | | | 3.28 | |
| | | Year ended 11/30/2013 | | | 36.68 | | | | .82 | | | | 8.11 | | | | 8.93 | |
| | | Year ended 11/30/2012 | | | 32.51 | | | | .87 | | | | 4.28 | | | | 5.15 | |
| | | Year ended 11/30/2011 | | | 33.69 | | | | .93 | | | | (1.22 | ) | | | (.29 | ) |
| | | Year ended 11/30/2010 | | | 33.74 | | | | .86 | | | | (.03 | ) | | | .83 | |
| | | Year ended 11/30/2009 | | | 25.46 | | | | .79 | | | | 8.50 | | | | 9.29 | |
| Class F-2: | | Six months ended 5/31/20145,6 | | | 44.67 | | | | .92 | | | | 2.42 | | | | 3.34 | |
| | | Year ended 11/30/2013 | | | 36.74 | | | | .94 | | | | 8.13 | | | | 9.07 | |
| | | Year ended 11/30/2012 | | | 32.56 | | | | .97 | | | | 4.28 | | | | 5.25 | |
| | | Year ended 11/30/2011 | | | 33.75 | | | | 1.02 | | | | (1.22 | ) | | | (.20 | ) |
| | | Year ended 11/30/2010 | | | 33.79 | | | | .94 | | | | (.02 | ) | | | .92 | |
| | | Year ended 11/30/2009 | | | 25.51 | | | | .72 | | | | 8.64 | | | | 9.36 | |
| 28 | Capital World Growth and Income Fund |
Dividends
(from net
investment
income) | | | Net asset
value, end
of period | | | Total
return3,4 | | | Net assets,
end of period
(in millions) | | | Ratio of
expenses to
average net
assets before
waivers | | | Ratio of
expenses to
average net
assets after
waivers4 | | | Ratio of
net income
to average
net assets2,4 | |
| $ | (.42 | ) | | $ | 47.56 | | | | 7.46 | % | | $ | 57,842 | | | | .78 | %7 | | | .78 | %7 | | | 3.79 | %7 |
| | (1.03 | ) | | | 44.68 | | | | 24.77 | | | | 54,676 | | | | .80 | | | | .80 | | | | 2.05 | |
| | (.97 | ) | | | 36.75 | | | | 16.14 | | | | 46,323 | | | | .82 | | | | .82 | | | | 2.52 | |
| | (.90 | ) | | | 32.57 | | | | (.99 | ) | | | 45,595 | | | | .79 | | | | .79 | | | | 2.67 | |
| | (.88 | ) | | | 33.75 | | | | 2.57 | | | | 52,156 | | | | .79 | | | | .79 | | | | 2.59 | |
| | (1.00 | ) | | | 33.80 | | | | 37.48 | | | | 56,058 | | | | .83 | | | | .83 | | | | 2.80 | |
| | (.24 | ) | | | 47.29 | | | | 7.05 | | | | 975 | | | | 1.53 | 7 | | | 1.53 | 7 | | | 2.96 | 7 |
| | (.72 | ) | | | 44.42 | | | | 23.83 | | | | 1,194 | | | | 1.56 | | | | 1.56 | | | | 1.31 | |
| | (.70 | ) | | | 36.53 | | | | 15.27 | | | | 1,433 | | | | 1.57 | | | | 1.57 | | | | 1.76 | |
| | (.62 | ) | | | 32.37 | | | | (1.74 | ) | | | 1,829 | | | | 1.56 | | | | 1.56 | | | | 1.90 | |
| | (.62 | ) | | | 33.53 | | | | 1.80 | | | | 2,459 | | | | 1.56 | | | | 1.56 | | | | 1.82 | |
| | (.79 | ) | | | 33.58 | | | | 36.43 | | | | 2,999 | | | | 1.61 | | | | 1.61 | | | | 2.04 | |
| | (.24 | ) | | | 47.04 | | | | 7.04 | | | | 4,825 | | | | 1.57 | 7 | | | 1.57 | 7 | | | 2.98 | 7 |
| | (.72 | ) | | | 44.19 | | | | 23.79 | | | | 4,819 | | | | 1.60 | | | | 1.60 | | | | 1.26 | |
| | (.70 | ) | | | 36.36 | | | | 15.19 | | | | 4,373 | | | | 1.61 | | | | 1.61 | | | | 1.73 | |
| | (.61 | ) | | | 32.23 | | | | (1.77 | ) | | | 4,683 | | | | 1.58 | | | | 1.58 | | | | 1.87 | |
| | (.62 | ) | | | 33.40 | | | | 1.78 | | | | 5,775 | | | | 1.59 | | | | 1.59 | | | | 1.80 | |
| | (.79 | ) | | | 33.45 | | | | 36.42 | | | | 6,428 | | | | 1.61 | | | | 1.61 | | | | 2.01 | |
| | (.41 | ) | | | 47.46 | | | | 7.44 | | | | 4,111 | | | | .81 | 7 | | | .81 | 7 | | | 3.78 | 7 |
| | (1.02 | ) | | | 44.59 | | | | 24.75 | | | | 3,976 | | | | .82 | | | | .82 | | | | 2.03 | |
| | (.98 | ) | | | 36.68 | | | | 16.16 | | | | 3,177 | | | | .80 | | | | .80 | | | | 2.52 | |
| | (.89 | ) | | | 32.51 | | | | (1.02 | ) | | | 3,299 | | | | .80 | | | | .80 | | | | 2.66 | |
| | (.88 | ) | | | 33.69 | | | | 2.58 | | | | 3,827 | | | | .80 | | | | .80 | | | | 2.60 | |
| | (1.01 | ) | | | 33.74 | | | | 37.49 | | | | 4,152 | | | | .82 | | | | .81 | | | | 2.83 | |
| | (.47 | ) | | | 47.54 | | | | 7.57 | | | | 3,314 | | | | .53 | 7 | | | .53 | 7 | | | 4.09 | 7 |
| | (1.14 | ) | | | 44.67 | | | | 25.13 | | | | 2,541 | | | | .54 | | | | .54 | | | | 2.31 | |
| | (1.07 | ) | | | 36.74 | | | | 16.43 | | | | 1,857 | | | | .54 | | | | .54 | | | | 2.80 | |
| | (.99 | ) | | | 32.56 | | | | (.75 | ) | | | 1,401 | | | | .54 | | | | .54 | | | | 2.91 | |
| | (.96 | ) | | | 33.75 | | | | 2.86 | | | | 1,464 | | | | .54 | | | | .54 | | | | 2.84 | |
| | (1.08 | ) | | | 33.79 | | | | 37.80 | | | | 1,165 | | | | .58 | | | | .58 | | | | 2.42 | |
See page 33 for footnotes.
| Capital World Growth and Income Fund | 29 |
Financial highlights (continued)
| | | | | | | | Income (loss) from investment operations1 | |
| | | | | Net asset
value,
beginning
of period | | | Net
investment
income2 | | | Net gains (losses)
on securities
(both realized
and unrealized) | | | Total from
Investment
operations | |
| Class 529-A: | | Six months ended 5/31/20145,6 | | $ | 44.55 | | | $ | .84 | | | $ | 2.43 | | | $ | 3.27 | |
| | | Year ended 11/30/2013 | | | 36.65 | | | | .80 | | | | 8.10 | | | | 8.90 | |
| | | Year ended 11/30/2012 | | | 32.49 | | | | .84 | | | | 4.27 | | | | 5.11 | |
| | | Year ended 11/30/2011 | | | 33.67 | | | | .91 | | | | (1.21 | ) | | | (.30 | ) |
| | | Year ended 11/30/2010 | | | 33.72 | | | | .84 | | | | (.02 | ) | | | .82 | |
| | | Year ended 11/30/2009 | | | 25.45 | | | | .77 | | | | 8.49 | | | | 9.26 | |
| Class 529-B: | | Six months ended 5/31/20145,6 | | | 44.40 | | | | .64 | | | | 2.44 | | | | 3.08 | |
| | | Year ended 11/30/2013 | | | 36.52 | | | | .48 | | | | 8.08 | | | | 8.56 | |
| | | Year ended 11/30/2012 | | | 32.36 | | | | .57 | | | | 4.26 | | | | 4.83 | |
| | | Year ended 11/30/2011 | | | 33.53 | | | | .63 | | | | (1.21 | ) | | | (.58 | ) |
| | | Year ended 11/30/2010 | | | 33.58 | | | | .57 | | | | (.02 | ) | | | .55 | |
| | | Year ended 11/30/2009 | | | 25.35 | | | | .54 | | | | 8.46 | | | | 9.00 | |
| Class 529-C: | | Six months ended 5/31/20145,6 | | | 44.33 | | | | .66 | | | | 2.43 | | | | 3.09 | |
| | | Year ended 11/30/2013 | | | 36.48 | | | | .48 | | | | 8.07 | | | | 8.55 | |
| | | Year ended 11/30/2012 | | | 32.34 | | | | .57 | | | | 4.25 | | | | 4.82 | |
| | | Year ended 11/30/2011 | | | 33.51 | | | | .63 | | | | (1.20 | ) | | | (.57 | ) |
| | | Year ended 11/30/2010 | | | 33.57 | | | | .58 | | | | (.03 | ) | | | .55 | |
| | | Year ended 11/30/2009 | | | 25.34 | | | | .54 | | | | 8.47 | | | | 9.01 | |
| Class 529-E: | | Six months ended 5/31/20145,6 | | | 44.48 | | | | .78 | | | | 2.44 | | | | 3.22 | |
| | | Year ended 11/30/2013 | | | 36.59 | | | | .70 | | | | 8.10 | | | | 8.80 | |
| | | Year ended 11/30/2012 | | | 32.44 | | | | .76 | | | | 4.26 | | | | 5.02 | |
| | | Year ended 11/30/2011 | | | 33.61 | | | | .82 | | | | (1.21 | ) | | | (.39 | ) |
| | | Year ended 11/30/2010 | | | 33.67 | | | | .74 | | | | (.03 | ) | | | .71 | |
| | | Year ended 11/30/2009 | | | 25.41 | | | | .68 | | | | 8.49 | | | | 9.17 | |
| Class 529-F-1: | | Six months ended 5/31/20145,6 | | | 44.60 | | | | .89 | | | | 2.43 | | | | 3.32 | |
| | | Year ended 11/30/2013 | | | 36.68 | | | | .89 | | | | 8.12 | | | | 9.01 | |
| | | Year ended 11/30/2012 | | | 32.51 | | | | .91 | | | | 4.28 | | | | 5.19 | |
| | | Year ended 11/30/2011 | | | 33.70 | | | | .98 | | | | (1.21 | ) | | | (.23 | ) |
| | | Year ended 11/30/2010 | | | 33.75 | | | | .91 | | | | (.02 | ) | | | .89 | |
| | | Year ended 11/30/2009 | | | 25.47 | | | | .82 | | | | 8.50 | | | | 9.32 | |
| Class R-1: | | Six months ended 5/31/20145,6 | | | 44.26 | | | | .68 | | | | 2.42 | | | | 3.10 | |
| | | Year ended 11/30/2013 | | | 36.42 | | | | .52 | | | | 8.06 | | | | 8.58 | |
| | | Year ended 11/30/2012 | | | 32.29 | | | | .61 | | | | 4.24 | | | | 4.85 | |
| | | Year ended 11/30/2011 | | | 33.46 | | | | .66 | | | | (1.20 | ) | | | (.54 | ) |
| | | Year ended 11/30/2010 | | | 33.52 | | | | .60 | | | | (.02 | ) | | | .58 | |
| | | Year ended 11/30/2009 | | | 25.31 | | | | .57 | | | | 8.45 | | | | 9.02 | |
| 30 | Capital World Growth and Income Fund |
Dividends
(from net
investment
income) | | | Net asset
value, end
of period | | | Total
return3,4 | | | Net assets,
end of period
(in millions) | | | Ratio of
expenses to
average net
assets before
waivers | | | Ratio of
expenses to
average net
assets after
waivers4 | | | Ratio of
net income
to average
net assets2,4 | |
| $ | (.40 | ) | | $ | 47.42 | | | | 7.42 | % | | $ | 3,082 | | | | .86 | %7 | | | .86 | %7 | | | 3.72 | %7 |
| | (1.00 | ) | | | 44.55 | | | | 24.67 | | | | 2,853 | | | | .88 | | | | .88 | | | | 1.97 | |
| | (.95 | ) | | | 36.65 | | | | 16.04 | | | | 2,299 | | | | .89 | | | | .89 | | | | 2.45 | |
| | (.88 | ) | | | 32.49 | | | | (1.06 | ) | | | 2,023 | | | | .85 | | | | .85 | | | | 2.61 | |
| | (.87 | ) | | | 33.67 | | | | 2.54 | | | | 1,972 | | | | .84 | | | | .84 | | | | 2.54 | |
| | (.99 | ) | | | 33.72 | | | | 37.41 | | | | 1,796 | | | | .87 | | | | .86 | | | | 2.75 | |
| | (.21 | ) | | | 47.27 | | | | 6.99 | | | | 92 | | | | 1.65 | 7 | | | 1.65 | 7 | | | 2.85 | 7 |
| | (.68 | ) | | | 44.40 | | | | 23.69 | | | | 105 | | | | 1.67 | | | | 1.67 | | | | 1.20 | |
| | (.67 | ) | | | 36.52 | | | | 15.11 | | | | 115 | | | | 1.69 | | | | 1.69 | | | | 1.65 | |
| | (.59 | ) | | | 32.36 | | | | (1.84 | ) | | | 134 | | | | 1.65 | | | | 1.65 | | | | 1.80 | |
| | (.60 | ) | | | 33.53 | | | | 1.72 | | | | 167 | | | | 1.65 | | | | 1.65 | | | | 1.74 | |
| | (.77 | ) | | | 33.58 | | | | 36.29 | | | | 188 | | | | 1.70 | | | | 1.69 | | | | 1.95 | |
| | (.23 | ) | | | 47.19 | | | | 7.01 | | | | 758 | | | | 1.64 | 7 | | | 1.64 | 7 | | | 2.93 | 7 |
| | (.70 | ) | | | 44.33 | | | | 23.69 | | | | 709 | | | | 1.66 | | | | 1.66 | | | | 1.19 | |
| | (.68 | ) | | | 36.48 | | | | 15.14 | | | | 582 | | | | 1.68 | | | | 1.68 | | | | 1.66 | |
| | (.60 | ) | | | 32.34 | | | | (1.84 | ) | | | 527 | | | | 1.65 | | | | 1.65 | | | | 1.81 | |
| | (.61 | ) | | | 33.51 | | | | 1.71 | | | | 526 | | | | 1.64 | | | | 1.64 | | | | 1.75 | |
| | (.78 | ) | | | 33.57 | | | | 36.32 | | | | 491 | | | | 1.69 | | | | 1.68 | | | | 1.93 | |
| | (.35 | ) | | | 47.35 | | | | 7.30 | | | | 130 | | | | 1.10 | 7 | | | 1.10 | 7 | | | 3.47 | 7 |
| | (.91 | ) | | | 44.48 | | | | 24.36 | | | | 122 | | | | 1.11 | | | | 1.11 | | | | 1.74 | |
| | (.87 | ) | | | 36.59 | | | | 15.78 | | | | 99 | | | | 1.13 | | | | 1.13 | | | | 2.20 | |
| | (.78 | ) | | | 32.44 | | | | (1.31 | ) | | | 89 | | | | 1.12 | | | | 1.12 | | | | 2.33 | |
| | (.77 | ) | | | 33.61 | | | | 2.21 | | | | 87 | | | | 1.13 | | | | 1.13 | | | | 2.25 | |
| | (.91 | ) | | | 33.67 | | | | 37.03 | | | | 80 | | | | 1.18 | | | | 1.17 | | | | 2.43 | |
| | (.45 | ) | | | 47.47 | | | | 7.52 | | | | 110 | | | | .64 | 7 | | | .64 | 7 | | | 3.94 | 7 |
| | (1.09 | ) | | | 44.60 | | | | 24.98 | | | | 100 | | | | .66 | | | | .66 | | | | 2.19 | |
| | (1.02 | ) | | | 36.68 | | | | 16.27 | | | | 78 | | | | .67 | | | | .67 | | | | 2.65 | |
| | (.96 | ) | | | 32.51 | | | | (.84 | ) | | | 66 | | | | .64 | | | | .64 | | | | 2.81 | |
| | (.94 | ) | | | 33.70 | | | | 2.74 | | | | 59 | | | | .63 | | | | .63 | | | | 2.75 | |
| | (1.04 | ) | | | 33.75 | | | | 37.68 | | | | 49 | | | | .68 | | | | .67 | | | | 2.93 | |
| | (.25 | ) | | | 47.11 | | | | 7.05 | | | | 314 | | | | 1.54 | 7 | | | 1.54 | 7 | | | 3.02 | 7 |
| | (.74 | ) | | | 44.26 | | | | 23.84 | | | | 302 | | | | 1.55 | | | | 1.55 | | | | 1.30 | |
| | (.72 | ) | | | 36.42 | | | | 15.27 | | | | 276 | | | | 1.56 | | | | 1.56 | | | | 1.79 | |
| | (.63 | ) | | | 32.29 | | | | (1.75 | ) | | | 275 | | | | 1.56 | | | | 1.56 | | | | 1.90 | |
| | (.64 | ) | | | 33.46 | | | | 1.80 | | | | 269 | | | | 1.56 | | | | 1.56 | | | | 1.84 | |
| | (.81 | ) | | | 33.52 | | | | 36.45 | | | | 217 | | | | 1.58 | | | | 1.58 | | | | 2.02 | |
See page 33 for footnotes.
| Capital World Growth and Income Fund | 31 |
Financial highlights (continued)
| | | | | | | | Income (loss) from investment operations1 | |
| | | | | Net asset
value,
beginning
of period | | | Net
investment
income2 | | | Net gains (losses)
on securities
(both realized
and unrealized) | | | Total from
investment
operations | |
| Class R-2: | | Six months ended 5/31/20145,6 | | $ | 44.17 | | | $ | .68 | | | $ | 2.42 | | | $ | 3.10 | |
| | | Year ended 11/30/2013 | | | 36.35 | | | | .54 | | | | 8.04 | | | | 8.58 | |
| | | Year ended 11/30/2012 | | | 32.22 | | | | .61 | | | | 4.24 | | | | 4.85 | |
| | | Year ended 11/30/2011 | | | 33.39 | | | | .66 | | | | (1.20 | ) | | | (.54 | ) |
| | | Year ended 11/30/2010 | | | 33.45 | | | | .59 | | | | (.03 | ) | | | .56 | |
| | | Year ended 11/30/2009 | | | 25.25 | | | | .55 | | | | 8.43 | | | | 8.98 | |
| Class R-3: | | Six months ended 5/31/20145,6 | | | 44.40 | | | | .78 | | | | 2.43 | | | | 3.21 | |
| | | Year ended 11/30/2013 | | | 36.53 | | | | .71 | | | | 8.08 | | | | 8.79 | |
| | | Year ended 11/30/2012 | | | 32.38 | | | | .77 | | | | 4.25 | | | | 5.02 | |
| | | Year ended 11/30/2011 | | | 33.56 | | | | .82 | | | | (1.21 | ) | | | (.39 | ) |
| | | Year ended 11/30/2010 | | | 33.61 | | | | .75 | | | | (.02 | ) | | | .73 | |
| | | Year ended 11/30/2009 | | | 25.37 | | | | .69 | | | | 8.48 | | | | 9.17 | |
| Class R-4: | | Six months ended 5/31/20145,6 | | | 44.58 | | | | .85 | | | | 2.44 | | | | 3.29 | |
| | | Year ended 11/30/2013 | | | 36.67 | | | | .83 | | | | 8.11 | | | | 8.94 | |
| | | Year ended 11/30/2012 | | | 32.50 | | | | .87 | | | | 4.28 | | | | 5.15 | |
| | | Year ended 11/30/2011 | | | 33.68 | | | | .93 | | | | (1.22 | ) | | | (.29 | ) |
| | | Year ended 11/30/2010 | | | 33.73 | | | | .85 | | | | (.02 | ) | | | .83 | |
| | | Year ended 11/30/2009 | | | 25.46 | | | | .78 | | | | 8.50 | | | | 9.28 | |
| Class R-5: | | Six months ended 5/31/20145,6 | | | 44.70 | | | | .92 | | | | 2.44 | | | | 3.36 | |
| | | Year ended 11/30/2013 | | | 36.77 | | | | .96 | | | | 8.12 | | | | 9.08 | |
| | | Year ended 11/30/2012 | | | 32.59 | | | | .98 | | | | 4.28 | | | | 5.26 | |
| | | Year ended 11/30/2011 | | | 33.77 | | | | 1.04 | | | | (1.22 | ) | | | (.18 | ) |
| | | Year ended 11/30/2010 | | | 33.81 | | | | .95 | | | | (.02 | ) | | | .93 | |
| | | Year ended 11/30/2009 | | | 25.51 | | | | .88 | | | | 8.51 | | | | 9.39 | |
| Class R-6: | | Six months ended 5/31/20145,6 | | | 44.70 | | | | .94 | | | | 2.43 | | | | 3.37 | |
| | | Year ended 11/30/2013 | | | 36.77 | | | | .97 | | | | 8.13 | | | | 9.10 | |
| | | Year ended 11/30/2012 | | | 32.59 | | | | .99 | | | | 4.29 | | | | 5.28 | |
| | | Year ended 11/30/2011 | | | 33.77 | | | | 1.03 | | | | (1.19 | ) | | | (.16 | ) |
| | | Year ended 11/30/2010 | | | 33.82 | | | | .98 | | | | (.04 | ) | | | .94 | |
| | | Period from 5/1/2009 to 11/30/20095,8 | | | 26.05 | | | | .51 | | | | 7.85 | | | | 8.36 | |
| | | Six months ended | | Year ended November 30 |
| | | May 31, 20145,6 | | 2013 | | 2012 | | 2011 | | 2010 | | | 2009 |
| Portfolio turnover rate for all share classes | | | 17 | % | | | 24 | % | | | 23 | % | | | 27 | % | | | 25 | % | | | 44 | % |
| 32 | Capital World Growth and Income Fund |
Dividends
(from net
investment
income) | | | Net asset
value, end
of period | | | Total
return3,4 | | | Net assets,
end of period
(in millions) | | | Ratio of
expenses to
average net
assets before
waivers | | | Ratio of
expenses to
average net
assets after
waivers4 | | | Ratio of
net income
to average
net assets2,4 | |
| $ | (.26 | ) | | $ | 47.01 | | | | 7.06 | % | | $ | 1,288 | | | | 1.52 | %7 | | | 1.52 | %7 | | | 3.03 | %7 |
| | (.76 | ) | | | 44.17 | | | | 23.88 | | | | 1,277 | | | | 1.51 | | | | 1.51 | | | | 1.35 | |
| | (.72 | ) | | | 36.35 | | | | 15.30 | | | | 1,150 | | | | 1.55 | | | | 1.55 | | | | 1.78 | |
| | (.63 | ) | | | 32.22 | | | | (1.75 | ) | | | 1,124 | | | | 1.56 | | | | 1.56 | | | | 1.90 | |
| | (.62 | ) | | | 33.39 | | | | 1.77 | | | | 1,259 | | | | 1.57 | | | | 1.57 | | | | 1.81 | |
| | (.78 | ) | | | 33.45 | | | | 36.34 | | | | 1,270 | | | | 1.66 | | | | 1.66 | | | | 1.95 | |
| | (.35 | ) | | | 47.26 | | | | 7.29 | | | | 2,679 | | | | 1.09 | 7 | | | 1.09 | 7 | | | 3.46 | 7 |
| | (.92 | ) | | | 44.40 | | | | 24.41 | | | | 2,651 | | | | 1.09 | | | | 1.09 | | | | 1.76 | |
| | (.87 | ) | | | 36.53 | | | | 15.81 | | | | 2,335 | | | | 1.10 | | | | 1.10 | | | | 2.23 | |
| | (.79 | ) | | | 32.38 | | | | (1.32 | ) | | | 2,159 | | | | 1.10 | | | | 1.10 | | | | 2.36 | |
| | (.78 | ) | | | 33.56 | | | | 2.27 | | | | 2,311 | | | | 1.10 | | | | 1.10 | | | | 2.29 | |
| | (.93 | ) | | | 33.61 | | | | 37.07 | | | | 2,208 | | | | 1.13 | | | | 1.13 | | | | 2.47 | |
| | (.42 | ) | | | 47.45 | | | | 7.45 | | | | 2,405 | | | | .79 | 7 | | | .79 | 7 | | | 3.75 | 7 |
| | (1.03 | ) | | | 44.58 | | | | 24.78 | | | | 2,380 | | | | .80 | | | | .80 | | | | 2.07 | |
| | (.98 | ) | | | 36.67 | | | | 16.13 | | | | 2,159 | | | | .80 | | | | .80 | | | | 2.53 | |
| | (.89 | ) | | | 32.50 | | | | (.98 | ) | | | 1,972 | | | | .80 | | | | .80 | | | | 2.66 | |
| | (.88 | ) | | | 33.68 | | | | 2.56 | | | | 2,062 | | | | .81 | | | | .81 | | | | 2.58 | |
| | (1.01 | ) | | | 33.73 | | | | 37.46 | | | | 1,840 | | | | .83 | | | | .83 | | | | 2.76 | |
| | (.48 | ) | | | 47.58 | | | | 7.61 | | | | 1,522 | | | | .49 | 7 | | | .49 | 7 | | | 4.06 | 7 |
| | (1.15 | ) | | | 44.70 | | | | 25.15 | | | | 1,615 | | | | .49 | | | | .49 | | | | 2.37 | |
| | (1.08 | ) | | | 36.77 | | | | 16.49 | | | | 1,381 | | | | .50 | | | | .50 | | | | 2.84 | |
| | (1.00 | ) | | | 32.59 | | | | (.71 | ) | | | 1,273 | | | | .50 | | | | .50 | | | | 2.95 | |
| | (.97 | ) | | | 33.77 | | | | 2.89 | | | | 1,371 | | | | .50 | | | | .50 | | | | 2.85 | |
| | (1.09 | ) | | | 33.81 | | | | 37.89 | | | | 1,598 | | | | .53 | | | | .53 | | | | 3.18 | |
| | (.49 | ) | | | 47.58 | | | | 7.64 | | | | 5,493 | | | | .44 | 7 | | | .44 | 7 | | | 4.18 | 7 |
| | (1.17 | ) | | | 44.70 | | | | 25.21 | | | | 4,418 | | | | .45 | | | | .45 | | | | 2.38 | |
| | (1.10 | ) | | | 36.77 | | | | 16.55 | | | | 2,518 | | | | .45 | | | | .45 | | | | 2.86 | |
| | (1.02 | ) | | | 32.59 | | | | (.65 | ) | | | 1,731 | | | | .45 | | | | .45 | | | | 2.97 | |
| | (.99 | ) | | | 33.77 | | | | 2.92 | | | | 1,158 | | | | .46 | | | | .46 | | | | 2.97 | |
| | (.59 | ) | | | 33.82 | | | | 32.50 | | | | 517 | | | | .49 | 7 | | | .49 | 7 | | | 2.84 | 7 |
| 1 | Based on average shares outstanding. |
| 2 | For the period ended May 31, 2014, this column reflects the impact of a corporate action event that resulted in a one-time increase to net investment income. If the corporate action event had not occurred, the Class A net investment income per share and ratio of net income to average net assets would have been lower by $.34 and .75 percentage points, respectively. The impact to the other share classes would have been similar. |
| 3 | Total returns exclude any applicable sales charges, including contingent deferred sales charges. |
| 4 | This column reflects the impact, if any, of certain waivers from CRMC. During one of the periods shown, CRMC reduced fees for investment advisory services. |
| 5 | Based on operations for the period shown and, accordingly, is not representative of a full year. |
| 6 | Unaudited. |
| 7 | Annualized. |
| 8 | Class R-6 shares were offered beginning May 1, 2009. |
See Notes to Financial Statements
| Capital World Growth and Income Fund | 33 |
As a fund shareholder, you incur two types of costs: (1) transaction costs, such as initial sales charges on purchase payments and contingent deferred sales charges on redemptions (loads), and (2) ongoing costs, including management fees, distribution and service (12b-1) fees, and other expenses. This example is intended to help you understand your ongoing costs (in dollars) of investing in the fund so you can compare these costs with the ongoing costs of investing in other mutual funds. The example is based on an investment of $1,000 invested at the beginning of the period and held for the entire six-month period (December 1, 2013, through May 31, 2014).
Actual expenses:
The first line of each share class in the table on the following page provides information about actual account values and actual expenses. You may use the information in this line, together with the amount you invested, to estimate the expenses that you paid over the period. Simply divide your account value by $1,000 (for example, an $8,600 account value divided by $1,000 = 8.6), then multiply the result by the number in the first line under the heading entitled “Expenses paid during period” to estimate the expenses you paid on your account during this period.
Hypothetical example for comparison purposes:
The second line of each share class in the table on the following page provides information about hypothetical account values and hypothetical expenses based on the actual expense ratio for the share class and an assumed rate of return of 5.00% per year before expenses, which is not the actual return of the share class. The hypothetical account values and expenses may not be used to estimate the actual ending account balance or expenses you paid for the period. You may use this information to compare the ongoing costs of investing in the fund and other funds. To do so, compare this 5.00% hypothetical example with the 5.00% hypothetical examples that appear in the shareholder reports of the other funds.
Notes:
Retirement plan participants may be subject to certain fees charged by the plan sponsor, and Class F-1, F-2 and 529-F-1 shareholders may be subject to fees charged by financial intermediaries, typically ranging from 0.75% to 1.50% of assets annually depending on services offered. You can estimate the impact of these fees by adding the amount of the fees to the total estimated expenses you paid on your account during the period as calculated above. In addition, your ending account value would be lower by the amount of these fees.
Note that the expenses shown in the table on the following page are meant to highlight your ongoing costs only and do not reflect any transactional costs, such as sales charges (loads). Therefore, the second line of each share class in the table is useful in comparing ongoing costs only and will not help you determine the relative total costs of owning different funds. In addition, if these transactional costs were included, your costs would have been higher.
| 34 | Capital World Growth and Income Fund |
| | | Beginning
account value
12/1/2013 | | | Ending
account value
5/31/2014 | | | Expenses paid
during period* | | | Annualized
expense ratio | |
| Class A — actual return | | $ | 1,000.00 | | | $ | 1,074.62 | | | $ | 4.03 | | | | .78 | % |
| Class A — assumed 5% return | | | 1,000.00 | | | | 1,021.04 | | | | 3.93 | | | | .78 | |
| Class B — actual return | | | 1,000.00 | | | | 1,070.50 | | | | 7.90 | | | | 1.53 | |
| Class B — assumed 5% return | | | 1,000.00 | | | | 1,017.30 | | | | 7.70 | | | | 1.53 | |
| Class C — actual return | | | 1,000.00 | | | | 1,070.44 | | | | 8.10 | | | | 1.57 | |
| Class C — assumed 5% return | | | 1,000.00 | | | | 1,017.10 | | | | 7.90 | | | | 1.57 | |
| Class F-1 — actual return | | | 1,000.00 | | | | 1,074.40 | | | | 4.19 | | | | .81 | |
| Class F-1 — assumed 5% return | | | 1,000.00 | | | | 1,020.89 | | | | 4.08 | | | | .81 | |
| Class F-2 — actual return | | | 1,000.00 | | | | 1,075.74 | | | | 2.74 | | | | .53 | |
| Class F-2 — assumed 5% return | | | 1,000.00 | | | | 1,022.29 | | | | 2.67 | | | | .53 | |
| Class 529-A — actual return | | | 1,000.00 | | | | 1,074.16 | | | | 4.45 | | | | .86 | |
| Class 529-A — assumed 5% return | | | 1,000.00 | | | | 1,020.64 | | | | 4.33 | | | | .86 | |
| Class 529-B — actual return | | | 1,000.00 | | | | 1,069.91 | | | | 8.51 | | | | 1.65 | |
| Class 529-B — assumed 5% return | | | 1,000.00 | | | | 1,016.70 | | | | 8.30 | | | | 1.65 | |
| Class 529-C — actual return | | | 1,000.00 | | | | 1,070.08 | | | | 8.46 | | | | 1.64 | |
| Class 529-C — assumed 5% return | | | 1,000.00 | | | | 1,016.75 | | | | 8.25 | | | | 1.64 | |
| Class 529-E — actual return | | | 1,000.00 | | | | 1,073.00 | | | | 5.69 | | | | 1.10 | |
| Class 529-E — assumed 5% return | | | 1,000.00 | | | | 1,019.45 | | | | 5.54 | | | | 1.10 | |
| Class 529-F-1 — actual return | | | 1,000.00 | | | | 1,075.24 | | | | 3.31 | | | | .64 | |
| Class 529-F-1 — assumed 5% return | | | 1,000.00 | | | | 1,021.74 | | | | 3.23 | | | | .64 | |
| Class R-1 — actual return | | | 1,000.00 | | | | 1,070.48 | | | | 7.95 | | | | 1.54 | |
| Class R-1 — assumed 5% return | | | 1,000.00 | | | | 1,017.25 | | | | 7.75 | | | | 1.54 | |
| Class R-2 — actual return | | | 1,000.00 | | | | 1,070.61 | | | | 7.85 | | | | 1.52 | |
| Class R-2 — assumed 5% return | | | 1,000.00 | | | | 1,017.35 | | | | 7.64 | | | | 1.52 | |
| Class R-3 — actual return | | | 1,000.00 | | | | 1,072.94 | | | | 5.63 | | | | 1.09 | |
| Class R-3 — assumed 5% return | | | 1,000.00 | | | | 1,019.50 | | | | 5.49 | | | | 1.09 | |
| Class R-4 — actual return | | | 1,000.00 | | | | 1,074.46 | | | | 4.09 | | | | .79 | |
| Class R-4 — assumed 5% return | | | 1,000.00 | | | | 1,020.99 | | | | 3.98 | | | | .79 | |
| Class R-5 — actual return | | | 1,000.00 | | | | 1,076.07 | | | | 2.54 | | | | .49 | |
| Class R-5 — assumed 5% return | | | 1,000.00 | | | | 1,022.49 | | | | 2.47 | | | | .49 | |
| Class R-6 — actual return | | | 1,000.00 | | | | 1,076.35 | | | | 2.28 | | | | .44 | |
| Class R-6 — assumed 5% return | | | 1,000.00 | | | | 1,022.74 | | | | 2.22 | | | | .44 | |
| * | The “expenses paid during period” are equal to the “annualized expense ratio,” multiplied by the average account value over the period, multiplied by the number of days in the period, and divided by 365 (to reflect the one-half year period). |
| Capital World Growth and Income Fund | 35 |
Offices of the fund and of the investment adviser
Capital Research and Management Company
333 South Hope Street
Los Angeles, CA 90071-1406
6455 Irvine Center Drive
Irvine, CA 92618-4518
Transfer agent for shareholder accounts
American Funds Service Company
(Write to the address near you.)
P.O. Box 6007
Indianapolis, IN 46206-6007
P.O. Box 2280
Norfolk, VA 23501-2280
Custodian of assets
JPMorgan Chase Bank
270 Park Avenue
New York, NY 10017-2070
Counsel
O’Melveny & Myers LLP
400 South Hope Street
Los Angeles, CA 90071-2899
Independent registered public accounting firm
PricewaterhouseCoopers LLP
601 South Figueroa Street
Los Angeles, CA 90017-3874
Principal underwriter
American Funds Distributors, Inc.
333 South Hope Street
Los Angeles, CA 90071-1406
| 36 | Capital World Growth and Income Fund |
Investors should carefully consider investment objectives, risks, charges and expenses. This and other important information is contained in the fund prospectus and summary prospectus, which can be obtained from your financial professional and should be read carefully before investing. You may also call American Funds Service Company (AFS) at (800) 421-4225 or visit the American Funds website at americanfunds.com.
“American Funds Proxy Voting Procedures and Principles” — which describes how we vote proxies relating to portfolio securities — is available on the American Funds website or upon request by calling AFS. The fund files its proxy voting record with the U.S. Securities and Exchange Commission (SEC) for the 12 months ended June 30 by August 31. The proxy voting record is available free of charge on the SEC website at sec.gov and on the American Funds website.
A complete May 31, 2014, portfolio of Capital World Growth and Income Fund’s investments is available free of charge by calling AFS or visiting the SEC website (where it is part of Form N-CSR).
Capital World Growth and Income Fund files a complete list of its portfolio holdings with the SEC for the first and third quarters of each fiscal year on Form N-Q. This filing is available free of charge on the SEC website. You may also review or, for a fee, copy this filing at the SEC’s Public Reference Room in Washington, D.C. Additional information regarding the operation of the Public Reference Room may be obtained by calling the SEC’s Office of Investor Education and Advocacy at (800) SEC-0330. Additionally, the list of portfolio holdings is available by calling AFS.
This report is for the information of shareholders of Capital World Growth and Income Fund, but it also may be used as sales literature when preceded or accompanied by the current prospectus or summary prospectus, which gives details about charges, expenses, investment objectives and operating policies of the fund. If used as sales material after September 30, 2014, this report must be accompanied by an American Funds statistical update for the most recently completed calendar quarter.
The American Funds Advantage
Since 1931, American Funds, part of Capital Group, has helped investors pursue long-term investment success. Our consistent approach — in combination with The Capital SystemSM — has resulted in a superior long-term track record.
| | Aligned with investor success |
| | We base our decisions on a long-term perspective, which we believe aligns our goals with the interests of our clients. Our portfolio managers average 26 years of investment experience, including 21 years at our company, reflecting a career commitment to our long-term approach.1 |
| | |
| | The Capital SystemSM |
| | Our investment process, The Capital System, combines individual accountability with teamwork. Each fund is divided into portions that are managed independently by investment professionals with diverse backgrounds, ages and investment approaches. An extensive global research effort is the backbone of our system. |
| | |
| | Superior long-term track record |
| | Our equity funds have beaten their Lipper peer indexes in 90% of 10-year periods and 96% of 20-year periods. Our fixed-income funds have beaten their Lipper indexes in 56% of 10-year periods and 57% of 20-year periods.2 Our fund management fees have been among the lowest in the industry.3 |
| | 1 | Portfolio manager experience as of December 31, 2013. |
| | 2 | Based on Class A share results for rolling periods through December 31, 2013. Periods covered are the shorter of the fund’s lifetime or since the comparable Lipper index inception date (except SMALLCAP World Fund, for which the Lipper average was used). |
| | 3 | Based on management fees for the 20-year period ended December 31, 2013, versus comparable Lipper categories, excluding funds of funds. |

ITEM 2 – Code of Ethics
Not applicable for filing of semi-annual reports to shareholders.
ITEM 3 – Audit Committee Financial Expert
Not applicable for filing of semi-annual reports to shareholders.
ITEM 4 – Principal Accountant Fees and Services
Not applicable for filing of semi-annual reports to shareholders.
ITEM 5 – Audit Committee of Listed Registrants
Not applicable to this Registrant, insofar as the Registrant is not a listed issuer as defined in Rule 10A-3 under the Securities Exchange Act of 1934.
ITEM 6 – Schedule of Investments
 | Capital World Growth and Income Fund Investment portfolio May 31, 2014 |
unaudited
| Common stocks 93.33% | | |
| | | Value |
| Health care 16.50% | Shares | (000) |
| | | |
| Novartis AG | 29,311,025 | $ 2,628,337 |
| Amgen Inc. | 20,084,932 | 2,329,651 |
| Gilead Sciences, Inc.1 | 22,733,525 | 1,846,190 |
| Bayer AG | 12,457,929 | 1,801,793 |
| AbbVie Inc. | 20,085,700 | 1,091,256 |
| St. Jude Medical, Inc. | 8,586,800 | 557,283 |
| Teva Pharmaceutical Industries Ltd. (ADR) | 10,457,486 | 527,999 |
| Thermo Fisher Scientific Inc. | 4,333,200 | 506,594 |
| Alexion Pharmaceuticals, Inc.1 | 2,974,400 | 494,702 |
| Roche Holding AG | 1,507,000 | 443,433 |
| UCB SA | 3,815,500 | 304,160 |
| Aetna Inc. | 3,741,500 | 290,153 |
| Stryker Corp. | 3,430,000 | 289,801 |
| UnitedHealth Group Inc. | 3,519,800 | 280,282 |
| Boston Scientific Corp.1 | 18,208,800 | 233,619 |
| Grifols, SA, Class B, non-registered shares | 4,048,090 | 167,752 |
| Grifols, SA, Class B (ADR) | 604,061 | 25,141 |
| ResMed Inc. | 2,860,000 | 143,172 |
| Sonic Healthcare Ltd. | 7,365,000 | 121,389 |
| GlaxoSmithKline PLC | 4,387,100 | 117,732 |
| Zimmer Holdings, Inc. | 1,044,000 | 108,941 |
| Fisher & Paykel Healthcare Corp. Ltd. | 23,339,600 | 91,167 |
| Edwards Lifesciences Corp.1 | 1,030,000 | 83,636 |
| Teleflex Inc. | 649,000 | 69,209 |
| Orion Oyj, Class B | 2,171,162 | 68,426 |
| Humana Inc. | 448,122 | 55,773 |
| | | 14,677,591 |
| Financials 14.63% | | |
| | | |
| Prudential PLC | 42,379,500 | 984,211 |
| HSBC Holdings PLC (Hong Kong) | 49,862,976 | 525,774 |
| HSBC Holdings PLC (United Kingdom) | 30,718,231 | 323,974 |
| UBS AG | 41,262,786 | 828,481 |
| Barclays PLC | 182,887,500 | 757,193 |
| Société Générale | 12,791,989 | 736,992 |
| AIA Group Ltd. | 117,195,396 | 587,266 |
| Link Real Estate Investment Trust | 109,299,002 | 582,236 |
| Aviva PLC | 62,639,200 | 550,178 |
| Siam Commercial Bank PCL | 91,818,000 | 444,687 |
| Credit Suisse Group AG | 13,483,897 | 400,828 |
| Industrial and Commercial Bank of China Ltd., Class H | 511,627,535 | 332,596 |
| BNP Paribas SA | 4,233,764 | 296,469 |
| Goldman Sachs Group, Inc. | 1,850,126 | 295,669 |
| China Construction Bank Corp., Class H | 388,840,735 | 285,376 |
| Mizuho Financial Group, Inc. | 141,604,000 | 275,418 |
| Common stocks | | |
| | | Value |
| Financials (continued) | Shares | (000) |
| | | |
| Deutsche Börse AG | 3,464,600 | $ 264,475 |
| UniCredit SpA | 27,111,723 | 236,342 |
| Agricultural Bank of China, Class H | 524,521,000 | 234,084 |
| HDFC Bank Ltd. | 15,511,652 | 208,104 |
| American International Group, Inc. | 3,819,800 | 206,537 |
| BB&T Corp. | 5,320,000 | 201,734 |
| RSA Insurance Group PLC | 24,550,508 | 197,446 |
| Crown Castle International Corp. | 2,270,000 | 174,177 |
| Lloyds Banking Group PLC1 | 131,000,000 | 170,967 |
| Sampo Oyj, Class A | 3,329,974 | 167,862 |
| Eurobank Ergasias SA1 | 290,445,482 | 162,328 |
| Bank of China Ltd., Class H | 325,662,000 | 154,998 |
| CIT Group Inc. | 3,405,000 | 151,454 |
| JPMorgan Chase & Co. | 2,700,000 | 150,039 |
| Woori Finance Holdings Co., Ltd.1 | 12,625,316 | 148,504 |
| Aberdeen Asset Management PLC | 18,580,682 | 138,626 |
| Sun Hung Kai Properties Ltd. | 9,938,000 | 135,874 |
| ING Groep NV, depository receipts1 | 9,625,000 | 134,811 |
| Citigroup Inc. | 2,750,000 | 130,818 |
| Weyerhaeuser Co.1 | 3,859,686 | 121,271 |
| Wharf (Holdings) Ltd. | 16,967,000 | 120,146 |
| Hang Seng Bank Ltd. | 7,000,000 | 115,569 |
| Willis Group Holdings PLC | 2,730,000 | 114,496 |
| Starwood Property Trust, Inc. | 4,275,000 | 104,267 |
| Progressive Corp. | 3,875,000 | 96,991 |
| HCP, Inc. | 2,319,796 | 96,851 |
| Public Storage | 517,300 | 89,172 |
| Samsung Card Co., Ltd. | 2,349,900 | 86,492 |
| Grupo Financiero Santander México, SAB de CV, Class B (ADR) | 5,820,800 | 77,999 |
| Cheung Kong (Holdings) Ltd. | 4,340,000 | 77,531 |
| Svenska Handelsbanken AB, Class A | 1,500,000 | 76,233 |
| KASIKORNBANK PCL, nonvoting depository receipts | 11,588,000 | 66,182 |
| PNC Financial Services Group, Inc. | 770,000 | 65,658 |
| Ascendas Real Estate Investment Trust | 31,991,000 | 62,742 |
| Henderson Land Development Co. Ltd. | 9,445,500 | 61,525 |
| | | 13,009,653 |
| Industrials 11.36% | | |
| | | |
| ASSA ABLOY AB, Class B | 16,312,507 | 823,669 |
| VINCI SA | 10,913,941 | 807,840 |
| Lockheed Martin Corp. | 3,988,400 | 652,702 |
| Schneider Electric SA | 6,086,719 | 573,164 |
| General Dynamics Corp. | 4,677,300 | 552,483 |
| Ryanair Holdings PLC (ADR)1 | 8,500,000 | 483,310 |
| Jardine Matheson Holdings Ltd. | 7,409,600 | 455,690 |
| PACCAR Inc | 5,720,000 | 362,419 |
| United Parcel Service, Inc., Class B | 3,455,846 | 358,993 |
| Nielsen NV | 6,973,391 | 336,536 |
| General Electric Co. | 12,350,000 | 330,857 |
| KONE Oyj, Class B | 7,410,000 | 305,048 |
| CSX Corp. | 9,485,865 | 278,884 |
| Emerson Electric Co. | 3,960,000 | 264,251 |
| ComfortDelGro Corp. Ltd.2 | 135,100,000 | 250,963 |
| Singapore Technologies Engineering Ltd | 76,260,000 | 235,292 |
| Common stocks | | |
| | | Value |
| Industrials (continued) | Shares | (000) |
| | | |
| Union Pacific Corp. | 1,064,700 | $ 212,163 |
| Bureau Veritas SA | 7,033,476 | 212,080 |
| Bunzl PLC | 7,326,600 | 205,336 |
| AB Volvo, Class B | 13,899,080 | 202,089 |
| Danaher Corp. | 2,500,000 | 196,075 |
| Waste Management, Inc. | 4,200,000 | 187,656 |
| Rexel SA1 | 7,523,427 | 179,780 |
| Cummins Inc. | 1,117,164 | 170,848 |
| Babcock International Group PLC | 8,284,153 | 168,574 |
| Qantas Airways Ltd.1,2 | 125,158,600 | 163,653 |
| Deutsche Post AG | 4,325,000 | 160,420 |
| easyJet PLC | 5,274,810 | 135,277 |
| United Continental Holdings, Inc.1 | 3,000,000 | 133,110 |
| Kühne + Nagel International AG | 720,000 | 98,171 |
| BAE Systems PLC | 13,675,000 | 96,983 |
| Andritz AG | 1,605,000 | 95,598 |
| SGS SA | 36,826 | 92,322 |
| ITOCHU Corp. | 7,535,000 | 89,043 |
| Capita PLC | 4,012,000 | 74,445 |
| Norfolk Southern Corp. | 712,000 | 71,734 |
| Siemens AG | 356,000 | 47,296 |
| United Technologies Corp. | 300,000 | 34,866 |
| Contax Participações SA, units | 152,400 | 1,156 |
| | | 10,100,776 |
| Consumer discretionary 10.35% | | |
| | | |
| DIRECTV1 | 9,872,686 | 813,904 |
| Amazon.com, Inc.1 | 2,538,400 | 793,377 |
| Kingfisher PLC | 84,568,999 | 555,678 |
| Volkswagen AG, nonvoting preferred | 2,051,602 | 545,345 |
| Home Depot, Inc. | 6,627,800 | 531,748 |
| General Motors Co. | 14,652,347 | 506,678 |
| Comcast Corp., Class A | 8,272,900 | 431,845 |
| ProSiebenSat.1 Media AG | 8,694,000 | 395,653 |
| Renault SA | 3,429,223 | 322,824 |
| Netflix, Inc.1 | 765,742 | 319,950 |
| Whitbread PLC | 4,370,892 | 306,687 |
| Intercontinental Hotels Group PLC | 7,409,560 | 292,489 |
| H & M Hennes & Mauritz AB, Class B | 6,714,300 | 283,742 |
| YUM! Brands, Inc. | 3,520,000 | 272,131 |
| SJM Holdings Ltd. | 91,615,000 | 262,924 |
| Nissan Motor Co., Ltd. | 28,423,000 | 256,589 |
| Galaxy Entertainment Group Ltd. | 26,272,000 | 209,927 |
| Twenty-First Century Fox, Inc., Class A | 5,689,758 | 201,474 |
| Daily Mail and General Trust PLC, Class A, nonvoting | 13,740,000 | 200,485 |
| Kering SA | 789,598 | 174,475 |
| NIKE, Inc., Class B | 2,000,000 | 153,820 |
| adidas AG | 1,286,500 | 138,086 |
| Johnson Controls, Inc. | 2,772,325 | 134,070 |
| Sands China Ltd. | 17,423,100 | 126,972 |
| Ford Motor Co. | 7,700,000 | 126,588 |
| Wynn Resorts, Ltd. | 517,800 | 111,311 |
| Daimler AG | 1,089,000 | 103,468 |
| Melco Crown Entertainment Ltd. (ADR) | 2,825,584 | 97,398 |
| Common stocks | | |
| | | Value |
| Consumer discretionary (continued) | Shares | (000) |
| | | |
| William Hill PLC | 15,971,511 | $ 95,199 |
| RTL Group SA, non-registered shares | 770,000 | 89,743 |
| MGM China Holdings Ltd. | 24,670,000 | 85,914 |
| Wynn Macau, Ltd. | 14,418,000 | 59,975 |
| Nordstrom, Inc. | 845,210 | 57,525 |
| Darden Restaurants, Inc. | 741,400 | 37,159 |
| Ladbrokes PLC | 12,101,600 | 30,954 |
| Stella International Holdings Ltd. | 10,024,500 | 26,571 |
| Darty PLC | 16,230,500 | 23,465 |
| Dixons Retail PLC1 | 23,103,600 | 18,782 |
| WPP PLC | 412,700 | 8,903 |
| | | 9,203,828 |
| Information technology 9.23% | | |
| | | |
| Google Inc., Class A1 | 1,037,629 | 593,161 |
| Google Inc., Class C1 | 1,037,629 | 582,089 |
| Samsung Electronics Co. Ltd. | 812,850 | 1,149,718 |
| Oracle Corp. | 20,422,000 | 858,132 |
| Texas Instruments Inc. | 16,070,000 | 754,969 |
| Motorola Solutions, Inc. | 7,780,062 | 524,532 |
| Apple Inc. | 733,413 | 464,250 |
| Delta Electronics, Inc. | 59,003,873 | 383,711 |
| Accenture PLC, Class A | 4,125,000 | 335,981 |
| Automatic Data Processing, Inc. | 3,305,000 | 263,342 |
| Baidu, Inc., Class A (ADR)1 | 1,352,800 | 224,565 |
| AAC Technologies Holdings Inc. | 37,127,000 | 219,086 |
| Maxim Integrated Products, Inc. | 5,723,000 | 196,013 |
| Murata Manufacturing Co., Ltd. | 2,174,000 | 184,149 |
| Western Union Co. | 11,294,000 | 182,624 |
| Hewlett-Packard Co. | 5,175,000 | 173,362 |
| Microsoft Corp. | 4,050,000 | 165,807 |
| Analog Devices, Inc. | 2,970,186 | 155,578 |
| Quanta Computer Inc. | 50,388,595 | 135,611 |
| Nintendo Co., Ltd. | 1,172,400 | 135,551 |
| Yahoo! Inc.1 | 3,423,798 | 118,635 |
| Avago Technologies Ltd. | 1,596,000 | 112,789 |
| Siliconware Precision Industries Co., Ltd. | 66,700,000 | 106,772 |
| SAP AG | 1,336,000 | 102,277 |
| HOYA Corp. | 2,763,000 | 85,523 |
| | | 8,208,227 |
| Consumer staples 7.18% | | |
| | | |
| Altria Group, Inc. | 41,743,300 | 1,734,852 |
| Philip Morris International Inc. | 16,440,200 | 1,455,615 |
| Nestlé SA | 8,454,443 | 663,232 |
| Pernod Ricard SA | 2,618,733 | 321,097 |
| Coca-Cola Co. | 4,958,800 | 202,865 |
| SABMiller PLC | 3,580,000 | 198,686 |
| Tingyi (Cayman Islands) Holding Corp. | 62,940,000 | 179,412 |
| Imperial Tobacco Group PLC | 3,840,354 | 173,289 |
| Associated British Foods PLC | 3,307,511 | 167,319 |
| Japan Tobacco Inc. | 4,590,000 | 155,285 |
| Lorillard, Inc. | 2,460,000 | 152,938 |
| British American Tobacco PLC | 2,392,000 | 144,361 |
| Common stocks | | |
| | | Value |
| Consumer staples (continued) | Shares | (000) |
| | | |
| Thai Beverage PCL | 274,204,000 | $ 137,725 |
| Mondelez International, Inc. | 3,000,000 | 112,860 |
| Anheuser-Busch InBev NV | 924,622 | 101,475 |
| Diageo PLC | 3,100,000 | 99,716 |
| Danone SA | 1,248,646 | 92,985 |
| ConAgra Foods, Inc. | 2,700,000 | 87,210 |
| Mead Johnson Nutrition Co. | 770,000 | 68,892 |
| Charoen Pokphand Foods PCL | 63,720,500 | 53,861 |
| Kraft Foods Group, Inc. | 787,166 | 46,805 |
| Treasury Wine Estates Ltd. | 7,212,137 | 34,902 |
| | | 6,385,382 |
| Energy 6.11% | | |
| | | |
| BP PLC | 193,063,649 | 1,627,775 |
| Royal Dutch Shell PLC, Class A | 10,010,000 | 393,462 |
| Royal Dutch Shell PLC, Class B | 9,203,685 | 375,653 |
| Royal Dutch Shell PLC, Class A (ADR) | 897,500 | 70,543 |
| Royal Dutch Shell PLC, Class A (EUR denominated) | 1,686,000 | 66,294 |
| Royal Dutch Shell PLC, Class B (ADR) | 344,800 | 28,218 |
| Eni SpA | 22,965,300 | 585,093 |
| Eni SpA (ADR) | 253,148 | 12,867 |
| Exxon Mobil Corp. | 4,523,627 | 454,760 |
| BG Group PLC | 20,070,000 | 410,761 |
| EOG Resources, Inc. | 2,786,000 | 294,759 |
| Schlumberger Ltd. | 2,200,000 | 228,888 |
| Devon Energy Corp. | 2,800,000 | 206,920 |
| Pacific Rubiales Energy Corp. | 7,156,000 | 139,847 |
| Kinder Morgan, Inc. | 4,000,000 | 133,560 |
| ConocoPhillips | 1,650,000 | 131,901 |
| Husky Energy Inc. | 3,456,000 | 116,560 |
| CNOOC Ltd. | 40,776,900 | 69,952 |
| OJSC Gazprom (ADR)1 | 6,870,000 | 55,997 |
| Apache Corp. | 380,000 | 35,424 |
| | | 5,439,234 |
| Telecommunication services 5.34% | | |
| | | |
| Verizon Communications Inc. | 29,517,339 | 1,474,686 |
| SoftBank Corp. | 8,127,700 | 586,424 |
| TeliaSonera AB | 74,332,564 | 550,608 |
| CenturyLink, Inc. | 13,456,000 | 506,888 |
| Advanced Info Service PCL | 45,026,700 | 314,076 |
| OJSC Mobile TeleSystems (ADR) | 15,734,680 | 290,934 |
| Singapore Telecommunications Ltd. | 89,868,810 | 279,429 |
| MTN Group Ltd. | 13,182,000 | 277,825 |
| Vodafone Group PLC | 46,659,273 | 163,851 |
| Türk Telekomünikasyon AS, Class D | 39,150,000 | 113,302 |
| Intouch Holdings PCL | 24,874,700 | 56,258 |
| Intouch Holdings PCL, nonvoting depository receipts | 13,830,000 | 31,279 |
| OJSC MegaFon (GDR)1,3 | 1,840,000 | 55,255 |
| Total Access Communication PCL | 12,331,500 | 45,074 |
| | | 4,745,889 |
| Common stocks | | |
| | | Value |
| Utilities 4.41% | Shares | (000) |
| | | |
| National Grid PLC | 70,136,919 | $ 1,046,315 |
| Fortum Oyj | 32,911,777 | 802,611 |
| Exelon Corp. | 11,743,700 | 432,521 |
| PT Perusahaan Gas Negara (Persero) Tbk | 835,780,000 | 388,360 |
| Dominion Resources, Inc. | 4,456,422 | 307,315 |
| NextEra Energy, Inc. | 2,181,952 | 212,435 |
| SSE PLC | 7,643,164 | 199,347 |
| EDP — Energias de Portugal, SA | 35,880,566 | 169,720 |
| Power Grid Corp. of India Ltd. | 64,038,000 | 132,216 |
| GDF SUEZ | 3,372,030 | 94,161 |
| PG&E Corp. | 1,835,000 | 84,171 |
| Power Assets Holdings Ltd. | 6,169,500 | 53,714 |
| | | 3,922,886 |
| Materials 3.31% | | |
| | | |
| BASF SE | 4,610,000 | 530,820 |
| Praxair, Inc. | 2,653,120 | 350,848 |
| Akzo Nobel NV | 4,238,000 | 317,621 |
| Amcor Ltd. | 30,684,007 | 302,980 |
| ArcelorMittal | 19,044,654 | 290,760 |
| Rio Tinto PLC | 5,402,300 | 276,821 |
| Syngenta AG | 613,000 | 235,822 |
| Linde AG | 959,000 | 200,338 |
| Sherwin-Williams Co. | 660,000 | 135,043 |
| Dow Chemical Co. | 2,250,000 | 117,270 |
| Celanese Corp., Series A | 1,320,000 | 82,764 |
| Koninklijke DSM NV | 1,054,000 | 76,005 |
| Boral Ltd. | 5,800,660 | 28,611 |
| | | 2,945,703 |
| Miscellaneous 4.91% | | |
| | | |
| Other common stocks in initial period of acquisition | | 4,367,960 |
| Total common stocks (cost: $59,193,383,000) | | 83,007,129 |
| Preferred securities 0.00% | | |
| | | |
| Financials 0.00% | | |
| | | |
| Citigroup Inc. 7.875% preferred | 122,000 | 3,352 |
| Total preferred securities (cost: $3,050,000) | | 3,352 |
| Rights & warrants 0.00% | | |
| | | |
| Miscellaneous 0.00% | | |
| | | |
| Other rights & warrants in initial period of acquisition | | 1,020 |
| Total rights & warrants (cost: $0) | | 1,020 |
| Convertible securities 0.13% | | |
| | Shares or | |
| Financials 0.06% | principal amount | |
| | | |
| Bank of Ireland 10.00% convertible notes 2016 | €23,175,000 | 35,202 |
| Bank of America Corp., Series L, 7.25% convertible preferred | 13,000 | 15,471 |
| | | 50,673 |
| Convertible securities | | |
| | Shares or | Value |
| Telecommunication services 0.05% | principal amount | (000) |
| | | |
| Clearwire Corp. 8.25% convertible notes 20403 | $38,630,000 | $ 44,956 |
| Industrials 0.02% | | |
| | | |
| United Continental Holdings, Inc. 6.00% convertible preferred 2030 | 397,000 | 20,249 |
| Total convertible securities (cost: $90,281,000) | | 115,878 |
| Bonds, notes & other debt instruments 0.93% | | |
| Corporate bonds & notes 0.64% | Principal amount | |
| Financials 0.27% | (000) | |
| | | |
| HBOS PLC 6.75% 20183 | $36,490 | 42,175 |
| Lloyds Banking Group PLC, junior subordinated 6.657% preference shares (undated)3,4 | 30,300 | 33,254 |
| Mizuho Capital Investment (USD) 2 Ltd, junior subordinated 14.95% (undated)3,4 | 60,000 | 61,420 |
| Bank of Ireland 10.24% (undated) | €24,030 | 35,964 |
| Simon Property Group, LP 5.25% 2016 | $3,540 | 3,886 |
| Simon Property Group, LP 6.10% 2016 | 860 | 937 |
| Simon Property Group, LP 5.875% 2017 | 165 | 185 |
| Simon Property Group, LP 6.125% 2018 | 890 | 1,041 |
| Simon Property Group, LP 10.35% 2019 | 5,170 | 7,050 |
| AXA SA 8.60% 2030 | 8,000 | 10,743 |
| Barclays Bank PLC, Series RCI, junior subordinated 14.00% (undated)4 | £4,520 | 10,398 |
| Developers Diversified Realty Corp. 7.875% 2020 | $ 8,075 | 10,293 |
| Standard Chartered Bank 6.40% 20173 | 8,451 | 9,586 |
| Discover Financial Services 10.25% 2019 | 4,334 | 5,530 |
| ERP Operating LP 5.125% 2016 | 2,886 | 3,113 |
| ERP Operating LP 5.75% 2017 | 2,055 | 2,329 |
| | | 237,904 |
| Telecommunication services 0.19% | | |
| | | |
| Sprint Nextel Corp. 9.125% 2017 | 27,750 | 32,953 |
| Sprint Nextel Corp. 11.50% 2021 | 33,950 | 46,342 |
| MTS International Funding Ltd. 8.625% 2020 | 29,630 | 35,141 |
| MTS International Funding Ltd. 8.625% 20203 | 6,190 | 7,341 |
| Numerical Group SA, First Lien, 6.00% 20223 | 21,500 | 22,333 |
| Numerical Group SA, First Lien, 6.25% 20243 | 8,000 | 8,380 |
| América Móvil, SAB de CV 6.45% 2022 | MXN63,350 | 4,867 |
| América Móvil, SAB de CV 8.46% 2036 | 55,000 | 4,173 |
| Altice Finco SA, First Lien, 7.75% 20223 | $ 6,750 | 7,113 |
| | | 168,643 |
| Materials 0.11% | | |
| | | |
| ArcelorMittal 4.25% 20154 | 16,500 | 16,995 |
| ArcelorMittal 4.25% 20154 | 8,200 | 8,364 |
| ArcelorMittal 10.35% 20194 | 20,000 | 25,450 |
| ArcelorMittal 6.75% 20224 | 24,365 | 27,411 |
| CRH America, Inc. 6.00% 2016 | 1,260 | 1,402 |
| CRH America, Inc. 8.125% 2018 | 15,540 | 19,160 |
| | | 98,782 |
| Energy 0.05% | | |
| | | |
| Gazprom OJSC 8.146% 2018 | 4,415 | 5,121 |
| Gazprom OJSC, Series 9, 6.51% 2022 | 30,710 | 33,066 |
| Gazprom OJSC, Series 2, 8.625% 2034 | 1,015 | 1,240 |
| Bonds, notes & other debt instruments | | |
| | Principal amount | Value |
| Corporate bonds & notes — Energy (continued) | (000) | (000) |
| | | |
| Gazprom OJSC 7.288% 2037 | $ 2,740 | $ 3,014 |
| BP Capital Markets PLC 3.875% 2015 | 7,320 | 7,522 |
| | | 49,963 |
| Consumer discretionary 0.02% | | |
| | | |
| Marks and Spencer Group PLC 6.25% 20173 | 100 | 112 |
| Marks and Spencer Group PLC 7.125% 20373 | 15,550 | 17,870 |
| | | 17,982 |
| Total corporate bonds & notes | | 573,274 |
| Bonds & notes of governments & government agencies outside the U.S. 0.15% | | |
| | | |
| Indonesia (Republic of) 9.00% 2018 | IDR 59,259,000 | 5,319 |
| Indonesia (Republic of) 7.875% 2019 | 491,119,000 | 42,550 |
| Indonesia (Republic of) 11.50% 2019 | 118,706,000 | 11,807 |
| Indonesia (Republic of), Series 31, 11.00% 2020 | 84,791,000 | 8,425 |
| Brazil (Federal Republic of) 10.00% 2019 | BRL156,000 | 65,668 |
| | | 133,769 |
| U.S. Treasury bonds & notes 0.14% | | |
| | | |
| U.S. Treasury 0.25% 2015 | $ 67,700 | 67,795 |
| U.S. Treasury 0.375% 20165 | 55,000 | 55,100 |
| | | 122,895 |
| Total bonds, notes & other debt instruments (cost: $720,852,000) | | 829,938 |
| | | |
| Short-term securities 4.99% | | |
| | | |
| Fannie Mae 0.055%–0.15% due 7/2–10/27/2014 | 935,103 | 934,998 |
| Freddie Mac 0.05%–0.15% due 6/2/2014–1/16/2015 | 879,800 | 879,615 |
| Federal Home Loan Bank 0.045%–0.18% due 6/4/2014–1/30/2015 | 864,734 | 864,607 |
| Sumitomo Mitsui Banking Corp. 0.15%–0.17% due 6/18–7/7/20143 | 174,600 | 174,577 |
| Bank of Tokyo-Mitsubishi UFJ, Ltd. 0.17% due 7/18/2014 | 80,000 | 79,979 |
| Gotham Funding Corp. 0.17% due 8/4/20143 | 50,000 | 49,983 |
| Mitsubishi UFJ Trust and Banking Corp. 0.17% due 7/14/20143 | 43,700 | 43,691 |
| Bank of Nova Scotia 0.155%–0.19% due 6/19–8/14/2014 | 168,300 | 168,268 |
| Mizuho Funding LLC 0.15%–0.225% due 6/27–7/25/20143 | 150,700 | 150,664 |
| Svenska Handelsbanken Inc. 0.17%–0.175% due 7/30–8/26/20143 | 150,000 | 149,953 |
| Nordea Bank AB 0.165%–0.185% due 6/16–9/16/20143 | 125,900 | 125,860 |
| Australia & New Zealand Banking Group, Ltd. 0.16%–0.165% due 9/15–9/16/20143 | 90,030 | 89,976 |
| ANZ National (International) Ltd. 0.17% due 9/29/20143 | 25,000 | 24,984 |
| General Electric Capital Corp. 0.15%–0.21% due 6/12/2014–1/13/2015 | 100,000 | 99,942 |
| General Electric Co. 0.06% due 6/2/2014 | 600 | 600 |
| Federal Farm Credit Banks 0.13% due 9/8–10/14/2014 | 96,000 | 95,983 |
| Toronto-Dominion Holdings USA Inc. 0.11%–0.16% due 6/9–6/20/20143 | 79,100 | 79,097 |
| BNP Paribas Finance Inc. 0.16% due 7/16–7/22/2014 | 77,800 | 77,782 |
| Kells Funding, LLC 0.20%–0.23% due 8/18–10/3/20143 | 75,000 | 74,959 |
| Old Line Funding, LLC 0.17% due 6/11/20143 | 65,097 | 65,096 |
| Nestlé Finance International Ltd. 0.11% due 6/17/2014 | 50,000 | 49,998 |
| GlaxoSmithKline Finance PLC 0.10% due 6/2/20143 | 30,000 | 30,000 |
| American Honda Finance Corp. 0.11% due 7/22/2014 | 30,000 | 29,995 |
| Private Export Funding Corp. 0.24% due 6/23/20143 | 29,000 | 28,998 |
| | Principal amount | Value |
| Short-term securities | (000) | (000) |
| | | |
| Province of Ontario 0.10% due 7/9/2014 | $25,300 | $ 25,297 |
| Electricité de France 0.14% due 8/25/20143 | 25,000 | 24,987 |
| Commonwealth Bank of Australia 0.14% due 8/7/20143 | 13,400 | 13,397 |
| Total short-term securities (cost: $4,432,924,000) | | 4,433,286 |
| Total investment securities (cost: $64,440,490,000) | | 88,390,603 |
| Other assets less liabilities | | 548,992 |
| Net assets | | $88,939,595 |
As permitted by U.S. Securities and Exchange Commission regulations, “Miscellaneous” securities include holdings in their first year of acquisition that have not previously been publicly disclosed.
| 1 | Security did not produce income during the last 12 months. |
| 2 | Represents an affiliated company as defined under the Investment Company Act of 1940. |
| 3 | Acquired in a transaction exempt from registration under Rule 144A or section 4(2) of the Securities Act of 1933. May be resold in the U.S. in transactions exempt from registration, normally to qualified institutional buyers. The total value of all such securities was $1,436,017,000, which represented 1.61% of the net assets of the fund. |
| 4 | Coupon rate may change periodically. |
| 5 | A portion of this security was pledged as collateral. The total value of pledged collateral was $588,000, which represented less than .01% of the net assets of the fund. |
Key to abbreviations and symbols
ADR = American Depositary Receipts
GDR = Global Depositary Receipts
BRL = Brazilian reais
EUR/€ = Euros
£ = British pounds
IDR = Indonesian rupiah
MXN = Mexican pesos
Investments are not FDIC-insured, nor are they deposits of or guaranteed by a bank or any other entity, so they may lose value.
Investors should carefully consider investment objectives, risks, charges and expenses. This and other important information is contained in the fund prospectus and summary prospectus, which can be obtained from your financial professional and should be read carefully before investing. You may also call American Funds Service Company (AFS) at (800) 421-4225 or visit the American Funds website at americanfunds.com.
MFGEFPX-033-0714O-S42163
ITEM 7 – Disclosure of Proxy Voting Policies and Procedures for Closed-End Management Investment Companies
Not applicable to this Registrant, insofar as the Registrant is not a closed-end management investment company.
ITEM 8 – Portfolio Managers of Closed-End Management Investment Companies
Not applicable to this Registrant, insofar as the Registrant is not a closed-end management investment company.
ITEM 9 – Purchases of Equity Securities by Closed-End Management Investment Company and Affiliated Purchasers
Not applicable to this Registrant, insofar as the Registrant is not a closed-end management investment company.
ITEM 10 – Submission of Matters to a Vote of Security Holders
There have been no material changes to the procedures by which shareholders may recommend nominees to the Registrant’s board of trustees since the Registrant last submitted a proxy statement to its shareholders. The procedures are as follows. The Registrant has a nominating and governance committee comprised solely of persons who are not considered ‘‘interested persons’’ of the Registrant within the meaning of the Investment Company Act of 1940, as amended. The committee periodically reviews such issues as the board’s composition, responsibilities, committees, compensation and other relevant issues, and recommends any appropriate changes to the full board of trustees. While the committee normally is able to identify from its own resources an ample number of qualified candidates, it will consider shareholder suggestions of persons to be considered as nominees to fill future vacancies on the board. Such suggestions must be sent in writing to the nominating and governance committee of the Registrant, c/o the Registrant’s Secretary, and must be accompanied by complete biographical and occupational data on the prospective nominee, along with a written consent of the prospective nominee for consideration of his or her name by the nominating and governance committee.
ITEM 11 – Controls and Procedures
| (a) | The Registrant’s Principal Executive Officer and Principal Financial Officer have concluded, based on their evaluation of the Registrant’s disclosure controls and procedures (as such term is defined in Rule 30a-3 under the Investment Company Act of 1940), that such controls and procedures are adequate and reasonably designed to achieve the purposes described in paragraph (c) of such rule. |
| | |
| (b) | There were no changes in the Registrant’s internal controls over financial reporting (as defined in Rule 30a-3(d) under the Investment Company Act of 1940) that occurred during the Registrant’s second fiscal quarter of the period covered by this report that has materially affected, or is reasonably likely to materially affect, the Registrant’s internal control over financial reporting. |
ITEM 12 – Exhibits
| (a)(1) | Not applicable for filing of semi-annual reports to shareholders. |
| | |
| (a)(2) | The certifications required by Rule 30a-2 of the Investment Company Act of 1940 and Sections 302 and 906 of the Sarbanes-Oxley Act of 2002 are attached as exhibits hereto. |
SIGNATURES
Pursuant to the requirements of the Securities Exchange Act of 1934 and the Investment Company Act of 1940, the Registrant has duly caused this report to be signed on its behalf by the undersigned, thereunto duly authorized.
| | CAPITAL WORLD GROWTH AND INCOME FUND |
| | |
| | By /s/ Michael J. Thawley |
| | Michael J. Thawley, Vice Chairman and Principal Executive Officer |
| | |
| | Date: July 31, 2014 |
Pursuant to the requirements of the Securities Exchange Act of 1934 and the Investment Company Act of 1940, this report has been signed below by the following persons on behalf of the Registrant and in the capacities and on the dates indicated.
| By /s/ Michael J. Thawley |
Michael J. Thawley, Vice Chairman and Principal Executive Officer |
| |
| Date: July 31, 2014 |
| By /s/ Neal F. Wellons |
Neal F. Wellons, Treasurer and Principal Financial Officer |
| |
| Date: July 31, 2014 |