UNITED STATES
SECURITIES AND EXCHANGE COMMISSION
Washington, D.C. 20549
FORM N-CSR
Certified Shareholder Report of
Registered Management Investment Companies
Investment Company Act File Number: 811-07338
Capital World Growth and Income Fund
(Exact Name of Registrant as Specified in Charter)
333 South Hope Street
Los Angeles, California 90071
(Address of Principal Executive Offices)
Registrant's telephone number, including area code: (213) 486-9200
Date of fiscal year end: November 30
Date of reporting period: May 31, 2018
Michael W. Stockton
Capital World Growth and Income Fund
333 South Hope Street
Los Angeles, California 90071
(Name and Address of Agent for Service)
ITEM 1 – Reports to Stockholders
 | Capital World Growth
and Income Fund®
Semi-annual report
for the six months ended
May 31, 2018 |

Global flexibility:
Following opportunity
anywhere.
Capital World Growth and Income Fund seeks to provide you with long-term growth of capital while providing current income.
This fund is one of more than 40 offered by one of the nation’s largest mutual fund families, American Funds, from Capital Group. For more than 85 years, Capital has invested with a long-term focus based on thorough research and attention to risk.
Fund results shown in this report, unless otherwise indicated, are for Class A shares at net asset value. If a sales charge (maximum 5.75%) had been deducted, the results would have been lower. Results are for past periods and are not predictive of results for future periods. Current and future results may be lower or higher than those shown. Share prices and returns will vary, so investors may lose money. Investing for short periods makes losses more likely. For current information and month-end results, visit americanfunds.com.
Here are the average annual total returns on a $1,000 investment with all distributions reinvested for periods ended June 30, 2018 (the most recent calendar quarter-end):
| Class A shares | 1 year | 5 years | 10 years |
| | | | |
| Reflecting 5.75% maximum sales charge | 4.46% | 8.26% | 5.55% |
For other share class results, visit americanfunds.com and americanfundsretirement.com.
The total annual fund operating expense ratio was 0.77% for Class A shares as of the prospectus dated February 1, 2018. The expense ratio is restated to reflect current fees.
Investment results assume all distributions are reinvested and reflect applicable fees and expenses. When applicable, investment results reflect fee waivers, without which results would have been lower. Visit americanfunds.com for more information.
The fund’s 30-day yield for Class A shares as of June 30, 2018, reflecting the 5.75% maximum sales charge and calculated in accordance with the U.S. Securities and Exchange Commission formula, was 1.97%.
Investing outside the United States may be subject to risks, such as currency fluctuations, periods of illiquidity and price volatility. These risks may be heightened in connection with investments in developing countries. Refer to the fund prospectus and the Risk Factors section of this report for more information on these and other risks associated with investing in the fund.
Investments are not FDIC-insured, nor are they deposits of or guaranteed by a bank or any other entity, so they may lose value.
Fellow investors:
Global stocks rose modestly during the first half of the fiscal year, as solid corporate earnings reports and ongoing central bank stimulus were tempered by slowing economic growth, political turmoil in Italy and Spain and escalating trade tensions between the U.S. and China.
For the six months ended May 31, 2018, Capital World Growth and Income Fund generated a total return of 2.94%. Over the same period, the MSCI ACWI (All Country World Index), the fund’s primary benchmark, returned 1.72%. The index measures the results of more than 40 developed and emerging equity markets. By way of comparison, the Lipper Global Funds Index, a peer group measure, rose 1.16%.
The fund aims to provide investors with both current income and long-term capital appreciation. For the period, quarterly dividend payments totaled 38 cents a share. This amounted to an income return of 0.74% for investors who reinvested dividends. Investors also received a capital gains distribution of $2.51 a share paid in December.
A strong start, but a shift in sentiment
The fiscal year began on an upbeat note, as the U.S., Europe, Japan and China enjoyed a period of synchronized economic growth, driving solid gains across most major equity markets. Early in the period, stock market returns were further bolstered
Results at a glance
For periods ended May 31, 2018, with all distributions reinvested
| | | Cumulative | | Average annual |
| | | total returns | | total returns |
| | | 6 months | | 1 year | | 5 years | | 10 years | | Lifetime
(since 3/26/93) |
| | | | | | | | | | | |
| Capital World Growth and Income Fund (Class A shares) | | | 2.94 | % | | | 12.74 | % | | | 9.26 | % | | | 5.38 | % | | | 10.69 | % |
| MSCI ACWI (All Country World Index)* | | | 1.72 | | | | 11.84 | | | | 8.88 | | | | 4.95 | | | | 7.49 | |
| Lipper Global Funds Index† | | | 1.16 | | | | 9.98 | | | | 8.95 | | | | 5.25 | | | | 7.60 | |
| * | Results for the MSCI ACWI reflect dividends gross of withholding taxes through December 31, 2000, and dividends net of withholding taxes thereafter. This index is a free float-adjusted market capitalization-weighted index that is designed to measure results of more than 40 developed and emerging equity markets. It is unmanaged and, therefore, has no expenses. Investors cannot invest directly in an index. Source: MSCI. |
| † | Results for the Lipper index do not reflect sales charges. Lipper indexes track the largest mutual funds (no more than 30), represented by one share class per fund, in the corresponding Lipper category. Source: Thomson Reuters Lipper. |
| Capital World Growth and Income Fund | 1 |
by rising corporate earnings, the passage of sweeping tax cuts in the U.S. and accommodative monetary policy. By February, however, equity market volatility rose sharply, as investors became increasingly concerned about trade tariffs, signs of emerging inflation and rising interest rates in the U.S.
In Europe, stocks declined despite signs of ongoing improvement in the eurozone economy. Growing trade tensions and, later in the period, political strife in Italy and Spain further fueled the volatility. Eurozone GDP growth rose at a year-over-year rate of 2.5% during the first quarter, slightly slower than in the previous quarter. The euro tumbled against the dollar in the closing weeks of the period after Italian President Sergio Mattarella momentarily blocked the formation of a coalition government, raising investor fears that Italy might consider leaving the European Union and eurozone. On the trade front, European leaders threatened to impose tariffs against American goods after the U.S. disclosed plans to impose tariffs of their own, including levys on European steel and aluminum. The strengthening of the U.S. dollar versus the euro during the period further dampened returns for U.S.-based investors. For the six months the MSCI Euro Index slid 3.00%.*
Conversely, Japanese equity prices rose 1.21% for U.S. investors, thanks in part to a strengthening yen versus the dollar. Japan’s economy contracted during the first quarter, the country’s first decline in economic output since the fourth quarter of 2015. The Consumer Price Index, a measure of inflation, rose a modest 0.6% in April, while prices excluding food and energy rose 0.4%. Both figures remained well below the Bank of Japan’s goal of 2% inflation. Japan’s central bank left interest rates unchanged during the period.
Despite heightened volatility, emerging markets equities rose, aided by steady growth in China and stronger oil prices. Chinese stocks advanced 5.65%, overcoming rising U.S.-China trade tensions. China’s economic growth during January and February exceeded expectations amid strong export growth and rising retail and home sales. Elsewhere in developing markets, Russian shares gained 5.30%, supported by climbing oil prices and signs that economic conditions are improving. Brazilian stocks experienced big gains after the central bank cut the benchmark interest rate to a record low. But shares ended the period down (–5.64%) amid uncertainty about the outcome of October’s presidential election and perceived lack of progress toward needed fiscal reforms.
U.S. equity markets posted increases, as robust demand and lower tax rates boosted earnings growth for U.S. companies. Economic data was mostly positive as first quarter GDP growth increased at a 2.0% annual rate. The MSCI USA Index rose 3.31% for the fiscal period.
| * | Unless otherwise noted, country stock returns are based on MSCI indexes, expressed in U.S. dollars and assume the reinvestment of dividends. Results reflect dividends net of withholding taxes, except the MSCI USA Index, which reflects dividends gross of withholding taxes. |
| 2 | Capital World Growth and Income Fund |
Where the fund’s assets are invested*
(percent invested by country of domicile)
| | | Capital World Growth
and Income Fund | | MSCI All Country
World Index† |
| | | | | | | | | |
| Europe | | | 29.4 | % | | | 20.8 | % |
| United Kingdom | | | 11.6 | | | | 5.8 | |
| France | | | 5.9 | | | | 3.5 | |
| Switzerland | | | 3.3 | | | | 2.4 | |
| Spain | | | 2.9 | | | | .9 | |
| Germany | | | 1.3 | | | | 3.1 | |
| Netherlands | | | 1.1 | | | | 1.1 | |
| Ireland | | | .6 | | | | .2 | |
| Italy | | | .6 | | | | .7 | |
| Other Europe | | | 2.1 | | | | 3.1 | |
| | | | | | | | | |
| The Americas | | | 39.2 | | | | 57.6 | |
| United States | | | 34.9 | | | | 53.3 | |
| Canada | | | 2.4 | | | | 3.1 | |
| Brazil | | | 1.6 | | | | .7 | |
| Other Americas | | | .3 | | | | .5 | |
| | | | | | | | | |
| Asia/Pacific | | | 24.6 | | | | 20.5 | |
| China | | | 5.8 | | | | 3.7 | |
| South Korea | | | 5.6 | | | | 1.8 | |
| Japan | | | 5.1 | | | | 7.9 | |
| Hong Kong | | | 3.0 | | | | 1.2 | |
| India | | | 1.9 | | | | 1.0 | |
| Australia | | | 1.3 | | | | 2.2 | |
| Taiwan | | | .8 | | | | 1.4 | |
| Other Asia/Pacific | | | 1.1 | | | | 1.3 | |
| | | | | | | | | |
| Other | | | .5 | | | | 1.1 | |
| | | | | | | | | |
| Bonds, notes & other debt instruments, short-term securities & other assets less liabilities | | | 6.3 | | | | — | |
| | | | | | | | | |
| Total | | | 100.0 | % | | | 100.0 | % |
| * | Percent of net assets by country as of May 31, 2018. |
| † | The MSCI All Country World Index is weighted by market capitalization. |
| Capital World Growth and Income Fund | 3 |
Inside the portfolio
The fund’s relatively light concentration of U.S.-domiciled shares and a strengthening U.S. dollar proved to be headwinds as the period came to a close, but these headwinds were offset by strong stock selection across several sectors.
The fund received some of its strongest contributions from select holdings in the consumer discretionary sector. Shares of Netflix (+87.44%), the fund’s fourth-largest position, and Amazon (+38.48%) — innovative companies that have used the internet to transform the way consumers shop and watch movies and television — both posted impressive gains. British online grocery retailer Ocado Group soared 150.1% as the company reached an agreement with U.S. supermarket giant Kroger to build and operate up to 20 distribution hubs in the U.S. Luxury goods retailer LVMH Moët Hennessy-Louise Vuitton advanced 19.24%, aided by strong demand from Chinese consumers.
Favorable stock selection among industrials and health care companies also supported the fund’s positive result. Global aerospace companies Boeing and Airbus SE both posted double-digit gains, bolstered by rising global demand for airplanes. Biotechnology companies AbbVie, the fund’s largest position, and No. 6 Amgen both posted modest increases.
Certain investments in the information technology sector detracted from returns. Shares of semiconductor maker BROADCOM INC slipped –9.31% as the company warned it would experience a larger-than-usual seasonal decline in smartphone customer sales and the U.S administration moved to block Broadcom’s $117 billion proposed acquisition of QUALCOMM. Hong Kong-based AAC Technologies Holdings (–26.05%) and No. 2 holding Samsung Electronics (–0.10%) also lost ground during
Largest equity holdings
(as of May 31, 2018)
| Company | | Country of domicile | | Percent of
net assets | | Six-month
return† |
| AbbVie | | United States | | | 2.9 | % | | | 2.08 | % |
| Samsung Electronics | | South Korea | | | 2.5 | | | | –0.10 | |
| Royal Dutch Shell* | | United Kingdom | | | 1.8 | | | | 8.64 | |
| Netflix | | United States | | | 1.6 | | | | 87.44 | |
| Prudential | | United Kingdom | | | 1.5 | | | | –4.53 | |
| Amgen | | United States | | | 1.4 | | | | 2.25 | |
| Amazon | | United States | | | 1.4 | | | | 38.48 | |
| Microsoft | | United States | | | 1.4 | | | | 17.43 | |
| Alphabet* | | United States | | | 1.3 | | | | 6.16 | |
| Vale | | Brazil | | | 1.2 | | | | 26.83 | |
| * | Six-month return for Royal Dutch Shell and Alphabet represents Class A shares only. |
| † | Returns shown are on a share price basis. |
| 4 | Capital World Growth and Income Fund |
the period. However, Microsoft (+17.43%) and Alphabet (+6.16%), the parent of Google, both posted gains that exceeded the broader market return.
Elsewhere among the fund’s top 10 investments, No. 3 holding Royal Dutch Shell (+8.64%) benefitted from higher oil prices, Brazilian mining company Vale rose 26.83% and insurer Prudential (–4.53%), the fund’s fifth-largest position, lost ground.
Looking forward
While there have been signs of slowing growth in some markets recently, we believe the global economic expansion can proceed for some time and we remain optimistic about the long-term outlook for equity markets. We are particularly encouraged by the strength of China’s economy and steps China’s leaders have taken to pursue more balanced growth.
That said, we believe the volatility in the early months of 2018 was overdue and a number of uncertainties remain. Valuations are stretched in some areas, particularly in the U.S., leaving equity prices vulnerable to geopolitical shocks and rising global trade tensions. We are closely monitoring developments in global trade talks. We are finding more attractive investment opportunities in Asia than in the U.S. or Europe, including select financial services companies that are positioned to benefit from rising demand among Asian consumers.
As always, we remain focused on the long term picture, and we believe, therefore, that we are well positioned to tolerate periods of short term market volatility and even use them as buying opportunities.
We thank you for your continued support of Capital World Growth and Income Fund and look forward to reporting to you at the close of the fiscal year.
Cordially,

Mark E. Denning
President

Michael Cohen
Vice President
July 11, 2018
For current information about the fund, visit americanfunds.com.
| Capital World Growth and Income Fund | 5 |
| Summary investment portfolio May 31, 2018 | unaudited |
| | |
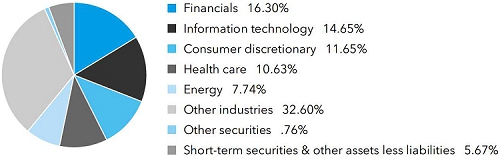
| Industry sector diversification | Percent of net assets |
| Country diversification by domicile | | Percent of
net assets | |
| United States | | | 34.90 | % |
| Eurozone* | | | 13.27 | |
| United Kingdom | | | 11.55 | |
| China | | | 5.83 | |
| South Korea | | | 5.64 | |
| Japan | | | 5.09 | |
| Switzerland | | | 3.26 | |
| Hong Kong | | | 3.03 | |
| Canada | | | 2.43 | |
| Other countries | | | 8.67 | |
| Bonds, notes & other debt instruments, short-term securities & other assets less liabilities | | | 6.33 | |
| * | Countries using the euro as a common currency; those represented in the fund’s portfolio are Belgium, Finland, France, Germany, Ireland, Italy, the Netherlands, Portugal and Spain. |
| Common stocks 93.57% | | Shares | | | Value
(000) | |
| Financials 16.30% | | | | | | |
| Prudential PLC1 | | | 61,782,299 | | | $ | 1,483,905 | |
| China Construction Bank Corp., Class H1 | | | 1,094,552,000 | | | | 1,102,462 | |
| HDFC Bank Ltd.1 | | | 25,338,610 | | | | 840,680 | |
| HDFC Bank Ltd. (ADR) | | | 540,900 | | | | 57,563 | |
| Barclays PLC1 | | | 330,771,594 | | | | 868,572 | |
| AIA Group Ltd.1 | | | 91,051,696 | | | | 830,842 | |
| Bank of China Ltd., Class H1 | | | 1,306,461,535 | | | | 678,336 | |
| Zurich Insurance Group AG1 | | | 2,232,339 | | | | 663,007 | |
| KB Financial Group Inc.1 | | | 12,728,814 | | | | 612,273 | |
| Banco Santander, SA1 | | | 105,424,155 | | | | 565,603 | |
| Other securities | | | | | | | 8,491,065 | |
| | | | | | | | 16,194,308 | |
| | | | | | | | | |
| Information technology 14.65% | | | | | | | | |
| Samsung Electronics Co., Ltd.1 | | | 53,026,225 | | | | 2,489,108 | |
| Samsung Electronics Co., Ltd., nonvoting preferred1 | | | 447,450 | | | | 16,779 | |
| Microsoft Corp. | | | 13,844,700 | | | | 1,368,410 | |
| 6 | Capital World Growth and Income Fund |
| | | Shares | | | Value
(000) | |
| Alphabet Inc., Class A2 | | | 706,480 | | | $ | 777,128 | |
| Alphabet Inc., Class C2 | | | 516,667 | | | | 560,578 | |
| Intel Corp. | | | 19,500,700 | | | | 1,076,439 | |
| Broadcom Inc. | | | 3,783,558 | | | | 953,721 | |
| SK hynix, Inc.1 | | | 8,149,500 | | | | 702,564 | |
| Tencent Holdings Ltd.1 | | | 13,053,400 | | | | 657,991 | |
| Micron Technology, Inc.2 | | | 11,125,000 | | | | 640,689 | |
| Texas Instruments Inc. | | | 5,116,885 | | | | 572,630 | |
| Other securities | | | | | | | 4,737,900 | |
| | | | | | | | 14,553,937 | |
| | | | | | | | | |
| Consumer discretionary 11.65% | | | | | | | | |
| Netflix, Inc.2 | | | 4,636,472 | | | | 1,630,184 | |
| Amazon.com, Inc.2 | | | 842,183 | | | | 1,372,438 | |
| Hyundai Motor Co.1 | | | 6,457,655 | | | | 830,712 | |
| LVMH Moët Hennessy-Louis Vuitton SE1 | | | 2,138,700 | | | | 742,779 | |
| NIKE, Inc., Class B | | | 8,171,800 | | | | 586,735 | |
| Other securities | | | | | | | 6,409,224 | |
| | | | | | | | 11,572,072 | |
| | | | | | | | | |
| Health care 10.63% | | | | | | | | |
| AbbVie Inc. | | | 29,611,073 | | | | 2,929,720 | |
| Amgen Inc. | | | 7,774,139 | | | | 1,396,391 | |
| Novartis AG1 | | | 12,905,991 | | | | 957,542 | |
| Stryker Corp. | | | 4,442,500 | | | | 773,084 | |
| Abbott Laboratories | | | 12,017,000 | | | | 739,406 | |
| Daiichi Sankyo Co., Ltd.1 | | | 21,749,700 | | | | 696,794 | |
| UnitedHealth Group Inc. | | | 2,329,100 | | | | 562,501 | |
| Other securities | | | | | | | 2,501,014 | |
| | | | | | | | 10,556,452 | |
| | | | | | | | | |
| Energy 7.74% | | | | | | | | |
| Royal Dutch Shell PLC, Class B1 | | | 29,029,700 | | | | 1,033,415 | |
| Royal Dutch Shell PLC, Class A1 | | | 20,119,110 | | | | 697,476 | |
| Royal Dutch Shell PLC, Class B (ADR) | | | 344,800 | | | | 24,940 | |
| Royal Dutch Shell PLC, Class A (ADR) | | | 45,689 | | | | 3,179 | |
| Royal Dutch Shell PLC, Class A (EUR denominated)1 | | | 15,502 | | | | 539 | |
| TOTAL SA1 | | | 12,842,637 | | | | 780,501 | |
| Canadian Natural Resources, Ltd. (CAD denominated) | | | 19,592,448 | | | | 678,316 | |
| Canadian Natural Resources, Ltd. | | | 1,467,000 | | | | 50,700 | |
| BP PLC1 | | | 81,560,778 | | | | 625,039 | |
| Other securities | | | | | | | 3,794,698 | |
| | | | | | | | 7,688,803 | |
| | | | | | | | | |
| Consumer staples 6.58% | | | | | | | | |
| British American Tobacco PLC1 | | | 17,195,830 | | | | 884,594 | |
| British American Tobacco PLC (ADR) | | | 4,457,483 | | | | 228,223 | |
| Imperial Brands PLC1 | | | 26,100,178 | | | | 940,461 | |
| Altria Group, Inc. | | | 13,455,500 | | | | 750,010 | |
| Nestlé SA1 | | | 9,003,052 | | | | 678,563 | |
| Pernod Ricard SA1 | | | 3,643,993 | | | | 613,847 | |
| Capital World Growth and Income Fund | 7 |
| Common stocks (continued) | | Shares | | | Value
(000) | |
| Consumer staples (continued) | | | | | | |
| Philip Morris International Inc. | | | 7,132,100 | | | $ | 567,287 | |
| Other securities | | | | | | | 1,875,691 | |
| | | | | | | | 6,538,676 | |
| | | | | | | | | |
| Industrials 6.57% | | | | | | | | |
| Airbus SE, non-registered shares1 | | | 7,296,798 | | | | 837,258 | |
| Other securities | | | | | | | 5,694,975 | |
| | | | | | | | 6,532,233 | |
| | | | | | | | | |
| Utilities 4.67% | | | | | | | | |
| ENGIE SA1 | | | 35,039,763 | | | | 557,443 | |
| ENGIE SA, bonus shares1 | | | 19,221,899 | | | | 305,799 | |
| Gas Natural SDG, SA1 | | | 25,306,000 | | | | 620,133 | |
| Other securities | | | | | | | 3,160,661 | |
| | | | | | | | 4,644,036 | |
| | | | | | | | | |
| Materials 4.60% | | | | | | | | |
| Vale SA, ordinary nominative | | | 51,612,611 | | | | 701,695 | |
| Vale SA, ordinary nominative (ADR) | | | 38,377,864 | | | | 521,939 | |
| Rio Tinto PLC1 | | | 18,220,575 | | | | 1,027,351 | |
| Other securities | | | | | | | 2,315,854 | |
| | | | | | | | 4,566,839 | |
| | | | | | | | | |
| Telecommunication services 2.76% | | | | | | | | |
| Verizon Communications Inc. | | | 19,068,310 | | | | 908,986 | |
| Nippon Telegraph and Telephone Corp.1 | | | 14,693,000 | | | | 688,039 | |
| Other securities | | | | | | | 1,143,299 | |
| | | | | | | | 2,740,324 | |
| | | | | | | | | |
| Real estate 2.70% | | | | | | | | |
| Other securities | | | | | | | 2,686,374 | |
| | | | | | | | | |
| Miscellaneous 4.72% | | | | | | | | |
| Other common stocks in initial period of acquisition | | | | | | | 4,687,738 | |
| | | | | | | | | |
| Total common stocks (cost: $70,101,923,000) | | | | | | | 92,961,792 | |
| | | | | | | | | |
| Convertible stocks 0.10% | | | | | | | | |
| Energy 0.04% | | | | | | | | |
| Other securities | | | | | | | 38,902 | |
| | | | | | | | | |
| Miscellaneous 0.06% | | | | | | | | |
| Other convertible stocks in initial period of acquisition | | | | | | | 63,777 | |
| | | | | | | | | |
| Total convertible stocks (cost: $111,388,000) | | | | | | | 102,679 | |
| | | | | | | | | |
| Bonds, notes & other debt instruments 0.66% | | Principal amount
(000) | | | | | |
| Bonds & notes of governments & government agencies outside the U.S. 0.32% | | | | | | | | |
| Other securities | | | | | | | 321,371 | |
| 8 | Capital World Growth and Income Fund |
| | | Principal amount | | | Value | |
| | | (000) | | | (000) | |
| Corporate bonds & notes 0.31% | | | | | | | | |
| Other securities | | | | | | $ | 307,887 | |
| | | | | | | | | |
| U.S. Treasury bonds & notes 0.03% | | | | | | | | |
| U.S. Treasury 0.03% | | | | | | | | |
| Other securities | | | | | | | 29,963 | |
| | | | | | | | | |
| Total bonds, notes & other debt instruments (cost: $664,025,000) | | | | | | | 659,221 | |
| | | | | | | | | |
| Short-term securities 5.41% | | | | | | | | |
| Federal Home Loan Bank 1.63%–1.90% due 6/4/2018–9/5/2018 | | $ | 1,408,700 | | | | 1,405,771 | |
| Novartis Finance Corp. 1.82%–1.88% due 6/5/2018–6/12/20183 | | | 65,000 | | | | 64,971 | |
| U.S. Treasury Bills 1.56%–1.89% due 6/14/2018–8/30/2018 | | | 827,800 | | | | 825,484 | |
| Other securities | | | | | | | 3,073,650 | |
| | | | | | | | | |
| Total short-term securities (cost: $5,369,862,000) | | | | | | | 5,369,876 | |
| Total investment securities 99.74% (cost: $76,247,198,000) | | | | | | | 99,093,568 | |
| Other assets less liabilities 0.26% | | | | | | | 255,097 | |
| | | | | | | | | |
| Net assets 100.00% | | | | | | $ | 99,348,665 | |
This summary investment portfolio is designed to streamline the report and help investors better focus on the fund’s principal holdings. See the inside back cover for details on how to obtain a complete schedule of portfolio holdings.
As permitted by U.S. Securities and Exchange Commission regulations, “Miscellaneous” securities include holdings in their first year of acquisition that have not previously been publicly disclosed.
“Other securities” includes all issues that are not disclosed separately in the summary investment portfolio.
Forward currency contracts
| Contract amount | | | | | | | | Unrealized
appreciation | |
Purchases
(000) | | | Sales
(000) | | | Counterparty | | Settlement date | | | at 5/31/2018
(000) | |
| USD | 24,920 | | | GBP | 17,739 | | | Citibank | | | 6/7/2018 | | | $ | 1,332 | |
| USD | 199,178 | | | GBP | 140,000 | | | JPMorgan Chase | | | 6/22/2018 | | | | 12,856 | |
| | | | | | | | | | | | | | | $ | 14,188 | |
| Capital World Growth and Income Fund | 9 |
Investments in affiliates
A company is an affiliate of the fund under the Investment Company Act of 1940 if the fund’s holdings in that company represent 5% or more of the outstanding voting shares. The value of the fund’s holdings in affiliated companies is included in “Other securities” under the respective industry sectors in the summary investment portfolio. Further details on these holdings and related transactions during the six months ended May 31, 2018, appear below.
| | | Beginning
shares | | | Additions | | | Reductions | | | Ending
shares | |
| Common stocks 0.82% | | | | | | | | | | | | | | | | |
| Consumer discretionary 0.50% | | | | | | | | | | | | | | | | |
| Ocado Group PLC1,2 | | | 39,080,197 | | | | 2,836,300 | | | | — | | | | 41,916,497 | |
| Greene King PLC1,4 | | | 16,165,653 | | | | — | | | | 5,505,250 | | | | 10,660,403 | |
| ProSiebenSat.1 Media SE1,4 | | | 13,255,754 | | | | — | | | | 2,486,754 | | | | 10,769,000 | |
| Telecommunication services 0.32% | | | | | | | | | | | | | | | | |
| LG Uplus Corp.1 | | | 29,169,442 | | | | — | | | | — | | | | 29,169,442 | |
| | | | Net
realized
loss
(000) | | | | Net
unrealized
appreciation
(depreciation)
(000) | | | | Dividend
income
(000) | | | | Value of
affiliates at
5/31/2018
(000) | |
| Common stocks 0.82% | | | | | | | | | | | | | | | | |
| Consumer discretionary 0.50% | | | | | | | | | | | | | | | | |
| Ocado Group PLC1,2 | | $ | — | | | $ | 295,875 | | | $ | — | | | $ | 500,460 | |
| Greene King PLC1,4 | | | (33,494 | ) | | | 42,866 | | | | 1,904 | | | | — | |
| ProSiebenSat.1 Media SE1,4 | | | (8,578 | ) | | | (6,292 | ) | | | 24,528 | | | | — | |
| | | | | | | | | | | | | | | | 500,460 | |
| Telecommunication services 0.32% | | | | | | | | | | | | | | | | |
| LG Uplus Corp.1 | | | — | | | | (58,009 | ) | | | 10,843 | | | | 315,798 | |
| Total 0.82% | | $ | (42,072 | ) | | $ | 274,440 | | | $ | 37,275 | | | $ | 816,258 | |
The following footnotes apply to either the individual securities noted or one or more of the securities aggregated and listed as a single line item.
| 1 | Valued under fair value procedures adopted by authority of the board of trustees. The total value of all such securities, including those in “Miscellaneous” and “Other securities,” was $52,100,984,000, which represented 52.44% of the net assets of the fund. This amount includes $50,861,772,000 related to certain securities trading outside the U.S. whose values were adjusted as a result of significant market movements following the close of local trading. |
| 2 | Security did not produce income during the last 12 months. |
| 3 | Acquired in a transaction exempt from registration under Rule 144A or Section 4(2) of the Securities Act of 1933. May be resold in the U.S. in transactions exempt from registration, normally to qualified institutional buyers. The total value of all such securities, including those in “Other securities,” was $2,693,801,000, which represented 2.71% of the net assets of the fund. |
| 4 | Unaffiliated issuer at 5/31/2018. |
| 10 | Capital World Growth and Income Fund |
Key to abbreviations and symbol
ADR = American Depositary Receipts
CAD = Canadian dollars
EUR = Euros
GBP = British pounds
USD/$ = U.S. dollars
See Notes to Financial Statements
| Capital World Growth and Income Fund | 11 |
Financial statements
| Statement of assets and liabilities | unaudited |
| at May 31, 2018 | (dollars in thousands) |
| Assets: | | | | | | |
| Investment securities, at value: | | | | | | | | |
| Unaffiliated issuers (cost: $75,646,105) | | $ | 98,277,310 | | | | | |
| Affiliated issuers (cost: $601,093) | | | 816,258 | | | $ | 99,093,568 | |
| Cash | | | | | | | 19,738 | |
| Cash denominated in currencies other than U.S. dollars (cost: $35,286) | | | | | | | 35,289 | |
| Unrealized appreciation on open forward currency contracts | | | | | | | 14,188 | |
| Receivables for: | | | | | | | | |
| Sales of investments | | | 105,245 | | | | | |
| Sales of fund’s shares | | | 71,657 | | | | | |
| Dividends and interest | | | 370,603 | | | | | |
| Other | | | 87 | | | | 547,592 | |
| | | | | | | | 99,710,375 | |
| Liabilities: | | | | | | | | |
| Payables for: | | | | | | | | |
| Purchases of investments | | | 185,520 | | | | | |
| Repurchases of fund’s shares | | | 67,712 | | | | | |
| Investment advisory services | | | 31,664 | | | | | |
| Services provided by related parties | | | 29,593 | | | | | |
| Trustees’ deferred compensation | | | 1,509 | | | | | |
| Non-U.S. taxes | | | 37,368 | | | | | |
| Other | | | 8,344 | | | | 361,710 | |
| Net assets at May 31, 2018 | | | | | | $ | 99,348,665 | |
| Net assets consist of: | | | | | | | | |
| Capital paid in on shares of beneficial interest | | | | | | $ | 72,784,233 | |
| Undistributed net investment income | | | | | | | 616,038 | |
| Undistributed net realized gain | | | | | | | 3,106,106 | |
| Net unrealized appreciation | | | | | | | 22,842,288 | |
| Net assets at May 31, 2018 | | | | | | $ | 99,348,665 | |
See Notes to Financial Statements
| 12 | Capital World Growth and Income Fund |
(dollars and shares in thousands, except per-share amounts)
Shares of beneficial interest issued and outstanding (no stated par value) —
unlimited shares authorized (1,925,416 total shares outstanding)
| | | | | | Shares | | | Net asset | |
| | | Net assets | | | outstanding | | | value per share | |
| Class A | | $ | 56,322,607 | | | | 1,090,575 | | | $ | 51.64 | |
| Class C | | | 2,386,595 | | | | 46,772 | | | | 51.03 | |
| Class T | | | 11 | | | | — | * | | | 51.65 | |
| Class F-1 | | | 3,876,730 | | | | 75,242 | | | | 51.52 | |
| Class F-2 | | | 8,088,308 | | | | 156,732 | | | | 51.61 | |
| Class F-3 | | | 3,000,371 | | | | 58,086 | | | | 51.65 | |
| Class 529-A | | | 3,649,704 | | | | 70,921 | | | | 51.46 | |
| Class 529-C | | | 552,249 | | | | 10,782 | | | | 51.22 | |
| Class 529-E | | | 138,768 | | | | 2,701 | | | | 51.38 | |
| Class 529-T | | | 12 | | | | — | * | | | 51.64 | |
| Class 529-F-1 | | | 160,268 | | | | 3,111 | | | | 51.52 | |
| Class R-1 | | | 224,156 | | | | 4,387 | | | | 51.09 | |
| Class R-2 | | | 876,767 | | | | 17,207 | | | | 50.95 | |
| Class R-2E | | | 58,598 | | | | 1,139 | | | | 51.42 | |
| Class R-3 | | | 1,993,419 | | | | 38,881 | | | | 51.27 | |
| Class R-4 | | | 1,878,680 | | | | 36,470 | | | | 51.51 | |
| Class R-5E | | | 28,314 | | | | 549 | | | | 51.58 | |
| Class R-5 | | | 1,285,798 | | | | 24,883 | | | | 51.67 | |
| Class R-6 | | | 14,827,310 | | | | 286,978 | | | | 51.67 | |
| * | Amount less than one thousand. |
See Notes to Financial Statements
| Capital World Growth and Income Fund | 13 |
| Statement of operations | | | unaudited | |
| for the six months ended May 31, 2018 | | | (dollars in thousands) | |
| | | | | | | | | |
| Investment income: | | | | | | | | |
| Income: | | | | | | | | |
| Dividends (net of non-U.S. taxes of $114,858; also includes $37,275 from affiliates) | | $ | 1,557,707 | | | | | |
| Interest (net of non-U.S. taxes of $357) | | | 63,857 | | | $ | 1,621,564 | |
| Fees and expenses*: | | | | | | | | |
| Investment advisory services | | | 185,101 | | | | | |
| Distribution services | | | 106,712 | | | | | |
| Transfer agent services | | | 45,179 | | | | | |
| Administrative services | | | 13,458 | | | | | |
| Reports to shareholders | | | 1,685 | | | | | |
| Registration statement and prospectus | | | 933 | | | | | |
| Trustees’ compensation | | | 275 | | | | | |
| Auditing and legal | | | 58 | | | | | |
| Custodian | | | 5,748 | | | | | |
| Other | | | 1,663 | | | | 360,812 | |
| Net investment income | | | | | | | 1,260,752 | |
| | | | | | | | | |
| Net realized gain and unrealized depreciation: | | | | | | | | |
| Net realized gain (loss) on: | | | | | | | | |
| Investments: | | | | | | | | |
| Unaffiliated issuers | | | 3,202,539 | | | | | |
| Affiliated issuers | | | (42,072 | ) | | | | |
| Forward currency contracts | | | (14,857 | ) | | | | |
| Currency transactions | | | (5,833 | ) | | | 3,139,777 | |
| Net unrealized (depreciation) appreciation on: | | | | | | | | |
| Investments (net of non-U.S. taxes of $16,686): | | | | | | | | |
| Unaffiliated issuers | | | (1,806,813 | ) | | | | |
| Affiliated issuers | | | 274,440 | | | | | |
| Forward currency contracts | | | 19,480 | | | | | |
| Currency translations | | | (2,749 | ) | | | (1,515,642 | ) |
| Net realized gain and unrealized depreciation | | | | | | | 1,624,135 | |
| Net increase in net assets resulting from operations | | | | | | $ | 2,884,887 | |
| * | Additional information related to class-specific fees and expenses is included in the Notes to Financial Statements. |
See Notes to Financial Statements
| 14 | Capital World Growth and Income Fund |
Statements of changes in net assets
(dollars in thousands)
| | | Six months ended | | | Year ended | |
| | | May 31, 2018* | | | November 30, 2017 | |
| Operations: | | | | | | | | |
| Net investment income | | $ | 1,260,752 | | | $ | 1,729,554 | |
| Net realized gain | | | 3,139,777 | | | | 4,902,858 | |
| Net unrealized (depreciation) appreciation | | | (1,515,642 | ) | | | 13,132,052 | |
| Net increase in net assets resulting from operations | | | 2,884,887 | | | | 19,764,464 | |
| |
| Dividends and distributions paid to shareholders: | | | | | | | | |
| Dividends from net investment income | | | (726,550 | ) | | | (1,969,024 | ) |
| Distributions from net realized gain on investments | | | (4,607,704 | ) | | | (2,239,604 | ) |
| Total dividends and distributions paid to shareholders | | | (5,334,254 | ) | | | (4,208,628 | ) |
| |
| Net capital share transactions | | | 4,387,303 | | | | 805,149 | |
| |
| Total increase in net assets | | | 1,937,936 | | | | 16,360,985 | |
| |
| Net assets: | | | | | | | | |
| Beginning of period | | | 97,410,729 | | | | 81,049,744 | |
| End of period (including undistributed net investment income: $616,038 and $81,836, respectively) | | $ | 99,348,665 | | | $ | 97,410,729 | |
See Notes to Financial Statements
| Capital World Growth and Income Fund | 15 |
| Notes to financial statements | unaudited |
1. Organization
Capital World Growth and Income Fund (the “fund”) is registered under the Investment Company Act of 1940 as an open-end, diversified management investment company. The fund seeks long-term growth of capital while providing current income.
The fund has 19 share classes consisting of six retail share classes (Classes A, C, T, F-1, F-2 and F-3), five 529 college savings plan share classes (Classes 529-A, 529-C, 529-E, 529-T and 529-F-1) and eight retirement plan share classes (Classes R-1, R-2, R-2E, R-3, R-4, R-5E, R-5 and R-6). The 529 college savings plan share classes can be used to save for college education. The retirement plan share classes are generally offered only through eligible employer-sponsored retirement plans. The fund’s share classes are described further in the following table:
| Share class | | Initial sales
charge | | Contingent deferred sales
charge upon redemption | | Conversion feature | |
| Classes A and 529-A | | Up to 5.75% | | None (except 1% for certain redemptions within 18 months of purchase without an initial sales charge) | | None | |
| Class C | | None | | 1% for redemptions within one year of purchase | | Class C converts to Class F-1 after 10 years | |
| Class 529-C | | None | | 1% for redemptions within one year of purchase | | Class 529-C converts to Class 529-A after 10 years | |
| Class 529-E | | None | | None | | None | |
| Classes T and 529-T* | | Up to 2.50% | | None | | None | |
| Classes F-1, F-2, F-3 and 529-F-1 | | None | | None | | None | |
| Classes R-1, R-2, R-2E, R-3, R-4, R-5E, R-5 and R-6 | | None | | None | | None | |
| * | Class T and 529-T shares are not available for purchase. |
Holders of all share classes have equal pro rata rights to the assets, dividends and liquidation proceeds of the fund. Each share class has identical voting rights, except for the exclusive right to vote on matters affecting only its class. Share classes have different fees and expenses (“class-specific fees and expenses”), primarily due to different arrangements for distribution, transfer agent and administrative services. Differences in class-specific fees and expenses will result in differences in net investment income and, therefore, the payment of different per-share dividends by each share class.
2. Significant accounting policies
The fund is an investment company that applies the accounting and reporting guidance issued in Topic 946 by the U.S. Financial Accounting Standards Board. The fund’s financial statements have been prepared to comply with U.S. generally accepted accounting
| 16 | Capital World Growth and Income Fund |
principles (“U.S. GAAP”). These principles require the fund’s investment adviser to make estimates and assumptions that affect reported amounts and disclosures. Actual results could differ from those estimates. Subsequent events, if any, have been evaluated through the date of issuance in the preparation of the financial statements. The fund follows the significant accounting policies described in this section, as well as the valuation policies described in the next section on valuation.
Security transactions and related investment income — Security transactions are recorded by the fund as of the date the trades are executed with brokers. Realized gains and losses from security transactions are determined based on the specific identified cost of the securities. In the event a security is purchased with a delayed payment date, the fund will segregate liquid assets sufficient to meet its payment obligations. Dividend income is recognized on the ex-dividend date and interest income is recognized on an accrual basis. Market discounts, premiums and original issue discounts on fixed-income securities are amortized daily over the expected life of the security.
Class allocations — Income, fees and expenses (other than class-specific fees and expenses) and realized and unrealized gains and losses are allocated daily among the various share classes based on their relative net assets. Class-specific fees and expenses, such as distribution, transfer agent and administrative services, are charged directly to the respective share class.
Dividends and distributions to shareholders — Dividends and distributions to shareholders are recorded on the ex-dividend date.
Currency translation — Assets and liabilities, including investment securities, denominated in currencies other than U.S. dollars are translated into U.S. dollars at the exchange rates supplied by one or more pricing vendors on the valuation date. Purchases and sales of investment securities and income and expenses are translated into U.S. dollars at the exchange rates on the dates of such transactions. The effects of changes in exchange rates on investment securities are included with the net realized gain or loss and net unrealized appreciation or depreciation on investments in the fund’s statement of operations. The realized gain or loss and unrealized appreciation or depreciation resulting from all other transactions denominated in currencies other than U.S. dollars are disclosed separately.
| Capital World Growth and Income Fund | 17 |
3. Valuation
Capital Research and Management Company (“CRMC”), the fund’s investment adviser, values the fund’s investments at fair value as defined by U.S. GAAP. The net asset value of each share class of the fund is generally determined as of approximately 4:00 p.m. New York time each day the New York Stock Exchange is open.
Methods and inputs — The fund’s investment adviser uses the following methods and inputs to establish the fair value of the fund’s assets and liabilities. Use of particular methods and inputs may vary over time based on availability and relevance as market and economic conditions evolve.
Equity securities are generally valued at the official closing price of, or the last reported sale price on, the exchange or market on which such securities are traded, as of the close of business on the day the securities are being valued or, lacking any sales, at the last available bid price. Prices for each security are taken from the principal exchange or market on which the security trades.
Fixed-income securities, including short-term securities, are generally valued at prices obtained from one or more pricing vendors. Vendors value such securities based on one or more of the inputs described in the following table. The table provides examples of inputs that are commonly relevant for valuing particular classes of fixed-income securities in which the fund is authorized to invest. However, these classifications are not exclusive, and any of the inputs may be used to value any other class of fixed-income security.
| Fixed-income class | Examples of standard inputs |
| All | Benchmark yields, transactions, bids, offers, quotations from dealers and trading systems, new issues, spreads and other relationships observed in the markets among comparable securities; and proprietary pricing models such as yield measures calculated using factors such as cash flows, financial or collateral performance and other reference data (collectively referred to as “standard inputs”) |
| Corporate bonds & notes; convertible securities | Standard inputs and underlying equity of the issuer |
| Bonds & notes of governments & government agencies | Standard inputs and interest rate volatilities |
| Mortgage-backed; asset-backed obligations | Standard inputs and cash flows, prepayment information, default rates, delinquency and loss assumptions, collateral characteristics, credit enhancements and specific deal information |
When the fund’s investment adviser deems it appropriate to do so (such as when vendor prices are unavailable or deemed to be not representative), fixed-income securities will be valued in good faith at the mean quoted bid and ask prices that are reasonably and timely available (or bid prices, if ask prices are not available) or at prices for securities of comparable maturity, quality and type.
| 18 | Capital World Growth and Income Fund |
Securities with both fixed-income and equity characteristics, or equity securities traded principally among fixed-income dealers, are generally valued in the manner described for either equity or fixed-income securities, depending on which method is deemed most appropriate by the fund’s investment adviser. Forward currency contracts are valued at the mean of representative quoted bid and ask prices, generally based on prices supplied by one or more pricing vendors.
Securities and other assets for which representative market quotations are not readily available or are considered unreliable by the fund’s investment adviser are fair valued as determined in good faith under fair valuation guidelines adopted by authority of the fund’s board of trustees as further described. The investment adviser follows fair valuation guidelines, consistent with U.S. Securities and Exchange Commission rules and guidance, to consider relevant principles and factors when making fair value determinations. The investment adviser considers relevant indications of value that are reasonably and timely available to it in determining the fair value to be assigned to a particular security, such as the type and cost of the security; contractual or legal restrictions on resale of the security; relevant financial or business developments of the issuer; actively traded similar or related securities; conversion or exchange rights on the security; related corporate actions; significant events occurring after the close of trading in the security; and changes in overall market conditions. In addition, the closing prices of equity securities that trade in markets outside U.S. time zones may be adjusted to reflect significant events that occur after the close of local trading but before the net asset value of each share class of the fund is determined. Fair valuations and valuations of investments that are not actively trading involve judgment and may differ materially from valuations that would have been used had greater market activity occurred.
Processes and structure — The fund’s board of trustees has delegated authority to the fund’s investment adviser to make fair value determinations, subject to board oversight. The investment adviser has established a Joint Fair Valuation Committee (the “Fair Valuation Committee”) to administer, implement and oversee the fair valuation process, and to make fair value decisions. The Fair Valuation Committee regularly reviews its own fair value decisions, as well as decisions made under its standing instructions to the investment adviser’s valuation teams. The Fair Valuation Committee reviews changes in fair value measurements from period to period and may, as deemed appropriate, update the fair valuation guidelines to better reflect the results of back testing and address new or evolving issues. The Fair Valuation Committee reports any changes to the fair valuation guidelines to the board of trustees. The fund’s board and audit committee also regularly review reports that describe fair value determinations and methods.
The fund’s investment adviser has also established a Fixed-Income Pricing Review Group to administer and oversee the fixed-income valuation process, including the use of fixed-income pricing vendors. This group regularly reviews pricing vendor information and market data. Pricing decisions, processes and controls over security valuation are also subject to additional internal reviews, including an annual control self-evaluation program facilitated by the investment adviser’s compliance group.
| Capital World Growth and Income Fund | 19 |
Classifications — The fund’s investment adviser classifies the fund’s assets and liabilities into three levels based on the inputs used to value the assets or liabilities. Level 1 values are based on quoted prices in active markets for identical securities. Level 2 values are based on significant observable market inputs, such as quoted prices for similar securities and quoted prices in inactive markets. Certain securities trading outside the U.S. may transfer between Level 1 and Level 2 due to valuation adjustments resulting from significant market movements following the close of local trading. Level 3 values are based on significant unobservable inputs that reflect the investment adviser’s determination of assumptions that market participants might reasonably use in valuing the securities. The valuation levels are not necessarily an indication of the risk or liquidity associated with the underlying investment. For example, U.S. government securities are reflected as Level 2 because the inputs used to determine fair value may not always be quoted prices in an active market. The following tables present the fund’s valuation levels as of May 31, 2018 (dollars in thousands):
| | | Investment securities | |
| | | Level 1 | | | Level 2* | | | Level 3 | | | Total | |
| Assets: | | | | | | | | | | | | | | | | |
| Common stocks: | | | | | | | | | | | | | | | | |
| Financials | | $ | 3,000,189 | | | $ | 13,194,119 | | | $ | — | | | $ | 16,194,308 | |
| Information technology | | | 8,322,174 | | | | 6,231,763 | | | | — | | | | 14,553,937 | |
| Consumer discretionary | | | 6,022,979 | | | | 5,549,093 | | | | — | | | | 11,572,072 | |
| Health care | | | 8,363,982 | | | | 2,192,470 | | | | — | | | | 10,556,452 | |
| Energy | | | 4,144,886 | | | | 3,543,917 | | | | — | | | | 7,688,803 | |
| Consumer staples | | | 2,072,458 | | | | 4,466,218 | | | | — | | | | 6,538,676 | |
| Industrials | | | 3,220,826 | | | | 3,311,407 | | | | — | | | | 6,532,233 | |
| Utilities | | | 749,946 | | | | 3,894,090 | | | | — | | | | 4,644,036 | |
| Materials | | | 1,719,547 | | | | 2,847,292 | | | | — | | | | 4,566,839 | |
| Telecommunication services | | | 1,036,607 | | | | 1,703,717 | | | | — | | | | 2,740,324 | |
| Real estate | | | 508,637 | | | | 2,177,737 | | | | — | | | | 2,686,374 | |
| Miscellaneous | | | 1,718,963 | | | | 2,968,775 | | | | — | | | | 4,687,738 | |
| Convertible stocks | | | 82,293 | | | | 20,386 | | | | — | | | | 102,679 | |
| Bonds, notes & other debt instruments | | | — | | | | 659,221 | | | | — | | | | 659,221 | |
| Short-term securities | | | — | | | | 5,369,876 | | | | — | | | | 5,369,876 | |
| Total | | $ | 40,963,487 | | | $ | 58,130,081 | | | $ | — | | | $ | 99,093,568 | |
| | | | | | | | | | | | | | | | | |
| | | Other investments† | |
| | | Level 1 | | | Level 2 | | | Level 3 | | | Total | |
| Assets: | | | | | | | | | | | | | | | | |
| Unrealized appreciation on open forward currency contracts | | $ | — | | | $ | 14,188 | | | $ | — | | | $ | 14,188 | |
| * | Securities with a value of $50,861,772,000, which represented 51.20% of the net assets of the fund, were classified as Level 2 due to significant market movements following the close of local trading. |
| † | Forward currency contracts are not included in the investment portfolio. |
| 20 | Capital World Growth and Income Fund |
4. Risk factors
Investing in the fund may involve certain risks including, but not limited to, those described below.
Market conditions — The prices of, and the income generated by, the common stocks and other securities held by the fund may decline — sometimes rapidly or unpredictably — due to various factors, including events or conditions affecting the general economy or particular industries; overall market changes; local, regional or global political, social or economic instability; governmental or governmental agency responses to economic conditions; and currency exchange rate, interest rate and commodity price fluctuations.
Issuer risks — The prices of, and the income generated by, securities held by the fund may decline in response to various factors directly related to the issuers of such securities, including reduced demand for an issuer’s goods or services, poor management performance and strategic initiatives such as mergers, acquisitions or dispositions and the market response to any such initiatives.
Investing outside the U.S. — Securities of issuers domiciled outside the U.S., or with significant operations or revenues outside the U.S., may lose value because of adverse political, social, economic or market developments (including social instability, regional conflicts, terrorism and war) in the countries or regions in which the issuers operate or generate revenue. These securities may also lose value due to changes in foreign currency exchange rates against the U.S. dollar and/or currencies of other countries. Issuers of these securities may be more susceptible to actions of foreign governments, such as the imposition of price controls or punitive taxes, that could adversely impact the value of these securities. Securities markets in certain countries may be more volatile and/or less liquid than those in the U.S. Investments outside the U.S. may also be subject to different accounting practices and different regulatory, legal and reporting standards and practices, and may be more difficult to value, than those in the U.S. In addition, the value of investments outside the U.S. may be reduced by foreign taxes, including foreign withholding taxes on interest and dividends. Further, there may be increased risks of delayed settlement of securities purchased or sold by the fund. The risks of investing outside the U.S. may be heightened in connection with investments in emerging markets.
Investing in emerging markets — Investing in emerging markets may involve risks in addition to and greater than those generally associated with investing in the securities markets of developed countries. For instance, developing countries may have less developed legal and accounting systems than those in developed countries. The governments of these countries may be less stable and more likely to impose capital controls, nationalize a company or industry, place restrictions on foreign ownership and on withdrawing sale proceeds of securities from the country, and/or impose punitive taxes that could adversely affect the prices of securities. In addition, the economies of these countries may be dependent on relatively few industries that are more susceptible to local and global changes. Securities markets in these countries can also be relatively small and have substantially lower trading volumes. As a result, securities issued in these
| Capital World Growth and Income Fund | 21 |
countries may be more volatile and less liquid, and may be more difficult to value, than securities issued in countries with more developed economies and/or markets. Less certainty with respect to security valuations may lead to additional challenges and risks in calculating the fund’s net asset value. Additionally, there may be increased settlement risks for transactions in local securities.
Investing in growth-oriented stocks — Growth-oriented common stocks and other equity-type securities (such as preferred stocks, convertible preferred stocks and convertible bonds) may involve larger price swings and greater potential for loss than other types of investments.
Investing in income-oriented stocks — Income provided by the fund may be reduced by changes in the dividend policies of, and the capital resources available for dividend payments at, the companies in which the fund invests.
Management — The investment adviser to the fund actively manages the fund’s investments. Consequently, the fund is subject to the risk that the methods and analyses employed by the investment adviser in this process may not produce the desired results. This could cause the fund to lose value or its investment results to lag relevant benchmarks or other funds with similar objectives.
5. Certain investment techniques
Forward currency contracts — The fund has entered into forward currency contracts, which represent agreements to exchange currencies on specific future dates at predetermined rates. The fund’s investment adviser uses forward currency contracts to manage the fund’s exposure to changes in exchange rates. Upon entering into these contracts, risks may arise from the potential inability of counterparties to meet the terms of their contracts and from possible movements in exchange rates.
On a daily basis, the fund’s investment adviser values forward currency contracts and records unrealized appreciation or depreciation for open forward currency contracts in the fund’s statement of assets and liabilities. Realized gains or losses are recorded at the time the forward currency contract is closed or offset by another contract with the same broker for the same settlement date and currency.
Closed forward currency contracts that have not reached their settlement date are included in the respective receivables or payables for closed forward currency contracts in the fund’s statement of assets and liabilities. Net realized gains or losses from closed forward currency contracts and net unrealized appreciation or depreciation from open forward currency contracts are recorded in the fund’s statement of operations. The average month-end notional amount of open forward currency contracts while held was $260,192,000.
| 22 | Capital World Growth and Income Fund |
The following tables present the financial statement impacts resulting from the fund’s use of forward currency contracts as of, or for the six months ended, May 31, 2018 (dollars in thousands):
| | | | | Assets | | | Liabilities | |
| Contracts | | Risk type | | Location on statement of
assets and liabilities | | Value | | | Location on statement of
assets and liabilities | | Value | |
| Forward currency | | Currency | | Unrealized appreciation on open forward currency contracts | | $ | 14,188 | | | Unrealized depreciation on open forward currency contracts | | $ | — | |
| | | | | | | | | | | | | | | |
| | | | | Net realized loss | | | Net unrealized appreciation | |
| Contracts | | Risk type | | Location on statement of
operations | | Value | | | Location on statement of
operations | | Value | |
| Forward currency | | Currency | | Net realized loss on forward currency contracts | | $ | (14,857) | | | Net unrealized appreciation on forward currency contracts | | $ | 19,480 | |
Collateral — The fund participates in a collateral program due to its use of forward currency contracts that calls for the fund to either receive or pledge highly liquid assets, such as cash or U.S. government securities, as collateral based on the net gain or loss on unsettled forward currency contracts by counterparty. The purpose of the collateral is to cover potential losses that could occur in the event that either party cannot meet its contractual obligation. Non-cash collateral pledged by the fund, if any, is disclosed in the fund’s investment portfolio, and cash collateral pledged by the fund, if any, is held in a segregated account with the fund’s custodian, which is reflected as pledged cash in the fund’s statement of assets and liabilities.
Rights of offset — The fund has entered into enforceable master netting agreements with certain counterparties for forward currency contracts, where on any date amounts payable by each party to the other (in the same currency with respect to the same transaction) may be closed or offset by each party’s payment obligation. If an early termination date occurs under these agreements following an event of default or termination event, all obligations of each party to its counterparty are settled net through a single payment in a single currency (“close-out netting“). For financial reporting purposes, the fund does not offset financial assets and financial liabilities that are subject to these master netting arrangements in the statement of assets and liabilities.
| Capital World Growth and Income Fund | 23 |
The following table presents the fund’s forward currency contracts by counterparty that are subject to master netting agreements but that are not offset in the fund’s statement of assets and liabilities. The net amount column shows the impact of offsetting on the fund’s statement of assets and liabilities as of May 31, 2018, if close-out netting was exercised (dollars in thousands):
| | | Gross amounts
recognized in the | | | Gross amounts not offset in the
statement of assets and liabilities and
subject to a master netting agreement | | | | |
| | | statement of assets | | | Available | | | Non-cash | | | Cash | | | Net | |
| Counterparty | | and liabilities | | | to offset | | | collateral* | | | collateral | | | amount | |
| Assets: | | | | | | | | | | | | | | | | | | | | |
| Citibank | | $ | 1,332 | | | $ | — | | | $ | — | | | $ | (1,010 | ) | | $ | 322 | |
| JPMorgan Chase | | | 12,856 | | | | — | | | | (11,657 | ) | | | — | | | | 1,199 | |
| Total | | $ | 14,188 | | | $ | — | | | $ | (11,657 | ) | | $ | (1,010 | ) | | $ | 1,521 | |
| * | Non-cash collateral is shown on a settlement basis. |
6. Taxation and distributions
Federal income taxation — The fund complies with the requirements under Subchapter M of the Internal Revenue Code applicable to mutual funds and intends to distribute substantially all of its net taxable income and net capital gains each year. The fund is not subject to income taxes to the extent such distributions are made. Therefore, no federal income tax provision is required.
As of and during the period ended May 31, 2018, the fund did not have a liability for any unrecognized tax benefits. The fund recognizes interest and penalties, if any, related to unrecognized tax benefits as income tax expense in the statement of operations. During the period, the fund did not incur any significant interest or penalties.
The fund’s tax returns are not subject to examination by federal, state and, if applicable, non-U.S. tax authorities after the expiration of each jurisdiction’s statute of limitations, which is generally three years after the date of filing but can be extended in certain jurisdictions.
Non-U.S. taxation — Dividend and interest income are recorded net of non-U.S. taxes paid. The fund may file withholding tax reclaims in certain jurisdictions to recover a portion of amounts previously withheld. As a result of rulings from European courts, the fund filed for additional reclaims related to prior years. These reclaims are recorded when the amount is known and there are no significant uncertainties on collectability. Gains realized by the fund on the sale of securities in certain countries, if any, may be subject to non-U.S. taxes. If applicable, the fund records an estimated deferred tax liability based on unrealized gains to provide for potential non-U.S. taxes payable upon the sale of these securities.
| 24 | Capital World Growth and Income Fund |
Distributions — Distributions paid to shareholders are based on net investment income and net realized gains determined on a tax basis, which may differ from net investment income and net realized gains for financial reporting purposes. These differences are due primarily to different treatment for items such as currency gains and losses; short-term capital gains and losses; capital losses related to sales of certain securities within 30 days of purchase; unrealized appreciation of certain investments in securities outside the U.S. and cost of investments sold. The fiscal year in which amounts are distributed may differ from the year in which the net investment income and net realized gains are recorded by the fund for financial reporting purposes.
The components of distributable earnings on a tax basis are reported as of the fund’s most recent year-end. As of November 30, 2017, the components of distributable earnings on a tax basis were as follows (dollars in thousands):
| Undistributed ordinary income | | $ | 316,169 | |
| Undistributed long-term capital gains | | | 4,606,188 | |
As of May 31, 2018, the tax basis unrealized appreciation (depreciation) and cost of investments were as follows (dollars in thousands):
| Gross unrealized appreciation on investments | | $ | 26,390,268 | |
| Gross unrealized depreciation on investments | | | (3,761,566 | ) |
| Net unrealized appreciation on investments | | | 22,628,702 | |
| Cost of investments | | | 76,479,054 | |
| Capital World Growth and Income Fund | 25 |
Distributions paid were characterized for tax purposes as follows (dollars in thousands):
| | | Six months ended May 31, 2018 | | | Year ended November 30, 2017 | |
| Share class | | Ordinary
income | | | Long-term
capital gains | | | Total
dividends and
distributions
paid | | | Ordinary
income | | | Long-term
capital gains | | | Total
dividends and
distributions
paid | |
| Class A | | $ | 412,016 | | | $ | 2,675,586 | | | $ | 3,087,602 | | | $ | 1,188,285 | | | $ | 1,387,059 | | | $ | 2,575,344 | |
| Class B1 | | | | | | | | | | | | | | | 240 | | | | 1,562 | | | | 1,802 | |
| Class C | | | 8,323 | | | | 125,516 | | | | 133,839 | | | | 40,873 | | | | 80,390 | | | | 121,263 | |
| Class T2 | | | — | 3 | | | — | 3 | | | — | 3 | | | — | 3 | | | — | | | | — | 3 |
| Class F-1 | | | 26,969 | | | | 181,528 | | | | 208,497 | | | | 77,749 | | | | 91,483 | | | | 169,232 | |
| Class F-2 | | | 62,689 | | | | 340,486 | | | | 403,175 | | | | 159,998 | | | | 159,723 | | | | 319,721 | |
| Class F-34 | | | 23,821 | | | | 121,092 | | | | 144,913 | | | | 16,016 | | | | — | | | | 16,016 | |
| Class 529-A | | | 25,268 | | | | 169,951 | | | | 195,219 | | | | 67,588 | | | | 79,155 | | | | 146,743 | |
| Class 529-B1 | | | | | | | | | | | | | | | 34 | | | | 220 | | | | 254 | |
| Class 529-C | | | 1,290 | | | | 27,414 | | | | 28,704 | | | | 9,956 | | | | 18,264 | | | | 28,220 | |
| Class 529-E | | | 800 | | | | 6,539 | | | | 7,339 | | | | 2,465 | | | | 3,236 | | | | 5,701 | |
| Class 529-T2 | | | — | 3 | | | 1 | | | | 1 | | | | — | 3 | | | — | | | | — | 3 |
| Class 529-F-1 | | | 1,252 | | | | 7,127 | | | | 8,379 | | | | 3,118 | | | | 3,215 | | | | 6,333 | |
| Class R-1 | | | 779 | | | | 11,125 | | | | 11,904 | | | | 3,398 | | | | 6,189 | | | | 9,587 | |
| Class R-2 | | | 3,088 | | | | 44,360 | | | | 47,448 | | | | 13,868 | | | | 25,406 | | | | 39,274 | |
| Class R-2E | | | 273 | | | | 2,530 | | | | 2,803 | | | | 566 | | | | 461 | | | | 1,027 | |
| Class R-3 | | | 11,585 | | | | 99,799 | | | | 111,384 | | | | 38,573 | | | | 52,656 | | | | 91,229 | |
| Class R-4 | | | 13,821 | | | | 94,670 | | | | 108,491 | | | | 40,948 | | | | 48,186 | | | | 89,134 | |
| Class R-5E | | | 154 | | | | 679 | | | | 833 | | | | 254 | | | | 240 | | | | 494 | |
| Class R-5 | | | 11,170 | | | | 61,406 | | | | 72,576 | | | | 29,985 | | | | 30,978 | | | | 60,963 | |
| Class R-6 | | | 123,252 | | | | 637,895 | | | | 761,147 | | | | 275,110 | | | | 251,181 | | | | 526,291 | |
| Total | | $ | 726,550 | | | $ | 4,607,704 | | | $ | 5,334,254 | | | $ | 1,969,024 | | | $ | 2,239,604 | | | $ | 4,208,628 | |
| 1 | Class B and 529-B shares were fully liquidated on May 5, 2017. |
| 2 | Class T and 529-T shares began investment operations on April 7, 2017. |
| 3 | Amount less than one thousand. |
| 4 | Class F-3 shares began investment operations on January 27, 2017. |
| 26 | Capital World Growth and Income Fund |
7. Fees and transactions with related parties
CRMC, the fund’s investment adviser, is the parent company of American Funds Distributors,® Inc. (“AFD”), the principal underwriter of the fund’s shares, and American Funds Service Company® (“AFS”), the fund’s transfer agent. CRMC, AFD and AFS are considered related parties to the fund.
Investment advisory services — The fund has an investment advisory and service agreement with CRMC that provides for monthly fees accrued daily. These fees are based on a series of decreasing annual rates beginning with 0.600% on the first $500 million of daily net assets and decreasing to 0.350% on such assets in excess of $115 billion. For the six months ended May 31, 2018, the investment advisory services fee was $185,101,000, which was equivalent to an annualized rate of 0.371% of average daily net assets.
Class-specific fees and expenses — Expenses that are specific to individual share classes are accrued directly to the respective share class. The principal class-specific fees and expenses are further described below:
Distribution services — The fund has plans of distribution for all share classes, except Class F-2, F-3, R-5E, R-5 and R-6 shares. Under the plans, the board of trustees approves certain categories of expenses that are used to finance activities primarily intended to sell fund shares and service existing accounts. The plans provide for payments, based on an annualized percentage of average daily net assets, ranging from 0.30% to 1.00% as noted in this section. In some cases, the board of trustees has limited the amounts that may be paid to less than the maximum allowed by the plans. All share classes with a plan may use up to 0.25% of average daily net assets to pay service fees, or to compensate AFD for paying service fees, to firms that have entered into agreements with AFD to provide certain shareholder services. The remaining amounts available to be paid under each plan are paid to dealers to compensate them for their sales activities.
| Share class | | Currently approved limits | | Plan limits |
| Class A | | | 0.30 | % | | | 0.30 | % |
| Class 529-A | | | 0.30 | | | | 0.50 | |
| Classes C, 529-C and R-1 | | | 1.00 | | | | 1.00 | |
| Class R-2 | | | 0.75 | | | | 1.00 | |
| Class R-2E | | | 0.60 | | | | 0.85 | |
| Classes 529-E and R-3 | | | 0.50 | | | | 0.75 | |
| Classes T, F-1, 529-T, 529-F-1 and R-4 | | | 0.25 | | | | 0.50 | |
For Class A and 529-A shares, distribution-related expenses include the reimbursement of dealer and wholesaler commissions paid by AFD for certain shares sold without a sales charge. These share classes reimburse AFD for amounts billed within the prior 15 months but only to the extent that the overall annual expense limits are not exceeded. As of May 31, 2018, there were no unreimbursed expenses subject to reimbursement for Class A or 529-A shares.
| Capital World Growth and Income Fund | 27 |
Transfer agent services — The fund has a shareholder services agreement with AFS under which the fund compensates AFS for providing transfer agent services to each of the fund’s share classes. These services include recordkeeping, shareholder communications and transaction processing. In addition, the fund reimburses AFS for amounts paid to third parties for performing transfer agent services on behalf of fund shareholders.
Administrative services — The fund has an administrative services agreement with CRMC under which the fund compensates CRMC for providing administrative services to Class A, C, T, F, 529 and R shares. These services include, but are not limited to, coordinating, monitoring, assisting and overseeing third parties that provide services to fund shareholders. Under the agreement, Class A shares pay an annual fee of 0.01% and Class C, T, F, 529 and R shares pay an annual fee of 0.05% of their respective average daily net assets.
529 plan services — Each 529 share class is subject to service fees to compensate the Virginia College Savings Plan (“Virginia529”) for its oversight and administration of the 529 college savings plan. The quarterly fee is based on a series of decreasing annual rates beginning with 0.10% on the first $20 billion of the net assets invested in the Class 529 shares of the American Funds and decreasing to 0.03% on such assets in excess of $100 billion. The fee for any given calendar quarter is accrued and calculated on the basis of the average net assets of Class 529 shares of the American Funds for the last month of the prior calendar quarter. The fee is included in other expenses in the fund’s statement of operations. Virginia529 is not considered a related party to the fund.
| 28 | Capital World Growth and Income Fund |
For the six months ended May 31, 2018, class-specific expenses under the agreements were as follows (dollars in thousands):
| Share class | | Distribution
services | | | Transfer agent
services | | | Administrative
services | | | 529 plan
services | |
| Class A | | $69,339 | | | $30,641 | | | $2,865 | | | Not applicable | |
| Class C | | 12,789 | | | 1,396 | | | 642 | | | Not applicable | |
| Class T | | — | | | — | * | | — | * | | Not applicable | |
| Class F-1 | | 4,850 | | | 2,464 | | | 974 | | | Not applicable | |
| Class F-2 | | Not applicable | | | 3,868 | | | 1,924 | | | Not applicable | |
| Class F-3 | | Not applicable | | | 69 | | | 700 | | | Not applicable | |
| Class 529-A | | 4,153 | | | 1,729 | | | 915 | | | $1,211 | |
| Class 529-C | | 2,885 | | | 300 | | | 146 | | | 193 | |
| Class 529-E | | 346 | | | 37 | | | 35 | | | 47 | |
| Class 529-T | | — | | | — | * | | — | * | | — | * |
| Class 529-F-1 | | — | | | 74 | | | 39 | | | 52 | |
| Class R-1 | | 1,155 | | | 116 | | | 58 | | | Not applicable | |
| Class R-2 | | 3,394 | | | 1,572 | | | 228 | | | Not applicable | |
| Class R-2E | | 173 | | | 56 | | | 14 | | | Not applicable | |
| Class R-3 | | 5,199 | | | 1,540 | | | 522 | | | Not applicable | |
| Class R-4 | | 2,429 | | | 957 | | | 487 | | | Not applicable | |
| Class R-5E | | Not applicable | | | 15 | | | 6 | | | Not applicable | |
| Class R-5 | | Not applicable | | | 320 | | | 328 | | | Not applicable | |
| Class R-6 | | Not applicable | | | 25 | | | 3,575 | | | Not applicable | |
| Total class-specific expenses | | $106,712 | | | $45,179 | | | $13,458 | | | $1,503 | |
| | * | Amount less than one thousand. |
Trustees’ deferred compensation — Trustees who are unaffiliated with CRMC may elect to defer the cash payment of part or all of their compensation. These deferred amounts, which remain as liabilities of the fund, are treated as if invested in shares of the fund or other American Funds. These amounts represent general, unsecured liabilities of the fund and vary according to the total returns of the selected funds. Trustees’ compensation of $275,000 in the fund’s statement of operations reflects $232,000 in current fees (either paid in cash or deferred) and a net increase of $43,000 in the value of the deferred amounts.
Affiliated officers and trustees — Officers and certain trustees of the fund are or may be considered to be affiliated with CRMC, AFD and AFS. No affiliated officers or trustees received any compensation directly from the fund.
Security transactions with related funds — The fund may purchase from, or sell securities to, other funds managed by CRMC (or funds managed by certain affiliates of CRMC) under procedures adopted by the fund’s board of trustees. The funds involved in such transactions are considered related by virtue of having a common investment adviser (or affiliated investment advisers), common trustees and/or common officers. When such transactions occur, each transaction is executed at the current market price of the security and no brokerage commissions or fees are paid in accordance with Rule 17a-7 of the 1940 Act.
| Capital World Growth and Income Fund | 29 |
Interfund lending — Pursuant to an exemptive order issued by the SEC, the fund, along with other CRMC-managed funds (or funds managed by certain affiliates of CRMC), may participate in an interfund lending program. The program provides an alternate credit facility that permits the funds to lend or borrow cash for temporary purposes directly to or from one another, subject to the conditions of the exemptive order. The fund did not lend or borrow cash through the interfund lending program at any time during the six months ended May 31, 2018.
8. Capital share transactions
Capital share transactions in the fund were as follows (dollars and shares in thousands):
| | | Sales1 | | | Reinvestments of
dividends and
distributions | | | Repurchases1 | | | Net increase
(decrease) |
| Share class | | Amount | | | Shares | | | Amount | | | Shares | | | Amount | | | Shares | | | Amount | | | Shares | |
| | | | | | | | | | | | | | | | | | | |
| Six months ended May 31, 2018 | | | | | | | | | | | | | | | | | | |
| | | | | | | | | | | | | | | | | | | |
| Class A | | $ | 1,488,489 | | | | 28,476 | | | $ | 3,033,885 | | | | 59,557 | | | $ | (3,577,080 | ) | | | (68,518 | ) | | $ | 945,294 | | | | 19,515 | |
| Class C | | | 148,064 | | | | 2,864 | | | | 132,486 | | | | 2,632 | | | | (504,428 | ) | | | (9,764 | ) | | | (223,878 | ) | | | (4,268 | ) |
| Class T | | | — | | | | — | | | | — | | | | — | | | | — | | | | — | | | | — | | | | — | |
| Class F-1 | | | 393,156 | | | | 7,532 | | | | 203,350 | | | | 4,001 | | | | (442,502 | ) | | | (8,503 | ) | | | 154,004 | | | | 3,030 | |
| Class F-2 | | | 1,472,891 | | | | 28,222 | | | | 387,241 | | | | 7,605 | | | | (679,895 | ) | | | (13,055 | ) | | | 1,180,237 | | | | 22,772 | |
| Class F-3 | | | 641,240 | | | | 12,285 | | | | 140,422 | | | | 2,756 | | | | (249,499 | ) | | | (4,768 | ) | | | 532,163 | | | | 10,273 | |
| Class 529-A | | | 354,250 | | | | 6,756 | | | | 195,152 | | | | 3,844 | | | | (224,612 | ) | | | (4,308 | ) | | | 324,790 | | | | 6,292 | |
| Class 529-C | | | 30,982 | | | | 597 | | | | 28,698 | | | | 568 | | | | (251,456 | ) | | | (4,805 | ) | | | (191,776 | ) | | | (3,640 | ) |
| Class 529-E | | | 6,954 | | | | 134 | | | | 7,338 | | | | 145 | | | | (10,107 | ) | | | (195 | ) | | | 4,185 | | | | 84 | |
| Class 529-T | | | — | | | | — | | | | 1 | | | | — | 2 | | | — | | | | — | | | | 1 | | | | — | 2 |
| Class 529-F-1 | | | 19,615 | | | | 376 | | | | 8,367 | | | | 165 | | | | (13,322 | ) | | | (255 | ) | | | 14,660 | | | | 286 | |
| Class R-1 | | | 8,113 | | | | 156 | | | | 11,893 | | | | 236 | | | | (23,524 | ) | | | (456 | ) | | | (3,518 | ) | | | (64 | ) |
| Class R-2 | | | 86,079 | | | | 1,663 | | | | 47,412 | | | | 943 | | | | (165,107 | ) | | | (3,209 | ) | | | (31,616 | ) | | | (603 | ) |
| Class R-2E | | | 10,377 | | | | 200 | | | | 2,803 | | | | 55 | | | | (6,121 | ) | | | (118 | ) | | | 7,059 | | | | 137 | |
| Class R-3 | | | 182,851 | | | | 3,532 | | | | 111,262 | | | | 2,200 | | | | (362,631 | ) | | | (6,999 | ) | | | (68,518 | ) | | | (1,267 | ) |
| Class R-4 | | | 164,213 | | | | 3,154 | | | | 108,432 | | | | 2,134 | | | | (346,365 | ) | | | (6,687 | ) | | | (73,720 | ) | | | (1,399 | ) |
| Class R-5E | | | 15,398 | | | | 299 | | | | 833 | | | | 17 | | | | (2,008 | ) | | | (39 | ) | | | 14,223 | | | | 277 | |
| Class R-5 | | | 102,634 | | | | 1,965 | | | | 72,488 | | | | 1,423 | | | | (162,103 | ) | | | (3,103 | ) | | | 13,019 | | | | 285 | |
| Class R-6 | | | 1,538,705 | | | | 29,576 | | | | 760,929 | | | | 14,930 | | | | (508,940 | ) | | | (9,794 | ) | | | 1,790,694 | | | | 34,712 | |
| Total net increase (decrease) | | $ | 6,664,011 | | | | 127,787 | | | $ | 5,252,992 | | | | 103,211 | | | $ | (7,529,700 | ) | | | (144,576 | ) | | $ | 4,387,303 | | | | 86,422 | |
| 30 | Capital World Growth and Income Fund |
| | | Sales1 | | | Reinvestments of
dividends and
distributions | | | Repurchases1 | | | Net (decrease)
increase |
| Share class | | Amount | | | Shares | | | Amount | | | Shares | | | Amount | | | Shares | | | Amount | | | Shares | |
| | | | | | | | | | | | | | | |
| Year ended November 30, 2017 | | | | | | | | | | | | | | |
| | | | | | | | | | | | | | | |
| Class A | | $ | 2,628,362 | | | | 54,577 | | | $ | 2,524,538 | | | | 55,645 | | | $ | (8,168,557 | ) | | | (170,064 | ) | | $ | (3,015,657 | ) | | | (59,842 | ) |
| Class B3 | | | 53 | | | | 1 | | | | 1,789 | | | | 41 | | | | (76,246 | ) | | | (1,666 | ) | | | (74,404 | ) | | | (1,624 | ) |
| Class C | | | 256,113 | | | | 5,351 | | | | 119,475 | | | | 2,690 | | | | (1,120,022 | ) | | | (23,604 | ) | | | (744,434 | ) | | | (15,563 | ) |
| Class T4 | | | 10 | | | | — | 2 | | | — | | | | — | | | | — | | | | — | | | | 10 | | | | — | 2 |
| Class F-1 | | | 804,915 | | | | 16,771 | | | | 164,457 | | | | 3,633 | | | | (1,060,101 | ) | | | (21,994 | ) | | | (90,729 | ) | | | (1,590 | ) |
| Class F-2 | | | 3,353,864 | | | | 69,747 | | | | 305,902 | | | | 6,723 | | | | (3,336,739 | ) | | | (69,128 | ) | | | 323,027 | | | | 7,342 | |
| Class F-35 | | | 2,513,596 | | | | 51,259 | | | | 14,297 | | | | 285 | | | | (188,965 | ) | | | (3,731 | ) | | | 2,338,928 | | | | 47,813 | |
| Class 529-A | | | 249,031 | | | | 5,202 | | | | 146,693 | | | | 3,242 | | | | (390,242 | ) | | | (8,103 | ) | | | 5,482 | | | | 341 | |
| Class 529-B3 | | | 25 | | | | 1 | | | | 254 | | | | 6 | | | | (11,073 | ) | | | (243 | ) | | | (10,794 | ) | | | (236 | ) |
| Class 529-C | | | 55,756 | | | | 1,168 | | | | 28,193 | | | | 632 | | | | (108,029 | ) | | | (2,269 | ) | | | (24,080 | ) | | | (469 | ) |
| Class 529-E | | | 11,860 | | | | 247 | | | | 5,700 | | | | 126 | | | | (19,056 | ) | | | (397 | ) | | | (1,496 | ) | | | (24 | ) |
| Class 529-T4 | | | 10 | | | | — | 2 | | | — | 2 | | | — | 2 | | | — | | | | — | | | | 10 | | | | — | 2 |
| Class 529-F-1 | | | 27,329 | | | | 567 | | | | 6,328 | | | | 139 | | | | (22,865 | ) | | | (472 | ) | | | 10,792 | | | | 234 | |
| Class R-1 | | | 15,092 | | | | 317 | | | | 9,576 | | | | 215 | | | | (53,986 | ) | | | (1,133 | ) | | | (29,318 | ) | | | (601 | ) |
| Class R-2 | | | 149,744 | | | | 3,148 | | | | 39,230 | | | | 883 | | | | (335,416 | ) | | | (7,085 | ) | | | (146,442 | ) | | | (3,054 | ) |
| Class R-2E | | | 35,881 | | | | 753 | | | | 1,027 | | | | 22 | | | | (6,630 | ) | | | (136 | ) | | | 30,278 | | | | 639 | |
| Class R-3 | | | 429,435 | | | | 8,982 | | | | 91,068 | | | | 2,026 | | | | (664,502 | ) | | | (13,926 | ) | | | (143,999 | ) | | | (2,918 | ) |
| Class R-4 | | | 431,764 | | | | 8,942 | | | | 89,098 | | | | 1,969 | | | | (587,924 | ) | | | (12,304 | ) | | | (67,062 | ) | | | (1,393 | ) |
| Class R-5E | | | 4,896 | | | | 99 | | | | 493 | | | | 11 | | | | (1,572 | ) | | | (32 | ) | | | 3,817 | | | | 78 | |
| Class R-5 | | | 294,683 | | | | 6,118 | | | | 60,888 | | | | 1,338 | | | | (378,138 | ) | | | (7,878 | ) | | | (22,567 | ) | | | (422 | ) |
| Class R-6 | | | 3,329,787 | | | | 68,917 | | | | 526,173 | | | | 11,516 | | | | (1,392,173 | ) | | | (28,694 | ) | | | 2,463,787 | | | | 51,739 | |
| Total net increase (decrease) | | $ | 14,592,206 | | | | 302,167 | | | $ | 4,135,179 | | | | 91,142 | | | $ | (17,922,236 | ) | | | (372,859 | ) | | $ | 805,149 | | | | 20,450 | |
| | | | | | | | | | | | | | | | | | | | | | | | | | | | | | | | | |
| 1 | Includes exchanges between share classes of the fund. |
| 2 | Amount less than one thousand. |
| 3 | Class B and 529-B shares were fully liquidated on May 5, 2017. |
| 4 | Class T and 529-T shares began investment operations on April 7, 2017. |
| 5 | Class F-3 shares began investment operations on January 27, 2017. |
9. Investment transactions
The fund made purchases and sales of investment securities, excluding short-term securities and U.S. government obligations, if any, of $16,177,831,000 and $15,683,626,000, respectively, during the six months ended May 31, 2018.
| Capital World Growth and Income Fund | 31 |
Financial highlights
| | | | | | Income (loss) from investment operations1 | |
| Period ended | | Net asset
value,
beginning
of period | | | Net
investment
income2 | | | Net gains (losses)
on securities (both
realized and
unrealized) | | | Total from
investment
operations | |
| Class A: | | | | | | | | | | | | | | | | |
| 5/31/20184,5 | | $ | 53.02 | | | $ | .65 | | | $ | .86 | | | $ | 1.51 | |
| 11/30/2017 | | | 44.61 | | | | .93 | | | | 9.79 | | | | 10.72 | |
| 11/30/2016 | | | 45.34 | | | | .96 | | | | .06 | | | | 1.02 | |
| 11/30/2015 | | | 47.87 | | | | .90 | | | | (2.38 | ) | | | (1.48 | ) |
| 11/30/2014 | | | 44.68 | | | | 1.20 | | | | 3.00 | | | | 4.20 | |
| 11/30/2013 | | | 36.75 | | | | .83 | | | | 8.13 | | | | 8.96 | |
| Class C: | | | | | | | | | | | | | | | | |
| 5/31/20184,5 | | | 52.41 | | | | .43 | | | | .87 | | | | 1.30 | |
| 11/30/2017 | | | 44.12 | | | | .55 | | | | 9.66 | | | | 10.21 | |
| 11/30/2016 | | | 44.85 | | | | .61 | | | | .05 | | | | .66 | |
| 11/30/2015 | | | 47.34 | | | | .52 | | | | (2.34 | ) | | | (1.82 | ) |
| 11/30/2014 | | | 44.19 | | | | .83 | | | | 2.96 | | | | 3.79 | |
| 11/30/2013 | | | 36.36 | | | | .50 | | | | 8.05 | | | | 8.55 | |
| Class T: | | | | | | | | | | | | | | | | |
| 5/31/20184,5 | | | 53.03 | | | | .70 | | | | .87 | | | | 1.57 | |
| 11/30/20174,10 | | | 46.73 | | | | .68 | | | | 6.22 | | | | 6.90 | |
| Class F-1: | | | | | | | | | | | | | | | | |
| 5/31/20184,5 | | | 52.90 | | | | .63 | | | | .87 | | | | 1.50 | |
| 11/30/2017 | | | 44.53 | | | | .90 | | | | 9.76 | | | | 10.66 | |
| 11/30/2016 | | | 45.25 | | | | .93 | | | | .08 | | | | 1.01 | |
| 11/30/2015 | | | 47.78 | | | | .89 | | | | (2.39 | ) | | | (1.50 | ) |
| 11/30/2014 | | | 44.59 | | | | 1.21 | | | | 2.97 | | | | 4.18 | |
| 11/30/2013 | | | 36.68 | | | | .82 | | | | 8.11 | | | | 8.93 | |
| Class F-2: | | | | | | | | | | | | | | | | |
| 5/31/20184,5 | | | 52.98 | | | | .72 | | | | .86 | | | | 1.58 | |
| 11/30/2017 | | | 44.59 | | | | 1.05 | | | | 9.76 | | | | 10.81 | |
| 11/30/2016 | | | 45.33 | | | | 1.07 | | | | .05 | | | | 1.12 | |
| 11/30/2015 | | | 47.85 | | | | 1.01 | | | | (2.37 | ) | | | (1.36 | ) |
| 11/30/2014 | | | 44.67 | | | | 1.23 | | | | 3.07 | | | | 4.30 | |
| 11/30/2013 | | | 36.74 | | | | .94 | | | | 8.13 | | | | 9.07 | |
| Class F-3: | | | | | | | | | | | | | | | | |
| 5/31/20184,5 | | | 53.03 | | | | .75 | | | | .84 | | | | 1.59 | |
| 11/30/20174,11 | | | 45.54 | | | | .82 | | | | 7.54 | | | | 8.36 | |
| 32 | Capital World Growth and Income Fund |
| Dividends and distributions | | | | | | | | | | | | | | | |
Dividends
(from net
investment
income) | | | Distributions
(from capital
gains) | | | Total
dividends
and
distributions | | | Net asset
value, end
of period | | | Total
return3 | | | Net assets,
end of period
(in millions) | | | Ratio of
expenses
to average
net assets | | | Ratio of net
income
to average
net assets2 | |
| | | | | | | | | | | | | | | | | | | | | | | |
| $ | (.38 | ) | | $ | (2.51 | ) | | $ | (2.89 | ) | | $ | 51.64 | | | | 2.94 | %6 | | $ | 56,323 | | | | .75 | %7 | | | 2.50 | %7 |
| | (1.07 | ) | | | (1.24 | ) | | | (2.31 | ) | | | 53.02 | | | | 24.96 | | | | 56,786 | | | | .77 | | | | 1.93 | |
| | (1.04 | ) | | | (.71 | ) | | | (1.75 | ) | | | 44.61 | | | | 2.42 | | | | 50,454 | | | | .79 | | | | 2.20 | |
| | (1.05 | ) | | | — | | | | (1.05 | ) | | | 45.34 | | | | (3.12 | ) | | | 53,886 | | | | .77 | | | | 1.93 | |
| | (1.01 | ) | | | — | | | | (1.01 | ) | | | 47.87 | | | | 9.52 | | | | 57,559 | | | | .77 | | | | 2.59 | |
| | (1.03 | ) | | | — | | | | (1.03 | ) | | | 44.68 | | | | 24.77 | | | | 54,676 | | | | .80 | | | | 2.05 | |
| | | | | | | | | | | | | | | | | | | | | | | | | | | | | | | |
| | (.17 | ) | | | (2.51 | ) | | | (2.68 | ) | | | 51.03 | | | | 2.55 | 6 | | | 2,387 | | | | 1.54 | 7 | | | 1.65 | 7 |
| | (.68 | ) | | | (1.24 | ) | | | (1.92 | ) | | | 52.41 | | | | 23.95 | | | | 2,675 | | | | 1.56 | | | | 1.14 | |
| | (.68 | ) | | | (.71 | ) | | | (1.39 | ) | | | 44.12 | | | | 1.60 | | | | 2,938 | | | | 1.59 | | | | 1.41 | |
| | (.67 | ) | | | — | | | | (.67 | ) | | | 44.85 | | | | (3.87 | ) | | | 3,757 | | | | 1.57 | | | | 1.13 | |
| | (.64 | ) | | | — | | | | (.64 | ) | | | 47.34 | | | | 8.65 | | | | 4,582 | | | | 1.57 | | | | 1.82 | |
| | (.72 | ) | | | — | | | | (.72 | ) | | | 44.19 | | | | 23.79 | | | | 4,819 | | | | 1.60 | | | | 1.26 | |
| | | | | | | | | | | | | | | | | | | | | | | | | | | | | | | |
| | (.44 | ) | | | (2.51 | ) | | | (2.95 | ) | | | 51.65 | | | | 3.06 | 6,8 | | | — | 9 | | | .53 | 7,8 | | | 2.70 | 7,8 |
| | (.60 | ) | | | — | | | | (.60 | ) | | | 53.03 | | | | 14.86 | 6,8 | | | — | 9 | | | .56 | 7,8 | | | 2.09 | 7,8 |
| | | | | | | | | | | | | | | | | | | | | | | | | | | | | | | |
| | (.37 | ) | | | (2.51 | ) | | | (2.88 | ) | | | 51.52 | | | | 2.92 | 6 | | | 3,877 | | | | .81 | 7 | | | 2.44 | 7 |
| | (1.05 | ) | | | (1.24 | ) | | | (2.29 | ) | | | 52.90 | | | | 24.86 | | | | 3,820 | | | | .83 | | | | 1.87 | |
| | (1.02 | ) | | | (.71 | ) | | | (1.73 | ) | | | 44.53 | | | | 2.39 | | | | 3,286 | | | | .83 | | | | 2.14 | |
| | (1.03 | ) | | | — | | | | (1.03 | ) | | | 45.25 | | | | (3.17 | ) | | | 3,791 | | | | .81 | | | | 1.90 | |
| | (.99 | ) | | | — | | | | (.99 | ) | | | 47.78 | | | | 9.48 | | | | 3,861 | | | | .81 | | | | 2.62 | |
| | (1.02 | ) | | | — | | | | (1.02 | ) | | | 44.59 | | | | 24.75 | | | | 3,976 | | | | .82 | | | | 2.03 | |
| | | | | | | | | | | | | | | | | | | | | | | | | | | | | | | |
| | (.44 | ) | | | (2.51 | ) | | | (2.95 | ) | | | 51.61 | | | | 3.08 | 6 | | | 8,088 | | | | .54 | 7 | | | 2.76 | 7 |
| | (1.18 | ) | | | (1.24 | ) | | | (2.42 | ) | | | 52.98 | | | | 25.21 | | | | 7,098 | | | | .55 | | | | 2.17 | |
| | (1.15 | ) | | | (.71 | ) | | | (1.86 | ) | | | 44.59 | | | | 2.66 | | | | 5,646 | | | | .55 | | | | 2.45 | |
| | (1.16 | ) | | | — | | | | (1.16 | ) | | | 45.33 | | | | (2.90 | ) | | | 4,244 | | | | .54 | | | | 2.16 | |
| | (1.12 | ) | | | — | | | | (1.12 | ) | | | 47.85 | | | | 9.76 | | | | 4,168 | | | | .53 | | | | 2.66 | |
| | (1.14 | ) | | | — | | | | (1.14 | ) | | | 44.67 | | | | 25.13 | | | | 2,541 | | | | .54 | | | | 2.31 | |
| | | | | | | | | | | | | | | | | | | | | | | | | | | | | | | |
| | (.46 | ) | | | (2.51 | ) | | | (2.97 | ) | | | 51.65 | | | | 3.10 | 6 | | | 3,000 | | | | .44 | 7 | | | 2.87 | 7 |
| | (.87 | ) | | | — | | | | (.87 | ) | | | 53.03 | | | | 18.53 | 6 | | | 2,536 | | | | .45 | 7 | | | 1.93 | 7 |
See end of table for footnotes.
| Capital World Growth and Income Fund | 33 |
Financial highlights (continued)
| | | | | | | Income (loss) from investment operations1 | |
| Period ended | | Net asset
value,
beginning
of period | | | Net
investment
income2 | | | Net gains (losses)
on securities (both
realized and
unrealized) | | | Total from
investment
operations | |
| Class 529-A: | | | | | | | | | | | | | | | | |
| 5/31/20184,5 | | $ | 52.84 | | | $ | .63 | | | $ | .86 | | | $ | 1.49 | |
| 11/30/2017 | | | 44.48 | | | | .90 | | | | 9.74 | | | | 10.64 | |
| 11/30/2016 | | | 45.21 | | | | .92 | | | | .06 | | | | .98 | |
| 11/30/2015 | | | 47.73 | | | | .86 | | | | (2.37 | ) | | | (1.51 | ) |
| 11/30/2014 | | | 44.55 | | | | 1.15 | | | | 3.00 | | | | 4.15 | |
| 11/30/2013 | | | 36.65 | | | | .80 | | | | 8.10 | | | | 8.90 | |
| Class 529-C: | | | | | | | | | | | | | | | | |
| 5/31/20184,5 | | | 52.56 | | | | .41 | | | | .88 | | | | 1.29 | |
| 11/30/2017 | | | 44.25 | | | | .52 | | | | 9.70 | | | | 10.22 | |
| 11/30/2016 | | | 44.98 | | | | .58 | | | | .06 | | | | .64 | |
| 11/30/2015 | | | 47.49 | | | | .49 | | | | (2.35 | ) | | | (1.86 | ) |
| 11/30/2014 | | | 44.33 | | | | .79 | | | | 2.99 | | | | 3.78 | |
| 11/30/2013 | | | 36.48 | | | | .48 | | | | 8.07 | | | | 8.55 | |
| Class 529-E: | | | | | | | | | | | | | | | | |
| 5/31/20184,5 | | | 52.76 | | | | .57 | | | | .86 | | | | 1.43 | |
| 11/30/2017 | | | 44.41 | | | | .79 | | | | 9.73 | | | | 10.52 | |
| 11/30/2016 | | | 45.14 | | | | .82 | | | | .07 | | | | .89 | |
| 11/30/2015 | | | 47.65 | | | | .75 | | | | (2.36 | ) | | | (1.61 | ) |
| 11/30/2014 | | | 44.48 | | | | 1.04 | | | | 2.99 | | | | 4.03 | |
| 11/30/2013 | | | 36.59 | | | | .70 | | | | 8.10 | | | | 8.80 | |
| Class 529-T: | | | | | | | | | | | | | | | | |
| 5/31/20184,5 | | | 53.02 | | | | .69 | | | | .86 | | | | 1.55 | |
| 11/30/20174,10 | | | 46.73 | | | | .66 | | | | 6.22 | | | | 6.88 | |
| Class 529-F-1: | | | | | | | | | | | | | | | | |
| 5/31/20184,5 | | | 52.90 | | | | .69 | | | | .86 | | | | 1.55 | |
| 11/30/2017 | | | 44.52 | | | | 1.01 | | | | 9.75 | | | | 10.76 | |
| 11/30/2016 | | | 45.25 | | | | 1.02 | | | | .06 | | | | 1.08 | |
| 11/30/2015 | | | 47.78 | | | | .96 | | | | (2.37 | ) | | | (1.41 | ) |
| 11/30/2014 | | | 44.60 | | | | 1.25 | | | | 3.00 | | | | 4.25 | |
| 11/30/2013 | | | 36.68 | | | | .89 | | | | 8.12 | | | | 9.01 | |
| Class R-1: | | | | | | | | | | | | | | | | |
| 5/31/20184,5 | | | 52.48 | | | | .44 | | | | .85 | | | | 1.29 | |
| 11/30/2017 | | | 44.18 | | | | .55 | | | | 9.69 | | | | 10.24 | |
| 11/30/2016 | | | 44.91 | | | | .62 | | | | .07 | | | | .69 | |
| 11/30/2015 | | | 47.42 | | | | .54 | | | | (2.36 | ) | | | (1.82 | ) |
| 11/30/2014 | | | 44.26 | | | | .84 | | | | 2.98 | | | | 3.82 | |
| 11/30/2013 | | | 36.42 | | | | .52 | | | | 8.06 | | | | 8.58 | |
| 34 | Capital World Growth and Income Fund |
| Dividends and distributions | | | | | | | | | | | | | | | |
Dividends
(from net
investment
income) | | | Distributions
(from capital
gains) | | | Total
dividends
and
distributions | | | Net asset
value, end
of period | | | Total
return3 | | | Net assets,
end of period
(in millions) | | | Ratio of
expenses
to average
net assets | | | Ratio of net
income
to average
net assets2 | |
| | | | | | | | | | | | | | | | | | | | | | | |
| $ | (.36 | ) | | $ | (2.51 | ) | | $ | (2.87 | ) | | $ | 51.46 | | | | 2.90 | %6 | | $ | 3,650 | | | | .83 | %7 | | | 2.43 | %7 |
| | (1.04 | ) | | | (1.24 | ) | | | (2.28 | ) | | | 52.84 | | | | 24.87 | | | | 3,415 | | | | .84 | | | | 1.86 | |
| | (1.00 | ) | | | (.71 | ) | | | (1.71 | ) | | | 44.48 | | | | 2.34 | | | | 2,859 | | | | .87 | | | | 2.12 | |
| | (1.01 | ) | | | — | | | | (1.01 | ) | | | 45.21 | | | | (3.19 | ) | | | 2,936 | | | | .86 | | | | 1.84 | |
| | (.97 | ) | | | — | | | | (.97 | ) | | | 47.73 | | | | 9.43 | | | | 3,104 | | | | .86 | | | | 2.50 | |
| | (1.00 | ) | | | — | | | | (1.00 | ) | | | 44.55 | | | | 24.67 | | | | 2,853 | | | | .88 | | | | 1.97 | |
| | | | | | | | | | | | | | | | | | | | | | | | | | | | | | | |
| | (.12 | ) | | | (2.51 | ) | | | (2.63 | ) | | | 51.22 | | | | 2.53 | 6 | | | 552 | | | | 1.60 | 7 | | | 1.60 | 7 |
| | (.67 | ) | | | (1.24 | ) | | | (1.91 | ) | | | 52.56 | | | | 23.90 | | | | 758 | | | | 1.61 | | | | 1.09 | |
| | (.66 | ) | | | (.71 | ) | | | (1.37 | ) | | | 44.25 | | | | 1.55 | | | | 659 | | | | 1.64 | | | | 1.35 | |
| | (.65 | ) | | | — | | | | (.65 | ) | | | 44.98 | | | | (3.95 | ) | | | 701 | | | | 1.64 | | | | 1.07 | |
| | (.62 | ) | | | — | | | | (.62 | ) | | | 47.49 | | | | 8.57 | | | | 756 | | | | 1.64 | | | | 1.73 | |
| | (.70 | ) | | | — | | | | (.70 | ) | | | 44.33 | | | | 23.69 | | | | 709 | | | | 1.66 | | | | 1.19 | |
| | | | | | | | | | | | | | | | | | | | | | | | | | | | | | | |
| | (.30 | ) | | | (2.51 | ) | | | (2.81 | ) | | | 51.38 | | | | 2.80 | 6 | | | 139 | | | | 1.05 | 7 | | | 2.20 | 7 |
| | (.93 | ) | | | (1.24 | ) | | | (2.17 | ) | | | 52.76 | | | | 24.58 | | | | 138 | | | | 1.06 | | | | 1.63 | |
| | (.91 | ) | | | (.71 | ) | | | (1.62 | ) | | | 44.41 | | | | 2.11 | | | | 117 | | | | 1.09 | | | | 1.90 | |
| | (.90 | ) | | | — | | | | (.90 | ) | | | 45.14 | | | | (3.41 | ) | | | 122 | | | | 1.09 | | | | 1.61 | |
| | (.86 | ) | | | — | | | | (.86 | ) | | | 47.65 | | | | 9.16 | | | | 130 | | | | 1.09 | | | | 2.27 | |
| | (.91 | ) | | | — | | | | (.91 | ) | | | 44.48 | | | | 24.36 | | | | 122 | | | | 1.11 | | | | 1.74 | |
| | | | | | | | | | | | | | | | | | | | | | | | | | | | | | | |
| | (.42 | ) | | | (2.51 | ) | | | (2.93 | ) | | | 51.64 | | | | 3.02 | 6,8 | | | — | 9 | | | .59 | 7,8 | | | 2.65 | 7,8 |
| | (.59 | ) | | | — | | | | (.59 | ) | | | 53.02 | | | | 14.81 | 6,8 | | | — | 9 | | | .61 | 7,8 | | | 2.03 | 7,8 |
| | | | | | | | | | | | | | | | | | | | | | | | | | | | | | | |
| | (.42 | ) | | | (2.51 | ) | | | (2.93 | ) | | | 51.52 | | | | 3.03 | 6 | | | 160 | | | | .60 | 7 | | | 2.67 | 7 |
| | (1.14 | ) | | | (1.24 | ) | | | (2.38 | ) | | | 52.90 | | | | 25.14 | | | | 149 | | | | .62 | | | | 2.08 | |
| | (1.10 | ) | | | (.71 | ) | | | (1.81 | ) | | | 44.52 | | | | 2.56 | | | | 115 | | | | .64 | | | | 2.34 | |
| | (1.12 | ) | | | — | | | | (1.12 | ) | | | 45.25 | | | | (2.99 | ) | | | 113 | | | | .64 | | | | 2.07 | |
| | (1.07 | ) | | | — | | | | (1.07 | ) | | | 47.78 | | | | 9.66 | | | | 114 | | | | .64 | | | | 2.71 | |
| | (1.09 | ) | | | — | | | | (1.09 | ) | | | 44.60 | | | | 24.98 | | | | 100 | | | | .66 | | | | 2.19 | |
| | | | | | | | | | | | | | | | | | | | | | | | | | | | | | | |
| | (.17 | ) | | | (2.51 | ) | | | (2.68 | ) | | | 51.09 | | | | 2.54 | 6 | | | 224 | | | | 1.53 | 7 | | | 1.70 | 7 |
| | (.70 | ) | | | (1.24 | ) | | | (1.94 | ) | | | 52.48 | | | | 23.99 | | | | 234 | | | | 1.54 | | | | 1.16 | |
| | (.71 | ) | | | (.71 | ) | | | (1.42 | ) | | | 44.18 | | | | 1.65 | | | | 223 | | | | 1.55 | | | | 1.44 | |
| | (.69 | ) | | | — | | | | (.69 | ) | | | 44.91 | | | | (3.87 | ) | | | 257 | | | | 1.54 | | | | 1.16 | |
| | (.66 | ) | | | — | | | | (.66 | ) | | | 47.42 | | | | 8.69 | | | | 302 | | | | 1.54 | | | | 1.83 | |
| | (.74 | ) | | | — | | | | (.74 | ) | | | 44.26 | | | | 23.84 | | | | 302 | | | | 1.55 | | | | 1.30 | |
See end of table for footnotes.
| Capital World Growth and Income Fund | 35 |
Financial highlights (continued)
| | | | | | Income (loss) from investment operations1 | |
| Period ended | | Net asset
value,
beginning
of period | | | Net
investment
income2 | | | Net gains (losses)
on securities (both
realized and
unrealized) | | | Total from
investment
operations | |
| Class R-2: | | | | | | | | | | | | | | | | |
| 5/31/20184,5 | | $ | 52.34 | | | $ | .44 | | | $ | .85 | | | $ | 1.29 | |
| 11/30/2017 | | | 44.07 | | | | .55 | | | | 9.66 | | | | 10.21 | |
| 11/30/2016 | | | 44.81 | | | | .62 | | | | .06 | | | | .68 | |
| 11/30/2015 | | | 47.31 | | | | .56 | | | | (2.35 | ) | | | (1.79 | ) |
| 11/30/2014 | | | 44.17 | | | | .85 | | | | 2.96 | | | | 3.81 | |
| 11/30/2013 | | | 36.35 | | | | .54 | | | | 8.04 | | | | 8.58 | |
| Class R-2E: | | | | | | | | | | | | | | | | |
| 5/31/20184,5 | | | 52.80 | | | | .53 | | | | .86 | | | | 1.39 | |
| 11/30/2017 | | | 44.47 | | | | .69 | | | | 9.75 | | | | 10.44 | |
| 11/30/2016 | | | 45.25 | | | | .73 | | | | .10 | | | | .83 | |
| 11/30/2015 | | | 47.84 | | | | .72 | | | | (2.39 | ) | | | (1.67 | ) |
| 11/30/20144,12 | | | 47.71 | | | | .12 | | | | .21 | | | | .33 | |
| Class R-3: | | | | | | | | | | | | | | | | |
| 5/31/20184,5 | | | 52.65 | | | | .55 | | | | .87 | | | | 1.42 | |
| 11/30/2017 | | | 44.32 | | | | .77 | | | | 9.72 | | | | 10.49 | |
| 11/30/2016 | | | 45.05 | | | | .82 | | | | .06 | | | | .88 | |
| 11/30/2015 | | | 47.57 | | | | .75 | | | | (2.37 | ) | | | (1.62 | ) |
| 11/30/2014 | | | 44.40 | | | | 1.05 | | | | 2.98 | | | | 4.03 | |
| 11/30/2013 | | | 36.53 | | | | .71 | | | | 8.08 | | | | 8.79 | |
| Class R-4: | | | | | | | | | | | | | | | | |
| 5/31/20184,5 | | | 52.89 | | | | .63 | | | | .87 | | | | 1.50 | |
| 11/30/2017 | | | 44.51 | | | | .92 | | | | 9.76 | | | | 10.68 | |
| 11/30/2016 | | | 45.24 | | | | .95 | | | | .06 | | | | 1.01 | |
| 11/30/2015 | | | 47.76 | | | | .89 | | | | (2.37 | ) | | | (1.48 | ) |
| 11/30/2014 | | | 44.58 | | | | 1.19 | | | | 2.99 | | | | 4.18 | |
| 11/30/2013 | | | 36.67 | | | | .83 | | | | 8.11 | | | | 8.94 | |
| Class R-5E: | | | | | | | | | | | | | | | | |
| 5/31/20184,5 | | | 52.96 | | | | .75 | | | | .81 | | | | 1.56 | |
| 11/30/2017 | | | 44.59 | | | | 1.01 | | | | 9.78 | | | | 10.79 | |
| 11/30/2016 | | | 45.34 | | | | 1.01 | | | | .06 | | | | 1.07 | |
| 11/30/20154,13 | | | 45.70 | | | | .02 | | | | (.38 | ) | | | (.36 | ) |
| Class R-5: | | | | | | | | | | | | | | | | |
| 5/31/20184,5 | | | 53.05 | | | | .72 | | | | .86 | | | | 1.58 | |
| 11/30/2017 | | | 44.64 | | | | 1.07 | | | | 9.78 | | | | 10.85 | |
| 11/30/2016 | | | 45.37 | | | | 1.10 | | | | .04 | | | | 1.14 | |
| 11/30/2015 | | | 47.90 | | | | 1.03 | | | | (2.38 | ) | | | (1.35 | ) |
| 11/30/2014 | | | 44.70 | | | | 1.35 | | | | 2.99 | | | | 4.34 | |
| 11/30/2013 | | | 36.77 | | | | .96 | | | | 8.12 | | | | 9.08 | |
| 36 | Capital World Growth and Income Fund |
| Dividends and distributions | | | | | | | | | | | | | | | | |
Dividends
(from net
investment
income) | | | Distributions
(from capital
gains) | | | Total
dividends
and
distributions | | | Net asset
value, end
of period | | | Total
return3 | | | Net assets,
end of period
(in millions) | | | Ratio of
expenses
to average
net assets | | | Ratio of net
income
to average
net assets2 | |
| | | | | | | | | | | | | | | | | | | | | | | |
| $ | (.17 | ) | | $ | (2.51 | ) | | $ | (2.68 | ) | | $ | 50.95 | | | | 2.55 | %6 | | $ | 877 | | | | 1.53 | %7 | | | 1.70 | %7 |
| | (.70 | ) | | | (1.24 | ) | | | (1.94 | ) | | | 52.34 | | | | 23.98 | | | | 932 | | | | 1.54 | | | | 1.16 | |
| | (.71 | ) | | | (.71 | ) | | | (1.42 | ) | | | 44.07 | | | | 1.63 | | | | 920 | | | | 1.54 | | | | 1.44 | |
| | (.71 | ) | | | — | | | | (.71 | ) | | | 44.81 | | | | (3.82 | ) | | | 1,061 | | | | 1.50 | | | | 1.20 | |
| | (.67 | ) | | | — | | | | (.67 | ) | | | 47.31 | | | | 8.69 | | | | 1,244 | | | | 1.52 | | | | 1.86 | |
| | (.76 | ) | | | — | | | | (.76 | ) | | | 44.17 | | | | 23.88 | | | | 1,277 | | | | 1.51 | | | | 1.35 | |
| | | | | | | | | | | | | | | | | | | | | | | | | | | | | | | |
| | (.26 | ) | | | (2.51 | ) | | | (2.77 | ) | | | 51.42 | | | | 2.71 | 6 | | | 59 | | | | 1.24 | 7 | | | 2.04 | 7 |
| | (.87 | ) | | | (1.24 | ) | | | (2.11 | ) | | | 52.80 | | | | 24.34 | | | | 53 | | | | 1.24 | | | | 1.42 | |
| | (.90 | ) | | | (.71 | ) | | | (1.61 | ) | | | 44.47 | | | | 1.98 | | | | 16 | | | | 1.23 | | | | 1.68 | |
| | (.92 | ) | | | — | | | | (.92 | ) | | | 45.25 | | | | (3.54 | ) | | | 1 | | | | 1.19 | | | | 1.54 | |
| | (.20 | ) | | | — | | | | (.20 | ) | | | 47.84 | | | | .70 | 6,8 | | | — | 9 | | | .30 | 6,8 | | | .26 | 6,8 |
| | | | | | | | | | | | | | | | | | | | | | | | | | | | | | | |
| | (.29 | ) | | | (2.51 | ) | | | (2.80 | ) | | | 51.27 | | | | 2.78 | 6 | | | 1,993 | | | | 1.08 | 7 | | | 2.14 | 7 |
| | (.92 | ) | | | (1.24 | ) | | | (2.16 | ) | | | 52.65 | | | | 24.54 | | | | 2,114 | | | | 1.09 | | | | 1.60 | |
| | (.90 | ) | | | (.71 | ) | | | (1.61 | ) | | | 44.32 | | | | 2.10 | | | | 1,909 | | | | 1.10 | | | | 1.88 | |
| | (.90 | ) | | | — | | | | (.90 | ) | | | 45.05 | | | | (3.43 | ) | | | 2,246 | | | | 1.09 | | | | 1.61 | |
| | (.86 | ) | | | — | | | | (.86 | ) | | | 47.57 | | | | 9.18 | | | | 2,629 | | | | 1.09 | | | | 2.28 | |
| | (.92 | ) | | | — | | | | (.92 | ) | | | 44.40 | | | | 24.41 | | | | 2,651 | | | | 1.09 | | | | 1.76 | |
| | | | | | | | | | | | | | | | | | | | | | | | | | | | | | | |
| | (.37 | ) | | | (2.51 | ) | | | (2.88 | ) | | | 51.51 | | | | 2.93 | 6 | | | 1,879 | | | | .79 | 7 | | | 2.44 | 7 |
| | (1.06 | ) | | | (1.24 | ) | | | (2.30 | ) | | | 52.89 | | | | 24.93 | | | | 2,003 | | | | .79 | | | | 1.90 | |
| | (1.03 | ) | | | (.71 | ) | | | (1.74 | ) | | | 44.51 | | | | 2.40 | | | | 1,748 | | | | .80 | | | | 2.18 | |
| | (1.04 | ) | | | — | | | | (1.04 | ) | | | 45.24 | | | | (3.13 | ) | | | 2,003 | | | | .79 | | | | 1.91 | |
| | (1.00 | ) | | | — | | | | (1.00 | ) | | | 47.76 | | | | 9.49 | | | | 2,275 | | | | .79 | | | | 2.59 | |
| | (1.03 | ) | | | — | | | | (1.03 | ) | | | 44.58 | | | | 24.78 | | | | 2,380 | | | | .80 | | | | 2.07 | |
| | | | | | | | | | | | | | | | | | | | | | | | | | | | | | | |
| | (.43 | ) | | | (2.51 | ) | | | (2.94 | ) | | | 51.58 | | | | 3.04 | 6 | | | 28 | | | | .57 | 7 | | | 2.89 | 7 |
| | (1.18 | ) | | | (1.24 | ) | | | (2.42 | ) | | | 52.96 | | | | 25.17 | | | | 14 | | | | .58 | | | | 2.09 | |
| | (1.11 | ) | | | (.71 | ) | | | (1.82 | ) | | | 44.59 | | | | 2.54 | | | | 9 | | | | .66 | | | | 2.31 | |
| | — | | | | — | | | | — | | | | 45.34 | | | | (.79 | )6 | | | — | 9 | | | .02 | 6 | | | .04 | 6 |
| | | | | | | | | | | | | | | | | | | | | | | | | | | | | | | |
| | (.45 | ) | | | (2.51 | ) | | | (2.96 | ) | | | 51.67 | | | | 3.08 | 6 | | | 1,286 | | | | .49 | 7 | | | 2.75 | 7 |
| | (1.20 | ) | | | (1.24 | ) | | | (2.44 | ) | | | 53.05 | | | | 25.29 | | | | 1,305 | | | | .49 | | | | 2.21 | |
| | (1.16 | ) | | | (.71 | ) | | | (1.87 | ) | | | 44.64 | | | | 2.71 | | | | 1,117 | | | | .50 | | | | 2.51 | |
| | (1.18 | ) | | | — | | | | (1.18 | ) | | | 45.37 | | | | (2.84 | ) | | | 1,393 | | | | .49 | | | | 2.21 | |
| | (1.14 | ) | | | — | | | | (1.14 | ) | | | 47.90 | | | | 9.83 | | | | 1,509 | | | | .49 | | | | 2.93 | |
| | (1.15 | ) | | | — | | | | (1.15 | ) | | | 44.70 | | | | 25.15 | | | | 1,615 | | | | .49 | | | | 2.37 | |
See end of table for footnotes.
| Capital World Growth and Income Fund | 37 |
Financial highlights (continued)
| | | | | | Income (loss) from investment operations1 | |
| Period ended | | Net asset
value,
beginning
of period | | | Net
investment
income2 | | | Net gains (losses)
on securities (both
realized and
unrealized) | | | Total from
investment
operations | |
| Class R-6: | | | | | | | | | | | | | | | | |
| 5/31/20184,5 | | $ | 53.04 | | | $ | .74 | | | $ | .86 | | | $ | 1.60 | |
| 11/30/2017 | | | 44.64 | | | | 1.08 | | | | 9.79 | | | | 10.87 | |
| 11/30/2016 | | | 45.37 | | | | 1.10 | | | | .07 | | | | 1.17 | |
| 11/30/2015 | | | 47.89 | | | | 1.05 | | | | (2.37 | ) | | | (1.32 | ) |
| 11/30/2014 | | | 44.70 | | | | 1.31 | | | | 3.04 | | | | 4.35 | |
| 11/30/2013 | | | 36.77 | | | | .97 | | | | 8.13 | | | | 9.10 | |
| | | Six months ended | | Year ended November 30 |
| | | May 31, 20184,5,6 | | 2017 | | 2016 | | 2015 | | 2014 | | 2013 |
| Portfolio turnover rate for all share classes | | | 17 | % | | | 35 | % | | | 35 | % | | | 35 | % | | | 36 | % | | | 24 | % |
See Notes to Financial Statements
| 38 | Capital World Growth and Income Fund |
| Dividends and distributions | | | | | | | | | | | | | | | | |
Dividends
(from net
investment income) | | | Distributions
(from capital
gains) | | | Total
dividends
and
distributions | | | Net asset
value, end
of period | | | Total
return3 | | | Net assets,
end of period
(in millions) | | | Ratio of
expenses
to average
net assets | | | Ratio of net
income
to average
net assets2 | |
| | | | | | | | | | | | | | | | | | | | | | | |
| $ | (.46 | ) | | $ | (2.51 | ) | | $ | (2.97 | ) | | $ | 51.67 | | | | 3.12 | %6 | | $ | 14,827 | | | | .44 | %7 | | | 2.84 | %7 |
| | (1.23 | ) | | | (1.24 | ) | | | (2.47 | ) | | | 53.04 | | | | 25.33 | | | | 13,381 | | | | .45 | | | | 2.23 | |
| | (1.19 | ) | | | (.71 | ) | | | (1.90 | ) | | | 44.64 | | | | 2.77 | | | | 8,951 | | | | .45 | | | | 2.52 | |
| | (1.20 | ) | | | — | | | | (1.20 | ) | | | 45.37 | | | | (2.78 | ) | | | 7,390 | | | | .45 | | | | 2.26 | |
| | (1.16 | ) | | | — | | | | (1.16 | ) | | | 47.89 | | | | 9.87 | | | | 6,334 | | | | .44 | | | | 2.83 | |
| | (1.17 | ) | | | — | | | | (1.17 | ) | | | 44.70 | | | | 25.21 | | | | 4,418 | | | | .45 | | | | 2.38 | |
| 1 | Based on average shares outstanding. |
| 2 | For the year ended November 30, 2014, this column reflects the impact of a corporate action event that resulted in a one-time increase to net investment income. If the corporate action event had not occurred, the Class A net investment income per share and ratio of net income to average net assets would have been lower by $.34 and .73 percentage points, respectively. The impact to the other share classes would have been similar. |
| 3 | Total returns exclude any applicable sales charges, including contingent deferred sales charges. |
| 4 | Based on operations for a period that is less than a full year. |
| 5 | Unaudited. |
| 6 | Not annualized. |
| 7 | Annualized. |
| 8 | All or a significant portion of assets in this class consisted of seed capital invested by CRMC and/or its affiliates. Fees for distribution services are not charged or accrued on these seed capital assets. If such fees were paid by the fund on seed capital assets, fund expenses would have been higher and net income and total return would have been lower. |
| 9 | Amount less than $1 million. |
| 10 | Class T and 529-T shares began investment operations on April 7, 2017. |
| 11 | Class F-3 shares began investment operations on January 27, 2017. |
| 12 | Class R-2E shares began investment operations on August 29, 2014. |
| 13 | Class R-5E shares began investment operations on November 20, 2015. |
| Capital World Growth and Income Fund | 39 |
As a fund shareholder, you incur two types of costs: (1) transaction costs, such as initial sales charges on purchase payments and contingent deferred sales charges on redemptions (loads), and (2) ongoing costs, including management fees, distribution and service (12b-1) fees, and other expenses. This example is intended to help you understand your ongoing costs (in dollars) of investing in the fund so you can compare these costs with the ongoing costs of investing in other mutual funds. The example is based on an investment of $1,000 invested at the beginning of the period and held for the entire six-month period (December 1, 2017, through May 31, 2018).
Actual expenses:
The first line of each share class in the table on the following page provides information about actual account values and actual expenses. You may use the information in this line, together with the amount you invested, to estimate the expenses that you paid over the period. Simply divide your account value by $1,000 (for example, an $8,600 account value divided by $1,000 = 8.6), then multiply the result by the number in the first line under the heading titled “Expenses paid during period” to estimate the expenses you paid on your account during this period.
Hypothetical example for comparison purposes:
The second line of each share class in the table on the following page provides information about hypothetical account values and hypothetical expenses based on the actual expense ratio for the share class and an assumed rate of return of 5.00% per year before expenses, which is not the actual return of the share class. The hypothetical account values and expenses may not be used to estimate the actual ending account balance or expenses you paid for the period. You may use this information to compare the ongoing costs of investing in the fund and other funds. To do so, compare this 5.00% hypothetical example with the 5.00% hypothetical examples that appear in the shareholder reports of the other funds.
Notes:
Retirement plan participants may be subject to certain fees charged by the plan sponsor, and Class F-1, F-2, F-3 and 529-F-1 shareholders may be subject to fees charged by financial intermediaries, typically ranging from 0.75% to 1.50% of assets annually depending on services offered. You can estimate the impact of these fees by adding the amount of the fees to the total estimated expenses you paid on your account during the period as calculated above. In addition, your ending account value would be lower by the amount of these fees.
Note that the expenses shown in the table on the following page are meant to highlight your ongoing costs only and do not reflect any transactional costs, such as sales charges (loads). Therefore, the second line of each share class in the table is useful in comparing ongoing costs only and will not help you determine the relative total costs of owning different funds. In addition, if these transactional costs were included, your costs would have been higher.
| 40 | Capital World Growth and Income Fund |
| | | Beginning
account value
12/1/2017 | | | Ending
account value
5/31/2018 | | | Expenses paid
during period* | | | Annualized
expense ratio | |
| Class A – actual return | | $ | 1,000.00 | | | $ | 1,029.44 | | | $ | 3.79 | | | | .75 | % |
| Class A – assumed 5% return | | | 1,000.00 | | | | 1,021.19 | | | | 3.78 | | | | .75 | |
| Class C – actual return | | | 1,000.00 | | | | 1,025.50 | | | | 7.78 | | | | 1.54 | |
| Class C – assumed 5% return | | | 1,000.00 | | | | 1,017.25 | | | | 7.75 | | | | 1.54 | |
| Class T – actual return | | | 1,000.00 | | | | 1,030.57 | | | | 2.68 | | | | .53 | |
| Class T – assumed 5% return | | | 1,000.00 | | | | 1,022.29 | | | | 2.67 | | | | .53 | |
| Class F-1 – actual return | | | 1,000.00 | | | | 1,029.22 | | | | 4.10 | | | | .81 | |
| Class F-1 – assumed 5% return | | | 1,000.00 | | | | 1,020.89 | | | | 4.08 | | | | .81 | |
| Class F-2 – actual return | | | 1,000.00 | | | | 1,030.75 | | | | 2.73 | | | | .54 | |
| Class F-2 – assumed 5% return | | | 1,000.00 | | | | 1,022.24 | | | | 2.72 | | | | .54 | |
| Class F-3 – actual return | | | 1,000.00 | | | | 1,031.04 | | | | 2.23 | | | | .44 | |
| Class F-3 – assumed 5% return | | | 1,000.00 | | | | 1,022.74 | | | | 2.22 | | | | .44 | |
| Class 529-A – actual return | | | 1,000.00 | | | | 1,028.99 | | | | 4.20 | | | | .83 | |
| Class 529-A – assumed 5% return | | | 1,000.00 | | | | 1,020.79 | | | | 4.18 | | | | .83 | |
| Class 529-C – actual return | | | 1,000.00 | | | | 1,025.27 | | | | 8.08 | | | | 1.60 | |
| Class 529-C – assumed 5% return | | | 1,000.00 | | | | 1,016.95 | | | | 8.05 | | | | 1.60 | |
| Class 529-E – actual return | | | 1,000.00 | | | | 1,028.01 | | | | 5.31 | | | | 1.05 | |
| Class 529-E – assumed 5% return | | | 1,000.00 | | | | 1,019.70 | | | | 5.29 | | | | 1.05 | |
| Class 529-T – actual return | | | 1,000.00 | | | | 1,030.22 | | | | 2.99 | | | | .59 | |
| Class 529-T – assumed 5% return | | | 1,000.00 | | | | 1,021.99 | | | | 2.97 | | | | .59 | |
| Class 529-F-1 – actual return | | | 1,000.00 | | | | 1,030.30 | | | | 3.04 | | | | .60 | |
| Class 529-F-1 – assumed 5% return | | | 1,000.00 | | | | 1,021.94 | | | | 3.02 | | | | .60 | |
| Class R-1 – actual return | | | 1,000.00 | | | | 1,025.43 | | | | 7.73 | | | | 1.53 | |
| Class R-1 – assumed 5% return | | | 1,000.00 | | | | 1,017.30 | | | | 7.70 | | | | 1.53 | |
| Class R-2 – actual return | | | 1,000.00 | | | | 1,025.47 | | | | 7.73 | | | | 1.53 | |
| Class R-2 – assumed 5% return | | | 1,000.00 | | | | 1,017.30 | | | | 7.70 | | | | 1.53 | |
| Class R-2E – actual return | | | 1,000.00 | | | | 1,027.11 | | | | 6.27 | | | | 1.24 | |
| Class R-2E – assumed 5% return | | | 1,000.00 | | | | 1,018.75 | | | | 6.24 | | | | 1.24 | |
| Class R-3 – actual return | | | 1,000.00 | | | | 1,027.76 | | | | 5.46 | | | | 1.08 | |
| Class R-3 – assumed 5% return | | | 1,000.00 | | | | 1,019.55 | | | | 5.44 | | | | 1.08 | |
| Class R-4 – actual return | | | 1,000.00 | | | | 1,029.27 | | | | 4.00 | | | | .79 | |
| Class R-4 – assumed 5% return | | | 1,000.00 | | | | 1,020.99 | | | | 3.98 | | | | .79 | |
| Class R-5E – actual return | | | 1,000.00 | | | | 1,030.36 | | | | 2.89 | | | | .57 | |
| Class R-5E – assumed 5% return | | | 1,000.00 | | | | 1,022.09 | | | | 2.87 | | | | .57 | |
| Class R-5 – actual return | | | 1,000.00 | | | | 1,030.76 | | | | 2.48 | | | | .49 | |
| Class R-5 – assumed 5% return | | | 1,000.00 | | | | 1,022.49 | | | | 2.47 | | | | .49 | |
| Class R-6 – actual return | | | 1,000.00 | | | | 1,031.23 | | | | 2.23 | | | | .44 | |
| Class R-6 – assumed 5% return | | | 1,000.00 | | | | 1,022.74 | | | | 2.22 | | | | .44 | |
| * | The “expenses paid during period” are equal to the “annualized expense ratio,” multiplied by the average account value over the period, multiplied by the number of days in the period, and divided by 365 (to reflect the one-half year period). |
| Capital World Growth and Income Fund | 41 |
This page was intentionally left blank.
| 42 | Capital World Growth and Income Fund |
This page was intentionally left blank.
| Capital World Growth and Income Fund | 43 |
Offices of the fund and of the investment adviser
Capital Research and Management Company
333 South Hope Street
Los Angeles, CA 90071-1406
6455 Irvine Center Drive
Irvine, CA 92618-4518
Transfer agent for shareholder accounts
American Funds Service Company
(Write to the address near you.)
P.O. Box 6007
Indianapolis, IN 46206-6007
P.O. Box 2280
Norfolk, VA 23501-2280
Custodian of assets
JPMorgan Chase Bank
270 Park Avenue
New York, NY 10017-2070
Counsel
O’Melveny & Myers LLP
400 South Hope Street
Los Angeles, CA 90071-2899
Independent registered public accounting firm
PricewaterhouseCoopers LLP
601 South Figueroa Street
Los Angeles, CA 90017-3874
Principal underwriter
American Funds Distributors, Inc.
333 South Hope Street
Los Angeles, CA 90071-1406
| 44 | Capital World Growth and Income Fund |
Investors should carefully consider investment objectives, risks, charges and expenses. This and other important information is contained in the fund prospectus and summary prospectus, which can be obtained from your financial professional and should be read carefully before investing. You may also call American Funds Service Company (AFS) at (800) 421-4225 or visit the American Funds website at americanfunds.com. Fund shares offered through American Funds Distributors, Inc.
“American Funds Proxy Voting Procedures and Principles” — which describes how we vote proxies relating to portfolio securities — is available on the American Funds website or upon request by calling AFS. The fund files its proxy voting record with the U.S. Securities and Exchange Commission (SEC) for the 12 months ended June 30 by August 31. The proxy voting record is available free of charge on the SEC website at sec.gov and on the American Funds website.
A complete May 31, 2018, portfolio of Capital World Growth and Income Fund’s investments is available free of charge by calling AFS or visiting the SEC website (where it is part of Form N-CSR).
Capital World Growth and Income Fund files a complete list of its portfolio holdings with the SEC for the first and third quarters of each fiscal year on Form N-Q. This filing is available free of charge on the SEC website. You may also review or, for a fee, copy this filing at the SEC’s Public Reference Room in Washington, D.C. Additional information regarding the operation of the Public Reference Room may be obtained by calling the SEC’s Office of Investor Education and Advocacy at (800) SEC-0330. Additionally, the list of portfolio holdings is available by calling AFS.
This report is for the information of shareholders of Capital World Growth and Income Fund, but it also may be used as sales literature when preceded or accompanied by the current prospectus or summary prospectus, which gives details about charges, expenses, investment objectives and operating policies of the fund. If used as sales material after September 30, 2018, this report must be accompanied by an American Funds statistical update for the most recently completed calendar quarter.
MSCI has not approved, reviewed or produced this report, makes no express or implied warranties or representations and is not liable whatsoever for any data in the report. You may not redistribute the MSCI data or use it as a basis for other indices or investment products.
American Funds from Capital Group
The Capital Advantage®
Since 1931, American Funds, part of Capital Group, has helped investors pursue long-term investment success. Our consistent approach — in combination with The Capital SystemSM — has resulted in a superior long-term track record.
| | Aligned with investor success |
| | We base our decisions on a long-term perspective, which we believe aligns our goals with the interests of our clients. Our portfolio managers average 27 years of investment experience, including 22 years at our company, reflecting a career commitment to our long-term approach.1 |
| | |
| | The Capital System |
| | The Capital System combines individual accountability with teamwork. Funds using The Capital System are divided into portions that are managed independently by investment professionals with diverse backgrounds, ages and investment approaches. An extensive global research effort is the backbone of our system. |
| | |
| | American Funds’ superior long-term track record |
| | Equity funds have beaten their Lipper peer indexes in 92% of 10-year periods and 99% of 20-year periods. Fixed income funds have beaten their Lipper indexes in 77% of 10-year periods and 80% of 20-year periods.2 Fund management fees have been among the lowest in the industry.3 |
| | 1 | Portfolio manager experience as of December 31, 2017. |
| | 2 | Based on Class F-2 share results for rolling periods through December 31, 2017. Periods covered are the shorter of the fund’s lifetime or since the comparable Lipper index inception date (except Capital Income Builder and SMALLCAP World Fund, for which the Lipper average was used). Expenses differ for each share class, so results will vary. Class F-2 shares were first offered on August 1, 2008. Class F-2 share results prior to the date of first sale are hypothetical based on Class A share results without a sales charge, adjusted for typical estimated expenses. Results for certain funds with an inception date after August 1, 2008, also include hypothetical returns because those funds’ Class F-2 shares sold after the funds’ date of first offering. Please see americanfunds.com for more information on specific expense adjustments and the actual dates of first sale. |
| | 3 | On average, our management fees were in the lowest quintile 71% of the time, based on the 20-year period ended December 31, 2017, versus comparable Lipper categories, excluding funds of funds. |

ITEM 2 – Code of Ethics
Not applicable for filing of semi-annual reports to shareholders.
ITEM 3 – Audit Committee Financial Expert
Not applicable for filing of semi-annual reports to shareholders.
ITEM 4 – Principal Accountant Fees and Services
Not applicable for filing of semi-annual reports to shareholders.
ITEM 5 – Audit Committee of Listed Registrants
Not applicable to this Registrant, insofar as the Registrant is not a listed issuer as defined in Rule 10A-3 under the Securities Exchange Act of 1934.
ITEM 6 – Schedule of Investments
Capital World Growth and Income Fund®
Investment portfolio
May 31, 2018
Common stocks 93.57%
Financials 16.30% | Shares | Value
(000) |
| Prudential PLC1 | 61,782,299 | $1,483,905 |
| China Construction Bank Corp., Class H1 | 1,094,552,000 | 1,102,462 |
| HDFC Bank Ltd.1 | 25,338,610 | 840,680 |
| HDFC Bank Ltd. (ADR) | 540,900 | 57,563 |
| Barclays PLC1 | 330,771,594 | 868,572 |
| AIA Group Ltd.1 | 91,051,696 | 830,842 |
| Bank of China Ltd., Class H1 | 1,306,461,535 | 678,336 |
| Zurich Insurance Group AG1 | 2,232,339 | 663,007 |
| KB Financial Group Inc.1 | 12,728,814 | 612,273 |
| Banco Santander, SA1 | 105,424,155 | 565,603 |
| Kotak Mahindra Bank Ltd.1 | 28,150,731 | 555,775 |
| Wells Fargo & Co. | 8,979,300 | 484,792 |
| Insurance Australia Group Ltd.1 | 72,205,756 | 442,701 |
| UBS Group AG1 | 27,361,166 | 411,150 |
| DBS Group Holdings Ltd1 | 19,353,219 | 408,223 |
| BNP Paribas SA1 | 6,319,530 | 394,021 |
| Agricultural Bank of China Ltd., Class H1 | 755,324,000 | 388,066 |
| PNC Financial Services Group, Inc. | 2,570,067 | 368,573 |
| Société Générale1 | 7,951,991 | 344,048 |
| Intesa Sanpaolo SpA1 | 103,084,388 | 305,855 |
| American International Group, Inc. | 5,581,423 | 294,643 |
| Lloyds Banking Group PLC1 | 335,446,748 | 281,923 |
| Sampo Oyj, Class A1 | 5,395,288 | 264,968 |
| JPMorgan Chase & Co. | 2,441,900 | 261,308 |
| Principal Financial Group, Inc. | 4,430,000 | 247,194 |
| Hana Financial Group Inc.1 | 5,820,560 | 223,996 |
| Julius Baer Group Ltd.1 | 3,183,351 | 185,236 |
| Standard Life Aberdeen PLC1 | 39,549,981 | 183,960 |
| HSBC Holdings PLC (HKD denominated)1 | 17,959,200 | 173,695 |
| ABN AMRO Group NV, depository receipts1 | 6,407,032 | 166,630 |
| CME Group Inc., Class A | 991,800 | 161,564 |
| Deutsche Boerse AG1 | 1,206,469 | 161,430 |
| CIT Group Inc. | 3,075,000 | 153,535 |
| Credit Suisse Group AG1 | 9,845,000 | 149,557 |
| Bank of Montreal | 1,842,961 | 142,763 |
| Itaú Unibanco Holding SA, preferred nominative (ADR) | 11,167,000 | 128,979 |
| Royal Bank of Canada | 1,695,000 | 128,112 |
| Bankia, SA1 | 31,272,478 | 119,259 |
| M&T Bank Corp. | 688,000 | 118,391 |
| BOC Hong Kong (Holdings) Ltd.1 | 18,710,000 | 93,635 |
| Fairfax Financial Holdings Ltd., subordinate voting (CAD denominated) | 166,100 | 93,262 |
| Bank of Ireland Group PLC1 | 7,755,610 | 64,285 |
Banco Santander (México), S.A., Institución de Banca Múltiple,
Grupo Financiero Santander México, Class B (ADR) | 9,750,000 | 63,082 |
| Sony Financial Holdings Inc.1 | 2,983,300 | 54,639 |
| Grupo Financiero Inbursa, SAB de CV | 37,819,423 | 53,416 |
| Tokio Marine Holdings, Inc.1 | 955,500 | 45,849 |
Capital World Growth and Income Fund — Page 1 of 10
Common stocks
Financials (continued) | Shares | Value
(000) |
| Resona Holdings, Inc.1 | 6,708,900 | $37,277 |
| Regions Financial Corp. | 1,700,000 | 31,008 |
| Citigroup Inc. | 450,000 | 30,010 |
| Housing Development Finance Corp. Ltd.1 | 918,492 | 24,897 |
| Sumitomo Mitsui Financial Group, Inc.1 | 578,948 | 23,911 |
| Moody’s Corp. | 139,500 | 23,795 |
| Banco Bilbao Vizcaya Argentaria, SA1 | 3,241,565 | 22,130 |
| Janus Henderson Group PLC | 704,740 | 21,769 |
| Akbank TAS1 | 12,030,000 | 21,323 |
| Intercontinental Exchange, Inc. | 292,700 | 20,750 |
| Huntington Bancshares Inc. | 1,385,000 | 20,595 |
| Invesco Ltd. | 746,300 | 20,389 |
| Aon PLC, Class A | 143,500 | 20,071 |
| Marsh & McLennan Companies, Inc. | 245,600 | 19,739 |
| BB&T Corp. | 370,000 | 19,425 |
| Chubb Ltd. | 118,300 | 15,461 |
| | | 16,194,308 |
| Information technology 14.65% | | |
| Samsung Electronics Co., Ltd.1 | 53,026,225 | 2,489,108 |
| Samsung Electronics Co., Ltd., nonvoting preferred1 | 447,450 | 16,779 |
| Microsoft Corp. | 13,844,700 | 1,368,410 |
| Alphabet Inc., Class A2 | 706,480 | 777,128 |
| Alphabet Inc., Class C2 | 516,667 | 560,578 |
| Intel Corp. | 19,500,700 | 1,076,439 |
| Broadcom Inc. | 3,783,558 | 953,721 |
| SK hynix, Inc.1 | 8,149,500 | 702,564 |
| Tencent Holdings Ltd.1 | 13,053,400 | 657,991 |
| Micron Technology, Inc.2 | 11,125,000 | 640,689 |
| Texas Instruments Inc. | 5,116,885 | 572,630 |
| QUALCOMM Inc. | 9,252,149 | 537,735 |
| Taiwan Semiconductor Manufacturing Co., Ltd.1 | 70,482,000 | 525,917 |
| Alibaba Group Holding Ltd. (ADR)2 | 2,641,400 | 523,024 |
| AAC Technologies Holdings Inc.1 | 31,220,500 | 465,776 |
| ASML Holding NV1 | 2,181,193 | 425,553 |
| Accenture PLC, Class A | 2,416,000 | 376,268 |
| Nintendo Co., Ltd.1 | 873,380 | 359,539 |
| Tokyo Electron Ltd.1 | 1,429,800 | 266,029 |
| Apple Inc. | 1,419,200 | 265,206 |
| Mastercard Inc., Class A | 1,345,572 | 255,820 |
| United Microelectronics Corp.1 | 437,846,000 | 243,114 |
| Western Union Co. | 10,558,165 | 210,002 |
| Tableau Software, Inc., Class A2 | 1,139,700 | 112,682 |
| HP Inc. | 2,606,000 | 57,410 |
| Murata Manufacturing Co., Ltd.1 | 376,000 | 55,710 |
| Visa Inc., Class A | 263,400 | 34,432 |
| MediaTek Inc.1 | 2,285,000 | 23,683 |
| | | 14,553,937 |
| Consumer discretionary 11.65% | | |
| Netflix, Inc.2 | 4,636,472 | 1,630,184 |
| Amazon.com, Inc.2 | 842,183 | 1,372,438 |
| Hyundai Motor Co.1 | 6,457,655 | 830,712 |
| LVMH Moët Hennessy-Louis Vuitton SE1 | 2,138,700 | 742,779 |
| NIKE, Inc., Class B | 8,171,800 | 586,735 |
Capital World Growth and Income Fund — Page 2 of 10
Common stocks
Consumer discretionary (continued) | Shares | Value
(000) |
| Home Depot, Inc. | 2,925,000 | $545,659 |
| Ocado Group PLC1,2,3 | 41,916,497 | 500,460 |
| Kering SA1 | 761,696 | 439,502 |
| ProSiebenSat.1 Media SE1 | 10,769,000 | 316,919 |
| Hyundai Mobis Co., Ltd.1 | 1,536,604 | 310,043 |
| Sony Corp.1 | 6,361,000 | 299,926 |
| InterContinental Hotels Group PLC1 | 3,915,065 | 250,606 |
| Galaxy Entertainment Group Ltd.1 | 26,773,000 | 235,089 |
| Norwegian Cruise Line Holdings Ltd.2 | 4,362,000 | 228,307 |
| ITV PLC1 | 100,850,000 | 217,558 |
| Viacom Inc., Class B | 7,560,688 | 204,895 |
| Daimler AG1 | 2,713,750 | 195,767 |
| Marriott International, Inc., Class A | 1,419,593 | 192,156 |
| Ctrip.com International, Ltd. (ADR)2 | 4,115,000 | 185,545 |
| Industria de Diseño Textil, SA1 | 5,828,833 | 183,707 |
| Paddy Power Betfair PLC1 | 1,443,997 | 176,061 |
| Bayerische Motoren Werke AG1 | 1,659,100 | 165,595 |
| Wynn Resorts, Ltd. | 832,260 | 163,131 |
| Shimano Inc.1 | 1,151,200 | 162,429 |
| McDonald’s Corp. | 1,000,000 | 160,010 |
| Six Flags Entertainment Corp. | 2,400,000 | 154,848 |
| Carnival Corp., units | 2,292,200 | 142,758 |
| Booking Holdings Inc.2 | 65,400 | 137,923 |
| Toyota Motor Corp.1 | 1,824,500 | 115,483 |
| Greene King PLC1 | 10,660,403 | 82,178 |
| Li & Fung Ltd.1 | 209,500,000 | 81,339 |
| Las Vegas Sands Corp. | 954,000 | 76,902 |
| Wynn Macau, Ltd.1 | 15,836,800 | 60,347 |
| Twenty-First Century Fox, Inc., Class A | 1,422,900 | 54,853 |
| SES SA, Class A (FDR)1 | 3,144,375 | 54,316 |
| Lowe’s Companies, Inc. | 558,000 | 53,016 |
| Merlin Entertainments PLC1 | 10,090,000 | 49,207 |
| MGM Resorts International | 1,367,000 | 42,992 |
| Astra International Tbk PT1 | 63,601,100 | 31,486 |
| Starbucks Corp. | 502,500 | 28,477 |
| Altice NV, Class A1,2 | 6,754,625 | 23,858 |
| Altice NV, Class B1,2 | 925,760 | 3,256 |
| Comcast Corp., Class A | 847,200 | 26,416 |
| YUM! Brands, Inc. | 282,600 | 22,984 |
| DENSO Corp.1 | 409,600 | 19,854 |
| Harley-Davidson, Inc. | 310,371 | 12,750 |
| JCDecaux SA1 | 19,797 | 616 |
| | | 11,572,072 |
| Health care 10.63% | | |
| AbbVie Inc. | 29,611,073 | 2,929,720 |
| Amgen Inc. | 7,774,139 | 1,396,391 |
| Novartis AG1 | 12,905,991 | 957,542 |
| Stryker Corp. | 4,442,500 | 773,084 |
| Abbott Laboratories | 12,017,000 | 739,406 |
| Daiichi Sankyo Co., Ltd.1 | 21,749,700 | 696,794 |
| UnitedHealth Group Inc. | 2,329,100 | 562,501 |
| Thermo Fisher Scientific Inc. | 2,498,933 | 520,453 |
| Gilead Sciences, Inc. | 5,054,820 | 340,695 |
| Medtronic PLC | 3,576,000 | 308,680 |
Capital World Growth and Income Fund — Page 3 of 10
Common stocks
Health care (continued) | Shares | Value
(000) |
| Teva Pharmaceutical Industries Ltd. (ADR) | 13,907,575 | $299,013 |
| Grifols, SA, Class B, preferred nonvoting, non-registered shares1 | 6,770,000 | 147,855 |
| Incyte Corp.2 | 1,761,800 | 120,278 |
| Essilor International SA1 | 868,900 | 118,752 |
| UCB SA1 | 1,287,815 | 101,407 |
| Illumina, Inc.2 | 355,382 | 96,820 |
| Merck & Co., Inc. | 1,524,400 | 90,748 |
| Express Scripts Holding Co.2 | 1,165,000 | 88,319 |
| GlaxoSmithKline PLC1 | 4,096,320 | 82,991 |
| Eli Lilly and Co. | 591,500 | 50,301 |
| Lupin Ltd.1 | 3,216,144 | 36,666 |
| Pfizer Inc. | 924,500 | 33,217 |
| AstraZeneca PLC1 | 411,700 | 30,051 |
| Shanghai Pharmaceutical (Group) Co., Ltd., Class H1 | 6,630,900 | 20,412 |
| Danaher Corp. | 144,600 | 14,356 |
| | | 10,556,452 |
| Energy 7.74% | | |
| Royal Dutch Shell PLC, Class B1 | 29,029,700 | 1,033,415 |
| Royal Dutch Shell PLC, Class A1 | 20,119,110 | 697,476 |
| Royal Dutch Shell PLC, Class B (ADR) | 344,800 | 24,940 |
| Royal Dutch Shell PLC, Class A (ADR) | 45,689 | 3,179 |
| Royal Dutch Shell PLC, Class A (EUR denominated)1 | 15,502 | 539 |
| TOTAL SA1 | 12,842,637 | 780,501 |
| Canadian Natural Resources, Ltd. (CAD denominated) | 19,592,448 | 678,316 |
| Canadian Natural Resources, Ltd. | 1,467,000 | 50,700 |
| BP PLC1 | 81,560,778 | 625,039 |
| EOG Resources, Inc. | 4,399,700 | 518,329 |
| Halliburton Co. | 9,502,100 | 472,634 |
| Enbridge Inc. (CAD denominated) | 10,123,225 | 314,565 |
| Enbridge Inc. (CAD denominated)1,4 | 2,351,836 | 72,349 |
| Suncor Energy Inc. | 8,892,044 | 354,146 |
| Noble Energy, Inc. | 8,837,400 | 315,495 |
| TransCanada Corp. | 7,052,586 | 295,245 |
| ONEOK, Inc. | 4,282,526 | 291,897 |
| Oil Search Ltd.1 | 37,973,251 | 236,760 |
| Chevron Corp. | 1,707,900 | 212,292 |
| Exxon Mobil Corp. | 1,696,000 | 137,783 |
| Eni SpA1 | 5,355,300 | 97,838 |
| Eni SpA (ADR) | 253,148 | 9,230 |
| Kinder Morgan, Inc. | 5,864,000 | 97,812 |
| Golar LNG Ltd. | 3,580,868 | 93,031 |
| Schlumberger Ltd. | 1,175,600 | 80,728 |
| Williams Companies, Inc. | 1,912,600 | 51,372 |
| Southwestern Energy Co.2 | 9,239,284 | 43,702 |
| Chesapeake Energy Corp.2 | 9,500,000 | 42,465 |
| Occidental Petroleum Corp. | 281,500 | 23,702 |
| Helmerich & Payne, Inc. | 295,400 | 19,609 |
| ConocoPhillips | 203,500 | 13,714 |
| | | 7,688,803 |
| Consumer staples 6.58% | | |
| British American Tobacco PLC1 | 17,195,830 | 884,594 |
| British American Tobacco PLC (ADR) | 4,457,483 | 228,223 |
| Imperial Brands PLC1 | 26,100,178 | 940,461 |
Capital World Growth and Income Fund — Page 4 of 10
Common stocks
Consumer staples (continued) | Shares | Value
(000) |
| Altria Group, Inc. | 13,455,500 | $750,010 |
| Nestlé SA1 | 9,003,052 | 678,563 |
| Pernod Ricard SA1 | 3,643,993 | 613,847 |
| Philip Morris International Inc. | 7,132,100 | 567,287 |
| Kirin Holdings Co., Ltd.1 | 13,728,800 | 388,548 |
| Treasury Wine Estates Ltd.1 | 28,717,307 | 358,947 |
| Thai Beverage PCL1 | 392,606,400 | 223,948 |
| Associated British Foods PLC1 | 3,972,211 | 139,874 |
| Kellogg Co. | 2,000,000 | 128,780 |
| Kimberly-Clark Corp. | 1,200,000 | 121,020 |
| Coca-Cola Co. | 2,643,000 | 113,649 |
| Procter & Gamble Co. | 1,500,000 | 109,755 |
| Japan Tobacco Inc.1 | 2,949,800 | 79,504 |
| Danone SA1 | 715,935 | 54,627 |
| Kroger Co. | 1,705,600 | 41,497 |
| Unilever PLC1 | 605,800 | 33,399 |
| Diageo PLC1 | 659,200 | 24,213 |
| Carlsberg A/S, Class B1 | 159,035 | 17,693 |
| Shoprite Holdings Ltd.1 | 815,169 | 14,979 |
| Reckitt Benckiser Group PLC1 | 170,000 | 13,021 |
| Mondelez International, Inc. | 311,600 | 12,237 |
| | | 6,538,676 |
| Industrials 6.57% | | |
| Airbus SE, non-registered shares1 | 7,296,798 | 837,258 |
| Lockheed Martin Corp. | 1,677,000 | 527,484 |
| CSX Corp. | 7,824,226 | 505,836 |
| General Dynamics Corp. | 2,399,500 | 484,003 |
| Aena SME, SA, non-registered shares1 | 2,077,743 | 399,111 |
| Boeing Co. | 916,000 | 322,579 |
| BAE Systems PLC1 | 32,114,000 | 273,034 |
| ASSA ABLOY AB, Class B1 | 12,246,167 | 263,462 |
| International Consolidated Airlines Group, SA (CDI)1 | 28,708,657 | 259,193 |
| J.B. Hunt Transport Services, Inc. | 1,818,000 | 232,886 |
| Edenred SA1 | 7,169,000 | 231,073 |
| Emerson Electric Co. | 3,000,000 | 212,520 |
| Komatsu Ltd.1 | 6,289,900 | 205,758 |
| Babcock International Group PLC1 | 17,383,149 | 192,538 |
| Ryanair Holdings PLC (ADR)2 | 1,627,235 | 188,613 |
| General Electric Co. | 13,278,000 | 186,954 |
| Union Pacific Corp. | 981,740 | 140,153 |
| Northrop Grumman Corp. | 420,769 | 137,697 |
| Adecco Group AG1 | 2,129,050 | 127,451 |
| RELX PLC1 | 5,740,700 | 126,135 |
| CCR SA, ordinary nominative | 44,348,044 | 122,658 |
| Fosun International Ltd.1 | 51,485,600 | 112,275 |
| Airports of Thailand PCL, foreign registered1 | 52,299,100 | 111,815 |
| Alliance Global Group, Inc.1,2 | 166,723,940 | 42,136 |
| Jardine Matheson Holdings Ltd.1 | 644,000 | 40,185 |
| United Technologies Corp. | 300,000 | 37,446 |
| Recruit Holdings Co., Ltd.1 | 1,341,000 | 37,159 |
| Waste Connections, Inc. | 474,000 | 36,441 |
| TransDigm Group Inc. | 104,200 | 34,814 |
| Deere & Co. | 213,400 | 31,905 |
| Safran SA1 | 195,275 | 23,322 |
Capital World Growth and Income Fund — Page 5 of 10
Common stocks
Industrials (continued) | Shares | Value
(000) |
| IDEX Corp. | 128,300 | $17,793 |
| Kubota Corp.1 | 849,000 | 14,234 |
| Hyundai Heavy Industries Co., Ltd.1,2 | 98,252 | 10,395 |
| Capita PLC1 | 2,713,000 | 4,873 |
| C.H. Robinson Worldwide, Inc. | 12,000 | 1,044 |
| | | 6,532,233 |
| Utilities 4.67% | | |
| ENGIE SA1 | 35,039,763 | 557,443 |
| ENGIE SA, bonus shares1 | 19,221,899 | 305,799 |
| Gas Natural SDG, SA1 | 25,306,000 | 620,133 |
| Iberdrola, SA, non-registered shares1 | 72,566,630 | 514,128 |
| Dominion Energy, Inc. | 4,732,422 | 303,774 |
| EDP - Energias de Portugal, SA1 | 69,457,457 | 271,742 |
| Ørsted AS1 | 4,479,790 | 268,767 |
| China Resources Gas Group Ltd.1 | 68,842,000 | 260,547 |
| Enel SPA1 | 37,469,273 | 205,778 |
| Sempra Energy | 1,900,800 | 202,492 |
| Power Grid Corp. of India Ltd.1 | 64,038,000 | 198,451 |
| National Grid PLC1 | 17,873,766 | 197,582 |
| CK Infrastructure Holdings Ltd.1 | 26,019,000 | 196,005 |
| SSE PLC1 | 7,505,462 | 136,449 |
| CMS Energy Corp. | 2,285,000 | 105,407 |
| Red Eléctrica de Corporación, SA1 | 4,781,000 | 93,380 |
| AES Corp. | 6,081,300 | 77,537 |
| Huaneng Power International, Inc., Class H1 | 88,050,000 | 67,886 |
| Exelon Corp. | 1,467,400 | 60,736 |
| | | 4,644,036 |
| Materials 4.60% | | |
| Vale SA, ordinary nominative | 51,612,611 | 701,695 |
| Vale SA, ordinary nominative (ADR) | 38,377,864 | 521,939 |
| Rio Tinto PLC1 | 18,220,575 | 1,027,351 |
| Asahi Kasei Corp.1 | 40,024,300 | 547,558 |
| Alcoa Corp.2 | 6,421,000 | 308,657 |
| Air Liquide SA, non-registered shares1 | 2,248,400 | 276,461 |
| Akzo Nobel NV1 | 3,024,678 | 265,079 |
| Nitto Denko Corp.1 | 2,146,100 | 167,714 |
| Fortescue Metals Group Ltd.1 | 42,923,981 | 151,753 |
| Koninklijke DSM NV1 | 1,135,972 | 112,841 |
| BASF SE1 | 951,000 | 93,725 |
| Nutrien Ltd. (CAD denominated) | 1,800,890 | 91,215 |
| LafargeHolcim Ltd.1 | 1,379,072 | 70,745 |
| AngloGold Ashanti Ltd.1 | 4,611,968 | 39,524 |
| AngloGold Ashanti Ltd. (ADR) | 1,950,480 | 16,813 |
| Newcrest Mining Ltd.1 | 2,610,597 | 40,859 |
| Freeport-McMoRan Inc. | 2,400,000 | 40,560 |
| Barrick Gold Corp. (CAD denominated) | 2,931,600 | 38,668 |
| Amcor Ltd.1 | 2,670,315 | 28,348 |
| Shin-Etsu Chemical Co., Ltd.1 | 255,000 | 25,334 |
| | | 4,566,839 |
Capital World Growth and Income Fund — Page 6 of 10
Common stocks
Telecommunication services 2.76% | Shares | Value
(000) |
| Verizon Communications Inc. | 19,068,310 | $908,986 |
| Nippon Telegraph and Telephone Corp.1 | 14,693,000 | 688,039 |
| LG Uplus Corp.1,3 | 29,169,442 | 315,798 |
| BT Group PLC1 | 76,877,186 | 209,420 |
| América Móvil, SAB de CV, Series L (ADR) | 8,228,300 | 127,621 |
| Koninklijke KPN NV1 | 33,420,921 | 90,789 |
| Vodafone Group PLC1 | 35,457,500 | 90,716 |
| Bharti Airtel Ltd.1 | 11,913,099 | 65,804 |
| Telia Co. AB1 | 13,155,906 | 61,574 |
| China Unicom (Hong Kong) Ltd.1 | 43,206,000 | 58,720 |
| Bezeq - The Israel Telecommunication Corp. Ltd.1 | 47,540,000 | 58,138 |
| MegaFon PJSC1 | 6,410,063 | 48,560 |
| NTT DoCoMo, Inc.1 | 625,100 | 16,159 |
| | | 2,740,324 |
| Real estate 2.70% | | |
| CK Asset Holdings Ltd.1 | 56,358,985 | 469,965 |
| Sun Hung Kai Properties Ltd.1 | 27,967,750 | 450,652 |
| Daito Trust Construction Co., Ltd.1 | 2,410,000 | 392,647 |
| China Resources Land Ltd.1 | 59,410,000 | 217,655 |
| SM Prime Holdings, Inc.1 | 300,819,759 | 211,436 |
| Sino Land Co. Ltd.1 | 92,610,000 | 159,846 |
| Link Real Estate Investment Trust REIT1 | 17,548,002 | 155,105 |
| Lamar Advertising Co. REIT, Class A | 2,173,546 | 150,453 |
| Crown Castle International Corp. REIT | 1,149,100 | 119,679 |
| American Campus Communities, Inc. REIT | 2,911,279 | 116,742 |
| Henderson Land Development Co. Ltd.1 | 13,594,500 | 89,315 |
| American Tower Corp. REIT | 381,138 | 52,738 |
| Fibra Uno Administración, SA de CV REIT | 31,315,000 | 43,225 |
| Unibail-Rodamco SE, non-registered shares REIT1 | 137,971 | 31,116 |
| Iron Mountain Inc. REIT | 775,000 | 25,800 |
| | | 2,686,374 |
| Miscellaneous 4.72% | | |
| Other common stocks in initial period of acquisition | | 4,687,738 |
| Total common stocks (cost: $70,101,923,000) | | 92,961,792 |
Convertible stocks 0.10%
Energy 0.04% | | |
| Kinder Morgan Inc., Series A, depository share, 9.75% convertible preferred 2018 | 1,188,200 | 38,902 |
| Miscellaneous 0.06% | | |
| Other convertible stocks in initial period of acquisition | | 63,777 |
| Total convertible stocks (cost: $111,388,000) | | 102,679 |
Bonds, notes & other debt instruments 0.66%
Bonds & notes of governments & government agencies outside the U.S. 0.32% | Principal amount
(000) | |
| Brazil (Federative Republic of) 0% 2022 | BRL97,500 | 18,754 |
| Brazil (Federative Republic of) 10.00% 2027 | 316,000 | 78,835 |
| Colombia (Republic of), Series B, 7.50% 2026 | COP80,150,000 | 29,641 |
Capital World Growth and Income Fund — Page 7 of 10
Bonds, notes & other debt instruments
Bonds & notes of governments & government agencies outside the U.S. (continued) | Principal amount
(000) | Value
(000) |
| India (Republic of) 8.60% 2028 | INR1,220,300 | $18,657 |
| Indonesia (Republic of), Series 68, 8.375% 2034 | IDR530,800,000 | 40,551 |
| Portuguese Republic 3.875% 2030 | €49,240 | 67,213 |
| Portuguese Republic 4.10% 2045 | 20,155 | 28,400 |
| Turkey (Republic of) 10.70% 2022 | TRY207,000 | 39,320 |
| | | 321,371 |
Corporate bonds & notes 0.31%
Health care 0.13% | | |
| Teva Pharmaceutical Finance Company BV 6.00% 2024 | $85,907 | 85,145 |
| Teva Pharmaceutical Finance Company BV 3.15% 2026 | 59,700 | 48,298 |
| | | 133,443 |
| Telecommunication services 0.10% | | |
| CenturyLink, Inc. 7.50% 2024 | 7,016 | 7,227 |
| CenturyLink, Inc., Series T, 5.80% 2022 | 20,048 | 19,822 |
| Sprint Corp. 11.50% 2021 | 33,950 | 40,146 |
| T-Mobile US, Inc. 6.375% 2025 | 7,105 | 7,442 |
| T-Mobile US, Inc. 6.50% 2026 | 22,126 | 23,149 |
| | | 97,786 |
| Energy 0.04% | | |
| Petróleos Mexicanos 6.35% 20484 | 3,378 | 3,077 |
| TransCanada Corp. 5.875% 2076 | 36,500 | 36,591 |
| | | 39,668 |
| Financials 0.04% | | |
| Discover Financial Services 10.25% 2019 | 4,334 | 4,645 |
| Lloyds Banking Group PLC, junior subordinated 6.657% preference shares (undated)4 | 30,300 | 32,345 |
| | | 36,990 |
| Total corporate bonds & notes | | 307,887 |
U.S. Treasury bonds & notes 0.03%
U.S. Treasury 0.03% | | |
| U.S. Treasury 0.875% 2018 | 30,000 | 29,963 |
| Total U.S. Treasury bonds & notes | | 29,963 |
| Total bonds, notes & other debt instruments (cost: $664,025,000) | | 659,221 |
| Short-term securities 5.41% | | |
| American Honda Finance Corp. 2.16% due 7/19/2018 | 27,120 | 27,050 |
| Apple Inc. 1.85%–1.95% due 6/7/2018–7/16/20184 | 140,000 | 139,778 |
| Bank of Tokyo-Mitsubishi UFJ, Ltd. 1.87% due 6/5/2018 | 25,000 | 24,994 |
| BASF SE 1.87%–1.99% due 6/1/2018–6/7/20184 | 45,000 | 44,995 |
| British Columbia (Province of) 1.95% due 7/11/2018 | 40,000 | 39,915 |
| CAFCO, LLC 2.27% due 8/7/20184 | 25,000 | 24,901 |
| Caisse d’Amortissement de la Dette Sociale 2.00% due 6/14/20184 | 50,000 | 49,964 |
| Canadian Imperial Bank of Commerce 2.18% due 6/14/20184 | 50,000 | 49,967 |
| Canadian Imperial Holdings Inc. 2.24% due 7/3/2018 | 30,000 | 29,947 |
| Coca-Cola Co. 2.06% due 8/2/20184 | 50,000 | 49,830 |
| CPPIB Capital Inc. 1.90%–2.05% due 6/26/2018–8/16/20184 | 185,600 | 185,050 |
| DBS Bank Ltd. 1.95% due 6/6/20184 | 30,000 | 29,991 |
| Essilor International 1.85% due 6/11/20184 | 35,000 | 34,981 |
Capital World Growth and Income Fund — Page 8 of 10
| Short-term securities | Principal amount
(000) | Value
(000) |
| Fannie Mae 1.63%–1.75% due 6/4/2018–6/18/2018 | $106,617 | $106,564 |
| Federal Home Loan Bank 1.63%–1.90% due 6/4/2018–9/5/2018 | 1,408,700 | 1,405,771 |
| Freddie Mac 1.77%–1.79% due 7/10/2018–7/26/2018 | 125,000 | 124,694 |
| Hydro-Québec 1.87% due 6/12/20184 | 10,000 | 9,994 |
| John Deere Canada ULC 1.98% due 7/10/20184 | 25,000 | 24,948 |
| John Deere Capital Corp. 2.01% due 7/9/20184 | 50,000 | 49,899 |
| KfW 2.11%–2.14% due 8/3/2018–8/22/20184 | 100,000 | 99,543 |
| Mitsubishi UFJ Trust and Banking Corp. 1.99% due 7/9/20184 | 75,000 | 74,844 |
| Mizuho Bank, Ltd. 1.84%–2.25% due 6/5/2018–9/6/20184 | 169,200 | 168,688 |
| National Australia Bank Ltd. 2.18% due 8/16/2018–8/17/20184 | 182,100 | 181,252 |
| Nordea Bank AB 2.15%–2.24% due 8/1/2018–9/21/20184 | 162,800 | 161,938 |
| Novartis Finance Corp. 1.82%–1.88% due 6/5/2018–6/12/20184 | 65,000 | 64,971 |
| PepsiCo Inc. 1.80% due 6/8/20184 | 39,400 | 39,385 |
| Province of Alberta 2.29% due 7/9/20184 | 30,000 | 29,940 |
| Québec (Province of) 1.93%–1.94% due 7/3/2018–7/16/20184 | 139,700 | 139,408 |
| Roche Holdings, Inc. 1.85% due 6/8/20184 | 40,000 | 39,985 |
| Siemens Capital Co. LLC 1.81%–1.82% due 6/1/2018–6/11/20184 | 75,000 | 74,972 |
| Starbird Funding Corp. 2.28% due 8/21/20184 | 21,000 | 20,893 |
| Sumitomo Mitsui Banking Corp. 1.86%–2.29% due 6/1/2018–9/24/20184 | 253,100 | 252,098 |
| Svenska Handelsbanken Inc. 2.16%–2.20% due 7/19/2018–8/30/20184 | 150,000 | 149,324 |
| Swedbank AB 2.20%–2.23% due 7/10/2018–8/14/2018 | 200,000 | 199,427 |
| Toronto-Dominion Bank 2.21%–2.25% due 7/24/2018–8/8/20184 | 200,000 | 199,294 |
| Toyota Industries Commercial Finance, Inc. 2.15% due 6/11/20184 | 40,000 | 39,980 |
| U.S. Treasury Bills 1.56%–1.89% due 6/14/2018–8/30/2018 | 827,800 | 825,484 |
| Victory Receivables Corp. 2.19%–2.32% due 6/6/2018–6/19/20184 | 80,000 | 79,941 |
| Wal-Mart Stores, Inc. 1.82%–1.85% due 6/4/2018–6/12/20184 | 75,300 | 75,276 |
| Total short-term securities (cost: $5,369,862,000) | | 5,369,876 |
| Total investment securities 99.74% (cost: $76,247,198,000) | | 99,093,568 |
| Other assets less liabilities 0.26% | | 255,097 |
| Net assets 100.00% | | $99,348,665 |
As permitted by U.S. Securities and Exchange Commission regulations, "Miscellaneous" securities include holdings in their first year of acquisition that have not previously been publicly disclosed.
Capital World Growth and Income Fund — Page 9 of 10
Forward currency contracts
| Contract amount | Counterparty | Settlement
date | Unrealized
appreciation
at 5/31/2018
(000) |
Purchases
(000) | Sales
(000) |
| USD24,920 | GBP17,739 | Citibank | 6/7/2018 | $1,332 |
| USD199,178 | GBP140,000 | JPMorgan Chase | 6/22/2018 | 12,856 |
| | | | | $14,188 |
The following footnotes apply to either the individual securities noted or one or more of the securities aggregated and listed as a single line item.
| 1 | Valued under fair value procedures adopted by authority of the board of trustees. The total value of all such securities, including those in “Miscellaneous,“ was $52,100,984,000, which represented 52.44% of the net assets of the fund. This amount includes $50,861,772,000 related to certain securities trading outside the U.S. whose values were adjusted as a result of significant market movements following the close of local trading. |
| 2 | Security did not produce income during the last 12 months. |
| 3 | Represents an affiliated company as defined under the Investment Company Act of 1940. |
| 4 | Acquired in a transaction exempt from registration under Rule 144A or Section 4(2) of the Securities Act of 1933. May be resold in the U.S. in transactions exempt from registration, normally to qualified institutional buyers. The total value of all such securities was $2,693,801,000, which represented 2.71% of the net assets of the fund. |
| Key to abbreviations and symbols |
| ADR = American Depositary Receipts |
| BRL = Brazilian reais |
| CAD = Canadian dollars |
| CDI = CREST Depository Interest |
| COP = Colombian pesos |
| EUR/€ = Euros |
| FDR = Fiduciary Depositary Receipts |
| GBP = British pounds |
| HKD = Hong Kong dollars |
| IDR = Indonesian rupiah |
| INR = Indian rupees |
| TRY = Turkish lira |
| USD/$ = U.S. dollars |
Additional financial disclosures are included in the fund’s current shareholder report and should be read in conjunction with this report.
Investments are not FDIC-insured, nor are they deposits of or guaranteed by a bank or any other entity, so they may lose value.
Investors should carefully consider investment objectives, risks, charges and expenses. This and other important information is contained in the fund prospectus and summary prospectus, which can be obtained from your financial professional and should be read carefully before investing. You may also call American Funds Service Company (AFS) at (800) 421-4225 or visit the American Funds website at americanfunds.com. Fund shares offered through American Funds Distributors, Inc.
| MFGEFPX-033-0718O-S66051 | Capital World Growth and Income Fund — Page 10 of 10 |
ITEM 7 – Disclosure of Proxy Voting Policies and Procedures for Closed-End Management Investment Companies
Not applicable to this Registrant, insofar as the Registrant is not a closed-end management investment company.
ITEM 8 – Portfolio Managers of Closed-End Management Investment Companies
Not applicable to this Registrant, insofar as the Registrant is not a closed-end management investment company.
ITEM 9 – Purchases of Equity Securities by Closed-End Management Investment Company and Affiliated Purchasers
Not applicable to this Registrant, insofar as the Registrant is not a closed-end management investment company.
ITEM 10 – Submission of Matters to a Vote of Security Holders
There have been no material changes to the procedures by which shareholders may recommend nominees to the Registrant’s board of trustees since the Registrant last submitted a proxy statement to its shareholders. The procedures are as follows. The Registrant has a nominating and governance committee comprised solely of persons who are not considered ‘‘interested persons’’ of the Registrant within the meaning of the Investment Company Act of 1940, as amended. The committee periodically reviews such issues as the board’s composition, responsibilities, committees, compensation and other relevant issues, and recommends any appropriate changes to the full board of trustees. While the committee normally is able to identify from its own resources an ample number of qualified candidates, it will consider shareholder suggestions of persons to be considered as nominees to fill future vacancies on the board. Such suggestions must be sent in writing to the nominating and governance committee of the Registrant, c/o the Registrant’s Secretary, and must be accompanied by complete biographical and occupational data on the prospective nominee, along with a written consent of the prospective nominee for consideration of his or her name by the nominating and governance committee.
ITEM 11 – Controls and Procedures
| (a) | The Registrant’s Principal Executive Officer and Principal Financial Officer have concluded, based on their evaluation of the Registrant’s disclosure controls and procedures (as such term is defined in Rule 30a-3 under the Investment Company Act of 1940), that such controls and procedures are adequate and reasonably designed to achieve the purposes described in paragraph (c) of such rule. |
| | |
| (b) | Effective May 28, 2018, the Capital World Growth and Income Fund’s investment adviser implemented a new fixed income order management, trading, and compliance system. In connection with introducing this new system, additional automated and manual controls were implemented and some existing controls were modified. None of these changes were in response to any identified deficiency or weakness in the Capital World Growth and Income Fund’s internal control over financial reporting. |
ITEM 12 – Exhibits
| (a)(1) | Not applicable for filing of semi-annual reports to shareholders. |
| | |
| (a)(2) | The certifications required by Rule 30a-2 of the Investment Company Act of 1940 and Sections 302 and 906 of the Sarbanes-Oxley Act of 2002 are attached as exhibits hereto. |
SIGNATURES
Pursuant to the requirements of the Securities Exchange Act of 1934 and the Investment Company Act of 1940, the Registrant has duly caused this report to be signed on its behalf by the undersigned, thereunto duly authorized.
| | CAPITAL WORLD GROWTH AND INCOME FUND |
| | |
| | By /s/ Donald H. Rolfe |
| | Donald H. Rolfe, Executive Vice President and Principal Executive Officer |
| | |
| | Date: July 31, 2018 |
Pursuant to the requirements of the Securities Exchange Act of 1934 and the Investment Company Act of 1940, this report has been signed below by the following persons on behalf of the Registrant and in the capacities and on the dates indicated.
| By /s/ Donald H. Rolfe |
Donald H. Rolfe, Executive Vice President and Principal Executive Officer |
| |
| Date: July 31, 2018 |
| By /s/ Gregory F. Niland |
Gregory F. Niland, Treasurer and Principal Financial Officer |
| |
| Date: July 31, 2018 |