 0 Investor Meetings May 2010 Exhibit 99.1 |
  1 Safe Harbor, Non-GAAP Reconciliations Except for historical information contained herein, the matters discussed in this presentation contain forward-looking statements that involve risks and uncertainties. There are a number of important factors that could cause Air Transport Services Group's ("ATSG's") actual results to differ materially from those indicated by such forward-looking statements. These factors include, but are not limited to, changes in market demand for our assets and services, the timely completion of 767 freighter modifications as anticipated under ABX Air’s new operating agreement with DHL, ABX Air’s ability to maintain on- time service and control costs under its new operating agreement with DHL, and other factors that are contained from time to time in ATSG's filings with the U.S. Securities and Exchange Commission, including its Annual Report on Form 10-K and Quarterly Reports on Form 10-Q. Readers should carefully review this presentation and should not place undue reliance on ATSG's forward-looking statements. These forward-looking statements were based on information, plans and estimates as of the date of this release. ATSG undertakes no obligation to update any forward-looking statements to reflect changes in underlying assumptions or factors, new information, future events or other changes. ATSG, Inc. Non-GAAP Reconciliation EBITDA, Adjusted EBITDA and Net Debt are non-GAAP financial measures and should not be considered alternatives to net income (loss) or any other performance measure derived in accordance with GAAP. EBITDA is defined as income (loss) from operations plus net interest expense, provision for income taxes, depreciation and amortization. Net Debt is defined as Long-term debt obligations plus Current portion of debt obligations minus Cash and cash equivalents. The Company’s management uses these adjusted financial measures in conjunction with GAAP finance measures to monitor and evaluate its performance, including as a measure of liquidity. EBITDA, Adjusted EBITDA and Net Debt should not be considered in isolation or as a substitute for analysis of the Company’s results as reported under GAAP, or as alternative measures of liquidity. 2007 2008 2009 1Q2009 1Q2010 25,721 (56,619) 45,358 13,193 10,784 Impairment of goodwill & intangibles 0 91,241 0 0 0 25,721 34,622 45,358 13,193 10,784 Interest Income (4,557) (2,335) (449) (178) (73) Interest Expense 14,067 37,002 26,881 7,646 5,189 Depreciation and amortization 51,635 93,752 83,964 21,473 20,800 86,866 163,041 155,754 42,134 36,700 2007 2008 2009 1Q2009 1Q2010 Long term obligations 567,987 450,628 325,690 392,351 307,865 Current portion of debt obligations 22,815 61,858 51,737 62,319 60,438 Cash and cash equivalents (59,271) (116,114) (83,229) (124,000) (108,685) Net Debt 531,531 396,372 294,198 330,670 259,618 Reconciliation Statement ($ in 000s) GAAP Pre-tax Earnings (Loss) Reconciliation Statement ($ in 000s) Adjusted EBITDA from Cont. Oper. from Continuing Operations Adjusted Pre-Tax Earnings from Continuing Operations Earnings from Continuing Operations Before Interest, Taxes, Depreciation & Amortization (Adjusted EBITDA) Net Debt |
 2 Investment Highlights Differentiated Business Model World’s largest fleet of owned and operated converted Boeing 767 freighters Most efficient medium range, widebody cargo aircraft Accretive 767 conversion plan will continue to fuel growth Provide full spectrum of air transport services throughout the world Dry leasing, ACMI (wet leasing), maintenance, technical, fuel management, logistic support services No fuel exposure New long-term A+CMI contract with DHL Diversified base of other established customers, including Bax Schenker, U.S. Military, USPS, TNT and Qantas Favorable Industry Dynamics Demand for 767s remained strong despite recession Customers more sensitive to price are seeking full-service, low cost producers Limited capacity in medium-range wide-body air cargo transportation Competitive aircraft significantly less efficient (crew, fuel and maintenance) than 767 Strong Financial Characteristics and Performance Secure balance sheet with low levels of leverage and no off-balance sheet liabilities or large capital commitments Strong cash flow generation Large NOL protects Company’s cash generation Disciplined capital allocation with established ROIC hurdles |
 3 ATSG Business Model Dry Leasing Business The majority of ATSG’s aircraft are leased out of its Cargo Aircraft Management (“CAM”) subsidiary ATSG subsidiaries must pay CAM market rates and compete with third party companies for access to asset Dry leases typically have minimum term of 5-7 years and require the assumption of operating risk Lessee must operate, insure, fuel and maintain leased aircraft The dry leasing business is the foundation of ATSG’s economic model -- all other aircraft-related services have to generate acceptable incremental returns Aircraft Crew Maintenance and Insurance (“ACMI”) Business Three of ATSG’s subsidiaries provide ACMI services for cargo transport companies In addition to the aircraft itself, crew, maintenance and insurance are provided to the customer No fuel risk is assumed Assuming market rates for aircraft, ACMI business is priced to generate incremental operating returns Flexibility to offer CMI services with aircraft provided by customer – incremental return without capital investment Value-added Complementary Services ATSG provides a host of services to complement its ACMI and leasing services Standalone Maintenance, Repair, and Overhaul (“MRO”) subsidiary provides full service maintenance operations to ATSG subsidiaries and third party customers The Company also leverages its expertise, market knowledge and relationships to provide other services such as: Freight sorting; facilities management; aircraft charter and truck brokerage, equipment sales and leasing |
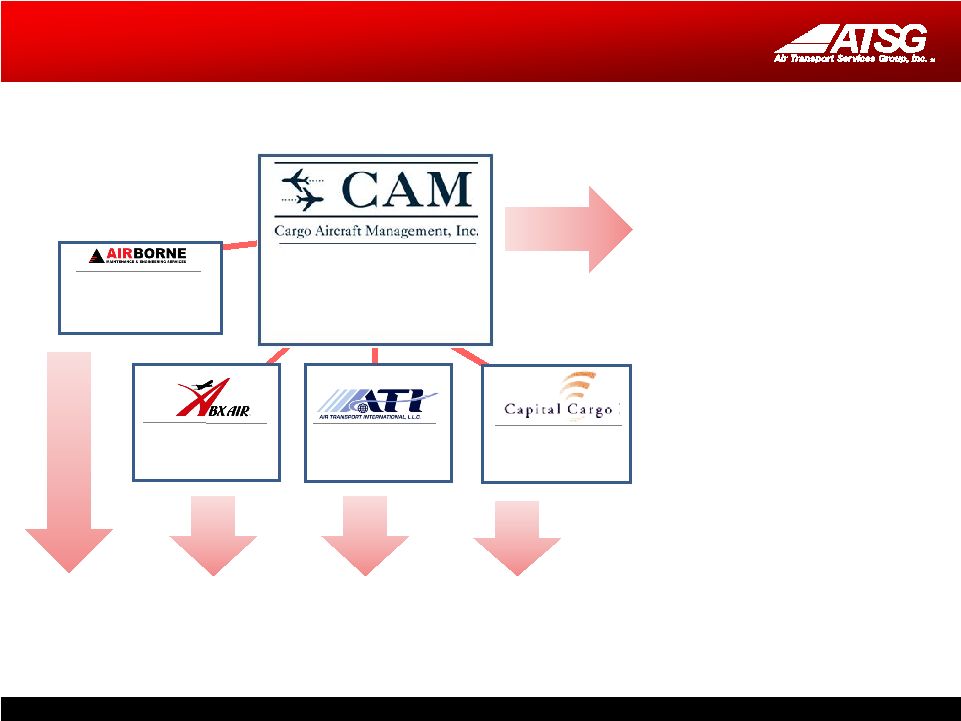
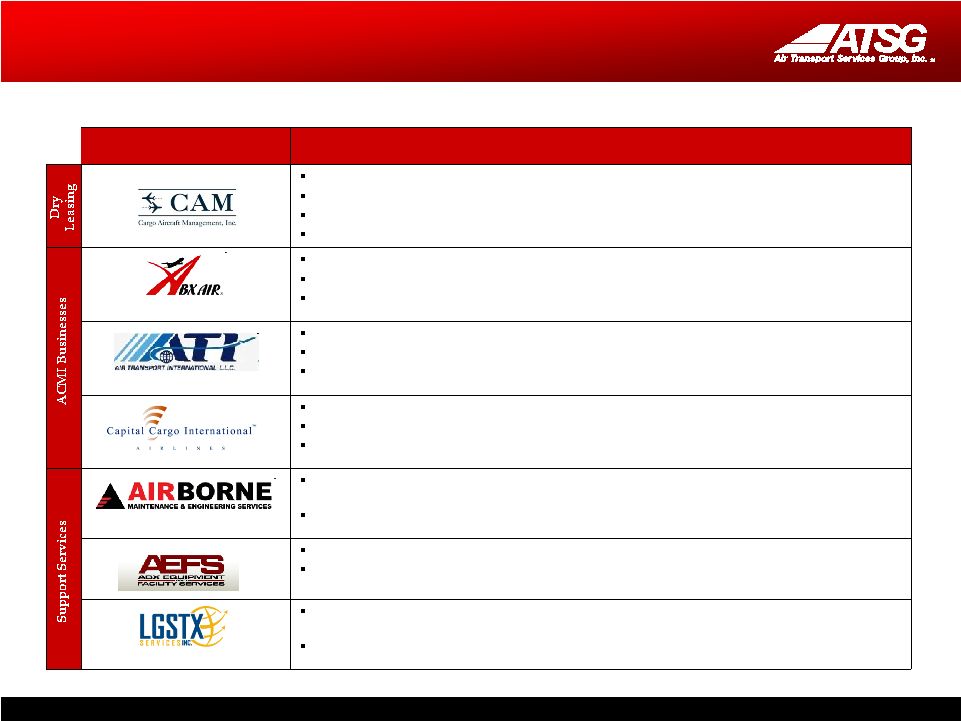 4 Summary of Business Units Provides aircraft charter and trucking services brokerage, import / export services, and fuel sales and management Customers include: DHL, BAX Schenker, UPS, Emirates Provides equipment leasing (of owned equipment) and facility management services Customers include: Allegiant Air, Branson Airport, Tampa International Jet Center Capabilities include heavy maintenance, component repair and overhaul, engineering and manufacturing, and line maintenance Provides third-party maintenance and technical services to major airlines, private operators Provides ACMI services Operates 727Fs, 757Fs Customers include BAX Schenker and DHL Provides ACMI Services Operates B767s, DC8Fs, DC-8 Combis Customers include BAX Schenker, U.S. Military and Quantas Provides ACMI services Operates B767 freighters Customers include DHL, USPS and TNT Dry leases 757, 767, 727 and DC-8 aircraft to ATSG subsidiaries and external customers Future acquired aircraft will be owned by CAM Offers conversion management, access to engine maintenance and component services External customers include DHL, CargoJet, Amerijet, First Air Description Business |
 5 New A+CMI Agreement with DHL New “A+CMI” Agreement Terms DHL leasing thirteen 767 aircraft from CAM under 7 year term ABX to operate aircraft for DHL under separate 5 year CMI agreement, with 2 year extension right to DHL, 5 year mutual Economics based upon pre-defined fee with performance incentive bonuses, scaled for number of aircraft operated by ABX CMI agreement subject to break-up fee that amortizes down from $70mm should DHL elect to prematurely terminate the agreement Under the CMI Agreement, ABX will be able to contract with its MRO, Airborne Maintenance and Engineering Services (“AMES”) for airframe heavy maintenance The remaining $31mm in the DHL Note will be amortized down over the course of the CMI with no cash requirement from ATSG DHL to provide fuel at its own expense Other Items Resolved $31.4mm of Severance and Retention payments for ABX pilots was contributed directly to pilot pension DHL agreed to pay ABX $31mm in settlement of open DC-9 and Boeing 767 aircraft put values ABX agreed to pay down $15mm of the DHL Note, reducing the outstanding balance to $31mm DHL agreed to pay $11.2mm for reimbursement of accrued vacation paid out to employees adversely impacted by DHL’s restructuring in the U.S. |
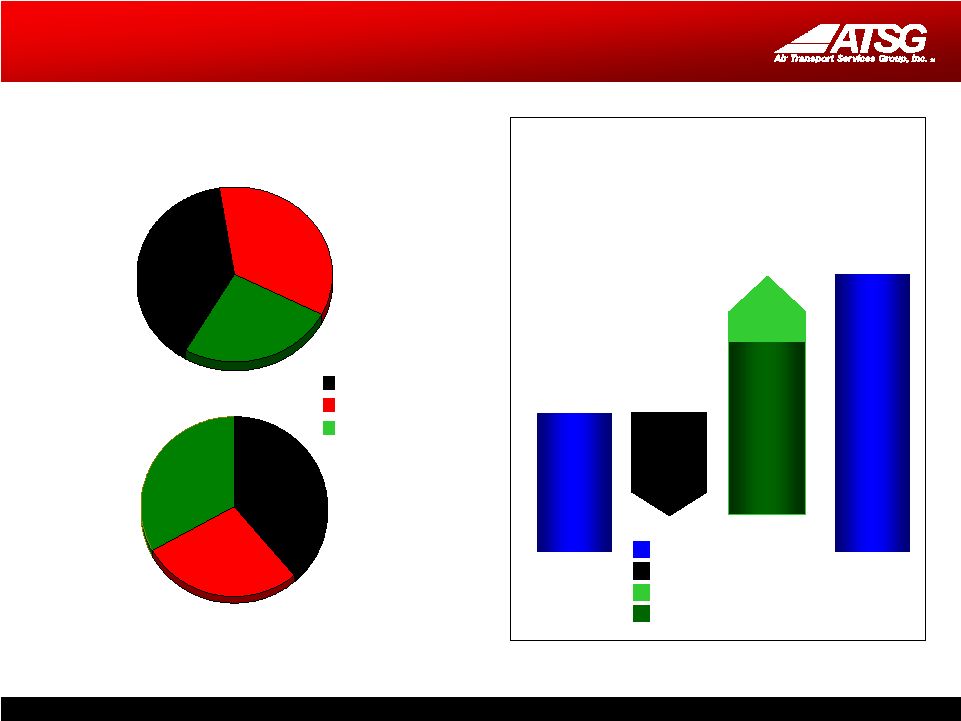
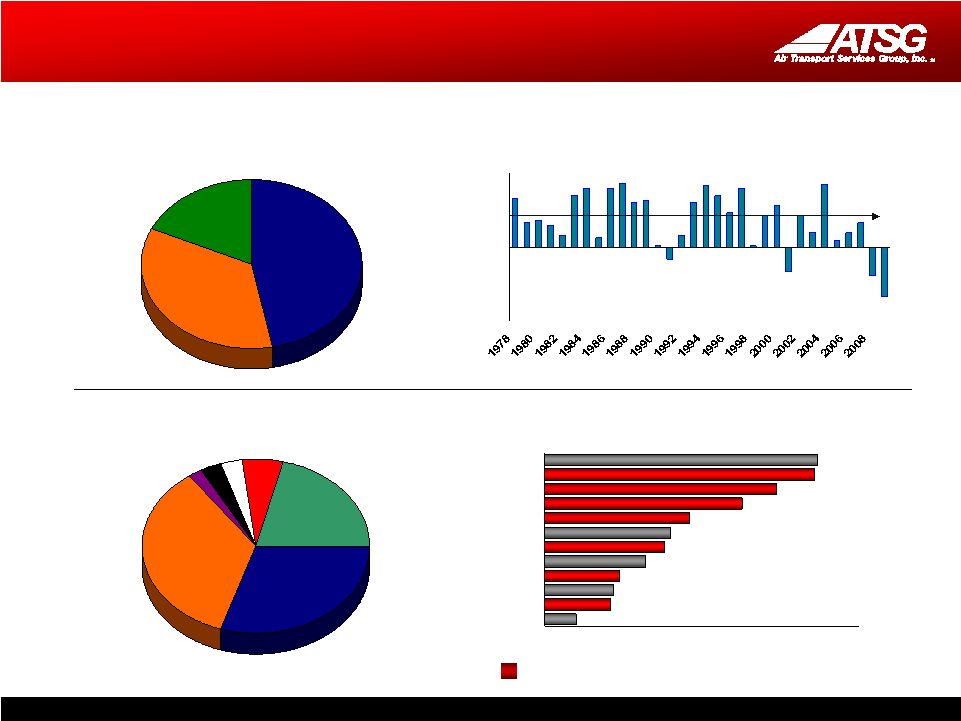 6 Market Overview Airlines 47% Forwarders 18% Express 35% Global Air Freight Market: $87 Billion -15% -10% -5% 0% 5% 10% 15% 30-Year Global Growth Trends Middle East 6% Lat. Amer. 3% Africa 3% Europe 21% North America 30% Other 2% Asia 35% Market Share By Region 0% 2% 4% 6% 8% 10% Japan-N.Amer. Europe-N. Amer. JapanEurope Europe-Other Asia India-N. Amer Africa-Europe Other Asia-N. Amer. S. Amer.-Europe Europe-India China-Europe Other Asia-China China-North America Growth Trends By Region, 2009-2018 Avg. +5.8% Source: ACMG, Boeing ATSG markets |
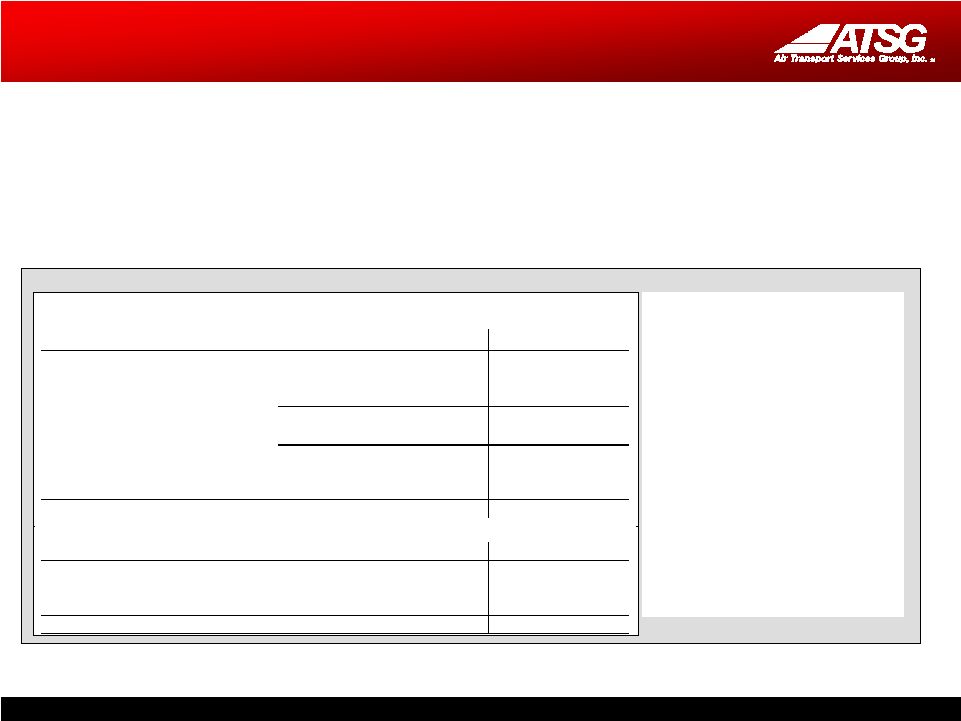
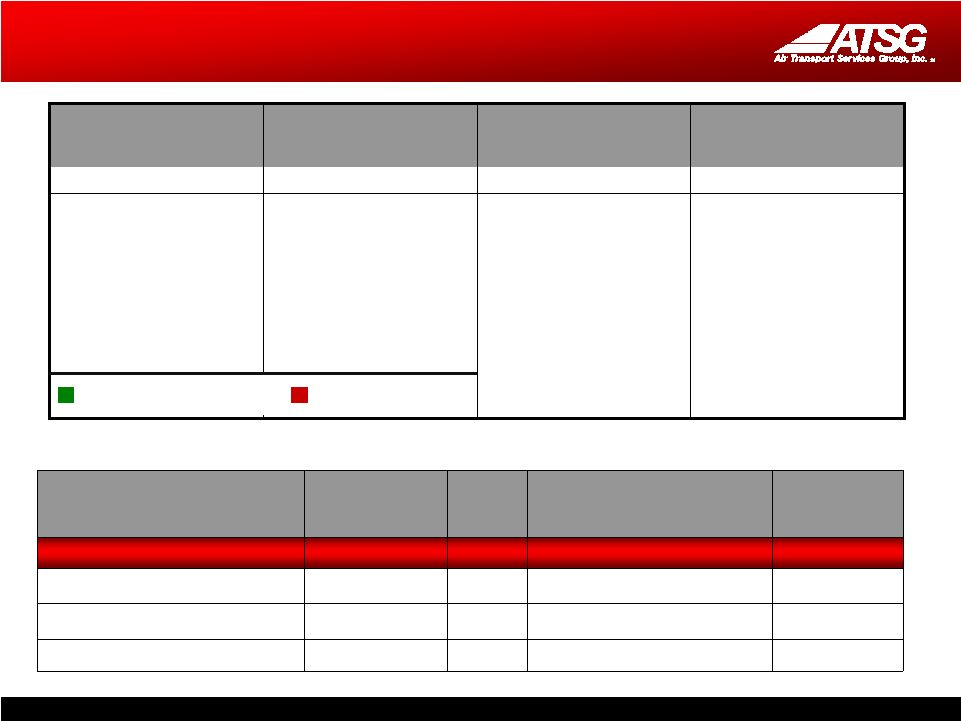 7 Global Freighter Fleets Today 5 B747-100s 77 B747-200s 3 B747-300s 205 B747-400s 38 DC-10-30s 2 DC-10-40s 159 MD-11s 16 777s 65 A310-200/300s 47 A300B4s 48 150 A300-600s 55 B767-200s (37) 59 B767-300s 59 DC-10-10s 1 L1011 12 B707-320s 146 B757-200s (2) 28 DC-8-50/60 (1*) 29 DC-8-70s (15*) * includes 4 combis 24 BAe 146 QTs 33 B737-200s 94 B737-300/400s 32 B727-100s 210 B727-200s (13) 13 DC-9s Large Wide-body 505 Units Medium Wide-body 436 Units Medium Narrow-body 213 Units Small 406 Units Source: ACMG Aircraft Fuel (gal./ block hr)* Crew Payload (lbs.)/ Capacity (cu. ft.) Range (NM) 767-200SF 1,380 2 100,000 / 11,138 2,800 A300-B4 1,900 3 99,200 / 11,445 1,680 DC-8 63 1,760 3 96,800 / 10,060 2,150 DC-8 73 1,600 3 111,800 / 10,060 2,470 Medium Freighter Comparisons ATSG fleet Prime 767 Replacement Candidates |
 8 Freighter Market Outlook Conversions Will Provide 74% of Global Freighter Fleet Adds Freighter Growth 2008 2027 1,940 3,250 +2,760 2,050 -1,450 710 Source: Boeing World Air Cargo Forecast Global Freighter Fleet Freighter Retirements New Freighters Passenger/Freighter Conversions 680 500 760 1,070 920 1,260 2008: 1,940 Freighters 2028: 3,250 Freighters Standard-body <45t Medium wide-body Large >80t |
 9 Deploying Our 767SFs 11-14 11-18 April 2011 Jan. 2012 DHL-CAM Dry Leased SFs Other Customers-CAM Dry Leased SFs 11-14 11 Jan. 2011 4 Pace of 767 modifications could be affected by possible assignment of modification slots to DHL. 7 11 April 2010 DHL- Interim Leased SFs ACMI Services – ACMI/Charter SFs 13 13 4 5-8 5-8 5-12 26 30 32 36 |
 10 Emerging Go-to-Market Strategy Drive higher return on capital by optimally positioning opportunities and bundling additional services CAM a neutral, non-airline, lead sales organization that can drive a bundled marketing strategy Develop packaged programs cross-selling entities Amerijet International program symbolizes this approach Market Approach Market Opportunities 767 ideal replacement for less efficient aircraft A300-B4s (47) DC-10-10s (59) DC-8s (57) Growth markets Intra-Asia: 9.3% Domestic China: 7.5% Europe-Asia: 5.9% Europe-Africa: 5.7% |
 11 ATSG Portfolio Marketing Individual companies continue to market and sell their own services CAM will bundle and sell the services of the individual companies into short- and long- term solutions for new and existing customers • ACMI / Wet Leasing • Cargo Handling • Charter Services • ACMI / Wet Leasing • Combi-freighters • Charter Services • ACMI / Wet Leasing • Charter Services • Aviation Solutions • Bundled Programs • Aircraft Leasing • Conversion Services • Heavy Maintenance • Line Maintenance • Component Overhaul & Sales • Engineering Services |
 12 Flexible Global Solutions Market Differentiation 767-200 with GE CF6-80A engines Low fuel cost Low maintenance cost Flexible configuration Power By Hour engine services The Global Leader of Medium Wide Body Operating and Leasing Solutions Efficient Medium Wide-Body Aircraft • ACMI/ wet leasing • CMI • Dry leasing • AMC charter • Full service charter • Flight operations • Heavy maintenance • Line maintenance • Maintenance programs • Engineering • Technical support • Manual services • Parts, components sales & service • Aircraft conversion services • Global aircraft deployment • Logistics support • DHL • BAX Schenker • TNT • UPS • Qantas • Amerijet • Air Mobility Command • CargoJet Bundled Maintenance Solutions Program Management Meeting Diverse Customer Needs |
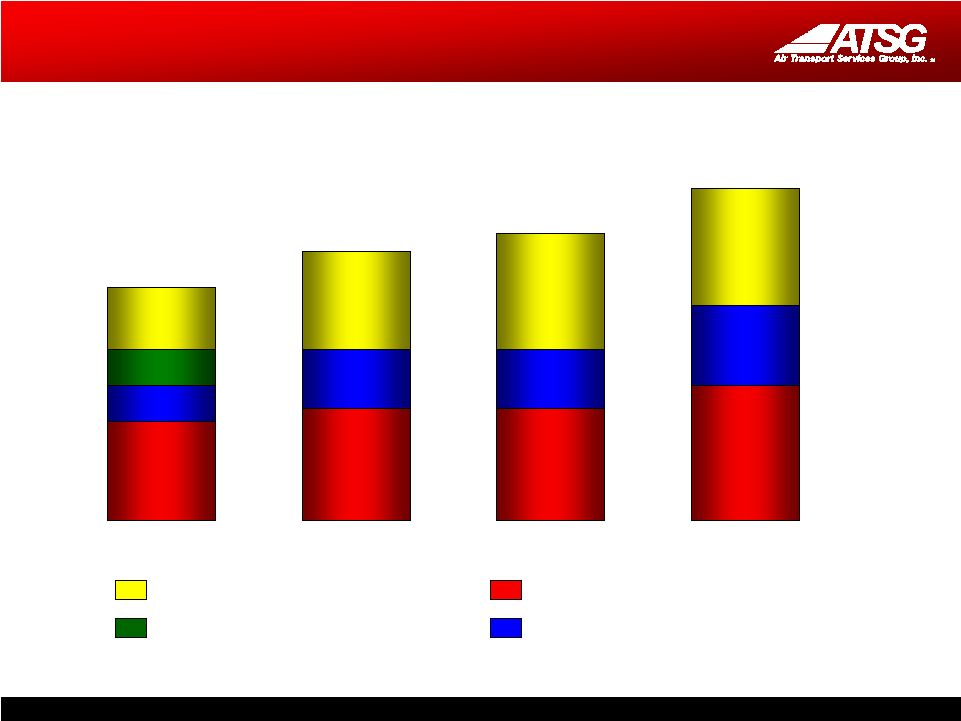
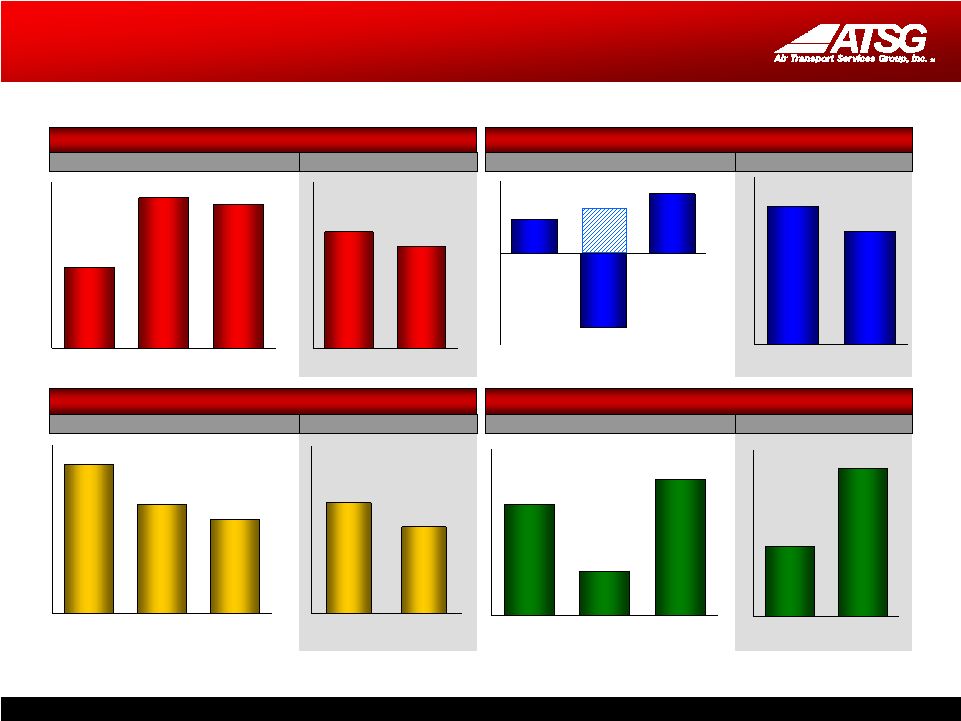 13 Summary Financials EBITDA* (from continuing operations) Pre-tax Earnings (from continuing operations) Net Debt* Stockholders’ Equity $200.0 $80.4 $246.0 2007 2008 2009 $86.9 $163.0 $155.8 2007 2008 2009 $42.1 $36.7 1Q 09 1Q 10 Year First Quarter Year First Quarter Year First Quarter Year First Quarter $330.7 $259.6 3/31/09 3/31/10 $126.8 $266.5 3/31/09 3/31/10 $25.7 -$56.6 $45.4 2007 2008 2009 $34.6** Adjusted* EBITDA is defined as income (loss) from operations plus net interest expense provision for income taxes, depreciation and amortization. Net Debt is defined as Long-Term Obligations plus Current Portion of Debt Obligations minus Cash and Cash Equivalents. EBITDA, Adjusted EBITDA and Net Debt are non-GAAP financial measures and should not be considered alternatives to net income (loss) or any other performance measure derived in accordance with GAAP. See Reconciliation Tables, slide #2 $13.2 $10.8 1Q 09 1Q 10 $443.0 $324.1 $281.3 2007 2008 2009 |
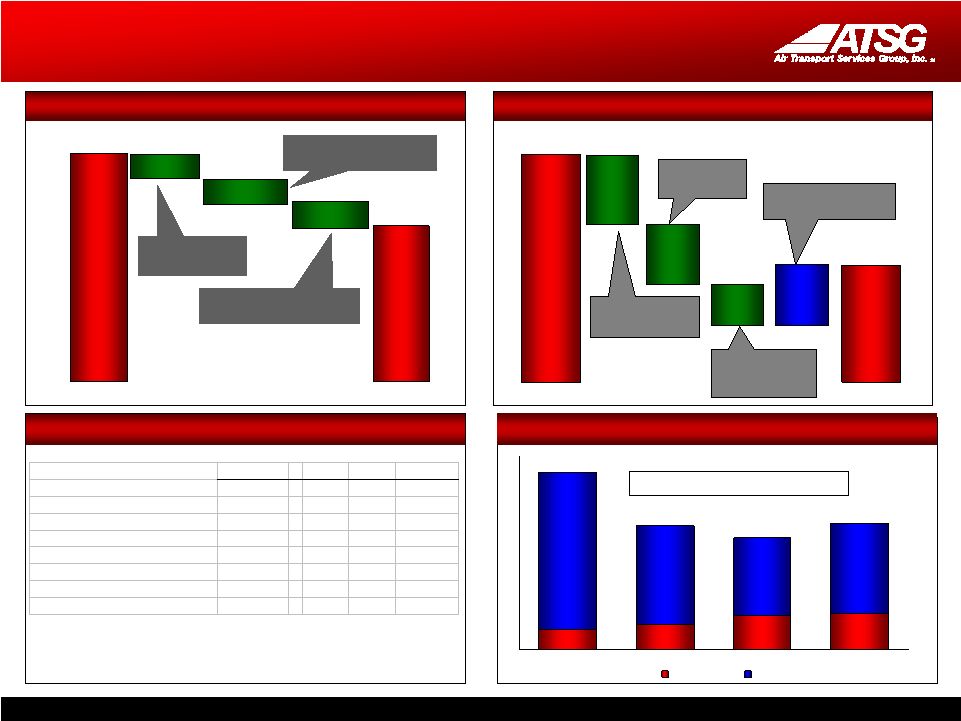 14 Leverage Substantially Reduced -$46.3 Transfer of Aircraft Transfer of Aircraft Capital Leases to DHL Capital Leases to DHL -$43.1 Principal Principal payments payments $377.4 $512.5 -$45.7 DHL Promissory DHL Promissory Note Extinguishment Note Extinguishment YE 2008 YE 2009 Total Debt Reduced 26% Credit Facility Covenant Compliance Required * 2008 2009 1Q2010 ** First Lien Debt / EBITDA < 2.75 2.58 2.17 2.24 Total Debt / EBITDA < 3.25 3.10 2.44 2.53 Fixed Charge Coverage Ratio > 1.50 2.55 1.99 1.93 Capital Expenditures > 1.05 1.58 1.65 1.42 Employer Employer contributions contributions $152.7 $297.3 Actuarial costs & Actuarial costs & adjustments adjustments $83.2 $75.8 $71.7 Workforce Workforce contraction contraction & plan freeze & plan freeze $57.3 $ in millions Gains on Gains on assets assets YE 2008 YE 2009 Post-Retirement Liabilities Reduced 49% $ in millions $22 $31 $32 $142 $90 $70 $82 $18 Maintenance Growth 2007 2008 2009 2010E $160 $112 $101 $114 $ in millions * Requirements at year-end 2008 were 3.00 / 3.50 / 1.50 / 1.25 ** Based upon twelve months trailing EBITDA Minimal Future Capex Commitments Capital Spending Trends |
 15 Value Proposition Strong cash returns from modified freighters 767 leases bring attractive cash returns ACMI/CMI flexibility offers options, wide-body migration path 10 more 767 freighters to be modified through 2011 — 50% market-value gain on $12M per plane invested Long-term agreements with key customers Lease/CMI approach an option for new customer relationships Unlocks value of aircraft from ACMI Opportunity to capture margin gains from fixed-price contracts Integrated, value-added services Increases return on invested capital Comprehensive mix allows for turnkey customer solutions Solid balance sheet and liquidity, growth capital capacity No off-balance sheet obligations Minimal future capital commitments Expanding opportunities around the globe Expanding presence in fastest-growing air cargo regions Uniquely positioned to capture significant share of replacement market as less-efficient mid-sized freighters are retired |
 16 Appendix |
  17 Balance Sheet Review March 31, Dec. 31, Dec. 31, 2010 2009 2008 ASSETS CURRENT ASSETS: Cash and cash equivalents 108,685 $ 83,229 $ 116,114 $ Marketable securities - available-for-sale - 26 Accounts receivable, net of allowances 19,506 25,036 24,495 Due from DHL 23,311 62,672 63,362 Inventory 5,142 5,226 11,259 Prepaid supplies and other 6,790 7,093 11,151 Deferred income taxes 31,597 31,597 20,172 Aircraft and engines held for sale 30,237 30,634 2,353 TOTAL CURRENT ASSETS 225,268 245,487 248,932 Property and equipment, net 639,240 636,089 671,552 Other assets 28,759 21,307 25,281 Deferred income taxes - - 54,807 Intangibles 9,900 10,113 11,000 Goodwill 89,777 89,777 89,777 TOTAL ASSETS 992,944 $ 1,002,773 $ 1,101,349 $ LIABILITIES AND STOCKHOLDERS' EQUITY CURRENT LIABILITIES: Accounts payable 38,614 $ 38,174 $ 36,618 $ Accrued salaries, wages and benefits 29,803 44,077 63,500 Accrued severance and retention 11,030 18,959 67,846 Accrued expenses 15,897 16,429 13,772 Current portion of debt obligations 60,438 51,737 61,858 Unearned revenue 10,288 15,340 14,813 TOTAL CURRENT LIABILITIES 166,070 184,716 258,407 Long-term obligations 307,865 325,690 450,628 Post-retirement liabilities 129,084 152,297 294,881 Other liabilities 61,029 44,044 17,041 Deferred income taxes 62,024 50,044 - STOCKHOLDERS' EQUITY: Preferred stock, 20,000,000 shares authorized, including 75,000 Series A Junior Participating Preferred Stock - - - Common stock, par value $0.01 per share; 75,000,000 shares authorized; 63,416,564 and 63,247,312 shares issued and outstanding in 2009 and 2008, respectively 634 634 632 Additional paid-in capital 502,897 502,822 460,155 Accumulated deficit (203,886) (211,085) (245,534) Accumulated other comprehensive loss (32,773) (46,389) (134,861) TOTAL STOCKHOLDERS' EQUITY 266,872 245,982 80,392 TOTAL LIABILITIES AND STOCKHOLDERS' EQUITY 992,944 $ 1,002,773 $ 1,101,349 $ |