![]() 0 Investor Meetings August 2010 Exhibit 99.1 |
![]() ![]() 1 Safe Harbor, Non-GAAP Reconciliations Except for historical information contained herein, the matters discussed in this presentation contain forward-looking statements that involve risks and uncertainties. There are a number of important factors that could cause Air Transport Services Group's ("ATSG's") actual results to differ materially from those indicated by such forward-looking statements. These factors include, but are not limited to, changes in market demand for our assets and services, the timely completion of 767 freighter modifications as anticipated under ABX Air’s new operating agreement with DHL, ABX Air’s ability to maintain on- time service and control costs under its new operating agreement with DHL, and other factors that are contained from time to time in ATSG's filings with the U.S. Securities and Exchange Commission, including its Annual Report on Form 10-K and Quarterly Reports on Form 10-Q. Readers should carefully review this presentation and should not place undue reliance on ATSG's forward-looking statements. These forward-looking statements were based on information, plans and estimates as of the date of this release. ATSG undertakes no obligation to update any forward-looking statements to reflect changes in underlying assumptions or factors, new information, future events or other changes. ATSG, Inc. Non-GAAP Reconciliation EBITDA, Adjusted EBITDA and Net Debt are non-GAAP financial measures and should not be considered alternatives to net income (loss) or any other performance measure derived in accordance with GAAP. EBITDA is defined as income (loss) from operations plus net interest expense, provision for income taxes, depreciation and amortization. Net Debt is defined as Long-term debt obligations plus Current portion of debt obligations minus Cash and cash equivalents. The Company’s management uses these adjusted financial measures in conjunction with GAAP finance measures to monitor and evaluate its performance, including as a measure of liquidity. EBITDA, Adjusted EBITDA and Net Debt should not be considered in isolation or as a substitute for analysis of the Company’s results as reported under GAAP, or as alternative measures of liquidity. 2008 2009 6Mo.10 2Q09 2Q10 (56,619) 45,358 26,682 9,872 15,898 Impairment of goodwill & intangibles 91,241 0 0 0 0 34,622 45,358 26,682 9,872 15,898 Interest Income (2,335) (449) (158) (129) (85) Interest Expense 37,002 26,881 9,783 7,166 4,594 Depreciation and amortization 93,752 83,964 42,552 20,927 21,752 163,041 155,754 78,859 37,836 42,159 GAAP Pre-tax Earnings (Loss) Reconciliation Statement ($ in 000s) Adjusted EBITDA from Cont. Oper. from Continuing Operations Adjusted Pre-Tax Earnings from Continuing Operations Earnings from Continuing Operations Before Interest, Taxes, Depreciation & Amortization (Adjusted EBITDA) Net Debt 12/31/07 12/31/08 12/31/09 6/30/10 Long term obligations 567,987 450,628 325,690 287,269 Current portion of debt obligations 22,815 61,858 51,737 36,788 Cash and cash equivalents (59,271) (116,114) (83,229) (63,660) Net Debt 531,531 396,372 294,198 260,397 Reconciliation Statement ($ in 000s) |
![]() 2 The Restructured ATSG: Cash Generation With Less Risk, More Growth Differentiated Business Model Lessor and operator of world’s largest fleet of converted medium widebody Boeing 767 freighters Accretive, lower-risk conversion plan will expand highly efficient 767 freighter fleet by 50% by 2012 Long-term leases and operating agreements with global leader DHL, long-term relationships with Bax Schenker, U.S. Military, USPS, TNT and Qantas Provide full spectrum of air transport services throughout the world: Dry leasing, ACMI (wet leasing), maintenance, technical, fuel management, logistic support services Favorable Industry Dynamics Booming air cargo recovery fueled by restocking, alternate mode issues, better logistics management 767 is most-favored replacement for 150-200 less efficient mid-sized freighters flying now 767 is ideal regional ‘spoke’ freighter complement to inter-continental 747 and 777 hub locations Strong Financial Characteristics and Performance Minimal leverage, and no off-balance sheet liabilities or large capital commitments Strong cash flow generation, not projected to be Federal Income Tax cash-payer until 2013 or later Disciplined capital allocation with established ROIC hurdles |
![]() 3 Unique Blend of Complementary Businesses Equipment leasing, and equipment and facility maintenance services Customers include: DHL, Allegiant Air, Branson Airport, Tampa International Jet Center Contracted sort management services for USPS Logistic support services Heavy & line maintenance, component overhaul, engineering and manufacturing Customers include major airlines, private operators Provides 727, 757 ACMI services Customers include BAX Schenker and DHL Provides 767, DC-8, DC-8 Combi ACMI services Customers include BAX Schenker, U.S. Military and Qantas Provides 767 ACMI services Customers include DHL and TNT Dry leases 767, 757, 727 and DC-8 freighters to ATSG airlines and external customers Access to engine maintenance and component services External customers include DHL, Amerijet, CargoJet, First Air Description Business |
![]() 4 ACMI: ACMI: Dedicated Aircraft, Dedicated Aircraft, Crew, Maintenance Crew, Maintenance & Insurance & Insurance (excludes fuel) (excludes fuel) Charter: Charter: Unscheduled & military Unscheduled & military Dry Lease Plus Dry Lease Plus Crew Crew Airframe Maintenance Airframe Maintenance Engine Maintenance Engine Maintenance Pilot Training Pilot Training Cert. Support Cert. Support Standard Standard Dry Lease Dry Lease ATSG Business Model: Cargo Aircraft Dry or ACMI, With Complementary Services Leased Externally Leased to ATSG Airline |
![]() 5 Recent DHL Agreements: Growth with Secure Cash Flows, Minimal Risk Aircraft Lease Terms DHL to lease thirteen 767Fs from CAM under 7 year terms; DHL responsible for airframe and engine maintenance costs Airborne Maintenance and Engineering Services (“AMES”) will provide airframe heavy maintenance DHL provides fuel at its own expense Crew, Maintenance, Insurance (CMI) Agreement Terms ABX operates 13 aircraft for DHL for 5 years, with 2-year extension right to DHL, 2 5 years mutual Defined-fee scaled for the number of aircraft; logical choice to support domestic network expansion ABX operates with monthly performance incentive bonuses Subject to $70mm amortizing break-up fee if DHL prematurely terminates $29.5mm balance of the DHL Note (at June 30, 2010) amortizes to zero over the CMI’s term; no cash, interest fully reimbursable Thirteen seven-year 767SF leases, Aircraft operating agreement for five to ten years nd |
![]() 6 Global Air Cargo Market: Rebounding in Multiple Regions June 2010 vs. June 2009 Volume Growth (FTK) Capacity Growth (AFTK) Africa 54.0% 23.3% Asia/Pacific 29.8% 20.5% Europe 15.3% 2.1% Latin America 44.9% 25.3% Middle East 39.6% 17.9% North America 24.2% 5.9% Industry 26.5% 12.2% YTD 2010 vs. YTD 2009 Africa 46.3% 14.8% Asia/Pacific 35.1% 14.8% Europe 12.6% -4.6% Latin America 48.2% 24.9% Middle East 34.1% 15.8% North America 29.4% 0.6% Industry 28.3% 6.8% International Air Cargo Growth – June 2010 Lufthansa Cargo ‘Booming’ Lufthansa CFO Stephan Gemkow: "The cargo business is currently absolutely booming.” June Sets Air Cargo Record in HK Hong Kong Air Cargo Terminals, which handles close to 80% of the cargo at Hong Kong International Airport, said its record June volume in Hong Kong was up 30.5% over June 2009, and also up over a strong 2008. LAN: S. America Volumes Growing LAN Airlines' chief executive officer Enrique Cueto said cargo traffic will grow 30% this year. “Traffic growth for the (South America) region is very strong, especially in Brazil.” Aerologic Boosts Europe-Asia Service The Aerologic joint venture between Lufthansa Cargo and DHL Express, will increase capacity between Europe and Asia due to high demand. DHL Express and Lufthansa Cargo plan to increase frequency of their flights to Shanghai and Seoul over the rest of 2010. DHL Projects 10-15% Growth in U.S. Ian Clough, chief executive of the U.S. division of DHL Express: DHL Express aims to achieve a 10% to 15% growth rate for international shipments in and out of the U.S. by early 2011. "The U.S. is absolutely critical to our global network,“ he said. "The [U.S.] business is strongly on the road to recovery. “ Source: IATA |
![]() 7 ATSG Global Presence: Positioned With Growth-Market Customers 1.0% 2.1% 2.2% 2.4% 3.2% 3.8% 4.0% 4.6% 6.3% 7.4% 8.6% 8.7% 0% 1% 2% 3% 4% 5% 6% 7% 8% 9% 10% Japan-N. America Europe-N. America Japan-Europe Europe-Other Asia India-N. America Africa-Europe Other Asia-N. America S. America-Europe Europe-India China-Europe Other Asia-China China-North America Growth Trends By Region, 2009-2018 ATSG markets |
![]() 8 Global Freighter Fleets: Big Opportunity in Medium-Size Market Source: ACMG 1,680 99,200 / 11,445 3 1,900 A300-B4 2,650 104,900 / 14,654 2 1,850 A300-600F 3,360 88,420/ 10,922 2 1,390 A310-300F 3,200 124,900 / 16,034 2 1,775 767-300SF Aircraft Fuel (gallon/ block hr)* Crew Payload (lbs.)/ Capacity (cu. ft.) Range (NM) 767-200SF 1,380 2 100,000 / 11,138 2,800 DC-8 63 1,760 3 96,800 / 10,060 2,150 DC-8 73 1,600 3 111,800 / 10,060 2,470 Medium Freighter Comparisons Narrow-body 213 Units 65 A310-200/300s 47 A300B4s 150 A300-600s 55 B767-200s (36) 59 B767-300s (3) Wide-body 436 Units 12 B707-320s 146 B757-200s (2) 28 DC-8-50/60 (1*) 29 DC-8-70s (15*) * includes 4 combis ATSG fleet (2012) Prime candidates for Replacement with 767s Medium Freighters- 2010 Source: Boeing, Airbus |
![]() 9 767 Covers Asia, Americas, Europe 767s provide 45-60 ton payload potential between the world’s principal inter-continental cargo airports and major cities in each region. Smooth interline pallet transfers between medium 767s and large 747/ 777s. Miami-based 767s reach principal perishable food and floral markets in Columbia, Brazil, Mexico, Venezuela, Puerto Rico, etc. All of China, Japan, SE Asia, Australia & India within range of 767 from Hong Kong, world’s largest air freight airport. With ETOPS, can cover principal trans- Atlantic routes. 767-200ER, 767-300 Ranges w/ max. payload Frankfurt Miami Hong Kong |
![]() 10 ATSG Investment Strategy: Value-Creating Freighter Conversions 11-14 12-19* April 2011 Jan. 2012 DHL-CAM Dry Leased Other Customers-CAM Dry Leased 11-14 11 Jan. 2011 4 * Includes freighter conversion by 2012 of ten owned Boeing 767-200s, three Boeing 767-300s pending purchase. Modification schedule of 767-200s subject to DHL options. Deployment as leased vs. ACMI operated aircraft subject to market conditions, customer preference. 7 11 April 2010 DHL- Interim Leased ACMI Services – ACMI/Charter 13 13 4 5-8 5-8 7-14* 26 30 32 39* Dry Lease Investment Return Illustration* $23.4 MM Projected EBIT 11.7% Unlevered ROIC $200 MM Capex Required (13) 767-Series Freighters (in millions) * Margin from ACMI or other complementary services would be incremental. |
![]() 11 Emerging Go-to-Market Strategy Drive higher return on capital by optimally positioning opportunities and bundling additional services CAM a neutral, non-airline, lead sales organization that can drive a bundled marketing strategy Develop packaged programs cross-selling entities Amerijet International program (ACMI migration to CAM-leased 767s, with full ATSG support) symbolizes this approach Market Approach Market Opportunities Airline Operators Key drivers Replacement Capacity growth New markets Non-Operators Examples Forwarders/Brokers Integrators Shippers |
![]() 12 Flexible Global Solutions Premier Source of Medium Freighter Solutions 767-200 with GE CF6-80A engines Low fuel cost Low maintenance cost Flexible configuration Power By Hour engine services The Global Leader of Medium Wide Body Operating and Leasing Solutions Efficient Medium Wide-Body Aircraft Dry leasing ACMI/ wet leasing CMI Combi Full service charter Flight operations Heavy maintenance Line maintenance Maintenance programs Engineering Technical support Manual services Parts, components sales & service Aircraft conversion services Global aircraft deployment Logistics support DHL BAX Schenker TNT UPS Qantas Amerijet Air Mobility Command CargoJet Bundled Maintenance Solutions Program Management Meeting Diverse Customer Needs |
![]() 13 Balance Sheet Improves as Earnings Grow EBITDA* (from continuing operations) Pre-tax Earnings (from continuing operations) Net Debt* Stockholders’ Equity $531.5 $396.4 $294.2 $260.4 $200.0 $80.4 $246.0 $276.3 $155.8 $78.9 2008 2009 1H 2010 $37.8 $42.2 2009 2010 Year Second Quarter Year Second Quarter $34.6** $9.9 $15.9 2009 2010 12/31/07 12/31/08 12/31/09 6/30/10 12/31/07 12/31/08 12/31/09 6/30/10 $163.0** -$56.6 $45.4 $26.7 2008 2009 1H 2010 EBITDA is defined as income (loss) from operations plus net interest expense, provision for income taxes, depreciation and amortization. Net Debt is defined as Long-Term Obligations plus Current Portion of Debt Obligations minus Cash and Cash Equivalents. EBITDA, and Net Debt are non-GAAP financial measures and should not be considered alternatives to net income (loss) 2008 EBITDA and 2008 Pre-tax Earnings adjusted to exclude impairment charges of $91.2 million. or any other performance measure derived in accordance with GAAP. See Reconciliation Tables. * ** |
![]() 14 Employer Employer contributions contributions DHL Promissory DHL Promissory Note Extinguishment Note Extinguishment De-levering Continues: Cash Flow Available for Current Capex Commits Transfer of Aircraft Transfer of Aircraft Capital Leases to DHL Capital Leases to DHL Principal Principal payments payments $324.1 $512.5 12/31/2008 6/30/2010 Total Debt Reduced 42% Credit Facility Covenant Compliance Required * 2008 2009 2Q10 ** First Lien Debt / EBITDA < 2.75 2.58 2.17 2.03 Total Debt / EBITDA < 3.25 3.10 2.44 2.22 Fixed Charge Coverage > 1.50 2.55 1.99 2.05 Capital Expenditures > 1.05 1.58 1.65 1.24 $106.3 $297.3 Actuarial costs Actuarial costs & adjustments & adjustments $113.7 $84.7 $86.7 Workforce Workforce contraction contraction & plan freeze & plan freeze $79.3 $ in millions Gains on Gains on assets assets 12/31/2008 6/30/2010 Post-Retirement Liabilities Reduced 64% $ in millions $22 $31 $32 $142 $90 $70 $82 $18 Maintenance Growth 2007 2008 2009 2010 est. $160 $112 $101 $114 $ in millions * Requirements at year-end 2008 were 3.00 / 3.50 / 1.50 / 1.25 ** Based upon twelve months trailing EBITDA Minimal Future Capex Commitments Capital Spending Trends $94.8 $47.9 $45.7 |
![]() 15 Fog Has Lifted – ATSG Value Cleared for Takeoff Limited risk, strong cash and asset-value returns from converted 767 freighters Expanding 767 freighter fleet will yield attractive, annuity-like cash ROIs via long-term leases ACMI/CMI flexibility offers options, low-risk transition to widebody 767s from older narrowbodys 767 platform flexible as trans-continental leader, compatible feeder to inter-continental 747s/777s Significant market-value gains on P-2-F aircraft conversion investments Long-term agreements with key customers Lease/CMI approach unlocks value of aircraft from ACMI, creates more options for customers 17 767/757s now under fixed 5-7 year leases with DHL, CargoJet, Amerijet, etc. 5-year CMI with DHL, with performance factor plus $31m amortized note forgiveness, DPW backing Integrated, value-added services Increase return on invested capital Comprehensive mix allows for turnkey customer solutions Competitive terms and service packages for third party maintenance business Attractive balance sheet and liquidity, growth capital capacity No off-balance sheet obligations; current low-rate term & revolver facility run through 2012 Manageable 2010-2011 capital commitments: maintenance plus convert 767-200s, and acquire and convert three 767-300s using existing cash and credit resources, yielding significant asset-value gains Secure long-term cash flow enhances access to growth capital if needed Expanding opportunities around the globe Expanding presence in large, fast-growing air cargo regions: Asia, South America, Europe & Africa Unique provider of combi airlift to military in South Pacific region Uniquely positioned as largest independent source of premier medium widebody freighter – the 767 |
![]() 16 Appendix |
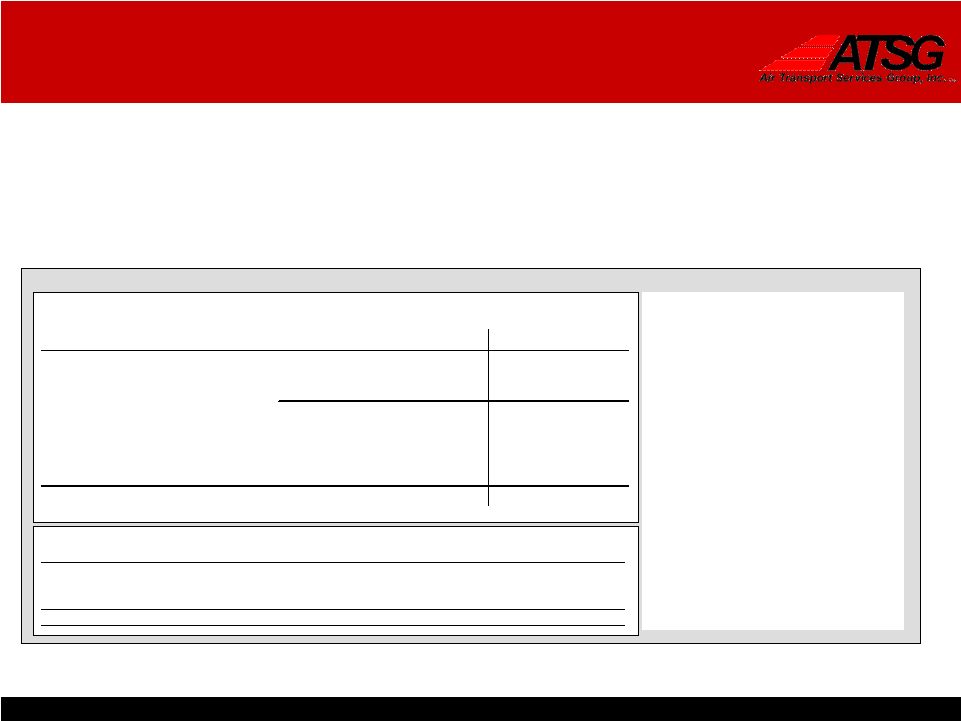
![]() ![]() 17 Balance Sheet Trend June 30, Dec. 31, June 30, Dec. 31 2010 2009 2009 2008 ASSETS CURRENT ASSETS: Cash and cash equivalents 63,660 83,229 112,064 116,114 Marketable securities - available-for-sale - - - 26 Accounts receivable, net of allowances 35,684 87,708 77,329 87,857 Inventory 5,740 5,226 7,611 11,259 Prepaid supplies and other 8,845 7,093 8,122 11,151 Deferred income taxes 31,597 31,597 20,171 20,172 Aircraft and engines held for sale - 30,634 32,901 2,353 TOTAL CURRENT ASSETS 145,526 245,487 258,198 248,932 Property and equipment, net 650,408 636,089 627,768 671,552 Other assets 29,948 21,307 23,265 25,281 Deferred income taxes - - 14,973 54,807 Intangibles 9,686 10,113 10,557 11,000 Goodwill 89,777 89,777 89,777 89,777 TOTAL ASSETS $925,345 $1,002,773 $1,024,538 $1,101,349 LIABILITIES AND STOCKHOLDERS' EQUITY CURRENT LIABILITIES: Accounts payable 31,912 38,174 30,625 36,618 Accrued salaries, wages and benefits 24,956 44,077 40,259 63,500 Accrued severance and retention 7,171 18,959 45,301 67,846 Accrued expenses 15,146 16,429 15,161 13,772 Current portion of debt obligations 36,788 51,737 62,774 61,858 Unearned revenue 16,775 15,340 9,232 14,813 TOTAL CURRENT LIABILITIES 132,748 184,716 203,352 258,407 Long-term obligations 287,269 325,690 380,225 450,628 Post-retirement liabilities 102,765 152,297 269,886 294,881 Other liabilities 59,311 44,044 17,163 17,041 Deferred income taxes 66,988 50,044 - - STOCKHOLDERS' EQUITY: Preferred stock, 20,000,000 shares authorized, including 75,000 Series A Junior Participating Preferred Stock - - - - Common stock, par value $0.01 per share; 638 634 635 632 Additional paid-in capital 503,441 502,822 490,349 460,155 Accumulated deficit (194,248) (211,085) (226,330) (245,534) Accumulated other comprehensive loss (33,567) (46,389) (110,742) (134,861) TOTAL STOCKHOLDERS' EQUITY 276,264 245,982 153,912 80,392 TOTAL LIABILITIES AND STOCKHOLDERS' EQUITY $925,345 $1,002,773 $1,024,538 $1,101,349 |