                                  UNITED STATES
                       SECURITIES AND EXCHANGE COMMISSION
                             Washington, D.C. 20549

                                   FORM N-CSR

                   CERTIFIED SHAREHOLDER REPORT OF REGISTERED
                         MANAGEMENT INVESTMENT COMPANIES

Investment Company Act file number: 811-07344

Morgan Stanley California Insured Municipal Income Trust
               (Exact name of registrant as specified in charter)

1221 Avenue of the Americas, New York, New York 10020
         (Address of principal executive offices)                     (Zip code)

Ronald E. Robison
1221 Avenue of the Americas, New York, New York 10020
                     (Name and address of agent for service)

Registrant's telephone number, including area code: 212-762-4000

Date of fiscal year end: October 31, 2004

Date of reporting period: April 30, 2004


Item 1 - Report to Shareholders
Welcome, Shareholder:
In this report, you'll learn about how your investment in Morgan Stanley California Insured Municipal Income Trust performed during the semiannual period. We will provide an overview of the market conditions, and discuss some of the factors that affected performance during the reporting period. In addition, this report includes the Trust's financial statements and a list of Trust investments.
| Market forecasts provided in this report may not necessarily come to pass. There is no assurance that the Trust will achieve its investment objective. The Trust is subject to market risk, which is the possibility that market values of securities owned by the Trust will decline and, therefore, the value of the Trust's shares may be less than what you paid for them. Accordingly, you can lose money investing in this Trust. |
| Fund Report | |
| For the six-month period ended April 30, 2004 | |
Market Conditions
The U.S. economy continued to show improvement over the six-month period under review. On the positive side, gross domestic product growth topped 4 percent in both quarters. While strength in output has historically led to higher interest rates, yields remained stubbornly low across the curve. These yields reflected low levels of observed inflation in the economy and gradual improvement in employment. The Federal Open Market Committee maintained its accommodative monetary policy.
Surprising job growth in March, combined with escalating oil prices, led investors to anticipate that the Fed would raise interest rates sooner rather than later. Yet at its April meeting the Federal Reserve did not change its short-term lending rate but did signal a prospective shift in policy. As a result, bond yields spiked across sectors and maturities.
The supply of new municipal bonds in calendar 2003 reached record levels as municipalities took advantage of historically low interest rates. Many cities and states reduced expenditures by refinancing existing debt at lower yields. In other cases, municipalities attempted to meet budget needs by issuing additional debt. Then in the first months of 2004 bond sales began to slow.
Low interest rates also had an impact on the demand for municipal bonds. Retail and mutual fund activity slowed as holders of municipal bonds saw little reason to sell bonds purchased at higher yields and reinvest at historically low yields. However, insurance companies and hedge funds purchased municipal bonds based on their attractiveness relative to taxable securities. Additionally, investors stretched for yield by buying lower-rated bonds, causing credit spreads to tighten.
California remained in the municipal credit market spotlight during this period. In March, voters approved a referendum authorizing the sale of up to $15 billion of economic recovery bonds to refinance the state's accumulated budget deficit. This led the major ratings agencies to improve the outlook but not the rating for the state's beleaguered bonds. S&P shifted its stance from a stable to a positive outlook and Moody's changed its from a negative to a stable outlook.
Performance Analysis
The net asset value (NAV) of Morgan Stanley California Insured Municipal Income Trust (IIC) decreased from $14.84 to $14.60 per share for the six-month period ended April 30, 2004. Based on this change plus reinvestment of tax-free dividends totaling $0.405 per share and long-term capital gains of $0.067983 per share, the Trust's total NAV return was 1.79 percent. The Trust's value on the New York Stock Exchange (NYSE) decreased from $13.87 to $12.68 per share during the same period. Based on this change plus reinvestment of distributions, the Trust's total market return was –5.42 percent. On April 30, 2004, IIC's NYSE market price was at a 13.15 percent discount to its NAV. Past performance is no guarantee of future results.
2
Monthly dividends for the second quarter of 2004, declared in March, were unchanged at $0.0675 per share. The dividend reflects the level of the Trust's undistributed net investment income and projected earnings power. The Trust's level of undistributed net investment income was $0.083 per share on April 30, 2004, versus $0.103 per share six months earlier.
The Trust's duration* was targeted to be shorter than its benchmark index. The duration, adjusted for leverage, was 12.7 years. Treasury futures were sold to reduce interest-rate exposure without raising the level of cash in the portfolio. We maintained an average tax-exempt bond maturity objective of 20 years to take advantage of the steepness of the municipal yield curve. Revenue bonds in sectors with reliable income streams from essential services such as municipal electric, transportation and water and sewer systems were emphasized. The Trust's net assets, including preferred shares, of $237.8 million were diversified across 50 credits in 10 long-term sectors.
As discussed in previous reports, the total income available for distribution to holders of common shares includes incremental income provided by the Trust's outstanding Auction Rate Preferred Shares (ARPS). ARPS dividends reflect prevailing short-term interest rates on maturities ranging from one week to two years. Incremental income to holders of common shares depends on two factors: the amount of ARPS outstanding and the spread between the portfolio's cost yield and its ARPS auction rate and expenses. The greater the spread and the higher the amount of ARPS outstanding, the greater the amount of incremental income there is available for distribution to holders of common shares. The level of net investment income available for distribution to holders of common shares varies with the level of short-term interest rates. ARPS leverage also increases the price volatility of common shares and has the effect of extending portfolio duration.
During the six-month period under review, ARPS leverage contributed approximately $0.06 per share to common-share earnings. The Trust has four ARPS series totaling $65 million and representing 27 percent of net assets, including preferred shares. These series are currently in two-year auction modes with maturities ranging from July 2004 to September 2005. The yields ranged from 1.43 to 2.22 percent.
The Trust's procedure for reinvesting all dividends and distributions in common shares is through purchases in the open market. This method helps support the market value of the Trust's shares. In addition, we would like to remind you that the Trustees have approved a procedure whereby the Trust may, when appropriate, purchase shares in the open market or in privately negotiated transactions at a price not above market value or net asset value, whichever is lower at the time of purchase. The Trust may also utilize procedures to reduce or eliminate the amount of outstanding ARPS, including their purchase in the open market or in privately negotiated transactions.
| * | A measure of the sensitivity of a bond's price to changes in interest rates, expressed in years. Each year of duration represents an expected 1 percent change in the price of a bond for every 1 percent change in interest rates. The longer a bond's duration, the greater the effect of interest-rate movements on its price. Typically, Trusts with shorter durations perform better in rising-interest-rate environments, while Trusts with longer durations perform better when rates decline. |
3
| LARGEST SECTORS | |||||||
| Transportation | 19.6 | % | |||||
| Water & Sewer | 19.3 | ||||||
| General Obligation | 15.0 | ||||||
| Public Facilities | 12.2 | ||||||
| Electric | 10.9 | ||||||
| CREDIT ENHANCEMENTS | |||||||
| Ambac | 29.6 | % | |||||
| MBIA | 26.2 | ||||||
| FSA | 25.3 | ||||||
| FGIC | 15.1 | ||||||
| US Gov't Backed | 2.4 | ||||||
| XLCA | 1.4 | ||||||
| Data as of April 30, 2004. Subject to change daily. All percentages are as a percentage of long-term investments. Provided for informational purposes only and should not be deemed a recommendation to buy or sell the securities mentioned. Morgan Stanley is a full-service securities firm engaged in securities trading and brokerage activities, investment banking, research and analysis, financing and financial advisory services. |
4
| Distribution by Maturity | |
(% of Long-Term Portfolio) As of April 30, 2004
Weighted Average Maturity: 21 Years
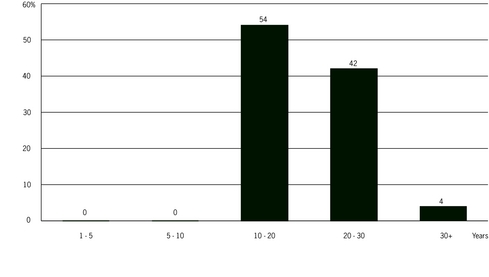
| Portfolio structure is subject to change. |
5
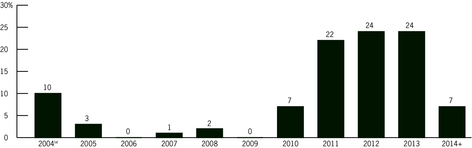
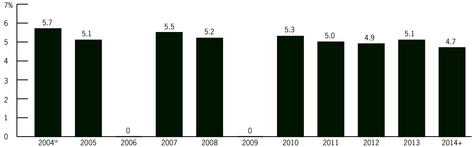
| Call and Cost (Book) Yield Structure | |
| (Based on Long-Term Portfolio) As of April 30, 2004 | |
Years Bonds Callable—Weighted Average Call Protection: 7 Years
Cost (Book) Yield(b)—Weighted Average Book Yield: 5.1%
| (a) | May include issues callable in previous years. |
| (b) | Cost or "book" yield is the annual income earned on a portfolio investment based on its original purchase price before the Trust's operating expenses. For example, the Trust is earning a book yield of 5.7% on 10% of the long-term portfolio that is callable in 2004. |
| Portfolio structure is subject to change. |
6
Morgan Stanley California Insured Municipal Income Trust
Portfolio of Investments  April 30, 2004 (unaudited)
| PRINCIPAL AMOUNT IN THOUSANDS | COUPON RATE | MATURITY DATE | VALUE | |||||||||||||||
| California Tax-Exempt Municipal Bonds (130.3%) | ||||||||||||||||||
| General Obligation (19.5%) | ||||||||||||||||||
| $ | 8,000 | California, Various Purpose dtd 04/01/93 (FSA) | 5.50 | % | 04/01/19 | $ | 8,188,320 | |||||||||||
| 3,000 | Los Angeles Community College District, 2001 Ser A (MBIA) | 5.00 | 06/01/26 | 3,008,820 | ||||||||||||||
| Los Angeles Unified School District, | ||||||||||||||||||
| 4,000 | 2003 Ser A (MBIA) | 5.25 | 07/01/19 | 4,252,480 | ||||||||||||||
| 3,000 | 2003 Ser A (MBIA) | 5.00 | 01/01/28 | 3,005,250 | ||||||||||||||
| North Orange County Community College District, | ||||||||||||||||||
| 2,000 | 2002 Ser A (MBIA) | 5.375 | 08/01/21 | 2,139,700 | ||||||||||||||
| 2,000 | 2004 Ser A (MBIA) | 5.00 | 08/01/23 | 2,034,700 | ||||||||||||||
| 3,000 | Oakland, Ser 2003 A (MBIA) | 5.00 | 01/15/33 | 2,992,980 | ||||||||||||||
| San Diego Unified School District, | ||||||||||||||||||
| 3,000 | 1998 Ser C (FSA) | 5.00 | 07/01/23 | 3,051,690 | ||||||||||||||
| 2,000 | 1998 Ser D (FGIC) | 5.25 | 07/01/23 | 2,090,920 | ||||||||||||||
| 3,000 | 1998 Ser B (MBIA) | 5.00 | 07/01/25 | 3,014,820 | ||||||||||||||
| 33,000 | 33,779,680 | |||||||||||||||||
| Educational Facilities Revenue (11.2%) | ||||||||||||||||||
| 2,000 | California Educational Facilities Authority, Pepperdine University Refg Ser 2003 A (FGIC) | 5.00 | 09/01/33 | 1,995,280 | ||||||||||||||
| 2,000 | California State University, Ser 2003 A (FGIC) | 5.25 | 11/01/21 | 2,104,740 | ||||||||||||||
| University of California, | ||||||||||||||||||
| 4,000 | Ser 2003 B (Ambac) | 5.00 | 05/15/22 | 4,088,960 | ||||||||||||||
| 5,000 | Multi Purpose Ser 2003 Q (FSA) | 5.00 | 09/01/23 | 5,087,400 | ||||||||||||||
| 6,000 | UCLA Medical Center Ser 2004A (Ambac) (WI) | 5.25 | 05/15/30 | 6,132,000 | ||||||||||||||
| 19,000 | 19,408,380 | |||||||||||||||||
| Electric Revenue (14.2%) | ||||||||||||||||||
| 8,000 | California Department of Water Resources, Power Supply Ser 2002 A (Ambac) | 5.375 | 05/01/18 | 8,571,600 | ||||||||||||||
| Los Angeles Department of Water & Power, | ||||||||||||||||||
| 4,000 | 2001 Ser A (FSA) | 5.25 | 07/01/21 | 4,189,840 | ||||||||||||||
| 5,000 | 2003 Ser A Subser A-2 (MBIA) | 5.00 | 07/01/27 | 5,016,100 | ||||||||||||||
| 4,000 | Modesto Irrigation District, Ser 2001 A COPs (FSA) | 5.00 | 07/01/26 | 4,006,040 | ||||||||||||||
| 610 | Sacramento Municipal Utility District, California Refg 1994 Ser I (MBIA) | 6.00 | 01/01/24 | 624,231 | ||||||||||||||
| 2,150 | Turlock Irrigation District, Refg 1998 Ser A (MBIA) | 5.00 | 01/01/26 | 2,154,580 | ||||||||||||||
| 23,760 | 24,562,391 | |||||||||||||||||
See Notes to Financial Statements
7
Morgan Stanley California Insured Municipal Income Trust
Portfolio of Investments April 30, 2004 (unaudited) continued
| PRINCIPAL AMOUNT IN THOUSANDS | COUPON RATE | MATURITY DATE | VALUE | |||||||||||||||
| Hospital Revenue (1.8%) | ||||||||||||||||||
| $ | 3,000 | California Health Facilities Financing Authority, Children's Hospital San Diego Ser 1993 (MBIA) | 5.75 | % | 07/01/23 | $ | 3,068,310 | |||||||||||
| Mortgage Revenue – Single Family (3.0%) | ||||||||||||||||||
| 5,000 | California Department of Veterans Affairs, Home Purchase 2002 Ser A (Ambac) | 5.35 | 12/01/27 | 5,132,550 | ||||||||||||||
| Public Facilities Revenue (15.9%) | ||||||||||||||||||
| 3,000 | California Public Works Board, Corrections 2004 Ser E (XLCA) | 5.00 | 06/01/17 | 3,131,550 | ||||||||||||||
| 2,000 | MidPeninsula Regional Space District Financing Authority, Ser 2004 (Ambac) | 5.00 | 09/01/34 | 1,978,600 | ||||||||||||||
| 5,000 | Modesto, Community Center Refg 1993 Ser A COPs (Ambac) | 5.00 | 11/01/23 | 5,154,600 | ||||||||||||||
| Sacramento Financing Authority, | ||||||||||||||||||
| 2,000 | City Hall 2002 Ser A (FSA) | 5.00 | 12/01/32 | 1,983,980 | ||||||||||||||
| 2,000 | 2003 Capital Impr (Ambac) | 5.00 | 12/01/33 | 1,986,160 | ||||||||||||||
| 5,000 | San Francisco Redevelopment Agency, George R Moscone Convention Center Refg Ser 2002 (FSA) | 5.25 | 07/01/18 | 5,290,450 | ||||||||||||||
| 8,000 | San Jose Financing Authority, Civic Center Ser 2002 B (Ambac) | 5.00 | 06/01/37 | 7,876,160 | ||||||||||||||
| 27,000 | 27,401,500 | |||||||||||||||||
| Tax Allocation Revenue (11.0%) | ||||||||||||||||||
| Burbank Public Financing Authority, | ||||||||||||||||||
| 1,300 | Golden State Redev 2003 Ser A (Ambac) | 5.25 | 12/01/22 | 1,357,174 | ||||||||||||||
| 1,500 | Golden State Redev 2003 Ser A (Ambac) | 5.25 | 12/01/23 | 1,557,735 | ||||||||||||||
| 2,000 | La Quinta Redevelopment Agency, Area # 1 Ser 2002 (Ambac) | 5.00 | 09/01/22 | 2,037,880 | ||||||||||||||
| 1,070 | Long Beach Bond Finance Authority, Downtown North Long Beach Poly High and West Beach 2002 Ser A (Ambac) | 5.375 | 08/01/18 | 1,144,140 | ||||||||||||||
| 3,000 | Long Beach Financing Authority, Ser 1992 (Ambac) | 6.00 | 11/01/17 | 3,483,120 | ||||||||||||||
| 3,000 | Milpitas Redevelopment Agency, Area # 1 Ser 2003 (MBIA) | 5.00 | 09/01/22 | 3,052,440 | ||||||||||||||
| 6,000 | Poway Redevelopment Agency, Pagway Redev DRIVERS Ser 372 (MBIA) | 9.141 | ‡ | 06/15/11 | 6,440,460 | |||||||||||||
| 17,870 | 19,072,949 | |||||||||||||||||
| Transportation Facilities Revenue (25.5%) | ||||||||||||||||||
| 5,000 | California Infrastructure and Economic Development Bank, Bay Area Toll Bridges Seismic Retrofit First Lien Ser 2003 A (FSA) | 5.25 | 07/01/21 | 5,265,450 | ||||||||||||||
| 5,000 | Long Beach Harbor, Ser 1995 (AMT) (MBIA) | 5.25 | 05/15/25 | 5,013,800 | ||||||||||||||
| 10,000 | Los Angeles, Harbor Department 2001 A (Ambac) | 5.00 | 08/01/25 | 10,056,600 | ||||||||||||||
| 5,000 | Los Angeles County Metropolitan Transportation Authority, Sales Tax Ser 2000 A (FGIC) | 5.25 | 07/01/30 | 5,080,200 | ||||||||||||||
See Notes to Financial Statements
8
Morgan Stanley California Insured Municipal Income Trust
Portfolio of Investments April 30, 2004 (unaudited) continued
| PRINCIPAL AMOUNT IN THOUSANDS | COUPON RATE | MATURITY DATE | VALUE | |||||||||||||||
| $ | 3,000 | Port of Oakland, 2000 Ser K (AMT) (FGIC) | 5.875 | % | 11/01/17 | $ | 3,278,160 | |||||||||||
| 5,000 | San Francisco Airports Commission, San Francisco Int'l Airport Refg Issue 27A (AMT) (MBIA) | 5.25 | 05/01/26 | 5,036,400 | ||||||||||||||
| San Francisco Bay Area Rapid Transit District, | ||||||||||||||||||
| 1,255 | Sales Tax Ser 1995 (FGIC) | 5.50 | 07/01/20 | 1,307,886 | ||||||||||||||
| 3,000 | Sales Tax Ser 1998 (Ambac) | 5.00 | 07/01/28 | 3,003,750 | ||||||||||||||
| 2,000 | San Joaquin Hills Transportation Corridor Agency, Toll Road Refg Ser 1997 A (MBIA) | 5.25 | 01/15/30 | 2,021,260 | ||||||||||||||
| 4,000 | San Jose, Airport Ser 2001 A (FGIC) | 5.00 | 03/01/25 | 4,007,760 | ||||||||||||||
| 43,255 | 44,071,266 | |||||||||||||||||
| Water & Sewer Revenue (25.1%) | ||||||||||||||||||
| 3,000 | California Department of Water Resources, Central Valley Ser Y (FGIC) | 5.25 | 12/01/19 | 3,188,010 | ||||||||||||||
| Contra Costa Water District, | ||||||||||||||||||
| 5,060 | Refg Ser L (FSA) | 5.00 | 10/01/20 | 5,215,797 | ||||||||||||||
| 2,135 | Refg Ser L (FSA) | 5.00 | 10/01/21 | 2,191,727 | ||||||||||||||
| 2,240 | Refg Ser L (FSA) | 5.00 | 10/01/22 | 2,286,973 | ||||||||||||||
| 3,000 | East Bay Municipal Utility District, Water Ser 2001 (MBIA) | 5.00 | 06/01/26 | 3,013,200 | ||||||||||||||
| 5,000 | Los Angeles Wastewater, Ser II-R RITES (FSA) | 8.82 | ‡ | 06/01/22 | 5,223,100 | |||||||||||||
| Metropolitan Waterworks District of Southern California, | ||||||||||||||||||
| 4,000 | 2003 Ser B-1 (FGIC) | 5.00 | 10/01/33 | 3,990,640 | ||||||||||||||
| 2,000 | 2003 Ser B-1 (FGIC) | 5.00 | �� | 10/01/36 | 1,985,940 | |||||||||||||
| 3,000 | Sacramento Financing Authority, Water & Cap Impr 2001 Ser A (Ambac) | 5.00 | 12/01/26 | 3,013,200 | ||||||||||||||
| 3,000 | San Francisco Public Utilities Commission, Clearwater Refg 2003 Ser A (MBIA) | 5.25 | 10/01/17 | 3,217,230 | ||||||||||||||
| 5,000 | Water Refg Ser A 2001 (FSA) | 5.00 | 11/01/31 | 5,001,550 | ||||||||||||||
| 5,000 | Santa Maria, Local Water & Refg Ser 1993 COPs (FGIC) | 5.50 | 08/01/21 | 5,036,350 | ||||||||||||||
| 42,435 | 43,363,717 | |||||||||||||||||
| Refunded (3.1%) | ||||||||||||||||||
| 5,000 | Puerto Rico Infrastructure Financing Authority, 2000 Ser A (ETM)†† | 5.50 | 10/01/32 | 5,349,550 | ||||||||||||||
| 219,320 | Total California Tax-Exempt Municipal Bonds (Cost $221,743,950) | 225,210,293 | ||||||||||||||||
See Notes to Financial Statements
9
Morgan Stanley California Insured Municipal Income Trust
Portfolio of Investments April 30, 2004 (unaudited) continued
| PRINCIPAL AMOUNT IN THOUSANDS | COUPON RATE | MATURITY DATE | VALUE | |||||||||||||||
| California Tax-Exempt Short-Term Municipal Obligations (8.7%) | ||||||||||||||||||
| $ | 5,300 | California Department of Water Resources, Power Supply Ser B Subser B-1 (Demand 05/03/04) | 1.07* | % | 05/01/22 | $ | 5,300,000 | |||||||||||
| 4,600 | Newport Beach, Hoag Memorial Hospital Presbyterian 1992 Ser (Demand 05/03/04) | 1.04 | * | 10/01/22 | 4,600,000 | |||||||||||||
| 5,000 | Port Hueneme Redevelopment Agency, Central Community 1993 Refg (Ambac) (Called for redemption 05/10/04) | 5.50 | 05/01/23 | 5,056,100 | ||||||||||||||
| 14,900 | Total California Tax-Exempt Short-Term Municipal Obligations (Cost $14,784,809) | 14,956,100 | ||||||||||||||||
| $ | 234,220 | Total Investments (Cost $236,528,759) (a) (b) | 139.0 | % | 240,166,393 | |||||||||||||
| Liabilities in Excess of Other Assets | (1.3 | ) | (2,288,783 | ) | ||||||||||||||
| Preferred Shares of Beneficial Interest | (37.7 | ) | (65,096,356 | ) | ||||||||||||||
| Net Assets Applicable to Common Shareholders | 100.0 | % | $ | 172,781,254 | ||||||||||||||
| Note: | The categories of investments are shown as a percentage of net assets applicable to common shareholders. |
| AMT | Alternative Minimum Tax. |
| COPs | Certificates of Participation. |
| ETM | Escrowed to maturity. |
| DRIVERS | Derivative Inverse Tax-Exempt Receipts. |
| RITES | Residual Interest Tax-Exempt Securities. |
| WI | Security purchased on a when-issued basis. |
| †† | A portion of this security has been physically segregated in connection with open futures contracts in the amount of $440,625. |
| ‡ | Current coupon rate for inverse floating rate municipal obligation. This rate resets periodically as the auction rate on the related security changes. Positions in inverse floating rate municipal obligations have a total value of $11,663,560 which represents 6.8% of net assets applicable to common shareholders. |
| * | Current coupon of variable rate demand obligation. |
| (a) | Securities have been designated as collateral in an amount equal to $41,397,270 in connection with the open futures contracts and the purchase of a when-issued security. |
| (b) | The aggregate cost for federal income tax purposes approximates the aggregate cost for book purposes. The aggregate gross unrealized appreciation is $4,632,009 and the aggregate gross unrealized depreciation is $994,375, resulting in net unrealized appreciation of $3,637,634. |
| Bond Insurance: |
| Ambac | Ambac Assurance Corporation. |
| FGIC | Financial Guaranty Insurance Company. |
| FSA | Financial Security Assurance Inc. |
| MBIA | Municipal Bond Investors Assurance Corporation. |
| XLCA | XL Capital Assurance Inc. |
See Notes to Financial Statements
10
Morgan Stanley California Insured Municipal Income Trust
Portfolio of Investments April 30, 2004 (unaudited) continued
Futures Contracts Open at April 30, 2004:
| NUMBER OF CONTRACTS | LONG/SHORT | DESCRIPTION, DELIVERY MONTH AND YEAR | UNDERLYING FACE AMOUNT AT VALUE | UNREALIZED APPRECIATION | |||||||||||||||
| 125 | Short | U.S. Treasury Note 5 Yr June/2004 | $(13,742,188) | $291,649 | |||||||||||||||
| 250 | Short | U.S. Treasury Note 10 Yr June/2004 | (27,625,000) | 807,312 | |||||||||||||||
| Total unrealized appreciation | $1,098,961 | ||||||||||||||||||
See Notes to Financial Statements
11
Morgan Stanley California Insured Municipal Income Trust
Financial Statements
Statement of Assets and Liabilities
April 30, 2004 (unaudited)
| Assets: | ||||||
| Investments in securities, at value (cost $236,528,759) | $ | 240,166,393 | ||||
| Cash | 42,220 | |||||
| Interest receivable | 3,903,301 | |||||
| Prepaid expenses and other assets | 240,608 | |||||
| Total Assets | 244,352,522 | |||||
| Liabilities: | ||||||
| Payable for: | ||||||
| Investment purchased | 6,155,460 | |||||
| Variation margin | 107,420 | |||||
| Investment management fee | 81,343 | |||||
| Common shares of beneficial interest repurchased | 35,959 | |||||
| Accrued expenses and other payables | 94,730 | |||||
| Total Liabilities | 6,474,912 | |||||
| Preferred shares of beneficial interest (at liquidation value) (1,000,000 shares authorized of non-participating $.01 par value, 1,300 shares outstanding) | 65,096,356 | |||||
| Net Assets Applicable to Common Shareholders | $ | 172,781,254 | ||||
| Composition of Net Assets Applicable to Common Shareholders: | ||||||
| Common shares of beneficial interest (unlimited shares authorized of $.01 par value, 11,833,062 shares outstanding) | $ | 167,534,106 | ||||
| Net unrealized appreciation | 4,736,595 | |||||
| Accumulated undistributed net investment income | 984,443 | |||||
| Accumulated net realized loss | (473,890 | ) | ||||
| Net Assets Applicable to Common Shareholders | $ | 172,781,254 | ||||
| Net Asset Value Per Common Share, ($172,781,254 divided by 11,833,062 common shares outstanding) | $ | 14.60 | ||||
Statement of Operations
For the six months ended April 30, 2004 (unaudited)
| Net Investment Income: | ||||||
| Interest Income | $ | 5,902,946 | ||||
| Expenses | ||||||
| Investment management fee | 429,045 | |||||
| Auction commission fees | 161,902 | |||||
| Professional fees | 31,317 | |||||
| Transfer agent fees and expenses | 31,052 | |||||
| Shareholder reports and notices | 12,254 | |||||
| Auction agent fees | 12,137 | |||||
| Registration fees | 8,287 | |||||
| Custodian fees | 7,882 | |||||
| Trustees' fees and expenses | 5,193 | |||||
| Other | 20,557 | |||||
| Total Expenses | 719,626 | |||||
| Less: expense offset | (7,769 | ) | ||||
| Net Expenses | 711,857 | |||||
| Net Investment Income | 5,191,089 | |||||
| Net Realized and Unrealized Gain (Loss): | ||||||
| Net Realized Gain (Loss) on: | ||||||
| Investments | 995,798 | |||||
| Futures contracts | (1,891,223 | ) | ||||
| Net Realized Loss | (895,425 | ) | ||||
| Net Change in Unrealized Appreciation/Depreciation on: | ||||||
| Investments | (2,535,402 | ) | ||||
| Futures contracts | 1,520,503 | |||||
| Net Depreciation | (1,014,899 | ) | ||||
| Net Loss | (1,910,324 | ) | ||||
| Dividends to preferred shareholders from net investment income | (606,516 | ) | ||||
| Net Increase | $ | 2,674,249 | ||||
See Notes to Financial Statements
12
Morgan Stanley California Insured Municipal Income Trust
Financial Statements continued
Statement of Changes in Net Assets
| FOR THE SIX MONTHS ENDED APRIL 30, 2004 | FOR THE YEAR ENDED OCTOBER 31, 2003 | |||||||||
| (unaudited) | ||||||||||
| Increase (Decrease) in Net Assets: | ||||||||||
| Operations: | ||||||||||
| Net investment income | $ | 5,191,089 | $ | 11,188,309 | ||||||
| Net realized gain (loss) | (895,425 | ) | 3,291,328 | |||||||
| Net change in unrealized appreciation/depreciation | (1,014,899 | ) | (4,702,937 | ) | ||||||
| Dividends to preferred shareholders from net investment income | (606,516 | ) | (1,031,300 | ) | ||||||
| Net Increase | 2,674,249 | 8,745,400 | ||||||||
| Dividends and Distributions to Common Shareholders from: | ||||||||||
| Net investment income | (4,841,258 | ) | (10,854,328 | ) | ||||||
| Net realized gain | (816,793 | ) | — | |||||||
| Total Dividends and Distributions | (5,658,051 | ) | (10,854,328 | ) | ||||||
| Decrease from transactions in common shares of beneficial interest | (2,772,019 | ) | (2,892,442 | ) | ||||||
| Net Decrease | (5,755,821 | ) | (5,001,370 | ) | ||||||
| Net Assets Applicable to Common Shareholders: | ||||||||||
| Beginning of period | 178,537,075 | 183,538,445 | ||||||||
| End of Period (Including accumulated undistributed net investment income of $984,443 and $1,241,128, respectively) | $ | 172,781,254 | $ | 178,537,075 | ||||||
See Notes to Financial Statements
13
Morgan Stanley California Insured Municipal Income Trust
Notes to Financial Statements April 30, 2004 (unaudited)
1. Organization and Accounting Policies
Morgan Stanley California Insured Municipal Income Trust (the "Trust") is registered under the Investment Company Act of 1940, as amended, as a non-diversified, closed-end management investment company. The Trust's investment objective is to provide current income which is exempt from both federal and California income taxes. The Trust was organized as a Massachusetts business trust on November 2, 1992 and commenced operations on February 26, 1993.
The following is a summary of significant accounting policies:
A. Valuation of Investments — (1) portfolio securities are valued by an outside independent pricing service approved by the Trustees. The pricing service uses both a computerized grid matrix of tax-exempt securities and evaluations by its staff, in each case based on information concerning market transactions and quotations from dealers which reflect the mean between the last reported bid and asked price. The portfolio securities are thus valued by reference to a combination of transactions and quotations for the same or other securities believed to be comparable in quality, coupon, maturity, type of issue, call provisions, trading characteristics and other features deemed to be relevant. The Trustees believe that timely and reliable market quotations are generally not readily available for purposes of valuing tax-exempt securities and that the valuations supplied by the pricing service are more likely to approximate the fair value of such securities; (2) futures are valued at the latest sale price on the commodities exchange on which they trade unless it is determined that such price does not reflect their market value, in which case they will be valued at their fair value as determined in good faith under procedures established by and under the supervision of the Trustees; and (3) short-term debt securities having a maturity date of more than sixty days at time of purchase are valued on a mark-to-market basis until sixty days prior to maturity and thereafter at amortized cost based on their value on the 61st day. Short-term debt securities having a maturity date of sixty days or less at the time of purchase are valued at amortized cost.
B. Accounting for Investments — Security transactions are accounted for on the trade date (date the order to buy or sell is executed). Realized gains and losses on security transactions are determined by the identified cost method. Discounts are accreted and premiums are amortized over the life of the respective securities. Interest income is accrued daily.
C. Futures Contracts — A futures contract is an agreement between two parties to buy and sell financial instruments or contracts based on financial indices at a set price on a future date. Upon entering into such a contract, the Trust is required to pledge to the broker cash, U.S. Government securities or other liquid portfolio securities equal to the minimum initial margin requirements of the applicable futures exchange. Pursuant to the contract, the Trust agrees to receive from or pay to the broker an amount of cash equal to the daily fluctuation in the value of the contract. Such receipts or payments known as variation margin are recorded by the Trust as unrealized gains and losses. Upon closing of the contract, the Trust realizes a gain or loss equal to the difference between the value of the contract at the time it was opened and the value at the time it was closed.
14
Morgan Stanley California Insured Municipal Income Trust
Notes to Financial Statements April 30, 2004 (unaudited) continued
D. Federal Income Tax Policy — It is the Trust's policy to comply with the requirements of the Internal Revenue Code applicable to regulated investment companies and to distribute substantially all of its taxable and nontaxable income to its shareholders. Accordingly, no federal income tax provision is required.
E. Dividends and Distributions to Shareholders — Dividends and distributions to shareholders are recorded on the ex-dividend date.
F. Use of Estimates — The preparation of financial statements in accordance with generally accepted accounting principles requires management to make estimates and assumptions that affect the reported amounts and disclosures. Actual results could differ from those estimates.
2. Investment Management Agreement
Pursuant to an Investment Management Agreement with Morgan Stanley Investment Advisors Inc. (the "Investment Manager"), the Trust pays a management fee, calculated weekly and payable monthly, by applying the annual rate of 0.35% to the Trust's weekly net assets including preferred shares.
3. Security Transactions and Transactions with Affiliates
The cost of purchases and proceeds from sales of portfolio securities, excluding short-term investments, for the six months ended April 30, 2004, aggregated $13,536,110 and $23,591,338, respectively.
Morgan Stanley Trust, an affiliate of the Investment Manager, is the Trust's transfer agent. At April 30, 2004, the Trust had transfer agent fees and expenses payable of approximately $4,950.
The Trust has an unfunded noncontributory defined benefit pension plan covering certain independent Trustees of the Trust who will have served as independent Trustees for at least five years at the time of retirement. Benefits under this plan are based on factors which include years of service and compensation. Aggregate pension costs for the six months ended April 30, 2004, included in Trustees' fees and expenses in the Statement of Operations amounted to $3,077. At April 30, 2004, the Trust had an accrued pension liability of $50,316 which is included in accrued expenses in the Statement of Assets and Liabilities. On December 2, 2003, the Trustees voted to close the plan to new participants and eliminate the future benefits growth due to increases to compensation after July 31, 2003.
Effective April 1, 2004, the Trust began an unfunded Deferred Compensation Plan (the "Compensation Plan"), which allows each independent Trustee to defer payment of all, or a portion, of the fees he receives for serving on the Board of Trustees. Each eligible Trustee generally may elect to have the deferred amounts credited with a return equal to the total return on one or more of the Morgan Stanley funds that are offered as investment options under the Compensation Plan. Appreciation/depreciation and distributions received from these investments are recorded with an offsetting increase/decrease in the deferred compensation obligation and do not affect the net asset value of the Trust.
15
Morgan Stanley California Insured Municipal Income Trust
Notes to Financial Statements April 30, 2004 (unaudited) continued
4. Preferred Shares of Beneficial Interest
The Trust is authorized to issue up to 1,000,000 non-participating preferred shares of beneficial interest having a par value of $.01 per share, in one or more series, with rights as determined by the Trustees, without approval of the common shareholders. The Trust has issued Series 1 through 4 Auction Rate Preferred Shares ("Preferred Shares") which have a liquidation value of $50,000 per share plus the redemption premium, if any, plus accumulated but unpaid dividends, whether or not declared, thereon to the date of distribution. The Trust may redeem such shares, in whole or in part, at the original purchase price of $50,000 per share plus accumulated but unpaid dividends, whether or not declared, thereon to the date of redemption.
Dividends, which are cumulative, are reset through auction procedures.
| SERIES | SHARES* | AMOUNT IN THOUSANDS* | RATE* | RESET DATE | RANGE OF DIVIDEND RATES** | |||||||||||||||||
| 1 | 200 | $ | 10,000 | 1.458 | % | 07/11/05 | 1.458 | % | ||||||||||||||
| 2 | 400 | 20,000 | 1.43 | 01/10/05 | 1.43 | |||||||||||||||||
| 3 | 500 | 25,000 | 2.22 | 07/12/04 | 2.22 | |||||||||||||||||
| 4 | 200 | 10,000 | 1.695 | 09/12/05 | 1.695 | |||||||||||||||||
| * | As of April 30, 2004. |
| ** | For the six months ended April 30, 2004. |
Subsequent to April 30, 2004 and up through June 4, 2004 the Trust paid dividends to Series 1 through 4 at rates ranging from 1.43% to 2.22% in the aggregate amount of $192,712.
The Trust is subject to certain restrictions relating to the preferred shares. Failure to comply with these restrictions could preclude the Trust from declaring any distributions to common shareholders or purchasing common shares and/or could trigger the mandatory redemption of preferred shares at liquidation value.
The preferred shares, which are entitled to one vote per share, generally vote with the common shares but vote separately as a class to elect two Trustees and on any matters affecting the rights of the preferred shares.
16
Morgan Stanley California Insured Municipal Income Trust
Notes to Financial Statements April 30, 2004 (unaudited) continued
5. Common Shares of Beneficial Interest
Transactions in common shares of beneficial interest were as follows:
| SHARES | PAR VALUE | CAPITAL PAID IN EXCESS OF PAR VALUE | ||||||||||||
| Balance, October 31, 2002 | 12,238,262 | $ | 122,382 | $ | 173,069,916 | |||||||||
| Treasury shares purchased and retired (weighted average discount 5.18%)* | (206,000 | ) | (2,060 | ) | (2,890,382 | ) | ||||||||
| Reclassification due to permanent book/tax differences | — | — | 6,269 | |||||||||||
| Balance, October 31, 2003 | 12,032,262 | 120,322 | 170,185,803 | |||||||||||
| Treasury shares purchased and retired (weighted average discount 7.80%)* | (199,200 | ) | (1,992 | ) | (2,770,027 | ) | ||||||||
| Balance, April 30, 2004 | 11,833,062 | $ | 118,330 | $ | 167,415,776 | |||||||||
| * | The Trustees have voted to retire the shares purchased. |
6. Dividends to Common Shareholders
On March 30, 2004, the Trust declared the following dividends from net investment income:
| AMOUNT PER SHARE | RECORD DATE | PAYABLE DATE | ||||||||||||||||
| $0.0675 | May 7, 2004 | May 21, 2004 | ||||||||||||||||
| $0.0675 | June 4, 2004 | June 18, 2004 | ||||||||||||||||
7. Expense Offset
The expense offset represents a reduction of the custodian fees for earnings on cash balances maintained by the Trust.
8. Risks Relating to Certain Financial Instruments
The Trust may invest a portion of its assets in residual interest bonds, which are inverse floating rate municipal obligations. The prices of these securities are subject to greater market fluctuations during periods of changing prevailing interest rates than are comparable fixed rate obligations.
To hedge against adverse interest rate changes, the Trust may invest in financial futures contracts or municipal bond index futures contracts ("futures contracts").
These futures contracts involve elements of market risk in excess of the amount reflected in the Statement of Assets and Liabilities. The Trust bears the risk of an unfavorable change in the value of the underlying securities. Risks may also arise upon entering into these contracts from the potential inability of the counterparties to meet the terms of their contracts.
17
Morgan Stanley California Insured Municipal Income Trust
Notes to Financial Statements April 30, 2004 (unaudited) continued
9. Federal Income Tax Status
The amount of dividends and distributions from net investment income and net realized capital gains are determined in accordance with federal income tax regulations which may differ from generally accepted accounting principles. These "book/tax" differences are either considered temporary or permanent in nature. To the extent these differences are permanent in nature, such amounts are reclassified within the capital accounts based on their federal tax-basis treatment; temporary differences do not require reclassification. Dividends and distributions which exceed net investment income and net realized capital gains for tax purposes are reported as distributions of paid-in-capital.
As of October 31, 2003, the Trust had temporary book/tax differences primarily attributable to book amortization of discounts on debt securities, mark-to-market of open futures contracts and dividend payable.
18
Morgan Stanley California Insured Municipal Income Trust
Financial Highlights
Selected ratios and per share data for a common share of beneficial interest outstanding throughout each period:
| FOR THE SIX MONTHS ENDED APRIL 30, 2004 | FOR THE YEAR ENDED OCTOBER 31, | ||||||||||||||||||||||||||
| 2003 | 2002 | 2001 | 2000 | 1999 | |||||||||||||||||||||||
| (unaudited) | |||||||||||||||||||||||||||
| Selected Per Share Data: | |||||||||||||||||||||||||||
| Net asset value, beginning of period | $ | 14.84 | $ | 15.00 | $ | 15.07 | $ | 14.28 | $ | 13.51 | $ | 15.00 | |||||||||||||||
| Income (loss) from investment operations: | |||||||||||||||||||||||||||
| Net investment income* | 0.43 | 0.92 | 1.00 | 0.97 | 0.95 | 0.94 | |||||||||||||||||||||
| Net realized and unrealized gain (loss) | (0.17 | ) | (0.12 | ) | (0.14 | ) | 0.79 | 0.77 | (1.52 | ) | |||||||||||||||||
| Common share equivalent of dividends paid to preferred shareholders* | (0.05 | ) | (0.08 | ) | (0.11 | ) | (0.19 | ) | (0.20 | ) | (0.17 | ) | |||||||||||||||
| Total income (loss) from investment operations | 0.21 | 0.72 | 0.75 | 1.57 | 1.52 | (0.75 | ) | ||||||||||||||||||||
| Less dividends and distributions from: | |||||||||||||||||||||||||||
| Net investment income | (0.40 | ) | (0.89 | ) | (0.82 | ) | (0.78 | ) | (0.78 | ) | (0.75 | ) | |||||||||||||||
| Net realized gain | (0.07 | ) | — | — | — | — | — | ||||||||||||||||||||
| Total dividends and distributions | (0.47 | ) | (0.89 | ) | (0.82 | ) | (0.78 | ) | (0.78 | ) | (0.75 | ) | |||||||||||||||
| Anti-dilutive effect of acquiring treasury shares* | 0.02 | 0.01 | 0.00 | 0.00 | 0.03 | 0.01 | |||||||||||||||||||||
| Net asset value, end of period | $ | 14.60 | $ | 14.84 | $ | 15.00 | $ | 15.07 | $ | 14.28 | $ | 13.51 | |||||||||||||||
| Market value, end of period | $ | 12.68 | $ | 13.87 | $ | 14.38 | $ | 14.57 | $ | 13.25 | $ | 12.50 | |||||||||||||||
| Total Return† | (5.42 | )%(1) | 2.61 | % | 4.41 | % | 16.08 | % | 12.61 | % | (8.69 | )% | |||||||||||||||
| Ratios to Average Net Assets of Common Shareholders: | |||||||||||||||||||||||||||
| Total expenses (before expense offset) | 0.80 | %(2)(3) | 0.77 | % (3) | 0.74 | % (3) | 0.75 | % | 0.77 | % (3) | 0.75 | %(3) | |||||||||||||||
| Net investment income before preferred stock dividends | 5.76 | %(2) | 6.14 | % | 6.75 | % | 6.57 | % | 6.85 | % | 6.41 | % | |||||||||||||||
| Preferred stock dividends | 0.67 | %(2) | 0.56 | % | 0.77 | % | 1.29 | % | 1.42 | % | 1.18 | % | |||||||||||||||
| Net investment income available to common shareholders | 5.09 | %(2) | 5.58 | % | 5.98 | % | 5.28 | % | 5.43 | % | 5.23 | % | |||||||||||||||
| Supplemental Data: | |||||||||||||||||||||||||||
| Net assets applicable to common shareholders, end of period, in thousands | $172,781 | $178,537 | $183,538 | $184,762 | $175,681 | $171,465 | |||||||||||||||||||||
| Asset coverage on preferred shares at end of period | 365 | % | 374 | % | 382 | % | 384 | % | 369 | % | 363 | % | |||||||||||||||
| Portfolio turnover rate | 6 | %(1) | 64 | % | 16 | % | 16 | % | 11 | % | 5 | % | |||||||||||||||
| * | The per share amounts were computed using an average number of common shares outstanding during the period. |
| † | Total return is based upon the current market value on the last day of each period reported. Dividends and distributions are assumed to be reinvested at the prices obtained under the Trust's dividend reinvestment plan. Total return does not reflect brokerage commissions. |
| (1) | Not annualized. |
| (2) | Annualized. |
| (3) | Does not reflect the effect of expense offset of 0.01%. |
See Notes to Financial Statements
19
Trustees Michael Bozic Officers Charles A. Fiumefreddo Mitchell M. Merin Ronald E. Robison Barry Fink Joseph J. McAlinden Stefanie V. Chang Francis J. Smith Thomas F. Caloia Mary E. Mullin Transfer Agent Morgan Stanley Trust Independent Auditors Deloitte & Touche LLP Investment Manager Morgan Stanley Investment Advisors Inc. The financial statements included herein have been taken from the records of the Trust without examination by the independent auditors and accordingly they do not express an opinion thereon. Investments and services offered through Morgan Stanley DW Inc., member SIPC. © 2004 Morgan Stanley  38503RPT-RA04-00251P-Y04/04 | MORGAN STANLEY FUNDS | |
Morgan Stanley California Insured Municipal Income Trust Semiannual Report April 30, 2004 | ||
 |
Item 2.  Code of Ethics.

Not applicable for semiannual reports.


Item 3.  Audit Committee Financial Expert.

Not applicable for semiannual reports.


Item 4. Principal Accountant Fees and Services

Not applicable for semiannual reports.


Item 5. Audit Committee of Listed Registrants.

Not applicable for semiannual reports.


Item 6. [Reserved.]


Item 7. Disclosure of Proxy Voting Policies and Procedures for Closed-End
Management Investment Companies.

Not applicable for semiannual reports.


Item 8. [Reserved.]


Item 9 - Controls and Procedures

(a) The Trust's principal executive officer and principal financial officer have
concluded that the Trust's disclosure controls and procedures are sufficient to
ensure that information required to be disclosed by the Trust in this Form N-CSR
was recorded, processed, summarized and reported within the time periods
specified in the Securities and Exchange Commission's rules and forms, based
upon such officers' evaluation of these controls and procedures as of a date
within 90 days of the filing date of the report.

    There were no significant changes or corrective actions with regard to
significant deficiencies or material weaknesses in the Trust's internal controls
or in other factors that could significantly affect the Trust's internal
controls subsequent to the date of their evaluation.


(b) There were no changes in the registrant's internal control over financial
reporting that occurred during the registrant's most recent fiscal half-year
(the registrant's second fiscal half-year in the case of an annual report) that
has materially affected, or is reasonably likely to materially affect, the
registrant's internal control over financial reporting.

Item 10 Exhibits
(a) Code of Ethics - Not applicable for semiannual reports.

(b) A separate certification for each principal executive officer and principal
financial officer of the registrant are attached hereto as part of EX-99.CERT.


                                       2


                                   SIGNATURES

         Pursuant to the requirements of the Securities Exchange Act of 1934 and
the Investment Company Act of 1940, the registrant has duly caused this report
to be signed on its behalf by the undersigned, thereunto duly authorized.

Morgan Stanley California Insured Municipal Income Trust

/s/ Ronald E. Robison
Ronald E. Robison
Principal Executive Officer
June 22, 2004

         Pursuant to the requirements of the Securities Exchange Act of 1934 and
the Investment Company Act of 1940, this report has been signed by the following
persons on behalf of the registrant and in the capacities and on the dates
indicated.

/s/ Ronald E. Robison
Ronald E. Robison
Principal Executive Officer
June 22, 2004

/s/ Francis Smith
Francis Smith
Principal Financial Officer
June 22, 2004


                                       3


                                                                   EXHIBIT 10 B1

                  CERTIFICATION OF PRINCIPAL EXECUTIVE OFFICER

                                 CERTIFICATIONS

I, Ronald E. Robison, certify that:

1.   I have reviewed this report on Form N-CSR of Morgan Stanley California
     Insured Municipal Income Trust;

2.   Based on my knowledge, this report does not contain any untrue statement of
     a material fact or omit to state a material fact necessary to make the
     statements made, in light of the circumstances under which such statements
     were made, not misleading with respect to the period covered by this
     report;

3.   Based on my knowledge, the financial statements and other financial
     information included in this report, fairly present in all material
     respects the financial condition, results of operations, changes in net
     assets, and cash flows (if the financial statements are required to include
     a statement of cash flows) of the registrant as of, and for, the periods
     presented in this report;

4.   The registrant's other certifying officers and I are responsible for
     establishing and maintaining disclosure controls and procedures (as defined
     in Rule 30a-3(c) under the Investment Company Act of 1940) for the
     registrant and have:

a)   designed such disclosure controls and procedures, or caused such disclosure
     controls and procedures to be designed under our supervision, to ensure
     that material information relating to the registrant, including its
     consolidated subsidiaries, is made known to us by others within those
     entities, particularly during the period in which this report is being
     prepared;

[b)  Omitted.]

c)   evaluated the effectiveness of the registrant's disclosure controls and
     procedures and presented in this report our conclusions about the
     effectiveness of the disclosure controls and procedures, as of a date
     within 90 days prior to the filing date of this report based on such
     evaluation; and

d)   disclosed in this report any change in the registrant's internal control
     over financial reporting that occurred during the registrant's most recent
     fiscal half-year (the registrant's second fiscal half-year in the case of
     an annual report) that has materially affected, or is reasonably likely to
     materially affect, the registrant's internal control over financial
     reporting; and

5.   The registrant's other certifying officer(s) and I have disclosed to the
     registrant's auditors and the audit committee of the registrant's board of
     directors (or persons performing the equivalent functions):


                                       4


a)   all significant deficiencies and material weaknesses in the design or
     operation of internal control over financial reporting which are reasonably
     likely to adversely affect the registrant's ability to record, process,
     summarize, and report financial information; and

b)   any fraud, whether or not material, that involves management or other
     employees who have a significant role in the registrant's internal controls
     over financial reporting.

Date:  June 22, 2004

                                                /s/ Ronald E. Robison
                                                Ronald E. Robison
                                                Principal Executive Officer


                                       5


                                                                   EXHIBIT 10 B2

                  CERTIFICATION OF PRINCIPAL FINANCIAL OFFICER

                                 CERTIFICATIONS

I, Francis Smith, certify that:

6.   I have reviewed this report on Form N-CSR of Morgan Stanley California
     Insured Municipal Income Trust;

7.   Based on my knowledge, this report does not contain any untrue statement of
     a material fact or omit to state a material fact necessary to make the
     statements made, in light of the circumstances under which such statements
     were made, not misleading with respect to the period covered by this
     report;

8.   Based on my knowledge, the financial statements and other financial
     information included in this report, fairly present in all material
     respects the financial condition, results of operations, changes in net
     assets, and cash flows (if the financial statements are required to include
     a statement of cash flows) of the registrant as of, and for, the periods
     presented in this report;

9.   The registrant's other certifying officers and I are responsible for
     establishing and maintaining disclosure controls and procedures (as defined
     in Rule 30a-3(c) under the Investment Company Act of 1940) for the
     registrant and have:

b)   designed such disclosure controls and procedures, or caused such disclosure
     controls and procedures to be designed under our supervision, to ensure
     that material information relating to the registrant, including its
     consolidated subsidiaries, is made known to us by others within those
     entities, particularly during the period in which this report is being
     prepared;

[b)  Omitted.]

e)   evaluated the effectiveness of the registrant's disclosure controls and
     procedures and presented in this report our conclusions about the
     effectiveness of the disclosure controls and procedures, as of a date
     within 90 days prior to the filing date of this report based on such
     evaluation; and

f)   disclosed in this report any change in the registrant's internal control
     over financial reporting that occurred during the registrant's most recent
     fiscal half-year (the registrant's second fiscal half-year in the case of
     an annual report) that has materially affected, or is reasonably likely to
     materially affect, the registrant's internal control over financial
     reporting; and

10.  The registrant's other certifying officer(s) and I have disclosed to the
     registrant's auditors and the audit committee of the registrant's board of
     directors (or persons performing the equivalent functions):

c)   all significant deficiencies and material weaknesses in the design or
     operation of internal control over financial reporting which are reasonably
     likely to adversely affect the registrant's ability to record, process,
     summarize, and report financial information; and


                                       6


d)   any fraud, whether or not material, that involves management or other
     employees who have a significant role in the registrant's internal controls
     over financial reporting.

Date:  June 22, 2004

                                            /s/ Francis Smith
                                            Francis Smith
                                            Principal Financial Officer


                                       7


                            SECTION 906 CERTIFICATION

                Certification Pursuant to 18 U.S.C. Section 1350,
                             As Adopted Pursuant to
                  Section 906 of the Sarbanes-Oxley Act of 2002

Morgan Stanley California Insured Municipal Income Trust

         In connection with the Report on Form N-CSR (the "Report") of the
above-named issuer for the period ended April 30, 2004 that is accompanied by
this certification, the undersigned hereby certifies that:

1.   The Report fully complies with the requirements of Section 13(a) or 15(d)
     of the Securities Exchange Act of 1934; and

2.   The information contained in the Report fairly presents, in all material
     respects, the financial condition and results of operations of the Issuer.


Date: June 22, 2004                           /s/ Ronald E. Robison
                                              ---------------------------
                                              Ronald E. Robison
                                              Principal Executive Officer


A signed original of this written statement required by Section 906 has been
provided to Morgan Stanley California Insured Municipal Income Trust and will be
retained by Morgan Stanley California Insured Municipal Income Trust and
furnished to the Securities and Exchange Commission or its staff upon request.


                                       8


                            SECTION 906 CERTIFICATION

                Certification Pursuant to 18 U.S.C. Section 1350,
                             As Adopted Pursuant to
                  Section 906 of the Sarbanes-Oxley Act of 2002

Morgan Stanley California Insured Municipal Income Trust

         In connection with the Report on Form N-CSR (the "Report") of the
above-named issuer for the period ended April 30, 2004 that is accompanied by
this certification, the undersigned hereby certifies that:

1.   The Report fully complies with the requirements of Section 13(a) or 15(d)
     of the Securities Exchange Act of 1934; and

2.   The information contained in the Report fairly presents, in all material
     respects, the financial condition and results of operations of the Issuer.


Date: June 22, 2004                           /s/ Francis Smith
                                              ----------------------
                                              Francis Smith
                                              Principal Financial Officer


A signed original of this written statement required by Section 906 has been
provided to Morgan Stanley California Insured Municipal Income Trust and will be
retained by Morgan Stanley California Insured Municipal Income Trust and
furnished to the Securities and Exchange Commission or its staff upon request.


                                       9