UNITED STATES
SECURITIES AND EXCHANGE COMMISSION
Washington, D.C. 20549
FORM N-CSR
CERTIFIED SHAREHOLDER REPORT OF REGISTERED
MANAGEMENT INVESTMENT COMPANIES
Investment Company Act file number 811-07358
Duff & Phelps Utility and Corporate Bond
Trust Inc.
(Exact name of registrant as specified in charter)
200 South Wacker Drive, Suite 500, Chicago, Illinois 60606
(Address of principal executive offices) (Zip code)
| | |
| Alan M. Meder | | Lawrence R. Hamilton |
| Duff & Phelps Utility and Corporate Bond Trust Inc. | | Mayer Brown LLP |
| 200 South Wacker Drive, Suite 500 | | 71 South Wacker Drive |
| Chicago, Illinois 60606 | | Chicago, Illinois 60606 |
(Name and address of agents for service)
Registrant’s telephone number, including area code: (800) 338-8214
Date of fiscal year end: December 31
Date of reporting period: June 30, 2012
| ITEM 1. | REPORTS TO STOCKHOLDERS. |
Board of Directors
David J. Vitale, Chairman
Nancy Lampton, Vice Chairperson
Stewart E. Conner
Robert J. Genetski
Philip R. McLoughlin
Geraldine M. McNamara
Eileen A. Moran
Nathan I. Partain, CFA
Christian H. Poindexter
Carl F. Pollard
Officers
Nathan I. Partain, CFA
President & Chief Executive Officer
T. Brooks Beittel, CFA
Senior Vice President & Secretary
Daniel J. Petrisko, CFA
Vice President & Chief Investment Officer
Alan M. Meder, CFA, CPA
Treasurer & Assistant Secretary
Joyce B. Riegel
Chief Compliance Officer
Investment Adviser
Duff & Phelps Investment Management Co.
200 South Wacker Drive, Suite 500
Chicago, IL 60606
Call toll-free (800) 338-8214
www.dpimc.com
Administrator
J.J.B. Hilliard, W.L. Lyons, LLC
500 West Jefferson Street
Louisville, KY 40202
Call toll-free (888) 878-7845
Custodian
The Bank of New York Mellon
One Wall Street
New York, NY 10005
Transfer Agent
Computershare Shareowner Services LLC
480 Washington Blvd.
Jersey City, NJ 07310
Call toll-free (866) 221-1681
Independent Registered Public Accounting Firm
Ernst & Young LLP
155 North Wacker Drive
Chicago, IL 60606
Legal Counsel
Mayer Brown LLP
71 South Wacker Drive
Chicago, IL 60606
This report is for stockholder information. This is not a prospectus intended for use in the purchase or sale of Fund shares. Information contained in this report is dated and subject to change. Past performance is no guarantee of future results.
Duff & Phelps
Utility and
Corporate
Bond Trust Inc.

SEMI-ANNUAL REPORT
JUNE 30, 2012
August 9, 2012
Dear Fellow Shareholders:
YOUR FUND’S PERFORMANCE
Over the first half of 2012 the performance of leveraged bond funds, including Duff & Phelps Utility and Corporate Bond Trust Inc. (the “DUC Fund”), was affected by uncertainties about the resiliency of the U.S. economic recovery and further turmoil in European debt markets. A number of disappointing economic indicators raised the level of concern, causing many investors to turn to the relative safety of high quality fixed income investments. As a result, the DUC Fund along with the broader fixed income markets, posted solid returns.
The following table compares the performance of the DUC Fund to a broad based investment grade bond market benchmark. It is important to note that the index returns stated below include no fees or expenses, whereas the DUC Fund’s NAV returns are net of fees and expenses.
| | | | | | | | | | | | |
For the period indicated through June 30, 2012
| | DUC Fund
(Per share
performance
with dividends
reinvested in
Fund plan)
| | | DUC Fund
(NAV based
performance)
| | | Barclays
Capital U.S.
Aggregate Bond
Index
| |
Six Months | | | 7.12 | % | | | 4.48 | % | | | 2.37 | % |
One Year | | | 18.03 | % | | | 8.70 | % | | | 7.47 | % |
Three Years (annualized) | | | 8.74 | % | | | 9.13 | % | | | 6.93 | % |
Five Years (annualized) | | | 10.06 | %�� | | | 7.78 | % | | | 6.79 | % |
DUC Fund per share based returns and DUC Fund NAV based returns were obtained from the Administrator of the DUC Fund. Performance returns for the Barclays U.S. Aggregate Bond Index were obtained from Bloomberg L.P. Past performance is not indicative of future results.
Based on the June 30, 2012 closing price of $12.45 and a monthly distribution of $0.07 per share the DUC Fund common stock had an annualized distribution rate of 6.75%. Please refer to the portion of this letter captioned “ABOUT YOUR FUND” for important information about the sources and characterizations of the DUC Fund’s distributions.
MARKET OVERVIEWAND OUTLOOK
U.S. GDP grew modestly during the first half of 2012. While a decline in energy prices and favorable mortgage rates provided some relief to consumers, persistently high unemployment and a still struggling housing market weighed on consumer sentiment. State and local governments remained under pressure due to weak local economies and reduced federal support, while election year politics added to unpredictability at the national level. Although many corporations enjoyed sound fundamentals, regulatory and fiscal uncertainty caused the business sector to remain cautious and reluctant to use its significant cash reserves to meaningfully increase capital spending or hiring. Recessionary fears in Europe, in part due to austerity measures intended to address the sovereign debt crisis, and the potential for a slowdown in China raised concerns about prospects for global growth.
During the first half of 2012, the Federal Open Market Committee (“FOMC”), the committee within the Federal Reserve that sets monetary policy, reaffirmed its commitment to an accommodative monetary policy. Accordingly, the FOMC held the federal funds rate to a “target range” of zero to 0.25%. Over the first half of the year the U.S. Treasury yield curve shifted downward and became less positively sloped (i.e., long-term rates higher than short-term rates). Yields increased by 6 basis points on two-year maturities, while yields decreased by 23 basis points on ten-year maturities and by 14 basis points on thirty-year maturities. Keeping downward pressure on the long end of the U.S. Treasury yield curve was a recurrence of the “flight to quality” as many investors sought refuge from market volatility in the relative safety of the U.S. Treasury market. Consequently, the higher quality sectors of the broader fixed income markets posted solid returns for the first half of 2012.
1
We believe that the U.S. economy remains on track to have positive albeit moderate growth over the next few quarters. However, in addition to a depressed housing market and only marginal improvement in employment, looming U.S. fiscal tightening and modest growth in the rest of the world is likely to keep the U.S. recovery slow and uneven. The FOMC recently stated that it expects “economic growth to remain moderate over coming quarters and then to pick up very gradually” and acknowledged that “strains in global financial markets continue to pose significant downside risk to the economic outlook”. The FOMC also indicated that longer-term inflation expectations have remained stable and announced the extension of the stimulus program known as “Operation Twist” until the end of the year. Therefore, monetary policy is expected to stay accommodative for the foreseeable future and the need for additional quantitative easing will remain a topic of debate.
If the U.S. economy continues to post sub-par growth and the European sovereign debt crisis remains largely unresolved, investors are likely to vacillate between risk on/risk off modes. As a result, the fixed income market is likely to remain volatile and reactive to the tone of economic data. In the near term, a tepid U.S. economic recovery and moderate inflation expectations are likely to keep U.S. Treasury yields at modest levels. Longer term, a self-sustaining economic recovery and rising inflation expectations could set the stage for upward pressure on interest rates. If that happens, the returns of leveraged bond funds, like the DUC Fund, could be reduced.
ABOUT YOUR FUND
The DUC Fund seeks to provide investors with a stable monthly distribution that is primarily derived from current fiscal year net investment income. At times a portion of the monthly distribution could be derived from realized capital gains, and to the extent necessary, paid-in-capital, in which case the DUC Fund is required to inform shareholders of the sources of the distribution based on U.S. generally accepted accounting principles (“GAAP”). A return of capital distribution does not necessarily reflect the DUC Fund’s investment performance and should not be confused with “yield” or “income”. A return of capital may occur, for example, when some or all of the money that is invested in the Fund is paid back to the investor. Based on GAAP, for the six month period ended June 30, 2012, 60% of the total distributions were attributable to current year net investment income and 40% were in excess of current year net investment income and were therefore attributable to paid-in-capital. The characterization of the distributions for GAAP purposes and federal income tax purposes may differ, primarily because of a difference in the tax and GAAP accounting treatment of amortization for premiums on fixed income securities. As of the date of this letter, for federal income tax purposes the DUC Fund estimates that its current year distributions will be derived entirely from net investment income. In early 2013, a form 1099-DIV will be sent to shareholders which will state the amount and tax characterization of the DUC Fund’s 2012 distributions.
The use of leverage enables the DUC Fund to borrow at short-term rates and invest at long-term rates. As of June 30, 2012, the DUC Fund’s leverage consisted of Auction Market Preferred Shares (“AMPS”) in the amount of $89.575 million and senior debt in the amount of $100.425 million. On that date, the total amount of leverage represented by the AMPS and senior debt constituted approximately 37% of the DUC Fund’s total assets. The amount and type of leverage used is reviewed by the Board of Directors based on the DUC Fund’s expected earnings relative to the anticipated costs (including fees and expenses) associated with the leverage. In addition, the long-term expected benefits of leverage are weighed against the potential effect of increasing the volatility of both the DUC Fund’s net asset value and the market value of its common stock. Historically, the tendency of the U.S. yield curve to exhibit a positive slope has fostered an environment in which leverage can make a positive contribution to the earnings of the DUC Fund. However, there is no assurance that this will continue to be the case in the future. If the use of leverage were to cease being beneficial, the amount and type of leverage employed by the DUC Fund could potentially be modified or eliminated.
Early in 2008, disruptions in the short-term fixed income markets resulted in failures in the periodic auctions and remarketings of many closed-end fund’s preferred shares, including the preferred shares of the the DUC Fund. After reviewing options for resolving preferred share illiquidity, in March 2009 management arranged a $190 million credit facility with a commercial bank. Subsequent to the implementation of the credit facility, the DUC Fund made a draw on the credit facility in the amount of $95 million and redeemed $95 million of AMPS.
In early May 2012, the DUC Fund commenced a voluntary tender offer, seeking to purchase up to $47.5 million of its outstanding AMPS at a price of $24,000 per share, equal to 96% of the $25,000 liquidation preference per share. In mid-June 2012, the DUC Fund accepted for purchase $5.425 million in aggregate liquidation preference (consisting of 217 shares) of AMPS. In order to maintain the same overall leverage following completion of the tender offer, the DUC Fund made an additional draw on the credit facility in the amount of $5.425 million.
2
In July 2012, Moody’s Investors Service, Inc. downgraded the ratings of debt and preferred shares issued by all equity, municipal bond and taxable fixed income closed end funds, including the DUC Fund. The rating actions follow the publication of Moody’s revised methodology for rating debt and preferred securities issued by closed end funds. The revised rating methodology incorporates the impact of market volatility, as experienced in the 2008 financial crisis, on the different types of assets in which funds invest, as well as the leverage, portfolio diversity and other factors. Under the terms of the DUC Fund’s charter the rating change will result in higher dividend rates on the AMPS. Management plans to review the amount and type of leverage employed by the DUC Fund in light of the resultant change in the cost of leverage.
There are a number of factors that continue to constrain the DUC Fund from refinancing additional preferred shares with debt. The DUC Fund is limited in its ability to use debt to refinance all of its outstanding AMPS because of the asset coverage requirements of the Investment Company Act of 1940 and related SEC rules. In addition, the DUC Fund is required to adhere to guidelines established by the two principal rating agencies unless (1) it has received written advice from the applicable rating agency as to the effect that any noncompliance would have on the rating of the AMPS and (2) the Board of Directors has determined, by a 75% vote, that, taking into account the pertinent facts and circumstances, such noncompliance is in the best interests of the DUC Fund. While the DUC Fund’s goal is to provide additional liquidity to preferred shareholders, the Board of Directors and the Adviser continue to believe that any action taken to provide such liquidity should not materially disadvantage common shareholders and their ability to benefit from leverage, should be long-term in nature and should not encumber the investment process or reduce the pool of available investment alternatives. Because of all the foregoing considerations, the amount and timing of any future preferred share redemptions are uncertain. The DUC Fund will announce any redemption through press releases and postings to its website.
The DUC Fund does not currently use derivatives and has no investments in complex securities or structured investment vehicles (“SIVs”). Additionally, the portfolio has no direct exposure to financial intermediaries that focus exclusively on derivatives or SIVs. The DUC Fund’s exposure is indirect and is limited to financial institutions with diversified revenue streams. However, due to the inherent interconnectivity of today’s financial intermediaries, corporate bond investors are faced with the task of identifying and quantifying counterparty risk that is often the result of derivatives positions among both financial and non-financial companies. Government intervention and the potential for additional regulation have also introduced additional uncertainty into the capital structure of various financial intermediaries. In normal market conditions, at least 80% of the DUC Fund’s total assets must be invested in Utility and Corporate Bonds, and at least 25% of the DUC Fund’s total assets must be invested in Utility Income Securities. Due to this mandated exposure, any disruptions in the broader credit market, such as fall-out from the European sovereign debt crisis, could materially and adversely impact the valuation of the investments held in the DUC Fund.
In addition to the risk of disruptions in the broader credit market, an environment of relatively low interest rates adds an element of reinvestment risk to bond funds including the DUC Fund. If bonds held in a portfolio mature during a period of low interest rates, the proceeds may necessarily be reinvested in lower yielding securities. Therefore, a prolonged period of low interest rates and the resultant modest reinvestment opportunities can be expected to adversely impact the earnings of the DUC Fund going forward.
It is impossible for the DUC Fund to be completely insulated from turmoil in the financial markets or adverse levels of interest rates. However, management believes that over the long term the diversification of the portfolio across sectors and issuers, in addition to the conservative distribution of the DUC Fund’s assets along the yield curve, should help limit volatility and reinvestment risk to some degree.
THE ANNUAL SHAREHOLDER MEETING
The annual meeting of the DUC Fund’s shareholders was held on May 10, 2012 at 151 West Adams Street, Chicago, Illinois. At that meeting, holders of the DUC Fund’s common stock re-elected Stewart E. Conner, Eileen A. Moran, and David J. Vitale as directors for terms expiring in 2015. Holders of the DUC Fund’s preferred stock re-elected Nancy Lampton as director for a term expiring in 2015.
3
In addition, the shareholders approved the Board of Directors’ proposal to amend provisions of the DUC Fund’s charter that govern the terms of the Fund’s outstanding AMPS. The Board had recommended approval of the charter amendment in order to give the DUC Fund the flexibility to depart from the rating agencies’ guidelines under certain circumstances as described above.
DIVIDEND REINVESTMENTAND CASH PURCHASE PLANAND DIRECT DEPOSIT
For those of you receiving dividends in cash, you may want to consider taking advantage of the dividend reinvestment and cash purchase plan (the “Plan”) available to all registered shareholders of the DUC Fund. Under the Plan, the DUC Fund absorbs all administrative costs (except brokerage commissions, if any) so that the total amount of your dividends and other distributions may be reinvested in additional shares of the DUC Fund. Also, the cash purchase option permits participants to purchase shares in the open market through the Plan Agent. Additional information about the Plan is available from the Plan Agent, Computershare Shareowner Services LLC, at 1-866-221-1681.
For those shareholders receiving dividend checks, you may want to consider having your monthly dividends deposited, free of charge, directly into your bank account through electronic funds transfer. Direct deposit provides the convenience of automatic and immediate access to your funds, while eliminating the possibility of mail delays and lost, stolen or destroyed checks. Additional information about direct deposit is available from Computershare Shareowner Services LLC, at 1-866-221-1681.
For more information about the DUC Fund, shareholders can access www.ducfund.com.
We appreciate your investment in Duff & Phelps Utility and Corporate Bond Trust Inc. and look forward to continuing our service to you.
Sincerely,
| | |
| Daniel J. Petrisko, CFA | | Nathan I. Partain, CFA |
| Chief Investment Officer | | Director, President & CEO |
4
DUFF & PHELPS UTILITY AND CORPORATE BOND TRUST INC.
SCHEDULE OF INVESTMENTS
June 30, 2012
(Unaudited)
| | | | | | | | |
Principal
Amount
(000) | | | Description | | Value
(Note 2) | |
| | | | | LONG-TERM INVESTMENTS—152.0% | |
| | | | | U.S. Government and Agency Obligations—0.3% | | | | |
| | | | | Federal National Mortgage Association, Pass-Through Certificates, | | | | |
| $ | 153 | | | 8.00%, 10/01/30 | | $ | 189,614 | |
| | 525 | | | 7.00%, 12/01/31 | | | 624,304 | |
| | | | | Government National Mortgage Association Pass-Through Certificates, | | | | |
| | 12 | | | 7.00%, 3/15/26 | | | 13,938 | |
| | 61 | | | 8.00%, 11/15/30 | | | 75,578 | |
| | 32 | | | 8.00%, 2/15/31 | | | 32,706 | |
| | | | | | |
|
|
|
| | | | | Total U.S. Government and Agency Obligations
(Cost $799,186) | | | 936,140 | |
| | | | | | |
|
|
|
| | | | | Corporate Bonds—148.8% | | | | |
| | | | | Financial—40.1% | | | | |
| | 5,000 | | | American Express Co., | | | | |
| | | | | 6.15%, 8/28/17 | | | 5,930,300 | |
| | 6,000 | | | Caterpillar Financial Services Corp., | | | | |
| | | | | 6.125%, 2/17/14 | | | 6,518,118 | |
| | 5,000 | | | DaimlerChrysler North America Holding Corp., | | | | |
| | | | | 6.50%, 11/15/13 | | | 5,361,485 | |
| | 5,000 | | | Duke Realty Limited Partnership, | | | | |
| | | | | 6.25%, 5/15/13 | | | 5,168,835 | |
| | 6,000 | | | General Electric Capital Corp., | | | | |
| | | | | 4.80%, 5/01/13 (a)(b) | | | 6,203,904 | |
| | 5,000 | | | The Goldman Sachs Group, Inc., | | | | |
| | | | | 5.50%, 11/15/14 | | | 5,283,735 | |
| | 5,000 | | | HCP, Inc., | | | | |
| | | | | 6.00%, 1/30/17 | | | 5,607,345 | |
| | 5,000 | | | JPMorgan Chase & Co., | | | | |
| | | | | 5.375%, 10/01/12 | | | 5,059,305 | |
| | 5,000 | | | JPMorgan Chase & Co., | | | | |
| | | | | 4.75%, 5/01/13 | | | 5,156,105 | |
| | 5,000 | | | Kimco Realty Corp., | | | | |
| | | | | 5.584%, 11/23/15 | | | 5,416,195 | |
| | 5,000 | | | Liberty Property L.P., | | | | |
| | | | | 5.125%, 3/02/15 | | | 5,318,485 | |
| | 5,000 | | | Mack-Cali Realty L.P., | | | | |
| | | | | 5.125%, 1/15/15 | | | 5,294,435 | |
| | 5,000 | | | MetLife, Inc., | | | | |
| | | | | 5.50%, 6/15/14 (a) | | | 5,392,740 | |
| | | | | | | | |
Principal
Amount
(000) | | | Description | | Value
(Note 2) | |
| $ | 6,000 | | | Morgan Stanley, | | | | |
| | | | | 6.00%, 4/28/15 | | $ | 6,206,232 | |
| | 10,000 | | | NationsBank Capital Trust IV, | | | | |
| | | | | 8.25%, 4/15/27 | | | 10,299,000 | |
| | 5,000 | | | National City Corp., | | | | |
| | | | | 6.875%, 5/15/19 | | | 6,043,140 | |
| | 5,000 | | | Northern Trust Corp., | | | | |
| | | | | 5.50%, 8/15/13 (a) | | | 5,267,945 | |
| | 5,000 | | | ProLogis L.P., | | | | |
| | | | | 5.75%, 4/01/16 (a) | | | 5,464,850 | |
| | 5,000 | | | Realty Income Corp., | | | | |
| | | | | 6.75%, 8/15/19 (a) | | | 5,899,380 | |
| | 5,000 | | | Simon Property Group, L.P., | | | | |
| | | | | 5.25%, 12/01/16 (a) | | | 5,624,925 | |
| | 6,000 | | | US Bank, N.A., | | | | |
| | | | | 4.95%, 10/30/14 | | | 6,528,792 | |
| | 6,000 | | | Wachovia Bank NA, | | | | |
| | | | | 6.00%, 11/15/17 | | | 6,999,462 | |
| | | | | | |
|
|
|
| | | | | | | | 130,044,713 | |
| | | | | | |
|
|
|
| | | | | Industrial—26.2% | | | | |
| | 4,000 | | | Archer-Daniels-Midland Company, | | | | |
| | | | | 7.125%, 3/01/13 (a)(b) | | | 4,172,148 | |
| | 5,000 | | | ConocoPhillips | | | | |
| | | | | 4.75%, 2/01/14 | | | 5,312,720 | |
| | 6,000 | | | Dow Chemical Company, | | | | |
| | | | | 9.00%, 4/01/21 | | | 7,808,256 | |
| | 7,000 | | | Hewlett-Packard Co., | | | | |
| | | | | 6.125%, 3/01/14 (a)(b) | | | 7,516,376 | |
| | 5,000 | | | Sun Company, Inc., | | | | |
| | | | | 9.00%, 11/01/24 | | | 6,300,155 | |
| | 5,000 | | | Target Corp., | | | | |
| | | | | 6.00%, 1/15/18 | | | 6,130,915 | |
| | 5,275 | | | Tele-Communications, Inc., | | | | |
| | | | | 10.125%, 4/15/22 (a) | | | 7,740,772 | |
| | 3,200 | | | Tele-Communications, Inc., | | | | |
| | | | | 9.875%, 6/15/22 (a)(b) | | | 4,658,806 | |
| | 5,000 | | | Time Warner Cable, Inc., | | | | |
| | | | | 7.50%, 4/01/14 | | | 5,545,760 | |
| | 5,000 | | | Time Warner Entertainment Company, L.P., | | | | |
| | | | | 8.875%, 10/01/12 (a)(b) | | | 5,092,140 | |
| | 5,000 | | | Time Warner, Inc., | | | | |
| | | | | 9.15%, 2/01/23 | | | 6,961,900 | |
| | 5,000 | | | Wal-Mart Stores, Inc., | | | | |
| | | | | 6.75%, 10/15/23 | | | 6,791,105 | |
The accompanying notes are an integral part of these financial statements.
DUFF & PHELPS UTILITY AND CORPORATE BOND TRUST INC.
SCHEDULE OF INVESTMENTS—(Continued)
June 30, 2012
(Unaudited)
| | | | | | | | |
Principal
Amount
(000) | | | Description | | Value
(Note 2) | |
| $ | 5,000 | | | Wellpoint, Inc., | | | | |
| | | | | 6.80%, 8/01/12 | | $ | 5,023,010 | |
| | 5,000 | | | Xerox Corp., | | | | |
| | | | | 6.35%, 5/15/18 | | | 5,836,575 | |
| | | | | | |
|
|
|
| | | | | | | | 84,890,638 | |
| | | | | | |
|
|
|
| | | | | Telephone—6.9% | | | | |
| | 5,000 | | | Deutsche Telekom International Finance, | | | | |
| | | | | 5.25%, 7/22/13 (Netherlands) | | | 5,220,045 | |
| | 6,000 | | | Rogers Communications, Inc., | | | | |
| | | | | 7.50%, 3/15/15 (Canada) (a) | | | 6,971,400 | |
| | 5,000 | | | Telecom Italia Capital SA, | | | | |
| | | | | 5.25%, 10/01/15 (Luxembourg) | | | 4,962,500 | |
| | 5,000 | | | Vodafone Group PLC, | | | | |
| | | | | 5.00%, 12/16/13 (United Kingdom) | | | 5,302,215 | |
| | | | | | |
|
|
|
| | | | | | | | 22,456,160 | |
| | | | | | |
|
|
|
| | | | | Utilities—75.6% | | | | |
| | 5,000 | | | American Water Capital Corp., | | | | |
| | | | | 6.085%, 10/15/17 | | | 5,860,395 | |
| | 5,000 | | | American Water Capital Corp., | | | | |
| | | | | 6.593%, 10/15/37 | | | 6,234,125 | |
| | 5,000 | | | Arizona Public Service Co., | | | | |
| | | | | 6.875%, 8/01/36 | | | 6,705,800 | |
| | 10,000 | | | CalEnergy Company, Inc., | | | | |
| | | | | 8.48%, 9/15/28 (a)(b) | | | 14,641,550 | |
| | 5,000 | | | CenterPoint Energy Resources Corp., | | | | |
| | | | | 6.00%, 5/15/18 | | | 5,830,910 | |
| | 10,713 | | | Cleveland Electric Illumination Co., | | | | |
| | | | | 8.875%, 11/15/18 (a)(b) | | | 14,335,429 | |
| | 5,000 | | | Commonwealth Edison Co., | | | | |
| | | | | 6.95%, 7/15/18 (a) | | | 6,067,465 | |
| | 5,000 | | | Consolidated Edison Company of New York Inc., | | | | |
| | | | | 5.85%, 4/01/18 | | | 6,100,485 | |
| | 5,000 | | | Dominion Resources, Inc. | | | | |
| | | | | 5.15%, 7/15/15 | | | 5,573,010 | |
| | 8,000 | | | EQT Corporation, | | | | |
| | | | | 8.125%, 6/01/19 (a) | | | 9,607,168 | |
| | 10,000 | | | Entergy Texas, Inc., | | | | |
| | | | | 7.125%, 2/01/19 (a)(b) | | | 12,253,000 | |
| | 5,475 | | | Exelon Generation Co. LLC, | | | | |
| | | | | 6.20%, 10/01/17 (a) | | | 6,319,365 | |
| | 7,750 | | | FPL Group Capital Inc., | | | | |
| | | | | 7.875%, 12/15/15 (a)(b) | | | 9,292,754 | |
| | | | | | | | |
Principal
Amount
(000) | | | Description | | Value
(Note 2) | |
| $ | 10,000 | | | Hydro-Quebec, | | | | |
| | | | | 7.50%, 4/01/16 (Canada) (a)(b) | | $ | 12,203,550 | |
| | 5,000 | | | Indiana Michigan Power Co., | | | | |
| | | | | 7.00%, 3/15/19 | | | 6,226,885 | |
| | 5,000 | | | Kinder Morgan Energy Partners, | | | | |
| | | | | 7.75%, 3/15/32 (a) | | | 6,243,010 | |
| | 6,000 | | | National Grid PLC | | | | |
| | | | | 6.30%, 8/01/16 (United Kingdom) | | | 6,928,758 | |
| | 6,500 | | | National Rural Utilities Cooperative Finance Corp., | | | | |
| | | | | 5.50%, 7/01/13 (a) | | | 6,822,582 | |
| | 5,000 | | | Oncor Electric Delivery Co., LLC, | | | | |
| | | | | 7.00%, 9/01/22 | | | 6,084,915 | |
| | 9,441 | | | ONEOK Partners, L.P., | | | | |
| | | | | 6.15%, 10/01/16 (a)(b) | | | 10,985,293 | |
| | 5,230 | | | PPL Energy Supply LLC, | | | | |
| | | | | 6.50%, 5/01/18 (a) | | | 6,050,849 | |
| | 5,000 | | | PSEG Power LLC, | | | | |
| | | | | 5.32%, 9/15/16 (a)(b) | | | 5,643,885 | |
| | 10,000 | | | Progress Energy, Inc., | | | | |
| | | | | 7.05%, 3/15/19 (a)(b) | | | 12,587,880 | |
| | 8,000 | | | Sempra Energy | | | | |
| | | | | 6.15%, 6/15/18 (a) | | | 9,669,368 | |
| | 7,785 | | | South Carolina Electric & Gas Co., | | | | |
| | | | | 6.50%, 11/01/18 (a) | | | 9,778,676 | |
| | 5,000 | | | Spectra Energy Capital LLC, | | | | |
| | | | | 6.20%, 4/15/18 | | | 5,975,635 | |
| | 10,000 | | | Trans-Canada Pipelines Limited, | | | | |
| | | | | 9.875%, 1/01/21 (Canada) | | | 14,837,980 | |
| | 8,571 | | | Williams Partners L.P., | | | | |
| | | | | 7.25%, 2/01/17 (a) | | | 10,280,075 | |
| | 5,000 | | | Xcel Energy, Inc., | | | | |
| | | | | 5.613%, 4/01/17 | | | 5,801,425 | |
| | | | | | |
|
|
|
| | | | | | | | 244,942,222 | |
| | | | | | |
|
|
|
| | | | | Total Corporate Bonds
(Cost $447,319,418) | | | 482,333,733 | |
| | | | | | |
|
|
|
| | | | | Asset-Backed Securities—1.7% | | | | |
| | 5,000 | | | Detroit Edison Securitization Funding LLC 2001-1 A6, | | | | |
| | | | | 6.62%, 3/01/16 | | | 5,577,037 | |
| | | | | | |
|
|
|
| | | | | Total Asset-Backed Securities
(Cost $5,292,974) | | | 5,577,037 | |
| | | | | | |
|
|
|
The accompanying notes are an integral part of these financial statements.
DUFF & PHELPS UTILITY AND CORPORATE BOND TRUST INC.
SCHEDULE OF INVESTMENTS—(Continued)
June 30, 2012
(Unaudited)
| | | | | | | | |
| | | |
| Shares | | | Description | | Value
(Note 2) | |
| | | | | Non-Convertible Preferred Stock—1.2% | |
| | | | | Financial—1.2% | | | | |
| | 100,000 | | | Kimco Realty Corp., Series G, | | | | |
| | | | | 7.75% | | $ | 2,565,000 | |
| | 50,000 | | | Vornado Realty Trust, Series I, | | | | |
| | | | | 6.625% | | | 1,284,500 | |
| | | | | | |
|
|
|
| | | | | Total Non-Convertible Preferred Stock
(Cost $3,675,000) | | | 3,849,500 | |
| | | | | | |
|
|
|
| | | | | TOTAL INVESTMENTS—152.0% | |
| | | | | (Cost $457,086,578) | | | 492,696,410 | |
| | | | | | |
|
|
|
| | | | | Other assets in excess of liabilities—6.6% | | | 21,520,662 | |
| | | | | Borrowings—(31.0)% | | | (100,425,000 | ) |
| | | | | Auction market preferred shares—(27.6)% | | | (89,575,000 | ) |
| | | | | | |
|
|
|
| | | | | NET ASSETS APPLICABLE TO COMMON STOCK—100% | | $ | 324,217,072 | |
| | | | | | |
|
|
|
| (a) | All or a portion of this security has been segregated and made available for loan. |
| (b) | All or a portion of this security has been loaned. |
The percentage shown for each investment category is the total value of that category as a percentage of the net assets applicable to common stock of the Fund.
The Fund’s investments are carried at fair value which is defined as the price that the Fund would receive upon selling an investment in a timely transaction to an
independent buyer in the principal or most advantageous market of the investment. The three-tier hierarchy of inputs established to classify fair value measurements for disclosure purposes is summarized in the three broad levels listed below:
Level 1—quoted prices in active markets for identical securities.
Level 2—other significant observable inputs (including quoted prices for similar securities, interest rates, prepayment speeds, credit risks, etc.).
Level 3—significant unobservable inputs (including the Fund’s own assumptions in determining fair value of investments).
The inputs or methodology used for valuing securities are not necessarily an indication of the risk associated with investing in these securities. The following is a summary of the inputs used to value each of the Fund’s investments at June 30, 2012:
| | | | | | | | |
| | | Level 1
| | | Level 2
| |
Asset-backed securities | | $ | — | | | $ | 5,577,037 | |
Corporate bonds | | | — | | | | 482,333,733 | |
Non-convertible preferred stock | | | 3,849,500 | | | | — | |
U.S. Government and Agency obligations | | | — | | | | 936,140 | |
| | |
|
|
| |
|
|
|
Total | | $ | 3,849,500 | | | $ | 488,846,910 | |
| | |
|
|
| |
|
|
|
There were no Level 3 priced securities held and there were no significant transfers between Level 1 and Level 2 during the six months ended June 30, 2012.
The accompanying notes are an integral part of these financial statements.
DUFF & PHELPS UTILITY AND CORPORATE BOND TRUST INC.
SCHEDULE OF INVESTMENTS—(Continued)
June 30, 2012
(Unaudited)
Summary of Ratings as a Percentage of
Long-Term Investments
(Unaudited)
At June 30, 2012
| | | | |
Rating *
| | %
| |
AAA | | | 1.3 | % |
AA | | | 1.4 | % |
A | | | 27.2 | % |
BBB | | | 66.7 | % |
BB | | | 3.4 | % |
| | |
|
|
|
| | | | 100.0 | % |
| | |
|
|
|
| * | Individual ratings are grouped based on the lower rating of Standard & Poor’s Financial Services LLC (“S&P”) or Moody’s Investors Service Inc. (“Moody’s”) and are expressed using the S&P ratings scale. If a particular security is rated by either S&P or Moody’s, but not both, then the single rating is used. If a particular security is not rated by either S&P or Moody’s, then a rating from Fitch Ratings Ltd. is used, if available. |
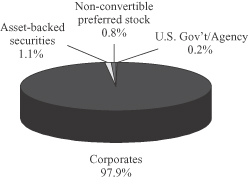
Sector Allocation as a Percentage
of Total Investments at June 30, 2012
The accompanying notes are an integral part of these financial statements.
DUFF & PHELPS UTILITY AND CORPORATE BOND TRUST INC.
STATEMENT OF ASSETS AND LIABILITIES
June 30, 2012
(Unaudited)
| | | | |
| |
ASSETS: | | | | |
| |
Investments at value (cost $457,086,578) including $96,193,613 of securities loaned | | $ | 492,696,410 | |
| |
Cash | | | 14,431,236 | |
| |
Receivables: | | | | |
| |
Interest | | | 7,304,991 | |
| |
Dividends | | | 69,141 | |
| |
Other assets | | | 21,551 | |
| | |
|
|
|
| |
Total assets | | | 514,523,329 | |
| | |
|
|
|
| |
LIABILITIES: | | | | |
| |
Borrowings (Note 9) | | | 100,425,000 | |
| |
Investment advisory fee (Note 3) | | | 210,804 | |
| |
Administrative fee (Note 3) | | | 37,222 | |
| |
Interest on borrowings (Note 9) | | | 10,968 | |
| |
Dividends payable on auction market preferred shares | | | 6,812 | |
| |
Accrued expenses | | | 49,379 | |
| | |
|
|
|
| |
Total liabilities | | | 100,740,185 | |
| | |
|
|
|
| |
Auction market preferred shares (3,583 shares issued and outstanding, liquidation preference $25,000 per share) (Note 7) | | | 89,575,000 | |
| | |
|
|
|
| |
NET ASSETS APPLICABLE TO COMMON STOCK | | $ | 324,208,144 | |
| | |
|
|
|
| |
CAPITAL: | | | | |
| |
Common stock, $.01 par value, 599,992,400 shares authorized, 27,393,079 shares issued and outstanding | | $ | 273,931 | |
| |
Additional paid-in capital | | | 359,706,537 | |
| |
Accumulated distributions in excess of net investment income | | | (8,053,099 | ) |
| |
Accumulated net realized loss on investments | | | (63,329,056 | ) |
| |
Net unrealized appreciation on investments | | | 35,609,831 | |
| | |
|
|
|
| |
Net assets applicable to common stock | | $ | 324,208,144 | |
| | |
|
|
|
| |
NET ASSET VALUE PER SHARE OF COMMON STOCK | | $ | 11.84 | |
| | |
|
|
|
The accompanying notes are an integral part of these financial statements.
DUFF & PHELPS UTILITY AND CORPORATE BOND TRUST INC.
STATEMENT OF OPERATIONS
For the six months ended June 30, 2012
(Unaudited)
| | | | |
| |
INVESTMENT INCOME: | | | | |
| |
Interest | | $ | 9,689,817 | |
| |
Dividends | | | 291,137 | |
| |
Securities lending income, net | | | 22,813 | |
| | |
|
|
|
| |
Total investment income | | | 10,003,767 | |
| | |
|
|
|
| |
EXPENSES: | | | | |
| |
Investment advisory fees (Note 3) | | | 1,275,377 | |
| |
Interest expense and fees (Note 9) | | | 1,031,467 | |
| |
Administrative fees (Note 3) | | | 224,831 | |
| |
Directors’ fees | | | 69,463 | |
| |
Broker-dealer commissions—auction market preferred shares | | | 71,770 | |
| |
Professional fees | | | 45,156 | |
| |
Reports to shareholders | | | 47,311 | |
| |
Custodian fees | | | 27,489 | |
| |
Transfer agent fees | | | 19,410 | |
| |
Tender offer expenses (Note 8) | | | 15,495 | |
| |
Other expenses | | | 34,714 | |
| | |
|
|
|
| |
Total expenses | | | 2,862,483 | |
| | |
|
|
|
| |
Net investment income | | | 7,141,284 | |
| | |
|
|
|
| |
REALIZED AND UNREALIZED GAIN: | | | | |
| |
Net realized gain on investments | | | 15,066 | |
| |
Net change in unrealized appreciation (depreciation) on investments | | | 7,345,739 | |
| | |
|
|
|
| |
Net realized and unrealized gain on investments | | | 7,360,805 | |
| | |
|
|
|
| |
DISTRIBUTIONS ON AUCTION MARKET PREFERRED SHARES FROM: | | | | |
| |
Net investment income | | | (690,364 | ) |
| | |
|
|
|
| |
Total distributions | | | (690,364 | ) |
| | |
|
|
|
| |
BENEFIT TO COMMON SHAREHOLDERS FROM TENDER OFFER FOR AUCTION MARKET PREFERRED SHARES (Note 8) | | | 217,000 | |
| | |
|
|
|
| |
NET INCREASE IN NET ASSETS APPLICABLE TO COMMON STOCK RESULTING FROM OPERATIONS | | $ | 14,028,725 | |
| | |
|
|
|
The accompanying notes are an integral part of these financial statements.
DUFF & PHELPS UTILITY AND CORPORATE BOND TRUST INC.
STATEMENTS OF CHANGES IN NET ASSETS
| | | | | | | | |
| | |
| | | For the
six months
ended
June 30,
2012
(Unaudited)
| | | For the
year ended
December 31,
2011
| |
INCREASE (DECREASE) IN NET ASSETS: | | | | | | | | |
| | |
FROM OPERATIONS: | | | | | | | | |
| | |
Net investment income | | $ | 7,141,284 | | | $ | 14,482,907 | |
| | |
Net realized gain | | | 15,066 | | | | 2,628,478 | |
| | |
Net change in unrealized appreciation (depreciation) | | | 7,345,739 | | | | 8,081,702 | |
| | |
Distributions on auction market preferred shares from net investment income | | | (690,364 | ) | | | (1,395,284 | ) |
| | |
Benefit to common shareholders from tender offer for auction market preferred shares (Note 8) | | | 217,000 | | | | — | |
| | |
|
|
| |
|
|
|
| | |
Net increase in net assets applicable to common stock resulting from operations | | | 14,028,725 | | | | 23,797,803 | |
| | |
|
|
| |
|
|
|
| | |
DISTRIBUTIONS TO COMMON STOCKHOLDERS FROM: | | | | | | | | |
| | |
And in excess of net investment income | | | (11,491,199 | ) | | | (22,947,029 | ) |
| | |
|
|
| |
|
|
|
| | |
FROM CAPITAL STOCK TRANSACTIONS: | | | | | | | | |
| | |
Shares issued to common stockholders from dividend reinvestment of 56,552 shares and 19,449 shares, respectively | | | 670,163 | | | | 227,561 | |
| | |
|
|
| |
|
|
|
| | |
Net increase in net assets derived from capital stock transactions | | | 670,163 | | | | 227,561 | |
| | |
|
|
| |
|
|
|
| | |
Total increase in net assets | | | 3,207,689 | | | | 1,078,335 | |
| | |
TOTAL NET ASSETS APPLICABLE TO COMMON STOCK: | | | | | | | | |
| | |
Beginning of period | | | 321,000,455 | | | | 319,922,120 | |
| | |
|
|
| |
|
|
|
| | |
End of period (including distributions in excess of net investment income of ($8,053,099) and ($5,718,920)) | | $ | 324,208,144 | | | $ | 321,000,455 | |
| | |
|
|
| |
|
|
|
The accompanying notes are an integral part of these financial statements.
DUFF & PHELPS UTILITY AND CORPORATE BOND TRUST INC.
STATEMENT OF CASH FLOWS
For the six months ended June 30, 2012
(Unaudited)
| | | | |
| |
INCREASE (DECREASE) IN CASH | | | | |
| |
Cash flows provided by (used in) operating activities: | | | | |
| |
Interest and dividends received (excluding discount and premium amortization of ($4,338,404)) | | $ | 14,450,917 | |
| |
Operating expenses paid | | | (2,248,172 | ) |
| |
Interest expense paid | | | (661,760 | ) |
| |
Dividends paid on preferred stock | | | (691,130 | ) |
| |
Purchase of long-term portfolio investments | | | (37,045,103 | ) |
| |
Proceeds from sales and maturities of long-term portfolio investments | | | 34,587,326 | |
| | |
|
|
|
| |
Net cash provided by operating activities | | | 8,392,078 | |
| | |
|
|
|
| |
Cash flows provided by (used in) financing activities: | | | | |
| |
Increase in borrowings | | | 5,425,000 | |
| |
Payout for auction market preferred shares redeemed through tender offer | | | (5,208,000 | ) |
| |
Dividends paid on common stock | | | (11,491,199 | ) |
| |
Proceeds from issuance of common stock under dividend reinvestment plan | | | 670,163 | |
| | |
|
|
|
| |
Net cash used in financing activities | | | (10,604,036 | ) |
| | |
|
|
|
| |
Net decrease in cash | | | (2,211,958 | ) |
| |
Cash at beginning of period | | | 16,643,194 | |
| | |
|
|
|
| |
Cash at end of period | | $ | 14,431,236 | |
| | |
|
|
|
| |
Reconciliation of net increase in net assets resulting from operations to net cash provided from operating activities: | | | | |
| |
Net increase in net assets resulting from operations | | $ | 14,028,725 | |
| |
Decrease in investments | | | 1,880,627 | |
| |
Net realized gain on investments | | | (15,066 | ) |
| |
Net change in unrealized appreciation on investments | | | (7,345,739 | ) |
| |
Decrease in interest receivable | | | 108,746 | |
| |
Increase in prepaid expenses and other assets | | | (5,868 | ) |
| |
Decrease in interest payable on borrowings | | | (2,340 | ) |
| |
Decrease in accrued expenses and other liabilities | | | (40,007 | ) |
| |
Benefit to common shareholders from tender offer for auction market preferred shares (Note 8) | | | (217,000 | ) |
| | |
|
|
|
| |
Total adjustments | | | (5,636,647 | ) |
| | |
|
|
|
| |
Net cash provided by operating activities | | $ | 8,392,078 | |
| | |
|
|
|
The accompanying notes are an integral part of these financial statements.
DUFF & PHELPS UTILITY AND CORPORATE BOND TRUST INC.
FINANCIAL HIGHLIGHTS
The table below provides information about income and capital changes for a share of common stock outstanding throughout the periods indicated (excluding supplemental data provided below):
| | | | | | | | | | | | | | | | | | | | | | | | |
| | | For the
six months
ended
June 30,
2012
(Unaudited)
| | | For the year ended December 31,
| |
| PER SHARE DATA: | | | 2011
| | | 2010
| | | 2009
| | | 2008
| | | 2007
| |
Net asset value, beginning of period | | $ | 11.74 | | | $ | 11.71 | | | $ | 11.70 | | | $ | 10.61 | | | $ | 11.65 | | | $ | 11.97 | |
| | |
|
|
| |
|
|
| |
|
|
| |
|
|
| |
|
|
| |
|
|
|
Net investment income(1) | | | 0.26 | | | | 0.53 | | | | 0.66 | | | | 0.77 | | | | 0.84 | | | | 0.93 | |
Net realized and unrealized gain (loss) | | | 0.27 | | | | 0.39 | | | | 0.24 | | | | 1.22 | | | | (0.83 | ) | | | (0.09 | ) |
Distributions on auction market preferred shares from: | | | | | | | | | | | | | | | | | | | | | | | | |
Net investment income | | | (0.02 | ) | | | (0.05 | ) | | | (0.05 | ) | | | (0.07 | ) | | | (0.27 | ) | | | (0.38 | ) |
Benefit to common shareholders from tender offer for auction market preferred shares (Note 8) | | | 0.01 | | | | — | | | | — | | | | — | | | | — | | | | — | |
| | |
|
|
| |
|
|
| |
|
|
| |
|
|
| |
|
|
| |
|
|
|
Net increase (decrease) from investment operations | | | 0.52 | | | | 0.87 | | | | 0.85 | | | | 1.92 | | | | (0.26 | ) | | | 0.46 | |
| | |
|
|
| |
|
|
| |
|
|
| |
|
|
| |
|
|
| |
|
|
|
Distributions on common stock from and in excess of: | | | | | | | | | | | | | | | | | | | | | | | | |
Net investment income | | | (0.42 | ) | | | (0.84 | ) | | | (0.84 | ) | | | (0.83 | ) | | | (0.78 | ) | | | (0.78 | ) |
| | |
|
|
| |
|
|
| |
|
|
| |
|
|
| |
|
|
| |
|
|
|
Net asset value, end of period | | $ | 11.84 | | | $ | 11.74 | | | $ | 11.71 | | | $ | 11.70 | | | $ | 10.61 | | | $ | 11.65 | |
| | |
|
|
| |
|
|
| |
|
|
| |
|
|
| |
|
|
| |
|
|
|
Per share market value, end of period | | $ | 12.45 | | | $ | 12.04 | | | $ | 11.39 | | | $ | 12.29 | | | $ | 10.11 | | | $ | 10.32 | |
| | |
|
|
| |
|
|
| |
|
|
| |
|
|
| |
|
|
| |
|
|
|
| RATIOS TO AVERAGE NET ASSETS APPLICABLE TO COMMON STOCK:(2) | | | | | | | | | | | | | | | | | | | | | | | | |
Total expenses | | | 1.78 | %(3) | | | 1.86 | % | | | 1.89 | % | | | 2.12 | % | | | 1.37 | % | | | 1.34 | % |
Net investment income | | | 4.44 | %(3) | | | 4.51 | % | | | 5.53 | % | | | 6.82 | % | | | 7.42 | % | | | 7.88 | % |
| SUPPLEMENTAL DATA: | | | | | | | | | | | | | | | | | | | | | | | | |
Total return on market value(4) | | | 7.12 | % | | | 13.79 | % | | | (0.61 | )% | | | 30.69 | % | | | 5.30 | % | | | (4.71 | )% |
Total return on net asset value(5) | | | 4.48 | % | | | 7.66 | % | | | 7.34 | % | | | 18.62 | % | | | (2.41 | )% | | | 3.97 | % |
Portfolio turnover rate | | | 7 | % | | | 36 | % | | | 37 | % | | | 23 | % | | | 12 | % | | | 19 | % |
Asset coverage ratio on preferred stock, end of period | | | 462 | % | | | 438 | % | | | 437 | % | | | 435 | % | | | 251 | % | | | 266 | % |
Asset coverage ratio on borrowings, end of period | | | 512 | % | | | 538 | % | | | 537 | % | | | 535 | % | | | — | | | | — | |
Net assets applicable to common stock, end of period (000) | | $ | 324,208 | | | $ | 321,000 | | | $ | 319,922 | | | $ | 318,393 | | | $ | 287,426 | | | $ | 315,439 | |
| (1) | Based on average number of shares of common stock outstanding. |
| (2) | Ratios calculated on the basis of income and expenses applicable to both the common and preferred stock relative to the average net assets applicable to common stock. Ratios do not reflect the effect of dividends paid on auction market preferred shares. |
| (4) | Total return on market value assumes a purchase of common stock at market value on the opening of the first business day and a sale at market value on the closing of the last business day of each period reported. Dividends and distributions are assumed, for purposes of this calculation, to be reinvested at prices obtained under the Fund’s dividend reinvestment plan. Brokerage commissions are not reflected. |
| (5) | Total return on net asset value assumes a purchase of common stock at the net asset value on the first business day and a sale at the closing net asset value on the last business day of each period reported. Dividends and distributions are assumed, for purposes of this calculation, to be reinvested at the net asset value on each valuation date for each dividend reinvested under the Fund’s dividend reinvestment plan. Brokerage commissions are not reflected. |
The accompanying notes are an integral part of these financial statements.
DUFF & PHELPS UTILITY AND CORPORATE BOND TRUST INC.
NOTES TO FINANCIAL STATEMENTS
June 30, 2012
(Unaudited)
Note 1. Organization
Duff & Phelps Utility and Corporate Bond Trust Inc. (the “Fund”) was incorporated in Maryland on November 23, 1992 as a diversified, closed-end management investment company registered under the Investment Company Act of 1940, as amended (the “1940 Act”). The Fund’s investment objective is to seek high current income consistent with investing in securities of investment-grade quality.
Note 2. Significant Accounting Policies
The following is a summary of significant accounting policies followed by the Fund in the preparation of its financial statements.
A. Securities Valuation: Equity securities traded on a national or foreign securities exchange or traded over-the-counter and quoted on the NASDAQ National List are valued at the last reported sale price or, if there was no sale on the pricing date, then the security is valued at the mean of the bid and ask prices as obtained on that day from one or more dealers regularly making a market in that security and are generally classified as Level 1. Equity securities traded on more than one securities exchange shall be valued at the last sale price on the pricing date at the close of the exchange representing the principal market for such securities and are classified as Level 1. Fixed income securities are valued at the mean of bid and ask prices provided by an independent pricing service when such prices are believed to reflect the fair value of such securities and are generally classified as Level 2. Such bid and ask prices are determined taking into account securities prices, yields, maturities, call features, ratings, and institutional size trading in similar securities and developments related to specific securities. Short-term investments having a maturity of 60 days or less at time of purchase are valued on an amortized cost basis, which approximates fair value and are classified as Level 2. Any securities for which it is determined that market prices are unavailable or inappropriate are valued at a fair value using a procedure determined in good faith by the Board of Directors and are generally classified as Level 2 or 3.
B. Securities Transactions and Investment Income: Securities transactions are recorded on the trade date. Realized gains and losses on sales of securities are calculated on the identified cost basis. Dividend income is recorded on the ex-dividend date and interest income is recorded on the accrual basis. The Fund amortizes premiums and accretes discounts on securities using the effective interest method.
C. Federal Income Taxes: It is the Fund’s intention to comply with requirements of Subchapter M of the Internal Revenue Code applicable to regulated investment companies and to distribute substantially all of its net taxable income and capital gains to its shareholders. Therefore, no provision for Federal income or excise tax is required. Management of the Fund has concluded that there are no significant uncertain tax positions that would require recognition in the financial statements. Since tax authorities can examine previously filed tax returns, the Fund’s tax returns for each of the four years in the period ended December 31, 2011 are subject to such review.
D. Dividends and Distributions: The Fund will declare and pay dividends on its common stock monthly from net investment income. Net long-term capital gains, if any, in excess of loss carryforwards are expected to be distributed annually. The Fund will make a determination at the end of its fiscal year as to whether to retain or distribute such gains. Dividends and distributions are recorded on the ex-dividend date. Dividends and distributions on the Fund’s preferred shares are accrued on a daily basis and are determined as described in Note 7.
The amount and timing of distributions are generally determined in accordance with federal tax regulations, which may differ from U.S. generally accepted accounting principles.
14
DUFF & PHELPS UTILITY AND CORPORATE BOND TRUST INC.
NOTES TO FINANCIAL STATEMENTS—(Continued)
June 30, 2012
(Unaudited)
E. Use of Estimates: The preparation of financial statements in conformity with U.S. generally accepted accounting principles requires management to make estimates and assumptions that affect the amounts reported in the financial statements and accompanying notes. Actual results could differ from those estimates.
Note 3. Agreements and Management Arrangements
A. Advisor: The Fund has an Advisory Agreement with Duff & Phelps Investment Management Co. (the “Adviser”), a subsidiary of Virtus Investment Partners, Inc. (“Virtus”).
The investment advisory fee is payable monthly at an annual rate of 0.50% of the Fund’s average weekly managed assets, which is defined as the average weekly value of the total assets of the Fund minus the sum of all accrued liabilities of the Fund (other than the aggregate amount of any outstanding borrowings or other indebtedness constituting financial leverage).
B. Administrator: The Fund has an Administration Agreement with J.J.B. Hilliard, W.L. Lyons, LLC (“Hilliard”). The administration fee is payable monthly at an annual rate of 0.14% of the Fund’s average weekly net assets, which is defined as the average weekly value of the total assets of the Fund minus the sum of all accrued liabilities of the Fund (including the aggregate amount of any outstanding borrowings or other indebtedness constituting financial leverage).
C. Directors: The Fund pays each director not affiliated with the Adviser an annual fee plus a fee for certain meetings of the board or committees of the board attended. Total fees paid to directors for the six months ended June 30, 2012 were $69,463.
D. Affiliated Shareholders: At June 30, 2012, Virtus Partners Inc. held 36,117 shares of the Fund. This represents 0.13% of the Fund’s outstanding shares on this date. These shares may be sold at any time.
Note 4. Investment Transactions
Purchases and sales of investment securities (excluding U.S. Government securities and short-term investments) for the six months ended June 30, 2012 aggregated $37,045,103 and $34,494,000, respectively. For the six months ended June 30, 2012, the Fund had purchases and sales of $-0- and $93,326 respectively, of U.S. Government securities.
Note 5. Distributions and Tax Information
At June 30, 2012, the federal tax cost of the Fund’s investments and the aggregate gross unrealized appreciation (depreciation) were as follows:
| | | | | | | | | | | | |
Federal Tax
Cost
| | Unrealized
Appreciation
| | | Unrealized
Depreciation
| | | Net
Unrealized
Appreciation
| |
| $474,938,286 | | $ | 25,372,617 | | | ($ | 7,614,494 | ) | | $ | 17,758,123 | |
The tax character of distributions paid during the fiscal year ended December 31, 2011 was as follows:
| | | | |
| | | 12/31/2011
| |
Distributions paid from: | | | | |
Ordinary income | | $ | 24,342,313 | |
| | |
|
|
|
Total distributions | | $ | 24,342,313 | |
| | |
|
|
|
15
DUFF & PHELPS UTILITY AND CORPORATE BOND TRUST INC.
NOTES TO FINANCIAL STATEMENTS—(Continued)
June 30, 2012
(Unaudited)
The difference between book basis and tax basis unrealized appreciation (depreciation) is attributable primarily to the difference between book and tax amortization methods for premiums and discounts on fixed income securities.
The tax character of the distributions paid in 2012 will be determined at the Fund’s fiscal year end, December 31, 2012.
At December 31, 2011, the Fund had a net capital loss carryforward of $60,855,023 which may be used to offset future capital gains. This net capital loss carryforward will be reduced by future realized capital gains.
Under the Regulated Investment Company Modernization Act of 2010 (the “Act”), net capital losses recognized for tax years beginning after December 22, 2010 may be carried forward indefinitely, and their character is retained as short-term and/or long-term losses. Previously, net capital losses were carried forward for eight years and treated as short-term losses. As a transition rule, the Act requires that post-enactment net capital losses be used before pre-enactment net capital losses.
At December 31, 2011, the Fund had post-enactment and pre-enactment net capital losses as follows:
| | | | | | | | | | | | | | | | |
| | | | | | Not Subject
to Expiration
| | | | |
| | | Subject to
Expiration
| | | Short
Term
| | | Long
Term
| | | Total
| |
Carryover loss: | | $ | 53,877,035 | | | $ | 155,708 | | | $ | 6,822,280 | | | $ | 60,855,023 | |
Expiration dates: | | | | | | | | | | | | | | | | |
2012 | | | 3,731,126 | | | | | | | | | | | | | |
2013 | | | 3,265,594 | | | | | | | | | | | | | |
2014 | | | 4,213,979 | | | | | | | | | | | | | |
2015 | | | 13,096,121 | | | | | | | | | | | | | |
2017 | | | 18,907,565 | | | | | | | | | | | | | |
2018 | | | 10,662,650 | | | | | | | | | | | | | |
Note 6. Reclassification of Capital Accounts
Due to inherent differences in the recognition and distribution of income and realized gains (losses) under U.S. generally accepted accounting principles and for federal income tax purposes, permanent differences between book and tax basis reporting have been identified and appropriately reclassified on the Statement of Assets and Liabilities. At June 30, 2012, the following reclassifications were recorded:
| | | | |
Accumulated net realized
loss on investments
| | Distributions in excess of
net investment income
| |
| ($2,489,099) | | $ | 2,489,099 | |
The reclassifications primarily relate to permanent differences attributable to amortization methods on fixed income securities. These reclassifications had no effect on net assets or net asset value per share.
Note 7. Auction Market Preferred Shares
The Fund’s Charter grants the authority to the Board of Directors to authorize the creation and issuance of one or more series of preferred stock out of the authorized and unissued stock of the Fund. Accordingly, on October 25, 2006, the Fund issued 7,600 shares of Auction Market Preferred Shares (“AMPS”) in two series of 3,800 shares each at a public offering price of $25,000 per share. The underwriting discount and other offering costs incurred in connection with
16
DUFF & PHELPS UTILITY AND CORPORATE BOND TRUST INC.
NOTES TO FINANCIAL STATEMENTS—(Continued)
June 30, 2012
(Unaudited)
the issuance of the AMPS were recorded as a reduction of paid-in capital on common stock. Dividends on shares of AMPS are cumulative from their date of original issue and payable on each dividend payment date. On March 24, 2009, the Fund redeemed 3,800 shares of its T7 series of AMPS at liquidation value. During the six months ended June 30, 2012, the Fund conducted a tender offer for its outstanding TH7 series of AMPS and accepted for purchase 217 AMPS, as more fully described in Note 8. As of June 30, 2012, there were 3,583 shares of TH7 series AMPS outstanding.
Under the 1940 Act, the Fund may not declare dividends or make other distributions on shares of common stock or purchase any such shares if, at the time of the declaration, distribution or purchase, asset coverage with respect to the outstanding preferred stock would be less than 200%.
The AMPS are redeemable at the option of the Fund, in whole or in part, on any dividend payment date at $25,000 per share plus any accumulated or unpaid dividends, whether or not declared. The AMPS are also subject to a mandatory redemption at $25,000 per share plus any accumulated or unpaid dividends, whether or not declared, if certain requirements relating to the composition of the assets and liabilities of the Fund as set forth in the Fund’s Charter are not satisfied.
The holders of AMPS have voting rights equal to the holders of common stock (one vote per share) and will vote together with holders of common stock as a single class. However, holders of AMPS, voting separately as a class, are also entitled to elect two of the Fund’s directors. In addition, the 1940 Act requires that along with any approval by shareholders that might otherwise be required, the approval of the holders of a majority of any outstanding shares of preferred stock, voting separately as a class, would be required to (a) adopt any plan of reorganization that would adversely affect the preferred stock, and (b) take certain actions requiring a vote of security holders, including, among other things, changes in the Fund’s subclassification as a closed-end investment company or changes in its fundamental investment restrictions. Since February 2008, the AMPS market has been ineffective at matching buyers with sellers. This has impacted the Fund’s AMPS. The AMPS dividend rate was reset to the maximum applicable rate. These maximum dividend rates ranged from 1.44% to 1.46% for the six months ended June 30, 2012. A failed auction is not an event of default for the Fund, but it is a liquidity problem for the holders of its AMPS. Dislocations in the auction rate securities markets have triggered numerous failed auctions for many closed-end funds. A failed auction occurs when there are more sellers of AMPS than buyers. It is impossible to predict how long this imbalance will last. A successful auction of the Fund’s AMPS may not occur for a long period of time, if ever. Even if the AMPS market becomes more liquid, the holders of the Fund’s AMPS may not have the amount of liquidity they desire or the ability to sell the AMPS at par.
Note 8. Auction Market Preferred Share Tender Offer
The Fund conducted a tender offer that commenced on May 3, 2012 and expired on June 18, 2012, for up to $47,500,000 of its outstanding AMPS at a price equal to 96% of the per share liquidation preference of $25,000 plus any unpaid dividends accrued through the expiration of the offer. Under the terms of the tender offer on June 18, 2012, the Fund accepted 217 AMPS at a price equal to 96% of its liquidation preference of $25,000 per share ($24,000 per share) plus dividends accrued and unpaid through the expiration of the offer. Because the tender offer was less than the AMPS per share liquidation preference, the tender offer had a positive impact on net asset value in the amount of $217,000, which is reflected in the Statement of Operations under the caption “Benefit to common shareholders from tender offer for auction market preferred shares.”
17
DUFF & PHELPS UTILITY AND CORPORATE BOND TRUST INC.
NOTES TO FINANCIAL STATEMENTS—(Continued)
June 30, 2012
(Unaudited)
Note 9. Borrowings
On March 6, 2009, the Fund entered into a Committed Facility Agreement (the “Facility”) with a commercial bank (the “Bank”) that allows the Fund to borrow cash from the Bank, up to a limit of $190,000,000 for the purpose of redeeming shares of preferred stock. Borrowings under the Facility are collateralized by certain assets of the Fund (the “Hypothecated Securities”). The Fund expressly grants the Bank the right to re-register the Hypothecated Securities in its own name or in another name other than the Fund’s and to pledge, repledge, hypothecate, rehypothecate, sell, lend or otherwise transfer or use the Hypothecated Securities. Interest is charged at 3 month LIBOR (London Inter-bank Offered Rate) plus an additional percentage rate on the amount borrowed and a percentage rate on the undrawn balance (the commitment fee). The Fund also paid a one time arrangement fee based on a percentage of the total borrowing limit. Total commitment fees paid for the six months ended June 30, 2012 were $374,365 and are included in Borrowing fees and expenses on the Statement of Operations. The Bank has the ability to require repayment of outstanding borrowings under the Facility upon six months notice or following an event of default. For the six months ended June 30, 2012, the average daily borrowings under the Facility and the weighted daily average interest rate were $95,357,692 and 1.37%, respectively. As of June 30, 2012, the amount of such outstanding borrowings was $100,425,000. The interest rate applicable to the borrowing on June 30, 2012 was 1.31%. The Bank has the ability to borrow the Hypothecated Securities (“Rehypothecated Securities”). The Fund is entitled to receive a fee from the Bank in connection with any borrowing of Rehypothecated Securities. The fee is computed daily based on a percentage of the difference between the fair market rate as determined by the Bank and the Fed Funds Open and is paid monthly. The Fund can designate any Hypothecated Security as ineligible for rehypothecation and can recall any Rehypothecated Security at any time and if the Bank fails to return it (or an equivalent security) in a timely fashion, the Bank will be liable to the Fund for the ultimate delivery of such security and certain costs associated with delayed delivery. In the event the Bank does not return the Rehypothecated Security or an equivalent security, the Fund will have the right to, among other things, apply and set off an amount equal to one hundred percent (100%) of the then-current fair market value of such Rehypothecated Securities against any amounts owed to the Bank under the Facility. At June 30, 2012, Hypothecated Securities under the Facility had a market value of $231,887,734 and Rehypothecated Securities had a market value of $96,193,613. If at the close of business any day, the value of all outstanding Hypothecated Securities exceeds the Hypothecation Limit, the Bank shall promptly, at its option, either reduce the amount of the outstanding securities or deliver an amount of cash at least equal to the excess amount.
Note 10. Indemnifications
Under the Fund’s organizational documents, its officers and directors are indemnified against certain liabilities arising out of the performance of their duties to the Fund. In addition, in the normal course of business, the Fund enters into contracts that provide general indemnifications to other parties. The Fund’s maximum exposure under these arrangements is unknown as this would involve future claims that may be made against the Fund that have not yet occurred. However, the Fund has not had prior claims or losses pursuant to these arrangements and expects the risk of loss to be remote.
Note 11. Subsequent Events
Management has evaluated the impact of all subsequent events on the Fund through the date the financial statements were available for issuance, and has determined that there were no subsequent events requiring recognition or disclosure in these financial statements.
18
RENEWAL OF INVESTMENT ADVISORY AGREEMENT (Unaudited)
Under Section 15(c) of the Investment Company Act of 1940 (the “1940 Act”), the terms of the Fund’s investment advisory agreement must be reviewed and approved at least annually by the Board of Directors of the Fund (the “Board”), including a majority of the directors who are not “interested persons” of the Fund, as defined in section 2(a)(19) of the 1940 Act (the “Independent Directors”). Section 15(c) of the 1940 Act also requires the Fund’s directors to request and evaluate, and the Fund’s investment adviser to furnish, such information as may reasonably be necessary to evaluate the terms of the investment advisory agreement. To assist the Board with this responsibility, the Board has appointed a Contracts Committee, which is composed of three Independent Directors and acts under a written charter that was most recently amended on May 11, 2011. A copy of the charter is available on the Fund’s website at www.ducfund.com and in print to any shareholder, upon request.
The Contracts Committee, assisted by the advice of independent legal counsel, conducted an annual review of the terms of the Fund’s contractual arrangements, including the investment advisory agreement with Duff & Phelps Investment Management Co. (the “Adviser”). Set forth below is a description of the Contracts Committee’s annual review of the Fund’s investment advisory agreement, which provided the material basis for the Board’s decision to continue the investment advisory agreement for a one-year term ending April 30, 2013.
In the course of the Contracts Committee’s review, the members of the Contracts Committee considered all of the information they deemed appropriate, including informational materials furnished by the Adviser in response to a request made by the Contracts Committee. In arriving at its recommendation that continuation of the investment advisory agreement was in the best interests of the Fund and its shareholders, the Contracts Committee took into account all factors that it deemed relevant, without identifying any single factor or group of factors as all-important or controlling. Among the factors considered by the Contracts Committee, and the conclusion reached with respect to each, were the following:
Nature, extent, and quality of services. The Contracts Committee considered the nature, extent and quality of the services provided to the Fund by the Adviser. Among other materials, the Adviser furnished the Contracts Committee with a copy of its most recent investment adviser registration form (Form ADV). In evaluating the quality of the Adviser’s services, the Contracts Committee noted the various complexities involved in the operations of the Fund, such as the use of leverage in the form of auction market preferred shares, borrowings under a credit facility and the rehypothecation of portfolio securities pledged under the credit facility, and concluded that the Adviser is consistently providing high-quality services to the Fund in an increasingly complex environment. The Contracts Committee also acknowledged the unprecedented disruption of the credit and capital markets during the recent period and the commendable skill shown by the Adviser and its personnel in managing the Fund’s portfolio in the face of such extraordinary challenges. The Contracts Committee also considered the length of service of the individual professional employees of the Adviser who provide services to the Fund and noted an almost total lack of turnover. In the Contracts Committee’s view, the long-term service of capable and conscientious professionals provides a significant benefit to the Fund and its shareholders. The Contracts Committee also considered the Fund’s investment performance as discussed below. The Contracts Committee also took into account its evaluation of the quality of the Adviser’s code of ethics and compliance program. In light of the foregoing, the Contracts Committee concluded that it was generally satisfied with the nature, extent and quality of the services provided to the Fund by the Adviser.
Investment performance of the Fund and the Adviser. The Adviser provided the Contracts Committee with performance information for the Fund for various periods, measured against two benchmarks: the Lipper General Bond Funds Average (the Fund’s Lipper category) and the Barclays Capital U.S. Aggregate Index (including the U.S. Credit Index which is a subset of the U.S. Aggregate Index). The Contracts Committee noted that the Fund’s performance generally compared favorably with the benchmarks.
Costs of services and profits realized. The Contracts Committee considered the reasonableness of the compensation paid to the Adviser, in both absolute and comparative terms, and also the profits realized by the Adviser and its affiliates from its relationship with the Fund. To facilitate this analysis, the Contracts Committee retained Lipper Fiduciary
19
Services, an independent provider of investment company data, to furnish a report comparing the Fund’s advisory fee and other expenses to the similar expenses of other bond funds. The Contracts Committee noted that the Fund’s advisory fees, as a percentage of leveraged and non-leveraged assets, were lower than the comparison group median. The Adviser also furnished the Contracts Committee with copies of its financial statements. In reviewing those financial statements, the Contracts Committee examined the profitability of the investment advisory agreement to the Adviser and determined that the profitability of that contract was within the range that courts had found reasonable. The Contracts Committee considered that the Adviser must be able to compensate its employees at competitive levels in order to attract and retain high-quality personnel to provide high-quality service to the Fund. The Contracts Committee concluded that the investment advisory fee was the product of arm’s length bargaining and that it was fair and reasonable to the Fund.
Economies of scale. The Contracts Committee considered whether the Fund has appropriately benefited from any economies of scale. The Contracts Committee concluded that currently the Fund is not sufficiently large to realize benefits from economies of scale with fee breakpoints. However, the Contracts Committee noted that the transition to a single administrator for the complex of three closed-end funds advised by the Adviser had streamlined the operations of the Fund. The Contracts Committee encouraged the Adviser to continue to work towards reducing costs by leveraging relationships with service providers across the complex of funds advised by the Adviser.
Comparison with other advisory contracts. The Contracts Committee also received comparative information from the Adviser with respect to the fees it charges to investment advisory clients other than the Fund. The Contracts Committee noted that, among all accounts managed by the Adviser, the Fund’s advisory fee rate ranks slightly above the median. The advisory fee structure for the Adviser’s other investment company clients ranges from 32 basis points to 100 basis points. The advisory fee structure for the Adviser’s institutional separately managed accounts ranges from 6 basis points for passively managed equity accounts to 85 basis points for actively managed specialized real estate securities accounts. However, the Contracts Committee noted that the services provided by the Adviser to the Fund are significantly more extensive and demanding than the services provided by the Adviser to institutional accounts. Specifically, in providing services to the Fund, the Adviser needs to: (1) comply with the 1940 Act, the Sarbanes-Oxley Act and other federal securities laws and New York Stock Exchange requirements, (2) provide for external reporting (including quarterly and semi-annual reports to shareholders, annual audited financial statements and disclosure of proxy voting), tax compliance and reporting (which are particularly complex for investment companies), requirements of Section 19 of the 1940 Act relating to the source of distributions, (3) prepare for and attend meetings of the Board and its committees, (4) communicate with Board and committee members between meetings, (5) communicate with a retail shareholder base consisting of thousands of investors, (6) manage the use of financial leverage and (7) respond to unanticipated issues such as the recent problems with the preferred stock auction markets. Based on the fact that the Adviser only provides the foregoing services to its investment company clients and not to its institutional account clients, the Contracts Committee concluded that comparisons between the two fee structures would not be appropriate or meaningful.
Indirect benefits. The Contracts Committee considered possible sources of indirect benefits to the Adviser from its relationship to the Fund. As a fixed-income fund, the Contracts Committee noted that the Fund does not utilize affiliates of the Adviser for brokerage purposes.
Based upon its evaluation of all material factors, including the foregoing, and assisted by the advice of independent legal counsel, the Contracts Committee concluded that the continued retention of the Adviser as investment adviser to the Fund was in the best interests of the Fund and its shareholders. Accordingly, the Contracts Committee recommended to the full Board that the investment advisory agreement with the Adviser be continued for a one-year term ending April 30, 2013. On February 21, 2012, the Contracts Committee presented its recommendations, and the criteria on which they were based, to the full Board, whereupon the Board, including all of the independent directors voting separately, accepted the Contracts Committee’s recommendations and unanimously approved the continuation of the current investment advisory agreement with the Adviser for a one-year term ending April 30, 2013.
ADDITIONAL INFORMATION (Unaudited)
Notice is hereby given in accordance with Section 23(c) of the 1940 Act that the Fund may from time to time purchase its shares of common stock in the open market.
20
INFORMATION ABOUT PROXY VOTING BY THE FUND (Unaudited)
Although the Fund does not typically hold voting securities, the Fund’s Board of Directors has adopted proxy voting policies and procedures whereby Duff & Phelps Investment Management Co., the Fund’s investment adviser (the “Adviser”), would review any proxy solicitation materials on a case-by-case basis and would vote any such securities in accordance with the Adviser’s good faith belief as to the best interests of the Fund and its shareholders. These proxy voting policies and procedures may be changed at any time or from time to time by the Fund’s Board of Directors. A description of the policies and procedures that the Fund uses to determine how to vote proxies relating to portfolio securities is available without charge, upon request, by calling the Administrator toll-free at (888) 878-7845 or is available on the Fund’s website at www.ducfund.com or on the SEC’s website at www.sec.gov.
INFORMATION ABOUT THE FUND’S PORTFOLIO HOLDINGS (Unaudited)
The Fund files its complete schedule of portfolio holdings with the SEC for the first and third fiscal quarters of each fiscal year (quarters ended March 31 and September 30) on Form N-Q. The Fund’s Form N-Q is available on the SEC’s website at www.sec.gov and may be reviewed and copied at the SEC’s Public Reference Room in Washington, D.C. Information on the operation of the SEC’s Public Reference Room may be obtained by calling (800) 732-0330. In addition, the Fund’s Form N-Q is available without charge, upon request, by calling the Administrator toll-free at (888) 878-7845 or is available on the Fund’s website at www.ducfund.com.
REPORT ON ANNUAL MEETING OF SHAREHOLDERS (Unaudited)
The Annual Meeting of Shareholders of the Fund was held on May 10, 2012. The following is a description of each matter voted upon at the meeting and the number of votes cast on each matter:
| | | | | | | | |
| | | For
| | | Withheld
| |
1. To elect four directors to serve until the Annual Meeting in the year indicated below or until their successors are duly elected and qualified: | | | | | | | | |
Stewart E. Conner (2015) | | | 14,673,808 | | | | 366,360 | |
Eileen A. Moran (2015) | | | 14,685,505 | | | | 365,213 | |
David J. Vitale (2015) | | | 14,673,808 | | | | 376,910 | |
Nancy Lampton (2015)* | | | 2,776 | | | | 0 | |
| * | Elected by holders of the Fund’s preferred stock voting as a separate class. |
Directors whose term of office continued beyond this meeting are as follows: Robert J. Genetski, Philip R. McLoughlin, Geraldine M. McNamara, Christian H. Poindexter, Nathan I. Partain, and Carl F. Pollard.
| | | | | | | | | | | | |
| | | For
| | | Against
| | | Abstain
| |
2. To consider a proposal to amend certain provisions of the Fund’s charter that govern the terms of the Fund’s preferred stock in order to permit the Fund, under certain circumstances, to depart from guidelines imposed by the ratings agencies. | | | | | | | | | | | | |
Common stock votes | | | 11,700,841 | | | | 558,234 | | | | 361,862 | |
Preferred stock votes | | | 2,765 | | | | 0 | | | | 0 | |
21
Not applicable to semi-annual reports.
| ITEM 3. | AUDIT COMMITTEE FINANCIAL EXPERT. |
Not applicable to semi-annual reports.
| ITEM 4. | PRINCIPAL ACCOUNTANT FEES AND SERVICES. |
Not applicable to semi-annual reports.
| ITEM 5. | AUDIT COMMITTEE OF LISTED REGISTRANTS. |
Not applicable to semi-annual reports.
A Schedule of Investments is included as part of the report to shareholders filed under Item 1 of this report.
| ITEM 7. | DISCLOSURE OF PROXY VOTING POLICIES AND PROCEDURES FOR CLOSED-END MANAGEMENT INVESTMENT COMPANIES. |
Not applicable to semi-annual reports.
| ITEM 8. | PORTFOLIO MANAGERS OF CLOSED-END MANAGEMENT INVESTMENT COMPANIES. |
Not applicable to semi-annual reports.
| ITEM 9. | PURCHASES OF EQUITY SECURITIES BY CLOSED-END MANAGEMENT INVESTMENT COMPANY AND AFFILIATED PURCHASERS. |
During the period covered by this report, no purchases were made by or on behalf of the registrant or any “affiliated purchaser” (as defined in Rule 10b-18(a)(3) under the Securities Exchange Act of 1934 (the “Exchange Act”)) of shares or other units of any class of the registrant’s equity securities that is registered by the registrant pursuant to Section 12 of the Exchange Act.
| ITEM 10. | SUBMISSION OF MATTERS TO A VOTE OF SECURITY HOLDERS. |
No changes to the procedures by which shareholders may recommend nominees to the registrant’s board of directors have been implemented after the registrant last provided disclosure in response to the requirements of Item 22(b)(15) of Schedule 14A (i.e., in the registrant’s Proxy Statement dated April 4, 2012) or this Item.
| ITEM 11. | CONTROLS AND PROCEDURES. |
(a) The registrant’s principal executive officer and principal financial officer have concluded that the registrant’s disclosure controls and procedures (as defined in Rule 30a-3(c) under the Investment Company Act of 1940 (the “1940 Act”)) are effective, based on an evaluation of those controls and procedures made as of a date within 90 days of the filing date of this report as required by Rule 30a-3(b) under the 1940 Act and Rule 13a-15(b) under the Exchange Act.
(b) There has been no change in the registrant’s internal control over financial reporting (as defined in Rule 30a-3(d) under the 1940 Act) that occurred during the second fiscal quarter of the period covered by this report that has materially affected, or is reasonably likely to materially affect, the registrant’s internal control over financial reporting.
| | | | |
| (a) | | Exhibit 99.CERT | | Certifications pursuant to Section 302 of the Sarbanes-Oxley Act of 2002 |
| | |
| (b) | | Exhibit 99.906CERT | | Certifications pursuant to Section 906 of the Sarbanes-Oxley Act of 2002 |
SIGNATURES
Pursuant to the requirements of the Securities Exchange Act of 1934 and the Investment Company Act of 1940, the registrant has duly caused this report to be signed on its behalf by the undersigned, thereunto duly authorized.
| | |
(Registrant) | | DUFF & PHELPS UTILITY AND CORPORATE BOND TRUST INC. |
| |
| By (Signature and Title) | | /s/ ALAN M. MEDER |
| | Alan M. Meder |
| | Treasurer |
| | (Principal Financial and Accounting Officer) |
| Date | | August 22, 2012 |
Pursuant to the requirements of the Securities Exchange Act of 1934 and the Investment Company Act of 1940, this report has been signed below by the following persons on behalf of the registrant and in the capacities and on the dates indicated.
| | |
| By (Signature and Title) | | /s/ NATHAN I. PARTAIN |
| | Nathan I. Partain |
| | President and Chief Executive Officer |
| Date | | August 22, 2012 |
| |
| By (Signature and Title) | | /s/ ALAN M. MEDER |
| | Alan M. Meder |
| | Treasurer |
| | (Principal Financial and Accounting Officer) |
| Date | | August 22, 2012 |