UNITED STATES
SECURITIES AND EXCHANGE COMMISSION
Washington, D.C. 20549
SECURITIES AND EXCHANGE COMMISSION
Washington, D.C. 20549
FORM N-CSR
CERTIFIED SHAREHOLDER REPORT OF REGISTERED
MANAGEMENT INVESTMENT COMPANIES
Investment Company Act file number 811-07360
Monetta Trust
(Exact name of Registrant as specified in charter)
(Exact name of Registrant as specified in charter)
1776-A S. Naperville Road, Suite 100
Wheaton, IL 60189-5831
(Address of principal executive offices) (Zip code)
(Address of principal executive offices) (Zip code)
Robert S. Bacarella
1776-A S. Naperville Road, Suite 100
Wheaton, IL 60189-5831
(Name and address of agent for service)
(Name and address of agent for service)
(630) 462-9800
Registrant's telephone number, including area code
Date of fiscal year end: December 31, 2022
Date of reporting period: December 31, 2022
Item 1. Reports to Stockholders.
| (a) |
Annual Report
December 31, 2022
Monetta Mutual Funds (No-Load)
| Monetta Trust: | ||
| ■ | Monetta Fund | |
| ■ | Monetta Young Investor Growth Fund | |
| 1-800-MONETTA | www.monetta.com |
Page 2
TABLE OF CONTENTS
| Letter to Shareholders | 5 | ||
| Performance Highlights | |||
| Monetta Fund | 6 | ||
| Monetta Young Investor Growth Fund | 7 | ||
| Disclosure of Fund Expenses | 8 | ||
| Schedules of Investments | |||
| Monetta Fund | 9 | ||
| Monetta Young Investor Growth Fund | 11 | ||
| Financial Statements | |||
| Statements of Assets and Liabilities | 12 | ||
| Statements of Operations | 13 | ||
| Statements of Changes in Net Assets | 14 | ||
| Financial Highlights | 15 | ||
| Notes to Financial Statements | 17 | ||
| Report of Independent Registered Public Accounting Firm | 22 | ||
| Other Information | 23 | ||
| Trustees & Officers | 25 | ||
| Notice to Shareholders | 27 | ||
| Privacy Policy | 28 |
Page 3
Principal Risks:
Mutual fund investing involves risk. Principal loss is possible. The Funds may make short-term investments, without limitation, for defensive purposes, which may provide lower returns than other types of investments. The portion of the Monetta Young Investor Growth Fund that invests in underlying ETFs that track the S&P 500® Index (the “Index”) will be subject to certain risks which are unique to tracking the Index. By investing in ETFs, you will indirectly bear your share of any fees and expenses charged by the underlying funds, in addition to indirectly bearing the principal risks of the funds. The Monetta Young Investor Growth Fund will invest approximately 50% of its net assets in funds that track the Index or other broad-based market indices that primarily include stocks of large capitalization U.S. companies, and your cost of investing will generally be higher than the cost of investing directly in the shares of the mutual funds that track an index, which will be subject to certain risks which are unique to tracking the Index. Growth stocks typically are more volatile than value stocks; however, value stocks have a lower expected growth rate in earnings and sales. Investments in smaller companies involve additional risks such as limited liquidity and greater volatility than larger companies. Please refer to the Funds’ prospectus for further details.
While the Funds are no-load, management and other expenses still apply.
Past performance is not a guarantee of future results.
Monetta Financial Services, Inc. (“MFSI” or the “Adviser”) is the investment adviser to the Monetta Funds. References to individual securities are the views of the Adviser at the date of this report and are subject to change. References are not a recommendation to buy or sell any security. Fund holdings and compositions are subject to change. MFSI and its affiliated officers, trustees and employees may, from time to time, have long or short positions in, and buy or sell, the securities of companies held, purchased or sold by the Monetta Funds. Current and future portfolio holdings are subject to risk. Please refer to the Schedules of Investments in this report for a complete list of Fund holdings.
Diversification does not assure a profit, nor does it protect against a loss in a declining market.
The S&P 500® Index is a broad based unmanaged index of 500 stocks, which is widely recognized as representative of the equity market in general. It is not possible to invest directly in an index.
The Russell 2500® Value Index measures the performance of the small to mid-cap value segment of the U.S. equity securities market. It includes those Russell 2500® Index companies with lower price-to-book ratios and lower forecasted growth values. It is not possible to invest directly in an index.
The Russell 2500® Growth Index measures the performance of the small to mid-cap growth segment of the U.S. equity securities market. It includes those Russell 2500® Index companies with higher price-to-book ratios and higher forecasted growth values. It is not possible to invest directly in an index.
ADR – American Depositary Receipt
Earnings growth is not a measure of the Funds’ future performance.
The Funds’ investment objectives, risks, charges and expenses must be considered carefully before investing. The summary and statutory prospectuses contains this and other important information about the investment company, and may be obtained by calling 1-866-964-4683, or visiting www.monetta.com. Read it carefully before investing.
Opinions expressed are those of the fund managers and are not intended to be a forecast of future events, a guarantee of future results, nor investment advice.
Distributor: Quasar Distributors, LLC.
Page 4
| Letter to Shareholders (Unaudited) |
2022 Annual Report
Dear Fellow Shareholders:
I am pleased to enclose your Fund’s annual report for the year ended December 31, 2022.
2022 was a difficult year for investors with almost every major asset class posting negative returns. For many stock-market investors, the atypical corresponding decline in bond prices made the year especially painful. For a smaller number, the collapse of the highly speculative cryptocurrency markets hurt as well.
Factors driving the markets lower included the Russia-Ukraine war, continuing pandemic concerns, excessive government spending and the end of the Fed’s multi-decade pattern of easy monetary policy. These events brought investors back to basics in terms of stock valuations. Investors focused more on sustainability of future earnings and growth estimates and favored those companies that can maintain profit margin levels in a rising inflationary environment.
The stock market, as measured by the S&P 500® Index, declined 18.11% for the year ended December 31, 2022, its largest loss since 2008, when it lost 38.4%. The traditional value sectors like energy, healthcare and defense performed the best, while the growth sectors—including semiconductors, technology and consumer discretionary—performed the worst. The performance gap between growth and value stocks was significant. For example, both the Vanguard Growth and Value ETFs declined, but Growth was down 33.9% while Value was down only 4.3%.
Of all the market drivers, the most significant was the sharp increase in the inflation rate. Prices increased primarily due to rising oil prices related to the Ukraine war, supply and demand imbalances from transportation bottlenecks and excess government spending and stimulus programs. As a result, the Fed aggressively hiked interest rates throughout the year. The result was an inverted yield curve, in which short-term rates are higher than longer-term rates. This relationship negatively impacted the real estate and fixed-income markets. Also, higher food and energy prices slowed consumer discretionary spending even as rising labor costs pressured companies to trim expenses and lay off workers—though the overall labor picture remains solid.
2023 Outlook
The main issue for 2023 is whether the upward inflationary pressure will ease sufficiently enough to allow the Fed to slow or halt future rate hikes. The speed and magnitude of Fed tightening will likely determine the steepness of an economic recession. We believe the current economic slowdown reflects a relatively mild recession. Household and corporate balance sheets remain in good shape. Supply and demand issues are not significant enough to create large economic imbalances. And the labor markets remain strong as reflected in the low unemployment rate.
Near-term we expect additional rate hikes, albeit at a slower pace, which could lead to a mid-cycle earnings adjustment rather than a steep economic downturn. There is no certainty that the market has bottomed, but many companies, especially those in the growth stock sector, are trading at deep discounts from the start of 2022.
We believe there’s a very good chance of a “soft-ish” economic landing. Consumers, whose spending makes up about 70% of domestic growth, remain extremely strong and healthy. The labor market has remained resilient. And while the slowing economy could force businesses to lay off workers, firms are actually improving balance sheets and income profitability. When expectations do improve, we could see a significant snapback in stocks.
If history is a guide, the S&P 500® Index has a good chance of rising in 2023. Historically, when it has posted a negative yearly return, the index has risen during the following year 80% of the time, with an average return of 15%. But be careful, there may be times when you think the storm has passed because it looks calm outside, while actually it’s the eye of the hurricane, and the back end of the storm is yet to come. We believe that now is the time to remain patient, ride out the storm, think long-term and not attempt to time the market.
While the market may be rocky and volatile in the short term, realize that today’s lower prices are likely to be seen as good bargains in just a few years. Volatility is normal in these types of unpredictable markets. Ultimately, stock price movements will likely reflect investors’ changing expectations surrounding Fed policy and corporate growth. Historically, stock prices generally bottom out about two quarters before earnings start to recover, suggesting we could be nearing a market bottom and entering the early innings of a new bull market. It’s important for investors to maintain a long-term perspective and not expect the sudden appearance of an “all-clear” sign that market risks have subsided.
Thank you for being a valued shareholder,

Robert S. Bacarella
President, Founder and Portfolio Manager
Page 5
| Performance Highlights (Unaudited) |
| Monetta Fund | Year ended December 31, 2022 | |
Investment Objective: | Average Market Capitalization: | Total Net Assets: |
| Long-Term Capital Growth | $452.3 billion | $58.37 million |
PERFORMANCE: | Average Annual Total Return | |||
1 Year | 3 Year | 5 Year | 10 Year | |
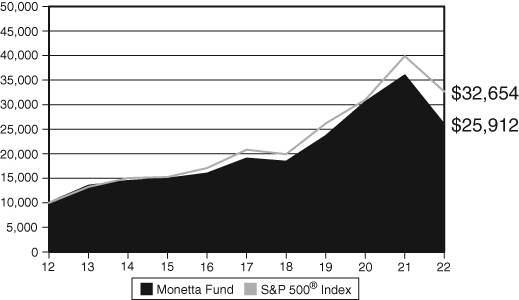
| Monetta Fund | -27.93% | 3.20% | 6.38% | 9.99% |
S&P 500® Index | -18.11% | 7.66% | 9.42% | 12.56% |
| Total Annual Operating Expenses* | 1.33% | |||
| * | Source Prospectus dated April 30, 2022. For the Fund’s current Expense Ratio, please refer to Page 15 of this Annual Report. |
Performance data quoted represents past performance; past performance does not guarantee future results. The investment return and principal value of an investment will fluctuate so that an investor’s shares, when redeemed, may be worth more or less than their original cost. The total returns do not reflect the deduction of taxes that a shareholder would pay on Fund distributions or the redemption of Fund shares. Current performance of the Fund may be lower or higher than the performance quoted. Performance data current to the most recent month end may be obtained by calling 1-800-MONETTA or visiting www.Monetta.com.
The hypothetical graph above compares the change in value of a $10,000 investment in the Monetta Fund and the S&P 500® Index, for the 10-year period ended December 31, 2022, with dividend and capital gains reinvested.
Portfolio Weightings(a): |
Technology | 31.0 | % | ||
Retail | 17.4 | % | ||
Healthcare | 15.0 | % | ||
Financial | 14.1 | % | ||
Consumer Cyclical | 6.1 | % | ||
Energy | 3.8 | % | ||
Capital Equipment | 3.2 | % | ||
Consumer Staple | 1.9 | % | ||
Basic Material | 1.1 | % | ||
Transportation | 0.9 | % | ||
Other(b) | 5.5 | % |
| Top 5 Equity Holdings: |
| % of Net Assets | ||||
Apple, Inc. | 7.1 | % | ||
Alphabet, Inc. - CL C | 5.8 | % | ||
Microsoft Corp. | 4.9 | % | ||
Amazon.com, Inc. | 4.5 | % | ||
Mastercard, Inc. - CL A | 4.2 | % | ||
| Total Top 5 Equity Holdings: | 26.5 | % | ||
(a) | Portfolio weightings are subject to change daily and are calculated as a percentage of net assets. |
(b) | Includes Money Market Funds and liabilities in excess of other assets. |
| Commentary |
What largely drove the market lower in 2022 was the surge in inflation, which hit a 40-year high due to the Russia-Ukraine war, spiking energy prices and imbalances between demand and supply of goods. The Fed aggressively increased interest rates in an attempt to slow economic growth and reduce inflationary pressures. Unfortunately, those rate hikes also increased the likelihood of an economic recession. As a result, investors generally abandoned the growth stock sector in favor of the more defensive value sector.
For the year, the Fund’s benchmark index, the S&P 500® Index, declined 18.11%. Within the Index, there was a large gap between the growth and value components, which declined 30.09% and 7.39% respectively. The Fund posted slightly better returns than the growth component but trailed the benchmark overall with a decline of 27.93%.
The holdings that had the largest negative impact on fund performance included Amazon.com Inc., Alphabet Inc. and Nvidia Corp., representing 4.53%, 5.78% and 1.75% respectively of the year-end net asset value. The largest contributors to fund performance were holdings in more defensive areas, including Occidental Petroleum, Merck & Co. and Vertex Pharmaceuticals Inc., representing 2.16, 1.52% and 1.24% respectively of the Fund’s year-end net asset value.
As we enter 2023, stocks are trading at a discount to historical average valuation levels. To rally back to fair value, investors will need evidence of a longer-term economic rebound and lower inflation levels. We expect the Fed will see inflation well enough controlled during the first half of the year to moderate and then pause its program of interest-rate hikes. A Fed pause would signal a reduced recession risk and set the stage for an improving market environment.
As opportunities arise, we intend to adjust portfolio holdings and weightings. We are focusing on those companies that have solid growth prospects, earnings stability and improved relative price strength to the market. Valuations could fall further over the near term, but we view these declines as opportunities to purchase premier growth stocks at deeper discounts.
While the market may be rocky in the short term, we believe investors must look past the doom and gloom of today, stay calm and focus on the long term.
Page 6
| Performance Highlights (Unaudited) |
| Monetta Young Investor Growth Fund | Year ended December 31, 2022 | |
Investment Objective: | Average Market Capitalization: | Total Net Assets: |
| Long-Term Capital Growth | $810.2 billion | $32.05 million |
PERFORMANCE: | Average Annual Total Return | |||
1 Year | 3 Year | 5 Year | 10 Year | |
| Monetta Young Investor | ||||
| Growth Fund | -25.79% | 3.18% | 6.64% | 10.69% |
S&P 500® Index | -18.11% | 7.66% | 9.42% | 12.56% |
| Total Annual Operating Expenses* | 1.37% | |||
| * | Source Prospectus dated April 30, 2022. Expense ratio of 1.37% includes Acquired Fund Fees and Expenses of 0.04%. For the Fund’s current Expense Ratio, please refer to Page 16 of this Annual Report. |

Performance data quoted represents past performance; past performance does not guarantee future results. The investment return and principal value of an investment will fluctuate so that an investor’s shares, when redeemed, may be worth more or less than their original cost. The total returns do not reflect the deduction of taxes that a shareholder would pay on Fund distributions or the redemption of Fund shares. Current performance of the Fund may be lower or higher than the performance quoted. Performance data current to the most recent month end may be obtained by calling 1-800-MONETTA or visiting www.Monetta.com.
The hypothetical graph above compares the change in value of a $10,000 investment in the Monetta Young Investor Growth Fund and the S&P 500® Index, for the 10-year period ended December 31, 2022, with dividend and capital gains reinvested.
Portfolio Weightings(a): | ||||
Exchange Traded Funds | 51.4 | % | ||
Technology | 18.4 | % | ||
Financial | 11.0 | % | ||
Retail | 9.5 | % | ||
Healthcare | 3.3 | % | ||
Consumer Cyclical | 2.9 | % | ||
Capital Equipment | 1.0 | % | ||
Energy | 1.0 | % | ||
Other(c) | 1.5 | % | ||
Top 5 Equity Holdings(b): | ||||
| % of Net Assets | ||||
Apple, Inc. | 8.1 | % | ||
JPMorgan Chase & Co. | 6.3 | % | ||
Alphabet, Inc. - CL C | 5.5 | % | ||
Amazon.com, Inc. | 5.2 | % | ||
Mastercard, Inc. - CL A | 4.7 | % | ||
| Total Top 5 Equity Holdings: | 29.8 | % | ||
(a) | Portfolio weightings are subject to change daily and are calculated as a percentage of net assets. |
(b) | Excludes Exchange Traded Funds. |
(c) | Includes Money Market Funds and liabilities in excess of other assets. |
| Commentary |
Investors’ concerns about rising interest rates, slowing economic growth and persistently high inflation resulted in the worst market decline for any year since 2008. The Fund could not avoid the market freefall, declining 25.79%, lagging the 18.11% decline of its benchmark, the S&P 500 Index.
However, the Fund’s return compared favorably to the Growth component of the S&P 500® Index, which fell 30.09%. Generally, investors sold off growth stocks indiscriminately—regardless of size, profitability and competitive edge. Investors generally revalued growth in a way last seen in the 2001 tech bust and the 2008 financial crisis. In this context, the Fund benefited from the broad diversification of its approximately 50% weighting in ETFs that tracked the index return.
The largest detractors from Fund performance included Amazon.com, Alphabet Inc. and Apple, Inc., representing 5.24%, 5.54% and 8.11% respectively of the year-end net asset value. Enhancing the Fund’s relative performance were its holdings in UnitedHealth Group, Inc., MasterCard, Inc. and Pfizer Inc., representing 3.31%, 4.66% and 0.00% respectively of year-end net asset value.
Fund turnover during the year was minimal. ETF weightings were trimmed to maintain an approximately 50% weighting in the market index. Positions were trimmed in Microsoft Corp. and Advanced Micro Devices. New positions were established in Boeing Company and Walt Disney Company.
As we head into 2023, the key influence will be the extent of an economic recession. We are seeing some signs that inflation may be subsiding, which may lead to the Fed easing up on interest rate hikes. We can’t predict when or how share prices will bounce back, but when they do, the growth sector tends to lead the way.
We continue to invest in sector leaders that have improving long-term growth prospects and strong fundamentals. We believe that many quality growth stocks have been tossed out like the baby with the bath water, as the saying goes. We believe eventually investors will gravitate back toward the growth sector resulting in what could be the beginning of a new bull market.
Page 7
| Disclosure of Fund Expenses (Unaudited) | Period Ended December 31, 2022 |
As a shareholder of a mutual fund, you incur ongoing costs, including investment advisory fees; distribution expense (Monetta Young Investor Growth Fund); and other Fund expenses. This Example is intended to help you understand your ongoing costs (in dollars) of investing in the Funds and to compare these costs with the ongoing costs of investing in other mutual funds. The Example is based on an investment of $1,000 invested at the beginning of the period and held for the most recent semi-annual period, July 1, 2022 - December 31, 2022.
ACTUAL EXPENSES
The table below provides information about actual account values and actual expenses. The Example below includes, but is not limited to, investment advisory fees, distribution expense, accounting, custodian and transfer agent fees. However, the Example below does not include portfolio trading commissions and related expenses. You may use the information in this table, together with the amount you invested, to estimate the expenses that you paid over the period. Simply divide your account value by $1,000 (for example, an $8,600 account value divided by $1,000 = 8.6), then multiply the result by the number in the table under the heading entitled “Actual Expenses Paid During Period” to estimate the expenses you paid on your account during this period.
HYPOTHETICAL EXAMPLE FOR COMPARISON PURPOSES
The table below also provides information about hypothetical account values and hypothetical expenses based on each Fund’s actual expense ratio and an assumed rate of return of 5% per year before expenses, which is not each Fund’s actual return. The hypothetical account values and expenses may not be used to estimate the actual ending account balance or expenses you paid for the period. You may use this information to compare the ongoing costs of investing in the Funds and other funds. To do so, compare this 5% hypothetical example with the 5% hypothetical examples that appear in the shareholder reports of the other funds.
Please note that the expenses shown in the table are meant to highlight your ongoing costs only and do not reflect any transactional costs. Therefore, the hypothetical information is useful in comparing ongoing costs only, and will not help you determine the relative total costs of owning different funds. In addition, if these transactional costs were included, your costs may have been higher.
| BEGINNING | ENDING | EXPENSES PAID | ||||||||||||||
| ACCOUNT VALUE | ACCOUNT VALUE | DURING PERIOD(a) | ANNUALIZED | |||||||||||||
| 7/1/22 | 12/31/22 | 7/1/22-12/31/22 | EXPENSE RATIO | |||||||||||||
| ACTUAL | ||||||||||||||||
| Monetta Fund | $ | 1,000.00 | $ | 971.70 | $ | 7.21 | 1.45 | % | ||||||||
| Monetta Young Investor Growth Fund | 1,000.00 | 975.50 | 7.47 | 1.50 | % | |||||||||||
| HYPOTHETICAL (5% ANNUAL RETURN BEFORE EXPENSES) | ||||||||||||||||
| Monetta Fund | $ | 1,000.00 | $ | 1,017.90 | $ | 7.37 | 1.45 | % | ||||||||
| Monetta Young Investor Growth Fund | 1,000.00 | 1,017.64 | 7.63 | 1.50 | % | |||||||||||
| (a) | Expenses are equal to each Fund’s annualized expense ratio, multiplied by the average account value over the period, multiplied by 184/365 (to reflect the one-half year period). |
Page 8
| Schedule of Investments | December 31, 2022 |
Monetta Fund
| COMMON STOCKS - 94.5% | |||||||
| NUMBER OF SHARES | VALUE | ||||||
| Basic Material - 1.1% | |||||||
| Chemical-Specialty-1.1% | |||||||
3,000 | Albemarle Corp. | $ | 650,580 | ||||
| Capital Equipment - 3.2% | |||||||
| Aerospace & Defense-1.1% | |||||||
3,400 | Boeing Co. * | 647,666 | |||||
| Machine Tool-1.0% | |||||||
5,500 | Xylem, Inc. | 608,135 | |||||
| Machinery-Miscellaneous-1.1% | |||||||
12,000 | Ingersoll Rand, Inc. | 627,000 | |||||
| Consumer Cyclical - 6.1% | |||||||
| Apparel Manufacturing-0.7% | |||||||
3,500 | NIKE, Inc. - CL B | 409,535 | |||||
| Housing-0.9% | |||||||
6,000 | Lennar Corp. - CL A | 543,000 | |||||
| Leisure Service-3.0% | |||||||
3,000 | Marriott International, Inc. | 446,670 | |||||
4,300 | Netflix, Inc. * | 1,267,984 | |||||
| 1,714,654 | |||||||
| Media-Radio/TV-1.5% | |||||||
10,000 | Walt Disney Co. * | 868,800 | |||||
| Consumer Staple - 1.9% | |||||||
| Beverage-Non-Alcoholic-0.8% | |||||||
5,000 | Monster Beverage Corp. * | 507,650 | |||||
| Food-1.1% | |||||||
7,000 | Lamb Weston | ||||||
Holdings, Inc. | 625,520 | ||||||
| Energy - 3.8% | |||||||
| Oil & Gas-Exploration & Production-2.2% | |||||||
20,000 | Occidental | ||||||
Petroleum Corp. | 1,259,800 | ||||||
| Oil & Gas-Integrated-1.6% | |||||||
8,500 | Exxon Mobil Corp. | 937,550 | |||||
| Financial - 14.1% | |||||||
| Bank-Money Center-8.7% | |||||||
20,000 | Bank of America Corp. | 662,400 | |||||
7,000 | Goldman Sachs | ||||||
Group, Inc. | 2,403,660 | ||||||
15,000 | JPMorgan Chase & Co. | 2,011,500 | |||||
| 5,077,560 | |||||||
| Finance-Miscellaneous-5.4% | |||||||
5,000 | American Express Co. | 738,750 | |||||
7,000 | MasterCard, Inc. - CL A | 2,434,110 | |||||
| 3,172,860 | |||||||
| Healthcare - 15.0% | |||||||
| Healthcare-Biomedical/Genetic-5.7% | |||||||
3,200 | Amgen, Inc. | 840,448 | |||||
3,300 | Biogen, Inc. * | 913,836 | |||||
1,500 | Thermo Fisher | ||||||
Scientific, Inc. | 826,035 | ||||||
2,500 | Vertex | ||||||
Pharmaceuticals, Inc. * | 721,950 | ||||||
| 3,302,269 | |||||||
| Healthcare-Drug/Diversified-1.5% | |||||||
8,000 | Merck & Co., Inc. | 887,600 | |||||
| Healthcare-Instrument-2.0% | |||||||
2,200 | Intuitive Surgical, Inc. * | 583,770 | |||||
1,400 | IDEXX Laboratories, Inc. * | 571,144 | |||||
| 1,154,914 | |||||||
| Healthcare-Patient Care-5.8% | |||||||
3,000 | HCA Healthcare, Inc. | 719,880 | |||||
1,100 | Humana, Inc. | 563,409 | |||||
4,000 | UnitedHealth Group, Inc. | 2,120,720 | |||||
| 3,404,009 | |||||||
| Retail - 17.4% | |||||||
| Retail-Major Chain-5.0% | |||||||
3,000 | Costco Wholesale Corp. | 1,369,500 | |||||
4,500 | Target Corp. | 670,680 | |||||
6,000 | Wal-Mart Stores, Inc. | 850,740 | |||||
| 2,890,920 | |||||||
The accompanying notes are an integral part of these financial statements.
Page 9
| Schedule of Investments | December 31, 2022 |
Monetta Fund (Continued)
| NUMBER OF SHARES | VALUE | ||||||
| Retail-Restaurant-3.0% | |||||||
500 | Chipotle Mexican | ||||||
Grill, Inc. * | $ | 693,745 | |||||
10,500 | Starbucks Corp. | 1,041,600 | |||||
| 1,735,345 | |||||||
| Retail-Specialty-9.4% | |||||||
31,500 | Amazon.com, Inc. * | 2,646,000 | |||||
4,000 | Genuine Parts Co. | 694,040 | |||||
2,000 | Home Depot, Inc. | 631,720 | |||||
1,100 | O’Reilly Automotive, Inc. * | 928,433 | |||||
1,300 | Ulta Beauty, Inc. * | 609,791 | |||||
| 5,509,984 | |||||||
| Technology - 31.0% # | |||||||
| Computer Data Storage-7.1% | |||||||
32,000 | Apple, Inc. | 4,157,760 | |||||
| Computer-Service-1.1% | |||||||
2,000 | EPAM Systems, Inc. * | 655,480 | |||||
| Computer-Software-8.0% | |||||||
14,000 | Cisco Systems, Inc. | 666,960 | |||||
4,100 | Crowdstrike Holdings, Inc. * | 431,689 | |||||
4,000 | Workday, Inc. * | 669,320 | |||||
12,000 | Microsoft Corp. | 2,877,840 | |||||
| 4,645,809 | |||||||
| Electronic Instrumentation-1.5% | |||||||
6,000 | Agilent Technologies, Inc. | 897,900 | |||||
| Electronic-Semiconductor-4.6% | |||||||
10,000 | Advanced Micro | ||||||
Devices, Inc. * | 647,700 | ||||||
7,000 | NVIDIA Corp. | 1,022,980 | |||||
4,000 | QUALCOMM, Inc. | 439,760 | |||||
1,000 | Broadcom, Inc. | 559,130 | |||||
| 2,669,570 | |||||||
| Internet-5.8% | |||||||
38,000 | Alphabet, Inc. - CL C * | 3,371,740 | |||||
| Office-Equipment-1.2% | |||||||
4,000 | Avery Dennison Corp. | 724,000 | |||||
| Telecommunication Service-1.7% | |||||||
7,000 | T-Mobile US, Inc. * | 980,000 | |||||
| Transportation - 0.9% | |||||||
| Transportation Service-0.9% | |||||||
5,200 | Expeditors International | ||||||
of Washington, Inc. | 540,384 | ||||||
| Total Common Stocks | |||||||
| (Cost $36,301,990) | 55,177,994 | ||||||
| MONEY MARKET FUNDS - 5.6% | |||||||
First American | |||||||
Government | |||||||
Obligations Fund - | |||||||
3,257,310 | Class X, 4.10% ^ | 3,257,310 | |||||
| Total Money Market Funds | |||||||
| (Cost $3,257,310) | 3,257,310 | ||||||
| Total Investments | |||||||
| (Cost $39,559,300) - 100.1% | 58,435,304 | ||||||
| Liabilities in Excess of | |||||||
| Other Assets - (0.1)% | (64,061 | ) | |||||
| TOTAL NET ASSETS - 100.0% | $ | 58,371,243 | |||||
| * | Non-Income Producing. |
| # | As of December 31, 2022, the Fund had a significant portion of its assets invested in this sector. See Note 6 in Notes to Financial Statements. |
| ^ | Rate shown is the seven day effective yield at December 31, 2022. |
Industry classification provided by William O’Neil & Co., Inc.
The accompanying notes are an integral part of these financial statements.
Page 10
| Schedule of Investments | December 31, 2022 |
Monetta Young Investor Growth Fund
| COMMON STOCKS - 47.1% | |||||||
| NUMBER OF SHARES | VALUE | ||||||
| Capital Equipment - 1.0% | |||||||
| Aerospace & Defense-1.0% | |||||||
1,700 | Boeing Co. * | $ | 323,833 | ||||
| Consumer Cyclical - 2.9% | |||||||
| Leisure Service-1.8% | |||||||
2,000 | Netflix, Inc. * | 589,760 | |||||
| Media-Radio/TV-1.1% | |||||||
4,000 | Walt Disney Co. * | 347,520 | |||||
| Energy - 1.0% | |||||||
| Oil & Gas-Equipment & Services-1.0% | |||||||
6,000 | Schlumberger Ltd. | 320,760 | |||||
| Financial - 11.0% | |||||||
| Bank-Money Center-6.3% | |||||||
15,000 | JPMorgan Chase & Co. | 2,011,500 | |||||
| Finance-Miscellaneous-4.7% | |||||||
4,300 | MasterCard, Inc. - CL A | 1,495,239 | |||||
| Healthcare - 3.3% | |||||||
| Healthcare-Patient Care-3.3% | |||||||
2,000 | UnitedHealth Group, Inc. | 1,060,360 | |||||
| Retail - 9.5% | |||||||
| Retail-Major Chain-4.3% | |||||||
3,000 | Costco Wholesale Corp. | 1,369,500 | |||||
| Retail-Specialty-5.2% | |||||||
20,000 | Amazon.com, Inc. * | 1,680,000 | |||||
| Technology - 18.4% | |||||||
| Computer Data Storage-8.1% | |||||||
20,000 | Apple, Inc. | 2,598,600 | |||||
| Computer-Software-3.8% | |||||||
5,000 | Microsoft Corp. | 1,199,100 | |||||
| Electronic-Semiconductor-1.0% | |||||||
5,000 | Advanced Micro | ||||||
Devices, Inc. * | 323,850 | ||||||
| Internet-5.5% | |||||||
20,000 | Alphabet, Inc. - CL C * | 1,774,600 | |||||
| Total Common Stocks | |||||||
| (Cost $5,377,713) | 15,094,622 | ||||||
| EXCHANGE TRADED FUNDS - 51.4% | |||||||
30,700 | SPDR S&P 500 Trust (a) | 11,740,601 | |||||
13,500 | Vanguard S&P 500 | 4,743,090 | |||||
| Total Exchange Traded Funds | |||||||
| (Cost $7,717,119) | 16,483,691 | ||||||
| MONEY MARKET FUNDS - 2.1% | |||||||
First American | |||||||
Government | |||||||
Obligations Fund - | |||||||
675,463 | Class X, 4.10% ^ | 675,463 | |||||
| Total Money Market Funds | |||||||
| (Cost $675,463) | 675,463 | ||||||
| Total Investments | |||||||
| (Cost $13,770,295) - 100.6% | 32,253,776 | ||||||
| Liabilities in Excess of | |||||||
| Other Assets - (0.6)% | (200,802 | ) | |||||
| TOTAL NET ASSETS - 100.0% | $ | 32,052,974 | |||||
| * | Non-Income Producing. |
| (a) | Fair value of this security exceeds 25% of the Fund’s net assets. Additional information of this security, including the financial statements, is available from the SEC’s EDGAR database at www.sec.gov. |
| ^ | Rate shown is the seven day effective yield at December 31, 2022. |
Industry classification provided by William O’Neil & Co., Inc.
The accompanying notes are an integral part of these financial statements.
Page 11
| Statements of Assets and Liabilities | December 31, 2022 |
| Monetta Young | ||||||||
| Investor Growth | ||||||||
| Monetta Fund | Fund | |||||||
| Assets: | ||||||||
Investments at value(a) | $ | 58,435,304 | $ | 32,253,776 | ||||
Receivables: | ||||||||
| Interest and dividends | 30,527 | 58,360 | ||||||
| Fund shares sold | 775 | 4,632 | ||||||
Prepaid expenses | 13,330 | 16,492 | ||||||
Total Assets | 58,479,936 | 32,333,260 | ||||||
| Liabilities: | ||||||||
Payables: | ||||||||
| Investment advisory fees (Note 2) | 48,590 | 15,586 | ||||||
| Distribution fees (Note 5) | — | 41,163 | ||||||
| Fund shares redeemed | — | 168,808 | ||||||
| Accrued trustee fees | 6,987 | 4,015 | ||||||
| Accrued compliance fees | 2,251 | 1,275 | ||||||
| Accrued transfer agent fees | 14,105 | 14,605 | ||||||
| Accrued fund administration fees | 6,699 | 6,498 | ||||||
| Accrued audit fees | 18,249 | 18,251 | ||||||
| Accrued other expenses | 11,812 | 10,085 | ||||||
Total Liabilities | 108,693 | 280,286 | ||||||
| Net Assets | $ | 58,371,243 | $ | 32,052,974 | ||||
| Analysis of net assets: | ||||||||
Paid-in capital | 42,874,409 | 13,581,234 | ||||||
Total distributable earnings | 15,496,834 | 18,471,740 | ||||||
| Net Assets | $ | 58,371,243 | $ | 32,052,974 | ||||
(a) Investments at cost | $ | 39,559,300 | $ | 13,770,295 | ||||
Shares of beneficial interest issued outstanding | 3,107,065 | 2,319,854 | ||||||
| Net asset value, offering price and redemption price per share | $ | 18.79 | $ | 13.82 | ||||
The accompanying notes are an integral part of these financial statements.
Page 12
| Statements of Operations | For The Year Ended |
| December 31, 2022 |
| Monetta Young | ||||||||
| Investor Growth | ||||||||
| Monetta Fund | Fund | |||||||
| Investment income and expenses: | ||||||||
Investment income: | ||||||||
| Interest | $ | 39,442 | $ | 11,680 | ||||
| Dividends | 726,527 | 470,722 | ||||||
Total investment income | 765,969 | 482,402 | ||||||
| Expenses: | ||||||||
| Investment advisory fees (Note 2) | 644,847 | 216,913 | ||||||
| Distribution expense (Note 5) | — | 98,597 | ||||||
| Transfer agent fees | 95,583 | 97,069 | ||||||
| Administration fees | 41,388 | 39,349 | ||||||
| State registration fees | 33,531 | 16,132 | ||||||
| Accounting fees | 31,140 | 30,008 | ||||||
| Compliance fees | 26,600 | 15,445 | ||||||
| Trustee fees | 24,069 | 13,931 | ||||||
| Legal fees | 18,397 | 8,381 | ||||||
| Audit fees | 17,254 | 18,255 | ||||||
| Custodian fees | 10,347 | 7,220 | ||||||
| Printing and postage fees | 5,891 | 4,933 | ||||||
| Other expenses | 4,723 | 4,276 | ||||||
| Insurance fees | 3,650 | 2,206 | ||||||
Total expenses | 957,420 | 572,715 | ||||||
| Net investment loss | (191,451 | ) | (90,313 | ) | ||||
| Realized and unrealized gain (loss) on investments: | ||||||||
Net realized gain (loss) on investments | (3,290,849 | ) | 452,702 | |||||
Net change in unrealized appreciation/depreciation of investments | (19,808,282 | ) | (12,860,621 | ) | ||||
| Net realized and unrealized loss on investments | (23,099,131 | ) | (12,407,919 | ) | ||||
| Net decrease in net assets from operations | $ | (23,290,582 | ) | $ | (12,498,232 | ) | ||
The accompanying notes are an integral part of these financial statements.
Page 13
| Statements of Changes in Net Assets | For The Year Ended |
| December 31, |
| Monetta Young | ||||||||||||||||
| Monetta Fund | Investor Growth Fund | |||||||||||||||
| 2022 | 2021 | 2022 | 2021 | |||||||||||||
| Operations: | ||||||||||||||||
Net investment loss | $ | (191,451 | ) | $ | (756,514 | ) | $ | (90,313 | ) | $ | (228,708 | ) | ||||
Net realized gain (loss) on investments | (3,290,849 | ) | 12,031,349 | 452,702 | 9,411,338 | |||||||||||
Net change in unrealized appreciation/ | ||||||||||||||||
depreciation of investments | (19,808,282 | ) | 2,008,702 | (12,860,621 | ) | 1,516,087 | ||||||||||
Net increase (decrease) in net | ||||||||||||||||
assets from operations | (23,290,582 | ) | 13,283,537 | (12,498,232 | ) | 10,698,717 | ||||||||||
| Distributions: | ||||||||||||||||
Total distributions to shareholders | (4,496,942 | ) | (9,702,085 | ) | (2,542,222 | ) | (9,442,879 | ) | ||||||||
| Capital transactions (Note 3): | ||||||||||||||||
Proceeds from shares sold | 400,177 | 563,509 | 1,021,277 | 2,018,156 | ||||||||||||
Net asset value of shares issued | ||||||||||||||||
through dividend reinvestment | 4,260,657 | 9,212,357 | 2,451,719 | 9,094,095 | ||||||||||||
Cost of shares redeemed | (2,796,399 | ) | (4,903,355 | ) | (7,853,482 | ) | (16,205,091 | ) | ||||||||
Increase (Decrease) in net assets | ||||||||||||||||
from capital transactions | 1,864,435 | 4,872,511 | (4,380,486 | ) | (5,092,840 | ) | ||||||||||
| Total increase (decrease) | ||||||||||||||||
| in net assets | (25,923,089 | ) | 8,453,963 | (19,420,940 | ) | (3,837,002 | ) | |||||||||
Net assets at beginning of year | $ | 84,294,332 | $ | 75,840,369 | $ | 51,473,914 | $ | 55,310,916 | ||||||||
| Net assets at end of year | $ | 58,371,243 | $ | 84,294,332 | $ | 32,052,974 | $ | 51,473,914 | ||||||||
The accompanying notes are an integral part of these financial statements.
Page 14
| Financial Highlights |
| Monetta Fund | ||||||||||||||||||||
| Year Ended | Year Ended | Year Ended | Year Ended | Year Ended | ||||||||||||||||
For a share outstanding | December 31, | December 31, | December 31, | December 31, | December 31, | |||||||||||||||
throughout the year: | 2022 | 2021 | 2020 | 2019 | 2018 | |||||||||||||||
Net asset value at beginning of year | $ | 28.09 | $ | 26.77 | $ | 21.58 | $ | 16.82 | $ | 18.89 | ||||||||||
Investment Operations: | ||||||||||||||||||||
Net investment loss(a) | (0.06 | ) | (0.27 | ) | (0.13 | ) | (0.04 | ) | (0.06 | ) | ||||||||||
Net realized and unrealized | ||||||||||||||||||||
gain (loss) on investments | (7.69 | ) | 5.18 | 6.41 | 4.80 | (0.44 | ) | |||||||||||||
Total from investment operations | (7.75 | ) | 4.91 | 6.28 | 4.76 | (0.50 | ) | |||||||||||||
Less Distributions: | ||||||||||||||||||||
From net investment income | — | — | — | — | — | |||||||||||||||
From net realized gains | (1.55 | ) | (3.59 | ) | (1.09 | ) | — | (1.57 | ) | |||||||||||
Total distributions | (1.55 | ) | (3.59 | ) | (1.09 | ) | — | (1.57 | ) | |||||||||||
Net asset value at end of year | $ | 18.79 | $ | 28.09 | $ | 26.77 | $ | 21.58 | $ | 16.82 | ||||||||||
Total return | -27.93 | % | 17.83 | % | 29.41 | % | 28.30 | % | -3.36 | % | ||||||||||
Ratios to average net assets: | ||||||||||||||||||||
| Expense Ratio | 1.41 | % | 1.33 | % | 1.37 | % | 1.40 | % | 1.37 | % | ||||||||||
| Net investment loss | (0.28 | )% | (0.93 | )% | (0.58 | )% | (0.20 | )% | (0.31 | )% | ||||||||||
| Portfolio turnover | 85.9 | % | 55.2 | % | 60.5 | % | 61.8 | % | 128.8 | % | ||||||||||
Net assets (in thousands) | $ | 58,371 | $ | 84,294 | $ | 75,840 | $ | 62,348 | $ | 52,811 | ||||||||||
| (a) | The per share amounts are calculated using the weighted average number of shares outstanding during the year. |
The accompanying notes are an integral part of these financial statements.
Page 15
| Financial Highlights |
| Monetta Young Investor Growth Fund | ||||||||||||||||||||
| Year Ended | Year Ended | Year Ended | Year Ended | Year Ended | ||||||||||||||||
For a share outstanding | December 31, | December 31, | December 31, | December 31, | December 31, | |||||||||||||||
throughout the year: | 2022 | 2021 | 2020 | 2019 | 2018 | |||||||||||||||
Net asset value at beginning of year | $ | 20.10 | $ | 19.90 | $ | 22.96 | $ | 18.64 | $ | 24.00 | ||||||||||
Investment Operations: | ||||||||||||||||||||
Net investment income (loss)(a) | (0.04 | ) | (0.10 | ) | (0.01 | ) | 0.05 | 0.06 | ||||||||||||
Net realized and unrealized | ||||||||||||||||||||
gain (loss) on investments | (5.09 | ) | 4.67 | 4.33 | 5.96 | (0.94 | )(e) | |||||||||||||
Total from investment operations | (5.13 | ) | 4.57 | 4.32 | 6.01 | (0.88 | ) | |||||||||||||
Less Distributions: | ||||||||||||||||||||
From net investment income | — | — | (0.00 | )(b) | (0.06 | ) | (0.07 | ) | ||||||||||||
From net realized gains | (1.15 | ) | (4.37 | ) | (7.38 | ) | (1.63 | ) | (4.41 | ) | ||||||||||
Total distributions | (1.15 | ) | (4.37 | ) | (7.38 | ) | (1.69 | ) | (4.48 | ) | ||||||||||
Net asset value at end of year | $ | 13.82 | $ | 20.10 | $ | 19.90 | $ | 22.96 | $ | 18.64 | ||||||||||
Total return | -25.79 | % | 22.87 | % | 20.47 | % | 32.58 | % | -5.30 | % | ||||||||||
Ratios to average net assets: | ||||||||||||||||||||
Expenses Ratio(c) | 1.45 | % | 1.33 | % | 1.31 | % | 1.26 | % | 1.17 | % | ||||||||||
Net investment income (loss)(c)(d) | (0.23 | )% | (0.44 | )% | (0.06 | )% | 0.23 | % | 0.23 | % | ||||||||||
| Portfolio turnover | 11.3 | % | 6.8 | % | 13.1 | % | 6.7 | % | 28.1 | % | ||||||||||
Net assets (in thousands) | $ | 32,053 | $ | 51,474 | $ | 55,311 | $ | 75,654 | $ | 77,640 | ||||||||||
| (a) | The per share amounts are calculated using the weighted average number of shares outstanding during the year. |
| (b) | Rounds to zero. |
| (c) | The ratios of expenses and net investment income do not include the Fund’s proportionate share of expense and income of the underlying investment companies in which it invests. |
| (d) | Recognition of net investment income by the Fund is affected by the timing of the declaration of dividends by the underlying investment companies in which it invests. |
| (e) | Realized and unrealized gains and losses per share in this caption are balancing amounts necessary to reconcile the change in net asset value per share for the year, and may not reconcile with the aggregate gains and losses in the Statements of Operations due to share transactions for the year. |
The accompanying notes are an integral part of these financial statements.
Page 16
| Notes to Financial Statements | December 31, 2022 |
| 1. | SIGNIFICANT ACCOUNTING POLICIES: |
| Monetta Trust (the “Trust”) is an open-end diversified management investment company registered under the Investment Company Act of 1940, as amended (the “1940 Act”). The following funds, collectively referred to as the Funds, are series of the Trust: | |
Monetta Fund. The primary objective of this Fund is long-term capital growth. The Fund seeks this objective by investing primarily in equity securities believed to have growth potential. The Fund presently invests primarily in large capitalization growth companies. | |
Monetta Young Investor Growth Fund. The objective of this Fund is long-term capital growth. The Fund seeks this objective by investing approximately 50% of its assets in exchange traded funds (“ETFs”) and other funds seeking to track the S&P 500® Index or other broad-based market indices that primarily include stocks of large capitalization U.S. companies and the remainder of its assets in common stocks of individual companies that Monetta Financial Services, Inc., (the “Adviser”) considers to be high quality well-known companies that produce products or provide services that are recognized by many investors. | |
The Funds are investment companies and accordingly follow the investment company accounting and reporting guidance of the Financial Accounting Standards Board (“FASB”) Accounting Standards Codification Topic 946, Financial Services – Investment Companies. | |
| The Monetta Fund and the Monetta Young Investor Growth Fund are each a diversified series with their own investment objectives and policies with the Trust. | |
| The following is a summary of significant accounting policies followed by the Funds in the preparation of their financial statements in accordance with accounting principles generally accepted in the United States of America (“U.S. GAAP”). | |
| (a) Securities Valuation | |
| Equity securities, including American Depositary Receipts (“ADR”s) and ETFs are stated at fair value, based on the official closing price as of the time of valuation. If there is no official closing price of a security on the valuation date, the security is valued at the mean between the most recent bid and ask quotation, in each case on the principal exchange or market on which that security is traded. If there are no reported sales and no reported bid quotations for a security on a valuation date, or it is not traded on an exchange, the securities are “fair valued” in accordance with the Funds’ Fair Value Procedures. To the extent these securities are actively traded, and valuation adjustments are not applied, they are categorized in Level 1 of the fair value hierarchy. Other securities traded over-the-counter shall be valued at the official closing price. If there is no official closing price, the security is valued at the most recent mean quotation. Investments in registered open-end management companies, including money market funds, will be valued based on the net asset value (“NAV”) of such investments and are categorized as Level 1 of the fair value hierarchy. | |
| Securities for which market quotations are not readily available or are deemed unreliable are valued at their fair value in accordance with procedures established by the Board of Trustees (“Board”). In determining the fair value of a security, the Adviser and the Board shall take into account the relevant factors and surrounding circumstances, which may include: (i) the nature and duration of restrictions, if any, on the disposition of the security; (ii) fundamental analytical data relating to the security; (iii) evaluation of the forces that influence the market in which the security is traded; (iv) information as to any transactions in or offers for the security; (v) the existence of any merger proposal, tender offer or other extraordinary events relating to the security; (vi) the price and extent of public trading in similar securities of the issuer or of comparable companies; and (vii) any other methodologies and factors that they consider appropriate. | |
| The Board has adopted a pricing and valuation policy for use by the Funds and its Valuation Designee (as defined below) in calculating the Funds’ NAVs. Pursuant to Rule 2a-5 under the 1940 Act, the Funds have designated the Adviser as their “Valuation Designee” to perform all of the fair value determinations as well as to perform all of the responsibilities that may be performed by the Valuation Designee in accordance with Rule 2a-5. The Valuation Designee is authorized to make all necessary determinations of the fair values of portfolio securities and other assets for which market quotations are not readily available or if it is deemed that the prices obtained from brokers and dealers or independent pricing services are unreliable. |
Page 17
| Notes to Financial Statements (continued) | December 31, 2022 |
| (b) Use of Estimates | |
| The preparation of financial statements, in conformity with U.S. GAAP, requires the Funds’ management to make estimates and assumptions that affect reported amounts of assets and liabilities and disclosures of contingent assets and liabilities at the date of the financial statements and the results of operations during the reporting period. Actual results could differ from those estimates. | |
| (c) General | |
| Security transactions are accounted for on a trade date basis. Daily realized gains and losses from security transactions are reported on the specific lot identification basis. Interest income is recorded daily on the accrual basis and dividend income on the ex-dividend date. Withholding taxes on foreign dividends have been provided for in accordance with the Funds’ understanding of the applicable country’s tax rules and regulations. Any distributions received from investments in ETFs which represent long-term capital gains are recorded by the Funds as a realized gain. | |
| (d) Expenses | |
| Expenses that are directly related to one of the Funds are charged directly to that Fund. Other operating expenses are allocated to the Funds on several bases, including relative net assets of all the Funds within the Monetta Trust. | |
| (e) Federal Income Taxes | |
| It is each Fund’s policy to comply with the requirements of the Internal Revenue Code applicable to regulated investment companies and to distribute substantially all of its taxable income to its shareholders. Accordingly, no provision for federal income taxes is required. As of and during the year ended December 31, 2022, the Funds did not have any tax positions that did not meet the “more-likely-than-not” threshold of being sustained by the applicable tax authority. As of and during the year ended December 31, 2022, the Funds did not have any liabilities for any unrecognized tax benefits. The Funds recognize interest and penalties, if any, related to unrecognized tax benefits on uncertain tax positions as income tax expense in the Statement of Operations. As of and during the year ended December 31, 2022, the Funds did not incur any interest and penalties. The Funds are not subject to examination by U.S. tax authorities for tax years prior to the fiscal year ended December 31, 2019. | |
| The Funds will utilize capital loss carry forwards as allowable, to minimize certain distributions of capital gains. The Funds intend to utilize provisions of the federal income tax laws which allow them to carry a realized loss forward indefinitely and retain their character as either short-term or long-term capital losses. At December 31, 2022, the Monetta Fund had a non-expiring short-term capital loss carryforward of $3,290,849. | |
| Net realized gains or losses differ for financial reporting and tax purposes as a result of losses from wash sales. At December 31, 2022, the Young Investor Growth Fund had post October losses of $11,741, which were realized after October 31, 2022 and deferred for tax purposes to January 1, 2023. | |
| (f) Distributions of Incomes and Gains | |
| Distributions to shareholders are recorded by the Funds on the ex-dividend date. Due to inherent differences in the characterization of short-term capital gains under U.S. GAAP, and for federal income tax purposes, the amount of distributable net investment income for book and federal income tax purposes may differ. | |
| Additionally, U.S. GAAP requires certain components of net assets relating to permanent difference be reclassified between financial and tax reporting. These reclassifications have no effect on net assets or net asset value per share. For the fiscal year ended December 31, 2022, the Monetta Fund increased distributable earnings by $191,455 and decreased paid-in capital by $191,455. These adjustments were made due to net operating losses for the Fund. For the fiscal year ended December 31, 2022, the Monetta Young Investor Growth Fund decreased distributable earnings by $374,123 and increased paid-in capital by $374,123. These adjustments were made due to the use of equalization, post-October losses, and net operating losses for the Fund. |
Page 18
Notes to Financial Statements (continued) | December 31, 2022 |
| The aggregate gross unrealized appreciation and depreciation of securities held by the Funds and the total cost of securities for federal income tax purposes at December 31, 2022, were as follows: |
| Monetta Young | |||||||||
| Monetta Fund | Investor Growth Fund | ||||||||
| Aggregate Gross Appreciation | $ | 20,471,372 | $ | 18,623,503 | |||||
| Aggregate Gross Depreciation | (1,683,689 | ) | (140,022 | ) | |||||
| Net Unrealized Appreciation | 18,787,683 | 18,483,481 | |||||||
| Federal Income Tax Cost | $ | 39,647,621 | $ | 13,770,295 | |||||
| Any differences between book-basis and tax-basis cost of investments for the Funds are attributable primarily to the deferral of wash sale losses. | |
| As of December 31, 2022, the components of distributable earnings on a tax basis were as follows: |
| Monetta Young | |||||||||
| Monetta Fund | Investor Growth Fund | ||||||||
| Undistributed Ordinary Income | $ | — | $ | — | |||||
| Undistributed Long-Term Capital Gain | — | — | |||||||
| Net Unrealized Appreciation | 18,787,683 | 18,483,481 | |||||||
| Other Accumulated Losses | (3,290,849 | ) | (11,741 | ) | |||||
| Total Distributable Earnings | $ | 15,496,834 | $ | 18,471,740 | |||||
| The tax character of distributions paid during the years ended December 31, 2022 and 2021 were as follows: |
| Monetta Young | |||||||||
| 2022 | Monetta Fund | Investor Growth Fund | |||||||
| Ordinary Income* | $ | — | $ | — | |||||
| Long-Term Capital Gain | 4,496,942 | 2,542,222 | |||||||
| Total Distributions to Shareholders | $ | 4,496,942 | $ | 2,542,222 | |||||
| Monetta Young | |||||||||
| 2021 | Monetta Fund | Investor Growth Fund | |||||||
| Ordinary Income* | $ | 671,071 | $ | 62,590 | |||||
| Long-Term Capital Gain | 9,031,014 | 9,380,289 | |||||||
| Total Distributions to Shareholders | $ | 9,702,085 | $ | 9,442,879 | |||||
| * For Federal income tax purposes, distributions of short-term capital gains are treated as ordinary income distributions. |
| (g) Fair Value Measurements |
| In accordance with ASC 820-10, fair value is defined as the price that a Fund would receive to sell an investment or pay to transfer a liability in an orderly transaction with an independent buyer in the principal market or, in the absence of a principal market, the most advantageous market for the investment or liability. ASC 820-10 establishes a three-tier hierarchy to distinguish between (1) inputs that reflect the assumptions market participants would use in pricing an asset or liability developed based on market data obtained from sources independent of the reporting entity (observable inputs) and (2) inputs that reflect the reporting entity’s own assumptions about the assumptions market participants would use in pricing an asset or liability developed based on the best information available in the circumstances (unobservable inputs) and to establish classification of fair value measurements for disclosure purposes. Various inputs are used in determining the value of each Fund’s investments. The inputs are summarized in the three broad Levels listed below. | |
| • Level 1 - quoted prices in active markets for identical investments; | |
| • Level 2 - other significant observable inputs (including quoted prices for similar investments, interest rates, prepayment speeds, credit risk, etc.); |
Page 19
Notes to Financial Statements (continued) | December 31, 2022 |
| • Level 3 - significant unobservable inputs (including each Fund’s own assumptions in determining the fair value of investments). | |
| The inputs or methodology used for valuing securities are not necessarily an indication of the risk associated with investing in those securities. | |
| The following table summarizes each respective Fund’s investments at December 31, 2022, based on the inputs used to value them: |
| INVESTMENTS IN SECURITIES | ||||||||||||||||
| Type of Investments | Level 1 | Level 2 | Level 3 | Total | ||||||||||||
| Monetta Fund | ||||||||||||||||
| Common Stocks | $ | 55,177,994 | $ | — | $ | — | $ | 55,177,994 | ||||||||
| Money Market Funds | $ | 3,257,310 | $ | — | $ | — | $ | 3,257,310 | ||||||||
| FUND TOTAL | $ | 58,435,304 | $ | — | $ | — | $ | 58,435,304 | ||||||||
| Monetta Young Investor Growth Fund | ||||||||||||||||
| Common Stocks | $ | 15,094,622 | $ | — | $ | — | $ | 15,094,622 | ||||||||
| Exchange Traded Funds | $ | 16,483,691 | $ | — | $ | — | $ | 16,483,691 | ||||||||
| Money Market Funds | $ | 675,463 | $ | — | $ | — | $ | 675,463 | ||||||||
| FUND TOTAL | $ | 32,253,776 | $ | — | $ | — | $ | 32,253,776 | ||||||||
| Refer to each Fund’s Schedule of Investments for further information on the classification of investments. | |
| 2. | RELATED PARTIES: |
| Robert S. Bacarella is an officer and trustee of the Funds and also an officer, director and majority shareholder of the Adviser. Robert J. Bacarella is an officer of the Funds and also an officer of the Adviser. As of and for the year ended December 31, 2022, remunerations required to be paid to all interested trustees have been directly paid by the Adviser. Fees paid to independent trustees have been directly paid by the Funds. | |
| Each Fund pays the Adviser a monthly investment advisory fee, based upon the average net assets of each Fund, which is calculated and accrued daily. | |
| The Monetta Fund pays the Adviser based on an annual rate of 0.95% for the first $300 million in net assets, 0.90% for the next $200 million in net assets, and 0.85% for net assets over $500 million. The Monetta Young Investor Growth Fund pays the Adviser based on an annual rate of 0.55% on all net assets. From these fees the Adviser pays for all necessary office facilities, equipment and personnel for managing the assets of each Fund. | |
| 3. | CAPITAL STOCK AND SHARE UNITS: |
| There is an unlimited number of “no par value” shares of beneficial interest authorized for each series of the Trust. |
| Monetta | Monetta Young | |||||||
| Fund | Investor Growth Fund | |||||||
| 2021 Beginning Shares | 2,833,436 | 2,779,176 | ||||||
| Shares sold | 19,390 | 92,645 | ||||||
| Shares issued upon dividend reinvestment | 315,925 | 450,426 | ||||||
| Shares redeemed | (168,203 | ) | (761,131 | ) | ||||
| Net increase (decrease) in shares outstanding | 167,112 | (218,060 | ) | |||||
| 2022 Beginning Shares | 3,000,548 | 2,561,116 | ||||||
| Shares sold | 17,557 | 60,162 | ||||||
| Shares issued upon dividend reinvestment | 213,139 | 169,084 | ||||||
| Shares redeemed | (124,179 | ) | (470,508 | ) | ||||
| Net increase (decrease) in shares outstanding | 106,517 | (241,262 | ) | |||||
| 2022 Ending Shares | 3,107,065 | 2,319,854 | ||||||
Page 20
Notes to Financial Statements (continued) | December 31, 2022 |
| 4. | PURCHASES AND SALES OF INVESTMENT SECURITIES: |
| The cost of purchases and proceeds from sales of securities for the year ended December 31, 2022, excluding short-term securities were: |
| U.S. Government Securities | Other Investment Securities | ||||||||||||||||
| Purchases | Sales | Purchases | Sales | ||||||||||||||
| Monetta Fund | $ | — | $ | — | $ | 56,110,487 | $ | 57,304,263 | |||||||||
| Monetta Young Investor Growth Fund | — | — | 4,395,133 | 10,272,844 | |||||||||||||
| 5. | DISTRIBUTION PLAN: |
| The Trust and its shareholders have adopted a service and distribution plan (the “Plan”) pursuant to Rule 12b-1 under the 1940 Act. The Plan permits the participating Fund to pay certain expenses associated with the distribution of its shares. Annual fees under the Plan up to 0.25% of the average daily net assets for the Monetta Young Investor Growth Fund are accrued daily. | |
| 6. | SECTOR RISK: |
| As of December 31, 2022, the Monetta Fund had a significant portion of its assets invested in the technology sector. The technology sector may be more sensitive to changes in domestic and international competition, economic cycles, financial resources, personnel availability, rapid innovation and intellectual property issues. | |
| 7. | ETF RISK: |
| As of December 31, 2022, the Monetta Young Investor Growth Fund had a significant portion of its assets invested in ETFs. ETFs are bought and sold on a securities exchange. An ETF trades like a common stock and often represents a fixed portfolio of securities designed to track the performance and dividend yield of a particular domestic or foreign market index. The Fund may purchase an ETF to gain exposure to a portion of the U.S. or a foreign market. The risks of owning an ETF generally reflect the risks of owning the underlying securities they are designed to track, although the lack of liquidity on an ETF could result in it being more volatile. Additionally, ETFs have fees and expenses that reduce their value. | |
| 8. | GENERAL RISKS: |
| The global outbreak of COVID-19 has disrupted economic markets and the prolonged economic impact is uncertain. The operational and financial performance of the issuers of securities in which each Fund invests depends on future developments, including the duration and spread of the outbreak, and such uncertainty may in turn impact the value of the Funds’ investments. | |
| On February 24, 2022, Russia commenced a military attack on Ukraine. The outbreak of hostilities between the two countries could result in more widespread conflict and could have a severe adverse effect on the region and the markets. In addition, sanctions imposed on Russia by the United States and other countries, and any sanctions imposed in the future could have a significant adverse impact on the Russian economy and related markets. The price and liquidity of investments may fluctuate widely as a result of the conflict and related events. How long such conflict and related events will last and whether it will escalate further cannot be predicted, nor its effect on the Funds. |
Page 21
| Report of Independent Registered Public Accounting Firm | December 31, 2022 |
To the Shareholders and Board of Trustees of
Monetta Trust
Opinion on the Financial Statements
We have audited the accompanying statements of assets and liabilities, including the schedules of investments, of Monetta Trust comprising Monetta Fund and Monetta Young Investor Growth Fund (the “Funds”), as of December 31, 2022, the related statements of operations for the year then ended, the statements of changes in net assets for each of the two years in the period then ended, the related notes, and the financial highlights for each of the five years in the period then ended (collectively referred to as the “financial statements”). In our opinion, the financial statements present fairly, in all material respects, the financial position of each of the Funds as of December 31, 2022, the results of their operations for the year then ended, the changes in net assets for each of the two years in the period then ended, and the financial highlights for each of the five years in the period then ended, in conformity with accounting principles generally accepted in the United States of America.
Basis for Opinion
These financial statements are the responsibility of the Funds’ management. Our responsibility is to express an opinion on the Funds’ financial statements based on our audits. We are a public accounting firm registered with the Public Company Accounting Oversight Board (United States) (“PCAOB”) and are required to be independent with respect to the Funds in accordance with the U.S. federal securities laws and the applicable rules and regulations of the Securities and Exchange Commission and the PCAOB.
We conducted our audits in accordance with the standards of the PCAOB. Those standards require that we plan and perform the audit to obtain reasonable assurance about whether the financial statements are free of material misstatement whether due to error or fraud.
Our audits included performing procedures to assess the risks of material misstatement of the financial statements, whether due to error or fraud, and performing procedures that respond to those risks. Such procedures included examining, on a test basis, evidence regarding the amounts and disclosures in the financial statements. Our procedures included confirmation of securities owned as of December 31, 2022, by correspondence with the custodian. Our audits also included evaluating the accounting principles used and significant estimates made by management, as well as evaluating the overall presentation of the financial statements. We believe that our audits provide a reasonable basis for our opinion.
We have served as the Funds’ auditor since 2013.

COHEN & COMPANY, LTD.
Milwaukee, Wisconsin
February 23, 2023
Page 22
| Other Information (Unaudited) | December 31, 2022 |
BOARD APPROVAL OF ADVISORY AGREEMENTS
At an in-person meeting held on November 18, 2022, the Board considered the renewal of two separate investment advisory agreements. One between the Trust, on behalf of the Monetta Fund and the Adviser, and another between the Trust, on behalf of the Young Investor Growth Fund and the Adviser. Both advisory agreements were required to be renewed on or before December 2, 2022 by a majority of the Trustees who are not interested persons of the Funds, voting in person, and at a meeting called for the specific purpose of approving this agreement.
The Board was presented with relative performance, fees, expenses, asset size and other information in connection with the continuation of each advisory agreement. The Board received a memorandum from Thompson Hine outlining the legal standards applicable to the renewal and continuation of an investment advisory agreement under the 1940 Act. The Board was informed that Thompson Hine had submitted a request for information from the Adviser, on behalf of the Board, pursuant to Section 15(c) of the 1940 Act, a copy of which is included with the Materials. Furthermore, the Board was provided with responsive information from the Adviser regarding each Fund prior to the Meeting being held. The Board fully reviewed the advisory agreements and materials considered relevant in connection with the renewal of each agreement, as set forth below.
In the approval of advisory fees and other expenses to be paid by the Funds, and the advisory agreements themselves, the Board considered the following factors (no single one of which was determinative):
| 1) | the nature, extent and quality of the services provided by the Adviser to the Funds, | |
| 2) | the investment performance of the Funds and the Adviser, | |
| 3) | the costs of the services to be provided and the profits to be realized by the Adviser and its affiliates from the relationship with the Funds, | |
| 4) | the extent to which economies of scale will be realized as the Funds grow, and | |
| 5) | whether the fee levels reflect these economies of scale to the benefit of shareholders. |
The Board discussed the nature, extent, and quality of services provided by the Adviser. Mr. Davalla noted there were no changes to Adviser personnel, key risks to the Funds remained static, the Funds had an insurance policy and there were no regulatory, litigation or compliance issues with the Funds. The Board noted their satisfaction with the Adviser’s personnel and resources and concluded that the Adviser was well-suited to continue to serve as the adviser for each Fund.
The Board was presented with performance information for each Fund in comparison to each Fund’s benchmark, Morningstar category average and peer grouping. The Board noted that the performance for each Fund was better than the peer group and Morningstar category averages for the year-to-date and 1-year periods but slightly lagged each for the 3-year period. The Board also reviewed information in connection with the advisory fee and net expense ratios for each Fund versus their respective peer grouping as set forth in the Materials. The Trustees noted that the advisory fee for the Monetta Fund was higher than its peer group average but within the range of the peer group. The Board then reviewed that the Young Investor Fund’s advisory fee was below its peer group average. Mr. Davalla commented that the Funds’ advisory fee peer groups tended to be in large Fund complexes and due to this, were more likely to benefit more with economies of scales. The Board determined that the advisory fee for each Fund was not unreasonable.
The Board next evaluated the cost of services and profitability of the Adviser, giving consideration to the Adviser’s continued ability to provide quality investment management services to the Funds in view of the total net assets of the Fund complex. The Board discussed the total revenues received from each Fund and the Adviser’s profitability with respect to each Fund.
The Board determined the revenue and profits of the Adviser were both reasonable and appropriate. They found the advisory fee for each Fund to be reasonable in light of the nature, quality and extent of the services being provided to each Fund, the size of each Fund and the costs incurred by the Adviser in providing such services. The Board determined the break points in the fee schedule for the Monetta Fund were reasonably likely to allow the shareholders of the Fund to share in economies of scale as the Fund grows.
No single factor was determinative of the Board’s decision to approve the renewal of the Advisory Agreements; rather, the Board based its determination on the total mix of information available. Based on a consideration of all the factors in their totality, the Board, including a majority of the Independent Trustees, determined that the renewal of the Advisory Agreements, including the compensation payable under the agreements, were fair and reasonable to the Funds. The Board, including a majority of the Independent Trustees, therefore determined that the approval of the renewal of the Advisory Agreements was in the best interest of each Fund and its shareholders.
Page 23
| Other Information (Unaudited) (continued) | December 31, 2022 |
STATEMENT REGARDING THE FUND’S LIQUIDITY RISK MANAGEMENT PROGRAM
Pursuant to Rule 22e-4 under the Investment Company Act of 1940, the Monetta Trust (the “Trust”), on behalf of the Monetta Fund and Monetta Young Investor Growth Fund (each a “Fund” and together, the “Funds”), has adopted and implemented a written liquidity risk management program (the “Program”) that includes policies and procedures reasonably designed to comply with the requirements of Rule 22e-4, including: (i) assessment, management and periodic review of liquidity risk; (ii) classification of portfolio holdings; (iii) establishment of a highly liquid investment minimum (“HLIM”), as applicable; (iv) limitation on illiquid investments; and (v) redemptions in-kind. The Trust’s Board of Trustees (the “Board”) has approved the designation of a group of individuals associated with the Trust and Monetta Financial Services, Inc. (the “Adviser”) as the administrator of the Program (the “Program Administrator”). Personnel of the Trust conduct the day-to-day operation of the Program pursuant to policies and procedures administered by the Trust Program Administrator.
In accordance with Rule 22e-4, the Board reviewed a report prepared by the Program Administrator (the “Report”) regarding the operation of the Program and its adequacy and effectiveness of implementation for the period January 1, 2022, through December 31, 2022 (the “Reporting Period”). No significant liquidity events impacting the Funds during the Reporting Period or material changes to the Program were noted in the Report.
Under the Program, the Program Administrator manages and periodically reviews each Fund’s liquidity risk, including consideration of applicable factors specified in Rule 22e-4 and the Program. Liquidity risk is defined as the risk that a Fund could not meet shareholder redemption requests without significant dilution of remaining shareholders’ interests in the Fund. In general, this risk was managed during the Reporting Period by monitoring the degree of liquidity of each Fund’s investments, limiting the amount of each Fund’s illiquid investments, and utilizing various risk management tools and facilities available to each Fund for meeting shareholder redemptions, among other means. In the Report, Monetta provided its assessment that, based on the information considered in its review, the Program remains reasonably designed to manage each Fund’s liquidity risk and each Fund’s investment strategy remains appropriate for an open-end fund.
Pursuant to the Program, the Program Administrator oversaw the classification of each of the Funds’ portfolio investments as highly liquid, moderately liquid, less liquid or illiquid during the Reporting Period, including in connection with recording investment classifications on Form N-PORT. The process utilized by the Trust for determining the degree of liquidity of each Fund’s investments is supported by one or more third-party liquidity assessment vendors.
Each Fund qualified as a “primarily highly liquid fund” as defined in the Program during the Reporting Period. Accordingly, each Fund was not required to establish a HLIM or comply with the related Program provisions during the Reporting Period.
During the Reporting Period, each Fund’s investments were monitored for compliance with the 15% limitation on illiquid investments pursuant to the Program and in accordance with Rule 22e-4.
The Report noted any redemptions in-kind effected by the Funds during the Reporting Period were effectuated in accordance with the Trust’s Redemption in Kind Policy. The Report concluded, with respect to each Fund: (i) the Program was implemented and operated effectively to achieve the goal of assessing and managing the Fund’s liquidity risk during the Reporting Period; and (ii) the Fund was able to meet requests for redemption without significant dilution of remaining investors’ interests in the Fund during the Reporting Period.
Page 24
| Trustees & Officers (Unaudited) | December 31, 2022 |
| Name (Birth Year) (Funds Overseen) | Other Directorships | |
| Mailing Address | Held by Trustees | |
| Position(s) with Trust | Principal Occupation(s) | During the |
| Term of Position | During Past Five Years | Past Five Years |
| Independent (“Disinterested”) Trustees: | ||
| John L. Guy (1952) (2 Funds) | EVP & Director of Business Banking, | None. |
| 1776-A S. Naperville Rd., Suite 100 | Webster Bank since 2010. | |
| Wheaton, IL 60189-5831 | ||
| Trustee since 1993; | ||
| Indefinite Term | ||
| Independent Chairman since 2014; | ||
| Indefinite Term | ||
| Marlene Z. Hodges (1948) (2 Funds) | EVP & CFO, Orchard Village | None. |
| 1776-A S. Naperville Rd., Suite 100 | (non-profit organization) since 2012. | |
| Wheaton, IL 60189-5831 | ||
| Founder and CEO of | ||
| Trustee since 2001; | Marlene Z. Hodges, LLC, | |
| Indefinite Term | a consultancy providing financial | |
| guidance to non-profits, since 2011. | ||
| Patricia J. Luscombe (1961) (2 Funds) | Managing Director of the Valuations | Trustee; Northern Lights |
| 1776-A S. Naperville Rd., Suite 100 | and Opinions Group, Lincoln | Fund III (31 Funds) |
| Wheaton, IL 60189-5831 | International, LLC (investment bank) | (since 2015) |
| since 2007. | ||
| Trustee since 2015; | ||
| Indefinite Term | ||
Inside (“Interested”) Trustee(1) | ||
Robert S. Bacarella(2) (1949) (2 Funds) | Chairman & President of the Adviser | None. |
| 1776-A S. Naperville Rd., Suite 100 | since 1997. | |
| Wheaton, IL 60189-5831 | ||
| Director of Adviser since 1984. | ||
| Trustee & President since 1993; | ||
| Indefinite Term | ||
| Principal Executive Officer 2002; | ||
| Indefinite Term | ||
(1) | Trustees who are employees or officers of the Adviser receive no compensation from the Trust. |
(2) | Mr. Robert J. Bacarella is the son of Mr. Robert S. Bacarella, President and Founder of the Adviser. |
Additional information about the Trustees is available in the Trust’s State of Additional Information (“SAI”), which is available, without charge, by calling 1-800-MONETTA.
Page 25
| Trustees & Officers (Unaudited) (continued) | December 31, 2022 |
| Name (Birth Year) (Funds Overseen) | Other Directorships | |
| Mailing Address | Held by Trustees | |
| Position(s) with Trust | Principal Occupation(s) | During the |
| Term of Position | During Past Five Years | Past Five Years |
| Officers Who Are Not Trustees | ||
Robert J. Bacarella(1) (1977) (2 Funds) | Vice President, Treasurer, | Not Applicable. |
| 1776-A S. Naperville Rd., Suite 100 | Chief Financial Officer, & Director | |
| Wheaton, IL 60189-5831 | of the Adviser since 2009. | |
| Vice President since 2009; | ||
| Indefinite Term | ||
| Treasurer 2010; | ||
| Indefinite Term | ||
| Secretary, Chief Financial Officer, | ||
| Principal Financial Officer & Principal | ||
| Accounting Officer Since 2012; | ||
| Indefinite Term | ||
| Adrea Scaramucci (1968) (2 Funds) | Chief Compliance Officer for the | Not Applicable. |
| 3 Canal Plaza, Suite 100 | Adviser since 2021; Senior Principal | |
| Portland, ME 04101 | Consultant, ACA Group (formerly known | |
| as Cipperman Compliance | ||
| Chief Compliance Officer | Services, LLC) since 2021; | |
| since 2021; | Chief Compliance Officer, Drexel | |
| Indefinite Term | Morgan Capital Advisers, Inc. | |
| (2005-2021). | ||
(1) | Mr. Robert J. Bacarella is the son of Mr. Robert S. Bacarella, President and Founder of the Adviser. |
Additional information about the Trustees is available in the Trust’s State of Additional Information (“SAI”), which is available, without charge, by calling 1-800-MONETTA.
Page 26
| Notice to Shareholders (Unaudited) | December 31, 2022 |
Tax Information
For the fiscal year ended December 31, 2022, certain dividends paid by the Funds may be reported as qualified dividend income and may be eligible for taxation at capital gain rates. The percentage of dividends declared from ordinary income designed as qualified dividend income was 0.00% and 0.00% for the Monetta Fund and Monetta Young Investor Growth Fund, respectively.
For corporate shareholders, the percent of ordinary income distributions qualifying for the corporate dividends received deduction for the fiscal year ended December 31, 2022 was 0.00% and 0.00% for the Monetta Fund and Monetta Young Investor Growth Fund, respectively.
The percentage of taxable ordinary income distributions that are designated as short-term capital gain distributions under Internal Revenue Section 871(k)(2)(c) was 0.00% and 0.00% for the Monetta Fund and Monetta Young Investor Growth Fund, respectively.
Proxy Voting Policies and Proxy Voting Record
The Funds’ proxy voting policies and procedures, as well as its proxy voting record for the most recent 12-month period ended June 30, are available without charge, upon request, by contacting the Adviser at 1-800-MONETTA, or by writing to Monetta Financial Services, Inc., 1776-A South Naperville Rd., Suite 100, Wheaton, IL 60189. The Funds’ proxy voting record is also available on the U.S. Securities and Exchange Commission’s website at www.sec.gov.
Availability of Fund Portfolio Information
Each Fund files complete schedules of portfolio holdings with the SEC for the first and third quarters of each fiscal year on Part F of Form N-PORT. The Funds’ Part F of Form N-PORT are available on the SEC’s website at www.sec.gov and may be reviewed and copied at the SEC’s Public Reference Room in Washington D.C. For more information on the Public Reference Room call 1-800-SEC-0330. In addition, each Fund’s Part F of Form N-PORT is available without charge upon request by calling 1-800-MONETTA.
Householding
In an effort to decrease costs, the Funds intend to reduce the number of duplicate prospectuses and annual and semi-annual reports you receive by sending only one copy of each to those addresses shared by two or more accounts and to shareholders we reasonably believe are from the same family or household (“householding”). If you would like to opt out of householding or, once implemented, if you would like to discontinue householding for your accounts, please call toll-free at 1-800-241-9772 to request individual copies of these documents. Once the Funds receive notice to stop householding, we will begin sending individual copies 30 days after receiving your request. This policy does not apply to account statements.
Information about the Funds’ Trustees
The Statement of Additional Information (“SAI”) includes information about the Funds’ Trustees and is available without charge, upon request, by calling 1-800-MONETTA.
Page 27
PRIVACY POLICY (Unaudited)
In order to provide the products and services of the Funds, we may collect nonpublic, personal information from you. We consider such information to be private and confidential and are committed to respecting your privacy and protecting your information.
We may collect nonpublic, personal information about you from the following sources:
| • information that you provide us on applications and other forms; | |
| • information that we generate to service your account, such as account statements; and | |
| • information that we may receive from third parties. |
We do not disclose nonpublic, personal information about you without your authorization, except as permitted by law or in response to inquiries from governmental authorities. We may share information with affiliated and unaffiliated third parties with whom we have contracts for servicing the Funds, including transfer agents and mailing services. We will provide unaffiliated third parties with only the information necessary to carry out their assigned responsibilities and require third parties to treat your non-public personal information with the same high degree of confidentiality.
We restrict access to your nonpublic, personal information to those employees who need to know such information to provide products or services to you. We maintain certain physical, electronic and procedural safeguards that are designed to protect your nonpublic, personal information.
In the event that you hold shares of the Funds through a financial intermediary, including, but not limited to, a broker-dealer, bank, or trust company, the privacy policy of your financial intermediary would govern how your non-public personal information would be shared with non-affiliated third parties.
Page 28
(This Page Intentionally Left Blank.)
Monetta Mutual Funds
1776-A South Naperville Road
Suite 100
Wheaton, IL 60189-5831
| (b) | Not applicable for this Registrant. |
Item 2. Code of Ethics.
The Registrant has adopted a code of ethics that applies to the Registrant’s principal executive officer and principal financial officer. The Registrant has not made any amendments to its code of ethics during the period covered by this report. The Registrant has not granted any waivers from any provisions of the code of ethics during the period covered by this report.
A copy of the Registrant’s Code of Ethics is filed herewith.
Item 3. Audit Committee Financial Expert.
The Registrant’s board of trustees has determined that there is at least one audit committee financial expert serving on its audit committee. Marlene Z. Hodges and John L. Guy are the “audit committee financial experts” and are considered to be “independent” as each term is defined in Item 3 of Form N‑CSR.
Item 4. Principal Accountant Fees and Services.
The Registrant has engaged its principal accountant to perform audit services, audit-related services, tax services and other services during the past two fiscal years. “Audit services” refer to performing an audit of the Registrant's annual financial statements or services that are normally provided by the accountant in connection with statutory and regulatory filings or engagements for those fiscal years. “Audit-related services” refer to the assurance and related services by the principal accountant that are reasonably related to the performance of the audit. “Tax services” refer to professional services rendered by the principal accountant for tax compliance, tax advice, and tax planning; including reviewing the Fund’s tax returns and distributions calculations. There were no “other services” provided by the principal accountant. For the fiscal years ended December 31, 2022 and December 31, 2021, the Fund’s principal accountant was Cohen & Company, Ltd. The following table details the aggregate fees billed or expected to be billed for each of the last two fiscal years for audit fees, audit-related fees, tax fees and other fees by the principal accountant.
| FYE 12/31/2022 | FYE 12/31/2021 | |
(a) Audit Fees | $27,500 | $25,000 |
(b) Audit-Related Fees | $0 | $0 |
(c) Tax Fees | $8,000 | $8,000 |
(d) All Other Fees | $- | $- |
(e)(1) The audit committee has adopted pre-approval policies and procedures that require the audit committee to pre‑approve all audit and non‑audit services of the Registrant, including services provided to any entity affiliated with the Registrant.
(e)(2) The percentage of fees billed by Cohen & Company, Ltd applicable to non-audit services pursuant to waiver of pre-approval requirement were as follows:
| FYE 12/31/2022 | FYE 12/31/2021 | |
Audit-Related Fees | 0% | 0% |
Tax Fees | 0% | 0% |
All Other Fees | 0% | 0% |
(f) The majority of the principal accountant’s hours spent on auditing the Registrant’s financial statements were attributed to work performed by full‑time permanent employees of the principal accountant.
(g) The following table indicates the non-audit fees billed or expected to be billed by the Registrant’s accountant for services to the Registrant and to the Registrant’s investment adviser (and any other controlling entity, etc.—not sub-adviser) for the last two years.
Non-Audit Related Fees | FYE 12/31/2022 | FYE 12/31/2021 |
Registrant | N/A | N/A |
Registrant’s Investment Adviser | N/A | N/A |
(h) The audit committee of the board of trustees/directors has considered whether the provision of non-audit services that were rendered to the Registrant's investment adviser is compatible with maintaining the principal accountant's independence and has concluded that the provision of such non-audit services by the accountant has not compromised the accountant’s independence.
(i) Not applicable.
(j) Not applicable.
Item 5. Audit Committee of Listed Registrants.
Not applicable to Registrant’s who are not listed issuers (as defined in Rule 10A-3 under the Securities Exchange Act of 1934).
Item 6. Schedule of Investments.
(a) Schedule of Investments is included as part of the report to shareholders filed under Item 1 of this form.
(b) Not applicable
Item 7. Disclosure of Proxy Voting Policies and Procedures for Closed-End Management Investment Companies.
Not applicable to open-end investment companies.
Item 8. Portfolio Managers of Closed-End Management Investment Companies.
Not applicable to open-end investment companies.
Item 9. Purchases of Equity Securities by Closed‑End Management Investment Company and Affiliated Purchasers.
Not applicable to open-end investment companies.
Item 10. Submission of Matters to a Vote of Security Holders.
There have been no material changes to the procedures by which shareholders may recommend nominees to the Registrant’s board of trustees.
Item 11. Controls and Procedures.
| (a) | The Registrant’s President and Treasurer have reviewed the Registrant's disclosure controls and procedures (as defined in Rule 30a-3(c) under the Investment Company Act of 1940 (the “Act”)) as of a date within 90 days of the filing of this report, as required by Rule 30a-3(b) under the Act and Rules 13a-15(b) or 15d‑15(b) under the Securities Exchange Act of 1934. Based on their review, such officers have concluded that the disclosure controls and procedures are effective in ensuring that information required to be disclosed in this report is appropriately recorded, processed, summarized and reported and made known to them by others within the Registrant and by the Registrant’s service provider. |
| (b) | There were no significant changes in the Registrant's internal control over financial reporting (as defined in Rule 30a-3(d) under the Act) that occurred during the period covered by this report that has materially affected, or is reasonably likely to materially affect, the Registrant's internal control over financial reporting. |
Item 12. Disclosure of Securities Lending Activities for Closed-End Management Investment Companies
Not applicable to open-end investment companies.
Item 13. Exhibits.
(3) Any written solicitation to purchase securities under Rule 23c‑1 under the Act sent or given during the period covered by the report by or on behalf of the Registrant to 10 or more persons. Not applicable to open-end investment companies.
(4) Change in the Registrant’s independent public accountant. There was no change in the Registrant’s independent public accountant for the period covered by this report.
SIGNATURES
Pursuant to the requirements of the Securities Exchange Act of 1934 and the Investment Company Act of 1940, the Registrant has duly caused this report to be signed on its behalf by the undersigned, thereunto duly authorized.
(Registrant) Monetta Trust
By (Signature and Title) /s/Robert S. Bacarella
Robert S. Bacarella, Chief Executive Officer
Date March 7, 2023
Pursuant to the requirements of the Securities Exchange Act of 1934 and the Investment Company Act of 1940, this report has been signed below by the following persons on behalf of the Registrant and in the capacities and on the dates indicated.
By (Signature and Title) /s/Robert S. Bacarella
Robert S. Bacarella, Chief Executive Officer
Date March 7, 2023
By (Signature and Title) /s/Robert J. Bacarella
Robert J. Bacarella, Chief Financial Officer
Date March 7, 2023