Developers Diversified Realty
Quarterly Financial Supplement
For the three months ended March 31, 2004
Developers Diversified Realty Corporation considers portions of this information to be forward-looking statements within the meaning of Section 27A of the Securities Exchange Act of 1933 and Section 21E of the Securities Exchange Act of 1934, both as amended, with respect to the Company’s expectation for future periods. Although the Company believes that the expectations reflected in such forward-looking statements are based upon reasonable assumptions, it can give no assurance that its expectations will be achieved. For this purpose, any statements contained herein that are not historical fact may be deemed to be forward-looking statements. There are a number of important factors that could cause the results of the Company to differ materially from those indicated by such forward-looking statements, including among other factors, local conditions such as oversupply of space or a reduction in demand for real estate in the area, competition from other available space, dependence on rental income from real property or the loss of a major tenant and other matters described in the Management’s Discussion and Analysis section of the Company’s Form 10-K for the year ended December 31, 2003.
Developers Diversified Realty
Quarterly Financial Supplement
For the three months ended March 31, 2004
TABLE OF CONTENTS
| Section | Tab | ||||
Earnings Release & Financial Statements | 1.0 | ||||
Financial Summary | 2.0 | ||||
| • Financial Highlights | 2.1 | ||||
| • Market Capitalization and Financial Ratios | 2.2 | ||||
| • Market Capitalization Summary | 2.3 | ||||
| • Significant Accounting Policies | 2.4 | ||||
| • Non-GAAP Financial Measures | 2.5 | ||||
Consolidated and Wholly Owned Financial Operations | 3.0 | ||||
| • Summary of Capital Transactions | 3.1 | ||||
| • Acquisitions, Dispositions, Expansions and Developments | 3.2 | ||||
| • Summary of Consolidated Debt | 3.3 | ||||
| • Summary of Consolidated Mortgage Principal Payments & Corporate Debt Maturities | 3.4 | ||||
Joint Venture Summaries | 4.0 | ||||
| • Joint Venture Financials | 4.1 | ||||
| • Joint Venture Partnership Summaries | 4.2 | ||||
Joint Venture Financial Operations | 5.0 | ||||
| • Summary of Capital Transactions | 5.1 | ||||
| • Acquisitions, Dispositions, Expansions and Developments | 5.2 | ||||
| • Summary of Joint Venture Debt | 5.3 | ||||
| • Summary of Pro Rata Joint Venture Debt | 5.4 | ||||
| • Summary of Joint Venture Mortgage Principal Payments | 5.5 | ||||
Portfolio Statistics | 6.0 | ||||
Appendix | 7.0 | ||||
| • Property Listing | 7.1 | ||||
| • Investor Information | 7.2 | ||||
DEVELOPERS DIVERSIFIED REALTY CORPORATION
| For Immediate Release: | ||||
| Contact: | Scott A. Wolstein | Michelle A. Mahue | ||
| Chairman | Vice President of Investor Relations | |||
| Chief Executive Officer | 216-755-5455 | |||
| 216-755-5500 | ||||
DEVELOPERS DIVERSIFIED REALTY REPORTS A 16.4%
INCREASE IN FFO PER SHARE FOR THE THREE MONTH PERIOD
ENDED MARCH 31, 2004
CLEVELAND, OHIO, April 29, 2004- Developers Diversified Realty Corporation (NYSE: DDR), a real estate investment trust (“REIT”), today announced that first quarter 2004 Funds From Operations (“FFO”), a widely accepted measure of REIT performance, on a per share basis was $0.71 (diluted) and $0.72 (basic) as compared to $0.61 (diluted) and $0.62 (basic) per share for the same period in the previous year, a per share increase of 16.4% diluted and 16.1% basic. FFO available to common shareholders reached $62.8 million for the quarter ended March 31, 2004, as compared to $44.3 million for 2003, an increase of 41.8%. Net income available to common shareholders for the three month period ended March 31, 2004 increased 51.7% to $40.2 million compared to first quarter 2003 net income of $26.5 million, or $0.46 per share (diluted) and $0.47 (basic) in 2004 compared to $0.37 per share (diluted) and $0.38 (basic) for the same period in 2003. The increase in net income for the quarter ended March 31, 2004 is primarily related to the results from operations attributable to the merger with JDN Realty Corporation on March 13, 2003 which are included in the three month period ended March 31, 2004 plus the redemption of preferred operating partnership units in 2003, offset, to some extent, by the sale of assets to the joint venture with MDT in the fourth quarter of 2003.
Scott Wolstein, DDR’s Chairman and Chief Executive Officer stated, “I am pleased to announce this quarter’s financial results, which reflect continued strong earnings growth and positive fundamentals in our core business. In addition, during the last month, we accessed a variety of public and private capital sources and arranged for the initial financing necessary to close the Benderson acquisition. Our ability to access capital quickly and efficiently despite the recent volatility in the REIT public equity markets is an important part of our franchise. We are proud to have generated the financing necessary to close this major acquisition and are appreciative of the strong support that we have received from the investment community for this very exciting initiative.”
FFO is a supplemental non-GAAP financial measurement used as a standard in the real estate industry. Management believes that FFO provides an additional indicator of the financial performance of a REIT. The Company also believes that FFO more appropriately measures the core operations of the Company and provides a benchmark to its peer group. FFO does not represent cash generated from operating activities in accordance with generally accepted accounting principles and is not necessarily indicative of cash available to fund cash needs and should not be considered as an alternative to net income and an indicator of the Company’s operating performance or as an alternative to cash flow as a measure of liquidity. FFO available to common shareholders is defined and calculated by the Company as net income, adjusted to exclude: (i) preferred dividends, (ii) gains (or losses) from sales of depreciable real estate property, except for those sold through the Company’s merchant building program, which are presented net of taxes, (iii) sales of securities, (iv) extraordinary items, (v) cumulative effect of changes in accounting standards and (vi) certain non-cash items. These non-cash items principally include real property depreciation and amortization of intangibles, equity income from joint ventures
and equity income from minority equity investments and adding the Company’s proportionate share of FFO from its unconsolidated joint ventures and minority equity investments, determined on a consistent basis. Other real estate companies may calculate FFO in a different manner. A reconciliation of net income to FFO is presented in the financial highlights section.
Leasing:
Leasing activity continues to be strong throughout the portfolio. During the first quarter of 2004, the Company executed 99 new leases aggregating approximately 526,000 square feet and 144 renewals aggregating approximately 920,000 square feet. Rental rates on new leases increased by 26.7% to $13.12 per square foot and rental rates on renewals increased by 6.7% to $8.78 per square foot. On a blended basis, rental rates for new leases and renewals increased by 12.8% to $10.36 per square foot.
At March 31, 2004, the average annualized base rent per occupied square foot, including those properties owned through joint ventures, was $10.94, as compared to $10.39 at March 31, 2003.
As of March 31, 2004, the portfolio was 95.0% leased as compared to 95.1% leased at December 31, 2003 and 94.7% leased at March 31, 2003. These percentages include tenants for which signed leases have been executed and occupancy has not occurred. Based on tenants in place and responsible for paying rent as of March 31, 2004, the portfolio was 94.4% occupied as compared to 94.3% occupied at December 31, 2003 and 94.7% occupied at March 31, 2003.
Same store tenant sales performance over the trailing 12 month period within the Company’s portfolio, for those tenants required to report, remained strong at approximately $235 per square foot in 2004 compared to $232 per square foot in 2003, an increase of 1.3%. Aggregate base and percentage rental revenues relating to Core Portfolio Properties (i.e., shopping center properties owned since January 1, 2003, excluding properties under redevelopment) increased approximately $0.7 million (or 1.3%) for the three month period ended March 31, 2004, compared to the same period in 2003.
Expansions:
For the three month period ended March 31, 2004, the Company completed the expansion and redevelopment project at the North Little Rock, Arkansas shopping center at an aggregate cost of approximately $5.8 million. The Company is currently expanding/redeveloping eight shopping centers located in Tallahassee, Florida; Suwanee, Georgia; Starkville, Mississippi; Princeton, New Jersey; Aurora, Ohio; Tiffin, Ohio; Monaca, Pennsylvania and Chattanooga, Tennessee at a projected incremental cost of approximately $38.8 million. The Company is also scheduled to commence five additional expansion projects during 2004 at the Gadsden, Alabama; Brandon, Florida; Hendersonville, North Carolina; Allentown, Pennsylvania and Brentwood, Tennessee shopping centers.
The Company’s joint ventures are currently expanding/redeveloping two shopping centers located in Deer Park, Illinois and Merriam, Kansas at a projected incremental cost of approximately $15 million. The Company is also scheduled to commence three additional expansion/redevelopment projects at the Phoenix, Arizona; Kansas City, Missouri and Kirkland, Washington shopping centers.
Strategic Real Estate Transactions:
The Company entered into an agreement to purchase an interest in 110 retail real estate assets, with 18.8 million square feet of GLA, from Benderson Development Company and related entities (“Benderson”). It is anticipated that Benderson will retain a 2% equity interest in certain assets not designated as like kind exchange assets. The purchase price of the interests in the assets is expected to
be approximately $2.3 billion and the transaction is expected to close during the second quarter of 2004. The Company intends to fund the transaction through a combination of assumed debt, new debt financing, asset transfers/sales and equity.
The Benderson assets include locations in eleven states, with over 80.0% of the GLA in New York and New Jersey. The Benderson assets are approximately 94.0% leased, including a Benderson master lease, aggregating approximately 1.1 million square feet, associated with executed leases and pending deals in which the tenants have not commenced rental payments. The largest tenants, based on revenues, include Tops Market (Ahold USA), Wal-Mart/Sam’s Club, Home Depot and Dick’s Sporting Goods. The Company currently owns less than 100,000 square feet in New York and approximately 2.7 million square feet in New Jersey. Upon completion of the transaction, the Company will own or manage over 470 operating and development retail properties in 44 states, with over 100 million square feet of GLA.
The Company previously announced that it had received all capital commitments necessary to complete the expansion of the joint venture relationship with Macquarie DDR Trust (“MDT”), an Australian Listed Property Trust that it owns with Macquarie Bank Limited, an international investment bank and advisor and manager of specialized real estate funds in Australia. The capital commitments will enable MDT to acquire an indirect ownership interest in 12 large, market-dominant community shopping centers, comprising of 23 retail properties, as discussed below, aggregating over 5.6 million square feet of GLA. The aggregate purchase value of these 12 community shopping centers is approximately $538.0 million.
The Company intends to assign its rights under the Benderson purchase agreement to the MDT equity affiliate, in which it effectively owns a 14.5% interest, to acquire four community shopping centers, comprising 14 retail properties. These assets, which are currently owned by Benderson, represent an aggregate purchase value of approximately $300 million and approximately 2.5 million square feet. The MDT equity affiliate will also acquire seven community shopping centers, comprising eight retail properties that are currently held in the Company’s wholly owned portfolio, for approximately $188 million, and one community shopping center that is held by the Company in a 50% joint venture for approximately $50 million. These seven assets aggregate over 3.1 million square feet.
Acquisitions:
In the first quarter of 2004, the Company, through its joint venture with Coventry II, acquired a 20% interest in Totem Lakes Mall, a 290,000 square foot shopping center in suburban Seattle, Washington, and Phoenix Spectrum Mall, a 1,145,000 square foot shopping center in Phoenix, Arizona, for approximately $37.0 million and $46.5 million, respectively, of which the Company’s proportionate share is approximately $7.4 million and $9.3 million, respectively.
In March 2004, the Company acquired its joint venture partner’s 50% interest in a 248,000 square foot shopping center located in Littleton, Colorado. The Company’s purchase price, net of 50% of the mortgage debt assumed of $23.5 million, was approximately $6.3 million for the 50% equity interest.
Development (Consolidated):
During the three month period ended March 31, 2004, the Company substantially completed the construction of a 506,000 square foot shopping center located in Hamilton, New Jersey.
The Company currently has eleven shopping center projects under construction. These projects are located in Long Beach, California; Fort Collins, Colorado; Overland Park, Kansas; Chesterfield, Michigan; Lansing, Michigan; St. Louis, Missouri; Apex, North Carolina; Mount Laurel, New Jersey; Pittsburgh, Pennsylvania; Irving, Texas and Mesquite, Texas. These projects are scheduled for completion during 2004 and 2005 at a projected cost of approximately $352.5 million and will create an additional 2.8 million square feet of retail space.
The Company anticipates commencing construction in 2004 on four additional shopping centers located in Miami, Florida; Norwood, Massachusetts; Freehold, New Jersey and McKinney, Texas.
Development (Joint Ventures):
The Company has joint venture development agreements for three shopping center projects. These three projects have an aggregate projected cost of approximately $74.4 million. These projects are located in Jefferson Country (St. Louis, Missouri) and Apex, North Carolina (Phases III and IV) adjacent to a wholly-owned development project. The project located in Jefferson County (St. Louis, Missouri) will be substantially completed in 2004. At March 31, 2004, approximately $7.3 million of costs were incurred in relation to these development projects.
Dispositions:
In January 2004, one of the Company’s RVIP joint ventures sold a portion, approximately 300,000 square feet of GLA, of a shopping center in Puente Hills, California for approximately $33.0 million and recognized a gain of approximately $4.9 million of which the Company’s proportionate share was approximately $0.7 million. This gain is not included in FFO.
In January 2004, a joint venture in which the Company owns a 35% interest, sold a 320,000 square foot shopping center property located in San Antonio, Texas for approximately $59.1 million and recognized a gain of $19.1 million, of which the Company’s proportionate share was approximately $6.7 million. This gain is not included in FFO.
Financings:
The Company has arranged the initial financing to close on the Benderson acquisition, for an aggregate purchase price of approximately $2.3 billion. The Company issued $250.0 million, 5.25% senior unsecured notes due April 2011. The Company also priced $170 million of Class I cumulative redeemable perpetual preferred shares with an annual dividend coupon rate of 7.5%. In addition, the Company entered into a $200 million commitment with Bank One, Wachovia and Wells Fargo for a three-year term loan with two, one-year extension options at an interest rate of LIBOR plus 75 basis points. Although the Company intends to issue equity securities and/or sales of assets to joint ventures to finance approximately $500 million of the purchase price, the Company has entered into a commitment for a $500 million one-year bridge facility at LIBOR plus 75 basis points to ensure the necessary transaction financing is in place at the time of the transaction closing. Any borrowings under this bridge facility are expected to be repaid through asset sales and/or the issuance of equity securities. In addition, the combination of the purchase of certain Benderson assets through MDT and related sale of DDR assets to MDT, as discussed above, will contribute nearly $500 million of proceeds, which will effectively be applied towards the acquisition of an interest in the Benderson assets. The balance of the acquisition will initially be funded through assumed debt of approximately $400 million and line of credit borrowings of approximately $300 million.
In January 2004, the Company issued $275 million of five-year unsecured senior notes with a coupon rate of 3.875%. Net proceeds from this offering of approximately $272.2 million were used to repay approximately $104 million of variable rate mortgage debt and $150 million of the Company’s unsecured term debt associated with the JDN merger. The balance was used to repay revolving credit facilities.
Accounting Pronouncements:
In January 2003, the FASB issued FASB Interpretation No. 46 (“FIN 46” or “Interpretation”), “Consolidation of Variable Interest Entities.” This Interpretation was revised in December 2003. The objective of this Interpretation is to provide guidance on how to identify a variable interest entity (“VIE”) and determine when the assets, liabilities, non-controlling interests, and results of operations of a VIE need to be included in a company’s consolidated financial statements.
The Company consolidated five entities that were previously accounted for under the equity method. Four of these entities represent investments in undeveloped land located in Round Rock, Texas; Opelika, Alabama; Jackson, Mississippi; and Monroe, Louisiana, with combined real estate balances of $8.3 million as of December 31, 2003, and liabilities of $0.9 million. The Company has a note receivable from one of these entities of approximately $0.7 million. The other entity is an operating shopping center property located in Martinsville, Virginia, in which DDR has a 50% interest, and advances of approximately $8.8 million. The total undepreciated real estate assets of this entity are $31.6 million and the total debt is approximately $20 million. In addition, the Company recorded a charge of $3.0 million as a cumulative effect of adoption of FIN 46 related to the consolidation of this asset.
Developers Diversified Realty Corporation currently owns and manages over 360 retail operating and development properties in 44 states comprising over 83 million square feet of real estate. DDR is a self-administered and self-managed real estate investment trust (REIT) operating as a fully integrated real estate company which acquires, develops, leases and manages shopping centers.
A copy of the Company’s Supplemental Financial/Operational package is available to all interested parties upon request at our corporate office to Michelle A. Mahue, Vice President of Investor Relations, Developers Diversified Realty Corporation, 3300 Enterprise Parkway, Beachwood, OH 44122 or on our Website which is located at http:/www.ddr.com.
Developers Diversified Realty Corporation considers portions of this information to be forward-looking statements within the meaning of Section 27A of the Securities Exchange Act of 1933 and Section 21 E of the Securities Exchange Act of 1934, both as amended, with respect to the Company’s expectation for future periods. Although the Company believes that the expectations reflected in such forward-looking statements are based upon reasonable assumptions, it can give no assurance that its expectations will be achieved. For this purpose, any statements contained herein that are not historical fact may be deemed to be forward looking statements. There are a number of important factors that could cause the results of the Company to differ materially from those indicated by such forward-looking statements, including, among other factors, local conditions such as oversupply of space or a reduction in demand for real estate in the area, competition from other available space, dependence on rental income from real property, the loss of a major tenant or inability to enter into definitive agreements with regard to our financing arrangements or our failure to satisfy conditions to the completion of these arrangements. For more details on the risk factors, please refer to the Company’s Form on 10-K as of December 31, 2003.
DEVELOPERS DIVERSIFIED REALTY CORPORATION
Financial Highlights
(In thousands — except per share data)
| Three Month Period | ||||||||
| Ended March 31, | ||||||||
| 2004 | 2003 | |||||||
Revenues: | ||||||||
| Minimum rent (A) | $ | 88,959 | $ | 73,639 | ||||
| Percentage and overage rents (A) | 1,728 | 1,185 | ||||||
| Recoveries from tenants | 25,791 | 19,680 | ||||||
| Ancillary income | 764 | 347 | ||||||
| Other property related income | 906 | 74 | ||||||
| Management fee income | 3,111 | 2,604 | ||||||
| Development fees | 191 | 329 | ||||||
| Interest income | 1,360 | 1,604 | ||||||
| Other (B) | 3,519 | 3,063 | ||||||
| 126,329 | 102,525 | |||||||
Expenses: | ||||||||
| Operating and maintenance | 16,265 | 12,904 | ||||||
| Real estate taxes | 15,870 | 12,130 | ||||||
| General and administrative (C) | 10,444 | 7,724 | ||||||
| Interest | 24,934 | 18,902 | ||||||
| Depreciation and amortization | 25,101 | 19,763 | ||||||
| 92,614 | 71,423 | |||||||
| Income before equity in net income of joint ventures, minority equity interests, income tax of taxable REIT subsidiaries, discontinued operations, gain on sales of real estate and real estate investments and cumulative effect of adoption of a new accounting standard | 33,715 | 31,102 | ||||||
| Equity in net income of joint ventures (D) | 18,221 | 10,099 | ||||||
| Minority equity interests (E) | (1,145 | ) | (3,064 | ) | ||||
| Income tax of taxable REIT subsidiaries and franchise taxes | (671 | ) | (239 | ) | ||||
| Income from continuing operations | 50,120 | 37,898 | ||||||
| (Loss) income from discontinued operations (F) | (703 | ) | 287 | |||||
| Income before gain on sales of real estate and real estate investments and cumulative effect of adoption of a new accounting standard | 49,417 | 38,185 | ||||||
| Gain on sales of real estate and real estate investments, net of tax | 4,370 | 200 | ||||||
| Income before cumulative effect of adoption of a new accounting standard | 53,787 | 38,385 | ||||||
| Cumulative effect of adoption of a new accounting standard (G) | (3,001 | ) | — | |||||
Net income | $ | 50,786 | $ | 38,385 | ||||
Net income, applicable to common shareholders | $ | 40,182 | $ | 26,510 | ||||
Funds From Operations (“FFO”): | ||||||||
| Net income applicable to common shareholders | $ | 40,182 | $ | 26,510 | ||||
| Depreciation and amortization of real estate investments | 24,757 | 19,721 | ||||||
| Equity in net income of joint ventures | (18,221 | ) | (10,099 | ) | ||||
| Joint ventures’ FFO (D) | 12,676 | 7,794 | ||||||
| Minority equity interests (OP Units) | 572 | 377 | ||||||
| Gain on sales of depreciable real estate and real estate investments, net | (160 | ) | — | |||||
| Cumulative effect of adoption of a new accounting standard (G) | 3,001 | — | ||||||
| FFO available to common shareholders | 62,807 | 44,303 | ||||||
| Preferred dividends | 10,604 | 11,875 | ||||||
| FFO | $ | 73,411 | $ | 56,178 | ||||
| Per share data: | ||||||||
| Earnings per common share | ||||||||
| Basic | $ | 0.47 | $ | 0.38 | ||||
| Diluted | $ | 0.46 | $ | 0.37 | ||||
| Dividends Declared | $ | 0.46 | $ | 0.41 | ||||
| Funds From Operations — Basic (H) | $ | 0.72 | $ | 0.62 | ||||
| Funds From Operations – Diluted (H) | $ | 0.71 | $ | 0.61 | ||||
| Basic – average shares outstanding (thousands) (H) | 86,344 | 70,087 | ||||||
| Diluted — average shares outstanding (thousands) (H) | 87,646 | 71,218 | ||||||
DEVELOPERS DIVERSIFIED REALTY CORPORATION
Financial Highlights
(In thousands — except per share data)
| (A) | Increases in base and percentage rental revenues for the three month period ended March 31, 2004 as compared to 2003, aggregated $15.4 million consisting of $0.7 million related to leasing of core portfolio properties (an increase of 1.3% from 2003), $3.7 million from the acquisition of four shopping centers in 2003 and 2004, $19.3 million from the JDN merger, $0.4 million related to developments and redevelopments and $0.7 million from the consolidation of a joint venture interest due to the adoption of FIN 46. These amounts were offset by a decrease of $0.5 million relating to the business center properties and $8.9 million due to the sale of eleven properties to joint ventures in 2003. Included in the rental revenues for the three month periods ended March 31, 2004 and 2003 is approximately $1.6 million and $1.4 million, respectively, of revenue resulting from the recognition of straight line rents. | |||
| (B) | Other income for the three month periods ended March 31, 2004 and 2003 was comprised of the following (in millions): | |||
| Three Month Period | ||||||||
| Ended March 31, | ||||||||
| 2004 | 2003 | |||||||
| Lease termination fees | $ | 3.5 | $ | 0.3 | ||||
| Settlement of call option (1) | — | 2.4 | ||||||
| Sale of option rights and other miscellaneous | — | 0.4 | ||||||
| $ | 3.5 | $ | 3.1 | |||||
| (1) | Settlement of a call option on March 31, 2003 relating to the MOPPRS debt assumed from JDN, principally arising from an increase in interest rates from the date of acquisition, March 13, 2003, to the date of settlement. |
| (C) | General and administrative expenses include internal leasing salaries, legal salaries and related expenses associated with the releasing of space, which are charged to operations as incurred. For the three month periods ended March 31, 2004 and 2003, general and administrative expenses were approximately 5.1% and 4.6%, respectively, of total revenues, including joint venture revenues, for each period. |
DEVELOPERS DIVERSIFIED REALTY CORPORATION
Financial Highlights
(In thousands — except per share data)
| (D) | The following is a summary of the Company’s share of the combined operating results relating to its joint ventures (in thousands): |
| Three month period | ||||||||
| ended March 31, | ||||||||
| 2004 (b) | 2003 (b) | |||||||
| Revenues from operations (a) | $ | 76,269 | $ | 58,603 | ||||
| Operating expense | 26,705 | 20,452 | ||||||
| Depreciation and amortization of real estate investments | 10,892 | 10,055 | ||||||
| Interest expense | 18,287 | 17,795 | ||||||
| 55,884 | 48,302 | |||||||
| Income from operations before gain on sale of real estate and real estate investments and discontinued operations | 20,385 | 10,301 | ||||||
| Loss on sale of real estate and real estate investments | (14 | ) | — | |||||
| Loss from discontinued operations, net of tax | (347 | ) | (94 | ) | ||||
| Gain on sale of discontinued operations, net of tax | 24,024 | 34,932 | ||||||
| Net income | $ | 44,048 | $ | 45,139 | ||||
| DDR Ownership interests (b) | $ | 18,301 | $ | 10,437 | ||||
| Funds From Operations from joint ventures are summarized as follows: | ||||||||
| Net income | 44,048 | $ | 45,139 | |||||
| Gain on sale of real estate and real estate investments, including discontinued operations | (23,967 | ) | (35,690 | ) | ||||
| Depreciation and amortization of real estate investments | 11,052 | 11,411 | ||||||
| $ | 31,133 | $ | 20,860 | |||||
| DDRC Ownership interests (b) | $ | 12,676 | $ | 7,794 | ||||
| DDRC Partnership distributions received, net | $ | 28,316 | $ | 20,641 | ||||
| (a) | Revenues for the three month periods ended March 31, 2004 and 2003 included approximately $1.1 million and $0.9 million, respectively, resulting from the recognition of straight line rents of which the Company’s proportionate share is $0.2 million and $0.3 million, respectively. | |||
| (b) | Included in equity in net income of joint ventures is approximately $2.9 million of promoted income received from the Company’s joint venture partners in the first quarter of 2004 which is include in the Company’s FFO. | |||
| The Company’s share of joint venture net income has been reduced by $0.1 million and $0.4 million for the three month periods ended March 31, 2004 and 2003, respectively, to reflect additional basis depreciation. | ||||
DEVELOPERS DIVERSIFIED REALTY CORPORATION
Financial Highlights
(In thousands — except per share data)
| At March 31, 2004 and 2003, the Company owned joint venture interests relating to 53 and 51 shopping center properties, respectively. In addition, at March 31, 2004 and 2003, respectively, the Company, through a joint venture, owned an interest of approximately 25% in 69 and 88 shopping center sites formerly owned by Service Merchandise, respectively. |
| (E) | Minority Equity Interests are comprised of the following (in thousands): |
| Three Month Period | ||||||||
| Ended March 31, | ||||||||
| 2004 | 2003 | |||||||
| Minority interests | $ | 573 | $ | 451 | ||||
| Preferred Operating Partnership Units | — | 2,236 | ||||||
| Operating Partnership Units | 572 | 377 | ||||||
| $ | 1,145 | $ | 3,064 | |||||
| (F) | The operating results relating to assets classified as discontinued operations are summarized as follows (in thousands): |
| Three Month Period | ||||||||
| Ended March 31, | ||||||||
| 2004 | 2003 | |||||||
| Revenues | $ | 145 | $ | 866 | ||||
| Expenses: | ||||||||
| Operating | 94 | 123 | ||||||
| Interest | 19 | 180 | ||||||
| Depreciation | 38 | 276 | ||||||
| 151 | 579 | |||||||
| (6 | ) | 287 | ||||||
| Minority interests | (4 | ) | — | |||||
| Loss on sales of real estate | (693 | ) | — | |||||
| $ | (703 | ) | $ | 287 | ||||
| (G) | The cumulative effect of adoption of a new accounting standard (FIN 46) of approximately $3.0 million is attributable to the consolidation of a 50% owned shopping center property in Martinsville, Virginia and the minority partner’s share of cumulative losses. | |||
| (H) | For purposes of computing FFO per share (basic), the weighted average shares outstanding were adjusted to reflect the conversion, on a weighted average basis of 1.1 million and 0.9 million Operating Partnership Units (OP Units) outstanding at March 31, 2004 and 2003 into 1.1 million and 0.9 million common shares of the Company for the three month periods ended March 31, 2004 and 2003, respectively. The weighted average diluted shares and OP Units outstanding were 88.9 million and 72.3 million for the three month periods ended March 31, 2004 and 2003, respectively. | |||
DEVELOPERS DIVERSIFIED REALTY CORPORATION
Financial Highlights
(In thousands)
| Selected Balance Sheet Data: | ||||||||
| March 31, 2004 | December 31, 2003 | |||||||
Assets: | ||||||||
| Real estate and rental property: | ||||||||
| Land | $ | 833,714 | $ | 821,893 | ||||
| Buildings | 2,809,436 | 2,719,764 | ||||||
| Fixtures and tenant improvements | 92,630 | 90,384 | ||||||
| Construction in progress | 268,407 | 252,870 | ||||||
| 4,004,187 | 3,884,911 | |||||||
| Less accumulated depreciation | (493,470 | ) | (458,213 | ) | ||||
| Real estate, net | 3,510,717 | 3,426,698 | ||||||
| Cash | 22,683 | 11,693 | ||||||
| Restricted cash | 4,800 | 99,340 | ||||||
| Advances to and investments in joint ventures | 245,905 | 260,143 | ||||||
| Notes receivable | 9,873 | 11,741 | ||||||
| Receivables, including straight line rent, net | 72,608 | 76,509 | ||||||
| Other assets, net | 54,829 | 55,027 | ||||||
| $ | 3,921,415 | $ | 3,941,151 | |||||
Liabilities: | ||||||||
| Indebtedness: | ||||||||
| Revolving credit facilities | $ | 102,500 | $ | 186,500 | ||||
| Variable rate unsecured term debt | 150,000 | 300,000 | ||||||
| Unsecured debt | 1,113,479 | 838,996 | ||||||
| Mortgage and other secured debt | 716,876 | 757,635 | ||||||
| 2,082,855 | 2,083,131 | |||||||
| Dividends payable | 43,672 | 43,520 | ||||||
| Other liabilities | 128,385 | 152,992 | ||||||
| 2,254,912 | 2,279,643 | |||||||
| Minority interests | 46,825 | 47,438 | ||||||
| Shareholders’ equity | 1,619,678 | 1,614,070 | ||||||
| $ | 3,921,415 | $ | 3,941,151 | |||||
DEVELOPERS DIVERSIFIED REALTY CORPORATION
Financial Highlights
(in thousands)
Selected Balance Sheet Data (Continued):
Combined condensed balance sheets relating to the Company’s joint ventures are as follows:
| March 31, | December 31, | |||||||
| 2004 | 2003 | |||||||
| Land | $ | 509,845 | $ | 519,846 | ||||
| Buildings | 1,620,366 | 1,692,367 | ||||||
| Fixtures and tenant improvements | 25,903 | 24,985 | ||||||
| Construction in progress | 34,519 | 38,018 | ||||||
| 2,190,633 | 2,275,216 | |||||||
| Accumulated depreciation | (107,183 | ) | (118,755 | ) | ||||
| Real estate, net | 2,083,450 | 2,156,461 | ||||||
| Receivables, including straight line rent, net | 44,161 | 47,165 | ||||||
| Leasehold interests | 27,584 | 28,895 | ||||||
| Other assets | 86,522 | 83,776 | ||||||
| $ | 2,241,717 | $ | 2,316,297 | |||||
| Mortgage debt (a) | $ | 1,262,276 | $ | 1,321,117 | ||||
| Notes and accrued interest payable to DDRC | 16,640 | 31,683 | ||||||
| Amounts payable to other partners | 34,934 | 32,121 | ||||||
| Other liabilities | 73,925 | 80,681 | ||||||
| 1,387,775 | 1,465,602 | |||||||
| Accumulated equity | 853,942 | 850,695 | ||||||
| $ | 2,241,717 | $ | 2,316,297 | |||||
| (a) | The Company’s proportionate share of joint venture debt aggregated approximately $339.6 million and $368.5 million at March 31, 2004 and December 31, 2003, respectively. |
Developers Diversified Realty
Quarterly Financial Supplement
For the Three Months Ended March 31, 2004
FINANCIAL HIGHLIGHTS
(In Thousands Except Per Share Information)
| Three Month | Three Month | |||||||||||||||||||||||
| Period Ended | Period Ended | |||||||||||||||||||||||
| 31-Mar | 31-Mar | Year Ended December 31 | ||||||||||||||||||||||
| 2004 | 2003 | 2003 | 2002 | 2001 | 2000 | |||||||||||||||||||
FUNDS FROM OPERATIONS: | ||||||||||||||||||||||||
| Net Income Applicable to Common Shareholders | $ | 40,182 | $ | 26,510 | (7) | $ | 189,056 | (7) | $ | 69,368 | (7) | $ | 65,111 | $ | 73,571 | |||||||||
| Depreciation and Amortization of Real Estate Investments | $ | 24,757 | $ | 19,721 | $ | 93,173 | $ | 76,462 | $ | 63,200 | $ | 52,975 | ||||||||||||
| Equity in Net Income From Joint Ventures | $ | (18,221 | ) | $ | (10,099 | ) | $ | (52,917 | ) | $ | (32,769 | ) | $ | (17,010 | ) | $ | (17,072 | ) | ||||||
| Equity in Net Income From Minority Equity Investment | $ | 0 | $ | 0 | $ | 0 | $ | 0 | $ | (1,550 | ) | $ | (6,224 | ) | ||||||||||
| Joint Venture Funds From Operations | $ | 12,676 | $ | 7,794 | $ | 47,942 | $ | 44,473 | $ | 31,546 | $ | 30,512 | ||||||||||||
| Minority Equity Investment Funds From Operations | $ | 0 | $ | 0 | $ | 0 | $ | 0 | $ | 6,448 | $ | 14,856 | ||||||||||||
| Operating Partnership Minority Interest Expense | $ | 572 | $ | 377 | $ | 1,770 | $ | 1,450 | $ | 1,531 | $ | 4,126 | ||||||||||||
| Non-Recurring & Extraordinary Charges | $ | 3,001 | $ | 0 | $ | 0 | $ | 0 | $ | 2,895 | $ | 0 | ||||||||||||
| (Gain) Loss on Sales of Real Estate | $ | (160 | ) | $ | 0 | $ | (64,712 | ) | $ | 454 | $ | (16,688 | ) | $ | (23,440 | ) | ||||||||
FUNDS FROM OPERATIONS AVAILABLE TO COMMON SHAREHOLDERS | $ | 62,807 | $ | 44,303 | $ | 214,312 | $ | 159,439 | $ | 135,482 | $ | 129,303 | ||||||||||||
PREFERRED DIVIDENDS | $ | 10,605 | $ | 11,875 | (7) | $ | 51,204 | (7) | $ | 32,602 | (7) | $ | 27,262 | $ | 27,262 | |||||||||
FUNDS FROM OPERATIONS | $ | 73,412 | $ | 56,178 | $ | 265,517 | $ | 192,041 | $ | 162,744 | $ | 156,565 | ||||||||||||
PER SHARE INFORMATION: | ||||||||||||||||||||||||
| Funds From Operations — Diluted | $ | 0.71 | $ | 0.61 | $ | 2.54 | $ | 2.42 | $ | 2.38 | $ | 2.19 | ||||||||||||
| Net Income — Diluted | $ | 0.46 | $ | 0.37 | $ | 2.27 | $ | 1.07 | $ | 1.17 | $ | 1.31 | ||||||||||||
| Cash Dividends | $ | 0.46 | $ | 0.41 | $ | 1.69 | $ | 1.52 | $ | 1.48 | $ | 1.44 | ||||||||||||
WEIGHTED AVERAGE SHARES AND OPERATING PARTNERSHIP UNITS, FFO | 88,908 | 72,287 | 84,319 | 65,910 | 56,957 | 59,037 | ||||||||||||||||||
TOTAL MARKET CAPITALIZATION(1) | $ | 6,162,863 | $ | 4,770,307 | $ | 5,551,748 | $ | 3,460,243 | $ | 2,982,461 | $ | 2,490,917 | ||||||||||||
DEBT TO TOTAL MARKET CAPITALIZATION(1) | 33.70 | % | 45.28 | % | 37.42 | % | 43.10 | % | 43.87 | % | 49.28 | % | ||||||||||||
DEBT TO TOTAL UNDEPRECIATED ASSETS, INVESTMENTS, CASH & NOTES REC. | 48.44 | % | 50.95 | % | 48.68 | % | 48.26 | % | 47.18 | % | 47.82 | % | ||||||||||||
DIVIDEND PAYOUT RATIO(1) | 64.47 | % | 71.35 | %(8) | 65.26 | %(8) | 60.93 | % | 62.53 | % | 65.19 | % | ||||||||||||
GEN. & ADMIN. EXPENSES AS A PERCENTAGE OF TOTAL REVENUES(2) | 5.12 | % | 4.55 | % | 5.35 | % | 4.80 | % | 4.25 | % | 4.27 | % | ||||||||||||
GENERAL AND ADMINISTRATIVE EXPENSES | $ | 10,444 | $ | 7,724 | $ | 40,820 | $ | 29,392 | $ | 24,175 | $ | 20,449 | ||||||||||||
REVENUES: | ||||||||||||||||||||||||
| DDR Revenues | $ | 126,474 | $ | 103,391 | $ | 478,696 | $ | 360,778 | $ | 324,148 | $ | 285,416 | ||||||||||||
| Joint Venture Revenues | $ | 77,422 | $ | 66,286 | $ | 284,158 | $ | 251,905 | $ | 244,663 | $ | 193,275 | ||||||||||||
| TOTAL REVENUES(3) | $ | 203,896 | $ | 169,678 | $ | 762,853 | $ | 612,683 | $ | 568,811 | $ | 478,691 | ||||||||||||
NET OPERATING INCOME: | ||||||||||||||||||||||||
| DDR Net Operating Income | $ | 93,237 | $ | 77,995 | $ | 356,348 | $ | 272,764 | $ | 248,838 | $ | 225,371 | ||||||||||||
| Joint Venture Net Operating Income | $ | 50,475 | $ | 42,472 | $ | 184,927 | $ | 167,573 | $ | 166,545 | $ | 136,440 | ||||||||||||
| TOTAL NET OPERATING INCOME(4) | $ | 143,712 | $ | 120,467 | $ | 541,274 | $ | 440,337 | $ | 415,383 | $ | 361,811 | ||||||||||||
REAL ESTATE AT COST: | ||||||||||||||||||||||||
| DDR Real Estate at Cost | $ | 4,004,187 | $ | 3,899,181 | $ | 3,884,911 | $ | 2,804,056 | $ | 2,493,665 | $ | 2,161,810 | ||||||||||||
| Joint Venture Real Estate at Cost(5) | $ | 2,190,633 | $ | 1,892,548 | $ | 2,275,216 | $ | 1,785,165 | $ | 1,862,515 | $ | 1,522,493 | ||||||||||||
| TOTAL REAL ESTATE AT COST(6) | $ | 6,194,820 | $ | 5,791,729 | $ | 6,160,127 | $ | 4,589,221 | $ | 4,356,179 | $ | 3,684,302 | ||||||||||||
| (1) | See Market Capitalization and Financial Ratio section for detail calculation. | |
| (2) | The calculation includes joint venture revenues. | |
| (3) | Includes revenues from discontinued operations. | |
| (4) | Includes NOI associated with acquisitions, expansions and developments from completion date of said capital transactions. | |
| (5) | Includes FMV purchase price gross up of assets shown as equity investment in joint ventures. | |
| (6) | Includes construction in progress (CIP) at March 31, 2004 of $302.9 million (includes $34.5 million of CIP included in joint ventures, of which $8.9 million represents the Company’s proportionate share), and at December 31, 2003, 2002, 2001, 2000 CIP aggregated $290.7 million $237.8 million, $287.7 million and $305.4 million, respectively. | |
| (7) | Amounts were adjusted to include original issuance costs associated with the redemption of Preferred Operating Partnership Units and preferred stock of $10,710,000 for the year ended December 31, 2003 and $5,543,734 for the year ended December 31, 2002 and $4,990,000 for the quarter ended March 31, 2003 pursuant to EITF topic NO. D-42. | |
| (8) | Includes the full dividend for shares issued in conjunction with the JDN merger during Q-1 2003, however, JDN operating results are only included in FFO subsequent to the merger date of 3/13/03. This number also includes the effect of the Regal Cinema litigation settlement. |
Financial Highlights 2.1
Developers Diversified Realty
Quarterly Financial Supplement
For the Three Months Ended March 31, 2004
MARKET CAPITALIZATION & FINANCIAL RATIOS
| Three Month | ||||||||||||||||||||
| Period Ended | ||||||||||||||||||||
| 31-Mar | Year Ended December 31 | |||||||||||||||||||
| 2004 | 2003 | 2002 | 2001 | 2000 | ||||||||||||||||
DDR RATIO OF DEBT TO TOTAL MARKET CAP: | ||||||||||||||||||||
| Total Debt | $ | 2,077,029 | $ | 2,077,558 | $ | 1,491,481 | $ | 1,308,301 | $ | 1,227,575 | ||||||||||
| Total Market Capitalization* | $ | 6,162,863 | $ | 5,551,748 | $ | 3,460,243 | $ | 2,982,461 | $ | 2,490,917 | ||||||||||
| 33.70 | % | 37.42 | % | 43.10 | % | 43.87 | % | 49.28 | % | |||||||||||
DDR DEBT TO UNDEPRECIATED REAL ESTATE ASSETS, INVESTMENTS AND NOTES RECEIVABLE | 48.44 | % | 48.68 | % | 48.26 | % | 47.18 | % | 47.82 | % | ||||||||||
DDR, INCLUDING PROPORTIONATE SHARE OF JV DEBT, TOTAL MARKET CAPITALIZATION: | ||||||||||||||||||||
| Total Debt* | $ | 2,416,640 | $ | 2,446,026 | $ | 1,878,575 | $ | 1,688,904 | $ | 1,550,398 | ||||||||||
| Total Market Capitalization* | $ | 6,502,473 | $ | 5,920,216 | $ | 3,847,336 | $ | 3,363,064 | $ | 2,813,740 | ||||||||||
| 37.16 | % | 41.32 | % | 48.83 | % | 50.22 | % | 55.10 | % | |||||||||||
DDR & JV DEBT TO UNDEPRECIATED REAL ESTATE ASSETS, INVESTMENTS & NOTES RECEIVABLE | 52.31 | % | 53.79 | % | 54.20 | % | 53.85 | % | 54.54 | % | ||||||||||
INTEREST COVERAGE RATIO: | ||||||||||||||||||||
| Interest Expense | $ | 24,953 | $ | 90,162 | $ | 77,208 | $ | 81,770 | $ | 77,030 | ||||||||||
| FFO Before Interest and Preferred Dividends* | $ | 98,365 | $ | 355,679 | $ | 287,586 | $ | 263,595 | $ | 248,896 | ||||||||||
| 3.94 | 3.94 | 3.72 | 3.22 | 3.23 | ||||||||||||||||
DEBT SERVICE COVERAGE RATIO: | ||||||||||||||||||||
| Debt Service* | $ | 29,356 | $ | 101,890 | $ | 83,958 | $ | 88,764 | $ | 82,103 | ||||||||||
| FFO Before Interest and Preferred Dividends* | $ | 98,365 | $ | 355,679 | $ | 287,586 | $ | 263,595 | $ | 248,896 | ||||||||||
| 3.35 | 3.49 | 3.43 | 2.97 | 3.03 | ||||||||||||||||
FIXED CHARGES (INCLUDING PREFERRED DIVIDENDS) COVERAGE RATIO | ||||||||||||||||||||
| Fixed Charges | $ | 39,961 | $ | 142,385 | $ | 129,353 | $ | 135,107 | $ | 124,666 | ||||||||||
| FFO Before Interest and Preferred Dividends* | $ | 98,365 | $ | 355,679 | $ | 287,586 | $ | 263,595 | $ | 248,896 | ||||||||||
| 2.46 | 2.50 | 2.22 | 1.95 | 2.00 | ||||||||||||||||
DIVIDEND PAYOUT RATIO | ||||||||||||||||||||
| Common Share Dividends and Operating Partnership Interest | $ | 40,493 | $ | 146,846 | $ | 100,531 | $ | 84,721 | $ | 84,297 | ||||||||||
| Funds From Operations exclusive of preferred dividend arising from preferred stock redemption | $ | 62,807 | $ | 225,022 | $ | 164,983 | $ | 135,482 | $ | 129,303 | ||||||||||
| 0.64 | 0.65 | (1) | 0.61 | 0.63 | 0.65 | |||||||||||||||
| * | See Attached for Detail Calculation | |
| (1) | Includes the full dividend for shares issued in conjunction with the JDN merger during Q-1 2003, however, JDN operating results are only included in FFO subsequent to the merger date of 3/13/03. |
Market Capitalization & Financial Ratios 2.2
Developers Diversified Realty
Quarterly Financial Supplement
For the Three Months Ended March 31, 2004
| Three Month | ||||||||||||||||||||
| Period Ended | ||||||||||||||||||||
| 31-Mar | Year Ended December 31 | |||||||||||||||||||
| 2004 | 2003 | 2002 | 2001 | 2000 | ||||||||||||||||
DDR TOTAL MARKET CAPITALIZATION | ||||||||||||||||||||
| Common Shares Outstanding | 86,763 | 86,425 | 66,609 | 59,455 | 54,880 | |||||||||||||||
| Operating Partnership Units Outstanding | 1,129 | 1,129 | 911 | 1,038 | 1,051 | |||||||||||||||
| Total | 87,892 | 87,554 | 67,520 | 60,493 | 55,932 | |||||||||||||||
| Share Price | $ | 40.4000 | $ | 33.5700 | $ | 21.9900 | $ | 19.1000 | $ | 13.3125 | ||||||||||
| Market Value of Common Shares | $ | 3,550,833 | $ | 2,939,190 | $ | 1,484,762 | $ | 1,155,410 | $ | 744,592 | ||||||||||
| Preferred Shares at Book Value | $ | 535,000 | $ | 535,000 | $ | 304,000 | $ | 303,750 | $ | 303,750 | ||||||||||
| Preferred Units and Warrant | $ | 0 | $ | 0 | $ | 180,000 | $ | 215,000 | $ | 215,000 | ||||||||||
| Total Debt | $ | 2,077,029 | $ | 2,077,558 | $ | 1,491,481 | $ | 1,308,301 | $ | 1,227,575 | ||||||||||
| TOTAL MARKET CAPITALIZATION | $ | 6,162,863 | $ | 5,551,748 | $ | 3,460,243 | $ | 2,982,461 | $ | 2,490,917 | ||||||||||
DDR TOTAL MARKET CAPITALIZATION — INCLUDING PROPORTIONATE SHARE OF JV DEBT | ||||||||||||||||||||
| Common Shares Outstanding | 86,763 | 86,425 | 66,609 | 59,455 | 54,880 | |||||||||||||||
| Operating Partnership Units Outstanding | 1,129 | 1,129 | 911 | 1,038 | 1,051 | |||||||||||||||
| Total | 87,892 | 87,554 | 67,520 | 60,493 | 55,932 | |||||||||||||||
| Share Price | $ | 40.4000 | $ | 33.5700 | $ | 21.9900 | $ | 19.1000 | $ | 13.3125 | ||||||||||
| Market Value of Common Shares | $ | 3,550,833 | $ | 2,939,190 | $ | 1,484,762 | $ | 1,155,410 | $ | 744,592 | ||||||||||
| Preferred Shares at Book Value | $ | 535,000 | $ | 535,000 | $ | 304,000 | $ | 303,750 | $ | 303,750 | ||||||||||
| Preferred Units and Warrant | $ | 0 | $ | 0 | $ | 180,000 | $ | 215,000 | $ | 215,000 | ||||||||||
| Total Debt | $ | 2,077,029 | $ | 2,077,558 | $ | 1,491,481 | $ | 1,308,301 | $ | 1,227,575 | ||||||||||
| Proportionate Share of JV Debt | $ | 339,611 | $ | 368,468 | $ | 387,094 | $ | 380,604 | $ | 322,823 | ||||||||||
| TOTAL MARKET CAPITALIZATION | $ | 6,502,473 | $ | 5,920,216 | $ | 3,847,336 | $ | 3,363,064 | $ | 2,813,740 | ||||||||||
Market Capitalization & Financial Ratios 2.2
Developers Diversified Realty
Quarterly Financial Supplement
For the Three Months Ended March 31, 2004
| Three Month | ||||||||||||||||||||
| Period Ended | ||||||||||||||||||||
| 31-Mar | Year Ended December 31 | |||||||||||||||||||
| 2004 | 2003 | 2002 | 2001 | 2000 | ||||||||||||||||
UNDEPRECIATED REAL ESTATE ASSETS, CASH, INVESTMENTS & NOTES RECEIVABLE | ||||||||||||||||||||
| Undepreciated Real Estate Assets | $ | 4,004,187 | $ | 3,884,911 | $ | 2,804,056 | $ | 2,493,665 | $ | 2,161,810 | ||||||||||
| Cash and Cash Equivalents | $ | 27,483 | $ | 111,033 | $ | 16,371 | $ | 19,070 | $ | 4,243 | ||||||||||
| Notes Receivable | $ | 9,873 | $ | 9,813 | $ | 11,662 | $ | 5,221 | $ | 4,824 | ||||||||||
| Advances and Investments in Joint Ventures | $ | 245,905 | $ | 262,072 | $ | 258,611 | $ | 255,327 | $ | 260,927 | ||||||||||
| Minority Equity Investment | $ | 0 | $ | 0 | $ | 0 | $ | 0 | $ | 135,028 | ||||||||||
| $ | 4,287,449 | $ | 4,267,829 | $ | 3,090,699 | $ | 2,773,281 | $ | 2,566,831 | |||||||||||
DDR & JV UNDEPRECIATED REAL ESTATE ASSETS, INVESTMENTS & NOTES RECEIVABLE | ||||||||||||||||||||
| Undepreciated Real Estate Assets | $ | 4,004,187 | $ | 3,884,911 | $ | 2,804,056 | $ | 2,493,665 | $ | 2,161,810 | ||||||||||
| Notes Receivable or Proportionate Share Thereof | $ | 36,643 | $ | 41,018 | $ | 50,521 | $ | 22,000 | $ | 42,187 | ||||||||||
| Minority Equity Investment | $ | 0 | $ | 0 | $ | 0 | $ | 0 | $ | 135,028 | ||||||||||
| Proportionate Share of JV Undepreciated Real Estate Assets | $ | 580,096 | $ | 621,113 | $ | 611,224 | $ | 620,688 | $ | 503,902 | ||||||||||
| $ | 4,620,926 | $ | 4,547,043 | $ | 3,465,801 | $ | 3,136,353 | $ | 2,842,926 | |||||||||||
FUNDS FROM OPERATIONS BEFORE INTEREST AND PREFERRED DIVIDENDS | ||||||||||||||||||||
| FFO | $ | 62,807 | $ | 214,312 | $ | 159,439 | $ | 135,482 | $ | 129,303 | ||||||||||
| Interest Expense | $ | 24,953 | $ | 90,162 | $ | 77,208 | $ | 81,770 | $ | 77,030 | ||||||||||
| Preferred Dividends, Including Preferred Operating Minority Interest & D-42 Dividend | $ | 10,605 | $ | 51,204 | $ | 50,939 | $ | 46,343 | $ | 42,563 | ||||||||||
| $ | 98,365 | $ | 355,679 | $ | 287,586 | $ | 263,595 | $ | 248,896 | |||||||||||
DEBT SERVICE | ||||||||||||||||||||
| Interest Expense | $ | 24,953 | $ | 90,162 | $ | 77,208 | $ | 81,770 | $ | 77,030 | ||||||||||
| Recurring Principal Amortization | $ | 4,403 | $ | 11,728 | $ | 6,750 | $ | 6,994 | $ | 5,073 | ||||||||||
| $ | 29,356 | $ | 101,890 | $ | 83,958 | $ | 88,764 | $ | 82,103 | |||||||||||
FIXED CHARGES | ||||||||||||||||||||
| Debt Service | $ | 29,356 | $ | 101,890 | $ | 83,958 | $ | 88,764 | $ | 82,103 | ||||||||||
| Preferred Dividends, Including Preferred Operating Minority Interest and excluding non-cash | $ | 10,605 | $ | 40,494 | $ | 45,395 | $ | 46,343 | $ | 42,563 | ||||||||||
| D-42 dividend. | $ | 39,961 | $ | 142,385 | $ | 129,353 | $ | 135,107 | $ | 124,666 | ||||||||||
Market Capitalization & Financial Ratios 2.2
Developers Diversified Realty
Quarterly Financial Supplement
For the three months ended March 31, 2004
Significant Accounting Policies
Revenues
| • | Percentage and overage rents are recognized after the tenants reported sales have exceeded the applicable sales breakpoint. | |
| • | Revenues associated with tenant reimbursements are recognized in the period in which the expenses are incurred based upon the provision of tenants’ leases. | |
| • | Lease termination fees are included in other income and recognized upon termination of a tenant’s lease, which generally coincides with the receipt of cash. |
General and Administrative Expenses
| • | General and administrative expenses include internal leasing salaries, legal salaries and related expenses associated with the leasing of space which are charged to operations as incurred. All indirect internal costs associated with acquisitions are expensed as incurred. |
Deferred Financing Costs
| • | Costs incurred in obtaining long-term financing are included in deferred charges and are amortized over the terms of the related debt agreements; such amortization is reflected as interest expense in the consolidated statements of operations. |
Real Estate
| • | Real estate assets are stated at cost less accumulated depreciation, which, in the opinion of management, is not in excess of the individual property’s estimated undiscounted future cash flows, including estimated proceeds from disposition. | |
| • | Depreciation and amortization are provided on a straight-line basis over the estimated useful lives of the assets as follows: |
| Buildings | 18 to 31 years | |
| Furniture/Fixtures | Useful lives, which approximate lease | |
| and Tenant Improvements | terms, where applicable |
Significant Accounting Policies 2.4
Developers Diversified Realty
Quarterly Financial Supplement
For the three months ended March 31, 2004
Significant Accounting Policies (Continued)
| • | Expenditures for maintenance and repairs are charged to operations as incurred. Renovations that improve or extend the life of the asset are capitalized. | |
| • | Included in land is undeveloped real estate, generally outlots or expansion pads adjacent to the shopping centers and enclosed malls owned by the Company. | |
| • | Construction in progress includes shopping center developments and significant expansions and re-developments. |
Capitalization
| • | The Company capitalizes interest on funds used for the construction or expansion of shopping centers. Capitalization of interest ceases when construction activities are completed and the property is available for occupancy by tenants. | |
| • | For the three month period ended March 31, 2004 and the years ended December 31, 2003, 2002, 2001 and 2000, the Company capitalized interest of $2.4 million, $11.4 million, $9.5 million, $12.9 million and $18.2 million, respectively. | |
| • | In addition, the Company capitalized certain construction administration costs of $2.2 million for the three month period ended March 31, 2004 and $5.1 million, $4.5 million, $3.3 million and $3.2 million for the years ended December 31, 2003, 2002, 2001 and 2000, respectively. | |
| • | Interest and real estate taxes incurred during the construction period are capitalized and depreciated over the building life. |
Gain on Sales of Real Estate
| • | Gain on sales of real estate generally related to the sale of outlots and land adjacent to existing shopping centers is recognized at closing when the earnings process is deemed to be complete. |
Significant Accounting Policies 2.4
Developers Diversified Realty
Quarterly Financial Supplement
For the three months ended March 31, 2004
Reconciliation of Supplemental
Non-GAAP Financial Measures
(Dollars in thousands)
(Unaudited)
Table 1 — Developers Diversified Realty Corporation and the Company’s Joint Ventures Combined
Reconciliation of Same Store Net Operating Income (NOI) to Total Revenues and Certain Expenses
| Three Month Period | ||||||||||||||||
| March 31, | ||||||||||||||||
| 2004 | 2003 | |||||||||||||||
| Total Revenues DDR | $ | 126,329 | $ | 102,525 | ||||||||||||
| Total Revenues DDR Combined Joint Ventures | 76,269 | 58,603 | ||||||||||||||
| Operating and Maintenance — DDR | (16,265 | ) | (12,904 | ) | ||||||||||||
| Real Estate Taxes — DDR | (15,870 | ) | (12,130 | ) | ||||||||||||
| Operating and Maintenance — DDR Combined Joint Ventures | (26,705 | ) | (20,452 | ) | ||||||||||||
Combined NOI | $ | 143,758 | $ | 115,642 | ||||||||||||
| Total Same Store NOI | $ | 71,460 | $ | 70,167 | 1.8 | % | ||||||||||
| Property NOI from other operating segments | 72,298 | 45,475 | ||||||||||||||
Combined NOI | $ | 143,758 | $ | 115,642 | ||||||||||||
Non-GAAP Financial Measures 2.5
Developers Diversified Realty
Quarterly Financial Supplement
For the three months ended March 31, 2004
Reconciliation of Supplemental
Non-GAAP Financial Measures
(Dollars in thousands)
(Unaudited)
Table 2 — Developers Diversified Realty Corporation
Reconciliation of Funds From Operations (FFO) to reflect the adjustment of preferred dividend charges in accordance with EITF Topic No. D-42
| Three Month Period | ||||||||||||
| Ended March 31, | ||||||||||||
| 2004 | 2003 | |||||||||||
FUNDS FROM OPERATIONS: | ||||||||||||
| Net Income Applicable to Common Shareholders | $ | 40,182 | $ | 26,510 | ||||||||
| Depreciation and Amortization of Real Estate Investments | 24,757 | 19,721 | ||||||||||
| Equity in Net Income From Joint Ventures | (18,221 | ) | (10,099 | ) | ||||||||
| Joint Venture Funds From Operations | 12,676 | 7,794 | ||||||||||
| Operating Partnership Minority Interest Expense | 572 | 377 | ||||||||||
| Gain on Sales of Real Estate | (160 | ) | — | |||||||||
| Cumulative effect of adoption of a new accounting standard | 3,001 | — | ||||||||||
FUNDS FROM OPERATIONS AVAILABLE TO COMMON SHAREHOLDERS | $ | 62,807 | $ | 44,303 | ||||||||
| Preferred dividend charges in accordance with EITF Topic No. D-42 | 10,604 | 11,875 | ||||||||||
ADJUSTED FUNDS FROM OPERATIONS AVAILABLE TO COMMON SHAREHOLDERS | $ | 73,411 | $ | 56,178 | ||||||||
Non-GAAP Financial Measures 2.5
Developers Diversified Realty
Quarterly Financial Supplement
For the three months ended March 31, 2004
Summary of Wholly Owned and Consolidated Capital Transactions
Acquisitions, Dispositions, Developments & Expansions
for the Three Month Period Ended March 31, 2004
| Three Months | ||||||||||||||||||||
| Ended | Year Ended | Year Ended | Year Ended | Year Ended | ||||||||||||||||
| March 31, | December 31, | December 31, | December 31, | December 31, | ||||||||||||||||
| 2004 | 2003 | 2002 | 2001 | 2000 | ||||||||||||||||
| Acquisitions/Transfers | $ | 100.6 | (2) | $ | 1,363.6 | (4) | $ | 298.6 | (6) | $ | 289.3 | (8) | $ | 81.1 | (9) | |||||
| Completed Expansions | 5.8 | 26.8 | 8.0 | 13.7 | 13.6 | |||||||||||||||
| Developments & Construction in Progress | 29.1 | 104.6 | 66.4 | 72.9 | 81.2 | |||||||||||||||
| Tenant Improvements & Building Renovations(1) | 2.0 | 6.3 | 7.3 | 6.1 | 6.3 | |||||||||||||||
| Furniture Fixtures & Equipment | 0.2 | 1.9 | 2.3 | 2.5 | 0.4 | |||||||||||||||
| 137.7 | 1,503.2 | $ | 382.6 | $ | 384.5 | $ | 182.6 | |||||||||||||
| Less: Real Estate Sales & Joint Venture Transfers | (18.4 | )(3) | (422.4 | )(5) | $ | (72.2 | )(7) | $ | (52.7 | ) | $ | (89.1 | ) | |||||||
| Total DDR Additions (Millions) | $ | 119.3 | $ | 1,080.8 | $ | 310.4 | $ | 331.8 | $ | 93.5 | ||||||||||
| (1) | The Company anticipates recurring capital expenditures, including tenant improvements, of approx. $7.0 million associated with its wholly owned and consolidated portfolio during 2004. |
| (2) | Includes the consolidation of certain joint venture assets aggregating $37.1 million due to FIN 46 and the transfer to DDR from joint venture of the Littleton, CO shopping center, which had a value of $63.5 million. |
| (3) | In addition to the sales listed in the disposition section, this balance includes the sale of several outparcels with an aggregate cost of $9.5 million. |
| (4) | Includes the merger of JDN and the transfer from joint ventures of the Leawood, KS and Suwanee, GA shopping centers, and the consolidation of the assets aggregating $118.2 million owned by DD Development Company. |
| (5) | In addition to the sales listed in the disposition section, which had an aggregate cost of $62.9 million, this balance includes the transfer of seven assets with an aggregate cost of $153.6 million to the joint venture with DDR Markaz LLC (Kuwait Financial Centre), these assets are shopping centers located in Richmond, CA, Winchester, VA, Tampa, FL, Toledo, OH, Highland, IN, Oviedo, FL and Grove City, OH and the sale of several outparcels, which had an aggregate cost of $13.5 million. The balance also includes the transfer of six assets with an aggregate cost of $192.4 million to the Macquarie DDR Trust joint venture, these assets are shopping centers located in Canton, OH, North Olmstead, OH, Independence, MO and St. Paul, MN. |
| (6) | Includes transfers from joint ventures of the Independence, MO shopping center, Phase IV of the Salisbury, MD shopping center, Canton, OH shopping center, Plainville, CT shopping center, and San Antonio, TX shopping center to DDR. |
| (7) | Includes a transfer to joint ventures for the newly developed shopping center in Kildeer, Illinois, the sales of shopping centers located in Cape Coral, Florida, Huntsville, Alabama, Ocala, Florida, Orlando, Florida and St. Louis, Missouri, the sale of three outlots, and a write-off of $5.0 million relating to the former K-mart space at North Little Rock, Arkansas which is being redeveloped. |
| (8) | The balance reflects the consolidation of the assets formerly owned by American Industrial Properties (AIP) which was merged during 2nd quarter 2001. |
| (9) | Includes transfers to DDR in the aggregate amount of $76.7 million relating to the Nassau Pavilion development project, two former DDR/Oliver McMillan projects, and Phase II of the Salisbury, MD development project. All of which were previously accounted for through joint ventures. |
Summary of Wholly Owned Capital Transactions 3.1
Developers Diversified Realty
Quarterly Financial Supplement
For the three months ended March 31, 2004
There were no wholly owned or consolidated retail acquisitions
for the three month period ended March 31, 2004
Wholly Owned and Consolidated Dispositions
for the Three Month Period Ended March 31, 2004
| Gross Sale | ||||||||||||
| Proceeds | ||||||||||||
| Property Location | GLA | (Millions) | Sale Date | |||||||||
| Trinidad, CO | 63,836 | 1.0 | 2/13/2004 | |||||||||
| North Olmsted, OH | 64,950 | $ | 5.6 | 3/17/2004 | ||||||||
| Total | 128,786 | $ | 6.6 | |||||||||
Wholly Owned Acquisitions and Dispositions 3.2
Developers Diversified Realty
Quarterly Financial Supplement
For the three months ended March 31, 2004
Wholly Owned and Consolidated
Expansion and Redevelopment Projects
for the Three Month Period Ended March 31, 2004
Projects Completed | ||||
| N. Little Rock, AR | Demolished the former Kmart space to construct a Bed, Bath & Beyond (opened 9/02), Sports Authority (opened 8/03), and Michael’s (opened 04/04). | |||
Total Net Cost (Millions) | $ | 5.8 | ||
Projects in Progress | ||||
| Tallahassee, FL | Retenanting of former Lowe’s with Bealls, Cato and It’s Fashion. | |||
| Suwanee, GA | Retenanting of former K-Mart with PetsMart and Shoe Gallery. | |||
| Starksville, MS | Retenanting of former Wal-Mart with Lowe’s Home Improvements and the relocation of Dollar Tree, Cato, It’s Fashion and Hibbetts. | |||
| Princeton, NJ | Expansion of the existing center to create a 37,200 sf Babies ‘R Us and additional 39,600 sf of retail space. | |||
| Aurora, OH | Expansion of the existing center to create a 38,000 sf Marquee Theatre (scheduled to open in 2nd Quarter 2004). | |||
| Tiffin, OH | Retenanting the former Kmart with Marquee Theatre (scheduled to open 2nd Quarter 2004) and 15,000 sf of additional retail space. | |||
| Monaca, PA | Expansion of the existing center to create 38,000 sf Cinemark Theater (scheduled to open 2nd quarter 2004) and 6,160 sf of retail space. | |||
| Chattanooga, TN | Retenanting of former K-Mart with Hobby Lobby and Fresh Market. | |||
Total Net Cost (Millions) | $ | 38.8 | ||
Projects to Commence Construction | ||||
| Gadsden, AL | Break-up of 64,400sf building to create 20,000 sf Fred’s and two mid-size retail units. | |||
| Brandon, FL | Recapture 23,391 sf from The Sports Authority and release to PetsMart. | |||
| Hendersonville, NC | Recapture of former Wal-Mart space; demolition of 45,000 sq ft for Epic Theater, Big Lots and 32,000 sf of retail space. | |||
| Allentown, PA | Construction of 18,200 sf outparcel building for retail tenants. | |||
| Brentwood, TN | Recapture The Sports Authority space and release the space to Ross Dress for Less and other retail tenants. | |||
Wholly Owned Expansions and Redevelopments 3.2
Developers Diversified Realty
Quarterly Financial Supplement
For the three months ended March 31, 2004
Summary of Wholly Owned and Consolidated Development Projects
for the Three Month Period Ended March 31, 2004
| Substantial | ||||||||||||||
| Net Cost | Completion | |||||||||||||
| GLA | (Millions) | Date | Major Tenants | |||||||||||
Projects Substantially Completed | ||||||||||||||
| Hamilton, NJ | 506,461 | $ | 79.5 | 1st Half 2004 | Wal-Mart, Lowe’s, BJ’s Wholesale, Kohl’s, Michaels, PetsMart, Famous Footwear, Ross Dress for Less, Pier One, Linens ‘N Things, Shop-Rite, and Barnes & Noble | |||||||||
Projects in Progress | ||||||||||||||
| Long Beach, CA (The Pike at Rainbow Harbor) Phase I | 346,233 | $ | 128.8 | 2nd Half 2003 and 2004 | Cinemark Theater, Gameworks, Carnival Club, Gladstones, Outback Steakhouse, Island Burgers, Bubba Gump Shrimp, California Pizza Kitchen, Kelly’s Coffee, Sharkies Woodfired Mexican Grill, Cold Stone Creamery, Candy Bouquet, Extreme Pizza, Great Steak and Potato Company, Laugh Factory and Auld Dubliner | |||||||||
| Fort Collins, CO | 18,540 | $ | 4.2 | 2004 | Wal-Mart, Home Depot and additional small shops and outparcels | |||||||||
| Overland Park, KS | 94,183 | $ | 10.4 | 2004 | Home Depot, Sam’s Club, Aldi’s Grocery, Party City, Goodyear Tire, Bank of America, Babies ‘R Us and 23,325 sf of additional retail space | |||||||||
| Chesterfield, MI | 101,200 | $ | 12.7 | 2005 | 45,000 sf of small shop retail. | |||||||||
| Lansing, MI | 165,869 | $ | 14.3 | 2005 | Wal-Mart, Lowe’s, Michael’s, Gander Mountain, Subway, Hallmark | |||||||||
| St. Louis, MO | 98,827 | $ | 14.0 | 2004 | PetsMart, Office Max, Walgreens and other retail tenants to be announced | |||||||||
| Apex, NC (Phase I & II) | 461,244 | $ | 26.1 | 2004 | Target, Lowe’s, Office Max, PetsMart, Linens ‘N Things, and other retail tenants and outparcels to be announced | |||||||||
| Mt. Laurel, NJ | 720,625 | $ | 58.4 | 2004 & 2005 | Target, Wegman’s, Costco, Bed, Bath & Beyond and other retail tenants and outparcels to be announced | |||||||||
| Pittsburgh, PA | 340,971 | $ | 26.5 | 2005 | Target, Sportsmans Warehouse and other retail to be announced | |||||||||
| Irving, TX | 312,126 | $ | 28.3 | 2004 | Wal-Mart, Sam’s Club, Kohl’s, PetsMart, Marquee Theater, Office Max | |||||||||
| Mesquite, TX | 213,665 | $ | 28.8 | 1st Half 2004 | Michael’s, Linens ‘N Things, Ross Dress for Less, Ultimate Electronics, Dress Barn, Famous Footwear | |||||||||
Projects to Commence Construction | ||||||||||||||
| Miami, FL | 609,606 | $ | 86.0 | 2005 | To be announced | |||||||||
| Norwood, MA | 115,147 | $ | 9.3 | 2005 | To be announced | |||||||||
| Freehold, NJ | 499,204 | $ | 25.2 | 2005 | Wal-Mart and Sam’s Club and other retail tenants and outparcels to be announced. | |||||||||
| McKinney, TX (Phase II) | 87,757 | $ | 7.3 | 2004 | To be announced | |||||||||
| Wholly Owned Development Totals | 4,185,197 | $ | 559.8 | |||||||||||
Wholly Owned Developments 3.2
Developers Diversified Realty
Quarterly Financial Supplement
For the three months ended March 31, 2004
Wholly Owned and Consolidated Development
Assets Placed in Service as of March 31, 2004
| Assets Placed in Service | ||||
| Date | (Millions) | |||
| As of December 31, 2003 | $ | 179.6 | ||
| 1st Quarter 2004 | $ | 12.4 | ||
| 2nd Quarter 2004 | $ | 25.9 | ||
| 3rd Quarter 2004 | $ | 29.6 | ||
| 4th Quarter 2004 | $ | 59.3 | ||
| Thereafter | $ | 253.0 | ||
| Total | $ | 559.8 | ||
Wholly Owned and Consolidated Development
Funding Schedule as of March 31, 2004
| Funded as of March 31, 2004 | $ | 355.6 | ||
| Projected Net Funding During 2004 | $ | 104.6 | (1) | |
| Projected Net Funding Thereafter | $ | 99.6 | (1) | |
| Total | $ | 559.8 | ||
| (1) | Amount will be reduced by the additional proceeds to be obtained through the construction loans and proceeds from land sales. |
Wholly Owned Development Delivery and Funding Schedules 3.2
Developers Diversified Realty Corporation
Quarterly Financial Supplement
For the three months ended March 31, 2004
Summary of Consolidated Debt
as of March 31, 2004
| Mortgage | Maturity | Interest | ||||||||||||||
| Balance(000’s) | Date | Rate(1) | ||||||||||||||
SENIOR DEBT: | ||||||||||||||||
| Unsecured Credit Facility: | ||||||||||||||||
| $650 Million Revolving Credit Facility | $ | 100,000 | (2) | 05/06 | 2.865 | |||||||||||
| $150 Million Term Loan | 150,000 | 09/04 | 2.090 | |||||||||||||
| Secured Credit Facility: | ||||||||||||||||
| $30 Million Revolving Credit Facility | 2,500 | 06/06 | 2.090 | |||||||||||||
| Total Credit Facility Debt | 252,500 | |||||||||||||||
Public Debt: | ||||||||||||||||
| Medium Term Notes | F | 10,000 | 07/04 | 6.900 | ||||||||||||
| Medium Term Notes | F | 5,000 | 07/04 | 6.940 | ||||||||||||
| Medium Term Notes | F | 50,000 | (3) | 12/04 | 6.840 | |||||||||||
| Medium Term Notes | F | 1,000 | 11/05 | 7.280 | ||||||||||||
| Medium Term Notes | F | 96,284 | (4) | 03/07 | 7.000 | |||||||||||
| Medium Term Notes | F | 10,000 | 07/07 | 6.950 | ||||||||||||
| Medium Term Notes | F | 2,000 | 12/07 | 7.050 | ||||||||||||
| Medium Term Notes | F | 99,902 | 01/08 | 6.625 | ||||||||||||
| Medium Term Notes | F | 273,894 | 01/09 | 3.875 | ||||||||||||
| Medium Term Notes | F | 299,574 | 07/10 | 4.625 | ||||||||||||
| Medium Term Notes | F | 100,000 | 07/18 | 7.500 | ||||||||||||
| Unsecured Notes | F | 75,000 | 08/04 | 6.800 | ||||||||||||
| Unsecured Notes | F | 85,000 | 08/07 | 6.950 | ||||||||||||
| Total Public Debt | 1,107,654 | |||||||||||||||
MORTGAGE DEBT: | ||||||||||||||||
| Plainville, CT | F | 7,260 | 04/21 | 7.125 | ||||||||||||
| Bayonet Point, FL | F | 5,327 | 08/06 | 9.750 | ||||||||||||
| Tupelo, MS | F | 11,957 | 03/08 | 4.410 | ||||||||||||
| Jacksonville, FL | F | 6,861 | 03/08 | 4.410 | ||||||||||||
| Denver, CO (Univ Hills) | F | 29,251 | 06/12 | 7.300 | ||||||||||||
| Henderson, TN | F | 9,593 | 01/19 | 7.660 | ||||||||||||
| Brown Deer, WI | F | 3,133 | 08/09 | 7.750 | ||||||||||||
| Allentown, PA | F | 19,103 | 06/21 | 6.950 | ||||||||||||
| Erie, PA | F | 25,784 | 04/11 | 6.880 | ||||||||||||
| Erie, PA | F | 2,975 | 04/11 | 6.880 | ||||||||||||
| Martinsville, VA | F | 19,995 | 12/09 | 8.460 | ||||||||||||
| Boardman, OH | F | 26,776 | 04/11 | 6.880 | ||||||||||||
| Solon, OH | F | 16,564 | 03/08 | 4.410 | ||||||||||||
| St. Louis, MO (Sunset) | F | 34,709 | 04/11 | 6.880 | ||||||||||||
| St. Louis, MO (Brentwood) | F | 25,784 | 04/11 | 6.880 | ||||||||||||
Summary of Consolidated Debt 3.3
Developers Diversified Realty Corporation
Quarterly Financial Supplement
For the three months ended March 31, 2004
Summary of Consolidated Debt
as of March 31, 2004 (con’t)
| Mortgage | Maturity | Interest | ||||||||||||||
| Balance | Date | Rate(1) | ||||||||||||||
| Denver, CO (Centennial) | F | $ | 38,676 | 04/11 | 6.880 | |||||||||||
| Cedar Rapids, IA | F | 10,285 | 01/20 | 9.375 | ||||||||||||
| St. Louis, MO (Olympic) | F | 3,761 | 08/07 | 9.150 | ||||||||||||
| St. Louis, MO (Gravois) | F | 2,032 | 07/12 | 8.625 | ||||||||||||
| St. Louis, MO (Keller) | F | 1,803 | 01/10 | 8.625 | ||||||||||||
| N. Charleston, SC | F | 11,859 | 03/08 | 4.410 | ||||||||||||
| Sault St. Marie, MI | F | 3,177 | 05/07 | 8.375 | ||||||||||||
| Walker, MI | F | 8,723 | 03/08 | 4.410 | ||||||||||||
| Detroit, MI | F | 4,500 | 09/05 | 7.375 | ||||||||||||
| Mt. Pleasant, SC (GS II) | F | 8,037 | 03/08 | 4.410 | ||||||||||||
| Meridian, ID (GS II) | F | 25,972 | 03/08 | 4.410 | ||||||||||||
| Logan, UT | F | 738 | 06/12 | 8.750 | ||||||||||||
| Riverdale, UT (North) | F | 9,161 | 10/20 | 9.300 | ||||||||||||
| Salt Lake City, UT (Hermes) | F | 204 | 08/04 | 5.900 | ||||||||||||
| Birmingham, AL (GS II) | F | 28,129 | 03/08 | 4.410 | ||||||||||||
| Wilmington, NC | F | 21,562 | 03/08 | 4.410 | ||||||||||||
| Berlin, VT | F | 4,940 | 08/07 | 9.750 | ||||||||||||
| Brainerd, MN | F | 145 | 02/05 | 6.800 | ||||||||||||
| Spring Hill, FL | F | 5,429 | 09/19 | 9.750 | ||||||||||||
| West Pasco, FL | F | 4,784 | 02/12 | 9.625 | ||||||||||||
| Princeton, NJ | F | 26,300 | 03/27 | 8.262 | ||||||||||||
| Woodmont — Riverchase | F | 8,077 | 01/13 | 5.500 | ||||||||||||
| Leawood, KS | F | 52,220 | 07/09 | 7.310 | ||||||||||||
| Durham, NC | F | 7,351 | 03/08 | 4.410 | ||||||||||||
| Bellefontaine, OH | F | 2,574 | 12/16 | 7.500 | ||||||||||||
| Dublin, OH | F | 9,644 | 09/06 | 8.375 | ||||||||||||
| Pickerington, OH | F | 4,451 | 12/06 | 8.250 | ||||||||||||
| Dallas, TX (Carpenter) | F | 28,329 | 01/08 | 7.250 | ||||||||||||
| Silver Springs, MD (Tech 29-1) | F | 6,989 | 02/09 | 7.330 | ||||||||||||
| Silver Springs, MD (Tech 29-2) | F | 3,533 | 09/06 | 9.050 | ||||||||||||
| Hamilton, NJ | F | 30,000 | 05/05 | 2.942 | ||||||||||||
| Hamilton, NJ | V | 26,005 | 05/05 | 2.740 | ||||||||||||
| Princeton, NJ | V | 24,999 | 09/25 | 2.590 | ||||||||||||
| Coon Rapids, MN | V | 1 | 06/05 | 2.590 | ||||||||||||
Summary of Consolidated Debt 3.3
Developers Diversified Realty Corporation
Quarterly Financial Supplement
For the three months ended March 31, 2004
Summary of Consolidated Debt
as of March 31, 2004 (con’t)
| Mortgage | Maturity | Interest | ||||||||||||||
| Balance | Date | Rate(1) | ||||||||||||||
| San Antonio, TX | V | $ | 1 | 07/06 | 2.590 | |||||||||||
| RVIP I, Best Products | V | $ | 411 | 08/04 | 2.840 | |||||||||||
| Littleton, CO | V | 47,002 | 05/04 | 2.940 | ||||||||||||
| Total Mortgage Debt | 716,876 | |||||||||||||||
| Total Debt | $ | 2,077,029 | ||||||||||||||
| Adjustment for Reverse Swap | 5,825 | (5) | ||||||||||||||
| $ | 2,082,855 | |||||||||||||||
| Weighted Average — Total | 5.37 years | 5.1 | % | |||||||||||||
| Weighted Average — Fixed | 5.94 years | �� | 5.6 | % | ||||||||||||
| Weighted Average — Floating | 2.56 years | 2.7 | % | |||||||||||||
Notes:
| F | — | Fixed Rate Debt |
| V | — | Variable Rate Debt |
| 1. | Interest rate figures reflect coupon rates of interest and do not include discounts or premiums. Annualized deferred finance cost amortization is approximately $3.0 million, net. | |
| 2. | Senior debt of $100 million has been converted to a fixed LIBOR rate of 1.865%. The fixed all-in rate is 2.865%. | |
| 3. | Public debt of $40 million has been converted to a variable rate of 3.74%. The remaining balance of $10 million is at the stated fixed rate. | |
| 4. | Public debt of $60 million has been converted to a variable rate of 3.065%. The remaining balance of $36.0 million is at the stated fixed rate. | |
| 5. | Offset included in other assets. |
Summary of Consolidated Debt 3.3
Developers Diversified Realty Corporation
Quarterly Financial Supplement
For the three months ended March 31, 2004
Summary of Consolidated Mortgage Principal Payments
and Corporate Debt Maturities
as of March 31, 2004
(000’s)
| 2004 | 2005 | 2006 | 2007 | 2008 | 2009 | 2010 | 2011 | 2012 | 2013 | |||||||||||||||||||||||||||||||||||||||
| Payments | Payments | Payments | Payments | Payments | Payments | Payments | Payments | Payments | Payments | Thereafter | Total | |||||||||||||||||||||||||||||||||||||
PROPERTY MORTGAGES | ||||||||||||||||||||||||||||||||||||||||||||||||
| Plainville, CT (TIF) | 7,260 | 7,260 | ||||||||||||||||||||||||||||||||||||||||||||||
| Bayonet Point, FL | 5,327 | 5,327 | ||||||||||||||||||||||||||||||||||||||||||||||
| Tupelo, MS | 273 | 287 | 300 | 313 | 10,852 | 12,025 | ||||||||||||||||||||||||||||||||||||||||||
| Jacksonville, FL | 156 | 164 | 172 | 180 | 6,227 | 6,900 | ||||||||||||||||||||||||||||||||||||||||||
| Denver, CO (Univ Hills) | 486 | 522 | 562 | 604 | 650 | 699 | 752 | 809 | 24,286 | 29,370 | ||||||||||||||||||||||||||||||||||||||
| Henderson, TN | 339 | 366 | 395 | 426 | 460 | 497 | 536 | 578 | 624 | 674 | 4,782 | 9,676 | ||||||||||||||||||||||||||||||||||||
| Brown Deer, WI | 475 | 513 | 554 | 599 | 647 | 460 | 3,248 | |||||||||||||||||||||||||||||||||||||||||
| Allentown, PA | 580 | 621 | 666 | 714 | 765 | 820 | 879 | 942 | 1,009 | 1,082 | 11,168 | 19,245 | ||||||||||||||||||||||||||||||||||||
| Erie, PA | 250 | 273 | 293 | 314 | 331 | 360 | 386 | 23,641 | 25,847 | |||||||||||||||||||||||||||||||||||||||
| Erie, PA | 28 | 31 | 33 | 36 | 38 | 41 | 44 | 2,732 | 2,983 | |||||||||||||||||||||||||||||||||||||||
| Martinsville, VA | 182 | 203 | 221 | 241 | 258 | 18,936 | 20,041 | |||||||||||||||||||||||||||||||||||||||||
| Boardman, OH | 259 | 283 | 303 | 325 | 343 | 373 | 400 | 24,556 | 26,842 | |||||||||||||||||||||||||||||||||||||||
| Solon, OH | 378 | 397 | 415 | 434 | 15,033 | 16,657 | ||||||||||||||||||||||||||||||||||||||||||
| St. Louis, MO (Sunset) | 335 | 366 | 392 | 421 | 444 | 483 | 518 | 31,836 | 34,795 | |||||||||||||||||||||||||||||||||||||||
| St. Louis, MO (Brentwood) | 250 | 273 | 293 | 314 | 331 | 360 | 386 | 23,641 | 25,847 | |||||||||||||||||||||||||||||||||||||||
| Denver, CO (Centennial) | 374 | 408 | 438 | 469 | 496 | 539 | 578 | 35,469 | 38,771 | |||||||||||||||||||||||||||||||||||||||
| Cedar Rapids, IA | 287 | 315 | 346 | 380 | 417 | 458 | 503 | 552 | 606 | 665 | 5,825 | 10,354 | ||||||||||||||||||||||||||||||||||||
| St. Louis, MO (Olympic) | 306 | 335 | 367 | 2,826 | 3,835 | |||||||||||||||||||||||||||||||||||||||||||
| St. Louis, MO (Gravois) | 282 | 310 | 355 | 389 | 292 | 115 | 125 | 136 | 147 | 2,150 | ||||||||||||||||||||||||||||||||||||||
| St. Louis, MO (Keller) | 243 | 265 | 289 | 315 | 343 | 374 | 33 | 1,862 | ||||||||||||||||||||||||||||||||||||||||
| N. Charleston, SC | 270 | 284 | 297 | 311 | 10,763 | 11,926 | ||||||||||||||||||||||||||||||||||||||||||
| Sault St Marie, MI | 911 | 990 | 1,079 | 418 | 3,398 | |||||||||||||||||||||||||||||||||||||||||||
| Walker, MI | 199 | 209 | 219 | 229 | 7,917 | 8,772 | ||||||||||||||||||||||||||||||||||||||||||
| Detroit, MI | 2,800 | 3,189 | 5,989 | |||||||||||||||||||||||||||||||||||||||||||||
| Mt. Pleasant, SC | 183 | 193 | 201 | 211 | 7,294 | 8,082 | ||||||||||||||||||||||||||||||||||||||||||
| Merridian, ID | 592 | 623 | 651 | 681 | 23,573 | 26,120 | ||||||||||||||||||||||||||||||||||||||||||
| Logan, UT | 63 | 68 | 74 | 81 | 89 | 97 | 105 | 115 | 61 | 754 | ||||||||||||||||||||||||||||||||||||||
| Riverdale, UT (North) | 238 | 261 | 287 | 315 | 345 | 379 | 415 | 456 | 500 | 548 | 5,475 | 9,218 | ||||||||||||||||||||||||||||||||||||
| Salt Lake City, UT | 315 | 315 | ||||||||||||||||||||||||||||||||||||||||||||||
| Birmingham, AL | 642 | 674 | 705 | 737 | 25,530 | 28,288 | ||||||||||||||||||||||||||||||||||||||||||
| Wilmington, NC | 492 | 517 | 541 | 565 | 19,570 | 21,684 | ||||||||||||||||||||||||||||||||||||||||||
| Berlin, VT | 4,940 | 4,940 | ||||||||||||||||||||||||||||||||||||||||||||||
| Brainerd, MN ( K-Mart) | 140 | 75 | 215 | |||||||||||||||||||||||||||||||||||||||||||||
| Spring Hill, FL | 154 | 170 | 187 | 206 | 227 | 251 | 276 | 304 | 335 | 370 | 2,985 | 5,467 | ||||||||||||||||||||||||||||||||||||
| West Pasco, FL | 4,784 | 4,784 | ||||||||||||||||||||||||||||||||||||||||||||||
| Princeton, NJ | 323 | 358 | 389 | 423 | 454 | 499 | 543 | 590 | 636 | 697 | 21,468 | 26,381 | ||||||||||||||||||||||||||||||||||||
| Hoover, AL (Riverchase) | 108 | 116 | 122 | 129 | 136 | 145 | 153 | 162 | 170 | 6,864 | 8,104 | |||||||||||||||||||||||||||||||||||||
| Leawood, KS | 1,038 | 1,117 | 1,201 | 1,292 | 1,390 | 46,435 | 52,473 | |||||||||||||||||||||||||||||||||||||||||
| Durham, NC | 168 | 176 | 184 | 193 | 6,672 | 7,392 | ||||||||||||||||||||||||||||||||||||||||||
| Bellefontaine, OH | 123 | 133 | 143 | 154 | 166 | 179 | 193 | 208 | 224 | 241 | 842 | 2,604 | ||||||||||||||||||||||||||||||||||||
Summary of Consolidated Mortgage Principal Payments and Corporate Debt Maturities 3.4
Developers Diversified Realty Corporation
Quarterly Financial Supplement
For the three months ended March 31, 2004
Summary of Consolidated Mortgage Principal Payments
and Corporate Debt Maturities
as of March 31, 2004 (con’t)
| 2004 | 2005 | 2006 | 2007 | 2008 | 2009 | 2010 | 2011 | 2012 | 2013 | |||||||||||||||||||||||||||||||||||||||
| Payments | Payments | Payments | Payments | Payments | Payments | Payments | Payments | Payments | Payments | Thereafter | Total | |||||||||||||||||||||||||||||||||||||
| Dublin, OH | 248 | 270 | 9,185 | 9,704 | ||||||||||||||||||||||||||||||||||||||||||||
| Pickerington, OH | 202 | 219 | 4,079 | 4,500 | ||||||||||||||||||||||||||||||||||||||||||||
| Dallas, TX (Carpenter) | 455 | 489 | 525 | 565 | 26,406 | 28,440 | ||||||||||||||||||||||||||||||||||||||||||
| Silver Springs, MD (Tech 29-1) | 145 | 158 | 170 | 183 | 196 | 6,173 | 7,025 | |||||||||||||||||||||||||||||||||||||||||
| Silver Springs, MD (Tech 29-2) | 85 | 93 | 3,376 | 3,554 | ||||||||||||||||||||||||||||||||||||||||||||
| Princeton, NJ (Nassau Pav) | 24,999 | 24,999 | ||||||||||||||||||||||||||||||||||||||||||||||
| San Antonio, TX | 1 | 1 | ||||||||||||||||||||||||||||||||||||||||||||||
| RVIP I, Best Products | 2,254 | 2,254 | ||||||||||||||||||||||||||||||||||||||||||||||
| Payments Made Through 03/31/04 | -6,549 | -6,549 | ||||||||||||||||||||||||||||||||||||||||||||||
| Total — Property Mortgages | 11,081 | 16,314 | 35,340 | 20,932 | 168,653 | 78,670 | 6,823 | 146,726 | 33,382 | 11,141 | 84,804 | 613,867 | ||||||||||||||||||||||||||||||||||||
CONSTRUCTION LOANS | ||||||||||||||||||||||||||||||||||||||||||||||||
| $34.4 Million Construction Loan | 1 | 1 | ||||||||||||||||||||||||||||||||||||||||||||||
| (National City Bank) | ||||||||||||||||||||||||||||||||||||||||||||||||
| Littleton, CO | 47,002 | 47,002 | ||||||||||||||||||||||||||||||||||||||||||||||
| Hamilton, NJ | 56,005 | 56,005 | ||||||||||||||||||||||||||||||||||||||||||||||
| Total — Construction Loans | 47,002 | 56,006 | 0 | 0 | 0 | 0 | 0 | 0 | 0 | 0 | 0 | 103,009 | ||||||||||||||||||||||||||||||||||||
DEBT OFFERINGS | ||||||||||||||||||||||||||||||||||||||||||||||||
| Senior Notes | 65,000 | 1,000 | 108,284 | 99,902 | 273,894 | 299,574 | �� | 100,000 | 947,654 | |||||||||||||||||||||||||||||||||||||||
| Unsecured Notes | 75,000 | 85,000 | 160,000 | |||||||||||||||||||||||||||||||||||||||||||||
| Total — Debt Offerings | 140,000 | 1,000 | 0 | 193,284 | 99,902 | 273,894 | 299,574 | 0 | 0 | 0 | 100,000 | 1,107,654 | ||||||||||||||||||||||||||||||||||||
| Total — Property Mortgages, | 198,083 | 73,321 | 35,340 | 214,216 | 268,555 | 352,564 | 306,397 | 146,726 | 33,382 | 11,141 | 184,804 | 1,824,529 | ||||||||||||||||||||||||||||||||||||
| Construction Loans & Debt Offerings | ||||||||||||||||||||||||||||||||||||||||||||||||
REVOLVING CREDIT FACILITIES | ||||||||||||||||||||||||||||||||||||||||||||||||
| $650 Million Unsecured Credit | 100,000 | (1) | 100,000 | |||||||||||||||||||||||||||||||||||||||||||||
| (Bank One) | ||||||||||||||||||||||||||||||||||||||||||||||||
| $150 Million Unsecured Credit | 150,000 | (1) | 150,000 | |||||||||||||||||||||||||||||||||||||||||||||
| (Bank of America) | ||||||||||||||||||||||||||||||||||||||||||||||||
| $30 Million Revolving Credit | 2,500 | (3) | 2,500 | |||||||||||||||||||||||||||||||||||||||||||||
| (National City Bank) | ||||||||||||||||||||||||||||||||||||||||||||||||
| Total — Debt | 348,083 | 73,321 | 137,840 | 214,216 | 268,555 | 352,564 | 306,397 | 146,726 | 33,382 | 11,141 | 184,804 | 2,077,029 | ||||||||||||||||||||||||||||||||||||
Notes:
| (1) | Balance at March 31, 2004 on $150 million term loan — (six month extension available until March 2005). | |
| (2) | Balance at March 31, 2004 on revolving construction credit facilities. | |
| (3) | Balance at March 31, 2004 on $30 million revolving credit facility. |
Summary of Consolidated Mortgage Principal Payments and Corporate Debt Maturities 3.4
Developers Diversified Realty
Quarterly Financial Supplement
For the three months ended March 31, 2004
Joint Ventures (Combining Financial Information) (1)
(in millions)
Combining Balance Sheets
as of March 31, 2004
| RVIP III B | RVIP VIII | Community | Community | Community | ||||||||||||||||||||||||||||||||||||
| RVIP III | Deer Park, IL | RVIP VI | RVIP VII | Tech Ridge LLC | Centers | Centers Four | Centers Five | |||||||||||||||||||||||||||||||||
| Real Estate Assets | $ | 55.6 | $ | 76.5 | $ | 31.7 | $ | 217.1 | $ | 25.5 | $ | 0.0 | $ | 0.0 | $ | 249.7 | ||||||||||||||||||||||||
| Accumulated Depreciation | (1.3 | ) | (5.6 | ) | (3.1 | ) | (14.4 | ) | (0.3 | ) | 0.0 | 0.0 | (29.0 | ) | ||||||||||||||||||||||||||
| Real Estate, net | 54.3 | 70.9 | 28.6 | 202.7 | 25.2 | 0.0 | 0.0 | 220.7 | ||||||||||||||||||||||||||||||||
| Receivables, Net | 1.7 | 1.1 | 0.8 | 0.4 | (0.4 | ) | 2.6 | 0.6 | 7.2 | |||||||||||||||||||||||||||||||
| Other assets | 1.0 | 1.2 | 1.4 | 17.4 | 3.3 | 3.9 | 0.2 | 7.0 | ||||||||||||||||||||||||||||||||
| $ | 57.0 | $ | 73.2 | $ | 30.8 | $ | 220.4 | $ | 28.1 | $ | 6.5 | $ | 0.8 | $ | 234.9 | |||||||||||||||||||||||||
| Mortgage Debt | $ | 29.7 | $ | 50.8 | $ | 18.6 | $ | 81.3 | $ | 26.9 | $ | 0.0 | $ | 0.0 | $ | 156.0 | ||||||||||||||||||||||||
| Amounts payable to DDRC | 0.0 | 0.0 | 0.0 | 0.0 | 0.0 | 0.0 | 0.0 | 0.0 | ||||||||||||||||||||||||||||||||
| Other liabilities | 0.5 | 2.7 | 0.9 | 18.5 | 0.4 | 5.5 | 0.4 | 4.2 | ||||||||||||||||||||||||||||||||
| 30.2 | 53.5 | 19.5 | 99.8 | 27.3 | 5.5 | 0.4 | 160.2 | |||||||||||||||||||||||||||||||||
| Accumulated equity (deficit) | 26.8 | 19.7 | 11.3 | 120.6 | 0.8 | 1.0 | 0.4 | 74.7 | ||||||||||||||||||||||||||||||||
| $ | 57.0 | $ | 73.2 | $ | 30.8 | $ | 220.4 | $ | 28.1 | $ | 6.5 | $ | 0.8 | $ | 234.9 | |||||||||||||||||||||||||
| Proportionate share of other assets/liabilities, net | $ | 0.0 | ($0.1 | ) | $ | 0.3 | ($0.2 | ) | $ | 0.3 | $ | 0.2 | $ | 0.1 | $ | 5.0 | ||||||||||||||||||||||||
| Disproportionate amount payable to DDR | $ | 0.0 | $ | 0.0 | $ | 0.0 | $ | 0.0 | $ | 0.0 | $ | 0.0 | $ | 0.0 | $ | 0.0 | ||||||||||||||||||||||||
Combining Statements of Operations for the period ended March 31, 2004 | ||||||||||||||||||||||||||||||||||||||||
| RVIP III B | RVIP VIII | Community | Community | Community | ||||||||||||||||||||||||||||
| RVIP III | Deer Park, IL | RVIP VI | RVIP VII | Tech Ridge LLC | Centers | Centers Four | Centers Five | |||||||||||||||||||||||||
| Revenues from operations | $ | 1.6 | $ | 2.8 | $ | 1.2 | $ | 6.4 | $ | 1.6 | $ | 0.0 | $ | 0.0 | $ | 8.7 | ||||||||||||||||
| Rental operation expenses | (0.5 | ) | (1.0 | ) | (0.6 | ) | (2.2 | ) | (0.2 | ) | (0.1 | ) | 0.0 | (2.6 | ) | |||||||||||||||||
| Net operating income | 1.1 | 1.8 | 0.6 | 4.2 | 1.4 | (0.1 | ) | 0.0 | 6.1 | |||||||||||||||||||||||
| Depreciation and amortization expense | (0.3 | ) | (0.4 | ) | (0.2 | ) | (1.3 | ) | (0.2 | ) | 0.0 | 0.0 | (0.7 | ) | ||||||||||||||||||
| Interest expense | (0.2 | ) | (0.4 | ) | (0.4 | ) | (1.5 | ) | (0.6 | ) | 0.0 | 0.0 | (2.7 | ) | ||||||||||||||||||
| Income (loss) before gain on sale | 0.6 | 1.0 | 0.0 | 1.4 | 0.6 | (0.1 | ) | 0.0 | 2.7 | |||||||||||||||||||||||
| Gain (loss) on sale of real estate | 0.0 | 0.0 | 0.0 | 0.0 | 0.0 | 0.0 | 0.0 | 0.0 | ||||||||||||||||||||||||
| Discontinued operations | 0.0 | 0.0 | 0.0 | (0.1 | ) | 0.0 | 0.0 | (0.2 | ) | 0.0 | ||||||||||||||||||||||
| Gain on sale of discontinued operations | 0.0 | 0.0 | 0.0 | 4.9 | 0.0 | 0.0 | 19.1 | 0.0 | ||||||||||||||||||||||||
| Net income (loss) | $ | 0.6 | $ | 1.0 | $ | 0.0 | $ | 6.2 | $ | 0.6 | ($0.1 | ) | $ | 18.9 | $ | 2.7 | ||||||||||||||||
| DDR Ownership interest | *** | *** | *** | *** | 20 | % | *** | 35 | % | 50 | % | |||||||||||||||||||||
| $ | 0.2 | $ | 0.4 | $ | 0.0 | $ | 2.5 | $ | 0.1 | $ | 0.3 | $ | 6.6 | $ | 1.4 | |||||||||||||||||
| Minority Interest | 0.0 | (0.1 | ) | 0.0 | (0.3 | ) | 0.0 | 0.0 | 0.0 | 0.0 | ||||||||||||||||||||||
| Amortization of basis differential | 0.0 | 0.0 | 0.0 | 0.0 | 0.0 | 0.0 | 0.0 | 0.1 | ||||||||||||||||||||||||
| $ | 0.2 | $ | 0.3 | $ | 0.0 | $ | 2.2 | $ | 0.1 | $ | 0.3 | $ | 6.6 | $ | 1.5 | |||||||||||||||||
| Proportionate share of net operating income | $ | 0.3 | $ | 0.7 | $ | 0.2 | $ | 0.9 | $ | 0.3 | $ | 0.0 | $ | 0.0 | $ | 3.0 | ||||||||||||||||
Funds From Operations (“FFO”): | ||||||||||||||||||||||||||||||||
| Net income (loss) | $ | 0.6 | $ | 1.0 | $ | 0.0 | $ | 6.2 | $ | 0.6 | ($0.1 | ) | $ | 18.9 | $ | 2.7 | ||||||||||||||||
| Depreciation of real property | 0.3 | 0.4 | 0.2 | 1.3 | 0.1 | 0.0 | 0.2 | 0.7 | ||||||||||||||||||||||||
| (Gain) loss on sale | 0.0 | 0.0 | 0.0 | (4.9 | ) | 0.0 | 0.0 | (19.1 | ) | 0.0 | ||||||||||||||||||||||
| $ | 0.9 | $ | 1.4 | $ | 0.2 | $ | 2.6 | $ | 0.7 | ($0.1 | ) | $ | 0.0 | $ | 3.4 | |||||||||||||||||
| DDR ownership interest | *** | *** | *** | *** | 20 | % | *** | 35 | % | 50 | % | |||||||||||||||||||||
| DDR FFO | $ | 0.2 | $ | 0.5 | $ | 0.1 | $ | 0.6 | $ | 0.2 | $ | 0.3 | 0.0 | $ | 1.7 | |||||||||||||||||
Joint Venture Financial 4.1
Developers Diversified Realty
Quarterly Financial Supplement
For the three months ended March 31, 2004
Joint Ventures (Combining Financial Information) (1)
(in millions)
Combining Balance Sheets
as of March 31, 2004
| Lennox | ||||||||||||||||||||||||||||||||||||||||
| Community | Community | Town | Sun Center | Dublin | Washington | |||||||||||||||||||||||||||||||||||
| Centers Seven | Centers Eight | Merriam | Kildeer, IL | Center (2) | Limited (2) | Village (2) | �� | Park (3) | ||||||||||||||||||||||||||||||||
| Real Estate Assets | $ | 15.6 | $ | 26.7 | $ | 49.0 | $ | 28.1 | $ | 21.1 | $ | 25.8 | $ | 29.7 | $ | 0.6 | ||||||||||||||||||||||||
| Accumulated Depreciation | (1.0 | ) | (2.0 | ) | (5.3 | ) | (1.2 | ) | (3.3 | ) | (5.3 | ) | (12.6 | ) | 0.0 | |||||||||||||||||||||||||
| Real Estate, net | 14.6 | 24.7 | 43.7 | 26.9 | 17.8 | 20.5 | 17.1 | 0.6 | ||||||||||||||||||||||||||||||||
| Receivables, Net | 0.3 | 0.9 | 2.4 | 0.4 | 1.6 | 0.6 | 0.4 | 0.0 | ||||||||||||||||||||||||||||||||
| Other assets | 0.1 | 0.7 | 2.4 | 0.4 | 0.5 | 1.0 | 0.5 | 0.0 | ||||||||||||||||||||||||||||||||
| $ | 15.0 | $ | 26.3 | $ | 48.5 | $ | 27.7 | $ | 19.9 | $ | 22.1 | $ | 18.0 | $ | 0.6 | |||||||||||||||||||||||||
| Mortgage Debt | $ | 9.9 | $ | 17.7 | $ | 39.1 | $ | 19.5 | $ | 18.9 | $ | 21.0 | $ | 0.0 | $ | 0.0 | ||||||||||||||||||||||||
| Amounts payable to DDRC | 0.0 | 0.0 | 0.0 | 0.1 | 0.0 | 0.1 | 0.0 | 0.0 | ||||||||||||||||||||||||||||||||
| Other liabilities | 0.2 | 0.6 | 1.1 | 0.6 | 0.9 | 0.6 | 0.6 | 0.0 | ||||||||||||||||||||||||||||||||
| 10.1 | 18.3 | 40.2 | 20.2 | 19.8 | 21.7 | 0.6 | 0.0 | |||||||||||||||||||||||||||||||||
| Accumulated equity (deficit) | 4.9 | 8.0 | 8.3 | 7.5 | 0.1 | 0.4 | 17.4 | 0.6 | ||||||||||||||||||||||||||||||||
| $ | 15.0 | $ | 26.3 | $ | 48.5 | $ | 27.7 | $ | 19.9 | $ | 22.1 | $ | 18.0 | $ | 0.6 | |||||||||||||||||||||||||
| Proportionate share of other assets/liabilities, net | $ | 0.1 | $ | 0.5 | $ | 1.9 | $ | 0.0 | $ | 0.6 | $ | 0.8 | $ | 0.3 | $ | 0.0 | ||||||||||||||||||||||||
| Disproportionate amount payable to DDR | $ | 0.0 | $ | 0.0 | $ | 0.0 | $ | 0.0 | $ | 0.0 | $ | 0.0 | $ | 0.0 | $ | 0.0 | ||||||||||||||||||||||||
Combining Statements of Operations for the period ended December 31, 2003 | ||||||||||||||||||||||||||||||||||||||||
| Lennox | ||||||||||||||||||||||||||||||||||||||||
| Community | Community | Town | Sun Center | Dublin | Washington | |||||||||||||||||||||||||||||||||||
| Centers Seven | Centers Eight | Merriam | Kildeer, IL | Center (2) | Limited (2) | Village (2) | Park (3) | |||||||||||||||||||||||||||||||||
| Revenues from operations | $ | 0.4 | $ | 1.0 | $ | 1.7 | $ | 1.0 | $ | 1.1 | $ | 1.1 | $ | 0.5 | $ | 0.0 | ||||||||||||||||||||||||
| Rental operation expenses | (0.1 | ) | (0.3 | ) | (0.5 | ) | (0.3 | ) | (0.3 | ) | (0.2 | ) | (0.3 | ) | 0.0 | |||||||||||||||||||||||||
| Net operating income | 0.3 | 0.7 | 1.2 | 0.7 | 0.8 | 0.9 | 0.2 | 0.0 | ||||||||||||||||||||||||||||||||
| Depreciation and amortization expense | (0.1 | ) | (0.1 | ) | (0.3 | ) | (0.1 | ) | (0.1 | ) | (0.2 | ) | (0.2 | ) | 0.0 | |||||||||||||||||||||||||
| Interest expense | (0.2 | ) | (0.4 | ) | (0.5 | ) | (0.3 | ) | (0.4 | ) | (0.5 | ) | 0.0 | 0.0 | ||||||||||||||||||||||||||
| Income (loss) before gain on sale | 0.0 | 0.2 | 0.4 | 0.3 | 0.3 | 0.2 | 0.0 | 0.0 | ||||||||||||||||||||||||||||||||
| Gain (loss) on sale of real estate | 0.0 | 0.0 | 0.0 | 0.0 | 0.0 | 0.0 | 0.0 | 0.0 | ||||||||||||||||||||||||||||||||
| Discontinued operations | 0.0 | 0.0 | 0.0 | 0.0 | 0.0 | 0.0 | 0.0 | 0.0 | ||||||||||||||||||||||||||||||||
| Gain on sale of discontinued operations | 0.0 | 0.0 | 0.0 | 0.0 | 0.0 | 0.0 | 0.0 | 0.0 | ||||||||||||||||||||||||||||||||
| Net income (loss) | $ | 0.0 | $ | 0.2 | $ | 0.4 | $ | 0.3 | $ | 0.3 | $ | 0.2 | 0.0 | $ | 0.0 | |||||||||||||||||||||||||
| DDR Ownership interest | 50 | % | 50 | % | 50 | % | 10 | % | 50 | % | *** | *** | 50 | % | ||||||||||||||||||||||||||
| $ | 0.0 | $ | 0.1 | $ | 0.2 | $ | 0.0 | $ | 0.2 | $ | 0.3 | $ | 0.0 | $ | 0.0 | |||||||||||||||||||||||||
| Minority Interest | 0.0 | 0.0 | 0.0 | 0.0 | 0.0 | 0.0 | 0.0 | 0.0 | ||||||||||||||||||||||||||||||||
| Amortization of basis differential | 0.0 | 0.0 | 0.0 | 0.0 | 0.0 | (0.1 | ) | (0.2 | ) | 0.0 | ||||||||||||||||||||||||||||||
| $ | 0.0 | $ | 0.1 | $ | 0.2 | $ | 0.0 | $ | 0.2 | $ | 0.2 | ($0.2 | ) | $ | 0.0 | |||||||||||||||||||||||||
| Proportionate share of net operating income | $ | 0.2 | $ | 0.3 | $ | 0.6 | $ | 0.1 | $ | 0.4 | $ | 0.7 | $ | 0.2 | $ | 0.0 | ||||||||||||||||||||||||
Funds From Operations (“FFO”): | ||||||||||||||||||||||||||||||||||||||||
| Net income (loss) | $ | 0.0 | $ | 0.2 | $ | 0.4 | $ | 0.3 | $ | 0.3 | $ | 0.2 | $ | 0.0 | $ | 0.0 | ||||||||||||||||||||||||
| Depreciation of real property | 0.1 | 0.1 | 0.3 | 0.1 | 0.1 | 0.2 | 0.2 | 0.0 | ||||||||||||||||||||||||||||||||
| (Gain) loss on sale | 0.0 | 0.0 | 0.0 | 0.0 | 0.0 | 0.0 | 0.0 | 0.0 | ||||||||||||||||||||||||||||||||
| $ | 0.1 | $ | 0.3 | $ | 0.7 | $ | 0.4 | $ | 0.4 | $ | 0.4 | $ | 0.2 | $ | 0.0 | |||||||||||||||||||||||||
| DDR ownership interest | 50 | % | 50 | % | 50 | % | 10 | % | 50 | % | *** | *** | 50 | % | ||||||||||||||||||||||||||
| DDR FFO | $ | 0.0 | $ | 0.2 | $ | 0.4 | $ | 0.0 | $ | 0.2 | $ | 0.5 | $ | 0.2 | $ | 0.0 | ||||||||||||||||||||||||
Joint Venture Financials 4.1
Developers Diversified Realty
Quarterly Financial Supplement
For the three months ended March 31, 2004
Joint Ventures (Combining Financial Information) (1)
(in millions)
Combining Balance Sheets
as of March 31, 2004
| Littleton, | Coon Rapids, | Phoenix, | Service | Jefferson | ||||||||||||||||||||||||||||
| DOTRS | CO (5) | Salisbury, MD | MN | AZ (2) | Pasadena, CA | Merchandise (4) | County, MO | |||||||||||||||||||||||||
| Real Estate Assets | $ | 24.9 | $ | 0.0 | $ | 2.1 | $ | 0.0 | $ | 27.4 | $ | 113.8 | $ | 129.4 | $ | 5.3 | ||||||||||||||||
| Accumulated Depreciation | (3.6 | ) | 0.0 | (0.2 | ) | 0.0 | (4.1 | ) | (3.1 | ) | (1.9 | ) | (0.2 | ) | ||||||||||||||||||
| Real Estate, net | 21.3 | 0.0 | 1.9 | 0.0 | 23.3 | 110.7 | 127.5 | 5.1 | ||||||||||||||||||||||||
| Receivables, Net | 0.9 | 0.0 | 0.0 | 0.5 | 0.9 | 2.1 | 6.5 | 0.0 | ||||||||||||||||||||||||
| Other assets | 0.2 | 0.0 | 0.2 | 2.7 | 1.0 | 6.0 | 35.9 | 0.2 | ||||||||||||||||||||||||
| $ | 22.4 | $ | 0.0 | $ | 2.1 | $ | 3.2 | $ | 25.2 | $ | 118.8 | $ | 169.9 | $ | 5.3 | |||||||||||||||||
| Mortgage Debt | $ | 11.1 | $ | 0.0 | $ | 1.8 | $ | 0.0 | $ | 17.6 | $ | 85.0 | $ | 75.1 | $ | 2.3 | ||||||||||||||||
| Amounts payable to DDRC | 0.0 | 0.0 | 0.0 | 0.0 | 0.0 | 0.1 | 11.7 | 3.1 | ||||||||||||||||||||||||
| Other liabilities | (0.2 | ) | 0.0 | 0.0 | 2.7 | 0.4 | 1.6 | 44.5 | 0.0 | |||||||||||||||||||||||
| 10.9 | 0.0 | 1.8 | 2.7 | 18.0 | 86.7 | 131.4 | 5.4 | |||||||||||||||||||||||||
| Accumulated equity (deficit) | 11.5 | 0.0 | 0.3 | 0.5 | 7.2 | 32.1 | 38.5 | (0.1 | ) | |||||||||||||||||||||||
| $ | 22.4 | $ | 0.0 | $ | 2.1 | $ | 3.2 | $ | 25.2 | $ | 118.8 | $ | 169.9 | $ | 5.3 | |||||||||||||||||
| Proportionate share of other assets/liabilities, net | $ | 0.6 | $ | 0.0 | $ | 0.1 | $ | 0.1 | $ | 1.0 | $ | 1.6 | $ | 5.3 | $ | 0.1 | ||||||||||||||||
| Disproportionate amount payable to DDR | $ | 0.0 | $ | 0.0 | $ | 0.0 | $ | 0.0 | $ | 0.0 | $ | 0.0 | $ | 0.0 | $ | 1.5 | ||||||||||||||||
Combining Statements of Operations for the period ended March 31, 2004 | ||||||||||||||||||||||||||||||||
| Littleton, | Coon | Service | Jefferson | |||||||||||||||||||||||||||||
| DOTRS | CO (5) | Salisbury, MD | Rapids, MN | Phoenix, AZ (2) | Pasadena, CA | Merchandise (4) | County, MO | |||||||||||||||||||||||||
| Revenues from operations | $ | 0.9 | $ | 2.4 | $ | 0.1 | $ | 0.0 | $ | 1.2 | $ | 4.6 | $ | 4.5 | $ | 0.2 | ||||||||||||||||
| Rental operation expenses | (0.2 | ) | (0.6 | ) | 0.0 | 0.0 | (0.3 | ) | (1.7 | ) | (3.2 | ) | (0.1 | ) | ||||||||||||||||||
| Net operating income | 0.7 | 1.8 | 0.1 | 0.0 | 0.9 | 2.9 | 1.3 | 0.1 | ||||||||||||||||||||||||
| Depreciation and amortization expense | (0.1 | ) | (0.3 | ) | 0.0 | 0.0 | (0.2 | ) | (0.6 | ) | (0.7 | ) | 0.0 | |||||||||||||||||||
| Interest expense | (0.1 | ) | (0.6 | ) | (0.1 | ) | 0.0 | (0.3 | ) | (1.2 | ) | (1.9 | ) | (0.1 | ) | |||||||||||||||||
| Income (loss) before gain on sale | 0.5 | 0.8 | 0.0 | 0.0 | 0.4 | 1.1 | (1.3 | ) | 0.0 | |||||||||||||||||||||||
| Gain (loss) on sale of real estate | 0.0 | 0.0 | 0.0 | 0.0 | 0.0 | 0.0 | 0.0 | 0.0 | ||||||||||||||||||||||||
| Discontinued operations | 0.0 | 0.0 | 0.0 | 0.0 | 0.0 | 0.0 | 0.0 | 0.0 | ||||||||||||||||||||||||
| Gain on sale of discontinued operations | 0.0 | 0.0 | 0.0 | 0.0 | 0.0 | 0.0 | 0.0 | 0.0 | ||||||||||||||||||||||||
| Net income (loss) | 0.5 | 0.8 | 0.0 | 0.0 | 0.4 | 1.1 | (1.3 | ) | 0.0 | |||||||||||||||||||||||
| DDR Ownership interest | 50 | % | 50 | % | 50 | % | * | ** | 67 | % | 25 | % | 25 | % | 50 | % | ||||||||||||||||
| $ | 0.2 | $ | 0.4 | $ | 0.0 | $ | 2.9 | $ | 0.3 | $ | 0.3 | ($0.3 | ) | $ | 0.0 | |||||||||||||||||
| Minority Interest | 0.0 | 0.0 | 0.0 | 0.0 | 0.0 | 0.0 | 0.0 | 0.0 | ||||||||||||||||||||||||
| Amortization of basis differential | 0.0 | 0.0 | 0.0 | 0.0 | (0.1 | ) | 0.0 | 0.0 | 0.0 | |||||||||||||||||||||||
| $ | 0.2 | $ | 0.4 | $ | 0.0 | $ | 2.9 | $ | 0.2 | $ | 0.3 | ($0.3 | ) | $ | 0.0 | |||||||||||||||||
| Proportionate share of net operating income | $ | 0.3 | $ | 0.9 | $ | 0.0 | $ | 0.0 | $ | 0.6 | $ | 0.7 | $ | 0.3 | $ | 0.1 | ||||||||||||||||
Funds From Operations (“FFO”): | ||||||||||||||||||||||||||||||||
| Net income (loss) | $ | 0.5 | $ | 0.9 | $ | 0.0 | $ | 0.0 | $ | 0.4 | $ | 1.1 | ($1.3 | ) | $ | 0.0 | ||||||||||||||||
| Depreciation of real property | 0.1 | 0.3 | 0.0 | 0.0 | 0.2 | 0.6 | 0.8 | 0.0 | ||||||||||||||||||||||||
| (Gain) loss on sale | 0.0 | 0.0 | 0.0 | 0.0 | 0.0 | 0.0 | 0.0 | 0.0 | ||||||||||||||||||||||||
| $ | 0.6 | $ | 1.1 | $ | 0.0 | $ | 0.0 | $ | 0.6 | $ | 1.7 | ($0.5 | ) | $ | 0.0 | |||||||||||||||||
| DDR ownership interest | 50 | % | 50 | % | 50 | % | * | ** | 67 | % | 25 | % | 25 | % | 50 | % | ||||||||||||||||
| DDR FFO | $ | 0.3 | $ | 0.5 | $ | 0.0 | $ | 2.9 | $ | 0.4 | $ | 0.4 | ($0.1 | ) | $ | 0.0 | ||||||||||||||||
Joint Venture Financials 4.1
Developers Diversified Realty
Quarterly Financial Supplement
For the three months ended March 31, 2004
Joint Ventures (Combining Financial Information) (1)
(in millions)
Combining Balance Sheets
as of March 31, 2004
| Sansone Group / | Coventry II DDR | Coventry II DDR | Coventry II DDR | DDR/Macquarie | DDR/Macquarie | |||||||||||||||||||||||||||||||
| DDRC LLC | DDR Markaz | Ward Parkway | Totem Lakes | Phoenix Spectrum | Fund LLC | Management LLC | Total | |||||||||||||||||||||||||||||
| Real Estate Assets | $ | 0.2 | $ | 167.3 | $ | 49.0 | $ | 37.0 | $ | 45.4 | $ | 735.9 | $ | 0.0 | $ | 2,190.6 | ||||||||||||||||||||
| Accumulated Depreciation | 0.0 | (3.6 | ) | (0.9 | ) | (0.1 | ) | (0.1 | ) | (4.8 | ) | 0.0 | (107.2 | ) | ||||||||||||||||||||||
| Real Estate, net | 0.2 | 163.7 | 48.1 | 36.9 | 45.3 | 731.1 | 0.0 | 2,083.4 | ||||||||||||||||||||||||||||
| Receivables, Net | 2.4 | 1.6 | 0.7 | (0.1 | ) | 0.7 | 6.2 | 1.0 | 44.1 | |||||||||||||||||||||||||||
| Other assets | 1.8 | 6.1 | 0.9 | 0.2 | 1.4 | 16.3 | 0.4 | 114.1 | ||||||||||||||||||||||||||||
| $ | 4.4 | $ | 171.4 | $ | 49.7 | $ | 37.1 | $ | 47.4 | $ | 753.6 | $ | 1.4 | $ | 2,241.6 | |||||||||||||||||||||
| Mortgage Debt | $ | 0.0 | $ | 110.0 | $ | 31.5 | $ | 25.0 | $ | 39.0 | $ | 374.5 | $ | 0.0 | $ | 1,262.3 | ||||||||||||||||||||
| Amounts payable to DDRC | 0.0 | 0.8 | 0.0 | 0.0 | 0.0 | 0.7 | 0.0 | 16.6 | ||||||||||||||||||||||||||||
| Other liabilities | 1.0 | 1.8 | 0.8 | 0.0 | 1.0 | 14.7 | 2.7 | 108.7 | ||||||||||||||||||||||||||||
| 1.0 | 112.6 | 32.3 | 25.0 | 40.0 | 389.9 | 2.7 | 1,387.6 | |||||||||||||||||||||||||||||
| Accumulated equity (deficit) | 3.4 | 58.8 | 17.4 | 12.1 | 7.4 | 363.7 | (1.3 | ) | 854.0 | |||||||||||||||||||||||||||
| $ | 4.4 | $ | 171.4 | $ | 49.7 | $ | 37.1 | $ | 47.4 | $ | 753.6 | $ | 1.4 | $ | 2,241.6 | |||||||||||||||||||||
| Proportionate share of other assets/liabilities, net | $ | 1.6 | $ | 1.2 | $ | 0.2 | $ | 0.0 | $ | 0.2 | $ | 1.1 | ($0.2 | ) | $ | 22.9 | ||||||||||||||||||||
| Disproportionate amount payable to DDR | $ | 0.0 | $ | 0.0 | $ | 0.0 | $ | 0.0 | $ | 0.0 | $ | 0.0 | $ | 0.0 | $ | 1.6 | ||||||||||||||||||||
Combining Statements of Operations for the period ended March 31, 2004 | ||||||||||||||||||||||||||||||||||||
| Sansone Group / | Coventry II DDR | Coventry II DDR | Coventry II DDR | DDR/Macquarie | DDR/Macquarie | |||||||||||||||||||||||||||
| DDRC LLC | DDR Markaz | Ward Parkway | Totem Lakes | Phoenix Spectrum | Fund LLC | Management LLC | Total | |||||||||||||||||||||||||
| Revenues from operations | $ | 2.7 | $ | 5.4 | $ | 1.7 | $ | 0.6 | $ | 0.6 | $ | 22.0 | $ | 0.0 | $ | 76.2 | ||||||||||||||||
| Rental operation expenses | (2.1 | ) | (1.7 | ) | (0.7 | ) | (0.1 | ) | (0.2 | ) | (6.3 | ) | (0.1 | ) | (26.6 | ) | ||||||||||||||||
| Net operating income | 0.6 | 3.7 | 1.0 | 0.5 | 0.4 | 15.7 | (0.1 | ) | 49.6 | |||||||||||||||||||||||
| Depreciation and amortization expense | 0.0 | (0.9 | ) | (0.3 | ) | (0.1 | ) | (0.1 | ) | (3.3 | ) | (0.0 | ) | (10.9 | ) | |||||||||||||||||
| Interest expense | 0.0 | (1.2 | ) | (0.3 | ) | (0.1 | ) | (0.1 | ) | (4.4 | ) | (0.0 | ) | (18.3 | ) | |||||||||||||||||
| Income (loss) before gain on sale | 0.6 | 1.6 | 0.4 | 0.3 | 0.2 | 8.0 | (0.1 | ) | 20.4 | |||||||||||||||||||||||
| Gain (loss) on sale of real estate | 0.0 | 0.0 | 0.0 | 0.0 | 0.0 | 0.0 | 0.0 | 0.0 | ||||||||||||||||||||||||
| Discontinued operations | 0.0 | 0.0 | 0.0 | 0.0 | 0.0 | 0.0 | 0.0 | (0.4 | ) | |||||||||||||||||||||||
| Gain on sale of discontinued operations | 0.0 | 0.0 | 0.0 | 0.0 | 0.0 | 0.0 | 0.0 | 24.0 | ||||||||||||||||||||||||
| Net income (loss) | 0.6 | 1.6 | 0.4 | 0.3 | 0.2 | 8.0 | (0.1 | ) | $ | 44.0 | ||||||||||||||||||||||
| DDR Ownership interest | *** | *** | 20 | % | *** | *** | *** | 50 | % | |||||||||||||||||||||||
| $ | 0.2 | $ | 0.3 | $ | 0.1 | $ | 0.1 | $ | 0.0 | $ | 1.5 | ($0.1 | ) | $ | 18.3 | |||||||||||||||||
| Minority Interest | 0.0 | 0.0 | 0.0 | 0.0 | 0.0 | 0.0 | 0.0 | (0.4 | ) | |||||||||||||||||||||||
| Amortization of basis differential | (0.1 | ) | 0.1 | 0.0 | 0.0 | 0.0 | 0.2 | 0.0 | (0.1 | ) | ||||||||||||||||||||||
| $ | 0.1 | $ | 0.4 | $ | 0.1 | $ | 0.1 | $ | 0.0 | $ | 1.7 | ($0.1 | ) | $ | 17.8 | |||||||||||||||||
| Proportionate share of net operating income | $ | 0.3 | $ | 0.9 | $ | 0.2 | $ | 0.1 | $ | 0.1 | $ | 3.0 | ($0.1 | ) | $ | 15.4 | ||||||||||||||||
Funds From Operations (“FFO”): | ||||||||||||||||||||||||||||||||
| Net income (loss) | $ | 0.6 | $ | 1.6 | $ | 0.4 | $ | 0.3 | $ | 0.2 | $ | 8.0 | ($0.1 | ) | $ | 44.0 | ||||||||||||||||
| Depreciation of real property | 0.0 | 0.9 | 0.3 | 0.1 | 0.1 | 3.3 | 0.0 | 11.1 | ||||||||||||||||||||||||
| (Gain) loss on sale | 0.0 | 0.0 | 0.0 | 0.0 | 0.0 | 0.0 | 0.0 | (24.0 | ) | |||||||||||||||||||||||
| $ | 0.6 | $ | 2.5 | $ | 0.7 | $ | 0.4 | $ | 0.3 | $ | 11.3 | ($0.1 | ) | $ | 31.1 | |||||||||||||||||
| DDR ownership interest | *** | *** | 20 | % | *** | *** | *** | 50 | % | |||||||||||||||||||||||
| DDR FFO | $ | 0.2 | $ | 0.6 | $ | 0.1 | $ | 0.1 | $ | 0.1 | $ | 2.0 | ($0.1 | ) | $ | 12.7 | ||||||||||||||||
Joint Venture Financials 4.1
Developers Diversified Realty
Quarterly Financial Supplement
For the three months ended March 31, 2004
| (1) | Amounts may differ slightly from actual results, due to rounding. | |
| (2) | Asset values reflect historical cost basis due to acquisition of partnership interest (i.e. does not reflect step up in basis). | |
| (3) | Represents undeveloped land. | |
| (4) | The Company owns an approximate 25% economic interest in a joint venture that acquired the designation rights to real estate assets owned and controlled by Service Merchandise. Tax expense, if applicable, is reflected in DDR Consolidated Statement of Operations The joint venture’s total related party interest expense for the three months ended March 31, 2004 totaled $1.1 million, of which $0.3 million, or approximately 25%, is reflected in revenues from operations in the Company’s Consolidated Statement of Operations. | |
| (5) | In the first quarter of 2004, the Company acquired the remaining interests in the joint venture. The Company consolidates the balance sheets and operations of the entity from the date of acquisition forward. | |
| *** | See Section 4.2, Joint Venture Summaries, discussing respective ownership percentage, as ownership percentage may have changed during the year, or the promoted interest is in effect. |
Joint Venture Financials 4.1
Developers Diversified Realty
Quarterly Financial Supplemental
For the three months ended March 31, 2004
Joint Venture Investment Summary
| Joint Venture Name: | Retail Value Investment Program LP III | |||
| Date Formed: | January 1998 | |||
| Property Name/Location: | City Place – Long Beach, CA | |||
| Major Tenants: | Wal-Mart | |||
| Albertson’s | ||||
| Ross Dress for Less | ||||
| Nordstrom Rack | ||||
| Savon | ||||
| Anna’s Linens | ||||
Partnership Structure
| Equity Contribution: | 1% — Coventry Real Estate Partners | |
| 24.75% — DDR | ||
| 74.25% — Prudential Real Estate Investors (PREI) | ||
| Cash Flow Distribution: | 1% — Coventry Real Estate Partners | |
| 24.75% — DDR | ||
| 74.25% — Prudential Real Estate Investors | ||
| Up to a leveraged 10% return on equity | ||
| Promote (current): | 33% Coventry Real Estate Partners (79% owned by DDR) once limited partners have received a 10% preferred return on equity | |
| Fees to DDR | ||
| Management Fee: | 3.50% | |
| Construction Management Fee: | 5% of cost of construction (including architectural & engineering and other soft costs) | |
| Asset Management Fee: | ..4% of gross asset cost (DDR’s pro-rata share of Coventry’s .5% fee) | |
| Leasing Fees: | N/A |
Capital Structure (in millions) | ||||
| DDR | $ | 6.6 | ||
| PREI | 19.9 | |||
| Coventry | 0.3 | |||
| Total Capital | $ | 26.8 | ||
| Debt | $ | 29.7 | ||
| Total Debt & Equity | $ | 56.5 | ||
Joint Venture Partnership Summaries 4.2
Developers Diversified Realty
Quarterly Financial Supplemental
For the three months ended March 31, 2004
Joint Venture Investment Summary
| Joint Venture Name: | RVIP IIIB | ||
| Date Formed: | September 2000 | ||
| Property Name/Location: | Deer Park, IL | ||
| Major Tenants: | Eddie Bauer | Pottery Barn | |
| Talbots | Coldwater Creek | ||
| Restoration Harware | J. Crew | ||
| Abercrombie & Fitch | Pier One Imports | ||
| GAP | Banana Republic | ||
| Barnes & Noble | Chico's | ||
| Century Theater | |||
| Partnership Structure RVIP IIIB | ||
| Equity Contribution: | 1% — Coventry Real Estate Partners | |
| 24.75% — DDR | ||
| 74.25% — Prudential Real Estate Investors (PREI) | ||
| Cash Flow Distribution: | 1% — Coventry Real Estate Partners | |
| 24.75% — DDR | ||
| 74.25% — Prudential Real Estate Investors | ||
| Up to a leveraged 10% preferred return on equity | ||
| Promote (current): | 33% Coventry Real Estate Partners (79% owned by DDR) once limited partners have received a 10% preferred return and return of equity | |
| Fees to DDR | ||
| Management Fee: | 3.5% | |
| Development Fee: | 1% of hard costs for all improvements | |
| Asset Management Fee: | .4% of gross asset cost (DDR's pro-rata share of Coventry’s .5% fee) | |
| Leasing Fees: | N/A | |
Capital Structure (in millions) | |||||
| DDRC | $ | 4.8 | |||
| Prudential | 14.2 | ||||
| Coventry | 0.7 | ||||
| Total Capital | $ | 19.7 | |||
| Debt | $ | 50.8 | |||
| Total Debt & Equity | $ | 70.5 | |||
Joint Venture Partnership Summaries 4.2
Developers Diversified Realty
Quarterly Financial Supplemental
For the three months ended March 31, 2004
Joint Venture Investment Summary
| Joint Venture Name: | Retail Value Investment Program LP VI | |
| Date Formed: | October 1999 | |
| Property Name/Location: | The joint venture consists of the following four properties: |
| Ten Quivira Plaza — Shawnee, KS | Devonshire Village — Olathe, KS | |||
| Cherokee North — Overland Park, KS | Brywood Center — Kansas City, MO |
| Major Tenants: | Price Chopper | La Petite Academy | ||
| Big Lots | Osco Drug | |||
| Dollar General | Deal$ | |||
| Sherwin Williams | Westlake Hardware | |||
| Eckerd Drug | ||||
| Hollywood Video |
| Partnership Structure | ||
| Equity Contribution: | 1% — Coventry Real Estate Partners | |
| 24.75% — DDR | ||
| 74.25% — Prudential Real Estate Investors (PREI) | ||
| Cash Flow Distribution: | 1% — Coventry Real Estate Partners | |
| 24.75% — DDR | ||
| 74.25% — Prudential Real Estate Investors (PREI) | ||
| Up to a leveraged 10% preferred return on equity | ||
| Promote (current): | 33% Coventry Real Estate Partners (79% owned by DDR) once limited partners have received a 10% preferred return and return of equity | |
| Fees to DDR | ||
| Management Fee: | 3.50% | |
| Asset Management Fee: | .4% of gross asset cost (DDR’s pro-rata share of Coventry’s .5% fee) |
Capital Structure (in millions) | |||||
| DDR | $ | 2.8 | |||
| PREI | 8.4 | ||||
| Coventry | 0.1 | ||||
| Total Capital | $ | 11.3 | |||
| Debt | $ | 18.6 | |||
| Total Debt & Equity | $ | 29.9 | |||
Joint Venture Partnership Summaries 4.2
Developers Diversified Realty
Quarterly Financial Supplemental
For the three months ended March 31, 2004
Joint Venture Investment Summary
| Joint Venture Name: | Retail Value Investment Program VII LLC | |
| Date Formed: | November 2000 | |
| Property Name/Location: | The joint venture consists of the following seven properties: |
| San Ysidro Village — San Ysidro, CA | Downtown Pleasant Hill — Pleasant Hill, CA | |||
| Olympiad Plaza — Mission Viejo, CA | Richmond City Center — Richmond, CA | |||
| Plaza at Puente Hills — City of Industry, CA | Puget Park Shopping Center — Everett, WA | |||
| Valley Central Shopping Center — Lancaster, CA |
| Major Tenants: | Office Depot | Michael’s | ||
| Century Theater | Staples | |||
| Ross Stores | Albertson’s | |||
| Circuit City | Bed, Bath & Beyond | |||
| Wal-Mart | K-Mart | |||
| T.J. Maxx | Kroger | |||
| Cinemark | Marshalls |
| Partnership Structure | ||
| Equity Contribution: | 1% — Coventry Real Estate Partners | |
| 20% — DDR | ||
| 79% — Prudential Real Estate Investors (PREI) | ||
| Cash Flow Distribution: | 1% — Coventry Real Estate Partners | |
| 20% — DDR | ||
| 79% — Prudential Real Estate Investors | ||
| Up to a leveraged 11% return on equity (10% year one, 10.5% year two, 11% thereafter) | ||
| Promote (current): | i) Pro rata in proportion to the member’s invested capital until the members have received, on a cumulative basis, an amount equal to the preferred return, (ii) 75% to all members in proportion to their invested capital and 25% to Coventry Real Estate Partners (79% owned by DDR) until DDR and PREI have been allocated, on a cumulative basis, an amount equal to a 15% return, (iii) 70% to all members in proportion to their invested capital and 30% to Coventry until DDR and PREI have been allocated, on a cumulative basis, an amount equal to a 20% return, and (iv) 65% to all members pro rata in proportion to their ownership percentages and 35% to Coventry. | |
| Fees to DDR | ||
| Management Fee: | 3.20% | |
| Construction Management Fee: | 5% of hard and soft costs | |
| Asset Management Fee: | ..63% (DDR’s pro-rata share of Coventry’s .8% fee) | |
| Leasing Fees (without co-broker): | 5% on new leases on years 1-5; 2.5% on years 6-10 (spaces < 15,000 square feet) 4% on new leases on years 1-5; 2% on years 6-10 (spaces > 15,000 square feet) | |
| 3% on new leases on years 1-5; 1.5% on years 6-10 (ground leases) | ||
| Renewals earn 50% of fees on new leases |
Capital Structure (in millions) | |||||
| DDR | $ | 23.4 | |||
| PREI | 92.0 | ||||
| Coventry | 5.2 | ||||
| Total Capital | $ | 120.6 | |||
| Debt | $ | 81.3 | |||
| Total Debt & Equity | $ | 201.9 | |||
Joint Venture Partnership Summaries 4.2
Developers Diversified Realty
Quarterly Financial Supplemental
For the three months ended March 31, 2004
Joint Venture Investment Summary
| Joint Venture Name: | RVIP VIII/DDR DB TECH VENTURES LP | ||||||
| Date Formed: | September 2003 | ||||||
| Property Name/Location: | Shops@TECH.RIDGE — Austin, TX | ||||||
| Major Tenants: | Target | Linen’s ‘N Things | |||||
| Pier One | Toys ‘R Us | ||||||
| Dress Barn | Hobby Lobby | ||||||
| Rack Room Shoes | Ultimate Electronics | ||||||
| PetsMart | Office Depot | ||||||
| Ross Dress for Less | |||||||
| Partnership Structure | ||
| DDR DB Tech Ventures LP | ||
| Ownership Percentage: | 50% — RVIP VIII | |
| 50% — David Berndt Interests, Inc. (Development Partner) | ||
| (No equity contributions at this partnership level) | ||
| Cash Flow Distribution: | 50% — RVIP VIII | |
| 50% — David Berndt Interests, Inc. (Development Partner) | ||
| RVIP VIII | ||
| Equity Contribution: | 1% — Coventry Real Estate Partners | |
| 24.75% — DDR | ||
| 74.25% — Prudential Real Estate Investors (PREI) | ||
| Cash Flow Distribution: | 1% — Coventry Real Estate Partners | |
| 24.75% — DDR | ||
| 74.25% — Prudential Real Estate Investors | ||
| Up to a leveraged 10% preferred return on equity | ||
| Promote (current): | 33% Coventry Real Estate Partners (79% owned by DDR) | |
| once limited partners have received a 10% preferred return | ||
| and return of equity |
| Fees to DDR | ||
| Management Fee: | 4% of Gross Revenues | |
| Development Fee: | 1% of hard costs for all improvements | |
| Asset Management Fee: | N/A | |
| Leasing Fees: * | 6% on new leases on years 1-5; 3% on remainder of term (spaces < 5,000 square feet) | |
| 5% on new leases on years 1-5; 2.5% on remainder of term (spaces 5,000 — 9,999 square feet) | ||
| 4% on new leases on years 1-5; 2% on remainder of term (spaces 10,000 — 19,999 square feet) | ||
| $2 per square foot (spaces 20,000 square feet and greater) | ||
| 3% on renewals on years 1-5; 1.5% on remainder of term (spaces < 5,000 square feet) | ||
| 2.5% on renewals on years 1-5; 1.25% on remainder of term (spaces 5,000 — 9,999 square feet) | ||
| 2% on renewals on years 1-5; 1% on remainder of term (spaces 10,000 — 19,999 square feet) | ||
| $2 per square foot on renewals (spaces 20,000 square feet and greater) | ||
| 4% on new leases years 1-5; 2% years 6-10 (outparcels/ground leases) | ||
| 2% on renewals on years 1-5; 1% years 6-10 (outparcels/ground leases) | ||
| 6% of Gross Sales Price up to $500,000 (Outparcel Sales) | ||
| 5% of Gross Sales Price over $500,000 but less than $1,000,000 (Outparcel Sales) | ||
| 4% of Gross Sales Price $1,000,000 or over (Outparcel Sales) | ||
| Development Fee: * | 5% of all development and tenant improvement work performed | |
| Tenant Coordination Fee: * | $5,000 for each in-line space less than 10,000 square feet |
| Capital Structure (in millions) | |||
| DDRC | $ | 0.2 | |
| Prudential | 0.6 | ||
| Coventry | 0.0 | ||
| Total Capital | $ | 0.8 | |
| Debt | $ | 26.9 | |
| Total Debt & Equity | $ | 27.7 | |
* Fees shall not be paid with respect to the initial leasing or development.
Joint Venture Partnership Summaries 4.2
Developers Diversified Realty
Quarterly Financial Supplement
For the three months ended March 31, 2004
| Joint Venture Investment Summary |
| Joint Venture Name: | DDRA Community Centers Five, L.P. | |
| Date Formed: | September, 1998 | |
| Property Name/Location: | The joint venture consists of the following six properties: |
| Foothills Towne Center — Ahwatukee, AZ | Maple Grove Crossing — Maple Grove, MN | |||
| Arrowhead Crossing — Phoenix, AZ | Tanasbourne Town Center — Portland, OR | |||
| Eagan Promenade — Eagan, MN | Eastchase Market — Fort Worth, TX |
| Major Tenants: | AMC Theatre | Gander Mountain | Oshman’s Sporting Goods | |||
| Ashley Homestores | Haggan’s | Petco | ||||
| Babies ‘R Us | Kohl’s Department | Petsmart | ||||
| Barnes & Noble | Linens ‘N Things | Pier One | ||||
| Bassett Furniture | Mac Frugal’s | Ross Dress for Less | ||||
| Bed Bath & Beyond | Mervyn’s (not owned) | Staples | ||||
| Byerly’s | Michael’s | Stein Mart | ||||
| Circuit City | Nordstrom Rack (not owned) | Target (not owned) | ||||
| Comp USA | Office Depot | TJ Maxx | ||||
| Cub Foods (not owned) | Office Depot (not owned) | Toys ‘R Us (not owned) | ||||
| Ethan Allen (not owned) | OfficeMax | United Artists Theatre | ||||
| Famous Footwear | Old Navy |
| Partnership Structure | ||
| Equity Contribution: | 50% — DDR | |
| 50% — DRA Advisors | ||
| Cash Flow Distribution: | 50% — DDR | |
| 50% — DRA Advisors | ||
| Fees to DDR | ||
| Management Fee: | 3.5% of gross retail income | |
| Development Fee: | 5% of hard costs for all improvements | |
| Leasing Fees: | 5% on new leases, 3% on renewals | |
| Commission on Outparcel Sales: | 10% of net sales price | |
Capital Structure (in millions) | |||||
| DDR | $ | 37.33 | |||
| DRA Advisors | 37.33 | ||||
| Total Capital | $ | 74.7 | |||
| Debt | $ | 156.0 | |||
| Total Debt & Equity | $ | 230.7 | |||
Joint Venture Partnership Summaries 4.2
Developers Diversified Realty
Quarterly Financial Supplement
For the three months ended March 31, 2004
Joint Venture Investment Summary
| Joint Venture Name: | DDRA Community Centers Seven, L.P. | |
| Date Formed: | October, 1999 | |
| Property Name/Location: | Ahwatukee Foothills Towne Center (Phase IV) — Phoenix, AZ | |
| Major Tenants: | Best Buy | |
| JoAnn, Etc. | ||
| Partnership Structure | ||
| Equity Contribution: | 50% — DDR | |
| 50% — DRA Advisors | ||
| Cash Flow Distribution: | 50% — DDR | |
| 50% — DRA Advisors | ||
| Fees to DDR | ||
| Management Fee: | 3.5% of gross retail income | |
| Development Fee: | 5% of hard costs for all improvements | |
| Leasing Fees: | 5% on new leases, 3% on renewals | |
| Commission on Outparcel Sales: | 10% of net sales price |
Capital Structure (in millions) | |||||
| DDR | $ | 2.45 | |||
| DRA Advisors | 2.45 | ||||
| Total Capital | $ | 4.9 | |||
| Debt | $ | 9.9 | |||
| Total Debt & Equity | $ | 14.8 | |||
Joint Venture Partnership Summaries 4.2
Developers Diversified Realty
Quarterly Financial Supplement
For the three months ended March 31, 2004
| Joint Venture Investment Summary | ||
| Joint Venture Name: | DDRA Community Centers Eight, L.P. | |
| Date Formed: | February, 2000 | |
| Property Name/Location: | Deer Valley Towne Center - Phoenix, AZ | |
| Major Tenants: | Michael’s | |
| OfficeMax | ||
| Petsmart | ||
| Ross Stores | ||
| AMC Theatres (not owned) | ||
| Target (not owned) | ||
| Partnership Structure | ||
| Equity Contribution: | 50% — DDR | |
| 50% — DRA Advisors | ||
| Cash Flow Distribution: | 50% — DDR | |
| 50% — DRA Advisors | ||
| Fees to DDR | ||
| Management Fee: | 3.5% of gross retail income | |
| Development Fee: | 5% of hard costs for all improvements | |
| Leasing Fees: | 5% on new leases, 3% on renewals | |
| Commission on Outparcel Sales: | 10% of net sales price |
Capital Structure (in millions) | |||||
| DDR | $ | 4.0 | |||
| DRA Advisors | $ | 4.0 | |||
| Total Capital | $ | 8.0 | |||
| Debt | $ | 17.7 | |||
| Total Debt & Equity | $ | 25.7 | |||
Joint Venture Partnership Summaries 4.2
Developers Diversified Realty
Quarterly Financial Supplement
For the twelve month period ended December 31, 2003
Joint Venture Investment Summary
| Joint Venture Name: | Merriam Town Center Ltd. | |||
| Date Formed: | October, 1996 | |||
| Property Name/Location: | Merriam Town Center — Merriam, KS | |||
| Major Tenants: | Cinemark | OfficeMax | ||
| Dick’s Sporting Goods | Petsmart | |||
| Hen House | Home Depot (not owned) | |||
| Marshalls | ||||
| Partnership Structure | ||||
| Equity Contribution: | 50% — DDR | |||
| 50% — DRA Advisors | ||||
| Cash Flow Distribution: | 50% — DDR | |||
| 50% — DRA Advisors | ||||
| Fees to DDR | ||||
| Management Fee: | 3.5% of gross retail income | |||
| Development Fee: | 5% of hard costs for all improvements | |||
| Leasing Fees: | 5% on new leases, 3% on renewals | |||
| Commission on Outparcel Sales: | 10% of net sales price | |||
Capital Structure (in millions) | |||||
| DDR | $ | 4.17 | |||
| DRA Advisors | 4.17 | ||||
| Total Capital | $ | 8.3 | |||
| Debt | $ | 39.1 | |||
| Total Debt & Equity | $ | 47.4 | |||
Joint Venture Partnership Summaries 4.2
Developers Diversified Realty
Quarterly Financial Supplement
For the three months ended March 31, 2004
Joint Venture Investment Summary
| Joint Venture Name: | DDRA Kildeer LLC | |
| Date Formed: | March 28, 2002 | |
| Property Name/Location: | The Shops at Kildeer — Kildeer, IL | |
| Major Tenants: | Bed, Bath & Beyond | |
| Circuit City | ||
| Cost Plus | ||
| Old Navy | ||
| Partnership Structure | ||
| Equity Contribution: | 10% — DDR | |
| 90% — DRA Advisors | ||
| Cash Flow Distribution: | 10% — DDR | |
| 90% — DRA Advisors | ||
| Promote: | After the partners have received distributions equal to their capital contributed, plus a preferred return of 15%, then the Company will receive 35% up to a preferred return of 20%, then 50% of remaining cash after a 20% preferred return has been achieved. | |
| Fees to DDR | ||
| Management Fee: | 3.5% of gross income | |
| Development Fee: | 5% of hard costs for all improvements | |
| Leasing Fees: | 5% on new leases, 3% on renewals | |
| Commission on Outparcel Sales: | 10% of net sales price | |
Capital Structure (in millions) | |||||
| DDR | $ | 0.7 | |||
| DRA Advisors | 6.8 | ||||
| Total Capital | $ | 7.5 | |||
| Payable to DDR | $ | 0.1 | |||
| Debt | $ | 19.5 | |||
| Total Debt & Equity | $ | 27.1 | |||
Joint Venture Partnership Summaries 4.2
Developers Diversified Realty
Quarterly Financial Supplement
For the three months ended March 31, 2004
Joint Venture Investment Summary
| Joint Venture Name: | Lennox Town Center Limited | |
| Date Formed: | February, 1998 | |
| Property Name/Location: | Lennox Town Center Shopping Center -Columbus, OH | |
| Major Tenants: | AMC Theatres Lennox 24 | |
| Barnes & Nobles | ||
| Staples | ||
| Target | ||
| Partnership Structure | ||
| Equity Contribution: | 50% — DDR | |
| 50% — DRA Advisors | ||
| Cash Flow Distribution: | 50% — DDR | |
| 50% — Casto Properties | ||
| Fees to DDR | ||
| Management Fee: | 1.312% of all rent | |
| Development Fee: | N/A | |
| Leasing Fees: | N/A | |
| Commission on Outparcel Sales: | N/A | |
Capital Structure (in millions) | |||||
| DDR | $ | 0.05 | |||
| Casto Properties | 0.05 | ||||
| Total Capital | $ | 0.1 | |||
| Debt | $ | 18.9 | |||
| Total Debt & Equity | $ | 19.0 | |||
Joint Venture Partnership Summaries 4.2
Developers Diversified Realty
Quarterly Financial Supplement
For the three months ended March 31, 2004
Joint Venture Investment Summary
| Joint Venture Name: | Sun Center Limited | |
| Date Formed: | February, 1998 | |
| Property Name/Location: | Sun Center — Columbus, OH | |
| Major Tenants: | Babies ‘R Us | |
| Big Bear | ||
| Michael’s | ||
| Rhodes Furniture | ||
| Staples | ||
| Stein Mart | ||
Partnership Structure | ||
| Equity Contribution: | 79.45% — DDR | |
| 20.55% — Casto Properties | ||
| Cash Flow Distribution: | 79.45% — DDR | |
| 20.55% — Casto Properties | ||
Fees to DDR | ||
| Management Fee: | 1.312% of all rent | |
| Development Fee: | N/A | |
| Leasing Fees: | N/A | |
| Commission on Outparcel Sales: | N/A |
Capital Structure in millions) | ||||
| DDR | $ | 0.30 | ||
| Casto Properties | 0.08 | |||
| Total Capital | $ | 0.4 | ||
| Payable to DDR | $ | 0.1 | ||
| Debt | $ | 21.0 | ||
| Total Debt & Equity | $ | 21.5 | ||
Joint Venture Partnership Summaries 4.2
Developers Diversified Realty
Quarterly Financial Supplement
For the three months ended March 31, 2004
Joint Venture Investment Summary
| Joint Venture Name: | Continental Sawmill Limited Partnership | |
| Date Formed: | February, 1998 | |
| Property Name/Location: | Dublin Village Center — Columbus, OH | |
| Major Tenant: | AMC Theatre | |
Partnership Structure | ||
| Equity Contribution: | 80.012% — DDR | |
| 19.988% — Casto Properties | ||
| Cash Flow Distribution: | 80.012% — DDR | |
| 19.988% — Casto Properties | ||
Fees to DDR | ||
| Management Fee: | 1.312% of all rent | |
| Development Fee: | N/A | |
| Leasing Fees: | N/A | |
| Commission on Outparcel Sales: | N/A |
Capital Structure (in millions) | ||||
| DDR | $ | 13.9 | ||
| Casto Properties | 3.5 | |||
| Total Capital | $ | 17.4 | ||
| Debt | $ | — | ||
| Total Debt & Equity | $ | 17.4 | ||
Joint Venture Partnership Summaries 4.2
Developers Diversified Realty
Quarterly Financial Supplement
For the three months ended March 31, 2004
Joint Venture Investment Summary
| Joint Venture Name: | DOTRS LLC | |
| Date Formed: | September, 1996 | |
| Property Name/Location: | Macedonia Commons — Macedonia, Ohio | |
| Major Tenants: | First National Supermarkets | |
| Kohl’s Department Store | ||
| Wal-Mart (not owned) | ||
Partnership Structure | ||
| Equity Contribution: | 50% — DDR | |
| 50% — The State Teachers Retirement Board of Ohio | ||
| Cash Flow Distribution: | 50% — DDR | |
| 50% — The State Teachers Retirement Board of Ohio | ||
Fees to DDR | ||
| Management Fee: | 5% of gross retail income | |
| Development Fee: | 5% of hard costs for all improvements | |
| Leasing Fees: | 5% on new leases, 3.5% on renewals | |
| Commission on Outparcel Sales: | N/A |
Capital Structure (in millions) | ||||
| DDR | $ | 5.75 | ||
| The State Teachers Retirement Board | 5.75 | |||
| Total Capital | $ | 11.5 | ||
| Debt | $ | 11.1 | ||
| Total Debt & Equity | $ | 22.6 | ||
Joint Venture Partnership Summaries 4.2
Developers Diversified Realty
Quarterly Financial Supplemental
For the three months ended March 31, 2004
Joint Venture Investment Summary
| Joint Venture Name: | DDRC PDK Salisbury Phase III LLC | |
| Date Formed: | March 2001 | |
| Property Name/Location: | Salisbury, MD | |
| Major Tenants: | Rugged Warehouse | |
| Famous Footwear | ||
| Dress Barn | ||
Partnership Structure | ||
| Ownership Percentage: | 50% — DDR | |
| 50% — PDK Commons Phase III L.C. | ||
| Cash Flow Distribution: | 50% — DDR | |
| 50% — PDK Commons Phase III L.C. | ||
Fees to DDR | ||
| Management Fee: | 4% | |
| Development Fee: | $.75 psf of leasehold improvements | |
| Leasing Fees: | N/A |
Capital Structure (in millions) | ||||
| DDR | $ | 0.138 | ||
| PDK Salisbury LLC | 0.138 | |||
| Total Capital | $ | 0.3 | ||
| Payable to DDR | $ | 0.0 | ||
| Debt | $ | 1.8 | ||
| Total Debt & Equity | $ | 2.1 | ||
Joint Venture Partnership Summaries 4.2
Developers Diversified Realty
Quarterly Financial Supplement
For the three months ended March 31, 2004
Joint Venture Investment Summary |
| Joint Venture Name: | Shea and Tatum Associates Limited Partnership | |
| Date Formed: | January 1, 1995 (acquired January 2, 2003) | |
| Property Name/Location: | Paradise Village Gateway — Phoenix, AZ | |
| �� | ||
| Major Tenants: | Albertson’s | |
| Bed Bath & Beyond | ||
| Petsmart | ||
| Ross | ||
| Staples | ||
Partnership Structure | ||
| Equity Contribution: | 67% — DDR | |
| 33% — Churchill Family Trust | ||
| Cash Flow Distribution: | 67% — DDR | |
| 33% — Churchill Family Trust | ||
Fees to DDR | ||
| Management Fee: | 5% of gross income | |
| Development Fee: | 5% of total costs for all improvements (excluding land) | |
| Leasing Fees (without co-broker): | $3.50 per square foot for spaces < 5,000 square feet | |
| $3.00 per square foot for spaces 5,000 — 10,000 square feet | ||
| $2.50 per square foot for spaces 10,000 — 25,000 square feet | ||
| $2.00 per square foot for spaces 25,000 — 50,000 square feet | ||
| $1.50 per square foot for spaces over 50,000 square feet | ||
| Renewals earn 50% of fees on new leases | ||
| 5.0% on new ground leases on years 1-5 | ||
| Commission on Outparcel Sales: | 5% of gross sales price |
Capital Structure (in millions) | ||||
| DDR | $ | 4.85 | ||
| Churchill Family Trust | 2.39 | |||
| Total Capital | $ | 7.2 | ||
| Debt | $ | 17.6 | ||
| Total Debt & Equity | $ | 24.8 | ||
Joint Venture Partnership Summaries 4.2
Developers Diversified Realty
Quarterly Financial Supplement
For the three months ended March 31, 2004
Joint Venture Investment Summary
| Joint Venture Name: | Paseo Colorado Holdings LLC | |
| Date Formed: | January 14, 2003 | |
| Property Name/Location: | Paseo Colorado — Pasadena, CA | |
| Major Tenants: | DSW Shoe Warehouse | |
| Equinox Health & Fitness | ||
| Gelson’s Market | ||
| Macy’s | ||
| Pacific Theaters | ||
Partnership Structure | ||
| Equity Contribution: | 25% — DDR | |
| 75% — Lehman Brothers | ||
| Cash Flow Distribution: | 25% — DDR | |
| 75% — Lehman Brothers | ||
| Promote: | After DDR and Lehman Brothers receive a return of equity and both partners have been allocated an amount equal to a 19% annual return, DDR will receive 50% of available proceeds. | |
Fees to DDR | ||
| Management Fee: | 3.5% of gross income | |
| Development Fee: | 3.5% of total costs for all improvements (excluding land) | |
| Leasing Fees: | 6.0% on new leases on years 1-5; 3.0% on remainder of term (spaces < 5,000 square feet) | |
| 4.5% on new leases on years 1-5; 2.25% on remainder of term (spaces 5,000 — 10,000 square feet) | ||
| 3.5% on new leases on years 1-5; 1.75% on remainder of term (spaces 10,000 — 20,000 square feet) | ||
| 3.0% on renewals on years 1-5; 1.5% on remainder of term (spaces < 5,000 square feet) | ||
| 2.25% on renewals on years 1-5; 1.125% on remainder of term (spaces 5,000 — 10,000 square feet) | ||
| 1.75% on renewals on years 1-5; 1.0% on remainder of term (spaces 10,000 — 20,000 square feet) | ||
| $2.00 per square foot (spaces > 20,000 square feet) on new leases and renewals | ||
| Commission on Outparcel Sales: | 6.0% of gross sales price up to $500,000 | |
| 5.0% of gross sales price over $500,000 but less than $1,000,000 | ||
| 4.0% of gross sales price over $1,000,000 |
Capital Structure (in millions) | ||||
| DDR | $ | 8.0 | ||
| Lehman Brothers | 24.1 | |||
| Total Capital | $ | 32.1 | ||
| Payable to DDR | $ | 0.1 | ||
| Debt | $ | 85.0 | ||
| Total Debt & Equity | $ | 117.2 | ||
Joint Venture Partnership Summaries 4.2
Developers Diversified Realty
Quarterly Financial Supplement
For the three months ended March 31, 2004
Joint Venture Investment Summary
| Joint Venture Name: | KLA/SM L.L.C. | |
| Date Formed: | March 2002 | |
| Property Name/Location: | The Joint Venture consists of 59 fee simple, leasehold and groundlease interests previously owned by the Service Merchandise Company, Inc.. The Joint Venture also owns designation rights to 11 assets for which it has not obtained final title through the bankruptcy court. These assets are in the process of being designated to the Joint Venture. In total, these properties are located in 27 states across the United States. | |
Partnership Structure | ||
| Equity Contribution: | 24.63% — DDR | |
| 12.32% — Klaff Realty, L.P. | ||
| 61.58% — Lubert-Adler Funds | ||
| 1.47% — Random Properties Acquisition Corp I | ||
| Cash Flow Distribution: | 24.63% — DDR | |
| 12.32% — Klaff Realty, L.P. | ||
| 61.58% — Lubert-Adler Funds | ||
| 1.47% — Random Properties Acquisition Corp I | ||
| Once all partners receive a return of all equity, plus a 12% preferred return thereon, plus $43 million, Service Merchandise will be entitled to share 20% of the excess. The remaining proceeds will be distributed in accordance with the percentages noted. | ||
| Promote: | Once all partners have received a return of all equity, plus a 10% preferred return thereon, DDR will receive 35% of available proceeds. | |
Fees to DDR | ||
| Management Fees: | 3.0% of gross revenues | |
| Development Fees: | 4.5% of hard costs for all improvements for all retail tenant leases | |
| 1.5% of hard costs for all non-retail or furniture leases | ||
| Leasing Fees: | $0.94 per square foot for all retail tenant leases | |
| $0.31 per square foot for all non-retail or furniture leases | ||
| Disposition Fees: | .75% of gross sales price for all sales to retail purchasers | |
| .25% of gross sales price for all sales to non-retail or furniture purchasers |
Capital Structure (in millions) | ||||
| DDR | $ | 20.5 | ||
| Klaff | 10.3 | |||
| Lubert-Adler | 51.4 | |||
| Random Properties Acquisition Corp. I | 1.2 | |||
| Total Capital | $ | 83.4 | (1) | |
| Payable to DDR | $ | 0.30 | ||
| Existing Debt | $ | 75.1 | ||
| Debt to be Assumed | $ | 1.8 | (2) | |
| �� | ||||
| Total Debt & Equity | $ | 160.6 | ||
| (1) | Total capital includes member equity loans to the joint venture of $44.9 million as of December 31, 2003. | |
| (2) | Represents the maximum amount of debt that could be assumed by the Joint Venture concurrent with the designation of the final 11 undesignated properties. |
Developers Diversified Realty
Quarterly Financial Supplemental
For the three months ended March 31, 2004
Joint Venture Investment Summary
| Joint Venture Name: | Jefferson County Plaza LLC | |
| Date Formed: | July 1999 | |
| Property Name/Location: | Arnold, MO | |
| Major Tenants: | Target (not owned) | |
| Home Depot (not owned) | ||
| Shoe Carnival | ||
| Sally Beauty Supply | ||
| Deal$ | ||
Partnership Structure | ||
| Equity Contribution: | 50% — DDR | |
| 50% — The Sansone Group (50% owned by DDR) | ||
| Cash Flow Distribution: | 50% — DDR | |
| 50% — The Sansone Group | ||
Fees to DDR | ||
| Management Fee: | 1.50% | |
| Development Fee: | NA | |
| Leasing Fees: | 2.5% of gross base rent plus reimbursables on new leases; 1.75% on renewals |
Capital Structure (in millions) | ||||
| DDRC | $ | (0.06 | ) | |
| The Sansone Group | (0.06 | ) | ||
| Total Capital (1) | $ | (0.1 | ) | |
| Payable to DDR | $ | 3.1 | ||
| Debt | $ | 2.3 | ||
| Total Debt & Equity | $ | 5.3 | ||
| (1) | Basis differentials occur primarily when the Company has purchased an interest in existing joint ventures at fair market values which differ from their proportionate share of the historical net assets of the joint ventures. |
Developers Diversified Realty
Quarterly Financial Supplemental
For the three months ended March 31, 2004
Joint Venture Investment Summary
| Joint Venture Name: | DDR Markaz LLC (Kuwaiti Financial Centre) | |||||
| Date Formed: | May 2003 | |||||
| Property Name/Location: | The joint venture consists of the following seven properties: | |||||
| Hilltop Plaza – Richmond, CA | Highland Grove Shopping Center– Highland, IN | |||||
| Derby Square – Grove City, OH | Springfield Commons Shopping Center – Toledo, OH | |||||
| Oviedo Park – Oviedo, FL | Apple Blossom Corners – Winchester, VA | |||||
| North Pointe Plaza – Tampa, FL | ||||||
| Major Tenants: | Babies R Us (not owned) | Lowe’s (not owned) | ||||
| Barnes & Noble | Marshalls | |||||
| Bed Bath & Beyond | Martin’s Food Store | |||||
| Big Bear | Michael’s | |||||
| Books-A-Million | OfficeMax | |||||
| Borders Books (not owned) | Old Navy | |||||
| Century Theatre | Petsmart | |||||
| Circuit City | Publix | |||||
| Gander Mountain | Ross Dress for Less | |||||
| Jewel (not owned) | Target (not owned) | |||||
| Kohl’s | T.J. Maxx | |||||
| Linens ‘N Things | Wal-mart (not owned) | |||||
Partnership Structure | ||||||
| Equity Contribution: | 80% — Kuwait Financial Centre S.A.K. and Bank of Bahrain and Kuwait B.S.C. (dba as “Markaz”) | |||||
| 20% — DDR | ||||||
| Cash Flow Distribution: | 80% — Markaz | |||||
| 20% — DDR | ||||||
| Promote (current): | (i) Pro rata in proportion to DDR and Markaz equity interest until both have been allocated an amount equal to a 12% annual return, and (ii) 20% to DDR and 80% to DDR and Markaz in proportion to their equity interest. | |||||
Fees to DDR | ||||||
| Property Management Fee: | 4.0% of revenues | |||||
| Development Fee: | 5.0% of total costs for all improvements | |||||
| Asset Management Fee: | 5.5% of net operating income | |||||
| Leasing Fees (without co-broker): | 6.0% on new leases on years 1-5; 3.0% on remainder of term (spaces < 5,000 square feet) | |||||
| 5.0% on new leases on years 1-5; 2.5% on remainder of term (spaces 5,000 - 10,000 square feet) | ||||||
| 4.0% on new leases on years 1-5; 2.0% on remainder of term (spaces 10,000 - 20,000 square feet) | ||||||
| $2.00 per square foot (spaces > 20,000 square feet) | ||||||
| 4.0% on new leases on years 1-5; 2.0% on years 6-10 (ground leases) | ||||||
| Renewals earn 50% of fees on new leases | ||||||
| Commission on Outparcel Sales: | 6.0% of gross sales price up to $500,000 | |||||
| 5.0% of gross sales price $500,000 - $1,000,000 | ||||||
| 4.0% of gross sales price over $1,000,000 | ||||||
Capital Structure (in millions) | ||||
| DDR | $ | 11.8 | ||
| Markaz | 47.0 | |||
| Total Capital | $ | 58.8 | ||
| Payable to DDR | $ | 0.8 | ||
| Debt | $ | 110.0 | ||
| Total Debt & Equity | $ | 169.6 | ||
Developers Diversified Realty
Quarterly Financial Supplemental
For the three months ended March 31, 2004
Joint Venture Investment Summary
| Joint Venture Name: | Coventry II DDR Ward Parkway LLC | |
| Date Formed: | June 2003 | |
| Property Name/Location: | Kansas City, MO | |
| Major Tenants: | Target (not owned) | |
| Dilliards | ||
| Pier One | ||
| TJ Maxx | ||
| AMC Theater | ||
| 24 Hour Fitness | ||
| Dick’s | ||
| Steinmart | ||
Partnership Structure | ||
| Equity Contribution: | 80% — Coventry II Fund | |
| 20% — DDR | ||
| Cash Flow Distribution: | 80% — Coventry II Fund * | |
| 20% — DDR | ||
Fees to DDR | ||
| Management Fee: | 3% of gross income for stabilized property (95% leased) | |
| 4% of gross income for unstabilized property | ||
| Construction Management Fee: | 5% of all hard and soft costs | |
| Leasing Fees: | 6% on new leases on years 1-5; 3% on remainder of term (spaces < 5,000 square feet) | |
| 4.5% on new leases on years 1-5; 2.25% on remainder of term (spaces 5,000 — 10,000 square feet) | ||
| 3.5% on new leases on years 1-5; 1.75% on remainder of term (spaces 10,000 — 20,000 square feet) | ||
| $2 per square foot (spaces > 20,000 square feet) | ||
| 4% on new leases on years 1-10 (ground lease) | ||
| 3% for renewals on years 1-5; 1.5% on remainder of term (spaces < 5,000 square feet) | ||
| 2.25% for renewals on years 1-5; 1.125% on remainder of term (spaces 5,000 — 10,000 square feet) | ||
| 1.75% for renewals on years 1-5; 1% on remainder of term (spaces 10,000 — 20,000 square feet) | ||
| $2 per square foot for renewals (spaces > 20,000 square feet) |
Capital Structure (in millions) | ||||
| Coventry II Fund | $ | 13.85 | ||
| DDR | 3.55 | |||
| Total Capital | $ | 17.4 | ||
| Debt | $ | 31.5 | ||
| Total Debt & Equity | $ | 48.9 | ||
| * | Coventry II Fund: | |
| DDR is also entitled to a promote as a special member of the Coventry II Fund equal to 10% of all cash flow distributions after the distribution to all members of the Coventry II Fund of (i) a 10% preferred return on all contributed capital in all Coventry II Fund investments and (ii) 100% of the unreturned contributed capital in all Coventry II Fund investments. |
Joint Venture Partnership Summaries 4.2
Developers Diversified Realty
Quarterly Financial Supplemental
For the three months ended March 31, 2004
Joint Venture Investment Summary
| Joint Venture Name: | Coventry II DDR Totem Lakes LLC | |
| Date Formed: | January 2004 | |
| Property Name/Location: | Totem Lakes Mall — Kirkland, WA | |
| Major Tenants: | Guitar Center | |
| Trader Joe’s | ||
| Big 5 Sporting Goods | ||
| Totem Lake Theater | ||
| Rite Aid | ||
| Ross Dress For Less | ||
| Famous Footwear | ||
| CompUSA | ||
Partnership Structure | ||
| Equity Contribution: | 80% — Coventry II Fund | |
| 20% — DDR | ||
| Cash Flow Distribution: | 80% — Coventry II Fund * | |
| 20% — DDR | ||
Fees to DDR | ||
| Management Fee: | 4% of gross income | |
| Construction Management Fee: | 5% of all hard and soft costs | |
| Leasing Fees: | 6% on new leases on years 1-5; 3% on remainder of term (spaces < 5,000 square feet) | |
| 4.5% on new leases on years 1-5; 2.25% on remainder of term (spaces 5,000 — 10,000 square feet) | ||
| 3.5% on new leases on years 1-5; 1.75% on remainder of term (spaces 10,000 — 20,000 square feet) | ||
| $2 per square foot (spaces > 20,000 square feet) | ||
| 4% on new leases on years 1-10 (ground lease) | ||
| 3% for renewals on years 1-5; 1.5% on remainder of term (spaces < 5,000 square feet) | ||
| 2.25% for renewals on years 1-5; 1.125% on remainder of term (spaces 5,000 — 10,000 square feet) | ||
| 1.75% for renewals on years 1-5; 1% on remainder of term (spaces 10,000 — 20,000 square feet) | ||
| $2 per square foot for renewals (spaces > 20,000 square feet) | ||
| 6% of gross sales price < $500,000 (outparcel sales) | ||
| 5% of gross sales price $500,001 — $1,000,000 (outparcel sales) | ||
| 4% of gross sales prices > $1,000,000 (outparcel sales) |
Capital Structure (in millions) | ||||
| Coventry II Fund | $ | 9.65 | ||
| DDR | $ | 2.45 | ||
| Total Capital | $ | 12.1 | ||
| Debt | $ | 25.0 | ||
| Total Debt & Equity | $ | 37.1 | ||
| * | Coventry II Fund: | |
| DDR is also entitled to a promote as a special member of the Coventry II Fund equal to 10% of all cash flow distributions after the distribution to all members of the Coventry II Fund of (i) 10% preferred return on all contributed capital in all Coventry II Fund investments and (ii) 100% of the unreturned contributed capital in all Coventry II Fund investments. |
Joint Venture Partnership Summary 4.2
Developers Diversified Realty
Quarterly Financial Supplemental
For the three months ended March 31, 2004
Joint Venture Investment Summary
| Joint Venture Name: | Coventry II DDR Phoenix Spectrum LLC | |
| Date Formed: | March 2004 | |
| Property Name/Location: | Spectrum Mall — Phoenix, AZ | |
| Major Tenants: | Wal-Mart | |
| Costco | ||
| Ross Dress For Less | ||
| PetsMart | ||
| Dilliard’s | ||
| Walgreens | ||
| Harkins Theater | ||
| Famous Footwear | ||
Partnership Structure | ||
| Equity Contribution: | 80% — Coventry II Fund | |
| 20% — DDR | ||
| Cash Flow Distribution: | 80% — Coventry II Fund * | |
| 20% — DDR | ||
Fees to DDR | ||
| Management Fee: | 4% of gross income | |
| Construction Management Fee: | 5% of all hard and soft costs | |
| Leasing Fees: | 6% on new leases on years 1-5; 3% on remainder of term (spaces < 5,000 square feet) | |
| 4.5% on new leases on years 1-5; 2.25% on remainder of term (spaces 5,000 — 10,000 square feet) | ||
| 3.5% on new leases on years 1-5; 1.75% on remainder of term (spaces 10,000 — 20,000 square feet) | ||
| $2 per square foot (spaces > 20,000 square feet) | ||
| 4% on new leases on years 1-10 (ground lease) | ||
| 3% for renewals on years 1-5; 1.5% on remainder of term (spaces < 5,000 square feet) | ||
| 2.25% for renewals on years 1-5; 1.125% on remainder of term (spaces 5,000 — 10,000 square feet) | ||
| 1.75% for renewals on years 1-5; 1% on remainder of term (spaces 10,000 — 20,000 square feet) | ||
| $2 per square foot for renewals (spaces > 20,000 square feet) | ||
| 6% of gross sales price < $500,000 (outparcel sales) | ||
| 5% of gross sales price $500,001 — $1,000,000 (outparcel sales) | ||
| 4% of gross sales prices > $1,000,000 (outparcel sales) |
Capital Structure (in millions) | ||||
| Coventry II Fund | $ | 5.9 | ||
| DDR | 1.5 | |||
| Total Capital | $ | 7.4 | ||
| Debt | $ | 39.0 | ||
| Total Debt & Equity | $ | 46.4 | ||
| * | Coventry II Fund: | |
| DDR is also entitled to a promote as a special member of the Coventry II Fund equal to 10% of all cash flow distributions after the distribution to all members of the Coventry II Fund of (i) a 10% preferred return on all contributed capital in all Coventry II Fund investments and (ii) 100% of the unreturned contributed capital in all Coventry II Fund investments. |
Joint Venture Partnership Summary 4.2
Developers Diversified Realty
Quarterly Financial Supplement
For the three months ended March 31, 2004
Joint Venture Investment Summary
| Joint Venture Name: | DDR Macquarie LLC (Fund LLC, Management LLC, and U.S. Trust Inc.) | |||||
| Date Formed: | November 2003 | |||||
| Property Name/Location: | The joint ventures consist of the following eleven properties: | |||||
| Carillon Place — Naples, FL | Perimeter Pointe — Atlanta, GA | |||||
| Town Center Prado — Marietta, GA | Woodfield Village Green — Schaumburg, IL | |||||
| Shopper’s World — Framingham, MA | Fairfax Towne Center — Fairfax, VA | |||||
| The Plazas at Great Northern — North Olmsted, OH | Belden Park Crossings — Canton, OH | |||||
| Riverdale Village — Coon Rapids, MI | Independence Commons — Independence, MO | |||||
| Midway Marketplace — St Paul, MI | ||||||
| Major Tenants: | AMC Theatres | Home Depot | PetsMart | |||
| Babies ‘R Us | General Cinema | Publix | ||||
| Barnes & Noble | Jordan Marsh/Federated | Ross Dress for Less | ||||
| Bed Bath & Beyond | Kohl’s | Safeway | ||||
| Best Buy | L.A. Fitness Sports Clubs | Sports Authority | ||||
| Bobs | Linens ‘N Things | TJ Maxx | ||||
| Borders Books | Marc’s | Tower Records | ||||
| Circuit City | Marshalls | Toys ‘R Us | ||||
| Container Store | Michael’s | United Artists Theatre | ||||
| Costco (not owned) | Nordstrom Rack | Winn Dixie | ||||
| Crunch Fitness | Off 5th | Jo-Ann Stores | ||||
| Dick’s Sporting Goods | Office Depot | Old Navy (Gap, Inc.) | ||||
| DSW Shoe Warehouse | OfficeMax | Wal-Mart |
Partnership Structure | ||||||
| Equity Contribution: | 14.5% — DDR | Cash Flow Distribution: | 14.5% — DDR | |||
| 4.5% — Macquarie Bank Limited (“MBL”) | 4.5% — MBL | |||||
| 81% — Macquarie DDR Trust (“MDT”) | 81% — MDT | |||||
| Promote: | Quarterly Base and Performance special income allocations to DDR and MBL | |||||
Fees to DDR | ||||||
| Property Management Fee: | 4.0% of gross revenues | |||||
| Development Fee: | 5.0% of total costs for all improvements | |||||
| Leasing Fees (without co-broker): | 6.0% on new leases on years 1-5; 3.0% on remainder of term (spaces < 5,000 square feet) | |||||
| 5.0% on new leases on years 1-5; 2.5% on remainder of term (spaces 5,000 - 10,000 square feet) | ||||||
| 4.0% on new leases on years 1-5; 2.0% on remainder of term (spaces 10,000 - 20,000 square feet) | ||||||
| $2.00 per square foot (spaces > 20,000 square feet) | ||||||
| 4.0% on new leases on years 1-5; 2.0% on years 6-10 (ground leases) | ||||||
| Renewals earn 50% of fees on new leases | ||||||
| Commission on Outparcel Sales: | 6.0% of gross sales price up to $500,000 | |||||
| 5.0% of gross sales price $500,000 — $1,000,000 | ||||||
| 4.0% of gross sales price over $1,000,000 | ||||||
| Sponsor’s Fee | .5% of MDT’s interest in US LLC assets payable upon the Australian initial public offering | |||||
| Acquisition Fees | Up to 1.0% gross asset value | |||||
| Disposition Fee | Market rate up to 1% | |||||
| Debt Placement Fee | Up to 50bp of the total amount of long term financing | |||||
| Due Diligence Fee | 12.5bp of MDT’s prorata interest in the purchase price of the acquisition | |||||
Capital Structure (in millions) | ||||
| DDR | $ | 52.5 | ||
| MBL | 16.3 | |||
| MDT | 293.5 | |||
| Total Capital | $ | 362.3 | ||
| Payable to DDR | $ | 0.7 | ||
| Debt | $ | 374.5 | ||
| Total Debt & Equity | $ | 737.5 | ||
Joint Venture Partnership Summary 4.2
Developers Diversified Realty
Quarterly Financial Supplement
For the three months ended March 31, 2004
Summary of Joint Venture Capital Transactions
Acquisitions, Dispositions, Developments & Expansions
for the Three Month Period Ended March 31, 2004
| Three Months | ||||||||||||||||||||
| Ended | Year Ended | Year Ended | Year Ended | Year Ended | ||||||||||||||||
| March 31, | December 31, | December 31, | December 31, | December 31, | ||||||||||||||||
| 2004 | 2003 | 2002 | 2001 | 2000 | ||||||||||||||||
| Acquisitions/Transfers | $ | 90.3 | (2) | $ | 1,221.7 | (4) | $ | 53.0 | $ | 213.1 | $ | 91.2 | (9) | |||||||
| Completed Expansions | 0.0 | 9.7 | 9.0 | 2.3 | 6.2 | |||||||||||||||
| Developments & Construction in Progress | 4.8 | 120.1 | 48.6 | 103.7 | 114.7 | |||||||||||||||
| Tenant Improvements & Building Renovations (1) | 0.0 | 0.6 | 1.6 | 4.9 | 1.9 | |||||||||||||||
| Other Real Estate Investments | 0.0 | 0.0 | 161.8 | (6) | 0.0 | 0.0 | ||||||||||||||
| Minority Equity Investment in AIP | 0.0 | 0.0 | 0.0 | (135.0 | )(8) | (2.2 | ) | |||||||||||||
| $ | 95.1 | $ | 1,352.1 | $ | 274.0 | $ | 189.0 | $ | 211.8 | |||||||||||
| Less: Real Estate Sales and Dispositions | ($179.7 | )(3) | ($781.5 | )(5) | ($361.4 | )(7) | ($16.9 | ) | ($115.9 | )(10) | ||||||||||
| Joint Venture Totals (Millions) | ($84.6 | ) | $ | 570.6 | ($87.4 | ) | $ | 172.1 | $ | 95.9 | ||||||||||
| (1) | The Company estimates recurring capital expenditures, including tenant improvements, of $.7 million associated with its joint venture portfolio during 2004. | |
| (2) | Balance includes $7.8 for the purchase of Poag & McEwen’s interest in RVIP IIIB. | |
| (3) | In addition to the sales listed in the disposition section which had an aggregate cost of $79.5 this balance includes the transfer to DDR of the Littleton, CO shopping center which had an aggregate cost of $58.2 million and $42.0 million of assets owned by various joint ventures that were consolidated into DDR, due to FIN 46. | |
| (4) | Balance includes the $87.7 million of equity investments previously held by DD Development Company for shopping centers in Long Beach, CA, Shawnee, KS, Overland Pointe, KS, Olathe, KS and Kansas City, MO. | |
| (5) | In addition to the sales listed in the disposition section, which had an aggregate cost of $167.5 million, this balance includes the disposition of shopping centers located in Dayton and Niles, OH, the sale of an outparcel, the transfer of the Leawood, KS and Suwanee, GA shopping centers to DDR and the rejection of two of the Service Merchandise leases, the aggregate cost of these transactions was $116.6 million. During the fourth quarter the shopping centers located in Coon Rapids, MN, Naples, FL, Atlanta, GA, Marietta, GA, Schaumburg, IL, Framingham, MA and Fairfax, VA, which had an aggregate cost of $379.2 million, were sold to the Macquarie DDR Trust joint venture, and $118.2 million of assets owned by DD Development Company were consolidated into DDR. | |
| (6) | Amount represents the net cost of assets acquired from Service Merchandise pursuant to the designation rights agreement. | |
| (7) | Includes transfers to DDR in the aggregate amounts of $58.7 million, $38.7 million, $25.6 million and $30.6 million relating to shopping centers in Plainville, CT, Independence, MO, Canton, OH and San Antonio, TX, respectively. This amount also includes sales of shopping centers in Denver, CO; Hagerstown, MD; Salem, NH, Eatontown, NJ, Durham, NC and Round Rock, TX and the sales of outlot parcels in Round Rock, TX and San Antonio, TX. | |
| (8) | The balance reflects the consolidation of the assets formerly owned by American Industrial Properties (AIP) during 2nd quarter 2001. | |
| (9) | Includes transfers from DDR to joint ventures in the aggregate amount of $39.6 million relating to a development project in San Antonio, TX, a transfer of a Phoenix, AZ property, and the outparcel land at Round Rock, TX. | |
| (10) | Includes transfers to DDR in the aggregate amount of $76.7 million relating to the Nassau Pavillion development project, two former DDR/Oliver McMillan projects, and Phase II of the Salisbury, MD development project. All of which were previously accounted for through joint ventures. |
Summary of Joint Venture Capital Transactions 5.1
Developers Diversified Realty
Quarterly Financial Supplement
For the three months ended March 31, 2004
Joint Venture Acquisitions
for the Three Month Period Ended March 31, 2004
| DDR’s | Joint | |||||||||||||||
| Cost | Acquisition | Ownership | Venture | |||||||||||||
| Property Location | GLA | (Millions) | Date | Percentage | Partner | |||||||||||
| Kirkland, WA | 290,708 | $ | 37.0 | 1/21/2004 | 20.00 | % | Coventry II | |||||||||
| Phoenix, AZ | 1,134,062 | $ | 45.5 | 3/3/2004 | 20.00 | % | Coventry II | |||||||||
| Total | 1,424,770 | $ | 82.5 | |||||||||||||
Joint Venture Dispositions
for the Three Month Period Ended March 31, 2004
| Gross Sale | DDR's | Joint | ||||||||||||||
| Proceeds | Ownership | Venture | ||||||||||||||
| Property Location | GLA | (Millions) | Sale Date | Percentage | Partner | |||||||||||
| Puente Hills, CA | 297,998 | $ | 33.0 | 1/8/2004 | 20.00 | % | Prudential & Coventry Real Estate Partners | |||||||||
| San Antonio, TX | 320,345 | $ | 58.0 | 1/22/2004 | 35.00 | % | DRA Advisors | |||||||||
| Service Merchandise locations | 189,745 | $ | 6.5 | Various | 25.00 | % | Various | |||||||||
| Total | 808,088 | $ | 97.5 | |||||||||||||
Summary of Joint Venture Capital Transactions 5.1
Developers Diversified Realty
Quarterly Financial Supplement
For the three months ended March 31, 2004
Joint Venture Expansion and Redevelopment Projects
for the Three Month Period Ended March 31, 2004
| DDR’s | Joint | |||||||
| Ownership | Venture | |||||||
| Projects in Progress | Percentage | Partner | Description | |||||
| Deer Park, IL | 24.75 | % | Prudential Real Estate Investors | Expansion of the existing center to create a 50,000 sf Century Theater (scheduled to open 3rd Quarter of 2004) and to create an additional 23,800 sf of small retail specialty shops and two outparcels. | ||||
| Merriam, KS | 50.00 | % | DRA Advisors | Expansion of the 7,300 sf outparcel for additional retail tenants | ||||
| Total Cost (Millions) | $ | 15.0 | ||||||
| Projects to Commence | Percentage | |||||||
| Phoenix, AZ | 20.00 | % | Coventry II | Relocation of several existing tenants to accommodate an anchor tenant, several junior anchors and other retail tenants to be announced. | ||||
| Kansas City, MO | 20.00 | % | Coventry II | Relocation of several small shop tenants in the shopping center to accommodate several mid-size anchors and other retail tenants to be announced. | ||||
| Kirkland, WA | 20.00 | % | Coventry II | Large-scale redevelopment to include the relocation of several existing tenants, plus an expansion of the existing center to create additional GLA for two anchors, junior anchors, small shops and restaurants to be announced. | ||||
Joint Venture Expansions and Redevelopment 5.2
Developers Diversified Realty
Quarterly Financial Supplement
For the three months ended March 31, 2004
| Summary of Joint Venture Development Projects for the Three Month Period Ended March 31, 2004 | ||||||||||||||||||||||||
| DDR’s | ||||||||||||||||||||||||
| DDR’s | Joint | Total | Proportionate | Substantial | ||||||||||||||||||||
| Total | Ownership | Venture | Cost | Cost | Completion | |||||||||||||||||||
| Projects in Progress | GLA | Percentage | Partner | (Millions) | (Millions) | Date | Major Tenants | |||||||||||||||||
| Jefferson County (St. Louis), MO | 330,051 | (1) | 50.0 | % | Sansone | $ | 9.7 | $ | 4.9 | 2004 | Target, Home Depot, Shoe Carnival, Deal$, Sally Beauty | |||||||||||||
Projects to Commence Construction | ||||||||||||||||||||||||
| Apex, NC (Phase III) | 434,408 | 80.0 | % | First Carolina Properties | $ | 37.7 | $ | 30.1 | 2005 | To be announced | ||||||||||||||
| Apex, NC (Phase IV) | 277,235 | 20.0 | % | First Carolina Properties | $ | 27.0 | $ | 5.4 | 2005 | To be announced | ||||||||||||||
| Joint Venture Development Totals | 1,041,694 | $ | 74.4 | $ | 40.4 | |||||||||||||||||||
| $ | ||||||||||||||||||||||||
Notes:
| (1) | Includes square footage which will not be Company owned. |
Joint Venture Developments 5.2
Developers Diversified Realty
Quarterly Financial Supplement
For the three months ended March 31, 2004
Joint Venture Development
Assets Placed in Service as of March 31, 2004
| Assets Placed | DDR’s Current | |||||||
| in Service | Proportionate Share | |||||||
| Date | (Millions) | (Millions) | ||||||
| As of December 31, 2003 | $ | 4.5 | $ | 2.3 | ||||
| 1st Quarter 2004 | $ | 0.0 | $ | 0.0 | ||||
| 2nd Quarter 2004 | $ | 0.0 | $ | 0.0 | ||||
| 3rd Quarter 2004 | $ | 2.6 | $ | 1.3 | ||||
| 4th Quarter 2004 | $ | 2.6 | $ | 1.3 | ||||
| During 2005 and Thereafter | $ | 64.7 | $ | 35.5 | ||||
| Total | $ | 74.4 | $ | 40.4 | ||||
Joint Venture Development
Funding Schedule as of March 31, 2004
| DDR’s | JV Partners’ | Proceeds from | ||||||||||||||
| Proportionate | Proportionate | Construction | ||||||||||||||
| Share | Share | Loans | Total | |||||||||||||
| (Millions) | (Millions) | (Millions) | (Millions) | |||||||||||||
| Funded as of March 31, 2004 | $ | 5.0 | $ | 0.0 | $ | 2.3 | $ | 7.3 | ||||||||
| Projected Net Funding During 2004 | 11.1 | 5.1 | 2.8 | 19.0 | ||||||||||||
| Projected Net Funding Thereafter | 0.0 | 0.0 | 48.1 | 48.1 | ||||||||||||
| Total | $ | 16.1 | $ | 5.1 | $ | 53.2 | $ | 74.4 | ||||||||
Joint Venture Development Delivery and Funding Schedules 5.2
Developers Diversified Realty Corporation
Quarterly Financial Supplement
For the three months ended March 31, 2004
Summary of Joint Venture Debt
as of March 31, 2004
| Mortgage | ||||||||||||||||
| Property/Entity | Balance (000’s) | Maturity Date | Interest Rate | |||||||||||||
| RVIP III Long Beach, CA | V | 29,695 | 06/04 | Libor + 170 | ||||||||||||
| RVIP III B Deer Park, IL | V | 50,836 | 07/04 | Libor + 175 | ||||||||||||
| RVIP VI | 18,575 | (1) | ||||||||||||||
| RVIP VII | V | 67,500 | (2) | 03/07 | Libor + 140 | |||||||||||
| F | 13,822 | (2) | ||||||||||||||
| RVIP VIII | V | 26,870 | 01/06 | Libor + 175 | ||||||||||||
| DDRA Community Centers Five | F | 156,000 | (3) | 10/05 | 6.64 | |||||||||||
| DDRA Community Centers Seven Ahwatukee, AZ (Phase IV) | F | 9,903 | 01/05 | 8.07 | ||||||||||||
| DDRA Community Centers Eight Deer Valley, AZ | F | 17,689 | 09/10 | 8.01 | ||||||||||||
| Merriam Town Center Merriam, KS | V | 30,000 | 06/05 | Libor +205 | ||||||||||||
| Tax Incremental Financing Obligation | F | 9,075 | 02/16 | 6.90 | ||||||||||||
| DDRA Kildeer LLC | V | 4,500 | 08/07 | Libor + 180 | ||||||||||||
| Kildeer, IL | F | 15,000 | 08/07 | 5.64 | ||||||||||||
| Lennox Town Center Limited Columbus, OH | F | 18,931 | 07/22 | 8.11 | ||||||||||||
| Sun Center Limited | F | 5,801 | 05/07 | 8.29 | ||||||||||||
| Columbus, OH | F | 15,208 | 04/11 | 8.48 | ||||||||||||
| DOTRS LLC Macedonia, OH | V | 11,064 | 09/06 | Libor +100 | ||||||||||||
| DDRC PDK Salisbury Phase III LLC Salisbury, MD | F | 1,852 | 04/06 | 7.61 | ||||||||||||
| KLA/SM LLC | V | 45,508 | 07/04 | Libor + 350 | ||||||||||||
| F | 12,716 | 11/13 | 6.2555 | |||||||||||||
| F | 16,880 | 10/13 | 6.365 | |||||||||||||
| Jefferson County Plaza, LLC Arnold, MO | V | 2,288 | 05/05 | Libor + 175 | ||||||||||||
Summary of Joint Venture Debt 5.3
Developers Diversified Realty Corporation
Quarterly Financial Supplement
For the three months ended March 31, 2004
Summary of Joint Venture Debt
as of March 31, 2004 (continued)
| Mortgage | ||||||||||||||||
| Property/Entity | Balance (000’s) | Maturity Date | Interest Rate | |||||||||||||
| Paradise Village Gateway Phoenix, AZ | F | 17,563 | 05/07 | 7.78 | ||||||||||||
| Paseo Colorado Holdings | F | 55,000 | 02/06 | 5.78 | ||||||||||||
| Pasadena, CA | V | 30,000 | 02/06 | 4.45 | ||||||||||||
| DDR Markaz | F | 110,000 | (4) | 06/08 | 4.129 | |||||||||||
| DDR Ward Parkway | V | 31,500 | 08/06 | Libor + 240 | ||||||||||||
| Coventry II DDR Totem Lakes | V | 25,000 | 06/04 | Libor + 87.5 | ||||||||||||
| Coventry II DDR Phoenix Spectrum | V | 39,000 | 07/06 | Libor + 275 | ||||||||||||
| DDR Maquarie CRRV Perimeter One & Two | V | 42,000 | 02/06 | 6.625 | ||||||||||||
| DDR Maquarie | F | 290,500 | (5) | 11/08 | 4.225 | |||||||||||
| DDR Maquarie | F | 9,100 | (6) | 11/05 | 4.913 | |||||||||||
| $100 Million Revolving Credit Facility | V | 32,900 | (6) | 11/05 | Libor + 137.5 | |||||||||||
| $ | 1,262,276 | |||||||||||||||
Notes:
| (1) | Encumbers five shopping center properties located in Kansas City, MO with mortgage interest rates ranging from 7.79% to 8.16% and maturity dates ranging from October 2007 to November 2007. | |||
| (2) | Encumbers seven shopping center properties located in California and Washington with mortgage interest rates ranging from LIBOR+140 to 9.5% and maturity dates ranging from March 2007 to March 2020. | |||
| (3) | Encumbers six shopping center properties as follows: | |||
| Ahwatukee, AZ | Maple Grove, MN | |
| Phoenix, AZ | Portland, OR | |
| Eagan, MN | Fort Worth, TX |
| (4) | Encumbers seven shopping center properties as follows: |
| Oviedo, FL | Tampa, FL | |
| Richmond, CA | Highland, IN | |
| Toledo, OH | Winchester, VA | |
| Grove City, OH |
| (5) | Encumbers seven shopping center properties as follows: |
| Independence, MO | Framingham, MA | |
| Schaumburg, IL | Atlanta, GA | |
| Naples, FL | Marietta, GA | |
| Fairfax, VA |
| (6) | Encumbers three shopping center properties as follows: |
| Canton, OH | St. Paul, MN | |
| North Olmsted, OH |
Summary of Joint Venture Debt 5.3
Developers Diversified Realty Corporation
Quarterly Financial Supplement
For the three months ended March 31, 2004
Summary of Pro Rata Joint Venture Debt
as of March 31, 2004
| DDR's | DDR's | |||||||
| Pro Rata | Pro Rata | |||||||
| Joint Venture | Interest | Debt (000's) | ||||||
| RVIP III Long Beach | 25.54 | % | $ | 7,584 | ||||
| RVIP III B | 25.54 | % | 12,983 | |||||
| RVIP VI | 25.54 | % | 4,744 | |||||
| RVIP VII | 20.79 | % | 16,907 | |||||
| RVIP VIII | 12.77 | % | 3,431 | |||||
| DDRA Comm Ctr Five | 50.00 | % | 78,000 | |||||
| DDRA Comm Ctr Seven | 50.00 | % | 4,952 | |||||
| DDRA Comm Ctr Eight | 50.00 | % | 8,845 | |||||
| Merriam Town Center | 50.00 | % | 19,538 | |||||
| DDRA Kildeer, LLC | 10.00 | % | 1,950 | |||||
| Lennox Town Center | 50.00 | % | 9,466 | |||||
| Sun Center | 79.45 | % | 16,691 | |||||
| DOTRS LLC | 50.00 | % | 5,532 | |||||
| DDRC PDK Salisbury | 50.00 | % | 926 | |||||
| KLA/SM LLC | 24.63 | % | 18,498 | |||||
| Jefferson County Plaza | 50.00 | % | 1,144 | |||||
| Paradise Village Gateway | 67.00 | % | 11,767 | |||||
| Paseo Colorado Holdings | 25.00 | % | 21,250 | |||||
| DDR Markaz | 20.00 | % | 22,000 | |||||
| DDR Ward Parkway | 20.00 | % | 6,300 | |||||
| Coventry II DDR Totem Lakes | 20.00 | % | 5,000 | |||||
| Coventry II DDR Phoenix Spectrum | 20.00 | % | 7,800 | |||||
| DDR Maquarie | 14.50 | % | 6,090 | |||||
| DDR Maquarie | 14.50 | % | 42,123 | |||||
| DDR Maquarie Revolving Credit Facility | 14.50 | % | 6,090 | |||||
| Total | $ | 339,611 | ||||||
Summary of Joint Venture Debt 5.4
Developers Diversified Realty Corporation
Quarterly Financial Supplement
For the three months ended March 31, 2004
Summary of Joint Venture Mortgage Principal Payments
as of March 31, 2004
(000’s)
| JOINT VENTURE | 2004 Payments | 2005 Payments | 2006 Payments | 2007 Payments | 2008 Payments | 2009 Payments | 2010 Payments | 2011 Payments | 2012 Payments | 2013 Payments | Thereafter | Total | ||||||||||||||
| RVIP III (Long Beach, CA) | 29,695 | 29,695 | ||||||||||||||||||||||||
| RVIP III B (Deer Park) | 48,584 | 48,584 | ||||||||||||||||||||||||
| RVIP VI | 204 | 293 | 317 | 17,761 | 18,575 | |||||||||||||||||||||
| RVIP VII | 304 | 437 | 476 | 74,702 | 253 | 278 | 305 | 336 | 369 | 407 | 3,455 | 81,322 | ||||||||||||||
| RVIP VIII | 26,870 | 26,870 | ||||||||||||||||||||||||
| DDRA Community Centers Five | 156,000 | 156,000 | ||||||||||||||||||||||||
| DDRA Community Centers Seven | 89 | 9,836 | 9,925 | |||||||||||||||||||||||
| DDRA Community Centers Eight | 166 | 184 | 200 | 217 | 231 | 255 | 16,479 | 17,732 | ||||||||||||||||||
| Merriam Town Center | 30,000 | 30,000 | ||||||||||||||||||||||||
| Merriam TIF | 9,075 | 9,075 | ||||||||||||||||||||||||
| DDRA Kildeer, LLC (Kildeer, IL) | 19,500 | 19,500 | ||||||||||||||||||||||||
| Lennox Town Center Limited | 459 | 498 | 540 | 585 | 635 | 688 | 746 | 809 | 877 | 950 | 12,256 | 19,043 | ||||||||||||||
| Sun Center Limited | ||||||||||||||||||||||||||
| Principal Mutual Life Ins Co | 406 | 442 | 480 | 523 | 569 | 619 | 674 | 11,594 | 15,306 | |||||||||||||||||
| W. Lyman Case & Co | 156 | 170 | 184 | 5,328 | 5,838 | |||||||||||||||||||||
| DOTRS LLC | ||||||||||||||||||||||||||
| National City Bank | 428 | 453 | 10,285 | 11,165 | ||||||||||||||||||||||
| DDRC PDK Salisbury Phase III | 1,857 | 1,857 | ||||||||||||||||||||||||
| KLA/SM LLC | 49,502 | 29,690 | 79,192 | |||||||||||||||||||||||
| Jefferson County Plaza LLC | 2,288 | 2,288 | ||||||||||||||||||||||||
| Paradise Village Gateway | 276 | 298 | 323 | 16,733 | 17,630 | |||||||||||||||||||||
| Paseo Colorado Holdings | 85,000 | 85,000 | ||||||||||||||||||||||||
| DDR Markaz | 110,000 | 110,000 | ||||||||||||||||||||||||
| DDR Ward Parkway | 31,500 | 31,500 | ||||||||||||||||||||||||
| Coventry II DDR Totem Lakes | 25,000 | 25,000 | ||||||||||||||||||||||||
| Coventry II DDR Phoenix Spectrum | 39,000 | 39,000 | ||||||||||||||||||||||||
| DDR Macquarie | 42,000 | 42,000 | ||||||||||||||||||||||||
| DDR Macquarie | 290,500 | 290,500 | ||||||||||||||||||||||||
| DDR Macquarie Revolving Credit Facility | 42,000 | 42,000 | ||||||||||||||||||||||||
| Payments through 3/31/04 | -2,322 | -2,322 | ||||||||||||||||||||||||
| Total — Debt | 152,948 | 242,899 | 239,032 | 135,349 | 402,187 | 1,839 | 18,204 | 12,738 | 1,246 | 31,047 | 24,787 | 1,262,276 | ||||||||||||||
Joint Venture Partnership Summary 5.5
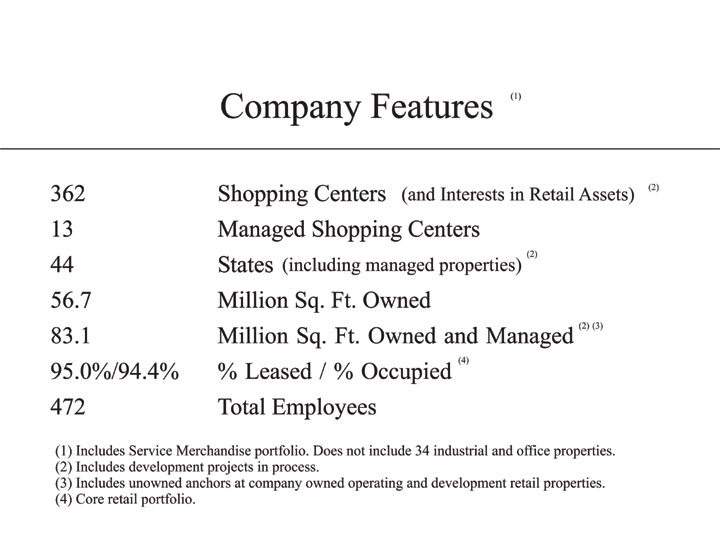
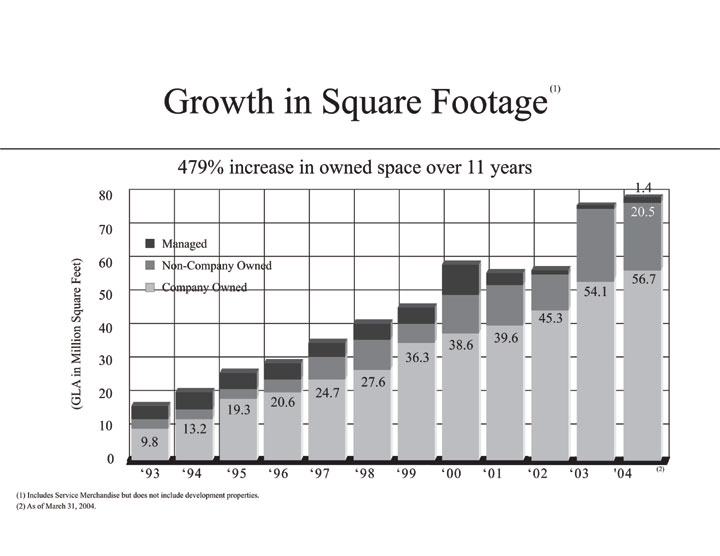

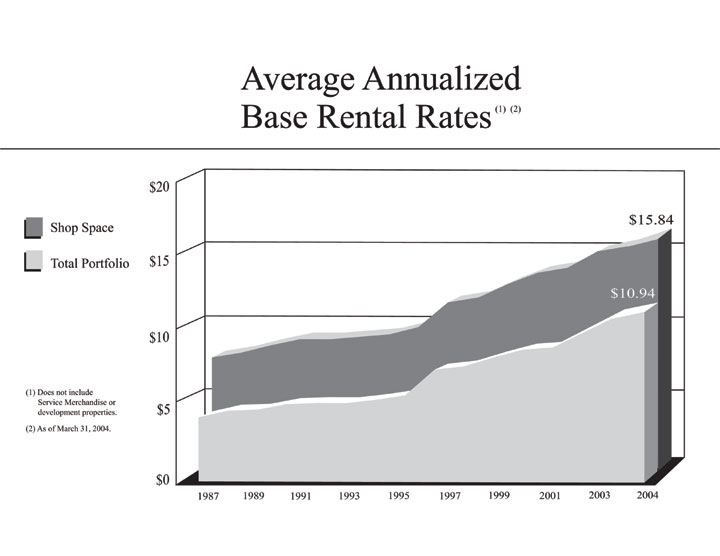
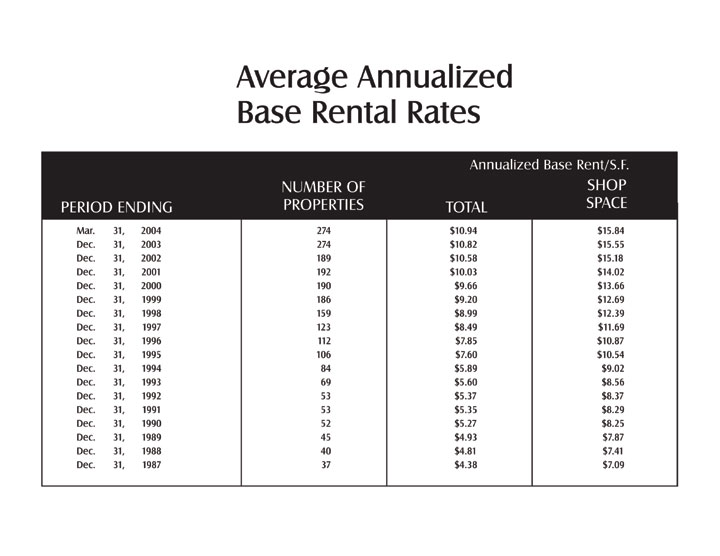
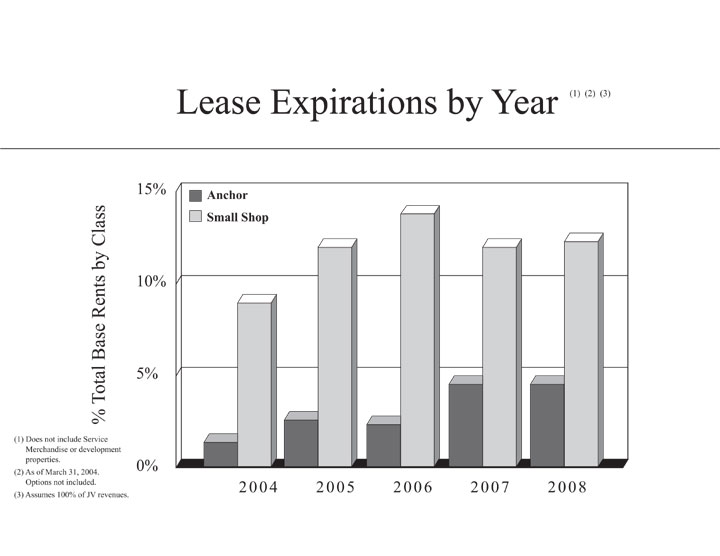
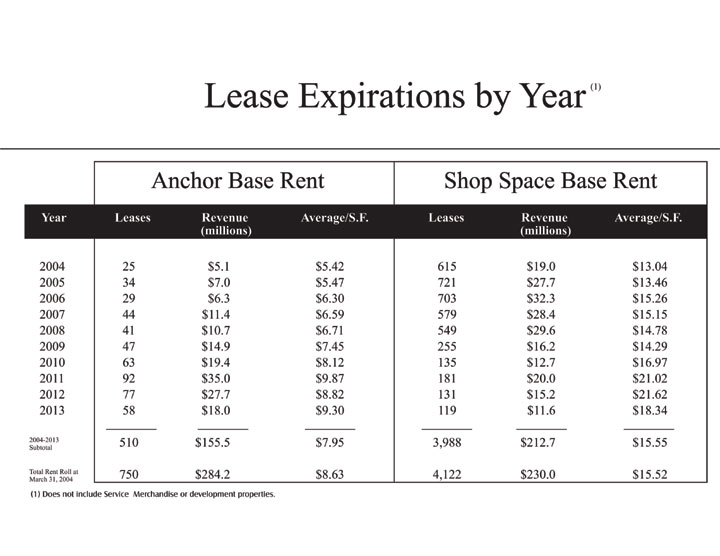
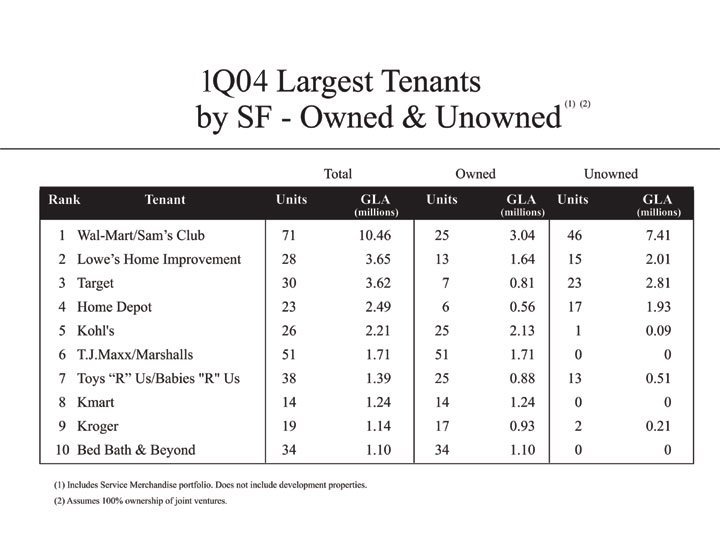
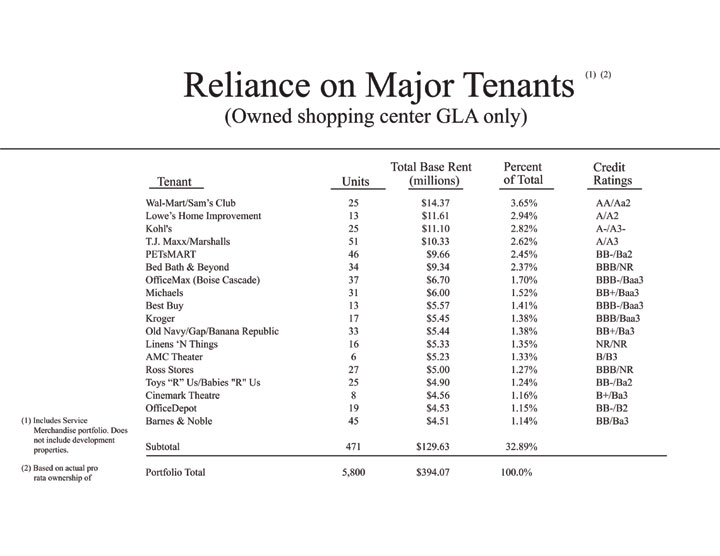
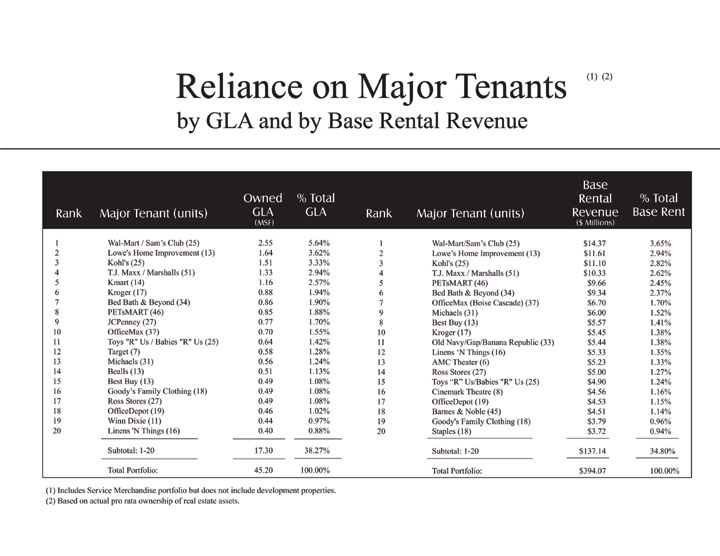

| Benderson Acquisition Portfolio Overview |
| Company Features (1) The Benderson acquisition is scheduled to close during 2Q04. (2) Calculated as common shares and OP Units outstanding multiplied by the closing price of the common shares on the NYSE at 3/31/04 of $40.40, plus preferred shares at liquidation value and consolidated debt. Does not include proportionate share of joint venture debt aggregating $339.6 million. (3) Includes properties owned and managed. Does not include DDR's 34 industrial and office properties. (4) Includes managed properties and unowned anchors at company-owned shopping centers. DDR Benderson Combined Total Market Cap (Billions) $6.2 $2.3 $8.5 (2) Number of Retail Operating Properties (3) 362 110 472 GLA (MSF) (4) 83.1 18.8 101.9 Number of States 44 11 44 (1) |
| Benderson Development Acquisition Portfolio +14.0 MSF +1.0 - 2.0 MSF 500,000 - 1.0 MSF Less than 500,000 SF 18.8 MSF / 11 States GLA by State Includes unowned Benderson anchors at owned operating properties. (1) (1) 14.1 msf 75.0% 1.5 msf 8.2% 0.7 msf 3.9% 0.6 msf 3.1% 0.6 msf 2.9% |
| Combined Retail Portfolio +10.0 MSF +5.0 - 10.0 MSF +3.0 - 5.0 MSF +1.0 - 3.0 MSF Less than 1.0 SF 101.9 MSF / 44 States GLA by State Includes unowned Benderson anchors at owned operating properties and includes Service Merchandise units and unowned anchors at DDR development and owned operating retail properties. (1) (1) 14.1 msf 13.9% 8.3 msf 8.2% 6.8 msf 6.8% 6.5 msf 6.4% 5.2 msf 5.1% 4.3 msf 4.2% 3.9 msf 3.9% 4.1 msf 4.1% 3.3 msf 3.2% 3.6 msf 3.6% |
| Benderson Reliance on Major Tenants Owned Locations (1) Tenant Units Percent of Total Credit Ratings Total Base Rent (millions) Tops 38 $25.70 17.08% BB/B1 Wal-Mart/Sam's Club 12 $8.77 5.8% AA/Aa2 Home Depot 6 $5.22 3.5% AA/Aa3 BJ's Wholesale Club 8 $4.91 3.3% NR/NR Regal Cinemas 5 $3.07 2.0% BB-/Ba2 Dick's Sporting Goods 7 $2.96 2.0% NR/NR Dollar Tree 37 $2.80 1.9% NR/NR PetsMart 12 $2.73 1.8% BB-/Ba2 Barnes & Noble 7 $2.33 1.6% BB/Ba3 T.J. Maxx/Marshall's 10 $2.11 1.4% A/A3 Staples 9 $2.05 1.4% BBB-/Baa2 Hollywood Video 13 $1.96 1.3% BB-/Ba3 Blockbuster 23 $1.95 1.3% A-/A3 Bed Bath & Beyond 6 $1.81 1.2% BBB/NR JoAnn Stores 7 $1.74 1.2% B-/B1 Target 5 $1.68 1.1% A+/A2 Subtotal 205 $71.79 47.72% Total 1,459 $150.45 100.0% (1) Based on pro forma ownership of real estate assets and reflective of pending sale to Macquarie DDR Trust. |
| Benderson Largest Tenants by GLA Owned and Unowned 1. Tops 40 2.46 38 2.36 2 0.10 2. Wal-Mart /Sam's Club 13 2.19 12 1.99 1 0.20 3. Home Depot 8 0.84 6 0.62 2 0.22 4. BJ's Wholesale Club 8 0.82 8 0.82 0 0.00 5. Target 6 0.74 5 0.62 1 0.12 6. Lowe's Home Improvement 4 0.50 2 0.27 2 0.23 7. Kmart 4 0.41 3 0.31 0 0.00 8. Dick's Sporting Goods 7 0.39 7 0.39 0 0.00 9. Dollar Tree 37 0.32 37 0.32 0 0.00 10. Regal Cinemas 5 0.32 5 0.32 0 0.00 TOTAL 132 8.99 123 8.02 8 0.87 Total Units Total GLA (millions) Owned Units Owned GLA (millions) Unowned Units Unowned GLA (millions) (1) Assumes 100% ownership of assets (1) |
| Combined Portfolio Largest Tenants by GLA Owned and Unowned 1. Wal-Mart / Sam's Club 84 12.65 37 5.03 47 7.62 2. Target 36 4.35 12 1.43 24 2.93 3. Lowe's Home Improvement 32 4.15 15 1.91 17 2.24 4. Home Depot 31 3.33 12 1.18 19 2.15 5. Tops 43 2.65 41 2.55 2 0.10 6. Kohl's 27 2.30 26 2.21 1 0.09 7. T.J.Maxx / Marshall's 61 2.01 61 2.01 0 0.00 8. Toys "R" Us / Babies "R" Us 44 1.64 29 1.04 15 0.60 9. Kmart 17 1.55 17 1.55 0 0.00 10. PETsMART 57 1.27 57 1.27 0 0.00 TOTAL 432 35.89 307 20.17 126 15.72 Total Units Total GLA (millions) Owned Units Owned GLA (millions) Unowned Units Unowned GLA (millions) (1) Assumes 100% ownership of DDR joint ventures and 100% ownership of Benderson assets (1) |
| Benderson Portfolio Lease Expirations by Year 2004 2005 2006 2007 2008 Anchor 0.008 0.013 0.018 0.005 0.027 Small Shop 0.101 0.117 0.139 0.161 0.152 Anchor Small Shop Percent of Total Base Rents by Class |
| Combined Portfolio Lease Expirations by Year 2004 2005 2006 2007 2008 Anchor 0.018 0.024 0.019 0.035 0.035 Small Shop 0.112 0.12 0.14 0.128 0.128 Anchor Small Shop Percent of Total Base Rents by Class |
 | Run Date: 04/16/2004 Time: 8:51:14AM Page 1 of 20 |
Property List*
| Owned | ||||||||||||||||||||||||||||||||
| DDR | Gross | Total | ||||||||||||||||||||||||||||||
| Zip | Type of | Year | Year | OwnerShip | Leasable | Annualized | Anchor Tenants | |||||||||||||||||||||||||
| Center/Property | Location | Code | Property | Developed | Acquired | Interest | Area | Rent | (Lease Expiration) | |||||||||||||||||||||||
| Alabama | ||||||||||||||||||||||||||||||||
| 1 | BIRMINGHAM, AL (BROOK) | BROOK HIGHLAND PLAZA 5291 HWY 280 SOUTH | 35242 | SC | 1994 | 1994 | 100.00 | % | 423,393 | $ | 4,485,245 | WINN DIXIE STORES #417(2014), RHODES#3029/MARKS FITZGERALD(2004), GOODY’S #165(2004), REGAL CINEMAS, INC.(2014), STEIN MART#67(2011), OFFICEMAX #588(2011), MICHAEL’S #9986(2009 BOOKS-A-MILLION-4(2005), ROSS STORES, INC.(2014), LOWES HOME CENTERS(NOT OWNED) | ||||||||||||||||||||
| 2 | BIRMINGHAM, AL (EASTWOOD) | EASTWOOD FESTIVAL CENTER 7001 CRESTWOOD BLVD | 35210 | SC | 1989 | 1995 | 100.00 | % | 301,074 | $ | 1,855,048 | OFFICE DEPOT #43(2004), DOLLAR TREE(2009), BURLINGTON COAT FACTORY #297(2008), REGAL CINEMAS, INC.(2006), HOME DEPOT(NOT OWNED), WESTERN SUPERMARKETS(NOT OWNED) | ||||||||||||||||||||
| 3 | BIRMINGHAM, AL (RIVERCHASE) | RIVERCHASE PROMENADE MONTGOMERY HIGHWAY | 35244 | SC | 1989 | 2002 | 100.00 | % | 98,016 | $ | 1,245,988 | MARSHALL’S #411(2006), GOODY’S(NOT OWNED), TOY’S R US(NOT OWNED), KID’S R US(NOT OWNED) | ||||||||||||||||||||
| 4 | GADSDEN, AL | EAST SIDE PLAZA 3010-3036 E. MEIGHAN BOULEVARD | 35903 | SC | 1979 | 2003 | 100.00 | % | 85,340 | $ | 138,642 | FOOD WORLD(NOT OWNED) | ||||||||||||||||||||
| 5 | OPELIKA, AL | PEPPERELL CORNERS 2300-2600 PEPPERELL PARKWAY OP | 36801 | SC | 1995 | 2003 | 100.00 | % | 190,127 | $ | 1,158,291 | Lowe’s #0398(2012), Winn-Dixie #409(2013), Goody’s 20921 — #121(2010) | ||||||||||||||||||||
| 6 | SCOTTSBORO, AL | SCOTTSBORO MARKETPLACE 24833 JOHN P REID PARKWAY | 35766 | SC | 1999 | 2003 | 100.00 | % | 40,560 | $ | 426,948 | Goody’s #55(2011), WAL-MART(NOT OWNED) | ||||||||||||||||||||
| Arizona | ||||||||||||||||||||||||||||||||
| 7 | AHWATUKEE, AZ | FOOTHILLS TOWNE CTR (II) 4711 EAST RAY ROAD | 85044 | SC | 1996 | 1997 | 50.00 | % | 647,904 | $ | 9,497,345 | BASSETT FURNITURE(2010), ASHLEY HOMESTORES(2011), STEIN MART #106(2011), AMC THEATRE(2021), BARNES & NOBLE #2781(2012 BABIES R US #5670(2007), ROSS STORES, INC. #369(2007), OFFICEMA #743(2012), JO-ANN, ETC. #1917(2010), BEST BUY #177(2014) | ||||||||||||||||||||
| 8 | PHOENIX, AZ | PARADISE VILLAGE GATEWAY TATUM & SHEA BLVDS. | 85028 | SC | 1997 | 2003 | 67.00 | % | 223,243 | $ | 4,066,489 | BED BATH & BEYOND(2011), ROSS(2007), PETSMART #1071(2015), STAPLES #0395(2005), ALBERTSONS-OSCO DRUG(NOT OWNED) | ||||||||||||||||||||
| 9 | PHOENIX, AZ (DEER VALLEY) | DEER VALLEY TOWNE CENTER 2805 WEST AGUA FRIA FREEWAY | 85027 | SC | 1996 | 1999 | 50.00 | % | 197,009 | $ | 2,904,086 | ROSS STORES #412(2009), OFFICEMAX #739(2013), PETSMART #1333(2014), MICHAEL’S #9922(2009), TARGET(NOT OWNED), AMC THEATRES(NOT OWNED) | ||||||||||||||||||||
| 10 | PHOENIX, AZ (PEORIA) | ARROWHEAD CROSSING 7553 WEST BELL ROAD | 85382 | SC | 1995 | 1996 | 50.00 | % | 346,430 | $ | 4,062,645 | STAPLES #289(2009), COMP USA#318(2013), MAC FRUGAL’S #333 - -1(2010), BARNES & NOBLE #2746-1(2011), T.J. MAXX #162 -1(2005), CIRCUIT CITY — #3362-1(2016), OSHMAN’S SPORTING GOODS, #690(2017), BASSETT FURNITURE(2009), LINENS ’N THINGS #427-1(2011), FRY’S(NOT OWNED) | ||||||||||||||||||||
| 11 | PHOENIX, AZ (SPE) | PHOENIX SPECTRUM MALL 1703 WEST BETHANY HOME ROAD | 85015 | SC | 1961 | 2004 | 20.00 | % | 491,859 | $ | 5,809,835 | COSTCO WHOLESALE CORP #665(2020), ROSS DRESS FOR LESS(201 PETsMART(2019), HARKINS THEATRE(2002), SPECTRUM CINEMAS(2005), WALMART(NOT OWNED), DILLARD’S(NOT OWNED) | ||||||||||||||||||||
| Arkansas | ||||||||||||||||||||||||||||||||
| 12 | FAYETTEVILLE, AR | SPRING CREEK CENTRE 464 E. JOYCE BOULEVARD | 72703 | SC | 1997 | 1997 | 100.00 | % | 262,827 | $ | 2,870,665 | T.J. MAXX #159(2005), BEST BUY(2017), GOODY’S #231(2013), OLD NAV #6169(2005), BED, BATH & BEYOND #278(2009), WAL-MART SUPER CENTER(NOT OWNED), HOME DEPOT(NOT OWNED) | ||||||||||||||||||||
| 13 | FAYETTEVILLE, AR (STEELE) | STEELE CROSSING 3533-3595 N. SHILOH DR | 72703 | SC | 2001 | 2003 | 100.00 | % | 41,249 | $ | 1,114,163 | KOHL’S(NOT OWNED), TARGET(NOT OWNED) | ||||||||||||||||||||
| *1. Property Developed by the Company | * SC — Shopping Center | |
| *2. Original IPO Property | * MM — Mini-Mall | |
| * BC — Business Center | ||
| * LC — Lifestyle Center |
* Does Not Include Service Merchandise Interests
Property Listing 7.1
| Run Date: 04/16/2004 Time: 8:51:14AM Page 2 of 20 |
Property List*
| Owned | ||||||||||||||||||||||||||||||||
| DDR | Gross | Total | ||||||||||||||||||||||||||||||
| Zip | Type of | Year | Year | OwnerShip | Leasable | Annualized | Anchor Tenants | |||||||||||||||||||||||||
| Center/Property | Location | Code | Property | Developed | Acquired | Interest | Area | Rent | (Lease Expiration) | |||||||||||||||||||||||
| 14 | N. LITTLE ROCK, AR | MCCAIN PLAZA 4124 EAST MCCAIN BOULEVARD | 72117 | SC | 1991 | 1994 | 100.00 | % | 270,878 | $ | 1,604,937 | BED BATH & BEYOND #517(2013), T.J. MAXX #721(2007), CINEMARK THEATRE-TANDY 10(2011), BURLINGTON COAT FACTORY WHSE(2014) SPORTS AUTHORITY(2013) | ||||||||||||||||||||
| 15 | RUSSELLVILLE, AR | VALLEY PARK CENTRE 3093 EAST MAIN STREET | 72801 | SC | 1992 | 1994 | 100.00 | % | 272,245 | $ | 1,717,872 | WAL-MART STORES #58(2011), STAGE #301(2010), J.C. PENNEY #351(2012) | ||||||||||||||||||||
| California | ||||||||||||||||||||||||||||||||
| 16 | CITY OF INDUSTRY, CA (I) | PLAZA AT PUENTE HILLS 17647-18271 GALE AVENUE | 91748 | SC | 1987 | 2001 | 20.00 | % | 218,540 | $ | 3,290,317 | MILLER’S OUTPOST/HUB DIST#334(2008), OFFICE DEPOT, INC.(2012) | ||||||||||||||||||||
| 17 | LANCASTER, CA | VALLEY CENTRAL — DISCOUNT 44707-44765 VALLEY CENTRAL WAY | 93536 | SC | 1990 | 2001 | 20.00 | % | 336,403 | $ | 3,841,451 | WAL-MART #1563(2010), MOVIES 12/ CINEMARK(2017), MARSHALLS #375(2007), CIRCUIT CITY #411(2011), STAPLES #88(2008), COSTCO(NOT OWNED) | ||||||||||||||||||||
| 18 | LONG BEACH, CA | CITY PLACE 95 SOUTH PINE AVE | 90802 | SC | 2002 | 1* | 24.75 | % | 278,906 | $ | 5,568,874 | NORDSTROM, INC.(2012), ROSS STORES, INC(2013), WAL-MART #2949(2022), MRS. FIELDS(2013), ALBERTSON’S(NOT OWNED) | ||||||||||||||||||||
| �� | ||||||||||||||||||||||||||||||||
| 19 | MISSION VIEJO, CA | OLYMPIAD PLAZA 23002-23072 ALICIA PARKWAY | 92691 | SC | 1989 | 2001 | 20.00 | % | 45,600 | $ | 1,317,682 | |||||||||||||||||||||
| 20 | OCEANSIDE, CA. | OCEAN PLACE CINEMAS 401-409 MISSION AVENUE | 92054 | SC | 2000 | 1* | 100.00 | % | 80,450 | $ | 1,083,136 | REGAL CINEMAS(2014) | ||||||||||||||||||||
| 21 | PASADENA, CA | PASEO COLORADO 280 EAST COLORADO BLVD. | 91101 | LC | 2001 | 2003 | 25.00 | % | 556,163 | $ | 11,136,287 | GELSON’S MARKET(2021), EQUINOX(2017), MACY’S(2010), PACIFIC THEATRES EXHIB. CORP(2016), DSW SHOE WAREHOUSE(2011), J. JILL(2012), CAFE MED/BRICE(2011), DELMONICOS SEAFOOD(2012), P.F CHANGS CHINA BISTRO(2016), BOMBAY COMPANY(2011), TOMMY BAHAMA(2011), SEPHORA(2011) | ||||||||||||||||||||
| 22 | PLEASANT HILL, CA. | DOWNTOWN PLEASANT HILL 2255 CONTRA COSTA BLVD #101 | 94523 | SC | 1999 | 2001 | 20.00 | % | 347,647 | $ | 6,174,585 | ALBERTSON’S(2020), MICHAEL’S #2109(2010), BORDERS BOOK & MUSIC(2015), CENTURY THEATRES, INC(2016), BED,BATH & BEYOND(2010), ROSS STORES, INC(2010) | ||||||||||||||||||||
| 23 | RICHMOND, CA (HILLTOP) | HILLTOP PLAZA 3401 BLUME DRIVE | 94806 | SC | 1997 | 2002 | 20.00 | % | 245,774 | $ | 3,668,211 | OFFICEMAX #558(2011), PETSMART #062(2012), ROSS DRESS FOR LESS(2008), BARNES & NOBLE BOOKSELLERS(2011), CIRCUIT CITY#3374(2017), CENTURY THEATRE(2016) | ||||||||||||||||||||
| 24 | RICHMOND, CA | RICHMOND CITY CENTER MACDONALD AVENUE | 94801 | SC | 1993 | 2001 | 20.00 | % | 76,692 | $ | 1,220,858 | FOOD 4 LESS/FOODSCO(2013) | ||||||||||||||||||||
| 25 | SAN FRANCISCO, CA (RETAIL) | VAN NESS PLAZA 215 1000 VAN NESS AVENUE | 94109 | SC | 1998 | 2002 | 100.00 | % | 123,755 | $ | 4,454,901 | AMC VAN NESS 14 THEATRES(2030), CRUNCH FITNESS INT’L, INC.(2008) | ||||||||||||||||||||
| 26 | SAN YSIDRO, CA | SAN YSIDRO VILLAGE CAMINO DE LA PLAZA | 92173 | SC | 1988 | 2000 | 20.00 | % | 162,932 | $ | 2,850,072 | ROSS DRESS FOR LESS(2014), MARSHALLS(2013), K-MART(NOT OWNED) | ||||||||||||||||||||
| Colorado | ||||||||||||||||||||||||||||||||
| 27 | ALAMOSA, CO | ALAMOSA PLAZA 145 CRAFT DRIVE | 81101 | SC | 1986 | 2* | 100.00 | % | 19,875 | $ | 99,589 | CITY MARKET, INC.(NOT OWNED), BIG “R”(NOT OWNED) | ||||||||||||||||||||
| *1. Property Developed by the Company | * SC — Shopping Center | |
| *2. Original IPO Property | * MM — Mini-Mall | |
| * BC — Business Center | ||
| * LC — Lifestyle Center |
* Does Not Include Service Merchandise Interests
Property Listing 7.1
| Run Date: 04/16/2004 Time: 8:51:14AM Page 3 of 20 |
Property List*
| Owned | ||||||||||||||||||||||||||||||||
| DDR | Gross | Total | ||||||||||||||||||||||||||||||
| Zip | Type of | Year | Year | OwnerShip | Leasable | Annualized | Anchor Tenants | |||||||||||||||||||||||||
| Center/Property | Location | Code | Property | Developed | Acquired | Interest | Area | Rent | (Lease Expiration) | |||||||||||||||||||||||
| 28 | AURORA, CO | PIONEER HILLS 5400-5820 SOUTH PARKER | 80012 | SC | 2002 | 2003 | 100.00 | % | 127,643 | $ | 2,361,139 | BED BATH & BEYOND #436(2012), OFFICE DEPOT #2184(2017), HOME DEPOT(NOT OWNED), WAL-MART(NOT OWNED) | ||||||||||||||||||||
| 29 | BROOMFIELD, CO | FLATIRON MARKETPLACE GARDEN 1 WEST FLATIRON CIRCLE | 80021 | SC | 2001 | 2003 | 100.00 | % | 245,217 | $ | 5,240,525 | Best Buy(2016), Office Depot(2016), Nordstrom(2011), Linen’s ‘N Things(2017), GREAT INDOORS(NOT OWNED) | ||||||||||||||||||||
| 30 | DENVER, CO | TAMARAC SQUARE 7777 E. HAMPDEN | 80231 | SC | 1976 | 2001 | 100.00 | % | 174,780 | $ | 1,950,192 | MADSTONE THEATRES(2007) | ||||||||||||||||||||
| 31 | DENVER, CO (CENTENNIAL) | CENTENNIAL PROMENADE 9555 E. COUNTY LINE ROAD | 80223 | SC | 1997 | 1997 | 100.00 | % | 408,515 | $ | 6,084,052 | GOLFSMITH GOLF CENTER(2007), SOUNDTRACK(2017), ROSS DRESS FOR LESS #388(2008), OFFICEMAX #686(2012), MICHAEL’S #9710(2007) TOYS R US#9540(2011), BORDERS #163(2017), LOEHMANN’S R.E. HOLDINGS, INC.(2012), HOME DEPOT(NOT OWNED), RECREATIONAL EQUIPMENT(NOT OWNED) | ||||||||||||||||||||
| 32 | DENVER, CO (UNIVERSITY) | UNIVERSITY HILLS 2730 SOUTH COLORADO BOULEVARD | 80222 | SC | 1997 | 2003 | 100.00 | % | 244,383 | $ | 4,064,660 | Linens N Things #119(2013), Pier One Imports(2014), Officemax #416(2012 King Soopers/Krogers(2017) | ||||||||||||||||||||
| 33 | FORT COLLINS. CO | MULBERRY AND LEMAY CROSSINGS MULBERRY ST. & S. LEMAY AVE. | 80525 | SC | 1 | 2003 | 100.00 | % | 16,421 | $ | 348,593 | |||||||||||||||||||||
| 34 | LITTLETON, CO | ASPEN GROVE 7301 SOUTH SANTA FE | 80120 | LC | 2002 | 1* | 100.00 | % | 247,504 | $ | 6,752,458 | COLDWATER CREEK(2011), TALBOTS(2012), ANN TAYLOR(2012), J. CREW(2012), BANANA REPUBLIC(2012), GAP(2012), WILLIAMS-SONOMA(2014), J. JILL(2012), BOMBAY COMPANY(2012), POTTERY BARN(2014), PIER 1 IMPORTS(2011), JOSEPH A. BANK CLOTHIERS(2012), BUCA di BEPPO (2013), CHAMPPS(2022) | ||||||||||||||||||||
| 35 | PARKER, CO (FLATACRES) | FLATACRES MARKETCENTER SOUTH PARKER ROAD | 80134 | SC | 2004 | 1* | 100.00 | % | 103,722 | $ | 1,585,111 | BED BATH & BEYOND #605(2014), GART SPORTS(2014), MICHAEL’S #3751(2013) | ||||||||||||||||||||
| 36 | PARKER, CO (PAVILIONS) | PARKER PAVILIONS 11153-11183 SOUTH PARKER ROAD | 80134 | SC | 2001 | 2003 | 100.00 | % | 77,787 | $ | 1,396,760 | Office Depot #2165(2016), HOME DEPOT(NOT OWNED), WAL-MART(NOT OWNED) | ||||||||||||||||||||
| Connecticut | ||||||||||||||||||||||||||||||||
| 37 | PLAINVILLE, CT | CONNECTICUT COMMONS I-84 & RTE 9 | 06062 | SC | 1999 | 1* | 100.00 | % | 465,453 | $ | 5,189,112 | LOWE’S OF PLAINVILLE #650(2019), KOHL’S #461(2022), A.C. MOORE(2014), OLD NAVY #6187(2011), LEVITZ FURNITURE(2015), LINENS ‘N THINGS(2017), PLAINVILLE THEATRE(NOT OWNED), LOEW ‘ THEATRE(NOT OWNED) | ||||||||||||||||||||
| 38 | WATERBURY, CT | KMART PLAZA 899 WOLCOTT STREET | 06705 | SC | 1973 | 2* | 100.00 | % | 124,310 | $ | 417,500 | K MART #3152(2003), JO-ANN STORES #0254(2010) | ||||||||||||||||||||
| Florida | ||||||||||||||||||||||||||||||||
| 39 | BAYONET POINT, FL | POINT PLAZA US 19 & SR 52 | 34667 | SC | 1985 | 2* | 100.00 | % | 209,720 | $ | 1,341,102 | PUBLIX SUPER MARKETS #295(2005), BEALL’S #11(2014), T.J. MAXX #794(2010) | ||||||||||||||||||||
| 40 | BRANDON, FL | KMART SHOPPING CENTER 1602 BRANDON BL | 33511 | SC | 1972 | 2* | 100.00 | % | 161,900 | $ | 553,873 | K MART #4311(2007), KANE FURNITURE(NOT OWNED) | ||||||||||||||||||||
| 41 | BRANDON, FL (PLAZA) | LAKE BRANDON PLAZA CAUSEWAY BOULEVARD | 33511 | SC | 1999 | 2003 | 100.00 | % | 148,267 | $ | 1,996,952 | Compusa #603(2017), Jo-Ann Fabrics #1959(2017), Publix #663(2019), BABIES R US(NOT OWNED) | ||||||||||||||||||||
| *1. Property Developed by the Company | * SC — Shopping Center | |
| *2. Original IPO Property | * MM — Mini-Mall | |
| * BC — Business Center | ||
| * LC — Lifestyle Center |
* Does Not Include Service Merchandise Interests
Property Listing 7.1
| Run Date: 04/16/2004 Time: 8:51:14AM Page 4 of 20 |
Property List*
| Owned | ||||||||||||||||||||||||||||||||
| DDR | Gross | Total | ||||||||||||||||||||||||||||||
| Zip | Type of | Year | Year | OwnerShip | Leasable | Annualized | Anchor Tenants | |||||||||||||||||||||||||
| Center/Property | Location | Code | Property | Developed | Acquired | Interest | Area | Rent | (Lease Expiration) | |||||||||||||||||||||||
| 42 | BRANDON, FL (VILLAGE) | LAKE BRANDON VILLAGE CAUSEWAY BOULEVARD | 33511 | SC | 1997 | 2003 | 100.00 | % | 113,548 | $ | 1,429,613 | Linens ‘N Things #496(2014), Sports Authority #213(2018), LOWE’S(NOT OWNED) | ||||||||||||||||||||
| 43 | CRYSTAL RIVER, FL | CRYSTAL RIVER PLAZA 420 SUN COAST HWY | 33523 | SC | 1986 | 2* | 100.00 | % | 160,190 | $ | 873,029 | BEALL’S #38 -4(2012), BEALL’S OUTLET(2006), SCOTTY’S #130(2008) | ||||||||||||||||||||
| 44 | DAYTONA BEACH, FL | VOLUSIA 1808 W. INTERNATIONAL SPEEDWAY | 32114 | SC | 1984 | 2001 | 100.00 | % | 76,087 | $ | 924,334 | TJMF, Inc.(2004), Marshalls of MA, Inc.(2005) | ||||||||||||||||||||
| 45 | FERN PARK, FL | FERN PARK SHOPPING CENTER 6735 US #17-92 SOUTH | 32720 | SC | 1970 | 2* | 100.00 | % | 16,000 | $ | 136,600 | |||||||||||||||||||||
| 46 | GULF BREEZE, FL | GULF BREEZE MARKETPLACE 3749-3767 GULF BREEZE PARKWAY | 32561 | SC | 1998 | 2003 | 100.00 | % | 29,827 | $ | 453,202 | LOWE’S(NOT OWNED), WAL-MART(NOT OWNED) | ||||||||||||||||||||
| 47 | JACKSONVILLE, FL | JACKSONVILLE REGIONAL 3000 DUNN AVENUE | 32218 | SC | 1988 | 1995 | 100.00 | % | 219,735 | $ | 1,316,714 | J.C. PENNEY #1033-4(2007), WINN DIXIE STORES #167(2009) | ||||||||||||||||||||
| 48 | MARIANNA, FL | THE CROSSROADS 2814-2822 HIGHWAY 71 | 32446 | SC | 1990 | 2* | 100.00 | % | 63,894 | $ | 252,675 | BEALL’S #54 -4(2005), WAL-MART(NOT OWNED) | ||||||||||||||||||||
| 49 | MELBOURNE, FL | MELBOURNE SHOPPING CENTER 750-850 APOLLO BOULEVARD | 32935 | SC | 1978 | 2* | 100.00 | % | 121,913 | $ | 130,913 | |||||||||||||||||||||
| 50 | NAPLES, FL | CARILLON PLACE 5010 AIRPORT ROAD NORTH | 33942 | SC | 1994 | 1995 | 14.50 | % | 267,808 | $ | 3,103,935 | WINN DIXIE #739(2014), T.J. MAXX #084(2009), CIRCUIT CITY(2015), ROSS DRESS FOR LESS #305(2010), CIRCUIT CITY #3205(2015), OFFICEMAX #159(2010) | ||||||||||||||||||||
| 51 | OCALA, FL | OCALA WEST 2400 SW COLLEGE ROAD | 32674 | SC | 1991 | 2003 | 100.00 | % | 101,438 | $ | 605,952 | Sports Authority(2012), Winn-Dixie #2284(2004) | ||||||||||||||||||||
| 52 | ORMOND BEACH, FL | ORMOND TOWNE SQUARE 1458 WEST GRANADA BLVD | 32174 | SC | 1993 | 1994 | 100.00 | % | 234,045 | $ | 1,910,484 | BEALL’S #60(2018), BEALL’S #89(2004), PUBLIX SUPER MARKETS #446(2013) | ||||||||||||||||||||
| 53 | OVIEDO, FL | OVIEDO PARK CROSSING RTE 417 & RED BUG LAKE ROAD | 32765 | SC | 1999 | 1* | 20.00 | % | 186,212 | $ | 1,870,312 | OFFICEMAX #531(2014), ROSS DRESS FOR LESS(2010), MICHAEL’S #9941(2009), T.J. MAXX #802(2010), LINENS ‘N THINGS(2011), LOWE’S(NOT OWNED) | ||||||||||||||||||||
| 54 | PALM HARBOR, FL | THE SHOPPES OF BOOT RANCH 300 EAST LAKEROAD | 34685 | SC | 1990 | 1995 | 100.00 | % | 52,395 | $ | 884,763 | ALBERTSON’S(NOT OWNED), TARGET(NOT OWNED) | ||||||||||||||||||||
| 55 | PENSACOLA, FL | PALAFOX SQUARE 8934 PENSACOLA BLVD | 32534 | SC | 1988 | 1* | 100.00 | % | 17,150 | $ | 220,962 | |||||||||||||||||||||
| 56 | SPRING HILL, FL | MARINER SQUARE 13050 CORTEZ BLVD. | 34613 | SC | 1988 | 2* | 100.00 | % | 188,924 | $ | 1,455,123 | BEALL’S #28(2006), ROSS DRESS FOR LESS #659(2014), WALMART(NO OWNED) | ||||||||||||||||||||
| *1. Property Developed by the Company | * SC — Shopping Center | |
| *2. Original IPO Property | * MM — Mini-Mall | |
| * BC — Business Center | ||
| * LC — Lifestyle Center |
* Does Not Include Service Merchandise Interests
Property Listing 7.1
| Run Date: 04/16/2004 Time: 8:51:14AM Page 5 of 20 |
Property List*
| Owned | ||||||||||||||||||||||||||||||||
| DDR | Gross | Total | ||||||||||||||||||||||||||||||
| Zip | Type of | Year | Year | OwnerShip | Leasable | Annualized | Anchor Tenants | |||||||||||||||||||||||||
| Center/Property | Location | Code | Property | Developed | Acquired | Interest | Area | Rent | (Lease Expiration) | |||||||||||||||||||||||
| 57 | TALLAHASSEE, FL | CAPITAL WEST 4330 WEST TENNESSEE STREET | 32312 | SC | 1994 | 2003 | 100.00 | % | 21,400 | $ | 156,820 | WAL-MART(NOT OWNED) | ||||||||||||||||||||
| 58 | TAMPA, FL (DALE) | NORTH POINTE PLAZA 15001-15233 NORTH DALE MABRY | 33618 | SC | 1990 | 2* | 20.00 | % | 104,460 | $ | 1,182,828 | PUBLIX SUPER MARKETS #398(2010), WALMART(NOT OWNED) | ||||||||||||||||||||
| 59 | TAMPA, FL (WATERS) | TOWN N’ COUNTRY 7021-7091 WEST WATERS AVENUE | 33634 | SC | 1990 | 2* | 100.00 | % | 134,366 | $ | 1,130,666 | BEALL’S #56 -4(2005), KASH ‘N KARRY-2 STORE #1745(2010), WALMART(NOT OWNED) | ||||||||||||||||||||
| 60 | TARPON SPRINGS, FL | TARPON SQUARE 41232 U.S. 19, NORTH | 34689 | SC | 1974 | 2* | 100.00 | % | 198,797 | $ | 1,388,549 | K MART #3257-2(2009), BIG LOTS #564(2007), STAPLES #882 SUPERSTORE(2013) | ||||||||||||||||||||
| 61 | WEST PASCO, FL | PASCO SQUARE 7201 COUNTY ROAD 54 | 34653 | SC | 1986 | 2* | 100.00 | % | 135,421 | $ | 893,256 | BEALL’S OUTLET#430(2013), PUBLIX SUPER MARKETS #307(2006), PLYMOUTH BLIMPIE, INC.-4(2006), WALMART(NOT OWNED) | ||||||||||||||||||||
| Georgia | ||||||||||||||||||||||||||||||||
| 62 | ATHENS, GA | ATHENS EAST 4375 LEXINGTON ROAD | 30605 | SC | 2000 | 2003 | 100.00 | % | 24,000 | $ | 344,460 | WAL MART(NOT OWNED) | ||||||||||||||||||||
| 63 | ATLANTA, GA (DULUTH) | PLEASANT HILL PLAZA 1630 PLEASANT HILL ROAD | 30136 | SC | 1990 | 1994 | 100.00 | % | 99,025 | $ | 1,255,230 | OFFICE DEPOT #076-2(2005), WAL-MART(NOT OWNED) | ||||||||||||||||||||
| 64 | ATLANTA, GA (PERIMETER) | PERIMETER POINTE 1155 MT. VERNON HIGHWAY | 30136 | SC | 1995 | 1995 | 14.50 | % | 343,155 | $ | 5,252,189 | STEIN MART #092(2010), BABIES R US, #8892(2007), SPORTS AUTHORITY(2012), L.A. FITNESS SPORTS CLUBS(2016), OFFICE DEPO #434(2012), ST. JOSEPH’S HOSPITAL/ATLANTA(2006), UNITED ARTISTS THEATRE #33272(2015) | ||||||||||||||||||||
| 65 | CANTON, GA (RIVERPLACE) | RIVERPLACE 104-150 RIVERSTONE PARKWAY | 30114 | SC | 1983 | 2003 | 100.00 | % | 127,853 | $ | 876,776 | Staples #796(2014), Ingles # 96(2019) | ||||||||||||||||||||
| 66 | CANTON, GA (RIVERPOINTE) | RIVER POINTE 1550-1558 RIVERSTONE PARKWAY | 30114 | SC | 1996 | 2003 | 100.00 | % | 39,000 | $ | 561,430 | WALMART(NOT OWNED) | ||||||||||||||||||||
| 67 | CARTERSVILLE, GA | FELTON’S CROSSING 877 JOE FRANK HARRIS PARKWAY S | 30120 | SC | 1984 | 2003 | 100.00 | % | 112,240 | $ | 866,174 | Ross Dress For Less(2013), Ingles #76(2019) | ||||||||||||||||||||
| 68 | CHAMBLEE, GA | CHAMBLEE PLAZA PEACHTREE INDUSTRIAL BOULEVARD | 30341 | SC | 1976 | 2003 | 100.00 | % | 175,969 | $ | 1,266,678 | Save Rite #2718(2006) | ||||||||||||||||||||
| 69 | COLUMBUS, GA | BRADLEY PARK CROSSING 1591 BRADLEY PARK DRIVE COLUMB | 31904 | SC | 1999 | 2003 | 100.00 | % | 119,786 | $ | 1,195,041 | Goody’s #296(2011), Petsmart #0294(2015), Michael’s # 9929(2009), TARGET(NOT OWNED) | ||||||||||||||||||||
| 70 | CUMMING, GA | CUMMING MARKETPLACE MARKETPLACE BOULEVARD | 30041 | SC | 1997 | 2003 | 100.00 | % | 318,695 | $ | 3,660,610 | Goody’s #219(2012), Lowe’s(2019), Michael’s(2010), Officemax #928(2013), HOME DEPOT(NOT OWNED), WAL MART(NOT OWNED) | ||||||||||||||||||||
| 71 | CUMMING, GA (PINETREE) | PINETREE VILLAGE 2350 ATLANTA HIGHWAY | 30040 | SC | 1999 | 2003 | 100.00 | % | 27,600 | $ | 500,411 | |||||||||||||||||||||
| *1. Property Developed by the Company | * SC — Shopping Center | |
| *2. Original IPO Property | * MM — Mini-Mall | |
| * BC — Business Center | ||
| * LC — Lifestyle Center |
* Does Not Include Service Merchandise Interests
Property Listing 7.1
| Run Date: 04/16/2004 Time: 8:51:14AM Page 6 of 20 |
Property List*
| Owned | ||||||||||||||||||||||||||||||||
| DDR | Gross | Total | ||||||||||||||||||||||||||||||
| Zip | Type of | Year | Year | OwnerShip | Leasable | Annualized | Anchor Tenants | |||||||||||||||||||||||||
| Center/Property | Location | Code | Property | Developed | Acquired | Interest | Area | Rent | (Lease Expiration) | |||||||||||||||||||||||
| 72 | DOUGLASVILLE, GA | DOUGLASVILLE MARKETPLACE 6875 DOUGLAS BOULEVARD | 30135 | SC | 1999 | 2003 | 100.00 | % | 97,458 | $ | 1,660,967 | Best Buy(2015), Babies R Us(2006), LOWES(NOT OWNED) | ||||||||||||||||||||
| 73 | FT. OGLETHORPE, GA | FORT OGLETHORPE MARKETPLACE 101 BATTLEFIELD PARKWAY FORT | 30742 | SC | 1992 | 2003 | 100.00 | % | 176,903 | $ | 449,750 | K Mart #3083(2007) | ||||||||||||||||||||
| 74 | GRIFFIN, GA | ELLIS CROSSING 649-687 NORTH EXPRESSWAY | 30223 | SC | 1986 | 2003 | 100.00 | % | 64,770 | $ | 280,236 | Winn-Dixie #1811(2006), WAL MART(NOT OWNED) | ||||||||||||||||||||
| 75 | LAFAYETTE, GA | LAFAYETTE CENTER 1109 NORTH MAIN STREET | 30728 | SC | 1990 | 2003 | 100.00 | % | 78,422 | $ | 452,585 | Food Lion #890(2019) | ||||||||||||||||||||
| 76 | LAWRENCEVILLE, GA | FIVE FORKS VILLAGE 850 DOGWOOD ROAD | 30044 | SC | 1990 | 2003 | 100.00 | % | 89,064 | $ | 956,989 | Winn-Dixie (Save-Rite) #2735(2010) | ||||||||||||||||||||
| 77 | LILBURN, GA (FIVE FORKS) | FIVE FORKS CROSSING 3055 FIVE FORKS TRICKUM ROAD | 30047 | SC | 1990 | 2003 | 100.00 | % | 73,950 | $ | 668,448 | Kroger #394(2012) | ||||||||||||||||||||
| 78 | LITHONIA, GA | THE SHOPPES AT TURNER HILL 8200 MALL PARKWAY | 30038 | SC | 2001 | 2003 | 100.00 | % | 74,375 | $ | 1,107,800 | Best Buy #389(2018), Bed Bath & Beyond(2012), TOYS R US(NOT OWNED | ||||||||||||||||||||
| 79 | LOGANVILLE, GA | MIDWAY PLAZA 910 ATHENS HWY | 30052 | SC | 1995 | 2003 | 100.00 | % | 91,196 | $ | 949,271 | Kroger #443(2016) | ||||||||||||||||||||
| 80 | MADISON, GA | BEACON HEIGHTS 1462-1532 EATONTON ROAD | 30650 | SC | 1989 | 2003 | 100.00 | % | 106,144 | $ | 488,963 | Ingles #444(2010), Wal-Mart #1363(2009) | ||||||||||||||||||||
| 81 | MARIETTA, GA | TOWN CENTER PRADO 2609 BELLS FERRY ROAD | 30066 | SC | 1995 | 1995 | 14.50 | % | 300,977 | $ | 3,818,030 | STEIN MART #141(2007), ROSS DRESS FOR LESS(2013), PUBLIX #548(2015), CRUNCH FITNESS INTERNATIONAL(2011) | ||||||||||||||||||||
| 82 | MARIETTA, GA (GARRISON) | GARRISON RIDGE CROSSING 2650 DALLAS HIGHWAY | 30064 | SC | 1997 | 2003 | 100.00 | % | 18,200 | $ | 318,114 | LOWES(NOT OWNED) | ||||||||||||||||||||
| 83 | MCDONOUGH, GA | MCDONOUGH MARKETPLACE (LP-II) NE CORNER 175 & HIGHWAY 20 | 30253 | SC | 1999 | 2003 | 100.00 | % | 23,500 | $ | 600,345 | LOWES(NOT OWNED), WALMART(NOT OWNED) | ||||||||||||||||||||
| 84 | NEWNAN, GA | NEWNAN CROSSING 955-1063 BULLSBORO DRIVE NEWNA | 30264 | SC | 1995 | 2003 | 100.00 | % | 156,497 | $ | 1,298,908 | Lowe’s #0033(2015), BELK(NOT OWNED), WAL MART(NOT OWNED) | ||||||||||||||||||||
| 85 | PEACHTREE CITY, GA | PEACHTREE CITY MARKETPLACE MARKETPLACE CONNECTOR PEACHTRE | 30269 | SC | 1999 | 2003 | 100.00 | % | 50,367 | $ | 638,779 | Staples(2015) | ||||||||||||||||||||
| 86 | STOCKBRIDGE, GA (FREEWAY) | FREEWAY JUNCTION 3797-3879 HIGHWAY 138 SE STOCK | 30281 | SC | 1988 | 2003 | 100.00 | % | 162,778 | $ | 364,305 | Ingles #466(2009) | ||||||||||||||||||||
| *1. Property Developed by the Company | * SC — Shopping Center | |
| *2. Original IPO Property | * MM — Mini-Mall | |
| * BC — Business Center | ||
| * LC — Lifestyle Center |
* Does Not Include Service Merchandise Interests
Property Listing 7.1
| Run Date: 04/16/2004 Time: 8:51:14AM Page 7 of 20 |
Property List*
| Owned | ||||||||||||||||||||||||||||||||
| DDR | Gross | Total | ||||||||||||||||||||||||||||||
| Zip | Type of | Year | Year | OwnerShip | Leasable | Annualized | Anchor Tenants | |||||||||||||||||||||||||
| Center/Property | Location | Code | Property | Developed | Acquired | Interest | Area | Rent | (Lease Expiration) | |||||||||||||||||||||||
| 87 | STOCKBRIDGE, GA (PIKE) | PIKE NURSERIES-STOCKBRIDGE 599 HIGHWAY 138W | 30281 | SC | 1997 | 2003 | 100.00 | % | 0 | $ | 244,145 | |||||||||||||||||||||
| 88 | STONE MOUNTAIN, GA (RIVER) | RIVERCLIFF VILLAGE STONE MOUNTAIN HIGHWAY STONE M | 30047 | SC | 1999 | 2003 | 100.00 | % | 2,000 | $ | 42,000 | |||||||||||||||||||||
| 89 | SUWANEE, GA (JOHNS) | JOHNS CREEK TOWNE CENTER 3630 PEACHTREE PARKWAY SUWANEE | 30024 | SC | 2001 | 2003 | 100.00 | % | 306,206 | $ | 2,743,306 | Kohl’s #447(2022), Michael’s #1587(2011), Staples #1162(2016) | ||||||||||||||||||||
| 90 | SUWANEE, GA (NOBLE) | THE VILLAGE AT NOBLE FARMS 1145 PEACHTREE INDUSTRIAL BOUL | 30024 | SC | 1997 | 2003 | 100.00 | % | 43,393 | $ | 792,418 | |||||||||||||||||||||
| 91 | TUCKER, GA | COFER CROSSING 4349-4375 LAWRENCEVILLE HWY | 30084 | SC | 1998 | 2003 | 100.00 | % | 129,432 | $ | 1,218,135 | Goody’s #299(2014), Kroger #482(2019), WALMART(NOT OWNED) | ||||||||||||||||||||
| 92 | UNION CITY, GA | SHANNON SQUARE 4720 JONESBORO ROAD | 30291 | SC | 1986 | 2003 | 100.00 | % | 100,002 | $ | 787,927 | Ingles #407(2006), WAL MART(NOT OWNED) | ||||||||||||||||||||
| 93 | WARNER ROBBINS, GA | WARNER ROBINS PLACE 2724 WATSON BOULEVARD | 31093 | SC | 1997 | 2003 | 100.00 | % | 107,941 | $ | 1,294,770 | T.J. Maxx #032(2010), Staples(2016), LOWE’S(NOT OWNED), WAL MART(NOT OWNED) | ||||||||||||||||||||
| 94 | WOODSTOCK, GA | WOODSTOCK PLACE 10029 HIGHWAY 928 | 30188 | SC | 1995 | 2003 | 100.00 | % | 170,940 | $ | 1,499,789 | Wal-Mart #575(2020) | ||||||||||||||||||||
| Idaho | ||||||||||||||||||||||||||||||||
| 95 | IDAHO FALLS, ID | COUNTRY CLUB MALL 1515 NORTHGATE MILE | 83401 | SC | 1976 | 1998 | 100.00 | % | 148,593 | $ | 717,797 | OFFICE MAX #666(2011), WORLD GYM(2008), FRED MEYER, INC.(NOT OWNED) | ||||||||||||||||||||
| 96 | MERIDIAN, ID | MERIDIAN CROSSROADS EAGLE AND FAIRVIEW ROAD | 83642 | SC | 1999 | 1* | 100.00 | % | 417,727 | $ | 5,195,104 | BED BATH & BEYOND #333(2011), OLD NAVY #6046(2005), SHOPKO STORES, INC.(2020), OFFICE DEPOT # 02087(2010), ROSS DRESS FOR LESS # 530(2012), MARSHALLS #871(2012), SPORTSMAN’S WAREHOUSE(2015), CRAFT WAREHOUSE(2013), BABIES R US(NOT OWNED) | ||||||||||||||||||||
| Illinois | ||||||||||||||||||||||||||||||||
| 97 | DECATUR, IL | DECATUR MARKETPLACE MARYLAND STREET | 62521 | SC | 1999 | 2003 | 100.00 | % | 22,775 | $ | 272,550 | WAL MART(NOT OWNED) | ||||||||||||||||||||
| 98 | DEER PARK, IL | DEER PARK TOWN CENTER 20530 NORTH RAND RD #303 | 60010 | LC | 2000 | 1* | 24.75 | % | 268,980 | $ | 7,248,581 | GAP # 581(2010), BARNES & NOBLE(NOT OWNED), PIER 1 IMPORTS(2012), BANANA REPUBLIC(2010), BOMBAY COMPANY(2011), ABERCROMBIE & FITCH(2005), POTTERY BARN KIDS(2012), POTTERY BARN(2013), RESTORATION HARDWARE(2010), EDDIE BAUER HOME(2011), EDDIE BAUER SPORTSWEAR(2011), COLDWATER CREEK(2010), J. CREW(2011), ANN TAYLOR(2011), TALBOTS/TALBOT PETITES(2011), WILLIAMS-SONOMA(2013), JOSEPH A. BANK CLOTHIERS(2011), CALIFORNIA PIZZA KITCHEN(2013) | ||||||||||||||||||||
| 99 | HARRISBURG, IL | ARROWHEAD POINT 701 NORTH COMMERCIAL | 62946 | SC | 1991 | 1994 | 100.00 | % | 167,074 | $ | 834,893 | WAL-MART STORES #237(2011), MAD-PRICER STORE/ROUNDY’S(2011 | ||||||||||||||||||||
| *1. Property Developed by the Company | * SC — Shopping Center | |
| *2. Original IPO Property | * MM — Mini-Mall | |
| * BC — Business Center | ||
| * LC — Lifestyle Center |
* Does Not Include Service Merchandise Interests
Property Listing 7.1
| Run Date: 04/16/2004 Time: 8:51:14AM Page 8 of 20 |
Property List*
| Owned | ||||||||||||||||||||||||||||||||
| DDR | Gross | Total | ||||||||||||||||||||||||||||||
| Zip | Type of | Year | Year | OwnerShip | Leasable | Annualized | Anchor Tenants | |||||||||||||||||||||||||
| Center/Property | Location | Code | Property | Developed | Acquired | Interest | Area | Rent | (Lease Expiration) | |||||||||||||||||||||||
| 100 | KILDEER, IL | THE SHOPS AT KILDEER 20505 NORTH HIGHWAY 12 | 60047 | SC | 2001 | 2001 | 10.00 | % | 161,038 | $ | 3,145,743 | BED BATH & BEYOND(2012), CIRCUIT CITY(2017), OLD NAVY #6574(2006) | ||||||||||||||||||||
| 101 | MOUNT VERNON, IL | TIMES SQUARE MALL 42ND AND BROADWAY | 62864 | MM | 1974 | 2* | 100.00 | % | 268,328 | $ | 902,138 | SEARS #2181(2013), COUNTRY FAIR MARKET FRESH(2004), J.C. PENNEY #1717(2007) | ||||||||||||||||||||
| 102 | SCHAUMBURG, IL | WOODFIELD VILLAGE GREEN 1430 EAST GOLF ROAD | 60173 | SC | 1993 | 1995 | 14.50 | % | 458,819 | $ | 8,097,829 | CIRCUIT CITY #3111(2009), OFF 5TH(2011), OFFICEMAX #203(2010), CONTAINER STORE(2011), FILENE’S BASEMENT(2014), MARSHALLS #544(2009), NORDSTROM RACK #224(2009), BORDERS BOOKS#61(2009) EXPO DESIGN CENTER(2019), COSTCO(NOT OWNED), KLA/SM NEWCO SCHAUMBURG, LLC(NOT OWNED), PRAIRIE ROCK RESTAURANT(NOT OWNED) | ||||||||||||||||||||
| Indiana | ||||||||||||||||||||||||||||||||
| 103 | BEDFORD, IN | TOWN FAIR CENTER 1320 JAMES AVENUE | 47421 | SC | 1993 | 2* | 100.00 | % | 223,431 | $ | 1,321,929 | K MART #7455(2008), GOODY’S #119 -4(2008), J.C. PENNEY #1324-4(2008), BUEHLER’S BUY LOW #4163(2010) | ||||||||||||||||||||
| 104 | CONNERSVILLE, IN | WHITEWATER TRADE CENTER 2100 PARK ROAD | 47331 | SC | 1991 | 2* | 100.00 | % | 141,770 | $ | 840,863 | COX NEW MARKET-4(2011), WAL-MART STORES #1729(2011) | ||||||||||||||||||||
| 105 | HIGHLAND, IN | HIGHLAND GROVE SHOPPING CENTER HIGHWAY 41 & MAIN STREET | 46322 | SC | 1995 | 1996 | 20.00 | % | 312,546 | $ | 3,289,565 | MARSHALL’S#663-1(2011), KOHL’S #229-1(2016), CIRCUIT CITY-1(2016), OFFICE MAX #590(2012), TARGET(NOT OWNED), JEWEL(NOT OWNED) BORDERS(NOT OWNED) | ||||||||||||||||||||
| 106 | LAFAYETTE, IN | PARK EAST MARKETPLACE 4205-4315 COMMERCE DRIVE | 47905 | SC | 2000 | 2003 | 100.00 | % | 35,100 | $ | 383,085 | WAL MART(NOT OWNED) | ||||||||||||||||||||
| Iowa | ||||||||||||||||||||||||||||||||
| 107 | CEDAR RAPIDS, IA | NORTHLAND SQUARE 303-367 COLLINS ROAD, NE | 52404 | SC | 1984 | 1998 | 100.00 | % | 187,068 | $ | 1,760,537 | T.J. MAXX #119(2004), OFFICE MAX #211(2010), BARNES & NOBLE #2587(2010), KOHL’S #217(2021) | ||||||||||||||||||||
| 108 | OTTUMWA, IA | QUINCY PLACE MALL 1110 QUINCY AVENUE | 52501 | MM | 1990 | 2* | 100.00 | % | 194,703 | $ | 1,251,645 | HERBERGER’S #326(2005), J.C. PENNEY #2438(2005), OFFICEMAX #1033(2015), TARGET(NOT OWNED) | ||||||||||||||||||||
| Kansas | ||||||||||||||||||||||||||||||||
| 109 | LEAWOOD, KS | TOWN CENTER PLAZA 5000 W 119 STREET | 66209 | LC | 1990 | 1998 | 100.00 | % | 291,646 | $ | 6,484,524 | BARNES & NOBLE #2668(2011), COLDWATER CREEK(2009), LIMITED/LIMITED TOO(2009), ABERCROMBIE & FITCH(2009), VICTORIA SECRET(2009), EXPRESS/BATH&BODY/STRUCTURE(2009), GAP/GAP BODY(2008), GAP KIDS(2005), J. JILL(2013), POTTERY BARN(2009), WILLIAMS-SONOMA(2009), AMERICAN EAGLE(2013), PACIFIC SUNWEAR(2012), BRAVO CUCINA ITALIANA(2013), RESTORATION HARDWARE(2012), HOULIHANS, BRISTOL SEAFOOD BAR & GRILL(2011) | ||||||||||||||||||||
| 110 | MERRIAM, KS | MERRIAM TOWN CENTER 5700 ANTIOCH ROAD | 66202 | SC | 1998 | 1* | 50.00 | % | 344,009 | $ | 4,089,206 | OFFICEMAX #924(2013), PETSMART #240(2019), HEN HOUSE #31(2018) MARSHALLS #8716(2008), DICK’S SPORTING GOODS # 119(2016), CINEMARK(2018), HOME DEPOT #2202(NOT OWNED) | ||||||||||||||||||||
| 111 | OLATHE, KS (DEVONSHIRE) | DEVONSHIRE VILLAGE 127th STREET & MUR-LEN ROAD | 66062 | SC | 1987 | 1998 | 24.75 | % | 48,802 | $ | 364,279 | |||||||||||||||||||||
| 112 | OVERLAND PARK, KS (CHEROKEE) | CHEROKEE NORTH SHOPPING CENTER 8800-8934 W 95th STREET | 66212 | SC | 1987 | 1998 | 24.75 | % | 55,565 | $ | 647,986 | |||||||||||||||||||||
| *1. Property Developed by the Company | * SC — Shopping Center | |
| *2. Original IPO Property | * MM — Mini-Mall | |
| * BC — Business Center | ||
| * LC — Lifestyle Center |
* Does Not Include Service Merchandise Interests
Property Listing 7.1
| Run Date: 04/16/2004 Time: 8:51:14AM Page 9 of 20 |
Property List*
| Owned | ||||||||||||||||||||||||||||||||
| DDR | Gross | Total | ||||||||||||||||||||||||||||||
| Zip | Type of | Year | Year | OwnerShip | Leasable | Annualized | Anchor Tenants | |||||||||||||||||||||||||
| Center/Property | Location | Code | Property | Developed | Acquired | Interest | Area | Rent | (Lease Expiration) | |||||||||||||||||||||||
| 113 | OVERLAND PARK, KS (POINTE) | OVERLAND POINTE MARKETPLACE INTER 135TH & ANTIOCH RD | 66213 | SC | 2001 | 2003 | 100.00 | % | 7,000 | $ | 127,092 | |||||||||||||||||||||
| 114 | SHAWNEE, KS (QUIVIRA PARCEL) | TEN QUIVIRA PARCEL 63rd ST. & QUIVIRA ROAD | 66216 | SC | 1972 | 1998 | 24.75 | % | 12,000 | $ | 194,271 | |||||||||||||||||||||
| 115 | SHAWNEE, KS (TEN QUIVIRA) | TEN QUIVIRA SHOPPING CENTER 63rd STREET & QUIVIRA ROAD | 66216 | SC | 1992 | 1998 | 24.75 | % | 162,843 | $ | 853,794 | PRICE CHOPPER FOODS(2005), WESTLAKE HARDWARE #17(2005) | ||||||||||||||||||||
| 116 | WICHITA, KS (EASTGATE) | EASTGATE PLAZA SOUTH ROCK ROAD | 67207 | SC | 1955 | 2002 | 100.00 | % | 205,200 | $ | 2,003,510 | OFFICEMAX #31(2007), T.J. MAXX #316(2006), BARNES & NOBLE #2824(2012), KCBB, INC BURLINGTON(NOT OWNED) | ||||||||||||||||||||
| Kentucky | ||||||||||||||||||||||||||||||||
| 117 | HAZARD, KY | GRAND VUE PLAZA KENTUCKY HIGHWAY 80 | 41701 | SC | 1978 | 2* | 100.00 | % | 110,610 | $ | 429,776 | WRIGHT LUMBER(2007) | ||||||||||||||||||||
| 118 | LEXINGTON, KY (NORTH) | NORTH PARK MARKETPLACE 524 WEST NEW CIRCLE | 40511 | SC | 1998 | 2003 | 100.00 | % | 48,920 | $ | 609,650 | Staples(2016), WAL MART(NOT OWNED) | ||||||||||||||||||||
| 119 | LEXINGTON, KY (SOUTH) | SOUTH FARM MARKETPLACE MAN-O-WAR BOULEVARD AND NICHOL | 40503 | SC | 1998 | 2003 | 100.00 | % | 27,643 | $ | 582,564 | LOWE’S(NOT OWNED), WAL MART(NOT OWNED) | ||||||||||||||||||||
| 120 | RICHMOND, KY | CARRIAGE GATE 833-847 EASTERN BY-PASS | 40475 | SC | 1992 | 2003 | 100.00 | % | 158,041 | $ | 375,889 | Food Lion #1203(2017), BALLARD’S(NOT OWNED) | ||||||||||||||||||||
| Maine | ||||||||||||||||||||||||||||||||
| 121 | BRUNSWICK, ME | COOK’S CORNERS 172 BATH ROAD | 04011 | SC | 1965 | 1997 | 100.00 | % | 305,692 | $ | 2,526,371 | HOYTS CINEMAS #445-02 BRUNSWIK(2010), BRUNSWICK BOOKLAND(2014), BIG LOTS(2008), T.J. MAXX #114(2010), SEARS #2203(2012) | ||||||||||||||||||||
| Maryland | ||||||||||||||||||||||||||||||||
| 122 | SALISBURY, MD | THE COMMONS E. NORTH POINT DRIVE | 21801 | SC | 1999 | 1* | 100.00 | % | 98,635 | $ | 1,339,665 | OFFICEMAX #798(2013), MICHAEL’S #9914(2009), HOME DEPOT(NOT OWNED), TARGET(NOT OWNED) | ||||||||||||||||||||
| 123 | SALISBURY, MD (DEV JV) | THE COMMONS (PHASE III) NORTH POINTE DRIVE | 21801 | SC | 2000 | 1* | 50.00 | % | 27,500 | $ | 346,500 | |||||||||||||||||||||
| Massachusetts | ||||||||||||||||||||||||||||||||
| 124 | EVERETT, MA | GATEWAY CENTER 1 MYSTIC VIEW ROAD | 02149 | SC | 2001 | 1* | 100.00 | % | 222,287 | $ | 4,363,862 | BED BATH AND BEYOND(2011), OLD NAVY #6172(2011), OFFICEMAX # 600(2020), BABIES R US #6443(2013), MICHAEL’S #01597(2012), COSTCO(NOT OWNED), TARGET(NOT OWNED), HOME DEPOT(NOT OWNED) | ||||||||||||||||||||
| 125 | FRAMINGHAM, MA | SHOPPER’S WORLD 1 WORCESTER ROAD | 01701 | SC | 1994 | 1995 | 14.50 | % | 768,555 | $ | 13,726,836 | TOYS R US #7505(2020), JORDON MARSH / FEDERATED(2020), T.J. MAXX#147(2010), BABIES R US(2013), DSW SHOE WAREHOUSE(2007) A.C. MOORE(2007), MARSHALLS#612(2011), BOBS(2011), LINENS ‘N THINGS#436(2011), SPORTS AUTHORITY#858(2015), OFFICEMAX #121(2011), BEST BUY#532(2014), BARNES & NOBLE #2645(2011), KOHL’S # 575(2005), GENERAL CINEMA #971(2014) | ||||||||||||||||||||
| Michigan | ||||||||||||||||||||||||||||||||
| *1. Property Developed by the Company | * SC — Shopping Center | |
| *2. Original IPO Property | * MM — Mini-Mall | |
| * BC — Business Center | ||
| * LC — Lifestyle Center |
* Does Not Include Service Merchandise Interests
Property Listing 7.1
| Run Date: 04/16/2004 Time: 8:51:14AM Page 10 of 20 |
Property List*
| Owned | ||||||||||||||||||||||||||||||||
| DDR | Gross | Total | ||||||||||||||||||||||||||||||
| Zip | Type of | Year | Year | OwnerShip | Leasable | Annualized | Anchor Tenants | |||||||||||||||||||||||||
| Center/Property | Location | Code | Property | Developed | Acquired | Interest | Area | Rent | (Lease Expiration) | |||||||||||||||||||||||
| 126 | BAD AXE, MI | HURON CREST PLAZA 850 NORTH VAN DYKE ROAD | 48413 | SC | 1991 | 2* | 100.00 | % | 63,415 | $ | 565,108 | GREAT A & P TEA #55492(2012), WAL-MART(NOT OWNED) | ||||||||||||||||||||
| 127 | CHEBOYGAN, MI | KMART SHOPPING PLAZA 1109 EAST STATE | 49721 | SC | 1988 | 2* | 100.00 | % | 95,094 | $ | 327,984 | CARTER’S FOOD CENTER(2004), K MART #9245(2005), KMART(NOT OWNED) | ||||||||||||||||||||
| 128 | DETROIT, MI | BELAIR CENTER 8400 E. EIGHT MILE ROAD | 48234 | SC | 1989 | 1998 | 100.00 | % | 343,502 | $ | 2,143,099 | PHOENIX THEATERS(2011), BALLY TOTAL FITNESS(2016), BIG LOTS STORES, INC.(2008), KIDS R US #1167(2013), TOYS R US, INC.(2021), TARGET(NOT OWNED) | ||||||||||||||||||||
| 129 | GAYLORD, MI | PINE RIDGE SQUARE 1401 WEST MAIN STREET | 49735 | SC | 1991 | 2* | 100.00 | % | 190,482 | $ | 1,001,728 | WAL-MART STORES #1542(2010), BUY LOW/ROUNDY’S — 4(2011) | ||||||||||||||||||||
| 130 | GRANDVILLE, MI | GRANDVILLE MARKETPLACE INTERSECT 44TH ST & CANAL AVE | 49418 | SC | 2001 | 2003 | 100.00 | % | 210,118 | $ | 2,428,333 | Circuit City(2017), Linen ‘N Things #682(2013), Gander Mountain(2016), OFFICE MAX #1243(2013), LOWE’S(NOT OWNED) | ||||||||||||||||||||
| 131 | HOUGHTON, MI | COPPER COUNTRY MALL HIGHWAY M26 | 49931 | MM | 1981 | 2* | 100.00 | % | 257,863 | $ | 719,772 | J.C. PENNEY #20430(2005), OFFICEMAX #1116(2014) | ||||||||||||||||||||
| 132 | HOWELL, MI | GRAND RIVER PLAZA 3599 EAST GRAND RIVER | 48843 | SC | 1991 | 2* | 100.00 | % | 215,047 | $ | 1,407,255 | Elder-Beerman(2011), Dunham’s Sporting Goods(2011), KROGER #633(201 | ||||||||||||||||||||
| 133 | LANSING, MI | THE MARKETPLACE AT DELTA TOWNS 8305 WEST SAGINAW HWY 196 RAMP | 48917 | SC | 2000 | 2003 | 100.00 | % | 95,369 | $ | 959,373 | Michael’s #1590(2011), Gander Mountain(2015), LOWE’S(NOT OWNED), WAL MART(NOT OWNED) | ||||||||||||||||||||
| 134 | MT. PLEASANT, MI | INDIAN HILLS PLAZA 4208 E BLUE GRASS ROAD | 48858 | SC | 1990 | 2* | 100.00 | % | 248,963 | $ | 1,267,536 | WAL-MART STORES #1428(2009), KROGER #889(2011) | ||||||||||||||||||||
| 135 | SAULT ST. MARIE, MI | CASCADE CROSSINGS 4516 I-75 BUSINESS SPUR | 49783 | SC | 1993 | 1994 | 100.00 | % | 270,761 | $ | 1,762,598 | WAL-MART STORES #1936(2012), J.C. PENNEY #2625(2008), OFFICE MAX #731(2013), GLEN’S MARKET(2013) | ||||||||||||||||||||
| 136 | WALKER, MI (GRAND RAPIDS) | GREEN RIDGE SQUARE 3390-B ALPINE AVE NW | 49504 | SC | 1989 | 1995 | 100.00 | % | 133,877 | $ | 1,403,429 | T.J. MAXX #160(2005), OFFICE DEPOT #241(2005), TARGET(NOT OWNED), MEDIA PLAY(NOT OWNED), TOYS R US(NOT OWNED), CIICU CITY(NOT OWNED) | ||||||||||||||||||||
| Minnesota | ||||||||||||||||||||||||||||||||
| 137 | BEMIDJI, MN | PAUL BUNYAN MALL 1201 PAUL BUNYAN DRIVE | 56601 | MM | 1977 | 2* | 100.00 | % | 297,586 | $ | 1,411,349 | K MART #9204(2007), HERBERGER’S #348(2005), J.C. PENNEY #1091-8(2008) | ||||||||||||||||||||
| 138 | BRAINERD, MN | WESTGATE MALL 1200 HIGHWAY 210 WEST | 56401 | MM | 1985 | 2* | 100.00 | % | 260,319 | $ | 1,880,845 | K MART #9525(2004), HERBERGER’S #23(2013), MOVIES 10/WESTGATE MALL/#205(2011) | ||||||||||||||||||||
| 139 | COON RAPIDS, MN | RIVERDALE VILLAGE PERIMETER 12921 RIVERDALE DRIVE | 55433 | SC | 1999 | 1* | 14.50 | % | 364,998 | $ | 5,297,658 | KOHL’S #408(2020), JO-ANN STORES #1941(2010), LINENS ‘N THINGS(2016), OLD NAVY # 5958(2007), SPORTSMEN’S WAREHOUSE(2017), BEST BUY STORES, L.P.(2013), SEARS(NOT OWNED), COSTCO(NOT OWNED) | ||||||||||||||||||||
| 140 | COON RAPIDS, MN (INNER) | RIVERDALE VILLAGE — INNER 12921 RIVERDALE DRIVE | 55433 | SC | 2003 | 1* | 100.00 | % | 234,073 | $ | 3,147,541 | BORDERS(2023), J.C. PENNEY(2024) | ||||||||||||||||||||
| *1. Property Developed by the Company | * SC — Shopping Center | |
| *2. Original IPO Property | * MM — Mini-Mall | |
| * BC — Business Center | ||
| * LC — Lifestyle Center |
* Does Not Include Service Merchandise Interests
Property Listing 7.1
| Run Date: 04/16/2004 Time: 8:51:14AM Page 11 of 20 |
Property List*
| Owned | ||||||||||||||||||||||||||||||||
| DDR | Gross | Total | ||||||||||||||||||||||||||||||
| Zip | Type of | Year | Year | OwnerShip | Leasable | Annualized | Anchor Tenants | |||||||||||||||||||||||||
| Center/Property | Location | Code | Property | Developed | Acquired | Interest | Area | Rent | (Lease Expiration) | |||||||||||||||||||||||
| 141 | EAGAN, MN | EAGAN PROMENADE 1299 PROMENADE PLACE | 55122 | SC | 1997 | 1997 | 50.00 | % | 278,211 | $ | 3,466,905 | BYERLY’S(2016), PETSMART #469(2018), BARNES & NOBLE #2820(2012), OFFICEMAX #604(2013), T.J. MAXX #379(2007), BED BATH & BEYOND(2012), ETHAN ALLEN FURNITURE(NOT OWNED) | ||||||||||||||||||||
| 142 | HUTCHINSON, MN | HUTCHINSON MALL 1060 SR 15 | 55350 | MM | 1981 | 2* | 100.00 | % | 121,001 | $ | 608,213 | J.C. PENNEY #1076-9 -4(2006), KMART(NOT OWNED) | ||||||||||||||||||||
| 143 | MINNEAPOLIS, MN (MAPLE GROVE) | MAPLE GROVE CROSSING WEAVER LAKE ROAD & I-94 | 55369 | SC | 1995 | 1996 | 50.00 | % | 265,957 | $ | 2,837,043 | KOHL’S #241(2016), BARNES & NOBLE-#2749(2011), GANDER MOUNTAIN(2011), MICHAEL’S STORES, INC.(2012), BED, BATH AND BEYOND(2012), CUB FOODS(NOT OWNED) | ||||||||||||||||||||
| 144 | ST. PAUL, MN | MIDWAY MARKETPLACE 1450 UNIVERSITY AVENUE WEST | 55104 | SC | 1995 | 1997 | 14.50 | % | 324,354 | $ | 2,641,237 | WAL-MART #5437(2022), CUB FOODS(2015), PETSMART #466(2011), MERVYN’S #312(2016), BORDERS BOOKS AND MUSIC(NOT OWNED), HERBERGER’S(NOT OWNED) | ||||||||||||||||||||
| 145 | WORTHINGTON, MN | NORTHLAND MALL 1635 OXFORD STREET | 56187 | MM | 1977 | 2* | 100.00 | % | 185,658 | $ | 519,915 | J.C. PENNEY #2271-5 -4(2007), HY VEE FOOD STORES-3(2011) | ||||||||||||||||||||
| Mississippi | ||||||||||||||||||||||||||||||||
| 146 | GULFPORT, MS | CROSSROADS CENTER CROSSROADS PARWAY | 39503 | SC | 1999 | 2003 | 100.00 | % | 455,302 | $ | 4,804,779 | ACADEMY(2015), BED, BATH AND BEYOND #589(2014), GOODY’S FAMILY CLOTHING(2011), T.J. MAXX(2009), TINSELTOWN(2019), OFFICE DEPOT #437(2014), BARNES & NOBLE(2015), BELK’S(NOT OWNED) | ||||||||||||||||||||
| 147 | JACKSON, MS (JUNCTION) | THE JUNCTION 6351 I-55 NORTH3 | 39213 | SC | 1996 | 2003 | 100.00 | % | 107,780 | $ | 1,105,048 | Petsmart #520(2012), Office Depot #358(2016), HOME DEPOT(NOT OWNED), TARGET(NOT OWNED) | ||||||||||||||||||||
| 148 | JACKSON, MS (METRO) | METRO STATION 4700 ROBINSON ROAD | 39204 | SC | 1997 | 2003 | 100.00 | % | 52,617 | $ | 331,356 | Office Depot #414(2012), HOME DEPOT(NOT OWNED) | ||||||||||||||||||||
| 149 | OXFORD, MS | OXFORD PLACE 2015-2035 UNIVERSITY AVENUE | 38655 | SC | 2000 | 2003 | 100.00 | % | 71,866 | $ | 287,216 | Kroger #473(2020) | ||||||||||||||||||||
| 150 | SALTILLO, MS | CROSS CREEK SHOPPING CENTER 1040-1184 CROSS CREEK DRIVE | 38866 | SC | 1999 | 2003 | 100.00 | % | 65,269 | $ | 586,623 | Staples 1172(2016), HOME DEPOT(NOT OWNED) | ||||||||||||||||||||
| 151 | STARKVILLE, MS | STARKVILLE CROSSING 882 HIGHWAY 12 WEST | 39759 | SC | 1990 | 1994 | 100.00 | % | 125,248 | $ | 813,238 | J.C. PENNEY #2447(2010), KROGER #381(2012) | ||||||||||||||||||||
| 152 | TUPELO, MS | BIG OAKS CROSSING 3850 N GLOSTER ST | 38801 | SC | 1992 | 1994 | 100.00 | % | 348,236 | $ | 1,984,431 | SAM’S WHOLESALE CLUB#6329(2012), GOODY’S #39(2002), WAL-MART STORES #258(2012) | ||||||||||||||||||||
| Missouri | ||||||||||||||||||||||||||||||||
| 153 | ARNOLD, MO | JEFFERSON COUNTY PLAZA VOGEL ROAD | 63010 | SC | 2002 | 1* | 50.00 | % | 34,567 | $ | 457,364 | HOME DEPOT(NOT OWNED), TARGET(NOT OWNED) | ||||||||||||||||||||
| 154 | FENTON, MO | FENTON PLAZA GRAVOIS & HIGHWAY 141 | 63206 | SC | 1970 | 2* | 100.00 | % | 93,068 | $ | 799,968 | |||||||||||||||||||||
| *1. Property Developed by the Company | * SC — Shopping Center | |
| *2. Original IPO Property | * MM — Mini-Mall | |
| * BC — Business Center | ||
| * LC — Lifestyle Center |
* Does Not Include Service Merchandise Interests
Property Listing 7.1
| Run Date: 04/16/2004 Time: 8:51:14AM Page 12 of 20 |
Property List*
| Owned | ||||||||||||||||||||||||||||||||
| DDR | Gross | Total | ||||||||||||||||||||||||||||||
| Zip | Type of | Year | Year | OwnerShip | Leasable | Annualized | Anchor Tenants | |||||||||||||||||||||||||
| Center/Property | Location | Code | Property | Developed | Acquired | Interest | Area | Rent | (Lease Expiration) | |||||||||||||||||||||||
| 155 | INDEPENDENCE, MO | INDEPENDENCE COMMONS 900 EAST 39TH STREET | 64057 | SC | 1995 | 1995 | 14.50 | % | 382,955 | $ | 4,277,388 | KOHL’S DEPARTMENT #230(2016), BED, BATH & BEYOND #107(2012), MARSHALLS #675(2012), RHODES FURNITURE, INC.(2016), BARNES & NOBLE #2732(2011), AMC THEATRE(2015) | ||||||||||||||||||||
| 156 | KANSAS CITY, MO (BRYWOOD) | BRYWOOD CENTER 8600 E. 63rd STREET | 64133 | SC | 1972 | 1998 | 24.75 | % | 208,234 | $ | 824,159 | BIG LOTS #489(2009), PRICE CHOPPER(2004) | ||||||||||||||||||||
| 157 | KANSAS CITY, MO (WARD PARKW) | WARD PARKWAY 8600 WARD PARKWAY | 64114 | SC | 1959 | 2003 | 20.00 | % | 275,783 | $ | 4,469,191 | AMC Theaters(2011), Stein Mart #030(2004), T.J. Maxx(2013), Dick’s(2016), 24 Hour Fitness(2023), TARGET(NOT OWNED), DILLARD’S(NOT OWNED | ||||||||||||||||||||
| 158 | SPRINGFIELD, MO (MORRIS) | MORRIS CORNERS 1425 EAST BATTLEFIELD | 65804 | SC | 1989 | 1998 | 100.00 | % | 56,033 | $ | 486,741 | TOYS R US #9512(2013) | ||||||||||||||||||||
| 159 | ST. JOHN, MO | ST. JOHN CROSSINGS 9000-9070 ST. CHARLES ROCK ROA | 63114 | SC | 2002 | 2003 | 100.00 | % | 84,281 | $ | 868,524 | Shop ‘N Save(2022) | ||||||||||||||||||||
| 160 | ST. LOUIS (SUNSET), MO | PLAZA AT SUNSET HILL 10980 SUNSET PLAZA | 63128 | SC | 1997 | 1998 | 100.00 | % | 415,435 | $ | 5,318,717 | BED BATH AND BEYOND(2012), MARSHALLS OF SUNSET HILLS(2012) HOME DEPOT #1089(2023), PETSMART #260(2012), BORDERS #110(2011), TOYS R US #9565(2013), COMPUSA COMPUTER SUPER #1012(2013) | ||||||||||||||||||||
| 161 | ST. LOUIS, MO (KELLER PLAZA) | KELLER PLAZA 4500 LEMAY FERRY ROAD | 63129 | SC | 1987 | 1998 | 100.00 | % | 52,842 | $ | 453,803 | SENSIBLE CINEMAS, INC(2006), SAM’S(NOT OWNED) | ||||||||||||||||||||
| 162 | ST. LOUIS, MO (BRENTWOOD) | PROMENADE AT BRENTWOOD 1 BRENTWOOD PROMENADE COURT | 63144 | SC | 1998 | 1998 | 100.00 | % | 299,584 | $ | 3,736,712 | TARGET #1102(2023), BED BATH & BEYOND #219(2009), PETSMART #255(2014), SPORTS AUTHORITY(2013) | ||||||||||||||||||||
| 163 | ST. LOUIS, MO (GRAVOIS VILLAGE) | GRAVOIS VILLAGE 4523 GRAVOIS VILLAGE PLAZA | 63049 | SC | 1983 | 1998 | 100.00 | % | 110,992 | $ | 635,664 | K MART #7543(2008) | ||||||||||||||||||||
| 164 | ST. LOUIS, MO (OLYMPIC OAKS) | OLYMPIC OAKS VILLAGE 12109 MANCHESTER ROAD | 63121 | SC | 1985 | 1998 | 100.00 | % | 92,372 | $ | 1,444,947 | T.J. MAXX #329(2006) | ||||||||||||||||||||
| Nevada | ||||||||||||||||||||||||||||||||
| 165 | LAS VEGAS, NV (DECATUR) | FAMILY CENTER @ LAS VEGAS CHARLESTON & DECATUR BLVD | 89102 | SC | 1973 | 1998 | 100.00 | % | 49,555 | $ | 390,272 | ALBERTSON’S(NOT OWNED) | ||||||||||||||||||||
| 166 | LAS VEGAS, NV (MARYLAND) | FAMILY PLACE @ LAS VEGAS CHARLESTON & MARYLAND BLVD | 89102 | SC | 2003 | 1* | 100.00 | % | 24,032 | $ | 428,856 | |||||||||||||||||||||
| 167 | RENO, NV. | RENO RIVERSIDE EAST FIRST STREET AND SIERRA | 89505 | SC | 2000 | 2000 | 100.00 | % | 52,474 | $ | 32,136 | CENTURY THEATRE, INC.(2014) | ||||||||||||||||||||
| New Jersey | ||||||||||||||||||||||||||||||||
| 168 | HAMILTON, NJ | HAMILTON MARKETPLACE NJ STATE HWY 130 & KLOCKNER RD | 08691 | SC | 2002 | 2003 | 100.00 | % | 369,049 | $ | 5,868,283 | Kohl’s #469(2023), Linens ‘N Things #142(2014), Michael’s(2013), Ross Dress For Less #634(2014), Shop Rite(2028), LOWE’S(NOT OWNED), BJ’S WHOLESALE(NOT OWNED), WALMART(NOT OWNED) | ||||||||||||||||||||
| *1. Property Developed by the Company | * SC — Shopping Center | |
| *2. Original IPO Property | * MM — Mini-Mall | |
| * BC — Business Center | ||
| * LC — Lifestyle Center |
* Does Not Include Service Merchandise Interests
Property Listing 7.1
| Run Date: 04/16/2004 Time: 8:51:14AM Page 13 of 20 |
Property List*
| Owned | ||||||||||||||||||||||||||||||||
| DDR | Gross | Total | ||||||||||||||||||||||||||||||
| Zip | Type of | Year | Year | OwnerShip | Leasable | Annualized | Anchor Tenants | |||||||||||||||||||||||||
| Center/Property | Location | Code | Property | Developed | Acquired | Interest | Area | Rent | (Lease Expiration) | |||||||||||||||||||||||
| 169 | PRINCETON, NJ | NASSAU PARK SHOPPING CENTER ROUTE 1 & QUAKER BRIDGE ROAD | 42071 | SC | 1995 | 1997 | 100.00 | % | 198,401 | $ | 3,806,990 | BORDERS #131(2011), BEST BUY #578(2012), LINENS ‘N THINGS #462(2011), PETSMART #577(2011), WAL-MART(NOT OWNED), SAM’S(NOT OWNED), HOME DEPOT(NOT OWNED), TARGET(NOT OWNED) | ||||||||||||||||||||
| 170 | PRINCETON, NJ (PAVILION) | NASSAU PARK PAVILION ROUTE 1 AND QUAKER BRIDGE ROAD | 42071 | SC | 1999 | 1* | 100.00 | % | 202,622 | $ | 3,991,250 | DICK’S SPORTING GOOD #105(2015), MICHAEL’S(2009), KOHL’S #294(2019), WEGMAN’S MARKET(NOT OWNED) | ||||||||||||||||||||
| New Mexico | ||||||||||||||||||||||||||||||||
| 171 | LOS ALAMOS, NM | MARI MAC VILLAGE 800 TRINITY DRIVE | 87533 | SC | 1978 | 2* | 100.00 | % | 97,970 | $ | 618,183 | SMITH’S FOOD & DRUG CENTERS497(2007), FURR’S PHARMACY #887-4(2003), BEALL’S #0180(2009) | ||||||||||||||||||||
| North Carolina | ||||||||||||||||||||||||||||||||
| 172 | ASHEVILLE, NC | RIVER HILLS 299 SWANNANOA RIVER ROAD | 28805 | SC | 1996 | 2003 | 100.00 | % | 190,970 | $ | 1,989,799 | Goody’s 20923 — #123(2007), Carmike Cinemas(2017), Circuit City(2017), Dick’s Sporting Goods(2017), Michael’s(2008), Officemax #577(2011) | ||||||||||||||||||||
| 173 | DURHAM, NC | OXFORD COMMONS 3500 OXFORD ROAD | 27702 | SC | 1990 | 2* | 100.00 | % | 213,934 | $ | 1,210,473 | FOOD LION #747-3(2010), BURLINGTON COAT FACTORY(2007), WAL-MART(NOT OWNED) | ||||||||||||||||||||
| 174 | FAYETTEVILLE, NC | CROSS POINTE CENTRE 5075 MORGANTON ROAD | 28314 | SC | 1985 | 2003 | 100.00 | % | 198,984 | $ | 1,556,609 | Dev Rlty(Ac Mre/Circcty/Stpls)(2012), T.J. Maxx #354(2006), Bed Bath and Beyond(2014) | ||||||||||||||||||||
| 175 | HENDERSONVILLE, NC | EASTRIDGE CROSSING 200 THOMPSON STREET | 28792 | SC | 1995 | 2003 | 100.00 | % | 47,530 | $ | 231,772 | Ingles #112(2009) | ||||||||||||||||||||
| 176 | NEW BERN, NC | RIVERTOWNE SQUARE 3003 CLAREDON BLVD | 28561 | SC | 1989 | 2* | 100.00 | % | 68,130 | $ | 596,681 | GOODY’S #4(2007), WAL-MART(NOT OWNED) | ||||||||||||||||||||
| 177 | WASHINGTON, NC | PAMLICO PLAZA 536 PAMLICO PLAZA | 27889 | SC | 1990 | 2* | 100.00 | % | 93,527 | $ | 455,755 | WAL-MART STORES #1354(2009), WAL-MART(NOT OWNED) | ||||||||||||||||||||
| 178 | WAYNESVILLE, NC | LAKESIDE PLAZA 201 PARAGON PARKWAY | 28721 | SC | 1990 | 2* | 100.00 | % | 181,894 | $ | 1,162,316 | WAL-MART STORE #1663(2011), FOOD LION #957-2(2011) | ||||||||||||||||||||
| 179 | WILMINGTON, NC | UNIVERSITY CENTRE S. COLLEGE RD & NEW CENTRE DR. | 28403 | SC | 1989 | 2* | 100.00 | % | 410,491 | $ | 3,188,227 | BARNES & NOBLE #2762(2007), LOWE’S HOME CENTER #445 -4(2014) OLD NAVY #5471(2006), BED BATH & BEYOND # 418(2012), ROSS DRESS FOR LESS(2012), GOODY’S #175 -4(2005), SAM’S(NOT OWNED) | ||||||||||||||||||||
| North Dakota | ||||||||||||||||||||||||||||||||
| 180 | DICKINSON, ND | PRAIRIE HILLS MALL 1681 THIRD AVENUE | 58601 | MM | 1978 | 2* | 100.00 | % | 266,502 | $ | 1,074,320 | K MART #9564(2008), HERBERGER’S #30(2005), J.C. PENNEY #1628-7(2008) | ||||||||||||||||||||
| 181 | GRAND FORKS, ND | OFFICE MAX 2500 S COLUMBIA ROAD | 58201 | SC | 1978 | 1999 | 83.75 | % | 31,812 | $ | 0 | |||||||||||||||||||||
| Ohio | ||||||||||||||||||||||||||||||||
| *1. Property Developed by the Company | * SC — Shopping Center | |
| *2. Original IPO Property | * MM — Mini-Mall | |
| * BC — Business Center | ||
| * LC — Lifestyle Center |
* Does Not Include Service Merchandise Interests
Property Listing 7.1
| Run Date: 04/16/2004 Time: 8:51:14AM Page 14 of 20 |
Property List*
| Owned | ||||||||||||||||||||||||||||||||
| DDR | Gross | Total | ||||||||||||||||||||||||||||||
| Zip | Type of | Year | Year | OwnerShip | Leasable | Annualized | Anchor Tenants | |||||||||||||||||||||||||
| Center/Property | Location | Code | Property | Developed | Acquired | Interest | Area | Rent | (Lease Expiration) | |||||||||||||||||||||||
| 182 | ASHLAND, OH | CLAREMONT PLAZA US ROUTE 42 | 44805 | SC | 1977 | 2* | 100.00 | % | 110,656 | $ | 72,773 | QUALITY STORES #3116(2005) | ||||||||||||||||||||
| 183 | AURORA, OH | BARRINGTON TOWN SQUARE 70-130 BARRINGTON TOWN SQUARE | 44202 | SC | 1996 | 1* | 100.00 | % | 64,700 | $ | 1,275,966 | MARQUEE CINEMAS(NOT OWNED), HEINEN’S(NOT OWNED) | ||||||||||||||||||||
| 184 | BELLEFONTAINE, OH | SOUTH MAIN STREET PLAZA 2250 SOUTH MAIN STREET | 43311 | SC | 1995 | 1998 | 100.00 | % | 52,399 | $ | 432,292 | GOODY’S STORE # 314(2010), STAPLES # 1146(2010) | ||||||||||||||||||||
| 185 | BOARDMAN, OH | SOUTHLAND CROSSING I-680 & US ROUTE 224 | 44514 | SC | 1997 | 1* | 100.00 | % | 506,254 | $ | 4,088,477 | LOWE’S COMPANIES #188(2016), BABIES R US #9254(2009), STAPLES STORE #817(2012), DICKS CLOTHING & SPORTING(2012), WAL-MART STORES #2211(2017), PETSMART #558(2013), GIANT EAGLE, INC # 4075(2018) | ||||||||||||||||||||
| 186 | CANTON, OH (PHASE I & II) | BELDEN PARK CROSSINGS 5496 DRESSLER ROAD | 44720 | SC | 1995 | 1* | 14.50 | % | 478,106 | $ | 5,028,894 | VALUE CITY FURNITURE #55(2011), H.H. GREGG APPLIANCES(2011), JO-ANN STORES #1900(2008), PETSMART #523(2013), DICK’S CLOTHIN & SPORTING #64(2010), DSW SHOE WAREHOUSE(2012), KOHL’S DEPARTMENT STORE #239(2016) | ||||||||||||||||||||
| 187 | CHILLICOTHE, OH | CHILLICOTHE PLACE 867 N BRIDGE STREET | 45601 | SC | 1974 | 2* | 100.00 | % | 236,009 | $ | 1,834,641 | LOWE’S HOME CENTERS #472-2(2015), KROGER #348(2016), OFFICE MAX #617(2013) | ||||||||||||||||||||
| 188 | CINCINNATI, OH | GLENWAY CROSSING 5100 GLENCROSSING WAY | 45238 | SC | 1990 | 2* | 100.00 | % | 235,433 | $ | 2,073,980 | WINN DIXIE STORES #1771 -4(2010), MICHAEL’S(2006) | ||||||||||||||||||||
| 189 | CLEVELAND, OH (WEST 65th) | KMART PLAZA- WEST 65TH 3250 WEST 65TH STREET | 44102 | SC | 1977 | 2* | 100.00 | % | 49,420 | $ | 284,716 | GREAT A & P TEA #23001-4(2007), KMART(NOT OWNED) | ||||||||||||||||||||
| 190 | COLUMBUS, OH (DUBLIN VILLAGE) | DUBLIN VILLAGE CENTER 6561-6815 DUBLIN CENTER DRIVE | 43017 | SC | 1987 | 1998 | 80.01 | % | 326,912 | $ | 1,561,357 | AMC THEATRE(2007), B.J.’S WHOLESALE CLUB(NOT OWNED) | ||||||||||||||||||||
| 191 | COLUMBUS, OH (EASTON MARKET) | EASTON MARKET 3740 EASTON MARKET | 43230 | SC | 1998 | 1998 | 100.00 | % | 509,611 | $ | 5,963,788 | COMPUSA, INC #533(2013), STAPLES, INC. #603(2013), PETSMART, INC #550(2015), GOLFSMITH GOLF CENTER(2013), MICHAEL’S #9876(2013), GALYAN’S(2013), DSW SHOE WAREHOUSE(2012), KITTLE’S HOME FURNISHINGS(2012), BED BATH & BEYOND, INC.(2014), T.J. MAXX#447(2008) | ||||||||||||||||||||
| 192 | COLUMBUS, OH (LENNOX TOWN) | LENNOX TOWN CENTER 1647 OLENTANGY RIVER ROAD | 43212 | SC | 1997 | 1998 | 50.00 | % | 352,913 | $ | 3,344,654 | TARGET#1058(2016), BARNES & NOBLE#2860(2007), STAPLES #451(2011), AMC THEATRES LENNOX 24(2021) | ||||||||||||||||||||
| 193 | COLUMBUS, OH (SUN CENTER) | SUN CENTER 3622-3860 DUBLIN GRANVILLE RD | 43017 | SC | 1995 | 1998 | 79.45 | % | 305,428 | $ | 3,433,830 | BABIES R US #9242(2011), MICHAEL’S #2873(2013), RHODES FURNITURE(2012), STEIN MART #130(2007), BIG BEAR(2016), STAPLE #403(2010) | ||||||||||||||||||||
| 194 | DUBLIN, OH (PERIMETER CENTER) | PERIMETER CENTER 6644-6804 PERIMETER LOOP ROAD | 43017 | SC | 1996 | 1998 | 100.00 | % | 137,556 | $ | 1,428,245 | GIANT EAGLE(2014) | ||||||||||||||||||||
| 195 | ELYRIA, OH | ELYRIA SHOPPING CENTER 825 CLEVELAND | 44035 | SC | 1977 | 2* | 100.00 | % | 150,200 | $ | 521,970 | FIRST NAT’L SUPERMARKET #811(2010) | ||||||||||||||||||||
| 196 | GALLIPOLIS, OH | GALLIPOLIS MARKETPLACE 2145 EASTERN AVENUE | 45631 | SC | 1998 | 2003 | 100.00 | % | 25,950 | $ | 302,094 | WAL MART(NOT OWNED) | ||||||||||||||||||||
| *1. Property Developed by the Company | * SC — Shopping Center | |
| *2. Original IPO Property | * MM — Mini-Mall | |
| * BC — Business Center | ||
| * LC — Lifestyle Center |
* Does Not Include Service Merchandise Interests
Property Listing 7.1
| Run Date: 04/16/2004 Time: 8:51:14AM Page 15 of 20 |
Property List*
| Owned | ||||||||||||||||||||||||||||||||
| DDR | Gross | Total | ||||||||||||||||||||||||||||||
| Zip | Type of | Year | Year | OwnerShip | Leasable | Annualized | Anchor Tenants | |||||||||||||||||||||||||
| Center/Property | Location | Code | Property | Developed | Acquired | Interest | Area | Rent | (Lease Expiration) | |||||||||||||||||||||||
| 197 | GROVE CITY, OH (DERBY SQUARE) | DERBY SQUARE SHOPPING CENTER 2161-2263 STRINGTOWN ROAD | 43123 | SC | 1992 | 1998 | 20.00 | % | 128,210 | $ | 1,340,837 | BIG BEAR(2012) | ||||||||||||||||||||
| 198 | HAMILTON, OH | H.H. GREG 1371 MAIN STREET | 43450 | SC | 1986 | 1998 | 100.00 | % | 40,000 | $ | 230,000 | ROUNDY’S(2006) | ||||||||||||||||||||
| 199 | HILLSBORO, OH | HILLSBORO SHOPPING CENTER 1100 NORTH HIGH STREET | 45133 | SC | 1979 | 2* | 100.00 | % | 58,564 | $ | 174,411 | BOB & CARL’S(NOT OWNED) | ||||||||||||||||||||
| 200 | HUBER HTS., OH | NORTH HEIGHTS PLAZA 8280 OLD TROY PIKE | 45424 | SC | 1990 | 2* | 100.00 | % | 163,819 | $ | 1,377,388 | CUB FOODS(2011), WAL-MART(NOT OWNED) | ||||||||||||||||||||
| 201 | LEBANON, OH | COUNTRYSIDE PLACE 1879 DEERFIELD ROAD | 45036 | SC | 1990 | 2* | 100.00 | % | 17,000 | $ | 174,484 | WAL-MART(NOT OWNED), ERB LUMBER(NOT OWNED) | ||||||||||||||||||||
| 202 | MACEDONIA, OH | MACEDONIA COMMONS MACEDONIA COMMONS BLVD. | 44056 | SC | 1994 | 1994 | 50.00 | % | 233,639 | $ | 2,679,050 | FIRST NATL. SUPERMARKETS #826(2018), KOHL’S #235(2016), WAL-MART(NOT OWNED) | ||||||||||||||||||||
| 203 | MACEDONIA, OH (PHASE II) | MACEDONIA COMMONS (PHASE II) 8210 MACEDONIA COMMONS | 44056 | SC | 1999 | 1* | 100.00 | % | 169,481 | $ | 1,601,734 | CINEMARK(2019), HOME DEPOT #3824(2020) | ||||||||||||||||||||
| 204 | NORTH OLMSTED, OH | GREAT NORTHERN PLAZA NORTH 25859-26437 GREAT NORTHERN | 44070 | SC | 1958 | 1997 | 14.50 | % | 624,660 | $ | 7,907,133 | KIDS R US #1173(2008), BED BATH & BEYOND, INC.(2012), PETSMART #529(2008), HOME DEPOT USA #3803(2019), K & G MEN’S COMPANY, INC.(2008), JO-ANN STORES #1923(2009), MARC’S(2012), COMPUSA INC #577(2008), BEST BUY #279(2010), MARSHALLS #8267/TJX COMPANY(2005), KRONHEIMS FURNITURE(2012), TOP’S SUPERMARKET(NOT OWNED) | ||||||||||||||||||||
| 205 | PATASKALA, OH | VILLAGE MARKET/RITE AID CENTER 78-80 OAK MEADOW DRIVE | 43062 | SC | 1980 | 1998 | 100.00 | % | 33,270 | $ | 194,600 | CARDINAL (GARDNERS/LANCASTER)(2007) | ||||||||||||||||||||
| 206 | PICKERINGTON, OH | SHOPPES AT TURNBERRY 1701-1797 HILL ROAD NORTH | 43147 | SC | 1990 | 1998 | 100.00 | % | 59,495 | $ | 656,066 | |||||||||||||||||||||
| 207 | SOLON, OH | UPTOWN SOLON KRUSE DRIVE | 44139 | SC | 1998 | 1* | 100.00 | % | 183,288 | $ | 2,590,660 | MUSTARD SEED MKT & CAFE(2019), BED, BATH AND BEYOND#204(2009), BORDERS #286(2018) | ||||||||||||||||||||
| 208 | STOW, OH | STOW COMMUNITY SHOPPING CENTER KENT ROAD | 44224 | SC | 1997 | 1* | 100.00 | % | 404,505 | $ | 2,848,933 | K MART #4264(2006), BED BATH AND BEYOND #360(2011), GIANT EAGLE, INC. #4096(2017), KOHL’S #331(2019), OFFICE MAX #626(2011), BORDERS OUTLET #249(2003), TARGET(NOT OWNED) | ||||||||||||||||||||
| 209 | TIFFIN, OH | TIFFIN MALL 870 WEST MARKET STREET | 44883 | MM | 1980 | 2* | 100.00 | % | 180,969 | $ | 856,046 | MARQUEE CINEMAS(2018), J.C. PENNEY #324-4(2005), AARON RENTS INC.#C0399(2004) | ||||||||||||||||||||
| 210 | TOLEDO, OH | SPRINGFIELD COMMONS SHOPPING S. HOLLAND-SYLVANIA ROAD | 43528 | SC | 1999 | 1* | 20.00 | % | 241,129 | $ | 2,699,142 | KOHL’S #324(2019), GANDER MOUNTAIN, L.L.C.(2014), BED BATH & BEYOND #240(2010), OLD NAVY #6429(2005), BABIES R US(NOT OWNED) | ||||||||||||||||||||
| 211 | WESTLAKE, OH | WEST BAY PLAZA 30100 DETROIT ROAD | 44145 | SC | 1974 | 2* | 100.00 | % | 162,330 | $ | 1,268,939 | MARC’S #37(2004), K MART #3234(2004) | ||||||||||||||||||||
| *1. Property Developed by the Company | * SC — Shopping Center | |
| *2. Original IPO Property | * MM — Mini-Mall | |
| * BC — Business Center | ||
| * LC — Lifestyle Center |
* Does Not Include Service Merchandise Interests
Property Listing 7.1
| Run Date: 04/16/2004 Time: 8:51:14AM Page 16 of 20 |
Property List*
| Owned | ||||||||||||||||||||||||||||||||
| DDR | Gross | Total | ||||||||||||||||||||||||||||||
| Zip | Type of | Year | Year | OwnerShip | Leasable | Annualized | Anchor Tenants | |||||||||||||||||||||||||
| Center/Property | Location | Code | Property | Developed | Acquired | Interest | Area | Rent | (Lease Expiration) | |||||||||||||||||||||||
| 212 | WILMINGTON, OH | SOUTH RIDGE SHOPPING CENTER 1025 S SOUTH STREET | 45177 | SC | 1977 | 2* | 100.00 | % | 55,130 | $ | 214,324 | COMMUNITY MARKETS(2013) | ||||||||||||||||||||
| 213 | XENIA, OH | WEST PARK SQUARE 1700 WEST PARK SQUARE | 45385 | SC | 1994 | 1* | 100.00 | % | 104,873 | $ | 808,431 | KROGER #829(2019), WAL-MART(NOT OWNED) | ||||||||||||||||||||
| Oregon | ||||||||||||||||||||||||||||||||
| 214 | PORTLAND, OR | TANASBOURNE TOWN CENTER NW EVERGREEN PKWY & NW RING RD | 97006 | SC | 1995 | 1996 | 50.00 | % | 309,617 | $ | 5,193,374 | BARNES & NOBLE #2748(2011), OFFICE DEPOT-#00954(2010), HAGGAN’S(2021), LINENS N THINGS(2017), ROSS DRESS FOR LESS #399(2008), MICHAEL’S #9887(2009), NORDSTROM(NOT OWNED), TARGET(NOT OWNED), MERVYN’S(NOT OWNED) | ||||||||||||||||||||
| �� | ||||||||||||||||||||||||||||||||
| Pennsylvania | ||||||||||||||||||||||||||||||||
| 215 | ALLENTOWN, PA (WEST) | WEST VALLEY MARKETPLACE 1091 MILL CREEK ROAD | 18106 | SC | 2001 | 2003 | 100.00 | % | 241,077 | $ | 2,309,810 | Wal-Mart #2641(2021) | ||||||||||||||||||||
| 216 | E. NORRITON, PA | KMART PLAZA 2692 DEKALB PIKE | 19401 | SC | 1975 | 2* | 100.00 | % | 173,876 | $ | 1,222,309 | K MART #3026(2005), BIG LOTS(2010) | ||||||||||||||||||||
| 217 | ERIE (PEACHSTREET), PA | PEACH STREET SQUARE 1902 KEYSTONE DRIVE | 16509 | SC | 1995 | 1* | 100.00 | % | 556,281 | $ | 5,005,727 | LOWE’S HOME CTR #226(2015), MEDIA PLAY-4 #8158(2011), KOHL’S-#221-4(2016), WAL-MART STORES #2278(2015), CINEMARK #186(2011), PETSMART #556(2015), CIRCUIT CITY SUPERSTORE 3744(2020), HOME DEPOT(NOT OWNED) | ||||||||||||||||||||
| 218 | ERIE, PA (MARKET) | ERIE MARKETPLACE 6660-6750 PEACH STREET | 16509 | SC | 2000 | 2003 | 100.00 | % | 93,097 | $ | 862,089 | Marshalls(2013), Bed Bath & Beyond #447(2013), BABIES R US(2015), TARGET(NOT OWNED) | ||||||||||||||||||||
| 219 | MONACA, PA | TOWNSHIP MARKETPLACE 115 WAGNER ROAD | 15061 | SC | 1999 | 2003 | 100.00 | % | 253,110 | $ | 1,953,763 | Lowe’s #500(2027), Shop ‘N Save(2019) | ||||||||||||||||||||
| South Carolina | ||||||||||||||||||||||||||||||||
| 220 | CAMDEN, SC | SPRINGDALE PLAZA 1671 SPRINGDALE DRIVE | 29020 | SC | 1990 | 2* | 100.00 | % | 180,127 | $ | 1,151,981 | WINN DIXIE STORES #2174(2011), BELK #227(2015), WAL-MART SUPE CENTER(NOT OWNED) | ||||||||||||||||||||
| 221 | CHARLESTON, SC | ASHLEY CROSSING 2245 ASHLEY CROSSING DRIVE | 29414 | SC | 1991 | 2003 | 100.00 | % | 196,048 | $ | 1,514,421 | Food Lion #933(2011), Wal-Mart #1748(2011) | ||||||||||||||||||||
| 222 | COLUMBIA, SC (HARBISON) | HARBISON COURT HARBISON BLVD | 29212 | SC | 1991 | 2002 | 100.00 | % | 252,689 | $ | 2,597,247 | Barnes & Noble #2688(2011), ROSS DRESS FOR LESS #668(2014), Marshall’s #458(2007), OfficeMax #640(2011), BABIES R’ US #8890(NOT OWNED) | ||||||||||||||||||||
| 223 | MT. PLEASANT, SC | WANDO CROSSING 1500 HIGHWAY 17 NORTH | 29465 | SC | 1992 | 1995 | 100.00 | % | 209,139 | $ | 2,076,640 | PIGGLY WIGGLY #29-4(2012), OFFICE DEPOT # 2002(2010), T.J. MAXX #780 -3(2007), MARSHALL’S OF MA, INC.(2011), WAL-MART(NOT OWNED | ||||||||||||||||||||
| 224 | N. CHARLESTON, SC | NORTH POINTE PLAZA 7400 RIVERS AVENUE | 29406 | SC | 1989 | 2* | 100.00 | % | 294,471 | $ | 2,048,807 | WAL-MART STORES #1359(2009), OFFICE MAX #342(2007), HELIG MEYERS(NOT OWNED), SERVICE MERCHANDISE(NOT OWNED) | ||||||||||||||||||||
| 225 | ORANGEBURG, SC | NORTH ROAD PLAZA 2795 NORTH ROAD | 29115 | SC | 1994 | 1995 | 100.00 | % | 50,760 | $ | 511,947 | GOODY’S #282(2008), WAL-MART(NOT OWNED) | ||||||||||||||||||||
| *1. Property Developed by the Company | * SC — Shopping Center | |
| *2. Original IPO Property | * MM — Mini-Mall | |
| * BC — Business Center | ||
| * LC — Lifestyle Center |
* Does Not Include Service Merchandise Interests
Property Listing 7.1
| Run Date: 04/16/2004 Time: 8:51:14AM Page 17 of 20 |
Property List*
| Owned | ||||||||||||||||||||||||||||||||
| DDR | Gross | Total | ||||||||||||||||||||||||||||||
| Zip | Type of | Year | Year | OwnerShip | Leasable | Annualized | Anchor Tenants | |||||||||||||||||||||||||
| Center/Property | Location | Code | Property | Developed | Acquired | Interest | Area | Rent | (Lease Expiration) | |||||||||||||||||||||||
| 226 | S. ANDERSON, SC | CROSSROADS PLAZA 406 HIGHWAY 28 BY-PASS | 29624 | SC | 1990 | 1994 | 100.00 | % | 14,800 | $ | 63,600 | |||||||||||||||||||||
| 227 | SIMPSONVILLE, SC | FAIRVIEW STATION 621 FAIRVIEW ROAD | 29681 | SC | 1990 | 1994 | 100.00 | % | 142,133 | $ | 857,871 | INGLES MARKETS #41(2011), KOHL’S DEPARTMENT STORES #673(201 | ||||||||||||||||||||
| 228 | SUMTER, SC | MERCHANT’S WALK 837-839 BROAD STREET | 29150 | SC | 1987 | 2003 | 100.00 | % | 19,140 | $ | 86,100 | KROGER’S (DARK)(NOT OWNED), WAL MART(NOT OWNED) | ||||||||||||||||||||
| 229 | UNION, SC | WEST TOWNE PLAZA U.S. HWY 176 BY-PASS #1 | 29379 | SC | 1990 | 2* | 100.00 | % | 184,331 | $ | 981,182 | WAL-MART STORES #629(2009), BELK STORES SERVICES, INC.(2010) WINN DIXIE STORES #1255(2010) | ||||||||||||||||||||
| South Dakota | ||||||||||||||||||||||||||||||||
| 230 | WATERTOWN, SD | WATERTOWN MALL 1300 9TH AVENUE | 56401 | MM | 1977 | 2* | 100.00 | % | 285,372 | $ | 1,318,861 | HERBERGER’S #15(2009), J.C. PENNEY #0495-2 -4(2008), HY VEE SUPERMARKET(NOT OWNED) | ||||||||||||||||||||
| Tennessee | ||||||||||||||||||||||||||||||||
| 231 | BRENTWOOD, TN | COOL SPRINGS POINTE I-65 AND MOORE’S LANE | 37027 | SC | 1999 | 2000 | 100.00 | % | 201,516 | $ | 1,862,632 | BEST BUY #170(2014), LINENS ‘N THINGS #521(2014), DSW SHOE WAREHOUSE #29103(2008) | ||||||||||||||||||||
| 232 | CHATTANOOGA, TN | OVERLOOK AT HAMILTON PLACE 2288 GUNBARREL ROAD | 37421 | SC | 1992 | 2003 | 100.00 | % | 215,905 | $ | 1,014,361 | Best Buy #4720(2014) | ||||||||||||||||||||
| 233 | COLUMBIA, TN | COLUMBIA SQUARE 845 NASHVILLE HIGHWAY | 38401 | SC | 1993 | 2003 | 100.00 | % | 68,948 | $ | 490,590 | KROGER #538(2022) | ||||||||||||||||||||
| 234 | FARRAGUT, TN | FARRAGUT POINTE 11132 KINGSTON PIKE | 37922 | SC | 1991 | 2003 | 100.00 | % | 71,311 | $ | 508,664 | Bi-Lo #367(2011) | ||||||||||||||||||||
| 235 | FRANKLIN, TN | ALEXANDER PLAZA 541 ALEXANDER PLAZA | 37064 | SC | 1983 | 2003 | 100.00 | % | 17,999 | $ | 150,812 | BIG LOTS(NOT OWNED) | ||||||||||||||||||||
| 236 | GOODLETTSVILLE, TN | NORTHCREEK COMMONS 101-139 NORTHCREEK BOULEVARD | 37072 | SC | 1987 | 2003 | 100.00 | % | 84,441 | $ | 722,791 | Kroger #541(2012) | ||||||||||||||||||||
| 237 | HENDERSONVILLE, TN | HENDERSONVILLE LOWE’S 1050 LOWE’S ROAD | 37075 | SC | 1999 | 2003 | 100.00 | % | 133,144 | $ | 1,214,939 | Lowe’s(2019) | ||||||||||||||||||||
| 238 | MEMPHIS, TN | COUNTRY BRIDGE 9020 US HIGHWAY 64 | 38002 | SC | 1993 | 2003 | 100.00 | % | 64,223 | $ | 565,197 | Kroger #436(2012) | ||||||||||||||||||||
| 239 | MURFREESBORO, TN (MEMORIAL) | MEMORIAL VILLAGE 710 MEMORIAL BOULEVARD | 37130 | SC | 1993 | 2003 | 100.00 | % | 117,750 | $ | 806,552 | Albertson’s #4730(2014) | ||||||||||||||||||||
| *1. Property Developed by the Company | * SC — Shopping Center | |
| *2. Original IPO Property | * MM — Mini-Mall | |
| * BC — Business Center | ||
| * LC — Lifestyle Center |
* Does Not Include Service Merchandise Interests
Property Listing 7.1
| Run Date: 04/16/2004 Time: 8:51:14AM Page 18 of 20 |
Property List*
| Owned | ||||||||||||||||||||||||||||||||
| DDR | Gross | Total | ||||||||||||||||||||||||||||||
| Zip | Type of | Year | Year | OwnerShip | Leasable | Annualized | Anchor Tenants | |||||||||||||||||||||||||
| Center/Property | Location | Code | Property | Developed | Acquired | Interest | Area | Rent | (Lease Expiration) | |||||||||||||||||||||||
| 240 | MURFREESBORO, TN (TOWNE) | TOWNE CENTRE OLD FORT PARKWAY | 37129 | SC | 1998 | 2003 | 100.00 | % | 108,180 | $ | 1,299,330 | T.J. Maxx #579(2008), Books-A-Million(2007), LOWE’S(NOT OWNED), TOY R US(NOT OWNED), TARGET(NOT OWNED) | ||||||||||||||||||||
| 241 | NASHVILLE, TN | THE MARKETPLACE CHARLOTTE PIKE | 37209 | SC | 1998 | 2003 | 100.00 | % | 167,795 | $ | 1,628,857 | Lowe’s(2019), WAL MART(NOT OWNED) | ||||||||||||||||||||
| Texas | ||||||||||||||||||||||||||||||||
| 242 | AUSTIN, TX | SHOPS AT TECH RIDGE CENTER RIDGE DRIVE | 78728 | SC | 2003 | 2003 | 24.75 | % | 240,920 | $ | 3,420,940 | ROSS DRESS FOR LESS(2014), LINEN N THINGS #291(2014), HOBBY LOBBY(2018), ULTIMATE ELECTRONICS(2019), TOYS R US(NOT OWNED), SUPER TARGET(NOT OWNED) | ||||||||||||||||||||
| 243 | FRISCO, TX | FRISCO MARKETPLACE 7010 PRESTON ROAD, | 75035 | SC | 2001 | 2003 | 100.00 | % | 12,559 | $ | 894,191 | KOHL’S(NOT OWNED) | ||||||||||||||||||||
| 244 | FT. WORTH, TX | EASTCHASE MARKET SWC EASTCHASE PKWY & I-30 | 76112 | SC | 1995 | 1996 | 50.00 | % | 205,017 | $ | 2,045,946 | UNITED ARTISTS THEATRE #33306(2012), PETSMART #182(2011), ROSS DRESS FOR LESS #351-1(2006), TARGET(NOT OWNED), TOYS R US(NOT OWNED), OFFICE DEPOT(NOT OWNED) | ||||||||||||||||||||
| 245 | FT. WORTH, TX (FOSSIL CREEK) | FOSSIL CREEK WESTERN CENTER BLVD | 76137 | SC | 1991 | 2002 | 100.00 | % | 68,515 | $ | 788,554 | |||||||||||||||||||||
| 246 | IRVING, TX | MACARTHUR MARKETPLACE MARKET PLACE BOULEVARD | 75063 | SC | 1999 | 2003 | 100.00 | % | 131,176 | $ | 2,388,241 | Marquee Cinema(2018), KOHL’S(NOT OWNED), SAM’S CLUB(NOT OWNED WAL MART(NOT OWNED) | ||||||||||||||||||||
| 247 | LEWISVILLE, TX (LAKEPOINTE) | LAKEPOINTE CROSSINGS S STEMMONS FREEWAY | 75067 | SC | 1991 | 2002 | 100.00 | % | 311,039 | $ | 2,943,879 | THE ROOMSTORE #1055(2007), PETsMART #176(2009), BEST BUY #258(2010), ACADEMY SPORTS(2016), MARDEL CHRISTIAN BOOKSTORE(2012), TOYS R’ US(NOT OWNED), SERVICE MERCHANDISE(NOT OWNED), GARDEN RIDGE(NOT OWNED) | ||||||||||||||||||||
| 248 | MCKINNEY, TX | MCKINNEY MARKETPLACE US HWY 75 & EL DORADO PKWY | 75070 | SC | 2000 | 2003 | 100.00 | % | 118,970 | $ | 1,145,154 | Kohl’s #416(2021), ALBERTSON’S(NOT OWNED) | ||||||||||||||||||||
| 249 | MESQUITE, TX | THE MARKETPLACE AT TOWN CENTER SOUTHBOUND FRONTAGE RD I 635 | 75150 | SC | 2001 | 2003 | 100.00 | % | 153,286 | $ | 2,079,730 | Ultimate Electronics(2018), Linen ‘N Things #267(2013), Michael’s(2012), Ross Dress For Less(2013), KOHL’S(NOT OWNED) | ||||||||||||||||||||
| 250 | SAN ANTONIO, TX (BANDERA PT) | BANDERA POINT NORTH STATE LOOP 1604/BANDERA ROAD | 78227 | SC | 2001 | 1* | 100.00 | % | 278,727 | $ | 4,578,412 | T.J. MAXX(2011), LINENS ‘N THINGS # 594(2012), OLD NAVY #6499(2006 ROSS DRESS FOR LESS(2012), BARNES & NOBLE # 2055(2011), TARGET(NOT OWNED), LOWE’S(NOT OWNED) | ||||||||||||||||||||
| Utah | ||||||||||||||||||||||||||||||||
| 251 | LOGAN, UT | FAMILY PLACE @ LOGAN 400 NORTH STREET | 84321 | SC | 1975 | 1998 | 100.00 | % | 19,200 | $ | 97,560 | RITE AID(NOT OWNED) | ||||||||||||||||||||
| 252 | MIDVALE, UT | FAMILY CENTER AT FORT UNION 50 900 EAST FT UNION BLVD | 84047 | SC | 1973 | 1998 | 100.00 | % | 659,849 | $ | 6,993,733 | BABIES R US(NOT OWNED)(2005), BABIES R US #9568(2014), OFFICE MAX #126(2007), SMITH’S FOOD & DRUGS#85(2024), MEDIA PLAY #8122(2016), BED BATH & BEYOND #198(2014), ROSS DRESS FOR LESS #502(2011), WAL-MART STORES #2207(2015) | ||||||||||||||||||||
| 253 | OGDEN, UT | FAMILY CENTER AT OGDEN 5-POINT 21-129 HARRISVILLE ROAD | 84404 | SC | 1977 | 1998 | 100.00 | % | 162,316 | $ | 751,524 | HARMONS(2012) | ||||||||||||||||||||
| *1. Property Developed by the Company | * SC — Shopping Center | |
| *2. Original IPO Property | * MM — Mini-Mall | |
| * BC — Business Center | ||
| * LC — Lifestyle Center |
* Does Not Include Service Merchandise Interests
Property Listing 7.1
| Run Date: 04/16/2004 Time: 8:51:14AM Page 19 of 20 |
Property List*
| Owned | ||||||||||||||||||||||||||||||||
| DDR | Gross | Total | ||||||||||||||||||||||||||||||
| Zip | Type of | Year | Year | OwnerShip | Leasable | Annualized | Anchor Tenants | |||||||||||||||||||||||||
| Center/Property | Location | Code | Property | Developed | Acquired | Interest | Area | Rent | (Lease Expiration) | |||||||||||||||||||||||
| 254 | OREM, UT | FAMILY CENTER AT OREM 1300 SOUTH STREET | 84058 | SC | 1991 | 1998 | 100.00 | % | 150,667 | $ | 1,552,954 | KIDS R US # 1347(2011), MEDIA PLAY #8120(2015), OFFICE DEPOT #538(2008), JO-ANN FABRICS AND CRAFTS#1756(2012), R.C. WILLEY(NOT OWNED), TOYS R US(NOT OWNED) | ||||||||||||||||||||
| 255 | RIVERDALE, UT | FAMILY CENTER AT RIVERDALE 510 1050 WEST RIVERDALE ROAD | 84405 | SC | 1995 | 1998 | 100.00 | % | 590,313 | $ | 4,613,490 | TARGET SUPERSTORE #1753(2017), MEIER & FRANK(2011), OFFICE MAX #76(2008), GART SPORTS #326(2012), SPORTMAN’S WAREHOUSE(2009), MEDIA PLAY(2016), CIRCUIT CITY#3349(2016) | ||||||||||||||||||||
| 256 | SALT LAKE CITY, UT (33RD) | FAMILY PLACE @ 33RD SOUTH 3300 SOUTH STREET | 84115 | SC | 1978 | 1998 | 100.00 | % | 35,459 | $ | 224,535 | |||||||||||||||||||||
| 257 | TAYLORSVILLE, UT | FAMILY CENTER AT MIDVALLEY 503 5600 SOUTH REDWOOD | 84123 | SC | 1982 | 1998 | 100.00 | % | 710,713 | $ | 6,799,739 | JOLENE’S(2003), MEDIA PLAY #8121(2015), OFFICE MAX #127(2008), CIRCUIT CITY #3353(2016), PETSMART #168(2012), SHOPKO #085(2014 GART SPORTS #324(2017), 24 HOUR FITNESS(2017), BED, BATH & BEYOND #270(2015), ROSS DRESS FOR LESS(2014), HARMONS SUPERSTORE(NOT OWNED) | ||||||||||||||||||||
| Vermont | ||||||||||||||||||||||||||||||||
| 258 | BERLIN, VT | BERLIN MALL 282 BERLIN MALL RD., UNIT #28 | 05602 | MM | 1986 | 2* | 100.00 | % | 174,515 | $ | 1,535,095 | WAL-MART STORES #2682(2014), J.C. PENNEY #2342(2009) | ||||||||||||||||||||
| Virginia | ||||||||||||||||||||||||||||||||
| 259 | CHESTER, VA | BERMUDA SQUARE 12607-12649 JEFFERSON DAVIS | 23831 | SC | 1978 | 2003 | 100.00 | % | 116,310 | $ | 1,157,721 | Ukrop’s(2008) | ||||||||||||||||||||
| 260 | FAIRFAX, VA | FAIRFAX TOWNE CENTER 12210 FAIRFAX TOWNE CENTER | 22033 | SC | 1994 | 1995 | 14.50 | % | 253,941 | $ | 3,974,809 | SAFEWAY #1431(2019), T.J. MAXX #106(2009), TOWER RECORDS#822(2009), BED, BATH & BEYOND#65(2010), UNITED ARTISTS #33191(2014) | ||||||||||||||||||||
| 261 | LYNCHBURG, VA | CANDLERS STATION 3700 CANDLERS MOUNTAIN ROAD | 24502 | SC | 1990 | 2003 | 100.00 | % | 275,765 | $ | 2,028,703 | Goody’s #174(2006), Movies 10 #113(2015), Circuit City(2009), Staples #0319(2013), T.J. Maxx #797(2009), TOYS “R” US(NOT OWNED) | ||||||||||||||||||||
| 262 | MARTINSVILLE, VA | LIBERTY FAIR MALL 240 COMMONWEALTH BOULEVARD | 24112 | MM | 1989 | 2* | 50.00 | % | 435,057 | $ | 2,713,050 | GOODY’S #166(2006), BELK/LEGGETTS(2009), J.C. PENNEY #3010(2009), SEARS #2094 -4(2009), OFFICEMAX #744(2012), KROGER #R-350(2017) | ||||||||||||||||||||
| 263 | MIDLOTHIAN, VA | GENITO CROSSING HULL STREET ROAD | 23112 | SC | 1985 | 2003 | 100.00 | % | 79,407 | $ | 730,764 | Food Lion #299(2005) | ||||||||||||||||||||
| 264 | PULASKI, VA | MEMORIAL SQUARE 1000 MEMORIAL DRIVE | 24301 | SC | 1990 | 2* | 100.00 | % | 143,299 | $ | 812,831 | WAL-MART STORES #1652(2011), FOOD LION #799-2(2011) | ||||||||||||||||||||
| 265 | WINCHESTER, VA | APPLE BLOSSOM CORNERS 2190 S. PLEASANT VALLEY | 22601 | SC | 1990 | 2* | 20.00 | % | 240,560 | $ | 2,373,568 | MARTIN’S FOOD STORE #78(2040), KOHL’S #283(2018), OFFICE MAX #844(2012), BOOKS-A-MILLION #954(2008) | ||||||||||||||||||||
| �� | ||||||||||||||||||||||||||||||||
| Washington | ||||||||||||||||||||||||||||||||
| 266 | EVERETT, WA | PUGET PARK 520 128TH STREET SW | 98204 | SC | 1981 | 2001 | 20.00 | % | 41,065 | $ | 406,996 | ALBERTSON’S(NOT OWNED) | ||||||||||||||||||||
| 267 | KIRKLAND, WA | TOTEM LAKES TOTEM LAKES BOULEVARD | 98034 | SC | 1999 | 2004 | 20.00 | % | 178,283 | $ | 2,728,583 | GUITAR CENTER(2007), ROSS DRESS FOR LESS(2010), COMPUSA(2006), RITE AID(NOT OWNED) | ||||||||||||||||||||
| *1. Property Developed by the Company | * SC — Shopping Center | |
| *2. Original IPO Property | * MM — Mini-Mall | |
| * BC — Business Center | ||
| * LC — Lifestyle Center |
* Does Not Include Service Merchandise Interests
Property Listing 7.1
| Run Date: 04/16/2004 Time: 8:51:14AM Page 20 of 20 |
Property List*
| Owned | ||||||||||||||||||||||||||||||||
| DDR | Gross | Total | ||||||||||||||||||||||||||||||
| Zip | Type of | Year | Year | OwnerShip | Leasable | Annualized | Anchor Tenants | |||||||||||||||||||||||||
| Center/Property | Location | Code | Property | Developed | Acquired | Interest | Area | Rent | (Lease Expiration) | |||||||||||||||||||||||
| West Virginia | ||||||||||||||||||||||||||||||||
| 268 | BARBOURSVILLE, WV | OFFICE MAX CENTER 5-13 MALL ROAD | 25504 | SC | 1985 | 1998 | 100.00 | % | 70,900 | $ | 301,437 | DISCOUNT EMPORIUM(2006), OFFICEMAX #263(2006), VALUE CITY (NO OWNED) | ||||||||||||||||||||
| Wisconsin | ||||||||||||||||||||||||||||||||
| 269 | BROOKFIELD, WI (SW) | SHOPPERS WORLD OF BROOKFIELD NORTH 124TH STREET AND WEST CA | 53005 | SC | 1967 | 2003 | 100.00 | % | 190,142 | $ | 1,462,213 | T.J. Maxx #202(2005), Marshall’s Mega Store # 737(2004), Officemax #16(2010), Burlington Coat Factory #112(2007) | ||||||||||||||||||||
| 270 | BROWN DEER, WI (CENTER) | BROWN DEER CENTER NORTH GREEN BAY ROAD | 53209 | SC | 1967 | 2003 | 100.00 | % | 266,716 | $ | 1,934,067 | Kohl’s #44(2023), Michael’s(2012), Officemax #17(2005), T.J. Maxx/Burlington#201(2008), Old Navy #5482(2012) | ||||||||||||||||||||
| 271 | BROWN DEER, WI (MARKET) | MARKET PLACE OF BROWN DEER NORTH GREEN BAY ROAD | 53209 | SC | 1989 | 2003 | 100.00 | % | 143,372 | $ | 989,085 | Marshall’s Mega Store #736(2004), Pick ‘N Save #6867(2005) | ||||||||||||||||||||
| 272 | MILWAUKEE, WI | POINT LOOMIS SOUTH 27TH STREET | 53221 | SC | 1962 | 2003 | 100.00 | % | 160,533 | $ | 707,571 | Kohl’s #43(2007), Pick ‘N Save # 6845(2007) | ||||||||||||||||||||
| 273 | MILWAUKEE, WI (SOUTH) | SOUTHGATE MARKETPLACE SOUTH 27TH STREET | 53215 | SC | 1951 | 2003 | 100.00 | % | 54,913 | $ | 389,306 | Always 99C(2011), MOVIES 10(NOT OWNED), WAL MART(NOT OWNED) | ||||||||||||||||||||
| 274 | WEST ALLIS, WI (WEST) | WEST ALLIS CENTER WEST CLEVELAND AVE. AND S. 108 | 53214 | SC | 1968 | 2003 | 100.00 | % | 246,081 | $ | 1,392,012 | Kohl’s #41(2008), Marshall’s Mega Store #738(2004), Pick ‘N Save#6846(2008) | ||||||||||||||||||||
| Grand Total | 49,814,624 | $ | 522,381,340 | |||||||||||||||||||||||||||||
| *1. Property Developed by the Company | * SC — Shopping Center | |
| *2. Original IPO Property | * MM — Mini-Mall | |
| * BC — Business Center | ||
| * LC — Lifestyle Center |
* Does Not Include Service Merchandise Interests
Property Listing 7.1
Developers Diversified Realty
Quarterly Financial Supplement
For the three months ended March 31, 2004
Investor Information
Developers Diversified Realty
www.ddr.com
3300 Enterprise Parkway/Beachwood, Ohio 44122
Phone: (216) 755-5500 Fax: (216) 755-1500
| Board of Directors | Officers | |
| Scott A. Wolstein, Chairman of the Board & Chief Executive Officer, Developers Diversified Realty | Scott A. Wolstein, Chairman of the Board & Chief Executive Officer | |
| Bert L. Wolstein, Chairman Emeritus Chief Executive Officer, Heritage Development | David M. Jacobstein, President & Chief Operating Officer | |
| Daniel B. Hurwitz, Executive Vice President | ||
| David M. Jacobstein, President & Chief Operating Officer, Developers Diversified Realty | ||
| Daniel B. Hurwitz, Executive Vice President, Developers Diversified Realty | Joan U. Allgood, Sr. Vice President of Corporate Affairs & Governance | |
| Albert T. Adams, Chairman, Cleveland Office Baker & Hostetler LLP | Richard E. Brown, Sr. Vice President of Real Estate Operations | |
| Dean S. Adler, Principal, Lubert-Adler Management, Inc | Timothy J. Bruce, Sr. Vice President of Development | |
| Terrance R. Ahern, Principal, The Townsend Group | William H. Schafer, Sr. Vice President & Chief Financial Officer | |
| Robert H. Gidel, Managing Partner, Liberty Partners, LP | Ralph J. Conti, Vice President of Development | |
| Victor B. MacFarlane, Founder and Managing Principal, MacFarlane Partners, LLC | Steven M. Dorsky, Vice President of Leasing - Northeast | |
| Craig Macnab, CEO, Commercial Net Lease Realty, Inc | David J. Favorite, Vice President of Operations | |
| Barry A. Sholem, Retired, former Chairman, DLJ Real Estate Capital Partners | Susan Hennessey, Vice President of Human Resources | |
| Michelle A. Mahue, Vice President of Investor Relations | ||
| Lorraine McGlone, Vice President of Information Technology | ||
| Joseph G. Padanilam, Vice President of Acquisitions & Dispositions | ||
| Anthony L. Vodicka, Vice President of Leasing - West | ||
| Robin Walker-Gibbons, Vice President of Leasing - Southeast | ||
| David E. Weiss, Vice President & General Counsel | ||
Developers Diversified Realty
Quarterly Financial Supplement
For the three months ended March 31, 2004
Investor Information (Continued)
| Research Coverage | Research Coverage, continued | |||||
| AG Edwards | Merrill Lynch | |||||
| Bill Camp | (314) 955-5368 | Steve Sakwa | (212) 449-0335 | |||
| Craig Schmidt | (212) 449-1944 | |||||
| Deutsche Bank Alex Brown | Morgan Stanley | |||||
| Lou Taylor | (212) 250-4912 | Matthew Ostrower | (212) 761-6284 | |||
| Chris Capolongo | (212) 250-7726 | Suzanne Sorkin | (212) 761-6385 | |||
| Goldman Sachs | Prudential Securities | |||||
| Carey Callahan | (212) 902-4351 | Jim Sullivan | (212) 778-2515 | |||
| Michael Bilerman | (212) 902-1970 | Bill Acheson | (212) 778-1417 | |||
| Green Street Advisors | Wachovia Securities | |||||
| John Herold | (949) 640-8780 | Jeff Donnelly | (617) 603-4262 | |||
| Sarah Woodward | (949) 640-8780 | Eric Rothman | (617) 603-4263 | |||
| Hilliard Lyons | Transfer Agent | |||||
| Tony Howard | (502) 588-1142 | National City Bank | ||||
| JP Morgan Michael Mueller Josh Bederman | (212) 622-6689 (212) 622-6530 | Corporate Trust Operations P.O. Box 92301 Cleveland, Ohio 44193-0900 1-800-622-6757 | ||||
| Lehman Brothers | Investor Relations | |||||
| David Shulman | (212) 526-3410 | Michelle A. Mahue | ||||
| Alexander Goldfarb | (212) 526-5232 | VP of Investor Relations | ||||
| Phone: (216) 755-5455 | ||||||
| McDonald & Company | Fax: (216) 755-1455 | |||||
| Richard Moore | (216) 443-2815 | Email: mmahue@ddr.com | ||||
| Richard Sweigard | (216) 563-2501 |