EXHIBIT 99.2

Quarterly Financial Supplement
For the six months ended
June 30, 2005
Investor Relations Department
3300 Enterprise Parkway • Beachwood, Ohio 44122
(216) 755-5500 • (216) 755-1500 (fax)
www.ddr.com
Developers Diversified Realty
Quarterly Financial Supplement
For the six months ended June 30, 2005
Developers Diversified Realty Corporation considers portions of this information to be forward-looking statements within the meaning of Section 27A of the Securities Act of 1933 and Section 21E of the Securities Exchange Act of 1934, both as amended, with respect to the Company’s expectation for future periods. Although the Company believes that the expectations reflected in such forward-looking statements are based upon reasonable assumptions, it can give no assurance that its expectations will be achieved. For this purpose, any statements contained herein that are not historical fact may be deemed to be forward-looking statements. There are a number of important factors that could cause the results of the Company to differ materially from those indicated by such forward-looking statements, including among other factors, local conditions such as oversupply of space or a reduction in demand for real estate in the area, competition from other available space, dependence on rental income from real property, the loss of a major tenant or inability to enter into definitive agreements with regard to our financing arrangements or our failure to satisfy conditions to the completion of these arrangements. For more details on the risk factors, please refer to the Company’s Form on 10-K as of December 31, 2004.
Developers Diversified Realty
Quarterly Financial Supplement
For the six months ended June 30, 2005
TABLE OF CONTENTS
| | | | | |
| Section | | Tab | |
Earnings Release & Financial Statements | | | 1.0 | |
Financial Summary | | | 2.0 | |
• Financial Highlights | | | 2.1 | |
• Market Capitalization and Financial Ratios | | | 2.2 | |
• Market Capitalization Summary | | | 2.3 | |
• Significant Accounting Policies | | | 2.4 | |
• Non-GAAP Financial Measures | | | 2.5 | |
Consolidated and Wholly Owned Financial Operations | | | 3.0 | |
• Summary of Capital Transactions | | | 3.1 | |
• Acquisitions, Dispositions, Expansions and Developments | | | 3.2 | |
• Summary of Consolidated Debt | | | 3.3 | |
• Summary of Consolidated Mortgage Principal Payments & Corporate Debt Maturities | | | 3.4 | |
Joint Venture Summaries | | | 4.0 | |
• Joint Venture Financials | | | 4.1 | |
• Joint Venture Partnership Summaries | | | 4.2 | |
Joint Venture Financial Operations | | | 5.0 | |
• Summary of Capital Transactions | | | 5.1 | |
• Acquisitions, Dispositions, Expansions and Developments | | | 5.2 | |
• Summary of Joint Venture Debt | | | 5.3 | |
• Summary of Pro Rata Joint Venture Debt | | | 5.4 | |
• Summary of Joint Venture Mortgage Principal Payments | | | 5.5 | |
Portfolio Statistics | | | 6.0 | |
Appendix | | | 7.0 | |
• Property Listing | | | 7.1 | |
• Investor Information | | | 7.2 | |
DEVELOPERS DIVERSIFIED REALTY CORPORATION
For Immediate Release:
| | | | | |
| Contact: | | Scott A. Wolstein | | Michelle M. Dawson |
| | | Chairman | | Vice President of Investor Relations |
| | | Chief Executive Officer | | 216-755-5455 |
| | | 216-755-5500 | | |
DEVELOPERS DIVERSIFIED REALTY REPORTS FFO of $0.84 PER SHARE FOR THE THREE
MONTH PERIOD ENDED JUNE 30, 2005
CLEVELAND, OHIO, July 27, 2005- Developers Diversified Realty Corporation (NYSE: DDR), a real estate investment trust (“REIT”), today announced that second quarter 2005 Funds From Operations (“FFO”), a widely accepted measure of REIT performance, on a per share basis was $0.84 (diluted) and $0.84 (basic) as compared to $0.84 (diluted) and $0.85 (basic) per share for the same period in the previous year. FFO available to common shareholders reached $92.5 million for the quarter ended June 30, 2005, as compared to $81.6 million for the second quarter of 2004, an increase of 13.4%. Net income available to common shareholders for the three month period ended June 30, 2005 decreased 27.1% to $54.2 million or $0.50 per share (diluted) and $0.50 (basic) compared to second quarter 2004 net income of $74.3 million, or $0.77 per share (diluted) and $0.78 (basic). The decrease in net income for the quarter ended June 30, 2005 is primarily related to a decrease on gain on sales of real estate primarily to the Company’s MDT Joint Venture.
On a per share basis, FFO (diluted) was $1.73 and $1.55 for the six month periods ended June 30, 2005 and 2004, respectively, an increase of 11.6%. FFO available to common shareholders for the six months ended June 30, 2005 was $191.6 million compared to FFO available to common shareholders for the six month period ended June 30, 2004 of $144.4 million. Net income available to common shareholders for the six month period ended June 30, 2005 was $145.9 million, or $1.34 per share (diluted) and $1.35 (basic) in 2005, compared to net income available to common shareholders of $114.5 million, or $1.24 per share (diluted) and $1.26 (basic) for the prior comparable period. The increase in net income is primarily attributable to an increase on gain on sales of real estate, primarily to the Company’s MDT Joint Venture, the acquisition of assets from Benderson in May 2004 and the acquisition of 15 properties from CPG in late January 2005.
Scott Wolstein, DDR’s Chairman and Chief Executive Officer stated, “I am pleased to report this quarter’s earnings, which reflect the continuing solid performance of our portfolio and our successful leasing efforts. We continue to identify and capitalize on opportunities in all aspects of our business, including a burgeoning tenant roster offering a multitude of new open air store formats, a growing development pipeline of key retail sites, and a strengthening financial position achieved through a series of strategic capital markets transactions.”
FFO is a supplemental non-GAAP financial measurement used as a standard in the real estate industry. Management believes that FFO provides an additional indicator of the financial performance of a REIT. The Company also believes that FFO more appropriately measures the core operations of the Company and provides a benchmark to its peer group. FFO does not represent cash generated from operating activities in accordance with generally accepted accounting principles, is not necessarily indicative of cash available to fund cash needs and should not be considered as an alternative to net income computed in accordance with GAAP as an indicator of the Company’s operating performance or as an alternative to cash flow as a measure of liquidity. FFO is defined and calculated by the Company as net income, adjusted to exclude: (i) preferred dividends, (ii) gains (or losses) from sales of depreciable real estate property, except for those sold through the Company’s merchant building program, which are presented net of taxes, (iii) sales of securities, (iv) extraordinary items, (v) cumulative effect of changes in accounting standards and (vi) certain non-cash items.
These non-cash items principally include real property depreciation and amortization of intangibles, equity income from joint ventures and equity income from minority equity investments and adding the Company’s proportionate share of FFO from its unconsolidated joint ventures and minority equity investments, determined on a consistent basis. Other real estate companies may calculate FFO in a different manner. A reconciliation of net income to FFO is presented in the financial highlights section.
Leasing:
Leasing activity continues to be strong throughout the portfolio. During the second quarter of 2005, the Company executed 121 new leases aggregating approximately 860,000 square feet and 167 renewals aggregating approximately 841,000 square feet. Rental rates on new leases increased by 26.7% to $13.14 per square foot and rental rates on renewals increased by 8.5% to $12.18 per square foot as compared to previously occupied rental rates. On a blended basis, rental rates for new leases and renewals increased by 12.7% to $12.67 per square foot. At June 30, 2005, the average annualized base rent per occupied square foot, including those properties owned through joint ventures, was $11.27.
At June 30, 2005, the portfolio, including those properties owned through joint ventures, was 95.6% leased. Excluding the impact of the properties acquired from CPG and Benderson, the portfolio was 95.5% leased, as compared to 95.0% at June 30, 2004. These percentages include tenants for which signed leases have been executed and occupancy has not occurred. Based on tenants in place and responsible for paying rent as of June 30, 2005, the portfolio was 95.0% occupied. Excluding the impact of the properties acquired from CPG and Benderson, the portfolio was 95.0% occupied, as compared to 94.4% at June 30, 2004.
Same store Net Operating Income (“NOI”) relating to Core Portfolio Properties (i.e., shopping center properties owned since January 1, 2004, excluding properties under redevelopment) increased approximately $3.6 million (or 1.9%) for the six months ended June 30, 2005.
Strategic Real Estate Transactions:
MDT Joint Venture
In April 2005, the Company sold three properties to the Company’s MDT Joint Venture for approximately $63.8 million and recognized additional merchant building gains of approximately $14.6 million in the second quarter of 2005. The Company maintains an approximate 14.5% ownership in the properties through this joint venture. The Company has been engaged for all day-to-day operations of the properties and will receive its share of ongoing fees for property management, leasing and construction management, in addition to other periodic fees for financing and due diligence.
Expansions:
During the six month period ended June 30, 2005, the Company completed four expansion and redevelopment projects located in Tallahassee, Florida; Suwanee, Georgia; Hendersonville, North Carolina and Johnson City, Tennessee at an aggregate cost of $13.6 million. The Company is currently expanding/redeveloping eleven shopping centers located in Gadsden, Alabama; Hoover, Alabama; Ocala, Florida; Ottumwa, Iowa; Gaylord, Michigan; Princeton, New Jersey; Mooresville, North Carolina; Allentown, Pennsylvania; Erie, Pennsylvania and two projects in Bayamon, Puerto Rico, at a projected incremental cost of approximately $57.2 million. The Company is also scheduled to commence construction on an additional expansion and redevelopment project at its shopping center located in Amherst, New York.
During the six month period ended June 30, 2005, a joint venture of the Company completed the expansion of its shopping center located in Merriam, Kansas at an aggregate cost of $1.2 million. Three of the Company’s joint ventures are currently expanding/redeveloping their shopping centers located in Phoenix, Arizona; Lancaster, California and Kansas City, Missouri at a projected incremental cost of approximately $48 million. Two of the Company’s joint ventures are also scheduled to commence additional expansion/redevelopment projects at their shopping centers located in Deer Park, Illinois and Kirkland, Washington.
Development (Consolidated):
During the six month period ended June 30, 2005, the Company substantially completed the construction of its shopping center located in Overland Park, Kansas.
The Company currently has seven shopping center projects under construction. These projects are located in Miami, Florida; Chesterfield, Michigan; Lansing, Michigan; Freehold, New Jersey; Mount Laurel, New Jersey; Apex, North Carolina (Beaver Creek Crossings – Phase I) and Pittsburgh, Pennsylvania. These projects are scheduled for completion during 2005 and 2006 at a projected aggregate cost of approximately $287.4 million and will create an additional 2.8 million square feet of retail space. At June 30, 2005, approximately $172.3 million of costs were incurred in relation to these development projects.
The Company anticipates commencing construction in 2005 on five additional shopping centers located in McHenry, Illinois; Norwood, Massachusetts; Seabrook, New Hampshire; Horseheads, New York and McKinney, Texas.
Development (Joint Ventures):
The Company has joint venture development agreements for four shopping center projects. These projects have an aggregate projected cost of approximately $110.1 million. These projects are located in Merriam, Kansas; Jefferson County (St. Louis), Missouri; Apex, North Carolina (Beaver Creek Crossings – Phase II), adjacent to a wholly-owned development project; and San Antonio, Texas. The projects located in Merriam, Kansas and San Antonio, Texas are being developed through the Coventry II program. A portion of the project located in Jefferson County (St. Louis), Missouri has been substantially completed. The remaining projects are scheduled for completion in 2005 and 2006. At June 30, 2005, approximately $48.7 million of costs were incurred in relation to these development projects.
Dispositions:
In April 2005, one of the Company’s RVIP joint ventures sold a 77,000 square foot shopping center in Richmond, California (Richmond City Center) for approximately $13 million. The joint venture recognized a non-FFO gain of approximately $2.4 million, of which the Company’s proportionate shares was approximately $0.9 million in the second quarter of 2005.
In the second quarter of 2005, the Company sold two shopping center properties aggregating 0.1 million square feet for approximately $4.2 million and recognized a non-FFO gain of approximately $3.0 million. The Company sold several out parcels during the second quarter and recognized a gain of approximately $2.7 million from these sales. In July, the Company sold two shopping center properties aggregating 0.2 million square feet for approximately $2.0 million and will recognize a non-FFO gain of approximately $1.0 million in the third quarter of 2005. The second quarter operating results for these assets are reflected in discontinued operations.
Financings:
In June 2005, the Company entered into a $220 million secured term loan agreement with KeyBank Capital Markets and Banc of America Securities LLC acting as joint lead arrangers for the facility. The secured term loan matures in June 2008 with two one-year extension options available to the Company. The interest rate, which is currently 0.85% over LIBOR, is based on grid pricing determined by the Company’s corporate credit ratings from S&P and Moody’s. The term loan is secured by the equity in certain assets that are already encumbered by first mortgages. The initial amount of the term loan is $220 million, with an accordion feature that allows for a future increase to $400 million. Proceeds from the term loan were used to repay amounts outstanding on the Company’s revolving credit facilities.
In July 2005, the Company’s Community Centers V and VII joint ventures closed on several loans aggregating $298.0 million of which $280.0 million bears a fixed rate of 5.295% for five years and the remaining $18.0 million bears a floating rate of LIBOR plus 2.0% for two years. The loan proceeds were used to repay existing debt of approximately $167.0 million, with a weighted average interest rate of 6.5%. The additional $131 million was remitted to DDR, of which $65.2 million related to the repayment of an advance made to certain joint venture partners in the Community Centers V and VII joint ventures in April 2005.
In April 2005, the Company issued $400 million of senior unsecured notes, $200 million of five-year notes and $200 million of ten-year notes. The five-year notes have an interest rate of 5.0%, are due on May 3, 2010 and were offered at 99.806% of par. The ten-year notes have an interest rate of 5.5%, are due on May 1, 2015 and were offered at 99.642% of par. The effective interest rate, after taking into account the treasury rate locks that were previously entered into by the Company, will adjust the five-year rate to approximately 4.95% and the ten-year rate to approximately 5.37%. Proceeds from the offering were primarily used to repay indebtedness of the Company’s subsidiary, DDR PR Ventures LLC, S.E., under the Company’s primary revolving credit facility.
Developers Diversified Realty Corporation currently owns and manages approximately 470 retail operating and development properties in 44 states, plus Puerto Rico, comprising approximately 107 million square feet of real estate. DDR is a self-administered and self-managed real estate investment trust (REIT) operating as a fully integrated real estate company which acquires, develops, leases and manages shopping centers.
A copy of the Company’s Supplemental Financial/Operational package is available to all interested parties upon request at our corporate office to Michelle M. Dawson, Vice President of Investor Relations, Developers Diversified Realty Corporation, 3300 Enterprise Parkway, Beachwood, OH 44122 or on our Website which is located at http://www.ddr.com.
Developers Diversified Realty Corporation considers portions of this information to be forward-looking statements within the meaning of Section 27A of the Securities Act of 1933 and Section 21 E of the Securities Exchange Act of 1934, both as amended, with respect to the Company’s expectation for future periods. Although the Company believes that the expectations reflected in such forward-looking statements are based upon reasonable assumptions, it can give no assurance that its expectations will be achieved. For this purpose, any statements contained herein that are not historical fact may be deemed to be forward-looking statements. There are a number of important factors that could cause the results of the Company to differ materially from those indicated by such forward-looking statements, including, among other factors, local conditions such as oversupply of space or a reduction in demand for real estate in the area, competition from other available space, dependence on rental income from real property, the loss of a major tenant, constructing
properties or expansions that produce a desired yield on investment or inability to enter into definitive agreements with regard to our financing arrangements or our failure to satisfy conditions to the completion of these arrangements. For more details on the risk factors, please refer to the Company’s Form on 10-K as of December 31, 2004.
DEVELOPERS DIVERSIFIED REALTY CORPORATION
Financial Highlights
(In thousands — except per share data)
| | | | | | | | | | | | | | | | | |
| | | Three Month Period | | | Six Month Period | |
| | | Ended June 30, | | | Ended June 30, | |
| | | 2005 | | | 2004 | | | 2005 | | | 2004 | |
Revenues: | | | | | | | | | | | | | | | | |
| Minimum rents (A) | | $ | 130,229 | | | $ | 103,195 | | | $ | 258,887 | | | $ | 190,504 | |
| Percentage and overage rents (A) | | | 1,586 | | | | 1,400 | | | | 3,619 | | | | 3,128 | |
| Recoveries from tenants | | | 39,742 | | | | 29,587 | | | | 78,012 | | | | 54,973 | |
| Ancillary income | | | 2,063 | | | | 615 | | | | 3,880 | | | | 1,377 | |
| Other property related income | | | 1,657 | | | | 1,157 | | | | 2,747 | | | | 2,055 | |
| Management fee income | | | 4,983 | | | | 3,592 | | | | 9,275 | | | | 6,702 | |
| Development fees | | | 681 | | | | 604 | | | | 1,168 | | | | 794 | |
| Other (B) | | | 2,236 | | | | 6,516 | | | | 4,379 | | | | 10,056 | |
| | | | | | | | | | | | | |
| | | | 183,177 | | | | 146,666 | | | | 361,967 | | | | 269,589 | |
| | | | | | | | | | | | | |
Expenses: | | | | | | | | | | | | | | | | |
| Operating and maintenance | | | 25,399 | | | | 15,714 | | | | 50,429 | | | | 31,646 | |
| Real estate taxes | | | 21,115 | | | | 19,624 | | | | 42,748 | | | | 34,933 | |
| General and administrative (C) | | | 12,964 | | | | 11,050 | | | | 26,607 | | | | 21,494 | |
| Depreciation and amortization | | | 39,620 | | | | 31,558 | | | | 80,942 | | | | 56,289 | |
| | | | | | | | | | | | | |
| | | | 99,098 | | | | 77,946 | | | | 200,726 | | | | 144,362 | |
| | | | | | | | | | | | | |
| Other income (expense): | | | | | | | | | | | | | | | | |
| Interest income | | | 2,425 | | | | 997 | | | | 3,434 | | | | 2,358 | |
| Interest expense | | | (45,196 | ) | | | (30,471 | ) | | | (87,119 | ) | | | (55,142 | ) |
| Other expense (D) | | | (1,642 | ) | | | (11 | ) | | | (1,942 | ) | | | (32 | ) |
| | | | | | | | | | | | | |
| | | | (44,413 | ) | | | (29,485 | ) | | | (85,627 | ) | | | (52,816 | ) |
| Income before equity in net income of joint ventures, minority equity interests, income tax of taxable REIT subsidiaries, discontinued operations, gain on sales of real estate and cumulative effect of adoption of a new accounting standard | | | 39,666 | | | | 39,235 | | | | 75,614 | | | | 72,411 | |
| Equity in net income of joint ventures (E) | | | 8,055 | | | | 6,943 | | | | 14,566 | | | | 25,164 | |
| Minority equity interests (F) | | | (1,253 | ) | | | (966 | ) | | | (2,660 | ) | | | (2,110 | ) |
| Income tax of taxable REIT subsidiaries and franchise taxes | | | (398 | ) | | | (221 | ) | | | (565 | ) | | | (892 | ) |
| | | | | | | | | | | | | |
| Income from continuing operations | | | 46,070 | | | | 44,991 | | | | 86,955 | | | | 94,573 | |
| Income from discontinued operations (G) | | | 3,010 | | | | 815 | | | | 3,014 | | | | 650 | |
| | | | | | | | | | | | | |
| Income before gain on sales of real estate and cumulative effect of adoption of a new accounting standard | | | 49,080 | | | | 45,806 | | | | 89,969 | | | | 95,223 | |
| Gain on sales of real estate, net of tax | | | 18,874 | | | | 41,006 | | | | 83,534 | | | | 45,376 | |
| | | | | | | | | | | | | |
| Income before cumulative effect of adoption of a new accounting standard | | | 67,954 | | | | 86,812 | | | | 173,503 | | | | 140,599 | |
| Cumulative effect of adoption of a new accounting standard (H) | | | — | | | | — | | | | — | | | | (3,001 | ) |
| | | | | | | | | | | | | |
Net income | | $ | 67,954 | | | $ | 86,812 | | | $ | 173,503 | | | | 137,598 | |
| | | | | | | | | | | | | |
Net income, applicable to common shareholders | | $ | 54,162 | | | $ | 74,295 | | | $ | 145,920 | | | | 114,476 | |
| | | | | | | | | | | | | |
Funds From Operations (“FFO”): | | | | | | | | | | | | | | | | |
| Net income applicable to common shareholders | | $ | 54,162 | | | $ | 74,295 | | | $ | 145,920 | | | | 114,476 | |
| Depreciation and amortization of real estate investments | | | 39,492 | | | | 31,208 | | | | 80,335 | | | | 55,966 | |
| Equity in net income of joint ventures (E) | | | (8,055 | ) | | | (6,943 | ) | | | (14,566 | ) | | | (25,164 | ) |
| Joint ventures’ FFO (E) | | | 10,764 | | | | 11,065 | | | | 22,080 | | | | 23,741 | |
| Minority equity interests (OP Units) (F) | | | 729 | | | | 625 | | | | 1,458 | | | | 1,197 | |
| Gain on sales of depreciable real estate, net (D) | | | (4,557 | ) | | | (28,639 | ) | | | (43,620 | ) | | | (28,799 | ) |
| Cumulative effect of adoption of a new accounting standard (H) | | | — | | | | — | | | | — | | | | 3,001 | |
| | | | | | | | | | | | | |
| FFO available to common shareholders | | | 92,535 | | | | 81,611 | | | | 191,607 | | | | 144,418 | |
| Preferred dividends | | | 13,792 | | | | 12,517 | | | | 27,583 | | | | 23,122 | |
| | | | | | | | | | | | | |
| FFO | | $ | 106,327 | | | $ | 94,128 | | | $ | 219,190 | | | $ | 167,540 | |
| | | | | | | | | | | | | |
| Per share data: | | | | | | | | | | | | | | | | |
| Earnings per common share | | | | | | | | | | | | | | | | |
| Basic | | $ | 0.50 | | | $ | 0.78 | | | $ | 1.35 | | | $ | 1.26 | |
| | | | | | | | | | | | | |
| Diluted | | $ | 0.50 | | | $ | 0.77 | | | $ | 1.34 | | | $ | 1.24 | |
| | | | | | | | | | | | | |
| Dividends Declared | | $ | 0.54 | | | $ | 0.46 | | | $ | 1.08 | | | $ | 0.92 | |
| | | | | | | | | | | | | |
| Funds From Operations — Basic (I) | | $ | 0.84 | | | $ | 0.85 | | | $ | 1.74 | | | $ | 1.57 | |
| | | | | | | | | | | | | |
| Funds From Operations – Diluted (I) | | $ | 0.84 | | | $ | 0.84 | | | $ | 1.73 | | | $ | 1.55 | |
| | | | | | | | | | | | | |
| Basic – average shares outstanding (thousands) (I) | | | 108,276 | | | | 95,018 | | | | 108,142 | | | | 90,682 | |
| | | | | | | | | | | | | |
| Diluted — average shares outstanding (thousands) (I) | | | 109,022 | | | | 97,415 | | | | 110,354 | | | | 93,104 | |
| | | | | | | | | | | | | |
DEVELOPERS DIVERSIFIED REALTY CORPORATION
Financial Highlights
(In thousands — except per share data)
| | | |
| (A) | | Increases in base and percentage rental revenues for the six month period ended June 30, 2005 as compared to 2004, aggregated $66.5 million consisting of $2.8 million related to leasing of core portfolio properties (an increase of 2.2% from 2004), $81.3 million from the acquisition of assets, and $3.5 million related to developments and redevelopments. These amounts were offset by a decrease of $0.9 million relating to the business center properties and $20.2 million due to the sale of properties to joint ventures in 2004 and 2005. Included in the rental revenues for the six month period ended June 30, 2005 and 2004 is approximately $5.8 million and $3.5 million, respectively, of revenue resulting from the recognition of straight line rents. |
| | | |
| (B) | | Other income for the three and six month periods ended June 30, 2005 and 2004 was comprised of the following (in millions): |
| | | | | | | | | | | | | | | | | |
| | | Three Month Period | | | Six Month Period | |
| | | Ended June 30, | | | Ended June 30 | |
| | | 2005 | | | 2004 | | | 2005 | | | 2004 | |
| Lease termination fees | | $ | 1.0 | | | $ | 3.5 | | | $ | 1.5 | | | $ | 7.0 | |
| Financing fees | | | 0.9 | | | | 3.0 | | | | 2.3 | | | | 3.0 | |
| Other miscellaneous | | | 0.3 | | | | — | | | | 0.6 | | | | 0.1 | |
| | | | | | | | | | | | | |
| | | $ | 2.2 | | | $ | 6.5 | | | $ | 4.4 | | | $ | 10.1 | |
| | | | | | | | | | | | | |
| | | |
| (C) | | General and administrative expenses include internal leasing salaries, legal salaries and related expenses associated with the releasing of space, which are charged to operations as incurred. For the six month periods ended June 30, 2005 and 2004, general and administrative expenses were approximately 4.6% and 4.9%, respectively, of total revenues, including joint venture revenues, for each period. |
| | | |
| (D) | | Other expense is comprised of abandoned acquisition and development project costs, an impairment charge and certain litigation costs. In the second quarter of 2005, the Company recorded an impairment charge of approximately $0.6 million relating to the one remaining former Best Products site and certain non-recurring litigation costs of $0.7 million. |
| | | |
| (E) | | The following is a summary of the Company’s share of the combined operating results relating to its joint ventures (in thousands): |
| | | | | | | | | | | | | | | | | |
| | | Three month period | | | Six month period | |
| | | ended June 30, | | | ended June 30, | |
| | | 2005 (b) | | | 2004 (b) | | | 2005 | | | 2004 | |
| Revenues from operations (a) | | $ | 109,577 | | | $ | 80,273 | | | $ | 212,297 | | | $ | 154,013 | |
| | | | | | | | | | | | | |
| Operating expense | | | 38,893 | | | | 27,797 | | | | 75,221 | | | | 52,904 | |
| Depreciation and amortization of real estate investments | | | 22,983 | | | | 13,829 | | | | 42,605 | | | | 24,315 | |
| Interest expense | | | 32,502 | | | | 17,669 | | | | 58,345 | | | | 35,560 | |
| | | | | | | | | | | | | |
| | | | 94,378 | | | | 59,295 | | | | 176,171 | | | | 112,779 | |
| | | | | | | | | | | | | |
| Income from operations before gain on sale of real estate and discontinued operations | | | 15,199 | | | | 20,978 | | | | 37,126 | | | | 41,234 | |
| Gain (loss) on sale of real estate | | | 456 | | | | 5 | | | | 759 | | | | (8 | ) |
| (Loss) income from discontinued operations, net of tax | | | (115 | ) | | | 515 | | | | 339 | | | | 297 | |
| Gain (loss) on sale of discontinued operations, net of tax | | | 7,721 | | | | (132 | ) | | | 8,722 | | | | 23,892 | |
| | | | | | | | | | | | | |
| Net income | | $ | 23,261 | | | $ | 21,366 | | | $ | 46,946 | | | $ | 65,415 | |
| | | | | | | | | | | | | |
| DDR Ownership interests (b) | | $ | 7,502 | | | $ | 7,064 | | | $ | 13,997 | | | $ | 25,365 | |
| | | | | | | | | | | | | |
| | | | | | | | | | | | | | | | | |
| Funds From Operations from joint ventures are summarized as follows: | | | | | | | | | | | | | | | | |
| Net income | | $ | 23,261 | | | $ | 21,366 | | | $ | 46,946 | | | $ | 65,415 | |
| (Gain) loss on sale of real estate, including discontinued operations | | | (7,443 | ) | | | 126 | | | | (7,773 | ) | | | (23,988 | ) |
| Depreciation and amortization of real estate investments | | | 23,042 | | | | 14,260 | | | | 42,925 | | | | 25,038 | |
| | | | | | | | | | | | | |
| | | $ | 38,860 | | | $ | 35,752 | | | $ | 82,098 | | | $ | 66,465 | |
| | | | | | | | | | | | | |
| DDRC Ownership interests (b) | | $ | 10,764 | | | $ | 11,065 | | | $ | 22,080 | | | $ | 23,741 | |
| | | | | | | | | | | | | |
| DDRC Partnership distributions received, net | | $ | 12,330 | | | $ | 20,738 | | | $ | 23,470 | | | $ | 49,054 | |
| | | | | | | | | | | | | |
DEVELOPERS DIVERSIFIED REALTY CORPORATION
Financial Highlights
(In thousands — except per share data)
| | | |
| (a) | | Revenues for the three month periods ended June 30, 2005 and 2004 included approximately $2.1 million and $1.6 million, respectively, resulting from the recognition of straight line rents of which the Company’s proportionate share is $0.3 million in each period. Revenues for the six month periods ended June 30, 2005 and 2004 included approximately $3.6 million and $2.7 million, respectively, resulting from the recognition of straight line rents of which the Company’s proportionate share is $0.6 million and $0.5 million, respectively. |
| | | |
| (b) | | Included in the Company’s equity in net income and FFO from joint ventures for the six months ended June 30, 2004, is approximately $3.2 million of gain related to the sale of joint venture property at the end of 2003. This amount was recorded as a gain at the joint venture level in 2003 but was deferred by DDR until certain construction and leasing obligations were achieved. |
| | | |
| | | The Company’s share of joint venture net income has been reduced by $0.5 million and $0.1 million for the three month period ended June 30, 2005 and 2004, respectively and by $0.6 million and $0.2 million for the six month period ended June 30, 2005 and 2004, respectively, to reflect additional basis depreciation and adjustments to gain on sale. |
| | | |
| | | At June 30, 2005 and 2004, the Company owned joint venture interests relating to 113 and 74 shopping center properties, respectively. In addition, at June 30, 2005 and 2004, respectively, the Company, through a joint venture, owned an interest of approximately 25% in 59 and 69 shopping center sites formerly owned by Service Merchandise, respectively. |
| | | |
| (F) | | Minority equity interests are comprised of the following (in thousands): |
| | | | | | | | | | | | | | | | | |
| | | Three Month Period | | | Six Month Period | |
| | | Ended June 30, | | | Ended June 30, | |
| | | 2005 | | | 2004 | | | 2005 | | | 2004 | |
| Minority interests | | $ | 524 | | | $ | 341 | | | $ | 1,202 | | | $ | 914 | |
| Operating partnership units | | | 729 | | | | 625 | | | | 1,458 | | | | 1,196 | |
| | | | | | | | | | | | | |
| | | $ | 1,253 | | | $ | 966 | | | $ | 2,660 | | | $ | 2,110 | |
| | | | | | | | | | | | | |
| | | |
| (G) | | The operating results relating to assets classified as discontinued operations are summarized as follows (in thousands): |
| | | | | | | | | | | | | | | | | |
| | | Three Month Period | | | Six Month Period | |
| | | Ended June 30, | | | Ended June 30, | |
| | | 2005 | | | 2004 | | | 2005 | | | 2004 | |
| Revenues | | $ | 233 | | | $ | 1,836 | | | $ | 489 | | | $ | 3,788 | |
| | | | | | | | | | | | | |
| | | | | | | | | | | | | | | | | |
| Expenses: | | | | | | | | | | | | | | | | |
| Operating | | | 118 | | | | 487 | | | | 254 | | | | 1,352 | |
| Interest | | | 37 | | | | 224 | | | | 78 | | | | 468 | |
| Depreciation | | | 67 | | | | 302 | | | | 142 | | | | 642 | |
| Minority interests | | | — | | | | — | | | | — | | | | 4 | |
| | | | | | | | | | | | | |
| Total expenses | | | 222 | | | | 1,013 | | | | 474 | | | | 2,466 | |
| | | | | | | | | | | | | |
| Income before loss on sale of real estate | | | 11 | | | | 823 | | | | 15 | | | | 1,322 | |
| Gain (loss) on sales of real estate | | | 2,999 | | | | (9 | ) | | | 2,999 | | | | (700 | ) |
| | | | | | | | | | | | | |
| Net income | | $ | 3,010 | | | $ | 814 | | | $ | 3,014 | | | $ | 622 | |
| | | | | | | | | | | | | |
DEVELOPERS DIVERSIFIED REALTY CORPORATION
Financial Highlights
(In thousands — except per share data)
| | | |
| (H) | | The Company recorded a charge of $3.0 million in 2004 as a cumulative effect of adoption of a new accounting standard (FIN 46) attributable to the consolidation of the shopping center in Martinsville, Virginia. This amount represents the minority partner’s share of cumulative losses in the partnership. |
| | | |
| (I) | | For purposes of computing FFO per share (basic), the weighted average shares outstanding were adjusted to reflect the conversion of 1.3 million and 1.4 million Operating Partnership Units (OP Units) outstanding at June 30, 2005 and 2004 into 1.3 million common shares of the Company for each of the three month periods ended June 30, 2005 and 2004, respectively, and 1.3 million and 1.2 million for the six month periods ended June 30, 2005 and 2004, respectively, on a weighted average basis. The weighted average diluted shares and OP Units outstanding were 110.7 million and 97.6 million for the three month periods ended June 30, 2005 and 2004, respectively, and 110.6 million and 93.2 million for the six month periods ended June 30, 2005 and 2004, respectively. |
DEVELOPERS DIVERSIFIED REALTY CORPORATION
Financial Highlights
(In thousands)
Selected Balance Sheet Data:
| | | | | | | | | |
| | | June 30, 2005 | | | December 31, 2004 | |
Assets: | | | | | | | | |
| Real estate and rental property: | | | | | | | | |
| Land | | $ | 1,730,868 | | | $ | 1,238,242 | |
| Buildings | | | 4,452,344 | | | | 3,998,972 | |
| Fixtures and tenant improvements | | | 138,811 | | | | 120,350 | |
| Construction in progress | | | 283,495 | | | | 245,860 | |
| | | | | | | |
| | | | 6,605,518 | | | | 5,603,424 | |
| Less accumulated depreciation | | | (622,942 | ) | | | (568,231 | ) |
| | | | | | | |
| Real estate, net | | | 5,982,576 | | | | 5,035,193 | |
| | | | | | | | | |
| Cash | | | 36,310 | | | | 49,871 | |
| Restricted cash | | | 17,509 | | | | — | |
| Advances to and investments in joint ventures | | | 440,352 | (1) | | | 288,020 | |
| Notes receivable | | | 17,056 | | | | 17,823 | |
| Receivables, including straight line rent, net | | | 93,197 | | | | 84,843 | |
| Other assets, net | | | 94,232 | | | | 107,797 | |
| Real estate property held for sale, net | | | 939 | | | | — | |
| | | | | | | |
| | | $ | 6,682,171 | | | $ | 5,583,547 | |
| | | | | | | |
| | | | | | | | | |
Liabilities: | | | | | | | | |
| Indebtedness: | | | | | | | | |
| Revolving credit facilities | | $ | 338,250 | | | $ | 60,000 | |
| Variable rate unsecured term debt | | | 200,000 | | | | 350,000 | |
| Unsecured debt | | | 1,618,984 | | | | 1,220,143 | |
| Mortgage and other secured debt | | | 1,597,250 | | | | 1,088,547 | |
| | | | | | | |
| | | | 3,754,484 | | | | 2,718,690 | |
| Dividends payable | | | 65,668 | | | | 62,089 | |
| Other liabilities | | | 214,462 | | | | 192,514 | |
| | | | | | | |
| | | | 4,034,614 | | | | 2,973,293 | |
| Minority interests | | | 54,650 | | | | 55,935 | |
| Shareholders’ equity | | | 2,592,907 | | | | 2,554,319 | |
| | | | | | | |
| | | $ | 6,682,171 | | | $ | 5,583,547 | |
| | | | | | | |
| | | |
| (1) | | Includes approximately $100 million of advances to the Service Merchandise Joint Venture advanced in the second quarter of 2005. Includes $65 million advanced to certain joint venture partners in the Community Center V and VII joint ventures in April 2005. This note was repaid in July 2005. |
DEVELOPERS DIVERSIFIED REALTY CORPORATION
Financial Highlights
(in thousands)
Selected Balance Sheet Data (Continued):
Combined condensed balance sheets relating to the Company’s joint ventures are as follows:
| | | | | | | | | |
| | | June 30, | | | December 31, | |
| | | 2005 | | | 2004 | |
| Land | | $ | 905,570 | | | $ | 798,852 | |
| Buildings | | | 2,552,810 | | | | 2,298,424 | |
| Fixtures and tenant improvements | | | 55,714 | | | | 42,922 | |
| Construction in progress | | | 37,298 | | | | 25,151 | |
| | | | | | | |
| | | | 3,551,392 | | | | 3,165,349 | |
| | | | | | | | | |
| Accumulated depreciation | | | (179,758 | ) | | | (143,170 | ) |
| | | | | | | |
| Real estate, net | | | 3,371,634 | | | | 3,022,179 | |
| Receivables, including straight line rent, net | | | 68,422 | | | | 68,596 | |
| Leasehold interests | | | 26,098 | | | | 26,727 | |
| Other assets | | | 124,823 | | | | 96,264 | |
| | | | | | | |
| | | $ | 3,590,977 | | | $ | 3,213,766 | |
| | | | | | | |
| | | | | | | | | |
| Mortgage debt (a) | | $ | 2,096,892 | | | $ | 1,803,420 | |
| Notes and accrued interest payable to DDR | | | 112,507 | | | | 20,616 | |
| Amounts payable to other partners | | | — | | | | 46,161 | |
| Other liabilities | | | 76,894 | | | | 75,979 | |
| | | | | | | |
| | | | 2,286,293 | | | | 1,946,176 | |
| Accumulated equity | | | 1,304,684 | | | | 1,267,590 | |
| | | | | | | |
| | | $ | 3,590,977 | | | $ | 3,213,766 | |
| | | | | | | |
| | | |
| (a) | | The Company’s proportionate share of joint venture debt aggregated approximately $457.9 million and $420.8 million at June 30, 2005 and December 31, 2004, respectively. |
| | | |
Developers Diversified Realty | | |
| Quarterly Financial Supplement | | |
| For the Six Months Ended June 30, 2005 | | |
| |
| | | | | | | | | | | | | | | | | | | | | | | | | |
| FINANCIAL HIGHLIGHTS | | Six Month | | Six Month | | |
| (In Thousands Except Per Share Information) | | Period Ended | | Period Ended | | |
| | | June 30 | | June 30 | | Year Ended December 31 |
| | | 2005 | | 2004 | | 2004 | | 2003 | | 2002 | | 2001 |
FUNDS FROM OPERATIONS: | | | | | | | | | | | | | | | | | | | | | | | | |
| Net Income Applicable to Common Shareholders | | $ | 145,920 | | | $ | 114,476 | | | $ | 219,056 | | | $ | 189,056 | (7) | | $ | 69,368 | (7) | | $ | 65,111 | |
| Depreciation and Amortization of Real Estate Investments | | $ | 80,335 | | | $ | 55,966 | | | $ | 130,537 | | | $ | 93,173 | | | $ | 76,462 | | | $ | 63,200 | |
| Equity in Net Income From Joint Ventures | | ($ | 14,566 | ) | | ($ | 25,164 | ) | | ($ | 40,896 | ) | | ($ | 52,917 | ) | | ($ | 32,769 | ) | | ($ | 17,010 | ) |
| Equity in Net Income From Minority Equity Investment | | $ | 0 | | | $ | 0 | | | $ | 0 | | | $ | 0 | | | $ | 0 | | | ($ | 1,550 | ) |
| Joint Venture Funds From Operations | | $ | 22,080 | | | $ | 23,742 | | | $ | 46,209 | | | $ | 47,942 | | | $ | 44,473 | | | $ | 31,546 | |
| Minority Equity Investment Funds From Operations | | $ | 0 | | | $ | 0 | | | $ | 0 | | | $ | 0 | | | $ | 0 | | | $ | 6,448 | |
| Operating Partnership Minority Interest Expense | | $ | 1,458 | | | $ | 1,197 | | | $ | 2,607 | | | $ | 1,770 | | | $ | 1,450 | | | $ | 1,531 | |
| Cumulative Effect & Extraordinary Charges | | $ | 0 | | | $ | 3,001 | | | $ | 3,001 | | | $ | 0 | | | $ | 0 | | | $ | 0 | |
| Gain on Sales of Real Estate | | ($ | 43,619 | ) | | ($ | 28,799 | ) | | ($ | 68,179 | ) | | ($ | 67,352 | ) | | ($ | 4,276 | ) | | ($ | 16,688 | ) |
| | | | | | | | | | | | | | | | | | | | | | | | | |
FUNDS FROM OPERATIONS AVAILABLE TO COMMON SHAREHOLDERS | | $ | 191,607 | | | $ | 144,418 | | | $ | 292,335 | | | $ | 211,672 | | | $ | 154,709 | | | $ | 132,587 | |
PREFERRED DIVIDENDS | | $ | 27,584 | | | $ | 23,122 | | | $ | 50,706 | | | $ | 51,204 | (7) | | $ | 32,602 | (7) | | $ | 27,262 | |
| | | | | | | | | | | | | | | | | | | | | | | | | |
FUNDS FROM OPERATIONS | | $ | 219,192 | | | $ | 167,540 | | | $ | 343,041 | | | $ | 262,877 | | | $ | 187,311 | | | $ | 159,849 | |
| | | | | | | | | | | | | | | | | | | | | | | | | |
| | | | | | | | | | | | | | | | | | | | | | | | | |
PER SHARE INFORMATION: | | | | | | | | | | | | | | | | | | | | | | | | |
| Funds From Operations — Diluted | | $ | 1.73 | | | $ | 1.55 | | | $ | 2.95 | | | $ | 2.51 | | | $ | 2.35 | | | $ | 2.33 | |
| Net Income — Diluted | | $ | 1.34 | | | $ | 1.24 | | | $ | 2.24 | | | $ | 2.27 | | | $ | 1.07 | | | $ | 1.17 | |
| Cash Dividends | | $ | 1.08 | | | $ | 0.92 | | | $ | 1.94 | | | $ | 1.69 | | | $ | 1.52 | | | $ | 1.48 | |
| | | | | | | | | | | | | | | | | | | | | | | | | |
WEIGHTED AVERAGE SHARES AND OPERATING PARTNERSHIP UNITS, FFO | | | 110,673 | | | | 93,239 | | | | 99,147 | | | | 84,319 | | | | 65,910 | | | | 56,957 | |
| |
TOTAL MARKET CAPITALIZATION (1) | | $ | 9,516,897 | | | $ | 7,602,014 | | | $ | 8,276,943 | | | $ | 5,551,748 | | | $ | 3,460,243 | | | $ | 2,982,461 | |
DEBT TO TOTAL MARKET CAPITALIZATION (1) | | | 39.44 | % | | | 42.51 | % | | | 32.82 | % | | | 37.42 | % | | | 43.10 | % | | | 43.87 | % |
DEBT TO TOTAL UNDEPRECIATED ASSETS, INVESTMENTS, CASH & NOTES REC. | | | 52.90 | % | | | 52.35 | % | | | 45.58 | % | | | 48.68 | % | | | 48.26 | % | | | 47.18 | % |
DIVIDEND PAYOUT RATIO (1) | | | 61.99 | % | | | 60.92 | % | | | 67.28 | % | | | 66.03 | % | | | 62.73 | % | | | 63.90 | % |
| | | | | | | | | | | | | | | | | | | | | | | | | |
GEN. & ADMIN. EXPENSES AS A PERCENTAGE OF TOTAL REVENUES (2) | | | 4.60 | % | | | 4.95 | % | | | 4.94 | % | | | 5.35 | % | | | 4.80 | % | | | 4.25 | % |
| | | | | | | | | | | | | | | | | | | | | | | | | |
GENERAL AND ADMINISTRATIVE EXPENSES | | $ | 26,607 | | | $ | 21,495 | | | $ | 47,126 | | | $ | 40,820 | | | $ | 29,392 | | | $ | 24,175 | |
| | | | | | | | | | | | | | | | | | | | | | | | | |
REVENUES: | | | | | | | | | | | | | | | | | | | | | | | | |
| DDR Revenues | | $ | 362,458 | | | $ | 273,840 | | | $ | 605,246 | | | $ | 478,696 | | | $ | 360,778 | | | $ | 324,148 | |
| Joint Venture Revenues | | $ | 215,626 | | | $ | 160,049 | | | $ | 348,740 | | | $ | 284,158 | | | $ | 251,905 | | | $ | 244,663 | |
| | | | | | | | | | | | | | | | | | | | | | | | | |
| TOTAL REVENUES (3) | | $ | 578,084 | | | $ | 433,889 | | | $ | 953,987 | | | $ | 762,853 | | | $ | 612,683 | | | $ | 568,811 | |
| | | | | | | | | | | | | | | | | | | | | | | | | |
| | | | | | | | | | | | | | | | | | | | | | | | | |
NET OPERATING INCOME: | | | | | | | | | | | | | | | | | | | | | | | | |
| DDR Net Operating Income | | $ | 269,027 | | | $ | 208,018 | | | $ | 453,501 | | | $ | 356,348 | | | $ | 272,764 | | | $ | 248,838 | |
| Joint Venture Net Operating Income | | $ | 139,258 | | | $ | 103,522 | | | $ | 228,358 | | | $ | 184,927 | | | $ | 167,573 | | | $ | 166,545 | |
| | | | | | | | | | | | | | | | | | | | | | | | | |
| TOTAL NET OPERATING INCOME (4) | | $ | 408,285 | | | $ | 311,540 | | | $ | 681,859 | | | $ | 541,274 | | | $ | 440,337 | | | $ | 415,383 | |
| | | | | | | | | | | | | | | | | | | | | | | | | |
| | | | | | | | | | | | | | | | | | | | | | | | | |
REAL ESTATE AT COST: | | | | | | | | | | | | | | | | | | | | | | | | |
| DDR Real Estate at Cost | | $ | 6,610,157 | | | $ | 5,873,324 | | | $ | 5,603,424 | | | $ | 3,884,911 | | | $ | 2,804,056 | | | $ | 2,493,665 | |
| Joint Venture Real Estate at Cost (5) | | $ | 3,551,392 | | | $ | 2,687,473 | | | $ | 3,165,335 | | | $ | 2,275,216 | | | $ | 1,785,165 | | | $ | 1,862,515 | |
| | | | | | | | | | | | | | | | | | | | | | | | | |
| TOTAL REAL ESTATE AT COST (6) | | $ | 10,161,549 | | | $ | 8,560,797 | | | $ | 8,768,759 | | | $ | 6,160,127 | | | $ | 4,589,221 | | | $ | 4,356,179 | |
| | | | | | | | | | | | | | | | | | | | | | | | | |
| | |
| (1) | | See Market Capitalization and Financial Ratio section for detail calculation. |
| |
| (2) | | The calculation includes joint venture revenues. |
| |
| (3) | | Includes revenues from discontinued operations. |
| |
| (4) | | Includes NOI associated with acquisitions, expansions and developments from completion date of said capital transactions. |
| |
| (5) | | Includes FMV purchase price gross up of assets shown as equity investment in joint ventures. |
| |
| (6) | | Includes construction in progress (CIP) at June 30, 2005 of $320.8 million (includes $37.3 million of CIP included in joint ventures, of which $5.8 million represents the Company’s proportionate share), and at December 31, 2004, 2003, 2002, 2001 CIP aggregated $271.0 million, $290.7 million $237.8 million and $287.7 million, respectively. |
| |
| (7) | | Amounts were adjusted to include original issuance costs associated with the redemption of Preferred Operating Partnership Units and preferred stock of $10,710,000 for the year ended December 31, 2003 and $5,543,734 for the year ended December 31, 2002 pursuant to EITF topic NO. D-42. |
Financial Highlights 2.1
| | | |
Developers Diversified Realty | | |
| Quarterly Financial Supplement | | |
| For the Six Months Ended June 30, 2005 | | |
| |
| | | | | | | | | | | | | | | | | | | | | |
| MARKET CAPITALIZATION & FINANCIAL RATIOS | | Six Month | | |
| | | Period Ended | | |
| | | June 30 | | Year Ended December 31 |
| | | 2005 | | 2004 | | 2003 | | 2002 | | 2001 |
DDR RATIO OF DEBT TO TOTAL MARKET CAP: | | | | | | | | | | | | | | | | | | | | |
| Total Debt | | $ | 3,753,166 | | | $ | 2,716,426 | | | $ | 2,077,558 | | | $ | 1,491,481 | | | $ | 1,308,301 | |
| Total Market Capitalization * | | $ | 9,516,897 | | | $ | 8,276,943 | | | $ | 5,551,748 | | | $ | 3,460,243 | | | $ | 2,982,461 | |
| | | | | | | | | | | | | | | | | | | | | |
| | | | 39.44 | % | | | 32.82 | % | | | 37.42 | % | | | 43.10 | % | | | 43.87 | % |
| | | | | | | | | | | | | | | | | | | | | |
DDR DEBT TO UNDEPRECIATED REAL ESTATE ASSETS, INVESTMENTS AND NOTES RECEIVABLE | | | 52.90 | % | | | 45.58 | % | | | 48.68 | % | | | 48.26 | % | | | 47.18 | % |
| |
DDR, INCLUDING PROPORTIONATE SHARE OF JV DEBT, TOTAL MARKET CAPITALIZATION: | | | | | | | | | | | | | | | | | | | | |
| Total Debt * | | $ | 4,211,111 | | | $ | 3,137,184 | | | $ | 2,446,026 | | | $ | 1,878,575 | | | $ | 1,688,904 | |
| Total Market Capitalization * | | $ | 9,974,843 | | | $ | 8,697,701 | | | $ | 5,920,216 | | | $ | 3,847,336 | | | $ | 3,363,064 | |
| | | | | | | | | | | | | | | | | | | | | |
| | | | 42.22 | % | | | 36.07 | % | | | 41.32 | % | | | 48.83 | % | | | 50.22 | % |
DDR & JV DEBT TO UNDEPRECIATED REAL ESTATE ASSETS, INVESTMENTS & NOTES RECEIVABLE | | | 55.68 | % | | | 49.27 | % | | | 53.79 | % | | | 54.20 | % | | | 53.85 | % |
| |
INTEREST COVERAGE RATIO: | | | | | | | | | | | | | | | | | | | | |
| Interest Expense | | $ | 87,197 | | | $ | 130,447 | | | $ | 90,162 | | | $ | 77,208 | | | $ | 81,770 | |
| FFO Before Interest and Preferred Dividends * | | $ | 306,389 | | | $ | 473,488 | | | $ | 353,039 | | | $ | 282,856 | | | $ | 260,700 | |
| | | | | | | | | | | | | | | | | | | | | |
| | | | 3.51 | | | | 3.63 | | | | 3.92 | | | | 3.66 | | | | 3.19 | |
DEBT SERVICE COVERAGE RATIO: | | | | | | | | | | | | | | | | | | | | |
| Debt Service * | | $ | 103,663 | | | $ | 152,927 | | | $ | 101,890 | | | $ | 83,958 | | | $ | 88,764 | |
| FFO Before Interest and Preferred Dividends * | | $ | 306,389 | | | $ | 473,488 | | | $ | 353,039 | | | $ | 282,856 | | | $ | 260,700 | |
| | | | | | | | | | | | | | | | | | | | | |
| | | | 2.96 | | | | 3.10 | | | | 3.46 | | | | 3.37 | | | | 2.94 | |
FIXED CHARGES (INCLUDING PREFERRED DIVIDENDS) COVERAGE RATIO | | | | | | | | | | | | | | | | | | | | |
| Fixed Charges | | $ | 131,248 | | | $ | 203,633 | | | $ | 142,385 | | | $ | 129,353 | | | $ | 135,107 | |
| FFO Before Interest and Preferred Dividends * | | $ | 306,389 | | | $ | 473,488 | | | $ | 353,039 | | | $ | 282,856 | | | $ | 260,700 | |
| | | | | | | | | | | | | | | | | | | | | |
| | | | 2.33 | | | | 2.33 | | | | 2.48 | | | | 2.19 | | | | 1.93 | |
DIVIDEND PAYOUT RATIO | | | | | | | | | | | | | | | | | | | | |
| Common Share Dividends and Operating Partnership Interest | | $ | 118,781 | | | $ | 196,685 | | | $ | 146,846 | | | $ | 100,531 | | | $ | 84,721 | |
| Funds From Operations exclusive of charge associated with preferred stock redemption | | $ | 191,607 | | | $ | 292,335 | | | $ | 222,382 | | | $ | 160,253 | | | $ | 132,587 | |
| | | | | | | | | | | | | | | | | | | | | |
| | | | 0.62 | | | | 0.67 | | | | 0.66 | | | | 0.63 | | | | 0.64 | |
| | |
| * | | See Attached for Detail Calculation |
Market Capitalization and Financial Ratios 2.2
| | | |
Developers Diversified Realty | | |
| Quarterly Financial Supplement | | |
| For the Six Months Ended June 30, 2005 | | |
| |
| | | | | | | | | | | | | | | | | | | | | |
| | | Six Month | | |
| | | Period Ended | | |
| | | June 30 | | Year Ended December 31 |
| | | 2005 | | 2004 | | 2003 | | 2002 | | 2001 |
DDR TOTAL MARKET CAPITALIZATION | | | | | | | | | | | | | | | | | | | | |
| Common Shares Outstanding | | | 108,718 | | | | 108,083 | | | | 86,425 | | | | 66,609 | | | | 59,455 | |
| Operating Partnership Units Outstanding | | | 1,350 | | | | 1,350 | | | | 1,129 | | | | 911 | | | | 1,038 | |
| | | | | | | | | | | | | | | | | | | | | |
| Total | | | 110,068 | | | | 109,432 | | | | 87,554 | | | | 67,520 | | | | 60,493 | |
| Share Price | | $ | 45.9600 | | | $ | 44.3700 | | | $ | 33.5700 | | | $ | 21.9900 | | | $ | 19.1000 | |
| | | | | | | | | | | | | | | | | | | | | |
| Market Value of Common Shares | | $ | 5,058,731 | | | $ | 4,855,516 | | | $ | 2,939,190 | | | $ | 1,484,762 | | | $ | 1,155,410 | |
| | | | | | | | | | | | | | | | | | | | | |
| Preferred Shares at Book Value | | $ | 705,000 | | | $ | 705,000 | | | $ | 535,000 | | | $ | 304,000 | | | $ | 303,750 | |
| Preferred Units and Warrant | | $ | 0 | | | $ | 0 | | | $ | 0 | | | $ | 180,000 | | | $ | 215,000 | |
| Total Debt | | $ | 3,753,166 | | | $ | 2,716,426 | | | $ | 2,077,558 | | | $ | 1,491,481 | | | $ | 1,308,301 | |
| | | | | | | | | | | | | | | | | | | | | |
| TOTAL MARKET CAPITALIZATION | | $ | 9,516,897 | | | $ | 8,276,943 | | | $ | 5,551,748 | | | $ | 3,460,243 | | | $ | 2,982,461 | |
| | | | | | | | | | | | | | | | | | | | | |
| | | | | | | | | | | | | | | | | | | | | |
DDR TOTAL MARKET CAPITALIZATION — INCLUDING PROPORTIONATE SHARE OF JV DEBT | | | | | | | | | | | | | | | | | | | | |
| Common Shares Outstanding | | | 108,718 | | | | 108,083 | | | | 86,425 | | | | 66,609 | | | | 59,455 | |
| Operating Partnership Units Outstanding | | | 1,350 | | | | 1,350 | | | | 1,129 | | | | 911 | | | | 1,038 | |
| | | | | | | | | | | | | | | | | | | | | |
| Total | | | 110,068 | | | | 109,432 | | | | 87,554 | | | | 67,520 | | | | 60,493 | |
| Share Price | | $ | 45.9600 | | | $ | 44.3700 | | | $ | 33.5700 | | | $ | 21.9900 | | | $ | 19.1000 | |
| | | | | | | | | | | | | | | | | | | | | |
| Market Value of Common Shares | | $ | 5,058,731 | | | $ | 4,855,516 | | | $ | 2,939,190 | | | $ | 1,484,762 | | | $ | 1,155,410 | |
| | | | | | | | | | | | | | | | | | | | | |
| Preferred Shares at Book Value | | $ | 705,000 | | | $ | 705,000 | | | $ | 535,000 | | | $ | 304,000 | | | $ | 303,750 | |
| Preferred Units and Warrant | | $ | 0 | | | $ | 0 | | | $ | 0 | | | $ | 180,000 | | | $ | 215,000 | |
| Total Debt | | $ | 3,753,166 | | | $ | 2,716,426 | | | $ | 2,077,558 | | | $ | 1,491,481 | | | $ | 1,308,301 | |
| Proportionate Share of JV Debt | | $ | 457,945 | | | $ | 420,758 | | | $ | 368,468 | | | $ | 387,094 | | | $ | 380,604 | |
| | | | | | | | | | | | | | | | | | | | | |
| TOTAL MARKET CAPITALIZATION | | $ | 9,974,843 | | | $ | 8,697,701 | | | $ | 5,920,216 | | | $ | 3,847,336 | | | $ | 3,363,064 | |
| | | | | | | | | | | | | | | | | | | | | |
Market Capitalization and Financial Ratios 2.2
| | | |
Developers Diversified Realty | | |
| Quarterly Financial Supplement | | |
| For the Six Months Ended June 30, 2005 | | |
| |
| | | | | | | | | | | | | | | | | | | | | |
| | | Six Month | | |
| | | Period Ended | | |
| | | June 30 | | Year Ended December 31 |
| | | 2005 | | 2004 | | 2003 | | 2002 | | 2001 |
UNDEPRECIATED REAL ESTATE ASSETS, CASH, INVESTMENTS & NOTES RECEIVABLE | | | | | | | | | | | | | | | | | | | | |
| Undepreciated Real Estate Assets | | $ | 6,610,157 | | | $ | 5,603,424 | | | $ | 3,884,911 | | | $ | 2,804,056 | | | $ | 2,493,665 | |
| Cash and Cash Equivalents | | $ | 27,474 | | | $ | 49,871 | | | $ | 111,033 | | | $ | 16,371 | | | $ | 19,070 | |
| Notes Receivable | | $ | 17,056 | | | $ | 17,823 | | | $ | 9,813 | | | $ | 11,662 | | | $ | 5,221 | |
| Advances and Investments in Joint Ventures | | $ | 440,352 | | | $ | 288,020 | | | $ | 262,072 | | | $ | 258,611 | | | $ | 255,327 | |
| | | | | | | | | | | | | | | | | | | | | |
| | | $ | 7,095,038 | | | $ | 5,959,138 | | | $ | 4,267,829 | | | $ | 3,090,699 | | | $ | 2,773,281 | |
| | | | | | | | | | | | | | | | | | | | | |
DDR & JV UNDEPRECIATED REAL ESTATE ASSETS, INVESTMENTS & NOTES RECEIVABLE | | | | | | | | | | | | | | | | | | | | |
| Undepreciated Real Estate Assets | | $ | 6,610,157 | | | $ | 5,603,424 | | | $ | 3,884,911 | | | $ | 2,804,056 | | | $ | 2,493,665 | |
| Notes Receivable or Proportionate Share Thereof | | $ | 179,412 | | | $ | 44,536 | | | $ | 41,018 | | | $ | 50,521 | | | $ | 22,000 | |
| Proportionate Share of JV Undepreciated Real Estate Assets | | $ | 773,554 | | | $ | 719,619 | | | $ | 621,113 | | | $ | 611,224 | | | $ | 620,688 | |
| | | | | | | | | | | | | | | | | | | | | |
| | | $ | 7,563,123 | | | $ | 6,367,578 | | | $ | 4,547,043 | | | $ | 3,465,801 | | | $ | 3,136,353 | |
| | | | | | | | | | | | | | | | | | | | | |
FUNDS FROM OPERATIONS BEFORE INTEREST AND PREFERRED DIVIDENDS | | | | | | | | | | | | | | | | | | | | |
| FFO | | $ | 191,607 | | | $ | 292,335 | | | $ | 211,672 | | | $ | 154,709 | | | $ | 132,587 | |
| Interest Expense | | $ | 87,197 | | | $ | 130,447 | | | $ | 90,162 | | | $ | 77,208 | | | $ | 81,770 | |
| Preferred Dividends, Including Preferred Operating Minority Interest & D-42 Dividend | | $ | 27,584 | | | $ | 50,706 | | | $ | 51,204 | | | $ | 50,939 | | | $ | 46,343 | |
| | | | | | | | | | | | | | | | | | | | | |
| | | $ | 306,389 | | | $ | 473,488 | | | $ | 353,039 | | | $ | 282,856 | | | $ | 260,700 | |
| | | | | | | | | | | | | | | | | | | | | |
DEBT SERVICE | | | | | | | | | | | | | | | | | | | | |
| Interest Expense | | $ | 87,197 | | | $ | 130,447 | | | $ | 90,162 | | | $ | 77,208 | | | $ | 81,770 | |
| Recurring Principal Amortization | | $ | 16,466 | | | $ | 22,480 | | | $ | 11,728 | | | $ | 6,750 | | | $ | 6,994 | |
| | | | | | | | | | | | | | | | | | | | | |
| | | $ | 103,663 | | | $ | 152,927 | | | $ | 101,890 | | | $ | 83,958 | | | $ | 88,764 | |
| | | | | | | | | | | | | | | | | | | | | |
FIXED CHARGES | | | | | | | | | | | | | | | | | | | | |
| Debt Service | | $ | 103,663 | | | $ | 152,927 | | | $ | 101,890 | | | $ | 83,958 | | | $ | 88,764 | |
| Preferred Dividends, Including Preferred Operating Minority Interest and excluding non-cash | | $ | 27,584 | | | $ | 50,706 | | | $ | 40,494 | | | $ | 45,395 | | | $ | 46,343 | |
| | | | | | | | | | | | | | | | | | | | | |
| D-42 dividend. | | $ | 131,248 | | | $ | 203,633 | | | $ | 142,385 | | | $ | 129,353 | | | $ | 135,107 | |
| | | | | | | | | | | | | | | | | | | | | |
Market Capitalization and Financial Ratios 2.2
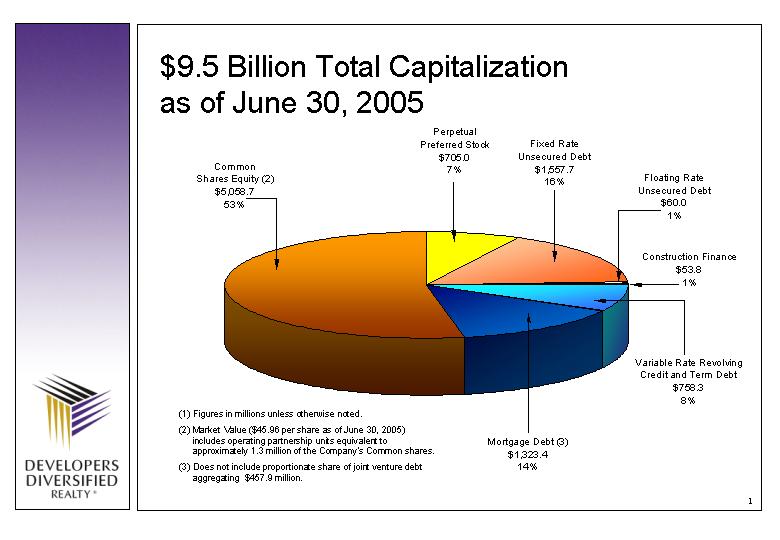
| $9.5 Billion Total Capitalization as of June 30, 2005 Common Shares Equity (2) $5,058.7 53% Perpetual Preferred Stock $705.0 7% Fixed Rate Unsecured Debt $1,557.7 16% Floating Rate Unsecured Debt $60.0 1% Construction Finance $53.8 1% Variable Rate Revolving Credit and Term Debt $758.3 8% Mortgage Debt (3) $1,323.4 14% (1) Figures in millions unless otherwise noted. (2) Market Value ($45.96 per share as of June 30, 2005) includes operating partnership units equivalent to approximately 1.3 million of the Company's Common shares. (3) Does not include proportionate share of joint venture debt aggregating $457.9 million. |
Developers Diversified Realty
Quarterly Financial Supplement
For the six months ended June 30, 2005
Significant Accounting Policies
Revenues
| • | | Percentage and overage rents are recognized after the tenants reported sales have exceeded the applicable sales breakpoint. |
| • | | Revenues associated with tenant reimbursements are recognized in the period in which the expenses are incurred based upon the provision of tenants’ leases. |
| • | | Lease termination fees are included in other income and recognized upon termination of a tenant’s lease, which generally coincides with the receipt of cash. |
General and Administrative Expenses
| • | | General and administrative expenses include internal leasing salaries, legal salaries and related expenses associated with the leasing of space which are charged to operations as incurred. All indirect internal costs associated with acquisitions are expensed as incurred. |
Deferred Financing Costs
| • | | Costs incurred in obtaining long-term financing are included in deferred charges and are amortized over the terms of the related debt agreements; such amortization is reflected as interest expense in the consolidated statements of operations. |
Real Estate
| • | | Real estate assets are stated at cost less accumulated depreciation, which, in the opinion of management, is not in excess of the individual property’s estimated undiscounted future cash flows, including estimated proceeds from disposition. |
| • | | Depreciation and amortization are provided on a straight-line basis over the estimated useful lives of the assets as follows: |
| | | |
| Buildings | | 18 to 31 years |
Furniture/Fixtures
and Tenant Improvements | | Useful lives, which approximate lease
terms, where applicable |
Significant Accounting Policies 2.4
Developers Diversified Realty
Quarterly Financial Supplement
For the six months ended June 30, 2005
Significant Accounting Policies (Continued)
| • | | Expenditures for maintenance and repairs are charged to operations as incurred. Renovations that improve or extend the life of the asset are capitalized. |
| • | | Included in land is undeveloped real estate, generally outlots or expansion pads adjacent to the shopping centers and enclosed malls owned by the Company. |
| • | | Construction in progress includes shopping center developments and significant expansions and re-developments. |
Capitalization
| • | | The Company capitalizes interest on funds used for the construction or expansion of shopping centers. Capitalization of interest ceases when construction activities are completed and the property is available for occupancy by tenants. |
| • | | For the six month period ended June 30, 2005 and the years ended December 31, 2004, 2003, 2002 and 2001, the Company capitalized interest of $4.8 million, $10.0 million, $11.4 million, $9.5 million and $12.9 million, respectively. |
| • | | In addition, the Company capitalized certain construction administration costs of $3.3 million for the six month period ended June 30, 2005 and $5.5 million, $5.1 million, $4.5 million and $3.3 million for the years ended December 31, 2004, 2003, 2002 and 2001, respectively. |
| • | | Interest and real estate taxes incurred during the construction period are capitalized and depreciated over the building life. |
Gain on Sales of Real Estate
| • | | Gain on sales of real estate generally related to the sale of outlots and land adjacent to existing shopping centers is recognized at closing when the earnings process is deemed to be complete. |
Significant Accounting Policies 2.4
| | | |
Developers Diversified Realty | | |
| Quarterly Financial Supplement | | |
| For the six months ended June 30, 2005 | | |
| |
Reconciliation of Supplemental
Non-GAAP Financial Measures
(Dollars in thousands)
(Unaudited)
Table 1 — Developers Diversified Realty Corporation and the Company’s Joint Ventures Combined
Reconciliation of Same Store Net Operating Income (NOI) to Total Revenues and Certain Expenses
| | | | | | | | | | | | | |
| | | Six Month Period | | | | |
| | | June 30, | | | | |
| | | 2005 | | 2004 | | | | |
| Total Revenues DDR | | $ | 361,967 | | | $ | 269,589 | | | | | |
| Total Revenues DDR Combined Joint Ventures | | | 213,297 | | | | 154,013 | | | | | |
| Operating and Maintenance — DDR | | | (50,429 | ) | | | (31,645 | ) | | | | |
| Real Estate Taxes — DDR | | | (42,748 | ) | | | (34,933 | ) | | | | |
| Operating and Maintenance — DDR Combined Joint Ventures | | | (75,221 | ) | | | (52,904 | ) | | | | |
| | | | | | | | | | | | | |
| | | | | | | | | | | | | |
Combined NOI | | $ | 406,866 | | | $ | 304,120 | | | | | |
| | | | | | | | | | | | | |
| | | | | | | | | | | | | |
| Total Same Store NOI | | $ | 190,700 | | | $ | 187,149 | | | | 1.9 | % |
| Property NOI from other operating segments | | | 216,166 | | | | 116,971 | | | | | |
| | | | | | | | | | | | | |
| | | | | | | | | | | | | |
Combined NOI | | $ | 406,866 | | | $ | 304,120 | | | | | |
| | | | | | | | | | | | | |
Non-GAAP Financial Measures 2.5
| | | |
Developers Diversified Realty | | |
| Quarterly Financial Supplement | | |
| For the six months ended June 30, 2005 | | |
| |
Reconciliation of Supplemental
Non-GAAP Financial Measures
(Dollars in thousands)
(Unaudited)
Table 2 — Developers Diversified Realty Corporation
Reconciliation of Funds From Operations (FFO):
| | | | | | | | | | | | | | | | | |
| | | Three Month Period | | Six Month Period |
| | | Ended June 30, | | Ended June 30, |
| | | 2005 | | 2004 | | 2005 | | 2004 |
FUNDS FROM OPERATIONS: | | | | | | | | | | | | | | | | |
| Net Income Applicable to Common Shareholders | | $ | 54,162 | | | $ | 74,295 | | | $ | 145,920 | | | $ | 114,476 | |
| Depreciation and Amortization of Real Estate Investments | | | 39,492 | | | | 31,208 | | | | 80,335 | | | | 55,966 | |
| Equity in Net Income From Joint Ventures | | | (8,055 | ) | | | (6,943 | ) | | | (14,566 | ) | | | (25,164 | ) |
| Joint Venture Funds From Operations | | | 10,764 | | | | 11,065 | | | | 22,080 | | | | 23,741 | |
| Operating Partnership Minority Interest Expense | | | 729 | | | | 625 | | | | 1,458 | | | | 1,197 | |
| Gain on Sales of Real Estate | | | (4,557 | ) | | | (28,639 | ) | | | (43,620 | ) | | | (28,799 | ) |
| Cumulative effect of adoption of a new accounting standard | | | — | | | | — | | | | — | | | | 3,001 | |
| | | | | | | | | | | | | | | | | |
FUNDS FROM OPERATIONS AVAILABLE TO COMMON SHAREHOLDERS | | $ | 92,535 | | | $ | 81,611 | | | $ | 191,607 | | | $ | 144,418 | |
| | | | | | | | | | | | | | | | | |
| | | | | | | | | | | | | | | | | |
| Preferred dividend charges in accordance with EITF Topic No. D-42 | | | 13,792 | | | | 12,517 | | | | 27,583 | | | | 23,122 | |
| | | | | | | | | | | | | | | | | |
ADJUSTED FUNDS FROM OPERATIONS AVAILABLE TO COMMON SHAREHOLDERS | | $ | 106,327 | | | $ | 94,128 | | | $ | 219,190 | | | $ | 167,540 | |
| | | | | | | | | | | | | | | | | |
Non-GAAP Financial Measures 2.5
Developers Diversified Realty
Quarterly Financial Supplement
For the six months ended June 30, 2005
Summary of Wholly Owned and Consolidated Capital Transactions
Acquisitions, Dispositions, Developments & Expansions
| | | | | | | | | | | | | | | | | | | | | |
| | | Six Months | | | | | | | | | | | | | |
| | | Ended | | | Year Ended | | | Year Ended | | | Year Ended | | | Year Ended | |
| | | June 30, | | | December 31, | | | December 31, | | | December 31, | | | December 31, | |
| | | 2005 | | | 2004 | | | 2003 | | | 2002 | | | 2001 | |
| Acquisitions/Transfers | | $ | 1,148.2 | | | $ | 2,170.8 | (3) | | $ | 1,363.6 | (5) | | $ | 298.6 | (7) | | $ | 289.3 | (9) |
| Completed Expansions | | | 13.6 | | | | 25.2 | | | | 26.8 | | | | 8.0 | | | | 13.7 | |
| Developments & Construction in Progress | | | 105.5 | | | | 203.8 | | | | 104.6 | | | | 66.4 | | | | 72.9 | |
| Tenant Improvements & Building Renovations (1) | | | 4.0 | | | | 6.6 | | | | 6.3 | | | | 7.3 | | | | 6.1 | |
| Furniture Fixtures & Equipment | | | 6.3 | | | | 1.3 | | | | 1.9 | | | | 2.3 | | | | 2.5 | |
| | | | | | | | | | | | | | | | |
| | | | 1,277.6 | | | | 2,407.7 | | | | 1,503.2 | | | $ | 382.6 | | | $ | 384.5 | |
| Less: Real Estate Sales & Joint Venture Transfers | | | (275.5 | )(2) | | | (689.2 | )(4) | | | (422.4 | )(6) | | | ($72.2 | )(8) | | | ($52.7 | ) |
| | | | | | | | | | | | | | | | |
| |
| Total DDR Net Additions (Millions) | | $ | 1,002.1 | | | $ | 1,718.5 | | | $ | 1,080.8 | | | $ | 310.4 | | | $ | 331.8 | |
| |
| |
| (1) | | The Company anticipates recurring capital expenditures, including tenant improvements, of approx. $8.0 million associated with its wholly owned and consolidated portfolio during 2005. |
| |
| (2) | | In addition to the asset sales which had an aggregate cost of $3.8 million, this balance includes the transfer of twelve assets with an aggregate cost of $258.6 million to the Macquarie DDR Trust joint venture, three properties held for sale at June 30, 2005 and the sale of several outparcels. |
| |
| (3) | | Includes the consolidation of certain joint venture assets aggregating $37.9 million due to FIN 46 and transfers to DDR from joint ventures of the Littleton, CO and Merriam, KS shopping centers which had an aggregate value of $111.8 million. This also includes the purchase of DDR corporate headquarters for $6.7 million. |
| |
| (4) | | In addition to the asset sales which had an aggregate cost of $62.6 million, this balance includes the sale of several land parcels with an aggregate cost of $41.1 million. This balance also includes the transfer of twelve assets with an aggregate cost of $258.3 million to the Macquarie DDR Trust joint venture, the transfer of twelve assets with an aggregate cost of $124.0 to the DPG Realty Holdings joint venture and the transfer of thirteen assets with an aggregate cost of $203.2 to the DDR Markaz II joint venture. |
| |
| (5) | | Includes the merger of JDN and the transfer from joint ventures of the Leawood, KS and Suwanee, GA shopping centers, and the consolidation of the assets aggregating $118.2 million owned by DD Development Company. |
| |
| (6) | | In addition to asset sales which had an aggregate cost of $62.9 million, this balance includes the transfer of seven assets with an aggregate cost of $153.6 million to the joint venture with DDR Markaz LLC (Kuwait Financial Centre), these assets are shopping centers located in Richmond, CA, Winchester, VA, Tampa, FL, Toledo, OH, Highland, IN, Oviedo, FL and Grove City, OH and the sale of several outparcels, which had an aggregate cost of $13.5 million. The balance also includes the transfer of six assets with an aggregate cost of $192.4 million to the Macquarie DDR Trust joint venture, these assets are shopping centers located in Canton, OH, North Olmsted, OH, Independence, MO and St. Paul, MN. |
| |
| (7) | | Includes transfers from joint ventures of the Independence, MO shopping center, Phase IV of the Salisbury, MD shopping center, Canton, OH shopping center, Plainville, CT shopping center, and San Antonio, TX shopping center to DDR. |
| |
| (8) | | Includes a transfer to joint ventures for the newly developed shopping center in Kildeer, Illinois, the sales of shopping centers located in Cape Coral, Florida, Huntsville, Alabama, Ocala, Florida, Orlando, Florida and St. Louis, Missouri, the sale of three outlots, and a write-off of $5.0 million relating to the former K-mart space at North Little Rock, Arkansas which is being redeveloped. |
| |
| (9) | | The balance reflects the consolidation of the assets formerly owned by American Industrial Properties (AIP) which was merged during 2nd quarter 2001. |
Summary of Wholly Owned Capital Transactions 3.1
Developers Diversified Realty
Quarterly Financial Supplement
For the six months ended June 30, 2005
Wholly Owned and Consolidated Acquisitions
for the Six Month Period Ended June 30, 2005
| | | | | | | | | | | | | | | | | | | | | |
| | | | | | | | | | | Cost | | | Acquisition | | | | |
| Property Location | | GLA | | | (1) | | | (Millions) | | | Date | | | Major Tenants | |
| Caribbean Property Group | | | 4,851,922 | | | | | | | $ | 1,148.2 | | | | 01/27/05 | | | Portfolio of 15 operating properties
located in Puerto Rico |
| |
| Total | | | 4,851,922 | | | | | | | $ | 1,148.2 | | | | | | | | | |
| |
| (1) | | GLA may include property managed, but not owned. |
Wholly Owned and Consolidated Dispositions
for the Six Month Period Ended June 30, 2005
| | | | | | | | | | | | | |
| | | | | | | Gross Sale | | | | |
| | | | | | | Proceeds | | | | |
| Property Location | | GLA | | | (Millions) | | | Sale Date | |
| Wilmington, OH | | | 55,130 | | | | 2.0 | | | | 5/17/2005 | |
| Cleveland, OH | | | 49,420 | | | | 2.2 | | | | 6/30/2005 | |
| |
| Total | | | 104,550 | | | $ | 4.2 | | | | | |
| |
| |
Wholly Owned Acquisitions and Dispositions 3.2
Developers Diversified Realty
Quarterly Financial Supplement
For the six months ended June 30, 2005
Wholly Owned and Consolidated
Expansion and Redevelopment Projects
for the Six Month Period Ended June 30, 2005
| | | |
Projects Completed | | |
| |
| Tallahassee, FL | | Retenanting of former Lowe’s with Bealls (opened 04/04), Cato and It’s Fashion (opened 01/05) plus an additional junior anchor. |
| |
| Suwanee, GA | | Retenanting of former K-Mart with PetsMart (opened 4/05) and Shoe Gallery (opened 03/04) plus an additional junior anchor. |
| |
| Hendersonville, NC | | Recapture of former Wal-Mart space; demolition of 45,000 sq ft for Epic Theater (opened 6/05), Big Lots (opened 4/05) and an additional junior anchor. |
| |
| Johnson City, TN | | Kohl’s to construct 88,248 sf retail building (opened 4/05), plus construction of 25,000 sf additional retail space. |
| | | | | | | | | |
| | | | | |
| Total Net Cost (Millions) | | $ | 13.6 | | | | | |
| | | | | |
| | | |
Projects in Progress | | |
| |
| Gadsden, AL | | Break-up of 64,400 sf building to create a 20,000 sf Fred’s (opened 05/04), a 14,000 sf Burke’s Outlet (opened 12/04) and another junior anchor |
| |
| Hoover, AL | | Constructing a 12,000 sf David’s Bridal and renovating the shopping center. |
| |
| Ocala, FL | | Recaptured the Winn Dixie and expanding the space by 6,000 sf for Hobby Lobby |
| |
| Ottumwa, IA | | Recapture Wal-Mart and release to 34,500 sf Goody’s (opened 9/04) and 47,422 sf of additional junior anchor stores. |
| |
| Gaylord, MI | | Recapture Wal-Mart and release to 38,594 sf Big Lots and 72,213 sf of additional junior anchor stores. |
| |
| Princeton, NJ | | Expansion of the existing center to create a 37,200 sf Babies ‘R Us and additional 39,600 sf of retail space including West Elm, Snip Its, Yankee Candle, Barbeques Galore, and other retailers to be announced. |
| |
| Mooresville, NC | | Construction of a 63,000 sf Gander Mountain and relocation of 12,000 sf for Rugged Warehouse. |
| |
| Allentown, PA | | Construction of 18,200 sf outparcel building for retail tenants including Sleepys, Super Cuts, Quiznos, Cold Stone Creamery and other retailers to be announced. |
| |
| Erie, PA | | Construct 6,700 sf free standing building for retail shops. |
| |
| Bayamon, PR (Plaza Del Sol) | | Construction of parking deck and expansion to accommodate a junior anchor. |
| |
| Bayamon, PR (Rio Hondo) | | Construction of 55,500 sf Super Marshall’s, 33,000 sf Comp USA, 19,800 sf of small shops and a freestanding outparcel. |
| | | | | | | | | |
| | | | | |
| Total Net Cost (Millions) | | $ | 57.2 | | | | | |
| | | | | |
| | | |
Projects to Commence Construction | | |
| |
| Amherst, NY | | Construct 5,300 sf free standing building for retail shops. |
Wholly Owned Expansions and Redevelopments 3.2
Developers Diversified Realty
Quarterly Financial Supplement
For the six months ended June 30, 2005
Summary of Wholly Owned and Consolidated Development Projects
for the Six Month Period Ended June 30, 2005
| | | | | | | | | | | | | | | |
| | | | | | | | | | | Substantial | | |
| | | | | | | Net Cost | | Completion | | |
| | | GLA | | (Millions) | | Date | | Major Tenants |
Projects Substantially Completed | | | | | | |
| |
| Overland Park, KS | | | 83,642 | | | $ | 9.2 | | | | 2005 | | | Home Depot, Sam’s Club, Aldi’s Grocery, Party City, Goodyear Tire, Bank of America, Babies ‘R Us (opened 12/04), Golf Galaxy (opened 3/05), CiCi’s Pizza(opened 5/05) and 3,427 sf of additional retail space |
Projects in Progress | | | | | | | | | | | | | | |
| |
| Miami, FL | | | 633,994 | | | $ | 98.5 | | | | 2006 | | | To be announced |
| |
| Chesterfield, MI | | | 105,400 | | | $ | 13.6 | | | | 2005 &
2006 | | | 25,400 sf of small shop retail and additional retail space |
| |
| Lansing, MI | | | 181,604 | | | $ | 17.4 | | | | 2005 | | | Wal-Mart, Lowe’s, Michael’s, Gander Mountain, PetsMart (opened 6/05) |
| |
| Freehold, NJ | | | 500,000 | | | $ | 28.2 | | | | 2005 | | | Wal-Mart and Sam’s Club and other retail tenants and outparcels to be announced |
| |
| Mt. Laurel, NJ | | | 715,251 | | | $ | 57.3 | | | | 2004 & 2005 | | | Target, Bed, Bath & Beyond, Lane Bryant, Payless ShoeSource (opened 4th quarter 2004). Costco and Panera Bread (opened 1st quarter 2005). TJ Maxx, PetsMart, JoAnn’s, DSW, and Golf Galaxy (opened 2nd quarter 2005), and The Sports Authority (scheduled to open 3rd quarter 2005), Wegman’s (scheduled to open 1st quarter 2006), and other retail tenants and outparcels to be announced |
| |
Apex, NC (Beaver Creek Crossings-
Phase I) (1) | | | 341,691 | | | $ | 56.6 | | | | 2006 | | | Consolidated Theaters and other retail tenants to be announced |
| |
| Pittsburgh, PA | | | 367,307 | | | $ | 15.8 | | | | 2006 | | | Target, Sportsmans Warehouse and other retail tenants to be announced |
Projects to Commence Construction | | | | | | |
| |
| McHenry, IL | | | 426,027 | | | $ | 25.6 | | | | 2007 | | | To be announced |
| |
| Norwood, MA | | | 107,015 | | | $ | 25.6 | | | | 2006 | | | To be announced |
| |
| Seabrook, NH | | | 437,507 | | | $ | 44.1 | | | | 2007 | | | To be announced |
| |
| Horseheads, NY | | | 684,866 | | | $ | 48.6 | | | | 2007 | | | To be announced |
| |
| McKinney, TX (Phase II) | | | 87,757 | | | $ | 7.3 | | | | 2006 | | | To be announced |
| |
| Wholly Owned Development Totals | | | 4,672,061 | | | $ | 447.7 | | | | | | | |
| |
| |
| | |
| (1) | | The asset is being developed with First Carolina Properties who has a 20% minority interest. |
Wholly Owned Developments 3.2
Developers Diversified Realty
Quarterly Financial Supplement
For the six months ended June 30, 2005
Wholly Owned and Consolidated Development
Assets Placed in Service as of June 30, 2005
| | | | | |
| | | Assets Placed | |
| | | in Service | |
| Date | | (Millions) | |
| |
| As of December 31, 2004 | | $ | 40.6 | |
| 1st Quarter 2005 | | $ | 4.1 | |
| 2nd Quarter 2005 | | $ | 24.0 | |
| 3rd Quarter 2005 | | $ | 8.5 | |
| 4th Quarter 2005 | | $ | 24.5 | |
| Thereafter | | $ | 346.0 | |
| |
| Total | | $ | 447.7 | |
| |
| |
Wholly Owned and Consolidated Development
Funding Schedule as of June 30, 2005
| | | | | |
| Funded as of June 30, 2005 | | $ | 228.7 | |
| Projected Net Funding During 2005 | | $ | 51.1 | (1) |
| Projected Net Funding Thereafter | | $ | 167.9 | (1) |
| |
| Total | | $ | 447.7 | |
| |
| |
| | |
| (1) | | Amount will be reduced by the additional proceeds to be obtained through construction loans. |
Wholly Owned Development Delivery and Funding Schedules 3.2
Developers Diversified Realty Corporation
Quarterly Financial Supplement
For the six months ended June 30, 2005
Summary of Consolidated Debt
as of June 30, 2005
| | | | | | | | | | | | | | | | | |
| | | | | | | Mortgage | | | Maturity | | | Interest | |
| | | | | | | Balance(000's) | | | Date | | | Rate(1) | |
SENIOR DEBT: | | | | | | | | | | | | | | | | |
| Unsecured Credit Facility: | | | | | | | | | | | | | | | | |
| $200 Million Term Loan | | | | | | $ | 200,000 | | | | 05/07 | | | | 3.890 | |
| $1 Billion Revolving Credit Facility | | | | | | | 315,750 | | | | 05/08 | | | | 3.781 | |
| $60 Million Revolving Credit Facility | | | | | | | 22,500 | | | | 05/08 | | | | 3.844 | |
| Secured Credit Facility: | | | | | | | | | | | | | | | | |
| $400 Million Term Loan | | | | | | | 220,000 | | | | 06/08 | | | | 4.176 | |
| | | | | | | | | | | | | | | | |
| Total Term and Credit Facility Debt | | | | | | | 758,250 | | | | | | | | | |
| | | | | | | | | | | | | | | | | |
PUBLIC DEBT: | | | | | | | | | | | | | | | | |
| Medium Term Notes | | | F | | | | 1,000 | | | | 11/05 | | | | 7.280 | |
| Medium Term Notes | | | F | | | | 97,854 | (2) | | | 03/07 | | | | 7.000 | |
| Medium Term Notes | | | F | | | | 10,000 | | | | 07/07 | | | | 7.020 | |
| Unsecured Notes | | | F | | | | 85,000 | | | | 08/07 | | | | 6.950 | |
| Medium Term Notes | | | F | | | | 2,000 | | | | 12/07 | | | | 6.960 | |
| Medium Term Notes | | | F | | | | 99,934 | | | | 01/08 | | | | 6.625 | |
| Medium Term Notes | | | F | | | | 274,180 | | | | 01/09 | | | | 3.875 | |
| Medium Term Notes | | | F | | | | 199,625 | | | | 05/10 | | | | 5.000 | |
| Medium Term Notes | | | F | | | | 299,658 | | | | 07/10 | | | | 4.625 | |
| Medium Term Notes | | | F | | | | 249,119 | | | | 04/11 | | | | 5.250 | |
| Medium Term Notes | | | F | | | | 199,296 | | | | 05/15 | | | | 5.500 | |
| Medium Term Notes | | | F | | | | 100,000 | | | | 07/18 | | | | 7.500 | |
| | | | | | | | | | | | | | | | |
| Total Public Debt | | | | | | | 1,617,666 | | | | | | | | | |
| | | | | | | | | | | | | | | | | |
MORTGAGE DEBT: | | | | | | | | | | | | | | | | |
| MPR Portfolio | | | V | | | | 175,000 | (3) | | | 07/05 | | | | 5.569 | |
| MPR Portfolio (Mezzanine) | | | V | | | | 25,000 | (3) | | | 07/05 | | | | 9.340 | |
| Detroit, MI | | | F | | | | 793 | | | | 11/05 | | | | 7.375 | |
| San Antonio, TX | | | V | | | | 25,000 | | | | 07/06 | | | | 4.840 | |
| Bayonet Point, FL | | | F | | | | 5,327 | | | | 08/06 | | | | 9.750 | |
| Silver Springs, MD (Tech 29-2) | | | F | | | | 3,424 | | | | 09/06 | | | | 9.050 | |
| Dublin, OH | | | F | | | | 9,323 | | | | 09/06 | | | | 8.375 | |
| Pickerington, OH | | | F | | | | 4,191 | | | | 12/06 | | | | 8.250 | |
| Sault St. Marie, MI | | | F | | | | 2,002 | | | | 05/07 | | | | 8.375 | |
| Hamilton, NJ | | | V | | | | 65,000 | | | | 05/07 | | | | 4.140 | |
| St. Louis, MO (Olympic) | | | F | | | | 3,365 | | | | 08/07 | | | | 9.150 | |
| Berlin, VT | | | F | | | | 4,940 | | | | 08/07 | | | | 9.750 | |
| Mt. Laurel, NJ | | | V | | | | 38,250 | | | | 09/07 | | | | 4.240 | |
| Apex, NC | | | V | | | | 15,573 | | | | 10/07 | | | | 4.340 | |
| Dallas, TX (Carpenter) | | | F | | | | 27,745 | | | | 01/08 | | | | 7.250 | |
| Tupelo, MS | | | F | | | | 11,610 | | | | 03/08 | | | | 4.410 | |
| Jacksonville, FL | | | F | | | | 6,661 | | | | 03/08 | | | | 4.410 | |
| Solon, OH | | | F | | | | 16,082 | | | | 03/08 | | | | 4.410 | |
| N. Charleston, SC | | | F | | | | 11,515 | | | | 03/08 | | | | 4.410 | |
| Walker, MI | | | F | | | | 8,469 | | | | 03/08 | | | | 4.410 | |
| Mt. Pleasant, SC (GS II) | | | F | | | | 7,803 | | | | 03/08 | | | | 4.410 | |
Summary of Consolidated Debt 3.3
Developers Diversified Realty Corporation
Quarterly Financial Supplement
For the six months ended June 30, 2005
Summary of Consolidated Debt
as of June 30, 2005 (con’t)
| | | | | | | | | | | | | | | | | |
| | | | | | | Mortgage | | | Maturity | | | Interest | |
| | | | | | | Balance | | | Date | | | Rate(1) | |
| Meridian, ID (GS II) | | | F | | | $ | 25,218 | | | | 03/08 | | | | 4.410 | |
| Birmingham, AL (GS II) | | | F | | | | 27,311 | | | | 03/08 | | | | 4.410 | |
| Wilmington, NC (GS II) | | | F | | | | 20,936 | | | | 03/08 | | | | 4.410 | |
| Durham, NC (GS II) | | | F | | | | 7,137 | | | | 03/08 | | | | 4.410 | |
| Silver Springs, MD (Tech 29-1) | | | F | | | | 6,802 | | | | 02/09 | | | | 7.330 | |
| Leawood, KS | | | F | | | | 50,887 | | | | 07/09 | | | | 7.310 | |
| Martinsville, VA | | | F | | | | 19,757 | | | | 12/09 | | | | 8.460 | |
| St. Louis, MO (Keller) | | | F | | | | 1,489 | | | | 01/10 | | | | 8.625 | |
| Big Flats, NY (Big Flats I) | | | F | | | | 10,986 | | | | 12/10 | | | | 8.011 | |
| Plattsburgh, NY | | | F | | | | 10,727 | | | | 12/10 | | | | 8.000 | |
| Erie, PA | | | F | | | | 25,454 | | | | 04/11 | | | | 6.884 | |
| Erie, PA | | | F | | | | 2,938 | | | | 04/11 | | | | 6.884 | |
| Boardman, OH | | | F | | | | 26,434 | | | | 04/11 | | | | 6.884 | |
| St. Louis, MO (Sunset) | | | F | | | | 34,267 | | | | 04/11 | | | | 6.884 | |
| St. Louis, MO (Brentwood) | | | F | | | | 25,454 | | | | 04/11 | | | | 6.884 | |
| Denver, CO (Centennial) | | | F | | | | 38,182 | | | | 04/11 | | | | 6.884 | |
| Gates, NY (Westgate) | | | F | | | | 24,898 | | | | 10/11 | | | | 7.240 | |
| Indian Train, NC (Union TC Ph I) | | | F | | | | 6,961 | | | | 10/11 | | | | 7.000 | |
| Ashtabula, OH | | | F | | | | 6,929 | | | | 12/11 | | | | 7.000 | |
| West Pasco, FL | | | F | | | | 4,784 | | | | 02/12 | | | | 9.625 | |
| Denver, CO (Univ Hills) | | | F | | | | 28,627 | | | | 06/12 | | | | 7.300 | |
| St. Louis, MO (Gravois) | | | F | | | | 1,728 | | | | 07/12 | | | | 8.625 | |
| N. Charleston, SC | | | F | | | | 10,737 | | | | 07/12 | | | | 7.370 | |
| Moorseville, NC | | | F | | | | 23,901 | | | | 12/12 | | | | 6.930 | |
| Big Flats, NY (Big Flats IV) | | | F | | | | 1,057 | | | | 01/13 | | | | 7.600 | |
| Big Flats, NY (Big Flats II & III) | | | F | | | | 4,623 | | | | 01/13 | | | | 8.010 | |
| Buffalo, NY (Delaware Commons) | | | F | | | | 1,186 | | | | 01/13 | | | | 6.960 | |
| Jamestown, NY (Southside Plaza) | | | F | | | | 1,697 | | | | 04/13 | | | | 7.590 | |
| Victor, NY (Victor Square) | | | F | | | | 6,644 | | | | 04/13 | | | | 5.800 | |
| Mays Landing, NJ (Wrangleboro) | | | F | | | | 51,214 | | | | 05/13 | | | | 6.990 | |
| Beachwood, OH | | | F | | | | 3,713 | | | | 07/13 | | | | 7.640 | |
| W. Long Branch, NJ (Monmouth) | | | F | | | | 14,773 | | | | 07/13 | | | | 8.570 | |
| Boynton Beach, FL (Meadows Square) | | | F | | | | 4,616 | | | | 07/13 | | | | 6.720 | |
| Englewood, FL (Rotonda) | | | F | | | | 2,168 | | | | 07/13 | | | | 5.800 | |
| Reno, NV | | | V | | | | 3,584 | | | | 02/15 | | | | 5.950 | |
| Olean, NY | | | F | | | | 4,888 | | | | 07/15 | | | | 8.995 | |
| Mays Landing, NJ (Hamilton) | | | F | | | | 15,962 | | | | 09/15 | | | | 4.700 | |
| Columbus, OH (Consumer II West) | | | F | | | | 14,137 | | | | 11/15 | | | | 10.188 | |
| Amherst, NY (Kmart/Blvd Cons. II) | | | F | | | | 12,910 | | | | 11/15 | | | | 7.850 | |
| Lockport, NY (Walmart/Tops) | | | F | | | | 13,372 | | | | 01/16 | | | | 8.000 | |
| Merriam, KS (TIF) | | | F | | | | 7,975 | | | | 02/16 | | | | 6.900 | |
| Rome, NY (Freedom) | | | F | | | | 4,580 | | | | 09/16 | | | | 7.850 | |
| Medina, NY | | | F | | | | 3,984 | | | | 11/16 | | | | 7.660 | |
| Bellefontaine, OH | | | F | | | | 2,416 | | | | 12/16 | | | | 7.500 | |
| Amherst, NY (Tops Transit + French) | | | F | | | | 5,374 | | | | 12/16 | | | | 7.680 | |
Summary of Consolidated Debt 3.3
Developers Diversified Realty Corporation
Quarterly Financial Supplement
For the six months ended June 30, 2005
Summary of Consolidated Debt
as of June 30, 2005 (con’t)
| | | | | | | | | | | | | | | | | |
| | | | | | | Mortgage | | | Maturity | | | Interest | |
| | | | | | | Balance | | | Date | | | Rate(1) | |
| Canandaigua, NY | | | F | | | $ | 5,914 | | | | 01/17 | | | | 6.150 | |
| Cheektowaga, NY (Walmart Thruway) | | | F | | | | 5,107 | | | | 10/17 | | | | 6.780 | |
| Ithaca, NY | | | F | | | | 19,822 | | | | 01/18 | | | | 7.050 | |
| Amherst, NY (Target/Blvd Cons. II) | | | F | | | | 13,989 | | | | 07/18 | | | | 5.670 | |
| Springville, NY | | | F | | | | 6,339 | | | | 07/18 | | | | 6.375 | |
| Niskayuna, NY (Mohawk) | | | F | | | | 25,689 | | | | 12/18 | | | | 5.750 | |
| Henderson, TN | | | F | | | | 9,157 | | | | 01/19 | | | | 7.660 | |
| Spring Hill, FL | | | F | | | | 5,229 | | | | 09/19 | | | | 9.750 | |
| Alden, NY | | | F | | | | 4,491 | | | | 10/19 | | | | 8.100 | |
| Cedar Rapids, IA | | | F | | | | 9,913 | | | | 01/20 | | | | 9.375 | |
| Riverdale, UT (North) | | | F | | | | 8,852 | | | | 10/20 | | | | 9.300 | |
| Plainville, CT | | | F | | | | 7,100 | | | | 04/21 | | | | 7.125 | |
| Allentown, PA | | | F | | | | 18,360 | | | | 06/21 | | | | 6.950 | |
| Princeton, NJ | | | V | | | | 24,998 | | | | 09/25 | | | | 4.840 | |
| Princeton, NJ | | | F | | | | 25,879 | | | | 03/27 | | | | 8.262 | |
| Bayamon, PR (Rio Hondo) | | | F | | | | 57,182 | | | | 05/28 | | | | 7.180 | |
| San Juan, PR (Seniorial Plaza) | | | F | | | | 14,849 | | | | 05/28 | | | | 7.180 | |
| Bayamon, PR (Rexville Plaza) | | | F | | | | 8,946 | | | | 05/28 | | | | 7.180 | |
| Arecibo, PR (Atlantico) | | | F | | | | 14,941 | | | | 05/28 | | | | 7.180 | |
| Total Mortgage Debt | | | | | | | 1,377,250 | | | | | | | | | |
| | | | | | | | | | | | | | | | |
| Total Debt | | | | | | $ | 3,753,166 | | | | | | | | | |
| | | | | | | | | | | | | | | | | |
| Adjustment for Reverse Swap | | | | | | | 1,318 | (4) | | | | | | | | |
| | | | | | | | | | | | | | | | |
| | | | | | | $ | 3,754,484 | | | | | | | | | |
| | | | | | | | | | | | | | | | |
| Weighted Average — Total | | | | | | | | | | 5.48 years | | | 5.4 | % |
| | | | | | | | | | | | | | | | |
| Weighted Average — Fixed | | | | | | | | | | 6.87 years | | | 5.9 | % |
| | | | | | | | | | | | | | | | |
| Weighted Average — Floating | | | | | | | | | | 2.48 years | | | 4.4 | % |
| | | | | | | | | | | | | | | | |
Notes:
F — Fixed Rate Debt V — Variable Rate Debt
| | | | | | | |
| 1. | | Interest rate figures reflect coupon rates of interest and do not include discounts or premiums. Annualized 2005 deferred finance cost amortization of approximately $7.0 million, net is offset by approximately $12.5 million of annualized fair market value adjustment. |
| 2. | | Public debt of $60 million has been converted to a variable rate of 5.285%. The remaining balance of $37.8 million is at the stated fixed rate. |
| 3. | | Encumbers five shopping center properties as follows: Plaza Vega Baja |
| | | | | Plaza Del Norte | | Plaza Wal-Mart |
| | | | | Plaza Del Oeste | | |
| | | | | Plaza Fajardo | | |
| 4. | | Offset included in other assets. | | |
Summary of Consolidated Debt 3.3
Developers Diversified Realty Corporation
Quarterly Financial Supplement
For the six months ended June 30, 2005
Summary of Consolidated Mortgage Principal Payments
and Corporate Debt Maturities
as of June 30, 2005
(000’s)
| | | | | | | | | | | | | | | | | | | | | | | | | | | | | | | | | | | | | | | | | | | | | | | | | |
| | | 2005 Payments | | 2006 Payments | | 2007 Payments | | 2008 Payments | | 2009 Payments | | 2010 Payments | | 2011 Payments | | 2012 Payments | | 2013 Payments | | 2014 Payments | | Thereafter | | Total |
PROPERTY MORTGAGES | | | | | | | | | | | | | | | | | | | | | | | | | | | | | | | | | | | | | | | | | | | | | | | | |
| Plainville, CT (TIF) | | | | | | | | | | | | | | | | | | | | | | | | | | | | | | | | | | | | | | | | | | | 7,100 | | | | 7,100 | |
| Bayonet Point, FL | | | | | | | 5,327 | | | | | | | | | | | | | | | | | | | | | | | | | | | | | | | | | | | | | | | | 5,327 | |
| Tupelo, MS | | | 287 | | | | 300 | | | | 313 | | | | 10,852 | | | | | | | | | | | | | | | | | | | | | | | | | | | | | | | | 11,752 | |
| Jacksonville, FL | | | 164 | | | | 172 | | | | 180 | | | | 6,227 | | | | | | | | | | | | | | | | | | | | | | | | | | | | | | | | 6,743 | |
| Reno, NV | | | 32 | | | | 59 | | | | 64 | | | | 67 | | | | 73 | | | | 78 | | | | 84 | | | | 89 | | | | 96 | | | | 103 | | | | 2,854 | | | | 3,600 | |
| Denver, CO (Univ Hills) | | | 522 | | | | 562 | | | | 604 | | | | 650 | | | | 699 | | | | 752 | | | | 809 | | | | 24,286 | | | | | | | | | | | | | | | | 28,884 | |
| Henderson, TN | | | 366 | | | | 395 | | | | 426 | | | | 460 | | | | 497 | | | | 536 | | | | 578 | | | | 624 | | | | 674 | | | | 727 | | | | 4,055 | | | | 9,337 | |
| Allentown, PA | | | 621 | | | | 666 | | | | 714 | | | | 765 | | | | 820 | | | | 879 | | | | 942 | | | | 1,009 | | | | 1,082 | | | | 1,159 | | | | 10,009 | | | | 18,665 | |
| Erie, PA | | | 273 | | | | 293 | | | | 314 | | | | 331 | | | | 360 | | | | 386 | | | | 23,640 | | | | | | | | | | | | | | | | | | | | 25,596 | |
| Erie, PA | | | 31 | | | | 33 | | | | 36 | | | | 38 | | | | 41 | | | | 44 | | | | 2,731 | | | | | | | | | | | | | | | | | | | | 2,954 | |
| Martinsville, VA | | | 203 | | | | 221 | | | | 241 | | | | 258 | | | | 18,936 | | | | | | | | | | | | | | | | | | | | | | | | | | | | 19,859 | |
| Boardman, OH | | | 283 | | | | 303 | | | | 325 | | | | 343 | | | | 373 | | | | 400 | | | | 24,555 | | | | | | | | | | | | | | | | | | | | 26,581 | |
| Solon, OH | | | 397 | | | | 415 | | | | 434 | | | | 15,033 | | | | | | | | | | | | | | | | | | | | | | | | | | | | | | | | 16,280 | |
| St. Louis, MO (Sunset) | | | 366 | | | | 392 | | | | 421 | | | | 444 | | | | 483 | | | | 518 | | | | 31,834 | | | | | | | | | | | | | | | | | | | | 34,458 | |
| St. Louis, MO (Brentwood) | | | 273 | | | | 293 | | | | 314 | | | | 331 | | | | 360 | | | | 386 | | | | 23,640 | | | | | | | | | | | | | | | | | | | | 25,596 | |
| Denver, CO (Centennial) | | | 408 | | | | 438 | | | | 469 | | | | 496 | | | | 539 | | | | 578 | | | | 35,467 | | | | | | | | | | | | | | | | | | | | 38,395 | |
| Cedar Rapids, IA | | | 315 | | | | 346 | | | | 380 | | | | 417 | | | | 458 | | | | 503 | | | | 552 | | | | 606 | | | | 665 | | | | 730 | | | | 5,094 | | | | 10,067 | |
| St. Louis, MO (Olympic) | | | 335 | | | | 367 | | | | 2,826 | | | | | | | | | | | | | | | | | | | | | | | | | | | | | | | | | | | | 3,529 | |
| St. Louis, MO (Gravois) | | | 310 | | | | 355 | | | | 389 | | | | 292 | | | | 115 | | | | 125 | | | | 136 | | | | 162 | | | | | | | | | | | | | | | | 1,883 | |
| St. Louis, MO (Keller) | | | 265 | | | | 289 | | | | 315 | | | | 343 | | | | 374 | | | | 33 | | | | | | | | | | | | | | | | | | | | | | | | 1,619 | |
| N. Charleston, SC | | | 284 | | | | 297 | | | | 311 | | | | 10,763 | | | | | | | | | | | | | | | | | | | | | | | | | | | | | | | | 11,656 | |
| Sault St Marie, MI | | | 990 | | | | 1,079 | | | | 418 | | | | | | | | | | | | | | | | | | | | | | | | | | | | | | | | | | | | 2,487 | |
| Walker, MI | | | 209 | | | | 219 | | | | 229 | | | | 7,917 | | | | | | | | | | | | | | | | | | | | | | | | | | | | | | | | 8,573 | |
| Detroit, MI | | | 2,922 | | | | | | | | | | | | | | | | | | | | | | | | | | | | | | | | | | | | | | | | | | | | 2,922 | |
| Mt. Pleasant, SC | | | 193 | | | | 201 | | | | 211 | | | | 7,294 | | | | | | | | | | | | | | | | | | | | | | | | | | | | | | | | 7,899 | |
| Meridian, ID | | | 623 | | | | 651 | | | | 681 | | | | 23,573 | | | | | | | | | | | | | | | | | | | | | | | | | | | | | | | | 25,527 | |
| Riverdale, UT (North) | | | 261 | | | | 287 | | | | 315 | | | | 345 | | | | 379 | | | | 415 | | | | 456 | | | | 500 | | | | 548 | | | | 602 | | | | 4,873 | | | | 8,980 | |
| Birmingham, AL | | | 674 | | | | 705 | | | | 737 | | | | 25,530 | | | | | | | | | | | | | | | | | | | | | | | | | | | | | | | | 27,646 | |
| Wilmington, NC | | | 517 | | | | 541 | | | | 565 | | | | 19,570 | | | | | | | | | | | | | | | | | | | | | | | | | | | | | | | | 21,192 | |
| Berlin, VT | | | | | | | | | | | 4,940 | | | | | | | | | | | | | | | | | | | | | | | | | | | | | | | | | | | | 4,940 | |
| Spring Hill, FL | | | 170 | | | | 187 | | | | 206 | | | | 227 | | | | 251 | | | | 276 | | | | 304 | | | | 335 | | | | 370 | | | | 407 | | | | 2,578 | | | | 5,312 | |
| West Pasco, FL | | | | | | | | | | | | | | | | | | | | | | | | | | | | | | | 4,784 | | | | | | | | | | | | | | | | 4,784 | |
| Princeton, NJ | | | 358 | | | | 389 | | | | 423 | | | | 454 | | | | 499 | | | | 543 | | | | 590 | | | | 636 | | | | 697 | | | | 758 | | | | 20,711 | | | | 26,057 | |
| Beachwood, OH | | | 332 | | | | 359 | | | | 387 | | | | 420 | | | | 451 | | | | 487 | | | | 525 | | | | 567 | | | | 349 | | | | | | | | | | | | 3,876 | |
| Leawood, KS | | | 1,117 | | | | 1,201 | | | | 1,292 | | | | 1,390 | | | | 46,435 | | | | | | | | | | | | | | | | | | | | | | | | | | | | 51,435 | |
| Durham, NC | | | 176 | | | | 184 | | | | 193 | | | | 6,672 | | | | | | | | | | | | | | | | | | | | | | | | | | | | | | | | 7,225 | |
| Bellefontaine, OH | | | 133 | | | | 143 | | | | 154 | | | �� | 166 | | | | 179 | | | | 193 | | | | 208 | | | | 224 | | | | 241 | | | | 260 | | | | 582 | | | | 2,481 | |
| Dublin, OH | | | 270 | | | | 9,185 | | | | | | | | | | | | | | | | | | | | | | | | | | | | | | | | | | | | | | | | 9,455 | |
| Pickerington, OH | | | 219 | | | | 4,079 | | | | | | | | | | | | | | | | | | | | | | | | | | | | | | | | | | | | | | | | 4,298 | |
| Dallas, TX (Carpenter) | | | 489 | | | | 525 | | | | 565 | | | | 26,406 | | | | | | | | | | | | | | | | | | | | | | | | | | | | | | | | 27,985 | |
| Silver Springs, MD (Tech 29-1) | | | 158 | | | | 170 | | | | 183 | | | | 196 | | | | 6,173 | | | | | | | | | | | | | | | | | | | | | | | | | | | | 6,880 | |
| Silver Springs, MD (Tech 29-2) | | | 93 | | | | 3,376 | | | | | | | | | | | | | | | | | | | | | | | | | | | | | | | | | | | | | | | | 3,469 | |
Summary of Consolidated Mortgage Principal Payments & Corporate Debt Maturities 3.4
Developers Diversified Realty Corporation
Quarterly Financial Supplement
For the six months ended June 30, 2005
Summary of Consolidated Mortgage Principal Payments
and Corporate Debt Maturities
as of June 30, 2005 (con’t)
(000’s)
| | | | | | | | | | | | | | | | | | | | | | | | | | | | | | | | | | | | | | | | | | | | | | | | | |
| | | 2005 Payments | | 2006 Payments | | 2007 Payments | | 2008 Payments | | 2009 Payments | | 2010 Payments | | 2011 Payments | | 2012 Payments | | 2013 Payments | | 2014 Payments | | Thereafter | | Total |
| Jamestown, NY (Southside Plaza) | | | 153 | | | | 165 | | | | 178 | | | | 193 | | | | 208 | | | | 225 | | | | 242 | | | | 262 | | | | 147 | | | | | | | | | | | | 1,773 | |
| Ithaca, NY | | | 980 | | | | 1,052 | | | | 1,128 | | | | 1,210 | | | | 1,298 | | | | 1,393 | | | | 1,494 | | | | 1,603 | | | | 1,720 | | | | 1,845 | | | | 6,579 | | | | 20,303 | |
| Columbus, OH (Consumer II West) | | | 380 | | | | 420 | | | | 465 | | | | 514 | | | | 568 | | | | 628 | | | | 694 | | | | 767 | | | | 848 | | | | 937 | | | | 8,103 | | | | 14,322 | |
| Olean, NY | | | 298 | | | | 326 | | | | 357 | | | | 390 | | | | 427 | | | | 467 | | | | 511 | | | | 559 | | | | 611 | | | | 669 | | | | 419 | | | | 5,034 | |
| N. Charleston, SC | | | 192 | | | | 206 | | | | 222 | | | | 239 | | | | 257 | | | | 277 | | | | 298 | | | | 9,140 | | | | | | | | | | | | | | | | 10,831 | |
| W. Long Branch, NJ (Monmouth) | | | 1,269 | | | | 1,382 | | | | 1,506 | | | | 1,640 | | | | 1,786 | | | | 1,945 | | | | 2,119 | | | | 2,307 | | | | 1,440 | | | | | | | | | | | | 15,394 | |
| Big Flats, NY (Big Flats I) | | | 1,592 | | | | 1,724 | | | | 1,867 | | | | 2,022 | | | | 2,190 | | | | 2,374 | | | | | | | | | | | | | | | | | | | | | | | | 11,767 | |
| Mays Landing, NJ (Wrangleboro) | | | 1,953 | | | | 2,094 | | | | 2,245 | | | | 2,407 | | | | 2,581 | | | | 2,767 | | | | 2,967 | | | | 3,181 | | | | 31,981 | | | | | | | | | | | | 52,174 | |
| Plattsburgh, NY | | | 1,554 | | | | 1,683 | | | | 1,823 | | | | 1,974 | | | | 2,138 | | | | 2,317 | | | | | | | | | | | | | | | | | | | | | | | | 11,489 | |
| Amherst, NY (Kmart/Blvd Cons. II) | | | 802 | | | | 868 | | | | 938 | | | | 1,015 | | | | 1,097 | | | | 1,187 | | | | 1,283 | | | | 1,388 | | | | 1,500 | | | | 1,623 | | | | 1,603 | | | | 13,304 | |
| Big Flats, NY (Big Flats IV) | | | 58 | | | | 63 | | | | 68 | | | | 73 | | | | 79 | | | | 86 | | | | 92 | | | | 100 | | | | 464 | | | | | | | | | | | | 1,083 | |
| Lockport, NY (Walmart/Tops) | | | 805 | | | | 872 | | | | 944 | | | | 1,022 | | | | 1,107 | | | | 1,199 | | | | 1,298 | | | | 1,406 | | | | 1,523 | | | | 1,649 | | | | 1,942 | | | | 13,767 | |
| Big Flats, NY (Big Flats II) | | | 426 | | | | 462 | | | | 501 | | | | 543 | | | | 589 | | | | 639 | | | | 693 | | | | 751 | | | | 228 | | | | | | | | | | | | 4,832 | |
| Amherst, NY (Tops Transit + French) | | | 291 | | | | 315 | | | | 340 | | | | 367 | | | | 396 | | | | 427 | | | | 461 | | | | 498 | | | | 538 | | | | 580 | | | | 1,303 | | | | 5,516 | |
| Amherst, NY (Target/Blvd Cons. II) | | | 722 | | | | 764 | | | | 808 | | | | 856 | | | | 905 | | | | 958 | | | | 1,014 | | | | 1,073 | | | | 1,135 | | | | 1,201 | | | | 4,908 | | | | 14,345 | |
| Medina, NY | | | 219 | | | | 236 | | | | 255 | | | | 275 | | | | 297 | | | | 320 | | | | 346 | | | | 373 | | | | 403 | | | | 435 | | | | 932 | | | | 4,092 | |
| Mays Landing, NJ (Hamilton) | | | 1,213 | | | | 1,271 | | | | 1,332 | | | | 1,396 | | | | 1,463 | | | | 1,534 | | | | 1,607 | | | | 1,684 | | | | 1,765 | | | | 1,850 | | | | 1,446 | | | | 16,562 | |
| Gates, NY (Westgate) | | | 280 | | | | 301 | | | | 324 | | | | 349 | | | | 375 | | | | 404 | | | | 23,004 | | | | | | | | | | | | | | | | | | | | 25,039 | |
| Boynton Beach, FL (Meadows Square) | | | 389 | | | | 453 | | | | 485 | | | | 519 | | | | 556 | | | | 595 | | | | 637 | | | | 682 | | | | 513 | | | | | | | | | | | | 4,828 | |
| Rome, NY (Freedom) | | | 253 | | | | 273 | | | | 295 | | | | 319 | | | | 345 | | | | 374 | | | | 404 | | | | 437 | | | | 472 | | | | 511 | | | | 1,019 | | | | 4,703 | |
| Englewood, FL (Rotonda) | | | 210 | | | | 223 | | | | 236 | | | | 250 | | | | 265 | | | | 281 | | | | 298 | | | | 315 | | | | 176 | | | | | | | | | | | | 2,255 | |
| Moorseville, NC | | | 261 | | | | 279 | | | | 300 | | | | 322 | | | | 345 | | | | 370 | | | | 397 | | | | 426 | | | | 21,334 | | | | | | | | | | | | 24,032 | |
| Alden, NY | | | 148 | | | | 160 | | | | 173 | | | | 188 | | | | 208 | | | | 246 | | | | 266 | | | | 289 | | | | 313 | | | | 343 | | | | 2,229 | | | | 4,563 | |
| Indian Train, NC (Union TC Ph I) | | | 82 | | | | 88 | | | | 95 | | | | 102 | | | | 109 | | | | 117 | | | | 6,408 | | | | | | | | | | | | | | | | | | | | 7,002 | |
| Cheektowaga, NY (Walmart Thruway) | | | 265 | | | | 284 | | | | 304 | | | | 325 | | | | 348 | | | | 372 | | | | 398 | | | | 426 | | | | 456 | | | | 487 | | | | 1,574 | | | | 5,238 | |
| Ashtabula, OH | | | 81 | | | | 87 | | | | 93 | | | | 100 | | | | 107 | | | | 115 | | | | 6,386 | | | | | | | | | | | | | | | | | | | | 6,969 | |
| Buffalo, NY (Delaware Commons) | | | 119 | | | | 127 | | | | 137 | | | | 146 | | | | 157 | | | | 168 | | | | 180 | | | | 193 | | | | 26 | | | | | | | | | | | | 1,254 | |
| Springville, NY | | | 311 | | | | 331 | | | | 353 | | | | 376 | | | | 401 | | | | 427 | | | | 455 | | | | 485 | | | | 517 | | | | 551 | | | | 2,287 | | | | 6,492 | |
| Niskayuna, NY (Mohawk) | | | 1,260 | | | | 1,335 | | | | 1,414 | | | | 1,497 | | | | 1,585 | | | | 1,679 | | | | 1,778 | | | | 1,883 | | | | 1,994 | | | | 2,112 | | | | 9,771 | | | | 26,310 | |
| Canandaigua, NY | | | 351 | | | | 373 | | | | 396 | | | | 421 | | | | 448 | | | | 476 | | | | 507 | | | | 539 | | | | 573 | | | | 609 | | | | 1,395 | | | | 6,087 | |
| Victor, NY (Victor Square) | | | 89 | | | | 95 | | | | 100 | | | | 107 | | | | 113 | | | | 120 | | | | 127 | | | | 135 | | | | 5,803 | | | | | | | | | | | | 6,689 | |
| Bayamon, PR (Rio Hondo) | | | 811 | | | | 941 | | | | 1,011 | | | | 1,076 | | | | 1,169 | | | | 1,256 | | | | 1,351 | | | | 1,442 | | | | 1,561 | | | | 1,679 | | | | 45,256 | | | | 57,554 | |
| San Juan, PR (Seniorial Plaza) | | | 211 | | | | 244 | | | | 263 | | | | 279 | | | | 303 | | | | 326 | | | | 351 | | | | 375 | | | | 405 | | | | 436 | | | | 11,752 | | | | 14,945 | |
| Bayamon, PR (Rexville Plaza) | | | 127 | | | | 147 | | | | 158 | | | | 168 | | | | 183 | | | | 197 | | | | 211 | | | | 226 | | | | 244 | | | | 263 | | | | 7,080 | | | | 9,004 | |
| Arecibo, PR (Atlantico) | | | 212 | | | | 246 | | | | 264 | | | | 281 | | | | 305 | | | | 328 | | | | 353 | | | | 377 | | | | 408 | | | | 439 | | | | 11,825 | | | | 15,038 | |
| MPR Portfolio | | | 175,000 | | | | | | | | | | | | | | | | | | | | | | | | | | | | | | | | | | | | | | | | | | | | 175,000 | |
| MPR Portfolio (Mezzanine) | | | 25,000 | | | | | | | | | | | | | | | | | | | | | | | | | | | | | | | | | | | | | | | | | | | | 25,000 | |
| Merriam, KS (TIF) | | | | | | | | | | | | | | | | | | | | | | | | | | | | | | | | | | | | | | | | | | | 7,975 | | | | 7,975 | |
| Princeton, NJ (Nassau Pav) | | | | | | | | | | | | | | | | | | | | | | | | | | | | | | | | | | | | | | | | | | | 24,998 | | | | 24,998 | |
| San Antonio, TX | | | | | | | 25,000 | | | | | | | | | | | | | | | | | | | | | | | | | | | | | | | | | | | | | | | | 25,000 | |
| Hamilton, NJ | | | | | | | | | | | 65,000 | | | | | | | | | | | | | | | | | | | | | | | | | | | | | | | | | | | | 65,000 | |
| Payments Made Through 6/30/05 | | | -17,442 | | | | | | | | | | | | | | | | | | | | | | | | | | | | | | | | | | | | | | | | | | | | -17,442 | |
| | | | | | | | | | | | | | | | | | | | | | | | | | | | | | | | | | | | | | | | | | | | | | | | | |
| Total — Property Mortgages | | | 216,564 | | | | 79,897 | | | | 106,952 | | | | 191,231 | | | | 103,202 | | | | 33,723 | | | | 205,680 | | | | 67,142 | | | | 83,819 | | | | 22,966 | | | | 212,252 | | | | 1,323,427 | |
Summary of Consolidated Mortgage Principal Payments & Corporate Debt Maturities 3.4
Developers Diversified Realty Corporation
Quarterly Financial Supplement
For the six months ended June 30, 2005
Summary of Consolidated Mortgage Principal Payments
and Corporate Debt Maturities
as of June 30, 2005 (con’t)
(000’s)
| | | | | | | | | | | | | | | | | | | | | | | | | | | | | | | | | | | | | | | | | | | | | | | | | |
| | | 2005 Payments | | 2006 Payments | | 2007 Payments | | 2008 Payments | | 2009 Payments | | 2010 Payments | | 2011 Payments | | 2012 Payments | | 2013 Payments | | 2014 Payments | | Thereafter | | Total |
CONSTRUCTION LOANS | | | | | | | | | | | | | | | | | | | | | | | | | | | | | | | | | | | | | | | | | | | | | | | | |
$20 Million Construction Loan
(National City Bank) | | | | | | | | | | | 15,573 | | | | | | | | | | | | | | | | | | | | | | | | | | | | | | | | | | | | 15,573 | |
$48 Million Construction Loan
(Wachovia Bank) | | | | | | | | | | | 38,250 | | | | | | | | | | | | | | | | | | | | | | | | | | | | | | | | | | | | 38,250 | |
| | | | | | | | | | | | | | | | | | | | | | | | | | | | | | | | | | | | | | | | | | | | | | | | | |
| Total — Construction Loans | | | 0 | | | | 0 | | | | 53,823 | | | | 0 | | | | 0 | | | | 0 | | | | 0 | | | | 0 | | | | 0 | | | | 0 | | | | 0 | | | | 53,823 | |
| | | | | | | | | | | | | | | | | | | | | | | | | | | | | | | | | | | | | | | | | | | | | | | | | |
DEBT OFFERINGS | | | | | | | | | | | | | | | | | | | | | | | | | | | | | | | | | | | | | | | | | | | | | | | | |
| Senior Notes | | | 1,000 | | | | | | | | 109,854 | | | | 99,934 | | | | 274,180 | | | | 499,283 | | | | 249,119 | | | | | | | | | | | | | | | | 299,296 | | | | 1,532,667 | |
| Unsecured Notes | | | | | | | | | | | 85,000 | | | | | | | | | | | | | | | | | | | | | | | | | | | | | | | | | | | | 85,000 | |
| | | | | | | | | | | | | | | | | | | | | | | | | | | | | | | | | | | | | | | | | | | | | | | | | |
| Total — Debt Offerings | | | 1,000 | | | | 0 | | | | 194,854 | | | | 99,934 | | | | 274,180 | | | | 499,283 | | | | 249,119 | | | | 0 | | | | 0 | | | | 0 | | | | 299,296 | | | | 1,617,666 | |
| | | | | | | | | | | | | | | | | | | | | | | | | | | | | | | | | | | | | | | | | | | | | | | | | |
| Total — Property Mortgages, Construction Loans & Debt Offerings | | | 217,564 | | | | 79,897 | | | | 355,629 | | | | 291,165 | | | | 377,383 | | | | 533,006 | | | | 454,799 | | | | 67,142 | | | | 83,819 | | | | 22,966 | | | | 511,548 | | | | 2,994,916 | |
| | | | | | | | | | | | | | | | | | | | | | | | | | | | | | | | | | | | | | | | | | | | | | | | | |
REVOLVING CREDIT FACILITIES & TERM LOANS | | | | | | | | | | | | | | | | | | | | | | | | | | | | | | | | | | | | | | | | | | | | | | | | |
$1 Billion Unsecured Credit
(JPMorgan Chase) | | | | | | | | | | | | | | | 315,750 | (1) | | | | | | | | | | | | | | | | | | | | | | | | | | | | | | | 315,750 | |
$400 Million Secured Credit
(Key Bank) | | | | | | | | | | | | | | | 220,000 | | | | | | | | | | | | | | | | | | | | | | | | | | | | | | | | 220,000 | |
$200 Million Unsecured Credit
(JPMorgan Chase) | | | | | | | | | | | 200,000 | (1) | | | | | | | | | | | | | | | | | | | | | | | | | | | | | | | | | | | 200,000 | |
$60 Million Unsecured Credit
(National City Bank) | | | | | | | | | | | | | | | 22,500 | (1) | | | | | | | | | | | | | | | | | | | | | | | | | | | | | | | 22,500 | |
| | | | | | | | | | | | | | | | | | | | | | | | | | | | | | | | | | | | | | | | | | | | | | | | | |
| Total — Debt | | $ | 217,564 | | | $ | 79,897 | | | $ | 555,629 | | | $ | 849,415 | | | $ | 377,383 | | | $ | 533,006 | | | $ | 454,799 | | | $ | 67,142 | | | $ | 83,819 | | | $ | 22,966 | | | $ | 511,548 | | | $ | 3,753,166 | |
| | | | | | | | | | | | | | | | | | | | | | | | | | | | | | | | | | | | | | | | | | | | | | | | | |
Notes:
| (1) | | Balance at June 30, 2005 on revolving credit facilities. The $1 billion JPMorgan Chase facility has one one-year extension option to 2009. The $400 million Key Bank facility has two one-year extension options to 2010. The $200 million JPMorgan Chase facility has one one-year extension option to 2008. The $60 million National City Bank facility has one one-year extension option to 2009 |
Summary of Consolidated Mortgage Principal Payments & Corporate Debt Maturities 3.4
| | | |
Developers Diversified Realty | | |
| Quarterly Financial Supplement | | |
| For the six months ended June 30, 2005 | | |
| |
Joint Ventures (Combining Financial Information) (1)
(in millions)
Combining Balance Sheets
as of June 30, 2005
| | | | | | | | | | | | | | | | | | | | | | | | | | | | | | | | | | | | | |
| | | | | | | RVIP III B | | | | | | | | | | RVIP VIII | | | | | | Community Centers | | Community Centers | | Community Centers |
| | | RVIP III | | Deer Park, IL | | RVIP VI | | RVIP VII | | Tech Ridge LLC | | DPG | | (5) | | Five | | Seven |
| Real Estate Assets | | | 55.5 | | | | 84.4 | | | | 32.2 | | | | 159.2 | | | | 32.4 | | | | 129.0 | | | | 0.0 | | | $ | 249.8 | | | $ | 15.6 | |
| Accumulated Depreciation | | | (2.4 | ) | | | (8.3 | ) | | | (4.2 | ) | | | (16.3 | ) | | | (1.3 | ) | | | (2.2 | ) | | | 0.0 | | | | (36.1 | ) | | | (1.3 | ) |
| | | | | | | | | | | | | | | | | | | | | | | | | | | | | | | | | | | | | |
| Real Estate, net | | | 53.1 | | | | 76.1 | | | | 28.0 | | | | 142.9 | | | | 31.1 | | | | 126.8 | | | | 0.0 | | | | 213.7 | | | | 14.3 | |
| | | | | | | | | | | | | | | | | | | | | | | | | | | | | | | | | | | | | |
| Receivables, Net | | | 1.4 | | | | 1.1 | | | | 0.7 | | | | 3.2 | | | | 0.5 | | | | 1.0 | | | | 0.1 | | | | 5.1 | | | | 0.3 | |
| Other assets | | | 1.2 | | | | 0.7 | | | | 1.2 | | | | 8.7 | | | | 1.5 | | | | 2.6 | | | | 1.1 | | | | 12.5 | | | | 0.2 | |
| | | | | | | | | | | | | | | | | | | | | | | | | | | | | | | | | | | | | |
| | | $ | 55.7 | | | $ | 77.9 | | | $ | 29.9 | | | $ | 154.8 | | | $ | 33.1 | | | $ | 130.4 | | | $ | 1.2 | | | $ | 231.3 | | | $ | 14.8 | |
| | | | | | | | | | | | | | | | | | | | | | | | | | | | | | | | | | | | | |
| | | | | | | | | | | | | | | | | | | | | | | | | | | | | | | | | | | | | |
| Mortgage Debt | | $ | 28.0 | | | $ | 55.4 | | | $ | 18.2 | | | $ | 100.7 | | | $ | 23.3 | | | $ | 11.6 | | | $ | 0.0 | | | $ | 156.0 | | | $ | 11.0 | |
| Amounts payable to DDRC | | | 0.0 | | | | 0.0 | | | | 0.0 | | | | 0.0 | | | | 0.0 | | | | 0.0 | | | | 0.0 | | | | 0.0 | | | | 0.0 | |
| Other liabilities | | | 0.7 | | | | 3.7 | | | | 0.7 | | | | 16.8 | | | | 0.9 | | | | 2.2 | | | | 0.8 | | | | 3.7 | | | | 0.3 | |
| | | | | | | | | | | | | | | | | | | | | | | | | | | | | | | | | | | | | |
| | | | 28.7 | | | | 59.1 | | | | 18.9 | | | | 117.5 | | | | 24.2 | | | | 13.8 | | | | 0.8 | | | | 159.7 | | | | 11.3 | |
| Accumulated equity (deficit) | | | 27.0 | | | | 18.8 | | | | 11.0 | | | | 37.3 | | | | 8.9 | | | | 116.6 | | | | 0.4 | | | | 71.6 | | | | 3.5 | |
| | | | | | | | | | | | | | | | | | | | | | | | | | | | | | | | | | | | | |
| | | $ | 55.7 | | | $ | 77.9 | | | $ | 29.9 | | | $ | 154.8 | | | $ | 33.1 | | | $ | 130.4 | | | $ | 1.2 | | | $ | 231.3 | | | $ | 14.8 | |
| | | | | | | | | | | | | | | | | | | | | | | | | | | | | | | | | | | | | |
| | | | | | | | | | | | | | | | | | | | | | | | | | | | | | | | | | | | | |
| Proportionate share of other assets/liabilities, net | | $ | 0.5 | | | ($ | 0.5 | ) | | $ | 0.3 | | | ($ | 1.0 | ) | | $ | 0.3 | | | $ | 0.1 | | | $ | 0.2 | | | $ | 7.0 | | | $ | 0.1 | |
| | | | | | | | | | | | | | | | | | | | | | | | | | | | | | | | | | | | | |
| Disproportionate amount payable to DDR | | $ | 0.0 | | | $ | 0.0 | | | $ | 0.0 | | | $ | 0.0 | | | $ | 0.0 | | | $ | 0.0 | | | $ | 0.0 | | | $ | 0.0 | | | $ | 0.0 | |
| | | | | | | | | | | | | | | | | | | | | | | | | | | | | | | | | | | | | |
Combining Statements of Operations
for the period ended June 30, 2005
| | | | | | | | | | | | | | | | | | | | | | | | | | | | | | | | | | | | | |
| | | | | | | RVIP III B | | | | | | | | | | RVIP VIII | | | | | | Community Centers | | Community Centers | | Community Centers |
| | | RVIP III | | Deer Park, IL | | RVIP VI | | RVIP VII | | Tech Ridge LLC | | DPG | | (5) | | Five | | Seven |
| Revenues from operations | | $ | 2.7 | | | $ | 6.4 | | | $ | 2.2 | | | $ | 8.6 | | | $ | 2.8 | | | $ | 6.6 | | | $ | 0.0 | | | $ | 17.0 | | | $ | 0.9 | |
| Rental operation expenses | | | (1.2 | ) | | | (2.3 | ) | | | (1.1 | ) | | | (3.1 | ) | | | (0.8 | ) | | | (1.6 | ) | | | 0.0 | | | | (5.3 | ) | | | (0.3 | ) |
| | | | | | | | | | | | | | | | | | | | | | | | | | | | | | | | | | | | | |
| Net operating income | | | 1.5 | | | | 4.1 | | | | 1.1 | | | | 5.5 | | | | 2.0 | | | | 5.0 | | | | 0.0 | | | | 11.7 | | | | 0.6 | |
| Depreciation and amortization expense | | | (0.6 | ) | | | (1.2 | ) | | | (0.5 | ) | | | (1.9 | ) | | | (0.5 | ) | | | (1.6 | ) | | | 0.0 | | | | (3.0 | ) | | | (0.1 | ) |
| Interest expense | | | (0.7 | ) | | | (1.3 | ) | | | (0.7 | ) | | | (2.7 | ) | | | (0.6 | ) | | | (0.3 | ) | | | 0.0 | | | | (5.3 | ) | | | (0.3 | ) |
| | | | | | | | | | | | | | | | | | | | | | | | | | | | | | | | | | | | | |
| Income (loss) before gain on sale | | | 0.2 | | | | 1.6 | | | | (0.1 | ) | | | 0.9 | | | | 0.9 | | | | 3.1 | | | | 0.0 | | | | 3.4 | | | | 0.2 | |
| Gain (loss) on sale of real estate | | | 0.0 | | | | 0.0 | | | | 0.0 | | | | 0.0 | | | | 0.0 | | | | 0.0 | | | | 0.8 | | | | 0.0 | | | | 0.0 | |
| Discontinued operations | | | 0.0 | | | | 0.0 | | | | 0.0 | | | | 0.0 | | | | 0.0 | | | | 0.0 | | | | 0.0 | | | | 0.0 | | | | 0.0 | |
| Gain on sale of discontinued operations | | | 0.0 | | | | 0.0 | | | | 0.0 | | | | 7.0 | | | | 0.0 | | | | 0.0 | | | | 0.0 | | | | 0.0 | | | | 0.0 | |
| | | | | | | | | | | | | | | | | | | | | | | | | | | | | | | | | | | | | |
| Net income (loss) | | $ | 0.2 | | | $ | 1.6 | | | ($ | 0.1 | ) | | $ | 7.9 | | | $ | 0.9 | | | $ | 3.1 | | | $ | 0.8 | | | $ | 3.4 | | | $ | 0.2 | |
| DDR Ownership interest | | | *** | | | | *** | | | | *** | | | | *** | | | | *** | | | | *** | | | | *** | | | | 50 | % | | | 50 | % |
| | | | | | | | | | | | | | | | | | | | | | | | | | | | | | | | | | | | | |
| | | $ | 0.1 | | | $ | 0.7 | | | ($ | 0.1 | ) | | $ | 3.1 | | | $ | 0.3 | | | $ | 0.3 | | | $ | 0.8 | | | $ | 1.7 | | | $ | 0.1 | |
| Amortization of basis differential | | | 0.0 | | | | 0.0 | | | | 0.0 | | | | 0.0 | | | | 0.0 | | | | 0.0 | | | | (0.4 | ) | | | 0.1 | | | | 0.0 | |
| | | | | | | | | | | | | | | | | | | | | | | | | | | | | | | | | | | | | |
| | | $ | 0.1 | | | $ | 0.7 | | | ($ | 0.1 | ) | | $ | 3.1 | | | $ | 0.3 | | | $ | 0.3 | | | $ | 0.4 | | | $ | 1.8 | | | $ | 0.1 | |
| | | | | | | | | | | | | | | | | | | | | | | | | | | | | | | | | | | | | |
| | | | | | | | | | | | | | | | | | | | | | | | | | | | | | | | | | | | | |
| Proportionate share of net operating income | | $ | 0.4 | | | $ | 1.0 | | | $ | 0.3 | | | $ | 1.1 | | | $ | 0.5 | | | $ | 0.5 | | | $ | 0.0 | | | $ | 5.8 | | | $ | 0.3 | |
| | | | | | | | | | | | | | | | | | | | | | | | | | | | | | | | | | | | | |
| Proportionate share of interest expense | | $ | 0.2 | | | $ | 0.3 | | | $ | 0.2 | | | $ | 0.6 | | | $ | 0.2 | | | $ | 0.0 | | | $ | 0.0 | | | $ | 2.6 | | | $ | 0.1 | |
| | | | | | | | | | | | | | | | | | | | | | | | | | | | | | | | | | | | | |
| | | | | | | | | | | | | | | | | | | | | | | | | | | | | | | | | | | | | |
Funds From Operations (“FFO”): | | | | | | | | | | | | | | | | | | | | | | | | | | | | | | | | | | | | |
| | | | | | | | | | | | | | | | | | | | | | | | | | | | | | | | | | | | | |
| Net income (loss) | | $ | 0.2 | | | $ | 1.6 | | | ($ | 0.1 | ) | | $ | 7.9 | | | $ | 0.9 | | | $ | 3.1 | | | $ | 0.8 | | | $ | 3.4 | | | $ | 0.2 | |
| Depreciation of real property | | | 0.6 | | | | 1.2 | | | | 0.5 | | | | 2.0 | | | | 0.5 | | | | 1.6 | | | | 0.0 | | | | 3.0 | | | | 0.1 | |
| (Gain) loss on sale | | | 0.0 | | | | 0.0 | | | | 0.0 | | | | (7.0 | ) | | | 0.0 | | | | 0.0 | | | | (0.8 | ) | | | 0.0 | | | | 0.0 | |
| | | | | | | | | | | | | | | | | | | | | | | | | | | | | | | | | | | | | |
| | | $ | 0.8 | | | $ | 2.8 | | | $ | 0.4 | | | $ | 2.9 | | | $ | 1.4 | | | $ | 4.7 | | | $ | 0.0 | | | $ | 6.4 | | | $ | 0.3 | |
| DDR ownership interest | | | *** | | | | *** | | | | *** | | | | *** | | | | *** | | | | 10 | % | | | *** | | | | 50 | % | | | 50 | % |
| | | | | | | | | | | | | | | | | | | | | | | | | | | | | | | | | | | | | |
| DDR FFO | | $ | 0.3 | | | $ | 1.1 | | | $ | 0.1 | | | $ | 0.8 | | | $ | 0.5 | | | $ | 0.5 | | | $ | 0.1 | | | $ | 3.2 | | | $ | 0.2 | |
| | | | | | | | | | | | | | | | | | | | | | | | | | | | | | | | | | | | | |
| | | |
Developers Diversified Realty | | |
| Quarterly Financial Supplement | | |
| For the six months ended June 30, 2005 | | |
| |
Joint Ventures (Combining Financial Information) (1)
(in millions)
Combining Balance Sheets
as of June 30, 2005
| | | | | | | | | | | | | | | | | | | | | | | | | | | | | | | | | | | | | |
| | | Community | | | | | | Lennox Town | | Sun Center | | Dublin Village | | Dublin Village | | | | | | |
| | | Centers Eight | | Kildeer, IL | | Center (2) | | Limited (2) | | (2) | | (2)(3) | | DOTRS | | Littleton, CO (3) | | Salisbury, MD |
| Real Estate Assets | | $ | 26.8 | | | $ | 31.0 | | | $ | 21.0 | | | $ | 25.5 | | | $ | 29.2 | | | $ | 0.1 | | | $ | 25.3 | | | $ | 3.2 | | | $ | 2.2 | |
| Accumulated Depreciation | | | (2.6 | ) | | | (1.9 | ) | | | (3.7 | ) | | | (6.0 | ) | | | (14.7 | ) | | | 0.0 | | | | (4.2 | ) | | | 0.0 | | | | (0.3 | ) |
| | | | | | | | | | | | | | | | | | | | | | | | | | | | | | | | | | | | | |
| Real Estate, net | | | 24.2 | | | | 29.1 | | | | 17.3 | | | | 19.5 | | | | 14.5 | | | | 0.1 | | | | 21.1 | | | | 3.2 | | | | 1.9 | |
| | | | | | | | | | | | | | | | | | | | | | | | | | | | | | | | | | | | | |
| Receivables, Net | | | 0.8 | | | | 0.4 | | | | 1.4 | | | | 0.6 | | | | 0.2 | | | | 0.0 | | | | 0.8 | | | | 0.0 | | | | 0.0 | |
| Other assets | | | 0.6 | | | | 0.5 | | | | 0.4 | | | | 0.9 | | | | 1.6 | | | | 0.0 | | | | 0.1 | | | | 0.0 | | | | 0.1 | |
| | | | | | | | | | | | | | | | | | | | | | | | | | | | | | | | | | | | | |
| | | $ | 25.6 | | | $ | 30.0 | | | $ | 19.1 | | | $ | 21.0 | | | $ | 16.3 | | | $ | 0.1 | | | $ | 22.0 | | | $ | 3.2 | | | $ | 2.0 | |
| | | | | | | | | | | | | | | | | | | | | | | | | | | | | | | | | | | | | |
| | | | | | | | | | | | | | | | | | | | | | | | | | | | | | | | | | | | | |
| Mortgage Debt | | $ | 17.5 | | | $ | 19.5 | | | $ | 18.3 | | | $ | 20.9 | | | $ | 0.0 | | | $ | 0.0 | | | $ | 10.5 | | | $ | 0.0 | | | $ | 1.8 | |
| Amounts payable to DDRC | | | 0.0 | | | | 0.0 | | | | 0.0 | | | | 0.0 | | | | 0.0 | | | | 0.0 | | | | 0.0 | | | | 0.0 | | | | 0.0 | |
| Other liabilities | | | 0.5 | | | | 0.5 | | | | 0.6 | | | | 0.4 | | | | 0.3 | | | | 0.0 | | | | 0.2 | | | | 0.1 | | | | 0.0 | |
| | | | | | | | | | | | | | | | | | | | | | | | | | | | | | | | | | | | | |
| | | | 18.0 | | | | 20.0 | | | | 18.9 | | | | 21.3 | | | | 0.3 | | | | 0.0 | | | | 10.7 | | | | 0.1 | | | | 1.8 | |
| Accumulated equity (deficit) | | | 7.6 | | | | 10.0 | | | | 0.2 | | | | (0.3 | ) | | | 16.0 | | | | 0.1 | | | | 11.3 | | | | 3.1 | | | | 0.2 | |
| | | | | | | | | | | | | | | | | | | | | | | | | | | | | | | | | | | | | |
| | | $ | 25.6 | | | $ | 30.0 | | | $ | 19.1 | | | $ | 21.0 | | | $ | 16.3 | | | $ | 0.1 | | | $ | 22.0 | | | $ | 3.2 | | | $ | 2.0 | |
| | | | | | | | | | | | | | | | | | | | | | | | | | | | | | | | | | | | | |
| | | | | | | | | | | | | | | | | | | | | | | | | | | | | | | | | | | | | |
| Proportionate share of other assets/liabilities, net | | $ | 0.5 | | | $ | 0.0 | | | $ | 0.6 | | | $ | 0.8 | | | $ | 1.3 | | | ($ | 0.0 | ) | | $ | 0.3 | | | ($ | 0.0 | ) | | $ | 0.1 | |
| | | | | | | | | | | | | | | | | | | | | | | | | | | | | | | | | | | | | |
| Disproportionate amount payable to DDR | | $ | 0.0 | | | $ | 0.0 | | | $ | 0.0 | | | $ | 0.0 | | | $ | 0.0 | | | $ | 0.0 | | | $ | 0.0 | | | $ | 0.0 | | | $ | 0.0 | |
| | | | | | | | | | | | | | | | | | | | | | | | | | | | | | | | | | | | | |
Combining Statements of Operations
for the period ended June 30, 2005
| | | | | | | | | | | | | | | | | | | | | | | | | | | | | | | | | | | | | |
| | | Community | | | | | | Lennox Town | | Sun Center | | Dublin Village | | Dublin Village | | | | | | |
| | | Centers Eight | | Kildeer, IL | | Center (2) | | Limited (2) | | (2) | | (2) (3) | | DOTRS | | Littleton, CO (3) | | Salisbury, MD |
| Revenues from operations | | $ | 2.2 | | | $ | 2.1 | | | $ | 2.3 | | | $ | 1.9 | | | $ | 1.0 | | | $ | 0.0 | | | $ | 1.9 | | | $ | 0.0 | | | $ | 0.2 | |
| Rental operation expenses | | | (0.7 | ) | | | (0.5 | ) | | | (0.6 | ) | | | (0.5 | ) | | | (0.4 | ) | | | (0.0 | ) | | | (0.5 | ) | | | (0.0 | ) | | | (0.1 | ) |
| | | | | | | | | | | | | | | | | | | | | | | | | | | | | | | | | | | | | |
| Net operating income | | | 1.5 | | | | 1.6 | | | | 1.7 | | | | 1.4 | | | | 0.6 | | | | 0.0 | | | | 1.4 | | | | 0.0 | | | | 0.1 | |
| Depreciation and amortization expense | | | (0.3 | ) | | | (0.3 | ) | | | (0.2 | ) | | | (0.4 | ) | | | (1.9 | ) | | | 0.0 | | | | (0.3 | ) | | | 0.0 | | | | (0.0 | ) |
| Interest expense | | | (0.7 | ) | | | (0.6 | ) | | | (0.8 | ) | | | (0.8 | ) | | | 0.0 | | | | 0.0 | | | | (0.2 | ) | | | 0.0 | | | | (0.1 | ) |
| | | | | | | | | | | | | | | | | | | | | | | | | | | | | | | | | | | | | |
| Income (loss) before gain on sale | | | 0.5 | | | | 0.7 | | | | 0.7 | | | | 0.2 | | | | (1.3 | ) | | | 0.0 | | | | 0.9 | | | | 0.0 | | | | 0.0 | |
| Gain (loss) on sale of real estate | | | 0.0 | | | | 0.0 | | | | 0.0 | | | | 0.0 | | | | 0.0 | | | | 0.0 | | | | 0.0 | | | | 0.0 | | | | 0.0 | |
| Discontinued operations | | | 0.0 | | | | 0.0 | | | | 0.0 | | | | 0.0 | | | | 0.0 | | | | 0.0 | | | | 0.0 | | | | 0.0 | | | | 0.0 | |
| Gain on sale of discontinued operations | | | 0.0 | | | | 0.0 | | | | 0.0 | | | | 0.0 | | | | 0.0 | | | | 0.0 | | | | 0.0 | | | | 0.0 | | | | 0.0 | |
| | | | | | | | | | | | | | | | | | | | | | | | | | | | | | | | | | | | | |
| Net income (loss) | | $ | 0.5 | | | $ | 0.7 | | | $ | 0.7 | | | $ | 0.2 | | | ($ | 1.3 | ) | | $ | 0.0 | | | $ | 0.9 | | | $ | 0.0 | | | $ | 0.0 | |
| DDR Ownership interest | | | 50 | % | | | 10 | % | | | *** | | | | *** | | | | 80 | % | | | 63 | % | | | 50 | % | | | 50 | % | | | 50 | % |
| | | | | | | | | | | | | | | | | | | | | | | | | | | | | | | | | | | | | |
| | | $ | 0.2 | | | $ | 0.1 | | | $ | 0.4 | | | $ | 0.1 | | | ($ | 1.0 | ) | | ($ | 0.0 | ) | | $ | 0.4 | | | ($ | 0.0 | ) | | $ | 0.0 | |
| Amortization of basis differential | | | 0.0 | | | | 0.0 | | | | 0.0 | | | | (0.1 | ) | | | 0.6 | | | | 0.0 | | | | 0.0 | | | | 0.0 | | | | 0.0 | |
| | | | | | | | | | | | | | | | | | | | | | | | | | | | | | | | | | | | | |
| | | $ | 0.2 | | | $ | 0.1 | | | $ | 0.4 | | | $ | 0.0 | | | ($ | 0.4 | ) | | $ | 0.0 | | | $ | 0.4 | | | $ | 0.0 | | | $ | 0.0 | |
| | | | | | | | | | | | | | | | | | | | | | | | | | | | | | | | | | | | | |
| | | | | | | | | | | | | | | | | | | | | | | | | | | | | | | | | | | | | |
| Proportionate share of net operating income | | $ | 0.7 | | | $ | 0.2 | | | $ | 0.8 | | | $ | 1.1 | | | $ | 0.5 | | | ($ | 0.0 | ) | | $ | 0.7 | | | ($ | 0.0 | ) | | $ | 0.1 | |
| | | | | | | | | | | | | | | | | | | | | | | | | | | | | | | | | | | | | |
| Proportionate share of interest expense | | $ | 0.4 | | | $ | 0.1 | | | $ | 0.4 | | | $ | 0.7 | | | $ | 0.0 | | | $ | 0.0 | | | $ | 0.1 | | | $ | 0.0 | | | $ | 0.0 | |
| | | | | | | | | | | | | | | | | | | | | | | | | | | | | | | | | | | | | |
| | | | | | | | | | | | | | | | | | | | | | | | | | | | | | | | | | | | | |
Funds From Operations (“FFO”): | | | | | | | | | | | | | | | | | | | | | | | | | | | | | | | | | | | | |
| | | | | | | | | | | | | | | | | | | | | | | | | | | | | | | | | | | | | |
| Net income (loss) | | $ | 0.5 | | | $ | 0.7 | | | $ | 0.7 | | | $ | 0.2 | | | ($ | 1.3 | ) | | ($ | 0.0 | ) | | $ | 0.9 | | | ($ | 0.0 | ) | | $ | 0.0 | |
| Depreciation of real property | | | 0.3 | | | | 0.3 | | | | 0.2 | | | | 0.4 | | | | 1.9 | | | | 0.0 | | | | 0.3 | | | | 0.0 | | | | 0.0 | |
| (Gain) loss on sale | | | 0.0 | | | | 0.0 | | | | 0.0 | | | | 0.0 | | | | 0.0 | | | | 0.0 | | | | 0.0 | | | | 0.0 | | | | 0.0 | |
| | | | | | | | | | | | | | | | | | | | | | | | | | | | | | | | | | | | | |
| | | $ | 0.8 | | | $ | 1.0 | | | $ | 0.9 | | | $ | 0.6 | | | $ | 0.6 | | | $ | 0.0 | | | $ | 1.2 | | | $ | 0.0 | | | $ | 0.0 | |
| DDR ownership interest | | | 50 | % | | | 10 | % | | | *** | | | | *** | | | | 80 | % | | | 63 | % | | | 50 | % | | | 50 | % | | | 50 | % |
| | | | | | | | | | | | | | | | | | | | | | | | | | | | | | | | | | | | | |
| DDR FFO | | $ | 0.4 | | | $ | 0.1 | | | $ | 0.5 | | | $ | 0.5 | | | $ | 0.5 | | | ($ | 0.0 | ) | | $ | 0.6 | | | ($ | 0.0 | ) | | $ | 0.0 | |
| | | | | | | | | | | | | | | | | | | | | | | | | | | | | | | | | | | | | |
| | | |
Developers Diversified Realty
Quarterly Financial Supplement | | |
| For the six months ended June 30, 2005 | | |
| |
Joint Ventures (Combining Financial Information) (1)
(in millions)
Combining Balance Sheets
as of June 30, 2005
| | | | | | | | | | | | | | | | | | | | | | | | | | | | | | | | | | | | | |
| | | | | | | | | | | | | | | Service | | Jefferson County, | | | | | | Sansone Group / | | | | |
| | | Coon Rapids, MN (5) | | Phoenix, AZ (2) | | Pasadena, CA | | Merchandise (4) | | MO | | Apex IV (3) | | DDRC LLC | | DDR Markaz | | DDR Markaz II |
| Real Estate Assets | | $ | 0.0 | | | $ | 27.5 | | | $ | 113.4 | | | $ | 132.5 | | | $ | 6.4 | | | $ | 8.3 | | | $ | 0.4 | | | $ | 167.2 | | | $ | 202.0 | |
| Accumulated Depreciation | | | 0.0 | | | | (4.8 | ) | | | (8.0 | ) | | | (6.8 | ) | | | (0.4 | ) | | | 0.0 | | | | (0.2 | ) | | | (8.4 | ) | | | (3.5 | ) |
| | | | | | | | | | | | | | | | | | | | | | | | | | | | | | | | | | | | | |
| Real Estate, net | | | 0.0 | | | | 22.7 | | | | 105.4 | | | | 125.7 | | | | 6.0 | | | | 8.3 | | | | 0.2 | | | | 158.8 | | | | 198.5 | |
| | | | | | | | | | | | | | | | | | | | | | | | | | | | | | | | | | | | | |
| Receivables, Net | | | 0.0 | | | | 1.2 | | | | 1.9 | | | | 12.6 | | | | 0.0 | | | | 0.0 | | | | 1.5 | | | | 1.9 | | | | 2.2 | |
| Other assets | | | 0.9 | | | | 0.8 | | | | 4.4 | | | | 41.8 | | | | 0.3 | | | | (0.1 | ) | | | 2.1 | | | | 6.5 | | | | 7.3 | |
| | | | | | | | | | | | | | | | | | | | | | | | | | | | | | | | | | | | | |
| | | $ | 0.9 | | | $ | 24.7 | | | $ | 111.7 | | | $ | 180.1 | | | $ | 6.3 | | | $ | 8.2 | | | $ | 3.8 | | | $ | 167.2 | | | $ | 208.0 | |
| | | | | | | | | | | | | | | | | | | | | | | | | | | | | | | | | | | | | |
| | | | | | | | | | | | | | | | | | | | | | | | | | | | | | | | | | | | | |
| Mortgage Debt | | $ | 0.0 | | | $ | 17.2 | | | $ | 85.0 | | | $ | 29.2 | | | $ | 3.4 | | | $ | 0.0 | | | $ | 0.0 | | | $ | 110.0 | | | $ | 150.4 | |
| Amounts payable to DDRC | | | 0.0 | | | | 0.0 | | | | 0.1 | | | | 100.0 | | | | 3.1 | | | | 7.5 | | | | 0.0 | | | | 0.8 | | | | 0.4 | |
| Other liabilities | | | 0.7 | | | | 0.6 | | | | 0.7 | | | | 13.2 | | | | 0.1 | | | | 0.5 | | | | 0.7 | | | | 2.3 | | | | 0.2 | |
| | | | | | | | | | | | | | | | | | | | | | | | | | | | | | | | | | | | | |
| | | | 0.7 | | | | 17.8 | | | | 85.8 | | | | 142.4 | | | | 6.6 | | | | 8.0 | | | | 0.7 | | | | 113.1 | | | | 151.0 | |
| Accumulated equity (deficit) | | | 0.2 | | | | 6.9 | | | | 25.9 | | | | 37.7 | | | | (0.3 | ) | | | 0.2 | | | | 3.1 | | | | 54.1 | | | | 57.0 | |
| | | | | | | | | | | | | | | | | | | | | | | | | | | | | | | | | | | | | |
| | | $ | 0.9 | | | $ | 24.7 | | | $ | 111.7 | | | $ | 180.1 | | | $ | 6.3 | | | $ | 8.2 | | | $ | 3.8 | | | $ | 167.2 | | | $ | 208.0 | |
| | | | | | | | | | | | | | | | | | | | | | | | | | | | | | | | | | | | | |
| | | | | | | | | | | | | | | | | | | | | | | | | | | | | | | | | | | | | |
| Proportionate share of other assets/liabilities, net | | $ | 0.1 | | | $ | 0.9 | | | $ | 1.4 | | | $ | 10.1 | | | $ | 0.1 | | | ($ | 0.1 | ) | | $ | 1.5 | | | $ | 1.2 | | | $ | 1.9 | |
| | | | | | | | | | | | | | | | | | | | | | | | | | | | | | | | | | | | | |
| Disproportionate amount payable to DDR | | $ | 0.0 | | | $ | 0.0 | | | $ | 0.0 | | | $ | 75.4 | | | $ | 1.5 | | | $ | 6.0 | | | $ | 0.0 | | | $ | 0.0 | | | $ | 0.0 | |
| | | | | | | | | | | | | | | | | | | | | | | | | | | | | | | | | | | | | |
Combining Statements of Operations
for the period ended June 30, 2005
| | | | | | | | | | | | | | | | | | | | | | | | | | | | | | | | | | | | | |
| | | | | | | | | | | | | | | Service | | Jefferson County, | | | | | | Sansone Group / | | | | |
| | | Coon Rapids, MN (5) | | Phoenix, AZ (2) | | Pasadena, CA | | Merchandise (4) | | MO | | Apex IV (3) | | DDRC LLC | | DDR Markaz | | DDR Markaz II |
| Revenues from operations | | $ | 0.0 | | | $ | 2.6 | | | $ | 8.0 | | | $ | 12.5 | | | $ | 0.4 | | | $ | 0.0 | | | $ | 6.3 | | | $ | 10.5 | | | $ | 10.6 | |
| Rental operation expenses | | | (0.0 | ) | | | (0.7 | ) | | | (3.1 | ) | | | (6.6 | ) | | | (0.2 | ) | | | 0.0 | | | | (5.1 | ) | | | (3.3 | ) | | | (3.6 | ) |
| | | | | | | | | | | | | | | | | | | | | | | | | | | | | | | | | | | | | |
| Net operating income | | | 0.0 | | | | 1.9 | | | | 4.9 | | | | 5.9 | | | | 0.2 | | | | 0.0 | | | | 1.2 | | | | 7.2 | | | | 7.0 | |
| Depreciation and amortization expense | | | 0.0 | | | | (0.4 | ) | | | (1.8 | ) | | | (3.7 | ) | | | (0.0 | ) | | | 0.0 | | | | 0.0 | | | | (2.1 | ) | | | (2.7 | ) |
| Interest expense | | | 0.0 | | | | (0.7 | ) | | | (2.6 | ) | | | (4.9 | ) | | | (0.2 | ) | | | 0.0 | | | | 0.0 | | | | (2.3 | ) | | | (4.0 | ) |
| | | | | | | | | | | | | | | | | | | | | | | | | | | | | | | | | | | | | |
| Income (loss) before gain on sale | | | 0.0 | | | | 0.8 | | | | 0.5 | | | | (2.7 | ) | | | 0.0 | | | | 0.0 | | | | 1.2 | | | | 2.8 | | | | 0.3 | |
| Gain (loss) on sale of real estate | | | 0.0 | | | | 0.0 | | | | 0.0 | | | | 0.0 | | | | 0.0 | | | | 0.0 | | | | 0.0 | | | | 0.0 | | | | 0.0 | |
| Discontinued operations | | | 0.0 | | | | 0.0 | | | | 0.0 | | | | 0.3 | | | | 0.0 | | | | 0.0 | | | | 0.0 | | | | 0.0 | | | | 0.0 | |
| Gain on sale of discontinued operations | | | 0.0 | | | | 0.0 | | | | 0.0 | | | | 1.7 | | | | 0.0 | | | | 0.0 | | | | 0.0 | | | | 0.0 | | | | 0.0 | |
| | | | | | | | | | | | | | | | | | | | | | | | | | | | | | | | | | | | | |
| Net income (loss) | | $ | 0.0 | | | $ | 0.8 | | | $ | 0.5 | | | ($ | 0.7 | ) | | $ | 0.0 | | | $ | 0.0 | | | $ | 1.2 | | | $ | 2.8 | | | $ | 0.3 | |
| DDR Ownership interest | | | 25 | % | | | 67 | % | | | 25 | % | | | 25 | % | | | 50 | % | | | 20 | % | | | *** | | | | 20 | % | | | 20 | % |
| | | | | | | | | | | | | | | | | | | | | | | | | | | | | | | | | | | | | |
| | | $ | 0.0 | | | $ | 0.6 | | | $ | 0.1 | | | ($ | 0.3 | ) | | ($ | 0.0 | ) | | $ | 0.0 | | | $ | 0.6 | | | $ | 0.6 | | | $ | 0.1 | |
| Amortization of basis differential | | | 0.0 | | | | 0.0 | | | | (0.2 | ) | | | 0.0 | | | | 0.0 | | | | 0.0 | | | | (0.1 | ) | | | 0.1 | | | | 0.1 | |
| | | | | | | | | | | | | | | | | | | | | | | | | | | | | | | | | | | | | |
| | | $ | 0.0 | | | $ | 0.6 | | | $ | 0.0 | | | ($ | 0.3 | ) | | $ | 0.0 | | | $ | 0.0 | | | $ | 0.5 | | | $ | 0.6 | | | $ | 0.2 | |
| | | | | | | | | | | | | | | | | | | | | | | | | | | | | | | | | | | | | |
| | | | | | | | | | | | | | | | | | | | | | | | | | | | | | | | | | | | | |
| Proportionate share of net operating income | | $ | 0.0 | | | $ | 1.3 | | | $ | 1.2 | | | $ | 1.4 | | | $ | 0.1 | | | $ | 0.0 | | | $ | 0.6 | | | $ | 1.4 | | | $ | 1.4 | |
| | | | | | | | | | | | | | | | | | | | | | | | | | | | | | | | | | | | | |
| Proportionate share of interest expense | | $ | 0.0 | | | $ | 0.5 | | | $ | 0.6 | | | $ | 1.2 | | | $ | 0.1 | | | $ | 0.0 | | | $ | 0.0 | | | $ | 0.5 | | | $ | 0.8 | |
| | | | | | | | | | | | | | | | | | | | | | | | | | | | | | | | | | | | | |
| | | | | | | | | | | | | | | | | | | | | | | | | | | | | | | | | | | | | |
Funds From Operations (“FFO”): | | | | | | | | | | | | | | | | | | | | | | | | | | | | | | | | | | | | |
| | | | | | | | | | | | | | | | | | | | | | | | | | | | | | | | | | | | | |
| Net income (loss) | | ($ | 0.0 | ) | | $ | 0.8 | | | $ | 0.5 | | | ($ | 0.7 | ) | | ($ | 0.0 | ) | | $ | 0.0 | | | $ | 1.2 | | | $ | 2.8 | | | $ | 0.3 | |
| Depreciation of real property | | | 0.0 | | | | 0.4 | | | | 1.8 | | | | 3.9 | | | | 0.0 | | | | 0.0 | | | | 0.0 | | | | 2.1 | | | | 2.7 | |
| (Gain) loss on sale | | | 0.0 | | | | 0.0 | | | | 0.0 | | | | 0.0 | | | | 0.0 | | | | 0.0 | | | | 0.0 | | | | 0.0 | | | | 0.0 | |
| | | | | | | | | | | | | | | | | | | | | | | | | | | | | | | | | | | | | |
| | | $ | 0.0 | | | $ | 1.2 | | | $ | 2.3 | | | $ | 3.2 | | | $ | 0.0 | | | $ | 0.0 | | | $ | 1.2 | | | $ | 4.9 | | | $ | 3.0 | |
| DDR ownership interest | | | 25 | % | | | 67 | % | | | 25 | % | | | 25 | % | | | 50 | % | | | 20 | % | | | *** | | | | 20 | % | | | 20 | % |
| | | | | | | | | | | | | | | | | | | | | | | | | | | | | | | | | | | | | |
| DDR FFO | | $ | 0.0 | | | $ | 0.8 | | | $ | 0.6 | | | $ | 0.8 | | | $ | 0.0 | | | $ | 0.0 | | | $ | 0.6 | | | $ | 1.0 | | | $ | 0.7 | |
| | | | | | | | | | | | | | | | | | | | | | | | | | | | | | | | | | | | | |
| | | |
Developers Diversified Realty | | |
| Quarterly Financial Supplement | | |
| For the six months ended June 30, 2005 | | |
| |
Joint Ventures (Combining Financial Information) (1)
(in millions)
Combining Balance Sheets
as of June 30, 2005
| | | | | | | | | | | | | | | | | | | | | | | | | | | | | | | | | | | | | |
| | | Coventry II DDR | | Coventry II DDR | | Coventry II DDR | | Coventry II DDR | | Coventry II DDR | | Coventry II DDR | | DDR/Macquarie | | DDR/Macquarie | | |
| | | Ward Parkway | | Totem Lakes | | Phoenix Spectrum | | Westover | | Buena Park | | Merriam, KS | | Fund LLC | | Management LLC | | Total |
| Real Estate Assets | | $ | 54.2 | | | $ | 38.5 | | | $ | 49.2 | | | $ | 19.0 | | | $ | 91.6 | | | $ | 15.1 | | | $ | 1,703.8 | | | $ | 0.0 | | | $ | 3,551.4 | |
| Accumulated Depreciation | | | (1.8 | ) | | | (0.9 | ) | | | (1.5 | ) | | | 0.0 | | | | (1.0 | ) | | | 0.0 | | | | (36.8 | ) | | | 0.0 | | | | (179.7 | ) |
| | | | | | | | | | | | | | | | | | | | | | | | | | | | | | | | | | | | | |
| Real Estate, net | | | 52.4 | | | | 37.6 | | | | 47.7 | | | | 19.0 | | | | 90.6 | | | | 15.1 | | | | 1,667.0 | | | | 0.0 | | | | 3,371.8 | |
| | | | | | | | | | | | | | | | | | | | | | | | | | | | | | | | | | | | | |
| Receivables, Net | | | 0.8 | | | | 0.2 | | | | 0.7 | | | | 0.0 | | | | 0.0 | | | | 0.0 | | | | 27.5 | | | | 0.0 | | | | 68.4 | |
| Other assets | | | 0.9 | | | | 0.5 | | | | 1.3 | | | | 0.0 | | | | 1.2 | | | | 0.3 | | | | 43.6 | | | | 5.2 | | | | 150.8 | |
| | | | | | | | | | | | | | | | | | | | | | | | | | | | | | | | | | | | | |
| | | $ | 54.1 | | | $ | 38.3 | | | $ | 49.7 | | | $ | 19.0 | | | $ | 91.8 | | | $ | 15.4 | | | $ | 1,738.1 | | | $ | 5.2 | | | $ | 3,590.9 | |
| | | | | | | | | | | | | | | | | | | | | | | | | | | | | | | | | | | | | |
| | | | | | | | | | | | | | | | | | | | | | | | | | | | | | | | | | | | | |
| Mortgage Debt | | $ | 31.5 | | | $ | 26.0 | | | $ | 39.0 | | | $ | 11.3 | | | $ | 61.0 | | | $ | 14.3 | | | $ | 1,025.7 | | | $ | 0.0 | | | $ | 2,096.9 | |
| Amounts payable to DDRC | | | 0.0 | | | | 0.0 | | | | 0.0 | | | | 0.0 | | | | 0.0 | | | | 0.0 | | | | 0.2 | | | | 0.3 | | | | 112.5 | |
| Other liabilities | | | 1.3 | | | | 0.5 | | | | 1.5 | | | | 0.1 | | | | 2.3 | | | | 1.0 | | | | 18.9 | | | | 0.0 | | | | 76.8 | |
| | | | | | | | | | | | | | | | | | | | | | | | | | | | | | | | | | | | | |
| | | | 32.8 | | | | 26.5 | | | | 40.5 | | | | 11.4 | | | | 63.3 | | | | 15.3 | | | | 1,044.8 | | | | 0.3 | | | | 2,286.2 | |
| Accumulated equity (deficit) | | | 21.3 | | | | 11.8 | | | | 9.2 | | | | 7.6 | | | | 28.5 | | | | 0.1 | | | | 693.3 | | | | 4.9 | | | | 1,304.7 | |
| | | | | | | | | | | | | | | | | | | | | | | | | | | | | | | | | | | | | |
| | | $ | 54.1 | | | $ | 38.3 | | | $ | 49.7 | | | $ | 19.0 | | | $ | 91.8 | | | $ | 15.4 | | | $ | 1,738.1 | | | $ | 5.2 | | | $ | 3,590.9 | |
| | | | | | | | | | | | | | | | | | | | | | | | | | | | | | | | | | | | | |
| | | | | | | | | | | | | | | | | | | | | | | | | | | | | | | | | | | | | |
| Proportionate share of other assets/liabilities, net | | $ | 0.1 | | | $ | 0.0 | | | $ | 0.1 | | | ($ | 0.0 | ) | | ($ | 0.2 | ) | | ($ | 0.1 | ) | | $ | 7.6 | | | $ | 2.6 | | | $ | 37.7 | |
| | | | | | | | | | | | | | | | | | | | | | | | | | | | | | | | | | | | | |
| Disproportionate amount payable to DDR | | $ | 0.0 | | | $ | 0.0 | | | $ | 0.0 | | | $ | 0.0 | | | $ | 0.0 | | | $ | 0.0 | | | $ | 0.0 | | | $ | 0.0 | | | $ | 82.9 | |
| | | | | | | | | | | | | | | | | | | | | | | | | | | | | | | | | | | | | |
Combining Statements of Operations
for the period ended June 30, 2005
| | | | | | | | | | | | | | | | | | | | | | | | | | | | | | | | | | | | | |
| | | Coventry II DDR | | Coventry II DDR | | Coventry II DDR | | Coventry II DDR | | Coventry II DDR | | Coventry II DDR | | DDR/Macquarie | | DDR/Macquarie | | |
| | | Ward Parkway | | Totem Lakes | | Phoenix Spectrum | | Westover | | Buena Park | | Merriam, KS | | Fund LLC | | Management LLC | | Total |
| Revenues from operations | | $ | 3.0 | | | $ | 1.8 | | | $ | 4.1 | | | $ | 0.0 | | | $ | 5.9 | | | $ | 0.0 | | | $ | 88.3 | | | $ | 0.8 | | | $ | 213.3 | |
| Rental operation expenses | | | (1.6 | ) | | | (0.6 | ) | | | (2.0 | ) | | | (0.0 | ) | | | (2.7 | ) | | | 0.0 | | | | (26.6 | ) | | | (0.1 | ) | | | (75.2 | ) |
| | | | | | | | | | | | | | | | | | | | | | | | | | | | | | | | | | | | | |
| Net operating income | | | 1.4 | | | | 1.2 | | | | 2.1 | | | | 0.0 | | | | 3.2 | | | | 0.0 | | | | 61.7 | | | | 0.7 | | | | 138.1 | |
| Depreciation and amortization expense | | | (0.4 | ) | | | (0.3 | ) | | | (0.6 | ) | | | 0.0 | | | | (0.9 | ) | | | 0.0 | | | | (16.6 | ) | | | (0.3 | ) | | | (42.6 | ) |
| Interest expense | | | (0.8 | ) | | | (0.7 | ) | | | (1.1 | ) | | | 0.0 | | | | (1.3 | ) | | | 0.0 | | | | (24.7 | ) | | | (0.0 | ) | | | (58.3 | ) |
| | | | | | | | | | | | | | | | | | | | | | | | | | | | | | | | | | | | | |
| Income (loss) before gain on sale | | | 0.2 | | | | 0.2 | | | | 0.4 | | | | 0.0 | | | | 1.0 | | | | 0.0 | | | | 20.4 | | | | 0.4 | | | | 37.2 | |
| Gain (loss) on sale of real estate | | | 0.0 | | | | 0.0 | | | | 0.0 | | | | 0.0 | | | | 0.0 | | | | 0.0 | | | | 0.0 | | | | 0.0 | | | | 0.8 | |
| Discontinued operations | | | 0.0 | | | | 0.0 | | | | 0.0 | | | | 0.0 | | | | 0.0 | | | | 0.0 | | | | 0.0 | | | | 0.0 | | | | 0.3 | |
| Gain on sale of discontinued operations | | | 0.0 | | | | 0.0 | | | | 0.0 | | | | 0.0 | | | | 0.0 | | | | 0.0 | | | | 0.0 | | | | 0.0 | | | | 8.7 | |
| | | | | | | | | | | | | | | | | | | | | | | | | | | | | | | | | | | | | |
| Net income (loss) | | $ | 0.2 | | | $ | 0.2 | | | $ | 0.4 | | | $ | 0.0 | | | $ | 1.0 | | | $ | 0.0 | | | $ | 20.4 | | | $ | 0.4 | | | $ | 47.0 | |
| DDR Ownership interest | | | 20 | % | | | 20 | % | | | 20 | % | | | 20 | % | | | 20 | % | | | 20 | % | | | *** | | | | 50 | % | | | | |
| | | | | | | | | | | | | | | | | | | | | | | | | | | | | | | | | | | | | |
| | | $ | 0.0 | | | $ | 0.0 | | | $ | 0.1 | | | ($ | 0.0 | ) | | $ | 0.2 | | | $ | 0.0 | | | $ | 4.6 | | | $ | 0.2 | | | $ | 14.0 | |
| Amortization of basis differential | | | 0.0 | | | | 0.0 | | | | 0.0 | | | | 0.0 | | | | 0.0 | | | | 0.0 | | | | 0.5 | | | | 0.0 | | | | 0.6 | |
| | | | | | | | | | | | | | | | | | | | | | | | | | | | | | | | | | | | | |
| | | $ | 0.0 | | | $ | 0.0 | | | $ | 0.1 | | | $ | 0.0 | | | $ | 0.2 | | | $ | 0.0 | | | $ | 5.1 | | | $ | 0.2 | | | $ | 14.6 | |
| | | | | | | | | | | | | | | | | | | | | | | | | | | | | | | | | | | | | |
| | | | | | | | | | | | | | | | | | | | | | | | | | | | | | | | | | | | | |
| Proportionate share of net operating income | | $ | 0.3 | | | $ | 0.2 | | | $ | 0.4 | | | ($ | 0.0 | ) | | $ | 0.6 | | | $ | 0.0 | | | $ | 8.9 | | | $ | 0.3 | | | $ | 32.2 | |
| | | | | | | | | | | | | | | | | | | | | | | | | | | | | | | | | | | | | |
| Proportionate share of interest expense | | $ | 0.2 | | | $ | 0.1 | | | $ | 0.2 | | | $ | 0.0 | | | $ | 0.3 | | | $ | 0.0 | | | $ | 3.6 | | | $ | 0.0 | | | $ | 13.8 | |
| | | | | | | | | | | | | | | | | | | | | | | | | | | | | | | | | | | | | |
| | | | | | | | | | | | | | | | | | | | | | | | | | | | | | | | | | | | | |
Funds From Operations (“FFO”): | | | | | | | | | | | | | | | | | | | | | | | | | | | | | | | | | | | | |
| | | | | | | | | | | | | | | | | | | | | | | | | | | | | | | | | | | | | |
| Net income (loss) | | | 0.2 | | | | 0.2 | | | | 0.4 | | | | (0.0 | ) | | | 1.0 | | | | 0.0 | | | | 20.4 | | | | 0.4 | | | | 47.0 | |
| Depreciation of real property | | | 0.4 | | | | 0.3 | | | | 0.6 | | | | 0.0 | | | | 0.9 | | | | 0.0 | | | | 16.6 | | | | 0.3 | | | | 42.9 | |
| (Gain) loss on sale | | | 0.0 | | | | 0.0 | | | | 0.0 | | | | 0.0 | | | | 0.0 | | | | 0.0 | | | | 0.0 | | | | 0.0 | | | | (7.8 | ) |
| | | | | | | | | | | | | | | | | | | | | | | | | | | | | | | | | | | | | |
| | | $ | 0.6 | | | $ | 0.5 | | | $ | 1.0 | | | $ | 0.0 | | | $ | 1.9 | | | $ | 0.0 | | | $ | 37.0 | | | $ | 0.7 | | | $ | 82.1 | |
| DDR ownership interest | | | 20 | % | | | 20 | % | | | 20 | % | | | 20 | % | | | 20 | % | | | 20 | % | | | *** | | | | 50 | % | | | | |
| | | | | | | | | | | | | | | | | | | | | | | | | | | | | | | | | | | | | |
| DDR FFO | | $ | 0.1 | | | $ | 0.1 | | | $ | 0.2 | | | ($ | 0.0 | ) | | $ | 0.4 | | | $ | 0.0 | | | $ | 7.3 | | | $ | 0.3 | | | $ | 22.1 | |
| | | | | | | | | | | | | | | | | | | | | | | | | | | | | | | | | | | | | |
Joint Venture Financials 4.1
| | | |
Developers Diversified Realty | | |
| Quarterly Financial Supplement | | |
| For the six months ended June 30, 2005 | | |
| |
| | |
| (1) | | Amounts may differ slightly from actual results, due to rounding. |
| |
| (2) | | Asset values reflect historical cost basis due to acquisition of partnership interest (i.e. does not reflect step up in basis). |
| |
| (3) | | Represents undeveloped land. |
| |
| (4) | | The Company owns an approximate 25% economic interest in a joint venture that acquired the designation rights to real estate assets owned and controlled by Service Merchandise. Tax expense, if applicable, is reflected in DDR Consolidated Statement of Operations. The joint venture’s total related party interest expense for the six months ended June 30, 2005 totaled $2.7 million, of which $0.7 million, or approximately 25%, is reflected in revenues from operations in the Company’s Consolidated Statement of Operations. |
| |
| (5) | | Real estate assets sold to the MDT joint venture in 2003 and 2004. |
| |
| *** | | See Section 4.2, Joint Venture Summaries, discussing respective ownership percentage, as ownership percentage may have changed during the year, or the promoted interest is in effect. |
Joint Venture Financials 4.1
Developers Diversified Realty
Quarterly Financial Supplemental
For the six months ended June 30, 2005
Joint Venture Investment Summary
| | | |
| Joint Venture Name: | | Retail Value Investment Program LP III |
| Date Formed: | | January 1998 |
| Property Name/Location: | | City Place — Long Beach, CA |
| | | |
| Major Tenants: | | Wal-Mart |
| | | Ross Dress for Less |
| | | Nordstrom Rack |
| | | Anna’s Linens |
| | | Hometown Buffet |
| | | Payless Shoe Source |
| | | |
Partnership Structure | | |
| Equity Contribution: | | 1% — Coventry Real Estate Partners |
| | | 24.75% — DDR |
| | | 74.25% — Prudential Real Estate Investors (PREI) |
| | | |
| Cash Flow Distribution: | | 1% — Coventry Real Estate Partners |
| | | 24.75% — DDR |
| | | 74.25% — Prudential Real Estate Investors |
| | | Up to a leveraged 10% return on equity |
| | | |
| Promote (current): | | 33% Coventry Real Estate Partners (75% owned by DDR) once limited partners have received a 10% preferred return on equity |
| | | |
Fees to DDR | | |
| Management Fee: | | 3.5% of gross rents |
| Construction Management Fee: | | 5% of cost of construction (including architectural & engineering and other soft costs) |
| Asset Management Fee: | | .4% of gross asset cost (DDR’s pro-rata share of Coventry’s .5% fee) |
| Leasing Fees: | | N/A |
| | | |
Capital Structure (in millions) | | |
| | | | | |
| DDR | | $ | 6.7 | |
| PREI | | | 20.1 | |
| Coventry | | | 0.3 | |
| | | | |
| Total Capital | | $ | 27.0 | |
| | | | |
| Debt | | $ | 28.0 | |
| | | | |
| Total Debt & Equity | | $ | 55.0 | |
| | | | |
Joint Venture Partnership Summaries 4.2
Developers Diversified Realty
Quarterly Financial Supplemental
For the six months ended June 30, 2005
Joint Venture Investment Summary
| | | | | |
| Joint Venture Name: | | RVIP IIIB | | |
| Date Formed: | | September 2000 | | |
| Property Name/Location: | | Deer Park, IL | | |
| Major Tenants: | | Eddie Bauer | | Pottery Barn |
| | | Talbots | | Coldwater Creek |
| | | Restoration Harware | | J. Crew |
| | | Abercrombie & Fitch | | Pier One Imports |
| | | GAP | | Banana Republic |
| | | Barnes & Noble | | Chico’s |
| | | Century Theater | | |
Partnership Structure | | | | |
| RVIP IIIB | | | | |
| Equity Contribution: | | 1% — Coventry Real Estate Partners |
| | | 24.75% — DDR |
| | | 74.25% — Prudential Real Estate Investors (PREI) |
| | | | | |
| Cash Flow Distribution: | | 1% — Coventry Real Estate Partners |
| | | 24.75% — DDR |
| | | 74.25% — Prudential Real Estate Investors |
| | | Up to a leveraged 10% preferred return on equity |
| | | | | |
| Promote (current): | | 33% Coventry Real Estate Partners (75% owned by DDR) once limited partners have received a 10% preferred return and return of equity |
| | | | | |
Fees to DDR | | | | |
| Management Fee: | | 3.5% of gross rents |
| Development Fee: | | 1% of hard costs for all improvements |
| Asset Management Fee: | | .4% of gross asset cost (DDR’s pro-rata share of Coventry’s .5% fee) |
| Leasing Fees: | | N/A |
Capital Structure (in millions) | | | | |
| | | | | |
| DDRC | | $ | 4.3 | |
| Prudential | | | 12.8 | |
| Coventry | | | 1.7 | |
| | | | |
| Total Capital | | $ | 18.8 | |
| | | | |
| Debt | | $ | 55.4 | |
| | | | |
| Total Debt & Equity | | $ | 74.2 | |
| | | | |
Joint Venture Partnership Summaries 4.2
Developers Diversified Realty
Quarterly Financial Supplemental
For the six months ended June 30, 2005
Joint Venture Investment Summary
| | | | | |
| Joint Venture Name: | | Retail Value Investment Program LP VI |
| Date Formed: | | October 1999 |
| Property Name/Location: | | The joint venture consists of the following four properties: |
| | | | | |
| | | Ten Quivira Plaza — Shawnee, KS | | Devonshire Village — Olathe, KS |
| | | Cherokee North — Overland Park, KS | | Brywood Center — Kansas City, MO |
| | | | | | | |
| Major Tenants: | | Price Chopper | | La Petite Academy | | |
| | | Big Lots | | Osco Drug | | |
| | | Dollar General | | Deal$ | | |
| | | Sherwin Williams | | Westlake Hardware | | |
| | | Eckerd Drug | | | | |
| | | Hollywood Video | | | | |
| | | | | | | |
Partnership Structure | | | | | | |
| Equity Contribution: | | 1% — Coventry Real Estate Partners |
| | | 24.75% — DDR |
| | | 74.25% — Prudential Real Estate Investors (PREI) |
| | | | | | | |
| Cash Flow Distribution: | | 1% — Coventry Real Estate Partners |
| | | 24.75% — DDR |
| | | 74.25% — Prudential Real Estate Investors (PREI) |
| | | Up to a leveraged 10% preferred return on equity |
| | | | | | | |
| Promote (current): | | 33% Coventry Real Estate Partners (75% owned by DDR) once limited partners have received a 10% preferred return and return of equity |
| | | | | | | |
Fees to DDR | | | | | | |
| Management Fee: | | 3.5% of gross operating revenues |
| Asset Management Fee: | | .4% of gross asset cost (DDR’s pro-rata share of Coventry’s .5% fee) |
| | | | | | | |
Capital Structure (in millions) | | | | | | |
| | | | | |
| DDR | | $ | 2.7 | |
| PREI | | | 8.2 | |
| Coventry | | | 0.1 | |
| | | | |
| Total Capital | | $ | 11.0 | |
| | | | |
| Debt | | $ | 18.2 | |
| | | | |
| Total Debt & Equity | | $ | 29.2 | |
| | | | |
Joint Venture Partnership Summaries 4.2
Developers Diversified Realty
Quarterly Financial Supplemental
For the six months ended June 30, 2005
Joint Venture Investment Summary
| | | | | |
| Joint Venture Name: | | Retail Value Investment Program VII LLC |
| Date Formed: | | November 2000 |
| Property Name/Location: | | The joint venture consists of the following six properties: |
| | | | | |
| | | San Ysidro Village — San Ysidro, CA | | Downtown Pleasant Hill — Pleasant Hill, CA |
| | | Plaza at Puente Hills — City of Industry, CA | | Richmond City Center — Richmond, CA |
| | | Valley Central Shopping Center — Lancaster, CA | | Puget Park Shopping Center — Everett, WA |
| | | | | | | |
| Major Tenants: | | Home Base | | Michael’s | | |
| | | Century Theater | | Staples | | |
| | | Ross Stores | | Albertson’s | | |
| | | Circuit City | | Bed, Bath & Beyond | | |
| | | Wal-Mart | | K-Mart | | |
| | | Cinemark | | Marshalls | | |
| | | | | | | |
Partnership Structure | | | | | | |
| Equity Contribution: | | 1% — Coventry Real Estate Partners |
| | | 20% — DDR |
| | | 79% — Prudential Real Estate Investors (PREI) |
| | | | | | | |
| Cash Flow Distribution: | | 1% — Coventry Real Estate Partners |
| | | 20% — DDR |
| | | 79% — Prudential Real Estate Investors |
| | | Up to a leveraged 11% return on equity (10% year one, 10.5% year two, 11% thereafter) |
| | | | | | | |
| Promote (current): | | (i) Pro rata in proportion to the member’s invested capital until the members have received, on a cumulative basis, an amount equal to the preferred return, (ii) 75% to all members in proportion to their invested capital and 25% to Coventry Real Estate Partners (75% owned by DDR) until DDR and PREI have been allocated, on a cumulative basis, an amount equal to a 15% return, (iii) 70% to all members in proportion to their invested capital and 30% to Coventry until DDR and PREI have been allocated, on a cumulative basis, an amount equal to a 20% return, and (iv) 65% to all members pro rata in proportion to their ownership percentages and 35% to Coventry. |
| | | | | | | |
Fees to DDR | | | | | | |
| Management Fee: | | 3.2% of gross rents |
| Construction Management Fee: | | 5% of hard and soft costs |
| Asset Management Fee: | | .63% (DDR’s pro-rata share of Coventry’s .8% fee) |
| Leasing Fees (without co-broker): | | 5% on new leases on years 1-5; 2.5% on years 6-10 (spaces < 15,000 square feet) |
| | | 4% on new leases on years 1-5; 2% on years 6-10 (spaces > 15,000 square feet) |
| | | 3% on new leases on years 1-5; 1.5% on years 6-10 (ground leases) |
| | | Renewals earn 50% of fees on new leases |
| | | | | | | |
Capital Structure (in millions) | | | | | | |
| | | | | |
| DDR | | $ | 6.4 | |
| PREI | | | 25.3 | |
| Coventry | | | 5.6 | |
| | | | |
| Total Capital | | $ | 37.3 | |
| | | | |
| Debt | | $ | 100.7 | |
| | | | |
| Total Debt & Equity | | $ | 138.0 | |
| | | | |
Joint Venture Partnership Summaries 4.2
Developers Diversified Realty
Quarterly Financial Supplemental
For the six months ended June 30, 2005
Joint Venture Investment Summary
| | | | | |
| Joint Venture Name: | | RVIP VIII | | |
| Date Formed: | | September 2003 | | |
| Property Name/Location: | | Shops@TECH.RIDGE — Austin, TX | | |
| Major Tenants: | | Target | | Linen’s ‘N Things |
| | | Pier One | | Toys ‘R Us |
| | | Dress Barn | | Hobby Lobby |
| | | Rack Room Shoes | | Office Depot |
| | | PetsMart | | |
| | | Ross Dress for Less | | |
| | | | | |
Partnership Structure | | | | |
| RVIP VIII | | | | |
| | | | | |
| Equity Contribution: | | 1% — Coventry Real Estate Partners |
| | | 24.75% — DDR |
| | | 74.25% — Prudential Real Estate Investors (PREI) |
| | | | | |
| Cash Flow Distribution: | | 1% — Coventry Real Estate Partners |
| | | 24.75% — DDR |
| | | 74.25% — Prudential Real Estate Investors |
| | | Up to a leveraged 10% preferred return on equity |
| | | | | |
| Promote (current): | | 33% Coventry Real Estate Partners (75% owned by DDR) once limited partners have received a 10% preferred return and return of equity |
| | | | | |
Fees to DDR | | | | |
| Management Fee: | | 3.5% of gross rents |
| Development Fee: | | 1% of hard costs for all improvements |
| Asset Management Fee: | | N/A |
| Leasing Fees: * | | 6% on new leases on years 1-5; 3% on remainder of term (spaces < 5,000 square feet) |
| | | 5% on new leases on years 1-5; 2.5% on remainder of term (spaces 5,000 - 9,999 square feet) |
| | | 4% on new leases on years 1-5; 2% on remainder of term (spaces 10,000 - 19,999 square feet) |
| | | $2 per square foot (spaces 20,000 square feet and greater) |
| | | 3% on renewals on years 1-5; 1.5% on remainder of term (spaces < 5,000 square feet) |
| | | 2.5% on renewals on years 1-5; 1.25% on remainder of term (spaces 5,000 - 9,999 square feet) |
| | | 2% on renewals on years 1-5; 1% on remainder of term (spaces 10,000 - 19,999 square feet) |
| | | $2 per square foot on renewals (spaces 20,000 square feet and greater) |
| | | 4% on new leases years 1-5; 2% years 6-10 (outparcels/ground leases) |
| | | 2% on renewals on years 1-5; 1% years 6-10 (outparcels/ground leases) |
| | | 6% of Gross Sales Price up to $500,000 (Outparcel Sales) |
| | | 5% of Gross Sales Price over $500,000 but less than $1,000,000 (Outparcel Sales) |
| | | 4% of Gross Sales Price $1,000,000 or over (Outparcel Sales) |
| Development Fee: * | | 5% of all development and tenant improvement work performed |
| Tenant Coordination Fee: * | | $5,000 for each in-line space less than 10,000 square feet |
| | | | | |
Capital Structure (in millions) | | | | |
| | | | | |
| DDRC | | $ | 2.3 | |
| Prudential | | | 6.9 | |
| Coventry | | | (0.3 | ) |
| | | | |
| Total Capital | | $ | 8.9 | |
| | | | |
| Debt | | $ | 23.3 | |
| | | | |
| Total Debt & Equity | | $ | 32.2 | |
| | | | |
| * | | Fees shall not be paid with respect to the initial leasing or development. |
Joint Venture Partnership Summaries 4.2
Developers Diversified Realty
Quarterly Financial Supplemental
For the six months ended June 30, 2005
Joint Venture Investment Summary
| | | | | |
| Joint Venture Name: | | DPG Realty Holdings LLC |
| Date Formed: | | October 2004 |
| Property Name/Location: | | The joint venture consists of the following twelve properties: |
| | | | | |
| | | Tops Plaza — Elmira, NY | | Tops Plaza — Avon, NY |
| | | Tops Plaza — Hamburg, NY | | Tops Plaza — Hamlin, NY |
| | | Tops Plaza — Norwich, NY | | Farragut Pointe — Farragut, TN |
| | | Tops-Gander Mnt. Plaza — Tonawanda, NY | | Columbia Square — Columbia, TN |
| | | Tops Plaza — Arcade, NY | | Five Forks Crossing — Lilburn, GA |
| | | Tops Plaza — Tonawanda, NY | | Five Forks Village — Lawrenceville, GA |
| | | | | |
| Major Tenants: | | Bi-Lo | | |
| | | BJ’s Wholesale Club | | |
| | | Gander Mountain Company | | |
| | | Kroger | | |
| | | Save-Rite | | |
| | | Tops | | |
| | | | | |
Partnership Structure | | | | |
| Equity Contribution: | | 10.0% — JDN QRS, Inc. |
| | | 90.0% — Prudential Insurance Company of America (PICA) |
| | | | | |
| Cash Flow Distribution: | | 10.0% — JDN QRS, Inc. |
| | | 90.0% — Prudential Insurance Company of America (PICA) |
| | | | | |
Fees to DDR | | | | |
| Management Fee: | | 4% of gross income |
| Construction Supervision Fee: | | 5% of gross cost of all development and tenant improvement work (including hard and soft costs) |
| Leasing Fees: | | 6% on new leases on years 1-5; 3% on remainder of term, max 10 yrs. (spaces < 5,000 square feet) |
| | | 5% on new leases on years 1-5; 2.5% on remainder of term, max 10 yrs. (spaces 5,000 - 10,000 square feet) |
| | | 4% on new leases on years 1-5; 2% on remainder of term, max 10 yrs. (spaces 10,000 - 20,000 square feet) |
| | | $2 per square foot (spaces > 20,000 square feet) |
| | | 3% for renewals on years 1-5; 1.5% on remainder of term, max 10 yrs. (spaces < 5,000 square feet) |
| | | 2.5% for renewals on years 1-5; 1.25% on remainder of term, max 10 yrs. (spaces 5,000 - 10,000 square feet) |
| | | 2% for renewals on years 1-5; 1% on remainder of term, max 10 yrs. (spaces 10,000 - 20,000 square feet) |
| | | $2 per square foot for renewals with a material amendment to the lease; 1$ if renewed without a material amendment (spaces > 20,000 square feet) |
| | | 4% on new outparcels/ground leases on years 1-5; 2% on remainder of term, max 10 yrs. |
| | | 2% on renewal outparcels/ground leases on years 1-5; 1% on remainder of term, max 10 yrs. |
| | | 6% of gross sales price < $500,000 (outparcel sales) |
| | | 5% of gross sales price $500,000 - $1,000,000 (outparcel sales) |
| | | 4% of gross sales prices > $1,000,000 (outparcel sales) |
| | | | | |
Capital Structure (in millions) | | | | |
| | | | | |
| JDN | | $ | 11.7 | |
| PICA | | | 104.9 | |
| | | | |
| Total Capital | | $ | 116.6 | |
| | | | |
| Debt | | $ | 11.6 | |
| | | | |
| Total Debt & Equity | | $ | 128.2 | |
| | | | |
Joint Venture Partnership Summaries 4.2
Developers Diversified Realty
Quarterly Financial Supplement
For the six months ended June 30, 2005
Joint Venture Investment Summary
| | | | | |
| Joint Venture Name: | | DDRA Community Centers Five, L.P. | | |
| Date Formed: | | September, 1998 | | |
| Property Name/Location: | | The joint venture consists of the following six properties: | | |
| | | | | |
| | | Foothills Towne Center - Ahwatukee, AZ | | Maple Grove Crossing - Maple Grove, MN |
| | | Arrowhead Crossing - Phoenix, AZ | | Tanasbourne Town Center - Portland, OR |
| | | Eagan Promenade - Eagan, MN | | Eastchase Market - Fort Worth, TX |
| | | | | |
| | | | | | | |
| Major Tenants: | | AMC Theatre | | Gander Mountain | | Old Navy |
| | | Ashley Homestores | | Haggan's | | Petco |
| | | Babies 'R Us | | Kohl's Department | | Petsmart |
| | | Barnes & Noble | | Linens 'N Things | | Pier One |
| | | Bassett Furniture | | Mac Frugal's | | Ross Dress for Less |
| | | Bed Bath & Beyond | | Mervyn's (not owned) | | Staples |
| | | Byerly's | | Michael's | | Stein Mart |
| | | Circuit City | | Nordstrom Rack (not owned) | | Target (not owned) |
| | | Comp USA | | Office Depot | | TJ Maxx |
| | | Cub Foods (not owned) | | Office Depot (not owned) | | Toys 'R Us (not owned) |
| | | Ethan Allen (not owned) | | OfficeMax | | United Artists Theatre |
| | | Famous Footwear | | | | |
| | | | | | | |
Partnership Structure | | | | | | |
| Equity Contribution: | | 50% - DDR | | | | |
| | | 50% - DRA Advisors | | | | |
| | | | | | | |
| Cash Flow Distribution: | | 50% - DDR | | | | |
| | | 50% - DRA Advisors | | | | |
| | | | | | | |
Fees to DDR | | | | | | |
| Management Fee: | | 3.5% of gross retail income | | | | |
| Development Fee: | | 5.0% of total costs for all improvements | | |
| Leasing Fees (without co-broker): | | 6.0% on new leases on years 1-5; 3.0% on remainder of term (spaces < 5,000 square feet) |
| | | 5.0% on new leases on years 1-5; 2.5% on remainder of term (spaces 5,000 - 10,000 square feet) |
| | | 4.0% on new leases on years 1-5; 2.0% on remainder of term (spaces 10,000 - 20,000 square feet) |
| | | $2.00 per square foot (spaces > 20,000 square feet) |
| | | 4.0% on new leases on years 1-5; 2.0% on years 6-10 (ground leases) |
| | | Renewals earn 50% of fees on new leases |
| Commission on Outparcel Sales: | | 6.0% of gross sales price up to $500,000 |
| | | 5.0% of gross sales price $500,000 - $1,000,000 | | |
| | | 4.0% of gross sales price over $1,000,000 | | |
Capital Structure (in millions)
| | | | | |
| DDR | | $ | 35.8 | |
| DRA Advisors | | | 35.8 | |
| | | | |
| Total Capital | | $ | 71.6 | |
| | | | |
| | | | | |
| Debt | | $ | 156.0 | |
| | | | |
| | | | | |
| Total Debt & Equity | | $ | 227.6 | |
| | | | |
Joint Venture Partnership Summaries 4.2
Developers Diversified Realty
Quarterly Financial Supplement
For the six months ended June 30, 2005
Joint Venture Investment Summary
| | | |
| Joint Venture Name: | | DDRA Community Centers Seven, L.P. |
| Date Formed: | | October, 1999 |
| Property Name/Location: | | Ahwatukee Foothills Towne Center (Phase IV) - Phoenix, AZ |
| Major Tenants: | | Best Buy |
| | | JoAnn, Etc. |
| | | |
Partnership Structure | | |
| Equity Contribution: | | 50% - DDR |
| | | 50% - DRA Advisors |
| | | |
| Cash Flow Distribution: | | 50% - DDR |
| | | 50% - DRA Advisors |
| | | |
Fees to DDR | | |
| Management Fee: | | 3.5% of gross retail income |
| Development Fee: | | 5.0% of total costs for all improvements |
| Leasing Fees (without co-broker): | | 6.0% on new leases on years 1-5; 3.0% on remainder of term (spaces < 5,000 square feet) |
| | | 5.0% on new leases on years 1-5; 2.5% on remainder of term (spaces 5,000 - 10,000 square feet) |
| | | 4.0% on new leases on years 1-5; 2.0% on remainder of term (spaces 10,000 - 20,000 square feet) |
| | | $2.00 per square foot (spaces > 20,000 square feet) |
| | | 4.0% on new leases on years 1-5; 2.0% on years 6-10 (ground leases) |
| | | Renewals earn 50% of fees on new leases |
| Commission on Outparcel Sales: | | 6.0% of gross sales price up to $500,000 |
| | | 5.0% of gross sales price $500,000 - $1,000,000 |
| | | 4.0% of gross sales price over $1,000,000 |
| | | |
Capital Structure (in millions)
| | | | | |
| DDR | | $ | 1.7 | |
| DRA Advisors | | | 1.7 | |
| | | | |
| Total Capital | | $ | 3.4 | |
| | | | |
| | | | | |
| Debt | | $ | 11.0 | |
| | | | |
| | | | | |
| Total Debt & Equity | | $ | 14.4 | |
| | | | |
Joint Venture Partnership Summaries 4.2
Developers Diversified Realty
Quarterly Financial Supplement
For the six months ended June 30, 2005
Joint Venture Investment Summary
| | | |
| Joint Venture Name: | | DDRA Community Centers Eight, L.P. |
| Date Formed: | | February, 2000 |
| Property Name/Location: | | Deer Valley Towne Center - Phoenix, AZ |
| Major Tenants: | | Michael's |
| | | OfficeMax |
| | | Petsmart |
| | | Ross Stores |
| | | AMC Theatres (not owned) |
| | | Target (not owned) |
Partnership Structure | | |
| Equity Contribution: | | 50% - DDR |
| | | 50% - DRA Advisors |
| | |
| Cash Flow Distribution: | | 50% - DDR |
| | | 50% - DRA Advisors |
Fees to DDR | | |
| Management Fee: | | 3.5% of gross retail income |
| Development Fee: | | 5% of hard costs for all improvements |
| Leasing Fees: | | 5% on new leases, 3% on renewals |
| Commission on Outparcel Sales: | | 10% of net sales price |
Capital Structure (in millions)
| | | | | |
| DDR | | $ | 3.8 | |
| DRA Advisors | | | 3.8 | |
| | | | |
| Total Capital | | $ | 7.6 | |
| | | | |
| | | | | |
| Debt | | $ | 17.5 | |
| | | | |
| | | | | |
| Total Debt & Equity | | $ | 25.1 | |
| | | | |
Joint Venture Partnership Summaries 4.2
Developers Diversified Realty
Quarterly Financial Supplement
For the six months ended June 30, 2005
Joint Venture Investment Summary
| | | |
| Joint Venture Name: | | DDRA Kildeer LLC |
| Date Formed: | | March 28, 2002 |
| Property Name/Location: | | The Shops at Kildeer - Kildeer, IL |
| Major Tenants: | | Bed, Bath & Beyond |
| | | Circuit City |
| | | Cost Plus |
| | | Old Navy |
| | | |
Partnership Structure | | |
| Equity Contribution: | | 10% - DDR |
| | | 90% - DRA Advisors |
| | | |
| Cash Flow Distribution: | | 10% - DDR |
| | | 90% - DRA Advisors |
| | | |
| Promote: | | After the partners have received distributions |
| | | equal to their capital contributed, plus a |
| | | preferred return of 15%, then the Company will |
| | | receive 35% up to a preferred return of 20%, |
| | | then 50% of remaining cash after a 20% |
| | | preferred return has been achieved. |
| | | |
Fees to DDR | | |
| Management Fee: | | 3.5% of gross income |
| Development Fee: | | 5% of hard costs for all improvements |
| Leasing Fees: | | 5% on new leases, 3% on renewals |
| Commission on Outparcel Sales: | | 10% of net sales price |
| | | |
Capital Structure (in millions)
| | | | | |
| DDR | | $ | 1.0 | |
| DRA Advisors | | | 9.0 | |
| | | | |
| Total Capital | | $ | 10.0 | |
| | | | |
| | | | | |
| Debt | | $ | 19.5 | |
| | | | |
| | | | | |
| Total Debt & Equity | | $ | 29.5 | |
| | | | |
Joint Venture Partnership Summaries 4.2
Developers Diversified Realty
Quarterly Financial Supplement
For the six months ended June 30, 2005
Joint Venture Investment Summary
| | | |
| Joint Venture Name: | | Lennox Town Center Limited |
| Date Formed: | | February, 1998 |
| Property Name/Location: | | Lennox Town Center Shopping |
| | | Center - Columbus, OH |
| Major Tenants: | | AMC Theatres Lennox 24 |
| | | Barnes & Noble |
| | | Staples |
| | | Target |
| | | |
Partnership Structure | | |
| Equity Contribution: | | 50% - DDR |
| | | 50% - Casto Properties |
| | | |
| Cash Flow Distribution: | | 50% - DDR |
| | | 50% - Casto Properties |
| | | |
Fees to DDR | | |
| Management Fee: | | 1.312% of all rent |
| Development Fee: | | N/A |
| Leasing Fees: | | N/A |
| Commission on Outparcel Sales: | | N/A |
| | | |
Capital Structure (in millions)
| | | | | |
| DDR | | $ | 0.1 | |
| Casto Properties | | | 0.1 | |
| | | | |
| Total Capital | | $ | 0.2 | |
| | | | |
| | | | | |
| Debt | | $ | 18.3 | |
| | | | |
| | | | | |
| Total Debt & Equity | | $ | 18.5 | |
| | | | |
Joint Venture Partnership Summaries 4.2
Developers Diversified Realty
Quarterly Financial Supplement
For the six months ended June 30, 2005
Joint Venture Investment Summary
| | | |
| Joint Venture Name: | | Sun Center Limited |
| Date Formed: | | February, 1998 |
| Property Name/Location: | | Sun Center - Columbus, OH |
| Major Tenants: | | Babies 'R Us |
| | | Big Bear |
| | | Michael's |
| | | Staples |
| | | Stein Mart |
| | | |
Partnership Structure | | |
| Equity Contribution: | | 79.45% - DDR |
| | | 20.55% - Casto Properties |
| | | |
| Cash Flow Distribution: | | 79.45% - DDR |
| | | 20.55% - Casto Properties |
| | | |
Fees to DDR | | |
| Management Fee: | | 1.312% of all rent |
| Development Fee: | | N/A |
| Leasing Fees: | | N/A |
| Commission on Outparcel Sales: | | N/A |
| | | |
Capital Structure (in millions)
| | | | | |
| DDR | | $ | (0.2 | ) |
| Casto Properties | | | (0.1 | ) |
| | | | |
| Total Capital (1) | | $ | (0.3 | ) |
| | | | |
| | | | | |
| Debt | | $ | 20.9 | |
| | | | |
| | | | | |
| Total Debt & Equity | | $ | 20.6 | |
| | | | |
(1) Basis differentials occur primarily when the Company has purchased an interest in existing joint ventures at fair market values which differ from their proportionate share of the historical net assets of the joint ventures.
Joint Venture Partnership Summaries 4.2
Developers Diversified Realty
Quarterly Financial Supplement
For the six months ended June 30, 2005
Joint Venture Investment Summary
| | | |
| Joint Venture Name: | | Continental Sawmill Limited Partnership |
| Date Formed: | | February, 1998 |
| Property Name/Location: | | Dublin Village Center - Columbus, OH |
| Major Tenant: | | AMC Theatre |
| | | |
Partnership Structure | | |
| Equity Contribution: | | 80.012% - DDR |
| | | 19.988% - Casto Properties |
| | | |
| Cash Flow Distribution: | | 80.012% - DDR |
| | | 19.988% - Casto Properties |
| | | |
Fees to DDR | | |
| Management Fee: | | 1.312% of all rent |
| Development Fee: | | N/A |
| Leasing Fees: | | N/A |
| Commission on Outparcel Sales: | | N/A |
| | | |
Capital Structure (in millions)
| | | | | |
| DDR | | $ | 12.8 | |
| Casto Properties | | | 3.2 | |
| | | | |
| Total Capital | | $ | 16.0 | |
| | | | |
| | | | | |
| Debt | | $ | — | |
| | | | |
| | | | | |
| Total Debt & Equity | | $ | 16.0 | |
| | | | |
Joint Venture Partnership Summaries 4.2
Developers Diversified Realty
Quarterly Financial Supplement
For the six months ended June 30, 2005
Joint Venture Investment Summary
| | | |
| Joint Venture Name: | | DOTRS LLC |
| Date Formed: | | September, 1996 |
| Property Name/Location: | | Macedonia Commons - Macedonia, Ohio |
| | | |
| Major Tenants: | | First National Supermarkets |
| | | Kohl's Department Store |
| | | Wal-Mart (not owned) |
| | | |
Partnership Structure | | |
| Equity Contribution: | | 50% - DDR |
| | | 50% - The State Teachers Retirement Board of Ohio |
| | | |
| Cash Flow Distribution: | | 50% - DDR |
| | | 50% - The State Teachers Retirement Board of Ohio |
| | | |
Fees to DDR | | |
| Management Fee: | | 5% of gross retail income |
| Development Fee: | | 5% of hard costs for all improvements |
| Leasing Fees: | | 5% on new leases, 3.5% on renewals |
| Commission on Outparcel Sales: | | N/A |
| | | |
Capital Structure (in millions)
| | | | | |
| DDR | | $ | 5.6 | |
| The State Teachers Retirement Board | | | 5.6 | |
| | | | |
| Total Capital | | $ | 11.2 | |
| | | | |
| | | | | |
| Debt | | $ | 10.5 | |
| | | | |
| | | | | |
| Total Debt & Equity | | $ | 21.7 | |
| | | | |
Joint Venture Partnership Summaries 4.2
Developers Diversified Realty
Quarterly Financial Supplemental
For the six months ended June 30, 2005
Joint Venture Investment Summary
| | | |
| Joint Venture Name: | | DDRC PDK Salisbury Phase III LLC |
| Date Formed: | | March 2001 |
| Property Name/Location: | | Salisbury, MD |
| Major Tenants: | | Rugged Warehouse |
| | | Dress Barn |
| | | |
Partnership Structure | | |
| Ownership Percentage: | | 50% - DDR |
| | | 50% - PDK Commons Phase III L.C. |
| | | |
| Cash Flow Distribution: | | 50% - DDR |
| | | 50% - PDK Commons Phase III L.C. |
| | | |
Fees to DDR | | |
| Management Fee: | | 4% of gross rental income |
| Development Fee: | | $.75 psf of leasehold improvements |
| Leasing Fees: | | N/A |
| | | |
Capital Structure (in millions)
| | | | | |
| DDR | | $ | 0.1 | |
| PDK Salisbury LLC | | | 0.1 | |
| | | | |
| Total Capital | | $ | 0.2 | |
| | | | |
| | | | | |
| Debt | | $ | 1.8 | |
| | | | |
| | | | | |
| Total Debt & Equity | | $ | 2.0 | |
| | | | |
Joint Venture Partnership Summaries 4.2
Developers Diversified Realty
Quarterly Financial Supplement
For the six months ended June 30, 2005
Joint Venture Investment Summary
| | | |
| Joint Venture Name: | | Shea and Tatum Associates Limited Partnership |
| Date Formed: | | January 1, 1995 (acquired January 2, 2003) |
| Property Name/Location: | | Paradise Village Gateway - Phoenix, AZ |
| Major Tenants: | | Albertson's |
| | | Bed Bath & Beyond |
| | | Petsmart |
| | | Ross |
| | | Staples |
| | | |
Partnership Structure | | |
| Equity Contribution: | | 67% - DDR |
| | | 33% - Churchill Family Trust |
| | | |
| Cash Flow Distribution: | | 67% - DDR |
| | | 33% - Churchill Family Trust |
| | | |
Fees to DDR | | |
| Management Fee: | | 5% of gross income |
| Development Fee: | | 5% of total costs for all improvements (excluding land) |
| Leasing Fees (without co-broker): | | $3.50 per square foot for spaces < 5,000 square feet |
| | | $3.00 per square foot for spaces 5,000 - 10,000 square feet |
| | | $2.50 per square foot for spaces 10,000 - 25,000 square feet |
| | | $2.00 per square foot for spaces 25,000 - 50,000 square feet |
| | | $1.50 per square foot for spaces over 50,000 square feet |
| | | Renewals earn 50% of fees on new leases |
| | | 5.0% on new ground leases on years 1-5 |
| Commission on Outparcel Sales: | | 5% of gross sales price |
| | | |
Capital Structure (in millions)
| | | | | |
| DDR | | $ | 4.6 | |
| Churchill Family Trust | | | 2.3 | |
| | | | |
| Total Capital | | $ | 6.9 | |
| | | | |
| | | | | |
| Debt | | $ | 17.2 | |
| | | | |
| | | | | |
| Total Debt & Equity | | $ | 24.1 | |
| | | | |
Joint Venture Partnership Summaries 4.2
Developers Diversified Realty
Quarterly Financial Supplement
For the six months ended June 30, 2005
Joint Venture Investment Summary
| | | |
| Joint Venture Name: | | Paseo Colorado Holdings LLC |
| Date Formed: | | January 14, 2003 |
| Property Name/Location: | | Paseo Colorado - Pasadena, CA |
| | | |
| Major Tenants: | | DSW Shoe Warehouse |
| | | Equinox Health & Fitness |
| | | Gelson's Market |
| | | Loehmann's |
| | | Macy's |
| | | Pacific Theaters |
| | | |
Partnership Structure | | |
| Equity Contribution: | | 25% - DDR |
| | | 75% - Lehman Brothers |
| | | |
| Cash Flow Distribution: | | 25% - DDR |
| | | 75% - Lehman Brothers |
| | | |
| Promote: | | After DDR and Lehman Brothers receive a return of equity and both partners have been allocated |
| | | an amount equal to a 19% annual return, DDR will receive 50% of available proceeds. |
| | | |
Fees to DDR | | |
| Management Fee: | | 3.5% of gross income |
| Development Fee: | | 3.5% of total costs for all improvements (excluding land) |
| Leasing Fees: | | 6.0% on new leases on years 1-5; 3.0% on remainder of term (spaces < 5,000 square feet) |
| | | 4.5% on new leases on years 1-5; 2.25% on remainder of term (spaces 5,000 - 10,000 square feet) |
| | | 3.5% on new leases on years 1-5; 1.75% on remainder of term (spaces 10,000 - 20,000 square feet) |
| | | 3.0% on renewals on years 1-5; 1.5% on remainder of term (spaces < 5,000 square feet) |
| | | 2.25% on renewals on years 1-5; 1.125% on remainder of term (spaces 5,000 - 10,000 square feet) |
| | | 1.75% on renewals on years 1-5; 1.0% on remainder of term (spaces 10,000 - 20,000 square feet) |
| | | $2.00 per square foot (spaces > 20,000 square feet) on new leases and renewals |
| Commission on Outparcel Sales: | | 6.0% of gross sales price up to $500,000 |
| | | 5.0% of gross sales price over $500,000 but less than $1,000,000 |
| | | 4.0% of gross sales price over $1,000,000 |
Capital Structure (in millions)
| | | | | |
| DDR | | $ | 6.5 | |
| Lehman Brothers | | | 19.4 | |
| | | | |
| Total Capital | | $ | 25.9 | |
| | | | |
| | | | | |
| Debt | | $ | 85.0 | |
| | | | |
| | | | | |
| Total Debt & Equity | | $ | 110.9 | |
| | | | |
Joint Venture Partnership Summaries 4.2
Developers Diversified Realty
Quarterly Financial Supplement
For the six months ended June 30, 2005
Joint Venture Investment Summary
| | | |
| Joint Venture Name: | | KLA/SM L.L.C. |
| Date Formed: | | March 2002 |
| Property Name/Location: | | The Joint Venture consists of 59 fee simple, leasehold and groundlease interests previously owned by the Service Merchandise Company, Inc. In total, these properties are located in 26 states across the United States. |
| | | |
Partnership Structure | | |
| Equity Contribution: | | 24.63% - DDR |
| | | 12.32% - Klaff Realty, L.P. |
| | | 61.58% - Lubert-Adler Funds |
| | | 1.47% - Random Properties Acquisition Corp I |
| | | |
| Cash Flow Distribution: | | 24.63% - DDR |
| | | 12.32% - Klaff Realty, L.P. |
| | | 61.58% - Lubert-Adler Funds |
| | | 1.47% - Random Properties Acquisition Corp I |
| | | |
| | | Once all partners receive a return of all equity, plus a 12% preferred return thereon, plus $43 million, Service Merchandise will be entitled to share 20% of the excess. The remaining proceeds will be distributed in accordance with the percentages noted. |
| | | |
| Promote: | | Once all partners have received a return of all equity, plus a 10% preferred return thereon, DDR will receive 35% of available proceeds. |
| | | |
Fees to DDR | | |
| Management Fees: | | 3.0% of gross revenues |
| Development Fees: | | 4.5% of hard costs for all improvements for all retail tenant leases |
| | | 1.5% of hard costs for all non-retail or furniture leases |
| Leasing Fees: | | $0.94 per square foot for all retail tenant leases |
| | | $0.31 per square foot for all non-retail or furniture leases |
| Disposition Fees: | | .75% of gross sales price for all sales to retail purchasers |
| | | .25% of gross sales price for all sales to non-retail or furniture purchasers |
| | | |
Capital Structure (in millions)
| | | | | |
| DDR | | $ | 9.3 | |
| Klaff | | | 4.6 | |
| Lubert-Adler | | | 23.2 | |
| Random Properties Acquisition Corp. I | | | 0.6 | |
| | | | |
| Total Capital | | $ | 37.7 | |
| | | | |
| | | | | |
| Payable to DDR | | $ | 100.0 | (1) |
| | | | |
| | | | | |
| Existing Debt | | $ | 29.2 | |
| | | | |
| | | | | |
| Total Debt & Equity | | $ | 166.9 | |
| | | | |
(1) Includes mortgage note to DDR for $99.8 million.
Joint Venture Partnership Summaries 4.2
Developers Diversified Realty
Quarterly Financial Supplemental
For the six months ended June 30, 2005
Joint Venture Investment Summary
| | | |
| Joint Venture Name: | | Jefferson County Plaza LLC |
| Date Formed: | | July 1999 |
| Property Name/Location: | | Arnold, MO |
| Major Tenants: | | Target (not owned) |
| | | Home Depot (not owned) |
| | | Shoe Carnival |
| | | Sally Beauty Supply |
| | | Deal$ |
| | | |
Partnership Structure | | |
| Equity Contribution: | | 50% - DDR |
| | | 50% - The Sansone Group (50% owned by DDR) |
| | | |
| Cash Flow Distribution: | | 50% - DDR |
| | | 50% - The Sansone Group |
| | | |
Fees to DDR | | |
| Management Fee: | | 1.5% of gross rental income |
| Development Fee: | | NA |
| Leasing Fees: | | 2.5% of gross base rent plus reimbursables on new leases; 1.75% on renewals |
| | | |
Capital Structure (in millions)
| | | | | |
| DDRC | | $ | (0.1 | ) |
| The Sansone Group | | | (0.1 | ) |
| | | | |
| Total Capital (1) | | $ | (0.2 | ) |
| | | | |
| | | | | |
| Payable to DDR | | $ | 3.1 | |
| | | | |
| | | | | |
| Debt | | $ | 3.4 | |
| | | | |
| | | | | |
| Total Debt & Equity | | $ | 6.3 | |
| | | | |
(1) Basis differentials occur primarily when the Company has purchased an interest in existing joint ventures at fair market values which differ from their proportionate share of the historical net assets of the joint ventures.
Joint Venture Partnership Summaries 4.2
Developers Diversified Realty
Quarterly Financial Supplemental
For the six months ended June 30, 2005
Joint Venture Investment Summary
| | | |
| Joint Venture Name: | | DDR/1st Carolina Apex Phase IV LLC |
| Date Formed: | | November 2004 |
| Property Name/Location: | | Beaver Creek Crossings - Phase II, Apex, NC |
| Major Tenants: | | Kohl's and other retail tenants to be announced |
| | | |
Partnership Structure | | |
| Equity Contribution: | | 80% - 1st Carolina Holdings, LLC |
| | | 20% - DDR |
| | | |
| Cash Flow Distribution: | | 80% - 1st Carolina Holdings, LLC |
| | | 20% - DDR |
| | | |
Fees to DDR | | |
| Management Fee: | | 4% of gross income |
| Development Fee: | | 1% of the project cost |
| Leasing Fees: | | 6% on new leases on years 1-5; 3% on remainder of term (spaces < 5,000 square feet) |
| | | 5% on new leases on years 1-5; 2.5% on remainder of term (spaces 5,000 - 10,000 square feet) |
| | | 4% on new leases on years 1-5; 2% on remainder of term (spaces 10,000 - 20,000 square feet) |
| | | $2 per square foot (spaces > 20,000 square feet) |
| | | 4% on new leases on years 1-5, 2% on years 6-10 (ground lease) |
| | | 3% for renewals on years 1-5; 1.5% on remainder of term (spaces < 5,000 square feet) |
| | | 2.5% for renewals on years 1-5; 1.25% on remainder of term (spaces 5,000 - 10,000 square feet) |
| | | 2% for renewals on years 1-5; 1% on remainder of term (spaces 10,000 - 20,000 square feet) |
| | | $2 per square foot for renewals (spaces > 20,000 square feet) |
| | | 2% on years 1-5, 1% on years 6-10 (ground lease renewals) |
| | | 5% of termination fees collected from tenants |
| | | 6% of gross sales price < $500,000 (outparcel sales) |
| | | 5% of gross sales price $500,001 - $1,000,000 (outparcel sales) |
| | | 4% of Gross Sales Price $1,000,000 or over (Outparcel Sales) |
| Tenant Coordination Fee: | | 5% of the project cost |
Capital Structure (in millions)
| | | | | |
| 1st Carolina | | $ | 0.2 | |
| DDR | | $ | 0.0 | |
| | | | |
| Total Capital | | $ | 0.2 | |
| | | | |
| | | | | |
| Payable to DDR | | $ | 7.5 | |
| | | | |
| | | | | |
| Debt | | $ | — | |
| | | | |
| | | | | |
| Total Debt & Equity | | $ | 7.7 | |
| | | | |
Joint Venture Partnership Summaries 4.2
Developers Diversified Realty
Quarterly Financial Supplemental
For the six months ended June 30, 2005
Joint Venture Investment Summary
| | | | | |
| Joint Venture Name: | | DDR Markaz LLC (Kuwaiti Financial Centre) |
| Date Formed: | | May 2003 | | |
| Property Name/Location: | | The joint venture consists of the following seven properties: |
| | | | | |
| | | Hilltop Plaza - Richmond, CA | | Highland Grove Shopping Center- Highland, IN |
| | | Derby Square - Grove City, OH | | Springfield Commons Shopping Center - Toledo, OH |
| | | Oviedo Park - Oviedo, FL | | Apple Blossom Corners - Winchester, VA |
| | | North Pointe Plaza - Tampa, FL | | |
| | | | | |
| Major Tenants: | | Babies R Us (not owned) | | Marshalls |
| | | Barnes & Noble | | Martin's Food Store |
| | | Bed Bath & Beyond | | Michael's |
| | | Books-A-Million | | OfficeMax |
| | | Borders Books (not owned) | | Old Navy |
| | | Century Theatre | | Petsmart |
| | | Circuit City | | Publix |
| | | Gander Mountain | | Ross Dress for Less |
| | | Jewel (not owned) | | Target (not owned) |
| | | Kohl's | | T.J. Maxx |
| | | Linens 'N Things | | Wal-mart (not owned) |
| | | Lowe's (not owned) | | |
| | | |
Partnership Structure | | |
| Equity Contribution: | | 80% - Kuwait Financial Centre S.A.K. and Bank of Bahrain and Kuwait B.S.C. (dba as "Markaz") |
| | | 20% - DDR |
| | | |
| Cash Flow Distribution: | | 80% - Markaz |
| | | 20% - DDR |
| | | |
| Promote (current): | | (i) Pro rata in proportion to DDR and Markaz equity interest until both have been allocated an amount equal to a 12% annual internal rate of return, and (ii) 20% to DDR and 80% to DDR and Markaz in proportion to their equity interest. |
| | | |
Fees to DDR | | |
| Property Management Fee: | | 4.0% of revenues |
| Development Fee: | | 5.0% of total costs for all improvements |
| Asset Management Fee: | | 5.5% of net operating income |
| Leasing Fees (without co-broker): | | 6.0% on new leases on years 1-5; 3.0% on remainder of term (spaces < 5,000 square feet) |
| | | 5.0% on new leases on years 1-5; 2.5% on remainder of term (spaces 5,000 - 10,000 square feet) |
| | | 4.0% on new leases on years 1-5; 2.0% on remainder of term (spaces 10,000 - 20,000 square feet) |
| | | $2.00 per square foot (spaces > 20,000 square feet) |
| | | 4.0% on new leases on years 1-5; 2.0% on years 6-10 (ground leases) |
| | | Renewals earn 50% of fees on new leases |
| Commission on Outparcel Sales: | | 6.0% of gross sales price up to $500,000 |
| | | 5.0% of gross sales price $500,000 - $1,000,000 |
| | | 4.0% of gross sales price over $1,000,000 |
Capital Structure (in millions)
| | | | | |
| DDR | | $ | 10.8 | |
| Markaz | | | 43.3 | |
| | | | |
| Total Capital | | $ | 54.1 | |
| | | | |
| | | | | |
| Payable to DDR | | $ | 0.8 | |
| | | | |
| | | | | |
| Debt | | $ | 110.0 | |
| | | | |
| | | | | |
| Total Debt & Equity | | $ | 164.9 | |
| | | | |
Joint Venture Partnership Summaries 4.2
Developers Diversified Realty
Quarterly Financial Supplemental
For the six months ended June 30, 2005
Joint Venture Investment Summary
| | | | | |
| Joint Venture Name: | | DDR Markaz II LLC (Kuwaiti Financial Centre II) |
| Date Formed: | | November 2004 | | |
| Property Name/Location: | | The joint venture consists of the following thirteen properties: |
| | | | | |
| | | Culver Ridge Plaza - Irondequoit, NY | | Oxford Place - Oxford, MS |
| | | Tops Plaza - LeRoy, NY | | Midway Plaza - Loganville, GA |
| | | Tops Plaza - Jamestown, NY | | Chillicothe Place - Chillicothe, OH * excluding Lowe's |
| | | Tops Plaza - Ontario, NY | | Northcreek Commons - Goodlettsville, TN |
| | | Tops Plaza Union - Cheektowaga, NY | | Panorama Plaza - Rochester, NY |
| | | Tops Plaza - Warsaw, NY | | Crossroads Centre - Orchard Park, NY |
| | | Tops Plaza Robinson - Amherst, NY | | |
| | | | | |
| Major Tenants: | | AJ Wright | | Lowe's (not owned) |
| | | Blockbuster | | Office Max |
| | | Dollar Tree | | Regal Cinemas |
| | | Factory Card Outlet | | Stein Mart |
| | | Kroger | | Tops Markets |
| | | Linens 'N Things | | |
| | | | | |
| | | |
Partnership Structure | | |
| Equity Contribution: | | 80% - Kuwait Financial Centre S.A.K. and Bank of Bahrain and Kuwait B.S.C. (dba as "Markaz") |
| | | 20% - DDR |
| | | |
| Cash Flow Distribution: | | 80% - Markaz |
| | | 20% - DDR |
| | | |
| Promote (current): | | (i) Pro rata in proportion to DDR and Markaz equity interest until both have been allocated an amount equal to a 11.5% annual internal rate of return, and (ii) 50% to DDR and 50% to DDR and Markaz in proportion to their equity interest. |
| | | |
Fees to DDR | | |
| Property Management Fee: | | 4.0% of revenues |
| Development Fee: | | 5.0% of total costs for all improvements |
| Asset Management Fee: | | 6.25% of net operating income |
| Leasing Fees (without co-broker): | | 6.0% on new leases on years 1-5; 3.0% on remainder of term (spaces < 5,000 square feet) |
| | | 5.0% on new leases on years 1-5; 2.5% on remainder of term (spaces 5,000 - 10,000 square feet) |
| | | 4.0% on new leases on years 1-5; 2.0% on remainder of term (spaces 10,000 - 20,000 square feet) |
| | | $2.00 per square foot (spaces > 20,000 square feet) |
| | | 4.0% on new leases on years 1-5; 2.0% on years 6-10 (ground leases) |
| | | Renewals earn 50% of fees on new leases |
| Commission on Outparcel Sales: | | 6.0% of gross sales price up to $500,000 |
| | | 5.0% of gross sales price $500,000 - $1,000,000 |
| | | 4.0% of gross sales price over $1,000,000 |
Capital Structure (in millions)
| | | | | |
| DDR | | $ | 11.4 | |
| Markaz | | | 45.6 | |
| | | | |
| Total Capital | | $ | 57.0 | |
| | | | |
| | | | | |
| Receivable from DDR | | $ | (2.2 | ) |
| | | | |
| | | | | |
| Payable to DDR | | $ | 0.4 | |
| | | | |
| | | | | |
| Debt | | $ | 150.4 | |
| | | | |
| | | | | |
| Total Debt & Equity | | $ | 205.6 | |
| | | | |
Joint Venture Partnership Summaries 4.2
Developers Diversified Realty
Quarterly Financial Supplemental
For the six months ended June 30, 2005
Joint Venture Investment Summary
| | | |
| Joint Venture Name: | | Coventry II DDR Ward Parkway LLC |
| Date Formed: | | June 2003 |
| Property Name/Location: | | Kansas City, MO |
| Major Tenants: | | Target (not owned) |
| | | Dilliards |
| | | Pier One |
| | | TJ Maxx |
| | | AMC Theater |
| | | 24 Hour Fitness |
| | | Dick's |
| | | |
Partnership Structure | | |
| Equity Contribution: | | 80% - Coventry II Fund |
| | | 20% - DDR |
| | | |
| Cash Flow Distribution: | | 80% - Coventry II Fund * |
| | | 20% - DDR |
| | | |
Fees to DDR | | |
| Management Fee: | | 4% of gross income |
| Development Fee: | | 5% of all hard and soft costs |
| Leasing Fees: | | 6% on new leases on years 1-5; 3% on remainder of term (spaces < 5,000 square feet) |
| | | 4.5% on new leases on years 1-5; 2.25% on remainder of term (spaces 5,000 - 10,000 square feet) |
| | | 3.5% on new leases on years 1-5; 1.75% on remainder of term (spaces 10,000 - 20,000 square feet) |
| | | $2 per square foot (spaces > 20,000 square feet) |
| | | 4% on new leases on years 1-10 (ground lease) |
| | | 3% for renewals on years 1-5; 1.5% on remainder of term (spaces < 5,000 square feet) |
| | | 2.25% for renewals on years 1-5; 1.125% on remainder of term (spaces 5,000 - 10,000 square feet) |
| | | 1.75% for renewals on years 1-5; 1% on remainder of term (spaces 10,000 - 20,000 square feet) |
| | | $1 per square foot for renewals (spaces > 20,000 square feet) |
| | | 2% on renewals on years 1-10 (ground lease) |
| | | 6% of gross sales price < $500,000 (outparcel sales) |
| | | 5% of gross sales price $500,001 - $1,000,000 (outparcel sales) |
| | | 4% of gross sales prices > $1,000,000 (outparcel sales) |
| Construction Management Fee: | | 5% of all development and tenant improvement work performed |
| Tenant Coordination Fee: | | 5% of all hard and soft costs |
Capital Structure (in millions)
| | | | | |
| Coventry II Fund | | $ | 17.0 | |
| DDR | | | 4.3 | |
| | | | |
| Total Capital | | $ | 21.3 | |
| | | | |
| | | | | |
| Debt | | $ | 31.5 | |
| | | | |
| | | | | |
| Total Debt & Equity | | $ | 52.8 | |
| | | | |
* Coventry II Fund:
DDR also is entitled to a promote as a special member of the Coventry II Fund equal to 10% of all cash flow distributions after the distribution to all members of the Coventry II Fund of (i) a 10% preferred return on all contributed capital in all Coventry II Fund investments and (ii) 100% of the unreturned contributed capital in all Coventry II Fund investments.
Joint Venture Partnership Summaries 4.2
Developers Diversified Realty
Quarterly Financial Supplemental
For the six months ended June 30, 2005
Joint Venture Investment Summary
| | | |
| Joint Venture Name: | | Coventry II DDR Totem Lakes LLC |
| Date Formed: | | January 2004 |
| Property Name/Location: | | Totem Lakes Mall - Kirkland, WA |
| Major Tenants: | | Guitar Center |
| | | Trader Joe's |
| | | Big 5 Sporting Goods |
| | | Totem Lake Theater |
| | | Rite Aid |
| | | Ross Dress For Less |
| | | Famous Footwear |
| | | CompUSA |
| | | |
Partnership Structure | | |
| Equity Contribution: | | 80% - Coventry II Fund |
| | | 20% - DDR |
| | | |
| Cash Flow Distribution: | | 80% - Coventry II Fund * |
| | | 20% - DDR |
| | | |
Fees to DDR | | |
| Management Fee: | | 4% of gross income |
| Development Fee: | | 5% of all hard and soft costs |
| Leasing Fees: | | 6% on new leases on years 1-5; 3% on remainder of term (spaces < 5,000 square feet) |
| | | 4.5% on new leases on years 1-5; 2.25% on remainder of term (spaces 5,000 - 10,000 square feet) |
| | | 3.5% on new leases on years 1-5; 1.75% on remainder of term (spaces 10,000 - 20,000 square feet) |
| | | $2 per square foot (spaces > 20,000 square feet) |
| | | 4% on new leases on years 1-10 (ground lease) |
| | | 3% for renewals on years 1-5; 1.5% on remainder of term (spaces < 5,000 square feet) |
| | | 2.25% for renewals on years 1-5; 1.125% on remainder of term (spaces 5,000 - 10,000 square feet) |
| | | 1.75% for renewals on years 1-5; 1% on remainder of term (spaces 10,000 - 20,000 square feet) |
| | | $1 per square foot for renewals (spaces > 20,000 square feet) |
| | | 2% on renewals on years 1-10 (ground lease) |
| | | 6% of gross sales price < $500,000 (outparcel sales) |
| | | 5% of gross sales price $500,001 - $1,000,000 (outparcel sales) |
| | | 4% of gross sales prices > $1,000,000 (outparcel sales) |
| Construction Management Fee: | | 5% of all development and tenant improvement work performed |
| Tenant Coordination Fee: | | 5% of all hard and soft costs |
Capital Structure (in millions)
| | | | | |
| Coventry II Fund | | $ | 9.4 | |
| DDR | | | 2.4 | |
| | | | |
| Total Capital | | $ | 11.8 | |
| | | | |
| | | | | |
| Debt | | $ | 26.0 | |
| | | | |
| | | | | |
| Total Debt & Equity | | $ | 37.8 | |
| | | | |
* Coventry II Fund:
DDR also is entitled to a promote as a special member of the Coventry II Fund equal to 10% of all cash flow distributions after the distribution to all members of the Coventry II Fund of (i) a 10% preferred return on all contributed capital in all Coventry II Fund investments and (ii) 100% of the unreturned contributed capital in all Coventry II Fund investments.
Joint Venture Partnership Summaries 4.2
Developers Diversified Realty
Quarterly Financial Supplemental
For the six months ended June 30, 2005
Joint Venture Investment Summary
| | | |
| Joint Venture Name: | | Coventry II DDR Phoenix Spectrum LLC |
| Date Formed: | | March 2004 |
| Property Name/Location: | | Spectrum Mall - Phoenix, AZ |
| Major Tenants: | | Wal-Mart |
| | | Costco |
| | | Ross Dress For Less |
| | | PetsMart |
| | | Walgreens |
| | | Harkins Theater |
| | | Famous Footwear |
| | | |
Partnership Structure | | |
| Equity Contribution: | | 80% - Coventry II Fund |
| | | 20% - DDR |
| | | |
| Cash Flow Distribution: | | 80% - Coventry II Fund * |
| | | 20% - DDR |
| | | |
Fees to DDR | | |
| Management Fee: | | 4% of gross income |
| Development Fee: | | 5% of all hard and soft costs |
| Leasing Fees: | | 6% on new leases on years 1-5; 3% on remainder of term (spaces < 5,000 square feet) |
| | | 4.5% on new leases on years 1-5; 2.25% on remainder of term (spaces 5,000 - 10,000 square feet) |
| | | 3.5% on new leases on years 1-5; 1.75% on remainder of term (spaces 10,000 - 20,000 square feet) |
| | | $2 per square foot (spaces > 20,000 square feet) |
| | | 4% on new leases on years 1-10 (ground lease) |
| | | 3% for renewals on years 1-5; 1.5% on remainder of term (spaces < 5,000 square feet) |
| | | 2.25% for renewals on years 1-5; 1.125% on remainder of term (spaces 5,000 - 10,000 square feet) |
| | | 1.75% for renewals on years 1-5; 1% on remainder of term (spaces 10,000 - 20,000 square feet) |
| | | $1 per square foot for renewals (spaces > 20,000 square feet) |
| | | 2% on renewals on years 1-10 (ground lease) |
| | | 6% of gross sales price < $500,000 (outparcel sales) |
| | | 5% of gross sales price $500,001 - $1,000,000 (outparcel sales) |
| | | 4% of gross sales prices > $1,000,000 (outparcel sales) |
| Construction Management Fee: | | 5% of all development and tenant improvement work performed |
| Tenant Coordination Fee: | | 5% of all hard and soft costs |
| |
Capital Structure (in millions) | | |
| | | | | |
| Coventry II Fund | | $ | 7.4 | |
| DDR | | | 1.8 | |
| | | | |
| Total Capital | | $ | 9.2 | |
| | | | |
| | | | | |
| Debt | | $ | 39.0 | |
| | | | |
| | | | | |
| Total Debt & Equity | | $ | 48.2 | |
| | | | |
* Coventry II Fund:
DDR also is entitled to a promote as a special member of the Coventry II Fund equal to 10% of all cash flow distributions after the distribution to all members of the Coventry II Fund of (i) a 10% preferred return on all contributed capital in all Coventry II Fund investments and (ii) 100% of the unreturned contributed capital in all Coventry II Fund investments.
Joint Venture Partnership Summaries 4.2
Developers Diversified Realty
Quarterly Financial Supplemental
For the six months ended June 30, 2005
Joint Venture Investment Summary
| | | |
| Joint Venture Name: | | Coventry II DDR Westover LLC / DDR DB 151 Ventures LP |
| Date Formed: | | June 2004 |
| Property Name/Location: | | Westover Marketplace, San Antonio, TX |
| Major Tenants: | | Target (not owned) |
| | | Lowe's |
| | | Ross |
| | | Petsmart |
| | | Sportsman's Warehouse |
| | | Office Depot |
| | | |
Partnership Structure | | |
| DDR DB 151 Ventures LP | | |
| | | |
| Ownership Percentage: | | 50% - Coventry II DDR Westover LLC |
| | | 50% - ERA 151 Partners, Ltd. (Development Partner) |
| | | (No equity contributions at the partnership level) |
| | | |
| Cash Flow Distribution: | | 50% - Coventry II DDR Westover LLC |
| | | 50% - ERA 151 Partners, Ltd. (Development Partner) |
| | | (After repayment of 10.5% interest on the Coventry II DDR Westover loan and repayment of the loan) |
| | | |
| Coventry II DDR Westover LLC | | |
| | | |
| Equity Contribution: | | 80% - Coventry II Fund* |
| | | 20% - DDR |
| | | |
| Cash Flow Distribution: | | 80% - Coventry II Fund* |
| | | 20% - DDR |
| | | |
Fees to DDR | | |
| Management Fee: | | 4% of gross income |
| Development Fee: | | 1% of all project costs less land |
| Leasing Fees: ** | | 6% on new leases on years 1-5; 3% on remainder of term (spaces < 5,000 square feet) |
| | | 4.5% on new leases on years 1-5; 2.25% on remainder of term (spaces 5,000 - 10,000 square feet) |
| | | 3.5% on new leases on years 1-5; 1.75% on remainder of term (spaces 10,000 - 20,000 square feet) |
| | | $2 per square foot (spaces > 20,000 square feet) |
| | | 4% on new leases on years 1-10 (ground lease) |
| | | 3% for renewals on years 1-5; 1.5% on remainder of term (spaces < 5,000 square feet) |
| | | 2.25% for renewals on years 1-5; 1.125% on remainder of term (spaces 5,000 - 10,000 square feet) |
| | | 1.75% for renewals on years 1-5; 1% on remainder of term (spaces 10,000 - 20,000 square feet) |
| | | $1 per square foot for renewals (spaces > 20,000 square feet) |
| | | 2% on renewals on years 1-10 (ground lease) |
| | | 6% of Gross Sales Price up to $500,000 (Outparcel Sales) |
| | | 5% of Gross Sales Price over $500,000 but less than $1,000,000 (Outparcel Sales) |
| | | 4% of Gross Sales Price $1,000,000 or over (Outparcel Sales) |
| Construction Management Fee: ** | | 5% of all development and tenant improvement work performed |
| Tenant Coordination Fee: ** | | 5% of all hard and soft costs |
| | | |
Capital Structure (in millions)
| | | | | |
| Coventry II Fund | | $ | 6.1 | |
| DDR | | | 1.5 | |
| | | | |
| Total Capital | | $ | 7.6 | |
| | | | |
| | | | | |
| Debt | | $ | 11.3 | |
| | | | |
| | | | | |
| Total Debt & Equity | | $ | 18.9 | |
| | | | |
*DDR also is entitled to a promote as a special member of the Coventry II Fund equal to 10% of all cash flow distributions after the distribution to all members of the Coventry II Fund of (i) a 10% preferred return on all contributed capital in all Coventry II Fund investments and (ii) 100% of the unreturned contributed capital in all Coventry II Fund investments.
** Fee shall not be paid with respect to the initial leasing or development.
Joint Venture Partnership Summaries 4.2
Developers Diversified Realty
Quarterly Financial Supplemental
For the six months ended June 30, 2005
Joint Venture Investment Summary
| | | |
| Joint Venture Name: | | Coventry II DDR Buena Park LLC |
| Date Formed: | | November 2004 |
| Property Name/Location: | | Buena Park Mall - Buena Park, CA |
| Major Tenants: | | Wal-Mart (unowned) |
| | | Sears (unowned) |
| | | Krikorian Theater |
| | | Ross Dress For Less |
| | | PetsMart |
| | | Kohl's |
| | | |
Partnership Structure | | |
| Equity Contribution: | | 80% - Coventry II Fund |
| | | 20% - DDR |
| | | |
| Cash Flow Distribution: | | 80% - Coventry II Fund * |
| | | 20% - DDR |
| | | |
Fees to DDR | | |
| Management Fee: | | 4% of gross income |
| Leasing Fees: | | 6% on new leases on years 1-5; 3% on remainder of term (spaces < 5,000 square feet) |
| | | 4.5% on new leases on years 1-5; 2.25% on remainder of term (spaces 5,000 - 10,000 square feet) |
| | | 3.5% on new leases on years 1-5; 1.75% on remainder of term (spaces 10,000 - 20,000 square feet) |
| | | $2 per square foot (spaces > 20,000 square feet) |
| | | 4% on new leases on years 1-10 (ground lease) |
| | | 3% for renewals on years 1-5; 1.5% on remainder of term (spaces < 5,000 square feet) |
| | | 2.25% for renewals on years 1-5; 1.125% on remainder of term (spaces 5,000 - 10,000 square feet) |
| | | 1.75% for renewals on years 1-5; 1% on remainder of term (spaces 10,000 - 20,000 square feet) |
| | | $1 per square foot for renewals (spaces > 20,000 square feet) |
| | | 2% on renewals on years 1-10 (ground lease) |
| | | 6% of gross sales price < $500,000 (outparcel sales) |
| | | 5% of gross sales price $500,001 - $1,000,000 (outparcel sales) |
| | | 4% of gross sales prices > $1,000,000 (outparcel sales) |
| Construction Management Fee: | | 5% of all development and tenant improvement work performed |
| Tenant Coordination Fee: | | 5% of all hard and soft costs |
Capital Structure (in millions)
| | | | | |
| Coventry II Fund | | $ | 22.8 | |
| DDR | | | 5.7 | |
| | | | |
| Total Capital | | $ | 28.5 | |
| | | | |
| | | | | |
| Debt | | $ | 61.0 | |
| | | | |
| | | | | |
| Total Debt & Equity | | $ | 89.5 | |
| | | | |
* Coventry II Fund:
DDR also is entitled to a promote as a special member of the Coventry II Fund equal to 10% of all cash flow distributions after the distribution to all members of the Coventry II Fund of (i) a 10% preferred return on all contributed capital in all Coventry II Fund investments and (ii) 100% of the unreturned contributed capital in all Coventry II Fund investments.
Joint Venture Partnership Summaries 4.2
Developers Diversified Realty
Quarterly Financial Supplemental
For the six months ended June 30, 2005
Joint Venture Investment Summary
| | | |
| Joint Venture Name: | | Coventry II DDR Merriam Village LLC |
| Date Formed: | | March 2005 |
| Property Name/Location: | | Merriam Village, Merriam, Kansas |
| Major Tenants: | | To be announced |
| | | |
Partnership Structure | | |
| Equity Contribution: | | 80% - Coventry II Fund |
| | | 20% - DDR |
| | | |
| Cash Flow Distribution: | | 80% - Coventry II Fund * |
| | | 20% - DDR |
| | | |
Fees to DDR | | |
| Management Fee: | | 4% of gross income |
| Development Fee: | | 5% of all hard and soft costs |
| Leasing Fees: | | 6% on new leases on years 1-5; 3% on remainder of term (spaces < 5,000 square feet) |
| | | 4.5% on new leases on years 1-5; 2.25% on remainder of term (spaces 5,000 - 10,000 square feet) |
| | | 3.5% on new leases on years 1-5; 1.75% on remainder of term (spaces 10,000 - 20,000 square feet) |
| | | $2 per square foot (spaces > 20,000 square feet) |
| | | 4% on new leases on years 1-10 (ground lease) |
| | | 3% for renewals on years 1-5; 1.5% on remainder of term (spaces < 5,000 square feet) |
| | | 2.25% for renewals on years 1-5; 1.125% on remainder of term (spaces 5,000 - 10,000 square feet) |
| | | 1.75% for renewals on years 1-5; 1% on remainder of term (spaces 10,000 - 20,000 square feet) |
| | | $1 per square foot for renewals (spaces > 20,000 square feet) |
| | | 2% on renewals on years 1-10 (ground lease) |
| | | 6% of gross sales price < $500,000 (outparcel sales) |
| | | 5% of gross sales price $500,001 - $1,000,000 (outparcel sales) |
| | | 4% of gross sales prices > $1,000,000 (outparcel sales) |
| Construction Management Fee: ** | | 5% of all development and tenant improvement work performed |
| Tenant Coordination Fee: ** | | 5% of all hard and soft costs |
Capital Structure (in millions)
| | | | | |
| Coventry II Fund | | | 0.08 | |
| DDR | | | 0.02 | |
| | | | |
| Total Capital | | $ | 0.1 | |
| | | | |
| | | | | |
| Payable to DDR | | $ | — | |
| | | | |
| | | | | |
| Debt | | $ | 14.3 | |
| | | | |
| | | | | |
| Total Debt & Equity | | $ | 14.4 | |
| | | | |
* Coventry II Fund:
DDR also is entitled to a promote as a special member of the Coventry II Fund equal to 10% of all cash flow distributions after the distribution to all members of the Coventry II Fund of (i) a 10% preferred return on all contributed capital in all Coventry II Fund investments and (ii) 100% of the unreturned contributed capital in all Coventry II Fund investments.
** Fee shall not be paid with respect to the initial leasing or development.
Joint Venture Partnership Summaries 4.2
Developers Diversified Realty
Quarterly Financial Supplement
For the six months ended June 30, 2005
Joint Venture Investment Summary
| | | | | |
| Joint Venture Name: | | DDR Macquarie LLC (Fund LLC, Management LLC, and U.S. Trust Inc.) |
| Date Formed: | | November 2003 | | |
| Property Name/Location: | | The joint venture consists of the following 48 properties: |
| | | | | |
| | | Union Consumer Square - Cheektowaga, NY | | The Plazas at Great Northern - North Olmsted, OH |
| | | Walden Consumer Square - Cheektowaga, NY | | Riverdale Village - Coon Rapids, MN |
| | | Dick’s Plaza - Cheektowaga, NY | | Midway Marketplace - St. Paul, MN |
| | | Walden Place - Cheektowaga, NY | | River Hills Shopping Center - Asheville, NC |
| | | Borders Books - Cheektowaga, NY | | Township Marketplace - Monaca, PA |
| | | Eastgate Plaza - Clarence, NY | | The Marketplace - Nashville, TN |
| | | Premier Place - Clarence, NY | | BJ’s Batavia - Batavia, NY |
| | | Regal Cinemas - Clarence, NY | | Tops Plaza - Batavia, NY |
| | | Jo-Ann Plaza - Clarence, NY | | Batavia Commons - Batavia, NY |
| | | Barnes & Noble - Clarence, NY | | Towne Center - Murfreesboro, TN |
| | | New Hartford Consumer Square - Utica, NY | | Perimeter Pointe - Atlanta, GA |
| | | Merriam Town Center - Merriam, KS | | Woodfield Village Green - Schaumburg, IL |
| | | Spring Creek Center - Fayetteville, AR | | Fairfax Towne Center - Fairfax, VA |
| | | Steele Crossing - Fayetteville, AR | | Belden Park Crossings - Canton, OH |
| | | Carillon Place - Naples, FL | | Independence Commons - Independence, MO |
| | | Towne Center Prado - Marietta, GA | | Erie Marketplace - Erie, PA |
| | | Shoppers’ World - Framingham, MA | | Riverchase Promenade - Birmingham, AL |
| | | Harbison Court - Columbia, SC | | Lakepoint Crossing - Lewisville, TX |
| | | Connecticut Commons - Plainville, CT | | Lake Brandon Village -Brandon, FL |
| | | Pioneer Hills - Aurora, CO | | Lake Brandon Plaza -Brandon, FL |
| | | Cool Springs Pointe - Brentwood, TN | | MacArthur Marketplace - Irving, TX |
| | | Brown Deer Center - Brown Deer, WI | | Shoppers World of Brookfield - Brookfield, WI |
| | | Brown Deer Market - Brown Deer, WI | | Parker Pavilions - Parker, CO |
| | | McDonough Maarketplace - McDonoudgh, GA | | Grandville Marketplace - Grandville, MI |
| | | | | | | |
| Major Tenants: | | AMC Theatres | | Famous Footwear | | PetsMart |
| | | AC Moore | | General Cinema | | Plainville Theatre |
| | | Barnes & Noble Superstores | | Hallmark | | Pier 1 Imports |
| | | Bed Bath & Beyond | | Home Depot/Expo Design Center | | Publix Supermarkets |
| | | Best Buy | | Jo-Ann Stores | | Regal Cinemas |
| | | BJ’s Wholesale Club | | Kohl’s | | Ross Dress for Less |
| | | Bobs | | Linens ’N Things | | Safeway |
| | | Borders Books | | Lowe’s | | Sports Authority |
| | | Catherine’s/Fashion Bug/Lane Bryant | | Marquee Cinema | | Supervalue, Inc. |
| | | Cinemark Theatres | | Michael’s | | TJ Maxx/Marshalls |
| | | Circuit City | | Office Depot | | Toys “R” Us/Babies “R” Us/Kids “R” Us |
| | | Cost Plus World Market | | OfficeMax | | United Artists Theatre |
| | | Dick’s Sporting Goods | | Old Navy (Gap, Inc.) | | Wal-Mart/Sam’s Club |
| | | DSW Shoe Warehouse/Filene’s Basement | | Party City | | |
| | | | | | | |
Partnership Structure | | | | | | |
| Equity Contribution: | | 14.82% - DDR | | Cash Flow Distribution: | | Variable* |
| | | 2.76% - Macquarie Bank Limited (“MBL”) | | | | |
| | | 84.42% - Macquarie DDR Trust (“MDT”) | | | | |
| |
| Promote: | | Quarterly Base Fee allocation to DDR and MBL. If certain criteria are met, there is a special income allocation to DDR and MBL for a Performace Fee. | | |
Joint Venture Partnership Summaries 4.2
| | | |
Fees to DDR | | |
| Property Management Fee: | | 4.0% of gross revenues |
| Development Fee: | | 5.0% of total costs for all improvements |
| Leasing Fees (without co-broker): | | 6.0% on new leases on years 1-5; 3.0% on remainder of term (spaces < 5,000 square feet) |
| | | 5.0% on new leases on years 1-5; 2.5% on remainder of term (spaces 5,000 - 10,000 square feet) |
| | | 4.0% on new leases on years 1-5; 2.0% on remainder of term (spaces 10,000 - 20,000 square feet) |
| | | $2.00 per square foot (spaces > 20,000 square feet) |
| | | 4.0% on new leases on years 1-5; 2.0% on years 6-10 (outparcels and ground leases) |
| | | Renewals earn 50% of fees on new leases for spaces less than 20,000 square feet. For spaces of 20,000 square feet or more, renewals earn $2.00 per square foot for an amendment to a material term of a lease or $1.00 per square foot where there is no amendment to a material term of the lease. |
| Commission on Outparcel Sales: | | 6.0% of gross sales price up to $500,000 |
| | | 5.0% of gross sales price $500,000 - $1,000,000 |
| | | 4.0% of gross sales price $1,000,000 or over |
| Sponsor’s Fee: | | DDR received $2.9 million which was paid upon completion of the Australian initial public offering. |
| Acquisition Fees: | | Up to 1.0% of the purchase price for third party assets |
| Disposition Fee: | | Market rate not to exceed 1% of the sale price of the property to a third party |
| Debt Placement Fee: | | 50bp of the borrowings raised |
| Due Diligence Fee: | | 12.5bp of MDT's interest in the purchase price of the acquisition |
| Construction Management Fee: | | 5.0% of the cost of capital improvement |
Capital Structure (in millions)
| | | | | |
| DDR | | $ | 103.5 | |
| MBL | | | 19.3 | |
| MDT | | | 575.4 | |
| | | | |
| Total Capital | | $ | 698.2 | |
| | | | |
| | | | | |
| Receivable from DDR, net | | $ | (6.9 | ) |
| | | | |
| | | | | |
| Debt | | $ | 1,025.7 | |
| | | | |
| | | | | |
| Total Debt & Equity | | $ | 1,717.0 | |
| | | | |
* DDR and MBL receive a Base Fee as part of their distributions. The Base Fee is a percentage of the fair market value of the properties held by DDR Macquarie Fund LLC plus the book value of certain other assets held by DDR Macquarie Fund LLC. The prorata share of distributions made to MDT is reduced by the Base Fee. As such, the distribution percentages as well as the dollar amount of the distribution vary depending on the amount of the Base Fee.
Joint Venture Partnership Summaries 4.2
Developers Diversified Realty
Quarterly Financial Supplement
For the six months ended June 30, 2005
Summary of Joint Venture Capital Transactions
Acquisitions, Dispositions, Developments & Expansions
for the Six Month Period Ended June 30, 2005
| | | | | | | | | | | | | | | | | | | | | |
| | | Six Months | | | | | | | | | | | | | |
| | | Ended | | | Year Ended | | | Year Ended | | | Year Ended | | | Year Ended | |
| | | June 30, | | | December 31, | | | December 31, | | | December 31, | | | December 31, | |
| | | 2005 | | | 2004 | | | 2003 | | | 2002 | | | 2001 | |
| Acquisitions/Transfers | | $ | 349.3 | | | $ | 1,147.0 | (3) | | $ | 1,221.7 | (5) | | $ | 53.0 | | | $ | 213.1 | |
| Completed Expansions | | | 1.2 | | | | 10.3 | | | | 9.7 | | | | 9.0 | | | | 2.3 | |
| Developments & Construction in Progress | | | 52.7 | | | | 38.9 | | | | 120.1 | | | | 48.6 | | | | 103.7 | |
| Tenant Improvements & Building Renovations (1) | | | 0.8 | | | | 0.6 | | | | 0.6 | | | | 1.6 | | | | 4.9 | |
| Other Real Estate Investments | | | 0.0 | | | | 0.0 | | | | 0.0 | | | | 161.8 | (7) | | | 0.0 | |
| Minority Equity Investment in AIP | | | 0.0 | | | | 0.0 | | | | 0.0 | | | | 0.0 | | | | (135.0 | )(9) |
| | | | | | | | | | | | | | | | |
| | | $ | 404.0 | | | $ | 1,196.8 | | | $ | 1,352.1 | | | $ | 274.0 | | | $ | 189.0 | |
| | | | | | | | | | | | | | | | | | | | | |
| Less: Real Estate Sales and Dispositions | | | ($18.0 | )(2) | | | ($306.7 | )(4) | | | ($781.5 | )(6) | | | ($361.4 | )(8) | | | ($16.9 | ) |
| | | | | | | | | | | | | | | | |
| |
| Joint Venture Totals (Millions) | | $ | 386.0 | | | $ | 890.1 | | | $ | 570.6 | | | | ($87.4 | ) | | $ | 172.1 | |
| |
(1) The Company estimates recurring capital expenditures, including tenant improvements, of $2 million associated with its joint venture portfolio during 2005.
(2) In addition to asset sales which had an aggregate cost of $12.8, this balance includes the sale of three outparcels at Plaza at Puente Hills, which were owned by RVIP VII.
(3) Balance includes $14.9 for the purchase of Poag & McEwen’s interest and David Berndt interests in RVIP IIIB and RVIP VIII, respectively, $5.2 million for the purchase of a fee interest in several assets in the Service Merchandise portfolio and the $3.0 million earnout for an outparcel in Kildeer, IL.
(4) In addition to asset sales which had an aggregate cost of $141.7, this balance includes the transfer to DDR of the Littleton, CO and Merriam, KS shopping centers which had an aggregate cost of $107.3 million, $51.2 million of adjustments due to GAAP presentation including FIN 46 and a $6.5 million write-off for the demolition of a portion of an asset in Lancaster, CA.
(5) Balance includes the $87.7 million of equity investments previously held by DD Development Company for shopping centers in Long Beach, CA, Shawnee, KS, Overland Pointe, KS, Olathe, KS and Kansas City, MO.
(6) In addition to the assets sales which had an aggregate cost of $167.5 million, this balance includes the disposition of shopping centers located in Dayton and Niles, OH, the sale of an outparcel, the transfer of the Leawood, KS and Suwanee, GA shopping centers to DDR and the rejection of two of the Service Merchandise leases, the aggregate cost of these transactions was $116.6 million. During the fourth quarter the shopping centers located in Coon Rapids, MN, Naples, FL, Atlanta, GA, Marietta, GA, Schaumburg, IL, Framingham, MA and Fairfax, VA, which had an aggregate cost of $379.2 million, were sold to the Macquarie DDR Trust joint venture, and $118.2 million of assets owned by DD Development Company were consolidated into DDR.
(7) Amount represents the net cost of assets acquired from Service Merchandise pursuant to the designation rights agreement.
(8) Includes transfers to DDR in the aggregate amounts of $58.7 million, $38.7 million, $25.6 million and $30.6 million relating to shopping centers in Plainville, CT, Independence, MO, Canton, OH and San Antonio, TX, respectively. This amount also includes sales of shopping centers in Denver, CO; Hagerstown, MD; Salem, NH, Eatontown, NJ, Durham, NC and Round Rock, TX and the sales of outlot parcels in Round Rock, TX and San Antonio, TX.
(9) The balance reflects the consolidation of the assets formerly owned by American Industrial Properties (AIP) during 2nd quarter 2001.
Summary of Joint Venture Capital Transactions 5.1
Developers Diversified Realty
Quarterly Financial Supplement
For the six months ended June 30, 2005
Joint Venture Acquisitions
for the Six Month Period Ended June 30, 2005
| | | | | | | | | | | | | | | | | | | | | |
| | | | | | | | | | | | | | | DDR's | | | Joint | |
| | | | | | | Cost | | | Acquisition | | | Ownership | | | Venture | |
| Property Location | | GLA | | | (Millions) | | | Date | | | Percentage | | | Partner | |
| Macquarie DDR Trust | | | 2,437,685 | | | $ | 349.3 | (1) | | Various | | | 14.50 | % | | Macquarie Bank Limited |
| |
| | | | | | | | | | | | | | | | | | | | | |
| Total | | | 2,437,685 | | | $ | 349.3 | | | | | | | | | | | | | |
| |
Joint Venture Dispositions
for the Six Month Period Ended June 30, 2005
| | | | | | | | | | | | | | | | | | | | | |
| | | | | | | Gross Sale | | | | | | | DDR's | | | Joint | |
| | | | | | | Proceeds | | | | | | | Ownership | | | Venture | |
| Property Location | | GLA | | | (Millions) | | | Sale Date | | | Percentage | | | Partner | |
| Richmond, CA | | | 73,892 | | | $ | 13.0 | | | | 4/1/2005 | | | | 20.00 | % | | Prudential & Coventry Real Estate Partners |
| Service Merchandise locations | | | 128,928 | | | $ | 3.6 | | | Various | | | 25.00 | % | | Various |
| |
| | | | | | | | | | | | | | | | | | | | | |
| Total | | | 202,820 | | | $ | 16.6 | | | | | | | | | | | | | |
| |
Joint Venture Acquisitions and Dispositions 5.2
Developers Diversified Realty
Quarterly Financial Supplement
For the six months ended June 30, 2005
Joint Venture Expansion and Redevelopment Projects
for the Six Month Period Ended June 30, 2005
| | | | | | | | | |
| | | DDR's | | Joint | | |
| | | Ownership | | Venture | | |
| Projects Substantially Complete | | Percentage | | Partner | | Description |
| |
| Merriam, KS | | | 14.50 | % | | MDT | | Expansion of the 7,300 sf outparcel to include Quiznos, Nextel, Fast Frame, and other retail tenants. |
| | | | | |
| Total Cost (Millions) | | $ | 1.2 | | | | | |
| | | | | |
| | | | | | | | | |
Projects in Progress | | Percentage | | | | |
| |
| Phoenix, AZ | | | 20.00 | % | | Coventry II | | Relocation of several existing tenants to accommodate the relocation of Harkins Theatre and new anchor tenants, several junior anchors and other retail tenants to be announced. |
| | | | | | | | | |
| Lancaster, CA | | | 20.00 | % | | Prudential Real Estate
Investors | | Relocate existing Wal-Mart to the area previously occupied by House to Home and Costco, which were demolished so that 20 acres of land could be sold to Wal-Mart for development of a Supercenter. Relocated the existing 99 Cent store and will redemise the former Wal-Mart for four junior anchors and three outparcels when Wal-Mart vacates. |
| | | | | | | | | |
| Kansas City, MO | | | 20.00 | % | | Coventry II | | Relocation of several small shop tenants in the shopping center to accommodate PetsMart and Old Navy (scheduled to open 3rd quarter 2005) and several mid-size anchors and other retail tenants to be announced. |
| | | | | | | | | |
| | | | | |
| Total Cost (Millions) | | $ | 48.0 | | | | | |
| | | | | |
| | | | | | | | | |
Projects to Commence | | Percentage | | | | |
| |
| | | | | | | | | |
| Deer Park, IL | | | 24.75 | % | | Prudential Real Estate
Investors | | Approximately eight acres of land to be developed. |
| | | | | | | | | |
| Kirkland, WA | | | 20.00 | % | | Coventry II | | Large-scale redevelopment to include the relocation of several existing tenants, plus an expansion of the existing center to create additional GLA for two anchors, junior anchors, small shops and restaurants to be announced. |
Joint Venture Expansions and Redevelopment 5.2
Developers Diversified Realty
Quarterly Financial Supplement
For the six months ended June 30, 2005
Summary of Joint Venture Development Projects
for the Six Month Period Ended June 30, 2005
| | | | | | | | | | | | | | | | | | | | | | | | | |
| | | | | | | | | | | | | | | | | DDR's | | | | |
| | | | | | | DDR's | | Joint | | Total | | Proportionate | | Substantial | | |
| | | Total | | Ownership | | Venture | | Cost | | Cost | | Completion | | |
| Projects Substantially Complete | | GLA | | Percentage | | Partner | | (Millions) | | (Millions) | | Date | | Major Tenants |
| |
| Jefferson County (St. Louis), MO | | | 330,051 | (1) | | | 50.0 | % | | Sansone | | $ | 9.7 | | | $ | 4.8 | | | | 2005 | | | Target, Home Depot, Shoe Carnival, Deal$, Sally Beauty |
Projects in Progress | | | | | | | �� | | | | | | | | | | | | | | | | | |
| |
Apex, NC (Beaver Creek
Crossings-Phase II) | | | 284,830 | | | | 20.0 | % | | First Carolina
Properties | | $ | 31.0 | | | $ | 6.2 | | | | 2006 | | | Kohl’s and other retail tenants to be announced. |
| San Antonio, TX | | | 294,769 | | | | 10.0 | % | | David Berndt
Interests &
Coventry II | | $ | 34.3 | | | $ | 3.4 | | | | 2005 | | | Target, Lowe’s, Ross Dress for Less, Sportsman Warehouse, Office Depot, PetsMart and other retail tenants to be announced. |
Projects to Commence Construction | | | | | | | | | | | | | | | | | | | | | | | | |
| |
| Merriam Village, KS | | | 307,598 | | | | 20 | % | | Coventry II | | $ | 35.1 | | | $ | 7.0 | | | | 2006 | | | To be announced. |
| |
| Joint Venture Development Totals | | | 1,217,248 | | | | | | | | | $ | 110.1 | | | $ | 21.5 | | | | | | | |
| |
Notes:
(1) Includes square footage which will not be Company owned.
Joint Venture Developments 5.2
Developers Diversified Realty
Quarterly Financial Supplement
For the six months ended June 30, 2005
Joint Venture Development
Assets Placed in Service as of June 30, 2005
| | | | | | | | | |
| | | Assets Placed | | | DDR's Current | |
| | | in Service | | | Proportionate Share | |
| Date | | (Millions) | | | (Millions) | |
| |
| As of December 31, 2004 | | $ | 4.5 | | | $ | 2.3 | |
| 1st Quarter 2005 | | $ | 0.0 | | | $ | 0.0 | |
| 2nd Quarter 2005 | | $ | 1.9 | | | $ | 0.9 | |
| 3rd Quarter 2005 | | $ | 0.0 | | | $ | 0.0 | |
| 4th Quarter 2005 | | $ | 18.0 | | | $ | 2.2 | |
| During 2006 and Thereafter | | $ | 85.7 | | | $ | 16.0 | |
| |
| Total | | $ | 110.1 | | | $ | 21.5 | |
| |
Joint Venture Development
Funding Schedule as of June 30, 2005
| | | | | | | | | | | | | | | | | |
| | | DDR's | | | JV Partners' | | | Proceeds from | | | | |
| | | Proportionate | | | Proportionate | | | Construction | | | | |
| | | Share | | | Share | | | Loans | | | Total | |
| | | (Millions) | | | (Millions) | | | (Millions) | | | (Millions) | |
| Funded as of June 30, 2005 | | $ | 12.7 | | | $ | 6.3 | | | $ | 29.8 | | | $ | 48.8 | |
| Projected Net Funding During 2005 | | | 0.4 | | | | 1.2 | | | | 24.2 | | | $ | 25.8 | |
| Projected Net Funding Thereafter | | | 0.3 | | | | 1.5 | | | | 33.7 | | | $ | 35.5 | |
| |
| Total | | $ | 13.4 | | | $ | 9.0 | | | $ | 87.7 | | | $ | 110.1 | |
| |
Joint Venture Development Delivery and Funding Schedules 5.2
Developers Diversified Realty Corporation
Quarterly Financial Supplement
For the six months ended June 30, 2005
Summary of Joint Venture Debt
as of June 30, 2005
| | | | | | | | | | | | | | | | | |
| | | | | | | Mortgage | | | | | | | |
| Property/Entity | | | | | | Balance (000's) | | | Maturity Date | | | Interest Rate | |
| | | | | | | | | | | | | | | | | |
RVIP III
Long Beach, CA | | | V | | | $ | 28,000 | | | | 03/07 | | | Libor + 150 |
| | | | | | | | | | | | | | | | | |
RVIP III B
Deer Park, IL | | | V | | | | 55,368 | | | | 07/06 | | | Libor + 150 |
| | | | | | | | | | | | | | | | | |
| RVIP VI | | | F | | | | 18,227 | (1) | | | | | | | | |
| | | | | | | | | | | | | | | | | |
| RVIP VII | | | V | | | | 98,720 | (2) | | | 04/07 | | | Libor + 140 |
| | | | F | | | | 2,028 | (2) | | | 07/07 | | | | 8.3750 | |
| | | | | | | | | | | | | | | | | |
| RVIP VIII | | | V | | | | 23,259 | | | | 01/06 | | | Libor + 175 |
| | | | | | | | | | | | | | | | | |
| DDRA Community Centers Five | | | F | | | | 156,000 | (3)(4) | | | 10/05 | | | | 6.64 | |
| | | | | | | | | | | | | | | | | |
DDRA Community Centers Seven
Ahwatukee, AZ (Phase IV) | | | V | | | | 11,000 | (4) | | | 12/05 | | | Libor + 100 |
| | | | | | | | | | | | | | | | | |
DDRA Community Centers Eight
Deer Valley, AZ | | | F | | | | 17,473 | | | | 09/10 | | | | 8.01 | |
| | | | | | | | | | | | | | | | | |
| DDRA Kildeer LLC | | | V | | | | 4,500 | | | | 08/07 | | | Libor + 180 |
| Kildeer, IL | | | F | | | | 15,000 | | | | 08/07 | | | | 5.64 | |
| | | | | | | | | | | | | | | | | |
Lennox Town Center Limited
Columbus, OH | | | F | | | | 18,339 | | | | 07/22 | | | | 8.11 | |
| | | | | | | | | | | | | | | | | |
| Sun Center Limited | | | F | | | | 6,219 | | | | 05/11 | | | | 5.42 | |
| Columbus, OH | | | F | | | | 14,684 | | | | 04/11 | | | | 8.48 | |
| | | | | | | | | | | | | | | | | |
DOTRS LLC
Macedonia, OH | | | V | | | | 10,527 | | | | 09/06 | | | Libor +100 |
| | | | | | | | | | | | | | | | | |
DDRC PDK Salisbury Phase III LLC
Salisbury, MD | | | F | | | | 1,829 | | | | 04/06 | | | | 7.61 | |
| | | | | | | | | | | | | | | | | |
| KLA/SM LLC | | | F | | | | 12,528 | | | | 11/13 | | | | 6.2555 | |
| | | | F | | | | 16,634 | | | | 10/13 | | | | 6.365 | |
| | | | | | | | | | | | | | | | | |
Jefferson County Plaza, LLC
Arnold, MO | | | V | | | | 3,450 | | | | 08/05 | | | Libor + 175 |
| | | | | | | | | | | | | | | | | |
Paradise Village Gateway
Phoenix, AZ | | | F | | | | 17,208 | | | | 05/07 | | | | 7.78 | |
| | | | | | | | | | | | | | | | | |
| Paseo Colorado Holdings | | | F | | | | 55,000 | | | | 02/06 | | | | 5.78 | |
| Pasadena, CA | | | V | | | | 30,000 | | | | 02/06 | | | Libor + 245 |
Summary of Joint Venture Debt 5.3
Developers Diversified Realty Corporation
Quarterly Financial Supplement
For the six months ended June 30, 2005
Summary of Joint Venture Debt
as of June 30, 2005 (continued)
| | | | | | | | | | | | | | | | | |
| | | | | | | Mortgage | | | | | | | |
| Property/Entity | | | | | | Balance (000's) | | | Maturity Date | | | Interest Rate | |
| | | | | | | | | | | | | | | | | |
| DDR Markaz | | | F | | | $ | 110,000 | (5) | | | 06/08 | | | | 4.129 | |
| | | | | | | | | | | | | | | | | |
| DDR Markaz II | | | F | | | | 150,480 | (6) | | | 11/14 | | | | 5.147 | |
| | | | | | | | | | | | | | | | | |
| Coventry II DDR Ward Parkway | | | V | | | | 31,500 | | | | 08/06 | | | Libor + 240 |
| | | | | | | | | | | | | | | | | |
| Coventry II DDR Totem Lakes | | | V | | | | 26,000 | | | | 07/07 | | | Libor + 215 |
| | | | | | | | | | | | | | | | | |
| Coventry II DDR Phoenix Spectrum | | | V | | | | 39,000 | | | | 07/06 | | | Libor + 275 |
| | | | | | | | | | | | | | | | | |
| Coventry II DDR Westover Marketplace | | | V | | | | 11,330 | | | | 07/07 | | | Libor + 195 |
| | | | | | | | | | | | | | | | | |
| Coventry II DDR Buena Park | | | V | | | | 61,000 | | | | 03/10 | | | Libor + 115 |
| | | | | | | | | | | | | | | | | |
| Coventry II DDR Merriam Village | | | V | | | | 14,332 | | | | 06/08 | | | Libor + 150 |
| | | | | | | | | | | | | | | | | |
| DPG Realty Holdings, LLC | | | | | | | | | | | | | | | | |
| Tonawanda, NY | | | F | | | | 6,256 | | | | 05/17 | | | | 7.630 | |
| Tonawanda, NY | | | F | | | | 5,315 | | | | 06/21 | | | | 7.660 | |
| | | | | | | | | | | | | | | | | |
DDR Maquarie | | | | | | | | | | | | | | | | |
| $125 Million Revolving Credit Facility | | | V | | | | 69,544 | (7) | | | 11/07 | | | Libor + 100 |
| JPMorgan Chase | | | F | | | | 9,100 | (7) | | | 11/07 | | | | 4.913 | |
| | | | | | | | | | | | | | | | | |
| Secured Financing | | | F | | | | 290,500 | (8) | | | 11/08 | | | | 4.225 | |
| | | | V | | | | 50,000 | (8) | | | 12/08 | | | Libor + 130 |
| | | | F | | | | 165,250 | (9) | | | 06/09 | | | | 4.180 | |
| | | | F | | | | 20,000 | (9) | | | 06/07 | | | | 4.800 | |
| | | | V | | | | 29,750 | (9) | | | 06/07 | | | Libor + 84 |
| | | | | | | | | | | | | | | | | |
| BJ’s Clarence | | | F | | | | 4,951 | | | | 03/22 | | | | 7.070 | |
| JoAnn Transit | | | F | | | | 3,440 | | | | 08/13 | | | | 6.250 | |
| New Hartford Consumer Square | | | F | | | | 37,212 | | | | 11/18 | | | | 5.750 | |
| Birmingham, AL (Riverchase) | | | F | | | | 7,938 | | | | 01/13 | | | | 5.500 | |
| Merriam Town Center | | | V | | | | 30,000 | | | | 11/06 | | | Libor + 110 |
| | | | | | | | | | | | | | | | | |
| DDR Macquarie Longhorn Holdings | | | F | | | | 85,000 | (10) | | | 01/12 | | | | 4.910 | |
| | | | | | | | | | | | | | | | | |
| DDR Macquarie Longhorn Holdings II | | | F | | | | 157,250 | (11) | | | 04/10 | | | | 4.822 | |
| | | | V | | | | 26,450 | (11) | | | 04/10 | | | Libor + 85 |
| | | | | | | | | | | | | | | | | |
| DDR Macquarie Longhorn Holdings III | | | F | | | | 39,300 | (12) | | | 04/10 | | | | 5.098 | |
| | | | | | | | | | | | | | | | | |
| | | | | | | $ | 2,096,892 | | | | | | | | | |
| | | | | | | | | | | | | | | | |
Summary of Joint Venture Debt 5.3
Developers Diversified Realty Corporation
Quarterly Financial Supplement
For the six months ended June 30, 2005
Notes:
| (1) | | Encumbers five shopping center properties located in Kansas City, MO with mortgage interest rates ranging from 7.79% to 8.16% and maturity dates ranging from October 2007 to November 2007. |
| |
| (2) | | Encumbers four shopping center properties located in California and Washington. |
| |
| (3) | | Encumbers six shopping center properties as follows: |
| | | | | |
| Ahwatukee, AZ | | Maple Grove, MN | | Eagan, MN |
| Phoenix, AZ | | Portland, OR | | Fort Worth, TX |
| (4) | | Refinanced on July 11, 2005. $280 million fixed at 5.295% maturing August 1, 2010. $18 million floating at Libor + 200 maturing on July 11, 2007. |
| (5) | | Encumbers seven shopping center properties as follows: |
| | | | | |
| Oviedo, FL | | Tampa, FL | | Grove City, OH |
| Richmond, CA | | Highland, IN | | Toledo, OH |
| Winchester, VA | | | | |
| (6) | | Encumbers thirteen shopping center properties as follows: |
| | | | | |
| Orchard Park, NY | | Warsaw, NY | | Chillicothe, OH |
| Rochester, NY | | Leroy, NY | | Loganville, GA |
| Cheektowaga, NY | | Jamestown, NY | | Oxford, MS |
| Amherst, NY | | Ontario, NY | | Goodlettsville, TN |
| Irondequoit, NY | | | | |
| (7) | | Encumbers three shopping center properties as follows: |
| | | | | |
| Canton, OH | | St. Paul, MN | | North Olmsted, OH |
| (8) | | Encumbers seven shopping center properties as follows: |
| | | | | |
| Independence, MO | | Framingham, MA | | Fairfax, VA |
| Schaumburg, IL | | Atlanta, GA | | Naples, FL |
| Marietta, GA | | | | |
| (9) | | Encumbers ten shopping center properties as follows: |
| | | | | |
| Clarence, NY | | Monaca, PA | | Nashville, TN |
| Cheektowaga, NY | | Erie, PA | | Coon Rapids, MN |
| Batavia, NY | | Murfreesboro, TN | | Ashville, NC |
| Fayetteville, AR | | | | |
| (10) | | Encumbers four shopping center properties as follows: |
| | | | | |
| Pioneer Hills (Aurora, CO) | | Harbison Court (Columbia, SC) | | |
| MacArthur Marketplace (Irving, TX) | | Lakepointe Crossing (Lewisville, TX) | | |
| (11) | | Encumbers eight shopping center properties as follows: |
| | | | | |
| Plainville Commons (Plainville, CT) | | Cool Springs Pointe (Brentwood, TN) | | |
| Riverdale Village (Coon Rapids, MN) | | Shoppers World of Brookfield (Brookfield, WI) |
| Brandon Village (Brandon, FL) | | Brown Deer Center (Brown Deer, WI) |
| Brandon Plaza (Brandon, FL) | | Brown Deer Marketplace (Brown Deer, WI) |
| (12) | | Encumbers three shopping center properties as follows: |
| | | | | |
| Grandville Marketplace (Grandville, MI) | | Parker Pavillions (Parker, CO) | | |
| McDonough Marketplace (McDonough, GA) | | | | |
Summary of Joint Venture Debt 5.3
Developers Diversified Realty Corporation
Quarterly Financial Supplement
For the six months ended June 30, 2005
Summary of Pro Rata Joint Venture Debt
as of June 30, 2005
| | | | | | | | | | | | | |
| | | DDR's | | | DDR's | | | | |
| | | Pro Rata | | | Pro Rata | | | Interest | |
| Joint Venture | | Interest | | | Debt (000's) | | | Rate (1) | |
| RVIP III Long Beach | | | 25.50 | % | | $ | 7,140 | | | | 4.840 | |
| RVIP III B | | | 25.50 | % | | | 14,119 | | | | 4.840 | |
| RVIP VI | | | 25.50 | % | | | 4,648 | | | | 8.098 | |
| RVIP VII | | | 20.75 | % | | | 20,905 | | | | 4.814 | |
| RVIP VIII | | | 25.50 | % | | | 5,931 | | | | 5.090 | |
| DDRA Comm Ctr Five | | | 50.00 | % | | | 78,000 | | | | 6.640 | |
| DDRA Comm Ctr Seven | | | 50.00 | % | | | 5,500 | | | | 4.340 | |
| DDRA Comm Ctr Eight | | | 50.00 | % | | | 8,737 | | | | 8.010 | |
| DDRA Kildeer, LLC | | | 10.00 | % | | | 1,950 | | | | 5.524 | |
| Lennox Town Center | | | 50.00 | % | | | 9,170 | | | | 8.110 | |
| Sun Center | | | 79.45 | % | | | 16,607 | | | | 7.569 | |
| DOTRS LLC | | | 50.00 | % | | | 5,263 | | | | 4.340 | |
| DDRC PDK Salisbury | | | 50.00 | % | | | 914 | | | | 7.610 | |
| KLA/SM LLC | | | 24.63 | % | | | 7,183 | | | | 6.318 | |
| Jefferson County Plaza | | | 50.00 | % | | | 1,725 | | | | 5.090 | |
| Paradise Village Gateway | | | 67.00 | % | | | 11,529 | | | | 7.780 | |
| Paseo Colorado Holdings | | | 25.00 | % | | | 21,250 | | | | 5.784 | |
| DDR Markaz | | | 20.00 | % | | | 22,000 | | | | 4.129 | |
| DDR Markaz II | | | 20.00 | % | | | 30,096 | | | | 5.147 | |
| Coventry II DDR Ward Parkway | | | 20.00 | % | | | 6,300 | | | | 5.740 | |
| Coventry II DDR Totem Lakes | | | 20.00 | % | | | 5,200 | | | | 5.490 | |
| Coventry II DDR Phoenix Spectrum | | | 20.00 | % | | | 7,800 | | | | 6.090 | |
| Coventry II DDR Westover Marketplace | | | 10.00 | % | | | 1,133 | | | | 5.290 | |
| Coventry II DDR Buena Park | | | 20.00 | % | | | 12,200 | | | | 4.490 | |
| Coventry II DDR Merriam Village | | | 20.00 | % | | | 2,866 | | | | 4.840 | |
| DPG Realty Holdings, LLC | | | 10.00 | % | | | 1,157 | | | | 7.644 | |
| DDR Maquarie | | | 14.49 | % | | | 148,622 | | | | 4.535 | |
| | | | | | | | | | | | | |
| Total | | | | | | $ | 457,945 | | | | | |
| | | | | | | | | | | | |
| | | | | | | | | | | | | |
| | Fixed Rate | | $ | 324,521 | | | | | |
| | Variable Rate | | $ | 133,424 | | | | | |
| | | | | | | | | | | | | |
| | | | | | | $ | 457,945 | | | | | |
| | | | | | | | | | | | |
| | | | | | | | | | | | | |
| Weighted Average — Total | | | | | | 3.82 years | | | 5.0 | % |
| | | | | | | | | | | | |
| Weighted Average — Fixed | | | | | | 4.66 years | | | 5.2 | % |
| | | | | | | | | | | | |
| Weighted Average — Floating | | | | | | 1.95 Years | | | 4.8 | % |
| | | | | | | | | | | | |
Notes:
| | |
| (1) | | Interest rate on floating rate debt determined by using the LIBOR rate in effect on June 30, 2005. One-month LIBOR was 3.34% on June 30, 2005. |
Summary of Joint Venture Mortage Principal Payments 5.4
Developers Diversified Realty Corporation
Quarterly Financial Supplement
For the six months ended June 30, 2005
Summary of Joint Venture Mortgage Principal Payments
as of June 30, 2005
(000’s)
| | | | | | | | | | | | | | | | | | | | | | | | | | | | | | | | | | | | | | | | | | | | | | | | | |
| | | 2005 | | | 2006 | | | 2007 | | | 2008 | | | 2009 | | | 2010 | | | 2011 | | | 2012 | | | 2013 | | | 2014 | | | | | | | |
| JOINT VENTURE | | Payments | | | Payments | | | Payments | | | Payments | | | Payments | | | Payments | | | Payments | | | Payments | | | Payments | | | Payments | | | Thereafter | | | Total | |
| | | | | | | | | | | | | | | | | | | | | | | | | | | | | | | | | | | | | | | | | | | | | | | | | |
| RVIP III (Long Beach, CA) | | | | | | | | | | | 28,000 | | | | | | | | | | | | | | | | | | | | | | | | | | | | | | | | | | | | 28,000 | |
| RVIP III B (Deer Park) | | | | | | | 55,368 | | | | | | | | | | | | | | | | | | | | | | | | | | | | | | | | | | | | | | | | 55,368 | |
| RVIP VI | | | 293 | | | | 317 | | | | 17,761 | | | | | | | | | | | | | | | | | | | | | | | | | | | | | | | | | | | | 18,371 | |
| RVIP VII | | | 97 | | | | 106 | | | | 100,593 | | | | | | | | | | | | | | | | | | | | | | | | | | | | | | | | | | | | 100,796 | |
| RVIP VIII | | | | | | | 23,259 | | | | | | | | | | | | | | | | | | | | | | | | | | | | | | | | | | | | | | | | 23,259 | |
| DDRA Community Centers Five | | | 156,000 | | | | | | | | | | | | | | | | | | | | | | | | | | | | | | | | | | | | | | | | | | | | 156,000 | |
| DDRA Community Centers Seven | | | 11,000 | | | | | | | | | | | | | | | | | | | | | | | | | | | | | | | | | | | | | | | | | | | | 11,000 | |
| DDRA Community Centers Eight | | | 184 | | | | 200 | | | | 217 | | | | 231 | | | | 255 | | | | 16,479 | | | | | | | | | | | | | | | | | | | | | | | | 17,565 | |
| DDRA Kildeer, LLC (Kildeer, IL) | | | | | | | | | | | 19,500 | | | | | | | | | | | | | | | | | | | | | | | | | | | | | | | | | | | | 19,500 | |
| Lennox Town Center Limited | | | 498 | | | | 540 | | | | 585 | | | | 635 | | | | 688 | | | | 746 | | | | 809 | | | | 877 | | | | 950 | | | | 1,031 | | | | 11,226 | | | | 18,583 | |
| Sun Center Limited | | | | | | | | | | | | | | | | | | | | | | | | | | | | | | | | | | | | | | | | | | | | | | | | |
| Principal Mutual Life Ins Co | | | 442 | | | | 480 | | | | 523 | | | | 569 | | | | 619 | | | | 674 | | | | 11,594 | | | | | | | | | | | | | | | | | | | | 14,900 | |
| W. Lyman Case & Co | | | 84 | | | | 88 | | | | 93 | | | | 98 | | | | 104 | | | | 110 | | | | 5,684 | | | | | | | | | | | | | | | | | | | | 6,260 | |
| DOTRS LLC | | | | | | | | | | | | | | | | | | | | | | | | | | | | | | | | | | | | | | | | | | | | | | | | |
| National City Bank | | | 453 | | | | 10,295 | | | | | | | | | | | | | | | | | | | | | | | | | | | | | | | | | | | | | | | | 10,748 | |
| DDRC PDK Salisbury Phase III | | | | | | | 1,829 | | | | | | | | | | | | | | | | | | | | | | | | | | | | | | | | | | | | | | | | 1,829 | |
| KLA/SM LLC | | | | | | | | | | | | | | | | | | | | | | | | | | | | | | | | | | | 29,162 | | | | | | | | | | | | 29,162 | |
| Jefferson County Plaza LLC | | | 3,450 | | | | | | | | | | | | | | | | | | | | | | | | | | | | | | | | | | | | | | | | | | | | 3,450 | |
| Paradise Village Gateway | | | 298 | | | | 323 | | | | 16,733 | | | | | | | | | | | | | | | | | | | | | | | | | | | | | | | | | | | | 17,354 | |
| Paseo Colorado Holdings | | | | | | | 85,000 | | | | | | | | | | | | | | | | | | | | | | | | | | | | | | | | | | | | | | | | 85,000 | |
| DDR Markaz | | | | | | | | | | | | | | | 110,000 | | | | | | | | | | | | | | | | | | | | | | | | | | | | | | | | 110,000 | |
| DDR Markaz II | | | | | | | | | | | | | | | | | | | | | | | | | | | | | | | | | | | | | | | 150,480 | | | | | | | | 150,480 | |
| Coventry II DDR Ward Parkway | | | | | | | 31,500 | | | | | | | | | | | | | | | | | | | | | | | | | | | | | | | | | | | | | | | | 31,500 | |
| Coventry II DDR Totem Lakes | | | | | | | | | | | 26,000 | | | | | | | | | | | | | | | | | | | | | | | | | | | | | | | | | | | | 26,000 | |
| Coventry II DDR Phoenix Spectrum | | | | | | | 39,000 | | | | | | | | | | | | | | | | | | | | | | | | | | | | | | | | | | | | | | | | 39,000 | |
| Coventry II DDR Westover Marketplace | | | | | | | | | | | 11,330 | | | | | | | | | | | | | | | | | | | | | | | | | | | | | | | | | | | | 11,330 | |
| Coventry II DDR Buena Park | | | | | | | | | | | | | | | | | | | | | | | 61,000 | | | | | | | | | | | | | | | | | | | | | | | | 61,000 | |
| Coventry II DDR Merriam Village | | | | | | | | | | | | | | | 14,332 | | | | | | | | | | | | | | | | | | | | | | | | | | | | | | | | 14,332 | |
| Tonawanda, NY (Hollywood/Tops) | | | 170 | | | | 183 | | | | 198 | | | | 213 | | | | 230 | | | | 249 | | | | 268 | | | | 290 | | | | 312 | | | | 337 | | | | 2,949 | | | | 5,399 | |
| Tonawanda, NY (Tops/Gander Mtn.) | | | 324 | | | | 350 | | | | 377 | | | | 407 | | | | 439 | | | | 474 | | | | 511 | | | | 552 | | | | 595 | | | | 642 | | | | 1,770 | | | | 6,442 | |
DDR Macquarie | | | | | | | | | | | | | | | | | | | | | | | | | | | | | | | | | | | | | | | | | | | | | | | | |
| Bank One $100M Revolver | | | | | | | | | | | 78,644 | | | | | | | | | | | | | | | | | | | | | | | | | | | | | | | | | | | | 78,644 | |
| Secured Financing | | | | | | | | | | | 49,750 | | | | 340,500 | | | | 165,250 | | | | | | | | | | | | | | | | | | | | | | | | | | | | 555,500 | |
| BJ’s Clarence | | | 155 | | | | 166 | | | | 178 | | | | 191 | | | | 205 | | | | 220 | | | | 236 | | | | 253 | | | | 272 | | | | 292 | | | | 2,859 | | | | 5,027 | |
| JoAnn Transit | | | 323 | | | | 344 | | | | 366 | | | | 390 | | | | 415 | | | | 441 | | | | 470 | | | | 500 | | | | 351 | | | | | | | | | | | | 3,599 | |
| New Hartford Consumer Square | | | 1,842 | | | | 1,951 | | | | 2,066 | | | | 2,188 | | | | 2,317 | | | | 2,454 | | | | 2,599 | | | | 2,752 | | | | 2,915 | | | | 3,087 | | | | 13,949 | | | | 38,120 | |
| Birmingham, AL (Riverchase) | | | 116 | | | | 122 | | | | 129 | | | | 136 | | | | 145 | | | | 153 | | | | 162 | | | | 170 | | | | 6,864 | | | | | | | | | | | | 7,996 | |
| Merriam Town Center | | | | | | | 30,000 | | | | | | | | | | | | | | | | | | | | | | | | | | | | | | | | | | | | | | | | 30,000 | |
| DDR Macquarie Longhorn Hldgs | | | | | | | | | | | | | | | | | | | | | | | | | | | | | | | 85,000 | | | | | | | | | | | | | | | | 85,000 | |
| DDR Macquarie Longhorn Hldgs II | | | | | | | | | | | | | | | | | | | | | | | 183,700 | | | | | | | | | | | | | | | | | | | | | | | | 183,700 | |
| DDR Macquarie Longhorn Hldgs III | | | | | | | | | | | | | | | | | | | | | | | 39,300 | | | | | | | | | | | | | | | | | | | | | | | | 39,300 | |
| Payments through 6/30/05 | | | -2,622 | | | | | | | | | | | | | | | | | | | | | | | | | | | | | | | | | | | | | | | | | | | | -2,622 | |
| | | | | | | | | | | | | | | | | | | | | | | | | | | | | | | | | | | | | |
| Total — Debt | | | 173,106 | | | | 281,420 | | | | 353,044 | | | | 469,889 | | | | 170,666 | | | | 305,999 | | | | 22,332 | | | | 90,393 | | | | 41,422 | | | | 155,869 | | | | 32,752 | | | | 2,096,892 | |
Summary of Joint Venture Mortage Principal Payments 5.5
| Company Features 473 Shopping Centers (and interests in Retail Assets) 13 Managed Shopping Centers 44 / 1 States / Commonwealth (including managed properties) 79.7 Million Sq. Ft. Owned 110.4 Million Sq. Ft. Owned and Managed 95.6% / 95.0% % Leased / % Occupied 557 Total Employees (1) Includes Service Merchandise portfolio. Does not include 32 industrial and office properties. (2) Includes retail development projects in process. (3) Assumes 100% ownership of joint venture assets. Based on actual pro rata ownership of joint venture assets, total owned GLA is 57 million. (4) Includes unowned anchors at Company-owned operating and development retail properties. (5) Core retail portfolio. (6) Excluding the impact of assets acquired from Benderson Development and the Caribbean Property Group, the Company's core portfolio was 95.5% leased and 95.0% occupied. (1) (1) (2) (2) (3) (2) (3) (4) (5) (6) |
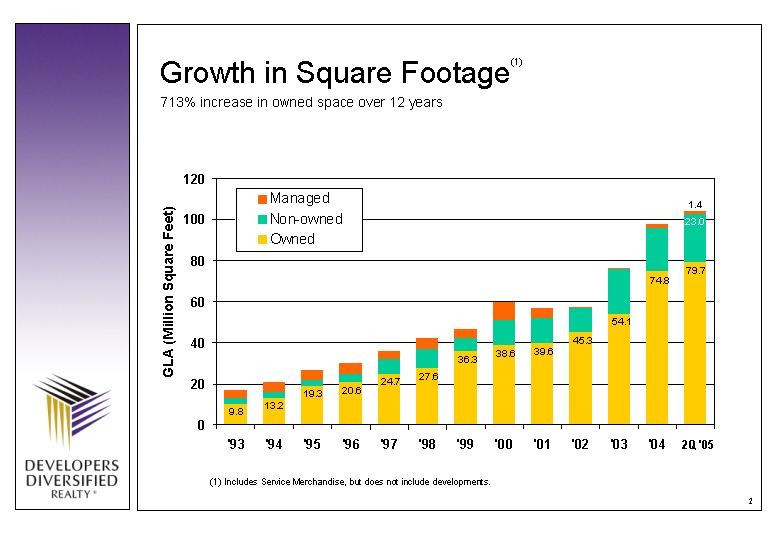
| Growth in Square Footage 713% increase in owned space over 12 years (1) '93 '94 '95 '96 '97 '98 '99 '00 '01 '02 '03 '04 Owned 10 13 19 21 25 28 36 39 40 45.3 54.1 74.8 79.7 Non-owned 3 3 3 4 7 9 6 12 12 11.6 22.1 21.4 23 Managed 4 5 5 5 4 5 5 9 5 0.7 0.2 1.4 1.4 (1) Includes Service Merchandise, but does not include developments. 13.2 9.8 19.3 20.6 24.7 27.6 36.3 38.6 39.6 45.3 54.1 74.8 23.0 1.4 GLA (Million Square Feet) 79.7 2Q '05 |
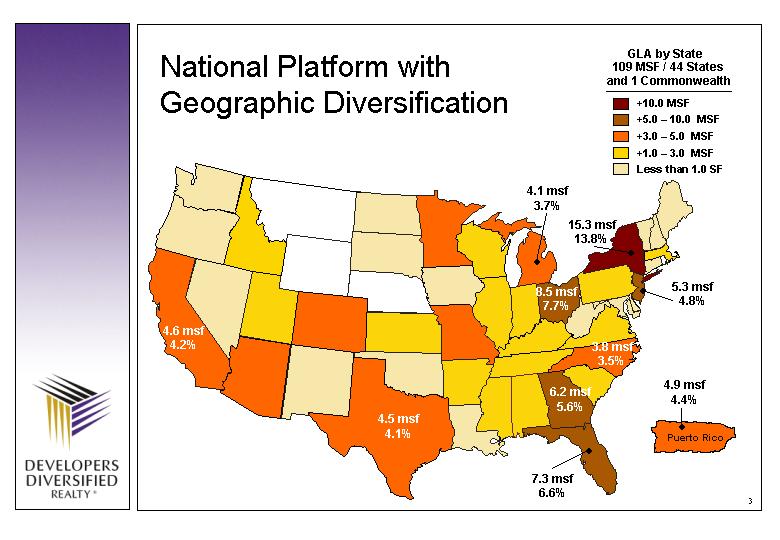
| National Platform with Geographic Diversification 5.3 msf 4.8% 15.3 msf 13.8% 8.5 msf 7.7% 6.2 msf 5.6% 7.3 msf 6.6% 4.5 msf 4.1% 4.6 msf 4.2% 4.1 msf 3.7% Puerto Rico 4.9 msf 4.4% 3.8 msf 3.5% GLA by State 109 MSF / 44 States and 1 Commonwealth +10.0 MSF +5.0 - 10.0 MSF +3.0 - 5.0 MSF +1.0 - 3.0 MSF Less than 1.0 SF |
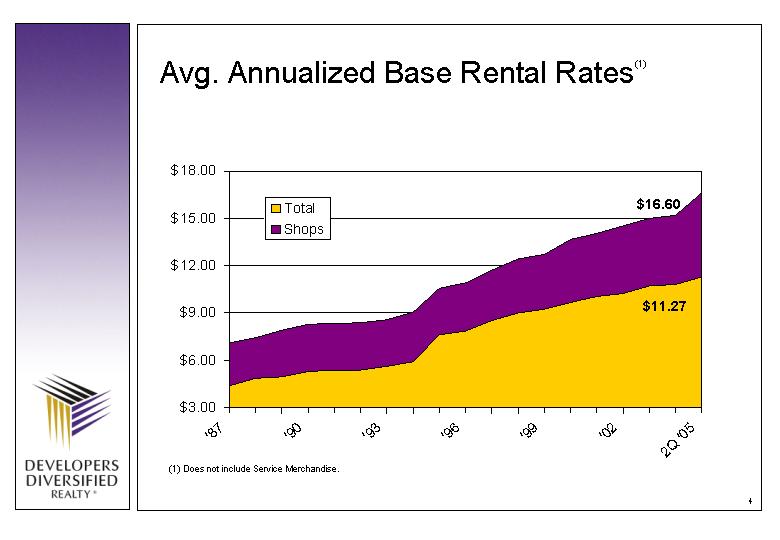
| '87 '88 '89 '90 '91 '92 '93 '94 '95 '96 '97 '98 '99 '00 '01 '02 '03 '04 2Q '05 Total 4.38 4.81 4.93 5.27 5.35 5.37 5.6 5.89 7.6 7.85 8.49 8.99 9.2 9.66 10.03 10.2 10.7 10.79 11.27 Shops 7.09 7.41 7.87 8.25 8.29 8.37 8.56 9.02 10.54 10.87 11.69 12.39 12.69 13.66 14.02 14.5 15 15.15 16.6 Avg. Annualized Base Rental Rates $16.60 $11.27 (1) (1) Does not include Service Merchandise. |
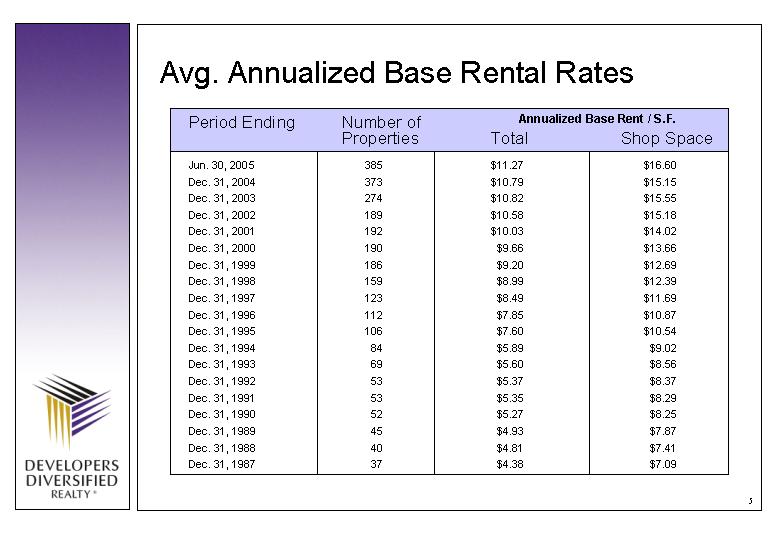
| Avg. Annualized Base Rental Rates Jun. 30, 2005 385 $11.27 $16.60 Dec. 31, 2004 373 $10.79 $15.15 Dec. 31, 2003 274 $10.82 $15.55 Dec. 31, 2002 189 $10.58 $15.18 Dec. 31, 2001 192 $10.03 $14.02 Dec. 31, 2000 190 $9.66 $13.66 Dec. 31, 1999 186 $9.20 $12.69 Dec. 31, 1998 159 $8.99 $12.39 Dec. 31, 1997 123 $8.49 $11.69 Dec. 31, 1996 112 $7.85 $10.87 Dec. 31, 1995 106 $7.60 $10.54 Dec. 31, 1994 84 $5.89 $9.02 Dec. 31, 1993 69 $5.60 $8.56 Dec. 31, 1992 53 $5.37 $8.37 Dec. 31, 1991 53 $5.35 $8.29 Dec. 31, 1990 52 $5.27 $8.25 Dec. 31, 1989 45 $4.93 $7.87 Dec. 31, 1988 40 $4.81 $7.41 Dec. 31, 1987 37 $4.38 $7.09 Period Ending Number of Properties Total Shop Space Annualized Base Rent / S.F. |

| Lease Expirations by Year 2005 2006 2007 2008 2009 Anchor 0.008 0.019 0.029 0.032 0.056 Small Shop 0.053 0.118 0.14 0.139 0.14 (1) Does not include Service Merchandise or development properties. (2) Options not included. % Total Base Rents by Class (1) (2) |
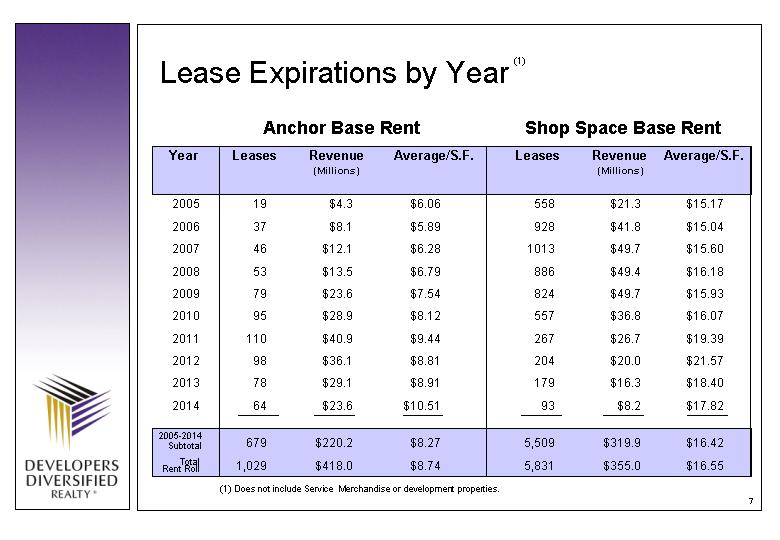
| Lease Expirations by Year (1) 2005 19 $4.3 $6.06 558 $21.3 $15.17 2006 37 $8.1 $5.89 928 $41.8 $15.04 2007 46 $12.1 $6.28 1013 $49.7 $15.60 2008 53 $13.5 $6.79 886 $49.4 $16.18 2009 79 $23.6 $7.54 824 $49.7 $15.93 2010 95 $28.9 $8.12 557 $36.8 $16.07 2011 110 $40.9 $9.44 267 $26.7 $19.39 2012 98 $36.1 $8.81 204 $20.0 $21.57 2013 78 $29.1 $8.91 179 $16.3 $18.40 2014 64 $23.6 $10.51 93 $8.2 $17.82 679 $220.2 $8.27 5,509 $319.9 $16.42 1,029 $418.0 $8.74 5,831 $355.0 $16.55 Year Leases Revenue Average/S.F. Leases Revenue Average/S.F. 2005-2014 Subtotal (1) Does not include Service Merchandise or development properties. Anchor Base Rent Shop Space Base Rent (Millions) (Millions) Total Rent Roll |

| Largest Tenants by GLA Owned & Unowned 1. Wal-Mart / Sam's Club 99 14.33 46 5.99 53 8.34 2. Target 33 4.14 10 1.26 23 2.88 3. Lowe's 28 3.64 14 1.77 14 1.86 4. Home Depot 33 3.47 12 1.11 21 2.36 5. Kmart / Sears 32 2.72 30 2.34 2 0.38 6. Royal Ahold (Tops Market) 44 2.64 42 2.52 2 0.12 7. Kohl's 30 2.56 27 2.30 3 0.26 8. T.J. Maxx / Marshall's 67 2.22 67 2.22 0 0.00 9. Toys "R" Us / Babies "R" Us 39 1.54 30 1.15 9 0.39 10. PETsMART 67 1.48 67 1.48 0 0.00 Total Units Total GLA (millions) Owned Units Owned GLA (millions) Unowned Units Unowned GLA (millions) (1) Includes Service Merchandise portfolio. Does not include development properties. (2) Assumes 100% ownership of joint ventures. (1) (2) |

| Reliance on Major Tenants (Owned Shopping Center GLA Only) (1) (2) (3) Tenant Units Percent of Total Credit Ratings Total Base Rent (millions) (1) Includes Service Merchandise portfolio. Does not include development properties. (2) Based on pro rata ownership of joint venture properties. (3) Reflects major tenants with a percentage of total portfolio of 1% and higher. Wal-Mart / Sam's Club 46 $30.65 5.51% AA/Aa2 Royal Ahold (Tops Markets) 42 $18.07 3.25% BB-/Ba2 PETsMART 67 $11.20 2.01% BB-/Ba2 T.J. Maxx / Marshalls 67 $10.60 1.91% A/A3 Bed Bath & Beyond 44 $10.05 1.81% BBB/NR Kohl's 27 $9.46 1.70% A-/A3 Lowe's Home Improvement 14 $8.93 1.61% A+/A2 Kmart / Sears 30 $7.77 1.40% BBB-/Baa3 OfficeMax (Boise Cascade) 47 $7.46 1.34% BB/Ba1 Michaels 43 $7.29 1.31% BB+/Ba1 Home Depot 12 $7.29 1.31% AA/Aa3 Old Navy / GAP / Banana Republic 43 $6.87 1.24% BBB-/Baa3 Barnes & Noble 28 $6.30 1.13% NR/NR Ross Stores 32 $5.74 1.03% BBB/NR Toys "R" Us / Babies "R" Us 30 $5.72 1.03% B-/Ba2 Best Buy 18 $5.54 1.00% BBB/Baa3 Subtotal 590 $158.95 28.60% Total Portfolio 6,860 $555.71 100.00% |

| Reliance on Major Tenants by GLA and Base Rental Revenues (1) (2) 1. Wal-Mart / Sam's Club (46) $30.65 5.51% 2. Royal Ahold (Tops Markets) (42) $18.07 3.25% 3. PETsMART (67) $11.20 2.01% 4. T.J. Maxx / Marshalls (67) $10.60 1.91% 5. Bed Bath & Beyond (44) $10.05 1.81% 6. Kohl's (27) $9.46 1.70% 7. Lowe's Home Improvement (14) $8.93 1.61% 8. Kmart / Sears (30) $7.77 1.40% 9. OfficeMax (Boise Cascade) (47) $7.46 1.34% 10. Michaels (43) $7.29 1.31% 11. Home Depot (12) $7.29 1.31% 12. Old Navy / GAP / Banana Republic (43) $6.87 1.24% 13. Barnes & Noble (28) $6.30 1.13% 14. Ross Stores (32) $5.74 1.03% 15. Toys "R" Us / Babies "R" Us (30) $5.72 1.03% 16. Best Buy (18) $5.54 1.00% 17. Dick's Sporting Goods (15) $5.43 0.98% 18. Dollar Tree Stores (92) $5.35 0.96% 19. AMC Theater (6) $5.23 0.94% 20 . Staples (25) $5.15 0.93% Subtotal 1-20 $180.11 32.41% Total Portfolio $555.71 100.00% 1. Wal-Mart / Sam's Club (46) 5.04 8.83% 2. Kmart / Sears (30) 2.34 4.09% 3. Royal Ahold (Tops Markets) (42) 1.63 2.86% 4. Lowe's Home Improvement (14) 1.43 2.51% 5. Kohl's (27) 1.31 2.30% 6. T.J. Maxx / Marshalls (67) 1.24 2.17% 7. Target (10) 1.00 1.75% 8. Home Depot (12) 0.92 1.61% 9. PETsMART (67) 0.90 1.57% 10. Bed Bath & Beyond (44) 0.89 1.56% 11. Toys "R" Us / Babies "R" Us (30) 0.87 1.52% 12. JCPenney (20) 0.79 1.38% 13. OfficeMax (Boise Cascade) (47) 0.71 1.24% 14. Kroger (18) 0.70 1.23% 15. Michaels (43) 0.65 1.14% 16. Dollar Tree (92) 0.62 1.08% 17. Ross Stores (32) 0.56 0.99% 18. Goody's Family Clothing (22) 0.56 0.98% 19. Bealls (16) 0.55 0.96% 20. Dick's Sporting Goods (16) 0.52 0.92% Subtotal 1-20 23.21 40.70% Total Portfolio 57.04 100.00% Major Tenant (units) Owned GLA % Total GLA Base Rental Revenue ($Millions) % Total Base Rent Major Tenant (units) (1) Includes Service Merchandise portfolio. Does not include development properties. (2) Based on pro rata ownership of joint venture properties. |
Exhibit 99.2
Property List*
| | | | | | | | | | | | | | | | | | | | | | | | | | | | | | | | | | | | | |
| | | | | | | | | | | | | Year | | | | | | DDR | | Owned | | Owned/Unowned | | Total | | |
| | | | | | | Zip | | Type of | | Developed/ | | Year | | Ownership | | Gross | | Gross | | Annualized | | |
| Center/Property | | Location | | Code | | Property | | Redeveloped | | Acquired | | Interest | | Leasable Area | | Leasable Area | | Rent | | Anchor Tenants(Lease Expiration) |
| Alabama | | | | | | | | | | | | | | | | | | | | | | | | | | | | | | | | | | |
| | | | | | | | | | | | | | | | | | | | | | | | | | | | | | | | | | | | | |
| 1 | | BIRMINGHAM, AL (BROOK) | | BROOK HIGHLAND PLAZA
5291 HWY 280 SOUTH | | | 35242 | | | SC | | | 1994/2003 | | | | 1994 | | | | 100.00 | % | | | 423,493 | | | | 550,410 | | | | 3,981,450 | | | WINN DIXIE STORES #417(2014), GOODY’S #165(2009), REGAL CINEMAS, INC.#010401(2014), STEIN MART#67(2011), OFFICEMAX #588(2011), MICHAEL’S #9986(2009), BOOKS-A-MILLION #181(2010), ROSS STORES #637(2014), LOWES HOME CENTERS(NOT OWNED) |
| | | | | | | | | | | | | | | | | | | | | | | | | | | | | | | | | | | | | |
| 2 | | BIRMINGHAM, AL (EASTWOOD) | | EASTWOOD FESTIVAL CENTER
7001 CRESTWOOD BLVD | | | 35210 | | | SC | | | 1989/1999 | | | | 1995 | | | | 100.00 | % | | | 301,074 | | | | 454,904 | | | | 1,911,605 | | | OFFICE DEPOT #43(2007), DOLLAR TREE #1130(2009), BURLINGTON COAT FACTORY #297(2008), REGAL CINEMAS, INC.#010402(2006), HOME DEPOT(NOT OWNED), WESTERN SUPERMARKETS(NOT OWNED) |
| | | | | | | | | | | | | | | | | | | | | | | | | | | | | | | | | | | | | |
| 3 | | BIRMINGHAM, AL (RIVERCHASE) | | RIVERCHASE PROMENADE
MONTGOMERY HIGHWAY | | | 35244 | | | SC | | | 1989 | | | | 2002 | | | | 14.50 | % | | | 98,016 | | | | 228,344 | | | | 1,475,060 | | | MARSHALL’S #411(2006), GOODY’S(NOT OWNED), TOY’S R US(NOT OWNED), KID’S R US(NOT OWNED) |
| | | | | | | | | | | | | | | | | | | | | | | | | | | | | | | | | | | | | |
| 4 | | GADSDEN, AL | | EAST SIDE PLAZA
3010-3036 E. MEIGHAN BOULEVARD | | | 35903 | | | SC | | | 1979/2004 | | | | 2003 | | | | 100.00 | % | | | 85,196 | | | | 130,899 | | | | 281,489 | | | FRED’S(2009), FOOD WORLD(NOT OWNED) |
| | | | | | | | | | | | | | | | | | | | | | | | | | | | | | | | | | | | | |
| 5 | | OPELIKA, AL | | PEPPERELL CORNERS
2300-2600 PEPPERELL PARKWAY OP | | | 36801 | | | SC | | | 1995 | | | | 2003 | | | | 100.00 | % | | | 190,127 | | | | 190,127 | | | | 1,189,884 | | | Lowe’s #0398(2012), Goody’s 20921 - #121(2010), Winn-Dixie #409(2013) |
| | | | | | | | | | | | | | | | | | | | | | | | | | | | | | | | | | | | | |
| 6 | | SCOTTSBORO, AL | | SCOTTSBORO MARKETPLACE
24833 JOHN P REID PARKWAY | | | 35766 | | | SC | | | 1999 | | | | 2003 | | | | 100.00 | % | | | 40,560 | | | | 223,750 | | | | 411,012 | | | Goody’s #55(2011), WAL-MART(NOT OWNED) |
| | | | | | | | | | | | | | | | | | | | | | | | | | | | | | | | | | | | | |
| Arizona | | | | | | | | | | | | | | | | | | | | | | | | | | | | | | | | | | |
| | | | | | | | | | | | | | | | | | | | | | | | | | | | | | | | | | | | | |
| 7 | | AHWATUKEE, AZ | | FOOTHILLS TOWNE CTR (II)
4711 EAST RAY ROAD | | | 85044 | | | SC | | | 1996/1997/1999 | | | | 1997 | | | | 50.00 | % | | | 647,904 | | | | 686,435 | | | | 9,155,648 | | | JO-ANN, ETC. #1917(2010), BEST BUY #177(2014), BASSETT FURNITURE(2010), AMC THEATRE(2021), BARNES & NOBLE #2781(2012), ASHLEY HOMESTORES(2011), STEIN MART #106(2011), BABIES R US #5670(2007), ROSS STORES, INC. #369(2007), OFFICEMAX #743(2012) |
| | | | | | | | | | | | | | | | | | | | | | | | | | | | | | | | | | | | | |
| 8 | | PHOENIX, AZ | | PARADISE VILLAGE GATEWAY TATUM & SHEA BLVDS. | | | 85028 | | | SC | | | 1997/2004 | | | | 2003 | | | | 67.00 | % | | | 223,208 | | | | 296,118 | | | | 4,094,252 | | | BED BATH & BEYOND(2011), ROSS #364(2007), PETSMART #131(2015), STAPLES #0395(2005), ALBERTSONS-OSCO DRUG(NOT OWNED) |
| | | | | | | | | | | | | | | | | | | | | | | | | | | | | | | | | | | | | |
| 9 | | PHOENIX, AZ (DEER VALLEY) | | DEER VALLEY TOWNE CENTER
2805 WEST AGUA FRIA FREEWAY | | | 85027 | | | SC | | | 1996 | | | | 1999 | | | | 50.00 | % | | | 197,009 | | | | 459,939 | | | | 3,076,529 | | | ROSS STORES #412(2009), OFFICEMAX #739(2013), PETSMART #1333(2014), MICHAEL’S #9922(2009), TARGET(NOT OWNED), AMC THEATRES(NOT OWNED) |
| | | | | | | | | | | | | | | | | | | | | | | | | | | | | | | | | | | | | |
| 10 | | PHOENIX, AZ (PEORIA) | | ARROWHEAD CROSSING
7553 WEST BELL ROAD | | | 85382 | | | SC | | | 1995 | | | | 1996 | | | | 50.00 | % | | | 346,428 | | | | 416,606 | | | | 4,332,955 | | | STAPLES #289(2009), COMP USA#318(2013), MAC FRUGAL’S #333 -1(2010), BARNES & NOBLE #2746-1(2011), T.J. MAXX #162 -1(2005), CIRCUIT CITY - #3362-1(2016), DSW SHOE WAREHOUSE #29103(2017), BASSETT FURNITURE(2009), LINENS ‘N THINGS #427-1(2011), FRY’S(NOT OWNED) |
| | | | | | | | | | | | | | | | | | | | | | | | | | | | | | | | | | | | | |
| 11 | | PHOENIX, AZ (SPE) | | PHOENIX SPECTRUM MALL
1703 WEST BETHANY HOME ROAD | | | 85015 | | | SC | | | 1961 | | | | 2004 | | | | 20.00 | % | | | 443,831 | | | | 898,462 | | | | 5,573,381 | | | COSTCO WHOLESALE CORP #665(2020), ROSS DRESS FOR LESS(2013), PETsMART(2019), HARKINS THEATRE(2002), WALMART(NOT OWNED), DILLARD’S(NOT OWNED) |
| | | | | | | | | | | | | | | | | | | | | | | | | | | | | | | | | | | | | |
| | | | | | | | | | | | | | | | | | | | | | | | | | | | | | | | | | | | | |
| Arkansas | | | | | | | | | | | | | | | | | | | | | | | | | | | | | | | | | | |
| | | | | | | | | | | | | | | | | | | | | | | | | | | | | | | | | | | | | |
| 12 | | FAYETTEVILLE, AR | | SPRING CREEK CENTRE
464 E. JOYCE BOULEVARD | | | 72703 | | | SC | | | 1997/1999/2000/2001 | | | | 1997 | | | | 14.50 | % | | | 262,827 | | | | 590,161 | | | | 2,948,892 | | | T.J. MAXX #159(2011), BEST BUY(2017), GOODY’S #231(2013), OLD NAVY #02625(2010), BED, BATH & BEYOND #278(2009), WAL-MART SUPER CENTER(NOT OWNED), HOME DEPOT(NOT OWNED) |
| | | | | | | | | | | | | | | | | | | | | | | | | | | | | | | | | | | | | |
| 13 | | FAYETTEVILLE, AR (STEELE) | | STEELE CROSSING
3533-3595 N. SHILOH DR | | | 72703 | | | SC | | | 2003 | | | | 2003 | | | | 14.50 | % | | | 50,293 | | | | 261,644 | | | | 989,215 | | | KOHL’S(NOT OWNED), TARGET(NOT OWNED) |
| | | | | | | | | | | | | | | | | | | | | | | | | | | | | | | | | | | | | |
| 14 | | N. LITTLE ROCK, AR | | MCCAIN PLAZA
4124 EAST MCCAIN BOULEVARD | | | 72117 | | | SC | | | 1991/2004 | | | | 1994 | | | | 100.00 | % | | | 295,013 | | | | 295,013 | | | | 1,819,343 | | | BED BATH & BEYOND #517(2013), T.J. MAXX #721(2007), CINEMARK THEATRE-TANDY 10(2011), BURLINGTON COAT FACTORY WHSE(2014), Michael’s Stores(2014), SPORTS AUTHORITY(2013) |
| | | | | | | | | | | | | | | | | | | | | | | | | | | | | | | | | | | | | |
| 15 | | RUSSELLVILLE, AR | | VALLEY PARK CENTRE
3093 EAST MAIN STREET | | | 72801 | | | SC | | | 1992 | | | | 1994 | | | | 100.00 | % | | | 272,245 | | | | 272,245 | | | | 1,680,852 | | | WAL-MART STORES #58(2011), STAGE #301(2010), J.C. PENNEY #351(2012) |
| | | | | | | | | | | | | | | | | | | | | | | | | | | | | | | | | | | | | |
| California | | | | | | | | | | | | | | | | | | | | | | | | | | | | | | | | | | |
| | | | | | | | | | | | | | | | | | | | | | | | | | | | | | | | | | | | | |
| 16 | | BUENA PARK, CA | | BUENA PARK MALL AND ENTERTAIN
100 BUENA PARK | | | 90620 | | | SC | | | 1965 | | | | 2004 | | | | 20.00 | % | | | 737,533 | | | | 1,139,714 | | | | 8,489,539 | | | Circuit City #405(2018), DSW Shoe Warehouse(2013), Ross Dress for Less
#440(2010), Bed Bath & Beyond(2011), Burlington Coat Factory(2011),
Kohls Department Store #589(2024), Krikorian Premier Theatres(2023),
Michaels(2014), SEARS(NOT OWNED), WALMART(NOT OWNED) |
| | | |
* 1. Property Developed by the Company | | * SC — Shopping |
* 2. Original IPO Property | | * MM — Mini-Mall |
| | | * BC — Business Center |
| | | * LC — Lifestyle Center |
Property Listing 7.1
Does Not Include Service Merchandise Interests
Property List*
| | | | | | | | | | | | | | | | | | | | | | | | | | | | | | | | | | | | | |
| | | | | | | | | | | | | Year | | | | | | DDR | | Owned | | Owned/Unowned | | Total | | |
| | | | | | | Zip | | Type of | | Developed/ | | Year | | Ownership | | Gross | | Gross | | Annualized | | |
| Center/Property | | Location | | Code | | Property | | Redeveloped | | Acquired | | Interest | | Leasable Area | | Leasable Area | | Rent | | Anchor Tenants(Lease Expiration) |
| 17 | | CITY OF INDUSTRY, CA (I) | | PLAZA AT PUENTE HILLS
17647-18271 GALE AVENUE | | | 91748 | | | SC | | | 1987 | | | | 2001 | | | | 20.00 | % | | | 48,380 | | | | 483,322 | | | | 598,259 | | | SAMS CLUB(NOT OWNED), TOYS R US(NOT OWNED), SAM ASH MUSIC(NOT OWNED),
OFFICE DEPOT(NOT OWNED) |
| | | | | | | | | | | | | | | | | | | | | | | | | | | | | | | | | | | | | |
| 18 | | LANCASTER, CA | | VALLEY CENTRAL — DISCOUNT 44707-44765 VALLEY CENTRAL WAY | | | 93536 | | | SC | | | 1990 | | | | 2001 | | | | 20.00 | % | | | 326,945 | | | | 485,464 | | | | 3,841,078 | | | MARSHALLS #375(2007), CIRCUIT CITY #411(2011), STAPLES #88(2008),
MOVIES 12/ CINEMARK(2017), WAL-MART #1563(2010), COSTCO(NOT OWNED) |
| | | | | | | | | | | | | | | | | | | | | | | | | | | | | | | | | | | | | |
| 19 | | LONG BEACH, CA | | CITY PLACE
95 SOUTH PINE AVE | | | 90802 | | | SC | | | 2002/2003/2004 | | | | 1 * | | | | 24.75 | % | | | 298,325 | | | | 298,325 | | | | 4,127,575 | | | NORDSTROM, INC.(2012), ROSS STORES, INC(2013), WAL-MART #2949(2022), ALBERTSON’S/SOLD PROPERTY(NOT OWNED) |
| | | | | | | | | | | | | | | | | | | | | | | | | | | | | | | | | | | | | |
| 20 | | LONG BEACH, CA (PIKE) | | THE PIKE
95 SOUTH PINE AVE | | | 90802 | | | SC | | | 2005 | | | | 1 * | | | | 100.00 | % | | | 168,375 | | | | 188,448 | | | | 2,705,116 | | | CINEMARK(2008), CLUB V 20(2019) |
| | | | | | | | | | | | | | | | | | | | | | | | | | | | | | | | | | | | | |
| 21 | | OCEANSIDE, CA. | | OCEAN PLACE CINEMAS
401-409 MISSION AVENUE | | | 92054 | | | SC | | | 2000 | | | | 1 * | | | | 100.00 | % | | | 80,450 | | | | 80,450 | | | | 1,077,785 | | | REGAL CINEMAS(2014) |
| | | | | | | | | | | | | | | | | | | | | | | | | | | | | | | | | | | | | |
| 22 | | PASADENA, CA | | PASEO COLORADO 280 EAST COLORADO BLVD. | | | 91101 | | | LC | | | 2001 | | | | 2003 | | | | 25.00 | % | | | 556,991 | | | | 556,991 | | | | 10,544,708 | | | GELSON’S MARKET(2021), LOEHMANN’S(2015), EQUINOX(2017), MACY’S(2010), PACIFIC THEATRES EXHIB. CORP(2016), DSW SHOE WAREHOUSE(2011), J.JILL(2012), DELMONICOS SEAFOOD(2012), PF CHANGS CHINA BISTRO(2016), BOMBAY COMPANY(2011), TOMMY BAHAMA(2011), SEPHORA(2011) |
| | | | | | | | | | | | | | | | | | | | | | | | | | | | | | | | | | | | | |
| 23 | | PLEASANT HILL, CA. | | DOWNTOWN PLEASANT HILL
2255 CONTRA COSTA BLVD #101 | | | 94523 | | | SC | | | 1999/2000 | | | | 2001 | | | | 20.00 | % | | | 347,678 | | | | 347,678 | | | | 6,367,299 | | | COSTCO(NOT OWNED)(2020), MICHAEL’S #2109(2010), BORDERS BOOK & MUSIC(2015), CENTURY THEATRES, INC(2016), BED,BATH & BEYOND #261(2010), ROSS STORES #449(2010) |
| | | | | | | | | | | | | | | | | | | | | | | | | | | | | | | | | | | | | |
| 24 | | RICHMOND, CA (HILLTOP) | | HILLTOP PLAZA
3401 BLUME DRIVE | | | 94806 | | | SC | | | 1996/2000 | | | | 2002 | | | | 20.00 | % | | | 245,774 | | | | 245,774 | | | | 3,634,854 | | | OFFICEMAX #558(2011), PETSMART #062(2012), ROSS DRESS FOR LESS
#375(2008), BARNES & NOBLE BOOKSELLERS(2011), CIRCUIT CITY#3374(2017),
CENTURY THEATRE(2016) |
| | | | | | | | | | | | | | | | | | | | | | | | | | | | | | | | | | | | | |
| 25 | | RICHMOND, CA | | RICHMOND CITY CENTER
MACDONALD AVENUE | | | 94801 | | | SC | | | 1993 | | | | 2001 | | | | 20.00 | % | | | 2,800 | | | | 2,800 | | | | 96,800 | | | |
| | | | | | | | | | | | | | | | | | | | | | | | | | | | | | | | | | | | | |
| 26 | | SAN FRANCISCO, CA (RETAIL) | | VAN NESS PLAZA 215
1000 VAN NESS AVENUE | | | 94109 | | | SC | | | 1998 | | | | 2002 | | | | 100.00 | % | | | 123,755 | | | | 123,755 | | | | 3,796,164 | | | AMC VAN NESS 14 THEATRES(2030), CRUNCH FITNESS INT’L, INC.(2008) |
| | | | | | | | | | | | | | | | | | | | | | | | | | | | | | | | | | | | | |
| 27 | | SAN YSIDRO, CA | | SAN YSIDRO VILLAGE
CAMINO DE LA PLAZA | | | 92173 | | | SC | | | 1988/2003 | | | | 2000 | | | | 20.00 | % | | | 160,668 | | | | 258,862 | | | | 2,666,063 | | | ROSS DRESS FOR LESS #672(2014), MARSHALLS #0515(2013), K-MART (NOT OWNED) |
| | | | | | | | | | | | | | | | | | | | | | | | | | | | | | | | | | | | | |
| Colorado | | | | | | | | | | | | | | | | | | | | | | | | | | | | | | | | | | |
| | | | | | | | | | | | | | | | | | | | | | | | | | | | | | | | | | | | | |
| 28 | | ALAMOSA, CO | | ALAMOSA PLAZA
145 CRAFT DRIVE | | | 81101 | | | SC | | | 1986 | | | | 1/2 | | | | 100.00 | % | | | 19,875 | | | | 161,924 | | | | 84,287 | | | CITY MARKET, INC.(NOT OWNED), BIG “R”(NOT OWNED) |
| | | | | | | | | | | | | | | | | | | | | | | | | | | | | | | | | | | | | |
| 29 | | AURORA, CO | | PIONEER HILLS
5400-5820 SOUTH PARKER | | | 80012 | | | SC | | | 2003 | | | | 2003 | | | | 14.50 | % | | | 127,215 | | | | 479,541 | | | | 2,399,519 | | | BED BATH & BEYOND #436(2012), OFFICE DEPOT #2184(2017), HOME DEPOT (NOT OWNED), WAL-MART(NOT OWNED) |
| | | | | | | | | | | | | | | | | | | | | | | | | | | | | | | | | | | | | |
| 30 | | BROOMFIELD, CO | | FLATIRON MARKETPLACE GARDEN
1 WEST FLATIRON CIRCLE | | | 80021 | | | SC | | | 2001 | | | | 2003 | | | | 100.00 | % | | | 245,217 | | | | 421,482 | | | | 5,213,408 | | | Nordstrom(2011), Linen’s ‘N Things #614(2017), Best Buy(2016), Office Depot(2016), GREAT INDOORS(NOT OWNED) |
| | | | | | | | | | | | | | | | | | | | | | | | | | | | | | | | | | | | | |
| 31 | | DENVER, CO | | TAMARAC SQUARE
7777 E. HAMPDEN | | | 80231 | | | SC | | | 1976 | | | | 2001 | | | | 100.00 | % | | | 174,780 | | | | 196,580 | | | | 1,874,920 | | | REGENCY THEATRES TAMARAC SQ.(2008) |
| | | | | | | | | | | | | | | | | | | | | | | | | | | | | | | | | | | | | |
| 32 | | DENVER, CO (CENTENNIAL) | | CENTENNIAL PROMENADE 9555 E. COUNTY LINE ROAD | | | 80223 | | | SC | | | 1997/2002 | | | | 1997 | | | | 100.00 | % | | | 408,337 | | | | 529,488 | | | | 6,227,527 | | | GOLFSMITH GOLF CENTER(2007), SOUNDTRACK(2017), ROSS DRESS FOR LESS #388(2008), OFFICEMAX #686(2012), MICHAEL’S #9710(2007), TOYS R US#9540(2011), BORDERS #163(2017), LOEHMANN’S R.E. HOLDINGS, INC.(2012), HOME DEPOT(NOT OWNED), RECREATIONAL EQUIPMENT(NOT OWNED) |
| | | | | | | | | | | | | | | | | | | | | | | | | | | | | | | | | | | | | |
| 33 | | DENVER, CO (UNIVERSITY) | | UNIVERSITY HILLS
2730 SOUTH COLORADO BOULEVARD | | | 80222 | | | SC | | | 1997 | | | | 2003 | | | | 100.00 | % | | | 244,383 | | | | 244,383 | | | | 3,648,389 | | | Linens N Things #119(2013), Pier 1 Imports #1116(2014), Officemax
#416(2012), King Soopers/Krogers(2017) |
| | | | | | | | | | | | | | | | | | | | | | | | | | | | | | | | | | | | | |
| 34 | | FORT COLLINS. CO | | MULBERRY AND LEMAY CROSSINGS
MULBERRY ST. & S. LEMAY AVE. | | | 80525 | | | SC | | | 1 | | | | 2003 | | | | 100.00 | % | | | 18,988 | | | | 316,420 | | | | 364,953 | | | WAL-MART(NOT OWNED), HOME DEPOT(NOT OWNED) |
| | | | | | | | | | | | | | | | | | | | | | | | | | | | | | | | | | | | | |
| 35 | | LITTLETON, CO | | ASPEN GROVE
7301 SOUTH SANTA FE | | | 80120 | | | LC | | | 2002 | | | | 1 * | | | | 100.00 | % | | | 227,800 | | | | 251,534 | | | | 6,774,566 | | | COLDWATER CREEK(2011), TALBOTS(2012),ANN TAYLOR(2012), J.CREW(2012), BANANA REPUBLIC(2012), GAP(2012), WILLIAMS-SONOMA(2014), J.JILL(2012), BOMBAY COMPANY(2012), POTTERY BARN(2014), PIER 1 IMPORTS(2011), JOSEPH A. BANK CLOTHERS(2012), BUCA di BEPPO(2013), CHAMPPS(2022) |
| | | | | | | | | | | | | | | | | | | | | | | | | | | | | | | | | | | | | |
| 36 | | PARKER, CO (FLATACRES) | | FLATACRES MARKETCENTER
SOUTH PARKER ROAD | | | 80134 | | | SC | | | 2003 | | | | 1 * | | | | 100.00 | % | | | 110,209 | | | | 215,085 | | | | 1,835,485 | | | BED BATH & BEYOND #605(2014), GART SPORTS(2014), MICHAEL’S #3751(2013), KOHL’S(NOT OWNED) |
| | | | | | | | | | | | | | | | | | | | | | | | | | | | | | | | | | | | | |
| 37 | | PARKER, CO (PAVILIONS) | | PARKER PAVILIONS
11153-11183 SOUTH PARKER ROAD | | | 80134 | | | SC | | | 2003 | | | | 2003 | | | | 14.50 | % | | | 89,487 | | | | 410,724 | | | | 1,706,576 | | | Office Depot #2165(2016), HOME DEPOT(NOT OWNED), WAL-MART (NOT OWNED) |
| | | | | | | | | | | | | | | | | | | | | | | | | | | | | | | | | | | | | |
| Connecticut | | | | | | | | | | | | | | | | | | | | | | | | | | | | | | | | | | |
| | | | | | | | | | | | | | | | | | | | | | | | | | | | | | | | | | | | | |
| 38 | | PLAINVILLE, CT | | CONNECTICUT COMMONS
I-84 & RTE 9 | | | 06062 | | | SC | | | 1999/2001 | | | | 1 * | | | | 14.50 | % | | | 463,394 | | | | 566,537 | | | | 6,493,121 | | | LOWE’S OF PLAINVILLE #650(2019), KOHL’S #461(2022), DICK’S SPORTING GOODS(2020), PETSMART(2015), A.C. MOORE(2014), OLD NAVY #02758(2011), LEVITZ FURNITURE(2015), LINENS ‘N THINGS(2017), PLAINVILLE THEATRE(NOT OWNED), |
| | | |
* 1. Property Developed by the Company | | * SC — Shopping |
* 2. Original IPO Property | | * MM — Mini-Mall |
| | | * BC — Business Center |
| | | * LC — Lifestyle Center |
Property Listing 7.1
Does Not Include Service Merchandise Interests
Property List*
| | | | | | | | | | | | | | | | | | | | | | | | | | | | | | | | | | | | | |
| | | | | | | | | | | | | Year | | | | | | DDR | | Owned | | Owned/Unowned | | Total | | |
| | | | | | | Zip | | Type of | | Developed/ | | Year | | Ownership | | Gross | | Gross | | Annualized | | |
| Center/Property | | Location | | Code | | Property | | Redeveloped | | Acquired | | Interest | | Leasable Area | | Leasable Area | | Rent | | Anchor Tenants(Lease Expiration) |
| Florida | | | | | | | | | | | | | | | | | | | | | | | | | | | | | | | | | | |
| | | | | | | | | | | | | | | | | | | | | | | | | | | | | | | | | | | | | |
| 39 | | BAYONET POINT,
FL | | POINT PLAZA
US 19 & SR 52 | | | 34667 | | | SC | | | 1985/2003 | | | | 1/2 | | | | 100.00 | % | | | 209,720 | | | | 209,720 | | | | 1,330,864 | | | PUBLIX SUPER MARKETS #295(2010), BEALL’S #11(2014), T.J. MAXX #794(2010) |
| | | | | | | | | | | | | | | | | | | | | | | | | | | | | | | | | | | | | |
| 40 | | BOYNTON BEACH, FL | | MEADOWS SQUARE
HYPOLUXO RD & N. CONGRESS AVE | | | 33461 | | | SC | | | 1986 | | | | 2004 | | | | 100.00 | % | | | 106,224 | | | | 106,224 | | | | 1,439,193 | | | Publix Super Markets #14(2006) |
| | | | | | | | | | | | | | | | | | | | | | | | | | | | | | | | | | | | | |
| 41 | | BRANDON, FL | | KMART SHOPPING CENTER
1602 BRANDON BL | | | 33511 | | | SC | | | 1972/1997/2003 | | | | 2 * | | | | 100.00 | % | | | 161,900 | | | | 228,022 | | | | 738,153 | | | K MART #4311(2007), KANE FURNITURE(NOT OWNED) |
| | | | | | | | | | | | | | | | | | | | | | | | | | | | | | | | | | | | | |
| 42 | | BRANDON, FL (PLAZA) | | LAKE BRANDON PLAZA
CAUSEWAY BOULEVARD | | | 33511 | | | SC | | | 1999 | | | | 2003 | | | | 14.50 | % | | | 148,267 | | | | 196,801 | | | | 1,860,435 | | | Compusa #603(2017), Jo-Ann Fabrics #1959(2017), Publix Super Markets
#663(2019), BABIES R US(NOT OWNED) |
| | | | | | | | | | | | | | | | | | | | | | | | | | | | | | | | | | | | | |
| 43 | | BRANDON, FL (VILLAGE) | | LAKE BRANDON VILLAGE
CAUSEWAY BOULEVARD | | | 33511 | | | SC | | | 1997/2004 | | | | 2003 | | | | 14.50 | % | | | 113,986 | | | | 243,641 | | | | 1,479,328 | | | Linens ‘N Things #496(2014), Sports Authority #213(2018), PETSMART(2020), LOWE’S(NOT OWNED) |
| | | | | | | | | | | | | | | | | | | | | | | | | | | | | | | | | | | | | |
| 44 | | CRYSTAL RIVER, FL | | CRYSTAL RIVER PLAZA
420 SUN COAST HWY | | | 33523 | | | SC | | | 1986/2001 | | | | 1/2 | | | | 100.00 | % | | | 160,135 | | | | 160,135 | | | | 666,148 | | | BEALL’S #38 -4(2012), BEALL’S OUTLET #191(2006), TECHNOLOGY CONSERVATION GROUP(2006) |
| | | | | | | | | | | | | | | | | | | | | | | | | | | | | | | | | | | | | |
| 45 | | DAYTONA BEACH, FL | | VOLUSIA
1808 W. INTERNATIONAL SPEEDWAY | | | 32114 | | | SC | | | 1984 | | | | 2001 | | | | 100.00 | % | | | 76,087 | | | | 76,087 | | | | 853,878 | | | Marshalls of MA, Inc.(2010) |
| | | | | | | | | | | | | | | | | | | | | | | | | | | | | | | | | | | | | |
| 46 | | ENGLEWOOD, FL | | ROTONDA PLAZA
5855 PLACIDA ROAD | | | 34224 | | | SC | | | 1991 | | | | 2004 | | | | 100.00 | % | | | 46,835 | | | | 46,835 | | | | 442,272 | | | Kash n Karry #1885(2011) |
| | | | | | | | | | | | | | | | | | | | | | | | | | | | | | | | | | | | | |
| 47 | | FERN PARK, FL | | FERN PARK SHOPPING CENTER
6735 US #17-92 SOUTH | | | 32720 | | | SC | | | 1970 | | | | 1/2 | | | | 100.00 | % | | | 16,000 | | | | 133,020 | | | | 137,400 | | | |
| | | | | | | | | | | | | | | | | | | | | | | | | | | | | | | | | | | | | |
| 48 | | GULF BREEZE, FL | | GULF BREEZE MARKETPLACE
3749-3767 GULF BREEZE PARKWAY | | | 32561 | | | SC | | | 1998 | | | | 2003 | | | | 100.00 | % | | | 29,827 | | | | 333,654 | | | | 474,982 | | | LOWE’S(NOT OWNED), WAL-MART (NOT OWNED) |
| | | | | | | | | | | | | | | | | | | | | | | | | | | | | | | | | | | | | |
| 49 | | JACKSONVILLE, FL | | JACKSONVILLE REGIONAL
3000 DUNN AVENUE | | | 32218 | | | SC | | | 1988 | | | | 1995 | | | | 100.00 | % | | | 219,735 | | | | 295,752 | | | | 1,333,515 | | | J.C. PENNEY #1033-4(2007), WINN DIXIE STORES #167(2009) |
| | | | | | | | | | | | | | | | | | | | | | | | | | | | | | | | | | | | | |
| 50 | | JACKSONVILLE, FL(ARLINGTON RD) | | ARLINGTON ROAD PLAZA
926 ARLINGTON ROAD | | | 32211 | | | SC | | | 1990/1999 | | | | 2004 | | | | 100.00 | % | | | 182,098 | | | | 182,098 | | | | 1,009,237 | | | Food Lion #833(2010) |
| | | | | | | | | | | | | | | | | | | | | | | | | | | | | | | | | | | | | |
| 51 | | LAKELAND, FL (HIGHLANDS) | | HIGHLANDS PLAZA SHOPPING CTR
2228 LAKELANDS HIGHLAND ROAD | | | 33803 | | | SC | | | 1990 | | | | 2004 | | | | 100.00 | % | | | 102,572 | | | | 102,572 | | | | 790,854 | | | Winn-Dixie #631(2017) |
| | | | | | | | | | | | | | | | | | | | | | | | | | | | | | | | | | | | | |
| 52 | | MARIANNA, FL | | THE CROSSROADS
2814-2822 HIGHWAY 71 | | | 32446 | | | SC | | | 1990 | | | | 1/2 | | | | 100.00 | % | | | 63,894 | | | | 155,155 | | | | 311,171 | | | BEALL’S #54 -4(2005), WAL-MART (NOT OWNED) |
| | | | | | | | | | | | | | | | | | | | | | | | | | | | | | | | | | | | | |
| 53 | | MELBOURNE, FL | | MELBOURNE SHOPPING CENTER
750-850 APOLLO BOULEVARD | | | 32935 | | | SC | | | 1978 | | | | 1/2 | | | | 100.00 | % | | | 41,733 | | | | 41,733 | | | | 155,285 | | | |
| | | | | | | | | | | | | | | | | | | | | | | | | | | | | | | | | | | | | |
| 54 | | NAPLES, FL | | CARILLON PLACE
5010 AIRPORT ROAD NORTH | | | 33942 | | | SC | | | 1994 | | | | 1995 | | | | 14.50 | % | | | 267,808 | | | | 283,208 | | | | 3,171,815 | | | WINN DIXIE #739(2014), T.J. MAXX #084(2009), CIRCUIT CITY(2015), ROSS DRESS FOR LESS #305(2010), CIRCUIT CITY #3205(2015), OFFICEMAX #159(2010) |
| | | | | | | | | | | | | | | | | | | | | | | | | | | | | | | | | | | | | |
| 55 | | OCALA, FL | | OCALA WEST
2400 SW COLLEGE ROAD | | | 32674 | | | SC | | | 1991 | | | | 2003 | | | | 100.00 | % | | | 40,075 | | | | 40,075 | | | | 359,859 | | | Sports Authority(2012) |
| | | | | | | | | | | | | | | | | | | | | | | | | | | | | | | | | | | | | |
| 56 | | ORANGE PARK, FL (THE VILLAGE) | | THE VILLAGE SHOPPING CENTER
950 BLANDING BLVD | | | 32065 | | | SC | | | 1993/2000 | | | | 2004 | | | | 100.00 | % | | | 72,531 | | | | 135,473 | | | | 678,499 | | | Bealls Dept Store #47(2009), ALBERTSON’S(NOT OWNED) |
| | | | | | | | | | | | | | | | | | | | | | | | | | | | | | | | | | | | | |
| 57 | | ORMOND BEACH, FL | | ORMOND TOWNE SQUARE
1458 WEST GRANADA BLVD | | | 32174 | | | SC | | | 1993 | | | | 1994 | | | | 100.00 | % | | | 234,042 | | | | 234,042 | | | | 1,973,440 | | | BEALL’S #60(2018), ROSS DRESS(2016), PUBLIX SUPER MARKETS #446(2013) |
| | | | | | | | | | | | | | | | | | | | | | | | | | | | | | | | | | | | | |
| 58 | | OVIEDO, FL | | OVIEDO PARK CROSSING
RTE 417 & RED BUG LAKE ROAD | | | 32765 | | | SC | | | 1999 | | | | 1 * | | | | 20.00 | % | | | 186,212 | | | | 321,249 | | | | 1,955,907 | | | OFFICEMAX #531(2014), ROSS DRESS FOR LESS #439(2010), MICHAEL’S #9941(2009), T.J. MAXX #802(2010), LINENS ‘N THINGS #663(2011), LOWE’S (NOT OWNED) |
| | | | | | | | | | | | | | | | | | | | | | | | | | | | | | | | | | | | | |
| 59 | | PALM HARBOR, FL | | THE SHOPPES OF BOOT RANCH
300 EAST LAKEROAD | | | 34685 | | | SC | | | 1990 | | | | 1995 | | | | 100.00 | % | | | 52,395 | | | | 229,188 | | | | 923,052 | | | ALBERTSON’S(NOT OWNED), TARGET(NOT OWNED) |
| | | | | | | | | | | | | | | | | | | | | | | | | | | | | | | | | | | | | |
| 60 | | PENSACOLA, FL | | PALAFOX SQUARE
8934 PENSACOLA BLVD | | | 32534 | | | SC | | | 1988/1997/1999 | | | | 1/2 | | | | 100.00 | % | | | 17,150 | | | | 236,892 | | | | 207,030 | | | WALMART(NOT OWNED) |
| | | | | | | | | | | | | | | | | | | | | | | | | | | | | | | | | | | | | |
| 61 | | SPRING HILL, FL | | MARINER SQUARE
13050 CORTEZ BLVD. | | | 34613 | | | SC | | | 1988/1997 | | | | 1/2 | | | | 100.00 | % | | | 188,924 | | | | 393,000 | | | | 1,572,603 | | | BEALL’S #28(2006), ROSS DRESS FOR LESS #659(2014), WALMART (NOT OWNED) |
| | | | | | | | | | | | | | | | | | | | | | | | | | | | | | | | | | | | | |
| 62 | | TALLAHASSEE, FL | | CAPITAL WEST
4330 WEST TENNESSEE STREET | | | 32312 | | | SC | | | 1994/2004 | | | | 2003 | | | | 100.00 | % | | | 58,386 | | | | 231,035 | | | | 405,066 | | | BEALL’S OUTLET(2009), WAL-MART (NOT OWNED) |
| | | | | | | | | | | | | | | | | | | | | | | | | | | | | | | | | | | | | |
| 63 | | TAMPA, FL (DALE) | | NORTH POINTE PLAZA
15001-15233 NORTH DALE MABRY | | | 33618 | | | SC | | | 1990 | | | | 1/2 | | | | 20.00 | % | | | 104,460 | | | | 222,388 | | | | 1,288,910 | | | PUBLIX SUPER MARKETS #398(2010), WALMART(NOT OWNED) |
| | | |
* 1. Property Developed by the Company | | * SC — Shopping |
* 2. Original IPO Property | | * MM — Mini-Mall |
| | | * BC — Business Center |
| | | * LC — Lifestyle Center |
Property Listing 7.1
Does Not Include Service Merchandise Interests
Property List*
| | | | | | | | | | | | | | | | | | | | | | | | | | | | | | | | | | | | | |
| | | | | | | | | | | | | Year | | | | | | DDR | | Owned | | Owned/Unowned | | Total | | |
| | | | | | | Zip | | Type of | | Developed/ | | Year | | Ownership | | Gross | | Gross | | Annualized | | |
| Center/Property | | Location | | Code | | Property | | Redeveloped | | Acquired | | Interest | | Leasable Area | | Leasable Area | | Rent | | Anchor Tenants(Lease Expiration) |
| 64 | | TAMPA, FL (HORIZON PARK) | | HORIZON PARK SHOPPING CENTER
3908 WEST HILLSBOROUGH HIGHWAY | | | 33614 | | | SC | | | 1987/2003 | | | | 2004 | | | | 100.00 | % | | | 216,284 | | | | 216,284 | | | | 1,481,300 | | | BABIES R US(2008), Pearl Artist & Craft Supply(2007) |
| | | | | | | | | | | | | | | | | | | | | | | | | | | | | | | | | | | | | |
| 65 | | TAMPA, FL (WATERS) | | TOWN N’ COUNTRY 7021-7091 WEST WATERS AVENUE | | | 33634 | | | SC | | | 1990 | | | | 1/2 | | | | 100.00 | % | | | 134,366 | | | | 249,747 | | | | 1,047,931 | | | BEALL’S #56 -4(2005), KASH ‘N KARRY-2 STORE #1745(2010), WALMART(NOT OWNED) |
| | | | | | | | | | | | | | | | | | | | | | | | | | | | | | | | | | | | | |
| 66 | | TARPON SPRINGS, FL | | TARPON SQUARE
41232 U.S. 19, NORTH | | | 34689 | | | SC | | | 1974/1998 | | | | 1/2 | | | | 100.00 | % | | | 198,797 | | | | 199,447 | | | | 1,456,216 | | | K MART #3257-2(2009), BIG LOTS #564(2007), STAPLES #882 SUPERSTORE(2013) |
| | | | | | | | | | | | | | | | | | | | | | | | | | | | | | | | | | | | | |
| 67 | | WEST PASCO, FL | | PASCO SQUARE
7201 COUNTY ROAD 54 | | | 34653 | | | SC | | | 1986 | | | | 1/2 | | | | 100.00 | % | | | 135,421 | | | | 215,661 | | | | 821,247 | | | BEALL’S OUTLET#430(2013), PUBLIX SUPER MARKETS #307(2006), PLYMOUTH BLIMPIE, INC.-4(2006), WALMART(NOT OWNED) |
| | | | | | | | | | | | | | | | | | | | | | | | | | | | | | | | | | | | | |
| Georgia | | | | | | | | | | | | | | | | | | | | | | | | | | | | | | | | | | |
| | | | | | | | | | | | | | | | | | | | | | | | | | | | | | | | | | | | | |
| 68 | | ATHENS, GA | | ATHENS EAST
4375 LEXINGTON ROAD | | | 30605 | | | SC | | | 2000 | | | | 2003 | | | | 100.00 | % | | | 24,000 | | | | 218,879 | | | | 331,464 | | | WAL MART(NOT OWNED) |
| | | | | | | | | | | | | | | | | | | | | | | | | | | | | | | | | | | | | |
| 69 | | ATLANTA, GA (DULUTH) | | PLEASANT HILL PLAZA
1630 PLEASANT HILL ROAD | | | 30136 | | | SC | | | 1990 | | | | 1994 | | | | 100.00 | % | | | 99,025 | | | | 219,025 | | | | 1,050,600 | | | OFFICE DEPOT #076-2(2005), WAL-MART(NOT OWNED) |
| | | | | | | | | | | | | | | | | | | | | | | | | | | | | | | | | | | | | |
| 70 | | ATLANTA, GA (PERIMETER) | | PERIMETER POINTE 1155 MT. VERNON HIGHWAY | | | 30136 | | | SC | | | 1995/2002 | | | | 1995 | | | | 14.50 | % | | | 343,155 | | | | 352,755 | | | | 5,297,676 | | | STEIN MART #092(2010), BABIES R US, #8892(2007), SPORTS AUTHORITY(2012), L.A. FITNESS SPORTS CLUBS(2016), OFFICE DEPOT #434(2012), ST. JOSEPH’S HOSPITAL/ATLANTA(2006), UNITED ARTISTS THEATRE #33272(2015) |
| | | | | | | | | | | | | | | | | | | | | | | | | | | | | | | | | | | | | |
| 71 | | CANTON, GA (RIVERPLACE) | | RIVERPLACE
104-150 RIVERSTONE PARKWAY | | | 30114 | | | SC | | | 1983 | | | | 2003 | | | | 100.00 | % | | | 127,853 | | | | 127,853 | | | | 885,992 | | | Staples #796(2014), Ingles # 96(2019) |
| | | | | | | | | | | | | | | | | | | | | | | | | | | | | | | | | | | | | |
| 72 | | CARTERSVILLE, GA | | FELTON’S CROSSING
877 JOE FRANK HARRIS PARKWAY S | | | 30120 | | | SC | | | 1984 | | | | 2003 | | | | 100.00 | % | | | 112,240 | | | | 112,240 | | | | 834,190 | | | Ross Dress For Less #582(2013), Ingles #76(2020) |
| | | | | | | | | | | | | | | | | | | | | | | | | | | | | | | | | | | | | |
| 73 | | CHAMBLEE, GA | | CHAMBLEE PLAZA
PEACHTREE INDUSTRIAL BOULEVARD | | | 30341 | | | SC | | | 1976 | | | | 2003 | | | | 100.00 | % | | | 175,969 | | | | 175,969 | | | | 1,179,574 | | | Save Rite #2718(2006) |
| | | | | | | | | | | | | | | | | | | | | | | | | | | | | | | | | | | | | |
| 74 | | COLUMBUS, GA | | BRADLEY PARK CROSSING
1591 BRADLEY PARK DRIVE COLUMB | | | 31904 | | | SC | | | 1999 | | | | 2003 | | | | 100.00 | % | | | 119,786 | | | | 242,786 | | | | 1,167,464 | | | Goody’s #296(2011), Petsmart #0294(2015), Michael’s # 9929(2009), TARGET(NOT OWNED) |
| | | | | | | | | | | | | | | | | | | | | | | | | | | | | | | | | | | | | |
| 75 | | CUMMING, GA | | CUMMING MARKETPLACE
MARKETPLACE BOULEVARD | | | 30041 | | | SC | | | 1997/1999 | | | | 2003 | | | | 100.00 | % | | | 308,557 | | | | 652,642 | | | | 3,667,063 | | | Goody’s #219(2012), Lowe’s(2019), Michael’s(2010), Officemax #928(2013), HOME DEPOT(NOT OWNED), WAL MART(NOT OWNED) |
| | | | | | | | | | | | | | | | | | | | | | | | | | | | | | | | | | | | | |
| 76 | | DOUGLASVILLE, GA | | DOUGLASVILLE MARKETPLACE
6875 DOUGLAS BOULEVARD | | | 30135 | | | SC | | | 1999 | | | | 2003 | | | | 100.00 | % | | | 86,158 | | | | 261,353 | | | | 1,408,398 | | | Best Buy(2015), Babies R Us(2006), LOWES(NOT OWNED) |
| | | | | | | | | | | | | | | | | | | | | | | | | | | | | | | | | | | | | |
| 77 | | FT. OGLETHORPE, GA | | FORT OGLETHORPE MARKETPLACE
101 BATTLEFIELD PARKWAY FORT | | | 30742 | | | SC | | | 1992 | | | | 2003 | | | | 100.00 | % | | | 176,903 | | | | 176,903 | | | | 650,780 | | | K Mart #3083(2007) |
| | | | | | | | | | | | | | | | | | | | | | | | | | | | | | | | | | | | | |
| 78 | | LAFAYETTE, GA | | LAFAYETTE CENTER
1109 NORTH MAIN STREET | | | 30728 | | | SC | | | 1990 | | | | 2003 | | | | 100.00 | % | | | 75,622 | | | | 78,422 | | | | 490,745 | | | FARMERS FURNITURE(2009), Food Lion #890(2019) |
| | | | | | | | | | | | | | | | | | | | | | | | | | | | | | | | | | | | | |
| 79 | | LAWRENCEVILLE, GA | | FIVE FORKS VILLAGE
850 DOGWOOD ROAD | | | 30044 | | | SC | | | 1990 | | | | 2003 | | | | 10.00 | % | | | 89,064 | | | | 89,064 | | | | 930,119 | | | Winn-Dixie (Save-Rite) #2735(2010) |
| | | | | | | | | | | | | | | | | | | | | | | | | | | | | | | | | | | | | |
| 80 | | LILBURN, GA (FIVE FORKS) | | FIVE FORKS CROSSING
3055 FIVE FORKS TRICKUM ROAD | | | 30047 | | | SC | | | 2000/2001 | | | | 2003 | | | | 10.00 | % | | | 73,950 | | | | 73,950 | | | | 653,800 | | | Kroger #394(2012) |
| | | | | | | | | | | | | | | | | | | | | | | | | | | | | | | | | | | | | |
| 81 | | LITHONIA, GA | | THE SHOPPES AT TURNER HILL
8200 MALL PARKWAY | | | 30038 | | | SC | | | 2004 | | | | 2003 | | | | 100.00 | % | | | 96,075 | | | | 276,070 | | | | 1,324,213 | | | Best Buy #389(2018), Bed Bath & Beyond #516(2013), TOYS R US(NOT OWNED), SAM’S CLUB(NOT OWNED) |
| | | | | | | | | | | | | | | | | | | | | | | | | | | | | | | | | | | | | |
| 82 | | LOGANVILLE, GA | | MIDWAY PLAZA
910 ATHENS HWY | | | 30052 | | | SC | | | 1995 | | | | 2003 | | | | 20.00 | % | | | 91,196 | | | | 91,196 | | | | 963,518 | | | Kroger #443(2016) |
| | | | | | | | | | | | | | | | | | | | | | | | | | | | | | | | | | | | | |
| 83 | | MADISON, GA | | BEACON HEIGHTS
1462-1532 EATONTON ROAD | | | 30650 | | | SC | | | 1989 | | | | 2003 | | | | 100.00 | % | | | 105,849 | | | | 105,849 | | | | 492,146 | | | Ingles #444 (DARK)(2010), Wal-Mart #1363(2009) |
| | | | | | | | | | | | | | | | | | | | | | | | | | | | | | | | | | | | | |
| 84 | | MARIETTA, GA | | TOWN CENTER PRADO
2609 BELLS FERRY ROAD | | | 30066 | | | SC | | | 1995/2002 | | | | 1995 | | | | 14.50 | % | | | 301,297 | | | | 311,194 | | | | 3,753,532 | | | STEIN MART #141(2007), ROSS DRESS FOR LESS #572(2013), PUBLIX SUPER
MARKETS #548(2015), CRUNCH FITNESS INTERNATIONAL(2011) |
| | | | | | | | | | | | | | | | | | | | | | | | | | | | | | | | | | | | | |
| 85 | | MCDONOUGH, GA | | MCDONOUGH MARKETPLACE (LP-II)
NE CORNER 175 & HIGHWAY 20 | | | 30253 | | | SC | | | 2003 | | | | 2003 | | | | 14.50 | % | | | 30,500 | | | | 338,071 | | | | 566,639 | | | LOWES(NOT OWNED), WALMART(NOT OWNED) |
| | | | | | | | | | | | | | | | | | | | | | | | | | | | | | | | | | | | | |
| 86 | | NEWNAN, GA | | NEWNAN CROSSING
955-1063 BULLSBORO DRIVE NEWNA | | | 30264 | | | SC | | | 1995 | | | | 2003 | | | | 100.00 | % | | | 156,497 | | | | 426,723 | | | | 1,295,200 | | | Lowe’s #0033(2015), BELK(NOT OWNED), WAL MART(NOT OWNED) |
| | | | | | | | | | | | | | | | | | | | | | | | | | | | | | | | | | | | | |
| 87 | | STOCKBRIDGE, GA (FREEWAY) | | FREEWAY JUNCTION
3797-3879 HIGHWAY 138 SE STOCK | | | 30281 | | | SC | | | 1988 | | | | 2003 | | | | 100.00 | % | | | 162,778 | | | | 162,778 | | | | 286,422 | | | Ingles #466(2009) |
| | | | | | | | | | | | | | | | | | | | | | | | | | | | | | | | | | | | | |
| 88 | | STOCKBRIDGE, GA (PIKE) | | PIKE NURSERIES-STOCKBRIDGE
599 HIGHWAY 138W | | | 30281 | | | SC | | | 1997 | | | | 2003 | | | | 100.00 | % | | | 0 | | | | 10,800 | | | | 244,145 | | | |
| | | |
* 1. Property Developed by the Company | | * SC — Shopping |
* 2. Original IPO Property | | * MM — Mini-Mall |
| | | * BC — Business Center |
| | | * LC — Lifestyle Center |
Property Listing 7.1
Does Not Include Service Merchandise Interests
Property List*
| | | | | | | | | | | | | | | | | | | | | | | | | | | | | | | | | | | | | |
| | | | | | | | | | | | | Year | | | | | | DDR | | Owned | | Owned/Unowned | | Total | | |
| | | | | | | Zip | | Type of | | Developed/ | | Year | | Ownership | | Gross | | Gross | | Annualized | | |
| Center/Property | | Location | | Code | | Property | | Redeveloped | | Acquired | | Interest | | Leasable Area | | Leasable Area | | Rent | | Anchor Tenants(Lease Expiration) |
| 89 | | STONE MOUNTAIN, GA (RIVER) | | RIVERCLIFF VILLAGE
STONE MOUNTAIN HIGHWAY STONE M | | | 30047 | | | SC | | | 1999 | | | | 2003 | | | | 100.00 | % | | | 2,000 | | | | 2,000 | | | | 42,000 | | | |
| | | | | | | | | | | | | | | | | | | | | | | | | | | | | | | | | | | | | |
| 90 | | SUWANEE, GA (JOHNS) | | JOHNS CREEK TOWNE CENTER
3630 PEACHTREE PARKWAY SUWANEE | | | 30024 | | | SC | | | 2001/2004 | | | | 2003 | | | | 100.00 | % | | | 261,655 | | | | 261,655 | | | | 3,288,424 | | | PetsMart(2020), Kohl’s #447(2022), Michael’s #1587(2011), Staples #1162(2016), SHOE GALLERY(2014) |
| | | | | | | | | | | | | | | | | | | | | | | | | | | | | | | | | | | | | |
| 91 | | TUCKER, GA | | COFER CROSSING
4349-4375 LAWRENCEVILLE HWY | | | 30084 | | | SC | | | 1998/2003 | | | | 2003 | | | | 100.00 | % | | | 130,832 | | | | 279,020 | | | | 1,182,803 | | | Goody’s #299(2014), Kroger #482(2019), WALMART(NOT OWNED) |
| | | | | | | | | | | | | | | | | | | | | | | | | | | | | | | | | | | | | |
| 92 | | UNION CITY, GA | | SHANNON SQUARE
4720 JONESBORO ROAD | | | 30291 | | | SC | | | 1986 | | | | 2003 | | | | 100.00 | % | | | 100,002 | | | | 181,954 | | | | 747,819 | | | Ingles #407(2006), WAL MART(NOT OWNED) |
| | | | | | | | | | | | | | | | | | | | | | | | | | | | | | | | | | | | | |
| 93 | | WARNER ROBBINS, GA | | WARNER ROBINS PLACE
2724 WATSON BOULEVARD | | | 31093 | | | SC | | | 1997 | | | | 2003 | | | | 100.00 | % | | | 107,941 | | | | 459,700 | | | | 1,284,903 | | | T.J. Maxx #032(2010), Staples(2016), LOWE’S(NOT OWNED), WAL MART(NOT OWNED) |
| | | | | | | | | | | | | | | | | | | | | | | | | | | | | | | | | | | | | |
| 94 | | WOODSTOCK, GA | | WOODSTOCK PLACE
10029 HIGHWAY 928 | | | 30188 | | | SC | | | 1995 | | | | 2003 | | | | 100.00 | % | | | 170,940 | | | | 170,940 | | | | 1,288,766 | | | Wal-Mart #575(2020) |
| | | | | | | | | | | | | | | | | | | | | | | | | | | | | | | | | | | | | |
| Idaho | | | | | | | | | | | | | | | | | | | | | | | | | | | | | | | | | | |
| | | | | | | | | | | | | | | | | | | | | | | | | | | | | | | | | | | | | |
| 95 | | IDAHO FALLS, ID | | COUNTRY CLUB MALL
1515 NORTHGATE MILE | | | 83401 | | | SC | | | 1976/1992/1997 | | | | 1998 | | | | 100.00 | % | | | 148,593 | | | | 306,201 | | | | 723,797 | | | OFFICE MAX #666(2011), WORLD GYM(2008), FRED MEYER, INC.(NOT OWNED) |
| | | | | | | | | | | | | | | | | | | | | | | | | | | | | | | | | | | | | |
| 96 | | MERIDIAN, ID | | MERIDIAN CROSSROADS
EAGLE AND FAIRVIEW ROAD | | | 83642 | | | SC | | | 1999/2001/2002/2003/
2004 | | | | 1 * | | | | 100.00 | % | | | 459,719 | | | | 725,178 | | | | 6,019,889 | | | BED BATH & BEYOND #333(2011), OLD NAVY #02448(2005), SHOPKO STORES, INC.(2020), OFFICE DEPOT # 02087(2010), ROSS DRESS FOR LESS # 530(2012), MARSHALLS #871(2012), SPORTSMAN’S WAREHOUSE(2015), CRAFT WAREHOUSE(2013), BABIES R US(NOT OWNED), WALMART(NOT OWNED) |
| | | | | | | | | | | | | | | | | | | | | | | | | | | | | | | | | | | | | |
| Illinois | | | | | | | | | | | | | | | | | | | | | | | | | | | | | | | | | | |
| | | | | | | | | | | | | | | | | | | | | | | | | | | | | | | | | | | | | |
| 97 | | DECATUR, IL | | DECATUR MARKETPLACE
MARYLAND STREET | | | 62521 | | | SC | | | 1999 | | | | 2003 | | | | 100.00 | % | | | 22,775 | | | | 194,775 | | | | 254,610 | | | WAL MART(NOT OWNED) |
| | | | | | | | | | | | | | | | | | | | | | | | | | | | | | | | | | | | | |
| 98 | | DEER PARK, IL | | DEER PARK TOWN CENTER
20530 NORTH RAND RD #303 | | | 60010 | | | LC | | | 2000/2004 | | | | 1 * | | | | 24.75 | % | | | 292,076 | | | | 397,831 | | | | 8,316,311 | | | GAP # 581(2010), BARNES & NOBLE(NOT OWNED), CENTURY CINEMAS(NOT OWNED), PIER 1 IMPORTS(201), BANANA REPUBLIC(2010), AMBERCROMBIE&FITCH(2005), POTTERY BARN KIDS(2012), POTTERY BARN(2013), RESTORATION HARDWARE(2010), EDDIE BAUER HOME(2011), EDDIE BAUER SPORTSWEAR(2011), COLDWATER CREEK(2010), J.CREW(2011), ANN TAYLOR(2011), TALBOTS/TALBOTS PETITES(2011), WILLIAMS-SONOMA(2013), JOSEPH A. BANKCLOTHERS(2011), CALIFORNIA PIZZA KITCHEN(2013), BATH AND BODY WORKS(2011), J.JILL(2013) |
| | | | | | | | | | | | | | | | | | | | | | | | | | | | | | | | | | | | | |
| 99 | | HARRISBURG, IL | | ARROWHEAD POINT
701 NORTH COMMERCIAL | | | 62946 | | | SC | | | 1991 | | | | 1994 | | | | 100.00 | % | | | 167,074 | | | | 167,074 | | | | 847,463 | | | WAL-MART STORES #237(2011), MAD-PRICER STORE/ROUNDY’S(2011) |
| | | | | | | | | | | | | | | | | | | | | | | | | | | | | | | | | | | | | |
| 100 | | KILDEER, IL | | THE SHOPS AT KILDEER
20505 NORTH HIGHWAY 12 | | | 60047 | | | SC | | | 2001 | | | | 2001 | | | | 10.00 | % | | | 161,770 | | | | 167,477 | | | | 3,158,415 | | | BED BATH & BEYOND #415(2012), CIRCUIT CITY(2017), OLD NAVY #03641(2006) |
| | | | | | | | | | | | | | | | | | | | | | | | | | | | | | | | | | | | | |
| 101 | | MOUNT VERNON, IL | | TIMES SQUARE MALL
42ND AND BROADWAY | | | 62864 | | | MM | | | 1974/1998/2000 | | | | 2 * | | | | 100.00 | % | | | 269,328 | | | | 269,328 | | | | 960,087 | | | SEARS #2181(2013), GOODY’S #407(2015), J.C. PENNEY #1717(2007) |
| | | | | | | | | | | | | | | | | | | | | | | | | | | | | | | | | | | | | |
| 102 | | ORLAND PARK, IL (HOME DEPOT) | | HOME DEPOT CENTER
15800 HARLEM AVENUE | | | 60462 | | | SC | | | 1987/1993 | | | | 2004 | | | | 100.00 | % | | | 149,498 | | | | 149,498 | | | | 1,456,101 | | | Home Depot #1906(2012) |
| | | | | | | | | | | | | | | | | | | | | | | | | | | | | | | | | | | | | |
| 103 | | SCHAUMBURG, IL | | WOODFIELD VILLAGE GREEN
1430 EAST GOLF ROAD | | | 60173 | | | SC | | | 1993/1998/2002 | | | | 1995 | | | | 14.50 | % | | | 508,815 | | | | 674,504 | | | | 8,402,644 | | | CIRCUIT CITY #3111(2009), OFF 5TH(2011), PETSMART(2014), HOMEGOODS #229(2014), OFFICEMAX #203(2010), CONTAINER STORE(2011), FILENE’S BASEMENT(2014), MARSHALLS #544(2009), NORDSTROM RACK #224(2009), BORDERS BOOKS#61(2009), EXPO DESIGN CENTER(2019), COSTCO(NOT OWNED), PRAIRIE ROCK RESTAURANT(NOT OWNED) |
| | | | | | | | | | | | | | | | | | | | | | | | | | | | | | | | | | | | | |
| Indiana | | | | | | | | | | | | | | | | | | | | | | | | | | | | | | | | | | |
| | | | | | | | | | | | | | | | | | | | | | | | | | | | | | | | | | | | | |
| 104 | | BEDFORD, IN | | TOWN FAIR CENTER
1320 JAMES AVENUE | | | 47421 | | | SC | | | 1993/1997 | | | | 2 * | | | | 100.00 | % | | | 223,431 | | | | 223,431 | | | | 1,310,013 | | | K MART #7455(2008), GOODY’S #119 -4(2008), J.C. PENNEY #1324-4(2008), BUEHLER’S BUY LOW #4163(2010) |
| | | | | | | | | | | | | | | | | | | | | | | | | | | | | | | | | | | | | |
| 105 | | CONNERSVILLE, IN | | WHITEWATER TRADE CENTER
2100 PARK ROAD | | | 47331 | | | SC | | | 1991 | | | | 2 * | | | | 100.00 | % | | | 141,770 | | | | 141,770 | | | | 838,763 | | | COX NEW MARKET-4(2011), WAL-MART STORES #1729(2011) |
| | | | | | | | | | | | | | | | | | | | | | | | | | | | | | | | | | | | | |
| 106 | | HIGHLAND, IN | | HIGHLAND GROVE SHOPPING CENTER
HIGHWAY 41 & MAIN STREET | | | 46322 | | | SC | | | 1995/2001 | | | | 1996 | | | | 20.00 | % | | | 312,546 | | | | 524,410 | | | | 3,287,875 | | | MARSHALL’S#663-1(2011), KOHL’S #229-1(2016), CIRCUIT CITY-1(2016), OFFICE MAX #590(2012), TARGET(NOT OWNED), JEWEL(NOT OWNED), BORDERS(NOT OWNED) |
| | | | | | | | | | | | | | | | | | | | | | | | | | | | | | | | | | | | | |
| 107 | | LAFAYETTE, IN | | PARK EAST MARKETPLACE
4205 — 4315 COMMERCE DRIVE | | | 47905 | | | SC | | | 2000 | | | | 2003 | | | | 100.00 | % | | | 35,100 | | | | 243,850 | | | | 392,973 | | | WAL MART(NOT OWNED) |
| | | | | | | | | | | | | | | | | | | | | | | | | | | | | | | | | | | | | |
| Iowa | | | | | | | | | | | | | | | | | | | | | | | | | | | | | | | | | | |
| | | | | | | | | | | | | | | | | | | | | | | | | | | | | | | | | | | | | |
| 108 | | CEDAR RAPIDS, IA | | NORTHLAND SQUARE
303 -367 COLLINS ROAD, NE | | | 52404 | | | SC | | | 1984 | | | | 1998 | | | | 100.00 | % | | | 187,068 | | | | 207,405 | | | | 1,858,809 | | | T.J. MAXX #119(2010), OFFICE MAX #211(2010), BARNES & NOBLE #2587(2010), KOHL’S #217(2021) |
| | | |
* 1. Property Developed by the Company | | * SC — Shopping |
* 2. Original IPO Property | | * MM — Mini-Mall |
| | | * BC — Business Center |
| | | * LC — Lifestyle Center |
Property Listing 7.1
Does Not Include Service Merchandise Interests
Property List*
| | | | | | | | | | | | | | | | | | | | | | | | | | | | | | | | | | | | | |
| | | | | | | | | | | | | Year | | | | | | DDR | | Owned | | Owned/Unowned | | Total | | |
| | | | | | | Zip | | Type of | | Developed/ | | Year | | Ownership | | Gross | | Gross | | Annualized | | |
| Center/Property | | Location | | Code | | Property | | Redeveloped | | Acquired | | Interest | | Leasable Area | | Leasable Area | | Rent | | Anchor Tenants(Lease Expiration) |
| 109 | | OTTUMWA, IA | | QUINCY PLACE MALL
1110 QUINCY AVENUE | | | 52501 | | | MM | | | 1990/1999/2002 | | | | 1/2 | | | | 100.00 | % | | | 229,427 | | | | 332,677 | | | | 1,450,947 | | | HERBERGER’S #326(2020), J.C. PENNEY #2438(2010), OFFICEMAX #1033(2015), GOODY’S #391(2014), TARGET(NOT OWNED) |
| | | | | | | | | | | | | | | | | | | | | | | | | | | | | | | | | | | | | |
| Kansas | | | | | | | | | | | | | | | | | | | | | | | | | | | | | | | | | | |
| | | | | | | | | | | | | | | | | | | | | | | | | | | | | | | | | | | | | |
| 110 | | LEAWOOD, KS | | TOWN CENTER PLAZA
5000 W 119 STREET | | | 66209 | | | LC | | | 1996/2002 | | | | 1998 | | | | 100.00 | % | | | 291,289 | | | | 473,660 | | | | 6,762,440 | | | BARNES & NOBLE #2668(2011), COLDWATER CREEK(2009), LIMITED/LIMITED TOO(2009), AMBERCROMBIE & FITCH(2009), VICTORIA’S SECRET(2009), EXPRESS/BATH&BODY/STRUCTURE(2009), GAP/GAP BODY(2008), GAP KIDS(2005), J.JILL(2013), POTTERY BARN(2009), WILLIAMS-SONOMA(2009), AMERICAN EAGLE(2013), PACIFIC SUNWEAR(2012), BRAVO CUCINA ITALIANA(2013), RESTORATION HARDWARE(2012), HOULIHANS(2025), BRISTOL SEAFOOD BAR & GRILL(2011), BOMBAY(2006) |
| | | | | | | | | | | | | | | | | | | | | | | | | | | | | | | | | | | | | |
| 111 | | MERRIAM, KS | | MERRIAM TOWN CENTER
5700 ANTIOCH ROAD | | | 66202 | | | SC | | | 1998/2004 | | | | 1 * | | | | 14.50 | % | | | 348,536 | | | | 471,042 | | | | 4,107,326 | | | TARGET(NOT OWNED)(2013), PETSMART #240(2019), HEN HOUSE #31(2018), MARSHALLS #8716(2008), DICK’S SPORTING GOODS # 119(2016), CINEMARK(2018), HOME DEPOT #2202(NOT OWNED) |
| | | | | | | | | | | | | | | | | | | | | | | | | | | | | | | | | | | | | |
| 112 | | OLATHE, KS (DEVONSHIRE) | | DEVONSHIRE VILLAGE
127th STREET & MUR-LEN ROAD | | | 66062 | | | SC | | | 1987 | | | | 1998 | | | | 24.75 | % | | | 48,802 | | | | 48,802 | | | | 356,740 | | | |
| | | | | | | | | | | | | | | | | | | | | | | | | | | | | | | | | | | | | |
| 113 | | OVERLAND PARK, KS (CHEROKEE) | | CHEROKEE NORTH SHOPPING CENTER
8800-8934 W 95th STREET | | | 66212 | | | SC | | | 1987/2002 | | | | 1998 | | | | 24.75 | % | | | 60,765 | | | | 60,981 | | | | 735,119 | | | |
| | | | | | | | | | | | | | | | | | | | | | | | | | | | | | | | | | | | | |
| 114 | | OVERLAND PARK, KS (POINTE) | | OVERLAND POINTE MARKETPLACE
INTER 135TH & ANTIOCH RD | | | 66213 | | | SC | | | 2001/2004 | | | | 2003 | | | | 100.00 | % | | | 36,518 | | | | 328,800 | | | | 725,838 | | | HOME DEPOT(NOT OWNED), SAM’S CLUB(NOT OWNED), BABIES R US(NOT OWNED) |
| | | | | | | | | | | | | | | | | | | | | | | | | | | | | | | | | | | | | |
| 115 | | SHAWNEE, KS (QUIVIRA PARCEL) | | TEN QUIVIRA PARCEL
63rd ST. & QUIVIRA ROAD | | | 66216 | | | SC | | | 1972 | | | | 1998 | | | | 24.75 | % | | | 12,000 | | | | 12,000 | | | | 206,911 | | | |
| | | | | | | | | | | | | | | | | | | | | | | | | | | | | | | | | | | | | |
| 116 | | SHAWNEE, KS (TEN QUIVIRA) | | TEN QUIVIRA SHOPPING CENTER
63rd STREET & QUIVIRA ROAD | | | 66216 | | | SC | | | 1999/2003 | | | | 1998 | | | | 24.75 | % | | | 162,843 | | | | 162,843 | | | | 932,455 | | | PRICE CHOPPER FOODS # 439(2008), WESTLAKE HARDWARE #17(2005) |
| | | | | | | | | | | | | | | | | | | | | | | | | | | | | | | | | | | | | |
| 117 | | WICHITA, KS (EASTGATE) | | EASTGATE PLAZA
SOUTH ROCK ROAD | | | 67207 | | | SC | | | 1955 | | | | 2002 | | | | 100.00 | % | | | 203,997 | | | | 253,997 | | | | 1,955,235 | | | OFFICEMAX #31(2007), T.J. MAXX #316(2006), BARNES & NOBLE #2824(2012), KCBB, INC BURLINGTON(NOT OWNED) |
| | | | | | | | | | | | | | | | | | | | | | | | | | | | | | | | | | | | | |
| Kentucky | | | | | | | | | | | | | | | | | | | | | | | | | | | | | | | | | | |
| | | | | | | | | | | | | | | | | | | | | | | | | | | | | | | | | | | | | |
| 118 | | FLORENCE, KY (TURFWAY) | | TURFWAY PLAZA
6825 TURFWAY ROAD | | | 41042 | | | SC | | | 1975/1998 | | | | 2004 | | | | 100.00 | % | | | 133,985 | | | | 133,985 | | | | 854,582 | | | Party Town & Office Depot #176(2006), Big Lots, Inc. #00296B(2008) |
| | | | | | | | | | | | | | | | | | | | | | | | | | | | | | | | | | | | | |
| 119 | | FRANKFORT, KY (EASTWOOD) | | EASTWOOD SHOPPING CENTER
260 VERSAILLES ROAD | | | 40601 | | | SC | | | 1963/1994 | | | | 2004 | | | | 100.00 | % | | | 155,104 | | | | 155,104 | | | | 586,369 | | | Sears, Roebuck & Co. #2090(2006) |
| | | | | | | | | | | | | | | | | | | | | | | | | | | | | | | | | | | | | |
| 120 | | LEXINGTON, KY (NORTH) | | NORTH PARK MARKETPLACE
524 WEST NEW CIRCLE | | | 40511 | | | SC | | | 1998 | | | | 2003 | | | | 100.00 | % | | | 48,920 | | | | 228,878 | | | | 632,311 | | | Staples #1214(2016), WAL MART(NOT OWNED) |
| | | | | | | | | | | | | | | | | | | | | | | | | | | | | | | | | | | | | |
| 121 | | LEXINGTON, KY (SOUTH) | | SOUTH FARM MARKETPLACE
MAN-O-WAR BOULEVARD AND NICHOL | | | 40503 | | | SC | | | 1998 | | | | 2003 | | | | 100.00 | % | | | 27,643 | | | | 344,280 | | | | 586,932 | | | LOWE’S(NOT OWNED), WAL MART(NOT OWNED) |
| | | | | | | | | | | | | | | | | | | | | | | | | | | | | | | | | | | | | |
| 122 | | LOUISVILLE, KY (OUTER LOOP) | | OUTER LOOP PLAZA
7505 OUTER LOOP HIGHWAY | | | 40228 | | | SC | | | 1973/1989/1998 | | | | 2004 | | | | 100.00 | % | | | 120,477 | | | | 120,477 | | | | 610,806 | | | Valu Discount, Inc. #3354(2009) |
| | | | | | | | | | | | | | | | | | | | | | | | | | | | | | | | | | | | | |
| 123 | | RICHMOND, KY | | CARRIAGE GATE
833-847 EASTERN BY-PASS | | | 40475 | | | SC | | | 1992 | | | | 2003 | | | | 100.00 | % | | | 158,041 | | | | 229,313 | | | | 391,866 | | | Food Lion #1203(2017), BALLARD’S(NOT OWNED) |
| | | | | | | | | | | | | | | | | | | | | | | | | | | | | | | | | | | | | |
| Maine | | | | | | | | | | | | | | | | | | | | | | | | | | | | | | | | | | |
| | | | | | | | | | | | | | | | | | | | | | | | | | | | | | | | | | | | | |
| 124 | | BRUNSWICK, ME | | COOK’S CORNERS 172 BATH ROAD | | | 04011 | | | SC | | | 1965 | | | | 1997 | | | | 100.00 | % | | | 301,992 | | | | 310,229 | | | | 2,542,720 | | | HOYTS CINEMAS #445-02 BRUNSWIK(2010), BRUNSWICK BOOKLAND(2014), BIG LOTS(2008), T.J. MAXX #114(2010), SEARS #2203(2012) |
| | | | | | | | | | | | | | | | | | | | | | | | | | | | | | | | | | | | | |
| Maryland | | | | | | | | | | | | | | | | | | | | | | | | | | | | | | | | | | |
| | | | | | | | | | | | | | | | | | | | | | | | | | | | | | | | | | | | | |
| 125 | | SALISBURY, MD | | THE COMMONS E. NORTH POINT DRIVE | | | 21801 | | | SC | | | 1999 | | | | 1 * | | | | 100.00 | % | | | 98,635 | | | | 322,512 | | | | 1,310,784 | | | BEST BUY(2013), MICHAEL’S #9914(2009), HOME DEPOT(NOT OWNED), TARGET(NOT OWNED) |
| | | | | | | | | | | | | | | | | | | | | | | | | | | | | | | | | | | | | |
| 126 | | SALISBURY, MD (DEV JV) | | THE COMMONS(PHASE III)
NORTH POINTE DRIVE | | | 21801 | | | SC | | | 2000 | | | | 1 * | | | | 50.00 | % | | | 27,500 | | | | 27,500 | | | | 243,250 | | | |
| | | | | | | | | | | | | | | | | | | | | | | | | | | | | | | | | | | | | |
| Massachusetts | | | | | | | | | | | | | | | | | | | | | | | | | | | | | | | | | | |
| | | | | | | | | | | | | | | | | | | | | | | | | | | | | | | | | | | | | |
| 127 | | EVERETT, MA | | GATEWAY CENTER
1 MYSTIC VIEW ROAD | | | 02149 | | | SC | | | 2001 | | | | 1 * | | | | 100.00 | % | | | 222,287 | | | | 639,807 | | | | 4,381,062 | | | BED BATH AND BEYOND #310(2011), OLD NAVY #02746(2011), OFFICEMAX # 600(2020), BABIES R US #6443(2013), MICHAEL’S #01597(2012), COSTCO(NOT OWNED) |
| | | | | | | | | | | | | | | | | | | | | | | | | | | | | | | | | | | | | |
| 128 | | FRAMINGHAM, MA | | SHOPPER’S WORLD | | | 01701 | | | SC | | | 1994 | | | | 1995 | | | | 14.50 | % | | | 769,276 | | | | 778,701 | | | | 13,737,619 | | | TOYS R US(2020), JORDON MARSH / FEDERATED(2020), T.J. MAXX#147(2010), BABIES R US #6450(2013), DSW SHOE WAREHOUSE(2007), A.C. MOORE(2007), MARSHALLS#612(2011), BOBS # 031(2011), LINENS ‘N THINGS#436(2011), SPORTS AUTHORITY#858(2015), OFFICEMAX #121(2011), BEST BUY#532(2014), BARNES & NOBLE #2645(2011), GENERAL CINEMA #971(2014), KOHL’S # 575(2010) |
| | | | | 1 WORCESTER ROAD | | | | | | | | | | | | | | | | | | | | | | | | | | | | | | | | |
| | | |
* 1. Property Developed by the Company | | * SC — Shopping |
* 2. Original IPO Property | | * MM — Mini-Mall |
| | | * BC — Business Center |
| | | * LC — Lifestyle Center |
Property Listing 7.1
Does Not Include Service Merchandise Interests
Property List*
| | | | | | | | | | | | | | | | | | | | | | | | | | | | | | | | | | | | | |
| | | | | | | | | | | | | Year | | | | | | DDR | | Owned | | Owned/Unowned | | Total | | |
| | | | | | | Zip | | Type of | | Developed/ | | Year | | Ownership | | Gross | | Gross | | Annualized | | |
| Center/Property | | Location | | Code | | Property | | Redeveloped | | Acquired | | Interest | | Leasable Area | | Leasable Area | | Rent | | Anchor Tenants(Lease Expiration) |
| Michigan | | | | | | | | | | | | | | | | | | | | | | | | | | | | | | | | | | |
| | | | | | | | | | | | | | | | | | | | | | | | | | | | | | | | | | | | | |
| 129 | | BAD AXE, MI | | HURON CREST PLAZA
850 NORTH VAN DYKE ROAD | | | 48413 | | | SC | | | 1991 | | | | 1993 | | | | 100.00 | % | | | 63,415 | | | | 134,574 | | | | 503,508 | | | GREAT A & P TEA #55492(2012), WAL-MART(NOT OWNED) |
| | | | | | | | | | | | | | | | | | | | | | | | | | | | | | | | | | | | | |
| 130 | | CHEBOYGAN, MI | | KMART SHOPPING PLAZA
1109 EAST STATE | | | 49721 | | | SC | | | 1988 | | | | 1994 | | | | 100.00 | % | | | 95,094 | | | | 170,845 | | | | 203,776 | | | K MART #9245(2010), KMART(NOT OWNED) |
| | | | | | | | | | | | | | | | | | | | | | | | | | | | | | | | | | | | | |
| 131 | | DETROIT, MI | | BELAIR CENTER 8400 E. EIGHT MILE ROAD | | | 48234 | | | SC | | | 1989/2002 | | | | 1998 | | | | 100.00 | % | | | 343,619 | | | | 450,349 | | | | 2,299,094 | | | NATIONAL WHOLESALE LIQUIDATORS(2016), PHOENIX THEATERS(2011), BALLY TOTAL FITNESS(2016), BIG LOTS STORES, INC.(2008), KIDS R US #1167(2013), TOYS R US, INC.(2011) |
| | | | | | | | | | | | | | | | | | | | | | | | | | | | | | | | | | | | | |
| 132 | | GAYLORD, MI | | PINE RIDGE SQUARE
1401 WEST MAIN STREET | | | 49735 | | | SC | | | 1991/2004 | | | | 1993 | | | | 100.00 | % | | | 150,203 | | | | 150,203 | | | | 728,207 | | | Dunham’s(2011), Big Lots(2010), BUY LOW/ROUNDY’S — 4(2011) |
| | | | | | | | | | | | | | | | | | | | | | | | | | | | | | | | | | | | | |
| 133 | | GRANDVILLE, MI | | GRANDVILLE MARKETPLACE
INTERSECT 44TH ST & CANAL AVE | | | 49418 | | | SC | | | 2003 | | | | 2003 | | | | 14.50 | % | | | 201,726 | | | | 352,098 | | | | 2,557,705 | | | Circuit City(2017), Linens ‘N Things#682(2013), Gander Mountain(2016), OFFICE MAX #1243(2013), LOWE’S(NOT OWNED) |
| | | | | | | | | | | | | | | | | | | | | | | | | | | | | | | | | | | | | |
| 134 | | HOUGHTON, MI | | COPPER COUNTRY MALL
HIGHWAY M26 | | | 49931 | | | MM | | | 1981/1999 | | | | 1/2 | | | | 100.00 | % | | | 169,021 | | | | 169,021 | | | | 638,097 | | | J.C. PENNEY #20430(2010), OFFICEMAX #1116(2014) |
| | | | | | | | | | | | | | | | | | | | | | | | | | | | | | | | | | | | | |
| 135 | | HOWELL, MI | | GRAND RIVER PLAZA | | | 48843 | | | SC | | | 1991 | | | | 1993 | | | | 100.00 | % | | | 215,047 | | | | 215,047 | | | | 1,316,055 | | | Elder-Beerman(2011), Dunham’s Sporting Goods(2011), KROGER #633(2012) |
| | | | | 3599 EAST GRAND RIVER | | | | | | | | | | | | | | | | | | | | | | | | | | | | | | | | |
| | | | | | | | | | | | | | | | | | | | | | | | | | | | | | | | | | | | | |
| 136 | | LANSING, MI | | THE MARKETPLACE AT DELTA TOWNS
8305 WEST SAGINAW HWY 196 RAMP | | | 48917 | | | SC | | | 2000/2001 | | | | 2003 | | | | 100.00 | % | | | 115,469 | | | | 468,876 | | | | 1,207,538 | | | Michael’s #1590(2011), Gander Mountain(2015), Petsmart(2015), LOWE’S(NOT OWNED), WAL MART(NOT OWNED) |
| | | | | | | | | | | | | | | | | | | | | | | | | | | | | | | | | | | | | |
| 137 | | MT. PLEASANT, MI | | INDIAN HILLS PLAZA
4208 E BLUE GRASS ROAD | | | 48858 | | | SC | | | 1990 | | | | 2 * | | | | 100.00 | % | | | 249,680 | | | | 249,680 | | | | 1,663,984 | | | WAL-MART STORES #1428(2009), TJX(2014), KROGER #889(2011) |
| | | | | | | | | | | | | | | | | | | | | | | | | | | | | | | | | | | | | |
| 138 | | SAULT ST. MARIE, MI | | CASCADE CROSSINGS
4516 I-75 BUSINESS SPUR | | | 49783 | | | SC | | | 1993/1998 | | | | 1994 | | | | 100.00 | % | | | 270,761 | | | | 270,761 | | | | 1,738,196 | | | WAL-MART STORES #1936(2012), J.C. PENNEY #2625(2008), OFFICE MAX #731(2013), GLEN’S MARKET(2013) |
| | | | | | | | | | | | | | | | | | | | | | | | | | | | | | | | | | | | | |
| 139 | | WALKER, MI (ALPINE AVE) | | GREEN RIDGE SQUARE II
3410 ALPINE AVENUE | | | 49504 | | | SC | | | 1991/1995 | | | | 2004 | | | | 100.00 | % | | | 88,133 | | | | 88,133 | | | | 902,807 | | | Circuit City #3632(2003), BED BATH AND BEYOND(2015) |
| | | | | | | | | | | | | | | | | | | | | | | | | | | | | | | | | | | | | |
| 140 | | WALKER, MI (GRAND RAPIDS) | | GREEN RIDGE SQUARE
3390-B ALPINE AVE NW | | | 49504 | | | SC | | | 1989 | | | | 1995 | | | | 100.00 | % | | | 133,627 | | | | 398,465 | | | | 1,394,718 | | | T.J. MAXX #160(2011), OFFICE DEPOT #241(2010), BED BATH AND BEYOND(NOT OWNED), TARGET(NOT OWNED), TOYS R US(NOT OWNED) |
| | | | | | | | | | | | | | | | | | | | | | | | | | | | | | | | | | | | | |
| Minnesota | | | | | | | | | | | | | | | | | | | | | | | | | | | | | | | | | | |
| | | | | | | | | | | | | | | | | | | | | | | | | | | | | | | | | | | | | |
| 141 | | BEMIDJI, MN | | PAUL BUNYAN MALL
1201 PAUL BUNYAN DRIVE | | | 56601 | | | MM | | | 1977/1998 | | | | 2 * | | | | 100.00 | % | | | 297,803 | | | | 297,803 | | | | 1,478,160 | | | K MART #9204(2007), HERBERGER’S #348(2005), J.C. PENNEY #1091-8(2008) |
| | | | | | | | | | | | | | | | | | | | | | | | | | | | | | | | | | | | | |
| 142 | | BRAINERD, MN | | WESTGATE MALL
1200 HIGHWAY 210 WEST | | | 56401 | | | MM | | | 1985/1998 | | | | 1/2 | | | | 100.00 | % | | | 260,319 | | | | 260,319 | | | | 1,871,235 | | | STEVE & BARRY’S UNIVERSITY(2013), HERBERGER’S #323(2013), MOVIES 10/WESTGATE MALL/#205(2011) |
| | | | | | | | | | | | | | | | | | | | | | | | | | | | | | | | | | | | | |
| 143 | | COON RAPIDS, MN | | RIVERDALE VILLAGE
12921 RIVERDALE DRIVE | | | 55433 | | | SC | | | 2003 | | | | 1 * | | | | 14.50 | % | | | 516,532 | | | | 897,712 | | | | 8,561,770 | | | KOHL’S #408(2020), JO-ANN STORES #1941(2010), LINENS ‘N THINGS(2016), BORDERS(2023), OLD NAVY #03546(2007), SPORTSMAN’S WAREHOUSE(2017), BEST BUY STORES, L.P.(2013), SEARS(NOT OWNED), COSTCO(NOT OWNED), J.C. PENNEY(NOT OWNED) |
| | | | | | | | | | | | | | | | | | | | | | | | | | | | | | | | | | | | | |
| 144 | | EAGAN, MN | | EAGAN PROMENADE
1299 PROMENADE PLACE | | | 55122 | | | SC | | | 1997/2001 | | | | 1997 | | | | 50.00 | % | | | 278,211 | | | | 342,014 | | | | 3,450,768 | | | BYERLY’S(2016), PETSMART #469(2018), BARNES & NOBLE #2820(2012), OFFICEMAX #604(2013), T.J. MAXX #379(2007), BED BATH & BEYOND #457(2012), ETHAN ALLEN FURNITURE(NOT OWNED) |
| | | | | | | | | | | | | | | | | | | | | | | | | | | | | | | | | | | | | |
| 145 | | HUTCHINSON, MN | | HUTCHINSON MALL
1060 SR 15 | | | 55350 | | | MM | | | 1981 | | | | 1/2 | | | | 100.00 | % | | | 121,001 | | | | 209,843 | | | | 509,679 | | | J.C. PENNEY #1076-9 -4(2006), HENNEN’S FURNITURE(NOT OWNED) |
| | | | | | | | | | | | | | | | | | | | | | | | | | | | | | | | | | | | | |
| 146 | | MINNEAPOLIS, MN (MAPLE GROVE) | | MAPLE GROVE CROSSING
WEAVER LAKE ROAD & I-94 | | | 55369 | | | SC | | | 1995/2002 | | | | 1996 | | | | 50.00 | % | | | 265,957 | | | | 354,321 | | | | 2,842,443 | | | KOHL’S #241(2016), BARNES & NOBLE-#2749(2011), GANDER MOUNTAIN(2011), MICHAEL’S STORES, INC. #2752(2012), BED, BATH AND BEYOND #456(2012), CUB FOODS(NOT OWNED) |
| | | | | | | | | | | | | | | | | | | | | | | | | | | | | | | | | | | | | |
| 147 | | ST. PAUL, MN | | MIDWAY MARKETPLACE
1450 UNIVERSITY AVENUE WEST | | | 55104 | | | SC | | | 1995 | | | | 1997 | | | | 14.50 | % | | | 324,354 | | | | 473,596 | | | | 2,606,377 | | | WAL-MART #5437(2022), CUB FOODS(2015), PETSMART #466(2011), MERVYN’S #312(2016), BORDERS BOOKS AND MUSIC(NOT OWNED), HERBERGER’S(NOT OWNED) |
| | | | | | | | | | | | | | | | | | | | | | | | | | | | | | | | | | | | | |
| 148 | | WORTHINGTON, MN | | NORTHLAND MALL
1635 OXFORD STREET | | | 56187 | | | MM | | | 1977 | | | | 1/2 | | | | 100.00 | % | | | 185,658 | | | | 185,658 | | | | 521,659 | | | J.C. PENNEY #2271-5 -4(2007), HY VEE FOOD STORES-3(2011) |
| | | | | | | | | | | | | | | | | | | | | | | | | | | | | | | | | | | | | |
| Mississippi | | | | | | | | | | | | | | | | | | | | | | | | | | | | | | | | | | |
| | | | | | | | | | | | | | | | | | | | | | | | | | | | | | | | | | | | | |
| 149 | | GULFPORT, MS | | CROSSROADS CENTER
CROSSROADS PARWAY | | | 39503 | | | SC | | | 1999 | | | | 2003 | | | | 100.00 | % | | | 457,027 | | | | 532,158 | | | | 5,233,610 | | | ACADEMY(2015), BED, BATH AND BEYOND #589(2014), ROSS DRESS FOR LESS #820(2015), GOODY’S FAMILY CLOTHING(2011), T.J. MAXX(2009), TINSELTOWN(2019), OFFICE DEPOT #437(2014), BARNES & NOBLE(2014), BELK’S(NOT OWNED) |
| | | | | | | | | | | | | | | | | | | | | | | | | | | | | | | | | | | | | |
| 150 | | JACKSON, MS (JUNCTION) | | THE JUNCTION
6351 I-55 NORTH3 | | | 39213 | | | SC | | | 1996 | | | | 2003 | | | | 100.00 | % | | | 107,780 | | | | 326,319 | | | | 1,064,392 | | | Petsmart #520(2012), Office Depot #358(2016), HOME DEPOT(NOT OWNED),
TARGET(NOT OWNED) |
| | | | | | | | | | | | | | | | | | | | | | | | | | | | | | | | | | | | | |
| 151 | | JACKSON, MS (METRO) | | METRO STATION
4700 ROBINSON ROAD | | | 39204 | | | SC | | | 1997 | | | | 2003 | | | | 100.00 | % | | | 52,617 | | | | 182,300 | | | | 331,788 | | | Office Depot #414(2012), HOME DEPOT(NOT OWNED) |
| | | |
* 1. Property Developed by the Company | | * SC — Shopping |
* 2. Original IPO Property | | * MM — Mini-Mall |
| | | * BC — Business Center |
| | | * LC — Lifestyle Center |
Property Listing 7.1
Does Not Include Service Merchandise Interests
Property List*
| | | | | | | | | | | | | | | | | | | | | | | | | | | | | | | | | | | | | |
| | | | | | | | | | | | | Year | | | | | | DDR | | Owned | | Owned/Unowned | | Total | | |
| | | | | | | Zip | | Type of | | Developed/ | | Year | | Ownership | | Gross | | Gross | | Annualized | | |
| Center/Property | | Location | | Code | | Property | | Redeveloped | | Acquired | | Interest | | Leasable Area | | Leasable Area | | Rent | | Anchor Tenants(Lease Expiration) |
| 152 | | OXFORD, MS | | OXFORD PLACE
2015-2035 UNIVERSITY AVENUE | | | 38655 | | | SC | | | 2000 | | | | 2003 | | | | 20.00 | % | | | 13,200 | | | | 71,866 | | | | 324,224 | | | KROGER(NOT OWNED) |
| | | | | | | | | | | | | | | | | | | | | | | | | | | | | | | | | | | | | |
| 153 | | SALTILLO, MS | | CROSS CREEK SHOPPING CENTER
1040-1184 CROSS CREEK DRIVE | | | 38866 | | | SC | | | 1999 | | | | 2003 | | | | 100.00 | % | | | 55,749 | | | | 173,269 | | | | 561,707 | | | Staples 1172(2016), HOME DEPOT(NOT OWNED) |
| | | | | | | | | | | | | | | | | | | | | | | | | | | | | | | | | | | | | |
| 154 | | STARKVILLE, MS | | STARKVILLE CROSSING
882 HIGHWAY 12 WEST | | | 39759 | | | SC | | | 1999/2004 | | | | 1994 | | | | 100.00 | % | | | 133,691 | | | | 268,254 | | | | 903,907 | | | J.C. PENNEY #2447(2010), KROGER #381(2042), LOWE’S(NOT OWNED) |
| | | | | | | | | | | | | | | | | | | | | | | | | | | | | | | | | | | | | |
| 155 | | TUPELO, MS | | BIG OAKS CROSSING
3850 N GLOSTER ST | | | 38801 | | | SC | | | 1992 | | | | 1994 | | | | 100.00 | % | | | 348,236 | | | | 348,236 | | | | 1,895,912 | | | SAM’S CLUB #6329(2012), GOODY’S #39(2007), WAL-MART STORES #258(2012) |
| | | | | | | | | | | | | | | | | | | | | | | | | | | | | | | | | | | | | |
| Missouri | | | | | | | | | | | | | | | | | | | | | | | | | | | | | | | | | | |
| | | | | | | | | | | | | | | | | | | | | | | | | | | | | | | | | | | | | |
| 156 | | ARNOLD, MO | | JEFFERSON COUNTY PLAZA
VOGEL ROAD | | | 63010 | | | SC | | | 2002 | | | | 1 * | | | | 50.00 | % | | | 34,567 | | | | 282,623 | | | | 503,364 | | | HOME DEPOT(NOT OWNED), TARGET(NOT OWNED) |
| | | | | | | | | | | | | | | | | | | | | | | | | | | | | | | | | | | | | |
| 157 | | FENTON, MO | | FENTON PLAZA
GRAVOIS & HIGHWAY 141 | | | 63206 | | | SC | | | 1970/1997 | | | | 1/2 | | | | 100.00 | % | | | 93,548 | | | | 100,548 | | | | 900,021 | | | |
| | | | | | | | | | | | | | | | | | | | | | | | | | | | | | | | | | | | | |
| 158 | | INDEPENDENCE, MO | | INDEPENDENCE COMMONS
900 EAST 39TH STREET | | | 64057 | | | SC | | | 1995/1999 | | | | 1995 | | | | 14.50 | % | | | 386,070 | | | | 403,170 | | | | 4,053,606 | | | KOHL’S DEPARTMENT #230(2016), BED, BATH & BEYOND #107(2012), MARSHALLS #675(2012), BARNES & NOBLE #2732(2011), AMC THEATRE(2015) |
| | | | | | | | | | | | | | | | | | | | | | | | | | | | | | | | | | | | | |
| 159 | | KANSAS CITY, MO (BRYWOOD) | | BRYWOOD CENTER
8600 E. 63rd STREET | | | 64133 | | | SC | | | 1972 | | | | 1998 | | | | 24.75 | % | | | 208,234 | | | | 208,234 | | | | 892,469 | | | BIG LOTS #489(2009), PRICE CHOPPER # 106(2009) |
| | | | | | | | | | | | | | | | | | | | | | | | | | | | | | | | | | | | | |
| 160 | | KANSAS CITY, MO (WARD PARKWAY) | | WARD PARKWAY
8600 WARD PARKWAY | | | 64114 | | | SC | | | 1959/2004 | | | | 2003 | | | | 20.00 | % | | | 214,530 | | | | 534,104 | | | | 3,811,422 | | | Dick’s(2016), 24 Hour Fitness(2023), AMC Theaters(2011), T.J. Maxx(2013), TARGET(NOT OWNED), DILLARD’S(NOT OWNED) |
| | | | | | | | | | | | | | | | | | | | | | | | | | | | | | | | | | | | | |
| 161 | | SPRINGFIELD,MO (MORRIS) | | MORRIS CORNERS
1425 EAST BATTLEFIELD | | | 65804 | | | SC | | | 1989 | | | | 1998 | | | | 100.00 | % | | | 56,033 | | | | 56,033 | | | | 491,757 | | | TOYS R US #9512(2013) |
| | | | | | | | | | | | | | | | | | | | | | | | | | | | | | | | | | | | | |
| 162 | | ST. JOHN, MO | | ST JOHN CROSSING
9000-9070 ST CHARLES ROCK RD | | | 63114 | | | SC | | | 2003 | | | | 2003 | | | | 100.00 | % | | | 93,513 | | | | 93,513 | | | | 959,893 | | | Shop N Save(2022) |
| | | | | | | | | | | | | | | | | | | | | | | | | | | | | | | | | | | | | |
| 163 | | ST. LOUIS (SUNSET), MO | | PLAZA AT SUNSET HILL
10980 SUNSET PLAZA | | | 63128 | | | SC | | | 1997 | | | | 1998 | | | | 100.00 | % | | | 415,435 | | | | 450,938 | | | | 5,312,752 | | | TOYS R US #9565(2013), COMPUSA COMPUTER SUPER #1012(2013), BED BATH AND BEYOND #460(2012), MARSHALLS OF SUNSET HILLS(2012), HOME DEPOT #1089(2023), PETSMART #260(2012), BORDERS #110(2011) |
| | | | | | | | | | | | | | | | | | | | | | | | | | | | | | | | | | | | | |
| 164 | | ST.LOUIS, MO (KELLER PLAZA) | | KELLER PLAZA
4500 LEMAY FERRY ROAD | | | 63129 | | | SC | | | 1987 | | | | 1998 | | | | 100.00 | % | | | 52,842 | | | | 169,699 | | | | 467,039 | | | SENSIBLE CINEMAS, INC(2006), SAM’S(NOT OWNED) |
| | | | | | | | | | | | | | | | | | | | | | | | | | | | | | | | | | | | | |
| 165 | | ST.LOUIS, MO (SOUTHTOWNE) | | SOUTHTOWNE
KINGS HIGHWAY & CHIPPEWA | | | 63109 | | | SC | | | 2004 | | | | 1998 | | | | 100.00 | % | | | 67,628 | | | | 67,628 | | | | 1,114,458 | | | OFFICE MAX(2014) |
| | | | | | | | | | | | | | | | | | | | | | | | | | | | | | | | | | | | | |
| 166 | | ST.LOUIS,MO (BRENTWOOD) | | PROMENADE AT BRENTWOOD
1 BRENTWOOD PROMENADE COURT | | | 63144 | | | SC | | | 1998 | | | | 1998 | | | | 100.00 | % | | | 299,584 | | | | 299,584 | | | | 4,022,889 | | | TARGET #1102(2023), BED BATH & BEYOND #219(2009), PETSMART #255(2014), LANE HOME FURNISHINGS(2013) |
| | | | | | | | | | | | | | | | | | | | | | | | | | | | | | | | | | | | | |
| 167 | | ST.LOUIS,MO (GRAVOIS VILLAGE) | | GRAVOIS VILLAGE
4523 GRAVOIS VILLAGE PLAZA | | | 63049 | | | SC | | | 1983 | | | | 1998 | | | | 100.00 | % | | | 110,992 | | | | 114,992 | | | | 597,117 | | | K MART #7543(2008) |
| | | | | | | | | | | | | | | | | | | | | | | | | | | | | | | | | | | | | |
| 168 | | ST.LOUIS,MO (OLYMPIC OAKS) | | OLYMPIC OAKS VILLAGE
12109 MANCHESTER ROAD | | | 63121 | | | SC | | | 1985 | | | | 1998 | | | | 100.00 | % | | | 92,372 | | | | 92,372 | | | | 1,395,719 | | | T.J. MAXX #329(2006) |
| | | | | | | | | | | | | | | | | | | | | | | | | | | | | | | | | | | | | |
| Nevada | | | | | | | | | | | | | | | | | | | | | | | | | | | | | | | | | | |
| | | | | | | | | | | | | | | | | | | | | | | | | | | | | | | | | | | | | |
| 169 | | LAS VEGAS, NV (MARYLAND) | | FAMILY PLACE @ LAS VEGAS
CHARLESTON & MARYLAND BLVD | | | 89102 | | | SC | | | 2003 | | | | 1 * | | | | 100.00 | % | | | 24,032 | | | | 27,300 | | | | 428,856 | | | |
| | | | | | | | | | | | | | | | | | | | | | | | | | | | | | | | | | | | | |
| 170 | | RENO, NV. | | RENO RIVERSIDE
EAST FIRST STREET AND SIERRA | | | 89505 | | | SC | | | 2000 | | | | 2000 | | | | 100.00 | % | | | 52,474 | | | | 52,474 | | | | 692,484 | | | CENTURY THEATRE, INC.(2014) |
| | | | | | | | | | | | | | | | | | | | | | | | | | | | | | | | | | | | | |
| New Jersey | | | | | | | | | | | | | | | | | | | | | | | | | | | | | | | | | | |
| | | | | | | | | | | | | | | | | | | | | | | | | | | | | | | | | | | | | |
| 171 | | HAMILTON, NJ | | HAMILTON MARKETPLACE
NJ STATE HWY 130 & KLOCKNER RD | | | 08691 | | | SC | | | 2004 | | | | 2003 | | | | 100.00 | % | | | 425,168 | | | | 916,751 | | | | 6,880,124 | | | Kohl’s #469(2023), Linens ‘N Things #142(2014), Michael’s #03716(2013), Ross Dress For Less #634(2014), Shop Rite(2028), BARNES & NOBLE(2014), LOWE’S(NOT OWNED), BJ’S WHOLESALE(NOT OWNED), WALMART(NOT OWNED) |
| | | | | | | | | | | | | | | | | | | | | | | | | | | | | | | | | | | | | |
| 172 | | MAYS LANDING, NJ (HAMILTON) | | HAMILTON COMMONS
4215 BLACK HORSE PIKE | | | 08330 | | | SC | | | 2001 | | | | 2004 | | | | 100.00 | % | | | 401,891 | | | | 401,891 | | | | 5,751,042 | | | Regal Cinemas #311729(2021), Ross Stores #518(2012), Bed Bath and Beyond, Inc #38(2017), Marshalls #377(2012), SPORTS AUTHORITY #459(2015), CIRCUIT CITY(2020) |
| | | | | | | | | | | | | | | | | | | | | | | | | | | | | | | | | | | | | |
| 173 | | MAYS LANDING, NJ (WRANGLEBORO) | | WRANGLEBORO CONSUMER SQUARE
2300 WRANGLEBORO ROAD | | | 08330 | | | SC | | | 1997 | | | | 2004 | | | | 100.00 | % | | | 839,446 | | | | 839,446 | | | | 9,151,405 | | | Best Buy Stores, L.P. #581(2017), Borders #193(2017), Kohls Store #279(2018), Staples #784(2012), Babies R Us # 6373(2013), BJs Wholesale Club #74(2016), Dicks Sporting Goods, Inc. #85(2013), Seamans Furniture(2012), Linens N Things #148(2012), Michaels #9832(2008), Target Stores #T-1109A(2023), Petsmart #576(2013) |
| | | | | | | | | | | | | | | | | | | | | | | | | | | | | | | | | | | | | |
| 174 | | MT. LAUREL, NJ (DEV) | | CENTERTON SQUARE CENTERTON ROAD & MARTER AVE. | | | 08054 | | | SC | | | 2005 | | | | 1 * | | | | 100.00 | % | | | 228,667 | | | | 643,963 | | | | 5,299,094 | | | BED BATH & BEYOND(2015), PETSMART(2015), DSW SHOE WAREHOUSE(2015), JO ANN FABRICS(2015), TJ MAXX(2015), WEGMANS(NOT OWNED), TARGET(NOT OWNED), COSTCO(NOT OWNED) |
| | | |
* 1. Property Developed by the Company | | * SC — Shopping |
* 2. Original IPO Property | | * MM — Mini-Mall |
| | | * BC — Business Center |
| | | * LC — Lifestyle Center |
Property Listing 7.1
Does Not Include Service Merchandise Interests
Property List*
| | | | | | | | | | | | | | | | | | | | | | | | | | | | | | | | | | | | | |
| | | | | | | | | | | | | Year | | | | | | DDR | | Owned | | Owned/Unowned | | Total | | |
| | | | | | | Zip | | Type of | | Developed/ | | Year | | Ownership | | Gross | | Gross | | Annualized | | |
| Center/Property | | Location | | Code | | Property | | Redeveloped | Acquired | Interest | Leasable Area | Leasable Area | | Rent | | Anchor Tenants(Lease Expiration) |
| 175 | | PRINCETON, NJ | | NASSAU PARK SHOPPING CENTER
ROUTE 1 & QUAKER BRIDGE ROAD | | | 02071 | | | SC | | | 1995 | | | | 1997 | | | | 100.00 | % | | | 211,807 | | | | 720,616 | | | | 3,867,050 | | | BORDERS #131(2011), BEST BUY #578(2012), LINENS ‘N THINGS #462(2011), PETSMART #577(2011), TARGET(NOT OWNED) |
| | | | | | | | | | | | | | | | | | | | | | | | | | | | | | | | | | | | | |
| 176 | | PRINCETON, NJ (PAVILION) | | NASSAU PARK PAVILION
ROUTE 1 AND QUAKER BRIDGE ROAD | | | 02071 | | | SC | | | 1999/2004 | | | | 1 * | | | | 100.00 | % | | | 202,622 | | | | 309,285 | | | | 4,024,629 | | | DICK’S SPORTING GOOD #105(2015), MICHAEL’S #9936(2009), KOHL’S #294(2019) |
| | | | | | | | | | | | | | | | | | | | | | | | | | | | | | | | | | | | | |
| 177 | | WEST LONG BRANCH, NJ(MONMOUTH) | | CONSUMER CENTER
310 STATE HIGHWAY #36 | | | 07764 | | | SC | | | 1993 | | | | 2004 | | | | 100.00 | % | | | 292,999 | | | | 292,999 | | | | 3,797,852 | | | Sports Authority #464(2012), Barnes and Noble #1885(2009), Petsmart #0760(2008), Home Depot #0907(2013) |
| | | | | | | | | | | | | | | | | | | | | | | | | | | | | | | | | | | | | |
| New Mexico | | | | | | | | | | | | | | | | | | | | | | | | | | | | | | | | | | |
| | | | | | | | | | | | | | | | | | | | | | | | | | | | | | | | | | | | | |
| 178 | | LOS ALAMOS, NM | | MARI MAC VILLAGE
800 TRINITY DRIVE | | | 87533 | | | SC | | | 1978/1997 | | | | 1/2 | | | | 100.00 | % | | | 93,021 | | | | 93,021 | | | | 631,687 | | | SMITH’S FOOD & DRUG CENTERS497(2007), FURR’S PHARMACY #887-4(2008), BEALL’S #0180(2009) |
| | | | | | | | | | | | | | | | | | | | | | | | | | | | | | | | | | | | | |
| New York | | | | | | | | | | | | | | | | | | | | | | | | | | | | | | | | | | |
| | | | | | | | | | | | | | | | | | | | | | | | | | | | | | | | | | | | | |
| 179 | | ALDEN, NY (TOPS) | | TOPS PLAZA — ALDEN
12775 BROADWAY | | | 14004 | | | SC | | | 1999 | | | | 2004 | | | | 100.00 | % | | | 67,992 | | | | 67,992 | | | | 736,269 | | | Tops Markets #261(2019) |
| | | | | | | | | | | | | | | | | | | | | | | | | | | | | | | | | | | | | |
| 180 | | AMHERST, NY | | TOPS PLAZA — AMHERST
3035 NIAGARA FALLS BLVD. | | | 14828 | | | SC | | | 1986 | | | | 2004 | | | | 20.00 | % | | | 145,192 | | | | 145,192 | | | | 1,161,149 | | | Tops Markets #207(2010) |
| | | | | | | | | | | | | | | | | | | | | | | | | | | | | | | | | | | | | |
| 181 | | AMHERST, NY (BOULEVARD CONSUME | | K MART PLAZA
1641-1703 NIAGARA FALLS BLVD | | | 14228 | | | SC | | | 1998/2001/2003 | | | | 2004 | | | | 100.00 | % | | | 707,264 | | | | 707,264 | | | | 6,381,386 | | | Target Stores #T-1010A(2019), K Mart #4199(2007), Babies R Us #9282(2015), Barnes & Noble #2958(2014), Best Buy #459(2016), Bed Bath & Beyond # 532(2018), A.C. Moore(2013) |
| | | | | | | | | | | | | | | | | | | | | | | | | | | | | | | | | | | | | |
| 182 | | AMHERST, NY (BURLINGTON/JOANN) | | BURLINGTON PLAZA
1551 NIAGARA FALLS BOULEVARD | | | 14228 | | | SC | | | 1978/1982/1990/1998 | | | | 2004 | | | | 100.00 | % | | | 199,504 | | | | 199,504 | | | | 2,060,976 | | | Burlington Coat #62(2014), Jo-Ann Fabrics and Crafts#1930(2014) |
| | | | | | | | | | | | | | | | | | | | | | | | | | | | | | | | | | | | | |
| 183 | | AMHERST, NY (DICKS) | | DICKS SPORTING GOODS-AMHERST
281 MEYER ROAD | | | 14226 | | | SC | | | 1993/2003 | | | | 2004 | | | | 100.00 | % | | | 55,745 | | | | 55,745 | | | | 720,783 | | | Dicks Sporting Goods # 11(2015) |
| | | | | | | | | | | | | | | | | | | | | | | | | | | | | | | | | | | | | |
| 184 | | AMHERST, NY (SHERIDAN/HARLEM) | | SHERIDAN HARLEM PLAZA
4990 HARLEM ROAD | | | 14226 | | | SC | | | 1960/1973/1982/1988/
2003 | | | | 2004 | | | | 100.00 | % | | | 58,413 | | | | 58,413 | | | | 565,307 | | | |
| | | | | | | | | | | | | | | | | | | | | | | | | | | | | | | | | | | | | |
| 185 | | AMHERST, NY (TOPS-TRANSIT COMM | | TOPS PLAZA — TRANSIT/N. FRENCH
9660 TRANSIT ROAD | | | 14226 | | | SC | | | 1995/1998 | | | | 2004 | | | | 100.00 | % | | | 112,427 | | | | 112,427 | | | | 1,063,625 | | | Tops Markets(2016) |
| | | | | | | | | | | | | | | | | | | | | | | | | | | | | | | | | | | | | |
| 186 | | AMHERST, NY (UNIVERSITY PLAZA) | | UNIVERSITY PLAZA
3500 MAIN STREET | | | 14226 | | | SC | | | 1965/1995/2002 | | | | 2004 | | | | 100.00 | % | | | 162,879 | | | | 162,879 | | | | 1,344,678 | | | A.J. Wright #162(2012), Tops Markets #42(2009) |
| | | | | | | | | | | | | | | | | | | | | | | | | | | | | | | | | | | | | |
| 187 | | ARCADE, NY | | TOPS PLAZA-ARCADE
ROUTE 39 | | | 14009 | | | SC | | | 1995 | | | | 2004 | | | | 10.00 | % | | | 65,915 | | | | 65,915 | | | | 640,409 | | | Tops Markets # 238(2015) |
| | | | | | | | | | | | | | | | | | | | | | | | | | | | | | | | | | | | | |
| 188 | | AVON, NY | | TOPS PLAZA-AVON
270 E. MAIN STREET | | | 14414 | | | SC | | | 1997/2002 | | | | 2004 | | | | 10.00 | % | | | 62,988 | | | | 62,988 | | | | 488,356 | | | Tops Markets (B) #4(2017) |
| | | | | | | | | | | | | | | | | | | | | | | | | | | | | | | | | | | | | |
| 189 | | BATAVIA, NY (BJS) | | BJs PLAZA
8326 LEWISTON ROAD | | | 14020 | | | SC | | | 1996 | | | | 2004 | | | | 14.50 | % | | | 95,846 | | | | 95,846 | | | | 770,278 | | | BJs Wholesale Club #311(2016) |
| | | | | | | | | | | | | | | | | | | | | | | | | | | | | | | | | | | | | |
| 190 | | BATAVIA, NY (COMMONS) | | BATAVIA COMMONS
419 WEST MAIN STREET | | | 14020 | | | SC | | | 1990 | | | | 2004 | | | | 14.50 | % | | | 49,431 | | | | 49,431 | | | | 439,613 | | | |
| | | | | | | | | | | | | | | | | | | | | | | | | | | | | | | | | | | | | |
| 191 | | BATAVIA, NY (TOPS PLAZA) | | TOPS PLAZA
8351 LEWISTON ROAD | | | 14020 | | | SC | | | 1994 | | | | 2004 | | | | 14.50 | % | | | 37,140 | | | | 115,161 | | | | 430,150 | | | TOPS(NOT OWNED) |
| | | | | | | | | | | | | | | | | | | | | | | | | | | | | | | | | | | | | |
| 192 | | BIG FLATS, NY (CONSUMER SQUARE | | BIG FLATS CONSUMER SQUARE
830 COUNTY ROUTE 64 | | | 14814 | | | SC | | | 1993/2001 | | | | 2004 | | | | 100.00 | % | | | 641,264 | | | | 641,264 | | | | 6,033,810 | | | Dicks Sporting Goods, Inc. #25(2008), Wal-Mart #10-1976(2013), Wal-Mart-Sams #6431(2013), Tops Markets #542(2013), Bed, Bath, and Beyond #448(2014), Michaels #2035(2010), Old Navy #02324(2009), Staples #279(2011), Barnes and Noble #2825(2011), TJ Maxx #198(2007) |
| | | | | | | | | | | | | | | | | | | | | | | | | | | | | | | | | | | | | |
| 193 | | BUFFALO, NY (DELAWARE CONSUMER | | DELAWARE CONSUMER SQUARE
2636-2658 DELAWARE AVENUE | | | 14216 | | | SC | | | 1995 | | | | 2004 | | | | 100.00 | % | | | 229,707 | | | | 229,707 | | | | 2,014,190 | | | Target Stores #T-1013A(2015), A.J. Wright #174(2012), OfficeMax #834(2012) |
| | | | | | | | | | | | | | | | | | | | | | | | | | | | | | | | | | | | | |
| 194 | | BUFFALO, NY (ELMWOOD) | | ELMWOOD REGAL CENTER
1951 — 2023 ELMWOOD AVENUE | | | 14207 | | | SC | | | 1997 | | | | 2004 | | | | 100.00 | % | | | 133,940 | | | | 133,940 | | | | 1,492,266 | | | Regal Cinema #330341(2017), Office Depot #412(2012) |
| | | | | | | | | | | | | | | | | | | | | | | | | | | | | | | | | | | | | |
| 195 | | BUFFALO, NY (MARSHALLS) | | MARSHALLS PLAZA
2150 DELAWARE AVENUE | | | 14216 | | | SC | | | 1960/1975/1983/1995 | | | | 2004 | | | | 100.00 | % | | | 82,196 | | | | 82,196 | | | | 763,429 | | | Marshalls #331(2009) |
| | | | | | | | | | | | | | | | | | | | | | | | | | | | | | | | | | | | | |
| 196 | | CANANDAIGUA, NY | | TOPS PLAZA
5150 North Street | | | 14424 | | | SC | | | 2002 | | | | 2004 | | | | 100.00 | % | | | 57,498 | | | | 57,498 | | | | 769,500 | | | Tops Markets #432(2023) |
| | | | | | | | | | | | | | | | | | | | | | | | | | | | | | | | | | | | | |
| 197 | | CHEEKTOWAGA, NY (BORDERS) | | BORDERS BOOKS
2015 WALDEN AVENUE | | | 14225 | | | SC | | | 1994 | | | | 2004 | | | | 14.50 | % | | | 26,500 | | | | 26,500 | | | | 609,500 | | | Borders #100(2015) |
| | | | | | | | | | | | | | | | | | | | | | | | | | | | | | | | | | | | | |
| 198 | | CHEEKTOWAGA, NY (DICKS) | | DICKS PLAZA
3637 UNION ROAD | | | 14225 | | | SC | | | 1979/1982/1997/2003 | | | | 2004 | | | | 14.50 | % | | | 174,438 | | | | 174,438 | | | | 1,192,596 | | | Dicks Sporting Goods, Inc.(2015) |
| | | |
* 1. Property Developed by the Company | | * SC — Shopping |
* 2. Original IPO Property | | * MM — Mini-Mall |
| | | * BC — Business Center |
| | | * LC — Lifestyle Center |
Property Listing 7.1
Does Not Include Service Merchandise Interests
Property List*
| | | | | | | | | | | | | | | | | | | | | | | | | | | | | | | | | | | | | |
| | | | | | | | | | | | | Year | | | | | | DDR | | Owned | | Owned/Unowned | | Total | | |
| | | | | | | Zip | | Type of | | Developed/ | | Year | | Ownership | | Gross | | Gross | | Annualized | | |
| Center/Property | | Location | | Code | | Property | | Redeveloped | | Acquired | | Interest | | Leasable Area | | Leasable Area | | Rent | | Anchor Tenants(Lease Expiration) |
| 199 | | CHEEKTOWAGA, NY (THRUWAY PLAZA | | THRUWAY PLAZA
2195 HARLEM ROAD | | | 14225 | | | SC | | | 1965/1995/1997/2004 | | | | 2004 | | | | 100.00 | % | | | 347,202 | | | | 479,534 | | | | 2,399,258 | | | Wal-Mart #01-2586(2017), MovieLand 8 Theatres(2019), Tops Markets #131(2019), Value City Furniture #76(2009), M & T Bank(2007), HOME
DEPOT(NOT OWNED) |
| | | | | | | | | | | | | | | | | | | | | | | | | | | | | | | | | | | | | |
| 200 | | CHEEKTOWAGA, NY (TOPS UNION) | | TOPS PLAZA — UNION ROAD
3825 — 3875 UNION ROAD | | | 14225 | | | SC | | | 1978/1989/1995/2004 | | | | 2004 | | | | 20.00 | % | | | 151,357 | | | | 151,357 | | | | 1,757,837 | | | Tops Markets #202(2013) |
| | | | | | | | | | | | | | | | | | | | | | | | | | | | | | | | | | | | | |
| 201 | | CHEEKTOWAGA, NY (UNION CONSUME | | UNION CONSUMER SQUARE 3733 — 3735 UNION ROAD | | | 14225 | | | SC | | | 1989/1998/2004 | | | | 2004 | | | | 14.50 | % | | | 381,193 | | | | 381,193 | | | | 4,193,948 | | | Marshalls #366(2009), Office Max #320(2010), Sam’s Club #6673(2024), Circuit City Stores #3151(2016), Jo-Ann ETC. #1931(2015) |
| | | | | | | | | | | | | | | | | | | | | | | | | | | | | | | | | | | | | |
| 202 | | CHEEKTOWAGA, NY (WALDEN PLACE) | | WALDEN PLACE
2130-2190 WALDEN AVENUE | | | 14225 | | | SC | | | 1994/1999 | | | | 2004 | | | | 14.50 | % | | | 68,002 | | | | 68,002 | | | | 681,625 | | | Media Play #8290(2010) |
| | | | | | | | | | | | | | | | | | | | | | | | | | | | | | | | | | | | | |
| 203 | | CHEEKTOWAGA, NY (WALDEN) | | CONSUMER SQUARE 1700 — 1750 WALDEN AVENUE | | | 14225 | | | SC | | | 1997/1999/2004 | | | | 2004 | | | | 14.50 | % | | | 255,964 | | | | 255,964 | | | | 2,216,083 | | | Office Depot #00673(2009), Linens N Things(2015), Michaels #3862(2013),
Target Stores #T-1014A(2015) |
| | | | | | | | | | | | | | | | | | | | | | | | | | | | | | | | | | | | | |
| 204 | | CHILI, NY (KMART) | | CHILI PLAZA
800 PAUL ROAD | | | 14606 | | | SC | | | 1998 | | | | 2004 | | | | 100.00 | % | | | 116,868 | | | | 120,368 | | | | 748,189 | | | Sears, Roebuck and Co.(2019) |
| | | | | | | | | | | | | | | | | | | | | | | | | | | | | | | | | | | | | |
| 205 | | CICERO, NY (BEAR RD) | | BEAR ROAD PLAZA
709-729 NORTH MAIN STREET | | | 13212 | | | SC | | | 1978/1988/1995 | | | | 2004 | | | | 100.00 | % | | | 59,483 | | | | 59,483 | | | | 486,278 | | | |
| | | | | | | | | | | | | | | | | | | | | | | | | | | | | | | | | | | | | |
| 206 | | CLARENCE, NY (BARNES) | | BARNES & NOBLE
7370 TRANSIT ROAD | | | 14031 | | | SC | | | 1992 | | | | 2004 | | | | 14.50 | % | | | 16,030 | | | | 16,030 | | | | 304,249 | | | |
| | | | | | | | | | | | | | | | | | | | | | | | | | | | | | | | | | | | | |
| 207 | | CLARENCE, NY (EASTGATE PLAZA) | | EASTGATE PLAZA
TRANSIT & GREINER ROADS | | | 14031 | | | SC | | | 1995/1997/1999/2001/
2004 | | | | 2004 | | | | 14.50 | % | | | 527,476 | | | | 527,476 | | | | 4,144,525 | | | BJS Wholesale Club, Inc.(2021), Dicks Sporting Goods, Inc.(2011), Linens N Things #622(2015), Michaels #2014(2010), Wal-Mart #2355(2019) |
| | | | | | | | | | | | | | | | | | | | | | | | | | | | | | | | | | | | | |
| 208 | | CLARENCE, NY (JOANN) | | JOANN PLAZA
4101 TRANSIT ROAD | | | 14221 | | | SC | | | 1994 | | | | 2004 | | | | 14.50 | % | | | 92,720 | | | | 202,720 | | | | 743,588 | | | Office Max #81(2009), JO-ANN FABRICS(2015), BIG LOTS(2015), HOME DEPOT
(NOT OWNED) |
| | | | | | | | | | | | | | | | | | | | | | | | | | | | | | | | | | | | | |
| 209 | | CLARENCE, NY (PREMIER) | | PREMIER PLACE | | | 14221 | | | SC | | | 1986/1994/1998 | | | | 2004 | | | | 14.50 | % | | | 142,536 | | | | 142,536 | | | | 1,374,177 | | | Premier Liquors — I(2010), Stein Mart #155(2008) 7864 — 8020 TRANSIT ROAD |
| | | | | | | | | | | | | | | | | | | | | | | | | | | | | | | | | | | | | |
| 210 | | CORTLAND, NY (TOPS PLAZA) | | TOPS PLAZA — CORTLAND
3836 ROUTE 281 | | | 13045 | | | SC | | | 1995 | | | | 2004 | | | | 100.00 | % | | | 134,223 | | | | 134,223 | | | | 1,688,442 | | | Tops Markets #517(2016), Staples #1235(2017) |
| | | | | | | | | | | | | | | | | | | | | | | | | | | | | | | | | | | | | |
| 211 | | DANSVILLE, NY (TOPS) | | TOPS PLAZA — DANSVILLE
23-65 FRANKLIN STREET | | | 14437 | | | SC | | | 2001 | | | | 2004 | | | | 100.00 | % | | | 62,400 | | | | 62,400 | | | | 626,969 | | | Tops Markets #520(2021), Blockbuster(2014) |
| | | | | | | | | | | | | | | | | | | | | | | | | | | | | | | | | | | | | |
| 212 | | DEPEW, NY | | TOPS PLAZA — DEPEW
5175 BROADWAY | | | 14043 | | | SC | | | 1980/1990/1996 | | | | 2004 | | | | 100.00 | % | | | 148,245 | | | | 148,245 | | | | 1,440,601 | | | Tops Markets #114(2016), Big Lots #00391 B(2011) |
| | | | | | | | | | | | | | | | | | | | | | | | | | | | | | | | | | | | | |
| 213 | | DEWITT, NY (DEWITT COMMONS) | | MARSHALLS PLAZA
3401 ERIE BOULEVARD EAST | | | 13214 | | | SC | | | 2001/2003 | | | | 2004 | | | | 100.00 | % | | | 318,809 | | | | 318,809 | | | | 2,389,186 | | | Toys R Us #7525(2018), Marshalls #217(2019), Bed, Bath & Beyond #515(2018), A.C. Moore(2014), Syracuse Orthopedic Specialist(2017) |
| | | | | | | | | | | | | | | | | | | | | | | | | | | | | | | | | | | | | |
| 214 | | DEWITT, NY (MICHAELS/CHUCK E C | | MICHAELS — DEWITT
3133 ERIE BOULEVARD | | | 13214 | | | SC | | | 2002 | | | | 2004 | | | | 100.00 | % | | | 49,713 | | | | 49,713 | | | | 570,166 | | | Michaels #2011(2010) |
| | | | | | | | | | | | | | | | | | | | | | | | | | | | | | | | | | | | | |
| 215 | | ELMIRA, NY | | TOPS PLAZA-ELMIRA
HUDSON STREET | | | 14904 | | | SC | | | 1997 | | | | 2004 | | | | 10.00 | % | | | 98,330 | | | | 98,330 | | | | 1,117,100 | | | Tops Market #551(2017) |
| | | | | | | | | | | | | | | | | | | | | | | | | | | | | | | | | | | | | |
| 216 | | GATES, NY (WESTGATE PLAZA) | | WESTGATE PLAZA
2000 CHILI AVENUE | | | 14624 | | | SC | | | 1998 | | | | 2004 | | | | 100.00 | % | | | 327,809 | | | | 327,809 | | | | 3,106,665 | | | Wal-Mart #2859(2021), Staples the Office Superstore(2015) |
| | | | | | | | | | | | | | | | | | | | | | | | | | | | | | | | | | | | | |
| 217 | | GREECE, NY | | WEST RIDGE PLAZA
3042 WEST RIDGE ROAD | | | 14626 | | | SC | | | 1993/1999 | | | | 2004 | | | | 100.00 | % | | | 75,916 | | | | 75,916 | | | | 799,191 | | | Petsmart #774(2008), Jo-Ann etc. #1949(2015) |
| | | | | | | | | | | | | | | | | | | | | | | | | | | | | | | | | | | | | |
| 218 | | HAMBURG, NY (BJS) | | BJS PLAZA — HAMBURG
4408 MILESTRIP ROAD | | | 14075 | | | SC | | | 1990/1997 | | | | 2004 | | | | 100.00 | % | | | 175,965 | | | | 175,965 | | | | 1,700,349 | | | OfficeMax #0027(2010), BJs Wholesale Club #35(2010) |
| | | | | | | | | | | | | | | | | | | | | | | | | | | | | | | | | | | | | |
| 219 | | HAMBURG, NY (DICKS-MCKINLEY) | | MCKINLEY PLACE
3701 MCKINLEY PARKWAY | | | 14075 | | | SC | | | 1990/2001 | | | | 2004 | | | | 100.00 | % | | | 128,944 | | | | 128,944 | | | | 1,355,410 | | | Dicks Sporting Goods #12(2011), Rosas Home Store(2009) |
| | | | | | | | | | | | | | | | | | | | | | | | | | | | | | | | | | | | | |
| 220 | | HAMBURG, NY (HAMBURG VILLAGE) | | HAMBURG VILLAGE SQUARE
140 PINE STREET | | | 14075 | | | SC | | | 1960/1972/1984/1996 | | | | 2004 | | | | 100.00 | % | | | 92,717 | | | | 92,717 | | | | 883,877 | | | |
| | | | | | | | | | | | | | | | | | | | | | | | | | | | | | | | | | | | | |
| 221 | | HAMBURG, NY (HOME DEPOT) | | HOME DEPOT PLAZA — HAMBURG
4405 MILESTRIP ROAD | | | 14219 | | | SC | | | 1999/2000 | | | | 2004 | | | | 100.00 | % | | | 139,413 | | | | 139,413 | | | | 1,506,174 | | | Home Depot #1286(2012) |
| | | | | | | | | | | | | | | | | | | | | | | | | | | | | | | | | | | | | |
| 222 | | HAMBURG, NY (MILESTRIP) | | MCKINLEY MILESTRIP CENTER
3540 MCKINLEY PARKWAY | | | 14075 | | | SC | | | 1999 | | | | 2004 | | | | 100.00 | % | | | 106,774 | | | | 106,774 | | | | 1,333,249 | | | Old Navy #03046(2010), Jo-Ann Fabrics & Crafts #1932(2015) |
| | | | | | | | | | | | | | | | | | | | | | | | | | | | | | | | | | | | | |
| 223 | | HAMBURG, NY (TOPS) | | SOUTH PARK PLAZA-TOPS
6150 SOUTH PARK AVENUE | | | 14075 | | | SC | | | 1990/1992 | | | | 2004 | | | | 10.00 | % | | | 84,000 | | | | 84,000 | | | | 730,500 | | | Tops Markets #236(2015) |
| | | | | | | | | | | | | | | | | | | | | | | | | | | | | | | | | | | | | |
| 224 | | HAMLIN, NY | | TOPS PLAZA-HAMLIN
1800 LAKE ROAD | | | 14464 | | | SC | | | 1997 | | | | 2004 | | | | 10.00 | % | | | 60,488 | | | | 60,488 | | | | 489,395 | | | Tops Markets (B) #4(2017) |
| | | |
* 1. Property Developed by the Company | | * SC — Shopping |
* 2. Original IPO Property | | * MM — Mini-Mall |
| | | * BC — Business Center |
| | | * LC — Lifestyle Center |
Property Listing 7.1
Does Not Include Service Merchandise Interests
Property List*
| | | | | | | | | | | | | | | | | | | | | | | | | | | | | | | | | | | | | |
| | | | | | | | | | | | | Year | | | | | | DDR | | Owned | | Owned/Unowned | | Total | | |
| | | | | | | Zip | | Type of | | Developed/ | | Year | | Ownership | | Gross | | Gross | | Annualized | | |
| Center/Property | | Location | | Code | | Property | | Redeveloped | | Acquired | | Interest | | Leasable Area | | Leasable Area | | Rent | | Anchor Tenants(Lease Expiration) |
| 225 | | IRONDEQUOIT, NY (CULVER RIDGE) | | CULVER RIDGE PLAZA
2255 RIDGE ROAD EAST | | | 14622 | | | SC | | | 1972/1984/1997 | | | | 2004 | | | | 20.00 | % | | | 226,812 | | | | 226,812 | | | | 2,413,138 | | | Regal Cinemas, Inc. #330332(2022), A.J. WRIGHT #0211(2014) |
| | | | | | | | | | | | | | | | | | | | | | | | | | | | | | | | | | | | | |
| 226 | | IRONDEQUOIT, NY (RIDGEVIEW) | | RIDGEVIEW PLACE
1850 RIDGE ROAD EAST | | | 14617 | | | SC | | | 2000 | | | | 2004 | | | | 100.00 | % | | | 64,732 | | | | 64,732 | | | | 835,971 | | | |
| | | | | | | | | | | | | | | | | | | | | | | | | | | | | | | | | | | | | |
| 227 | | ITHACA, NY (TOPS PLAZA) | | TOPS PLAZA — ITHACA 614 — 722 SOUTH MEADOW | | | 14850 | | | SC | | | 1990/1999/2003 | | | | 2004 | | | | 100.00 | % | | | 229,320 | | | | 229,320 | | | | 3,678,845 | | | OFFICE MAX #908(2014), Tops Markets #525(2021), Michaels #3718(2013), Barnes & Noble Booksellers2122(2018) |
| | | | | | | | | | | | | | | | | | | | | | | | | | | | | | | | | | | | | |
| 228 | | JAMESTOWN, NY | | TOPS PLAZA — JAMESTOWN
75 WASHINGTON STREET | | | 14702 | | | SC | | | 1997 | | | | 2004 | | | | 20.00 | % | | | 98,001 | | | | 98,001 | | | | 1,272,966 | | | Tops Markets (B) #2 — Jamestow(2018) |
| | | | | | | | | | | | | | | | | | | | | | | | | | | | | | | | | | | | | |
| 229 | | JAMESTOWN, NY (SOUTHSIDE) | | SOUTHSIDE PLAZA
708-744 FOOTE AVENUE | | | 14701 | | | SC | | | 1980/1997 | | | | 2004 | | | | 100.00 | % | | | 63,140 | | | | 63,140 | | | | 594,322 | | | Quality Market #6661(2017) |
| | | | | | | | | | | | | | | | | | | | | | | | | | | | | | | | | | | | | |
| 230 | | LANCASTER, NY (REGAL) | | REGAL CENTER
6703-6733 TRANSIT ROAD | | | 14221 | | | SC | | | 1997 | | | | 2004 | | | | 14.50 | % | | | 112,949 | | | | 112,949 | | | | 921,583 | | | Regal Cinema #33294(2017) |
| | | | | | | | | | | | | | | | | | | | | | | | | | | | | | | | | | | | | |
| 231 | | LEROY, NY | | TOPS PLAZAl — LEROY
128 WEST MAIN STREET | | | 14482 | | | SC | | | 1997 | | | | 2004 | | | | 20.00 | % | | | 62,747 | | | | 62,747 | | | | 564,043 | | | Tops Markets, Inc. #2 — Leroy(2017) |
| | | | | | | | | | | | | | | | | | | | | | | | | | | | | | | | | | | | | |
| 232 | | LOCKPORT, NY | | WAL-MART/TOPS PLAZA — LOCKPORT 5789 & 5839 TRANSIT RD & HAMM | | | 14094 | | | SC | | | 1993 | | | | 2004 | | | | 100.00 | % | | | 296,582 | | | | 296,582 | | | | 2,621,761 | | | Wal-Mart #10-2107(2015), Tops Markets #21(2021), Sears Hardware
#5073(2006) |
| | | | | | | | | | | | | | | | | | | | | | | | | | | | | | | | | | | | | |
| 233 | | MEDINA, NY (TOPS) | | TOPS PLAZA — MEDINA
11200 MAPLE RIDGE ROAD | | | 14103 | | | SC | | | 1996 | | | | 2004 | | | | 100.00 | % | | | 80,028 | | | | 80,028 | | | | 526,400 | | | Tops Market #248(2016) |
| | | | | | | | | | | | | | | | | | | | | | | | | | | | | | | | | | | | | |
| 234 | | NEW HARTFORD, NY | | CONSUMER SQUARE 4725 — 4829 COMMERCIAL DRIVE | | | 13413 | | | SC | | | 2002 | | | | 2004 | | | | 14.50 | % | | | 516,140 | | | | 516,140 | | | | 5,787,171 | | | Barnes & Noble #2133(2013), Bed Bath & Beyond #511(2018), Best Buy
#545(2013), Staples the Office Superstore(2018), Michaels #2770(2013), Wal-Mart #1677-02(2022), TJ Maxx #865(2012) |
| | | | | | | | | | | | | | | | | | | | | | | | | | | | | | | | | | | | | |
| 235 | | NEW HARTFORD, NY (TOPS) | | TOPS PLAZA — NEW HARTFORD
40 KELLOPP ROAD | | | 13413 | | | SC | | | 1998 | | | | 2004 | | | | 100.00 | % | | | 127,740 | | | | 127,740 | | | | 1,243,912 | | | Tops Markets #570(2018) |
| | | | | | | | | | | | | | | | | | | | | | | | | | | | | | | | | | | | | |
| 236 | | NIAGARA FALLS, NY (HOME DEPOT) | | HOME DEPOT PLAZA — N FALLS
720 & 750 BUILDERS WAY | | | 14304 | | | SC | | | 1994/2000 | | | | 2004 | | | | 100.00 | % | | | 154,510 | | | | 154,510 | | | | 1,461,852 | | | Home Depot #1287(2019), Regal Cinemas #330393(2019) |
| | | | | | | | | | | | | | | | | | | | | | | | | | | | | | | | | | | | | |
| 237 | | NIAGARA FALLS, NY (PINE PLAZA) | | PINE PLAZA
8207-8351 NIAGARA FALLS BLVD | | | 14304 | | | SC | | | 1980/1992/1998 | | | | 2004 | | | | 100.00 | % | | | 82,755 | | | | 82,755 | | | | 751,129 | | | OfficeMax #328(2015) |
| | | | | | | | | | | | | | | | | | | | | | | | | | | | | | | | | | | | | |
| 238 | | NIAGARA FALLS, NY (WEGMANS) | | WEGMANS PLAZA — N FALLS
1575 — 1653 MILITARY ROAD | | | 14304 | | | SC | | | 1998 | | | | 2004 | | | | 100.00 | % | | | 122,876 | | | | 122,876 | | | | 663,171 | | | Wegmans Food Markets, Inc.(2023) |
| | | | | | | | | | | | | | | | | | | | | | | | | | | | | | | | | | | | | |
| 239 | | NIAGRA FALLS, NY (TOPS-PORTAGE | | TOPS PARCEL — PORTAGE ROAD
1000 PORTAGE ROAD | | | 14301 | | | SC | | | 1991 | | | | 2004 | | | | 100.00 | % | | | 116,903 | | | | 116,903 | | | | 1,139,727 | | | Tops Markets/Eckerd Corp #009(2013) |
| | | | | | | | | | | | | | | | | | | | | | | | | | | | | | | | | | | | | |
| 240 | | NISKAYUNA, NY | | MOHAWK COMMONS 402 — 442 BALLTOWN ROAD | | | 12121 | | | SC | | | 2002 | | | | 2004 | | | | 100.00 | % | | | 404,994 | | | | 530,394 | | | | 4,477,155 | | | Price Chopper # 191(2022), Lowes Home Centers #1612(2022), Marshalls #0528(2012), Barnes & Noble # 2180(2014), Bed, Bath and Beyond # 566(2019), TARGET(NOT OWNED) |
| | | | | | | | | | | | | | | | | | | | | | | | | | | | | | | | | | | | | |
| 241 | | NORTH TONAWANDA, NY (MID-CITY | | MID-CITY PLAZAza
955-987 PAYNE AVENUE | | | 14120 | | | SC | | | 1960/1976/1980/1995/
2004 | | | | 2004 | | | | 100.00 | % | | | 212,418 | | | | 212,418 | | | | 2,102,378 | | | Sears, Roebuck and Company #50(2006), TOPS(2024) |
| | | | | | | | | | | | | | | | | | | | | | | | | | | | | | | | | | | | | |
| 242 | | NORWICH, NY (TOPS) | | TOPS PLAZA-NORWICH
54 EAST MAIN STREET | | | 13815 | | | SC | | | 1997 | | | | 2004 | | | | 10.00 | % | | | 85,453 | | | | 85,453 | | | | 1,101,525 | | | Tops Markets #560(2018) |
| | | | | | | | | | | | | | | | | | | | | | | | | | | | | | | | | | | | | |
| 243 | | OLEAN, NY (WAL-MART) | | WAL-MART PLAZA — OLEAN 3142 WEST STATE STREET | | | 14760 | | | SC | | | 1993/2004 | | | | 2004 | | | | 100.00 | % | | | 285,400 | | | | 401,406 | | | | 2,288,114 | | | Wal-Mart #2159(2014), Eastwynn Theatres, Inc.(2014), BJs Wholesale Club #302(2014), HOME DEPOT(NOT OWNED) |
| | | | | | | | | | | | | | | | | | | | | | | | | | | | | | | | | | | | | |
| 244 | | ONTARIO, NY | | TOPS PLAZA — ONTARIO
6254-6272 FURNACE ROAD | | | 14519 | | | SC | | | 1998 | | | | 2004 | | | | 20.00 | % | | | 77,040 | | | | 77,040 | | | | 754,455 | | | Tops Markets #4 — Ontario(2019) |
| | | | | | | | | | | | | | | | | | | | | | | | | | | | | | | | | | | | | |
| 245 | | ORCHARD PARK, NY | | CROSSROAD PLAZA
3245 SOUTHWESTERN BOULEVARD | | | 14127 | | | SC | | | 2000 | | | | 2004 | | | | 20.00 | % | | | 167,805 | | | | 279,920 | | | | 1,965,739 | | | Tops Markets #108 — Orchard(2022), Stein Mart #269(2012), LOWES(NOT OWNED) |
| | | | | | | | | | | | | | | | | | | | | | | | | | | | | | | | | | | | | |
| 246 | | PLATTSBURGH, NY | | CONSUMER SQUARE Rt. 3 — CORNELIA ROAD | | | 12901 | | | SC | | | 1993/2004 | | | | 2004 | | | | 100.00 | % | | | 484,806 | | | | 484,806 | | | | 3,414,354 | | | Wal-Mart-Sams #6456(2013), Wal-Mart #01-1994(2020), TJ Maxx #423(2013),
PetsMart #1290(2014), Michaels #1555(2011) |
| | | | | | | | | | | | | | | | | | | | | | | | | | | | | | | | | | | | | |
| 247 | | ROCHESTER, NY (HEN-JEF) | | HEN-JEF PLAZA
400 JEFFERSON RD @ HENRIETTA | | | 14620 | | | SC | | | 1983/1993 | | | | 2004 | | | | 100.00 | % | | | 159,517 | | | | 159,517 | | | | 1,119,298 | | | City Mattress(2009), Comp USA #1557(2008), PETsMART #773(2008), The Tile Shop(2015) |
| | | | | | | | | | | | | | | | | | | | | | | | | | | | | | | | | | | | | |
| 248 | | ROCHESTER, NY (PANORAMA) | | PANORAMA PLAZA
1601 PENFIELD ROAD | | | 14625 | | | SC | | | 1959/1965/1972/1980/
1986/1994 | | | | 2004 | | | | 20.00 | % | | | 278,241 | | | | 278,241 | | | | 3,464,717 | | | Linens N Things #371(2008), Tops Markets #417(2014) |
| | | | | | | | | | | | | | | | | | | | | | | | | | | | | | | | | | | | | |
| 249 | | ROCHESTER, NY(HENRIETTA PLAZA) | | HENRIETTA PLAZA
1100 JEFFERSON ROAD | | | 14467 | | | SC | | | 1972/1980/1988/1999 | | | | 2004 | | | | 100.00 | % | | | 245,426 | | | | 245,426 | | | | 2,110,445 | | | Big Lots, Inc. #01474 B(2010), Office Depot #2011(2009), Tops Markets #415(2013) |
| | | |
* 1. Property Developed by the Company | | * SC — Shopping |
* 2. Original IPO Property | | * MM — Mini-Mall |
| | | * BC — Business Center |
| | | * LC — Lifestyle Center |
Property Listing 7.1
Does Not Include Service Merchandise Interests
Property List*
| | | | | | | | | | | | | | | | | | | | | | | | | | | | | | | | | | | | | |
| | | | | | | | | | | | | Year | | | | | | DDR | | Owned | | Owned/Unowned | | Total | | |
| | | | | | | Zip | | Type of | | Developed/ | | Year | | Ownership | | Gross | | Gross | | Annualized | | |
| Center/Property | | Location | | Code | | Property | | Redeveloped | | Acquired | | Interest | | Leasable Area | | Leasable Area | | Rent | | Anchor Tenants(Lease Expiration) |
| 250 | | ROME, NY (FREEDOM) | | FREEDON PLAZA
205-211 ERIE BOULEVARD WEST | | | 13440 | | | SC | | | 1978/2000/2001 | | | | 2004 | | | | 100.00 | % | | | 161,967 | | | | 161,967 | | | | 853,212 | | | Staples the Office Superstore(2015), J.C. Penney #2008(2008), Tops Markets #572(2021) |
| | | | | | | | | | | | | | | | | | | | | | | | | | | | | | | | | | | | | |
| 251 | | SPRINGVILLE, NY | | SPRINGVILLE PLAZA
172 — 218 SOUTH CASCADE DRIVE | | | 14141 | | | SC | | | 1980/1999/2004 | | | | 2004 | | | | 100.00 | % | | | 107,924 | | | | 107,924 | | | | 902,505 | | | Tops Markets(2023), SALVATION ARMY(2009) |
| | | | | | | | | | | | | | | | | | | | | | | | | | | | | | | | | | | | | |
| 252 | | TONAWANDA, NY (DEL-TON) | | DEL-TON PLAZA
4220 DELAWARE AVENUE | | | 14150 | | | SC | | | 1985/1996 | | | | 2004 | | | | 100.00 | % | | | 55,473 | | | | 55,473 | | | | 357,498 | | | |
| | | | | | | | | | | | | | | | | | | | | | | | | | | | | | | | | | | | | |
| 253 | | TONAWANDA, NY (OFFICE DEPOT) | | OFFICE DEPOT PLAZA
2309 EGGERT ROAD | | | 14150 | | | SC | | | 1976/1985/1996 | | | | 2004 | | | | 100.00 | % | | | 121,846 | | | | 121,846 | | | | 1,108,448 | | | CompUSA Inc., Stores LP. #29-4(2010), Office Depot #398(2011) |
| | | | | | | | | | | | | | | | | | | | | | | | | | | | | | | | | | | | | |
| 254 | | TONAWANDA, NY (SHER/DELAWARE) | | SHERIDAN/DELAWARE PLAZA
1692-1752 SHERIDAN DRIVE | | | 14223 | | | SC | | | 1950/1965/1975/1986/
2000 | | | | 2004 | | | | 100.00 | % | | | 188,200 | | | | 188,200 | | | | 1,352,158 | | | The Bon Ton #63(2010), Bon-Ton Home Store(2010), Tops Markets #239(2020) |
| | | | | | | | | | | | | | | | | | | | | | | | | | | | | | | | | | | | | |
| 255 | | TONAWANDA, NY (TOPS) | | TOPS PLAZA-NIAGARA STREET
150 NIAGARA STREET | | | 14150 | | | SC | | | 1997 | | | | 2004 | | | | 10.00 | % | | | 97,014 | | | | 97,014 | | | | 1,236,230 | | | Tops Markets #228(2017) |
| | | | | | | | | | | | | | | | | | | | | | | | | | | | | | | | | | | | | |
| 256 | | TONAWANDA, NY (TOPS/GANDER MTN | | YOUNGMANN PLAZA
750 YOUNG STREET | | | 14150 | | | SC | | | 1985/ 2003 | | | | 2004 | | | | 10.00 | % | | | 310,921 | | | | 310,921 | | | | 2,213,383 | | | BJ’s Wholesale Club #6(2010), Big Lots #1629(2012), Gander Mountain Company #251(2015), Tops Markets #226(2021) |
| | | | | | | | | | | | | | | | | | | | | | | | | | | | | | | | | | | | | |
| 257 | | UTICA, NY (TOPS MOHAWK ST.) | | TOPS PLAZA — UTICA
1154 MOHAWK STREET | | | 13501 | | | SC | | | 1961/1972/1988/1998 | | | | 2004 | | | | 100.00 | % | | | 191,047 | | | | 191,047 | | | | 1,664,513 | | | A.J. Wright #0208(2014), Tops Markets (B) #5(2019) |
| | | | | | | | | | | | | | | | | | | | | | | | | | | | | | | | | | | | | |
| 258 | | VICTOR, NY | | VICTOR SQUARE
2-10 COMMERCE DRIVE | | | 14564 | | | SC | | | 2000 | | | | 2004 | | | | 100.00 | % | | | 56,134 | | | | 56,134 | | | | 947,180 | | | |
| | | | | | | | | | | | | | | | | | | | | | | | | | | | | | | | | | | | | |
| 259 | | WARSAW, NY | | TOPS PLAZA — WARSAW
2382 ROUTE 19 | | | 14569 | | | SC | | | 1998 | | | | 2004 | | | | 20.00 | % | | | 74,105 | | | | 74,105 | | | | 711,298 | | | Tops Markets (B) #2 — Warsaw(2015) |
| | | | | | | | | | | | | | | | | | | | | | | | | | | | | | | | | | | | | |
| 260 | | WEST SENECA, NY (HOME DEPOT) | | HOME DEPOT PLAZA
1881 RIDGE ROAD | | | 14224 | | | SC | | | 1975/1983/1987/1995 | | | | 2004 | | | | 100.00 | % | | | 139,453 | | | | 139,453 | | | | 1,336,264 | | | Home Depot #1231(2016) |
| | | | | | | | | | | | | | | | | | | | | | | | | | | | | | | | | | | | | |
| 261 | | WEST SENECA, NY (SENECA RIDGE) | | SENECA — RIDGE PLAZA
3531 SENECA STREET | | | 14224 | | | SC | | | 1980/1996/2004 | | | | 2004 | | | | 100.00 | % | | | 62,403 | | | | 62,403 | | | | 551,570 | | | Sears, Roebuck & Co. #5163(2006) |
| | | | | | | | | | | | | | | | | | | | | | | | | | | | | | | | | | | | | |
| 262 | | WILLIAMSVILLE, NY | | WILLIAMSVILLE PLACE
5395 SHERIDAN DRIVE | | | 14221 | | | SC | | | 1986/1995/2003 | | | | 2004 | | | | 100.00 | % | | | 92,382 | | | | 92,382 | | | | 1,080,995 | | | |
| | | | | | | | | | | | | | | | | | | | | | | | | | | | | | | | | | | | | |
| North Carolina | | | | | | | | | | | | | | | | | | | | | | | | | | | | | | | | | | |
| | | | | | | | | | | | | | | | | | | | | | | | | | | | | | | | | | | | | |
| 263 | | APEX, NC | | BEAVER CREEK COMMONS
1335 W WILLIAMS STREET | | | 27502 | | | SC | | | 2005 | | | | 1 * | | | | 100.00 | % | | | 110,433 | | | | 429,990 | | | | 1,975,606 | | | LINEN’S N THINGS #1180(2016), OFFICEMAX(2014), LOWE’S(NOT OWNED), SUPER TARGET(NOT OWNED) |
| | | | | | | | | | | | | | | | | | | | | | | | | | | | | | | | | | | | | |
| 264 | | ASHEVILLE, NC | | RIVER HILLS
299 SWANNANOA RIVER ROAD | | | 28805 | | | SC | | | 1996 | | | | 2003 | | | | 14.50 | % | | | 190,970 | | | | 190,970 | | | | 1,989,799 | | | Goody’s 20923 - #123(2007), Carmike Cinemas(2017), Circuit City(2017), Dick’s Sporting Goods(2017), Michael’s(2008), Officemax #577(2011) |
| | | | | | | | | | | | | | | | | | | | | | | | | | | | | | | | | | | | | |
| 265 | | DURHAM, NC | | OXFORD COMMONS
3500 OXFORD ROAD | | | 27702 | | | SC | | | 1990/2001 | | | | 1/2 | | | | 100.00 | % | | | 203,934 | | | | 322,200 | | | | 1,146,454 | | | FOOD LION #747-3(2010), BURLINGTON COAT FACTORY(2007), WAL-MART(NOT
OWNED) |
| | | | | | | | | | | | | | | | | | | | | | | | | | | | | | | | | | | | | |
| 266 | | FAYETTEVILLE, NC | | CROSS POINTE CENTRE
5075 MORGANTON ROAD | | | 28314 | | | SC | | | 1985/2003 | | | | 2003 | | | | 100.00 | % | | | 196,279 | | | | 196,279 | | | | 1,562,021 | | | Dev Rlty(Ac Mre/Circcty/Stpls)(2012), T.J. Maxx #354(2006), Bed Bath and Beyond #560(2014) |
| | | | | | | | | | | | | | | | | | | | | | | | | | | | | | | | | | | | | |
| 267 | | HENDERSONVILLE, NC | | EASTRIDGE CROSSING
200 THOMPSON STREET | | | 28792 | | | SC | | | 1995/2004 | | | | 2003 | | | | 100.00 | % | | | 88,590 | | | | 123,587 | | | | 522,063 | | | EPIC THEATRES(2018), Ingles #112(2009), BIG LOTS(NOT OWNED) |
| | | | | | | | | | | | | | | | | | | | | | | | | | | | | | | | | | | | | |
| 268 | | INDIAN TRAIL, NC | | UNION TOWN CENTER
INDEPENDENCE & FAITH CHURCH RD | | | 28079 | | | SC | | | 1999 | | | | 2004 | | | | 100.00 | % | | | 91,360 | | | | 91,360 | | | | 876,892 | | | Food Lion #1614(2020) |
| | | | | | | | | | | | | | | | | | | | | | | | | | | | | | | | | | | | | |
| 269 | | MOORESVILLE, NC | | MOORESVILLE CONSUMER SQUARE
355 WEST PLAZA DRIVE | | | 28117 | | | SC | | | 1999 | | | | 2004 | | | | 100.00 | % | | | 447,946 | | | | 447,946 | | | | 3,505,375 | | | Wal-Mart #1156(2019), Goodys #322(2010) |
| | | | | | | | | | | | | | | | | | | | | | | | | | | | | | | | | | | | | |
| 270 | | NEW BERN, NC | | RIVERTOWNE SQUARE
3003 CLAREDON BLVD | | | 28561 | | | SC | | | 1989/1999 | | | | 1/2 | | | | 100.00 | % | | | 68,130 | | | | 200,228 | | | | 612,223 | | | GOODY’S #4(2007), WAL-MART(NOT OWNED) |
| | | | | | | | | | | | | | | | | | | | | | | | | | | | | | | | | | | | | |
| 271 | | WASHINGTON, NC | | PAMLICO PLAZA
536 PAMLICO PLAZA | | | 27889 | | | SC | | | 1990/1999 | | | | 1/2 | | | | 100.00 | % | | | 93,527 | | | | 278,311 | | | | 463,200 | | | WAL-MART STORES #1354(2009), WAL-MART(NOT OWNED) |
| | | | | | | | | | | | | | | | | | | | | | | | | | | | | | | | | | | | | |
| 272 | | WAYNESVILLE, NC | | LAKESIDE PLAZA
201 PARAGON PARKWAY | | | 28721 | | | SC | | | 1990 | | | | 2 * | | | | 100.00 | % | | | 181,894 | | | | 181,894 | | | | 1,145,476 | | | WAL-MART STORE #1663(2011), FOOD LION #957-2(2011) |
| | | | | | | | | | | | | | | | | | | | | | | | | | | | | | | | | | | | | |
| 273 | | WILMINGTON, NC | | UNIVERSITY CENTRE S. COLLEGE RD & NEW CENTRE DR. | | | 28403 | | | SC | | | 1989/2001 | | | | 1/2 | | | | 100.00 | % | | | 410,491 | | | | 517,339 | | | | 3,010,912 | | | LOWE’S HOME CENTER #445 -4(2014), OLD NAVY #03841(2006), BED BATH & BEYOND # 418(2012), ROSS DRESS FOR LESS(2012), GOODY’S #175 -4(2005), BADCOCK FURNITURE(2014), SAM’S(NOT OWNED) |
| | | |
* 1. Property Developed by the Company | | * SC — Shopping |
* 2. Original IPO Property | | * MM — Mini-Mall |
| | | * BC — Business Center |
| | | * LC — Lifestyle Center |
Property Listing 7.1
Does Not Include Service Merchandise Interests
Property List*
| | | | | | | | | | | | | | | | | | | | | | | | | | | | | | | | | | | | | |
| | | | | | | | | | | | | Year | | | | | | DDR | | Owned | | Owned/Unowned | | Total | | |
| | | | | | | Zip | | Type of | | Developed/ | | Year | | Ownership | | Gross | | Gross | | Annualized | | |
| Center/Property | | Location | | Code | | Property | | Redeveloped | | Acquired | | Interest | | Leasable Area | | Leasable Area | | Rent | | Anchor Tenants(Lease Expiration) |
| North Dakota | | | | | | | | | | | | | | | | | | | | | | | | | | | | | | | | | | |
| | | | | | | | | | | | | | | | | | | | | | | | | | | | | | | | | | | | | |
| 274 | | DICKINSON, ND | | PRAIRIE HILLS MALL
1681 THIRD AVENUE | | | 58601 | | | MM | | | 1978 | | | | 1/2 | | | | 100.00 | % | | | 266,502 | | | | 266,502 | | | | 1,077,614 | | | K MART #9564(2008), HERBERGER’S #330(2005), J.C. PENNEY #1628-7(2008) |
| | | | | | | | | | | | | | | | | | | | | | | | | | | | | | | | | | | | | |
| 275 | | GRAND FORKS, ND | | OFFICE MAX
2500 S COLUMBIA ROAD | | | 58201 | | | SC | | | 1978 | | | | 1999 | | | | 83.75 | % | | | 31,812 | | | | 31,812 | | | | 0 | | | |
| | | | | | | | | | | | | | | | | | | | | | | | | | | | | | | | | | | | | |
| Ohio | | | | | | | | | | | | | | | | | | | | | | | | | | | | | | | | | | |
| | | | | | | | | | | | | | | | | | | | | | | | | | | | | | | | | | | | | |
| 276 | | ASHLAND, OH | | CLAREMONT PLAZA
US ROUTE 42 | | | 44805 | | | SC | | | 1977 | | | | 1/2 | | | | 100.00 | % | | | 110,505 | | | | 110,505 | | | | 80,859 | | | TRACTOR SUPPLY(2010) |
| | | | | | | | | | | | | | | | | | | | | | | | | | | | | | | | | | | | | |
| 277 | | ASHTABULA, OH (TOPS) | | TOPS PLAZA — ASHTABULA
1144 WEST PROSPECT ROAD | | | 44004 | | | SC | | | 2000 | | | | 2004 | | | | 100.00 | % | | | 57,874 | | | | 57,874 | | | | 898,312 | | | Tops Markets #884(2021) |
| | | | | | | | | | | | | | | | | | | | | | | | | | | | | | | | | | | | | |
| 278 | | AURORA, OH | | BARRINGTON TOWN SQUARE
70-130 BARRINGTON TOWN SQUARE | | | 44202 | | | SC | | | 1996/2004 | | | | 1 * | | | | 100.00 | % | | | 64,700 | | | | 159,982 | | | | 1,284,711 | | | MARQUEE CINEMAS(NOT OWNED), HEINEN’S(NOT OWNED) |
| | | | | | | | | | | | | | | | | | | | | | | | | | | | | | | | | | | | | |
| 279 | | BELLEFONTAINE, OH | | SOUTH MAIN STREET PLAZA
2250 SOUTH MAIN STREET | | | 43311 | | | SC | | | 1995 | | | | 1998 | | | | 100.00 | % | | | 52,399 | | | | 52,399 | | | | 445,579 | | | GOODY’S STORE # 314(2010), STAPLES # 1146(2010) |
| | | | | | | | | | | | | | | | | | | | | | | | | | | | | | | | | | | | | |
| 280 | | BOARDMAN, OH | | SOUTHLAND CROSSING
I-680 & US ROUTE 224 | | | 44514 | | | SC | | | 1997 | | | | 1 * | | | | 100.00 | % | | | 506,254 | | | | 511,654 | | | | 4,117,827 | | | LOWE’S COMPANIES #188(2016), BABIES R US #9254(2009), STAPLES STORE #817(2012), DICKS CLOTHING & SPORTING(2012), WAL-MART STORES #2211(2017), PETSMART #558(2013), GIANT EAGLE # 4075(2018) |
| | | | | | | | | | | | | | | | | | | | | | | | | | | | | | | | | | | | | |
| 281 | | CANTON, OH (PHASE I & II) | | BELDEN PARK CROSSINGS
5496 DRESSLER ROAD | | | 44720 | | | SC | | | 1995/2001/2003 | | | | 1 * | | | | 14.50 | % | | | 478,106 | | | | 593,610 | | | | 5,022,784 | | | AMERICAN SIGNATURE(2011), H.H. GREGG APPLIANCES(2011), JO-ANN STORES #1900(2008), PETSMART #523(2013), DICK’S CLOTHING & SPORTING #64(2010), DSW SHOE WAREHOUSE(2012), KOHL’S DEPARTMENT STORE#239(2016), TARGET(NOT OWNED) |
| | | | | | | | | | | | | | | | | | | | | | | | | | | | | | | | | | | | | |
| 282 | | CHILLICOTHE, OH | | CHILLICOTHE PLACE
867 N BRIDGE STREET | | | 45601 | | | SC | | | 1974/1998 | | | | 1/2 | | | | 20.00 | % | | | 105,512 | | | | 105,512 | | | | 1,017,930 | | | KROGER #348(2041), OFFICE MAX #617(2013) |
| | | | | | | | | | | | | | | | | | | | | | | | | | | | | | | | | | | | | |
| 283 | | CHILLICOTHE, OH(LOWES) | | CHILLICOTHE PLACE (LOWES)
867 N BRIDGE STREET | | | 45601 | | | SC | | | 1974/1998 | | | | 1/2 | | | | 100.00 | % | | | 130,497 | | | | 130,497 | | | | 822,132 | | | LOWE’S HOME CENTERS #472-2(2015) |
| | | | | | | | | | | | | | | | | | | | | | | | | | | | | | | | | | | | | |
| 284 | | CINCINNATI, OH | | GLENWAY CROSSING
5100 GLENCROSSING WAY | | | 45238 | | | SC | | | 1990 | | | | 2 * | | | | 100.00 | % | | | 235,433 | | | | 235,433 | | | | 1,347,996 | | | MICHAEL’S(2006) |
| | | | | | | | | | | | | | | | | | | | | | | | | | | | | | | | | | | | | |
| 285 | | COLUMBUS, OH (CONSUMER SQUARE) | | CONSUMER SQUARE WEST COLUMBUS
3630 SOLDANO BLVD | | | 43228 | | | SC | | | 1989/2003 | | | | 2004 | | | | 100.00 | % | | | 356,515 | | | | 356,515 | | | | 2,376,306 | | | Office Max #282(2010), Kroger Store #598(2014), Target Stores
#T-668(2011) |
| | | | | | | | | | | | | | | | | | | | | | | | | | | | | | | | | | | | | |
| 286 | | COLUMBUS, OH (DUBLIN VILLAGE) | | DUBLIN VILLAGE CENTER
6561-6815 DUBLIN CENTER DRIVE | | | 43017 | | | SC | | | 1987 | | | | 1998 | | | | 80.01 | % | | | 326,912 | | | | 435,993 | | | | 1,686,032 | | | AMC THEATRE(2007), MAX SPORTS CENTER(2006), B.J.’S WHOLESALE CLUB(NOT OWNED) |
| | | | | | | | | | | | | | | | | | | | | | | | | | | | | | | | | | | | | |
| 287 | | COLUMBUS, OH (EASTON MARKET) | | EASTON MARKET
3740 EASTON MARKET | | | 43230 | | | SC | | | 1998 | | | | 1998 | | | | 100.00 | % | | | 509,611 | | | | 509,611 | | | | 6,180,788 | | | COMPUSA, INC #533(2013), STAPLES, INC. #603(2013), PETSMART, INC. #550(2014), GOLFSMITH GOLF CENTER(2013), MICHAEL’S #9876(2008), DICK’S #410(2013), DSW SHOE WAREHOUSE(2012), KITTLE’S HOME FURNISHINGS(2012), BED BATH & BEYOND, INC. #195(2014), T.J. MAXX#447(2008) |
| | | | | | | | | | | | | | | | | | | | | | | | | | | | | | | | | | | | | |
| 288 | | COLUMBUS, OH (LENNOX TOWN) | | LENNOX TOWN CENTER
1647 OLENTANGY RIVER ROAD | | | 43212 | | | SC | | | 1997 | | | | 1998 | | | | 50.00 | % | | | 352,913 | | | | 352,913 | | | | 3,358,654 | | | TARGET#1058(2016), BARNES & NOBLE#2860(2007), STAPLES #451(2011), AMC
THEATRES LENNOX 24(2021) |
| | | | | | | | | | | | | | | | | | | | | | | | | | | | | | | | | | | | | |
| 289 | | COLUMBUS, OH (SUN CENTER) | | SUN CENTER
3622-3860 DUBLIN GRANVILLE RD | | | 43017 | | | SC | | | 1995 | | | | 1998 | | | | 79.45 | % | | | 305,428 | | | | 305,428 | | | | 3,073,945 | | | BABIES R US #9242(2011), MICHAEL’S #2873(2013), STEIN MART #130(2007), BIG BEAR(2016), STAPLES #403(2010) |
| | | | | | | | | | | | | | | | | | | | | | | | | | | | | | | | | | | | | |
| 290 | | DUBLIN, OH (PERIMETER CENTER) | | PERIMETER CENTER
6644-6804 PERIMETER LOOP ROAD | | | 43017 | | | SC | | | 1996 | | | | 1998 | | | | 100.00 | % | | | 137,556 | | | | 137,556 | | | | 1,518,759 | | | GIANT EAGLE(2014) |
| | | | | | | | | | | | | | | | | | | | | | | | | | | | | | | | | | | | | |
| 291 | | ELYRIA, OH | | ELYRIA SHOPPING CENTER
825 CLEVELAND | | | 44035 | | | SC | | | 1977 | | | | 1/2 | | | | 100.00 | % | | | 85,125 | | | | 85,125 | | | | 626,445 | | | TOPS MARKETS #811(2010) |
| | | | | | | | | | | | | | | | | | | | | | | | | | | | | | | | | | | | | |
| 292 | | GALLIPOLIS, OH | | GALLIPOLIS MARKETPLACE
2145 EASTERN AVENUE | | | 45631 | | | SC | | | 1998 | | | | 2003 | | | | 100.00 | % | | | 25,950 | | | | 205,908 | | | | 346,350 | | | WAL MART(NOT OWNED) |
| | | | | | | | | | | | | | | | | | | | | | | | | | | | | | | | | | | | | |
| 293 | | GROVE CITY, OH (DERBY SQUARE) | | DERBY SQUARE SHOPPING CENTER
2161-2263 STRINGTOWN ROAD | | | 43123 | | | SC | | | 1992 | | | | 1998 | | | | 20.00 | % | | | 128,210 | | | | 128,210 | | | | 807,314 | | | |
| | | | | | | | | | | | | | | | | | | | | | | | | | | | | | | | | | | | | |
| 294 | | HAMILTON, OH | | H.H. GREGG
1371 MAIN STREET | | | 43450 | | | SC | | | 1986 | | | | 1998 | | | | 100.00 | % | | | 40,000 | | | | 40,000 | | | | 230,000 | | | ROUNDY’S(2006) |
| | | | | | | | | | | | | | | | | | | | | | | | | | | | | | | | | | | | | |
| 295 | | HILLSBORO, OH | | HILLSBORO SHOPPING CENTER
1100 NORTH HIGH STREET | | | 45133 | | | SC | | | 1979 | | | | 1/2 | | | | 100.00 | % | | | 58,564 | | | | 89,734 | | | | 169,971 | | | |
| | | | | | | | | | | | | | | | | | | | | | | | | | | | | | | | | | | | | |
| 296 | | HUBER HTS., OH | | NORTH HEIGHTS PLAZA
8280 OLD TROY PIKE | | | 45424 | | | SC | | | 1990 | | | | 1993 | | | | 100.00 | % | | | 163,819 | | | | 278,376 | | | | 1,327,146 | | | CUB FOODS(2011), WAL-MART(NOT OWNED) |
| | | | | | | | | | | | | | | | | | | | | | | | | | | | | | | | | | | | | |
| 297 | | LEBANON, OH | | COUNTRYSIDE PLACE
1879 DEERFIELD ROAD | | | 45036 | | | SC | | | 1990/2002 | | | | 1993 | | | | 100.00 | % | | | 17,000 | | | | 110,480 | | | | 175,237 | | | WALMART #1407(NOT OWNED), ERB LUMBER(NOT OWNED) |
| | | |
* 1. Property Developed by the Company | | * SC — Shopping |
* 2. Original IPO Property | | * MM — Mini-Mall |
| | | * BC — Business Center |
| | | * LC — Lifestyle Center |
Property Listing 7.1
Does Not Include Service Merchandise Interests
Property List*
| | | | | | | | | | | | | | | | | | | | | | | | | | | | | | | | | | | | | |
| | | | | | | | | | | | | Year | | | | | | DDR | | Owned | | Owned/Unowned | | Total | | |
| | | | | | | Zip | | Type of | | Developed/ | | Year | | Ownership | | Gross | | Gross | | Annualized | | |
| Center/Property | | Location | | Code | | Property | | Redeveloped | | Acquired | | Interest | | Leasable Area | | Leasable Area | | Rent | | Anchor Tenants(Lease Expiration) |
| 298 | | MACEDONIA, OH | | MACEDONIA COMMONS MACEDONIA COMMONS BLVD. | | | 44056 | | | SC | | | 1994 | | | | 1994 | | | | 50.00 | % | | | 233,639 | | | | 374,506 | | | | 2,948,798 | | | FIRST NATL. SUPERMARKETS #826(2018), KOHL’S #235(2016), WAL-MART(NOT OWNED) |
| | | | | | | | | | | | | | | | | | | | | | | | | | | | | | | | | | | | | |
| 299 | | MACEDONIA, OH (PHASE II) | | MACEDONIA COMMONS (PHASE II)
8210 MACEDONIA COMMONS | | | 44056 | | | SC | | | 1999 | | | | 1 * | | | | 100.00 | % | | | 169,481 | | | | 169,481 | | | | 1,601,734 | | | CINEMARK(2019), HOME DEPOT #3824(2020) |
| | | | | | | | | | | | | | | | | | | | | | | | | | | | | | | | | | | | | |
| 300 | | NORTH OLMSTED, OH | | GREAT NORTHERN PLAZA NORTH
25859-26437 GREAT NORTHERN | | | 44070 | | | SC | | | 1958/1998/2003 | | | | 1997 | | | | 14.50 | % | | | 624,587 | | | | 665,487 | | | | 7,717,346 | | | BEST BUY #279(2010), DSW(2015), BED BATH & BEYOND, INC. #458(2012), MARSHALLS #267(2006), PETSMART #529(2008), HOME DEPOT #3803(2019), K & G MEN’S COMPANY, INC.(2008), JO-ANN STORES #1923(2009), MARC’S(2012), COMPUSA INC. #577(2008), TOP’S SUPERMARKET(NOT OWNED) |
| | | | | | | | | | | | | | | | | | | | | | | | | | | | | | | | | | | | | |
| 301 | | PATASKALA, OH | | VILLAGE MARKET/RITE AID CENTER
78-80 OAK MEADOW DRIVE | | | 43062 | | | SC | | | 1980 | | | | 1998 | | | | 100.00 | % | | | 33,270 | | | | 33,270 | | | | 194,600 | | | CARDINAL (GARDNERS/LANCASTER)(2007) |
| | | | | | | | | | | | | | | | | | | | | | | | | | | | | | | | | | | | | |
| 302 | | PICKERINGTON, OH | | SHOPPES AT TURNBERRY
1701-1797 HILL ROAD NORTH | | | 43147 | | | SC | | | 1990 | | | | 1998 | | | | 100.00 | % | | | 59,495 | | | | 61,872 | | | | 613,009 | | | |
| | | | | | | | | | | | | | | | | | | | | | | | | | | | | | | | | | | | | |
| 303 | | SOLON, OH | | UPTOWN SOLON
KRUSE DRIVE | | | 44139 | | | SC | | | 1998 | | | | 1 * | | | | 100.00 | % | | | 183,288 | | | | 183,288 | | | | 2,644,866 | | | MUSTARD SEED MKT & CAFE(2019), BED, BATH AND BEYOND#204(2009), BORDERS
#286(2018) |
| | | | | | | | | | | | | | | | | | | | | | | | | | | | | | | | | | | | | |
| 304 | | STOW, OH | | STOW COMMUNITY SHOPPING CENTER
KENT ROAD | | | 44224 | | | SC | | | 1997/2000 | | | | 1 * | | | | 100.00 | % | | | 404,480 | | | | 506,563 | | | | 2,913,900 | | | K MART #4264(2006), BED BATH AND BEYOND #360(2011), GIANT EAGLE, INC. #4096(2017), KOHL’S #331(2019), OFFICE MAX #626(2011), BORDERS OUTLET #249(2003), TARGET(NOT OWNED) |
| | | | | | | | | | | | | | | | | | | | | | | | | | | | | | | | | | | | | |
| 305 | | TIFFIN, OH | | TIFFIN MALL
870 WEST MARKET STREET | | | 44883 | | | MM | | | 1980/2004 | | | | 1/2 | | | | 100.00 | % | | | 170,868 | | | | 170,868 | | | | 795,639 | | | MARQUEE CINEMAS(2018), J.C. PENNEY #324-4(2010) |
| | | | | | | | | | | | | | | | | | | | | | | | | | | | | | | | | | | | | |
| 306 | | TOLEDO, OH | | SPRINGFIELD COMMONS SHOPPING S. HOLLAND-SYLVANIA ROAD | | | 43528 | | | SC | | | 1999 | | | | 1 * | | | | 20.00 | % | | | 241,129 | | | | 271,729 | | | | 2,744,714 | | | KOHL’S #324(2019), GANDER MOUNTAIN, L.L.C.(2014), BED BATH & BEYOND #240(2010), OLD NAVY #03786(2010) |
| | | | | | | | | | | | | | | | | | | | | | | | | | | | | | | | | | | | | |
| 307 | | TOLEDO, OH (DICKS) | | DICKS — TOLEDO
851 WEST ALEXIS ROAD | | | 43612 | | | SC | | | 1995 | | | | 2004 | | | | 100.00 | % | | | 80,160 | | | | 80,160 | | | | 501,000 | | | Dicks Sporting Goods #1563(2016) |
| | | | | | | | | | | | | | | | | | | | | | | | | | | | | | | | | | | | | |
| 308 | | WESTLAKE, OH | | WEST BAY PLAZA
30100 DETROIT ROAD | | | 44145 | | | SC | | | 1974/1997/2000 | | | | 1/2 | | | | 100.00 | % | | | 162,330 | | | | 162,330 | | | | 1,369,983 | | | MARC’S #37(2009), K MART #3234(2009) |
| | | | | | | | | | | | | | | | | | | | | | | | | | | | | | | | | | | | | |
| 309 | | XENIA, OH | | WEST PARK SQUARE
1700 WEST PARK SQUARE | | | 45385 | | | SC | | | 1994/1997/2001 | | | | 1 * | | | | 100.00 | % | | | 104,873 | | | | 203,282 | | | | 763,736 | | | KROGER #829(2019), WAL-MART(NOT OWNED) |
| | | | | | | | | | | | | | | | | | | | | | | | | | | | | | | | | | | | | |
| Oregon | | | | | | | | | | | | | | | | | | | | | | | | | | | | | | | | | | |
| | | | | | | | | | | | | | | | | | | | | | | | | | | | | | | | | | | | | |
| 310 | | PORTLAND, OR | | TANASBOURNE TOWN CENTER
NW EVERGREEN PKWY & NW RING RD | | | 97006 | | | SC | | | 1995/2001 | | | | 1996 | | | | 50.00 | % | | | 309,617 | | | | 566,457 | | | | 5,124,007 | | | LINENS N THINGS(2012), ROSS DRESS FOR LESS #399(2008), BARNES & NOBLE #2748(2011), MICHAEL’S #9887(2009), OFFICE DEPOT-#00954(2010), HAGGAN’S(2021), NORDSTROM(NOT OWNED), TARGET(NOT OWNED), MERVYN’S(NOT OWNED) |
| | | | | | | | | | | | | | | | | | | | | | | | | | | | | | | | | | | | | |
| Pennsylvania | | | | | | | | | | | | | | | | | | | | | | | | | | | | | | | | | | |
| | | | | | | | | | | | | | | | | | | | | | | | | | | | | | | | | | | | | |
| 311 | | ALLENTOWN, PA (WEST) | | WEST VALLEY MARKETPLACE
1091 MILL CREEK ROAD | | | 18106 | | | SC | | | 2001/2004 | | | | 2003 | | | | 100.00 | % | | | 241,077 | | | | 241,077 | | | | 2,312,117 | | | Wal-Mart #2641(2021) |
| | | | | | | | | | | | | | | | | | | | | | | | | | | | | | | | | | | | | |
| 312 | | E. NORRITON, PA | | KMART PLAZA
2692 DEKALB PIKE | | | 19401 | | | SC | | | 1975/1997 | | | | 1/2 | | | | 100.00 | % | | | 173,876 | | | | 179,376 | | | | 1,318,809 | | | K MART #3026(2005), BIG LOTS #1713(2010) |
| | | | | | | | | | | | | | | | | | | | | | | | | | | | | | | | | | | | | |
| 313 | | ERIE (PEACHSTREET), PA | | PEACH STREET SQUARE
1902 KEYSTONE DRIVE | | | 16509 | | | SC | | | 1995/1998/2003 | | | | 1 * | | | | 100.00 | % | | | 557,769 | | | | 679,074 | | | | 5,076,611 | | | LOWE’S HOME CTR #226(2015), PETSMART #556(2015), CIRCUIT CITY SUPERSTORE 3744(2020), MEDIA PLAY-4 #8158(2011), KOHL’S-#221-4(2016), WAL-MART STORES #2278(2015), CINEMARK #186(2011), HOME DEPOT(NOT OWNED) |
| | | | | | | | | | | | | | | | | | | | | | | | | | | | | | | | | | | | | |
| 314 | | ERIE, PA (MARKET) | | ERIE MARKETPLACE
6660-6750 PEACH STREET | | | 16509 | | | SC | | | 2003 | | | | 2003 | | | | 14.50 | % | | | 107,537 | | | | 238,387 | | | | 1,051,339 | | | Marshalls(2013), Bed Bath & Beyond #447(2013), BABIES R US(2015),
TARGET(NOT OWNED) |
| | | | | | | | | | | | | | | | | | | | | | | | | | | | | | | | | | | | | |
| 315 | | ERIE, PA (TOPS-ERIE) | | TOPS PLAZA — ERIE
1520 WEST 25TH STREET | | | 16505 | | | SC | | | 1995 | | | | 2004 | | | | 100.00 | % | | | 99,631 | | | | 99,631 | | | | 1,253,532 | | | Tops Markets (B) #602(2016) |
| | | | | | | | | | | | | | | | | | | | | | | | | | | | | | | | | | | | | |
| 316 | | HANOVER, PA (BJS) | | BJS — HANOVER
1785 AIRPORT ROAD SOUTH | | | 18109 | | | SC | | | 1991 | | | | 2004 | | | | 100.00 | % | | | 112,230 | | | | 112,230 | | | | 784,631 | | | BJs Wholesale Club #21(2011) |
| | | | | | | | | | | | | | | | | | | | | | | | | | | | | | | | | | | | | |
| 317 | | MONACA, PA | | TOWNSHIP MARKETPLACE
115 WAGNER ROAD | | | 15061 | | | SC | | | 1999/2004 | | | | 2003 | | | | 14.50 | % | | | 253,110 | | | | 253,110 | | | | 1,999,010 | | | Lowe’s #500(2027), Shop N Save(2019) |
| | | | | | | | | | | | | | | | | | | | | | | | | | | | | | | | | | | | | |
| 318 | | MONACA, PA (CINEMARK) | | TOWNSHIP MARKETPLACE
115 WAGNER ROAD | | | 15061 | | | SC | | | 1999 | | | | 2003 | | | | 100.00 | % | | | 41,172 | | | | 41,172 | | | | 672,024 | | | CINEMARK #344(2019) |
| | | | | | | | | | | | | | | | | | | | | | | | | | | | | | | | | | | | | |
| Puerto Rico | | | | | | | | | | | | | | | | | | | | | | | | | | | | | | | | | | |
| | | | | | | | | | | | | | | | | | | | | | | | | | | | | | | | | | | | | |
| 319 | | ARECIBO, PR (ATLANTICO) | | PLAZA DEL ATLANTICO
PR #KM 80.3 | | | 00612 | | | MM | | | 1980/1993 | | | | 2005 | | | | 100.00 | % | | | 215,080 | | | | 224,579 | | | | 3,242,564 | | | K MART #7566(2013), CAPRI DEL ATLANTICO(2013) |
| | | |
* 1. Property Developed by the Company | | * SC — Shopping |
* 2. Original IPO Property | | * MM — Mini-Mall |
| | | * BC — Business Center |
| | | * LC — Lifestyle Center |
Property Listing 7.1
Does Not Include Service Merchandise Interests
Property List*
| | | | | | | | | | | | | | | | | | | | | | | | | | | | | | | | | | | | | |
| | | | | | | | | | | | | Year | | | | | | DDR | | Owned | | Owned/Unowned | | Total | | |
| | | | | | | Zip | | Type of | | Developed/ | | Year | | Ownership | | Gross | | Gross | | Annualized | | |
| Center/Property | | Location | | Code | | Property | | Redeveloped | | Acquired | | Interest | | Leasable Area | | Leasable Area | | Rent | | Anchor Tenants(Lease Expiration) |
| 320 | | BAYAMON, PR (PLAZA DEL SOL) | | PLAZA DEL SOL
RD PR#29 & PR#167, HATO TEJAS | | | 00961 | | | MM | | | 1998/2003/2004 | | | | 2005 | | | | 100.00 | % | | | 526,230 | | | | 675,451 | | | | 15,047,333 | | | WAL*MART #2501(2022), OLD NAVY #5830(2007), SCIENCE PARK CINEMA CORP.(2019), BED BATH & BEYOND, STORE #381(2017), HOME DEPOT(NOT OWNED) |
| | | | | | | | | | | | | | | | | | | | | | | | | | | | | | | | | | | | | |
| 321 | | BAYAMON, PR (REXVILLE PLAZA) | | REXVILLE PLAZA
PR #167, KM 18.8 | | | 00961 | | | SC | | | 1980/2002 | | | | 2005 | | | | 100.00 | % | | | 126,098 | | | | 132,384 | | | | 1,310,000 | | | PUEBLO XTRA #156(2009), TIENDAS CAPRI(2013) |
| | | | | | | | | | | | | | | | | | | | | | | | | | | | | | | | | | | | | |
| 322 | | BAYAMON, PR (RIO HONDO) | | RIO HONDO
PR #22, PR #167 | | | 00961 | | | MM | | | 1982/2001 | | | | 2005 | | | | 100.00 | % | | | 396,505 | | | | 461,807 | | | | 9,404,596 | | | CAYEY CINEMA CORP.(NOT OWNED)(2009), MARSHALLS #749(2009), K MART #7570(2013), XTRA #159(2012), RIO HONDO CINEMA(NOT OWNED) |
| | | | | | | | | | | | | | | | | | | | | | | | | | | | | | | | | | | | | |
| 323 | | CAROLINA, PR (PLAZA ESCORIAL) | | PLAZA ESCORIAL CARRETERA #3, KM 6.1 | | | 00987 | | | SC | | | 1997 | | | | 2005 | | | | 100.00 | % | | | 385,665 | | | | 601,535 | | | | 7,414,354 | | | OFFICEMAX STORE #1117(2015), WAL*MART PUERTO RICO, INC.(2024), BORDERS STORE #482(2017), OLD NAVY(2009), SAM’S WHOLESALE CLUB(2024), HOME DEPOT(NOT OWNED), CARIBBEAN CINEMAS(NOT OWNED) |
| | | | | | | | | | | | | | | | | | | | | | | | | | | | | | | | | | | | | |
| 324 | | CAYEY, PR (PLAZA CAYEY) | | PLAZA CAYEY | | | 00736 | | | SC | | | 1999/2004 | | | | 2005 | | | | 100.00 | % | | | 261,402 | | | | 340,116 | | | | 2,732,023 | | | WAL*MART #2721(2021), CAYEY CINEMA CORP.(NOT OWNED) |
| | | | | STATE RD #1 & PR #735 | | | | | | | | | | | | | | | | | | | | | | | | | | | | | | | | |
| | | | | | | | | | | | | | | | | | | | | | | | | | | | | | | | | | | | | |
| 325 | | FAJARDO, PR (PLAZA FAJARDO) | | PLAZA FAJARDO
ROAD PR #3 INT PR #940 | | | 00738 | | | SC | | | 1992 | | | | 2005 | | | | 100.00 | % | | | 245,402 | | | | 251,402 | | | | 3,814,255 | | | Wal*Mart #1822(2012), Pueblo Xtra #171(2012) |
| | | | | | | | | | | | | | | | | | | | | | | | | | | | | | | | | | | | | |
| 326 | | GUAYAMA, PR (PLAZA WAL-MART) | | PLAZA WAL-MART
ROAD PR #3 KM 135.0 | | | 00784 | | | SC | | | 1994 | | | | 2005 | | | | 100.00 | % | | | 163,598 | | | | 163,598 | | | | 1,681,129 | | | Wal*Mart #2072(2018) |
| | | | | | | | | | | | | | | | | | | | | | | | | | | | | | | | | | | | | |
| 327 | | HATILLO, PR (PLAZA DEL NORTE) | | PLAZA DEL NORTE ROAD #2,KM 81.9 | | | 00659 | | | MM | | | 1992 | | | | 2005 | | | | 100.00 | % | | | 505,591 | | | | 671,020 | | | | 10,679,063 | | | Almacenes Pitusa(2003), JC Penney #651(2012), Pueblo Xtra #166(2012), Wal*Mart #1854(2012), TOYS R’ US/KID’SRUS(NOT OWNED) |
| | | | | | | | | | | | | | | | | | | | | | | | | | | | | | | | | | | | | |
| 328 | | HUMACAO, PR (PALMA REAL) | | PALMA REAL STATE ROAD #3, KM 78.20 | | | 00791 | | | SC | | | 1995 | | | | 2005 | | | | 100.00 | % | | | 340,608 | | | | 442,614 | | | | 6,056,550 | | | CAPRI STORES(2011), XTRA/PUEBLO INTERNATIONAL, INC(2020), CINEVISTA THEATRES(2005), WAL*MART #2240(2020), PEP BOYS(NOT OWNED), J C
PENNY(NOT OWNED) |
| | | | | | | | | | | | | | | | | | | | | | | | | | | | | | | | | | | | | |
| 329 | | ISABELA, PR (PLAZA ISABELA) | | PLAZA ISABELA | | | 00662 | | | SC | | | 1994 | | | | 2005 | | | | 100.00 | % | | | 238,410 | | | | 259,016 | | | | 3,383,141 | | | PUEBLO INTERNATONAL, LLC(2014), WAL-MART PUERTO RICO, INC#2085(2019) |
| | | | | STATE RD #2 & #454,KM 111.6 | | | | | | | | | | | | | | | | | | | | | | | | | | | | | | | | |
| | | | | | | | | | | | | | | | | | | | | | | | | | | | | | | | | | | | | |
| 330 | | SAN GERMAN, PR (CAMINO REAL) | | CAMINO REAL
STATE RD PR #122 | | | 00683 | | | SC | | | 1991 | | | | 2005 | | | | 100.00 | % | | | 22,356 | | | | 49,172 | | | | 305,500 | | | PEP BOYS #907(2015) |
| | | | | | | | | | | | | | | | | | | | | | | | | | | | | | | | | | | | | |
| 331 | | SAN GERMAN, PR (DEL OESTE) | | DEL OESTE
ROAD PR #2 INT PR #122 | | | 00683 | | | SC | | | 1991 | | | | 2005 | | | | 100.00 | % | | | 174,172 | | | | 184,746 | | | | 2,273,565 | | | K Mart #3896(2016), Pueblo Xtra #163(2011) |
| | | | | | | | | | | | | | | | | | | | | | | | | | | | | | | | | | | | | |
| 332 | | SAN JUAN, PR (SENIORIAL PLAZA) | | SENIORIAL PLAZA
PR #53 & PR #177 | | | 00926 | | | MM | | 1978/Mutiple | | | 2005 | | | | 100.00 | % | | | 169,138 | | | | 209,598 | | | | 2,500,555 | | | RIO HONDO CINEMA(NOT OWNED)(2005), PUEBLO EXT(NOT OWNED) |
| | | | | | | | | | | | | | | | | | | | | | | | | | | | | | | | | | | | | |
| 333 | | VEGA BAJA, PR (PLZA VEGA BAJA) | | PLAZA VEGA BAJA
ROAD PR #2 INT PR #155 | | | 00693 | | | SC | | | 1990 | | | | 2005 | | | | 100.00 | % | | | 174,728 | | | | 184,938 | | | | 2,099,309 | | | K Mart Corp #3679(2015), Pueblo Xtra #158(2010) |
| | | | | | | | | | | | | | | | | | | | | | | | | | | | | | | | | | | | | |
| South Carolina | | | | | | | | | | | | | | | | | | | | | | | | | | | | | | | | | | |
| | | | | | | | | | | | | | | | | | | | | | | | | | | | | | | | | | | | | |
| 334 | | CAMDEN, SC | | SPRINGDALE PLAZA
1671 SPRINGDALE DRIVE | | | 29020 | | | SC | | | 1990/2000 | | | | 1993 | | | | 100.00 | % | | | 180,127 | | | | 363,405 | | | | 993,249 | | | BELK #227(2015), WAL-MART SUPER CENTER(NOT OWNED) |
| | | | | | | | | | | | | | | | | | | | | | | | | | | | | | | | | | | | | |
| 335 | | CHARLESTON, SC | | ASHLEY CROSSING
2245 ASHLEY CROSSING DRIVE | | | 29414 | | | SC | | | 1991 | | | | 2003 | | | | 100.00 | % | | | 188,883 | | | | 196,048 | | | | 1,585,428 | | | Food Lion #933(2011), Wal-Mart #1748(2011) |
| | | | | | | | | | | | | | | | | | | | | | | | | | | | | | | | | | | | | |
| 336 | | COLUMBIA, SC (HARBISON) | | HARBISON COURT
HARBISON BLVD | | | 29212 | | | SC | | | 1991 | | | | 2002 | | | | 14.50 | % | | | 259,551 | | | | 319,040 | | | | 2,814,666 | | | Barnes & Noble #2688(2011), ROSS DRESS FOR LESS #712(2014), Marshall’s #458(2012), OfficeMax #640(2011), BABIES ‘R’ US #8890(NOT OWNED) |
| | | | | | | | | | | | | | | | | | | | | | | | | | | | | | | | | | | | | |
| 337 | | MT. PLEASANT, SC | | WANDO CROSSING
1500 HIGHWAY 17 NORTH | | | 29465 | | | SC | | | 1992/2000 | | | | 1995 | | | | 100.00 | % | | | 209,139 | | | | 325,236 | | | | 1,967,960 | | | PIGGLY WIGGLY #29-4(2012), OFFICE DEPOT # 2002(2010), T.J. MAXX #780 - -3(2007), MARSHALL’S OF MA, INC.(2011), WAL-MART(NOT OWNED) |
| | | | | | | | | | | | | | | | | | | | | | | | | | | | | | | | | | | | | |
| 338 | | N. CHARLESTON, SC | | NORTH POINTE PLAZA
7400 RIVERS AVENUE | | | 29406 | | | SC | | | 1989/2001 | | | | 2 * | | | | 100.00 | % | | | 294,471 | | | | 375,451 | | | | 2,069,854 | | | WAL-MART STORES #1359(2009), OFFICE MAX #342(2007), HELIG MEYERS (NOT OWNED) |
| | | | | | | | | | | | | | | | | | | | | | | | | | | | | | | | | | | | | |
| 339 | | N. CHARLESTON, SC(N CHARL CTR) | | NORTH CHARLESTON CENTER
5900 RIVERS AVENUE | | | 29406 | | | SC | | | 1980/1993 | | | | 2004 | | | | 100.00 | % | | | 235,501 | | | | 235,501 | | | | 1,322,307 | | | Babies R Us(2005), Big Lots #00004 B(2009) |
| | | | | | | | | | | | | | | | | | | | | | | | | | | | | | | | | | | | | |
| 340 | | ORANGEBURG, SC | | NORTH ROAD PLAZA
2795 NORTH ROAD | | | 29115 | | | SC | | | 1994/1999 | | | | 1995 | | | | 100.00 | % | | | 50,760 | | | | 247,434 | | | | 526,479 | | | GOODY’S #282(2008), WAL-MART(NOT OWNED) |
| | | | | | | | | | | | | | | | | | | | | | | | | | | | | | | | | | | | | |
| 341 | | S. ANDERSON, SC | | CROSSROADS PLAZA | | | 29624 | | | SC | | | 1990 | | | | 1994 | | | | 100.00 | % | | | 22,050 | | | | 22,050 | | | | 94,462 | | | |
| | | | | 406 HIGHWAY 28 BY-PASS | | | | | | | | | | | | | | | | | | | | | | | | | | | | | | | | |
| | | | | | | | | | | | | | | | | | | | | | | | | | | | | | | | | | | | | |
| 342 | | SIMPSONVILLE, SC | | FAIRVIEW STATION
621 FAIRVIEW ROAD | | | 29681 | | | SC | | | 1990 | | | | 1994 | | | | 100.00 | % | | | 142,080 | | | | 142,080 | | | | 854,374 | | | INGLES MARKETS #41(2011), KOHL’S DEPARTMENT STORES #673(2015) |
| | | | | | | | | | | | | | | | | | | | | | | | | | | | | | | | | | | | | |
| 343 | | UNION, SC | | WEST TOWNE PLAZA U.S.HWY 176 BY-PASS #1 | | | 29379 | | | SC | | | 1990 | | | | 1993 | | | | 100.00 | % | | | 184,331 | | | | 184,331 | | | | 987,354 | | | WAL-MART STORES #629(2009), BELK STORES SERVICES, INC.(2010), WINN DIXIE STORES #1255(2010) |
| | | |
* 1. Property Developed by the Company | | * SC — Shopping |
* 2. Original IPO Property | | * MM — Mini-Mall |
| | | * BC — Business Center |
| | | * LC — Lifestyle Center |
Property Listing 7.1
Does Not Include Service Merchandise Interests
Property List*
| | | | | | | | | | | | | | | | | | | | | | | | | | | | | | | | | | | | | |
| | | | | | | | | | | | | Year | | | | | | DDR | | Owned | | Owned/Unowned | | Total | | |
| | | | | | | Zip | | Type of | | Developed/ | | Year | | Ownership | | Gross | | Gross | | Annualized | | |
| Center/Property | | Location | | Code | | Property | | Redeveloped | | Acquired | | Interest | | Leasable Area | | Leasable Area | | Rent | | Anchor Tenants(Lease Expiration) |
| South Dakota | | | | | | | | | | | | | | | | | | | | | | | | | | | | | | | | | | |
| | | | | | | | | | | | | | | | | | | | | | | | | | | | | | | | | | | | | |
| 344 | | WATERTOWN, SD | | WATERTOWN MALL
1300 9TH AVENUE | | | 56401 | | | MM | | | 1977 | | | | 1/2 | | | | 100.00 | % | | | 285,372 | | | | 327,372 | | | | 1,291,264 | | | HERBERGER’S #315(2009), J.C. PENNEY #0495-2 -4(2008), HY VEE SUPERMARKET(NOT OWNED) |
| | | | | | | | | | | | | | | | | | | | | | | | | | | | | | | | | | | | | |
| Tennessee | | | | | | | | | | | | | | | | | | | | | | | | | | | | | | | | | | |
| | | | | | | | | | | | | | | | | | | | | | | | | | | | | | | | | | | | | |
| 345 | | BRENTWOOD, TN | | COOL SPRINGS POINTE I-65 AND MOORE’S LANE | | | 37027 | | | SC | | | 1999/2004 | | | | 2000 | | | | 14.50 | % | | | 201,414 | | | | 201,414 | | | | 2,568,734 | | | BEST BUY #170(2014), ROSS DRESS FOR LESS #823(2015), LINENS ‘N THINGS #521(2014), DSW SHOE WAREHOUSE #29103(2008) |
| | | | | | | | | | | | | | | | | | | | | | | | | | | | | | | | | | | | | |
| 346 | | CHATTANOOGA, TN | | OVERLOOK AT HAMILTON PLACE
2288 GUNBARREL ROAD | | | 37421 | | | SC | | | 1992/2004 | | | | 2003 | | | | 100.00 | % | | | 214,918 | | | | 214,918 | | | | 1,663,911 | | | Best Buy #4720(2014), Hobby Lobby #317(2014), Fresh Market(2014) |
| | | | | | | | | | | | | | | | | | | | | | | | | | | | | | | | | | | | | |
| 347 | | COLUMBIA, TN | | COLUMBIA SQUARE
845 NASHVILLE HIGHWAY | | | 38401 | | | SC | | | 1993 | | | | 2003 | | | | 10.00 | % | | | 68,948 | | | | 68,948 | | | | 480,018 | | | KROGER #538(2022) |
| | | | | | | | | | | | | | | | | | | | | | | | | | | | | | | | | | | | | |
| 348 | | FARRAGUT, TN | | FARRAGUT POINTE
11132 KINGSTON PIKE | | | 37922 | | | SC | | | 1991 | | | | 2003 | | | | 10.00 | % | | | 71,311 | | | | 71,311 | | | | 546,707 | | | Bi-Lo #367(2011) |
| | | | | | | | | | | | | | | | | | | | | | | | | | | | | | | | | | | | | |
| 349 | | GOODLETTSVILLE, TN | | NORTHCREEK COMMONS
101-139 NORTHCREEK BOULEVARD | | | 37072 | | | SC | | | 1987 | | | | 2003 | | | | 20.00 | % | | | 84,441 | | | | 84,441 | | | | 706,426 | | | Kroger #541(2012) |
| | | | | | | | | | | | | | | | | | | | | | | | | | | | | | | | | | | | | |
| 350 | | HENDERSONVILLE, TN | | HENDERSONVILLE LOWE’S
1050LOWE’S ROAD | | | 37075 | | | SC | | | 1999 | | | | 2003 | | | | 100.00 | % | | | 133,144 | | | | 133,144 | | | | 1,222,439 | | | Lowe’s(2019) |
| | | | | | | | | | | | | | | | | | | | | | | | | | | | | | | | | | | | | |
| 351 | | MEMPHIS, TN | | COUNTRY BRIDGE
9020 US HIGHWAY 64 | | | 38002 | | | SC | | | 1993 | | | | 2003 | | | | 100.00 | % | | | 64,223 | | | | 64,223 | | | | 547,586 | | | Kroger #436(2012) |
| | | | | | | | | | | | | | | | | | | | | | | | | | | | | | | | | | | | | |
| 352 | | MURFREESBORO, TN (MEMORIAL) | | MEMORIAL VILLAGE
710 MEMORIAL BOULEVARD | | | 37130 | | | SC | | | 1993 | | | | 2003 | | | | 100.00 | % | | | 117,750 | | | | 117,750 | | | | 706,679 | | | Murfreesboro Athletic Club(2014) |
| | | | | | | | | | | | | | | | | | | | | | | | | | | | | | | | | | | | | |
| 353 | | MURFREESBORO, TN (TOWNE) | | TOWNE CENTRE
OLD FORT PARKWAY | | | 37129 | | | SC | | | 1998 | | | | 2003 | | | | 14.50 | % | | | 108,180 | | | | 390,802 | | | | 1,310,610 | | | T.J. Maxx #579(2008), Books-A-Million(2009), LOWE’S(NOT OWNED), TOYS R US(NOT OWNED), TARGET(NOT OWNED) |
| | | | | | | | | | | | | | | | | | | | | | | | | | | | | | | | | | | | | |
| 354 | | NASHVILLE, TN | | THE MARKETPLACE | | | 37209 | | | SC | | | 1998 | | | | 2003 | | | | 14.50 | % | | | 167,795 | | | | 367,879 | | | | 1,654,047 | | | Lowe’s(2019), WAL MART(NOT OWNED) |
| | | | | CHARLOTTE PIKE | | | | | | | | | | | | | | | | | | | | | | | | | | | | | | | | |
| | | | | | | | | | | | | | | | | | | | | | | | | | | �� | | | | | | | | | | |
| Texas | | | | | | | | | | | | | | | | | | | | | | | | | | | | | | | | | | |
| | | | | | | | | | | | | | | | | | | | | | | | | | | | | | | | | | | | | |
| 355 | | AUSTIN, TX | | SHOPS AT TECH RIDGE
CENTER RIDGE DRIVE | | | 78728 | | | SC | | | 2003 | | | | 2003 | | | | 24.75 | % | | | 279,877 | | | | 519,813 | | | | 4,200,663 | | | ROSS DRESS FOR LESS #706(2014), LINEN N THINGS #291(2014), HOBBY LOBBY #306(2018), ULTIMATE ELECTRONICS(2019), TOYS R US(NOT OWNED), SUPER
TARGET(NOT OWNED) |
| | | | | | | | | | | | | | | | | | | | | | | | | | | | | | | | | | | | | |
| 356 | | FRISCO, TX | | FRISCO MARKETPLACE | | | 75035 | | | SC | | | 2003 | | | | 2003 | | | | 100.00 | % | | | 19,759 | | | | 106,343 | | | | 576,241 | | | KOHL’S(NOT OWNED) |
| | | | | 7010 PRESTON ROAD, | | | | | | | | | | | | | | | | | | | | | | | | | | | | | | | | |
| | | | | | | | | | | | | | | | | | | | | | | | | | | | | | | | | | | | | |
| 357 | | FT. WORTH, TX | | EASTCHASE MARKET
SWC EASTCHASE PKWY & I-30 | | | 76112 | | | SC | | | 1995 | | | | 1996 | | | | 50.00 | % | | | 205,017 | | | | 385,039 | | | | 2,123,258 | | | UNITED ARTISTS THEATRE #33306(2012), PETSMART #182(2011), ROSS DRESS FOR LESS #351-1(2011), TARGET(NOT OWNED), TOYS R US(NOT OWNED), OFFICE DEPOT(NOT OWNED) |
| | | | | | | | | | | | | | | | | | | | | | | | | | | | | | | | | | | | | |
| 358 | | FT. WORTH, TX (FOSSIL CREEK) | | FOSSIL CREEK
WESTERN CENTER BLVD | | | 76137 | | | SC | | | 1991 | | | | 2002 | | | | 100.00 | % | | | 68,492 | | | | 68,492 | | | | 876,367 | | | |
| | | | | | | | | | | | | | | | | | | | | | | | | | | | | | | | | | | | | |
| 359 | | IRVING, TX | | MACARTHUR MARKETPLACE
MARKET PLACE BOULEVARD | | | 75063 | | | SC | | | 2004 | | | | 2003 | | | | 14.50 | % | | | 146,941 | | | | 598,651 | | | | 2,609,714 | | | Marquee Cinema(2018), OFFICE MAX(2014), KOHL’S(NOT OWNED), SAM’S CLUB(NOT OWNED), WAL MART(NOT OWNED) |
| | | | | | | | | | | | | | | | | | | | | | | | | | | | | | | | | | | | | |
| 360 | | LEWISVILLE, TX (LAKEPOINTE) | | LAKEPOINTE CROSSINGS
S STEMMONS FREEWAY | | | 75067 | | | SC | | | 1991 | | | | 2002 | | | | 14.50 | % | | | 311,039 | | | | 567,069 | | | | 3,551,446 | | | 99 CENTS ONLY STORE(2009), THE ROOMSTORE #1055(2007), PETsMART #176(2009), BEST BUY #258(2010), ACADEMY SPORTS(2016), MARDEL CHRISTIAN BOOKSTORE(2012), TOYS R’ US(NOT OWNED), CONN’S APPLIANCE(NOT OWNED), GARDEN RIDGE(NOT OWNED) |
| | | | | | | | | | | | | | | | | | | | | | | | | | | | | | | | | | | | | |
| 361 | | MCKINNEY, TX | | MCKINNEY MARKETPLACE
US HWY 75 & EL DORADO PKWY | | | 75070 | | | SC | | | 2000 | | | | 2003 | | | | 100.00 | % | | | 118,970 | | | | 183,813 | | | | 1,264,733 | | | Kohl’s #416(2021), ALBERTSON’S(NOT OWNED) |
| | | | | | | | | | | | | | | | | | | | | | | | | | | | | | | | | | | | | |
| 362 | | MESQUITE, TX | | THE MARKETPLACE AT TOWN CENTER
SOUTHBOUND FRONTAGE RD I 635 | | | 75150 | | | SC | | | 2001 | | | | 2003 | | | | 100.00 | % | | | 164,625 | | | | 257,475 | | | | 2,283,544 | | | Ultimate Electronics(2018), Linen ‘N Things #267(2013), Michael’s(2012), Ross Dress For Less #603(2013), KOHL’S(NOT OWNED) |
| | | | | | | | | | | | | | | | | | | | | | | | | | | | | | | | | | | | | |
| 363 | | SAN ANTONIO, TX (BANDERA PT) | | BANDERA POINT NORTH
STATE LOOP 1604/BANDERA ROAD | | | 78227 | | | SC | | | 2001/2002 | | | | 1 * | | | | 100.00 | % | | | 278,727 | | | | 678,684 | | | | 4,163,451 | | | T.J. MAXX #0808(2011), LINENS ‘N THINGS # 594(2012), OLD NAVY #03797(2006), ROSS DRESS FOR LESS #509(2012), BARNES & NOBLE # 2055(2011), TARGET(NOT OWNED), LOWE’S(NOT OWNED), KOHL’S(NOT OWNED) |
| | | |
* 1. Property Developed by the Company | | * SC — Shopping |
* 2. Original IPO Property | | * MM — Mini-Mall |
| | | * BC — Business Center |
| | | * LC — Lifestyle Center |
Property Listing 7.1
Does Not Include Service Merchandise Interests
Property List*
| | | | | | | | | | | | | | | | | | | | | | | | | | | | | | | | | | | | | |
| | | | | | | | | | | | | Year | | | | | | DDR | | Owned | | Owned/Unowned | | Total | | |
| | | | | | | Zip | | Type of | | Developed/ | | Year | | Ownership | | Gross | | Gross | | Annualized | | |
| Center/Property | | Location | | Code | | Property | | Redeveloped | | Acquired | | Interest | | Leasable Area | | Leasable Area | | Rent | | Anchor Tenants(Lease Expiration) |
| Utah | | | | | | | | | | | | | | | | | | | | | | | | | | | | | | | | | | |
| | | | | | | | | | | | | | | | | | | | | | | | | | | | | | | | | | | | | |
| 364 | | LOGAN, UT | | FAMILY PLACE @ LOGAN
400 NORTH STREET | | | 84321 | | | SC | | | 1975 | | | | 1998 | | | | 100.00 | % | | | 19,200 | | | | 44,200 | | | | 206,672 | | | RITE AID(NOT OWNED) |
| | | | | | | | | | | | | | | | | | | | | | | | | | | | | | | | | | | | | |
| 365 | | MIDVALE, UT | | FAMILY CENTER AT FORT UNION 50
900 EAST FT UNION BLVD | | | 84047 | | | SC | | | 1973/2000 | | | | 1998 | | | | 100.00 | % | | | 661,469 | | | | 661,469 | | | | 6,882,727 | | | MERVYN’S #M-0065A(2015), BABIES R US #9568(2014), OFFICE MAX #126(2007), SMITH’S FOOD & DRUGS#85(2024), MEDIA PLAY #8122(2016), BED BATH & BEYOND #198(2014), ROSS DRESS FOR LESS #502(2011), WAL-MART STORES #2207(2015) |
| | | | | | | | | | | | | | | | | | | | | | | | | | | | | | | | | | | | | |
| 366 | | OGDEN, UT | | FAMILY CENTER AT OGDEN 5-POINT
21-129 HARRISVILLE ROAD | | | 84404 | | | SC | | | 1977 | | | | 1998 | | | | 100.00 | % | | | 162,316 | | | | 162,316 | | | | 720,554 | | | HARMONS(2012) |
| | | | | | | | | | | | | | | | | | | | | | | | | | | | | | | | | | | | | |
| 367 | | OREM, UT | | FAMILY CENTER AT OREM
1300 SOUTH STREET | | | 84058 | | | SC | | | 1991 | | | | 1998 | | | | 100.00 | % | | | 150,667 | | | | 281,931 | | | | 1,595,890 | | | KIDS R US # 1347(2011), MEDIA PLAY #8120(2015), OFFICE DEPOT #538(2008), JO-ANN FABRICS AND CRAFTS#1756(2012), R.C. WILLEY(NOT OWNED) |
| | | | | | | | | | | | | | | | | | | | | | | | | | | | | | | | | | | | | |
| 368 | | RIVERDALE, UT | | FAMILY CENTER AT RIVERDALE 510
1050 WEST RIVERDALE ROAD | | | 84405 | | | SC | | | 1995/2003 | | | | 1998 | | | | 100.00 | % | | | 590,313 | | | | 593,398 | | | | 4,615,173 | | | MEIER & FRANK(2011), OFFICE MAX #76(2008), GART SPORTS #326(2012), SPORTMAN’S WAREHOUSE(2009), TARGET SUPERSTORE #1753(2017), MEDIA PLAY(2016), CIRCUIT CITY#3349(2016) |
| | | | | | | | | | | | | | | | | | | | | | | | | | | | | | | | | | | | | |
| 369 | | SALT LAKE CITY, UT (33RD) | | FAMILY PLACE @ 33RD SOUTH
3300 SOUTH STREET | | | 84115 | | | SC | | | 1978 | | | | 1998 | | | | 100.00 | % | | | 34,209 | | | | 34,209 | | | | 244,421 | | | |
| | | | | | | | | | | | | | | | | | | | | | | | | | | | | | | | | | | | | |
| 370 | | TAYLORSVILLE, UT | | FAMILY CENTER AT MIDVALLEY 503
5600 SOUTH REDWOOD | | | 84123 | | | SC | | | 1982/2003 | | | | 1998 | | | | 100.00 | % | | | 746,890 | | | | 818,890 | | | | 7,213,947 | | | SHOPKO #085(2014), Jo-Ann Stores #2074(2015), GART SPORTS #324(2017), 24 HOUR FITNESS(2017), BED, BATH & BEYOND #270(2015), ROSS DRESS FOR LESS #658(2014), HOME USA WAREHOUSE(2012), MEDIA PLAY #8121(2015), OFFICE MAX #127(2008), CIRCUIT CITY #3353(2016), PETSMART #168(2012), HARMONS SUPERSTORE(NOT OWNED) |
| | | | | | | | | | | | | | | | | | | | | | | | | | | | | | | | | | | | | |
| Vermont | | | | | | | | | | | | | | | | | | | | | | | | | | | | | | | | | | |
| | | | | | | | | | | | | | | | | | | | | | | | | | | | | | | | | | | | | |
| 371 | | BERLIN, VT | | BERLIN MALL
282 BERLIN MALL RD., UNIT #28 | | | 05602 | | | MM | | | 1986/1999 | | | | 2 * | | | | 100.00 | % | | | 174,515 | | | | 174,515 | | | | 1,613,862 | | | WAL-MART STORES #2682(2014), J.C. PENNEY #2342(2009) |
| | | | | | | | | | | | | | | | | | | | | | | | | | | | | | | | | | | | | |
| Virginia | | | | | | | | | | | | | | | | | | | | | | | | | | | | | | | | | | |
| | | | | | | | | | | | | | | | | | | | | | | | | | | | | | | | | | | | | |
| 372 | | CHESTER, VA | | BERMUDA SQUARE
12607-12649 JEFFERSON DAVIS | | | 23831 | | | SC | | | 1978 | | | | 2003 | | | | 100.00 | % | | | 116,310 | | | | 116,310 | | | | 1,134,708 | | | Ukrop’s(2008) |
| | | | | | | | | | | | | | | | | | | | | | | | | | | | | | | | | | | | | |
| 373 | | FAIRFAX, VA | | FAIRFAX TOWNE CENTER
12210 FAIRFAX TOWNE CENTER | | | 22033 | | | SC | | | 1994 | | | | 1995 | | | | 14.50 | % | | | 253,392 | | | | 253,392 | | | | 4,783,418 | | | SAFEWAY #1431(2019), T.J. MAXX #106(2009), TOWER RECORDS#822(2009), BED, BATH & BEYOND #65(2010), UNITED ARTISTS #33191(2014) |
| | | | | | | | | | | | | | | | | | | | | | | | | | | | | | | | | | | | | |
| 374 | | LYNCHBURG, VA | | CANDLERS STATION
3700 CANDLERS MOUNTAIN ROAD | | | 24502 | | | SC | | | 1990 | | | | 2003 | | | | 100.00 | % | | | 275,765 | | | | 337,765 | | | | 2,099,667 | | | Goody’s #174(2006), Movies 10 #113(2015), Circuit City(2009), Staples #0319(2013), T.J. Maxx #797(2009), TOYS “R” US(NOT OWNED) |
| | | | | | | | | | | | | | | | | | | | | | | | | | | | | | | | | | | | | |
| 375 | | LYNCHBURG, VA (FAIRVIEW) | | FAIRVIEW SQUARE
2215 FLORIDA AVENUE | | | 24501 | | | SC | | | 1992 | | | | 2004 | | | | 100.00 | % | | | 87,209 | | | | 87,209 | | | | 338,376 | | | Food Lion #992(2012) |
| | | | | | | | | | | | | | | | | | | | | | | | | | | | | | | | | | | | | |
| 376 | | MARTINSVILLE, VA | | LIBERTY FAIR MALL
240 COMMONWEALTH BOULEVARD | | | 24112 | | | MM | | | 1989/1997 | | | | 1/2 | | | | 50.00 | % | | | 435,057 | | | | 435,057 | | | | 2,739,681 | | | GOODY’S #166(2006), BELK/LEGGETTS(2009), J.C. PENNEY #3010(2009), SEARS #2094 -4(2009), OFFICEMAX #744(2012), KROGER #R-350(2017) |
| | | | | | | | | | | | | | | | | | | | | | | | | | | | | | | | | | | | | |
| 377 | | MIDLOTHIAN, VA | | GENITO CROSSING | | | 23112 | | | SC | | | 1985 | | | | 2003 | | | | 100.00 | % | | | 79,407 | | | | 79,407 | | | | 702,925 | | | Food Lion #299(2010) |
| | | | | HULL STREET ROAD | | | | | | | | | | | | | | | | | | | | | | | | | | | | | | | | |
| | | | | | | | | | | | | | | | | | | | | | | | | | | | | | | | | | | | | |
| 378 | | PULASKI, VA | | MEMORIAL SQUARE
1000 MEMORIAL DRIVE | | | 24301 | | | SC | | | 1990 | | | | 1993 | | | | 100.00 | % | | | 143,299 | | | | 143,299 | | | | 887,691 | | | WAL-MART STORES #1652(2011), FOOD LION #799-2(2011) |
| | | | | | | | | | | | | | | | | | | | | | | | | | | | | | | | | | | | | |
| 379 | | WINCHESTER, VA | | APPLE BLOSSOM CORNERS 2190 S. PLEASANT VALLEY | | | 22601 | | | SC | | | 1990/1997 | | | | 2 * | | | | 20.00 | % | | | 240,560 | | | | 240,560 | | | | 2,386,796 | | | MARTIN’S FOOD STORE #78(2040), KOHL’S #283(2018), OFFICE MAX #844(2012), BOOKS-A-MILLION #954(2008) |
| | | | | | | | | | | | | | | | | | | | | | | | | | | | | | | | | | | | | |
| Washington | | | | | | | | | | | | | | | | | | | | | | | | | | | | | | | | | | |
| | | | | | | | | | | | | | | | | | | | | | | | | | | | | | | | | | | | | |
| 380 | | EVERETT, WA | | PUGET PARK
520 128TH STREET SW | | | 98204 | | | SC | | | 1981 | | | | 2001 | | | | 20.00 | % | | | 41,065 | | | | 88,961 | | | | 480,768 | | | ALBERTSON’S(NOT OWNED) |
| | | | | | | | | | | | | | | | | | | | | | | | | | | | | | | | | | | | | |
| 381 | | KIRKLAND, WA | | TOTEM LAKES
TOTEM LAKES BOULEVARD | | | 98034 | | | SC | | | 1999/2004 | | | | 2004 | | | | 20.00 | % | | | 175,805 | | | | 221,784 | | | | 2,750,961 | | | GUITAR CENTER(2007), ROSS DRESS FOR LESS(2010), COMPUSA(2006), RITE
AID(NOT OWNED) |
| | | | | | | | | | | | | | | | | | | | | | | | | | | | | | | | | | | | | |
| West Virginia | | | | | | | | | | | | | | | | | | | | | | | | | | | | | | | | | | |
| | | | | | | | | | | | | | | | | | | | | | | | | | | | | | | | | | | | | |
| 382 | | BARBOURSVILLE, WV | | OFFICE MAX CENTER
5-13 MALL ROAD | | | 25504 | | | SC | | | 1985 | | | | 1998 | | | | 100.00 | % | | | 70,900 | | | | 133,396 | | | | 383,825 | | | DISCOUNT EMPORIUM(2006), GOODY’S(2014), VALUE CITY(NOT OWNED) |
| | | | | | | | | | | | | | | | | | | | | | | | | | | | | | | | | | | | | |
| Wisconsin | | | | | | | | | | | | | | | | | | | | | | | | | | | | | | | | | | |
| | | | | | | | | | | | | | | | | | | | | | | | | | | | | | | | | | | | | |
| 383 | | BROOKFIELD, WI (CARX) | | SW OF BROOKFIELD (CARX) | | | 53005 | | | SC | | | 1967 | | | | 2003 | | | | 100.00 | % | | | 7,420 | | | | 7,420 | | | | 133,560 | | | |
| | | | | NORTH 124TH STREET AND WEST CA | | | | | | | | | | | | | | | | | | | | | | | | | | | | | | | | |
| | | | | | | | | | | | | | | | | | | | | | | | | | | | | | | | | | | | �� | |
| 384 | | BROOKFIELD, WI (SW) | | SHOPPERS WORLD OF BROOKFIELD
NORTH 124TH STREET AND WEST CA | | | 53005 | | | SC | | | 1967 | | | | 2003 | | | | 14.50 | % | | | 182,722 | | | | 190,142 | | | | 1,383,239 | | | T.J. Maxx #202(2005), Marshall’s Mega Store # 737(2009), Officemax #16(2010), Burlington Coat Factory #112(2007) |
| | | | | | | | | | | | | | | | | | | | | | | | | | | | | | | | | | | | | |
| 385 | | BROWN DEER, WI (CENTER) | | BROWN DEER CENTER
NORTH GREEN BAY ROAD | | | 53209 | | | SC | | | 1967 | | | | 2003 | | | | 14.50 | % | | | 266,716 | | | | 266,716 | | | | 1,935,459 | | | Kohl’s #44(2023), Michael’s(2012), Officemax #17(2010), T.J. Maxx/Burlington#201(2007), Old Navy #3792(2012) |
| | | |
* 1. Property Developed by the Company | | * SC — Shopping |
* 2. Original IPO Property | | * MM — Mini-Mall |
| | | * BC — Business Center |
| | | * LC — Lifestyle Center |
Property Listing 7.1
Does Not Include Service Merchandise Interests
Property List*
| | | | | | | | | | | | | | | | | | | | | | | | | | | | | | | | | | | | | |
| | | | | | | | | | | | | Year | | | | | | DDR | | Owned | | Owned/Unowned | | Total | | |
| | | | | | | Zip | | Type of | | Developed/ | | Year | | Ownership | | Gross | | Gross | | Annualized | | |
| Center/Property | | Location | | Code | | Property | | Redeveloped | | Acquired | | Interest | | Leasable Area | | Leasable Area | | Rent | | Anchor Tenants(Lease Expiration) |
| 386 | | BROWN DEER, WI (MARKET) | | MARKET PLACE OF BROWN DEER
NORTH GREEN BAY ROAD | | | 53209 | | | SC | | | 1989 | | | | 2003 | | | | 14.50 | % | | | 143,372 | | | | 143,372 | | | | 1,159,492 | | | Marshall’s Mega Store #736(2009), Pick ‘N Save #6867(2005) |
| | | | | | | | | | | | | | | | | | | | | | | | | | | | | | | | | | | | | |
| 387 | | MILWAUKEE, WI | | POINT LOOMIS
SOUTH 27TH STREET | | | 53221 | | | SC | | | 1962 | | | | 2003 | | | | 100.00 | % | | | 160,533 | | | | 160,533 | | | | 707,571 | | | Kohl’s #43(2007), Pick ‘N Save # 6845(2007) |
| | | | | | | | | | | | | | | | | | | | | | | | | | | | | | | | | | | | | |
| 388 | | WEST ALLIS, WI (WEST) | | WEST ALLIS CENTER WEST CLEVELAND AVE. AND S. 108 | | | 53214 | | | SC | | | 1968 | | | | 2003 | | | | 100.00 | % | | | 246,081 | | | | 259,981 | | | | 1,421,496 | | | Kohl’s #41(2008), Marshall’s Mega Store #738(2009), Pick ‘N Save #6846(2008) |
| | | | | | | | | | | | | Grand Total: | | | | | | | 72,195,737 | | | | 97,173,373 | | | | 783,750,278 | | | |
| | | | | | | | | | | | | | | | | | | | | | | | | | | | | | | |
| | | |
* 1. Property Developed by the Company | | * SC — Shopping |
* 2. Original IPO Property | | * MM — Mini-Mall |
| | | * BC — Business Center |
| | | * LC — Lifestyle Center |
Property Listing 7.1
Does Not Include Service Merchandise Interests
Developers Diversified Realty
Quarterly Financial Supplement
For the six months ended June 30, 2005
Investor Information
Developers Diversified Realty
www.ddr.com
3300 Enterprise Parkway
Beachwood, Ohio 44122
Phone: (216) 755-5500
Fax: (216) 755-1500
Board of Directors
Scott A. Wolstein, Chairman of the Board & Chief Executive Officer, Developers Diversified Realty
Dean S. Adler, Principal, Lubert-Adler Partners, L.P.
Terrance R. Ahern, Principal, The Townsend Group
Mohsen Anvari, Dean of School of Business Administration, University of San Diego
Robert H. Gidel, Managing Partner, Liberty Partners, L.P.
Victor B. MacFarlane, Managing Principal, MacFarlane Partners
Craig Macnab, Chief Executive Officer, Commercial Net Lease Realty
Scott D. Roulston, Managing Partner, Fairport Asset
Management, LLC
Barry A. Sholem, Principal, MDS Capital, L.P.
William B. Summers Jr., Non-Executive Chairman, McDonald Investments, Inc.
Officers
Scott A. Wolstein, Chief Executive Officer & Chairman of the Board
David M. Jacobstein, President & Chief Operating Officer
Daniel B. Hurwitz, Senior Executive Vice President & Chief Investment Officer
Joan U. Allgood, Senior Vice President, Chief Compliance Officer & Secretary
Richard E. Brown, Senior Vice President of Real Estate Operations
Timothy J. Bruce, Senior Vice President of Development
Steven M. Dorsky, Senior Vice President of Leasing — Northern Region
William H. Schafer, Senior Vice President and Chief Financial Officer Managing Partner, Liberty Partners, LP
Anthony L. Vodicka, Senior Vice President of Leasing – Western Region
Robin R. Walker-Gibbons, Senior Vice President of Leasing – Southern Region
Developers Diversified Realty
Quarterly Financial Supplement
For the six months ended June 30, 2005
Investor Information (Continued)
Research Coverage
| | | | | |
| AG Edwards | | | | |
| David AuBuchon | | | (314) 955-5452 | |
| | | | | |
| Citigroup Smith Barney | | | | |
| Michael Bilerman | | | (212) 816-1383 | |
| David Carlisle | | | (212) 816-1382 | |
| | | | | |
| Deutsche Bank Securities | | | | |
| Lou Taylor | | | (212) 250-4912 | |
| Chris Capolongo | | | (212) 250-7726 | |
| | | | | |
| Goldman Sachs | | | | |
| Carey Callaghan | | | (212) 902-4351 | |
| Deron Kennedy | | | (212) 357-2482 | |
| | | | | |
| Green Street Advisors | | | | |
| Greg Andrews | | | (949) 640-8780 | |
| Thomas Youn | | | (949) 640-8780 | |
| | | | | |
| Hilliard Lyons | | | | |
| Tony Howard | | | (502) 588-1142 | |
| | | | | |
| JP Morgan | | | | |
| Michael Mueller | | | (212) 622-6689 | |
| Josh Bederman | | | (212) 622-6530 | |
| | | | | |
| Keybanc Capital Markets | | | | |
| Richard Moore | | | (216) 443-2815 | |
| Chris Chapman | | | (216) 563-2357 | |
Research Coverage, continued
| | | | | |
| Lehman Brothers | | | | |
| David Harris | | | (212) 526-1790 | |
| Alexander Goldfarb | | | (212) 526-5232 | |
| | | | | |
| Merrill Lynch | | | | |
| Steve Sakwa | | | (212) 449-0335 | |
| Craig Schmidt | | | (212) 449-1944 | |
| | | | | |
| Morgan Stanley | | | | |
| Matthew Ostrower | | | (212) 761-6284 | |
| Mickey Chiang | | | (212) 761-6385 | |
| | | | | |
| Prudential Equity Group | | | | |
| Jim Sullivan | | | (212) 778-2515 | |
| Michael Gorman | | | (212) 778-1417 | |
| | | | | |
| Wachovia Securities | | | | |
| Jeff Donnelly | | | (617) 603-4262 | |
| Eric Rothman | | | (617) 603-4263 | |
Transfer Agent
National City Bank
Corporate Trust Operations
P.O. Box 92301
Cleveland, Ohio 44193-0900
1-800-622-6757
Investor Relations
Michelle Dawson
VP of Investor Relations
Phone: (216) 755-5455
Fax: (216) 755-1455
Email: mdawson@ddr.com