Exhibit 99.2
Quarterly Financial Supplement
For the nine months ended
September 30, 2006
Investor Relations Department
3300 Enterprise Parkway• Beachwood, Ohio 44122
(216) 755-5500• (216) 755-1500 (fax)
www.ddr.com
Developers Diversified Realty
Quarterly Financial Supplement
For the nine months ended September 30, 2006
Developers Diversified Realty Corporation considers portions of this information to be forward-looking statements within the meaning of Section 27A of the Securities Act of 1933 and Section 21E of the Securities Exchange Act of 1934, both as amended, with respect to the Company’s expectation for future periods. Although the Company believes that the expectations reflected in such forward-looking statements are based upon reasonable assumptions, it can give no assurance that its expectations will be achieved. For this purpose, any statements contained herein that are not historical fact may be deemed to be forward-looking statements. There are a number of important factors that could cause the results of the Company to differ materially from those indicated by such forward-looking statements, including among other factors, local conditions such as oversupply of space or a reduction in demand for real estate in the area, competition from other available space, dependence on rental income from real property, the loss of a major tenant or inability to enter into definitive agreements with regard to our financing arrangements or our failure to satisfy conditions to the completion of these arrangements. For more details on the risk factors, please refer to the Company’s Form on 10-K as of December 31, 2005.
Developers Diversified Realty
Quarterly Financial Supplement
For the nine months ended September 30, 2006
TABLE OF CONTENTS
| | | | | |
| Section | | Tab | |
Earnings Release & Financial Statements | | | 1.0 | |
Financial Summary | | | 2.0 | |
• Financial Highlights | | | 2.1 | |
• Market Capitalization and Financial Ratios | | | 2.2 | |
• Market Capitalization Summary | | | 2.3 | |
• Significant Accounting Policies | | | 2.4 | |
• Reconciliation of Supplemental Non-GAAP Financial Measures (Same Store NOI, FFO and Summary of Consolidated and JV Transactional Income) | | | 2.5 | |
Consolidated and Wholly Owned Financial Operations | | | 3.0 | |
• Summary of Capital Transactions | | | 3.1 | |
• Acquisitions, Dispositions, Expansions and Developments | | | 3.2 | |
• Summary of Consolidated Debt | | | 3.3 | |
• Summary of Consolidated Mortgage Principal Payments and Corporate Debt Maturities | | | 3.4 | |
Joint Venture Summaries | | | 4.0 | |
• Joint Venture Financials | | | 4.1 | |
• Joint Venture Partnership Summaries | | | 4.2 | |
Joint Venture Financial Operations | | | 5.0 | |
• Summary of Capital Transactions | | | 5.1 | |
• Acquisitions, Dispositions, Expansions and Developments | | | 5.2 | |
• Summary of Joint Venture Debt | | | 5.3 | |
• Summary of Pro Rata Joint Venture Debt | | | 5.4 | |
• Summary of Joint Venture Mortgage Principal Payments | | | 5.5 | |
Portfolio Statistics | | | 6.0 | |
Appendix | | | 7.0 | |
• Property Listing | | | 7.1 | |
• Investor Information | | | 7.2 | |
DEVELOPERS DIVERSIFIED REALTY CORPORATION
For Immediate Release:
| | | | | |
| Contact: | | Scott A. Wolstein | | Michelle M. Dawson |
| | | Chairman and | | Vice President of Investor Relations |
| | | Chief Executive Officer | | 216-755-5455 |
| | | 216-755-5500 | | |
DEVELOPERS DIVERSIFIED REALTY REPORTS AN INCREASE OF 12.2%
IN DILUTED FFO PER SHARE FOR THE QUARTER ENDED SEPTEMBER 30, 2006
CLEVELAND, OHIO, October 26, 2006- Developers Diversified Realty Corporation (NYSE: DDR), the nation’s leading owner, manager and developer of market-dominant community centers, today reported operating results for the third quarter ended September 30, 2006.
| | • | | Funds From Operations (“FFO”) per diluted share increased 12.2% to $0.83 and net income per diluted share increased 4.7% to $0.45 for the three months ended September 30, 2006 as compared to the prior year |
| |
| | • | | Core portfolio leased percentage increased 30 basis points over the prior year to 96.1% |
| |
| | • | | Executed leases during the third quarter totaled approximately 1.6 million square feet, including 132 new leases and 214 renewals |
| |
| | • | | Base rents increased 29.5% on new leases, 11.7% on renewals and 15.5% on a blended basis |
| |
| | • | | Same store net operating income (“NOI”) for the quarter increased 3.2% over the prior year quarter |
Scott Wolstein, Developers Diversified’s Chairman and Chief Executive Officer stated, “We’re pleased to announce this quarter’s strong FFO per share growth of over 12%. We continue to see outstanding leasing activity in our operating and development portfolio. This demand for space reflects the underlying health of the retail industry and the success of our core tenants. Our recent announcements regarding our merger agreement with Inland Retail Real Estate Trust, Inc. and our joint venture investment in Sonae Sierra Brazil reflect acquisitions that provide long-term strategic benefits for the Company and represent significant opportunities to grow shareholder value.”
Financial Results:
FFO, a widely accepted measure of a Real Estate Investment Trust (“REIT”) performance, on a diluted and basic per share basis was $0.83 for the three months ended September 30, 2006, as compared to $0.74 for the same period in the previous year, an increase of 12.2%. FFO available to common shareholders was $91.7 million, as compared to $81.8 million for the three months ended September 30, 2006 and 2005, respectively, an increase of 12.1%. Net income available to common shareholders was $49.0 million or $0.45 per share (diluted and basic) for the three months ended September 30, 2006, as compared to $46.5 million, or $0.43 per share (diluted and basic) for the prior comparable period. The increase in net income and FFO for the three months ended September 30, 2006, is primarily related to an increase in gain on sale of real estate assets comprised of land sales and sales through the Company’s merchant building program as compared to 2005.
FFO was $2.59 (diluted) and $2.61 (basic) for the nine months ended September 30, 2006, as compared to $2.47 (diluted) and $2.49 (basic) for the same period in the previous year, an increase of 4.9% (diluted) and 4.8% (basic) basis. FFO available to common shareholders was $287.7 million, as compared to $273.4 million for the nine months ended September 30, 2006 and 2005, respectively, an increase of 5.2%. Net income available to common shareholders was $149.9 million or $1.37 per share (diluted and basic) for the nine months ended September 30, 2006, as compared to $192.4 million, or $1.76 per share (diluted) and $1.78 per share (basic) for the prior comparable period. The decrease in net income for the nine months ended September 30, 2006 is primarily related to a decrease in gain on sale of real estate assets as compared to 2005.
FFO is a supplemental non-GAAP financial measurement used as a standard in the real estate industry. Management believes that FFO provides an additional indicator of the financial performance of a REIT. The Company also believes that FFO more appropriately measures the core operations of the Company and provides a benchmark to its peer group. FFO does not represent cash generated from operating activities in accordance with generally accepted accounting principles, is not necessarily indicative of cash available to fund cash needs and should not be considered as an alternative to net income computed in accordance with GAAP as an indicator of the Company’s operating performance or as an alternative to cash flow as a measure of liquidity. FFO is defined and calculated by the Company as net income, adjusted to exclude: (i) preferred dividends, (ii) gains (or losses) from sales of depreciable real estate property, except for those sold through the Company’s merchant building program, (iii) sales of securities, (iv) extraordinary items, (v) cumulative effect of changes in accounting standards and (vi) certain non-cash items. These non-cash items principally include real property depreciation and amortization of intangibles, equity income from joint ventures and equity income from minority equity investments and adding the Company’s proportionate share of FFO from its unconsolidated joint ventures and minority equity investments, determined on a consistent basis. Other real estate companies may calculate FFO in a different manner. A reconciliation of net income to FFO is presented in the financial highlights section.
Leasing:
Leasing activity continues to be strong throughout the portfolio. During the third quarter of 2006, the Company executed 132 new leases aggregating 784,332 square feet and 214 renewals aggregating 833,721 square feet. Rental rates on new leases increased by 29.5% and rental rates on renewals increased by 11.7%. On a blended basis, rental rates for new leases and renewals increased by 15.5%. At September 30, 2006, the average annualized base rent per occupied square foot, including those properties owned through joint ventures and excluding the impact of the properties acquired from Mervyns, was $11.68, as compared to $11.23 at September 30, 2005.
At September 30, 2006, the portfolio, including those properties owned through joint ventures, was 96.2% leased. Excluding the impact of the properties acquired from Mervyns, the core portfolio was 96.1% leased, as compared to 95.8% at September 30, 2005. These percentages include tenants for which signed leases have been executed and occupancy has not occurred. Based on tenants in place and responsible for paying rent as of September 30, 2006, the portfolio was 95.3% occupied. Excluding the impact of the properties acquired from Mervyns, the core portfolio was 95.1% occupied, as compared to 94.8% at September 30, 2005.
Strategic Real Estate Transactions:
Inland:
In October, 2006, the Company (“DDR”) and Inland Retail Real Estate Trust, Inc. (“IRRETI”) announced that they have entered into a definitive merger agreement. Under the terms of the agreement, DDR will acquire all of the outstanding shares of IRRETI for a total merger consideration of $14.00 per share in
cash. DDR may elect to issue up to $4.00 per share of the total merger consideration in the form of DDR common stock to be based upon the ten day average closing price of DDR’s shares two trading days prior to the IRRETI stockholders’ meeting to approve the transaction. The election to issue DDR common stock may be made up to 15 calendar days prior to the IRRETI stockholders’ meeting and may be revoked by DDR at any time if the revocation would not delay the stockholders’ meeting for more than ten business days.
The transaction has a total enterprise value of approximately $6.2 billion. This amount includes approximately $2.3 billion of existing debt, a significant portion of which is expected to be prepaid at closing. IRRETI’s real estate portfolio aggregates 307 community shopping centers, neighborhood shopping centers and single tenant/net leased retail properties, comprising approximately 43.6 million square feet of total GLA.
DDR has reached agreement with a major U.S. institutional investor on a joint venture which will acquire 67 of IRRETI’s community center assets for approximately $3.0 billion of total asset value. The joint venture is anticipated to have a 60% loan to value ratio and DDR will contribute 15% of the equity. In addition to its earnings from the joint venture, DDR will be entitled to certain fees for asset management, leasing, property management, development/tenant coordination and acquisitions. DDR will also earn a promoted interest equal to 20% of the cash flow of the joint venture after the partners have received an internal rate of return equal to 10% on their equity investment. Additionally, DDR has received financing commitments totaling in excess of $3.0 billion, which it may use to fund all or a portion of the total merger consideration.
In addition to the portfolio of operating properties, DDR will acquire a development pipeline of five projects and numerous potential expansion and redevelopment projects. DDR plans to generate additional value by implementing its proactive leasing, development, redevelopment and property management systems. In addition, DDR intends, immediately upon closing, to incorporate the IRRETI assets in its highly successful ancillary income program, which we anticipate will result in additional value creation.
Completion of the transaction, which is expected to occur in the first quarter of 2007, is subject to approval of the merger agreement by IRRETI shareholders and other customary closing conditions described in the merger agreement. The merger was unanimously approved by DDR’s Board of Directors. The merger was unanimously approved by IRRETI’s Board of Directors, with two related party directors recusing themselves.
Sonae Sierra Brazil:
In October 2006, the Company announced the acquisition of a 50% joint venture interest in Sonae Sierra Brazil, a fully integrated retail real estate company based in Sao Paulo, Brazil. Sonae Sierra Brazil is a subsidiary of Sonae Sierra, an international owner, developer and manager of shopping centers based in Portugal. Sonae Sierra Brazil is the managing partner of a partnership that owns direct and indirect interests in nine retail assets aggregating 3.4 million square feet and a property management company in Sao Paulo, Brazil that oversees the leasing and management operations of the portfolio. Sonae Sierra Brazil owns approximately 93% of the partnership and Enplanta Engenharia (“Enplanta”) owns approximately 7%. The aggregate market value of Sonae Sierra Brazil is approximately $300 million (U.S.). Developers Diversified’s aggregate proportionate share investment is approximately $150 million (U.S.).
MDT Joint Venture:
In July 2006, the Company sold two additional expansion areas in McDonough, Georgia and Coon Rapids, Minnesota to the MDT Joint Venture for approximately $10.1 million. These expansion areas are adjacent to shopping centers currently owned by the MDT Joint Venture. The Company recognized an
aggregate merchant build gain of $3.1 million, and deferred gains of approximately $0.5 million relating to the Company’s effective 14.5% ownership interest in the venture.
Service Merchandise Joint Venture:
In August 2006, the Company purchased its partners’ approximate 75% interest in the remaining 52 assets owned by the Service Merchandise Joint Venture agreement at a gross purchase price of approximately $138 million relating to our partners’ approximately 75% interest, based on a total valuation of approximately $185 million for all remaining assets.
In September 2006, the Company sold 51 of the assets to the Coventry II Joint Venture. The Company retained a 20% interest in the joint venture. The Company recorded a gain of approximately $6.4 million of which $3.6 million is included in FFO.
Coventry II Joint Venture:
In September 2006, the Coventry II Joint Venture acquired an 88 acre site located in Bloomfield Hills, Michigan at a cost of approximately $68.4 million. The Company anticipates commencing construction of a 600,000 square foot lifestyle center. The Company is generally responsible for the day-to-day development, management and leasing of the property. Pursuant to the terms of the joint venture, the Company earns fees for property management, leasing and construction management plus a promoted interest, along with Coventry, after return of capital to investors.
Dispositions:
In September 2006, one of the Company’s RVIP joint ventures, in which the Company has an effective 25.5% ownership interest, sold a 41,000 square foot shopping center in Everett, Washington for approximately $8.1 million. The joint venture recorded an aggregate gain of $3.7 million of which approximately $1.2 million represents the Company’s share of the gain.
In August 2006, the joint venture shopping center in Kildeer, Illinois, of which the Company owned a 10% interest, was sold for approximately $47.3 million. The joint venture recorded a gain of approximately $17.7 million. The Company recorded a gain of approximately $7.3 million which includes promoted income from the sale of the asset of approximately $5.5 million. The promoted income of $5.5 million is included in FFO.
Expansions:
During the nine month period ended September 30, 2006, the Company completed five expansions and redevelopment projects located in Lakeland, Florida; Ocala, Florida; Stockbridge, Georgia; Rome, New York and Mooresville, North Carolina at an aggregate gross cost of $25.3 million. The Company is currently expanding/redeveloping eleven shopping centers located in Birmingham, Alabama; Gadsden, Alabama; Ottumwa, Iowa; Chesterfield, Michigan; Gaylord, Michigan; Hamilton, New Jersey; Olean, New York; Stow, Ohio; Bayamon, Puerto Rico (Rio Hondo); Ft. Union, Utah and Brookfield, Wisconsin at a projected aggregate gross cost of approximately $92.1 million. At September 30, 2006, approximately $41.4 million of costs were incurred in relation to these projects. The Company anticipates commencing construction on nine additional expansion and redevelopment projects at shopping centers located in Crystal River, Florida; Louisville, Kentucky; Gulfport, Mississippi; Huber Heights, Ohio; Amherst, New York; Bayamon, Puerto Rico (Plaza Del Sol), Hatillo, Puerto Rico, and San Juan, Puerto Rico and McKinney, Texas.
Five of the Company’s joint ventures are currently expanding/redeveloping their shopping centers located in Phoenix, Arizona; Lancaster, California; Benton Harbor, Michigan; Kansas City, Missouri and Cincinnati, Ohio at a projected gross cost of approximately $466.8 million (which includes the initial acquisition costs for the Coventry II redevelopment projects located in Phoenix, Arizona; Benton Harbor, Michigan; Kansas City, Missouri and Cincinnati, Ohio). At September 30, 2006, approximately $349.3 million of costs were incurred in relation to these projects. Three of the Company’s joint ventures anticipate commencing expansion/redevelopment projects at their shopping centers located in Buena Park, California; Deer Park, Illinois and Kirkland, Washington.
Development (Wholly-Owned and Consolidated Joint Ventures):
As of September 30, 2006, the Company has substantially completed the construction of the Freehold, New Jersey and Pittsburgh, Pennsylvania shopping centers, at an aggregate gross cost of $85.2 million.
The Company currently has eight shopping center projects under construction. These projects are located in Miami, Florida; Nampa, Idaho; McHenry, Illinois; Seabrook, New Hampshire; Horseheads, New York; two projects in Apex, North Carolina (Beaver Creek Crossings — Phases I and II), and San Antonio, Texas, (which is being developed through a joint venture with David Berndt Interests). These projects are scheduled for completion during 2006 through 2007 at a projected aggregate gross cost of approximately $672.6 million and will create an additional 4.4 million square feet of gross leasable retail space.
The Company anticipates commencing construction in 2006 on two additional shopping centers located in Ukiah, California and Homestead, Florida. These projects have an estimated aggregate gross cost of $186.1 million and will create an additional 1.1 million square feet of gross leasable retail space.
At September 30, 2006, approximately $340.4 million of costs were incurred in relation to the above projects under construction and projects that will be commencing construction.
Development (Joint Ventures):
In addition to the Bloomfield Hills, Michigan project previously disclosed, three of the Company’s joint ventures currently have shopping center projects under construction. These projects are located in Merriam, Kansas; Allen, Texas and San Antonio, Texas. These three projects are being developed through the Coventry II program. A significant portion of the project located in San Antonio, Texas was substantially completed during 2005. The remaining two projects are scheduled for completion during 2007 and 2008. These projects have an aggregate gross projected cost of approximately $496.5 million. At September 30, 2006, approximately $130.4 million of costs were incurred in relation to these development projects.
Financing:
In August 2006, the Company issued $250 million, 3.50% convertible senior unsecured notes due 2011. The notes have an initial conversion rate of approximately 15.3589 common shares per $1,000 principal amount of the notes, represent a conversion price of approximately $65.11 per common share and a conversion premium of approximately 22.5% based on the last reported sale price of $53.15 per common share on August 22, 2006. The initial conversion rate is subject to adjustment under certain circumstances. Upon closing of the sale of the notes, the Company repurchased $48.3 million of its common shares.
In connection with the offering, the Company entered into an option arrangement, that is settled in shares of our common stock, with an investment bank that had the economic impact of effectively increasing the conversion price of the notes to $74.41 per common share, which represents a 40.0% premium based on the August 22, 2006 closing price of $53.15 per common share. The cost of this arrangement was approximately $10.3 million and has been recorded as an equity transaction in our consolidated balance sheet.
In addition, in late September and early October the Company entered into an aggregate $300 million of interest rate swaps which converted floating rate debt to a weighted average fixed Libor rate of approximately 4.94%. As a result, the effective floating rate debt, as a percentage of total debt, was 6.6% at September 30, 2006.
Developers Diversified currently owns and manages over 500 retail operating and development properties in 44 states, plus Puerto Rico and Brazil, totaling 118 million square feet. Developers Diversified Realty is a self-administered and self-managed real estate investment trust (REIT) operating as a fully integrated real estate company which acquires, develops, leases and manages shopping centers.
A copy of the Company’s Supplemental Financial/Operational package is available to all interested parties upon request at our corporate office to Michelle M. Dawson, Vice President of Investor Relations, Developers Diversified Realty Corporation, 3300 Enterprise Parkway, Beachwood, OH 44122 or on our Website which is located at http://www.ddr.com.
Developers Diversified Realty Corporation considers portions of this information to be forward-looking statements within the meaning of Section 27A of the Securities Act of 1933 and Section 21 E of the Securities Exchange Act of 1934, both as amended, with respect to the Company’s expectation for future periods. Although the Company believes that the expectations reflected in such forward-looking statements are based upon reasonable assumptions, it can give no assurance that its expectations will be achieved. For this purpose, any statements contained herein that are not historical fact may be deemed to be forward-looking statements. There are a number of important factors that could cause the results of the Company to differ materially from those indicated by such forward-looking statements, including, among other factors, local conditions such as oversupply of space or a reduction in demand for real estate in the area, competition from other available space, dependence on rental income from real property, the loss of a major tenant, constructing properties or expansions that produce a desired yield on investment or inability to enter into definitive agreements with regard to our financing arrangements or our failure to satisfy conditions to the completion of these arrangements. For more details on the risk factors, please refer to the Company’s Form on 10-K as of December 31, 2005. In addition, there are risks and uncertainties related to the proposed merger with IRRETI, including approval of the transaction by the shareholders of IRRETI, the satisfaction of closing conditions to the transaction, difficulties encountered in integrating the companies, the marketing and sale of non-core assets, and the effects of general and local economic and real estate conditions.
Additional Information and Where to Find It
This press release does not constitute an offer of any securities for sale. In connection with the proposed transaction, Developers Diversified and IRRETI expect to file a proxy statement/ prospectus as part of a registration statement regarding the proposed merger with the Securities and Exchange Commission. Investors and security holders are urged to read the proxy statement/prospectus because it will contain important information about Developers Diversified and IRRETI and the proposed merger. Investors and security holders may obtain a free copy of the definitive proxy statement/prospectus and other documents filed by Developers Diversified and IRRETI with the SEC at the SEC’s website at www.sec.gov. The definitive proxy statement/prospectus and other relevant documents may also be obtained free of charge from Developers Diversified and IRRETI by directing such request to: Developers Diversified Realty Corporation, Attention: Investor Relations, 3300 Enterprise Parkway, Beachwood, Ohio 44122 or Inland Retail Real Estate Trust, Inc., Attention: Investor Relations, 2901 Butterfield Road, Oak Brook, IL 60523. Investors and security holders are urged to read the proxy statement, prospectus and other relevant material when they become available before making any voting or investment decisions with respect to the merger.
Developers Diversified and IRRETI and their respective directors and executive officers may be deemed to be participants in the solicitation of proxies from the shareholders of IRRETI in connection with the merger. Information about Developers Diversified and its directors and executive officers, and their ownership of Developers Diversified securities, is set forth in the proxy statement for the 2006 Annual Meeting of Stockholders of Developers Diversified, which was filed with the SEC on April 3, 2006. Information about IRRETI and its directors and executive officers, and their ownership of IRRETI securities, is set forth in the proxy statement for the 2006 Annual Meeting of Stockholders of IRRETI, which was filed with the SEC on October 14, 2006. Additional information regarding the interests of those persons may be obtained by reading the proxy statement/prospectus when it becomes available. As a result of this transaction, IRRETI does not intend to hold an annual stockholder meeting and instead will hold a special meeting to vote on the proposed merger.
DEVELOPERS DIVERSIFIED REALTY CORPORATION
Financial Highlights
(In thousands — except per share data)
| | | | | | | | | | | | | | | | | |
| | | Three Month Period | | | Nine Month Period | |
| | | Ended September 30, | | | Ended September 30, | |
| | | 2006 | | | 2005 | | | 2006 | | | 2005 | |
Revenues: | | | | | | | | | | | | | | | | |
| Minimum rents (A) | | $ | 143,769 | | | $ | 125,628 | | | $ | 424,153 | | | $ | 371,959 | |
| Percentage and overage rents (A) | | | 1,775 | | | | 1,335 | | | | 5,779 | | | | 4,823 | |
| Recoveries from tenants | | | 45,821 | | | | 39,183 | | | | 131,586 | | | | 114,306 | |
| Ancillary income | | | 3,365 | | | | 2,793 | | | | 9,552 | | | | 6,585 | |
| Other property related income | | | 1,470 | | | | 1,334 | | | | 5,387 | | | | 3,993 | |
| Management and other fee income | | | 7,517 | | | | 4,701 | | | | 19,199 | | | | 13,976 | |
| Development fees | | | 849 | | | | 745 | | | | 2,121 | | | | 1,913 | |
| Other (B) | | | 1,040 | | | | 3,771 | | | | 8,565 | | | | 8,126 | |
| | | | | | | | | | | | | |
| | | | 205,606 | | | | 179,490 | | | | 606,342 | | | | 525,681 | |
| | | | | | | | | | | | | |
| | | | | | | | | | | | | | | | | |
Expenses: | | | | | | | | | | | | | | | | |
| Operating and maintenance | | | 28,181 | | | | 22,758 | | | | 82,481 | | | | 69,783 | |
| Real estate taxes | | | 25,101 | | | | 21,560 | | | | 70,959 | | | | 61,910 | |
| General and administrative (C) | | | 14,974 | | | | 14,146 | | | | 45,805 | | | | 40,188 | |
| Depreciation and amortization | | | 48,835 | | | | 39,646 | | | | 143,309 | | | | 116,412 | |
| | | | | | | | | | | | | |
| | | | 117,091 | | | | 98,110 | | | | 342,554 | | | | 288,293 | |
| | | | | | | | | | | | | |
| | | | | | | | | | | | | | | | | |
| Other income (expense): | | | | | | | | | | | | | | | | |
| Interest income | | | 1,602 | | | | 2,959 | | | | 7,586 | | | | 6,392 | |
| Interest expense | | | (55,386 | ) | | | (46,697 | ) | | | (164,812 | ) | | | (130,947 | ) |
| Other income (expense) (D) | | | (203 | ) | | | (660 | ) | | | 464 | | | | (2,526 | ) |
| | | | | | | | | | | | | |
| | | | (53,987 | ) | | | (44,398 | ) | | | (156,762 | ) | | | (127,081 | ) |
| | | | | | | | | | | | | |
| Income before equity in net income of joint ventures, minority equity interests, income tax of taxable REIT subsidiaries and franchise taxes, discontinued operations and gain on sales of real estate | | | 34,528 | | | | 36,982 | | | | 107,026 | | | | 110,307 | |
| Equity in net income of joint ventures (E) | | | 12,868 | | | | 11,418 | | | | 22,956 | | | | 25,984 | |
| Minority equity interests (F) | | | (2,283 | ) | | | (2,605 | ) | | | (6,504 | ) | | | (5,204 | ) |
| Income tax benefit (expense) of taxable REIT subsidiaries and franchise taxes (G) | | | 315 | | | | 10 | | | | 2,646 | | | | (555 | ) |
| | | | | | | | | | | | | |
| Income from continuing operations | | | 45,428 | | | | 45,805 | | | | 126,124 | | | | 130,532 | |
| Income from discontinued operations (H) | | | 3,422 | | | | 11,941 | | | | 4,027 | | | | 17,185 | |
| | | | | | | | | | | | | |
| Income before gain on sales of real estate | | | 48,850 | | | | 57,746 | | | | 130,151 | | | | 147,717 | |
| Gain on sales of real estate, net of tax | | | 13,962 | | | | 2,531 | | | | 61,124 | | | | 86,065 | |
| | | | | | | | | | | | | |
Net income | | $ | 62,812 | | | $ | 60,277 | | | $ | 191,275 | | | $ | 233,782 | |
| | | | | | | | | | | | | |
Net income, applicable to common shareholders | | $ | 49,020 | | | $ | 46,485 | | | $ | 149,898 | | | $ | 192,405 | |
| | | | | | | | | | | | | |
Funds From Operations (“FFO”): | | | | | | | | | | | | | | | | |
| Net income applicable to common shareholders | | $ | 49,020 | | | $ | 46,485 | | | $ | 149,898 | | | $ | 192,405 | |
| Depreciation and amortization of real estate investments | | | 47,235 | | | | 42,172 | | | | 138,072 | | | | 122,506 | |
| Equity in net income of joint ventures (E) | | | (12,868 | ) | | | (11,418 | ) | | | (22,956 | ) | | | (25,984 | ) |
| Joint ventures’ FFO (E) | | | 13,682 | | | | 15,358 | | | | 32,963 | | | | 37,438 | |
| Minority equity interests (OP Units) (F) | | | 534 | | | | 729 | | | | 1,601 | | | | 2,187 | |
| Gain on sales of depreciable real estate, net | | | (5,870 | ) | | | (11,543 | ) | | | (11,869 | ) | | | (55,162 | ) |
| | | | | | | | | | | | | |
| FFO available to common shareholders | | | 91,733 | | | | 81,783 | | | | 287,709 | | | | 273,390 | |
| Preferred dividends | | | 13,792 | | | | 13,792 | | | | 41,377 | | | | 41,377 | |
| | | | | | | | | | | | | |
| FFO | | $ | 105,525 | | | $ | 95,575 | | | $ | 329,086 | | | $ | 314,767 | |
| | | | | | | | | | | | | |
| Per share data: | | | | | | | | | | | | | | | | |
| Earnings per common share | | | | | | | | | | | | | | | | |
| Basic | | $ | 0.45 | | | $ | 0.43 | | | $ | 1.37 | | | $ | 1.78 | |
| | | | | | | | | | | | | |
| Diluted | | $ | 0.45 | | | $ | 0.43 | | | $ | 1.37 | | | $ | 1.76 | |
| | | | | | | | | | | | | |
| Dividends Declared | | $ | 0.59 | | | $ | 0.54 | | | $ | 1.77 | | | $ | 1.62 | |
| | | | | | | | | | | | | |
| Funds From Operations — Basic (I) | | $ | 0.83 | | | $ | 0.74 | | | $ | 2.61 | | | $ | 2.49 | |
| | | | | | | | | | | | | |
| Funds From Operations — Diluted (I) | | $ | 0.83 | | | $ | 0.74 | | | $ | 2.59 | | | $ | 2.47 | |
| | | | | | | | | | | | | |
| Basic — average shares outstanding (thousands) (I) | | | 109,120 | | | | 108,431 | | | | 109,124 | | | | 108,239 | |
| | | | | | | | | | | | | |
| Diluted — average shares outstanding (thousands) (I) | | | 109,670 | | | | 109,211 | | | | 109,714 | | | | 110,453 | |
| | | | | | | | | | | | | |
DEVELOPERS DIVERSIFIED REALTY CORPORATION
Financial Highlights
(In thousands — except per share data)
| (A) | | Increases in base and percentage rental revenues for the nine month period ended September 30, 2006 as compared to 2005, aggregated $50.0 million consisting of $10.4 million related to leasing of core portfolio properties and an increase from the assets located in Puerto Rico for a comparable eight months of ownership (an increase of 3.0% from 2005), $42.3 million from the acquisition of assets, $2.5 million related to developments and redevelopments and $3.2 million due to the consolidation of a joint venture asset. These amounts were offset by a decrease of $1.4 million primarily related to one business center under redevelopment and $7.0 million due to the sale of properties in 2006 and 2005 to joint ventures. Included in the rental revenues for the nine month periods ended September 30, 2006 and 2005 is approximately $12.1 million and $9.0 million, respectively, of revenue resulting from the recognition of straight line rents. |
| (B) | | Other income for the three and nine month periods ended September 30, 2006 and 2005 was comprised of the following (in millions): |
| | | | | | | | | | | | | | | | | |
| | | Three Month Period | | | Nine Month Period | |
| | | Ended September 30, | | | Ended September 30, | |
| | | 2006 | | | 2005 | | | 2006 | | | 2005 | |
| Lease termination fees | | $ | 0.9 | | | $ | 3.6 | | | $ | 7.7 | | | $ | 5.1 | |
| Financings fees | | | — | | | | — | | | | 0.4 | | | | 2.3 | |
| Other miscellaneous | | | 0.1 | | | | 0.2 | | | | 0.5 | | | | 0.7 | |
| | | | | | | | | | | | | |
| | | $ | 1.0 | | | $ | 3.8 | | | $ | 8.6 | | | $ | 8.1 | |
| | | | | | | | | | | | | |
| (C) | | General and administrative expenses include internal leasing salaries, legal salaries and related expenses associated with the releasing of space, which are charged to operations as incurred. For the nine month periods ended September 30, 2006 and 2005, general and administrative expenses were approximately 5.0 % and 4.6%, respectively, of total revenues, including joint venture revenues, respectively. |
| (D) | | Other income/expense is comprised of litigation settlements or costs and abandoned acquisition and development project costs. |
| (E) | | The following is a summary of the Company’s share of the combined operating results relating to its joint ventures (in thousands): |
| | | | | | | | | | | | | | | | | |
| | | Three Month Period | | | Nine Month Period | |
| | | Ended September 30, | | | Ended September 30, | |
| | | 2006 | | | 2005 | | | 2006 | | | 2005 | |
| Revenues from operations (a) | | $ | 105,308 | | | $ | 105,773 | | | $ | 309,947 | | | $ | 310,076 | |
| | | | | | | | | | | | | |
| Operating expense | | | 35,536 | | | | 36,567 | | | | 102,417 | | | | 107,917 | |
| Depreciation and amortization of real estate investments | | | 19,752 | | | | 21,557 | | | | 59,669 | | | | 61,833 | |
| Interest expense | | | 36,384 | | | | 28,607 | | | | 95,123 | | | | 84,098 | |
| | | | | | | | | | | | | |
| | | | 91,672 | | | | 86,731 | | | | 257,209 | | | | 253,848 | |
| | | | | | | | | | | | | |
| Income from operations before gain on sales of real estate and discontinued operations | | | 13,636 | | | | 19,042 | | | | 52,738 | | | | 56,228 | |
| Gain on sales of real estate | | | 193 | | | | 38 | | | | 237 | | | | 797 | |
| Income (loss) from discontinued operations, net of tax | | | 116 | | | | (222 | ) | | | 943 | | | | 57 | |
| Gain on sales of discontinued operations, net of tax | | | 21,460 | | | | 26,773 | | | | 19,910 | | | | 35,495 | |
| | | | | | | | | | | | | |
| Net income | | $ | 35,405 | | | $ | 45,631 | | | $ | 73,828 | | | $ | 92,577 | |
| | | | | | | | | | | | | |
| DDR Ownership interests (b) | | $ | 12,583 | | | $ | 14,086 | | | $ | 22,360 | | | $ | 28,083 | |
| | | | | | | | | | | | | |
| | | | | | | | | | | | | | | | | |
| Funds From Operations from joint ventures are summarized as follows: | | | | | | | | | | | | |
| Net income | | $ | 35,405 | | | $ | 45,631 | | | $ | 73,828 | | | $ | 92,577 | |
| Gain on sales of real estate, including discontinued operations | | | (21,418 | ) | | | (4,954 | ) | | | (21,437 | ) | | | (12,727 | ) |
| Depreciation and amortization of real estate investments | | | 19,795 | | | | 22,554 | | | | 60,510 | | | | 65,478 | |
| | | | | | | | | | | | | |
| | | $ | 33,782 | | | $ | 63,231 | | | $ | 112,901 | | | $ | 145,328 | |
| | | | | | | | | | | | | |
| DDR Ownership interests (b) | | $ | 13,682 | | | $ | 15,358 | | | $ | 32,963 | | | $ | 37,438 | |
| | | | | | | | | | | | | |
| DDR Partnership distributions received (c) | | $ | 23,686 | | | $ | 90,250 | | | $ | 43,366 | | | $ | 113,720 | |
| | | | | | | | | | | | | |
DEVELOPERS DIVERSIFIED REALTY CORPORATION
Financial Highlights
(In thousands — except per share data)
| | | |
| (a) | | Revenues for the three month periods ended September 30, 2006 and 2005 included approximately $1.4 million and $2.0 million, respectively, resulting from the recognition of straight line rents of which the Company’s proportionate share is $0.2 million and $0.4 million, respectively. Revenues for the nine month periods ended September 30, 2006 and 2005 included approximately $3.9 million and $5.6 million, respectively, resulting from the recognition of straight line rents of which the Company’s proportionate share is $0.7 million and $1.0 million, respectively. |
| | | |
| (b) | | The Company’s share of joint venture net income has been increased by $0.2 million and $2.6 million for the three month periods ended September 30, 2006 and 2005, respectively, and $0.5 million and $2.1 million for the nine month periods ended September 30, 2006 and 2005, respectively, to reflect adjustments for basis differences impacting amortization and depreciation and gain on sales. |
| | | |
| | | Included in DDR’s share of FFO for the three and nine months ended September 30, 2006 is promoted income of approximately $5.5 million received from the sale of the joint venture asset in Kildeer, Illinois. This gain is included in gain on sale of discontinued operations and not reflected in total FFO from the joint ventures. |
| | | |
| | | At September 30, 2006 and 2005, the Company owned joint venture interests, excluding consolidated joint ventures, relating to 108 and 112 shopping center properties, respectively. In addition, at September 30, 2006, the Company owned, through a Coventry II Joint Venture, a 20% interest in 51 shopping center sites formerly owned by Service Merchandise. At September 30, 2005, the Company, through the KLA/SM joint venture, owned an approximate 25% interest in 55 shopping center sites formerly owned by Service Merchandise. |
| | | |
| (c) | | Distributions include funds received from asset sales and refinancings in addition to ongoing operating distributions. |
| (F) | | Minority equity interests are comprised of the following (in thousands): |
| | | | | | | | | | | | | | | | | |
| | | Three Month Period | | | Nine Month Period | |
| | | Ended September 30, | | | Ended September 30, | |
| | | 2006 | | | 2005 | | | 2006 | | | 2005 | |
| Minority interests | | $ | 1,749 | | | $ | 1,876 | | | $ | 4,903 | | | $ | 3,017 | |
| Operating partnership units | | | 534 | | | | 729 | | | | 1,601 | | | | 2,187 | |
| | | | | | | | | | | | | |
| | | $ | 2,283 | | | $ | 2,605 | | | $ | 6,504 | | | $ | 5,204 | |
| | | | | | | | | | | | | |
| (G) | | Interest costs within taxable REIT subsidiaries are subject to certain limitations based upon taxable income as required under Internal Revenue Code Section 163(j). The 2006 income tax benefit is primarily attributable to the Company’s ability to deduct previously incurred intercompany interest costs due to the increased gain on sales. |
DEVELOPERS DIVERSIFIED REALTY CORPORATION
Financial Highlights
(In thousands — except per share data)
| (H) | | The operating results relating to assets classified as discontinued operations are summarized as follows (in thousands): |
| | | | | | | | | | | | | | | | | |
| | | Three Month Period | | | Nine Month Period | |
| | | Ended September 30, | | | Ended September 30, | |
| | | 2006 | | | 2005 | | | 2006 | | | 2005 | |
| Revenues | | $ | 900 | | | $ | 7,927 | | | $ | 2,812 | | | $ | 24,194 | |
| | | | | | | | | | | | | |
| | | | | | | | | | | | | | | | | |
| Expenses: | | | | | | | | | | | | | | | | |
| Operating | | | 236 | | | | 3,453 | | | | 703 | | | | 9,509 | |
| Impairment charge | | | — | | | | — | | | | — | | | | 642 | |
| Interest, net | | | 192 | | | | 1,416 | | | | 595 | | | | 4,361 | |
| Depreciation | | | 219 | | | | 2,092 | | | | 656 | | | | 6,410 | |
| Minority interests | | | — | | | | 3 | | | | — | | | | 64 | |
| | | | | | | | | | | | | |
| Total expenses | | | 647 | | | | 6,964 | | | | 1,954 | | | | 20,986 | |
| | | | | | | | | | | | | |
| Income before gain on sales of real estate | | | 253 | | | | 963 | | | | 858 | | | | 3,208 | |
| Gain on sales of real estate | | | 3,169 | | | | 10,978 | | | | 3,169 | | | | 13,977 | |
| | | | | | | | | | | | | |
| Net income | | $ | 3,422 | | | $ | 11,941 | | | $ | 4,027 | | | $ | 17,185 | |
| | | | | | | | | | | | | |
| (I) | | For purposes of computing FFO per share (basic), the weighted average shares outstanding were adjusted to reflect the conversion of approximately 0.9 million and 1.3 million of Operating Partnership Units (OP Units) outstanding at September 30, 2006 and 2005, respectively, into 0.9 million and 1.3 million common shares of the Company for the three month periods ended September 30, 2006 and 2005, respectively, and 1.0 million and 1.3 million for the nine month periods ended September 30, 2006 and 2005, respectively, on a weighted average basis. The weighted average diluted shares and OP Units outstanding, for purposes of computing FFO, were approximately 110.8 million and 110.8 million for the three month periods ended September 30, 2006 and 2005, respectively, and 111.0 million and 110.7 million for the nine month periods ended September 30, 2006 and 2005, respectively. |
DEVELOPERS DIVERSIFIED REALTY CORPORATION
Financial Highlights
(In thousands)
Selected Balance Sheet Data:
| | | | | | | | | |
| | | September 30, 2006 (A) | | | December 31, 2005 (A) | |
Assets: | | | | | | | | |
| Real estate and rental property: | | | | | | | | |
| Land | | $ | 1,769,490 | | | $ | 1,721,321 | |
| Buildings | | | 4,987,320 | | | | 4,806,373 | |
| Fixtures and tenant improvements | | | 191,065 | | | | 152,958 | |
| Construction in progress | | | 447,260 | | | | 348,685 | |
| | | | | | | |
| | | | 7,395,135 | | | | 7,029,337 | |
| Less accumulated depreciation | | | (822,074 | ) | | | (692,823 | ) |
| | | | | | | |
| Real estate, net | | | 6,573,061 | | | | 6,336,514 | |
| | | | | | | | | |
| Cash | | | 48,431 | | | | 30,655 | |
| Advances to and investments in joint ventures (B) | | | 133,643 | | | | 275,136 | |
| Notes receivable | | | 24,250 | | | | 24,996 | |
| Receivables, including straight line rent, net | | | 115,035 | | | | 112,464 | |
| Assets held for sale | | | 19,126 | | | | — | |
| Other assets, net | | | 103,962 | | | | 83,212 | |
| | | | | | | |
| | | $ | 7,017,508 | | | $ | 6,862,977 | |
| | | | | | | |
| | | | | | | | | |
Liabilities: | | | | | | | | |
| Indebtedness: | | | | | | | | |
| Revolving credit facilities | | $ | 125,000 | | | $ | 150,000 | |
| Variable rate unsecured term debt | | | — | | | | 200,000 | |
| Unsecured debt | | | 2,217,501 | | | | 1,966,268 | |
| Mortgage and other secured debt | | | 1,735,783 | | | | 1,574,733 | |
| | | | | | | |
| | | | 4,078,284 | | | | 3,891,001 | |
| Dividends payable | | | 71,211 | | | | 65,799 | |
| Other liabilities | | | 237,366 | | | | 204,447 | |
| | | | | | | |
| | | | 4,386,861 | | | | 4,161,247 | |
| Minority interests | | | 123,453 | | | | 131,449 | |
| Shareholders’ equity | | | 2,507,194 | | | | 2,570,281 | |
| | | | | | | |
| | | $ | 7,017,508 | | | $ | 6,862,977 | |
| | | | | | | |
| (A) | | Amounts include the consolidation of the Mervyns, 50% owned joint venture, formed in September 2005, which includes $405.8 million and $394.7 million of real estate assets at September 30, 2006 and December 31, 2005, respectively, $258.5 million of mortgage debt at September 30, 2006 and December 31, 2005, and $78.1 million and $75.1 million of minority interests at September 30, 2006 and December 31, 2005, respectively. |
| (B) | | Includes $91.6 million of advances to the Service Merchandise Joint Venture at December 31, 2005 that was repaid in connection with the acquisition of our partners interest in August 2006. |
DEVELOPERS DIVERSIFIED REALTY CORPORATION
Financial Highlights
(in thousands)
Selected Balance Sheet Data (Continued):
Combined condensed balance sheets relating to the Company’s joint ventures are as follows:
| | | | | | | | | |
| | | September 30, 2006 | | | December 31, 2005 | |
| Land | | $ | 1,031,065 | | | $ | 894,477 | |
| Buildings | | | 2,619,275 | | | | 2,480,025 | |
| Fixtures and tenant improvements | | | 44,866 | | | | 58,060 | |
| Construction in progress | | | 46,389 | | | | 37,550 | |
| | | | | | | |
| | | | 3,741,595 | | | | 3,470,112 | |
| Accumulated depreciation | | | (214,561 | ) | | | (195,708 | ) |
| | | | | | | |
| Real estate, net | | | 3,527,034 | | | | 3,274,404 | |
| Receivables, including straight line rent, net | | | 73,703 | | | | 76,744 | |
| Leasehold interests | | | 16,880 | | | | 23,297 | |
| Other assets | | | 120,193 | | | | 109,490 | |
| | | | | | | |
| | | $ | 3,737,810 | | | $ | 3,483,935 | |
| | | | | | | |
| Mortgage debt (a) | | $ | 2,526,608 | | | $ | 2,173,401 | |
| Notes and accrued interest payable to DDR | | | 8,370 | | | | 108,020 | |
| Other liabilities | | | 90,182 | | | | 78,406 | |
| | | | | | | |
| | | | 2,625,160 | | | | 2,359,827 | |
| Accumulated equity | | | 1,112,650 | | | | 1,124,108 | |
| | | | | | | |
| | | $ | 3,737,810 | | | $ | 3,483,935 | |
| | | | | | | |
| (a) | | The Company’s proportionate share of joint venture debt aggregated approximately $544.0 million and $510.5 million at September 30, 2006 and December 31, 2005, respectively. |
Developers Diversified Realty
Quarterly Financial Supplement
For the Nine Months Ended September 30, 2006
FINANCIAL HIGHLIGHTS
(In Thousands Except Per Share Information)
| | | | | | | | | | | | | | | | | | | | | | | | | |
| | | Nine Month | | | Nine Month | | | | |
| | | Period Ended | | | Period Ended | | | | |
| | | September 30 | | | September 30 | | | Year Ended December 31 | |
| | | 2006 | | | 2005 | | | 2005 | | | 2004 | | | 2003 | | | 2002 | |
FUNDS FROM OPERATIONS: | | | | | | | | | | | | | | | | | | | | | | | | |
| Net Income Applicable to Common Shareholders | | $ | 149,898 | | | $ | 192,405 | | | $ | 227,474 | | | $ | 219,056 | | | $ | 189,056 | (6) | | $ | 69,368 | (6) |
| Depreciation and Amortization of Real Estate Investments | | $ | 138,072 | | | $ | 122,506 | | | $ | 169,117 | | | $ | 130,537 | | | $ | 93,173 | | | $ | 76,462 | |
| Equity in Net Income From Joint Ventures | | ($ | 22,956 | ) | | ($ | 25,984 | ) | | ($ | 34,873 | ) | | ($ | 40,896 | ) | | ($ | 52,917 | ) | | ($ | 32,769 | ) |
| Joint Venture Funds From Operations | | $ | 32,963 | | | $ | 37,438 | | | $ | 49,302 | | | $ | 46,209 | | | $ | 47,942 | | | $ | 44,473 | |
| Operating Partnership Minority Interest Expense | | $ | 1,601 | | | $ | 2,187 | | | $ | 2,916 | | | $ | 2,607 | | | $ | 1,770 | | | $ | 1,450 | |
| Cumulative Effect & Extraordinary Charges | | $ | 0 | | | $ | 0 | | | $ | 0 | | | $ | 3,001 | | | $ | 0 | | | $ | 0 | |
| Gain on Sales of Real Estate | | ($ | 11,869 | ) | | ($ | 55,163 | ) | | ($ | 58,834 | ) | | ($ | 68,179 | ) | | ($ | 67,352 | ) | | ($ | 4,276 | ) |
| | | | | | | | | | | | | | | | | | | |
FUNDS FROM OPERATIONS AVAILABLE TO COMMON SHAREHOLDERS | | $ | 287,709 | | | $ | 273,390 | | | $ | 355,102 | | | $ | 292,335 | | | $ | 211,672 | | | $ | 154,709 | |
PREFERRED DIVIDENDS | | $ | 41,377 | | | $ | 41,377 | | | $ | 55,169 | | | $ | 50,706 | | | $ | 51,204 | (6) | | $ | 32,602 | (6) |
| | | | | | | | | | | | | | | | | | | |
FUNDS FROM OPERATIONS | | $ | 329,086 | | | $ | 314,767 | | | $ | 410,271 | | | $ | 343,041 | | | $ | 262,877 | | | $ | 187,311 | |
| | | | | | | | | | | | | | | | | | | |
| | | | | | | | | | | | | | | | | | | | | | | | | |
PER SHARE INFORMATION: | | | | | | | | | | | | | | | | | | | | | | | | |
| Funds From Operations — Diluted | | $ | 2.59 | | | $ | 2.47 | | | $ | 3.21 | | | $ | 2.95 | | | $ | 2.51 | | | $ | 2.35 | |
| Net Income — Diluted | | $ | 1.37 | | | $ | 1.76 | | | $ | 2.08 | | | $ | 2.24 | | | $ | 2.27 | | | $ | 1.07 | |
| Cash Dividends | | $ | 1.77 | | | $ | 1.62 | | | $ | 2.16 | | | $ | 1.94 | | | $ | 1.69 | | | $ | 1.52 | |
| | | | | | | | | | | | | | | | | | | | | | | | | |
WEIGHTED AVERAGE SHARES AND OPERATING PARTNERSHIP UNITS, FFO | | | 110,965 | | | | 110,663 | | | | 110,700 | | | | 99,147 | | | | 84,319 | | | | 65,910 | |
| | | | | | | | | | | | | | | | | | | | | | | | | |
TOTAL MARKET CAPITALIZATION (1) | | $ | 10,905,670 | | | $ | 9,689,099 | | | $ | 9,781,900 | | | $ | 8,276,943 | | | $ | 5,551,748 | | | $ | 3,460,243 | |
DEBT TO TOTAL MARKET CAPITALIZATION (1) | | | 37.40 | % | | | 39.60 | % | | | 39.77 | % | | | 32.82 | % | | | 37.42 | % | | | 43.10 | % |
DEBT TO TOTAL UNDEPRECIATED ASSETS, INVESTMENTS, CASH & NOTES REC. | | | 53.47 | % | | | 52.75 | % | | | 52.86 | % | | | 45.58 | % | | | 48.68 | % | | | 48.26 | % |
DIVIDEND PAYOUT RATIO (1) | | | 67.86 | % | | | 65.22 | % | | | 66.98 | % | | | 67.28 | % | | | 66.03 | % | | | 62.73 | % |
| | | | | | | | | | | | | | | | | | | | | | | | | |
GEN. & ADMIN. EXPENSES AS A PERCENTAGE OF TOTAL REVENUES (2) | | | 4.96 | % | | | 4.56 | % | | | 4.55 | % | | | 4.94 | % | | | 5.35 | % | | | 4.80 | % |
| | | | | | | | | | | | | | | | | | | | | | | | | |
GENERAL AND ADMINISTRATIVE EXPENSES | | $ | 45,805 | | | $ | 40,188 | | | $ | 54,048 | | | $ | 47,126 | | | $ | 40,820 | | | $ | 29,392 | |
| | | | | | | | | | | | | | | | | | | | | | | | | |
REVENUES: | | | | | | | | | | | | | | | | | | | | | | | | |
| DDR Revenues | | $ | 609,153 | | | $ | 549,875 | | | $ | 748,571 | | | $ | 605,246 | | | $ | 478,696 | | | $ | 360,778 | |
| Joint Venture Revenues | | $ | 314,845 | | | $ | 331,401 | | | $ | 438,103 | | | $ | 348,740 | | | $ | 284,158 | | | $ | 251,905 | |
| | | | | | | | | | | | | | | | | | | |
| TOTAL REVENUES (3) | | $ | 923,998 | | | $ | 881,276 | | | $ | 1,186,675 | | | $ | 953,987 | | | $ | 762,853 | | | $ | 612,683 | |
| | | | | | | | | | | | | | | | | | | |
| | | | | | | | | | | | | | | | | | | | | | | | | |
NET OPERATING INCOME: | | | | | | | | | | | | | | | | | | | | | | | | |
| DDR Net Operating Income | | $ | 455,012 | | | $ | 408,673 | | | $ | 555,291 | | | $ | 453,501 | | | $ | 356,348 | | | $ | 272,764 | |
| Joint Venture Net Operating Income | | $ | 210,726 | | | $ | 216,566 | | | $ | 280,617 | | | $ | 228,358 | | | $ | 184,927 | | | $ | 167,573 | |
| | | | | | | | | | | | | | | | | | | |
| TOTAL NET OPERATING INCOME (4) | | $ | 665,738 | | | $ | 625,240 | | | $ | 835,907 | | | $ | 681,859 | | | $ | 541,274 | | | $ | 440,337 | |
| | | | | | | | | | | | | | | | | | | |
| | | | | | | | | | | | | | | | | | | | | | | | | |
REAL ESTATE AT COST: | | | | | | | | | | | | | | | | | | | | | | | | |
| DDR Real Estate at Cost | | $ | 7,421,242 | | | $ | 6,923,899 | | | $ | 7,029,337 | | | $ | 5,603,424 | | | $ | 3,884,911 | | | $ | 2,804,056 | |
| Joint Venture Real Estate at Cost | | $ | 3,741,595 | | | $ | 3,511,234 | | | $ | 3,470,112 | | | $ | 3,165,335 | | | $ | 2,275,216 | | | $ | 1,785,165 | |
| | | | | | | | | | | | | | | | | | | |
| TOTAL REAL ESTATE AT COST (5) | | $ | 11,162,837 | | | $ | 10,435,133 | | | $ | 10,499,449 | | | $ | 8,768,759 | | | $ | 6,160,127 | | | $ | 4,589,221 | |
| | | | | | | | | | | | | | | | | | | |
| | |
| (1) | | See Market Capitalization and Financial Ratio section for detail calculation. |
| |
| (2) | | The calculation includes joint venture revenues. |
| |
| (3) | | Includes revenues from discontinued operations. |
| |
| (4) | | Includes NOI associated with acquisitions, expansions and developments from completion date of said capital transactions. |
| |
| (5) | | Includes construction in progress (CIP) at September 30, 2006 of $493.6 million (includes $46.3 million of CIP included in joint ventures, of which $8.5 million represents the Company’s proportionate share), and at December 31, 2005, 2004, 2003, 2002 CIP aggregated $386.2 million, $271.0 million $290.7 million and $237.8 million, respectively. |
| |
| (6) | | Amounts were adjusted to include original issuance costs associated with the redemption of Preferred Operating Partnership Units and preferred stock of $10,710,000 for the year ended December 31, 2003 and $5,543,734 for the year ended December 31, 2002 pursuant to EITF topic NO. D-42. |
Financial Highlights 2.1
Developers Diversified Realty
Quarterly Financial Supplement
For the Nine Months Ended September 30, 2006
MARKET CAPITALIZATION & FINANCIAL RATIOS
| | | | | | | | | | | | | | | | | | | | | |
| | | Nine Month | | | | |
| | | Period Ended | | | | |
| | | September 30 | | | Year Ended December 31 | |
| | | 2006 | | | 2005 | | | 2004 | | | 2003 | | | 2002 | |
DDR RATIO OF DEBT TO TOTAL MARKET CAP: | | | | | | | | | | | | | | | | | | | | |
| Total Debt | | $ | 4,078,284 | | | $ | 3,890,709 | | | $ | 2,716,426 | | | $ | 2,077,558 | | | $ | 1,491,481 | |
| Total Market Capitalization * | | $ | 10,905,670 | | | $ | 9,781,900 | | | $ | 8,276,943 | | | $ | 5,551,748 | | | $ | 3,460,243 | |
| | | | | | | | | | | | | | | | |
| | | | 37.40 | % | | | 39.77 | % | | | 32.82 | % | | | 37.42 | % | | | 43.10 | % |
| | | | | | | | | | | | | | | | | | | | | |
DDR DEBT TO UNDEPRECIATED REAL ESTATE ASSETS, INVESTMENTS AND NOTES RECEIVABLE | | | 53.47 | % | | | 52.86 | % | | | 45.58 | % | | | 48.68 | % | | | 48.26 | % |
| | | | | | | | | | | | | | | | | | | | | |
DDR, INCLUDING PROPORTIONATE SHARE OF JV DEBT, TOTAL MARKET CAPITALIZATION: | | | | | | | | | | | | | | | | | | | | |
| Total Debt * | | $ | 4,622,291 | | | $ | 4,401,169 | | | $ | 3,137,184 | | | $ | 2,446,026 | | | $ | 1,878,575 | |
| Total Market Capitalization * | | $ | 11,449,677 | | | $ | 10,292,361 | | | $ | 8,697,701 | | | $ | 5,920,216 | | | $ | 3,847,336 | |
| | | | | | | | | | | | | | | | |
| | | | 40.37 | % | | | 42.76 | % | | | 36.07 | % | | | 41.32 | % | | | 48.83 | % |
| | | | | | | | | | | | | | | | | | | | | |
DDR & JV DEBT TO UNDEPRECIATED REAL ESTATE ASSETS, INVESTMENTS & NOTES RECEIVABLE | | | 56.42 | % | | | 55.84 | % | | | 49.27 | % | | | 53.79 | % | | | 54.20 | % |
| | | | | | | | | | | | | | | | | | | | | |
INTEREST COVERAGE RATIO: | | | | | | | | | | | | | | | | | | | | |
| Interest Expense (1) | | $ | 153,794 | | | $ | 182,365 | | | $ | 130,447 | | | $ | 90,162 | | | $ | 77,208 | |
| FFO Before Interest and Preferred Dividends * | | $ | 482,879 | | | $ | 592,636 | | | $ | 473,488 | | | $ | 353,039 | | | $ | 282,856 | |
| | | | | | | | | | | | | | | | |
| | | | 3.14 | | | | 3.25 | | | | 3.63 | | | | 3.92 | | | | 3.66 | |
| | | | | | | | | | | | | | | | | | | | | |
DEBT SERVICE COVERAGE RATIO: | | | | | | | | | | | | | | | | | | | | |
| Debt Service * (1) | | $ | 177,057 | | | $ | 215,519 | | | $ | 152,927 | | | $ | 101,890 | | | $ | 83,958 | |
| FFO Before Interest and Preferred Dividends * | | $ | 482,879 | | | $ | 592,636 | | | $ | 473,488 | | | $ | 353,039 | | | $ | 282,856 | |
| | | | | | | | | | | | | | | | |
| | | | 2.73 | | | | 2.75 | | | | 3.10 | | | | 3.46 | | | | 3.37 | |
| | | | | | �� | | | | | | | | | | | | | | | |
FIXED CHARGES (INCLUDING PREFERRED DIVIDENDS) COVERAGE RATIO | | | | | | | | | | | | | | | | | | | | |
| Fixed Charges (1) | | $ | 218,433 | | | $ | 270,688 | | | $ | 203,633 | | | $ | 142,385 | | | $ | 129,353 | |
| FFO Before Interest and Preferred Dividends * | | $ | 482,879 | | | $ | 592,636 | | | $ | 473,488 | | | $ | 353,039 | | | $ | 282,856 | |
| | | | | | | | | | | | | | | | |
| | | | 2.21 | | | | 2.19 | | | | 2.33 | | | | 2.48 | | | | 2.19 | |
| | | | | | | | | | | | | | | | | | | | | |
DIVIDEND PAYOUT RATIO | | | | | | | | | | | | | | | | | | | | |
| Common Share Dividends and Operating Partnership Interest | | $ | 195,253 | | | $ | 237,856 | | | $ | 196,685 | | | $ | 146,846 | | | $ | 100,531 | |
| Funds From Operations exclusive of charge associated with preferred stock redemption | | $ | 287,709 | | | $ | 355,102 | | | $ | 292,335 | | | $ | 222,382 | | | $ | 160,253 | |
| | | | | | | | | | | | | | | | |
| | | | 0.68 | | | | 0.67 | | | | 0.67 | | | | 0.66 | | | | 0.63 | |
| | |
| * | | See Attached for Detail Calculation |
| |
| (1) | | Amounts have been adjusted to eliminate interest and debt service costs of joint venture consolidations due to FIN 46 as FFO does not include the joint venture Partners’ proportionate share. |
Market Capitalization and Financial Ratios 2.2
Developers Diversified Realty
Quarterly Financial Supplement
For the Nine Months Ended September 30, 2006
| | | | | | | | | | | | | | | | | | | | | |
| | | Nine Month | | | | |
| | | Period Ended | | | | |
| | | September 30 | | | Year Ended December 31 | |
| | | 2006 | | | 2005 | | | 2004 | | | 2003 | | | 2002 | |
DDR TOTAL MARKET CAPITALIZATION | | | | | | | | | | | | | | | | | | | | |
| Common Shares Outstanding | | | 108,894 | | | | 108,948 | | | | 108,083 | | | | 86,425 | | | | 66,609 | |
| Operating Partnership Units Outstanding | | | 905 | | | | 1,350 | | | | 1,350 | | | | 1,129 | | | | 911 | |
| | | | | | | | | | | | | | | | |
| Total | | | 109,799 | | | | 110,298 | | | | 109,432 | | | | 87,554 | | | | 67,520 | |
| Share Price | | $ | 55.76 | | | $ | 47.02 | | | $ | 44.37 | | | $ | 33.57 | | | $ | 21.99 | |
| | | | | | | | | | | | | | | | |
| Market Value of Common Shares | | $ | 6,122,386 | | | $ | 5,186,192 | | | $ | 4,855,516 | | | $ | 2,939,190 | | | $ | 1,484,762 | |
| | | | | | | | | | | | | | | | | | | | | |
| Preferred Shares at Book Value | | $ | 705,000 | | | $ | 705,000 | | | $ | 705,000 | | | $ | 535,000 | | | $ | 304,000 | |
| Preferred Units and Warrant | | $ | 0 | | | $ | 0 | | | $ | 0 | | | $ | 0 | | | $ | 180,000 | |
| Total Debt | | $ | 4,078,284 | (1) | | $ | 3,890,709 | (1) | | $ | 2,716,426 | | | $ | 2,077,558 | | | $ | 1,491,481 | |
| | | | | | | | | | | | | | | | |
| TOTAL MARKET CAPITALIZATION | | $ | 10,905,670 | | | $ | 9,781,900 | | | $ | 8,276,943 | | | $ | 5,551,748 | | | $ | 3,460,243 | |
| | | | | | | | | | | | | | | | |
| | | | | | | | | | | | | | | | | | | | | |
DDR TOTAL MARKET CAPITALIZATION — INCLUDING PROPORTIONATE SHARE OF JV DEBT | | | | | | | | | | | | | | | | | | | | |
| Common Shares Outstanding | | | 108,894 | | | | 108,948 | | | | 108,083 | | | | 86,425 | | | | 66,609 | |
| Operating Partnership Units Outstanding | | | 905 | | | | 1,350 | | | | 1,350 | | | | 1,129 | | | | 911 | |
| | | | | | | | | | | | | | | | |
| Total | | | 109,799 | | | | 110,298 | | | | 109,432 | | | | 87,554 | | | | 67,520 | |
| Share Price | | $ | 55.76 | | | $ | 47.02 | | | $ | 44.37 | | | $ | 33.57 | | | $ | 21.99 | |
| | | | | | | | | | | | | | | | |
| Market Value of Common Shares | | $ | 6,122,386 | | | $ | 5,186,192 | | | $ | 4,855,516 | | | $ | 2,939,190 | | | $ | 1,484,762 | |
| | | | | | | | | | | | | | | | | | | | | |
| Preferred Shares at Book Value | | $ | 705,000 | | | $ | 705,000 | | | $ | 705,000 | | | $ | 535,000 | | | $ | 304,000 | |
| Preferred Units and Warrant | | $ | 0 | | | $ | 0 | | | $ | 0 | | | $ | 0 | | | $ | 180,000 | |
| Total Debt | | $ | 4,078,284 | (1) | | $ | 3,890,709 | (1) | | $ | 2,716,426 | | | $ | 2,077,558 | | | $ | 1,491,481 | |
| Proportionate Share of JV Debt | | $ | 544,007 | | | $ | 510,460 | | | $ | 420,758 | | | $ | 368,468 | | | $ | 387,094 | |
| | | | | | | | | | | | | | | | |
| TOTAL MARKET CAPITALIZATION | | $ | 11,449,677 | | | $ | 10,292,361 | | | $ | 8,697,701 | | | $ | 5,920,216 | | | $ | 3,847,336 | |
| | | | | | | | | | | | | | | | |
| | |
| (1) | | Includes $282.0 million of consolidated joint venture debt at September 30, 2006 (of which $138.1 million represents the joint venture partners’ share) and $280.5 million at December 31, 2005. |
Market Capitalization and Financial Ratios 2.2
Developers Diversified Realty
Quarterly Financial Supplement
For the Nine Months Ended September 30, 2006
| | | | | | | | | | | | | | | | | | | | | |
| | | Nine Month | | | | |
| | | Period Ended | | | | |
| | | September 30 | | | Year Ended December 31 | |
| | | 2006 | | | 2005 | | | 2004 | | | 2003 | | | 2002 | |
UNDEPRECIATED REAL ESTATE ASSETS, CASH, INVESTMENTS & NOTES RECEIVABLE | | | | | | | | | | | | | | | | | | | | |
| Undepreciated Real Estate Assets | | $ | 7,421,242 | | | $ | 7,029,337 | | | $ | 5,603,424 | | | $ | 3,884,911 | | | $ | 2,804,056 | |
| Cash and Cash Equivalents | | $ | 48,431 | | | $ | 30,655 | | | $ | 49,871 | | | $ | 111,033 | | | $ | 16,371 | |
| Notes Receivable | | $ | 24,250 | | | $ | 24,996 | | | $ | 17,823 | | | $ | 9,813 | | | $ | 11,662 | |
| Advances and Investments in Joint Ventures | | $ | 133,643 | | | $ | 275,136 | | | $ | 288,020 | | | $ | 262,072 | | | $ | 258,611 | |
| | | | | | | | | | | | | | | | |
| | | $ | 7,627,566 | | | $ | 7,360,124 | | | $ | 5,959,138 | | | $ | 4,267,829 | | | $ | 3,090,699 | |
| | | | | | | | | | | | | | | | |
| | | | | | | | | | | | | | | | | | | | | |
DDR & JV UNDEPRECIATED REAL ESTATE ASSETS, INVESTMENTS & NOTES RECEIVABLE | | | | | | | | | | | | | | | | | | | | |
| Undepreciated Real Estate Assets | | $ | 7,421,242 | | | $ | 7,029,337 | | | $ | 5,603,424 | | | $ | 3,884,911 | | | $ | 2,804,056 | |
| Notes Receivable or Proportionate Share Thereof | | $ | 41,413 | | | $ | 116,212 | | | $ | 44,536 | | | $ | 41,018 | | | $ | 50,521 | |
| Proportionate Share of JV Undepreciated Real Estate Assets | | $ | 729,556 | | | $ | 736,109 | | | $ | 719,619 | | | $ | 621,113 | | | $ | 611,224 | |
| | | | | | | | | | | | | | | | |
| | | $ | 8,192,211 | | | $ | 7,881,658 | | | $ | 6,367,578 | | | $ | 4,547,043 | | | $ | 3,465,801 | |
| | | | | | | | | | | | | | | | |
| | | | | | | | | | | | | | | | | | | | | |
FUNDS FROM OPERATIONS BEFORE INTEREST AND PREFERRED DIVIDENDS | | | | | | | | | | | | | | | | | | | | |
| FFO | | $ | 287,709 | | | $ | 355,102 | | | $ | 292,335 | | | $ | 211,672 | | | $ | 154,709 | |
| Interest Expense | | $ | 165,407 | | | $ | 186,196 | | | $ | 130,447 | | | $ | 90,162 | | | $ | 77,208 | |
| Adjustment to interest expense for consolidated joint ventures due to FIN 46 | | ($ | 11,613 | ) | | ($ | 3,830 | ) | | $ | 0 | | | $ | 0 | | | $ | 0 | |
| Preferred Dividends, Including Preferred Operating Minority Interest & D-42 Dividend | | $ | 41,377 | | | $ | 55,169 | | | $ | 50,706 | | | $ | 51,204 | | | $ | 50,939 | |
| | | | | | | | | | | | | | | | |
| | | $ | 482,879 | | | $ | 592,636 | | | $ | 473,488 | | | $ | 353,039 | | | $ | 282,856 | |
| | | | | | | | | | | | | | | | |
| | | | | | | | | | | | | | | | | | | | | |
DEBT SERVICE | | | | | | | | | | | | | | | | | | | | |
| Interest Expense | | $ | 165,407 | | | $ | 186,196 | | | $ | 130,447 | | | $ | 90,162 | | | $ | 77,208 | |
| Adjustment to interest expense for consolidated joint ventures due to FIN 46 | | ($ | 11,613 | ) | | ($ | 3,830 | ) | | $ | 0 | | | $ | 0 | | | $ | 0 | |
| Recurring Principal Amortization | | $ | 23,263 | | | $ | 33,154 | | | $ | 22,480 | | | $ | 11,728 | | | $ | 6,750 | |
| | | | | | | | | | | | | | | | |
| | | $ | 177,057 | | | $ | 215,519 | | | $ | 152,927 | | | $ | 101,890 | | | $ | 83,958 | |
| | | | | | | | | | | | | | | | |
| | | | | | | | | | | | | | | | | | | | | |
FIXED CHARGES | | | | | | | | | | | | | | | | | | | | |
| Debt Service | | $ | 177,057 | | | $ | 215,519 | | | $ | 152,927 | | | $ | 101,890 | | | $ | 83,958 | |
| Preferred Dividends, Including Preferred Operating Minority Interest and excluding non-cash | | $ | 41,377 | | | $ | 55,169 | | | $ | 50,706 | | | $ | 40,494 | | | $ | 45,395 | |
| | | | | | | | | | | | | | | | |
| D-42 dividend. | | $ | 218,433 | | | $ | 270,688 | | | $ | 203,633 | | | $ | 142,385 | | | $ | 129,353 | |
| | | | | | | | | | | | | | | | |
Market Capitalization and Financial Ratios 2.2
Developers Diversified Realty
Quarterly Financial Supplement
For the nine months ended September 30, 2006
Significant Accounting Policies
Revenues
| • | | Percentage and overage rents are recognized after the tenants reported sales have exceeded the applicable sales breakpoint. |
| • | | Revenues associated with tenant reimbursements are recognized in the period in which the expenses are incurred based upon the provision of tenants’ leases. |
| • | | Lease termination fees are included in other income and recognized upon termination of a tenant’s lease, which generally coincides with the receipt of cash. |
General and Administrative Expenses
| • | | General and administrative expenses include internal leasing salaries, legal salaries and related expenses associated with the leasing of space which are charged to operations as incurred. All indirect internal costs associated with acquisitions are expensed as incurred. |
Deferred Financing Costs
| • | | Costs incurred in obtaining long-term financing are included in deferred charges and are amortized over the terms of the related debt agreements; such amortization is reflected as interest expense in the consolidated statements of operations. |
Real Estate
| • | | Real estate assets are stated at cost less accumulated depreciation, which, in the opinion of management, is not in excess of the individual property’s estimated undiscounted future cash flows, including estimated proceeds from disposition. |
| • | | Depreciation and amortization are provided on a straight-line basis over the estimated useful lives of the assets as follows: |
| | | |
| Buildings | | 18 to 31 years |
| Furniture/Fixtures | | Useful lives, which approximate lease |
| and Tenant Improvements | | terms, where applicable |
Significant Accounting Policies 2.4
Developers Diversified Realty
Quarterly Financial Supplement
For the nine months ended September 30, 2006
Significant Accounting Policies (Continued)
| • | | Expenditures for maintenance and repairs are charged to operations as incurred. Renovations that improve or extend the life of the asset are capitalized. |
| • | | Included in land is undeveloped real estate, generally outlots or expansion pads adjacent to the shopping centers and enclosed malls owned by the Company. At December 31, 2005, the Company estimated the value of the unleased outparcels and expansion pads at approximately $58 million. |
| • | | Construction in progress includes shopping center developments and significant expansions and re-developments. |
Capitalization
| • | | The Company capitalizes interest on funds used for the construction or expansion of shopping centers. Capitalization of interest ceases when construction activities are completed and the property is available for occupancy by tenants. |
| • | | For the nine month period ended September 30, 2006 and for the years ended December 31, 2005, 2004, 2003, and 2002, the Company capitalized interest of $14.7 million, $12.5 million, $10.0 million, $11.4 million and $9.5 million, respectively. |
| • | | In addition, the Company capitalized certain construction administration costs of $6.8 million for the nine month period ended September 30, 2006 and $6.2 million, $5.5 million, $5.1 million and $4.5 million for the years ended December 31, 2005, 2004, 2003 and 2002, respectively. |
| • | | Interest and real estate taxes incurred during the construction period are capitalized and depreciated over the building life. |
Gain on Sales of Real Estate
| • | | Gain on sales of real estate generally related to the sale of outlots and land adjacent to existing shopping centers is recognized at closing when the earnings process is deemed to be complete. |
Significant Accounting Policies 2.4
Developers Diversified Realty
Quarterly Financial Supplement
For the nine months ended September 30, 2006
Reconciliation of Supplemental
Non-GAAP Financial Measures
(Dollars in thousands)
(Unaudited)
Table 1 — Developers Diversified Realty Corporation and the Company’s Joint Ventures Combined
Same Store Net Operating Income (NOI) represents shopping center assets owned in comparable periods, excluding those under redevelopment. NOI generally includes revenues and expenses for each comparable asset, but excludes straight-line rent, lease termination income and provisions for uncollectible amounts and/or recoveries thereof. Reconciliation of Same Store NOI to Total Revenues and Certain Expenses is as follows:
| | | | | | | | | | | | | |
| | | Nine Month Period | | | | | |
| | | Ended September 30, | | | | | |
| | | 2006 | | | 2005 | | | | | |
| Total Revenues DDR | | $ | 606,342 | | | $ | 525,681 | | | | | |
| Total Revenues DDR Combined Joint Ventures | | | 309,948 | | | | 310,076 | | | | | |
| Operating and Maintenance — DDR | | | (82,481 | ) | | | (69,783 | ) | | | | |
| Real Estate Taxes — DDR | | | (70,959 | ) | | | (61,910 | ) | | | | |
| Operating and Maintenance and Real Estate Taxes- DDR Combined Joint Ventures | | | (102,417 | ) | | | (107,916 | ) | | | | |
| | | | | | | | | | | |
| | | | | | | | | | | | | |
Combined NOI | | $ | 660,433 | | | $ | 596,148 | | | | | |
| | | | | | | | | | | |
| | | | | | | | | | | | | |
| Total Same Store NOI | | $ | 515,980 | | | $ | 501,333 | | | | 2.9 | % |
| Property NOI from other operating segments | | | 144,453 | | | | 94,815 | | | | | |
| | | | | | | | | | | |
| | | | | | | | | | | | | |
Combined NOI | | $ | 660,433 | | | $ | 596,148 | | | | | |
| | | | | | | | | | | |
Reconciliation of Supplemental Non-GAAP Financial Measures 2.5
Developers Diversified Realty
Quarterly Financial Supplement
For the nine months ended September 30, 2006
Reconciliation of Supplemental
Non-GAAP Financial Measures
(Dollars in thousands)
(Unaudited)
Table 2 — Developers Diversified Realty Corporation
Reconciliation of Funds From Operations (FFO):
| | | | | | | | | | | | | | | | | |
| | | Three Month Period | | | Nine Month Period | |
| | | Ended September 30, | | | Ended September 30, | |
| | | 2006 | | | 2005 | | | 2006 | | | 2005 | |
FUNDS FROM OPERATIONS: | | | | | | | | | | | | | | | | |
| Net Income Applicable to Common Shareholders | | $ | 49,020 | | | $ | 46,485 | | | $ | 149,898 | | | $ | 192,405 | |
| Depreciation and Amortization of Real Estate Investments | | | 47,235 | | | | 42,172 | | | | 138,072 | | | | 122,506 | |
| Equity in Net Income From Joint Ventures | | | (12,868 | ) | | | (11,418 | ) | | | (22,956 | ) | | | (25,984 | ) |
| Joint Venture Funds From Operations | | | 13,682 | | | | 15,358 | | | | 32,963 | | | | 37,438 | |
| Minority Equity Interests (OP Units) | | | 534 | | | | 729 | | | | 1,601 | | | | 2,187 | |
| Gain on Sales of Real Estate | | | (5,870 | ) | | | (11,543 | ) | | | (11,869 | ) | | | (55,162 | ) |
| | | | | | | | | | | | | |
| | | | | | | | | | | | | | | | | |
FUNDS FROM OPERATIONS AVAILABLE TO COMMON SHAREHOLDERS | | $ | 91,733 | | | $ | 81,783 | | | $ | 287,709 | | | $ | 273,390 | |
| | | | | | | | | | | | | |
| | | | | | | | | | | | | | | | | |
| Preferred dividend charges in accordance with EITF Topic No. D-42 | | | 13,792 | | | | 13,792 | | | | 41,377 | | | | 41,377 | |
| | | | | | | | | | | | | |
ADJUSTED FUNDS FROM OPERATIONS AVAILABLE TO COMMON SHAREHOLDERS | | $ | 105,525 | | | $ | 95,575 | | | $ | 329,086 | | | $ | 314,767 | |
| | | | | | | | | | | | | |
Reconciliation of Supplemental Non-GAAP Financial Measures 2.5
Developers Diversified Realty
Quarterly Financial Supplement
For the nine months ended September 30, 2006
Reconciliation of Supplemental
Non-GAAP Financial Measures
(Dollars in thousands)
(Unaudited)
Table 3 — Developers Diversified Realty Corporation
Summary of Consolidated Transactional Income
| | | | | | | | | | | | | | | | | | | |
| | | Three Month Period | | | Nine Month Period | | | |
| | | Ended September 30, | | | Ended September 30, | | | |
| | | 2006 | | | 2005 | | | 2006 | | | 2005 | | | Income Statement Caption |
Transactional Income Included in FFO Consolidated | | | | | | | | | | | | | | | | | | |
| Merchant Building Gains, Net | | $ | 6,779 | | | $ | 590 | | | $ | 45,579 | | | $ | 38,805 | | | Gain on Sales of Real Estate |
| Land Sale Gains | | | 4,482 | | | | 1,344 | | | | 6,845 | | | | 6,042 | | | Gain on Sales of Real Estate |
| | | | | | | | | | | | | | | |
| | | $ | 11,261 | | | $ | 1,934 | | | $ | 52,424 | | | $ | 44,847 | | | |
| | | | | | | | | | | | | | | |
| | | | | | | | | | | | | | | | | | | |
Transactional Income NOT Included in FFO Consolidated | | | | | | | | | | | | | | | | | | |
| Gain on Sales | | $ | 2,701 | | | $ | 597 | | | $ | 8,700 | | | $ | 41,218 | | | Gain on Sales of Real Estate |
| Gain on Sales from Discontinued Operations | | | 3,169 | | | | 10,978 | | | | 3,169 | | | | 13,977 | | | Gain on Sales of Discontinued Operations |
| | | | | | | | | | | | | | | |
| | | $ | 5,870 | | | $ | 11,575 | | | $ | 11,869 | | | $ | 55,195 | | | FFO Reconciliation |
| | | | | | | | | | | | | | | |
| | | | | | | | | | | | | | | | | | | |
Gain on Sales of Real Estate | | | | | | | | | | | | | | | | | | |
| Merchant Building Gains, Net | | $ | 6,779 | | | $ | 590 | | | $ | 45,579 | | | $ | 38,805 | | | |
| Land Sale Gains | | | 4,482 | | | | 1,344 | | | | 6,845 | | | | 6,042 | | | |
| Gain on Sales | | | 2,701 | | | | 597 | | | | 8,700 | | | | 41,218 | | | |
| | | | | | | | | | | | | | | |
| | | $ | 13,962 | | | $ | 2,531 | | | $ | 61,124 | | | $ | 86,065 | | | Consolidated Income Statement |
| | | | | | | | | | | | | | | |
| | | | | | | | | | | | | | | | | | | |
Gain on Sales of Real Estate From Discontinued Operations | | | | | | | | | | | | | | | | | | |
| Gain on Sales from Discontinued Operations | | $ | 3,169 | | | $ | 10,978 | | | $ | 3,169 | | | $ | 13,977 | | | Consolidated Income Statement |
| | | | | | | | | | | | | | | |
Reconciliation of Supplemental Non-GAAP Financial Measures 2.5
Developers Diversified Realty
Quarterly Financial Supplement
For the nine months ended September 30, 2006
Reconciliation of Supplemental
Non-GAAP Financial Measures
(Dollars in thousands)
(Unaudited)
Table 4 — Developers Diversified Realty Corporation
Summary of Joint Venture Transactional Income
| | | | | | | | | | | | | | | | | | | |
| | | Three Month Period | | | Nine Month Period | | | |
| | | Ended September 30, | | | Ended September 30, | | | |
| | | 2006 | | | 2005 | | | 2006 | | | 2005 | | | Income Statement Caption |
Transactional Income Included in FFO | | | | | | | | | | | | | | | | | | |
Joint Ventures | | | | | | | | | | | | | | | | | | |
| Gain (Loss) on Sales from Discontinued Operations | | $ | 40 | | | $ | 21,858 | | | $ | (1,497 | ) | | $ | 23,565 | | | Gain (Loss) on Sales of Real Estate |
| Land Sales Gains | | | 195 | | | | — | | | | 207 | | | | — | | | Gain on Sales of Real Estate |
| | | | | | | | | | | | | | | |
| | | $ | 235 | | | $ | 21,858 | | | $ | (1,290 | ) | | $ | 23,565 | | | |
| | | | | | | | | | | | | | | |
DDR’s Proportionate Share | | | 51 | | | | 4,792 | | | | (341 | ) | | | 5,212 | | | |
| Promoted Income (a) | | | 5,483 | | | | — | | | | 5,483 | | | | — | | | |
| | | | | | | | | | | | | | | |
DDR’s Proportionate Share | | $ | 5,534 | | | $ | 4,792 | | | $ | 5,142 | | | $ | 5,212 | | | |
| | | | | | | | | | | | | | | |
Transactional Income NOT Included in FFO | | | | | | | | | | | | | | | | | | |
Joint Ventures | | | | | | | | | | | | | | | | | | |
| Gain on Sales from Discontinued Operations | | $ | 21,420 | | | $ | 4,915 | | | $ | 21,407 | | | $ | 11,930 | | | Gain on Sales of Real Estate |
| Other Gains on Sales | | | (2 | ) | | | 38 | | | | 30 | | | | 797 | | | Gain on Sales of Real Estate |
| | | | | | | | | | | | | | | |
| | | $ | 21,418 | | | $ | 4,953 | | | $ | 21,437 | | | $ | 12,727 | | | FFO Reconciliation |
| | | | | | | | | | | | | | | |
DDR’s Proportionate Share | | $ | 2,997 | | | $ | 1,456 | | | $ | 3,029 | | | $ | 4,609 | | | |
| | | | | | | | | | | | | | | |
| |
Gain on Sales of Real Estate | | | | | | | | | | | | | | | | | | |
| Land Sales Gains | | $ | 195 | | | $ | — | | | $ | 207 | | | $ | — | | | |
| Other Gains on Sales | | | (2 | ) | | | 38 | | | | 30 | | | | 797 | | | |
| | | | | | | | | | | | | | | |
| | | $ | 193 | | | $ | 38 | | | $ | 237 | | | $ | 797 | | | Gain on Sales of Real Estate |
| | | | | | | | | | | | | | | |
Gain on Sales of Real Estate From Discontinued Operations | | | | | | | | | | | | | | | | | | |
| Gain (Loss) on Sales from Discontinued Operations Included in FFO | | $ | 40 | | | $ | 21,858 | | | $ | (1,497 | ) | | $ | 23,565 | | | |
| Gain on Sales from Discontinued Operations NOT Included in FFO | | | 21,420 | | | | 4,915 | | | | 21,407 | | | | 11,930 | | | |
| | | | | | | | | | | | | | | |
| | | $ | 21,460 | | | $ | 26,773 | | | $ | 19,910 | | | $ | 35,495 | | | Gain on Sales of Discontinued Operations |
| | | | | | | | | | | | | | | |
| | |
| (a) | | Represents promoted income received from the sale of the joint venture asset in Kildeer, Illinois included in gain on sale of discontinued operations. |
Reconciliation of Supplemental Non-GAAP Financial Measures 2.5
Developers Diversified Realty
Quarterly Financial Supplement
For the nine months ended September 30, 2006
Summary of Wholly Owned and Consolidated Capital Transactions
Acquisitions, Dispositions, Developments & Expansions
for the Nine Month Period Ended September 30, 2006
| | | | | | | | | | | | | | | | | | | | | |
| | | Nine Months | | | | | | | | | | | | | |
| | | Ended | | | Year Ended | | | Year Ended | | | Year Ended | | | Year Ended | |
| | | September 30, | | | December 31, | | | December 31, | | | December 31, | | | December 31, | |
| | | 2006 | | | 2005 | | | 2004 | | | 2003 | | | 2002 | |
| Acquisitions/Transfers | | $ | 381.2 | (1) | | $ | 1,610.8 | (4) | | $ | 2,170.8 | (7) | | $ | 1,363.6 | (9) | | $ | 298.6 | (11) |
| Completed Expansions | | | 25.3 | | | | 41.6 | | | | 25.2 | | | | 26.8 | | | | 8.0 | |
| Developments & Construction in Progress | | | 185.9 | | | | 246.1 | | | | 203.8 | | | | 104.6 | | | | 66.4 | |
| Tenant Improvements & Building Renovations | | | 10.4 | (2) | | | 7.5 | | | | 6.6 | | | | 6.3 | | | | 7.3 | |
| Furniture Fixtures & Equipment | | | 7.7 | | | | 10.7 | (5) | | | 1.3 | | | | 1.9 | | | | 2.3 | |
| | | | | | | | | | | | | | | | |
| | | | 610.5 | | | | 1,916.7 | | | | 2,407.7 | | | | 1,503.2 | | | $ | 382.6 | |
| Less: Real Estate Sales & Joint Venture Transfers | | | (218.6 | )(3) | | | (490.8 | )(6) | | | (689.2 | )(8) | | | (422.4 | )(10) | | $ | (72.2 | )(12) |
| | | | | | | | | | | | | | | | |
| |
| Total DDR Net Additions (Millions) | | $ | 391.9 | | | $ | 1,425.9 | | | $ | 1,718.5 | | | $ | 1,080.8 | | | $ | 310.4 | |
| |
| | |
| (1) | | Includes transfer to DDR from joint venture of the Service Merchandise portfolio and Salisbury, MD shopping center, aggregating $111.9 and $4.0 million, respectively, the final earn out adjustments for the Benderson and Caribbean Property Group acquisitions aggregating $11.8 million, and the consolidation of joint venture assets for a shopping center located in Phoenix, AZ aggregating $41.4 million pursuant to EITF 04 05. |
| |
| (2) | | The Company anticipates recurring capital expenditures, including tenant improvements, of approx. $12.0 million associated with its wholly owned and consolidated portfolio during 2006. |
| |
| (3) | | Includes the sale of the Service Merchandise Portfolio to Coventry II which had an aggregate cost of $112.6, the sale to Macquarie DDR Trust joint venture of seven assets with an aggregate cost of $80.5 million, plus four earnout parcels with an aggregate cost of $12.5 million, and the sale of several outparcels. |
| |
| (4) | | Includes the acquisition of the Caribbean Property Group portfolio and the Mervyn’s portfolio aggregating $1,160.1 million and $409.1 million, respectively, the transfer to DDR from joint ventures of the Dublin, OH shopping center, which has an aggregate cost of $36.2 million and a $5.4 million basis adjustment to the Benderson acquisition relating to master lease adjustments. |
| |
| (5) | | The large increase in FF& E in 2005 is primarily attributed to certain IT projects, expansion of corporate headquarters, and fractional ownership interest in corporate jets. |
| |
| (6) | | In addition to the asset sales which had an aggregate cost of $219.1 million, this balance includes the transfer of twelve assets with an aggregate cost of $258.6 million to the Macquarie DDR Trust joint venture and the sale of several outparcels. |
| |
| (7) | | Includes the acquisition of the Benderson portfolio aggregating $2,014.4 million, the consolidation of certain joint venture assets aggregating $37.9 million due to FIN 46 and transfers to DDR from joint ventures of the Littleton, CO and Merriam, KS shopping centers which had an aggregate value of $111.8 million. This also includes the purchase of DDR corporate headquarters for $6.7 million. |
| |
| (8) | | In addition to the asset sales which had an aggregate cost of $62.6 million, this balance includes the sale of several land parcels with an aggregate cost of $41.1 million. This balance also includes the transfer of twelve assets with an aggregate cost of $258.3 million to the Macquarie DDR Trust joint venture, the transfer of twelve assets with an aggregate cost of $124.0 to the DPG Realty Holdings joint venture and the transfer of thirteen assets with an aggregate cost of $203.2 to the DDR Markaz II joint venture. |
| |
| (9) | | Includes the merger of JDN which had an aggregate value of $1,064.0, the acquisition of a shopping center in Broomfield, CO aggregating $55.5, and the transfer from joint ventures of the Leawood, KS and Suwanee, GA shopping centers aggregating $125.9, and the consolidation of the assets aggregating $118.2 million owned by DD Development Company. |
| |
| (10) | | In addition to asset sales which had an aggregate cost of $62.9 million, this balance includes the transfer of seven assets with an aggregate cost of $153.6 million to the joint venture with DDR Markaz LLC (Kuwait Financial Centre), these assets are shopping centers located in Richmond, CA, Winchester, VA, Tampa, FL, Toledo, OH, Highland, IN, Oviedo, FL and Grove City, OH and the sale of several outparcels, which had an aggregate cost of $13.5 million. The balance also includes the transfer of six assets with an aggregate cost of $192.4 million to the Macquarie DDR Trust joint venture, these assets are shopping centers located in Canton, OH, North Olmsted, OH, Independence, MO and St. Paul, MN. |
| |
| (11) | | Includes transfers from joint ventures of the Independence, MO shopping center, Phase IV of the Salisbury, MD shopping center, Canton, OH shopping center, Plainville, CT shopping center, and San Antonio, TX shopping center to DDR. |
| |
| (12) | | Includes a transfer to joint ventures for the newly developed shopping center in Kildeer, Illinois, the sales of shopping centers located in Cape Coral, Florida, Huntsville, Alabama, Ocala, Florida, Orlando, Florida and St. Louis, Missouri, the sale of three outlots, and a write-off of $5.0 million relating to the former K-mart space at North Little Rock, Arkansas which is being redeveloped. |
Summary of Wholly Owned Capital Transactions 3.1
Developers Diversified Realty
Quarterly Financial Supplement
For the nine months ended September 30, 2006
Wholly Owned and Consolidated Acquisitions
for the Nine Month Period Ended September 30, 2006
| | | | | | | | | | | | | | | |
| | | | | | | | | Cost | | Acquisition | | |
| Property Location | | GLA | | (1) | | (Millions) | | Date | | Major Tenants |
| Pasadena, CA | | | 556,961 | | | | | $ | 151.0 | | | 01/13/06 | | Macy’s, Pacific Theatres, Gelson’s Market, DSW Show Warehouse, Loehmann’s, Equinox |
| | | | | | | | | | | | | | | |
| San Diego, CA (College) | | | 73,872 | | | | | $ | 11.1 | | | 01/31/06 | | Mervyn’s |
| | | | | | | | | | | | | | | |
| Phoenix, AR (Deer Valley) | | | 453,815 | | | | | $ | 37.6 | | | 04/21/06 | | Target, AMC Theatre, Ross Dress for Less, PetsMart, Michael’s, OfficeMax |
| | | | | | | | | | | | | | | |
| Valencia, CA | | | 77,776 | | | | | $ | 12.4 | | | 08/31/06 | | Mervyn’s |
| |
| Total | | | 1,162,424 | | | | | $ | 212.1 | | | | | |
| |
| | |
| (1) | | GLA may include property managed, but not owned. |
Wholly Owned and Consolidated Dispositions
for the Nine Month Period Ended September 30, 2006
| | | | | | | | | | | |
| | | | | | | Gross Sale | | |
| | | | | | | Proceeds | | |
| Property Location | | GLA | | (Millions) | | Sale Date |
| Ft. Oglethorpe, GA 1 | | | 176,903 | | | $ | 7.7 | | | 9/6/2006 |
| |
| Total | | | 176,903 | | | $ | 7.7 | | | |
| |
Wholly Owned Acquisitions and Dispositions 3.2
Developers Diversified Realty
Quarterly Financial Supplement
For the nine months ended September 30, 2006
Wholly Owned and Consolidated
Expansion and Redevelopment Projects
for the Nine Month Period Ended September 30, 2006
| | | | | | | |
Projects Completed | | | | | | |
| |
| Lakeland, FL | | Construction of a 77,557 sf Bealls Department Store (opened 7/06). |
| | | | | | | |
| Ocala, FL | | Recaptured the Winn Dixie and expanded the space by 6,000 sf for Hobby Lobby (opened 2/06). |
| | | | | | | |
| Stockbridge, GA | | Redemised space to accommodate a Northern Tool (opened 10/05), Farmer’s Furniture (opened 3/06) and a Goodwill Store (opened 7/06). |
| | | | | | | |
| Rome, NY | | Expansion of the shopping center to accommodate a new Marshall’s (opened 3/06). |
| | | | | | | |
| Mooresville, NC | | Construction of a Gander Mountain (opened 6/06) and relocation of Rugged Warehouse (opened 7/05). |
| | | | | | | |
| | | |
| Total Gross Cost (Millions) | | | $ | 25.3 | | |
| | | |
| Total Net Cost (Millions) | | | $ | 25.3 | | |
| | | |
| | | | | | | |
Projects in Progress | | | | | | |
| |
| Birmingham, AL | | Construction of a 8,000 sf free standing outparcel and re-tenanting the former Winn Dixie building. |
| | | | | | | |
| Gadsden, AL | | Break-up of 64,400 sf building to create a Fred’s (opened 05/04), a Burke’s Outlet (opened 12/04) and another junior anchor. |
| | | | | | | |
| Ottumwa, IA | | Recaptured Wal-Mart and release to Goody’s (opened 9/04), Dollar Tree (opened 8/05) and 35,422 sf of additional junior anchor stores. |
| | | | | | | |
| Chesterfield, MI | | Wal-Mart, Sportsman Warehouse, 25,400 sf of small shop retail and additional retail space to be announced. |
| | | | | | | |
| Gaylord, MI | | Recaptured Wal-Mart and release to Big Lots (opened 10/04), Dunhams (opened 5/05) and 39,767 sf of additional junior anchor stores. |
| | | | | | | |
| Hamilton, NJ | | Expansion of the shopping center to construct a 18,000 sf Old Navy and 4,500 sf Bombay Company. |
| | | | | | | |
| Olean, NY | | Relocate two tenants to accommodate Wal-Mart expansion to a Supercenter. |
| | | | | | | |
| Stow, OH | | Recapture 116,000 sf K-Mart and release to junior anchor stores. Create outparcels. |
| | | | | | | |
| Bayamon, PR (Rio Hondo) | | Expansion of the shopping center to construct a Super Marshall’s (opened 11/05), a Comp USA in the former Marshall’s space (opened 6/06), and 19,800 sf of small shops and a freestanding outparcel. |
| | | | | | | |
| Ft. Union, UT | | Demise of former Mervyn’s to accommodate 30,548 sf Ross Dress for Less (opened 10/06), 16,975 sf DSW, 23,400 sf Michael’s and retail shops. |
| | | | | | | |
| Brookfield, WI | | Construction of 15,000 sf free standing building for retail shops. |
| | | | | | | |
| | | |
| Total Gross Cost (Millions) | | | $ | 92.1 | | |
| | | |
| Total Net Cost (Millions) | | | $ | 89.0 | | |
| | | |
| | | | | | | |
Projects to Commence Construction | | | | | | |
| |
| Crystal River, FL | | Construct 9,000 sf Dollar General and 15,000 sf of shops. |
| | | | | | | |
| Louisville, KY | | Construct a 6,000 sf free standing building for retail shops. |
| | | | | | | |
| Gulfport, MS | | Construct retail shops and restaurants on a 4.37 acre outparcel. |
| | | | | | | |
| Huber Hts., OH | | Expansion of the shopping center to construct a 45,000 sf junior anchor. |
| | | | | | | |
| Amherst, NY | | Construct 5,300 sf free standing building for retail shops. |
| | | | | | | |
| Bayamon, PR (Plaza Del Sol) | | 144,000 sf expansion of the mall to accommodate two junior anchors and additional shop space. |
| | | | | | | |
| Hatillo, PR | | Expansion of the shopping center to accommodate a 21,000 sf junior anchor. |
| | | | | | | |
| San Juan, PR | | Redemise shop space and construct a food court. |
| | | | | | | |
| McKinney, TX | | Construction of 87,757 sf retail shops and outparcels. |
Wholly Owned Expansions and Redevelopments 3.2
Developers Diversified Realty
Quarterly Financial Supplement
For the nine months ended September 30, 2006
Summary of Wholly Owned and Consolidated Development Projects
for the Nine Month Period Ended September 30, 2006
| | | | | | | | | | | | | | | | | | | |
| | | | | | | | | | | | | | | Substantial | | | | |
| | | | | | | Gross Cost | | Net Cost | | Completion | | | | |
| | | GLA | | (Millions) | | (Millions) | | Date | | Description | | Major Tenants |
Projects Substantially Completed | | | | | | | | | | | | | | | | | | |
| |
| Freehold, NJ | | | 500,000 | | | $ | 51.4 | | | $ | 30.4 | | | 2005 & 2006 | | Community Center | | Wal-Mart (opened 3/06), Sam’s Club (opened 4/06), Chase Manhattan, Ocean First Bank, Golden Corral (scheduled to open 2nd quarter 2007) and other retail tenants and outparcels to be announced |
| | | | | | | | | | | | | | | | | | | |
| Pittsburgh, PA | | | 367,719 | (1) | | $ | 33.8 | | | $ | 15.7 | | | 2006 | | Community Center | | Target (opened 3/06), Sportsmans Warehouse (opened 11/05), Sam’s Club (opened 6/06), PNC Bank and Hallmark (opened 3/06) and other retail tenants and restaurants to be announced |
| | | | | | | | | | | | | | | | | | | |
Projects in Progress | | | | | | | | | | | | | | | | | | |
| |
| Miami, FL | | | 633,001 | | | $ | 153.8 | | | $ | 141.9 | | | 2006 & 2007 | | Mixed-Use | | Target, Linens N Things, and Circuit City, (scheduled to open 4th qtr 2006), Ross Dress for Less, Marshalls, West Elm, PetsMart and additional retail space to be announced |
| | | | | | | | | | | | | | | | | | | |
| Nampa, ID | | | 858,396 | | | $ | 95.0 | | | $ | 93.3 | | | 2007 | | Community Center | | JC Penney and other retail tenants to be announced |
| | | | | | | | | | | | | | | | | | | |
| McHenry, IL | | | 426,078 | (1) | | $ | 71.4 | | | $ | 65.0 | | | 2007 | | Community Center | | Dick’s, PETsMART, Bed Bath & Beyond, Best Buy, Office Max and other retail tenants to be announced |
| | | | | | | | | | | | | | | | | | | |
| Seabrook, NH | | | 456,290 | (1) | | $ | 61.7 | | | $ | 37.2 | | | 2008 | | Community Center | | To be announced |
| | | | | | | | | | | | | | | | | | | |
| Horseheads, NY | | | 712,697 | (1) | | $ | 81.8 | | | $ | 53.8 | | | 2007 | | Community Center | | Wal-Mart, Kohl’s and additional retail space to be announced |
| | | | | | | | | | | | | | | | | | | |
| Apex, NC (Beaver Creek | | | | | | | | | | | | | | | | | | |
| Crossings-Phase I) | | | 347,527 | | | $ | 71.5 | | | $ | 66.9 | | | 2006 | | Community Center | | Consolidated Theaters (opened 2nd quarter 2006), Dick’s, Old Navy, Justice, Circuit City, TJ Maxx, (opened 3rd quarter 2006) Borders, (scheduled to open 4th quarter 2006) and other retail tenants to be announced |
| | | | | | | | | | | | | | | | | | | |
| Apex, NC (Beaver Creek Crossings-Phase II) | | | 281,996 | | | $ | 47.2 | | | $ | 38.6 | | | 2007 | | Community Center | | To be announced |
| | | | | | | | | | | | | | | | | | | |
| San Antonio, TX (Stone Oak) | | | 665,229 | (1) | | $ | 93.4 | | | $ | 84.5 | | | 2007 | | Community Center/Lifestyle Center | | Target, Office Max, Hobby Lobby, DSW, TJ Maxx, World Market, Chico’s, Ann Taylor Loft, Joseph Banks, Coldwater Creek, Talbots, Soma, Cold Stone Creamery, Victoria’s Secret, Chili’s and other tenants to be announced |
| | | | | | | | | | | | | | | | | | | |
Projects to Commence Construction | | | | | | | | | | | | | | | | | | |
| |
| Ukiah, CA | | | 666,616 | | | $ | 102.5 | | | $ | 86.5 | | | 2008 | | Community Center | | To be announced |
| | | | | | | | | | | | | | | | | | | |
| Homestead, FL | | | 399,868 | (1) | | $ | 83.6 | | | $ | 53.8 | | | 2007 | | Community Center | | To be announced |
| | | | | | | | | | | | | | | | | | | |
| |
| Wholly Owned Development Totals | | | 6,315,417 | | | $ | 947.1 | | | $ | 767.6 | | | | | | | |
| |
| | |
| (1) | | Includes square footage not owned by the company. |
Wholly Owned Developments 3.2
Developers Diversified Realty
Quarterly Financial Supplement
For the nine months ended September 30, 2006
Wholly Owned and Consolidated Development
Assets Placed in Service as of September 30, 2006
| | | | | |
| | | Assets Placed | |
| | | in Service | |
| Date | | (Millions) | |
| |
| As of December 31, 2005 | | $ | 18.4 | |
| 1st Quarter 2006 | | $ | 1.2 | |
| 2nd Quarter 2006 | | $ | 17.4 | |
| 3rd Quarter 2006 | | $ | 15.9 | |
| 4th Quarter 2006 | | $ | 57.2 | |
| Thereafter | | $ | 657.5 | |
| |
| Total | | $ | 767.6 | |
| |
Wholly Owned and Consolidated Development
Funding Schedule as of September 30, 2006
| | | | | |
| Funded as of September 30, 2006 | | $ | 382.7 | |
| Projected Net Funding During 2006 | | $ | 58.6 | |
| Projected Net Funding Thereafter | | $ | 326.3 | |
| |
| Total | | $ | 767.6 | |
| |
Wholly Owned Development Delivery and Funding Schedules 3.2
Developers Diversified Realty Corporation
Quarterly Financial Supplement
For the nine months ended September 30, 2006
Summary of Consolidated Debt
as of September 30, 2006
| | | | | | | | | | | | | |
| | | | | Mortgage | | | Maturity | | Interest | |
| | | | | Balance(000’s) | | | Date | | Rate(1) | |
SENIOR DEBT: | | | | | | | | | | | | |
| Unsecured Credit Facilities: | | | | | | | | | | | | |
| $1.2 Billion Revolving Credit Facility | | | | $ | 120,000 | (2) | | 06/10 | | | 5.306 | |
| $60 Million Revolving Credit Facility | | | | | 5,000 | | | 06/10 | | | 5.975 | |
| Secured Credit Facility: | | | | | | | | | | | | |
| $400 Million Term Loan | | | | | 400,000 | (3) | | 06/08 | | | 6.090 | |
| | | | | | | | | | | | |
| Total Term and Credit Facility Debt | | | | | 525,000 | | | | | | | |
| | | | | | | | | | | | | |
PUBLIC DEBT: | | | | | | | | | | | | |
| Medium Term Notes | | F | | | 99,424 | (4) | | 03/07 | | | 7.000 | |
| Medium Term Notes | | F | | | 10,000 | | | 07/07 | | | 7.020 | |
| Unsecured Notes | | F | | | 85,000 | | | 08/07 | | | 6.950 | |
| Medium Term Notes | | F | | | 2,000 | | | 12/07 | | | 6.960 | |
| Medium Term Notes | | F | | | 99,966 | | | 01/08 | | | 6.625 | |
| Medium Term Notes | | F | | | 274,466 | | | 01/09 | | | 3.875 | |
| Medium Term Notes | | F | | | 199,722 | | | 05/10 | | | 5.000 | |
| Medium Term Notes | | F | | | 299,742 | | | 07/10 | | | 4.625 | |
| Medium Term Notes | | F | | | 249,309 | | | 04/11 | | | 5.250 | |
| Convertible Notes | | F | | | 250,000 | (5) | | 08/11 | | | 3.500 | |
| Medium Term Notes | | F | | | 348,550 | | | 10/12 | | | 5.375 | |
| Medium Term Notes | | F | | | 199,385 | | | 05/15 | | | 5.500 | |
| Medium Term Notes | | F | | | 100,000 | | | 07/18 | | | 7.500 | |
| Total Public Debt | | | | | 2,217,565 | | | | | | | |
| | | | | | | | | | | | | |
MORTGAGE DEBT: | | | | | | | | | | | | |
| Hamilton, NJ | | V | | | 65,000 | | | 05/07 | | | 6.122 | |
| Phoenix, AZ (Paradise Valley) | | F | | | 16,816 | (6) | | 05/07 | | | 7.780 | |
| St. Louis, MO (Olympic) | | F | | | 2,921 | | | 08/07 | | | 9.150 | |
| Berlin, VT | | F | | | 4,940 | | | 08/07 | | | 9.750 | |
| Mt. Laurel, NJ | | V | | | 48,000 | | | 09/07 | | | 6.222 | |
| Apex, NC | | V | | | 15,573 | | | 10/07 | | | 6.322 | |
| DDR MDT MV, LLC | | V | | | 45,923 | (7) | | 10/07 | | | 6.042 | |
| Tupelo, MS | | F | | | 11,242 | | | 03/08 | | | 4.410 | |
| Jacksonville, FL | | F | | | 6,450 | | | 03/08 | | | 4.410 | |
| Solon, OH | | F | | | 15,573 | | | 03/08 | | | 4.410 | |
| N. Charleston, SC | | F | | | 11,150 | | | 03/08 | | | 4.410 | |
| Walker, MI | | F | | | 8,201 | | | 03/08 | | | 4.410 | |
| Mt. Pleasant, SC (GS II) | | F | | | 7,556 | | | 03/08 | | | 4.410 | |
| Meridian, ID (GS II) | | F | | | 24,420 | | | 03/08 | | | 4.410 | |
| Birmingham, AL (GS II) | | F | | | 26,447 | | | 03/08 | | | 4.410 | |
| Wilmington, NC (GS II) | | F | | | 20,273 | | | 03/08 | | | 4.410 | |
| Durham, NC (GS II) | | F | | | 6,911 | | | 03/08 | | | 4.410 | |
| Stone Oak, TX | | V | | | 6,701 | (8) | | 02/09 | | | 6.572 | |
| Silver Springs, MD (Tech 29-1) | | F | | | 6,596 | | | 02/09 | | | 7.330 | |
Summary of Consolidated Debt 3.3
Developers Diversified Realty Corporation
Quarterly Financial Supplement
For the nine months ended September 30, 2006
Summary of Consolidated Debt
as of September 30, 2006 (con’t)
| | | | | | | | | | | | | |
| | | | | Mortgage | | | Maturity | | Interest | |
| | | | | Balance(000’s) | | | Date | | Rate(1) | |
| Leawood, KS | | F | | $ | 49,425 | | | 07/09 | | | 7.310 | |
| Martinsville, VA | | F | | | 19,493 | | | 12/09 | | | 8.460 | |
| St. Louis, MO (Keller) | | F | | | 1,139 | | | 01/10 | | | 8.625 | |
| Deer Valley — Phoenix, AZ | | F | | | 17,234 | | | 09/10 | | | 8.010 | |
| DDR MDT MV, LLC | | F | | | 212,550 | (7) | | 10/10 | | | 5.211 | |
| Big Flats, NY (Big Flats I) | | F | | | 8,898 | | | 12/10 | | | 8.011 | |
| Plattsburgh, NY | | F | | | 8,687 | | | 12/10 | | | 8.000 | |
| Erie, PA | | F | | | 25,099 | | | 04/11 | | | 6.884 | |
| Erie, PA | | F | | | 2,897 | | | 04/11 | | | 6.884 | |
| Boardman, OH | | F | | | 26,067 | | | 04/11 | | | 6.884 | |
| St. Louis, MO (Sunset) | | F | | | 33,792 | | | 04/11 | | | 6.884 | |
| St. Louis, MO (Brentwood) | | F | | | 25,099 | | | 04/11 | | | 6.884 | |
| Denver, CO (Centennial) | | F | | | 37,651 | | | 04/11 | | | 6.884 | |
| Gates, NY (Westgate) | | F | | | 24,533 | | | 10/11 | | | 7.240 | |
| Indian Train, NC (Union TC Ph I) | | F | | | 6,854 | | | 10/11 | | | 7.000 | |
| Ashtabula, OH | | F | | | 6,824 | | | 12/11 | | | 7.000 | |
| West Pasco, FL | | F | | | 4,784 | | | 02/12 | | | 9.625 | |
| Denver, CO (Univ Hills) | | F | | | 27,944 | | | 06/12 | | | 7.300 | |
| St. Louis, MO (Gravois) | | F | | | 1,266 | | | 07/12 | | | 8.625 | |
| N. Charleston, SC | | F | | | 10,508 | | | 07/12 | | | 7.370 | |
| Mooresville, NC | | F | | | 23,562 | | | 12/12 | | | 6.930 | |
| Big Flats, NY (Big Flats IV) | | F | | | 980 | | | 01/13 | | | 7.600 | |
| Big Flats, NY (Big Flats II & III) | | F | | | 4,063 | | | 01/13 | | | 8.010 | |
| Buffalo, NY (Delaware Commons) | | F | | | 1,031 | | | 01/13 | | | 6.960 | |
| Jamestown, NY (Southside Plaza) | | F | | | 1,497 | | | 04/13 | | | 7.590 | |
| Victor, NY (Victor Square) | | F | | | 6,528 | | | 04/13 | | | 5.800 | |
| Mays Landing, NJ (Wrangleboro) | | F | | | 48,664 | | | 05/13 | | | 6.990 | |
| Beachwood, OH | | F | | | 3,277 | | | 07/13 | | | 7.640 | |
| W. Long Branch, NJ (Monmouth) | | F | | | 13,099 | | | 07/13 | | | 8.570 | |
| Boynton Beach, FL (Meadows Square) | | F | | | 4,055 | | | 07/13 | | | 6.720 | |
| Englewood, FL (Rotonda) | | F | | | 1,896 | | | 07/13 | | | 5.800 | |
| Reno, NV | | V | | | 3,499 | | | 02/15 | | | 9.000 | |
| Olean, NY | | F | | | 4,494 | | | 07/15 | | | 8.995 | |
| Mays Landing, NJ (Hamilton) | | F | | | 14,401 | | | 09/15 | | | 4.700 | |
| Columbus, OH (Consumer II West) | | F | | | 13,631 | | | 11/15 | | | 10.188 | |
| Amherst, NY (Kmart/Blvd Cons. II) | | F | | | 11,857 | | | 11/15 | | | 7.850 | |
| Lockport, NY (Walmart/Tops) | | F | | | 12,315 | | | 01/16 | | | 8.000 | |
| Merriam, KS (TIF) | | F | | | 7,075 | | | 02/16 | | | 6.900 | |
| Rome, NY (Freedom) | | F | | | 4,251 | | | 09/16 | | | 7.850 | |
| Medina, NY | | F | | | 3,697 | | | 11/16 | | | 7.660 | |
| Bellefontaine, OH | | F | | | 2,242 | | | 12/16 | | | 7.500 | |
| Amherst, NY (Tops Transit + French) | | F | | | 4,991 | | | 12/16 | | | 7.680 | |
| Canandaigua, NY | | F | | | 5,459 | | | 01/17 | | | 6.150 | |
| Cheektowaga, NY (Walmart Thruway) | | F | | | 4,762 | | | 10/17 | | | 6.780 | |
Summary of Consolidated Debt 3.3
Developers Diversified Realty Corporation
Quarterly Financial Supplement
For the nine months ended September 30, 2006
Summary of Consolidated Debt
as of September 30, 2006 (con’t)
| | | | | | | | | | | | | |
| | | | | Mortgage | | | Maturity | | Interest | |
| | | | | Balance(000’s) | | | Date | | Rate(1) | |
| Ithaca, NY | | F | | $ | 18,542 | | | 01/18 | | | 7.050 | |
| Amherst, NY (Target/Blvd Cons. II) | | F | | | 13,054 | | | 07/18 | | | 5.670 | |
| Springville, NY | | F | | | 5,935 | | | 07/18 | | | 6.375 | |
| Niskayuna, NY (Mohawk) | | F | | | 24,056 | | | 12/18 | | | 5.750 | |
| Henderson, TN | | F | | | 8,678 | | | 01/19 | | | 7.660 | |
| Spring Hill, FL | | F | | | 5,004 | | | 09/19 | | | 9.750 | |
| Alden, NY | | F | | | 4,297 | | | 10/19 | | | 8.100 | |
| Cedar Rapids, IA | | F | | | 9,495 | | | 01/20 | | | 9.375 | |
| Plainville, CT | | F | | | 6,985 | | | 04/21 | | | 7.125 | |
| Allentown, PA | | F | | | 17,549 | | | 06/21 | | | 6.950 | |
| Princeton, NJ | | F | | | 25,412 | | | 03/27 | | | 8.262 | |
| Bayamon, PR (Rio Hondo) | | F | | | 56,046 | | | 05/28 | | | 7.180 | |
| San Juan, PR (Senorial Plaza) | | F | | | 14,554 | | | 05/28 | | | 7.180 | |
| Bayamon, PR (Rexville Plaza) | | F | | | 8,768 | | | 05/28 | | | 7.180 | |
| Arecibo, PR (Atlantico) | | F | | | 14,644 | | | 05/28 | | | 7.180 | |
| | | | | | | | | | | | |
| Total Mortgage Debt | | | | | 1,335,783 | | | | | | | |
| | | | | | | | | | | | |
| Total Debt | | | | $ | 4,078,348 | | | | | | | |
| Adjustment for Reverse Swap | | | | | -64 | (9) | | | | | | |
| | | | | | | | | | | | |
| | | | | $ | 4,078,284 | | | | | | | |
| | | | | | | | | | | | |
| Weighted Average — Total | | | | | | | | 4.72 years | | | 5.7 | % |
| | | | | | | | | | | | | |
| Weighted Average — Fixed | | | | $ | 3,608,653 | | | 5.16 years | | | 5.6 | % |
| | | | | | | | | | | | | |
| Weighted Average — Floating | | | | $ | 469,695 | | | 1.35 years | | | 6.3 | % |
| | | | | | | | | | | | | |
Notes:
F — Fixed Rate Debt V — Variable Rate Debt
| | |
| 1. | | Interest rate figures reflect coupon rates of interest and do not include discounts or premiums. Annualized 2006 deferred finance cost amortization of approximately $7.5 million, net is offset by approximately $9.1 million of annualized fair market value adjustment in 2006. |
| |
| 2. | | The LIBOR rate on $100 million of the $1.2 billion Revolving Credit Facility has been fixed at 4.942% through September 2010 via interest rate swap. The weighted average spread on this $100 million borrowing was 0.306 % on September 30, 2006 resulting in a fixed rate of 5.248% on this borrowing. |
| |
| 3. | | Secured term loan debt of $200 million has been converted to a fixed rate of 5.99% until June 28, 2010. Effective October 18, 2006, $100 million of secured term loan debt will be converted to a fixed rate of 5.78% and $100 million will be converted to a fixed rate of 5.81% until October 18, 2009. The weighted average rate of all traunches, reflecting the rates fixed by interest rate swaps, will be 5.90%. |
| |
| 4. | | Public debt of $60 million has been converted to a variable rate of 7.075%. The remaining balance of $39.4 million is at the stated fixed rate. |
| |
| 5. | | The convertible notes may net share settled with shares of DDR’s common stock once the stock price rises above $65.11 per share, however, this conversion price has been increased to $74.41 per share through the purchase of a convertible note hedge. |
| |
| 6. | | The company’s 67% joint venture with Shea and Tatum Associates is consolidated within DDR’s accounts pursuant to EITF 04-05. |
| |
| 7. | | The company’s 50% joint venture with DDR Macquarie is consolidated within DDR’s accounts pursuant to FIN 46. |
| |
| 8. | | The company’s 50% joint venture with David Berndt Interests is consolidated within DDR’s accounts pursuant to FIN 46. |
| |
| 9. | | Offset included in other liabilities. |
Summary of Consolidated Debt 3.3
Developers Diversified Realty Corporation
Quarterly Financial Supplement
For the nine months ended September 30, 2006
Summary of Consolidated Mortgage Principal Payments
and Corporate Debt Maturities
as of September 30, 2006
(000’s)
| | | | | | | | | | | | | | | | | | | | | | | | | | | | | | | | | | | | | | | | | | | | | | | | | |
| | | 2006 Payments | | 2007 Payments | | 2008 Payments | | 2009 Payments | | 2010 Payments | | 2011 Payments | | 2012 Payments | | 2013 Payments | | 2014 Payments | | 2015 Payments | | Thereafter | | Total |
PROPERTY MORTGAGES | | | | | | | | | | | | | | | | | | | | | | | | | | | | | | | | | | | | | | | | | | | | | | | | |
| Plainville, CT (TIF) | | | | | | | | | | | | | | | | | | | | | | | | | | | | | | | | | | | | | | | | | | | 7,100 | | | | 7,100 | |
| Tupelo, MS | | | 300 | | | | 313 | | | | 10,852 | | | | | | | | | | | | | | | | | | | | | | | | | | | | | | | | | | | | 11,466 | |
| Jacksonville, FL | | | 172 | | | | 180 | | | | 6,227 | | | | | | | | | | | | | | | | | | | | | | | | | | | | | | | | | | | | 6,579 | |
| Reno, NV | | | 59 | | | | 64 | | | | 67 | | | | 73 | | | | 78 | | | | 84 | | | | 89 | | | | 96 | | | | 103 | | | | 2,831 | | | | | | | | 3,544 | |
| Denver, CO (Univ Hills) | | | 562 | | | | 604 | | | | 650 | | | | 699 | | | | 752 | | | | 809 | | | | 24,286 | | | | | | | | | | | | | | | | | | | | 28,361 | |
| Henderson, TN | | | 395 | | | | 426 | | | | 460 | | | | 497 | | | | 536 | | | | 578 | | | | 624 | | | | 674 | | | | 727 | | | | 785 | | | | 3,270 | | | | 8,971 | |
| Allentown, PA | | | 666 | | | | 714 | | | | 765 | | | | 820 | | | | 879 | | | | 942 | | | | 1,009 | | | | 1,082 | | | | 1,159 | | | | 1,242 | | | | 8,767 | | | | 18,044 | |
| Erie, PA | | | 293 | | | | 314 | | | | 331 | | | | 360 | | | | 386 | | | | 23,638 | | | | | | | | | | | | | | | | | | | | | | | | 25,322 | |
| Erie, PA | | | 33 | | | | 36 | | | | 38 | | | | 41 | | | | 44 | | | | 2,731 | | | | | | | | | | | | | | | | | | | | | | | | 2,923 | |
| Phoenix, AZ (Deer Valley) | | | 200 | | | | 217 | | | | 231 | | | | 255 | | | | 16,479 | | | | | | | | | | | | | | | | | | | | | | | | | | | | 17,381 | |
| Martinsville, VA | | | 221 | | | | 241 | | | | 258 | | | | 18,936 | | | | | | | | | | | | | | | | | | | | | | | | | | | | | | | | 19,656 | |
| Boardman, OH | | | 303 | | | | 325 | | | | 343 | | | | 373 | | | | 400 | | | | 24,553 | | | | | | | | | | | | | | | | | | | | | | | | 26,297 | |
| Solon, OH | | | 415 | | | | 434 | | | | 15,033 | | | | | | | | | | | | | | | | | | | | | | | | | | | | | | | | | | | | 15,883 | |
| St. Louis, MO (Sunset) | | | 392 | | | | 421 | | | | 444 | | | | 483 | | | | 518 | | | | 31,832 | | | | | | | | | | | | | | | | | | | | | | | | 34,090 | |
| St. Louis, MO (Brentwood) | | | 293 | | | | 314 | | | | 331 | | | | 360 | | | | 386 | | | | 23,638 | | | | | | | | | | | | | | | | | | | | | | | | 25,322 | |
| Denver, CO (Centennial) | | | 438 | | | | 469 | | | | 496 | | | | 539 | | | | 578 | | | | 35,464 | | | | | | | | | | | | | | | | | | | | | | | | 37,984 | |
| Cedar Rapids, IA | | | 346 | | | | 380 | | | | 417 | | | | 458 | | | | 503 | | | | 552 | | | | 606 | | | | 665 | | | | 730 | | | | 802 | | | | 4,292 | | | | 9,752 | |
| St. Louis, MO (Olympic) | | | 367 | | | | 2,826 | | | | | | | | | | | | | | | | | | | | | | | | | | | | | | | | | | | | | | | | 3,193 | |
| St. Louis, MO (Gravois) | | | 355 | | | | 389 | | | | 292 | | | | 115 | | | | 125 | | | | 136 | | | | 170 | | | | | | | | | | | | | | | | | | | | 1,582 | |
| St. Louis, MO (Keller) | | | 289 | | | | 315 | | | | 343 | | | | 374 | | | | 33 | | | | | | | | | | | | | | | | | | | | | | | | | | | | 1,353 | |
| N. Charleston, SC | | | 297 | | | | 311 | | | | 10,763 | | | | | | | | | | | | | | | | | | | | | | | | | | | | | | | | | | | | 11,372 | |
| Walker, MI | | | 219 | | | | 229 | | | | 7,917 | | | | | | | | | | | | | | | | | | | | | | | | | | | | | | | | | | | | 8,364 | |
| Mt. Pleasant, SC | | | 201 | | | | 211 | | | | 7,294 | | | | | | | | | | | | | | | | | | | | | | | | | | | | | | | | | | | | 7,706 | |
| Meridian, ID | | | 651 | | | | 681 | | | | 23,573 | | | | | | | | | | | | | | | | | | | | | | | | | | | | | | | | | | | | 24,905 | |
| Birmingham, AL | | | 705 | | | | 737 | | | | 25,530 | | | | | | | | | | | | | | | | | | | | | | | | | | | | | | | | | | | | 26,972 | |
| Wilmington, NC | | | 541 | | | | 565 | | | | 19,570 | | | | | | | | | | | | | | | | | | | | | | | | | | | | | | | | | | | | 20,676 | |
| Berlin, VT | | | | | | | 4,940 | | | | | | | | | | | | | | | | | | | | | | | | | | | | | | | | | | | | | | | | 4,940 | |
| Spring Hill, FL | | | 187 | | | | 206 | | | | 227 | | | | 251 | | | | 276 | | | | 304 | | | | 335 | | | | 370 | | | | 407 | | | | 449 | | | | 2,129 | | | | 5,142 | |
| West Pasco, FL | | | | | | | | | | | | | | | | | | | | | | | | | | | 4,784 | | | | | | | | | | | | | | | | | | | | 4,784 | |
| Princeton, NJ | | | 389 | | | | 423 | | | | 454 | | | | 499 | | | | 543 | | | | 590 | | | | 636 | | | | 697 | | | | 758 | | | | 823 | | | | 19,887 | | | | 25,699 | |
| Beachwood, OH | | | 359 | | | | 387 | | | | 420 | | | | 451 | | | | 487 | | | | 525 | | | | 567 | | | | 349 | | | | | | | | | | | | | | | | 3,544 | |
| Phoenix, AZ | | | 323 | | | | 16,733 | | | | | | | | | | | | | | | | | | | | | | | | | | | | | | | | | | | | | | | | 17,056 | |
| Leawood, KS | | | 1,201 | | | | 1,292 | | | | 1,390 | | | | 46,435 | | | | | | | | | | | | | | | | | | | | | | | | | | | | | | | | 50,318 | |
| Durham, NC | | | 184 | | | | 193 | | | | 6,672 | | | | | | | | | | | | | | | | | | | | | | | | | | | | | | | | | | | | 7,049 | |
| Bellefontaine, OH | | | 143 | | | | 154 | | | | 166 | | | | 179 | | | | 193 | | | | 208 | | | | 224 | | | | 241 | | | | 260 | | | | 280 | | | | 302 | | | | 2,349 | |
| Silver Springs, MD (Tech 29-1) | | | 170 | | | | 183 | | | | 196 | | | | 6,173 | | | | | | | | | | | | | | | | | | | | | | | | | | | | | | | | 6,722 | |
Summary of Consolidated Mortgage Principal Payments Corporate Debt Maturities 3.4
Developers Diversified Realty Corporation
Quarterly Financial Supplement
For the nine months ended September 30, 2006
Summary of Consolidated Mortgage Principal Payments
and Corporate Debt Maturities
as of September 30, 2006 (con’t)
(000’s)
| | | | | | | | | | | | | | | | | | | | | | | | | | | | | | | | | | | | | | | | | | | | | | | | | |
| | | 2006 Payments | | | 2007 Payments | | | 2008 Payments | | | 2009 Payments | | | 2010 Payments | | | 2011 Payments | | | 2012 Payments | | | 2013 Payments | | | 2014 Payments | | | 2015 Payments | | | Thereafter | | | Total | |
| Jamestown, NY (Southside Plaza) | | | 165 | | | | 178 | | | | 193 | | | | 208 | | | | 225 | | | | 242 | | | | 262 | | | | 147 | | | | | | | | | | | | | | | | 1,619 | |
| Ithaca, NY | | | 1,052 | | | | 1,128 | | | | 1,210 | | | | 1,298 | | | | 1,393 | | | | 1,494 | | | | 1,603 | | | | 1,720 | | | | 1,845 | | | | 1,980 | | | | 4,599 | | | | 19,323 | |
| Columbus, OH (Consumer II West) | | | 420 | | | | 465 | | | | 514 | | | | 568 | | | | 628 | | | | 694 | | | | 767 | | | | 848 | | | | 937 | | | | 8,103 | | | | | | | | 13,942 | |
| Olean, NY | | | 326 | | | | 357 | | | | 390 | | | | 427 | | | | 467 | | | | 511 | | | | 559 | | | | 611 | | | | 669 | | | | 418 | | | | | | | | 4,736 | |
| N. Charleston, SC | | | 206 | | | | 222 | | | | 239 | | | | 257 | | | | 277 | | | | 298 | | | | 9,152 | | | | | | | | | | | | | | | | | | | | 10,651 | |
| W. Long Branch, NJ (Monmouth) | | | 1,382 | | | | 1,506 | | | | 1,640 | | | | 1,786 | | | | 1,945 | | | | 2,119 | | | | 2,307 | | | | 1,440 | | | | | | | | | | | | | | | | 14,125 | |
| Big Flats, NY (Big Flats I) | | | 1,724 | | | | 1,867 | | | | 2,022 | | | | 2,190 | | | | 2,374 | | | | | | | | | | | | | | | | | | | | | | | | | | | | 10,176 | |
| Mays Landing, NJ (Wrangleboro) | | | 2,094 | | | | 2,245 | | | | 2,407 | | | | 2,581 | | | | 2,767 | | | | 2,967 | | | | 3,181 | | | | 31,980 | | | | | | | | | | | | | | | | 50,221 | |
| Plattsburgh, NY | | | 1,683 | | | | 1,823 | | | | 1,974 | | | | 2,138 | | | | 2,318 | | | | | | | | | | | | | | | | | | | | | | | | | | | | 9,936 | |
| Amherst, NY (Kmart/Blvd Cons. II) | | | 868 | | | | 938 | | | | 1,015 | | | | 1,097 | | | | 1,187 | | | | 1,283 | | | | 1,388 | | | | 1,500 | | | | 1,623 | | | | 1,603 | | | | | | | | 12,501 | |
| Big Flats, NY (Big Flats IV) | | | 63 | | | | 68 | | | | 73 | | | | 79 | | | | 86 | | | | 92 | | | | 100 | | | | 466 | | | | | | | | | | | | | | | | 1,027 | |
| Lockport, NY (Walmart/Tops) | | | 872 | | | | 944 | | | | 1,022 | | | | 1,107 | | | | 1,199 | | | | 1,298 | | | | 1,406 | | | | 1,523 | | | | 1,649 | | | | 1,786 | | | | 155 | | | | 12,962 | |
| Big Flats, NY (Big Flats II) | | | 462 | | | | 501 | | | | 543 | | | | 589 | | | | 639 | | | | 693 | | | | 751 | | | | 227 | | | | | | | | | | | | | | | | 4,406 | |
| Amherst, NY (Tops Transit + French) | | | 315 | | | | 340 | | | | 367 | | | | 396 | | | | 427 | | | | 461 | | | | 498 | | | | 538 | | | | 580 | | | | 627 | | | | 677 | | | | 5,225 | |
| Amherst, NY (Target/Blvd Cons. II) | | | 764 | | | | 808 | | | | 856 | | | | 905 | | | | 958 | | | | 1,014 | | | | 1,073 | | | | 1,135 | | | | 1,201 | | | | 1,271 | | | | 3,637 | | | | 13,623 | |
| Medina, NY | | | 236 | | | | 255 | | | | 275 | | | | 297 | | | | 320 | | | | 346 | | | | 373 | | | | 403 | | | | 435 | | | | 469 | | | | 463 | | | | 3,873 | |
| Mays Landing, NJ (Hamilton) | | | 1,271 | | | | 1,332 | | | | 1,396 | | | | 1,463 | | | | 1,534 | | | | 1,607 | | | | 1,684 | | | | 1,765 | | | | 1,850 | | | | 1,446 | | | | | | | | 15,349 | |
| Gates, NY (Westgate) | | | 301 | | | | 324 | | | | 349 | | | | 375 | | | | 404 | | | | 23,003 | | | | | | | | | | | | | | | | | | | | | | | | 24,757 | |
| Boynton Beach, FL (Meadows Square) | | | 453 | | | | 485 | | | | 519 | | | | 556 | | | | 595 | | | | 637 | | | | 682 | | | | 483 | | | | | | | | | | | | | | | | 4,410 | |
| Rome, NY (Freedom) | | | 273 | | | | 295 | | | | 319 | | | | 345 | | | | 374 | | | | 404 | | | | 437 | | | | 472 | | | | 511 | | | | 552 | | | | 469 | | | | 4,452 | |
| Englewood, FL (Rotonda) | | | 223 | | | | 236 | | | | 250 | | | | 265 | | | | 281 | | | | 298 | | | | 315 | | | | 193 | | | | | | | | | | | | | | | | 2,062 | |
| Mooresville, NC | | | 279 | | | | 300 | | | | 322 | | | | 345 | | | | 370 | | | | 397 | | | | 426 | | | | 21,332 | | | | | | | | | | | | | | | | 23,770 | |
| Alden, NY | | | 160 | | | | 173 | | | | 188 | | | | 208 | | | | 246 | | | | 266 | | | | 289 | | | | 313 | | | | 343 | | | | 393 | | | | 1,836 | | | | 4,416 | |
| Indian Train, NC (Union TC Ph I) | | | 88 | | | | 95 | | | | 102 | | | | 109 | | | | 117 | | | | 6,407 | | | | | | | | | | | | | | | | | | | | | | | | 6,919 | |
| Cheektowaga, NY (Walmart Thruway) | | | 284 | | | | 304 | | | | 325 | | | | 348 | | | | 372 | | | | 398 | | | | 426 | | | | 456 | | | | 487 | | | | 521 | | | | 1,053 | | | | 4,973 | |
| Ashtabula, OH | | | 87 | | | | 93 | | | | 100 | | | | 107 | | | | 115 | | | | 6,385 | | | | | | | | | | | | | | | | | | | | | | | | 6,888 | |
| Buffalo, NY (Delaware Commons) | | | 127 | | | | 137 | | | | 146 | | | | 157 | | | | 168 | | | | 180 | | | | 193 | | | | 17 | | | | | | | | | | | | | | | | 1,125 | |
| Springville, NY | | | 331 | | | | 353 | | | | 376 | | | | 401 | | | | 427 | | | | 455 | | | | 485 | | | | 517 | | | | 551 | | | | 587 | | | | 1,700 | | | | 6,182 | |
| Niskayuna, NY (Mohawk) | | | 1,335 | | | | 1,414 | | | | 1,497 | | | | 1,585 | | | | 1,679 | | | | 1,778 | | | | 1,883 | | | | 1,994 | | | | 2,112 | | | | 2,237 | | | | 7,535 | | | | 25,049 | |
| Canandaigua, NY | | | 373 | | | | 396 | | | | 421 | | | | 448 | | | | 476 | | | | 507 | | | | 539 | | | | 573 | | | | 609 | | | | 647 | | | | 748 | | | | 5,736 | |
| Victor, NY (Victor Square) | | | 95 | | | | 100 | | | | 107 | | | | 113 | | | | 120 | | | | 127 | | | | 135 | | | | 5,802 | | | | | | | | | | | | | | | | 6,599 | |
| Bayamon, PR (Rio Hondo) | | | 941 | | | | 1,011 | | | | 1,076 | | | | 1,169 | | | | 1,256 | | | | 1,351 | | | | 1,442 | | | | 1,561 | | | | 1,679 | | | | 1,805 | | | | 43,451 | | | | 56,743 | |
| San Juan, PR (Senorial Plaza) | | | 244 | | | | 263 | | | | 279 | | | | 303 | | | | 326 | | | | 351 | | | | 375 | | | | 405 | | | | 436 | | | | 469 | | | | 11,283 | | | | 14,735 | |
| Bayamon, PR (Rexville Plaza) | | | 147 | | | | 158 | | | | 168 | | | | 183 | | | | 197 | | | | 211 | | | | 226 | | | | 244 | | | | 263 | | | | 282 | | | | 6,798 | | | | 8,877 | |
| Arecibo, PR (Atlantico) | | | 246 | | | | 264 | | | | 281 | | | | 305 | | | | 328 | | | | 353 | | | | 377 | | | | 408 | | | | 439 | | | | 472 | | | | 11,353 | | | | 14,826 | |
| Merriam, KS (TIF) | | | | | | | | | | | | | | | | | | | | | | | | | | | | | | | | | | | | | | | | | | | 7,975 | | | | 7,975 | |
| DDR MDT MV, LLC | | | | | | | 45,923 | | | | | | | | | | | | 212,550 | | | | | | | | | | | | | | | | | | | | | | | | | | | | 258,473 | |
| Hamilton, NJ | | | | | | | 65,000 | | | | | | | | | | | | | | | | | | | | | | | | | | | | | | | | | | | | | | | | 65,000 | |
| Payments Made Through 9/30/06 | | | -24,550 | | | | | | | | | | | | | | | | | | | | | | | | | | | | | | | | | | | | | | | | | | | | -24,550 | |
| | | | | | | | | | | | | | | | | | | | | | | | | | | | | | | | | | | | | |
| Total — Property Mortgages | | | 7,010 | | | | 168,527 | | | | 164,711 | | | | 103,078 | | | | 262,338 | | | | 205,213 | | | | 66,662 | | | | 83,248 | | | | 22,364 | | | | 32,881 | | | | 149,478 | | | | 1,265,510 | |
Summary of Consolidated Mortgage Principal Payments Corporate Debt Maturities 3.4
Developers Diversified Realty Corporation
Quarterly Financial Supplement
For the nine months ended September 30, 2006
Summary of Consolidated Mortgage Principal Payments
and Corporate Debt Maturities
as of September 30, 2006 (con’t)
(000’s)
| | | | | | | | | | | | | | | | | | | | | | | | | | | | | | | | | | | | | | | | | | | | | | | | | |
| | | 2006 Payments | | | 2007 Payments | | | 2008 Payments | | | 2009 Payments | | | 2010 Payments | | | 2011 Payments | | | 2012 Payments | | | 2013 Payments | | | 2014 Payments | | | 2015 Payments | | | Thereafter | | | Total | |
CONSTRUCTION LOANS | | | | | | | | | | | | | | | | | | | | | | | | | | | | | | | | | | | | | | | | | | | | | | | | |
| $68 Million Construction Loan | | | | | | | | | | | | | | | 6,701 | | | | | | | | | | | | | | | | | | | | | | | | | | | | | | | | 6,701 | |
| (Compass Bank) | | | | | | | | | | | | | | | | | | | | | | | | | | | | | | | | | | | | | | | | | | | | | | | | |
| $20 Million Construction Loan | | | | | | | 15,573 | | | | | | | | | | | | | | | | | | | | | | | | | | | | | | | | | | | | | | | | 15,573 | |
| (National City Bank) | | | | | | | | | | | | | | | | | | | | | | | | | | | | | | | | | | | | | | | | | | | | | | | | |
| $48 Million Construction Loan | | | | | | | 48,000 | | | | | | | | | | | | | | | | | | | | | | | | | | | | | | | | | | | | | | | | 48,000 | |
| (Wachovia Bank) | | | | | | | | | | | | | | | | | | | | | | | | | | | | | | | | | | | | | | | | | | | | | | | | |
| Total — Construction Loans | | | 0 | | | | 63,573 | | | | 0 | | | | 6,701 | | | | 0 | | | | 0 | | | | 0 | | | | 0 | | | | 0 | | | | 0 | | | | 0 | | | | 70,274 | |
| | | | | | | | | | | | | | | | | | | | | | | | | | | | | | | | | | | | | |
| | | | | | | | | | | | | | | | | | | | | | | | | | | | | | | | | | | | | | | | | | | | | | | | | |
DEBT OFFERINGS | | | | | | | | | | | | | | | | | | | | | | | | | | | | | | | | | | | | | | | | | | | | | | | | |
| Senior Notes | | | | | | | 111,424 | | | | 99,966 | | | | 274,466 | | | | 499,464 | | | | 499,309 | | | | 348,550 | | | | | | | | | | | | 199,385 | | | | 100,000 | | | | 2,132,566 | |
| Unsecured Notes | | | | | | | 85,000 | | | | | | | | | | | | | | | | | | | | | | | | | | | | | | | | | | | | | | | | 85,000 | |
| | | | | | | | | | | | | | | | | | | | | | | | | | | | | | | | | | | | | |
| Total — Debt Offerings | | | 0 | | | | 196,424 | | | | 99,966 | | | | 274,466 | | | | 499,464 | | | | 499,309 | | | | 348,550 | | | | 0 | | | | 0 | | | | 199,385 | | | | 100,000 | | | | 2,217,565 | |
| | | | | | | | | | | | | | | | | | | | | | | | | | | | | | | | | | | | | | | | | | | | | | | | | |
| Total — Property Mortgages, | | | 7,010 | | | | 428,524 | | | | 264,677 | | | | 384,245 | | | | 761,802 | | | | 704,522 | | | | 415,212 | | | | 83,248 | | | | 22,364 | | | | 232,267 | | | | 249,478 | | | | 3,553,348 | |
| Construction Loans & Debt Offerings | | | | | | | | | | | | | | | | | | | | | | | | | | | | | | | | | | | | | | | | | | | | | | | | |
| | | | | | | | | | | | | | | | | | | | | | | | | | | | | | | | | | | | | | | | | | | | | | | | | |
REVOLVING CREDIT FACILITIES & TERM LOANS | | | | | | | | | | | | | | | | | | | | | | | | | | | | | | | | | | | | | | | | | | | | | | | | |
| $1.2 Billion Unsecured Credit Facility | | | | | | | | | | | | | | | | | | | 120,000 | (1) | | | | | | | | | | | | | | | | | | | | | | | | | | | 120,000 | |
| (JPMorgan Chase) | | | | | | | | | | | | | | | | | | | | | | | | | | | | | | | | | | | | | | | | | | | | | | | | |
| $400 Million Secured Term Loan | | | | | | | | | | | 400,000 | (1) | | | | | | | | | | | | | | | | | | | | | | | | | | | | | | | | | | | 400,000 | |
| (Key Bank) | | | | | | | | | | | | | | | | | | | | | | | | | | | | | | | | | | | | | | | | | | | | | | | | |
| $60 Million Unsecured Credit Facility | | | | | | | | | | | | | | | | | | | 5,000 | (1) | | | | | | | | | | | | | | | | | | | | | | | | | | | 5,000 | |
| (National City Bank) | | | | | | | | | | | | | | | | | | | | | | | | | | | | | | | | | | | | | | | | | | | | | | | | |
| | | | | | | | | | | | | | | | | | | | | | | | | | | | | | | | | | | | | |
| Total — Debt | | $ | 7,010 | | | $ | 428,524 | | | $ | 664,677 | | | $ | 384,245 | | | $ | 886,802 | | | $ | 704,522 | | | $ | 415,212 | | | $ | 83,248 | | | $ | 22,364 | | | $ | 232,267 | | | $ | 249,478 | | | $ | 4,078,348 | |
| | | | | | | | | | | | | | | | | | | | | | | | | | | | | | | | | | | | | |
Notes:
| (1) | | Balance at September 30, 2006 on revolving credit facilities. The $1.2 billion JPMorgan Chase facility has one one-year extension option to 2011. The $400 million Key Bank facility has two one-year extension options to 2010. The $60 million National City Bank facility has one one-year extension option to 2011. |
Summary of Consolidated Mortgage Principal Payments & Corporate Debt Maturities 3.4
Developers Diversified Realty
Quarterly Financial Supplement
For the nine months ended September 30, 2006
Joint Ventures (Combining Financial Information) (1)
(in millions)
Combining Balance Sheets
as of September 30, 2006
| | | | | | | | | | | | | | | | | | | | | | | | | | | | | | | | | |
| | | RVIP III B | | | | | | | | | | | RVIP VIII | | | | | | | Community Centers | | | Lennox Town | | | Sun Center | |
| | | Deer Park, IL | | | RVIP VI | | | RVIP VII | | | Tech Ridge LLC | | | DPG | | | Five | | | Center (2) | | | Limited (2) | |
| Real Estate Assets | | $ | 83.8 | | | $ | 7.7 | | | $ | 117.2 | | | $ | 33.9 | | | $ | 130.4 | | | $ | 266.5 | | | $ | 21.0 | | | $ | 25.9 | |
| Accumulated Depreciation | | | (11.1 | ) | | | (1.1 | ) | | | (15.5 | ) | | | (2.5 | ) | | | (6.0 | ) | | | (45.1 | ) | | | (4.3 | ) | | | (6.9 | ) |
| | | | | | | | | | | | | | | | | | | | | | | | | |
| Real Estate, net | | | 72.7 | | | | 6.6 | | | | 101.7 | | | | 31.4 | | | | 124.4 | | | | 221.5 | | | | 16.8 | | | | 19.0 | |
| | | | | | | | | | | | | | | | | | | | | | | | | |
| Receivables, Net | | | 0.6 | | | | 0.3 | | | | 10.3 | | | | 1.2 | | | | 1.6 | | | | 7.0 | | | | 1.5 | | | | 0.8 | |
| Other assets | | | 4.7 | | | | 0.4 | | | | 7.2 | | | | 1.7 | | | | 2.4 | | | | 10.4 | | | | 0.6 | | | | 0.9 | |
| Disproportionate Share of Equity | | | — | | | | — | | | | — | | | | — | | | | — | | | | — | | | | — | | | | — | |
| | | | | | | | | | | | | | | | | | | | | | | | | |
| | | $ | 78.0 | | | $ | 7.3 | | | $ | 119.2 | | | $ | 34.3 | | | $ | 128.4 | | | $ | 238.9 | | | $ | 18.9 | | | $ | 20.7 | |
| | | | | | | | | | | | | | | | | | | | | | | | | |
| | | | | | | | | | | | | | | | | | | | | | | | | | | | | | | | | |
| Mortgage Debt | | $ | 60.0 | | | $ | 3.0 | | | $ | 74.0 | | | $ | 23.4 | | | $ | 11.0 | | | $ | 298.0 | | | $ | 17.7 | | | $ | 20.2 | |
| Amounts payable to DDRC | | | 0.0 | | | | 0.0 | | | | 0.0 | | | | 0.0 | | | | 0.0 | | | | 0.1 | | | | 0.0 | | | | 0.0 | |
| Other liabilities | | | 2.1 | | | | 0.3 | | | | 16.7 | | | | 1.5 | | | | 2.8 | | | | 6.0 | | | | 0.8 | | | | 0.6 | |
| | | | | | | | | | | | | | | | | | | | | | | | | |
| | | | 62.1 | | | | 3.3 | | | | 90.7 | | | | 24.9 | | | | 13.8 | | | | 304.1 | | | | 18.5 | | | | 20.8 | |
| | | | | | | | | | | | | | | | | | | | | | | | | | | | | | | | | |
| Accumulated equity (deficit) | | | 15.9 | | | | 4.0 | | | | 28.5 | | | | 9.4 | | | | 114.6 | | | | (65.2 | ) | | | 0.4 | | | | (0.1 | ) |
| Disproportionate Share of Equity | | | — | | | | — | | | | — | | | | — | | | | — | | | | — | | | | — | | | | — | |
| | | | | | | | | | | | | | | | | | | | | | | | | |
| | | $ | 78.0 | | | $ | 7.3 | | | $ | 119.2 | | | $ | 34.3 | | | $ | 128.4 | | | $ | 238.9 | | | $ | 18.9 | | | $ | 20.7 | |
| | | | | | | | | | | | | | | | | | | | | | | | | |
| | | | | | | | | | | | | | | | | | | | | | | | | | | | | | | | | |
| Proportionate share of other assets/liabilities, net | | $ | 0.8 | | | $ | 0.1 | | | $ | 0.2 | | | $ | 0.4 | | | $ | 0.1 | | | $ | 5.7 | | | $ | 0.6 | | | $ | 0.9 | |
| | | | | | | | | | | | | | | | | | | | | | | | | |
| Disproportionate amount payable to DDR | | $ | 0.0 | | | $ | 0.0 | | | $ | 0.0 | | | $ | 0.0 | | | $ | 0.0 | | | $ | 0.0 | | | $ | 0.0 | | | $ | 0.0 | |
| | | | | | | | | | | | | | | | | | | | | | | | | |
Combining Statements of Operations
for the period ended September 30, 2006
| | | | | | | | | | | | | | | | | | | | | | | | | | | | | | | | | |
| | | RVIP III B | | | | | | | | | | | RVIP VIII | | | | | | | Community Centers | | | Lennox Town | | | Sun Center | |
| | | Deer Park, IL | | | RVIP VI | | | RVIP VII | | | Tech Ridge LLC | | | DPG | | | Five | | | Center (2) | | | Limited (2) | |
| Revenues from operations | | $ | 8.9 | | | $ | 0.7 | | | $ | 11.0 | | | $ | 4.5 | | | $ | 9.6 | | | $ | 28.3 | | | $ | 3.5 | | | $ | 3.4 | |
| Rental operation expenses | | | (3.3 | ) | | | (0.2 | ) | | | (3.1 | ) | | | (1.7 | ) | | | (2.6 | ) | | | (8.5 | ) | | | (1.0 | ) | | | (0.8 | ) |
| | | | | | | | | | | | | | | | | | | | | | | | | |
| Net operating income | | | 5.6 | | | | 0.5 | | | | 7.9 | | | | 2.8 | | | | 7.0 | | | | 19.8 | | | | 2.5 | | | | 2.6 | |
| Depreciation and amortization expense | | | (1.7 | ) | | | (0.2 | ) | | | (2.1 | ) | | | (0.8 | ) | | | (2.4 | ) | | | (4.8 | ) | | | (0.3 | ) | | | (0.6 | ) |
| Interest expense | | | (2.8 | ) | | | (0.2 | ) | | | (4.3 | ) | | | (1.1 | ) | | | (0.6 | ) | | | (12.9 | ) | | | (1.1 | ) | | | (1.2 | ) |
| | | | | | | | | | | | | | | | | | | | | | | | | |
| Income (loss) before gain on sale | | | 1.1 | | | | 0.1 | | | | 1.5 | | | | 0.9 | | | | 4.0 | | | | 2.1 | | | | 1.1 | | | | 0.8 | |
| Gain (loss) on sale of real estate | | | 0.0 | | | | 0.0 | | | | 0.0 | | | | 0.0 | | | | 0.0 | | | | 0.0 | | | | 0.0 | | | | 0.0 | |
| Discontinued operations | | | 0.0 | | | | (0.1 | ) | | | 0.5 | | | | 0.0 | | | | 0.0 | | | | 0.0 | | | | 0.0 | | | | 0.0 | |
| Gain on sale of discontinued operations | | | 0.0 | | | | (1.8 | ) | | | 3.7 | | | | (0.0 | ) | | | 0.0 | | | | 0.0 | | | | 0.0 | | | | 0.0 | |
| Disproportionate Share of Income | | | — | | | | — | | | | — | | | | — | | | | — | | | | — | | | | — | | | | — | |
| | | | | | | | | | | | | | | | | | | | | | | | | |
| Net income (loss) | | $ | 1.1 | | | | ($1.8 | ) | | $ | 5.7 | | | $ | 0.9 | | | $ | 4.0 | | | $ | 2.1 | | | $ | 1.1 | | | $ | 0.8 | |
| DDR Ownership interest | | | *** | | | | *** | | | | *** | | | | *** | | | | 10 | % | | | 50 | % | | | *** | | | | *** | |
| | | | | | | | | | | | | | | | | | | | | | | | | |
| | | $ | 0.4 | | | | ($0.4 | ) | | $ | 1.9 | | | $ | 0.3 | | | $ | 0.4 | | | $ | 1.1 | | | $ | 0.6 | | | $ | 0.7 | |
| Amortization of basis differential | | | 0.0 | | | | (0.2 | ) | | | 0.0 | | | | 0.0 | | | | 0.0 | | | | 0.1 | | | | (0.1 | ) | | | (0.1 | ) |
| | | | | | | | | | | | | | | | | | | | | | | | | |
| | | $ | 0.4 | | | | ($0.7 | ) | | $ | 1.9 | | | $ | 0.3 | | | $ | 0.4 | | | $ | 1.2 | | | $ | 0.5 | | | $ | 0.5 | |
| | | | | | | | | | | | | | | | | | | | | | | | | |
| | | | | | | | | | | | | | | | | | | | | | | | | | | | | | | | | |
| Proportionate share of net operating income (6) | | $ | 1.4 | | | $ | 0.1 | | | $ | 1.6 | | | $ | 0.7 | | | $ | 0.7 | | | $ | 9.9 | | | $ | 1.3 | | | $ | 2.1 | |
| | | | | | | | | | | | | | | | | | | | | | | | | |
| Proportionate share of interest expense (6) | | $ | 0.7 | | | $ | 0.0 | | | $ | 0.9 | | | $ | 0.3 | | | $ | 0.0 | | | $ | 6.4 | | | $ | 0.5 | | | $ | 1.0 | |
| | | | | | | | | | | | | | | | | | | | | | | | | |
| | | | | | | | | | | | | | | | | | | | | | | | | | | | | | | | | |
Funds From Operations (“FFO”): | | | | | | | | | | | | | | | | | | | | | | | | | | | | | | | | |
| | | | | | | | | | | | | | | | | | | | | | | | | | | | | | | | | |
| Net income (loss) | | $ | 1.1 | | | | ($1.8 | ) | | $ | 5.7 | | | $ | 0.9 | | | $ | 4.0 | | | $ | 2.1 | | | $ | 1.1 | | | $ | 0.8 | |
| Depreciation of real property | | | 1.7 | | | | 0.5 | | | | 2.2 | | | | 0.8 | | | | 2.4 | | | | 4.8 | | | | 0.3 | | | | 0.6 | |
| (Gain) loss on sale | | | 0.0 | | | | 0.0 | | | | (3.7 | ) | | | 0.0 | | | | 0.0 | | | | 0.0 | | | | 0.0 | | | | 0.0 | |
| Disproportionate Share of Income | | | — | | | | — | | | | — | | | | — | | | | — | | | | — | | | | — | | | | — | |
| | | | | | | | | | | | | | | | | | | | | | | | | |
| | | $ | 2.8 | | | | ($1.3 | ) | | $ | 4.2 | | | $ | 1.7 | | | $ | 6.4 | | | $ | 6.9 | | | $ | 1.4 | | | $ | 1.4 | |
| DDR ownership interest | | | *** | | | | *** | | | | *** | | | | *** | | | | 10 | % | | | 50 | % | | | *** | | | | *** | |
| | | | | | | | | | | | | | | | | | | | | | | | | |
| DDR FFO | | $ | 1.1 | | | | ($0.3 | ) | | $ | 1.4 | | | $ | 0.6 | | | $ | 0.6 | | | $ | 3.5 | | | $ | 0.7 | | | $ | 1.1 | |
| | | | | | | | | | | | | | | | | | | | | | | | | |
Joint Venture Financials 4.1
Developers Diversified Realty
Quarterly Financial Supplement
For the nine months ended September 30, 2006
Joint Ventures (Combining Financial Information) (1)
(in millions)
Combining Balance Sheets
as of September 30, 2006
| | | | | | | | | | | | | | | | | | | | | | | | | | | | | | | | | |
| | | | | | | | | | | | | | | | | | | | | | | | | | | | | | | Coventry II | |
| | | Dublin | | | | | | | | | | | Jefferson | | | Sansone Group / | | | | | | | DDR Markaz | | | DDR | |
| | | Village (3) | | | DOTRS | | | Littleton, CO (3) | | | County, MO | | | DDRC LLC | | | DDR Markaz | | | II | | | Bloomfield | |
| Real Estate Assets | | $ | 0.1 | | | $ | 24.7 | | | $ | 3.1 | | | $ | 6.6 | | | $ | 0.4 | | | $ | 167.4 | | | $ | 202.5 | | | $ | 69.3 | |
| Accumulated Depreciation | | | 0.0 | | | | (4.9 | ) | | | 0.0 | | | | (0.6 | ) | | | (0.2 | ) | | | (13.3 | ) | | | (10.2 | ) | | | 0.0 | |
| | | | | | | | | | | | | | | | | | | | | | | | | |
| Real Estate, net | | | 0.1 | | | | 19.8 | | | | 3.1 | | | | 6.0 | | | | 0.2 | | | | 154.1 | | | | 192.3 | | | | 69.3 | |
| | | | | | | | | | | | | | | | | | | | | | | | | |
| Receivables, Net | | | 0.0 | | | | 0.7 | | | | 0.0 | | | | 0.0 | | | | 1.4 | | | | 2.8 | | | | 1.5 | | | | 0.0 | |
| Other assets | | | 0.0 | | | | 0.8 | | | | 0.2 | | | | 0.3 | | | | 2.6 | | | | 6.5 | | | | 6.7 | | | | 0.1 | |
| Disproportionate Share of Equity | | | — | | | | — | | | | — | | | | — | | | | — | | | | — | | | | — | | | | — | |
| | | | | | | | | | | | | | | | | | | | | | | | | |
| | | $ | 0.1 | | | $ | 21.3 | | | $ | 3.3 | | | $ | 6.3 | | | $ | 4.2 | | | $ | 163.4 | | | $ | 200.5 | | | $ | 69.4 | |
| | | | | | | | | | | | | | | | | | | | | | | | | |
| | | | | | | | | | | | | | | | | | | | | | | | | | | | | | | | | |
| Mortgage Debt | | $ | 0.0 | | | $ | 21.0 | | | $ | 0.0 | | | $ | 3.7 | | | $ | 0.0 | | | $ | 110.0 | | | $ | 150.5 | | | $ | 68.0 | |
| Amounts payable to DDRC | | | 0.0 | | | | 0.0 | | | | 0.0 | | | | 3.1 | | | | 0.0 | | | | 0.8 | | | | 0.3 | | | | 0.0 | |
| Other liabilities | | | 0.0 | | | | 0.6 | | | | 0.2 | | | | 0.1 | | | | 0.9 | | | | 3.2 | | | | 0.2 | | | | 0.0 | |
| | | | | | | | | | | | | | | | | | | | | | | | | |
| | | | 0.0 | | | | 21.6 | | | | 0.2 | | | | 6.9 | | | | 0.9 | | | | 114.0 | | | | 151.0 | | | | 68.0 | |
| Accumulated equity (deficit) | | | 0.1 | | | | (0.3 | ) | | | 3.1 | | | | (0.6 | ) | | | 3.3 | | | | 49.4 | | | | 49.5 | | | | 1.4 | |
| Disproportionate Share of Equity | | | — | | | | — | | | | — | | | | — | | | | — | | | | — | | | | — | | | | — | |
| | | | | | | | | | | | | | | | | | | | | | | | | |
| | | $ | 0.1 | | | $ | 21.3 | | | $ | 3.3 | | | $ | 6.3 | | | $ | 4.2 | | | $ | 163.4 | | | $ | 200.5 | | | $ | 69.4 | |
| | | | | | | | | | | | | | | | | | | | | | | | | |
| | | | | | | | | | | | | | | | | | | | | | | | | | | | | | | | | |
| Proportionate share of other assets/liabilities, net | | | ($0.0 | ) | | $ | 0.5 | | | | ($0.0 | ) | | $ | 0.1 | | | $ | 1.5 | | | $ | 1.2 | | | $ | 1.6 | | | $ | 0.0 | |
| | | | | | | | | | | | | | | | | | | | | | | | | |
| Disproportionate amount payable to DDR | | $ | 0.0 | | | $ | 0.0 | | | $ | 0.0 | | | $ | 1.5 | | | $ | 0.0 | | | $ | 0.0 | | | $ | 0.0 | | | $ | 0.0 | |
| | | | | | | | | | | | | | | | | | | | | | | | | |
Combining Statements of Operations
for the period ended September 30, 2006
| | | | | | | | | | | | | | | | | | | | | | | | | | | | | | | | | |
| | | | | | | | | | | | | | | | | | | | | | | | | | | | | | Coventry II | |
| | | Dublin | | | | | | | | | | | Jefferson | | | Sansone Group / | | | | | | | DDR Markaz | | | DDR | |
| | | Village (3) | | | DOTRS | | | Littleton, CO (3) | | | County, MO | | | DDRC LLC | | | DDR Markaz | | | II | | | Bloomfield | |
| Revenues from operations | | | ($0.0 | ) | | $ | 3.0 | | | $ | 0.0 | | | $ | 0.5 | | | $ | 2.0 | | | $ | 16.6 | | | $ | 16.3 | | | $ | 0.0 | |
| Rental operation expenses | | | (0.0 | ) | | | (0.8 | ) | | | (0.1 | ) | | | (0.2 | ) | | | 0.0 | | | | (5.5 | ) | | | (5.6 | ) | | | 0.0 | |
| | | | | | | | | | | | | | | | | | | | | | | | | |
| Net operating income | | | 0.0 | | | | 2.2 | | | | (0.1 | ) | | | 0.3 | | | | 2.0 | | | | 11.1 | | | | 10.7 | | | | 0.0 | |
| Depreciation and amortization expense | | | 0.0 | | | | (0.4 | ) | | | 0.0 | | | | (0.2 | ) | | | (0.0 | ) | | | (3.2 | ) | | | (4.1 | ) | | | (0.0 | ) |
| Interest expense | | | (0.0 | ) | | | (0.5 | ) | | | 0.0 | | | | (0.4 | ) | | | 0.0 | | | | (3.5 | ) | | | (6.0 | ) | | | 0.0 | |
| | | | | | | | | | | | | | | | | | | | | | | | | |
| Income (loss) before gain on sale | | | 0.0 | | | | 1.3 | | | | (0.1 | ) | | | (0.3 | ) | | | 2.0 | | | | 4.4 | | | | 0.6 | | | | (0.0 | ) |
| | | | | | | | | | | | | | | | | | | | | | | | | | | | | | | | | |
| Gain (loss) on sale of real estate | | | 0.0 | | | | 0.0 | | | | 0.0 | | | | 0.0 | | | | 0.0 | | | | 0.0 | | | | 0.0 | | | | 0.0 | |
| Discontinued operations | | | 0.0 | | | | 0.0 | | | | 0.0 | | | | 0.0 | | | | 0.0 | | | | 0.0 | | | | 0.0 | | | | 0.0 | |
| Gain on sale of discontinued operations | | | 0.0 | | | | 0.0 | | | | 0.0 | | | | 0.0 | | | | 0.0 | | | | 0.0 | | | | 0.0 | | | | 0.0 | |
| Disproportionate Share of Income | | | — | | | | — | | | | — | | | | — | | | | — | | | | — | | | | — | | | | — | |
| | | | | | | | | | | | | | | | | | | | | | | | | |
| Net income (loss) | | $ | 0.0 | | | $ | 1.3 | | | | ($0.1 | ) | | | ($0.3 | ) | | $ | 2.0 | | | $ | 4.4 | | | $ | 0.6 | | | | ($0.0 | ) |
| DDR Ownership interest | | | 63 | % | | | 50 | % | | | 50 | % | | | 50 | % | | | *** | | | | 20 | % | | | 20 | % | | | 20 | % |
| | | | | | | | | | | | | | | | | | | | | | | | | |
| | | | ($0.0 | ) | | $ | 0.6 | | | | ($0.0 | ) | | | ($0.1 | ) | | $ | 1.0 | | | $ | 0.9 | | | $ | 0.1 | | | $ | 0.0 | |
| | | | | | | | | | | | | | | | | | | | | | | | | | | | | | | | | |
| Amortization of basis differential | | | 0.0 | | | | 0.1 | | | | 0.0 | | | | 0.0 | | | | (0.3 | ) | | | 0.1 | | | | 0.1 | | | | 0.0 | |
| | | | | | | | | | | | | | | | | | | | | | | | | |
| | | $ | 0.0 | | | $ | 0.6 | | | $ | 0.0 | | | | ($0.1 | ) | | $ | 0.8 | | | $ | 1.1 | | | $ | 0.3 | | | $ | 0.0 | |
| | | | | | | | | | | | | | | | | | | | | | | | | |
| | | | | | | | | | | | | | | | | | | | | | | | | | | | | | | | | |
| Proportionate share of net operating income (6) | | | ($0.0 | ) | | $ | 1.1 | | | | ($0.0 | ) | | $ | 0.2 | | | $ | 1.0 | | | $ | 2.2 | | | $ | 2.1 | | | $ | 0.0 | |
| | | | | | | | | | | | | | | | | | | | | | | | | |
| Proportionate share of interest expense (6) | | $ | 0.0 | | | $ | 0.2 | | | $ | 0.0 | | | $ | 0.2 | | | $ | 0.0 | | | $ | 0.7 | | | $ | 1.2 | | | $ | 0.0 | |
| | | | | | | | | | | | | | | | | | | | | | | | | |
| | | | | | | | | | | | | | | | | | | | | | | | | | | | | | | | | |
Funds From Operations (“FFO”): | | | | | | | | | | | | | | | | | | | | | | | | | | | | | | | | |
| | | | | | | | | | | | | | | | | | | | | | | | | | | | | | | | | |
| Net income (loss) | | | ($0.0 | ) | | $ | 1.3 | | | | ($0.1 | ) | | | ($0.3 | ) | | $ | 2.0 | | | $ | 4.4 | | | $ | 0.6 | | | $ | 0.0 | |
| Depreciation of real property | | | 0.0 | | | | 0.4 | | | | 0.0 | | | | 0.2 | | | | 0.0 | | | | 3.2 | | | | 4.1 | | | | 0.0 | |
| (Gain) loss on sale | | | 0.0 | | | | 0.0 | | | | 0.0 | | | | 0.0 | | | | 0.0 | | | | 0.0 | | | | 0.0 | | | | 0.0 | |
| Disproportionate Share of Income | | | — | | | | — | | | | — | | | | — | | | | — | | | | — | | | | — | | | | — | |
| | | | | | | | | | | | | | | | | | | | | | | | | |
| | | $ | 0.0 | | | $ | 1.7 | | | | ($0.1 | ) | | | ($0.1 | ) | | $ | 2.0 | | | $ | 7.6 | | | $ | 4.7 | | | $ | 0.0 | |
| DDR ownership interest | | | 63 | % | | | 50 | % | | | 50 | % | | | 50 | % | | | *** | | | | 20 | % | | | *** | | | | 20 | % |
| | | | | | | | | | | | | | | | | | | | | | | | | |
| DDR FFO | | | ($0.0 | ) | | $ | 0.8 | | | | ($0.0 | ) | | | ($0.0 | ) | | $ | 1.0 | | | $ | 1.5 | | | $ | 1.1 | | | $ | 0.0 | |
| | | | | | | | | | | | | | | | | | | | | | | | | |
Joint Venture Financials 4.1
Developers Diversified Realty
Quarterly Financial Supplement
For the nine months ended September 30, 2006
Joint Ventures (Combining Financial Information) (1)
(in millions)
Combining Balance Sheets
as of September 30, 2006
| | | | | | | | | | | | | | | | | | | | | | | | | | | | | | | | | |
| | | | | | | | | | | | | | | | | | | Coventry II DDR | | | | | | | | | | |
| | | Coventry II DDR | | | Coventry II DDR | | | Coventry II DDR | | | Coventry II DDR | | | Phoenix | | | Coventry II DDR | | | Coventry II DDR | | | Coventry II DDR | |
| | | Buena Park | | | Fairplain Plaza | | | Merriam Village | | | Montgomery Farm | | | Spectrum | | | SM (4) | | | Totem Lakes | | | Tri-County Mall | |
| Real Estate Assets | | $ | 95.0 | | | $ | 27.2 | | | $ | 21.0 | | | $ | 15.0 | | | $ | 74.8 | | | $ | 171.9 | | | $ | 39.9 | | | $ | 194.9 | |
| Accumulated Depreciation | | | (3.3 | ) | | | (0.2 | ) | | | 0.0 | | | | 0.0 | | | | (2.9 | ) | | | 0.0 | | | | (1.7 | ) | | | (1.4 | ) |
| | | | | | | | | | | | | | | | | | | | | | | | | |
| Real Estate, net | | | 91.7 | | | | 27.0 | | | | 21.0 | | | | 15.0 | | | | 71.9 | | | | 171.9 | | | | 38.2 | | | | 193.5 | |
| | | | | | | | | | | | | | | | | | | | | | | | | |
| Receivables, Net | | | 0.7 | | | | 0.1 | | | | 0.0 | | | | 0.0 | | | | 1.3 | | | | 3.4 | | | | 0.1 | | | | 1.2 | |
| Other assets | | | 2.1 | | | | 0.4 | | | | 0.6 | | | | 0.7 | | | | 1.5 | | | | 17.2 | | | | 0.6 | | | | 20.7 | |
| Disproportionate Share of Equity | | | — | | | | — | | | | — | | | | — | | | | — | | | | — | | | | — | | | | — | |
| | | | | | | | | | | | | | | | | | | | | | | | | |
| | | $ | 94.5 | | | $ | 27.5 | | | $ | 21.6 | | | $ | 15.7 | | | $ | 74.7 | | | $ | 192.5 | | | $ | 38.9 | | | $ | 215.4 | |
| | | | | | | | | | | | | | | | | | | | | | | | | |
| | | | | | | | | | | | | | | | | | | | | | | | | | | | | | | | | |
| Mortgage Debt | | $ | 61.0 | | | $ | 15.9 | | | $ | 18.5 | | | $ | 8.5 | | | $ | 47.5 | | | $ | 139.0 | | | $ | 26.0 | | | $ | 170.0 | |
| Amounts payable to DDRC | | | 0.0 | | | | 0.0 | | | | 0.0 | | | | 0.0 | | | | 0.0 | | | | 0.0 | | | | 0.0 | | | | 0.0 | |
| Other liabilities | | | 3.1 | | | | 0.2 | | | | 1.1 | | | | 0.0 | | | | 3.2 | | | | 4.7 | | | | 1.0 | | | | 8.1 | |
| | | | | | | | | | | | | | | | | | | | | | | | | |
| | | | 64.1 | | | | 16.1 | | | | 19.6 | | | | 8.5 | | | | 50.7 | | | | 143.7 | | | | 27.0 | | | | 178.1 | |
| Accumulated equity (deficit) | | | 30.4 | | | | 11.4 | | | | 2.0 | | | | 7.2 | | | | 24.0 | | | | 48.8 | | | | 11.9 | | | | 37.3 | |
| Disproportionate Share of Equity | | | — | | | | — | | | | — | | | | — | | | | — | | | | — | | | | — | | | | — | |
| | | | | | | | | | | | | | | | | | | | | | | | | |
| | | $ | 94.5 | | | $ | 27.5 | | | $ | 21.6 | | | $ | 15.7 | | | $ | 74.7 | | | $ | 192.5 | | | $ | 38.9 | | | $ | 215.4 | |
| | | | | | | | | | | | | | | | | | | | | | | | | |
| | | | | | | | | | | | | | | | | | | | | | | | | | | | | | | | | |
| Proportionate share of other assets/liabilities, net | | ($ | 0.1 | ) | | $ | 0.1 | | | ($ | 0.1 | ) | | $ | 0.1 | | | ($ | 0.1 | ) | | $ | 3.2 | | | ($ | 0.1 | ) | | $ | 2.5 | |
| | | | | | | | | | | | | | | | | | | | | | | | | |
| Disproportionate amount payable to DDR | | $ | 0.0 | | | $ | 0.0 | | | $ | 0.0 | | | $ | 0.0 | | | $ | 0.0 | | | $ | 0.0 | | | $ | 0.0 | | | $ | 0.0 | |
| | | | | | | | | | | | | | | | | | | | | | | | | |
Combining Statements of Operations
for the period ended September 30, 2006
| | | | | | | | | | | | | | | | | | | | | | | | | | | | | | | | | |
| | | | | | | | | | | | | | | | | | | Coventry II DDR | | | | | | | | | | |
| | | Coventry II DDR | | | Coventry II DDR | | | Coventry II DDR | | | Coventry II DDR | | | Phoenix | | | Coventry II DDR | | | Coventry II DDR | | | Coventry II DDR | |
| | | Buena Park | | | Fairplain Plaza | | | Merriam Village | | | Montgomery Farm | | | Spectrum | | | SM (4) | | | Totem Lakes | | | Tri-County Mall | |
| | | | | | | | | | | | | | | | | | | | | | | | | |
| Revenues from operations | | | 9.1 | | | | 0.9 | | | | 0.0 | | | | 0.0 | | | | 5.4 | | | | 0.8 | | | | 2.7 | | | | 6.9 | |
| Rental operation expenses | | | (4.2 | ) | | | (0.3 | ) | | | (0.0 | ) | | | (0.0 | ) | | | (2.4 | ) | | | (0.3 | ) | | | (1.0 | ) | | | (2.5 | ) |
| | | | | | | | | | | | | | | | | | | | | | | | | |
| Net operating income | | | 4.9 | | | | 0.6 | | | | (0.0 | ) | | | 0.0 | | | | 3.0 | | | | 0.5 | | | | 1.7 | | | | 4.5 | |
| Depreciation and amortization expense | | | (1.5 | ) | | | (0.2 | ) | | | 0.0 | | | | 0.0 | | | | (0.9 | ) | | | 0.0 | | | | (0.5 | ) | | | (1.2 | ) |
| Interest expense | | | (3.0 | ) | | | (0.5 | ) | | | 0.0 | | | | 0.0 | | | | (1.4 | ) | | | (0.4 | ) | | | (1.5 | ) | | | (4.6 | ) |
| | | | | | | | | | | | | | | | | | | | | | | | | |
| Income (loss) before gain on sale | | | 0.4 | | | | (0.1 | ) | | | (0.0 | ) | | | (0.0 | ) | | | 0.7 | | | | 0.1 | | | | (0.2 | ) | | | (1.5 | ) |
| Gain (loss) on sale of real estate | | | 0.0 | | | | 0.0 | | | | 0.0 | | | | 0.0 | | | | 0.0 | | | | 0.0 | | | | 0.0 | | | | 0.0 | |
| Discontinued operations | | | 0.0 | | | | 0.0 | | | | 0.0 | | | | 0.0 | | | | 0.0 | | | | 0.0 | | | | 0.0 | | | | 0.0 | |
| Gain on sale of discontinued operations | | | 0.0 | | | | 0.0 | | | | 0.0 | | | | 0.0 | | | | 0.0 | | | | 0.0 | | | | 0.0 | | | | 0.0 | |
| Disproportionate Share of Income | | | — | | | | — | | | | — | | | | — | | | | — | | | | — | | | | — | | | | — | |
| | | | | | | | | | | | | | | | | | | | | | | | | |
| Net income (loss) | | $ | 0.4 | | | ($ | 0.1 | ) | | $ | 0.0 | | | $ | 0.0 | | | $ | 0.7 | | | $ | 0.1 | | | ($ | 0.2 | ) | | ($ | 1.5 | ) |
| DDR Ownership interest | | | 20 | % | | | 20 | % | | | 20 | % | | | 20 | % | | | 20 | % | | | 20 | % | | | 20 | % | | | 20 | % |
| | | | | | | | | | | | | | | | | | | | | | | | | |
| | | $ | 0.1 | | | ($ | 0.0 | ) | | ($ | 0.0 | ) | | $ | 0.0 | | | $ | 0.1 | | | $ | 0.0 | | | ($ | 0.0 | ) | | ($ | 0.3 | ) |
| Amortization of basis differential | | | 0.0 | | | | 0.0 | | | | 0.0 | | | | 0.0 | | | | 0.0 | | | | 0.0 | | | | 0.0 | | | | 0.0 | |
| | | | | | | | | | | | | | | | | | | | | | | | | |
| | | $ | 0.1 | | | $ | 0.0 | | | $ | 0.0 | | | $ | 0.0 | | | $ | 0.1 | | | $ | 0.0 | | | ($ | 0.0 | ) | | ($ | 0.3 | ) |
| | | | | | | | | | | | | | | | | | | | | | | | | |
| | | | | | | | | | | | | | | | | | | | | | | | | | | | | | | | | |
| Proportionate share of net operating income (6) | | $ | 1.0 | | | $ | 0.1 | | | ($ | 0.0 | ) | | $ | 0.0 | | | $ | 0.6 | | | $ | 0.1 | | | $ | 0.4 | | | $ | 0.9 | |
| | | | | | | | | | | | | | | | | | | | | | | | | |
| Proportionate share of interest expense (6) | | $ | 0.6 | | | $ | 0.1 | | | $ | 0.0 | | | $ | 0.0 | | | $ | 0.3 | | | $ | 0.1 | | | $ | 0.3 | | | $ | 0.9 | |
| | | | | | | | | | | | | | | | | | | | | | | | | |
| | | | | | | | | | | | | | | | | | | | | | | | | | | | | | | | | |
Funds From Operations (“FFO”): | | | | | | | | | | | | | | | | | | | | | | | | | | | | | | | | |
| | | | | | | | | | | | | | | | | | | | | | | | | | | | | | | | | |
| Net income (loss) | | | 0.4 | | | | (0.1 | ) | | | (0.0 | ) | | | (0.0 | ) | | | 0.7 | | | | 0.1 | | | | (0.2 | ) | | | (1.5 | ) |
| Depreciation of real property | | | 1.5 | | | | 0.2 | | | | 0.0 | | | | 0.0 | | | | 0.9 | | | | 0.0 | | | | 0.5 | | | | 1.2 | |
| (Gain) loss on sale | | | 0.0 | | | | 0.0 | | | | 0.0 | | | | 0.0 | | | | 0.0 | | | | 0.0 | | | | 0.0 | | | | 0.0 | |
| Disproportionate Share of Income | | | — | | | | — | | | | — | | | | — | | | | — | | | | — | | | | — | | | | — | |
| | | | | | | | | | | | | | | | | | | | | | | | | |
| | | $ | 1.9 | | | $ | 0.1 | | | $ | 0.0 | | | $ | 0.0 | | | $ | 1.6 | | | $ | 0.1 | | | $ | 0.3 | | | ($ | 0.2 | ) |
| DDR ownership interest | | | 20 | % | | | 20 | % | | | 20 | % | | | 20 | % | | | 20 | % | | | 20 | % | | | 20 | % | | | 20 | % |
| | | | | | | | | | | | | | | | | | | | | | | | | |
| DDR FFO | | $ | 0.4 | | | $ | 0.0 | | | ($ | 0.0 | ) | | $ | 0.0 | | | $ | 0.3 | | | $ | 0.0 | | | $ | 0.1 | | | ($ | 0.0 | ) |
| | | | | | | | | | | | | | | | | | | | | | | | | |
Joint Venture Financials 4.1
Developers Diversified Realty
Quarterly Financial Supplement
For the nine months ended September 30, 2006
Joint Ventures (Combining Financial Information) (1)
(in millions)
Combining Balance Sheets
as of September 30, 2006
| | | | | | | | | | | | | | | | | | | | | | | | | | | | | | | | | |
| | | Coventry II DDR | | | Coventry II DDR | | | DDR/Macquarie | | | | | | | DDR/Macquarie | | | Sold/Acquired JVs | | | | | | | DDRs Proportionate | |
| | | Ward Parkway | | | Westover | | | Fund LLC | | | DDR MDT PS LLC | | | Management | | | (5) | | | Total | | | Share | |
| Real Estate Assets | | $ | 60.3 | | | $ | 25.2 | | | $ | 1,738.2 | | | $ | 117.5 | | | $ | 0.0 | | | $ | 0.0 | | | $ | 3,741.6 | | | $ | 736.0 | |
| Accumulated Depreciation | | | (3.1 | ) | | | (0.4 | ) | | | (79.0 | ) | | | (0.8 | ) | | | 0.0 | | | | 0.0 | | | | (214.5 | ) | | | (59.4 | ) |
| | | | | | | | | | | | | | | | | | | | | | | | | |
| Real Estate, net | | | 57.2 | | | | 24.8 | | | | 1,659.2 | | | | 116.7 | | | | 0.0 | | | | 0.0 | | | | 3,527.1 | | | | 676.6 | |
| | | | | | | | | | | | | | | | | | | | | | | | | |
| Receivables, Net | | | 2.3 | | | | 0.4 | | | | 29.7 | | | | 4.3 | | | | 0.0 | | | | 0.4 | | | | 73.7 | | | | 16.0 | |
| Other assets | | | 1.0 | | | | 1.2 | | | | 31.6 | | | | 3.8 | | | | 7.9 | | | | 2.2 | | | | 137.0 | | | | 32.4 | |
| Disproportionate Share of Equity | | | — | | | | — | | | | — | | | | — | | | | — | | | | — | | | | — | | | | 4.5 | (7) |
| | | | | | | | | | | | | | | | | | | | | | | | | |
| | | $ | 60.5 | | | $ | 26.4 | | | $ | 1,720.5 | | | $ | 124.8 | | | $ | 7.9 | | | $ | 2.6 | | | $ | 3,737.8 | | | $ | 729.5 | |
| | | | | | | | | | | | | | | | | | | | | | | | | |
| | | | | | | | | | | | | | | | | | | | | | | | | | | | | | | | | |
| Mortgage Debt | | $ | 36.0 | | | $ | 17.5 | | | $ | 1,040.3 | | | $ | 86.0 | | | $ | 0.0 | | | $ | 0.0 | | | $ | 2,526.6 | | | $ | 549.2 | |
| Amounts payable to DDRC | | | 0.0 | | | | 0.0 | | | | 4.0 | | | | 0.0 | | | $ | 0.0 | | | | 0.0 | | | | 8.3 | | | | 2.4 | |
| Other liabilities | | | 2.2 | | | | 0.9 | | | | 24.4 | | | | 2.4 | | | $ | 1.6 | | | | 1.1 | | | | 90.3 | | | | 19.5 | |
| | | | | | | | | | | | | | | | | | | | | | | | | |
| | | | 38.2 | | | | 18.4 | | | | 1,068.7 | | | | 88.4 | | | | 1.6 | | | | 1.1 | | | | 2,625.2 | | | | 571.1 | |
| Accumulated equity (deficit) | | | 22.3 | | | | 8.0 | | | | 651.8 | | | | 36.4 | | | | 6.3 | | | | 1.5 | | | | 1,112.6 | | | | 153.9 | |
| Disproportionate Share of Equity | | | — | | | | — | | | | — | | | | — | | | | — | | | | — | | | | — | | | | 4.5 | (7) |
| | | | | | | | | | | | | | | | | | | | | | | | | |
| | | $ | 60.5 | | | $ | 26.4 | | | $ | 1,720.5 | | | $ | 124.8 | | | $ | 7.9 | | | $ | 2.6 | | | $ | 3,737.8 | | | $ | 729.5 | |
| | | | | | | | | | | | | | | | | | | | | | | | | |
| | | | | | | | | | | | | | | | | | | | | | | | | | | | | | | | | |
| Proportionate share of other assets/liabilities, net | | $ | 0.2 | | | $ | 0.1 | | | $ | 5.4 | | | $ | 0.0 | | | $ | 3.1 | | | $ | 0.6 | | | $ | 28.6 | | | | | |
| | | | | | | | | | | | | | | | | | | | | | | | | | |
| Disproportionate amount payable to DDR | | $ | 0.0 | | | $ | 0.0 | | | $ | 0.0 | | | $ | 0.0 | | | $ | 0.0 | | | $ | 0.0 | | | $ | 1.5 | | | | | |
| | | | | | | | | | | | | | | | | | | | | | | | | | |
Combining Statements of Operations
for the period ended September 30, 2006
| | | | | | | | | | | | | | | | | | | | | | | | | | | | | | | | | |
| | | Coventry II DDR | | | Coventry II DDR | | | DDR/Macquarie | | | | | | | DDR/Macquarie | | | Sold/Acquired JVs | | | | | | | DDRs Proportionate | |
| | | Ward Parkway | | | Westover | | | Fund LLC | | | DDR MDT PS LLC | | | Management | | | (5) | | | Total | | | Share | |
| Revenues from operations | | $ | 6.1 | | | $ | 2.2 | | | $ | 144.1 | | | $ | 3.5 | | | $ | 1.2 | | | $ | 18.4 | | | $ | 309.9 | | | $ | 68.1 | |
| Rental operation expenses | | | (3.0 | ) | | | (1.1 | ) | | | (44.8 | ) | | | (1.4 | ) | | | (0.2 | ) | | | (7.6 | ) | | | (102.3 | ) | | | (22.0 | ) |
| | | | | | | | | | | | | | | | | | | | | | | | | |
| Net operating income | | | 3.1 | | | | 1.1 | | | | 99.3 | | | | 2.1 | | | | 1.0 | | | | 10.8 | | | | 207.6 | | | | 46.1 | |
| Depreciation and amortization expense | | | (0.9 | ) | | | (0.3 | ) | | | (27.4 | ) | | | (0.9 | ) | | | (0.5 | ) | | | (4.7 | ) | | | (59.7 | ) | | | (12.6 | ) |
| Interest expense | | | (1.9 | ) | | | (0.6 | ) | | | (38.7 | ) | | | (1.7 | ) | | | 0.0 | | | | (6.5 | ) | | | (95.1 | ) | | | (22.2 | ) |
| | | | | | | | | | | | | | | | | | | | | | | | | |
| Income (loss) before gain on sale | | | 0.3 | | | | 0.2 | | | | 33.2 | | | | (0.5 | ) | | | 0.5 | | | | (0.4 | ) | | | 52.7 | | | | 11.3 | |
| Gain (loss) on sale of real estate | | | 0.0 | | | | 0.0 | | | | 0.0 | | | | 0.0 | | | | 0.0 | | | | 0.2 | | | | 0.2 | | | | (0.0 | ) |
| Discontinued operations | | | 0.0 | | | | 0.0 | | | | 0.0 | | | | 0.0 | | | | 0.0 | | | | 0.6 | | | | 0.9 | | | | 0.1 | |
| Gain on sale of discontinued operations | | | 0.0 | | | | 0.0 | | | | 0.0 | | | | 0.0 | | | | 0.0 | | | | 18.0 | | | | 19.9 | | | | 2.2 | |
| Disproportionate Share of Income | | | — | | | | — | | | | — | | | | — | | | | — | | | | — | | | | — | | | | 8.7 | (8) |
| | | | | | | | | | | | | | | | | | | | | | | | | |
| Net income (loss) | | $ | 0.3 | | | $ | 0.2 | | | $ | 33.2 | | | ($ | 0.5 | ) | | $ | 0.5 | | | $ | 18.4 | | | $ | 73.8 | | | $ | 22.4 | |
| DDR Ownership interest | | | 20 | % | | | 20 | % | | | *** | | | | *** | | | | *** | | | | *** | | | | *** | | | | | |
| | | | | | | | | | | | | | | | | | | | | | | | | | |
| | | $ | 0.1 | | | $ | 0.1 | | | $ | 7.1 | | | $ | 0.2 | | | $ | 0.3 | | | $ | 7.5 | | | $ | 22.4 | | | $ | 22.4 | |
| Amortization of basis differential | | | 0.0 | | | | 0.0 | | | | 0.8 | | | | 0.0 | | | | 0.0 | | | | 0.0 | | | | 0.6 | | | | 0.6 | |
| | | | | | | | | | | | | | | | | | | | | | | | | | | | | | | | |
| | | $ | 0.1 | | | $ | 0.1 | | | $ | 7.9 | | | | 0.2 | | | | 0.3 | | | $ | 7.5 | | | $ | 23.0 | | | $ | 23.0 | |
| | | | | | | | | | | | | | | | | | | | | | | | | |
| | | | | | | | | | | | | | | | | | | | | | | | | | | | | | | | | |
| Proportionate share of net operating income (6) | | $ | 0.6 | | | $ | 0.2 | | | $ | 14.4 | | | $ | 0.0 | | | $ | 0.5 | | | $ | 2.9 | | | $ | 46.1 | | | | | |
| | | | | | | | | | | | | | | | | | | | | | | | | | |
| Proportionate share of interest expense (6) | | $ | 0.4 | | | $ | 0.1 | | | $ | 5.6 | | | $ | 0.0 | | | $ | 0.0 | | | $ | 1.6 | | | $ | 22.2 | | | | | |
| | | | | | | | | | | | | | | | | | | | | | | | | | |
| | | | | | | | | | | | | | | | | | | | | | | | | | | | | | | | | |
Funds From Operations (“FFO”): | | | | | | | | | | | | | | | | | | | | | | | | | | | | | | | | |
| | | | | | | | | | | | | | | | | | | | | | | | | | | | | | | | | |
| Net income (loss) | | | 0.3 | | | | 0.2 | | | | 33.2 | | | | (0.5 | ) | | | 0.5 | | | | 18.4 | | | | 73.8 | | | | 22.4 | |
| Depreciation of real property | | | 0.9 | | | | 0.3 | | | | 27.4 | | | | 0.9 | | | | 0.5 | | | | 5.1 | | | | 60.5 | | | | 12.8 | |
| (Gain) loss on sale | | | 0.0 | | | | 0.0 | | | | 0.0 | | | | 0.0 | | | | 0.0 | | | | (17.7 | ) | | | (21.4 | ) | | | (2.6 | ) |
| Disproportionate Share of Income | | | — | | | | — | | | | — | | | | — | | | | — | | | | — | | | | — | | | | 0.2 | (9) |
| | | | | | | | | | | | | | | | | | | | | | | | | |
| | | $ | 1.2 | | | $ | 0.5 | | | $ | 60.6 | | | $ | 0.4 | | | $ | 1.0 | | | $ | 5.8 | | | $ | 112.9 | | | $ | 32.8 | |
| | | | | | | | | | | | | | | | | | | | | | | | | | | | | | | | |
| DDR ownership interest | | | 20 | % | | | 20 | % | | | *** | | | | *** | | | | *** | | | | *** | | | | *** | | | | | |
| | | | | | | | | | | | | | | | | | | | | | | | | | |
| DDR FFO | | $ | 0.2 | | | $ | 0.1 | | | $ | 11.0 | | | $ | 0.1 | | | $ | 0.5 | | | $ | 6.9 | | | $ | 32.8 | | | | | |
| | | | | | | | | | | | | | | | | | | | | | | | | | |
Joint Venture Financials 4.1
Developers Diversified Realty
Quarterly Financial Supplement
For the nine months ended September 30, 2006
| | |
| (1) | | Amounts may differ slightly from actual results, due to rounding. |
| |
| (2) | | Asset values reflect historical cost basis due to acquisition of partnership interest (i.e. does not reflect step up in basis). |
| |
| (3) | | Represents undeveloped land. |
| |
| (4) | | Represents operating income of Coventry II DDR SM LLC as of the acquisition date of September 22, 2006. |
| |
| (5) | | Represents residual joint venture assets sold to the MDT Joint Venture, operating income of the joint ventures in Phoenix, Arizona; Pasedena, California; Salisbury, Maryland; and Apex, North Carolina acquired by DDR in 2006 and operating income of the RVIP III and Kildeer joint ventures, which were sold in 2006. Additionally, this amount includes the operating income of the KLA/SM joint venture assets acquired by DDR through August 2006 and subsequently sold to the Coventry II DDR SM joint venture in September 2006. |
| |
| (6) | | Does not include share of net operating income or interest expense for sales of properties classified as discontinued operations. |
| |
| (7) | | Adjustments represent the effect of promoted equity structures. These adjustments are primarily at the RVIP IIIB, RVIP VII, RVIP VIII and the DDR/Macquarie Fund LLC joint ventures. |
| |
| (8) | | Adjustments represent the effect of promoted interests on DDR’s share of the income primarily from an asset management promote through DDR/Macquarie Fund LLC and promoted income from the sale of the shopping centers in Kildeer, IL and the RVIP VII Joint Ventures. |
| |
| (9) | | Adjustments associated with Coventry’s minority ownership interests primarily at the RVIP IIIB, RVIP VII, and RVIP VIII joint ventures. |
| |
| *** | | See Section 4.2, Joint Venture Summaries, discussing respective ownership percentage, as ownership percentage may have changed during the year, or the promoted interest is in effect. |
Joint Venture Financials 4.1
Developers Diversified Realty
Quarterly Financial Supplemental
For the nine months ended September 30, 2006
Joint Venture Investment Summary
| | | | | |
| Joint Venture Name: | | Retail Value Investment Program LP IIIB |
| Date Formed: | | September 2000 |
| Property Name/Location: | | Deer Park, IL |
| | | | | |
| Major Tenants: | | Century Theater | | Pottery Barn |
| | | Talbots | | Coldwater Creek |
| | | Restoration Harware | | J. Crew |
| | | Victoria’s Secret | | Pier 1 Imports |
| | | GAP | | Banana Republic |
| | | Barnes & Noble | | Ann Taylor |
| | | | | |
| Partnership Structure | | |
| Equity Contribution: | | 1% — Coventry Real Estate Partners |
| | | 24.75% — DDR |
| | | 74.25% — Prudential Real Estate Investors (PREI) |
| | | | | |
| Cash Flow Distribution: | | 1% — Coventry Real Estate Partners |
| | | 24.75% — DDR |
| | | 74.25% — Prudential Real Estate Investors |
| | | Up to a leveraged 10% preferred return on equity |
| | | | | |
| Promote (current): | | 33% Coventry Real Estate Partners (75% owned by DDR) once limited partners have received a 10% preferred return and return of equity |
| | | | | |
| Fees to DDR | | |
| Management Fee: | | 3.5% of gross rents |
| Development Fee: | | 1% of hard costs for all improvements |
| Asset Management Fee: | | .4% of gross asset cost (DDR’s pro-rata share of Coventry’s .5% fee) |
| Leasing Fees: | | N/A |
Capital Structure (in millions)
| | | | | |
| DDRC | | $ | 3.6 | |
| Prudential | | | 10.4 | |
| Coventry | | | 1.9 | |
| | | | |
| Total Capital | | $ | 15.9 | |
| | | | |
| Debt | | $ | 60.0 | |
| | | | |
| Total Debt & Equity | | $ | 75.9 | |
| | | | |
Joint Venture Partnership Summaries 4.2
Developers Diversified Realty
Quarterly Financial Supplemental
For the nine months ended September 30, 2006
Joint Venture Investment Summary
| | | |
| Joint Venture Name: | | Retail Value Investment Program LP VI |
| Date Formed: | | October 1999 |
| Property Name/Location: | | Cherokee North — Overland Park, KS |
| | | |
| Major Tenants: | | Osco Drug |
| | | Deals Nothing Over $1 |
| | | Bargains 365 |
| | | |
| Partnership Structure |
| Equity Contribution: | | 1% — Coventry Real Estate Partners |
| | | 24.75% — DDR |
| | | 74.25% — Prudential Real Estate Investors (PREI) |
| | | |
| Cash Flow Distribution: | | 1% — Coventry Real Estate Partners |
| | | 24.75% — DDR |
| | | 74.25% — Prudential Real Estate Investors (PREI) |
| | | Up to a leveraged 10% preferred return on equity |
| | | |
| Promote (current): | | 33% Coventry Real Estate Partners (75% owned by DDR) once limited partners have received a 10% preferred return and return of equity |
| | | |
| Fees to DDR |
| Management Fee: | | 3.5% of gross operating revenues |
| Asset Management Fee: | | .4% of gross asset cost (DDR’s pro-rata share of Coventry’s .5% fee) |
Capital Structure (in millions)
| | | | | |
| DDR | | $ | 0.9 | |
| PREI | | | 3.0 | |
| Coventry | | $ | 0.1 | |
| | | | |
| Total Capital | | $ | 4.0 | |
| | | | |
| Debt | | $ | 3.0 | |
| | | | |
| Total Debt & Equity | | $ | 7.0 | |
| | | | |
Joint Venture Partnership Summaries 4.2
Developers Diversified Realty
Quarterly Financial Supplemental
For the nine months ended September 30, 2006
Joint Venture Investment Summary
| | | | | |
| Joint Venture Name: | | Retail Value Investment Program VII LLC |
| Date Formed: | | November 2000 |
| Property Name/Location: | | The joint venture consists of the following 2 properties: |
| | | | | |
| | | Downtown Pleasant Hill — Pleasant Hill, CA |
| | | Valley Central Shopping Center — Lancaster, CA |
| | | | | |
| Major Tenants: | | Century Theater | | Michael’s |
| | | Ross Stores | | Staples |
| | | Wal-Mart | | Bed, Bath & Beyond |
| | | Cinemark | | Albertson’s
Marshalls |
| | | | | |
| Partnership Structure | | |
| Equity Contribution: | | 1% — Coventry Real Estate Partners |
| | | 20% — DDR |
| | | 79% — Prudential Real Estate Investors (PREI) |
| | | | | |
| Cash Flow Distribution: | | 1% — Coventry Real Estate Partners |
| | | 20% — DDR |
| | | 79% — Prudential Real Estate Investors
Up to a leveraged 11% return on equity (10% year one, 10.5% year two, 11% thereafter) |
| | | | | |
| Promote (current): | | (i) Pro rata in proportion to the member’s invested capital until the members have received, on a cumulative basis, an amount equal to the preferred return, (ii) 75% to all members in proportion to their invested capital and 25% to Coventry Real Estate P |
| | | | | |
| Fees to DDR | | |
| Management Fee: | | 3.2% of gross rents |
| Construction Management Fee: | | 5% of hard and soft costs |
| Asset Management Fee: | | .6% (DDR’s pro-rata share of Coventry’s .8% fee) |
| Leasing Fees (without co-broker): | | 5% on new leases on years 1-5; 2.5% on years 6-10 (spaces < 15,000 square feet) |
| | | 4% on new leases on years 1-5; 2% on years 6-10 (spaces > 15,000 square feet) |
| | | 3% on new leases on years 1-5; 1.5% on years 6-10 (ground leases) |
| | | Renewals earn 50% of fees on new leases |
Capital Structure (in millions)
| | | | | |
| DDR | | $ | 4.3 | |
| PREI | | | 16.7 | |
| Coventry | | | 7.5 | |
| | | | |
| Total Capital | | $ | 28.5 | |
| | | | |
| Debt | | $ | 74.0 | |
| | | | |
| Total Debt & Equity | | $ | 102.5 | |
| | | | |
Joint Venture Partnership Summaries 4.2
Developers Diversified Realty
Quarterly Financial Supplemental
For the nine months ended September 30, 2006
Joint Venture Investment Summary
| | | | | |
| Joint Venture Name: | | Retail Value Investment Program LP VIII |
| Date Formed: | | September 2003 |
| Property Name/Location: | | Shops@Tech.Ridge — Austin, TX |
| | | | | |
| Major Tenants: | | Target | | Linen’s ‘N Things |
| | | Pier One | | Toys ‘R Us |
| | | Dress Barn | | Hobby Lobby |
| | | Rack Room Shoes | | Office Depot |
| | | PetsMart | | Best Buy |
| | | Ross Dress for Less | | |
| | | | | |
| Partnership Structure | | |
| Equity Contribution: | | 1% — Coventry Real Estate Partners |
| | | 24.75% — DDR |
| | | 74.25% — Prudential Real Estate Investors (PREI) |
| | | | | |
| Cash Flow Distribution: | | 1% — Coventry Real Estate Partners |
| | | 24.75% — DDR |
| | | 74.25% — Prudential Real Estate Investors |
| | | Up to a leveraged 10% preferred return on equity |
| | | | | |
| Promote (current): | | 33% Coventry Real Estate Partners (75% owned by DDR) once limited partners have received a 10% preferred return and return of equity |
| | | | | |
| Fees to DDR | | |
| Management Fee: | | 3.5% of gross rents |
| Development Fee: | | 1% of hard costs for all improvements |
| Asset Management Fee: | | N/A |
| Leasing Fees: * | | 6% on new leases on years 1-5; 3% on remainder of term (spaces < 5,000 square feet) |
| | | 5% on new leases on years 1-5; 2.5% on remainder of term (spaces 5,000 - 9,999 square feet) |
| | | 4% on new leases on years 1-5; 2% on remainder of term (spaces 10,000 - 19,999 square feet) |
| | | $2 per square foot (spaces 20,000 square feet and greater) |
| | | 3% on renewals on years 1-5; 1.5% on remainder of term (spaces < 5,000 square feet) |
| | | 2.5% on renewals on years 1-5; 1.25% on remainder of term (spaces 5,000 - 9,999 square feet) |
| | | 2% on renewals on years 1-5; 1% on remainder of term (spaces 10,000 - 19,999 square feet) |
| | | $2 per square foot on renewals (spaces 20,000 square feet and greater) |
| | | 4% on new leases years 1-5; 2% years 6-10; (outparcels/ground leases) |
| | | 2% on renewals on years 1-5; 1% years 6-10 (outparcels/ground leases) |
| | | 6% on Gross Sales Price up to $500,000 (outparcels) |
| | | 5% of Gross Sales Price over $500,000 but less than $1,000,000 (Outparcel Sales) |
| | | 4% of Gross Sales Price $1,000,000 or over (Outparcel Sales) |
| Development Fee: * | | 5% of all development and tenant improvement work performed |
| Tenant Coordination Fee: * | | $5,000 for each in-line space less than 10,000 square feet |
Capital Structure (in millions)
| | | | | |
| DDRC | | $ | 2.5 | |
| Prudential | | | 7.5 | |
| Coventry | | | (0.6 | ) |
| | | | |
| Total Capital | | $ | 9.4 | |
| | | | |
| Debt | | $ | 23.4 | |
| | | | |
| Total Debt & Equity | | $ | 32.8 | |
| | | | |
* Fees shall not be paid with respect to the initial leasing or development.
Joint Venture Partnership Summaries 4.2
Developers Diversified Realty
Quarterly Financial Supplemental
For the nine months ended September 30, 2006
Joint Venture Investment Summary
| | | | | |
| Joint Venture Name: | | DPG Realty Holdings LLC |
| Date Formed: | | October 2004 |
| Property Name/Location: | | The joint venture consists of the following twelve properties: |
| | | | | |
| | | Tops Plaza — Elmira, NY | | Tops Plaza — Avon, NY |
| | | Tops Plaza — Hamburg, NY | | Tops Plaza — Hamlin, NY |
| | | Tops Plaza — Norwich, NY | | Farragut Pointe — Farragut, TN |
| | | Tops-Gander Mnt. Plaza — Tonawanda, NY | | Columbia Square — Columbia, TN |
| | | Tops Plaza — Arcade, NY | | Five Forks Crossing — Lilburn, GA |
| | | Tops Plaza — Tonawanda, NY | | Five Forks Village — Lawrenceville, GA |
| | | | | |
| Major Tenants: | | Bi-Lo |
| | | BJ’s Wholesale Club |
| | | Gander Mountain Company |
| | | Kroger |
| | | Tops |
| | | | | |
| Partnership Structure | | |
| Equity Contribution: | | 10.0% — JDN QRS, Inc. |
| | | 90.0% — Prudential Insurance Company of America (PICA) |
| | | | | |
| Cash Flow Distribution: | | 10.0% — JDN QRS, Inc. |
| | | 90.0% — Prudential Insurance Company of America (PICA) |
| | | | | |
| Fees to DDR | | |
| Management Fee: | | 4% of gross income |
Construction
Supervision Fee: | | 5% of gross cost of all development and tenant improvement work (including hard and soft costs) |
| Leasing Fees: | | 6% on new leases on years 1-5; 3% on remainder of term, max 10 yrs. (spaces < 5,000 square feet) |
| | | 5% on new leases on years 1-5; 2.5% on remainder of term, max 10 yrs. (spaces 5,000 - 10,000 square feet) |
| | | 4% on new leases on years 1-5; 2% on remainder of term, max 10 yrs. (spaces 10,000 - 20,000 square feet) |
| | | $2 per square foot (spaces > 20,000 square feet) |
| | | 3% for renewals on years 1-5; 1.5% on remainder of term, max 10 yrs. (spaces < 5,000 square feet) |
| | | 2.5% for renewals on years 1-5; 1.25% on remainder of term, max 10 yrs. (spaces 5,000 - 10,000 square feet) |
| | | 2% for renewals on years 1-5; 1% on remainder of term, max 10 yrs. (spaces 10,000 - 20,000 square feet) |
| | | $2 per square foot for renewals with a material amendment to the lease; 1$ if renewed without a material amendment (spaces > 20,000 square feet) |
| | | 4% on new outparcels/ground leases on years 1-5; 2% on remainder of term, max 10 years |
| | | 2% on renewal outparcels/ground leases on years 1-5; 1% on remainder of term, max 10 years |
| | | 6% of gross sales price < $500,000 (outparcel sales) |
| | | 5% of gross sales price $500,000 - $1,000,000 (outparcel sales) |
| | | 4% of gross sales prices ≥ $1,000,000 (outparcel sales) |
Capital Structure (in millions)
| | | | | |
| JDN | | $ | 11.5 | |
| PICA | | | 103.1 | |
| | | | |
| Total Capital | | $ | 114.6 | |
| | | | |
| Debt | | $ | 11.0 | |
| | | | |
| Total Debt & Equity | | $ | 125.6 | |
| | | | |
Joint Venture Partnership Summaries 4.2
Developers Diversified Realty
Quarterly Financial Supplement
For the nine months ended September 30, 2006
Joint Venture Investment Summary
| | | | | | | | | |
| Joint Venture Name: | | DDRA Community Centers Five, L.P. |
| Date Formed: | | September, 1998; DDRA CC Seven, L.P. merged July, 2005 |
| Property Name/Location: | | The joint venture consists of the following six properties: |
| | | | | | | | | |
| | | Foothills Towne Center — Ahwatukee, AZ | Maple Grove Crossing — Maple Grove, MN |
| | | Arrowhead Crossing — Phoenix, AZ | Tanasbourne Town Center — Portland, OR |
| | | Eagan Promenade — Eagan, MN | Eastchase Market — Fort Worth, TX |
| | | | | | | | | |
| Major Tenants: | | AMC Theatre | | Ethan Allen (not owned) | | OfficeMax |
| | | Ashley’s Furniture | | Famous Footwear | | Old Navy |
| | | Babies ‘R Us | | Gander Mountain | | Petco |
| | | Barnes & Noble | | Haggan’s | | Petsmart |
| | | Bassett Furniture | | JoAnn, Etc. | | Pier 1 Imports |
| | | Bed Bath & Beyond | | Kohl’s Department | | Ross Dress for Less |
| | | Best Buy | | Linens ‘N Things | | Staples |
| | | Byerly’s | | Mac Frugal’s | | Stein Mart |
| | | Circuit City | | Mervyns (not owned) | | Target (not owned) |
| | | Comp USA | | Michael’s | | TJ Maxx |
| | | Cub Foods (not owned) | | Nordstrom Rack (not owned) | | United Artists Theatre |
| | | DSW Shoe Warehouse | | Office Depot | | |
| | | | | | | | | |
| Partnership Structure | | | | | | |
| Equity Contribution: | | 50% — DDR |
| | | 50% — DRA Advisors |
| | | | | | | | | |
| Cash Flow Distribution: | | 50% — DDR |
| | | 50% — DRA Advisors |
| | | | | | | | | |
| Fees to DDR | | | | | | |
| Management Fee: | | 3.5% of gross retail income |
| Development Fee: | | 5.0% of total costs for all improvements |
| Leasing Fees (without co-broker): | | 6.0% on new leases on years 1-5; 3.0% on remainder of term (spaces < 5,000 square feet) |
| | | 5.0% on new leases on years 1-5; 2.5% on remainder of term (spaces 5,000 - 10,000 square feet) |
| | | 4.0% on new leases on years 1-5; 2.0% on remainder of term (spaces 10,000 - 20,000 square feet) |
| | | $2.00 per square foot (spaces > 20,000 square feet) |
| | | 4.0% on new leases on years 1-5; 2.0% on years 6-10 (ground leases) |
| | | Renewals earn 50% of fees on new leases |
| Commission on Outparcel Sales: | | 6.0% of gross sales price up to $500,000 |
| | | 5.0% of gross sales price $500,000 - $1,000,000 |
| | | 4.0% of gross sales price over $1,000,000 |
Capital Structure (in millions)
| | | | | |
| DDR | | $ | (32.6 | ) |
| DRA Advisors | | | (32.6 | ) |
| | | | |
| Total Capital (1) | | $ | (65.2 | ) |
| | | | |
| Payable to DDR | | $ | 0.1 | |
| | | | |
| Debt | | $ | 298.0 | |
| | | | |
| Total Debt & Equity | | $ | 232.9 | |
| | | | |
(1) Equity position is attributable to the Company refinancing mortgage debt at the fair market value of the assets, which is different than the historical net assets of the joint venture.
Joint Venture Partnership Summaries 4.2
Developers Diversified Realty
Quarterly Financial Supplement
For the nine months ended September 30, 2006
Joint Venture Investment Summary
| | | |
| Joint Venture Name: | | Lennox Town Center Limited |
| Date Formed: | | February, 1998 |
| Property Name/Location: | | Lennox Town Center Shopping Center — Columbus, OH |
| | | |
| Major Tenants: | | AMC Theatres Lennox 24 |
| | | Barnes & Noble |
| | | Staples |
| | | Target |
| | | |
Partnership Structure | | |
| Equity Contribution: | | 50% — DDR |
| | | 50% — Casto Properties |
| | | |
| Cash Flow Distribution: | | 50% — DDR |
| | | 50% — Casto Properties |
| | | |
Fees to DDR | | |
| Management Fee: | | 1.312% of all rent |
| Development Fee: | | N/A |
| Leasing Fees: | | N/A |
| Commission on Outparcel Sales: | | N/A |
Capital Structure (in millions)
| | | | | |
| DDR | | $ | 0.2 | |
| Casto Properties | | | 0.2 | |
| | | | |
| Total Capital | | $ | 0.4 | |
| | | | |
| Debt | | $ | 17.7 | |
| | | | |
| Total Debt & Equity | | $ | 18.1 | |
| | | | |
Joint Venture Partnership Summaries 4.2
Developers Diversified Realty
Quarterly Financial Supplement
For the nine months ended September 30, 2006
Joint Venture Investment Summary
| | | |
| Joint Venture Name: | | Sun Center Limited |
| Date Formed: | | February, 1998 |
| Property Name/Location: | | Sun Center — Columbus, OH |
| | | |
| Major Tenants: | | Ashley Furniture Homestore |
| | | Babies ‘R Us |
| | | Michael’s |
| | | Staples |
| | | Stein Mart |
| | | Whole Food Markets |
| | | |
Partnership Structure | | |
| Equity Contribution: | | 79.45% — DDR |
| | | 20.55% — Casto Properties |
| | | |
| Cash Flow Distribution: | | 79.45% — DDR |
| | | 20.55% — Casto Properties |
| | | |
Fees to DDR | | |
| Management Fee: | | 1.312% of all rent |
| Development Fee: | | N/A |
| Leasing Fees: | | N/A |
| Commission on Outparcel Sales: | | N/A |
Capital Structure (in millions)
| | | | | |
| DDR | | $ | (0.1 | ) |
| Casto Properties | | | — | |
| | | | |
| Total Capital (1) | | $ | (0.1 | ) |
| | | | |
| Debt | | $ | 20.2 | |
| | | | |
| Total Debt & Equity | | $ | 20.1 | |
| | | | |
(1) Basis differentials occur primarily when the Company has purchased an interest in existing joint ventures at fair market values which differ from their proportionate share of the historical net assets of the joint ventures.
Joint Venture Partnership Summaries 4.2
Developers Diversified Realty
Quarterly Financial Supplement
For the nine months ended September 30, 2006
Joint Venture Investment Summary
| | | |
| Joint Venture Name: | | DOTRS LLC |
| Date Formed: | | September, 1996 |
| Property Name/Location: | | Macedonia Commons — Macedonia, Ohio |
| | | |
| Major Tenants: | | Kohl’s Department Store |
| | | Tops Markets |
| | | Wal-Mart (not owned) |
| | | |
Partnership Structure | | |
| Equity Contribution: | | 50% — DDR |
| | | 50% — The State Teachers Retirement Board of Ohio |
| | | |
| Cash Flow Distribution: | | 50% — DDR |
| | | 50% — The State Teachers Retirement Board of Ohio |
| | | |
Fees to DDR | | |
| Management Fee: | | 5% of gross retail income |
| Development Fee: | | 5% of hard costs for all improvements |
| Leasing Fees: | | 5% on new leases, 3.5% on renewals |
| Commission on Outparcel Sales: | | N/A |
Capital Structure (in millions)
| | | | | |
| DDR | | $ | (0.15 | ) |
| The State Teachers Retirement Board | | | (0.15 | ) |
| | | | |
| Total Capital | | $ | (0.3 | ) |
| | | | |
| Debt | | $ | 21.0 | |
| | | | |
| Total Debt & Equity | | $ | 20.7 | |
| | | | |
Joint Venture Partnership Summaries 4.2
Developers Diversified Realty
Quarterly Financial Supplemental
For the nine months ended September 30, 2006
Joint Venture Investment Summary
| | | |
| Joint Venture Name: | | Jefferson County Plaza LLC |
| Date Formed: | | July 1999 |
| Property Name/Location: | | Arnold, MO |
| | | |
| Major Tenants: | | Deal$ |
| | | Home Depot (not owned) |
| | | Sally Beauty Supply |
| | | Shoe Carnival |
| | | Target (not owned) |
| | | |
Partnership Structure | | |
| Equity Contribution: | | 50% — DDR |
| | | 50% — The Sansone Group (50% owned by DDR) |
| | | |
| Cash Flow Distribution: | | 50% — DDR |
| | | 50% — The Sansone Group |
| | | |
Fees to DDR | | |
| Management Fee: | | 1.5% of gross rental income |
| Development Fee: | | NA |
| Leasing Fees: | | 2.5% of gross base rent plus reimbursables on new leases; 1.75% on renewals |
Capital Structure (in millions)
| | | | | |
| DDRC | | $ | (0.3 | ) |
| The Sansone Group | | | (0.3 | ) |
| | | | |
| Total Capital (1) | | $ | (0.6 | ) |
| | | | |
| Payable to DDR | | $ | 3.1 | |
| | | | |
| Debt | | $ | 3.7 | |
| | | | |
| Total Debt & Equity | | $ | 6.2 | |
| | | | |
(1) Basis differentials occur primarily when the Company has purchased an interest in existing joint ventures at fair market values which differ from their proportionate share of the historical net assets of the joint ventures.
Joint Venture Partnership Summaries 4.2
Developers Diversified Realty
Quarterly Financial Supplemental
For the nine months ended September 30, 2006
Joint Venture Investment Summary
| | | | | |
| Joint Venture Name: | | DDR Markaz LLC (Kuwaiti Financial Centre) |
| Date Formed: | | May 2003 |
| Property Name/Location: | | The joint venture consists of the following seven properties: |
| | | | | |
| | | Hilltop Plaza — Richmond, CA | | Highland Grove Shopping Center— Highland, IN |
| | | Derby Square — Grove City, OH | | Springfield Commons Shopping Center — Toledo, OH |
| | | Oviedo Park — Oviedo, FL | | Apple Blossom Corners — Winchester, VA |
| | | North Pointe Plaza — Tampa, FL | | |
| | | | | |
| Major Tenants: | | Babies R Us | | Marshalls |
| | | Barnes & Noble | | Martin’s Food Store |
| | | Bed Bath & Beyond | | Michael’s |
| | | Books-A-Million | | OfficeMax |
| | | Borders Books (not owned) | | Old Navy |
| | | Century Theatre | | Petco |
| | | Circuit City | | Petsmart |
| | | Gander Mountain | | Publix |
| | | Giant Eagle | | Ross Dress for Less |
| | | Jewel (not owned) | | Shoe Carnival |
| | | Kohl’s | | Target (not owned) |
| | | Linens ‘N Things | | T.J. Maxx |
| | | Lowe’s (not owned) | | Wal-mart (not owned) |
| | | | | |
| Partnership Structure | | |
| Equity Contribution: | | 80% — Kuwait Financial Centre S.A.K. and Bank of Bahrain and Kuwait B.S.C. (dba as “Markaz”) |
| | | 20% — DDR |
| | | | | |
| Cash Flow Distribution: | | 80% — Markaz |
| | | 20% — DDR |
| | | | | |
| Promote (current): | | (i) Pro rata in proportion to DDR and Markaz equity interest until both have been allocated an amount equal to a 12% annual internal rate of return, and (ii) 20% to DDR and 80% to DDR and Markaz in proportion to their equity interest. |
| | | | | |
Fees to DDR | | | | |
| Property Management Fee: | | 4.0% of revenues |
| Development Fee: | | 5.0% of total costs for all improvements |
| Asset Management Fee: | | 5.5% of net operating income |
| Leasing Fees (without co-broker): | | 6.0% on new leases on years 1-5; 3.0% on remainder of term (spaces < 5,000 square feet) |
| | | 5.0% on new leases on years 1-5; 2.5% on remainder of term (spaces 5,000 - 10,000 square feet) |
| | | 4.0% on new leases on years 1-5; 2.0% on remainder of term (spaces 10,000 - 20,000 square feet) |
| | | $2.00 per square foot (spaces > 20,000 square feet) |
| | | 4.0% on new leases on years 1-5; 2.0% on years 6-10 (ground leases) |
| | | Renewals earn 50% of fees on new leases |
| Commission on Outparcel Sales: | | 6.0% of gross sales price up to $500,000 |
| | | 5.0% of gross sales price $500,000 - $1,000,000 |
| | | 4.0% of gross sales price over $1,000,000 |
Capital Structure (in millions)
| | | | | |
| DDR | | $ | 9.9 | |
| Markaz | | | 39.5 | |
| | | | |
| Total Capital | | $ | 49.4 | |
| | | | |
| Payable to DDR | | $ | 0.8 | |
| | | | |
| Debt | | $ | 110.0 | |
| | | | |
| Total Debt & Equity | | $ | 160.2 | |
| | | | |
Joint Venture Partnership Summaries 4.2
Developers Diversified Realty
Quarterly Financial Supplemental
For the nine months ended September 30, 2006
Joint Venture Investment Summary
| | | | | |
| Joint Venture Name: | | DDR Markaz II LLC (Kuwaiti Financial Centre II) |
| Date Formed: | | November 2004 |
| Property Name/Location: | | The joint venture consists of the following thirteen properties: |
| | | | | |
| | | Culver Ridge Plaza — Irondequoit, NY | | Oxford Place — Oxford, MS |
| | | Tops Plaza — LeRoy, NY | | Midway Plaza — Loganville, GA |
| | | Tops Plaza — Jamestown, NY | | Chillicothe Place — Chillicothe, OH * excluding Lowe’s |
| | | Tops Plaza — Ontario, NY | | Northcreek Commons — Goodlettsville, TN |
| | | Tops Plaza Union — Cheektowaga, NY | | Panorama Plaza — Rochester, NY |
| | | Tops Plaza — Warsaw, NY | | Crossroads Centre — Orchard Park, NY |
| | | Tops Plaza Robinson — Amherst, NY | | |
| | | | | |
| Major Tenants: | | AJ Wright | | Lowe’s (not owned) |
| | | Blockbuster Video | | Office Max |
| | | Dollar Tree | | Regal Cinemas |
| | | Factory Card Outlet | | Stein Mart |
| | | Kroger | | Tops Markets |
| | | Linens ‘N Things | | |
| | | | | |
| Partnership Structure | | |
| Equity Contribution: | | 80% — Kuwait Financial Centre S.A.K. and Bank of Bahrain and Kuwait B.S.C. (dba as “Markaz”) |
| | | 20% — DDR |
| | | | | |
| Cash Flow Distribution: | | 80% — Markaz |
| | | 20% — DDR |
| | | | | |
| Promote (current): | | (i) Pro rata in proportion to DDR and Markaz equity interest until both have been allocated an amount equal to a 11.5% annual internal rate of return, and (ii) 50% to DDR and 50% to DDR and Markaz in proportion to their equity interest. |
| | | | | |
| Fees to DDR | | |
| Property Management Fee: | | 4.0% of revenues |
| Development Fee: | | 5.0% of total costs for all improvements |
| Asset Management Fee: | | 6.25% of net operating income |
| Leasing Fees (without co-broker): | | 6.0% on new leases on years 1-5; 3.0% on remainder of term (spaces < 5,000 square feet) |
| | | 5.0% on new leases on years 1-5; 2.5% on remainder of term (spaces 5,000 - 10,000 square feet) |
| | | 4.0% on new leases on years 1-5; 2.0% on remainder of term (spaces 10,000 - 20,000 square feet) |
| | | $2.00 per square foot (spaces > 20,000 square feet) |
| | | 4.0% on new leases on years 1-5; 2.0% on years 6-10 (ground leases) |
| | | Renewals earn 50% of fees on new leases |
| Commission on Outparcel Sales: | | 6.0% of gross sales price up to $500,000 |
| | | 5.0% of gross sales price $500,000 - $1,000,000 |
| | | 4.0% of gross sales price over $1,000,000 |
Capital Structure (in millions)
| | | | | |
| DDR | | $ | 9.9 | |
| Markaz | | | 39.6 | |
| | | | |
| Total Capital | | $ | 49.5 | |
| | | | |
| Receivable from DDR | | $ | (1.2 | ) |
| | | | |
| Payable to DDR | | $ | 0.3 | |
| | | | |
| Debt | | $ | 150.5 | |
| | | | |
| Total Debt & Equity | | $ | 199.1 | |
| | | | |
Joint Venture Partnership Summaries 4.2
Developers Diversified Realty
Quarterly Financial Supplemental
For the nine months ended September 30, 2006
| | | |
| | | Joint Venture Investment Summary |
| | | |
| Joint Venture Name: | | Coventry II DDR Bloomfield LLC |
| Date Formed: | | August 2006 |
| Property Name/Location: | | Bloomfield Park — Bloomfield Hills, MI |
| | | |
| Major Tenants: | | To be announced |
| | | |
Partnership Structure | | |
Coventry II DDR Bloomfield LLC | | |
| |
| Equity Contribution: | | 80% — Coventry II Fund |
| | | 20% — DDR |
| | | |
| Cash Flow Distribution: | | 80% — Coventry II Fund |
| | | 20% — DDR |
| | | |
| Coventry II DDR Harbor Bloomfield Phase I LLC |
| | | |
| Equity Contribution: | | 50% — BP 1, LLC |
| | | 50% — Coventry II DDR Bloomfield LLC |
| | | |
| Cash Flow Distribution: | | 50% — BP 1, LLC |
| | | 50% — Coventry II DDR Bloomfield LLC |
| | | |
| Coventry II DDR Harbor Bloomfield Phase II LLC |
| | | |
| Equity Contribution: | | 70% — BP 2, LLC |
| | | 30% — Coventry II DDR Bloomfield LLC |
| | | |
| Cash Flow Distribution: | | 70% — BP 2, LLC |
| | | 30% — Coventry II DDR Bloomfield LLC |
| | | |
Fees to DDR | | |
| Management Fee: | | 4% of gross income |
| Development Fee: | | 4% of all hard and soft costs |
| Leasing Fees: | | $3 per square foot (for initial leasing during development) |
| | | 6% on new leases on years 1-5; 3% on remainder of term (spaces < 5,000 square feet) |
| | | 4.5% on new leases on years 1-5; 2.25% on remainder of term (spaces 5,000 — 10,000 square feet) |
| | | 3.5% on new leases on years 1-5; 1.75% on remainder of term (spaces 10,000 — 20,000 square feet) |
| | | $2 per square foot (spaces > 20,000 square feet) |
| | | 4% on new leases on years 1-10 (ground lease) |
| | | 3% for renewals on years 1-5; 1.5% on remainder of term (spaces < 5,000 square feet) |
| | | 2.25% for renewals on years 1-5; 1.125% on remainder of term (spaces 5,000 — 10,000 square feet) |
| | | 1.75% for renewals on years 1-5; 1% on remainder of term (spaces 10,000 — 20,000 square feet) |
| | | $1 per square foot for renewals (spaces > 20,000 square feet) |
| | | 2% on renewals on years 1-10 (ground lease) |
| | | 6% of gross sales price ≤ $500,000 (outparcel sales) |
| | | 5% of gross sales price $500,001 — $1,000,000 (outparcel sales) |
| | | 4% of gross sales prices > $1,000,000 (outparcel sales) |
| Construction Management Fee: ** | | 5% of all development and tenant improvement work performed |
| Tenant Coordination Fee: ** | | 5% of all hard and soft costs |
Capital Structure (in millions)
| | | | | |
| Coventry II Fund | | $ | 1.1 | |
| DDR | | | 0.3 | |
| | | | |
| Total Capital | | $ | 1.4 | |
| | | | |
| Debt | | $ | 68.0 | |
| | | | |
| Total Debt & Equity | | $ | 69.4 | |
| | | | |
| | |
| * | | Coventry II Fund: |
| |
| | | DDR also is entitled to a promote as a special member of the Coventry II Fund equal to 10% of all cash flow distributions after the distribution to all members of the Coventry II Fund of (i) a 10% preferred return on all contributed capital in all Coventry II Fund investments and (ii) 100% of the unreturned contributed capital in all Coventry II Fund investments. |
| |
| ** | | Fee shall not be paid with respect to the initial leasing or development. |
Joint Venture Partnership Summaries 4.2
Developers Diversified Realty
Quarterly Financial Supplemental
For the nine months ended September 30, 2006
| | | | | |
| | | Joint Venture Investment Summary |
| | | | | |
| Joint Venture Name: | | Coventry II DDR Buena Park LLC |
| Date Formed: | | November 2004 |
| Property Name/Location: | | Buena Park Mall — Buena Park, CA |
| | | | | |
| Major Tenants: | | Ross Dress For Less | | Circuit City |
| | | PetsMart | | Office Depot |
| | | Kohl’s | | Walmart |
| | | Bed Bath & Beyond | | Sears |
| | | Michael’s | | Steve & Barry’s University |
| | | DSW Shoe Warehouse | | Tower Records |
| | | Krikorian Premier Theater | | |
| | | | | |
Partnership Structure | | | | |
| Equity Contribution: | | 80% — Coventry II Fund |
| | | 20% — DDR |
| | | | | |
| Cash Flow Distribution: | | 80% — Coventry II Fund * |
| | | 20% — DDR |
| | | | | |
Fees to DDR | | | | |
| Management Fee: | | 4% of gross income |
| Leasing Fees: | | 6% on new leases on years 1-5; 3% on remainder of term (spaces < 5,000 square feet) |
| | | 4.5% on new leases on years 1-5; 2.25% on remainder of term (spaces 5,000 - 10,000 square feet) |
| | | 3.5% on new leases on years 1-5; 1.75% on remainder of term (spaces 10,000 - 20,000 square feet) |
| | | $2 per square foot (spaces > 20,000 square feet) |
| | | 4% on new leases on years 1-10 (ground lease) |
| | | 3% for renewals on years 1-5; 1.5% on remainder of term (spaces < 5,000 square feet) |
| | | 2.25% for renewals on years 1-5; 1.125% on remainder of term (spaces 5,000 - 10,000 square feet) |
| | | 1.75% for renewals on years 1-5; 1% on remainder of term (spaces 10,000 - 20,000 square feet) |
| | | $1 per square foot for renewals (spaces > 20,000 square feet) |
| | | 2% on renewals on years 1-10 (ground lease) |
| | | 6% of gross sales price ≤ $500,000 (outparcel sales) |
| | | 5% of gross sales price $500,001 - $1,000,000 (outparcel sales) |
| | | 4% of gross sales prices > $1,000,000 (outparcel sales) |
| Construction Management Fee: | | 5% of all development and tenant improvement work performed |
| Tenant Coordination Fee: | | 5% of all hard and soft costs |
Capital Structure (in millions)
| | | | | |
| Coventry II Fund | | $ | 24.3 | |
| DDR | | | 6.1 | |
| | | | |
| Total Capital | | $ | 30.4 | |
| | | | |
| Debt | | $ | 61.0 | |
| | | | |
| Total Debt & Equity | | $ | 91.4 | |
| | | | |
| | |
| * | | Coventry II Fund: |
| |
| | | DDR also is entitled to a promote as a special member of the Coventry II Fund equal to 10% of all cash flow distributions after the distribution to all members of the Coventry II Fund of (i) a 10% preferred return on all contributed capital in all Coventry II Fund investments and (ii) 100% of the unreturned contributed capital in all Coventry II Fund investments. |
Joint Venture Partnership Summaries 4.2
Developers Diversified Realty
Quarterly Financial Supplemental
For the nine months ended September 30, 2006
| | | | | |
| | | Joint Venture Investment Summary |
| | | | | |
| Joint Venture Name: | | Coventry II DDR Fairplain LLC |
| Date Formed: | | May 2006 |
| Property Name/Location: | | Fairplain Plaza — Benton Harbor, MI |
| | | | | |
| Major Tenants: | | Target (not owned) | | Pier 1 Imports |
| | | TJ Maxx | | Dunham’s Sports |
| | | Office Depot | | Old Navy |
| | | Dollar Tree | | Rite Aid |
| | | | | |
Partnership Structure | | | | |
| Equity Contribution: | | 80% — Coventry II Fund |
| | | 20% — DDR |
| | | | | |
| Cash Flow Distribution: | | 80% — Coventry II Fund |
| | | 20% — DDR |
| | | | | |
Fees to DDR | | | | |
| Management Fee: | | 4% of gross income |
| Development Fee: | | 5% of all hard and soft costs |
| Leasing Fees: | | 6% on new leases on years 1-5; 3% on remainder of term (spaces < 5,000 square feet) |
| | | 4.5% on new leases on years 1-5; 2.25% on remainder of term (spaces 5,000 - 10,000 square feet) |
| | | 3.5% on new leases on years 1-5; 1.75% on remainder of term (spaces 10,000 - 20,000 square feet) |
| | | $2 per square foot (spaces > 20,000 square feet) |
| | | 4% on new leases on years 1-10 (ground lease) |
| | | 3% for renewals on years 1-5; 1.5% on remainder of term (spaces < 5,000 square feet) |
| | | 2.25% for renewals on years 1-5; 1.125% on remainder of term (spaces 5,000 - 10,000 square feet) |
| | | 1.75% for renewals on years 1-5; 1% on remainder of term (spaces 10,000 - 20,000 square feet) |
| | | $1 per square foot for renewals (spaces > 20,000 square feet) |
| | | 2% on renewals on years 1-10 (ground lease) |
| | | 6% of gross sales price ≤ $500,000 (outparcel sales) |
| | | 5% of gross sales price $500,001 - $1,000,000 (outparcel sales) |
| | | 4% of gross sales prices > $1,000,000 (outparcel sales) |
| Construction Management Fee: | | 5% of all development and tenant improvement work performed |
| Tenant Coordination Fee: | | 5% of all hard and soft costs |
Capital Structure (in millions)
| | | | | |
| Coventry II Fund | | $ | 9.1 | |
| DDR | | | 2.3 | |
| | | | |
| Total Capital | | $ | 11.4 | |
| | | | |
| Debt | | $ | 15.9 | |
| | | | |
| Total Debt & Equity | | $ | 27.3 | |
| | | | |
| | |
| * | | Coventry II Fund: |
| |
| | | DDR also is entitled to a promote as a special member of the Coventry II Fund equal to 10% of all cash flow distributions after the distribution to all members of the Coventry II Fund of (i) a 10% preferred return on all contributed capital in all Coventry II Fund investments and (ii) 100% of the unreturned contributed capital in all Coventry II Fund investments. |
Joint Venture Partnership Summaries 4.2
Developers Diversified Realty
Quarterly Financial
Supplemental
For the nine months ended September 30, 2006
| | | |
| | | Joint Venture Investment Summary |
| | | |
| Joint Venture Name: | | Coventry II DDR Merriam Village LLC |
| Date Formed: | | March 2005 |
| Property Name/Location: | | Merriam Village - Merriam, Kansas |
| | | |
| Major Tenants: | | To be announced |
| | | |
Partnership Structure | | |
| Equity Contribution: | | 80% — Coventry II Fund |
| | | 20% — DDR |
| | | |
| Cash Flow Distribution: | | 80% — Coventry II Fund * |
| | | 20% — DDR |
| | | |
Fees to DDR | | |
| Management Fee: | | 4% of gross income |
| Development Fee: | | 5% of all hard and soft costs |
| Leasing Fees: | | 6% on new leases on years 1-5; 3% on remainder of term (spaces < 5,000 square feet) |
| | | 4.5% on new leases on years 1-5; 2.25% on remainder of term (spaces 5,000 — 10,000 square feet) |
| | | 3.5% on new leases on years 1-5; 1.75% on remainder of term (spaces 10,000 — 20,000 square feet) |
| | | $2 per square foot (spaces > 20,000 square feet) |
| | | 4% on new leases on years 1-10 (ground lease) |
| | | 3% for renewals on years 1-5; 1.5% on remainder of term (spaces < 5,000 square feet) |
| | | 2.25% for renewals on years 1-5; 1.125% on remainder of term (spaces 5,000 — 10,000 square feet) |
| | | 1.75% for renewals on years 1-5; 1% on remainder of term (spaces 10,000 — 20,000 square feet) |
| | | $1 per square foot for renewals (spaces > 20,000 square feet) |
| | | 2% on renewals on years 1-10 (ground lease) |
| | | 6% of gross sales price ≤ $500,000 (outparcel sales) |
| | | 5% of gross sales price $500,001 — $1,000,000 (outparcel sales) |
| | | 4% of gross sales prices > $1,000,000 (outparcel sales) |
| Construction Management Fee: ** | | 5% of all development and tenant improvement work performed |
| Tenant Coordination Fee: ** | | 5% of all hard and soft costs |
Capital Structure (in millions)
| | | | | |
| Coventry II Fund | | $ | 1.6 | |
| DDR | | | 0.4 | |
| | | | |
| Total Capital | | $ | 2.0 | |
| | | | |
| Debt | | $ | 18.5 | |
| | | | |
| Total Debt & Equity | | $ | 20.5 | |
| | | | |
| | |
| * | | Coventry II Fund: |
| |
| | | DDR also is entitled to a promote as a special member of the Coventry II Fund equal to 10% of all cash flow distributions after the distribution to all members of the Coventry II Fund of (i) a 10% preferred return on all contributed capital in all Coventry II Fund investments and (ii) 100% of the unreturned contributed capital in all Coventry II Fund investments. |
| |
| ** | | Fee shall not be paid with respect to the initial leasing or development. |
Joint Venture Partnership Summaries 4.2
Developers Diversified Realty
Quarterly Financial Supplemental
For the nine months ended September 30, 2006
| | | |
| | | Joint Venture Investment Summary |
| | | |
| Joint Venture Name: | | Coventry II DDR Montgomery Farm LLC |
| Date Formed: | | May, 2006 |
| Property Name/Location: | | Montgomery Farm — Allen, TX |
| | | |
| Major Tenants: | | To be Announced |
| | | |
Partnership Structure | | |
| Coventry II DDR/Trademark Montgomery Farm L.P. |
| | | |
| Equity Contribution: | | 50% — Trademark Montgomery Farm L.P |
| | | 50% —Coventry II DDR Montgomery Farm LLC |
| | | |
| Cash Flow Distribution: | | 50% — Trademark Montgomery Farm L.P |
| | | 50% —Coventry II DDR Montgomery Farm LLC |
| | | |
| Coventry II DDR Montgomery Farm LLC |
| | | |
| Equity Contribution: | | 80% — Coventry II Fund |
| | | 20% — DDR |
| | | |
| Cash Flow Distribution: | | 80% — Coventry II Fund |
| | | 20% — DDR |
| | | |
Fees to DDR | | |
| Management Fee: | | 2% of gross income |
| Development Fee: | | 1% of all hard and soft costs |
| Lease Review Fee: | | $1 per square foot |
Capital Structure (in millions)
| | | | | |
| Coventry II Fund | | $ | 5.8 | |
| DDR | | | 1.4 | |
| | | | |
| Total Capital | | $ | 7.2 | |
| | | | |
| Debt | | $ | 8.5 | |
| | | | |
| Total Debt & Equity | | $ | 15.7 | |
| | | | |
| | |
| * | | Coventry II Fund: |
| |
| | | DDR also is entitled to a promote as a special member of the Coventry II Fund equal to 10% of all cash flow distributions after the distribution to all members of the Coventry II Fund of (i) a 10% preferred return on all contributed capital in all Coventry II Fund investments and (ii) 100% of the unreturned contributed capital in all Coventry II Fund investments. |
Joint Venture Partnership Summaries 4.2
Developers Diversified Realty
Quarterly Financial Supplemental
For the nine months ended September 30, 2006
| | | |
| | | Joint Venture Investment Summary |
| | | |
| Joint Venture Name: | | Coventry II DDR Phoenix Spectrum LLC |
| Date Formed: | | March 2004 |
| Property Name/Location: | | Spectrum Mall — Phoenix, AZ |
| | | |
| Major Tenants: | | Wal-Mart |
| | | Costco Wholesale |
| | | Ross Dress For Less |
| | | PetsMart |
| | | Walgreens |
| | | Harkins Theater |
| | | Famous Footwear |
| | | Big 5 Sporting Goods |
| | | |
Partnership Structure | | |
| Equity Contribution: | | 80% — Coventry II Fund |
| | | 20% — DDR |
| | | |
| Cash Flow Distribution: | | 80% — Coventry II Fund * |
| | | 20% — DDR |
| | | |
Fees to DDR | | |
| Management Fee: | | 4% of gross income |
| Development Fee: | | 5% of all hard and soft costs |
| Leasing Fees: | | 6% on new leases on years 1-5; 3% on remainder of term (spaces < 5,000 square feet) |
| | | 4.5% on new leases on years 1-5; 2.25% on remainder of term (spaces 5,000 — 10,000 square feet) |
| | | 3.5% on new leases on years 1-5; 1.75% on remainder of term (spaces 10,000 — 20,000 square feet) |
| | | $2 per square foot (spaces > 20,000 square feet) |
| | | 4% on new leases on years 1-10 (ground lease) |
| | | 3% for renewals on years 1-5; 1.5% on remainder of term (spaces < 5,000 square feet) |
| | | 2.25% for renewals on years 1-5; 1.125% on remainder of term (spaces 5,000 — 10,000 square feet) |
| | | 1.75% for renewals on years 1-5; 1% on remainder of term (spaces 10,000 — 20,000 square feet) |
| | | $1 per square foot for renewals (spaces > 20,000 square feet) |
| | | 2% on renewals on years 1-10 (ground lease) |
| | | 6% of gross sales price ≤ $500,000 (outparcel sales) |
| | | 5% of gross sales price $500,001 — $1,000,000 (outparcel sales) |
| | | 4% of gross sales prices > $1,000,000 (outparcel sales) |
| Construction Management Fee: | | 5% of all development and tenant improvement work performed |
| Tenant Coordination Fee: | | 5% of all hard and soft costs |
Capital Structure (in millions)
| | | | | |
| Coventry II Fund | | $ | 19.2 | |
| DDR | | | 4.8 | |
| | | | |
| Total Capital | | $ | 24.0 | |
| | | | |
| Debt | | $ | 47.5 | |
| | | | |
| Total Debt & Equity | | $ | 71.5 | |
| | | | |
| | |
| * | | Coventry II Fund: |
| |
| | | DDR also is entitled to a promote as a special member of the Coventry II Fund equal to 10% of all cash flow distributions after the distribution to all members of the Coventry II Fund of (i) a 10% preferred return on all contributed capital in all Coventry II Fund investments and (ii) 100% of the unreturned contributed capital in all Coventry II Fund investments. |
Joint Venture Partnership Summaries 4.2
Developers Diversified Realty
Quarterly Financial Supplement
For the nine months ended September 30, 2006
Joint Venture Investment Summary
| | | |
| Joint Venture Name: | | Service Holdings LLC |
| Date Formed: | | September 2006 |
| Property Name/Location: | | The Joint Venture consists of 51 fee simple, leasehold and groundlease interests previously owned by the Service Merchandise Company, Inc. In total, these properties are located in 24 states across the United States. |
| | | |
Partnership Structure | | |
| Equity Contribution: | | 20.00% — DDR |
| | | 61.95% — Coventry Real Estate Fund II, LLC |
| | | 18.05% — Coventry Fund II Parallel Fund, LLC |
| | | |
| Cash Flow Distribution: | | 20.00% — DDR |
| | | 61.95% — Coventry Real Estate Fund II, LLC |
| | | 18.05% — Coventry Fund II Parallel Fund, LLC |
| | | |
| Fees to DDR |
| Management Fee: | | 4.0% of gross income |
| Development Fee: | | 5.0% of all hard costs |
| Leasing Fees: | | 6.0% on new leases on years 1-5; 3.0% on remainder of term (spaces < 5,000 square feet) |
| | | 4.5% on new leases on years 1-5; 2.25% on remainder of term (spaces 5,000 — 10,000 square feet) |
| | | 3.5% on new leases on years 1-5; 1.75% on remainder of term (spaces 10,000 — 20,000 square feet) |
| | | $2.00 per square foot (spaces > 20,000 square feet) |
| | | 4.0% on new leases on years 1-10 (ground leases) |
| | | 3% for renewals on years 1-5; 1.5% on remainder of term (spaces < 5,000 square feet) |
| | | 2.25% for renewals on years 1-5; 1.125% on remainder of term (spaces 5,000 — 10,000 square feet) |
| | | 1.75% for renewals on years 1-5; 1% on remainder of term (spaces 10,000 — 20,000 square feet) |
| | | $1 per square foot for renewals (spaces > 20,000 square feet) |
| | | 2% on renewals on years 1-10 (ground lease) |
| Commission on Outparcel Sales: | | 6% of gross sales price ≤ $500,000 (outparcel sales) |
| | | 5% of gross sales price $500,001 — $1,000,000 (outparcel sales) |
| | | 4% of gross sales prices > $1,000,000 (outparcel sales) |
| Construction Management Fee: ** | | 5% of all development and tenant improvement work performed |
| Tenant Coordination Fee: ** | | 5% of all hard and soft costs |
Capital Structure (in millions)
| | | | | |
| DDR | | $ | 9.8 | |
| Coventry Real Estate Fund II | | | 30.2 | |
| Coventry Fund II Parallel Fund | | | 8.8 | |
| | | | |
| Total Capital | | $ | 48.8 | |
| | | | |
| Payable to DDR | | $ | — | |
| | | | |
| Debt | | $ | 139.0 | |
| | | | |
| Total Debt & Equity | | $ | 187.8 | |
| | | | |
Joint Venture Partnership Summaries 4.2
Developers Diversified Realty
Quarterly Financial Supplemental
For the nine months ended September 30, 2006
| | | | | |
| | | Joint Venture Investment Summary |
| | | | | |
| Joint Venture Name: | | Coventry II DDR Totem Lakes LLC | | |
| Date Formed: | | January 2004 | | |
| Property Name/Location: | | Totem Lakes Mall — Kirkland, WA | | |
| |
| Major Tenants: | | Guitar Center | | Denny’s Pet World |
| | | Trader Joe’s | | CompUSA |
| | | Big 5 Sporting Goods | | Famous Footwear |
| | | Totem Lake Theater | | Ross Dress For Less |
| | | Rite Aid | | |
| | | | | |
Partnership Structure | | | | |
| Equity Contribution: | | 80% — Coventry II Fund | | |
| | | 20% — DDR | | |
| |
| Cash Flow Distribution: | | 80% — Coventry II Fund * | | |
| | | 20% — DDR | | |
| | | | | |
Fees to DDR | | | | |
| Management Fee: | | 4% of gross income |
| Development Fee: | | 5% of all hard and soft costs |
| Leasing Fees: | | 6% on new leases on years 1-5; 3% on remainder of term (spaces < 5,000 square feet) |
| | | 4.5% on new leases on years 1-5; 2.25% on remainder of term (spaces 5,000 — 10,000 square feet) |
| | | 3.5% on new leases on years 1-5; 1.75% on remainder of term (spaces 10,000 — 20,000 square feet) |
| | | $2 per square foot (spaces > 20,000 square feet) |
| | | 4% on new leases on years 1-10 (ground lease) |
| | | 3% for renewals on years 1-5; 1.5% on remainder of term (spaces < 5,000 square feet) |
| | | 2.25% for renewals on years 1-5; 1.125% on remainder of term (spaces 5,000 — 10,000 square feet) |
| | | 1.75% for renewals on years 1-5; 1% on remainder of term (spaces 10,000 — 20,000 square feet) |
| | | $1 per square foot for renewals (spaces > 20,000 square feet) |
| | | 2% on renewals on years 1-10 (ground lease) |
| | | 6% of gross sales price ≤ $500,000 (outparcel sales) |
| | | 5% of gross sales price $500,001 - $1,000,000 (outparcel sales) |
| | | 4% of gross sales prices > $1,000,000 (outparcel sales) |
| Construction Management Fee: | | 5% of all development and tenant improvement work performed |
| Tenant Coordination Fee: | | 5% of all hard and soft costs |
| | | | | |
Capital Structure (in millions) | | | | |
| | | | | |
| Coventry II Fund | | $ | 9.5 | |
| DDR | | | 2.4 | |
| | | | |
| Total Capital | | $ | 11.9 | |
| | | | |
| Debt | | $ | 26.0 | |
| | | | |
| Total Debt & Equity | | $ | 37.9 | |
| | | | |
DDR also is entitled to a promote as a special member of the Coventry II Fund equal to 10% of all cash flow distributions after the distribution to all members of the Coventry II Fund of (i) a 10% preferred return on all contributed capital in all Coventry II Fund investments and (ii) 100% of the unreturned contributed capital in all Coventry II Fund investments.
Joint Venture Partnership Summaries 4.2
Developers Diversified Realty
Quarterly Financial Supplemental
For the nine months ended September 30, 2006
| | | | | |
| | | Joint Venture Investment Summary |
| | | | | |
| Joint Venture Name: | | Coventry II DDR Tri County LLC | | |
| Date Formed: | | May 2006 | | |
| Property Name/Location: | | Tri County Mall — Cincinnati, OH | | |
| |
| Major Tenants: | | Dillard’s | | Macy’s (Not Owned) |
| | | Abercrombie & Fitch | | Sears |
| | | Limited | | New York & Co. |
| | | Victoria’s Secret | | Ann Taylor Loft |
| | | | | |
Partnership Structure | | | | |
Thor Gallery at Tri County, LLC | | | | |
| |
| Ownership Percentage: | | .5% — Thor MM Gallery at Tri County, LLC |
| | | 9.5% — Thor Gallery at Tri County Mezz, LLC |
| | | 90.0% — Coventry II DDR Tri County LLC |
| |
| Equity Contribution: | | .5% — Thor MM Gallery at Tri County, LLC |
| | | 9.5% — Thor Gallery at Tri County Mezz, LLC |
| | | 90.0% — Coventry II DDR Tri County LLC |
| |
Coventry II DDR Tri County LLC | | | | |
| Equity Contribution: | | 80% — Coventry II Fund * | | |
| | | 20% — DDR | | |
| |
| Cash Flow Distribution: | | 80% — Coventry II Fund * | | |
| | | 20% — DDR | | |
| | | | | |
Fees to DDR | | | | |
| Management Fee: | | The Greater of $650,000 or 2.5% of Gross Income |
| Development/Leasing Fee: | | $500,000 | | |
| | | | | |
Capital Structure (in millions) | | | | |
| | | | | |
| Coventry II Fund | | $ | 29.9 | |
| DDR | | | 7.4 | |
| | | | |
| Total Capital | | $ | 37.3 | |
| | | | |
| Debt | | $ | 170.0 | |
| | | | |
| Total Debt & Equity | | $ | 207.3 | |
| | | | |
DDR also is entitled to a promote as a special member of the Coventry II Fund equal to 10% of all cash flow distributions after the distribution to all members of the Coventry II Fund of (i) a 10% preferred return on all contributed capital in all Coventry II Fund investments and (ii) 100% of the unreturned contributed capital in all Coventry II Fund investments.
Joint Venture Partnership Summaries 4.2
Developers Diversified Realty
Quarterly Financial Supplemental
For the nine months ended September 30, 2006
| | | | | |
| | | Joint Venture Investment Summary |
| | | | | |
| Joint Venture Name: | | Coventry II DDR Ward Parkway LLC |
| Date Formed: | | June 2003 | | |
| Property Name/Location: | | Ward Parkway — Kansas City, MO |
| |
| Major Tenants: | | Target (not owned) | | Old Navy |
| | | Dillards | | Off Broadway Shoes |
| | | Pier One Imports | | 24 Hour Fitness |
| | | TJ Maxx | | Dick’s Sporting Goods |
| | | AMC Theatre | | Petsmart |
| | | | | |
Partnership Structure | | | | |
| Equity Contribution: | | 80% — Coventry II Fund | | |
| | | 20% — DDR | | |
| |
| Cash Flow Distribution: | | 80% — Coventry II Fund * | | |
| | | 20% — DDR | | |
| | | | | |
Fees to DDR | | | | |
| Management Fee: | | 4% of gross income | | |
| Development Fee: | | 5% of all hard and soft costs |
| Leasing Fees: | | 6% on new leases on years 1-5; 3% on remainder of term (spaces < 5,000 square feet) |
| | | 4.5% on new leases on years 1-5; 2.25% on remainder of term (spaces 5,000 - 10,000 square feet) |
| | | 3.5% on new leases on years 1-5; 1.75% on remainder of term (spaces 10,000 - 20,000 square feet) |
| | | $2 per square foot (spaces > 20,000 square feet) |
| | | 4% on new leases on years 1-10 (ground lease) |
| | | 3% for renewals on years 1-5; 1.5% on remainder of term (spaces < 5,000 square feet) |
| | | 2.25% for renewals on years 1-5; 1.125% on remainder of term (spaces 5,000 - 10,000 square feet) |
| | | 1.75% for renewals on years 1-5; 1% on remainder of term (spaces 10,000 - 20,000 square feet) |
| | | $1 per square foot for renewals (spaces > 20,000 square feet) |
| | | 2% on renewals on years 1-10 (ground lease) |
| | | 6% of gross sales price ≤ $500,000 (outparcel sales) |
| | | 5% of gross sales price $500,001 - $1,000,000 (outparcel sales) |
| | | 4% of gross sales prices > $1,000,000 (outparcel sales) |
| Construction Management Fee: | | 5% of all development and tenant improvement work performed |
| Tenant Coordination Fee: | | 5% of all hard and soft costs |
| | | | | |
Capital Structure (in millions) | | | | |
| | | | | |
| Coventry II Fund | | $ | 17.8 | |
| DDR | | | 4.5 | |
| | | | |
| Total Capital | | $ | 22.3 | |
| | | | |
| Debt | | $ | 36.0 | |
| | | | |
| Total Debt & Equity | | $ | 58.3 | |
| | | | |
DDR also is entitled to a promote as a special member of the Coventry II Fund equal to 10% of all cash flow distributions after the distribution to all members of the Coventry II Fund of (i) a 10% preferred return on all contributed capital in all Coventry II Fund investments and (ii) 100% of the unreturned contributed capital in all Coventry II Fund investments.
Joint Venture Partnership Summaries 4.2
Developers Diversified Realty
Quarterly Financial Supplemental
For the nine months ended September 30, 2006
| | | |
| | | Joint Venture Investment Summary |
| | | |
| Joint Venture Name: | | Coventry II DDR Westover LLC / DDR DB 151 Ventures LP |
| Date Formed: | | June 2004 |
| Property Name/Location: | | Westover Marketplace — San Antonio, TX |
| | | |
| Major Tenants: | | Target (not owned) |
| | | Lowe’s (not owned) |
| | | Ross |
| | | Petsmart |
| | | Sportsman’s Warehouse |
| | | Office Depot |
| | | |
Partnership Structure | | |
DDR DB 151 Ventures LP | | |
| |
| Ownership Percentage: | | 50% — Coventry II DDR Westover LLC |
| | | 50% — ERA 151 Partners, Ltd. (Development Partner) |
| | | (No equity contributions at the partnership level) |
| | | |
| Cash Flow Distribution: | | 50% — Coventry II DDR Westover LLC |
| | | 50% — ERA 151 Partners, Ltd. (Development Partner) |
| | | (After repayment of 10.5% interest on the Coventry II DDR Westover loan and repayment of the loan) |
| | | |
Coventry II DDR Westover LLC | | |
| | | |
| Equity Contribution: | | 80% — Coventry II Fund* |
| | | 20% — DDR |
| | | |
| Cash Flow Distribution: | | 80% — Coventry II Fund* |
| | | 20% — DDR |
| | | |
Fees to DDR | | |
| Management Fee: | | 4% of gross income |
| Development Fee: | | 1% of all project costs less land |
| Leasing Fees: ** | | 6% on new leases on years 1-5; 3% on remainder of term (spaces < 5,000 square feet) |
| | | 4.5% on new leases on years 1-5; 2.25% on remainder of term (spaces 5,000 — 10,000 square feet) |
| | | 3.5% on new leases on years 1-5; 1.75% on remainder of term (spaces 10,000 — 20,000 square feet) |
| | | $2 per square foot (spaces > 20,000 square feet) |
| | | 4% on new leases on years 1-10 (ground lease) |
| | | 3% for renewals on years 1-5; 1.5% on remainder of term (spaces < 5,000 square feet) |
| | | 2.25% for renewals on years 1-5; 1.125% on remainder of term (spaces 5,000 — 10,000 square feet) |
| | | 1.75% for renewals on years 1-5; 1% on remainder of term (spaces 10,000 — 20,000 square feet) |
| | | $1 per square foot for renewals (spaces > 20,000 square feet) |
| | | 2% on renewals on years 1-10 (ground lease) |
| | | 6% of Gross Sales Price up to $500,000 (Outparcel Sales) |
| | | 5% of Gross Sales Price over $500,000 but less than $1,000,000 (Outparcel Sales) |
| | | 4% of Gross Sales Price $1,000,000 or over (Outparcel Sales) |
| Construction Management Fee: ** | | 5% of all development and tenant improvement work performed |
| Tenant Coordination Fee: ** | | 5% of all hard and soft costs |
| | | |
Capital Structure (in millions) | | |
| | | | | |
| Coventry II Fund | | $ | 6.4 | |
| DDR | | | 1.6 | |
| | | | |
| Total Capital | | $ | 8.0 | |
| | | | |
| Debt | | $ | 17.5 | |
| | | | |
| Total Debt & Equity | | $ | 25.5 | |
| | | | |
| | |
| * | | DDR also is entitled to a promote as a special member of the Coventry II Fund equal to 10% of all cash flow distributions after the distribution to all members of the Coventry II Fund of (i) a 10% preferred return on all contributed capital in all Coventry II Fund investments and (ii) 100% of the unreturned contributed capital in all Coventry II Fund investments. |
| |
| ** | | Fee shall not be paid with respect to the initial leasing or development. |
Joint Venture Partnership Summaries 4.2
Developers Diversified Realty
Quarterly Financial Supplement
For the nine months ended September 30, 2006
Joint Venture Investment Summary
| | | | | |
| Joint Venture Name: | | DDR Macquarie LLC (Fund LLC, Management LLC, and U.S. Trust Inc.) |
| Date Formed: | | November 2003 |
| Property Name/Location: | | The joint venture consists of the following 48 properties: |
| | | | | |
| | | Union Consumer Square — Cheektowaga, NY | | The Plazas at Great Northern — North Olmsted, OH |
| | | Walden Consumer Square — Cheektowaga, NY | | Riverdale Village — Coon Rapids, MN |
| | | Dick’s Plaza — Cheektowaga, NY | | Midway Marketplace — St. Paul, MN |
| | | Walden Place — Cheektowaga, NY | | River Hills Shopping Center — Asheville, NC |
| | | Borders Books — Cheektowaga, NY | | Township Marketplace — Monaca, PA |
| | | Eastgate Plaza — Clarence, NY | | The Marketplace — Nashville, TN |
| | | Premier Place — Clarence, NY | | BJ’s Batavia — Batavia, NY |
| | | Regal Cinemas — Clarence, NY | | Tops Plaza — Batavia, NY |
| | | Jo-Ann Plaza — Clarence, NY | | Batavia Commons — Batavia, NY |
| | | Barnes & Noble — Clarence, NY | | Towne Center — Murfreesboro, TN |
| | | New Hartford Consumer Square — Utica, NY | | Perimeter Pointe — Atlanta, GA |
| | | Merriam Town Center — Merriam, KS | | Woodfield Village Green — Schaumburg, IL |
| | | Spring Creek Center — Fayetteville, AR | | Fairfax Towne Center — Fairfax, VA |
| | | Steele Crossing — Fayetteville, AR | | Belden Park Crossings — Canton, OH |
| | | Carillon Place — Naples, FL | | Independence Commons — Independence, MO |
| | | Towne Center Prado — Marietta, GA | | Erie Marketplace — Erie, PA |
| | | Shoppers World — Framingham, MA | | Riverchase Promenade — Birmingham, AL |
| | | Harbison Court — Columbia, SC | | Lakepointe Crossing — Lewisville, TX |
| | | Connecticut Commons — Plainville, CT | | Lake Brandon Village — Brandon, FL |
| | | Pioneer Hills — Aurora, CO | | Lake Brandon Plaza — Brandon, FL |
| | | Cool Springs Pointe — Brentwood, TN | | MacArthur Marketplace — Irving, TX |
| | | Brown Deer Center — Brown Deer, WI | | Shoppers World of Brookfield — Brookfield, WI |
| | | Brown Deer Market — Brown Deer, WI | | Parker Pavilions — Parker, CO |
| | | McDonough Marketplace — McDonough, GA | | Grandville Marketplace — Grandville, MI |
| | | | | | | |
| | | | | Dick’s Sporting Goods | | |
| Major Tenants: | | A.C. Moore | | DSW Shoe Warehouse/Filene’s | | PetSmart |
| | | AMC Theatres/General Cinema | | Basement | | Pier 1 Imports |
| | | Barnes & Noble Superstores | | Famous Footwear | | Publix Supermarkets |
| | | Bed Bath & Beyond | | Hallmark | | Regal Cinemas |
| | | Best Buy | | Home Depot | | Ross Dress for Less |
| | | BJ’s Wholesale Club | | Jo-Ann Stores | | Safeway |
| | | Blockbuster | | Kohl’s | | Sports Authority |
| | | Bobs | | Linens ‘N Things | | Stein Mart |
| | | Borders Books | | Lowe’s | | Supervalue, Inc. |
| | | Catherine’s/Fashion Bug/Lane Bryant | | Michael’s | | TJX Companies |
| | | Cinemark Theatres | | Office Depot | | Toys “R” Us/Babies “R” Us |
| | | Circuit City | | OfficeMax | | United Artists Theatre |
| | | Comp USA | | Old Navy (Gap, Inc.) | | Wal-Mart/Sam’s Club |
| | | Cost Plus World Market | | Party City | | |
| | | | | |
| Partnership Structure |
| Equity Contribution: | | 14.78% — DDR | | Cash Flow Distribution: Variable* |
| | | 0.64% — Macquarie Bank Limited (“MBL”) | | |
| | | 84.58% — Macquarie DDR Trust (“MDT”) | | |
| | | | | |
| Promote: | | Quarterly Base Fee allocation to DDR and MBL. If certain criteria are met, there is a special income allocation to DDR and MBL for a Performance Fee. |
Joint Venture Partnership Summaries 4.2
| | | |
| Fees to DDR |
| Property Management Fee: | | 4.0% of gross revenues |
| Development Fee: | | 5.0% of total costs for all improvements |
Leasing Fees (without
co-broker): | | 6.0% on new leases on years 1-5; 3.0% on remainder of term (spaces < 5,000 square feet) |
| | | 5.0% on new leases on years 1-5; 2.5% on remainder of term (spaces 5,000 — 10,000 square feet) |
| | | 4.0% on new leases on years 1-5; 2.0% on remainder of term (spaces 10,000 — 20,000 square feet) |
| | | $2.00 per square foot (spaces > 20,000 square feet) |
| | | 4.0% on new leases on years 1-5; 2.0% on years 6-10 (outparcels and ground leases) |
| | | Renewals earn 50% of fees on new leases for spaces less than 20,000 square feet. For spaces of 20,000 square feet or more, renewals earn $2.00 per square foot for an amendment to a material term of a lease or $1.00 per square foot where there is no amendment to a material term of the lease. |
| Commission on Outparcel Sales: | | 6.0% of gross sales price up to $500,000 |
| | | 5.0% of gross sales price $500,000 — $1,000,000 |
| | | 4.0% of gross sales price $1,000,000 or over |
| Sponsor’s Fee: | | DDR received $2.9 million which was paid upon completion of the Australian initial public offering. |
| Acquisition Fees: | | Up to 1.0% of the purchase price for third party assets |
| Disposition Fee: | | Market rate not to exceed 1% of the sale price of the property to a third party |
| Debt Placement Fee: | | 50bp of the borrowings raised |
| Due Diligence Fee: | | 12.5bp of MDT’s interest in the purchase price of the acquisition |
| Construction Management Fee: | | 5.0% of the cost of capital improvements |
| Maintenance Service Fee: | | Based on time spent at the properties by DDR personnel |
Capital Structure (in millions)
| | | | | |
| DDR | | $ | 97.3 | |
| MBL | | | 4.2 | |
| MDT | | | 556.7 | |
| | | | |
| Total Capital | | $ | 658.2 | |
| | | | |
| Payable to DDR, net | | $ | 2.2 | |
| | | | |
| Debt | | $ | 1,040.3 | |
| | | | |
| Total Debt & Equity | | $ | 1,700.7 | |
| | | | |
*DDR and MBL receive a Base Fee as part of their distributions. The Base Fee is a percentage of the fair market value of the properties held by DDR Macquarie Fund LLC plus the book value of certain other assets held by DDR Macquarie Fund LLC. The prorata share of distributions made to MDT is reduced by the Base Fee. As such, the distribution percentages as well as the dollar amount of the distribution vary depending on the amount of the Base Fee.
Joint Venture Partnership Summaries 4.2
Developers Diversified Realty
Quarterly Financial Supplement
For the nine months ended September 30 2006
Joint Venture Investment Summary
| | | | | |
| Joint Venture Name: | | DDR MDT PS LLC |
| Date Formed: | | June 2006 |
| Property Name/Location: | | The joint venture consists of the following 6 properties: |
| | | | | |
| | | The Shops at Turner Hill — Lithonia, GA | | McKinney, TX — McKinney, TX |
| | | Flatacres Marketcenter — Parker, CO | | The Marketplace at Towne Center — Mesquite, TX |
| | | Frisco Marketplace — Frisco, TX | | Overland Pointe Marketplace — Overland Park, KS |
| | | | | |
| Major Tenants: | | Babies R Us | | Linens ‘N Things |
| | | Bed Bath & Beyond | | Michael’s |
| | | Famous Footwear | | Pier 1 Imports |
| | | Gart Sports | | Ross Dress for Less |
| | | Golf Galaxy | | Toys R Us |
| | | Kohl’s | | |
| | | |
Partnership Structure | | |
| Equity Contribution: | | Peferred: |
| | | 100% — MDT (entitled to a 9% return) |
| | | |
| | | Common: |
| | | Senior 85.5% — MDT (entitled to a 10% return) |
| | | Subordinate 14.5% — DDR (entitled to a 10% return) |
| | | |
| Cash Flow Distribution: | | Variable* |
| | | |
| Promote: | | DDR is entitled to a 20% promote and 14.5% of the remaining 80% that is allocated to all members in proportion to their ownership interests once all cash flow distributions discussed above are achieved. |
| | | |
Fees to DDR | | |
| Property Management Fee: | | 4.0% of gross revenues |
| Development Fee: | | 5.0% of total costs for all improvements |
| Leasing Fees (without co-broker): | | 6.0% on new leases on years 1-5; 3.0% on remainder of term (spaces < 5,000 square feet) |
| | | 5.0% on new leases on years 1-5; 2.5% on remainder of term (spaces 5,000 — 10,000 square feet) |
| | | 4.0% on new leases on years 1-5; 2.0% on remainder of term (spaces 10,000 — 20,000 square feet) |
| | | $2.00 per square foot (spaces > 20,000 square feet) |
| | | 4.0% on new leases on years 1-5; 2.0% on years 6-10 (outparcels and ground leases) |
| | | Renewals earn 50% of fees on new leases for spaces less than 20,000 square feet. For spaces of 20,000 square feet or more, renewals earn $2.00 per square foot for an amendment to a material term of a lease or $1.00 per square foot where there is no amendment to a material term of the lease. |
| Commission on Outparcel Sales: | | 6.0% of gross sales price up to $500,000 |
| | | 5.0% of gross sales price $500,000 — $1,000,000 |
| | | 4.0% of gross sales price $1,000,000 or over |
| Acquisition Fees: | | Up to 1.0% of the purchase price for third party assets |
| Disposition Fee: | | Market rate not to exceed 1% of the sale price of the property to a third party |
| Debt Placement Fee: | | 12.5bps of the borrowings raised |
| Structuring & Advising Fee: | | 25bps of purchase price |
| Due Diligence Fee: | | 25bps of MDT’s interest in the purchase price of the acquisition |
| Construction Management Fee: | | 5.0% of the cost of capital improvements |
| Maintenance Service Fee: | | Based on time spent at the properties by DDR personnel |
Capital Structure (in millions)
| | | | | | | |
| DDR | | $ | 1.9 | | | ** |
| MDT — preferred | | | 12.6 | | | |
| MDT — senior | | | 21.7 | | | |
| | | | | | |
| Total Capital | | $ | 36.2 | | | |
| | | | | | |
| Receivable from DDR, net | | $ | (2.9 | ) | | (primarily master lease receivable) |
| | | | | | |
| Debt | | $ | 86.0 | | | |
| | | | | | |
| Total Debt & Equity | | $ | 119.3 | | | |
| | | | | | |
*(i) DDR and MBL receive a Base Fee as part of their distributions. The Base Fee is a percentage (0.45%) of the fair market value of the properties held by DDR MDT PS LLC plus the book value of certain other assets held by DDR MDT PS LLC. The prorata share of distributions made to MDT is reduced by the Base Fee. As such, the distribution percentages as well as the dollar amount of the distribution vary depending on the amount of the Base Fee. After distribution of Base Fee (ii) to MDT in an amount equal to their 9% preferred return on $12.2 million, (iii) to MDT in an amount equal to their 10% senior return on $20.8 million, (iv) to DDR in an amount equal to their 10% subordinate return on $3.5 million, (v) 20% of remaining funds to DDR with 14.5% to DDR and 85.5% to MDT of remaining 80%.
** Due to subordination of returns, investment balance on DDR accounts is at $0.
Joint Venture Partnership Summaries 4.2
Developers Diversified Realty
Quarterly Financial Supplement
For the nine months ended September 30, 2006
Consolidated Joint Ventures
Joint Venture Partnership Summaries 4.2
Developers Diversified Realty
Quarterly Financial Supplement
For the nine months ended September 30, 2006
Joint Venture Investment Summary
| | | | | | | |
| Joint Venture Name: | | * | | DDR MDT MV LLC |
| Date Formed: | | | | September 2005 |
| Property Name/Location: | | | | The joint venture consists of 37 fee simple, leasehold and groundlease interests. |
| | | | | The properties are located in California, Arizona, Nevada and Texas. |
| | | | | | | |
| Partnership Structure | | | | |
| Equity Contribution: | | | | 50.0225% — DDR | | Cash Flow Distribution: Variable (1) |
| | | | | 49.9775% — Macquarie DDR Trust (“MDT”) |
| | | | | | | |
| Promote: | | | | Quarterly Base Fee allocation to DDR and MBL. If certain criteria are met, there is a special income allocation to DDR and MBL for a Performance Fee. |
| | | | | | | |
Fees to DDR | | | | | | |
| Property Management Fee: | | | | 4.0% of gross revenues |
| Development Fee: | | | | 5.0% of total costs for all improvements |
| Leasing Fees (without co-broker): | | | | 6.0% on new leases on years 1-5; 3.0% on remainder of term (spaces < 5,000 square feet) |
| | | | | 5.0% on new leases on years 1-5; 2.5% on remainder of term (spaces 5,000 - 10,000 square feet) |
| | | | | 4.0% on new leases on years 1-5; 2.0% on remainder of term (spaces 10,000 - 20,000 square feet) |
| | | | | $2.00 per square foot (spaces > 20,000 square feet) |
| | | | | 4.0% on new leases on years 1-5; 2.0% on years 6-10 (outparcels and ground leases) |
| | | | | Renewals earn 50% of fees on new leases for spaces less than 20,000 square feet. For spaces of 20,000 square feet or more, renewals earn $2.00 per square foot for an amendment to a material term of a lease or $1.00 per square foot where there is no amendment to a material term of the lease. |
| Commission on Outparcel Sales: | | | | 6.0% of gross sales price up to $500,000 |
| | | | | 5.0% of gross sales price $500,000 - $1,000,000 |
| | | | | 4.0% of gross sales price $1,000,000 or over |
| Acquistion Fee | | | | Up to 1.0% of the purchase price for third party assets |
| Debt Placement Fee | | | | 12.5bp of the borrowings raised |
| Structuring & Advisory Fee | | | | 25bp of Purchase Price |
| Disposition Fee: | | | | Market rate not to exceed 1% of the sale price of the property to a third party |
| Due Diligence Fee: | | | | 12.5bp of MDT’s interest in the purchase price of the acquisition |
| Construction Management Fee: | | | | 5.0% of the cost of capital improvements |
Capital Structure (in millions)
| | | | | |
| DDR | | $ | 78.75 | |
| MDT | | | 78.75 | |
| MBL | | | — | |
| | | | |
| Total Capital | | $ | 157.5 | |
| | | | |
| Payable to DDR | | $ | 0.1 | |
| | | | |
| Debt | | $ | 258.5 | |
| | | | |
| Total Debt & Equity | | $ | 416.1 | |
| | | | |
* The joint venture was consolidated into DDR in accordance with FIN 46.
(1)DDR and MBL receive a Base Fee as part of their distributions. The Base Fee is a percentage of the fair market value of the properties held by DDR MDT MV LLC plus the book value of certain other assets held by DDR MDT MV LLC. The prorata share of distributions made to MDT is reduced by the Base Fee. As such, the distribution percentages as well as the dollar amount of the distribution vary depending on the amount of the Base Fee.
Joint Venture Partnership Summaries 4.2
Developers Diversified Realty
Quarterly Financial Supplement
For the nine months ended September 30, 2006
Joint Venture Investment Summary
| | | |
| Joint Venture Name: | | *Shea and Tatum Associates Limited Partnership |
| Date Formed: | | January 1, 1995 (acquired January 2, 2003) |
| Property Name/Location: | | Paradise Village Gateway — Phoenix, AZ |
| | | |
| Major Tenants: | | Albertson’s |
| | | Bed Bath & Beyond |
| | | Petsmart |
| | | Ross |
| | | Staples |
| | | |
Partnership Structure | | |
| Equity Contribution: | | 67% — DDR |
| | | 33% — Churchill Family Trust |
| | | |
| Cash Flow Distribution: | | 67% — DDR |
| | | 33% — Churchill Family Trust |
| | | |
Fees to DDR | | |
| Management Fee: | | 5% of gross income |
| Development Fee: | | 5% of total costs for all improvements (excluding land) |
| Leasing Fees (without co-broker): | | $3.50 per square foot for spaces < 5,000 square feet |
| | | $3.00 per square foot for spaces 5,000 — 10,000 square feet |
| | | $2.50 per square foot for spaces 10,000 — 25,000 square feet |
| | | $2.00 per square foot for spaces 25,000 — 50,000 square feet |
| | | $1.50 per square foot for spaces over 50,000 square feet |
| | | Renewals earn 50% of fees on new leases |
| | | 5.0% on new ground leases on years 1-5 |
| Commission on Outparcel Sales: | | 5% of gross sales price |
Capital Structure (in millions)
| | | | | |
| DDR | | $ | 4.4 | |
| Churchill Family Trust | | | 2.1 | |
| | | | |
| Total Capital | | $ | 6.5 | |
| | | | |
| Debt | | $ | 16.9 | |
| | | | |
| Total Debt & Equity | | $ | 23.4 | |
| | | | |
*The joint venture was consolidated into DDR in accordance with EITF 04-05.
Joint Venture Partnership Summaries 4.2
Developers Diversified Realty
Quarterly Financial Supplement
For the nine months ended September 30, 2006
Summary of Joint Venture Capital Transactions
Acquisitions, Dispositions, Developments & Expansions
for the Nine Month Period Ended September 30, 2006
.
| | | | | | | | | | | | | | | | | | | | | |
| | | Nine Months | | | | | | | | | | | | | |
| | | Ended | | | Year Ended | | | Year Ended | | | Year Ended | | | Year Ended | |
| | | September 30, | | | December 31, | | | December 31, | | | December 31, | | | December 31, | |
| | | 2006 | | | 2005 | | | 2004 | | | 2003 | | | 2002 | |
| Acquisitions/Transfers | | $ | 536.5 | (1) | | $ | 350.0 | (5) | | $ | 1,147.0 | (7) | | $ | 1,221.7 | (9) | | $ | 53.0 | |
| Completed Expansions | | | 0.0 | | | | 9.3 | | | | 10.3 | | | | 9.7 | | | | 9.0 | |
| Developments & Construction in Progress | | | 112.9 | (2) | | | 87.5 | | | | 38.9 | | | | 120.1 | | | | 48.6 | |
| Tenant Improvements & Building Renovations (3) | | | 6.3 | | | | 6.8 | | | | 0.6 | | | | 0.6 | | | | 1.6 | |
| Other Real Estate Investments | | | 0.0 | | | | 0.0 | | | | 0.0 | | | | 0.0 | | | | 241.6 | (11) |
| | | | | | | | | | | | | | | | |
| | | $ | 655.7 | | | $ | 453.6 | | | $ | 1,196.8 | | | $ | 1,352.1 | | | $ | 353.8 | |
| Less: Real Estate Sales and Dispositions | | $ | (384.2 | )(4) | | $ | (148.8 | ) (6) | | $ | (306.7 | ) (8) | | $ | (781.5 | )(10) | | $ | (441.2 | ) (12) |
| | | | | | | | | | | | | | | | |
| |
| Joint Venture Totals (Millions) | | $ | 271.5 | | | $ | 304.8 | | | $ | 890.1 | | | $ | 570.6 | | | $ | (87.4 | ) |
| |
| | |
| (1) | | Includes DPG’s acquisition of an outparcel and a basis adjustment to the previous Macquarie DDR Trust acquisition. |
| |
| (2) | | Includes the acquisition of 34 acres of land in Allen, TX for the development of a 429,873 square foot shopping center and 88 acres of land in Bloomfield Hills, Michigan for the development of a 602,137 square foot shopping center. Both of these shopping centers are being developed with Coventry II. |
| |
| (3) | | The Company estimates recurring capital expenditures, including tenant improvements, of $8.5 million for its joint venture portfolio during 2006. |
| |
| (4) | | In addition to asset sales which had an aggregate cost of $64.1, the balance includes the transfer to DDR of the Service Merchandise portfolio, five assets located in Pasadena, CA, Phoenix, AZ (two properties), Salisbury, MD and Apex, NC. These assets had an aggregate cost of $320.1 million. |
| |
| (5) | | In addition to the Macquarie acquisition there was a basis adjustment to the DPG Realty Holdings and DDR Markaz II LLC acquisitions. |
| |
| (6) | | In addition to asset sales which had an aggregate cost of $111.1 million, this balance includes the transfer to DDR of the Dublin, Ohio shopping center which had an aggregate cost of $30 million and the sale of five outparcels at Plaza at Puente Hills, which were owned by RVIP VII. |
| |
| (7) | | Balance includes the acquisition of three Coventry II assets aggregating $174.1 million, the formation of DPG and DDR Markaz II aggregating $128.7 and $201.6, respectively, MDT’s acquisition of an additional $619.5 million of assets, plus the acquisition of the Poag & McEwen’s interest and David Berndt’s interest in RVIP IIIB and RVIP VIII, respectively, for $14.9 million, the purchase of a fee interest in several assets in the Service Merchandise portfolio for $5.2 million and a $3.0 million earnout for an outparcel in Kildeer, IL. |
| |
| (8) | | In addition to asset sales which had an aggregate cost of $141.7, this balance includes the transfer to DDR of the Littleton, CO and Merriam, KS shopping centers which had an aggregate cost of $107.3 million, $51.2 million of adjustments due to GAAP presentation including FIN 46 and a $6.5 million write-off for the demolition of a portion of an asset in Lancaster, CA. |
| |
| (9) | | Balance includes the formation of Macquarie DDR Trust and DDR Markaz aggregating $735.9 and $169.3, respectively, plus several new joint ventures with assets aggregating $228.8 million and the consolidation of equity investments previously held by DD Development Company for shopping centers in Long Beach, CA, Shawnee, KS, Overland Pointe, KS, Olathe, KS and Kansas City, MO which aggregated $87.7 million. |
| |
| (10) | | In addition to asset sales which had an aggregate cost of $167.5 million, this balance includes the disposition of shopping centers located in Dayton and Niles, OH, the sale of an outparcel, the transfer of the Leawood, KS and Suwanee, GA shopping centers to DDR and the rejection of two of the Service Merchandise leases, the aggregate cost of these transactions was $116.6 million. During the fourth quarter the shopping centers located in Coon Rapids, MN, Naples, FL, Atlanta, GA, Marietta, GA, Schaumburg, IL, Framingham, MA and Fairfax, VA, which had an aggregate cost of $379.2 million, were sold to the Macquarie DDR Trust joint venture, and $118.2 million of assets owned by DD Development Company were consolidated into DDR. |
| |
| (11) | | Amount represents the net cost of assets acquired from Service Merchandise pursuant to the designation rights agreement. |
| |
| (12) | | Includes transfers to DDR in the aggregate amounts of $58.7 million, $38.7 million, $25.6 million and $30.6 million relating to shopping centers in Plainville, CT, Independence, MO, Canton, OH and San Antonio, TX, respectively. This amount also includes sales of shopping centers in Denver, CO; Hagerstown, MD; Salem, NH, Eatontown, NJ, Durham, NC and Round Rock, TX and the sales of outlot parcels in Round Rock, TX and San Antonio, TX. |
Summary of Joint Venture Capital Transactions 5.1
Developers Diversified Realty
Quarterly Financial Supplement
For the nine months ended September 30, 2006
Joint Venture Acquisitions
for the Nine Month Period Ended September 30, 2006
| | | | | | | | | | | | | | | | | | | | | |
| | | | | | | | | | | | | | | DDR’s | | Joint |
| | | | | | | Cost | | Acquisition | | Ownership | | Venture |
| Property Location | | GLA | | (Millions) | | Date | | Percentage | | Partner |
| Monaca, PA | | | 46,470 | | | $ | 10.2 | | | | 3/23/2006 | | | | 14.50 | % | | Macquarie Bank Limited |
| Birmingham, AL | | | 21,774 | | | $ | 4.4 | | | | 3/23/2006 | | | | 14.50 | % | | Macquarie Bank Limited |
| Frisco, TX | | | 107,543 | | | $ | 10.4 | | | | 6/7/2006 | | | | 14.50 | % | | Macquarie Bank Limited |
| McKinney, TX | | | 118,967 | | | $ | 18.8 | | | | 6/7/2006 | | | | 14.50 | % | | Macquarie Bank Limited |
| Parker, CO | | | 221,520 | | | $ | 19.2 | | | | 6/7/2006 | | | | 14.50 | % | | Macquarie Bank Limited |
| Mesquite, TX | | | 178,925 | | | $ | 33.7 | | | | 6/7/2006 | | | | 14.50 | % | | Macquarie Bank Limited |
| Overland Park, KS | | | 83,047 | | | $ | 12.3 | | | | 6/7/2006 | | | | 14.50 | % | | Macquarie Bank Limited |
| Lithonia, GA | | | 157,175 | | | $ | 23.0 | | | | 6/7/2006 | | | | 14.50 | % | | Macquarie Bank Limited |
| Benton Harbor, MI | | | 222,739 | | | $ | 27.0 | | | | 5/18/2006 | | | | 20.00 | % | | Coventry II |
| Cincinnati, OH | | | 1,336,157 | | | $ | 194.4 | | | | 5/4/2006 | | | | 18.00 | % | | Coventry II |
| McDonough, GA | | | 22,658 | | | $ | 3.1 | | | | 7/5/2006 | | | | 14.50 | % | | Macquarie Bank Limited |
| Coon Rapids, MN | | | 33,637 | | | $ | 6.4 | | | | 7/5/2006 | | | | 14.50 | % | | Macquarie Bank Limited |
| Service Merchandise portfolio | | | 2,748,379 | | | $ | 171.9 | | | | 9/21/2006 | | | | 20.00 | % | | Coventry II |
| | | | | | | | | | | | | | | | | | | | | |
| |
| Total | | | 5,298,991 | | | $ | 534.8 | | | | | | | | | | | | | |
| |
Joint Venture Dispositions
for the Nine Month Period Ended September 30, 2006
| | | | | | | | | | | | | | | | | | | | | |
| | | | | | | Gross Sale | | | | | | DDR’s | | Joint |
| | | | | | | Proceeds | | | | | | Ownership | | Venture |
| Property Location | | GLA | | (Millions) | | Sale Date | | Percentage | | Partner |
| Service Merchandise location | | | 51,933 | | | $ | 3.2 | | | | 2/15/2006 | | | | 25.00 | % | | Various |
| Shawnee, KS | | | 174,843 | | | $ | 11.7 | | | | 5/15/2006 | | | | 24.75 | % | | Prudential and Coventry Partners |
| Olathe, KS | | | 48,802 | | | $ | 3.1 | | | | 5/15/2006 | | | | 24.75 | % | | Prudential and Coventry Partners |
| Kansas City, MO | | | 208,234 | | | $ | 5.2 | | | | 5/15/2006 | | | | 24.75 | % | | Prudential and Coventry Partners |
| Kildeer, IL | | | 167,477 | | | $ | 47.3 | | | | 8/10/2006 | | | | 10.00 | % | | DRA Advisors |
| Everett, WA | | | 88,961 | | | $ | 8.2 | | | | 9/29/2006 | | | | 20.00 | % | | Prudential and Coventry Partners |
| | | | | | | | | | | | | | | | | | | | | |
| |
| Total | | | 740,250 | | | $ | 78.7 | | | | | | | | | | | | | |
| |
Summary of Joint Venture Capital Transactions 5.1
Developers Diversified Realty
Quarterly Financial Supplement
For the nine months ended September 30, 2006
Joint Venture Expansion and Redevelopment Projects
for the Nine Month Period Ended September 30, 2006
| | | | | | | | | |
| | | DDR’s | | Joint | | |
| | | Ownership | | Venture | | |
| | | Percentage | | Partner | | Description |
Projects in Progress | | | | | | | | |
| |
| Phoenix, AZ | | | 20.00 | % | | Coventry II | | Relocation of several existing mall tenants to accommodate a new JC Penney, the relocation of Harkins Theatre, for a new Super Target as well as several new junior anchors and other retail tenants to be announced. |
| | | | | | | | | |
| Lancaster, CA | | | 20.00 | % | | Prudential Real
Estate Investors | | Relocate existing Wal-Mart to the area previously occupied by 99 Cent Store (relocated), House to Home and Costco (which were demolished) for development of a Wal-Mart Supercenter. Will recapture and redemise the former Wal-Mart for four junior anchors and three outparcels when Wal-Mart vacates. |
| | | | | | | | | |
| Benton Harbor, MI | | | 20.00 | % | | Coventry II | | Expansion of the existing shopping center to include an 89,000 square foot Kohl’s, a 20,087 sf PETsMART and additional retail tenants to be announced. |
| | | | | | | | | |
| Kansas City, MO | | | 20.00 | % | | Coventry II | | Relocation of several small shop tenants in the shopping center to accommodate PETsMART (opened 7/05), Old Navy (opened 9/05), Steve and Barrys plus additional mid-size anchors and other retail tenants to be announced. |
| | | | | | | | | |
| Cincinnati, OH | | | 18.00 | % | | Coventry II/ Thor
Equities | | Major redevelopment of the former JC Penney store to include several new retail tenants and restaurants to be announced. |
| | | | | | |
| Total Gross Cost (Millions) | | $ | 466.8 | (1) | | | | |
| | | | | | |
| Total Net Cost(Millions) | | $ | 438.8 | (1) | | | | |
| | | | | | |
| | | | | | | | | |
Projects to Commence | | | | | | | | |
| |
| Buena Park, CA | | | 20.00 | % | | Coventry II | | Underconstruction of Steve and Barry’s and 24 Fitness and redevelopment of the lower level of the mall for several tenants to be announced. |
| | | | | | | | | |
| Deer Park, IL | | | 24.75 | % | | Prudential Real
Estate Investors | | Approximately eight acres of land to be developed, which is under contract with Grace Community. |
| | | | | | | | | |
| Kirkland, WA | | | 20.00 | % | | Coventry II | | Large-scale redevelopment to include the relocation of several existing tenants, plus an expansion of the existing center to create additional GLA for two anchors, junior anchors, a theater, small shops and restaurants to be announced. |
Notes:
| (1) | | Total Cost includes the acquisition costs for the Coventry II redevelopments. |
Joint Venture Expansions and Redevelopment 5.2
Developers Diversified Realty
Quarterly Financial Supplement
For the nine months ended September 30, 2006
Summary of Joint Venture Development Projects
for the Nine Month Period Ended September 30, 2006
| | | | | | | | | | | | | | | | | | | | | | | | | | | | | |
| | | | | | | | | | | | | | | DDR’S | | | | | | |
| | | | | | | DDR’s | | Joint | | Gross | | Net | | Proportionate | | Substantial | | | | |
| | | Total | | Ownership | | Venture | | Cost | | Cost | | Cost | | Completion | | | | |
| Projects Substantially Complete | | GLA | | Percentage | | Partner | | (Millions) | | (Millions) | | (Millions) | | Date | | Description | | Major Tenants |
| |
| San Antonio, TX (Westover) | | | 560,220 | (1) | | | 10.0 | % | | David Berndt | | $ | 45.4 | | | $ | 34.8 | | | $ | 3.5 | | | 2005 & 2006 | | Community Center | | Lowe’s (opened in |
| | | | | | | | | | | Interests & | | | | | | | | | | | | | | | | | | 2003), Target, Ross |
| | | | | | | | | | | Coventry II | | | | | | | | | | | | | | | | | | Dress for Less, |
| | | | | | | | | | | | | | | | | | | | | | | | | | | | | Sportsman |
| | | | | | | | | | | | | | | | | | | | | | | | | | | | | Warehouse, Office |
| | | | | | | | | | | | | | | | | | | | | | | | | | | | | Depot, PetsMart, |
| | | | | | | | | | | | | | | | | | | | | | | | | | | | | Rack Room Shoes, |
| | | | | | | | | | | | | | | | | | | | | | | | | | | | | Mattress Pro, |
| | | | | | | | | | | | | | | | | | | | | | | | | | | | | Quizno’s, Radio |
| | | | | | | | | | | | | | | | | | | | | | | | | | | | | Shack, and Sports |
| | | | | | | | | | | | | | | | | | | | | | | | | | | | | Clips (opened in |
| | | | | | | | | | | | | | | | | | | | | | | | | | | | | 2005). The final |
| | | | | | | | | | | | | | | | | | | | | | | | | | | | | phase of the |
| | | | | | | | | | | | | | | | | | | | | | | | | | | | | development |
| | | | | | | | | | | | | | | | | | | | | | | | | | | | | includes Starbucks, |
| | | | | | | | | | | | | | | | | | | | | | | | | | | | | Sally Beauty, GNC, |
| | | | | | | | | | | | | | | | | | | | | | | | | | | | | Payless and Dots |
| | | | | | | | | | | | | | | | | | | | | | | | | | | | | (opened in 2006) |
| | | | | | | | | | | | | | | | | | | | | | | | | | | | | plus other retail |
| | | | | | | | | | | | | | | | | | | | | | | | | | | | | tenants to be |
| | | | | | | | | | | | | | | | | | | | | | | | | | | | | announced. |
| | | | | | | | | | | | | | | | | | | | | | | | | | | | | |
Projects in Progress | | | | | | | | | | | | | | | | | | | | | | | | | | | | |
| |
| Merriam Village, KS | | | 271,992 | | | | 20.0 | % | | Coventry II | | $ | 64.6 | | | $ | 43.5 | | | $ | 8.7 | | | 2007 | | Community Center | | To be announced. |
| | | | | | | | | | | | | | | | | | | | | | | | | | | | | |
| Allen, TX | | | 429,873 | | | | 10.0 | % | | Coventry II/ | | $ | 117.0 | | | $ | 93.3 | | | $ | 9.3 | | | 2008 | | Lifestyle Center | | Market Street |
| | | | | | | | | | | Trademark Property | | | | | | | | | | | | | | | | | | United, P.F. |
| | | | | | | | | | | Company | | | | | | | | | | | | | | | | | | Changs, Eddie |
| | | | | | | | | | | | | | | | | | | | | | | | | | | | | Bauer, Francesca’s |
| | | | | | | | | | | | | | | | | | | | | | | | | | | | | Collection, Origins |
| | | | | | | | | | | | | | | | | | | | | | | | | | | | | and other retail |
| | | | | | | | | | | | | | | | | | | | | | | | | | | | | tenants and |
| | | | | | | | | | | | | | | | | | | | | | | | | | | | | restaurants to be |
| | | | | | | | | | | | | | | | | | | | | | | | | | | | | announced. |
| | | | | | | | | | | | | | | | | | | | | | | | | | | | | |
Projects to Commence Construction | | | | | | | | | | | | | | | | | | | | | | | | | | | | |
| |
| | | | | | | | | | | | | | | | | | | | | | | | | | | | | |
| Bloomfield Park, MI | | | 602,137 | | | | 10.0 | % | | Coventry II/ BP1, | | $ | 269.5 | | | $ | 165.8 | | | $ | 16.6 | | | 2008 & 2009 | | Lifestyle Center | | Blue Point Ocean |
| | | | | | | | | | | LLC | | | | | | | | | | | | | | | | | | Grill, Bar Louie, |
| | | | | | | | | | | | | | | | | | | | | | | | | | | | | BCBG, BCBG Girls, |
| | | | | | | | | | | | | | | | | | | | | | | | | | | | | PacSun, Faro Design |
| | | | | | | | | | | | | | | | | | | | | | | | | | | | | and other retail |
| | | | | | | | | | | | | | | | | | | | | | | | | | | | | tenants and |
| | | | | | | | | | | | | | | | | | | | | | | | | | | | | restaurants to be |
| | | | | | | | | | | | | | | | | | | | | | | | | | | | | announced. |
| |
| Joint Venture Development Totals | | | 1,864,222 | | | | | | | | | $ | 496.5 | | | $ | 337.4 | �� | | $ | 38.1 | | | | | | | |
| |
Notes:
| (1) | | Includes square footage which will not be owned by the Company. |
Joint Venture Developments 5.2
Developers Diversified Realty
Quarterly Financial Supplement
For the nine months ended September 30, 2006
Joint Venture Development
Assets Placed in Service as of September 30, 2006
| | | | | | | | | |
| | | Assets Placed | | DDR’s Current |
| | | in Service | | Proportionate Share |
| Date | | (Millions) | | (Millions) |
| As of December 31, 2005 | | $ | 14.3 | | | $ | 1.4 | |
| 1st Quarter 2006 | | $ | 1.2 | | | $ | 0.1 | |
| 2nd Quarter 2006 | | $ | 1.4 | | | $ | 0.1 | |
| 3rd Quarter 2006 | | $ | 1.4 | | | $ | 0.2 | |
| 4th Quarter 2006 | | $ | 8.6 | | | $ | 0.9 | |
| Projected Thereafter | | $ | 310.5 | | | $ | 35.4 | |
| |
| Total | | $ | 337.4 | | | $ | 38.1 | |
| |
Joint Venture Development
Funding Schedule as of September 30, 2006
| | | | | | | | | | | | | | | | | |
| | | DDR’s | | JV Partners’ | | Proceeds from | | |
| | | Proportionate | | Proportionate | | Construction | | |
| | | Share | | Share | | Loans | | Total |
| | | (Millions) | | (Millions) | | (Millions) | | (Millions) |
| Funded as of September 30, 2006 | | $ | 3.4 | | | $ | 14.6 | | | $ | 112.4 | | | $ | 130.4 | |
| Projected Net Funding During 2006 | | | 1.2 | | | | 4.9 | | | | 8.9 | | | $ | 15.0 | |
| Projected Net Funding Thereafter | | | 11.0 | | | | 43.6 | | | | 137.4 | | | $ | 192.0 | |
| |
| Total | | $ | 15.6 | | | $ | 63.1 | | | $ | 258.7 | | | $ | 337.4 | |
| |
Joint Venture Development Delivery and Funding Schedules 5.2
Developers Diversified Realty Corporation
Quarterly Financial Supplement
For the nine months ended September 30, 2006
Summary of Joint Venture Debt
as of September 30, 2006
| | | | | | | | | | | | | | | | | |
| | | | | | | Mortgage | | | | |
| Property/Entity | | | | | | Balance (000’s) | | Maturity Date | | Interest Rate |
| RVIP III B | | | | | | | | | | | | | | | | |
| Deer Park, IL | | | F | | | $ | 60,000 | | | | 10/11 | | | | 5.590 | |
| | | | | | | | | | | | | | | | | |
| RVIP VI | | | | | | | | | | | | | | | | |
| Overland Park, KS | | | F | | | | 2,958 | | | | 11/07 | | | | 7.790 | |
| | | | | | | | | | | | | | | | | |
| RVIP VII | | | V | | | | 72,120 | (1) | | | 04/07 | | | Libor + 140 |
| | | | F | | | | 1,900 | (1) | | | 07/07 | | | | 8.375 | |
| | | | | | | | | | | | | | | | | |
| RVIP VIII | | | V | | | | 23,356 | | | | 01/09 | | | Libor + 100 |
| | | | | | | | | | | | | | | | | |
| DPG Realty Holdings, LLC | | | | | | | | | | | | | | | | |
| Tonawanda, NY | | | F | | | | 5,858 | | | | 05/17 | | | | 7.630 | |
| Tonawanda, NY | | | F | | | | 5,093 | | | | 06/21 | | | | 7.660 | |
| | | | | | | | | | | | | | | | | |
| DDRA Community Centers Five | | | V | | | | 18,000 | (2) | | | 07/07 | | | Libor + 200 |
| | | | F | | | | 280,000 | (2) | | | 08/10 | | | | 5.295 | |
| | | | | | | | | | | | | | | | | |
| Lennox Town Center Limited | | | | | | | | | | | | | | | | |
| Columbus, OH | | | F | | | | 17,685 | | | | 07/22 | | | | 8.110 | |
| | | | | | | | | | | | | | | | | |
| Sun Center Limited | | | F | | | | 6,111 | | | | 05/11 | | | | 5.420 | |
| Columbus, OH | | | F | | | | 14,102 | | | | 04/11 | | | | 8.480 | |
| | | | | | | | | | | | | | | | | |
| DOTRS LLC | | | | | | | | | | | | | | | | |
| Macedonia, OH | | | F | | | | 21,000 | | | | 08/11 | | | | 6.050 | |
| | | | | | | | | | | | | | | | | |
| Jefferson County Plaza, LLC | | | | | | | | | | | | | | | | |
| Arnold, MO | | | V | | | | 3,749 | | | | 08/08 | | | Libor + 175 |
| | | | | | | | | | | | | | | | | |
| DDR Markaz | | | F | | | | 110,000 | (3) | | | 06/08 | | | | 4.129 | |
| | | | | | | | | | | | | | | | | |
| DDR Markaz II | | | F | | | | 150,480 | (4) | | | 11/14 | | | | 5.147 | |
| | | | | | | | | | | | | | | | | |
| Coventry II DDR Buena Park | | | V | | | | 61,000 | | | | 03/10 | | | Libor + 115 |
| | | | | | | | | | | | | | | | | |
| Coventry II DDR Bloomfield | | | V | | | | 36,000 | | | | 11/06 | | | | 6.205 | |
| | | | V | | | | 32,000 | | | | 11/06 | | | | 6.195 | |
| | | | | | | | | | | | | | | | | |
| Coventry II DDR Fairplain | | | V | | | | 15,925 | | | | 11/06 | | | | 6.195 | |
| | | | | | | | | | | | | | | | | |
| Coventry II DDR Merriam Village | | | V | | | | 18,539 | | | | 06/08 | | | Libor + 150 |
| | | | | | | | | | | | | | | | | |
| Coventry II DDR Montgomery Farm | | | V | | | | 8,450 | | | | 11/06 | | | | 6.195 | |
| | | | | | | | | | | | | | | | | |
| Coventry II DDR Phoenix Spectrum | | | V | | | | 47,500 | | | | 01/09 | | | Libor + 70 |
| | | | | | | | | | | | | | | | | |
| Coventry II DDR SM | | | V | | | | 139,000 | | | | 01/07 | | | Libor + 100 |
Summary of Joint Venture Debt 5.3
Developers Diversified Realty CorporationQuarterly Financial Supplement
For the nine months ended September 30, 2006
Summary of Joint Venture Debt
as of September 30, 2006 (continued)
| | | | | | | | | | | | | | | | | |
| | | | | | | Mortgage | | | | | | | |
| Property/Entity | | | | | | Balance (000’s) | | | Maturity Date | | | Interest Rate | |
| Coventry II DDR Totem Lakes | | | V | | | $ | 26,000 | | | | 07/07 | | | Libor + 215 | |
| | | | | | | | | | | | | | | | | |
| Coventry II DDR Tri County | | | F | | | | 158,000 | | | | 02/15 | | | | 5.655 | |
| | | | F | | | | 12,000 | | | | 02/15 | | | | 10.304 | |
| | | | | | | | | | | | | | | | | |
| Coventry II DDR Ward Parkway | | | V | | | | 36,000 | | | | 08/08 | | | Libor + 125 | |
| | | | | | | | | | | | | | | | | |
| Coventry II DDR Westover Marketplace | | | V | | | | 17,474 | | | | 07/07 | | | Libor + 195 | |
| | | | | | | | | | | | | | | | | |
| DDR MDT PS, LLC | | | F | | | | 86,000 | (5) | | | 07/13 | | | | 6.004 | |
| | | | | | | | | | | | | | | | | |
DDR Macquarie(6) | | | | | | | | | | | | | | | | |
| $125 Million Revolving Credit Facility | | | V | | | | 87,325 | (7) | | | 11/07 | | | Libor + 100 | |
| JPMorgan Chase | | | F | | | | 9,100 | (7) | | | 11/07 | | | | 4.913 | |
| | | | | | | | | | | | | | | | | |
| Secured Financing | | | F | | | | 290,500 | (8) | | | 12/08 | | | | 4.225 | |
| | | | V | | | | 50,000 | (8) | | | 12/08 | | | Libor + 130 | |
| | | | F | | | | 165,250 | (9) | | | 06/09 | | | | 4.180 | |
| | | | F | | | | 20,000 | (9) | | | 06/07 | | | | 4.800 | |
| | | | V | | | | 29,750 | (9) | | | 06/07 | | | Libor + 84 | |
| | | | | | | | | | | | | | | | | |
| BJ’s Clarence | | | F | | | | 4,749 | | | | 03/22 | | | | 7.070 | |
| JoAnn Transit | | | F | | | | 3,020 | | | | 08/13 | | | | 6.250 | |
| New Hartford Consumer Square | | | F | | | | 34,825 | | | | 11/18 | | | | 5.750 | |
| Birmingham, AL (Riverchase) | | | F | | | | 7,789 | | | | 01/13 | | | | 5.500 | |
| Merriam Town Center | | | V | | | | 30,000 | | | | 11/06 | | | Libor + 110 | |
| | | | | | | | | | | | | | | | | |
| DDR Macquarie Longhorn Holdings | | | F | | | | 85,000 | (10) | | | 01/12 | | | | 4.910 | |
| | | | | | | | | | | | | | | | | |
| DDR Macquarie Longhorn Holdings II | | | F | | | | 157,250 | (11) | | | 04/10 | | | | 4.822 | |
| | | | V | | | | 26,450 | (11) | | | 04/10 | | | Libor + 85 | |
| | | | | | | | | | | | | | | | | |
| DDR Macquarie Longhorn Holdings III | | | F | | | | 39,300 | (12) | | | 04/10 | | | | 5.098 | |
| | | | | | | | | | | | | | | | | |
| | | | | | | $ | 2,526,608 | | | | | | | | | |
| | | | | | | | | | | | | | | | |
| | | | | | | | | |
| Notes: | | |
| | | | | | | | | |
| (1) Encumbers three shopping center properties located in California and Washington. | | |
| | | | | | | | | |
| (2) Encumbers six shopping center properties as follows: | | |
| | | Ahwatukee, AZ | | Maple Grove, MN | | | | Eagan, MN |
| | | Phoenix, AZ | | Portland, OR | | | | Fort Worth, TX |
Summary of Joint Venture Debt 5.3
Developers Diversified Realty CorporationQuarterly Financial Supplement
For the nine months ended September 30, 2006
| | | | | | | | | |
| Notes (con’t): | | |
| (3) Encumbers seven shopping center properties as follows: | | |
| | | Oviedo, FL | | Tampa, FL | | | | Grove City, OH |
| | | Richmond, CA | | Highland, IN | | | | Toledo, OH |
| | | Winchester, VA | | | | | | |
| | | | | | | | | |
| (4) Encumbers thirteen shopping center properties as follows: | | |
| | | Orchard Park, NY | | Warsaw, NY | | | | Chillicothe, OH |
| | | Rochester, NY | | Leroy, NY | | | | Loganville, GA |
| | | Cheektowaga, NY | | Jamestown, NY | | | | Oxford, MS |
| | | Amherst, NY | | Ontario, NY | | | | Goodlettsville, TN |
| | | Irondequoit, NY | | | | | | |
| | | | | | | | | |
| (5) Encumbers seven shopping center properties as follows: | | |
| | | Shops at Turner Hill (Lithonia, GA) | | | | McKinney Marketplace (McKinney, TX) |
| | | Turner Hill Marketplace (Lithonia, GA) | | | | Marketplace at Town Center (Mesquite, TX) |
| | | Flatacres Marketcenter (Parker, CO) | | | | Frisco Marketplace (Frisco, TX) |
| | | Overland Pointe Marketplace (Overland Park, KS) | | | | | | |
| | | | | | | | | |
| (6) The company’s 50% joint venture associated with the Mervyns Portfolio acquisition is not reflected below as it is consolidated within DDR’s accounts pursuant to FIN 46. |
| | | | | | | | | |
| (7) Encumbers three shopping center properties as follows: | | |
| | | Canton, OH | | St. Paul, MN | | | | North Olmsted, OH |
| | | | | | | | | |
| (8) Encumbers seven shopping center properties as follows: | | |
| | | Independence, MO | | Framingham, MA | | | | Fairfax, VA |
| | | Schaumburg, IL | | Atlanta, GA | | | | Naples, FL |
| | | Marietta, GA | | | | | | |
| | | | | | | | | |
| (9) Encumbers ten shopping center properties as follows: | | |
| | | Clarence, NY | | Monaca, PA | | | | Nashville, TN |
| | | Cheektowaga, NY | | Erie, PA | | | | Coon Rapids, MN |
| | | Batavia, NY | | Murfreesboro, TN | | | | Ashville, NC |
| | | Fayetteville, AR | | | | | | |
| | | | | | | | | |
| (10) Encumbers four shopping center properties as follows: | | |
| | | Pioneer Hills (Aurora, CO) | | Harbison Court (Columbia, SC) | | |
| | | MacArthur Marketplace (Irving, TX) | | Lakepointe Crossing (Lewisville, TX) | | |
| | | | | | | | | |
| (11) Encumbers eight shopping center properties as follows: | | |
| | | Plainville Commons (Plainville, CT) | | Cool Springs Pointe (Brentwood, TN) | | |
| | | Riverdale Village (Coon Rapids, MN) | | Shoppers World of Brookfield (Brookfield, WI) | | |
| | | Brandon Village (Brandon, FL) | | Brown Deer Center (Brown Deer, WI) | | |
| | | Brandon Plaza (Brandon, FL) | | Brown Deer Marketplace (Brown Deer, WI) | | |
| | | | | | | | | |
| (12) Encumbers three shopping center properties as follows: | | |
| | | Grandville Marketplace (Grandville, MI) | | | | Parker Pavilions (Parker, CO) |
| | | McDonough Marketplace (McDonough, GA) | | | | | | |
Summary of Joint Venture Debt 5.3
Developers Diversified Realty Corporation
Quarterly Financial Supplement
For the nine months ended September 30, 2006
Summary of Pro Rata Joint Venture Debt
as of September 30, 2006
| | | | | | | | | | | | | |
| | | DDR’s | | | DDR’s | | | | |
| | | Pro Rata | | | Pro Rata | | | Interest | |
| Joint Venture | | Interest | | | Debt (000's) | | | Rate (1) | |
| RVIP III B | | | 25.50 | % | | $ | 15,300 | | | | 5.590 | |
| RVIP VI | | | 25.50 | % | | | 754 | | | | 7.790 | |
| RVIP VII | | | 20.75 | % | | | 15,359 | | | | 6.765 | |
| RVIP VIII | | | 25.50 | % | | | 5,956 | | | | 6.322 | |
| DPG Realty Holdings, LLC | | | 10.00 | % | | | 1,095 | | | | 7.644 | |
| DDRA Comm Ctr Five | | | 50.00 | % | | | 149,000 | | | | 5.417 | |
| Lennox Town Center | | | 50.00 | % | | | 8,842 | | | | 8.110 | |
| Sun Center | | | 79.45 | % | | | 16,060 | | | | 7.555 | |
| DOTRS LLC | | | 50.00 | % | | | 10,500 | | | | 6.050 | |
| Jefferson County Plaza | | | 50.00 | % | | | 1,874 | | | | 7.072 | |
| DDR Markaz | | | 20.00 | % | | | 22,000 | | | | 4.129 | |
| DDR Markaz II | | | 20.00 | % | | | 30,096 | | | | 5.147 | |
| Coventry II DDR Buena Park | | | 20.00 | % | | | 12,200 | | | | 6.472 | |
| Coventry II DDR Bloomfield | | | 20.00 | % | | | 13,600 | | | | 6.200 | |
| Coventry II DDR Fairplain | | | 20.00 | % | | | 3,185 | | | | 6.195 | |
| Coventry II DDR Merriam Village | | | 20.00 | % | | | 3,708 | | | | 6.822 | |
| Coventry II DDR Montgomery Farm | | | 20.00 | % | | | 1,690 | | | | 6.195 | |
| Coventry II DDR Phoenix Spectrum | | | 20.00 | % | | | 9,500 | | | | 6.022 | |
| Coventry II DDR SM | | | 20.00 | % | | | 27,800 | | | | 6.322 | |
| Coventry II DDR Totem Lakes | | | 20.00 | % | | | 5,200 | | | | 7.472 | |
| Coventry II DDR Tri County | | | 18.00 | % | | | 30,600 | | | | 5.983 | |
| Coventry II DDR Ward Parkway | | | 20.00 | % | | | 7,200 | | | | 6.572 | |
| Coventry II DDR Westover Marketplace | | | 10.00 | % | | | 1,747 | | | | 7.272 | |
| DDR Macquarie (2) (3) | | | 14.49 | % | | | 150,741 | | | | 4.952 | |
| | | | | | | | | | | | | |
| Total | | | | | | $ | 544,007 | | | | | |
| | | | | | | | | | | | |
| | | | | | | | | | | | | |
| Fixed Rate | | | | | | $ | 393,993 | | | | | |
| Variable Rate | | | | | | $ | 150,014 | | | | | |
| | | | | | | | | | | | | |
| | | | | | | $ | 544,007 | | | | | |
| | | | | | | | | | | | |
| | | | | | | | | | | | | |
| Weighted Average — Total | | | | | | 3.60 years | | | 5.5 | % |
| | | | | | | | | | | | |
| Weighted Average — Fixed | | | 1,747,971 | | | 4.68 years | | | 5.1 | % |
| | | | | | | | | | | | |
| Weighted Average — Floating | | | 778,637 | | | 1.17 Years | | | 6.5 | % |
| | | | | | | | | | | | |
Notes:
| (1) | | Interest rate on floating rate debt determined by using the LIBOR rate in effect on September 30, 2006. One-month LIBOR was 5.32188% on September 30, 2006. |
| |
| (2) | | The company’s 50% joint venture associated with the Mervyns Portfolio acquisition is not reflected as it is consolidated within DDR’s accounts pursuant to FIN 46. |
| |
| (3) | | The company’s 14.49% of debt on DDR MDT PS, LLC is not reflected in this number as DDR’s position in this venture is completely subordinated with no corresponding assets reflected in the company’s financial results. |
Summary of Pro Rata Joint Venture Debt 5.4
Developers Diversified Realty Corporation
Quarterly Financial Supplement
For the nine months ended September 30, 2006
Summary of Joint Venture Mortgage Principal Payments
as of September 30, 2006
(000’s)
| | | | | | | | | | | | | | | | | | | | | | | | | | | | | | | | | | | | | | | | | | | | | | | | | |
| | | 2006 | | | 2007 | | | 2008 | | | 2009 | | | 2010 | | | 2011 | | | 2012 | | | 2013 | | | 2014 | | | 2015 | | | | | | | |
| JOINT VENTURE | | Payments | | | Payments | | | Payments | | | Payments | | | Payments | | | Payments | | | Payments | | | Payments | | | Payments | | | Payments | | | Thereafter | | | Total | |
| RVIP III B (Deer Park) | | | | | | | | | | | | | | | | | | | | | | | 60,000 | | | | | | | | | | | | | | | | | | | | | | | | 60,000 | |
| RVIP VI | | | 54 | | | | 2,949 | | | | | | | | | | | | | | | | | | | | | | | | | | | | | | | | | | | | | | | | 3,003 | |
| RVIP VII | | | 106 | | | | 73,993 | | | | | | | | | | | | | | | | | | | | | | | | | | | | | | | | | | | | | | | | 74,098 | |
| RVIP VIII | | | | | | | | | | | | | | | 23,356 | | | | | | | | | | | | | | | | | | | | | | | | | | | | | | | | 23,356 | |
| Tonawanda, NY (Hollywood/Tops) | | | 183 | | | | 198 | | | | 213 | | | | 230 | | | | 249 | | | | 268 | | | | 290 | | | | 312 | | | | 337 | | | | 364 | | | | 2,585 | | | | 5,229 | |
| Tonawanda, NY (Tops/Gander Mtn.) | | | 350 | | | | 377 | | | | 407 | | | | 439 | | | | 474 | | | | 511 | | | | 552 | | | | 595 | | | | 642 | | | | 693 | | | | 1,077 | | | | 6,118 | |
| DDRA Community Centers Five | | | | | | | 18,000 | | | | | | | | | | | | 280,000 | | | | | | | | | | | | | | | | | | | | | | | | | | | | 298,000 | |
| Lennox Town Center Limited | | | 540 | | | | 585 | | | | 635 | | | | 688 | | | | 746 | | | | 809 | | | | 877 | | | | 950 | | | | 1,031 | | | | 1,117 | | | | 10,109 | | | | 18,085 | |
| Sun Center Limited | | | | | | | | | | | | | | | | | | | | | | | | | | | | | | | | | | | | | | | | | | | | | | | | |
| Principal Mutual Life Ins Co | | | 480 | | | | 523 | | | | 569 | | | | 619 | | | | 674 | | | | 11,594 | | | | | | | | | | | | | | | | | | | | | | | | 14,459 | |
| W. Lyman Case & Co | | | 88 | | | | 93 | | | | 98 | | | | 104 | | | | 110 | | | | 5,684 | | | | | | | | | | | | | | | | | | | | | | | | 6,177 | |
| DOTRS LLC | | | | | | | | | | | | | | | | | | | | | | | 21,000 | | | | | | | | | | | | | | | | | | | | | | | | 21,000 | |
| Jefferson County Plaza LLC | | | | | | | | | | | 3,749 | | | | | | | | | | | | | | | | | | | | | | | | | | | | | | | | | | | | 3,749 | |
| DDR Markaz | | | | | | | | | | | 110,000 | | | | | | | | | | | | | | | | | | | | | | | | | | | | | | | | | | | | 110,000 | |
| DDR Markaz II | | | | | | | | | | | | | | | | | | | | | | | | | | | | | | | | | | | 150,480 | | | | | | | | | | | | 150,480 | |
| Coventry II DDR Buena Park | | | | | | | | | | | | | | | | | | | 61,000 | | | | | | | | | | | | | | | | | | | | | | | | | | | | 61,000 | |
| Coventry II DDR Bloomfield | | | 68,000 | | | | | | | | | | | | | | | | | | | | | | | | | | | | | | | | | | | | | | | | | | | | 68,000 | |
| Coventry II DDR Fairplain | | | 15,925 | | | | | | | | | | | | | | | | | | | | | | | | | | | | | | | | | | | | | | | | | | | | 15,925 | |
| Coventry II DDR Merriam Village | | | | | | | | | | | 18,539 | | | | | | | | | | | | | | | | | | | | | | | | | | | | | | | | | | | | 18,539 | |
| Coventry II DDR Montgomery Farm | | | 8,450 | | | | | | | | | | | | | | | | | | | | | | | | | | | | | | | | | | | | | | | | | | | | 8,450 | |
| Coventry II DDR Phoenix Spectrum | | | | | | | | | | | | | | | 47,500 | | | | | | | | | | | | | | | | | | | | | | | | | | | | | | | | 47,500 | |
| Coventry II DDR SM | | | | | | | 139,000 | | | | | | | | | | | | | | | | | | | | | | | | | | | | | | | | | | | | | | | | 139,000 | |
| Coventry II DDR Totem Lakes | | | | | | | 26,000 | | | | | | | | | | | | | | | | | | | | | | | | | | | | | | | | | | | | | | | | 26,000 | |
| Coventry II DDR Tri County | | | | | | | | | | | | | | | | | | | | | | | | | | | | | | | | | | | | | | | 170,000 | | | | | | | | 170,000 | |
| Coventry II DDR Ward Parkway | | | | | | | | | | | 36,000 | | | | | | | | | | | | | | | | | | | | | | | | | | | | | | | | | | | | 36,000 | |
| Coventry II DDR Westover | | | | | | | | | | | | | | | | | | | | | | | | | | | | | | | | | | | | | | | | | | | | | | | | |
| Marketplace | | | | | | | 17,474 | | | | | | | | | | | | | | | | | | | | | | | | | | | | | | | | | | | | | | | | 17,474 | |
| DDR MDT PS, LLC | | | | | | | | | | | | | | | | | | | | | | | | | | | | | | | 86,000 | | | | | | | | | | | | | | | | 86,000 | |
DDR Macquarie | | | | | | | | | | | | | | | | | | | | | | | | | | | | | | | | | | | | | | | | | | | | | | | | |
| $125M Revolver | | | | | | | 96,425 | | | | | | | | | | | | | | | | | | | | | | | | | | | | | | | | | | | | | | | | 96,425 | |
| Secured Financing | | | | | | | 49,750 | | | | 340,500 | | | | 165,250 | | | | | | | | | | | | | | | | | | | | | | | | | | | | | | | | 555,500 | |
| BJ’s Clarence | | | 166 | | | | 178 | | | | 191 | | | | 205 | | | | 220 | | | | 236 | | | | 253 | | | | 272 | | | | 292 | | | | 313 | | | | 2,546 | | | | 4,872 | |
| JoAnn Transit | | | 344 | | | | 366 | | | | 390 | | | | 415 | | | | 441 | | | | 470 | | | | 500 | | | | 351 | | | | | | | | | | | | | | | | 3,276 | |
| New Hartford Consumer Square | | | 1,951 | | | | 2,066 | | | | 2,188 | | | | 2,317 | | | | 2,454 | | | | 2,599 | | | | 2,752 | | | | 2,915 | | | | 3,087 | | | | 3,269 | | | | 10,680 | | | | 36,278 | |
| Birmingham, AL (Riverchase) | | | 122 | | | | 129 | | | | 136 | | | | 145 | | | | 153 | | | | 162 | | | | 170 | | | | 6,864 | | | | | | | | | | | | | | | | 7,880 | |
| Merriam Town Center | | | 30,000 | | | | | | | | | | | | | | | | | | | | | | | | | | | | | | | | | | | | | | | | | | | | 30,000 | |
| DDR Macquarie Longhorn Hldgs | | | | | | | | | | | | | | | | | | | | | | | | | | | 85,000 | | | | | | | | | | | | | | | | | | | | 85,000 | |
| DDR Macquarie Longhorn Hldgs II | | | | | | | | | | | | | | | | | | | 183,700 | | | | | | | | | | | | | | | | | | | | | | | | | | | | 183,700 | |
| DDR Macquarie Longhorn Hldgs III | | | | | | | | | | | | | | | | | | | 39,300 | | | | | | | | | | | | | | | | | | | | | | | | | | | | 39,300 | |
| Payments through 9/30/06 | | | -3,264 | | | | | | | | | | | | | | | | | | | | | | | | | | | | | | | | | | | | | | | | | | | | -3,264 | |
| | | | | | | | | | | | | | | | | | | | | | | | | | | | | | | | | | | | | |
| | | | | | | | | | | | | | | | | | | | | | | | | | | | | | | | | | | | | | | | | | | | | | | | | |
| Total — Debt | | | 123,495 | | | | 428,106 | | | | 513,613 | | | | 241,267 | | | | 569,520 | | | | 103,332 | | | | 90,393 | | | | 98,260 | | | | 155,869 | | | | 175,757 | | | | 26,996 | | | | 2,526,608 | |
| | | | | | | | | | | | | | | | | | | | | | | | | | | | | | | | | | | | | |
Summary of Joint Venture Mortgage Principal Payments 5.5
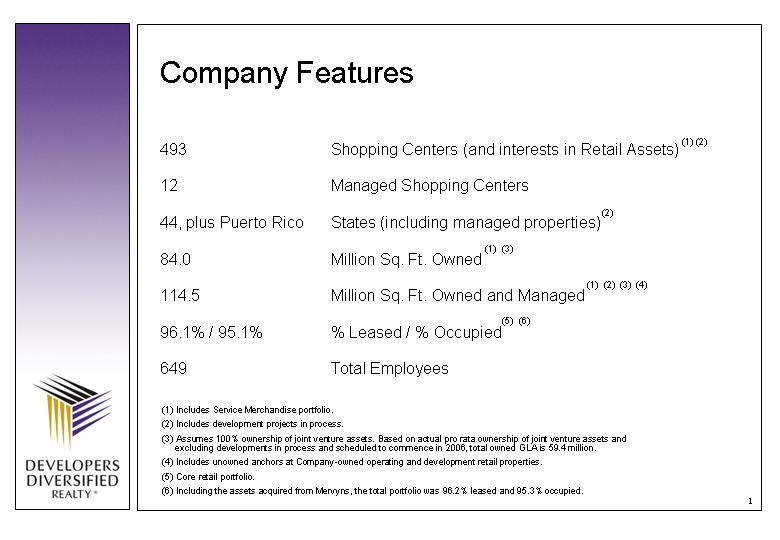
| 493 Shopping Centers (and interests in Retail Assets) 12 Managed Shopping Centers 44, plus Puerto Rico States (including managed properties) 84.0 Million Sq. Ft. Owned 114.5 Million Sq. Ft. Owned and Managed 96.1% / 95.1% % Leased / % Occupied 649 Total Employees Company Features (1) Includes Service Merchandise portfolio. (2) Includes development projects in process. (3) Assumes 100% ownership of joint venture assets. Based on actual pro rata ownership of joint venture assets and excluding developments in process and scheduled to commence in 2006, total owned GLA is 59.4 million. (4) Includes unowned anchors at Company-owned operating and development retail properties. (5) Core retail portfolio. (6) Including the assets acquired from Mervyns, the total portfolio was 96.2% leased and 95.3% occupied. (1) (2) (2) (1) (3) (1) (2) (3) (4) (5) (6) |
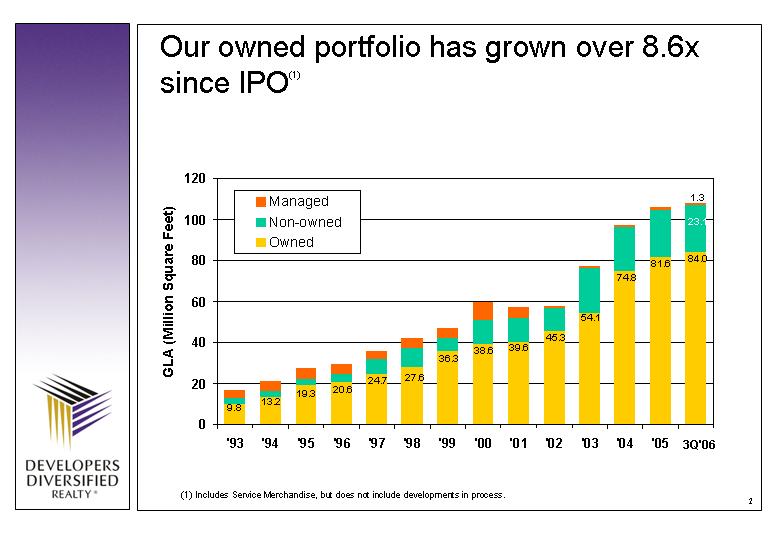
| Our owned portfolio has grown over 8.6x since IPO (1) '93 '94 '95 '96 '97 '98 '99 '00 '01 '02 '03 '04 '05 Owned 9.8 13.2 19.3 20.6 24.7 28 36 39 40 45.3 54.1 74.8 81.6 84 Non-owned 3 3 3 4 7 9 6 12 12 11.6 22.1 21.4 22.8 23.1 Managed 4 5 5 5 4 5 5 9 5 0.7 1 1.4 1.4 1.3 (1) Includes Service Merchandise, but does not include developments in process. 9.8 13.2 19.3 20.6 24.7 27.6 36.3 38.6 39.6 45.3 54.1 23.1 1.3 GLA (Million Square Feet) 84.0 74.8 3Q'06 81.6 |
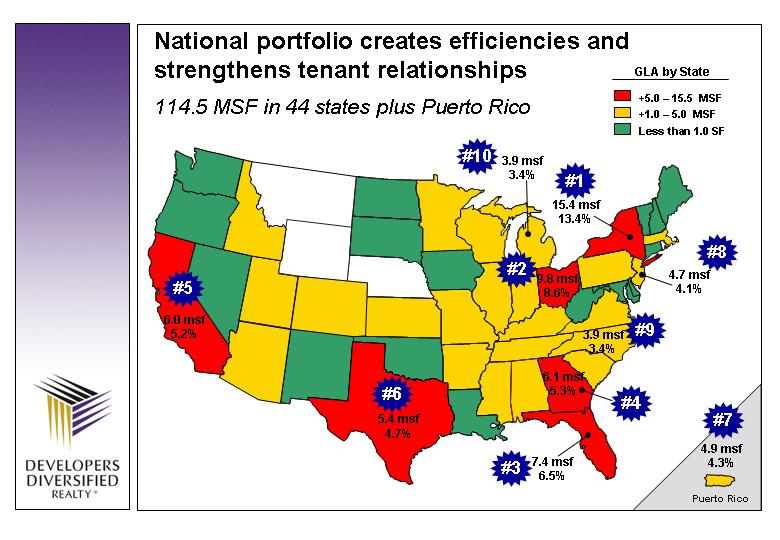
| 4.7 msf 4.1% GLA by State +5.0 - 15.5 MSF +1.0 - 5.0 MSF Less than 1.0 SF National portfolio creates efficiencies and strengthens tenant relationships Puerto Rico 4.9 msf 4.3% 114.5 MSF in 44 states plus Puerto Rico 15.4 msf 13.4% 9.8 msf 8.6% 6.1 msf 5.3% 7.4 msf 6.5% 5.4 msf 4.7% 6.0 msf 5.2% 3.9 msf 3.4% 3.9 msf 3.4% #1 #2 #3 #4 #6 #5 #7 #8 #9 #10 |
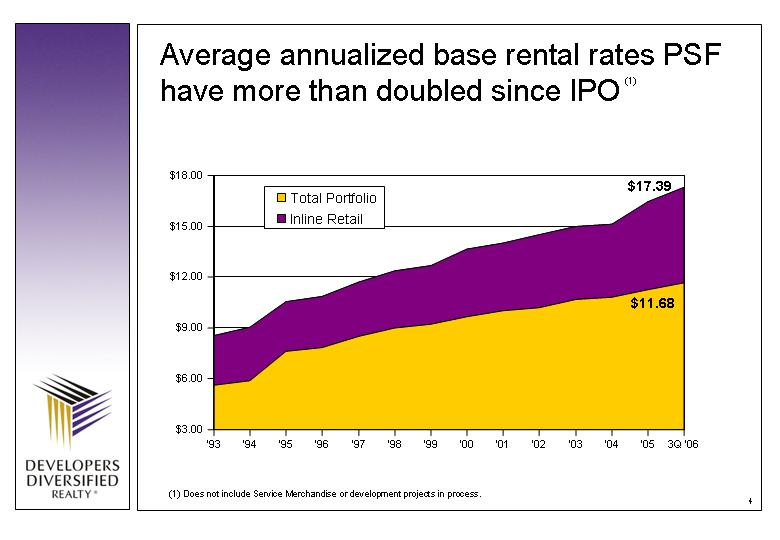
| '93 '94 '95 '96 '97 '98 '99 '00 '01 '02 '03 '04 '05 3Q '06 $3.00 $6.00 $9.00 $12.00 $15.00 $18.00 Average annualized base rental rates PSF have more than doubled since IPO $17.39 $11.68 (1) (1) Does not include Service Merchandise or development projects in process. Total Portfolio Inline Retail |
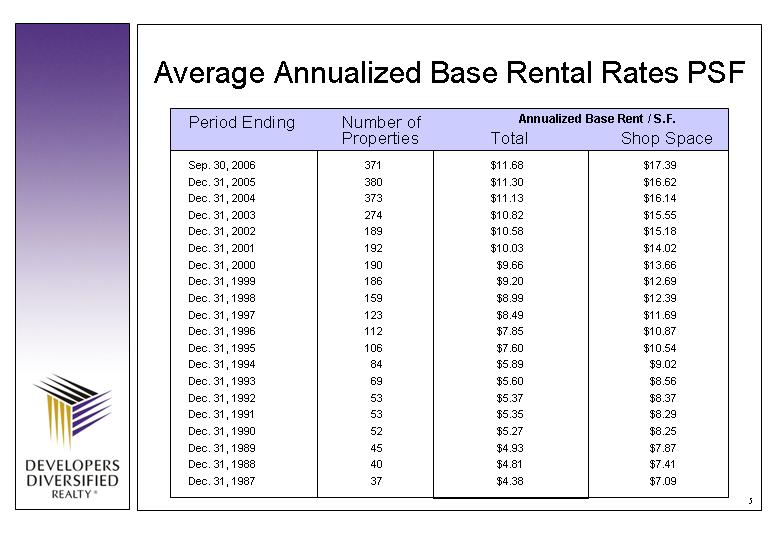
| Average Annualized Base Rental Rates PSF Sep. 30, 2006 371 $11.68 $17.39 Dec. 31, 2005 380 $11.30 $16.62 Dec. 31, 2004 373 $11.13 $16.14 Dec. 31, 2003 274 $10.82 $15.55 Dec. 31, 2002 189 $10.58 $15.18 Dec. 31, 2001 192 $10.03 $14.02 Dec. 31, 2000 190 $9.66 $13.66 Dec. 31, 1999 186 $9.20 $12.69 Dec. 31, 1998 159 $8.99 $12.39 Dec. 31, 1997 123 $8.49 $11.69 Dec. 31, 1996 112 $7.85 $10.87 Dec. 31, 1995 106 $7.60 $10.54 Dec. 31, 1994 84 $5.89 $9.02 Dec. 31, 1993 69 $5.60 $8.56 Dec. 31, 1992 53 $5.37 $8.37 Dec. 31, 1991 53 $5.35 $8.29 Dec. 31, 1990 52 $5.27 $8.25 Dec. 31, 1989 45 $4.93 $7.87 Dec. 31, 1988 40 $4.81 $7.41 Dec. 31, 1987 37 $4.38 $7.09 Period Ending Number of Properties Total Shop Space Annualized Base Rent / S.F. |
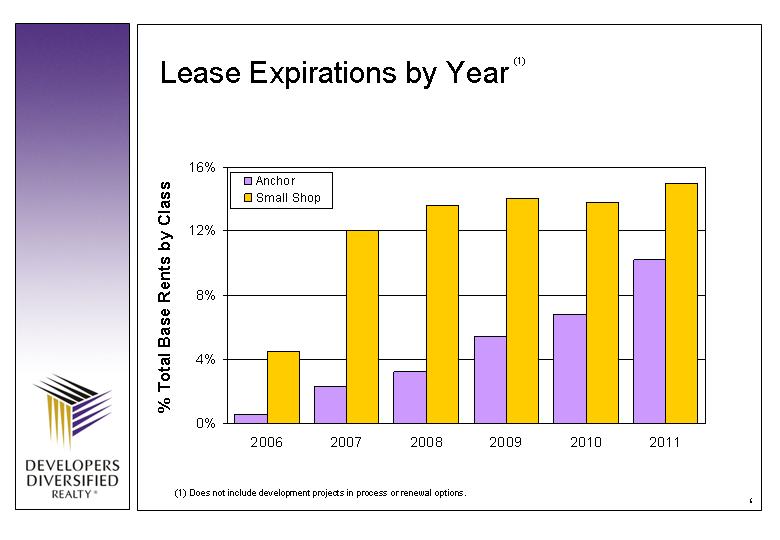
| Lease Expirations by Year 2006 2007 2008 2009 2010 2011 Anchor 0.005 0.023 0.032 0.054 0.068 0.102 Small Shop 0.045 0.12 0.136 0.141 0.138 0.15 (1) Does not include development projects in process or renewal options. % Total Base Rents by Class (1) |
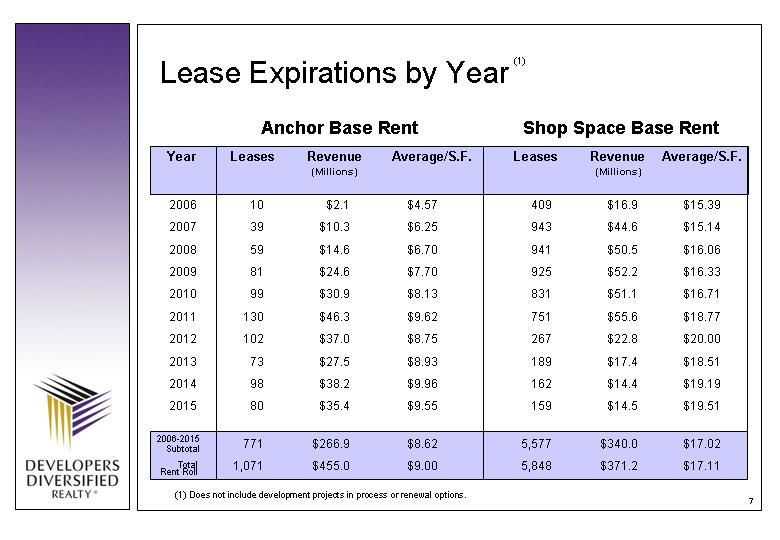
| Lease Expirations by Year (1) 2006 10 $2.1 $4.57 409 $16.9 $15.39 2007 39 $10.3 $6.25 943 $44.6 $15.14 2008 59 $14.6 $6.70 941 $50.5 $16.06 2009 81 $24.6 $7.70 925 $52.2 $16.33 2010 99 $30.9 $8.13 831 $51.1 $16.71 2011 130 $46.3 $9.62 751 $55.6 $18.77 2012 102 $37.0 $8.75 267 $22.8 $20.00 2013 73 $27.5 $8.93 189 $17.4 $18.51 2014 98 $38.2 $9.96 162 $14.4 $19.19 2015 80 $35.4 $9.55 159 $14.5 $19.51 771 $266.9 $8.62 5,577 $340.0 $17.02 1,071 $455.0 $9.00 5,848 $371.2 $17.11 Year Leases Revenue Average/S.F. Leases Revenue Average/S.F. 2006-2015 Subtotal (1) Does not include development projects in process or renewal options. Anchor Base Rent Shop Space Base Rent (Millions) (Millions) Total Rent Roll |
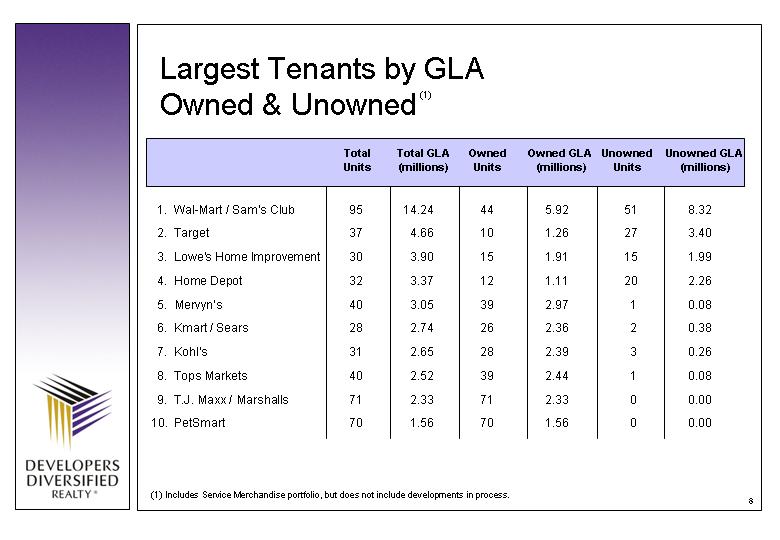
| Largest Tenants by GLA Owned & Unowned (1) Includes Service Merchandise portfolio, but does not include developments in process. 1. Wal-Mart / Sam's Club 95 14.24 44 5.92 51 8.32 2. Target 37 4.66 10 1.26 27 3.40 3. Lowe's Home Improvement 30 3.90 15 1.91 15 1.99 4. Home Depot 32 3.37 12 1.11 20 2.26 5. Mervyn's 40 3.05 39 2.97 1 0.08 6. Kmart / Sears 28 2.74 26 2.36 2 0.38 7. Kohl's 31 2.65 28 2.39 3 0.26 8. Tops Markets 40 2.52 39 2.44 1 0.08 9. T.J. Maxx / Marshalls 71 2.33 71 2.33 0 0.00 10. PetSmart 70 1.56 70 1.56 0 0.00 Total Units Total GLA (millions) Owned Units Owned GLA (millions) Unowned Units Unowned GLA (millions) (1) |
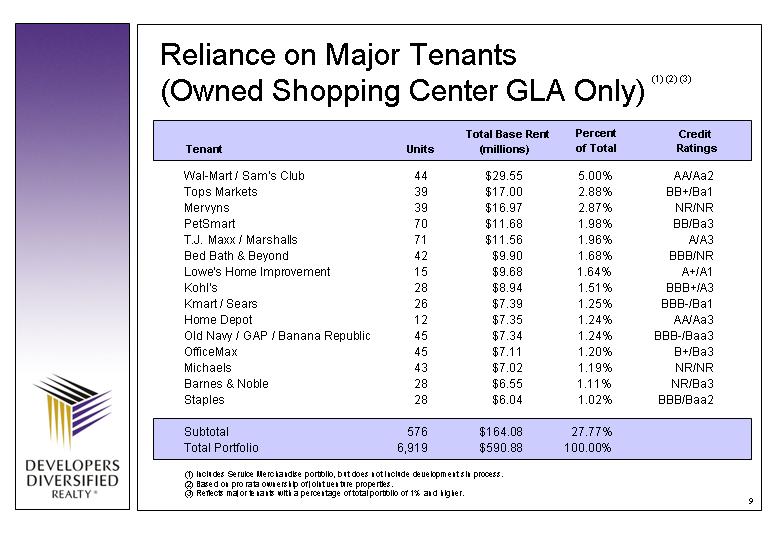
| Reliance on Major Tenants (Owned Shopping Center GLA Only) (1) (2) (3) Tenant Units Percent of Total Credit Ratings Total Base Rent (millions) (1) Includes Service Merchandise portfolio, but does not include development sin process. (2) Based on pro rata ownership of joint venture properties. (3) Reflects major tenants with a percentage of total portfolio of 1% and higher. Wal-Mart / Sam's Club 44 $29.55 5.00% AA/Aa2 Tops Markets 39 $17.00 2.88% BB+/Ba1 Mervyns 39 $16.97 2.87% NR/NR PetSmart 70 $11.68 1.98% BB/Ba3 T.J. Maxx / Marshalls 71 $11.56 1.96% A/A3 Bed Bath & Beyond 42 $9.90 1.68% BBB/NR Lowe's Home Improvement 15 $9.68 1.64% A+/A1 Kohl's 28 $8.94 1.51% BBB+/A3 Kmart / Sears 26 $7.39 1.25% BBB-/Ba1 Home Depot 12 $7.35 1.24% AA/Aa3 Old Navy / GAP / Banana Republic 45 $7.34 1.24% BBB-/Baa3 OfficeMax 45 $7.11 1.20% B+/Ba3 Michaels 43 $7.02 1.19% NR/NR Barnes & Noble 28 $6.55 1.11% NR/Ba3 Staples 28 $6.04 1.02% BBB/Baa2 Subtotal 576 $164.08 27.77% Total Portfolio 6,919 $590.88 100.00% |
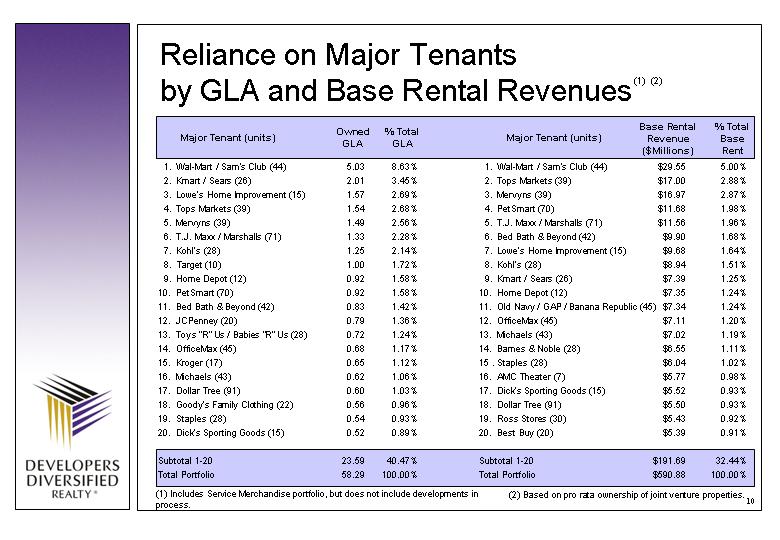
| Reliance on Major Tenants by GLA and Base Rental Revenues (1) (2) 1. Wal-Mart / Sam's Club (44) $29.55 5.00% 2. Tops Markets (39) $17.00 2.88% 3. Mervyns (39) $16.97 2.87% 4. PetSmart (70) $11.68 1.98% 5. T.J. Maxx / Marshalls (71) $11.56 1.96% 6. Bed Bath & Beyond (42) $9.90 1.68% 7. Lowe's Home Improvement (15) $9.68 1.64% 8. Kohl's (28) $8.94 1.51% 9. Kmart / Sears (26) $7.39 1.25% 10. Home Depot (12) $7.35 1.24% 11. Old Navy / GAP / Banana Republic (45) $7.34 1.24% 12. OfficeMax (45) $7.11 1.20% 13. Michaels (43) $7.02 1.19% 14. Barnes & Noble (28) $6.55 1.11% 15 . Staples (28) $6.04 1.02% 16. AMC Theater (7) $5.77 0.98% 17. Dick's Sporting Goods (15) $5.52 0.93% 18. Dollar Tree (91) $5.50 0.93% 19. Ross Stores (30) $5.43 0.92% 20. Best Buy (20) $5.39 0.91% Subtotal 1-20 $191.69 32.44% Total Portfolio $590.88 100.00% 1. Wal-Mart / Sam's Club (44) 5.03 8.63% 2. Kmart / Sears (26) 2.01 3.45% 3. Lowe's Home Improvement (15) 1.57 2.69% 4. Tops Markets (39) 1.54 2.68% 5. Mervyns (39) 1.49 2.56% 6. T.J. Maxx / Marshalls (71) 1.33 2.28% 7. Kohl's (28) 1.25 2.14% 8. Target (10) 1.00 1.72% 9. Home Depot (12) 0.92 1.58% 10. PetSmart (70) 0.92 1.58% 11. Bed Bath & Beyond (42) 0.83 1.42% 12. JCPenney (20) 0.79 1.36% 13. Toys "R" Us / Babies "R" Us (28) 0.72 1.24% 14. OfficeMax (45) 0.68 1.17% 15. Kroger (17) 0.65 1.12% 16. Michaels (43) 0.62 1.06% 17. Dollar Tree (91) 0.60 1.03% 18. Goody's Family Clothing (22) 0.56 0.96% 19. Staples (28) 0.54 0.93% 20. Dick's Sporting Goods (15) 0.52 0.89% Subtotal 1-20 23.59 40.47% Total Portfolio 58.29 100.00% Major Tenant (units) Owned GLA % Total GLA Base Rental Revenue ($Millions) % Total Base Rent Major Tenant (units) (1) Includes Service Merchandise portfolio, but does not include developments in process. (2) Based on pro rata ownership of joint venture properties. |
| | | |
| | Run Date: 10/09/2006 |
| | Time: 5:13:20PM |
| | Page 1 of 22 |
| | Quarter: 3Q06 |
Retail Property List*
| | | | | | | | | | | | | | | | | | | | | | | | | | | | | | | | | | | | | |
| | | | | | | | | | | | | Year | | | | | | DDR | | Owned | | Owned/Unowned | | Total | | |
| | | | | Zip | | Type of | | Developed/ | | Year | | Ownership | | Gross | | Gross | | Annualized | | |
| Center/Property | | Location | | Code | | Property | | Redeveloped | | Acquired | | Interest | | Leasable Area | | Leasable Area | | Rent | | Anchor Tenants(Lease Expiration) |
| Alabama | | | | | | | | | | | | | | | | | | | | | | | | | | | | | | | | | | | | |
| | | | | | | | | | | | | | | | | | | | | | | | | | | | | | | | | | | | | |
| 1 BIRMINGHAM, AL (BROOK) | | BROOK HIGHLAND PLAZA 5291 HWY 280 SOUTH | | | 35242 | | | SC | | | 1994/2003 | | | | 1994 | | | | 100.00 | % | | | 423,493 | | | | 550,410 | | | | 4,199,197 | | | GOODY’S(2009), REGAL CINEMAS(2014), STEIN MART(2011), OFFICE MAX(2011), MICHAEL’S(2009), HOMEGOODS(2016), BOOKS-A-MILLION(2010), ROSS DRESS FOR LESS(2014), LOWES HOME CENTERS(NOT OWNED) |
| | | | | | | | | | | | | | | | | | | | | | | | | | | | | | | | | | | | | |
| 2 BIRMINGHAM, AL (EASTWOOD) | | EASTWOOD FESTIVAL CENTER
7001 CRESTWOOD BLVD | | | 35210 | | | SC | | | 1989/1999 | | | | 1995 | | | | 100.00 | % | | | 300,280 | | | | 454,110 | | | | 1,450,654 | | | OFFICE DEPOT(2007), DOLLAR TREE(2009), BURLINGTON COAT FACTORY(2008), HOME
DEPOT(NOT OWNED), WESTERN SUPERMARKETS(NOT OWNED) |
| | | | | | | | | | | | | | | | | | | | | | | | | | | | | | | | | | | | | |
| | | | | | | | | | | | | | | | | | | | | | | | | | | | | | | | | | | | | |
| 3 BIRMINGHAM, AL (RIVERCHASE) | | RIVERCHASE PROMENADE(I)
MONTGOMERY HIGHWAY | | | 35244 | | | SC | | | 1989 | | | | 2002 | | | | 14.50 | % | | | 120,108 | | | | 228,416 | | | | 1,796,173 | | | MARSHALLS(2008), GOODY'S(NOT OWNED), TOY'S R US(NOT OWNED) |
| | | | | | | | | | | | | | | | | | | | | | | | | | | | | | | | | | | | | |
| 4 GADSDEN, AL | | EAST SIDE PLAZA
3010-3036 E. MEIGHAN BOULEVARD | | | 35903 | | | SC | | | 1979/2004 | | | | 2003 | | | | 100.00 | % | | | 85,196 | | | | 130,899 | | | | 269,844 | | | FRED’S(2009), FOOD WORLD(NOT OWNED) |
| | | | | | | | | | | | | | | | | | | | | | | | | | | | | | | | | | | | | |
| 5 OPELIKA, AL | | PEPPERELL CORNERS
2300-2600 PEPPERELL PARKWAY OP | | | 36801 | | | SC | | | 1995 | | | | 2003 | | | | 100.00 | % | | | 306,224 | | | | 306,224 | | | | 1,543,667 | | | LOWE’S(2012), GOODY'S(2010), STEVE & BARRY'S(2014) |
| | | | | | | | | | | | | | | | | | | | | | | | | | | | | | | | | | | | | |
| 6 SCOTTSBORO, AL | | SCOTTSBORO MARKETPLACE
24833 JOHN P REID PARKWAY | | | 35766 | | | SC | | | 1999 | | | | 2003 | | | | 100.00 | % | | | 40,560 | | | | 223,750 | | | | 455,004 | | | GOODY’S(2011), WAL-MART(NOT OWNED) |
| | | | | | | | | | | | | | | | | | | | | | | | | | | | | | | | | | | | | |
| Arizona | | | | | | | | | | | | | | | | | | | | | | | | | | | | | | | | | | | | |
| | | | | | | | | | | | | | | | | | | | | | | | | | | | | | | | | | | | | |
| 7 AHWATUKEE, AZ | | FOOTHILLS TOWNE CTR (II) 4711 EAST RAY ROAD | | | 85044 | | | SC | | | 1996/1997/1999 | | | | 1997 | | | | 50.00 | % | | | 647,883 | | | | 686,414 | | | | 10,133,346 | | | JO-ANN STORES(2010), BEST BUY(2014), BASSETT FURNITURE(2010), AMC |
| | | | | | | | | | | | | | | | | | | | | | | | | | | | | | | | | | | | | THEATRE(2021), ASHLEY FURNITURE HOMESTORE(2011), BARNES & NOBLE(2012), STEIN |
| | | | | | | | | | | | | | | | | | | | | | | | | | | | | | | | | | | | | MART(2011), BABIES R US(2007), ROSS DRESS FOR LESS(2012), OFFICE MAX(2012) |
| | | | | | | | | | | | | | | | | | | | | | | | | | | | | | | | | | | | | |
| 8 CHANDLER, AZ | | MERVYN'S PLAZA | | | 85224 | | | FO | | | 1985 | | | | 2005 | | | | 50.00 | % | | | 74,862 | | | | 74,862 | | | | 673,200 | | | MERVYN'S(2020) |
| | | 2992 N. ALMA SCHOOL ROAD | | | | | | | | | | | | | | | | | | | | | | | | | | | | | | | | | | |
| | | | | | | | | | | | | | | | | | | | | | | | | | | | | | | | | | | | | |
| 9 MESA, AZ (SUPERS) | | SUPERSTITION SPRINGS CENTER
6505 E. SOUTHERN AVE | | | 85206 | | | FO | | | 1990 | | | | 2005 | | | | 50.00 | % | | | 86,858 | | | | 86,858 | | | | 1,151,580 | | | MERVYN’S(2020) |
| | | | | | | | | | | | | | | | | | | | | | | | | | | | | | | | | | | | | |
| 10 PHOENIX, AZ | | PARADISE VILLAGE GATEWAY
TATUM & SHEA BLVDS. | | | 85028 | | | SC | | | 1997/2004 | | | | 2003 | | | | 67.00 | % | | | 223,208 | | | | 296,118 | | | | 4,263,412 | | | BED BATH & BEYOND(2011), ROSS DRESS FOR LESS(2007), PETSMART(2015), STAPLES(2010), ALBERTSONS-OSCO DRUG(NOT OWNED) |
| | | | | | | | | | | | | | | | | | | | | | | | | | | | | | | | | | | | | |
| 11 PHOENIX, AZ (DEER VALLEY) | | DEER VALLEY TOWNE CENTER
2805 WEST AGUA FRIA FREEWAY | | | 85027 | | | SC | | | 1996 | | | | 1999 | | | | 100.00 | % | | | 197,009 | | | | 459,939 | | | | 3,099,342 | | | ROSS DRESS FOR LESS(2009), OFFICE MAX(2013), PETSMART(2014), MICHAEL’S(2009), TARGET(NOT OWNED), AMC THEATRES(NOT OWNED) |
| | | | | | | | | | | | | | | | | | | | | | | | | | | | | | | | | | | | | |
| 12 PHOENIX, AZ (DV) | | DEER VALLEY | | | 85053 | | | FO | | | 1979 | | | | 2005 | | | | 50.00 | % | | | 81,009 | | | | 81,009 | | | | 819,060 | | | MERVYN'S(2020) |
| | | 4255 W. THUNDERBIRD ROAD | | | | | | | | | | | | | | | | | | | | | | | | | | | | | | | | | | |
| | | | | | | | | | | | | | | | | | | | | | | | | | | | | | | | | | | | | |
| 13 PHOENIX, AZ (PEORIA) | | ARROWHEAD CROSSING
7553 WEST BELL ROAD | | | 85382 | | | SC | | | 1995 | | | | 1996 | | | | 50.00 | % | | | 346,428 | | | | 416,606 | | | | 4,567,266 | | | STAPLES(2009), COMPUSA(2013), MAC FRUGAL'S(2010), BARNES & NOBLE(2011), T.J. MAXX(2011), CIRCUIT CITY(2016), DSW SHOE WAREHOUSE(2017), BASSETT |
| | | | | | | | | | | | | | | | | | | | | | | | | | | | | | | | | | | | | FURNITURE(2009), LINENS 'N THINGS(2011), FRY'S(NOT OWNED) |
| | | | | | | | | | | | | | | | | | | | | | | | | | | | | | | | | | | | | |
| | | | | | | | | | | | | | | | | | | | | | | | | | | | | | | | | | | | | |
| 14 PHOENIX, AZ (SILVER) | | SILVER CREEK PLAZA | | | 85044 | | | FO | | | 1994 | | | | 2005 | | | | 50.00 | % | | | 76,214 | | | | 76,214 | | | | 855,780 | | | MERVYN'S(2020) |
| | | 4710 E. RAY ROAD | | | | | | | | | | | | | | | | | | | | | | | | | | | | | | | | | | |
| | | | | | | | | | | | | | | | | | | | | | | | | | | | | | | | | | | | | |
| 15 PHOENIX, AZ (SPE) | | PHOENIX SPECTRUM MALL 1641 WEST BETHANY HOME ROAD | | | 85015 | | | SC | | | 1961 | | | | 2004 | | | | 20.00 | % | | | 395,129 | | | | 849,760 | | | | 5,333,149 | | | COSTCO WHOLESALE(2020), ROSS DRESS FOR LESS(2013), PETSMART(2019), HARKINS THEATRE(2002), WALMART(NOT OWNED), DILLARD’S(NOT OWNED) |
| | | | | | | | | | | | | | | | | | | | | | | | | | | | | | | | | | | | | |
| 16 TUCSON, AZ | | SANTA CRUZ PLAZA | | | 85713 | | | FO | | | 1982 | | | | 2005 | | | | 50.00 | % | | | 76,126 | | | | 76,126 | | | | 513,060 | | | MERVYN’S(2020) |
| | | 3660 S. 16TH AVE | | | | | | | | | | | | | | | | | | | | | | | | | | | | | | | | | | |
| | | | | | | | | | | | | | | | | | | | | | | | | | | | | | | | | | | | | |
| Arkansas | | | | | | | | | | | | | | | | | | | | | | | | | | | | | | | | | | | | |
| | | | | | | | | | | | | | | | | | | | | | | | | | | | | | | | | | | | | |
| 17 FAYETTEVILLE, AR | | SPRING CREEK CENTRE
464 E. JOYCE BOULEVARD | | | 72703 | | | SC | | | 1997/1999/2000/2001 | | | | 1997 | | | | 14.50 | % | | | 262,827 | | | | 590,161 | | | | 3,076,174 | | | T.J. MAXX(2011), BEST BUY(2017), GOODY’S(2013), OLD NAVY(2010), BED BATH & BEYOND(2009), WAL-MART SUPER CENTER(NOT OWNED), HOME DEPOT(NOT OWNED) |
| | | | | | | | | | | | | | | | | | | | | | | | | | | | | | | | | | | | | |
| 18 FAYETTEVILLE, AR (STEELE) | | STEELE CROSSING
3533-3595 N. SHILOH DR | | | 72703 | | | SC | | | 2003 | | | | 2003 | | | | 14.50 | % | | | 50,293 | | | | 261,644 | | | | 945,423 | | | KOHL’S(NOT OWNED), TARGET(NOT OWNED) |
| | | | | |
| | | | | Mervyns Locations |
| * 1. Property Developed by the Company | | * SC — Shopping Center | | * FO — Fee Owned |
| * 2. Original IPO Property | | * MM — Mall | | * LH — Leasehold |
| | | * LC — Lifestyle Center | | * GL — Ground Lease |
| | |
| | | |
| Does Not Include Service Merchandise Interests | | Property Listing 7.1 |
| | | |
| | Run Date: 10/09/2006 |
| | Time: 5:13:20PM |
| | Page 2 of 22 |
| | Quarter: 3Q06 |
Retail Property List*
| | | | | | | | | | | | | | | | | | | | | | | | | | | | | | | | | | | | | |
| | | | | | | | | | | | | Year | | | | | | DDR | | Owned | | Owned/Unowned | | Total | | |
| | | | | Zip | | Type of | | Developed/ | | Year | | Ownership | | Gross | | Gross | | Annualized | | |
| Center/Property | | Location | | Code | | Property | | Redeveloped | | Acquired | | Interest | | Leasable Area | | Leasable Area | | Rent | | Anchor Tenants(Lease Expiration) |
| 19 N. LITTLE ROCK, AR | | MCCAIN PLAZA
4124 EAST MCCAIN BOULEVARD | | | 72117 | | | SC | | | 1991/2004 | | | | 1994 | | | | 100.00 | % | | | 295,013 | | | | 295,013 | | | | 1,860,600 | | | BED BATH & BEYOND(2013), T.J. MAXX(2007), CINEMARK(2011), BURLINGTON COAT FACTORY(2014), MICHAEL’S(2014), SPORTS AUTHORITY(2013) |
| | | | | | | | | | | | | | | | | | | | | | | | | | | | | | | | | | | | | |
| 20 RUSSELLVILLE, AR | | VALLEY PARK CENTRE | | | 72801 | | | SC | | | 1992 | | | | 1994 | | | | 100.00 | % | | | 152,083 | | | | 152,083 | | | | 1,120,999 | | | STAGE(2010), J.C. PENNEY(2012) |
| | | 3093 EAST MAIN STREET | | | | | | | | | | | | | | | | | | | | | | | | | | | | | | | | | | |
| | | | | | | | | | | | | | | | | | | | | | | | | | | | | | | | | | | | | |
| California | | | | | | | | | | | | | | | | | | | | | | | | | | | | | | | | | | | | |
| | | | | | | | | | | | | | | | | | | | | | | | | | | | | | | | | | | | | |
| 21 ANAHEIM, CA | | ANAHEIM HILLS FESTIVAL CENTER | | | 92808 | | | FO | | | 1992 | | | | 2005 | | | | 50.00 | % | | | 77,883 | | | | 77,883 | | | | 1,301,520 | | | MERVYN’S(2020) |
| | | 8100 E. SANTA ANA CANYON ROAD | | | | | | | | | | | | | | | | | | | | | | | | | | | | | | | | | | |
| | | | | | | | | | | | | | | | | | | | | | | | | | | | | | | | | | | | | |
| 22 ANTIOCH, CA | | COUNTY EAST SHOPPING CENTER | | | 94509 | | | FO | | | 1970 | | | | 2005 | | | | 50.00 | % | | | 75,339 | | | | 75,339 | | | | 1,181,160 | | | MERVYN’S(2020) |
| | | 2602 SOMERSVILLE ROAD | | | | | | | | | | | | | | | | | | | | | | | | | | | | | | | | | | |
| | | | | | | | | | | | | | | | | | | | | | | | | | | | | | | | | | | | | |
| 23 BUENA PARK, CA | | BUENA PARK MALL AND ENTERTAIN
100 BUENA PARK | | | 90620 | | | SC | | | 1965 | | | | 2004 | | | | 20.00 | % | | | 723,988 | | | | 1,131,651 | | | | 9,010,404 | | | CIRCUIT CITY(2018), DSW SHOE WAREHOUSE(2013), ROSS DRESS FOR LESS(2010), BED BATH & BEYOND(2011), STEVE & BARRY’S(2014), KOHL’S(2024), KRIKORIAN PREMIER THEATRES(2023), MICHAEL’S(2014), SEARS(NOT OWNED), WALMART(NOT OWNED) |
| | | | | | | | | | | | | | | | | | | | | | | | | | | | | | | | | | | | | |
| 24 BURBANK, CA | | BURBANK TOWN CENTER | | | 91502 | | | GL | | | 1991 | | | | 2005 | | | | 50.00 | % | | | 89,182 | | | | 89,182 | | | | 1,593,000 | | | MERVYN’S(2020) |
| | | 245 E. MAGNOLIA BLVD | | | | | | | | | | | | | | | | | | | | | | | | | | | | | | | | | | |
| | | | | | | | | | | | | | | | | | | | | | | | | | | | | | | | | | | | | |
| 25 CHINO, CA | | CHINO TOWN SQUARE SHOPPING | | | 91710 | | | FO | | | 1986 | | | | 2005 | | | | 50.00 | % | | | 81,282 | | | | 81,282 | | | | 870,060 | | | MERVYN’S(2020) |
| | | 5517 PHILADELPHIA STREET | | | | | | | | | | | | | | | | | | | | | | | | | | | | | | | | | | |
| | | | | | | | | | | | | | | | | | | | | | | | | | | | | | | | | | | | | |
| 26 CLOVIS, CA | | SIERRA VISTA MALL | | | 93612 | | | GL | | | 1988 | | | | 2005 | | | | 50.00 | % | | | 75,088 | | | | 75,088 | | | | 714,000 | | | MERVYN’S(2020) |
| | | 1000 SHAW AVE | | | | | | | | | | | | | | | | | | | | | | | | | | | | | | | | | | |
| | | | | | | | | | | | | | | | | | | | | | | | | | | | | | | | | | | | | |
| 27 EL CAJON, CA | | WESTFIELD SHOPPING TOWN | | | 92020 | | | GL | | | 1989 | | | | 2005 | | | | 50.00 | % | | | 85,744 | | | | 85,744 | | | | 1,253,580 | | | MERVYN’S(2020) |
| | | 565 FLETCHER PARKWAY | | | | | | | | | | | | | | | | | | | | | | | | | | | | | | | | | | |
| | | | | | | | | | | | | | | | | | | | | | | | | | | | | | | | | | | | | |
| 28 FAIRFIELD, CA | | WESTFIELD SOLANO MALL | | | 94533 | | | FO | | | 1981 | | | | 2005 | | | | 50.00 | % | | | 89,223 | | | | 89,223 | | | | 1,625,880 | | | MERVYN’S(2020) |
| | | 1451 GATEWAY BLVD | | | | | | | | | | | | | | | | | | | | | | | | | | | | | | | | | | |
| | | | | | | | | | | | | | | | | | | | | | | | | | | | | | | | | | | | | |
| 29 FOLSOM, CA | | FOLSOM SQUARE | | | 95630 | | | FO | | | 2003 | | | | 2005 | | | | 50.00 | % | | | 79,080 | | | | 79,080 | | | | 1,154,640 | | | MERVYN’S(2020) |
| | | 1010 E. BIDWELL STREET | | | | | | | | | | | | | | | | | | | | | | | | | | | | | | | | | | |
| | | | | | | | | | | | | | | | | | | | | | | | | | | | | | | | | | | | | |
| 30 FOOTHILL RANCH, CA | | FOOTHILLS RANCH TOWN CENTRE | | | 92610 | | | FO | | | 1993 | | | | 2005 | | | | 50.00 | % | | | 77,934 | | | | 77,934 | | | | 1,050,600 | | | MERVYN’S(2020) |
| | | 26732 PORTOLA PKWY | | | | | | | | | | | | | | | | | | | | | | | | | | | | | | | | | | |
| | | | | | | | | | | | | | | | | | | | | | | | | | | | | | | | | | | | | |
| 31 GARDEN GROVE, CA | | GARDEN GROVE CENTER | | | 92843 | | | FO | | | 1982 | | | | 2005 | | | | 50.00 | % | | | 83,746 | | | | 83,746 | | | | 752,760 | | | MERVYN’S(2020) |
| | | 13092 HARBOR BLVD | | | | | | | | | | | | | | | | | | | | | | | | | | | | | | | | | | |
| | | | | | | | | | | | | | | | | | | | | | | | | | | | | | | | | | | | | |
| 32 LANCASTER, CA | | VALLEY CENTRAL — DISCOUNT
44707-44765 VALLEY CENTRAL WAY | | | 93536 | | | SC | | | 1990 | | | | 2001 | | | | 20.00 | % | | | 353,483 | | | | 483,787 | | | | 3,771,933 | | | MARSHALL’S(2007), CIRCUIT CITY(2011), STAPLES(2008), CINEMARK MOVIES 12(2017), WAL-MART(2010), 99 CENTS ONLY(2014), COSTCO(NOT OWNED) |
| | | | | | | | | | | | | | | | | | | | | | | | | | | | | | | | | | | | | |
| 33 LOMPOC, CA | | MISSION PLAZA | | | 93436 | | | FO | | | 1992 | | | | 2005 | | | | 50.00 | % | | | 62,523 | | | | 62,523 | | | | 350,880 | | | MERVYN’S(2020) |
| | | 1600 N H STREET | | | | | | | | | | | | | | | | | | | | | | | | | | | | | | | | | | |
| | | | | | | | | | | | | | | | | | | | | | | | | | | | | | | | | | | | | |
| 34 LONG BEACH, CA (PIKE) | | THE PIKE
95 SOUTH PINE AVE | | | 90802 | | | SC | | | 2005 | | | | 1 | * | | | 100.00 | % | | | 212,040 | | | | 238,351 | | | | 3,057,400 | | | CINEMARK(2008), BORDERS(2016), CLUB V2O(2019) |
| | | | | | | | | | | | | | | | | | | | | | | | | | | | | | | | | | | | | |
| 35 MADERA, CA | | MADERA
1467 COUNTRY CLUB DRIVE | | | 93638 | | | FO | | | 1990 | | | | 2005 | | | | 50.00 | % | | | 59,720 | | | | 59,720 | | | | 200,940 | | | MERVYN’S(2020) |
| | | | | | | | | | | | | | | | | | | | | | | | | | | | | | | | | | | | | |
| 36 NORTH FULLERTON, CA | | NORTH FULLERTON
200 IMPERIAL HWY | | | 92835 | | | FO | | | 1991 | | | | 2005 | | | | 50.00 | % | | | 76,360 | | | | 76,360 | | | | 772,140 | | | MERVYN’S(2020) |
| | | | | | | | | | | | | | | | | | | | | | | | | | | | | | | | | | | | | |
| 37 NORTHRIDGE, CA | | NORTHRIDGE PLAZA | | | 91324 | | | LH | | | 1980 | | | | 2005 | | | | 50.00 | % | | | 75,326 | | | | 75,326 | | | | 542,640 | | | MERVYN’S(2020) |
| | | 8800 CORBIN AVE | | | | | | | | | | | | | | | | | | | | | | | | | | | | | | | | | | |
| | | | | | | | | | | | | | | | | | | | | | | | | | | | | | | | | | | | | |
| 38 OCEANSIDE, CA | | OCEAN PLACE CINEMAS | | | 92054 | | | SC | | | 2000 | | | | 1 | * | | | 100.00 | % | | | 80,450 | | | | 80,450 | | | | 1,264,960 | | | REGAL CINEMAS(2014) |
| | | 401-409 MISSION AVENUE | | | | | | | | | | | | | | | | | | | | | | | | | | | | | | | | | | |
| | | | | |
| | | | | Mervyns Locations |
| * 1. Property Developed by the Company | | * SC — Shopping Center | | * FO — Fee Owned |
| * 2. Original IPO Property | | * MM — Mall | | * LH — Leasehold |
| | | * LC — Lifestyle Center | | * GL — Ground Lease |
| | |
| | | |
| Does Not Include Service Merchandise Interests | | Property Listing 7.1 |
| | | |
| | Run Date: 10/09/2006 |
| | Time: 5:13:20PM |
| | Page 3 of 22 |
| | Quarter: 3Q06 |
Retail Property List*
| | | | | | | | | | | | | | | | | | | | | | | | | | | | | | | | | | | | | |
| | | | | | | | | | | | | Year | | | | | | DDR | | Owned | | Owned/Unowned | | Total | | |
| | | | | Zip | | Type of | | Developed/ | | Year | | Ownership | | Gross | | Gross | | Annualized | | |
| Center/Property | | Location | | Code | | Property | | Redeveloped | | Acquired | | Interest | | Leasable Area | | Leasable Area | | Rent | | Anchor Tenants(Lease Expiration) |
| 39 PALMDALE, CA | | ANTELOPE VALLEY MALL
1305 W. RANCHO VISTA BLVD | | | 93551 | | | FO | | | 1992 | | | | 2005 | | | | 50.00 | % | | | 76,550 | | | | 76,550 | | | | 829,260 | | | MERVYN’S(2020) |
| | | | | | | | | | | | | | | | | | | | | | | | | | | | | | | | | | | | | |
| 40 PASADENA, CA | | PASEO COLORADO
280 EAST COLORADO BLVD. | | | 91101 | | | LC | | | 2001 | | | | 2003 | | | | 100.00 | % | | | 556,961 | | | | 556,961 | | | | 11,346,236 | | | GELSON’S MARKET(2021), LOEHMANN’S(2015), EQUINOX(2017), MACY’S(2010), PACIFIC THEATRES EXHIB. CORP(2016), DSW SHOE WAREHOUSE(2011), J.JILL(2012), DELMONICOS SEAFOOD(2012), PF CHANGS CHINA BISTRO(2016), BOMBAY |
| | | | | | | | | | | | | | | | | | | | | | | | | | | | | | | | | | | | | COMPANY(2011), TOMMY BAHAMA(2011), SEPHORA(2011) |
| | | | | | | | | | | | | | | | | | | | | | | | | | | | | | | | | | | | | |
| 41 PLEASANT HILL, CA | | DOWNTOWN PLEASANT HILL | | | 94523 | | | SC | | | 1999/2000 | | | | 2001 | | | | 20.00 | % | | | 345,930 | | | | 345,930 | | | | 6,634,714 | | | ALBERTSON’S(2020), MICHAEL’S(2010), BORDERS(2015), CENTURY THEATRE(2016), BED |
| | | 2255 CONTRA COSTA BLVD #101 | | | | | | | | | | | | | | | | | | | | | | | | | | | | | | | | | | BATH & BEYOND(2010), ROSS DRESS FOR LESS(2010) |
| | | | | | | | | | | | | | | | | | | | | | | | | | | | | | | | | | | | | |
| 42 PORTERVILLE, CA | | PORTERVILLE MARKET PLACE | | | 93257 | | | FO | | | 1991 | | | | 2005 | | | | 50.00 | % | | | 76,378 | | | | 76,378 | | | | 515,100 | | | MERVYN’S(2020) |
| | | 1275 W. HENDERSON AVE | | | | | | | | | | | | | | | | | | | | | | | | | | | | | | | | | | |
| | | | | | | | | | | | | | | | | | | | | | | | | | | | | | | | | | | | | |
| 43 REDDING, CA | | SHASTA CENTER | | | 96002 | | | FO | | | 1984 | | | | 2005 | | | | 50.00 | % | | | 61,363 | | | | 61,363 | | | | 620,160 | | | MERVYN’S(2020) |
| | | 1755 HILLTOP DRIVE | | | | | | | | | | | | | | | | | | | | | | | | | | | | | | | | | | |
| | | | | | | | | | | | | | | | | | | | | | | | | | | | | | | | | | | | | |
| 44 RICHMOND, CA (HILLTOP) | | HILLTOP PLAZA
3401 BLUME DRIVE | | | 94806 | | | SC | | | 1996/2000 | | | | 2002 | | | | 20.00 | % | | | 245,774 | | | | 245,774 | | | | 3,736,677 | | | OFFICE MAX(2011), PETSMART(2012), ROSS DRESS FOR LESS(2008), BARNES & NOBLE(2011), CIRCUIT CITY(2017), CENTURY THEATRE(2016) |
| | | | | | | | | | | | | | | | | | | | | | | | | | | | | | | | | | | | | |
| 45 SAN DIEGO, CA | | SOUTHLAND PLAZA SHOPPING | | | 92154 | | | FO | | | 1982 | | | | 2005 | | | | 50.00 | % | | | 75,207 | | | | 75,207 | | | | 1,013,880 | | | MERVYN’S(2020) |
| | | 575 SATURN BLVD | | | | | | | | | | | | | | | | | | | | | | | | | | | | | | | | | | |
| | | | | | | | | | | | | | | | | | | | | | | | | | | | | | | | | | | | | |
| 46 SAN DIEGO, CA (COLLEGE) | | COLLEGE GROVE SHOPPING CENTER | | | 92115 | | | FO | | | 1991 | | | | 2005 | | | | 50.00 | % | | | 73,872 | | | | 73,872 | | | | 846,576 | | | MERVYN’S(2021) |
| | | 3450 COLLEGE AVE | | | | | | | | | | | | | | | | | | | | | | | | | | | | | | | | | | |
| | | | | | | | | | | | | | | | | | | | | | | | | | | | | | | | | | | | | |
| 47 SAN FRANCISCO, CA (RETAIL) | | VAN NESS PLAZA 215 1000 VAN NESS AVENUE | | | 94109 | | | SC | | | 1998 | | | | 2002 | | | | 100.00 | % | | | 123,755 | | | | 123,755 | | | | 3,796,758 | | | AMC THEATRE(2030), CRUNCH FITNESS(2008) |
| | | | | | | | | | | | | | | | | | | | | | | | | | | | | | | | | | | | | |
| 48 SANTA MARIA, CA | | TOWN CENTER WEST SHOPPING | | | 93458 | | | FO | | | 1988 | | | | 2005 | | | | 50.00 | % | | | 84,886 | | | | 84,886 | | | | 762,960 | | | MERVYN’S(2020) |
| | | 201 TOWN CENTER W | | | | | | | | | | | | | | | | | | | | | | | | | | | | | | | | | | |
| | | | | | | | | | | | | | | | | | | | | | | | | | | | | | | | | | | | | |
| 49 SANTA ROSA, CA | | SANTA ROSA PLAZA | | | 95401 | | | FO | | | 1981 | | | | 2005 | | | | 50.00 | % | | | 90,348 | | | | 90,348 | | | | 1,526,940 | | | MERVYN’S(2020) |
| | | 600 SANTA ROSA PLAZA | | | | | | | | | | | | | | | | | | | | | | | | | | | | | | | | | | |
| | | | | | | | | | | | | | | | | | | | | | | | | | | | | | | | | | | | | |
| 50 SLATTEN RANCH, CA | | SLATTEN RANCH SHOPPING CENTER | | | 94531 | | | FO | | | 2002 | | | | 2005 | | | | 50.00 | % | | | 78,819 | | | | 78,819 | | | | 1,328,040 | | | MERVYN’S(2020) |
| | | 5849 LONE TREE WAY | | | | | | | | | | | | | | | | | | | | | | | | | | | | | | | | | | |
| | | | | | | | | | | | | | | | | | | | | | | | | | | | | | | | | | | | | |
| 51 SONORA, CA | | SONORA CROSSROAD SHOPPING | | | 95370 | | | FO | | | 1993 | | | | 2005 | | | | 50.00 | % | | | 62,214 | | | | 62,214 | | | | 733,380 | | | MERVYN’S(2020) |
| | | 1151 SANGUINETTI ROAD | | | | | | | | | | | | | | | | | | | | | | | | | | | | | | | | | | |
| | | | | | | | | | | | | | | | | | | | | | | | | | | | | | | | | | | | | |
| 52 TULARE, CA | | ARBOR FAIRE SHOPPING CENTER | | | 93274 | | | FO | | | 1991 | | | | 2005 | | | | 50.00 | % | | | 62,947 | | | | 62,947 | | | | 566,100 | | | MERVYN’S(2020) |
| | | 1675 HILLMAN STREET | | | | | | | | | | | | | | | | | | | | | | | | | | | | | | | | | | |
| | | | | | | | | | | | | | | | | | | | | | | | | | | | | | | | | | | | | |
| 53 UKIAH, CA | | UKIAH | | | 95482 | | | FO | | | 1990 | | | | 2005 | | | | 50.00 | % | | | 58,841 | | | | 58,841 | | | | 330,480 | | | MERVYN’S(2020) |
| | | 437 N. ORCHARD AVE | | | | | | | | | | | | | | | | | | | | | | | | | | | | | | | | | | |
| | | | | | | | | | | | | | | | | | | | | | | | | | | | | | | | | | | | | |
| 54 VALENCIA, CA | | 24235 MAGIC MOUNTAIN PKWY | | | 91355 | | | SC | | | 1986 | | | | 2006 | | | | 100.00 | % | | | 75,590 | | | | 75,590 | | | | 951,000 | | | MERVYN’S(2035) |
| | | | | | | | | | | | | | | | | | | | | | | | | | | | | | | | | | | | | |
| 55 WEST COVINA, CA | | WEST COVINA SHOPPING CENTER | | | 91791 | | | GL | | | 1979 | | | | 2005 | | | | 50.00 | % | | | 79,800 | | | | 79,800 | | | | 1,545,300 | | | MERVYN’S(2020) |
| | | 2753 E. EASTLAND CTR DRIVE | | | | | | | | | | | | | | | | | | | | | | | | | | | | | | | | | | |
| | | | | | | | | | | | | | | | | | | | | | | | | | | | | | | | | | | | | |
| Colorado | | | | | | | | | | | | | | | | | | | | | | | | | | | | | | | | | | | | |
| | | | | | | | | | | | | | | | | | | | | | | | | | | | | | | | | | | | | |
| 56 ALAMOSA, CO | | ALAMOSA PLAZA
145 CRAFT DRIVE | | | 81101 | | | SC | | | 1986 | | | | 1/2 | * | | | 100.00 | % | | | 19,875 | | | | 161,924 | | | | 76,213 | | | CITY MARKET, INC.(NOT OWNED), BIG "R"(NOT OWNED) |
| | | | | | | | | | | | | | | | | | | | | | | | | | | | | | | | | | | | | |
| 57 AURORA, CO | | PIONEER HILLS
5400-5820 SOUTH PARKER | | | 80012 | | | SC | | | 2003 | | | | 2003 | | | | 14.50 | % | | | 127,215 | | | | 479,541 | | | | 2,436,577 | | | BED BATH & BEYOND(2012), OFFICE DEPOT(2017), HOME DEPOT(NOT OWNED), WALMART(NOT OWNED) |
| | | | | | | | | | | | | | | | | | | | | | | | | | | | | | | | | | | | | |
| | | | | | | | | | | | | | | | | | | | | | | | | | | | | | | | | | | | | |
| 58 BROOMFIELD, CO | | FLATIRON MARKETPLACE GARDEN
1 WEST FLATIRON CIRCLE | | | 80021 | | | SC | | | 2001 | | | | 2003 | | | | 100.00 | % | | | 245,217 | | | | 421,482 | | | | 5,017,046 | | | NORDSTROM RACK(2011), LINENS ’N THINGS(2017), BEST BUY(2016), OFFICE DEPOT(2016), GREAT INDOORS(NOT OWNED) |
| | | | | | | | | | | | | | | | | | | | | | | | | | | | | | | | | | | | | |
| | | | | |
| | | | | Mervyns Locations |
| * 1. Property Developed by the Company | | * SC — Shopping Center | | * FO — Fee Owned |
| * 2. Original IPO Property | | * MM — Mall | | * LH — Leasehold |
| | | * LC — Lifestyle Center | | * GL — Ground Lease |
| | |
| | | |
| Does Not Include Service Merchandise Interests | | Property Listing 7.1 |
| | | |
| | Run Date: 10/09/2006 |
| | Time: 5:13:20PM |
| | Page 4 of 22 |
| | Quarter: 3Q06 |
Retail Property List*
| | | | | | | | | | | | | | | | | | | | | | | | | | | | | | | | | | | | | |
| | | | | | | | | | | | | Year | | | | | | DDR | | Owned | | Owned/Unowned | | Total | | |
| | | | | Zip | | Type of | | Developed/ | | Year | | Ownership | | Gross | | Gross | | Annualized | | |
| Center/Property | | Location | | Code | | Property | | Redeveloped | | Acquired | | Interest | | Leasable Area | | Leasable Area | | Rent | | Anchor Tenants(Lease Expiration) |
| 59 DENVER, CO | | TAMARAC SQUARE
7777 E. HAMPDEN | | | 80231 | | | SC | | | 1976 | | | | 2001 | | | | 100.00 | % | | | 174,780 | | | | 196,580 | | | | 1,874,902 | | | REGENCY THEATRES TAMARAC SQ.(2008) |
| | | | | | | | | | | | | | | | | | | | | | | | | | | | | | | | | | | | | |
| 60 DENVER, CO (CENTENNIAL) | | CENTENNIAL PROMENADE
9555 E. COUNTY LINE ROAD | | | 80223 | | | SC | | | 1997/2002 | | | | 1997 | | | | 100.00 | % | | | 408,337 | | | | 529,488 | | | | 6,782,791 | | | GOLFSMITH GOLF CENTER(2012), SOUNDTRACK(2017), ROSS DRESS FOR LESS(2008), OFFICE MAX(2012), MICHAEL’S(2007), TOYS R US(2011), BORDERS(2017), LOEHMANN’S(2012), HOME DEPOT(NOT OWNED), RECREATIONAL EQUIPMENT(NOT OWNED) |
| | | | | | | | | | | | | | | | | | | | | | | | | | | | | | | | | | | | | |
| 61 DENVER, CO (UNIVERSITY) | | UNIVERSITY HILLS
2730 SOUTH COLORADO BOULEVARD | | | 80222 | | | SC | | | 1997 | | | | 2003 | | | | 100.00 | % | | | 244,383 | | | | 244,383 | | | | 4,041,753 | | | LINENS ’N THINGS(2013), PIER 1 IMPORTS(2014), OFFICE MAX(2012), KING SOOPERS(2017) |
| | | | | | | | | | | | | | | | | | | | | | | | | | | | | | | | | | | | | |
| 62 FORT COLLINS. CO | | MULBERRY AND LEMAY CROSSINGS
MULBERRY ST. & S. LEMAY AVE. | | | 80525 | | | SC | | | 2004 | | | | 2003 | | | | 100.00 | % | | | 18,988 | | | | 316,420 | | | | 423,178 | | | WAL-MART(NOT OWNED), HOME DEPOT(NOT OWNED) |
| | | | | | | | | | | | | | | | | | | | | | | | | | | | | | | | | | | | | |
| 63 LITTLETON, CO | | ASPEN GROVE
7301 SOUTH SANTA FE | | | 80120 | | | LC | | | 2002 | | | | 1 | * | | | 100.00 | % | | | 231,450 | | | | 255,184 | | | | 6,636,650 | | | COLDWATER CREEK(2011), TALBOTS(2012),ANN TAYLOR(2012), J.CREW(2012), BANANA REPUBLIC(2012), GAP(2012), WILLIAMS-SONOMA(2014), J.JILL(2012), BOMBAY COMPANY(2012), POTTERY BARN(2014), PIER 1 IMPORTS(2011), JOSEPH A. BANK CLOTHERS(2012), BUCA di BEPPO(2013), CHAMPPS(2022),POTTERY BARN(2014) |
| | | | | | | | | | | | | | | | | | | | | | | | | | | | | | | | | | | | | |
| 64 PARKER, CO (FLATACRES) | | FLATACRES MARKETCENTER SOUTH PARKER ROAD | | | 80134 | | | SC | | | 2003 | | | | 2003 | | | | 14.50 | % | | | 116,644 | | | | 221,520 | | | | 2,035,894 | | | BED BATH & BEYOND(2014), GART SPORTS(2014), MICHAEL’S(2013), KOHL’S(NOT OWNED) |
| | | | | | | | | | | | | | | | | | | | | | | | | | | | | | | | | | | | | |
| 65 PARKER, CO (PAVILIONS) | | PARKER PAVILIONS
11153-11183 SOUTH PARKER ROAD | | | 80134 | | | SC | | | 2003 | | | | 2003 | | | | 14.50 | % | | | 89,631 | | | | 410,868 | | | | 1,687,552 | | | OFFICE DEPOT(2016), HOME DEPOT(NOT OWNED), WAL-MART(NOT OWNED) |
| | | | | | | | | | | | | | | | | | | | | | | | | | | | | | | | | | | | | |
| Connecticut | | | | | | | | | | | | | | | | | | | | | | | | | | | | | | | | | | | | |
| | | | | | | | | | | | | | | | | | | | | | | | | | | | | | | | | | | | | |
| 66 PLAINVILLE, CT | | CONNECTICUT COMMONS
I-84 & RTE 9 | | | 06062 | | | SC | | | 1999/2001 | | | | 1 | * | | | 14.50 | % | | | 463,394 | | | | 566,537 | | | | 6,066,433 | | | LOWE’S(2019), KOHL’S(2022), DSW SHOE WAREHOUSE(2015), DICK’S SPORTING GOODS(2020), PETSMART(2015), A.C. MOORE(2014), OLD NAVY(2011), LINENS ’N THINGS(2017), PLAINVILLE THEATRE(NOT OWNED) |
| | | | | | | | | | | | | | | | | | | | | | | | | | | | | | | | | | | | | |
| Florida | | | | | | | | | | | | | | | | | | | | | | | | | | | | | | | | | | | | |
| | | | | | | | | | | | | | | | | | | | | | | | | | | | | | | | | | | | | |
| 67 BAYONET POINT, FL | | POINT PLAZA
US 19 & SR 52 | | | 34667 | | | SC | | | 1985/2003 | | | | 1/2 | * | | | 100.00 | % | | | 209,714 | | | | 209,714 | | | | 1,365,252 | | | PUBLIX SUPER MARKETS(2010), BEALL’S(2014), T.J. MAXX(2010) |
| | | | | | | | | | | | | | | | | | | | | | | | | | | | | | | | | | | | | |
| 68 BOYNTON BEACH, FL | | MEADOWS SQUARE | | | 33461 | | | SC | | | 1986 | | | | 2004 | | | | 100.00 | % | | | 106,224 | | | | 106,224 | | | | 1,422,393 | | | PUBLIX SUPER MARKETS(2011) |
| | | HYPOLUXO RD & N. CONGRESS AVE | | | | | | | | | | | | | | | | | | | | | | | | | | | | | | | | | | |
| | | | | | | | | | | | | | | | | | | | | | | | | | | | | | | | | | | | | |
| 69 BRANDON, FL | | KMART SHOPPING CENTER
1602 BRANDON BL | | | 33511 | | | SC | | | 1972/1997/2003 | | | | 2 | * | | | 100.00 | % | | | 161,900 | | | | 228,022 | | | | 781,516 | | | K MART(2007), KANE FURNITURE(NOT OWNED) |
| | | | | | | | | | | | | | | | | | | | | | | | | | | | | | | | | | | | | |
| 70 BRANDON, FL (PLAZA) | | LAKE BRANDON PLAZA CAUSEWAY BOULEVARD | | | 33511 | | | SC | | | 1999 | | | | 2003 | | | | 14.50 | % | | | 148,267 | | | | 196,801 | | | | 1,880,787 | | | COMPUSA(2017), JO-ANN STORES(2017), PUBLIX SUPER MARKETS(2019), BABIES R US(NOT OWNED) |
| | | | | | | | | | | | | | | | | | | | | | | | | | | | | | | | | | | | | |
| 71 BRANDON, FL (VILLAGE) | | LAKE BRANDON VILLAGE CAUSEWAY BOULEVARD | | | 33511 | | | SC | | | 1997/2004 | | | | 2003 | | | | 14.50 | % | | | 113,986 | | | | 243,641 | | | | 1,483,048 | | | LINENS ’N THINGS(2014), SPORTS AUTHORITY(2018), PETSMART(2020), LOWE’S(NOT OWNED) |
| | | | | | | | | | | | | | | | | | | | | | | | | | | | | | | | | | | | | |
| 72 CRYSTAL RIVER, FL | | CRYSTAL RIVER PLAZA
420 SUN COAST HWY | | | 33523 | | | SC | | | 1986/2001 | | | | 1/2 | * | | | 100.00 | % | | | 160,135 | | | | 160,135 | | | | 768,030 | | | BEALL’S(2012), BEALL’S OUTLET(2011) |
| | | | | | | | | | | | | | | | | | | | | | | | | | | | | | | | | | | | | |
| 73 DAYTONA BEACH, FL | | VOLUSIA
1808 W. INTERNATIONAL SPEEDWAY | | | 32114 | | | SC | | | 1984 | | | | 2001 | | | | 100.00 | % | | | 76,087 | | | | 76,087 | | | | 855,858 | | | MARSHALLS(2010) |
| | | | | | | | | | | | | | | | | | | | | | | | | | | | | | | | | | | | | |
| 74 ENGLEWOOD, FL | | ROTONDA PLAZA
5855 PLACIDA ROAD | | | 34224 | | | SC | | | 1991 | | | | 2004 | | | | 100.00 | % | | | 46,835 | | | | 46,835 | | | | 471,466 | | | KASH N KARRY(2011) |
| | | | | | | | | | | | | | | | | | | | | | | | | | | | | | | | | | | | | |
| 75 GULF BREEZE, FL | | GULF BREEZE MARKETPLACE 3749-3767 GULF BREEZE PARKWAY | | | 32561 | | | SC | | | 1998 | | | | 2003 | | | | 100.00 | % | | | 29,827 | | | | 333,654 | | | | 414,404 | | | LOWE’S(NOT OWNED), WAL-MART(NOT OWNED) |
| | | | | | | | | | | | | | | | | | | | | | | | | | | | | | | | | | | | | |
| 76 JACKSONVILLE, FL | | JACKSONVILLE REGIONAL
3000 DUNN AVENUE | | | 32218 | | | SC | | | 1988 | | | | 1995 | | | | 100.00 | % | | | 219,735 | | | | 295,752 | | | | 1,407,068 | | | J.C. PENNEY(2007), WINN DIXIE STORES(2009) |
| | | | | | | | | | | | | | | | | | | | | | | | | | | | | | | | | | | | | |
| 77 JACKSONVILLE, FL(ARLINGTON RD) | | ARLINGTON ROAD PLAZA
926 ARLINGTON ROAD | | | 32211 | | | SC | | | 1990/1999 | | | | 2004 | | | | 100.00 | % | | | 182,098 | | | | 182,098 | | | | 856,952 | | | FOOD LION(2010) |
| | | | | |
| | | | | Mervyns Locations |
| * 1. Property Developed by the Company | | * SC — Shopping Center | | * FO — Fee Owned |
| * 2. Original IPO Property | | * MM — Mall | | * LH — Leasehold |
| | | * LC — Lifestyle Center | | * GL — Ground Lease |
| | |
| | | |
| Does Not Include Service Merchandise Interests | | Property Listing 7.1 |
| | | |
| | Run Date: 10/09/2006 |
| | Time: 5:13:20PM |
| | Page 5 of 22 |
| | Quarter: 3Q06 |
Retail Property List*
| | | | | | | | | | | | | | | | | | | | | | | | | | | | | | | | | | | | | |
| | | | | | | | | | | | | Year | | | | | | DDR | | Owned | | Owned/Unowned | | Total | | |
| | | | | Zip | | Type of | | Developed/ | | Year | | Ownership | | Gross | | Gross | | Annualized | | |
| Center/Property | | Location | | Code | | Property | | Redeveloped | | Acquired | | Interest | | Leasable Area | | Leasable Area | | Rent | | Anchor Tenants(Lease Expiration) |
| 78 LAKELAND, FL (HIGHLANDS) | | HIGHLANDS PLAZA SHOPPING CTR
2228 LAKELANDS HIGHLAND ROAD | | | 33803 | | | SC | | | 1990 | | | | 2004 | | | | 100.00 | % | | | 102,572 | | | | 102,572 | | | | 802,919 | | | WINN DIXIE STORES(2017) |
| | | | | | | | | | | | | | | | | | | | | | | | | | | | | | | | | | | | | |
| 79 MARIANNA, FL | | THE CROSSROADS | | | 32446 | | | SC | | | 1990 | | | | 1/2 | * | | | 100.00 | % | | | 63,894 | | | | 63,894 | | | | 350,035 | | | BEALL’S(2008) |
| | | 2814-2822 HIGHWAY 71 | | | | | | | | | | | | | | | | | | | | | | | | | | | | | | | | | | |
| | | | | | | | | | | | | | | | | | | | | | | | | | | | | | | | | | | | | |
| 80 NAPLES, FL | | CARILLON PLACE
5010 AIRPORT ROAD NORTH | | | 33942 | | | SC | | | 1994 | | | | 1995 | | | | 14.50 | % | | | 267,808 | | | | 283,208 | | | | 3,177,120 | | | WAL-MART(2014), T.J. MAXX(2009), CIRCUIT CITY(2015), ROSS DRESS FOR LESS(2010), CIRCUIT CITY(2015), OFFICE MAX(2010) |
| | | | | | | | | | | | | | | | | | | | | | | | | | | | | | | | | | | | | |
| 81 OCALA, FL (WEST) | | OCALA WEST
2400 SW COLLEGE ROAD | | | 32674 | | | SC | | | 1991 | | | | 2003 | | | | 100.00 | % | | | 99,716 | | | | 99,716 | | | | 753,519 | | | SPORTS AUTHORITY(2012), HOBBY LOBBY(2016) |
| | | | | | | | | | | | | | | | | | | | | | | | | | | | | | | | | | | | | |
| 82 ORANGE PARK, FL (THE VILLAGE) | | THE VILLAGE SHOPPING CENTER 950 BLANDING BLVD | | | 32065 | | | SC | | | 1993/2000 | | | | 2004 | | | | 100.00 | % | | | 72,531 | | | | 135,473 | | | | 691,488 | | | BEALL’S(2009), ALBERTSON’S(NOT OWNED) |
| | | | | | | | | | | | | | | | | | | | | | | | | | | | | | | | | | | | | |
| 83 ORMOND BEACH, FL | | ORMOND TOWNE SQUARE
1458 WEST GRANADA BLVD | | | 32174 | | | SC | | | 1993 | | | | 1994 | | | | 100.00 | % | | | 234,042 | | | | 234,042 | | | | 1,944,493 | | | BEALL’S(2018), ROSS DRESS FOR LESS(2016), PUBLIX SUPER MARKETS(2013) |
| | | | | | | | | | | | | | | | | | | | | | | | | | | | | | | | | | | | | |
| 84 OVIEDO, FL | | OVIEDO PARK CROSSING
RTE 417 & RED BUG LAKE ROAD | | | 32765 | | | SC | | | 1999 | | | | 1 | * | | | 20.00 | % | | | 186,212 | | | | 321,249 | | | | 2,015,892 | | | OFFICE MAX(2014), ROSS DRESS FOR LESS(2010), MICHAEL’S(2009), T.J. MAXX(2010), LINENS ’N THINGS(2011), LOWE’S(NOT OWNED) |
| | | | | | | | | | | | | | | | | | | | | | | | | | | | | | | | | | | | | |
| 85 PALM HARBOR, FL | | THE SHOPPES OF BOOT RANCH 300 EAST LAKEROAD | | | 34685 | | | SC | | | 1990 | | | | 1995 | | | | 100.00 | % | | | 52,395 | | | | 229,188 | | | | 957,792 | | | ALBERTSON’S(NOT OWNED), TARGET(NOT OWNED) |
| | | | | | | | | | | | | | | | | | | | | | | | | | | | | | | | | | | | | |
| 86 PENSACOLA, FL | | PALAFOX SQUARE
8934 PENSACOLA BLVD | | | 32534 | | | SC | | | 1988/1997/1999 | | | | 1/2 | * | | | 100.00 | % | | | 17,150 | | | | 236,892 | | | | 243,830 | | | WALMART(NOT OWNED) |
| | | | | | | | | | | | | | | | | | | | | | | | | | | | | | | | | | | | | |
| 87 SPRING HILL, FL | | MARINER SQUARE
13050 CORTEZ BLVD. | | | 34613 | | | SC | | | 1988/1997 | | | | 1/2 | * | | | 100.00 | % | | | 188,924 | | | | 393,000 | | | | 1,612,537 | | | BEALL’S(2011), ROSS DRESS FOR LESS(2014), WALMART(NOT OWNED) |
| | | | | | | | | | | | | | | | | | | | | | | | | | | | | | | | | | | | | |
| 88 TALLAHASSEE, FL | | CAPITAL WEST
4330 WEST TENNESSEE STREET | | | 32312 | | | SC | | | 1994/2004 | | | | 2003 | | | | 100.00 | % | | | 58,386 | | | | 231,035 | | | | 423,376 | | | BEALL’S OUTLET(2009), WAL-MART(NOT OWNED) |
| | | | | | | | | | | | | | | | | | | | | | | | | | | | | | | | | | | | | |
| 89 TAMPA, FL (DALE) | | NORTH POINTE PLAZA
15001-15233 NORTH DALE MABRY | | | 33618 | | | SC | | | 1990 | | | | 1/2 | * | | | 20.00 | % | | | 104,460 | | | | 222,388 | | | | 1,337,348 | | | PUBLIX SUPER MARKETS(2010), WALMART(NOT OWNED) |
| | | | | | | | | | | | | | | | | | | | | | | | | | | | | | | | | | | | | |
| 90 TAMPA, FL (HORIZON PARK) | | HORIZON PARK SHOPPING CENTER
3908 WEST HILLSBOROUGH HIGHWAY | | | 33614 | | | SC | | | 1987/2003 | | | | 2004 | | | | 100.00 | % | | | 216,284 | | | | 216,284 | | | | 1,763,558 | | | NORTHERN TOOL(2015), BABIES R US(2008), PEARL ARTIST & CRAFT SUPPLY(2007) |
| | | | | | | | | | | | | | | | | | | | | | | | | | | | | | | | | | | | | |
| 91 TAMPA, FL (WATERS) | | TOWN N’ COUNTRY
7021-7091 WEST WATERS AVENUE | | | 33634 | | | SC | | | 1990 | | | | 1/2 | * | | | 100.00 | % | | | 134,366 | | | | 249,747 | | | | 920,507 | | | ANNA’S LINENS(2011), KASH N KARRY(2010), WALMART(NOT OWNED) |
| | | | | | | | | | | | | | | | | | | | | | | | | | | | | | | | | | | | | |
| 92 TARPON SPRINGS, FL | | TARPON SQUARE
41232 U.S. 19, NORTH | | | 34689 | | | SC | | | 1974/1998 | | | | 1/2 | * | | | 100.00 | % | | | 198,797 | | | | 199,447 | | | | 1,402,282 | | | K MART(2009), BIG LOTS(2012), STAPLES(2013) |
| | | | | | | | | | | | | | | | | | | | | | | | | | | | | | | | | | | | | |
| 93 WEST PASCO, FL | | PASCO SQUARE
7201 COUNTY ROAD 54 | | | 34653 | | | SC | | | 1986 | | | | 1/2 | * | | | 100.00 | % | | | 135,421 | | | | 215,661 | | | | 583,531 | | | BEALL’S OUTLET(2013), WALMART(NOT OWNED) |
| | | | | | | | | | | | | | | | | | | | | | | | | | | | | | | | | | | | | |
| Georgia | | | | | | | | | | | | | | | | | | | | | | | | | | | | | | | | | | | | |
| | | | | | | | | | | | | | | | | | | | | | | | | | | | | | | | | | | | | |
| 94 ATHENS, GA | | ATHENS EAST
4375 LEXINGTON ROAD | | | 30605 | | | SC | | | 2000 | | | | 2003 | | | | 100.00 | % | | | 24,000 | | | | 218,879 | | | | 284,712 | | | WAL MART(NOT OWNED) |
| | | | | | | | | | | | | | | | | | | | | | | | | | | | | | | | | | | | | |
| 95 ATLANTA, GA (DULUTH) | | PLEASANT HILL PLAZA
1630 PLEASANT HILL ROAD | | | 30136 | | | SC | | | 1990 | | | | 1994 | | | | 100.00 | % | | | 99,025 | | | | 219,025 | | | | 1,061,068 | | | OFFICE DEPOT(2007), WAL-MART(NOT OWNED) |
| | | | | | | | | | | | | | | | | | | | | | | | | | | | | | | | | | | | | |
| 96 ATLANTA, GA (PERIMETER) | | PERIMETER POINTE
1155 MT. VERNON HIGHWAY | | | 30136 | | | SC | | | 1995/2002 | | | | 1995 | | | | 14.50 | % | | | 343,155 | | | | 352,755 | | | | 4,718,172 | | | STEIN MART(2010), BABIES R US(2012), SPORTS AUTHORITY(2012), L.A. FITNESS(2016), OFFICE DEPOT(2012), UNITED ARTISTS THEATRE(2015) |
| | | | | | | | | | | | | | | | | | | | | | | | | | | | | | | | | | | | | |
| 97 CANTON, GA (RIVERPLACE) | | RIVERPLACE
104-150 RIVERSTONE PARKWAY | | | 30114 | | | SC | | | 1983 | | | | 2003 | | | | 100.00 | % | | | 127,853 | | | | 127,853 | | | | 943,659 | | | STAPLES(2014), INGLES(2019) |
| | | | | |
| | | | | Mervyns Locations |
| * 1. Property Developed by the Company | | * SC — Shopping Center | | * FO — Fee Owned |
| * 2. Original IPO Property | | * MM — Mall | | * LH — Leasehold |
| | | * LC — Lifestyle Center | | * GL — Ground Lease |
| | |
| | | |
| Does Not Include Service Merchandise Interests | | Property Listing 7.1 |
| | | |
| | Run Date: 10/09/2006 |
| | Time: 5:13:20PM |
| | Page 6 of 22 |
| | Quarter: 3Q06 |
Retail Property List*
| | | | | | | | | | | | | | | | | | | | | | | | | | | | | | | | | | | | | |
| | | | | | | | | | | | | Year | | | | | | DDR | | Owned | | Owned/Unowned | | Total | | |
| | | | | Zip | | Type of | | Developed/ | | Year | | Ownership | | Gross | | Gross | | Annualized | | |
| Center/Property | | Location | | Code | | Property | | Redeveloped | | Acquired | | Interest | | Leasable Area | | Leasable Area | | Rent | | Anchor Tenants(Lease Expiration) |
| 98 CHAMBLEE, GA | | CHAMBLEE PLAZA
PEACHTREE INDUSTRIAL BOULEVARD | | | 30341 | | | SC | | | 1976 | | | | 2003 | | | | 100.00 | % | | | 175,969 | | | | 175,969 | | | | 883,397 | | | |
| | | | | | | | | | | | | | | | | | | | | | | | | | | | | | | | | | | | | |
| 99 COLUMBUS, GA | | BRADLEY PARK CROSSING
1591 BRADLEY PARK DRIVE COLUMB | | | 31904 | | | SC | | | 1999 | | | | 2003 | | | | 100.00 | % | | | 119,786 | | | | 242,786 | | | | 1,339,258 | | | GOODY’S(2011), PETSMART(2015), MICHAEL’S(2009), TARGET(NOT OWNED) |
| | | | | | | | | | | | | | | | | | | | | | | | | | | | | | | | | | | | | |
| 100 CUMMING, GA | | CUMMING MARKETPLACE MARKETPLACE BOULEVARD | | | 30041 | | | SC | | | 1997/1999 | | | | 2003 | | | | 100.00 | % | | | 308,557 | | | | 652,642 | | | | 3,744,970 | | | GOODY’S(2012), LOWE’S(2019), MICHAEL’S(2010), OFFICE MAX(2013), HOME DEPOT(NOT OWNED), WAL MART(NOT OWNED) |
| | | | | | | | | | | | | | | | | | | | | | | | | | | | | | | | | | | | | |
| 101 DOUGLASVILLE, GA | | DOUGLASVILLE MARKETPLACE
6875 DOUGLAS BOULEVARD | | | 30135 | | | SC | | | 1999 | | | | 2003 | | | | 100.00 | % | | | 86,158 | | | | 261,353 | | | | 1,450,285 | | | BEST BUY(2015), BABIES R US(2011), LOWES(NOT OWNED) |
| | | | | | | | | | | | | | | | | | | | | | | | | | | | | | | | | | | | | |
| 102 LAFAYETTE, GA | | LAFAYETTE CENTER
1109 NORTH MAIN STREET | | | 30728 | | | SC | | | 1990 | | | | 2003 | | | | 100.00 | % | | | 75,622 | | | | 78,422 | | | | 465,521 | | | FARMERS HOME FURNITURE(2009), FOOD LION(2019) |
| | | | | | | | | | | | | | | | | | | | | | | | | | | | | | | | | | | | | |
| 103 LAWRENCEVILLE, GA | | FIVE FORKS VILLAGE
850 DOGWOOD ROAD | | | 30044 | | | SC | | | 1990 | | | | 2003 | | | | 10.00 | % | | | 89,064 | | | | 89,064 | | | | 504,188 | | | |
| | | | | | | | | | | | | | | | | | | | | | | | | | | | | | | | | | | | | |
| 104 LILBURN, GA (FIVE FORKS) | | FIVE FORKS CROSSING
3055 FIVE FORKS TRICKUM ROAD | | | 30047 | | | SC | | | 2000/2001 | | | | 2003 | | | | 10.00 | % | | | 73,910 | | | | 73,910 | | | | 699,140 | | | KROGER(2012) |
| | | | | | | | | | | | | | | | | | | | | | | | | | | | | | | | | | | | | |
| 105 LITHONIA, GA | | THE SHOPS AT TURNER HILL
8200 MALL PARKWAY | | | 30038 | | | SC | | | 2004 | | | | 2003 | | | | 14.50 | % | | | 113,675 | | | | 293,670 | | | | 1,658,019 | | | BEST BUY(2018), BED BATH & BEYOND(2013), TOYS R US(NOT OWNED), SAM’S CLUB(NOT OWNED) |
| | | | | | | | | | | | | | | | | | | | | | | | | | | | | | | | | | | | | |
| 106 LOGANVILLE, GA | | MIDWAY PLAZA
910 ATHENS HWY | | | 30052 | | | SC | | | 1995 | | | | 2003 | | | | 20.00 | % | | | 91,196 | | | | 91,196 | | | | 957,767 | | | KROGER(2016) |
| | | | | | | | | | | | | | | | | | | | | | | | | | | | | | | | | | | | | |
| 107 MADISON, GA | | BEACON HEIGHTS
1462-1532 EATONTON ROAD | | | 30650 | | | SC | | | 1989 | | | | 2003 | | | | 100.00 | % | | | 64,545 | | | | 64,545 | | | | 367,187 | | | INGLES(2010) |
| | | | | | | | | | | | | | | | | | | | | | | | | | | | | | | | | | | | | |
| 108 MARIETTA, GA | | TOWN CENTER PRADO
2609 BELLS FERRY ROAD | | | 30066 | | | SC | | | 1995/2002 | | | | 1995 | | | | 14.50 | % | | | 301,297 | | | | 311,194 | | | | 3,804,790 | | | STEIN MART(2007), ROSS DRESS FOR LESS(2013), PUBLIX SUPER MARKETS(2015), CRUNCH FITNESS(2011) |
| | | | | | | | | | | | | | | | | | | | | | | | | | | | | | | | | | | | | |
| 109 MCDONOUGH, GA | | MCDONOUGH MARKETPLACE (LP-II)
NE CORNER 175 & HIGHWAY 20 | | | 30253 | | | SC | | | 2003 | | | | 2003 | | | | 14.50 | % | | | 53,158 | | | | 360,729 | | | | 840,363 | | | OFFICE DEPOT(2016), LOWES(NOT OWNED), WALMART(NOT OWNED) |
| | | | | | | | | | | | | | | | | | | | | | | | | | | | | | | | | | | | | |
| 110 NEWNAN, GA | | NEWNAN CROSSING
955-1063 BULLSBORO DRIVE NEWNA | | | 30264 | | | SC | | | 1995 | | | | 2003 | | | | 100.00 | % | | | 156,497 | | | | 426,723 | | | | 1,227,115 | | | LOWE’S(2015), BELK(NOT OWNED), WAL MART(NOT OWNED) |
| | | | | | | | | | | | | | | | | | | | | | | | | | | | | | | | | | | | | |
| 111 STOCKBRIDGE, GA (FREEWAY) | | FREEWAY JUNCTION
3797-3879 HIGHWAY 138 SE STOCK | | | 30281 | | | SC | | | 1988 | | | | 2003 | | | | 100.00 | % | | | 162,778 | | | | 162,778 | | | | 634,587 | | | NORTHERN TOOL(2015), FARMERS HOME FURNITURE(2011), GOODWILL(2011) |
| | | | | | | | | | | | | | | | | | | | | | | | | | | | | | | | | | | | | |
| 112 STOCKBRIDGE, GA (PIKE) | | PIKE NURSERIES-STOCKBRIDGE
599 HIGHWAY 138W | | | 30281 | | | SC | | | 1997 | | | | 2003 | | | | 100.00 | % | | | 0 | | | | 10,800 | | | | 244,145 | | | |
| | | | | | | | | | | | | | | | | | | | | | | | | | | | | | | | | | | | | |
| 113 STONE MOUNTAIN, GA (RIVER) | | RIVERCLIFF VILLAGE
STONE MOUNTAIN HIGHWAY STONE M | | | 30047 | | | SC | | | 1999 | | | | 2003 | | | | 100.00 | % | | | 2,000 | | | | 2,000 | | | | 46,200 | | | |
| | | | | | | | | | | | | | | | | | | | | | | | | | | | | | | | | | | | | |
| 114 SUWANEE, GA (JOHNS) | | JOHNS CREEK TOWNE CENTER
3630 PEACHTREE PARKWAY SUWANEE | | | 30024 | | | SC | | | 2001/2004 | | | | 2003 | | | | 100.00 | % | | | 285,336 | | | | 285,336 | | | | 3,895,998 | | | BORDERS(2021), PETSMART(2020), KOHL’S(2022), MICHAEL’S(2011), STAPLES(2016), SHOE GALLERY(2014) |
| | | | | | | | | | | | | | | | | | | | | | | | | | | | | | | | | | | | | |
| 115 TUCKER, GA | | COFER CROSSING
4349-4375 LAWRENCEVILLE HWY | | | 30084 | | | SC | | | 1998/2003 | | | | 2003 | | | | 100.00 | % | | | 130,832 | | | | 279,020 | | | | 1,278,955 | | | GOODY’S(2014), KROGER(2019), WALMART(NOT OWNED) |
| | | | | | | | | | | | | | | | | | | | | | | | | | | | | | | | | | | | | |
| 116 UNION CITY, GA | | SHANNON SQUARE
4720 JONESBORO ROAD | | | 30291 | | | SC | | | 1986 | | | | 2003 | | | | 100.00 | % | | | 100,002 | | | | 181,954 | | | | 429,936 | | | WAL MART(NOT OWNED) |
| | | | | | | | | | | | | | | | | | | | | | | | | | | | | | | | | | | | | |
| 117 WARNER ROBBINS, GA | | WARNER ROBINS PLACE
2724 WATSON BOULEVARD | | | 31093 | | | SC | | | 1997 | | | | 2003 | | | | 100.00 | % | | | 107,941 | | | | 459,700 | | | | 1,248,755 | | | T.J. MAXX(2010), STAPLES(2016), LOWE’S(NOT OWNED), WAL MART(NOT OWNED) |
| | | | | | | | | | | | | | | | | | | | | | | | | | | | | | | | | | | | | |
| 118 WOODSTOCK, GA | | WOODSTOCK PLACE
10029 HIGHWAY 928 | | | 30188 | | | SC | | | 1995 | | | | 2003 | | | | 100.00 | % | | | 44,691 | | | | 44,691 | | | | 348,858 | | | |
| | | | | |
| | | | | Mervyns Locations |
| * 1. Property Developed by the Company | | * SC — Shopping Center | | * FO — Fee Owned |
| * 2. Original IPO Property | | * MM — Mall | | * LH — Leasehold |
| | | * LC — Lifestyle Center | | * GL — Ground Lease |
| | |
| | | |
| Does Not Include Service Merchandise Interests | | Property Listing 7.1 |
| | |
| | Run Date: 10/09/2006 |
| | Time: 5:13:20PM |
| | Page 7 of 22 |
| | Quarter: 3Q06 |
Retail Property List*
| | | | | | | | | | | | | | | | | | | | | | | | | | | | | | | | | | | | | |
| | | | | | | | | | | | | Year | | | | | | DDR | | Owned | | Owned/Unowned | | Total | | |
| | | | | Zip | | Type of | | Developed/ | | Year | | Ownership | | Gross | | Gross | | Annualized | | |
| Center/Property | | Location | | Code | | Property | | Redeveloped | | Acquired | | Interest | | Leasable Area | | Leasable Area | | Rent | | Anchor Tenants(Lease Expiration) |
| Idaho | | | | | | | | | | | | | | | | | | | | | | | | | | | | | | | | | | | | |
| | | | | | | | | | | | | | | | | | | | | | | | | | | | | | | | | | | | | |
| 119 IDAHO FALLS, ID | | COUNTRY CLUB MALL
1515 NORTHGATE MILE | | | 83401 | | | SC | | | 1976/1992/1997 | | | | 1998 | | | | 100.00 | % | | | 148,593 | | | | 306,201 | | | | 732,713 | | | OFFICE MAX(2011), WORLD GYM(2008), FRED MEYER, INC.(NOT OWNED) |
| | | | | | | | | | | | | | | | | | | | | | | | | | | | | | | | | | | | | |
| 120 MERIDIAN, ID | | MERIDIAN CROSSROADS EAGLE AND FAIRVIEW ROAD | | | 83642 | | | SC | | | 1999/2001/2002/2003/
2004 | | | | 1 | * | | | 100.00 | % | | | 461,023 | | | | 731,482 | | | | 6,179,924 | | | BED BATH & BEYOND(2011), OLD NAVY(2010), SHOPKO(2020), OFFICE DEPOT(2010), ROSS DRESS FOR LESS(2012), MARSHALLS(2012), SPORTSMAN’S WAREHOUSE(2015), CRAFT WAREHOUSE(2013), BABIES R US(NOT OWNED), WALMART(NOT OWNED) |
| | | | | | | | | | | | | | | | | | | | | | | | | | | | | | | | | | | | | |
| Illinois | | | | | | | | | | | | | | | | | | | | | | | | | | | | | | | | | | | | |
| | | | | | | | | | | | | | | | | | | | | | | | | | | | | | | | | | | | | |
| 121 DECATUR, IL | | DECATUR MARKETPLACE MARYLAND STREET | | | 62521 | | | SC | | | 1999 | | | | 2003 | | | | 100.00 | % | | | 22,775 | | | | 194,775 | | | | 256,998 | | | WAL MART(NOT OWNED) |
| | | | | | | | | | | | | | | | | | | | | | | | | | | | | | | | | | | | | |
| 122 DEER PARK, IL | | DEER PARK TOWN CENTER
20530 NORTH RAND RD #303 | | | 60010 | | | LC | | | 2000/2004 | | | | 1 | * | | | 24.75 | % | | | 286,889 | | | | 391,084 | | | | 7,833,241 | | | GAP # 581(2010), BARNES & NOBLE(NOT OWNED), CENTURY CINEMAS(NOT OWNED), PIER 1 IMPORTS(201), BANANA REPUBLIC(2010), POTTERY BARN KIDS(2012), POTTERY BARN(2013), RESTORATION HARDWARE(2010), EDDIE BAUER HOME(2011), EDDIE BAUER SPORTSWEAR(2011), COLDWATER CREEK(2010), J.CREW(2011), ANN TAYLOR(2011), TALBOTS/TALBOTS PETITES(2011), WILLIAMS-SONOMA(2013), JOSEPH A. BANKCLOTHERS(2011), CALIFORNIA PIZZA KITCHEN(2013), BATH AND BODY WORKS(2011), J.JILL(2013), BOMBAY(2007), AMERICAN EAGLE(2007), VICTORIA’S SECRET(2007) |
| | | | | | | | | | | | | | | | | | | | | | | | | | | | | | | | | | | | | |
| 123 HARRISBURG, IL | | ARROWHEAD POINT
701 NORTH COMMERCIAL | | | 62946 | | | SC | | | 1991 | | | | 1994 | | | | 100.00 | % | | | 167,074 | | | | 167,074 | | | | 878,783 | | | WAL-MART(2011), MAD PRICER(2011) |
| | | | | | | | | | | | | | | | | | | | | | | | | | | | | | | | | | | | | |
| 124 MOUNT VERNON, IL | | TIMES SQUARE MALL
42ND AND BROADWAY | | | 62864 | | | MM | | | 1974/1998/2000 | | | | 2 | * | | | 100.00 | % | | | 269,328 | | | | 269,328 | | | | 995,334 | | | SEARS(2013), GOODY’S(2015), J.C. PENNEY(2007) |
| | | | | | | | | | | | | | | | | | | | | | | | | | | | | | | | | | | | | |
| 125 ORLAND PARK, IL (HOME DEPOT) | | HOME DEPOT CENTER
15800 HARLEM AVENUE | | | 60462 | | | SC | | | 1987/1993 | | | | 2004 | | | | 100.00 | % | | | 149,498 | | | | 149,498 | | | | 1,447,015 | | | HOME DEPOT(2012) |
| | | | | | | | | | | | | | | | | | | | | | | | | | | | | | | | | | | | | |
| 126 SCHAUMBURG, IL | | WOODFIELD VILLAGE GREEN
1430 EAST GOLF ROAD | | | 60173 | | | SC | | | 1993/1998/2002 | | | | 1995 | | | | 14.50 | % | | | 508,815 | | | | 674,504 | | | | 8,690,198 | | | CIRCUIT CITY(2009), OFF 5TH(2011), PETSMART(2014), HOMEGOODS(2014), OFFICE MAX(2010), CONTAINER STORE(2011), FILENE’S BASEMENT(2014), MARSHALLS(2009), NORDSTROM RACK(2009), BORDERS(2009), EXPO DESIGN CENTER(2019), COSTCO(NOT OWNED), PRAIRIE ROCK RESTAURANT(NOT OWNED) |
| | | | | | | | | | | | | | | | | | | | | | | | | | | | | | | | | | | | | |
| Indiana | | | | | | | | | | | | | | | | | | | | | | | | | | | | | | | | | | | | |
| | | | | | | | | | | | | | | | | | | | | | | | | | | | | | | | | | | | | |
| 127 BEDFORD, IN | | TOWN FAIR CENTER
1320 JAMES AVENUE | | | 47421 | | | SC | | | 1993/1997 | | | | 2 | * | | | 100.00 | % | | | 223,431 | | | | 223,431 | | | | 1,120,853 | | | K MART(2008), GOODY’S(2008), J.C. PENNEY(2008) |
| | | | | | | | | | | | | | | | | | | | | | | | | | | | | | | | | | | | | |
| 128 HIGHLAND, IN | | HIGHLAND GROVE SHOPPING CENTER
HIGHWAY 41 & MAIN STREET | | | 46322 | | | SC | | | 1995/2001 | | | | 1996 | | | | 20.00 | % | | | 312,546 | | | | 524,410 | | | | 3,549,791 | | | MARSHALLS(2011), KOHL’S(2016), CIRCUIT CITY(2016), OFFICE MAX(2012), TARGET(NOT OWNED), JEWEL(NOT OWNED), BORDERS(NOT OWNED) |
| | | | | | | | | | | | | | | | | | | | | | | | | | | | | | | | | | | | | |
| 129 LAFAYETTE, IN | | PARK EAST MARKETPLACE
4205 - 4315 COMMERCE DRIVE | | | 47905 | | | SC | | | 2000 | | | | 2003 | | | | 100.00 | % | | | 35,100 | | | | 243,850 | | | | 377,650 | | | WAL MART(NOT OWNED) |
| | | | | | | | | | | | | | | | | | | | | | | | | | | | | | | | | | | | | |
| Iowa | | | | | | | | | | | | | | | | | | | | | | | | | | | | | | | | | | | | |
| | | | | | | | | | | | | | | | | | | | | | | | | | | | | | | | | | | | | |
| 130 CEDAR RAPIDS, IA | | NORTHLAND SQUARE
303 -367 COLLINS ROAD, NE | | | 52404 | | | SC | | | 1984 | | | | 1998 | | | | 100.00 | % | | | 187,068 | | | | 207,405 | | | | 1,871,609 | | | T.J. MAXX(2010), OFFICE MAX(2010), BARNES & NOBLE(2010), KOHL’S(2021) |
| | | | | | | | | | | | | | | | | | | | | | | | | | | | | | | | | | | | | |
| 131 OTTUMWA, IA | | QUINCY PLACE MALL
1110 QUINCY AVENUE | | | 52501 | | | MM | | | 1990/1999/2002 | | | | 1/2 | * | | | 100.00 | % | | | 241,427 | | | | 344,677 | | | | 1,537,166 | | | HERBERGER’S(2020), J.C. PENNEY(2010), OFFICE MAX(2015), GOODY’S(2014), TARGET(NOT OWNED) |
| | | | | | | | | | | | | | | | | | | | | | | | | | | | | | | | | | | | | |
| Kansas | | | | | | | | | | | | | | | | | | | | | | | | | | | | | | | | | | | | |
| | | | | | | | | | | | | | | | | | | | | | | | | | | | | | | | | | | | | |
| 132 LEAWOOD, KS | | TOWN CENTER PLAZA
5000 W 119 STREET | | | 66209 | | | LC | | | 1996/2002 | | | | 1998 | | | | 100.00 | % | | | 308,628 | | | | 490,999 | | | | 7,710,924 | | | BARNES & NOBLE #2668(2011), COLDWATER CREEK(2009), LIMITED/LIMITED TOO(2009), VICTORIA’S SECRET(2009), EXPRESS/BATH&BODY/STRUCTURE(2009), GAP/GAP BODY(2008), GAP KIDS(2005), J.JILL(2013), POTTERY BARN(2009), WILLIAMS- SONOMA(2009), AMERICAN EAGLE(2013), PACIFIC SUNWEAR(2012), BRAVO CUCINA ITALIANA(2013), RESTORATION HARDWARE(2012), HOULIHANS(2025), BRISTOL SEAFOOD BAR & GRILL(2011), BOMBAY(2006),THE JONES STORE(2009) |
| | | | | |
| | | | | Mervyns Locations |
| * 1. Property Developed by the Company | | * SC — Shopping Center | | * FO — Fee Owned |
| * 2. Original IPO Property | | * MM — Mall | | * LH — Leasehold |
| | | * LC — Lifestyle Center | | * GL — Ground Lease |
| | |
| | | |
| Does Not Include Service Merchandise Interests | | Property Listing 7.1 |
| | | |
| | Run Date: 10/09/2006 |
| | Time: 5:13:20PM |
| | Page 8 of 22 |
| | Quarter: 3Q06 |
Retail Property List*
| | | | | | | | | | | | | | | | | | | | | | | | | | | | | | | | | | | | | |
| | | | | | | | | | | | | Year | | | | | | DDR | | Owned | | Owned/Unowned | | Total | | |
| | | | | Zip | | Type of | | Developed/ | | Year | | Ownership | | Gross | | Gross | | Annualized | | |
| Center/Property | | Location | | Code | | Property | | Redeveloped | | Acquired | | Interest | | Leasable Area | | Leasable Area | | Rent | | Anchor Tenants(Lease Expiration) |
| 133 MERRIAM, KS | | MERRIAM TOWN CENTER
5700 ANTIOCH ROAD | | | 66202 | | | SC | | | 1998/2004 | | | | 1 | * | | | 14.50 | % | | | 351,234 | | | | 473,740 | | | | 4,188,716 | | | OFFICE MAX(2013), PETSMART(2019), HEN HOUSE(2018), MARSHALLS(2008), DICK’S SPORTING GOODS(2016), CINEMARK(2018), HOME DEPOT #2202(NOT OWNED) |
| | | | | | | | | | | | | | | | | | | | | | | | | | | | | | | | | | | |
| | | | | | | | | | | | | | | | | | | | | | | | | | | | | | | | | | | | | |
| 134 OVERLAND PARK, KS (CHEROKEE) | | CHEROKEE NORTH SHOPPING CENTER | | | 66212 | | | SC | | | 1987/2002 | | | | 1998 | | | | 24.75 | % | | | 60,765 | | | | 60,981 | | | | 760,879 | | | |
| | | 8800-8934 W 95th STREET | | | | | | | | | | | | | | | | | | | | | | | | | | | | | | | | | | |
| | | | | | | | | | | | | | | | | | | | | | | | | | | | | | | | | | | | | |
| 135 OVERLAND PARK, KS (POINTE) | | OVERLAND POINTE MARKETPLACE | | | 66213 | | | SC | | | 2001/2004 | | | | 2003 | | | | 14.50 | % | | | 42,632 | | | | 361,759 | | | | 903,967 | | | HOME DEPOT(NOT OWNED), SAM’S CLUB(NOT OWNED), BABIES R US(NOT OWNED) |
| | | INTER 135TH & ANTIOCH RD | | | | | | | | | | | | | | | | | | | | | | | | | | | | | | | | | |
| | | | | | | | | | | | | | | | | | | | | | | | | | | | | | | | | | | | | |
| 136 WICHITA, KS (EASTGATE) | | EASTGATE PLAZA
SOUTH ROCK ROAD | | | 67207 | | | SC | | | 1955 | | | | 2002 | | | | 100.00 | % | | | 203,997 | | | | 253,997 | | | | 2,041,319 | | | OFFICE MAX(2007), T.J. MAXX(2011), BARNES & NOBLE(2012), KCBB, INC |
| | | | | | | | | | | | | | | | | | | | | | | | | | | | | | | | | | | | BURLINGTON(NOT OWNED) |
| | | | | | | | | | | | | | | | | | | | | | | | | | | | | | | | | | | | | |
| Kentucky | | | | | | | | | | | | | | | | | | | | | | | | | | | | | | | | | | | | |
| | | | | | | | | | | | | | | | | | | | | | | | | | | | | | | | | | | | | |
| 137 FLORENCE, KY (TURFWAY) | | TURFWAY PLAZA | | | 41042 | | | SC | | | 1975/1998 | | | | 2004 | | | | 100.00 | % | | | 133,985 | | | | 133,985 | | | | 961,211 | | | OFFICE DEPOT(2011), PARTY TOWN(2016), BIG LOTS(2008) |
| | | 6825 TURFWAY ROAD | | | | | | | | | | | | | | | | | | | | | | | | | | | | | | | | | |
| | | | | | | | | | | | | | | | | | | | | | | | | | | | | | | | | | | | | |
| 138 FRANKFORT, KY (EASTWOOD) | | EASTWOOD SHOPPING CENTER | | | 40601 | | | SC | | | 1963/1994 | | | | 2004 | | | | 100.00 | % | | | 155,104 | | | | 155,104 | | | | 845,965 | | | SEARS(2011) |
| | | 260 VERSAILLES ROAD | | | | | | | | | | | | | | | | | | | | | | | | | | | | | | | | | | |
| | | | | | | | | | | | | | | | | | | | | | | | | | | | | | | | | | | | | |
| 139 LEXINGTON, KY (NORTH) | | NORTH PARK MARKETPLACE | | | 40511 | | | SC | | | 1998 | | | | 2003 | | | | 100.00 | % | | | 48,920 | | | | 228,878 | | | | 598,403 | | | STAPLES(2016), WAL MART(NOT OWNED) |
| | | 524 WEST NEW CIRCLE | | | | | | | | | | | | | | | | | | | | | | | | | | | | | | | | | |
| | | | | | | | | | | | | | | | | | | | | | | | | | | | | | | | | | | | | |
| 140 LEXINGTON, KY (SOUTH) | | SOUTH FARM MARKETPLACE | | | 40503 | | | SC | | | 1998 | | | | 2003 | | | | 100.00 | % | | | 27,643 | | | | 344,280 | | | | 595,780 | | | LOWE’S(NOT OWNED), WAL MART(NOT OWNED) |
| | | MAN-O-WAR BOULEVARD AND NICHOL | | | | | | | | | | | | | | | | | | | | | | | | | | | | | | | | | | |
| | | | | | | | | | | | | | | | | | | | | | | | | | | | | | | | | | | | | |
| 141 LOUISVILLE, KY (OUTER LOOP) | | OUTER LOOP PLAZA | | | 40228 | | | SC | | | 1973/1989/1998 | | | | 2004 | | | | 100.00 | % | | | 120,777 | | | | 120,777 | | | | 644,549 | | | VALU DISCOUNT(2009) |
| | 7505 OUTER LOOP HIGHWAY | | | | | | | | | | | | | | | | | | | | | | | | | | | | | | | | | | |
| | | | | | | | | | | | | | | | | | | | | | | | | | | | | | | | | | | | | |
| 142 RICHMOND, KY | | CARRIAGE GATE | | | 40475 | | | SC | | | 1992 | | | | 2003 | | | | 100.00 | % | | | 158,041 | | | | 229,313 | | | | 264,300 | | | FOOD LION(2017), BALLARD’S(NOT OWNED) |
| | | 833-847 EASTERN BY-PASS | | | | | | | | | | | | | | | | | | | | | | | | | | | | | | | | | |
| | | | | | | | | | | | | | | | | | | | | | | | | | | | | | | | | | | | | |
| Maine | | | | | | | | | | | | | | | | | | | | | | | | | | | | | | | | | | | | |
| | | | | | | | | | | | | | | | | | | | | | | | | | | | | | | | | | | | | |
| 143 BRUNSWICK, ME | | COOK’S CORNERS
172 BATH ROAD | | | 04011 | | | SC | | | 1965 | | | | 1997 | | | | 100.00 | % | | | 301,992 | | | | 310,229 | | | | 2,589,416 | | | HOYTS CINEMAS(2010), BRUNSWICK BOOKLAND(2014), BIG LOTS(2008), T.J. MAXX(2010), SEARS(2012) |
| | | | | | | | | | | | | | | | | | | | | | | | | | | | | | | | | | | | |
| | | | | | | | | | | | | | | | | | | | | | | | | | | | | | | | | | | | | |
| Maryland | | | | | | | | | | | | | | | | | | | | | | | | | | | | | | | | | | | | |
| | | | | | | | | | | | | | | | | | | | | | | | | | | | | | | | | | | | | |
| 144 SALISBURY, MD | | THE COMMONS
E. NORTH POINT DRIVE | | | 21801 | | | SC | | | 1999 | | | | 1 | * | | | 100.00 | % | | | 126,135 | | | | 350,012 | | | | 1,681,422 | | | BEST BUY(2013), MICHAEL’S(2009), HOME DEPOT(NOT OWNED), TARGET(NOT OWNED) |
| | | | | | | | | | | | | | | | | | | | | | | | | | | | | | | | | | | | | |
| Massachusetts | | | | | | | | | | | | | | | | | | | | | | | | | | | | | | | | | | | | |
| | | | | | | | | | | | | | | | | | | | | | | | | | | | | | | | | | | | | |
| 145 EVERETT, MA | | GATEWAY CENTER
1 MYSTIC VIEW ROAD | | | 02149 | | | SC | | | 2001 | | | | 1 | * | | | 100.00 | % | | | 222,287 | | | | 639,807 | | | | 4,465,747 | | | BED BATH & BEYOND(2011), OLD NAVY(2011), OFFICE MAX(2020), BABIES R US(2013), MICHAEL’S(2012), COSTCO(NOT OWNED) |
| | | | | | | | | | | | | | | | | | | | | | | | | | | | | | | | | | | |
| | | | | | | | | | | | | | | | | | | | | | | | | | | | | | | | | | | | | |
| 146 FRAMINGHAM, MA | | SHOPPER’S WORLD
1 WORCESTER ROAD | | | 01701 | | | SC | | | 1994 | | | | 1995 | | | | 14.50 | % | | | 769,276 | | | | 778,701 | | | | 14,428,379 | | | TOYS R US(2020), MACY’S FURNTURE GALLERY(2020), T.J. MAXX(2010), BABIES R US(2013), DSW SHOE WAREHOUSE(2007), A.C. MOORE(2007), MARSHALLS(2011), BOBS(2011), LINENS ’N THINGS(2011), SPORTS AUTHORITY(2015), PETSMART(2011), BEST BUY(2014), BARNES & NOBLE(2011), AMC THEATRE(2014), KOHL’S(2010) |
| | | | | | | | | | | | | | | | | | | | | | | | | | | | | | | | | | | |
| | | | | | | | | | | | | | | | | | | | | | | | | | | | | | | | | | | | | |
| | | | | | | | | | | | | | | | | | | | | | | | | | | | | | | | | | | | | |
| | | | | | | | | | | | | | | | | | | | | | | | | | | | | | | | | | | | | |
| Michigan | | | | | | | | | | | | | | | | | | | | | | | | | | | | | | | | | | | | |
| | | | | | | | | | | | | | | | | | | | | | | | | | | | | | | | | | | | | |
| 147 BAD AXE, MI | | HURON CREST PLAZA | | | 48413 | | | SC | | | 1991 | | | | 1993 | | | | 100.00 | % | | | 63,415 | | | | 134,574 | | | | 411,308 | | | FARMER JACK(2012), WAL-MART(NOT OWNED) |
| | | 850 NORTH VAN DYKE ROAD | | | | | | | | | | | | | | | | | | | | | | | | | | | | | | | | | |
| | | | | | | | | | | | | | | | | | | | | | | | | | | | | | | | | | | | | |
| 148 BENTON HARBOR, MI | | FAIRPLAIN PLAZA | | | 49022 | | | SC | | | 1998 | | | | 2006 | | | | 20.00 | % | | | 222,739 | | | | 324,739 | | | | 1,561,268 | | | OFFICE DEPOT(2008), T.J. MAXX(2009), TARGET(NOT OWNED) |
| | | 1000 NAPIER AVE | | | | | | | | | | | | | | | | | | | | | | | | | | | | | | | | | |
| | | | | | | | | | | | | | | | | | | | | | | | | | | | | | | | | | | | | |
| 149 CHEBOYGAN, MI | | KMART SHOPPING PLAZA | | | 49721 | | | SC | | | 1988 | | | | 1994 | | | | 100.00 | % | | | 53,588 | | | | 129,339 | | | | 200,463 | | | K MART(2010), KMART(NOT OWNED) |
| | | 1109 EAST STATE | | | | | | | | | | | | | | | | | | | | | | | | | | | | | | | | | | |
| | | | | |
| | | | | Mervyns Locations |
| * 1. Property Developed by the Company | | * SC — Shopping Center | | * FO — Fee Owned |
| * 2. Original IPO Property | | * MM — Mall | | * LH — Leasehold |
| | | * LC — Lifestyle Center | | * GL — Ground Lease |
| | |
| | | |
| Does Not Include Service Merchandise Interests | | Property Listing 7.1 |
| | | |
| | Run Date: 10/09/2006 |
| | Time: 5:13:20PM |
| | Page 9 of 22 |
| | Quarter: 3Q06 |
Retail Property List*
| | | | | | | | | | | | | | | | | | | | | | | | | | | | | | | | | | | | | |
| | | | | | | | | | | | | Year | | | | | | DDR | | Owned | | Owned/Unowned | | Total | | |
| | | | | Zip | | Type of | | Developed/ | | Year | | Ownership | | Gross | | Gross | | Annualized | | |
| Center/Property | | Location | | Code | | Property | | Redeveloped | | Acquired | | Interest | | Leasable Area | | Leasable Area | | Rent | | Anchor Tenants(Lease Expiration) |
| 150 DETROIT, MI | | BELAIR CENTER
8400 E. EIGHT MILE ROAD | | | 48234 | | | SC | | | 1989/2002 | | | | 1998 | | | | 100.00 | % | | | 343,619 | | | | 450,349 | | | | 2,424,912 | | | NATIONAL WHOLESALE LIQUIDATORS(2016), PHOENIX THEATERS(2011), BALLY TOTAL FITNESS(2016), BIG LOTS(2008), KIDS R US(2013), FORMAN MILLS(2012), TARGET(NOT OWNED) |
| | | | | | | | | | | | | | | | | | | | | | | | | | | | | | | | | | | |
| | | | | | | | | | | | | | | | | | | | | | | | | | | | | | | | | | | | |
| | | | | | | | | | | | | | | | | | | | | | | | | | | | | | | | | | | | | |
| 151 GAYLORD, MI | | PINE RIDGE SQUARE | | | 49735 | | | SC | | | 1991/2004 | | | | 1993 | | | | 100.00 | % | | | 150,203 | | | | 150,203 | | | | 682,194 | | | DUNHAM’S SPORTING GOODS(2011), BIG LOTS(2010), BUY LOW(2011) |
| | | 1401 WEST MAIN STREET | | | | | | | | | | | | | | | | | | | | | | | | | | | | | | | | | |
| | | | | | | | | | | | | | | | | | | | | | | | | | | | | | | | | | | | | |
| 152 GRANDVILLE, MI | | GRANDVILLE MARKETPLACE
INTERSECT 44TH ST & CANAL AVE | | | 49418 | | | SC | | | 2003 | | | | 2003 | | | | 14.50 | % | | | 201,726 | | | | 352,098 | | | | 2,551,727 | | | CIRCUIT CITY(2017), LINENS ’N THINGS(2013), GANDER MOUNTAIN(2016), OFFICE MAX(2013), LOWE’S(NOT OWNED) |
| | | | | | | | | | | | | | | | | | | | | | | | | | | | | | | | | | | |
| | | | | | | | | | | | | | | | | | | | | | | | | | | | | | | | | | | | | |
| 153 HOUGHTON, MI | | COPPER COUNTRY MALL | | | 49931 | | | MM | | | 1981/1999 | | | | 1/2 | * | | | 100.00 | % | | | 257,863 | | | | 257,863 | | | | 992,004 | | | STEVE & BARRY’S(2013), J.C. PENNEY(2010), OFFICE MAX(2014) |
| | | HIGHWAY M26 | | | | | | | | | | | | | | | | | | | | | | | | | | | | | | | | | |
| | | | | | | | | | | | | | | | | | | | | | | | | | | | | | | | | | | | | |
| 154 HOWELL, MI | | GRAND RIVER PLAZA
3599 EAST GRAND RIVER | | | 48843 | | | SC | | | 1991 | | | | 1993 | | | | 100.00 | % | | | 215,047 | | | | 215,047 | | | | 1,396,605 | | | ELDER-BEERMAN(2011), DUNHAM’S SPORTING GOODS(2011), KROGER(2012) |
| | | | | | | | | | | | | | | | | | | | | | | | | | | | | | | | | | | | | |
| 155 LANSING, MI | | THE MARKETPLACE AT DELTA TOWNS
8305 WEST SAGINAW HWY 196 RAMP | | | 48917 | | | SC | | | 2000/2001 | | | | 2003 | | | | 100.00 | % | | | 135,697 | | | | 489,104 | | | | 1,449,584 | | | MICHAEL’S(2011), GANDER MOUNTAIN(2015), STAPLES(2016), PETSMART(2016), LOWE’S(NOT OWNED), WAL MART(NOT OWNED) |
| | | | | | | | | | | | | | | | | | | | | | | | | | | | | | | | | | | |
| | | | | | | | | | | | | | | | | | | | | | | | | | | | | | | | | | | | | |
| 156 MT. PLEASANT, MI | | INDIAN HILLS PLAZA | | | 48858 | | | SC | | | 1990 | | | | 2 | * | | | 100.00 | % | | | 249,680 | | | | 249,680 | | | | 1,665,584 | | | WAL-MART(2009), T.J. MAXX(2014), KROGER(2011) |
| | | 4208 E BLUE GRASS ROAD | | | | | | | | | | | | | | | | | | | | | | | | | | | | | | | | | |
| | | | | | | | | | | | | | | | | | | | | | | | | | | | | | | | | | | | | |
| 157 SAULT ST. MARIE, MI | | CASCADE CROSSINGS
4516 I-75 BUSINESS SPUR | | | 49783 | | | SC | | | 1993/1998 | | | | 1994 | | | | 100.00 | % | | | 270,761 | | | | 270,761 | | | | 1,696,322 | | | WAL-MART(2012), J.C. PENNEY(2008), DUNHAM’S SPORTING GOODS(2011), GLEN’S MARKET(2013) |
| | | | | | | | | | | | | | | | | | | | | | | | | | | | | | | | | | | |
| | | | | | | | | | | | | | | | | | | | | | | | | | | | | | | | | | | | | |
| 158 WALKER, MI (ALPINE AVE) | | GREEN RIDGE SQUARE II | | | 49504 | | | SC | | | 1991/1995 | | | | 2004 | | | | 100.00 | % | | | 91,749 | | | | 91,749 | | | | 930,669 | | | CIRCUIT CITY(2010), BED BATH & BEYOND(2015) |
| | | 3410 ALPINE AVENUE | | | | | | | | | | | | | | | | | | | | | | | | | | | | | | | | | |
| | | | | | | | | | | | | | | | | | | | | | | | | | | | | | | | | | | | | |
| 159 WALKER, MI (GRAND RAPIDS) | | GREEN RIDGE SQUARE | | | 49504 | | | SC | | | 1989 | | | | 1995 | | | | 100.00 | % | | | 133,538 | | | | 303,447 | | | | 1,542,456 | | | T.J. MAXX(2011), OFFICE DEPOT(2010), TARGET(NOT OWNED), TOYS R US(NOT OWNED) |
| | | 3390-B ALPINE AVE NW | | | | | | | | | | | | | | | | | | | | | | | | | | | | | | | | | |
| | | | | | | | | | | | | | | | | | | | | | | | | | | | | | | | | | | | |
| Minnesota | | | | | | | | | | | | | | | | | | | | | | | | | | | | | | | | | | | | |
| | | | | | | | | | | | | | | | | | | | | | | | | | | | | | | | | | | | | |
| 160 BEMIDJI, MN | | PAUL BUNYAN MALL | | | 56601 | | | MM | | | 1977/1998 | | | | 2 | * | | | 100.00 | % | | | 297,803 | | | | 297,803 | | | | 1,514,085 | | | K MART(2007), HERBERGER’S(2010), J.C. PENNEY(2008) |
| | | 1201 PAUL BUNYAN DRIVE | | | | | | | | | | | | | | | | | | | | | | | | | | | | | | | | | |
| | | | | | | | | | | | | | | | | | | | | | | | | | | | | | | | | | | | | |
| 161 BRAINERD, MN | | WESTGATE MALL | | | 56401 | | | MM | | | 1985/1998 | | | | 1/2 | * | | | 100.00 | % | | | 260,319 | | | | 260,319 | | | | 1,916,176 | | | STEVE & BARRY’S(2013), HERBERGER’S(2013), MOVIES 10(2011) |
| | | 1200 HIGHWAY 210 WEST | | | | | | | | | | | | | | | | | | | | | | | | | | | | | | | | | |
| | | | | | | | | | | | | | | | | | | | | | | | | | | | | | | | | | | | | |
| 162 COON RAPIDS, MN | | RIVERDALE VILLAGE
12921 RIVERDALE DRIVE | | | 55433 | | | SC | | | 2003 | | | | 1 | * | | | 14.50 | % | | | 551,898 | | | | 940,402 | | | | 8,930,733 | | | KOHL’S(2020), JO-ANN STORES(2010), LINENS ’N THINGS(2016), BORDERS(2023), OLD NAVY(2007), SPORTSMAN’S WAREHOUSE(2017), BEST BUY(2013), DSW SHOE WAREHOUSE(2016), SEARS(NOT OWNED), COSTCO(NOT OWNED), J.C. PENNEY(NOT OWNED) |
| | | | | | | | | | | | | | | | | | | | | | | | | | | | | | | | | | | |
| | | | | | | | | | | | | | | | | | | | | | | | | | | | | | | | | | | | |
| | | | | | | | | | | | | | | | | | | | | | | | | | | | | | | | | | | | |
| | | | | | | | | | | | | | | | | | | | | | | | | | | | | | | | | | | | | |
| 163 EAGAN, MN | | EAGAN PROMENADE
1299 PROMENADE PLACE | | | 55122 | | | SC | | | 1997/2001 | | | | 1997 | | | | 50.00 | % | | | 278,211 | | | | 342,014 | | | | 3,552,835 | | | BYERLY’S(2016), PETSMART(2018), BARNES & NOBLE(2012), OFFICE MAX(2013), T.J. MAXX(2007), BED BATH & BEYOND(2012), ETHAN ALLEN FURNITURE(NOT OWNED) |
| | | | | | | | | | | | | | | | | | | | | | | | | | | | | | | | | | | |
| | | | | | | | | | | | | | | | | | | | | | | | | | | | | | | | | | | | | |
| 164 HUTCHINSON, MN | | HUTCHINSON MALL | | | 55350 | | | MM | | | 1981 | | | | 1/2 | * | | | 100.00 | % | | | 121,001 | | | | 209,843 | | | | 449,534 | | | J.C. PENNEY(2011), HENNEN’S FURNITURE(NOT OWNED) |
| | | 1060 SR 15 | | | | | | | | | | | | | | | | | | | | | | | | | | | | | | | | | |
| | | | | | | | | | | | | | | | | | | | | | | | | | | | | | | | | | | | | |
| 165 MINNEAPOLIS, MN (MAPLE GROVE) | | MAPLE GROVE CROSSING
WEAVER LAKE ROAD & I-94 | | | 55369 | | | SC | | | 1995/2002 | | | | 1996 | | | | 50.00 | % | | | 265,957 | | | | 354,321 | | | | 2,964,654 | | | KOHL’S(2016), BARNES & NOBLE(2011), GANDER MOUNTAIN(2011), MICHAEL’S(2012), BED BATH & BEYOND(2012), CUB FOODS(NOT OWNED) |
| | | | | | | | | | | | | | | | | | | | | | | | | | | | | | | | | | | |
| | | | | | | | | | | | | | | | | | | | | | | | | | | | | | | | | | | | | |
| 166 ST. PAUL, MN | | MIDWAY MARKETPLACE
1450 UNIVERSITY AVENUE WEST | | | 55104 | | | SC | | | 1995 | | | | 1997 | | | | 14.50 | % | | | 324,354 | | | | 473,596 | | | | 2,684,640 | | | WAL-MART(2022), CUB FOODS(2015), PETSMART(2011), MERVYN’S(2016), BORDERS BOOKS AND MUSIC(NOT OWNED), HERBERGER’S(NOT OWNED) |
| | | | | | | | | | | | | | | | | | | | | | | | | | | | | | | | | | | |
| | | | | | | | | | | | | | | | | | | | | | | | | | | | | | | | | | | | | |
| 167 WORTHINGTON, MN | | NORTHLAND MALL | | | 56187 | | | MM | | | 1977 | | | | 1/2 | * | | | 100.00 | % | | | 185,658 | | | | 185,658 | | | | 533,516 | | | J.C. PENNEY(2007), HY VEE FOOD STORES(2011) |
| | | 1635 OXFORD STREET | | | | | | | | | | | | | | | | | | | | | | | | | | | | | | | | | |
| | | | | | | | | | | | | | | | | | | | | | | | | | | | | | | | | | | | | |
| Mississippi | | | | | | | | | | | | | | | | | | | | | | | | | | | | | | | | | | | | |
| | | | | | | | | | | | | | | | | | | | | | | | | | | | | | | | | | | | | |
| 168 GULFPORT, MS | | CROSSROADS CENTER
CROSSROADS PARKWAY | | | 39503 | | | SC | | | 1999 | | | | 2003 | | | | 100.00 | % | | | 457,027 | | | | 532,158 | | | | 5,285,910 | | | ACADEMY SPORTS(2015), BED BATH & BEYOND(2014), ROSS DRESS FOR LESS(2015), GOODY’S(2011), T.J. MAXX(2009), CINEMARK(2019), OFFICE DEPOT(2014), BARNES & NOBLE(2014), BELK’S(NOT OWNED) |
| | | | | | | | | | | | | | | | | | | | | | | | | | | | | | | | | | | |
| | | | | | | | | | | | | | | | | | | | | | | | | | | | | | | | | | | | |
| | | | | |
| | | | | Mervyns Locations |
| * 1. Property Developed by the Company | | * SC — Shopping Center | | * FO — Fee Owned |
| * 2. Original IPO Property | | * MM — Mall | | * LH — Leasehold |
| | | * LC — Lifestyle Center | | * GL — Ground Lease |
| | |
| | | |
| Does Not Include Service Merchandise Interests | | Property Listing 7.1 |
| | | |
| | Run Date: 10/09/2006 |
| | Time: 5:13:20PM |
| | Page 10 of 22 |
| | Quarter: 3Q06 |
Retail Property List*
| | | | | | | | | | | | | | | | | | | | | | | | | | | | | | | | | | | | | |
| | | | | | | | | | | | | Year | | | | | | DDR | | Owned | | Owned/Unowned | | Total | | |
| | | | | Zip | | Type of | | Developed/ | | Year | | Ownership | | Gross | | Gross | | Annualized | | |
| Center/Property | | Location | | Code | | Property | | Redeveloped | | Acquired | | Interest | | Leasable Area | | Leasable Area | | Rent | | Anchor Tenants(Lease Expiration) |
| 169 JACKSON, MS (JUNCTION) | | THE JUNCTION
6351 I-55 NORTH3 | | | 39213 | | | SC | | | 1996 | | | | 2003 | | | | 100.00 | % | | | 107,780 | | | | 326,319 | | | | 1,170,520 | | | PETSMART(2012), OFFICE DEPOT(2016), HOME DEPOT(NOT OWNED), TARGET(NOT OWNED) |
| | | | | | | | | | | | | | | | | | | | | | | | | | | | | | | | | | | | | |
| 170 JACKSON, MS (METRO) | | METRO STATION
4700 ROBINSON ROAD | | | 39204 | | | SC | | | 1997 | | | | 2003 | | | | 100.00 | % | | | 52,617 | | | | 182,300 | | | | 293,052 | | | OFFICE DEPOT(2012), HOME DEPOT(NOT OWNED) |
| | | | | | | | | | | | | | | | | | | | | | | | | | | | | | | | | | | | | |
| 171 OXFORD, MS | | OXFORD PLACE
2015-2035 UNIVERSITY AVENUE | | | 38655 | | | SC | | | 2000 | | | | 2003 | | | | 20.00 | % | | | 13,200 | | | | 71,866 | | | | 330,488 | | | KROGER(NOT OWNED) |
| | | | | | | | | | | | | | | | | | | | | | | | | | | | | | | | | | | | | |
| 172 SALTILLO, MS | | CROSS CREEK SHOPPING CENTER
1040-1184 CROSS CREEK DRIVE | | | 38866 | | | SC | | | 1999 | | | | 2003 | | | | 100.00 | % | | | 55,749 | | | | 173,269 | | | | 545,774 | | | STAPLES(2016), HOME DEPOT(NOT OWNED) |
| | | | | | | | | | | | | | | | | | | | | | | | | | | | | | | | | | | | | |
| 173 STARKVILLE, MS | | STARKVILLE CROSSING
882 HIGHWAY 12 WEST | | | 39759 | | | SC | | | 1999/2004 | | | | 1994 | | | | 100.00 | % | | | 133,691 | | | | 268,254 | | | | 907,246 | | | J.C. PENNEY(2010), KROGER(2042), LOWE’S(NOT OWNED) |
| | | | | | | | | | | | | | | | | | | | | | | | | | | | | | | | | | | | | |
| 174 TUPELO, MS | | BIG OAKS CROSSING
3850 N GLOSTER ST | | | 38801 | | | SC | | | 1992 | | | | 1994 | | | | 100.00 | % | | | 348,236 | | | | 348,236 | | | | 1,925,550 | | | SAM’S CLUB(2012), GOODY’S(2007), WAL-MART(2012) |
| | | | | | | | | | | | | | | | | | | | | | | | | | | | | | | | | | | | | |
| Missouri | | | | | | | | | | | | | | | | | | | | | | | | | | | | | | | | | | | | |
| | | | | | | | | | | | | | | | | | | | | | | | | | | | | | | | | | | | | |
| 175 ARNOLD, MO | | JEFFERSON COUNTY PLAZA
VOGEL ROAD | | | 63010 | | | SC | | | 2002 | | | | 1 | * | | | 50.00 | % | | | 42,091 | | | | 290,147 | | | | 442,720 | | | HOME DEPOT(NOT OWNED), TARGET(NOT OWNED) |
| | | | | | | | | | | | | | | | | | | | | | | | | | | | | | | | | | | | | |
| 176 FENTON, MO | | FENTON PLAZA
GRAVOIS & HIGHWAY 141 | | | 63206 | | | SC | | | 1970/1997 | | | | 1/2 | * | | | 100.00 | % | | | 93,420 | | | | 100,420 | | | | 951,092 | | | |
| | | | | | | | | | | | | | | | | | | | | | | | | | | | | | | | | | | | | |
| 177 INDEPENDENCE, MO | | INDEPENDENCE COMMONS
900 EAST 39TH STREET | | | 64057 | | | SC | | | 1995/1999 | | | | 1995 | | | | 14.50 | % | | | 386,070 | | | | 403,170 | | | | 4,949,735 | | | KOHL’S(2016), BED BATH & BEYOND(2012), MARSHALLS(2012), BEST BUY(2016), BARNES & NOBLE(2011), AMC THEATRE(2015) |
| | | | | | | | | | | | | | | | | | | | | | | | | | | | | | | | | | | | | |
| 178 KANSAS CITY, MO (WARD PARKWAY) | | WARD PARKWAY
8600 WARD PARKWAY | | | 64114 | | | SC | | | 1959/2004 | | | | 2003 | | | | 20.00 | % | | | 288,254 | | | | 611,759 | | | | 4,985,738 | | | DICK’S SPORTING GOODS(2016), 24 HOUR FITNESS(2023), PETSMART(2016), AMC THEATRE(2011), OFF BROADWAY SHOES(2015), T.J. MAXX(2013), TARGET(NOT OWNED), DILLARD’S(NOT OWNED) |
| | | | | | | | | | | | | | | | | | | | | | | | | | | | | | | | | | | | | |
| 179 SPRINGFIELD,MO (MORRIS) | | MORRIS CORNERS
1425 EAST BATTLEFIELD | | | 65804 | | | SC | | | 1989 | | | | 1998 | | | | 100.00 | % | | | 56,033 | | | | 56,033 | | | | 491,757 | | | TOYS R US(2013) |
| | | | | | | | | | | | | | | | | | | | | | | | | | | | | | | | | | | | | |
| 180 ST. JOHN, MO | | ST JOHN CROSSING
9000-9070 ST CHARLES ROCK RD | | | 63114 | | | SC | | | 2003 | | | | 2003 | | | | 100.00 | % | | | 93,513 | | | | 93,513 | | | | 984,042 | | | SHOP ’N SAVE(2022) |
| | | | | | | | | | | | | | | | | | | | | | | | | | | | | | | | | | | | | |
| 181 ST. LOUIS (SUNSET), MO | | PLAZA AT SUNSET HILL
10980 SUNSET PLAZA | | | 63128 | | | SC | | | 1997 | | | | 1998 | | | | 100.00 | % | | | 415,435 | | | | 450,938 | | | | 5,459,298 | | | TOYS R US(2013), COMPUSA(2013), BED BATH & BEYOND(2012), MARSHALLS(2012), HOME DEPOT(2023), PETSMART(2012), BORDERS(2011) |
| | | | | | | | | | | | | | | | | | | | | | | | | | | | | | | | | | | | | |
| 182 ST.LOUIS, MO (KELLER PLAZA) | | KELLER PLAZA
4500 LEMAY FERRY ROAD | | | 63129 | | | SC | | | 1987 | | | | 1998 | | | | 100.00 | % | | | 52,842 | | | | 169,699 | | | | 528,029 | | | KELLER PLAZA 8(2011), SAM’S(NOT OWNED) |
| | | | | | | | | | | | | | | | | | | | | | | | | | | | | | | | | | | | | |
| 183 ST.LOUIS, MO (SOUTHTOWNE) | | SOUTHTOWNE
KINGS HIGHWAY & CHIPPEWA | | | 63109 | | | SC | | | 2004 | | | | 1998 | | | | 100.00 | % | | | 67,628 | | | | 67,628 | | | | 1,062,666 | | | OFFICE MAX(2014) |
| | | | | | | | | | | | | | | | | | | | | | | | | | | | | | | | | | | | | |
| 184 ST.LOUIS,MO (BRENTWOOD) | | PROMENADE AT BRENTWOOD
1 BRENTWOOD PROMENADE COURT | | | 63144 | | | SC | | | 1998 | | | | 1998 | | | | 100.00 | % | | | 299,584 | | | | 299,584 | | | | 4,022,889 | | | TARGET(2023), BED BATH & BEYOND(2009), PETSMART(2014), LANE HOME FURNISHINGS(2013) |
| | | | | | | | | | | | | | | | | | | | | | | | | | | | | | | | | | | | | |
| 185 ST.LOUIS,MO (GRAVOIS VILLAGE) | | GRAVOIS VILLAGE
4523 GRAVOIS VILLAGE PLAZA | | | 63049 | | | SC | | | 1983 | | | | 1998 | | | | 100.00 | % | | | 110,992 | | | | 114,992 | | | | 634,512 | | | K MART(2008) |
| | | | | | | | | | | | | | | | | | | | | | | | | | | | | | | | | | | | | |
| 186 ST.LOUIS,MO (OLYMPIC OAKS) | | OLYMPIC OAKS VILLAGE
12109 MANCHESTER ROAD | | | 63121 | | | SC | | | 1985 | | | | 1998 | | | | 100.00 | % | | | 92,372 | | | | 92,372 | | | | 1,220,385 | | | T.J. MAXX(2008) |
| | | | | | | | | | | | | | | | | | | | | | | | | | | | | | | | | | | | | |
| Nevada | | | | | | | | | | | | | | | | | | | | | | | | | | | | | | | | | | | | |
| | | | | | | | | | | | | | | | | | | | | | | | | | | | | | | | | | | | | |
| 187 CARSON CITY, NV | | EAGLE STATION
3871 S. CARSON STREET | | | 89701 | | | FO | | | 1983 | | | | 2005 | | | | 50.00 | % | | | 60,494 | | | | 60,494 | | | | 543,660 | | | MERVYN’S(2020) |
| | | | | | | | | | | | | | | | | | | | | | | | | | | | | | | | | | | | | |
| 188 LAS VEGAS, NV (MARYLAND) | | FAMILY PLACE @ LAS VEGAS
CHARLESTON & MARYLAND BLVD | | | 89102 | | | SC | | | 2003 | | | | 1 | * | | | 100.00 | % | | | 24,032 | | | | 27,300 | | | | 431,256 | | | |
| | | | | |
| | | | | Mervyns Locations |
| * 1. Property Developed by the Company | | * SC — Shopping Center | | * FO — Fee Owned |
| * 2. Original IPO Property | | * MM — Mall | | * LH — Leasehold |
| | | * LC — Lifestyle Center | | * GL — Ground Lease |
| | |
| | | |
| Does Not Include Service Merchandise Interests | | Property Listing 7.1 |
| | | |
| | Run Date: 10/09/2006 |
| Time: 5:13:20PM |
| | Page 11 of 22 |
| | Quarter: 3Q06 |
Retail Property List*
| | | | | | | | | | | | | | | | | | | | | | | | | | | | | | | | | | | |
| | | | | | | | | | | Year | | | | | | DDR | | Owned | | Owned/Unowned | | Total | | |
| | | | | Zip | | Type of | | Developed/ | | Year | | Ownership | | Gross | | Gross | | Annualized | | |
| Center/Property | | Location | | Code | | Property | | Redeveloped | | Acquired | | Interest | | Leasable Area | | Leasable Area | | Rent | | Anchor Tenants(Lease Expiration) |
| 189 LAS VEGAS, NV(LOMA) | | LOMA VISTA SHOPPING CENTER | | | 89107 | | | FO | | | 1979 | | | | 2005 | | | | 50.00 | % | | | 75,687 | | | | 75,687 | | | | 765,000 | | | MERVYN’S(2020) |
| | | 4700 MEADOW LANE | | | | | | | | | | | | | | | | | | | | | | | | | | | | | | | | |
| | | | | | | | | | | | | | | | | | | | | | | | | | | | | | | | | | | |
| 190 LAS VEGAS, NV(NELLIS) | | NELLIS CROSSING SHOPPING | | | 89104 | | | FO | | | 1986 | | | | 2005 | | | | 50.00 | % | | | 76,016 | | | | 76,016 | | | | 683,400 | | | MERVYN’S(2020) |
| | | 1300 S. NELLIS BLVD | | | | | | | | | | | | | | | | | | | | | | | | | | | | | | | | |
| | | | | | | | | | | | | | | | | | | | | | | | | | | | | | | | | | | |
| 191 RENO, NV (SIERRA) | | SIERRA TOWN CENTER | | | 89511 | | | FO | | | 2002 | | | | 2005 | | | | 50.00 | % | | | 79,239 | | | | 79,239 | | | | 623,220 | | | MERVYN’S(2020) |
| | | 6895 SIERRA CTR PKWY | | | | | | | | | | | | | | | | | | | | | | | | | | | | | | | | |
| | | | | | | | | | | | | | | | | | | | | | | | | | | | | | | | | | | |
| 192 RENO, NV. | | RENO RIVERSIDE | | | 89505 | | | SC | | | 2000 | | | | 2000 | | | | 100.00 | % | | | 52,474 | | | | 52,474 | | | | 693,728 | | | CENTURY THEATRE(2014) |
| | | EAST FIRST STREET AND SIERRA | | | | | | | | | | | | | | | | | | | | | | | | | | | | | | | | |
| | | | | | | | | | | | | | | | | | | | | | | | | | | | | | | | | | | |
| 193 SW LAS VEGAS, NV | | GRAND CANYON PARKWAY S. C. | | | 89147 | | | FO | | | 2003 | | | | 2005 | | | | 50.00 | % | | | 79,294 | | | | 79,294 | | | | 890,460 | | | MERVYN’S(2020) |
| | | 4265 S. GRAND CANYON DRIVE | | | | | | | | | | | | | | | | | | | | | | | | | | | | | | | | |
| | | | | | | | | | | | | | | | | | | | | | | | | | | | | | | | | | | |
| New Jersey | | | | | | | | | | | | | | | | | | | | | | | | | | | | | | | | | | |
| | | | | | | | | | | | | | | | | | | | | | | | | | | | | | | | | | | |
| 194 FREEHOLD, NJ | | FREEHOLD MARKETPLACE | | | 07728 | | | SC | | | 2005 | | | | 1 | * | | | 100.00 | % | | | 0 | | | | 302,920 | | | | 1,199,913 | | | WALMART(NOT OWNED), SAM’S CLUB(NOT OWNED) |
| | | NJ HWY 33 & W. MAIN ST(RT 537) | | | | | | | | | | | | | | | | | | | | | | | | | | | | | | | |
| | | | | | | | | | | | | | | | | | | | | | | | | | | | | | | | | | | |
| 195 HAMILTON, NJ | | HAMILTON MARKETPLACE
NJ STATE HWY 130 & KLOCKNER RD | | | 08691 | | | SC | | | 2004 | | | | 2003 | | | | 100.00 | % | | | 446,940 | | | | 937,430 | | | | 7,779,277 | | | STAPLES(2015), KOHL’S(2023), LINENS ’N THINGS(2014), MICHAEL’S(2013), ROSS DRESS FOR LESS(2014), SHOPRITE(2028), BARNES & NOBLE(2014), LOWE’S(NOT OWNED), BJ’S WHOLESALE(NOT OWNED), WALMART(NOT OWNED) |
| | | | | | | | | | | | | | | | | | | | | | | | | | | | | | | | | |
| | | | | | | | | | | | | | | | | | | | | | | | | | | | | | | | | | |
| | | | | | | | | | | | | | | | | | | | | | | | | | | | | | | | | | | |
| 196 MAYS LANDING, NJ (HAMILTON) | | HAMILTON COMMONS
4215 BLACK HORSE PIKE | | | 08330 | | | SC | | | 2001 | | | | 2004 | | | | 100.00 | % | | | 398,870 | | | | 398,870 | | | | 6,166,242 | | | REGAL CINEMAS(2021), ROSS DRESS FOR LESS(2012), BED BATH & BEYOND(2017), MARSHALLS(2012), SPORTS AUTHORITY(2015), CIRCUIT CITY(2020) |
| | | | | | | | | | | | | | | | | | | | | | | | | | | | | | | | | |
| | | | | | | | | | | | | | | | | | | | | | | | | | | | | | | | | | | |
| 197 MAYS LANDING, NJ (WRANGLEBORO | | WRANGLEBORO CONSUMER SQUARE
2300 WRANGLEBORO ROAD | | | 08330 | | | SC | | | 1997 | | | | 2004 | | | | 100.00 | % | | | 839,019 | | | | 839,019 | | | | 9,096,512 | | | BEST BUY(2017), BORDERS(2017), KOHL’S(2018), STAPLES(2012), BABIES R US(2013), BJ’S WHOLESALE CLUB(2016), DICK’S SPORTING GOODS(2013), LINENS ’N THINGS(2012), MICHAEL’S(2008), TARGET(2023), PETSMART(2013) |
| | | | | | | | | | | | | | | | | | | | | | | | | | | | | | | | | |
| | | | | | | | | | | | | | | | | | | | | | | | | | | | | | | | | | |
| | | | | | | | | | | | | | | | | | | | | | | | | | | | | | | | | | | |
| 198 MT. LAUREL, NJ | | CENTERTON SQUARE
CENTERTON ROAD & MARTER AVE. | | | 08054 | | | SC | | | 2005 | | | | 1 | * | | | 100.00 | % | | | 284,177 | | | | 713,973 | | | | 6,626,094 | | | BED BATH & BEYOND(2015), PETSMART(2015), DSW SHOE WAREHOUSE(2015), JO-ANN STORES(2015), T.J. MAXX(2015), SPORTS AUTHORITY(2016), WEGMANS(NOT OWNED), TARGET(NOT OWNED), COSTCO(NOT OWNED) |
| | | | | | | | | | | | | | | | | | | | | | | | | | | | | | | | | |
| | | | | | | | | | | | | | | | | | | | | | | | | | | | | | | | | | |
| | | | | | | | | | | | | | | | | | | | | | | | | | | | | | | | | | | |
| 199 PRINCETON, NJ | | NASSAU PARK SHOPPING CENTER
ROUTE 1 & QUAKER BRIDGE ROAD | | | 02071 | | | SC | | | 1995 | | | | 1997 | | | | 100.00 | % | | | 281,080 | | | | 789,889 | | | | 5,208,309 | | | BORDERS(2011), BEST BUY(2012), LINENS ’N THINGS(2011), PETSMART(2011), BABIES R US(2016), TARGET(NOT OWNED) |
| | | | | | | | | | | | | | | | | | | | | | | | | | | | | | | | | |
| | | | | | | | | | | | | | | | | | | | | | | | | | | | | | | | | | | |
| 200 PRINCETON, NJ (PAVILION) | | NASSAU PARK PAVILION | | | 02071 | | | SC | | | 1999/2004 | | | | 1 | * | | | 100.00 | % | | | 202,622 | | | | 309,285 | | | | 4,028,229 | | | DICK’S SPORTING GOODS(2015), MICHAEL’S(2009), KOHL’S(2019) |
| | ROUTE 1 AND QUAKER BRIDGE ROAD | | | | | | | | | | | | | | | | | | | | | | | | | | | | | | | |
| | | | | | | | | | | | | | | | | | | | | | | | | | | | | | | | | | | |
| 201 WEST LONG BRANCH, NJ(MONMOUTH) | | MONMOUTH CONSUMER CENTER
310 STATE HIGHWAY #36 | | | 07764 | | | SC | | | 1993 | | | | 2004 | | | | 100.00 | % | | | 292,999 | | | | 292,999 | | | | 4,029,362 | | | SPORTS AUTHORITY(2012), BARNES & NOBLE(2009), PETSMART(2008), HOME DEPOT(2013) |
| | | | | | | | | | | | | | | | | | | | | | | | | | | | | | | | | |
| | | | | | | | | | | | | | | | | | | | | | | | | | | | | | | | | | | |
| New Mexico | | | | | | | | | | | | | | | | | | | | | | | | | | | | | | | | | | |
| | | | | | | | | | | | | | | | | | | | | | | | | | | | | | | | | | | |
| 202 LOS ALAMOS, NM | | MARI MAC VILLAGE
800 TRINITY DRIVE | | | 87533 | | | SC | | | 1978/1997 | | | | 1/2 | * | | | 100.00 | % | | | 93,021 | | | | 93,021 | | | | 661,041 | | | SMITH’S FOOD & DRUG(2007), FURR’S PHARMACY(2008), BEALLS(2009) |
| | | | | | | | | | | | | | | | | | | | | | | | | | | | | | | | | |
| | | | | | | | | | | | | | | | | | | | | | | | | | | | | | | | | | | |
| New York | | | | | | | | | | | | | | | | | | | | | | | | | | | | | | | | | | |
| | | | | | | | | | | | | | | | | | | | | | | | | | | | | | | | | | | |
| 203 ALDEN, NY (TOPS) | | TOPS PLAZA — ALDEN | | | 14004 | | | SC | | | 1999 | | | | 2004 | | | | 100.00 | % | | | 67,992 | | | | 67,992 | | | | 711,350 | | | TOPS MARKETS(2019) |
| | | 12775 BROADWAY | | | | | | | | | | | | | | | | | | | | | | | | | | | | | | | | |
| | | | | | | | | | | | | | | | | | | | | | | | | | | | | | | | | | | |
| 204 AMHERST, NY | | TOPS PLAZA — AMHERST | | | 14828 | | | SC | | | 1986 | | | | 2004 | | | | 20.00 | % | | | 145,192 | | | | 145,192 | | | | 1,141,412 | | | TOPS MARKETS(2010) |
| | | 3035 NIAGARA FALLS BLVD. | | | | | | | | | | | | | | | | | | | | | | | | | | | | | | | | |
| | | | | | | | | | | | | | | | | | | | | | | | | | | | | | | | | | | |
| 205 AMHERST, NY (BOULEVARD CONSUME | | BOULEVARD CONSUMER SQUARE
1641-1703 NIAGARA FALLS BLVD | | | 14228 | | | SC | | | 1998/2001/2003 | | | | 2004 | | | | 100.00 | % | | | 573,952 | | | | 709,114 | | | | 6,466,003 | | | TARGET(2019), K MART(2007), BABIES R US(2015), BARNES & NOBLE(2014), BEST BUY(2016), BED BATH & BEYOND(2018), A.C. MOORE(2013), LOWES(NOT OWNED) |
| | | | | | | | | | | | | | | | | | | | | | | | | | | | | | | | | |
| | | | | | | | | | | | | | | | | | | | | | | | | | | | | | | | | | | |
| 206 AMHERST, NY (BURLINGTON/JOANN) | | BURLINGTON PLAZA
1551 NIAGARA FALLS BOULEVARD | | | 14228 | | | SC | | | 1978/1982/1990/1998 | | | | 2004 | | | | 100.00 | % | | | 199,504 | | | | 199,504 | | | | 2,104,588 | | | BURLINGTON COAT FACTORY(2014), JO-ANN STORES(2014) |
| | | | | | | | | | | | | | | | | | | | | | | | | | | | | | | | | | |
| | | | | | | | | | | | | | | | | | | | | | | | | | | | | | | | | | | |
| 207 AMHERST, NY (DICKS) | | DICKS SPORTING GOODS — AMHERST | | | 14226 | | | SC | | | 1993/2003 | | | | 2004 | | | | 100.00 | % | | | 55,745 | | | | 55,745 | | | | 762,592 | | | DICK’S SPORTING GOODS(2015) |
| | | 281 MEYER ROAD | | | | | | | | | | | | | | | | | | | | | | | | | | | | | | | | |
| | | | | |
| | | | | Mervyns Locations |
| * 1. Property Developed by the Company | | * SC — Shopping Center | | * FO — Fee Owned |
| * 2. Original IPO Property | | * MM — Mall | | * LH — Leasehold |
| | | * LC — Lifestyle Center | | * GL — Ground Lease |
| | |
| | | |
| Does Not Include Service Merchandise Interests | | Property Listing 7.1 |
| | | |
| | Run Date: 10/09/2006 |
| | Time: 5:13:20PM |
| | Page 12 of 22 |
| | Quarter: 3Q06 |
Retail Property List*
| | | | | | | | | | | | | | | | | | | | | | | | | | | | | | | | | | | |
| | | | | | | | | | | Year | | | | | | DDR | | Owned | | Owned/Unowned | | Total | | |
| | | | Zip | | Type of | | Developed/ | | Year | | Ownership | | Gross | | Gross | | Annualized | | |
| Center/Property | | Location | | Code | | Property | | Redeveloped | | Acquired | | Interest | | Leasable Area | | Leasable Area | | Rent | | Anchor Tenants(Lease Expiration) |
| 208 AMHERST, NY (SHERIDAN/HARLEM) | | SHERIDAN HARLEM PLAZA | | | 14226 | | | SC | | | 1960/1973/1982/1988/ | | | | 2004 | | | | 100.00 | % | | | 58,413 | | | | 58,413 | | | | 610,390 | | | |
| | 4990 HARLEM ROAD | | | | | | | | | 2003 | | | | | | | | | | | | | | | | | | | | | | | |
| | | | | | | | | | | | | | | | | | | | | | | | | | | | | | | | | | | |
| 209 AMHERST, NY (TOPS-TRANSIT COMM | | TOPS PLAZA — TRANSIT/N. FRENCH | | | 14226 | | | SC | | | 1995/1998 | | | | 2004 | | | | 100.00 | % | | | 114,177 | | | | 114,177 | | | | 1,132,939 | | | TOPS MARKETS(2016) |
| | 9660 TRANSIT ROAD | | | | | | | | | | | | | | | | | | | | | | | | | | | | | | | | |
| | | | | | | | | | | | | | | | | | | | | | | | | | | | | | | | | | | |
| 210 AMHERST, NY (UNIVERSITY PLAZA) | | UNIVERSITY PLAZA | | | 14226 | | | SC | | | 1965/1995/2002 | | | | 2004 | | | | 100.00 | % | | | 162,879 | | | | 162,879 | | | | 1,396,120 | | | A.J. WRIGHT(2012), TOPS MARKETS(2009) |
| | 3500 MAIN STREET | | | | | | | | | | | | | | | | | | | | | | | | | | | | | | | |
| | | | | | | | | | | | | | | | | | | | | | | | | | | | | | | | | | | |
| 211 ARCADE, NY | | TOPS PLAZA — ARCADE | | | 14009 | | | SC | | | 1995 | | | | 2004 | | | | 10.00 | % | | | 65,915 | | | | 65,915 | | | | 661,409 | | | TOPS MARKETS(2015) |
| | | ROUTE 39 | | | | | | | | | | | | | | | | | | | | | | | | | | | | | | | | |
| | | | | | | | | | | | | | | | | | | | | | | | | | | | | | | | | | | |
| 212 AVON, NY | | TOPS PLAZA — AVON | | | 14414 | | | SC | | | 1997/2002 | | | | 2004 | | | | 10.00 | % | | | 63,288 | | | | 63,288 | | | | 454,162 | | | TOPS MARKETS(2017) |
| | | 270 E. MAIN STREET | | | | | | | | | | | | | | | | | | | | | | | | | | | | | | | | |
| | | | | | | | | | | | | | | | | | | | | | | | | | | | | | | | | | | |
| 213 BATAVIA, NY (BJS) | | BJs PLAZA
8326 LEWISTON ROAD | | | 14020 | | | SC | | | 1996 | | | | 2004 | | | | 14.50 | % | | | 95,846 | | | | 95,846 | | | | 816,222 | | | BJ’S WHOLESALE CLUB(2016) |
| | | | | | | | | | | | | | | | | | | | | | | | | | | | | | | | | | |
| | | | | | | | | | | | | | | | | | | | | | | | | | | | | | | | | | | |
| 214 BATAVIA, NY (COMMONS) | | BATAVIA COMMONS | | | 14020 | | | SC | | | 1990 | | | | 2004 | | | | 14.50 | % | | | 49,431 | | | | 49,431 | | | | 524,327 | | | |
| | | 419 WEST MAIN STREET | | | | | | | | | | | | | | | | | | | | | | | | | | | | | | | | |
| | | | | | | | | | | | | | | | | | | | | | | | | | | | | | | | | | | |
| 215 BATAVIA, NY (MARTIN’S PLAZA) | | MARTIN’S PLAZA | | | 14020 | | | SC | | | 1994 | | | | 2004 | | | | 14.50 | % | | | 37,140 | | | | 115,161 | | | | 442,448 | | | MARTIN'S(NOT OWNED) |
| | | 8351 LEWISTON ROAD | | | | | | | | | | | | | | | | | | | | | | | | | | | | | | | | |
| | | | | | | | | | | | | | | | | | | | | | | | | | | | | | | | | | | |
| 216 BIG FLATS, NY (CONSUMER SQUARE | | BIG FLATS CONSUMER SQUARE
830 COUNTY ROUTE 64 | | | 14814 | | | SC | | | 1993/2001 | | | | 2004 | | | | 100.00 | % | | | 641,264 | | | | 641,264 | | | | 6,132,912 | | | DICK’S SPORTING GOODS(2008), WAL-MART(2013), SAM’S CLUB(2013), TOPS MARKETS(2013), BED BATH & BEYOND(2014), MICHAEL’S(2010), OLD NAVY(2009), STAPLES(2011), BARNES & NOBLE(2011), T.J. MAXX(2007) |
| | | | | | | | | | | | | | | | | | | | | | | | | | | | | | | | | |
| | | | | | | | | | | | | | | | | | | | | | | | | | | | | | | | | | |
| | | | | | | | | | | | | | | | | | | | | | | | | | | | | | | | | | |
| | | | | | | | | | | | | | | | | | | | | | | | | | | | | | | | | | | |
| 217 BUFFALO, NY (DELAWARE CONSUMER | | DELAWARE CONSUMER SQUARE | | | 14216 | | | SC | | | 1995 | | | | 2004 | | | | 100.00 | % | | | 238,531 | | | | 238,531 | | | | 2,138,328 | | | A.J. WRIGHT(2012), OFFICE MAX(2012), TARGET(2015) |
| | | 2636-2658 DELAWARE AVENUE | | | | | | | | | | | | | | | | | | | | | | | | | | | | | | | |
| | | | | | | | | | | | | | | | | | | | | | | | | | | | | | | | | | | |
| 218 BUFFALO, NY (ELMWOOD) | | ELMWOOD REGAL CENTER | | | 14207 | | | SC | | | 1997 | | | | 2004 | | | | 100.00 | % | | | 133,940 | | | | 133,940 | | | | 1,524,235 | | | REGAL CINEMAS(2017), OFFICE DEPOT(2012) |
| | | 1951 - 2023 ELMWOOD AVENUE | | | | | | | | | | | | | | | | | | | | | | | | | | | | | | | |
| | | | | | | | | | | | | | | | | | | | | | | | | | | | | | | | | | | |
| 219 BUFFALO, NY (MARSHALLS) | | MARSHALLS PLAZA | | | 14216 | | | SC | | | 1960/1975/1983/1995 | | | | 2004 | | | | 100.00 | % | | | 82,196 | | | | 82,196 | | | | 787,882 | | | MARSHALLS(2009) |
| | | 2150 DELAWARE AVENUE | | | | | | | | | | | | | | | | | | | | | | | | | | | | | | | | |
| | | | | | | | | | | | | | | | | | | | | | | | | | | | | | | | | | | |
| 220 CANANDAIGUA, NY | | TOPS PLAZA | | | 14424 | | | SC | | | 2002 | | | | 2004 | | | | 100.00 | % | | | 57,498 | | | | 57,498 | | | | 769,500 | | | TOPS MARKETS(2023) |
| | | 5150 North Street | | | | | | | | | | | | | | | | | | | | | | | | | | | | | | | | |
| | | | | | | | | | | | | | | | | | | | | | | | | | | | | | | | | | | |
| 221 CHEEKTOWAGA, NY (BORDERS) | | BORDERS BOOKS | | | 14225 | | | SC | | | 1994 | | | | 2004 | | | | 14.50 | % | | | 26,500 | | | | 26,500 | | | | 609,500 | | | BORDERS(2015) |
| | | 2015 WALDEN AVENUE | | | | | | | | | | | | | | | | | | | | | | | | | | | | | | | | |
| | | | | | | | | | | | | | | | | | | | | | | | | | | | | | | | | | | |
| 222 CHEEKTOWAGA, NY (THRUWAY PLAZA | | THRUWAY PLAZA
2195 HARLEM ROAD | | | 14225 | | | SC | | | 1965/1995/1997/2004 | | | | 2004 | | | | 100.00 | % | | | 371,512 | | | | 503,844 | | | | 2,644,718 | | | WAL-MART(2017), MOVIELAND 8 THEATRES(2019), TOPS MARKETS(2019), A.J. WRIGHT(2015), VALUE CITY FURNITURE(2009), M & T BANK(2017), HOME DEPOT(NOT OWNED) |
| | | | | | | | | | | | | | | | | | | | | | | | | | | | | | | | | |
| | | | | | | | | | | | | | | | | | | | | | | | | | | | | | | | | | |
| | | | | | | | | | | | | | | | | | | | | | | | | | | | | | | | | | |
| | | | | | | | | | | | | | | | | | | | | | | | | | | | | | | | | | | |
| 223 CHEEKTOWAGA, NY (TOPS UNION) | | TOPS PLAZA — UNION ROAD | | | 14225 | | | SC | | | 1978/1989/1995/2004 | | | | 2004 | | | | 20.00 | % | | | 151,357 | | | | 151,357 | | | | 1,753,461 | | | TOPS MARKETS(2013) |
| | 3825 - 3875 UNION ROAD | | | | | | | | | | | | | | | | | | | | | | | | | | | | | | | | |
| | | | | | | | | | | | | | | | | | | | | | | | | | | | | | | | | | | |
| 224 CHEEKTOWAGA, NY (UNION CONSUME | | UNION CONSUMER SQUARE
3733 - 3735 UNION ROAD | | | 14225 | | | SC | | | 1989/1998/2004 | | | | 2004 | | | | 14.50 | % | | | 386,548 | | | | 386,548 | | | | 4,390,405 | | | MARSHALLS(2009), OFFICE MAX(2010), SAM’S CLUB(2024), CIRCUIT CITY(2016), JO-ANN STORES(2015) |
| | | | | | | | | | | | | | | | | | | | | | | | | | | | | | | | | |
| | | | | | | | | | | | | | | | | | | | | | | | | | | | | | | | | | | |
| 225 CHEEKTOWAGA, NY (UNION) | | UNION ROAD PLAZA
3637 UNION ROAD | | | 14225 | | | SC | | | 1979/1982/1997/2003 | | | | 2004 | | | | 14.50 | % | | | 174,438 | | | | 174,438 | | | | 1,198,011 | | | DICK’S SPORTING GOODS(2015) |
| | | | | | | | | | | | | | | | | | | | | | | | | | | | | | | | | | |
| | | | | | | | | | | | | | | | | | | | | | | | | | | | | | | | | | | |
| 226 CHEEKTOWAGA, NY (WALDEN PLACE) | | WALDEN PLACE | | | 14225 | | | SC | | | 1994/1999 | | | | 2004 | | | | 14.50 | % | | | 68,002 | | | | 68,002 | | | | 267,125 | | | |
| | 2130-2190 WALDEN AVENUE | | | | | | | | | | | | | | | | | | | | | | | | | | | | | | | | |
| | | | | | | | | | | | | | | | | | | | | | | | | | | | | | | | | | | |
| 227 CHEEKTOWAGA, NY (WALDEN) | | CONSUMER SQUARE
1700 - 1750 WALDEN AVENUE | | | 14225 | | | SC | | | 1997/1999/2004 | | | | 2004 | | | | 14.50 | % | | | 255,964 | | | | 255,964 | | | | 2,330,224 | | | OFFICE DEPOT(2009), LINENS ’N THINGS(2015), MICHAEL’S(2013), TARGET(2015) |
| | | | | | | | | | | | | | | | | | | | | | | | | | | | | | | | | |
| | | | | | | | | | | | | | | | | | | | | | | | | | | | | | | | | | | |
| 228 CHILI, NY (KMART) | | CHILI PLAZA | | | 14606 | | | SC | | | 1998 | | | | 2004 | | | | 100.00 | % | | | 116,868 | | | | 120,368 | | | | 748,189 | | | SEARS(2019) |
| | | 800 PAUL ROAD | | | | | | | | | | | | | | | | | | | | | | | | | | | | | | | | |
| | | | | |
| | | | | Mervyns Locations |
| * 1. Property Developed by the Company | | * SC — Shopping Center | | * FO — Fee Owned |
| * 2. Original IPO Property | | * MM — Mall | | * LH — Leasehold |
| | | * LC — Lifestyle Center | | * GL — Ground Lease |
| | |
| | | |
| Does Not Include Service Merchandise Interests | | Property Listing 7.1 |
| | | |
| | Run Date: 10/09/2006 |
| | Time: 5:13:20PM |
| | Page 13 of 22 |
| | Quarter: 3Q06 |
Retail Property List*
| | | | | | | | | | | | | | | | | | | | | | | | | | | | | | | | | | | | | |
| | | | | | | | | | | | | Year | | | | | | DDR | | Owned | | Owned/Unowned | | Total | | |
| | | | | Zip | | Type of | | Developed/ | | Year | | Ownership | | Gross | | Gross | | Annualized | | |
| Center/Property | | Location | | Code | | Property | | Redeveloped | | Acquired | | Interest | | Leasable Area | | Leasable Area | | Rent | | Anchor Tenants(Lease Expiration) |
| 229 CICERO, NY (BEAR RD) | | BEAR ROAD PLAZA
709-729 NORTH MAIN STREET | | | 13212 | | | SC | | | 1978/1988/1995 | | | | 2004 | | | | 100.00 | % | | | 59,483 | | | | 59,483 | | | | 447,223 | | | |
| | | | | | | | | | | | | | | | | | | | | | | | | | | | | | | | | | | | |
| | | | | | | | | | | | | | | | | | | | | | | | | | | | | | | | | | | | | |
| 230 CLARENCE, NY (BARNES) | | BARNES & NOBLE | | | 14031 | | | SC | | | 1992 | | | | 2004 | | | | 14.50 | % | | | 16,030 | | | | 16,030 | | | | 304,249 | | | |
| | | 7370 TRANSIT ROAD | | | | | | | | | | | | | | | | | | | | | | | | | | | | | | | | | | |
| | | | | | | | | | | | | | | | | | | | | | | | | | | | | | | | | | | | | |
| 231 CLARENCE, NY (EASTGATE PLAZA) | | EASTGATE PLAZA
TRANSIT & GREINER ROADS | | | 14031 | | | SC | | | 1995/1997/1999/2001/
2004 | | | | 2004 | | | | 14.50 | % | | | 520,876 | | | | 520,876 | | | | 4,156,109 | | | BJ’S WHOLESALE CLUB(2021), DICK’S SPORTING GOODS(2011), LINENS ’N THINGS(2015), MICHAEL’S(2010), WAL-MART(2019) |
| | | | | | | | | | | | | | | | | | | | | | | | | | | | | | | | | | |
| | | | | | | | | | | | | | | | | | | | | | | | | | | | | | | | | | | | | |
| 232 CLARENCE, NY (JOANN) | | JOANN PLAZA
4101 TRANSIT ROAD | | | 14221 | | | SC | | | 1994 | | | | 2004 | | | | 14.50 | % | | | 92,720 | | | | 202,720 | | | | 743,588 | | | OFFICE MAX(2009), JO-ANN STORES(2015), BIG LOTS(2015), HOME DEPOT(NOT OWNED) |
| | | | | | | | | | | | | | | | | | | | | | | | | | | | | | | | | | |
| | | | | | | | | | | | | | | | | | | | | | | | | | | | | | | | | | | | | |
| 233 CORTLAND, NY (TOPS PLAZA) | | TOPS PLAZA — CORTLAND STAPLES | | | 13045 | | | SC | | | 1995 | | | | 2004 | | | | 100.00 | % | | | 134,223 | | | | 134,223 | | | | 1,731,453 | | | TOPS MARKETS(2016), STAPLES(2017) |
| | | 3836 ROUTE 281 | | | | | | | | | | | | | | | | | | | | | | | | | | | | | | | | | | |
| | | | | | | | | | | | | | | | | | | | | | | | | | | | | | | | | | | | | |
| 234 DANSVILLE, NY (TOPS) | | TOPS PLAZA — DANSVILLE | | | 14437 | | | SC | | | 2001 | | | | 2004 | | | | 100.00 | % | | | 62,400 | | | | 62,400 | | | | 626,969 | | | TOPS MARKETS(2021) |
| | | 23-65 FRANKLIN STREET | | | | | | | | | | | | | | | | | | | | | | | | | | | | | | | | | | |
| | | | | | | | | | | | | | | | | | | | | | | | | | | | | | | | | | | | | |
| 235 DEPEW, NY | | TOPS PLAZA — DEPEW
5175 BROADWAY | | | 14043 | | | SC | | | 1980/1990/1996 | | | | 2004 | | | | 100.00 | % | | | 148,245 | | | | 148,245 | | | | 1,511,814 | | | TOPS MARKETS(2016), BIG LOTS(2011) |
| | | | | | | | | | | | | | | | | | | | | | | | | | | | | | | | | | | |
| | | | | | | | | | | | | | | | | | | | | | | | | | | | | | | | | | | | | |
| 236 DEWITT, NY (DEWITT COMMONS) | | MARSHALLS PLAZA
3401 ERIE BOULEVARD EAST | | | 13214 | | | SC | | | 2001/2003 | | | | 2004 | | | | 100.00 | % | | | 321,620 | | | | 321,620 | | | | 2,870,186 | | | TOYS R US(2018), OLD NAVY(2011), MARSHALLS(2019), BED BATH & BEYOND(2018), A.C. MOORE(2014), SYRACUSE ORTHOPEDIC SPECIALIST(2017) |
| | | | | | | | | | | | | | | | | | | | | | | | | | | | | | | | | | |
| | | | | | | | | | | | | | | | | | | | | | | | | | | | | | | | | | | | | |
| 237 DEWITT, NY (MICHAELS/CHUCK E C | | MICHAELS — DEWITT | | | 13214 | | | SC | | | 2002 | | | | 2004 | | | | 100.00 | % | | | 49,713 | | | | 49,713 | | | | 570,166 | | | MICHAEL’S(2010) |
| | 3133 ERIE BOULEVARD | | | | | | | | | | | | | | | | | | | | | | | | | | | | | | | | | | |
| | | | | | | | | | | | | | | | | | | | | | | | | | | | | | | | | | | | | |
| 238 ELMIRA, NY | | TOPS PLAZA — ELMIRA | | | 14904 | | | SC | | | 1997 | | | | 2004 | | | | 10.00 | % | | | 98,330 | | | | 98,330 | | | | 1,117,100 | | | TOPS MARKETS(2017) |
| | | HUDSON STREET | | | | | | | | | | | | | | | | | | | | | | | | | | | | | | | | | | |
| | | | | | | | | | | | | | | | | | | | | | | | | | | | | | | | | | | | | |
| 239 GATES, NY (WESTGATE PLAZA) | | WESTGATE PLAZA | | | 14624 | | | SC | | | 1998 | | | | 2004 | | | | 100.00 | % | | | 335,215 | | | | 335,215 | | | | 3,117,862 | | | WAL-MART(2021), STAPLES(2015) |
| | 2000 CHILI AVENUE | | | | | | | | | | | | | | | | | | | | | | | | | | | | | | | | | |
| | | | | | | | | | | | | | | | | | | | | | | | | | | | | | | | | | | | | |
| 240 GREECE, NY | | JOANN/PETSMART PLAZA
3042 WEST RIDGE ROAD | | | 14626 | | | SC | | | 1993/1999 | | | | 2004 | | | | 100.00 | % | | | 75,916 | | | | 75,916 | | | | 799,191 | | | PETSMART(2008), JO-ANN STORES(2015) |
| | | | | | | | | | | | | | | | | | | | | | | | | | | | | | | | | | | |
| | | | | | | | | | | | | | | | | | | | | | | | | | | | | | | | | | | | | |
| 241 HAMBURG, NY (BJS) | | BJS PLAZA — HAMBURG | | | 14075 | | | SC | | | 1990/1997 | | | | 2004 | | | | 100.00 | % | | | 175,965 | | | | 175,965 | | | | 1,797,756 | | | OFFICE MAX(2010), BJ’S WHOLESALE CLUB(2010) |
| | | 4408 MILESTRIP ROAD | | | | | | | | | | | | | | | | | | | | | | | | | | | | | | | | | |
| | | | | | | | | | | | | | | | | | | | | | | | | | | | | | | | | | | | | |
| 242 HAMBURG, NY (DICKS-MCKINLEY) | | MCKINLEY PLACE | | | 14075 | | | SC | | | 1990/2001 | | | | 2004 | | | | 100.00 | % | | | 128,944 | | | | 128,944 | | | | 1,434,999 | | | DICK'S SPORTING GOODS(2011), ROSA'S HOME STORE(2009) |
| | 3701 MCKINLEY PARKWAY | | | | | | | | | | | | | | | | | | | | | | | | | | | | | | | | | |
| | | | | | | | | | | | | | | | | | | | | | | | | | | | | | | | | | | | | |
| 243 HAMBURG, NY (HAMBURG VILLAGE) | | HAMBURG VILLAGE SQUARE | | | 14075 | | | SC | | | 1960/1972/1984/1996 | | | | 2004 | | | | 100.00 | % | | | 92,717 | | | | 92,717 | | | | 880,396 | | | |
| | 140 PINE STREET | | | | | | | | | | | | | | | | | | | | | | | | | | | | | | | | | | |
| | | | | | | | | | | | | | | | | | | | | | | | | | | | | | | | | | | | | |
| 244 HAMBURG, NY (HOME DEPOT) | | HOME DEPOT PLAZA — HAMBURG | | | 14219 | | | SC | | | 1999/2000 | | | | 2004 | | | | 100.00 | % | | | 139,413 | | | | 139,413 | | | | 1,507,396 | | | HOME DEPOT(2012) |
| | | 4405 MILESTRIP ROAD | | | | | | | | | | | | | | | | | | | | | | | | | | | | | | | | | | |
| | | | | | | | | | | | | | | | | | | | | | | | | | | | | | | | | | | | | |
| 245 HAMBURG, NY (MILESTRIP) | | MCKINLEY MILESTRIP CENTER | | | 14075 | | | SC | | | 1999 | | | | 2004 | | | | 100.00 | % | | | 106,774 | | | | 106,774 | | | | 1,458,689 | | | OLD NAVY(2010), JO-ANN STORES(2015) |
| | | 3540 MCKINLEY PARKWAY | | | | | | | | | | | | | | | | | | | | | | | | | | | | | | | | | | |
| | | | | | | | | | | | | | | | | | | | | | | | | | | | | | | | | | | | | |
| 246 HAMBURG, NY (TOPS) | | SOUTH PARK PLAZA — TOPS | | | 14075 | | | SC | | | 1990/1992 | | | | 2004 | | | | 10.00 | % | | | 84,000 | | | | 84,000 | | | | 730,500 | | | TOPS MARKETS(2015) |
| | | 6150 SOUTH PARK AVENUE | | | | | | | | | | | | | | | | | | | | | | | | | | | | | | | | | | |
| | | | | | | | | | | | | | | | | | | | | | | | | | | | | | | | | | | | | |
| 247 HAMLIN, NY | | TOPS PLAZA — HAMLIN | | | 14464 | | | SC | | | 1997 | | | | 2004 | | | | 10.00 | % | | | 60,488 | | | | 60,488 | | | | 491,305 | | | TOPS MARKETS(2017) |
| | | 1800 LAKE ROAD | | | | | | | | | | | | | | | | | | | | | | | | | | | | | | | | | | |
| | | | | | | | | | | | | | | | | | | | | | | | | | | | | | | | | | | | | |
| 248 IRONDEQUOIT, NY (CULVER RIDGE) | | CULVER RIDGE PLAZA | | | 14622 | | | SC | | | 1972/1984/1997 | | | | 2004 | | | | 20.00 | % | | | 226,812 | | | | 226,812 | | | | 2,313,795 | | | REGAL CINEMAS(2022), A.J. WRIGHT(2014) |
| | 2255 RIDGE ROAD EAST | | | | | | | | | | | | | | | | | | | | | | | | | | | | | | | | | |
| | | | | | | | | | | | | | | | | | | | | | | | | | | | | | | | | | | | | |
| 249 IRONDEQUOIT, NY (RIDGEVIEW) | | RIDGEVIEW PLACE | | | 14617 | | | SC | | | 2000 | | | | 2004 | | | | 100.00 | % | | | 64,732 | | | | 64,732 | | | | 847,639 | | | |
| | 1850 RIDGE ROAD EAST | | | | | | | | | | | | | | | | | | | | | | | | | | | | | | | | | | |
| | | | | |
| | | | | Mervyns Locations |
| * 1. Property Developed by the Company | | * SC — Shopping Center | | * FO — Fee Owned |
| * 2. Original IPO Property | | * MM — Mall | | * LH — Leasehold |
| | | * LC — Lifestyle Center | | * GL — Ground Lease |
| | |
| | | |
| Does Not Include Service Merchandise Interests | | Property Listing 7.1 |
| | | |
| | Run Date: 10/09/2006 |
| | Time: 5:13:20PM |
| | Page 14 of 22 |
| | Quarter: 3Q06 |
Retail Property List*
| | | | | | | | | | | | | | | | | | | | | | | | | | | | | | | | | | | | | |
| | | | | | | | | | | | | Year | | | | | | DDR | | Owned | | Owned/Unowned | | Total | | |
| | | | | Zip | | Type of | | Developed/ | | Year | | Ownership | | Gross | | Gross | | Annualized | | |
| Center/Property | | Location | | Code | | Property | | Redeveloped | | Acquired | | Interest | | Leasable Area | | Leasable Area | | Rent | | Anchor Tenants(Lease Expiration) |
| 250 ITHACA, NY (TOPS PLAZA) | | TOPS PLAZA — ITHACA
614 - 722 SOUTH MEADOW | | | 14850 | | | SC | | | 1990/1999/2003 | | | | 2004 | | | | 100.00 | % | | | 229,320 | | | | 229,320 | | | | 3,720,267 | | | OFFICE DEPOT(2014), TOPS MARKETS(2021), MICHAEL’S(2013), BARNES & NOBLE(2018) |
| | | | | | | | | | | | | | | | | | | | | | | | | | | | | | | | | | |
| | | | | | | | | | | | | | | | | | | | | | | | | | | | | | | | | | | | | |
| 251 JAMESTOWN, NY | | TOPS PLAZA — JAMESTOWN | | | 14702 | | | SC | | | 1997 | | | | 2004 | | | | 20.00 | % | | | 98,001 | | | | 98,001 | | | | 1,295,166 | | | TOPS MARKETS(2018) |
| | | 75 WASHINGTON STREET | | | | | | | | | | | | | | | | | | | | | | | | | | | | | | | | | | |
| | | | | | | | | | | | | | | | | | | | | | | | | | | | | | | | | | | | | |
| 252 JAMESTOWN, NY (SOUTHSIDE) | | SOUTHSIDE PLAZA | | | 14701 | | | SC | | | 1980/1997 | | | | 2004 | | | | 100.00 | % | | | 63,140 | | | | 63,140 | | | | 573,269 | | | QUALITY MARKET(2017) |
| | 708-744 FOOTE AVENUE | | | | | | | | | | | | | | | | | | | | | | | | | | | | | | | | | | |
| | | | | | | | | | | | | | | | | | | | | | | | | | | | | | | | | | | | | |
| 253 LANCASTER, NY (REGAL) | | REGAL CENTER | | | 14221 | | | SC | | | 1997 | | | | 2004 | | | | 14.50 | % | | | 112,949 | | | | 112,949 | | | | 927,990 | | | REGAL CINEMAS(2017) |
| | 6703-6733 TRANSIT ROAD | | | | | | | | | | | | | | | | | | | | | | | | | | | | | | | | | | |
| | | | | | | | | | | | | | | | | | | | | | | | | | | | | | | | | | | | | |
| 254 LEROY, NY | | TOPS PLAZAl — LEROY | | | 14482 | | | SC | | | 1997 | | | | 2004 | | | | 20.00 | % | | | 62,747 | | | | 62,747 | | | | 564,043 | | | TOPS MARKETS(2017) |
| | | 128 WEST MAIN STREET | | | | | | | | | | | | | | | | | | | | | | | | | | | | | | | | | | |
| | | | | | | | | | | | | | | | | | | | | | | | | | | | | | | | | | | | | |
| 255 LOCKPORT, NY | | WAL-MART/TOPS PLAZA — LOCKPORT | | | 14094 | | | SC | | | 1993 | | | | 2004 | | | | 100.00 | % | | | 296,582 | | | | 296,582 | | | | 2,694,761 | | | WAL-MART(2015), TOPS MARKETS(2021), SEARS HARDWARE(2011) |
| | | 5789 & 5839 TRANSIT RD & HAMM | | | | | | | | | | | | | | | | | | | | | | | | | | | | | | | | | | |
| | | | | | | | | | | | | | | | | | | | | | | | | | | | | | | | | | | | | |
| 256 MEDINA, NY (TOPS) | | TOPS PLAZA — MEDINA | | | 14103 | | | SC | | | 1996 | | | | 2004 | | | | 100.00 | % | | | 80,028 | | | | 80,028 | | | | 526,400 | | | TOPS MARKETS(2016) |
| | | 11200 MAPLE RIDGE ROAD | | | | | | | | | | | | | | | | | | | | | | | | | | | | | | | | | | |
| | | | | | | | | | | | | | | | | | | | | | | | | | | | | | | | | | | | | |
| 257 NEW HARTFORD, NY | | CONSUMER SQUARE
4725 - 4829 COMMERCIAL DRIVE | | | 13413 | | | SC | | | 2002 | | | | 2004 | | | | 14.50 | % | | | 514,717 | | | | 514,717 | | | | 6,115,602 | | | BARNES & NOBLE(2013), BED BATH & BEYOND(2018), BEST BUY(2013), STAPLES(2018), MICHAEL’S(2013), WAL-MART(2022), T.J. MAXX(2012) |
| | | | | | | | | | | | | | | | | | | | | | | | | | | | | | | | | | | |
| | | | | | | | | | | | | | | | | | | | | | | | | | | | | | | | | | | | | |
| 258 NEW HARTFORD, NY (TOPS) | | TOPS PLAZA — NEW HARTFORD | | | 13413 | | | SC | | | 1998 | | | | 2004 | | | | 100.00 | % | | | 127,740 | | | | 127,740 | | | | 1,260,670 | | | HANAFORD BROTHERS(2018) |
| | 40 KELLOPP ROAD | | | | | | | | | | | | | | | | | | | | | | | | | | | | | | | | | | |
| | | | | | | | | | | | | | | | | | | | | | | | | | | | | | | | | | | | | |
| 259 NIAGARA FALLS, NY (HOME DEPOT) | | HOME DEPOT PLAZA — N FALLS | | | 14304 | | | SC | | | 1994/2000 | | | | 2004 | | | | 100.00 | % | | | 154,510 | | | | 154,510 | | | | 1,461,852 | | | HOME DEPOT(2019), REGAL CINEMAS(2019) |
| | | 720 & 750 BUILDERS WAY | | | | | | | | | | | | | | | | | | | | | | | | | | | | | | | | | | |
| | | | | | | | | | | | | | | | | | | | | | | | | | | | | | | | | | | | | |
| 260 NIAGARA FALLS, NY (PINE PLAZA) | | PINE PLAZA | | | 14304 | | | SC | | | 1980/1992/1998 | | | | 2004 | | | | 100.00 | % | | | 83,273 | | | | 83,273 | | | | 704,990 | | | OFFICE MAX(2015) |
| | 8207-8351 NIAGARA FALLS BLVD | | | | | | | | | | | | | | | | | | | | | | | | | | | | | | | | | | |
| | | | | | | | | | | | | | | | | | | | | | | | | | | | | | | | | | | | | |
| 261 NIAGARA FALLS, NY (TOPS-PORTAG | | TOPS — PORTAGE | | | 14301 | | | SC | | | 1991 | | | | 2004 | | | | 100.00 | % | | | 116,903 | | | | 116,903 | | | | 1,033,327 | | | TOPS MARKETS(2013) |
| | 1000 PORTAGE ROAD | | | | | | | | | | | | | | | | | | | | | | | | | | | | | | | | | | |
| | | | | | | | | | | | | | | | | | | | | | | | | | | | | | | | | | | | | |
| 262 NIAGARA FALLS, NY (WEGMANS) | | WEGMANS PLAZA — N FALLS | | | 14304 | | | SC | | | 1998 | | | | 2004 | | | | 100.00 | % | | | 122,876 | | | | 122,876 | | | | 680,001 | | | WEGMAN’S FOOD MARKETS(2023) |
| | 1575 - 1653 MILITARY ROAD | | | | | | | | | | | | | | | | | | | | | | | | | | | | | | | | | | |
| | | | | | | | | | | | | | | | | | | | | | | | | | | | | | | | | | | | | |
| 263 NISKAYUNA, NY | | MOHAWK COMMONS
402 - 442 BALLTOWN ROAD | | | 12121 | | | SC | | | 2002 | | | | 2004 | | | | 100.00 | % | | | 399,901 | | | | 530,375 | | | | 4,560,167 | | | PRICE CHOPPER(2022), LOWE’S(2022), MARSHALLS(2012), BARNES & NOBLE(2014), BED BATH & BEYOND(2019), TARGET(NOT OWNED) |
| | | | | | | | | | | | | | | | | | | | | | | | | | | | | | | | | | | |
| | | | | | | | | | | | | | | | | | | | | | | | | | | | | | | | | | | | | |
| 264 NORTH TONAWANDA, NY (MID-CITY | | MID-CITY PLAZA | | | 14120 | | | SC | | | 1960/1976/1980/1995/ | | | | 2004 | | | | 100.00 | % | | | 215,998 | | | | 215,998 | | | | 2,285,453 | | | SEARS(2006), TOPS MARKETS(2024) |
| | 955-987 PAYNE AVENUE | | | | | | | | | | | 2004 | | | | | | | | | | | | | | | | | | | | | | | |
| | | | | | | | | | | | | | | | | | | | | | | | | | | | | | | | | | | | | |
| 265 NORWICH, NY (TOPS) | | TOPS PLAZA — NORWICH | | | 13815 | | | SC | | | 1997 | | | | 2004 | | | | 10.00 | % | | | 85,453 | | | | 85,453 | | | | 1,094,085 | | | TOPS MARKETS(2018) |
| | | 54 EAST MAIN STREET | | | | | | | | | | | | | | | | | | | | | | | | | | | | | | | | | | |
| | | | | | | | | | | | | | | | | | | | | | | | | | | | | | | | | | | | | |
| 266 OLEAN, NY (WAL-MART) | | WAL-MART PLAZA — OLEAN
3142 WEST STATE STREET | | | 14760 | | | SC | | | 1993/2004 | | | | 2004 | | | | 100.00 | % | | | 285,400 | | | | 401,406 | | | | 2,246,957 | | | WAL-MART(2014), EASTWYNN THEATRES(2014), BJ’S WHOLESALE CLUB(2014), HOME DEPOT(NOT OWNED) |
| | | | | | | | | | | | | | | | | | | | | | | | | | | | | | | | | | | |
| | | | | | | | | | | | | | | | | | | | | | | | | | | | | | | | | | | | | |
| 267 ONTARIO, NY | | TOPS PLAZA — ONTARIO BLOCKBUST | | | 14519 | | | SC | | | 1998 | | | | 2004 | | | | 20.00 | % | | | 77,040 | | | | 77,040 | | | | 787,174 | | | TOPS MARKETS(2019) |
| | | 6254-6272 FURNACE ROAD | | | | | | | | | | | | | | | | | | | | | | | | | | | | | | | | | | |
| | | | | | | | | | | | | | | | | | | | | | | | | | | | | | | | | | | | | |
| 268 ORCHARD PARK, NY | | CROSSROAD PLAZA | | | 14127 | | | SC | | | 2000 | | | | 2004 | | | | 20.00 | % | | | 167,805 | | | | 279,920 | | | | 1,944,211 | | | TOPS MARKETS(2022), STEIN MART(2012), LOWES(NOT OWNED) |
| | | 3245 SOUTHWESTERN BOULEVARD | | | | | | | | | | | | | | | | | | | | | | | | | | | | | | | | | |
| | | | | | | | | | | | | | | | | | | | | | | | | | | | | | | | | | | | | |
| 269 PLATTSBURGH, NY | | CONSUMER SQUARE
Rt. 3 - CORNELIA ROAD | | | 12901 | | | SC | | | 1993/2004 | | | | 2004 | | | | 100.00 | % | | | 491,513 | | | | 491,513 | | | | 3,452,394 | | | SAM'S CLUB(2013), WAL-MART(2020), T.J. MAXX(2013), PETSMART(2014), MICHAEL'S(2011) |
| | | | | | | | | | | | | | | | | | | | | | | | | | | | | | | | | | | |
| | | | | | | | | | | | | | | | | | | | | | | | | | | | | | | | | | | | | |
| 270 ROCHESTER, NY (HEN-JEF) | | HEN-JEF PLAZA | | | 14620 | | | SC | | | 1983/1993 | | | | 2004 | | | | 100.00 | % | | | 159,517 | | | | 159,517 | | | | 1,218,833 | | | CITY MATTRESS(2009), COMPUSA(2008), PETSMART(2008), TILE SHOP, THE(2015) |
| | 400 JEFFERSON RD @ HENRIETTA | | | | | | | | | | | | | | | | | | | | | | | | | | | | | | | | | |
| | | | | |
| | | | | Mervyns Locations |
| * 1. Property Developed by the Company | | * SC — Shopping Center | | * FO �� Fee Owned |
| * 2. Original IPO Property | | * MM — Mall | | * LH — Leasehold |
| | | * LC — Lifestyle Center | | * GL — Ground Lease |
| | |
| | | |
| Does Not Include Service Merchandise Interests | | Property Listing 7.1 |
| | | |
| | Run Date: 10/09/2006 |
| | Time: 5:13:20PM |
| | Page 15 of 22 |
| | Quarter: 3Q06 |
Retail Property List*
| | | | | | | | | | | | | | | | | | | | | | | | | | | | | | | | | | | | | |
| | | | | | | | | | | | | Year | | | | | | DDR | | Owned | | Owned/Unowned | | Total | | |
| | | | | Zip | | Type of | | Developed/ | | Year | | Ownership | | Gross | | Gross | | Annualized | | |
| Center/Property | | Location | | Code | | Property | | Redeveloped | | Acquired | | Interest | | Leasable Area | | Leasable Area | | Rent | | Anchor Tenants(Lease Expiration) |
| 271 ROCHESTER, NY (PANORAMA) | | PANORAMA PLAZA | | | 14625 | | | SC | | | 1959/1965/1972/1980/ | | | | 2004 | | | | 20.00 | % | | | 278,241 | | | | 278,241 | | | | 3,364,778 | | | LINENS ’N THINGS(2008), TOPS MARKETS(2014) |
| | 1601 PENFIELD ROAD | | | | | | | | | | | 1986/1994 | | | | | | | | | | | | | | | | | | | | | | |
| | | | | | | | | | | | | | | | | | | | | | | | | | | | | | | | | | | | | |
| 272 ROCHESTER, NY(HENRIETTA PLAZA) | | HENRIETTA PLAZA | | | 14467 | | | SC | | | 1972/1980/1988/1999 | | | | 2004 | | | | 100.00 | % | | | 245,426 | | | | 245,426 | | | | 1,823,285 | | | BIG LOTS(2010), OFFICE DEPOT(2009), TOPS MARKETS(2013) |
| | 1100 JEFFERSON ROAD | | | | | | | | | | | | | | | | | | | | | | | | | | | | | | | | | |
| | | | | | | | | | | | | | | | | | | | | | | | | | | | | | | | | | | | | |
| 273 ROME, NY (FREEDOM) | | FREEDOM PLAZA | | | 13440 | | | SC | | | 1978/2000/2001 | | | | 2004 | | | | 100.00 | % | | | 194,467 | | | | 199,867 | | | | 1,192,712 | | | STAPLES(2015), J.C. PENNEY(2008), TOPS MARKETS(2021), MARSHALLS(2016) |
| | | 205-211 ERIE BOULEVARD WEST | | | | | | | | | | | | | | | | | | | | | | | | | | | | | | | | | |
| | | | | | | | | | | | | | | | | | | | | | | | | | | | | | | | | | | | | |
| 274 SPRINGVILLE, NY | | SPRINGVILLE PLAZA | | | 14141 | | | SC | | | 1980/1999/2004 | | | | 2004 | | | | 100.00 | % | | | 105,636 | | | | 105,636 | | | | 910,679 | | | TOPS MARKETS(2023), SALVATION ARMY(2009) |
| | | 172 - 218 SOUTH CASCADE DRIVE | | | | | | | | | | | | | | | | | | | | | | | | | | | | | | | | | |
| | | | | | | | | | | | | | | | | | | | | | | | | | | | | | | | | | | | | |
| 275 TONAWANDA, NY (DEL-TON) | | DEL-TON PLAZA | | | 14150 | | | SC | | | 1985/1996 | | | | 2004 | | | | 100.00 | % | | | 55,473 | | | | 55,473 | | | | 375,366 | | | |
| | 4220 DELAWARE AVENUE | | | | | | | | | | | | | | | | | | | | | | | | | | | | | | | | | | |
| | | | | | | | | | | | | | | | | | | | | | | | | | | | | | | | | | | | | |
| 276 TONAWANDA, NY (OFFICE DEPOT) | | OFFICE DEPOT PLAZA | | | 14150 | | | SC | | | 1976/1985/1996 | | | | 2004 | | | | 100.00 | % | | | 121,846 | | | | 121,846 | | | | 1,006,746 | | | COMPUSA(2010), OFFICE DEPOT(2011) |
| | 2309 EGGERT ROAD | | | | | | | | | | | | | | | | | | | | | | | | | | | | | | | | | |
| | | | | | | | | | | | | | | | | | | | | | | | | | | | | | | | | | | | | |
| 277 TONAWANDA, NY (SHER/DELAWARE) | | SHERIDAN/DELAWARE PLAZA | | | 14223 | | | SC | | | 1950/1965/1975/1986/ | | | | 2004 | | | | 100.00 | % | | | 188,200 | | | | 188,200 | | | | 1,342,313 | | | BON TON(2010), BON TON HOME STORE(2010), TOPS MARKETS(2020) |
| | 1692-1752 SHERIDAN DRIVE | | | | | | | | | | | 2000 | | | | | | | | | | | | | | | | | | | | | | |
| | | | | | | | | | | | | | | | | | | | | | | | | | | | | | | | | | | | | |
| 278 TONAWANDA, NY (TOPS) | | TOPS PLAZA — NIAGARA STREET | | | 14150 | | | SC | | | 1997 | | | | 2004 | | | | 10.00 | % | | | 97,014 | | | | 97,014 | | | | 1,236,950 | | | TOPS MARKETS(2017) |
| | | 150 NIAGARA STREET | | | | | | | | | | | | | | | | | | | | | | | | | | | | | | | | | | |
| | | | | | | | | | | | | | | | | | | | | | | | | | | | | | | | | | | | | |
| 279 TONAWANDA, NY (TOPS/GANDER MTN | | YOUNGMAN PLAZA
750 YOUNG STREET | | | 14150 | | | SC | | | 1985/ 2003 | | | | 2004 | | | | 10.00 | % | | | 310,921 | | | | 318,166 | | | | 2,317,895 | | | BJ’S WHOLESALE CLUB(2010), BIG LOTS(2012), GANDER MOUNTAIN(2015), TOPS MARKETS(2021) |
| | | | | | | | | | | | | | | | | | | | | | | | | | | | | | | | | | |
| | | | | | | | | | | | | | | | | | | | | | | | | | | | | | | | | | | | | |
| 280 UTICA, NY (TOPS MOHAWK ST.) | | TOPS PLAZA — DOLLAR TREE | | | 13501 | | | SC | | | 1961/1972/1988/1998 | | | | 2004 | | | | 100.00 | % | | | 191,047 | | | | 191,047 | | | | 1,464,632 | | | A.J. WRIGHT(2014), HANAFORD BROTHERS(2025) |
| | | 1154 MOHAWK STREET | | | | | | | | | | | | | | | | | | | | | | | | | | | | | | | | | |
| | | | | | | | | | | | | | | | | | | | | | | | | | | | | | | | | | | | | |
| 281 VICTOR, NY | | VICTOR SQUARE | | | 14564 | | | SC | | | 2000 | | | | 2004 | | | | 100.00 | % | | | 56,134 | | | | 56,134 | | | | 898,696 | | | |
| | | 2-10 COMMERCE DRIVE | | | | | | | | | | | | | | | | | | | | | | | | | | | | | | | | | | |
| | | | | | | | | | | | | | | | | | | | | | | | | | | | | | | | | | | | | |
| 282 WARSAW, NY | | TOPS PLAZA — WARSAW | | | 14569 | | | SC | | | 1998 | | | | 2004 | | | | 20.00 | % | | | 74,105 | | | | 74,105 | | | | 715,721 | | | TOPS MARKETS(2015) |
| | | 2382 ROUTE 19 | | | | | | | | | | | | | | | | | | | | | | | | | | | | | | | | | | |
| | | | | | | | | | | | | | | | | | | | | | | | | | | | | | | | | | | | | |
| 283 WEST SENECA, NY (HOME DEPOT) | | HOME DEPOT PLAZA | | | 14224 | | | SC | | | 1975/1983/1987/1995 | | | | 2004 | | | | 100.00 | % | | | 139,453 | | | | 139,453 | | | | 1,399,505 | | | HOME DEPOT(2016) |
| | 1881 RIDGE ROAD | | | | | | | | | | | | | | | | | | | | | | | | | | | | | | | | | | |
| | | | | | | | | | | | | | | | | | | | | | | | | | | | | | | | | | | | | |
| 284 WEST SENECA, NY (SENECA RIDGE) | | SENECA — RIDGE PLAZA | | | 14224 | | | SC | | | 1980/1996/2004 | | | | 2004 | | | | 100.00 | % | | | 62,403 | | | | 62,403 | | | | 531,482 | | | SEARS(2006) |
| | 3531 SENECA STREET | | | | | | | | | | | | | | | | | | | | | | | | | | | | | | | | | |
| | | | | | | | | | | | | | | | | | | | | | | | | | | | | | | | | | | | | |
| 285 WILLIAMSVILLE, NY | | WILLIAMSVILLE PLACE | | | 14221 | | | SC | | | 1986/1995/2003 | | | | 2004 | | | | 100.00 | % | | | 92,382 | | | | 92,382 | | | | 1,028,349 | | | |
| | | 5395 SHERIDAN DRIVE | | | | | | | | | | | | | | | | | | | | | | | | | | | | | | | | | | |
| | | | | | | | | | | | | | | | | | | | | | | | | | | | | | | | | | | | | |
| 286 WILLIAMSVILLE, NY(PREMIER) | | PREMIER PLACE
7864 - 8020 TRANSIT ROAD | | | 14221 | | | SC | | | 1986/1994/1998 | | | | 2004 | | | | 14.50 | % | | | 142,536 | | | | 142,536 | | | | 1,384,891 | | | PREMIER LIQUORS(2010), STEIN MART(2008) |
| | | | | | | | | | | | | | | | | | | | | | | | | | | | | | | | | | |
| | | | | | | | | | | | | | | | | | | | | | | | | | | | | | | | | | | | | |
| North Carolina | | | | | | | | | | | | | | | | | | | | | | | | | | | | | | | | | | | | |
| | | | | | | | | | | | | | | | | | | | | | | | | | | | | | | | | | | | | |
| 287 APEX, NC | | BEAVER CREEK COMMONS
1335 W WILLIAMS STREET | | | 27502 | | | SC | | | 2005 | | | | 1 | * | | | 100.00 | % | | | 110,429 | | | | 438,711 | | | | 2,250,511 | | | LINENS 'N THINGS(2016), OFFICE MAX(2014), LOWE'S(NOT OWNED), SUPER TARGET(NOT OWNED) |
| | | | | | | | | | | | | | | | | | | | | | | | | | | | | | | | | | | |
| | | | | | | | | | | | | | | | | | | | | | | | | | | | | | | | | | | | | |
| 288 ASHEVILLE, NC | | RIVER HILLS
299 SWANNANOA RIVER ROAD | | | 28805 | | | SC | | | 1996 | | | | 2003 | | | | 14.50 | % | | | 190,970 | | | | 190,970 | | | | 1,996,049 | | | GOODY’S(2007), CARMIKE CINEMAS(2017), CIRCUIT CITY(2017), DICK’S SPORTING GOODS(2017), MICHAEL’S(2008), OFFICE MAX(2011) |
| | | | | | | | | | | | | | | | | | | | | | | | | | | | | | | | | | | |
| | | | | | | | | | | | | | | | | | | | | | | | | | | | | | | | | | | | | |
| 289 DURHAM, NC | | OXFORD COMMONS
3500 OXFORD ROAD | | | 27702 | | | SC | | | 1990/2001 | | | | 1/2 | * | | | 100.00 | % | | | 208,669 | | | | 326,935 | | | | 1,250,001 | | | FOOD LION(2010), BURLINGTON COAT FACTORY(2007), WAL-MART(NOT OWNED) |
| | | | | | | | | | | | | | | | | | | | | | | | | | | | | | | | | | | |
| | | | | | | | | | | | | | | | | | | | | | | | | | | | | | | | | | | | | |
| 290 FAYETTEVILLE, NC | | CROSS POINTE CENTRE
5075 MORGANTON ROAD | | | 28314 | | | SC | | | 1985/2003 | | | | 2003 | | | | 100.00 | % | | | 196,279 | | | | 196,279 | | | | 1,485,496 | | | DEVELOPERS REALTY CORP.(2012), T.J. MAXX(2011), BED BATH & BEYOND(2014) |
| | | | | | | | | | | | | | | | | | | | | | | | | | | | | | | | | | | |
| | | | | |
| | | | | Mervyns Locations |
| * 1. Property Developed by the Company | | * SC — Shopping Center | | * FO — Fee Owned |
| * 2. Original IPO Property | | * MM — Mall | | * LH — Leasehold |
| | | * LC — Lifestyle Center | | * GL — Ground Lease |
| | |
| | | |
| Does Not Include Service Merchandise Interests | | Property Listing 7.1 |
| | | |
| | Run Date: 10/09/2006 |
| | Time: 5:13:20PM |
| | Page 16 of 22 |
| | Quarter: 3Q06 |
Retail Property List*
| | | | | | | | | | | | | | | | | | | | | | | | | | | | | | | | | | | | | |
| | | | | | | | | | | | | Year | | | | | | DDR | | Owned | | Owned/Unowned | | Total | | |
| | | | | Zip | | Type of | | Developed/ | | Year | | Ownership | | Gross | | Gross | | Annualized | | |
| Center/Property | | Location | | Code | | Property | | Redeveloped | | Acquired | | Interest | | Leasable Area | | Leasable Area | | Rent | | Anchor Tenants(Lease Expiration) |
| 291 HENDERSONVILLE, NC | | EASTRIDGE CROSSING
200 THOMPSON STREET | | | 28792 | | | SC | | | 1995/2004 | | | | 2003 | | | | 100.00 | % | | | 124,432 | | | | 159,429 | | | | 655,227 | | | EPIC THEATRES(2018), INGLES(2009), BURKE’S OUTLET(2011), BIG LOTS(NOT OWNED) |
| | | | | | | | | | | | | | | | | | | | | | | | | | | | | | | | | | | |
| | | | | | | | | | | | | | | | | | | | | | | | | | | | | | | | | | | | | |
| 292 INDIAN TRAIL, NC | | UNION TOWN CENTER | | | 28079 | | | SC | | | 1999 | | | | 2004 | | | | 100.00 | % | | | 102,360 | | | | 102,360 | | | | 855,705 | | | FOOD LION(2020) |
| | | INDEPENDENCE & FAITH CHURCH RD | | | | | | | | | | | | | | | | | | | | | | | | | | | | | | | | | | |
| | | | | | | | | | | | | | | | | | | | | | | | | | | | | | | | | | | | | |
| 293 MOORESVILLE, NC | | MOORESVILLE CONSUMER SQUARE I | | | 28117 | | | SC | | | 1999/2006 | | | | 2004 | | | | 100.00 | % | | | 472,182 | | | | 472,182 | | | | 4,333,963 | | | WAL-MART(2019),GOODY’S(2010),GANDER MOUNTAIN(2021) |
| | | 355 WEST PLAZA DRIVE | | | | | | | | | | | | | | | | | | | | | | | | | | | | | | | | | |
| | | | | | | | | | | | | | | | | | | | | | | | | | | | | | | | | | | | | |
| 294 NEW BERN, NC | | RIVERTOWNE SQUARE | | | 28561 | | | SC | | | 1989/1999 | | | | 1/2 | * | | | 100.00 | % | | | 68,130 | | | | 200,228 | | | | 598,019 | | | GOODY’S(2012), WAL-MART(NOT OWNED) |
| | | 3003 CLAREDON BLVD | | | | | | | | | | | | | | | | | | | | | | | | | | | | | | | | | |
| | | | | | | | | | | | | | | | | | | | | | | | | | | | | | | | | | | | | |
| 295 WASHINGTON, NC | | PAMLICO PLAZA | | | 27889 | | | SC | | | 1990/1999 | | | | 1/2 | * | | | 100.00 | % | | | 80,269 | | | | 265,053 | | | | 484,956 | | | GOODY’S(2009), OFFICE DEPOT(2009), WAL-MART(NOT OWNED) |
| | 536 PAMLICO PLAZA | | | | | | | | | | | | | | | | | | | | | | | | | | | | | | | | | |
| | | | | | | | | | | | | | | | | | | | | | | | | | | | | | | | | | | | | |
| 296 WAYNESVILLE, NC | | LAKESIDE PLAZA | | | 28721 | | | SC | | | 1990 | | | | 1993 | | | | 100.00 | % | | | 181,894 | | | | 181,894 | | | | 1,109,626 | | | WAL-MART(2011), FOOD LION(2011) |
| | | 201 PARAGON PARKWAY | | | | | | | | | | | | | | | | | | | | | | | | | | | | | | | | | | |
| | | | | | | | | | | | | | | | | | | | | | | | | | | | | | | | | | | | | |
| 297 WILMINGTON, NC | | UNIVERSITY CENTRE
S. COLLEGE RD & NEW CENTRE DR. | | | 28403 | | | SC | | | 1989/2001 | | | | 1/2 | * | | | 100.00 | % | | | 411,887 | | | | 518,735 | | | | 3,536,859 | | | LOWE’S(2014), OLD NAVY(2011), BED BATH & BEYOND(2012), ROSS DRESS FOR LESS(2012), STEVE & BARRY’S(2014), BADCOCK FURNITURE(2014), SAM’S(NOT OWNED) |
| | | | | | | | | | | | | | | | | | | | | | | | | | | | | | | | | | | |
| | | | | | | | | | | | | | | | | | | | | | | | | | | | | | | | | | | | | |
| North Dakota | | | | | | | | | | | | | | | | | | | | | | | | | | | | | | | | | | | | |
| | | | | | | | | | | | | | | | | | | | | | | | | | | | | | | | | | | | | |
| 298 DICKINSON, ND | | PRAIRIE HILLS MALL | | | 58601 | | | MM | | | 1978 | | | | 1/2 | * | | | 100.00 | % | | | 266,502 | | | | 266,502 | | | | 1,117,914 | | | K MART(2008), HERBERGER’S(2010), J.C. PENNEY(2008) |
| | | 1681 THIRD AVENUE | | | | | | | | | | | | | | | | | | | | | | | | | | | | | | | | | |
| | | | | | | | | | | | | | | | | | | | | | | | | | | | | | | | | | | | | |
| Ohio | | | | | | | | | | | | | | | | | | | | | | | | | | | | | | | | | | | | |
| | | | | | | | | | | | | | | | | | | | | | | | | | | | | | | | | | | | | |
| 299 ASHTABULA, OH (TOPS) | | TOPS PLAZA — ASHTABULA | | | 44004 | | | SC | | | 2000 | | | | 2004 | | | | 100.00 | % | | | 57,874 | | | | 57,874 | | | | 904,720 | | | TOPS MARKETS(2021) |
| | | 1144 WEST PROSPECT ROAD | | | | | | | | | | | | | | | | | | | | | | | | | | | | | | | | | | |
| | | | | | | | | | | | | | | | | | | | | | | | | | | | | | | | | | | | | |
| 300 AURORA, OH | | BARRINGTON TOWN SQUARE | | | 44202 | | | SC | | | 1996/2004 | | | | 1 | * | | | 100.00 | % | | | 102,683 | | | | 159,982 | | | | 1,036,287 | | | CINEMARK(2011), HEINEN’S(NOT OWNED) |
| | | 70-130 BARRINGTON TOWN SQUARE | | | | | | | | | | | | | | | | | | | | | | | | | | | | | | | | | |
| | | | | | | | | | | | | | | | | | | | | | | | | | | | | | | | | | | | | |
| 301 BELLEFONTAINE, OH | | SOUTH MAIN STREET PLAZA | | | 43311 | | | SC | | | 1995 | | | | 1998 | | | | 100.00 | % | | | 52,399 | | | | 52,399 | | | | 445,579 | | | GOODY’S(2010), STAPLES(2010) |
| | | 2250 SOUTH MAIN STREET | | | | | | | | | | | | | | | | | | | | | | | | | | | | | | | | | | |
| | | | | | | | | | | | | | | | | | | | | | | | | | | | | | | | | | | | | |
| 302 BOARDMAN, OH | | SOUTHLAND CROSSING
I-680 & US ROUTE 224 | | | 44514 | | | SC | | | 1997 | | | | 1 | * | | | 100.00 | % | | | 506,254 | | | | 511,654 | | | | 4,185,017 | | | LOWE’S(2016), BABIES R US(2009), STAPLES(2012), DICK’S SPORTING GOODS(2012), WAL-MART(2017), PETSMART(2013), GIANT EAGLE(2018) |
| | | | | | | | | | | | | | | | | | | | | | | | | | | | | | | | | | | |
| | | | | | | | | | | | | | | | | | | | | | | | | | | | | | | | | | | | | |
| 303 CANTON, OH (PHASE I & II) | | BELDEN PARK CROSSINGS
5496 DRESSLER ROAD | | | 44720 | | | SC | | | 1995/2001/2003 | | | | 1 | * | | | 14.50 | % | | | 478,106 | | | | 593,610 | | | | 5,025,632 | | | VALUE CITY FURNITURE(2011), H.H. GREGG APPLIANCES(2011), JO-ANN STORES(2008), PETSMART(2013), DICK’S SPORTING GOODS(2010), DSW SHOE WAREHOUSE(2012), KOHL’S(2016), TARGET(NOT OWNED) |
| | | | | | | | | | | | | | | | | | | | | | | | | | | | | | | | | | | |
| | | | | | | | | | | | | | | | | | | | | | | | | | | | | | | | | | | | |
| | | | | | | | | | | | | | | | | | | | | | | | | | | | | | | | | | | | | |
| 304 CHILLICOTHE, OH | | CHILLICOTHE PLACE | | | 45601 | | | SC | | | 1974/1998 | | | | 1/2 | * | | | 20.00 | % | | | 106,262 | | | | 106,262 | | | | 1,019,135 | | | KROGER(2041), OFFICE MAX(2013) |
| | | 867 N BRIDGE STREET | | | | | | | | | | | | | | | | | | | | | | | | | | | | | | | | | | |
| | | | | | | | | | | | | | | | | | | | | | | | | | | | | | | | | | | | | |
| 305 CHILLICOTHE, OH(LOWES) | | CHILLICOTHE PLACE (LOWES) | | | 45601 | | | SC | | | 1998 | | | | 1 | * | | | 100.00 | % | | | 130,497 | | | | 130,497 | | | | 822,132 | | | LOWE’S(2015) |
| | | 867 N BRIDGE STREET | | | | | | | | | | | | | | | | | | | | | | | | | | | | | | | | | | |
| | | | | | | | | | | | | | | | | | | | | | | | | | | | | | | | | | | | | |
| 306 CINCINNATI, OH | | GLENWAY CROSSING | | | 45238 | | | SC | | | 1990 | | | | 2 | * | | | 100.00 | % | | | 235,433 | | | | 235,433 | | | | 1,892,660 | | | STEVE & BARRY'S(2014), MICHAEL'S(2011) |
| | | 5100 GLENCROSSING WAY | | | | | | | | | | | | | | | | | | | | | | | | | | | | | | | | | |
| | | | | | | | | | | | | | | | | | | | | | | | | | | | | | | | | | | | | |
| 307 CINCINNATI, OH(TRI COUNTY) | | TRI COUNTY MALL | | | 45246 | | | SC | | | | | | | 2005 | | | | 18.00 | % | | | 667,659 | | | | 1,180,139 | | | | 10,549,564 | | | DILLARD'S(2018), MACY'S(NOT OWNED), SEAR(NOT OWNED) |
| | 117000 PRINCETON PK | | | | | | | | | | | | | | | | | | | | | | | | | | | | | | | | | |
| | | | | | | | | | | | | | | | | | | | | | | | | | | | | | | | | | | | | |
| 308 COLUMBUS, OH (CONSUMER SQUARE) | | CONSUMER SQUARE
WEST COLUMBUS | | | 43228 | | | SC | | | 1989/2003 | | | | 2004 | | | | 100.00 | % | | | 356,515 | | | | 356,515 | | | | 2,489,066 | | | OFFICE MAX(2010), KROGER(2014), TARGET(2011) |
| | | 3630 SOLDANO BLVD | | | | | | | | | | | | | | | | | | | | | | | | | | | | | | | | | | |
| | | | | | | | | | | | | | | | | | | | | | | | | | | | | | | | | | | | | |
| 309 COLUMBUS, OH (DUBLIN VILLAGE) | | DUBLIN VILLAGE CENTER | | | 43017 | | | SC | | | 1987 | | | | 1998 | | | | 100.00 | % | | | 219,983 | | | | 329,064 | | | | 1,576,300 | | | AMC THEATRE(2007), MAX SPORTS CENTER(2007), B.J.’S WHOLESALE CLUB(NOT OWNED) |
| | 6561-6815 DUBLIN CENTER DRIVE | | | | | | | | | | | | | | | | | | | | | | | | | | | | | | | | | |
| | | | | |
| | | | | Mervyns Locations |
| * 1. Property Developed by the Company | | * SC — Shopping Center | | * FO — Fee Owned |
| * 2. Original IPO Property | | * MM — Mall | | * LH — Leasehold |
| | | * LC — Lifestyle Center | | * GL — Ground Lease |
| | |
| | | |
| Does Not Include Service Merchandise Interests | | Property Listing 7.1 |
| | | |
| | Run Date: 10/09/2006 |
| | Time: 5:13:20PM |
| | Page 17 of 22 |
| | Quarter: 3Q06 |
Retail Property List*
| | | | | | | | | | | | | | | | | | | | | | | | | | | | | | | | | | | | | |
| | | | | | | | | | | | | Year | | | | | | DDR | | Owned | | Owned/Unowned | | Total | | |
| | | | | Zip | | Type of | | Developed/ | | Year | | Ownership | | Gross | | Gross | | Annualized | | |
| Center/Property | | Location | | Code | | Property | | Redeveloped | | Acquired | | Interest | | Leasable Area | | Leasable Area | | Rent | | Anchor Tenants(Lease Expiration) |
| 310 COLUMBUS, OH (EASTON MARKET) | | EASTON MARKET
3740 EASTON MARKET | | | 43230 | | | SC | | | 1998 | | | | 1998 | | | | 100.00 | % | | | 509,611 | | | | 509,611 | | | | 6,010,166 | | | COMPUSA(2013), STAPLES(2013), PETSMART(2014), GOLFSMITH GOLF CENTER(2013), MICHAEL’S(2008), DICK’S SPORTING GOODS(2013), DSW SHOE WAREHOUSE(2012), KITTLE’S HOME FURNISHINGS(2012), BED BATH & BEYOND(2014), T.J. MAXX(2008) |
| | | | | | | | | | | | | | | | | | | | | | | | | | | | | | | | | | | |
| | | | | | | | | | | | | | | | | | | | | | | | | | | | | | | | | | | | |
| | | | | | | | | | | | | | | | | | | | | | | | | | | | | | | | | | | | | |
| 311 COLUMBUS, OH (LENNOX TOWN) | | LENNOX TOWN CENTER
1647 OLENTANGY RIVER ROAD | | | 43212 | | | SC | | | 1997 | | | | 1998 | | | | 50.00 | % | | | 352,913 | | | | 352,913 | | | | 3,391,741 | | | TARGET(2016), BARNES & NOBLE(2007), STAPLES(2011), AMC THEATRE(2021) |
| | | | | | | | | | | | | | | | | | | | | | | | | | | | | | | | | | |
| | | | | | | | | | | | | | | | | | | | | | | | | | | | | | | | | | | | | |
| 312 COLUMBUS, OH (SUN CENTER) | | SUN CENTER
3622-3860 DUBLIN GRANVILLE RD | | | 43017 | | | SC | | | 1995 | | | | 1998 | | | | 79.45 | % | | | 305,428 | | | | 305,428 | | | | 3,649,108 | | | BABIES R US(2011), MICHAEL’S(2013), ASHLEY FURNITURE HOMESTORE(2012), STEIN MART(2007), WHOLE FOOD MARKETS(2016), STAPLES(2010) |
| | | | | | | | | | | | | | | | | | | | | | | | | | | | | | | | | | | |
| | | | | | | | | | | | | | | | | | | | | | | | | | | | | | | | | | | | | |
| 313 DUBLIN, OH (PERIMETER CENTER) | | PERIMETER CENTER | | | 43017 | | | SC | | | 1996 | | | | 1998 | | | | 100.00 | % | | | 137,556 | | | | 137,556 | | | | 1,511,205 | | | GIANT EAGLE(2014) |
| | 6644-6804 PERIMETER LOOP ROAD | | | | | | | | | | | | | | | | | | | | | | | | | | | | | | | | | | |
| | | | | | | | | | | | | | | | | | | | | | | | | | | | | | | | | | | | | |
| 314 ELYRIA, OH | | ELYRIA SHOPPING CENTER | | | 44035 | | | SC | | | 1977 | | | | 2 | * | | | 100.00 | % | | | 92,125 | | | | 92,125 | | | | 704,695 | | | TOPS MARKETS(2010) |
| | | 841 CLEVELAND ST | | | | | | | | | | | | | | | | | | | | | | | | | | | | | | | | | | |
| | | | | | | | | | | | | | | | | | | | | | | | | | | | | | | | | | | | | |
| 315 GALLIPOLIS, OH | | GALLIPOLIS MARKETPLACE | | | 45631 | | | SC | | | 1998 | | | | 2003 | | | | 100.00 | % | | | 25,950 | | | | 205,908 | | | | 335,154 | | | WAL MART(NOT OWNED) |
| | | 2145 EASTERN AVENUE | | | | | | | | | | | | | | | | | | | | | | | | | | | | | | | | | | |
| | | | | | | | | | | | | | | | | | | | | | | | | | | | | | | | | | | | | |
| 316 GROVE CITY, OH (DERBY SQUARE) | | DERBY SQUARE SHOPPING CENTER | | | 43123 | | | SC | | | 1992 | | | | 1998 | | | | 20.00 | % | | | 128,210 | | | | 128,210 | | | | 1,168,935 | | | GIANT EAGLE(2016) |
| | 2161-2263 STRINGTOWN ROAD | | | | | | | | | | | | | | | | | | | | | | | | | | | | | | | | | | |
| | | | | | | | | | | | | | | | | | | | | | | | | | | | | | | | | | | | | |
| 317 HUBER HTS., OH | | NORTH HEIGHTS PLAZA | | | 45424 | | | SC | | | 1990 | | | | 1993 | | | | 100.00 | % | | | 163,819 | | | | 278,376 | | | | 1,343,849 | | | CUB FOODS(2011), WAL-MART(NOT OWNED) |
| | | 8280 OLD TROY PIKE | | | | | | | | | | | | | | | | | | | | | | | | | | | | | | | | | |
| | | | | | | | | | | | | | | | | | | | | | | | | | | | | | | | | | | | | |
| 318 LEBANON, OH | | COUNTRYSIDE PLACE | | | 45036 | | | SC | | | 1990/2002 | | | | 1993 | | | | 100.00 | % | | | 17,000 | | | | 110,480 | | | | 79,374 | | | WALMART #1407(NOT OWNED), ERB LUMBER(NOT OWNED) |
| | 1879 DEERFIELD ROAD | | | | | | | | | | | | | | | | | | | | | | | | | | | | | | | | | |
| | | | | | | | | | | | | | | | | | | | | | | | | | | | | | | | | | | | | |
| 319 MACEDONIA, OH | | MACEDONIA COMMONS | | | 44056 | | | SC | | | 1994 | | | | 1994 | | | | 50.00 | % | | | 233,619 | | | | 372,786 | | | | 3,054,969 | | | TOPS MARKETS(2019), KOHL’S(2016), WAL-MART(NOT OWNED) |
| | | MACEDONIA COMMONS BLVD. | | | | | | | | | | | | | | | | | | | | | | | | | | | | | | | | | |
| | | | | | | | | | | | | | | | | | | | | | | | | | | | | | | | | | | | | |
| 320 MACEDONIA, OH (PHASE II) | | MACEDONIA COMMONS (PHASE II) | | | 44056 | | | SC | | | 1999 | | | | 1 | * | | | 100.00 | % | | | 169,481 | | | | 169,481 | | | | 1,601,734 | | | CINEMARK(2019), HOME DEPOT(2020) |
| | | 8210 MACEDONIA COMMONS | | | | | | | | | | | | | | | | | | | | | | | | | | | | | | | | | |
| | | | | | | | | | | | | | | | | | | | | | | | | | | | | | | | | | | | | |
| 321 NORTH OLMSTED, OH | | GREAT NORTHERN PLAZA NORTH
25859-26437 GREAT NORTHERN | | | 44070 | | | SC | | | 1958/1998/2003 | | | | 1997 | | | | 14.50 | % | | | 624,587 | | | | 665,487 | | | | 7,764,251 | | | BEST BUY(2010), DSW SHOE WAREHOUSE(2015), BED BATH & BEYOND(2012), MARSHALLS(2008), PETSMART(2008), HOME DEPOT(2019), K & G MENSWEAR(2008), JO-ANN STORES(2009), MARC’S(2012), COMPUSA(2008), REMINGTON COLLEGE(NOT OWNED) |
| | | | | | | | | | | | | | | | | | | | | | | | | | | | | | | | | | | |
| | | | | | | | | | | | | | | | | | | | | | | | | | | | | | | | | | | | |
| | | | | | | | | | | | | | | | | | | | | | | | | | | | | | | | | | | | | |
| 322 PATASKALA, OH | | VILLAGE MARKET/RITE AID CENTER | | | 43062 | | | SC | | | 1980 | | | | 1998 | | | | 100.00 | % | | | 33,270 | | | | 33,270 | | | | 201,200 | | | CARDINAL FOODS(2007) |
| | | 78-80 OAK MEADOW DRIVE | | | | | | | | | | | | | | | | | | | | | | | | | | | | | | | | | | |
| | | | | | | | | | | | | | | | | | | | | | | | | | | | | | | | | | | | | |
| 323 PICKERINGTON, OH | | SHOPPES AT TURNBERRY | | | 43147 | | | SC | | | 1990 | | | | 1998 | | | | 100.00 | % | | | 59,495 | | | | 61,872 | | | | 628,011 | | | |
| | | 1701-1797 HILL ROAD NORTH | | | | | | | | | | | | | | | | | | | | | | | | | | | | | | | | | | |
| | | | | | | | | | | | | | | | | | | | | | | | | | | | | | | | | | | | | |
| 324 SOLON, OH | | UPTOWN SOLON
KRUSE DRIVE | | | 44139 | | | SC | | | 1998 | | | | 1 | * | | | 100.00 | % | | | 183,255 | | | | 183,255 | | | | 2,790,384 | | | MUSTARD SEED MARKET & CAFE(2019), BED BATH & BEYOND(2009), BORDERS(2018) |
| | | | | | | | | | | | | | | | | | | | | | | | | | | | | | | | | | | | |
| | | | | | | | | | | | | | | | | | | | | | | | | | | | | | | | | | | | | |
| 325 STOW, OH | | STOW COMMUNITY SHOPPING CENTER
KENT ROAD | | | 44224 | | | SC | | | 1997/2000 | | | | 1 | * | | | 100.00 | % | | | 404,480 | | | | 506,563 | | | | 2,856,535 | | | K MART(2006), BED BATH & BEYOND(2011), GIANT EAGLE(2017), KOHL’S(2019), OFFICE MAX(2011), TARGET(NOT OWNED) |
| | | | | | | | | | | | | | | | | | | | | | | | | | | | | | | | | | | |
| | | | | | | | | | | | | | | | | | | | | | | | | | | | | | | | | | | | | |
| 326 TIFFIN, OH | | TIFFIN MALL | | | 44883 | | | MM | | | 1980/2004 | | | | 1/2 | * | | | 100.00 | % | | | 170,868 | | | | 170,868 | | | | 731,821 | | | CINEMARK(2011), J.C. PENNEY(2010) |
| | | 870 WEST MARKET STREET | | | | | | | | | | | | | | | | | | | | | | | | | | | | | | | | | | |
| | | | | | | | | | | | | | | | | | | | | | | | | | | | | | | | | | | | | |
| 327 TOLEDO, OH | | SPRINGFIELD COMMONS SHOPPING | | | 43528 | | | SC | | | 1999 | | | | 1 | * | | | 20.00 | % | | | 241,129 | | | | 271,729 | | | | 2,816,908 | | | KOHL’S(2019), GANDER MOUNTAIN(2014), BED BATH & BEYOND(2010), OLD NAVY(2010) |
| | | S. HOLLAND-SYLVANIA ROAD | | | | | | | | | | | | | | | | | | | | | | | | | | | | | | | | | |
| | | | | | | | | | | | | | | | | | | | | | | | | | | | | | | | | | | | | |
| 328 TOLEDO, OH (DICKS) | | DICKS — TOLEDO | | | 43612 | | | SC | | | 1995 | | | | 2004 | | | | 100.00 | % | | | 80,160 | | | | 80,160 | | | | 501,000 | | | DICK’S SPORTING GOODS(2016) |
| | | 851 WEST ALEXIS ROAD | | | | | | | | | | | | | | | | | | | | | | | | | | | | | | | | | | |
| | | | | | | | | | | | | | | | | | | | | | | | | | | | | | | | | | | | | |
| 329 WESTLAKE, OH | | WEST BAY PLAZA | | | 44145 | | | SC | | | 1974/1997/2000 | | | | 1/2 | * | | | 100.00 | % | | | 162,330 | | | | 162,330 | | | | 1,370,403 | | | MARC’S(2009), K MART(2009) |
| | | 30100 DETROIT ROAD | | | | | | | | | | | | | | | | | | | | | | | | | | | | | | | | | | |
| | | | | | | | | | | | | | | | | | | | | | | | | | | | | | | | | | | | | |
| | | | | |
| | | | | Mervyns Locations |
| * 1. Property Developed by the Company | | * SC — Shopping Center | | * FO — Fee Owned |
| 2. Original IPO Property | | * MM — Mall | | * LH — Leasehold |
| | | * LC — Lifestyle Center | | * GL — Ground Lease |
| | |
| | | |
| Does Not Include Service Merchandise Interests | | Property Listing 7.1 |
| | | |
| | Run Date: 10/09/2006 |
| | Time: 5:13:20PM |
| | Page 18 of 22 |
| | Quarter: 3Q06 |
Retail Property List*
| | | | | | | | | | | | | | | | | | | | | | | | | | | | | | | | | | | | | |
| | | | | | | | | | | | | Year | | | | | | DDR | | Owned | | Owned/Unowned | | Total | | |
| | | | | Zip | | Type of | | Developed/ | | Year | | Ownership | | Gross | | Gross | | Annualized | | |
| Center/Property | | Location | | Code | | Property | | Redeveloped | | Acquired | | Interest | | Leasable Area | | Leasable Area | | Rent | | Anchor Tenants(Lease Expiration) |
| 330 XENIA, OH | | WEST PARK SQUARE | | | 45385 | | | SC | | | 1994/1997/2001 | | | | 1 | * | | | 100.00 | % | | | 104,873 | | | | 203,282 | | | | 746,182 | | | KROGER(2019), WAL-MART(NOT OWNED) |
| | | 1700 WEST PARK SQUARE | | | | | | | | | | | | | | | | | | | | | | | | | | | | | | | | | |
| | | | | | | | | | | | | | | | | | | | | | | | | | | | | | | | | | | | | |
| Oregon | | | | | | | | | | | | | | | | | | | | | | | | | | | | | | | | | | | | |
| | | | | | | | | | | | | | | | | | | | | | | | | | | | | | | | | | | | | |
| 331 PORTLAND, OR | | TANASBOURNE TOWN CENTER
NW EVERGREEN PKWY & NW RING RD | | | 97006 | | | SC | | | 1995/2001 | | | | 1996 | | | | 50.00 | % | | | 309,617 | | | | 566,457 | | | | 5,526,180 | | | LINENS ’N THINGS(2012), ROSS DRESS FOR LESS(2008), BARNES & NOBLE(2011), MICHAEL’S(2009), OFFICE DEPOT(2010), HAGGAN’S(2021), NORDSTROM(NOT OWNED), TARGET(NOT OWNED), MERVYN’S(NOT OWNED) |
| | | | | | | | | | | | | | | | | | | | | | | | | | | | | | | | | | | |
| | | | | | | | | | | | | | | | | | | | | | | | | | | | | | | | | | | | |
| | | | | | | | | | | | | | | | | | | | | | | | | | | | | | | | | | | | | |
| Pennsylvania | | | | | | | | | | | | | | | | | | | | | | | | | | | | | | | | | | | | |
| | | | | | | | | | | | | | | | | | | | | | | | | | | | | | | | | | | | | |
| 332 ALLENTOWN, PA (WEST) | | WEST VALLEY MARKETPLACE | | | 18106 | | | SC | | | 2001/2004 | | | | 2003 | | | | 100.00 | % | | | 259,239 | | | | 259,239 | | | | 2,688,189 | | | WAL-MART(2021) |
| | | 1091 MILL CREEK ROAD | | | | | | | | | | | | | | | | | | | | | | | | | | | | | | | | | | |
| | | | | | | | | | | | | | | | | | | | | | | | | | | | | | | | | | | | | |
| 333 E. NORRITON, PA | | KMART PLAZA | | | 19401 | | | SC | | | 1975/1997 | | | | 1/2 | * | | | 100.00 | % | | | 173,876 | | | | 179,376 | | | | 1,326,409 | | | K MART(2010), BIG LOTS(2010) |
| | | 2692 DEKALB PIKE | | | | | | | | | | | | | | | | | | | | | | | | | | | | | | | | | | |
| | | | | | | | | | | | | | | | | | | | | | | | | | | | | | | | | | | | | |
| 334 ERIE (PEACHSTREET), PA | | PEACH STREET SQUARE
1902 KEYSTONE DRIVE | | | 16509 | | | SC | | | 1995/1998/2003 | | | | 1 | * | | | 100.00 | % | | | 557,769 | | | | 679,074 | | | | 4,779,195 | | | LOWE’S(2015), PETSMART(2015), CIRCUIT CITY(2020), KOHL’S(2016), WAL-MART(2015), CINEMARK(2011), HOME DEPOT(NOT OWNED) |
| | | | | | | | | | | | | | | | | | | | | | | | | | | | | | | | | | | |
| | | | | | | | | | | | | | | | | | | | | | | | | | | | | | | | | | | | | |
| 335 ERIE, PA (MARKET) | | ERIE MARKETPLACE
6660-6750 PEACH STREET | | | 16509 | | | SC | | | 2003 | | | | 2003 | | | | 14.50 | % | | | 107,537 | | | | 238,387 | | | | 1,063,113 | | | MARSHALLS(2013), BED BATH & BEYOND(2013), BABIES R US(2015), TARGET(NOT OWNED) |
| | | | | | | | | | | | | | | | | | | | | | | | | | | | | | | | | | | |
| | | | | | | | | | | | | | | | | | | | | | | | | | | | | | | | | | | | | |
| 336 ERIE, PA (TOPS-ERIE) | | TOPS PLAZA — ERIE | | | 16505 | | | SC | | | 1995 | | | | 2004 | | | | 100.00 | % | | | 103,691 | | | | 103,691 | | | | 1,305,224 | | | TOPS MARKETS(2016) |
| | | 1520 WEST 25TH STREET | | | | | | | | | | | | | | | | | | | | | | | | | | | | | | | | | | |
| | | | | | | | | | | | | | | | | | | | | | | | | | | | | | | | | | | | | |
| 337 HANOVER, PA (BJS) | | BJS — HANOVER | | | 18109 | | | SC | | | 1991 | | | | 2004 | | | | 100.00 | % | | | 112,230 | | | | 112,230 | | | | 785,881 | | | BJ’S WHOLESALE CLUB(2011) |
| | | 1785 AIRPORT ROAD SOUTH | | | | | | | | | | | | | | | | | | | | | | | | | | | | | | | | | | |
| | | | | | | | | | | | | | | | | | | | | | | | | | | | | | | | | | | | | |
| 338 MONACA, PA | | TOWNSHIP MARKETPLACE
115 WAGNER ROAD | | | 15061 | | | SC | | | 1999/2004 | | | | 2003 | | | | 14.50 | % | | | 298,589 | | | | 298,589 | | | | 2,681,967 | | | CINEMARK(2019), LOWE’S(2016), SHOP ’N SAVE(2019) |
| | | | | | | | | | | | | | | | | | | | | | | | | | | | | | | | | | | | |
| | | | | | | | | | | | | | | | | | | | | | | | | | | | | | | | | | | | | |
| 339 MT. NEBO, PA | | MT NEBO POINT | | | 15237 | | | SC | | | 2005 | | | | 1 | * | | | 100.00 | % | | | 72,882 | | | | 336,267 | | | | 1,124,207 | | | SPORTSMAN’S WAREHOUSE(2020), SAM’S CLUB(NOT OWNED), TARGET(NOT OWNED) |
| | MT. NEBO RD & LOWRIES RUN RD | | | | | | | | | | | | | | | | | | | | | | | | | | | | | | | | | |
| | | | | | | | | | | | | | | | | | | | | | | | | | | | | | | | | | | | | |
| Puerto Rico | | | | | | | | | | | | | | | | | | | | | | | | | | | | | | | | | | | | |
| | | | | | | | | | | | | | | | | | | | | | | | | | | | | | | | | | | | | |
| 340 ARECIBO, PR (ATLANTICO) | | PLAZA DEL ATLANTICO | | | 00612 | | | MM | | | 1980/1993 | | | | 2005 | | | | 100.00 | % | | | 215,451 | | | | 224,950 | | | | 3,291,584 | | | K MART(2013), CAPRI DEL ATLANTICO(2013) |
| | PR #KM 80.3 | | | | | | | | | | | | | | | | | | | | | | | | | | | | | | | | | |
| | | | | | | | | | | | | | | | | | | | | | | | | | | | | | | | | | | | | |
| 341 BAYAMON, PR (PLAZA DEL SOL) | | PLAZA DEL SOL
RD PR#29 & PR#167, HATO TEJAS | | | 00961 | | | MM | | | 1998/2003/2004 | | | | 2005 | | | | 100.00 | % | | | 526,373 | | | | 675,594 | | | | 16,130,819 | | | WAL-MART(2022), OLD NAVY(2011), SCIENCE PARK CINEMA(2019), BED BATH & BEYOND(2017), HOME DEPOT(NOT OWNED) |
| | | | | | | | | | | | | | | | | | | | | | | | | | | | | | | | | | | | |
| | | | | | | | | | | | | | | | | | | | | | | | | | | | | | | | | | | | | |
| 342 BAYAMON, PR (REXVILLE PLAZA) | | REXVILLE PLAZA | | | 00961 | | | SC | | | 1980/2002 | | | | 2005 | | | | 100.00 | % | | | 126,023 | | | | 132,309 | | | | 1,546,898 | | | PUEBLO XTRA(2009), TIENDAS CAPRI(2013) |
| | PR #167, KM 18.8 | | | | | | | | | | | | | | | | | | | | | | | | | | | | | | | | | |
| | | | | | | | | | | | | | | | | | | | | | | | | | | | | | | | | | | | | |
| 343 BAYAMON, PR (RIO HONDO) | | RIO HONDO
PR #22, PR #167 | | | 00961 | | | MM | | | 1982/2001 | | | | 2005 | | | | 100.00 | % | | | 459,847 | | | | 525,149 | | | | 11,116,917 | | | TIENDAS CAPRI(2009), COMPUSA(2021), K MART(2011), PUEBLO XTRA(2012), MARSHALLS(2015), RIO HONDO CINEMA(NOT OWNED) |
| | | | | | | | | | | | | | | | | | | | | | | | | | | | | | | | | | | | |
| | | | | | | | | | | | | | | | | | | | | | | | | | | | | | | | | | | | | |
| 344 CAROLINA, PR (PLAZA ESCORIAL) | | PLAZA ESCORIAL
CARRETERA #3, KM 6.1 | | | 00987 | | | SC | | | 1997 | | | | 2005 | | | | 100.00 | % | | | 385,665 | | | | 601,535 | | | | 7,534,321 | | | OFFICE MAX(2015), WAL-MART(2024), BORDERS(2017), OLD NAVY(2009), SAM’S CLUB(2024), HOME DEPOT(NOT OWNED), CARIBBEAN CINEMAS(NOT OWNED) |
| | | | | | | | | | | | | | | | | | | | | | | | | | | | | | | | | | | |
| | | | | | | | | | | | | | | | | | | | | | | | | | | | | | | | | | | | | |
| 345 CAYEY, PR (PLAZA CAYEY) | | PLAZA CAYEY | | | 00736 | | | SC | | | 1999/2004 | | | | 2005 | | | | 100.00 | % | | | 261,126 | | | | 339,840 | | | | 2,968,964 | | | WAL-MART(2021), CAYEY CINEMA CORP.(NOT OWNED) |
| | STATE RD #1 & PR #735 | | | | | | | | | | | | | | | | | | | | | | | | | | | | | | | | | |
| | | | | | | | | | | | | | | | | | | | | | | | | | | | | | | | | | | | | |
| 346 FAJARDO, PR (PLAZA FAJARDO) | | PLAZA FAJARDO | | | 00738 | | | SC | | | 1992 | | | | 2005 | | | | 100.00 | % | | | 245,319 | | | | 251,319 | | | | 3,823,351 | | | WAL-MART(2012), PUEBLO XTRA(2012) |
| | ROAD PR #3 INT PR #940 | | | | | | | | | | | | | | | | | | | | | | | | | | | | | | | | | |
| | | | | | | | | | | | | | | | | | | | | | | | | | | | | | | | | | | | | |
| 347 GUAYAMA, PR (PLAZA WAL-MART) | | PLAZA WAL-MART | | | 00784 | | | SC | | | 1994 | | | | 2005 | | | | 100.00 | % | | | 163,598 | | | | 163,598 | | | | 1,676,518 | | | WAL-MART(2018) |
| | ROAD PR #3 KM 135.0 | | | | | | | | | | | | | | | | | | | | | | | | | | | | | | | | | | |
| | | | | | | | | | | | | | | | | | | | | | | | | | | | | | | | | | | | | |
| 348 HATILLO, PR (PLAZA DEL NORTE) | | PLAZA DEL NORTE
ROAD #2,KM 81.9 | | | 00659 | | | MM | | | 1992 | | | | 2005 | | | | 100.00 | % | | | 505,849 | | | | 671,278 | | | | 10,816,845 | | | J.C. PENNEY(2012), PUEBLO XTRA(2012), WAL-MART(2012), TOYS R’ US/KID’SRUS(NOT OWNED) |
| | | | | | | | | | | | | | | | | | | | | | | | | | | | | | | | | | |
| | | | | | | | | | | | | | | | | | | | | | | | | | | | | | | | | | | | | |
| | | | | |
| | | | | Mervyns Locations |
| * 1. Property Developed by the Company | | * SC — Shopping Center | | * FO — Fee Owned |
| * 2. Original IPO Property | | * MM — Mall | | * LH — Leasehold |
| | | * LC — Lifestyle Center | | * GL — Ground Lease |
| | |
| | | |
| Does Not Include Service Merchandise Interests | | Property Listing 7.1 |
| | | |
| | Run Date: 10/09/2006 |
| | Time: 5:13:20PM |
| | Page 19 of 22 |
| | Quarter: 3Q06 |
Retail Property List*
| | | | | | | | | | | | | | | | | | | | | | | | | | | | | | | | | | | | | |
| | | | | | | | | | | | | Year | | | | | | DDR | | Owned | | Owned/Unowned | | Total | | |
| | | | | Zip | | Type of | | Developed/ | | Year | | Ownership | | Gross | | Gross | | Annualized | | |
| Center/Property | | Location | | Code | | Property | | Redeveloped | | Acquired | | Interest | | Leasable Area | | Leasable Area | | Rent | | Anchor Tenants(Lease Expiration) |
| 349 HUMACAO, PR (PALMA REAL) | | PALMA REAL
STATE ROAD #3, KM 820 | | | 00791 | | | SC | | | 1995 | | | | 2005 | | | | 100.00 | % | | | 340,608 | | | | 442,614 | | | | 6,398,394 | | | CAPRI STORES(2011), PUEBLO XTRA(2020), CINEVISTA THEATRES(2006), WAL-MART(2020), PEP BOYS(NOT OWNED), J C PENNY(NOT OWNED) |
| | | | | | | | | | | | | | | | | | | | | | | | | | | | | | | | | | | |
| | | | | | | | | | | | | | | | | | | | | | | | | | | | | | | | | | | | | |
| 350 ISABELA, PR (PLAZA ISABELA) | | PLAZA ISABELA | | | 00662 | | | SC | | | 1994 | | | | 2005 | | | | 100.00 | % | | | 238,410 | | | | 259,016 | | | | 3,572,058 | | | PUEBLO XTRA(2014), WAL-MART(2019) |
| | STATE RD #2 & #454,KM 111.6 | | | | | | | | | | | | | | | | | | | | | | | | | | | | | | | | | |
| | | | | | | | | | | | | | | | | | | | | | | | | | | | | | | | | | | | | |
| 351 SAN GERMAN, PR (CAMINO REAL) | | CAMINO REAL | | | 00683 | | | SC | | | 1991 | | | | 2005 | | | | 100.00 | % | | | 22,356 | | | | 49,172 | | | | 315,950 | | | PEP BOYS(2015) |
| | STATE RD PR #122 | | | | | | | | | | | | | | | | | | | | | | | | | | | | | | | | | | |
| | | | | | | | | | | | | | | | | | | | | | | | | | | | | | | | | | | | | |
| 352 SAN GERMAN, PR (DEL OESTE) | | DEL OESTE | | | 00683 | | | SC | | | 1991 | | | | 2005 | | | | 100.00 | % | | | 174,172 | | | | 184,746 | | | | 2,298,218 | | | K MART(2016), PUEBLO XTRA(2011) |
| | ROAD PR #2 INT PR #122 | | | | | | | | | | | | | | | | | | | | | | | | | | | | | | | | | |
| | | | | | | | | | | | | | | | | | | | | | | | | | | | | | | | | | | | | |
| 353 SAN JUAN, PR (SENORIAL PLAZA) | | SENORIAL PLAZA
PR #53 & PR #177 | | | 00926 | | | MM | | | 1978/Mutiple | | | | 2005 | | | | 100.00 | % | | | 169,136 | | | | 209,596 | | | | 2,647,116 | | | K MART(2010), PUEBLO EXT(NOT OWNED) |
| | | | | | | | | | | | | | | | | | | | | | | | | | | | | | | | | | |
| | | | | | | | | | | | | | | | | | | | | | | | | | | | | | | | | | | | | |
| 354 VEGA BAJA, PR (PLZA VEGA BAJA) | | PLAZA VEGA BAJA | | | 00693 | | | SC | | | 1990 | | | | 2005 | | | | 100.00 | % | | | 174,728 | | | | 184,938 | | | | 2,099,502 | | | K MART(2015), PUEBLO XTRA(2010) |
| | ROAD PR #2 INT PR #155 | | | | | | | | | | | | | | | | | | | | | | | | | | | | | | | | | |
| | | | | | | | | | | | | | | | | | | | | | | | | | | | | | | | | | | | | |
| South Carolina | | | | | | | | | | | | | | | | | | | | | | | | | | | | | | | | | | | | |
| | | | | | | | | | | | | | | | | | | | | | | | | | | | | | | | | | | | | |
| 355 CAMDEN, SC | | SPRINGDALE PLAZA
1671 SPRINGDALE DRIVE | | | 29020 | | | SC | | | 1990/2000 | | | | 1993 | | | | 100.00 | % | | | 180,127 | | | | 363,405 | | | | 1,002,120 | | | BELK(2015), WAL-MART SUPER CENTER(NOT OWNED) |
| | | | | | | | | | | | | | | | | | | | | | | | | | | | | | | | | | | | |
| | | | | | | | | | | | | | | | | | | | | | | | | | | | | | | | | | | | | |
| 356 CHARLESTON, SC | | ASHLEY CROSSING | | | 29414 | | | SC | | | 1991 | | | | 2003 | | | | 100.00 | % | | | 188,883 | | | | 196,048 | | | | 1,612,848 | | | FOOD LION(2011), WAL-MART(2011) |
| | | 2245 ASHLEY CROSSING DRIVE | | | | | | | | | | | | | | | | | | | | | | | | | | | | | | | | | |
| | | | | | | | | | | | | | | | | | | | | | | | | | | | | | | | | | | | | |
| 357 COLUMBIA, SC (HARBISON) | | HARBISON COURT
HARBISON BLVD | | | 29212 | | | SC | | | 1991 | | | | 2002 | | | | 14.50 | % | | | 257,908 | | | | 317,397 | | | | 2,848,715 | | | BARNES & NOBLE(2011), ROSS DRESS FOR LESS(2014), MARSHALLS(2012), OFFICE MAX(2011), BABIES ’R’ US #8890(NOT OWNED) |
| | | | | | | | | | | | | | | | | | | | | | | | | | | | | | | | | | | | |
| | | | | | | | | | | | | | | | | | | | | | | | | | | | | | | | | | | | | |
| 358 MT. PLEASANT, SC | | WANDO CROSSING
1500 HIGHWAY 17 NORTH | | | 29465 | | | SC | | | 1992/2000 | | | | 1995 | | | | 100.00 | % | | | 209,139 | | | | 325,236 | | | | 1,718,399 | | | OFFICE DEPOT(2010), T.J. MAXX(2007), MARSHALLS(2011), WAL-MART(NOT OWNED) |
| | | | | | | | | | | | | | | | | | | | | | | | | | | | | | | | | | | | |
| | | | | | | | | | | | | | | | | | | | | | | | | | | | | | | | | | | | | |
| 359 N. CHARLESTON, SC | | NORTH POINTE PLAZA
7400 RIVERS AVENUE | | | 29406 | | | SC | | | 1989/2001 | | | | 2 | * | | | 100.00 | % | | | 294,471 | | | | 375,451 | | | | 2,065,272 | | | WAL-MART(2009), OFFICE MAX(2007), HELIG MEYERS(NOT OWNED) |
| | | | | | | | | | | | | | | | | | | | | | | | | | | | | | | | | | | | |
| | | | | | | | | | | | | | | | | | | | | | | | | | | | | | | | | | | | | |
| 360 N. CHARLESTON, SC(N CHARL CTR) | | NORTH CHARLESTON CENTER | | | 29406 | | | SC | | | 1980/1993 | | | | 2004 | | | | 100.00 | % | | | 235,501 | | | | 235,501 | | | | 1,071,400 | | | NORTHERN TOOL(2016), BIG LOTS(2009) |
| | 5900 RIVERS AVENUE | | | | | | | | | | | | | | | | | | | | | | | | | | | | | | | | | |
| | | | | | | | | | | | | | | | | | | | | | | | | | | | | | | | | | | | | |
| 361 ORANGEBURG, SC | | NORTH ROAD PLAZA | | | 29115 | | | SC | | | 1994/1999 | | | | 1995 | | | | 100.00 | % | | | 50,760 | | | | 247,434 | | | | 496,649 | | | GOODY’S(2008), WAL-MART(NOT OWNED) |
| | 2795 NORTH ROAD | | | | | | | | | | | | | | | | | | | | | | | | | | | | | | | | | |
| | | | | | | | | | | | | | | | | | | | | | | | | | | | | | | | | | | | | |
| 362 S. ANDERSON, SC | | CROSSROADS PLAZA | | | 29624 | | | SC | | | 1990 | | | | 1994 | | | | 100.00 | % | | | 13,600 | | | | 13,600 | | | | 53,812 | | | |
| | | 406 HIGHWAY 28 BY-PASS | | | | | | | | | | | | | | | | | | | | | | | | | | | | | | | | | | |
| | | | | | | | | | | | | | | | | | | | | | | | | | | | | | | | | | | | | |
| 363 SIMPSONVILLE, SC | | FAIRVIEW STATION | | | 29681 | | | SC | | | 1990 | | | | 1994 | | | | 100.00 | % | | | 142,086 | | | | 142,086 | | | | 860,137 | | | INGLES(2011), KOHL’S(2015) |
| | | 621 FAIRVIEW ROAD | | | | | | | | | | | | | | | | | | | | | | | | | | | | | | | | | | |
| | | | | | | | | | | | | | | | | | | | | | | | | | | | | | | | | | | | | |
| 364 UNION, SC | | WEST TOWNE PLAZA | | | 29379 | | | SC | | | 1990 | | | | 1993 | | | | 100.00 | % | | | 184,331 | | | | 184,331 | | | | 651,550 | | | WAL-MART(2009), BELK(2010) |
| | | U.S.HWY 176 BY-PASS #1 | | | | | | | | | | | | | | | | | | | | | | | | | | | | | | | | | |
| | | | | | | | | | | | | | | | | | | | | | | | | | | | | | | | | | | | | |
| South Dakota | | | | | | | | | | | | | | | | | | | | | | | | | | | | | | | | | | | | |
| | | | | | | | | | | | | | | | | | | | | | | | | | | | | | | | | | | | | |
| 365 WATERTOWN, SD | | WATERTOWN MALL
1300 9TH AVENUE | | | 56401 | | | MM | | | 1977 | | | | 1/2 | * | | | 100.00 | % | | | 240,262 | | | | 282,262 | | | | 1,509,161 | | | DUNHAM’S SPORTING GOODS(2011), HERBERGER’S(2009), J.C. PENNEY(2008), HY VEE SUPERMARKET(NOT OWNED) |
| | | | | | | | | | | | | | | | | | | | | | | | | | | | | | | | | | | |
| | | | | | | | | | | | | | | | | | | | | | | | | | | | | | | | | | | | | |
| Tennessee | | | | | | | | | | | | | | | | | | | | | | | | | | | | | | | | | | | | |
| | | | | | | | | | | | | | | | | | | | | | | | | | | | | | | | | | | | | |
| 366 BRENTWOOD, TN | | COOL SPRINGS POINTE
I-65 AND MOORE’S LANE | | | 37027 | | | SC | | | 1999/2004 | | | | 2000 | | | | 14.50 | % | | | 201,414 | | | | 201,414 | | | | 2,572,784 | | | BEST BUY(2014), ROSS DRESS FOR LESS(2015), LINENS ’N THINGS(2014), DSW SHOE WAREHOUSE(2008) |
| | | | | | | | | | | | | | | | | | | | | | | | | | | | | | | | | | | |
| | | | | | | | | | | | | | | | | | | | | | | | | | | | | | | | | | | | | |
| 367 CHATTANOOGA, TN | | OVERLOOK AT HAMILTON PLACE | | | 37421 | | | SC | | | 1992/2004 | | | | 2003 | | | | 100.00 | % | | | 214,918 | | | | 214,918 | | | | 1,687,703 | | | BEST BUY(2014), HOBBY LOBBY(2014), FRESH MARKET(2014) |
| | | 2288 GUNBARREL ROAD | | | | | | | | | | | | | | | | | | | | | | | | | | | | | | | | | |
| | | | | | | | | | | | | | | | | | | | | | | | | | | | | | | | | | | | | |
| | | | | |
| | | | | Mervyns Locations |
| * 1. Property Developed by the Company | | * SC — Shopping Center | | * FO — Fee Owned |
| * 2. Original IPO Property | | * MM — Mall | | * LH — Leasehold |
| | | * LC — Lifestyle Center | | * GL — Ground Lease |
| | |
| | | |
| Does Not Include Service Merchandise Interests | | Property Listing 7.1 |
| | | |
| | Run Date: 10/09/2006 |
| | Time: 5:13:20PM |
| | Page 20 of 22 |
| | Quarter: 3Q06 |
Retail Property List*
| | | | | | | | | | | | | | | | | | | | | | | | | | | | | | | | | | | | | |
| | | | | | | | | | | | | Year | | | | | | DDR | | Owned | | Owned/Unowned | | Total | | |
| | | | | Zip | | Type of | | Developed/ | | Year | | Ownership | | Gross | | Gross | | Annualized | | |
| Center/Property | | Location | | Code | | Property | | Redeveloped | | Acquired | | Interest | | Leasable Area | | Leasable Area | | Rent | | Anchor Tenants(Lease Expiration) |
| 368 COLUMBIA, TN | | COLUMBIA SQUARE | | | 38401 | | | SC | | | 1993 | | | | 2003 | | | | 10.00 | % | | | 68,948 | | | | 68,948 | | | | 502,041 | | | KROGER(2022) |
| | | 845 NASHVILLE HIGHWAY | | | | | | | | | | | | | | | | | | | | | | | | | | | | | | | | | | |
| | | | | | | | | | | | | | | | | | | | | | | | | | | | | | | | | | | | | |
| 369 FARRAGUT, TN | | FARRAGUT POINTE | | | 37922 | | | SC | | | 1991 | | | | 2003 | | | | 10.00 | % | | | 71,311 | | | | 71,311 | | | | 515,525 | | | FOOD CITY(2011) |
| | | 11132 KINGSTON PIKE | | | | | | | | | | | | | | | | | | | | | | | | | | | | | | | | | | |
| | | | | | | | | | | | | | | | | | | | | | | | | | | | | | | | | | | | | |
| 370 GOODLETTSVILLE, TN | | NORTHCREEK COMMONS | | | 37072 | | | SC | | | 1987 | | | | 2003 | | | | 20.00 | % | | | 84,441 | | | | 84,441 | | | | 726,933 | | | KROGER(2012) |
| | | 101-139 NORTHCREEK BOULEVARD | | | | | | | | | | | | | | | | | | | | | | | | | | | | | | | | | | |
| | | | | | | | | | | | | | | | | | | | | | | | | | | | | | | | | | | | | |
| 371 HENDERSONVILLE, TN | | HENDERSONVILLE LOWE’S | | | 37075 | | | SC | | | 1999 | | | | 2003 | | | | 100.00 | % | | | 133,144 | | | | 133,144 | | | | 1,222,439 | | | LOWE’S(2019) |
| | | 1050 LOWE’S ROAD | | | | | | | | | | | | | | | | | | | | | | | | | | | | | | | | | | |
| | | | | | | | | | | | | | | | | | | | | | | | | | | | | | | | | | | | | |
| 372 JOHNSON CITY, TN | | JOHNSON CITY MARKETPLACE | | | 37604 | | | SC | | | 2005 | | | | 2003 | | | | 100.00 | % | | | 0 | | | | 88,248 | | | | 352,992 | | | KOHL’S(NOT OWNED) |
| | | FRANKLIN & KNOB CREEK ROADS | | | | | | | | | | | | | | | | | | | | | | | | | | | | | | | | | | |
| | | | | | | | | | | | | | | | | | | | | | | | | | | | | | | | | | | | | |
| 373 MURFREESBORO, TN (MEMORIAL) | | MEMORIAL VILLAGE | | | 37130 | | | SC | | | 1993 | | | | 2003 | | | | 100.00 | % | | | 117,697 | | | | 117,697 | | | | 631,493 | | | MURFREESBORO ATHLETIC CLUB(2014) |
| | 710 MEMORIAL BOULEVARD | | | | | | | | | | | | | | | | | | | | | | | | | | | | | | | | | |
| | | | | | | | | | | | | | | | | | | | | | | | | | | | | | | | | | | | | |
| 374 MURFREESBORO, TN (TOWNE) | | TOWNE CENTRE
OLD FORT PARKWAY | | | 37129 | | | SC | | | 1998 | | | | 2003 | | | | 14.50 | % | | | 108,180 | | | | 390,802 | | | | 1,320,615 | | | T.J. MAXX(2008), BOOKS-A-MILLION(2009), LOWE’S(NOT OWNED), TOYS R US(NOT OWNED), TARGET(NOT OWNED) |
| | | | | | | | | | | | | | | | | | | | | | | | | | | | | | | | | | | |
| | | | | | | | | | | | | | | | | | | | | | | | | | | | | | | | | | | | | |
| 375 NASHVILLE, TN | | THE MARKETPLACE | | | 37209 | | | SC | | | 1998 | | | | 2003 | | | | 14.50 | % | | | 167,795 | | | | 367,879 | | | | 1,673,209 | | | LOWE’S(2019), WAL MART(NOT OWNED) |
| | | CHARLOTTE PIKE | | | | | | | | | | | | | | | | | | | | | | | | | | | | | | | | | |
| | | | | | | | | | | | | | | | | | | | | | | | | | | | | | | | | | | | | |
| Texas | | | | | | | | | | | | | | | | | | | | | | | | | | | | | | | | | | | | |
| | | | | | | | | | | | | | | | | | | | | | | | | | | | | | | | | | | | | |
| 376 AUSTIN, TX | | SHOPS AT TECH RIDGE
CENTER RIDGE DRIVE | | | 78728 | | | SC | | | 2003 | | | | 2003 | | | | 24.75 | % | | | 282,789 | | | | 572,027 | | | | 4,249,769 | | | ROSS DRESS FOR LESS(2014), LINENS ’N THINGS(2014), HOBBY LOBBY(2018), BEST BUY(2017), TOYS R US(NOT OWNED), SUPER TARGET(NOT OWNED), CHICK-FIL-A(NOT OWNED) |
| | | | | | | | | | | | | | | | | | | | | | | | | | | | | | | | | | | |
| | | | | | | | | | | | | | | | | | | | | | | | | | | | | | | | | | | | |
| | | | | | | | | | | | | | | | | | | | | | | | | | | | | | | | | | | | | |
| 377 FRISCO, TX | | FRISCO MARKETPLACE | | | 75035 | | | SC | | | 2003 | | | | 2003 | | | | 14.50 | % | | | 20,959 | | | | 107,543 | | | | 729,659 | | | KOHL’S(NOT OWNED) |
| | | 7010 PRESTON ROAD | | | | | | | | | | | | | | | | | | | | | | | | | | | | | | | | | | |
| | | | | | | | | | | | | | | | | | | | | | | | | | | | | | | | | | | | | |
| 378 FT. WORTH, TX | | EASTCHASE MARKET
SWC EASTCHASE PKWY & I-30 | | | 76112 | | | SC | | | 1995 | | | | 1996 | | | | 50.00 | % | | | 235,017 | | | | 385,039 | | | | 1,993,651 | | | UNITED ARTISTS THEATRE(2012), PETSMART(2011), ROSS DRESS FOR LESS(2011), TARGET(NOT OWNED), OFFICE DEPOT(NOT OWNED) |
| | | | | | | | | | | | | | | | | | | | | | | | | | | | | | | | | | | |
| | | | | | | | | | | | | | | | | | | | | | | | | | | | | | | | | | | | | |
| 379 IRVING, TX | | MACARTHUR MARKETPLACE
MARKET PLACE BOULEVARD | | | 75063 | | | SC | | | 2004 | | | | 2003 | | | | 14.50 | % | | | 146,941 | | | | 598,651 | | | | 2,084,490 | | | HOLLYWOOD THEATERS(2016), OFFICE MAX(2014), KOHL’S(NOT OWNED), SAM’S CLUB(NOT OWNED), WAL MART(NOT OWNED) |
| | | | | | | | | | | | | | | | | | | | | | | | | | | | | | | | | | | |
| | | | | | | | | | | | | | | | | | | | | | | | | | | | | | | | | | | | | |
| 380 LEWISVILLE, TX (LAKEPOINTE) | | LAKEPOINTE CROSSINGS
S STEMMONS FREEWAY | | | 75067 | | | SC | | | 1991 | | | | 2002 | | | | 14.50 | % | | | 311,039 | | | | 567,069 | | | | 3,476,615 | | | 99 CENTS ONLY STORE(2009), ROOMSTORE, THE(2007), PETSMART(2009), BEST BUY(2010), ACADEMY SPORTS(2016), MARDEL CHRISTIAN BOOKSTORE(2012), TOYS R’ US(NOT OWNED), CONN’S APPLIANCE(NOT OWNED), GARDEN RIDGE(NOT OWNED) |
| | | | | | | | | | | | | | | | | | | | | | | | | | | | | | | | | | | |
| | | | | | | | | | | | | | | | | | | | | | | | | | | | | | | | | | | | |
| | | | | | | | | | | | | | | | | | | | | | | | | | | | | | | | | | | | | |
| 381 MCKINNEY, TX | | MCKINNEY MARKETPLACE | | | 75070 | | | SC | | | 2000 | | | | 2003 | | | | 14.50 | % | | | 118,967 | | | | 183,810 | | | | 1,229,358 | | | KOHL’S(2021), ALBERTSON’S(NOT OWNED) |
| | | US HWY 75 & EL DORADO PKWY | | | | | | | | | | | | | | | | | | | | | | | | | | | | | | | | | |
| | | | | | | | | | | | | | | | | | | | | | | | | | | | | | | | | | | | | |
| 382 MESQUITE, TX | | THE MARKETPLACE AT TOWNE CENTE
SOUTHBOUND FRONTAGE RD I 635 | | | 75150 | | | SC | | | 2001 | | | | 2003 | | | | 14.50 | % | | | 170,625 | | | | 378,775 | | | | 2,349,200 | | | LINENS ’N THINGS(2013), MICHAEL’S(2012), ROSS DRESS FOR LESS(2013), HOME DEPOT(NOT OWNED), KOHL’S(NOT OWNED) |
| | | | | | | | | | | | | | | | | | | | | | | | | | | | | | | | | | | |
| | | | | | | | | | | | | | | | | | | | | | | | | | | | | | | | | | | | | |
| 383 SAN ANTONIO, TX (BANDERA PT) | | BANDERA POINT NORTH
STATE LOOP1604/BANDERA ROAD | | | 78227 | | | SC | | | 2001/2002 | | | | 1 | * | | | 100.00 | % | | | 278,721 | | | | 887,911 | | | | 4,358,790 | | | T.J. MAXX(2011), LINENS ’N THINGS(2012), OLD NAVY(2011), ROSS DRESS FOR LESS(2012), BARNES & NOBLE(2011), TARGET(NOT OWNED), LOWE’S(NOT OWNED), KOHL’S(NOT OWNED), CHUCK E CHEESE(NOT OWNED), CHUCK E CHEESE(NOT OWNED), CREDIT UNION(NOT OWNED), RAQUETBALL & FITNESS(NOT OWNED) |
| | | | | | | | | | | | | | | | | | | | | | | | | | | | | | | | | | | |
| | | | | | | | | | | | | | | | | | | | | | | | | | | | | | | | | | | | |
| | | | | | | | | | | | | | | | | | | | | | | | | | | | | | | | | | | | |
| | | | | | | | | | | | | | | | | | | | | | | | | | | | | | | | | | | | | |
| 384 SAN ANTONIO, TX (INGRAM) | | INGRAM PARK | | | 78238 | | | FO | | | 1985 | | | | 2005 | | | | 50.00 | % | | | 76,597 | | | | 76,597 | | | | 430,440 | | | MERVYN’S(2020) |
| | 6157 NW LOOP410 | | | | | | | | | | | | | | | | | | | | | | | | | | | | | | | | | | |
| | | | | | | | | | | | | | | | | | | | | | | | | | | | | | | | | | | | | |
| 385 SAN ANTONIO, TX (WESTOVER) | | WESTOVER MARKETPLACE
SH 151@LOOP410 | | | 78209 | | | SC | | | 2005 | | | | 1 | * | | | 10.00 | % | | | 178,107 | | | | 469,307 | | | | 2,385,563 | | | PETSMART(2016), OFFICE DEPOT(2016), SPORTSMAN’S WAREHOUSE(2015), ROSS DRESS FOR LESS(2016), LOWES(NOT OWNED), TARGET(NOT OWNED) |
| | | | | | | | | | | | | | | | | | | | | | | | | | | | | | | | | | | | |
| | | | | | | | | | | | | | | | | | | | | | | | | | | | | | | | | | | | | |
| Utah | | | | | | | | | | | | | | | | | | | | | | | | | | | | | | | | | | | | |
| | | | | | | | | | | | | | | | | | | | | | | | | | | | | | | | | | | | | |
| 386 LOGAN, UT | | FAMILY PLACE @ LOGAN | | | 84321 | | | SC | | | 1975 | | | | 1998 | | | | 100.00 | % | | | 19,200 | | | | 44,200 | | | | 208,422 | | | RITE AID(NOT OWNED) |
| | | 400 NORTH STREET | | | | | | | | | | | | | | | | | | | | | | | | | | | | | | | | | | |
| | | | | |
| | | | | Mervyns Locations |
| * 1. Property Developed by the Company | | * SC — Shopping Center | | * FO — Fee Owned |
| * 2. Original IPO Property | | * MM — Mall | | * LH — Leasehold |
| | | * LC — Lifestyle Center | | * GL — Ground Lease |
| | |
| | | |
| Does Not Include Service Merchandise Interests | | Property Listing 7.1 |
| | | |
| | Run Date: 10/09/2006 |
| | Time: 5:13:20PM |
| | Page 21 of 22 |
| | Quarter: 3Q06 |
Retail Property List*
| | | | | | | | | | | | | | | | | | | | | | | | | | | | | | | | | | | | | |
| | | | | | | | | | | | | Year | | | | | | DDR | | Owned | | Owned/Unowned | | Total | | |
| | | | | Zip | | Type of | | Developed/ | | Year | | Ownership | | Gross | | Gross | | Annualized | | |
| Center/Property | | Location | | Code | | Property | | Redeveloped | | Acquired | | Interest | | Leasable Area | | Leasable Area | | Rent | | Anchor Tenants(Lease Expiration) |
| 387 MIDVALE, UT | | FAMILY CENTER AT FORT UNION 50
900 EAST FT UNION BLVD | | | 84047 | | | SC | | | 1973/2000 | | | | 1998 | | | | 100.00 | % | | | 581,469 | | | | 581,469 | | | | 6,862,211 | | | BABIES R US(2014), OFFICE MAX(2012), SMITH’S FOOD & DRUG(2024), MEDIA PLAY(2009), BED BATH & BEYOND(2014), ROSS DRESS FOR LESS(2011), WAL-MART(2015) |
| | | | | | | | | | | | | | | | | | | | | | | | | | | | | | | | | | | |
| | | | | | | | | | | | | | | | | | | | | | | | | | | | | | | | | | | | | |
| 388 OGDEN, UT | | FAMILY CENTER AT OGDEN 5-POINT | | | 84404 | | | SC | | | 1977 | | | | 1998 | | | | 100.00 | % | | | 162,316 | | | | 162,316 | | | | 640,780 | | | HARMONS(2012) |
| | | 21-129 HARRISVILLE ROAD | | | | | | | | | | | | | | | | | | | | | | | | | | | | | | | | | | |
| | | | | | | | | | | | | | | | | | | | | | | | | | | | | | | | | | | | | |
| 389 OREM, UT | | FAMILY CENTER AT OREM
1300 SOUTH STREET | | | 84058 | | | SC | | | 1991 | | | | 1998 | | | | 100.00 | % | | | 150,667 | | | | 281,931 | | | | 1,616,659 | | | KIDS R US(2011), MEDIA PLAY(2009), OFFICE DEPOT(2008), JO-ANN STORES(2012), R.C. WILLEY(NOT OWNED) |
| | | | | | | | | | | | | | | | | | | | | | | | | | | | | | | | | | | |
| | | | | | | | | | | | | | | | | | | | | | | | | | | | | | | | | | | | | |
| 390 RIVERDALE, UT | | FAMILY CENTER AT RIVERDALE 510
1050 WEST RIVERDALE ROAD | | | 84405 | | | SC | | | 1995/2003 | | | | 1998 | | | | 100.00 | % | | | 593,398 | | | | 596,198 | | | | 4,771,000 | | | MEIER & FRANK DEPARTMENT STORE(2011), OFFICE MAX(2008), GART SPORTS(2012), SPORTSMANS WAREHOUSE(2009), TARGET SUPERSTORE(2017), MEDIA PLAY(2009), CIRCUIT CITY(2016) |
| | | | | | | | | | | | | | | | | | | | | | | | | | | | | | | | | | | |
| | | | | | | | | | | | | | | | | | | | | | | | | | | | | | | | | | | | |
| | | | | | | | | | | | | | | | | | | | | | | | | | | | | | | | | | | | | |
| 391 RIVERDALE, UT (WEBER) | | FAMILY CENTER @ RIVERDALE 526
1050 WEST RIVERDALE ROAD | | | 84405 | | | SC | | | 2005 | | | | 1 | * | | | 100.00 | % | | | 35,347 | | | | 386,110 | | | | 335,796 | | | JO-ANN STORES(2015), SAM#146;S CLUB(NOT OWNED), SUPER WALMART(NOT OWNED) |
| | | | | | | | | | | | | | | | | | | | | | | | | | | | | | | | | | | | |
| | | | | | | | | | | | | | | | | | | | | | | | | | | | | | | | | | | | | |
| 392 SALT LAKE CITY, UT (33RD) | | FAMILY PLACE @ 33RD SOUTH | | | 84115 | | | SC | | | 1978 | | | | 1998 | | | | 100.00 | % | | | 34,209 | | | | 34,209 | | | | 233,708 | | | |
| | 3300 SOUTH STREET | | | | | | | | | | | | | | | | | | | | | | | | | | | | | | | | | | |
| | | | | | | | | | | | | | | | | | | | | | | | | | | | | | | | | | | | | |
| 393 TAYLORSVILLE, UT | | FAMILY CENTER AT MIDVALLEY 503
5600 SOUTH REDWOOD | | | 84123 | | | SC | | | 1982/2003 | | | | 1998 | | | | 100.00 | % | | | 746,890 | | | | 818,890 | | | | 6,923,670 | | | SHOPKO(2014), JO-ANN STORES(2015), GART SPORTS(2017), 24 HOUR FITNESS(2017), BED BATH & BEYOND(2015), ROSS DRESS FOR LESS(2014), HOME USA WAREHOUSE(2012), MEDIA PLAY(2009), OFFICE MAX(2008), CIRCUIT CITY(2016), PETSMART(2012), HARMONS SUPERSTORE(NOT OWNED) |
| | | | | | | | | | | | | | | | | | | | | | | | | | | | | | | | | | | |
| | | | | | | | | | | | | | | | | | | | | | | | | | | | | | | | | | | | |
| | | | | | | | | | | | | | | | | | | | | | | | | | | | | | | | | | | | |
| | | | | | | | | | | | | | | | | | | | | | | | | | | | | | | | | | | | | |
| Vermont | | | | | | | | | | | | | | | | | | | | | | | | | | | | | | | | | | | | |
| | | | | | | | | | | | | | | | | | | | | | | | | | | | | | | | | | | | | |
| 394 BERLIN, VT | | BERLIN MALL
282 BERLIN MALL RD., UNIT #28 | | | 05602 | | | MM | | | 1986/1999 | | | | 2 | * | | | 100.00 | % | | | 174,432 | | | | 174,432 | | | | 1,646,005 | | | WAL-MART(2014), J.C. PENNEY(2009) |
| | | | | | | | | | | | | | | | | | | | | | | | | | | | | | | | | | | | |
| | | | | | | | | | | | | | | | | | | | | | | | | | | | | | | | | | | | | |
| Virginia | | | | | | | | | | | | | | | | | | | | | | | | | | | | | | | | | | | | |
| | | | | | | | | | | | | | | | | | | | | | | | | | | | | | | | | | | | | |
| 395 CHESTER, VA | | BERMUDA SQUARE | | | 23831 | | | SC | | | 1978 | | | | 2003 | | | | 100.00 | % | | | 116,310 | | | | 116,310 | | | | 1,199,413 | | | UKROP#146;S(2008) |
| | | 12607-12649 JEFFERSON DAVIS | | | | | | | | | | | | | | | | | | | | | | | | | | | | | | | | | | |
| | | | | | | | | | | | | | | | | | | | | | | | | | | | | | | | | | | | | |
| 396 FAIRFAX, VA | | FAIRFAX TOWNE CENTER
12210 FAIRFAX TOWNE CENTER | | | 22033 | | | SC | | | 1994 | | | | 1995 | | | | 14.50 | % | | | 253,392 | | | | 253,392 | | | | 4,770,349 | | | SAFEWAY(2019), T.J. MAXX(2009), TOWER RECORDS(2009), BED BATH & BEYOND(2010), UNITED ARTISTS THEATRE(2014) |
| | | | | | | | | | | | | | | | | | | | | | | | | | | | | | | | | | | |
| | | | | | | | | | | | | | | | | | | | | | | | | | | | | | | | | | | | | |
| 397 LYNCHBURG, VA | | CANDLERS STATION
3700 CANDLERS MOUNTAIN ROAD | | | 24502 | | | SC | | | 1990 | | | | 2003 | | | | 100.00 | % | | | 270,765 | | | | 337,765 | | | | 2,050,481 | | | GOODY#146;S(2008), CINEMARK(2015), CIRCUIT CITY(2009), STAPLES(2013), T.J. MAXX(2009), TOYS "R" US(NOT OWNED) |
| | | | | | | | | | | | | | | | | | | | | | | | | | | | | | | | | | | |
| | | | | | | | | | | | | | | | | | | | | | | | | | | | | | | | | | | | | |
| 398 LYNCHBURG, VA (FAIRVIEW) | | FAIRVIEW SQUARE | | | 24501 | | | SC | | | 1992 | | | | 2004 | | | | 100.00 | % | | | 85,209 | | | | 85,209 | | | | 362,373 | | | FOOD LION(2012) |
| | 2215 FLORIDA AVENUE | | | | | | | | | | | | | | | | | | | | | | | | | | | | | | | | | | |
| | | | | | | | | | | | | | | | | | | | | | | | | | | | | | | | | | | | | |
| 399 MARTINSVILLE, VA | | LIBERTY FAIR MALL
240 COMMONWEALTH BOULEVARD | | | 24112 | | | MM | | | 1989/1997 | | | | 1/2 | * | | | 50.00 | % | | | 435,057 | | | | 479,256 | | | | 2,795,289 | | | GOODY#146;S(2007), BELK(2009), J.C. PENNEY(2009), SEARS(2009), OFFICE MAX(2012), KROGER(2017), MCDONALD#146;S(NOT OWNED) |
| | | | | | | | | | | | | | | | | | | | | | | | | | | | | | | | | | | |
| | | | | | | | | | | | | | | | | | | | | | | | | | | | | | | | | | | | | |
| 400 MIDLOTHIAN, VA | | GENITO CROSSING | | | 23112 | | | SC | | | 1985 | | | | 2003 | | | | 100.00 | % | | | 79,407 | | | | 79,407 | | | | 676,189 | | | FOOD LION(2010) |
| | | HULL STREET ROAD | | | | | | | | | | | | | | | | | | | | | | | | | | | | | | | | | | |
| | | | | | | | | | | | | | | | | | | | | | | | | | | | | | | | | | | | | |
| 401 PULASKI, VA | | MEMORIAL SQUARE | | | 24301 | | | SC | | | 1990 | | | | 1993 | | | | 100.00 | % | | | 143,299 | | | | 143,299 | | | | 897,844 | | | WAL-MART(2011), FOOD LION(2011) |
| | | 1000 MEMORIAL DRIVE | | | | | | | | | | | | | | | | | | | | | | | | | | | | | | | | | | |
| | | | | | | | | | | | | | | | | | | | | | | | | | | | | | | | | | | | | |
| 402 WINCHESTER, VA | | APPLE BLOSSOM CORNERS
2190 S. PLEASANT VALLEY | | | 22601 | | | SC | | | 1990/1997 | | | | 2 | * | | | 20.00 | % | | | 240,560 | | | | 240,560 | | | | 2,459,057 | | | MARTIN#146;S FOOD STORE(2040), KOHL#146;S(2018), OFFICE MAX(2012), BOOKS-A-MILLION(2008) |
| | | | | | | | | | | | | | | | | | | | | | | | | | | | | | | | | | | | |
| | | | | | | | | | | | | | | | | | | | | | | | | | | | | | | | | | | | | |
| Washington | | | | | | | | | | | | | | | | | | | | | | | | | | | | | | | | | | | | |
| | | | | | | | | | | | | | | | | | | | | | | | | | | | | | | | | | | | | |
| 403 KIRKLAND, WA | | TOTEM LAKES UPPER
TOTEM LAKES BOULEVARD | | | 98034 | | | SC | | | 1999/2004 | | | | 2004 | | | | 20.00 | % | | | 228,210 | | | | 274,189 | | | | 2,720,261 | | | GUITAR CENTER(2007), ROSS DRESS FOR LESS(2010), COMPUSA(2006), RITE AID(NOT OWNED) |
| | | | | | | | | | | | | | | | | | | | | | | | | | | | | | | | | | | |
| | | | | | | | | | | | | | | | | | | | | | | | | | | | | | | | | | | | | |
| West Virginia | | | | | | | | | | | | | | | | | | | | | | | | | | | | | | | | | | | | |
| | | | | | | | | | | | | | | | | | | | | | | | | | | | | | | | | | | | | |
| 404 BARBOURSVILLE, WV | | BARBOURSVILLE CENTER
5-13 MALL ROAD | | | 25504 | | | SC | | | 1985 | | | | 1998 | | | | 100.00 | % | | | 70,900 | | | | 133,396 | | | | 389,425 | | | DISCOUNT EMPORIUM(2006), GOODY#146;S(2014), VALUE CITY(NOT OWNED) |
| | | | | | | | | | | | | | | | | | | | | | | | | | | | | | | | | | | | |
| | | | | |
| | | | | Mervyns Locations |
| * 1. Property Developed by the Company | | * SC — Shopping Center | | * FO — Fee Owned |
| * 2. Original IPO Property | | * MM — Mall | | * LH — Leasehold |
| | | * LC — Lifestyle Center | | * GL — Ground Lease |
| | |
| | | |
| Does Not Include Service Merchandise Interests | | Property Listing 7.1 |
| | | |
| | Run Date: 10/09/2006 |
| | Time: 5:13:20PM |
| | Page 22 of 22 |
| | Quarter: 3Q06 |
Retail Property List*
| | | | | | | | | | | | | | | | | | | | | | | | | | | | | | | | | | | | | |
| | | | | | | | | | | | | Year | | | | | | DDR | | Owned | | Owned/Unowned | | Total | | |
| | | | | Zip | | Type of | | Developed/ | | Year | | Ownership | | Gross | | Gross | | Annualized | | |
| Center/Property | | Location | | Code | | Property | | Redeveloped | | Acquired | | Interest | | Leasable Area | | Leasable Area | | Rent | | Anchor Tenants(Lease Expiration) |
| Wisconsin | | | | | | | | | | | | | | | | | | | | | | | | | | | | | | | | | | | | |
| | | | | | | | | | | | | | | | | | | | | | | | | | | | | | | | | | | | | |
| 405 BROOKFIELD, WI (SW) | | SHOPPERS WORLD OF BROOKFIELD | | | 53005 | | | SC | | | | 1967 | | | 2003 | | | | 14.50 | % | | | 182,722 | | | | 190,142 | | | | 1,412,423 | | | T.J. MAXX(2010), MARSHALLS MEGA STORE(2009), OFFICE MAX(2010), BURLINGTON COAT |
| | NORTH 124TH STREET AND WEST CA | | | | | | | | | | | | | | | | | | | | | | | | | | | | | | | | | | FACTORY(2012) |
| | | | | | | | | | | | | | | | | | | | | | | | | | | | | | | | | | | | | |
| 406 BROWN DEER, WI (CENTER) | | BROWN DEER CENTER | | | 53209 | | | SC | | | | 1967 | | | 2003 | | | | 14.50 | % | | | 266,716 | | | | 266,716 | | | | 1,943,135 | | | KOHL'S(2023), MICHAEL'S(2012), OFFICE MAX(2010), T.J. MAXX(2007), OLD NAVY(2012) |
| | NORTH GREEN BAY ROAD | | | | | | | | | | | | | | | | | | | | | | | | | | | | | | | | | | |
| | | | | | | | | | | | | | | | | | | | | | | | | | | | | | | | | | | | | |
| 407 BROWN DEER, WI (MARKET) | | MARKET PLACE OF BROWN DEER | | | 53209 | | | SC | | | | 1989 | | | 2003 | | | | 14.50 | % | | | 143,372 | | | | 143,372 | | | | 1,177,211 | | | MARSHALLS MEGA STORE(2009), PICK 'N SAVE(2010) |
| | | NORTH GREEN BAY ROAD | | | | | | | | | | | | | | | | | | | | | | | | | | | | | | | | | | |
| | | | | | | | | | | | | | | | | | | | | | | | | | | | | | | | | | | | | |
| 408 MILWAUKEE, WI | | POINT LOOMIS | | | 53221 | | | SC | | | | 1962 | | | 2003 | | | | 100.00 | % | | | 160,533 | | | | 160,533 | | | | 707,571 | | | KOHL'S(2007), PICK 'N SAVE(2007) |
| | | SOUTH 27TH STREET | | | | | | | | | | | | | | | | | | | | | | | | | | | | | | | | | | |
| | | | | | | | | | | | | | | | | | | | | | | | | | | | | | | | | | | | | |
| 409 WEST ALLIS, WI (WEST) | | WEST ALLIS CENTER
WEST CLEVELAND AVE. AND S. 108 | | | 53214 | | | SC | | | | 1968 | | | 2003 | | | | 100.00 | % | | | 246,081 | | | | 259,981 | | | | 1,421,496 | | | KOHL'S(2008), MARSHALLS MEGA STORE(2009), PICK 'N SAVE(2008) |
| | | | | | | | | | | | | | | | | | | | | | | | | | | | | | | | | | | | |
| | | | | | | | | | | | | | | | | | | | | | | | | | | | | | | | | | | | | |
| | | | | | | | | | | | | | | Grand Total: | | | | | | | | 74,591,925 | | | | 101,090,542 | | | | 839,461,059 | | | |
| | | | | |
| | | | | Mervyns Locations |
| * 1. Property Developed by the Company | | * SC — Shopping Center | | * FO — Fee Owned |
| * 2. Original IPO Property | | * MM — Mall | | * LH — Leasehold |
| | | * LC — Lifestyle Center | | * GL — Ground Lease |
| | |
| | | |
| Does Not Include Service Merchandise Interests | | Property Listing 7.1 |
Developers Diversified Realty
Quarterly Financial Supplement
For the nine months ended September 30, 2006
Investor Information
Developers Diversified
www.ddr.com
3300 Enterprise Parkway
Beachwood, Ohio 44122
Phone: (216) 755-5500
Fax: (216) 755-1500
Board of Directors
Scott A. Wolstein, Chief Executive Officer & Chairman of the Board, Developers Diversified Realty
Dean S. Adler, Principal, Lubert-Adler Partners, L.P.
Terrance R. Ahern, Principal, The Townsend Group
Robert H. Gidel, Managing Partner, Liberty Partners, L.P.
Victor B. MacFarlane, Managing Principal, MacFarlane Partners
Craig Macnab, Chief Executive Officer, Commercial Net Lease Realty
Scott D. Roulston, Managing Partner, Fairport Asset
Management, LLC
Barry A. Sholem, Principal, MDS Capital, L.P.
William B. Summers Jr., Chairman & Chief Executive Officer, McDonald Investments, Inc., Retired
Officers
Scott A. Wolstein, Chief Executive Officer & Chairman of the Board
David M. Jacobstein, President & Chief Operating Officer
Daniel B. Hurwitz, Senior Executive Vice President & Chief Investment
Officer
Joan U. Allgood, Executive Vice President, Corporate Transactions and Governance
Richard E. Brown, Executive Vice President of Real Estate Operations
Timothy J. Bruce, Executive Vice President of Development
William H. Schafer, Executive Vice President & Chief Financial Officer
Robin R. Walker-Gibbons, Executive Vice President of Leasing
David Dieterle, Senior Vice President of Leasing — Southeast Region
Steven M. Dorsky, Senior Vice President of Leasing — Northern Region
Marc Hays, Senior Vice President of Leasing — Specialty Centers
Daniel M. Herman, Senior Vice President of Development
John S. Kokinchak, SCSM, CLS, Senior Vice President of Property Management
Joseph Padanilam, Senior Vice President of Acquisitions and Dispositions
Anthony L. Vodicka, Senior Vice President of Leasing — Western Region
David Weiss, Senior Vice President and General Counsel Managing Partner, Liberty Partners, LP
Nan Zieleniec, Senior Vice President of Human Resources
Developers Diversified Realty
Quarterly Financial Supplement
For the nine months ended September 30, 2006
Investor Information (Continued)
| | | |
Research Coverage | | |
| | | |
| AG Edwards | | |
| David AuBuchon | | (314) 955-5452 |
| | | |
| Citigroup Smith Barney | | |
| Jonathan Litt | | (212) 816-0231 |
| Ambika Goel | | (212) 816-6981 |
| | | |
| Deutsche Bank Securities | | |
| Lou Taylor | | (212) 250-4912 |
| Christeen Kim | | (212) 250-8705 |
| | | |
| Goldman Sachs | | |
| Dennis Maloney | | (212) 902-1970 |
| Jay Habermann | | (917) 343-4260 |
| | | |
| Green Street Advisors | | |
| Jim Sullivan | | (949) 640-8780 |
| | | |
| Hilliard Lyons | | |
| Tony Howard | | (502) 588-1142 |
| | | |
| Lehman Brothers | | |
| David Harris | | (212) 526-1790 |
| | | |
| Merrill Lynch | | |
| Steve Sakwa | | (212) 449-0335 |
| Craig Schmidt | | (212) 449-1944 |
| | | |
| JP Morgan | | |
| Michael Mueller | | (212) 622-6689 |
| Joe Dazio | | (212) 622-6416 |
| | | |
| Research Coverage, continued |
| | | |
| Morgan Stanley | | |
| Matthew Ostrower | | (212) 761-6284 |
| Mick Chiang | | (212) 761-6385 |
| | | |
| RBC Capital Markets | | |
| Rich Moore | | (216) 378-7625 |
| | | |
| UBS | | |
| Scott Crowe | | (212) 713-1419 |
| Jeff Spector | | (212) 713-6144 |
| | | |
| Wachovia Securities | | |
| Jeff Donnelly | | (617) 603-4262 |
| | | |
| Transfer Agent |
| National City Bank |
| Corporate Trust Operations |
| P.O. Box 92301 |
| Cleveland, Ohio 44193-0900 |
| 1-800-622-6757 |
| | | |
| Investor Relations |
| Michelle M. Dawson |
| VP of Investor Relations |
| Phone: (216) 755-5455 |
| Fax: (216) 755-1455 |
| Email: mdawson@ddr.com |