SITE QUARTERLY FINANCIAL SUPPLEMENT FOR THE PERIOD ENDED MARCH 31, 2024 RECENT ACQUISITION GROVE AT HARPER'S PRESERVE CONROE, TEXAS SITC LISTED NYSE.
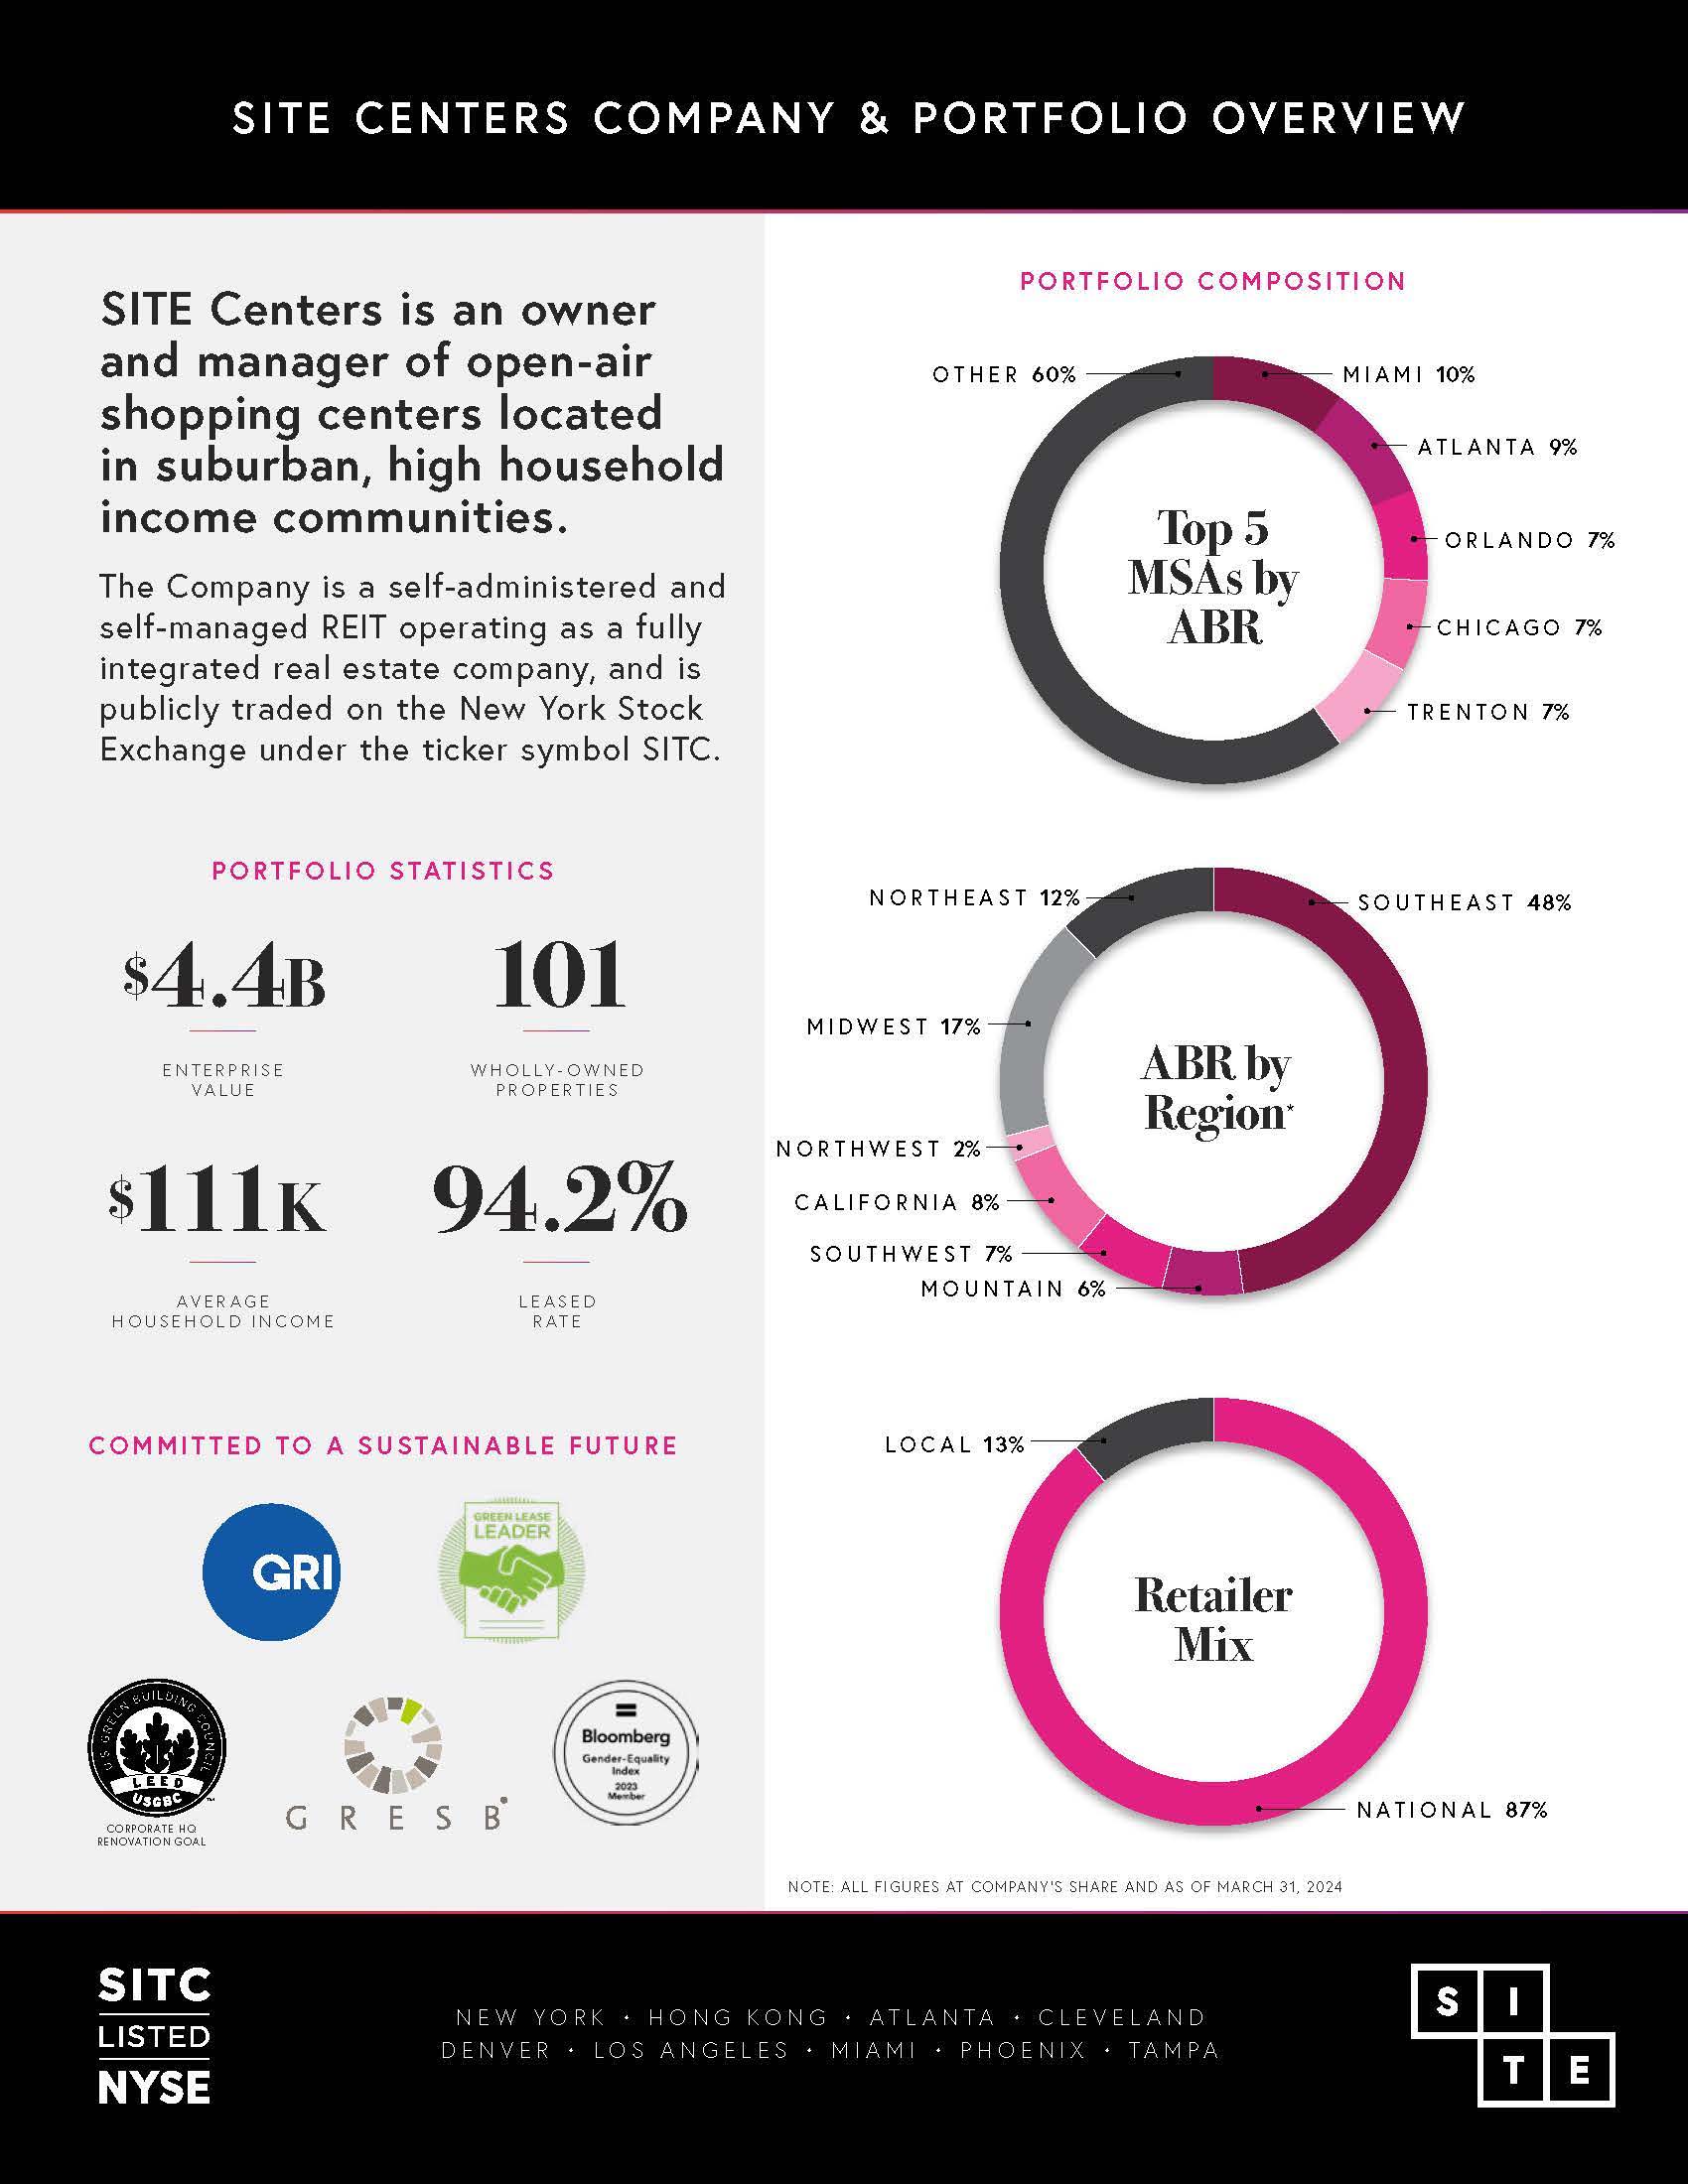
SITE CENTERS COMPANY & PORTFOLIO OVERVIEW SITE Centers is an owner and manager of open-air shopping centers located in suburban, high household income communities. The Company is a self-administered and self-managed REIT operating as a fully integrated real estate company, and is publicly traded on the New York Stock Exchange under the ticker symbol SITC. PORTFOLIO STATISTICS $4.4B ENTERPRISE VALUE 101 WHOLLY - OWNED PROPERTIES $111K AVERAGE HOUSEHOLD INCOME 94.2% LEASED RATE COMMITTED TO A SUSTAINABLE FUTURE GLOBAL REPORTING INITIATIVE GREEN LEASE LEADER U.S. GREEN BUILDING COUNCIL LEED USGBCTM CORPORATE HQ RENOVATION GOAL GRESB® Bloomberg Gender-Equality Index 2023 Member PORTFOLIO COMPOSITION Top 5 MSAs by ABR OTHER 60% MIAMI 10% ATLANTA 9% ORLANDO 7% CHICAGO 7% Trenton 7% ABR by Region* NORTHEAST 12% SOUTHEAST 48% MIDWEST 17% NORTHWEST 2% CALIFORNIA 8% SOUTHWEST 7% MOUNTAIN 6% Retailer Mix LOCAL 13% NATIONAL 87% NOTE: ALL FIGURES AT COMPANY’S SHARE AND AS OF March 31, 2024. NEW YORK • HONG KONG • ATLANTA • CLEVELAND DENVER • LOS ANGELES • MIAMI • PHOENIX • TAMPA SITC LISTED NYSE SITE
SITE Centers Corp.
Table of Contents
SITE Centers Corp. considers portions of the information in this press release to be forward-looking statements within the meaning of Section 27A of the Securities Act of 1933 and Section 21E of the Securities Exchange Act of 1934, both as amended, with respect to the Company's expectation for future periods. Although the Company believes that the expectations reflected in such forward-looking statements are based upon reasonable assumptions, it can give no assurance that its expectations will be achieved. For this purpose, any statements contained herein that are not historical fact, including statements regarding the Company's projected operational and financial performance, strategy, prospects and plans, may be deemed to be forward-looking statements. There are a number of important factors that could cause our results to differ materially from those indicated by such forward-looking statements, including, among other factors, general economic conditions, including inflation and interest rate volatility; local conditions such as the supply of, and demand for, retail real estate space in our geographic markets; the consistency with future results of assumptions based on past performance; the impact of e-commerce; dependence on rental income from real property; the loss of, significant downsizing of or bankruptcy of a major tenant and the impact of any such event on rental income from other tenants and our properties; our ability to enter into agreements to buy and sell properties on commercially reasonable terms and to satisfy closing conditions applicable to such sales; our ability to complete the spin-off of Curbline Properties in a timely manner or at all; our ability to secure equity or debt financing on commercially acceptable terms or at all; redevelopment and construction activities may not achieve a desired return on investment; impairment charges; valuation and risks relating to our joint venture investments; the termination of any joint venture arrangements or arrangements to manage real property; property damage, expenses related thereto and other business and economic consequences (including the potential loss of rental revenues) resulting from extreme weather conditions or natural disasters in locations where we own properties, and the ability to estimate accurately the amounts thereof; sufficiency and timing of any insurance recovery payments related to damages from extreme weather conditions or natural disasters; any change in strategy; the impact of pandemics and other public health crises; unauthorized access, use, theft or destruction of financial, operations or third party data maintained in our information systems or by third parties on our behalf; our ability to maintain REIT status; and the finalization of the financial statements for the period ended March 31, 2024. For additional factors that could cause the results of the Company to differ materially from those indicated in the forward-looking statements, please refer to the Company's most recent reports on Forms 10-K and 10-Q. The Company undertakes no obligation to publicly revise these forward-looking statements to reflect events or circumstances that arise after the date hereof.
| | |
| 
| |
SITE Centers Corp. | For additional information: |
3300 Enterprise Parkway | Conor Fennerty, EVP and |
Beachwood, OH 44122
216-755-5500 | Chief Financial Officer |
FOR IMMEDIATE RELEASE:
SITE Centers Reports First Quarter 2024 Results
Beachwood, Ohio, April 30, 2024 - SITE Centers Corp. (NYSE: SITC), an owner of open-air shopping centers in suburban, high household income communities, announced today operating results for the quarter ended March 31, 2024.
“SITE Centers made additional progress on the announced planned spin-off of the Company’s Convenience assets in the first quarter highlighted by $189 million of year-to-date transaction activity and remains on track to form and scale what is expected to be the first public real estate company focused exclusively on Convenience properties,” commented David R. Lukes, President and Chief Executive Officer. “We remain excited by the prospects and opportunity set for both SITE Centers and Curbline Properties and believe both companies remain positioned to achieve their business plans and create stakeholder value.”
Results for the First Quarter
•First quarter net loss attributable to common shareholders was $26.3 million, or $0.13 per diluted share, as compared to net income of $12.5 million, or $0.06 per diluted share, in the year-ago period. The decrease year-over-year primarily was the result of the impact of net property dispositions and impairment charges, partially offset by higher gain on sale from dispositions.
•First quarter operating funds from operations attributable to common shareholders (“Operating FFO” or “OFFO”) was $59.8 million, or $0.28 per diluted share, compared to $62.7 million, or $0.30 per diluted share, in the year-ago period. The decrease year-over-year primarily was due to the impact of net property dispositions, partially offset by property net operating income ("NOI") growth and increased interest income.
Significant First Quarter and Recent Activity
•SITE Centers sold five wholly-owned shopping centers in the first quarter and second quarter to date for an aggregate price of $169.6 million including three wholly-owned shopping centers sold during the first quarter for an aggregate price of $119.4 million.
•Acquired two convenience shopping centers during the first quarter for an aggregate price of $19.1 million, including Grove at Harper's Preserve (Houston, TX) for $10.6 million and Shops at Gilbert Crossroads (Phoenix, AZ) for $8.5 million.
•During the quarter, repurchased $61.6 million aggregate principal amount of outstanding senior unsecured notes due in 2025 and 2026 for a total consideration, including expenses, of $60.8 million and recorded a gain on retirement of debt of approximately $0.8 million.
•During the quarter, recorded impairments of $66.6 million due to changes in hold period assumptions for three wholly-owned assets. Two of the properties, representing $55.7 million of the first quarter impairment, were development projects commenced in 2007 and 2010. These properties were 96.6% leased as of March 31, 2024.
•In October 2023, announced the expected spin-off of the Company’s Convenience assets into a separate publicly-traded REIT to be named Curbline Properties Corp. (“Curbline Properties” or “CURB”). The spin-off is expected to be completed on or around October 1, 2024. As of March 31, 2024, the Company has amassed a portfolio of 67 wholly-owned properties to be included in the CURB portfolio, including assets separated or in the process of being separated from SITE Centers properties. The transaction is subject to certain conditions, including the effectiveness of CURB’s Form 10 registration statement and final approval and declaration of the distribution by SITE Centers' Board of Directors.
•In October 2023, obtained a commitment from affiliates of Apollo, including ATLAS SP Partners, to provide a $1.1 billion mortgage facility to be secured by 40 properties with flexibility to reduce the commitment or loan balance with proceeds from asset sales or other sources of capital. The mortgage is expected to be funded prior to the spin-off date with loan and additional asset sale proceeds expected to be used to retire all unsecured debt, including all outstanding public notes, prior to the spin-off of CURB. In the first quarter of 2024, the Company released two properties that had previously been identified to serve as collateral for the facility, thereby reducing the committed
amount to $1.0 billion as of March 31, 2024. The Company expensed $0.7 million of fees related to the facility in the first quarter as a result of the property releases.
Key Quarterly Operating Results
•Reported an increase of 1.5% in same-store net operating income (“SSNOI”) on a pro rata basis for the first quarter of 2024 as compared to the year-ago period which included a 310 basis-point headwind due to lost revenue related to the bankruptcy of Bed Bath & Beyond.
•Generated cash new leasing spreads of 29.0% and cash renewal leasing spreads of 6.5%, both on a pro rata basis, for the trailing twelve-month period ended March 31, 2024 and cash new leasing spreads of 11.5% and cash renewal leasing spreads of 8.0%, both on a pro rata basis, for the first quarter of 2024.
•Generated straight-lined new leasing spreads of 40.3% and straight-lined renewal leasing spreads of 11.0%, both on a pro rata basis, for the trailing twelve-month period ended March 31, 2024 and straight-lined new leasing spreads of 26.9% and straight-lined renewal leasing spreads of 12.4%, both on a pro rata basis, for the first quarter of 2024.
•Reported a leased rate of 94.2% at March 31, 2024 compared to 94.5% at December 31, 2023 and 95.9% at March 31, 2023, all on a pro rata basis.
•As of March 31, 2024, the Signed Not Opened (“SNO”) spread was 260 basis points, representing $13.1 million of annualized base rent on a pro rata basis.
Property NOI Projection
The Company projects, based on the assumptions below, 2024 property level NOI to be as follows:
| | |
Portfolio | | NOI Projection ($M) |
SITE Centers | | $252.8 – $260.6 |
Curbline Properties | | $76.9 – $80.2 |
These projections:
•Calculate NOI pursuant to the definition of NOI used in the SSNOI calculation as described below, except that it includes lease termination fees, assumes all SITE Centers properties owned as of March 31, 2024 are held for the full year 2024 and includes NOI for Curbline Properties assets acquired in 2024 from the date of acquisition,
•Assume 2024 SSNOI growth of 3.5% – 5.5% for Curbline Properties,
•Exclude from NOI G&A allocated to operating expenses which totaled $2.6 million in 1Q2024, or $10.2 million annualized and
•Adjust NOI for the estimated impact of remaining expected parcel separations and includes NOI for SITE Centers from its Beachwood, OH office headquarters.
In reliance on the exception provided by Item 10(e)(1)(i)(B) of Regulation S-K, reconciliation of the projected NOI and assumed range of 2024 SSNOI growth to the most directly comparable GAAP financial measure is not provided because the Company is unable to provide such reconciliations without unreasonable effort due to the multiple components of the calculations which for the same-store calculation only includes properties owned for comparable periods and excludes all corporate level activity as described below under Non-GAAP Measures and Other Operational Metrics.
About SITE Centers Corp.
SITE Centers is an owner and manager of open-air shopping centers located in suburban, high household income communities. The Company is a self-administered and self-managed REIT operating as a fully integrated real estate company, and is publicly traded on the New York Stock Exchange under the ticker symbol SITC. Additional information about the Company is available at www.sitecenters.com. To be included in the Company’s e-mail distributions for press releases and other investor news, please click here.
Conference Call and Supplemental Information
The Company will hold its quarterly conference call today at 8:00 a.m. Eastern Time. To participate with access to the slide presentation, please visit the Investor Relations portion of SITE's website, ir.sitecenters.com, or for audio only, dial 888‑317‑6003 (U.S.), 866-284-3684 (Canada) or 412-317-6061 (international) using pass code 7262807 at least ten minutes prior to the scheduled start of the call. The call will also be webcast and available in a listen-only mode on SITE Centers’ website at ir.sitecenters.com. If you are unable to participate during the live call, a replay of the conference call will also be available at ir.sitecenters.com for further review. You may also access the telephone replay by dialing 877-344-7529 (U.S.), 855-669-9658 (Canada) or 412-317-0088 (international) using passcode 4967980 through May 30, 2024. Copies of the Company’s supplemental package and earnings slide presentation are available on the Company’s website.
Non-GAAP Measures and Other Operational Metrics
Funds from Operations (“FFO”) is a supplemental non-GAAP financial measure used as a standard in the real estate industry and is a widely accepted measure of real estate investment trust (“REIT”) performance. Management believes that both FFO and Operating FFO provide additional indicators of the financial performance of a REIT. The Company also believes that FFO and Operating FFO more appropriately measure the core operations of the Company and provide benchmarks to its peer group.
FFO is generally defined and calculated by the Company as net income (loss) (computed in accordance with generally accepted accounting principles in the United States (“GAAP”)), adjusted to exclude (i) preferred share dividends, (ii) gains and losses from disposition of real estate property and related investments, which are presented net of taxes, (iii) impairment charges on real estate property and related investments, (iv) gains and losses from changes in control and (v) certain non-cash items. These non-cash items principally include real property depreciation and amortization of intangibles, equity income (loss) from joint ventures and equity income (loss) from non-controlling interests and adding the Company’s proportionate share of FFO from its unconsolidated joint ventures and non-controlling interests, determined on a consistent basis. The Company’s calculation of FFO is consistent with the definition of FFO provided by NAREIT. The Company calculates Operating FFO as FFO excluding certain non-operating charges, income and gains/losses. Operating FFO is useful to investors as the Company removes non-comparable charges, income and gains/losses to analyze the results of its operations and assess performance of the core operating real estate portfolio. Other real estate companies may calculate FFO and Operating FFO in a different manner.
The Company also uses NOI, a non-GAAP financial measure, as a supplemental performance measure. NOI is calculated as property revenues less property-related expenses. The Company believes NOI provides useful information to investors regarding the Company’s financial condition and results of operations because it reflects only those income and expense items that are incurred at the property level and, when compared across periods, reflects the impact on operations from trends in occupancy rates, rental rates, operating costs and acquisition and disposition activity on an unleveraged basis.
The Company presents NOI information herein on a same store basis or “SSNOI.” The Company defines SSNOI as property revenues less property-related expenses, which exclude straight-line rental income and reimbursements and expenses, lease termination income, management fee expense, fair market value of leases and expense recovery adjustments. SSNOI includes assets owned in comparable periods (15 months for prior period comparisons). In addition, SSNOI is presented including activity associated with redevelopment. SSNOI excludes all non-property and corporate level revenue and expenses. Other real estate companies may calculate NOI and SSNOI in a different manner. The Company believes SSNOI at its effective ownership interest provides investors with additional information regarding the operating performances of comparable assets because it excludes certain non-cash and non-comparable items as noted above.
FFO, Operating FFO, NOI and SSNOI do not represent cash generated from operating activities in accordance with GAAP, are not necessarily indicative of cash available to fund cash needs and should not be considered as alternatives to net income (loss) computed in accordance with GAAP, as indicators of the Company’s operating performance or as alternatives to cash flow as a measure of liquidity. Reconciliations of these non-GAAP measures to their most directly comparable GAAP measures have been provided herein. In reliance on the exception provided by Item 10(e)(1)(i)(B) of Regulation S-K, reconciliation of the projected NOI and assumed rate of 2024 SSNOI growth to the most directly comparable GAAP financial measure is not provided because the Company is unable to provide such reconciliations without unreasonable effort due to the multiple components of the calculations which for the same-store calculation only includes properties owned for comparable periods and excludes all corporate level activity as noted above.
The Company calculates Cash Leasing Spreads by comparing the prior tenant's annual base rent in the final year of the prior lease to the executed tenant's annual base rent in the first year of the executed lease. Straight-Lined Leasing Spreads are calculated by comparing the prior tenant's average base rent over the prior lease term to the executed tenant's average base rent over the term of the executed lease. For both Cash and Straight-Lined Leasing Spreads, the reported calculation includes only comparable leases which are deals executed within one year of the date that the prior tenant vacated. Deals executed after one year of the date the prior tenant vacated, deals which are a combination of existing units, new leases at redevelopment properties, and deals for units vacant at the time of acquisition are considered non-comparable and excluded from the calculation.
Safe Harbor
SITE Centers Corp. considers portions of the information in this press release to be forward-looking statements within the meaning of Section 27A of the Securities Act of 1933 and Section 21E of the Securities Exchange Act of 1934, both as amended, with respect to the Company's expectation for future periods. Although the Company believes that the expectations reflected in such forward-looking statements are based upon reasonable assumptions, it can give no assurance
that its expectations will be achieved. For this purpose, any statements contained herein that are not historical fact, including statements regarding the Company's projected operational and financial performance, strategy, prospects and plans, may be deemed to be forward-looking statements. There are a number of important factors that could cause our results to differ materially from those indicated by such forward-looking statements, including, among other factors, general economic conditions, including inflation and interest rate volatility; local conditions such as the supply of, and demand for, retail real estate space in our geographic markets; the consistency with future results of assumptions based on past performance; the impact of e-commerce; dependence on rental income from real property; the loss of, significant downsizing of or bankruptcy of a major tenant and the impact of any such event on rental income from other tenants and our properties; our ability to enter into agreements to buy and sell properties on commercially reasonable terms and to satisfy closing conditions applicable to such sales; our ability to complete the spin-off of Curbline Properties in a timely manner or at all; our ability to secure equity or debt financing on commercially acceptable terms or at all; redevelopment and construction activities may not achieve a desired return on investment; impairment charges; valuation and risks relating to our joint venture investments; the termination of any joint venture arrangements or arrangements to manage real property; property damage, expenses related thereto and other business and economic consequences (including the potential loss of rental revenues) resulting from extreme weather conditions or natural disasters in locations where we own properties, and the ability to estimate accurately the amounts thereof; sufficiency and timing of any insurance recovery payments related to damages from extreme weather conditions or natural disasters; any change in strategy; the impact of pandemics and other public health crises; unauthorized access, use, theft or destruction of financial, operations or third party data maintained in our information systems or by third parties on our behalf; our ability to maintain REIT status; and the finalization of the financial statements for the period ended March 31, 2024. For additional factors that could cause the results of the Company to differ materially from those indicated in the forward-looking statements, please refer to the Company's most recent reports on Forms 10-K and 10-Q. The Company undertakes no obligation to publicly revise these forward-looking statements to reflect events or circumstances that arise after the date hereof.
SITE Centers Corp.
Income Statement: Consolidated Interests
| | | | | |
| in thousands, except per share | | |
| | | 1Q24 | | 1Q23 |
| Revenues: | | | | |
| Rental income (1) | | $119,592 | | $135,872 |
| Other property revenues | | 1,029 | | 961 |
| | | 120,621 | | 136,833 |
| Expenses: | | | | |
| Operating and maintenance | | 20,544 | | 23,166 |
| Real estate taxes | | 16,738 | | 20,053 |
| | | 37,282 | | 43,219 |
| | | | | |
| Net operating income (2) | | 83,339 | | 93,614 |
| | | | | |
| Other income (expense): | | | | |
| JV and other fee income | | 1,470 | | 1,859 |
| Interest expense | | (18,913) | | (19,923) |
| Depreciation and amortization | | (43,150) | | (54,016) |
| General and administrative | | (11,072) | | (10,645) |
| Other income (expense), net (3) | | (105) | | (687) |
| Impairment charges | | (66,600) | | 0 |
| (Loss) income before earnings from JVs and other | | (55,031) | | 10,202 |
| | | | | |
| Equity in net income of JVs | | 17 | | 1,359 |
| Gain on sale and change in control of interests | | 0 | | 3,749 |
| Gain on disposition of real estate, net | | 31,714 | | 205 |
| Tax expense | | (252) | | (213) |
| Net (loss) income | | (23,552) | | 15,302 |
| Non-controlling interests | | 0 | | (18) |
| Net (loss) income SITE Centers | | (23,552) | | 15,284 |
| Preferred dividends | | (2,789) | | (2,789) |
| Net (loss) income Common Shareholders | | ($26,341) | | $12,495 |
| | | | | |
| Weighted average shares – Basic – EPS | | 209,419 | | 209,971 |
| Assumed conversion of diluted securities | | 0 | | 436 |
| Weighted average shares – Diluted – EPS | | 209,419 | | 210,407 |
| | | | | |
| (Loss) earnings per common share – Basic | | $(0.13) | | $0.06 |
| (Loss) earnings per common share – Diluted | | $(0.13) | | $0.06 |
| | | | | |
(1) | Rental income: | | | | |
| Minimum rents | | $76,062 | | $88,973 |
| Ground lease minimum rents | | 5,444 | | 6,469 |
| Straight-line rent, net | | 680 | | 676 |
| Amortization of (above)/below-market rent, net | | 1,152 | | 1,185 |
| Percentage and overage rent | | 1,927 | | 1,151 |
| Recoveries | | 29,682 | | 35,316 |
| Uncollectible revenue | | 355 | | 233 |
| Ancillary and other rental income | | 1,236 | | 1,757 |
| Lease termination fees | | 3,054 | | 112 |
| | | | | |
(2) | Includes NOI from wholly-owned assets sold in 1Q24 | | 937 | | N/A |
| | | | | |
(3) | Interest income (fees), net | | 7,294 | | (23) |
| Transaction costs | | (3,398) | | (664) |
| Debt extinguishment costs | | (665) | | 0 |
| Gain on debt retirement | | 760 | | 0 |
| Loss on equity derivative instruments | | (4,096) | | 0 |
SITE Centers Corp.
Reconciliation: Net Income to FFO and Operating FFO
and Other Financial Information
| | | | | |
| in thousands, except per share | | |
| | 1Q24 | | 1Q23 | |
| Net (loss) income attributable to Common Shareholders | ($26,341) | | $12,495 | |
| Depreciation and amortization of real estate | 41,819 | | 52,717 | |
| Equity in net income of JVs | (17) | | (1,359) | |
| JVs' FFO | 1,584 | | 1,982 | |
| Non-controlling interests | 0 | | 18 | |
| Impairment of real estate | 66,600 | | 0 | |
| Gain on sale and change in control of interests | 0 | | (3,749) | |
| Gain on disposition of real estate, net | (31,714) | | (205) | |
| FFO attributable to Common Shareholders | $51,931 | | $61,899 | |
| Gain on debt retirement | (760) | | 0 | |
| Loss on equity derivative instruments | 4,096 | | 0 | |
| Transaction, debt extinguishment and other (at SITE's share) | 4,139 | | 829 | |
| Other charges | 395 | | 0 | |
| Total non-operating items, net | 7,870 | | 829 | |
| Operating FFO attributable to Common Shareholders | $59,801 | | $62,728 | |
| | | | | |
| Weighted average shares & units – Basic: FFO & OFFO | 209,419 | | 210,112 | |
| Assumed conversion of dilutive securities | 802 | | 436 | |
| Weighted average shares & units – Diluted: FFO & OFFO | 210,221 | | 210,548 | |
| | | | | |
| FFO per share – Basic | $0.25 | | $0.29 | |
| FFO per share – Diluted | $0.25 | | $0.29 | |
| Operating FFO per share – Basic | $0.29 | | $0.30 | |
| Operating FFO per share – Diluted | $0.28 | | $0.30 | |
| Common stock dividends declared, per share | $0.13 | | $0.13 | |
| | | | | |
| Capital expenditures (SITE Centers share): | | | | |
| Redevelopment costs | 3,053 | | 4,410 | |
| Maintenance capital expenditures | 1,286 | | 2,146 | |
| Tenant allowances and landlord work | 12,035 | | 14,721 | |
| Leasing commissions | 1,959 | | 2,328 | |
| Construction administrative costs (capitalized) | 961 | | 796 | |
| | | | | |
| Certain non-cash items (SITE Centers share): | | | | |
| Straight-line rent | 714 | | 696 | |
| Straight-line fixed CAM | 63 | | 75 | |
| Amortization of below-market rent/(above), net | 1,269 | | 1,269 | |
| Straight-line ground rent expense | (5) | | (64) | |
| Debt fair value and loan cost amortization | (1,411) | | (1,228) | |
| Capitalized interest expense | 293 | | 286 | |
| Stock compensation expense | (1,888) | | (1,620) | |
| Non-real estate depreciation expense | (1,333) | | (1,303) | |
| | | | | |
| | | | |
SITE Centers Corp.
Balance Sheet: Consolidated Interests
| | | | |
| $ in thousands | | | |
| | At Period End |
| | 1Q24 | | 4Q23 |
| Assets: | | | |
| Land | $906,727 | | $930,540 |
| Buildings | 3,185,457 | | 3,311,368 |
| Fixtures and tenant improvements | 542,875 | | 537,872 |
| | 4,635,059 | | 4,779,780 |
| Depreciation | (1,575,920) | | (1,570,377) |
| | 3,059,139 | | 3,209,403 |
| Construction in progress and land | 54,148 | | 51,379 |
| Real estate, net | 3,113,287 | | 3,260,782 |
| | | | |
| Investments in and advances to JVs | 38,607 | | 39,372 |
| Cash | 551,285 | | 551,968 |
| Restricted cash | 5,433 | | 17,063 |
| Receivables and straight-line (1) | 57,159 | | 65,623 |
| Intangible assets, net (2) | 79,015 | | 86,363 |
| Other assets, net | 47,792 | | 40,180 |
| Total Assets | 3,892,578 | | 4,061,351 |
| | | | |
| Liabilities and Equity: | | | |
| Revolving credit facilities | 0 | | 0 |
| Unsecured debt | 1,242,191 | | 1,303,243 |
| Unsecured term loan | 198,940 | | 198,856 |
| Secured debt | 124,100 | | 124,176 |
| | 1,565,231 | | 1,626,275 |
| Dividends payable | 30,161 | | 63,806 |
| Other liabilities (3) | 173,242 | | 195,727 |
| Total Liabilities | 1,768,634 | | 1,885,808 |
| | | | |
| Preferred shares | 175,000 | | 175,000 |
| Common shares | 21,437 | | 21,437 |
| Paid-in capital | 5,971,666 | | 5,974,904 |
| Distributions in excess of net income | (3,988,449) | | (3,934,736) |
| Deferred compensation | 5,052 | | 5,167 |
| Accumulated comprehensive income | 8,723 | | 6,121 |
| Common shares in treasury at cost | (69,485) | | (72,350) |
| Total Equity | 2,123,944 | | 2,175,543 |
| | | | |
| Total Liabilities and Equity | $3,892,578 | | $4,061,351 |
| | | | |
(1) | SL rents (including fixed CAM), net | $31,395 | | $31,206 |
| | | | |
(2) | Operating lease right of use assets | 17,107 | | 17,373 |
| | | | |
(3) | Operating lease liabilities | 36,847 | | 37,108 |
| Below-market leases, net | 43,241 | | 46,096 |
| | | | |
SITE Centers Corp.
Reconciliation of Net Income Attributable to SITE to Same Store NOI
| | | | | | | |
$ in thousands | | | | | | | |
| 1Q24 | | 1Q23 | | 1Q24 | | 1Q23 |
| SITE Centers at 100% | | At SITE Centers Share
(Non-GAAP) |
GAAP Reconciliation: | | | | | | | |
Net (loss) income attributable to SITE Centers | ($23,552) | | $15,284 | | ($23,552) | | $15,284 |
Fee income | (1,470) | | (1,859) | | (1,470) | | (1,859) |
Interest expense | 18,913 | | 19,923 | | 18,913 | | 19,923 |
Depreciation and amortization | 43,150 | | 54,016 | | 43,150 | | 54,016 |
General and administrative | 11,072 | | 10,645 | | 11,072 | | 10,645 |
Other expense (income), net | 105 | | 687 | | 105 | | 687 |
Impairment charges | 66,600 | | 0 | | 66,600 | | 0 |
Equity in net income of joint ventures | (17) | | (1,359) | | (17) | | (1,359) |
Tax expense | 252 | | 213 | | 252 | | 213 |
Gain on sale and change in control of interests | 0 | | (3,749) | | 0 | | (3,749) |
Gain on disposition of real estate, net | (31,714) | | (205) | | (31,714) | | (205) |
Income from non-controlling interests | 0 | | 18 | | 0 | | 18 |
Consolidated NOI | 83,339 | | 93,614 | | 83,339 | | 93,614 |
Less: Non-Same Store NOI adjustments | | | | | (6,684) | | (18,137) |
Total Consolidated SSNOI | | | | | $76,655 | | $75,477 |
| | | | | | | |
Consolidated SSNOI % Change | | | | | 1.6% | | |
| | | | | | | |
Net (loss) income from unconsolidated joint ventures | (1,155) | | 4,767 | | (176) | | 1,004 |
Interest expense | 8,271 | | 7,041 | | 1,832 | | 1,587 |
Depreciation and amortization | 7,145 | | 9,062 | | 1,727 | | 2,091 |
Other expense (income), net | 1,896 | | 2,560 | | 441 | | 574 |
Loss (gain) on disposition of real estate, net | 29 | | (5,304) | | 6 | | (1,062) |
Unconsolidated NOI | $16,186 | | $18,126 | | 3,830 | | 4,194 |
Less: Non-Same Store NOI adjustments | | | | | (164) | | (547) |
Total Unconsolidated SSNOI at SITE share | | | | | $3,666 | | $3,647 |
| | | | | | | |
Unconsolidated SSNOI % Change | | | | | 0.5% | | |
| | | | | | | |
SSNOI % Change at SITE Share | | | | | 1.5% | | |
SITE Centers Corp.
Portfolio Summary
| | | | | | | | | | | | | |
| | | | | | | | | | | |
| | | | | 3/31/2024 | | 12/31/2023 | | 9/30/2023 | | 6/30/2023 | | 3/31/2023 |
Shopping Center Count | | | | | | | | | | |
Operating Centers - 100% | | 114 | | 114 | | 119 | | 121 | | 120 |
Wholly Owned | | 101 | | 101 | | 106 | | 108 | | 105 |
JV Portfolio | | 13 | | 13 | | 13 | | 13 | | 15 |
| | | | | | | | | | | | | |
Gross Leasable Area (GLA) | | | | | | | | | | |
Owned and Ground Lease - Pro Rata Share | | 18,686 | | 19,312 | | 22,329 | | 22,999 | | 23,014 |
Wholly Owned | | 17,740 | | 18,369 | | 21,386 | | 22,056 | | 21,990 |
JV Portfolio - Pro Rata Share | | 946 | | 943 | | 943 | | 943 | | 1,024 |
| | | | | | | | | | | | | |
| | | | | | | | | | | | | |
Quarterly Operational Overview | | | | | | | | | | |
Pro Rata Share | | | | | | | | | | |
Base Rent PSF | | $20.69 | | $20.35 | | $20.20 | | $19.89 | | $19.65 |
Base Rent PSF < 10K | | $33.18 | | $32.76 | | $32.09 | | $31.59 | | $31.28 |
Base Rent PSF > 10K | | $15.66 | | $15.48 | | $15.88 | | $15.77 | | $15.74 |
| | | | | | | | | | | | | |
Commenced Rate | | 91.6% | | 92.0% | | 92.0% | | 92.4% | | 92.9% |
Commenced Rate < 10K SF | | 88.6% | | 88.2% | | 87.3% | | 86.4% | | 85.3% |
Commenced Rate > 10K SF | | 92.9% | | 93.5% | | 93.7% | | 94.7% | | 95.6% |
| | | | | | | | | | | | | |
Leased Rate | | 94.2% | | 94.5% | | 94.6% | | 95.5% | | 95.9% |
Leased Rate < 10K SF | | 91.0% | | 90.9% | | 91.0% | | 90.7% | | 90.8% |
Leased Rate > 10K SF | | 95.5% | | 95.9% | | 95.9% | | 97.2% | | 97.7% |
| | | | | | | | | | | | | |
| | | | | | | | | | | | | |
Operational Statistics | | | | | | | | | | |
% of Aggregate Property NOI - Wholly Owned | | 95.4% | | 95.4% | | 95.9% | | 96.1% | | 95.7% |
% of Aggregate Property NOI - Joint Venture – Pro Rata Share | | 4.6% | | 4.6% | | 4.1% | | 3.9% | | 4.3% |
| | | | | | | | | | | | | |
Quarterly SITE SSNOI at share including redevelopment | | 1.5% | | 0.3% | | 2.9% | | 1.7% | | 4.2% |
| | | | | | | | | | | | | |
TTM New Leasing - at pro rata share (GLA in 000's) | | 552 | | 613 | | 699 | | 703 | | 965 |
TTM Renewals - at pro rata share (GLA in 000's) | | 2,933 | | 2,685 | | 2,943 | | 3,156 | | 2,956 |
TTM Total Leasing - at pro rata share (GLA in 000's) | | 3,485 | | 3,298 | | 3,642 | | 3,859 | | 3,921 |
TTM Cash Blended New and Renewal Rent Spreads - at pro rata share | | 8.8% | | 9.0% | | 10.6% | | 8.9% | | 8.9% |
TTM GAAP Blended New and Renewal Rent Spreads - at pro rata share | | 13.9% | | 14.5% | | 15.6% | | 13.6% | | 13.9% |
| | | | | | | | | | | | | |
Top 20 MSA Exposure | | | | | | | | | | | |
| | | | | | | | | | | | | |
| | MSA | Properties | | GLA | | % of GLA | | ABR | | % of ABR | | ABR PSF |
1 | | Miami-Fort Lauderdale-West Palm Beach, FL | 7 | | 1,567 | | 8.4% | | $32,040 | | 9.6% | | $24.62 |
2 | | Atlanta-Sandy Springs-Roswell, GA | 14 | | 2,057 | | 11.0% | | 31,348 | | 9.3% | | $16.83 |
3 | | Orlando-Kissimmee-Sanford, FL | 4 | | 1,181 | | 6.3% | | 24,381 | | 7.3% | | $21.53 |
4 | | Chicago-Naperville-Elgin, IL-IN-WI | 5 | | 973 | | 5.2% | | 24,151 | | 7.2% | | $27.53 |
5 | | Trenton, NJ | 2 | | 1,306 | | 7.0% | | 22,831 | | 6.8% | | $18.91 |
6 | | Phoenix-Mesa-Scottsdale, AZ | 11 | | 1,090 | | 5.8% | | 21,325 | | 6.4% | | $22.29 |
7 | | Denver-Aurora-Lakewood, CO | 7 | | 1,162 | | 6.2% | | 20,591 | | 6.1% | | $19.33 |
8 | | Charlotte-Concord-Gastonia, NC-SC | 5 | | 1,137 | | 6.1% | | 16,779 | | 5.0% | | $16.31 |
9 | | Columbus, OH | 2 | | 961 | | 5.1% | | 14,520 | | 4.3% | | $16.25 |
10 | | Los Angeles-Long Beach-Anaheim, CA | 2 | | 666 | | 3.6% | | 12,801 | | 3.8% | | $24.71 |
11 | | San Antonio-New Braunfels, TX | 3 | | 932 | | 5.0% | | 12,735 | | 3.8% | | $18.01 |
12 | | Richmond, VA | 4 | | 598 | | 3.2% | | 10,171 | | 3.0% | | $21.41 |
13 | | Washington-Arlington-Alexandria, DC-VA-MD-WV | 5 | | 479 | | 2.6% | | 8,770 | | 2.6% | | $27.58 |
14 | | New York-Newark-Jersey City, NY-NJ-PA | 5 | | 466 | | 2.5% | | 8,723 | | 2.6% | | $23.66 |
15 | | Tampa-St. Petersburg-Clearwater, FL | 4 | | 432 | | 2.3% | | 7,949 | | 2.4% | | $21.22 |
16 | | Cincinnati, OH-KY-IN | 1 | | 427 | | 2.3% | | 7,619 | | 2.3% | | $17.62 |
17 | | San Francisco-Oakland-Hayward, CA | 4 | | 181 | | 1.0% | | 7,068 | | 2.1% | | $43.80 |
18 | | Portland-Vancouver-Hillsboro, OR-WA | 2 | | 384 | | 2.1% | | 7,046 | | 2.1% | | $27.76 |
19 | | Sacramento-Roseville-Arden-Arcade, CA | 2 | | 275 | | 1.5% | | 5,828 | | 1.7% | | $30.29 |
20 | | St. Louis, MO-IL | 1 | | 338 | | 1.8% | | 5,511 | | 1.6% | | $25.40 |
| | Other | 24 | | 2,074 | | 11.1% | | 33,297 | | 9.9% | | $17.83 |
| | Total | 114 | | 18,686 | | 100.0% | | $335,484 | | 100.0% | | $20.69 |
| | | | | | | | | | | | | |
Note: $ and GLA in thousands except shopping center count and base rent PSF; Top 20 MSA figures for SITE at share except for property count |
SITE Centers Corp.
Capital Structure
| | | | | | |
$, shares and units in thousands, except per share | | | | | | |
| | March 31, 2024 | | December 31, 2023 | | December 31, 2022 |
Capital Structure | | | | | | |
Market Value Per Share | | $14.65 | | $13.63 | | $13.66 |
| | | | | | |
Common Shares Outstanding | | 209,544 | | 209,328 | | 210,853 |
Operating Partnership Units | | 0 | | 0 | | 141 |
Total Outstanding Common Shares | | 209,544 | | 209,328 | | 210,994 |
| | | | | | |
Common Shares Equity | | $3,069,820 | | $2,853,141 | | $2,882,178 |
Perpetual Preferred Stock - Class A | | 175,000 | | 175,000 | | 175,000 |
| | | | | | |
Unsecured Credit Facilities | | 0 | | 0 | | 0 |
Unsecured Term Loan | | 200,000 | | 200,000 | | 200,000 |
Unsecured Notes Payable | | 1,244,372 | | 1,305,758 | | 1,457,741 |
Mortgage Debt (includes JVs at SITE share) | | 240,624 | | 240,882 | | 165,408 |
Total Debt (includes JVs at SITE share) | | 1,684,996 | | 1,746,640 | | 1,823,149 |
Less: Cash (including restricted cash) | | 568,725 | | 581,760 | | 31,011 |
Net Debt | | $1,116,271 | | $1,164,880 | | $1,792,138 |
| | | | | | |
Total Market Capitalization | | $4,361,090 | | $4,193,020 | | $4,849,316 |
| | | | | | |
Leverage / Public Debt Covenants | | | | | | |
Average Consolidated Net Effective Debt | | 1,387,263 | | 1,376,540 | | 1,664,859 |
Consolidated Adjusted EBITDA - TTM | | 343,681 | | 347,807 | | 348,406 |
Average Consolidated Net Debt / Adjusted EBITDA(1) | | 4.0X | | 4.0X | | 4.8X |
| | | | | | |
Average Pro-Rata Net Effective Debt | | 1,490,910 | | 1,484,533 | | 1,806,016 |
Pro-Rata Adjusted EBITDA - TTM | | 349,847 | | 353,822 | | 356,198 |
Average Pro-Rata Net Debt / Adjusted EBITDA(1) | | 4.3X | | 4.2X | | 5.1X |
| | | | | | |
Outstanding Debt & Obligations | | 1,584,630 | | 1,649,895 | | 1,730,562 |
Undepreciated Real Estate Assets | | 4,727,813 | | 4,870,531 | | 5,477,767 |
Total Debt to Real Estate Assets Ratio(2) | | 34% | | 34% | | 32% |
Covenant | | 65% | | 65% | | 65% |
| | | | | | |
Secured Debt & Obligations | | 125,516 | | 125,651 | | 54,173 |
Total Assets | | 5,463,724 | | 5,626,403 | | 5,690,332 |
Secured Debt to Assets Ratio | | 2% | | 2% | | 1% |
Covenant | | 40% | | 40% | | 40% |
| | | | | | |
Unencumbered Real Estate Assets | | 4,479,188 | | 4,622,639 | | 5,319,838 |
Unsecured Debt & Obligations | | 1,459,113 | | 1,524,244 | | 1,676,388 |
Unencumbered Assets to Unsecured Debt(2) | | 307% | | 303% | | 317% |
Covenant | | 135% | | 135% | | 135% |
| | | | | | |
Net Income Available for Debt Service | | 325,082 | | 331,462 | | 336,115 |
Maximum Annual Service Charge | | 83,124 | | 84,195 | | 81,425 |
Fixed Charge Coverage Ratio | | 3.9X | | 3.9X | | 4.1X |
Covenant | | 1.5X | | 1.5X | | 1.5X |
| | | | | | |
Credit Ratings (Outlook) | | | | | | |
Moody's | | Baa3 (Negative) | | Baa3 (Negative) | | Baa3 (Stable) |
S&P | | BBB- (Negative) | | BBB- (Negative) | | BBB- (Stable) |
Fitch | | BBB (Positive) | | BBB (Positive) | | BBB (Stable) |
| | | | | | |
(1) Excludes Perpetual Preferred Stock. See definition in the Non-GAAP Measures section. | | | | |
(2) Real Estate Assets and Unencumbered Assets exclude consolidated cash and cash equivalents. | | | | |
| | | | | | |
| | | | |
SITE Centers Corp.
Same Store Metrics (1)
| | | | | |
| | | | |
| | | | | |
| Same Store Net Operating Income |
| Quarterly Same Store NOI | |
| 1Q24 | | 1Q23 | Change | |
| | | | | |
Consolidated SSNOI Leased rate | 94.2% | | 95.7% | (1.5%) | |
Consolidated SSNOI Commenced rate | 91.6% | | 92.7% | (1.1%) | |
| | | | | |
Revenues: | | | | | |
Minimum rents | $76,954 | | $76,428 | | |
Recoveries | 28,921 | | 28,329 | | |
Uncollectible revenue | 282 | | 115 | | |
Percentage and overage rents | 1,884 | | 1,045 | | |
Ancillary and other rental income | 1,618 | | 1,825 | | |
| 109,659 | | 107,742 | 1.8% | |
Expenses: | | | | | |
Operating and maintenance | (16,356) | | (15,900) | | |
Real estate taxes | (16,648) | | (16,365) | | |
| (33,004) | | (32,265) | 2.3% | |
Total Consolidated SSNOI | $76,655 | | $75,477 | 1.6% | |
| | | | | |
Total Unconsolidated SSNOI at SITE share | 3,666 | | 3,647 | | |
Total SSNOI at SITE share | $80,321 | | $79,124 | 1.5% | |
| | | | | |
Consolidated SSNOI Operating Margin | 69.9% | | 70.1% | | |
Consolidated SSNOI Recovery Rate | 87.6% | | 87.8% | | |
|
(1) See calculation definition in the Non-GAAP Measures section and GAAP reconciliation on page 8. Figures reported include redevelopment. |
SITE Centers Corp.
Leasing Summary
| | | | | | | | | | | |
At pro rata share except for count | | | | | |
| | | | | | | | | | | |
Leasing Activity | | | | | | | | | | | |
| Comparable Pool | | Total Pool |
| | | | Leasing Spreads | | | | | | |
| Count | GLA | ABR PSF | Cash | Straight-lined | Term | | Count | GLA | ABR PSF | Term |
New Leases | | | | | | | | | | | |
1Q24 | 10 | 17,120 | $37.38 | 11.5% | 26.9% | 8.3 | | 15 | 69,438 | $26.28 | 11.0 |
4Q23 | 9 | 64,639 | $17.81 | 9.2% | 17.3% | 9.5 | | 21 | 106,733 | $21.62 | 9.3 |
3Q23 | 14 | 157,937 | $20.76 | 58.2% | 73.0% | 9.8 | | 26 | 205,775 | $22.22 | 9.9 |
2Q23 | 11 | 89,204 | $26.73 | 14.8% | 23.3% | 9.4 | | 33 | 170,016 | $25.97 | 8.6 |
| 44 | 328,900 | $22.67 | 29.0% | 40.3% | 9.6 | | 95 | 551,962 | $23.77 | 9.6 |
| | | | | | | | | | | |
Renewals | | | | | | | | | | | |
1Q24 | 84 | 576,746 | $19.77 | 8.0% | 12.4% | 5.3 | | 84 | 576,746 | $19.77 | 5.3 |
4Q23 | 68 | 383,399 | $23.73 | 3.1% | 9.0% | 5.1 | | 68 | 383,399 | $23.73 | 5.1 |
3Q23 | 93 | 1,027,931 | $17.63 | 6.6% | 10.2% | 5.7 | | 93 | 1,027,931 | $17.63 | 5.7 |
2Q23 | 104 | 945,162 | $17.29 | 7.2% | 11.9% | 5.7 | | 104 | 945,162 | $17.29 | 5.7 |
| 349 | 2,933,238 | $18.74 | 6.5% | 11.0% | 5.5 | | 349 | 2,933,238 | $18.74 | 5.5 |
| | | | | | | | | | | |
New + Renewals | | | | | | | | | | | |
1Q24 | 94 | 593,866 | $20.28 | 8.2% | 13.1% | 5.4 | | 99 | 646,184 | $20.47 | 5.9 |
4Q23 | 77 | 448,038 | $22.88 | 3.8% | 9.9% | 5.7 | | 89 | 490,132 | $23.27 | 6.0 |
3Q23 | 107 | 1,185,868 | $18.05 | 12.2% | 16.9% | 6.2 | | 119 | 1,233,706 | $18.39 | 6.4 |
2Q23 | 115 | 1,034,366 | $18.11 | 8.1% | 13.3% | 6.0 | | 137 | 1,115,178 | $18.62 | 6.1 |
| 393 | 3,262,138 | $19.14 | 8.8% | 13.9% | 5.9 | | 444 | 3,485,200 | $19.54 | 6.2 |
| | | | | | | | | | |
Net Effective Rents | | | | | | | | | |
| | | Capex PSF | NER | | % of GLA |
| GLA | ABR PSF | TA | LL Work | LC | Total | PSF | Term | >10K SF | <10K SF |
New Leases | | | | | | | | | | |
1Q24 | 47,281 | $29.17 | $3.59 | $0.03 | $1.31 | $4.93 | $24.24 | 9.2 | 61% | 39% |
4Q23 | 94,689 | $22.60 | $1.68 | $2.59 | $1.02 | $5.29 | $17.31 | 9.3 | 61% | 39% |
3Q23 | 182,231 | $22.90 | $1.99 | $0.60 | $0.81 | $3.40 | $19.50 | 9.8 | 80% | 20% |
2Q23 | 160,230 | $26.21 | $3.89 | $0.92 | $1.25 | $6.06 | $20.15 | 8.5 | 57% | 43% |
| 484,431 | $24.55 | $2.67 | $1.03 | $1.04 | $4.74 | $19.81 | 9.2 | 67% | 33% |
| | | | | | | | | | |
Renewals | | | | | | | | | | |
1Q24 | 576,746 | $20.26 | $0.10 | $0.00 | $0.00 | $0.10 | $20.16 | 5.3 | 72% | 28% |
4Q23 | 383,399 | $24.19 | $0.03 | $0.00 | $0.01 | $0.04 | $24.15 | 5.1 | 66% | 34% |
3Q23 | 1,027,931 | $17.90 | $0.12 | $0.00 | $0.00 | $0.12 | $17.78 | 5.7 | 81% | 19% |
2Q23 | 945,162 | $17.62 | $0.05 | $0.00 | $0.00 | $0.05 | $17.57 | 5.7 | 78% | 22% |
| 2,933,238 | $19.09 | $0.08 | $0.00 | $0.00 | $0.08 | $19.01 | 5.5 | 76% | 24% |
| | | | | | | | | | |
New + Renewals | | | | | | | | | |
1Q24 | 624,027 | $20.93 | $0.54 | $0.00 | $0.17 | $0.71 | $20.22 | 5.6 | 72% | 28% |
4Q23 | 478,088 | $23.88 | $0.54 | $0.80 | $0.32 | $1.66 | $22.22 | 5.9 | 65% | 35% |
3Q23 | 1,210,162 | $18.65 | $0.56 | $0.14 | $0.19 | $0.89 | $17.76 | 6.3 | 81% | 19% |
2Q23 | 1,105,392 | $18.86 | $0.84 | $0.19 | $0.26 | $1.29 | $17.57 | 6.1 | 75% | 25% |
| 3,417,669 | $19.87 | $0.64 | $0.22 | $0.23 | $1.09 | $18.78 | 6.0 | 75% | 25% |
| | | | | | | | | | |
Note: ABR PSF represents year one base rent for leasing spreads and the average rent for the initial term for net effective rent. Term is weighted average in years. New Leases exclude leases at redevelopment properties and first generation space. |
| |
SITE Centers Corp.
Lease Expirations
| | | | | | | | | | | | | | | | | | | | | | | | | | |
At pro rata share except for count; $ and GLA in thousands | | | | | | | | | | | | |
| | | | | | | | | | | | | | | | | | | | | | | | | | |
Assumes no exercise of lease options | | | | | | | | | | | | | | | | | | | | | |
| | | | | | | | | | | | | | | | | | | | | | | | | | |
| Greater than 10K SF | | Less than 10K SF | | Total |
Year | # of
Leases | | Expiring
SF | % of SF
> 10K | ABR | % of ABR
> 10K | | Rent
PSF | | # of
Leases | | Expiring
SF | % of SF
< 10K | ABR | % of ABR
< 10K | | Rent
PSF | | # of
Leases | | Expiring
SF | % of SF
Total | ABR | % of ABR
Total | | Rent
PSF |
MTM | 0 | | 0 | 0.0% | $0 | 0.0% | | $0.00 | | 14 | | 32 | 0.7% | $785 | 0.5% | | $24.53 | | 14 | | 32 | 0.2% | $785 | 0.2% | | $24.53 |
2024 | 13 | | 350 | 2.9% | 4,217 | 2.4% | | $12.05 | | 93 | | 192 | 4.0% | 5,908 | 3.7% | | $30.77 | | 106 | | 542 | 3.2% | 10,125 | 3.0% | | $18.68 |
2025 | 68 | | 1,706 | 13.9% | 25,589 | 14.5% | | $15.00 | | 231 | | 613 | 12.6% | 18,817 | 11.8% | | $30.70 | | 299 | | 2,319 | 13.5% | 44,406 | 13.2% | | $19.15 |
2026 | 57 | | 1,221 | 10.0% | 14,101 | 8.0% | | $11.55 | | 223 | | 535 | 11.0% | 17,182 | 10.8% | | $32.12 | | 280 | | 1,756 | 10.3% | 31,283 | 9.3% | | $17.81 |
2027 | 73 | | 1,968 | 16.0% | 31,492 | 17.8% | | $16.00 | | 239 | | 682 | 14.0% | 21,829 | 13.7% | | $32.01 | | 312 | | 2,650 | 15.5% | 53,321 | 15.9% | | $20.12 |
2028 | 92 | | 2,381 | 19.4% | 33,055 | 18.7% | | $13.88 | | 274 | | 702 | 14.5% | 24,595 | 15.5% | | $35.04 | | 366 | | 3,083 | 18.0% | 57,650 | 17.2% | | $18.70 |
2029 | 61 | | 1,556 | 12.7% | 21,902 | 12.4% | | $14.08 | | 201 | | 553 | 11.4% | 18,065 | 11.4% | | $32.67 | | 262 | | 2,109 | 12.3% | 39,967 | 11.9% | | $18.95 |
2030 | 26 | | 652 | 5.3% | 9,861 | 5.6% | | $15.12 | | 99 | | 263 | 5.4% | 9,053 | 5.7% | | $34.42 | | 125 | | 915 | 5.3% | 18,914 | 5.6% | | $20.67 |
2031 | 21 | | 597 | 4.9% | 7,785 | 4.4% | | $13.04 | | 83 | | 232 | 4.8% | 7,230 | 4.6% | | $31.16 | | 104 | | 829 | 4.8% | 15,015 | 4.5% | | $18.11 |
2032 | 20 | | 429 | 3.5% | 6,526 | 3.7% | | $15.21 | | 140 | | 398 | 8.2% | 13,283 | 8.4% | | $33.37 | | 160 | | 827 | 4.8% | 19,809 | 5.9% | | $23.95 |
2033 | 27 | | 489 | 4.0% | 7,092 | 4.0% | | $14.50 | | 132 | | 400 | 8.2% | 13,587 | 8.6% | | $33.97 | | 159 | | 889 | 5.2% | 20,679 | 6.2% | | $23.26 |
Thereafter | 27 | | 913 | 7.4% | 15,004 | 8.5% | | $16.43 | | 82 | | 253 | 5.2% | 8,526 | 5.4% | | $33.70 | | 109 | | 1,166 | 6.8% | 23,530 | 7.0% | | $20.18 |
Total | 485 | | 12,262 | 100.0% | $176,624 | 100.0% | | $14.40 | | 1,811 | | 4,855 | 100.0% | $158,860 | 100.0% | | $32.72 | | 2,296 | | 17,117 | 100.0% | $335,484 | 100.0% | | $19.60 |
| | | | | | | | | | | | | | | | | | | | | | | | | | |
Signed Not Open | 19 | | 388 | | $7,236 | | | $18.65 | | 58 | | 141 | | $5,850 | | | $41.49 | | 77 | | 529 | | $13,086 | | | $24.74 |
Vacant | 23 | | 601 | | | | | | | 213 | | 493 | | | | | | | 236 | | 1,094 | | | | | |
| | | | | | | | | | | | | | | | | | | | | | | | | | |
| | | | | | | | | | | | | | | | | | | | | | | | | | |
Assumes all lease options are exercised | | | | | | | | | | | | | | | | | | | | |
| | | | | | | | | | | | | | | | | | | | | | | | | | |
| Greater than 10K SF | | Less than 10K SF | | Total |
Year | # of
Leases | | Expiring
SF | % of SF
> 10K | ABR | % of ABR
> 10K | | Rent
PSF | | # of
Leases | | Expiring
SF | % of SF
< 10K | ABR | % of ABR
< 10K | | Rent
PSF | | # of
Leases | | Expiring
SF | % of SF
Total | ABR | % of ABR
Total | | Rent
PSF |
MTM | 0 | | 0 | 0.0% | $0 | 0.0% | | $0.00 | | 12 | | 29 | 0.6% | $708 | 0.4% | | $24.41 | | 12 | | 29 | 0.2% | $708 | 0.2% | | $24.41 |
2024 | 5 | | 55 | 0.4% | 992 | 0.6% | | $18.04 | | 67 | | 125 | 2.6% | 3,887 | 2.4% | | $31.10 | | 72 | | 180 | 1.1% | 4,879 | 1.5% | | $27.11 |
2025 | 15 | | 262 | 2.1% | 3,877 | 2.2% | | $14.80 | | 138 | | 295 | 6.1% | 9,863 | 6.2% | | $33.43 | | 153 | | 557 | 3.3% | 13,740 | 4.1% | | $24.67 |
2026 | 6 | | 60 | 0.5% | 983 | 0.6% | | $16.38 | | 111 | | 234 | 4.8% | 7,487 | 4.7% | | $32.00 | | 117 | | 294 | 1.7% | 8,470 | 2.5% | | $28.81 |
2027 | 16 | | 261 | 2.1% | 5,113 | 2.9% | | $19.59 | | 109 | | 259 | 5.3% | 8,193 | 5.2% | | $31.63 | | 125 | | 520 | 3.0% | 13,306 | 4.0% | | $25.59 |
2028 | 19 | | 299 | 2.4% | 5,187 | 2.9% | | $17.35 | | 151 | | 363 | 7.5% | 12,615 | 7.9% | | $34.75 | | 170 | | 662 | 3.9% | 17,802 | 5.3% | | $26.89 |
2029 | 7 | | 175 | 1.4% | 2,735 | 1.5% | | $15.63 | | 136 | | 294 | 6.1% | 10,074 | 6.3% | | $34.27 | | 143 | | 469 | 2.7% | 12,809 | 3.8% | | $27.31 |
2030 | 16 | | 320 | 2.6% | 5,714 | 3.2% | | $17.86 | | 84 | | 199 | 4.1% | 6,123 | 3.9% | | $30.77 | | 100 | | 519 | 3.0% | 11,837 | 3.5% | | $22.81 |
2031 | 19 | | 239 | 1.9% | 4,068 | 2.3% | | $17.02 | | 84 | | 175 | 3.6% | 5,410 | 3.4% | | $30.91 | | 103 | | 414 | 2.4% | 9,478 | 2.8% | | $22.89 |
2032 | 14 | | 283 | 2.3% | 4,983 | 2.8% | | $17.61 | | 108 | | 280 | 5.8% | 9,238 | 5.8% | | $32.99 | | 122 | | 563 | 3.3% | 14,221 | 4.2% | | $25.26 |
2033 | 24 | | 458 | 3.7% | 7,381 | 4.2% | | $16.12 | | 102 | | 262 | 5.4% | 8,640 | 5.4% | | $32.98 | | 126 | | 720 | 4.2% | 16,021 | 4.8% | | $22.25 |
Thereafter | 344 | | 9,850 | 80.3% | 135,591 | 76.8% | | $13.77 | | 709 | | 2,340 | 48.2% | 76,622 | 48.2% | | $32.74 | | 1,053 | | 12,190 | 71.2% | 212,213 | 63.3% | | $17.41 |
Total | 485 | | 12,262 | 100.0% | $176,624 | 100.0% | | $14.40 | | 1,811 | | 4,855 | 100.0% | $158,860 | 100.0% | | $32.72 | | 2,296 | | 17,117 | 100.0% | $335,484 | 100.0% | | $19.60 |
| | | | | | | | | | | | | | | | | | | | | | | | | | |
Note: Includes ground leases | | | | | | | | | | | | | | | | | | | | | |
SITE Centers Corp.
Top 50 Tenants
| | | | | | | | | | | | |
$ and GLA in thousands | | | | | | | |
| | | Number of Units | Base Rent | Owned GLA | Credit Ratings |
| | Tenant | WO | JV | Total | Pro Rata | % of Total | At 100% | Pro Rata | % of Total | At 100% | (S&P/Moody's/Fitch) |
1 | | TJX Companies (1) | 43 | 8 | 51 | $16,891 | 5.0% | $18,803 | 1,261 | 6.7% | 1,425 | A/A2/NR |
2 | | Dick's Sporting Goods (2) | 11 | 4 | 15 | 8,728 | 2.6% | 10,453 | 523 | 2.8% | 670 | BBB/Baa3/NR |
3 | | Ross Stores (3) | 18 | 8 | 26 | 7,803 | 2.3% | 10,081 | 565 | 3.0% | 753 | BBB+/A2/NR |
4 | | PetSmart | 19 | 3 | 22 | 7,310 | 2.2% | 8,030 | 433 | 2.3% | 476 | B+/B1/NR |
5 | | Burlington | 12 | 1 | 13 | 6,888 | 2.1% | 7,272 | 458 | 2.5% | 491 | BB+/NR/NR |
6 | | Michaels | 18 | 4 | 22 | 5,695 | 1.7% | 6,675 | 441 | 2.4% | 518 | CCC+/B3/NR |
7 | | Gap (4) | 16 | 7 | 23 | 5,193 | 1.5% | 6,427 | 280 | 1.5% | 363 | BB/Ba3/NR |
8 | | Kroger (5) | 5 | 1 | 6 | 5,176 | 1.5% | 5,734 | 318 | 1.7% | 354 | BBB/Baa1/NR |
9 | | Ulta | 20 | 5 | 25 | 5,165 | 1.5% | 6,054 | 214 | 1.1% | 258 | NR |
10 | | Nordstrom Rack | 7 | 0 | 7 | 5,093 | 1.5% | 5,093 | 258 | 1.4% | 258 | BB+/Ba1/BB |
11 | | Best Buy | 6 | 3 | 9 | 4,602 | 1.4% | 6,171 | 286 | 1.5% | 399 | BBB+/A3/NR |
12 | | Five Below | 24 | 5 | 29 | 4,543 | 1.4% | 5,192 | 221 | 1.2% | 256 | NR |
13 | | Whole Foods | 2 | 0 | 2 | 3,910 | 1.2% | 3,910 | 99 | 0.5% | 99 | AA/A1/AA- |
14 | | Kohl's | 4 | 3 | 7 | 3,569 | 1.1% | 5,213 | 415 | 2.2% | 605 | BB/Ba2/BB+ |
15 | | Macy's (6) | 6 | 0 | 6 | 3,239 | 1.0% | 3,239 | 206 | 1.1% | 206 | BB+/Ba1/BBB- |
16 | | Party City | 12 | 3 | 15 | 2,977 | 0.9% | 3,388 | 155 | 0.8% | 187 | NR |
17 | | Designer Brands Inc. (DSW) | 8 | 1 | 9 | 2,934 | 0.9% | 3,218 | 182 | 1.0% | 198 | NR |
18 | | JOANN | 7 | 3 | 10 | 2,849 | 0.8% | 3,451 | 225 | 1.2% | 285 | D/NR/NR |
19 | | AMC Theatres | 1 | 3 | 4 | 2,838 | 0.8% | 6,912 | 130 | 0.7% | 315 | CCC+/Caa2/NR |
20 | | Petco | 8 | 3 | 11 | 2,520 | 0.8% | 3,160 | 115 | 0.6% | 152 | B/B3/NR |
21 | | Total Wine & More | 4 | 0 | 4 | 2,518 | 0.8% | 2,518 | 115 | 0.6% | 115 | NR |
22 | | Office Depot (7) | 7 | 1 | 8 | 2,481 | 0.7% | 2,717 | 149 | 0.8% | 168 | NR |
23 | | Cost Plus | 7 | 1 | 8 | 2,446 | 0.7% | 2,680 | 134 | 0.7% | 149 | NR |
24 | | AT&T | 21 | 4 | 25 | 2,364 | 0.7% | 2,569 | 62 | 0.3% | 71 | BBB/Baa2/BBB+ |
25 | | Barnes & Noble | 5 | 1 | 6 | 2,333 | 0.7% | 2,653 | 116 | 0.6% | 132 | NR |
26 | | Starbucks | 22 | 0 | 22 | 2,264 | 0.7% | 2,264 | 40 | 0.2% | 40 | BBB+/Baa1/NR |
27 | | Publix | 3 | 1 | 4 | 2,211 | 0.7% | 2,570 | 175 | 0.9% | 220 | NR |
28 | | Dollar Tree | 17 | 2 | 19 | 2,131 | 0.6% | 2,293 | 186 | 1.0% | 204 | BBB/Baa2/NR |
29 | | Staples | 6 | 1 | 7 | 1,949 | 0.6% | 2,176 | 118 | 0.6% | 134 | B-/B3/NR |
30 | | Hobby Lobby | 4 | 0 | 4 | 1,920 | 0.6% | 1,920 | 222 | 1.2% | 222 | NR |
31 | | Lowe's | 2 | 2 | 4 | 1,918 | 0.6% | 3,608 | 322 | 1.7% | 531 | BBB+/Baa1/NR |
32 | | Tailored Brands (8) | 10 | 2 | 12 | 1,885 | 0.6% | 2,038 | 80 | 0.4% | 87 | B/NR/NR |
33 | | Mattress Firm | 12 | 3 | 15 | 1,856 | 0.6% | 2,150 | 55 | 0.3% | 65 | NR |
34 | | JPMorgan Chase | 9 | 0 | 9 | 1,792 | 0.5% | 1,792 | 40 | 0.2% | 40 | A-/A2/AA- |
35 | | LA Fitness | 2 | 1 | 3 | 1,764 | 0.5% | 2,410 | 99 | 0.5% | 130 | B/B3/NR |
36 | | Bath & Body Works | 13 | 3 | 16 | 1,709 | 0.5% | 1,937 | 50 | 0.3% | 58 | BB/Ba2/NR |
37 | | JAB Holding (9) | 11 | 1 | 12 | 1,694 | 0.5% | 1,779 | 53 | 0.3% | 56 | NR/Baa1/NR |
38 | | Franchise Group (10) | 9 | 1 | 10 | 1,676 | 0.5% | 1,771 | 99 | 0.5% | 101 | B-/B3/NR |
39 | | Caleres Inc. | 9 | 1 | 10 | 1,625 | 0.5% | 1,805 | 81 | 0.4% | 89 | BB-/NR/NR |
40 | | Target | 2 | 0 | 2 | 1,610 | 0.5% | 1,610 | 295 | 1.6% | 295 | A/A2/A |
41 | | Darden (11) | 8 | 0 | 8 | 1,602 | 0.5% | 1,602 | 58 | 0.3% | 58 | BBB/Baa2/BBB |
42 | | Verizon | 10 | 2 | 12 | 1,586 | 0.5% | 1,926 | 35 | 0.2% | 42 | BBB+/Baa1/A- |
43 | | Inspire Brands (12) | 17 | 0 | 17 | 1,570 | 0.5% | 1,570 | 41 | 0.2% | 41 | B+/NR/NR |
44 | | America's Best Contacts | 14 | 3 | 17 | 1,537 | 0.5% | 1,760 | 51 | 0.3% | 59 | NR |
45 | | Xsport Fitness | 1 | 0 | 1 | 1,502 | 0.4% | 1,502 | 45 | 0.2% | 45 | NR |
46 | | Carter's Childrenswear | 11 | 1 | 12 | 1,460 | 0.4% | 1,549 | 46 | 0.2% | 49 | BB+/NR/NR |
47 | | Cinemark | 1 | 2 | 3 | 1,430 | 0.4% | 1,950 | 111 | 0.6% | 176 | BB-/NR/B+ |
48 | | Visionworks | 11 | 3 | 14 | 1,372 | 0.4% | 1,709 | 39 | 0.2% | 48 | NR |
49 | | Brinker International (Chili's) | 9 | 0 | 9 | 1,362 | 0.4% | 1,362 | 52 | 0.3% | 52 | BB-/Ba3/NR |
50 | | Fresh Market | 3 | 1 | 4 | 1,313 | 0.4% | 1,650 | 78 | 0.4% | 96 | NR |
| | | 507 | 102 | 609 | $162,803 | 48.5% | $190,316 | 9,832 | 52.6% | 11,841 | |
| | Total Portfolio | | | | $335,484 | 100.0% | $382,670 | 18,686 | 100.0% | 21,938 | |
| | | | | | | | | | | | |
(1) T.J. Maxx (13) / Marshalls (15) / HomeGoods (13) / Sierra Trading (5) / Combo Store (2) / HomeSense (3) | (7) Office Depot (4) / OfficeMax (4) |
(2) Dick's Sporting Goods (12) / Golf Galaxy (3) | | (8) Men's Wearhouse (10) / Jos. A. Bank (1) / K&G Fashion Superstore (1) |
(3) Ross Dress for Less (25) / dd's Discounts (1) | | (9) Panera (11) / Bruegger's (1) |
(4) Gap (2) / Old Navy (20) / Banana Republic (1) | | (10) Vitamin Shoppe (5) / Pet Supplies Plus (3) / American Freight (2) |
(5) Kroger (2) / Harris Teeter (1) / King Soopers (1) / Mariano's (1) / Lucky's (1) | | (11) Longhorn Steakhouse (5) / Olive Garden (3) |
(6) Macy's Furniture (2) / Market by Macy's (2) / Bloomingdale's Outlet (1) / Bluemercury (1) | | (12) Dunkin (7) / Buffalo Wild Wings (6) / Jimmy John's (2) / Baskin Robbins (2) |
| | | | | | | | | | | | |
Note: All data as of March 31, 2024 |
SITE Centers Corp.
Redevelopment Pipeline (1)
| | | | | | | | | | | | | | | | | | | | |
$ in thousands | | | | | | | | | | | | | | | | | | | | |
| | | | | | | | | | | | | | | | | | | | |
| | | | | | | | | | | | | | | | | | | |
Shopping Center | MSA | SITE
Own
% | | Est.
Yield (%) | | Est.
Net
Costs | | Costs
to Date | | Est.
Remain.
Costs | | Placed
In
Service | | CIP | | Initial
Occ. | | Est.
Stabilize | | Key Tenants |
| | | | | | | | | | | | | | | | | | | | |
University Hills | Denver, CO | 100% | | | | $6,718 | | $5,736 | | $982 | | $5,736 | | $0 | | 3Q23 | | 3Q24 | | Wendy's, Sweetgreen, Heyday |
Shops at Framingham | Boston, MA | 100% | | | | 2,414 | | 2,303 | | 111 | | 0 | | 2,303 | | 2Q24 | | 2Q24 | | Starbucks |
Tanasbourne Town Center | Portland, OR | 100% | | | | 15,573 | | 10,826 | | 4,747 | | 0 | | 10,826 | | 2Q25 | | 1Q26 | | New Seasons, Fast Casual Restaurant |
Perimeter Pointe | Atlanta, GA | 100% | | | | 0 | | 1,417 | | 0 | | 0 | | 1,417 | | TBD | | TBD | | — |
Total Redevelopment Pipeline | | | 10% | | $24,705 | | $20,282 | | $5,840 | | $5,736 | | $14,546 | | | | | | |
| | | | | | | | | | | | | | | | | | | | |
Other (2) | | | | | 0 | | 34,339 | | 0 | | 0 | | 34,339 | | | | | | |
Undeveloped land (3) | | | | | 0 | | 5,263 | | 0 | | 0 | | 5,263 | | | | | | |
Total Redevelopment Costs | | | | | $24,705 | | $59,884 | | $5,840 | | $5,736 | | $54,148 | | | | | | |
| | | | | | | | | | | | | | | | | | | | |
| | | | | | | | | | | | | | | | | | | | |
(1) Projects included in SSNOI. |
(2) Includes predevelopment and retenanting expenditures. |
(3) Balance excludes owned land adjacent to existing centers with an estimated value of $9 million and the net book basis of the Company's Beachwood, OH headquarters office buildings of $25 million (non-income producing portion). The income producing portion of the Company's headquarters buildings generated $353 thousand of NOI in 1Q24. |
|
SITE Centers Corp.
Transactions
| | | | | | | | | | |
$ and GLA in thousands | | | | | | | | |
Acquisitions | | SITE | | Owned | | Price |
| | Property Name | MSA | Own % | | GLA | | At 100% | | At Share |
| | | | | | | | | | |
02/02/24 | | Meadowmont Village-Outparcels & Parcel K | Raleigh, NC | 20% | | 14 | | $8,100 | | $1,620 |
02/14/24 | | Grove at Harper's Preserve | Houston-The Woodlands-Sugar Land, TX | 100% | | 22 | | 10,650 | | 10,650 |
03/29/24 | | Shops at Gilbert Crossroads | Phoenix-Mesa-Scottsdale, AZ | 100% | | 15 | | 8,460 | | 8,460 |
| | | 1Q 2024 Total | | | 51 | | $27,210 | | $20,730 |
| | | | | | | | | | |
04/17/24 | | Collection at Brandon Boulevard- Ground Lease | Tampa-St. Petersburg-Clearwater, FL | 100% | | 0 | | $1,000 | | $1,000 |
| | | 2Q 2024 QTD | | | 0 | | $1,000 | | $1,000 |
| | | | | | | | | | |
| | | Total 2024 YTD | | | 51 | | $28,210 | | $21,730 |
| | | | | | | | | | |
Dispositions | | SITE | | Owned | | Price |
| | Property Name | MSA | Own % | | GLA | | At 100% | | At Share |
| | | | | | | | | | |
01/22/24 | | The Marketplace at Highland Village | Dallas-Fort Worth-Arlington, TX | 100% | | 207 | | $42,100 | | $42,100 |
01/26/24 | | Casselberry Commons (1) | Orlando-Kissimmee-Sanford, FL | 100% | | 237 | | 40,300 | | 40,300 |
03/01/24 | | Chapel Hills East | Denver-Aurora-Lakewood, CO | 100% | | 225 | | 37,000 | | 37,000 |
| | | 1Q 2024 Total | | | 669 | | $119,400 | | $119,400 |
| | | | | | | | | | |
04/17/24 | | Cool Springs Pointe | Nashville-Davidson-Murfreesboro-Franklin, TN | 100% | | 198 | | $34,550 | | $34,550 |
04/25/24 | | Market Square (2) | Atlanta-Sandy Springs-Roswell, GA | 100% | | 117 | | 15,600 | | 15,600 |
| | | 2Q 2024 QTD | | | 315 | | $50,150 | | $50,150 |
| | | | | | | | | | |
| | | Total 2024 YTD | | | 984 | | $169,550 | | $169,550 |
| | | | | | | | | | |
| | | | | | | | | | |
| | | | | | | | | | |
| | | | | | | | | | |
(1) Excludes 8K SF retained by SITE Centers (Shops at Casselberry). | | | | | | | |
(2) Excludes 9K SF retained by SITE Centers (Plaza at Market Square). | | | | | | | |
SITE Centers Corp.
Debt Summary
| | | | | | | | |
$ in thousands | | | | | | | | |
| Consolidated Debt | Unconsolidated Debt | Total Debt |
Debt Composition | 100% | SITE Share | Interest Rate | 100% | SITE Share | Interest Rate | SITE Share | Interest Rate |
Unsecured Credit Facilities | $0 | $0 | - | $0 | $0 | - | $0 | - |
Unsecured Term Loan | 200,000 | 200,000 | 3.99% | 0 | 0 | - | 200,000 | 3.99% |
Unsecured Public Debt | 1,244,372 | 1,244,372 | 4.36% | 0 | 0 | - | 1,244,372 | 4.36% |
Fixed Rate Mortgage Loans | 125,516 | 125,516 | 6.36% | 380,600 | 76,120 | 7.48% | 201,636 | 6.78% |
Variable Rate Mortgage Loans | 0 | 0 | - | 102,852 | 38,988 | 4.47% | 38,988 | 4.47% |
Subtotal | $1,569,888 | $1,569,888 | 4.47% | $483,452 | $115,108 | 6.46% | $1,684,996 | 4.61% |
Fair Market Value Adjustment | 160 | 160 | - | 0 | 0 | - | 160 | - |
Unamortized Loan Costs, Net | (4,817) | (4,817) | - | (18,292) | (3,707) | - | (8,524) | - |
Total | $1,565,231 | $1,565,231 | 4.47% | $465,160 | $111,401 | 6.46% | $1,676,632 | 4.61% |
| | | | | | | | |
| Consolidated Maturities | | Unconsolidated | Total | | Total | |
Maturity Schedule(1) | Secured | Unsecured | | Maturities | 100% | | SITE Share | Interest Rate |
2024 | $550 | $0 | | $41,683 | $42,233 | | $9,107 | 6.90% |
2025 | 26,732 | 400,376 | | 1,046 | 428,154 | | 427,628 | 3.80% |
2026 | 1,740 | 395,144 | | 60,123 | 457,007 | | 426,795 | 4.39% |
2027 | 1,861 | 650,000 | | 0 | 651,861 | | 651,861 | 4.55% |
2028 | 94,633 | 0 | | 0 | 94,633 | | 94,633 | 6.99% |
2029 | 0 | 0 | | 380,600 | 380,600 | | 76,120 | 7.48% |
2030 | 0 | 0 | | 0 | 0 | | 0 | - |
2031 | 0 | 0 | | 0 | 0 | | 0 | - |
2032 | 0 | 0 | | 0 | 0 | | 0 | - |
2033 and beyond | 0 | 0 | | 0 | 0 | | 0 | - |
Unsecured debt discount | 0 | (1,148) | | 0 | (1,148) | | (1,148) | - |
Total | $125,516 | $1,444,372 | | $483,452 | $2,053,340 | | $1,684,996 | 4.61% |
| | | | | | | | |
| | | | | | | | |
% of Total (at SITE share) | Consolidated | Interest Rate | | Unconsolidated | Interest Rate | | Total | Interest Rate |
Fixed | 100.0% | 4.47% | | 66.1% | 7.48% | | 97.7% | 4.61% |
Variable | 0.0% | 0.00% | | 33.9% | 4.47% | | 2.3% | 4.47% |
| | | | | | | | |
(1) Includes Consolidated and Unconsolidated Debt and assumes borrower extension options are exercised. | |
Note: Interest rate is GAAP at SITE Share. | |
| |
| | | | | | | | |
|
SITE Centers Corp.
Debt Detail
| | | | |
$ in thousands | | | | |
| Balance
100% | Balance
SITE Share | Maturity
Date | GAAP Interest
Rate |
Bank Debt | | | | |
Unsecured Term Loan ($200m)(1) | $200,000 | $200,000 | 06/27 | 3.99% |
Unsecured Revolver ($950m) | - | - | 06/27 | SOFR + 95(2) |
| $200,000 | $200,000 | | |
Unsecured Debt | | | | |
Unsecured Notes - 2025 | 400,129 | 400,129 | 02/25 | 3.79% |
Unsecured Notes - 2026 | 394,504 | 394,504 | 02/26 | 4.43% |
Unsecured Notes - 2027 | 449,739 | 449,739 | 06/27 | 4.80% |
| $1,244,372 | $1,244,372 | | |
Mortgage Debt | | | | |
DDRM Loan Pool B (2 assets)(3) | 40,943 | 8,188 | 07/24 | 6.90% |
Shoppes at Addison Place (North), FL | 8,655 | 8,655 | 02/25 | 4.08% |
Shoppes at Addison Place (South), FL | 6,512 | 6,512 | 02/25 | 4.11% |
Shoppes at Addison Place (Outlot), FL | 1,249 | 1,249 | 02/25 | 4.08% |
Southtown Center, FL | 9,100 | 9,100 | 05/25 | 3.51% |
Deer Park Town Center, IL(4) | 61,909 | 30,800 | 12/26 | 3.83% |
Nassau Park Pavilion, NJ | 100,000 | 100,000 | 11/28 | 6.99% |
DTP Loan Pool (10 assets) | 380,600 | 76,120 | 01/29 | 7.48% |
| $608,968 | $240,624 | | |
| | | | |
Consolidated & Unconsolidated Debt Subtotal | $2,053,340 | $1,684,996 | | |
FMV Adjustment – Assumed Debt | 160 | 160 | | |
Unamortized Loan Costs, Net | (23,109) | (8,524) | | |
Total Consolidated & Unconsolidated Debt | $2,030,391 | $1,676,632 | | |
| | | | |
| | | | |
Rate Type | | | | |
Fixed | $1,950,488 | $1,646,008 | 2.4 years | 4.61% |
Variable | 102,852 | 38,988 | 2.2 years | 4.47% |
| $2,053,340 | $1,684,996 | 2.4 years | 4.61% |
Perpetual Preferred Stock | | | | |
Class A | 175,000 | 175,000 | N/A(5) | 6.38% |
| | | | |
Note: Maturity dates assume all borrower extension options are exercised. GAAP interest rates shown as swapped or capped all-in interest rate where applicable. |
(1) Fixed all-in swap rate through June 2027. |
(2) Excludes loan fees and unamortized loan costs. |
(3) 3.00% SOFR Interest Rate Cap through July 2024. |
(4) 1.00% SOFR Interest Rate Cap through December 2024. Debt shown at share including promote. |
(5) Redeemable at par as of June 2022. |
SITE Centers Corp.
Debt/Adjusted EBITDA
| | |
$ in thousands | | |
| Twelve months ended
March 31, 2024 | Twelve months ended
March 31, 2023 |
Consolidated | | |
Consolidated net income to SITE | $226,867 | $170,067 |
Interest expense | 80,993 | 79,357 |
Tax expense | 2,084 | 776 |
Depreciation and amortization | 201,594 | 207,198 |
EBITDA | 511,538 | 457,398 |
Impairment charges | 66,600 | 2,536 |
Gain on sale and change in control of interests | 0 | (45,974) |
Gain on disposition of real estate, net | (250,535) | (46,991) |
EBITDAre | 327,603 | 366,969 |
Separation and other charges | 5,163 | 0 |
Equity in net income of JVs | (5,235) | (29,082) |
Loss on equity derivative instruments | 1,994 | 0 |
Gain on debt retirement | (760) | 0 |
Transaction, debt extinguishment and other | 6,661 | 2,217 |
JV OFFO (at SITE Share) | 8,255 | 10,962 |
Adjusted EBITDA (1) | 343,681 | 351,066 |
| | |
Consolidated debt-average | 1,673,750 | 1,770,299 |
Loan costs, net-average | 4,993 | 5,350 |
Face value adjustments-average | (391) | (849) |
Cash and restricted cash-average | (291,089) | (22,337) |
Average net effective debt | $1,387,263 | $1,752,463 |
| | |
Debt/Adjusted EBITDA – Consolidated (2) | 4.0x | 5.0x |
| | |
Pro rata including JVs | | |
EBITDAre | 329,950 | 347,829 |
Adjusted EBITDA | 349,847 | 358,398 |
| | |
Consolidated net debt-average | 1,387,263 | 1,752,463 |
JV debt (at SITE Share)-average | 118,038 | 148,086 |
JV cash and restricted cash (at SITE Share)-average | (14,391) | (11,926) |
Average net effective debt | $1,490,910 | $1,888,623 |
| | |
Debt/Adjusted EBITDA – Pro Rata (2) | 4.3x | 5.3x |
| | |
(1) See definition in the Non-GAAP Measures section. |
(2) Excludes perpetual preferred stock. |
SITE Centers Corp.
Unconsolidated Joint Ventures
| | | | | | | | | | | | | | | | |
$ and GLA in thousands | | | | | | | | | | | | | | | | |
Joint Venture | | SITE
Own % | | Number of Properties | | Owned
GLA | | Leased Rate | | ABR | | 1Q24 NOI
at 100% (1) | | Gross
RE Assets | | Debt Balance
at 100% (2) |
Chinese Institutional Investors
DTP | | 20% | | 10 | | 3,397 | | 95.8% | | $14.91 | | $12,165 | | $594,035 | | $380,600 |
| | | | | | | | | | | | | | | | |
Madison International
DDRM | | 20% | | 2 | | 444 | | 89.9% | | $18.16 | | 1,363 | | 105,819 | | 40,943 |
| | | | | | | | | | | | | | | | |
Prudential
RVIP IIIB, Deer Park, IL (3) | | 50% | | 1 | | 357 | | 81.2% | | $37.82 | | 1,896 | | 108,337 | | 61,909 |
Total | | | | 13 | | 4,198 | | | | | | $15,424 | | $808,191 | | $483,452 |
Property management fees | | | | | | | | | | | | 749 | (1) | | | |
NOI from assets sold | | | | | | | | | | | | 13 | | | | |
Net operating income | | | | | | | | | | | | $16,186 | (4) | | | |
|
(1) Property management fees charged by SITE to the joint venture are included as an expense in NOI, although presented in the combined income statement on the next page in the Other Expense line item. |
| | | | | | | | | | | | | | | | |
(2) Excludes unamortized loan costs, net of $18.3 million or $3.7 million at SITE's share. |
| | | | | | | | | | | | | | | | |
(3) Ownership shown at share including promote. |
| | | | | | | | | | | | | | | | |
(4) Amount agrees to the combined income statement of the joint ventures which includes a reconciliation of the Non-GAAP measure to the applicable GAAP measure. |
See calculation definition in the Non-GAAP Measures section. |
SITE Centers Corp.
Unconsolidated Joint Ventures
| | | | |
Combined SITE JV Pro Rata Adjustments (1) |
| | | | |
Income Statement Pro Rata Adjustments 1Q24 | | Balance Sheet Pro Rata Adjustments 1Q24 |
Revenues: | | | Assets: | |
Rental Income (2) | $5,237 | | Land | $40,230 |
Other income (3) | 76 | | Buildings | 135,761 |
| 5,313 | | Improvements | 17,878 |
Expenses: | | | | 193,869 |
Operating and maintenance | 832 | | Depreciation | (58,401) |
Real estate taxes | 651 | | | 135,468 |
| 1,483 | | Construction in progress and land | 0 |
Net Operating Income | 3,830 | | Real estate, net | 135,468 |
| | | Investment in JVs | (91) |
Other Income (expense): | | | Cash and restricted cash | 12,007 |
Fee income | (346) | | Receivables, net | 2,367 |
Interest expense | (1,832) | | Other assets, net | 6,070 |
Depreciation and amortization | (1,727) | | Total Assets | 155,821 |
Other income (expense), net | (95) | | | |
Loss before earnings from JVs | (170) | | Liabilities and Equity: | |
Equity in net income of JVs | (17) | | Mortgage debt | 111,401 |
Basis differences of JVs | 193 | | Notes payable to SITE | 527 |
Loss on disposition of real estate | (6) | | Other liabilities | 8,528 |
Net income | $0 | | Total Liabilities | 120,456 |
| | | JVs share of equity | (91) |
FFO Reconciliation 1Q24 | | Distributions in excess of net income | 35,456 |
Loss before earnings from JVs | ($170) | | Total Equity | 35,365 |
Depreciation and amortization | 1,727 | | Total Liabilities and Equity | $155,821 |
Basis differences of JVs | 27 | | | |
FFO at SITE's Ownership Interests | $1,584 | | | |
OFFO at SITE's Ownership Interests | $1,661 | | | |
| | | | |
(1) Information provided for SITE's share of JV investments and can be combined with SITE's consolidated financial statements for the same period. |
| | | | |
(2) Rental Income: | | | | |
Minimum rents | $3,630 | | | |
Ground lease minimum rents | 147 | | | |
Straight-line rent, net | 34 | | | |
Amortization of (above) below market rent, net | 117 | | | |
Percentage and overage rent | 77 | | | |
Recoveries | 1,177 | | | |
Uncollectible revenue | 55 | | | |
| | | | |
(3) Other Income: | | | | |
Ancillary and other rental income | 76 | | | |
| | | | |
| | | | |
SITE Centers Corp.
Unconsolidated Joint Ventures at 100%
| | | | |
$ in thousands | | | | |
Combined Income Statement |
| | 1Q24 | | 1Q23 |
Revenues: | | | | |
Rental income (1) | | $21,758 | | $24,316 |
Other income (2) | | 296 | | 374 |
| | 22,054 | | 24,690 |
Expenses: | | | | |
Operating and maintenance | | 3,294 | | 3,619 |
Real estate taxes | | 2,574 | | 2,945 |
| | 5,868 | | 6,564 |
| | | | |
Net operating income | | 16,186 | | 18,126 |
| | | | |
Other income (expense): | | | | |
Interest expense | | (8,271) | | (7,041) |
Depreciation and amortization | | (7,145) | | (9,062) |
Other income (expense), net | | (1,896) | | (2,560) |
| | (1,126) | | (537) |
(Loss) gain on disposition of real estate, net | | (29) | | 5,304 |
Net (loss) income attributable to unconsolidated JVs | | (1,155) | | 4,767 |
Depreciation and amortization | | 7,145 | | 9,062 |
Loss (gain) on disposition of real estate, net | | 29 | | (5,304) |
FFO | | $6,019 | | $8,525 |
FFO at SITE's ownership interests | | $1,584 | | $1,982 |
Operating FFO at SITE's ownership interests | | $1,661 | | $2,148 |
| | | | |
(1) Rental Income: | | | | |
Minimum rents | | 14,947 | | $17,397 |
Ground lease minimum rents | | 734 | | 722 |
Straight-line rent, net | | 134 | | 79 |
Amortization of (above) below market rent, net | | 586 | | 421 |
Percentage and overage rent | | 245 | | 385 |
Recoveries | | 4,866 | | 5,318 |
Uncollectible revenue | | 246 | | (6) |
(2) Other Income: | | | | |
Ancillary and other rental income | | 296 | | 374 |
| | | | |
| | | | |
Combined Balance Sheet |
| | At Period End |
| | 1Q24 | | 4Q23 |
Assets: | | | | |
Land | | $185,384 | | $180,588 |
Buildings | | 562,013 | | 558,585 |
Improvements | | 60,794 | | 58,626 |
| | 808,191 | | 797,799 |
Depreciation | | (193,232) | | (187,557) |
| | 614,959 | | 610,242 |
Construction in progress and land | | 0 | | 1,616 |
Real estate, net | | 614,959 | | 611,858 |
Cash and restricted cash | | 37,665 | | 41,250 |
Receivables, net | | 9,486 | | 9,847 |
Other assets, net | | 24,716 | | 25,498 |
Total Assets | | 686,826 | | 688,453 |
| | | | |
Liabilities and Equity: | | | | |
Mortgage debt | | 465,160 | | 464,255 |
Notes and accrued interest payable to SITE | | 2,007 | | 2,627 |
Other liabilities | | 35,888 | | 36,279 |
Total Liabilities | | 503,055 | | 503,161 |
Accumulated equity | | 183,771 | | 185,292 |
Total Equity | | 183,771 | | 185,292 |
Total Liabilities and Equity | | $686,826 | | $688,453 |
SITE Centers Corp.
Property List as of March 31, 2024
Note: GLA in thousands. Anchors include tenants greater than 20K SF.
| | | | | | | | | |
# | Center | MSA | Location | ST | SITE Own % | JV | Owned
GLA | ABR
PSF | Anchor Tenants |
1 | Chandler Center | Phoenix-Mesa-Scottsdale, AZ | Chandler | AZ | 100% | | 7 | $43.58 | — |
2 | Shops at Gilbert Crossroads | Phoenix-Mesa-Scottsdale, AZ | Gilbert | AZ | 100% | | 15 | $38.04 | — |
3 | Shops at Power and Baseline | Phoenix-Mesa-Scottsdale, AZ | Mesa | AZ | 100% | | 4 | $56.22 | — |
4 | Shops at Lake Pleasant | Phoenix-Mesa-Scottsdale, AZ | Peoria | AZ | 100% | | 47 | $40.25 | — |
5 | Ahwatukee Foothills Towne Center | Phoenix-Mesa-Scottsdale, AZ | Phoenix | AZ | 20% | DTP | 691 | $18.25 | AMC Theatres, Best Buy, Big Lots, Burlington, HomeGoods, JOANN, Lina Home Furnishings, Marshalls, Michaels, OfficeMax, Ross Dress for Less, Sprouts Farmers Market |
6 | Arrowhead Crossing | Phoenix-Mesa-Scottsdale, AZ | Phoenix | AZ | 100% | | 353 | $16.98 | Burlington, DSW, Golf Galaxy, Hobby Lobby, HomeGoods, Nordstrom Rack, Staples, T.J. Maxx |
7 | Deer Valley Towne Center | Phoenix-Mesa-Scottsdale, AZ | Phoenix | AZ | 100% | | 190 | $21.07 | Michaels, PetSmart, Ross Dress for Less |
8 | Paradise Village Gateway | Phoenix-Mesa-Scottsdale, AZ | Phoenix | AZ | 100% | | 295 | $26.09 | PetSmart, Ross Dress for Less, Sun & Ski Sports |
9 | Artesia Village | Phoenix-Mesa-Scottsdale, AZ | Scottsdale | AZ | 100% | | 21 | $40.90 | — |
10 | Northsight Plaza | Phoenix-Mesa-Scottsdale, AZ | Scottsdale | AZ | 100% | | 10 | $35.00 | — |
11 | Broadway Center | Phoenix-Mesa-Scottsdale, AZ | Tempe | AZ | 100% | | 11 | $36.68 | — |
12 | Falcon Ridge Town Center | Los Angeles-Long Beach-Anaheim, CA | Fontana | CA | 100% | | 277 | $23.59 | 24 Hour Fitness, Michaels, Ross Dress for Less, Stater Bros Markets |
13 | The Pike Outlets | Los Angeles-Long Beach-Anaheim, CA | Long Beach | CA | 100% | | 389 | $25.28 | Cinemark, H & M, Nike, Restoration Hardware |
14 | Creekside Plaza | Sacramento-Roseville-Arden-Arcade, CA | Roseville | CA | 100% | | 32 | $42.83 | — |
15 | Ridge at Creekside | Sacramento-Roseville-Arden-Arcade, CA | Roseville | CA | 100% | | 243 | $27.63 | Macy's Furniture Gallery, REI, World Market |
16 | La Fiesta Square | San Francisco-Oakland-Hayward, CA | Lafayette | CA | 100% | | 53 | $55.59 | — |
17 | Lafayette Mercantile | San Francisco-Oakland-Hayward, CA | Lafayette | CA | 100% | | 22 | $56.32 | — |
18 | Whole Foods at Bay Place | San Francisco-Oakland-Hayward, CA | Oakland | CA | 100% | | 57 | $51.02 | Whole Foods |
19 | Hilltop Plaza | San Francisco-Oakland-Hayward, CA | Richmond | CA | 20% | DDRM | 246 | $16.17 | 99 Cents Only, Century Theatre, City Sports Club, dd's Discounts, Ross Dress for Less |
20 | Centennial Promenade | Denver-Aurora-Lakewood, CO | Centennial | CO | 100% | | 443 | $20.23 | American Freight, Conn's, Golf Galaxy, HomeGoods, Michaels, Movement Climbing Yoga And Fitness, Ross Dress for Less, Stickley Furniture, Total Wine & More |
21 | Chapel Hills West | Denver-Aurora-Lakewood, CO | Colorado Springs | CO | 100% | | 225 | $12.21 | Burlington, PetSmart, Ross Dress for Less, Urban Air Adventure Park |
22 | Parker Keystone | Denver-Aurora-Lakewood, CO | Denver | CO | 100% | | 17 | $41.14 | — |
23 | Shops on Montview | Denver-Aurora-Lakewood, CO | Denver | CO | 100% | | 9 | $37.90 | — |
24 | University Hills | Denver-Aurora-Lakewood, CO | Denver | CO | 100% | | 236 | $21.31 | King Soopers, Marshalls, Michaels |
25 | FlatAcres MarketCenter | Denver-Aurora-Lakewood, CO | Parker | CO | 100% | | 136 | $17.57 | 24 Hour Fitness, Michaels |
26 | Parker Pavilions | Denver-Aurora-Lakewood, CO | Parker | CO | 100% | | 96 | $22.34 | Office Depot |
27 | Guilford Commons | Hartford-West Hartford-East Hartford, CT | Guilford | CT | 100% | | 129 | $22.01 | The Fresh Market |
28 | Connecticut Commons | Hartford-West Hartford-East Hartford, CT | Plainville | CT | 20% | DTP | 561 | $13.81 | AMC Theatres, Dick's Sporting Goods, DSW, Kohl's, Lowe's, Marshalls, PetSmart |
29 | Estero Crossing | Cape Coral-Fort Myers, FL | Estero | FL | 100% | | 34 | $33.58 | — |
30 | Shoppes at Paradise Pointe | Crestview-Fort Walton Beach-Destin, FL | Fort Walton Beach | FL | 100% | | 73 | $12.73 | Publix |
31 | Shops at Boca Center | Miami-Fort Lauderdale-West Palm Beach, FL | Boca Raton | FL | 100% | | 117 | $42.17 | Total Wine & More |
32 | Village Square at Golf | Miami-Fort Lauderdale-West Palm Beach, FL | Boynton Beach | FL | 100% | | 135 | $18.21 | KC Mart |
33 | Shoppes at Addison Place | Miami-Fort Lauderdale-West Palm Beach, FL | Delray Beach | FL | 100% | | 56 | $46.39 | — |
34 | Concourse Village | Miami-Fort Lauderdale-West Palm Beach, FL | Jupiter | FL | 100% | | 134 | $19.10 | Ross Dress for Less, T.J. Maxx |
35 | The Shops at Midtown Miami | Miami-Fort Lauderdale-West Palm Beach, FL | Miami | FL | 100% | | 467 | $22.84 | Dick's Sporting Goods, HomeGoods, Marshalls, Nordstrom Rack, Ross Dress for Less, Target, west elm |
36 | The Fountains | Miami-Fort Lauderdale-West Palm Beach, FL | Plantation | FL | 100% | | 430 | $17.17 | Dick's Sporting Goods, JOANN, Kohl's, Marshalls/HomeGoods, Total Wine & More, Urban Air Trampoline & Adventure Park |
37 | Midway Plaza | Miami-Fort Lauderdale-West Palm Beach, FL | Tamarac | FL | 100% | | 228 | $15.30 | Publix, Ross Dress for Less |
38 | Carillon Place | Naples-Immokalee-Marco Island, FL | Naples | FL | 100% | | 265 | $16.20 | Bealls OUTLET, DSW, OfficeMax, Ross Dress for Less, T.J. Maxx, Walmart Market |
39 | Shops at Casselberry | Orlando-Kissimmee-Sanford, FL | Casselberry | FL | 100% | | 8 | $28.76 | — |
SITE Centers Corp.
Property List as of March 31, 2024
Note: GLA in thousands. Anchors include tenants greater than 20K SF.
| | | | | | | | | |
# | Center | MSA | Location | ST | SITE Own % | JV | Owned
GLA | ABR
PSF | Anchor Tenants |
40 | Lee Vista Promenade | Orlando-Kissimmee-Sanford, FL | Orlando | FL | 100% | | 314 | $17.39 | Academy Sports, Bealls OUTLET, Epic Theatres, HomeGoods, Michaels, Ross Dress for Less |
41 | Millenia Crossing | Orlando-Kissimmee-Sanford, FL | Orlando | FL | 100% | | 100 | $23.14 | Nordstrom Rack |
42 | Winter Garden Village | Orlando-Kissimmee-Sanford, FL | Winter Garden | FL | 100% | | 759 | $22.50 | Bealls, Best Buy, Burlington, Forever 21, Havertys, JOANN, LA Fitness, Market By Macy's, Marshalls, PetSmart, Ross Dress for Less, Staples |
43 | Lake Brandon Village | Tampa-St. Petersburg-Clearwater, FL | Brandon | FL | 100% | | 114 | $15.48 | PetSmart, Scandinavian Designs, Sprouts Farmers Market |
44 | The Collection at Brandon Boulevard | Tampa-St. Petersburg-Clearwater, FL | Brandon | FL | 100% | | 222 | $13.81 | Bealls OUTLET, Chuck E. Cheese's, Crunch Fitness, Kane's Furniture |
45 | The Shoppes of Boot Ranch | Tampa-St. Petersburg-Clearwater, FL | Palm Harbor | FL | 100% | | 52 | $29.28 | — |
46 | Southtown Center | Tampa-St. Petersburg-Clearwater, FL | Tampa | FL | 100% | | 44 | $40.28 | — |
47 | Alpha Soda Center | Atlanta-Sandy Springs-Roswell, GA | Alpharetta | GA | 100% | | 15 | $39.98 | — |
48 | Shoppes of Crabapple | Atlanta-Sandy Springs-Roswell, GA | Alpharetta | GA | 100% | | 8 | $29.92 | — |
49 | Hammond Springs | Atlanta-Sandy Springs-Roswell, GA | Atlanta | GA | 100% | | 69 | $31.87 | — |
50 | Parkwood Shops | Atlanta-Sandy Springs-Roswell, GA | Atlanta | GA | 100% | | 20 | $24.62 | — |
51 | Perimeter Pointe | Atlanta-Sandy Springs-Roswell, GA | Atlanta | GA | 100% | | 360 | $17.63 | Dick's Sporting Goods, LA Fitness, Regal Cinemas |
52 | Cumming Marketplace | Atlanta-Sandy Springs-Roswell, GA | Cumming | GA | 100% | | 310 | $14.37 | Lowe's, Marshalls, Michaels, OfficeMax |
53 | Cumming Town Center | Atlanta-Sandy Springs-Roswell, GA | Cumming | GA | 100% | | 311 | $17.03 | Ashley Furniture HomeStore, Best Buy, Burlington, Dick's Sporting Goods, T.J. Maxx/HomeGoods |
54 | Market Square | Atlanta-Sandy Springs-Roswell, GA | Douglasville | GA | 100% | | 125 | $13.35 | Aaron's |
55 | Barrett Corners | Atlanta-Sandy Springs-Roswell, GA | Kennesaw | GA | 100% | | 19 | $47.14 | — |
56 | Towne Center Prado | Atlanta-Sandy Springs-Roswell, GA | Marietta | GA | 20% | DTP | 287 | $13.00 | Going Going Gone, Publix, Ross Dress for Less |
57 | Sandy Plains Village | Atlanta-Sandy Springs-Roswell, GA | Roswell | GA | 100% | | 174 | $14.35 | Movie Tavern, Painted Tree Marketplace |
58 | Presidential Commons | Atlanta-Sandy Springs-Roswell, GA | Snellville | GA | 100% | | 274 | $16.34 | Burlington, JOANN, Kroger |
59 | Presidential Plaza North | Atlanta-Sandy Springs-Roswell, GA | Snellville | GA | 100% | | 11 | $42.50 | — |
60 | Johns Creek Town Center | Atlanta-Sandy Springs-Roswell, GA | Suwanee | GA | 100% | | 303 | $16.60 | HomeGoods, Kohl's, Market By Macy's, Michaels, PetSmart, Sprouts Farmers Market |
61 | 3030 North Broadway | Chicago-Naperville-Elgin, IL-IN-WI | Chicago | IL | 100% | | 132 | $35.61 | Mariano's, XSport Fitness |
62 | The Maxwell | Chicago-Naperville-Elgin, IL-IN-WI | Chicago | IL | 100% | | 240 | $25.87 | Burlington, Dick's Sporting Goods, Nordstrom Rack |
63 | Deer Park Town Center | Chicago-Naperville-Elgin, IL-IN-WI | Deer Park | IL | 50% | RVIP IIIB | 357 | $37.87 | Century Theatre, Crate & Barrel, Gap |
64 | Woodfield Village Green | Chicago-Naperville-Elgin, IL-IN-WI | Schaumburg | IL | 100% | | 360 | $24.28 | Bloomingdale's The Outlet Store, Container Store, HomeGoods, Marshalls, Michaels, Nordstrom Rack, PetSmart, Sierra Trading Post, Trader Joe's |
65 | Brookside Marketplace | Chicago-Naperville-Elgin, IL-IN-WI | Tinley Park | IL | 20% | DTP | 317 | $15.97 | Best Buy, Dick's Sporting Goods, HomeGoods, Michaels, PetSmart, Ross Dress for Less, T.J. Maxx |
66 | Shops at Framingham | Boston-Cambridge-Newton, MA-NH | Framingham | MA | 100% | | 19 | $56.90 | — |
67 | Foxtail Center | Baltimore-Columbia-Towson, MD | Timonium | MD | 100% | | 30 | $35.26 | — |
68 | Independence Commons | Kansas City, MO-KS | Independence | MO | 20% | DTP | 386 | $15.54 | AMC Theatres, Best Buy, Bob's Discount Furniture, Kohl's, Marshalls, Ross Dress for Less |
69 | The Promenade at Brentwood | St. Louis, MO-IL | Brentwood | MO | 100% | | 338 | $16.31 | Burlington, Micro Center, PetSmart, Target, Trader Joe's |
70 | East Hanover Plaza | New York-Newark-Jersey City, NY-NJ-PA | East Hanover | NJ | 100% | | 98 | $21.52 | HomeGoods, HomeSense |
71 | Edgewater Towne Center | New York-Newark-Jersey City, NY-NJ-PA | Edgewater | NJ | 100% | | 76 | $31.49 | Whole Foods |
72 | Freehold Marketplace | New York-Newark-Jersey City, NY-NJ-PA | Freehold | NJ | 100% | | 21 | $37.18 | — |
73 | Route 22 Retail Center | New York-Newark-Jersey City, NY-NJ-PA | Union | NJ | 20% | DTP | 112 | $16.43 | Big Lots, Dick's Sporting Goods |
74 | Echelon Village Plaza | Philadelphia-Camden-Wilmington, PA-NJ-DE-MD | Voorhees | NJ | 100% | | 89 | $13.49 | The Edge Fitness Clubs |
75 | Hamilton Marketplace | Trenton, NJ | Hamilton | NJ | 100% | | 547 | $20.93 | Barnes & Noble, Burlington, Kohl's, Michaels, Ross Dress for Less, ShopRite, Staples |
76 | Nassau Park Pavilion | Trenton, NJ | Princeton | NJ | 100% | | 759 | $16.07 | At Home, Best Buy, Burlington, Dick's Sporting Goods, HomeGoods, HomeSense, Michaels, PetSmart, Planet Fitness, Raymour & Flanigan, T.J. Maxx, Wegmans |
77 | The Hub | New York-Newark-Jersey City, NY-NJ-PA | Hempstead | NY | 100% | | 249 | $13.42 | Home Depot, Stop & Shop |
78 | Belgate Plaza | Charlotte-Concord-Gastonia, NC-SC | Charlotte | NC | 100% | | 20 | $36.55 | — |
SITE Centers Corp.
Property List as of March 31, 2024
Note: GLA in thousands. Anchors include tenants greater than 20K SF.
| | | | | | | | | |
# | Center | MSA | Location | ST | SITE Own % | JV | Owned
GLA | ABR
PSF | Anchor Tenants |
79 | Belgate Shopping Center | Charlotte-Concord-Gastonia, NC-SC | Charlotte | NC | 100% | | 269 | $16.08 | Burlington, Cost Plus World Market, Hobby Lobby, Marshalls, Old Navy, PetSmart, T.J. Maxx |
80 | Carolina Pavilion | Charlotte-Concord-Gastonia, NC-SC | Charlotte | NC | 100% | | 701 | $14.85 | AMC Theatres, American Freight Outlet Stores, AutoZone, Big Lots, Burlington, Conn's, Floor & Decor, Frontgate Outlet Store, JOANN, Nordstrom Rack, Old Navy, Ross Dress for Less, Value City Furniture |
81 | Point at University | Charlotte-Concord-Gastonia, NC-SC | Charlotte | NC | 100% | | 14 | $38.58 | — |
82 | The Shops at The Fresh Market | Charlotte-Concord-Gastonia, NC-SC | Cornelius | NC | 100% | | 132 | $18.45 | HomeSense, The Fresh Market, Total Wine & More |
83 | Meadowmont Village | Raleigh, NC | Chapel Hill | NC | 20% | DDRM | 199 | $22.80 | Harris Teeter |
84 | Poyner Place | Raleigh, NC | Raleigh | NC | 20% | DTP | 252 | $16.89 | Cost Plus World Market, Marshalls, Michaels, Ross Dress for Less, Urban Air Trampoline & Adventure Park |
85 | University Centre | Wilmington, NC | Wilmington | NC | 20% | DTP | 418 | $10.92 | Lowe's, Old Navy, Ollie's Bargain Outlet, Ross Dress for Less |
86 | Kenwood Square | Cincinnati, OH-KY-IN | Cincinnati | OH | 100% | | 427 | $17.95 | Big Sandy Superstore, Dick's Sporting Goods, Macy's Furniture Gallery, Marshalls/HomeGoods, Michaels, T.J. Maxx, The Fresh Market |
87 | Stow Community Center | Cleveland-Elyria, OH | Stow | OH | 100% | | 406 | $12.66 | Giant Eagle, Hobby Lobby, HomeGoods, Kohl's, T.J. Maxx |
88 | Easton Market | Columbus, OH | Columbus | OH | 100% | | 502 | $15.70 | Burlington, DSW, HomeGoods, Marshalls, Michaels, Nordstrom Rack, PetSmart, Ross Dress for Less, Sierra Trading Post, T.J. Maxx, Value City Furniture |
89 | Polaris Towne Center | Columbus, OH | Columbus | OH | 100% | | 459 | $17.41 | Best Buy, JOANN, Kroger, OfficeMax, T.J. Maxx |
90 | Tanasbourne Town Center | Portland-Vancouver-Hillsboro, OR-WA | Hillsboro | OR | 100% | | 287 | $24.82 | Marshalls, Michaels, Ross Dress for Less, Sierra Trading Post |
91 | The Blocks | Portland-Vancouver-Hillsboro, OR-WA | Portland | OR | 100% | | 97 | $36.21 | — |
92 | Southmont Plaza | Allentown-Bethlehem-Easton, PA-NJ | Easton | PA | 100% | | 251 | $16.96 | Barnes & Noble, Best Buy, Dick's Sporting Goods, Michaels, Staples |
93 | Ashley Crossing | Charleston-North Charleston, SC | Charleston | SC | 20% | DTP | 208 | $11.46 | Food Lion, JOANN, Kohl's, Marshalls |
94 | Cool Springs Pointe | Nashville-Davidson-Murfreesboro-Franklin, TN | Brentwood | TN | 100% | | 198 | $16.47 | Best Buy, Restoration Hardware, Ross Dress for Less |
95 | Oaks at Slaughter | Austin, TX | Austin | TX | 100% | | 26 | $35.62 | — |
96 | Vintage Plaza | Austin, TX | Round Rock | TX | 100% | | 41 | $28.01 | — |
97 | Grove at Harper's Preserve | Houston-The Woodlands-Sugar Land, TX | Conroe | TX | 100% | | 21 | $32.92 | — |
98 | Briarcroft Center | Houston-The Woodlands-Sugar Land, TX | Houston | TX | 100% | | 33 | $42.38 | — |
99 | Marketplace at 249 | Houston-The Woodlands-Sugar Land, TX | Houston | TX | 100% | | 17 | $38.36 | — |
100 | Shops at Tanglewood | Houston-The Woodlands-Sugar Land, TX | Houston | TX | 100% | | 26 | $48.17 | — |
101 | Bandera Pointe | San Antonio-New Braunfels, TX | San Antonio | TX | 100% | | 441 | $11.36 | Gold's Gym, JOANN, Lowe's, Old Navy, PetSmart, Ross Dress for Less, T.J. Maxx, Urban Air Trampoline & Adventure Park |
102 | Shops at Bandera Pointe | San Antonio-New Braunfels, TX | San Antonio | TX | 100% | | 48 | $25.69 | — |
103 | Village at Stone Oak | San Antonio-New Braunfels, TX | San Antonio | TX | 100% | | 442 | $19.16 | Alamo Drafthouse Cinema, Hobby Lobby, HomeGoods, Ross Dress for Less |
104 | Emmet Street North | Charlottesville, VA | Charlottesville | VA | 100% | | 2 | $78.55 | — |
105 | Emmet Street Station | Charlottesville, VA | Charlottesville | VA | 100% | | 11 | $52.08 | — |
106 | Commonwealth Center | Richmond, VA | Midlothian | VA | 20% | DTP | 166 | $15.99 | Michaels, Painted Tree Marketplace, The Fresh Market |
107 | Towne Crossing Shops | Richmond, VA | Midlothian | VA | 100% | | 7 | $39.79 | — |
108 | Downtown Short Pump | Richmond, VA | Richmond | VA | 100% | | 126 | $22.32 | Barnes & Noble, Regal Cinemas |
109 | White Oak Village | Richmond, VA | Richmond | VA | 100% | | 432 | $17.11 | JCPenney, K&G Fashion Superstore, Michaels, PetSmart, Publix |
110 | Boulevard Marketplace | Washington-Arlington-Alexandria, DC-VA-MD-WV | Fairfax | VA | 100% | | 19 | $41.88 | — |
111 | Fairfax Marketplace | Washington-Arlington-Alexandria, DC-VA-MD-WV | Fairfax | VA | 100% | | 19 | $58.39 | — |
112 | Fairfax Pointe | Washington-Arlington-Alexandria, DC-VA-MD-WV | Fairfax | VA | 100% | | 10 | $50.34 | — |
113 | Fairfax Towne Center | Washington-Arlington-Alexandria, DC-VA-MD-WV | Fairfax | VA | 100% | | 253 | $25.62 | JOANN, Regal Cinemas, Safeway, T.J. Maxx |
114 | Springfield Center | Washington-Arlington-Alexandria, DC-VA-MD-WV | Springfield | VA | 100% | | 177 | $23.21 | Barnes & Noble, DSW, Marshalls, Michaels, The Tile Shop |
| | | | | | | | | |
DDRM - DDRM Properties | | | | | | |
DTP - Dividend Trust Portfolio | | | | | | |
RVIP IIIB - Deer Park, IL | | | | | | |
SITE Centers Corp.
Notable Accounting and Supplemental Policies
The information contained in the Quarterly Financial Supplement does not purport to disclose all items required by the accounting principles generally accepted in the United States of America (“GAAP”) and is unaudited information. The Company’s Quarterly Financial Supplement should be read in conjunction with the Company’s Form 10-K and Form 10-Q.
Rental Income (Revenues)
•Percentage and overage rents that are recognized after the tenants’ reported sales have exceeded the applicable sales breakpoint.
•Tenant reimbursements are recognized in the period in which the expenses are incurred.
•Lease termination fees are recognized upon termination of a tenant’s lease when the Company has no further obligations under the lease.
Lease Modification Accounting
•Elected not to apply lease modification accounting to lease amendments in which the total amount of rent due under the lease is substantially the same and there has been no increase in the lease term. A majority of the Company’s concession amendments within this category provide for the deferral of rental payments to a later date within the remaining lease term.
•If abatements are granted as part of a lease amendment, the Company has elected to not treat the abatements as variable rent and instead will record the concession’s impact over the tenant’s remaining lease term on a straight-line basis. Modifications to leases that involve an increase in the lease term have been treated as a lease modification.
•For those tenants where the Company is unable to assert that collection of amounts due over the lease term is probable, regardless if the Company has entered into a deferral agreement to extend the payment terms, the Company has categorized these tenants on the cash basis of accounting. As a result, no rental income is recognized from such tenants once they have been placed on the cash basis of accounting until payments are received and all existing accounts receivable relating to these tenants have been reserved in full, including straight-line rental income. The Company will remove the cash basis designation and resume recording rental income from such tenants during the period earned at such time it believes collection from the tenants is probable based upon a demonstrated payment history or recapitalization event.
General and Administrative Expenses
•General and administrative expenses include certain internal leasing salaries, legal salaries and related expenses associated with the leasing of space which are charged to operations as incurred.
•The Company does not capitalize any executive officer compensation.
•General and administrative expenses include executive property management compensation and related expenses. Property management services’ direct compensation is reflected in operating and maintenance expenses.
Deferred Financing Costs
•Costs incurred in obtaining term financing are included as a reduction of the related debt liability and costs incurred related to the revolving credit facilities are included in other assets on the consolidated balance sheets. All costs are amortized on a straight-line basis over the term of the related debt agreement; such amortization is reflected as interest expense in the consolidated income statements.
SITE Centers Corp.
Notable Accounting and Supplemental Policies
Real Estate
•Real estate assets are stated at cost less accumulated depreciation, which, in the opinion of management, is not in excess of the individual property's estimated undiscounted future cash flows, including estimated proceeds from disposition.
•Construction in progress includes shopping center developments and significant expansions and redevelopments.
•Acquisitions of a partner’s interest in an unconsolidated joint venture in which a change of control has occurred are recorded at fair value.
•Depreciation and amortization are provided on a straight-line basis over the estimated useful lives of the assets as follows:
| |
Buildings | 30 to 40 years |
Building Improvements | 3 to 20 years |
Furniture/Fixtures/ Tenant Improvements | Shorter of economic life or lease terms |
Capitalization
•Expenditures for maintenance and repairs are charged to operations as incurred. Renovations and expenditures that improve or extend the life of the asset are capitalized.
•The Company capitalizes interest on funds used for the construction or expansion of shopping centers and certain construction administration costs. Capitalization of interest and administration costs ceases when construction activities are completed and the property is available for occupancy by tenants or when activities are suspended.
•Interest expense and real estate taxes incurred during construction are capitalized and depreciated over the building life. The Company does not capitalize interest on land held for development which is on hold and is not undergoing any development activities.
Gains on Sales of Real Estate
•Gains on sales of real estate generally related to the sale of outlots and land adjacent to existing shopping centers are recognized at closing when the earnings process is deemed to be complete.
Leasing Spreads
•Cash Leasing Spreads are calculated by comparing the prior tenant's annual base rent in the final year of the prior lease to the executed tenant's annual base rent in the first year of the executed lease.
•Straight-Lined Leasing Spreads are calculated by comparing the prior tenant's average base rent over the prior lease term to the executed tenant's average base rent over the term of the executed lease.
•For both Cash and Straight-Lined Leasing Spreads, the reported calculations of “Comparable”, only include deals executed within one year of the date that the prior tenant vacated. Deals executed after one year of the date the prior tenant vacated, deals which are a combination of existing units, new leases at "Redevelopment” properties, and deals for units vacant at the time of acquisition are considered non-comparable and excluded from the calculation.
Net Effective Rents
•Net effective rents are calculated as a weighted average per rentable square foot over the lease term with full consideration for all costs associated with leasing the space rather than pro rata costs. Landlord work represents property level improvements associated with the lease transactions; however, those improvements are attributed to the landlord's property value and typically extend the life of the asset in excess of the lease term.
SITE Centers Corp.
Non-GAAP Measures
Performance Measures
FFO and Operating FFO
The Company believes that Funds from Operations (“FFO”) and Operating FFO, both non-GAAP financial measures, provide additional and useful means to assess the financial performance of REITs. FFO and Operating FFO are frequently used by the real estate industry, as well as securities analysts, investors and other interested parties, to evaluate the performance of REITs. The Company also believes that FFO and Operating FFO more appropriately measure the core operations of the Company and provide benchmarks to its peer group.
FFO excludes GAAP historical cost depreciation and amortization of real estate and real estate investments, which assume that the value of real estate assets diminishes ratably over time. Historically, however, real estate values have risen or fallen with market conditions, and many companies use different depreciable lives and methods. Because FFO excludes depreciation and amortization unique to real estate and gains and losses from depreciable property dispositions, it can provide a performance measure that, when compared year over year, reflects the impact on operations from trends in occupancy rates, rental rates, operating costs, interest costs and acquisition, disposition and development activities. This provides a perspective of the Company’s financial performance not immediately apparent from net income determined in accordance with GAAP.
FFO is generally defined and calculated by the Company as net income (loss) (computed in accordance with GAAP), adjusted to exclude (i) preferred share dividends, (ii) gains and losses from disposition of real estate property and related investments, which are presented net of taxes, (iii) impairment charges on real estate property and related investments, (iv) gains and losses from changes in control and (v) certain non-cash items. These non-cash items principally include real property depreciation and amortization of intangibles, equity income (loss) from joint ventures and equity income (loss) from non-controlling interests and adding the Company’s proportionate share of FFO from its unconsolidated joint ventures and non-controlling interests, determined on a consistent basis. The Company’s calculation of FFO is consistent with the definition of FFO provided by NAREIT.
The Company believes that certain charges, income and gains/losses recorded in its operating results are not comparable or reflective of its core operating performance. Operating FFO is useful to investors as the Company removes non-comparable charges, income and gains to analyze the results of its operations and assess performance of the core operating real estate portfolio. As a result, the Company also computes Operating FFO and discusses it with the users of its financial statements, in addition to other measures such as net income (loss) determined in accordance with GAAP and FFO. Operating FFO is generally defined and calculated by the Company as FFO excluding certain charges, income and gains/losses that management believes are not comparable and indicative of the results of the Company’s operating real estate portfolio. Such adjustments include write-off of preferred share original issuance costs, gains/losses on the early extinguishment of debt, certain transaction fee income, transaction costs and other restructuring type costs, including employee separation costs. The disclosure of these adjustments is regularly requested by users of the Company’s financial statements. The adjustment for these charges, income and gains/losses may not be comparable to how other REITs or real estate companies calculate their results of operations, and the Company’s calculation of Operating FFO differs from NAREIT’s definition of FFO. Additionally, the Company provides no assurances that these charges, income and gains/losses are non-recurring. These charges, income and gains/losses could be reasonably expected to recur in future results of operations.
These measures of performance are used by the Company for several business purposes and by other REITs. The Company uses FFO and/or Operating FFO in part (i) as a disclosure to improve the understanding of the Company’s operating results among the investing public, (ii) as a measure of a real estate asset’s performance, (iii) to influence acquisition, disposition and capital investment strategies and (iv) to compare the Company’s performance to that of other publicly traded shopping center REITs. For the reasons described above, management believes that FFO and Operating FFO provide the Company and investors with an important indicator of the Company’s operating performance. They provide recognized measures of performance other than GAAP net income, which may include non-cash items (often significant). Other real estate companies may calculate FFO and Operating FFO in a different manner.
SITE Centers Corp.
Non-GAAP Measures
In calculating the expected range for or amount of net (loss) income attributable to common shareholders to estimate projected FFO and Operating FFO for future periods, the Company does not include a projection of gain and losses from the disposition of real estate property, potential impairments and reserves of real estate property and related investments, debt extinguishment costs and certain transaction costs. Other real estate companies may calculate expected FFO and Operating FFO in a different manner.
Management recognizes the limitations of FFO and Operating FFO when compared to GAAP’s net income. FFO and Operating FFO do not represent amounts available for dividends, capital replacement or expansion, debt service obligations or other commitments and uncertainties. Management does not use FFO or Operating FFO as an indicator of the Company’s cash obligations and funding requirements for future commitments, acquisitions or development activities. Neither FFO nor Operating FFO represents cash generated from operating activities in accordance with GAAP, and neither is necessarily indicative of cash available to fund cash needs. Neither FFO nor Operating FFO should be considered an alternative to net income (computed in accordance with GAAP) or as an alternative to cash flow as a measure of liquidity. FFO and Operating FFO are simply used as additional indicators of the Company’s operating performance. The Company believes that to further understand its performance, FFO and Operating FFO should be compared with the Company’s reported net income (loss) and considered in addition to cash flows determined in accordance with GAAP, as presented in its condensed consolidated financial statements. Reconciliations of these measures to their most directly comparable GAAP measure of net income (loss) have been provided herein.
Net Operating Income (“NOI”) and Same Store Net Operating Income (“SSNOI”)
The Company uses NOI, which is a non-GAAP financial measure, as a supplemental performance measure. NOI is calculated as property revenues less property-related expenses. The Company believes NOI provides useful information to investors regarding the Company’s financial condition and results of operations because it reflects only those income and expense items that are incurred at the property level and, when compared across periods, reflects the impact on operations from trends in occupancy rates, rental rates, operating costs and acquisition and disposition activity on an unleveraged basis.
The Company also presents NOI information on a same store basis, or SSNOI. The Company defines SSNOI as property revenues less property-related expenses, which exclude straight-line rental income and reimbursements and expenses, lease termination income, management fee expense, fair market value of leases and expense recovery adjustments. SSNOI includes assets owned in comparable periods (15 months for prior period comparisons). In addition, SSNOI is presented including activity associated with redevelopment. SSNOI excludes all non-property and corporate level revenue and expenses. Other real estate companies may calculate NOI and SSNOI in a different manner. The Company believes SSNOI at its effective ownership interest provides investors with additional information regarding the operating performances of comparable assets because it excludes certain non-cash and non-comparable items as noted above. SSNOI is frequently used by the real estate industry, as well as securities analysts, investors and other interested parties, to evaluate the performance of REITs.
SSNOI is not, and is not intended to be, a presentation in accordance with GAAP. SSNOI information has its limitations as it excludes any capital expenditures associated with the re-leasing of tenant space or as needed to operate the assets. SSNOI does not represent amounts available for dividends, capital replacement or expansion, debt service obligations or other commitments and uncertainties. Management does not use SSNOI as an indicator of the Company’s cash obligations and funding requirements for future commitments, acquisitions or development activities. SSNOI does not represent cash generated from operating activities in accordance with GAAP and is not necessarily indicative of cash available to fund cash needs. SSNOI should not be considered as an alternative to net income (computed in accordance with GAAP) or as an alternative to cash flow as a measure of liquidity. A reconciliation of SSNOI to its most directly comparable GAAP measure of net income (loss) has been provided herein. In reliance on the exception provided by Item 10(e)(1)(i)(B) of Regulation S-K, reconciliation of the projected NOI and assumed rate of 2024 SSNOI growth to the most directly comparable GAAP financial measure is not provided because the Company is unable to provide such reconciliations without unreasonable effort due to the multiple components of the calculations which for the same store calculation only includes properties owned for comparable periods and excludes all corporate level activity as noted above.
SITE Centers Corp.
Non-GAAP Measures
Other Measures
SITE Pro Rata Share Financial Information
The Company believes that the SITE pro rata share of its joint ventures presented in the quarterly supplement is not, and is not intended to be, a presentation in accordance with GAAP. SITE share financial information is frequently used by the real estate industry including securities analysts, investors and other interested parties to evaluate the performance of SITE compared to other REITs. Other real estate companies may calculate such information in a different manner.
SITE does not control the unconsolidated joint ventures and the presentations of SITE JV Pro Rata Adjustments of the unconsolidated joint ventures presented in the quarterly supplement do not represent the Company’s legal claim to such items. The Company provides this information because the Company believes it assists investors and analysts in estimating the effective interest in SITE’s unconsolidated joint ventures when read in conjunction with the Company’s reported results under GAAP. The presentation of this information has limitations as an analytical tool. Because of the limitations, this information should not be considered in isolation or as a substitute for the Company’s financial statements as reported under GAAP.
Debt/Adjusted Earnings before Interest, Taxes, Depreciation and Amortization (Adjusted EBITDA)
The Company uses the ratio Debt to Adjusted EBITDA (“Debt/Adjusted EBITDA”) as it believes it provides a meaningful metric as it relates to the Company’s ability to meet various leverage tests for the corresponding periods.
The Components of Debt/Adjusted EBITDA include net effective debt divided by adjusted EBITDA (trailing twelve months), as opposed to net income determined in accordance with GAAP. Adjusted EBITDA is calculated as net income attributable to SITE before interest, income taxes, depreciation and amortization for the trailing twelve months and further adjusted to eliminate the impact of certain items that the Company does not consider indicative of its ongoing performance. Net effective debt is calculated as the average of the Company’s consolidated debt outstanding excluding unamortized loan costs and fair market value adjustments, less cash and restricted cash as of the beginning of the twelve-month period and the balance sheet date presented. Such amounts are calculated at the Company’s proportionate share of ownership.
The Company also calculates EBITDAre as net income attributable to SITE before interest, income taxes, depreciation and amortization, gains and losses from disposition of real estate property and related investments, impairment charges on real estate property and related investments, including gain and losses from changes in control, all for the trailing twelve months. Such amount is also calculated at the Company’s proportionate share of ownership.
Adjusted EBITDA should not be considered as an alternative to earnings as an indicator of the Company’s financial performance, or an alternative to cash flow from operating activities as a measure of liquidity. The Company’s calculation of Adjusted EBITDA may differ from the methodology utilized by other companies. Investors are cautioned that items excluded from Adjusted EBITDA are significant components in understanding and assessing the Company’s financial condition. The reconciliations of Adjusted EBITDA and net effective debt used in the consolidated and prorata Debt/Adjusted EBITDA ratios to their most directly comparable GAAP measures of net income (loss) and debt have been provided in the Debt Summary section.
SITE Centers Corp.
Portfolio Summary at 100%
| | | | | | | | | | |
GLA in thousands | | | | | | | | | | |
| | 3/31/2024 | | 12/31/2023 | | 9/30/2023 | | 6/30/2023 | | 3/31/2023 |
Shopping Center Summary | | | | | | | | | | |
Operating Centers – 100% | | 114 | | 114 | | 119 | | 121 | | 120 |
Wholly Owned - SITE | | 101 | | 101 | | 106 | | 108 | | 105 |
JV Portfolio | | 13 | | 13 | | 13 | | 13 | | 15 |
| | | | | | | | | | |
Owned and Ground Lease GLA – 100% | | 21,938 | | 22,553 | | 25,570 | | 26,240 | | 26,578 |
Wholly Owned - SITE | | 17,740 | | 18,369 | | 21,386 | | 22,056 | | 21,990 |
JV Portfolio – 100% | | 4,198 | | 4,184 | | 4,184 | | 4,184 | | 4,588 |
Unowned GLA – 100% | | 7,653 | | 7,972 | | 8,298 | | 8,709 | | 8,938 |
| | | | | | | | | | |
Quarterly Operational Overview | | | | | | | | | | |
SITE (100%) | | | | | | | | | | |
Base Rent PSF | | $19.98 | | $19.69 | | $19.63 | | $19.38 | | $19.16 |
Base Rent PSF < 10K | | $32.54 | | $32.17 | | $31.59 | | $31.12 | | $30.83 |
Base Rent PSF > 10K | | $15.21 | | $15.06 | | $15.45 | | $15.38 | | $15.37 |
Commenced Rate | | 91.7% | | 92.0% | | 92.0% | | 92.5% | | 92.8% |
Leased Rate | | 94.2% | | 94.6% | | 94.5% | | 95.4% | | 95.9% |
Leased Rate < 10K SF | | 90.2% | | 90.3% | | 90.6% | | 90.3% | | 90.4% |
Leased Rate > 10K SF | | 95.8% | | 96.2% | | 96.0% | | 97.2% | | 97.8% |
| | | | | | | | | | |
| | | | | | | | | | |
Wholly Owned SITE | | | | | | | | | | |
Base Rent PSF | | $20.81 | | $20.46 | | $20.29 | | $19.97 | | $19.71 |
Leased Rate | | 94.2% | | 94.5% | | 94.7% | | 95.6% | | 96.0% |
Leased Rate < 10K SF | | 91.5% | | 91.4% | | 91.4% | | 91.2% | | 91.2% |
Leased Rate > 10K SF | | 95.4% | | 95.9% | | 95.9% | | 97.2% | | 97.7% |
| | | | | | | | | | |
Joint Venture (100%) | | | | | | | | | | |
Base Rent PSF | | $16.62 | | $16.43 | | $16.41 | | $16.43 | | $16.61 |
Leased Rate | | 94.0% | | 94.6% | | 93.8% | | 94.2% | | 95.4% |
Leased Rate < 10K SF | | 83.6% | | 84.7% | | 86.3% | | 85.1% | | 85.7% |
Leased Rate > 10K SF | | 97.5% | | 97.8% | | 96.3% | | 97.3% | | 98.4% |
| | | | | | | | | | |
Joint Venture at Pro Rata Share | | | | | | | | | | |
Base Rent PSF | | $18.41 | | $18.20 | | $18.16 | | $18.08 | | $18.19 |
Leased Rate | | 92.5% | | 93.0% | | 92.3% | | 92.2% | | 93.4% |
Leased Rate < 10K SF | | 81.8% | | 82.3% | | 83.3% | | 81.0% | | 81.5% |
Leased Rate > 10K SF | | 97.1% | | 97.4% | | 96.0% | | 96.9% | | 98.0% |
SITE Centers Corp.
Leasing Summary
| | | | | | | | | | | |
Wholly Owned at 100% | | | | | | | | | | |
| | | | | | | | | | | |
Leasing Activity | | | | | | | | | | | |
| Comparable Pool | | Total Pool |
| | | | Leasing Spreads | | | | | | |
| Count | GLA | ABR PSF | Cash | Straight-lined | Term | | Count | GLA | ABR PSF | Term |
New Leases | | | | | | | | | | | |
1Q24 | 10 | 17,120 | $37.38 | 11.5% | 26.9% | 8.3 | | 15 | 69,438 | $26.28 | 11.0 |
4Q23 | 9 | 64,639 | $17.81 | 9.2% | 17.3% | 9.5 | | 17 | 97,092 | $22.05 | 9.3 |
3Q23 | 13 | 157,037 | $20.65 | 58.3% | 73.5% | 9.8 | | 25 | 204,875 | $22.14 | 9.9 |
2Q23 | 11 | 89,204 | $26.73 | 14.8% | 23.3% | 9.4 | | 28 | 164,964 | $26.12 | 8.6 |
| 43 | 328,000 | $22.62 | 28.9% | 40.3% | 9.6 | | 85 | 536,369 | $23.88 | 9.6 |
| | | | | | | | | | | |
Renewals | | | | | | | | | | | |
1Q24 | 77 | 549,220 | $20.10 | 8.2% | 12.7% | 5.3 | | 77 | 549,220 | $20.10 | 5.3 |
4Q23 | 61 | 374,469 | $24.01 | 3.1% | 9.0% | 5.1 | | 61 | 374,469 | $24.01 | 5.1 |
3Q23 | 82 | 1,010,717 | $17.62 | 6.7% | 10.5% | 5.7 | | 82 | 1,010,717 | $17.62 | 5.7 |
2Q23 | 88 | 920,876 | $17.30 | 7.4% | 12.1% | 5.7 | | 88 | 920,876 | $17.30 | 5.7 |
| 308 | 2,855,282 | $18.83 | 6.6% | 11.2% | 5.5 | | 308 | 2,855,282 | $18.83 | 5.5 |
| | | | | | | | | | | |
New + Renewals | | | | | | | | | | | |
1Q24 | 87 | 566,340 | $20.62 | 8.4% | 13.4% | 5.4 | | 92 | 618,658 | $20.79 | 5.9 |
4Q23 | 70 | 439,108 | $23.10 | 3.7% | 9.9% | 5.7 | | 78 | 471,561 | $23.60 | 5.9 |
3Q23 | 95 | 1,167,754 | $18.03 | 12.3% | 17.3% | 6.2 | | 107 | 1,215,592 | $18.38 | 6.4 |
2Q23 | 99 | 1,010,080 | $18.13 | 8.3% | 13.5% | 6.0 | | 116 | 1,085,840 | $18.64 | 6.1 |
| 351 | 3,183,282 | $19.22 | 8.9% | 14.1% | 5.9 | | 393 | 3,391,651 | $19.63 | 6.2 |
| | | | | | | | |
Net Effective Rents | | | | | | | |
| | | Capex PSF | NER | |
| GLA | ABR PSF | TA | LL Work | LC | Total | PSF | Term |
New Leases | | | | | | | | |
1Q24 | 47,281 | $29.17 | $3.59 | $0.03 | $1.31 | $4.93 | $24.24 | 9.2 |
4Q23 | 85,048 | $23.14 | $1.42 | $2.45 | $1.04 | $4.91 | $18.23 | 9.2 |
3Q23 | 181,331 | $22.80 | $1.98 | $0.59 | $0.81 | $3.38 | $19.42 | 9.8 |
2Q23 | 155,178 | $26.30 | $3.95 | $0.91 | $1.27 | $6.13 | $20.17 | 8.5 |
| 468,838 | $24.66 | $2.65 | $0.97 | $1.04 | $4.66 | $20.00 | 9.2 |
| | | | | | | | |
Renewals | | | | | | | | |
1Q24 | 549,220 | $20.60 | $0.11 | $0.00 | $0.00 | $0.11 | $20.49 | 5.3 |
4Q23 | 374,469 | $24.47 | $0.03 | $0.00 | $0.01 | $0.04 | $24.43 | 5.1 |
3Q23 | 1,010,717 | $17.89 | $0.10 | $0.00 | $0.00 | $0.10 | $17.79 | 5.7 |
2Q23 | 920,876 | $17.62 | $0.05 | $0.00 | $0.00 | $0.05 | $17.57 | 5.7 |
| 2,855,282 | $19.19 | $0.08 | $0.00 | $0.00 | $0.08 | $19.11 | 5.5 |
| | | | | | | | |
New + Renewals | | | | | | | | |
1Q24 | 596,501 | $21.28 | $0.56 | $0.00 | $0.17 | $0.73 | $20.55 | 5.6 |
4Q23 | 459,517 | $24.23 | $0.43 | $0.71 | $0.31 | $1.45 | $22.78 | 5.8 |
3Q23 | 1,192,048 | $18.64 | $0.55 | $0.14 | $0.19 | $0.88 | $17.76 | 6.3 |
2Q23 | 1,076,054 | $18.87 | $0.84 | $0.18 | $0.26 | $1.28 | $17.59 | 6.1 |
| 3,324,120 | $19.96 | $0.63 | $0.21 | $0.22 | $1.06 | $18.90 | 6.0 |
| | | | | | | | |
Note: ABR PSF represents year one base rent for leasing spreads and the average rent for the initial term for net effective rent. Term is weighted average in years. New Leases exclude leases at redevelopment properties and first generation space. |
|
SITE Centers Corp.
Leasing Summary
| | | | | | | | | | | |
Unconsolidated Joint Ventures at 100% | | | | | | | | | |
| | | | | | | | | | | |
Leasing Activity | | | | | | | | | | | |
| Comparable Pool | | Total Pool |
| | | | Leasing Spreads | | | | | | |
| Count | GLA | ABR PSF | Cash | Straight-lined | Term | | Count | GLA | ABR PSF | Term |
New Leases | | | | | | | | | | | |
1Q24 | 0 | 0 | $0.00 | ---% | ---% | 0.0 | | 0 | 0 | $0.00 | 0.0 |
4Q23 | 0 | 0 | $0.00 | ---% | ---% | 0.0 | | 4 | 48,204 | $17.32 | 10.0 |
3Q23 | 1 | 4,500 | $40.00 | 47.4% | 37.0% | 10.0 | | 1 | 4,500 | $40.00 | 10.0 |
2Q23 | 0 | 0 | $0.00 | ---% | ---% | 0.0 | | 5 | 25,262 | $21.11 | 9.2 |
| 1 | 4,500 | $40.00 | 47.4% | 37.0% | 10.0 | | 10 | 77,966 | $19.86 | 9.7 |
| | | | | | | | | | | |
Renewals | | | | | | | | | | | |
1Q24 | 7 | 137,628 | $13.27 | 2.8% | 4.6% | 5.1 | | 7 | 137,628 | $13.27 | 5.1 |
4Q23 | 7 | 44,651 | $12.25 | 7.1% | 10.7% | 4.9 | | 7 | 44,651 | $12.25 | 4.9 |
3Q23 | 11 | 86,071 | $18.16 | 2.9% | (4.4%) | 6.2 | | 11 | 86,071 | $18.16 | 6.2 |
2Q23 | 16 | 121,431 | $17.08 | 0.0% | 5.7% | 5.1 | | 16 | 121,431 | $17.08 | 5.1 |
| 41 | 389,781 | $15.42 | 2.2% | 3.0% | 5.3 | | 41 | 389,781 | $15.42 | 5.3 |
| | | | | | | | | | | |
New + Renewals | | | | | | | | | | | |
1Q24 | 7 | 137,628 | $13.27 | 2.8% | 4.6% | 5.1 | | 7 | 137,628 | $13.27 | 5.1 |
4Q23 | 7 | 44,651 | $12.25 | 7.1% | 10.7% | 4.9 | | 11 | 92,855 | $14.89 | 7.6 |
3Q23 | 12 | 90,571 | $19.25 | 6.3% | (1.1%) | 6.4 | | 12 | 90,571 | $19.25 | 6.4 |
2Q23 | 16 | 121,431 | $17.08 | 0.0% | 5.7% | 5.1 | | 21 | 146,693 | $17.78 | 5.8 |
| 42 | 394,281 | $15.70 | 3.2% | 3.8% | 5.4 | | 51 | 467,747 | $16.16 | 6.0 |
| | | | | | | | |
Net Effective Rents | | | | | | | |
| | | Capex PSF | NER | |
| GLA | ABR PSF | TA | LL Work | LC | Total | PSF | Term |
New Leases | | | | | | | | |
1Q24 | 0 | $0.00 | $0.00 | $0.00 | $0.00 | $0.00 | $0.00 | 0.0 |
4Q23 | 48,204 | $17.79 | $3.85 | $3.65 | $0.88 | $8.38 | $9.41 | 10.0 |
3Q23 | 4,500 | $43.80 | $5.00 | $1.82 | $1.33 | $8.15 | $35.65 | 10.0 |
2Q23 | 25,262 | $23.29 | $2.07 | $1.22 | $0.72 | $4.01 | $19.28 | 9.2 |
| 77,966 | $21.07 | $3.38 | $2.80 | $0.86 | $7.04 | $14.03 | 9.7 |
| | | | | | | | |
Renewals | | | | | | | | |
1Q24 | 137,628 | $13.41 | $0.00 | $0.00 | $0.04 | $0.04 | $13.37 | 5.1 |
4Q23 | 44,651 | $12.46 | $0.04 | $0.00 | $0.00 | $0.04 | $12.42 | 4.9 |
3Q23 | 86,071 | $18.34 | $1.13 | $0.00 | $0.00 | $1.13 | $17.21 | 6.2 |
2Q23 | 121,431 | $17.44 | $0.00 | $0.02 | $0.00 | $0.02 | $17.42 | 5.1 |
| 389,781 | $15.65 | $0.29 | $0.01 | $0.01 | $0.31 | $15.34 | 5.3 |
| | | | | | | | |
New + Renewals | | | | | | | | |
1Q24 | 137,628 | $13.41 | $0.00 | $0.00 | $0.04 | $0.04 | $13.37 | 5.1 |
4Q23 | 92,855 | $15.22 | $2.65 | $2.50 | $0.60 | $5.75 | $9.47 | 7.6 |
3Q23 | 90,571 | $19.61 | $1.43 | $0.14 | $0.10 | $1.67 | $17.94 | 6.4 |
2Q23 | 146,693 | $18.45 | $0.57 | $0.35 | $0.20 | $1.12 | $17.33 | 5.8 |
| 467,747 | $16.55 | $1.12 | $0.75 | $0.24 | $2.11 | $14.44 | 6.0 |
|
Note: ABR PSF represents year one base rent for leasing spreads and the average rent for the initial term for net effective rent. Term is weighted average in years. New Leases exclude leases at redevelopment properties and first generation space. |
SITE Centers Corp.
Leasing Expirations
| | | | | | | | | | | | | | | | | | | | | | | | | | |
Wholly Owned at 100%; $ and GLA in thousands | | | | | | | | | | | | |
| | | | | | | | | | | | | | | | | | | | | | | | | | |
Assumes no exercise of lease options | | | | | | | | | | | | | | | | | | | | | |
| | | | | | | | | | | | | | | | | | | | | | | | | | |
| Greater than 10K SF | | Less than 10K SF | | Total |
Year | # of
Leases | | Expiring
SF | % of SF
> 10K | ABR | % of ABR
> 10K | | Rent
PSF | | # of
Leases | | Expiring
SF | % of SF
< 10K | ABR | % of ABR
< 10K | | Rent
PSF | | # of
Leases | | Expiring
SF | % of SF
Total | ABR | % of ABR
Total | | Rent
PSF |
MTM | 0 | | 0 | 0.0% | $0 | 0.0% | | $0.00 | | 12 | | 31 | 0.7% | $714 | 0.5% | | $23.03 | | 12 | | 31 | 0.2% | $714 | 0.2% | | $23.03 |
2024 | 7 | | 273 | 2.3% | $3,504 | 2.1% | | $12.84 | | 73 | | 178 | 3.8% | 5,471 | 3.6% | | $30.74 | | 80 | | 451 | 2.8% | 8,975 | 2.8% | | $19.90 |
2025 | 55 | | 1,646 | 14.1% | 24,775 | 14.7% | | $15.05 | | 193 | | 587 | 12.7% | 18,148 | 12.0% | | $30.92 | | 248 | | 2,233 | 13.7% | 42,923 | 13.4% | | $19.22 |
2026 | 41 | | 1,132 | 9.7% | 13,356 | 7.9% | | $11.80 | | 187 | | 507 | 10.9% | 16,405 | 10.8% | | $32.36 | | 228 | | 1,639 | 10.1% | 29,761 | 9.3% | | $18.16 |
2027 | 58 | | 1,878 | 16.1% | 30,307 | 18.0% | | $16.14 | | 211 | | 656 | 14.2% | 20,915 | 13.8% | | $31.88 | | 269 | | 2,534 | 15.6% | 51,222 | 16.0% | | $20.21 |
2028 | 76 | | 2,284 | 19.6% | 31,765 | 18.8% | | $13.91 | | 235 | | 671 | 14.5% | 23,483 | 15.5% | | $35.00 | | 311 | | 2,955 | 18.2% | 55,248 | 17.2% | | $18.70 |
2029 | 54 | | 1,513 | 13.0% | 21,308 | 12.6% | | $14.08 | | 171 | | 519 | 11.2% | 17,057 | 11.2% | | $32.87 | | 225 | | 2,032 | 12.5% | 38,365 | 12.0% | | $18.88 |
2030 | 23 | | 635 | 5.5% | 9,665 | 5.7% | | $15.22 | | 84 | | 251 | 5.4% | 8,733 | 5.8% | | $34.79 | | 107 | | 886 | 5.4% | 18,398 | 5.7% | | $20.77 |
2031 | 14 | | 547 | 4.7% | 7,013 | 4.2% | | $12.82 | | 74 | | 222 | 4.8% | 6,844 | 4.5% | | $30.83 | | 88 | | 769 | 4.7% | 13,857 | 4.3% | | $18.02 |
2032 | 18 | | 411 | 3.5% | 6,412 | 3.8% | | $15.60 | | 121 | | 378 | 8.2% | 12,585 | 8.3% | | $33.29 | | 139 | | 789 | 4.9% | 18,997 | 5.9% | | $24.08 |
2033 | 20 | | 440 | 3.8% | 6,092 | 3.6% | | $13.85 | | 122 | | 393 | 8.5% | 13,382 | 8.8% | | $34.05 | | 142 | | 833 | 5.1% | 19,474 | 6.1% | | $23.38 |
Thereafter | 23 | | 874 | 7.5% | 14,448 | 8.6% | | $16.53 | | 72 | | 241 | 5.2% | 8,122 | 5.3% | | $33.70 | | 95 | | 1,115 | 6.9% | 22,570 | 7.0% | | $20.24 |
Total | 389 | | 11,633 | 100.0% | $168,645 | 100.0% | | $14.50 | | 1,555 | | 4,634 | 100.0% | $151,859 | 100.0% | | $32.77 | | 1,944 | | 16,267 | 100.0% | $320,504 | 100.0% | | $19.70 |
| | | | | | | | | | | | | | | | | | | | | | | | | | |
Assumes all lease options are exercised | | | | | | | | | | | | | | | | | | | | | |
| | | | | | | | | | | | | | | | | | | | | | | | | | |
| Greater than 10K SF | | Less than 10K SF | | Total |
Year | # of
Leases | | Expiring
SF | % of SF
> 10K | ABR | % of ABR
> 10K | | Rent
PSF | | # of
Leases | | Expiring
SF | % of SF
< 10K | ABR | % of ABR
< 10K | | Rent
PSF | | # of
Leases | | Expiring
SF | % of SF
Total | ABR | % of ABR
Total | | Rent
PSF |
MTM | 0 | | 0 | 0.0% | 0 | 0.0% | | $0.00 | | 11 | | 28 | 0.6% | $644 | 0.4% | | $23.00 | | 11 | | 28 | 0.2% | $644 | 0.2% | | $23.00 |
2024 | 2 | | 39 | 0.3% | 826 | 0.5% | | $21.18 | | 49 | | 112 | 2.4% | 3,476 | 2.3% | | $31.04 | | 51 | | 151 | 0.9% | 4,302 | 1.3% | | $28.49 |
2025 | 11 | | 250 | 2.1% | 3,696 | 2.2% | | $14.78 | | 112 | | 279 | 6.0% | 9,421 | 6.2% | | $33.77 | | 123 | | 529 | 3.3% | 13,117 | 4.1% | | $24.80 |
2026 | 4 | | 53 | 0.5% | 896 | 0.5% | | $16.91 | | 90 | | 223 | 4.8% | 7,199 | 4.7% | | $32.28 | | 94 | | 276 | 1.7% | 8,095 | 2.5% | | $29.33 |
2027 | 13 | | 252 | 2.2% | 5,027 | 3.0% | | $19.95 | | 94 | | 244 | 5.3% | 7,648 | 5.0% | | $31.34 | | 107 | | 496 | 3.0% | 12,675 | 4.0% | | $25.55 |
2028 | 17 | | 284 | 2.4% | 4,918 | 2.9% | | $17.32 | | 125 | | 341 | 7.4% | 11,709 | 7.7% | | $34.34 | | 142 | | 625 | 3.8% | 16,627 | 5.2% | | $26.60 |
2029 | 5 | | 160 | 1.4% | 2,575 | 1.5% | | $16.09 | | 114 | | 275 | 5.9% | 9,454 | 6.2% | | $34.38 | | 119 | | 435 | 2.7% | 12,029 | 3.8% | | $27.65 |
2030 | 14 | | 307 | 2.6% | 5,561 | 3.3% | | $18.11 | | 67 | | 187 | 4.0% | 5,800 | 3.8% | | $31.02 | | 81 | | 494 | 3.0% | 11,361 | 3.5% | | $23.00 |
2031 | 13 | | 220 | 1.9% | 3,861 | 2.3% | | $17.55 | | 70 | | 162 | 3.5% | 4,974 | 3.3% | | $30.70 | | 83 | | 382 | 2.3% | 8,835 | 2.8% | | $23.13 |
2032 | 12 | | 271 | 2.3% | 4,835 | 2.9% | | $17.84 | | 89 | | 262 | 5.7% | 8,610 | 5.7% | | $32.86 | | 101 | | 533 | 3.3% | 13,445 | 4.2% | | $25.23 |
2033 | 18 | | 415 | 3.6% | 6,533 | 3.9% | | $15.74 | | 90 | | 254 | 5.5% | 8,457 | 5.6% | | $33.30 | | 108 | | 669 | 4.1% | 14,990 | 4.7% | | $22.41 |
Thereafter | 280 | | 9,382 | 80.6% | 129,917 | 77.0% | | $13.85 | | 644 | | 2,267 | 48.9% | 74,467 | 49.0% | | $32.85 | | 924 | | 11,649 | 71.6% | 204,384 | 63.8% | | $17.55 |
Total | 389 | | 11,633 | 100.0% | $168,645 | 100.0% | | $14.50 | | 1,555 | | 4,634 | 100.0% | $151,859 | 100.0% | | $32.77 | | 1,944 | | 16,267 | 100.0% | $320,504 | 100.0% | | $19.70 |
| | | | | | | | | | | | | | | | | | | | | | | | | | |
Note: Includes ground leases | | | | | | | | | | | | | | | | | | | | | |
SITE Centers Corp.
Leasing Expirations
| | | | | | | | | | | | | | | | | | | | | | | | | | |
Unconsolidated Joint Ventures at 100%; $ and GLA in thousands | | | | | | | | | |
| | | | | | | | | | | | | | | | | | | | | | | | | | |
Assumes no exercise of lease options | | | | | | | | | | | | | | | | | | | | | |
| | | | | | | | | | | | | | | | | | | | | | | | | | |
| Greater than 10K SF | | Less than 10K SF | | Total |
Year | # of
Leases | | Expiring
SF | % of SF
> 10K | ABR | % of ABR
> 10K | | Rent
PSF | | # of
Leases | | Expiring
SF | % of SF
< 10K | ABR | % of ABR
< 10K | | Rent
PSF | | # of
Leases | | Expiring
SF | % of SF
Total | ABR | % of ABR
Total | | Rent
PSF |
MTM | 0 | | 0 | 0.0% | $0 | 0.0% | | $0.00 | | 2 | | 2 | 0.2% | $168 | 0.7% | | $84.00 | | 2 | | 2 | 0.1% | $168 | 0.3% | | $84.00 |
2024 | 6 | | 383 | 12.9% | 3,568 | 9.5% | | $9.32 | | 20 | | 51 | 5.9% | 1,592 | 6.5% | | $31.22 | | 26 | | 434 | 11.3% | 5,160 | 8.3% | | $11.89 |
2025 | 13 | | 297 | 10.0% | 4,069 | 10.9% | | $13.70 | | 38 | | 120 | 13.9% | 2,958 | 12.0% | | $24.65 | | 51 | | 417 | 10.9% | 7,027 | 11.3% | | $16.85 |
2026 | 16 | | 376 | 12.6% | 3,722 | 9.9% | | $9.90 | | 36 | | 120 | 13.9% | 3,114 | 12.6% | | $25.95 | | 52 | | 496 | 12.9% | 6,836 | 11.0% | | $13.78 |
2027 | 15 | | 449 | 15.1% | 5,926 | 15.8% | | $13.20 | | 28 | | 100 | 11.6% | 3,212 | 13.0% | | $32.12 | | 43 | | 549 | 14.3% | 9,138 | 14.7% | | $16.64 |
2028 | 16 | | 441 | 14.8% | 5,647 | 15.1% | | $12.80 | | 39 | | 119 | 13.8% | 3,730 | 15.1% | | $31.34 | | 55 | | 560 | 14.6% | 9,377 | 15.1% | | $16.74 |
2029 | 7 | | 216 | 7.3% | 2,968 | 7.9% | | $13.74 | | 30 | | 121 | 14.0% | 3,204 | 13.0% | | $26.48 | | 37 | | 337 | 8.8% | 6,172 | 9.9% | | $18.31 |
2030 | 3 | | 85 | 2.9% | 977 | 2.6% | | $11.49 | | 15 | | 47 | 5.5% | 1,133 | 4.6% | | $24.11 | | 18 | | 132 | 3.4% | 2,110 | 3.4% | | $15.98 |
2031 | 7 | | 249 | 8.4% | 3,860 | 10.3% | | $15.50 | | 9 | | 33 | 3.8% | 1,093 | 4.4% | | $33.12 | | 16 | | 282 | 7.3% | 4,953 | 8.0% | | $17.56 |
2032 | 2 | | 93 | 3.1% | 571 | 1.5% | | $6.14 | | 19 | | 78 | 9.0% | 2,454 | 9.9% | | $31.46 | | 21 | | 171 | 4.5% | 3,025 | 4.9% | | $17.69 |
2033 | 7 | | 196 | 6.6% | 3,400 | 9.1% | | $17.35 | | 10 | | 37 | 4.3% | 868 | 3.5% | | $23.46 | | 17 | | 233 | 6.1% | 4,268 | 6.9% | | $18.32 |
Thereafter | 4 | | 193 | 6.5% | 2,781 | 7.4% | | $14.41 | | 10 | | 34 | 3.9% | 1,151 | 4.7% | | $33.85 | | 14 | | 227 | 5.9% | 3,932 | 6.3% | | $17.32 |
Total | 96 | | 2,978 | 100.0% | $37,489 | 100.0% | | $12.59 | | 256 | | 862 | 100.0% | $24,677 | 100.0% | | $28.63 | | 352 | | 3,840 | 100.0% | $62,166 | 100.0% | | $16.19 |
| | | | | | | | | | | | | | | | | | | | | | | | | | |
Assumes all lease options are exercised | | | | | | | | | | | | | | | | | | | | |
| | | | | | | | | | | | | | | | | | | | | | | | | | |
| Greater than 10K SF | | Less than 10K SF | | Total |
Year | # of
Leases | | Expiring
SF | % of SF
> 10K | ABR | % of ABR
> 10K | | Rent
PSF | | # of
Leases | | Expiring
SF | % of SF
< 10K | ABR | % of ABR
< 10K | | Rent
PSF | | # of
Leases | | Expiring
SF | % of SF
Total | ABR | % of ABR
Total | | Rent
PSF |
MTM | 0 | | 0 | 0.0% | 0 | 0.0% | | $0.00 | | 1 | | 1 | 0.1% | $128 | 0.5% | | $128.00 | | 1 | | 1 | 0.0% | $128 | 0.2% | | $128.00 |
2024 | 3 | | 78 | 2.6% | 832 | 2.2% | | $10.67 | | 18 | | 47 | 5.5% | 1,458 | 5.9% | | $31.02 | | 21 | | 125 | 3.3% | 2,290 | 3.7% | | $18.32 |
2025 | 4 | | 59 | 2.0% | 907 | 2.4% | | $15.37 | | 26 | | 75 | 8.7% | 1,909 | 7.7% | | $25.45 | | 30 | | 134 | 3.5% | 2,816 | 4.5% | | $21.01 |
2026 | 2 | | 36 | 1.2% | 434 | 1.2% | | $12.06 | | 21 | | 51 | 5.9% | 1,307 | 5.3% | | $25.63 | | 23 | | 87 | 2.3% | 1,741 | 2.8% | | $20.01 |
2027 | 3 | | 41 | 1.4% | 427 | 1.1% | | $10.41 | | 15 | | 50 | 5.8% | 1,642 | 6.7% | | $32.84 | | 18 | | 91 | 2.4% | 2,069 | 3.3% | | $22.74 |
2028 | 2 | | 30 | 1.0% | 540 | 1.4% | | $18.00 | | 26 | | 76 | 8.8% | 2,700 | 10.9% | | $35.53 | | 28 | | 106 | 2.8% | 3,240 | 5.2% | | $30.57 |
2029 | 2 | | 75 | 2.5% | 799 | 2.1% | | $10.65 | | 22 | | 71 | 8.2% | 2,053 | 8.3% | | $28.92 | | 24 | | 146 | 3.8% | 2,852 | 4.6% | | $19.53 |
2030 | 2 | | 69 | 2.3% | 763 | 2.0% | | $11.06 | | 17 | | 51 | 5.9% | 1,265 | 5.1% | | $24.80 | | 19 | | 120 | 3.1% | 2,028 | 3.3% | | $16.90 |
2031 | 6 | | 94 | 3.2% | 1,036 | 2.8% | | $11.02 | | 14 | | 46 | 5.3% | 1,419 | 5.8% | | $30.85 | | 20 | | 140 | 3.6% | 2,455 | 3.9% | | $17.54 |
2032 | 2 | | 61 | 2.0% | 742 | 2.0% | | $12.16 | | 19 | | 70 | 8.1% | 2,279 | 9.2% | | $32.56 | | 21 | | 131 | 3.4% | 3,021 | 4.9% | | $23.06 |
2033 | 6 | | 165 | 5.5% | 2,639 | 7.0% | | $15.99 | | 12 | | 40 | 4.6% | 917 | 3.7% | | $22.93 | | 18 | | 205 | 5.3% | 3,556 | 5.7% | | $17.35 |
Thereafter | 64 | | 2,270 | 76.2% | 28,370 | 75.7% | | $12.50 | | 65 | | 284 | 32.9% | 7,600 | 30.8% | | $26.76 | | 129 | | 2,554 | 66.5% | 35,970 | 57.9% | | $14.08 |
Total | 96 | | 2,978 | 100.0% | $37,489 | 100.0% | | $12.59 | | 256 | | 862 | 100.0% | $24,677 | 100.0% | | $28.63 | | 352 | | 3,840 | 100.0% | $62,166 | 100.0% | | $16.19 |
| | | | | | | | | | | | | | | | | | | | | | | | | | |
Note: Includes ground leases | | | | | | | | | | | | | | | | | | | | | |
SITE CENTERS INVESTOR RELATIONS DEPARTMENT e: ir@sitecenters.com w: ir.sitecenters.com 3300 Enterprise Pkwy, Beachwood, OH 44122 o:216-755-5500 f:216-755-1500 w: sitecenters.com • NYSE:SITC