| 4Q’22 Earnings Presentation |
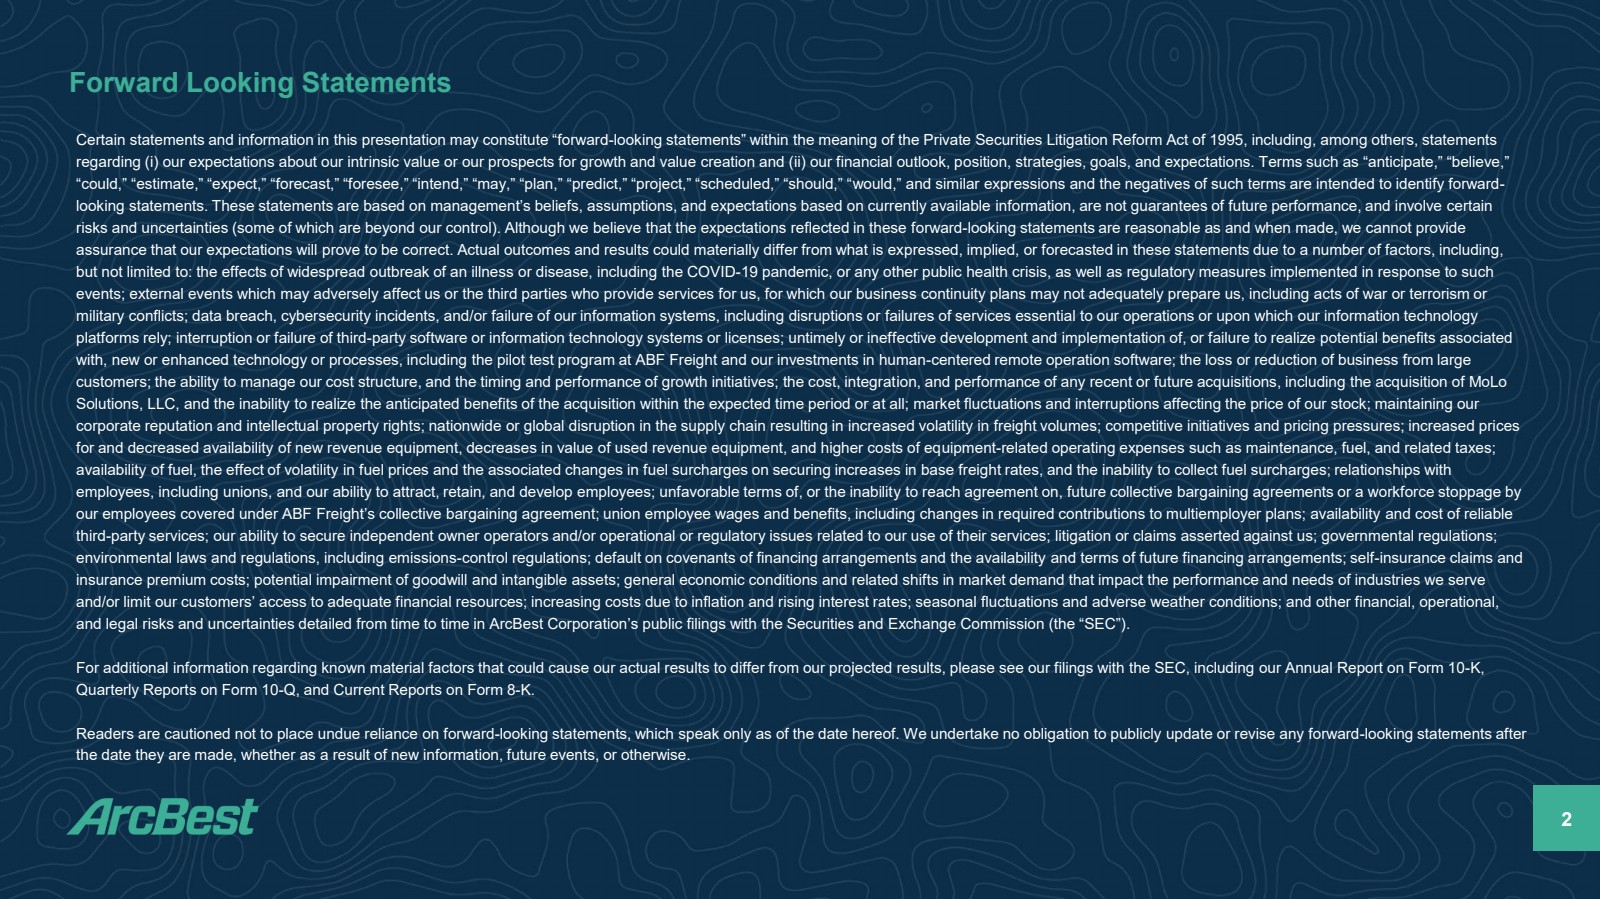
| Forward Looking Statements 2 Certain statements and information in this presentation may constitute “forward - looking statements” within the meaning of the Pr ivate Securities Litigation Reform Act of 1995, including, among others, statements regarding ( i ) our expectations about our intrinsic value or our prospects for growth and value creation and (ii) our financial outlook, p osi tion, strategies, goals, and expectations. Terms such as “anticipate,” “believe,” “could,” “estimate,” “expect,” “forecast,” “foresee,” “intend,” “may,” “plan,” “predict,” “project,” “scheduled,” “should,” “ wou ld,” and similar expressions and the negatives of such terms are intended to identify forward - looking statements. These statements are based on management’s beliefs, assumptions, and expectations based on currently avai lab le information, are not guarantees of future performance, and involve certain risks and uncertainties (some of which are beyond our control). Although we believe that the expectations reflected in these for ward - looking statements are reasonable as and when made, we cannot provide assurance that our expectations will prove to be correct. Actual outcomes and results could materially differ from what is ex pre ssed, implied, or forecasted in these statements due to a number of factors, including, but not limited to: the effects of widespread outbreak of an illness or disease, including the COVID - 19 pandemic, or any other p ublic health crisis, as well as regulatory measures implemented in response to such events; external events which may adversely affect us or the third parties who provide services for us, for which our busines s c ontinuity plans may not adequately prepare us, including acts of war or terrorism or military conflicts; data breach, cybersecurity incidents, and/or failure of our information systems, including disruptions or fa ilures of services essential to our operations or upon which our information technology platforms rely; interruption or failure of third - party software or information technology systems or licenses; untimely or ineff ective development and implementation of, or failure to realize potential benefits associated with, new or enhanced technology or processes, including the pilot test program at ABF Freight and our investments in human - cent ered remote operation software; the loss or reduction of business from large customers; the ability to manage our cost structure, and the timing and performance of growth initiatives; the cost, integrat ion , and performance of any recent or future acquisitions, including the acquisition of MoLo Solutions, LLC, and the inability to realize the anticipated benefits of the acquisition within the expected time period or a t a ll; market fluctuations and interruptions affecting the price of our stock; maintaining our corporate reputation and intellectual property rights; nationwide or global disruption in the supply chain resulting in incre ase d volatility in freight volumes; competitive initiatives and pricing pressures; increased prices for and decreased availability of new revenue equipment, decreases in value of used revenue equipment, and higher costs of eq uip ment - related operating expenses such as maintenance, fuel, and related taxes; availability of fuel, the effect of volatility in fuel prices and the associated changes in fuel surcharges on securing incre ase s in base freight rates, and the inability to collect fuel surcharges; relationships with employees, including unions, and our ability to attract, retain, and develop employees; unfavorable terms of, or the inabilit y t o reach agreement on, future collective bargaining agreements or a workforce stoppage by our employees covered under ABF Freight’s collective bargaining agreement; union employee wages and benefits, including chang es in required contributions to multiemployer plans; availability and cost of reliable third - party services; our ability to secure independent owner operators and/or operational or regulatory issues related to our u se of their services; litigation or claims asserted against us; governmental regulations; environmental laws and regulations, including emissions - control regulations; default on covenants of financing arrangements and the availability and terms of future financing arrangements; self - insurance claims and insurance premium costs; potential impairment of goodwill and intangible assets; general economic conditions and related shif ts in market demand that impact the performance and needs of industries we serve and/or limit our customers’ access to adequate financial resources; increasing costs due to inflation and rising interest rat es; seasonal fluctuations and adverse weather conditions; and other financial, operational, and legal risks and uncertainties detailed from time to time in ArcBest Corporation’s public filings with the Securities and Exc hange Commission (the “SEC”). For additional information regarding known material factors that could cause our actual results to differ from our projected res ults, please see our filings with the SEC, including our Annual Report on Form 10 - K, Quarterly Reports on Form 10 - Q, and Current Reports on Form 8 - K. Readers are cautioned not to place undue reliance on forward - looking statements, which speak only as of the date hereof. We unde rtake no obligation to publicly update or revise any forward - looking statements after the date they are made, whether as a result of new information, future events, or otherwise. |
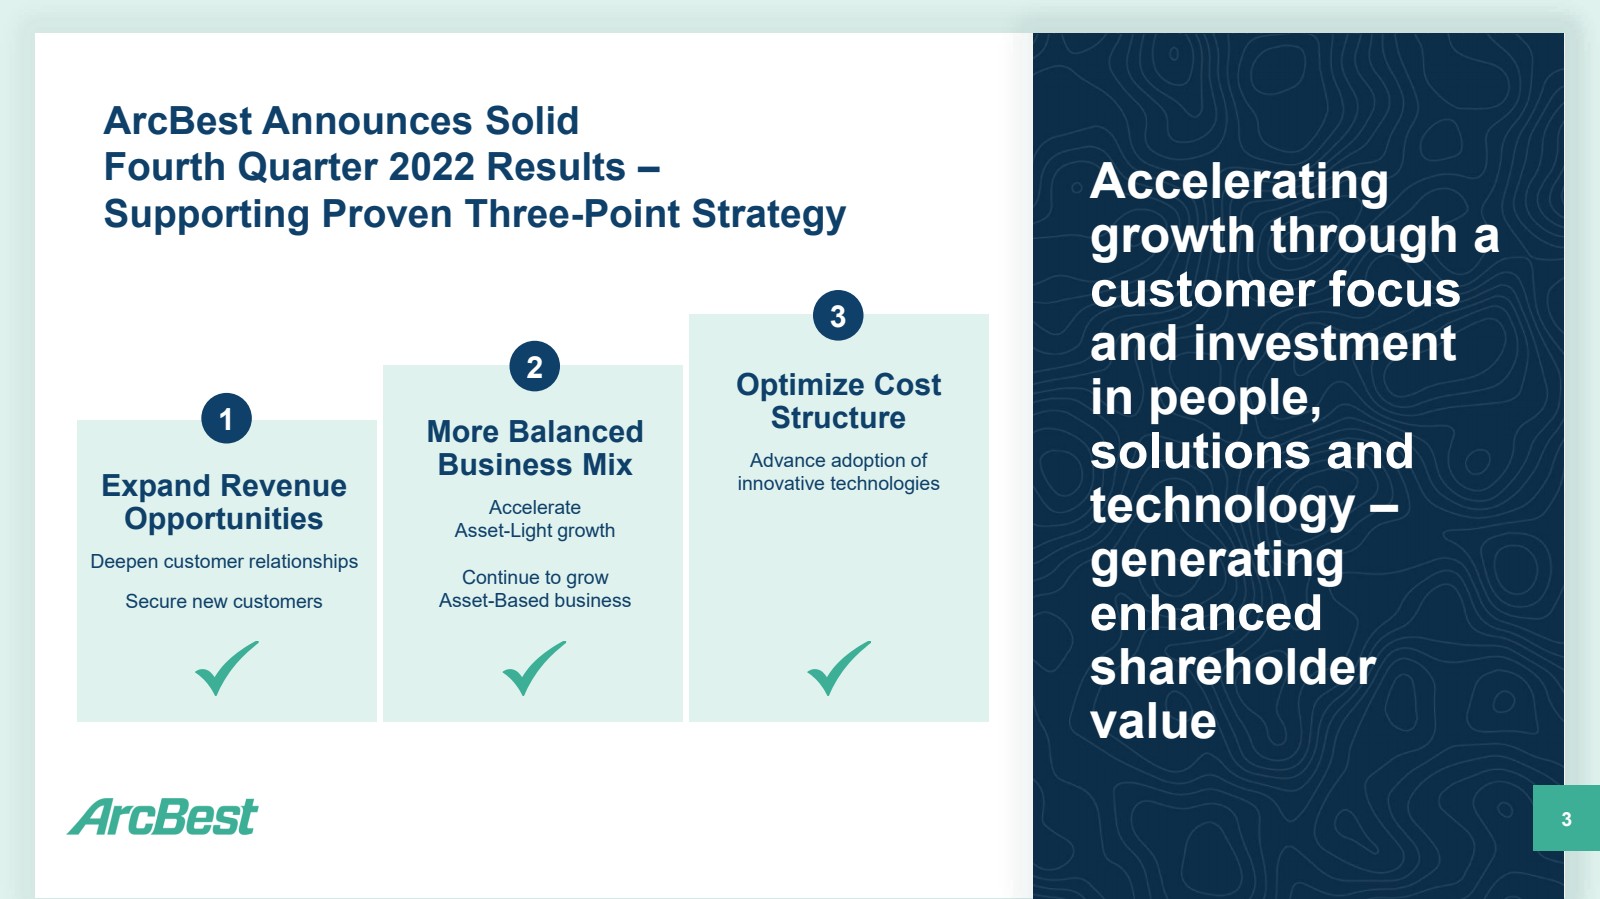
| 3 Accelerating growth through a customer focus and investment in people, solutions and technology – generating enhanced shareholder value 1 2 3 More Balanced Business Mix Accelerate Asset - Light growth Continue to grow Asset - Based business Optimize Cost Structure Advance adoption of innovative technologies Expand Revenue Opportunities Deepen customer relationships Secure new customers ArcBest Announces Solid Fourth Quarter 2022 Results – Supporting Proven Three - Point Strategy |
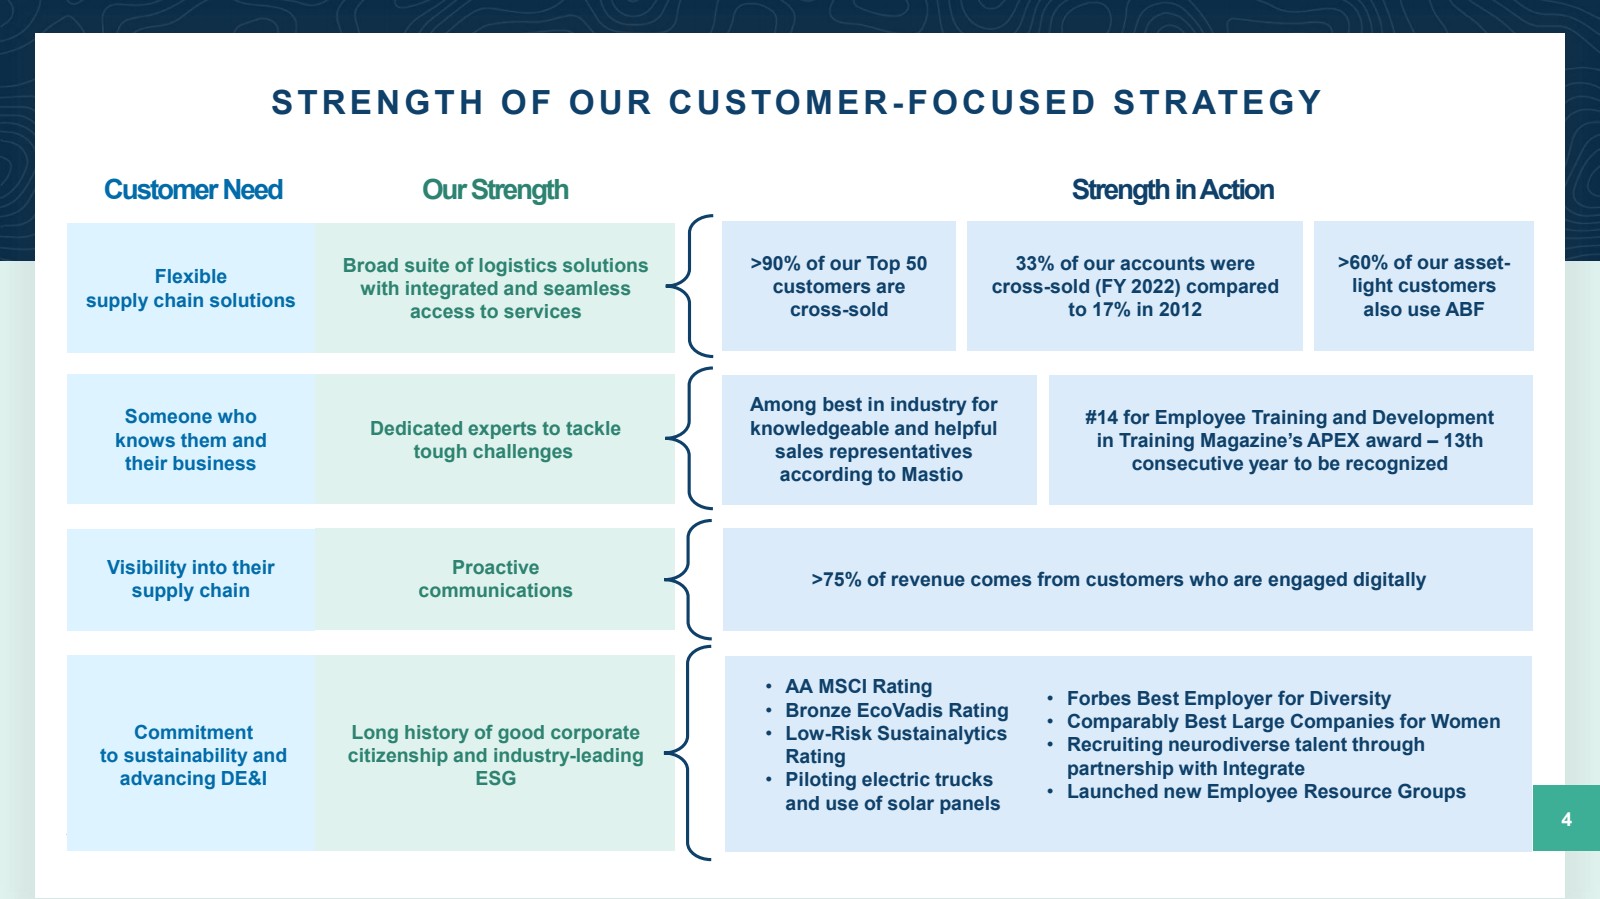
| STRENGTH OF OUR CUSTOMER - FOCUSED STRATEGY 4 Customer Need Our Strength Flexible supply chain solutions Broad suite of logistics solutions with integrated and seamless access to services Strength in Action Someone who knows them and their business Dedicated experts to tackle tough challenges Visibility into their supply chain Proactive communications >75% of revenue comes from customers who are engaged digitally Commitment to sustainability and advancing DE&I Long history of good corporate citizenship and industry - leading ESG • AA MSCI Rating • Bronze EcoVadis Rating • Low - Risk Sustainalytics Rating • Piloting electric trucks and use of solar panels >90% of our Top 50 customers are cross - sold 33% of our accounts were cross - sold (FY 2022) compared to 17% in 2012 >60% of our asset - light customers also use ABF Among best in industry for knowledgeable and helpful sales representatives according to Mastio #14 for Employee Training and Development in Training Magazine’s APEX award – 13th consecutive year to be recognized • Forbes Best Employer for Diversity • Comparably Best Large Companies for Women • Recruiting neurodiverse talent through partnership with Integrate • Launched new Employee Resource Groups |
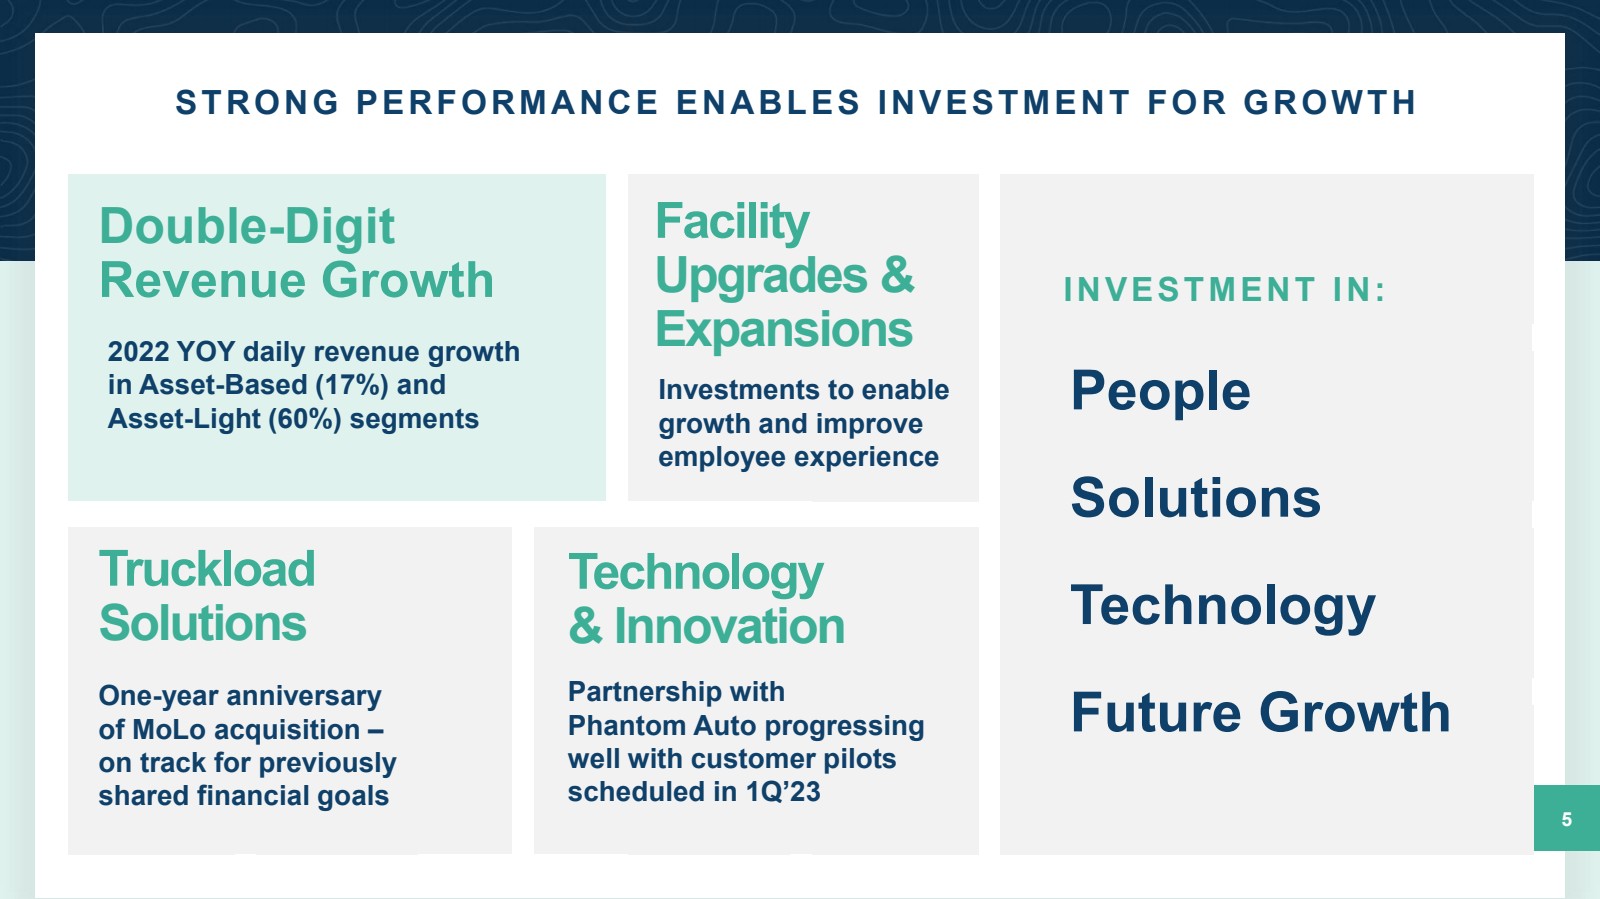
| STRONG PERFORMANCE ENABLES INVESTMENT FOR GROWTH 5 INVESTMENT IN: People Solutions Technology Future Growth Double - Digit Revenue Growth 2022 YOY daily revenue growth in Asset - Based (17%) and Asset - Light (60%) segments Facility Upgrades & Expansions Investments to enable growth and improve employee experience One - year anniversary of MoLo acquisition – on track for previously shared financial goals Truckload Solutions Technology & Innovation Partnership with Phantom Auto progressing well with customer pilots scheduled in 1Q’23 |
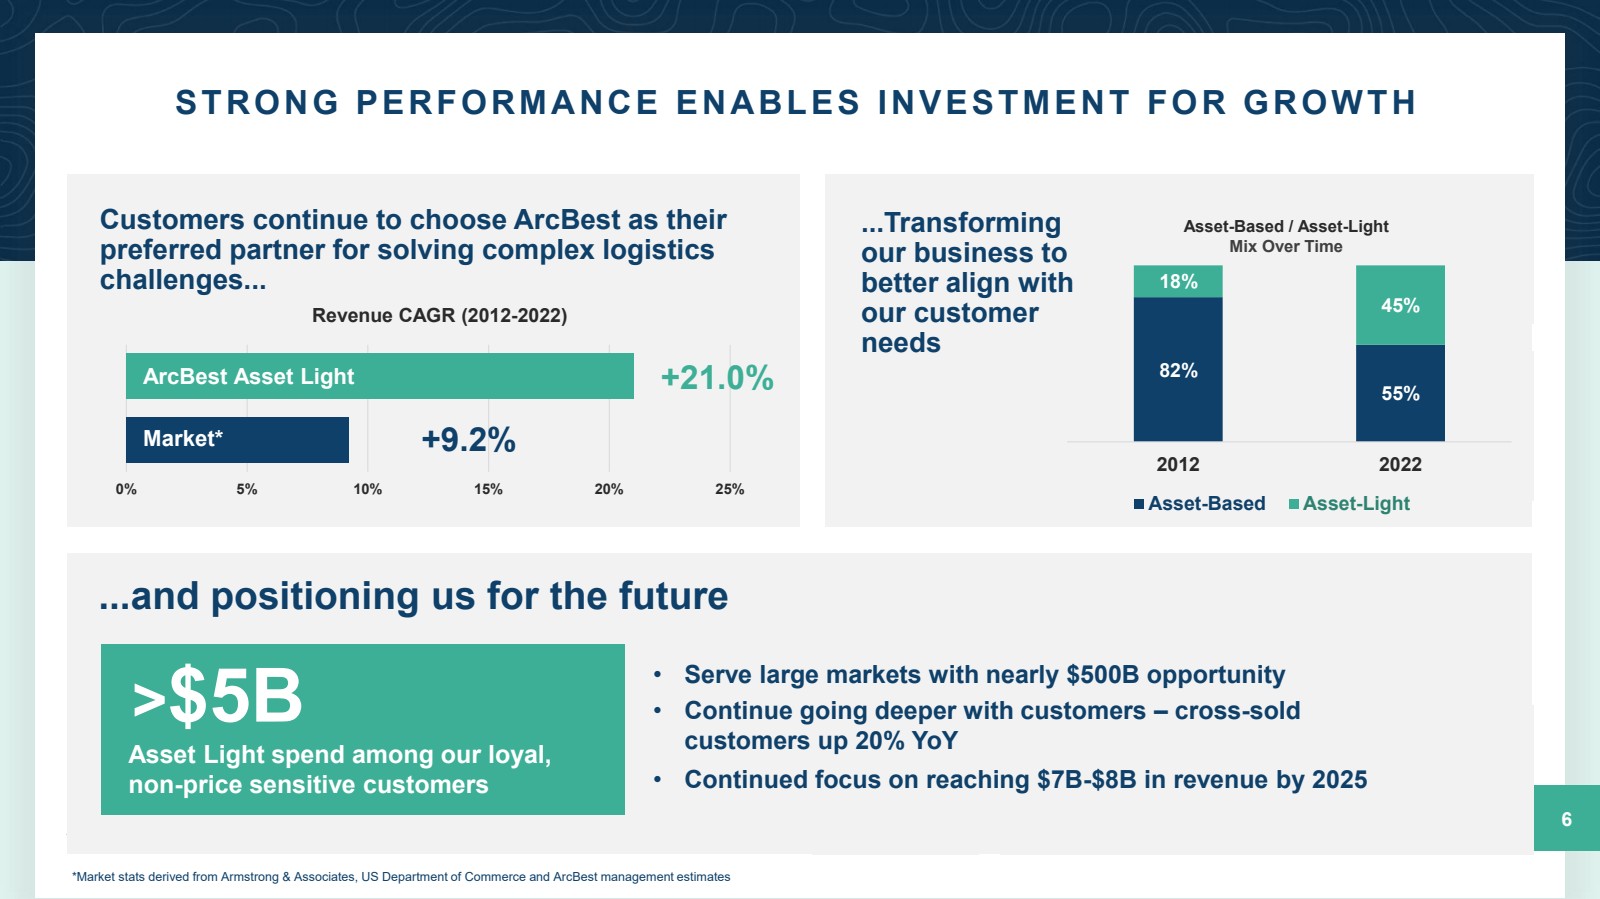
| STRONG PERFORMANCE ENABLES INVESTMENT FOR GROWTH 6 Customers continue to choose ArcBest as their preferred partner for solving complex logistics challenges... ....and positioning us for the future ....Transforming our business to better align with our customer needs 82% 55% 18% 45% 2012 2022 Asset-Based Asset-Light Asset - Based / Asset - Light Mix Over Time 0% 5% 10% 15% 20% 25% Revenue CAGR (2012 - 2022) ArcBest Asset Light Market* +21.0% +9.2% > $5B Asset Light spend among our loyal, non - price sensitive customers • Serve large markets with nearly $500B opportunity • Continue going deeper with customers – cross - sold customers up 20% YoY • Continued focus on reaching $7B - $8B in revenue by 2025 *Market stats derived from Armstrong & Associates, US Department of Commerce and ArcBest management estimates |
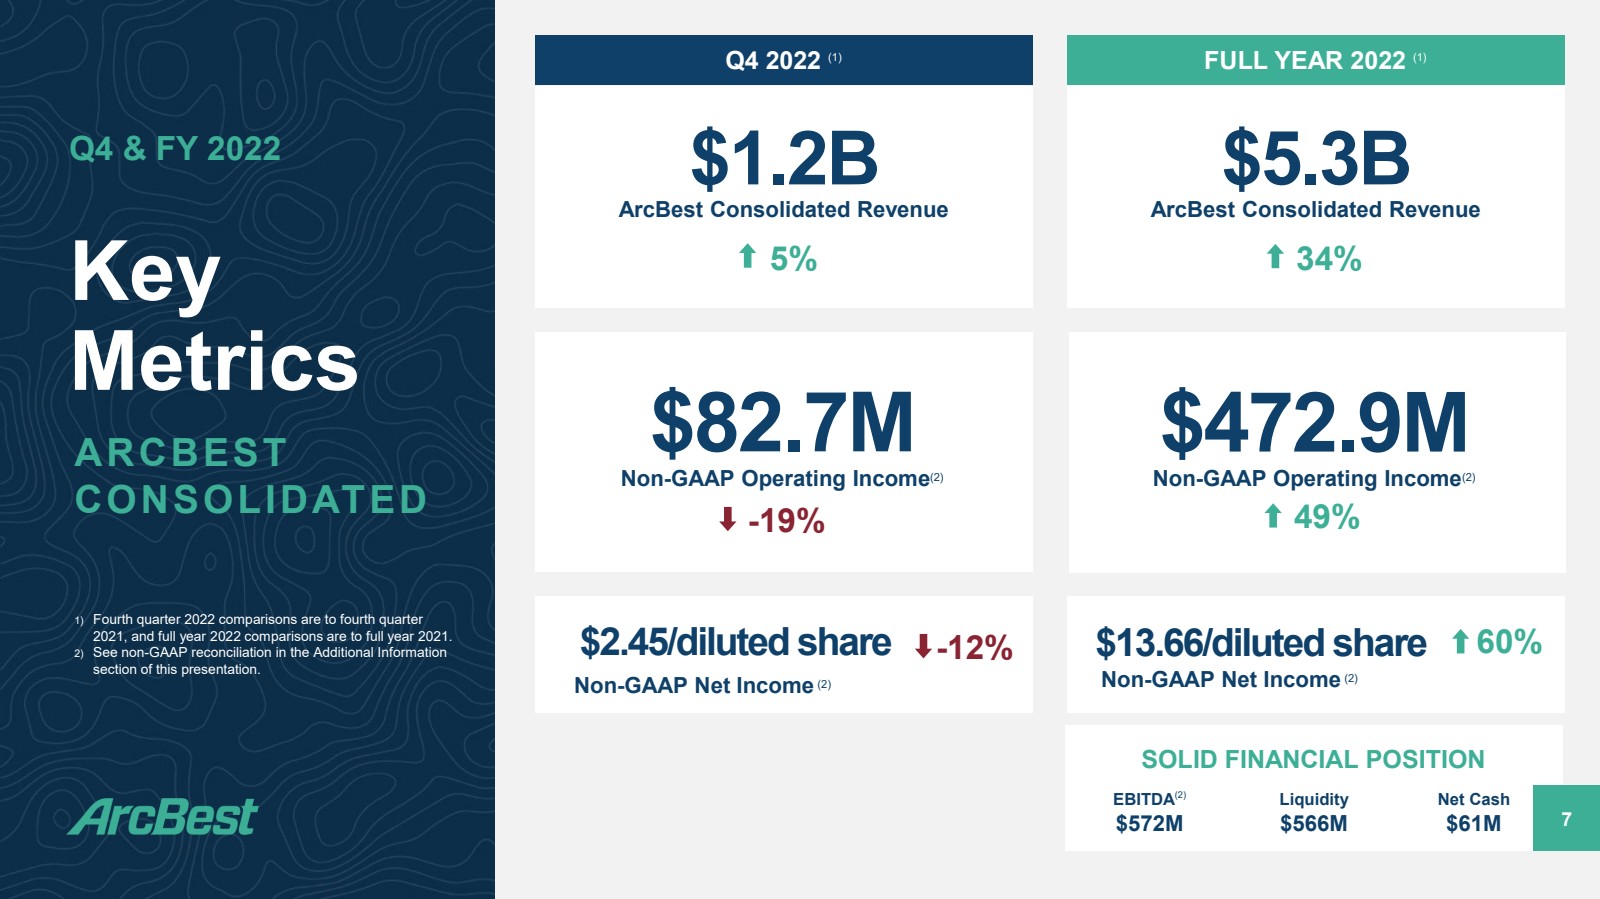
| SOLID FINANCIAL POSITION EBITDA (2) $ 572 M Key Metrics Q4 & FY 2022 7 $1.2B ArcBest Consolidated Revenue 5% $82.7M Non - GAAP Operating Income (2) $2.45/diluted share Non - GAAP Net Income (2) - 12% ARCBEST CONSOLIDATED 1) Fourth quarter 2022 comparisons are to fourth quarter 2021, and full year 2022 comparisons are to full year 2021. 2) See non - GAAP reconciliation in the Additional Information section of this presentation. Q4 2022 (1) - 19% $13.66/diluted share Non - GAAP Net Income (2) $5.3B ArcBest Consolidated Revenue 34% $472.9M Non - GAAP Operating Income (2) FULL YEAR 2022 (1) 49% 60% Liquidity $ 566 M Net Cash $ 61 M |
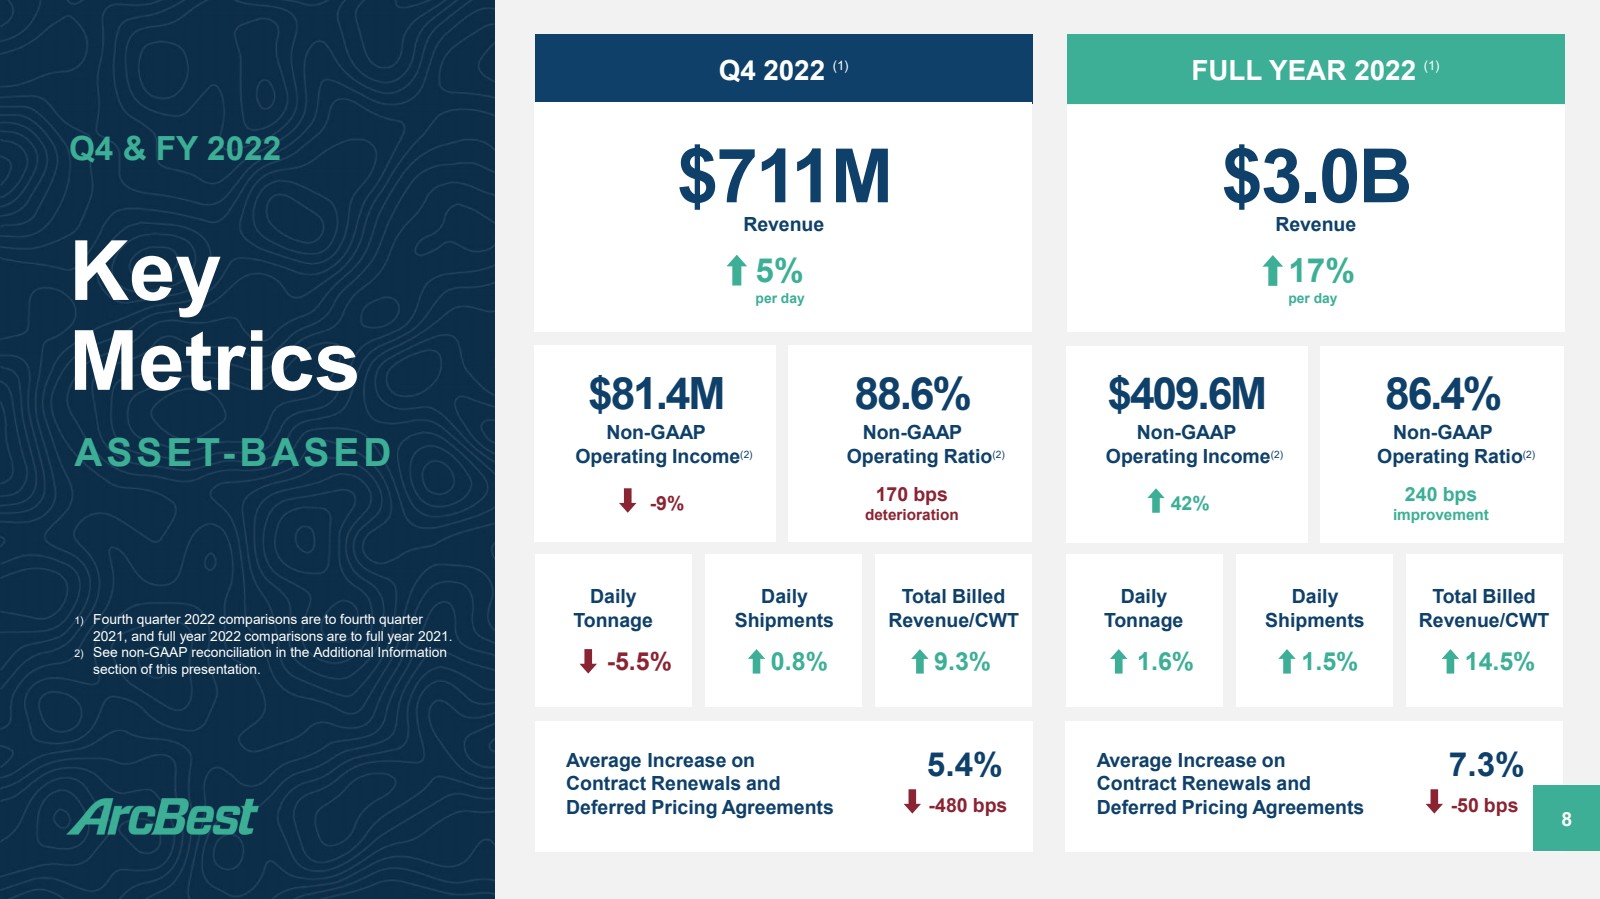
| Key Metrics Q4 & FY 2022 8 ASSET - BASED 1) Fourth quarter 2022 comparisons are to fourth quarter 2021, and full year 2022 comparisons are to full year 2021. 2) See non - GAAP reconciliation in the Additional Information section of this presentation. Q4 2022 (1) FULL YEAR 2022 (1) $711M Revenue 5% per day $3.0B Revenue 17% per day Average Increase on Contract Renewals and Deferred Pricing Agreements - 480 bps Daily Tonnage - 5.5% Daily Shipments 0.8% Total Billed Revenue/CWT 9.3% 5 .. 4 % $81.4M Non - GAAP Operating Income (2) 88.6% Non - GAAP Operating Ratio (2) 170 bps deterioration Average Increase on Contract Renewals and Deferred Pricing Agreements - 50 bps Daily Tonnage 1.6% Daily Shipments 1.5% Total Billed Revenue/CWT 14.5% 7 .. 3 % $409.6M Non - GAAP Operating Income (2) 86.4% Non - GAAP Operating Ratio (2) 42% - 9% 240 bps improvement |
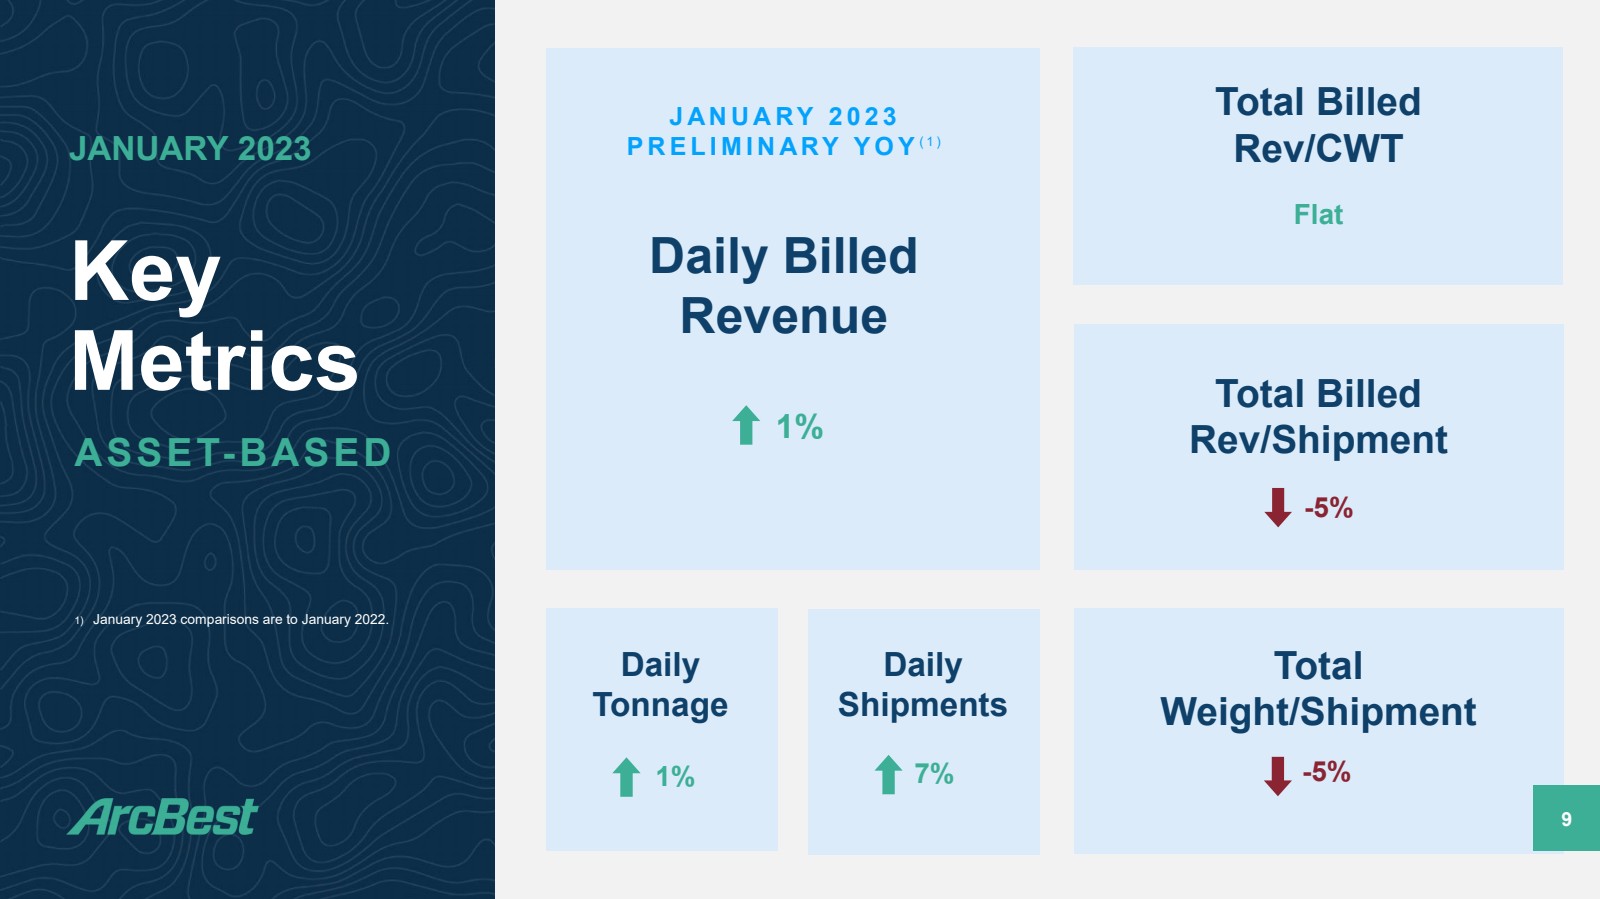
| Key Metrics JANUARY 2023 9 Daily Billed Revenue Total Billed Rev/CWT ASSET - BASED Daily Tonnage Daily Shipments Flat Total Billed Rev/Shipment Total Weight/Shipment 1% - 5% JANUARY 2023 PRELIMINARY YOY (1) 1) January 2023 comparisons are to January 2022. - 5% 1% 7% |
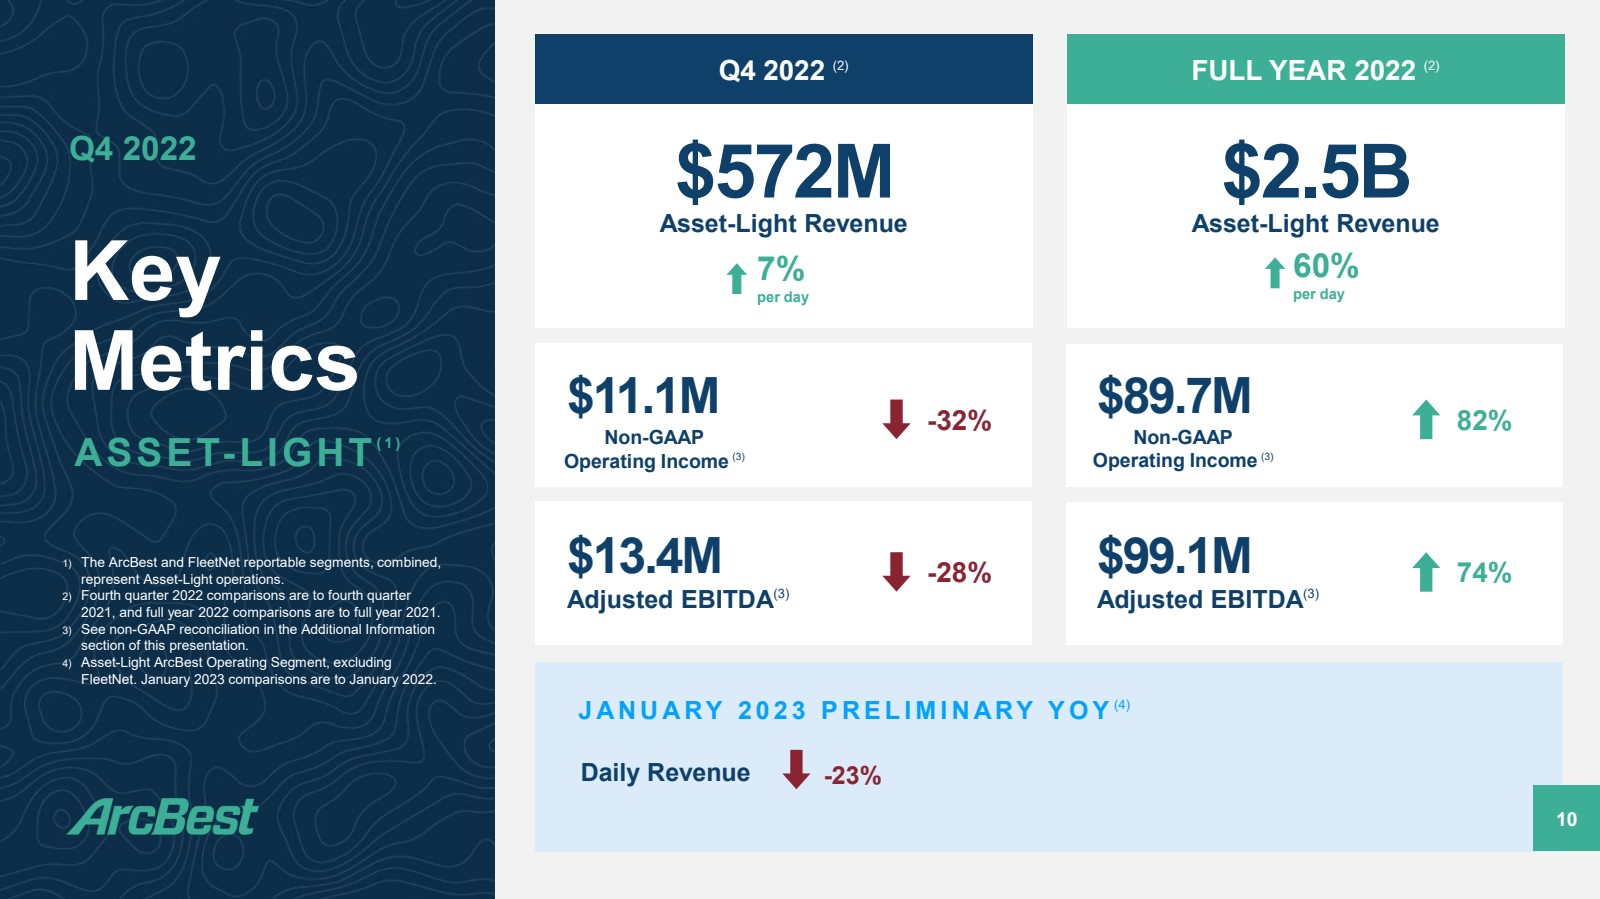
| Key Metrics Q4 2022 10 ASSET - LIGHT (1) JANUARY 2023 PRELIMINARY YOY (4) Daily Revenue 1) The ArcBest and FleetNet reportable segments, combined, represent Asset - Light operations. 2) Fourth quarter 2022 comparisons are to fourth quarter 2021, and full year 2022 comparisons are to full year 2021. 3) See non - GAAP reconciliation in the Additional Information section of this presentation. 4) Asset - Light ArcBest Operating Segment, excluding FleetNet. January 2023 comparisons are to January 2022. - 23% Q4 2022 (2) FULL YEAR 2022 (2) $572M Asset - Light Revenue 7% per day $2.5B Asset - Light Revenue Non - GAAP Operating Income (3) - 32% Adjusted EBITDA (3) $13.4M $11.1M - 28% 82% Adjusted EBITDA (3) $99.1M $89.7M 74% Non - GAAP Operating Income (3) 60% per day |
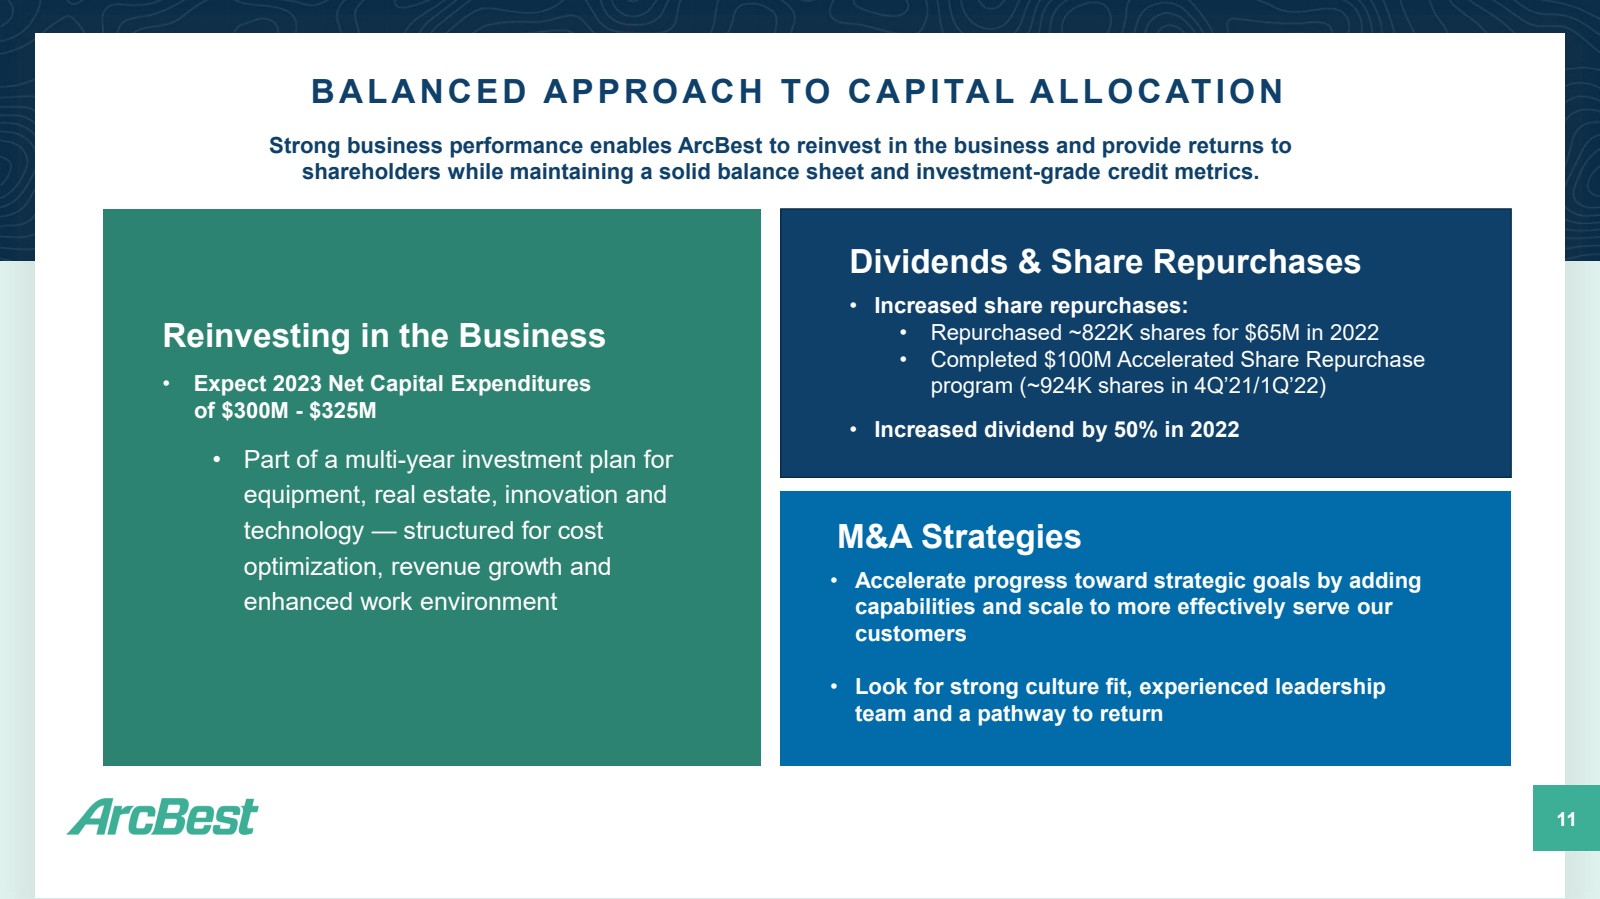
| 11 BALANCED APPROACH TO CAPITAL ALLOCATION Strong business performance enables ArcBest to reinvest in the business and provide returns to shareholders while maintaining a solid balance sheet and investment - grade credit metrics. Reinvesting in the Business Dividends & Share Repurchases M&A Strategies • Expect 2023 Net Capital Expenditures of $300M - $325M • Part of a multi - year investment plan for equipment, real estate, innovation and technology — structured for cost optimization, revenue growth and enhanced work environment • Increased share r epurchases: • Repurchased ~822K shares for $65M in 2022 • Completed $100M Accelerated Share Repurchase program (~924K shares in 4Q’21/1Q’22) • Increased dividend by 50% in 2022 • Accelerate progress toward strategic goals by adding capabilities and scale to more effectively serve our customers • Look for strong culture fit, experienced leadership team and a pathway to return |
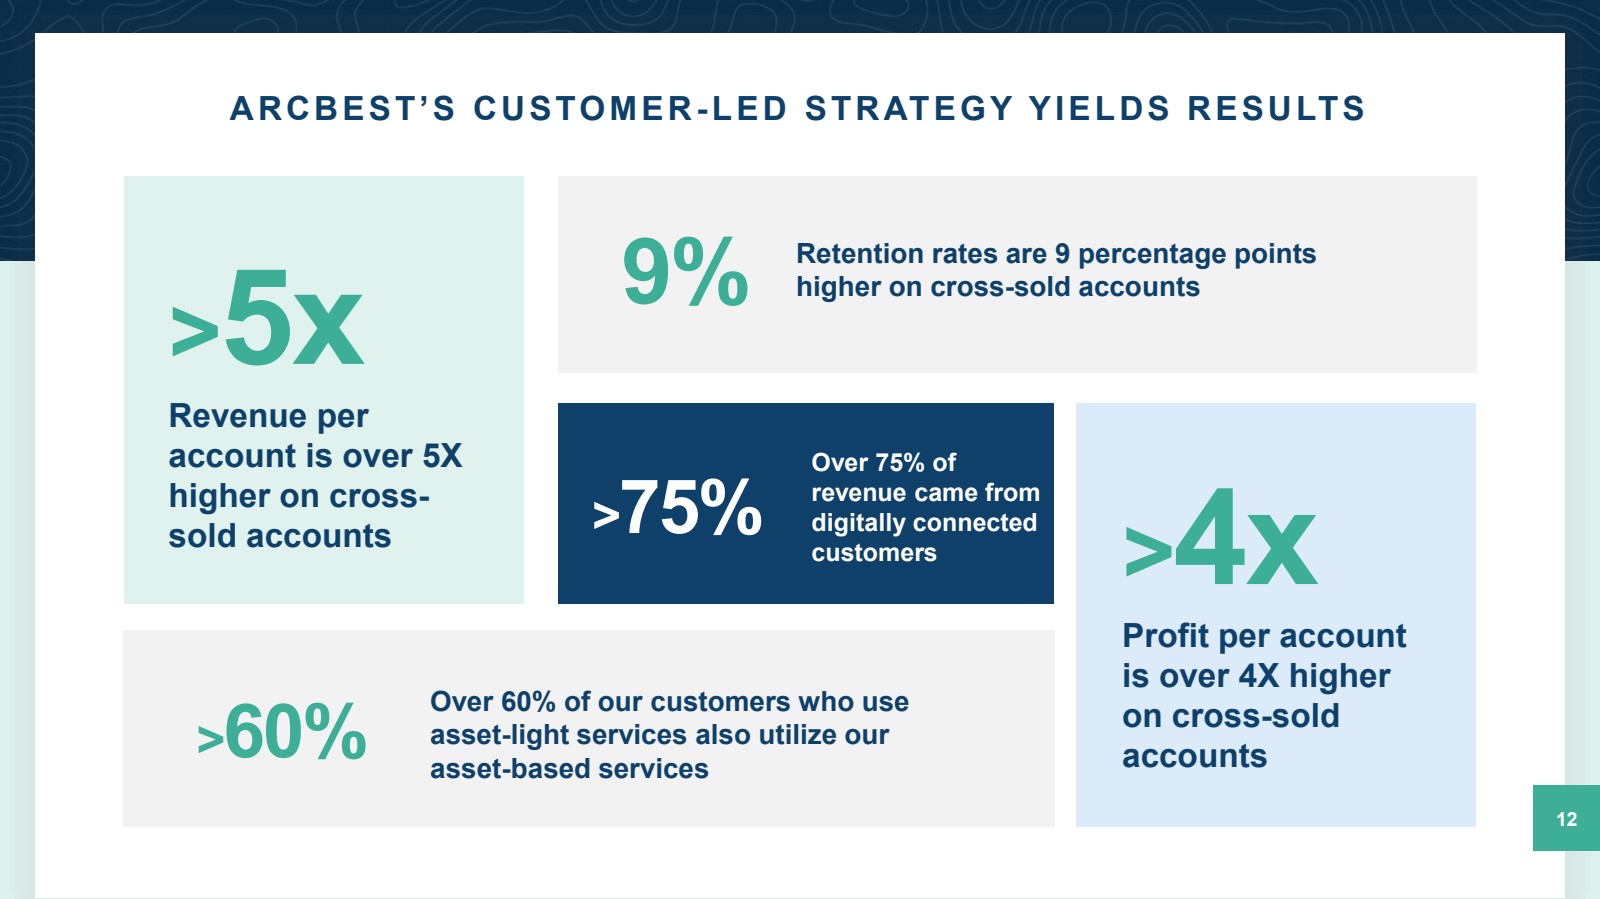
| ARCBEST’S CUSTOMER - LED STRATEGY YIELDS RESULTS 12 > 5x Revenue per account is over 5X higher on cross - sold accounts > 4x Profit per account is over 4X higher on cross - sold accounts 9% Retention rates are 9 percentage points higher on cross - sold accounts > 60% Over 60% of our customers who use asset - light services also utilize our asset - based services > 75% Over 75% of revenue came from digitally connected customers |
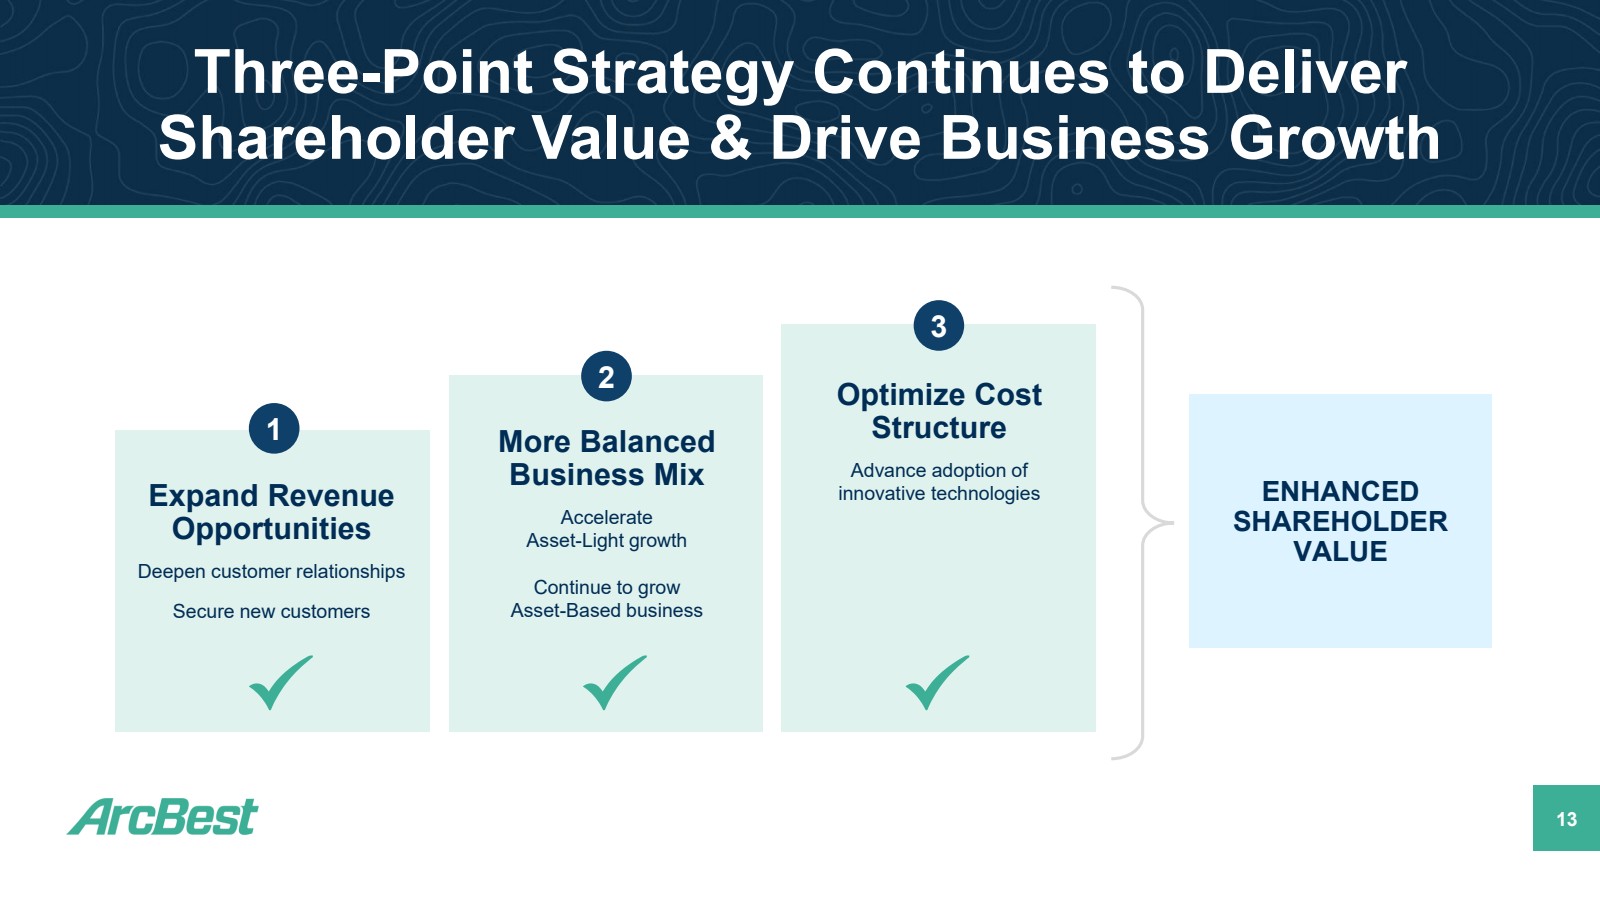
| Three - Point Strategy Continues to Deliver Shareholder Value & Drive Business Growth 13 1 2 3 More Balanced Business Mix Accelerate Asset - Light growth Continue to grow Asset - Based business Optimize Cost Structure Advance adoption of innovative technologies Expand Revenue Opportunities Deepen customer relationships Secure new customers ENHANCED SHAREHOLDER VALUE |
| 14 Note: ArcBest Corporation reports its financial results in accordance with generally accepted accounting principles (“GAAP”) .. H owever, management believes that certain non - GAAP performance measures utilized for internal analysis provides analysts, investors, and others the same information that we use internally for purposes of assessing our core operating performance and provides meaningful comp ari sons between current and prior period results, as well as important information regarding performance trends. Accordingly, using t hes e measures improves comparability in analyzing our performance because it removes the impact of items from operating results that, in ma nag ement's opinion, do not reflect our core operating performance. Non - GAAP financial measures should be viewed in addition to, and not as an alternative for, our reported results. These financial measures should not be construed as better measurements than operating income, ope rat ing cash flow, net income or earnings per share, as determined under GAAP. Reconciliations of GAAP to Non - GAAP Financial Measures (Unaudited) ADDITIONAL INFORMATION |
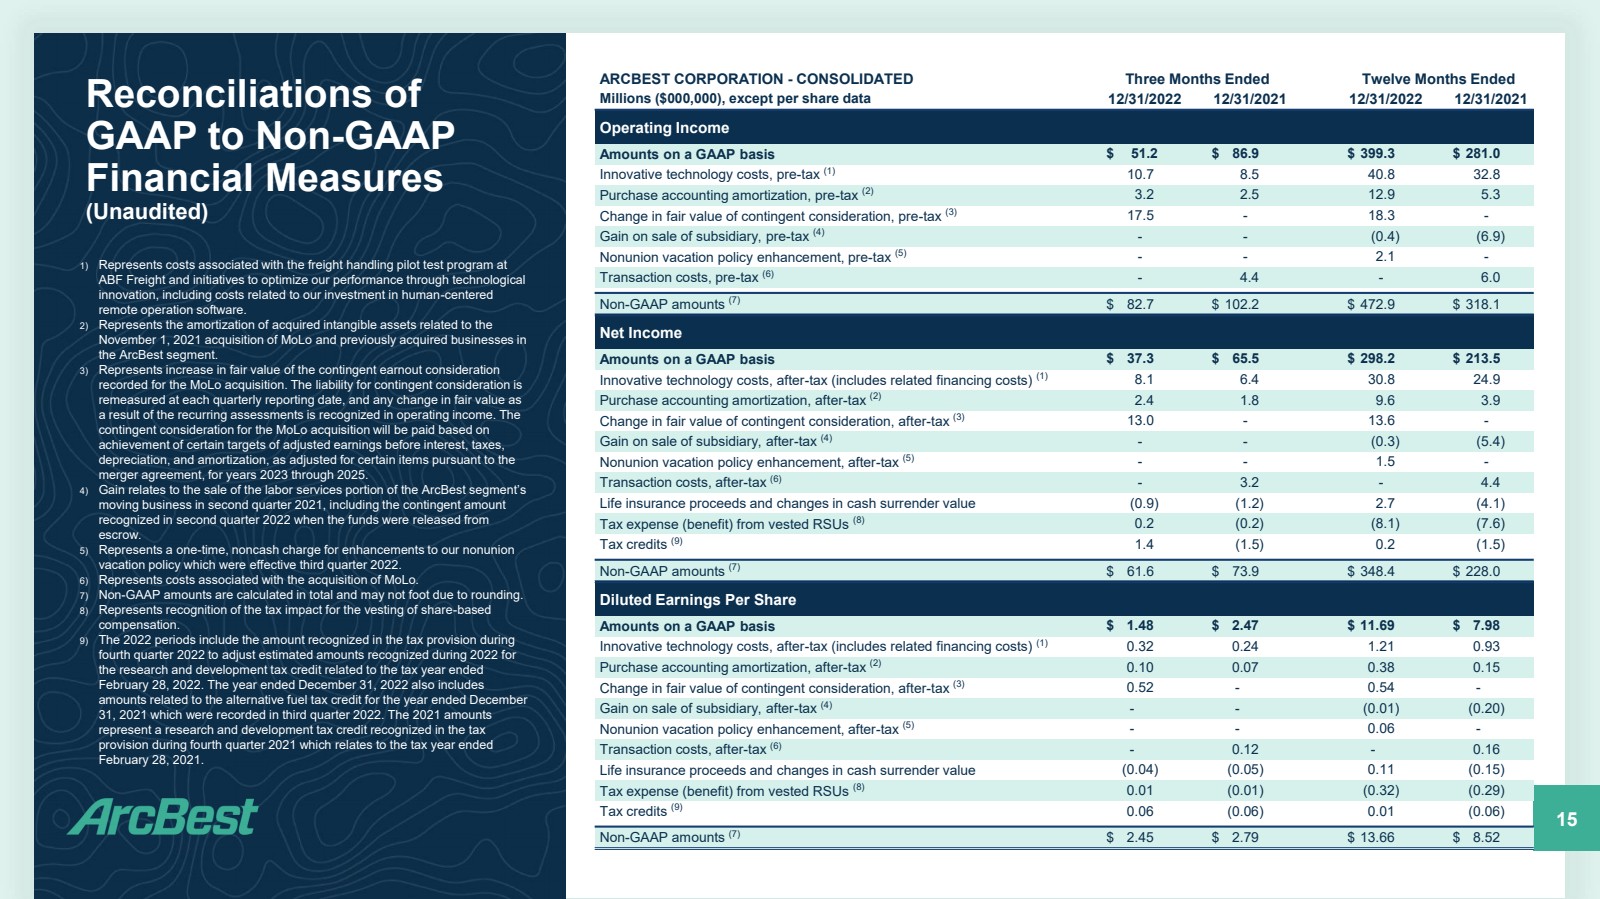
| ARCBEST CORPORATION - CONSOLIDATED Three Months Ended Twelve Months Ended Millions ($000,000), except per share data 12/31/2022 12/31/2021 12/31/2022 12/31/2021 Operating Income Amounts on a GAAP basis $ 51.2 $ 86.9 $ 399.3 $ 281.0 Innovative technology costs, pre - tax (1) 10.7 8.5 40.8 32.8 Purchase accounting amortization, pre - tax (2) 3.2 2.5 12.9 5.3 Change in fair value of contingent consideration, pre - tax (3) 17.5 - 18.3 - Gain on sale of subsidiary, pre - tax (4) - - (0.4) (6.9) Nonunion vacation policy enhancement, pre - tax (5) - - 2.1 - Transaction costs, pre - tax (6) - 4.4 - 6.0 Non - GAAP amounts (7) $ 82.7 $ 102.2 $ 472.9 $ 318.1 Net Income Amounts on a GAAP basis $ 37.3 $ 65.5 $ 298.2 $ 213.5 Innovative technology costs, after - tax (includes related financing costs) (1) 8.1 6.4 30.8 24.9 Purchase accounting amortization, after - tax (2) 2.4 1.8 9.6 3.9 Change in fair value of contingent consideration, after - tax (3) 13.0 - 13.6 - Gain on sale of subsidiary, after - tax (4) - - (0.3) (5.4) Nonunion vacation policy enhancement, after - tax (5) - - 1.5 - Transaction costs, after - tax (6) - 3.2 - 4.4 Life insurance proceeds and changes in cash surrender value (0.9) (1.2) 2.7 (4.1) Tax expense (benefit) from vested RSUs (8) 0.2 (0.2) (8.1) (7.6) Tax credits (9) 1.4 (1.5) 0.2 (1.5) Non - GAAP amounts (7) $ 61.6 $ 73.9 $ 348.4 $ 228.0 Diluted Earnings Per Share Amounts on a GAAP basis $ 1.48 $ 2.47 $ 11.69 $ 7.98 Innovative technology costs, after - tax (includes related financing costs) (1) 0.32 0.24 1.21 0.93 Purchase accounting amortization, after - tax (2) 0.10 0.07 0.38 0.15 Change in fair value of contingent consideration, after - tax (3) 0.52 - 0.54 - Gain on sale of subsidiary, after - tax (4) - - (0.01) (0.20) Nonunion vacation policy enhancement, after - tax (5) - - 0.06 - Transaction costs, after - tax (6) - 0.12 - 0.16 Life insurance proceeds and changes in cash surrender value (0.04) (0.05) 0.11 (0.15) Tax expense (benefit) from vested RSUs (8) 0.01 (0.01) (0.32) (0.29) Tax credits (9) 0.06 (0.06) 0.01 (0.06) Non - GAAP amounts (7) $ 2.45 $ 2.79 $ 13.66 $ 8.52 Reconciliations of GAAP to Non - GAAP Financial Measures (Unaudited) 15 1) Represents costs associated with the freight handling pilot test program at ABF Freight and initiatives to optimize our performance through technological innovation, including costs related to our investment in human - centered remote operation software. 2) Represents the amortization of acquired intangible assets related to the November 1, 2021 acquisition of MoLo and previously acquired businesses in the ArcBest segment. 3) Represents increase in fair value of the contingent earnout consideration recorded for the MoLo acquisition. The liability for contingent consideration is remeasured at each quarterly reporting date, and any change in fair value as a result of the recurring assessments is recognized in operating income. The contingent consideration for the MoLo acquisition will be paid based on achievement of certain targets of adjusted earnings before interest, taxes, depreciation, and amortization, as adjusted for certain items pursuant to the merger agreement, for years 2023 through 2025. 4) Gain relates to the sale of the labor services portion of the ArcBest segment’s moving business in second quarter 2021, including the contingent amount recognized in second quarter 2022 when the funds were released from escrow. 5) Represents a one - time, noncash charge for enhancements to our nonunion vacation policy which were effective third quarter 2022. 6) Represents costs associated with the acquisition of MoLo. 7) Non - GAAP amounts are calculated in total and may not foot due to rounding. 8) Represents recognition of the tax impact for the vesting of share - based compensation. 9) The 2022 periods include the amount recognized in the tax provision during fourth quarter 2022 to adjust estimated amounts recognized during 2022 for the research and development tax credit related to the tax year ended February 28, 2022. The year ended December 31, 2022 also includes amounts related to the alternative fuel tax credit for the year ended December 31, 2021 which were recorded in third quarter 2022. The 2021 amounts represent a research and development tax credit recognized in the tax provision during fourth quarter 2021 which relates to the tax year ended February 28, 2021. |
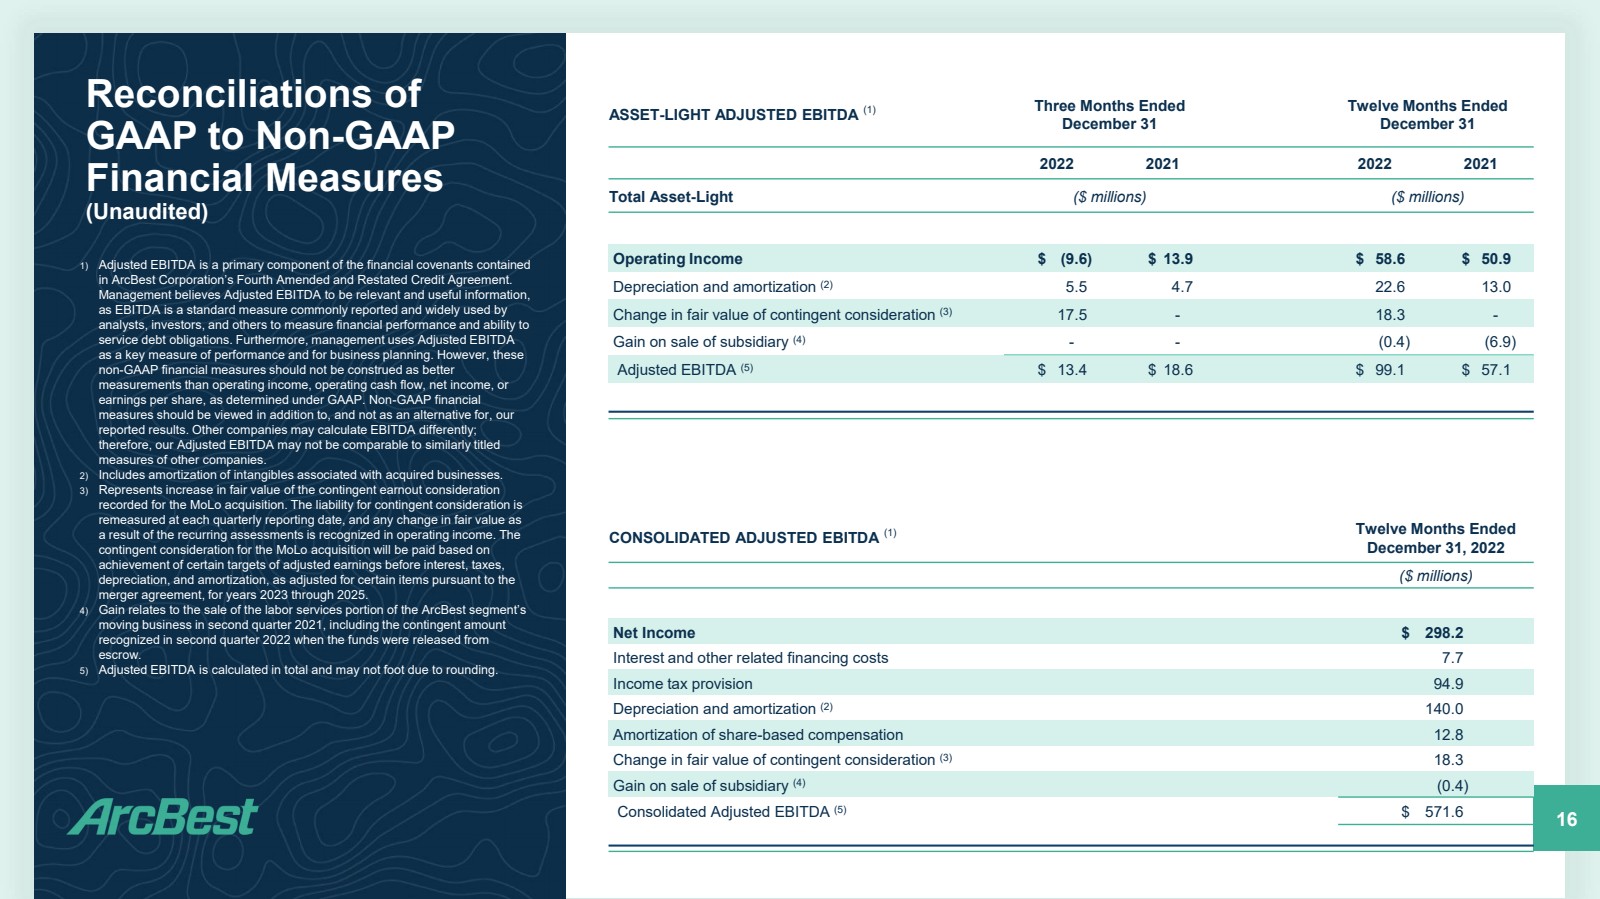
| Reconciliations of GAAP to Non - GAAP Financial Measures (Unaudited) 16 1) Adjusted EBITDA is a primary component of the financial covenants contained in ArcBest Corporation’s Fourth Amended and Restated Credit Agreement. Management believes Adjusted EBITDA to be relevant and useful information, as EBITDA is a standard measure commonly reported and widely used by analysts, investors, and others to measure financial performance and ability to service debt obligations. Furthermore, management uses Adjusted EBITDA as a key measure of performance and for business planning. However, these non - GAAP financial measures should not be construed as better measurements than operating income, operating cash flow, net income, or earnings per share, as determined under GAAP. Non - GAAP financial measures should be viewed in addition to, and not as an alternative for, our reported results. Other companies may calculate EBITDA differently; therefore, our Adjusted EBITDA may not be comparable to similarly titled measures of other companies. 2) Includes amortization of intangibles associated with acquired businesses. 3) Represents increase in fair value of the contingent earnout consideration recorded for the MoLo acquisition. The liability for contingent consideration is remeasured at each quarterly reporting date, and any change in fair value as a result of the recurring assessments is recognized in operating income. The contingent consideration for the MoLo acquisition will be paid based on achievement of certain targets of adjusted earnings before interest, taxes, depreciation, and amortization, as adjusted for certain items pursuant to the merger agreement, for years 2023 through 2025. 4) Gain relates to the sale of the labor services portion of the ArcBest segment’s moving business in second quarter 2021, including the contingent amount recognized in second quarter 2022 when the funds were released from escrow. 5) Adjusted EBITDA is calculated in total and may not foot due to rounding. ASSET - LIGHT ADJUSTED EBITDA (1) Three Months Ended December 31 Twelve Months Ended December 31 2022 2021 2022 2021 Total Asset - Light ($ millions) ($ millions) Operating Income $ (9.6) $ 13.9 $ 58.6 $ 50.9 Depreciation and amortization (2) 5.5 4.7 22.6 13.0 Change in fair value of contingent consideration (3) 17.5 - 18.3 - Gain on sale of subsidiary (4) - - (0.4) (6.9) Adjusted EBITDA (5) $ 13.4 $ 18.6 $ 99.1 $ 57.1 CONSOLIDATED ADJUSTED EBITDA (1) Twelve Months Ended December 31, 2022 ($ millions) Net Income $ 298.2 Interest and other related financing costs 7.7 Income tax provision 94.9 Depreciation and amortization (2) 140.0 Amortization of share - based compensation 12.8 Change in fair value of contingent consideration (3) 18.3 Gain on sale of subsidiary (4) (0.4) Consolidated Adjusted EBITDA (5) $ 571.6 |
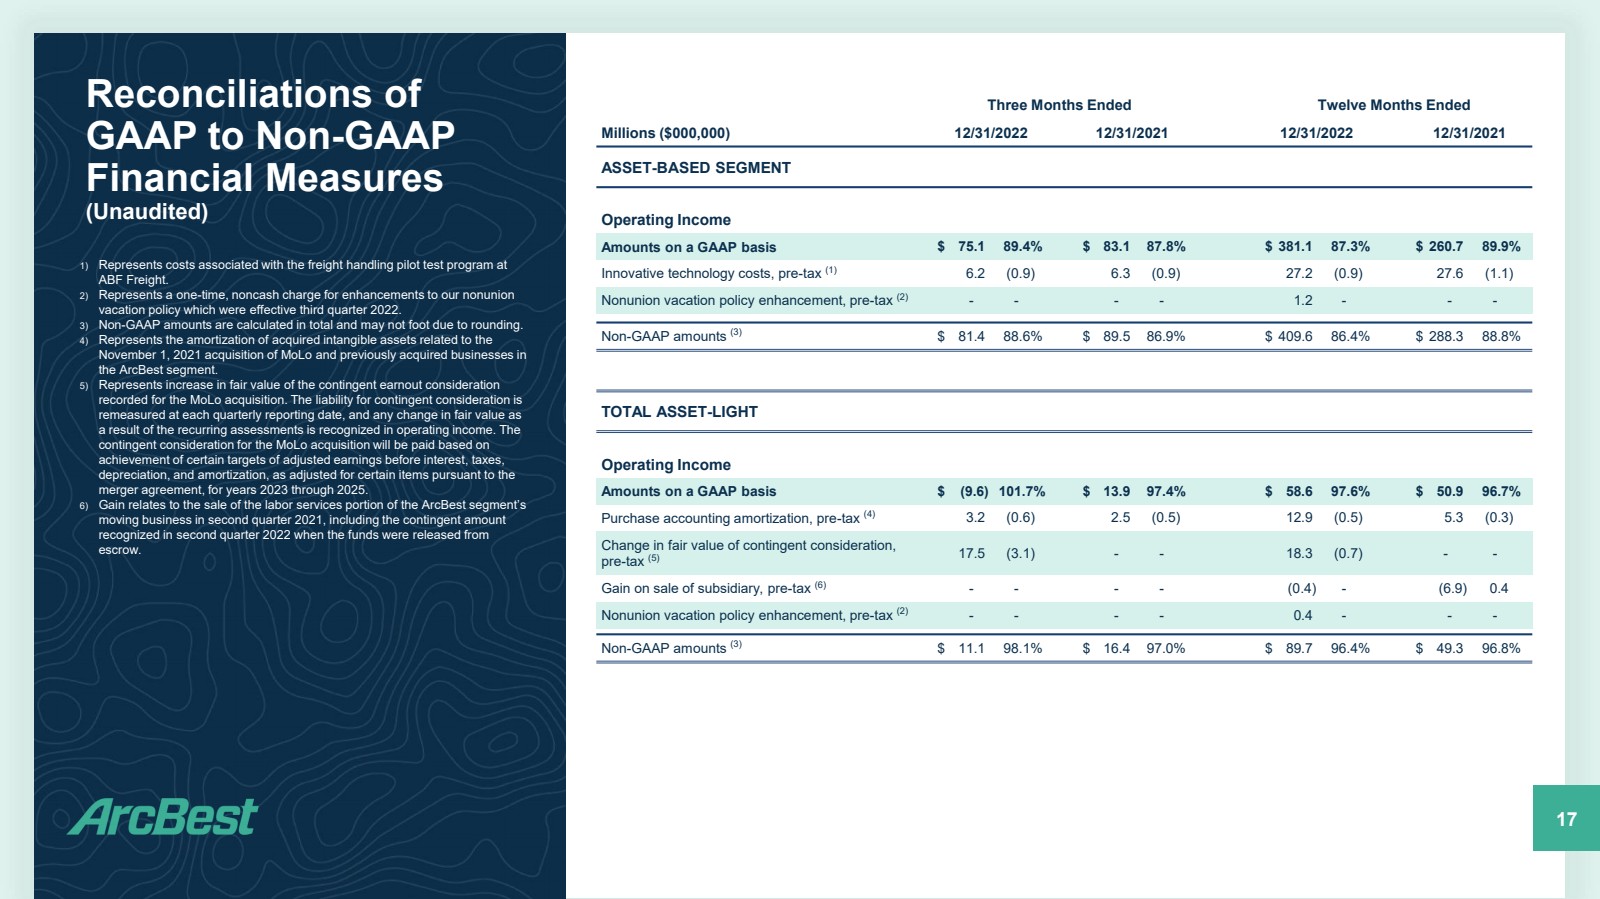
| Reconciliations of GAAP to Non - GAAP Financial Measures (Unaudited) 17 1) Represents costs associated with the freight handling pilot test program at ABF Freight. 2) Represents a one - time, noncash charge for enhancements to our nonunion vacation policy which were effective third quarter 2022. 3) Non - GAAP amounts are calculated in total and may not foot due to rounding. 4) Represents the amortization of acquired intangible assets related to the November 1, 2021 acquisition of MoLo and previously acquired businesses in the ArcBest segment. 5) Represents increase in fair value of the contingent earnout consideration recorded for the MoLo acquisition. The liability for contingent consideration is remeasured at each quarterly reporting date, and any change in fair value as a result of the recurring assessments is recognized in operating income. The contingent consideration for the MoLo acquisition will be paid based on achievement of certain targets of adjusted earnings before interest, taxes, depreciation, and amortization, as adjusted for certain items pursuant to the merger agreement, for years 2023 through 2025. 6) Gain relates to the sale of the labor services portion of the ArcBest segment’s moving business in second quarter 2021, including the contingent amount recognized in second quarter 2022 when the funds were released from escrow. Three Months Ended Twelve Months Ended Millions ($000,000) 12/31/2022 12/31/2021 12/31/2022 12/31/2021 ASSET - BASED SEGMENT Operating Income Amounts on a GAAP basis $ 75.1 89.4% $ 83.1 87.8% $ 381.1 87.3% $ 260.7 89.9% Innovative technology costs, pre - tax (1) 6.2 (0.9) 6.3 (0.9) 27.2 (0.9) 27.6 (1.1) Nonunion vacation policy enhancement, pre - tax (2) - - - - 1.2 - - - Non - GAAP amounts (3) $ 81.4 88.6% $ 89.5 86.9% $ 409.6 86.4% $ 288.3 88.8% TOTAL ASSET - LIGHT Operating Income Amounts on a GAAP basis $ (9.6) 101.7% $ 13.9 97.4% $ 58.6 97.6% $ 50.9 96.7% Purchase accounting amortization, pre - tax (4) 3.2 (0.6) 2.5 (0.5) 12.9 (0.5) 5.3 (0.3) Change in fair value of contingent consideration, pre - tax (5) 17.5 (3.1) - - 18.3 (0.7) - - Gain on sale of subsidiary, pre - tax (6) - - - - (0.4) - (6.9) 0.4 Nonunion vacation policy enhancement, pre - tax (2) - - - - 0.4 - - - Non - GAAP amounts (3) $ 11.1 98.1% $ 16.4 97.0% $ 89.7 96.4% $ 49.3 96.8% |