Q4 and Fiscal Year 2019 Earnings Release Conference Call May 20, 2019 1

Safe Harbor Statement Certain statements herein about our expectations of future events or results constitute forward- looking statements for purposes of the safe harbor provisions of The Private Securities Litigation Reform Act of 1995. You can identify forward-looking statements by terminology such as, “may,” “should,” “expects,” “plans,” “anticipates,” “believes,” “estimates,” “predicts,” “potential,” “continue,” or the negative of these terms or other comparable terminology. Such forward-looking statements are based on currently available competitive, financial and economic data and management’s views and assumptions regarding future events. Such forward-looking statements are inherently uncertain, and investors must recognize that actual results may differ from those expressed or implied in the forward-looking statements. This release may contain forward-looking statements that involve risks and uncertainties including, but not limited to, changes in customer demand and response to products and services offered by AZZ, including demand by the power generation markets, electrical transmission and distribution markets, the industrial markets, and the hot dip galvanizing markets; prices and raw material cost, including zinc and natural gas which are used in the hot dip galvanizing process; changes in the political stability and economic conditions of the various markets that AZZ serves, foreign and domestic, customer requested delays of shipments, acquisition opportunities, currency exchange rates, adequacy of financing, and availability of experienced management and employees to implement AZZ’s growth strategy. AZZ has provided additional information regarding risks associated with the business in AZZ’s Annual Report on Form 10-K for the fiscal year ended February 28, 2019 and other filings with the SEC, available for viewing on AZZ’s website at www.azz.com and on the SEC’s website at www.sec.gov. You are urged to consider these factors carefully in evaluating the forward-looking statements herein and are cautioned not to place undue reliance on such forward-looking statements, which are qualified in their entirety by this cautionary statement. These statements are based on information as of the date hereof and AZZ assumes no obligation to update any forward- looking statements, whether as a result of new information, future events, or otherwise. 2
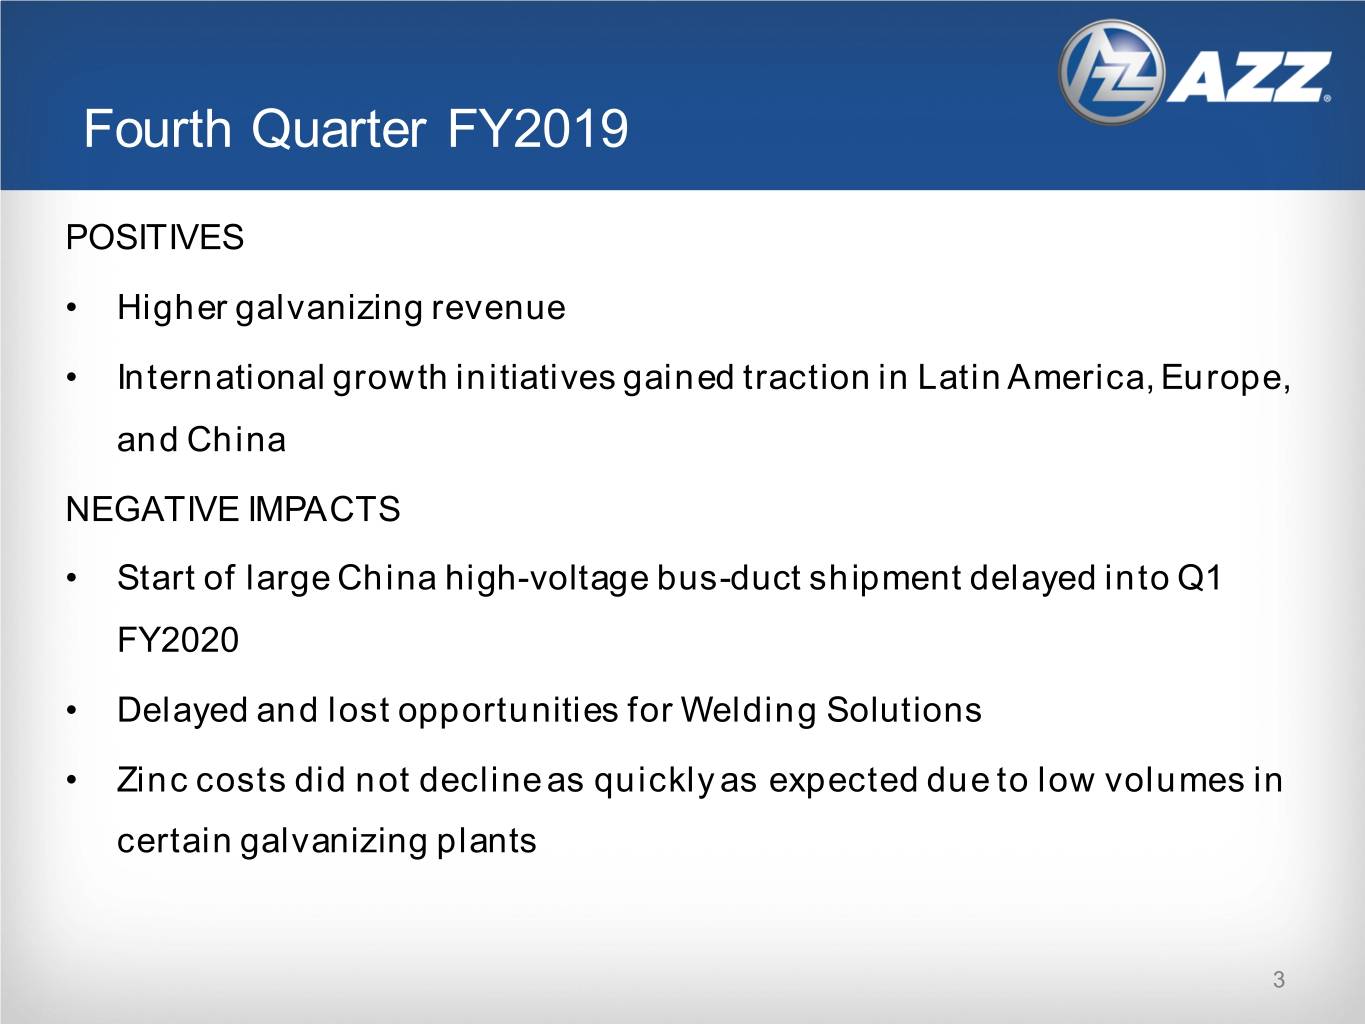
Fourth Quarter FY2019 POSITIVES • Higher galvanizing revenue • International growth initiatives gained traction in Latin America, Europe, and China NEGATIVE IMPACTS • Start of large China high-voltage bus-duct shipment delayed into Q1 FY2020 • Delayed and lost opportunities for Welding Solutions • Zinc costs did not decline as quickly as expected due to low volumes in certain galvanizing plants 3
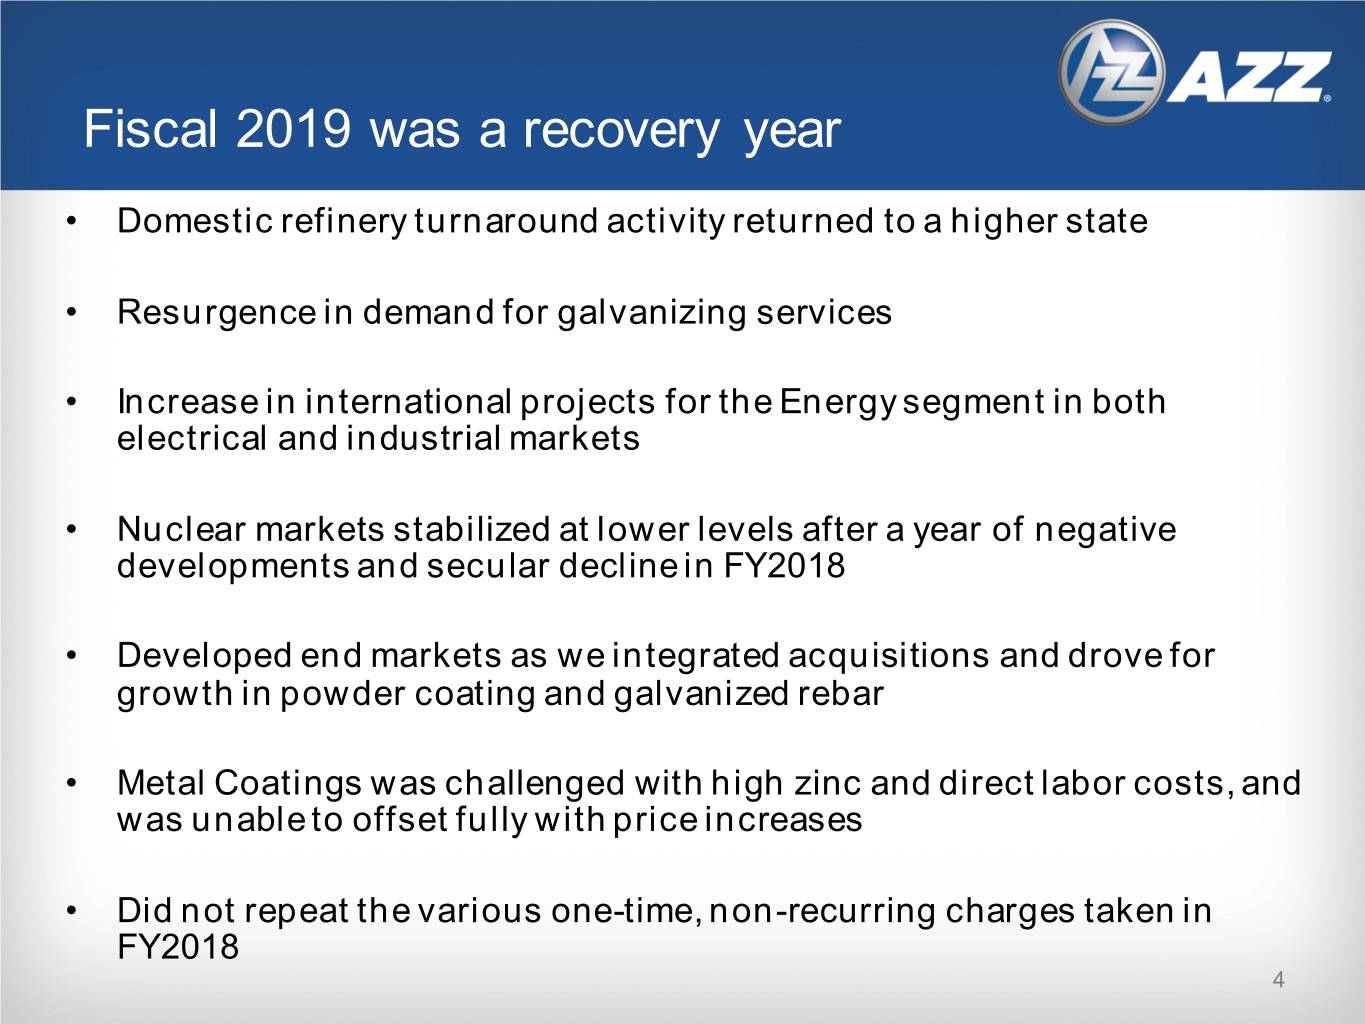
Fiscal 2019 was a recovery year • Domestic refinery turnaround activity returned to a higher state • Resurgence in demand for galvanizing services • Increase in international projects for the Energy segment in both electrical and industrial markets • Nuclear markets stabilized at lower levels after a year of negative developments and secular decline in FY2018 • Developed end markets as we integrated acquisitions and drove for growth in powder coating and galvanized rebar • Metal Coatings was challenged with high zinc and direct labor costs, and was unable to offset fully with price increases • Did not repeat the various one-time, non-recurring charges taken in FY2018 4
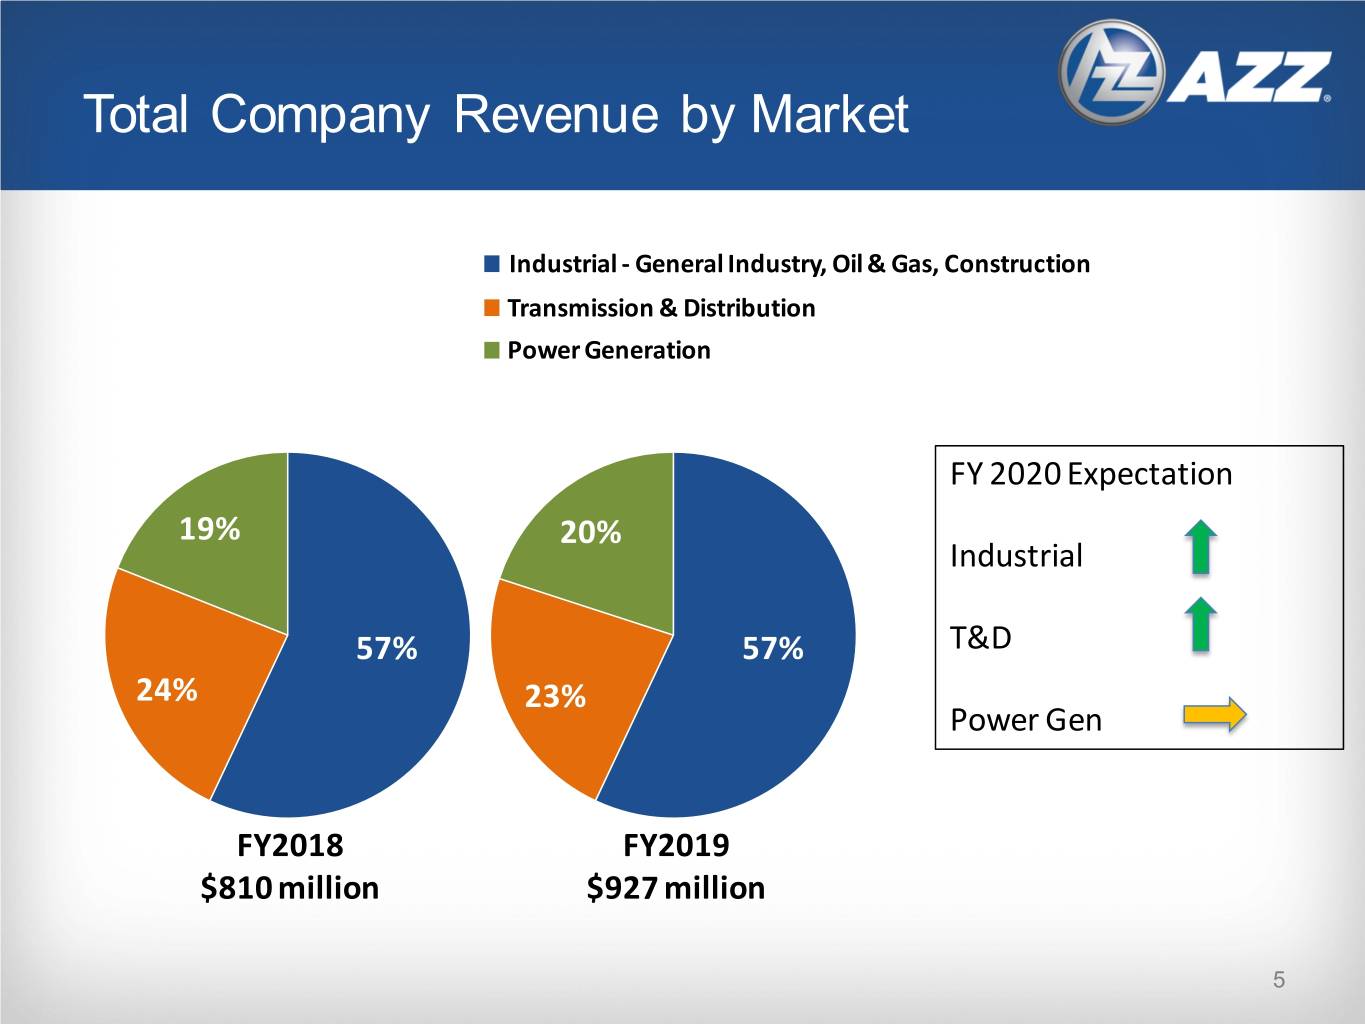
Total Company Revenue by Market Industrial - General Industry, Oil & Gas, Construction Transmission & Distribution Power Generation FY 2020 Expectation 19% 20% Industrial 57% 57% T&D 24% 23% Power Gen FY2018 FY2019 $810 million $927 million 5

Energy: Revenue by Market FY 2020 Expectation Power Gen 35% 36% 36% 34% Industrial 29% 30% T&D FY2018 FY2019 $421 million $487 million Power Generation Industrial Transmission & Distribution 6
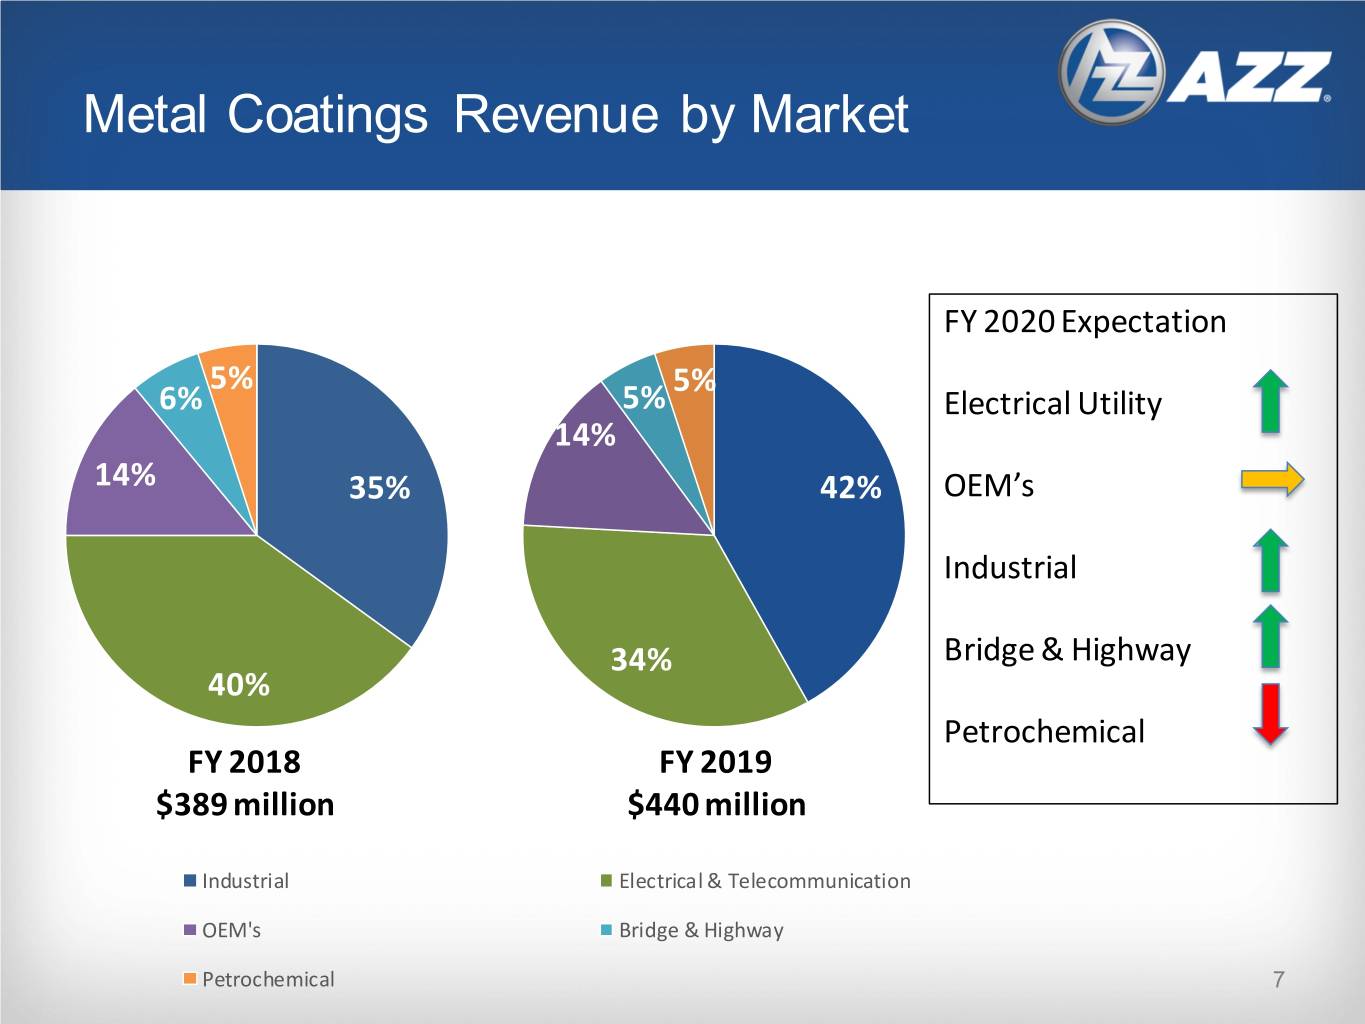
Metal Coatings Revenue by Market FY 2020 Expectation 5% 5% 6% 5% Electrical Utility 14% 14% 35% 42% OEM’s Industrial 34% Bridge & Highway 40% 0 Petrochemical FY 2018 FY 2019 $389 million $440 million Industrial Electrical & Telecommunication OEM's Bridge & Highway Petrochemical 7
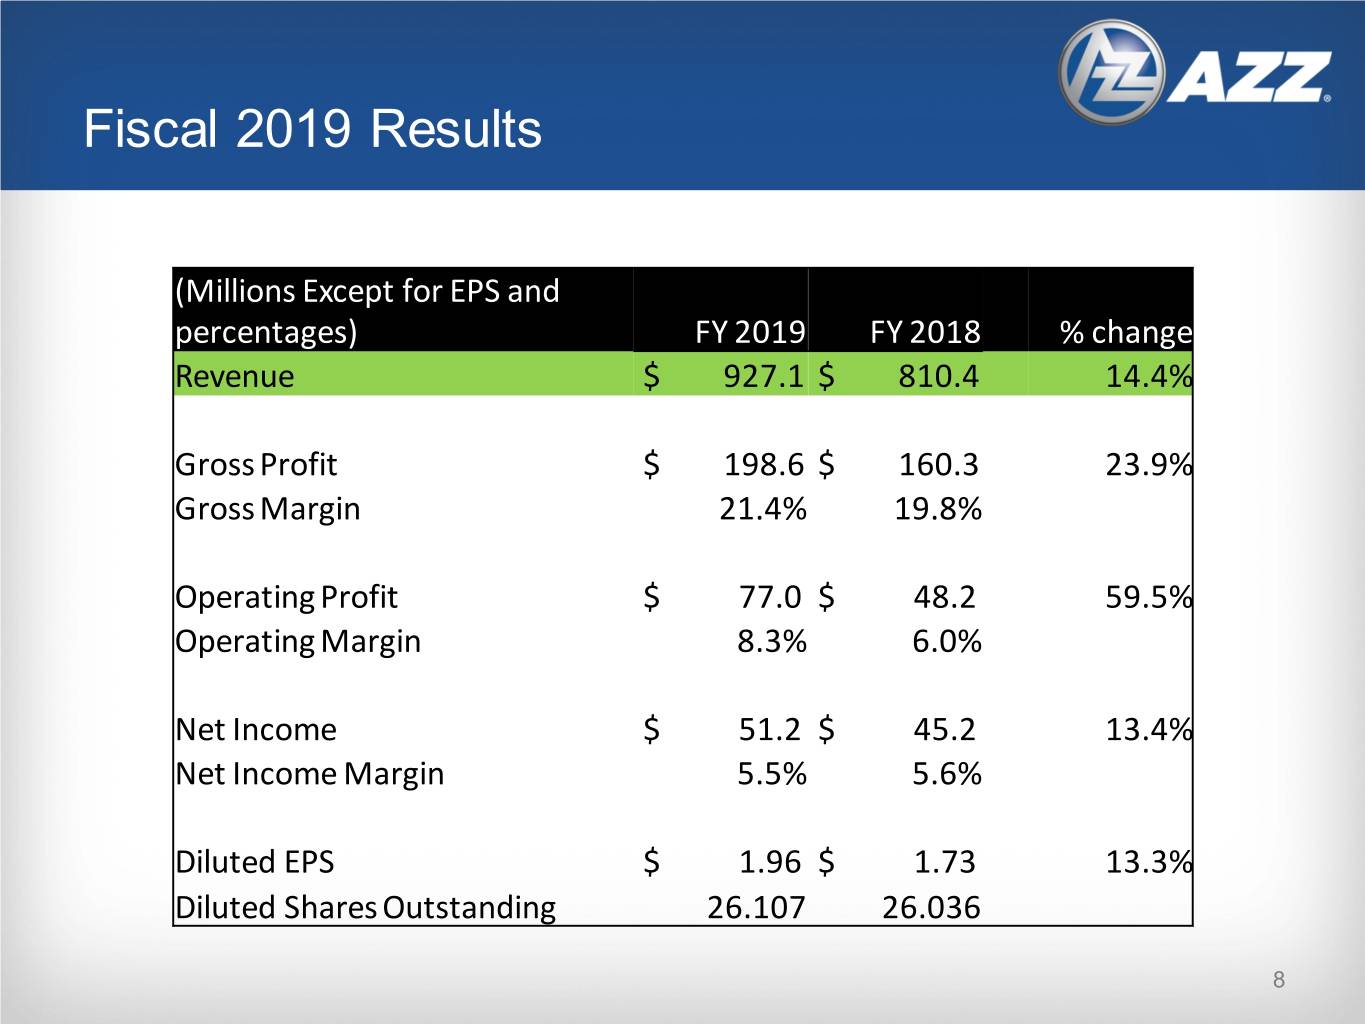
Fiscal 2019 Results (Millions Except for EPS and percentages) FY 2019 FY 2018 % change Revenue $ 927.1 $ 810.4 14.4% Gross Profit $ 198.6 $ 160.3 23.9% Gross Margin 21.4% 19.8% Operating Profit $ 77.0 $ 48.2 59.5% Operating Margin 8.3% 6.0% Net Income $ 51.2 $ 45.2 13.4% Net Income Margin 5.5% 5.6% Diluted EPS $ 1.96 $ 1.73 13.3% Diluted Shares Outstanding 26.107 26.036 8
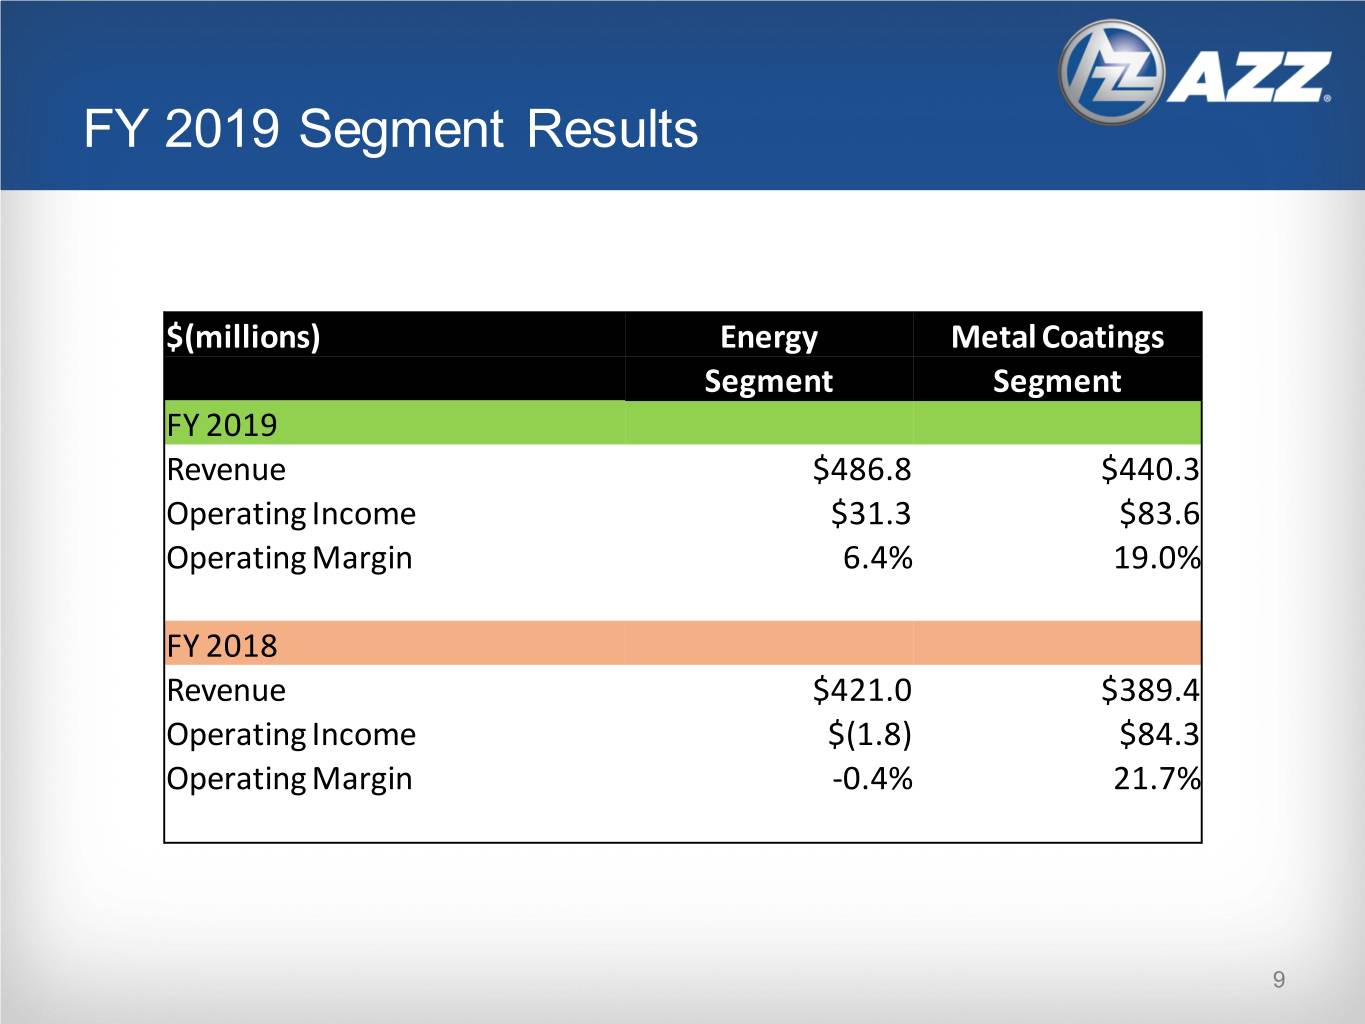
FY 2019 Segment Results $(millions) Energy Metal Coatings Segment Segment FY 2019 Revenue $486.8 $440.3 Operating Income $31.3 $83.6 Operating Margin 6.4% 19.0% FY 2018 Revenue $421.0 $389.4 Operating Income $(1.8) $84.3 Operating Margin -0.4% 21.7% 9
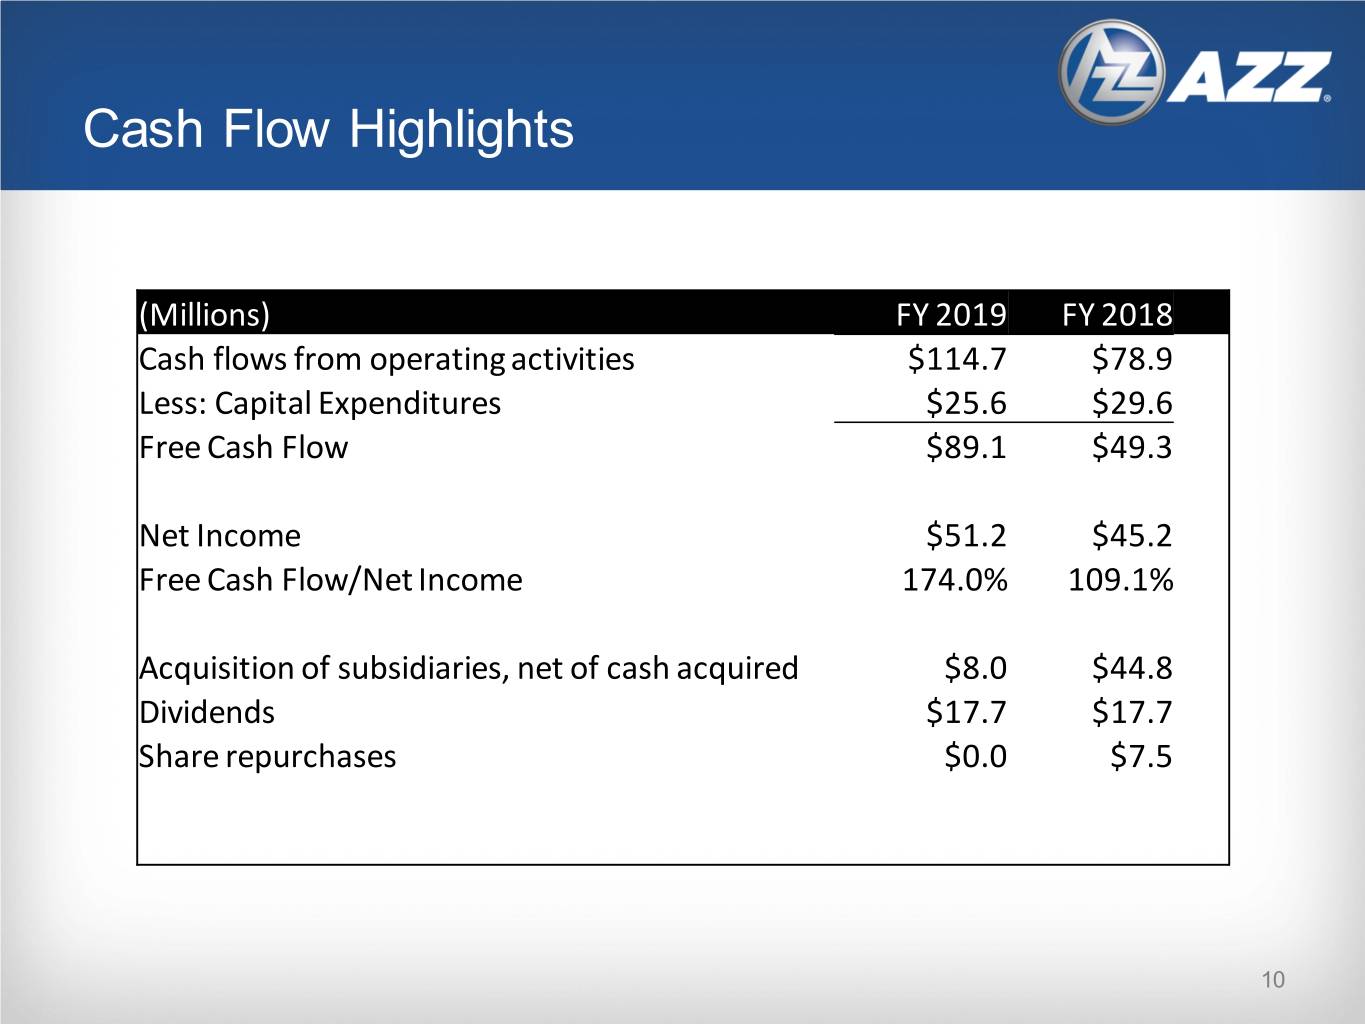
Cash Flow Highlights (Millions) FY 2019 FY 2018 Cash flows from operating activities $114.7 $78.9 Less: Capital Expenditures $25.6 $29.6 Free Cash Flow $89.1 $49.3 Net Income $51.2 $45.2 Free Cash Flow/Net Income 174.0% 109.1% Acquisition of subsidiaries, net of cash acquired $8.0 $44.8 Dividends $17.7 $17.7 Share repurchases $0.0 $7.5 10

Cash Flow by Fiscal Year ($ in Millions) $160.0 $140.0 $120.0 $100.0 $80.0 $60.0 $40.0 $20.0 $0.0 2010 2011 2012 2013 2014 2015 2016 2017 2018 2019 Cash Pro. By Oper. Net Income Free Cash Flow 11
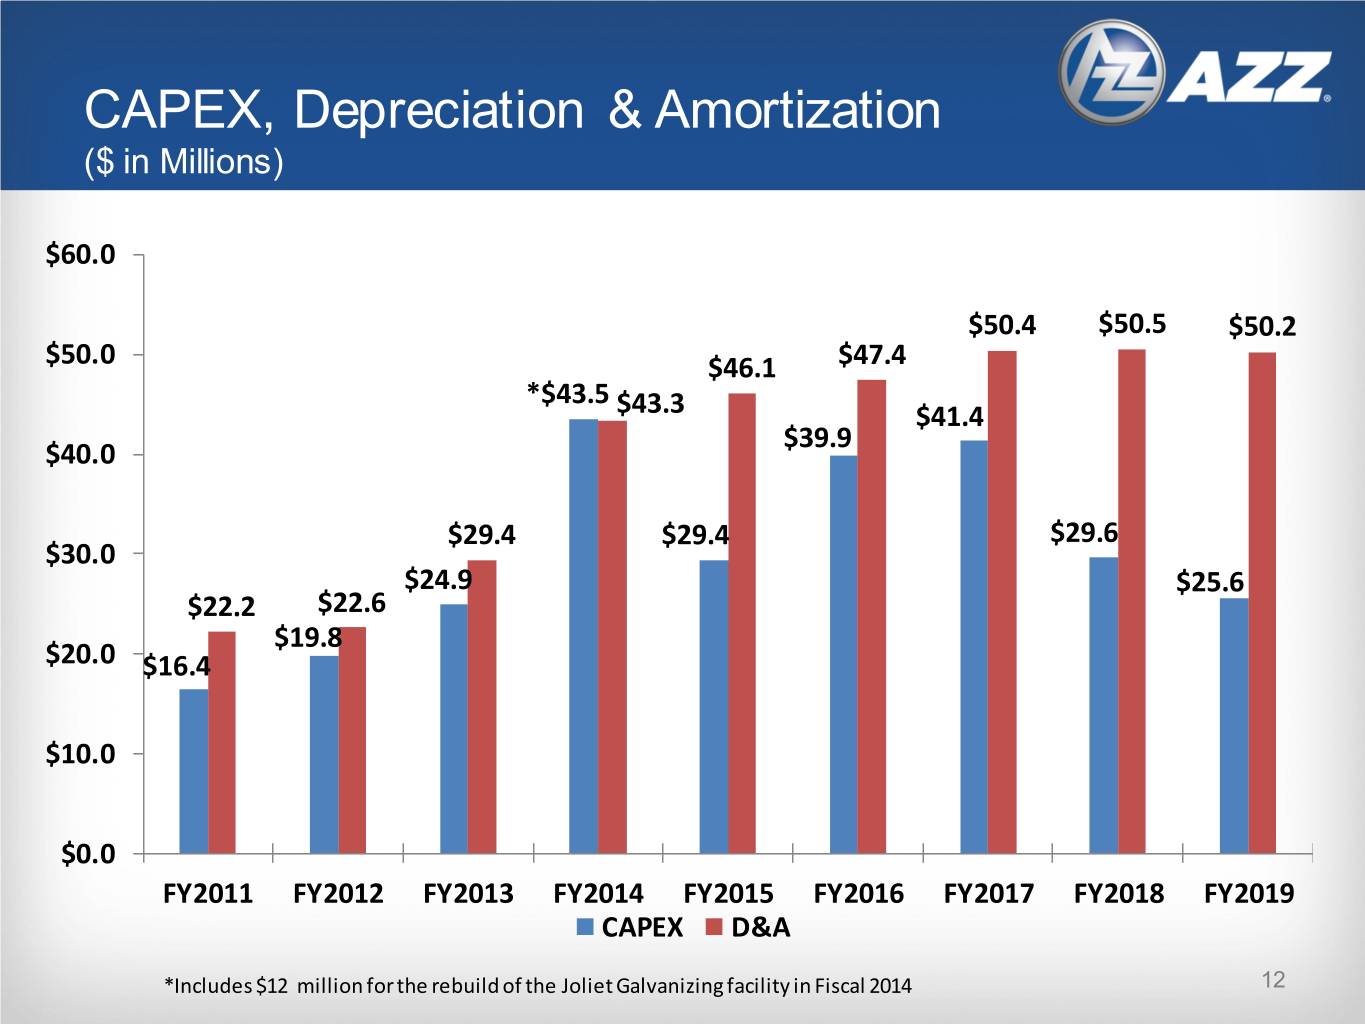
CAPEX, Depreciation & Amortization ($ in Millions) $60.0 $50.4 $50.5 $50.2 $50.0 $46.1 $47.4 *$43.5 $43.3 $41.4 $39.9 $40.0 $29.4 $29.4 $29.6 $30.0 $24.9 $25.6 $22.2 $22.6 $19.8 $20.0 $16.4 $10.0 $0.0 FY2011 FY2012 FY2013 FY2014 FY2015 FY2016 FY2017 FY2018 FY2019 CAPEX D&A *Includes $12 million for the rebuild of the Joliet Galvanizing facility in Fiscal 2014 12
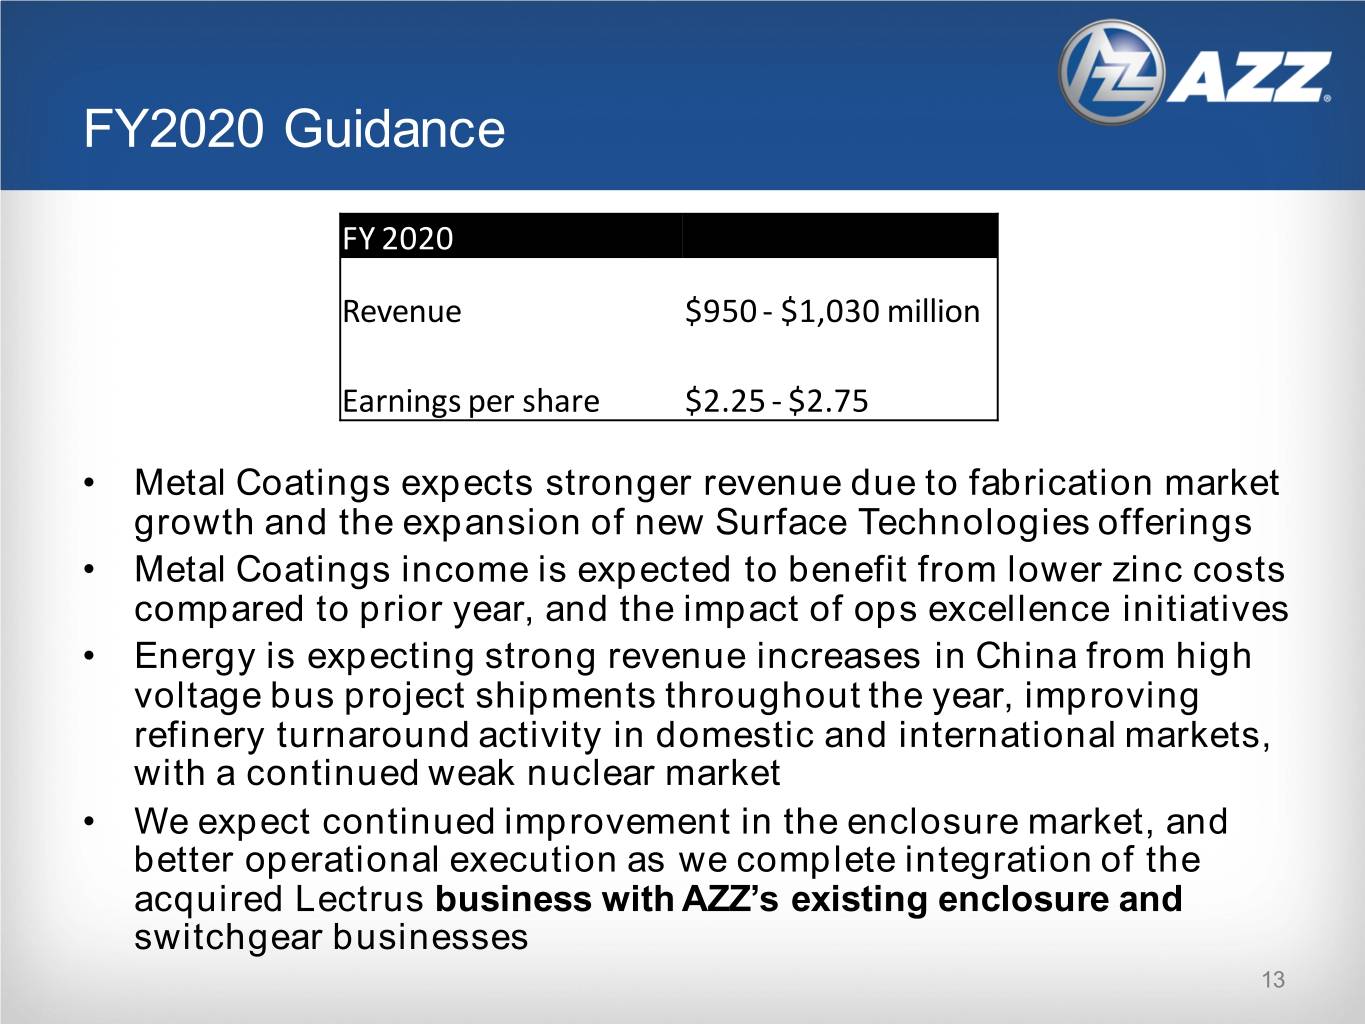
FY2020 Guidance FY 2020 Revenue $950 - $1,030 million Earnings per share $2.25 - $2.75 • Metal Coatings expects stronger revenue due to fabrication market growth and the expansion of new Surface Technologies offerings • Metal Coatings income is expected to benefit from lower zinc costs compared to prior year, and the impact of ops excellence initiatives • Energy is expecting strong revenue increases in China from high voltage bus project shipments throughout the year, improving refinery turnaround activity in domestic and international markets, with a continued weak nuclear market • We expect continued improvement in the enclosure market, and better operational execution as we complete integration of the acquired Lectrus business with AZZ’s existing enclosure and switchgear businesses 13
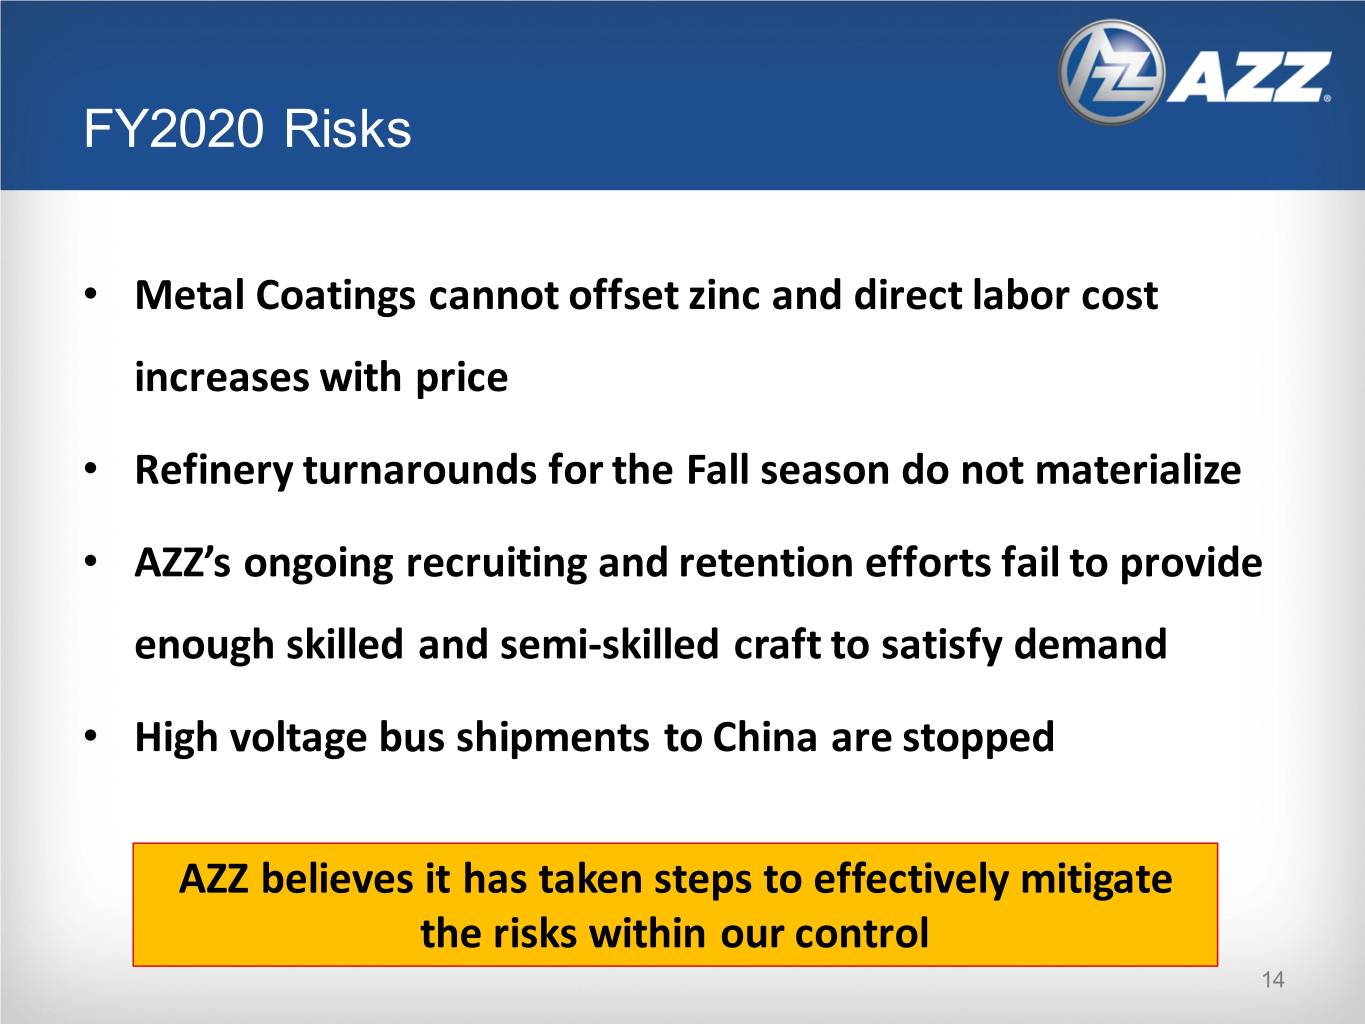
FY2020 Risks • Metal Coatings cannot offset zinc and direct labor cost increases with price • Refinery turnarounds for the Fall season do not materialize • AZZ’s ongoing recruiting and retention efforts fail to provide enough skilled and semi-skilled craft to satisfy demand • High voltage bus shipments to China are stopped AZZ believes it has taken steps to effectively mitigate the risks within our control 14

Q&A 15
Reg G Tables 16

Non-GAAP Adjusted Earnings Reconciliation In addition to reporting financial results in accordance with Generally Accepted Accounting Principles in the United States ("GAAP"), AZZ has provided adjusted earnings and adjusted earnings per share, which are non-GAAP measures. Management believes that the presentation of these measures provides investors with greater transparency comparison of operating results across a broad spectrum of companies, which provides a more complete understanding of AZZ’s financial performance, competitive position and prospects for the future. Management also believes that investors regularly rely on non-GAAP financial measures, such as adjusted earnings and adjusted earnings per share, to assess operating performance and that such measures may highlight trends in the Company’s business that may not otherwise be apparent when relying on financial measures calculated in accordance with GAAP. The following table provides a reconciliation for the year ended February 28, 2019 between net income and diluted earnings per share calculated in accordance with GAAP to adjusted earnings and adjusted earnings per share, respectively, which are shown net of tax (thousands, except per share data). 17

GAAP to Non-GAAP Free Cash Flow Reconciliation Fiscal Years 2010 2011 2012 2013 2014 2015 2016 2017 2018 2019 Cash from Operations 82,588 42,085 64,065 92,738 107,275 118,157 143,589 111,176 78,909 114,668 Less Capital Spending 12,037 16,411 19,784 24,923 43,472 29,377 39,861 41,434 29,612 25,616 Free Cash Flow 70,551 25,674 44,281 67,815 63,803 88,780 103,728 69,742 49,297 89,052 18


