
Fiscal Year 2020 First Quarter Earnings Release Conference Call July 8, 2019
Safe Harbor Statement Certain statements herein about our expectations of future events or results constitute forward- looking statements for purposes of the safe harbor provisions of The Private Securities Litigation Reform Act of 1995. You can identify forward-looking statements by terminology such as, “may,” “should,” “expects,” “plans,” “anticipates,” “believes,” “estimates,” “predicts,” “potential,” “continue,” or the negative of these terms or other comparable terminology. Such forward-looking statements are based on currently available competitive, financial and economic data and management’s views and assumptions regarding future events. Such forward-looking statements are inherently uncertain, and investors must recognize that actual results may differ from those expressed or implied in the forward-looking statements. This presentation may contain forward- looking statements that involve risks and uncertainties including, but not limited to, changes in customer demand and response to products and services offered by AZZ, including demand by the power generation markets, electrical transmission and distribution markets, the industrial markets, and the metal coatings markets; prices and raw material cost, including zinc and natural gas which are used in the hot dip galvanizing process; changes in the political stability and economic conditions of the various markets that AZZ serves, foreign and domestic, customer requested delays of shipments, acquisition opportunities, currency exchange rates, adequacy of financing, and availability of experienced management and employees to implement AZZ’s growth strategies. AZZ has provided additional information regarding risks associated with the business in AZZ’s Annual Report on Form 10-K for the fiscal year ended February 28, 2019 and other filings with the SEC, available for viewing on AZZ’s website at www.azz.com and on the SEC’s website at www.sec.gov. You are urged to consider these factors carefully in evaluating the forward-looking statements herein and are cautioned not to place undue reliance on such forward-looking statements, which are qualified in their entirety by this cautionary statement. These statements are based on information as of the date hereof and AZZ assumes no obligation to update any forward- looking statements, whether as a result of new information, future events, or otherwise. 2
First Quarter Fiscal Year 2020 Consolidated Highlights • Earnings per share of $0.81, up 35% from prior year • Revenues up 10.3% to $289.1 million compared to prior year • Net Income of $21.3 million, up 35.4% from prior year • Energy Segment revenues up 13.6% year-over-year, with operating margin of 7.5% • Metal Coatings Segment revenues up 6% year-over-year, with operating margin of 24.1% 3

Q1 Fiscal Year 2020 Highlights • Improved operational execution, price realization, lower zinc costs, and contributions from recent acquisitions helped to drive Metal Coatings revenue and margin increases • Normal seasonal domestic refinery turnaround activity, but there was no repeat of a large international refinery project from Q1 FY2019 • Began recognizing revenue on large Chinese HV Bus project that had pushed out of the last quarter, but Energy bookings are lower due to no repeat of large Chinese project orders from Q1 and Q2 of last year • Domestic Nuclear market activity is fairly low, but has stabilized • Improved powder coating offerings from newly acquired plants already having a positive impact 4
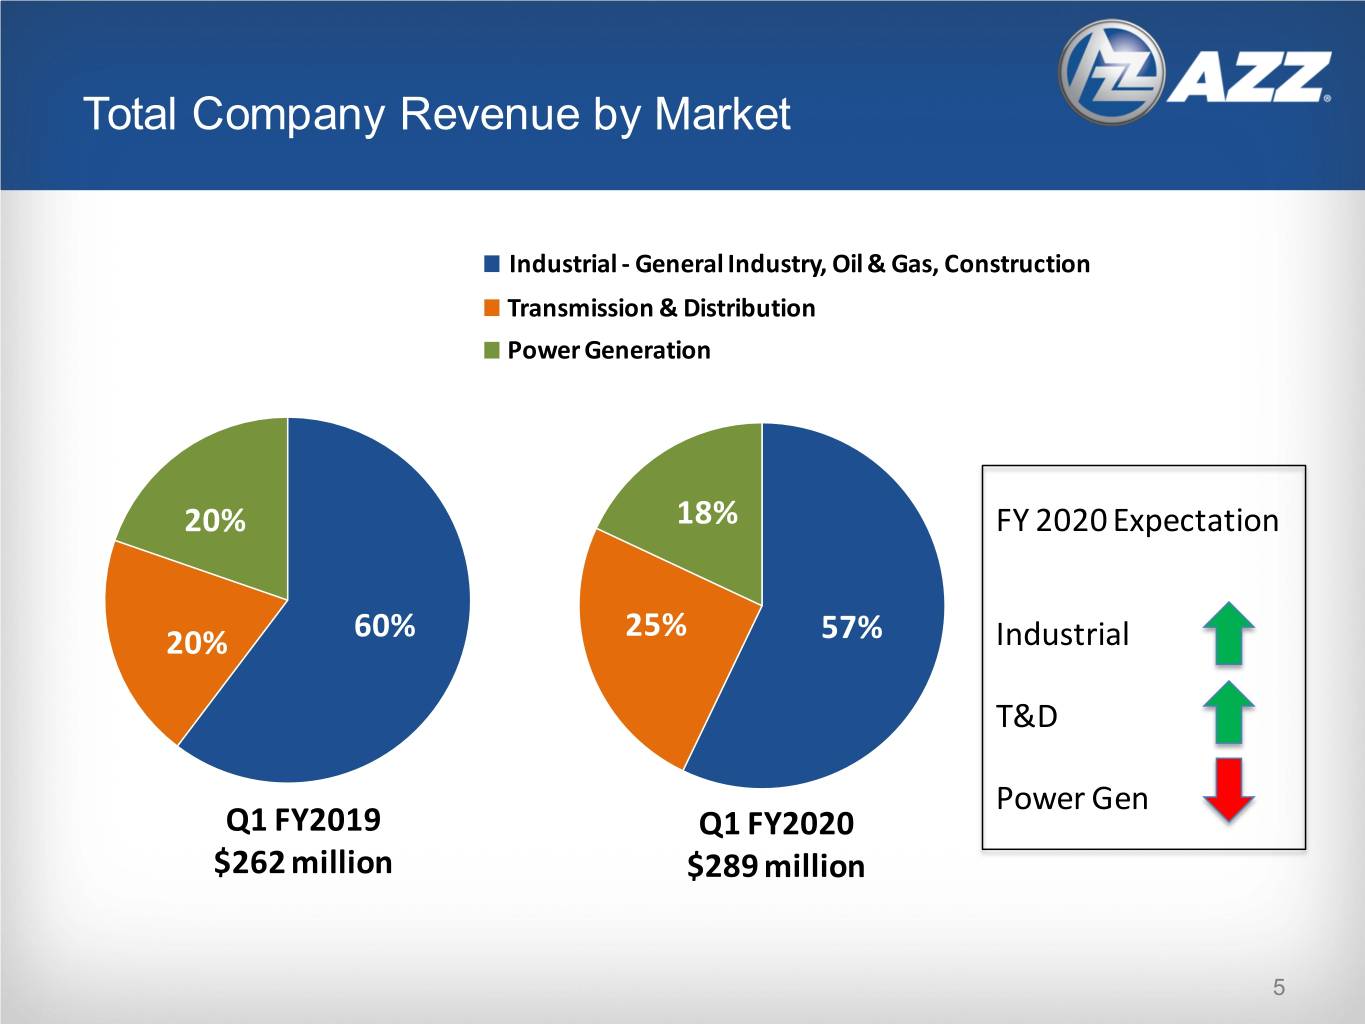
Total Company Revenue by Market Industrial - General Industry, Oil & Gas, Construction Transmission & Distribution Power Generation 20% 18% FY 2020 Expectation 25% 20% 60% 57% Industrial T&D Power Gen Q1 FY2019 Q1 FY2020 $262 million $289 million 5

Reaffirming FY 2020 Guidance FY 2020 Revenue $950 - $1,030 million Earnings per share $2.25 - $2.75 • Business Units are, generally, performing as expected Metal Coatings - Stronger Revenue due to price realization and contribution from AZZ Surface Technologies Energy - Revenue increases in China from high voltage bus project shipments, improving refinery turnaround activity, and growth from Welding Solutions’ international business units Metal Coatings – Higher income from lower zinc costs compared to prior year, and the margin impact of Operational Excellence initiatives Energy - Improvement in Electrical Platform operational execution and Chinese order volume are both driving income growth 6
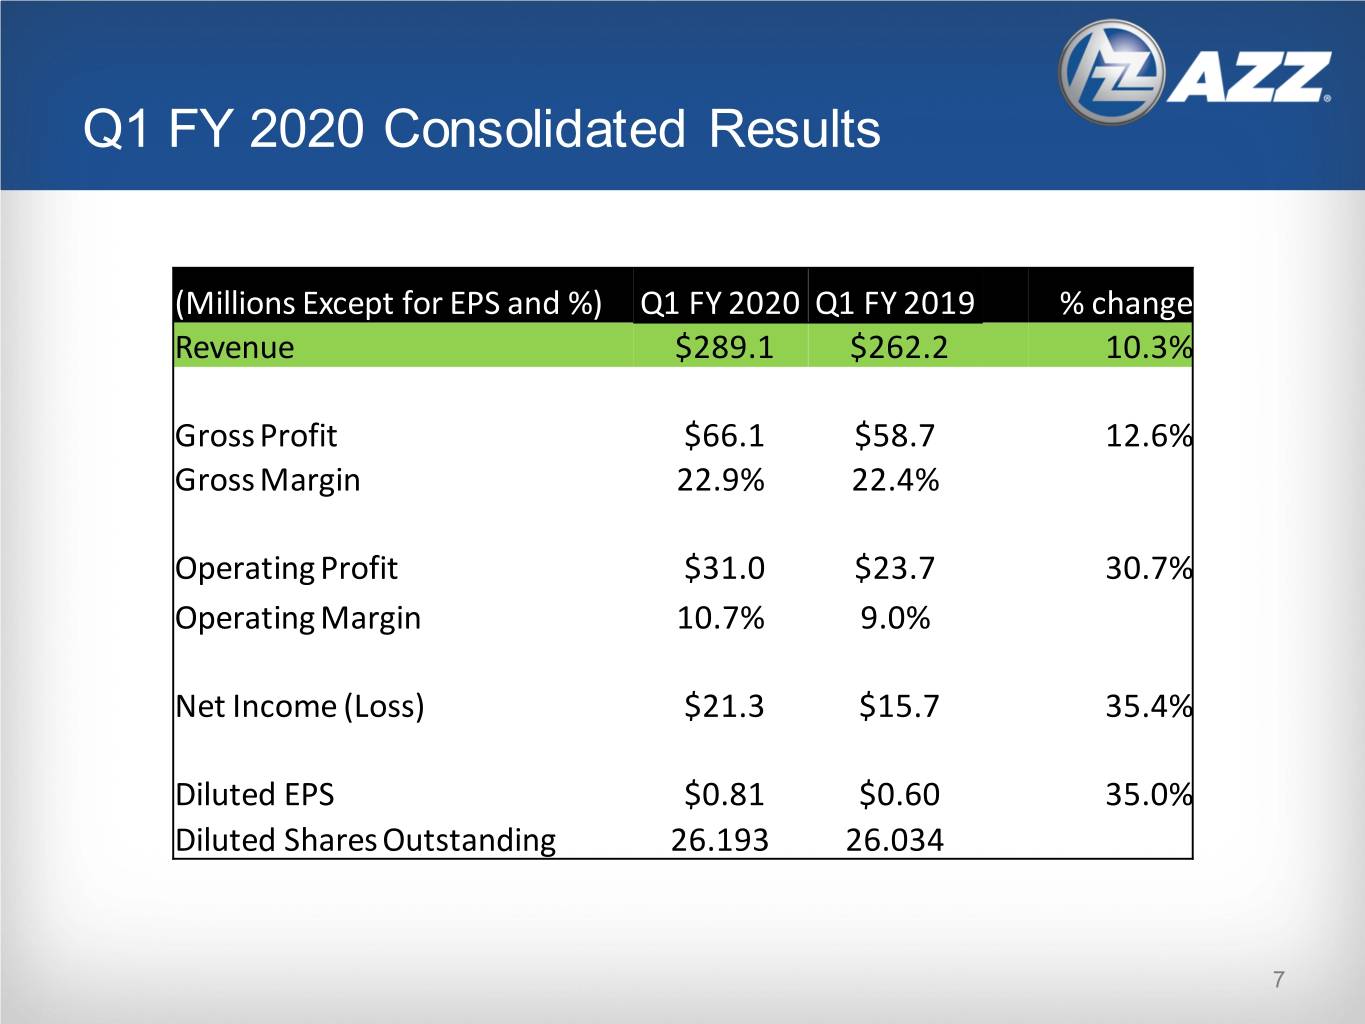
Q1 FY 2020 Consolidated Results (Millions Except for EPS and %) Q1 FY 2020 Q1 FY 2019 % change Revenue $289.1 $262.2 10.3% Gross Profit $66.1 $58.7 12.6% Gross Margin 22.9% 22.4% Operating Profit $31.0 $23.7 30.7% Operating Margin 10.7% 9.0% Net Income (Loss) $21.3 $15.7 35.4% Diluted EPS $0.81 $0.60 35.0% Diluted Shares Outstanding 26.193 26.034 7
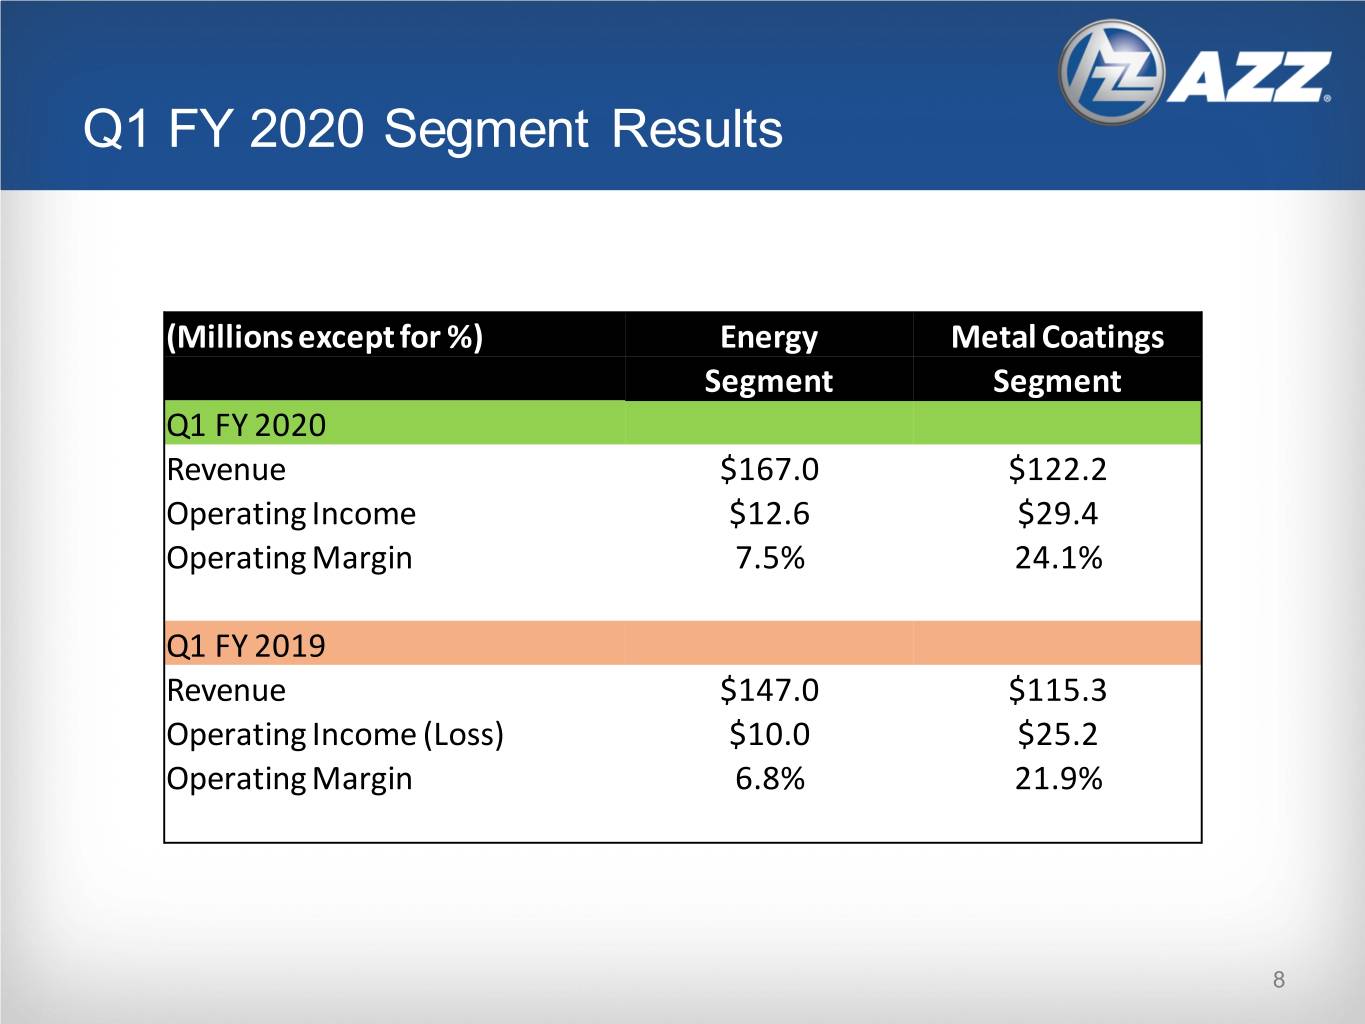
Q1 FY 2020 Segment Results (Millions except for %) Energy Metal Coatings Segment Segment Q1 FY 2020 Revenue $167.0 $122.2 Operating Income $12.6 $29.4 Operating Margin 7.5% 24.1% Q1 FY 2019 Revenue $147.0 $115.3 Operating Income (Loss) $10.0 $25.2 Operating Margin 6.8% 21.9% 8
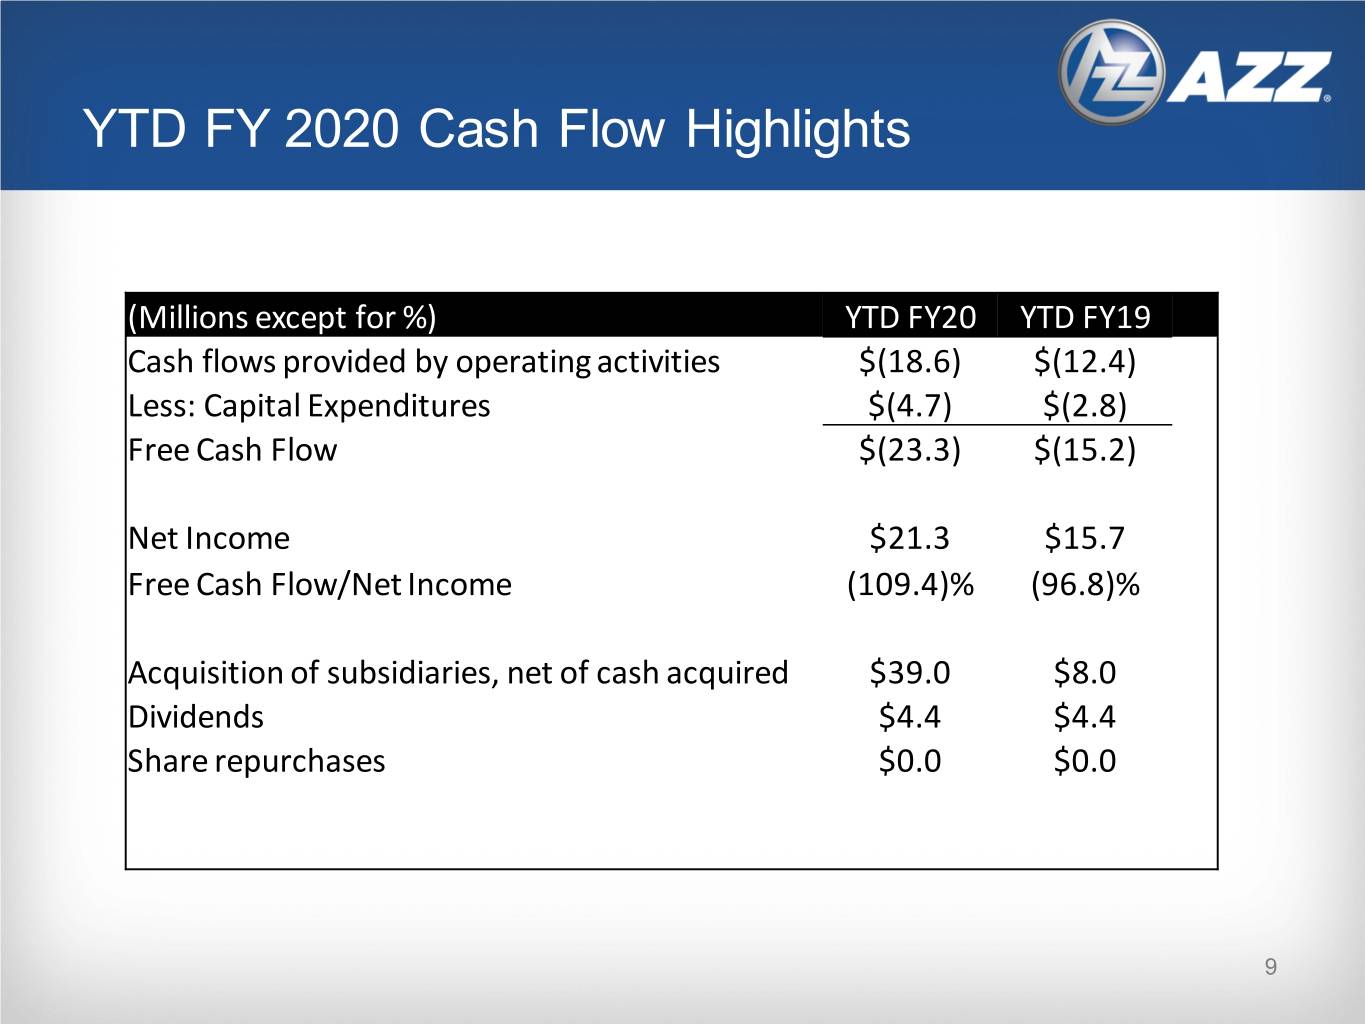
YTD FY 2020 Cash Flow Highlights (Millions except for %) YTD FY20 YTD FY19 Cash flows provided by operating activities $(18.6) $(12.4) Less: Capital Expenditures $(4.7) $(2.8) Free Cash Flow $(23.3) $(15.2) Net Income $21.3 $15.7 Free Cash Flow/Net Income (109.4)% (96.8)% Acquisition of subsidiaries, net of cash acquired $39.0 $8.0 Dividends $4.4 $4.4 Share repurchases $0.0 $0.0 9

FY 2020 Risks • Several risks identified for the year still exist, but did not emerge during the first quarter: • Metal Coatings – improved pricing and operational initiatives are unable to offset any unplanned increase in costs • Refinery turnarounds for the Fall season do not materialize • AZZ’s ongoing recruiting and retention efforts fail to provide enough skilled and semi-skilled craft to satisfy demand • High voltage bus shipments to China are impacted by international trade disputes AZZ believes it has taken steps to effectively mitigate the risks within our control 10

Closing Comments 11

Q&A


