AZZ Inc. Reports Second Quarter Fiscal Year 2021 Results; Generates Adjusted EPS of $0.49 Excluding Restructuring Charges October 13, 2020 - FORT WORTH, TX - AZZ Inc. (NYSE: AZZ), a global provider of metal coating solutions, welding solutions, specialty electrical equipment and highly engineered services today announced financial results for the second quarter of fiscal year 2021, ended August 31, 2020. Second Quarter Overview and Recent Highlights: Adjusted EPS of $0.49 and net income of $13.0 million, excluding one-time pre-tax restructuring charges of $18.7 million or $0.71 per share; as reported EPS of $(0.07) or loss of $(1.8) million. Completed refinancing through a private placement of $150 million seven and twelve year senior unsecured notes (maturity 2028 and 2032) at average coupon of 2.98%, which will generate approximately $2.5 million of annual interest savings. Effectively managed debt; $393 million of available credit Sales of $203.4 million, down 13.9% versus the same quarter, prior year. Metal Coatings segment results versus same quarter, prior year: o Sales of $117.0 million, down 6.3% o Adjusted operating income of $26.9 million, down 6.1% o Adjusted operating margin of 23% for both periods Infrastructure Solutions (formerly Energy) segment results versus same quarter, prior year: o Sales of $86.3 million, down 22.5% o Adjusted operating income of $3.1 million, down 27.9% o Adjusted operating margin of 3.5% versus 3.8% Declared second quarter cash dividend in the amount of $0.17 per common share. Fiscal year 2021 Q3 expected to show sequential improvement in both revenue and earnings per share versus second quarter. Management Discussion Tom Ferguson, President and Chief Executive Officer of AZZ, commented, “We continued to navigate the protracted global business disruption resulting from COVID-19 during the second quarter, with Page 1 of 11
sales of $203.4 million and adjusted net income of $13.0 million, or $0.49 on a per share diluted basis. In the midst of a difficult macroeconomic environment, I am particularly pleased that our Metal Coatings segment continues to deliver solid operating results with sales of $117 million, and adjusted operating margins of 23%, which are consistent with the same quarter, in the prior year. Our digital galvanizing system (DGS) continues to provide operational efficiencies throughout our plants and contributes to the safety of our employees and customers. Within our Infrastructure Solutions segment, the ongoing impact of the pandemic caused travel restrictions within certain geographical areas and key international markets served by our teams, significantly reducing refining turnaround work, as customers delay or defer maintenance and lower order volume for electrical products. We are optimistic for continued modest improvement in the second half of the year, and are positioning our operations for a potentially strong fiscal year 2022, including a robust spring refining turnaround season following COVID-related maintenance delays. We are already seeing signs of improvement including earlier and stronger quoting activity for our welding solutions business. Given shifting industry and customer dynamics, and continued impact from the pandemic, we are taking the necessary steps to restructure our portfolio of businesses to focus our future investments into our core operations. We recorded one-time impairment charges of $18.7 million during the second quarter and expect to divest or consolidate certain assets in both the Metal Coatings and Infrastructure Solutions segments to improve each segment’s operational and financial performance. We believe restructuring our portfolio will streamline our continued efforts to improve operational efficiencies, increase margins and allow us to focus on organic growth from the core businesses. As part of this strategic process, we are renaming our Energy segment to Infrastructure Solutions, which we believe better reflects the businesses we consider core to our corporate strategy. Additionally, we have announced the promotion of Gary Hill to Chief Operating Officer of Infrastructure Solutions as part of our overall strategic restructuring plan. Gary is a proven results-driven leader and has been instrumental in overseeing the strategic development of our Industrial platform. I am confident that consolidating both the Electrical and Industrial operating platforms under his leadership will result in rapid realization of greater organizational efficiencies, and a more successful Infrastructure Solutions segment in the future. Again, I want to express my sincere gratitude to all our employees for their hard work and dedication during this unprecedented time. We remain committed to emerge from this year a much stronger company well positioned to excel in the post-COVID era.” Second Quarter Results Page 2 of 11

Sales for the second quarter of fiscal year 2021 were $203.4 million compared to $236.2 million for the comparable period last year, a decrease of 13.9%. Reported net loss for the quarter was $(1.8) million, or $(0.07) on a diluted basis, down $17.4 million from the prior year, same quarter. Adjusted net income was $13.0 million, or $0.49 per share for the quarter, down 16.9% compared to the comparable prior year period on a diluted basis. Incoming orders for the three-month period declined to $208.6 million, as compared to $238.0 million for the same quarter last year. The book-to-sales ratio improved to 1.03, compared to 1.01 in last year’s comparable period. Backlog at the end of the quarter was $210.6 million, a decrease of 30.2% as compared to backlog at the end of the same quarter in the prior year. Metal Coatings Segment For the second quarter of fiscal year 2021, Metal Coatings segment sales decreased 6.3% to $117.0 million and adjusted operating income of $26.9 million was $1.7 million, or 6.1% lower than the comparable prior year quarter. Adjusted operating margins were 23% of net sales, which was comparable to prior year quarterly operating margin. On a year-to-date basis, adjusted operating income of $52 million was $6.1 million, or 10.4% lower than the comparable prior year-to-date period. Infrastructure Solutions Segment (formerly the Energy Segment) For the second quarter of fiscal year 2021, Infrastructure Solutions segment sales decreased 22.5% to $86.3 million as compared to $111.3 million in the same quarter of the prior year. Infrastructure Solutions operating income of $3.1 million was $1.2 million, or 27.8% lower than the comparable prior year quarter, on an adjusted basis. Adjusted operating margin of 3.5% was 30 basis points lower than the comparable prior year quarter operating margin of 3.8%. On a year-to-date basis, adjusted operating income of $2.0 million was $14.8 million, or 88.0% lower than the comparable prior year-to-date period. Year-to-date operating margin of 1.1% was 490 basis points lower than the prior year. The decrease in net sales and operating income was primarily attributable to several COVID-related factors, including travel restrictions within certain geographical areas served by our Infrastructure Solutions teams, significant reductions in turnaround activity in both the U.S. and international markets, and a marked slow-down of orders for our electrical products as customers temporarily shuttered facilities. The following chart provides an overview of operating income for both our Metal Coatings and Infrastructure Solutions segments, as adjusted for the impairment charges recorded during the quarter: Page 3 of 11
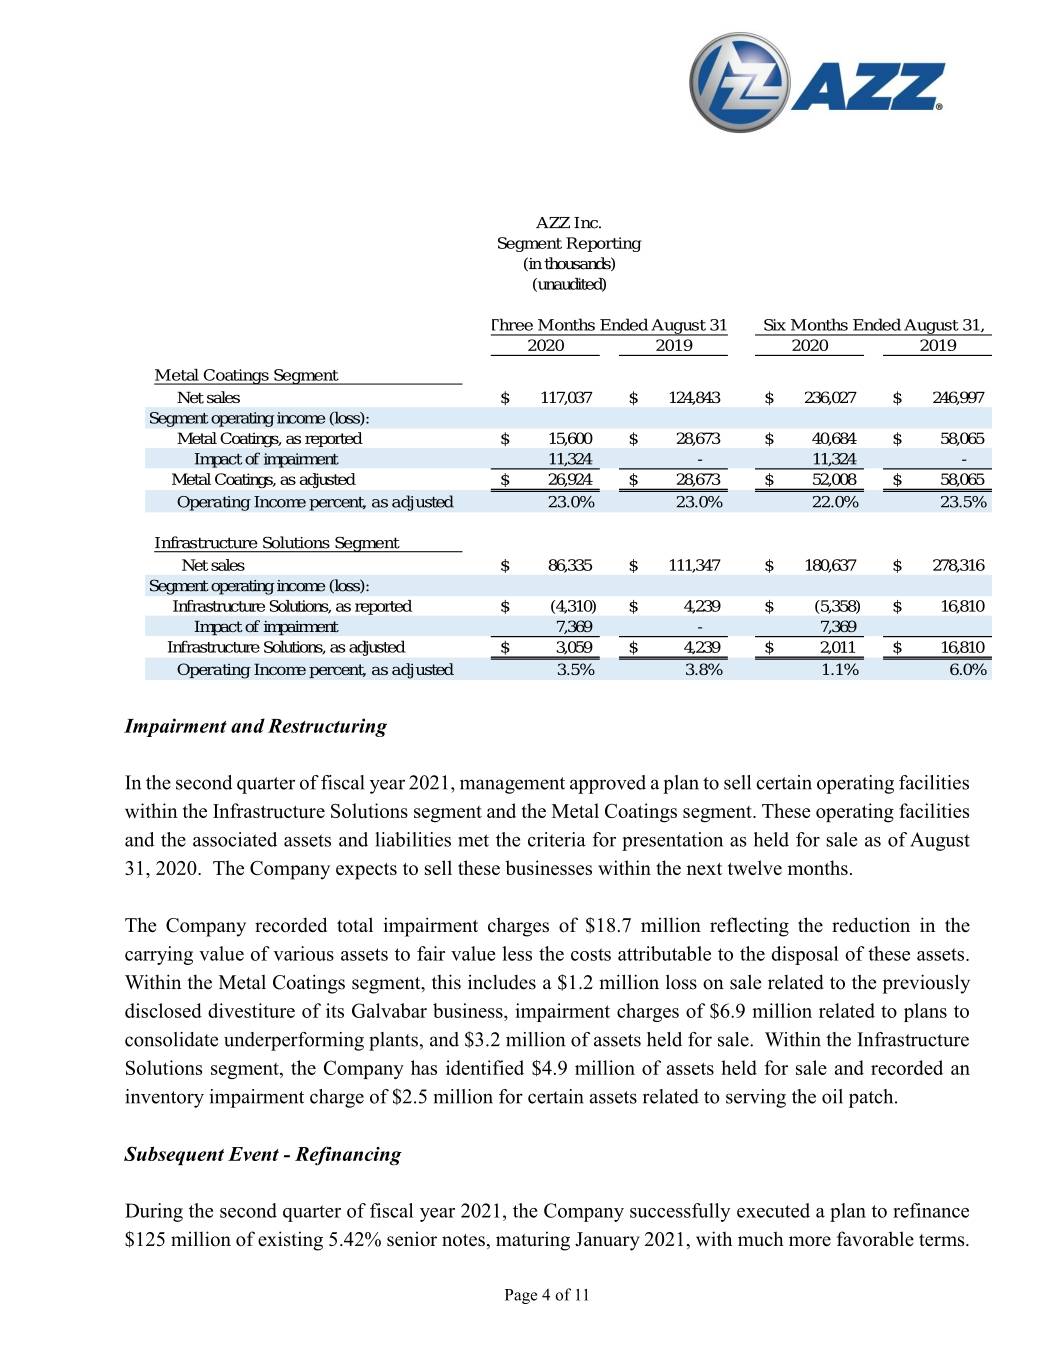
AZZ Inc. Segment Reporting (in thousands) (unaudited) Three Months Ended August 31, Six Months Ended August 31, 2020 2019 2020 2019 Metal Coatings Segment Net sales $ 117,037 $ 124,843 $ 236,027 $ 246,997 Segment operating income (loss): Metal Coatings, as reported $ 15,600 $ 28,673 $ 40,684 $ 58,065 Impact of impairment 11,324 - 11,324 - Metal Coatings, as adjusted $ 26,924 $ 28,673 $ 52,008 $ 58,065 Operating Income percent, as adjusted 23.0% 23.0% 22.0% 23.5% Infrastructure Solutions Segment Net sales $ 86,335 $ 111,347 $ 180,637 $ 278,316 Segment operating income (loss): Infrastructure Solutions, as reported $ (4,310) $ 4,239 $ (5,358) $ 16,810 Impact of impairment 7,369 - 7,369 Infrastructure Solutions, as adjusted $ 3,059 $ 4,239 $ 2,011 $ 16,810 Operating Income percent, as adjusted 3.5% 3.8% 1.1% 6.0% Impairment and Restructuring In the second quarter of fiscal year 2021, management approved a plan to sell certain operating facilities within the Infrastructure Solutions segment and the Metal Coatings segment. These operating facilities and the associated assets and liabilities met the criteria for presentation as held for sale as of August 31, 2020. The Company expects to sell these businesses within the next twelve months. The Company recorded total impairment charges of $18.7 million reflecting the reduction in the carrying value of various assets to fair value less the costs attributable to the disposal of these assets. Within the Metal Coatings segment, this includes a $1.2 million loss on sale related to the previously disclosed divestiture of its Galvabar business, impairment charges of $6.9 million related to plans to consolidate underperforming plants, and $3.2 million of assets held for sale. Within the Infrastructure Solutions segment, the Company has identified $4.9 million of assets held for sale and recorded an inventory impairment charge of $2.5 million for certain assets related to serving the oil patch. Subsequent Event - Refinancing During the second quarter of fiscal year 2021, the Company successfully executed a plan to refinance $125 million of existing 5.42% senior notes, maturing January 2021, with much more favorable terms. Page 4 of 11
The new private placement offering increased the current $125 million face value to $150 million as the Company sought to take advantage of the extremely favorable interest rate environment. The Company executed on two tranches of 7-year and 12-year borrowings of $70 million and $80 million, respectively. The average coupon rate associated with our new borrowings is 2.98%. The new private placement notes will reduce the annual interest costs by more than $2.5 million, after funding in December 2020 and January 2021. Fiscal Year 2021 Guidance Mr. Ferguson added, “Given the continued disruption from COVID-19 we will continue to suspend our guidance for fiscal 2021 at this time. Based upon the evaluation of information currently available to management, we believe the third quarter will show sequential improvement in both sales and earnings per share versus the second quarter, and anticipate results will fall short of a very strong third quarter of last year. We continue to experience COVID-related travel restrictions within certain geographical areas served by our Infrastructure Solutions teams, particularly in some key international markets where we have projects scheduled for completion during the quarter. The strong cash flow generated by our operations will continue to help the Company manage both debt and liquidity effectively throughout the remainder of fiscal 2021 and well beyond. We continue to be prudent with our cash by focusing capital expenditures on core growth initiatives and safety-related spending, reducing debt, and repurchasing shares to minimize dilution. We will continue to carefully manage our workforce to ensure a safe and healthy operating environment, while flexing our capacity to better match our customer demands. We are focused on executing the following opportunities: fully integrating the Galvanizing and Powder Coating and Plating platforms to drive market share growth and operating efficiencies; building backlog in our Infrastructure Solutions segment; ensuring our ability to deploy resources effectively during, what appears to be, a modest fall turnaround season; completing M&A activities in support of our strategic initiatives and continuing to manage our liquidity to ensure we enter fiscal 2022 in a solid position.” Conference Call Details AZZ Inc. will conduct a conference call to discuss financial results for the second quarter of fiscal year 2021 today, Tuesday, October 13, 2020, at 11:00 A.M. ET. Interested parties can access the conference call by dialing (844) 855-9499 or (412) 317-5497 (international). A webcast of the call will be available on the Company’s Investor Relations page at http://www.azz.com/investor-relations. Page 5 of 11
A replay of the call will be available for three days at (877) 344-7529 or (412) 317-0088 (international), confirmation # 10148393, or for 30 days at http://www.azz.com/investor-relations. There will be a slide presentation accompanying today’s call. The Company’s slide presentation for the call will be available on the Investor Relations page at http://www.azz.com/investor-relations. About AZZ Inc. AZZ Inc. is a global provider of metal coating solutions, welding solutions, specialty electrical equipment and highly engineered services to the markets of power generation, transmission, distribution and industrial in protecting metal and electrical systems used to build and enhance the world’s infrastructure. AZZ Metal Coatings is a leading provider of metal finishing solutions for corrosion protection, including hot dip galvanizing to the North American steel fabrication industry. AZZ Infrastructure Solutions (formerly Energy) is dedicated to delivering safe and reliable transmission of power from generation sources to end customers, and automated weld overlay solutions for corrosion and erosion mitigation to critical infrastructure in the energy markets worldwide. Safe Harbor Statement Certain statements herein about our expectations of future events or results constitute forward-looking statements for purposes of the safe harbor provisions of The Private Securities Litigation Reform Act of 1995. You can identify forward-looking statements by terminology such as “may,” “should,” “expects,” “plans,” “anticipates,” “believes,” “estimates,” “predicts,” “potential,” “continue,” or the negative of these terms or other comparable terminology. Such forward-looking statements are based on currently available competitive, financial and economic data and management’s views and assumptions regarding future events. Such forward- looking statements are inherently uncertain, and investors must recognize that actual results may differ from those expressed or implied in the forward-looking statements. Certain factors could affect the outcome of the matters described herein. This press release may contain forward-looking statements that involve risks and uncertainties including, but not limited to, changes in customer demand for our products and services, including demand by the power generation markets, electrical transmission and distribution markets, the industrial markets, and the metal coatings markets. In addition, within each of the markets we serve, our customers and our operations could potentially be adversely impacted by the ongoing COVID-19 pandemic. We could also experience fluctuations in prices and raw material cost, including zinc and natural gas which are used in the hot dip galvanizing process; supply-chain vendor delays; customer requested delays of our products or services; delays in additional acquisition opportunities; currency exchange rates; adequacy of financing; availability of experienced management and employees to implement AZZ’s growth strategy; a downturn in market conditions in any industry relating to the products we inventory or sell or the services that we provide; economic volatility or changes in the political stability in the United States and other foreign markets in which we operate; acts of Page 6 of 11
war or terrorism inside the United States or abroad; and other changes in economic and financial conditions. AZZ has provided additional information regarding risks associated with the business in AZZ’s Annual Report on Form 10-K for the fiscal year ended February 29, 2020 and other filings with the Securities and Exchange Commission (“SEC”), available for viewing on AZZ’s website at www.azz.com and on the SEC’s website at www.sec.gov. You are urged to consider these factors carefully in evaluating the forward-looking statements herein and are cautioned not to place undue reliance on such forward-looking statements, which are qualified in their entirety by this cautionary statement. These statements are based on information as of the date hereof and AZZ assumes no obligation to update any forward-looking statements, whether as a result of new information, future events, or otherwise. Company Contact: David Nark, Senior Vice President of Marketing and Investor Relations AZZ Inc. (817) 810-0095 www.azz.com Investor Contact: Joe Dorame, Managing Partner Lytham Partners (602) 889-9700 www.lythampartners.com ---Financial tables on the following page--- Page 7 of 11
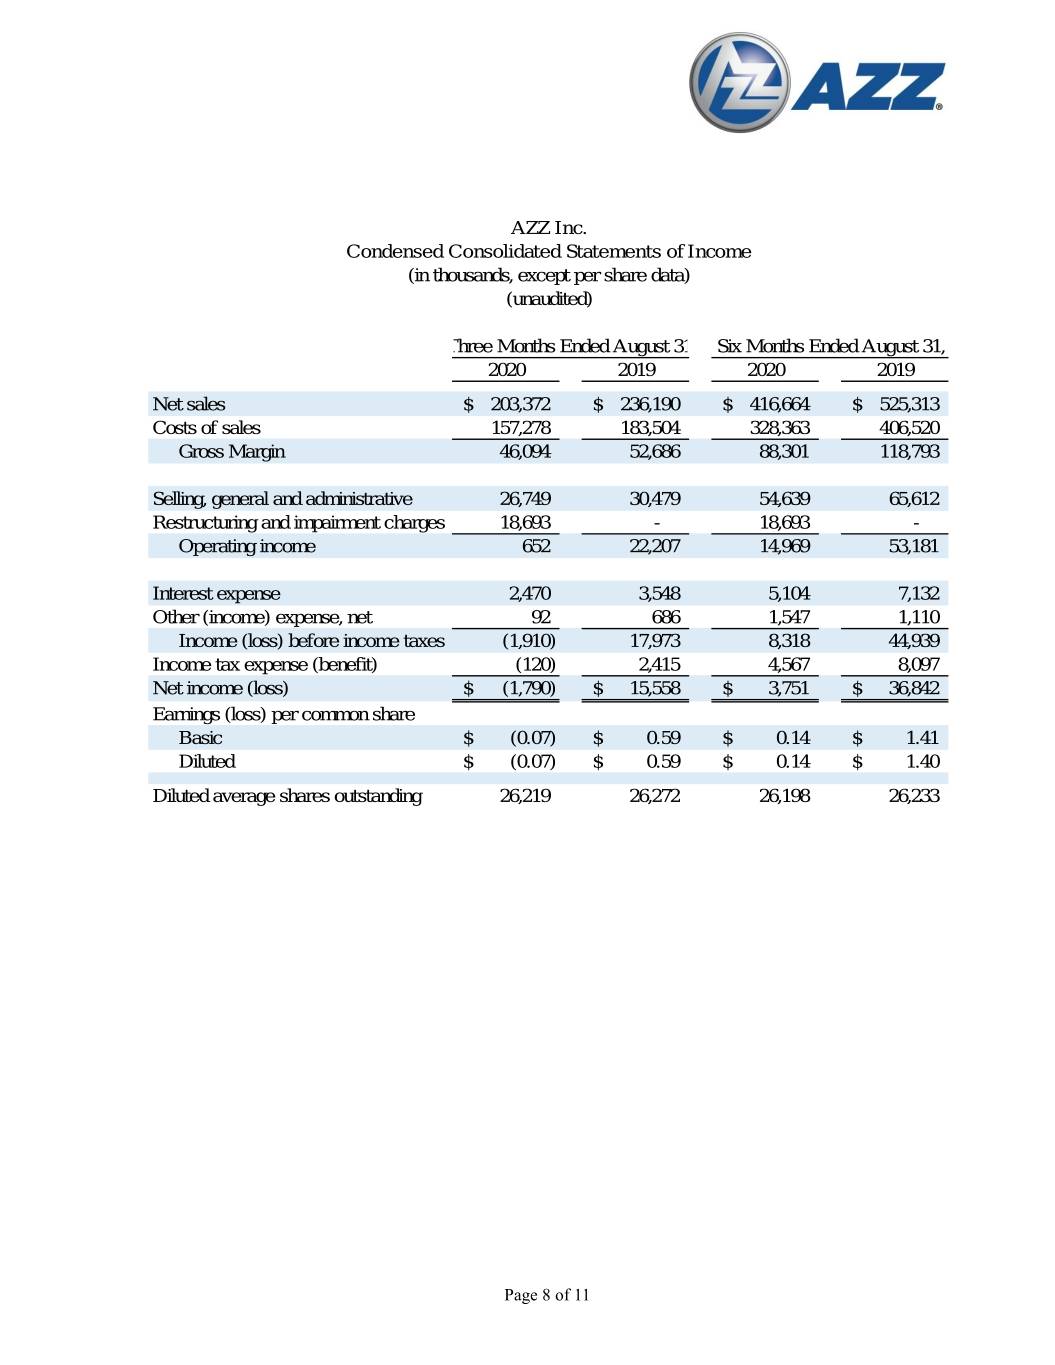
AZZ Inc. Condensed Consolidated Statements of Income (in thousands, except per share data) (unaudited) Three Months Ended August 31, Six Months Ended August 31, 2020 2019 2020 2019 Net sales $ 203,372 $ 236,190 $ 416,664 $ 525,313 Costs of sales 157,278 183,504 328,363 406,520 Gross Margin 46,094 52,686 88,301 118,793 Selling, general and administrative 26,749 30,479 54,639 65,612 Restructuring and impairment charges 18,693 - 18,693 - Operating income 652 22,207 14,969 53,181 Interest expense 2,470 3,548 5,104 7,132 Other (income) expense, net 92 686 1,547 1,110 Income (loss) before income taxes (1,910) 17,973 8,318 44,939 Income tax expense (benefit) (120) 2,415 4,567 8,097 Net income (loss) $ (1,790) $ 15,558 $ 3,751 $ 36,842 Earnings (loss) per common share Basic $ (0.07) $ 0.59 $ 0.14 $ 1.41 Diluted $ (0.07) $ 0.59 $ 0.14 $ 1.40 Diluted average shares outstanding 26,219 26,272 26,198 26,233 Page 8 of 11
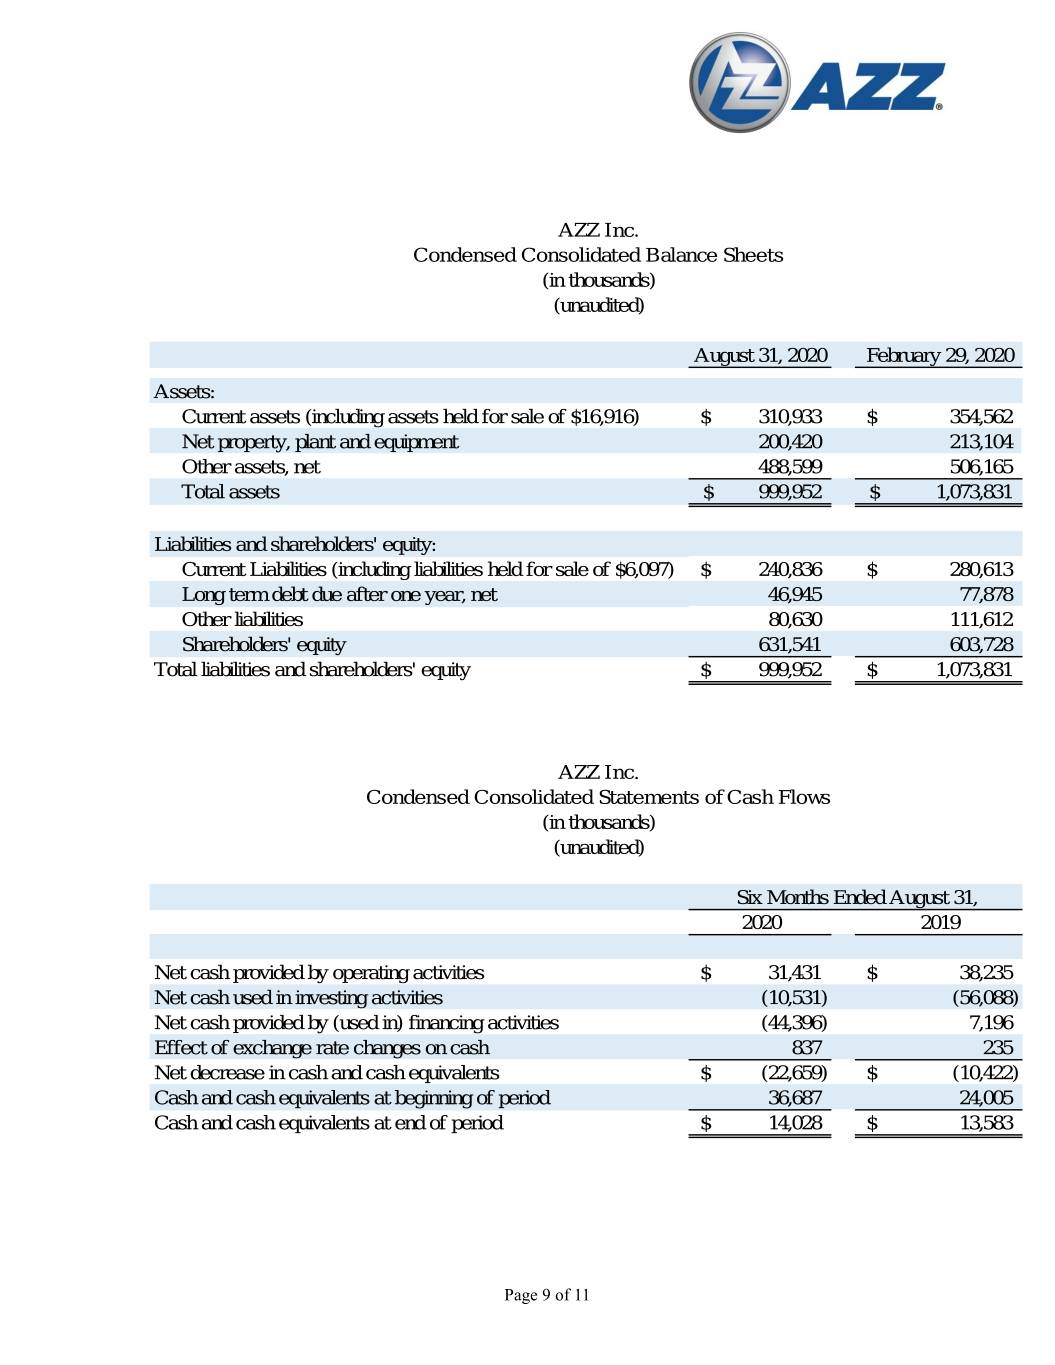
AZZ Inc. Condensed Consolidated Balance Sheets (in thousands) (unaudited) August 31, 2020 February 29, 2020 Assets: Current assets (including assets held for sale of $16,916) $ 310,933 $ 354,562 Net property, plant and equipment 200,420 213,104 Other assets, net 488,599 506,165 Total assets $ 999,952 $ 1,073,831 Liabilities and shareholders' equity: Current Liabilities (including liabilities held for sale of $6,097) $ 240,836 $ 280,613 Long term debt due after one year, net 46,945 77,878 Other liabilities 80,630 111,612 Shareholders' equity 631,541 603,728 Total liabilities and shareholders' equity $ 999,952 $ 1,073,831 AZZ Inc. Condensed Consolidated Statements of Cash Flows (in thousands) (unaudited) Six Months Ended August 31, 2020 2019 Net cash provided by operating activities $ 31,431 $ 38,235 Net cash used in investing activities (10,531) (56,088) Net cash provided by (used in) financing activities (44,396) 7,196 Effect of exchange rate changes on cash 837 235 Net decrease in cash and cash equivalents $ (22,659) $ (10,422) Cash and cash equivalents at beginning of period 36,687 24,005 Cash and cash equivalents at end of period $ 14,028 $ 13,583 Page 9 of 11
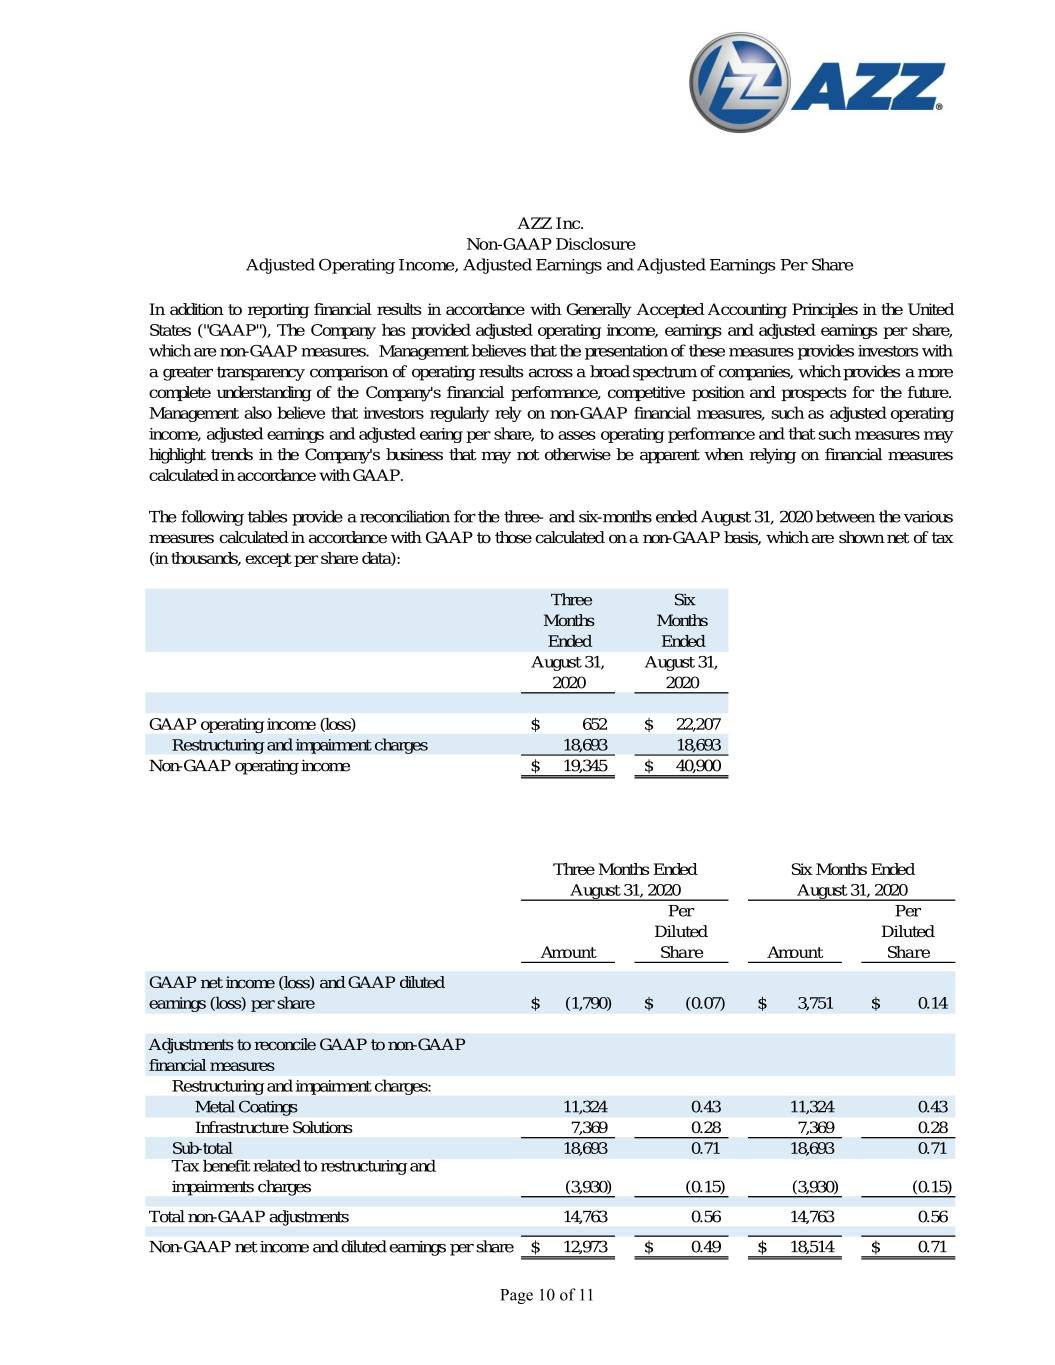
AZZ Inc. Non-GAAP Disclosure Adjusted Operating Income, Adjusted Earnings and Adjusted Earnings Per Share In addition to reporting financial results in accordance with Generally Accepted Accounting Principles in the United States ("GAAP"), The Company has provided adjusted operating income, earnings and adjusted earnings per share, which are non-GAAP measures. Management believes that the presentation of these measures provides investors with a greater transparency comparison of operating results across a broad spectrum of companies, which provides a more complete understanding of the Company's financial performance, competitive position and prospects for the future. Management also believe that investors regularly rely on non-GAAP financial measures, such as adjusted operating income, adjusted earnings and adjusted earing per share, to asses operating performance and that such measures may highlight trends in the Company's business that may not otherwise be apparent when relying on financial measures calculated in accordance with GAAP. The following tables provide a reconciliation for the three- and six-months ended August 31, 2020 between the various measures calculated in accordance with GAAP to those calculated on a non-GAAP basis, which are shown net of tax (in thousands, except per share data): Three Six Months Months Ended Ended August 31, August 31, 2020 2020 GAAP operating income (loss) $ 652 $ 22,207 Restructuring and impairment charges 18,693 18,693 Non-GAAP operating income $ 19,345 $ 40,900 Three Months Ended Six Months Ended August 31, 2020 August 31, 2020 Per Per Diluted Diluted Amount Share Amount Share GAAP net income (loss) and GAAP diluted earnings (loss) per share $ (1,790) $ (0.07) $ 3,751 $ 0.14 Adjustments to reconcile GAAP to non-GAAP financial measures Restructuring and impairment charges: Metal Coatings 11,324 0.43 11,324 0.43 Infrastructure Solutions 7,369 0.28 7,369 0.28 Sub-total 18,693 0.71 18,693 0.71 Tax benefit related to restructuring and impairments charges (3,930) (0.15) (3,930) (0.15) Total non-GAAP adjustments 14,763 0.56 14,763 0.56 Non-GAAP net income and diluted earnings per share $ 12,973 $ 0.49 $ 18,514 $ 0.71 Page 10 of 11
Page 11 of 11


