
AZZ Inc. Investor Presentation NYSE:AZZ November 2020
INVESTOR PRESENTATION Safe Harbor Statement Certain statements herein about our expectations of future events or results constitute forward-looking statements for purposes of the safe harbor provisions of The Private Securities Litigation Reform Act of 1995, including the statements regarding our strategic and financial initiatives. You can identify forward-looking statements by terminology such as “may,” “should,” “expects,” “plans,” “intends,” “anticipates,” “believes,” “estimates,” “predicts,” “potential,” “continue,” or the negative of these terms or other comparable terminology. Such forward-looking statements are based on currently available competitive, financial and economic data and management’s views and assumptions regarding future events. Such forward-looking statements are inherently uncertain, and investors must recognize that actual results may differ from those expressed or implied in the forward-looking statements. Certain factors could affect the outcome of the matters described herein. This presentation may contain forward-looking statements that involve risks and uncertainties including, but not limited to, changes in customer demand for our products and services, including demand by the power generation markets, electrical transmission and distribution markets, the industrial markets, and the metal coatings markets. In addition, within each of the markets we serve, our customers and our operations could potentially be adversely impacted by the ongoing COVID-19 pandemic. We could also experience fluctuations in prices and raw material cost, including zinc and natural gas which are used in the hot-dip galvanizing process; supply-chain vendor delays ; customer requested delays of our products or services; delays in additional acquisition opportunities; currency exchange rates; adequacy of financing; availability of experienced management and employees to implement AZZ’s growth strategy; a downturn in market conditions in any industry relating to the products we inventory or sell or the services that we provide; economic volatility or changes in the political stability in the United States and other foreign markets in which we operate; acts of war or terrorism inside the United States or abroad; and other changes in economic and financial conditions. AZZ has provided additional information regarding risks associated with the business in AZZ’s Annual Report on Form 10-K for the fiscal year ended February 29, 2020 and other filings with the Securities and Exchange Commission (“SEC”), available for viewing on AZZ’s website at www.azz.com and on the SEC’s website at www.sec.gov. You are urged to consider these factors carefully in evaluating the forward-looking statements herein and are cautioned not to place undue reliance on such forward-looking statements, which are qualified in their entirety by this cautionary statement. These statements are based on information as of the date hereof and AZZ assumes no obligation to update any forward-looking statements, whether as a result of new information, future events, or otherwise. 2

INVESTOR PRESENTATION Vision and Values GUIDING VALUES Environmental, Social and ■ We Value Our Dedicated Employees and their Governance “ESG” communities by fully training and equipping them, and . Formed Sustainability Council with Board Oversight providing a safe environment to grow . Integrating Sustainability into our Operations and Company Culture ■ We Value Our Customers by reliably providing high- quality products and services with outstanding customer . Continued Commitment to Employee Safety, service Development and Diversity . Experienced Board from a Range of Relevant ■ We Value Our Shareholders by striving to consistently Backgrounds provide solid returns 3
INVESTOR PRESENTATION Strategic and Financial Initiatives to Enhance Shareholder Value Metal Coatings Infrastructure Solutions Capital Allocation Targeting Increased Capital Returns to Focus on Driving Profitable Growth Conducting Comprehensive Review Shareholders ■ #1 in hot-dip galvanizing ■ Impacted by COVID-19 ■ Deploy balance sheet targeting a net leverage ratio of 2.5x ■ Strategic plant network with superior ■ Drive cost and margin improvement service ■ Exit of low performing and low value ■ Board authorized $100M share ■ Highly attractive margins and returns creation businesses underway repurchase program ■ Pipeline of synergistic Metal Coatings ■ Maintaining competitive position to ► Intend to complete new acquisitions in North America maximize value in post COVID-19 authorization by end of Fiscal Year recovery ■ Resilient performance through 2022, subject to market conditions COVID-19 uncertainty ■ Evaluating opportunities to accelerate and acquisition opportunities becoming a focused Coatings company ■ Continued prioritization of coatings acquisitions Strengthened Management Team ■ Grow dividend over time ■ Appointed CFO with deep accounting, controls and compliance experience ■ Subject to macro environment ■ Appointed SVP of IR to enhance investor communication 4
INVESTOR PRESENTATION AZZ at a Glance (NYSE: AZZ) By Pro Forma Sales Pro Forma Sales Contribution ($ in millions) Headquarters Ft. Worth, Texas $987 $856 $899 $745 50% 50% Total Employees ~3,700 FY18 FY19 FY20 LTM Facilities >60 By Pro Forma Operating Income PF Adj. Operating Income Contribution Note: totals include corporate expenses ($ in millions) $96 Pro Forma FY20 Sales ~$1 billion $77 20% $59 $61 80% Pro Forma FY20 $96 million Adj. Operating Income FY18 FY19 FY20 LTM Metal Coatings Infrastructure Solutions Note: Financials pro forma for divestitures of Galvabar, NLI and SMS and one-time expenses. See appendix for reconciliation to reported GAAP financials 5
INVESTOR PRESENTATION Our Current Portfolio Metal Coatings Infrastructure Solutions (PF FY20 Sales: $496 million) (PF FY20 Sales: $491 million) #1 in Hot-Dip Galvanizing of Prefabricated Steel Diverse portfolio of Electrical and Industrial businesses Galvanizing Surface Technologies Electrical Products Industrial Solutions Enclosure Systems Switchgear ■ Protects, extends and ■ Powder ■ Corrosion + ■ Specialty weld overlay enhances critical infrastructure coatings cosmetic services for critical component ■ Plating benefits maintenance & repair ■ Anodizing ■ Highly automated High Voltage Bus Medium Voltage Bus Tubular Products Lighting Systems Note: Financials pro forma for divestitures of Galvabar, NLI and SMS. See appendix for reconciliation to reported GAAP financials 6
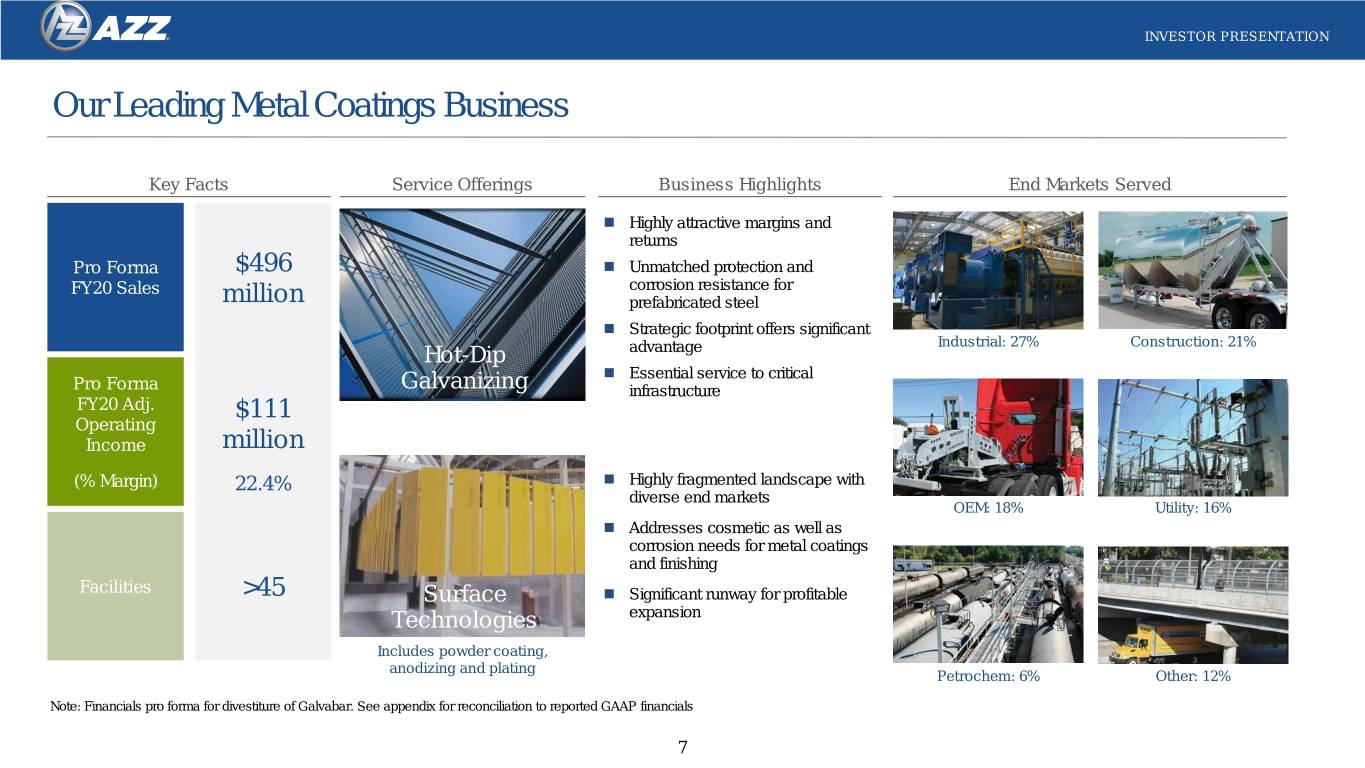
INVESTOR PRESENTATION Our Leading Metal Coatings Business Key Facts Service Offerings Business Highlights End Markets Served Highly attractive margins and returns Pro Forma $496 Unmatched protection and FY20 Sales corrosion resistance for million prefabricated steel Strategic footprint offers significant Industrial: 27% Construction: 21% Hot-Dip advantage Essential service to critical Pro Forma Galvanizing infrastructure FY20 Adj. $111 Operating Income million (% Margin) 22.4% Highly fragmented landscape with diverse end markets OEM: 18% Utility: 16% Addresses cosmetic as well as corrosion needs for metal coatings and finishing Facilities >45 Surface Significant runway for profitable Technologies expansion Includes powder coating, anodizing and plating Petrochem: 6% Other: 12% Note: Financials pro forma for divestiture of Galvabar. See appendix for reconciliation to reported GAAP financials 7

INVESTOR PRESENTATION # 1 Hot-Dip Galvanizing Market Position in North America North America’s Largest Hot-Dip Galvanizer ■ Expansive footprint with 40 galvanizing locations throughout the U.S. and Canada ► Proximity to customers offers competitive advantage ► Strong back-office and logistics network drive sales and operational efficiencies ► Facilities differentiated on services and quality ■ Compelling platform poised for growth ► Geographic expansion ► Adjacency opportunities in corrosion protection ► Digital Galvanizing System driving greater operational efficiency, productivity and customer service 8
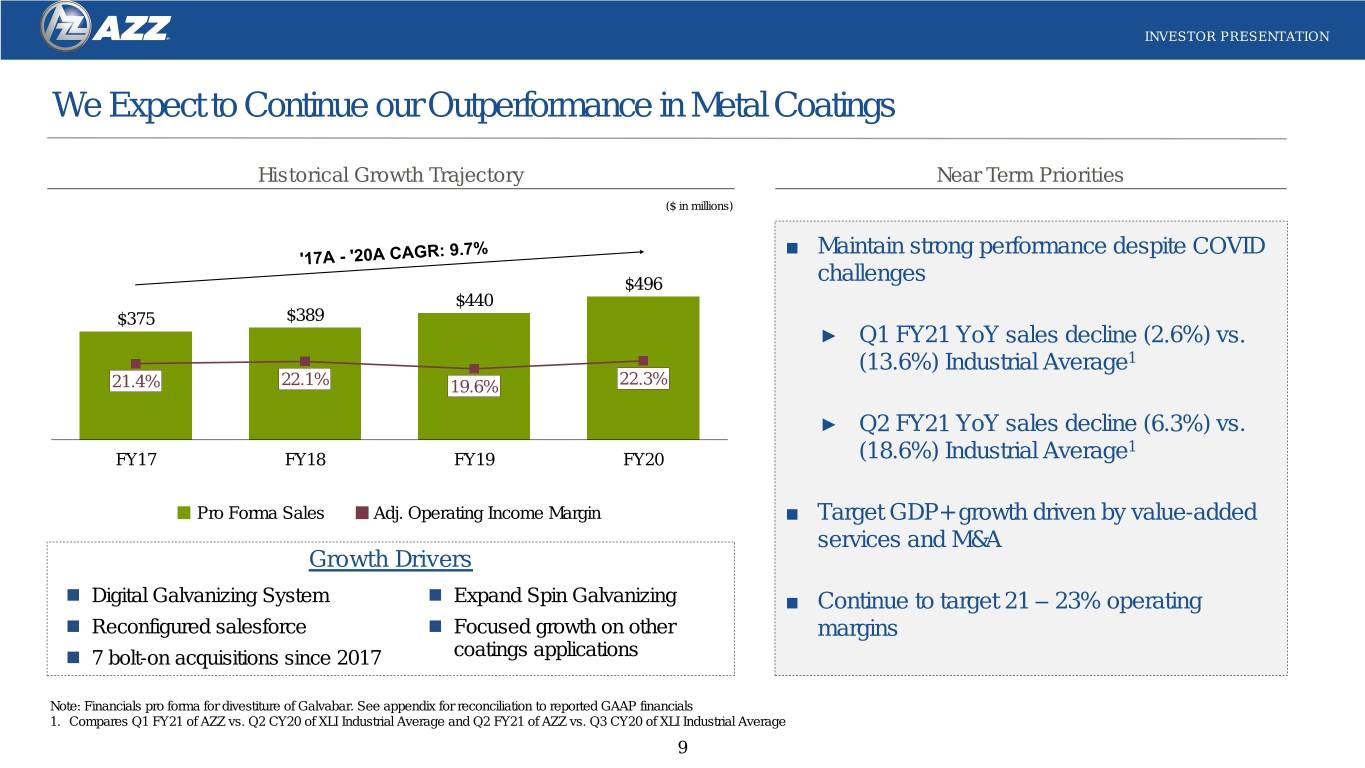
INVESTOR PRESENTATION We Expect to Continue our Outperformance in Metal Coatings Historical Growth Trajectory Near Term Priorities ($ in millions) ■ Maintain strong performance despite COVID $496 challenges $440 $375 $389 ► Q1 FY21 YoY sales decline (2.6%) vs. (13.6%) Industrial Average1 21.4% 22.1% 19.6% 22.3% ► Q2 FY21 YoY sales decline (6.3%) vs. 1 FY17 FY18 FY19 FY20 (18.6%) Industrial Average Pro Forma Sales Adj. Operating Income Margin ■ Target GDP+ growth driven by value-added services and M&A Growth Drivers Digital Galvanizing System Expand Spin Galvanizing ■ Continue to target 21 – 23% operating Reconfigured salesforce Focused growth on other margins 7 bolt-on acquisitions since 2017 coatings applications Note: Financials pro forma for divestiture of Galvabar. See appendix for reconciliation to reported GAAP financials 1. Compares Q1 FY21 of AZZ vs. Q2 CY20 of XLI Industrial Average and Q2 FY21 of AZZ vs. Q3 CY20 of XLI Industrial Average 9
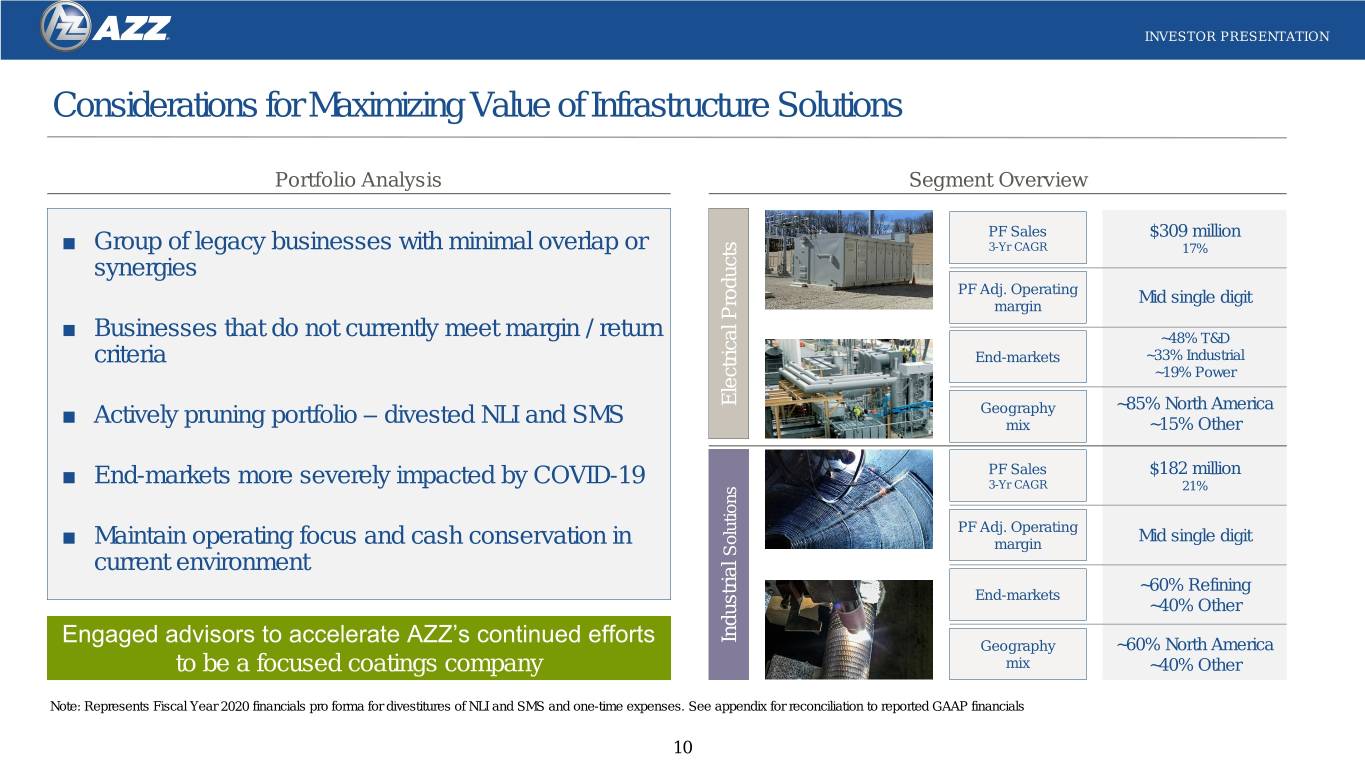
INVESTOR PRESENTATION Considerations for Maximizing Value of Infrastructure Solutions Portfolio Analysis Segment Overview PF Sales $309 million ■ Group of legacy businesses with minimal overlap or 3-Yr CAGR 17% synergies PF Adj. Operating Mid single digit margin ■ Businesses that do not currently meet margin / return ~48% T&D criteria End-markets ~33% Industrial ~19% Power ElectricalProducts Geography ~85% North America ■ Actively pruning portfolio – divested NLI and SMS mix ~15% Other PF Sales $182 million ■ End-markets more severely impacted by COVID-19 3-Yr CAGR 21% PF Adj. Operating ■ Maintain operating focus and cash conservation in margin Mid single digit current environment Solutions ~60% Refining End-markets ~40% Other Engaged advisors to accelerate AZZ’s continued efforts Industrial Geography ~60% North America to be a focused coatings company mix ~40% Other Note: Represents Fiscal Year 2020 financials pro forma for divestitures of NLI and SMS and one-time expenses. See appendix for reconciliation to reported GAAP financials 10
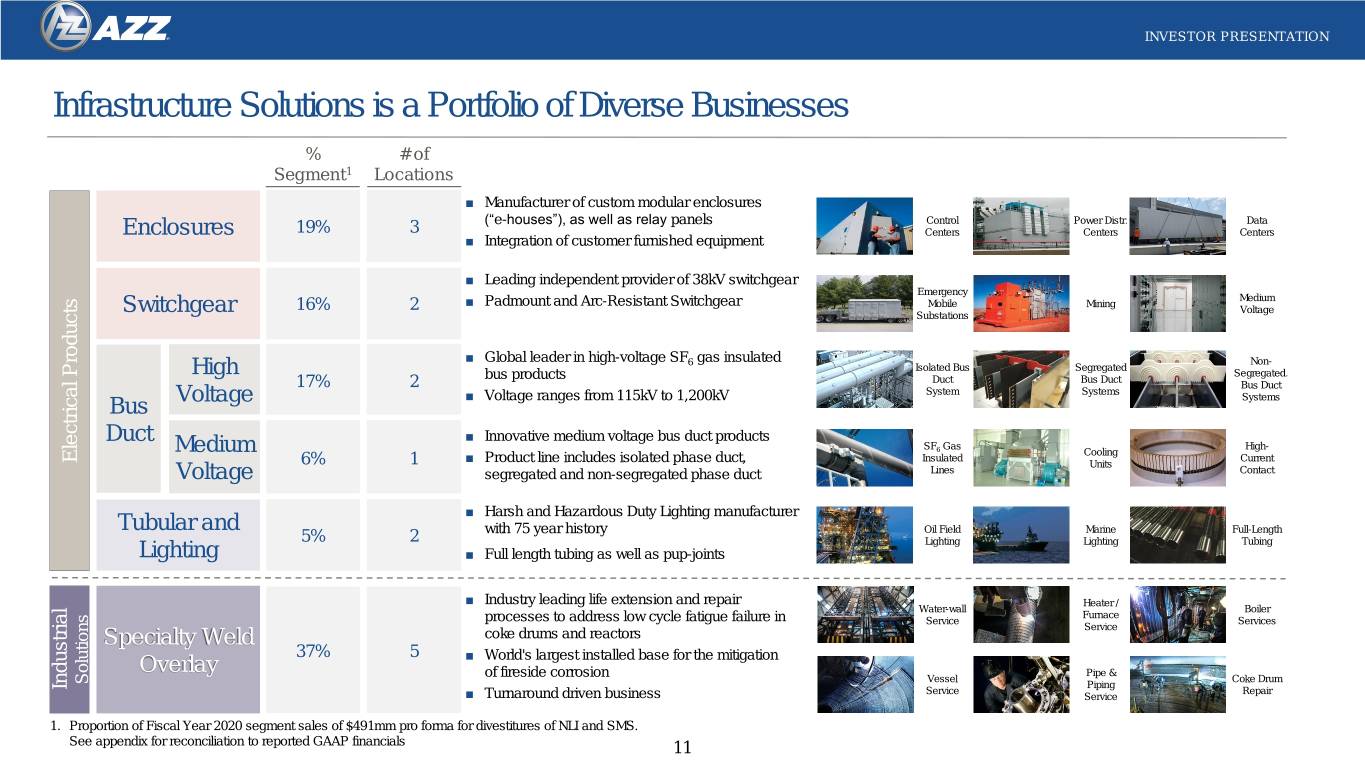
INVESTOR PRESENTATION Infrastructure Solutions is a Portfolio of Diverse Businesses % # of Segment1 Locations ■ Manufacturer of custom modular enclosures (“e-houses”), as well as relay panels Control Power Distr. Data Enclosures 19% 3 Centers Centers Centers ■ Integration of customer furnished equipment ■ Leading independent provider of 38kV switchgear Emergency Medium ■ Padmount and Arc-Resistant Switchgear Mobile Mining 16% 2 Voltage Switchgear Substations ■ Global leader in high-voltage SF6 gas insulated Non- Isolated Bus Segregated High Segregated. bus products Duct Bus Duct 17% 2 Bus Duct System Systems Voltage ■ Voltage ranges from 115kV to 1,200kV Systems Bus Duct ■ Innovative medium voltage bus duct products SF Gas High- Medium 6 Cooling ElectricalProducts Insulated Current 6% 1 ■ Product line includes isolated phase duct, Units Voltage segregated and non-segregated phase duct Lines Contact ■ Harsh and Hazardous Duty Lighting manufacturer Tubular and with 75 year history Oil Field Marine Full-Length 5% 2 Lighting Lighting Tubing Lighting ■ Full length tubing as well as pup-joints ■ Industry leading life extension and repair Heater / Water-wall Boiler Furnace processes to address low cycle fatigue failure in Service Services Specialty Weld coke drums and reactors Service 37% 5 ■ World's largest installed base for the mitigation Overlay Pipe & of fireside corrosion Vessel Coke Drum Solutions Industrial Piping Service Repair ■ Turnaround driven business Service 1. Proportion of Fiscal Year 2020 segment sales of $491mm pro forma for divestitures of NLI and SMS. See appendix for reconciliation to reported GAAP financials 11
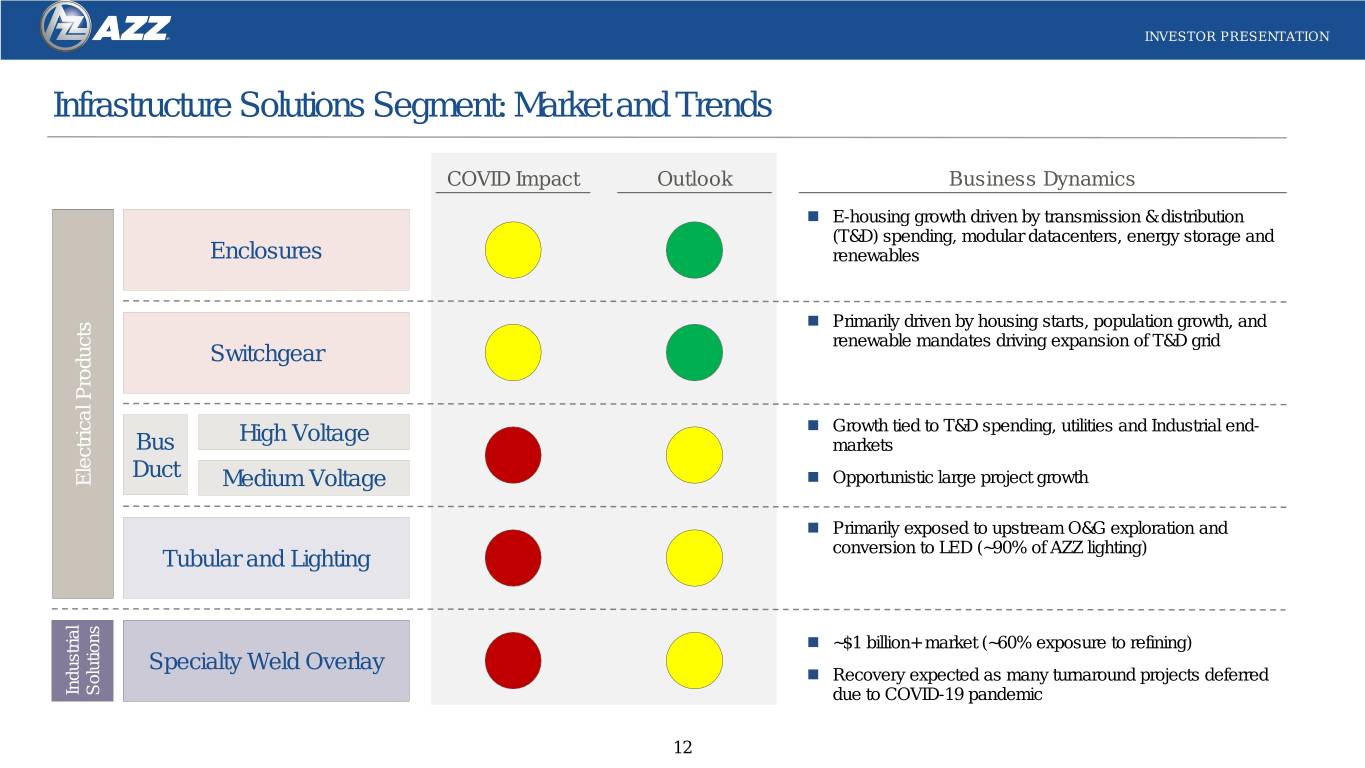
INVESTOR PRESENTATION Infrastructure Solutions Segment: Market and Trends COVID Impact Outlook Business Dynamics E-housing growth driven by transmission & distribution (T&D) spending, modular datacenters, energy storage and Enclosures renewables Primarily driven by housing starts, population growth, and renewable mandates driving expansion of T&D grid Switchgear High Voltage Growth tied to T&D spending, utilities and Industrial end- Bus markets Duct ElectricalProducts Medium Voltage Opportunistic large project growth Primarily exposed to upstream O&G exploration and conversion to LED (~90% of AZZ lighting) Tubular and Lighting ~$1 billion+ market (~60% exposure to refining) Specialty Weld Overlay Recovery expected as many turnaround projects deferred Industrial Solutions due to COVID-19 pandemic 12
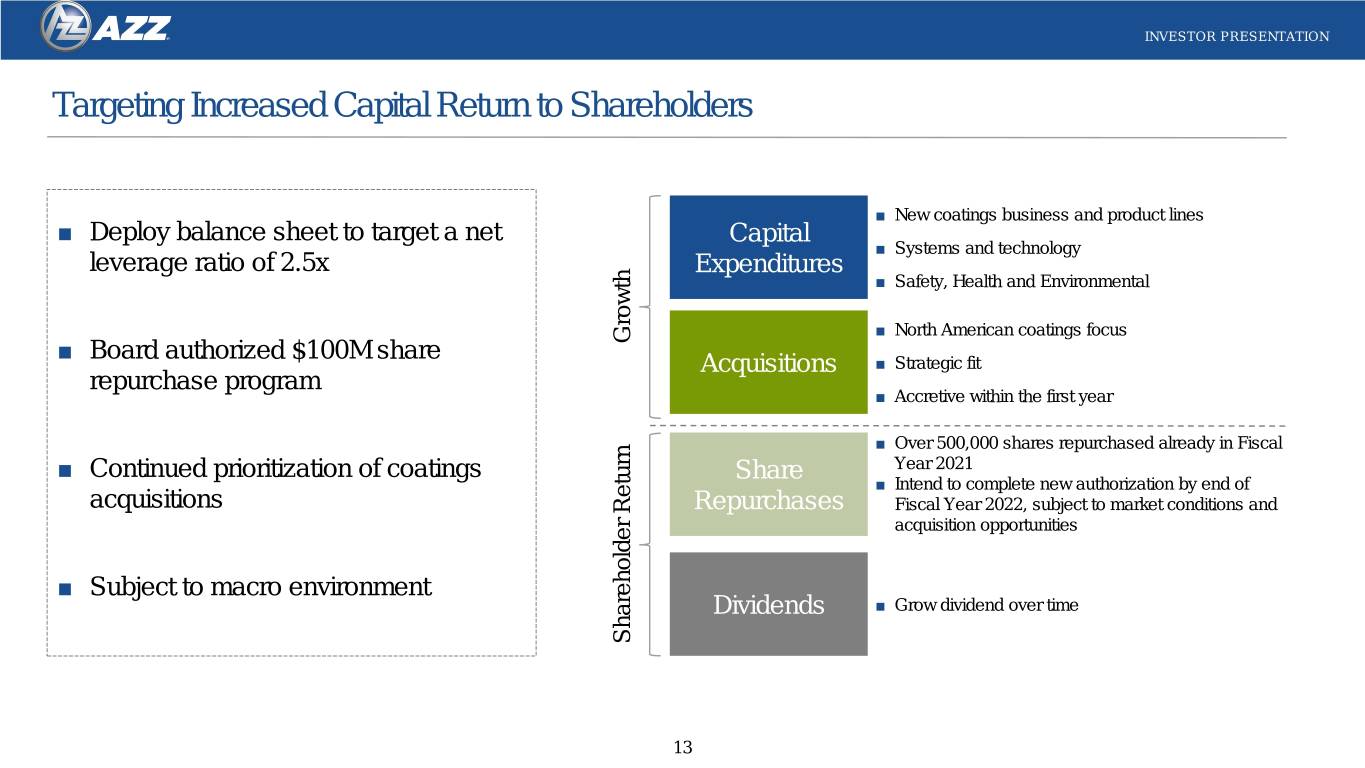
INVESTOR PRESENTATION Targeting Increased Capital Return to Shareholders ■ New coatings business and product lines ■ Deploy balance sheet to target a net Capital ■ Systems and technology leverage ratio of 2.5x Expenditures ■ Safety, Health and Environmental ■ North American coatings focus ■ Board authorized $100M share Growth Acquisitions ■ Strategic fit repurchase program ■ Accretive within the first year ■ Over 500,000 shares repurchased already in Fiscal ■ Continued prioritization of coatings Share Year 2021 ■ Intend to complete new authorization by end of acquisitions Repurchases Fiscal Year 2022, subject to market conditions and acquisition opportunities ■ Subject to macro environment Dividends ■ Grow dividend over time Shareholder Return Shareholder 13

Appendix and Additional Information
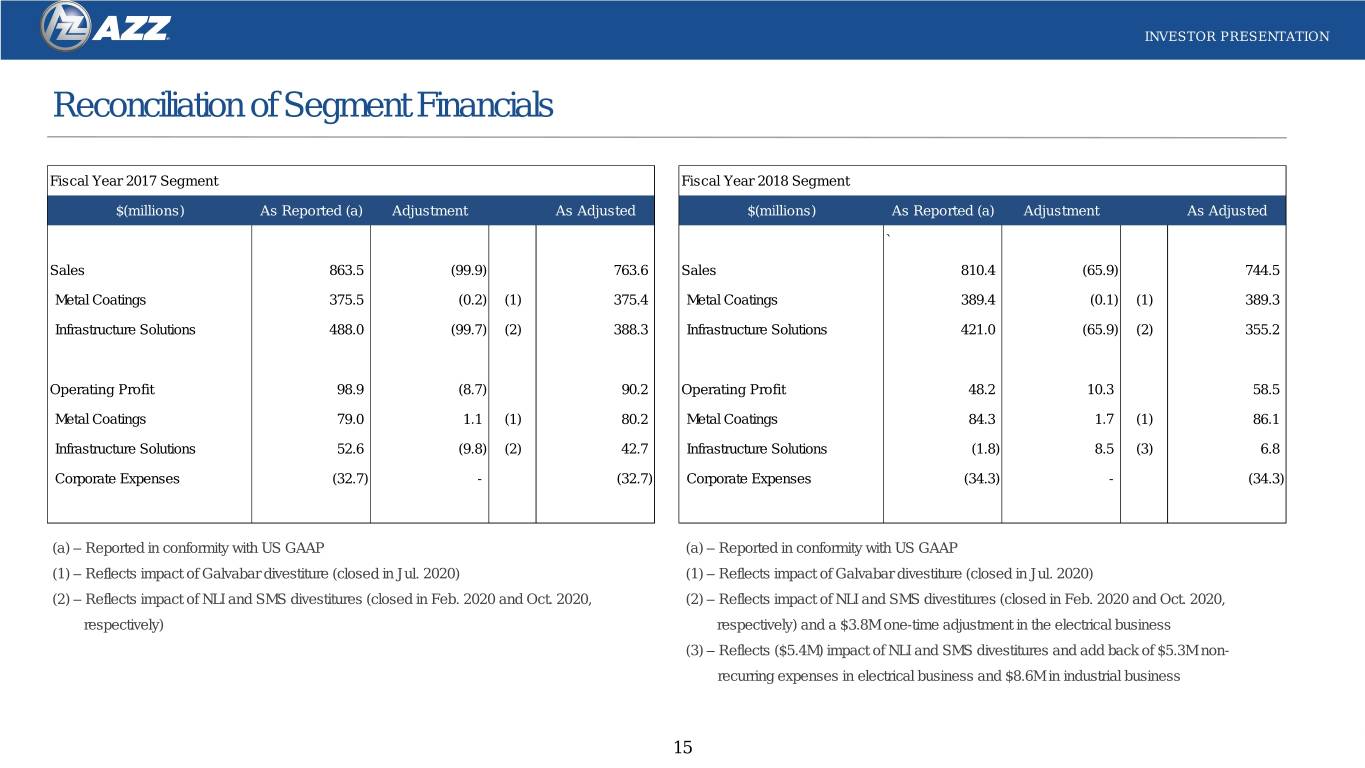
INVESTOR PRESENTATION Reconciliation of Segment Financials Fiscal Year 2017 Segment Fiscal Year 2018 Segment $(millions) As Reported (a) Adjustment As Adjusted $(millions) As Reported (a) Adjustment As Adjusted ` Sales 863.5 (99.9) 763.6 Sales 810.4 (65.9) 744.5 Metal Coatings 375.5 (0.2) (1) 375.4 Metal Coatings 389.4 (0.1) (1) 389.3 Infrastructure Solutions 488.0 (99.7) (2) 388.3 Infrastructure Solutions 421.0 (65.9) (2) 355.2 Operating Profit 98.9 (8.7) 90.2 Operating Profit 48.2 10.3 58.5 Metal Coatings 79.0 1.1 (1) 80.2 Metal Coatings 84.3 1.7 (1) 86.1 Infrastructure Solutions 52.6 (9.8) (2) 42.7 Infrastructure Solutions (1.8) 8.5 (3) 6.8 Corporate Expenses (32.7) - (32.7) Corporate Expenses (34.3) - (34.3) (a) – Reported in conformity with US GAAP (a) – Reported in conformity with US GAAP (1) – Reflects impact of Galvabar divestiture (closed in Jul. 2020) (1) – Reflects impact of Galvabar divestiture (closed in Jul. 2020) (2) – Reflects impact of NLI and SMS divestitures (closed in Feb. 2020 and Oct. 2020, (2) – Reflects impact of NLI and SMS divestitures (closed in Feb. 2020 and Oct. 2020, respectively) respectively) and a $3.8M one-time adjustment in the electrical business (3) – Reflects ($5.4M) impact of NLI and SMS divestitures and add back of $5.3M non- recurring expenses in electrical business and $8.6M in industrial business 15
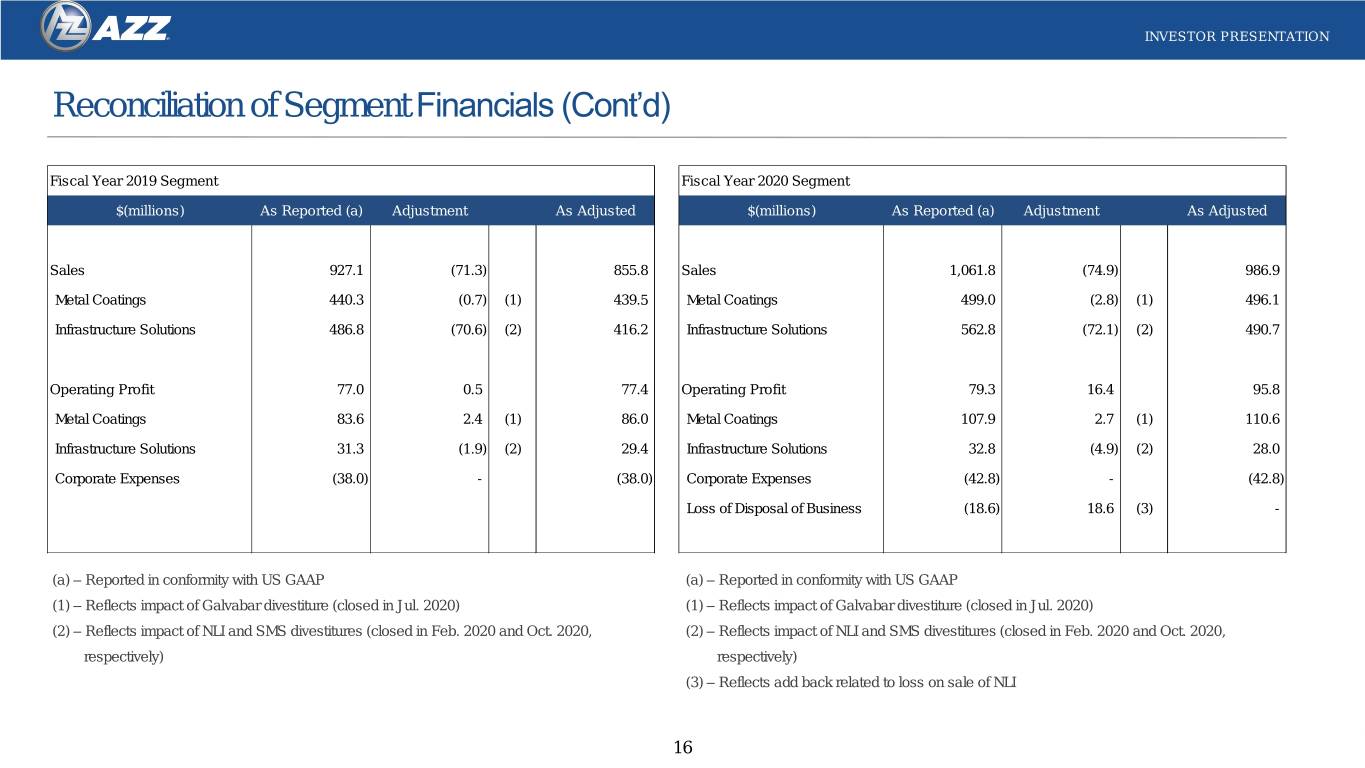
INVESTOR PRESENTATION Reconciliation of Segment Financials (Cont’d) Fiscal Year 2019 Segment Fiscal Year 2020 Segment $(millions) As Reported (a) Adjustment As Adjusted $(millions) As Reported (a) Adjustment As Adjusted Sales 927.1 (71.3) 855.8 Sales 1,061.8 (74.9) 986.9 Metal Coatings 440.3 (0.7) (1) 439.5 Metal Coatings 499.0 (2.8) (1) 496.1 Infrastructure Solutions 486.8 (70.6) (2) 416.2 Infrastructure Solutions 562.8 (72.1) (2) 490.7 Operating Profit 77.0 0.5 77.4 Operating Profit 79.3 16.4 95.8 Metal Coatings 83.6 2.4 (1) 86.0 Metal Coatings 107.9 2.7 (1) 110.6 Infrastructure Solutions 31.3 (1.9) (2) 29.4 Infrastructure Solutions 32.8 (4.9) (2) 28.0 Corporate Expenses (38.0) - (38.0) Corporate Expenses (42.8) - (42.8) Loss of Disposal of Business (18.6) 18.6 (3) - (a) – Reported in conformity with US GAAP (a) – Reported in conformity with US GAAP (1) – Reflects impact of Galvabar divestiture (closed in Jul. 2020) (1) – Reflects impact of Galvabar divestiture (closed in Jul. 2020) (2) – Reflects impact of NLI and SMS divestitures (closed in Feb. 2020 and Oct. 2020, (2) – Reflects impact of NLI and SMS divestitures (closed in Feb. 2020 and Oct. 2020, respectively) respectively) (3) – Reflects add back related to loss on sale of NLI 16
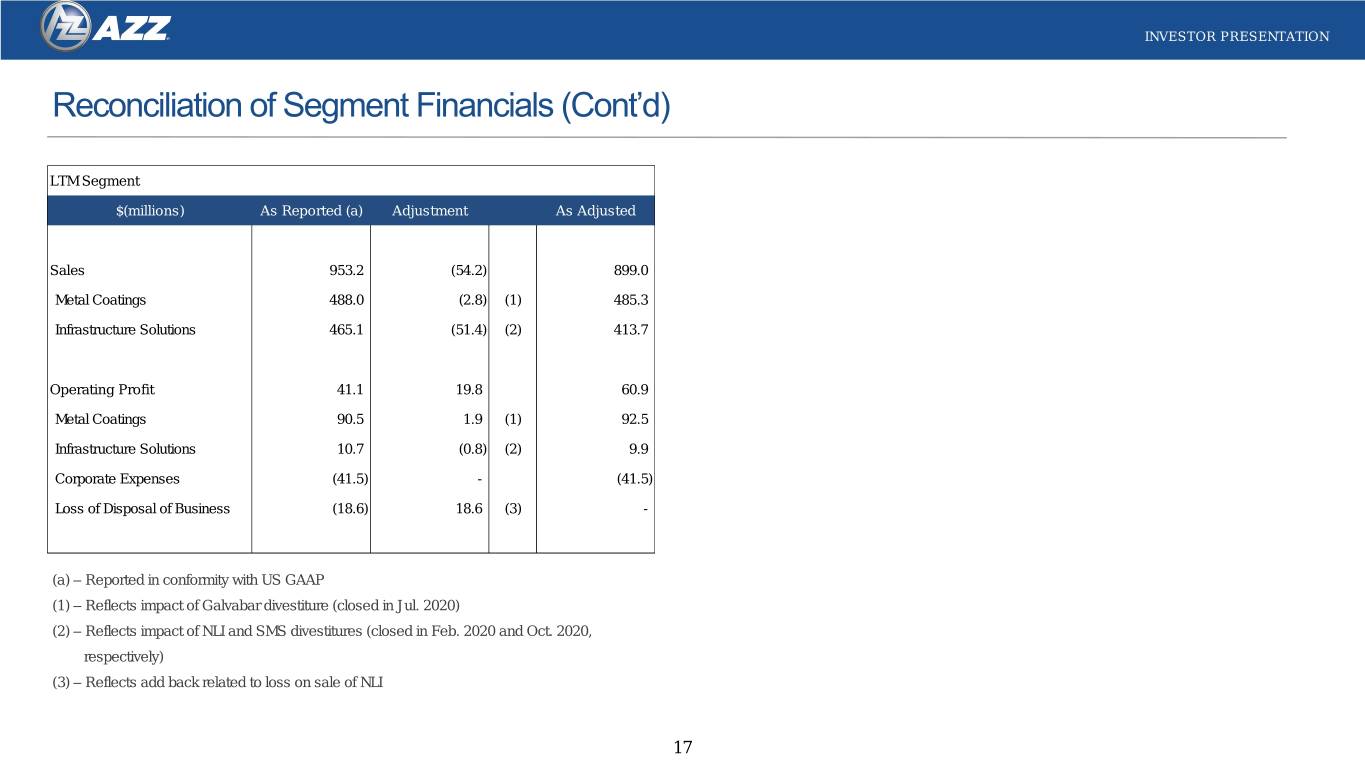
INVESTOR PRESENTATION Reconciliation of Segment Financials (Cont’d) LTM Segment $(millions) As Reported (a) Adjustment As Adjusted Sales 953.2 (54.2) 899.0 Metal Coatings 488.0 (2.8) (1) 485.3 Infrastructure Solutions 465.1 (51.4) (2) 413.7 Operating Profit 41.1 19.8 60.9 Metal Coatings 90.5 1.9 (1) 92.5 Infrastructure Solutions 10.7 (0.8) (2) 9.9 Corporate Expenses (41.5) - (41.5) Loss of Disposal of Business (18.6) 18.6 (3) - (a) – Reported in conformity with US GAAP (1) – Reflects impact of Galvabar divestiture (closed in Jul. 2020) (2) – Reflects impact of NLI and SMS divestitures (closed in Feb. 2020 and Oct. 2020, respectively) (3) – Reflects add back related to loss on sale of NLI 17
Thank You NYSE:AZZ


