
AZZ Inc. Q4 and Full Year FY2023 Earnings Release Presentation April 26, 2023
Q4 and Full Year FY2023 Earnings Presentation Disclaimers Cautionary Statements Regarding Forward Looking Statements — Certain statements herein about our expectations of future events or results constitute forward- looking statements for purposes of the safe harbor provisions of The Private Securities Litigation Reform Act of 1995. You can identify forward-looking statements by terminology such as "may," "could," "should," "expects," "plans," "will," "might," "projects," "currently," "intends," "outlook," "forecasts," "targets," "anticipates," "believes," "estimates," "predicts," "potential," "continue," or the negative of these terms or other comparable terminology. Such forward-looking statements are based on currently available competitive, financial and economic data and management’s views and assumptions regarding future events. Such forward-looking statements are inherently uncertain, and investors must recognize that actual results may differ from those expressed or implied in the forward-looking statements. Forward-looking statements speak only as of the date they are made and are subject to risks that could cause them to differ materially from actual results. Certain factors could affect the outcome of the matters described herein. This presentation may contain forward-looking statements that involve risks and uncertainties including, but not limited to, changes in customer demand for our products and services, including demand by the construction markets, the industrial markets and the metal coatings markets. We could also experience additional increases in labor costs, components, and raw materials including zinc and natural gas, which are used in our hot-dip galvanizing process; supply-chain vendor delays; customer requested delays of our products or services; delays in additional acquisition opportunities; currency exchange rates; an increase in our debt leverage and/or interest rates on our debt, of which a significant portion is tied to variable interest rates; availability of experienced management and employees to implement AZZ’s growth strategy; a downturn in market conditions in any industry relating to the products we inventory or sell or the services that we provide; economic volatility, including a prolonged economic downturn or macroeconomic conditions such as inflation or changes in the political stability in the United States and other foreign markets in which we operate; acts of war or terrorism inside the United States or abroad; and other changes in economic and financial conditions. The Company has provided additional information regarding risks associated with the business in the Company’s Annual Report on Form 10-K for the fiscal year ended February 28, 2023, and other filings with the Securities and Exchange Commission ("SEC"), available for viewing on the Company’s website at www.azz.com and on the SEC’s website at www.sec.gov. You are urged to consider these factors carefully in evaluating the forward- looking statements herein and are cautioned not to place undue reliance on such forward-looking statements, which are qualified in their entirety by this cautionary statement. These statements are based on information as of the date hereof and AZZ assumes no obligation to update any forward-looking statements, whether as a result of new information, future events, or otherwise. Non-GAAP – Regulation G Disclosures — In addition to reporting financial results in accordance with Generally Accepted Accounting Principles in the United States ("GAAP"), AZZ has provided Adjusted EBITDA, which is a non-GAAP measures. Management believes that the presentation of these measures provides investors with a greater transparency comparison of operating results across a broad spectrum of companies, which provides a more complete understanding of AZZ’s financial performance, competitive position and prospects for the future. Management also believes that investors regularly rely on non-GAAP financial measures, such as Adjusted EBITDA, to assess operating performance and that such measures may highlight trends in the Company’s business that may not otherwise be apparent when relying on financial measures calculated in accordance with GAAP. 2
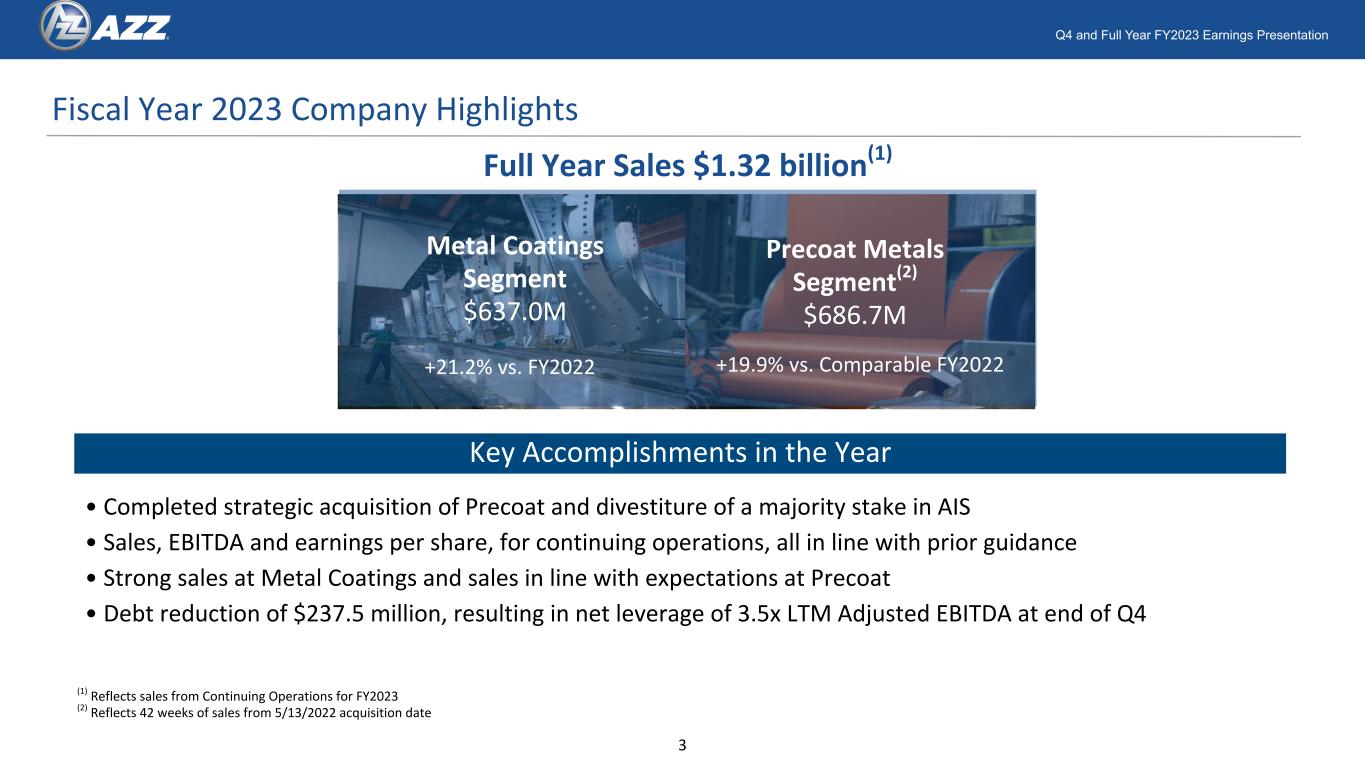
Q4 and Full Year FY2023 Earnings Presentation Fiscal Year 2023 Company Highlights Full Year Sales $1.32 billion(1) Metal Coatings Segment $637.0M +21.2% vs. FY2022 Precoat Metals Segment(2) $686.7M Key Accomplishments in the Year +19.9% vs. Comparable FY2022 • Completed strategic acquisition of Precoat and divestiture of a majority stake in AIS • Sales, EBITDA and earnings per share, for continuing operations, all in line with prior guidance • Strong sales at Metal Coatings and sales in line with expectations at Precoat • Debt reduction of $237.5 million, resulting in net leverage of 3.5x LTM Adjusted EBITDA at end of Q4 (1) Reflects sales from Continuing Operations for FY2023 (2) Reflects 42 weeks of sales from 5/13/2022 acquisition date 3
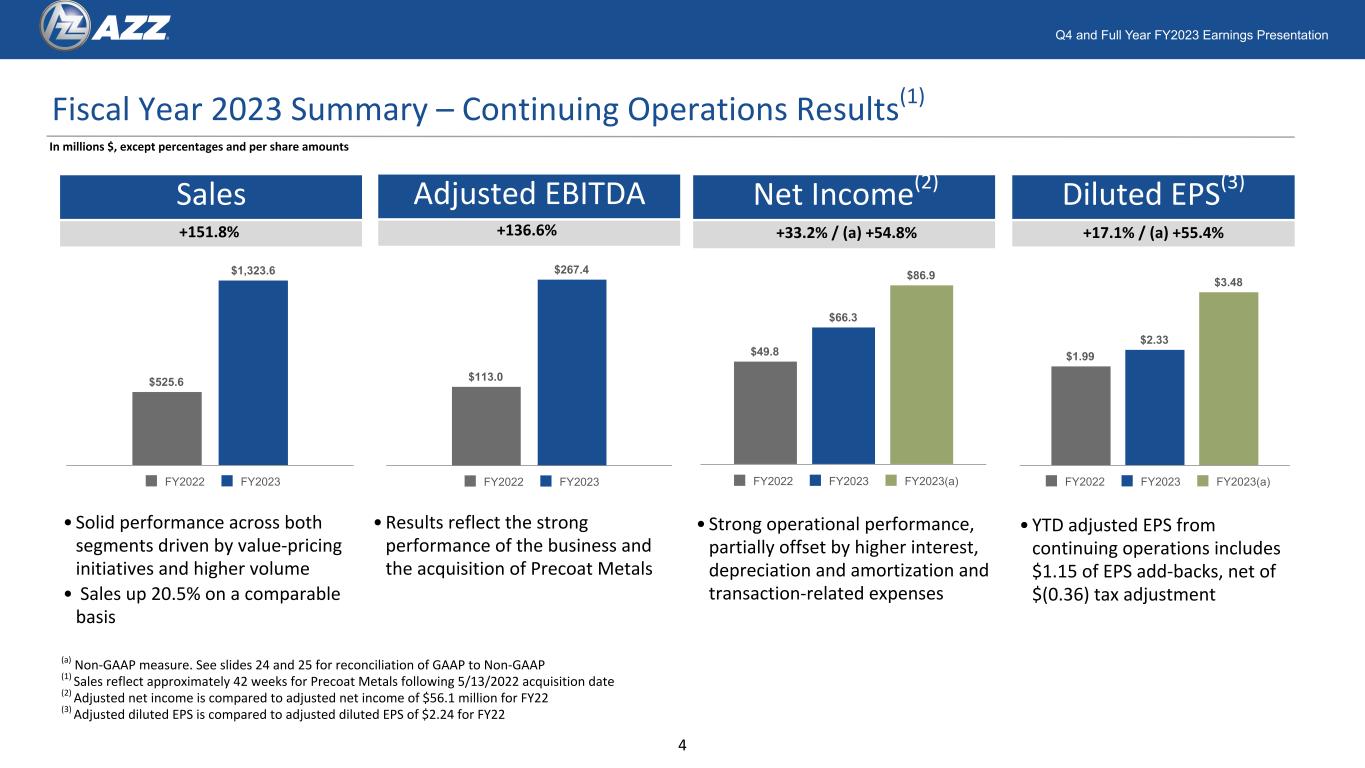
Q4 and Full Year FY2023 Earnings Presentation Sales Net Income(2) Diluted EPS(3) Fiscal Year 2023 Summary – Continuing Operations Results(1) +151.8% • Solid performance across both segments driven by value-pricing initiatives and higher volume • Sales up 20.5% on a comparable basis • Strong operational performance, partially offset by higher interest, depreciation and amortization and transaction-related expenses +33.2% / (a) +54.8% +17.1% / (a) +55.4% In millions $, except percentages and per share amounts Adjusted EBITDA +136.6% •Results reflect the strong performance of the business and the acquisition of Precoat Metals (a) Non-GAAP measure. See slides 24 and 25 for reconciliation of GAAP to Non-GAAP (1) Sales reflect approximately 42 weeks for Precoat Metals following 5/13/2022 acquisition date (2) Adjusted net income is compared to adjusted net income of $56.1 million for FY22 (3) Adjusted diluted EPS is compared to adjusted diluted EPS of $2.24 for FY22 •YTD adjusted EPS from continuing operations includes $1.15 of EPS add-backs, net of $(0.36) tax adjustment $525.6 $1,323.6 FY2022 FY2023 $113.0 $267.4 FY2022 FY2023 $49.8 $66.3 $86.9 FY2022 FY2023 FY2023(a) $1.99 $2.33 $3.48 FY2022 FY2023 FY2023(a) 4
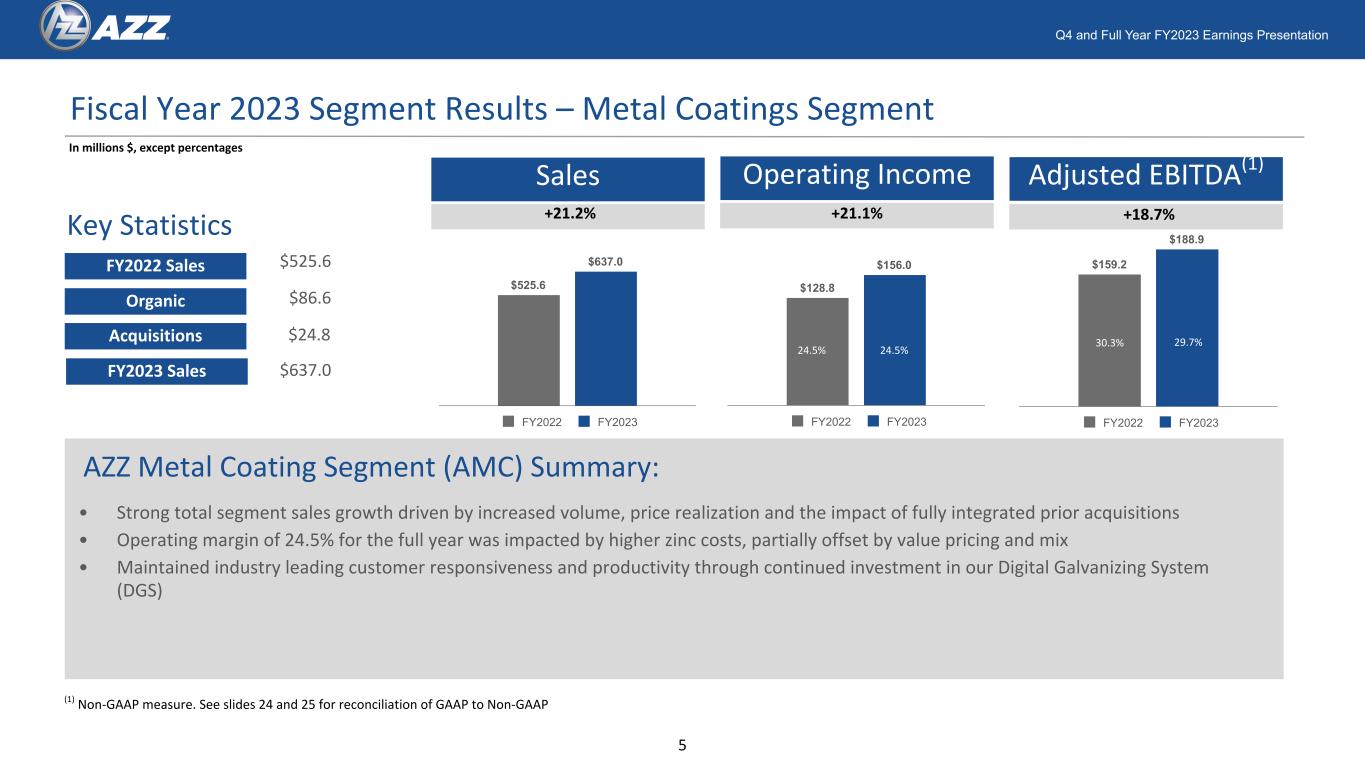
Q4 and Full Year FY2023 Earnings Presentation Fiscal Year 2023 Segment Results – Metal Coatings Segment • Strong total segment sales growth driven by increased volume, price realization and the impact of fully integrated prior acquisitions • Operating margin of 24.5% for the full year was impacted by higher zinc costs, partially offset by value pricing and mix • Maintained industry leading customer responsiveness and productivity through continued investment in our Digital Galvanizing System (DGS) In millions $, except percentages Sales +21.2% Operating Income +21.1%Key Statistics FY2022 Sales Organic Acquisitions FY2023 Sales $525.6 $637.0 $24.8 $86.6 AZZ Metal Coating Segment (AMC) Summary: Adjusted EBITDA(1) +18.7% 24.5% 21.2% (1) Non-GAAP measure. See slides 24 and 25 for reconciliation of GAAP to Non-GAAP $525.6 $637.0 FY2022 FY2023 $128.8 $156.0 FY2022 FY2023 24.5% 4.5 $159.2 $188.9 FY2022 FY2023 30.3% 29.7% 5
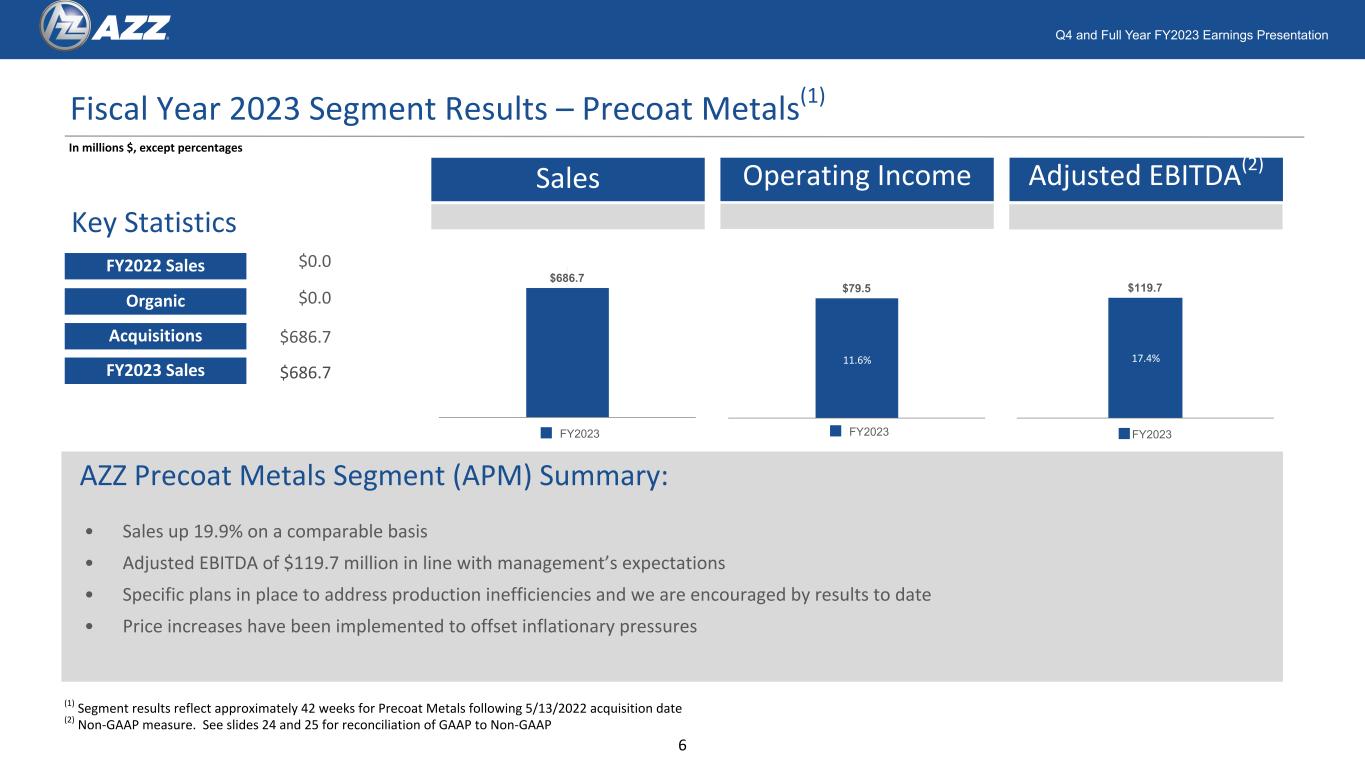
Q4 and Full Year FY2023 Earnings Presentation Fiscal Year 2023 Segment Results – Precoat Metals(1) • Sales up 19.9% on a comparable basis • Adjusted EBITDA of $119.7 million in line with management’s expectations • Specific plans in place to address production inefficiencies and we are encouraged by results to date • Price increases have been implemented to offset inflationary pressures In millions $, except percentages Key Statistics AZZ Precoat Metals Segment (APM) Summary: Sales Adjusted EBITDA(2) FY2022 Sales Organic Acquisitions $0.0 $686.7 $686.7 $0.0 16.0% (1) Segment results reflect approximately 42 weeks for Precoat Metals following 5/13/2022 acquisition date (2) Non-GAAP measure. See slides 24 and 25 for reconciliation of GAAP to Non-GAAP FY2023 Sales $686.7 FY2023 $79.5 FY2023 $119.7 FY2023 11.6% 6 17.4% Operating Income
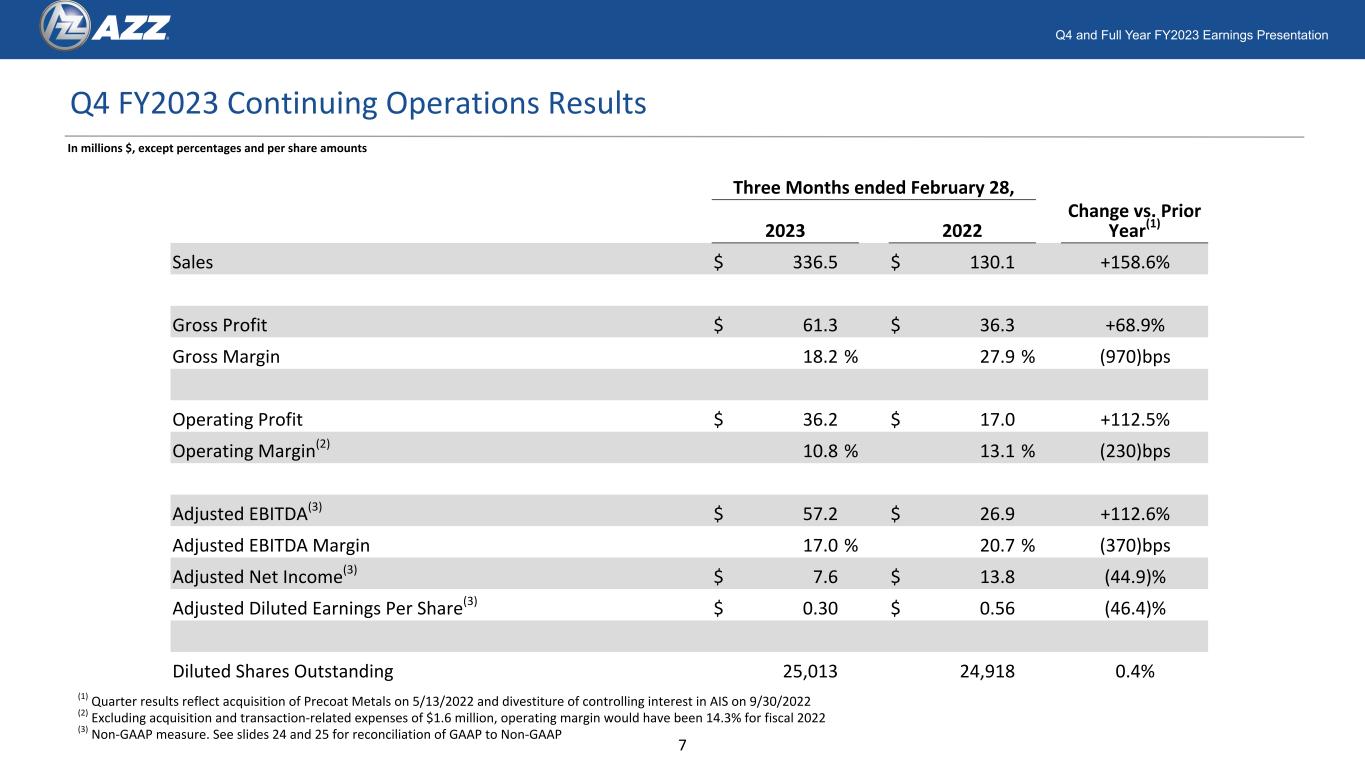
Q4 and Full Year FY2023 Earnings Presentation Q4 FY2023 Continuing Operations Results Three Months ended February 28, 2023 2022 Change vs. Prior Year(1) Sales $ 336.5 $ 130.1 +158.6% Gross Profit $ 61.3 $ 36.3 +68.9% Gross Margin 18.2 % 27.9 % (970)bps Operating Profit $ 36.2 $ 17.0 +112.5% Operating Margin(2) 10.8 % 13.1 % (230)bps Adjusted EBITDA(3) $ 57.2 $ 26.9 +112.6% Adjusted EBITDA Margin 17.0 % 20.7 % (370)bps Adjusted Net Income(3) $ 7.6 $ 13.8 (44.9)% Adjusted Diluted Earnings Per Share(3) $ 0.30 $ 0.56 (46.4)% Diluted Shares Outstanding 25,013 24,918 0.4% (1) Quarter results reflect acquisition of Precoat Metals on 5/13/2022 and divestiture of controlling interest in AIS on 9/30/2022 (2) Excluding acquisition and transaction-related expenses of $1.6 million, operating margin would have been 14.3% for fiscal 2022 (3) Non-GAAP measure. See slides 24 and 25 for reconciliation of GAAP to Non-GAAP 7 In millions $, except percentages and per share amounts
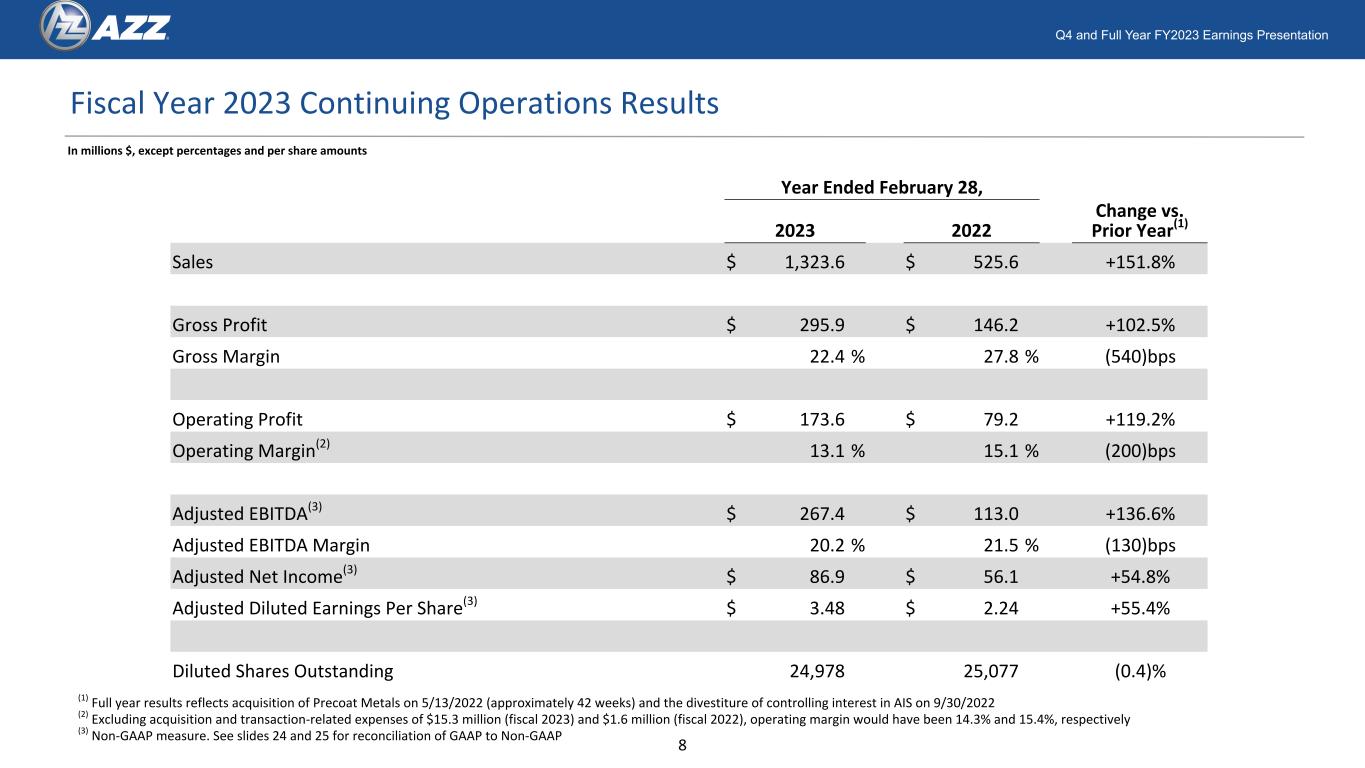
Q4 and Full Year FY2023 Earnings Presentation Fiscal Year 2023 Continuing Operations Results Year Ended February 28, 2023 2022 Change vs. Prior Year(1) Sales $ 1,323.6 $ 525.6 +151.8% Gross Profit $ 295.9 $ 146.2 +102.5% Gross Margin 22.4 % 27.8 % (540)bps Operating Profit $ 173.6 $ 79.2 +119.2% Operating Margin(2) 13.1 % 15.1 % (200)bps Adjusted EBITDA(3) $ 267.4 $ 113.0 +136.6% Adjusted EBITDA Margin 20.2 % 21.5 % (130)bps Adjusted Net Income(3) $ 86.9 $ 56.1 +54.8% Adjusted Diluted Earnings Per Share(3) $ 3.48 $ 2.24 +55.4% Diluted Shares Outstanding 24,978 25,077 (0.4)% (1) Full year results reflects acquisition of Precoat Metals on 5/13/2022 (approximately 42 weeks) and the divestiture of controlling interest in AIS on 9/30/2022 (2) Excluding acquisition and transaction-related expenses of $15.3 million (fiscal 2023) and $1.6 million (fiscal 2022), operating margin would have been 14.3% and 15.4%, respectively (3) Non-GAAP measure. See slides 24 and 25 for reconciliation of GAAP to Non-GAAP 8 In millions $, except percentages and per share amounts

Q4 and Full Year FY2023 Earnings Presentation YTD FY2023 AZZ Cash Flow Highlights – Continuing Operations Year Ended February 28, 2023 2022 Net Cash Provided by Operating Activities $ 91.4 $ 60.6 Less: Capital Expenditures $ (57.1) $ (23.6) Free Cash Flow(1) $ 34.3 $ 37.0 Net Income from continuing operations $ 66.3 $ 49.8 Free Cash Flow / Net Income 51.7 % 74.3 % Acquisition of Subsidiaries, net of cash acquired $ 1,282.7 $ 61.2 Payment of Dividends on Common and Series A Preferred Stock(2) $ 22.7 $ 16.9 Share Repurchases $ — $ 30.8 (1) Free Cash Flow is a Non-GAAP measure that is reconciled to the GAAP measure (free cash flow defined as Net cash provided by operations, less capital expenditures) (2) Payment of dividends includes $16.9 million for common shares and $5.8 million for Series A Preferred Shares 9 In millions $, except percentages
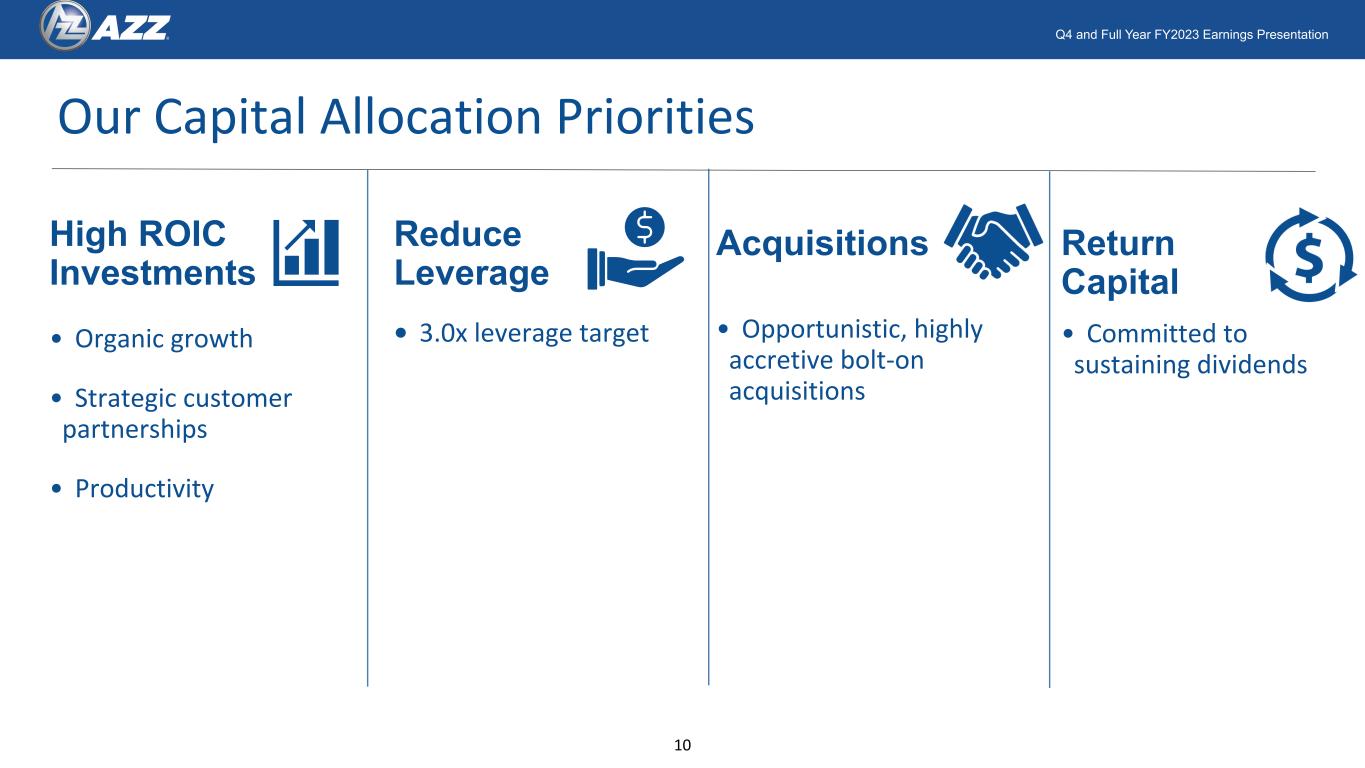
Q4 and Full Year FY2023 Earnings Presentation Our Capital Allocation Priorities High ROIC Investments • Organic growth • Strategic customer partnerships • Productivity Reduce Leverage • 3.0x leverage target Acquisitions • Opportunistic, highly accretive bolt-on acquisitions Return Capital • Committed to sustaining dividends 10
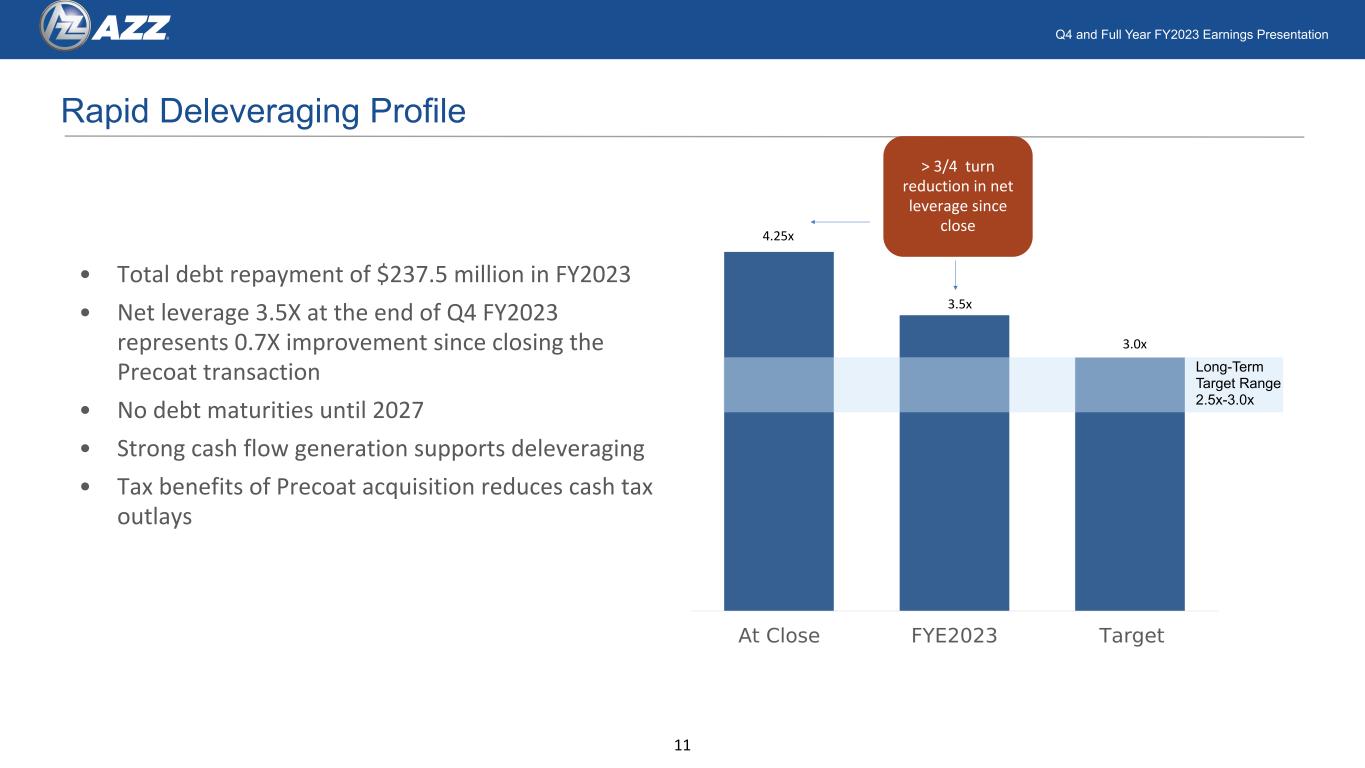
Q4 and Full Year FY2023 Earnings Presentation Rapid Deleveraging Profile • Total debt repayment of $237.5 million in FY2023 • Net leverage 3.5X at the end of Q4 FY2023 represents 0.7X improvement since closing the Precoat transaction • No debt maturities until 2027 • Strong cash flow generation supports deleveraging • Tax benefits of Precoat acquisition reduces cash tax outlays Long-Term Target Range 2.5x-3.0x > 3/4 turn reduction in net leverage since close 4.25x 3.5x 3.0x 11

Q1 Outlook And Financial Guidance 12

Q4 and Full Year FY2023 Earnings Presentation 13 ü Metal Coatings Segment • Sequential improvement over Q4, driven by Bridge and Highway, Utility Transmission and Distribution, and Solar, inclusive of infrastructure spending • Fabrication activity remains solid, with many customers noting robust backlog ü Precoat Metals Segment • Commercial construction, container and data center volume remain robust • Customer inventories have normalized based on management actions • Volume and pricing actions expected to recover margins ü Corporate • Continue to monitor cash flow, customer credit, expenses and ensure prudent capital deployment Q1 FY2024 Outlook

Q4 and Full Year FY2023 Earnings Presentation 14 FY2024 Guidance - Continuing Operations Adjusted EPS(1) Sales $3.85 - $4.35 $1,400 - $1,550m Sales Adjusted EBITDA $300 - $325m Adjusted EBITDA Adjusted EPS (1) Adjusted earnings and earnings per share includes after-tax add-back of amortization of acquisition-related intangibles Reaffirming Previously Issued Guidance
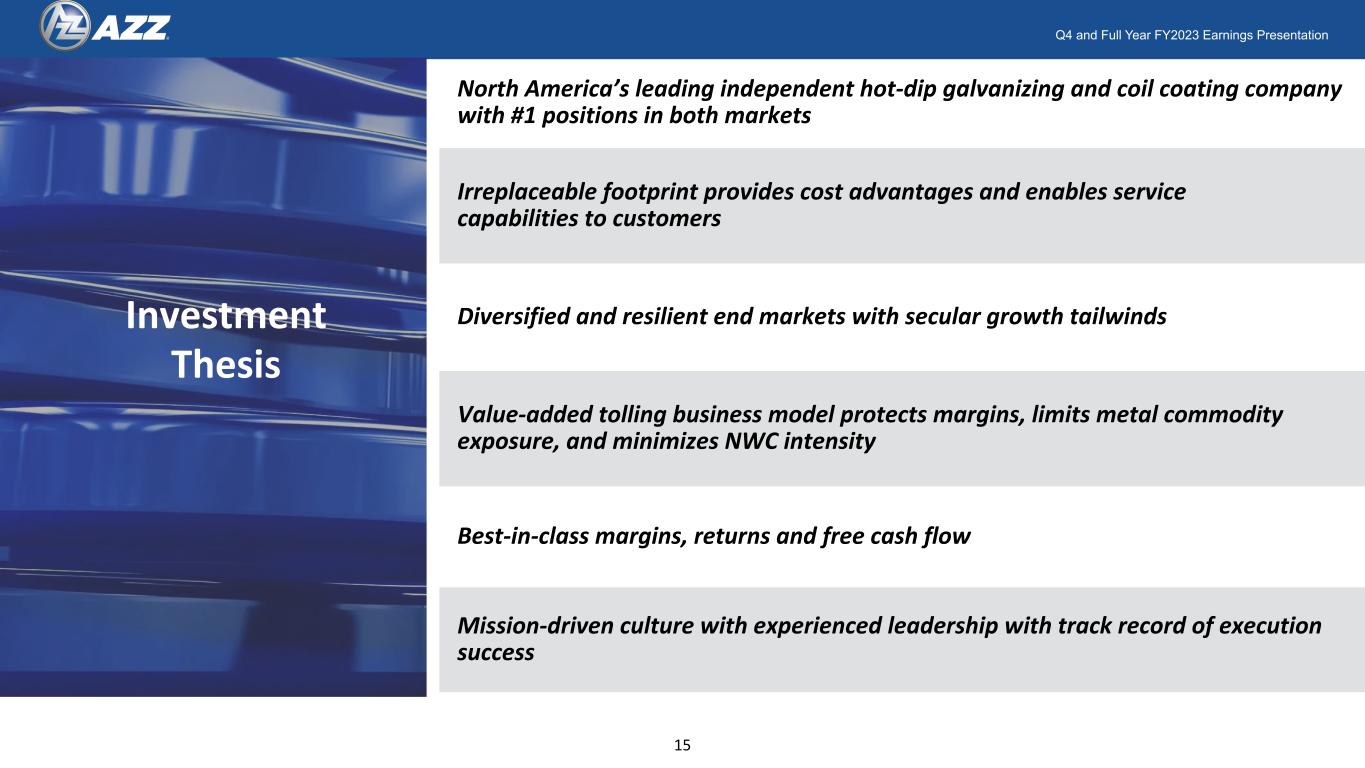
Q4 and Full Year FY2023 Earnings Presentation North America’s leading independent hot-dip galvanizing and coil coating company with #1 positions in both markets Value-added tolling business model protects margins, limits metal commodity exposure, and minimizes NWC intensity Diversified and resilient end markets with secular growth tailwinds Irreplaceable footprint provides cost advantages and enables service capabilities to customers Best-in-class margins, returns and free cash flow Mission-driven culture with experienced leadership with track record of execution success Investment Thesis 15
Q&A 16
Appendix 17
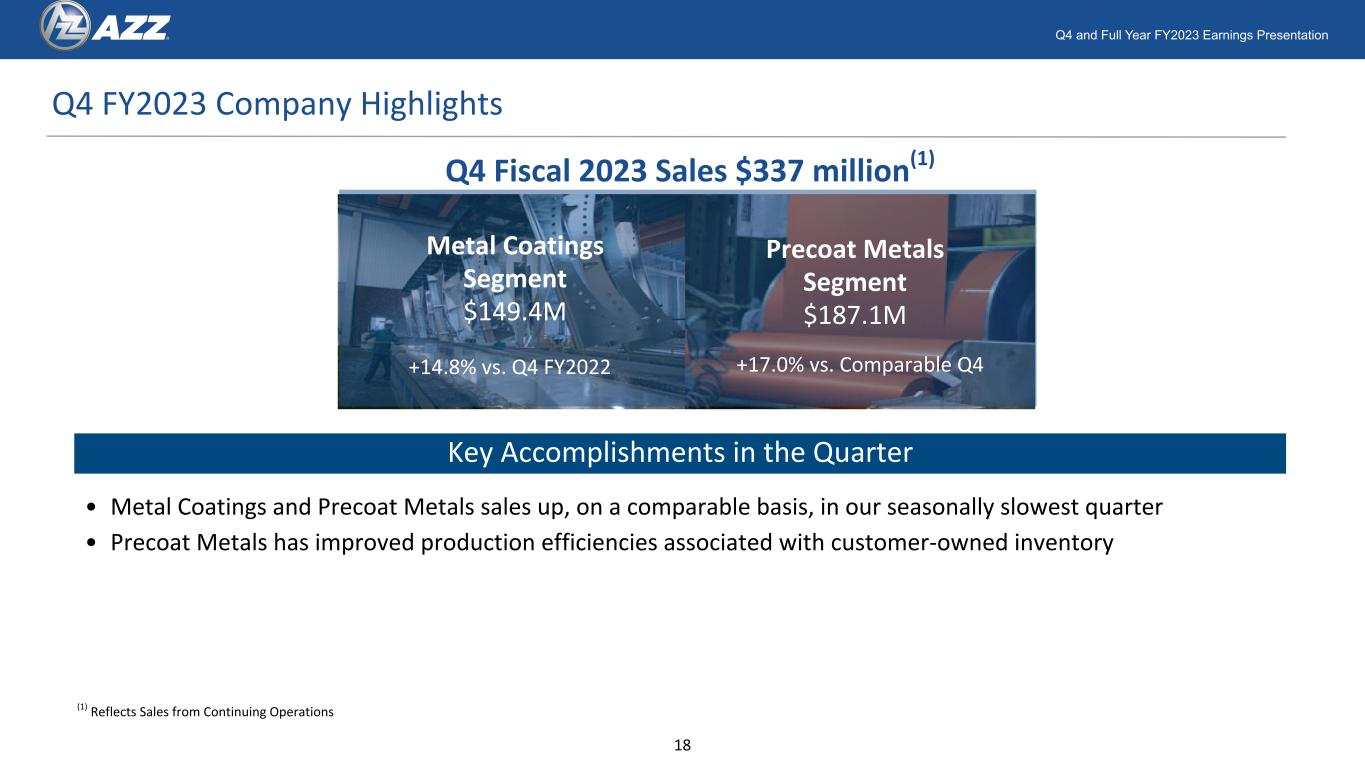
Q4 and Full Year FY2023 Earnings Presentation Q4 FY2023 Company Highlights Q4 Fiscal 2023 Sales $337 million(1) Metal Coatings Segment $149.4M +14.8% vs. Q4 FY2022 Precoat Metals Segment $187.1M Key Accomplishments in the Quarter +17.0% vs. Comparable Q4 • Metal Coatings and Precoat Metals sales up, on a comparable basis, in our seasonally slowest quarter • Precoat Metals has improved production efficiencies associated with customer-owned inventory (1) Reflects Sales from Continuing Operations 18
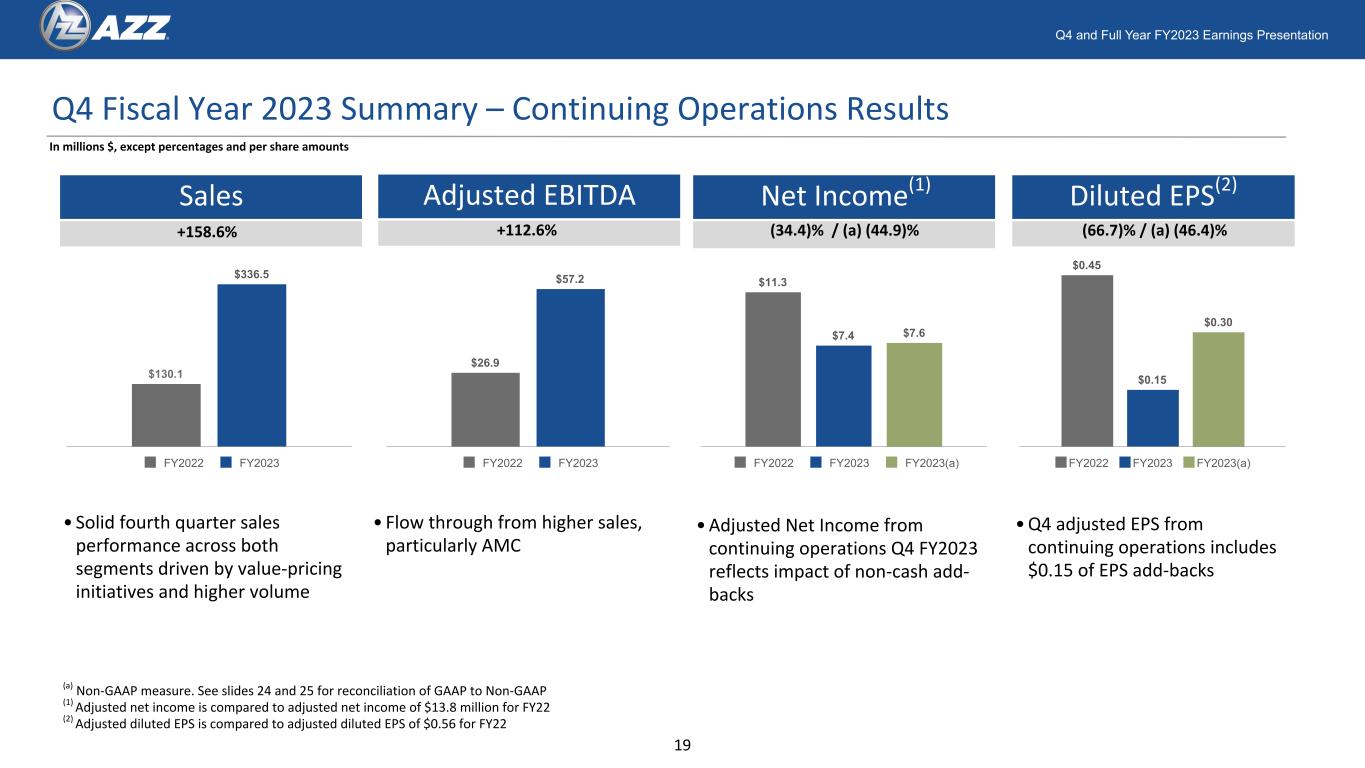
Q4 and Full Year FY2023 Earnings Presentation Sales Net Income(1) Diluted EPS(2) Q4 Fiscal Year 2023 Summary – Continuing Operations Results +158.6% • Solid fourth quarter sales performance across both segments driven by value-pricing initiatives and higher volume •Adjusted Net Income from continuing operations Q4 FY2023 reflects impact of non-cash add- backs •Q4 adjusted EPS from continuing operations includes $0.15 of EPS add-backs (34.4)% / (a) (44.9)% (66.7)% / (a) (46.4)% In millions $, except percentages and per share amounts Adjusted EBITDA +112.6% • Flow through from higher sales, particularly AMC (a) Non-GAAP measure. See slides 24 and 25 for reconciliation of GAAP to Non-GAAP (1) Adjusted net income is compared to adjusted net income of $13.8 million for FY22 (2) Adjusted diluted EPS is compared to adjusted diluted EPS of $0.56 for FY22 $130.1 $336.5 FY2022 FY2023 $0.45 $0.15 $0.30 FY2022 FY2023 FY2023(a) $26.9 $57.2 FY2022 FY2023 $11.3 $7.4 $7.6 FY2022 FY2023 FY2023(a) 19
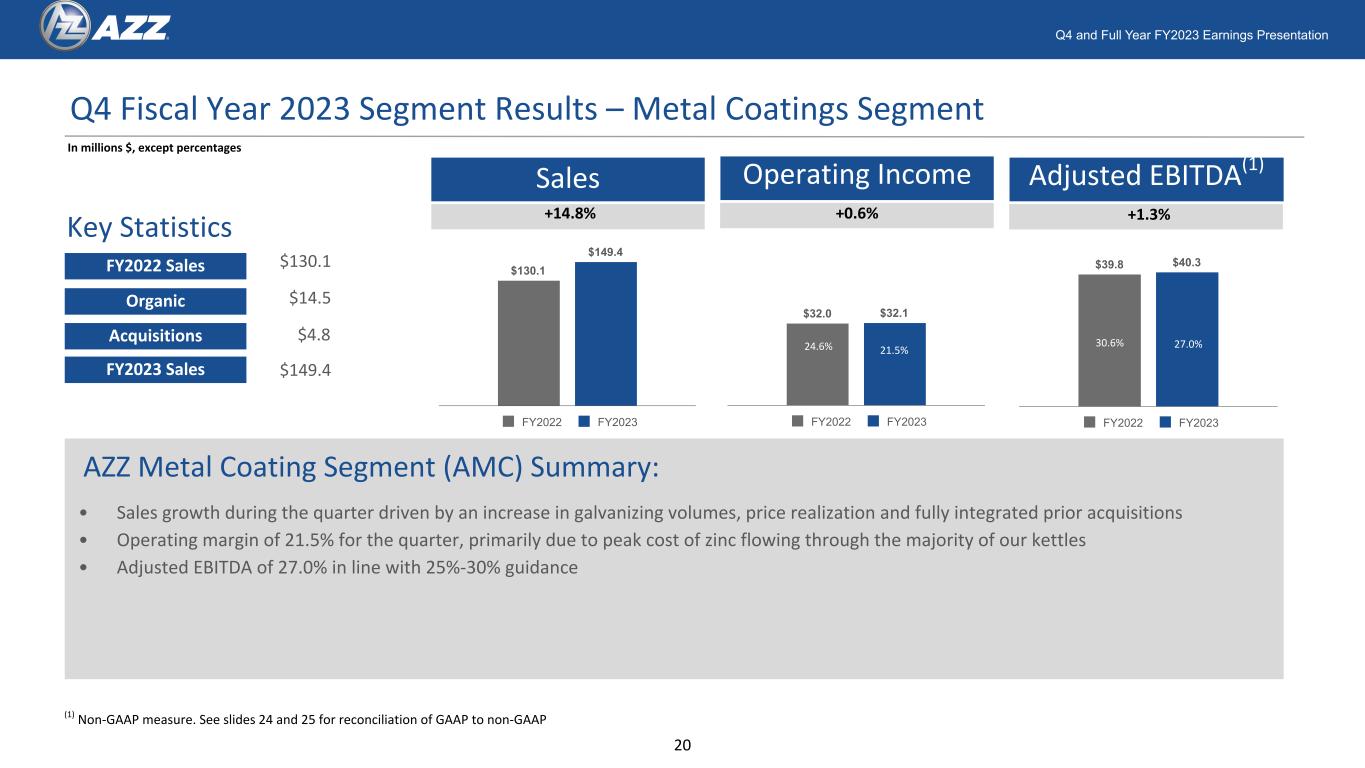
Q4 and Full Year FY2023 Earnings Presentation Q4 Fiscal Year 2023 Segment Results – Metal Coatings Segment • Sales growth during the quarter driven by an increase in galvanizing volumes, price realization and fully integrated prior acquisitions • Operating margin of 21.5% for the quarter, primarily due to peak cost of zinc flowing through the majority of our kettles • Adjusted EBITDA of 27.0% in line with 25%-30% guidance In millions $, except percentages Sales +14.8% Operating Income +0.6% Key Statistics FY2022 Sales Organic Acquisitions FY2023 Sales $130.1 $149.4 $4.8 $14.5 AZZ Metal Coating Segment (AMC) Summary: Adjusted EBITDA(1) +1.3% 24.5% 21.2% (1) Non-GAAP measure. See slides 24 and 25 for reconciliation of GAAP to non-GAAP $130.1 $149.4 FY2022 FY2023 $32.0 $32.1 FY2022 FY2023 24.6% .5 $39.8 $40.3 FY2022 FY2023 30.6% 27.0% 20
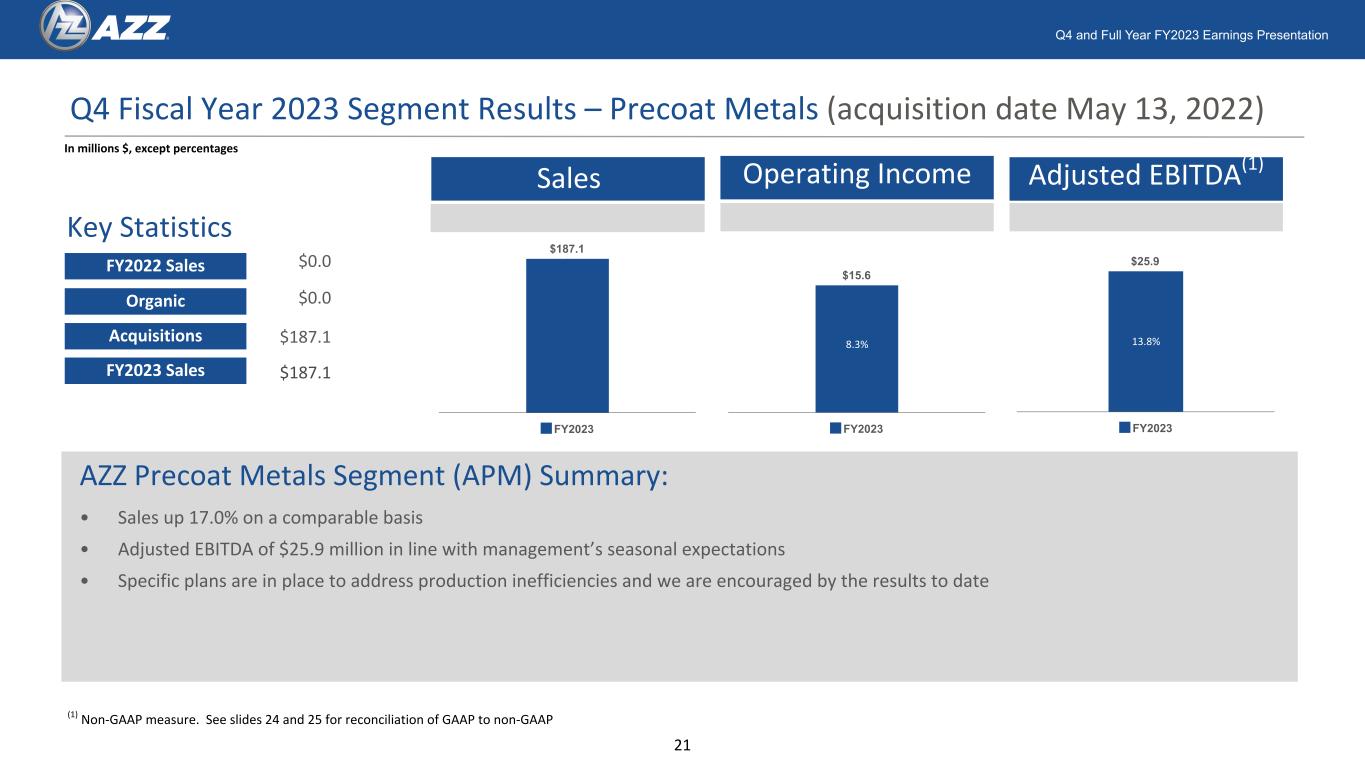
Q4 and Full Year FY2023 Earnings Presentation Q4 Fiscal Year 2023 Segment Results – Precoat Metals (acquisition date May 13, 2022) • Sales up 17.0% on a comparable basis • Adjusted EBITDA of $25.9 million in line with management’s seasonal expectations • Specific plans are in place to address production inefficiencies and we are encouraged by the results to date In millions $, except percentages AZZ Precoat Metals Segment (APM) Summary: Operating Income Adjusted EBITDA(1) FY2022 Sales Organic Acquisitions $0.0 $187.1 $187.1 $0.0 (1) Non-GAAP measure. See slides 24 and 25 for reconciliation of GAAP to non-GAAP FY2023 Sales $187.1 FY2023 $15.6 FY2023 $25.9 FY2023 21 Sales 13.8%8.3% Key Statistics
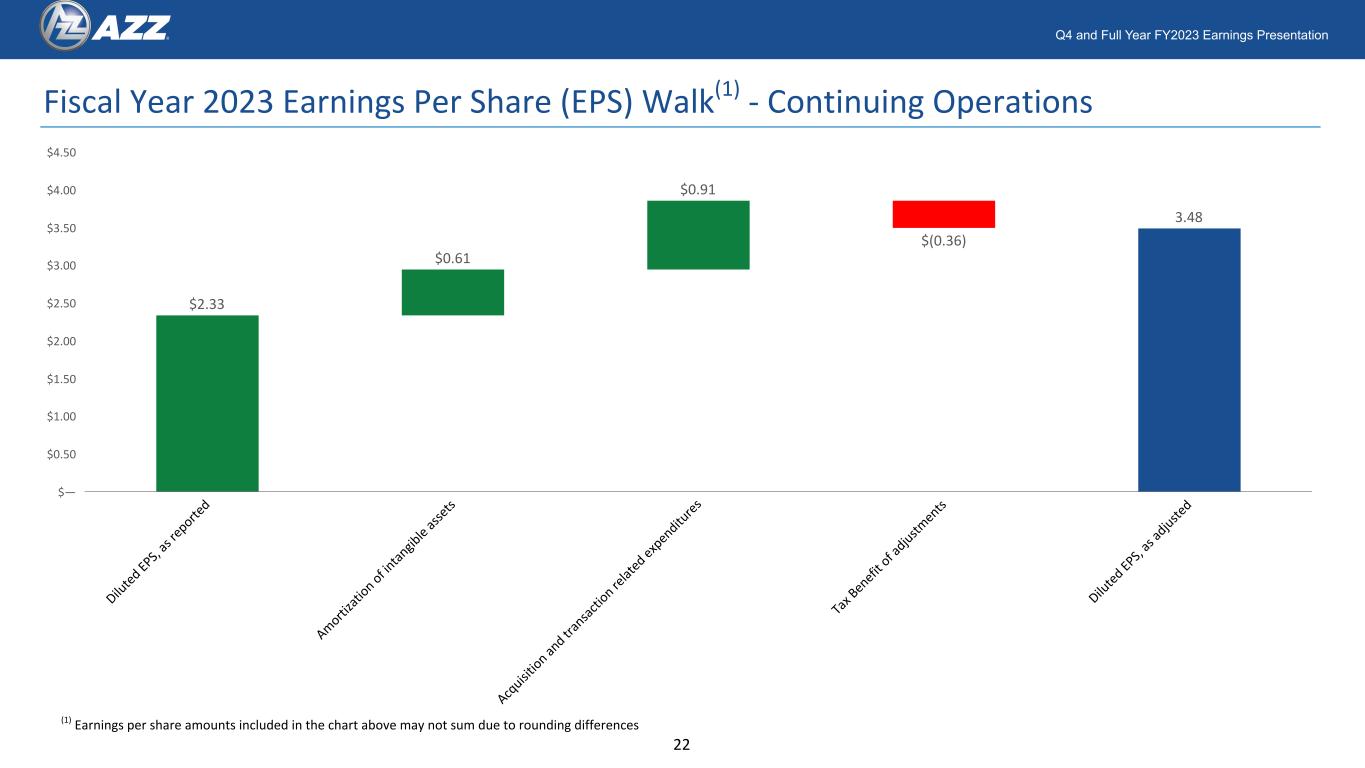
Q4 and Full Year FY2023 Earnings Presentation 22 Fiscal Year 2023 Earnings Per Share (EPS) Walk(1) - Continuing Operations $2.33 $0.61 $0.91 $(0.36) 3.48 Di lut ed EP S, as re po rte d Am or tiz at ion of in ta ng ibl e a sse ts Ac qu isi tio n a nd tr an sa cti on re lat ed ex pe nd itu re s Ta x B en efi t o f a dju stm en ts Di lut ed EP S, as ad jus te d $— $0.50 $1.00 $1.50 $2.00 $2.50 $3.00 $3.50 $4.00 $4.50 (1) Earnings per share amounts included in the chart above may not sum due to rounding differences
Reg “G” Tables 23

Q4 and Full Year FY2023 Earnings Presentation Continuing Operations Non-GAAP Disclosure Three Months ended February 28, Year Ended February 28, 2023 2022 2023 2022 Amount Per Diluted Share(1) Amount Per Diluted Share(1) Amount Per Diluted Share(1) Amount Per Diluted Share(1) Net income from continuing operations $ 7,427 $ — $ 11,322 $ — $ 66,339 $ — $ 49,817 $ — Less: Series A Preferred Stock dividends (3,600) — — — (8,240) — — — Net income (loss) from continuing operations available to common shareholders 3,827 0.15 11,322 0.45 58,099 2.33 49,817 1.99 Net income available to common shareholders and diluted earnings per share from continuing operations 3,827 — 11,322 — 58,099 — 49,817 — Adjustments: Acquisition and transaction related expenditures(2) — — 1,554 0.06 15,320 0.61 1,554 0.06 Amortization of intangible assets 4,998 0.20 1,662 0.07 22,613 0.91 6,658 0.27 Subtotal 4,998 0.20 3,216 0.13 37,933 1.51 8,212 0.33 Tax impact(3) (1,200) (0.05) (708) (0.03) (9,104) (0.36) (1,881) (0.08) Total adjustments 3,798 0.15 2,508 0.10 28,829 1.15 6,331 0.25 Adjusted earnings and adjusted earnings per share from continuing operations(4) $ 7,625 $ 0.30 $ 13,830 $ 0.56 $ 86,928 $ 3.48 $ 56,148 $ 2.24 (1) Earnings per share amounts included in the table above may not sum due to rounding differences. (2) Includes Corporate expenses related to the Precoat Metals acquisition, as well as the divestiture of AZZ Infrastructure Solutions business into the AIS JV. (3) The non-GAAP effective tax rates for the three months ended February 28, 2023 and 2022 were 24.0% and 22.0%, respectfully. The non-GAAP effective tax rates for the full year fiscal 2023 and 2022 were 24.0% and 22.9%, respectively. (4) Adjusted earnings from continuing operations includes $1.6 million and $2.6 million of equity in earnings for the three months ended February 28, 2023 and full year fiscal 2023, respectively. 24

Q4 and Full Year FY2023 Earnings Presentation Non-GAAP Disclosure of Continuing Operations Adjusted EBITDA Three Months Ended Year Ended February 28, February 28, 2023 2022 2023 2022 Net income from continuing operations $ 7,427 $ 11,322 $ 66,339 $ 49,817 Interest expense 27,061 1,345 88,800 6,363 Income tax (benefit) expense 3,956 4,436 22,336 23,214 Depreciation and amortization 18,777 8,252 74,590 32,081 Acquisition and transaction related-expenditures — 1,554 15,320 1,554 Adjusted EBITDA $ 57,221 $ 26,909 $ 267,385 $ 113,029 25
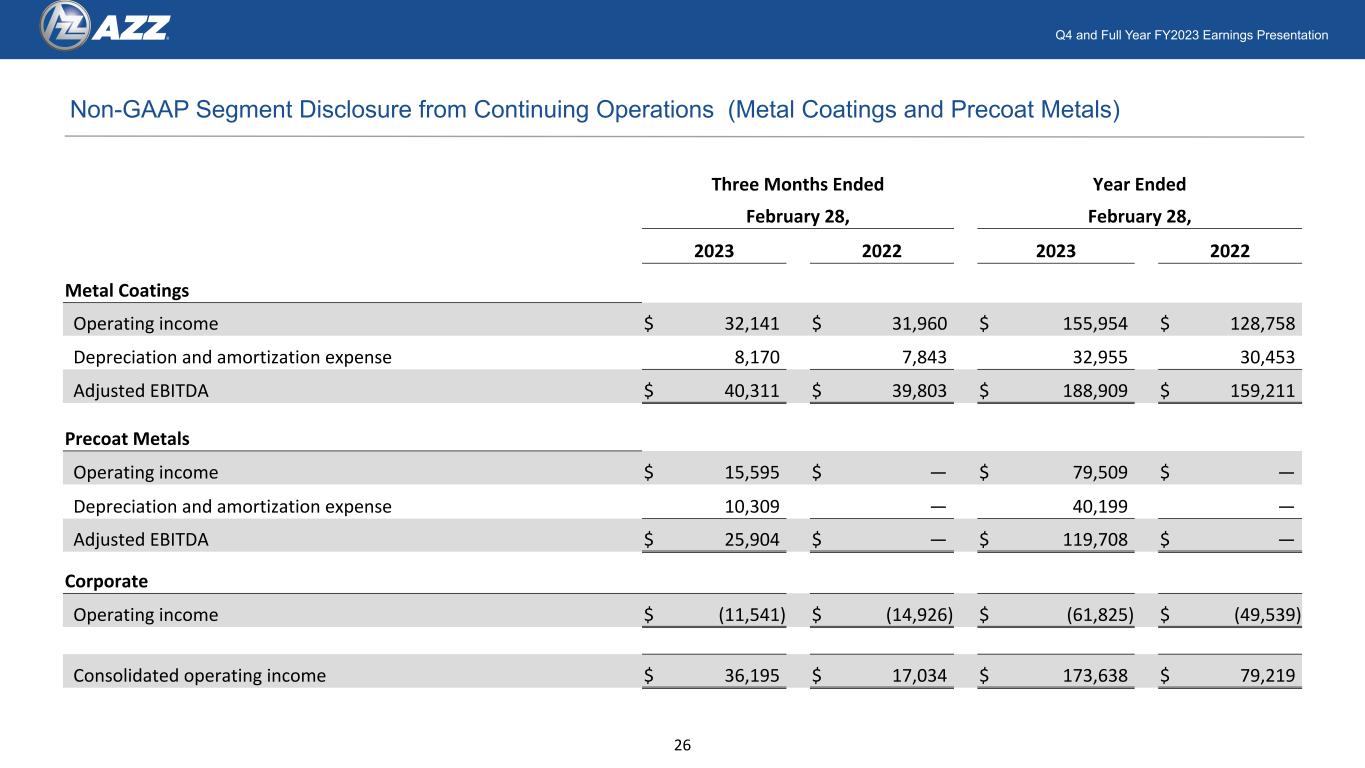
Q4 and Full Year FY2023 Earnings Presentation Non-GAAP Segment Disclosure from Continuing Operations (Metal Coatings and Precoat Metals) Three Months Ended Year Ended February 28, February 28, 2023 2022 2023 2022 Metal Coatings Operating income $ 32,141 $ 31,960 $ 155,954 $ 128,758 Depreciation and amortization expense 8,170 7,843 32,955 30,453 Adjusted EBITDA $ 40,311 $ 39,803 $ 188,909 $ 159,211 Precoat Metals Operating income $ 15,595 $ — $ 79,509 $ — Depreciation and amortization expense 10,309 — 40,199 — Adjusted EBITDA $ 25,904 $ — $ 119,708 $ — Corporate Operating income $ (11,541) $ (14,926) $ (61,825) $ (49,539) Consolidated operating income $ 36,195 $ 17,034 $ 173,638 $ 79,219 26


