
INVESTOR PRESENTATION INVESTOR PRESENTATION October 2023 (NYSE: AZZ)
2INVESTOR PRESENTATION Disclaimers Cautionary Statements Regarding Forward Looking Statements — Certain statements herein about our expectations of future events or results constitute forward- looking statements for purposes of the safe harbor provisions of The Private Securities Litigation Reform Act of 1995, including the statements regarding our strategic and financial initiatives. You can identify forward-looking statements by terminology such as “may,” “should,” “expects,” “plans,” “intends,” “anticipates,” “believes,” “estimates,” “predicts,” “potential,” “continue,” or the negative of these terms or other comparable terminology. Such forward-looking statements are based on currently available competitive, financial and economic data and management’s views and assumptions regarding future events. Such forward-looking statements are inherently uncertain, and investors must recognize that actual results may differ from those expressed or implied in the forward-looking statements. Certain factors could affect the outcome of the matters described herein. This presentation may contain forward-looking statements that involve risks and uncertainties including, but not limited to, changes in customer demand for our products and services, including demand by the power generation markets, electrical transmission and distribution markets, the industrial markets, and the metal coatings markets. In addition, within each of the markets we serve, we also continue to experience additional increases in labor costs, components, and raw materials including zinc and natural gas which are used in the hot-dip galvanizing process; supply-chain vendor delays; customer requested delays of our products or services; delays in additional acquisition or disposition opportunities; currency exchange rates; availability of experienced management and employees to implement the Company’s growth strategy; a downturn in market conditions in any industry relating to the products we inventory or sell or the services that we provide; economic volatility or changes in the political stability in the United States and other foreign markets in which we operate; acts of war or terrorism inside the United States or abroad; and other changes in economic and financial conditions. The Company has provided additional information regarding risks associated with the business in the Company’s Annual Report on Form 10-K for the fiscal year ended February 28, 2023, and other filings with the Securities and Exchange Commission (“SEC”), available for viewing on the Company’s website at www.azz.com and on the SEC’s website at www.sec.gov. You are urged to consider these factors carefully in evaluating the forward-looking statements herein and are cautioned not to place undue reliance on such forward-looking statements, which are qualified in their entirety by this cautionary statement. These statements are based on information as of the date hereof and the Company’s assumes no obligation to update any forward-looking statements, whether as a result of new information, future events, or otherwise. Non-GAAP – Regulation G Disclosures — In addition to reporting financial results in accordance with Generally Accepted Accounting Principles in the United States ("GAAP"), AZZ has provided EBITDA and Adjusted EBITDA, which are non-GAAP measures. Management believes that the presentation of these measures provides investors with a greater transparency comparison of operating results across a broad spectrum of companies, which provides a more complete understanding of AZZ’s financial performance, competitive position and prospects for the future. Management also believes that investors regularly rely on non-GAAP financial measures, such as EBITDA and Adjusted EBITDA, to assess operating performance and that such measures may highlight trends in the Company’s business that may not otherwise be apparent when relying on financial measures calculated in accordance with GAAP.

3INVESTOR PRESENTATION Key Messages: Differentiated, high value-add metal coatings provider with scale, expertise and customer centric technology uniquely positioned to serve the growing North American steel and aluminum markets Strong business foundation capable of growing sales and margins at or above market levels, supported by multi-year secular growth drivers; while generating significant free cash flow Coil coating and hot dip galvanizing provide environmentally friendly solutions that reduce emissions and extend the life cycle of the coated materials Focused capital allocation to reduce debt and improve leverage while supporting high ROIC investments, and returning capital to shareholders Commitment to EPS growth driven by operational improvement and debt reduction creates compelling investment opportunity and long-term shareholder value
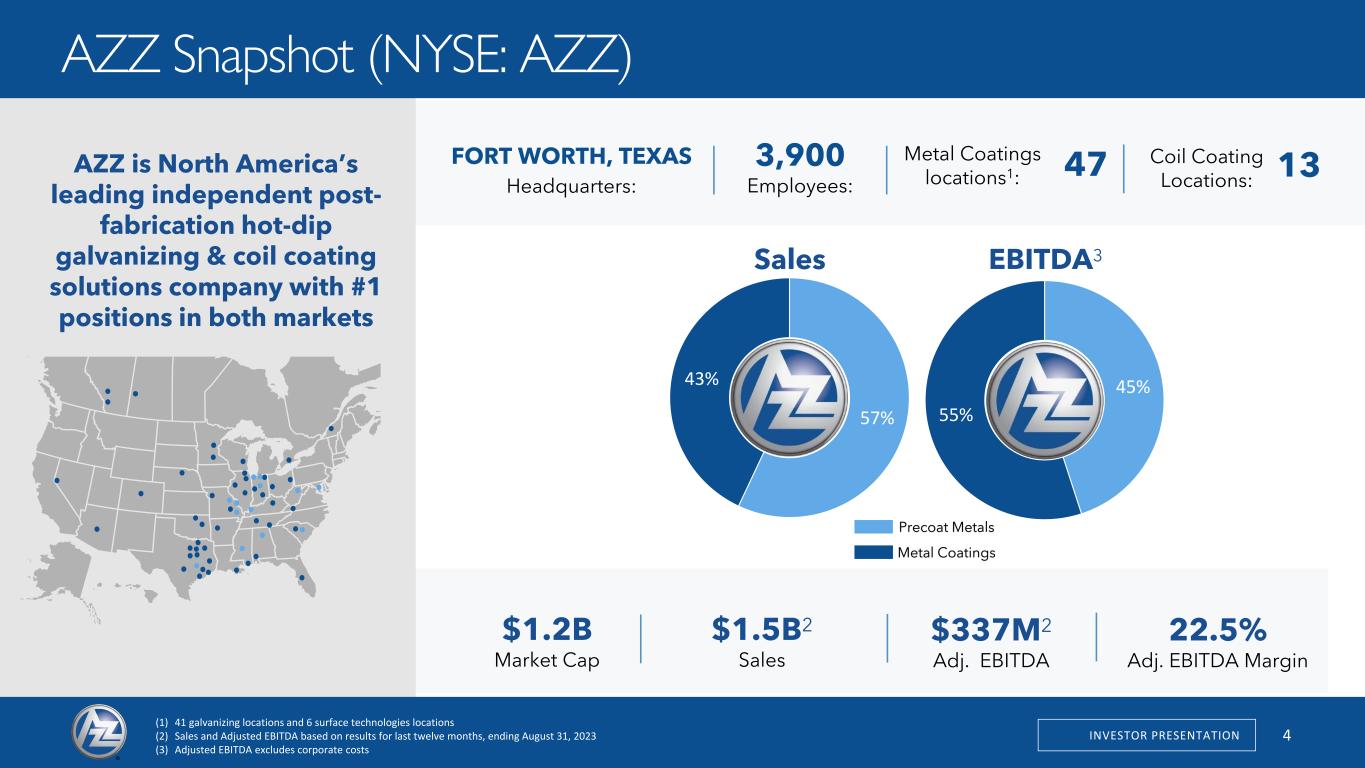
INVESTOR PRESENTATION 4 57% 43% AZZ Snapshot (NYSE: AZZ) Sales EBITDA3 AZZ is North America’s leading independent post- fabrication hot-dip galvanizing & coil coating solutions company with #1 positions in both markets Precoat Metals Metal Coatings (1) 41 galvanizing locations and 6 surface technologies locations (2) Sales and Adjusted EBITDA based on results for last twelve months, ending August 31, 2023 (3) Adjusted EBITDA excludes corporate costs FORT WORTH, TEXAS Headquarters: 3,900 Employees: Metal Coatings locations1: 47 Coil Coating Locations: 13 1 $1.5B2 Sales $337M2 Adj. EBITDA 22.5% Adj. EBITDA Margin $1.2B Market Cap 45% 55%
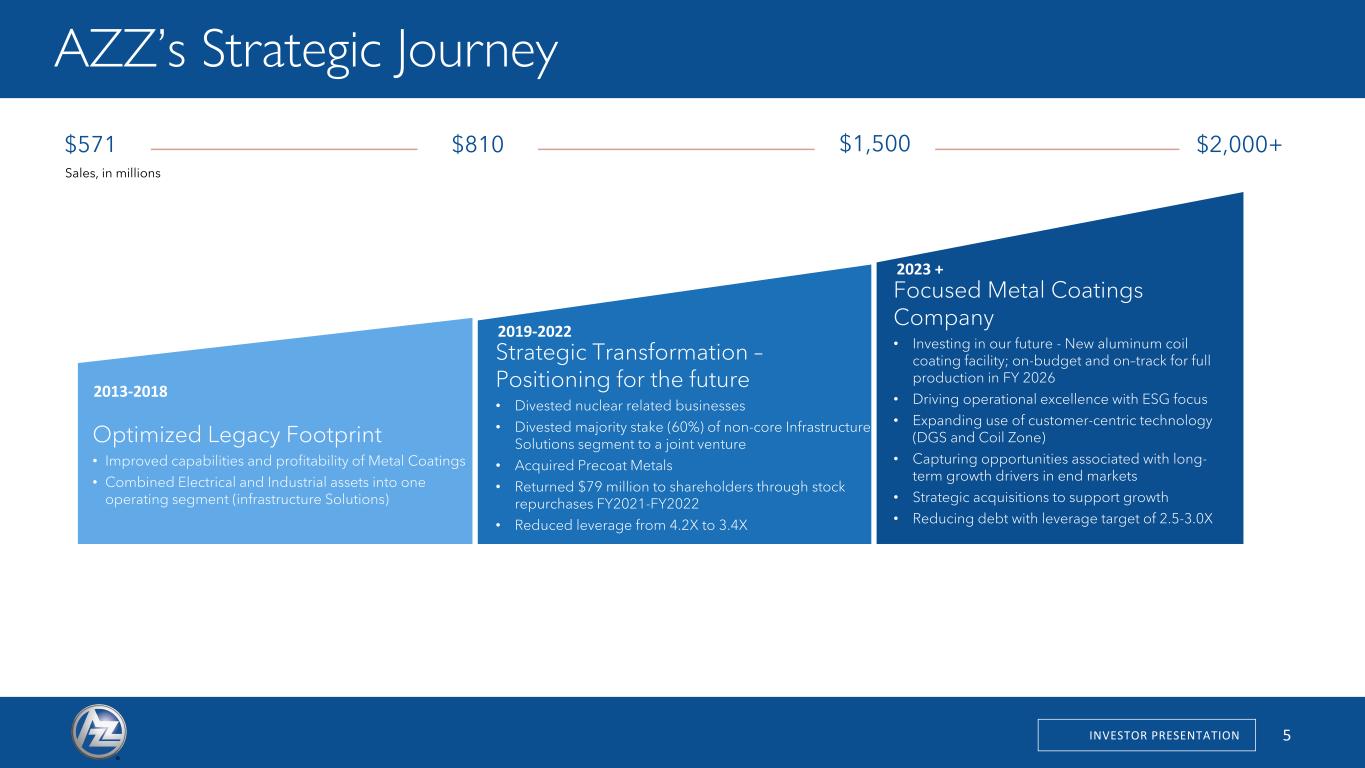
INVESTOR PRESENTATION 5 5 AZZ’s Strategic Journey 2013-2018 Optimized Legacy Footprint • Improved capabilities and profitability of Metal Coatings • Combined Electrical and Industrial assets into one operating segment (infrastructure Solutions) 2019-2022 Strategic Transformation – Positioning for the future • Divested nuclear related businesses • Divested majority stake (60%) of non-core Infrastructure Solutions segment to a joint venture • Acquired Precoat Metals • Returned $79 million to shareholders through stock repurchases FY2021-FY2022 • Reduced leverage from 4.2X to 3.4X 2023 + Focused Metal Coatings Company • Investing in our future - New aluminum coil coating facility; on-budget and on–track for full production in FY 2026 • Driving operational excellence with ESG focus • Expanding use of customer-centric technology (DGS and Coil Zone) • Capturing opportunities associated with long- term growth drivers in end markets • Strategic acquisitions to support growth • Reducing debt with leverage target of 2.5-3.0X $571 $810 $1,500 $2,000+ Sales, in millions

INVESTOR PRESENTATION 6 6 Why Our Focus is Coatings 65% 25% 5% 5% U.S. Demand by Product Type Flat Long Tubular Other Strategic acquisition of Precoat Metals creates new capability and allows AZZ to provide coatings solutions to the largest part of the market (flat steel) as well as the growing aluminum market AZZ’s independence provides customers complete flexibility in sourcing, uniquely positioning the company to coat domestic or imported steel and aluminum from any service center or mill Steel and aluminum are essential to a sustainable future, highly recyclable, and enable critical green energy technologies like wind and solar Hot-dip galvanizing and coil coating are environmentally friendly solutions that provide long-lasting corrosion and aesthetic benefits for steel and aluminum Strong support for re-shoring, green manufacturing, infrastructure renewal and trade enforcement provides significant market tailwinds Source: Worldsteel 122 146 North American Steel Market (in million net tons) Production Demand Imports
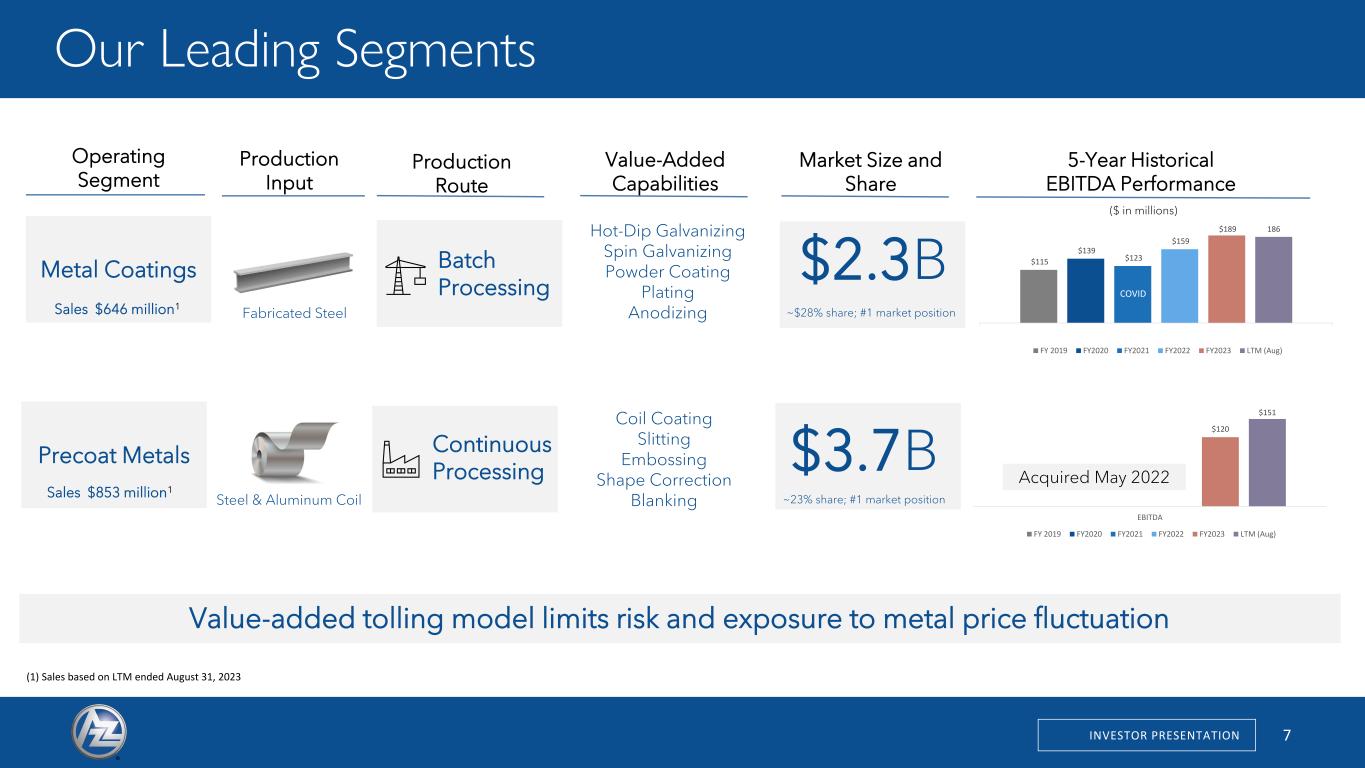
INVESTOR PRESENTATION 7 7 Our Leading Segments Operating Segment Production Route Value-Added Capabilities Market Size and Share 5-Year Historical EBITDA Performance ($ in millions) Metal Coatings Precoat Metals Batch Processing Continuous Processing Hot-Dip Galvanizing Spin Galvanizing Powder Coating Plating Anodizing Coil Coating Slitting Embossing Shape Correction Blanking $2.3B $3.7B ~$28% share; #1 market position ~23% share; #1 market position $115 $139 $123 $159 $189 186 FY 2019 FY2020 FY2021 FY2022 FY2023 LTM (Aug) $120 $151 EBITDA FY 2019 FY2020 FY2021 FY2022 FY2023 LTM (Aug) Production Input Fabricated Steel Steel & Aluminum Coil Sales $646 million1 Sales $853 million1 (1) Sales based on LTM ended August 31, 2023 Acquired May 2022 Value-added tolling model limits risk and exposure to metal price fluctuation COVID
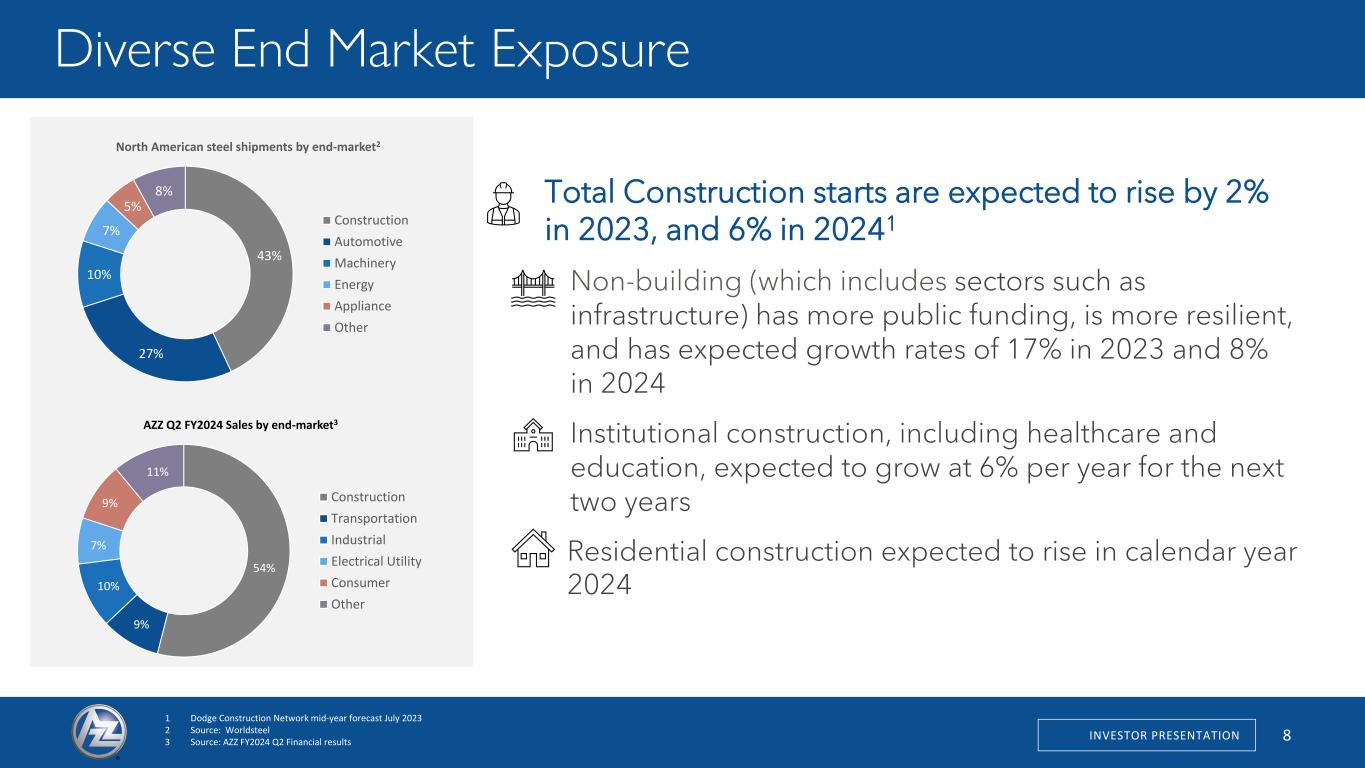
INVESTOR PRESENTATION 8 8 Total Construction starts are expected to rise by 2% in 2023, and 6% in 20241 Non-building (which includes sectors such as infrastructure) has more public funding, is more resilient, and has expected growth rates of 17% in 2023 and 8% in 2024 Institutional construction, including healthcare and education, expected to grow at 6% per year for the next two years Residential construction expected to rise in calendar year 2024 Diverse End Market Exposure 43% 27% 10% 7% 5% 8% North American steel shipments by end-market2 Construction Automotive Machinery Energy Appliance Other 54% 9% 10% 7% 9% 11% AZZ Q2 FY2024 Sales by end-market3 Construction Transportation Industrial Electrical Utility Consumer Other 1 Dodge Construction Network mid-year forecast July 2023 2 Source: Worldsteel 3 Source: AZZ FY2024 Q2 Financial results
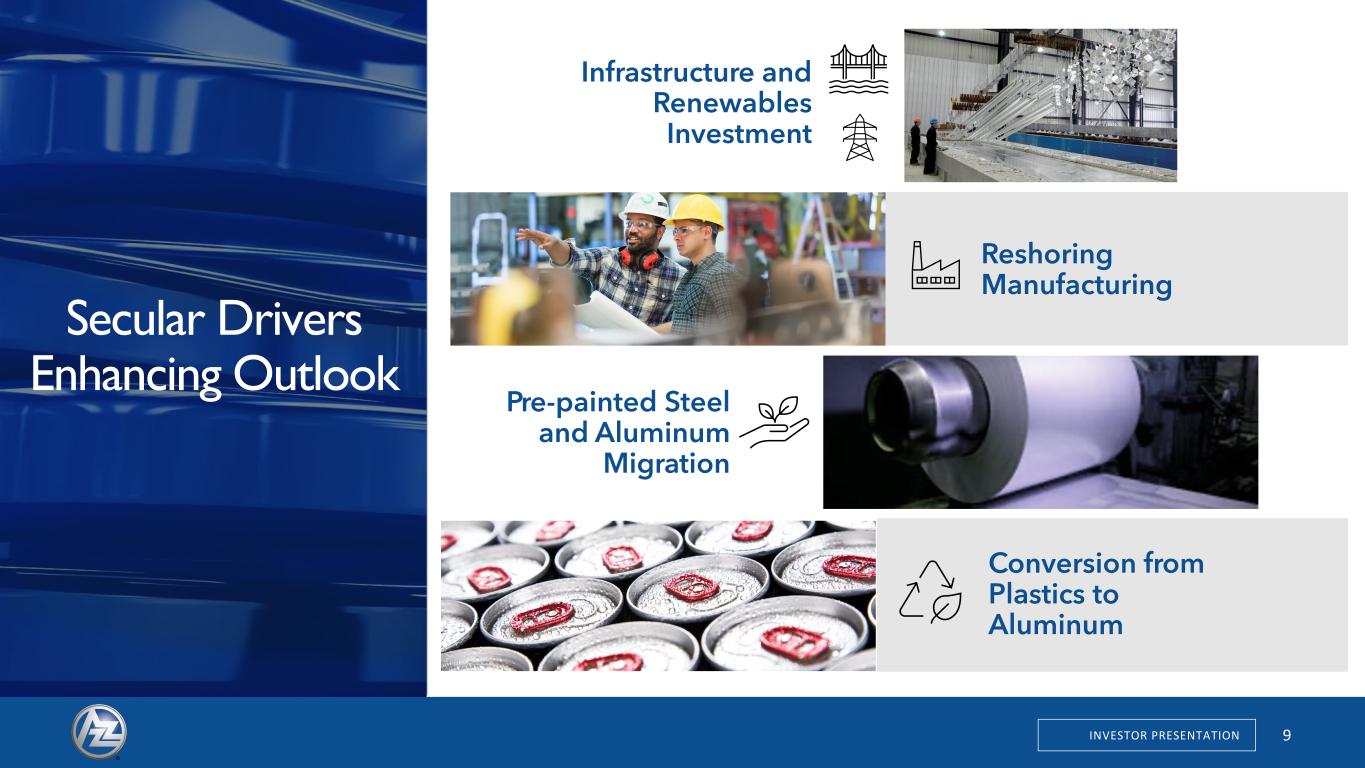
INVESTOR PRESENTATION 9 Secular Drivers Enhancing Outlook Infrastructure and Renewables Investment Reshoring Manufacturing Pre-painted Steel and Aluminum Migration Conversion from Plastics to Aluminum 9

INVESTOR PRESENTATION 10 Macro Tailwinds -American Infrastructure Investment and Jobs Act Roads, Bridges and Major Projects 10 Clean Energy and Power Water, Airports and Other Investment: +$110bn Investment: +$65bn Investment: +$75bn Investment to repair over 45,000 bridges and 1 in 5 miles of highways which are in poor condition Investment in clean energy transmission and grid by building thousands of miles of transmission lines Investment to improve critical infrastructure for water including both waste and drinking water, airports and data centers among many other areas Our Metal Coatings segment provides hot-dip galvanizing for many end uses including guardrails, signs, bridges and light poles Our Metal Coatings segment provides hot-dip galvanizing for transmission, distribution and solar, including monopoles and lattice towers Our Precoat Metals segment provides aesthetic coatings for the metal used in data centers, airports, and other critical infrastructure
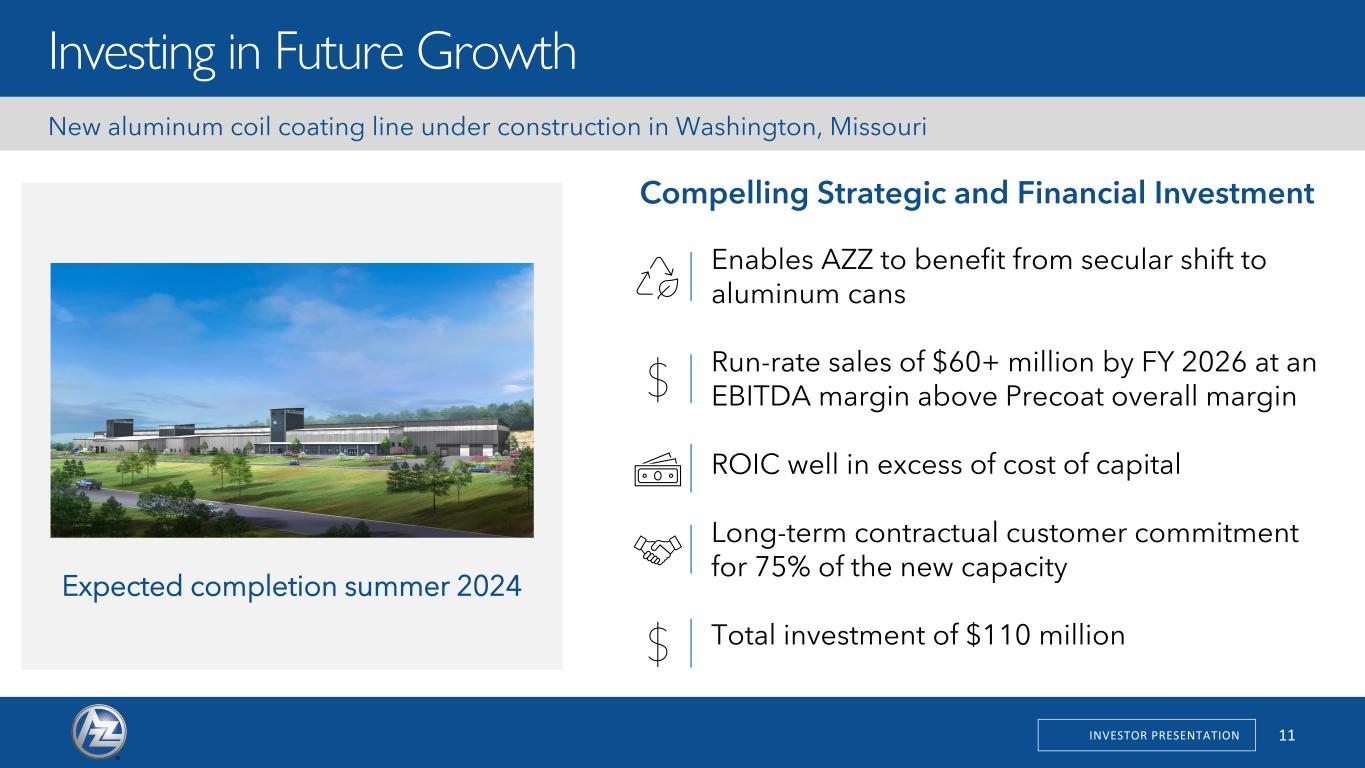
11INVESTOR PRESENTATION Enables AZZ to benefit from secular shift to aluminum cans Run-rate sales of $60+ million by FY 2026 at an EBITDA margin above Precoat overall margin ROIC well in excess of cost of capital Long-term contractual customer commitment for 75% of the new capacity Total investment of $110 million New aluminum coil coating line under construction in Washington, Missouri Compelling Strategic and Financial Investment 20 Investing in Future Growth Expected completion summer 2024
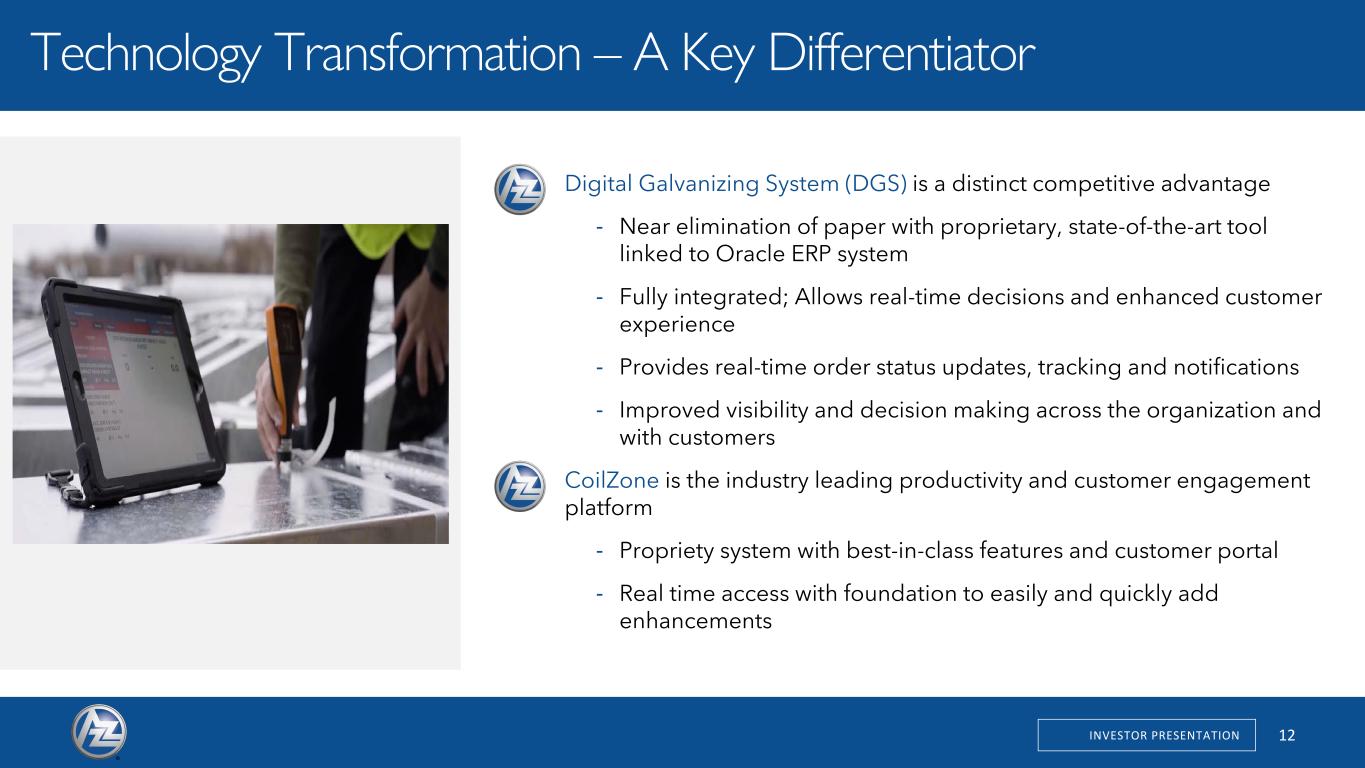
12INVESTOR PRESENTATION Digital Galvanizing System (DGS) is a distinct competitive advantage - Near elimination of paper with proprietary, state-of-the-art tool linked to Oracle ERP system - Fully integrated; Allows real-time decisions and enhanced customer experience - Provides real-time order status updates, tracking and notifications - Improved visibility and decision making across the organization and with customers CoilZone is the industry leading productivity and customer engagement platform - Propriety system with best-in-class features and customer portal - Real time access with foundation to easily and quickly add enhancements Technology Transformation – A Key Differentiator
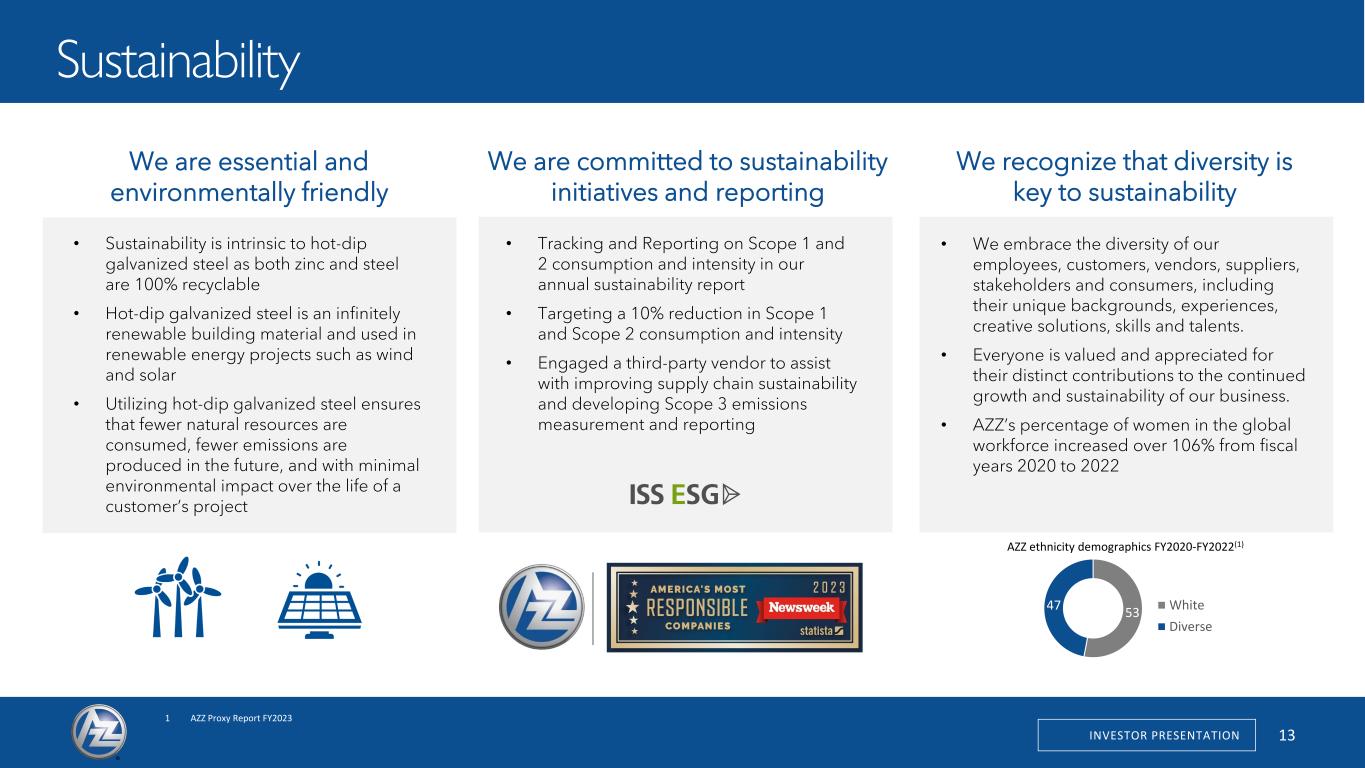
INVESTOR PRESENTATION 13 13 Investing in Future Growth Sustai ability • Sustainability is intrinsic to hot-dip galvanized steel as both zinc and steel are 100% recyclable • Hot-dip galvanized steel is an infinitely renewable building material and used in renewable energy projects such as wind and solar • Utilizing hot-dip galvanized steel ensures that fewer natural resources are consumed, fewer emissions are produced in the future, and with minimal environmental impact over the life of a customer’s project 53 47 White Diverse We are essential and environmentally friendly We are committed to sustainability initiatives and reporting We recognize that diversity is key to sustainability • Tracking and Reporting on Scope 1 and 2 consumption and intensity in our annual sustainability report • Targeting a 10% reduction in Scope 1 and Scope 2 consumption and intensity • Engaged a third-party vendor to assist with improving supply chain sustainability and developing Scope 3 emissions measurement and reporting • We embrace the diversity of our employees, customers, vendors, suppliers, stakeholders and consumers, including their unique backgrounds, experiences, creative solutions, skills and talents. • Everyone is valued and appreciated for their distinct contributions to the continued growth and sustainability of our business. • AZZ’s percentage of women in the global workforce increased over 106% from fiscal years 2020 to 2022 AZZ ethnicity demographics FY2020-FY2022(1) 1 AZZ Proxy Report FY2023
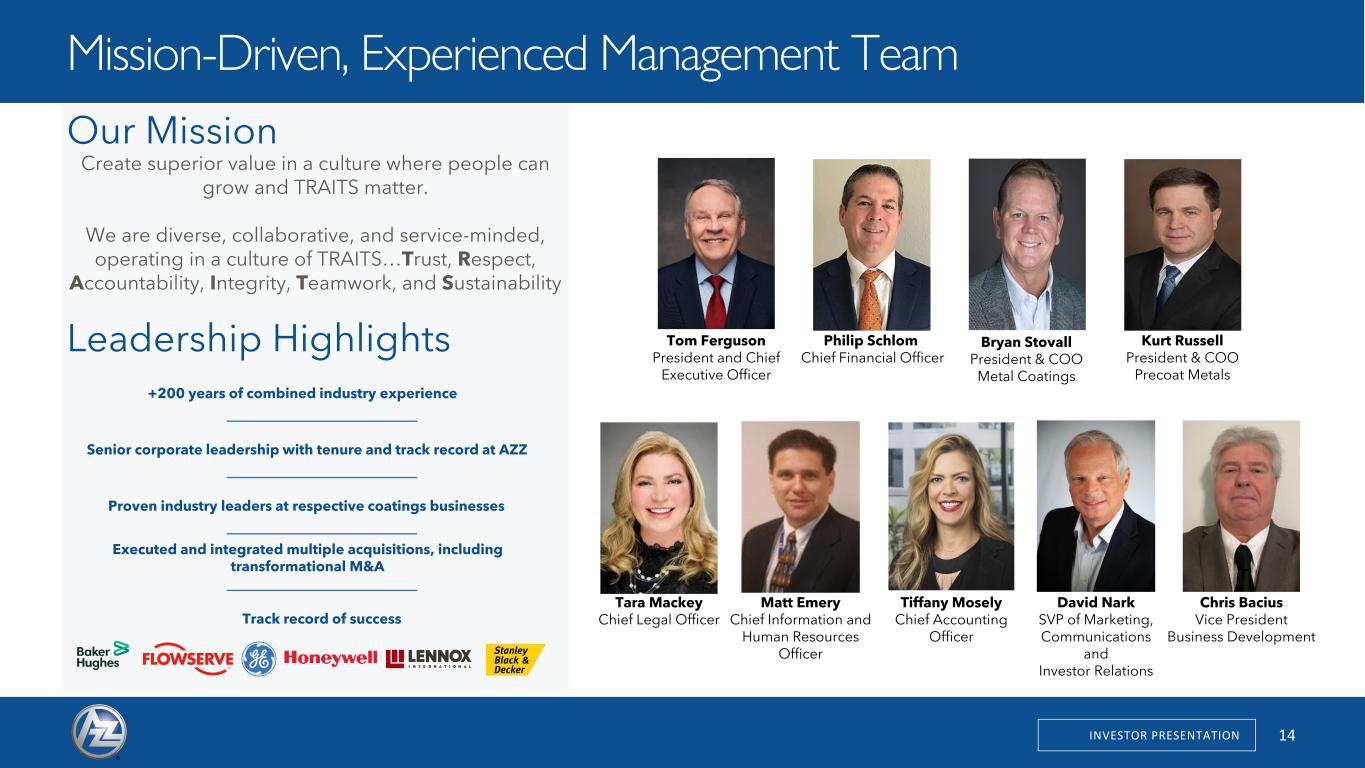
INVESTOR PRESENTATION 14 Tom Ferguson President and Chief Executive Officer Philip Schlom Chief Financial Officer David Nark SVP of Marketing, Communications and Investor Relations Matt Emery Chief Information and Human Resources Officer Tara Mackey Chief Legal Officer Chris Bacius Vice President Business Development Kurt Russell President & COO Precoat Metals Bryan Stovall President & COO Metal Coatings Our Mission Create superior value in a culture where people can grow and TRAITS matter. We are diverse, collaborative, and service-minded, operating in a culture of TRAITS…Trust, Respect, Accountability, Integrity, Teamwork, and Sustainability Leadership Highlights +200 years of combined industry experience Senior corporate leadership with tenure and track record at AZZ Proven industry leaders at respective coatings businesses Executed and integrated multiple acquisitions, including transformational M&A Track record of success Mission-Driven, Experienced Management Team 13 Tiffany Mosely Chief Accounting Officer
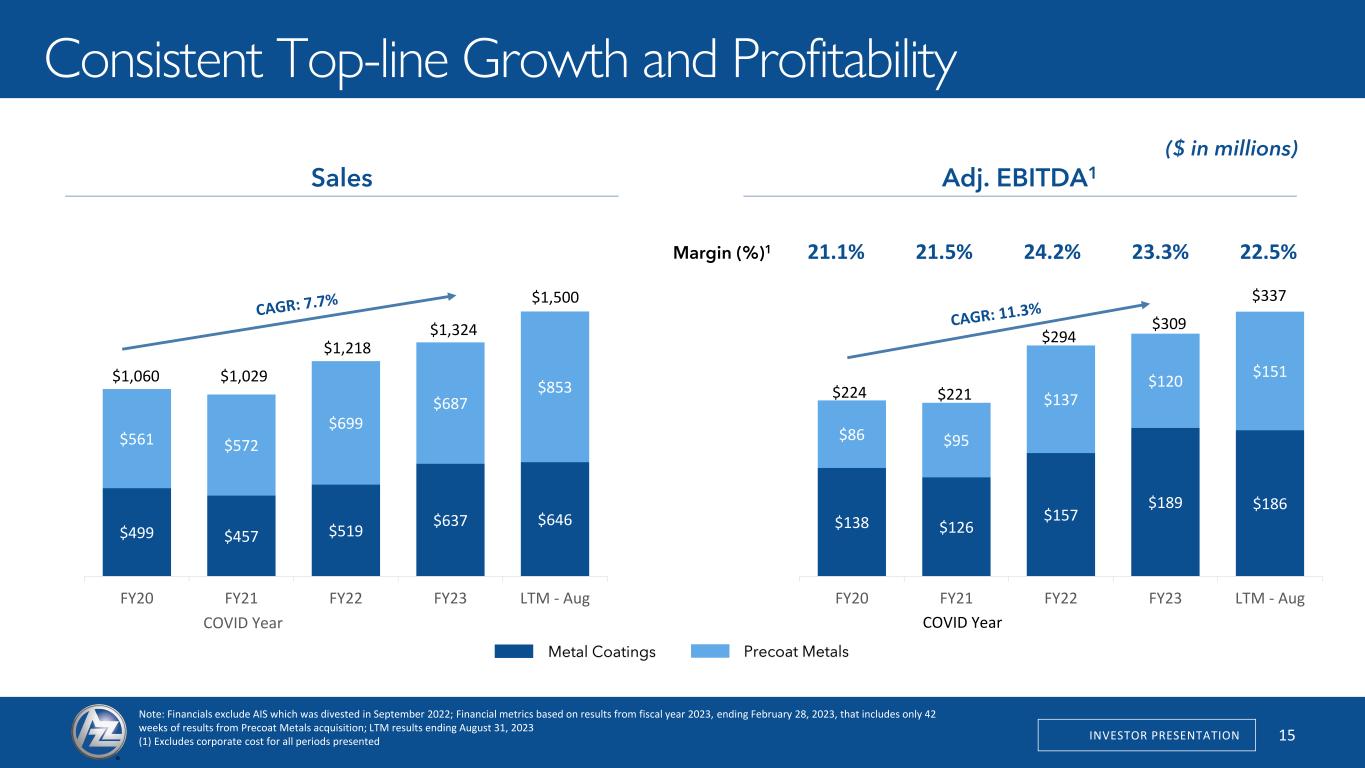
INVESTOR PRESENTATION 15 Consistent Top-line Growth and Profitability 12 Sales Adj. EBITDA1 Margin (%)1 Note: Financials exclude AIS which was divested in September 2022; Financial metrics based on results from fiscal year 2023, ending February 28, 2023, that includes only 42 weeks of results from Precoat Metals acquisition; LTM results ending August 31, 2023 (1) Excludes corporate cost for all periods presented Precoat MetalsMetal Coatings ($ in millions) COVID YearCOVID Year $499 $457 $519 $637 $646 $561 $572 $699 $687 $853 FY20 FY21 FY22 FY23 LTM - Aug $1,060 $1,029 $1,218 $1,324 $1,500 $138 $126 $157 $189 $186 $86 $95 $137 $120 $151 FY20 FY21 FY22 FY23 LTM - Aug 21.1% 21.5% 24.2% 23.3% 22.5% $224 $221 $294 $309 $337
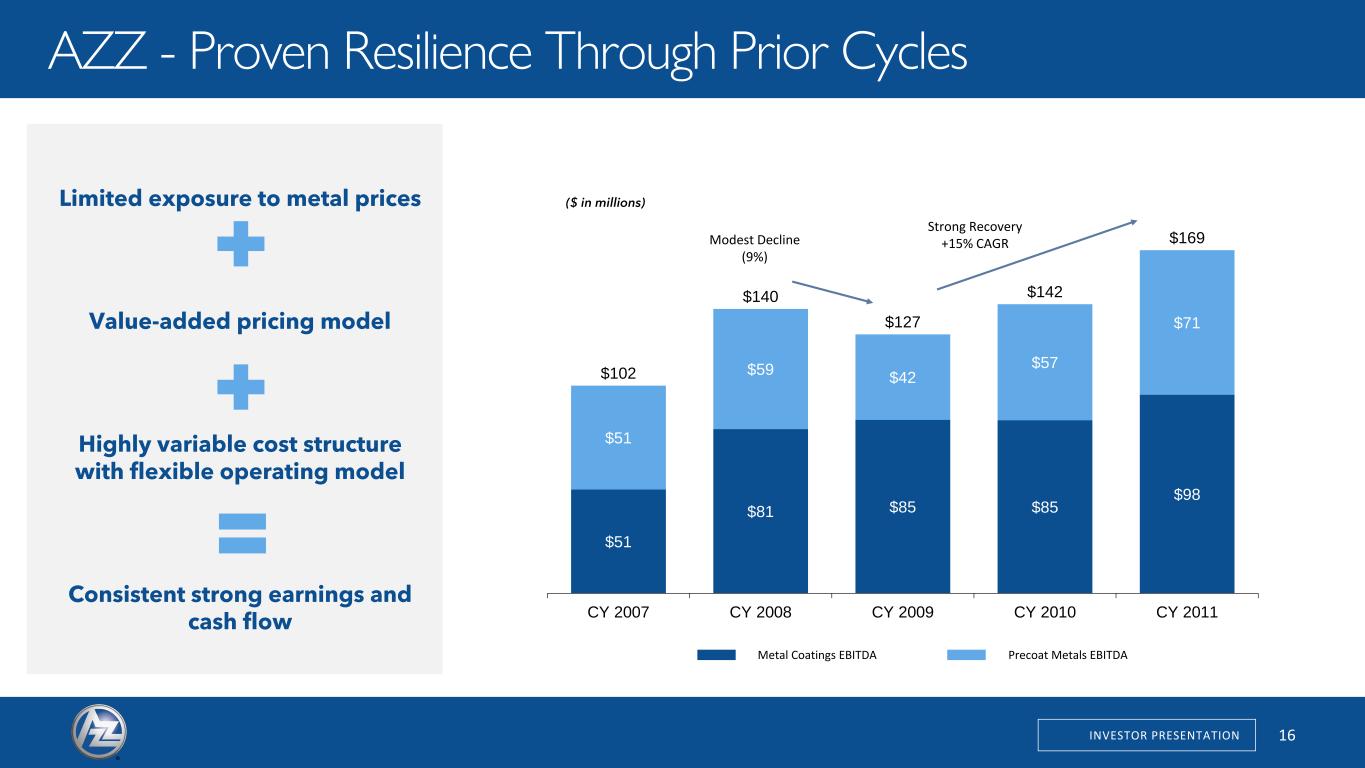
INVESTOR PRESENTATION 16 AZZ - Proven Resilience Through Prior Cycles 17 Metal Coatings EBITDA Precoat Metals EBITDA $51 $81 $85 $85 $98 $51 $59 $42 $57 $71 $102 $140 $127 $142 $169 CY 2007 CY 2008 CY 2009 CY 2010 CY 2011 Modest Decline (9%) Strong Recovery +15% CAGR ($ in millions)Limited exposure to metal prices Value-added pricing model Highly variable cost structure with flexible operating model Consistent strong earnings and cash flow
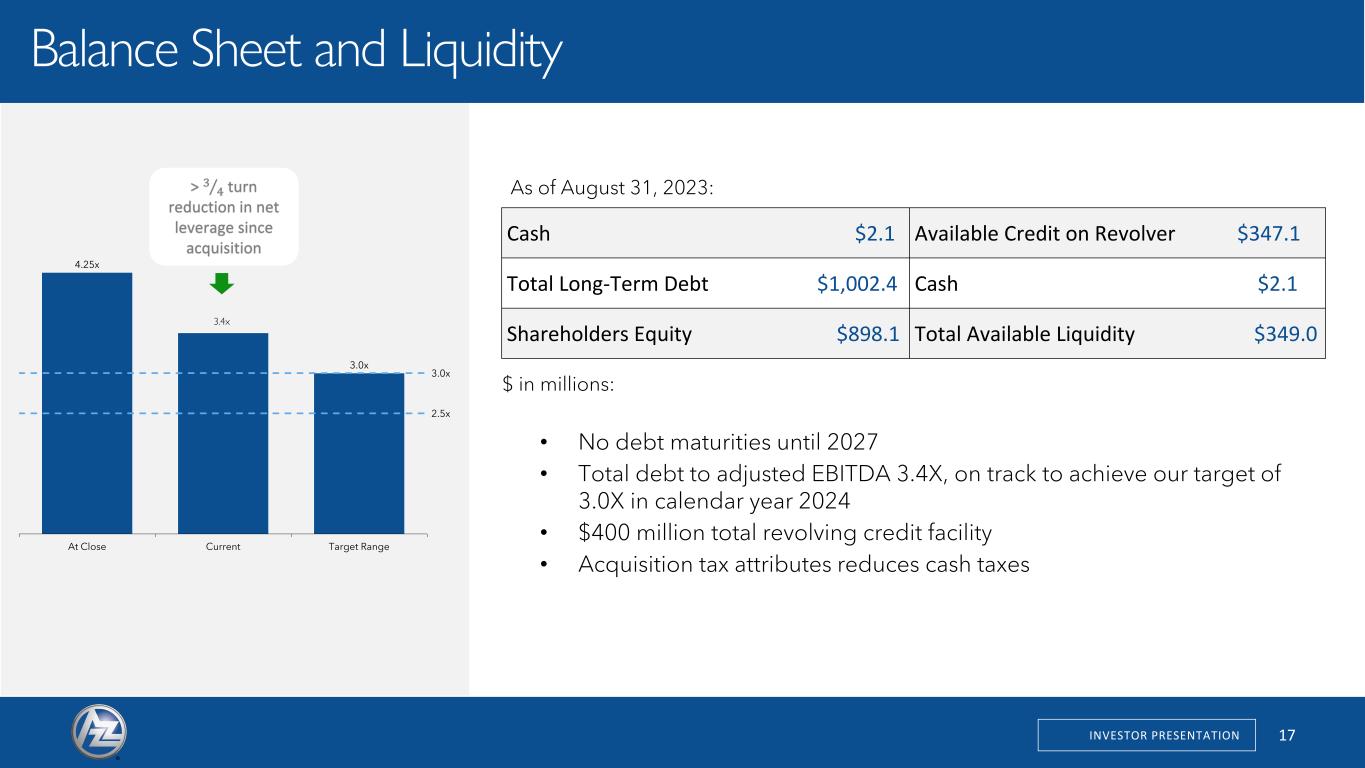
INVESTOR PRESENTATION 17 17 Balance Sheet and Liquidity 4.25x 3.5x 3.0x 3.0x 2.5x At Close Current Target Range > Τ3 4 turn reduction in net leverage since acquisition • No debt maturities until 2027 • Total debt to adjusted EBITDA 3.4X, on track to achieve our target of 3.0X in calendar year 2024 • $400 million total revolving credit facility • Acquisition tax attributes reduces cash taxes As of August 31, 2023: Cash $2.1 Available Credit on Revolver $347.1 Total Long-Term Debt $1,002.4 Cash $2.1 Shareholders Equity $898.1 Total Available Liquidity $349.0 $ in millions: 3.4x
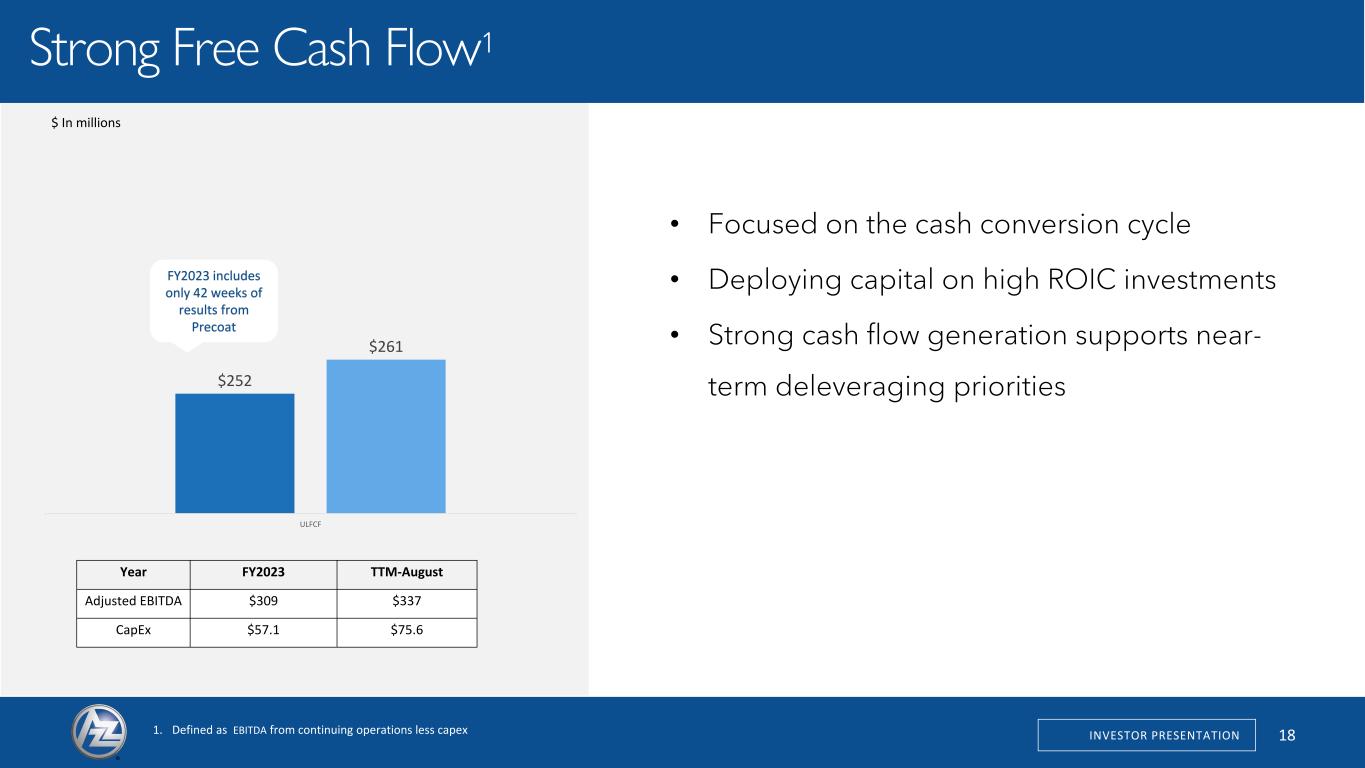
INVESTOR PRESENTATION 18 18 Strong Free Cash Flow1 • Focused on the cash conversion cycle • Deploying capital on high ROIC investments • Strong cash flow generation supports near- term deleveraging priorities 1. Defined as EBITDA from continuing operations less capex Year FY2023 TTM-August Adjusted EBITDA $309 $337 CapEx $57.1 $75.6 $252 $261 ULFCF $ In millions FY2023 includes only 42 weeks of results from Precoat
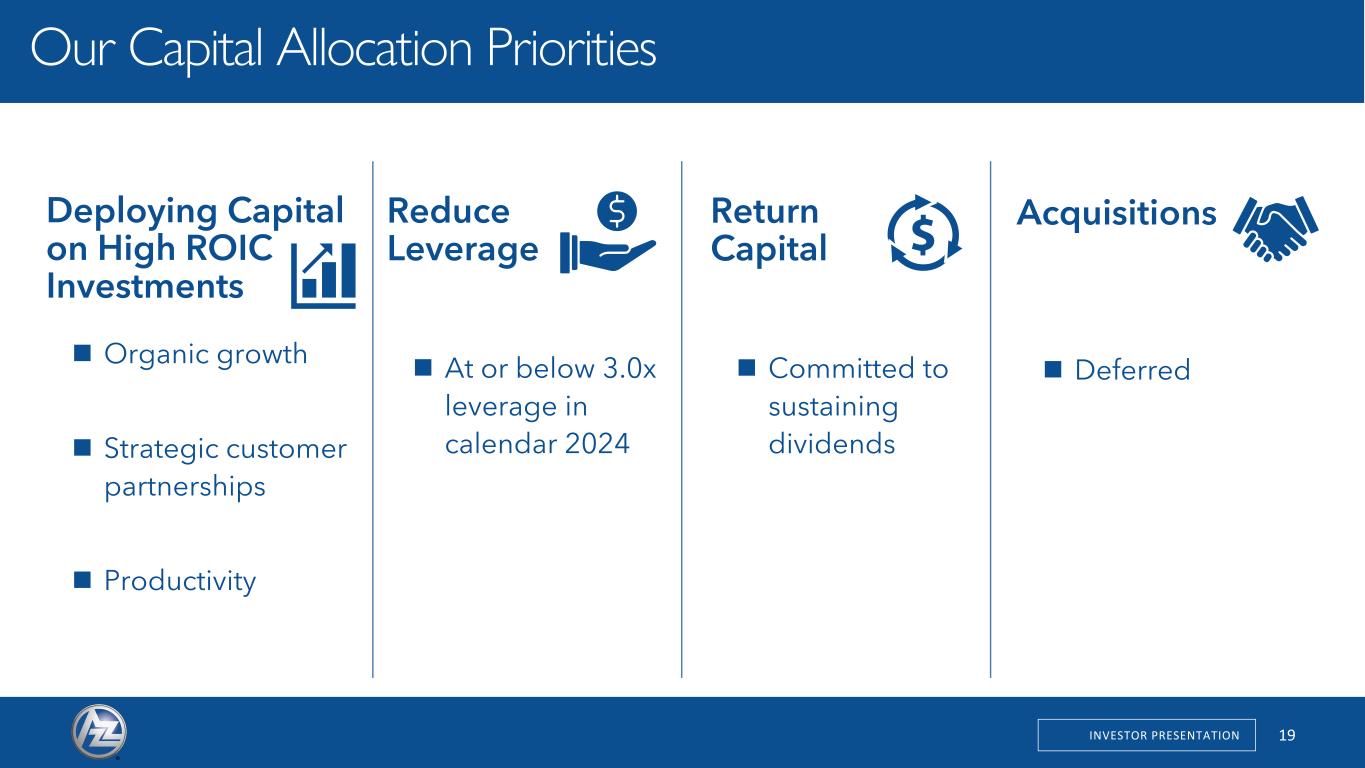
19INVESTOR PRESENTATION Acquisitions ◼ Deferred Return Capital ◼ Committed to sustaining dividends Deploying Capital on High ROIC Investments ◼ Organic growth ◼ Strategic customer partnerships ◼ Productivity Reduce Leverage ◼ At or below 3.0x leverage in calendar 2024 19 Our Capital Allocation Priorities
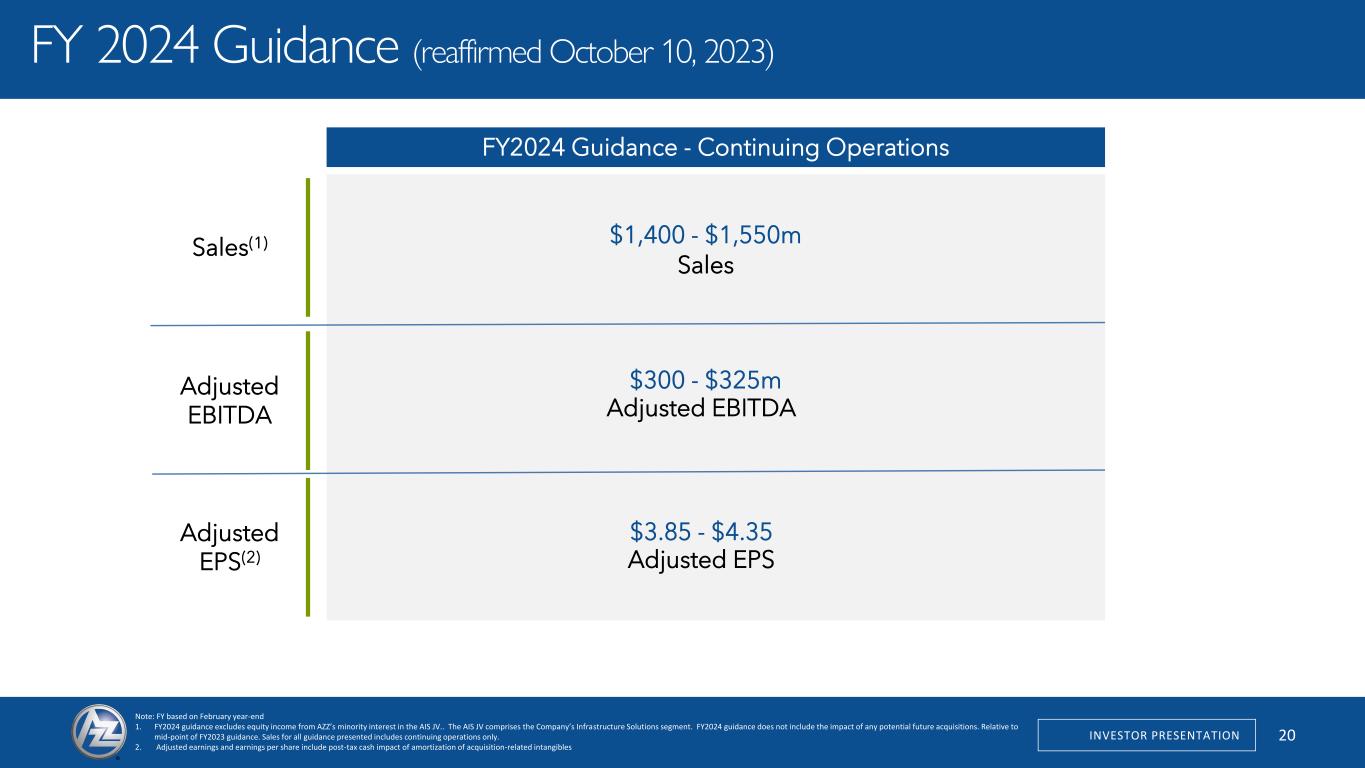
INVESTOR PRESENTATION 20 21 Note: FY based on February year-end 1. FY2024 guidance excludes equity income from AZZ’s minority interest in the AIS JV.. The AIS JV comprises the Company’s Infrastructure Solutions segment. FY2024 guidance does not include the impact of any potential future acquisitions. Relative to mid-point of FY2023 guidance. Sales for all guidance presented includes continuing operations only. 2. Adjusted earnings and earnings per share include post-tax cash impact of amortization of acquisition-related intangibles FY2024 Guidance - Continuing Operations Adjusted EPS(2) Sales(1) $3.85 - $4.35 $1,400 - $1,550m Sales Adjusted EBITDA $300 - $325m Adjusted EBITDA Adjusted EPS FY 2024 Guidance (reaffirmed October 10, 2023)
21INVESTOR PRESENTATION Key Messages: Differentiated, high value add metal coatings provider with scale, expertise and customer centric technology uniquely positioned to serve the growing North American steel and aluminum markets Strong business foundation capable of growing sales and margins at or above market levels, supported by multi-year secular growth drivers; while generating significant free cash flow Coil coating and hot dip galvanizing provide environmentally friendly solutions that reduce emissions and extend the life cycle of the coated materials Focused capital allocation to reduce debt and improve leverage while supporting high ROIC investments, and returning capital to shareholders Commitment to EPS growth coupled with multiple expansion creates compelling investment opportunity and long-term shareholder value
INVESTOR PRESENTATION Appendix 23
Reg “G” Tables 23
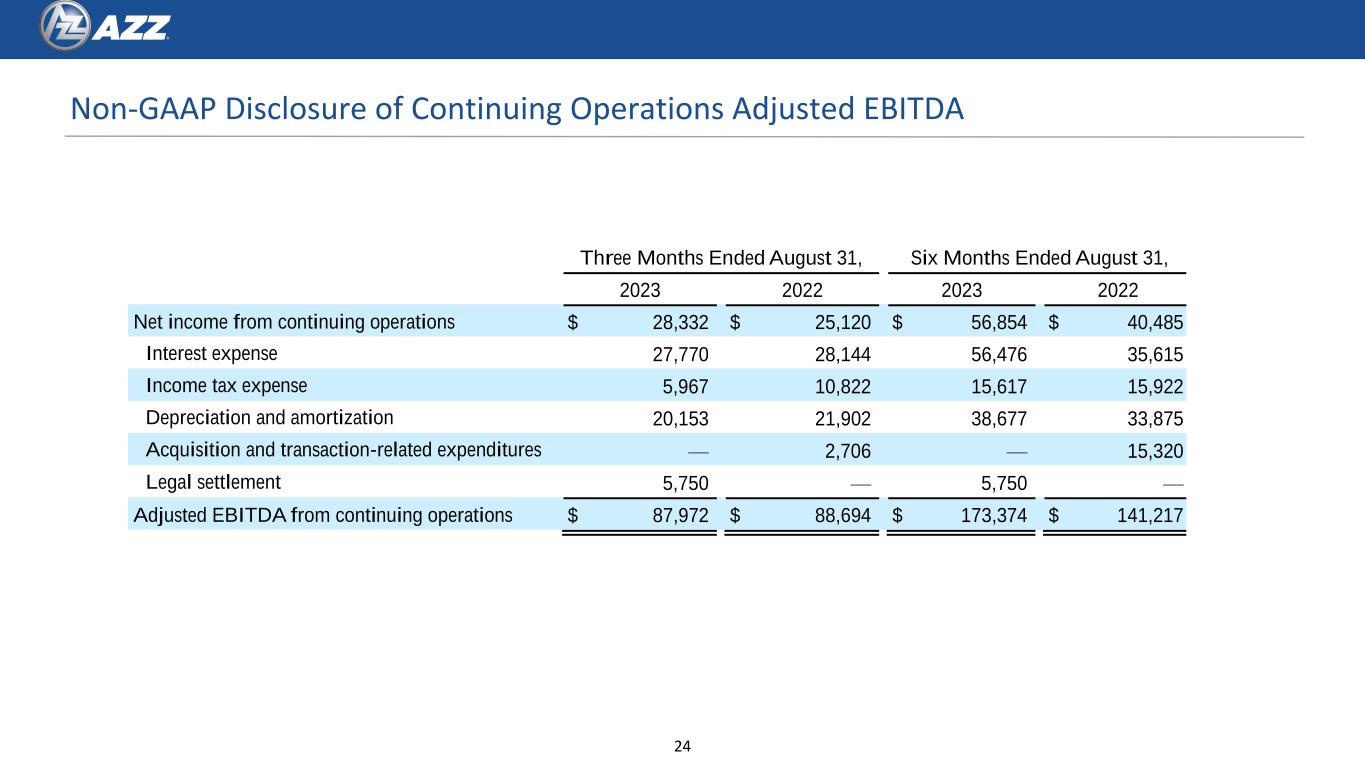
Non-GAAP Disclosure of Continuing Operations Adjusted EBITDA 24 Three Months Ended August 31, Six Months Ended August 31, 2023 2022 2023 2022 Net income from continuing operations $ 28,332 $ 25,120 $ 56,854 $ 40,485 Interest expense 27,770 28,144 56,476 35,615 Income tax expense 5,967 10,822 15,617 15,922 Depreciation and amortization 20,153 21,902 38,677 33,875 Acquisition and transaction-related expenditures — 2,706 — 15,320 Legal settlement 5,750 — 5,750 — Adjusted EBITDA from continuing operations $ 87,972 $ 88,694 $ 173,374 $ 141,217
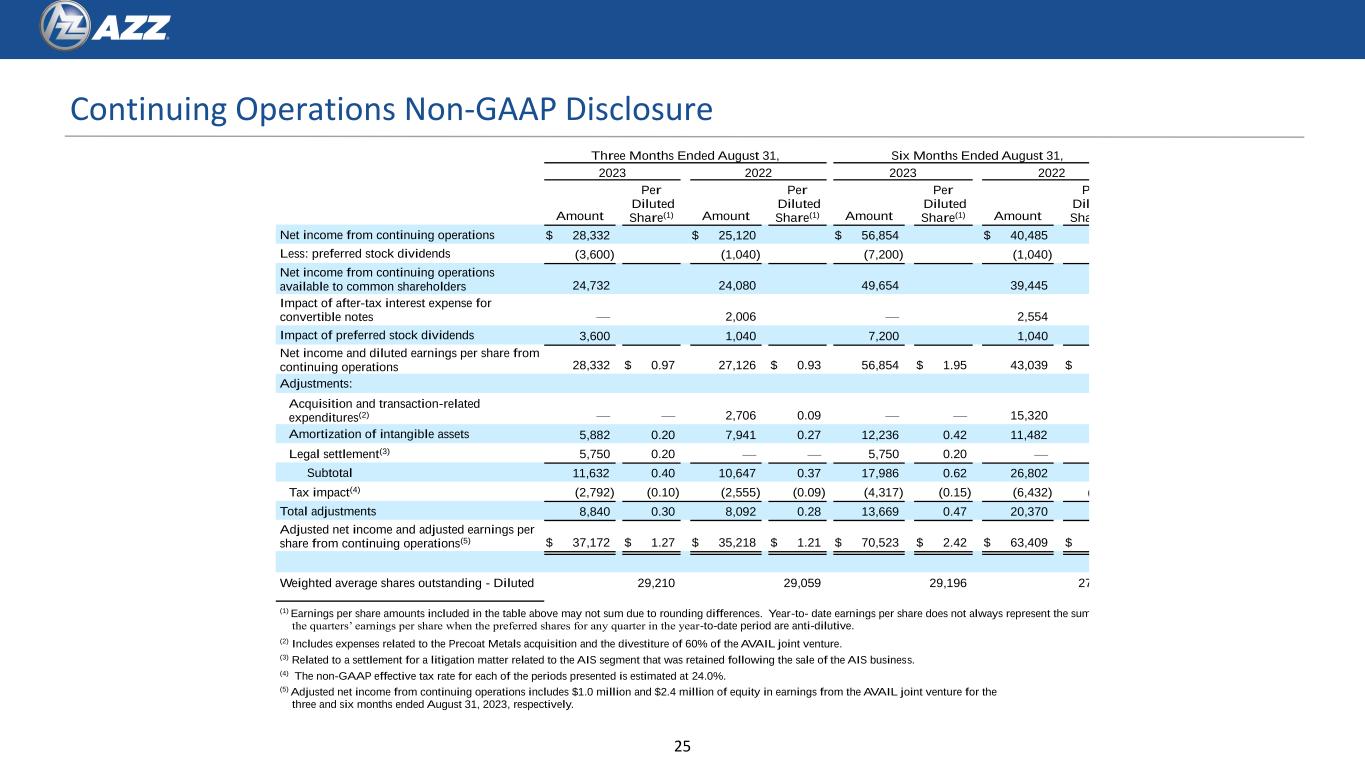
Continuing Operations Non-GAAP Disclosure 25 Three Months Ended August 31, Six Months Ended August 31, 2023 2022 2023 2022 Amount Per Diluted Share(1) Amount Per Diluted Share(1) Amount Per Diluted Share(1) Amount Per Diluted Share(1) Net income from continuing operations $ 28,332 $ 25,120 $ 56,854 $ 40,485 Less: preferred stock dividends (3,600) (1,040) (7,200) (1,040) Net income from continuing operations available to common shareholders 24,732 24,080 49,654 39,445 Impact of after-tax interest expense for convertible notes — 2,006 — 2,554 Impact of preferred stock dividends 3,600 1,040 7,200 1,040 Net income and diluted earnings per share from continuing operations 28,332 $ 0.97 27,126 $ 0.93 56,854 $ 1.95 43,039 $ 1.57 Adjustments: Acquisition and transaction-related expenditures(2) — — 2,706 0.09 — — 15,320 0.56 Amortization of intangible assets 5,882 0.20 7,941 0.27 12,236 0.42 11,482 0.42 Legal settlement(3) 5,750 0.20 — — 5,750 0.20 — — Subtotal 11,632 0.40 10,647 0.37 17,986 0.62 26,802 0.98 Tax impact(4) (2,792) (0.10) (2,555) (0.09) (4,317) (0.15) (6,432) (0.23) Total adjustments 8,840 0.30 8,092 0.28 13,669 0.47 20,370 0.74 Adjusted net income and adjusted earnings per share from continuing operations(5) $ 37,172 $ 1.27 $ 35,218 $ 1.21 $ 70,523 $ 2.42 $ 63,409 $ 2.31 Weighted average shares outstanding - Diluted 29,210 29,059 29,196 27,428 (1) Earnings per share amounts included in the table above may not sum due to rounding differences. Year-to- date earnings per share does not always represent the sum of the quarters’ earnings per share when the preferred shares for any quarter in the year-to-date period are anti-dilutive. (2) Includes expenses related to the Precoat Metals acquisition and the divestiture of 60% of the AVAIL joint venture. (3) Related to a settlement for a litigation matter related to the AIS segment that was retained following the sale of the AIS business. (4) The non-GAAP effective tax rate for each of the periods presented is estimated at 24.0%. (5) Adjusted net income from continuing operations includes $1.0 million and $2.4 million of equity in earnings from the AVAIL joint venture for the three and six months ended August 31, 2023, respectively.

Non-GAAP Segment Disclosure from Continuing Operations (Metal Coatings and Precoat Metals) 26 Three Months Ended August 31, Six Months Ended August 31, 2023 2022 2023 2022 Metal Coatings Operating income $ 45,081 $ 44,996 $ 90,552 $ 90,266 Depreciation and amortization expense 6,553 8,171 12,969 16,560 Other income (expense) 13 (141) (11) (131) EBITDA $ 51,647 $ 53,026 $ 103,510 $ 106,695 Precoat Metals Operating income $ 39,006 $ 36,213 $ 76,696 $ 42,861 Depreciation and amortization expense 7,440 13,329 12,905 16,510 Other income (expense) — 41 — 41 EBITDA $ 46,446 $ 49,583 $ 89,601 $ 59,412 Infrastructure Solutions Operating loss $ (5,932) $ — $ (5,954) $ — Equity in earnings of unconsolidated subsidiaries 974 — 2,394 — Legal Settlement 5,750 — 5,750 — Adjusted EBITDA $ 792 $ — $ 2,190 $ —


