Exhibit 99.1

Lehman Brothers Energy Conference
September 8, 2005
Certain Reserve & Production Information
The Securities and Exchange Commission has generally permitted oil and gas companies, in their filings with the SEC, to disclose only proved reserves that a company has demonstrated by actual production or conclusive formation tests to be economically and legally producible under existing economic and operating conditions. We use the terms “probable,” “possible” and “non-proven” reserves, reserve “potential” or “upside” or other descriptions of volumes of reserves potentially recoverable through additional drilling or recovery techniques that the SEC’s guidelines may prohibit us from including in filings with the SEC. These estimates are by their nature more speculative than estimates of proved reserves and accordingly are subject to substantially greater risk of being actually realized by the company.
Our production forecasts are dependent upon many assumptions, including estimates of production decline rates from existing wells and the outcome of future drilling activity. Also, our internal estimates of reserves, particularly those in our proposed acquisitions where we may have limited review of data or experience with the properties, may be subject to revision and may be different than those estimates by our external reservoir engineers at year-end. Although we believe the expectations, estimates and forecasts reflected in these and other forward-looking statements are reasonable, we can give no assurance they will prove to have been correct. They can be affected by inaccurate assumptions and data or by known or unknown risks and uncertainties.
CHK Overview
3rd largest independent producer of U.S. natural gas: (trail only DVN & APC), #8 overall (includes majors, utilities and pipelines) #1 driller in U.S.: #1 deep driller, 73 operated rigs, 61 non-operated rigs, collector of 10% of all daily drilling info generated in the U.S.
Active and focused consolidator: $7.1 billion since ‘98, $2.1 billion in ‘04, $1.8 billion to date in ‘05 Production growth(1): 1,260 mmcfe/day projected ‘05 production—27% YOY increase; 1,414 mmcfe/day projected ‘06 production—12% YOY increase Reserve growth(2): 6.0 tcfe of proved reserves at 6/30/05, 90% natural gas, 12.8 year R/P, 6.2 tcfe projected for 12/05 and 6.8 tcfe projected for 12/06 Upside potential: 5.0 tcfe of non-proven reserve potential in: i) conventional, ii) unconventional gas resource and iii) emerging gas resource plays: 9-year drilling inventory Industry’s largest inventories: 4.1 mm acres of leasehold plus 10.8 mm acres of 3-D seismic, believed to be largest onshore positions in the industry $16.4 billion EV(3): $12.1 billion equity value, $4.3 billion long-term debt 2006 estimates(1)(4): ebitda $3,141 mm; operating cash flow $2,924 mm; net income $1,157 mm CHK offers great value to investors(4): 4.1x operating cash flow, 5.2x ebitda, 10.4x P/E ratio Top stock price performance(3): CHK up 23x in 12 years as a public company, #2 performer among mid and large-cap E&P companies during that period
(1) Mid-point of guidance released 9/7/05
(2) Pro forma for acquisitions announced in August 2005
(3) Based on common stock price of $31.00; includes the August 2005 $600 mm senior notes issuance and assumes the issuance of 8 million shares of common stock at $31.00, and the issuance of $250 million of convertible preferred stock (4) Assumes NYMEX prices of $8.00/mcf and $50.00/bbl for 2006, and before effects of FAS 133 (unrealized hedging gain or loss), and charges incurred in connection with stock based compensation.
2
2Q05: Record Quarterly Results
Increased production to 1,244 mmcfe/day
– 31% YOY and 7% sequential growth (16th consecutive quarterly increase)
– Exceeded mid-point of forecast by 3.7 bcfe
– Annualized first half 2005 organic growth rate of 10.2% Strong quarterly financial performance
– Revenues reached $1,048 mm
–$565 mm in adjusted EBITDA(1)
–$513 mm in operating cash flow(1)(2)
– $174 million adjusted net income to common ($2.00 per fully diluted common share annualized) Increased reserves to 6.0 tcfe (or 1 billion barrel oil equivalent!)
– Proved reserves up 22% year to date to 6.0 tcfe (3)
– Added 948 bcfe in first half of 2005 at a drilling and acquisition cost of $1.49/mcfe
– 535% reserve replacement rate
– Pre-tax SEC PV10% of $14.6 billion for proved reserves (using NYMEX prices of $56.73/bbl and $7.08/mcf)
– Non-proved reserves increased by 25% to 5.0 tcfe
Announced acquisition of 294 bcfe of 3P reserves and 33 mmcfe/d of production for $410 mm from four privately-held companies, including remaining 56% share of Hallwood/CHK South Block AMI in Johnson County, Texas Barnett Shale sweet spot Made further drilling rig investments to mitigate rising oilfield service costs
– Up approximately $150 mm on various drilling rig investments to date
(1) Refer to our website for reconciliation of this non-GAAP measure to the comparable GAAP measure (2) Before changes in assets and liabilities (3) Includes proved reserves from acquisitions announced in August 2005
3
CHK’s Successful Business Strategy
Following operational failures and oil/gas price collapse in the late 1990s, CHK revamped its business strategy and for the past 7 years has executed a simple and highly effective business strategy:
– Balanced growth through acquisitions and the drillbit
• Focus on long-lived, low-decline, onshore US gas reserves that have become much more valuable over time
• Rediscover the lost art of deep gas exploration through new investments in people, land and seismic in the right areas
– Regional consolidation to generate operating scale, maintain low operating and administrative costs and deliver high returns
• CHK’s scale in its core areas (particularly the Mid-Continent) is a real competitive advantage and has created negotiating power, informational advantages and attracted top industry talent
– Concentration on gas
• One of the first companies to recognize and capitalize on tightening supply/demand fundamentals and permanent upward shift in gas prices that began in ‘99
CHK has benefited from substantial first mover advantages and has built one of the largest U.S. natural gas resources bases
4
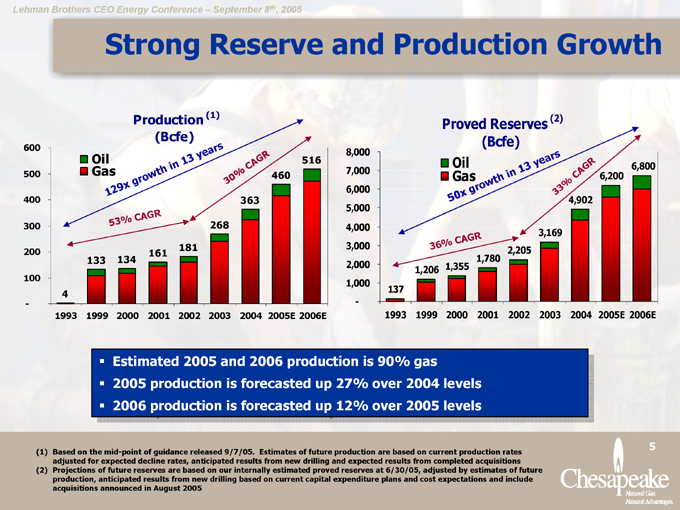
Strong Reserve and Production Growth
600 500 400 300 200 100 -
Production (1) (Bcfe)
Oil Gas
129x growth in 13 years
53% CAGR
30% CAGR
4
133
134
161
181
268
363
460
516
1993 1999 2000 2001 2002 2003 2004 2005E 2006E
8,000 7,000 6,000 5,000 4,000 3,000 2,000 1,000 -
Proved Reserves (2) (Bcfe)
50x GasOil growth in 13 years
36% CAGR
33% CAGR
137
1,206
1,355
1,780
2,205
3,169
4,902
6,200
6,800
1993 1999 2000 2001 2002 2003 2004 2005E 2006E
Estimated 2005 and 2006 production is 90% gas 2005 production is forecasted up 27% over 2004 levels 2006 production is forecasted up 12% over 2005 levels
(1) Based on the mid-point of guidance released 9/7/05. Estimates of future production are based on current production rates adjusted for expected decline rates, anticipated results from new drilling and expected results from completed acquisitions (2) Projections of future reserves are based on our internally estimated proved reserves at 6/30/05, adjusted by estimates of future production, anticipated results from new drilling based on current capital expenditure plans and cost expectations and include acquisitions announced in August 2005
5

CHK’s Focused Operations
Proved Reserves (bcfe) Proved Reserves % Production (mmcfe/d) Production % R/P (years)
Mid- Continent 3,726 62% 819 64% 12.5
Ark-La-Tex & Barnett Shale (1) 901 15% 169 13% 14.6
Permian (1) 685 12% 104 8% 8.1
S. Texas & Gulf Coast 605 10% 177 14% 9.3
Other (2) 46 1% 8 1% 15.8
Totals (1) 5,963 100% 1,277 100% 12.8
Permian Basin
Anadarko Basin
Barnett Shale
Ark-La-Tex
Arkoma Basin
South Texas
Texas
Gulf
Coast
Counties with CHK leasehold
CHK collects almost 20% of all daily drilling information in the SW USA
CHK OKC headquarters
CHK field offices
CHK operated rigs (73)
CHK non-operated rigs (61)
(1) As of 6/30/05—Pro forma for acquisitions announced in August 2005
(2) “Other” includes the Piceance Basin of Colorado and the Williston Basin of North Dakota and Montana.
6
CHK’s Business Strategy
Growth through acquisitions Growth through the drillbit Regional consolidation Gas, gas, gas
Result: High returns on invested capital and top tier returns to investors
7

Keys To Being A Successful Acquirer
Focus Know what you want to buy, where you want to buy it and how you want to buy it
Experience Inexperienced or occasional buyers generally do not succeed. CHK has a consistent approach to acquiring and assimilating acquisitions. CHK is always in the market and has 50 people working full-time on acquisition integration
Drillbit Expertise Must be able to accurately assess, accelerate and deliver upside from PUDs, probables, possibles and exploration opportunities
Operational Skill Must be able to operate acquired properties more efficiently than sellers. Significant operating scale and attention to detail are the keys to achieving efficiencies
CHK has executed more acquisition transactions in the past seven years than any other E&P company – experience helps prevent mistakes!
8
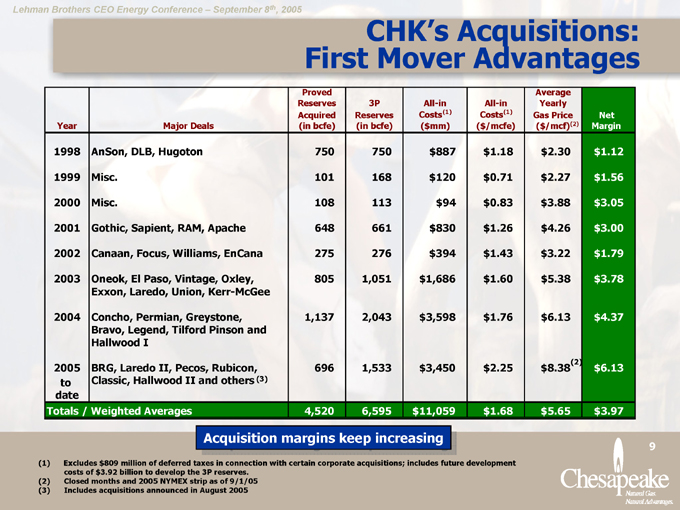
CHK’s Acquisitions: First Mover Advantages
Year Major Deals Proved Reserves Acquired (in bcfe) 3P Reserves (in bcfe) All-in Costs (1) ($mm) All-in Costs(1) ($/mcfe) Average Yearly Gas Price ($/ mcf)(2) Net Margin
1998 AnSon, DLB, Hugoton 750 750 $887 $1.18 $2.30 $1.12
1999 Misc. 101 168 $120 $0.71 $2.27 $1.56
2000 Misc. 108 113 $94 $0.83 $3.88 $3.05
2001 Gothic, Sapient, RAM, Apache 648 661 $830 $1.26 $4.26 $3.00
2002 Canaan, Focus, Williams, EnCana 275 276 $394 $1.43 $3.22 $1.79
2003 Oneok, El Paso, Vintage, Oxley, Exxon, Laredo, Union, Kerr-McGee 805 1,051 $1,686 $1.60 $5.38 $3.78
2004 Concho, Permian, Greystone, Bravo, Legend, Tilford Pinson and Hallwood I 1,137 2,043 $3,598 $1.76 $6.13 (2) $4.37
2005 to date BRG, Laredo II, Pecos, Rubicon, Classic, Hallwood II and others (3) 696 1,533 $3,450 $2.25 $8.38 $6.13
Totals / Weighted Averages 4,520 6,595 $11,059 $1.68 $5.65 $3.97
Acquisition margins keep increasing
(1) Excludes $809 million of deferred taxes in connection with certain corporate acquisitions; includes future development costs of $3.92 billion to develop the 3P reserves.
(2) Closed months and 2005 NYMEX strip as of 9/1/05 (3) Includes acquisitions announced in August 2005
9
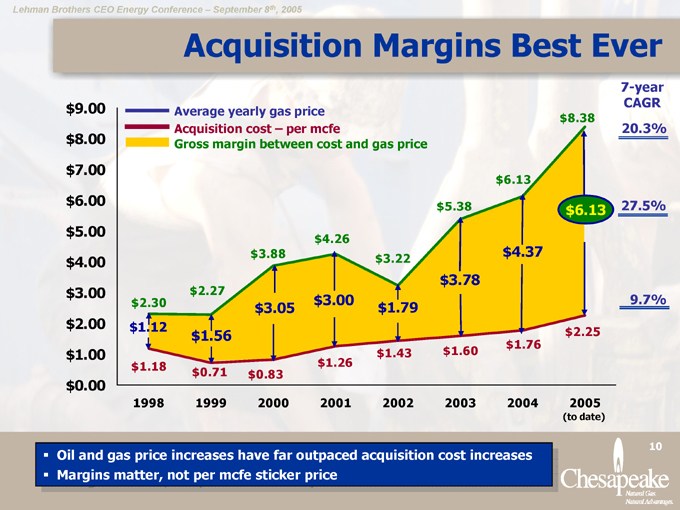
Acquisition Margins Best Ever
$9.00
$8.00
$7.00
$6.00
$5.00
$4.00
$3.00
$2.00
$1.00
$0.00
Average yearly gas price Acquisition cost – per mcfe
Gross margin between cost and gas price $2.30 $2.27 $3.88 $4.26 $3.22 $5.38 $6.13 $8.38 $1.12 $1.56 $3.05 $3.00 $1.79 $3.78 $4.37 $6.13 $1.18 $0.71 $0.83 $1.26 $1.43 $1.60 $1.76 $2.25
7-year CAGR 20.3%
27.5%
9.7%
1998 1999 2000 2001 2002 2003 2004 2005 (to date)
Oil and gas price increases have far outpaced acquisition cost increases Margins matter, not per mcfe sticker price
10
CHK’s Business Strategy
Growth through acquisitions Growth through the drillbit Regional consolidation Gas, gas, gas
Result: High returns on invested capital and top tier returns to investors
11
Why Is CHK the #1 Driller in the U.S.?
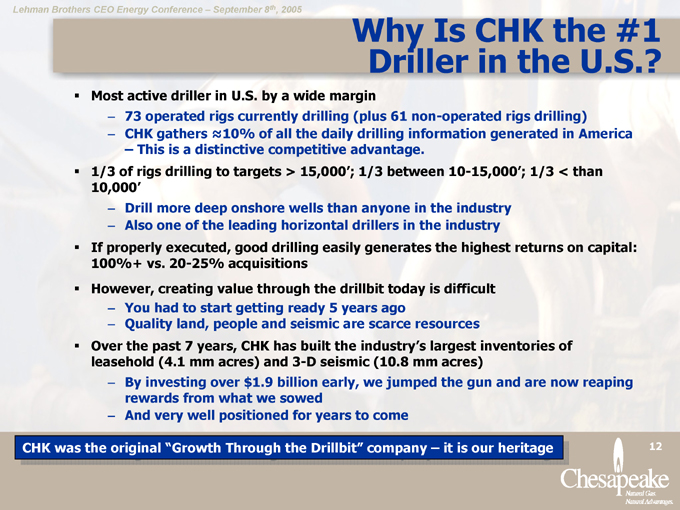
Most active driller in U.S. by a wide margin
– 73 operated rigs currently drilling (plus 61 non-operated rigs drilling)
– CHK gathers 10% of all the daily drilling information generated in America
– This is a distinctive competitive advantage.
1/3 of rigs drilling to targets > 15,000’; 1/3 between 10-15,000’; 1/3 < than 10,000’
– Drill more deep onshore wells than anyone in the industry
– Also one of the leading horizontal drillers in the industry
If properly executed, good drilling easily generates the highest returns on capital: 100%+ vs. 20-25% acquisitions However, creating value through the drillbit today is difficult
– You had to start getting ready 5 years ago
– Quality land, people and seismic are scarce resources
Over the past 7 years, CHK has built the industry’s largest inventories of leasehold (4.1 mm acres) and 3-D seismic (10.8 mm acres)
– By investing over $1.9 billion early, we jumped the gun and are now reaping rewards from what we sowed
– And very well positioned for years to come
CHK was the original “Growth Through the Drillbit” company – it is our heritage
12
Balanced Production Growth
Net mmcfe / day
1,400 1,300 1,200 1,100 1,000 900 800 700 600 500 400 300 200 100 0
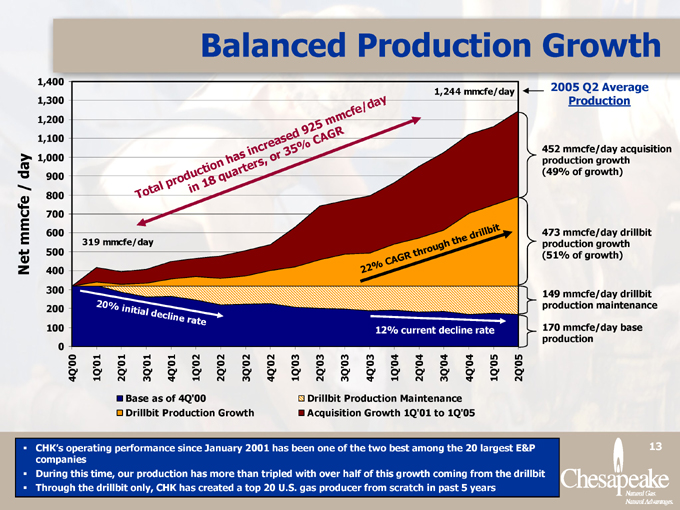
Total production has increased 925 mmcfe/ day in 18 quarters, or 35% CAGR
319 mmcfe/day
1,244 mmcfe/day
20% initial decline rate
22% CAGR through the drillbit
12% current decline rate
4Q’00 1Q’01 2Q’01 3Q’01 4Q’01 1Q’02 2Q’02 3Q’02 4Q’02 1Q’03 2Q’03 3Q’03 4Q’03 1Q’04 2Q’04 3Q’04 4Q’04 1Q’05 2Q’05
Base as of 4Q’00
Drillbit Production Growth
Drillbit Production Maintenance Acquisition Growth 1Q’01 to 1Q’05
2005 Q2 Average Production
452 mmcfe/day acquisition production growth (49% of growth)
473 mmcfe/day drillbit production growth (51% of growth)
149 mmcfe/day drillbit production maintenance
170 mmcfe/day base production
CHK’s operating performance since January 2001 has been one of the two best among the 20 largest E&P companies During this time, our production has more than tripled with over half of this growth coming from the drillbit Through the drillbit only, CHK has created a top 20 U.S. gas producer from scratch in past 5 years
13
Investing in the Future
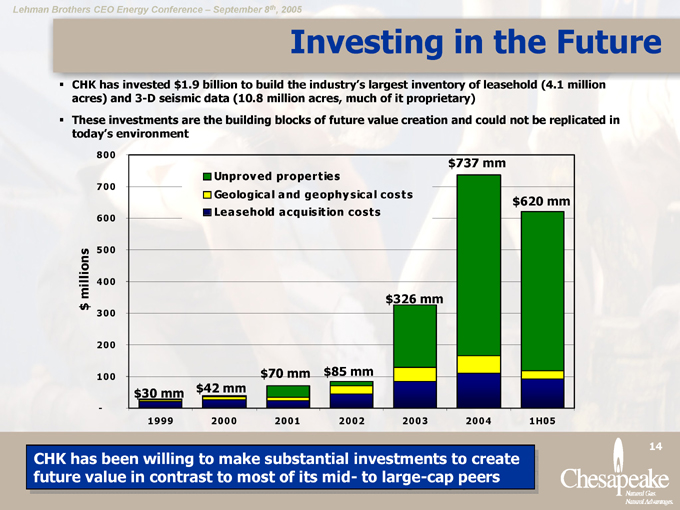
CHK has invested $1.9 billion to build the industry’s largest inventory of leasehold (4.1 million acres) and 3-D seismic data (10.8 million acres, much of it proprietary) These investments are the building blocks of future value creation and could not be replicated in today’s environment $ millions
800 700 600 500 400 300 200 100 -
Unproved properties
Geological and geophysical costs Leasehold acquisition costs $30 mm $42 mm $70 mm $85 mm $326 mm $737 mm $620 mm
1999 2000 2001 2002 2003 2004 1H05
CHK has been willing to make substantial investments to create future value in contrast to most of its mid-to large-cap peers
14
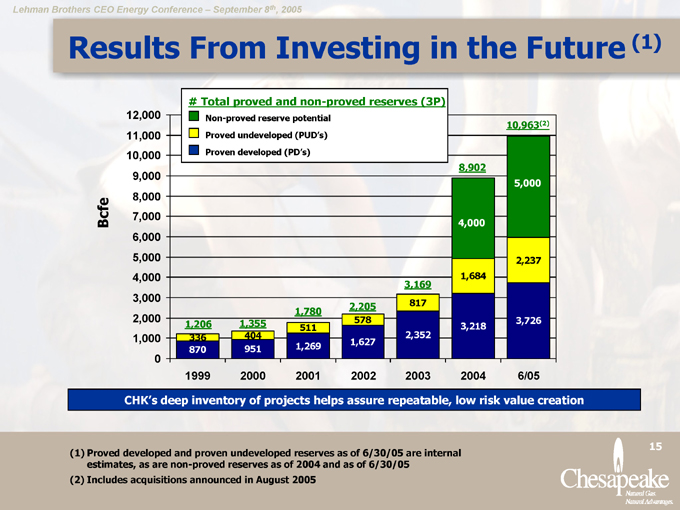
Results From Investing in the Future (1)
Bcfe
12,000 11,000 10,000 9,000 8,000 7,000 6,000 5,000 4,000 3,000 2,000 1,000 0
# Total proved and non-proved reserves (3P)
Non-proved reserve potential Proved undeveloped (PUD’s) Proven developed (PD’s)
1,206
1,355
1,780
2,205
3,169
8,902
10,963(2)
336
404
511
578
817
1,684
2,237
4,000
5,000
870
951
1,269
1,627
2,352
3,218
3,726
1999 2000 2001 2002 2003 2004 6/05
CHK’s deep inventory of projects helps assure repeatable, low risk value creation
(1) Proved developed and proven undeveloped reserves as of 6/30/05 are internal estimates, as are non-proved reserves as of 2004 and as of 6/30/05 (2) Includes acquisitions announced in August 2005
15
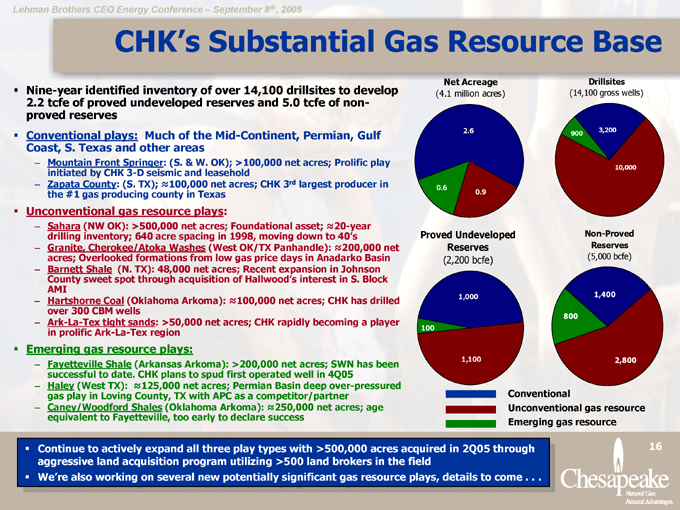
CHK’s Substantial Gas Resource Base
Nine-year identified inventory of over 14,100 drillsites to develop 2.2 tcfe of proved undeveloped reserves and 5.0 tcfe of non-proved reserves Conventional plays: Much of the Mid-Continent, Permian, Gulf Coast, S. Texas and other areas
Mountain Front Springer: (S. & W. OK); >100,000 net acres; Prolific play initiated by CHK 3-D seismic and leasehold
Zapata County: (S. TX); 100,000 net acres; CHK 3rd largest producer in the #1 gas producing county in Texas
Unconventional gas resource plays:
Sahara (NW OK): >500,000 net acres; Foundational asset; 20-year drilling inventory; 640 acre spacing in 1998, moving down to 40’s
Granite, Cherokee/Atoka Washes (West OK/TX Panhandle): 200,000 net acres; Overlooked formations from low gas price days in Anadarko Basin
Barnett Shale (N. TX): 48,000 net acres; Recent expansion in Johnson County sweet spot through acquisition of Hallwood’s interest in S. Block AMI
Hartshorne Coal (Oklahoma Arkoma): 100,000 net acres; CHK has drilled over 300 CBM wells
Ark-La-Tex tight sands: >50,000 net acres; CHK rapidly becoming a player in prolific Ark-La-Tex region
Emerging gas resource plays:
Fayetteville Shale (Arkansas Arkoma): >200,000 net acres; SWN has been successful to date. CHK plans to spud first operated well in 4Q05
Haley (West TX): 125,000 net acres; Permian Basin deep over-pressured gas play in Loving County, TX with APC as a competitor/partner
Caney/Woodford Shales (Oklahoma Arkoma): 250,000 net acres; age equivalent to Fayetteville, too early to declare success
Net Acreage
(4.1 million acres)
2.6
0.6
0.9
Drillsites
(14,100 gross wells)
900
3,200
10,000
Proved Undeveloped Reserves
(2,200 bcfe)
1,000
100
1,100
Non-Proved Reserves
(5,000 bcfe)
800
1,400
2,800
Conventional
Unconventional gas resource Emerging gas resource
Continue to actively expand all three play types with >500,000 acres acquired in 2Q05 through aggressive land acquisition program utilizing >500 land brokers in the field aggressive the field
We’re also working on several new potentially significant gas resource plays, details to come . . .
16
CHK’s Business Strategy
Growth through acquisitions Growth through the drillbit Regional consolidation Gas, gas, gas
Result: High returns on invested capital and top tier returns to investors
17
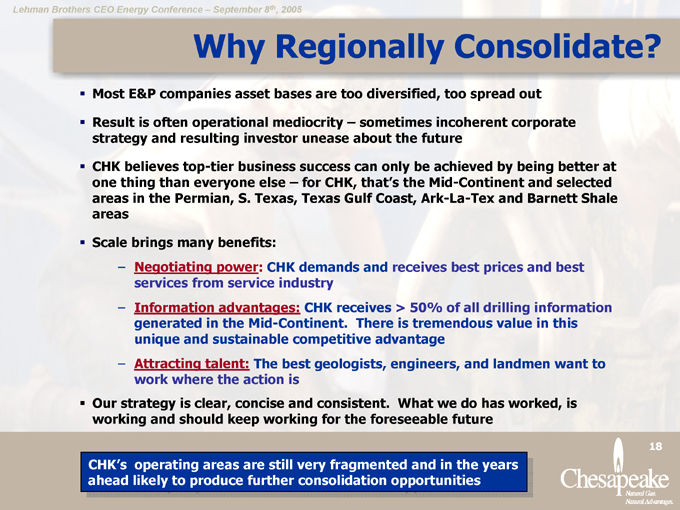
Why Regionally Consolidate?
Most E&P companies asset bases are too diversified, too spread out Result is often operational mediocrity – sometimes incoherent corporate strategy and resulting investor unease about the future CHK believes top-tier business success can only be achieved by being better at one thing than everyone else – for CHK, that’s the Mid-Continent and selected areas in the Permian, S. Texas, Texas Gulf Coast, Ark-La-Tex and Barnett Shale areas Scale brings many benefits:
– Negotiating power: CHK demands and receives best prices and best services from service industry
– Information advantages: CHK receives > 50% of all drilling information generated in the Mid-Continent. There is tremendous value in this unique and sustainable competitive advantage
– Attracting talent: The best geologists, engineers, and landmen want to work where the action is Our strategy is clear, concise and consistent. What we do has worked, is working and should keep working for the foreseeable future
CHK’s operating areas are still very fragmented and in the years ahead likely to produce further consolidation opportunities
18
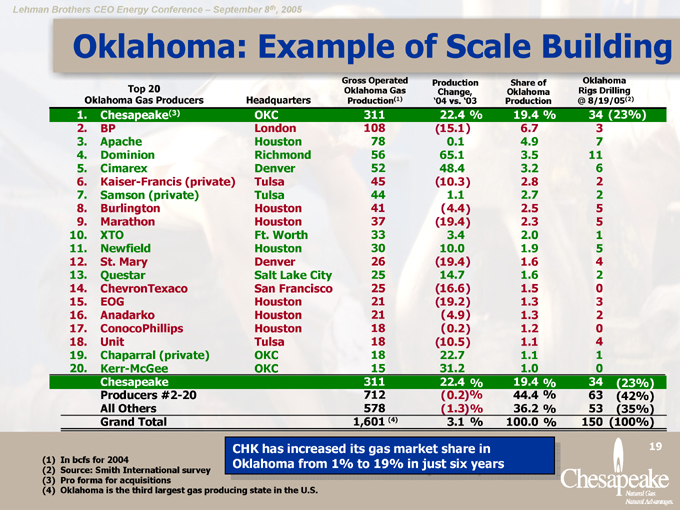
Oklahoma: Example of Scale Building
Oklahoma Gas Producers Top 20 Headquarters Production(1) Gross Operated Oklahoma Gas ‘04 vs. ‘03 Production Change, Production Share of Oklahoma @ 8/19/05(2) Oklahoma Rigs Drilling
1. Chesapeake(3) OKC 311 22.4 % 19.4 % 34 (23%)
2. BP London 108 (15.1) 6.7 3
3. Apache Houston 78 0.1 4.9 7
4. Dominion Richmond 56 65.1 3.5 11
5. Cimarex Denver 52 48.4 3.2 6
6. Kaiser-Francis (private) Tulsa 45 (10.3) 2.8 2
7. Samson (private) Tulsa 44 1.1 2.7 2
8. Burlington Houston 41 (4.4) 2.5 5
9. Marathon Houston 37 (19.4) 2.3 5
10. XTO Ft. Worth 33 3.4 2.0 1
11. Newfield Houston 30 10.0 1.9 5
12. St. Mary Denver 26 (19.4) 1.6 4
13. Questar Salt Lake City 25 14.7 1.6 2
14. ChevronTexaco San Francisco 25 (16.6) 1.5 0
15. EOG Houston 21 (19.2) 1.3 3
16. Anadarko Houston 21 (4.9) 1.3 2
17. ConocoPhillips Houston 18 (0.2) 1.2 0
18. Unit Tulsa 18 (10.5) 1.1 4
19. Chaparral (private) OKC 18 22.7 1.1 1
20. Kerr-McGee OKC 15 31.2 1.0 0
Chesapeake 311 22.4 % 19.4 % 34 (23%)
Producers #2-20 712 (0.2)% 44.4 % 63 (42%)
All Others 578 (1.3)% 36.2 % 53 (35%)
Grand Total 1,601 (4) 3.1 % 100.0 % 150 (100%)
CHK has increased its gas market share Oklahoma from 1% to 19% in just six years
(1) In bcfs for 2004
(2) Source: Smith International survey (3) Pro forma for acquisitions
(4) Oklahoma is the third largest gas producing state in the U.S.
19
CHK’s Business Strategy
Growth through acquisitions Growth through the drillbit Regional consolidation Gas, gas, gas
Result: High returns on invested capital and top tier returns to investors
20
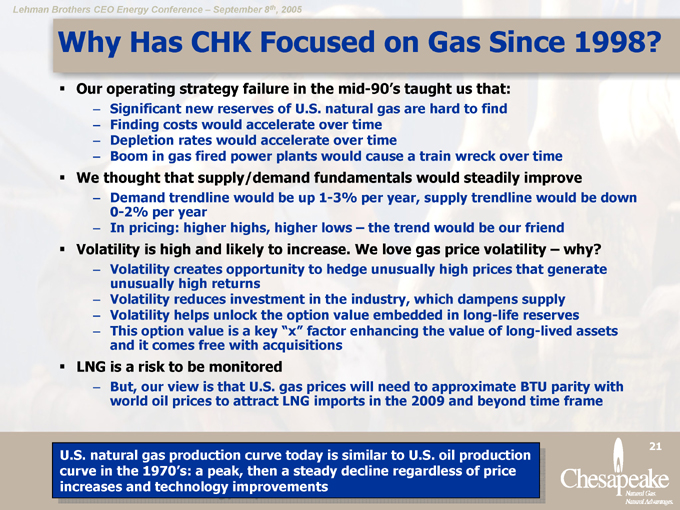
Why Has CHK Focused on Gas Since 1998?
Our operating strategy failure in the mid-90’s taught us that:
– Significant new reserves of U.S. natural gas are hard to find
– Finding costs would accelerate over time
– Depletion rates would accelerate over time
– Boom in gas fired power plants would cause a train wreck over time
We thought that supply/demand fundamentals would steadily improve
– Demand trendline would be up 1-3% per year, supply trendline would be down 0-2% per year
– In pricing: higher highs, higher lows – the trend would be our friend
Volatility is high and likely to increase. We love gas price volatility – why?
– Volatility creates opportunity to hedge unusually high prices that generate unusually high returns
– Volatility reduces investment in the industry, which dampens supply
– Volatility helps unlock the option value embedded in long-life reserves
– This option value is a key “x” factor enhancing the value of long-lived assets and it comes free with acquisitions
LNG is a risk to be monitored
– But, our view is that U.S. gas prices will need to approximate BTU parity with world oil prices to attract LNG imports in the 2009 and beyond time frame
U.S. natural gas production curve today is similar to U.S. oil production curve in the 1970’s: a peak, then a steady decline regardless of price increases and technology improvements
21
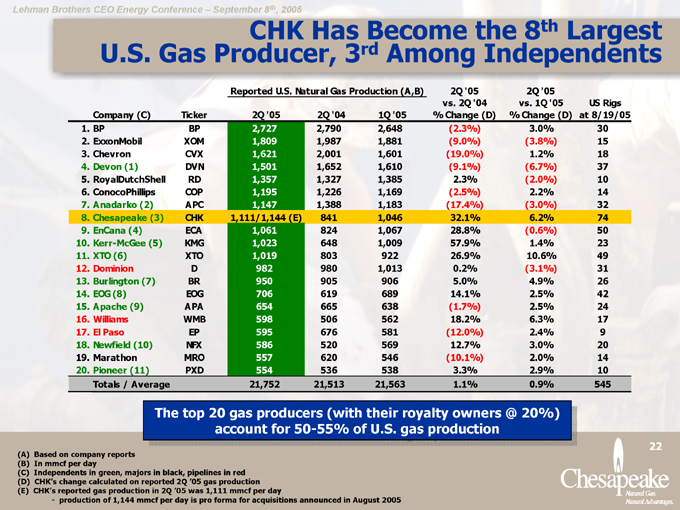
CHK Has Become the 8th Largest U.S. Gas Producer, 3rd Among Independents
Reported U.S. Natural Gas Production (A,B)
Company (C) Ticker 2Q ‘05 2Q ‘04 1Q ‘05 2Q ‘05 vs. 2Q ‘04 % Change (D) 2Q ‘05 vs. 1Q ‘05 % Change (D) US Rigs at 8/19/05
1. BP BP 2,727 2,790 2,648 (2.3%) 3.0% 30
2. ExxonMobil XOM 1,809 1,987 1,881 (9.0%) (3.8%) 15
3. Chevron CVX 1,621 2,001 1,601 (19.0%) 1.2% 18
4. Devon (1) DVN 1,501 1,652 1,610 (9.1%) (6.7%) 37
5. RoyalDutchShell RD 1,357 1,327 1,385 2.3% (2.0%) 10
6. ConocoPhillips COP 1,195 1,226 1,169 (2.5%) 2.2% 14
7. Anadarko (2) APC 1,147 1,388 1,183 (17.4%) (3.0%) 32
8. Chesapeake (3) CHK 1,111/1,144 (E) 841 1,046 32.1% 6.2% 74
9. EnCana (4) ECA 1,061 824 1,067 28.8% (0.6%) 50
10. Kerr-McGee (5) KMG 1,023 648 1,009 57.9% 1.4% 23
11. XTO (6) XTO 1,019 803 922 26.9% 10.6% 49
12. Dominion D 982 980 1,013 0.2% (3.1%) 31
13. Burlington (7) BR 950 905 906 5.0% 4.9% 26
14. EOG (8) EOG 706 619 689 14.1% 2.5% 42
15. Apache (9) APA 654 665 638 (1.7%) 2.5% 24
16. Williams WMB 598 506 562 18.2% 6.3% 17
17. El Paso EP 595 676 581 (12.0%) 2.4% 9
18. Newfield (10) NFX 586 520 569 12.7% 3.0% 20
19. Marathon MRO 557 620 546 (10.1%) 2.0% 14
20. Pioneer (11) PXD 554 536 538 3.3% 2.9% 10
Totals / Average 21,752 21,513 21,563 1.1% 0.9% 545
The top 20 gas producers (with their royalty owners @ 20%) account for 50-55% of U.S. gas production
(A) Based on company reports (B) In mmcf per day
(C) Independents in green, majors in black, pipelines in red (D) CHK’s change calculated on reported 2Q ‘05 gas production (E) CHK’s reported gas production in 2Q ‘05 was 1,111 mmcf per day
- production of 1,144 mmcf per day is pro forma for acquisitions announced in August 2005
22

Financial Information
23
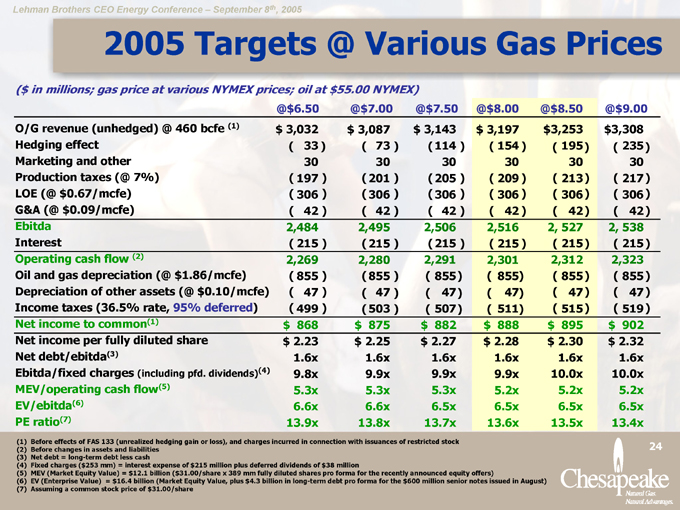
2005 Targets @ Various Gas Prices
($in millions; gas price at various NYMEX prices; oil at $55.00 NYMEX)
@ $6.50 @$7.00 @ $7.50 @ $8.00 @$8.50 @ $9.00
O/G revenue (unhedged) @ 460 bcfe (1) $3,032 $3,087 $3,143 $3,197 $3,253 $3,308
Hedging effect ( 33 ) ( 73 ) (114 ) ( 154 ) ( 195) ( 235)
Marketing and other 30 30 30 30 30 30
Production taxes (@ 7%) ( 197 ) ( 201 ) (205 ) ( 209 ) ( 213) ( 217)
LOE (@ $0.67/mcfe) ( 306 ) ( 306 ) (306 ) ( 306 ) ( 306) ( 306)
G&A (@ $0.09/mcfe) ( 42 ) ( 42 ) ( 42 ) ( 42 ) ( 42) ( 42)
Ebitda 2,484 2,495 2,506 2,516 2, 527 2, 538
Interest ( 215 ) ( 215 ) (215 ) ( 215 ) ( 215) ( 215)
Operating cash flow (2) 2,269 2,280 2,291 2,301 2,312 2,323
Oil and gas depreciation (@ $1.86/mcfe) ( 855 ) ( 855 ) ( 855) ( 855) ( 855) ( 855)
Depreciation of other assets (@ $0.10/mcfe) ( 47 ) ( 47 ) ( 47) ( 47) ( 47) ( 47)
Income taxes (36.5% rate, 95% deferred) ( 499 ) ( 503 ) ( 507) ( 511) ( 515) ( 519)
Net income to common(1) $868 $875 $882 $888 $895 $902
Net income per fully diluted share $2.23 $2.25 $2.27 $2.28 $2.30 $2.32
Net debt/ebitda(3) 1.6x 1.6x 1.6x 1.6x 1.6x 1.6x
Ebitda/fixed charges (including pfd. dividends)(4) 9.8x 9.9x 9.9x 9.9x 10.0x 10.0x
MEV/operating cash flow(5) 5.3x 5.3x 5.3x 5.2x 5.2x 5.2x
EV/ebitda (6) 6.6x 6.6x 6.5x 6.5x 6.5x 6.5x
PE ratio(7) 13.9x 13.8x 13.7x 13.6x 13.5x 13.4x
(1) Before effects of FAS 133 (unrealized hedging gain or loss), and charges incurred in connection with issuances of restricted stock (2) Before changes in assets and liabilities (3) Net debt = long-term debt less cash (4) Fixed charges ($253 mm) = interest expense of $215 million plus deferred dividends of $38 million
(5) MEV (Market Equity Value) = $12.1 billion ($31.00/share x 389 mm fully diluted shares pro forma for the recently announced equity offers)
(6) EV (Enterprise Value) = $16.4 billion (Market Equity Value, plus $4.3 billion in long-term debt pro forma for the $600 million senior notes issued in August) (7) Assuming a common stock price of $31.00/share
24
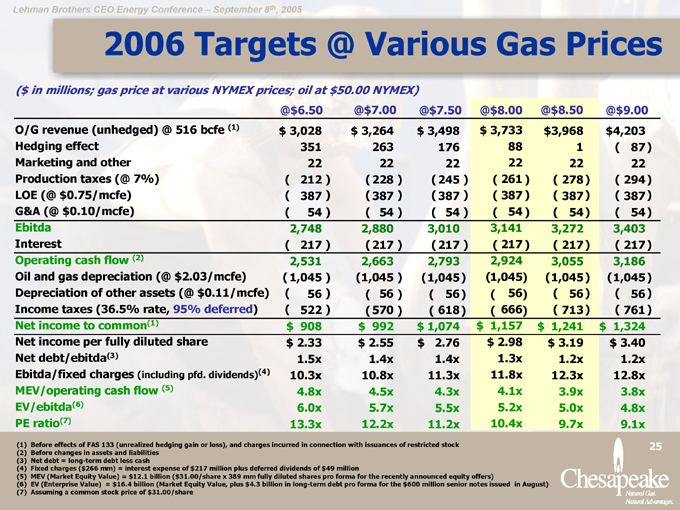
2006 Targets @ Various Gas Prices
($ in millions; gas price at various NYMEX prices; oil at $50.00 NYMEX)
@$6.50 @$7.00 @$7.50 @$8.00 @$8.50 @$9.00
O/G revenue (unhedged) @ 516 bcfe (1) $3,028 $3,264 $3,498 $3,733 $3,968 $4,203
Hedging effect 351 263 176 88 1 ( 87)
Marketing and other 22 22 22 22 22 22
Production taxes (@ 7%) ( 212 ) ( 228 ) ( 245 ) ( 261 ) ( 278) ( 294)
LOE (@ $0.75/mcfe) ( 387 ) ( 387 ) ( 387 ) ( 387 ) ( 387) ( 387)
G&A (@ $0.10/mcfe) ( 54 ) ( 54 ) ( 54 ) ( 54 ) ( 54) ( 54)
Ebitda 2,748 2,880 3,010 3,141 3,272 3,403
Interest ( 217 ) ( 217 ) ( 217 ) ( 217 ) ( 217) ( 217)
Operating cash flow (2) 2,531 2,663 2,793 2,924 3,055 3,186
Oil and gas depreciation (@ $2.03/mcfe) ( 1,045 ) ( 1,045 ) ( 1,045) ( 1,045) ( 1,045) ( 1,045)
Depreciation of other assets (@ $0.11/mcfe) ( 56 ) ( 56 ) ( 56) ( 56) ( 56) ( 56)
Income taxes (36.5% rate, 95% deferred) ( 522 ) ( 570 ) ( 618) ( 666) ( 713) ( 761)
Net income to common(1) $908 $992 $1,074 $1,157 $1,241 $1,324
Net income per fully diluted share $2.33 $2.55 $2.76 $2.98 $3.19 $3.40
Net debt/ebitda(3) 1.5x 1.4x 1.4x 1.3x 1.2x 1.2x
Ebitda/fixed charges (including pfd. dividends)(4) 10.3x 10.8x 11.3x 11.8x 12.3x 12.8x
MEV/operating cash flow(5) 4.8x 4.5x 4.3x 4.1x 3.9x 3.8x
EV/ebitda(6) 6.0x 5.7x 5.5x 5.2x 5.0x 4.8x
PE ratio(7) 13.3x 12.2x 11.2x 10.4x 9.7x 9.1x
(1) Before effects of FAS 133 (unrealized hedging gain or loss), and charges incurred in connection with issuances of restricted stock (2) Before changes in assets and liabilities (3) Net debt = long-term debt less cash (4) Fixed charges ($266 mm) = interest expense of $217 million plus deferred dividends of $49 million
(5) MEV (Market Equity Value) = $12.1 billion ($31.00/share x 389 mm fully diluted shares pro forma for the recently announced equity offers)
(6) EV (Enterprise Value) = $16.4 billion (Market Equity Value, plus $4.3 billion in long-term debt pro forma for the $600 million senior notes issued in August) (7) Assuming a common stock price of $31.00/share
25
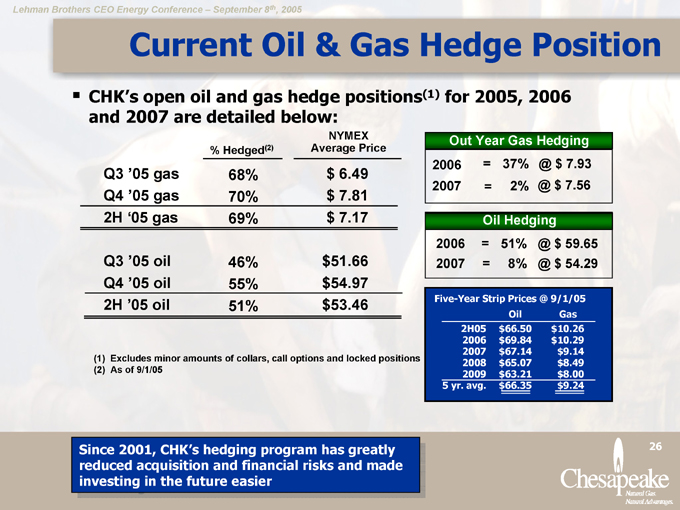
Current Oil & Gas Hedge Position
CHK’s open oil and gas hedge positions(1) for 2005, 2006 and 2007 are detailed below:
% Hedged(2) NYMEX Average Price
Q3 ‘05 gas 68% $6.49
Q4 ‘05 gas 70% $7.81
2H ‘05 gas 69% $7.17
Q3 ‘05 oil 46% $51.66
Q4 ‘05 oil 55% $54.97
2H ‘05 oil 51% $53.46
Out Year Gas Hedging
2006 = 37% @ $ 7.93
2007 = 2% @ $ 7.56
Oil Hedging
2006 = 51% @ $ 59.65
2007 = 8% @ $ 54.29
Five-Year Strip Prices @ 9/1/05
Oil Gas
2H05 $66.50 $10.26
2006 $69.84 $10.29
2007 $67.14 $9.14
2008 $65.07 $8.49
2009 $63.21 $8.00
5 yr. avg. $66.35 $9.24
(1) Excludes minor amounts of collars, call options and locked positions (2) As of 9/1/05
Since 2001, CHK’s hedging program has greatly reduced acquisition and financial risks and made investing in the future easier
26
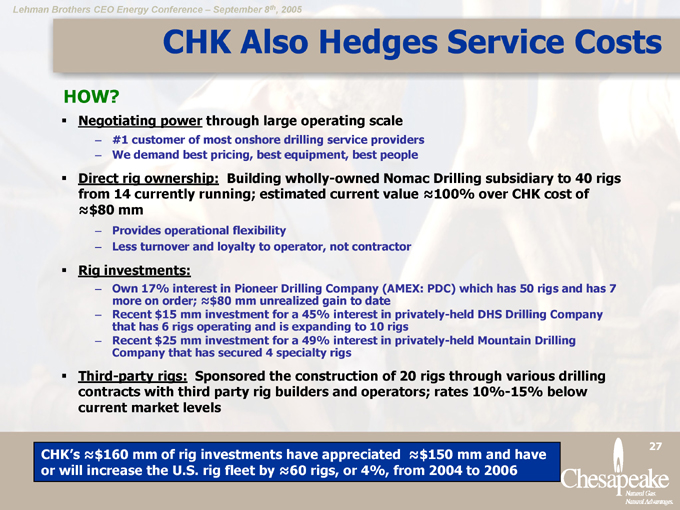
CHK Also Hedges Service Costs
HOW?
Negotiating power through large operating scale
#1 customer of most onshore drilling service providers
We demand best pricing, best equipment, best people
Direct rig ownership: Building wholly-owned Nomac Drilling subsidiary to 40 rigs from 14 currently running; estimated current value 100% over CHK cost of
$80 mm
Provides operational flexibility
Less turnover and loyalty to operator, not contractor
Rig investments:
Own 17% interest in Pioneer Drilling Company (AMEX: PDC) which has 50 rigs and has 7 more on order; $80 mm unrealized gain to date
Recent $15 mm investment for a 45% interest in privately-held DHS Drilling Company that has 6 rigs operating and is expanding to 10 rigs
Recent $25 mm investment for a 49% interest in privately-held Mountain Drilling Company that has secured 4 specialty rigs
Third-party rigs: Sponsored the construction of 20 rigs through various drilling contracts with third party rig builders and operators; rates 10%-15% below current market levels
CHK’s $160 mm of rig investments have appreciated $150 mm and have or will increase the U.S. rig fleet by 60 rigs, or 4%, from 2004 to 2006
27
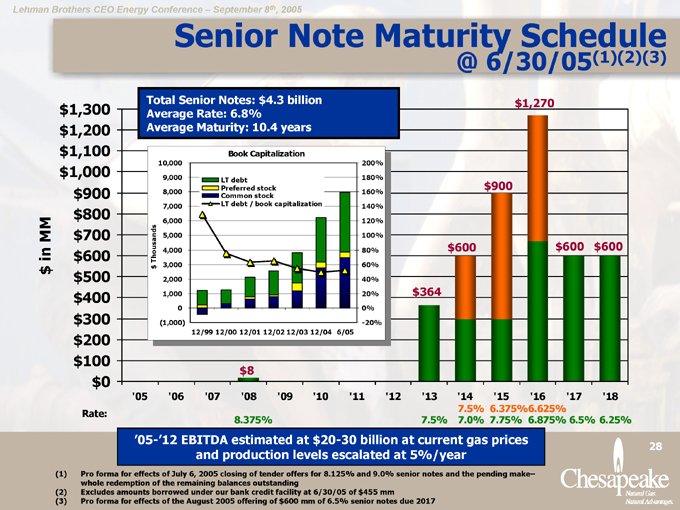
Senior Note Maturity Schedule @ 6/30/05(1)(2)(3) $in MM $1,300 $1,200 $1,100 $1,000 $900 $800 $700 $600 $500 $400 $300 $200 $100 $0
Total Senior Notes: $4.3 billion Average Rate: 6.8% Average Maturity: 10.4 years
Book Capitalization $Thousands
10,000 9,000 8,000 7,000 6,000 5,000 4,000 3,000 2,000 1,000 0 (1,000)
LT debt Preferred stock Common stock
LT debt / book capitalization
200% 180% 160% 140% 120% 100% 80% 60% 40% 20% 0% -20%
12/99 12/00 12/01 12/02 12/03 12/04 6/05 $8 $364 $600 $900 $1,270 $600 $600
‘05 ‘06 ‘07 ‘08 ‘09 ‘10 ‘11 ‘12 ‘13 ‘14 ‘15 ‘16 ‘17 ‘18
Rate:
8.375%
7.5% 6.375%6.625%
7.5% 7.0% 7.75% 6.875% 6.5% 6.25%
‘05-’12 EBITDA estimated at $20-30 billion at current gas prices and production levels escalated at 5%/year
(1) Pro forma for effects of July 6, 2005 closing of tender offers for 8.125% and 9.0% senior notes and the pending make–whole redemption of the remaining balances outstanding (2) Excludes amounts borrowed under our bank credit facility at 6/30/05 of $455 mm (3) Pro forma for effects of the August 2005 offering of $600 mm of 6.5% senior notes due 2017
28
Summary
29
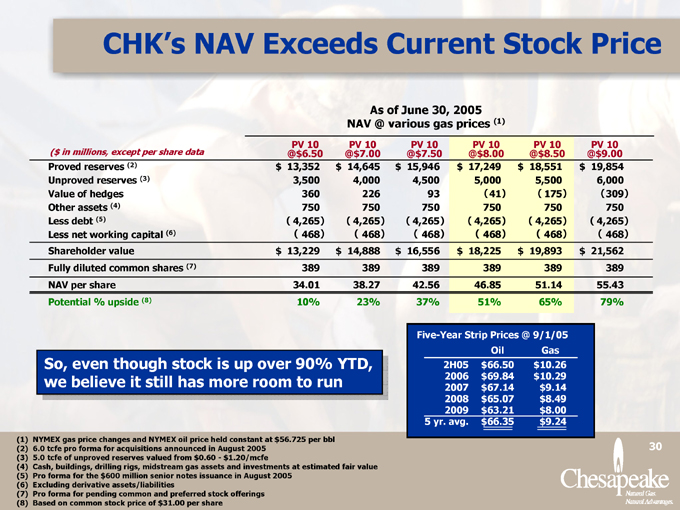
CHK’s NAV Exceeds Current Stock Price
NAV @ various gas prices (1) As of June 30, 2005
PV 10 PV 10 PV 10 PV 10 PV 10 PV 10
($ in millions, except per share data @$6.50 @$7.00 @$7.50 @$8.00 @$8.50 @$9.00
Proved reserves (2) $13,352 $14,645 $15,946 $17,249 $18,551 $19,854
Unproved reserves (3) 3,500 4,000 4,500 5,000 5,500 6,000
Value of hedges 360 226 93 (41) ( 175) (309)
Other assets (4) 750 750 750 750 750 750
Less debt (5) ( 4,265) ( 4,265) ( 4,265) ( 4,265) ( 4,265) ( 4,265)
Less net working capital (6) ( 468) ( 468) ( 468) ( 468) ( 468) ( 468)
Shareholder value $13,229 $14,888 $16,556 $18,225 $19,893 $21,562
Fully diluted common shares (7) 389 389 389 389 389 389
NAV per share 34.01 38.27 42.56 46.85 51.14 55.43
Potential % upside (8) 10% 23% 37% 51% 65% 79%
So, even though stock is up over 90% YTD, we believe it still has more room to run
Five-Year Strip Prices @ 9/1/05
Oil Gas
2H05 $66.50 $10.26
2006 $69.84 $10.29
2007 $67.14 $9.14
2008 $65.07 $8.49
2009 $63.21 $8.00
5 yr. avg. $66.35 $9.24
(1) NYMEX gas price changes and NYMEX oil price held constant at $56.725 per bbl (2) 6.0 tcfe pro forma for acquisitions announced in August 2005 (3) 5.0 tcfe of unproved reserves valued from $0.60—$1.20/mcfe
(4) Cash, buildings, drilling rigs, midstream gas assets and investments at estimated fair value (5) Pro forma for the $600 million senior notes issuance in August 2005 (6) Excluding derivative assets/liabilities (7) Pro forma for pending common and preferred stock offerings (8) Based on common stock price of $31.00 per share
30
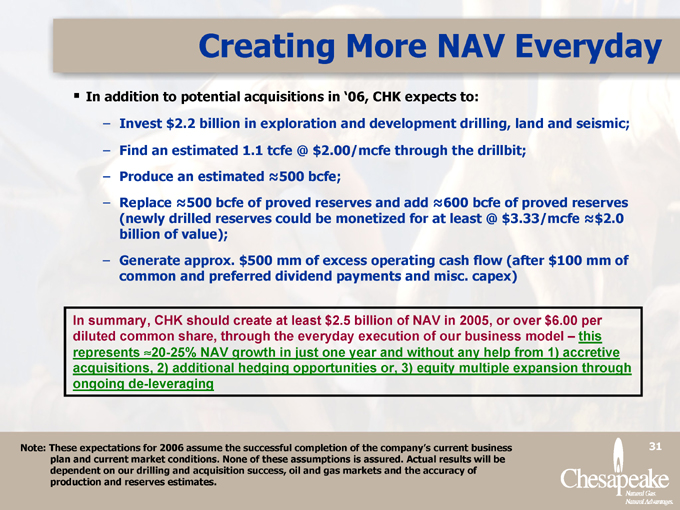
Creating More NAV Everyday
In addition to potential acquisitions in ‘06, CHK expects to:
– Invest $2.2 billion in exploration and development drilling, land and seismic;
– Find an estimated 1.1 tcfe @ $2.00/mcfe through the drillbit;
– Produce an estimated 500 bcfe;
– Replace 500 bcfe of proved reserves and add 600 bcfe of proved reserves (newly drilled reserves could be monetized for at least @ $3.33/mcfe $2.0 billion of value);
– Generate approx. $500 mm of excess operating cash flow (after $100 mm of common and preferred dividend payments and misc. capex)
In summary, CHK should create at least $2.5 billion of NAV in 2005, or over $6.00 per diluted common share, through the everyday execution of our business model – this represents 20-25% NAV growth in just one year and without any help from 1) accretive acquisitions, 2) additional hedging opportunities or, 3) equity multiple expansion through ongoing de-leveraging
Note: These expectations for 2006 assume the successful completion of the company’s current business plan and current market conditions. None of these assumptions is assured. Actual results will be dependent on our drilling and acquisition success, oil and gas markets and the accuracy of production and reserves estimates.
31
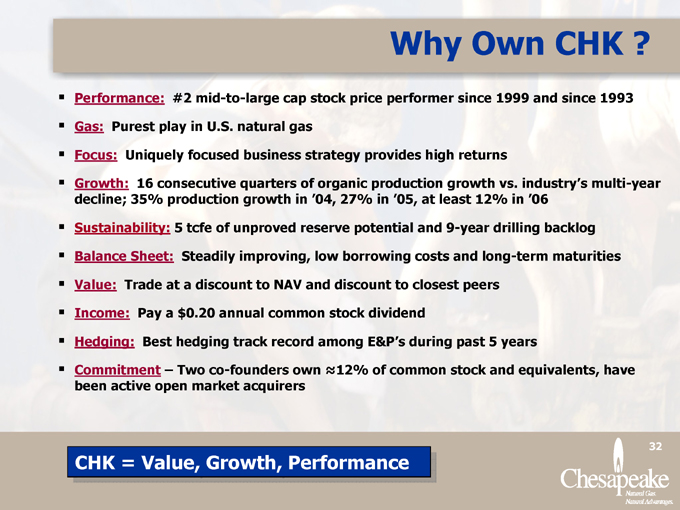
Why Own CHK ?
Performance: #2 mid-to-large cap stock price performer since 1999 and since 1993 Gas: Purest play in U.S. natural gas Focus: Uniquely focused business strategy provides high returns Growth: 16 consecutive quarters of organic production growth vs. industry’s multi-year decline; 35% production growth in ‘04, 27% in ‘05, at least 12% in ‘06 Sustainability: 5 tcfe of unproved reserve potential and 9-year drilling backlog Balance Sheet: Steadily improving, low borrowing costs and long-term maturities Value: Trade at a discount to NAV and discount to closest peers Income: Pay a $0.20 annual common stock dividend Hedging: Best hedging track record among E&P’s during past 5 years Commitment – Two co-founders own 12% of common stock and equivalents, have been active open market acquirers
CHK = Value, Growth, Performance
32
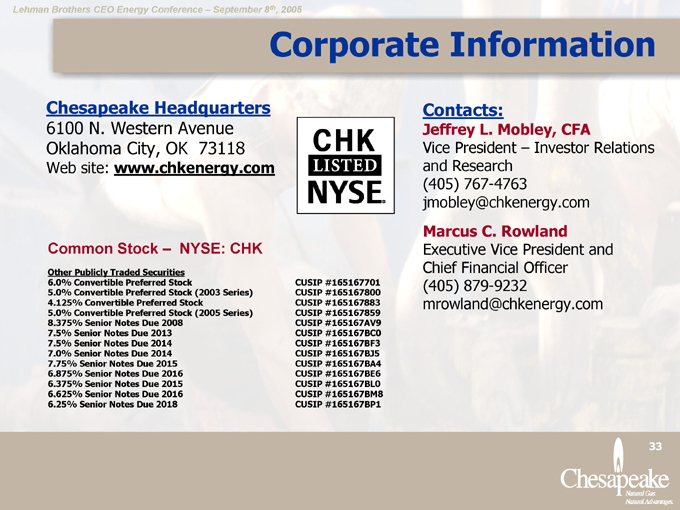
Corporate Information
Chesapeake Headquarters
6100 N. Western Avenue Oklahoma City, OK 73118
Web site: www.chkenergy.com
Common Stock – NYSE: CHK
Other Publicly Traded Securities
6.0% Convertible Preferred Stock CUSIP #165167701
5.0% Convertible Preferred Stock (2003 Series) CUSIP #165167800
4.125% Convertible Preferred Stock CUSIP #165167883
5.0% Convertible Preferred Stock (2005 Series) CUSIP #165167859
8.375% Senior Notes Due 2008 CUSIP #165167AV9
7.5% Senior Notes Due 2013 CUSIP #165167BC0
7.5% Senior Notes Due 2014 CUSIP #165167BF3
7.0% Senior Notes Due 2014 CUSIP #165167BJ5
7.75% Senior Notes Due 2015 CUSIP #165167BA4
6.875% Senior Notes Due 2016 CUSIP #165167BE6
6.375% Senior Notes Due 2015 CUSIP #165167BL0
6.625% Senior Notes Due 2016 CUSIP #165167BM8
6.25% Senior Notes Due 2018 CUSIP #165167BP1
Contacts:
Jeffrey L. Mobley, CFA
Vice President – Investor Relations and Research (405) 767-4763 jmobley@chkenergy.com
Marcus C. Rowland
Executive Vice President and Chief Financial Officer (405) 879-9232 mrowland@chkenergy.com
33
Forward Looking Statements
This report includes “forward-looking statements” within the meaning of Section 27A of the Securities Act of 1933 and Section 21E of the Securities Exchange Act of 1934. Forward-looking statements give our current expectations or forecasts of future events. They include estimates of oil and gas reserves, expected oil and gas production and future expenses, projections of future oil and gas prices, planned capital expenditures for drilling, leasehold acquisitions and seismic data, and statements concerning anticipated cash flow and liquidity, our business strategy and other plans and objectives for future operations. In addition, statements concerning the fair value of derivative contracts and their estimated contribution to our future results of operations are based upon market information as of a specific date. These market prices are subject to significant volatility.
Although we believe the expectations and forecasts reflected in these and other forward-looking statements are reasonable, we can give no assurance they will prove to have been correct. They can be affected by inaccurate assumptions or by known or unknown risks and uncertainties. Factors that could cause actual results to differ materially from expected results are described under “Risk Factors” in our registration statement on Form S-3 dated and filed with the Securities and Exchange Commission on June 9, 2005. They include the volatility of oil and gas prices, adverse effects our substantial indebtedness and preferred stock obligations could have on our operations and future growth and on our ability to make debt service and preferred stock dividend payments as they become due, our ability to compete effectively against strong independent oil and gas companies and majors, financial losses and significant collateral requirements as a result of our commodity price and interest rate risk management activities, uncertainties inherent in estimating quantities of oil and gas reserves, including reserves we acquire, projecting future rates of production and the timing of development expenditures, exposure to potential liabilities of acquired properties and companies, our ability to replace reserves, the availability of capital, writedowns of oil and gas carrying values if commodity prices decline, environmental and other claims in excess of insured amounts resulting from drilling and production operations and the loss of key personnel.
We caution you not to place undue reliance on these forward-looking statements, which speak only as of the date of this report, and we undertake no obligation to update this information. We urge you to carefully review and consider the disclosures made in this and our other filings with the Securities and Exchange Commission that attempt to advise interested parties of the risks and factors that may affect our business.
34

Non-GAAP Financial Information
This presentation contains projected “non-GAAP financial measures,” as defined in SEC rules. We have included reconciliations of projected operating cash flow (cash flow from operating activities before changes in assets and liabilities) and ebitda (net income before income tax expense (benefit), interest expense, and depreciation, depletion and amortization expense) to projected net income for 2005 and 2006 under various pricing scenarios. However, due to the uncertainties associated with projecting certain GAAP line items, including changes to assets and
liabilities and revenue and expense items affected by our hedging activities, these reconciliations are not as complete as reconciliations of our historical non-GAAP financial information. Reconciliations of historical non-GAAP to GAAP financial measures are posted in the Investor Relations section of our website, www.chkenergy.com, under Financial Reports.
35