 | Domenic J. Dell’Osso, Jr. Executive Vice President and Chief Financial Officer |
Chesapeake Energy Corporation
6100 North Western Avenue
Oklahoma City, Oklahoma 73118
CHESAPEAKE ENERGY CORPORATION HAS CLAIMED CONFIDENTIAL TREATMENT
OF A PORTION OF THIS LETTER IN ACCORDANCE WITH 17 C.F.R. § 200.83
August 22, 2011
Division of Corporation Finance
Securities and Exchange Commission
100 F Street, NE
Washington, DC 20549-7010
Attention: Mr. H. Roger Schwall, Assistant Director
| Re: | Chesapeake Energy Corporation |
Form 10-K for Fiscal Year Ended December 31, 2010
Filed March 1, 2011
File No. 1-13726
Ladies and Gentlemen:
This letter sets forth the responses of Chesapeake Energy Corporation to the comments of the staff (the “Staff”) of the Division of Corporation Finance of the Securities and Exchange Commission received by letter dated August 2, 2011. We have repeated below the Staff’s comments and followed each comment with the company’s response.
Form 10-K for Fiscal Year Ended December 31, 2010
Business, page 1
| 1. | We note your disclosure in your Form 10-K at page 1 that you “were one of the first companies to recognize the potential of horizontal drilling in unconventional natural gas reservoirs,” and at page 4 that in “2011 and 2012, [you]…intend to make significant investments in building [your] capability to hydraulically fracture [your] wells.” We also note your disclosure in your Form 10-K at page 28 that “[h]ydraulic fracturing is used in completing greater than 90% of all natural gas and oil wells drilled today in the United States.” Please tell us, with a view toward disclosure: |
| • | the location(s) of your hydraulic fracturing activities; |
| • | the amount of your acreage subject to hydraulic fracturing; |
| • | the percentage of your reserves subject to hydraulic fracturing; and |
Securities and Exchange Commission
August 22, 2011
Page 2 of 19
| • | the anticipated costs and funding associated with hydraulic fracturing activities (including the investments you intend to make in 2011 and 2012). |
Response:Hydraulic fracturing is an integral part of our natural gas and liquids operations. Our natural gas operations, for example, involve well design and surface preparation, drilling and cementing steel casing at multiple stages of well construction, well completion (including perforation, water and fracturing fluid preparation, multistage hydraulic fracturing, collection and handling of produced water), gas collection, processing and pipeline transmission, and site remediation. Each of these activities requires skilled personnel, involves numerous regulations, has various safety and environmental risks and presents operational challenges. Our corporate website,www.chk.com, and other websites and print and electronic publications we support present information about drilling and completion operations, hydraulic fracturing, pipeline processing and compression in detail and in different formats, including videos. We believe these education efforts help interested shareholders and the public generally understand our business.
You have asked that we respond to specific inquiries about hydraulic fracturing with a view toward disclosure. Our responses, below, underscore the fact that hydraulic fracturing is associated with all the wells we drill. It is our view that singling out hydraulic fracturing for enhanced disclosure is inappropriate because it is only one aspect of a many-stage process. We also believe our Form 10-K for the year ended December 31, 2010 (the “2010 Form 10-K”) discloses the aspects of hydraulic fracturing that are material to our business.
The following responds to the specific inquiries in this comment:
| • | We are conducting, or expect to conduct in accordance with our drilling plans, hydraulic fracturing activities in all of the states in which we drill wells, which presently include Arkansas, Colorado, Kansas, Kentucky, Louisiana, New Mexico, North Dakota, Ohio, Oklahoma, Pennsylvania, Texas, West Virginia and Wyoming. |
| • | We expect that all of the wells to be drilled on our current acreage will be subject to hydraulic fracturing. |
| • | All of our current proved undeveloped reserves are subject to hydraulic fracturing. |
| • | The anticipated costs of hydraulically fracturing our wells in 2011 and 2012, net to our ownership, are approximately $1.9 billion and $2.1 billion, respectively, before any drilling carries that would apply. We have budgeted to invest approximately $450 million in 2011 and 2012 in a new wholly owned pressure pumping subsidiary to build our internal capability to hydraulically fracture our wells to save costs and create value for our shareholders. We fund well |
Securities and Exchange Commission
August 22, 2011
Page 3 of 19
development costs, which includes the hydraulic fracturing of our wells, primarily with cash flow from operations and proceeds from asset monetizations, and we may also use borrowings under our corporate revolving bank credit facility. |
| 2. | In regard to your hydraulic fracturing operations, we note your disclosure at page 16 that “[your] well construction practices include installation of multiple layers of protective steel casing surrounded by cement that are specifically designed and installed to protect freshwater aquifers by preventing the migration of fracturing fluids into aquifers.” Please tell us more about what steps you have taken to minimize any potential environmental impact. For example, and without limitation, please explain if you: |
| • | have steps in place to ensure that your drilling, casing and cementing adhere to known best practices; |
| • | monitor the rate and pressure of the fracturing treatment in real time for any abrupt change in rate or pressure; |
| • | evaluate the environmental impact of additives to the hydraulic fracturing fluid; and |
| • | minimize the use of water and/or dispose of it in a way that minimizes the impact to nearby surface water. |
Response: We have developed best management practices (“BMPs”) that apply throughout the life cycle of a well, from site selection through site reclamation, and that are tailored to the local conditions of each of our operating areas. BMPs include simple processes such as strategically placing a berm, or barrier, on locations to control surface water runoff and also involve using cutting-edge operational technologies in casing and cement design. In striving to make our environmental footprint as small and temporary as possible, we regularly implement state-of-the-art technology and BMPs resulting from the efforts of our experienced scientists, engineers, geologists and chemists, as well as numerous other industry professionals.
In the planning and permitting of each well that we drill, we undertake a careful review to ensure that the well is isolated from fresh water aquifers and protective of the environment. We consult with the applicable state agency to determine the base of the area’s fresh water aquifer, and our engineering staff designs each well’s casing and cementing program to meet or exceed state regulations that specify the depth of the protective casing required to protect the fresh water, in each case extending well below the fresh water aquifer. Casing and cementing specifications are included in the state Application for Permit to Drill for each well we drill (and parallel federal application when we drill on federal lands) and are reviewed and approved by the applicable agencies prior to any drilling activity.
Securities and Exchange Commission
August 22, 2011
Page 4 of 19
During drilling operations through any fresh water aquifer, we use only fresh water mud or air drilling techniques, ensuring the protection of the aquifer. Once a bore hole is advanced to the approved depth below the aquifer, a threaded steel casing, which meets the standards of ASTM International (formerly known as the American Society for Testing and Materials), a globally recognized leader in the development and delivery of international voluntary consensus standards, is placed in the bore hole and the annular space is cemented from the bottom to the top, sealing off the aquifer. We notify the appropriate agencies when cementing takes place so that agency personnel can inspect the work. Isolation of the well bore is confirmed through casing integrity testing. Subsequent work is done inside this protective surface casing, and successive layers of steel casing and cement are added as the well advances deeper to ensure well bore integrity and safety.
During the hydraulic fracturing process, real time pressures, rates, and volumes are monitored in an on-site treatment monitoring van by the service company contracted to provide hydraulic fracturing services. One or more Chesapeake employees also monitor the job. Pressure transducers in the treatment lines are used to monitor wellhead pressures. Rate meters at the blender, which combines fluid, sand and a small amount of chemicals, measure treatment rates and fluid volumes. Both suction and discharge rates are monitored for accuracy. This pressure, rate, and volumetric data is used to ensure that equipment ratings are kept within acceptable tolerances, thresholds are not exceeded and treatment volumes are accurate.
To date and after approximately 15,000 hydraulic fracturing treatments performed since our company was founded in 1989, to our knowledge we have never had an incident in which our hydraulic fracturing process impacted a fresh water aquifer. It is true that small-scale surface spills of hydraulic fracturing liquids do occur from time to time in our industry. Please see our response to comment #8 for a description of our company’s successful efforts to limit the environmental impact of one such surface spill situation. In accordance with standards that apply generally to U.S. industrial operations, when chemical products or additives (including hydraulic fracturing fluid) are stored on our drilling locations, we post Material Safety Data Sheets that describe the potential hazards associated with these products, along with medical treatment instructions should an employee be exposed, specific processes that are required for handling the products, and information needed to clean up the site in the event of a product spill at the surface. These are standards adopted by the Occupational Safety and Health Administration and the Environmental Protection Agency pursuant to the Emergency Planning and Community Right-to-Know Act. The products used by Chesapeake, and other industrial entities, contain chemicals that may also be regulated at the manufacturing level by the Toxic Substances Control Act and federal regulatory programs which address the manufacture and use of chemicals. Chesapeake complies with the applicable state and federal regulations for chemical transportation, handling and use. Chesapeake has an internal staff of chemists and engineers that monitor all products used in the fracturing treatment process and continually strive to use safe products to protect our employees and
Securities and Exchange Commission
August 22, 2011
Page 5 of 19
subcontractors and the environment. Our engineering staff also ensures that the facilities and wells we construct are protective of the environment. Chesapeake has a robust residential well sampling process, and such sampling is required by many of the states in which we operate.
Through our Green Frac® program, which we started in October 2009, we evaluate the types of chemical additives typically used in the process of hydraulic fracturing to determine their environmental friendliness. The goal of this program is to eliminate any additive not critical to successful well completion and assess whether greener alternatives are available for essential additives. To date, the company has eliminated, or replaced with substitutes, 25% of the additives used in fracturing fluids in most of its shale plays.
We use fresh water in our fracturing treatments in accordance with applicable state water management plans and laws. We strive to find alternative sources of water. We have technical staff dedicated to the development of water recycling and re-use systems, and our Aqua Renew® program uses state-of-the-art technology in an effort to recycle produced water in our operations. Produced, or formation, water is a naturally occurring by-product of natural gas and oil extraction. The Aqua Renew program is expected to grow throughout our areas of operation. More information about Green Frac and Aqua Renew is available on our website,www.chk.com, under the Environment section.
Chesapeake disposes of produced formation water in Class II underground injection control wells, which are designed and permitted to place the water into deep geologic formations, isolated from fresh water sources. These Class II wells are overseen by the Environmental Protection Agency in its Underground Injection Control Program. Where Class II underground injection control wells are not available for disposal, such as in Pennsylvania, we recycle virtually all produced water and re-use it in subsequent fracturing operations.
| 3. | Please also expand on your disclosure, currently in your Definitive Proxy Statement on Schedule 14A at page 13, regarding your participation in a “national, publicly accessible, web-based registry to report the additives used in the hydraulic fracturing process.” For example, and without limitation, please identify the registry and any effects your participation has had on your operations. |
Response: Chesapeake was one of the first energy companies to call for disclosure of additives used in the hydraulic fracturing process. We announced through a press release in April 2011, which was furnished to the SEC as an exhibit to our Form 8-K filed on April 13, 2011, that we are actively participating in FracFocus, a national publicly accessible web-based registry developed by the Ground Water Protection Council and the Interstate Oil and Gas Compact Commission, with support of the U.S. Department of Energy, to report additives used in the hydraulic fracturing process on a well-by-well basis. The website,www.fracfocus.org, also includes information about how hydraulic fracturing works, the chemicals used in hydraulic fracturing and how fresh water aquifers are protected. Chesapeake began loading well completion data onto the FracFocus
Securities and Exchange Commission
August 22, 2011
Page 6 of 19
registry in the spring of 2011 for wells hydraulically fractured after February 15, 2011 where completion reports have been filed with the appropriate state agencies. Over 50 oil and gas producing companies currently participate in FracFocus along with Chesapeake. To date, Chesapeake has posted more well information on this site than any other company in the industry.
We report on the FracFocus registry additives and chemicals, as well as the amount of water, used in the hydraulic fracturing process for each well we drill and hydraulically fracture. In addition, many states are now requiring disclosure of chemicals used in hydraulic fracturing, some of which are requiring operators to use the FracFocus website. Other than the efforts attendant to compiling and reporting the data, the reporting of additives used in hydraulic fracturing has had no effect on our operations.
In view of the extensive public information available on additives used in hydraulic fracturing by us and other producers, and the fact that the information is updated frequently, by way of expanded disclosure we propose to include in our future annual reports on Form 10-K reference to the FracFocus registry and state agency reporting systems that may be accessed for such information. We note that our 2010 annual report contains a description on page 11 of FracFocus reporting and provides the FracFocus website address.
| 4. | Please tell us which chemicals are being injected in connection with your hydraulic fracturing operations. In addition, please tell us how many gallons of water on average are used for a well completion or stimulation or workover of an existing well, as applicable. |
Response: Each hydraulic fracturing treatment is uniquely designed and applied. The amount of water, proppant and additives used varies with each well. In addition, we constantly review and improve the process and products used. As stated above in our response to comment #3, Chesapeake reports on the FracFocus website additives and chemicals, as well as the amount of water, used in the hydraulic fracturing process.
InAppendix A to this letter, we have provided a list of ten wells we have recently completed in different operating areas, along with instructions to access the corresponding FracFocus well reports. You will note the additives listed in the FracFocus reports are different for every well, and the amount of water used varies greatly—from 2.2 million to 8.4 million gallons per well depending on well location (the highest associated with a Granite Wash well in Texas). There is no “average” water use for hydraulic fracturing across our operations.
| 5. | We note your disclosure at page 2 that you “have entered into five significant industry participation agreements.” Please revise your disclosure to describe whether these agreements or any other similar agreements contain indemnification provisions and, if so, please describe such provisions. In addition, please provide the basis for not filing these agreements, any similar agreements or form of agreement. |
Securities and Exchange Commission
August 22, 2011
Page 7 of 19
Response: The industry participation agreements (the “JV Agreements”) referenced are those agreements (principally a Purchase and Sale Agreement (“PSA”) and a Development Agreement (“DA”)) we entered into with Plains Exploration & Production Company, BP America, Statoil, Total S.A. and CNOOC Limited. In February 2011, as noted on page 3 of our 2010 Form 10-K, we entered into a second joint venture with CNOOC Limited resulting in a total of six joint ventures. In each transaction, the PSA contains customary indemnification provisions for both the buyer and Chesapeake. Our indemnification obligations are limited and generally relate to breaches of specified representations and warranties, breaches of covenants under the PSA, retained liabilities and actions or circumstances existing prior to the effective date of the transaction. In addition, our indemnification obligations related to breaches of representations and warranties are generally subject to both baskets and caps on liability. Our indemnity obligations under the PSAs are also subject to survival provisions limiting the time period in which the counterparty may bring claims. The indemnity period has expired for many of the types of claims that could be brought under the 2008 JV Agreements. In each transaction, the DA does not contain indemnification obligations.
While quantifying the exposure that exists under indemnity provisions is not possible because any claim for indemnity would be based on facts not known at the time of contract execution and the uncertainty of whether any such claims would ever arise, we concluded that our indemnification exposure in each of the joint venture PSAs under all reasonably foreseeable circumstances was not material to the company. In fact, to date we have not made any payments to a joint venture partner pursuant to the indemnification provisions under any of the JV Agreements nor are we aware of any impending payments that will be required. Given that the indemnification obligations under the JV Agreements are immaterial to the company as a whole, we believe disclosure is unwarranted.
We also note that it is common industry practice in the purchase and sale of oil and gas assets to have indemnification provisions binding on both the buyer and the seller which are similar to the provisions in the joint venture PSAs, and most of our other acquisition and divestiture purchase and sale agreements contain such provisions. All such indemnities are mutual in that both buyer and seller indemnify the other party with respect to certain potential liabilities. Like the joint venture PSAs, we do not believe any of those other agreements presents a material indemnification exposure to the company.
In considering whether to file any or all of the JV Agreements as material contracts, we reviewed the exhibit filing requirements in Regulation S-K Item 601(b)(10). We concluded that the substance of each transaction was in the ordinary course of our business and, in any event, none of the transactions was individually material based on all relevant facts and circumstances.
| • | For each transaction, the PSA provided for the sale of an undivided interest in Chesapeake’s acreage in a defined area of mutual interest (“AMI”). Chesapeake |
Securities and Exchange Commission
August 22, 2011
Page 8 of 19
routinely makes dispositions of proved and unproved oil and gas properties. Chesapeake received total proceeds from such divestitures of $7.7 billion in 2008 (of which $4.0 billion related to cash proceeds from the Statoil, BP and Plains joint venture sales), $1.7 billion in 2009, $4.4 billion in 2010 (of which $1.9 billion related to cash proceeds from the Total and CNOOC (Eagle Ford) joint venture sales) and $6.1 billion in the first half of 2011 (of which $570 million related to cash proceeds from the CNOOC (Niobrara) joint venture sale). Divestiture proceeds related to 38 transactions in 2008, 25 transactions in 2009, 36 transactions in 2010 and 22 transactions in the first half of 2011. |
| • | In no case did the sale proceeds from a referenced joint venture transaction (whether measured by the PSA closing cash proceeds alone or aggregated with future drilling carries) meet the significance tests of Item 2.01 of Form 8-K. None of the joint venture dispositions involved a “significant amount of assets”; that is, neither the company’s equity in the net book value of the assets sold nor the amount received for the assets upon such disposition exceeded 10% of the total assets of the company and, applying another metric of Item 2.01 for dispositions involving a business, the assets sold did not exceed any of the 10% significance tests of Regulation S-X Rule 11-01(b). |
| • | The joint development of unevaluated leasehold in an AMI commonly occurs in the E&P industry. It provides a company financing to accelerate the development of an area while maintaining operating control, it de-risks a new play and it offers a means to recoup the expenses of leasehold acquisition long before that would occur through production. For Chesapeake, the JV Agreements were significant but each was the type of contract that ordinarily accompanies the business we conduct. |
We recognize that certain types of contracts that ordinarily accompany the kind of business conducted by a registrant are required to be filed pursuant to Regulation S-K Item 601(b)(10)(ii) if they reach a prescribed level of materiality. We analyzed those provisions as follows:
| • | Contract upon which the registrant’s business is substantially dependent, as in the case of continuing contracts to sell the major part of registrant’s products or services. Chesapeake’s business was not substantially dependent upon any of the JV Agreements, and none of the JV Agreements related to the sale of a major part of our production. |
| • | Contract calling for the sale of any property, plant or equipment for a consideration exceeding 15 percent of such fixed assets of the registrant on a consolidated basis. For each of the joint venture transactions, neither the cash paid at closing nor the full transaction amount (i.e., the closing cash payment plus the counterparty’s “carry” obligation) exceeded this 15% test. |
Securities and Exchange Commission
August 22, 2011
Page 9 of 19
| • | Material lease under which a part of the property described in the registration statement or report is held by the registrant. None of the joint venture transactions involved a single material lease. Each transaction involved the disposition of a portion of our interest in numerous leases in an AMI and the right to acquire an interest in additional such leases to be acquired in the future. The sale involved in each joint venture transaction reduced Chesapeake’s current production, proved reserves and unproved resources by an immaterial amount. |
Finally, our filings have disclosed the essential features of our JV Agreements. We believe a reasonable investor would not have found that including the agreements as exhibits to our periodic reports materially altered the total mix of information available about the referenced joint ventures. For all of these reasons, we concluded the JV Agreements were not “material contracts,” as contemplated in Regulation S-K Item 601(b)(10), and therefore did not file them.
Engineering Comments
Business, page 1
Natural Gas and Oil Reserves, page 10
| 6. | We note your statement, “As of December 31, 2010, there were no PUDs that had remained undeveloped for five years or more.” Separately, you state that you plan to expend, in the next three years, about one-half of your $10.7 billion estimated future development costs. Please tell us if you have proved undeveloped reserves scheduled for development five years beyond initial booking. If so, please explain to us the circumstances surrounding the delay(s). |
Response: We have no proved undeveloped reserves scheduled for development beyond five years from the initial booking date.
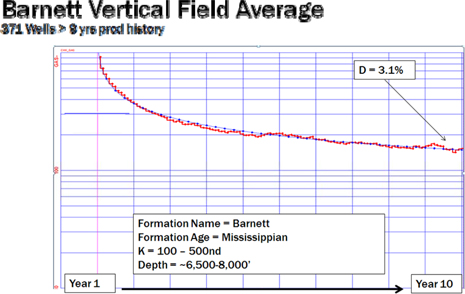
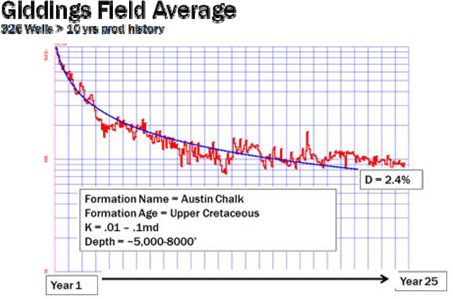
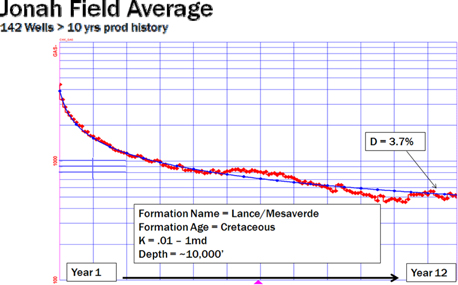
| 7. | You state, “Our annual net decline rate on producing properties is projected to be 30% from 2011 to 2012, 19% from 2012 to 2013, 14% from 2013 to 2014, 12% from 2014 to 2015 and 10% from 2015 to 2016.” With reasonable detail, please explain to us the terminal net decline rates employed in the proved reserve estimates for your three largest shale plays, the technical support for them (including analogy fields) and the effect of increasing/decreasing the decline rates by 25%. |
Response: Based on proved reserves, Chesapeake’s three largest shale plays as of December 31, 2010 were the Barnett, Fayetteville and Haynesville. In each of these three plays, we used a net terminal decline rate of 5% for forecasting reserves.
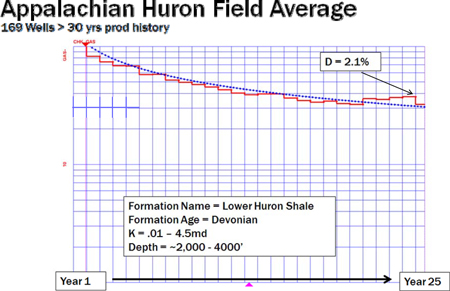
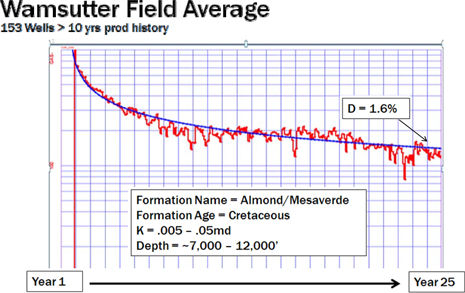
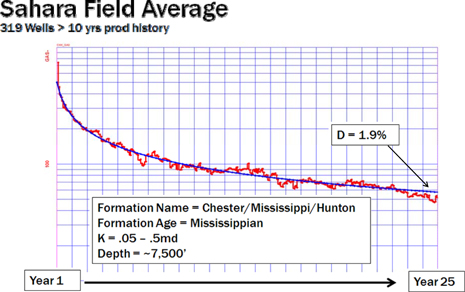
To establish the 5% terminal decline rates for these shale plays, Chesapeake examined the long-term performance of wells in various tight gas formations across the continental United States, as reported in commercially available and public sources. By normalizing
Securities and Exchange Commission
August 22, 2011
Page 10 of 19
significant numbers of older well production in these plays, one can observe and summarize their terminal decline rates. The results of that study are shown in the series of plots below:
Securities and Exchange Commission
August 22, 2011
Page 11 of 19
Securities and Exchange Commission
August 22, 2011
Page 12 of 19
Securities and Exchange Commission
August 22, 2011
Page 13 of 19
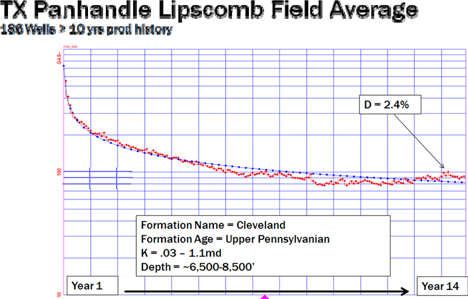
As summarized in the table below, the terminal declines observed in these formations vary from 1.6% to 3.7%. By comparison, the 5% terminal decline we employ in our reserve estimations is conservative and constitutes reasonable certainty, as evidence points toward terminal decline being much more likely to be less than 5%.
Play | Terminal Decline % | |||
Barnett Vertical - Observed | 3.1 | |||
Huron - Observed | 2.1 | |||
Wamsutter - Observed | 1.6 | |||
Sahara - Observed | 1.9 | |||
Giddings - Observed | 2.4 | |||
Jonah - Observed | 3.7 | |||
Lipscomb - Observed | 2.4 | |||
Average of Observed Plays | 2.5 | |||
Direct observation of the terminal decline rates for horizontal wells within the Barnett, Fayetteville and Haynesville shale plays is not yet possible. Our estimation of the time required from initial production to being able to directly observe the terminal decline rate for a statistically significant number of wells in each play is presented below.
| • | Barnett = 12 years from first sales; 3.5 to 4 years from current date for the first horizontal wells to reach terminal decline. |
Securities and Exchange Commission
August 22, 2011
Page 14 of 19
| • | Fayetteville = 12 years; 7 to 7.5 years from current date for the earliest horizontal wells to decline to terminal rates. |
| • | Haynesville = 20 years; approximately 17 years from current date before terminal decline is directly observed in wells. |
Further, the Barnett, Fayetteville and Haynesville shale plays each contain material volumes of adsorbed gas. This gas is released from the organic materials as the reservoir pressure depletes. This production mechanism will result in lower terminal decline rates than observed from other low permeability natural gas fields that do not produce from self-sourcing rocks.
Additionally, Netherland, Sewell & Associates, Inc. (“NSAI”) has prepared reports on our Barnett, Fayetteville and Haynesville reserves and has extensive knowledge of the practices and data of multiple owners within these plays. Although there are other important factors to consider when determining the reasonable certainty of the reserve and revenue estimate for individual wells, NSAI has found the use of the 5% terminal decline rate meets the threshold of reasonable certainty.
Finally, you have inquired about the effect on the proved reserves in each of these plays of increasing and decreasing the terminal decline by 25%. The table below summarizes our total proved reserve volumes at the requested terminal decline (Dmin) rates and includes the 5% used within our reserve report for comparative purposes:
[CONFIDENTIAL INFORMATION HAS BEEN OMITTED AND FURNISHED SEPARATELY TO THE SECURITIES AND EXCHANGE COMMISSION]
Risk Factors, page 23
Hydraulic Fracturing, page 28
| 8. | With reasonable detail, please explain to us the circumstances that caused the April, 2011 fracture fluid spill in Bradford County, Pennsylvania. Address the measures you have taken to prevent such future occurrences. |
Response: On April 29, 2011, Chesapeake provided a written incident response to the Pennsylvania Department of Environmental Protection (“PADEP”) regarding the well control incident on the Atgas 2H well in Bradford County, Pennsylvania. It is more than 700 pages long and addresses the wellhead equipment failure at the location, the additives used in the completion process and the water testing protocols used to conduct an environmental assessment of the impact to the area. Please note that the incident occurred a month and a half after the company filed its 2010 Form 10-K. The company provided disclosure on the incident in Part II, Item 1 of its Form 10-Q for both the 2011 first and second quarters and issued a press release on May 13, 2011 with detailed information about this single-well incident which had a minimal environmental impact.
Securities and Exchange Commission
August 22, 2011
Page 15 of 19
Below is a summary of key points from Chesapeake’s response to the PADEP.
The Incident
The incident occurred around 11:45 p.m. on April 19, 2011 during completion operations when the well was being fracture stimulated. Chesapeake’s investigation determined that a failure occurred at a valve flange connection to the wellhead, causing fluid to be discharged from the wellhead at high pressure. An equipment failure of this type is extremely rare in the industry and is the first valve flange failure of this magnitude in more than 15,000 wells Chesapeake has completed since its founding in 1989.
Rapid Well Control Response
Personnel onsite promptly responded and notified the appropriate authorities and first responders, including Chesapeake’s team of certified well-control specialists, who began arriving within 45 minutes. We also requested that a contract well-control company and construction crews bring equipment to the location to enhance the containment process.
Chesapeake’s well-control team assessed the situation, secured the location, ensured the safety of neighbors and took appropriate and safe steps to begin limiting the flow of the fluid from the well by inserting loss control material into the well to begin plugging it. These initial steps were successful in reducing the flow of the fluid from the well by approximately 50 percent by 10:00 a.m. on April 20 and approximately 70 percent by 12:30 p.m. that day, allowing for further actions to bring the well under full control. At 3:50 p.m. on April 21, the well was successfully brought under control. At 6:05 p.m. on April 25, the compromised wellhead was replaced.
Fluid Containment Actions
In the early hours of the incident, a mixture of well fluid and rain water accumulated in the containment area of our well location, and we estimate approximately 240 barrels flowed over the top of the containment berms onto nearby land, with an even more limited amount of fluid making its way into an unnamed tributary of Towanda Creek. Chesapeake estimates that the fluid that escaped initial containment included the equivalent of approximately one barrel of highly diluted chemical additives used in the hydraulic fracturing process. Chesapeake promptly provided the list of these additives to the PADEP. Even though the well was only partially completed, the company posted this information for public disclosure on the FracFocus web site (www.fracfocus.org).
Chesapeake began utilizing vacuum trucks shortly after the incident first occurred to help maintain containment of the fluid. Additional trucks were quickly mobilized for on-going assistance. Water that began escaping containment at 2:30 a.m. on April 20 was stopped about four hours later.
Securities and Exchange Commission
August 22, 2011
Page 16 of 19
In addition to on-site containment measures that we typically employ and the design of our work locations, which are constructed as containment mechanisms themselves, construction crews worked successfully to create a diversion channel to pre-constructed sediment basins that contained the vast majority of the fluid, greatly minimizing the amount released from the site. All recovered fluid was stored in steel tanks, treated and disposed. No fluid was disposed in systems that discharge to rivers or other surface waters.
Rapid Environmental Response and Assessment
Chesapeake conducted extensive surface and well-water sampling beginning the day of the incident. The PADEP has also taken extensive samples from both surface water and nearby water wells. The EPA has collected samples as well. To date, our testing results indicate minimal and localized impact to the soils immediately surrounding our location, and no impact to Towanda Creek or the Susquehanna River.
Chesapeake and the PADEP have sampled a wide area for various constituents in an effort to properly and thoroughly analyze any environmental effect from this incident. No residents have been impacted. Chesapeake is working closely with the PADEP to formulate a plan for restoration of the site, which will likely require some soil remediation activities to return the affected area to its original condition. We will be submitting to the PADEP an additional report on the results of the investigation in the next few weeks.
Equipment Testing and Assessment
As a result of this incident, Chesapeake voluntarily suspended completion operations in its Eastern Division to perform a review of the integrity of comparable wellheads. The suspension lasted 23 days. Every wellhead in the review was disassembled, components were studied and pressure tested and reassembled. We developed confidence that this was an isolated incident and that all wellhead equipment and connections were fully functional and structurally sound. For future operations, Chesapeake has implemented changes in its oversight of the contractors that assemble and test our wellheads. Certification of contract employees will be reviewed more thoroughly and we will implement more extensive documentation for all phases of pressure testing and equipment calibration. In addition to these steps, we are instituting an independent auditing system to serve as an extra layer of oversight in wellhead assembly.
Management’s Discussion and Analysis of Financial Condition and Results of Operations, page 34
Results of Operations, page 49
Securities and Exchange Commission
August 22, 2011
Page 17 of 19
| 9. | We note the significant difference between the 2010 average benchmark of $4.38/MCFG and Barnett Shale production, $2.13/MCFG. Please explain this difference to us. |
Response: Our natural gas price realizations reflect the netback price we receive at the wellhead, which is net of applicable gathering, transportation and processing fees. Our realizations in the Barnett Shale are lower than our realizations in other operating areas in which we are active because Barnett Shale production is concentrated primarily in urban areas (particularly in and the area around Fort Worth, Texas) where the costs to secure right-of-way, to develop the necessary infrastructure and to gather and deliver the natural gas to intrastate pipelines has far exceeded the cost of similar infrastructure in other operating areas. Additionally, the rapid development of the Barnett Shale required the construction of new pipelines to provide an adequate market for these new gas reserves. In order to support the timely construction of these new pipelines, we entered into firm transportation contracts that obligate the company to pay demand fees if we do not deliver specified volumes of natural gas into certain gathering systems and intrastate pipelines. The demand fees associated with unused capacity and the other gathering and transportation fees described above have resulted in lower natural gas price realizations in the Barnett Shale. In future filings, we will provide disclosure to explain this variance.
Exhibit 99.1
| 10. | Item 1202(a)(8)(v) of Regulation S-K requires “A discussion of primary economic assumptions” to be included in the third party report. Please furnish a third party report that discusses the considerations of and sources for the estimated future capital costs used. |
Response: We have provided a copy of this comment to, and discussed it with, our principal contact at Netherland, Sewell & Associates (“NSAI”).
First, we note that the NSAI report filed with the 2010 Form 10-K as Exhibit 99.1 does include a discussion of primary economic assumptions, as required by Regulation S-K Item 1202(a)(8)(v). The report discusses, among other things, the calculation of future gross revenue and future net revenue, prices, lease and well operating costs and imbalances. Following is specific disclosure on capital costs included on page 2 of the report: “Capital costs are included as required for workovers, new development wells, and production equipment. The future capital costs are held constant to the date of expenditure.” The last paragraph of the report addresses the sources of data used in NSAI reserve estimates, as follows: “The data used in our estimates were obtained from Chesapeake, other interest owners, various operators of the properties, public data sources, and the nonconfidential files of [NSAI] and were accepted as accurate.” We believe the quoted portions of the report address the request for information on the considerations of and sources for the estimated future capital costs used by NSAI.
Securities and Exchange Commission
August 22, 2011
Page 18 of 19
Exhibit 99.2
| 11. | Please furnish a third party report that discloses the adjusted (after differentials) average prices used to estimate proved reserves. |
Response: We have provided a copy of this comment to, and discussed it with, our principal contact at Data & Consulting Services, Division of Schlumberger Technology Corporation (“Schlumberger”).
Schlumberger’s reserve report included as Exhibit 99.2, on page 4, indicates that the prices used in the preparation of its report were based on the 12-month unweighted arithmetic average of the first day of the month price for the period January through December 2010. It further states that the resulting Henry Hub reference gas price used was $4.376 per MMBtu and the resulting West Texas Intermediate reference oil and natural gas liquids price used was $79.42 per barrel. The Henry Hub gas price and West Texas Intermediate oil price are common reference prices for natural gas and oil production in the U.S. Schlumberger also indicates in its report that these prices were adjusted for local differentials, gravity and Btu where applicable. These adjustments were made for each well based on the differences between the actual product prices received by well and the reference prices over a 12-month period.
While we believe the pricing information provided in the Schlumberger report complies with the requirements of Regulation S-K Item 1202(a)(8), we will ensure that any reserve report included with our future filings will contain the adjusted average prices used to estimate proved reserves.
Exhibit 99.3
| 12. | Please furnish a third party report that satisfies Item 1202(a)(8) of Regulation S-K: |
| (i) | The purpose for which the report was prepared and for whom it was prepared; |
| (v) | A discussion of primary economic assumptions [including the adjusted (after differentials) average prices used to estimate proved reserves]; |
| (x) | The signature of the third party. |
Response: We have provided a copy of this comment to, and discussed it with, our principal contact at Lee Keeling and Associates, Inc. (“Keeling”).
We believe the first sentence of the Keeling report states the purpose for which it was prepared: “we have prepared an estimate of reserves and future net revenue to be realized from interests owned by Chesapeake Energy Corporation (Chesapeake) and
Securities and Exchange Commission
August 22, 2011
Page 19 of 19
located in the states of Arkansas, Louisiana, Oklahoma and Texas.” We also believe it is clear that the report was prepared for Chesapeake, considering that the report is addressed to Chesapeake and the first sentence of the report begins with the following: “In accordance with your request.”
The report discusses the primary economic assumptions used to estimate proved reserves, including the pricing method to arrive at oil, gas and NGL income, operating expenses and future expenditures. The report specifically states that adjustments were made for the difference between the field price and the referenced prices. As stated in response to comment #11, however, we will ensure that any reserve report included with our future filings will contain the adjusted average prices used to estimate proved reserves.
The Keeling report contains the conformed signature of the firm, the form of signature commonly used by professional firms. We believe this complies with Regulation S-K Item 1202(a)(8)(x), which does not specify that the signature of a natural person is required.
Should any member of the Staff have a question regarding our responses to the comments set forth above, or need additional information, please do not hesitate to call Mike Johnson, our Chief Accounting Officer, at (405) 935-9229 or me at (405) 935-6125, or you may contact our outside counsel Connie Stamets at (214) 758-1622 at Bracewell & Giuliani LLP. For any future written correspondence sent by email, please use the following addresses:nick.dellosso@chk.com,mike.johnson@chk.com andconnie.stamets@bgllp.com.
As you requested in the comment letter, we acknowledge that:
| • | the company is responsible for the adequacy and accuracy of the disclosure in the filing; |
| • | staff comments or changes to disclosure in response to staff comments do not foreclose the Commission from taking any action with respect to the filing; and |
| • | the company may not assert staff comments as a defense in any proceeding initiated by the Commission or any person under the federal securities laws of the United States. |
| Very truly yours, |
/s/ DOMENIC J. DELL’OSSO, JR. |
Domenic J. Dell’Osso, Jr. Executive Vice President and Chief Financial Officer |
Appendix A
CHESAPEAKE ENERGY CORPORATION
SELECTED WELLS
HYDRAULIC FRACTURING FLUID PRODUCT COMPONENT
INFORMATION DISCLOSURE
www.fracfocus.org
The report posted on the FracFocus website for each of the wells listed below may be accessed using the following internet address and entering the well name in the well name field:https://www.hydraulicfracturingdisclosure.org/fracfocusfind/
Well Name | County and State | Formation | ||
| Lundy 2H | Bradford County, PA | Marcellus North | ||
| George Gantzer 8H | Ohio County, WV | Marcellus South | ||
| Renfro et al 33-13-11H-1 | Red River Parish, LA | Haynesville | ||
| Darby 6H | Johnson County, TX | Barnett | ||
| Monroe 1-6 1H | Ward County, TX | Bone Spring | ||
| Brownlow 3H | La Salle County, TX | Eagle Ford | ||
| Brummett 22A 6H | Wheeler County, TX | Granite Wash | ||
| Leola Meyer 8-28-13 1H | Woods County, OK | Mississippi Lime | ||
| Craig 1-25H | Roger Mills County, OK | Cleveland | ||
| Idarado 33-71 27-1H | Converse County, WY | Niobrara | ||