Exhibit 99.1

Exhibit 99.1
Equity LifeStyle Properties
INVESTOR
PRESENTATION
DECEMBER 2012

Colony Cove | Ellenton, FL
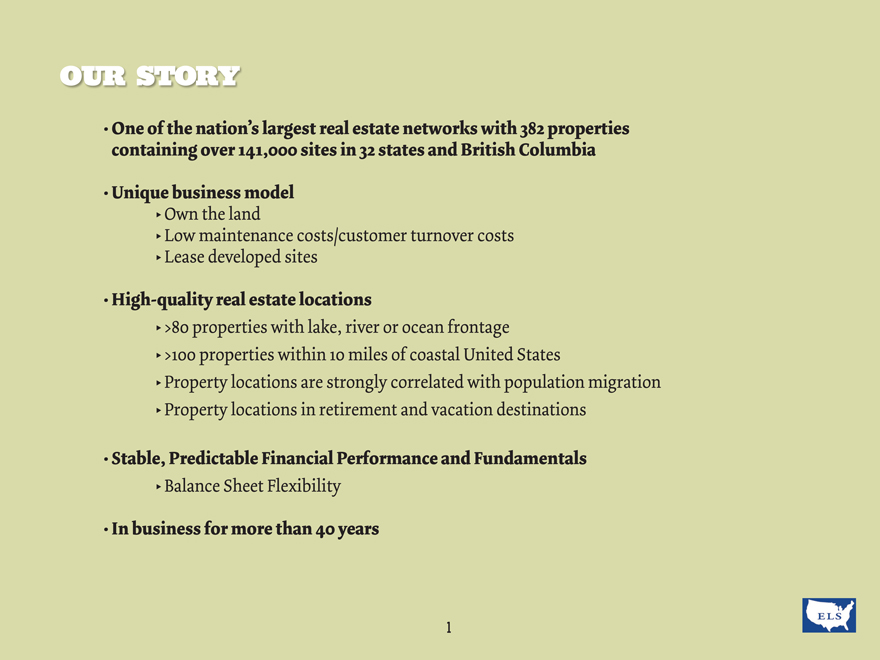
OUR STORY
One of the nation’s largest real estate networks with 382 properties containing over 141,000 sites in 32 states and British Columbia
Unique business model
Own the land
Low maintenance costs/customer turnover costs
Lease developed sites
High-quality real estate locations
>80 properties with lake, river or ocean frontage
>100 properties within 10 miles of coastal United States
Property locations are strongly correlated with population migration
Property locations in retirement and vacation destinations
Stable, Predictable Financial Performance and Fundamentals
Balance Sheet Flexibility
In business for more than 40 years
1
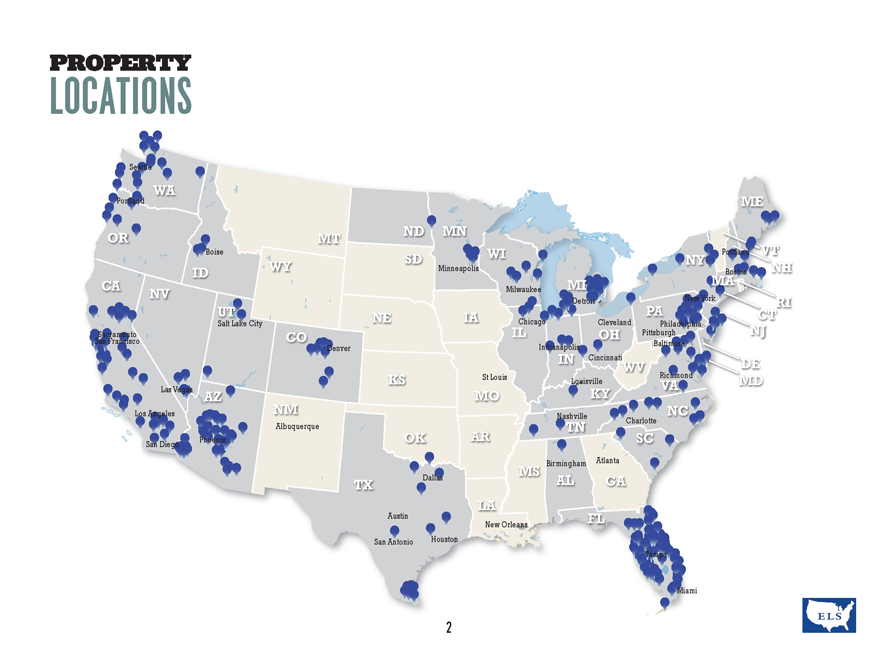
PROPERTY
LOCATIONS
Seattle
WA
Portland ME
ND MN OR MT
Boise SD WI Portland VT
NY
ID WY Minneapolis Boston NH
CA MI MA
NV Milwaukee
Detroit New York RI
UT IA PA CT
Salt Lake City NE Chicago Cleveland
Philadelphia NJ Sacramento CO IL OH Pittsburgh San Francisco Baltimore Denver Indianapolis IN Cincinnati DE
WV
St Louis Richmond
Las Vegas KS Bluegrass Louisville Pkwy VA MD
AZ MO KY
Los Angeles NM NC Nashville Charlotte Albuquerque TN
Phoenix OK AR SC San Diego MS Birmingham Atlanta
TX Dallas AL GA
Austin LA FL New Orleans San Antonio Houston
F l o r
Tampa i da’ s
Tpk
Pkwy Miami
2
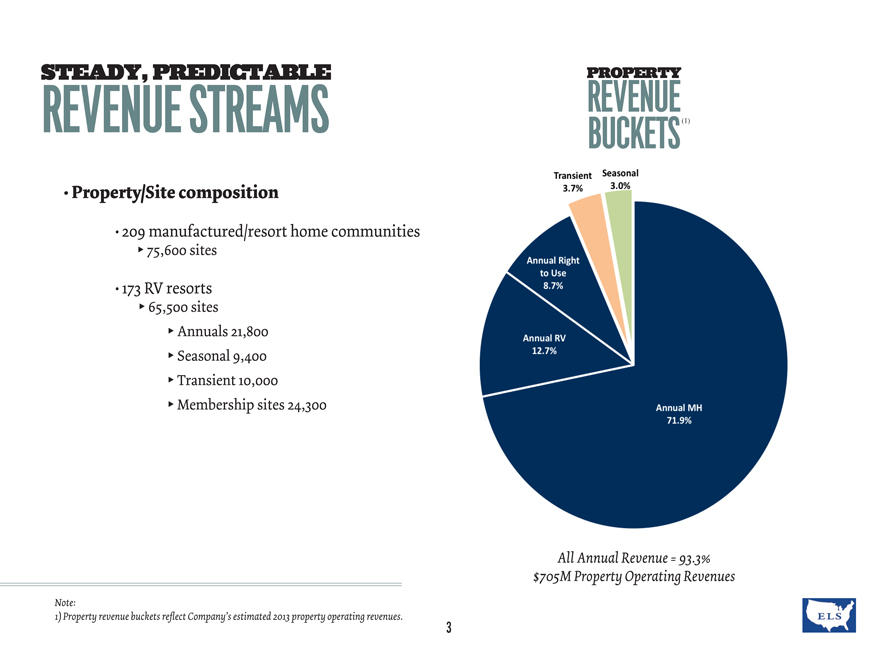
STEADY, PREDICTABLE
REVENUE STREAMS
Property/Site composition
209 manufactured/resort home communities
75,600 sites
173RV resorts
65,500 sites
Annuals 21,800
Seasonal 9,400
Transient 10,000
Membership sites 24,300
PROPERTY
REVENUE BUCKETS(1)
Transient
3.7%
Seasonal
3.0%
Annual Right to Use
8.7%
Annual RV
12.7%
Annual MH
71.9%
Note:
1) Property revenue buckets reflect Company’s estimated 2013 property operating revenues.
All Annual Revenue = 93.3% $705M Property Operating Revenues
3

OUR CUSTOMERS
Customers own the units they place on our sites
Manufactured homes
Resort cottages (park models) Recreational Vehicles
We offer a lifestyle and a variety of product options to meet our customers’ needs
We seek to create long-term relationships with our customers
Manufactured Home
RV Resort Cottage
RV Site
4

FAVORABLE CUSTOMER DEMOGRAPHICS
80M Baby Boomers
The population of people 50-74 is expected to grow 24% from 2010 to 2025.
U.S. Population Over Age 50 (in millions)
100M
80M
60M 40M 20M
2010 2015 2020 2025
Ages 50-54 55-59 60-64 65-69 70-74
RV Owners
8M-9MRV Owners
192KRVsales in 2011
Average of 42KRV
Owners within 100 miles of each ELS
Resort
Note:
Sources: University of Michigan’s Survey Research Center 2005, Acxiom 2009, Statistical Surveys 2011, US Census 2008.
5
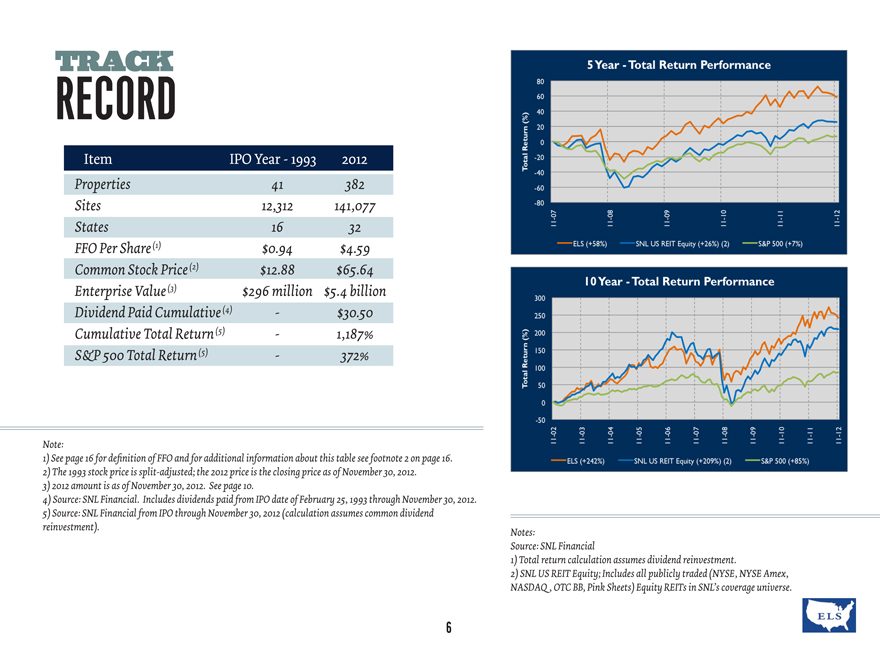
TRACK
RECORD
Item IPO Year-1993 2012
Properties 41 382
Sites 12,312 141,077
States 16 32
FFO Per Share (1) $0.94 $4.59
Common Stock Price (2) $12.88 $65.64
Enterprise Value (3) $296 million $5.4 billion
Dividend Paid Cumulative (4) — $30.50
Cumulative Total Return (5) — 1,187%
S&P 500 Total Return (5) — 372%
Note:
1) See page 16 for definition of FFO and for additional information about this table see footnote 2 on page 16.
2) The 1993 stock price is split-adjusted; the 2012 price is the closing price as of November 30, 2012.
3) 2012 amount is as of November 30, 2012. See page 10.
4) Source: SNL Financial. Includes dividends paid from IPO date of February 25, 1993 through November 30, 2012.
5) Source: SNL Financial from IPO through November 30, 2012 (calculation assumes common dividend
reinvestment).
5 Year – Total Return Perfomance
Total Return (%)
80
60
40
20
0
-20
-40
-60
-80
11-07 11-08 11-09 11-10 11-11 11-12
ELS (+58%) SNL US REIT Equity (+26%) (2) S&P 500 (+7%)
10 Year – Total Return Performance
Total Return (%)
300
250
200
150
100
50
0
-50
11-02 11-03 11-04 11-05 11-06 11-07 11-08 11-09 11-10 11-11 11-12
ELS (+242%) SNL US REIT Equity (+20%) (2) S&P 500 (+85%)
Notes:
Source: SNL Financial
1) Total return calculation assumes dividend reinvestment.
2) SNL US REIT Equity; Includes all publicly traded (NYSE, NYSE Amex, NASDAQ , OTC BB, Pink Sheets) Equity REITs in SNL’s coverage universe.
CONSISTENT
NOI SAME GROWTH STORE AND
OUT PERFORMANCE
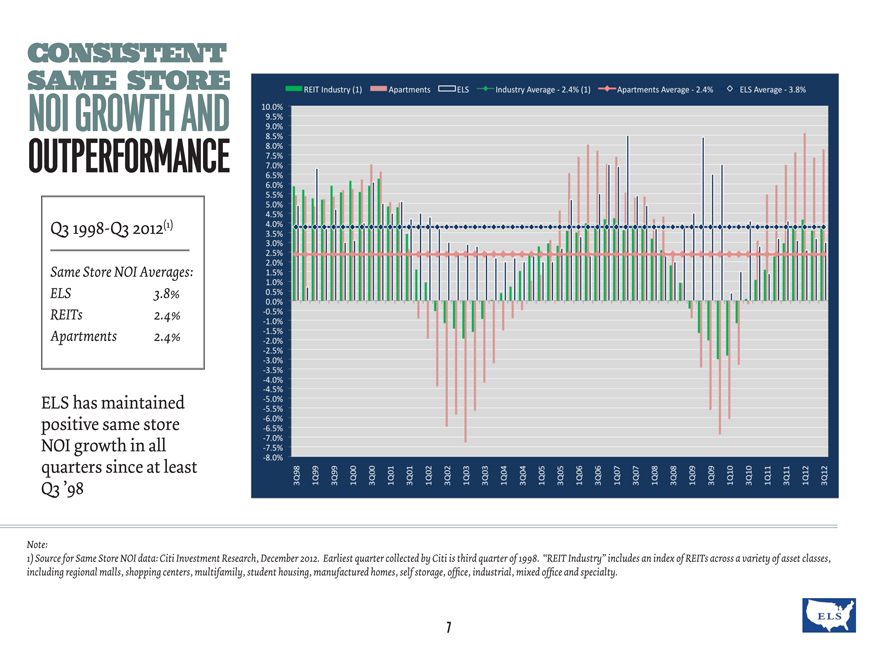
Q31998-Q32012(1)
Same Store NOI Averages:
ELS 3.8%
REITs 2.4%
Apartments 2.4%
ELS has maintained positive same store NOI growth in all quarters since at least
Q3’98
10.0% 9.5% 9.0% 8.5% 8.0% 7.5% 7.0% 6.5% 6.0% 5.5% 5.0% 4.5% 4.0% 3.5% 3.0% 2.5% 2.0% 1.5% 1.0% 0.5% 0.0% -0.5% -1.0% -1.5% -2.0% -2.5% -3.0% -3.5% -4.0% -4.5% -5.0% -5.5% -6.0% -6.5% -7.0% -7.5% -8.0%
REIT Industry (1) Apartments ELS Industry Average – 2.4% (1) Apartments Average – 2.4% ELS Average – 3.8%
3Q98 1Q99 3Q99 1Q00 3Q00 1Q01 3Q01 1Q02 3Q02 1Q03 3Q03 1Q04 3Q04 1Q05 3Q05 1Q06 3Q06 1Q07 3Q07 1Q08 3Q08 1Q09 3Q09 1Q10 3Q10 1Q11 3Q11 1Q12 3Q12
Note:
1) Source for Same Store NOI data: Citi Investment Research, December 2012. Earliest quarter collected by Citi is third quarter of 1998. “REIT Industry” includes an index of REITs across a variety of asset classes, including regional malls, shopping centers, multifamily, student housing, manufactured homes, self storage, office, industrial, mixed office and specialty.
7
ELS VS. MULTIFAMILY
SAME STORE NOI INDEXED GROWTH(1)
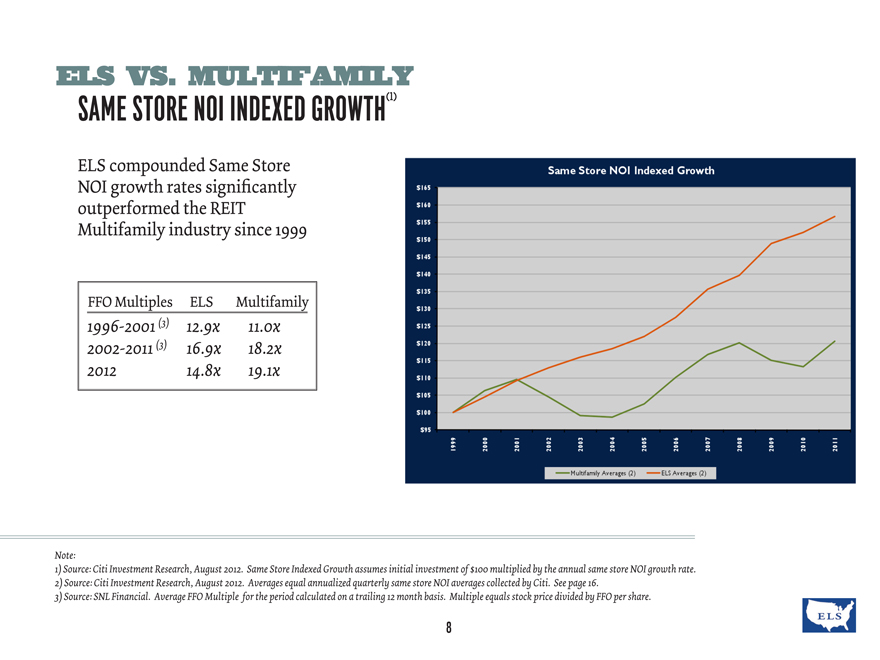
ELS compounded Same Store NOI growth rates significantly outperformed the REIT Multifamily industry since 1999
FFO Multiples ELS Multifamily
1996-2001 (3) 12.9x 11.0x
2002-2011 (3) 16.9x 18.2x
2012 14.8x 19.1x
Same Store NOI Indexed Growth
$165 $160 $155 $150 $145 $140 $135 $130 $125 $120 $115 $110 $105 $100 $95
1999 2000 2001 2002 2003 2004 2005 2006 2007 2008 2009 2010 2011
Multifamily Average (2) ELS Average (2)
Note:
1) Source: Citi Investment Research, August 2012. Same Store Indexed Growth assumes initial investment of $100 multiplied by the annual same store NOI growth rate.
2) Source: Citi Investment Research, August 2012. Averages equal annualized quarterly same store NOI averages collected by Citi. See page 16.
3) Source: SNL Financial. Average FFO Multiple for the period calculated on a trailing 12 month basis. Multiple equals stock price divided by FFO per share.
ELS VS. MULTIFAMILY
FFO/SHARE AND TOTAL RETURN
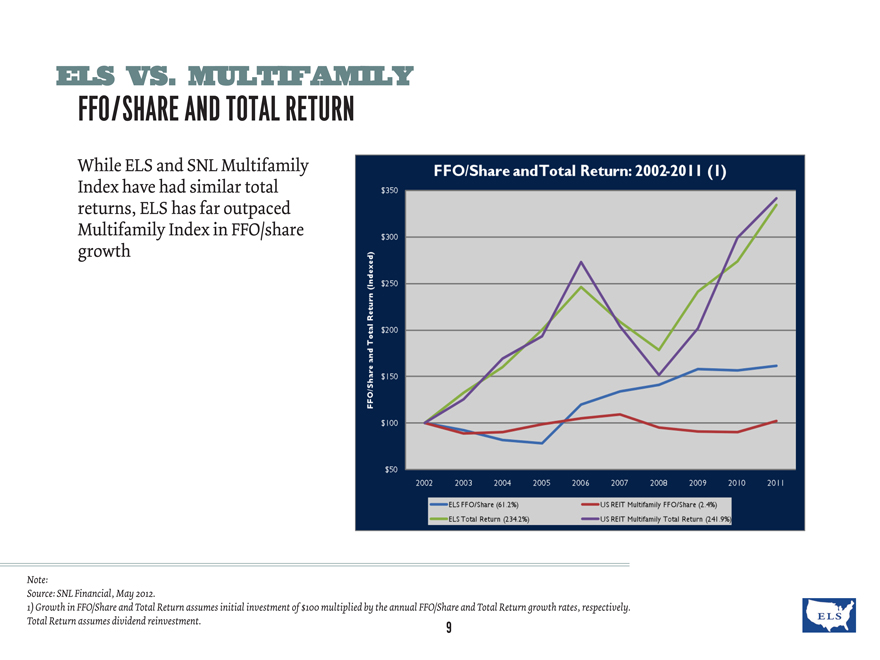
While ELS and SNL Multifamily Index have had similar total returns, ELS has far outpaced Multifamily Index in FFO/share growth
FFO/Share and Total Return: 2002-2011 (1)
FFO/Share and Total Return (Indexed)
$350 $300 $250 $200 $150 $100 $50 2002 2003 2004 2005 2006 2007 2008 2009 2010 2011
ELS FFO/Share (61.2%) US REIT Multifamily FFO/Share (2.4%)
ELS Total Return (234.2%) US REIT Multifamily Total Return (241.9%)
Note:
Source: SNL Financial, May 2012.
1) Growth in FFO/Share and Total Return assumes initial investment of $100 multiplied by the annual FFO/Share and Total Return growth rates, respectively.
Total Return assumes dividend reinvestment.
9
CAPITAL
STRUCTURE
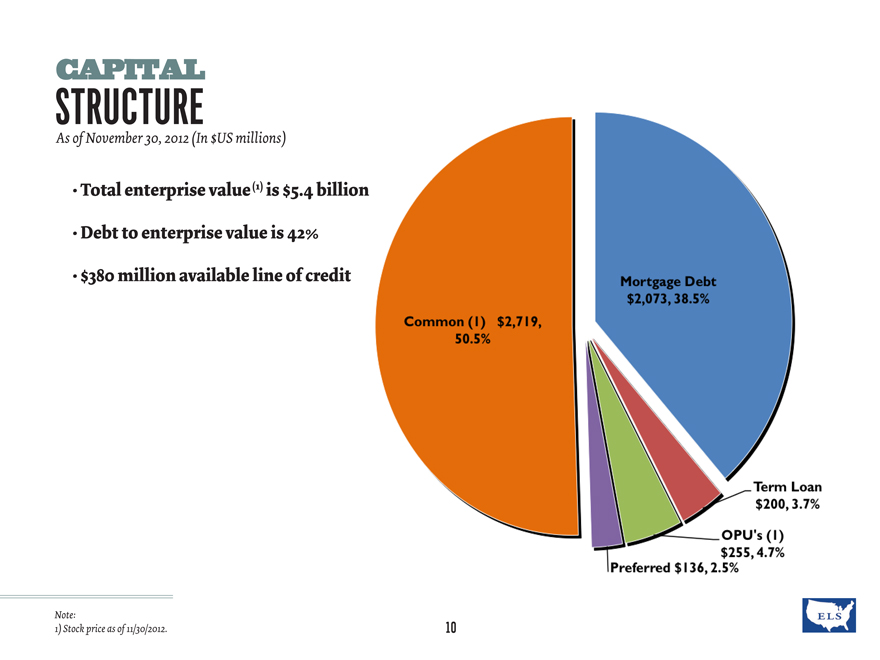
As of November 30, 2012 (In $US millions)
Total enterprise value (1) is $5.4 billion
Debt to enterprise value is 42%
$380 million available line of credit
Common (1) $2,719, 50.5%
Mortgage Debt
$2,073, 38.5%
Term Loan $200, 3.7%
OPU’s (1) $255, 4.7%
Preferred $136, 2.5%
Note:
1) Stock price as of 11/30/2012.
10
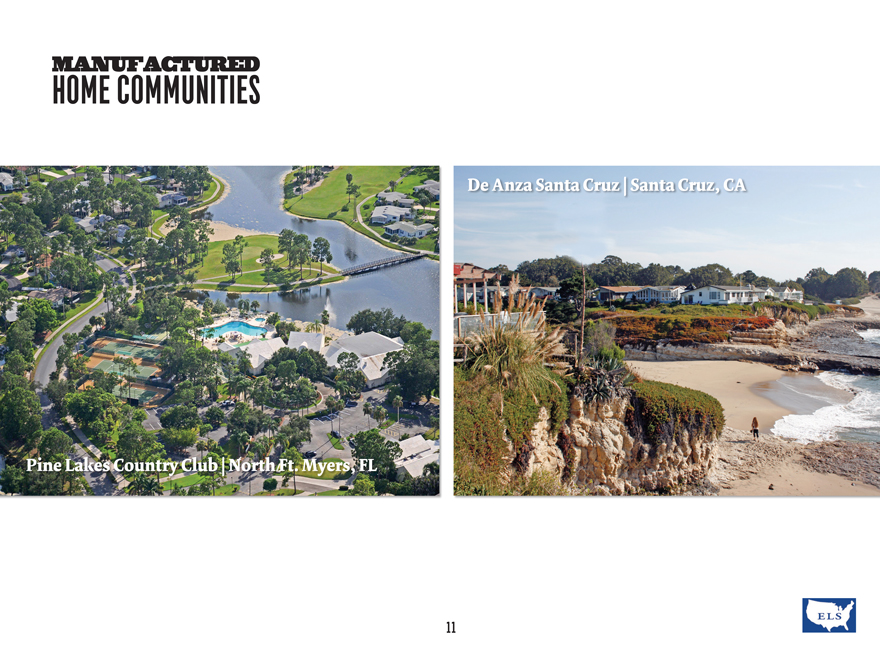
MANUFACTURED
HOME COMMUNITIES
Pine Lakes Country Club | North Ft. Myers, FL
De Anza Santa Cruz | Santa Cruz, CA
11
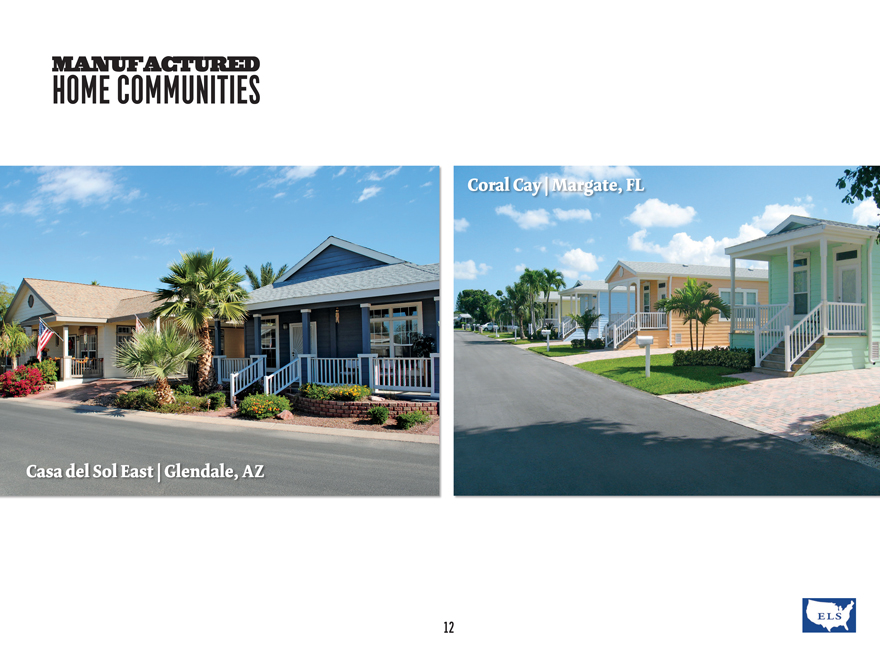
MANUFACTURED
HOME COMMUNITIES
Casa del Sol East | Glendale, AZ
Coral Cay | Margate, FL
12
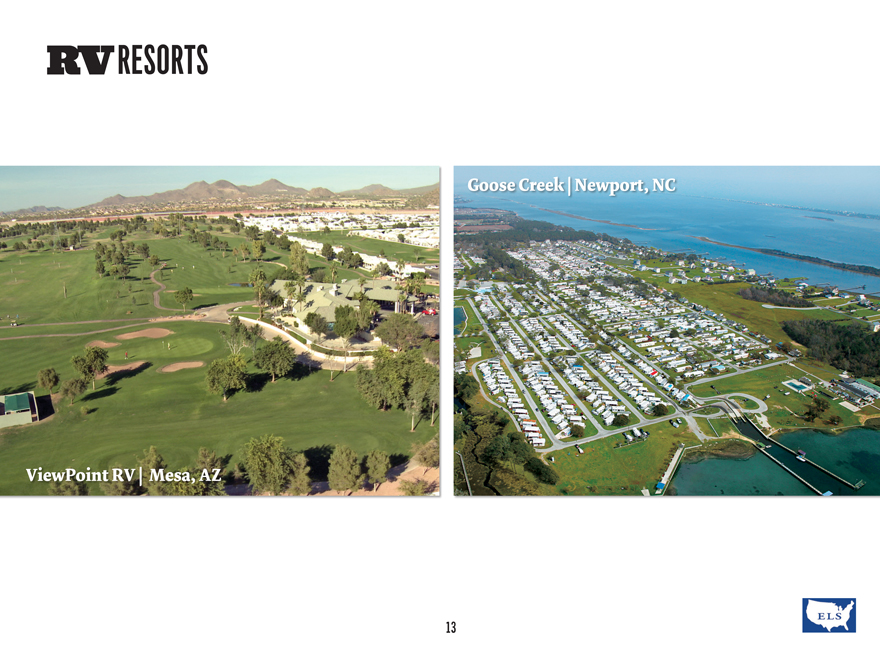
RV RESORTS
View Point RV | Mesa, AZ
Goose Creek | Newport, NC
13
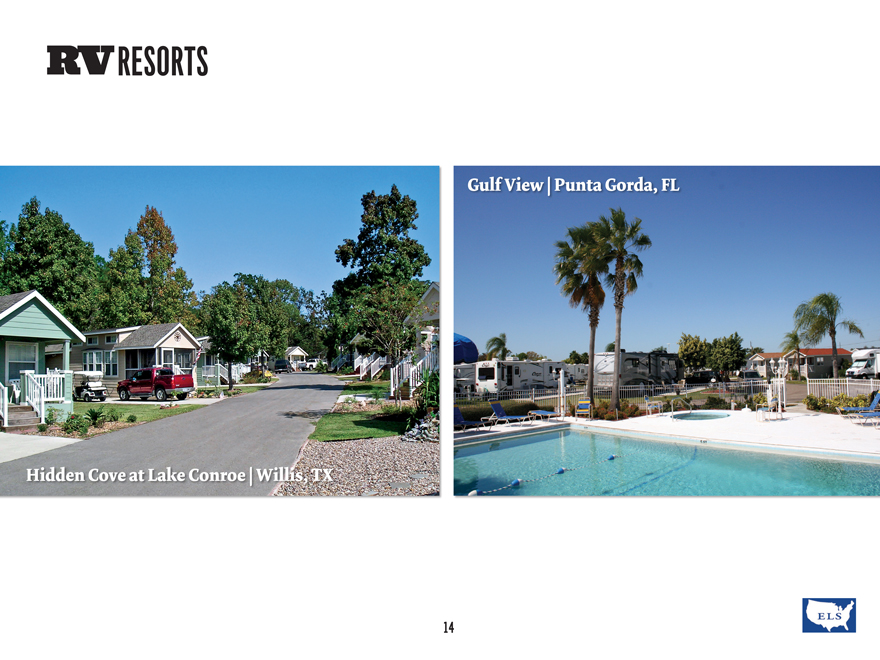
RV RESORTS
Hidden Cove at Lake Conroe | Willis, TX
Gulf View | Punta Gorda, FL
14
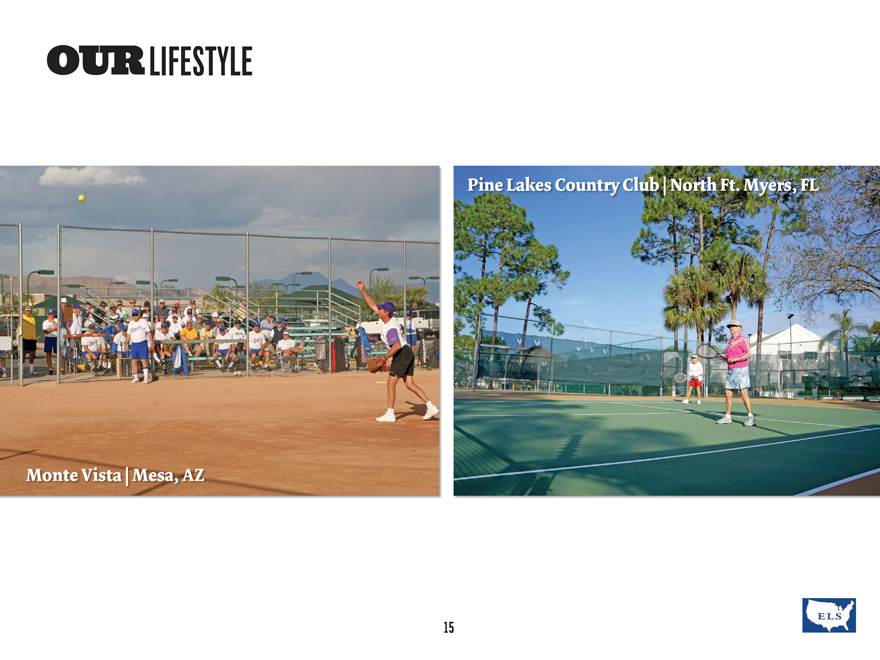
OUR LIFESTYLE
Monte Vista | Mesa, AZ
Pine Lakes Country Club | North Ft. Myers, FL
15
STATEMENT SAFE HARBOR
Under the Private Securities Litigation Reform Act of 1995:
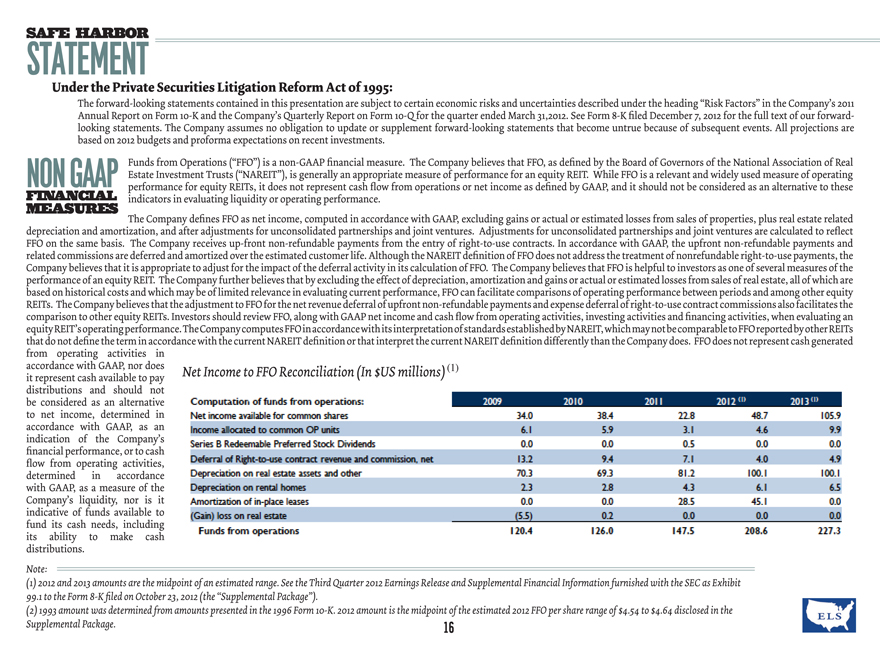
The forward-looking statements contained in this presentation are subject to certain economic risks and uncertainties described under the heading “Risk Factors” in the Company’s 2011 Annual Report on Form 10-K and the Company’s Quarterly Report on Form 10-Q for the quarter ended March 31, 2012. See Form 8-K filed December 7, 2012 for the full text of our forward-looking statements. The Company assumes no obligation to update or supplement forward-looking statements that become untrue because of subsequent events. All projections are based on 2012 budgets and proforma expectations on recent investments.
Funds from Operations (“FFO”) is a non-GAAP financial measure. The Company believes that FFO, as defined by the Board of Governors of the National Association of Real NON GAAP Estate Investment Trusts (“NAREIT”), is generally an appropriate measure of performance for an equity REIT. While FFO is a relevant and widely used measure of operating FINANCIAL performance for equity REITs, it does not represent cash flow from operations or net income as defined by GAAP, and it should not be considered as an alternative to these MEASURES indicators in evaluating liquidity or operating performance.
The Company defines FFO as net income, computed in accordance with GAAP, excluding gains or actual or estimated losses from sales of properties, plus real estate related depreciation and amortization, and after adjustments for unconsolidated partnerships and joint ventures. Adjustments for unconsolidated partnerships and jointventures are calculated to reflect FFO on the same basis. The Company receives up-front non-refundable payments from the entry of right-to-use contracts. In accordance with GAAP, the upfront non-refundable payments and related commissions are deferred and amortized over the estimated customer life. Although the NAREIT definition of FFO does not address the treatment of nonrefundable right-to-use payments, the Company believes that it is appropriate to adjust for the impact of the deferral activity in its calculation of FFO. The Company believes that FFO is helpful to investors as one of several measures of the performance of an equity REIT. The Company further believes that by excluding the effect of depreciation, amortization and gains or actual or estimated losses from sales of real estate, all of which are based on historical costs and which may be of limited relevance in evaluating current performance, FFO can facilitate comparisons of operating performance between periods and among other equity REITs. The Company believes that the adjustment to FFO for the net revenue deferral of up front non-refundable payments and expense deferral of right-to-use contract commissions also facilitates the comparison to other equity REITs. Investors should review FFO, along with GAAP net income and cash flow from operating activities, investing activities and financing activities, when evaluating an equity REIT ’s operating performance. The Company computes FFO in accordance with its interpretation of standards established by NAREIT, which may not be comparable to FFO reported by other REITs that do not define the term in accordance with the current NAREIT definition or that interpret the current NAREIT definition differently than the Company does. FFO does not represent cash generated from operating activities in accordance with GAAP, nor does it represent cash available to pay distributions and should not be considered as an alternative to net income, determined in accordance with GAAP, as an indication of the Company’s financial performance, or to cash flow from operating activities, determined in accordance with GAAP, as a measure of the Company’s liquidity, nor is it indicative of funds available to fund its cash needs, including its ability to make cash distributions.
Note:
(1) 2012 and 2013 amounts are the midpoint of an estimated range. See the Third Quarter 2012 Earnings Release and Supplemental Financial Information furnished with the SEC as Exhibit 99.1 to the Form 8-K filed on October 23, 2012 (the “Supplemental Package”).
(2) 1993 amount was determined from amounts presented in the 1996 Form 10-K. 2012 amount is the midpoint of the estimated 2012 FFO per share range of $4.54 to $4.64 disclosed in the Supplemental Package.
Net Income to FFO Reconciliation (In $US millions) (1)
Computation of funds from operations: 2009 2010 2011 2012 (1) 2013 (1)
Net Income available for common shares 34.0 38.4 22.8 48.7 105.9
Income allocated to common OP units 6.1 5.9 3.1 4.6 9.9
Series B Redeemable Preferred Stock Dividends 0.0 0.0 0.5 0.0 0.0
Deferral of Right-to-use contract revenue and commission, net 13.2 9.4 7.1 4.0 4.9
Depreciation on real estate assets and other 70.3 69.3 81.2 100.1 100.1
Depreciation on rental homes 2.3 2.8 4.3 6.1 6.5
Amortization of in-place leases 0.0 0.0 28.5 45.1 0.0
(Gain) loss on real estate (5.5) 0.2 0.0 0.0 0.0
Funds from operations 120.4 126.0 147.5 208.6 227.3
16

Monte Vista | Mesa, AZ