Exhibit 99.1
|

Equity LifeStyle Properties
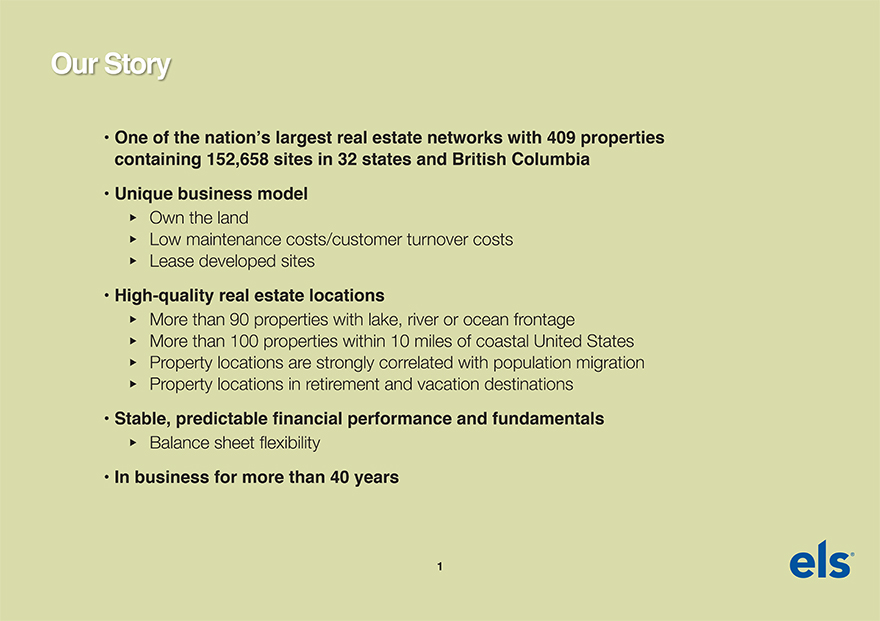 |
Our Story One of the nation’s largest real estate networks with 409 properties containing 152,658 sites in 32 states and British Columbia Unique business model uOwn the land uLow maintenance costs/customer turnover costs uLease developed sites High-quality real estate locations uMore than 90 properties with lake, river or ocean frontage uMore than 100 properties within 10 miles of coastal United States uProperty locations are strongly correlated with population migration uProperty locations in retirement and vacation destinations Stable, predictable financial performance and fundamentals uBalance sheet flexibility In business for more than 40 years1
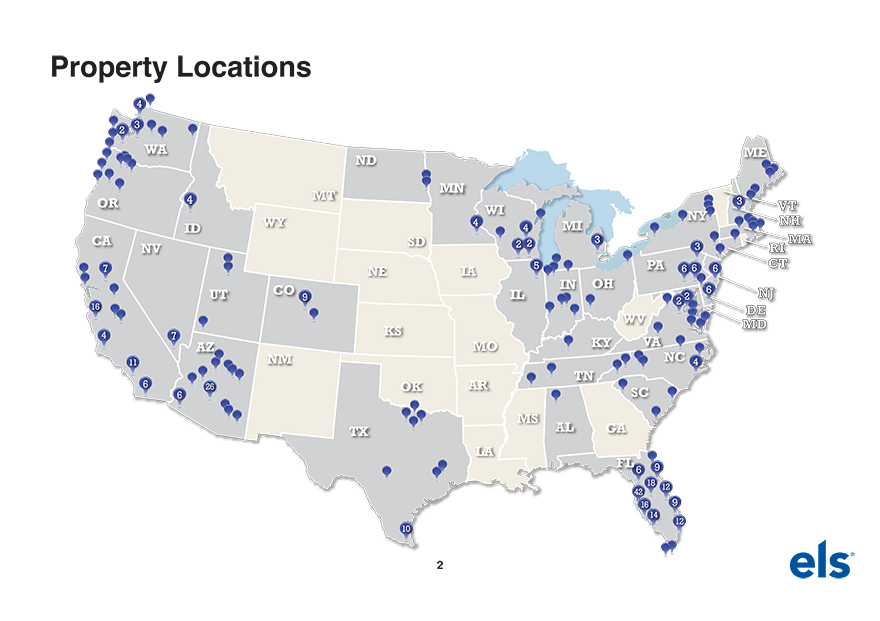 |
Property Locations4 3 2WA ME NDMN4 MT 3 OR VTWI NYWY 4 MI NH ID 4 CA SD 2 2 3 MANV 3 RI7 NE IA 5 PA 6 6 6 IN OHUT CO IL 6 NJ9 2 216 WV DE4 7 KSAZ MO KY VA11 NM NC 4 TN6 26 OK AR6 SCMSTX AL GA LAFL 9618 12 4216 9 1410 122
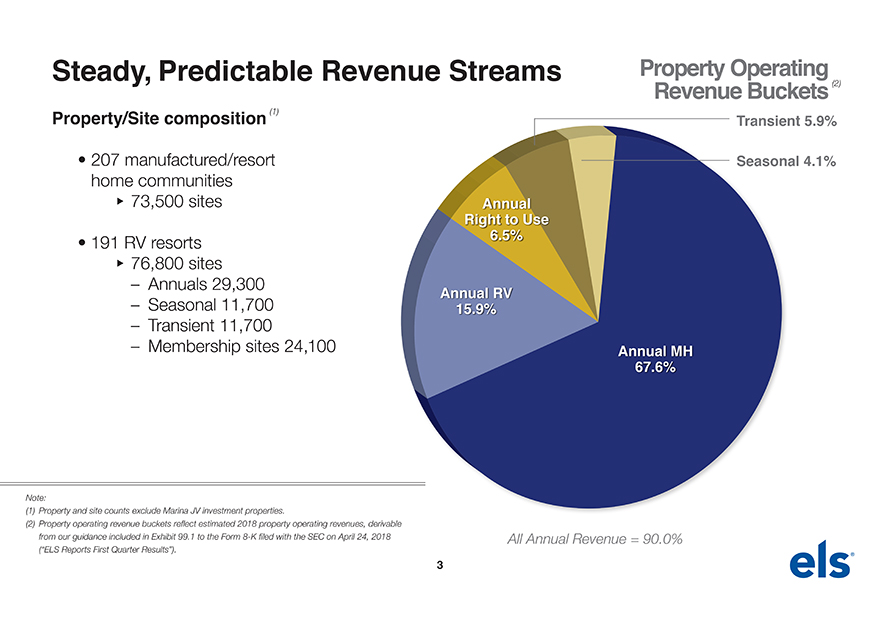 |
Steady,Predictable Revenue Streams Property OperatingRevenue Buckets(2)Property/Site composition(1) Transient 5.9% 207 manufactured/resort Seasonal 4.1% home communities u73,500 sites AnnualRight to Use 191 RV resorts 6.5% u76,800 sites – Annuals 29,300 Annual RV – Seasonal 11,700 15.9% – Transient 11,700 – Membership sites 24,100 Annual MH67.6%Note:(1) Property and site counts exclude Marina JV investment properties.(2) Property operating revenue buckets reflect estimated 2018 property operating revenues, derivable from our guidance included in Exhibit 99.1 to the Form8-K filed with the SEC on April 24, 2018 All Annual Revenue = 90.0% (“ELS Reports First Quarter Results”).3
 |
Our Lifestyle Options Customers own the units they place on our sites uManufactured homes uResort cottages (park models) uRecreational vehicles We offer a lifestyle and a variety of product options to meet our customers’ needs We seek to create long-term relationships with our customersRV Resort CottageManufactured RV Site Home Tiny House4
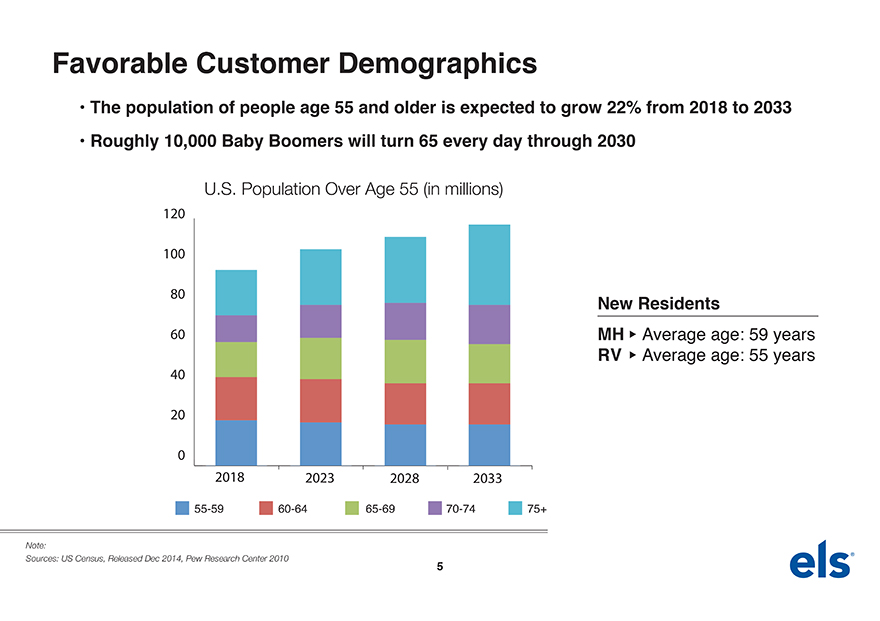 |
Favorable Customer Demographics The population of people age 55 and older is expected to grow 22% from 2018 to 2033 Roughly 10,000 Baby Boomers will turn 65 every day through 2030U.S. Population Over Age 55 (in millions)12010080 New Residents60 MH uAverage age: 59 years RV u Average age: 55 years40200 2018 2023 2028203355-5960-6465-6970-74 75+Note:Sources: US Census, Released Dec 2014, Pew Research Center 2010510-Year Total Return Performance
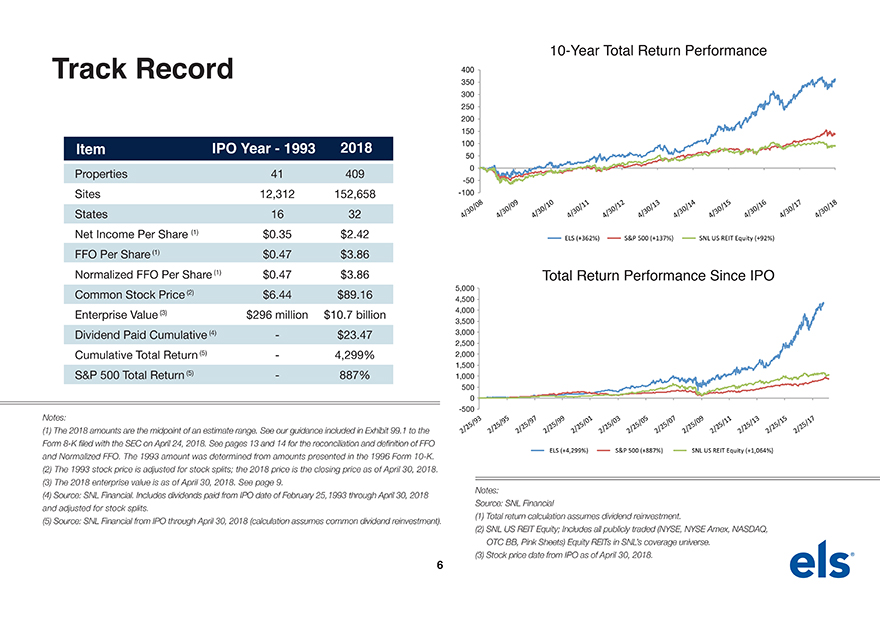 |
Track Record 400350 300 250 200 150Item IPO Year—1993 2018 10050 0Properties 41409-50Sites 12,312 152,658 -100States 16 32 4/30/08 4/30/09 4/30/10 4/30/11 4/30/12 4/30/13 4/30/14 4/30/15 4/30/16 4/30/17 4/30/18Net Income Per Share (1) $0.35 $2.42ELS (+362%) S&P 500 (+137%) SNL US REIT Equity (+92%)FFO Per Share (1) $0.47 $3.86Normalized FFO Per Share (1) $0.47 $3.86 Total Return Performance Since IPO5,000Common Stock Price (2) $6.44 $89.164,500Enterprise Value (3) $296 million $10.7 billion 4,0003,500Dividend Paid Cumulative (4)—$23.47 3,0002,500Cumulative Total Return (5)—4,299% 2,0001,500S&P 500 Total Return (5)—887% 1,000500 0Notes:-500(1) The 2018 amounts are the midpoint of an estimate range. See our guidance included in Exhibit 99.1 to the 2/25/93 2/25/95 2/25/97 2/25/99 2/25/01 2/25/03 2/25/05 2/25/07 2/25/09 2/25/11 2/25/13 2/25/15 2/25/17Form8-K filed with the SEC on April 24, 2018. See pages 13 and 14 for the reconciliation and definition of FFO ELS (+4,299%) S&P 500 (+887%) SNL US REIT Equity (+1,064%) and Normalized FFO. The 1993 amount was determined from amounts presented in the 1996 Form10-K.(2) The 1993 stock price is adjusted for stock splits; the 2018 price is the closing price as of April 30, 2018.(3) The 2018 enterprise value is as of April 30, 2018. See page 9. Notes:(4) Source: SNL Financial. Includes dividends paid from IPO date of February 25,1993 through April 30, 2018 Source: SNL Financial and adjusted for stock splits. (1) Total return calculation assumes dividend reinvestment.(5) Source: SNL Financial from IPO through April 30, 2018 (calculation assumes common dividend reinvestment). (2) SNL US REIT Equity; Includes all publicly traded (NYSE, NYSE Amex, NASDAQ, OTC BB, Pink Sheets) Equity REITs in SNL’s coverage universe.(3) Stock price date from IPO as of April 30, 2018.6
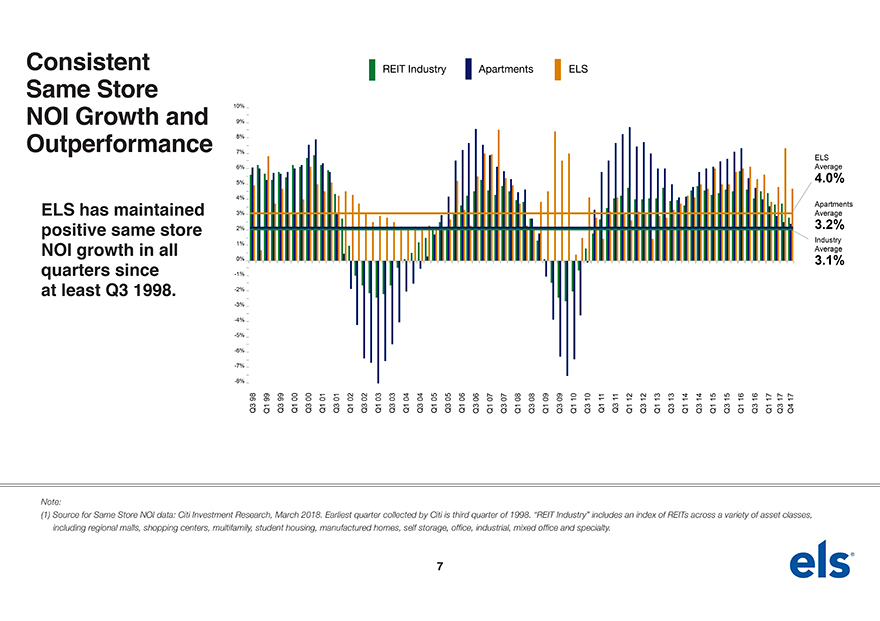 |
Consistent Same Store10%NOI Growth and 9% Outperformance 8%7%ELS6% 4. Average 0%5%4% ApartmentsELS has maintained 3% 3. Average 2% positive same store 2%Industry1%NOI growth in all Average quarters since 0%3.1%-1%at least Q3 1998.-2%-3%-4%-5%-6%-7%-8%98 99 99 000001 01 02 02 03 03 04 04 05 05 06 06 07 07 0808 09 09 10 10111112 12 131314 14 1515 16 16 17 17 17 Q3 Q1 Q3 Q1 Q3 Q1 Q3 Q1 Q3 Q1 Q3 Q1 Q3 Q1 Q3 Q1 Q3 Q1 Q3 Q1 Q3 Q1 Q3 Q1 Q3 Q1 Q3 Q1 Q3 Q1 Q3 Q1 Q3 Q1 Q3 Q1 Q3 Q1 Q3 Q4Note:(1) Source for Same Store NOI data: Citi Investment Research, March 2018. Earliest quarter collected by Citi is third quarter of 1998. “REIT Industry” includes an index of REITs across a variety of asset classes, including regional malls, shopping centers, multifamily, student housing, manufactured homes, self storage, office, industrial, mixed office and specialty.7
 |
Development – 2018 Construction Projects8
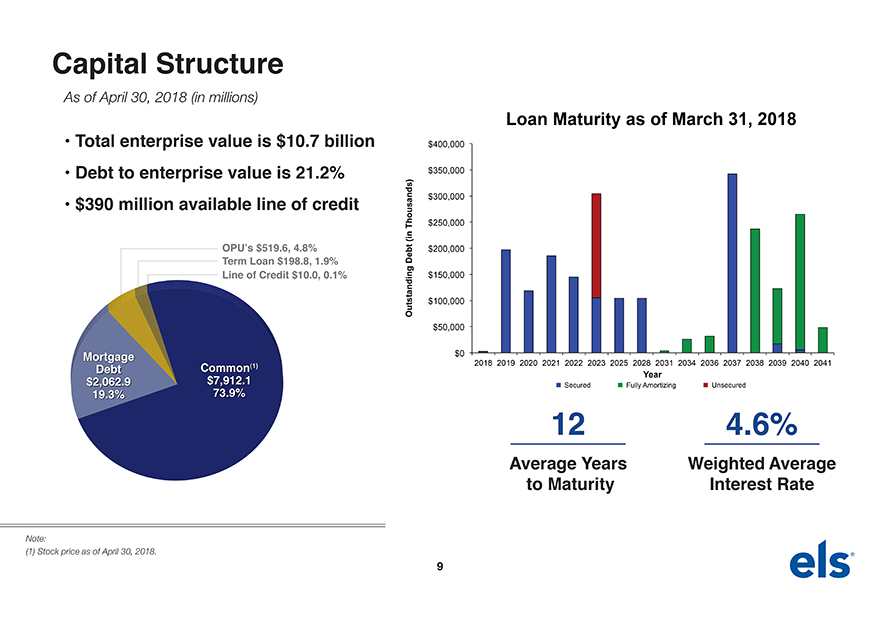 |
Capital StructureAs of April 30, 2018 (in millions)Loan Maturity as of March 31, 2018 Total enterprise value is $10.7 billion $400,000 Debt to enterprise value is 21.2% $350,000 $390 million available line of credit $300,000Thousands) $250,000 (in OPU’s $519.6, 4.8% Debt $200,000Term Loan $198.8, 1.9% Line of Credit $10.0, 0.1% $150,000Outstanding $100,000 $50,000Mortgage $0Debt Common(1) 2018 2019 2020 2021 2022 2023 2025 2028 2031 2034 2036 2037 2038 2039 2040 2041 $2,062.9 $7,912.1 Year73.9% Secured Fully Amortizing Unsecured 19.3% 12 4.6%Average to Maturity Years Weighted Interest Average RateNote:(1) Stock price as of April 30, 2018.9
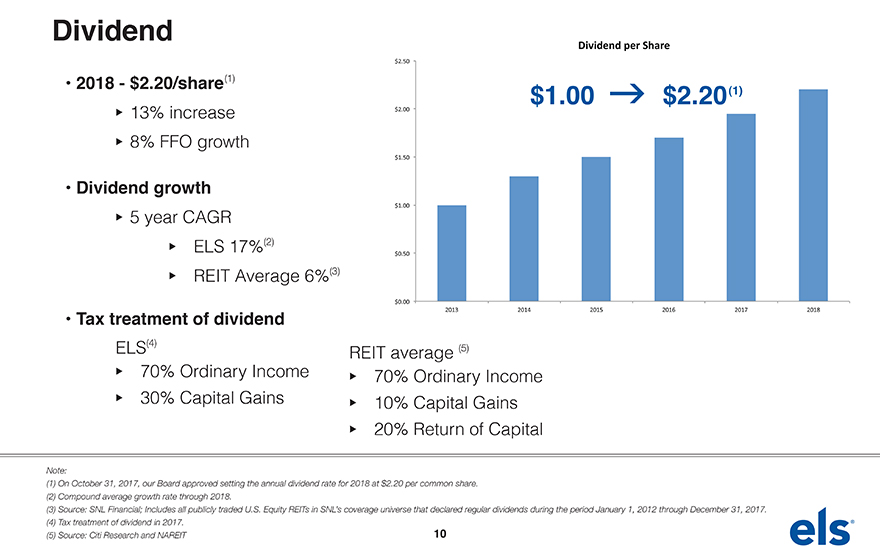 |
DividendDividend per Share$2.50 2018—$2.20/share(1)$1.00 g $2.20(1) u13% increase $2.00 u8% FFO growth$1.50 Dividend growth$1.00 u5 year CAGR(2) uELS 17% $0.50(3) uREIT Average 6%$0.00 Tax treatment of dividend 2013 2014 2015 2016 2017 2018(4) ELS REIT average (5) u70% Ordinary Income u70% Ordinary Income u30% Capital Gains u10% Capital Gains u20% Return of CapitalNote:(1) On October 31, 2017, our Board approved setting the annual dividend rate for 2018 at $2.20 per common share. (2) Compound average growth rate through 2018.(3) Source: SNL Financial; Includes all publicly traded U.S. Equity REITs in SNL’s coverage universe that declared regular dividends during the period January 1, 2012 through December 31, 2017. (4) Tax treatment of dividend in 2017.(5) Source: Citi Research and NAREIT 10
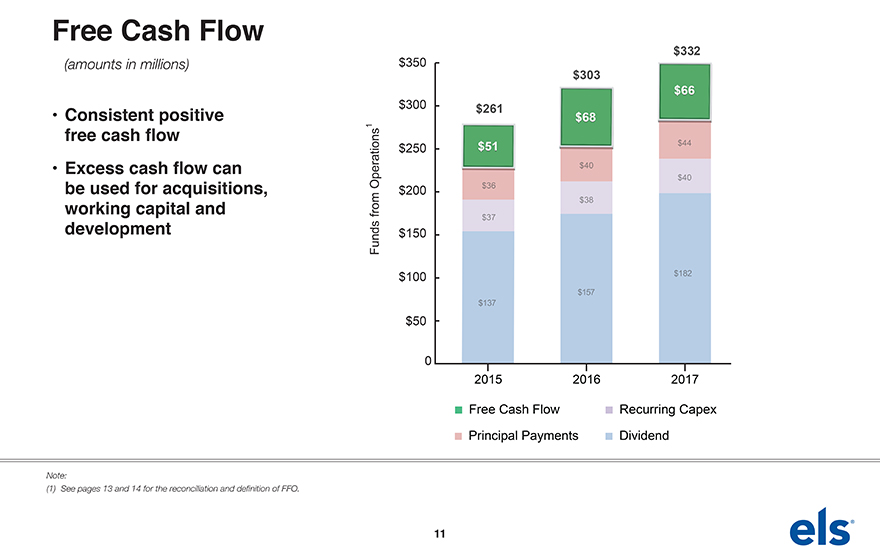 |
Free Cash Flow$332(amounts in millions) $350 $303 $66 Consistent positive $300 $261 $68 free cash flow 1 $250 $51 $44 Excess cash flow can $40Operations $36 $40 be used for acquisitions, $200 working capital and from $38 development $37Funds $150 $100 $182$157 $137$5002015 2016 2017Free Cash Flow Recurring Capex Principal Payments DividendNote:(1) See pages 13 and 14 for the reconciliation and definition of FFO.11
 |
Performance Update 202 Manufactured Home Communities(1) 190 RV Resorts(1) uCore(2) occupancy of 94.5% as of 4/30/18 uCore resort base rental income growth for the month ended uCore occupancy has grown 34 consecutive 4/30/18 is 7.3%(3) quarters through 3/31/18 uCore rental income growth from uCore community base rental income growth (3) annuals for the month ended for the month ended 4/30/18 is 4.6% 4/30/18 is 6.9%(3)Note:(1) Excludes joint venture properties.(2) Core Portfolio is defined as properties acquired prior to December 31, 2016. The Core Portfolio may change fromtime-to-time depending on acquisitions, dispositions and significant transactions or unique situations. (3) Compared to the month ended April 30, 2017.12
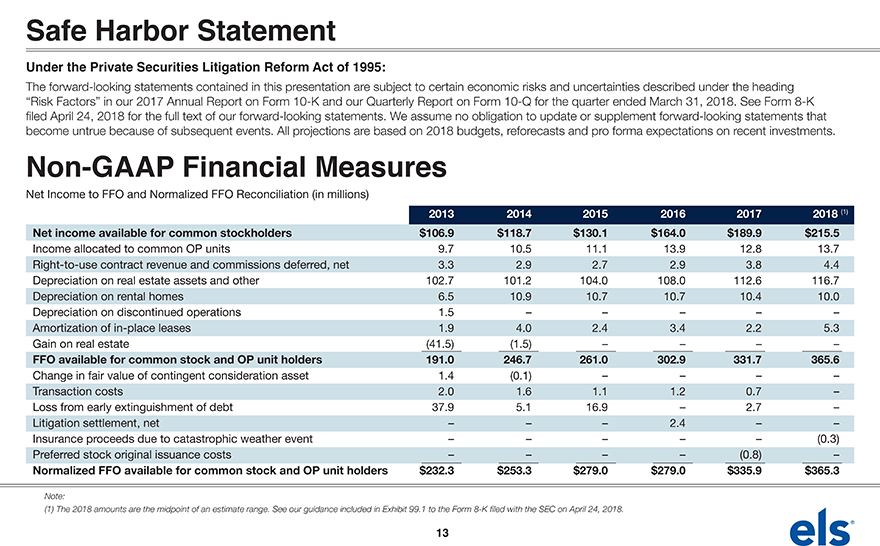 |
Safe Harbor StatementUnder the Private Securities Litigation Reform Act of 1995:The forward-looking statements contained in this presentation are subject to certain economic risks and uncertainties described under the heading “Risk Factors” in our 2017 Annual Report on Form10-K and our Quarterly Report on Form10-Q for the quarter ended March 31, 2018. See Form8-K filed April 24, 2018 for the full text of our forward-looking statements. We assume no obligation to update or supplement forward-looking statements that become untrue because of subsequent events. All projections are based on 2018 budgets, reforecasts and pro forma expectations on recent investments.Non-GAAP Financial MeasuresNet Income to FFO and Normalized FFO Reconciliation (in millions) 2013 2014 2015 2016 2017 2018(1)Netincomeavailableforcommonstockholders $106.9 $118.7 $130.1 $164.0 $189.9 $215.5Income allocated to common OP units 9.7 10.5 11.1 13.9 12.8 13.7Right-to-use contract revenue and commissions deferred, net 3.3 2.9 2.7 2.9 3.8 4.4 Depreciation on real estate assets and other 102.7 101.2 104.0 108.0 112.6 116.7 Depreciation on rental homes 6.5 10.9 10.7 10.7 10.4 10.0 Depreciation on discontinued operations 1.5 – – – – –Amortization ofin-place leases 1.9 4.0 2.4 3.4 2.2 5.3 Gain on real estate (41.5) (1.5) – – – –FFOavailableforcommonstockandOPunitholders 191.0 246.7 261.0 302.9 331.7 365.6Change in fair value of contingent consideration asset 1.4 (0.1) – – – –Transaction costs 2.0 1.6 1.1 1.2 0.7 –Loss from early extinguishment of debt 37.9 5.1 16.9 – 2.7 –Litigation settlement, net – – – 2.4 – –Insurance proceeds due to catastrophic weather event – – – – – (0.3) Preferred stock original issuance costs – – – – (0.8) –NormalizedFFOavailableforcommonstockandOPunitholders $232.3 $253.3 $279.0 $279.0 $335.9 $365.3Note:(1) The 2018 amounts are the midpoint of an estimate range. See our guidance included in Exhibit 99.1 to the Form8-K filed with the SEC on April 24, 2018.13
 |
Non-GAAP Financial MeasuresThis document contains certainnon-GAAP measures used by management that we believe are helpful in understanding our business, as further discussed in the paragraphs below. We believe investors should review thesenon-GAAP measures, along with GAAP net income and cash flow from operating activities, investing activities and financing activities, when evaluating an equity REIT’s operating performance. Our definitions and calculations of thesenon-GAAP financial and operating measures and other terms may differ from the definitions and methodologies used by other REITs and, accordingly, may not be comparable. Thesenon-GAAP financial and operating measures do not represent cash generated from operating activities in accordance with GAAP, nor do they represent cash available to pay distributions and should not be considered as an alternative to net income, determined in accordance with GAAP, as an indication of our financial performance, or to cash flow from operating activities, determined in accordance with GAAP, as a measure of our liquidity, nor is it indicative of funds available to fund our cash needs, including our ability to make cash distributions.FUNDSFROMOPERATIONS(FFO). We define FFO as net income, computed in accordance with GAAP, excluding gains and actual or estimated losses from sales of properties, plus real estate related depreciation and amortization, impairments, if any, and after adjustments for unconsolidated partnerships and joint ventures. Adjustments for unconsolidated partnerships and joint ventures are calculated to reflect FFO on the same basis. We compute FFO in accordance with our interpretation of standards established by the National Association of Real Estate Investment Trusts (“NAREIT”), which may not be comparable to FFO reported by other REITs that do not define the term in accordance with the current NAREIT definition or that interpret the current NAREIT definition differently than we do. We receiveup-frontnon-refundable payments from the entry ofright-to-use contracts. In accordance with GAAP, the upfrontnon-refundable payments and related commissions are deferred and amortized over the estimated customer life. Although the NAREIT definition of FFO does not address the treatment ofnon-refundableright-to-use payments, we believe that it is appropriate to adjust for the impact of the deferral activity in our calculation of FFO.NORMALIZEDFUNDSFROMOPERATIONS(NORMALIZEDFFO). We define Normalized FFO as FFO excluding the followingnon-operating income and expense items: a) gains and losses from early debt extinguishment, including prepayment penalties and defeasance costs; b) property acquisition and other transaction costs related to business combinations; and c) other miscellaneousnon-comparable items. Normalized FFO presented herein is not necessarily comparable to Normalized FFO presented by other real estate companies due to the fact that not all real estate companies use the same methodology for computing this amount.We believe that FFO and Normalized FFO are helpful to investors as supplemental measures of the performance of an equity REIT. We believe that by excluding the effect of depreciation, amortization, impairments, if any, and actual or estimated gains or losses from sales of real estate, all of which are based on historical costs and which may be of limited relevance in evaluating current performance, FFO can facilitate comparisons of operating performance between periods and among other equity REITs. We further believe that Normalized FFO provides useful information to investors, analysts and our management because it allows them to compare our operating performance to the operating performance of other real estate companies and between periods on a consistent basis without having to account for differences not related to our operations. For example, we believe that excluding the early extinguishment of debt, property acquisition and other transaction costs related to business combinations from Normalized FFO allows investors, analysts and our management to assess the sustainability of operating performance in future periods because these costs do not affect the future operations of the properties. In some cases, we provide information about identifiednon-cash components of FFO and Normalized FFO because it allows investors, analysts and our management to assess the impact of those items.14
 |
EquityLifeStylePropertiesTwo North Riverside Plaza, Chicago, Illinois 60606 800.247.5279 | EquityLifeStyleProperties.com5/18