Four Pillars of Morgan Stanley: The Integrated Firm Ted Pick, Chairman and Chief Executive Officer January 16, 2025

Notice 2 The information provided herein includes certain non-GAAP financial measures. The definition of such measures and/or the reconciliation of such measures to the comparable U.S. GAAP figures are included in this presentation, or in Morgan Stanley's (the ‘Company’) Annual Report on Form 10-K, Definitive Proxy Statement, Quarterly Reports on Form 10-Q and the Company’s Current Reports on Form 8-K, as applicable, including any amendments thereto, which are available on www.morganstanley.com. This presentation may contain forward-looking statements including the attainment of certain financial and other targets, and objectives and goals. You are cautioned not to place undue reliance on forward-looking statements, which speak only as of the date on which they are made, which reflect management’s current estimates, projections, expectations, assumptions, interpretation or beliefs and which are subject to risks and uncertainties that may cause actual results to differ materially. The Company does not undertake to update the forward-looking statements to reflect the impact of circumstances or events that may arise after the date of forward-looking statements. For a discussion of risks and uncertainties that may affect the future results of the Company, please see the Company’s most recent Annual Report on Form 10-K, Quarterly Reports on Form 10-Q and Current Reports on Form 8-K, as applicable, which are available on www.morganstanley.com. This presentation is not an offer to buy or sell any security. The End Notes are an integral part of this presentation. See Slides 17 – 20 at the back of this presentation for information related to the financial metrics and defined terms in this presentation. For information and impact of the Company’s acquisitions, please refer to prior period filings of the Company’s Annual Reports on Form 10-K and Quarterly Reports on Form 10-Q. Please note this presentation is available at www.morganstanley.com.
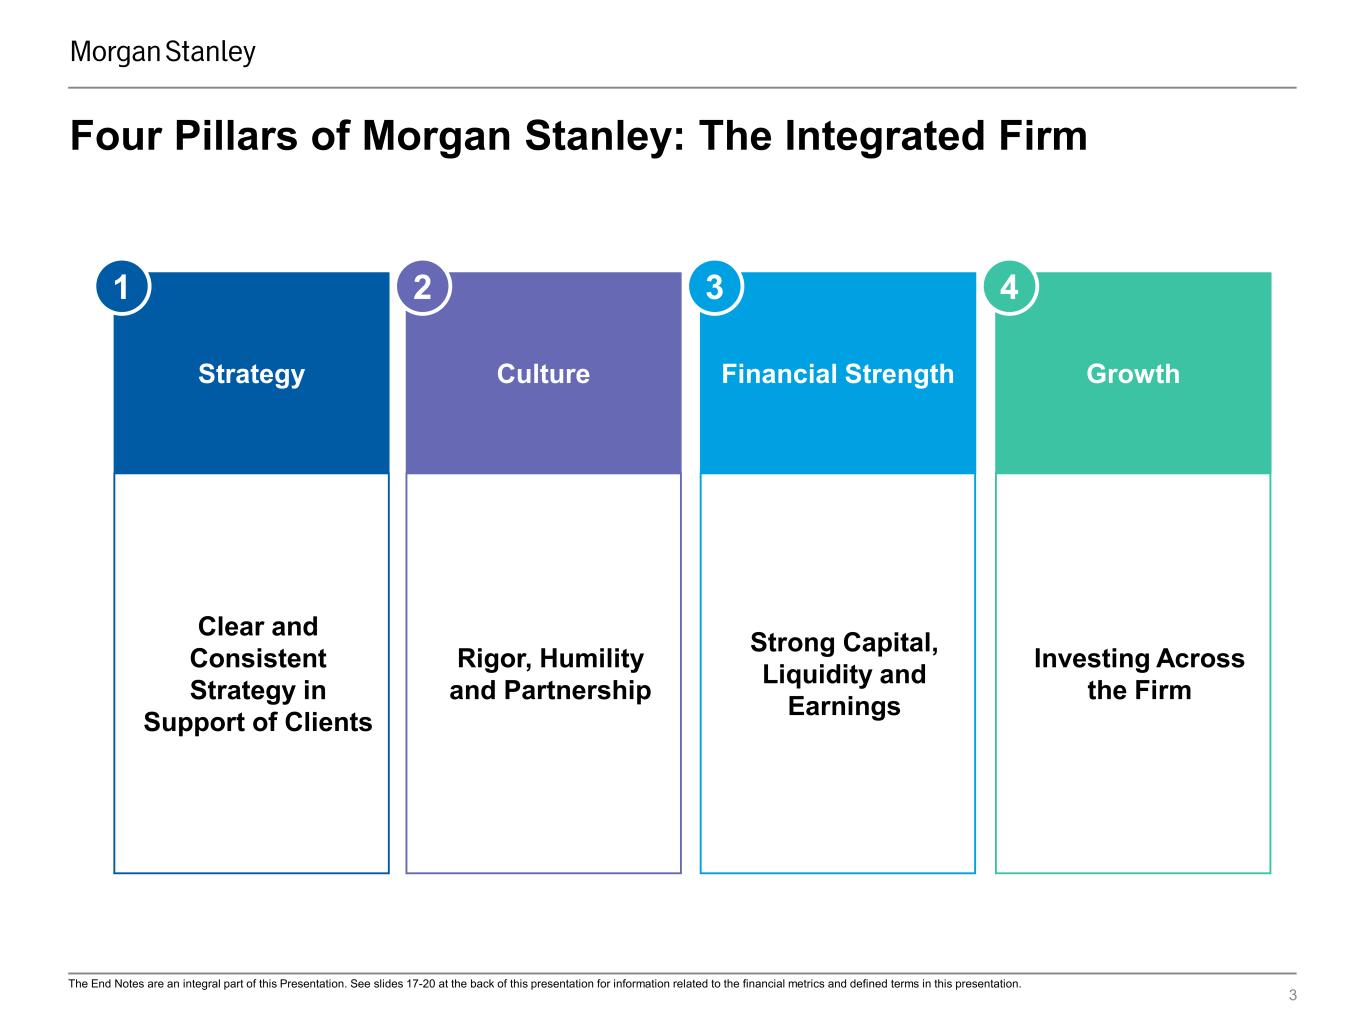
3 The End Notes are an integral part of this Presentation. See slides 17-20 at the back of this presentation for information related to the financial metrics and defined terms in this presentation. Strategy Clear and Consistent Strategy in Support of Clients 1 Culture Rigor, Humility and Partnership 2 Financial Strength Strong Capital, Liquidity and Earnings 3 Growth Investing Across the Firm 4 Four Pillars of Morgan Stanley: The Integrated Firm
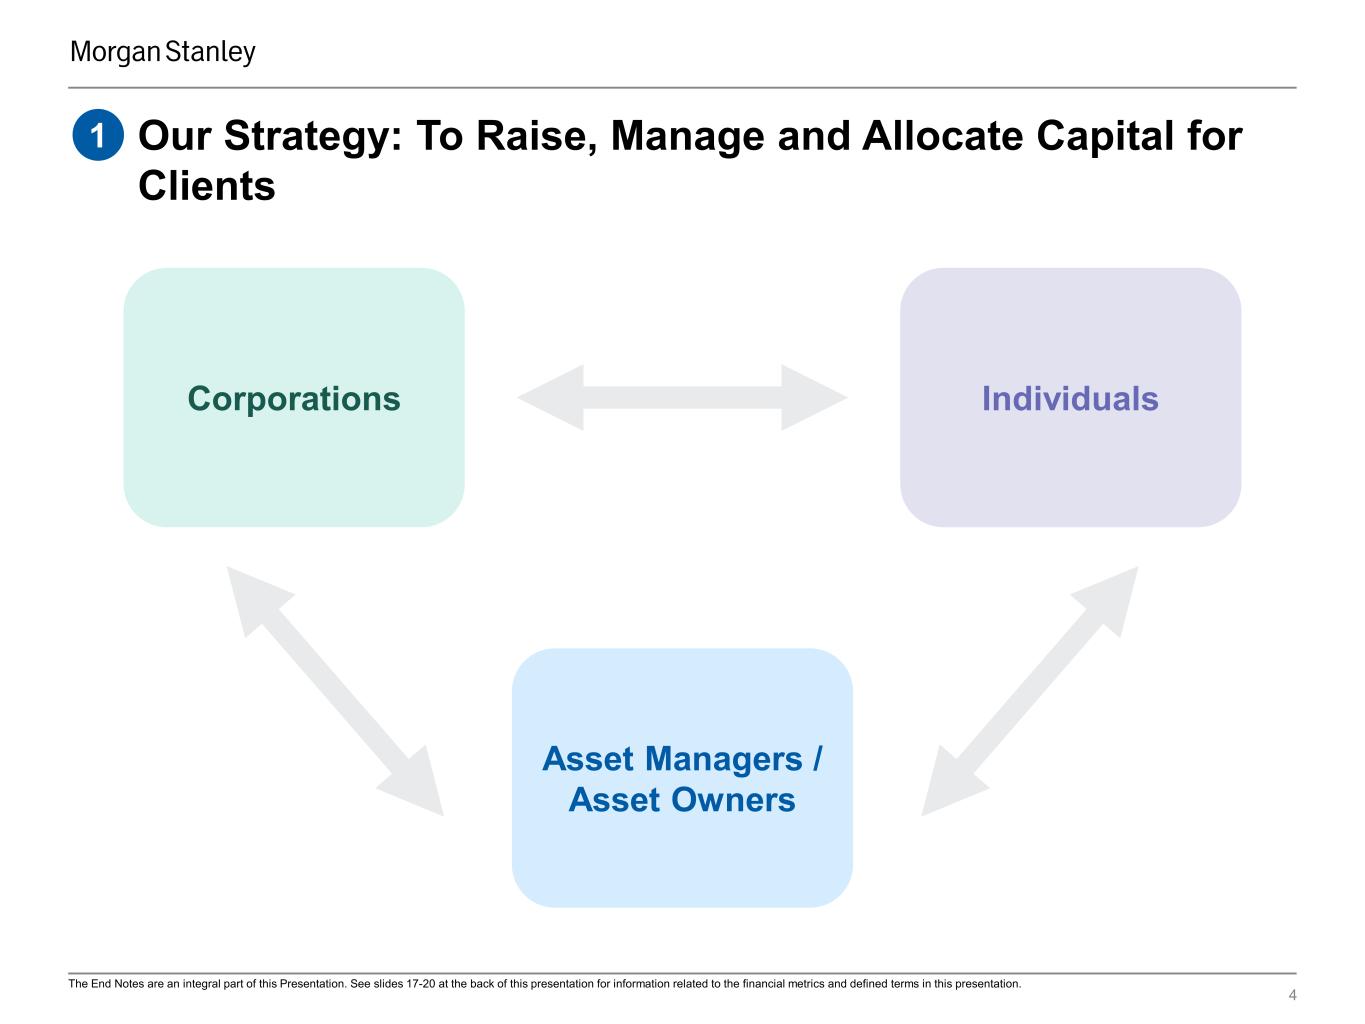
4 Asset Managers / Asset Owners IndividualsCorporations Our Strategy: To Raise, Manage and Allocate Capital for Clients 1 The End Notes are an integral part of this Presentation. See slides 17-20 at the back of this presentation for information related to the financial metrics and defined terms in this presentation.
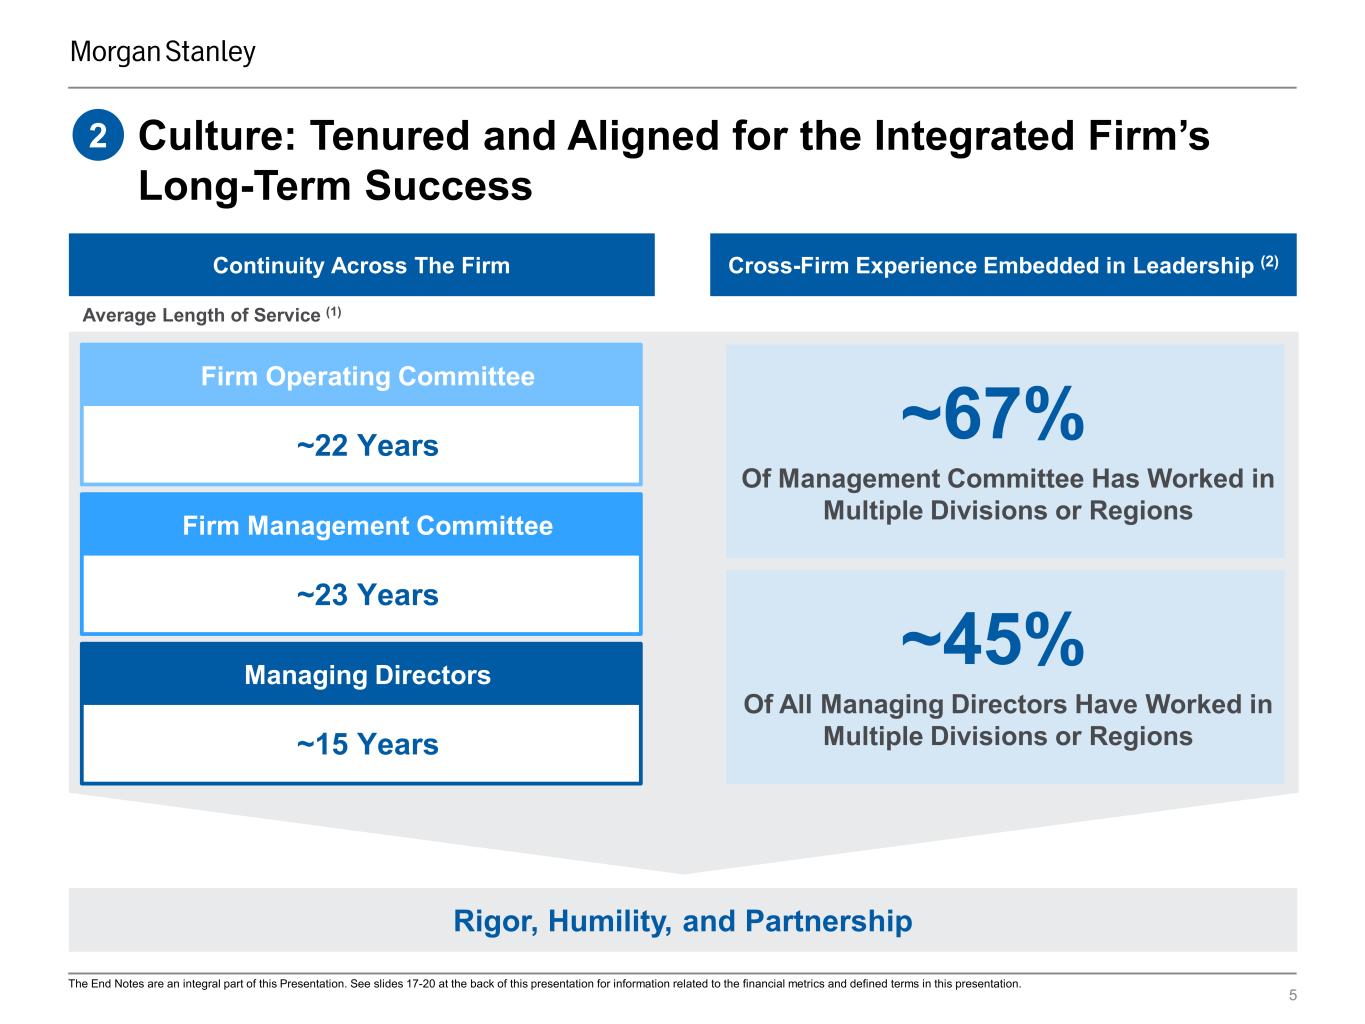
5 Cross-Firm Experience Embedded in Leadership (2) Culture: Tenured and Aligned for the Integrated Firm’s Long-Term Success 2 Continuity Across The Firm ~22 Years Firm Operating Committee Firm Management Committee ~23 Years Managing Directors Rigor, Humility, and Partnership Average Length of Service (1) ~15 Years ~67% Of Management Committee Has Worked in Multiple Divisions or Regions ~45% Of All Managing Directors Have Worked in Multiple Divisions or Regions The End Notes are an integral part of this Presentation. See slides 17-20 at the back of this presentation for information related to the financial metrics and defined terms in this presentation.
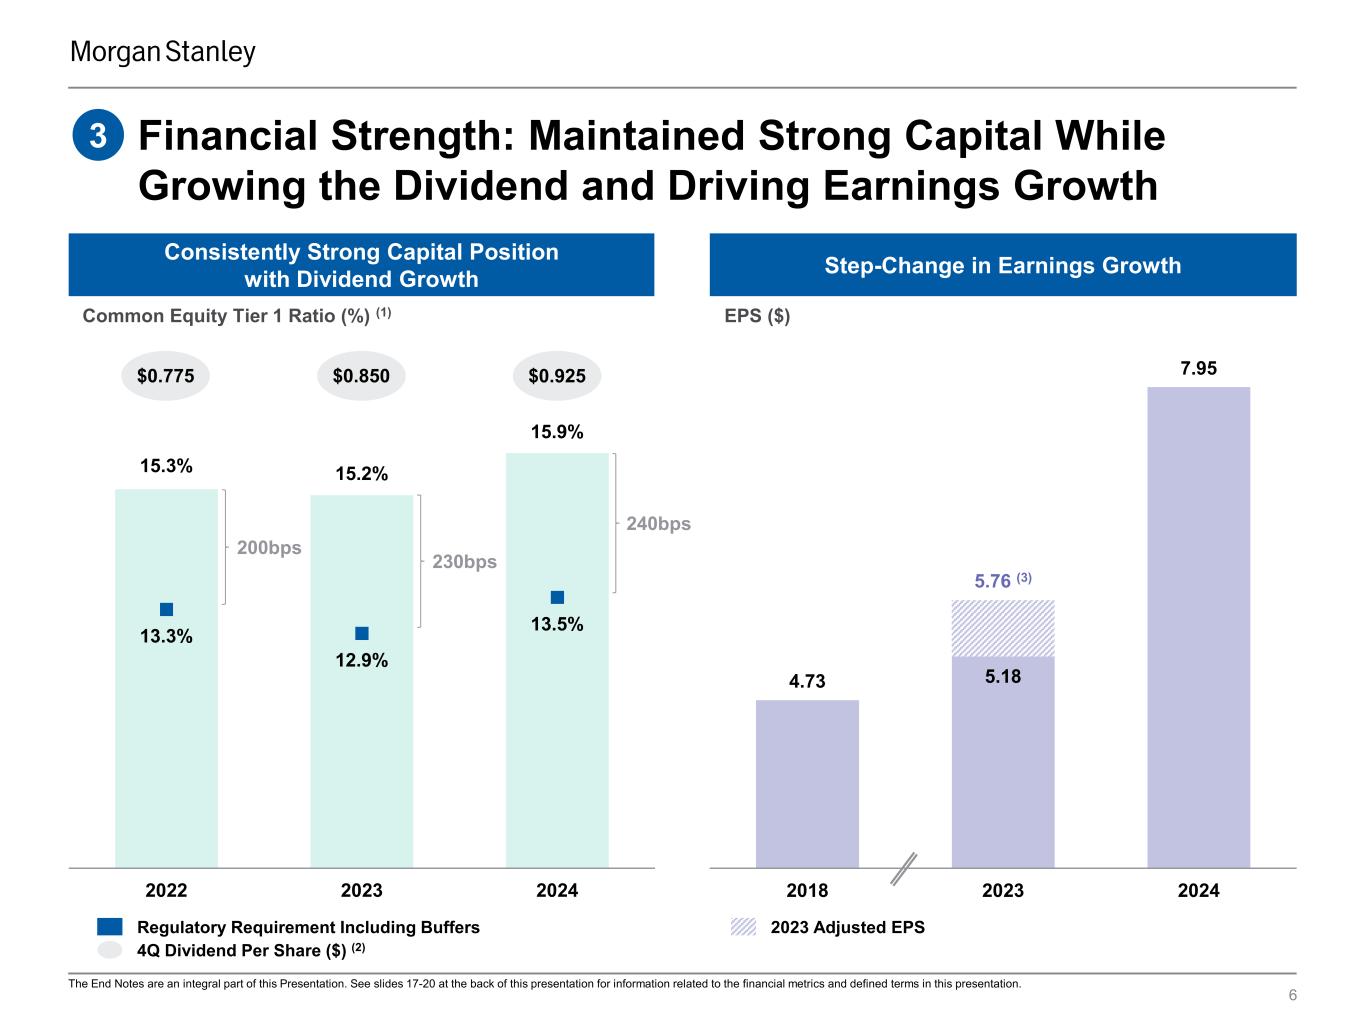
5.184.73 7.95 5.76 (3) 2018 2023 2024 15.3% 15.2% 15.9% 13.3% 12.9% 13.5% 2022 2023 2024 Consistently Strong Capital Position with Dividend Growth Financial Strength: Maintained Strong Capital While Growing the Dividend and Driving Earnings Growth 3 Step-Change in Earnings Growth 6 Regulatory Requirement Including Buffers $0.775 $0.850 $0.925 4Q Dividend Per Share ($) (2) 240bps 230bps 200bps 2023 Adjusted EPS The End Notes are an integral part of this Presentation. See slides 17-20 at the back of this presentation for information related to the financial metrics and defined terms in this presentation. Common Equity Tier 1 Ratio (%) (1) EPS ($)

Revenues and Earnings Growth Reflects Returns on Investments for Growth and Operating Leverage 4 Investments for Growth Revenue Growth Outpacing Expense Growth 7 29 42 44 2018 2023 2024 40 54 62 2018 2023 2024 14% 5% World-Class Technology and Modernization Expanded Bank Offering Talent Across Businesses Differentiated Client Solutions Infrastructure to Support Growth The Integrated Firm The End Notes are an integral part of this Presentation. See slides 17-20 at the back of this presentation for information related to the financial metrics and defined terms in this presentation. Firm Expenses ($Bn)Firm Net Revenues ($Bn)
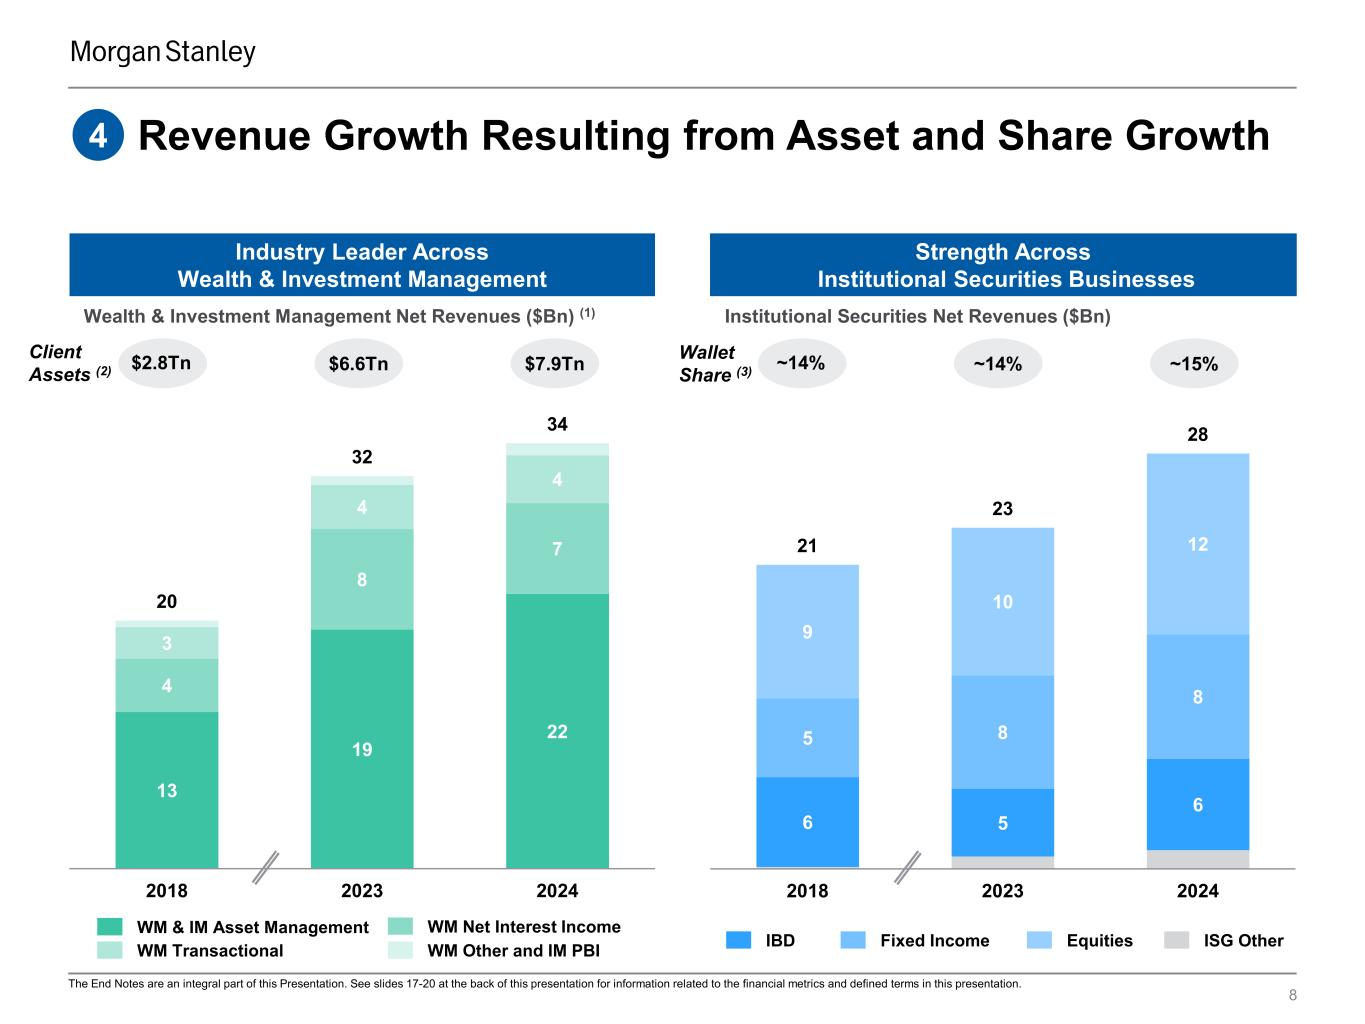
Industry Leader Across Wealth & Investment Management 13 19 22 4 8 7 3 4 4 20 32 34 2018 2023 2024 WM & IM Asset Management WM Net Interest Income WM Transactional WM Other and IM PBI 8 Revenue Growth Resulting from Asset and Share Growth4 6 5 6 5 8 8 9 10 1221 23 28 2018 2023 2024 Strength Across Institutional Securities Businesses IBD Fixed Income Equities ISG Other $7.9TnClient Assets (2) $2.8Tn $6.6Tn ~15%Wallet Share (3) ~14% ~14% The End Notes are an integral part of this Presentation. See slides 17-20 at the back of this presentation for information related to the financial metrics and defined terms in this presentation. Wealth & Investment Management Net Revenues ($Bn) (1) Institutional Securities Net Revenues ($Bn)
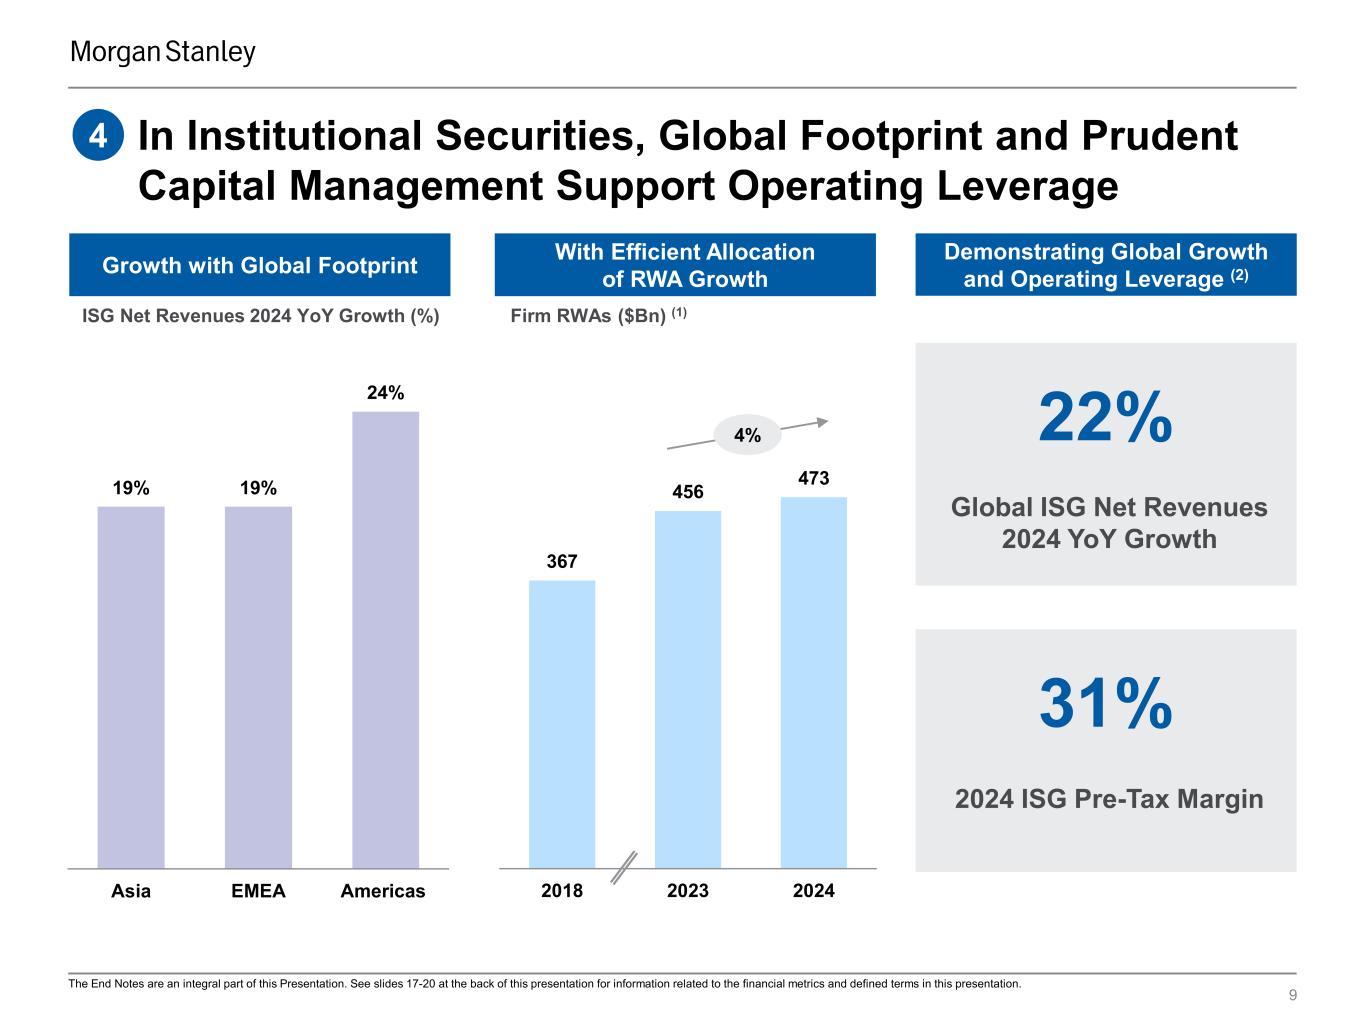
367 456 473 2018 2023 2024 9 Growth with Global Footprint Demonstrating Global Growth and Operating Leverage (2) With Efficient Allocation of RWA Growth Firm RWAs ($Bn) (1) 4 In Institutional Securities, Global Footprint and Prudent Capital Management Support Operating Leverage 19% 19% 24% Asia EMEA Americas ISG Net Revenues 2024 YoY Growth (%) 4% 31% 2024 ISG Pre-Tax Margin 22% Global ISG Net Revenues 2024 YoY Growth The End Notes are an integral part of this Presentation. See slides 17-20 at the back of this presentation for information related to the financial metrics and defined terms in this presentation.
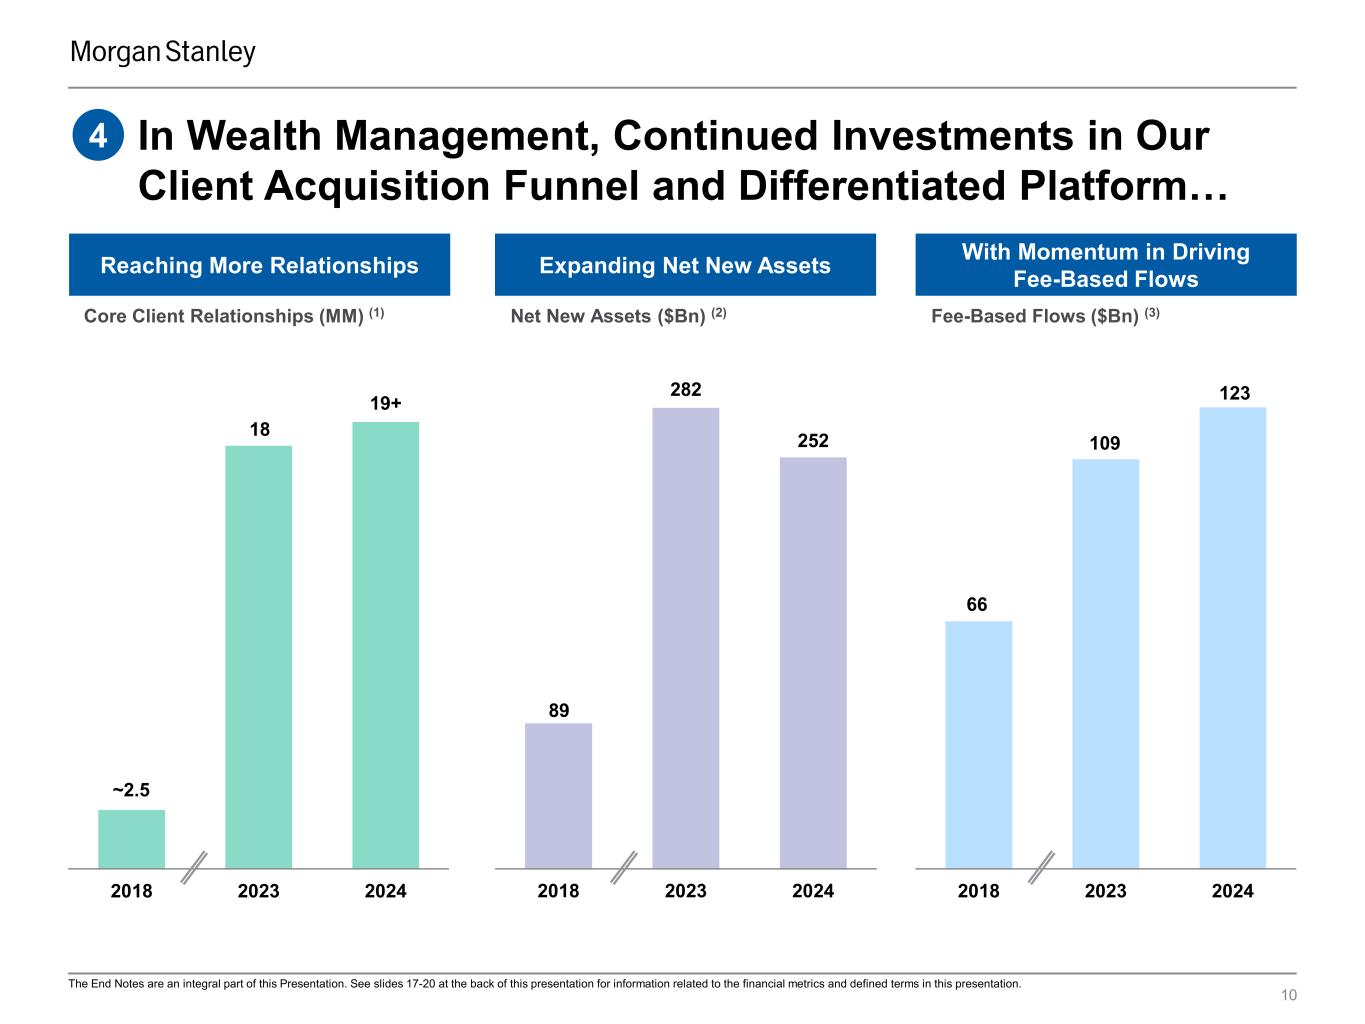
Growing Net New Assets 89 282 252 2018 2023 2024 ~2.5 18 19+ 2018 2023 2024 10 4 With Momentum in Driving Fee-Based FlowExpanding Net New AssetsReaching More Relationships 66 109 123 2018 2023 2024 Net New Assets ($Bn) (2) Core Client Relationships (MM) (1) Fee-Based Flows ($Bn) (3) In Wealth Management, Continued Investments in Our Client Acquisition Funnel and Differentiated Platform… The End Notes are an integral part of this Presentation. See slides 17-20 at the back of this presentation for information related to the financial metrics and defined terms in this presentation.
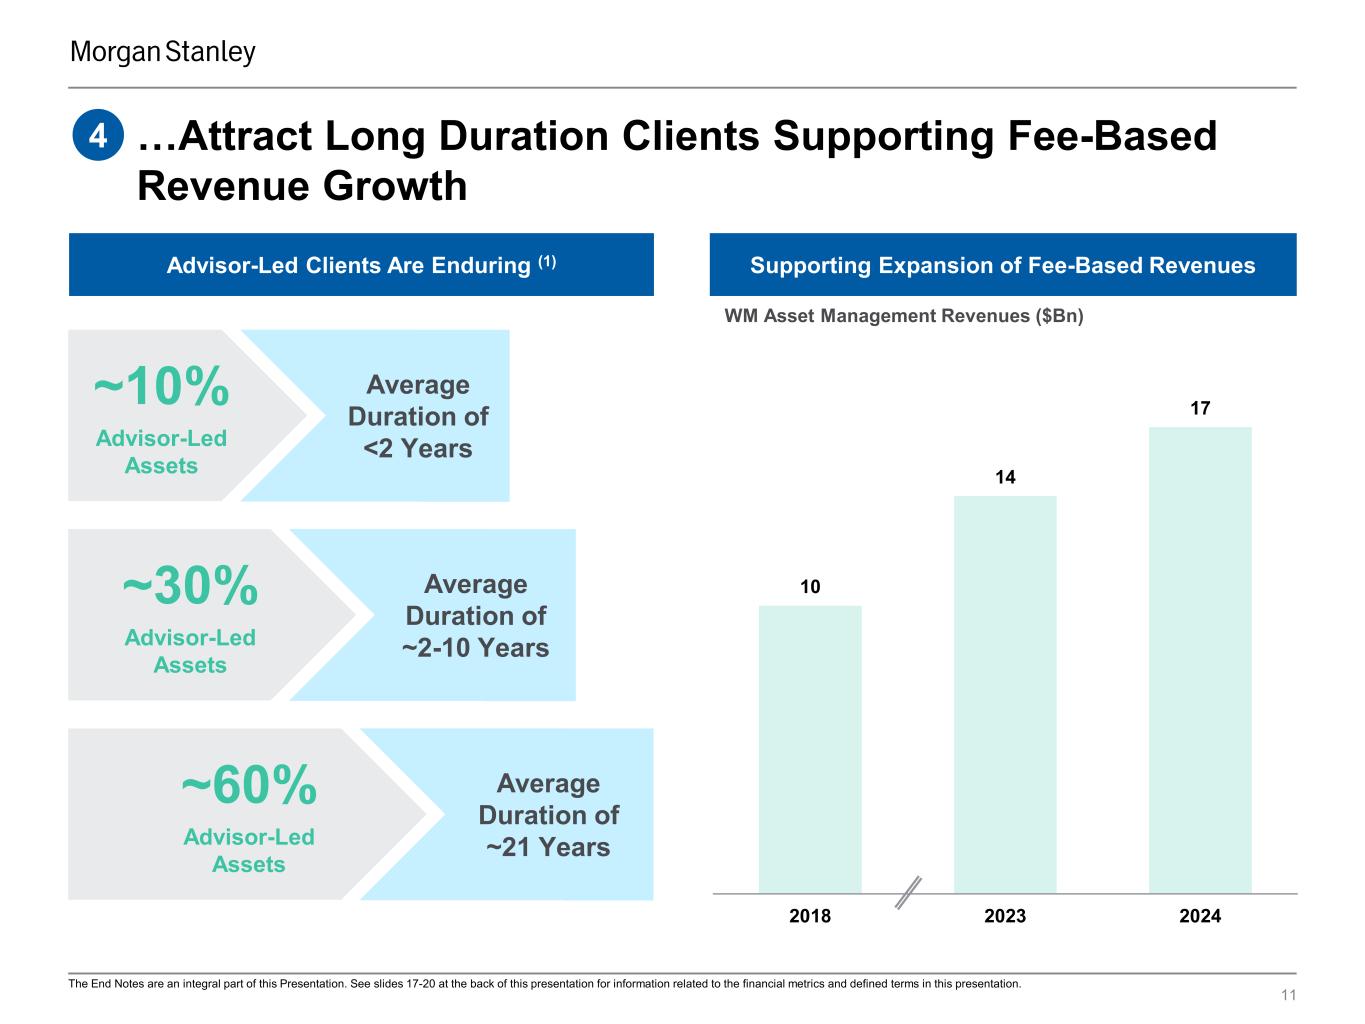
Advisor-Led Clients Are Enduring (1) ~60% Advisor-Led Assets Average Duration of ~21 Years Average Duration of ~2-10 Years ~30% Advisor-Led Assets Average Duration of <2 Years ~10% Advisor-Led Assets 11 …Attract Long Duration Clients Supporting Fee-Based Revenue Growth 4 Supporting Expansion of Fee-Based Revenues 10 14 17 2018 2023 2024 The End Notes are an integral part of this Presentation. See slides 17-20 at the back of this presentation for information related to the financial metrics and defined terms in this presentation. WM Asset Management Revenues ($Bn)
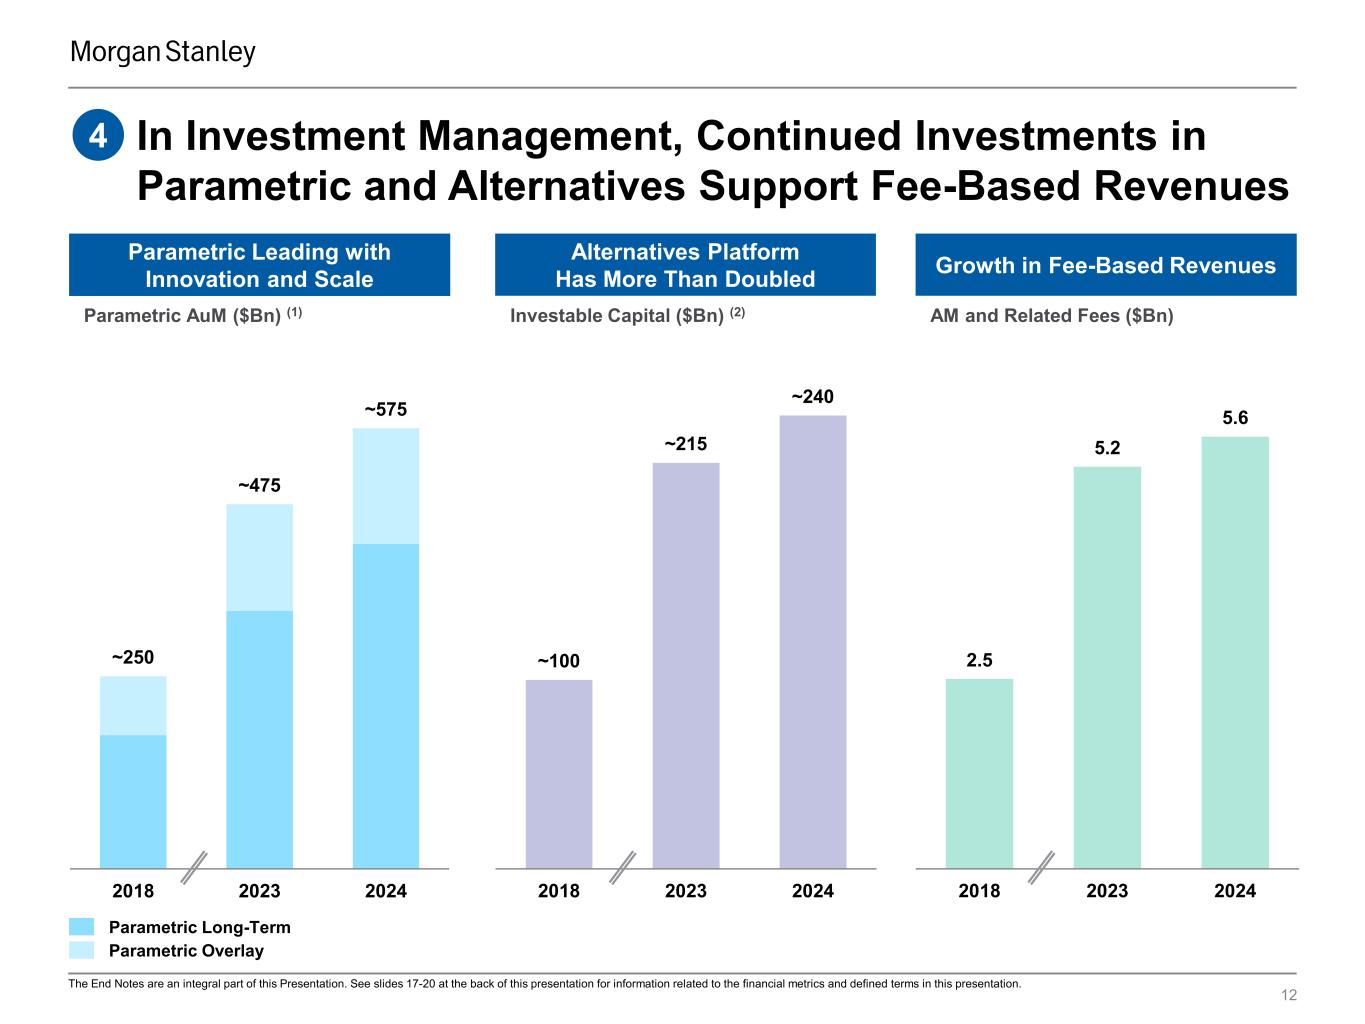
4 Parametric Leading with Innovation and Scale Parametric AuM ($Bn) (1) ~250 ~475 ~575 2018 2023 2024 Growth in Fee-Based Revenues AM and Related Fees ($Bn) 12 Alternatives Platform Has More Than Doubled Investable Capital ($Bn) (2) ~100 ~215 ~240 2018 2023 2024 2.5 5.2 5.6 2018 2023 2024 In Investment Management, Continued Investments in Parametric and Alternatives Support Fee-Based Revenues Parametric Long-Term Parametric Overlay The End Notes are an integral part of this Presentation. See slides 17-20 at the back of this presentation for information related to the financial metrics and defined terms in this presentation.
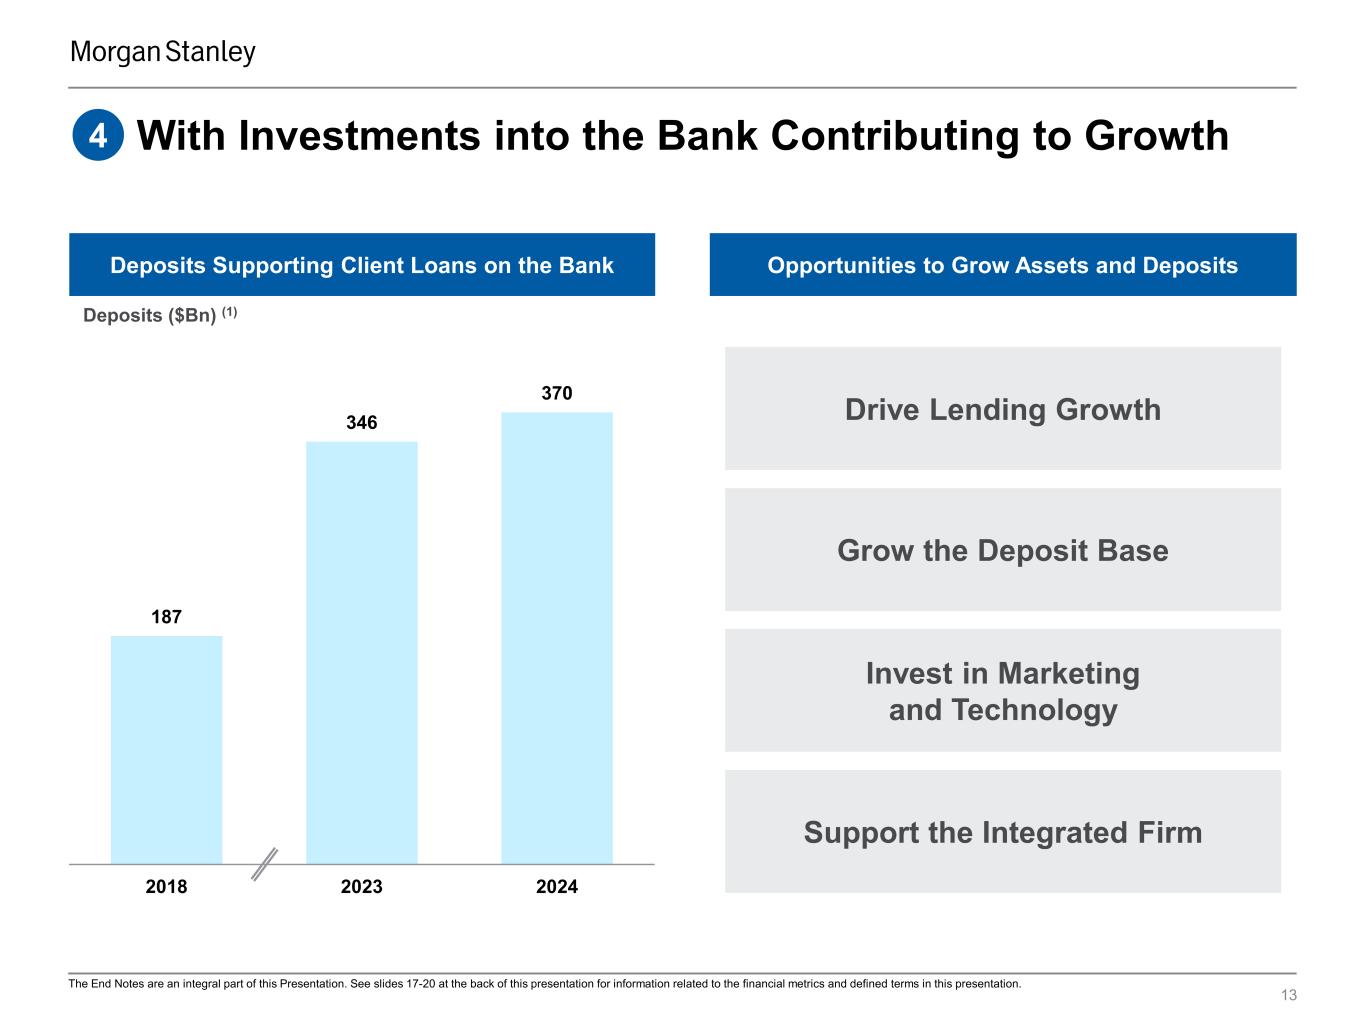
187 346 370 2018 2023 2024 Deposits ($Bn) (1) Deposits Supporting Client Loans on the Bank Opportunities to Grow Assets and Deposits 13 Grow the Deposit Base Invest in Marketing and Technology Support the Integrated Firm Drive Lending Growth With Investments into the Bank Contributing to Growth4 The End Notes are an integral part of this Presentation. See slides 17-20 at the back of this presentation for information related to the financial metrics and defined terms in this presentation.
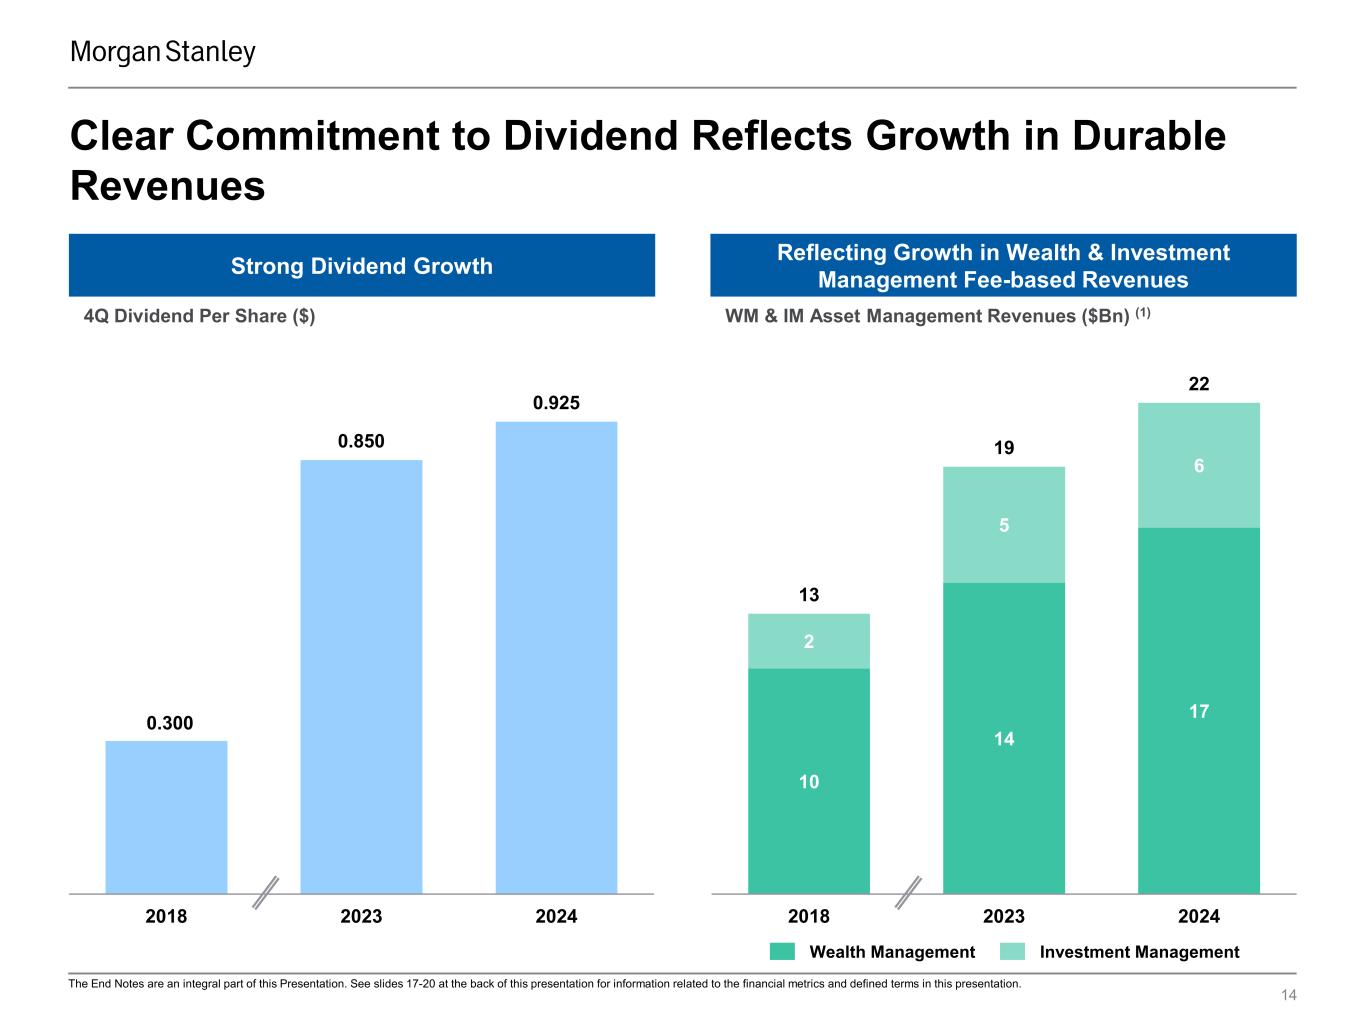
10 14 17 2 5 6 13 19 22 2018 2023 2024 14 Strong Dividend Growth Reflecting Growth in Wealth & Investment Management Fee-based Revenues 0.300 0.850 0.925 2018 2023 2024 Wealth Management Investment Management Clear Commitment to Dividend Reflects Growth in Durable Revenues The End Notes are an integral part of this Presentation. See slides 17-20 at the back of this presentation for information related to the financial metrics and defined terms in this presentation. 4Q Dividend Per Share ($) WM & IM Asset Management Revenues ($Bn) (1)

Raise, Manage and Allocate Capital for Our Clients Across the Integrated Firm 15 Future Path: Top Down at ScaleToday: Focused & Selected Collaborative Culture Focus on Top Firmwide Clients Selected Client Data Integrated Integrated Firm Organization and Executive Leadership Proactive Coverage at Scale Integrated Firmwide Client Data Platform Stable and Strong Risk Management and Infrastructure Scaled Risk Management and Infrastructure on Pace with Growth Looking Ahead, Growth Augmented by the Evolution of the Integrated Firm The End Notes are an integral part of this Presentation. See slides 17-20 at the back of this presentation for information related to the financial metrics and defined terms in this presentation.
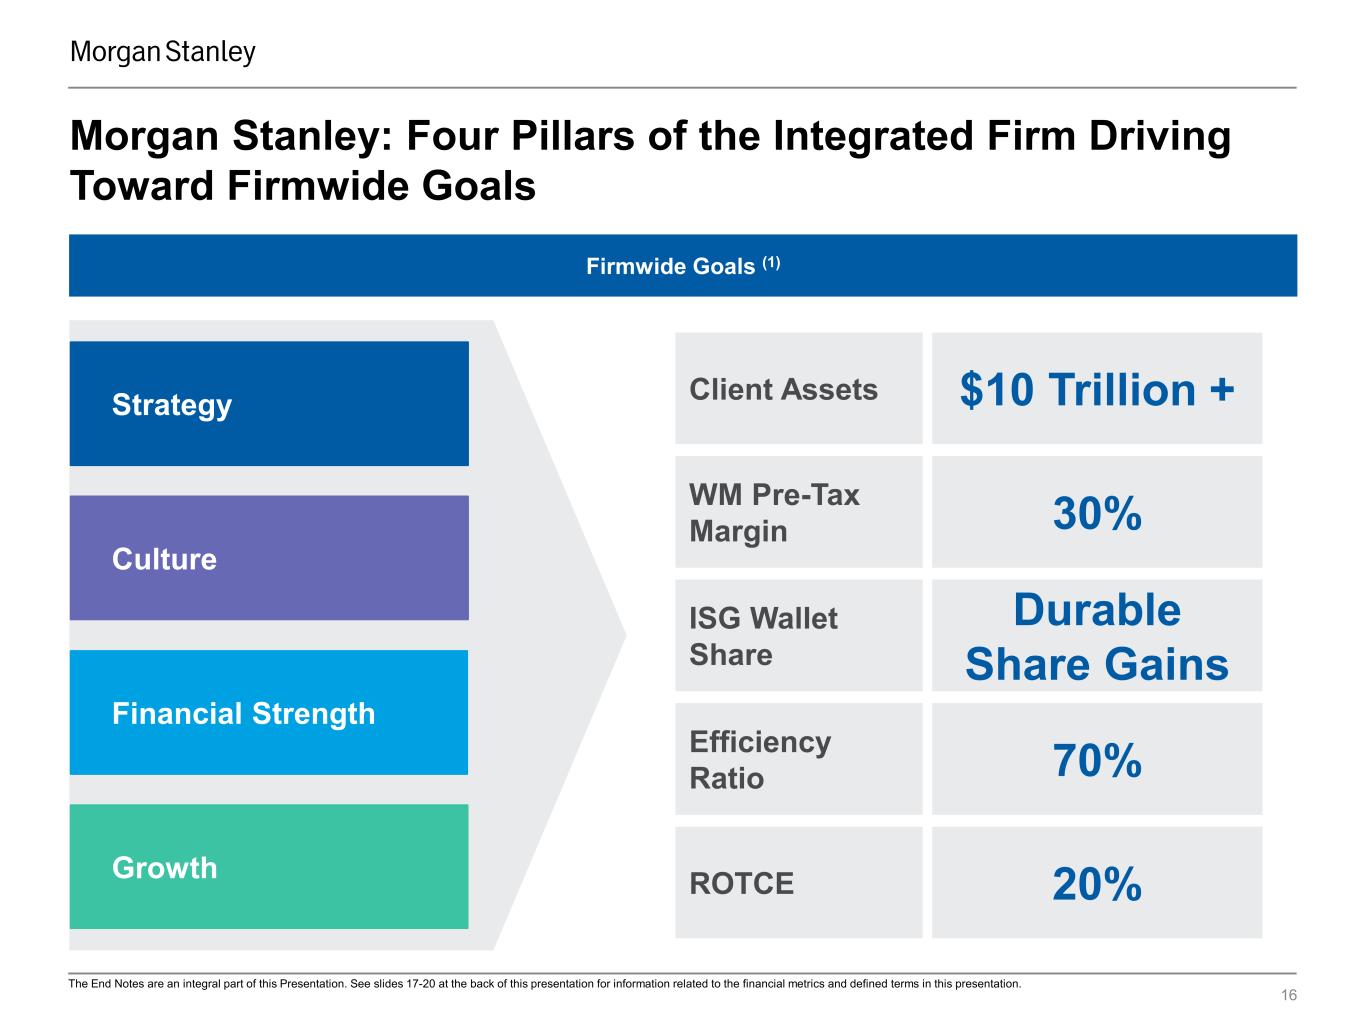
16 Morgan Stanley: Four Pillars of the Integrated Firm Driving Toward Firmwide Goals Strategy Culture Financial Strength Growth ISG Wallet Share Durable Share Gains WM Pre-Tax Margin 30% Client Assets $10 Trillion + ROTCE 20% Efficiency Ratio 70% Firmwide Goals (1) The End Notes are an integral part of this Presentation. See slides 17-20 at the back of this presentation for information related to the financial metrics and defined terms in this presentation.
End Notes 17 The Firm’s financial presentations, earnings releases, earnings conference calls, and other communications may include certain metrics, including non-GAAP financial measures, which we believe to be useful to us, investors, analysts and other stakeholders by providing further transparency about, or an additional means of assessing, our financial condition and operating results. The End Notes are an integral part of our presentations and other communications. For additional information, refer to the Definition of U.S. GAAP to Non-GAAP Measures, Definitions of Performance Metrics and Terms, Supplemental Quantitative Details and Calculations (includes reconciliation of GAAP to non-GAAP), and Legal Notice in the Morgan Stanley Fourth Quarter 2024 Financial Supplement included in the Current Report on Form 8-K dated January 16, 2025 (‘Morgan Stanley Fourth Quarter 2024 Financial Supplement’). For information and impact of the Company’s acquisitions, please refer to prior period filings of the Company’s Annual Reports on Form 10-K and Quarterly Reports on Form 10-Q.
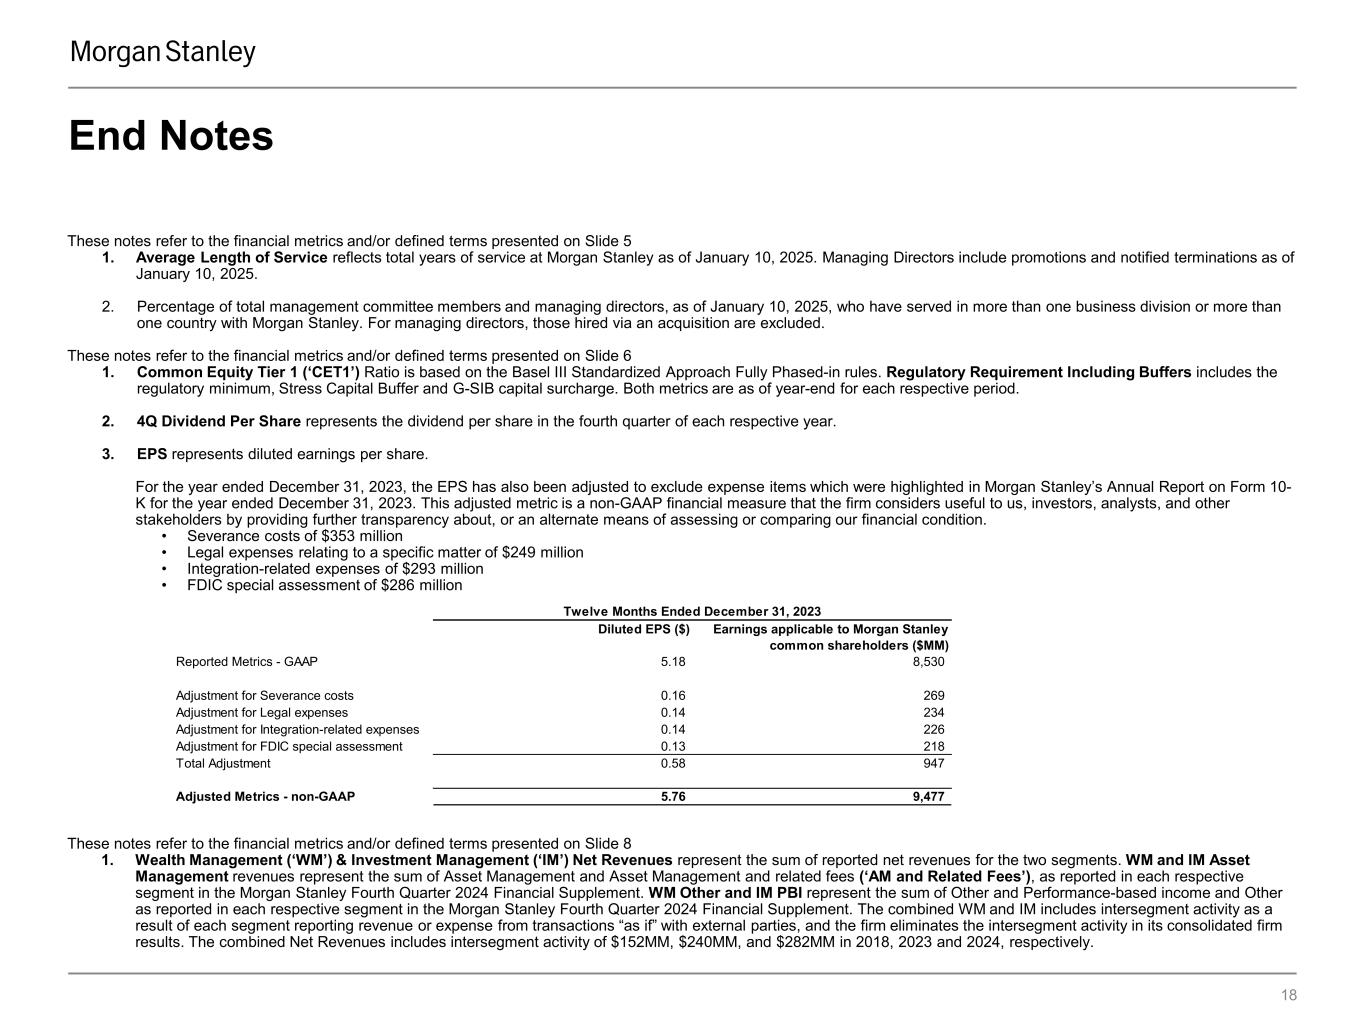
Diluted EPS ($) Earnings applicable to Morgan Stanley common shareholders ($MM) Reported Metrics - GAAP 5.18 8,530 Adjustment for Severance costs 0.16 269 Adjustment for Legal expenses 0.14 234 Adjustment for Integration-related expenses 0.14 226 Adjustment for FDIC special assessment 0.13 218 Total Adjustment 0.58 947 Adjusted Metrics - non-GAAP 5.76 9,477 Twelve Months Ended December 31, 2023 End Notes 18 These notes refer to the financial metrics and/or defined terms presented on Slide 5 1. Average Length of Service reflects total years of service at Morgan Stanley as of January 10, 2025. Managing Directors include promotions and notified terminations as of January 10, 2025. 2. Percentage of total management committee members and managing directors, as of January 10, 2025, who have served in more than one business division or more than one country with Morgan Stanley. For managing directors, those hired via an acquisition are excluded. These notes refer to the financial metrics and/or defined terms presented on Slide 6 1. Common Equity Tier 1 (‘CET1’) Ratio is based on the Basel III Standardized Approach Fully Phased-in rules. Regulatory Requirement Including Buffers includes the regulatory minimum, Stress Capital Buffer and G-SIB capital surcharge. Both metrics are as of year-end for each respective period. 2. 4Q Dividend Per Share represents the dividend per share in the fourth quarter of each respective year. 3. EPS represents diluted earnings per share. For the year ended December 31, 2023, the EPS has also been adjusted to exclude expense items which were highlighted in Morgan Stanley’s Annual Report on Form 10- K for the year ended December 31, 2023. This adjusted metric is a non-GAAP financial measure that the firm considers useful to us, investors, analysts, and other stakeholders by providing further transparency about, or an alternate means of assessing or comparing our financial condition. • Severance costs of $353 million • Legal expenses relating to a specific matter of $249 million • Integration-related expenses of $293 million • FDIC special assessment of $286 million These notes refer to the financial metrics and/or defined terms presented on Slide 8 1. Wealth Management (‘WM’) & Investment Management (‘IM’) Net Revenues represent the sum of reported net revenues for the two segments. WM and IM Asset Management revenues represent the sum of Asset Management and Asset Management and related fees (‘AM and Related Fees’), as reported in each respective segment in the Morgan Stanley Fourth Quarter 2024 Financial Supplement. WM Other and IM PBI represent the sum of Other and Performance-based income and Other as reported in each respective segment in the Morgan Stanley Fourth Quarter 2024 Financial Supplement. The combined WM and IM includes intersegment activity as a result of each segment reporting revenue or expense from transactions “as if” with external parties, and the firm eliminates the intersegment activity in its consolidated firm results. The combined Net Revenues includes intersegment activity of $152MM, $240MM, and $282MM in 2018, 2023 and 2024, respectively.

End Notes 19 These notes refer to the financial metrics and/or defined terms presented on Slide 8 2. Client Assets represent the sum of the reported WM client assets and IM assets under management (‘AuM’). WM client assets represent those assets for which WM is providing services including financial advisor‐led brokerage, custody, administrative and investment advisory services; self‐directed brokerage and investment advisory services; financial and wealth planning services; workplace services, including stock plan administration, and retirement plan services. Certain WM client assets are invested in IM products and are also included in IM’s AuM. 3. Wallet Share represents the percentage of Morgan Stanley’s Institutional Securities (‘ISG’) segment net revenues to the Wallet. The Wallet represents Investment Banking (‘IBD’), Equity Sales & Trading and Fixed Income Sales & Trading net revenues, where applicable, for Morgan Stanley and the following peer set: Bank of America, Barclays, Citigroup, Deutsche Bank, Goldman Sachs, JP Morgan, and UBS. For 2018 and 2023, the peer set includes Credit Suisse, prior to UBS’ acquisition completed in June 2023. For peers that disclose results between multiple segments, assumptions have been made based on company disclosures. European peer results were translated to USD using average exchange rates for the appropriate period, sourced from Bloomberg. The analysis utilizes data for peers that have reported full-year 2024 results as of January 15, 2025. For peers that have not yet reported, a full-year 2024 results estimate is derived assuming the aggregate share of those peers of the Wallet for the first nine months of 2024 remains constant in the fourth quarter of 2024. These notes refer to the financial metrics and/or defined terms presented on Slide 9 1. RWAs represent risk-weighted assets under the Standardized Approach as of year-end for each respective period. 2. Pre-Tax Margin represents income before provision for income taxes as a percentage of net revenues. These notes refer to the financial metrics and/or defined terms presented on Slide 10 1. Core Client Relationships represent Advisor-Led Households as of 4Q 2018 and Advisor-Led Households, Self-Directed Households, and Workplace Participants, excluding overlap, as of 4Q 2023 and 4Q 2024: • Advisor-Led Households represent the total number of households that include at least one account with Advisor-Led Clients Assets. Advisor-Led Client Assets represent client assets in accounts that have a WM representative assigned. • Self-Directed Households represent the total number of households that include at least one active account with Self-Directed Client Assets. Self-Directed Client Assets represent active accounts which are not advisor-led. Active accounts are defined as having at least $25 in assets. • Workplace Participants represent Stock Plan Participants, Institutional Consulting Participants, and Retirement and Financial Wellness Participants, excluding overlap. • Stock Plan Participants represent total accounts with vested and/or unvested stock plan assets in the workplace channel. Individuals with accounts in multiple plans are counted as participants in each plan. • Institutional Consulting Participants represent participants of corporate clients with institutional consulting plans serviced by Morgan Stanley at Work. • Retirement and Financial Wellness Participants represent participants of corporate clients with financial wellness and retirement plans serviced by Morgan Stanley at Work. 2. Net New Assets (‘NNA’) represent client asset inflows, inclusive of interest, dividends and asset acquisitions, less client asset outflows and exclude the impact of business combinations/divestitures and the impact of fees and commissions. 3. Fee-Based Flows include net new fee-based assets (including asset acquisitions), net account transfers, dividends, interest, and client fees, and exclude institutional cash management related activity. For a description of the Inflows and Outflows included in Fee-Based Flows, see Fee-based client assets in Morgan Stanley’s Annual Report on Form 10-K for the year ended December 31, 2023.
End Notes 20 These notes refer to the financial metrics and/or defined terms presented on Slide 11 1. Analysis represents tenure of clients that have advisor-led client assets at Morgan Stanley as of 4Q 2024 and excludes those clients associated with financial advisors recruited over the last nine years. These notes refer to the financial metrics and/or defined terms presented on Slide 12 1. Parametric Long-Term and Parametric Overlay represents AuM reported under the “Alternatives and Solutions” and “Liquidity and Overlay Services” categories, respectively, in the Morgan Stanley Fourth Quarter 2024 Financial Supplement. AuM is as of period end. 2018 data is prior to the close of the Eaton Vance acquisition. 2. Investable Capital includes AuM, unfunded commitments, co-investments and leverage across private alternative and liquid alternative strategies. The AuM portion of investable capital is reported under the “Alternatives and Solutions”, “Equities” and “Fixed Income” categories in the Morgan Stanley Fourth Quarter 2024 Financial Supplement. AuM is as of period end. These notes refer to the financial metrics and/or defined terms presented on Slide 13 1. Deposits reflect liabilities sourced from WM clients and other sources of funding on the U.S. Bank subsidiaries. U.S. Bank refers to the Firm's U.S. Bank subsidiaries, Morgan Stanley Bank, N.A. and Morgan Stanley Private Bank, National Association. Deposits include sweep deposit programs, savings and other deposits, and time deposits. Metrics are as of period end. These notes refer to the financial metrics and/or defined terms presented on Slide 14 1. The combined WM and IM Asset Management revenues includes intersegment activity as a result of each segment reporting revenue or expense from transactions “as if” with external parties, and the firm eliminates the intersegment activity in its consolidated firm results. The combined Asset Management revenues includes intersegment activity of $131MM, $197MM, and $237MM in 2018, 2023 and 2024, respectively. These notes refer to the financial metrics and/or defined terms presented on Slide 16 1. Efficiency Ratio represents total non-interest expenses as a percentage of net revenues. Return on average tangible common equity (‘ROTCE’) represents net income applicable to Morgan Stanley less preferred dividends as a percentage of average tangible common equity. Average tangible common equity represents average common equity adjusted to exclude goodwill and intangible assets net of allowable mortgage servicing rights deduction. ROTCE and average tangible common equity are non-GAAP financial measures that the Firm considers useful for analysts, investors and other stakeholders to assess operating performance. The attainment of these objectives assumes a normal market environment and may be impacted by external factors that cannot be predicted at this time, including geopolitical, macroeconomic and market conditions and future legislation and regulations and any changes thereto. Please also refer to the Notice on Slide 2 of this presentation.
Four Pillars of Morgan Stanley: The Integrated Firm Ted Pick, Chairman and Chief Executive Officer January 16, 2025


