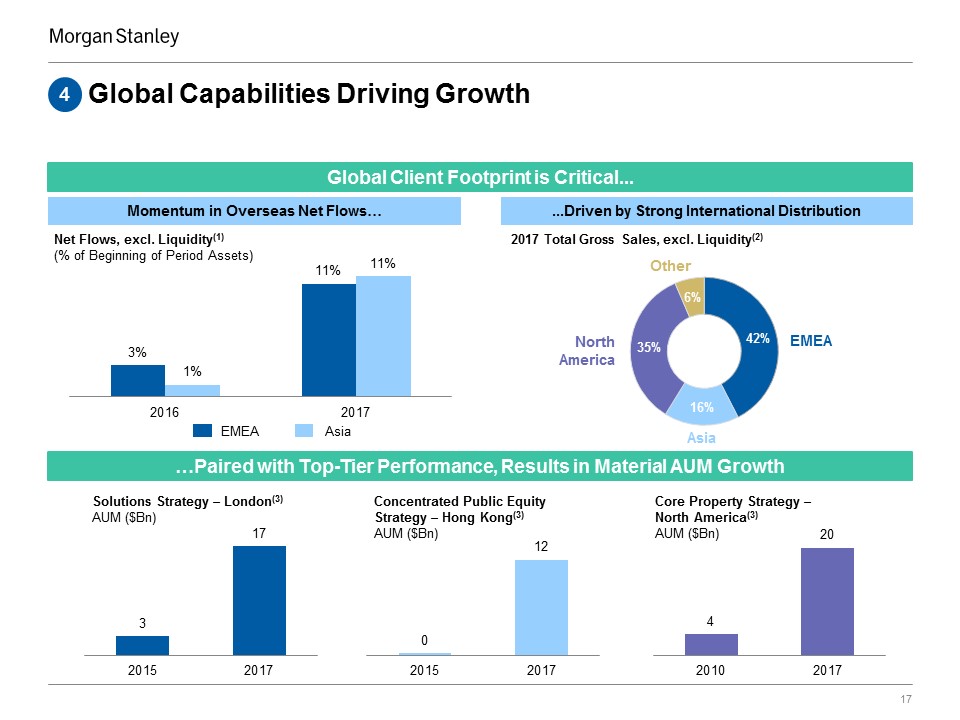
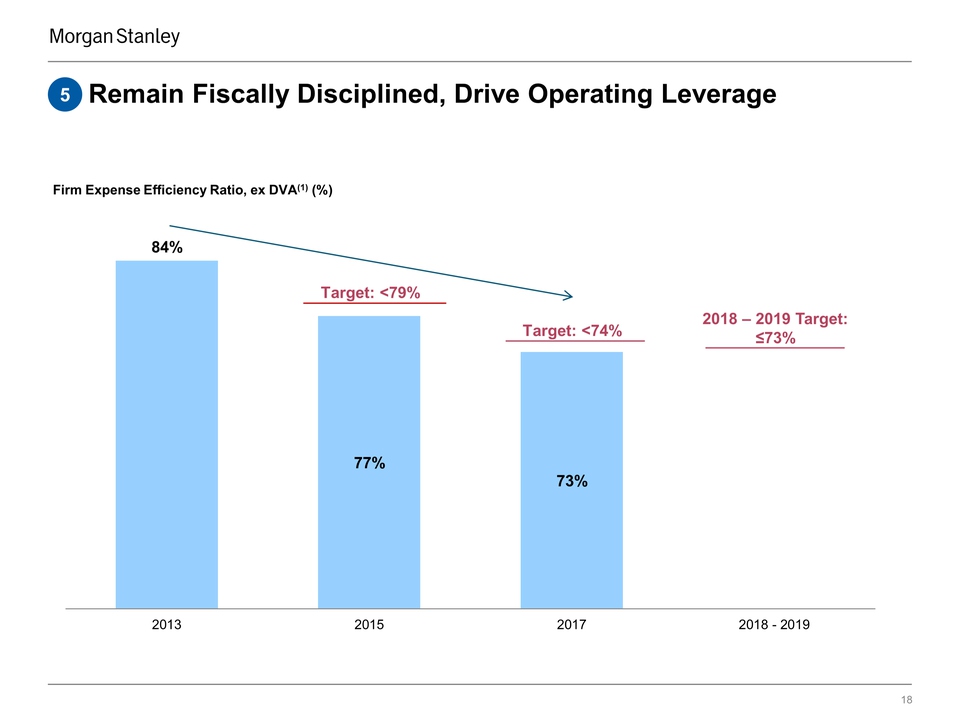
End Notes These notes refer to the financial metrics presented on Slide 15.Fixed Income Sales & Trading Net Revenues adjust for Debt Valuation Adjustment (‘DVA’) as follows: 2013 excludes the negative impact of $603 million; 2014 excludes the positive impact of $419 million and a negative impact from the initial implementation of Funding Valuation Adjustments (‘FVA’) of $466 million; and 2015 excludes the positive impact of $455 million. Fixed Income Sales & Trading Net Revenues, excluding DVA and FVA are non-GAAP financial measures the Firm considers useful for investors to allow better comparability of period to period operating performance.Total Wallet represents the aggregated reported Fixed Income Sales & Trading Net Revenues of Morgan Stanley and the following peers: Goldman Sachs, JP Morgan, Bank of America, Citigroup, UBS, Deutsche Bank, Credit Suisse, and Barclays. Morgan Stanley’s Wallet Share is calculated as the percentage of Morgan Stanley’s Sales & Trading Net Revenues, excluding DVA to Total Wallet.The 2017 estimated wallet uses the actual results for peers that have reported full-year 2017 results as of January 18, 2018. For peers that have not yet reported, the full year estimate is based on actual 9-month results plus 4Q’16 results multiplied by the average quarterly YoY change for peers that have reported.These notes refer to the financial metrics presented on Slide 16.Represents the reporting category of Alternatives / Other.Long-term organic growth is defined as Net Flows, excluding Liquidity, divided by Beginning AUM, excluding Liquidity; $12 billion / $254 billion = 5%.These notes refer to the financial metrics presented on Slide 17.Net Flows represent client inflows less client outflows, including fund reinvestment and distributions. Geography is determined by the location of the sales team that covers the client.Gross Sales represent client inflows only, including both new client assets and current clients adding additional assets. Geography is determined by the location of the sales team that covers the client.The Solutions strategy is a multi-asset strategy, which is included in the Alternative / Other reporting category, managed by a London based investment team. The Concentrated Public Equity strategy is a high conviction equity strategy, which is included in the Equity reporting category, managed by a Hong Kong based investment team. The Core Property strategy is a real estate strategy, which is included in the Alternative / Other reporting category, managed by a US based investment team.These notes refer to the financial metrics presented on Slide 18.Firm Expense Efficiency ratio represents total non-interest expenses as a percentage of Net Revenues (or in 2013 and 2015, Net Revenues, excluding Debt Valuation Adjustment (‘DVA’)). For 2013, the Expense Efficiency ratio was calculated as non-interest expenses of $27,935 million, divided by Net Revenues of $33,174, which excludes the negative impact of $681 million from DVA. For 2015, the Expense Efficiency ratio was calculated as non-interest expenses of $26,660 million, divided by Net Revenues of $34,537, which excludes the positive impact of $618 million from DVA. The Expense Efficiency ratio, excluding DVA is a non-GAAP financial measure the Firm considers useful for investors to assess operating performance.