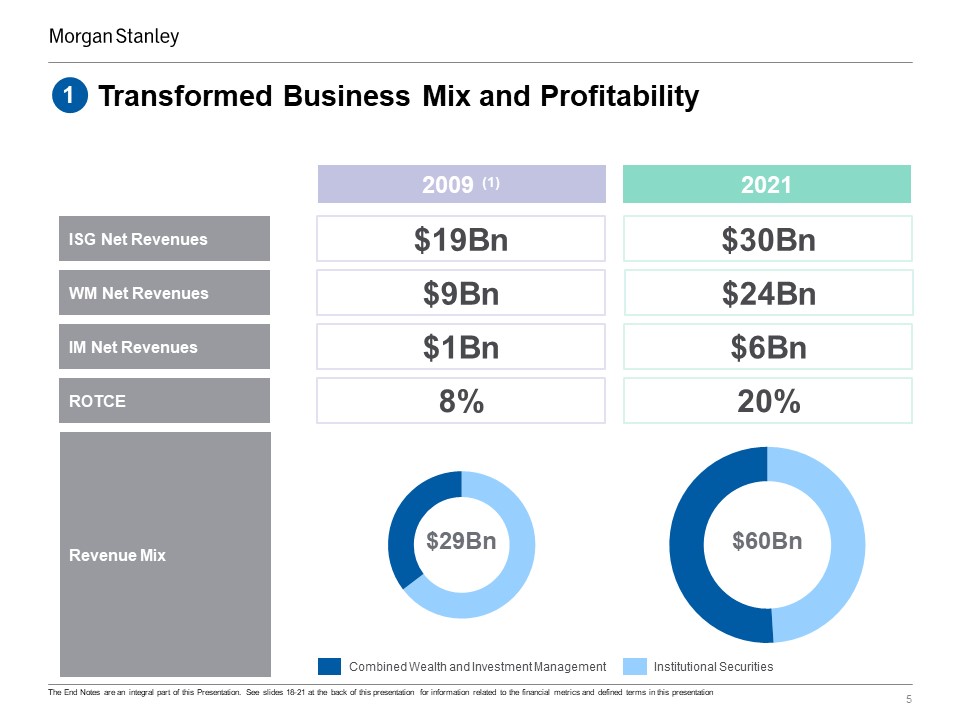
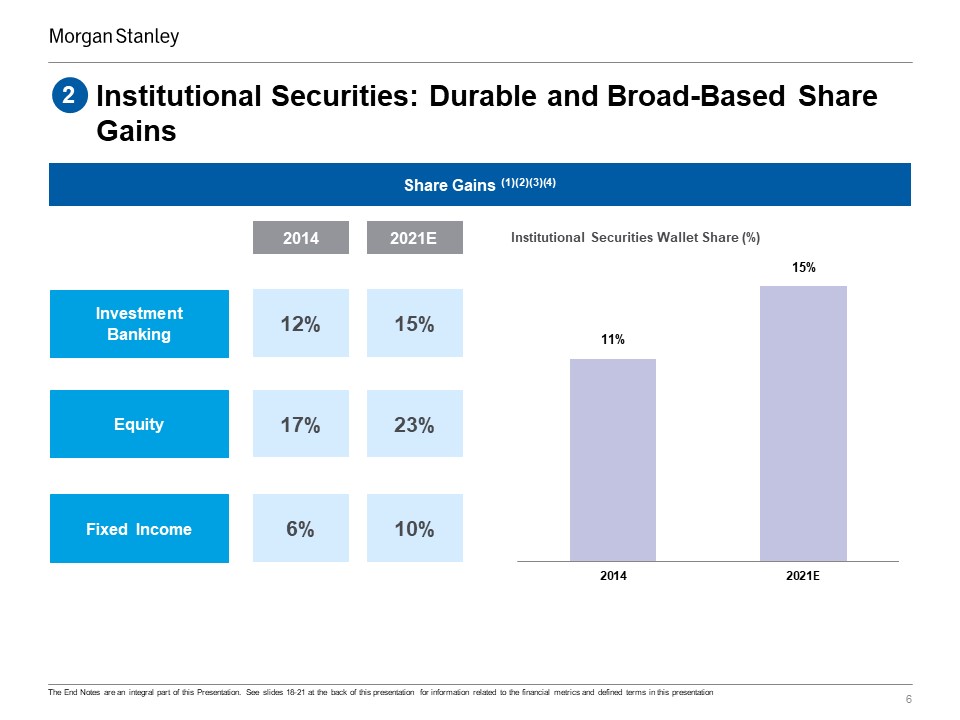
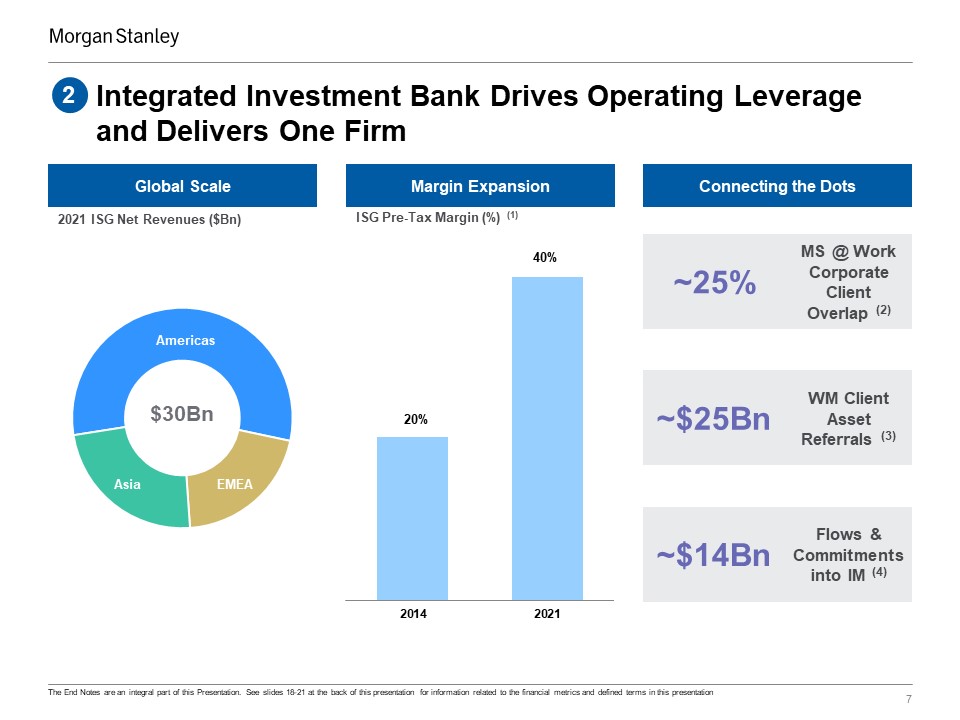
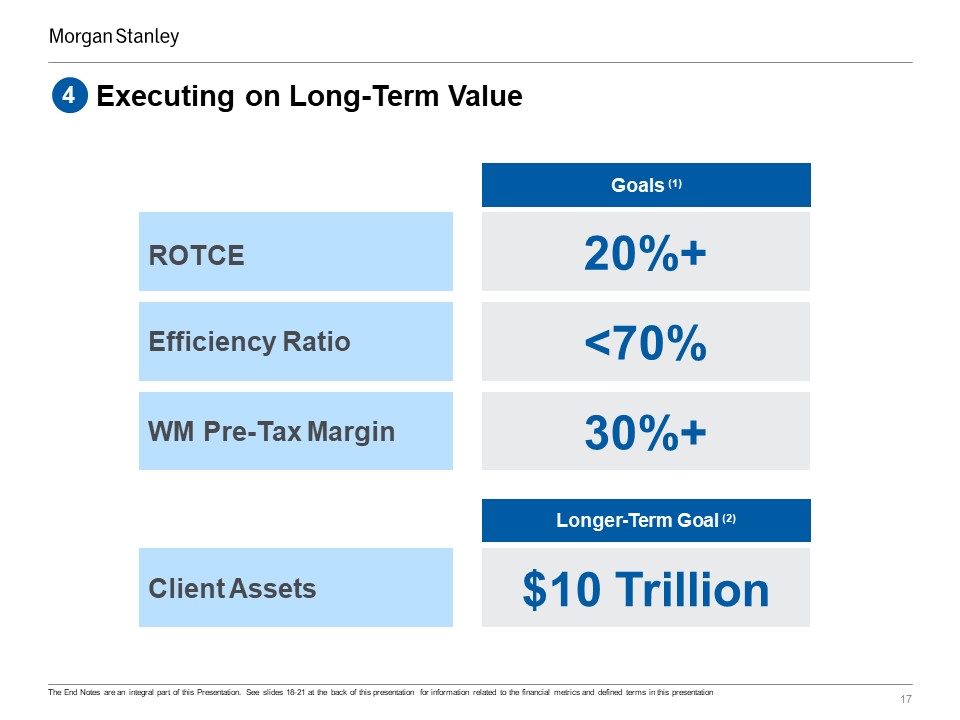
End Notes 19 These notes refer to the financial metrics and/or defined term presented on Slide 3 Return on average tangible common equity (‘ROTCE’) utilizes net income applicable to Morgan Stanley less preferred dividends as a percentage of average tangible common equity. Average tangible common equity represents average common equity adjusted to exclude goodwill and intangible assets net of allowable mortgage servicing rights deduction. The calculation is adjusted to exclude the impact of integration‐related expenses, which were $456 million on a pre-tax basis or $352 million on an after-tax basis in 2021. The adjusted ROTCE is a non-GAAP financial measure. The reported 2021 ROTCE is 19.8%. Efficiency Ratio represents total non-interest expenses as a percentage of net revenues. The calculation is adjusted to exclude the impact of integration-related expenses. The adjusted Efficiency Ratio is a non-GAAP financial measure. The reported 2021 Efficiency Ratio is 67%. Pre-Tax Margin represents income (loss) from continuing operations before taxes divided by net revenues. The calculation is adjusted to exclude the impact of integration-related expenses. The adjusted Pre-Tax Margin is a non-GAAP financial measure. The reported 2021 WM Pre-Tax Margin is 25%. These notes refer to the financial metrics and/or defined term presented on Slide 52009 net revenues are adjusted to exclude the negative impact of Debt Valuation Adjustment (‘DVA’) of approximately $5.5 billion across the following segments: Institutional Securities (‘ISG’) ($5.4Bn), Wealth Management (‘WM’) ($41MM) and Investment Management (‘IM’) ($48MM). 2009 ROTCE adjusted to exclude the aggregate net after-tax impacts of negative DVA adjustment ($3.4 billion) and positive Discrete Tax Benefit adjustment ($336 million). The adjusted ROTCE is a non-GAAP financial measure. These notes refer to the financial metrics and/or defined term presented on Slide 6Wallet represents aggregated reported net revenues of Morgan Stanley and the following peers: Bank of America, Barclays, Citigroup, Credit Suisse, Deutsche Bank, Goldman Sachs, JP Morgan, and UBS. Morgan Stanley’s ISG wallet share represents total ISG segment net revenues. Peer wallet includes revenues that represent Investment Banking, Equity Sales & Trading and Fixed Income Sales & Trading, where applicable. For firms that disclose results between multiple segments, assumptions have been made based on company disclosures. Morgan Stanley’s 2014 Wallet Share is calculated as the percentage of Morgan Stanley’s net revenues, excluding positive DVA ($651 million) to the Wallet and has been restated to conform with current reporting methodology. Peer data for 2014 has been adjusted for DVA, where it is reported and where applicable.Credit Suisse Equity Sales & Trading and Institutional Securities-equivalent revenues for nine months 2021 were adjusted to include net provisions of $4,582MM related to expected losses related to a U.S.-based hedge fund matter.European peer results were translated to USD using average exchange rates for the appropriate period; sourced from Bloomberg.The 2021 Wallet estimates utilize results for peers that have reported full-year 2021 results as of January 18, 2022. For the peers that have not yet reported, a full-year 2021 results estimate is based on Morgan Stanley Research as of January 6, 2022. These notes refer to the financial metrics and/or defined term presented on Slide 7Pre-Tax Margin for 2014 is adjusted to exclude the aggregation of the positive DVA adjustment ($651 million), negative impact of litigation costs of approximately $3.1 billion related to residential mortgage backed securities and other credit crisis-related matters, and the negative impact of compensation expense of approximately $904 million related to changes in the approach for awards of discretionary incentive compensation (i.e., reducing the average deferral of such awards to an approximate baseline of 50%) and the acceleration of vesting for certain outstanding deferred cash based incentive compensation awards. The adjusted Pre-Tax Margin is a non-GAAP financial measure. Client Overlap represents North American companies for which Morgan Stanley provides equity administration services and actively covers within Investment Banking as of December 31, 2021. Client Asset Referrals represents WM client assets sourced through ISG referrals for the year ended December 31, 2021.Flows and Commitments represents initial flows and commitments to IM sourced through ISG referrals for the year ended December 31, 2021.