| Exhibit 99.3 |
Strategic Update: Driving Growth Through The Next Decade James P. Gorman, Chairman and Chief Executive Officer January 17, 2023
Notice 2 The information provided herein includes certain non-GAAP financial measures. The definition of such measures and/or the reconciliation of such measures to the comparable U.S. GAAP figures are included in this presentation, or in Morgan Stanley's (the ‘Company’) Annual Report on Form 10-K, Definitive Proxy Statement, Quarterly Reports on Form 10-Q and the Company’s Current Reports on Form 8-K, as applicable, including any amendments thereto, which are available on www.morganstanley.com. This presentation may contain forward-looking statements including the attainment of certain financial and other targets, and objectives and goals. You are cautioned not to place undue reliance on forward-looking statements, which speak only as of the date on which they are made, which reflect management’s current estimates, projections, expectations, assumptions, interpretation or beliefs and which are subject to risks and uncertainties that may cause actual results to differ materially. The Company does not undertake to update the forward-looking statements to reflect the impact of circumstances or events that may arise after the date of forward-looking statements. For a discussion of risks and uncertainties that may affect the future results of the Company, please see the Company’s most recent Annual Report on Form 10-K, Quarterly Reports on Form 10-Q and Current Reports on Form 8-K, as applicable, which are available on www.morganstanley.com. This presentation is not an offer to buy or sell any security. The End Notes are an integral part of this presentation. See Slides 21 – 26 at the back of this presentation for information related to the financial metrics and defined terms in this presentation. Morgan Stanley closed its acquisition of E*TRADE on October 2, 2020, impacting prior period comparisons for the Firm and Wealth Management, and closed its acquisition of Eaton Vance on March 1, 2021, impacting prior period comparisons for the Firm and Investment Management. Please note this presentation is available at www.morganstanley.com.
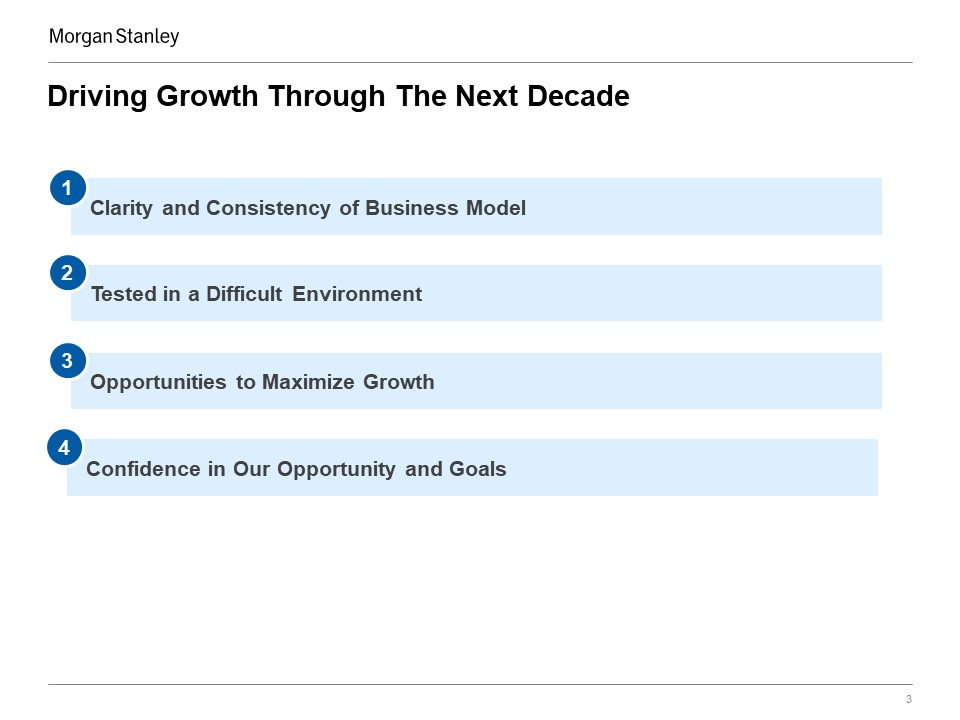
Driving Growth Through The Next Decade Tested in a Difficult Environment 2 3 Clarity and Consistency of Business Model 1 Opportunities to Maximize Growth 3 Confidence in Our Opportunity and Goals 4
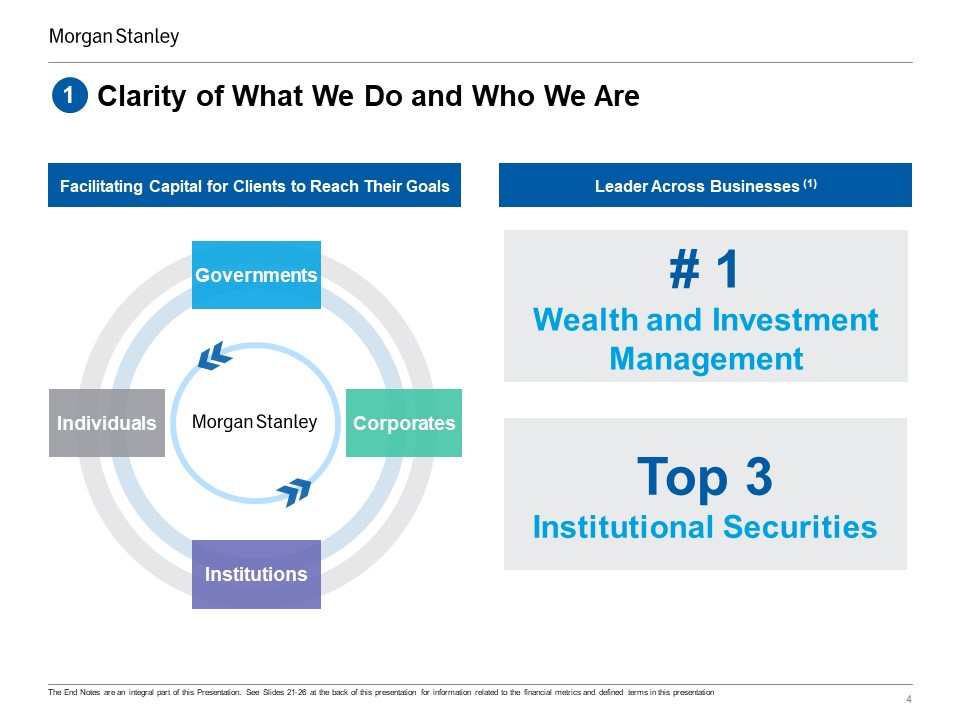
Clarity of What We Do and Who We Are 4 The End Notes are an integral part of this Presentation. See Slides 21-26 at the back of this presentation for information related to the financial metrics and defined terms in this presentation 1 Facilitating Capital for Clients to Reach Their Goals Leader Across Businesses (1) Governments Institutions Corporates Individuals # 1 Wealth and Investment Management Top 3 Institutional Securities
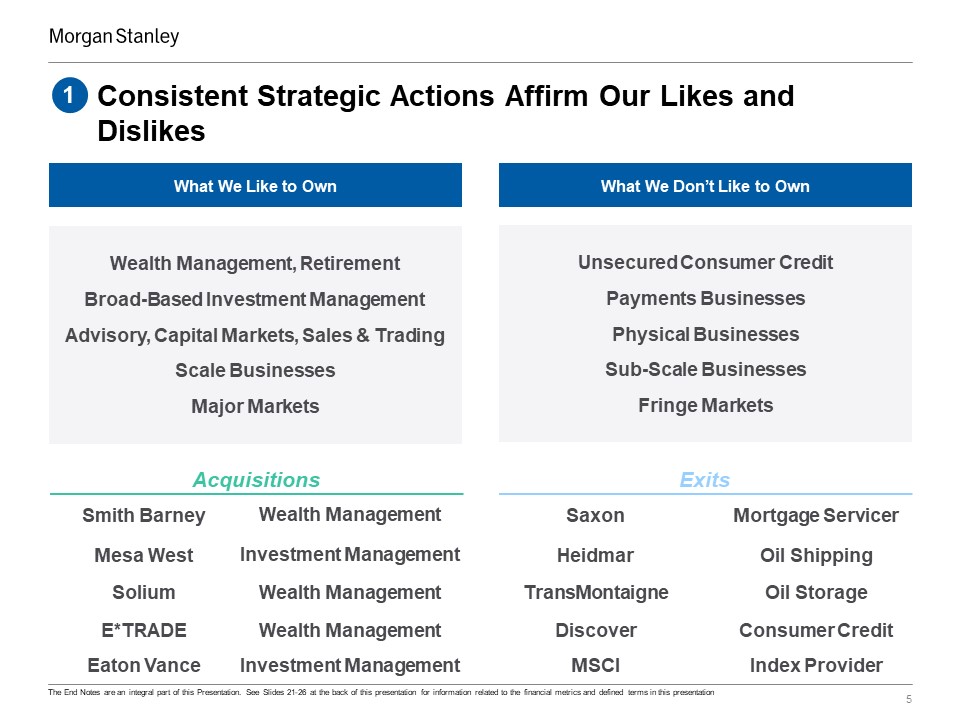
Consistent Strategic Actions Affirm Our Likes and Dislikes 5 1 What We Don’t Like to Own Unsecured Consumer Credit Payments Businesses Physical Businesses Sub-Scale Businesses Fringe Markets Saxon Mortgage Servicer Heidmar Oil Shipping TransMontaigne Oil Storage Discover Consumer Credit MSCI Index Provider Exits What We Like to Own Wealth Management, Retirement Broad-Based Investment Management Advisory, Capital Markets, Sales & Trading Scale Businesses Major Markets Smith Barney Mesa West Solium E*TRADE Eaton Vance Acquisitions Wealth Management Investment Management Wealth Management Wealth Management Investment Management The End Notes are an integral part of this Presentation. See Slides 21-26 at the back of this presentation for information related to the financial metrics and defined terms in this presentation
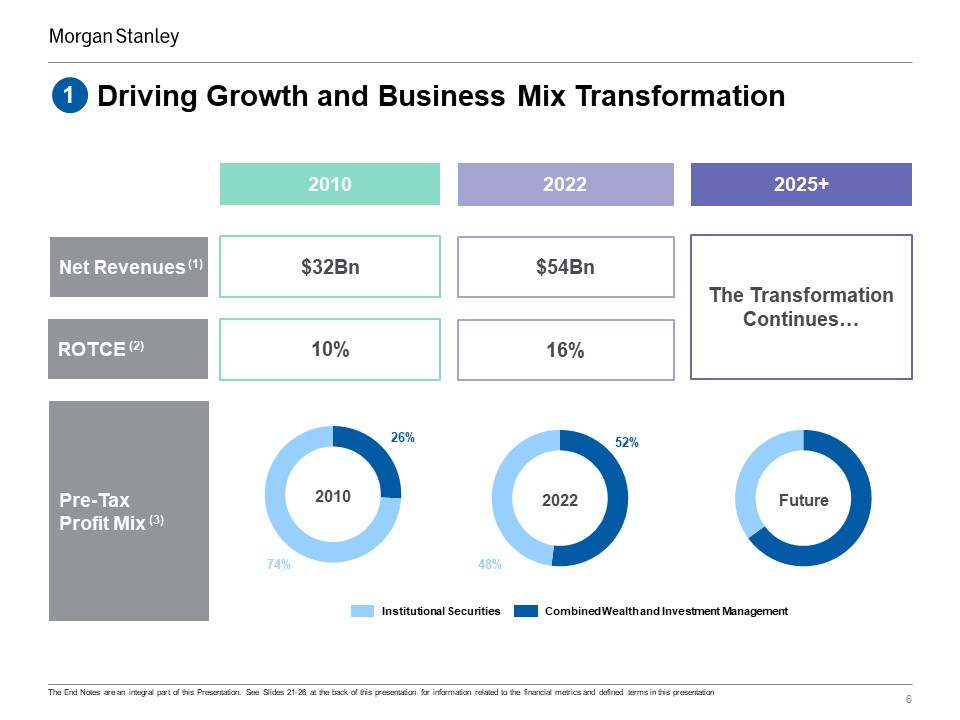
2010 Driving Growth and Business Mix Transformation 6 The End Notes are an integral part of this Presentation. See Slides 21-26 at the back of this presentation for information related to the financial metrics and defined terms in this presentation 1 Net Revenues (1) ROTCE (2) Institutional Securities Combined Wealth and Investment Management Pre-Tax Profit Mix (3) 2022 $54Bn 16% Future 2010 $32Bn 10% 2022 2025+ The Transformation Continues…
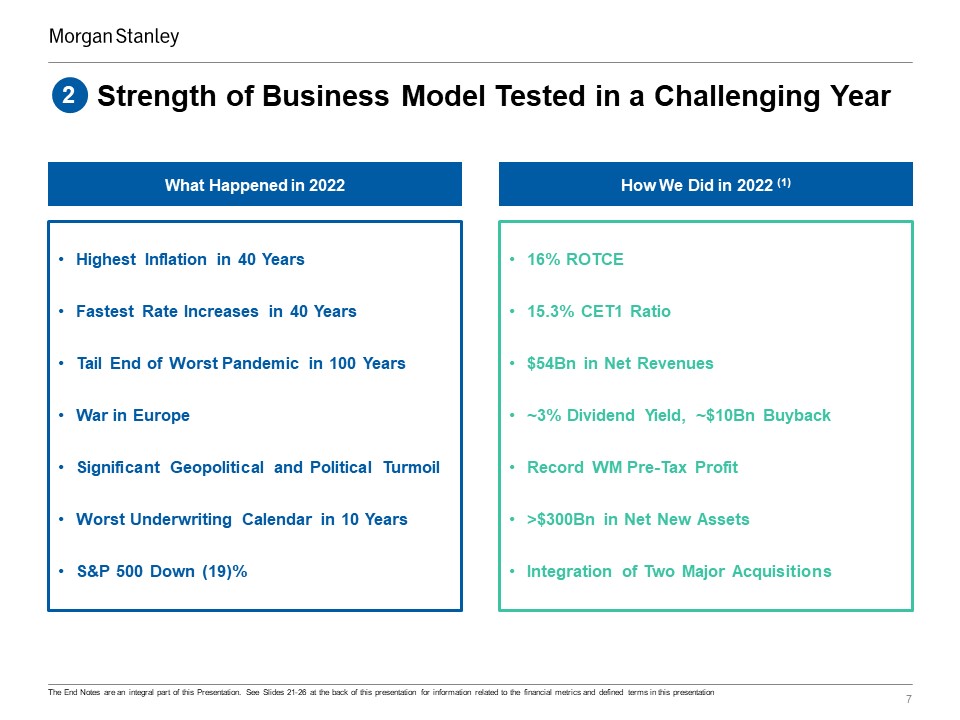
Strength of Business Model Tested in a Challenging Year 7 The End Notes are an integral part of this Presentation. See Slides 21-26 at the back of this presentation for information related to the financial metrics and defined terms in this presentation 2 How We Did in 2022 (1) What Happened in 2022 Highest Inflation in 40 Years Fastest Rate Increases in 40 Years Tail End of Worst Pandemic in 100 Years War in Europe Significant Geopolitical and Political Turmoil Worst Underwriting Calendar in 10 Years S&P 500 Down (19)% 16% ROTCE 15.3% CET1 Ratio $54Bn in Net Revenues ~3% Dividend Yield, ~$10Bn Buyback Record WM Pre-Tax Profit >$300Bn in Net New Assets Integration of Two Major Acquisitions
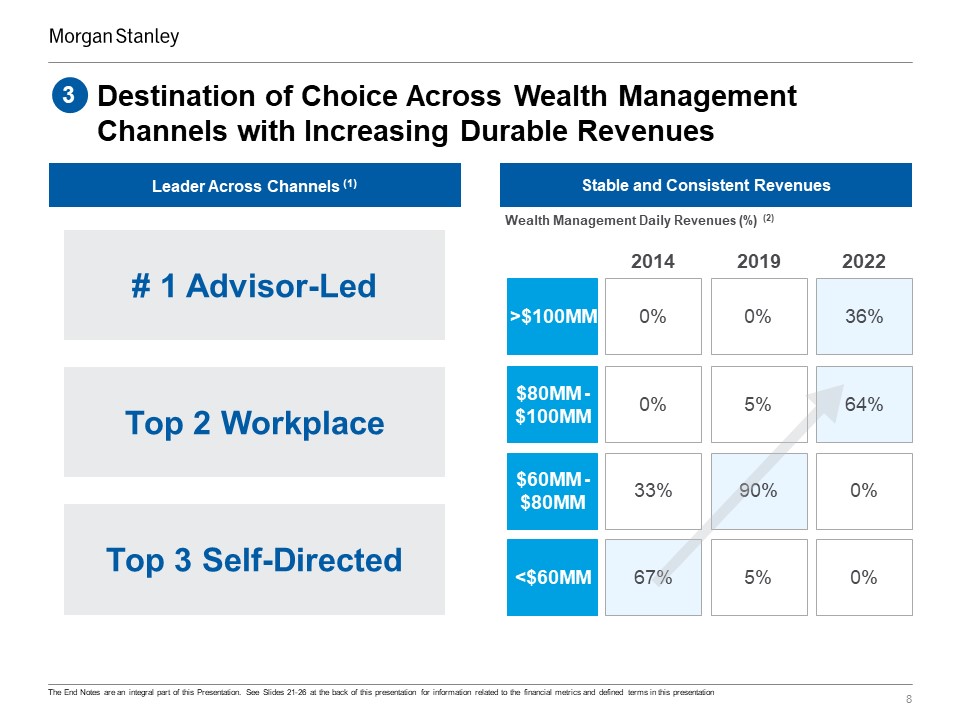
Destination of Choice Across Wealth Management Channels with Increasing Durable Revenues 8 The End Notes are an integral part of this Presentation. See Slides 21-26 at the back of this presentation for information related to the financial metrics and defined terms in this presentation 3 Wealth Management Daily Revenues (%) (2) Stable and Consistent Revenues 2014 2019 2022 $60MM - $80MM 33% $80MM - $100MM 0% >$100MM 0% 90% 0% 5% 64% 0% 36% Leader Across Channels (1) # 1 Advisor-Led Top 2 Workplace Top 3 Self-Directed <$60MM 67% 5% 0%
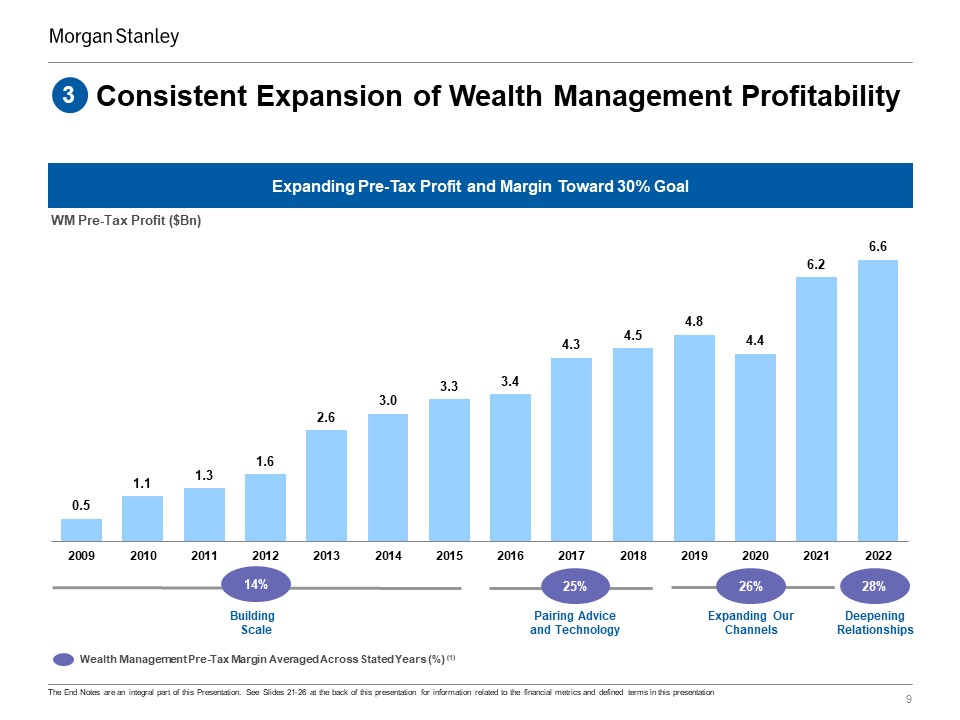
Consistent Expansion of Wealth Management Profitability 9 The End Notes are an integral part of this Presentation. See Slides 21-26 at the back of this presentation for information related to the financial metrics and defined terms in this presentation 3 Expanding Pre-Tax Profit and Margin Toward 30% Goal WM Pre-Tax Profit ($Bn) Wealth Management Pre-Tax Margin Averaged Across Stated Years (%) (1) 14% 25% 26% 28% Building Scale Expanding Our Channels Deepening Relationships Pairing Advice and Technology
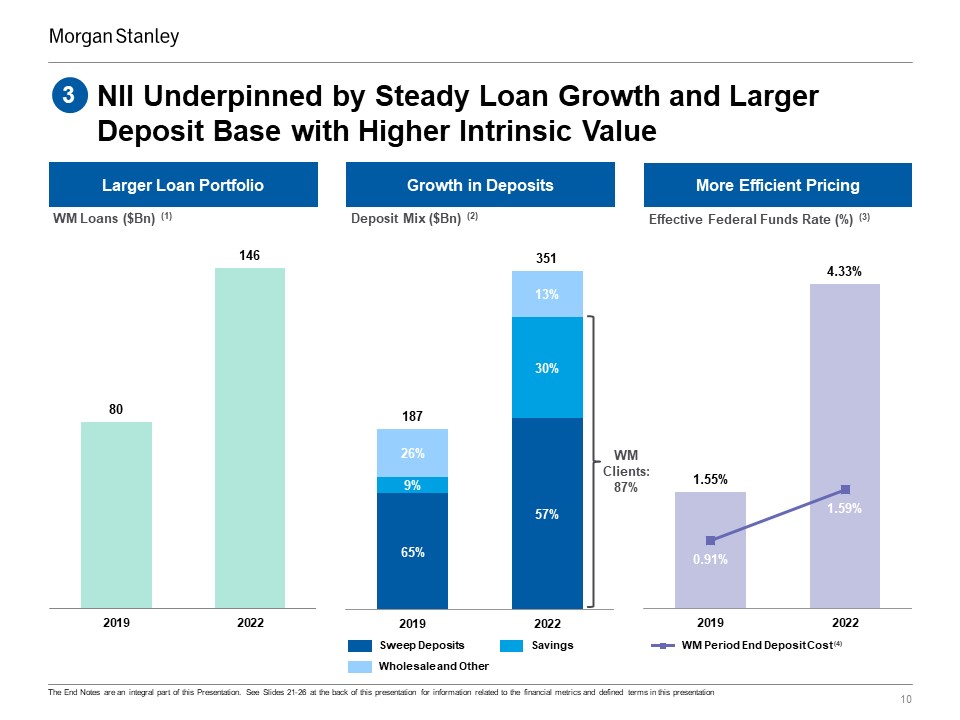
4Q18 Growth in Deposits NII Underpinned by Steady Loan Growth and Larger Deposit Base with Higher Intrinsic Value 3 Deposit Mix ($Bn) (2) Larger Loan Portfolio WM Loans ($Bn) (1) 10 The End Notes are an integral part of this Presentation. See Slides 21-26 at the back of this presentation for information related to the financial metrics and defined terms in this presentation More Efficient Pricing WM Period End Deposit Cost (4) Effective Federal Funds Rate (%) (3) WM Clients: 87% Savings Wholesale and Other Sweep Deposits
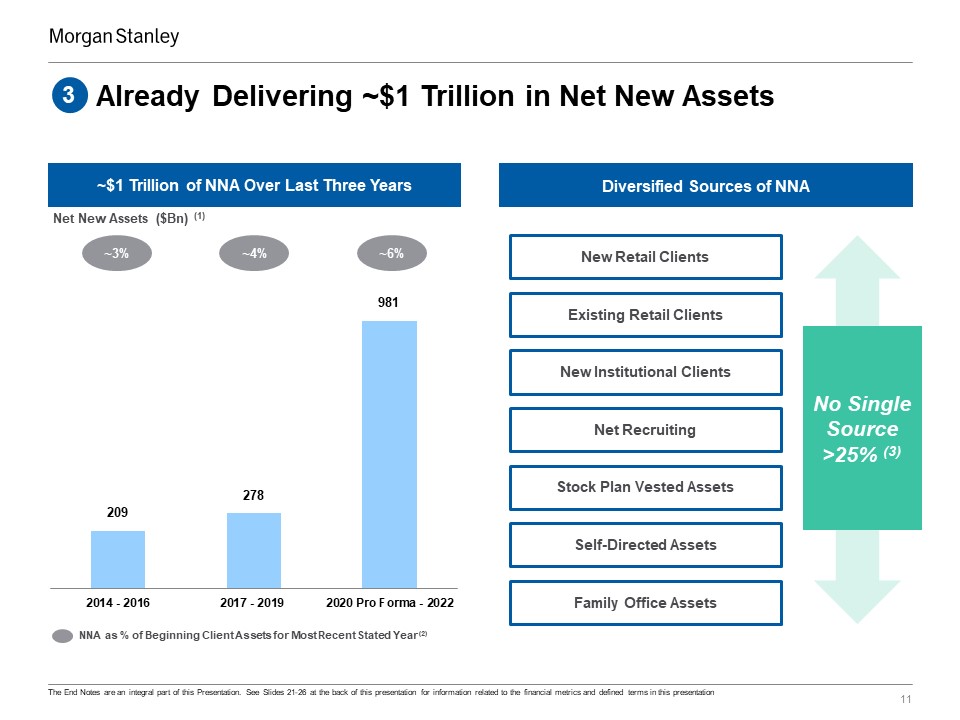
Already Delivering ~$1 Trillion in Net New Assets 11 The End Notes are an integral part of this Presentation. See Slides 21-26 at the back of this presentation for information related to the financial metrics and defined terms in this presentation 3 NNA as % of Beginning Client Assets for Most Recent Stated Year (2) ~$1 Trillion of NNA Over Last Three Years Net New Assets ($Bn) (1) ~4% ~6% ~3% Diversified Sources of NNA Net Recruiting New Retail Clients Self-Directed Assets Stock Plan Vested Assets Family Office Assets New Institutional Clients No Single Source >25% (3) Existing Retail Clients
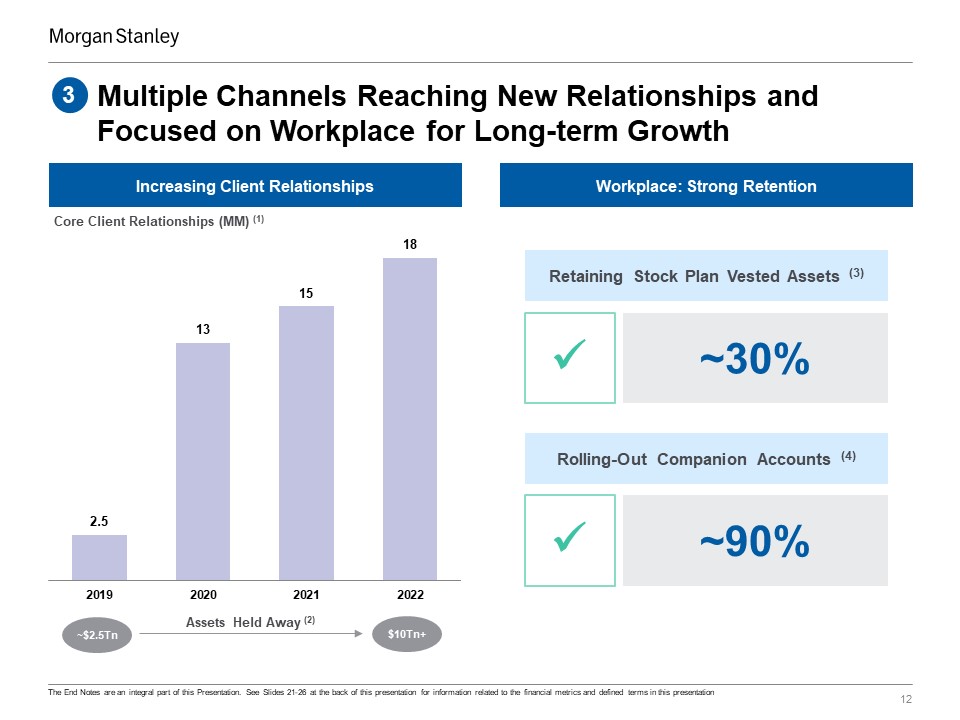
Multiple Channels Reaching New Relationships and Focused on Workplace for Long-term Growth 12 The End Notes are an integral part of this Presentation. See Slides 21-26 at the back of this presentation for information related to the financial metrics and defined terms in this presentation 3 Increasing Client Relationships Core Client Relationships (MM) (1) ~$2.5Tn $10Tn+ Assets Held Away (2) Workplace: Strong Retention Retaining Stock Plan Vested Assets (3) ~30% ~90% Rolling-Out Companion Accounts (4)
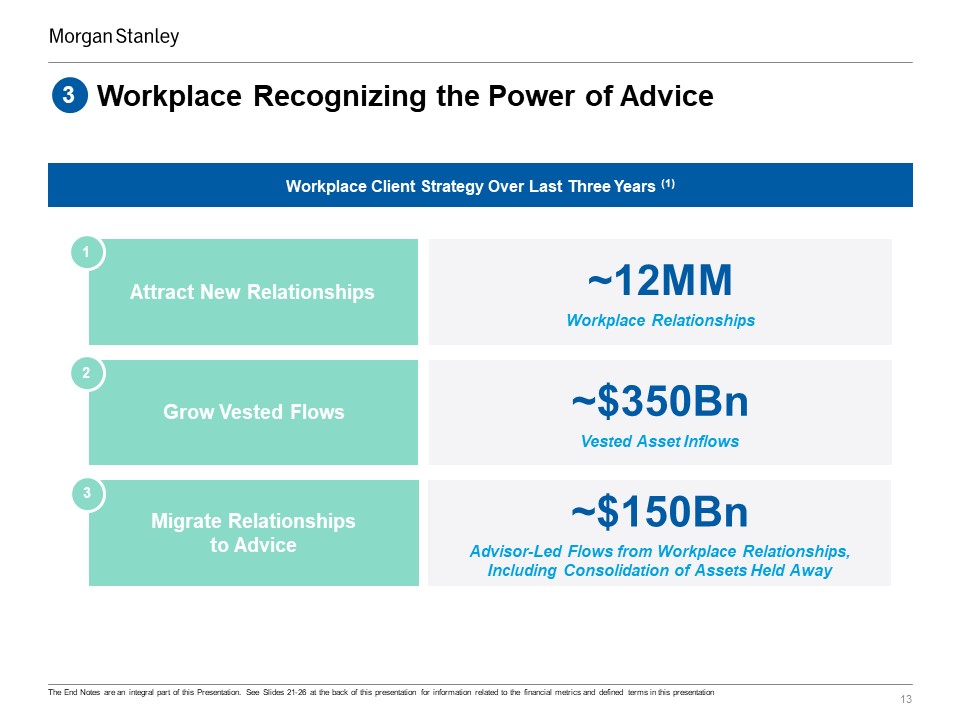
Workplace Recognizing the Power of Advice 13 The End Notes are an integral part of this Presentation. See Slides 21-26 at the back of this presentation for information related to the financial metrics and defined terms in this presentation 3 Workplace Client Strategy Over Last Three Years (1) ~12MM Workplace Relationships Attract New Relationships 1 Grow Vested Flows 2 ~$350Bn Vested Asset Inflows ~$150Bn Advisor-Led Flows from Workplace Relationships, Including Consolidation of Assets Held Away Migrate Relationships to Advice 3
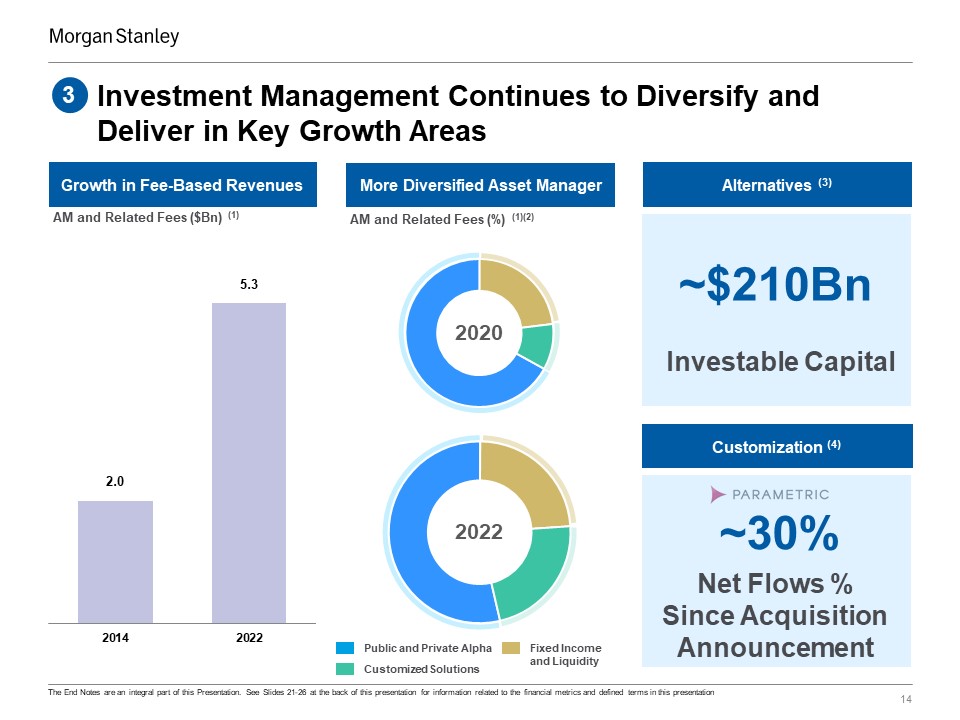
Investment Management Continues to Diversify and Deliver in Key Growth Areas 14 The End Notes are an integral part of this Presentation. See Slides 21-26 at the back of this presentation for information related to the financial metrics and defined terms in this presentation 3 Alternatives (3) ~$210Bn Investable Capital Customization (4) ~30% Net Flows % Since Acquisition Announcement Growth in Fee-Based Revenues Public and Private Alpha Fixed Income and Liquidity Customized Solutions AM and Related Fees (%) (1)(2) 2022 2020 More Diversified Asset Manager AM and Related Fees ($Bn) (1)

Institutional Securities Delivering Strength in Various Market Environments 15 The End Notes are an integral part of this Presentation. See Slides 21-26 at the back of this presentation for information related to the financial metrics and defined terms in this presentation Strength Across the Integrated Investment Bank (1) ISG Net Revenues ($Bn) (2) Top 3 Share Position Across ISG Leading Equities House Premier Advisory & Underwriting Franchise Restored Fixed Income Footprint 3
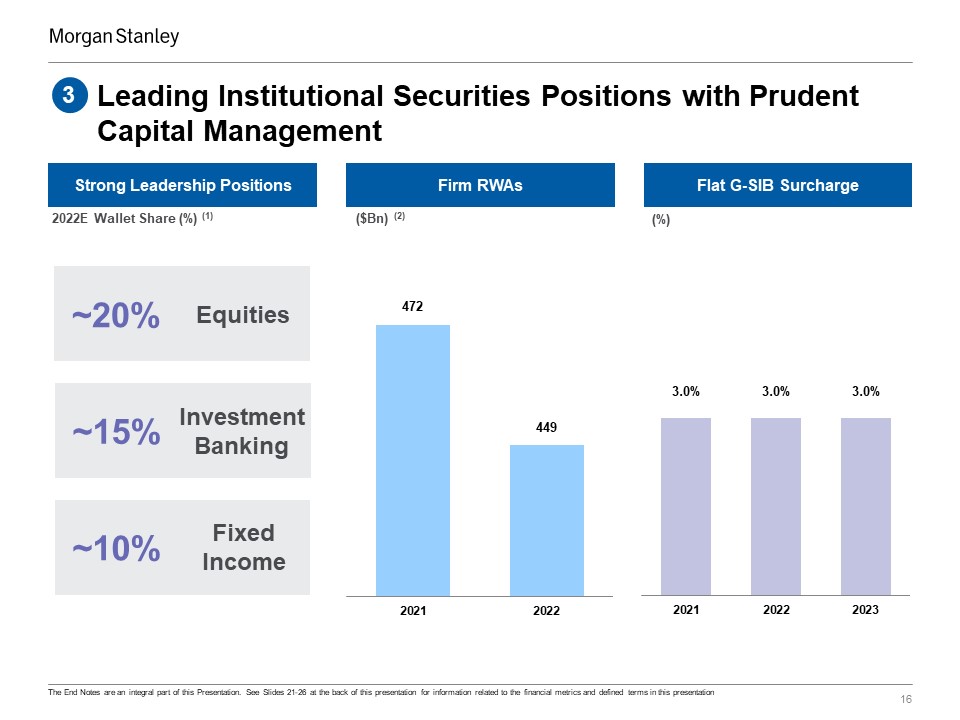
Leading Institutional Securities Positions with Prudent Capital Management 16 The End Notes are an integral part of this Presentation. See Slides 21-26 at the back of this presentation for information related to the financial metrics and defined terms in this presentation Flat G-SIB Surcharge (%) Firm RWAs ($Bn) (2) Strong Leadership Positions 2022E Wallet Share (%) (1) ~15% Investment Banking ~20% Equities ~10% Fixed Income 3
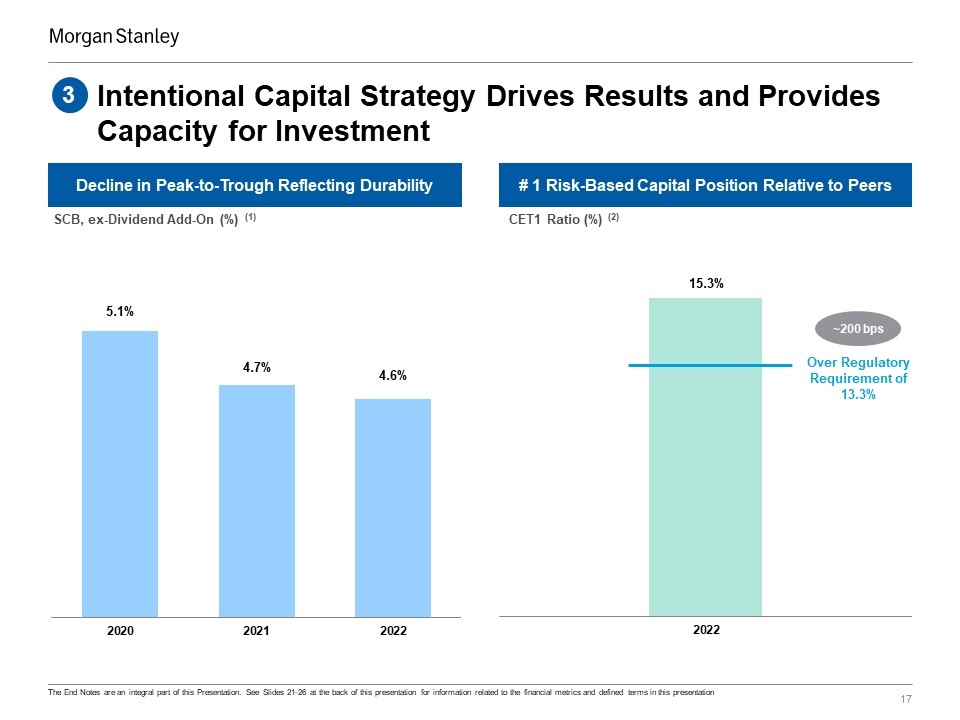
Intentional Capital Strategy Drives Results and Provides Capacity for Investment 17 The End Notes are an integral part of this Presentation. See Slides 21-26 at the back of this presentation for information related to the financial metrics and defined terms in this presentation 3 Decline in Peak-to-Trough Reflecting Durability SCB, ex-Dividend Add-On (%) (1) # 1 Risk-Based Capital Position Relative to Peers Over Regulatory Requirement of 13.3% CET1 Ratio (%) (2) ~200 bps
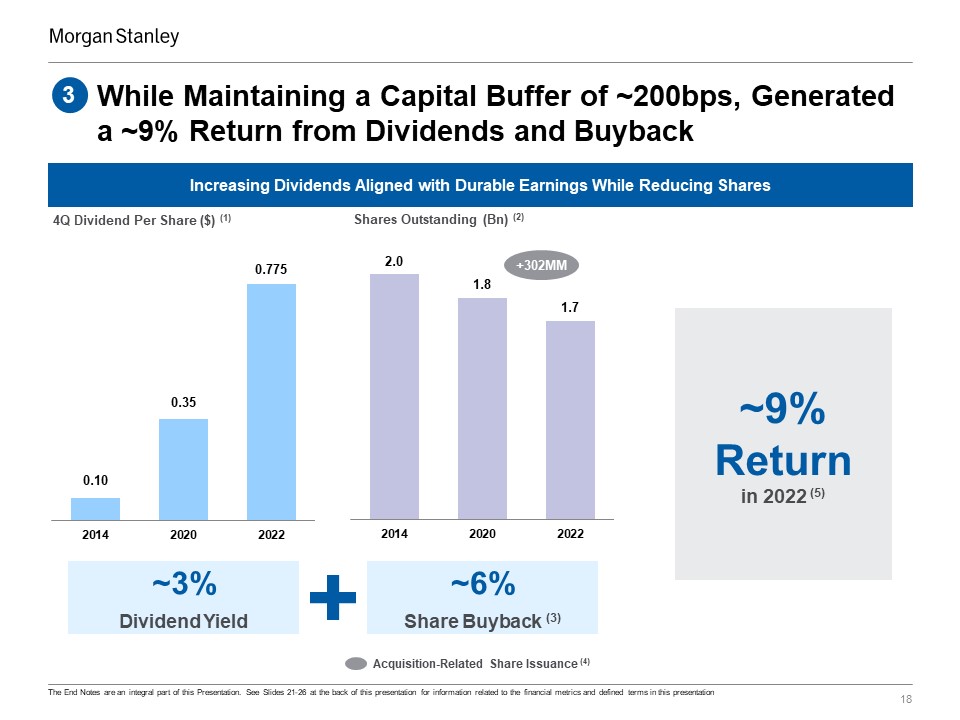
While Maintaining a Capital Buffer of ~200bps, Generated a ~9% Return from Dividends and Buyback 18 The End Notes are an integral part of this Presentation. See Slides 21-26 at the back of this presentation for information related to the financial metrics and defined terms in this presentation 3 Increasing Dividends Aligned with Durable Earnings While Reducing Shares 4Q Dividend Per Share ($) (1) Shares Outstanding (Bn) (2) ~9% Return in 2022 (5) ~3% Dividend Yield ~6% Share Buyback (3) Acquisition-Related Share Issuance (4) +302MM
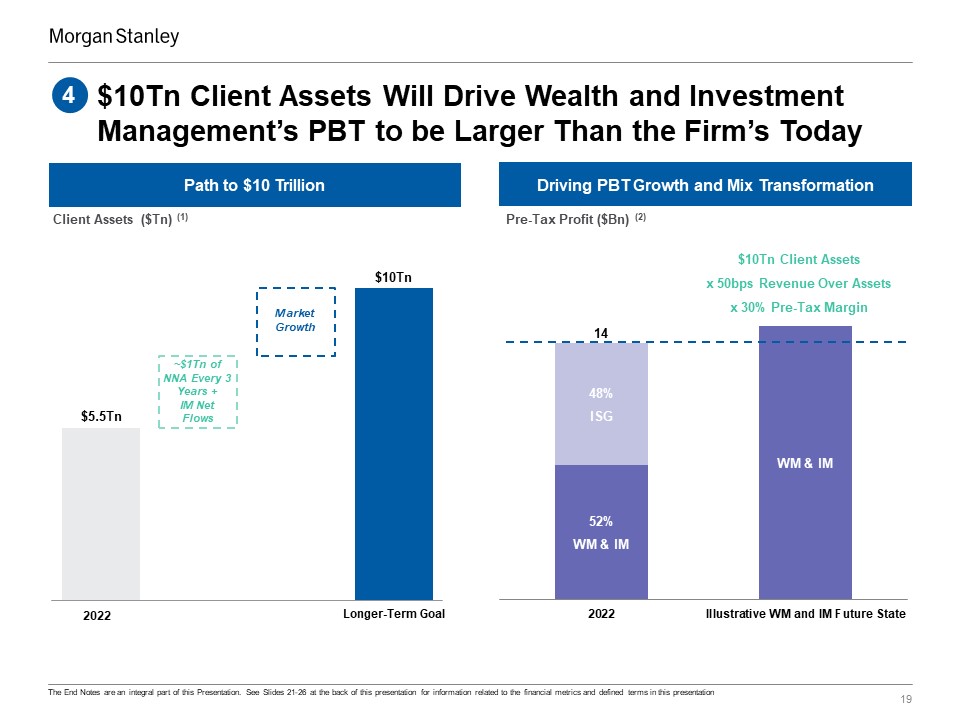
$10Tn Client Assets Will Drive Wealth and Investment Management’s PBT to be Larger Than the Firm’s Today 19 4 Path to $10 Trillion Client Assets Today Market Appreciation ~$1Tn of NNA Every 3 Years + IM Net Flows 2022 Longer-Term Goal Market Growth Driving PBT Growth and Mix Transformation Client Assets ($Tn) (1) Pre-Tax Profit ($Bn) (2) $10Tn Client Assets x 50bps Revenue Over Assets x 30% Pre-Tax Margin The End Notes are an integral part of this Presentation. See Slides 21-26 at the back of this presentation for information related to the financial metrics and defined terms in this presentation
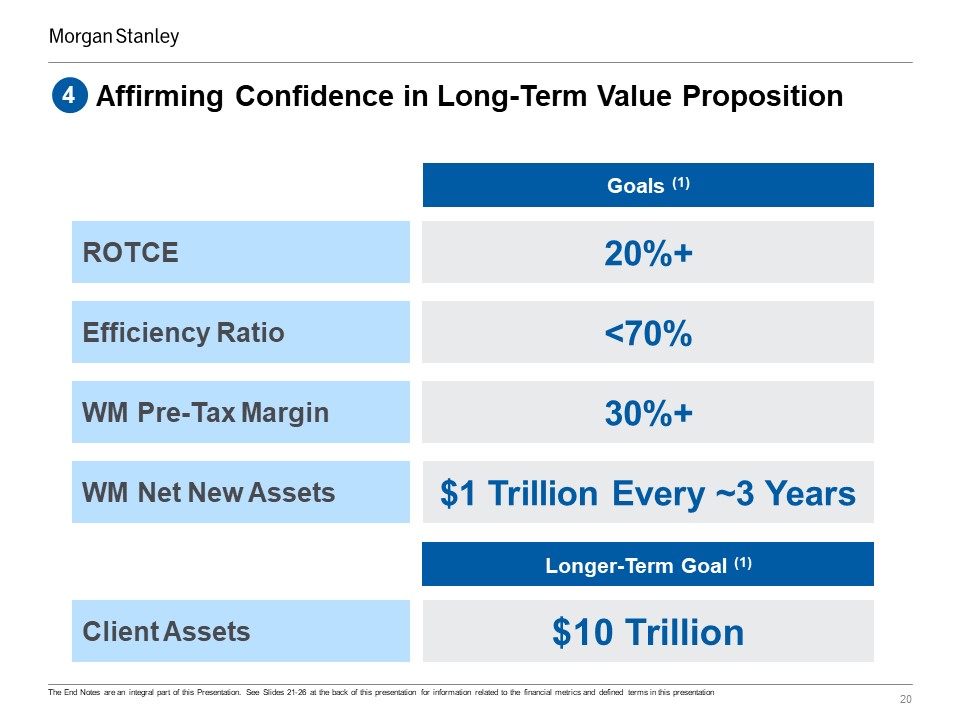
Affirming Confidence in Long-Term Value Proposition 20 Goals (1) 4 Longer-Term Goal (1) WM Net New Assets $1 Trillion Every ~3 Years WM Pre-Tax Margin 30%+ Efficiency Ratio <70% ROTCE 20%+ Client Assets $10 Trillion The End Notes are an integral part of this Presentation. See Slides 21-26 at the back of this presentation for information related to the financial metrics and defined terms in this presentation
End Notes 21 The Firm’s financial presentations, earnings releases, earnings conference calls, and other communications may include certain metrics, including non-GAAP financial measures, which we believe to be useful to us, investors, analysts and other stakeholders by providing further transparency about, or an additional means of assessing, our financial condition and operating results. The End Notes are an integral part of our presentations and other communications. For additional information, refer to the Definition of U.S. GAAP to Non-GAAP Measures, Definitions of Performance Metrics and Terms, Supplemental Quantitative Details and Calculations (includes reconciliation of GAAP to non-GAAP), and Legal Notice in the Morgan Stanley Fourth Quarter 2022 Financial Supplement included in the Current Report on Form 8-K dated January 17, 2023 (‘Morgan Stanley Fourth Quarter 2022 Financial Supplement’). Morgan Stanley closed its acquisition of E*TRADE on October 2, 2020, impacting prior period comparisons for the Firm and Wealth Management, and closed its acquisition of Eaton Vance on March 1, 2021, impacting prior period comparisons for the Firm and Investment Management.
End Notes 22 These notes refer to the financial metrics and/or defined term presented on Slide 4 Rankings are based on internal analysis of net revenues for Morgan Stanley and peers. For Wealth and Investment Management, net revenues represent the combination of Wealth Management and Investment Management for the peer set: Bank of America, BlackRock, Charles Schwab, Fidelity, Goldman Sachs, JP Morgan, UBS, and Wells Fargo. The analysis utilizes data for peers that have reported full-year 2022 results as of January 16, 2023. For peers that have not yet reported, excluding Fidelity, net revenues are based on the last twelve months as of September 30, 2022. For Fidelity, net revenues represent 2021 total company revenues. Net revenues for Morgan Stanley represent the addition of Morgan Stanley’s Wealth Management (‘WM’) and Investment Management (‘IM’) Net Revenues for full-year 2022, excluding intersegment activity. For Institutional Securities, net revenues represent Investment Banking, Equity Sales & Trading and Fixed Income Sales & Trading, where applicable for the peer set: Bank of America, Barclays, Citigroup, Credit Suisse, Deutsche Bank, Goldman Sachs, JP Morgan, and UBS (‘Wallet’). For peers that disclose results between multiple segments, assumptions have been made based on company disclosures. The analysis utilizes data for peers that have reported full-year 2022 results as of January 16, 2023. For peers that have not yet reported, a full-year 2022 results estimate is derived assuming the aggregate share of those peers of the Wallet for the first nine months of 2022 remains constant in the fourth quarter of 2022. European peer results were translated to USD using average exchange rates for the appropriate period; sourced from Bloomberg. Credit Suisse Equity Sales & Trading and Institutional Securities-equivalent revenues were adjusted to include net release of $167MM related to a U.S.-based hedge fund matter. Net revenues for Morgan Stanley represent segment revenues for Institutional Securities (‘ISG’). These notes refer to the financial metrics and/or defined term presented on Slide 6 Net revenues for 2010 have been adjusted to exclude the negative impact of Debt Valuation Adjustment (‘DVA’) of approximately $(873) million. The adjusted net revenues are a non-GAAP financial measure. Return on average tangible common equity (‘ROTCE’) utilizes net income applicable to Morgan Stanley less preferred dividends as a percentage of average tangible common equity. Average tangible common equity represents average common equity adjusted to exclude goodwill and intangible assets net of allowable mortgage servicing rights deduction. For 2010, the calculation is adjusted to exclude the aggregate net after-tax impacts of negative DVA of $(534) million and positive impact of Discrete Tax Benefit of $998 million. For 2022, ROTCE excludes integration‐related expenses, which were $470 million on a pre-tax basis or $360 million on an after-tax basis. The adjusted ROTCE is a non-GAAP financial measure. Income from continuing operations before income taxes (‘Pre-Tax Profit’) for 2010 excludes the negative impact of DVA. The adjusted Pre-Tax Profit is a non-GAAP financial measure. These notes refer to the financial metrics and/or defined term presented on Slide 7 1. Stated metrics are for full-year 2022. Common Equity Tier 1 (‘CET1’) Capital Ratio is based on the Basel III Standardized Approach Fully Phased-in rules. Dividend Yield represents the annual dividend for full-year 2022 divided by Morgan Stanley’s share price as of January 3, 2022. Net New Assets (‘NNA’) represent client inflows, including dividends and interest, and asset acquisitions, less client outflows, and exclude activity from business combinations / divestitures and the impact of fees and commissions.
End Notes 23 These notes refer to the financial metrics and/or defined term presented on Slide 8 Position in Advisor-Led derived from internal analysis based on client assets for Bank of America Merrill Lynch Global Wealth Management, UBS Wealth Management Americas and Wells Fargo Wealth and Investment Management per company filings as of most recently reported results. For Morgan Stanley, Advisor-Led Client Assets represent client assets in accounts that have a WM representative assigned. Workplace Rank Position derived from Morgan Stanley internal analysis based on number of stock plan participants informed by latest available data for Bank of America, Carta, Certent, Charles Schwab, Computershare, Fidelity, and UBS. Position in Self-Directed derived from Aite Group’s “New Realities in Wealth Management: Evolution Amid Turbulence” report (December 2022). Peers include Charles Schwab, Fidelity, Merrill Lynch, and others. 2. The daily revenue distribution reflects net revenues for the WM segment attributed as follows: Transactional revenues primarily on the day the revenue was recorded; and Asset Management, Net Interest and Other revenues based on a daily average, where the reported revenue for the period is divided by the number of business days in the period. These notes refer to the financial metrics and/or defined term presented on Slide 9 WM Pre-Tax Margin represents Pre-Tax Profit divided by net revenues and has been averaged across the stated years. For 2020, 2021 and 2022, the calculation excludes the impact of integration-related expenses on a pre-tax basis of $231 million, $346 million, and $357 million, respectively. These notes refer to the financial metrics and/or defined term presented on Slide 10 WM Loans represent loans from WM on U.S. Bank subsidiaries as of 4Q 2022. U.S. Bank refers to the Firm's U.S. Bank operating subsidiaries Morgan Stanley Bank, N.A. and Morgan Stanley Private Bank, National Association. Deposits reflect liabilities sourced from WM clients and other sources of funding on the U.S. Bank subsidiaries. Deposits include sweep deposit programs, savings and other, and time deposits. Excludes approximately $6 billion of off-balance sheet deposits as of 4Q 2022. Percentage of deposits sourced from WM clients includes sweep deposit programs and savings. Effective Federal Funds Rate represents the effective Federal Funds rate as of 4Q 2019 and 4Q 2022. WM Period End Deposit Cost represents the total annualized weighted average cost of the various deposit products, excluding the effect of related hedging derivatives. Period end cost of deposits is based upon balances and rates as of December 31, 2019, and December 31, 2022. These notes refer to the financial metrics and/or defined term presented on Slide 11 NNA is aggregated across the stated years. 2020 NNA is Pro Forma for E*TRADE, representing the addition of NNA for Morgan Stanley and E*TRADE for the full year. The comparisons of current and prior periods are impacted by asset acquisitions in 3Q 2021 and 1Q 2022. NNA as % of Beginning Client Assets represents NNA divided by beginning client assets for each period. The calculation shown is for the most recent year in the stated periods. Represents percentage of total NNA aggregated over 2020, 2021, and 2022 for the stated sources. 2020 NNA is Pro Forma for E*TRADE.
End Notes 24 These notes refer to the financial metrics and/or defined term presented on Slide 12 Core Client Relationships represent Advisor-Led Households, Self-Directed Households, Stock Plan Participants and Retirement and Financial Wellness Participants excluding overlap as of 4Q 2022. Advisor-Led Households represent the total number of households that include at least one account with Advisor-Led Clients Assets. Stock Plan Participants represent total accounts with vested or unvested stock plan assets. Individuals with accounts in multiple plans are counted as participants in each plan. Retirement and Financial Wellness Participants represent participants of corporate clients with financial wellness and retirement plans serviced by Morgan Stanley at Work. Self-Directed Households represent the total number of households that include at least one account with Self-Directed Assets. Self-Directed Assets represent active accounts which are not advisor-led. Active accounts are defined as having $25 or more in assets. Assets Held Away is estimated using data from IXI as of June 2022 for retail clients and Stock Plan Participants. Retention Rate for any given period is derived using the net of stock plan inflows for one year less outflows for a two-year period post the initial inflow and dividing it by total inflows. Companion Accounts Roll-Out represents percentage of eligible Stock Plan Participants with companion accounts activated by Morgan Stanley as of 4Q 2022. These notes refer to the financial metrics and/or defined term presented on Slide 13 Workplace Relationships represent the addition of Stock Plan Participants, and Retirement and Financial Wellness Participants as of 4Q 2022. Vested Asset Inflows represent inflows, excluding estimated taxes, from vested equity compensation solutions for company executives and employees aggregated for full-year 2020, 2021, and 2022. Advisor-Led Flows from Workplace Relationships represent assets brought into advisor‐led relationships, where the initial account was from workplace, aggregated for full-year 2020, 2021, and 2022. These notes refer to the financial metrics and/or defined term presented on Slide 14 Represents reported full-year asset management and related-fees revenue of IM, which include management and administrative fees, distribution fees, and performance‐based fees, not in the form of carried interest. Public & Private Alpha includes public equity strategies reported under the "Equity" category and real assets, private equity, private credit and private equity fund of funds reported under the "Alternatives and Solutions" category as of 4Q 2022 in the Morgan Stanley Fourth Quarter 2022 Financial Supplement. Fixed Income & Liquidity includes strategies reported under the "Fixed income" category and liquidity strategies reported under the "Liquidity and Overlay Services" category as of 4Q 2022 in the Morgan Stanley Fourth Quarter 2022 Financial Supplement. Customized Solutions includes multi-asset portfolios, hedge fund of funds, customized retail solutions and institutional portfolio solutions reported under the "Alternatives and Solutions" category, concentrated equity diversification strategies reported under the “Equity” category and overlay strategies reported under the “Liquidity and Overlay Services” category as of 4Q 2022 in the Firm’s Morgan Stanley Fourth Quarter 2022 Financial Supplement. Investable Capital includes assets under management, unfunded commitments, co-investments and leverage across private alternative and liquid alternative strategies as of 4Q 2022. The assets under management portion of investable capital is reported under the “Alternatives and Solutions”, “Equities” and “Fixed Income” categories in the Morgan Stanley Fourth Quarter 2022 Financial Supplement. Private Alternatives is ~$120 billion of the total Alternatives investable capital amount. Net Flows % Since Acquisition Announcement represent net flows since the announcement of the Eaton Vance acquisition, from 4Q 2020 to 4Q 2022 divided by assets under management as of 3Q 2020. Data from September 30, 2020, to March 1, 2021, is prior to the close of the acquisition. These net flows are across Parametric custom portfolios in retail separately managed accounts reported under the “Alternatives and Solutions” category in the Morgan Stanley Fourth Quarter 2022 Financial Supplement.
End Notes 25 These notes refer to the financial metrics and/or defined term presented on Slide 15 Top 3 Share Position across ISG is a ranking based on internal analysis of net revenues for Morgan Stanley and peers as described in end note 1 for Slide 4. ISG net revenues have been averaged across the stated years. These notes refer to the financial metrics and/or defined term presented on Slide 16 Wallet Share calculated as the percentage of ISG segment net revenues to the Wallet. RWA represent risk-weighted assets under the Standardized Approach. These notes refer to the financial metrics and/or defined term presented on Slide 17 Represents Morgan Stanley’s Stress Capital Buffer (‘SCB’), excluding the dividend add-on. Risk-Based Capital Position Ranking represents CET1 Ratio above the regulatory requirement which is inclusive of the SCB and G-SIB capital surcharge and is based on internal analysis for the peer set including Bank of America, Citigroup, Goldman Sachs, and JP Morgan per company filings for the most recently reported results as of January 16, 2023. Regulatory requirement includes 2022 SCB, and G-SIB capital surcharge effective January 2023. These notes refer to the financial metrics and/or defined term presented on Slide 18 4Q Dividend Per Share represents the dividend per share in the fourth quarter of each respective year. Shares Outstanding represents end of period common shares outstanding. Share Buyback Percentage represents total shares repurchased in 2022 divided by beginning of period common shares outstanding. Acquisition-Related Share Issuance represents common shares issued in relation to the acquisitions of E*TRADE and Eaton Vance in 2020 and 2021, respectively. Total Return is calculated by adding together the full-year 2022 Dividend Yield and Share Buyback Percentage. These notes refer to the financial metrics and/or defined term presented on Slide 19 Client Assets represent WM client assets and IM assets under management (‘AUM’). WM client assets represent those assets for which WM is providing services including financial advisor‐led brokerage, custody, administrative and investment advisory services; self‐directed brokerage services; financial and wealth planning services; workplace services, including stock plan administration, and retirement plan services. Certain WM client assets are invested in IM products and are also included in IM’s AUM. The attainment of future Client Assets assumes a normal market environment and may be impacted by external factors that cannot be predicted at this time, including geopolitical, macroeconomic and market conditions and future legislation and regulations and any changes thereto. Please also refer to the Notice on slide 2 of this presentation. Assumptions for the WM and IM Future State Pre-Tax Profit are illustrative, and we believe are a useful framework for us, investors, analysts and other stakeholders to assess our performance. The attainment of these assumptions assumes a normal market environment and may be impacted by external factors that cannot be predicted at this time, including geopolitical, macroeconomic and market conditions and future legislation and regulations and any changes thereto. Please also refer to the Notice on slide 2 of this presentation. Revenue Over Assets represents WM and IM Net Revenues divided by average Client Assets for an average of the five most recent quarters. For 2022, this is calculated to be 50 bps. Pre-Tax Margin represents WM and IM Pre-Tax Profit aggregated, divided by WM and IM Net Revenues. This is representative of our goal of achieving a 70% Firm Efficiency Ratio i.e. total non-interest expenses as a percentage of net revenues.
End Notes 26 These notes refer to the financial metrics and/or defined term presented on Slide 20 The attainment of these objectives assumes a normal market environment and may be impacted by external factors that cannot be predicted at this time, including geopolitical, macroeconomic and market conditions and future legislation and regulations and any changes thereto. Please also refer to the Notice on slide 2 of this presentation.
Strategic Update: Driving Growth Through The Next Decade James P. Gorman, Chairman and Chief Executive Officer January 17, 2023