UNITED STATES
SECURITIES AND EXCHANGE COMMISSION
Washington, D.C. 20549
FORM 10-Q
| x | QUARTERLY REPORT PURSUANT TO SECTION 13 OR 15(d) OF THE SECURITIES EXCHANGE ACT OF 1934 |
For the quarterly period ended May 31, 2005
OR
| ¨ | TRANSITION REPORT PURSUANT TO SECTION 13 OR 15(d) OF THE SECURITIES EXCHANGE ACT OF 1934 |
For the transition period from to
Commission file number 1-11758
Morgan Stanley
(Exact Name of Registrant as Specified in its Charter)
| | |
| Delaware | | 36-3145972 |
| (State of Incorporation) | | (I.R.S. Employer Identification No.) |
| |
1585 Broadway
New York, NY | | 10036 |
(Address of Principal
Executive Offices) | | (Zip Code) |
Registrant’s telephone number, including area code: (212) 761-4000
Indicate by check mark whether the Registrant (1) has filed all reports required to be filed by Section 13 or 15(d) of the Securities Exchange Act of 1934 during the preceding 12 months (or for such shorter period that the Registrant was required to file such reports), and (2) has been subject to such filing requirements for the past 90 days. Yes x No ¨
Indicate by check mark whether the Registrant is an accelerated filer (as defined in Rule 12b-2 of the Exchange Act). Yes x No ¨
As of June 30, 2005, there were 1,086,115,599 shares of the Registrant’s Common Stock, par value $.01 per share, outstanding.
MORGAN STANLEY
INDEX TO QUARTERLY REPORT ON FORM 10-Q
Quarter Ended May 31, 2005
AVAILABLE INFORMATION
Morgan Stanley (the “Company”) files annual, quarterly and current reports, proxy statements and other information with the Securities and Exchange Commission (the “SEC”). You may read and copy any document the Company files with the SEC at the SEC’s public reference room at 100 F Street, NE, Washington, DC 20549. Please call the SEC at 1-800-SEC-0330 for information on the public reference room. The SEC maintains an internet site that contains annual, quarterly and current reports, proxy and information statements and other information that issuers (including the Company) file electronically with the SEC. The SEC’s internet site iswww.sec.gov.
The Company’s internet site iswww.morganstanley.com. You can access the Company’s Investor Relations webpage through its internet site,www.morganstanley.com, by clicking on the “About the Company” link to the heading “Investor Relations.” You can also access its Investor Relations webpage directly atwww.morganstanley.com/about/ir. The Company makes available free of charge, on or through its Investor Relations webpage, its proxy statements, annual reports on Form 10-K, quarterly reports on Form 10-Q, current reports on Form 8-K and any amendments to those reports filed or furnished pursuant to the Securities Exchange Act of 1934, as amended (the “Exchange Act”), as soon as reasonably practicable after such material is electronically filed with, or furnished to, the SEC. The Company also makes available, through its Investor Relations webpage, via a link to the SEC’s internet site, statements of beneficial ownership of the Company’s equity securities filed by its directors, officers, 10% or greater shareholders and others under Section 16 of the Exchange Act.
| | | | |
| | | i | |  |
The Company also has a Corporate Governance webpage. You can access the Company’s Corporate Governance webpage through its internet site,www.morganstanley.com, by clicking on the “About the Company” link to the heading “Inside the Company.” You can also access its Corporate Governance webpage directly atwww.morganstanley.com/about/inside/governance. The Company posts the following on its Corporate Governance webpage:
| | • | | Composite Certificate of Incorporation, |
| | • | | Charters for its Audit Committee, Compensation, Management Development and Succession Committee and Nominating and Governance Committee, |
| | • | | Corporate Governance Policies, |
| | • | | Policy Regarding Communication with the Board of Directors, |
| | • | | Policy Regarding Director Candidates Recommended by Shareholders, |
| | • | | Policy Regarding Corporate Political Contributions, |
| | • | | Policy Regarding Shareholder Rights Plan, and |
| | • | | Code of Ethics and Business Conduct. |
The information on the Company’s internet site is not incorporated by reference into this report. You can request a copy of these documents, excluding exhibits, at no cost, by contacting Investor Relations at 1585 Broadway, New York, NY 10036 (212-761-4000).
| | | | |
| | ii | | |
MORGAN STANLEY
CONDENSED CONSOLIDATED STATEMENTS OF FINANCIAL CONDITION
(dollars in millions, except share data)
| | | | | | |
| | | May 31,
2005
| | November 30,
2004
|
| | | (unaudited) |
Assets | | | | | | |
Cash and cash equivalents | | $ | 25,086 | | $ | 32,811 |
Cash and securities deposited with clearing organizations or segregated under federal and other regulations (including securities at fair value of $38,330 at May 31, 2005 and $27,219 at November 30, 2004) | | | 49,378 | | | 36,742 |
Financial instruments owned (approximately $91 billion was pledged to various parties at both May 31, 2005 and November 30, 2004, respectively): | | | | | | |
U.S. government and agency securities | | | 34,386 | | | 26,201 |
Other sovereign government obligations | | | 24,276 | | | 19,782 |
Corporate and other debt | | | 96,131 | | | 80,306 |
Corporate equities | | | 36,443 | | | 27,608 |
Derivative contracts | | | 42,449 | | | 49,475 |
Physical commodities | | | 1,727 | | | 1,224 |
| | |
|
| |
|
|
Total financial instruments owned | | | 235,412 | | | 204,596 |
Securities purchased under agreements to resell | | | 145,579 | | | 123,041 |
Securities received as collateral | | | 41,032 | | | 37,848 |
Securities borrowed | | | 228,454 | | | 208,349 |
Receivables: | | | | | | |
Consumer loans (net of allowances of $840 at May 31, 2005 and $943 at November 30, 2004) | | | 19,741 | | | 20,226 |
Customers, net | | | 43,030 | | | 45,561 |
Brokers, dealers and clearing organizations | | | 4,142 | | | 12,707 |
Fees, interest and other | | | 8,303 | | | 5,801 |
Office facilities, at cost (less accumulated depreciation of $2,978 at May 31, 2005 and $2,780 at November 30, 2004) | | | 2,697 | | | 2,605 |
Aircraft under operating leases (less accumulated depreciation of $1,289 at May 31, 2005 and $1,174 at November 30, 2004) | | | 3,698 | | | 3,926 |
Goodwill and intangible assets | | | 2,528 | | | 2,199 |
Other assets | | | 9,631 | | | 9,101 |
| | |
|
| |
|
|
Total assets | | $ | 818,711 | | $ | 745,513 |
| | |
|
| |
|
|
| | | | |
| | 1 | | |
MORGAN STANLEY
CONDENSED CONSOLIDATED STATEMENTS OF FINANCIAL CONDITION—(Continued)
(dollars in millions, except share data)
| | | | | | | | |
| | | May 31,
2005
| | | November 30,
2004
| |
| | | (unaudited) | |
Liabilities and Shareholders’ Equity | | | | | | | | |
Commercial paper and other short-term borrowings | | $ | 40,057 | | | $ | 36,303 | |
Deposits | | | 16,253 | | | | 13,777 | |
Financial instruments sold, not yet purchased: | | | | | | | | |
U.S. government and agency securities | | | 16,237 | | | | 12,664 | |
Other sovereign government obligations | | | 24,193 | | | | 14,787 | |
Corporate and other debt | | | 8,208 | | | | 9,641 | |
Corporate equities | | | 40,661 | | | | 27,332 | |
Derivative contracts | | | 39,835 | | | | 43,540 | |
Physical commodities | | | 2,767 | | | | 3,351 | |
| | |
|
|
| |
|
|
|
Total financial instruments sold, not yet purchased | | | 131,901 | | | | 111,315 | |
Obligation to return securities received as collateral | | | 41,032 | | | | 37,848 | |
Collateralized financings: | | | | | | | | |
Securities sold under agreements to repurchase | | | 179,113 | | | | 181,598 | |
Securities loaned | | | 114,006 | | | | 97,146 | |
Other secured borrowings | | | 16,362 | | | | 7,047 | |
Payables: | | | | | | | | |
Customers | | | 124,119 | | | | 115,653 | |
Brokers, dealers and clearing organizations | | | 6,711 | | | | 4,550 | |
Interest and dividends | | | 3,450 | | | | 3,068 | |
Other liabilities and accrued expenses | | | 15,008 | | | | 13,650 | |
Long-term borrowings | | | 102,303 | | | | 95,286 | |
| | |
|
|
| |
|
|
|
| | | | 790,315 | | | | 717,241 | |
| | |
|
|
| |
|
|
|
Capital Units | | | 66 | | | | 66 | |
| | |
|
|
| |
|
|
|
Commitments and contingencies | | | | | | | | |
Shareholders’ equity: | | | | | | | | |
Common stock, $0.01 par value; | | | | | | | | |
Shares authorized: 3,500,000,000 at May 31, 2005 and November 30, 2004; | | | | | | | | |
Shares issued: 1,211,701,552 at May 31, 2005 and November 30, 2004; | | | | | | | | |
Shares outstanding: 1,086,652,691 at May 31, 2005 and 1,087,087,116 at November 30, 2004 | | | 12 | | | | 12 | |
Paid-in capital | | | 1,994 | | | | 2,088 | |
Retained earnings | | | 33,160 | | | | 31,426 | |
Employee stock trust | | | 3,648 | | | | 3,824 | |
Accumulated other comprehensive loss | | | (151 | ) | | | (56 | ) |
| | |
|
|
| |
|
|
|
Subtotal | | | 38,663 | | | | 37,294 | |
Common stock held in treasury, at cost, $0.01 par value; | | | | | | | | |
125,048,861 shares at May 31, 2005 and 124,614,436 shares at November 30, 2004 | | | (6,685 | ) | | | (6,614 | ) |
Common stock issued to employee trust | | | (3,648 | ) | | | (2,474 | ) |
| | |
|
|
| |
|
|
|
Total shareholders’ equity | | | 28,330 | | | | 28,206 | |
| | |
|
|
| |
|
|
|
Total liabilities and shareholders’ equity | | $ | 818,711 | | | $ | 745,513 | |
| | |
|
|
| |
|
|
|
See Notes to Condensed Consolidated Financial Statements.
| | | | |
| | | 2 | | |
MORGAN STANLEY
CONDENSED CONSOLIDATED STATEMENTS OF INCOME
(dollars in millions, except share and per share data)
| | | | | | | | | | | | | | | |
| | | Three Months Ended
May 31,
| | | Six Months Ended
May 31,
| |
| | | 2005
| | 2004
| | | 2005
| | | 2004
| |
| | | (unaudited) | | | (unaudited) | |
Revenues: | | | | | | | | | | | | | | | |
Investment banking | | $ | 814 | | $ | 983 | | | $ | 1,635 | | | $ | 1,812 | |
Principal transactions: | | | | | | | | | | | | | | | |
Trading | | | 1,911 | | | 2,064 | | | | 3,761 | | | | 3,896 | |
Investments | | | 123 | | | 191 | | | | 240 | | | | 220 | |
Commissions | | | 824 | | | 846 | | | | 1,648 | | | | 1,714 | |
Fees: | | | | | | | | | | | | | | | |
Asset management, distribution and administration | | | 1,246 | | | 1,159 | | | | 2,450 | | | | 2,271 | |
Merchant, cardmember and other | | | 318 | | | 306 | | | | 626 | | | | 643 | |
Servicing | | | 413 | | | 485 | | | | 939 | | | | 1,057 | |
Interest and dividends | | | 6,035 | | | 3,663 | | | | 11,878 | | | | 7,445 | |
Other | | | 161 | | | 103 | | | | 309 | | | | 217 | |
| | |
|
| |
|
|
| |
|
|
| |
|
|
|
Total revenues | | | 11,845 | | | 9,800 | | | | 23,486 | | | | 19,275 | |
Interest expense | | | 5,597 | | | 2,950 | | | | 10,257 | | | | 5,922 | |
Provision for consumer loan losses | | | 209 | | | 200 | | | | 344 | | | | 462 | |
| | |
|
| |
|
|
| |
|
|
| |
|
|
|
Net revenues | | | 6,039 | | | 6,650 | | | | 12,885 | | | | 12,891 | |
| | |
|
| |
|
|
| |
|
|
| |
|
|
|
Non-interest expenses: | | | | | | | | | | | | | | | |
Compensation and benefits | | | 2,630 | | | 2,923 | | | | 5,491 | | | | 5,635 | |
Occupancy and equipment | | | 233 | | | 206 | | | | 566 | | | | 406 | |
Brokerage, clearing and exchange fees | | | 276 | | | 237 | | | | 536 | | | | 461 | |
Information processing and communications | | | 349 | | | 318 | | | | 691 | | | | 638 | |
Marketing and business development | | | 299 | | | 263 | | | | 558 | | | | 517 | |
Professional services | | | 441 | | | 356 | | | | 821 | | | | 674 | |
Other | | | 421 | | | 544 | | | | 994 | | | | 844 | |
September 11th related insurance recoveries, net | | | — | | | — | | | | (251 | ) | | | — | |
| | |
|
| |
|
|
| |
|
|
| |
|
|
|
Total non-interest expenses | | | 4,649 | | | 4,847 | | | | 9,406 | | | | 9,175 | |
| | |
|
| |
|
|
| |
|
|
| |
|
|
|
Income from continuing operations before losses from unconsolidated investees, income taxes, dividends on preferred securities subject to mandatory redemption and cumulative effect of accounting change, net | | | 1,390 | | | 1,803 | | | | 3,479 | | | | 3,716 | |
Losses from unconsolidated investees | | | 67 | | | 81 | | | | 140 | | | | 174 | |
Provision for income taxes | | | 395 | | | 498 | | | | 1,066 | | | | 1,049 | |
Dividends on preferred securities subject to mandatory redemption | | | — | | | — | | | | — | | | | 45 | |
| | |
|
| |
|
|
| |
|
|
| |
|
|
|
Income from continuing operations before cumulative effect of accounting change, net | | | 928 | | | 1,224 | | | | 2,273 | | | | 2,448 | |
Discontinued operations: | | | | | | | | | | | | | | | |
Income/(loss) from discontinued operations | | | — | | | (1 | ) | | | 13 | | | | 2 | |
Provision for income taxes | | | — | | | — | | | | (5 | ) | | | (1 | ) |
| | |
|
| |
|
|
| |
|
|
| |
|
|
|
Income/(loss) on discontinued operations | | | — | | | (1 | ) | | | 8 | | | | 1 | |
Cumulative effect of accounting change, net | | | — | | | — | | | | 49 | | | | — | |
| | |
|
| |
|
|
| |
|
|
| |
|
|
|
Net income | | $ | 928 | | $ | 1,223 | | | $ | 2,330 | | | $ | 2,449 | |
| | |
|
| |
|
|
| |
|
|
| |
|
|
|
Earnings per basic share: | | | | | | | | | | | | | | | |
Income from continuing operations | | $ | 0.88 | | $ | 1.13 | | | $ | 2.14 | | | $ | 2.27 | |
Income on discontinued operations | | | — | | | — | | | | 0.01 | | | | — | |
Cumulative effect of accounting change, net | | | — | | | — | | | | 0.05 | | | | — | |
| | |
|
| |
|
|
| |
|
|
| |
|
|
|
Earnings per basic share | | $ | 0.88 | | $ | 1.13 | | | $ | 2.20 | | | $ | 2.27 | |
| | |
|
| |
|
|
| |
|
|
| |
|
|
|
Earnings per diluted share: | | | | | | | | | | | | | | | |
Income from continuing operations | | $ | 0.86 | | $ | 1.10 | | | $ | 2.09 | | | $ | 2.21 | |
Income on discontinued operations | | | — | | | — | | | | 0.01 | | | | — | |
Cumulative effect of accounting change, net | | | — | | | — | | | | 0.05 | | | | — | |
| | |
|
| |
|
|
| |
|
|
| |
|
|
|
Earnings per diluted share | | $ | 0.86 | | $ | 1.10 | | | $ | 2.15 | | | $ | 2.21 | |
| | |
|
| |
|
|
| |
|
|
| |
|
|
|
Average common shares outstanding: | | | | | | | | | | | | | | | |
Basic | | | 1,053,812,487 | | | 1,082,211,511 | | | | 1,061,632,036 | | | | 1,080,776,922 | |
| | |
|
| |
|
|
| |
|
|
| |
|
|
|
Diluted | | | 1,079,811,172 | | | 1,110,357,415 | | | | 1,084,988,764 | | | | 1,108,270,257 | |
| | |
|
| |
|
|
| |
|
|
| |
|
|
|
See Notes to Condensed Consolidated Financial Statements.
| | | | |
| | 3 | | |
MORGAN STANLEY
CONDENSED CONSOLIDATED STATEMENTS OF COMPREHENSIVE INCOME
(dollars in millions)
| | | | | | | | | | | | | | | |
| | | Three Months
Ended May 31,
| | | Six Months
Ended May 31,
|
| | | 2005
| | | 2004
| | | 2005
| | | 2004
|
| | | (unaudited) | | | (unaudited) |
Net income | | $ | 928 | | | $ | 1,223 | | | $ | 2,330 | | | $ | 2,449 |
Other comprehensive income (loss), net of tax: | | | | | | | | | | | | | | | |
Foreign currency translation adjustment | | | (41 | ) | | | (7 | ) | | | (45 | ) | | | 36 |
Net change in cash flow hedges | | | (56 | ) | | | 24 | | | | (50 | ) | | | 38 |
| | |
|
|
| |
|
|
| |
|
|
| |
|
|
Comprehensive income | | $ | 831 | | | $ | 1,240 | | | $ | 2,235 | | | $ | 2,523 |
| | |
|
|
| |
|
|
| |
|
|
| |
|
|
See Notes to Condensed Consolidated Financial Statements.
| | | | |
| | | 4 | | |
MORGAN STANLEY
CONDENSED CONSOLIDATED STATEMENTS OF CASH FLOWS
(dollars in millions)
| | | | | | | | |
| | | Six Months Ended
May 31,
| |
| | | 2005
| | | 2004
| |
| | | (unaudited) | |
CASH FLOWS FROM OPERATING ACTIVITIES | | | | | | | | |
Net income | | $ | 2,330 | | | $ | 2,449 | |
Income on discontinued operations | | | (8 | ) | | | (1 | ) |
Cumulative effect of accounting change, net | | | (49 | ) | | | — | |
| | |
|
|
| |
|
|
|
Income from continuing operations | | | 2,273 | | | | 2,448 | |
Adjustments to reconcile net income to net cash used for operating activities: | | | | | | | | |
Non-cash charges (credits) included in net income: | | | | | | | | |
Compensation payable in common stock and options | | | 408 | | | | 111 | |
Depreciation and amortization | | | 478 | | | | 294 | |
Provision for consumer loan losses | | | 344 | | | | 462 | |
Lease adjustment | | | 109 | | | | — | |
Insurance settlement | | | (251 | ) | | | — | |
Aircraft impairment charge | | | — | | | | 107 | |
Changes in assets and liabilities: | | | | | | | | |
Cash and securities deposited with clearing organizations or segregated under federal and other regulations | | | (12,636 | ) | | | (13,256 | ) |
Financial instruments owned, net of financial instruments sold, not yet purchased | | | (11,663 | ) | | | (10,436 | ) |
Securities borrowed, net of securities loaned | | | (3,245 | ) | | | (32,285 | ) |
Receivables and other assets | | | 6,204 | | | | (15,196 | ) |
Payables and other liabilities | | | 12,207 | | | | 24,294 | |
| | |
|
|
| |
|
|
|
Net cash used for operating activities | | | (5,772 | ) | | | (43,457 | ) |
| | |
|
|
| |
|
|
|
CASH FLOWS FROM INVESTING ACTIVITIES | | | | | | | | |
Net (payments for) proceeds from: | | | | | | | | |
Office facilities and aircraft under operating leases | | | (262 | ) | | | (186 | ) |
Purchase of PULSE, net of cash acquired | | | (279 | ) | | | — | |
Net principal disbursed on consumer loans | | | (4,813 | ) | | | (3,004 | ) |
Sales of consumer loans | | | 4,954 | | | | 4,435 | |
Sale of interest in POSIT | | | 90 | | | | — | |
Insurance settlement | | | 220 | | | | — | |
| | |
|
|
| |
|
|
|
Net cash (used for) provided by investing activities | | | (90 | ) | | | 1,245 | |
| | |
|
|
| |
|
|
|
CASH FLOWS FROM FINANCING ACTIVITIES | | | | | | | | |
Net (payments for) proceeds from: | | | | | | | | |
Short-term borrowings | | | 3,754 | | | | 6,383 | |
Securities sold under agreements to repurchase, net of securities purchased under agreements to resell, certain derivatives financing activities and other secured borrowings | | | (14,715 | ) | | | 27,962 | |
Deposits | | | 2,476 | | | | (1,545 | ) |
Tax benefits associated with stock-based awards | | | 261 | | | | — | |
Net proceeds from: | | | | | | | | |
Issuance of common stock | | | 253 | | | | 195 | |
Issuance of long-term borrowings | | | 15,768 | | | | 21,059 | |
Payments for: | | | | | | | | |
Repayments of long-term borrowings | | | (6,788 | ) | | | (8,729 | ) |
Repurchases of common stock | | | (2,276 | ) | | | (187 | ) |
Cash dividends | | | (596 | ) | | | (548 | ) |
| | |
|
|
| |
|
|
|
Net cash (used for) provided by financing activities | | | (1,863 | ) | | | 44,590 | |
| | |
|
|
| |
|
|
|
Net (decrease) increase in cash and cash equivalents | | | (7,725 | ) | | | 2,378 | |
Cash and cash equivalents, at beginning of period | | | 32,811 | | | | 29,692 | |
| | |
|
|
| |
|
|
|
Cash and cash equivalents, at end of period | | $ | 25,086 | | | $ | 32,070 | |
| | |
|
|
| |
|
|
|
See Notes to Condensed Consolidated Financial Statements.
| | | | |
| | 5 | | |
MORGAN STANLEY
NOTES TO CONDENSED CONSOLIDATED FINANCIAL STATEMENTS
| 1. | Introduction and Basis of Presentation. |
The Company. Morgan Stanley (the “Company”) is a global financial services firm that maintains leading market positions in each of its business segments—Institutional Securities, Individual Investor Group, Investment Management and Credit Services. The Company’s Institutional Securities business includes securities underwriting and distribution; financial advisory services, including advice on mergers and acquisitions, restructurings, real estate and project finance; sales, trading, financing and market-making activities in equity securities and related products and fixed income securities and related products, including foreign exchange and commodities; principal investing and real estate investment management; aircraft financing activities; providing benchmark indices and risk management analytics; and research. The Company’s Individual Investor Group business provides comprehensive brokerage, investment and financial services designed to accommodate individual investment goals and risk profiles. The Company’s Investment Management business provides global asset management products and services for individual and institutional investors through three principal distribution channels: a proprietary channel consisting of the Company’s representatives; a non-proprietary channel consisting of third-party broker-dealers, banks, financial planners and other intermediaries; and the Company’s institutional channel. The Company’s Credit Services business offers Discover®-branded cards and other consumer finance products and services, including residential mortgage loans, and includes the operations of Discover Network, a network of merchant and cash access locations based predominantly in the U.S., and PULSE EFT Association, Inc. (“PULSE®”), a U.S.-based automated teller machine/debit network. Morgan Stanley-branded credit cards and personal loan products that are offered in the U.K. are also included in the Credit Services business segment. The Company provides its products and services to a large and diversified group of clients and customers, including corporations, governments, financial institutions and individuals.
Beginning in the third quarter of fiscal 2005, the principal components of the Credit Services residential mortgage loan business will be managed and included within the results of the Institutional Securities business segment.
Basis of Financial Information. The condensed consolidated financial statements are prepared in accordance with accounting principles generally accepted in the U.S., which require the Company to make estimates and assumptions regarding the valuations of certain financial instruments, consumer loan loss levels, the outcome of litigation, and other matters that affect the condensed consolidated financial statements and related disclosures. The Company believes that the estimates utilized in the preparation of the condensed consolidated financial statements are prudent and reasonable. Actual results could differ materially from these estimates.
The condensed consolidated financial statements include the accounts of the Company, its wholly owned subsidiaries and other entities in which the Company has a controlling financial interest. The Company’s policy is to consolidate all entities in which it owns more than 50% of the outstanding voting stock unless it does not control the entity. In accordance with Financial Accounting Standards Board (“FASB”) Interpretation No. 46 (“FIN 46”), “Consolidation of Variable Interest Entities,” as revised, the Company also consolidates any variable interest entities for which it is the primary beneficiary (see Note 12). For investments in companies in which the Company has significant influence over operating and financial decisions (generally defined as owning a voting or economic interest of 20% to 50%), the Company applies the equity method of accounting. In those cases where the Company’s investment is less than 20% and significant influence does not exist, such investments are carried at cost.
The Company’s U.S. and international subsidiaries include Morgan Stanley & Co. Incorporated (“MS&Co.”), Morgan Stanley & Co. International Limited (“MSIL”), Morgan Stanley Japan Limited (“MSJL”), Morgan Stanley DW Inc. (“MSDWI”), Morgan Stanley Investment Advisors Inc. and NOVUS Credit Services Inc.
| | | | |
| | | 6 | | |
MORGAN STANLEY
NOTES TO CONDENSED CONSOLIDATED FINANCIAL STATEMENTS—(Continued)
Certain reclassifications have been made to prior-year amounts to conform to the current year’s presentation. All material intercompany balances and transactions have been eliminated.
The condensed consolidated financial statements should be read in conjunction with the Company’s consolidated financial statements and notes thereto included in the Company’s Annual Report on Form 10-K for the fiscal year ended November 30, 2004 (the “Form 10-K”). The condensed consolidated financial statements reflect all adjustments (consisting only of normal recurring adjustments) that are, in the opinion of management, necessary for the fair statement of the results for the interim period. The results of operations for interim periods are not necessarily indicative of results for the entire year.
Discontinued Operations. Revenues and expenses associated with certain aircraft designated as “held for sale” have been classified as discontinued operations for all periods presented in accordance with Statement of Financial Accounting Standards (“SFAS”) No. 144, “Accounting for the Impairment or Disposal of Long-Lived Assets.” See Note 17 for additional information on discontinued operations.
Revenue Recognition.
Investment Banking. Underwriting revenues and fees for merger, acquisition and advisory assignments are recorded when services for the transactions are determined to be completed, generally as set forth under the terms of the engagement. Transaction-related expenses, primarily consisting of legal, travel and other costs directly associated with the transaction, are deferred to match revenue recognition. Underwriting revenues are presented net of related expenses. Non-reimbursed expenses associated with advisory transactions are recorded within Non-interest expenses.
Commissions. The Company generates commissions from executing and clearing client transactions on stock, options and futures markets. Commission revenues are recorded in the accounts on trade date.
Asset Management, Distribution and Administration Fees. Asset management, distribution and administration fees are recognized over the relevant contract period, generally quarterly or annually. In certain management fee arrangements, the Company is entitled to receive performance fees when the return on assets under management exceeds certain benchmark returns or other performance targets. Performance fee revenue is accrued quarterly based on measuring account/fund performance to date versus the performance benchmark stated in the investment management agreement.
Merchant, Cardmember and Other Fees. Merchant, cardmember and other fees include revenues from fees charged to merchants on credit card sales (net of interchange fees paid to banks that issue cards on the Company’s merchant and cash access network), transaction fees on debit card transactions as well as charges to cardmembers for late payment fees, overlimit fees, balance transfer fees, credit protection fees and cash advance fees, net of cardmember rewards. Merchant, cardmember and other fees are recognized as earned. Cardmember rewards include various reward programs, including the Cashback Bonus® award program, pursuant to which the Company pays certain cardmembers a percentage of their purchase amounts based upon a cardmember’s level and type of purchases. The liability for cardmember rewards, included in Other liabilities and accrued expenses, is accrued at the time that qualified cardmember transactions occur and is calculated on an individual cardmember basis. In determining the liability for cardmember rewards, the Company considers estimated forfeitures based on historical account closure, charge-off and transaction activity. The Company records its cardmember reward programs as a reduction of Merchant, cardmember and other fees.
Consumer Loans. Consumer loans, which consist primarily of general purpose credit card, mortgage and consumer installment loans, are reported at their principal amounts outstanding less applicable allowances.
7
MORGAN STANLEY
NOTES TO CONDENSED CONSOLIDATED FINANCIAL STATEMENTS—(Continued)
Interest on consumer loans is recorded to income as earned. Interest is accrued on credit card loans until the date of charge-off, which generally occurs at the end of the month during which an account becomes 180 days past due, except in the case of bankruptcies, deceased cardmembers and fraudulent transactions, where loans are charged off earlier. The interest portion of charged-off credit card loans is written off against interest revenue. Origination costs related to the issuance of credit cards are charged to earnings over periods not exceeding 12 months.
Financial Instruments Used for Trading and Investment. Financial instruments owned and Financial instruments sold, not yet purchased, which include cash and derivative products, are recorded at fair value in the condensed consolidated statements of financial condition, and gains and losses are reflected in principal trading revenues in the condensed consolidated statements of income. Loans and lending commitments associated with the Company’s lending activities also are recorded at fair value. Fair value is the amount at which financial instruments could be exchanged in a current transaction between willing parties, other than in a forced or liquidation sale.
The fair value of the Company’s Financial instruments owned and Financial instruments sold, not yet purchased are generally based on observable market prices, observable market parameters or derived from such prices or parameters based on bid prices or parameters for Financial instruments owned and ask prices or parameters for Financial instruments sold, not yet purchased. In the case of financial instruments transacted on recognized exchanges the observable prices represent quotations for completed transactions from the exchange on which the financial instrument is principally traded. Bid prices represent the highest price a buyer is willing to pay for a financial instrument at a particular time. Ask prices represent the lowest price a seller is willing to accept for a financial instrument at a particular time.
A substantial percentage of the fair value of the Company’s Financial instruments owned and Financial instruments sold, not yet purchased is based on observable market prices, observable market parameters, or is derived from such prices or parameters. The availability of observable market prices and pricing parameters can vary from product to product. Where available, observable market prices and pricing parameters in a product (or a related product) may be used to derive a price without requiring significant judgment. In certain markets, observable market prices or market parameters are not available for all products, and fair value is determined using techniques appropriate for each particular product. These techniques involve some degree of judgment. The price transparency of the particular product will determine the degree of judgment involved in determining the fair value of the Company’s financial instruments. Price transparency is affected by a wide variety of factors, including, for example, the type of product, whether it is a new product and not yet established in the marketplace, and the characteristics particular to the transaction. Products for which actively quoted prices or pricing parameters are available or for which fair value is derived from actively quoted prices or pricing parameters will generally have a higher degree of price transparency. By contrast, products that are thinly traded or not quoted will generally have reduced to no price transparency.
The fair value of over-the-counter (“OTC”) derivative contracts is derived primarily using pricing models, which may require multiple market input parameters. Where appropriate, valuation adjustments are made to account for credit quality and market liquidity. These adjustments are applied on a consistent basis and are based upon observable market data where available. In the absence of observable market prices or parameters in an active market, observable prices or parameters of other comparable current market transactions, or other observable data supporting a fair value based on a pricing model at the inception of a contract, fair value is based on the transaction price. The Company also uses pricing models to manage the risks introduced by OTC derivatives. Depending on the product and the terms of the transaction, the fair value of OTC derivative products can be modeled using a series of techniques, including closed form analytic formulae, such as the Black-Scholes option pricing model, simulation models or a combination thereof, applied consistently. In the case of more established
8
MORGAN STANLEY
NOTES TO CONDENSED CONSOLIDATED FINANCIAL STATEMENTS—(Continued)
derivative products, the pricing models used by the Company are widely accepted by the financial services industry. Pricing models take into account the contract terms, including the maturity, as well as market parameters such as interest rates, volatility and the creditworthiness of the counterparty.
Interest and dividend revenue and interest expense arising from financial instruments used in trading activities are reflected in the condensed consolidated statements of income as interest and dividend revenue or interest expense. Purchases and sales of financial instruments and related expenses are recorded in the accounts on trade date. Unrealized gains and losses arising from the Company’s dealings in OTC financial instruments, including derivative contracts related to financial instruments and commodities, are presented in the accompanying condensed consolidated statements of financial condition on a net-by-counterparty basis, when appropriate.
Effective December 1, 2004, the Company elected, under FASB Interpretation No. 39, “Offsetting of Amounts Related to Certain Contracts,” to net cash collateral paid or received against its derivatives inventory under credit support annexes, which the Company views as conditional contracts, to legally enforceable master netting agreements. The Company believes the accounting treatment is preferable as compared to a gross basis as it is a better representation of its credit exposure and how it manages its credit risk related to these derivative contracts. Amounts as of November 30, 2004 have been reclassified to conform to the current presentation.
Equity securities purchased in connection with private equity and other principal investment activities initially are carried in the condensed consolidated financial statements at their original costs, which approximate fair value. The carrying value of such equity securities is adjusted when changes in the underlying fair values are readily ascertainable, generally as evidenced by observable market prices or transactions that directly affect the value of such equity securities. Downward adjustments relating to such equity securities are made in the event that the Company determines that the fair value is less than the carrying value. The Company’s partnership interests, including general partnership and limited partnership interests in real estate funds, are included within Other assets in the condensed consolidated statements of financial condition and are recorded at fair value based upon changes in the fair value of the underlying partnership’s net assets.
Financial Instruments Used for Asset and Liability Management. The Company enters into various derivative financial instruments for non-trading purposes. These instruments are included within Financial instruments owned—derivative contracts or Financial instruments sold, not yet purchased—derivative contracts within the condensed consolidated statements of financial condition and include interest rate swaps, foreign currency swaps, equity swaps and foreign exchange forwards. The Company uses interest rate and currency swaps and equity derivatives to manage interest rate, currency and equity price risk arising from certain liabilities. The Company also utilizes interest rate swaps to match the repricing characteristics of consumer loans with those of the borrowings that fund these loans. Certain of these derivative financial instruments are designated and qualify as fair value hedges and cash flow hedges in accordance with SFAS No. 133, “Accounting for Derivative Instruments and Hedging Activities,” as amended.
The Company’s designated fair value hedges consist primarily of hedges of fixed rate borrowings, including fixed rate borrowings that fund consumer loans. The Company’s designated cash flow hedges consist primarily of hedges of floating rate borrowings in connection with its aircraft financing business. In general, interest rate exposure in this business arises to the extent that the interest obligations associated with debt used to finance the Company’s aircraft portfolio do not correlate with the aircraft rental payments received by the Company. The Company’s objective is to manage the exposure created by its floating interest rate obligations given that future lease rates on new leases may not be repriced at levels that fully reflect changes in market interest rates. The Company utilizes interest rate swaps to minimize the risk created by its longer-term floating rate interest obligations and measures that risk by reference to the duration of those obligations and the expected sensitivity of future lease rates to future market interest rates.
9
MORGAN STANLEY
NOTES TO CONDENSED CONSOLIDATED FINANCIAL STATEMENTS—(Continued)
For qualifying fair value hedges, the changes in the fair value of the derivative and the gain or loss on the hedged asset or liability relating to the risk being hedged are recorded currently in earnings. These amounts are recorded in interest expense and provide offset of one another. For qualifying cash flow hedges, the changes in the fair value of the derivative are recorded in Accumulated other comprehensive income (loss) in Shareholders’ equity, net of tax effects, and amounts in Accumulated other comprehensive income (loss) are reclassified into earnings in the same period or periods during which the hedged transaction affects earnings. Ineffectiveness relating to fair value and cash flow hedges, if any, is recorded within interest expense. The impact of hedge ineffectiveness on the condensed consolidated statements of income was not material for all periods presented.
The Company also utilizes foreign exchange forward contracts to manage the currency exposure relating to its net monetary investments in non-U.S. dollar functional currency operations. The gain or loss from revaluing these contracts is deferred and reported within Accumulated other comprehensive income (loss) in Shareholders’ equity, net of tax effects, with the related unrealized amounts due from or to counterparties included in Financial instruments owned or Financial instruments sold, not yet purchased. The interest elements (forward points) on these foreign exchange forward contracts are recorded in earnings.
Securitization Activities. The Company engages in securitization activities related to commercial and residential mortgage loans, corporate bonds and loans, U.S. agency collateralized mortgage obligations, municipal bonds, credit card loans and other types of financial assets (see Notes 3 and 4). The Company may retain interests in the securitized financial assets as one or more tranches of the securitization, undivided seller’s interests, accrued interest receivable subordinate to investors’ interests (see Note 4), cash collateral accounts, servicing rights, rights to any excess cash flows remaining after payments to investors in the securitization trusts of their contractual rate of return and reimbursement of credit losses, and other retained interests. The exposure to credit losses from securitized loans is limited to the Company’s retained contingent risk, which represents the Company’s retained interest in securitized loans, including any credit enhancement provided. The gain or loss on the sale of financial assets depends in part on the previous carrying amount of the assets involved in the transfer, and each subsequent transfer in revolving structures, allocated between the assets sold and the retained interests based upon their respective fair values at the date of sale. To obtain fair values, observable market prices are used if available. However, observable market prices are generally not available for retained interests, so the Company estimates fair value based on the present value of expected future cash flows using its best estimates of the key assumptions, including forecasted credit losses, payment rates, forward yield curves and discount rates commensurate with the risks involved. The present value of future net servicing revenues that the Company estimates it will receive over the term of the securitized loans is recognized in income as the loans are securitized. A corresponding asset also is recorded and then amortized as a charge to income over the term of the securitized loans, with actual net servicing revenues continuing to be recognized in income as they are earned.
Aircraft under Operating Leases. Revenue from aircraft under operating leases is recognized on a straight-line basis over the lease term. Certain lease contracts may require the lessee to make separate payments for flight hours and passenger miles flown. In such instances, the Company recognizes these other revenues as they are earned in accordance with the terms of the applicable lease contract.
Aircraft under operating leases that are to be held and used are stated at cost less accumulated depreciation and impairment charges. Depreciation is calculated on a straight-line basis over the estimated useful life of the aircraft asset, which is generally 25 years from the date of manufacture. In accordance with SFAS No. 144, the Company’s aircraft that are to be held and used are reviewed for impairment whenever events or changes in circumstances indicate that the carrying value of the aircraft may not be recoverable (see Note 16).
Aircraft under operating leases that fulfill the criteria to be classified as held for sale in accordance with SFAS No. 144 are stated at the lower of carrying value (i.e., cost less accumulated depreciation and impairment
10
MORGAN STANLEY
NOTES TO CONDENSED CONSOLIDATED FINANCIAL STATEMENTS—(Continued)
charges) or fair value less estimated cost to sell. After an aircraft is designated as held for sale, no further depreciation expense is recorded. The Company recognizes a charge for any initial or subsequent write-down to fair value less estimated cost to sell (see Note 16). A gain is recognized for any subsequent increase in fair value less cost to sell but not in excess of the cumulative loss previously recognized (for a write-down to fair value less cost to sell). A gain or loss not previously recognized that results from the sale of an aircraft is recognized at the date of sale.
Stock-Based Compensation. Effective December 1, 2002, the Company adopted the fair value recognition provisions of SFAS No. 123, “Accounting for Stock-Based Compensation,” as amended by SFAS No. 148, “Accounting for Stock-Based Compensation—Transition and Disclosure, an amendment of FASB Statement No. 123,” using the prospective adoption method for both deferred stock and stock options. Effective December 1, 2004, the Company early adopted SFAS No. 123R, which revised the fair value based method of accounting for share-based payment liabilities, forfeitures and modifications of stock-based awards and clarified SFAS No. 123’s guidance in several areas, including measuring fair value, classifying an award as equity or as a liability and attributing compensation cost to service periods. SFAS No. 123R also amended SFAS No. 95, “Statement of Cash Flows,” to require that excess tax benefits be reported as financing cash inflows rather than as a reduction of taxes paid, which is included within operating cash flows.
Upon adoption of SFAS 123R using the modified prospective approach, the Company recognized an $80 million gain ($49 million after-tax) as a cumulative effect of a change in accounting principle in the first quarter of fiscal 2005 resulting from the requirement to estimate forfeitures at the date of grant instead of recognizing them as incurred. The cumulative effect gain increased both basic and diluted earnings per share by $0.05. In addition, effective December 1, 2004, excess tax benefits associated with stock-based compensation awards are included within cash flows from financing activities in the condensed consolidated statements of cash flows.
In addition, based upon the terms of the Company’s equity-based compensation program, the Company will no longer be able to recognize a portion of the award in the year of grant under SFAS No. 123R as previously allowed under SFAS 123. As a result, fiscal 2005 compensation expense includes the amortization of fiscal 2003 and fiscal 2004 awards but does not include any amortization for fiscal 2005 year-end awards. This will have the effect of reducing compensation expense in fiscal 2005. If SFAS No. 123R were not in effect, fiscal 2005’s compensation expense would have included three years of amortization (i.e., for awards granted in fiscal 2003, fiscal 2004 and fiscal 2005). In addition, the fiscal 2005 year-end awards, which will begin to be amortized in fiscal 2006, will be amortized over a shorter period (primarily 2 and 3 years) as compared with awards granted in fiscal 2004 and fiscal 2003 (primarily 3 and 4 years).
| 2. | Goodwill and Intangible Assets. |
During the first quarter of fiscal 2005, the Company completed the annual goodwill impairment test that is required by SFAS No. 142, “Goodwill and Other Intangible Assets.” The Company’s testing did not indicate any goodwill impairment.
11
MORGAN STANLEY
NOTES TO CONDENSED CONSOLIDATED FINANCIAL STATEMENTS—(Continued)
Changes in the carrying amount of the Company’s goodwill and intangible assets for the six month period ended May 31, 2005 were as follows:
| | | | | | | | | | | | | | | | | | | |
| | | Institutional Securities
| | | Individual Investor Group
| | | Investment Management
| | Credit Services(1)
| | | Total
| |
| | | (dollars in millions) | |
Goodwill: | | | | | | | | | | | | | | | | | | | |
Balance as of November 30, 2004 | | $ | 319 | | | $ | 583 | | | $ | 966 | | $ | — | | | $ | 1,868 | |
Translation adjustments | | | — | | | | (25 | ) | | | — | | | — | | | | (25 | ) |
Goodwill acquired during the year and other(2) | | | 125 | | | | — | | | | — | | | 230 | | | | 355 | |
| | |
|
|
| |
|
|
| |
|
| |
|
|
| |
|
|
|
Balance as of May 31, 2005 | | $ | 444 | | | $ | 558 | | | $ | 966 | | $ | 230 | | | $ | 2,198 | |
| | |
|
|
| |
|
|
| |
|
| |
|
|
| |
|
|
|
Intangible assets: | | | | | | | | | | | | | | | | | | | |
Balance as of November 30, 2004 | | $ | 331 | | | $ | — | | | $ | — | | $ | — | | | $ | 331 | |
Intangible assets sold(3) | | | (75 | ) | | | — | | | | — | | | — | | | | (75 | ) |
Intangible assets acquired | | | — | | | | — | | | | — | | | 91 | | | | 91 | |
Amortization expense | | | (15 | ) | | | — | | | | — | | | (2 | ) | | | (17 | ) |
| | |
|
|
| |
|
|
| |
|
| |
|
|
| |
|
|
|
Balance as of May 31, 2005 | | $ | 241 | | | $ | — | | | $ | — | | $ | 89 | | | $ | 330 | |
| | |
|
|
| |
|
|
| |
|
| |
|
|
| |
|
|
|
| (1) | Represents goodwill and intangible assets acquired in connection with the Company’s acquisition of PULSE (see Note 18). |
| (2) | Institutional Securities activity includes adjustments to goodwill related to the sale of the Company’s interest in POSIT (see Note 18) and for the recognition of deferred tax liabilities in connection with the Company’s acquisition of Barra, Inc. |
| (3) | Related to the sale of the Company’s interest in POSIT (see Note 18). |
| 3. | Securities Financing and Securitization Transactions. |
Securities purchased under agreements to resell (“reverse repurchase agreements”) and Securities sold under agreements to repurchase (“repurchase agreements”), principally government and agency securities, are treated as financing transactions and are carried at the amounts at which the securities subsequently will be resold or reacquired as specified in the respective agreements; such amounts include accrued interest. Reverse repurchase agreements and repurchase agreements are presented on a net-by-counterparty basis, when appropriate. The Company’s policy is to take possession of securities purchased under agreements to resell. Securities borrowed and Securities loaned also are treated as financing transactions and are carried at the amounts of cash collateral advanced and received in connection with the transactions. Other secured borrowings include the liabilities related to transfers of financial assets that are accounted for as financings rather than sales, consolidated variable interest entities where the Company is the primary beneficiary and certain equity-referenced securities where in all instances these liabilities are payable solely from the cash flows of the related assets accounted for as Financial instruments owned.
12
MORGAN STANLEY
NOTES TO CONDENSED CONSOLIDATED FINANCIAL STATEMENTS—(Continued)
The Company pledges its financial instruments owned to collateralize repurchase agreements and other securities financings. Pledged securities that can be sold or repledged by the secured party are identified as Financial instruments owned (pledged to various parties) on the condensed consolidated statements of financial condition. The carrying value and classification of securities owned by the Company that have been loaned or pledged to counterparties where those counterparties do not have the right to sell or repledge the collateral were as follows:
| | | | | | |
| | | At
May 31,
2005
| | At
November 30,
2004
|
| | | (dollars in millions) |
Financial instruments owned: | | | | | | |
U.S. government and agency securities | | $ | 13,031 | | $ | 6,283 |
Other sovereign government obligations | | | 228 | | | 249 |
Corporate and other debt | | | 18,507 | | | 15,564 |
Corporate equities | | | 4,961 | | | 2,754 |
| | |
|
| |
|
|
Total | | $ | 36,727 | | $ | 24,850 |
| | |
|
| |
|
|
The Company enters into reverse repurchase agreements, repurchase agreements, securities borrowed and securities loaned transactions to, among other things, finance the Company’s inventory positions, acquire securities to cover short positions and settle other securities obligations and to accommodate customers’ needs. The Company also engages in securities financing transactions for customers through margin lending. Under these agreements and transactions, the Company either receives or provides collateral, including U.S. government and agency securities, other sovereign government obligations, corporate and other debt, and corporate equities. The Company receives collateral in the form of securities in connection with reverse repurchase agreements, securities borrowed transactions and customer margin loans. In many cases, the Company is permitted to sell or repledge these securities held as collateral and use the securities to secure repurchase agreements, to enter into securities lending transactions or for delivery to counterparties to cover short positions. At May 31, 2005 and November 30, 2004, the fair value of securities received as collateral where the Company is permitted to sell or repledge the securities was $795 billion and $750 billion, respectively, and the fair value of the portion that has been sold or repledged was $739 billion and $679 billion, respectively.
The Company manages credit exposure arising from reverse repurchase agreements, repurchase agreements, securities borrowed and securities loaned transactions by, in appropriate circumstances, entering into master netting agreements and collateral arrangements with counterparties that provide the Company, in the event of a customer default, the right to liquidate collateral and the right to offset a counterparty’s rights and obligations. The Company also monitors the fair value of the underlying securities as compared with the related receivable or payable, including accrued interest, and, as necessary, requests additional collateral to ensure such transactions are adequately collateralized. Where deemed appropriate, the Company’s agreements with third parties specify its rights to request additional collateral. Customer receivables generated from margin lending activity are collateralized by customer-owned securities held by the Company. For these transactions, adherence to the Company’s collateral policies significantly limits the Company’s credit exposure in the event of customer default. The Company may request additional margin collateral from customers, if appropriate, and if necessary may sell securities that have not been paid for or purchase securities sold but not delivered from customers.
In connection with its Institutional Securities business, the Company engages in securitization activities related to residential and commercial mortgage loans, U.S. agency collateralized mortgage obligations, corporate bonds and loans, municipal bonds and other types of financial assets. These assets are carried at fair value, and any changes in fair value are recognized in the condensed consolidated statements of income. The Company may act
13
MORGAN STANLEY
NOTES TO CONDENSED CONSOLIDATED FINANCIAL STATEMENTS—(Continued)
as underwriter of the beneficial interests issued by securitization vehicles. Underwriting net revenues are recognized in connection with these transactions. The Company may retain interests in the securitized financial assets as one or more tranches of the securitization. These retained interests are included in the condensed consolidated statements of financial condition at fair value. Any changes in the fair value of such retained interests are recognized in the condensed consolidated statements of income. Retained interests in securitized financial assets associated with the Institutional Securities business were approximately $3.4 billion at May 31, 2005, the majority of which were related to residential mortgage loan, U.S. agency collateralized mortgage obligation and commercial mortgage loan securitization transactions. Net gains at the time of securitization were not material in the six month period ended May 31, 2005. The assumptions that the Company used to determine the fair value of its retained interests at the time of securitization related to those transactions that occurred during the quarter and six month period ended May 31, 2005 were not materially different from the assumptions included in the table below. Additionally, as indicated in the table below, the Company’s exposure to credit losses related to these retained interests at May 31, 2005 was not material to the Company’s results of operations.
The following table presents information on the Company’s residential mortgage loan, U.S. agency collateralized mortgage obligation and commercial mortgage loan securitization transactions. Key economic assumptions and the sensitivity of the current fair value of the retained interests to immediate 10% and 20% adverse changes in those assumptions at May 31, 2005 were as follows (dollars in millions):
| | | | | | | | | |
| | | Residential
Mortgage
Loans
| | | U.S. Agency
Collateralized
Mortgage
Obligations
| | | Commercial
Mortgage
Loans
| |
Retained interests (carrying amount/fair value) | | $1,666 | | | $1,387 | | | $ 152 | |
Weighted average life (in months) | | 34 | | | 92 | | | 71 | |
Credit losses (rate per annum)(1) | | 0.00-3.75 | % | | — | | | 0.00-2.00 | % |
Impact on fair value of 10% adverse change | | $ (70 | ) | | $ — | | | $ — | |
Impact on fair value of 20% adverse change | | $ (135 | ) | | $ — | | | $ — | |
Weighted average discount rate (rate per annum) | | 8.92 | % | | 5.25 | % | | 6.34 | % |
Impact on fair value of 10% adverse change | | $ (21 | ) | | $ (40 | ) | | $ (4 | ) |
Impact on fair value of 20% adverse change | | $ (42 | ) | | $ (77 | ) | | $ (8 | ) |
Prepayment speed assumption(2)(3) | | 269-1375 | PSA | | 154-513 | PSA | | — | |
Impact on fair value of 10% adverse change | | $ (39 | ) | | $ (3 | ) | | $ — | |
Impact on fair value of 20% adverse change | | $ (46 | ) | | $ (7 | ) | | $ — | |
| (1) | Commercial mortgage loans credit losses round to less than $1 million. |
| (2) | Amounts for residential mortgage loans exclude positive valuation effects from immediate 10% and 20% changes. |
| (3) | Commercial mortgage loans typically contain provisions that either prohibit or economically penalize the borrower from prepaying the loan for a specified period of time. |
The table above does not include the offsetting benefit of any financial instruments that the Company may utilize to hedge risks inherent in its retained interests. In addition, the sensitivity analysis is hypothetical and should be used with caution. Changes in fair value based on a 10% or 20% variation in an assumption generally cannot be extrapolated because the relationship of the change in the assumption to the change in fair value may not be linear. Also, the effect of a variation in a particular assumption on the fair value of the retained interests is calculated independent of changes in any other assumption; in practice, changes in one factor may result in changes in another, which might magnify or counteract the sensitivities. In addition, the sensitivity analysis does not consider any corrective action that the Company may take to mitigate the impact of any adverse changes in the key assumptions.
14
MORGAN STANLEY
NOTES TO CONDENSED CONSOLIDATED FINANCIAL STATEMENTS—(Continued)
In connection with its Institutional Securities business, during the six month periods ended May 31, 2005 and 2004, the Company received proceeds from new securitization transactions of $35 billion and $32 billion, respectively, and cash flows from retained interests in securitization transactions of $3.7 billion and $2.2 billion, respectively.
Consumer loans were as follows:
| | | | | | |
| | | At
May 31,
2005
| | At
November 30,
2004
|
| | | (dollars in millions) |
General purpose credit card, mortgage and consumer installment | | $ | 20,581 | | $ | 21,169 |
Less: | | | | | | |
Allowance for consumer loan losses | | | 840 | | | 943 |
| | |
|
| |
|
|
Consumer loans, net | | $ | 19,741 | | $ | 20,226 |
| | |
|
| |
|
|
Activity in the allowance for consumer loan losses was as follows:
| | | | | | | | | | | | | | | | |
| | | Three Months
Ended
May 31,
| | | Six Months
Ended
May 31,
| |
| | | 2005
| | | 2004
| | | 2005
| | | 2004
| |
| | | (dollars in millions) | |
Balance at beginning of period | | $ | 854 | | | $ | 1,004 | | | | 943 | | | $ | 1,002 | |
Additions: | | | | | | | | | | | | | | | | |
Provision for consumer loan losses | | | 209 | | | | 200 | | | | 344 | | | | 462 | |
Deductions: | | | | | | | | | | | | | | | | |
Charge-offs | | | 261 | | | | 280 | | | | 521 | | | | 571 | |
Recoveries | | | (38 | ) | | | (32 | ) | | | (74 | ) | | | (63 | ) |
| | |
|
|
| |
|
|
| |
|
|
| |
|
|
|
Net charge-offs | | | 223 | | | | 248 | | | | 447 | | | | 508 | |
| | |
|
|
| |
|
|
| |
|
|
| |
|
|
|
Balance at end of period | | $ | 840 | | | $ | 956 | | | $ | 840 | | | $ | 956 | |
| | |
|
|
| |
|
|
| |
|
|
| |
|
|
|
Information on net charge-offs of interest and cardmember fees was as follows:
| | | | | | | | | | | | |
| | | Three Months
Ended
May 31,
| | Six Months
Ended
May 31,
|
| | | 2005
| | 2004
| | 2005
| | 2004
|
| | | (dollars in millions) |
Interest accrued on general purpose credit card loans subsequently charged off, net of recoveries (recorded as a reduction of Interest revenue) | | $ | 50 | | $ | 64 | | $ | 106 | | $ | 123 |
| | |
|
| |
|
| |
|
| |
|
|
Cardmember fees accrued on general purpose credit card loans subsequently charged off, net of recoveries (recorded as a reduction to Merchant, cardmember and other fee revenue) | | $ | 27 | | $ | 38 | | $ | 60 | | $ | 78 |
| | |
|
| |
|
| |
|
| |
|
|
At May 31, 2005, the Company had commitments to extend credit for consumer loans of approximately $260 billion. Such commitments arise primarily from agreements with customers for unused lines of credit on certain
15
MORGAN STANLEY
NOTES TO CONDENSED CONSOLIDATED FINANCIAL STATEMENTS—(Continued)
credit cards, provided there is no violation of conditions established in the related agreement. These commitments, substantially all of which the Company can terminate at any time and which do not necessarily represent future cash requirements, are periodically reviewed based on account usage and customer creditworthiness.
The Company received net proceeds from consumer loan sales of $262 million and $4,954 million in the quarter and six month period ended May 31, 2005 and $1,239 million and $4,435 million in the quarter and six month period ended May 31, 2004.
Credit Card Securitization Activities. The Company’s retained interests in credit card asset securitizations include undivided seller’s interests, accrued interest receivable on securitized credit card receivables, cash collateral accounts, servicing rights, rights to any excess cash flows (“Residual Interests”) remaining after payments to investors in the securitization trusts of their contractual rate of return and reimbursement of credit losses, and other retained interests. The undivided seller’s interests less an applicable allowance for loan losses is recorded in Consumer loans. The Company’s undivided seller’s interests rankpari passuwith investors’ interests in the securitization trusts, and the remaining retained interests are subordinate to investors’ interests. Accrued interest receivable, cash collateral accounts and other subordinated retained interests are recorded in Other assets at amounts that approximate fair value. The Company receives annual servicing fees of 2% of the investor principal balance outstanding. The Company does not recognize servicing assets or servicing liabilities for servicing rights since the servicing contracts provide only adequate compensation (as defined in SFAS No. 140, “Accounting for Transfers and Servicing of Financial Assets and Extinguishments of Liabilities”) to the Company for performing the servicing. Residual Interests are recorded in Other assets and reflected at fair value with changes in fair value recorded currently in earnings. At May 31, 2005, the Company had $10.2 billion of retained interests, including $6.8 billion of undivided seller’s interests, in credit card asset securitizations. The retained interests are subject to credit, payment and interest rate risks on the transferred credit card assets. The investors and the securitization trusts have no recourse to the Company’s other assets for failure of cardmembers to pay when due.
During the six month periods ended May 31, 2005 and 2004, the Company completed credit card asset securitizations of $3.4 billion and $1.9 billion, respectively, and recognized net securitization gains of $16 million and $7 million, respectively, as servicing fees in the condensed consolidated statements of income. The uncollected balances of securitized general purpose credit card loans were $27.5 billion and $28.5 billion at May 31, 2005 and November 30, 2004, respectively.
Key economic assumptions used in measuring the Residual Interests at the date of securitization resulting from credit card asset securitizations completed during the six month periods ended May 31, 2005 and 2004 were as follows:
| | | | | | |
| | | Six Months
Ended
May 31,
| |
| | | 2005
| | | 2004
| |
Weighted average life (in months) | | 5.9 | | | 6.1 | |
Payment rate (rate per month) | | 18.52 | % | | 18.00 | % |
Credit losses (rate per annum) | | 6.00 | % | | 6.90 | % |
Discount rate (rate per annum) | | 12.00 | % | | 14.00 | % |
16
MORGAN STANLEY
NOTES TO CONDENSED CONSOLIDATED FINANCIAL STATEMENTS—(Continued)
Key economic assumptions and the sensitivity of the current fair value of the Residual Interests to immediate 10% and 20% adverse changes in those assumptions were as follows (dollars in millions):
| | | | |
| | | At
May 31,
2005
| |
Residual Interests (carrying amount/fair value) | | $ | 265 | |
Weighted average life (in months) | | | 5.2 | |
Weighted average payment rate (rate per month) | | | 19.86 | % |
Impact on fair value of 10% adverse change | | $ | (18 | ) |
Impact on fair value of 20% adverse change | | $ | (34 | ) |
Weighted average credit losses (rate per annum) | | | 5.68 | % |
Impact on fair value of 10% adverse change | | $ | (56 | ) |
Impact on fair value of 20% adverse change | | $ | (111 | ) |
Weighted average discount rate (rate per annum) | | | 11.00 | % |
Impact on fair value of 10% adverse change | | $ | (2 | ) |
Impact on fair value of 20% adverse change | | $ | (4 | ) |
The sensitivity analysis in the table above is hypothetical and should be used with caution. Changes in fair value based on a 10% or 20% variation in an assumption generally cannot be extrapolated because the relationship of the change in the assumption to the change in fair value may not be linear. Also, the effect of a variation in a particular assumption on the fair value of the Residual Interests is calculated independent of changes in any other assumption; in practice, changes in one factor may result in changes in another (for example, increases in market interest rates may result in lower payments and increased credit losses), which might magnify or counteract the sensitivities. In addition, the sensitivity analysis does not consider any corrective action that the Company may take to mitigate the impact of any adverse changes in the key assumptions.
The table below summarizes certain cash flows received from the securitization master trusts (dollars in billions):
| | | | | | |
| | | Six Months
Ended
May 31,
|
| | | 2005
| | 2004
|
Proceeds from new credit card asset securitizations | | $ | 3.4 | | $ | 1.9 |
Proceeds from collections reinvested in previous credit card asset securitizations | | $ | 29.1 | | $ | 31.7 |
Contractual servicing fees received | | $ | 0.3 | | $ | 0.3 |
Cash flows received from retained interests | | $ | 1.0 | | $ | 0.9 |
The table below presents quantitative information about delinquencies, net principal credit losses and components of managed general purpose credit card loans, including securitized loans (dollars in millions):
| | | | | | | | | | | | |
| | | At May 31, 2005
| | Six Months Ended
May 31, 2005
|
| | | Loans
Outstanding
| | Loans
Delinquent
| | Average
Loans
| | Net
Principal Credit
Losses
|
Managed general purpose credit card loans | | $ | 46,845 | | $ | 1,826 | | $ | 48,028 | | $ | 1,207 |
Less: Securitized general purpose credit card loans | | | 27,460 | | | | | | | | | |
| | |
|
| | | | | | | | | |
Owned general purpose credit card loans | | $ | 19,385 | | | | | | | | | |
| | |
|
| | | | | | | | | |
17
MORGAN STANLEY
NOTES TO CONDENSED CONSOLIDATED FINANCIAL STATEMENTS—(Continued)
Long-term borrowings at May 31, 2005 scheduled to mature within one year aggregated $17,375 million.
During the six month period ended May 31, 2005, the Company issued senior notes aggregating $15,642 million, including non-U.S. dollar currency notes aggregating $4,102 million. The Company has entered into certain transactions to obtain floating interest rates based primarily on short-term London Interbank Offered Rates trading levels. Maturities in the aggregate of these notes by fiscal year are as follows: 2005, $8 million; 2006, $2,647 million; 2007, $1,609 million; 2008, $4,276 million; 2009, $36 million; and thereafter, $7,066 million. In the six month period ended May 31, 2005, $6,788 million of senior notes were repaid.
The weighted average maturity of the Company’s long-term borrowings, based upon stated maturity dates, was approximately 5 years at May 31, 2005.
The Company has Capital Units outstanding that were issued by the Company and Morgan Stanley Finance plc (“MSF”), a U.K. subsidiary. A Capital Unit consists of (a) a Subordinated Debenture of MSF guaranteed by the Company and maturing in 2017 and (b) a related Purchase Contract issued by the Company, which may be accelerated by the Company, requiring the holder to purchase one Depositary Share representing shares of the Company’s Cumulative Preferred Stock. The aggregate amount of Capital Units outstanding was $66 million at both May 31, 2005 and November 30, 2004.
| 7. | Common Stock and Shareholders’ Equity. |
Regulatory Requirements. MS&Co. and MSDWI are registered broker-dealers and registered futures commission merchants and, accordingly, are subject to the minimum net capital requirements of the SEC, the NYSE and the Commodity Futures Trading Commission. MS&Co. and MSDWI have consistently operated in excess of these requirements. MS&Co.’s net capital totaled $3,689 million at May 31, 2005, which exceeded the amount required by $2,973 million. MSDWI’s net capital totaled $1,326 million at May 31, 2005, which exceeded the amount required by $1,236 million. MSIL, a London-based broker-dealer subsidiary, is subject to the capital requirements of the Financial Services Authority, and MSJL, a Tokyo-based broker-dealer subsidiary, is subject to the capital requirements of the Financial Services Agency. MSIL and MSJL have consistently operated in excess of their respective regulatory capital requirements.
Under regulatory capital requirements adopted by the Federal Deposit Insurance Corporation (the “FDIC”) and other bank regulatory agencies, FDIC-insured financial institutions must maintain (a) 3% to 5% of Tier 1 capital, as defined, to average assets (“leverage ratio”), (b) 4% of Tier 1 capital, as defined, to risk-weighted assets (“Tier 1 risk-weighted capital ratio”) and (c) 8% of total capital, as defined, to risk-weighted assets (“total risk-weighted capital ratio”). At May 31, 2005, the leverage ratio, Tier 1 risk-weighted capital ratio and total risk-weighted capital ratio of each of the Company’s FDIC-insured financial institutions exceeded these regulatory minimums.
Certain other U.S. and non-U.S. subsidiaries are subject to various securities, commodities and banking regulations, and capital adequacy requirements promulgated by the regulatory and exchange authorities of the countries in which they operate. These subsidiaries have consistently operated in excess of their local capital adequacy requirements. Morgan Stanley Derivative Products Inc., the Company’s triple-A rated derivative products subsidiary, maintains certain operating restrictions that have been reviewed by various rating agencies.
Treasury Shares. During the six month period ended May 31, 2005, the Company purchased approximately $2,276 million of its common stock through a combination of open market purchases and purchases from
18
MORGAN STANLEY
NOTES TO CONDENSED CONSOLIDATED FINANCIAL STATEMENTS—(Continued)
employees at an average cost of $55.13 per share. During the six month period ended May 31, 2004, the Company purchased approximately $187 million of its common stock through open market purchases at an average cost of $54.04 per share.
Basic EPS is computed by dividing income available to common shareholders by the weighted average number of common shares outstanding for the period. Diluted EPS reflects the assumed conversion of all dilutive securities. The following table presents the calculation of basic and diluted EPS (in millions, except for per share data):
| | | | | | | | | | | | | |
| | | Three Months
Ended
May 31,
| | | Six Months
Ended
May 31,
|
| | | 2005
| | 2004
| | | 2005
| | 2004
|
Basic EPS: | | | | | | | | | | | | | |
Income from continuing operations before cumulative effect of accounting change, net | | $ | 928 | | $ | 1,224 | | | $ | 2,273 | | $ | 2,448 |
Income/ (loss) on discontinued operations | | | — | | | (1 | ) | | | 8 | | | 1 |
Cumulative effect of accounting change, net | | | — | | | — | | | | 49 | | | — |
| | |
|
| |
|
|
| |
|
| |
|
|
Net income applicable to common shareholders | | $ | 928 | | $ | 1,223 | | | $ | 2,330 | | $ | 2,449 |
| | |
|
| |
|
|
| |
|
| |
|
|
Weighted average common shares outstanding | | | 1,054 | | | 1,082 | | | | 1,062 | | | 1,081 |
| | |
|
| |
|
|
| |
|
| |
|
|
Basic earnings per common share: | | | | | | | | | | | | | |
Income from continuing operations before cumulative effect of accounting change, net | | $ | 0.88 | | $ | 1.13 | | | $ | 2.14 | | $ | 2.27 |
Income on discontinued operations | | | — | | | — | | | | 0.01 | | | — |
Cumulative effect of accounting change, net | | | — | | | — | | | | 0.05 | | | — |
| | |
|
| |
|
|
| |
|
| |
|
|
Basic EPS | | $ | 0.88 | | $ | 1.13 | | | $ | 2.20 | | $ | 2.27 |
| | |
|
| |
|
|
| |
|
| |
|
|
Diluted EPS: | | | | | | | | | | | | | |
Net income applicable to common shareholders | | $ | 928 | | $ | 1,223 | | | $ | 2,330 | | $ | 2,449 |
| | |
|
| |
|
|
| |
|
| |
|
|
Weighted average common shares outstanding | | | 1,054 | | | 1,082 | | | | 1,062 | | | 1,081 |
Effect of dilutive securities: | | | | | | | | | | | | | |
Stock options | | | 26 | | | 28 | | | | 23 | | | 27 |
| | |
|
| |
|
|
| |
|
| |
|
|
Weighted average common shares outstanding and common stock equivalents | | | 1,080 | | | 1,110 | | | | 1,085 | | | 1,108 |
| | |
|
| |
|
|
| |
|
| |
|
|
Diluted earnings per common share: | | | | | | | | | | | | | |
Income from continuing operations before cumulative effect of accounting change, net | | $ | 0.86 | | $ | 1.10 | | | $ | 2.09 | | $ | 2.21 |
Income on discontinued operations | | | — | | | — | | | | 0.01 | | | — |
Cumulative effect of accounting change, net | | | — | | | — | | | | 0.05 | | | — |
| | |
|
| |
|
|
| |
|
| |
|
|
Diluted EPS | | $ | 0.86 | | $ | 1.10 | | | $ | 2.15 | | $ | 2.21 |
| | |
|
| |
|
|
| |
|
| |
|
|
19
MORGAN STANLEY
NOTES TO CONDENSED CONSOLIDATED FINANCIAL STATEMENTS—(Continued)
The following securities were considered antidilutive and therefore were excluded from the computation of diluted EPS:
| | | | | | | | |
| | | Three Months
Ended
May 31,
| | Six Months
Ended
May 31,
|
| | | 2005
| | 2004
| | 2005
| | 2004
|
| | | (shares in millions) |
Number of antidilutive securities (including stock options and restricted
stock units) outstanding at end of period | | 97 | | 86 | | 96 | | 85 |
Cash dividends declared per common share were $0.27 and $0.54 for the quarter and six month period ended May 31, 2005 and $0.25 and $0.50 for the quarter and six month period ended May 31, 2004.
| 9. | Commitments and Contingencies. |
Letters of Credit. At May 31, 2005 and November 30, 2004, the Company had approximately $9.0 billion and $8.5 billion, respectively, of letters of credit outstanding to satisfy various collateral requirements.
Securities Activities. In connection with certain of its Institutional Securities business activities, the Company provides loans or lending commitments (including bridge financing) to selected clients. The borrowers may be rated investment grade or non-investment grade. These loans and commitments have varying terms, may be senior or subordinated, are generally contingent upon representations, warranties and contractual conditions applicable to the borrower, and may be syndicated or traded by the Company.
The aggregate amount of the investment grade and non-investment grade lending commitments are shown below:
| | | | | | |
| | | At
May 31, 2005
| | At
November 30, 2004
|
| | | (dollars in millions) |
Investment grade lending commitments | | $ | 21,183 | | $ | 18,989 |
Non-investment grade lending commitments | | | 5,515 | | | 1,409 |
| | |
|
| |
|
|
Total | | $ | 26,698 | | $ | 20,398 |
| | |
|
| |
|
|
Financial instruments sold, not yet purchased represent obligations of the Company to deliver specified financial instruments at contracted prices, thereby creating commitments to purchase the financial instruments in the market at prevailing prices. Consequently, the Company’s ultimate obligation to satisfy the sale of financial instruments sold, not yet purchased may exceed the amounts recognized in the condensed consolidated statements of financial condition.
The Company has commitments to fund other less liquid investments, including at May 31, 2005, $172 million in connection with principal investment and private equity activities. Additionally, the Company has provided and will continue to provide financing, including margin lending and other extensions of credit to clients that may subject the Company to increased credit and liquidity risks.
At May 31, 2005, the Company had commitments to enter into reverse repurchase and repurchase agreements of approximately $78 billion and $96 billion, respectively.
Legal. In addition to the matters described in the Form 10-K, in the normal course of business, the Company has been named, from time to time, as a defendant in various legal actions, including arbitrations, class actions and other litigation, arising in connection with its activities as a global diversified financial services institution.
20
MORGAN STANLEY
NOTES TO CONDENSED CONSOLIDATED FINANCIAL STATEMENTS—(Continued)
Certain of the legal actions include claims for substantial compensatory and/or punitive damages or claims for indeterminate amounts of damages. In some cases, the issuers that would otherwise be the primary defendants in such cases are bankrupt or in financial distress. The Company is also involved, from time to time, in other reviews, investigations and proceedings by governmental and self-regulatory agencies (both formal and informal) regarding the Company’s business, including, among other matters, accounting and operational matters, certain of which may result in adverse judgments, settlements, fines, penalties, injunctions or other relief. The number of these investigations and proceedings has increased in recent years with regard to many firms in the financial services industry, including the Company.
The Company contests liability and/or the amount of damages in each pending matter. In view of the inherent difficulty of predicting the outcome of such matters, particularly in cases where claimants seek substantial or indeterminate damages or where investigations and proceedings are in the early stages, the Company cannot predict with certainty the loss or range of loss related to such matters, how such matters will be resolved, when they will ultimately be resolved, or what the eventual settlement, fine, penalty or other relief might be. Subject to the foregoing, and except as described in the paragraphs below, the Company believes, based on current knowledge and after consultation with counsel, that the outcome of each such pending matter will not have a material adverse effect on the condensed consolidated financial condition of the Company, although the outcome could be material to the Company’s or a business segment’s operating results for a particular future period, depending on, among other things, the level of the Company’s or a business segment’s income for such period. Legal reserves have been established in accordance with SFAS No. 5, “Accounting for Contingencies.” Once established, reserves are adjusted when there is more information available or when an event occurs requiring a change.
Coleman Litigation. On May 16, 2005, the jury in the litigation captionedColeman (Parent) Holdings, Inc. v. Morgan Stanley & Co., Inc. (“Coleman litigation”) returned a verdict in favor of Coleman (Parent) Holdings, Inc. (“CPH”) with respect to its claims against MS&Co. and awarded CPH $604 million in compensatory damages. On May 18, 2005, the jury awarded CPH an additional $850 million in punitive damages. On June 23, 2005, the state court of Palm Beach County, Florida entered its final judgment, awarding CPH $208 million for prejudgment interest and deducting $84 million from the award because of the settlements of related claims CPH entered into with others, resulting in a total judgment against MS&Co. of $1,578 million. On June 27, 2005, MS&Co. filed its notice of appeal and posted a bond which automatically stayed execution of the judgment pending appeal.
The Company believes, after consultation with outside counsel, that it is probable that the compensatory and punitive damages awards will be overturned on appeal and the case remanded for a new trial. Taking into account the advice of outside counsel, the Company is maintaining a reserve of $360 million for the Coleman litigation, which it believes to be a reasonable estimate, under SFAS No. 5, of the low end of the range of its probable exposure in the event the judgment is overturned and the case remanded for a new trial. If the compensatory and/or punitive awards are ultimately upheld on appeal, in whole or in part, the Company may incur an additional expense equal to the difference between the amount affirmed on appeal (and post- judgment interest thereon) and the amount of the reserve. While the Company cannot predict with certainty the amount of such additional expense, such additional expense could have a material adverse effect on the condensed consolidated financial condition of the Company and/or the Company’s or Institutional Securities operating results for a particular future period, and the upper end of the range could exceed $1.2 billion.
Parmalat. On June 23, 2005, the Company and its subsidiaries MSIL and Morgan Stanley Bank International Ltd. entered into a proposed settlement agreement (the “Parmalat Agreement”) with the administrator of Parmalat. Pursuant to the Parmalat Agreement, the Company agreed to pay €155 million to Parmalat as part of a global settlement of all existing and potential claims between the Company and Parmalat, while preserving the Company’s €35 million claim which was admitted in December 2004 in the administration of Parmalat. The Parmalat Agreement is subject to the approval of the Italian Government.
21
MORGAN STANLEY
NOTES TO CONDENSED CONSOLIDATED FINANCIAL STATEMENTS—(Continued)
Income Taxes. For information on contingencies associated with income tax examinations, see Note 19.
Other. The Company entered into agreements with John J. Mack, Chairman of the Board and CEO of the Company, and Philip J. Purcell, former Chairman of the Board and CEO of the Company, that were filed as exhibits to the Company’s Current Reports on Form 8-K dated July 5, 2005 and July 7, 2005, respectively. The Company also entered into agreements with certain senior executives relating to their continued services. In certain circumstances, compensation amounts due to such executives may be accelerated.
In the normal course of business, the Company enters into a variety of derivative contracts related to financial instruments and commodities. The Company uses these instruments for trading and investment purposes, as well as for asset and liability management (see Note 1). These instruments generally represent future commitments to swap interest payment streams, exchange currencies or purchase or sell other financial instruments on specific terms at specified future dates. Many of these products have maturities that do not extend beyond one year, although swaps and options and warrants on equities typically have longer maturities. For further discussion of these matters, refer to Note 11 to the consolidated financial statements for the fiscal year ended November 30, 2004, included in the Form 10-K.
The fair value (carrying amount) of derivative instruments represents the amount at which the derivative could be exchanged in a current transaction between willing parties, other than in a forced or liquidation sale, and is further described in Note 1. Future changes in interest rates, foreign currency exchange rates or the fair values of the financial instruments, commodities or indices underlying these contracts ultimately may result in cash settlements exceeding fair value amounts recognized in the condensed consolidated statements of financial condition. The amounts in the following table represent unrealized gains and losses on exchange traded and OTC options and other contracts (including interest rate, foreign exchange, and other forward contracts and swaps) for derivatives for trading and investment and for asset and liability management, net of offsetting positions in situations where netting is appropriate. The asset amounts are not reported net of non-cash collateral, which the Company obtains with respect to certain of these transactions to reduce its exposure to credit losses.
Credit risk with respect to derivative instruments arises from the failure of a counterparty to perform according to the terms of the contract. The Company’s exposure to credit risk at any point in time is represented by the fair value of the contracts reported as assets. The Company monitors the creditworthiness of counterparties to these transactions on an ongoing basis and requests additional collateral when deemed necessary. The Company believes the ultimate settlement of the transactions outstanding at May 31, 2005 will not have a material effect on the Company’s financial condition.
The Company’s derivatives (both listed and OTC) at May 31, 2005 and November 30, 2004 are summarized in the table below, showing the fair value of the related assets and liabilities by product:
| | | | | | | | | | | | |
| | | May 31, 2005(1)
| | At November 30, 2004(1)
|
| | | Assets
| | Liabilities
| | Assets
| | Liabilities
|
| | | (dollars in millions) |
Interest rate and currency swaps and options, credit derivatives and other fixed income securities contracts | | $ | 20,885 | | $ | 15,759 | | $ | 22,998 | | $ | 18,797 |
Foreign exchange forward contracts and options | | | 6,272 | | | 7,453 | | | 9,285 | | | 8,668 |
Equity securities contracts (including equity swaps, warrants and options) | | | 6,184 | | | 8,635 | | | 5,898 | | | 7,373 |
Commodity forwards, options and swaps | | | 9,108 | | | 7,988 | | | 11,294 | | | 8,702 |
| | |
|
| |
|
| |
|
| |
|
|
Total | | $ | 42,449 | | $ | 39,835 | | $ | 49,475 | | $ | 43,540 |
| | |
|
| |
|
| |
|
| |
|
|
| (1) | Effective December 1, 2004 the Company elected to net cash collateral paid or received against its OTC derivatives inventory under credit support annexes. See Note 1. |
22
MORGAN STANLEY
NOTES TO CONDENSED CONSOLIDATED FINANCIAL STATEMENTS—(Continued)
The Company structures its segments primarily based upon the nature of the financial products and services provided to customers and the Company’s management organization. The Company provides a wide range of financial products and services to its customers in each of its business segments: Institutional Securities, Individual Investor Group, Investment Management and Credit Services. For further discussion of the Company’s business segments, see Note 1. Certain reclassifications have been made to prior-period amounts to conform to the current year’s presentation.
Revenues and expenses directly associated with each respective segment are included in determining their operating results. Other revenues and expenses that are not directly attributable to a particular segment are allocated based upon the Company’s allocation methodologies, generally based on each segment’s respective net revenues, non-interest expenses or other relevant measures.
As a result of treating certain intersegment transactions as transactions with external parties, the Company includes an Intersegment Eliminations category to reconcile the segment results to the Company’s consolidated results. Income before taxes in Intersegment Eliminations represents the effect of timing differences associated with the revenue and expense recognition of commissions paid by Investment Management to the Individual Investor Group associated with sales of certain products and the related compensation costs paid to Individual Investor Group’s global representatives.
Beginning in the third quarter of fiscal 2005, the principal components of the Credit Services residential mortgage loan business will be managed and included within the results of the Institutional Securities business segment.
Selected financial information for the Company’s segments is presented below:
| | | | | | | | | | | | | | | | | | | |
Three Months Ended May 31, 2005
| | Institutional
Securities
| | Individual
Investor Group
| | Investment
Management
| | Credit
Services
| | Intersegment
Eliminations
| | | Total
|
| | | (dollars in millions) |
Net revenues excluding net interest | | $ | 3,357 | | $ | 1,149 | | $ | 641 | | $ | 520 | | $ | (66 | ) | | $ | 5,601 |
Net interest | | | — | | | 79 | | | 1 | | | 358 | | | — | | | | 438 |
| | |
|
| |
|
| |
|
| |
|
| |
|
|
| |
|
|
Net revenues | | $ | 3,357 | | $ | 1,228 | | $ | 642 | | $ | 878 | | $ | (66 | ) | | $ | 6,039 |
| | |
|
| |
|
| |
|
| |
|
| |
|
|
| |
|
|
Income from continuing operations before losses from unconsolidated investees and income taxes | | $ | 830 | | $ | 118 | | $ | 175 | | $ | 242 | | $ | 25 | | | $ | 1,390 |
Losses from unconsolidated investees | | | 67 | | | — | | | — | | | — | | | — | | | | 67 |
| | |
|
| |
|
| |
|
| |
|
| |
|
|
| |
|
|
Income from continuing operations before taxes(1) | | $ | 763 | | $ | 118 | | $ | 175 | | $ | 242 | | $ | 25 | | | $ | 1,323 |
| | |
|
| |
|
| |
|
| |
|
| |
|
|
| |
|
|
| | | | | | |
Three Months Ended May 31, 2004(2)
| | Institutional
Securities
| | Individual
Investor Group
| | Investment
Management
| | Credit
Services
| | Intersegment
Eliminations
| | | Total
|
| | | (dollars in millions) |
Net revenues excluding net interest | | $ | 3,566 | | $ | 1,149 | | $ | 690 | | $ | 607 | | $ | (75 | ) | | $ | 5,937 |
Net interest | | | 381 | | | 60 | | | — | | | 272 | | | — | | | | 713 |
| | |
|
| |
|
| |
|
| |
|
| |
|
|
| |
|
|
Net revenues | | $ | 3,947 | | $ | 1,209 | | $ | 690 | | $ | 879 | | $ | (75 | ) | | $ | 6,650 |
| | |
|
| |
|
| |
|
| |
|
| |
|
|
| |
|
|
Income from continuing operations before losses from unconsolidated investees and income taxes | | $ | 1,135 | | $ | 132 | | $ | 209 | | $ | 298 | | $ | 29 | | | $ | 1,803 |
Losses from unconsolidated investees | | | 81 | | | — | | | — | | | — | | | — | | | | 81 |
| | |
|
| |
|
| |
|
| |
|
| |
|
|
| |
|
|
Income from continuing operations before taxes(1) | | $ | 1,054 | | $ | 132 | | $ | 209 | | $ | 298 | | $ | 29 | | | $ | 1,722 |
| | |
|
| |
|
| |
|
| |
|
| |
|
|
| |
|
|
23
MORGAN STANLEY
NOTES TO CONDENSED CONSOLIDATED FINANCIAL STATEMENTS—(Continued)
| | | | | | | | | | | | | | | | | | | |
Six Months Ended May 31, 2005
| | Institutional
Securities
| | Individual
Investor
Group
| | Investment
Management
| | Credit
Services
| | Intersegment
Eliminations
| | | Total
|
| | | (dollars in millions) |
Net revenues excluding net interest | | $ | 6,530 | | $ | 2,312 | | $ | 1,336 | | $ | 1,221 | | $ | (135 | ) | | $ | 11,264 |
Net interest | | | 812 | | | 154 | | | 2 | | | 653 | | | — | | | | 1,621 |
| | |
|
| |
|
| |
|
| |
|
| |
|
|
| |
|
|
Net revenues | | $ | 7,342 | | $ | 2,466 | | $ | 1,338 | | $ | 1,874 | | $ | (135 | ) | | $ | 12,885 |
| | |
|
| |
|
| |
|
| |
|
| |
|
|
| |
|
|
Income from continuing operations before losses from unconsolidated investees, income taxes and cumulative effect of accounting change, net | | $ | 1,875 | | $ | 471 | | $ | 462 | | $ | 622 | | $ | 49 | | | $ | 3,479 |
Losses from unconsolidated investees | | | 140 | | | — | | | — | | | — | | | — | | | | 140 |
| | |
|
| |
|
| |
|
| |
|
| |
|
|
| |
|
|
Income from continuing operations before taxes and cumulative effect of accounting change, net(1)(3) | | $ | 1,735 | | $ | 471 | | $ | 462 | | $ | 622 | | $ | 49 | | | $ | 3,339 |
| | |
|
| |
|
| |
|
| |
|
| |
|
|
| |
|
|
| | | | | | |
Six Months Ended May 31, 2004(2)
| | Institutional
Securities
| | Individual
Investor
Group
| | Investment
Management
| | Credit
Services
| | Intersegment
Eliminations
| | | Total
|
| | | (dollars in millions) |
Net revenues excluding net interest | | $ | 6,626 | | $ | 2,300 | | $ | 1,332 | | $ | 1,259 | | $ | (149 | ) | | $ | 11,368 |
Net interest | | | 825 | | | 120 | | | — | | | 578 | | | — | | | | 1,523 |
| | |
|
| |
|
| |
|
| |
|
| |
|
|
| |
|
|
Net revenues | | $ | 7,451 | | $ | 2,420 | | $ | 1,332 | | $ | 1,837 | | $ | (149 | ) | | $ | 12,891 |
| | |
|
| |
|
| |
|
| |
|
| |
|
|
| |
|
|
Income from continuing operations before losses from unconsolidated investees, income taxes and dividends on preferred securities subject to mandatory redemption | | $ | 2,318 | | $ | 298 | | $ | 379 | | $ | 663 | | $ | 58 | | | $ | 3,716 |
Losses from unconsolidated investees | | | 174 | | | — | | | — | | | — | | | — | | | | 174 |
Dividends on preferred securities subject to mandatory redemption | | | 45 | | | — | | | — | | | — | | | — | | | | 45 |
| | |
|
| |
|
| |
|
| |
|
| |
|
|
| |
|
|
Income from continuing operations before taxes(1) | | $ | 2,099 | | $ | 298 | | $ | 379 | | $ | 663 | | $ | 58 | | | $ | 3,497 |
| | |
|
| |
|
| |
|
| |
|
| |
|
|
| |
|
|
| | | | | | |
Total Assets(4)
| | Institutional
Securities
| | Individual
Investor
Group
| | Investment
Management
| | Credit
Services
| | Intersegment
Eliminations
| | | Total
|
| | | (dollars in millions) |
At May 31, 2005 | | $ | 774,082 | | $ | 15,778 | | $ | 3,508 | | $ | 25,507 | | $ | (164 | ) | | $ | 818,711 |
| | |
|
| |
|
| |
|
| |
|
| |
|
|
| |
|
|
At November 30, 2004(2) | | $ | 698,743 | | $ | 17,839 | | $ | 3,759 | | $ | 25,385 | | $ | (213 | ) | | $ | 745,513 |
| | |
|
| |
|
| |
|
| |
|
| |
|
|
| |
|
|
| (1) | See Note 17 for a discussion of discontinued operations. |
| (2) | Certain reclassifications have been made to prior-period amounts to conform to the current year’s presentation. |
| (3) | See Note 1 for a discussion of the cumulative effect of accounting change, net. |
| (4) | Corporate assets have been fully allocated to the Company’s business segments. |
24
MORGAN STANLEY
NOTES TO CONDENSED CONSOLIDATED FINANCIAL STATEMENTS—(Continued)
| 12. | Variable Interest Entities. |
In January 2003, the FASB issued FIN 46, which clarified the application of Accounting Research Bulletin No. 51, “Consolidated Financial Statements,” to certain entities in which equity investors do not have the characteristics of a controlling financial interest or do not have sufficient equity at risk for the entity to finance its activities without additional subordinated financial support from other parties (“variable interest entities”). Variable interest entities (“VIE”) are required to be consolidated by their primary beneficiaries if they do not effectively disperse risks among parties involved. Under FIN 46, the primary beneficiary of a VIE is the party that absorbs a majority of the entity’s expected losses, receives a majority of its expected residual returns, or both, as a result of holding variable interests. FIN 46 also requires disclosures about VIEs. In December 2003, the FASB issued a revision of FIN 46 to address certain technical corrections and implementation issues.
The Company is involved with various entities in the normal course of business that may be deemed to be VIEs and may hold interests therein, including debt securities, interest-only strip investments and derivative instruments that may be considered variable interests. Transactions associated with these entities include asset- and mortgage-backed securitizations and structured financings (including collateralized debt, bond or loan obligations and credit-linked notes). The Company engages in these transactions principally to facilitate client needs and as a means of selling financial assets. The Company consolidates entities in which it has a controlling financial interest in accordance with accounting principles generally accepted in the U.S. For those entities deemed to be qualifying special purpose entities (as defined in SFAS No. 140), which includes the credit card asset securitization master trusts (see Note 4), the Company does not consolidate the entity.
The Company purchases and sells interests in entities that may be deemed to be VIEs in the ordinary course of its business. As a result of these activities, it is possible that such entities may be consolidated and deconsolidated at various points in time. Therefore, the Company’s variable interests included below may not be held by the Company at the end of future quarterly reporting periods.
At May 31, 2005, in connection with its Institutional Securities business, the aggregate size of VIEs, including financial asset-backed securitization, collateralized debt obligation, credit-linked note, structured note, municipal bond trust, loan issuing, commodities monetization, equity-linked note and exchangeable trust entities, for which the Company was the primary beneficiary of the entities was approximately $7.6 billion, which is the carrying amount of the consolidated assets recorded as Financial instruments owned that are collateral for the entities’ obligations. The nature and purpose of these entities that the Company consolidated were to issue a series of notes to investors that provide the investors a return based on the holdings of the entities. These transactions were executed to facilitate client investment objectives. The structured note, equity-linked note, certain credit-linked note, certain financial asset-backed securitization and municipal bond transactions also were executed as a means of selling financial assets. The Company holds either the entire class or a majority of the class of subordinated notes or entered into a derivative instrument with the VIE, which bears the majority of the expected losses or receives a majority of the expected residual returns of the entities. The Company consolidates these entities, in accordance with its consolidation accounting policy, and as a result eliminates all intercompany transactions, including derivatives and other intercompany transactions such as fees received to underwrite the notes or to structure the transactions. The Company accounts for the assets held by the entities as Financial instruments owned and the liabilities of the entities as Other secured borrowings. For those liabilities that include an embedded derivative, the Company has bifurcated such derivative in accordance with SFAS No. 133, as amended. The beneficial interests of these consolidated entities are payable solely from the cash flows of the assets held by the VIE.
At May 31, 2005, also in connection with its Institutional Securities business, the aggregate size of the entities for which the Company holds significant variable interests, which consist of subordinated and other classes of
25
MORGAN STANLEY
NOTES TO CONDENSED CONSOLIDATED FINANCIAL STATEMENTS—(Continued)
beneficial interests, derivative instruments, limited partnership investments and secondary guarantees, was approximately $30.9 billion. The Company’s variable interests associated with these entities, primarily credit-linked note, structured note, loan and bond issuing, collateralized debt and loan obligation, financial asset-backed securitization, mortgage-backed securitization and tax credit limited liability entities, including investments in affordable housing tax credit funds and underlying synthetic fuel production plants, were approximately $13.9 billion consisting primarily of senior beneficial interests, which represent the Company’s maximum exposure to loss at May 31, 2005. The Company may hedge the risks inherent in its variable interest holdings, thereby reducing its exposure to loss. The Company’s maximum exposure to loss does not include the offsetting benefit of any financial instruments that the Company utilizes to hedge these risks.
FASB Interpretation No. 45 (“FIN 45”), “Guarantor’s Accounting and Disclosure Requirements for Guarantees, Including Indirect Guarantees of Indebtedness of Others,” requires the Company to disclose information about its obligations under certain guarantee arrangements. FIN 45 defines guarantees as contracts and indemnification agreements that contingently require a guarantor to make payments to the guaranteed party based on changes in an underlying (such as an interest or foreign exchange rate, security or commodity price, an index or the occurrence or non-occurrence of a specified event) related to an asset, liability or equity security of a guaranteed party. FIN 45 also defines guarantees as contracts that contingently require the guarantor to make payments to the guaranteed party based on another entity’s failure to perform under an agreement as well as indirect guarantees of the indebtedness of others.
Derivative Contracts. Under FIN 45, certain derivative contracts meet the accounting definition of a guarantee, including certain written options, contingent forward contracts and credit default swaps. Although the Company’s derivative arrangements do not specifically identify whether the derivative counterparty retains the underlying asset, liability or equity security, the Company has disclosed information regarding all derivative contracts that could meet the FIN 45 definition of a guarantee. The maximum potential payout for certain derivative contracts, such as written interest rate caps and written foreign currency options, cannot be estimated as increases in interest or foreign exchange rates in the future could possibly be unlimited. Therefore, in order to provide information regarding the maximum potential amount of future payments that the Company could be required to make under certain derivative contracts, the notional amount of the contracts has been disclosed.
The Company records all derivative contracts at fair value. For this reason, the Company does not monitor its risk exposure to such derivative contracts based on derivative notional amounts; rather the Company manages its risk exposure on a fair value basis. Aggregate market risk limits have been established, and market risk measures are routinely monitored against these limits. The Company also manages its exposure to these derivative contracts through a variety of risk mitigation strategies, including, but not limited to, entering into offsetting economic hedge positions. The Company believes that the notional amounts of the derivative contracts generally overstate its exposure.
Financial Guarantees to Third Parties. In connection with its corporate lending business and other corporate activities, the Company provides standby letters of credit and other financial guarantees to counterparties. Such arrangements represent obligations to make payments to third parties if the counterparty fails to fulfill its obligation under a borrowing arrangement or other contractual obligation.
Market Value Guarantees. Market value guarantees are issued to guarantee return of principal invested to fund investors associated with certain European equity funds and to guarantee timely payment of a specified return to investors in certain affordable housing tax credit funds. The guarantees associated with certain European equity
26
MORGAN STANLEY
NOTES TO CONDENSED CONSOLIDATED FINANCIAL STATEMENTS—(Continued)
funds are designed to provide for any shortfall between the market value of the underlying fund assets and invested principal and a stipulated return amount. The guarantees provided to investors in certain affordable housing tax credit funds are designed to return an investor’s contribution to a fund and the investor’s share of tax losses and tax credits expected to be generated by a fund.
Liquidity Guarantees. The Company has entered into liquidity facilities with special purpose entities (“SPE”) and other counterparties, whereby the Company is required to make certain payments if losses or defaults occur. The Company often may have recourse to the underlying assets held by the SPEs in the event payments are required under such liquidity facilities.
The table below summarizes certain information regarding these guarantees at May 31, 2005:
| | | | | | | | | | | | | | | | | | | | | |
| | | Maximum Potential Payout/Notional
| | | | |
| | | Years to Maturity
| | | | |
Type of Guarantee
| | Less than 1
| | 1-3
| | 3-5
| | Over 5
| | Total
| | Carrying
Amount
| | Collateral/
Recourse
|
| | | (dollars in millions) |
Derivative contracts | | $ | 475,913 | | $ | 348,558 | | $ | 390,114 | | $ | 368,436 | | $ | 1,583,021 | | $ | 29,224 | | $ | 111 |
Standby letters of credit and other financial guarantees | | | 1,766 | | | 270 | | | 230 | | | 432 | | | 2,698 | | | 21 | | | 646 |
Market value guarantees | | | 4 | | | 33 | | | 227 | | | 654 | | | 918 | | | 53 | | | 133 |
Liquidity guarantees | | | 1,369 | | | 8 | | | 49 | | | 121 | | | 1,547 | | | — | | | — |
Indemnities. In the normal course of its business, the Company provides standard indemnities to counterparties for taxes, including U.S. and foreign withholding taxes, on interest and other payments made on derivatives, securities and stock lending transactions, certain annuity products and other financial arrangements. These indemnity payments could be required based on a change in the tax laws or change in interpretation of applicable tax rulings. Certain contracts contain provisions that enable the Company to terminate the agreement upon the occurrence of such events. The maximum potential amount of future payments that the Company could be required to make under these indemnifications cannot be estimated. The Company has not recorded any contingent liability in the condensed consolidated financial statements for these indemnifications and believes that the occurrence of any events that would trigger payments under these contracts is remote.
Exchange/Clearinghouse Member Guarantees. The Company is a member of various U.S. and non-U.S. exchanges and clearinghouses that trade and clear securities and/or futures contracts. Associated with its membership, the Company may be required to pay a proportionate share of the financial obligations of another member who may default on its obligations to the exchange or the clearinghouse. While the rules governing different exchange or clearinghouse memberships vary, in general the Company’s guarantee obligations would arise only if the exchange or clearinghouse had previously exhausted its resources. In addition, any such guarantee obligation would be apportioned among the other non-defaulting members of the exchange or clearinghouse. Any potential contingent liability under these membership agreements cannot be estimated. The Company has not recorded any contingent liability in the condensed consolidated financial statements for these agreements and believes that any potential requirement to make payments under these agreements is remote.
General Partner Guarantees. As a general partner in certain private equity and real estate partnerships, the Company receives distributions from the partnerships according to the provisions of the partnership agreements. The Company may, from time to time, be required to return all or a portion of such distributions to the limited partners in the event the limited partners do not achieve a certain return as specified in various partnership agreements, subject to certain limitations. The maximum potential amount of future payments that the Company
27
MORGAN STANLEY
NOTES TO CONDENSED CONSOLIDATED FINANCIAL STATEMENTS—(Continued)
could be required to make under these provisions at May 31, 2005 and November 30, 2004 was $287 million and $265 million, respectively. As of both May 31, 2005 and November 30, 2004, the Company’s accrued liability for distributions that the Company has determined it is probable it will be required to refund based on the applicable refund criteria specified in the various partnership agreements was $68 million.
Securitized Asset Guarantees. As part of the Company’s Institutional Securities and Credit Services securitization activities, the Company provides representations and warranties that certain securitized assets conform to specified guidelines. The Company may be required to repurchase such assets or indemnify the purchaser against losses if the assets do not meet certain conforming guidelines. Due diligence is performed by the Company to ensure that asset guideline qualifications are met, and to the extent the Company has acquired such assets to be securitized from other parties, the Company seeks to obtain its own representations and warranties regarding the assets. The maximum potential amount of future payments the Company could be required to make would be equal to the current outstanding balances of all assets subject to such securitization activities. Also, in connection with originations of residential mortgage loans under the Company’s FlexSource® program, the Company may permit borrowers to pledge marketable securities as collateral instead of requiring cash down payments for the purchase of the underlying residential property. Upon sale of the residential mortgage loans, the Company may provide a surety bond that reimburses the purchasers for shortfalls in the borrowers’ securities accounts up to certain limits if the collateral maintained in the securities accounts (along with the associated real estate collateral) is insufficient to cover losses that purchasers experience as a result of defaults by borrowers on the underlying residential mortgage loans. The Company requires the borrowers to meet daily collateral calls to ensure the marketable securities pledged in lieu of a cash down payment are sufficient. At May 31, 2005 and November 30, 2004, the maximum potential amount of future payments the Company may be required to make under its surety bond was $186 million and $198 million, respectively. The Company has not recorded any contingent liability in the condensed consolidated financial statements for these representations and warranties and reimbursement agreements and believes that the probability of any payments under these arrangements is remote.
Merchant Chargeback Guarantees. In connection with its Credit Services business, the Company owns and operates merchant processing services in the U.S. related to its general purpose credit cards. As a merchant processor in the U.S. and an issuer of credit cards in the U.K., the Company is contingently liable for processed credit card sales transactions in the event of a dispute between the cardmember and a merchant. If a dispute is resolved in the cardmember’s favor, the Company will credit or refund the amount to the cardmember and charge back the transaction to the merchant. If the Company is unable to collect the amount from the merchant, the Company will bear the loss for the amount credited or refunded to the cardmember. In most instances, a payment requirement by the Company is unlikely to arise because most products or services are delivered when purchased, and credits are issued by merchants on returned items in a timely fashion. However, where the product or service is not provided until some later date following the purchase, the likelihood of payment by the Company increases. The maximum potential amount of future payments related to this contingent liability is estimated to be the total cardmember sales transaction volume to date that could qualify as a valid disputed transaction under the Company’s merchant processing network and cardmember agreements; however, the Company believes that this amount is not representative of the Company’s actual potential loss exposure based on the Company’s historical experience. This amount cannot be quantified as the Company cannot determine whether the current or cumulative transaction volumes may include or result in disputed transactions.
28
MORGAN STANLEY
NOTES TO CONDENSED CONSOLIDATED FINANCIAL STATEMENTS—(Continued)
The table below summarizes certain information regarding merchant chargeback guarantees during the quarters and six month periods ended May 31, 2005 and 2004:
| | | | | | | | | | | | |
| | | Three Months
Ended
May 31,
| | Six Months
Ended
May 31,
|
| | | 2005
| | 2004
| | 2005
| | 2004
|
Losses related to merchant chargebacks (dollars in millions) | | $ | 2 | | $ | 1 | | $ | 4 | | $ | 2 |
Aggregate credit card transaction volume (dollars in billions) | | | 25.4 | | | 24.4 | | | 51.3 | | | 48.5 |
The amount of the liability related to the Company’s credit cardmember merchant guarantee was not material at May 31, 2005. The Company mitigates this risk by withholding settlement from merchants or obtaining escrow deposits from certain merchants that are considered higher risk due to various factors such as time delays in the delivery of products or services. The table below provides information regarding the settlement withholdings and escrow deposits:
| | | | | | |
| | | At May 31, 2005
| | At November 30,
2004
|
| | | (dollars in millions) |
Settlement withholdings and escrow deposits | | $ | 52 | | $ | 53 |
Other. The Company may, from time to time, in its role as investment banking advisor be required to provide guarantees in connection with certain European merger and acquisition transactions. If required by the regulating authorities, the Company provides a guarantee that the acquirer in the merger and acquisition transaction has or will have sufficient funds to complete the transaction and would then be required to make the acquisition payments in the event the acquirer’s funds are insufficient at the completion date of the transaction. These arrangements generally cover the time frame from the transaction offer date to its closing date and therefore are generally short term in nature. The maximum potential amount of future payments that the Company could be required to make cannot be estimated. The likelihood of any payment by the Company under these arrangements is remote given the level of the Company’s due diligence associated with its role as investment banking advisor.
The Company provides liquidity support to holders of certain bonds. If holders elect to sell supported bonds and such bonds cannot be remarketed, the Company is obligated to repurchase them at par and would then be the holder of record of such bonds. There have been no instances in which the Company has been required to perform under these arrangements.
| 14. | Investments in Unconsolidated Investees. |
The Company invests in unconsolidated investees that own synthetic fuel production plants. The Company accounts for these investments under the equity method of accounting. The Company’s share of the operating losses generated by these investments is recorded within Losses from unconsolidated investees, and the tax credits and the tax benefits associated with these operating losses are recorded within the Company’s Provision for income taxes.
29
MORGAN STANLEY
NOTES TO CONDENSED CONSOLIDATED FINANCIAL STATEMENTS—(Continued)
In the quarters and six month periods ended May 31, 2005 and 2004, the losses from unconsolidated investees were more than offset by the respective tax credits and tax benefits on the losses. The table below provides information regarding the losses from unconsolidated investees, tax credits and tax benefits on the losses:
| | | | | | | | | | | | |
| | | Three Months
Ended
May 31,
| | Six Months
Ended
May 31,
|
| | | 2005
| | 2004
| | 2005
| | 2004
|
| | | (dollars in millions) |
Losses from unconsolidated investees | | $ | 67 | | $ | 81 | | $ | 140 | | $ | 174 |
Tax credits | | | 67 | | | 78 | | | 145 | | | 182 |
Tax benefits on losses | | | 27 | | | 39 | | | 56 | | | 70 |
Under the current tax law, synthetic fuels tax credits under Section 29 of the Internal Revenue Code (“Section 29 tax credits”) are available in full only when the price of oil is less than a base price specified by the tax code, as adjusted for inflation (“Base Price”). The Base Price for each calendar year is determined by the Secretary of the Treasury by April 1 of the following year. If the annual average price of a barrel of oil in 2005 or future years exceeds the applicable Base Price, the Section 29 tax credits generated by the Company’s synthetic fuel facilities will be phased out, on a ratable basis, over the phase-out range. Section 29 tax credits realized in prior years are not affected by this limitation. In April 2005, the Company entered into a derivative contract designed to reduce its economic exposure to rising oil prices and the potential phase-out of the Section 29 tax credits in 2005. Changes in fair value relative to this derivative contract are included within Principal transactions—trading revenues.
Internal Revenue Service (“IRS”) field auditors had been contesting the placed-in-service date of several synthetic fuel facilities owned by one of the Company’s unconsolidated investees (the “LLC”). To qualify for the Section 29 tax credits, the production facility must have been placed in service before July 1, 1998. The IRS has issued a Technical Advice Memorandum confirming that the LLC’s synthetic fuel facilities at issue meet the placed in service requirement under Section 29 of the Internal Revenue Code. The LLC has been informed that the IRS field auditors have decided to close the audit without any disallowance of tax credits.
| 15. | Employee Benefit Plans. |
The Company maintains various pension and benefit plans for eligible employees.
The components of the Company’s net periodic benefit expense were as follows:
| | | | | | | | | | | | | | | | |
| | | Three Months
Ended
May 31,
| | | Six Months
Ended
May 31,
| |
| | | 2005
| | | 2004
| | | 2005
| | | 2004
| |
| | | (dollars in millions) | |
Service cost, benefits earned during the period | | $ | 33 | | | $ | 28 | | | $ | 66 | | | $ | 56 | |
Interest cost on projected benefit obligation | | | 35 | | | | 33 | | | | 70 | | | | 66 | |
Expected return on plan assets | | | (32 | ) | | | (32 | ) | | | (64 | ) | | | (64 | ) |
Net amortization and other | | | 9 | | | | 6 | | | | 18 | | | | 12 | |
| | |
|
|
| |
|
|
| |
|
|
| |
|
|
|
Net periodic benefit expense | | $ | 45 | | | $ | 35 | | | $ | 90 | | | $ | 70 | |
| | |
|
|
| |
|
|
| |
|
|
| |
|
|
|
| 16. | Aircraft under Operating Leases. |
In accordance with SFAS No. 144, the Company’s aircraft are reviewed for impairment whenever events or changes in circumstances indicate that the carrying value of an aircraft may not be recoverable. During the
30
MORGAN STANLEY
NOTES TO CONDENSED CONSOLIDATED FINANCIAL STATEMENTS—(Continued)
second quarter of fiscal 2004, the Company evaluated various financing strategies for its aircraft financing business. As part of that evaluation and to determine the potential debt ratings associated with the financing strategies, the Company commissioned appraisals of the aircraft portfolio from three independent aircraft appraisal firms. The appraisals indicated a decrease in the aircraft portfolio average market value of 12% from the appraisals obtained at the date of the prior impairment charge (May 31, 2003). In accordance with SFAS No. 144, the Company considered the decline in appraisal values a significant decrease in the market price of its aircraft portfolio and thus a trigger event to test for impairment in the carrying value of its aircraft.
In accordance with SFAS No. 144, the Company tested each of its aircraft for impairment by comparing each aircraft’s projected undiscounted cash flows with its respective carrying value. For those aircraft for which impairment was indicated (because the projected undiscounted cash flows were less than the carrying value), the Company adjusted the carrying value of each aircraft to its fair value if lower than the carrying value. To determine each aircraft’s fair value, the Company used the market value appraisals provided by independent appraisers (BK Associates, Inc., Morten Beyer & Agnew, Inc. and Airclaims Limited). As a result of this review, the Company recorded a non-cash pre-tax asset impairment charge of $109 million (of which $2 million is included in loss from discontinued operations) in the second quarter of fiscal 2004 based on the average of the market value appraisals provided by the three independent appraisers. The impairment charge was primarily concentrated in two particular types of aircraft, the MD-83 and A300-600R, which contributed approximately $85 million of the total $109 million charge. The decrease in the projected undiscounted cash flows and the significant decline in the appraisal values for these aircraft reflects, among other things, a very small operator base and therefore limited opportunities to lease such aircraft. The impairment charge is included within Other expenses in the condensed consolidated statement of income. The results of the aircraft financing business are included in the Institutional Securities business segment.
| 17. | Discontinued Operations. |
During fiscal 2004, the Company entered into agreements for the sale of certain aircraft and, accordingly, such aircraft had been designated as “held for sale” in accordance with SFAS No. 144. The revenues and expenses associated with these aircraft have been classified as discontinued operations for all periods presented. As of February 3, 2005, all of these aircraft were sold.
The Company recorded pre-tax income/(loss) on discontinued operations of $13 million for the six month period ended May 31, 2005 and $(1) million and $2 million for the three and six month periods ended May 31, 2004. The pre-tax income/(loss) from discontinued operations in the quarter and six month period ended May 31, 2004 included a $2 million non-cash pre-tax asset impairment charge.
| 18. | Business Acquisition and Sale. |
On January 12, 2005, the Company completed the acquisition of PULSE, a U.S.-based automated teller machine/debit network currently serving banks, credit unions and savings institutions. As of the date of acquisition, the results of PULSE are included within the Credit Services business segment. The acquisition price was approximately $311 million, of which $280 million was paid in cash during the first quarter of fiscal 2005. The Company recorded goodwill and other intangible assets of $321 million in connection with the acquisition.
31
MORGAN STANLEY
NOTES TO CONDENSED CONSOLIDATED FINANCIAL STATEMENTS—(Continued)
The following table summarizes the fair values of the assets acquired and liabilities assumed at the date of acquisition. The allocation of the purchase price is subject to refinement.
| | | |
| | | At
January 12,
2005
|
| | | (dollars in
millions) |
Cash and cash equivalents | | $ | 1 |
Receivables | | | 22 |
Office facilities | | | 14 |
Other assets | | | 14 |
Amortizable intangible assets | | | 91 |
Goodwill | | | 230 |
| | |
|
|
Total assets acquired | | | 372 |
Total liabilities assumed | | | 61 |
| | |
|
|
Net assets acquired | | $ | 311 |
| | |
|
|
The $91 million of acquired amortizable intangible assets include customer relationships of $88 million (19-year estimated useful life) and trademarks of $3 million (25-year estimated useful life).
Amortization expense associated with intangible assets acquired in connection with the acquisition of PULSE is estimated to be approximately $6 million per year over the next five fiscal years.
In February 2005, the Company sold its 50% interest in POSIT, an equity crossing system that matches institutional buyers and sellers, to Investment Technology Group, Inc. The Company acquired the POSIT interest as part of its acquisition of Barra, Inc. in June 2004. As a result of the sale, the net carrying amount of intangible assets decreased by approximately $75 million (see Note 2).
| 19. | Income Tax Examinations. |
The Company is under continuous examination by the IRS and other tax authorities in certain countries, such as Japan and the United Kingdom, and states in which the Company has significant business operations, such as New York. The tax years under examination vary by jurisdiction; for example, the current IRS examination covers 1994-1998. The Company expects the field work for the IRS examination to be completed during 2005 and intends to appeal any proposed adjustments relative to unresolved issues. The Company regularly assesses the likelihood of additional assessments in each of the taxing jurisdictions resulting from these and subsequent years’ examinations. Tax reserves have been established, which the Company believes to be adequate in relation to the potential for additional assessments. Once established, reserves are adjusted only when there is more information available or when an event occurs necessitating a change to the reserves. The Company believes that the resolution of tax matters will not have a material effect on the condensed consolidated financial condition of the Company, although a resolution could have a material impact on the Company’s condensed consolidated statement of income for a particular future period and on the Company’s effective income tax rate.
On September 11, 2001, the U.S. experienced terrorist attacks targeted against New York City and Washington, D.C. The attacks in New York resulted in the destruction of the World Trade Center complex, where approximately 3,700 of the Company’s employees were located, and the temporary closing of the debt and equity financial markets in the U.S. Through the implementation of its business recovery plans, the Company relocated its displaced employees to other facilities.
32
MORGAN STANLEY
NOTES TO CONDENSED CONSOLIDATED FINANCIAL STATEMENTS—(Continued)
In the first quarter of fiscal 2005, the Company settled its claim with its insurance carriers related to the events of September 11, 2001. The Company recorded a pre-tax gain of $251 million as the insurance recovery was in excess of previously recognized costs related to the terrorist attacks (primarily write-offs of leasehold improvements and destroyed technology and telecommunications equipment in the World Trade Center complex, employee relocation and certain other employee-related expenditures, and other business recovery costs).
The pre-tax gain, which was recorded as a reduction to non-interest expenses, is included within the Individual Investor Group ($198 million), Investment Management ($43 million) and Institutional Securities ($10 million) segments. The insurance settlement was allocated to the respective segments in accordance with the relative damages sustained by each segment.
Prior to the first quarter of fiscal 2005, the Company did not record the effects of scheduled rent increases and rent-free periods for certain real estate leases on a straight-line basis. In addition, the Company had been accounting for certain tenant improvement allowances as reductions to the related leasehold improvements instead of recording funds received as deferred rent and amortizing them as reductions to lease expense over the lease term. In the first quarter of fiscal 2005, the Company changed its method of accounting for these rent escalation clauses, rent-free periods and tenant improvement allowances to properly reflect lease expense over the lease term on a straight-line basis. The cumulative effect of this correction resulted in the Company recording $109 million of additional rent expense in the first quarter of fiscal 2005. The impact of this change was included within non-interest expenses and reduced income before taxes within the Institutional Securities ($71 million), Individual Investor Group ($29 million), Investment Management ($5 million) and Credit Services ($4 million) segments. The impact of this correction to the current six month period and prior periods was not material to the pre-tax income of each of the segments or to the Company.
| 22. | American Jobs Creation Act of 2004. |
In December 2004, the FASB issued Staff Position (“FSP”) No. 109-2, “Accounting and Disclosure Guidance for the Foreign Earnings Repatriation Provision within the American Jobs Creation Act of 2004.” The American Jobs Creation Act of 2004 (the “Act”), signed into law on October 22, 2004, provides for a special one-time tax deduction, or dividend received deduction (“DRD”), of 85% of qualifying foreign earnings that are repatriated in either a company’s last tax year that began before the enactment date or the first tax year that begins during the one-year period beginning on the enactment date. FSP 109-2 provides entities additional time to assess the effect of repatriating foreign earnings under the Act for purposes of applying SFAS No. 109, “Accounting for Income Taxes,” which typically requires the effect of a new tax law to be recorded in the period of enactment. The Company will elect, if applicable, to apply the DRD to qualifying dividends of foreign earnings repatriated in its fiscal year ending November 30, 2005.
The Company is awaiting further clarifying guidance from the U.S. Treasury Department on certain provisions of the Act. The Company expects to complete its evaluation of the effects of the Act once this guidance is received. Under the limitations on the amount of dividends qualifying for the DRD of the Act, the maximum repatriation of the Company’s foreign earnings that may qualify for the special one-time DRD is approximately $4.0 billion. Therefore, the range of possible amounts of qualifying dividends of foreign earnings is between zero and approximately $4.0 billion. If the final guidance from the U.S. Treasury enables the Company to repatriate foreign earnings under the Act, the income tax on such repatriation could have a material impact on the Company’s effective income tax rate.
33
REPORT OF INDEPENDENT REGISTERED PUBLIC ACCOUNTING FIRM
To the Board of Directors and Shareholders of
Morgan Stanley:
We have reviewed the accompanying condensed consolidated statement of financial condition of Morgan Stanley and subsidiaries (“Morgan Stanley”) as of May 31, 2005, and the related condensed consolidated statements of income and comprehensive income for the three-month and six-month periods ended May 31, 2005 and 2004, and condensed consolidated statements of cash flows for the six-month periods ended May 31, 2005 and 2004. These interim financial statements are the responsibility of the management of Morgan Stanley.
We conducted our reviews in accordance with standards of the Public Company Accounting Oversight Board (United States). A review of interim financial information consists principally of applying analytical procedures and making inquiries of persons responsible for financial and accounting matters. It is substantially less in scope than an audit conducted in accordance with standards of the Public Company Accounting Oversight Board (United States), the objective of which is the expression of an opinion regarding the financial statements taken as a whole. Accordingly, we do not express such an opinion.
Based on our reviews, we are not aware of any material modifications that should be made to such condensed consolidated interim financial statements for them to be in conformity with accounting principles generally accepted in the United States of America.
We have previously audited, in accordance with standards of the Public Company Accounting Oversight Board (United States), the consolidated statement of financial condition of Morgan Stanley and subsidiaries as of November 30, 2004, and the related consolidated statements of income, comprehensive income, cash flows and changes in shareholders’ equity for the fiscal year then ended (not presented herein) included in Morgan Stanley’s Annual Report on Form 10-K for the fiscal year ended November 30, 2004; and, in our report dated February 7, 2005, (which report contains an explanatory paragraph relating to the adoption in 2003 of Statement of Financial Accounting Standards (“SFAS”) No. 123, “Accounting for Stock-Based Compensation,” as amended by SFAS No. 148, “Accounting for Stock-Based Compensation—Transition and Disclosure, an amendment of FASB Statement No. 123”), we expressed an unqualified opinion on those consolidated financial statements. In our opinion, the information set forth in the accompanying condensed consolidated statement of financial condition as of November 30, 2004 is fairly stated, in all material respects, in relation to the consolidated statement of financial condition from which it has been derived.
As discussed in Note 1 to the condensed consolidated interim financial statements, effective December 1, 2004, Morgan Stanley adopted SFAS No. 123R, “Share-based Payment.”
/s/ DELOITTE & TOUCHE LLP
New York, New York
July 7, 2005
| Item 2. | Management’s Discussion and Analysis of Financial Condition and Results of Operations. |
Introduction.
Morgan Stanley (the “Company”) is a global financial services firm that maintains leading market positions in each of its business segments—Institutional Securities, Individual Investor Group, Investment Management and Credit Services. The Company’s Institutional Securities business includes securities underwriting and distribution; financial advisory services, including advice on mergers and acquisitions, restructurings, real estate and project finance; sales, trading, financing and market-making activities in equity securities and related products and fixed income securities and related products, including foreign exchange and commodities; principal investing and real estate investment management; aircraft financing activities; providing benchmark indices and risk management analytics; and research. The Company’s Individual Investor Group business provides comprehensive brokerage, investment and financial services designed to accommodate individual investment goals and risk profiles. The Company’s Investment Management business provides global asset management products and services for individual and institutional investors through three principal distribution channels: a proprietary channel consisting of the Company’s representatives; a non-proprietary channel consisting of third-party broker-dealers, banks, financial planners and other intermediaries; and the Company’s institutional channel. The Company’s Credit Services business offers Discover®-branded cards and other consumer finance products and services, including residential mortgage loans, and includes the operations of Discover Network, a network of merchant and cash access locations based predominantly in the U.S., and PULSE EFT Association, Inc. (“PULSE®”), a U.S.-based automated teller machine/debit network. Morgan Stanley-branded credit cards and personal loan products that are offered in the U.K. are also included in the Credit Services business segment. The Company provides its products and services to a large and diversified group of clients and customers, including corporations, governments, financial institutions and individuals.
On June 30, 2005, the Board of Directors announced that John J. Mack had been elected as Chairman of the Board and CEO of the Company, and that Philip J. Purcell has left the position of Chairman of the Board and CEO with Mr. Mack’s election, both effective immediately. Concurrently, the Company entered into agreements with Messrs. Mack and Purcell that were filed as exhibits to the Company’s Current Reports on Form 8-K dated July 5, 2005 and July 7, 2005, respectively. The Company also entered into agreements with certain senior executives relating to their continued services. In certain circumstances, compensation amounts due to such executives may be accelerated.
On June 30, 2005, the Company also announced that Stephen S. Crawford and Zoe Cruz resigned from their positions on the Board, effective immediately. Mr. Crawford and Ms. Cruz continue to serve as Co-Presidents of the Company.
The discussion of the Company’s results of operations below may contain forward-looking statements. These statements, which reflect management’s beliefs and expectations, are subject to risks and uncertainties that may cause actual results to differ materially. For a discussion of the risks and uncertainties that may affect the Company’s future results, please see “Forward-Looking Statements” immediately preceding Part I, Item 1, “Competition” and “Regulation” in Part I, Item 1, “Certain Factors Affecting Results of Operations” under “Management’s Discussion and Analysis of Financial Condition and Results of Operations” in Part II, Item 7 and other items throughout the Company’s Annual Report on Form 10-K for the fiscal year ended November 30, 2004 (the “Form 10-K”).
The Company’s results of operations for the three and six month periods ended May 31, 2005 and 2004 are discussed below.
| | | | |
| | 35 | | |
Results of Operations.
Executive Summary.
Financial Information.
| | | | | | | | | | | | | | | | |
| | | Three Months
Ended May 31,
| | | Six Months
Ended May 31,
| |
| | | 2005
| | | 2004(1)
| | | 2005
| | | 2004(1)
| |
Net revenues (dollars in millions): | | | | | | | | | | | | | | | | |
Institutional Securities | | $ | 3,357 | | | $ | 3,947 | | | $ | 7,342 | | | $ | 7,451 | |
Individual Investor Group | | | 1,228 | | | | 1,209 | | | | 2,466 | | | | 2,420 | |
Investment Management | | | 642 | | | | 690 | | | | 1,338 | | | | 1,332 | |
Credit Services | | | 878 | | | | 879 | | | | 1,874 | | | | 1,837 | |
Intersegment Eliminations | | | (66 | ) | | | (75 | ) | | | (135 | ) | | | (149 | ) |
| | |
|
|
| |
|
|
| |
|
|
| |
|
|
|
Consolidated net revenues | | $ | 6,039 | | | $ | 6,650 | | | $ | 12,885 | | | $ | 12,891 | |
| | |
|
|
| |
|
|
| |
|
|
| |
|
|
|
Income before taxes(2) (dollars in millions): | | | | | | | | | | | | | | | | |
Institutional Securities | | $ | 830 | | | $ | 1,135 | | | $ | 1,875 | | | $ | 2,318 | |
Individual Investor Group | | | 118 | | | | 132 | | | | 471 | | | | 298 | |
Investment Management | | | 175 | | | | 209 | | | | 462 | | | | 379 | |
Credit Services | | | 242 | | | | 298 | | | | 622 | | | | 663 | |
Intersegment Eliminations | | | 25 | | | | 29 | | | | 49 | | | | 58 | |
| | |
|
|
| |
|
|
| |
|
|
| |
|
|
|
Consolidated income before taxes | | $ | 1,390 | | | $ | 1,803 | | | $ | 3,479 | | | $ | 3,716 | |
| | |
|
|
| |
|
|
| |
|
|
| |
|
|
|
Consolidated net income (dollars in millions) | | $ | 928 | | | $ | 1,223 | | | $ | 2,330 | | | $ | 2,449 | |
| | |
|
|
| |
|
|
| |
|
|
| |
|
|
|
Basic earnings per common share: | | | | | | | | | | | | | | | | |
Income from continuing operations | | $ | 0.88 | | | $ | 1.13 | | | $ | 2.14 | | | $ | 2.27 | |
Income on discontinued operations | | | — | | | | — | | | | 0.01 | | | | — | |
Cumulative effect of accounting change, net | | | — | | | | — | | | | 0.05 | | | | — | |
| | |
|
|
| |
|
|
| |
|
|
| |
|
|
|
Basic earnings per common share | | $ | 0.88 | | | $ | 1.13 | | | $ | 2.20 | | | $ | 2.27 | |
| | |
|
|
| |
|
|
| |
|
|
| |
|
|
|
Diluted earnings per common share: | | | | | | | | | | | | | | | | |
Income from continuing operations | | $ | 0.86 | | | $ | 1.10 | | | $ | 2.09 | | | $ | 2.21 | |
Income on discontinued operations | | | — | | | | — | | | | 0.01 | | | | — | |
Cumulative effect of accounting change, net | | | — | | | | — | | | | 0.05 | | | | — | |
| | |
|
|
| |
|
|
| |
|
|
| |
|
|
|
Diluted earnings per common share | | $ | 0.86 | | | $ | 1.10 | | | $ | 2.15 | | | $ | 2.21 | |
| | |
|
|
| |
|
|
| |
|
|
| |
|
|
|
| | | | |
Statistical Data. | | | | | | | | | | | | | | | | |
| | | | |
Book value per common share(3) | | $ | 26.07 | | | $ | 24.59 | | | $ | 26.07 | | | $ | 24.59 | |
| | | | |
Return on average common equity | | | 13.1 | % | | | 18.4 | % | | | 16.4 | % | | | 18.8 | % |
| | | | |
Effective income tax rate | | | 29.9 | % | | | 28.9 | % | | | 32.1 | % | | | 30.0 | % |
| | | | |
Consolidated assets under management or supervision
(dollars in billions): | | | | | | | | | | | | | | | | |
Equity | | $ | 270 | | | $ | 226 | | | $ | 270 | | | $ | 226 | |
Fixed Income | | | 118 | | | | 128 | | | | 118 | | | | 128 | |
Money Market | | | 84 | | | | 70 | | | | 84 | | | | 70 | |
Other(4) | | | 93 | | | | 86 | | | | 93 | | | | 86 | |
| | |
|
|
| |
|
|
| |
|
|
| |
|
|
|
Total(5) | | $ | 565 | | | $ | 510 | | | $ | 565 | | | $ | 510 | |
| | |
|
|
| |
|
|
| |
|
|
| |
|
|
|
Worldwide employees | | | 54,142 | | | | 51,580 | | | | 54,142 | | | | 51,580 | |
| | | | |
| | | 36 | | |
Statistical Data—(Continued).
| | | | | | | | | | | | | | | | |
| | | Three Months
Ended May 31,
| | | Six Months
Ended May 31,
| |
| | | 2005
| | | 2004(1)
| | | 2005
| | | 2004(1)
| |
Institutional Securities: | | | | | | | | | | | | | | | | |
Mergers and acquisitions completed transactions (dollars in billions)(6): | | | | | | | | | | | | | | | | |
Global market volume | | $ | 92.2 | | | $ | 132.6 | | | $ | 122.3 | | | $ | 148.2 | |
Market share | | | 30.1 | % | | | 35.7 | % | | | 24.3 | % | | | 30.0 | % |
Rank | | | 1 | | | | 2 | | | | 3 | | | | 2 | |
Mergers and acquisitions announced transactions (dollars in billions)(6): | | | | | | | | | | | | | | | | |
Global market volume | | $ | 208.1 | | | $ | 76.5 | | | $ | 322.0 | | | $ | 181.2 | |
Market share | | | 39.0 | % | | | 21.7 | % | | | 35.9 | % | | | 26.6 | % |
Rank | | | 1 | | | | 3 | | | | 1 | | | | 2 | |
Global equity and equity-related issues (dollars in billions)(6): | | | | | | | | | | | | | | | | |
Global market volume | | $ | 5.7 | | | $ | 16.4 | | | $ | 14.6 | | | $ | 28.6 | |
Market share | | | 6.4 | % | | | 12.7 | % | | | 9.2 | % | | | 13.3 | % |
Rank | | | 6 | | | | 2 | | | | 4 | | | | 1 | |
Global debt issues (dollars in billions)(6): | | | | | | | | | | | | | | | | |
Global market volume | | $ | 81.1 | | | $ | 104.0 | | | $ | 150.8 | | | $ | 166.5 | |
Market share | | | 5.9 | % | | | 7.6 | % | | | 6.2 | % | | | 7.1 | % |
Rank | | | 5 | | | | 2 | | | | 4 | | | | 3 | |
Global initial public offerings (dollars in billions)(6): | | | | | | | | | | | | | | | | |
Global market volume | | $ | 2.1 | | | $ | 3.1 | | | $ | 4.0 | | | $ | 6.8 | |
Market share | | | 8.8 | % | | | 10.2 | % | | | 9.8 | % | | | 15.3 | % |
Rank | | | 2 | | | | 2 | | | | 2 | | | | 1 | |
Pre-tax profit margin(7) | | | 25 | % | | | 29 | % | | | 26 | % | | | 31 | % |
| | | | |
Individual Investor Group: | | | | | | | | | | | | | | | | |
Global representatives | | | 10,438 | | | | 10,722 | | | | 10,438 | | | | 10,722 | |
Annualized net revenue per global representative (dollars in thousands)(8) | | $ | 470 | | | $ | 449 | | | $ | 461 | | | $ | 444 | |
Total client assets (dollars in billions) | | $ | 613 | | | $ | 579 | | | $ | 613 | | | $ | 579 | |
Fee-based assets as a percentage of total client assets | | | 27 | % | | | 25 | % | | | 27 | % | | | 25 | % |
Pre-tax profit margin(7) | | | 10 | % | | | 11 | % | | | 19 | % | | | 12 | % |
| | | | |
Investment Management: | | | | | | | | | | | | | | | | |
Assets under management or supervision (dollars in billions) | | $ | 416 | | | $ | 384 | | | $ | 416 | | | $ | 384 | |
Percent of fund assets in top half of Lipper rankings(9) | | | 76 | % | | | 59 | % | | | 76 | % | | | 59 | % |
Pre-tax profit margin(7) | | | 27 | % | | | 30 | % | | | 35 | % | | | 29 | % |
Pre-tax profit margin(7) (excluding private equity) | | | 29 | % | | | 25 | % | | | 34 | % | | | 27 | % |
| | | | |
Credit Services (dollars in millions, unless otherwise noted)(10): | | | | | | | | | | | | | | | | |
Period-end credit card loans—Owned | | $ | 19,385 | | | $ | 17,506 | | | $ | 19,385 | | | $ | 17,506 | |
Period-end credit card loans—Managed | | $ | 46,845 | | | $ | 46,828 | | | $ | 46,845 | | | $ | 46,828 | |
Average credit card loans—Owned | | $ | 18,753 | | | $ | 16,202 | | | $ | 18,979 | | | $ | 17,036 | |
Average credit card loans—Managed | | $ | 47,146 | | | $ | 46,929 | | | $ | 48,028 | | | $ | 47,793 | |
Net principal charge-off rate—Owned | | | 4.62 | % | | | 6.02 | % | | | 4.62 | % | | | 5.91 | % |
Net principal charge-off rate—Managed | | | 4.94 | % | | | 6.48 | % | | | 5.03 | % | | | 6.40 | % |
Transaction volume (dollars in billions) | | $ | 25.4 | | | $ | 24.4 | | | $ | 51.3 | | | $ | 48.5 | |
Payment services transaction volume (in millions) | | | 766 | | | | 300 | | | | 1,293 | | | | 604 | |
Pre-tax profit margin(7) | | | 28 | % | | | 34 | % | | | 33 | % | | | 36 | % |
| (1) | Certain prior-period information has been reclassified to conform to the current year’s presentation. |
| (2) | Amounts represent income from continuing operations before losses from unconsolidated investees, income taxes, dividends on preferred securities subject to mandatory redemption and cumulative effect of accounting change, net. |
| (3) | Book value per common share equals shareholders’ equity of $28,330 million at May 31, 2005 and $27,002 million at May 31, 2004, divided by common shares outstanding of 1,087 million at May 31, 2005 and 1,098 million at May 31, 2004, respectively. |
| | | | |
| | 37 | | |
| (4) | Amounts include alternative investment vehicles. |
| (5) | Revenues and expenses associated with these assets are included in the Company’s Investment Management, Individual Investor Group and Institutional Securities segments. |
| (6) | Source: Thomson Financial, data as of June 9, 2005—The data for the three months ended May 31, 2005 and 2004 are for the periods from March 1 to May 31, 2005 and March 1 to May 31, 2004, respectively. The data for the six months ended May 31 are for the periods from January 1 to May 31, 2005 and January 1 to May 31, 2004, respectively, as Thomson Financial presents this data on a calendar-year basis. |
| (7) | Percentages represent income from continuing operations before losses from unconsolidated investees, income taxes and cumulative effect of accounting change, net as a percentage of net revenues. |
| (8) | Annualized Individual Investor Group net revenues divided by average global representative headcount. |
| (9) | Source: Lipper, one-year performance excluding money market funds as of May 31, 2005 and 2004, respectively. |
| (10) | Managed data include owned and securitized credit card loans. For an explanation of managed data and a reconciliation of credit card loan and asset quality data, see “Credit Services—Managed General Purpose Credit Card Loan Data” herein. |
Second Quarter 2005—Performance.
Company Results. The Company recorded net income of $928 million and diluted earnings per share of $0.86 for the quarter ended May 31, 2005, decreases of 24% and 22%, respectively, from the comparable fiscal 2004 period. Net revenues (total revenues less interest expense and the provision for loan losses) decreased 9% from last year’s second quarter to $6.0 billion and the return on average common equity was 13.1% compared with 18.4% in the second quarter of last year.
Non-interest expenses of $4.6 billion decreased 4% from the prior year, and included net expenses of approximately $140 million related to various legal matters, including an increase in legal reserves due to a proposed settlement agreement in theParmalatMatter (see “Legal Proceedings” in Part II, Item 1). The Company did not record any changes to the legal reserve associated with theColemanLitigation (see “Legal Proceedings” in Part II, Item 1).
The Company’s effective income tax rate was 29.9% for the second quarter of fiscal 2005 and 28.9% in the second quarter of fiscal 2004. The increase primarily reflected lower domestic tax credits and tax exempt income.
For the six month period ended May 31, 2005, net income was $2,330 million, a 5% decrease from the comparable fiscal 2004 period. Diluted earnings per share were $2.15, down 3% from a year ago. Net revenues in the six month period were relatively unchanged at $12.9 billion and non-interest expenses increased 3% to $9.4 billion. The annualized return on average common equity for the six month period was 16.4% compared with 18.8% last year.
Institutional Securities. The Company’s Institutional Securities business recorded income from continuing operations before losses from unconsolidated investees and income taxes of $830 million, a 27% decrease from last year’s second quarter. Net revenues decreased 15% to $3.4 billion, reflecting declines in fixed income sales and trading and equity underwriting revenues. Non-interest expenses were $2.5 billion, a 10% decrease from a year ago. Compensation and benefits expenses declined due to lower incentive-based compensation accruals. Non-compensation expenses were relatively unchanged compared to the second quarter of last year. The current quarter reflected higher expenses associated with increased levels of business activity while the prior year’s second quarter included an aircraft impairment charge.
Investment banking advisory revenues rose 10% from last year’s second quarter to $357 million, primarily reflecting higher revenues from the real estate sector. Underwriting revenues decreased 33% from last year’s second quarter to $378 million due to lower equity and fixed income underwriting revenues.
Fixed income sales and trading net revenues were $1.3 billion, down 28% from a strong second quarter of fiscal 2004. Net revenues declined sharply in interest rate and currency products as mixed U.S. economic data resulted in a less favorable interest rate trading environment and lower foreign exchange rate volatility led to a decline in foreign exchange revenues. Commodities net revenues were significantly lower, particularly in North America electricity, as compared with the strong level of revenues recorded in the second quarter of fiscal 2004.
| | | | |
| | | 38 | | |
Credit products revenues were up slightly as solid results in securitized products offset lower revenues, due to widening credit spreads in corporate credit products. Equity sales and trading net revenues were essentially equal to last year at $1.1 billion. Client flows remained steady in the cash and derivatives businesses, while trading revenues were weaker. Prime brokerage had a record quarter driven by growth in client assets.
Individual Investor Group. The Individual Investor Group recorded pre-tax income of $118 million, an 11% decrease from the second quarter of fiscal 2004. Net revenues increased 2% from last year’s second quarter to $1.2 billion, reflecting higher asset management, distribution and administration fees as client assets in fee-based accounts increased, partially offset by a 12% decline in commissions, reflecting lower revenue-based transaction volumes. Non-interest expenses were up 3% from a year ago to $1.1 billion, driven by higher professional services costs reflecting increased sub-advisory fees and consulting expenses. Total client assets were $613 billion, up 6% from a year ago. Client assets in fee-based accounts rose 14% to $165 billion at May 31, 2005 and increased as a percentage of total client assets to 27% from 25% in the prior year period. At quarter-end, the number of global representatives was 10,438, a decrease of 284 from May 31, 2004.
Investment Management. Investment Management recorded pre-tax income of $175 million, a 16% decrease from last year’s second quarter. The decrease reflected a 7% decrease in net revenues to $642 million driven by lower investment gains associated with the private equity business, partially offset by an increase in revenues generated by higher average assets under management. Non-interest expenses fell 3% to $467 million, largely due to a decline in compensation and benefits expense resulting from lower incentive-based compensation accruals. Assets under management or supervision within Investment Management of $416 billion were up $32 billion, or 8%, from the second quarter of last year, primarily due to an increase in institutional assets, reflecting an increase in net flows of liquidity products and market appreciation.
Credit Services. Credit Services pre-tax income was $242 million, a decrease of 19% from the second quarter of fiscal 2004. The decrease in earnings was driven by lower servicing fees, primarily due to lower levels of mortgage whole loan sales and an approximate $20 million charge for the impairment of mortgage servicing rights, and higher non-interest expenses, partially offset by an increase in net interest income and merchant, cardmember and other fees. Non-interest expenses were 9% higher than a year ago due to higher marketing and business development and compensation expenses. The managed credit card net charge-off rate for the second quarter decreased 154 basis points from the same period a year ago to 4.94%, benefiting from the Company’s credit quality and collection initiatives and generally favorable economic conditions. The managed over 30-day delinquency rate for the second quarter decreased 98 basis points from a year ago to 3.90%, and the managed over 90-day delinquency rate was 57 basis points lower than a year ago at 1.83%. Managed credit card loans were $46.8 billion at quarter-end, relatively unchanged from a year ago.
Business Outlook.
Entering the third quarter of fiscal 2005, global economic and market conditions were generally stable, although trading conditions remained mixed. U.S. consumer confidence improved, although investors remain concerned about corporate profits, persistently higher oil prices, inflation, the U.S. federal budget deficit and high levels of geopolitical risk. These factors and the lower level of business activity in Institutional Securities and the Individual Investor Group that typically occurs during the summer months could negatively impact the results of the Company in the third quarter of fiscal 2005.
Global Market and Economic Conditions in the Quarter and Six Month Period Ended May 31, 2005.
The U.S. economy remained generally strong during the six month period ended May 31, 2005, benefiting from accommodative fiscal and monetary policies, supported by productivity gains. Consumer confidence was mixed, reflecting concerns over, among other things, the level of oil prices. Consumer spending moderated while the U.S. unemployment rate declined to a four-year low of 5.1%. The equity markets declined during the second quarter of fiscal 2005, as concerns over oil prices, inflation, a growing U.S. federal budget deficit, a mixed
| | | | |
| | 39 | | |
earnings outlook and corporate credit rating actions more than offset other positive economic developments. The Federal Reserve Board (the “Fed”) continued its efforts to tighten credit conditions by raising both the overnight lending rate and the discount rate on four separate occasions by an aggregate of 1.00% during the six month period ended May 31, 2005. Long-term interest rates, however, declined as the yield curve flattened during the quarter. Subsequent to quarter-end, the Fed raised both the overnight lending rate and the discount rate by an additional 0.25%.
In Europe, economic growth remained sluggish, and inflation remained stable. Toward the end of the quarter, the U.S. dollar strengthened significantly against the euro. The European Central Bank left the benchmark interest rate unchanged during the six month period ended May 31, 2005. In the U.K., economic growth moderated, reflecting a decline in consumer consumption. During the six month period ended May 31, 2005, the Bank of England left the benchmark interest rate unchanged.
In Japan, the economy continued to show signs of recovery although export growth remained weak. The jobless rate in Japan fell to the lowest level since December 1998. In China, economic growth continued to be fueled by exports, although the pace of expansion moderated.
Business Segments.
The remainder of “Results of Operations” is presented on a business segment basis before discontinued operations and cumulative effect of accounting change. Substantially all of the operating revenues and operating expenses of the Company can be directly attributed to its business segments. Certain revenues and expenses have been allocated to each business segment, generally in proportion to its respective net revenues, non-interest expenses or other relevant measures.
As a result of treating certain intersegment transactions as transactions with external parties, the Company includes an Intersegment Eliminations category to reconcile the segment results to the Company’s consolidated results. Income before taxes in Intersegment Eliminations represents the effect of timing differences associated with the revenue and expense recognition of commissions paid by Investment Management to the Individual Investor Group associated with sales of certain products and the related compensation costs paid to Individual Investor Group’s global representatives. Income before taxes recorded in Intersegment Eliminations was $25 million and $29 million in the quarters ended May 31, 2005 and 2004, respectively, and $49 million and $58 million in the six month periods ended May 31, 2005 and 2004, respectively.
Certain reclassifications have been made to prior-period segment amounts to conform to the current year’s presentation.
Beginning in the third quarter of fiscal 2005, the principal components of the Credit Services residential mortgage loan business will be managed and included within the results of the Institutional Securities business segment.
| | | | |
| | | 40 | | |
INSTITUTIONAL SECURITIES
INCOME STATEMENT INFORMATION
| | | | | | | | | | | | |
| | | Three Months
Ended
May 31,
| | Six Months
Ended
May 31,
|
| | | 2005
| | 2004
| | 2005
| | 2004
|
| | | (dollars in millions) |
Revenues: | | | | | | | | | | | | |
Investment banking | | $ | 735 | | $ | 891 | | $ | 1,477 | | $ | 1,630 |
Principal transactions: | | | | | | | | | | | | |
Trading | | | 1,800 | | | 1,923 | | | 3,530 | | | 3,614 |
Investments | | | 123 | | | 136 | | | 178 | | | 152 |
Commissions | | | 538 | | | 527 | | | 1,041 | | | 1,032 |
Asset management, distribution and administration fees | | | 39 | | | 32 | | | 73 | | | 66 |
Interest and dividends | | | 5,371 | | | 3,151 | | | 10,636 | | | 6,376 |
Other | | | 122 | | | 57 | | | 231 | | | 132 |
| | |
|
| |
|
| |
|
| |
|
|
Total revenues | | | 8,728 | | | 6,717 | | | 17,166 | | | 13,002 |
Interest expense | | | 5,371 | | | 2,770 | | | 9,824 | | | 5,551 |
| | |
|
| |
|
| |
|
| |
|
|
Net revenues | | | 3,357 | | | 3,947 | | | 7,342 | | | 7,451 |
| | |
|
| |
|
| |
|
| |
|
|
Total non-interest expenses | | | 2,527 | | | 2,812 | | | 5,467 | | | 5,133 |
| | |
|
| |
|
| |
|
| |
|
|
Income from continuing operations before losses from unconsolidated investees, income taxes, dividends on preferred securities subject to mandatory redemption and cumulative effect of accounting change, net | | | 830 | | | 1,135 | | | 1,875 | | | 2,318 |
Losses from unconsolidated investees | | | 67 | | | 81 | | | 140 | | | 174 |
Dividends on preferred securities subject to mandatory redemption | | | — | | | — | | | — | | | 45 |
| | |
|
| |
|
| |
|
| |
|
|
Income from continuing operations before income taxes and cumulative effect of accounting change, net | | $ | 763 | | $ | 1,054 | | $ | 1,735 | | $ | 2,099 |
| | |
|
| |
|
| |
|
| |
|
|
Investment Banking. Investment banking revenues for the quarter declined 18% from the comparable period of fiscal 2004. Advisory fees from merger, acquisition and restructuring transactions were $357 million, an increase of 10% from the comparable period of fiscal 2004, even though industry-wide completion volumes fell 18% over the same period. Advisory revenues in the quarter were the highest since the quarterly levels reached in fiscal 2001 and primarily reflected higher revenues from the real estate sector. Underwriting revenues were $378 million, a decrease of 33% from the comparable period of fiscal 2004. Equity underwriting revenues were $145 million, a decrease of 54% from the exceptionally strong results recorded in the second quarter of fiscal 2004. The decrease primarily reflected lower transaction volume, as industry-wide transaction activity declined 31%. The Company’s equity underwriting revenues reflected decreases from the basic materials, industrial, technology and healthcare sectors, partially offset by higher revenues from the financial services sectors. Fixed income underwriting revenues decreased 8% to $233 million as compared with a 1% increase in industry-wide activity. The decrease primarily reflected lower underwriting revenues from structured fixed income products.
At May 31, 2005, the backlog of equity underwriting and merger, acquisition and restructuring transactions was higher as compared with the second quarter of fiscal 2004, while the backlog of fixed income underwriting transactions was relatively unchanged compared with the second quarter of fiscal 2004. The backlog of merger, acquisition and restructuring transactions and equity and fixed income underwriting transactions is subject to the risk that transactions may not be completed due to unforeseen economic and market conditions, adverse developments regarding one of the parties to the transaction, a failure to obtain required regulatory approval, or a decision on the part of the parties involved not to pursue a transaction.
| | | | |
| | 41 | | |
Investment banking revenues in the six month period ended May 31, 2005 decreased 9% from the comparable period of fiscal 2004. The decrease was due to lower revenues from equity underwriting transactions, partially offset by higher revenues from fixed income underwriting transactions and merger, acquisition and restructuring activities.
Sales and Trading Revenues. Sales and trading revenues are composed of principal transaction trading revenues, commissions and net interest revenues. In assessing the profitability of its sales and trading activities, the Company views principal trading, commissions and net interest revenues in the aggregate. In addition, decisions relating to principal transactions in securities are based on an overall review of aggregate revenues and costs associated with each transaction or series of transactions. This review includes, among other things, an assessment of the potential gain or loss associated with a trade, including any associated commissions, the interest income or expense associated with financing or hedging the Company’s positions and other related expenses.
Sales and trading revenues include the following:
| | | | | | | | | | | | |
| | | Three Months
Ended May 31,
| | Six Months
Ended May 31,
|
| | | 2005
| | 2004
| | 2005
| | 2004
|
| | | (dollars in millions) |
Equity | | $ | 1,119 | | $ | 1,113 | | $ | 2,333 | | $ | 2,218 |
Fixed income(1) | | | 1,323 | | | 1,828 | | | 3,319 | | | 3,479 |
| (1) | Amounts include revenues from interest rate and currency products, credit products and commodities. Amounts exclude revenues from aircraft financing and corporate lending activities. |
Total sales and trading revenues decreased 17% in the quarter ended May 31, 2005 from the comparable period of fiscal 2004, reflecting lower fixed income sales and trading revenues.
Equity sales and trading revenues were essentially flat as compared with the prior year quarter. Record revenues in the prime brokerage business, reflecting growth in global customer balances and new customer activity, were offset by lower equity trading revenues. The trading environment was generally difficult during the quarter due to a lack of market direction, low volatility levels, widening credit spreads and tightening liquidity. Client flows remained steady in the cash and derivatives businesses. Commission revenues continued to be affected by intense competition and a continued shift toward electronic trading.
Fixed income sales and trading revenues decreased 28% from a strong second quarter of fiscal 2004, primarily due to lower revenues from interest rate and currency products and commodity products. Interest rate and currency product revenues decreased 26%, primarily due to lower revenues from foreign exchange products and interest rate derivatives. Lower foreign exchange rate volatility primarily led to the decline in foreign exchange revenues, while mixed U.S. economic data resulted in a less favorable interest rate trading environment. Commodities revenues decreased 66% from the strong level of revenues recorded in the second quarter of fiscal 2004, primarily due to a sharp decline in revenues from electricity products. Credit product revenues increased 1% as higher revenues from securitized products offset lower revenues from corporate credit products, which were affected by widening global credit spreads.
Total sales and trading revenues decreased 2% in the six month period ended May 31, 2005 from the comparable period of fiscal 2004, reflecting lower revenues from fixed income products, partially offset by higher revenues from equity products. Equity sales and trading revenues increased 5%, driven primarily by higher revenues in the prime brokerage and derivatives businesses. Revenues in the prime brokerage business reflected growth in global customer balances and new customer activity. Revenues from derivatives products increased primarily due to higher customer volumes. Fixed income sales and trading revenues decreased 5% primarily due to lower revenues in commodities products. Commodities revenues decreased primarily due to lower revenues from
| | | | |
| | | 42 | | |
electricity and oil liquid products. Credit product revenues increased primarily due to strong demand in securitized products and improved results in distressed debt trading. Interest rate and currency product revenues decreased modestly, primarily due to lower revenues from foreign exchange products, partially offset by higher revenues from emerging market fixed income securities.
In addition to the equity and fixed income sales and trading revenues discussed above, sales and trading revenues include the net interest expense associated with the Company’s aircraft financing activities, as well as net revenues from corporate lending activities. In the quarter and six month period ended May 31, 2005, revenues from corporate lending activities decreased by approximately $70 million and $100 million, respectively, reflecting the impact of wider credit spreads on mark-to-market valuations on a higher level of loans made in the fiscal 2005 periods.
Principal Transactions-Investments. Principal transactions investment revenue decreased 10% in the quarter and increased 17% in the six month period ended May 31, 2005 from the comparable periods of fiscal 2004. The decrease in the quarter was primarily related to a gain on the sale of an investment in TradeWeb that was recorded in the second quarter of fiscal 2004. The increase in the six month period was primarily related to net gains associated with the Company’s principal investment activities.
Other. Other revenues increased 114% and 75% in the quarter and six month periods ended May 31, 2005, primarily driven by revenues associated with Barra, Inc., which was acquired on June 3, 2004. Net rental and other revenues associated with the Company’s aircraft financing activities were relatively unchanged in both the quarter and six month period ended May 31, 2005 when compared with the prior year periods.
At quarter-end, all of the Company’s aircraft were either leased or committed to a lease transaction. Unanticipated events, however, including the sale of additional aircraft or impairment charges, could have an adverse impact on the results of the aircraft financing business. For additional information on the aircraft financing business, see “Discontinued Operations” herein.
Non-Interest Expenses. Non-interest expenses decreased 10% in the quarter but increased 7% in the six month period ended May 31, 2005. Compensation and benefits expense decreased 16% and 5% in the quarter and six month period, respectively, due to lower incentive-based compensation accruals resulting from lower net revenues. Excluding compensation and benefits expense, non-interest expenses were relatively unchanged in the quarter and increased 29% in the six month period. Occupancy and equipment expense increased 29% and 65% in the quarter and six month period, respectively. The increase in both periods included higher rental and maintenance costs. The increase in the six month period also included a $71 million charge for the correction in the method of accounting for certain real estate leases (see “Lease Adjustment” herein). Brokerage, clearing and exchange fees increased 17% and 16% in the quarter and six month period, respectively, primarily reflecting increased trading activity. Information processing and communications expense increased 17% and 18% in the quarter and six month period, respectively, primarily due to higher telecommunication, data processing and market data costs. Professional services expense increased 33% and 32% in the quarter and six month period, respectively, primarily due to higher consulting and legal costs, including costs related to theColeman Litigation. Other expenses decreased 39% in the quarter but increased 39% in the six month period. The decrease in the quarter was primarily due to an aircraft impairment charge of $107 million that was recorded in the prior year. The current quarter included legal accruals of approximately $120 million related to theParmalat Matter (see Note 9 to the condensed consolidated financial statements and “Legal Proceedings” in Part II, Item 1), while the prior year quarter included legal accruals of approximately $110 million related to theParmalat Matter andIPO Allocation Matters.The increase in Other expenses in the six month period reflected a $360 million charge related to theColeman Litigation (see Note 9 to the condensed consolidated financial statements and “Legal Proceedings” in Part II, Item 1), while the prior year second quarter included the aircraft impairment charge of $107 million.
| | | | |
| | 43 | | |
INDIVIDUAL INVESTOR GROUP
INCOME STATEMENT INFORMATION
| | | | | | | | | | | | | | | |
| | | Three Months
Ended May 31,
| | | Six Months
Ended May 31,
|
| | | 2005
| | | 2004
| | | 2005
| | | 2004
|
Revenues: | | | | | | | | | | | | | | | |
Investment banking | | $ | 68 | | | $ | 82 | | | $ | 139 | | | $ | 159 |
Principal transactions: | | | | | | | | | | | | | | | |
Trading | | | 111 | | | | 141 | | | | 231 | | | | 282 |
Investments | | | (2 | ) | | | (4 | ) | | | (4 | ) | | | — |
Commissions | | | 295 | | | | 336 | | | | 624 | | | | 721 |
Asset management, distribution and administration fees | | | 632 | | | | 557 | | | | 1,239 | | | | 1,068 |
Interest and dividends | | | 149 | | | | 95 | | | | 284 | | | | 188 |
Other | | | 45 | | | | 37 | | | | 83 | | | | 70 |
| | |
|
|
| |
|
|
| |
|
|
| |
|
|
Total revenues | | | 1,298 | | | | 1,244 | | | | 2,596 | | | | 2,488 |
Interest expense | | | 70 | | | | 35 | | | | 130 | | | | 68 |
| | |
|
|
| |
|
|
| |
|
|
| |
|
|
Net revenues | | | 1,228 | | | | 1,209 | | | | 2,466 | | | | 2,420 |
| | |
|
|
| |
|
|
| |
|
|
| |
|
|
Total non-interest expenses | | | 1,110 | | | | 1,077 | | | | 1,995 | | | | 2,122 |
| | |
|
|
| |
|
|
| |
|
|
| |
|
|
Income before taxes and cumulative effective of accounting change, net | | $ | 118 | | | $ | 132 | | | $ | 471 | | | $ | 298 |
| | |
|
|
| |
|
|
| |
|
|
| |
|
|
Investment Banking. Investment banking revenues decreased 17% and 13% in the quarter and six month period ended May 31, 2005 primarily due to lower revenues from fixed income and equity underwriting transactions.
Principal Transactions. Principal transaction trading revenues decreased 21% and 18% in the quarter and six month period ended May 31, 2005 primarily due to lower revenues from fixed income products, reflecting lower customer transaction activity in government, corporate and municipal fixed income securities, partially offset by higher revenues from Unit Investment Trust products.
Commissions. Commission revenues decreased 12% and 13% in the quarter and six month period ended May 31, 2005 due to lower transaction volumes reflecting lower individual investor participation in the equity markets as compared with the prior year periods.
Net Interest. Net interest revenues increased 32% and 28% in the quarter and six month period ended May 31, 2005, primarily due to more favorable net interest spreads earned on client margin activity.
Asset Management, Distribution and Administration Fees. Asset management, distribution and administration fees increased 13% and 16% in the quarter and six month period ended May 31, 2005. An increase in client asset balances resulted in higher fees from investors electing fee-based pricing arrangements, including separately managed accounts.
Client asset balances increased to $613 billion at May 31, 2005 from $579 billion at May 31, 2004. The increase was due to net new assets and market appreciation, reflecting improvement in the global financial markets over the twelve-month period. Client assets in fee-based accounts rose 14% from May 31, 2004 to $165 billion at May 31, 2005 and increased as a percentage of total client assets to 27% from 25% at May 31, 2004.
| | | | |
| | | 44 | | |
Other. Other revenues increased 22% and 19% in the quarter and six month period ended May 31, 2005, primarily due to higher miscellaneous revenues.
Non-Interest Expenses. Non-interest expenses increased 3% in the quarter and decreased 6% in the six month period ended May 31, 2005. The decrease in the six month period was primarily due to the Individual Investor Group’s share ($198 million) of the insurance settlement related to the events of September 11, 2001 (see “Insurance Settlement” herein). Excluding the insurance settlement, non-interest expenses increased 3% in the six month period. Information processing and communications increased 11% and 5% in the quarter and six month period primarily due to an increase in telecommunications expense. Professional services expense increased 30% and 29% in the quarter and six month period largely due to higher sub-advisory fees associated with increased asset and revenue growth, as well as higher consulting fees. The six month period also included higher legal fees. Occupancy and equipment expense increased 24% in the six month period primarily due to a $29 million charge for the correction in the method of accounting for certain real estate leases (see “Lease Adjustment” herein). Other expenses decreased 11% in the six month period, as the prior year included higher litigation expenses related to legal matters within the branch system.
| | | | |
| | 45 | | |
INVESTMENT MANAGEMENT
INCOME STATEMENT INFORMATION
| | | | | | | | | | | | |
| | | Three Months
Ended May 31,
| | Six Months
Ended May 31,
|
| | | 2005
| | 2004
| | 2005
| | 2004
|
Revenues: | | | | | | | | | | | | |
Investment banking | | $ | 11 | | $ | 10 | | $ | 22 | | $ | 23 |
Principal transactions: | | | | | | | | | | | | |
Investments | | | 2 | | | 59 | | | 66 | | | 68 |
Commissions | | | 7 | | | 8 | | | 14 | | | 15 |
Asset management, distribution and administration fees | | | 615 | | | 607 | | | 1,220 | | | 1,211 |
Interest and dividends | | | 3 | | | 1 | | | 6 | | | 3 |
Other | | | 6 | | | 6 | | | 14 | | | 15 |
| | |
|
| |
|
| |
|
| |
|
|
Total revenues | | | 644 | | | 691 | | | 1,342 | | | 1,335 |
Interest expense | | | 2 | | | 1 | | | 4 | | | 3 |
| | |
|
| |
|
| |
|
| |
|
|
Net revenues | | | 642 | | | 690 | | | 1,338 | | | 1,332 |
| | |
|
| |
|
| |
|
| |
|
|
Total non-interest expenses | | | 467 | | | 481 | | | 876 | | | 953 |
| | |
|
| |
|
| |
|
| |
|
|
Income before taxes and cumulative effective of accounting change, net | | $ | 175 | | $ | 209 | | $ | 462 | | $ | 379 |
| | |
|
| |
|
| |
|
| |
|
|
Investment Banking. Investment banking revenues increased 10% in the quarter but decreased 4% in the six month period ended May 31, 2005. The increase in the quarter reflected higher fees from Unit Investment Trust sales, while the decrease in the six month period reflected lower fees from Unit Investment Trust sales.
Principal Transactions. Principal transaction net investment gains aggregating $2 million and $66 million were recognized in the quarter and six month period ended May 31, 2005 as compared with net gains of $59 million and $68 million in the quarter and six month period ended May 31, 2004. The decrease in the quarter primarily reflected lower net gains in the Company’s private equity portfolio.
Asset Management, Distribution and Administration Fees. Investment Management’s period-end and average customer assets under management or supervision were as follows:
| | | | | | | | | | | | | | | | | | |
| | | | | | | Average For the Three
Months Ended
| | Average For the
Six Months Ended
|
| | | At
May 31,
2005
| | At
May 31,
2004
| | May 31,
2005
| | May 31,
2004
| | May 31,
2005
| | May 31,
2004
|
| | | (dollars in billions) |
Assets under management or supervision by distribution channel: | | | | | | | | | | | | | | | | | | |
Retail | | $ | 199 | | $ | 195 | | $ | 201 | | $ | 197 | | $ | 202 | | $ | 199 |
Institutional | | | 217 | | | 189 | | | 219 | | | 187 | | | 222 | | | 179 |
| | |
|
| |
|
| |
|
| |
|
| |
|
| |
|
|
Total | | $ | 416 | | $ | 384 | | $ | 420 | | $ | 384 | | $ | 424 | | $ | 378 |
| | |
|
| |
|
| |
|
| |
|
| |
|
| |
|
|
Assets under management or supervision by asset class: | | | | | | | | | | | | | | | | | | |
Equity | | $ | 206 | | $ | 182 | | $ | 205 | | $ | 183 | | $ | 205 | | $ | 180 |
Fixed income | | | 103 | | | 114 | | | 106 | | | 116 | | | 110 | | | 114 |
Money market | | | 80 | | | 66 | | | 82 | | | 64 | | | 82 | | | 63 |
Other(1) | | | 27 | | | 22 | | | 27 | | | 21 | | | 27 | | | 21 |
| | |
|
| |
|
| |
|
| |
|
| |
|
| |
|
|
Total | | $ | 416 | | $ | 384 | | $ | 420 | | $ | 384 | | $ | 424 | | $ | 378 |
| | |
|
| |
|
| |
|
| |
|
| |
|
| |
|
|
| (1) | Amounts include alternative investment vehicles. |
| | | | |
| | | 46 | | |
Activity in Investment Management’s customer assets under management or supervision were as follows (dollars in billions):
| | | | | | | | | | | | | | | |
| | | Three Months Ended
| | | Six Months Ended
|
| | | May 31,
2005
| | | May 31,
2004
| | | May 31,
2005
| | | May 31,
2004
|
| | | (dollars in billions) |
Balance at beginning of period | | $ | 427 | | | $ | 380 | | | $ | 424 | | | $ | 357 |
Net flows excluding money markets | | | (4 | ) | | | 5 | | | | (12 | ) | | | 7 |
Net flows from money markets | | | (3 | ) | | | 4 | | | | (2 | ) | | | 6 |
Net market (depreciation)/appreciation | | | (4 | ) | | | (5 | ) | | | 6 | | | | 14 |
| | |
|
|
| |
|
|
| |
|
|
| |
|
|
Total net (decrease)/increase | | | (11 | ) | | | 4 | | | | (8 | ) | | | 27 |
| | |
|
|
| |
|
|
| |
|
|
| |
|
|
Balance at end of period | | $ | 416 | | | $ | 384 | | | $ | 416 | | | $ | 384 |
| | |
|
|
| |
|
|
| |
|
|
| |
|
|
Asset management, distribution and administration fees increased 1% in both the quarter and six month period ended May 31, 2005, as higher fund management and administration fees associated with a 9% and 12% increase in average assets under management in the quarter and six month period, respectively, were partly offset by lower distribution and performance fees. In addition, although average equity assets under management increased 12% in the quarter and 14% in the six month period, a greater proportion of these assets were in products generating lower fees as compared with the prior year periods.
As of May 31, 2005, customer assets under management or supervision increased $32 billion from May 31, 2004. The net increase was primarily due to an increase in institutional assets, reflecting an increase in net flows of liquidity products and market appreciation.
Non-Interest Expenses. Non-interest expenses decreased 3% and 8% in the quarter and six month period ended May 31, 2005. The decrease in the six month period was primarily due to Investment Management’s share ($43 million) of the insurance settlement related to the events of September 11, 2001 (see “Insurance Settlement” herein). Excluding the insurance settlement, non-interest expenses decreased 4% in the six month period ended May 31, 2005. Compensation and benefits expense decreased 8% and 2% in the quarter and six month period, primarily reflecting lower incentive-based compensation accruals. Brokerage, clearing and exchange fees decreased 7% and 6% in the quarter and six month period, primarily reflecting lower amortization expense associated with certain open-ended funds. The decrease in amortization expense reflected a lower level of deferred costs in recent periods due to a decrease in sales of certain open-ended funds. Other expenses increased 100% in the quarter, primarily due to a reduction in legal reserves recorded in the prior year period resulting from the resolution of certain legal matters. Other expenses decreased 40% in the six month period, primarily due to a reduction in legal reserves resulting from the resolution of certain legal matters in the first quarter of fiscal 2005.
| | | | |
| | 47 | | |
CREDIT SERVICES
INCOME STATEMENT INFORMATION
| | | | | | | | | | | | | |
| | | Three Months
Ended May 31,
| | Six Months
Ended May 31,
|
| | | 2005
| | | 2004
| | 2005
| | 2004
|
Fees: | | | | | | | | | | | | | |
Merchant, cardmember and other | | $ | 318 | | | $ | 306 | | $ | 626 | | $ | 643 |
Servicing | | | 413 | | | | 485 | | | 939 | | | 1,057 |
Other | | | (2 | ) | | | 16 | | | — | | | 21 |
| | |
|
|
| |
|
| |
|
| |
|
|
Total non-interest revenues | | | 729 | | | | 807 | | | 1,565 | | | 1,721 |
| | |
|
|
| |
|
| |
|
| |
|
|
Interest revenue | | | 544 | | | | 435 | | | 1,012 | | | 915 |
Interest expense | | | 186 | | | | 163 | | | 359 | | | 337 |
| | |
|
|
| |
|
| |
|
| |
|
|
Net interest income | | | 358 | | | | 272 | | | 653 | | | 578 |
Provision for consumer loan losses | | | 209 | | | | 200 | | | 344 | | | 462 |
| | |
|
|
| |
|
| |
|
| |
|
|
Net credit income | | | 149 | | | | 72 | | | 309 | | | 116 |
| | |
|
|
| |
|
| |
|
| |
|
|
Net revenues | | | 878 | | | | 879 | | | 1,874 | | | 1,837 |
| | |
|
|
| |
|
| |
|
| |
|
|
Total non-interest expenses | | | 636 | | | | 581 | | | 1,252 | | | 1,174 |
| | |
|
|
| |
|
| |
|
| |
|
|
Income before taxes and cumulative effect of accounting change, net | | $ | 242 | | | $ | 298 | | $ | 622 | | $ | 663 |
| | |
|
|
| |
|
| |
|
| |
|
|
Merchant, Cardmember and Other Fees. Merchant, cardmember and other fees increased 4% in the quarter ended May 31, 2005 primarily due to higher transaction processing revenues, merchant discount revenues and late payment fees, partially offset by the allocation of interchange revenues to certain securitization transactions and higher net cardmember rewards. Merchant, cardmember and other fees decreased 3% in the six month period ended May 31, 2005 primarily due to the allocation of interchange revenues to certain securitization transactions, higher net cardmember rewards and lower overlimit fees, partially offset by higher transaction processing revenues, merchant discount revenues, and balance transfer and late payment fees. The increase in transaction processing revenues in both periods was related to PULSE, which the Company acquired on January 12, 2005 (see “Business Acquisition and Sale” herein). The increase in net cardmember rewards in both periods reflected the impact of promotional programs and record sales volume. The increase in merchant discount revenues in both periods reflected record sales volume. The decline in overlimit fees in the six month period ended May 31, 2005 was due to fewer overlimit accounts and the Company’s modification of its overlimit fee policies and procedures in response to industry-wide regulatory guidance, partially offset by lower charge-offs of such fees. Balance transfer fees in the six month period increased as a result of the Company’s continued focus on improving balance transfer profitability.
| | | | |
| | | 48 | | |
Servicing Fees.
The table below presents the components of servicing fees:
| | | | | | | | | | | | | |
| | | Three Months
Ended May 31,
| | Six Months
Ended May 31,
|
| | | 2005
| | | 2004
| | 2005
| | 2004
|
| | | (dollars in millions) |
Merchant, cardmember and other fees | | $ | 168 | | | $ | 161 | | $ | 339 | | $ | 343 |
Other revenue | | | (36 | ) | | | — | | | 21 | | | 30 |
| | |
|
|
| |
|
| |
|
| |
|
|
Total non-interest revenues | | | 132 | | | | 161 | | | 360 | | | 373 |
| | |
|
|
| |
|
| |
|
| |
|
|
Interest revenue | | | 916 | | | | 1,015 | | | 1,864 | | | 2,059 |
Interest expense | | | 269 | | | | 174 | | | 516 | | | 350 |
| | |
|
|
| |
|
| |
|
| |
|
|
Net interest income | | | 647 | | | | 841 | | | 1,348 | | | 1,709 |
Provision for consumer loan losses | | | 366 | | | | 517 | | | 769 | | | 1,025 |
| | |
|
|
| |
|
| |
|
| |
|
|
Net credit income | | | 281 | | | | 324 | | | 579 | | | 684 |
| | |
|
|
| |
|
| |
|
| |
|
|
Servicing fees | | $ | 413 | | | $ | 485 | | $ | 939 | | $ | 1,057 |
| | |
|
|
| |
|
| |
|
| |
|
|
Servicing fees decreased 15% in the quarter and 11% in the six month period ended May 31, 2005 due to lower net interest cash flows and lower other revenues, partially offset by a lower provision for consumer loan losses. The decrease in net interest cash flows was largely attributable to a lower yield on securitized general purpose credit card loans and a higher weighted average coupon rate paid to investors, as well as a lower level of average securitized general purpose credit card loans. The lower provision for consumer loan losses was primarily attributable to a lower rate of net principal charge-offs related to the securitized general purpose credit card loan portfolio. The decline in the Other revenue component of servicing fees in the quarter and six month period was primarily due to lower levels of mortgage whole loan sales and an approximate $20 million charge for the impairment of mortgage servicing rights recorded in the quarter due to a decrease in fair value as a result of rising prepayments. In the six month period, this decline in Other revenue was partly offset by higher levels of general purpose credit card and mortgage loan securitization transactions.
The following table presents net proceeds received from consumer loan sales:
| | | | | | | | | | | | |
| | | Three Months
Ended May 31,
| | Six Months
Ended May 31,
|
| | | 2005
| | 2004
| | 2005
| | 2004
|
| | | (dollars in millions) |
General purpose credit card asset securitizations | | $ | — | | $ | — | | $ | 3,419 | | $ | 1,946 |
Mortgage loan securitization | | | — | | | — | | | 754 | | | — |
Mortgage whole loan sales | | | 262 | | | 1,239 | | | 781 | | | 2,489 |
| | |
|
| |
|
| |
|
| |
|
|
Net proceeds from consumer loan sales | | $ | 262 | | $ | 1,239 | | $ | 4,954 | | $ | 4,435 |
| | |
|
| |
|
| |
|
| |
|
|
The credit card asset securitization transactions completed in the six month period ended May 31, 2005 have expected maturities ranging from approximately three to five years from the date of issuance. The mortgage loan securitization transaction completed in the six month period ended May 31, 2005 has an expected maturity of approximately eight years from the date of issuance.
Net Interest Income. Net interest income increased 32% and 13% in the quarter and six month period ended May 31, 2005 due to a higher interest spread resulting primarily from an increase in interest revenue, partially offset by an increase in interest expense. The increase in interest revenue in both periods was primarily due to an increase in average general purpose credit card loans. In the quarter, the increase was also due to a higher yield
| | | | |
| | 49 | | |
on general purpose credit card loans. In the six month period, the increase in net interest income was partially offset by a lower yield on general purpose credit card loans, reflecting a higher level of general purpose credit cards with promotional interest rates, coupled with a decline in higher rate loans to higher risk cardmembers. The increase in interest expense in both periods was primarily due to a higher level of average interest bearing liabilities.
The following tables present analyses of Credit Services average balance sheets and interest rates for the quarters and six months ended May 31, 2005 and 2004 and changes in net interest income during those periods:
Average Balance Sheet Analysis.
| | | | | | | | | | | | | | | | | | | | | | |
| | | Three Months Ended May 31,
| |
| | | 2005
| | | 2004
| |
| | | Average Balance
| | | Rate
| | | Interest
| | | Average Balance
| | | Rate
| | | Interest
| |
| | | (dollars in millions) | |
ASSETS | | | | | | | | | | | | | | | | | | | | | | |
Interest earning assets: | | | | | | | | | | | | | | | | | | | | | | |
General purpose credit card loans | | $ | 18,753 | | | 10.56 | % | | $ | 499 | | | $ | 16,202 | | | 9.93 | % | | $ | 405 | |
Other consumer loans | | | 976 | | | 6.38 | | | | 16 | | | | 1,343 | | | 5.16 | | | | 18 | |
Investment securities | | | 136 | | | 0.67 | | | | — | | | | 111 | | | 0.67 | | | | — | |
Other | | | 3,293 | | | 3.46 | | | | 29 | | | | 2,679 | | | 1.84 | | | | 12 | |
| | |
|
|
| | | | |
|
|
| |
|
|
| | | | |
|
|
|
Total interest earning assets | | | 23,158 | | | 9.32 | | | | 544 | | | | 20,335 | | | 8.50 | | | | 435 | |
Allowance for loan losses | | | (848 | ) | | | | | | | | | | (999 | ) | | | | | | | |
Non-interest earning assets | | | 2,801 | | | | | | | | | | | 2,442 | | | | | | | | |
| | |
|
|
| | | | | | | | |
|
|
| | | | | | | |
Total assets | | $ | 25,111 | | | | | | | | | | $ | 21,778 | | | | | | | | |
| | |
|
|
| | | | | | | | |
|
|
| | | | | | | |
LIABILITIES AND SHAREHOLDER’S EQUITY | | | | | | | | | | | | | | | | | | | | | | |
Interest bearing liabilities: | | | | | | | | | | | | | | | | | | | | | | |
Interest bearing deposits | | | | | | | | | | | | | | | | | | | | | | |
Savings | | $ | 656 | | | 2.57 | % | | $ | 4 | | | $ | 699 | | | 0.83 | % | | $ | 1 | |
Brokered | | | 9,933 | | | 4.37 | | | | 109 | | | | 8,922 | | | 5.08 | | | | 114 | |
Other time | | | 2,374 | | | 3.63 | | | | 22 | | | | 1,386 | | | 4.29 | | | | 15 | |
| | |
|
|
| | | | |
|
|
| |
|
|
| | | | |
|
|
|
Total interest bearing deposits | | | 12,963 | | | 4.15 | | | | 135 | | | | 11,007 | | | 4.71 | | | | 130 | |
Other borrowings | | | 5,231 | | | 3.85 | | | | 51 | | | | 4,232 | | | 3.07 | | | | 33 | |
| | |
|
|
| | | | |
|
|
| |
|
|
| | | | |
|
|
|
Total interest bearing liabilities | | | 18,194 | | | 4.06 | | | | 186 | | | | 15,239 | | | 4.26 | | | | 163 | |
Shareholder’s equity/other liabilities | | | 6,917 | | | | | | | | | | | 6,539 | | | | | | | | |
| | |
|
|
| | | | | | | | |
|
|
| | | | | | | |
Total liabilities and shareholder’s equity | | $ | 25,111 | | | | | | | | | | $ | 21,778 | | | | | | | | |
| | |
|
|
| | | | | | | | |
|
|
| | | | | | | |
Net interest income | | | | | | | | | $ | 358 | | | | | | | | | | $ | 272 | |
| | | | | | | | | |
|
|
| | | | | | | | |
|
|
|
Net interest margin(1) | | | | | | | | | | 6.13 | % | | | | | | | | | | 5.31 | % |
Interest rate spread(2) | | | | | | 5.26 | % | | | | | | | | | | 4.24 | % | | | | |
| (1) | Net interest margin represents net interest income as a percentage of total interest earning assets. |
| (2) | Interest rate spread represents the difference between the rate on total interest earning assets and the rate on total interest bearing liabilities. |
| | | | |
| | | 50 | | |
Average Balance Sheet Analysis.
| | | | | | | | | | | | | | | | | | | | | | |
| | | Six Months Ended May 31,
| |
| | | 2005
| | | 2004
| |
| | | Average
Balance
| | | Rate
| | | Interest
| | | Average
Balance
| | | Rate
| | | Interest
| |
| | | (dollars in millions) | |
ASSETS | | | | | | | | | | | | | | | | | | | | | | |
Interest earning assets: | | | | | | | | | | | | | | | | | | | | | | |
General purpose credit card loans | | $ | 18,979 | | | 9.81 | % | | $ | 929 | | | $ | 17,036 | | | 10.03 | % | | $ | 855 | |
Other consumer loans | | | 1,103 | | | 6.06 | | | | 34 | | | | 1,347 | | | 5.22 | | | | 35 | |
Investment securities | | | 134 | | | 0.67 | | | | — | | | | 107 | | | 0.72 | | | | — | |
Other | | | 2,930 | | | 3.36 | | | | 49 | | | | 2,680 | | | 1.82 | | | | 25 | |
| | |
|
|
| | | | |
|
|
| |
|
|
| | | | |
|
|
|
Total interest earning assets | | | 23,146 | | | 8.76 | | | | 1,012 | | | | 21,170 | | | 8.64 | | | | 915 | |
Allowance for loan losses | | | (893 | ) | | | | | | | | | | (997 | ) | | | | | | | |
Non-interest earning assets | | | 2,886 | | | | | | | | | | | 2,458 | | | | | | | | |
| | |
|
|
| | | | | | | | |
|
|
| | | | | | | |
Total assets | | $ | 25,139 | | | | | | | | | | $ | 22,631 | | | | | | | | |
| | |
|
|
| | | | | | | | |
|
|
| | | | | | | |
LIABILITIES AND SHAREHOLDER’S EQUITY | | | | | | | | | | | | | | | | | | | | | | |
Interest bearing liabilities: | | | | | | | | | | | | | | | | | | | | | | |
Interest bearing deposits | | | | | | | | | | | | | | | | | | | | | | |
Savings | | $ | 651 | | | 2.33 | % | | $ | 8 | | | $ | 719 | | | 0.84 | % | | $ | 3 | |
Brokered | | | 9,382 | | | 4.45 | | | | 208 | | | | 9,251 | | | 5.10 | | | | 236 | |
Other time | | | 2,742 | | | 3.38 | | | | 46 | | | | 1,673 | | | 3.80 | | | | 32 | |
| | |
|
|
| | | | |
|
|
| |
|
|
| | | | |
|
|
|
Total interest bearing deposits | | | 12,775 | | | 4.11 | | | | 262 | | | | 11,643 | | | 4.65 | | | | 271 | |
Other borrowings | | | 5,415 | | | 3.61 | | | | 97 | | | | 4,598 | | | 2.87 | | | | 66 | |
| | |
|
|
| | | | |
|
|
| |
|
|
| | | | |
|
|
|
Total interest bearing liabilities | | | 18,190 | | | 3.96 | | | | 359 | | | | 16,241 | | | 4.15 | | | | 337 | |
Shareholder’s equity/other liabilities | | | 6,949 | | | | | | | | | | | 6,390 | | | | | | | | |
| | |
|
|
| | | | | | | | |
|
|
| | | | | | | |
Total liabilities and shareholder’s equity | | $ | 25,139 | | | | | | | | | | $ | 22,631 | | | | | | | | |
| | |
|
|
| | | | | | | | |
|
|
| | | | | | | |
Net interest income | | | | | | | | | $ | 653 | | | | | | | | | | $ | 578 | |
| | | | | | | | | |
|
|
| | | | | | | | |
|
|
|
Net interest margin(1) | | | | | | | | | | 5.65 | % | | | | | | | | | | 5.46 | % |
Interest rate spread(2) | | | | | | 4.80 | % | | | | | | | | | | 4.49 | % | | | | |
| (1) | Net interest margin represents net interest income as a percentage of total interest earning assets. |
| (2) | Interest rate spread represents the difference between the rate on total interest earning assets and the rate on total interest bearing liabilities. |
| | | | |
| | 51 | | |
Rate/Volume Analysis.
| | | | | | | | | | | | | | | | | | | | | | | | |
| | | Three Months Ended
May 31, 2005 vs. 2004
| | | Six Months Ended
May 31, 2005 vs. 2004
| |
Increase/(Decrease) due to Changes in:
| | Volume
| | | Rate
| | | Total
| | | Volume
| | | Rate
| | | Total
| |
| | | (dollars in millions) | |
Interest Revenue | | | | | | | | | | | | | | | | | | | | | | | | |
General purpose credit card loans | | $ | 64 | | | $ | 30 | | | $ | 94 | | | $ | 95 | | | $ | (21 | ) | | $ | 74 | |
Other consumer loans | | | (5 | ) | | | 3 | | | | (2 | ) | | | (6 | ) | | | 5 | | | | (1 | ) |
Other | | | 3 | | | | 14 | | | | 17 | | | | 2 | | | | 22 | | | | 24 | |
| | | | | | | | | | |
|
|
| | | | | | | | | |
|
|
|
Total interest revenue | | | 61 | | | | 48 | | | | 109 | | | | 83 | | | | 14 | | | | 97 | |
| | | | | | | | | | |
|
|
| | | | | | | | | |
|
|
|
Interest Expense | | | | | | | | | | | | | | | | | | | | | | | | |
Interest bearing deposits: | | | | | | | | | | | | | | | | | | | | | | | | |
Savings | | | — | | | | 3 | | | | 3 | | | | — | | | | 5 | | | | 5 | |
Brokered | | | 13 | | | | (18 | ) | | | (5 | ) | | | 3 | | | | (31 | ) | | | (28 | ) |
Other time | | | 11 | | | | (4 | ) | | | 7 | | | | 20 | | | | (6 | ) | | | 14 | |
| | | | | | | | | | |
|
|
| | | | | | | | | |
|
|
|
Total interest bearing deposits | | | 23 | | | | (18 | ) | | | 5 | | | | 26 | | | | (35 | ) | | | (9 | ) |
Other borrowings | | | 8 | | | | 10 | | | | 18 | | | | 11 | | | | 20 | | | | 31 | |
| | | | | | | | | | |
|
|
| | | | | | | | | |
|
|
|
Total interest expense | | | 32 | | | | (9 | ) | | | 23 | | | | 39 | | | | (17 | ) | | | 22 | |
| | | | | | | | | | |
|
|
| | | | | | | | | |
|
|
|
Net interest income | | $ | 29 | | | $ | 57 | | | $ | 86 | | | $ | 44 | | | $ | 31 | | | $ | 75 | |
| | |
|
|
| |
|
|
| |
|
|
| |
|
|
| |
|
|
| |
|
|
|
In response to industry-wide regulatory guidance, the Company has increased minimum payment requirements on certain general purpose credit card loans and is reviewing minimum payment requirements on other general purpose credit card loans. Bank regulators have broad discretion to change the guidance or its application, and changes in such guidance or its application by the regulators could impact minimum payment requirements. A change in minimum payment requirements may impact future levels of general purpose credit card loans and related interest and fee revenue and charge-offs.
Provision for Consumer Loan Losses. The provision for consumer loan losses increased 5% in the quarter but decreased 26% in the six month period ended May 31, 2005. The increase in the quarter primarily reflected a lower release of reserves in the second quarter of fiscal 2005 as compared with the second quarter of fiscal 2004. The decrease in the six month period ended May 31, 2005 reflected a higher release of reserves. The release of reserves totaled $11 million and $101 million in the quarter and six month period ended May 31, 2005, respectively, as compared with $47 million and $48 million in the comparable prior year periods, respectively. Both fiscal 2005 periods also reflected lower net principal charge-offs resulting from continued improvement in credit quality.
Delinquencies and Charge-offs. Delinquency rates in both the over 30- and over 90-day categories and net principal charge-off rates were lower for both the owned and managed portfolios, reflecting improvements in portfolio credit quality (see “Managed General Purpose Credit Card Loan Data” herein).
The Company expects charge-offs to increase in the second half of fiscal 2005 as compared with the first half of fiscal 2005 as personal bankruptcy claims may rise in anticipation of the new U.S. bankruptcy legislation, which is scheduled to become effective in October 2005.
Non-Interest Expenses. Non-interest expenses increased 9% and 7% in the quarter and six month period ended May 31, 2005. Compensation and benefits expense increased 9% and 10% in the quarter and six month period, partially due to higher employment levels. Excluding compensation and benefits expense, non-interest expenses increased 10% and 5% in the quarter and six month period ended May 31, 2005. Marketing and business development expenses increased 23% and 12% in the quarter and six month period due to increased marketing and advertising costs. Professional services expenses increased 14% and 10% in the quarter and six month period due to an increase in legal and account collection fees. The six month period also reflected higher consulting fees
| | | | |
| | | 52 | | |
associated with the acquisition of PULSE (see “Business Acquisition and Sale” herein). Other expenses decreased 5% in the six month period, primarily reflecting a decrease in certain operating expenses, including lower losses associated with cardmember fraud.
Managed General Purpose Credit Card Loan Data. The Company analyzes its financial performance on both a “managed” loan basis and as reported under U.S. Generally Accepted Accounting Principles (“U.S. GAAP”) (“owned” loan basis). Managed loan data assume that the Company’s securitized loan receivables have not been sold and present the results of the securitized loan receivables in the same manner as the Company’s owned loans. The Company operates its Credit Services business and analyzes its financial performance on a managed basis. Accordingly, underwriting and servicing standards are comparable for both owned and securitized loans. The Company believes that managed loan information is useful to investors because it provides information regarding the quality of loan origination and credit performance of the entire managed portfolio and allows investors to understand the related credit risks inherent in owned loans and retained interests in securitizations. In addition, investors often request information on a managed basis, which provides a more meaningful comparison with industry competitors.
The following table provides a reconciliation of owned and managed average loan balances, interest yields and interest rate spreads for the periods indicated:
Reconciliation of General Purpose Credit Card Loan Data (dollars in millions)
| | | | | | | | | | | | | | | | | | |
| | | Three Months Ended May 31,
| |
| | | 2005
| | | 2004
| |
| | | Average
Balance
| | Interest
Yield
| | | Interest
Rate
Spread
| | | Average
Balance
| | Interest
Yield
| | | Interest
Rate
Spread
| |
General Purpose Credit Card Loans: | | | | | | | | | | | | | | | | | | |
Owned | | $ | 18,753 | | 10.56 | % | | 6.50 | % | | $ | 16,202 | | 9.93 | % | | 5.67 | % |
Securitized | | | 28,393 | | 12.43 | % | | 8.90 | % | | | 30,727 | | 12.91 | % | | 10.77 | % |
| | |
|
| | | | | | | |
|
| | | | | | |
Managed | | $ | 47,146 | | 11.69 | % | | 7.96 | % | | $ | 46,929 | | 11.88 | % | | 9.06 | % |
| | |
|
| | | | | | | |
|
| | | | | | |
| |
| | | Six Months Ended May 31,
| |
| | | 2005
| | | 2004
| |
| | | Average
Balance
| | Interest
Yield
| | | Interest
Rate
Spread
| | | Average
Balance
| | Interest
Yield
| | | Interest
Rate
Spread
| |
General Purpose Credit Card Loans: | | | | | | | | | | | | | | | | | | |
Owned | | $ | 18,979 | | 9.81 | % | | 5.85 | % | | $ | 17,036 | | 10.03 | % | | 5.88 | % |
Securitized | | | 29,049 | | 12.53 | % | | 9.17 | % | | | 30,757 | | 13.15 | % | | 10.98 | % |
| | |
|
| | | | | | | |
|
| | | | | | |
Managed | | $ | 48,028 | | 11.46 | % | | 7.88 | % | | $ | 47,793 | | 12.04 | % | | 9.21 | % |
| | |
|
| | | | | | | |
|
| | | | | | |
| | | | |
| | 53 | | |
The following tables present a reconciliation of owned and managed general purpose credit card loans and delinquency and net charge-off rates.
Reconciliation of General Purpose Credit Card Loan Asset Quality Data (dollars in millions)
| | | | | | | | | | | | | | | | | | |
| | | Three Months Ended May 31,
| |
| | | 2005
| | | 2004
| |
| | | | | Delinquency
Rates
| | | | | Delinquency
Rates
| |
| | | Period
End
Loans
| | Over
30
Days
| | | Over
90
Days
| | | Period
End
Loans
| | Over
30
Days
| | | Over
90
Days
| |
General Purpose Credit Card Loans: | | | | | | | | | | | | | | | | | | |
Owned | | $ | 19,385 | | 3.48 | % | | 1.64 | % | | $ | 17,506 | | 4.37 | % | | 2.15 | % |
Securitized | | | 27,460 | | 4.19 | % | | 1.97 | % | | | 29,322 | | 5.18 | % | | 2.55 | % |
| | |
|
| | | | | | | |
|
| | | | | | |
Managed | | $ | 46,845 | | 3.90 | % | | 1.83 | % | | $ | 46,828 | | 4.88 | % | | 2.40 | % |
| | |
|
| | | | | | | |
|
| | | | | | |
| | | | | | | | | | | | |
| | | Three Months
Ended
May 31,
| | | Six Months
Ended
May 31,
| |
| | | 2005
| | | 2004
| | | 2005
| | | 2004
| |
Net Principal Charge-offs | | | | | | | | | | | | |
Owned | | 4.62 | % | | 6.02 | % | | 4.62 | % | | 5.91 | % |
Securitized | | 5.15 | % | | 6.73 | % | | 5.30 | % | | 6.67 | % |
Managed | | 4.94 | % | | 6.48 | % | | 5.03 | % | | 6.40 | % |
| | | | |
Net Total Charge-offs (inclusive of interest and fees) | | | | | | | | | | | | |
Owned | | 6.26 | % | | 8.57 | % | | 6.37 | % | | 8.26 | % |
Securitized | | 7.36 | % | | 9.55 | % | | 7.58 | % | | 9.55 | % |
Managed | | 6.92 | % | | 9.21 | % | | 7.10 | % | | 9.09 | % |
| | | | |
| | | 54 | | |
Other Items.
Coleman Litigation.
On May 16, 2005, the jury in the litigation captionedColeman (Parent) Holdings, Inc. v. Morgan Stanley & Co., Inc. (“Coleman litigation”) returned a verdict in favor of Coleman (Parent) Holdings, Inc. (“CPH”) with respect to its claims against Morgan Stanley & Co. Incorporated (“MS&Co.”) and awarded CPH $604 million in compensatory damages. On May 18, 2005, the jury awarded CPH an additional $850 million in punitive damages. On June 23, 2005, the state court of Palm Beach County, Florida entered its final judgment, awarding CPH $208 million for prejudgment interest and deducting $84 million from the award because of the settlements of related claims CPH entered into with others, resulting in a total judgment against MS&Co. of $1,578 million. On June 27, 2005, MS&Co. filed its notice of appeal and posted a bond which automatically stayed execution of the judgment pending appeal.
The Company believes, after consultation with outside counsel, that it is probable that the compensatory and punitive damages awards will be overturned on appeal and the case remanded for a new trial. Taking into account the advice of outside counsel, the Company is maintaining a reserve of $360 million for the Coleman litigation, which it believes to be a reasonable estimate, under SFAS No. 5, “Accounting for Contingencies,” of the low end of the range of its probable exposure in the event the judgment is overturned and the case remanded for a new trial. If the compensatory and/or punitive awards are ultimately upheld on appeal, in whole or in part, the Company may incur an additional expense equal to the difference between the amount affirmed on appeal (and post-judgment interest thereon) and the amount of the reserve. While the Company cannot predict with certainty the amount of such additional expense, such additional expense could have a material adverse effect on the condensed consolidated financial condition of the Company and/or the Company’s or Institutional Securities operating results for a particular future period, and the upper end of the range could exceed $1.2 billion. For further information, see “Legal Proceedings” in Part II, Item 1.
Parmalat.
On June 23, 2005, the Company and its subsidiaries Morgan Stanley & Co. International Ltd. and Morgan Stanley Bank International Ltd. entered into a proposed settlement agreement (the “Parmalat Agreement”) with the administrator of Parmalat. Pursuant to the Parmalat Agreement, the Company agreed to pay €155 million to Parmalat as part of a global settlement of all existing and potential claims between the Company and Parmalat, while preserving the Company’s €35 million claim which was admitted in December 2004 in the administration of Parmalat. The Parmalat Agreement is subject to the approval of the Italian Government.
Discover Spin-off.
On April 4, 2005, the Company announced that its board of directors authorized management to pursue a spin-off of Discover Financial Services (“Discover”). The Company continues to analyze the merits of a spin-off, with focus on how to ensure the transaction enhances overall shareholder value and positions Discover as a stand-alone public company. Management’s recommendations are to be reported to the Company’s Board of Directors for final determination.
Business Acquisition and Sale.
On January 12, 2005, the Company completed the acquisition of PULSE, a U.S.-based automated teller machine/debit network currently serving banks, credit unions and savings institutions. The Company believes that the combination of the PULSE network and the Discover Network will create a leading electronic payments company offering a full range of products and services for financial institutions, consumers and merchants. As of the date of acquisition, the results of PULSE are included within the Credit Services business segment. The Company recorded goodwill and other intangible assets of $321 million in connection with the acquisition (see Note 18 to the condensed consolidated financial statements).
| | | | |
| | 55 | | |
In February 2005, the Company sold its 50% interest in POSIT, an equity crossing system that matches institutional buyers and sellers, to Investment Technology Group, Inc. The Company acquired the POSIT interest as part of its acquisition of Barra, Inc. in June 2004. As a result of the sale, the net carrying amount of intangible assets decreased by approximately $75 million (see Note 2 to the condensed consolidated financial statements).
Insurance Settlement.
On September 11, 2001, the U.S. experienced terrorist attacks targeted against New York City and Washington, D.C. The attacks in New York resulted in the destruction of the World Trade Center complex, where approximately 3,700 of the Company’s employees were located, and the temporary closing of the debt and equity financial markets in the U.S. Through the implementation of its business recovery plans, the Company relocated its displaced employees to other facilities.
In the first quarter of fiscal 2005, the Company settled its claim with its insurance carriers related to the events of September 11, 2001. The Company recorded a pre-tax gain of $251 million as the insurance recovery was in excess of previously recognized costs related to the terrorist attacks (primarily write-offs of leasehold improvements and destroyed technology and telecommunications equipment in the World Trade Center complex, employee relocation and certain other employee-related expenditures, and other business recovery costs).
The pre-tax gain, which was recorded as a reduction to non-interest expenses, is included within the Individual Investor Group ($198 million), Investment Management ($43 million) and Institutional Securities ($10 million) segments. The insurance settlement was allocated to the respective segments in accordance with the relative damages sustained by each segment.
Stock-Based Compensation.
Effective December 1, 2002, the Company adopted the fair value recognition provisions of SFAS No. 123, “Accounting for Stock-Based Compensation,” as amended by SFAS No. 148, “Accounting for Stock-Based Compensation—Transition and Disclosure, an amendment of FASB Statement No. 123,” using the prospective adoption method for both deferred stock and stock options. Effective December 1, 2004, the Company early adopted SFAS No. 123R, which revised the fair value based method of accounting for share-based payment liabilities, forfeitures and modifications of stock-based awards and clarified SFAS No. 123’s guidance in several areas, including measuring fair value, classifying an award as equity or as a liability and attributing compensation cost to service periods. SFAS No. 123R also amended SFAS No. 95, “Statement of Cash Flows,” to require that excess tax benefits be reported as financing cash inflows rather than as a reduction of taxes paid, which is included within operating cash flows.
Upon adoption of SFAS 123R using the modified prospective approach, the Company recognized an $80 million gain ($49 million after-tax) as a cumulative effect of a change in accounting principle in the first quarter of fiscal 2005 resulting from the requirement to estimate forfeitures at the date of grant instead of recognizing them as incurred. The cumulative effect gain increased both basic and diluted earnings per share by $0.05. In addition, effective December 1, 2004, excess tax benefits associated with stock-based compensation awards are included within cash flows from financing activities in the condensed consolidated statements of cash flows.
In addition, based upon the terms of the Company’s equity-based compensation program, the Company will no longer be able to recognize a portion of the award in the year of grant under SFAS No. 123R as previously allowed under SFAS 123. As a result, fiscal 2005 compensation expense includes the amortization of fiscal 2003 and fiscal 2004 awards but does not include any amortization for fiscal 2005 year-end awards. This will have the effect of reducing compensation expense in fiscal 2005. If SFAS No. 123R were not in effect, fiscal 2005’s compensation expense would have included three years of amortization (i.e., for awards granted in fiscal 2003, fiscal 2004 and fiscal 2005). In addition, the fiscal 2005 year-end awards, which will begin to be amortized in fiscal 2006, will be amortized over a shorter period (primarily 2 and 3 years) as compared with awards granted in fiscal 2004 and fiscal 2003 (primarily 3 and 4 years).
| | | | |
| | | 56 | | |
Lease Adjustment.
Prior to the first quarter of fiscal 2005, the Company did not record the effects of scheduled rent increases and rent-free periods for certain real estate leases on a straight-line basis. In addition, the Company had been accounting for certain tenant improvement allowances as reductions to the related leasehold improvements instead of recording funds received as deferred rent and amortizing them as reductions to lease expense over the lease term. In the first quarter of fiscal 2005, the Company changed its method of accounting for these rent escalation clauses, rent-free periods and tenant improvement allowances to properly reflect lease expense over the lease term on a straight-line basis. The cumulative effect of this correction resulted in the Company recording $109 million of additional rent expense in the first quarter of fiscal 2005. The impact of this change was included within non-interest expenses and reduced income before taxes within the Institutional Securities ($71 million), Individual Investor Group ($29 million), Investment Management ($5 million) and Credit Services ($4 million) segments. The impact of this correction to the current six month period and prior periods was not material to the pre-tax income of each of the segments or to the Company.
Discontinued Operations.
During fiscal 2004, the Company entered into agreements for the sale of certain aircraft and, accordingly, such aircraft had been designated as “held for sale” in accordance with SFAS No. 144, “Accounting for the Impairment or Disposal of Long-Lived Assets” (“SFAS No. 144”). The revenues and expenses associated with these aircraft have been classified as discontinued operations for all periods presented. As of February 3, 2005, all of these aircraft were sold. The Company may sell additional aircraft from time to time.
The Company recorded pre-tax income/(loss) on discontinued operations of $13 million for the six month period ended May 31, 2005 and $(1) million and $2 million for the three and six month periods ended May 31, 2004. The pre-tax income/(loss) from discontinued operations in the quarter and six month period ended May 31, 2004 included a $2 million non-cash pre-tax asset impairment charge.
Income Tax Examinations.
The Company is under continuous examination by the Internal Revenue Service (the “IRS”) and other tax authorities in certain countries, such as Japan and the United Kingdom, and states in which the Company has significant business operations, such as New York. The tax years under examination vary by jurisdiction; for example, the current IRS examination covers 1994-1998. The Company expects the field work for the IRS examination to be completed during 2005 and intends to appeal any proposed adjustments relative to unresolved issues. The Company regularly assesses the likelihood of additional assessments in each of the taxing jurisdictions resulting from these and subsequent years’ examinations. Tax reserves have been established, which the Company believes to be adequate in relation to the potential for additional assessments. Once established, reserves are adjusted only when there is more information available or when an event occurs necessitating a change to the reserves. The Company believes that the resolution of tax matters will not have a material effect on the condensed consolidated financial condition of the Company, although a resolution could have a material impact on the Company’s condensed consolidated statement of income for a particular future period and on the Company’s effective income tax rate.
American Jobs Creation Act of 2004.
In December 2004, the Financial Accounting Standards Board (“FASB”) issued Staff Position (“FSP”) No. 109-2, “Accounting and Disclosure Guidance for the Foreign Earnings Repatriation Provision within the American Jobs Creation Act of 2004.” The American Jobs Creation Act of 2004 (the “Act”), signed into law on October 22, 2004, provides for a special one-time tax deduction, or dividend received deduction (“DRD”), of 85% of qualifying foreign earnings that are repatriated in either a company’s last tax year that began before the enactment date or the first tax year that begins during the one-year period beginning on the enactment date. FSP
| | | | |
| | 57 | | |
109-2 provides entities additional time to assess the effect of repatriating foreign earnings under the Act for purposes of applying SFAS No. 109, “Accounting for Income Taxes,” which typically requires the effect of a new tax law to be recorded in the period of enactment. The Company will elect, if applicable, to apply the DRD to qualifying dividends of foreign earnings repatriated in its fiscal year ending November 30, 2005.
The Company is awaiting further clarifying guidance from the U.S. Treasury Department on certain provisions of the Act. The Company expects to complete its evaluation of the effects of the Act once this guidance is received. Under the limitations on the amount of dividends qualifying for the DRD of the Act, the maximum repatriation of the Company’s foreign earnings that may qualify for the special one-time DRD is approximately $4.0 billion. Therefore, the range of possible amounts of qualifying dividends of foreign earnings is between zero and approximately $4.0 billion. If the final guidance from the U.S. Treasury enables the Company to repatriate foreign earnings under the Act, the income tax on such repatriation could have a material impact on the Company’s effective income tax rate.
| | | | |
| | | 58 | | |
Critical Accounting Policies.
The condensed consolidated financial statements are prepared in accordance with U.S. GAAP, which require the Company to make estimates and assumptions (see Note 1 to the condensed consolidated financial statements). The Company believes that of its significant accounting policies (see Note 2 to the consolidated financial statements for the fiscal year ended November 30, 2004 included in the Form 10-K), the following may involve a higher degree of judgment and complexity.
Fair Value of Financial Instruments. Financial instruments owned and Financial instruments sold, not yet purchased, which include cash and derivative products, are recorded at fair value in the condensed consolidated statements of financial condition, and gains and losses are reflected in principal trading revenues in the condensed consolidated statements of income. Fair value is the amount at which financial instruments could be exchanged in a current transaction between willing parties, other than in a forced or liquidation sale.
The fair value of the Company’s Financial instruments owned and Financial instruments sold, not yet purchased are generally based on observable market prices, observable market parameters or derived from such prices or parameters based on bid prices or parameters for Financial instruments owned and ask prices or parameters for Financial instruments sold, not yet purchased. In the case of financial instruments transacted on recognized exchanges, the observable prices represent quotations for completed transactions from the exchange on which the financial instrument is principally traded. Bid prices represent the highest price a buyer is willing to pay for a financial instrument at a particular time. Ask prices represent the lowest price a seller is willing to accept for a financial instrument at a particular time.
A substantial percentage of the fair value of the Company’s Financial instruments owned and Financial instruments sold, not yet purchased is based on observable market prices, observable market parameters, or is derived from such prices or parameters. The availability of observable market prices and pricing parameters can vary from product to product. Where available, observable market prices and pricing parameters in a product (or a related product) may be used to derive a price without requiring significant judgment. In certain markets, observable market prices or market parameters are not available for all products, and fair value is determined using techniques appropriate for each particular product. These techniques involve some degree of judgment.
The price transparency of the particular product will determine the degree of judgment involved in determining the fair value of the Company’s financial instruments. Price transparency is affected by a wide variety of factors, including, for example, the type of product, whether it is a new product and not yet established in the marketplace, and the characteristics particular to the transaction. Products for which actively quoted prices or pricing parameters are available or for which fair value is derived from actively quoted prices or pricing parameters will generally have a higher degree of price transparency. By contrast, products that are thinly traded or not quoted will generally have reduced to no price transparency. Even in normally active markets, the price transparency for actively quoted instruments may be reduced for periods of time during periods of market dislocation. Alternatively, in thinly quoted markets, the participation of market-makers willing to purchase and sell a product provides a source of transparency for products that otherwise are not actively quoted or during periods of market dislocation.
The Company’s cash products include securities issued by the U.S. government and its agencies, other sovereign debt obligations, corporate and other debt securities, corporate equity securities, exchange traded funds and physical commodities. The fair value of these products is based principally on observable market prices or is derived using observable market parameters. These products generally do not entail a significant degree of judgment in determining fair value. Examples of products for which actively quoted prices or pricing parameters are available or for which fair value is derived from actively quoted prices or pricing parameters include securities issued by the U.S. government and its agencies, exchange traded corporate equity securities, most municipal debt securities, most corporate debt securities, most high-yield debt securities, physical commodities, certain tradable loan products and most mortgage-backed securities.
| | | | |
| | 59 | | |
In certain circumstances, principally involving loan products and other financial instruments held for securitization transactions, the Company determines fair value from within the range of bid and ask prices such that fair value indicates the value likely to be realized in a current market transaction. Bid prices reflect the price that the Company and others pay, or stand ready to pay, to originators of such assets. Ask prices represent the prices that the Company and others require to sell such assets to the entities that acquire the financial instruments for purposes of completing the securitization transactions. Generally, the fair value of such acquired assets is based upon the bid price in the market for the instrument or similar instruments. In general, the loans and similar assets are valued at bid pricing levels until structuring of the related securitization is substantially complete and such that the value likely to be realized in a current transaction is consistent with the price that a securitization entity will pay to acquire the financial instruments. Factors affecting securitized value and investor demand relating specifically to loan products include, but are not limited to, loan type, underlying property type and geographic location, loan interest rate, loan to value ratios, debt service coverage ratio, investor demand and credit enhancement levels.
In addition, some cash products exhibit little or no price transparency, and the determination of the fair value requires more judgment. Examples of cash products with little or no price transparency include certain high-yield debt, certain collateralized mortgage obligations, certain tradable loan products, distressed debt securities (i.e., securities of issuers encountering financial difficulties, including bankruptcy or insolvency) and equity securities that are not publicly traded. Generally, the fair value of these types of cash products is determined using one of several valuation techniques appropriate for the product, which can include cash flow analysis, revenue or net income analysis, default recovery analysis (i.e., analysis of the likelihood of default and the potential for recovery) and other analyses applied consistently.
The following table presents the valuation of the Company’s cash products by level of price transparency (dollars in millions):
| | | | | | | | | | | | |
| | | At May 31, 2005
| | At November 30, 2004
|
| | | Assets
| | Liabilities
| | Assets
| | Liabilities
|
Observable market prices, parameters or derived from observable prices or parameters | | $ | 175,354 | | $ | 91,625 | | $ | 145,327 | | $ | 66,948 |
Reduced or no price transparency | | | 17,609 | | | 441 | | | 9,794 | | | 827 |
| | |
|
| |
|
| |
|
| |
|
|
Total | | $ | 192,963 | | $ | 92,066 | | $ | 155,121 | | $ | 67,775 |
| | |
|
| |
|
| |
|
| |
|
|
The Company’s derivative products include exchange traded and OTC derivatives. Exchange traded derivatives have valuation attributes similar to the cash products valued using observable market prices or market parameters described above. OTC derivatives, whose fair value is derived using pricing models, include a wide variety of instruments, such as interest rate swap and option contracts, foreign currency option contracts, credit and equity swap and option contracts, and commodity swap and option contracts.
The following table presents the fair value of the Company’s exchange traded and OTC derivative assets and liabilities (dollars in millions):
| | | | | | | | | | | | |
| | | At May 31, 2005
| | At November 30, 2004
|
| | | Assets
| | Liabilities
| | Assets
| | Liabilities
|
Exchange traded | | $ | 2,817 | | $ | 6,125 | | $ | 2,754 | | $ | 4,815 |
OTC(1) | | | 39,632 | | | 33,710 | | | 46,721 | | | 38,725 |
| | |
|
| |
|
| |
|
| |
|
|
Total | | $ | 42,449 | | $ | 39,835 | | $ | 49,475 | | $ | 43,540 |
| | |
|
| |
|
| |
|
| |
|
|
| (1) | Effective December 1, 2004 the Company elected to net cash collateral paid or received against its derivatives inventory under credit support annexes. |
| | | | |
| | | 60 | | |
The fair value of OTC derivative contracts is derived primarily using pricing models, which may require multiple market input parameters. Where appropriate, valuation adjustments are made to account for credit quality and market liquidity. These adjustments are applied on a consistent basis and are based upon observable market data where available. In the absence of observable market prices or parameters in an active market, observable prices or parameters of other comparable current market transactions, or other observable data supporting a fair value based on a pricing model at the inception of a contract, fair value is based on the transaction price. The Company also uses pricing models to manage the risks introduced by OTC derivatives. Depending on the product and the terms of the transaction, the fair value of OTC derivative products can be modeled using a series of techniques, including closed form analytic formulae, such as the Black-Scholes option pricing model, simulation models or a combination thereof, applied consistently. In the case of more established derivative products, the pricing models used by the Company are widely accepted by the financial services industry. Pricing models take into account the contract terms, including the maturity, as well as market parameters such as interest rates, volatility and the creditworthiness of the counterparty.
Many pricing models do not entail material subjectivity because the methodologies employed do not necessitate significant judgment, and the pricing inputs are observed from actively quoted markets, as is the case for generic interest rate swap and option contracts. A substantial majority of OTC derivative products valued by the Company using pricing models fall into this category. Other derivative products, typically the newest and most complex products, will require more judgment in the implementation of the modeling technique applied due to the complexity of the modeling assumptions and the reduced price transparency surrounding the model’s market parameters. The Company manages its market exposure for OTC derivative products primarily by entering into offsetting derivative contracts or other related financial instruments. The Company’s trading divisions, the Financial Control Department and the Market Risk Department continuously monitor the price changes of the OTC derivatives in relation to the offsetting positions. For a further discussion of the price transparency of the Company’s OTC derivative products, see “Quantitative and Qualitative Disclosures about Market Risk—Risk Management—Credit Risk” in Part II, Item 7A of the Form 10-K.
The Company employs control processes to validate the fair value of its financial instruments, including those derived from pricing models. These control processes are designed to assure that the values used for financial reporting are based on observable market prices or market-based parameters wherever possible. In the event that market prices or parameters are not available, the control processes are designed to assure that the valuation approach utilized is appropriate and consistently applied and the assumptions are reasonable. These control processes include reviews of the pricing model’s theoretical soundness and appropriateness by Company personnel with relevant expertise who are independent from the trading desks. Additionally, groups independent from the trading divisions within the Financial Control and Market Risk Departments participate in the review and validation of the fair values generated from pricing models, as appropriate. Where a pricing model is used to determine fair value, recently executed comparable transactions and other observable market data are considered for purposes of validating assumptions underlying the model. Consistent with market practice, the Company has individually negotiated agreements with certain counterparties to exchange collateral (“margining”) based on the level of fair values of the derivative contracts they have executed. Through this margining process, one party or both parties to a derivative contract provides the other party with information about the fair value of the derivative contract to calculate the amount of collateral required. This sharing of fair value information provides additional support of the Company’s recorded fair value for the relevant OTC derivative products. For certain OTC derivative products, the Company, along with other market participants, contributes derivative pricing information to aggregation services that synthesize the data and make it accessible to subscribers. This information is then used to evaluate the fair value of these OTC derivative products. For more information regarding the Company’s risk management practices, see “Quantitative and Qualitative Disclosures about Market Risk—Risk Management” in Part II, Item 7A of the Form 10-K.
Allowance for Consumer Loan Losses. The allowance for consumer loan losses in the Company’s Credit Services business is established through a charge to the provision for consumer loan losses. Provisions are made to reserve for estimated losses in outstanding loan balances. The allowance for consumer loan losses is a
| | | | |
| | 61 | | |
significant estimate that represents management’s estimate of probable losses inherent in the consumer loan portfolio. The allowance for consumer loan losses is primarily applicable to the owned homogeneous consumer credit card loan portfolio and is evaluated quarterly for adequacy.
In calculating the allowance for consumer loan losses, the Company uses a systematic and consistently applied approach. The Company regularly performs a migration analysis (a technique used to estimate the likelihood that a consumer loan will progress through the various stages of delinquency and ultimately charge-off) of delinquent and current consumer credit card accounts in order to determine the appropriate level of the allowance for consumer loan losses. The migration analysis considers uncollectible principal, interest and fees reflected in consumer loans. In evaluating the adequacy of the allowance for consumer loan losses, management also considers factors that may impact future credit loss experience, including current economic conditions, recent trends in delinquencies and bankruptcy filings, account collection management, policy changes, account seasoning, loan volume and amounts, payment rates and forecasting uncertainties. A provision for consumer loan losses is charged against earnings to maintain the allowance for consumer loan losses at an appropriate level. The use of different estimates or assumptions could produce different provisions for consumer loan losses (see “Credit Services—Provision for Consumer Loan Losses” herein).
Aircraft under Operating Leases. The Company’s aircraft portfolio has consisted of aircraft to be held and used and aircraft that are to be disposed of by sale (“held for sale”).
Aircraft under operating leases that are to be held and used are stated at cost less accumulated depreciation and impairment charges. Depreciation is calculated on a straight-line basis over the estimated useful life of the aircraft asset, which is generally 25 years from the date of manufacture. In accordance with SFAS No. 144, the Company’s aircraft that are to be held and used are reviewed for impairment whenever events or changes in circumstances indicate that the carrying value of the aircraft may not be recoverable. Under SFAS No. 144, the carrying value of an aircraft may not be recoverable if its projected undiscounted cash flows are less than its carrying value. If an aircraft’s projected undiscounted cash flows are less than its carrying value, the Company will recognize an impairment charge equal to the excess of the carrying value over the fair value of the aircraft. The fair value of the Company’s impaired aircraft is based upon the average market appraisal values obtained from independent appraisal companies. Estimates of future cash flows associated with the aircraft assets as well as the appraisals of fair value are critical to the determination of whether an impairment exists and the amount of the impairment charge, if any (see Note 16 to the condensed consolidated financial statements).
Aircraft under operating leases that fulfill the criteria to be classified as held for sale in accordance with SFAS No. 144 are stated at the lower of carrying value (i.e., cost less accumulated depreciation and impairment charges) or fair value less estimated cost to sell. Depreciation expense is not recorded for aircraft that are classified as held for sale. The Company will recognize a charge for any initial or subsequent write-down to fair value less estimated cost to sell (see Note 16 to the condensed consolidated financial statements). A gain would be recognized for any subsequent increase in fair value less cost to sell, but not in excess of the cumulative loss previously recognized (for a write-down to fair value less cost to sell).
Legal, Regulatory and Tax Contingencies. In the normal course of business, the Company has been named, from time to time, as a defendant in various legal actions, including arbitrations, class actions and other litigation, arising in connection with its activities as a global diversified financial services institution. Certain of the legal actions include claims for substantial compensatory and/or punitive damages or claims for indeterminate amounts of damages. In some cases, the issuers that would otherwise be the primary defendants in such cases are bankrupt or in financial distress. The Company is also involved, from time to time, in other reviews, investigations and proceedings by governmental and self-regulatory agencies (both formal and informal) regarding the Company’s business, including, among other matters, accounting and operational matters, certain of which may result in adverse judgments, settlements, fines, penalties, injunctions or other relief.
Reserves for litigation and regulatory proceedings are generally determined on a case-by-case basis and represent an estimate of probable losses after considering, among other factors, the progress of each case, prior experience
| | | | |
| | | 62 | | |
and the experience of others in similar cases, and the opinions and views of internal and external legal counsel. In view of the inherent difficulty of predicting the outcome of such matters, particularly in cases where claimants seek substantial or indeterminate damages or where investigations and proceedings are in the early stages, the Company cannot predict with certainty the loss or range of loss related to such matters, how such matters will be resolved, when they will ultimately be resolved, or what the eventual settlement, fine, penalty or other relief might be.
The Company is subject to the income tax laws of the U.S., its states and municipalities and those of the foreign jurisdictions in which the Company has significant business operations. These tax laws are complex and subject to different interpretations by the taxpayer and the relevant governmental taxing authorities. The Company must make judgments and interpretations about the application of these inherently complex tax laws when determining the provision for income taxes and must also make estimates about when in the future certain items affect taxable income in the various tax jurisdictions. Disputes over interpretations of the tax laws may be settled with the taxing authority upon examination or audit. The Company regularly assesses the likelihood of assessments in each of the taxing jurisdictions resulting from current and subsequent years’ examinations and tax reserves are established as appropriate.
The Company establishes reserves for potential losses that may arise out of litigation, regulatory proceedings and tax audits to the extent that such losses are probable and can be estimated, in accordance with SFAS No. 5, “Accounting for Contingencies.” Once established, reserves are adjusted when there is more information available or when an event occurs requiring a change. Significant judgment is required in making these estimates and the actual cost of a legal claim, tax assessment or regulatory fine/penalty may ultimately be materially different from the recorded reserves.
See Notes 9 and 19 to the condensed consolidated financial statements for additional information on legal proceedings and tax examinations.
| | | | |
| | 63 | | |
Liquidity and Capital Resources.
The Company’s senior management establishes the overall liquidity and capital policies of the Company. Through various risk and control committees, the Company’s senior management reviews business performance relative to these policies, monitors the availability of alternative sources of financing, and oversees the liquidity and interest rate and currency sensitivity of the Company’s asset and liability position. These committees, along with the Company’s Treasury Department and other control groups, also assist in evaluating, monitoring and controlling the impact that the Company’s business activities have on its consolidated balance sheet, liquidity and capital structure, thereby helping to ensure that its business activities are integrated with the Company’s liquidity and capital policies.
The Company’s liquidity and funding risk management policies are designed to mitigate the potential risk that the Company may be unable to access adequate financing to service its financial obligations when they come due without material, adverse franchise or business impact. The key objectives of the liquidity and funding risk management framework are to support the successful execution of the Company’s business strategies while ensuring ongoing and sufficient liquidity through the business cycle and during periods of financial distress. The principal elements of the Company’s liquidity framework are the cash capital policy, the liquidity reserve and stress testing through the contingency funding plan. Comprehensive financing guidelines (collateralized funding, long-term funding strategy, surplus capacity, diversification, staggered maturities and committed credit facilities) support the Company’s target liquidity profile.
For a more detailed summary of the Company’s Liquidity and Capital Policies and funding sources, including committed credit facilities and off-balance sheet funding, refer to “Management’s Discussion and Analysis of Financial Condition and Results of Operations—Liquidity and Capital Resources” in Part II, Item 7 of the Form 10-K.
The Balance Sheet.
The Company monitors and evaluates the composition and size of its balance sheet. Given the nature of the Company’s market making and customer financing activities, the overall size of the balance sheet fluctuates from time to time. A substantial portion of the Company’s total assets consists of highly liquid marketable securities and short-term receivables arising principally from its Institutional Securities sales and trading activities. The highly liquid nature of these assets provides the Company with flexibility in financing and managing its business.
The Company’s total assets increased to $818.7 billion at May 31, 2005 from $745.5 billion at November 30, 2004. The increase was primarily due to increases in securities purchased under agreements to resell, securities borrowed and financial instruments owned (largely driven by increases in U.S. government and agency securities, corporate and other debt and corporate equities, partially offset by a decrease in derivative contracts). The increase in securities purchased under agreements to resell and securities borrowed was largely due to growth in the Company’s financing related activities.
Balance sheet leverage ratios are one indicator of capital adequacy when viewed in the context of a company’s overall liquidity and capital policies. The Company views the adjusted leverage ratio as a more relevant measure of financial risk when comparing financial services firms and evaluating leverage trends. The Company has adopted a definition of adjusted assets that excludes certain self-funded assets considered to have minimal market, credit and/or liquidity risk. These low-risk assets generally are attributable to the Company’s matched book and securities lending businesses. Adjusted assets are calculated by reducing gross assets by aggregate resale agreements and securities borrowed less non-derivative short positions and assets recorded under certain provisions of SFAS No. 140, “Accounting for Transfers and Servicing of Financial Assets and Extinguishment of Liabilities—a replacement of FASB Statement No. 125,” and FASB Interpretation No. 46, “Consolidation of Variable Interest Entities” (“FIN 46”), as revised. The adjusted leverage ratio reflects the deduction from shareholders’ equity of the amount of equity used to support goodwill and intangible assets (as the Company does not view this amount of equity as available to support its risk capital needs). In addition, the Company views junior subordinated debt issued to capital trusts as a component of its capital base given the inherent
| | | | |
| | | 64 | | |
characteristics of the securities. These characteristics include the long dated nature (final maturity at issuance of 30 years extendible at the Company’s option by a further 19 years), the Company’s ability to defer coupon interest for up to 20 consecutive quarters and the subordinated nature of the obligations in the capital structure. The Company also receives rating agency equity credit for these securities.
The following table sets forth the Company’s total assets, adjusted assets and leverage ratios as of May 31, 2005 and November 30, 2004 and for the average month-end balances during the quarter and six month period ended May 31, 2005:
| | | | | | | | | | | | | | | | |
| | | Balance at
| | | Average Month-End Balance
| |
| | | May 31,
2005
| | | November 30,
2004
| | | For the Quarter
Ended
May 31, 2005
| | | For the Six Month
Period Ended
May 31, 2005
| |
| | | (dollars in millions, except ratio data) | |
Total assets(1) | | $ | 818,711 | | | $ | 745,513 | | | $ | 817,251 | | | $ | 796,818 | |
Less: Securities purchased under agreements to resell | | | (145,579 | ) | | | (123,041 | ) | | | (147,534 | ) | | | (141,999 | ) |
Securities borrowed | | | (228,454 | ) | | | (208,349 | ) | | | (221,570 | ) | | | (217,246 | ) |
Add: Financial instruments sold, not yet purchased | | | 131,901 | | | | 111,315 | | | | 128,267 | | | | 125,343 | |
Less: Derivative contracts sold, not yet purchased | | | (39,835 | ) | | | (43,540 | ) | | | (38,558 | ) | | | (39,891 | ) |
| | |
|
|
| |
|
|
| |
|
|
| |
|
|
|
Subtotal | | | 536,744 | | | | 481,898 | | | | 537,856 | | | | 523,025 | |
Less: Segregated customer cash and securities balances | | | (36,539 | ) | | | (26,534 | ) | | | (30,080 | ) | | | (29,128 | ) |
Assets recorded under certain provisions of SFAS No. 140 and FIN 46, as revised | | | (57,394 | ) | | | (44,895 | ) | | | (56,145 | ) | | | (51,376 | ) |
Goodwill and intangible assets | | | (2,528 | ) | | | (2,199 | ) | | | (2,548 | ) | | | (2,429 | ) |
| | |
|
|
| |
|
|
| |
|
|
| |
|
|
|
Adjusted assets | | $ | 440,283 | | | $ | 408,270 | | | $ | 449,083 | | | $ | 440,092 | |
| | |
|
|
| |
|
|
| |
|
|
| |
|
|
|
Shareholders’ equity | | $ | 28,330 | | | $ | 28,206 | | | $ | 28,419 | | | $ | 28,411 | |
Junior subordinated debt issued to capital trusts | | | 2,894 | | | | 2,897 | | | | 2,880 | | | | 2,886 | |
| | |
|
|
| |
|
|
| |
|
|
| |
|
|
|
Subtotal | | | 31,224 | | | | 31,103 | | | | 31,299 | | | | 31,297 | |
Less: Goodwill and intangible assets | | | (2,528 | ) | | | (2,199 | ) | | | (2,548 | ) | | | (2,429 | ) |
| | |
|
|
| |
|
|
| |
|
|
| |
|
|
|
Tangible shareholders’ equity | | $ | 28,696 | | | $ | 28,904 | | | $ | 28,751 | | | $ | 28,868 | |
| | |
|
|
| |
|
|
| |
|
|
| |
|
|
|
Leverage ratio(2) | | | 28.5 | x | | | 25.8 | x | | | 28.4 | x | | | 27.6 | x |
| | |
|
|
| |
|
|
| |
|
|
| |
|
|
|
Adjusted leverage ratio(3) | | | 15.3 | x | | | 14.1 | x | | | 15.6 | x | | | 15.2 | x |
| | |
|
|
| |
|
|
| |
|
|
| |
|
|
|
| (1) | Effective December 1, 2004 the Company elected to net cash collateral paid or received against its derivatives inventory under credit support annexes. |
| (2) | Leverage ratio equals total assets divided by tangible shareholders’ equity. |
| (3) | Adjusted leverage ratio equals adjusted assets divided by tangible shareholders’ equity. |
Activity in the Six Month Period Ended May 31, 2005.
The Company’s total capital consists of equity capital combined with long-term borrowings (debt obligations scheduled to mature in more than 12 months), junior subordinated debt issued to capital trusts, and Capital Units. At May 31, 2005, total capital was $113.3 billion, an increase of $2.5 billion from November 30, 2004.
During the six month period ended May 31, 2005, the Company issued senior notes aggregating $15.6 billion, including non-U.S. dollar currency notes aggregating $4.1 billion. In connection with the note issuances, the Company has entered into certain transactions to obtain floating interest rates based primarily on short-term London Interbank Offered Rates (“LIBOR”) trading levels. At May 31, 2005, the aggregate outstanding principal amount of the Company’s Senior Indebtedness (as defined in the Company’s public debt shelf registration statements) was approximately $134 billion (including guaranteed obligations of the indebtedness of subsidiaries). The weighted average maturity of the Company’s long-term borrowings, based upon stated maturity dates, was approximately 5 years at May 31, 2005.
| | | | |
| | 65 | | |
During the six month period ended May 31, 2005, the Company purchased approximately $2,276 million of its common stock (approximately 41 million shares) through a combination of open market purchases and purchases from employees at an average cost of $55.13 (see also “Unregistered Sales of Equity Securities and Use of Proceeds” in Part II, Item 2).
Liquidity Management Policies.
The primary goal of the Company’s liquidity and funding activities is to ensure adequate financing over a wide range of potential credit ratings and market environments. Given the highly liquid nature of the Company’s balance sheet, day-to-day funding requirements are largely fulfilled through the use of stable collateralized financing. The Company has centralized management of credit-sensitive unsecured funding sources in the Treasury Department. In order to meet target liquidity requirements and withstand an unforeseen contraction in credit availability, the Company has designed a liquidity management framework.
| | |
Liquidity Management
Framework: | | Designed to: |
| Contingency Funding Plan | | Ascertain the Company’s ability to manage a prolonged liquidity contraction and provide a course of action over a one-year time period to ensure orderly functioning of the businesses. The contingency funding plan sets forth the process and the internal and external communication flows necessary to ensure effective management of the contingency event. Analytical processes exist to periodically evaluate and report the liquidity risk exposures of the organization under management-defined scenarios. |
Cash Capital | | Ensure that the Company can fund its balance sheet while repaying its financial obligations maturing within one year without issuing new unsecured debt. The Company attempts to achieve this by maintaining sufficient cash capital (long-term debt and equity capital) to finance illiquid assets and the portion of its securities inventory that is not expected to be financed on a secured basis in a credit-stressed environment. |
Liquidity Reserve | | Maintain, at all times, a liquidity reserve comprised of immediately available cash and cash equivalents and a pool of unencumbered securities that can be sold or pledged to provide same-day liquidity to the Company. The reserve is periodically assessed and determined based on day-to-day funding requirements and strategic liquidity targets. The liquidity reserve averaged approximately $47 billion for the six month period ended May 31, 2005. |
Liquidity Reserve.
The Company seeks to maintain a target liquidity reserve which is sized to cover daily funding needs and to meet strategic liquidity targets, including coverage of a significant portion of expected cash outflows over a short-term horizon in a potential liquidity crisis. Prior to fiscal 2004, this liquidity reserve was held in the form of cash deposited with banks. Beginning in late fiscal 2004, this liquidity reserve was increased and separated into a cash component and a pool of unencumbered securities. The pool of unencumbered securities, against which funding can be raised, is managed on a global basis, and securities for the pool are chosen accordingly. The U.S. component, held in the form of a reverse repurchase agreement at the parent company, consists largely of U.S. government bonds and at May 31, 2005 was approximately $19 billion and averaged approximately $17 billion for the six month period ended May 31, 2005. The non-U.S. component consists of European government bonds and other high-quality collateral. The parent company cash component of the liquidity reserve at May 31, 2005 was approximately $14 billion and averaged approximately $16 billion for the six month period ended May 31, 2005. The Company believes that diversifying the form in which its liquidity reserve (cash and securities) is maintained enhances its ability to quickly and efficiently source funding in a stressed environment. The Company’s funding requirements and target liquidity reserve may vary based on changes in the level and composition of its balance sheet, timing of specific transactions, client financing activity, market conditions and seasonal factors.
| | | | |
| | | 66 | | |
Committed Credit Facilities.
During the second quarter of fiscal 2005, the Company renewed its committed credit facilities. As of May 31, 2005, the Company’s committed credit facilities include the Morgan Stanley and Morgan Stanley Japan Limited (“MS-MSJL”) Facility, the Morgan Stanley & Co. Incorporated (“MS&Co.”) Facility, and the Morgan Stanley & Co. International Limited (“MSIL”) Facility. Under the MS-MSJL Facility, a group of banks is committed to provide up to $5.5 billion under the U.S. dollar tranche and 70 billion Japanese yen under the Japanese yen tranche. Under the MS&Co. Facility, a group of banks is committed to provide up to $1.8 billion. Under the MSIL Facility, a group of banks is committed to provide up to $1.5 billion. For a more detailed discussion of the Company’s committed credit facilities, refer to “Management’s Discussion and Analysis of Financial Condition and Results of Operations—Liquidity and Capital Resources” in Part II, Item 7 of the Form 10-K.
Credit Ratings.
The Company’s reliance on external sources to finance a significant portion of its day-to-day operations makes access to global sources of financing important. The cost and availability of unsecured financing generally are dependent on the Company’s short-term and long-term credit ratings. Factors that are significant to the determination of the Company’s credit ratings or otherwise affect its ability to raise short-term and long-term financing include the Company’s level and volatility of earnings, relative positions in the markets in which it operates, geographic and product diversification, retention of key personnel, risk management policies, cash liquidity, capital structure, corporate lending credit risk, and legal and regulatory developments. In addition, continuing consolidation in the credit card industry presents Discover Card with stronger competitors that may challenge future growth. A deterioration in any of the previously mentioned factors or combination of these factors may lead rating agencies to downgrade the credit ratings of the Company, thereby increasing the cost to the Company in obtaining unsecured funding. In addition, the Company’s debt ratings can have a significant impact on certain trading revenues, particularly in those businesses where longer term counterparty performance is critical, such as OTC derivative transactions, including credit derivatives and interest rate swaps.
In connection with certain OTC trading agreements and certain other agreements associated with the Institutional Securities business, the Company would be required to provide additional collateral to certain counterparties in the event of a downgrade by either Moody’s Investors Service or Standard & Poor’s. At May 31, 2005, the amount of additional collateral that would be required in the event of a one-notch downgrade of the Company’s senior debt credit rating was approximately $1,125 million. Of this amount, $434 million relates to bilateral arrangements between the Company and other parties where upon the downgrade of one party, the downgraded party must deliver incremental collateral to the other. These bilateral downgrade arrangements are a risk management tool used extensively by the Company as credit exposures are reduced if counterparties are downgraded.
As of June 30, 2005, the Company’s credit ratings were as follows:
| | | | |
| | | Commercial Paper
| | Senior Debt
|
Dominion Bond Rating Service Limited(1) | | R-1 (middle) | | AA (low) |
Fitch Ratings(2) | | F1+ | | AA- |
Moody’s Investors Service(3) | | P-1 | | Aa3 |
Rating and Investment Information, Inc. | | a-1+ | | AA |
Standard & Poor’s(4) | | A-1 | | A+ |
| (1) | On April 5, 2005, Dominion Bond Rating Service Limited changed the outlook on the Company’s senior debt ratings from Stable to Negative. |
| (2) | On April 11, 2005, Fitch Ratings placed the Company’s senior and short term debt ratings on Rating Watch Negative. |
| (3) | On April 5, 2005, Moody’s Investors Service changed the outlook on the Company’s senior debt ratings from Stable to Negative. |
| (4) | On April 15, 2005, Standard & Poor’s changed the outlook on the Company’s senior debt ratings from Stable to Negative. |
| | | | |
| | 67 | | |
Commitments.
The Company’s commitments associated with outstanding letters of credit, principal investments and private equity activities, and lending and financing commitments as of May 31, 2005 are summarized below by period of expiration. Since commitments associated with letters of credit and lending and financing arrangements may expire unused, the amounts shown do not necessarily reflect the actual future cash funding requirements:
| | | | | | | | | | | | | | | |
| | | Remaining
Fiscal
2005
| | Fiscal
2006-2007
| | Fiscal
2008-2009
| | Thereafter
| | Total
|
| | | (dollars in millions) |
Letters of credit(1) | | $ | 6,980 | | $ | 2,003 | | $ | — | | $ | — | | $ | 8,983 |
Principal investment and private equity activities | | | 53 | | | 7 | | | 75 | | | 37 | | | 172 |
Investment grade lending commitments(2) | | | 4,458 | | | 4,682 | | | 10,270 | | | 1,773 | | | 21,183 |
Non-investment grade lending commitments(2) | | | 618 | | | 1,360 | | | 1,726 | | | 1,811 | | | 5,515 |
Commitments for secured lending transactions(3) | | | 7,039 | | | 1,900 | | | 186 | | | 170 | | | 9,295 |
Commitments to purchase mortgage loans(4) | | | 4,302 | | | — | | | — | | | — | | | 4,302 |
| | |
|
| |
|
| |
|
| |
|
| |
|
|
Total(5) | | $ | 23,450 | | $ | 9,952 | | $ | 12,257 | | $ | 3,791 | | $ | 49,450 |
| | |
|
| |
|
| |
|
| |
|
| |
|
|
| (1) | This amount represents the Company’s outstanding letters of credit, which are primarily used to satisfy various collateral requirements. |
| (2) | The Company’s investment grade and non-investment grade lending commitments are made in connection with its corporate lending activities. See “Less Liquid Assets—Lending Activities” herein. Credit ratings are determined by the Company’s Institutional Credit Department using methodologies generally consistent with those employed by external rating agencies. Credit ratings of BB+ or lower are considered non-investment grade. |
| (3) | This amount represents lending commitments extended by the Company to companies that are secured by assets of the borrower. Loans made under these arrangements typically are at variable rates and generally provide for over-collateralization based upon the creditworthiness of the borrower. |
| (4) | This amount represents the Company’s forward purchase contracts involving mortgage loans. |
| (5) | See Note 9 to the condensed consolidated financial statements. |
The table above does not include commitments to extend credit for consumer loans of approximately $260 billion. Such commitments arise primarily from agreements with customers for unused lines of credit on certain credit cards, provided there is no violation of conditions established in the related agreement. These commitments, substantially all of which the Company can terminate at any time and which do not necessarily represent future cash requirements, are periodically reviewed based on account usage and customer creditworthiness (see Note 4 to the condensed consolidated financial statements). In addition, in the ordinary course of business, the Company guarantees the debt and/or certain trading obligations (including obligations associated with derivatives, foreign exchange contracts and the settlement of physical commodities) of certain subsidiaries. These guarantees generally are entity or product specific and are required by investors or trading counterparties. The activities of the subsidiaries covered by these guarantees (including any related debt or trading obligations) are included in the Company’s condensed consolidated financial statements.
At May 31, 2005, the Company had commitments to enter into reverse repurchase and repurchase agreements of approximately $78 billion and $96 billion, respectively.
Less Liquid Assets.
At May 31, 2005, certain assets of the Company, such as real property, equipment and leasehold improvements of $2.7 billion, aircraft assets of $3.7 billion, and goodwill and intangible assets of $2.5 billion, were illiquid. Certain equity investments made in connection with the Company’s private equity and other principal investment activities, certain high-yield debt securities, certain collateralized mortgage obligations and mortgage-related loan products, bridge financings, and certain senior secured loans and positions also are not highly liquid.
At May 31, 2005, the Company had aggregate principal investments associated with its private equity and other principal investment activities (including direct investments and partnership interests) with a carrying value of approximately $1.0 billion, of which approximately $400 million represented the Company’s investments in its real estate funds.
| | | | |
| | | 68 | | |
High-Yield Instruments. In connection with the Company’s fixed income securities activities, the Company underwrites, trades, invests and makes markets in non-investment grade instruments (“high-yield instruments”). For purposes of this discussion, high-yield instruments are defined as fixed income, emerging market, preferred equity securities and distressed debt rated BB+ or lower (or equivalent ratings by recognized credit rating agencies) as well as non-rated securities which, in the opinion of the Company, contain credit risks associated with non-investment grade instruments. For purposes of this discussion, positions associated with the Company’s credit derivatives business are not included because reporting gross market value exposures would not accurately reflect the risks associated with these positions due to the manner in which they are risk-managed. High-yield instruments generally involve greater risk than investment grade securities due to the lower credit ratings of the issuers, which typically have relatively high levels of indebtedness and, therefore, are more sensitive to adverse economic conditions. In addition, the market for high-yield instruments can be characterized as having periods of higher volatility and reduced liquidity. The Company monitors total inventory positions and risk concentrations for high-yield instruments in a manner consistent with the Company’s market risk management policies and control structure. The Company manages its aggregate and single-issuer net exposure through the use of derivatives and other financial instruments. The Company records high-yield instruments at fair value. Unrealized gains and losses are recognized currently in the condensed consolidated statements of income.
The fair value of the Company’s high-yield instruments owned and high-yield instruments sold, not yet purchased are shown below:
| | | | | | |
| | | At May 31, 2005
| | At November 30, 2004
|
| | | (dollars in billions) |
High-yield instruments owned | | $ | 12.0 | | $ | 7.2 |
High-yield instruments sold, not yet purchased | | | 1.5 | | | 2.4 |
Lending Activities. In connection with certain of its Institutional business activities, the Company provides loans or lending commitments (including bridge financing) to selected clients. The borrowers may be rated investment grade or non-investment grade. These loans and commitments have varying terms, may be senior or subordinated, are generally contingent upon representations, warranties and contractual conditions applicable to the borrower, and may be syndicated or traded by the Company. During the quarter ended May 31, 2005, the Firm Risk Committee increased the limits available to the Institutional Securities business to undertake such financings. As a result, the amount of outstanding loans or lending commitments may increase in future periods. At May 31, 2005 and November 30, 2004, the aggregate value of lending commitments outstanding was $26.7 billion and $20.4 billion, respectively. The increase in lending commitments primarily reflected higher levels of event lending due to increased merger, acquisition and restructuring activity. For further information on these activities, see “Quantitative and Qualitative Disclosures about Market Risk—Credit Risk” in Part I, Item 3.
| | | | |
| | 69 | | |
| Item 3. | Quantitative and Qualitative Disclosures about Market Risk. |
Market Risk.
The Company (other than Credit Services) uses 99%/One-Day Value-at-Risk (“VaR”) as one of a range of risk management tools. VaR values should be interpreted in light of the method’s strengths and limitations. A small proportion of trading positions generating market risk is not included in VaR (e.g., certain credit default baskets), and the modeling of the risk characteristics of some positions relies upon approximations that, under certain circumstances, could produce significantly different VaR results from those produced using more precise measures. For a further discussion of the Company’s VaR methodology and its limitations, and the Company’s risk management policies and control structure, see “Quantitative and Qualitative Disclosures about Market Risk—Risk Management” in Part II, Item 7A of the Form 10-K.
The tables below present the following: the Company’s quarter-end Aggregate (Trading and Non-trading), Trading, and Non-trading VaR (see Table 1 below); the Company’s quarterly average, high, and low Trading VaR (see Table 2 below); and the VaR statistics that would result if the Company were to adopt alternative parameters for its calculations, such as the reported confidence level (99% vs. 95%) for the VaR statistic or a shorter historical time series (four years vs. one year) of market data upon which it bases its simulations (see Table 3 below). Non-trading VaR incorporates certain non-trading positions which are not included in Trading VaR; these include (a) the funding liabilities related to institutional trading positions and (b) public-company equity positions recorded as principal investments by the Company.
The table below presents VaR for each of the Company’s primary risk exposures and on an aggregate basis at May 31, 2005, February 28, 2005 and November 30, 2004:
| | | | | | | | | | | | | | | | | | | | | | | | | | | |
| | | Aggregate
(Trading and Non-trading)
| | Trading
| | Non-trading
|
| Table 1: 99% Total VaR | | 99%/One-Day VaR at
| | 99%/One-Day VaR at
| | 99%/One-Day VaR at
|
Primary Market Risk Category
| | May 31, 2005
| | February 28, 2005
| | November 30, 2004
| | May 31, 2005
| | February 28, 2005
| | November 30, 2004
| | May 31, 2005
| | February 28, 2005
| | November 30, 2004
|
| | | (dollars in millions) |
Interest rate and credit spread | | $ | 66 | | $ | 66 | | $ | 71 | | $ | 51 | | $ | 60 | | $ | 53 | | $ | 22 | | $ | 13 | | $ | 30 |
Equity price | | | 34 | | | 40 | | | 42 | | | 32 | | | 37 | | | 38 | | | 4 | | | 5 | | | 5 |
Foreign exchange rate | | | 14 | | | 17 | | | 10 | | | 14 | | | 17 | | | 10 | | | — | | | — | | | — |
Commodity price | | | 36 | | | 35 | | | 27 | | | 36 | | | 35 | | | 27 | | | — | | | — | | | — |
| | |
|
| |
|
| |
|
| |
|
| |
|
| |
|
| |
|
| |
|
| |
|
|
Subtotal | | | 150 | | | 158 | | | 150 | | | 133 | | | 149 | | | 128 | | | 26 | | | 18 | | | 35 |
Less diversification benefit(1) | | | 53 | | | 62 | | | 56 | | | 51 | | | 60 | | | 48 | | | 2 | | | 2 | | | 5 |
| | |
|
| |
|
| |
|
| |
|
| |
|
| |
|
| |
|
| |
|
| |
|
|
Total VaR | | $ | 97 | | $ | 96 | | $ | 94 | | $ | 82 | | $ | 89 | | $ | 80 | | $ | 24 | | $ | 16 | | $ | 30 |
| | |
|
| |
|
| |
|
| |
|
| |
|
| |
|
| |
|
| |
|
| |
|
|
| (1) | Diversification benefit equals the difference between Total VaR and the sum of the VaRs for the four risk categories. This benefit arises because the simulated one-day losses for each of the four primary market risk categories occur on different days; similar diversification benefits also are taken into account within each category. |
The Company’s Aggregate VaR and Trading VaR at May 31, 2005 were $97 million and $82 million, respectively. Non-trading VaR increased to $24 million at May 31, 2005 from $16 million at February 28, 2005.
The Company views average Trading VaR as more representative of trends in the business than VaR at any single point in time. Table 2 below, which presents the high, low and average 99%/one-day Trading VaR during the quarters ended May 31, 2005, February 28, 2005 and November 30, 2004, represents substantially all of the Company’s trading activities. Certain market risks included in the period-end Aggregate VaR discussed above are excluded from these measures (e.g., equity price risk in public company equity positions recorded as principal investments by the Company and certain funding liabilities related to trading positions).
| | | | |
| | | 70 | | |
Average Trading VaR for the quarter ended May 31, 2005 decreased to $87 million from $96 million for the quarter ended February 28, 2005. Trading VaR trended downward during the quarter, driven predominantly by a decrease in interest rate and credit spread VaR and equity price VaR. Average interest rate and credit spread VaR decreased to $62 million from $66 million, driven primarily by a decrease in exposure to corporate credit spreads in response to higher levels of credit spread volatility. Average equity price VaR also decreased during the quarter, driven by a decrease in directional exposures and portfolio concentration.
| | | | | | | | | | | | | | | | | | | | | | | | | | | |
Table 2: 99%High/Low/Average
Trading VaR | | Daily 99%/One-Day VaR
for the Quarter Ended
May 31, 2005
| | Daily 99%/One-Day VaR
for the Quarter Ended
February 28, 2005
| | Daily 99%/One-Day VaR
for the Quarter Ended
November 30, 2004
|
Primary Market Risk Category
| | High
| | Low
| | Average
| | High
| | Low
| | Average
| | High
| | Low
| | Average
|
| | | (dollars in millions) |
Interest rate and credit spread | | $ | 81 | | $ | 46 | | $ | 62 | | $ | 77 | | $ | 52 | | $ | 66 | | $ | 59 | | $ | 45 | | $ | 51 |
Equity price | | | 39 | | | 25 | | | 31 | | | 48 | | | 34 | | | 41 | | | 48 | | | 28 | | | 37 |
Foreign exchange rate | | | 22 | | | 8 | | | 12 | | | 19 | | | 7 | | | 12 | | | 16 | | | 6 | | | 10 |
Commodity price | | | 45 | | | 31 | | | 35 | | | 40 | | | 30 | | | 34 | | | 39 | | | 25 | | | 30 |
Trading VaR | | $ | 109 | | $ | 72 | | $ | 87 | | $ | 107 | | $ | 84 | | $ | 96 | | $ | 89 | | $ | 69 | | $ | 80 |
VaR Statistics for Comparisons with Other Global Financial Services Firms.
VaR statistics are not readily comparable across firms because of differences in the breadth of products included in the VaR model, the statistical assumptions made when simulating changes in market factors, as well as in the methods used to approximate portfolio revaluations under the simulated market conditions. These differences can result in materially different VaR estimates for similar portfolios. As a result, VaR statistics are more reliable and relevant when used as indicators of trends in risk-taking within a firm rather than as a basis for inferring differences in risk-taking across firms. Table 3 below presents the VaR statistics that would result if the Company were to adopt alternative parameters for its calculations, such as the reported confidence level (99% versus 95%) for the VaR statistic or a shorter historical time series (four years versus one year) of market data upon which it bases its simulations:
| | | | | | | | | | | | |
Table 3: Average 99% and 95% Trading VaR with Four-Year/One-Year Historical Time Series | | Average 99%/One-Day VaR
| | Average 95%/One-Day VaR
|
| | for the Quarter
Ended May 31, 2005
| | for the Quarter
Ended May 31, 2005
|
Primary Market Risk Category
| | Four-Year
Factor History
| | One-Year
Factor History
| | Four-Year
Factor History
| | One-Year
Factor History
|
| | | (dollars in millions) |
Interest rate and credit spread | | $ | 62 | | $ | 54 | | $ | 41 | | $ | 36 |
Equity price | | | 31 | | | 28 | | | 22 | | | 20 |
Foreign exchange rate | | | 12 | | | 11 | | | 8 | | | 8 |
Commodity price | | | 35 | | | 29 | | | 24 | | | 21 |
Trading VaR | | $ | 87 | | $ | 73 | | $ | 59 | | $ | 50 |
In addition, if the Company were to report Trading VaR (using a four-year historical time series) with respect to a 10-day holding period, the Company’s 99% and 95% Average Trading VaR for the quarter ended May 31, 2005 would have been $277 million and $188 million, respectively.
| | | | |
| | 71 | | |
Distribution of VaR Statistics and Net Revenues for the quarter ended May 31, 2005.
The histogram below presents the distribution of the Company’s daily 99%/one-day Trading VaR for the quarter ended May 31, 2005. Although the Company’s average 99%/one-day Trading VaR for the quarter ended May 31, 2005 was $87 million, the most frequently occurring value was between $78 million and $81 million. Because VaR trended down over the quarter, the majority of days where VaR was greater than its average occurred earlier in the quarter.
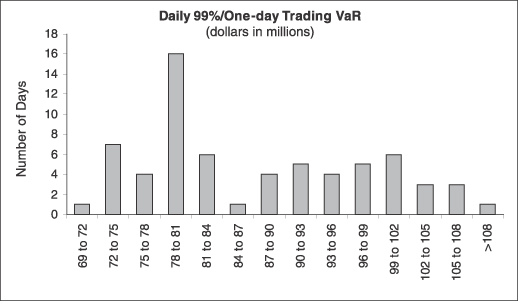
| | | | |
| | | 72 | | |
One method of evaluating the reasonableness of the Company’s VaR model as a measure of the Company’s potential volatility of net revenue is to compare the VaR with actual trading revenue. Assuming no intra-day trading, for a 99%/one-day VaR, the expected number of times that trading losses should exceed VaR during the fiscal year is three, and, in general, if trading losses were to exceed VaR more than five times in a year, the accuracy of the VaR model could be questioned. Accordingly, the Company evaluates the reasonableness of its VaR model by comparing the potential declines in portfolio values generated by the model with actual trading results. The histogram below shows the distribution of daily net revenue during the quarter ended May 31, 2005 for the Company’s trading businesses (including net interest and commissions but excluding primary and prime brokerage revenue credited to the trading businesses). There were no days during the quarter ended May 31, 2005 in which the Company incurred daily trading losses in excess of the 99%/one-day Trading VaR.
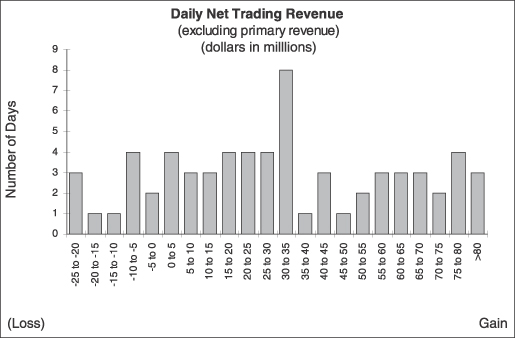
As of May 31, 2005, interest rate risk exposure associated with the Company’s consumer lending activities, included within Credit Services, as measured by the reduction in pre-tax income resulting from a hypothetical, immediate 100 basis point increase in interest rates, had not changed significantly from November 30, 2004.
| | | | |
| | 73 | | |
Credit Risk.
For a further discussion of the Company’s credit risks, see “Quantitative and Qualitative Disclosures about Market Risks—Credit Risk” in Part II, Item 7A of the Form 10-K. In addition, for a discussion of the Company’s corporate lending activities, see “Management’s Discussion and Analysis of Financial Condition and Results of Operations—Liquidity and Capital Resources—Less Liquid Assets—Lending Activities” in Part I, Item 2.
Credit Exposure-Lending. At May 31, 2005 and November 30, 2004, the aggregate value of investment grade loans and positions was $1.8 billion and $1.2 billion, respectively, and the aggregate value of non-investment grade loans and positions was $1.9 billion and $0.5 billion, respectively. At May 31, 2005 and November 30, 2004, the aggregate value of lending commitments outstanding was $26.7 billion and $20.4 billion, respectively. The increase in lending commitments primarily reflected higher levels of event lending due to increased merger, acquisition and restructuring activity. In connection with these business activities (which include funded loans and lending commitments), the Company had hedges with a notional amount of $14.3 billion and $11.6 billion at May 31, 2005 and November 30, 2004, respectively, including both internal and external hedges utilized by the lending business. The table below shows the Company’s credit exposure from its lending positions and commitments as of May 31, 2005:
Lending Commitments and Funded Loans
| | | | | | | | | | | | | | | | | | |
| | | Years to Maturity
| | Total Lending
Exposure(2)
| | Funded Loans
|
Credit Rating(1)
| | Less than 1
| | 1-3
| | 3-5
| | Over 5
| | |
| | | (dollars in millions) |
AAA | | $ | 190 | | $ | 111 | | $ | 218 | | $ | — | | $ | 519 | | $ | — |
AA | | | 1,729 | | | 485 | | | 1,378 | | | 585 | | | 4,177 | | | 14 |
A | | | 1,577 | | | 2,143 | | | 4,105 | | | 650 | | | 8,475 | | | 202 |
BBB | | | 1,582 | | | 2,391 | | | 5,263 | | | 533 | | | 9,769 | | | 1,541 |
Non-investment grade | | | 838 | | | 1,666 | | | 2,179 | | | 2,776 | | | 7,459 | | | 1,944 |
| | |
|
| |
|
| |
|
| |
|
| |
|
| |
|
|
Total | | $ | 5,916 | | $ | 6,796 | | $ | 13,143 | | $ | 4,544 | | $ | 30,399 | | $ | 3,701 |
| | |
|
| |
|
| |
|
| |
|
| |
|
| |
|
|
Notional amount of hedges owned | | | | | | | | | | | | | | $ | 14,262 | | | |
| | | | | | | | | | | | | | |
|
| | | |
| (1) | Obligor credit ratings are determined by the Institutional Credit Department (“Institutional Credit”) using methodologies generally consistent with those employed by external rating agencies. |
| (2) | Total Lending Exposure includes both lending commitments and funded loans. |
| | | | |
| | | 74 | | |
Credit Exposure-Derivatives. The table below presents a summary by counterparty credit rating and remaining contract maturity of the fair value of OTC derivatives in a gain position at May 31, 2005. Fair value represents the risk reduction arising from master netting agreements, including cash collateral received or paid where applicable and, in the final column, net of non-cash collateral received (principally U.S. government and agency securities):
OTC Derivative Products—Financial Instruments Owned(1)
| | | | | | | | | | | | | | | | | | | | | | |
| | | Years to Maturity
| | Cross-Maturity and
Cash Collateral
Netting(3)
| | | Net Exposure
Post Cash
Collateral
| | Net Exposure
Post
Collateral
|
Credit Rating(2)
| | Less than 1
| | 1-3
| | 3-5
| | Over 5
| | | |
| | | (dollars in millions) |
AAA | | $ | 1,753 | | $ | 1,847 | | $ | 2,157 | | $ | 6,437 | | $ | (6,558 | ) | | $ | 5,636 | | $ | 5,278 |
AA | | | 6,382 | | | 4,119 | | | 3,632 | | | 12,312 | | | (14,008 | ) | | | 12,437 | | | 11,567 |
A | | | 3,461 | | | 2,039 | | | 2,331 | | | 4,800 | | | (5,298 | ) | | | 7,333 | | | 6,514 |
BBB | | | 3,371 | | | 2,869 | | | 1,390 | | | 4,970 | | | (3,711 | ) | | | 8,889 | | | 5,675 |
Non-investment grade | | | 1,653 | | | 1,051 | | | 1,222 | | | 2,899 | | | (2,972 | ) | | | 3,853 | | | 2,027 |
Unrated(4) | | | 795 | | | 391 | | | 218 | | | 191 | | | (111 | ) | | | 1,484 | | | 249 |
| | |
|
| |
|
| |
|
| |
|
| |
|
|
| |
|
| |
|
|
Total | | $ | 17,415 | | $ | 12,316 | | $ | 10,950 | | $ | 31,609 | | $ | (32,658 | ) | | $ | 39,632 | | $ | 31,310 |
| | |
|
| |
|
| |
|
| |
|
| |
|
|
| |
|
| |
|
|
| (1) | Fair values shown present the Company’s exposure to counterparties related to the Company’s OTC derivative products. The table does not include the effect of any related hedges utilized by the Company. The table also excludes fair values corresponding to other credit exposures, such as those arising from the Company’s lending activities. |
| (2) | Obligor credit ratings are determined by Institutional Credit using methodologies generally consistent with those employed by external rating agencies. |
| (3) | Amounts represent the netting of receivable balances with payable balances for the same counterparty across maturity categories. Receivable and payable balances with the same counterparty in the same maturity category are netted within such maturity category where appropriate. Cash collateral received is netted on a counterparty basis, provided legal right of offset exists. |
| (4) | In lieu of making an individual assessment of the creditworthiness of unrated companies, the Company makes a determination that the collateral held with respect to such obligations is sufficient to cover a substantial portion of its exposure. In making this determination, the Company takes into account various factors, including legal uncertainties and market volatility. |
The following tables summarize the fair values of the Company’s OTC derivative products recorded in Financial instruments owned and Financial instruments sold, not yet purchased by product category and maturity at May 31, 2005, including on a net basis, where applicable, reflecting the fair value of related non-cash collateral for financial instruments owned:
OTC Derivative Products—Financial Instruments Owned
| | | | | | | | | | | | | | | | | | | | | | |
| | | Years to Maturity
| | Cross-Maturity
and Cash
Collateral
Netting(1)
| | | Net Exposure
Post Cash
Collateral
| | Net Exposure
Post
Collateral
|
Product Type
| | Less than 1
| | 1-3
| | 3-5
| | Over 5
| | | |
| | | (dollars in millions) |
Interest rate and currency swaps and options, credit derivatives and other fixed income securities contracts | | $ | 4,922 | | $ | 6,672 | | $ | 9,183 | | $ | 28,286 | | $ | (28,238 | ) | | $ | 20,825 | | $ | 17,903 |
Foreign exchange forward contracts and options | | | 6,022 | | | 502 | | | 42 | | | 3 | | | (334 | ) | | | 6,235 | | | 5,820 |
Equity securities contracts (including equity swaps, warrants and options) | | | 1,488 | | | 929 | | | 542 | | | 1,151 | | | (603 | ) | | | 3,507 | | | 1,093 |
Commodity forwards, options and swaps | | | 4,983 | | | 4,213 | | | 1,183 | | | 2,169 | | | (3,483 | ) | | | 9,065 | | | 6,494 |
| | |
|
| |
|
| |
|
| |
|
| |
|
|
| |
|
| |
|
|
Total | | $ | 17,415 | | $ | 12,316 | | $ | 10,950 | | $ | 31,609 | | $ | (32,658 | ) | | $ | 39,632 | | $ | 31,310 |
| | |
|
| |
|
| |
|
| |
|
| |
|
|
| |
|
| |
|
|
| (1) | Amounts represent the netting of receivable balances with payable balances for the same counterparty across maturity and product categories. Receivable and payable balances with the same counterparty in the same maturity category are netted within the maturity category where appropriate. Cash collateral received is netted on a counterparty basis, provided legal right of offset exists. |
| | | | |
| | 75 | | |
OTC Derivative Products—Financial Instruments Sold, Not Yet Purchased(1)
| | | | | | | | | | | | | | | | | | | |
| | | Years to Maturity
| | Cross-Maturity
and Cash
Collateral
Netting(2)
| | | Total
|
Product Type
| | Less than 1
| | 1-3
| | 3-5
| | Over 5
| | |
| | | (dollars in millions) |
Interest rate and currency swaps and options, credit derivatives and other fixed income securities contracts | | $ | 4,492 | | $ | 6,494 | | $ | 7,927 | | $ | 19,438 | | $ | (22,664 | ) | | $ | 15,687 |
Foreign exchange forward contracts and options | | | 7,154 | | | 393 | | | 35 | | | 23 | | | (153 | ) | | | 7,452 |
Equity securities contracts (including equity swaps, warrants and options) | | | 1,460 | | | 1,044 | | | 504 | | | 297 | | | (354 | ) | | | 2,951 |
Commodity forwards, options and swaps | | | 4,807 | | | 4,386 | | | 1,650 | | | 901 | | | (4,124 | ) | | | 7,620 |
| | |
|
| |
|
| |
|
| |
|
| |
|
|
| |
|
|
Total | | $ | 17,913 | | $ | 12,317 | | $ | 10,116 | | $ | 20,659 | | $ | (27,295 | ) | | $ | 33,710 |
| | |
|
| |
|
| |
|
| |
|
| |
|
|
| |
|
|
| (1) | Since these amount are liabilities of the Company, they do not result in credit exposures. |
| (2) | Amounts represent the netting of receivable balances with payable balances for the same counterparty across maturity and product categories. Receivable and payable balances with the same counterparty in the same maturity category are netted within the maturity category where appropriate. Cash collateral paid is netted on a counterparty basis, provided legal right of offset exists. |
The Company’s derivatives (both listed and OTC) at May 31, 2005 and November 30, 2004 are summarized in the table below, showing the fair value of the related assets and liabilities by product:
| | | | | | | | | | | | |
| | | At May 31, 2005
| | At November 30, 2004
|
Product Type(1)
| | Assets
| | Liabilities
| | Assets
| | Liabilities
|
| | | (dollars in millions) |
Interest rate and currency swaps and options, credit derivatives and other fixed income securities contracts | | $ | 20,885 | | $ | 15,759 | | $ | 22,998 | | $ | 18,797 |
Foreign exchange forward contracts and options | | | 6,272 | | | 7,453 | | | 9,285 | | | 8,668 |
Equity securities contracts (including equity swaps, warrants and options) | | | 6,184 | | | 8,635 | | | 5,898 | | | 7,373 |
Commodity forwards, options and swaps | | | 9,108 | | | 7,988 | | | 11,294 | | | 8,702 |
| | |
|
| |
|
| |
|
| |
|
|
Total | | $ | 42,449 | | $ | 39,835 | | $ | 49,475 | | $ | 43,540 |
| | |
|
| |
|
| |
|
| |
|
|
| (1) | Effective December 1, 2004 the Company elected to net cash collateral paid or received against its OTC derivatives inventory under credit support annexes. |
Each category of OTC derivative products in the above tables includes a variety of instruments, which can differ substantially in their characteristics. Instruments in each category can be denominated in U.S. dollars or in one or more non-U.S. currencies.
The fair values recorded in the above tables are determined by the Company using various pricing models. For a discussion of fair value as it affects the condensed consolidated financial statements, see “Management’s Discussion and Analysis of Financial Condition and Results of Operations—Critical Accounting Policies” in Part I, Item 2 and Note 1 to the condensed consolidated financial statements. As discussed under “Critical Accounting Policies,” the structure of the transaction, including its maturity, is one of several important factors that may impact the price transparency. The impact of maturity on price transparency can differ significantly among product categories. For example, single currency and multi-currency interest rate derivative products involving highly standardized terms and the major currencies (e.g., the U.S. dollar or the euro) will generally have greater price transparency from published external sources even in maturity ranges beyond 20 years. Credit derivatives with highly standardized terms and liquid underlying reference instruments can have price transparency from
| | | | |
| | | 76 | | |
published external sources in a maturity ranging up to 10 years, while equity and foreign exchange derivative products with standardized terms in major currencies can have price transparency from published external sources within a two-year maturity range. Commodity derivatives with standardized terms and delivery locations can have price transparency from published external sources within various maturity ranges up to 10 years, depending on the commodity. In most instances of limited price transparency based on published external sources, dealers in these markets, in their capacities as market-makers and liquidity providers, provide price transparency beyond the above maturity ranges.
Country Exposure. The Company monitors its credit exposure and risk to individual countries. Credit exposure to a country arises from the Company’s lending activities and derivatives activities in a country. At May 31, 2005, less than 5% of the Company’s total credit exposure (including loans, lending commitments and derivative contracts) was to emerging markets, and no one emerging market country accounted for more than 1% of the Company’s total credit exposure. The Company defines emerging markets to include all countries that are not members of the Organization for Economic Co-operation and Development (“OECD”), excluding the Cayman Islands and the Channel Islands, and those OECD countries rated below “A” by Institutional Credit. These country credit ratings are derived using methodologies generally consistent with those employed by external rating agencies.
Industry Exposure. The Company also monitors its credit exposure and risk to individual industries. At May 31, 2005, the Company’s material credit exposure (including loans, lending commitments and derivative contracts) was to financial institutions, sovereign-related entities, the consumer-related sector and the telecommunications sector.
| Item 4. | Controls and Procedures |
Under the supervision and with the participation of the Company’s management, including our Chief Executive Officer and Chief Financial Officer, we conducted an evaluation of the effectiveness of the Company’s disclosure controls and procedures (as defined in Rule 13a-15(e) of the Securities Exchange Act of 1934, as amended (the “Exchange Act”)). Based on this evaluation, our Chief Executive Officer and Chief Financial Officer concluded that our disclosure controls and procedures were effective as of the end of the period covered by this report.
No change in the Company’s internal control over financial reporting (as defined in Rule 13a-15(f) of the Exchange Act) occurred during the period covered by this report that materially affected, or is reasonably likely to materially affect, the Company’s internal control over financial reporting.
| | | | |
| | 77 | | |
Part II OTHER INFORMATION
Item 1. Legal Proceedings
The following developments have occurred with respect to certain matters previously reported in the Company’s Annual Report on Form 10-K for the fiscal year ended November 30, 2004 and the Quarterly Report on Form 10-Q for the quarterly period ended February 28, 2005.
IPO Fee Litigation.
On May 25, 2005, defendants opposed plaintiffs’ motions for class certification in both the purchaser and issuer class actions.
IPO Allocation Matters.
On June 28, 2005, in theBreakaway Solutions matter, defendants filed a motion for revision of that portion of the Court’s order denying defendants’ motion to dismiss.
Regarding the class actions captionedIn re Initial Public Offering Securities Litigation, on June 30, 2005, the U.S. Court of Appeals for the Second Circuit granted defendants’ petition for permission to appeal the U.S. District Court for the Southern District of New York’s order granting plaintiffs’ motion for class certification.
Research Matters.
InStriffler v. Purcell, et al., plaintiff did not pursue the appeal, and the time for plaintiff to perfect such appeal has expired.
On March 14, 2005, inFogarazzo v. Lehman Bros., et al., defendants opposed plaintiffs’ motion for class certification.
On June 8, 2005, inState of West Virginia ex rel. Darrell v. Bear Stearns & Co., Inc., et al., the Supreme Court of Appeals of West Virginia heard oral argument on the certified question. On July 7, 2005, the Supreme Court of Appeals of West Virginia held that the Attorney General of West Virginia does not have authority under the West Virginia Consumer Credit and Protection Act to bring this action.
Mutual Fund Matters.
Sales Practices. On April 7, 2005, Morgan Stanley DW Inc. (“MSDWI”) entered into a consent agreement with the New Hampshire Bureau of Securities Regulation (the “Bureau”) that resolved all issues relating to the Bureau’s petition for relief filed on June 17, 2004. The Company agreed to pay a $425,000 fine, to entry of a cease and desist order, to pay $10,000 for the cost of investigation, and to comply with a variety of undertakings, including requirements to retain an independent consultant to review certain compliance and policy procedures, to provide rescission with respect to certain transactions, and to notify New Hampshire residents of certain rights with respect to arbitration agreements.
On April 7, 2005, the Massachusetts Securities Division filed a Motion for Reconsideration of the hearing officer’s decisions to dismiss all charges against the Company and the branch manager.
Late Trading and Market Timing. On May 13, 2005, inJackson v. Van Kampen Series Fund, Inc. and Van Kampen Investment Advisory Corp.,plaintiff sought leave to file an amended complaint in the U.S. District Court for the Southern District of Illinois. On May 27, 2005, the Court denied the motion and dismissed the claims with prejudice. On June 27, 2005, plaintiff filed an appeal of the dismissal with the U.S. Court of Appeals for the Seventh Circuit.
Other. On June 3, 2005, inAbrams v. Van Kampen Funds Inc., et al.,the U.S. District Court for the Northern District of Illinois entered an order preliminarily approving the proposed settlement.
Electricity Trading Matters.
On January 7, 2005, inMillar v. Allegheny Energy, the case was remanded to California Superior Court, and on May 6, 2005, all defendants sought dismissal of that action by filing demurrers.
| | | | |
| | | 78 | | |
AOL Time Warner Litigation.
On May 12, 2005, in the coordinated California actions, the Superior Court of the State of California, County of Los Angeles dismissed the claims against the Company for breach of fiduciary duty and violations of Section 11 of the Securities Act of 1933 and Section 25403 of the California Corporations Code. Other claims against the Company are the subject of additional demurrers that will be considered in hearings on July 22, 2005.
Coleman Litigation.
On May 16, 2005, a jury for the Circuit Court of the Fifteenth Judicial Circuit for Palm Beach County, Florida returned a verdict in favor of Coleman (Parent) Holdings, Inc. (“CPH”) with respect to its claims against Morgan Stanley & Co. Incorporated (“MS&Co.”). On May 16, and May 18, 2005, respectively, the jury awarded CPH $604 million in compensatory damages and $850 million in punitive damages. On June 23, 2005, the Court issued a final judgment in the amount of $1,578 million, which includes prejudgment interest of $208 million and excludes $84 million received by CPH in settlements of related claims with others. On June 27, 2005, MS&Co. filed its notice of appeal and posted a supersedeas bond, which automatically stayed execution of the judgment pending appeal.
Parmalat Matter.
On June 23, 2005, the Company and its subsidiaries Morgan Stanley & Co. International Ltd. and Morgan Stanley Bank International Ltd. entered into a proposed settlement agreement (the “Agreement”) with the administrator of Parmalat. Pursuant to the Agreement, the Company agreed to pay €155 million to Parmalat as part of a settlement of all existing and potential claims between the Company and Parmalat, while preserving the Company’s €35 million claim that was admitted in December 2004 in the administration of Parmalat. The Agreement is subject to the approval of the Italian Government.
Variable Annuity Matters.
On May 2, 2005, the plaintiff inDornan v. Morgan Stanley, Inc., et al., voluntarily dismissed, without prejudice, the action in the United States District Court of the Southern District of California against the Company and MSDWI.
Email Retention Matters.
On April 29, 2005, a putative class action complaint was filed in Miami-Dade County, Florida Circuit Court against MSDWI on behalf of individuals or entities that had arbitrated claims against MSDWI to award between January 1, 1999 and April 25, 2005. The complaint alleges that MSDWI did not properly comply with its discovery obligations in arbitrations given its recent statements concerning potentially additional sources of responsive emails. The complaint asserts common law causes of action for breach of contract, negligence and breach of fiduciary duty and seeks, among other things, compensatory damages of approximately $100 million, attorneys’ fees and costs. On May 24, 2005, MSDWI filed a notice of removal to the United States District Court for the Southern District of Florida and, on June 22, 2005, filed a motion to dismiss the complaint.
The Company continued to receive and respond to requests from the SEC for information relating to various email matters. The Company has received additional requests from other regulators and is cooperating with all inquiries.
Other Matters.
In addition to the matters described above and those previously reported in the Company’s Annual Report on Form 10-K for the fiscal year ended November 30, 2004 and Quarterly Report on Form 10-Q for the fiscal quarter ended February 28, 2005, in the normal course of business, the Company has been named, from time to time, as a defendant in various legal actions, including arbitrations, class actions, and other litigation, arising in connection with its activities as a global diversified financial services institution. Certain of the legal actions include claims for substantial compensatory and/or punitive damages or claims for indeterminate amounts of damages. In some cases, the issuers that would otherwise be the primary defendants in such cases are bankrupt or in financial distress.
The Company is also involved, from time to time, in other reviews, investigations and proceedings by governmental and self-regulatory agencies (both formal and informal) regarding the Company’s business, including, among other matters, accounting and operational matters, certain of which may result in adverse judgments, settlements, fines, penalties, injunctions or other relief. The number of these investigations and proceedings has increased in recent years with regard to many firms in the financial services industry, including the Company.
| | | | |
| | 79 | | |
The Company contests liability and/or the amount of damages in each pending matter. In view of the inherent difficulty of predicting the outcome of such matters, particularly in cases where claimants seek substantial or indeterminate damages or where investigations and proceedings are in the early stages, the Company cannot predict with certainty the loss or range of loss related to such matters, how such matters will be resolved, when they will ultimately be resolved, or what the eventual settlement, fine, penalty or other relief might be. Subject to the foregoing, the Company believes, based on current knowledge and after consultation with counsel, that the outcome of each such pending matter will not have a material adverse effect on the consolidated financial condition of the Company, although the outcome could be material to the Company’s or a business segment’s operating results for a particular future period, depending on, among other things, the level of the Company’s or a business segment’s income for such period.
Item 2. Unregistered Sales of Equity Securities and Use of Proceeds
The table below sets forth the information with respect to purchases made by or on behalf of the Company of the Company’s common stock during the quarterly period ended May 31, 2005.
Issuer Purchases of Equity Securities
(dollars in millions, except per share amounts)
| | | | | | | | | | | |
Period
| | Total Number
of Shares
Purchased
| | Average Price Paid Per
Share
| | Total Number of Shares Purchased As Part of Publicly Announced Plans
or Programs (C)
| | Approximate Dollar Value of Shares
that May Yet be
Purchased Under
the Plans or Programs
| |
Month #1 (March 1, 2005 – March 31, 2005) | | | | | | | | | | | |
Equity Anti-dilution Program (A) | | 7,542,000 | | $ | 57.3921 | | 7,542,000 | | | (A | ) |
Capital Management Program (B) | | — | | | N/A | | — | | $ | 600 | |
Employee Transactions (D) | | 551,082 | | $ | 57.3439 | | N/A | | | N/A | |
| | | | |
Month #2 (April 1, 2005 – April 30, 2005) | | | | | | | | | | | |
Equity Anti-dilution Program (A) | | 3,774,450 | | $ | 52.4645 | | 3,774,450 | | | (A | ) |
Capital Management Program (B) | | — | | | N/A | | — | | $ | 600 | |
Employee Transactions (D) | | 477,150 | | $ | 57.0087 | | N/A | | | N/A | |
| | | | |
Month #3 (May 1, 2005 – May 31, 2005) | | | | | | | | | | | |
Equity Anti-dilution Program (A) | | 5,473,630 | | $ | 49.8558 | | 5,473,630 | | | (A | ) |
Capital Management Program (B) | | — | | | N/A | | — | | $ | 600 | |
Employee Transactions (D) | | 89,333 | | $ | 49.8020 | | N/A | | | N/A | |
| | | | |
Total | | | | | | | | | | | |
Equity Anti-dilution Program (A) | | 16,790,080 | | $ | 53.8275 | | 16,790,080 | | | (A | ) |
Capital Management Program (B) | | — | | | N/A | | — | | $ | 600 | |
Employee Transactions (D) | | 1,117,565 | | $ | 56.5979 | | N/A | | | N/A | |
| (A) | The Company’s board of directors authorized this program to purchase common stock to help offset the dilutive impact of grants and exercises of awards under the Company’s equity-based compensation and benefit plans. The program was publicly announced on January 7, 1999 and has no set expiration or termination date. There is no maximum amount of shares that may be purchased under the program. |
| (B) | The Company’s board of directors authorized this program to purchase common stock for capital management purposes. The program was publicly announced on February 12, 1998 at which time up to $3 billion of stock was authorized to be purchased. The program was subsequently increased by $1 billion on December 18, 1998, $1 billion on December 20, 1999 and $1.5 billion on June 20, 2000. This program has a remaining capacity of $600 million at May 31, 2005 and has no set expiration or termination date. |
| (C) | Share purchases under publicly announced programs are made pursuant to open-market purchases, Rule 10b5-1 plans or privately negotiated transactions (including with employee benefit plans) as market conditions warrant and at prices the Company deems appropriate. |
| | | | |
| | | 80 | | |
| (D) | Includes: (1) shares delivered or attested to in satisfaction of the exercise price and/or tax withholding obligations by holders of employee stock options (granted under employee stock compensation plans) who exercised options; (2) restricted shares withheld (under the terms of grants under employee stock compensation plans) to offset tax withholding obligations that occur upon vesting and release of restricted shares; and (3) shares withheld (under the terms of grants under employee stock compensation plans) to offset tax withholding obligations that occur upon the delivery of outstanding shares underlying restricted stock units. The Company’s employee stock compensation plans provide that the value of the shares delivered or attested, or withheld, shall be the average of the high and low price of the Company’s common stock on the date the relevant transaction occurs. |
Item 6. Exhibits
An exhibit index has been filed as part of this Report on Page E-1.
| | | | |
| | 81 | | |
SIGNATURE
Pursuant to the requirements of the Securities Exchange Act of 1934, the Registrant has duly caused this report to be signed on its behalf by the undersigned thereunto duly authorized.
| | |
| MORGAN STANLEY |
| (Registrant) |
| |
| By: | | /s/ DAVID H. SIDWELL |
| | | David H. Sidwell, Chief Financial Officer |
| |
| By: | | /s/ PAUL C. WIRTH |
| | | Paul C. Wirth, Controller |
Date: July 8, 2005
| | | | |
| | | 82 | | |
EXHIBIT INDEX
MORGAN STANLEY
Quarterly Period Ended May 31, 2005
| | |
Exhibit
No.
| | Description
|
| 3 | | Amended and Restated Bylaws (incorporated by reference to Exhibit 3 to the Company’s Current Report on Form 8-K dated April 30, 2005). |
| |
| 10.1 | | Amendment to Morgan Stanley 401(k) Plan. |
| |
| 10.2 | | Base Salaries for Co-Presidents. |
| |
| 10.3 | | Agreement, dated May 4, 2005, between the Company and Mr. David W. Heleniak (incorporated by reference to Exhibit 10 to the Company’s Current Report on Form 8-K dated May 4, 2005). |
| |
| 10.4 | | Settlement and Release Agreement, dated May 13, 2005, between the Company and Mr. Tarek Abdel-Meguid (incorporated by reference to Exhibit 10.1 to the Company’s Current Report on Form 8-K dated May 13, 2005). |
| |
| 10.5 | | Settlement and Release Agreement, dated May 13, 2005, between the Company and Mr. Joseph R. Perella (incorporated by reference to Exhibit 10.2 to the Company’s Current Report on Form 8-K dated May 13, 2005). |
| |
| 11 | | Statement Re: Computation of Earnings Per Common Share (The calculation of per share earnings is in Part I, Item 1, Note 8 to the Condensed Consolidated Financial Statements (Earnings per Share) and is omitted in accordance with Section (b)(11) of Item 601 of Regulation S-K.) |
| |
| 12 | | Statement Re: Computation of Ratio of Earnings to Fixed Charges and Computation of Earnings to Fixed Charges and Preferred Stock Dividends. |
| |
| 15 | | Letter of awareness from Deloitte & Touche LLP, dated July 7, 2005, concerning unaudited interim financial information. |
| |
| 23.1 | | Consent of BK Associates, Inc. |
| |
| 23.2 | | Consent of Morten Beyer & Agnew, Inc. |
| |
| 23.3 | | Consent of Airclaims Limited. |
| |
| 31.1 | | Rule 13a-14(a) Certification of Chief Executive Officer. |
| |
| 31.2 | | Rule 13a-14(a) Certification of Chief Financial Officer. |
| |
| 32.1 | | Section 1350 Certification of Chief Executive Officer. |
| |
| 32.2 | | Section 1350 Certification of Chief Financial Officer. |
| | | | |
| | E-1 | | |