Item 2. Code of Ethics.
As of the end of the period covered by this report, Registrant had adopted a code of ethics, as defined in Item 2 of Form N-CSR, that applies to the Registrant’s principal executive officer and principal financial officer. There were no amendments to the Code during the period covered by the report. The Registrant did not grant any waivers, including implicit waivers, from any provisions of the Code during the period covered by this report. The code of ethics is filed herewith pursuant to Item 19(a)(1), Ex-99.CODE ETH.
Item 3. Audit Committee Financial Expert.
The Board of Trustees has determined that Colleen D. Baldwin, Martin J. Gavin, and Joseph E. Obermeyer are audit committee financial experts, as defined in Item 3 of Form N-CSR. Mr. Gavin, Ms. Baldwin, and Mr. Sullivan are “independent” for purposes of Item 3 of Form N-CSR.
Item 4. Principal Accountant Fees and Services.
Below are the amount of fees that Ernst & Young LLP (“EY”), the Registrant’s current Independent Registered Public Accounting Firm, billed and paid to the Registrant during the Registrant’s fiscal year ended October 31, 2024 and October 31, 2023.
| (a) | Audit Fees: The aggregate fees billed and paid for each of the last two fiscal years for professional services rendered by EY, the principal accountant for the audit of the registrant’s annual financial statements or services that are normally provided by the accountant in connection with statutory and regulatory filings or engagements for those fiscal years were $152,880 for the year ended October 31, 2024 and $254,580 for the year ended October 31, 2023. |
| (b) | Audit-Related Fees: The aggregate fees billed and paid in each of the last two fiscal years for assurance and related services by EY that are reasonably related to the performance of the audit of the registrant’s financial statements and are not reported under paragraph (a) of this Item were $0 for the year ended October 31, 2024 and $0 for the year ended October 31, 2023. |
| (c) | Tax Fees: The aggregate fees billed and paid in each of the last two fiscal years for professional services rendered by EY for tax compliance, tax advice, and tax planning were $62,363 for the year ended October 31, 2024 and $151,770 for the year ended October 31, 2023. Such services included review of excise distribution calculations (if applicable), preparation of the Registrants’ federal, state, and excise tax returns, tax services related to mergers and routine consulting. |
| (d) | All Other Fees: The aggregate fees billed and paid in each of the last two fiscal years for products and services provided by EY, other than the services reported in paragraphs (a) through (c) of this Item were $0 for the year ended October 31, 2024 and $0 for the year ended October 31, 2023. |
(e)(1) Audit Committee Pre-Approval Policies and Procedures
Appendix A
AUDIT AND NON-AUDIT SERVICES
PRE-APPROVAL POLICY
I. Statement of Principles
Under the Sarbanes-Oxley Act of 2002 (the “Act”), the Audit Committee of the Board of Directors or Trustees (the “Committee”) of the Voya funds (each a “Fund,” collectively, the “Funds”) set out on Exhibit A to this Audit and Non-Audit Services Pre-Approval Policy (“Policy”) is responsible for the oversight of the work of the Funds’ independent auditors. As part of its responsibilities, the Committee must pre-approve the audit and non-audit services performed by the auditors in order to assure that the provision of these services does not impair the auditors’ independence from the Funds. The Committee has adopted, and the Board has ratified, this Policy, which sets out the procedures and conditions under which the services of the independent auditors may be pre-approved.
Under Securities and Exchange Commission (“SEC”) rules promulgated in accordance with the Act, the Funds may establish two different approaches to pre-approving audit and non-audit services. The Committee may approve services without consideration of specific case-by-case services (“general pre-approval”) or it may pre-approve specific services (“specific pre-approval”). The Committee believes that the combination of these approaches contemplated in this Policy results in an effective and efficient method for pre-approving audit and non-audit services to be performed by the Funds’ independent auditors. Under this Policy, services that are not of a type that may receive general pre-approval require specific pre-approval by the Committee. Any proposed services that exceed pre-approved cost levels or budgeted amounts will also require the Committee’s specific pre-approval.
For both types of approval, the Committee considers whether the subject services are consistent with the SEC’s rules on auditor independence and that such services are compatible with maintaining the auditors independence. The Committee also considers whether a particular audit firm is in the best position to provide effective and efficient services to the Funds. Reasons that the auditors are in the best position include the auditors’ familiarity with the Funds’ business, personnel, culture, accounting systems, risk profile, and other factors, and whether the services will enhance the Funds’ ability to manage and control risk or improve audit quality. Such factors will be considered as a whole, with no one factor being determinative.
The appendices attached to this Policy describe the audit, audit-related, tax-related, and other services that have the Committee’s general pre-approval. For any service that has been approved through general pre-approval, the general pre-approval will remain in place for a period 12 months from the date of pre-approval, unless the Committee determines that a different period is appropriate. The Committee will annually review and pre-approve the services that may be provided by the independent auditors without specific pre-approval. The Committee will revise the list of services subject to general pre-approval as appropriate. This Policy does not serve as a delegation to Fund management of the Committee’s duty to pre-approve services performed by the Funds’ independent auditors.
II. Audit Services
The annual audit services engagement terms and fees are subject to the Committee’s specific pre-approval. Audit services are those services that are normally provided by auditors in connection with statutory and regulatory filings or engagements or those that generally only independent auditors can reasonably provide. They include the Funds’ annual financial statement audit and procedures that the independent auditors must perform in order to form an opinion on the Funds’ financial statements (e.g., information systems and procedural reviews and testing). The Committee will monitor the audit services engagement and approve any changes in terms, conditions or fees deemed by the Committee to be necessary or appropriate.
The Committee may grant general pre-approval to other audit services, such as statutory audits and services associated with SEC registration statements, periodic reports and other documents filed with the SEC or issued in connection with securities offerings.
The Committee has pre-approved the audit services listed on Appendix A. The Committee must specifically approve all audit services not listed on Appendix A.
III. Audit-related Services
Audit-related services are assurance and related services that are reasonably related to the performance of the audit or the review of the Funds’ financial statements or are traditionally performed by the independent auditors. The Committee believes that the provision of audit-related services will not impair the independent auditors’ independence, and therefore may grant pre-approval to audit-related services. Audit-related services include accounting consultations related to accounting, financial reporting or disclosure matters not classified as “audit services;” assistance with understanding and implementing new accounting and financial reporting guidance from rulemaking authorities; agreed-upon or expanded audit procedures relating to accounting and/or billing records required to respond to or comply with financial, accounting or regulatory reporting matters; and assistance with internal control reporting requirements under Form N-CEN or Form N-CSR.
The Committee has pre-approved the audit-related services listed on Appendix B. The Committee must specifically approve all audit-related services not listed on Appendix B.
IV. Tax Services
The Committee believes the independent auditors can provide tax services to the Funds, including tax compliance, tax planning, and tax advice, without compromising the auditors’ independence. Therefore, the Committee may grant general pre-approval with respect to tax services historically provided by the Funds’ independent auditors that do not, in the Committee’s view, impair auditor independence and that are consistent with the SEC’s rules on auditor independence.
The Committee will not grant pre-approval if the independent auditors initially recommends a transaction the sole business purpose of which is tax avoidance and the tax treatment of which may not be supported in the Internal Revenue Code and related regulations. The Committee may consult
outside counsel to determine that tax planning and reporting positions are consistent with this Policy.
The Committee has pre-approved the tax-related services listed on Appendix C. The Committee must specifically approve all tax-related services not listed on Appendix C.
V. Other Services
The Committee believes it may grant approval of non-audit services that are permissible services for independent auditors to a Fund. The Committee has determined to grant general pre-approval to other services that it believes are routine and recurring, do not impair auditor independence, and are consistent with SEC rules on auditor independence.
The Committee has pre-approved the non-audit services listed on Appendix D. The Committee must specifically approve all non-audit services not listed on Appendix D.
A list of the SEC’s prohibited non-audit services is attached to this Policy as Appendix E. The SEC’s rules and relevant guidance should be consulted to determine the precise definitions of these impermissible services and the applicability of exceptions to certain of the SEC’s prohibitions.
VI. Pre-approval of Fee levels and Budgeted Amounts
The Committee will annually establish pre-approval fee levels or budgeted amounts for audit, audit-related, tax and non-audit services to be provided to the Funds by the independent auditors. Any proposed services exceeding these levels or amounts require the Committee’s specific pre-approval. The Committee considers fees for audit and non-audit services when deciding whether to pre-approve services. The Committee may determine, for a pre-approval period of 12 months, the appropriate ratio between the total amount of fees for the Fund’s audit, audit-related, and tax services (including fees for services provided to Fund affiliates that are subject to pre-approval), and the total amount of fees for certain permissible non-audit services for the Fund classified as other services (including any such services provided to Fund affiliates that are subject to pre-approval).
VII. Procedures
Requests or applications for services to be provided by the independent auditors will be submitted to management. If management determines that the services do not fall within those services generally pre-approved by the Committee and set out in the appendices to these procedures, management will submit the services to the Committee or its delagee. Any such submission will include a detailed description of the services to be rendered. Notwithstanding this paragraph, the Committee will, on a quarterly basis, receive from the independent auditors a list of services provided for the previous calendar quarter on a cumulative basis by the auditors during the Pre-Approval Period.
VIII. Delegation
The Committee may delegate pre-approval authority to one or more of the Committee’s members. Any member or members to whom such pre-approval authority is delegated must report any pre-approval decisions, including any pre-approved services, to the Committee at its next scheduled meeting. The Committee will identify any member to whom pre-approval authority is delegated in writing. The member will retain such authority for a period of 12 months from the date of pre-approval unless the Committee determines that a different period is appropriate. The period of delegated authority may be terminated by the Committee or at the option of the member.
IX. Additional Requirements
The Committee will take any measures the Committee deems necessary or appropriate to oversee the work of the independent auditors and to assure the auditors’ independence from the Funds. This may include reviewing a formal written statement from the independent auditors delineating all relationships between the auditors and the Funds, consistent with Independence Standards Board No. 1, and discussing with the auditors their methods and procedures for ensuring independence.
Last Approved: November 16, 2023
Appendix A
Pre-Approved Audit Services for the Pre-Approval Period January 1, 2024 through December 31, 2024
| Service |
| | The Fund(s) | Fee Range |
| Statutory audits or financial audits (including tax services associated with audit services) | √ | As presented to Audit Committee1 |
| Services associated with SEC registration statements, periodic reports and other documents filed with the SEC or other documents issued in connection with securities offerings (e.g., consents), and assistance in responding to SEC comment letters. | √ | Not to exceed $9,750 per filing |
| Consultations by Fund management with respect to accounting or disclosure treatment of transactions or events and/or the actual or potential effect of final or proposed rules, standards or interpretations by the SEC, Financial Accounting Standards Board, or other regulatory or standard setting bodies. | √ | Not to exceed $8,000 during the Pre-Approval Period |
| Seed capital audit and related review and issuance of consent on the N-2 registration statement | √ | Not to exceed $14,750 per audit |
| Audit of summary portfolio of investments | √ | Not to exceed $840 per fund |
| 1 | For new Funds launched during the Pre-Approval Period, the fee ranges pre-approved will be the same as those for existing Funds, pro-rated in accordance with inception dates as provided in the auditors’ Proposal or any Engagement Letter covering the period at issue. Fees in the Engagement Letter will be controlling. |
Appendix B
Pre-Approved Audit-Related Services for the Pre-Approval Period January 1, 2024 through December 31, 2024
| Service |
| | The Fund(s) | Fund Affiliates | Fee Range |
| Services related to Fund mergers (Excludes tax services - See Appendix C for tax services associated with Fund mergers) | √ | √ | Not to exceed $10,000 per merger |
| Consultations by Fund management with respect to accounting or disclosure treatment of transactions or events and/or the actual or potential effect of final or proposed rules, standards or interpretations by the SEC, Financial Accounting Standards Board, or other regulatory or standard setting bodies. [Note: Under SEC rules some consultations may be “audit” services and others may be “audit-related” services.] | √ | | Not to exceed $5,000 per occurrence during the Pre-Approval Period |
| Review of the Funds’ semi-annual and quarterly financial statements | √ | | Not to exceed $2,700 per set of financial statements per fund |
| Reports to regulatory or government agencies related to the annual engagement | √ | | Up to $5,000 per occurrence during the Pre-Approval Period |
| Regulatory compliance assistance | √ | √ | Not to exceed $5,000 per quarter |
| Training courses | | √ | Not to exceed $5,000 per course |
Appendix C
Pre-Approved Tax Services for the Pre-Approval Period January 1, 2024 through December 31, 2024
| Service |
| | The Fund(s) | Fund
Affiliates | Fee Range |
| Preparation of federal and state income tax returns and federal excise tax returns for the Funds including assistance and review with excise tax distributions (Funds fees) | √ | | As presented to Audit Committee2 |
| Review of IRC Sections 851(b) and 817(h) diversification testing on a real-time basis | √ | | As presented to Audit Committee2 |
| Tax assistance and advice regarding statutory, regulatory or administrative developments | √ | √ | Not to exceed $5,000 for the Funds or for the Funds’ investment adviser during the Pre-Approval Period |
| 2 | For new Funds launched during the Pre-Approval Period, the fee ranges pre-approved will be the same as those for existing Funds, pro-rated in accordance with inception dates as provided in the auditors’ Proposal or any Engagement Letter covering the period at issue. Fees in the Engagement Letter will be controlling. |
Appendix C, continued Pre-Approved Tax Services for the Pre-Approval Period January 1, 2024 through December 31, 2024
| Service |
| | The Fund(s) | Fund
Affiliates | Fee Range |
| Tax and technology training sessions | | √ | Not to exceed $5,000 per course during the Pre-Approval Period |
| Tax services associated with Fund mergers | √ | √ | Not to exceed $4,000 per fund per merger during the Pre-Approval Period |
Tax compliance services related to return preparation for the Funds (Adviser Fees) | | √ | As presented to Audit Committee3 |
| Other tax-related assistance and consultation, including, without limitation, assistance in evaluating derivative financial instruments and international tax issues, qualification and distribution issues, year-end reporting for 1099’s, tax compliance services in foreign jurisdictions and similar routine tax consultations as requested. | √ | | Not to exceed $300,000 during the Pre-Approval Period |
| EU Reclaims IRS Closing Agreement Filings | √ | | $20,000 per Fund first closing agreement, $5,000 for subsequent closing agreements for same Fund |
| 3 | For new Funds launched during the Pre-Approval Period, the fee ranges pre-approved will be the same as those for existing Funds, pro-rated in accordance with inception dates as provided in the auditors’ Proposal or any Engagement Letter covering the period at issue. Fees in the Engagement Letter will be controlling. |
Appendix D
Pre-Approved Other Services for the Pre-Approval Period January 1, 2024 through December 31, 2024
| Service |
| | The Fund(s) | Fund Affiliates | Fee Range |
| Agreed-upon procedures for Class B share 12b-1 programs | | √ | Not to exceed $60,000 during the Pre-Approval Period |
Security counts performed pursuant to Rule 17f-2 of the 1940 Act (i.e., counts for Funds holding securities with affiliated sub-custodians) Cost to be borne 50% by the Funds and 50% by Voya Investments, LLC. | √ | √ | Not to exceed $5,700 per Fund during the Pre-Approval Period |
| Agreed upon procedures for 15 (c) FACT Books | √ | | Not to exceed $50,000 during the Pre-Approval Period |
Appendix E
Prohibited Non-Audit Services
Dated: January 1, 2024 to December 31, 2024
| ● | Bookkeeping or other services related to the accounting records or financial statements of the Funds |
| ● | Financial information systems design and implementation |
| ● | Appraisal or valuation services, fairness opinions, or contribution-in-kind reports |
| ● | Internal audit outsourcing services |
| ● | Broker-dealer, investment adviser, or investment banking services |
| ● | Expert services unrelated to the audit |
| ● | Any other service that the Public Company Accounting Oversight Board determines, by regulation, is impermissible. |
EXHIBIT A
VOYA ASIA PACIFIC HIGH DIVIDEND EQUITY INCOME FUND
VOYA BALANCED PORTFOLIO, INC.
VOYA CREDIT INCOME FUND
VOYA EMERGING MARKETS HIGH DIVIDEND EQUITY FUND
VOYA EQUITY TRUST
VOYA FUNDS TRUST
VOYA GLOBAL ADVANTAGE AND PREMIUM OPPORTUNITY FUND
VOYA GLOBAL EQUITY DIVIDEND AND PREMIUM OPPORTUNITY FUND
VOYA INFRASTRUCTURE, INDUSTRIALS, AND MATERIALS FUND
VOYA INTERMEDIATE BOND PORTFOLIO
VOYA INVESTORS TRUST
VOYA GOVERNMENT MONEY MARKET PORTFOLIO
VOYA MUTUAL FUNDS
VOYA PARTNERS, INC.
VOYA SEPARATE PORTFOLIOS TRUST
VOYA STRATEGIC ALLOCATIONS PORTFOLIOS, INC.
VOYA VARIABLE FUNDS
VOYA VARIABLE INSURANCE TRUST
VOYA VARIABLE PORTFOLIOS INC,
VOYA VARIABLE PRODUCTS TRUST
| (e)(2) | Percentage of services referred to in 4(b) – (4)(d) that were approved by the audit committee |
There were no services, or 0%, provided to the registrant by EY that were approved pursuant to paragraph (c)(7)(i)(C) of Rule 2-01 of Regulation S-X.
| (f) | Percentage of hours expended attributable to work performed by other than full time employees of EY if greater than 50% |
Not applicable.
| (g) | Non-Audit Fees: The following table presents (i) the aggregate non-audit fees (i.e., fees for audit-related, tax, and other services) billed and paid to each Registrant by the independent registered public accounting firm for the Registrant’s fiscal years ended October 31, 2024 and October 31, 2023; and (ii) the aggregate non-audit fees billed and paid to the investment adviser, or any of its affiliates that provide ongoing services to the registrant, by the independent registered public accounting firm for the same time periods. |
| Registrant/Investment Adviser | | 2024 | | | 2023 | |
| Voya Mutual Funds | | $ | 62,363 | | | $ | 151,770 | |
| Voya Investments, LLC (1) | | $ | 15,021,906 | | | $ | 18,012,035 | |
(1) The Registrant’s investment adviser and any of its affiliates, which are subsidiaries of Voya Financial, Inc.
| (h) | Principal Accountants Independence: The Registrant’s Audit committee has considered whether the provision of non-audit services that were rendered to the registrant’s investment adviser and any entity controlling, controlled by, or under common control with the investment adviser that provides ongoing services to the registrant that were not pre-approved pursuant to Rule 2-01(c)(7)(ii) of Regulation S-X is compatible with maintaining EY’s independence. |
Item 5. Audit Committee of Listed Registrants.
Not applicable.
Item 6. Schedule of Investments.
| (a) | Schedule is included as part of the report to shareholders filed under Item 7 of this Form. |

Annual Financial Statements and Other Information
October 31, 2024
Classes A, C, I, R, and W
| ■ | Voya Multi-Manager Emerging Markets Equity Fund |
| ■ | Voya Multi-Manager International Equity Fund |
| This report is submitted for general information to shareholders of the Voya mutual funds. It is not authorized for distribution to prospective shareholders unless accompanied or preceded by a prospectus which includes details regarding the funds’ investment objectives, risks, charges, expenses and other information. This information should be read carefully. |
 E-Delivery Sign-up – details inside E-Delivery Sign-up – details inside
INVESTMENT MANAGEMENT voyainvestments.com |  |
[This Page Intentionally Left Blank]
TABLE OF CONTENTS
Go Paperless with E-Delivery! Sign up now for on-line prospectuses, tailored shareholder reports, and proxy statements. Just go to individuals.voya.com/page/e-delivery, follow the directions and complete the quick 5 Steps to Enroll. You will be notified by e-mail when these communications become available on the internet. |
PROXY VOTING INFORMATION
A description of the policies and procedures that the Funds use to determine how to vote proxies related to portfolio securities is available: (1) without charge, upon request, by calling Shareholder Services toll-free at (800) 992-0180; (2) on the Funds’ website at www.voyainvestments.com; and (3) on the U.S. Securities and Exchange Commission’s (“SEC’s”) website at www.sec.gov. Information regarding how the Funds voted proxies related to portfolio securities during the most recent 12-month period ended June 30 is available without charge on the Funds’ website at www.voyainvestments.com and on the SEC’s website at www.sec.gov.
QUARTERLY PORTFOLIO HOLDINGS
The Funds file their complete schedule of portfolio holdings with the SEC for the first and third quarters of each fiscal year on Form NPORT-P. The Funds’ Forms NPORT-P are available on the SEC’s website at www.sec.gov. Each Fund’s complete schedule of portfolio holdings is available at: https://individuals.voya.com/product/mutual-fund/prospectuses-reports and without charge upon request from the Fund by calling Shareholder Services toll-free at (800) 992-0180.
REPORT OF INDEPENDENT REGISTERED PUBLIC ACCOUNTING FIRM
To the Shareholders of Voya Multi-Manager Emerging Markets Equity Fund and Voya Multi-Manager International Equity Fund and the Board of Trustees of Voya Mutual Funds
Opinion on the Financial Statements
We have audited the accompanying statements of assets and liabilities of Voya Multi-Manager Emerging Markets Equity Fund and Voya Multi-Manager International Equity Fund (collectively referred to as the “Funds”) (two of the funds constituting Voya Mutual Funds (the “Trust”)), including the portfolios of investments, as of October 31, 2024, and the related statements of operations for the year then ended, the statements of changes in net assets for each of the two years in the period then ended, the financial highlights for each of the five years in the period then ended and the related notes (collectively referred to as the “financial statements”). In our opinion, the financial statements present fairly, in all material respects, the financial position of each of the Funds (two of the funds constituting Voya Mutual Funds) at October 31, 2024, the results of their operations for the year then ended, the changes in their net assets for each of the two years in the period then ended and their financial highlights for each of the five years in the period then ended, in conformity with U.S. generally accepted accounting principles.
Basis for Opinion
These financial statements are the responsibility of the Trust’s management. Our responsibility is to express an opinion on each of the Funds’ financial statements based on our audits. We are a public accounting firm registered with the Public Company Accounting Oversight Board (United States) ("PCAOB") and are required to be independent with respect to the Trust in accordance with the U.S. federal securities laws and the applicable rules and regulations of the Securities and Exchange Commission and the PCAOB.
We conducted our audits in accordance with the standards of the PCAOB. Those standards require that we plan and perform the audits to obtain reasonable assurance about whether the financial statements are free of material misstatement, whether due to error or fraud. The Trust is not required to have, nor were we engaged to perform, an audit of the Trust’s internal control over financial reporting. As part of our audits, we are required to obtain an understanding of internal control over financial reporting, but not for the purpose of expressing an opinion on the effectiveness of the Trust’s internal control over financial reporting. Accordingly, we express no such opinion.
Our audits included performing procedures to assess the risks of material misstatement of the financial statements, whether due to error or fraud, and performing procedures that respond to those risks. Such procedures included examining, on a test basis, evidence regarding the amounts and disclosures in the financial statements. Our procedures included confirmation of securities owned as of October 31, 2024, by correspondence with the custodian, brokers and others; when replies were not received from brokers and others, we performed other auditing procedures. Our audits also included evaluating the accounting principles used and significant estimates made by management, as well as evaluating the overall presentation of the financial statements. We believe that our audits provide a reasonable basis for our opinion.

We have served as the auditor of one or more Voya investment companies since 2019.
Boston, Massachusetts
December 23, 2024
STATEMENTS OF ASSETS AND LIABILITIES as of October 31, 2024
| | | Voya Multi-
Manager
Emerging Markets Equity Fund | | | Voya Multi-
Manager
International Equity Fund | |
| ASSETS: | | | | | | | | |
| Investments in securities at fair value+* | | $ | 200,972,299 | | | $ | 481,627,290 | |
| Short-term investments at fair value† | | | 4,458,642 | | | | 5,044,593 | |
| Cash | | | 18,553 | | | | 4,898,511 | |
| Cash collateral for futures contracts | | | 39,923 | | | | 85,880 | |
| Foreign currencies at value‡ | | | 159,525 | | | | 149,333 | |
| Receivables: | | | | | | | | |
| Investment securities and currencies sold | | | 122,340 | | | | 4,463,582 | |
| Fund shares sold | | | 28,180 | | | | 85,684 | |
| Dividends | | | 339,312 | | | | 1,073,114 | |
| Interest | | | 85 | | | | 6,851 | |
| Foreign tax reclaims | | | 42,600 | | | | 1,164,742 | |
| Unrealized appreciation on forward foreign currency contracts | | | – | | | | 129 | |
| Prepaid expenses | | | 44,299 | | | | 24,517 | |
| Reimbursement due from Investment Adviser | | | 2,408 | | | | 89,738 | |
| Other assets | | | 14,244 | | | | 19,552 | |
| Total assets | | | 206,242,410 | | | | 498,733,516 | |
| | | | | | | | | |
| LIABILITIES: | | | | | | | | |
| Payable for investment securities and currencies purchased | | | 117,432 | | | | 2,375,152 | |
| Payable for fund shares redeemed | | | 204,870 | | | | 768,116 | |
| Payable upon receipt of securities loaned | | | 1,542,690 | | | | – | |
| Variation margin payable on futures contracts | | | 4,923 | | | | 14,950 | |
| Payable for investment management fees | | | 194,416 | | | | 397,324 | |
| Payable for distribution and shareholder service fees | | | 3,640 | | | | – | |
| Payable to trustees under the deferred compensation plan (Note 6) | | | 14,244 | | | | 19,552 | |
| Payable for trustee fees | | | 583 | | | | 1,077 | |
| Payable for foreign capital gains tax | | | 1,373,418 | | | | – | |
| Other accrued expenses and liabilities | | | 292,343 | | | | 212,120 | |
| Total liabilities | | | 3,748,559 | | | | 3,788,291 | |
| NET ASSETS | | $ | 202,493,851 | | | $ | 494,945,225 | |
| | | | | | | | | |
| NET ASSETS WERE COMPRISED OF: | | | | | | | | |
| Paid-in capital | | $ | 266,692,480 | | | $ | 469,690,241 | |
| Total distributable earnings (loss) | | | (64,198,629 | ) | | | 25,254,984 | |
| NET ASSETS | | $ | 202,493,851 | | | $ | 494,945,225 | |
| | | | | | | | | |
| + Including securities loaned at value | | $ | 1,499,341 | | | $ | — | |
| * Cost of investments in securities | | $ | 198,972,020 | | | $ | 457,996,717 | |
| † Cost of short-term investments | | $ | 4,458,642 | | | $ | 5,044,593 | |
| ‡ Cost of foreign currencies | | $ | 161,234 | | | $ | 149,426 | |
See Accompanying Notes to Financial Statements
STATEMENTS OF ASSETS AND LIABILITIES as of October 31, 2024(continued)
| | | Voya Multi-
Manager
Emerging Markets Equity Fund | | | Voya Multi-
Manager
International Equity Fund | |
| Class A | | | | | | | | |
| Net assets | | $ | 15,490,521 | | | | n/a | |
| Shares authorized | | | unlimited | | | | n/a | |
| Par value | | | — | | | | n/a | |
| Shares outstanding | | | 1,531,653 | | | | n/a | |
| Net asset value and redemption price per share† | | $ | 10.11 | | | | n/a | |
| Maximum offering price per share (5.75%)(1) | | $ | 10.73 | | | | n/a | |
| Class C | | | | | | | | |
| Net assets | | $ | 177,893 | | | | n/a | |
| Shares authorized | | | unlimited | | | | n/a | |
| Par value | | | — | | | | n/a | |
| Shares outstanding | | | 17,659 | | | | n/a | |
| Net asset value and redemption price per share† | | $ | 10.07 | | | | n/a | |
| Class I | | | | | | | | |
| Net assets | | $ | 161,704,981 | | | $ | 494,945,225 | |
| Shares authorized | | | unlimited | | | | unlimited | |
| Par value | | | — | | | | — | |
| Shares outstanding | | | 15,876,456 | | | | 46,419,707 | |
| Net asset value and redemption price per share | | $ | 10.19 | | | $ | 10.66 | |
| Class R | | | | | | | | |
| Net assets | | $ | 71,675 | | | | n/a | |
| Shares authorized | | | unlimited | | | | n/a | |
| Par value | | | — | | | | n/a | |
| Shares outstanding | | | 7,072 | | | | n/a | |
| Net asset value and redemption price per share | | $ | 10.13 | | | | n/a | |
| Class W | | | | | | | | |
| Net assets | | $ | 25,048,781 | | | | n/a | |
| Shares authorized | | | unlimited | | | | n/a | |
| Par value | | | — | | | | n/a | |
| Shares outstanding | | | 2,467,944 | | | | n/a | |
| Net asset value and redemption price per share | | $ | 10.15 | | | | n/a | |
| (1) | Maximum offering price is computed at 100/94.25 of net asset value. On purchases of $50,000 or more, the offering price is reduced. |
| † | Redemption price per share may be reduced for any applicable contingent deferred sales charges. |
See Accompanying Notes to Financial Statements
STATEMENTS OF OPERATIONS for the year ended October 31, 2024
| | | Voya Multi-
Manager
Emerging Markets Equity Fund | | | Voya Multi-
Manager
International Equity Fund | |
| INVESTMENT INCOME: | | | | | | | | |
| Dividends, net of foreign taxes withheld* | | $ | 6,109,452 | | | $ | 11,227,084 | |
| Interest | | | 2,435 | | | | 193,390 | |
| Securities lending income, net | | | 35,455 | | | | 1,080 | |
| Other | | | 1,269 | | | | 2,187 | |
| Total investment income | | | 6,148,611 | | | | 11,423,741 | |
| EXPENSES: | | | | | | | | |
| Investment management fees | | | 2,340,805 | | | | 3,661,920 | |
| Distribution and shareholder service fees: | | | | | | | | |
| Class A | | | 39,287 | | | | — | |
| Class C | | | 1,279 | | | | — | |
| Class R | | | 329 | | | | — | |
| Transfer agent fees: | | | | | | | | |
| Class A | | | 41,334 | | | | — | |
| Class C | | | 334 | | | | — | |
| Class I | | | 26,576 | | | | 32,091 | |
| Class R | | | 173 | | | | — | |
| Class W | | | 63,628 | | | | — | |
| Shareholder reporting expense | | | 21,175 | | | | 7,142 | |
| Registration fees | | | 84,333 | | | | 40,353 | |
| Professional fees | | | 97,131 | | | | 94,137 | |
| Custody and accounting expense | | | 247,335 | | | | 112,185 | |
| Trustee fees | | | 5,835 | | | | 10,775 | |
| Licensing fee (Note 7) | | | 17,746 | | | | — | |
| Miscellaneous expense | | | 45,953 | | | | 47,695 | |
| Interest expense | | | 27,242 | | | | 2,344 | |
| Total expenses | | | 3,060,495 | | | | 4,008,642 | |
| Waived and reimbursed fees | | | (296,677 | ) | | | (190,873 | ) |
| Brokerage commission recapture | | | — | | | | (435 | ) |
| Net expenses | | | 2,763,818 | | | | 3,817,334 | |
| Net investment income | | | 3,384,793 | | | | 7,606,407 | |
| REALIZED AND UNREALIZED GAIN (LOSS): | | | | | | | | |
| Net realized gain (loss) on: | | | | | | | | |
| Investments (net of foreign capital gains taxes withheld^) | | | 5,082,670 | | | | 19,132,400 | |
| Forward foreign currency contracts | | | 4,579 | | | | 50,660 | |
| Foreign currency related transactions | | | (200,052 | ) | | | (86,987 | ) |
| Futures | | | 186,691 | | | | 45,007 | |
| Net realized gain | | | 5,073,888 | | | | 19,141,080 | |
| Net change in unrealized appreciation (depreciation) on: | | | | | | | | |
| Investments (net of foreign capital gains taxes accrued#) | | | 36,070,419 | | | | 38,980,786 | |
| Forward foreign currency contracts | | | — | | | | 129 | |
| Foreign currency related transactions | | | (66,098 | ) | | | (4,159 | ) |
| Futures | | | 8,623 | | | | (100,606 | ) |
| Net change in unrealized appreciation (depreciation) | | | 36,012,944 | | | | 38,876,150 | |
| Net realized and unrealized gain | | | 41,086,832 | | | | 58,017,230 | |
| Increase in net assets resulting from operations | | $ | 44,471,625 | | | $ | 65,623,637 | |
| | | | | | | | | |
| * Foreign taxes withheld | | $ | 704,147 | | | $ | 1,179,403 | |
| ^ Foreign capital gains taxes withheld | | $ | 949,647 | | | $ | 92,937 | |
| # Change in foreign capital gains taxes accrued | | $ | 907,427 | | | $ | 39,853 | |
See Accompanying Notes to Financial Statements
STATEMENTS OF CHANGES IN NET ASSETS
| | | Voya Multi-Manager Emerging Markets Equity Fund | | | Voya Multi-Manager International Equity Fund | |
| | | Year Ended
October 31, 2024 | | | Year Ended
October 31, 2023 | | | Year Ended
October 31, 2024 | | | Year Ended
October 31, 2023 | |
| FROM OPERATIONS: | | | | | | | | | | | | | | | | |
| Net investment income | | $ | 3,384,793 | | | $ | 6,070,695 | | | $ | 7,606,407 | | | $ | 4,586,718 | |
| Net realized gain (loss) | | | 5,073,888 | | | | (27,404,824 | ) | | | 19,141,080 | | | | (1,848,399 | ) |
| Net change in unrealized appreciation (depreciation) | | | 36,012,944 | | | | 66,557,536 | | | | 38,876,150 | | | | 40,155,089 | |
| Increase in net assets resulting from operations | | | 44,471,625 | | | | 45,223,407 | | | | 65,623,637 | | | | 42,893,408 | |
| | | | | | | | | | | | | | | | | |
| FROM DISTRIBUTIONS TO SHAREHOLDERS: | | | | | | | | | | | | | | | | |
| Total distributions (excluding return of capital): | | | | | | | | | | | | | | | | |
| Class A | | | (256,991 | ) | | | (620,322 | ) | | | — | | | | — | |
| Class C | | | (900 | ) | | | (6,606 | ) | | | — | | | | — | |
| Class I | | | (4,275,258 | ) | | | (6,445,593 | ) | | | (5,245,490 | ) | | | (3,784,036 | ) |
| Class P(1) | | | — | | | | (5,179,457 | ) | | | — | | | | — | |
| Class P3(2),(3) | | | — | | | | (431,555 | ) | | | — | | | | (232,895 | ) |
| Class R | | | (907 | ) | | | (1,914 | ) | | | — | | | | — | |
| Class W | | | (276,266 | ) | | | (1,633,948 | ) | | | — | | | | — | |
| Total distributions | | | (4,810,322 | ) | | | (14,319,395 | ) | | | (5,245,490 | ) | | | (4,016,931 | ) |
| | | | | | | | | | | | | | | | | |
| FROM CAPITAL SHARE TRANSACTIONS: | | | | | | | | | | | | | | | | |
| Net proceeds from sale of shares | | | 59,143,769 | | | | 184,430,594 | | | | 408,149,338 | | | | 92,527,235 | |
| Reinvestment of distributions | | | 4,799,025 | | | | 14,293,629 | | | | 5,245,490 | | | | 4,014,435 | |
| | | | 63,942,794 | | | | 198,724,223 | | | | 413,394,828 | | | | 96,541,670 | |
| Cost of shares redeemed | | | (122,083,184 | ) | | | (342,725,617 | ) | | | (242,508,824 | ) | | | (194,337,977 | ) |
| Net increase (decrease) in net assets resulting from capital share transactions | | | (58,140,390 | ) | | | (144,001,394 | ) | | | 170,886,004 | | | | (97,796,307 | ) |
| Net increase (decrease) in net assets | | | (18,479,087 | ) | | | (113,097,382 | ) | | | 231,264,151 | | | | (58,919,830 | ) |
| | | | | | | | | | | | | | | | | |
| NET ASSETS: | | | | | | | | | | | | | | | | |
| Beginning of year or period | | | 220,972,938 | | | | 334,070,320 | | | | 263,681,074 | | | | 322,600,904 | |
| End of year or period | | $ | 202,493,851 | | | $ | 220,972,938 | | | $ | 494,945,225 | | | $ | 263,681,074 | |
| (1) | Class P for Voya Multi-Manager Emerging Markets Equity Fund was fully redeemed on close of business March 28, 2023. |
| (2) | Class P3 for Voya Multi-Manager Emerging Markets Equity Fund was fully redeemed on close of business March 28, 2023. |
| (3) | Class P3 for Voya Multi-Manager International Equity Fund was fully redeemed on close of business January 10, 2023. |
See Accompanying Notes to Financial Statements
FINANCIAL HIGHLIGHTS
Selected data for a share of beneficial interest outstanding throughout each year or period.
| | | | | | Income (loss)
from investment
operations | | | | Less Distributions | | | | | | | | | | | | | | Ratios to average net assets | | Supplemental
Data |
| | | | Net asset value, beginning of year or period | | | Net investment income (loss) | | | Net realized and unrealized gain (loss) | | | Total from investment operations | | | From net investment income | | | From net realized gains | | | From return of capital | | | Total distributions | | | Payment by affiliate | | | Net asset value, end of year or period | | | Total Return(1) | | | Expenses
before
reductions/
additions(2)(3) | | | Expenses net of fee waivers and/or recoupments if any(2)(3) | | | Expenses
net of all
reductions/
additions(2)(3) | | | Net investment income (loss)(2)(3) | | | Net assets, end of year or period | | | Portfolio turnover rate | |
| Year or period ended | | | ($) | | | ($) | | | ($) | | | ($) | | | ($) | | | ($) | | | ($) | | | ($) | | | ($) | | | ($) | | | (%) | | | (%) | | | (%) | | | (%) | | | (%) | | | ($000's) | | | (%) | |
| | | | | | | | | | | | | | | | | | | | | | | | | | | | | | | | | | | | | | | | | | | | | | | | | | | | | |
| Voya Multi-Manager Emerging Markets Equity Fund |
| Class A |
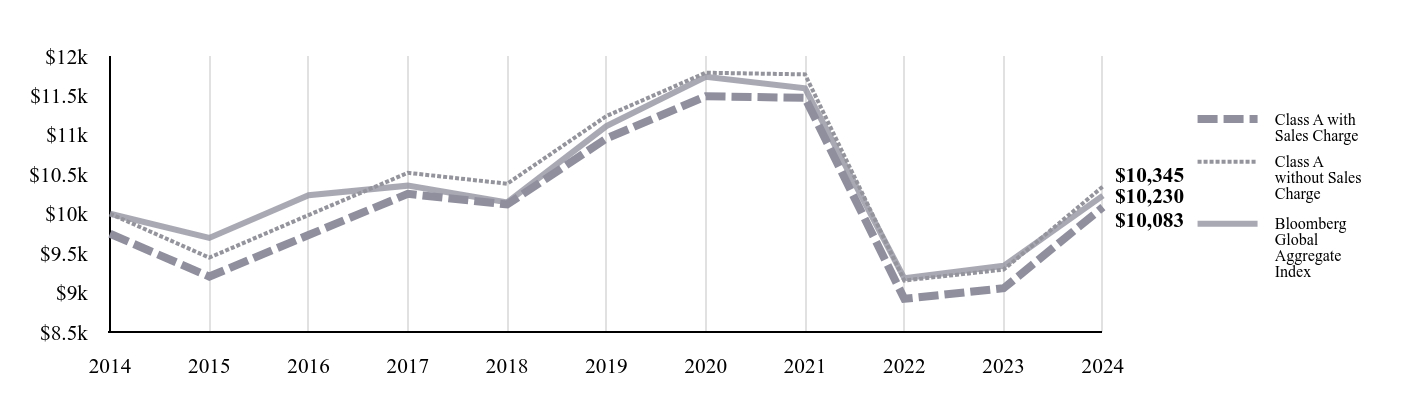
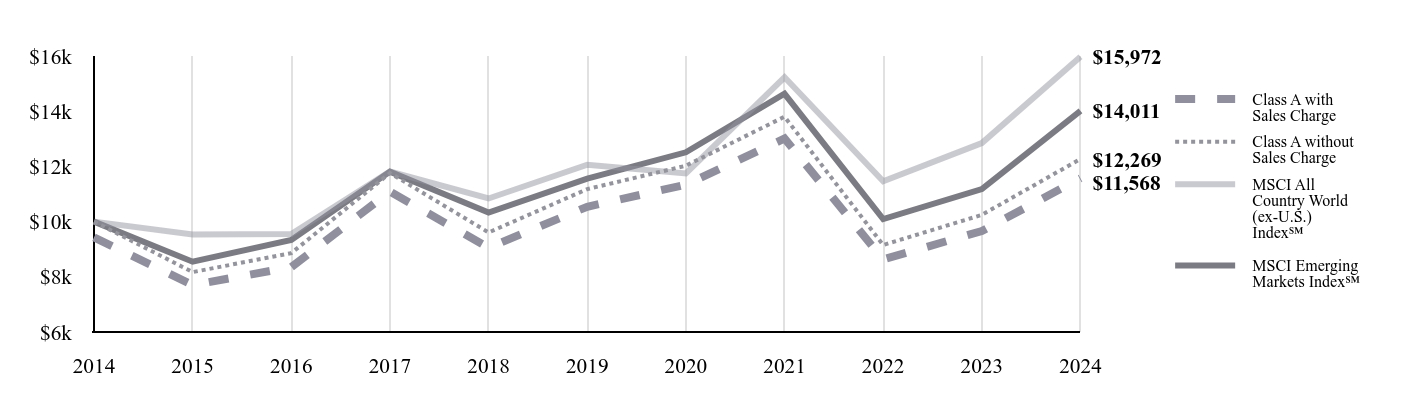
| 10-31-24 | | | 8.59 | | | 0.11 | • | | 1.57 | | | 1.68 | | | 0.16 | | | — | | | — | | | 0.16 | | | — | | | 10.11 | | | 19.76 | | | 1.75 | | | 1.50 | | | 1.50 | | | 1.14 | | | 15,491 | | | 37 | |
| 10-31-23 | | | 8.00 | | | 0.14 | • | | 0.81 | | | 0.95 | | | 0.36 | | | — | | | — | | | 0.36 | | | — | | | 8.59 | | | 11.94 | | | 1.76 | | | 1.51 | | | 1.51 | | | 1.52 | | | 14,328 | | | 85 | |
| 10-31-22 | | | 14.39 | | | 0.16 | • | | (4.31 | ) | | (4.15 | ) | | 0.24 | | | 2.00 | | | — | | | 2.24 | | | — | | | 8.00 | | | (33.68 | ) | | 1.69 | | | 1.50 | | | 1.50 | | | 1.60 | | | 14,138 | | | 53 | |
| 10-31-21 | | | 13.00 | | | 0.05 | • | | 1.87 | | | 1.92 | | | 0.09 | | | 0.44 | | | — | | | 0.53 | | | — | | | 14.39 | | | 14.76 | | | 1.64 | | | 1.50 | | | 1.50 | | | 0.36 | | | 24,177 | | | 59 | |
| 10-31-20 | | | 12.31 | | | 0.05 | | | 0.88 | | | 0.93 | | | 0.17 | | | 0.07 | | | — | | | 0.24 | | | — | | | 13.00 | | | 7.58 | | | 1.63 | | | 1.50 | | | 1.50 | | | 0.37 | | | 22,843 | | | 60 | |
| Class C |
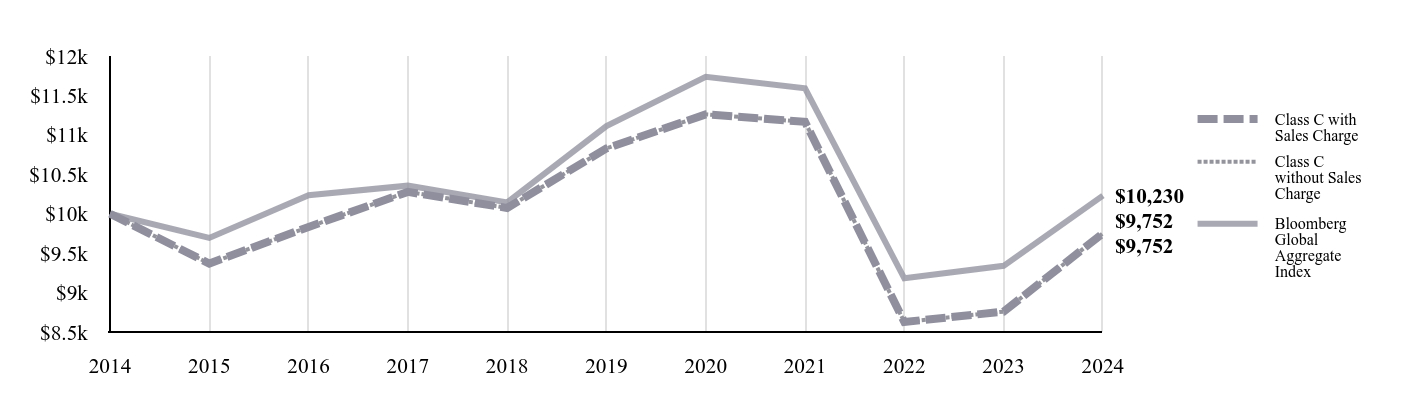
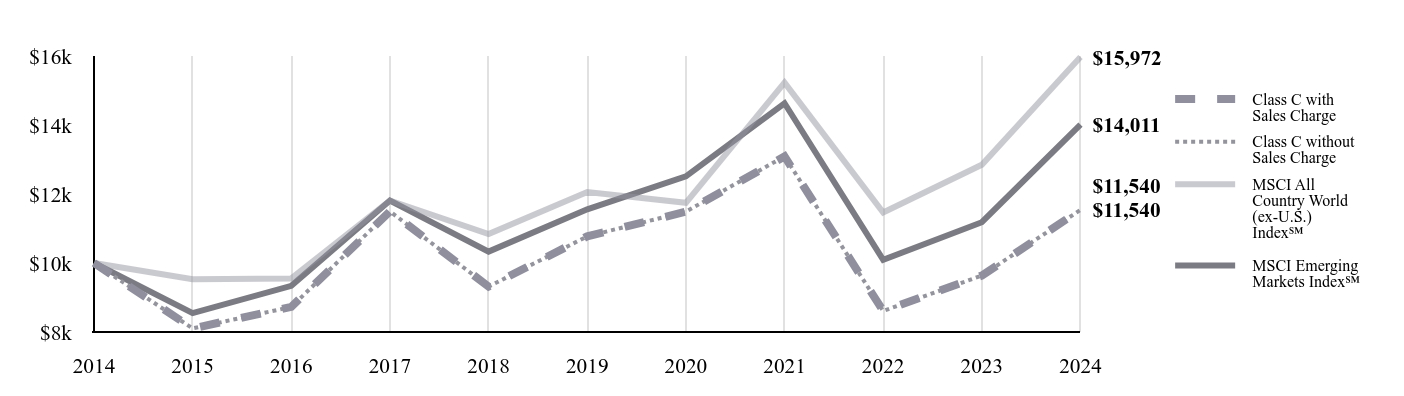
| 10-31-24 | | | 8.54 | | | 0.03 | • | | 1.57 | | | 1.60 | | | 0.07 | | | — | | | — | | | 0.07 | | | — | | | 10.07 | | | 18.85 | | | 2.50 | | | 2.25 | | | 2.25 | | | 0.31 | | | 178 | | | 37 | |
| 10-31-23 | | | 8.00 | | | 0.07 | • | | 0.83 | | | 0.90 | | | 0.36 | | | — | | | — | | | 0.36 | | | — | | | 8.54 | | | 11.23 | | | 2.51 | | | 2.26 | | | 2.26 | | | 0.80 | | | 108 | | | 85 | |
| 10-31-22 | | | 14.26 | | | 0.09 | • | | (4.33 | ) | | (4.24 | ) | | 0.02 | | | 2.00 | | | — | | | 2.02 | | | — | | | 8.00 | | | (34.24 | ) | | 2.44 | | | 2.25 | | | 2.25 | | | 0.85 | | | 158 | | | 53 | |
| 10-31-21 | | | 12.90 | | | (0.05 | )• | | 1.85 | | | 1.80 | | | — | | | 0.44 | | | — | | | 0.44 | | | — | | | 14.26 | | | 13.94 | | | 2.39 | | | 2.25 | | | 2.25 | | | (0.37 | ) | | 487 | | | 59 | |
| 10-31-20 | | | 12.21 | | | (0.06 | )• | | 0.87 | | | 0.81 | | | 0.05 | | | 0.07 | | | — | | | 0.12 | | | — | | | 12.90 | | | 6.66 | | | 2.38 | | | 2.25 | | | 2.25 | | | (0.52 | ) | | 542 | | | 60 | |
| Class I |
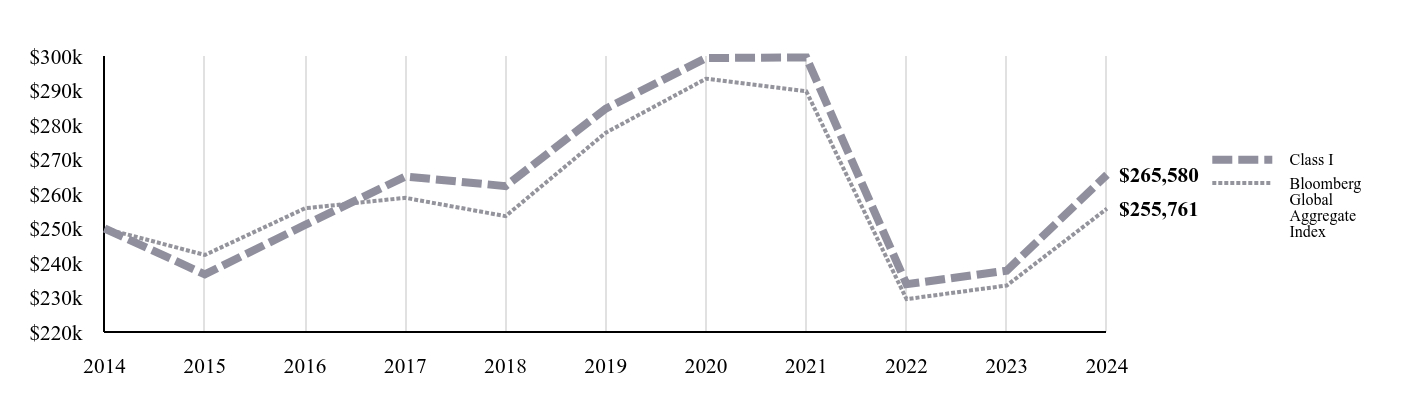
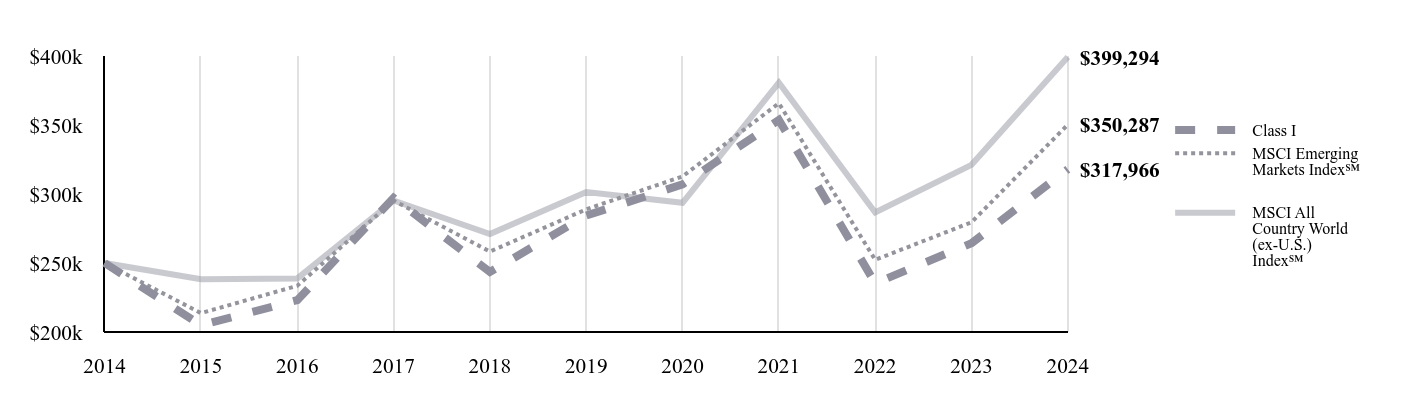
| 10-31-24 | | | 8.65 | | | 0.15 | • | | 1.58 | | | 1.73 | | | 0.19 | | | — | | | — | | | 0.19 | | | — | | | 10.19 | | | 20.30 | | | 1.25 | | | 1.15 | | | 1.15 | | | 1.49 | | | 161,705 | | | 37 | |
| 10-31-23 | | | 8.03 | | | 0.17 | • | | 0.81 | | | 0.98 | | | 0.36 | | | — | | | — | | | 0.36 | | | — | | | 8.65 | | | 12.31 | | | 1.21 | | | 1.16 | | | 1.16 | | | 1.92 | | | 192,678 | | | 85 | |
| 10-31-22 | | | 14.45 | | | 0.20 | • | | (4.32 | ) | | (4.12 | ) | | 0.30 | | | 2.00 | | | — | | | 2.30 | | | — | | | 8.03 | | | (33.46 | ) | | 1.20 | | | 1.15 | | | 1.15 | | | 1.94 | | | 148,389 | | | 53 | |
| 10-31-21 | | | 13.04 | | | 0.12 | • | | 1.86 | | | 1.98 | | | 0.13 | | | 0.44 | | | — | | | 0.57 | | | — | | | 14.45 | | | 15.23 | | | 1.18 | | | 1.15 | | | 1.15 | | | 0.80 | | | 245,082 | | | 59 | |
| 10-31-20 | | | 12.35 | | | 0.10 | | | 0.88 | | | 0.98 | | | 0.22 | | | 0.07 | | | — | | | 0.29 | | | — | | | 13.04 | | | 7.93 | | | 1.18 | | | 1.15 | | | 1.15 | | | 0.72 | | | 287,527 | | | 60 | |
| Class R |
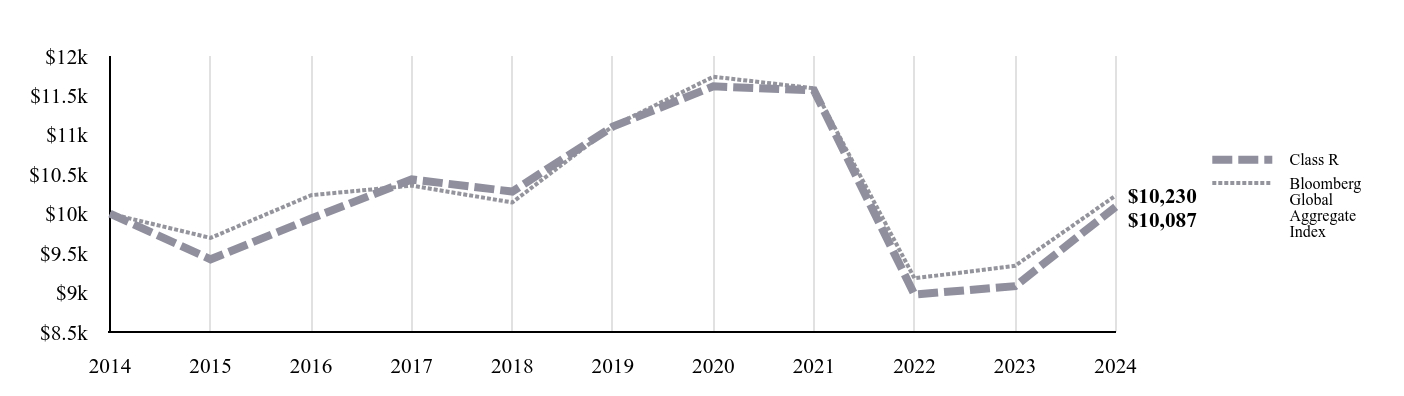
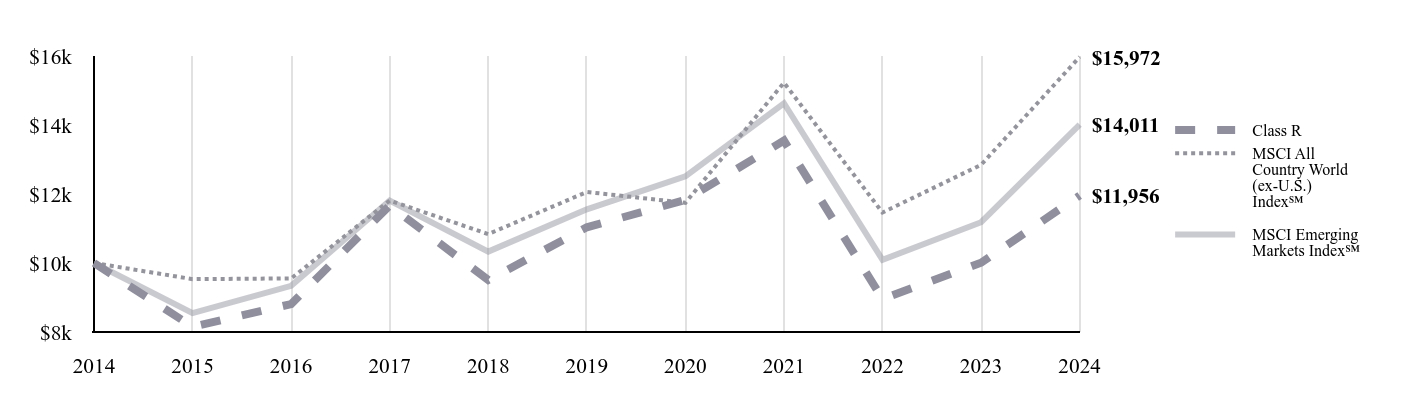
| 10-31-24 | | | 8.61 | | | 0.09 | • | | 1.57 | | | 1.66 | | | 0.14 | | | — | | | — | | | 0.14 | | | — | | | 10.13 | | | 19.46 | | | 2.00 | | | 1.75 | | | 1.75 | | | 0.90 | | | 72 | | | 37 | |
| 10-31-23 | | | 8.03 | | | 0.12 | • | | 0.82 | | | 0.94 | | | 0.36 | | | — | | | — | | | 0.36 | | | — | | | 8.61 | | | 11.74 | | | 2.01 | | | 1.76 | | | 1.76 | | | 1.29 | | | 55 | | | 85 | |
| 10-31-22 | | | 14.44 | | | 0.13 | • | | (4.33 | ) | | (4.20 | ) | | 0.21 | | | 2.00 | | | — | | | 2.21 | | | — | | | 8.03 | | | (33.89 | ) | | 1.94 | | | 1.75 | | | 1.75 | | | 1.30 | | | 42 | | | 53 | |
| 10-31-21 | | | 12.99 | | | 0.02 | • | | 1.87 | | | 1.89 | | | — | | | 0.44 | | | — | | | 0.44 | | | — | | | 14.44 | | | 14.55 | | | 1.89 | | | 1.75 | | | 1.75 | | | 0.15 | | | 51 | | | 59 | |
| 10-31-20 | | | 12.32 | | | 0.00 | *• | | 0.89 | | | 0.89 | | | 0.15 | | | 0.07 | | | — | | | 0.22 | | | — | | | 12.99 | | | 7.20 | | | 1.88 | | | 1.75 | | | 1.75 | | | 0.03 | | | 22 | | | 60 | |
| Class W |
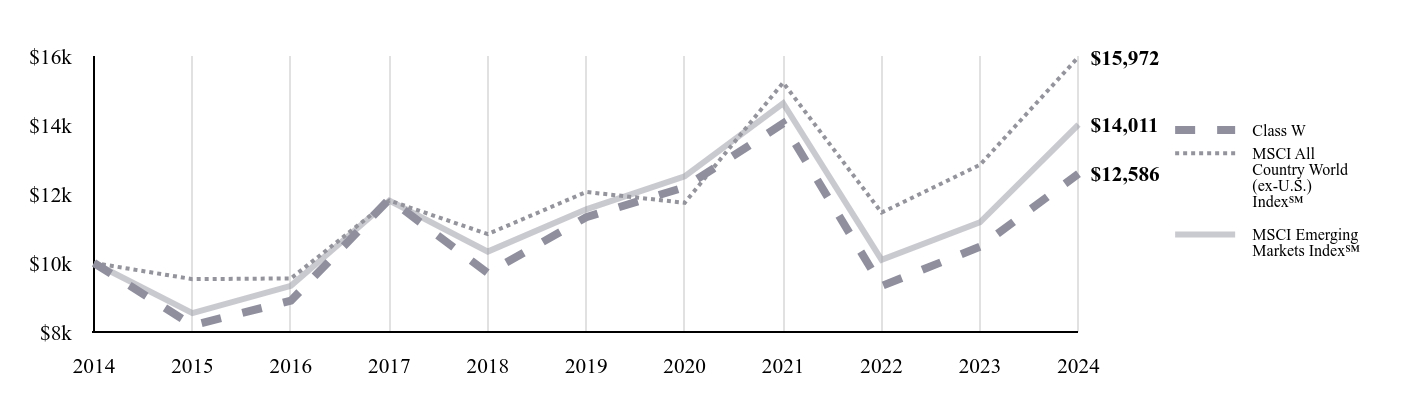
| 10-31-24 | | | 8.61 | | | 0.13 | • | | 1.59 | | | 1.72 | | | 0.18 | | | — | | | — | | | 0.18 | | | — | | | 10.15 | | | 20.19 | | | 1.50 | | | 1.25 | | | 1.25 | | | 1.35 | | | 25,049 | | | 37 | |
| 10-31-23 | | | 8.00 | | | 0.14 | • | | 0.83 | | | 0.97 | | | 0.36 | | | — | | | — | | | 0.36 | | | — | | | 8.61 | | | 12.22 | | | 1.51 | | | 1.26 | | | 1.26 | | | 1.57 | | | 13,804 | | | 85 | |
| 10-31-22 | | | 14.41 | | | 0.19 | • | | (4.32 | ) | | (4.13 | ) | | 0.28 | | | 2.00 | | | — | | | 2.28 | | | — | | | 8.00 | | | (33.56 | ) | | 1.44 | | | 1.25 | | | 1.25 | | | 1.84 | | | 37,408 | | | 53 | |
| 10-31-21 | | | 13.00 | | | 0.10 | • | | 1.87 | | | 1.97 | | | 0.12 | | | 0.44 | | | — | | | 0.56 | | | — | | | 14.41 | | | 15.15 | | | 1.39 | | | 1.25 | | | 1.25 | | | 0.64 | | | 65,102 | | | 59 | |
| 10-31-20 | | | 12.33 | | | 0.08 | • | | 0.86 | | | 0.94 | | | 0.20 | | | 0.07 | | | — | | | 0.27 | | | — | | | 13.00 | | | 7.67 | | | 1.38 | | | 1.25 | | | 1.25 | | | 0.69 | | | 33,162 | | | 60 | |
| Voya Multi-Manager International Equity Fund |
| Class I |
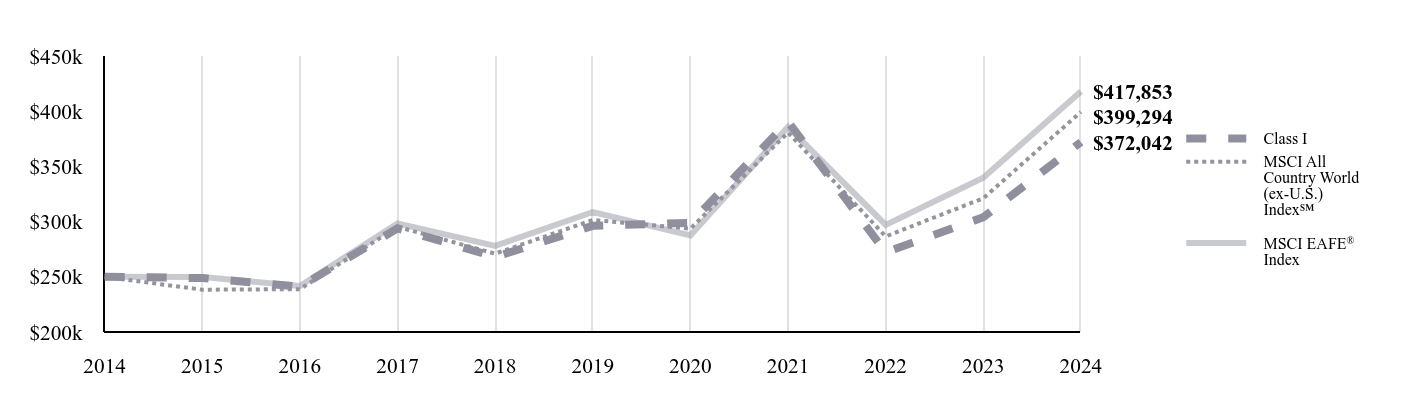
| 10-31-24 | | | 8.87 | | | 0.18 | • | | 1.79 | | | 1.97 | | | 0.18 | | | — | | | — | | | 0.18 | | | — | | | 10.66 | | | 22.42 | | | 0.93 | | | 0.89 | | | 0.89 | | | 1.76 | | | 494,945 | | | 85 | |
| 10-31-23 | | | 8.04 | | | 0.14 | • | | 0.80 | | | 0.94 | | | 0.11 | | | — | | | — | | | 0.11 | | | — | | | 8.87 | | | 11.65 | | | 0.94 | | | 0.90 | | | 0.90 | | | 1.45 | | | 263,681 | | | 49 | |
| 10-31-22 | | | 14.24 | | | 0.12 | • | | (3.69 | ) | | (3.57 | ) | | 0.20 | | | 2.43 | | | — | | | 2.63 | | | — | | | 8.04 | | | (30.30 | ) | | 0.94 | | | 0.93 | | | 0.93 | | | 1.16 | | | 301,161 | | | 63 | |
| 10-31-21 | | | 11.35 | | | 0.12 | • | | 3.31 | | | 3.43 | | | 0.12 | | | 0.42 | | | — | | | 0.54 | | | — | | | 14.24 | | | 30.69 | | | 0.96 | | | 0.96 | | | 0.96 | | | 0.87 | | | 554,017 | | | 49 | |
| 10-31-20 | | | 11.47 | | | 0.10 | | | 0.01 | | | 0.11 | | | 0.23 | | | — | | | — | | | 0.23 | | | — | | | 11.35 | | | 0.89 | | | 0.92 | | | 0.92 | | | 0.92 | | | 0.86 | | | 549,329 | | | 71 | |
| (1) | Total return is calculated assuming reinvestment of all dividends, capital gain distributions and return of capital distributions, if any, at net asset value and excluding the deduction of sales charges or contingent deferred sales charges, if applicable. Total return for periods less than one year is not annualized. |
| (2) | Annualized for periods less than one year. |
| (3) | Ratios reflect operating expenses of a Fund. Expenses before reductions/additions do not reflect amounts reimbursed or recouped by the Investment Adviser and/or Distributor or reductions from brokerage service arrangements or other expense offset arrangements and do not represent the amount paid by a Fund during periods when reimbursements or reductions occur. Expenses net of fee waivers reflect expenses after reimbursement by the Investment Adviser and/or Distributor or recoupment of previously reimbursed fees by the Investment Adviser, but prior to reductions from brokerage service arrangements or other expense offset arrangements. Expenses net of all reductions/additions represent the net expenses paid by a Fund. Net investment income (loss) is net of all such additions or reductions. |
See Accompanying Notes to Financial Statements
FINANCIAL HIGHLIGHTS (continued)
| * | Amount is less than $0.005 or 0.005% or more than $(0.005) or (0.005)%. |
| • | Calculated using average number of shares outstanding throughout the year or period. |
See Accompanying Notes to Financial Statements
NOTES TO FINANCIAL STATEMENTS as of October 31, 2024
NOTE 1 — ORGANIZATION
Voya Mutual Funds (the “Trust”) is a Delaware statutory trust organized on December 18, 1992 and is registered under the Investment Company Act of 1940, as amended (“1940 Act”), as an open-end investment management company. There are six separate active investment series, two of which are included in this report (each, a “Fund” and collectively, the “Funds”): Voya Multi-Manager Emerging Markets Equity Fund (“Multi-Manager Emerging Markets Equity”) and Voya Multi-Manager International Equity Fund (“Multi-Manager International Equity”). Each Fund is a diversified series of the Trust.
Each Fund offers at least one or more of the following classes of shares: Class A, Class C, Class I, Class R, and Class W. The separate classes of shares differ principally in the applicable sales charges (if any), distribution fees, shareholder servicing fees, and transfer agent fees, as well as differences in the amount of waiver fees and reimbursement of expenses, if any. Generally, shareholders of each class also bear certain expenses that pertain to that particular class. All shareholders are allocated the common expenses of a fund and earn income and realized gains/losses from a fund pro rata based on the daily ending net assets of each class, without distinction between share classes. Expenses that are specific to a fund or a class are charged directly to that fund or class. Other operating expenses shared by several funds are generally allocated among those funds based on average net assets. Distributions are determined separately for each class based on income and expenses allocated to each class pro rata based on the shares outstanding of each class on the date of distribution. Differences in per share dividend rates generally result from the differences in separate class expenses, including distribution and shareholder servicing fees, if applicable, as well as differences in the amount of waiver of fees and reimbursement of expenses between the separate classes, if any.
Class C shares, along with their pro rata reinvested dividend shares, automatically convert to Class A shares 8 years after purchase.
Voya Investments, LLC (“Voya Investments” or the “Investment Adviser”), an Arizona limited liability company, serves as the Investment Adviser to the Funds. Voya Investment Management Co. LLC (“Voya IM”), a Delaware limited liability company, serves as one of the multiple sub-advisers for Multi-Manager Emerging Markets Equity. Voya Investments Distributor, LLC (“VID” or the “Distributor”), a Delaware limited liability company, serves as the principal underwriter to the Funds.
NOTE 2 — SIGNIFICANT ACCOUNTING POLICIES
The Funds are investment companies and accordingly follow the investment company accounting and reporting guidance of the Financial Accounting Standards Board (“FASB”) Accounting Standards Board Codification Topic 946 Financial Services - Investment Companies.
The following significant accounting policies are consistently followed by the Funds in the preparation of their financial statements. Each Fund is considered an investment company under U.S. generally accepted accounting principles (“GAAP”) and follows the accounting and reporting guidance applicable to investment companies.
A. Security Valuation. Each Fund is open for business every day the New York Stock Exchange (“NYSE”) opens for regular trading (each such day, a “Business Day”). The net asset value (“NAV”) per share for each class of each Fund is determined each Business Day as of the close of the regular trading session (“Market Close”), as determined by the Consolidated Tape Association (“CTA”), the central distributor of transaction prices for exchange-traded securities (normally 4:00 p.m. Eastern Time unless otherwise designated by the CTA). The NAV per share of each class of each Fund is calculated by taking the value of the Fund’s assets attributable to that class, subtracting the Fund’s liabilities attributable to that class, and dividing by the number of shares of that class that are outstanding. On days when a Fund is closed for business, Fund shares will not be priced and the Fund does not transact purchase and redemption orders. To the extent a Fund’s assets are traded in other markets on days when a Fund does not price its shares, the value of a Fund’s assets will likely change and you will not be able to purchase or redeem shares of a Fund.
Portfolio securities for which market quotations are readily available are valued at market value. Investments in open-end registered investment companies that do not trade on an exchange are valued at the end of day NAV per share. The prospectuses of the open-end registered investment companies in which each Fund may invest explain the circumstances under which they will use fair value pricing and the effects of using fair value pricing. Foreign securities’ prices are converted into U.S. dollar amounts using the applicable exchange rates as of Market Close.
When a market quotation for a portfolio security is not readily available or is deemed unreliable (for example when trading has been halted or there are unexpected market closures or other material events that would suggest that the market quotation is unreliable) and for purposes of determining the value of other Fund assets, the asset is priced at its fair value. The Board has designated the Investment Adviser, as the valuation designee, to make fair value determinations in good faith. In determining the fair value of each Fund’s
NOTES TO FINANCIAL STATEMENTS as of October 31, 2024 (continued)
NOTE 2 — SIGNIFICANT ACCOUNTING POLICIES (continued)
assets, the Investment Adviser, pursuant to its fair valuation policy, may consider inputs from pricing service providers, broker-dealers, or each Fund’s sub-adviser(s). Issuer specific events, transaction price, position size, nature and duration of restrictions on disposition of the security, market trends, bid/ask quotes of brokers and other market data may be reviewed in the course of making a good faith determination of an asset’s fair value. Because trading hours for certain foreign securities end before Market Close, closing market quotations may become unreliable. The prices of foreign securities will generally be adjusted based on inputs from an independent pricing service that are intended to reflect valuation changes through the NYSE close. Because of the inherent uncertainties of fair valuation, the values used to determine each Fund’s NAV may materially differ from the value received upon actual sale of those investments. Thus, fair valuation may have an unintended dilutive or accretive effect on the value of shareholders’ investments in each Fund.
The Funds’ financial instruments are valued at the close of the NYSE and are reported at fair value, which GAAP defines as the price that would be received to sell an asset or paid to transfer a liability in an orderly transaction between market participants at the measurement date.
Various valuation techniques and inputs are used to determine the fair value of financial instruments. GAAP establishes the following fair value hierarchy that categorizes the inputs used to measure fair value:
Level 1 — quoted prices (unadjusted) in active markets for identical financial instruments that the fund can access at the reporting date.
Level 2 — inputs other than Level 1 quoted prices that are observable, either directly or indirectly (including, but not limited to, quoted prices for similar financial instruments in active markets, quoted prices for identical or similar financial instruments in inactive markets, interest rates and yield curves, implied volatilities, and credit spreads).
Level 3 — unobservable inputs (including the fund’s own assumptions in determining fair value).
Observable inputs are developed using market data, such as publicly available information about actual events or transactions, and reflect the assumptions that market participants would use to price the financial instrument. Unobservable inputs are those for which market data are not available and are developed using the best information available about the assumptions that market participants would use to price the financial instrument. GAAP requires valuation techniques to maximize the use of relevant observable inputs and minimize the use of unobservable
inputs. When multiple inputs are used to derive fair value, the financial instrument is assigned to the level within the fair value hierarchy based on the lowest-level input that is significant to the fair value of the financial instrument. Input levels are not necessarily an indication of the risk or liquidity associated with financial instruments at that level but rather the degree of judgment used in determining those values.
A table summarizing each Fund’s investments under these levels of classification is included within each Portfolio of Investments.
Each investment asset or liability of the Funds is assigned a level at measurement date based on the significance and source of the inputs to its valuation. Quoted prices in active markets for identical securities are classified as “Level 1,” inputs other than quoted prices for an asset or liability that are observable are classified as “Level 2” and significant unobservable inputs, including each sub-adviser’s or Pricing Committee’s judgment about the assumptions that a market participant would use in pricing an asset or liability are classified as “Level 3.” The inputs used for valuing securities are not necessarily an indication of the risks associated with investing in those securities. Short-term securities of sufficient credit quality are generally considered to be Level 2 securities under applicable accounting rules. A table summarizing each Fund’s investments under these levels of classification is included within the Portfolios of Investments.
GAAP requires a reconciliation of the beginning to ending balances for reported fair values that presents changes attributable to total realized and unrealized gains or losses, purchases and sales, and transfers in or out of the Level 3 category during the period. A reconciliation of Level 3 investments within the Portfolio of Investments is presented only when a Fund has a significant amount of Level 3 investments.
B. Securities Transactions and Revenue Recognition. Securities transactions are accounted for on the trade date. Realized gains and losses are reported on the basis of identified cost of securities sold. Interest income is recorded on an accrual basis. Dividend income is recorded, net of any applicable withholding tax, on the ex-dividend date, or for certain foreign securities, when the information becomes available to the Funds. Premium amortization and discount accretion are determined by the effective yield method.
C. Foreign Currency Translation. The books and records of the Funds are maintained in U.S. dollars.
Any foreign currency amounts are translated into U.S. dollars on the following basis:
| (1) | Market value of investment securities, other assets and liabilities — at the exchange rates prevailing at Market Close. |
NOTES TO FINANCIAL STATEMENTS as of October 31, 2024 (continued)
NOTE 2 — SIGNIFICANT ACCOUNTING POLICIES (continued)
| (2) | Purchases and sales of investment securities, income and expenses — at the rates of exchange prevailing on the respective dates of such transactions. |
Although the net assets and the market values are presented at the foreign exchange rates at Market Close, the Funds do not isolate the portion of the results of operations resulting from changes in foreign exchange rates on investments from the fluctuations arising from changes in market prices of securities held. Such fluctuations are included with the net realized and unrealized gains or losses from investments. For securities that are subject to foreign withholding tax upon disposition, liabilities are recorded on the Statements of Assets and Liabilities for the estimated tax withholding based on the securities’ current market value. Upon disposition, realized gains or losses on such securities are recorded net of foreign withholding tax.
Reported net realized foreign exchange gains or losses arise from sales of foreign currencies, currency gains or losses realized between the trade and settlement dates on securities transactions, the difference between the amounts of dividends, interest, and foreign withholding taxes recorded on each Fund’s books, and the U.S. dollar equivalent of the amounts actually received or paid. Net unrealized foreign exchange gains and losses arise from changes in the value of assets and liabilities other than investments in securities, resulting from changes in the exchange rate. Foreign security and currency transactions may involve certain considerations and risks not typically associated with investing in U.S. companies and U.S. government securities. These risks include, but are not limited to, revaluation of currencies and future adverse political and economic developments which could cause securities and their markets to be less liquid, and prices more volatile than those of comparable U.S. companies and U.S. government securities. The foregoing risks are even greater with respect to securities of issuers in emerging markets.
D. Risk Exposures and the Use of Derivative Instruments. The Funds’ investment strategies permit them to enter into various types of derivatives contracts, including, but not limited to, forward foreign currency exchange contracts, futures, purchased options, written options, and swaps. In doing so, the Funds will employ strategies in differing combinations to permit them to increase or decrease the level of risk, or change the level or types of exposure to risk factors. This may allow the Funds to pursue their objectives more quickly and efficiently than if they were to make direct purchases or sales of securities
capable of affecting a similar response to market or credit factors. In pursuit of their investment objectives, the Funds may seek to increase or decrease their exposure to the following market or credit risk factors.
Equity Risk. Stock prices may be volatile or have reduced liquidity in response to real or perceived impacts of factors including, but not limited to, economic conditions, changes in market interest rates, and political events. Stock markets tend to be cyclical, with periods when stock prices generally rise and periods when stock prices generally decline. Any given stock market segment may remain out of favor with investors for a short or long period of time, and stocks as an asset class may underperform bonds or other asset classes during some periods. Additionally, legislative, regulatory or tax policies or developments in these areas may adversely impact the investment techniques available to a manager, add to costs and impair the ability of a Fund to achieve its investment objectives.
Foreign Exchange Rate Risk. To the extent that a Fund invests directly in foreign (non-U.S.) currencies or in securities denominated in, or that trade in, foreign (non-U.S.) currencies, it is subject to the risk that those foreign (non-U.S.) currencies will decline in value relative to the U.S. dollar or, in the case of hedging positions, that the U.S. dollar will decline in value relative to the currency being hedged by a Fund through foreign currency exchange transactions.
Currency rates may fluctuate significantly over short periods of time. Currency rates may be affected by changes in market interest rates, intervention (or the failure to intervene) by U.S. or foreign governments, central banks or supranational entities such as the International Monetary Fund, by the imposition of currency controls, or other political or economic developments in the United States or abroad.
Risks of Investing in Derivatives. The Funds’ use of derivatives can result in losses due to unanticipated changes in the market or credit risk factors and the overall market. In instances where the Funds are using derivatives to decrease or hedge exposures to market or credit risk factors for securities held by the Funds, there are also risks that those derivatives may not perform as expected resulting in losses for the combined or hedged positions.
Derivative instruments are subject to a number of risks, including the risk of changes in the market price of the underlying securities, credit risk with respect to the counterparty, risk of loss due to changes in market interest rates and liquidity and volatility risk. The amounts required to purchase certain derivatives may be small relative to the magnitude of exposure assumed by a Fund. Therefore, the purchase of certain derivatives may have an economic leveraging effect on a Fund and exaggerate any increase
NOTES TO FINANCIAL STATEMENTS as of October 31, 2024 (continued)
NOTE 2 — SIGNIFICANT ACCOUNTING POLICIES (continued)
or decrease in the NAV. Derivatives may not perform as expected, so a Fund may not realize the intended benefits. When used for hedging purposes, the change in value of a derivative may not correlate as expected with the currency, security or other risk being hedged. When used as an alternative or substitute for direct cash investments, the return provided by the derivative may not provide the same return as direct cash investment. In addition, given their complexity, derivatives expose a Fund to the risk of improper valuation.
Generally, derivatives are sophisticated financial instruments whose performance is derived, at least in part, from the performance of an underlying asset or assets. Derivatives include, among other things, swap agreements, options, forwards and futures. Investments in derivatives are generally negotiated over-the-counter (“OTC”), with a single counterparty and as a result are subject to credit risks related to the counterparty’s ability or willingness to perform its obligations; any deterioration in the counterparty’s creditworthiness could adversely affect the value of the derivative. In addition, derivatives and their underlying securities may experience periods of illiquidity which could cause a Fund to hold a security it might otherwise sell, or to sell a security it otherwise might hold at inopportune times or at an unanticipated price. A manager might imperfectly judge the direction of the market. For instance, if a derivative is used as a hedge to offset investment risk in another security, the hedge might not correlate to the market’s movements and may have unexpected or undesired results such as a loss or a reduction in gains.
Counterparty Credit Risk and Credit Related Contingent Features. Certain derivative positions are subject to counterparty credit risk, which is the risk that the counterparty will not fulfill its obligation to the Funds. The Funds’ derivative counterparties are financial institutions who are subject to market conditions that may weaken their financial position. The Funds intend to enter into financial transactions with counterparties that they believe to be creditworthy at the time of the transaction. To reduce this risk, the Funds generally enter into master netting arrangements, established within the Funds’ International Swap and Derivatives Association, Inc. (“ISDA”) Master Agreements (“Master Agreements”). These agreements are with select counterparties and they govern transactions, including certain OTC derivative and forward foreign currency contracts, entered into by the Funds and the counterparty. The Master Agreements maintain provisions for general obligations, representations, agreements, collateral, and events of default or termination. The occurrence of a specified event of termination may give a counterparty the right to terminate all of its contracts and
affect settlement of all outstanding transactions under the applicable Master Agreement.
The Funds may also enter into collateral agreements with certain counterparties to further mitigate credit risk associated with OTC derivative and forward foreign currency contracts. Subject to established minimum levels, collateral is generally determined based on the net aggregate unrealized gain or loss on contracts with a certain counterparty. Collateral pledged to or from the Funds is held in a segregated account by a third-party agent and can be in the form of cash or debt securities issued by the U.S. government or related agencies.
As of October 31, 2024, the maximum amount of loss that Multi-Manager International Equity would incur if the counterparties to their derivative transactions failed to perform would be $129 on open forward foreign currency contracts. No cash collateral was pledged by any counterparty to any Fund as of October 31, 2024.
The Funds have credit related contingent features that if triggered would allow its derivatives counterparties to close out and demand payment or additional collateral to cover their exposure from the Funds. Credit related contingent features are established between the Funds and their derivatives counterparties to reduce the risk that the Funds will not fulfill their payment obligations to their counterparties. These triggering features include, but are not limited to, a percentage decrease in a Fund’s net assets and/or a percentage decrease in a Fund’s NAV, which could cause a Fund to accelerate payment of any net liability owed to the counterparty. The contingent features are established within the Funds Master Agreements.
There were no Funds with liability positions on OTC derivatives at October 31, 2024 nor did any Fund post cash collateral as of October 31, 2024.
E. Forward Foreign Currency Transactions and Futures Contracts. Each Fund may enter into forward foreign currency exchange transactions to convert to and from different foreign currencies and to and from the U.S. dollar, generally in connection with the planned purchases or sales of securities. The Funds either enter into these transactions on a spot basis at the spot rate prevailing in the foreign currency exchange market or may use forward foreign currency contracts to purchase or sell foreign currencies. When the contract is fulfilled or closed, gains or losses are realized. Until then, the gain or loss is included in unrealized appreciation or depreciation. Risks may arise upon entering into forward contracts from the potential inability of counterparties to meet the terms of their forward contracts and from unanticipated movements in the value of foreign currencies relative to the U.S. dollar.
NOTES TO FINANCIAL STATEMENTS as of October 31, 2024 (continued)
NOTE 2 — SIGNIFICANT ACCOUNTING POLICIES (continued)
Multi-Manager Emerging Markets Equity and Multi-Manager International Equity used forward foreign currency contracts primarily to protect their non-U.S. dollar denominated holdings from adverse currency movements. During the year ended October 31, 2024, the Funds had an average contract amount on forward foreign currency contracts to buy and sell as disclosed below:
| | | Buy | | | Sell | |
| Multi-Manager Emerging Markets Equity | | $ | 33,167 | | | $ | 24,535 | |
| Multi-Manager International Equity | | | 31,186 | | | | 45,103 | |
Please refer to the tables within the Portfolio of Investments for Multi-Manager International Equity for open forward foreign currency contracts at October 31, 2024. There were no open forward foreign currency contracts for Multi-Manager Emerging Markets Equity at October 31, 2024.
Each Fund may enter into futures contracts involving foreign currency, interest rates, securities and securities indices. Each Fund intends to limit its use of futures contracts and futures options to “bona fide hedging” transactions, as such term is defined in applicable regulations, interpretations and practice. A futures contract obligates the seller of the contract to deliver and the purchaser of the contract to take delivery of the type of foreign currency, financial instrument or security called for in the contract at a specified future time for a specified price.
Upon entering into a futures contract, the Funds are required to deposit either cash or securities (initial margin) in an amount equal to a certain percentage of the contract value. Subsequent payments (variation margin) are made or received by the Funds each day. The variation margin payments are equal to the daily changes in the contract value and are recorded as unrealized gains and losses and, if any, shown as variation margin receivable or payable on futures contracts on the Statement of Assets and Liabilities. Open futures contracts, if any, are reported on a table within each Fund’s Portfolio of Investments. Securities held in collateralized accounts to cover initial margin requirements, if any, on open futures contracts are footnoted in the Portfolio of Investments. Cash collateral held by the broker to cover initial margin requirements on open futures contracts are noted in each Fund’s Statement of Assets and Liabilities. The net change in unrealized appreciation and depreciation is reported in each Fund’s Statement of Operations. Realized gains (losses) are reported in each Fund’s Statement of Operations at the closing or expiration of futures contracts.
Futures contracts are exposed to the market risk factor of the underlying financial instrument. During the year ended October 31, 2024, Multi-Manager Emerging Markets Equity and Multi-Manager International Equity had purchased futures contracts on equity indices to “equitize” cash. Futures contracts are purchased to provide immediate market exposure proportionate to the size of the Fund’s respective cash flows and residual cash balances in order to decrease potential tracking error if the cash remained uninvested in the market. Additional associated risks of entering into futures contracts include the possibility that there may be an illiquid market where the Fund is unable to liquidate the contract or enter into an offsetting position and, if used for hedging purposes, the risk that the price of the contract will correlate imperfectly with the prices of the Fund’s securities. With futures, there is minimal counterparty credit risk to the Fund since futures are exchange traded and the exchange’s clearinghouse, as counterparty to all exchange traded futures, guarantees the futures against default.
During the year ended October 31, 2024, Multi-Manager Emerging Markets Equity and Multi-Manager International Equity had an average notional value on futures contracts purchased as disclosed below.
| | | Purchased | |
| Multi-Manager Emerging Markets Equity | | $ | 1,001,365 | |
| Multi-Manager International Equity | | | 2,008,533 | |
Please refer to the tables within the Portfolios of Investments for Multi-Manager Emerging Markets Equity and Multi-Manager International Equity for open futures contracts at October 31, 2024.
F. Distributions to Shareholders. The Funds record distributions to their shareholders on ex-dividend date. Each Fund declares and pays dividends and capital gain distributions, if any, annually. The Funds may make distributions on a more frequent basis to comply with the distribution requirements of the Internal Revenue Code. The characteristics of income and gains to be distributed are determined in accordance with income tax regulations, which may differ from GAAP for investment companies.
G. Federal Income Taxes. It is the policy of each Fund to comply with the requirements of subchapter M of the Internal Revenue Code that are applicable to regulated investment companies and to distribute substantially all of its net investment income and any net realized capital gains to its shareholders. Therefore, a federal income tax or excise tax provision is not required. Management has considered the sustainability of the Funds’ tax positions taken on federal income tax returns for all open tax years in making this determination. No capital gain distributions shall be made until the capital loss carryforwards have been fully utilized.
NOTES TO FINANCIAL STATEMENTS as of October 31, 2024 (continued)
NOTE 2 — SIGNIFICANT ACCOUNTING POLICIES (continued)
The Funds may utilize equalization accounting for tax purposes, whereby a portion of redemption payments are treated as distributions of income or gain.
H. Use of Estimates. The preparation of financial statements in conformity with GAAP requires management to make estimates and assumptions that affect the reported amounts of assets and liabilities and disclosure of contingent assets and liabilities at the date of the financial statements and the reported amounts of increases and decreases in net assets from operations during the reporting period. Actual results could differ from those estimates.
I. Securities Lending. Each Fund has the option to temporarily loan securities representing up to 331∕3% of its total assets to brokers, dealers or other financial institutions in exchange for a negotiated lender’s fee. Securities lending involves two primary risks: “investment risk” and “borrower default risk.” When lending securities, the Funds will receive cash or U.S. government securities as collateral. Investment risk is the risk that the Funds will lose money from the investment of the cash collateral received from the borrower. Borrower default risk is the risk that the Funds will lose money due to the failure of a borrower to return a borrowed security. Loans are subject to termination at the option of the borrower or the Funds. Securities lending may result in leverage. The use of leverage may exaggerate any increase or decrease in the NAV, causing the Funds to be more volatile. The use of leverage may increase expenses and increase the impact of the Funds’ other risks.
J. Restricted Securities. Each Fund may invest in restricted securities which include those sold under Rule 144A of the Securities Act of 1933, as amended (“1933 Act”) or securities offered pursuant to Section 4(a)(2) of the 1933 Act, and/or are subject to legal or contractual restrictions on resale and may not be publicly sold without registration under the 1933 Act. Restricted securities are fair valued using market quotations when readily available. In the absence of market quotations, the securities are valued based upon their fair value determined in good faith under procedures approved by the Board.
Securities that are not registered for sale to the public under the 1933 Act are referred to as “restricted securities.” These securities may be sold in private placement transactions between issuers and their purchasers and may be neither listed on an exchange nor traded in other established markets. Many times these securities are subject to legal or contractual restrictions on resale. As a result of the absence of a public trading market, the prices of these securities may be more volatile, less liquid and more difficult to value than publicly traded securities. The price realized from the sale of these securities could be less than
the amount originally paid or less than their fair value if they are resold in privately negotiated transactions. In addition, these securities may not be subject to disclosure and other investment protection requirements that are afforded to publicly traded securities. Certain investments may include investment in smaller, less seasoned issuers, which may involve greater risk.
K. Indemnifications. In the normal course of business, the Trust may enter into contracts that provide certain indemnifications. The Trust’s maximum exposure under these arrangements is dependent on future claims that may be made against the Funds and, therefore, cannot be estimated; however, based on experience, management considers risk of loss from such claims remote.
NOTE 3 — INVESTMENT TRANSACTIONS
For the year ended October 31, 2024, the cost of purchases and the proceeds from the sales of securities, excluding short-term securities, were as follows:
| | | Purchases | | | Sales | |
| Multi-Manager Emerging Markets Equity | | $ | 86,090,626 | | | $ | 146,361,424 | |
| Multi-Manager International Equity | | | 517,904,208 | | | | 351,850,490 | |
NOTE 4 — INVESTMENT MANAGEMENT FEES
The Funds have entered into an investment management agreement (“Management Agreement”) with the Investment Adviser. The Investment Adviser has overall responsibility for the management of the Funds. The Investment Adviser oversees all investment advisory and portfolio management services for the Funds and assists in managing and supervising all aspects of the general day-to-day business activities and operations of the Funds, including custodial, transfer agency, dividend disbursing, accounting, auditing, compliance and related services. Voya Investments, the Investment Adviser to Multi- Manager Emerging Markets Equity and Multi-Manager International Equity, may, from time to time, directly manage a portion of each Fund’s investment portfolio. The Management Agreement compensates the Investment Adviser with a management fee, computed daily and payable monthly, based on the average daily net assets of each Fund, at the following annual rates.
| Fund | | As a Percentage of Average
Daily Net Assets |
Multi-Manager Emerging Markets Equity(1) | | Direct Investments 1.10%;
Passively Managed Assets 0.70% |
| Multi-Manager International Equity(2) | | 0.85% |
NOTES TO FINANCIAL STATEMENTS as of October 31, 2024 (continued)
NOTE 4 — INVESTMENT MANAGEMENT FEES (continued)
| (1) | The Investment Adviser is contractually obligated to waive 0.020% of the management fee for Multi-Manager Emerging Markets Equity. This waiver is not eligible for recoupment. Termination or modification of this obligation requires approval by the Board. |
| (2) | Prior to May 6, 2024, the Investment Adviser was contractually obligated to waive 0.01% of the management fee for Multi-Manager International Equity. This waiver was not eligible for recoupment. Termination or modification of this obligation required approval by the Board. |
The Investment Adviser has entered into a sub-advisory agreement with each respective sub-adviser. These sub-advisers provide investment advice for the various Funds and are paid by the Investment Adviser based on the average daily net assets of the respective Funds. Subject to such policies as the Board or the Investment Adviser may determine, each sub-adviser manages each respective Fund’s assets in accordance with that Fund’s investment objectives, policies, and limitations. The sub-adviser of each Fund is as follows (*denotes an affiliated sub-adviser):
| Fund | | Sub-Adviser |
| | | |
| Multi-Manager Emerging Markets Equity | | Delaware Investments Fund Advisers, Sustainable Growth Advisers, LP and Voya IM* |
| Multi-Manager International Equity(1) | | Lazard Asset Management, LLC, |
| | | |
| | | Polaris Capital Management, LLC, Wellington Management Company LLP and Voya IM* |
(1) Effective May 6, 2024, Baillie Gifford Overseas Limited was removed as a sub-adviser.
NOTE 5 — DISTRIBUTION AND SERVICE FEES
Class A, Class C and Class R shares of each respective Fund has a plan (each a “Plan” and collectively, the “Plans”), whereby the Distributor is reimbursed or compensated (depending on the class of shares) by the Funds for expenses incurred in the distribution of each Fund’s shares (“Distribution Fees”). Pursuant to the Plans, the Distributor is entitled to a payment each month for expenses incurred in the distribution and promotion of each Fund’s shares, including expenses incurred in printing prospectuses and reports used for sales purposes, expenses incurred in preparing and printing sales literature and other such distribution related expenses, including any distribution or shareholder servicing fees (“Service Fees”) paid to securities dealers who have executed a distribution agreement with the Distributor. Under the Plans, each class of shares of a Fund pays the Distributor a Distribution and/ or Service Fee based on average daily net assets at the following annual rates:
| | | Class A | | Class C | | Class R |
| Multi-Manager Emerging Markets Equity | | 0.25% | | 1.00% | | 0.50% |
The Distributor may also retain the proceeds of the initial sales charge paid by shareholders upon the purchase of Class A shares, and the contingent deferred sales charge paid by shareholders upon certain redemptions for Class A and Class C shares. For the year ended October 31, 2024, the Distributor retained the following amounts in sales charges from the following Funds:
| | | Class A | |
| Initial Sales Charges: |
| Multi-Manager Emerging Markets Equity | | $ | 125 | |
NOTE 6 — OTHER TRANSACTIONS WITH AFFILIATES AND RELATED PARTIES
At October 31, 2024, the following direct or indirect, affiliated investment companies owned more than 5% of the following Funds:
Subsidiary/Affiliated
Investment Company | | Fund | | Percentage |
| Voya Solution 2025 Portfolio | | Multi-Manager International Equity | | 5.84 | % |
| Voya Solution 2035 Portfolio | | Multi-Manager Emerging Markets Equity | | 8.23 | |
| | | Multi-Manager International Equity | | 13.33 | |
| Voya Solution 2045 Portfolio | | Multi-Manager Emerging Markets Equity | | 10.81 | |
| | | Multi-Manager International Equity | | 14.02 | |
| Voya Solution 2055 Portfolio | | Multi-Manager International Equity | | 5.16 | |
The Investment Adviser may request that the Funds’ sub-advisers use their best efforts (subject to obtaining best execution of each transaction) to allocate a Fund’s equity security transactions through certain designated broker-dealers. The designated broker-dealer, in turn, will reimburse a portion of the brokerage commissions to pay certain expenses of that Fund. Any amounts credited to the Funds are reflected as brokerage commission recapture on the Statements of Operations.
The Funds have adopted a deferred compensation plan (the “DC Plan”), which allows eligible independent trustees, as described in the DC Plan, to defer the receipt of all or a portion of the trustees’ fees that they are entitled to receive from the Funds. For purposes of determining the amount owed to the trustee under the DC Plan, the amounts deferred are
NOTES TO FINANCIAL STATEMENTS as of October 31, 2024 (continued)
NOTE 6 — OTHER TRANSACTIONS WITH AFFILIATES AND RELATED PARTIES (continued)
invested in shares of the funds selected by the trustee (the “Notional Funds”). When the Funds purchase shares of the Notional Funds, which are all advised by Voya Investments, in amounts equal to the trustees’ deferred fees, this results in a Fund asset equal to the deferred compensation liability. Such assets, if applicable, are included as a component of “Other assets” on the accompanying Statements of Assets and Liabilities. Deferral of trustees’ fees under the DC Plan will not affect net assets of the Funds, and will not materially affect the Funds’ assets, liabilities or net investment income per share. Amounts will be deferred until distributed in accordance with the DC Plan.
The Funds may pay per account fees to affiliates of Voya Investments for recordkeeping services provided on certain assets. For the year ended October 31, 2024, the per account fees for affiliated recordkeeping services paid by each Fund were as follows:
| Fund | | Amount |
| Multi-Manager Emerging Markets Equity | | $286 |
NOTE 7 — LICENSING FEE
Multi-Manager Emerging Markets Equity pays an annual licensing fee to FTSE International Limited in order to obtain data and permissions necessary to achieve its principal investment strategy.
NOTE 8 — EXPENSE LIMITATION AGREEMENTS
The Investment Adviser has entered into a written expense limitation agreement (“Expense Limitation Agreement”) with each Fund whereby the Investment Adviser has agreed to limit expenses, excluding interest, taxes, investment-related costs, leverage expenses, extraordinary expenses and acquired fund fees and expenses to the levels listed below:
| | | Class | | Class | | Class | | Class | | Class |
| Fund | | A | | C | | I | | R | | W |
| Multi-Manager Emerging Markets Equity | | 1.60% | | 2.35% | | 1.35% | | 1.85% | | 1.35% |
| Multi-Manager International Equity(1) | | N/A | | N/A | | 0.88% | | N/A | | N/A |
| (1) | Effective May 6, 2024, the side letter agreement was eliminated for Multi-Manager International Equity. Any fees waived pursuant to the side letter agreement were not eligible for recoupment. Prior to May 6, 2024, the expenses limit agreement for class I was 0.97%. |
Pursuant to a side letter agreement, through March 1, 2025, the Investment Adviser has further lowered the expense limits for Multi-Manager Emerging Markets Equity. If the Investment Adviser elects not to renew the side letter agreement, the expense limits will revert to the limits listed in the table above. There is no guarantee that these side
letter agreement will continue. Termination or modification of this obligation requires approval by the Board.
| | | Class | | Class | | Class | | Class | | Class |
| Fund | | A | | C | | I | | R | | W |
| Multi-Manager Emerging Markets Equity(1) | | 1.50% | | 2.25% | | 1.15% | | 1.75% | | 1.25% |
| (1) | Any fees waived pursuant to the side letter agreement shall not be eligible for recoupment. |
Unless otherwise specified above, and with the exception of the non-recoupable management fee waiver for Multi-Manager Emerging Markets Equity, the Investment Adviser may at a later date recoup from a Fund for class specific fees waived and/or other expenses reimbursed by the Investment Adviser during the previous 36 months, but only if, after such recoupment, a Fund’s expense ratio does not exceed the percentage described above. Waived and reimbursed fees net of any recoupment by the Investment Adviser of such waived and reimbursed fees are reflected on the accompanying Statements of Operations. Amounts payable by the Investment Adviser are reflected on the accompanying Statements of Assets and Liabilities. As of October 31, 2024, the amounts of waived and/or reimbursed fees that are subject to possible recoupment by the Investment Adviser and the related expiration dates, are as follows:
| | | October 31, | | | | |
| | | 2025 | | | 2026 | | | 2027 | | | Total | |
| Multi-Manager Emerging Markets Equity | | $ | 237,950 | | | $ | 117,120 | | | $ | 158,574 | | | $ | 513,644 | |
| Multi-Manager International Equity | | | — | | | | — | | | | 117,041 | | | | 117,041 | |
| | | | | | | | | | | | | | | | | |
In addition to the above waived and/or reimbursed fees, the amount of class specific fees waived or reimbursed that are subject to possible recoupment by the Investment Adviser, and the related expiration dates as of October 31, 2024, are as follows:
| | | October 31, | | | | |
| | | 2025 | | | 2026 | | | 2027 | | | Total | |
| Multi-Manager Emerging Markets Equity | |
| Class A | | $ | 24,292 | | | $ | 30,652 | | | $ | 25,337 | | | $ | 80,281 | |
| Class C | | | 280 | | | | 305 | | | | 202 | | | | 787 | |
| Class I | | | — | | | | — | | | | 26,576 | | | | 26,576 | |
| Class R | | | 59 | | | | 105 | | | | 109 | | | | 273 | |
| Class W | | | 66,245 | | | | 65,023 | | | | 39,019 | | | | 170,287 | |
| | | | | | | | | | | | | | | | | |
The Expense Limitation Agreement is contractual through March 1, 2025, except Multi-Manager International Equity which is through March 1, 2026, and shall renew automatically for one-year terms. Termination or modification of this obligation requires approval by the Board.
NOTES TO FINANCIAL STATEMENTS as of October 31, 2024 (continued)
NOTE 9 — LINE OF CREDIT
Effective June 10, 2024, the Funds, in addition to certain other funds managed by the Investment Adviser, entered into a 364-day unsecured committed revolving line of credit agreement (the “Credit Agreement”) with The Bank of New York Mellon (“BNY”) for an aggregate amount of $400,000,000 through June 9, 2025. The proceeds may be used only to finance temporarily: (1) the purchase or sale of investment securities; or (2) the repurchase or redemption of shares of the Portfolio or certain other funds managed by the Investment Adviser. The funds to which the line of credit is available pay a commitment fee equal to 0.15% per annum on the daily unused portion of the committed line amount payable quarterly in arrears. Prior to June 10, 2024, the predecessor line of credit was for an aggregate amount of $400,000,000 and the funds to which the line of credit was available paid a commitment fee equal to 0.15%
per annum on the daily unused portion of the committed line amount through June 10, 2024.
Borrowings under the Credit Agreement accrue interest at the federal funds rate plus a specified margin. Repayments generally must be made within 60 days after the date of a revolving credit advance.
The following Funds utilized the line of credit during the year ended October 31, 2024:
| Fund | | Days
Utilized | | | Approximate
Average
Daily Balance
For Days
Utilized | | | Approximate
Weighted
Average
Interest Rate
For Days
Utilized |
| Multi-Manager Emerging Markets Equity | | 36 | | | $ | 4,358,667 | | | 6.25 | % |
| Multi-Manager International Equity | | 4 | | | | 3,521,250 | | | 5.99 | |
NOTE 10 — CAPITAL SHARES
Transactions in capital shares and dollars were as follows:
| | | Shares
sold | | | Shares
issued in
merger | | | Reinvestment
of
distributions | | | Shares
redeemed | | | Shares
converted | | | Net increase
(decrease) in
shares
outstanding | | | Shares
sold | | | Proceeds
from
shares
issued in
merger | | | Reinvestment
of
distributions | | | Shares
redeemed | | | Shares
converted | | | Net increase
(decrease) | |
Year or
period ended | | # | | | # | | | # | | | # | | | # | | | # | | | ($) | | | ($) | | | ($) | | | ($) | | | ($) | | | ($) | |
| | | | | | | | | | | | | | | | | | | | | | | | | | | | | | | | | | | | | |
| Multi-Manager Emerging Markets Equity | | | | | | | | | | | | | | | | |
| Class A | | | | | | | | | | | | | | | | | | | | | | | | | | | | | | | | | | | | |
| 10/31/2024 | | 49,788 | | | — | | | 27,113 | | | (213,828 | ) | | — | | | (136,927 | ) | | 489,572 | | | — | | | 245,912 | | | (2,103,016 | ) | | — | | | (1,367,532 | ) |
| 10/31/2023 | | 74,503 | | | — | | | 70,154 | | | (244,302 | ) | | — | | | (99,645 | ) | | 685,478 | | | — | | | 594,908 | | | (2,203,173 | ) | | — | | | (922,787 | ) |
| Class C | | | | | | | | | | | | | | | | | | | | | | | | | | | | | | | | | | | | |
| 10/31/2024 | | 8,547 | | | — | | | 99 | | | (3,645 | ) | | — | | | 5,001 | | | 89,314 | | | — | | | 900 | | | (36,970 | ) | | — | | | 53,244 | |
| 10/31/2023 | | 804 | | | — | | | 779 | | | (8,613 | ) | | — | | | (7,030 | ) | | 7,208 | | | — | | | 6,606 | | | (75,430 | ) | | — | | | (61,616 | ) |
| Class I | | | | | | | | | | | | | | | | | | | | | | | | | | | | | | | | | | | | |
| 10/31/2024 | | 4,586,049 | | | — | | | 469,788 | | | (11,460,297 | ) | | — | | | (6,404,460 | ) | | 44,341,830 | | | — | | | 4,275,075 | | | (113,121,444 | ) | | — | | | (64,504,539 | ) |
| 10/31/2023 | | 12,877,849 | | | — | | | 757,381 | | | (9,839,730 | ) | | — | | | 3,795,500 | | | 114,602,514 | | | — | | | 6,445,314 | | | (89,208,989 | ) | | — | | | 31,838,839 | |
| Class P(1) | | | | | | | | | | | | | | | | | | | | | | | | | | | | | | | | | | | | |
| 10/31/2024 | | — | | | — | | | — | | | — | | | — | | | — | | | — | | | — | | | — | | | — | | | — | | | — | |
| 10/31/2023 | | 5,512,925 | | | — | | | 580,657 | | | (20,326,734 | ) | | — | | | (14,233,152 | ) | | 50,131,492 | | | — | | | 5,179,457 | | | (187,152,377 | ) | | — | | | (131,841,428 | ) |
| Class P3(2) | | | | | | | | | | | | | | | | | | | | | | | | | | | | | | | | | | | | |
| 10/31/2024 | | — | | | — | | | — | | | — | | | — | | | — | | | — | | | — | | | — | | | — | | | — | | | — | |
| 10/31/2023 | | 463,009 | | | — | | | 47,528 | | | (2,225,705 | ) | | — | | | (1,715,168 | ) | | 4,338,346 | | | — | | | 431,555 | | | (20,651,033 | ) | | — | | | (15,881,132 | ) |
| Class R | | | | | | | | | | | | | | | | | | | | | | | | | | | | | | | | | | | | |
| 10/31/2024 | | 1,397 | | | — | | | 100 | | | (813 | ) | | — | | | 684 | | | 13,728 | | | — | | | 907 | | | (7,580 | ) | | — | | | 7,055 | |
| 10/31/2023 | | 1,206 | | | — | | | 225 | | | (304 | ) | | — | | | 1,127 | | | 10,852 | | | — | | | 1,914 | | | (2,685 | ) | | — | | | 10,081 | |
| Class W | | | | | | | | | | | | | | | | | | | | | | | | | | | | | | | | | | | | |
| 10/31/2024 | | 1,515,108 | | | — | | | 30,422 | | | (680,498 | ) | | — | | | 865,032 | | | 14,209,325 | | | — | | | 276,231 | | | (6,814,174 | ) | | — | | | 7,671,382 | |
| 10/31/2023 | | 1,582,833 | | | — | | | 192,674 | | | (4,849,316 | ) | | — | | | (3,073,809 | ) | | 14,654,704 | | | — | | | 1,633,875 | | | (43,431,930 | ) | | — | | | (27,143,351 | ) |
| Multi-Manager International Equity | | | | | | | | | | | | | | | | |
| Class I | | | | | | | | | | | | | | | | | | | | | | | | | | | | | | | | | | | | |
| 10/31/2024 | | 38,745,319 | | | — | | | 549,266 | | | (22,611,322 | ) | | — | | | 16,683,263 | | | 408,149,338 | | | — | | | 5,245,490 | | | (242,508,824 | ) | | — | | | 170,886,004 | |
| 10/31/2023 | | 9,222,500 | | | — | | | 427,310 | | | (17,369,731 | ) | | — | | | (7,719,921 | ) | | 87,173,526 | | | — | | | 3,781,540 | | | (164,363,561 | ) | | — | | | (73,408,495 | ) |
| Class P3(3) | | | | | | | | | | | | | | | | | | | | | | | | | | | | | | | | | | | | |
| 10/31/2024 | | — | | | — | | | — | | | — | | | — | | | — | | | — | | | — | | | — | | | — | | | — | | | — | |
| 10/31/2023 | | 576,353 | | | — | | | 24,963 | | | (3,135,561 | ) | | — | | | (2,534,245 | ) | | 5,353,709 | | | — | | | 232,895 | | | (29,974,416 | ) | | — | | | (24,387,812 | ) |
| (1) | Class P was fully redeemed on close of business March 28, 2023. |
| (2) | Class P3 was fully redeemed on close of business March 28, 2023. |
| (3) | Class P3 was fully redeemed on close of business January 10, 2023. |
NOTES TO FINANCIAL STATEMENTS as of October 31, 2024 (continued)
NOTE 11 — SECURITIES LENDING
Under a Master Securities Lending Agreement (the “Agreement”) with BNY, the Funds can lend their securities to approved brokers, dealers and other financial institutions. Loans are collateralized by cash and U.S. government securities. The collateral is equal to at least 105% of the market value of non-U.S. securities loaned and 102% of the market value of U.S. securities loaned. The market value of the loaned securities is determined at the close of business of the Funds at their last sale price or official closing price on the principal exchange or system on which they are traded and any additional collateral is delivered to the Funds on the next business day. The cash collateral received is invested in approved investments as defined in the Agreement with BNY. The Funds bear the risk of loss with respect to the investment of collateral with the following exception: BNY provides the Funds indemnification from loss with respect to the investment of collateral to the extent the cash collateral is invested in overnight repurchase agreements.
Cash collateral received in connection with securities lending is invested in cash equivalents, money market funds, repurchase agreements with maturities of not more than 99 days that are collateralized with U.S. Government securities, or certain short-term investments that have a remaining maturity of 190 days or less (“Permitted Investments”). Short-term investments include: securities, units, shares or other participations in short-term investment funds, pools or trusts; commercial paper, notes, bonds or other debt obligations, certificates of deposit, time deposits and other bank obligations and asset-backed commercial paper backed by diversified receivables and repurchase-backed programs. Permitted Investments are subject to certain guidelines established by the Adviser regarding liquidity, diversification, credit quality and average credit life/duration requirements. The securities purchased with
cash collateral received are reflected in the Portfolio of Investments under Short-Term Investments.
Generally, in the event of counterparty default, the Funds have the right to use the collateral to offset losses incurred. The Agreement contains certain guarantees by BNY in the event of counterparty default and/or a borrower’s failure to return a loaned security; however, there would be a potential loss to the Funds in the event the Funds are delayed or prevented from exercising their right to dispose of the collateral. Engaging in securities lending could have a leveraging effect, which may intensify the credit, market and other risks associated with investing in a fund.
The following tables represent a summary of each respective Fund’s securities lending agreements by counterparty which are subject to offset under the Agreement as of October 31, 2024:
Multi-Manager Emerging Markets Equity
| Counterparty | | Securities
Loaned at Value | | | Cash Collateral
Received(1) | | | Net
Amount | |
| BMO Capital Markets Corp | | $ | 729,460 | | | $ | (729,460 | ) | | $ | — | |
| BofA Securities Inc | | | 47,654 | | | | (47,654 | ) | | | — | |
| Citigroup Global Markets Inc. | | | 34,553 | | | | (34,553 | ) | | | — | |
| J.P. Morgan Securities LLC | | | 276,175 | | | | (276,175 | ) | | | — | |
| Merrill Lynch International | | | 80,569 | | | | (80,569 | ) | | | — | |
| National Financial Services LLC | | | 227,709 | | | | (227,709 | ) | | | — | |
| State Street Bank and Trust Company | | | 103,221 | | | | (103,221 | ) | | | — | |
| Total | | $ | 1,499,341 | | | $ | (1,499,341 | ) | | $ | — | |
| (1) | Cash collateral with a fair value of $1,542,690 has been received in connection with the above securities lending transactions. Excess cash collateral received from the individual counterparty is not shown for financial reporting purposes. |
NOTE 12 — FEDERAL INCOME TAXES
The amount of distributions from net investment income and net realized capital gains are determined in accordance with U.S. federal income tax regulations, which may differ from GAAP for investment companies. These book/tax differences may be either temporary or permanent. Permanent differences are reclassified within the capital accounts based on their federal tax-basis treatment; temporary differences are not reclassified. Key differences include the treatment of foreign currency transactions, futures contracts, income from passive foreign investment companies (PFICs), and wash sale deferrals.
Dividends paid by the Funds from net investment income and distributions of net realized short-term capital gains are, for federal income tax purposes, taxable as ordinary income to shareholders.
The tax composition of dividends and distributions to shareholders was as follows:
NOTES TO FINANCIAL STATEMENTS as of October 31, 2024 (continued)
NOTE 12 — FEDERAL INCOME TAXES (continued)
| | | Year Ended | | | Year Ended | |
| | | October 31, | | | October 31, | |
| | | 2024 | | | 2023 | |
| | | Ordinary | | | Ordinary | |
| | | Income | | | Income | |
| Multi-Manager Emerging Markets Equity | | $ | 4,810,322 | | | $ | 14,319,395 | |
| Multi-Manager International Equity | | | 5,245,490 | | | | 4,016,931 | |
The tax-basis components of distributable earnings and the capital loss carryforwards which may be used to offset future realized capital gains for federal income tax purposes as of October 31, 2024 were:
| | | Undistributed | | | Unrealized | | | | | | | | | | | | Total | |
| | | Ordinary | | | Appreciation/ | | | Capital Loss Carryforwards | | | | | | Distributable | |
| | | Income | | | (Depreciation) | | | Amount | | | Character | | | Other | | | Earnings/(Loss) | |
| Multi-Manager Emerging Markets Equity | | $ | 7,506,976 | | | $ | (9,324,380 | ) | | $ | (15,549,198 | ) | | Short-term | | | $ | (1,205,362 | ) | | $ | (64,198,629 | ) |
| | | | | | | | | | | | (45,626,665 | ) | | Long-term | | | | | | | | | |
| | | | | | | | | | | $ | (61,175,863 | ) | | | | | | | | | | | |
| Multi-Manager International Equity | | | 7,915,695 | | | | 18,714,690 | | | | (944,387 | ) | | Short-term | | | | (431,014 | ) | | | 25,254,984 | |
The Funds’ major tax jurisdictions are U.S. federal and Arizona state.
As of October 31, 2024, no provision for income tax is required in the Funds’ financial statements as a result of tax positions taken on federal and state income tax returns for open tax years. The Funds’ federal and state income and federal excise tax returns for tax years for which the applicable statutes of limitations have not expired are subject to examination by the Internal Revenue Service and state department of revenue. Generally, the preceding four tax years remain subject to examination by these jurisdictions.
NOTE 13 — MARKET DISRUPTION AND GEOPOLITICAL RISK
A Fund is subject to the risk that geopolitical events will disrupt securities markets and adversely affect global economies and markets. Due to the increasing interdependence among global economies and markets, conditions in one country, market, or region might adversely impact markets, issuers and/or foreign exchange rates in other countries, including the United States. Wars, terrorism, global health crises and pandemics, and other geopolitical events that have led, and may continue to lead, to increased market volatility and may have adverse short- or long-term effects on U.S. and global economies and markets, generally. For example, the COVID-19 pandemic resulted in significant market volatility, exchange suspensions and closures, declines in global financial markets, higher default rates, supply chain disruptions, and a substantial economic downturn in economies throughout the world. The economic impacts of COVID-19 have created a unique challenge for real estate markets. Many businesses have either partially or fully transitioned to a remote-working environment and this transition may negatively impact the occupancy rates of commercial real estate over time. Natural and environmental disasters and systemic market dislocations are also highly disruptive to economies and markets. In addition, military
action by Russia in Ukraine has, and may continue to, adversely affect global energy and financial markets and therefore could affect the value of investments, including beyond the direct exposure to Russian issuers or nearby geographic regions. The extent and duration of the military action, sanctions, and resulting market disruptions are impossible to predict and could be substantial. A number of U.S. domestic banks and foreign (non-U.S.) banks have experienced financial difficulties and, in some cases, failures. There can be no certainty that the actions taken by regulators to limit the effect of those financial difficulties and failures on other banks or other financial institutions or on the U.S. or foreign (non-U.S.) economies generally will be successful. It is possible that more banks or other financial institutions will experience financial difficulties or fail, which may affect adversely other U.S. or foreign (non-U.S.) financial institutions and economies. These events as well as other changes in foreign (non-U.S.) and domestic economic, social, and political conditions also could adversely affect individual issuers or related groups of issuers, securities markets, interest rates, credit ratings, inflation, investor sentiment, and other factors affecting the value of a Fund’s investments. Any of these occurrences could disrupt the operations of a Fund and of a Fund’s service providers
NOTES TO FINANCIAL STATEMENTS as of October 31, 2024 (continued)
NOTE 14 — SUBSEQUENT EVENTS
Dividends: Subsequent to October 31, 2024, the following Funds paid dividends and distributions per share of:
| | | Net | | | | | | | |
| | | Investment | | | Payable | | | Record | |
| | | Income | | | Date | | | Date | |
| Multi-Manager Emerging Markets Equity | | |
| Class A | | $ | 0.3976 | | | December 13, 2024 | | | December 11, 2024 | |
| Class C | | $ | 0.3471 | | | December 13, 2024 | | | December 11, 2024 | |
| Class I | | $ | 0.4349 | | | December 13, 2024 | | | December 11, 2024 | |
| Class R | | $ | 0.3770 | | | December 13, 2024 | | | December 11, 2024 | |
| Class W | | $ | 0.4238 | | | December 13, 2024 | | | December 11, 2024 | |
| | | | | | | | | | | |
| Multi-Manager International Equity | | |
| Class I | | $ | 0.1861 | | | December 13, 2024 | | | December 11, 2024 | |
| | | | | | | | | | | |
The Funds have evaluated events occurring after the Statements of Assets and Liabilities date through the date that the financial statements were issued (“subsequent events”) to determine whether any subsequent events necessitated adjustment to or disclosure in the financial statements. Other than the above, no such subsequent events were identified.
Voya Multi-Manager Emerging
Markets Equity Fund | PORTFOLIO OF INVESTMENTS
as of October 31, 2024 |
| Shares | | | | | Value | | | Percentage
of Net
Assets |
| COMMON STOCK: 98.6% | |
| | | | Argentina: 0.2% | |
| 16,358 | | | Cresud SACIF y A, ADR | | $ | 155,237 | | | | 0.1 | |
| 21,648 | | | IRSA Inversiones y Representaciones SA, ADR | | | 281,424 | | | | 0.1 | |
| | | | | | | 436,661 | | | | 0.2 | |
| | | | Brazil: 7.0% |
| 26,286 | | | Allos SA | | | 100,853 | | | | 0.0 | |
| 53,494 | | | Ambev SA | | | 116,595 | | | | 0.1 | |
| 58,654 | | | B3 SA - Brasil Bolsa Balcao | | | 107,854 | | | | 0.1 | |
| 286,219 | | | Banco Bradesco SA, ADR | | | 706,961 | | | | 0.3 | |
| 58,476 | | | Banco Santander Brasil SA, ADR | | | 276,591 | | | | 0.1 | |
| 36,548 | | | BB Seguridade Participacoes SA | | | 216,725 | | | | 0.1 | |
| 130,615 (1) | | | BRF SA, ADR | | | 596,910 | | | | 0.3 | |
| 7,204 | | | Cia de Saneamento Basico do Estado de Sao Paulo SABESP | | | 114,972 | | | | 0.1 | |
| 9,948 | | | Energisa S/A | | | 74,168 | | | | 0.0 | |
| 16,954 | | | Equatorial Energia SA | | | 94,435 | | | | 0.0 | |
| 145,592 | | | Itau Unibanco Holding SA, ADR | | | 880,832 | | | | 0.4 | |
| 32,015 | | | JBS S/A | | | 200,367 | | | | 0.1 | |
| 35,047 | | | Klabin SA | | | 127,253 | | | | 0.1 | |
| 13,356 | | | Petroleo Brasileiro SA | | | 89,989 | | | | 0.0 | |
| 122,836 | | | Petroleo Brasileiro SA - Foreign, ADR | | | 1,652,144 | | | | 0.8 | |
| 413,746 | | | Raia Drogasil SA | | | 1,749,916 | | | | 0.9 | |
| 26,613 | | | Rumo SA | | | 91,290 | | | | 0.0 | |
| 49,692 (1)(2) | | | Sitios Latinoamerica SAB de CV | | | 8,593 | | | | 0.0 | |
| 10,247 | | | Suzano SA | | | 105,840 | | | | 0.1 | |
| 19,100 | | | Telefonica Brasil SA | | | 174,054 | | | | 0.1 | |
| 70,974 | | | Telefonica Brasil SA, ADR | | | 646,573 | | | | 0.3 | |
| 218,471 | | | TIM SA/Brazil | | | 626,211 | | | | 0.3 | |
| 376,072 | | | Totvs SA | | | 1,941,218 | | | | 1.0 | |
| 38,814 | | | Vale SA, ADR | | | 415,310 | | | | 0.2 | |
| 36,675 | | | Vale SA - Foreign | | | 393,021 | | | | 0.2 | |
| 35,742 | | | Vibra Energia SA | | | 138,123 | | | | 0.1 | |
| 147,195 | | | XP, Inc. - Class A | | | 2,570,025 | | | | 1.3 | |
| | | | | | | 14,216,823 | | | | 7.0 | |
| | | | Chile: 0.3% |
| 42,264 | | | Cencosud SA | | | 87,656 | | | | 0.0 | |
| 14,789 (2) | | | Sociedad Quimica y Minera de Chile SA, ADR | | | 567,750 | | | | 0.3 | |
| | | | | | | 655,406 | | | | 0.3 | |
| | | | China: 12.9% |
| 336,600 | | | Alibaba Group Holding Ltd. | | | 4,117,397 | | | | 2.0 | |
| 7,990 (1)(2) | | | Baidu, Inc., ADR | | | 728,928 | | | | 0.4 | |
| 2,948 (1) | | | BeiGene Ltd., ADR | | | 597,383 | | | | 0.3 | |
| 3,000 | | | BYD Co. Ltd. - Class H | | | 108,356 | | | | 0.0 | |
| 855,000 (3) | | | CGN Power Co. Ltd. - Class H | | | 307,320 | | | | 0.1 | |
| 208,000 | | | China Communications Services Corp. Ltd. - Class H | | | 111,748 | | | | 0.1 | |
| Shares | | | | | Value | | | Percentage
of Net
Assets |
| COMMON STOCK: (continued) | |
| | | | China (continued) |
| 167,000 | | | China Construction Bank Corp. - Class H | | $ | 129,631 | | | | 0.1 | |
| 22,000 | | | China Shenhua Energy Co. Ltd. - Class H | | | 95,258 | | | | 0.0 | |
| 276,800 | | | CSPC Pharmaceutical Group Ltd. | | | 204,924 | | | | 0.1 | |
| 18,019 (1) | | | DiDi Global, Inc., ADR | | | 89,735 | | | | 0.0 | |
| 17,700 | | | ENN Energy Holdings Ltd. | | | 124,702 | | | | 0.1 | |
| 347,113 | | | H World Group Ltd. | | | 1,277,654 | | | | 0.6 | |
| 53,600 | | | Haier Smart Home Co. Ltd. - Class H | | | 194,527 | | | | 0.1 | |
| 115,000 | | | Hengan International Group Co. Ltd. | | | 339,579 | | | | 0.2 | |
| 84,500 | | | Inner Mongolia Yitai Coal Co. Ltd. - Class B | | | 195,890 | | | | 0.1 | |
| 79,000 (1)(3) | | | Innovent Biologics, Inc. | | | 343,427 | | | | 0.2 | |
| 27,145 (1) | | | iQIYI, Inc., ADR | | | 70,848 | | | | 0.0 | |
| 73,461 | | | JD.com, Inc. - Class A | | | 1,489,732 | | | | 0.7 | |
| 114,000 | | | Jiangsu Expressway Co. Ltd. - Class H | | | 114,820 | | | | 0.1 | |
| 60,000 | | | Jiangxi Copper Co. Ltd. - Class H | | | 100,927 | | | | 0.0 | |
| 36,500 | | | Lao Feng Xiang Co. Ltd. - Class B | | | 128,485 | | | | 0.1 | |
| 50,480 (1)(3) | | | Meituan - Class B | | | 1,192,861 | | | | 0.6 | |
| 7,900 | | | NetEase, Inc. | | | 127,102 | | | | 0.1 | |
| 262,000 | | | People’s Insurance Co. Group of China Ltd. - Class H | | | 132,246 | | | | 0.1 | |
| 968,000 | | | PetroChina Co. Ltd. - Class H | | | 726,885 | | | | 0.4 | |
| 126,000 | | | PICC Property & Casualty Co. Ltd. - Class H | | | 191,138 | | | | 0.1 | |
| 123,000 (3) | | | Qingdao Port International Co. Ltd. - Class H | | | 86,070 | | | | 0.0 | |
| 114,852 | | | Shenzhen International Holdings Ltd. | | | 97,506 | | | | 0.0 | |
| 19,157 | | | Shenzhen Mindray Bio- Medical Electronics Co. Ltd. - Class A | | | 717,733 | | | | 0.3 | |
| 15,234 (1) | | | Sohu.com Ltd., ADR | | | 214,647 | | | | 0.1 | |
| 107,354 | | | Tencent Holdings Ltd. | | | 5,597,666 | | | | 2.8 | |
| 420,000 | | | Tingyi Cayman Islands Holding Corp. | | | 612,735 | | | | 0.3 | |
| 2,800 (1) | | | Trip.com Group Ltd. | | | 180,193 | | | | 0.1 | |
| 21,317 (1) | | | Trip.com Group Ltd., ADR | | | 1,372,815 | | | | 0.7 | |
| 80,000 (2) | | | Tsingtao Brewery Co. Ltd. - Class H | | | 516,073 | | | | 0.3 | |
| 623,600 | | | Uni-President China Holdings Ltd. | | | 583,659 | | | | 0.3 | |
| 20,475 | | | Weibo Corp., ADR | | | 185,299 | | | | 0.1 | |
| 10,440 (2) | | | Weibo Corp. - Class A | | | 95,207 | | | | 0.0 | |
| 117,000 | | | Weichai Power Co. Ltd. - Class H | | | 176,794 | | | | 0.1 | |
| 150,500 | | | Yangzijiang Shipbuilding Holdings Ltd. | | | 292,391 | | | | 0.1 | |
| 47,564 | | | Yum China Holdings, Inc. | | | 2,137,308 | | | | 1.1 | |
| | | | | | | 26,107,599 | | | | 12.9 | |
See Accompanying Notes to Financial Statements
Voya Multi-Manager Emerging
Markets Equity Fund | PORTFOLIO OF INVESTMENTS
as of October 31, 2024 (continued) |
| Shares | | | | | Value | | | Percentage
of Net
Assets |
| COMMON STOCK: (continued) | |
| | | | Czechia: 0.1% | |
| 4,859 | | | CEZ AS | | $ | 188,282 | | | | 0.1 | |
| | | | | | | | | | | | |
| | | | Egypt: 0.1% |
| 66,302 | | | Commercial International Bank Egypt SAE | | | 108,359 | | | | 0.1 | |
| | | | | | | | | | | | |
| | | | France: 0.8% |
| 4,421 | | | L’Oreal SA | | | 1,658,627 | | | | 0.8 | |
| | | | | | | | | | | | |
| | | | Germany: 0.6% |
| 5,339 | | | Adidas AG | | | 1,278,642 | | | | 0.6 | |
| | | | | | | | | | | | |
| | | | Greece: 0.4% |
| 5,203 | | | GEK Terna Holding Real Estate Construction SA | | | 98,198 | | | | 0.1 | |
| 16,515 | | | Hellenic Telecommunications Organization SA | | | 272,895 | | | | 0.1 | |
| 11,125 | | | Helleniq Energy Holdings SA | | | 83,665 | | | | 0.0 | |
| 5,481 | | | Jumbo SA | | | 146,286 | | | | 0.1 | |
| 9,172 | | | OPAP SA | | | 156,437 | | | | 0.1 | |
| | | | | | | 757,481 | | | | 0.4 | |
| | | | Hong Kong: 2.6% |
| 324,343 | | | AIA Group Ltd. | | | 2,559,818 | | | | 1.3 | |
| 39,500 | | | Beijing Enterprises Holdings Ltd. | | | 129,416 | | | | 0.1 | |
| 1,271,144 (3) | | | Budweiser Brewing Co. APAC Ltd. | | | 1,325,775 | | | | 0.7 | |
| 219,000 | | | China Everbright Environment Group Ltd. | | | 106,051 | | | | 0.0 | |
| 99,400 | | | China Gas Holdings Ltd. | | | 85,360 | | | | 0.0 | |
| 50,000 | | | China Merchants Port Holdings Co. Ltd. | | | 82,226 | | | | 0.0 | |
| 39,700 | | | China Resources Gas Group Ltd. | | | 153,069 | | | | 0.1 | |
| 46,000 | | | China Resources Power Holdings Co. Ltd. | | | 110,653 | | | | 0.1 | |
| 62,000 | | | China State Construction International Holdings Ltd. | | | 91,077 | | | | 0.0 | |
| 616,000 | | | Kunlun Energy Co. Ltd. | | | 584,191 | | | | 0.3 | |
| | | | | | | 5,227,636 | | | | 2.6 | |
| | | | Hungary: 0.4% |
| 55,651 | | | Magyar Telekom Telecommunications PLC | | | 170,244 | | | | 0.1 | |
| 47,460 | | | MOL Hungarian Oil & Gas PLC | | | 329,350 | | | | 0.2 | |
| 8,428 | | | Richter Gedeon Nyrt | | | 243,450 | | | | 0.1 | |
| | | | | | | 743,044 | | | | 0.4 | |
| | | | Iceland: 0.1% |
| 174,437 | | | Hagar hf | | | 121,062 | | | | 0.1 | |
| | | | | | | | | | | | |
| | | | India: 18.4% |
| 4,159 | | | ACC Ltd. | | | 114,497 | | | | 0.1 | |
| 1,522 | | | AIA Engineering Ltd. | | | 69,033 | | | | 0.0 | |
| 1,614 | | | Alkem Laboratories Ltd. | | | 110,759 | | | | 0.1 | |
| 11,498 | | | Ambuja Cements Ltd. | | | 79,267 | | | | 0.0 | |
| 43,019 | | | Asian Paints Ltd. | | | 1,498,269 | | | | 0.7 | |
| 7,333 | | | Axis Bank Ltd. | | | 100,735 | | | | 0.1 | |
| 986 | | | Bajaj Auto Ltd. | | | 115,159 | | | | 0.1 | |
| 25,404 | | | Bajaj Finance Ltd. | | | 2,075,016 | | | | 1.0 | |
| Shares | | | | | Value | | | Percentage
of Net
Assets |
| COMMON STOCK: (continued) | |
| | | | India (continued) |
| 735 | | | Bajaj Holdings & Investment Ltd. | | $ | 89,322 | | | | 0.0 | |
| 43,232 | | | Bharat Electronics Ltd. | | | 145,934 | | | | 0.1 | |
| 5,118 | | | Bharat Forge Ltd. | | | 85,667 | | | | 0.0 | |
| 74,307 | | | Bharat Petroleum Corp. Ltd. | | | 274,104 | | | | 0.1 | |
| 11,793 | | | Bharti Airtel Ltd. | | | 195,730 | | | | 0.1 | |
| 260 | | | Bosch Ltd. | | | 108,456 | | | | 0.1 | |
| 2,498 | | | Britannia Industries Ltd. | | | 169,834 | | | | 0.1 | |
| 13,043 | | | Cipla Ltd./India | | | 239,949 | | | | 0.1 | |
| 48,753 | | | Coal India Ltd. | | | 261,509 | | | | 0.1 | |
| 1,593 | | | Coforge Ltd. | | | 143,627 | | | | 0.1 | |
| 4,010 | | | Colgate-Palmolive India Ltd. | | | 145,845 | | | | 0.1 | |
| 9,027 | | | Container Corp. Of India Ltd. | | | 90,771 | | | | 0.0 | |
| 4,277 | | | Coromandel International Ltd. | | | 84,740 | | | | 0.0 | |
| 3,366 | | | Cummins India Ltd. | | | 139,622 | | | | 0.1 | |
| 1,875 | | | Divi’s Laboratories Ltd. | | | 131,045 | | | | 0.1 | |
| 16,145 | | | Dr Reddy’s Laboratories Ltd. | | | 244,206 | | | | 0.1 | |
| 2,999 | | | Eicher Motors Ltd. | | | 174,055 | | | | 0.1 | |
| 20,875 | | | Exide Industries Ltd. | | | 112,917 | | | | 0.1 | |
| 38,869 | | | GAIL India Ltd. | | | 92,099 | | | | 0.0 | |
| 5,099 | | | Havells India Ltd. | | | 99,233 | | | | 0.1 | |
| 53,148 | | | HCL Technologies Ltd. | | | 1,112,102 | | | | 0.6 | |
| 3,347 (3) | | | HDFC Asset Management Co. Ltd. | | | 170,802 | | | | 0.1 | |
| 79,600 | | | HDFC Bank Ltd. | | | 1,636,155 | | | | 0.8 | |
| 65,281 | | | HDFC Bank Ltd., ADR | | | 4,114,662 | | | | 2.0 | |
| 5,161 | | | Hero MotoCorp Ltd. | | | 305,172 | | | | 0.2 | |
| 26,190 | | | Hindalco Industries Ltd. | | | 212,516 | | | | 0.1 | |
| 1,491 | | | Hindustan Aeronautics Ltd. | | | 75,030 | | | | 0.0 | |
| 20,343 | | | Hindustan Petroleum Corp. Ltd. | | | 91,985 | | | | 0.0 | |
| 2,786 | | | Hindustan Unilever Ltd. | | | 83,646 | | | | 0.0 | |
| 3,338 (3) | | | ICICI Lombard General Insurance Co. Ltd. | | | 75,830 | | | | 0.0 | |
| 10,316 | | | Indian Hotels Co. Ltd. | | | 82,732 | | | | 0.0 | |
| 76,830 | | | Indian Oil Corp. Ltd. | | | 129,488 | | | | 0.1 | |
| 18,950 | | | Indraprastha Gas Ltd. | | | 94,491 | | | | 0.1 | |
| 18,532 (1) | | | Indus Towers Ltd. | | | 74,775 | | | | 0.0 | |
| 57,752 | | | Infosys Ltd. | | | 1,204,975 | | | | 0.6 | |
| 161,014 | | | Infosys Ltd. - Foreign, ADR | | | 3,366,803 | | | | 1.7 | |
| 2,060 (1)(3) | | | InterGlobe Aviation Ltd. | | | 98,961 | | | | 0.1 | |
| 3,514 | | | Larsen & Toubro Ltd. | | | 150,950 | | | | 0.1 | |
| 6,953 | | | Lupin Ltd. | | | 180,408 | | | | 0.1 | |
| 2,758 | | | Mahindra & Mahindra Ltd. | | | 89,063 | | | | 0.0 | |
| 11,456 | | | Marico Ltd. | | | 87,044 | | | | 0.0 | |
| 844 | | | Maruti Suzuki India Ltd. | | | 110,777 | | | | 0.1 | |
| 10,413 | | | Max Healthcare Institute Ltd. | | | 125,699 | | | | 0.1 | |
| 121 | | | MRF Ltd. | | | 175,981 | | | | 0.1 | |
| 67,715 | | | NHPC Ltd. | | | 66,297 | | | | 0.0 | |
| 59,663 | | | NMDC Ltd. | | | 156,688 | | | | 0.1 | |
| 40,071 | | | NTPC Ltd. | | | 193,807 | | | | 0.1 | |
| 40,177 | | | Oil & Natural Gas Corp. Ltd. | | | 126,707 | | | | 0.1 | |
See Accompanying Notes to Financial Statements
Voya Multi-Manager Emerging
Markets Equity Fund | PORTFOLIO OF INVESTMENTS
as of October 31, 2024 (continued) |
| Shares | | | | | Value | | | Percentage
of Net
Assets |
| COMMON STOCK: (continued) | |
| | | | India (continued) |
| 689 | | | Oracle Financial Services Software Ltd. | | $ | 88,923 | | | | 0.0 | |
| 2,660 | | | Persistent Systems Ltd. | | | 169,366 | | | | 0.1 | |
| 56,613 | | | Petronet LNG Ltd. | | | 223,400 | | | | 0.1 | |
| 3,861 | | | Phoenix Mills Ltd. | | | 69,745 | | | | 0.0 | |
| 2,561 | | | PI Industries Ltd. | | | 136,230 | | | | 0.1 | |
| 2,510 | | | Pidilite Industries Ltd. | | | 93,723 | | | | 0.0 | |
| 59,001 | | | Power Grid Corp. of India Ltd. | | | 224,439 | | | | 0.1 | |
| 511,442 | | | Reliance Industries Ltd. | | | 8,086,908 | | | | 4.0 | |
| 119,704 (1) | | | Reliance Strategic Investments Ltd. | | | 457,846 | | | | 0.2 | |
| 1,138 | | | Siemens Ltd. | | | 94,143 | | | | 0.0 | |
| 8,961 | | | Sun Pharmaceutical Industries Ltd. | | | 196,652 | | | | 0.1 | |
| 1,373 | | | Supreme Industries Ltd. | | | 69,952 | | | | 0.0 | |
| 64,926 | | | Tata Consultancy Services Ltd. | | | 3,053,931 | | | | 1.5 | |
| 66,261 | | | Tata Consumer Products Ltd. | | | 788,321 | | | | 0.4 | |
| 13,372 | | | Tata Motors Ltd. | | | 132,263 | | | | 0.1 | |
| 20,616 | | | Tata Power Co. Ltd. | | | 107,462 | | | | 0.1 | |
| 66,605 | | | Tata Steel Ltd. | | | 117,060 | | | | 0.1 | |
| 13,148 | | | Tech Mahindra Ltd. | | | 250,259 | | | | 0.1 | |
| 2,298 | | | Titan Co. Ltd. | | | 89,013 | | | | 0.0 | |
| 2,288 | | | Torrent Pharmaceuticals Ltd. | | | 86,968 | | | | 0.0 | |
| 5,077 | | | Torrent Power Ltd. | | | 109,830 | | | | 0.1 | |
| 1,167 | | | Trent Ltd. | | | 98,615 | | | | 0.1 | |
| 1,201 | | | UltraTech Cement Ltd. | | | 157,710 | | | | 0.1 | |
| 4,787 | | | United Spirits Ltd. | | | 82,371 | | | | 0.0 | |
| 26,641 | | | Vedanta Ltd. | | | 146,650 | | | | 0.1 | |
| 7,528 | | | Voltas Ltd. | | | 147,356 | | | | 0.1 | |
| 21,975 | | | Wipro Ltd. | | | 143,045 | | | | 0.1 | |
| 28,353 (1) | | | Zomato Ltd. | | | 81,345 | | | | 0.0 | |
| 7,438 | | | Zydus Lifesciences Ltd. | | | 88,348 | | | | 0.0 | |
| | | | | | | 37,176,820 | | | | 18.4 | |
| | | | Indonesia: 2.1% |
| 424,500 | | | Adaro Energy Indonesia Tbk PT | | | 97,705 | | | | 0.0 | |
| 2,089,500 | | | Astra International Tbk PT | | | 678,351 | | | | 0.3 | |
| 4,237,974 | | | Bank Central Asia Tbk PT | | | 2,767,712 | | | | 1.4 | |
| 245,000 | | | Bank Mandiri Persero Tbk PT | | | 104,007 | | | | 0.1 | |
| 806,500 | | | Telkom Indonesia Persero Tbk PT | | | 144,156 | | | | 0.1 | |
| 1,918,900 | | | Unilever Indonesia Tbk PT | | | 240,167 | | | | 0.1 | |
| 91,000 | | | United Tractors Tbk PT | | | 158,842 | | | | 0.1 | |
| | | | | | | 4,190,940 | | | | 2.1 | |
| | | | Japan: 1.3% |
| 8,315 | | | Fast Retailing Co. Ltd. | | | 2,658,484 | | | | 1.3 | |
| | | | | | | | | | | | |
| | | | Kuwait: 0.1% |
| 86,592 | | | Mobile Telecommunications Co. KSCP | | | 128,820 | | | | 0.1 | |
| | | | | | | | | | | | |
| | | | Luxembourg: 0.1% |
| 8,107 | | | Reinet Investments SCA | | | 224,996 | | | | 0.1 | |
| Shares | | | | | Value | | | Percentage
of Net
Assets |
| COMMON STOCK: (continued) | |
| | | | Malaysia: 1.1% | |
| 73,500 | | | AMMB Holdings Bhd | | $ | 85,329 | | | | 0.0 | |
| 42,600 | | | CIMB Group Holdings Bhd | | | 77,248 | | | | 0.0 | |
| 102,200 | | | Gamuda Bhd | | | 198,408 | | | | 0.1 | |
| 88,900 | | | Genting Bhd | | | 79,863 | | | | 0.0 | |
| 189,300 | | | IJM Corp. Bhd | | | 129,817 | | | | 0.1 | |
| 41,700 | | | Malaysia Airports Holdings Bhd | | | 96,560 | | | | 0.1 | |
| 87,100 | | | MISC Bhd | | | 148,988 | | | | 0.1 | |
| 176,700 (3) | | | MR DIY Group M Bhd | | | 88,059 | | | | 0.0 | |
| 40,100 | | | Petronas Gas Bhd | | | 158,239 | | | | 0.1 | |
| 261,400 | | | Sime Darby Bhd | | | 137,853 | | | | 0.1 | |
| 88,900 | | | Telekom Malaysia Bhd | | | 131,614 | | | | 0.1 | |
| 201,500 | | | Tenaga Nasional Bhd | | | 644,627 | | | | 0.3 | |
| 143,587 | | | UEM Sunrise Bhd | | | 31,333 | | | | 0.0 | |
| 182,900 | | | YTL Corp. Bhd | | | 81,762 | | | | 0.0 | |
| 160,600 | | | YTL Power International Bhd | | | 111,867 | | | | 0.1 | |
| | | | | | | 2,201,567 | | | | 1.1 | |
| | | | Mexico: 5.6% |
| 160,492 | | | Alfa SAB de CV - Class A | | | 115,820 | | | | 0.1 | |
| 169,156 | | | America Movil SAB de CV | | | 133,824 | | | | 0.1 | |
| 48,053 | | | America Movil SAB de CV - Foreign, ADR | | | 756,354 | | | | 0.4 | |
| 14,954 | | | Arca Continental SAB de CV | | | 127,564 | | | | 0.1 | |
| 286,544 | | | Cemex SAB de CV | | | 150,221 | | | | 0.1 | |
| 86,744 | | | Cemex SAB de CV - Foreign, ADR | | | 452,804 | | | | 0.2 | |
| 36,250 | | | Coca-Cola Femsa SAB de CV | | | 299,971 | | | | 0.1 | |
| 7,015 | | | Coca-Cola Femsa SAB de CV - Foreign, ADR | | | 584,841 | | | | 0.3 | |
| 34,829 | | | Corp Inmobiliaria Vesta SAB de CV | | | 90,687 | | | | 0.0 | |
| 22,901 | | | El Puerto de Liverpool SAB de CV - Class C1 | | | 120,414 | | | | 0.1 | |
| 93,464 | | | Fibra Uno Administracion SA de CV | | | 107,666 | | | | 0.0 | |
| 48,241 | | | Fomento Economico Mexicano SAB de CV | | | 467,354 | | | | 0.2 | |
| 30,061 | | | Fomento Economico Mexicano SAB de CV - Foreign, ADR | | | 2,912,610 | | | | 1.4 | |
| 9,291 | | | Gruma SAB de CV - Class B | | | 159,729 | | | | 0.1 | |
| 10,094 | | | Grupo Aeroportuario del Centro Norte SAB de CV | | | 84,184 | | | | 0.0 | |
| 8,723 | | | Grupo Aeroportuario del Pacifico SAB de CV - Class B | | | 151,948 | | | | 0.1 | |
| 7,656 | | | Grupo Aeroportuario del Sureste SAB de CV - Class B | | | 204,196 | | | | 0.1 | |
| 22,026 | | | Grupo Bimbo SAB de CV | | | 68,215 | | | | 0.0 | |
| 16,582 | | | Grupo Comercial Chedraui SA de CV | | | 105,014 | | | | 0.0 | |
| 117,876 | | | Grupo Financiero Banorte SAB de CV - Class O | | | 822,678 | | | | 0.4 | |
| 49,259 (1) | | | Grupo Financiero Inbursa SAB de CV - Class O | | | 109,500 | | | | 0.1 | |
See Accompanying Notes to Financial Statements
Voya Multi-Manager Emerging
Markets Equity Fund | PORTFOLIO OF INVESTMENTS
as of October 31, 2024 (continued) |
| Shares | | | | | Value | | | Percentage
of Net
Assets |
| COMMON STOCK: (continued) | |
| | | | Mexico (continued) |
| 29,910 | | | Grupo Mexico SAB de CV | | $ | 156,938 | | | | 0.1 | |
| 126,274 | | | Grupo Televisa SAB, ADR | | | 315,685 | | | | 0.2 | |
| 44,337 (1)(2) | | | Ollamani SAB | | | 75,337 | | | | 0.0 | |
| 75,190 | | | Prologis Property Mexico SA de CV | | | 251,767 | | | | 0.1 | |
| 14,692 | | | Promotora y Operadora de Infraestructura SAB de CV | | | 128,009 | | | | 0.1 | |
| 858,517 | | | Wal-Mart de Mexico SAB de CV | | | 2,370,527 | | | | 1.2 | |
| | | | | | | 11,323,857 | | | | 5.6 | |
| | | | Netherlands: 1.0% |
| 23,585 | | | Heineken NV | | | 1,934,362 | | | | 0.9 | |
| 16,969 | | | NEPI Rockcastle NV | | | 133,182 | | | | 0.1 | |
| | | | | | | 2,067,544 | | | | 1.0 | |
| | | | Peru: 0.6% |
| 23,728 | | | Cia de Minas Buenaventura SAA, ADR | | | 309,888 | | | | 0.2 | |
| 4,670 | | | Credicorp Ltd. | | | 859,887 | | | | 0.4 | |
| | | | | | | 1,169,775 | | | | 0.6 | |
| | | | Philippines: 0.2% |
| 465,300 | | | DMCI Holdings, Inc. | | | 89,481 | | | | 0.0 | |
| 17,760 | | | International Container Terminal Services, Inc. | | | 121,028 | | | | 0.0 | |
| 16,220 | | | Manila Electric Co. | | | 136,772 | | | | 0.1 | |
| 6,360 | | | PLDT, Inc. | | | 156,303 | | | | 0.1 | |
| | | | | | | 503,584 | | | | 0.2 | |
| | | | Qatar: 0.2% |
| 31,537 | | | Ooredoo QPSC | | | 99,089 | | | | 0.0 | |
| 34,594 | | | Qatar Fuel QSC | | | 145,654 | | | | 0.1 | |
| 65,351 | | | Qatar Navigation QSC | | | 205,512 | | | | 0.1 | |
| | | | | | | 450,255 | | | | 0.2 | |
| | | | Romania: 0.2% |
| 1,481,471 | | | OMV Petrom SA | | | 239,791 | | | | 0.1 | |
| 4,455 | | | Societatea De Producere A Energiei Electrice in Hidrocentrale Hidroelectrica SA | | | 117,985 | | | | 0.1 | |
| | | | | | | 357,776 | | | | 0.2 | |
| | | | Russia: —% |
| 164,710 (4) | | | Alrosa PJSC | | | — | | | | — | |
| 951,000 (1)(3)(4) | | | Detsky Mir PJSC | | | — | | | | — | |
| 1,037,141 (1)(4) | | | Gazprom PJSC | | | — | | | | — | |
| 25,468 (4) | | | Lukoil PJSC | | | — | | | | — | |
| 14,210 (4) | | | Magnit PJSC | | | — | | | | — | |
| 271,070 (4) | | | Magnitogorsk Iron & Steel Works PJSC | | | — | | | | — | |
| 117,900 (4) | | | MMC Norilsk Nickel PJSC | | | — | | | | — | |
| 91,474 (4) | | | Mobile TeleSystems PJSC | | | — | | | | — | |
| 83,570 (4) | | | Novolipetsk Steel PJSC | | | — | | | | — | |
| 4,078 (4) | | | PhosAgro PJSC | | | — | | | | — | |
| 453,015 (4) | | | Rosneft Oil Co. PJSC | | | — | | | | — | |
| 1,076,340 (4) | | | Sberbank of Russia PJSC | | | — | | | | — | |
| 16,184 (4) | | | Severstal PAO | | | — | | | | — | |
| 34,543 (4) | | | Tatneft PJSC | | | — | | | | — | |
| | | | | | | — | | | | — | |
| | | | Saudi Arabia: 0.6% |
| 2,173 | | | Astra Industrial Group | | | 102,988 | | | | 0.0 | |
| Shares | | | | | Value | | | Percentage
of Net
Assets |
| COMMON STOCK: (continued) | |
| | | | Saudi Arabia (continued) |
| 1,844 | | | Bupa Arabia for Cooperative Insurance Co. | | $ | 98,885 | | | | 0.0 | |
| 13,708 | | | Etihad Etisalat Co. | | | 188,739 | | | | 0.1 | |
| 30,063 | | | Jarir Marketing Co. | | | 105,702 | | | | 0.1 | |
| 2,653 | | | Riyadh Cables Group Co. | | | 71,999 | | | | 0.0 | |
| 73,061 (3) | | | Saudi Arabian Oil Co. | | | 524,802 | | | | 0.3 | |
| 11,992 | | | Saudi Telecom Co. | | | 134,589 | | | | 0.1 | |
| | | | | | | 1,227,704 | | | | 0.6 | |
| | | | South Africa: 2.0% |
| 11,220 | | | Bid Corp. Ltd. | | | 265,481 | | | | 0.1 | |
| 10,235 | | | Bidvest Group Ltd. | | | 165,624 | | | | 0.1 | |
| 626 | | | Capitec Bank Holdings Ltd. | | | 113,087 | | | | 0.0 | |
| 10,860 | | | Clicks Group Ltd. | | | 231,824 | | | | 0.1 | |
| 16,160 | | | Exxaro Resources Ltd. | | | 152,390 | | | | 0.1 | |
| 13,401 | | | Foschini Group Ltd. | | | 116,634 | | | | 0.1 | |
| 15,144 | | | Mr Price Group Ltd. | | | 220,903 | | | | 0.1 | |
| 45,742 | | | OUTsurance Group Ltd. | | | 155,803 | | | | 0.1 | |
| 376,668 | | | Sanlam Ltd. | | | 1,874,367 | | | | 0.9 | |
| 15,268 | | | Shoprite Holdings Ltd. | | | 263,684 | | | | 0.1 | |
| 6,737 | | | Standard Bank Group Ltd. | | | 92,752 | | | | 0.0 | |
| 12,448 | | | Tiger Brands Ltd. | | | 166,936 | | | | 0.1 | |
| 19,670 | | | Vodacom Group Ltd. | | | 123,148 | | | | 0.1 | |
| 48,966 | | | Woolworths Holdings Ltd./South Africa | | | 180,810 | | | | 0.1 | |
| | | | | | | 4,123,443 | | | | 2.0 | |
| | | | South Korea: 15.9% |
| 929 | | | CJ Corp. | | | 68,872 | | | | 0.0 | |
| 1,751 | | | Coway Co. Ltd. | | | 79,998 | | | | 0.0 | |
| 1,665 | | | DB Insurance Co. Ltd. | | | 131,234 | | | | 0.1 | |
| 3,631 | | | GS Holdings Corp. | | | 108,153 | | | | 0.1 | |
| 2,060 | | | Hana Financial Group, Inc. | | | 88,878 | | | | 0.0 | |
| 7,448 | | | Hankook Tire & Technology Co. Ltd. | | | 189,690 | | | | 0.1 | |
| 2,386 | | | HD Hyundai Co. Ltd. | | | 137,669 | | | | 0.1 | |
| 1,125 (1) | | | HD Korea Shipbuilding & Offshore Engineering Co. Ltd. | | | 148,850 | | | | 0.1 | |
| 2,098 | | | Hyundai Glovis Co. Ltd. | | | 184,587 | | | | 0.1 | |
| 2,369 | | | Hyundai Mobis Co. Ltd. | | | 425,787 | | | | 0.2 | |
| 613 | | | Hyundai Motor Co. | | | 94,421 | | | | 0.0 | |
| 38,775 | | | Kakao Corp. | | | 1,032,022 | | | | 0.5 | |
| 2,202 | | | KB Financial Group, Inc. | | | 143,282 | | | | 0.1 | |
| 8,146 | | | Kia Corp. | | | 538,687 | | | | 0.3 | |
| 5,601 (1) | | | Korea Electric Power Corp. | | | 93,641 | | | | 0.0 | |
| 6,406 | | | Korean Air Lines Co. Ltd. | | | 110,579 | | | | 0.1 | |
| 2,571 | | | KT&G Corp. | | | 204,225 | | | | 0.1 | |
| 1,758 | | | LG Corp. | | | 96,067 | | | | 0.0 | |
| 1,215 | | | LG Electronics, Inc. | | | 78,244 | | | | 0.0 | |
| 77,994 | | | LG Uplus Corp. | | | 565,281 | | | | 0.3 | |
| 1,796 | | | Lotte Corp. | | | 31,064 | | | | 0.0 | |
| 384 | | | Lotte Wellfood Co. Ltd. | | | 36,282 | | | | 0.0 | |
| 20,455 | | | NAVER Corp. | | | 2,502,092 | | | | 1.2 | |
| 1,887 | | | S-1 Corp. | | | 88,261 | | | | 0.0 | |
| 8,242 | | | Samsung C&T Corp. | | | 695,925 | | | | 0.3 | |
| 1,177 | | | Samsung Electro-Mechanics Co. Ltd. | | | 100,074 | | | | 0.1 | |
See Accompanying Notes to Financial Statements
Voya Multi-Manager Emerging
Markets Equity Fund | PORTFOLIO OF INVESTMENTS
as of October 31, 2024 (continued) |
| Shares | | | | | Value | | | Percentage
of Net
Assets |
| COMMON STOCK: (continued) | |
| | | | South Korea (continued) |
| 131,419 | | | Samsung Electronics Co. Ltd. | | $ | 5,580,181 | | | | 2.8 | |
| 386 | | | Samsung Fire & Marine Insurance Co. Ltd. | | | 93,582 | | | | 0.0 | |
| 13,683 | | | Samsung Life Insurance Co. Ltd. | | | 1,001,246 | | | | 0.5 | |
| 15,905 | | | Shinhan Financial Group Co. Ltd. | | | 592,464 | | | | 0.3 | |
| 59,850 | | | SK Hynix, Inc. | | | 7,835,193 | | | | 3.9 | |
| 119,726 (1) | | | SK Square Co. Ltd. | | | 7,230,234 | | | | 3.6 | |
| 45,983 | | | SK Telecom Co. Ltd. | | | 1,887,109 | | | | 0.9 | |
| 9,282 | | | Woori Financial Group, Inc. | | | 103,337 | | | | 0.1 | |
| | | | | | | 32,297,211 | | | | 15.9 | |
| | | | Taiwan: 17.1% |
| 6,000 | | | Accton Technology Corp. | | | 100,822 | | | | 0.1 | |
| 11,471 | | | Advantech Co. Ltd. | | | 112,417 | | | | 0.1 | |
| 78,000 | | | ASE Technology Holding Co. Ltd. | | | 367,832 | | | | 0.2 | |
| 24,000 | | | Asustek Computer, Inc. | | | 423,790 | | | | 0.2 | |
| 16,000 | | | Catcher Technology Co. Ltd. | | | 116,451 | | | | 0.1 | |
| 83,000 | | | Cheng Shin Rubber Industry Co. Ltd. | | | 119,209 | | | | 0.1 | |
| 55,000 | | | Chicony Electronics Co. Ltd. | | | 277,370 | | | | 0.1 | |
| 51,000 | | | Chunghwa Telecom Co. Ltd. | | | 193,593 | | | | 0.1 | |
| 86,000 | | | Compal Electronics, Inc. | | | 94,406 | | | | 0.0 | |
| 88,000 | | | CTBC Financial Holding Co. Ltd. | | | 97,555 | | | | 0.0 | |
| 25,000 | | | Delta Electronics, Inc. | | | 308,772 | | | | 0.2 | |
| 148,000 | | | Eva Airways Corp. | | | 170,925 | | | | 0.1 | |
| 130,000 | | | Far Eastern New Century Corp. | | | 150,010 | | | | 0.1 | |
| 30,000 | | | Far EasTone Telecommunications Co. Ltd. | | | 82,842 | | | | 0.0 | |
| 740,000 (1)(3) | | | FIT Hon Teng Ltd. | | | 249,534 | | | | 0.1 | |
| 115,000 | | | Hon Hai Precision Industry Co. Ltd. | | | 737,118 | | | | 0.4 | |
| 4,000 | | | International Games System Co. Ltd. | | | 126,209 | | | | 0.1 | |
| 29,000 | | | King Yuan Electronics Co. Ltd. | | | 109,298 | | | | 0.1 | |
| 2,000 | | | Largan Precision Co. Ltd. | | | 140,081 | | | | 0.1 | |
| 50,000 | | | Lite-On Technology Corp. | | | 156,740 | | | | 0.1 | |
| 2,000 | | | Lotes Co. Ltd. | | | 101,717 | | | | 0.1 | |
| 116,300 | | | MediaTek, Inc. | | | 4,527,349 | | | | 2.2 | |
| 21,000 | | | Micro-Star International Co. Ltd. | | | 114,873 | | | | 0.1 | |
| 20,000 | | | Novatek Microelectronics Corp. | | | 309,027 | | | | 0.2 | |
| 291,000 | | | Pegatron Corp. | | | 882,361 | | | | 0.4 | |
| 157,000 | | | Pou Chen Corp. | | | 183,559 | | | | 0.1 | |
| 49,000 | | | Powertech Technology, Inc. | | | 190,802 | | | | 0.1 | |
| 10,000 | | | President Chain Store Corp. | | | 91,818 | | | | 0.0 | |
| 26,000 | | | Quanta Computer, Inc. | | | 236,115 | | | | 0.1 | |
| Shares | | | | | Value | | | Percentage
of Net
Assets |
| COMMON STOCK: (continued) | |
| | | | Taiwan (continued) |
| 14,000 | | | Realtek Semiconductor Corp. | | $ | 205,415 | | | | 0.1 | |
| 127,350 | | | SinoPac Financial Holdings Co. Ltd. | | | 90,403 | | | | 0.0 | |
| 71,000 | | | Synnex Technology International Corp. | | | 155,950 | | | | 0.1 | |
| 96,000 | | | Taiwan Cement Corp. | | | 95,368 | | | | 0.0 | |
| 46,000 | | | Taiwan Fertilizer Co. Ltd. | | | 81,528 | | | | 0.0 | |
| 18,000 | | | Taiwan Secom Co. Ltd. | | | 76,207 | | | | 0.0 | |
| 713,402 | | | Taiwan Semiconductor Manufacturing Co. Ltd. | | | 22,371,921 | | | | 11.0 | |
| 47,000 | | | Uni-President Enterprises Corp. | | | 131,619 | | | | 0.1 | |
| 203,000 | | | United Microelectronics Corp. | | | 292,878 | | | | 0.1 | |
| 1,000 | | | Voltronic Power Technology Corp. | | | 65,764 | | | | 0.0 | |
| 34,000 | | | WPG Holdings Ltd. | | | 77,250 | | | | 0.0 | |
| 5,000 | | | Yageo Corp. | | | 85,042 | | | | 0.0 | |
| 87,040 | | | Yuanta Financial Holding Co. Ltd. | | | 87,298 | | | | 0.0 | |
| 31,000 | | | Zhen Ding Technology Holding Ltd. | | | 106,897 | | | | 0.1 | |
| | | | | | | 34,696,135 | | | | 17.1 | |
| | | | Thailand: 1.7% |
| 12,800 | | | Advanced Info Service PCL | | | 104,191 | | | | 0.1 | |
| 169,600 | | | Bangkok Dusit Medical Services PCL - Class F | | | 138,248 | | | | 0.1 | |
| 1,426,636 | | | CP ALL PCL - Foreign | | | 2,674,059 | | | | 1.3 | |
| 19,900 | | | Kasikornbank PCL | | | 86,250 | | | | 0.0 | |
| 35,100 | | | PTT Exploration & Production PCL | | | 131,830 | | | | 0.1 | |
| 253,300 | | | PTT PCL - Foreign | | | 251,649 | | | | 0.1 | |
| | | | | | | 3,386,227 | | | | 1.7 | |
| | | | Turkey: 0.7% |
| 482,665 | | | Akbank TAS | | | 712,764 | | | | 0.4 | |
| 16,305 | | | BIM Birlesik Magazalar AS | | | 221,984 | | | | 0.1 | |
| 48,085 | | | Coca-Cola Icecek AS | | | 71,429 | | | | 0.0 | |
| 3,442 (1) | | | D-MARKET Elektronik Hizmetler ve Ticaret AS, ADR | | | 10,980 | | | | 0.0 | |
| 32,650 | | | KOC Holding AS | | | 161,013 | | | | 0.1 | |
| 5,342 | | | Migros Ticaret AS | | | 63,463 | | | | 0.0 | |
| 10,775 (1) | | | Turk Hava Yollari AO | | | 85,699 | | | | 0.0 | |
| 27,704 | | | Turkiye Petrol Rafinerileri AS | | | 116,912 | | | | 0.1 | |
| | | | | | | 1,444,244 | | | | 0.7 | |
| | | | United Arab Emirates: 0.6% |
| 205,990 | | | Air Arabia PJSC | | | 161,079 | | | | 0.1 | |
| 63,228 | | | Aldar Properties PJSC | | | 131,059 | | | | 0.1 | |
| 86,219 | | | Emaar Development PJSC | | | 217,485 | | | | 0.1 | |
| 248,946 | | | Emaar Properties PJSC | | | 588,593 | | | | 0.3 | |
| 16,875 | | | Emirates Telecommunications Group Co. PJSC | | | 81,411 | | | | 0.0 | |
| | | | | | | 1,179,627 | | | | 0.6 | |
| | | | United Kingdom: 1.3% |
| 342,800 (4) | | | Fix Price Group PLC, GDR | | | — | | | | — | |
See Accompanying Notes to Financial Statements
Voya Multi-Manager Emerging
Markets Equity Fund | PORTFOLIO OF INVESTMENTS
as of October 31, 2024 (continued) |
| Shares | | | | | Value | | | Percentage
of Net
Assets |
| COMMON STOCK: (continued) | |
| | | | United Kingdom (continued) |
| 43,303 | | | Unilever PLC, ADR | | $ | 2,637,586 | | | | 1.3 | |
| | | | | | 2,637,586 | | | | 1.3 | |
| | | | United States: 0.7% |
| 12,421 | | | Micron Technology, Inc. | | | 1,237,753 | | | | 0.6 | |
| 6,057 | | | Titan Cement International SA | | | 216,605 | | | | 0.1 | |
| | | | | | | 1,454,358 | | | | 0.7 | |
| | | | Uruguay: 1.6% |
| 1,582 (1) | | | MercadoLibre, Inc. | | | 3,222,819 | | | | 1.6 | |
| | | | | | | | | | | | |
| | | | Total Common Stock
(Cost $195,851,059) | | | 199,623,394 | | | | 98.6 | |
| | | | | | | | | | | | |
| PREFERRED STOCK: 0.7% |
| | | | Brazil: 0.5% |
| 142,871 | | | Cia Energetica de Minas Gerais | | | 280,508 | | | | 0.1 | |
| 38,007 | | | Gerdau SA | | | 120,052 | | | | 0.1 | |
| 279,717 | | | Itausa SA | | | 512,896 | | | | 0.2 | |
| 25,192 | | | Petroleo Brasileiro SA | | | 156,183 | | | | 0.1 | |
| | | | | | 1,069,639 | | | | 0.5 | |
| | | | Chile: 0.1% |
| 29,703 | | | Embotelladora Andina SA | | | 88,669 | | | | 0.1 | |
| | | | | | | | | | | | |
| | | | Russia: —% |
| 378 (4) | | | AK Transneft PJSC OAO | | | — | | | | — | |
| 863,754 (4) | | | Surgutneftegas PJSC | | | — | | | | — | |
| 217 (4) | | | Transneft PJSC | | | — | | | | — | |
| | | | | | | — | | | | — | |
| | | | South Korea: 0.1% |
| 971 | | | LG Chem Ltd. | | | 146,189 | | | | 0.1 | |
| | | | | | | | | | | | |
| | | | Total Preferred Stock
(Cost $3,120,961) | | | 1,304,497 | | | | 0.7 | |
| | | | | | | | | | | | |
| WARRANTS: 0.0% |
| | | | Argentina: 0.0% |
| 38,283 (1) | | | IRSA Inversiones y Representaciones SA | | | 44,408 | | | | 0.0 | |
| | | | | | | | | | | | |
| | | | Total Warrants
(Cost $–) | | | 44,408 | | | | 0.0 | | |
| | | | Total Long-Term Investments
(Cost $198,972,020) | | | 200,972,299 | | | | 99.3 | | |
Principal
Amount† | | | | | Value | | | Percentage
of Net
Assets |
| SHORT-TERM INVESTMENTS: 2.2% |
| | | | Repurchase Agreements: 0.8% |
| 1,000,000 (5) | | | Bank of Montreal, Repurchase Agreement dated 10/31/2024, 4.860%, due 11/01/2024 (Repurchase Amount $1,000,133, collateralized by various U.S. Government/U.S. Government Agency Obligations, 1.713%-7.623%, Market Value plus accrued interest $1,020,000, due 01/01/26-12/01/52) | | $ | 1,000,000 | | | | 0.5 | |
| 542,690 (5) | | | Daiwa Capital Markets America, Inc., Repurchase Agreement dated 10/31/2024, 4.890%, due 11/01/2024 (Repurchase Amount $542,763, collateralized by various U.S. Government/U.S. Government Agency Obligations, 0.625%-7.500%, Market Value plus accrued interest $553,544, due 05/15/25-11/01/54) | | | 542,690 | | | | 0.3 | |
| | | | Total Repurchase Agreements
(Cost $1,542,690) | | | 1,542,690 | | | | 0.8 | |
| | | | | | | | | | | | |
| Shares | | | | | Value | | | Percentage
of Net
Assets |
| SHORT-TERM INVESTMENTS: (continued) |
| | | | Mutual Funds: 1.4% |
| 2,221,952 (6) | | | BlackRock Liquidity Funds, FedFund, Institutional Class, 4.760% | | | 2,221,952 | | | | 1.1 | |
| 694,000 (6) | | | Morgan Stanley Institutional Liquidity Funds - Government Portfolio (Institutional Share Class), 4.780% | | | 694,000 | | | | 0.3 | |
| | | | Total Mutual Funds
(Cost $2,915,952) | | | 2,915,952 | | | | 1.4 | |
| | | | Total Short-Term Investments
(Cost $4,458,642) | | | 4,458,642 | | | | 2.2 | | |
| | | | Total Investments in Securities
(Cost $203,430,662) | | $ | 205,430,941 | | | | 101.5 | | |
| | | | Liabilities in Excess of Other Assets | | | (2,937,090 | ) | | | (1.5 | ) | |
| | | | Net Assets | | $ | 202,493,851 | | | | 100.0 | | |
| ADR | American Depositary Receipt |
| GDR | Global Depositary Receipt |
See Accompanying Notes to Financial Statements
Voya Multi-Manager Emerging
Markets Equity Fund | PORTFOLIO OF INVESTMENTS
as of October 31, 2024 (continued) |
| † | Unless otherwise indicated, principal amount is shown in USD. |
| (1) | Non-income producing security. |
| (2) | Security, or a portion of the security, is on loan. |
| (3) | Securities with purchases pursuant to Rule 144A or section 4(a)(2), under the Securities Act of 1933 and may not be resold subject to that rule except to qualified institutional buyers. |
| (4) | For fair value measurement disclosure purposes, security is categorized as Level 3, whose value was determined using significant unobservable inputs. |
| (5) | All or a portion of the security represents securities purchased with cash collateral received for securities on loan. |
| (6) | Rate shown is the 7-day yield as of October 31, 2024. |
| Sector Diversification | | Percentage
of Net Assets |
| Information Technology | | | 29.2 | % |
| Financials | | | 13.7 | |
| Consumer Staples | | | 12.8 | |
| Consumer Discretionary | | | 12.0 | |
| Communication Services | | | 8.9 | |
| Industrials | | | 7.4 | |
| Energy | | | 7.2 | |
| Materials | | | 3.1 | |
| Utilities | | | 2.2 | |
| Health Care | | | 1.8 | |
| Real Estate | | | 1.0 | |
| Warrants | | | 0.0 | |
| Short-Term Investments | | | 2.2 | |
| Liabilities in Excess of Other Assets | | | (1.5 | ) |
| Net Assets | | | 100.0 | % |
Portfolio holdings are subject to change daily.
See Accompanying Notes to Financial Statements
Voya Multi-Manager Emerging
Markets Equity Fund | PORTFOLIO OF INVESTMENTS
as of October 31, 2024 (continued) |
| Fair Value Measurements^ |
| |
| The following is a summary of the fair valuations according to the inputs used as of October 31, 2024 in valuing the assets and liabilities: |
| |
| | | Quoted Prices
in Active Markets
for Identical
Investments
(Level 1) | | Significant Other
Observable
Inputs#
(Level 2) | | Significant
Unobservable
Inputs
(Level 3) | | Fair Value
at October 31, 2024 |
| Asset Table |
| Investments, at fair value | | | | | | | | | | | | | | | | |
| Common Stock | | | | | | | | | | | | | | | | |
| Argentina | | $ | 436,661 | | | $ | — | | | $ | — | | | $ | 436,661 | |
| Brazil | | | 14,216,823 | | | | — | | | | — | | | | 14,216,823 | |
| Chile | | | 655,406 | | | | — | | | | — | | | | 655,406 | |
| China | | | 4,074,124 | | | | 22,033,475 | | | | — | | | | 26,107,599 | |
| Czechia | | | 188,282 | | | | — | | | | — | | | | 188,282 | |
| Egypt | | | 108,359 | | | | — | | | | — | | | | 108,359 | |
| France | | | — | | | | 1,658,627 | | | | — | | | | 1,658,627 | |
| Germany | | | — | | | | 1,278,642 | | | | — | | | | 1,278,642 | |
| Greece | | | 156,437 | | | | 601,044 | | | | — | | | | 757,481 | |
| Hong Kong | | | 91,077 | | | | 5,136,559 | | | | — | | | | 5,227,636 | |
| Hungary | | | 413,694 | | | | 329,350 | | | | — | | | | 743,044 | |
| Iceland | | | 121,062 | | | | — | | | | — | | | | 121,062 | |
| India | | | 7,481,465 | | | | 29,695,355 | | | | — | | | | 37,176,820 | |
| Indonesia | | | 2,767,712 | | | | 1,423,228 | | | | — | | | | 4,190,940 | |
| Japan | | | — | | | | 2,658,484 | | | | — | | | | 2,658,484 | |
| Kuwait | | | — | | | | 128,820 | | | | — | | | | 128,820 | |
| Luxembourg | | | 224,996 | | | | — | | | | — | | | | 224,996 | |
| Malaysia | | | 254,799 | | | | 1,946,768 | | | | — | | | | 2,201,567 | |
| Mexico | | | 11,323,857 | | | | — | | | | — | | | | 11,323,857 | |
| Netherlands | | | 133,182 | | | | 1,934,362 | | | | — | | | | 2,067,544 | |
| Peru | | | 1,169,775 | | | | — | | | | — | | | | 1,169,775 | |
| Philippines | | | 257,800 | | | | 245,784 | | | | — | | | | 503,584 | |
| Qatar | | | 450,255 | | | | — | | | | — | | | | 450,255 | |
| Romania | | | — | | | | 357,776 | | | | — | | | | 357,776 | |
| Russia | | | — | | | | — | | | | — | | | | — | |
| Saudi Arabia | | | 201,873 | | | | 1,025,831 | | | | — | | | | 1,227,704 | |
| South Africa | | | 2,991,855 | | | | 1,131,588 | | | | — | | | | 4,123,443 | |
| South Korea | | | — | | | | 32,297,211 | | | | — | | | | 32,297,211 | |
| Taiwan | | | — | | | | 34,696,135 | | | | — | | | | 34,696,135 | |
| Thailand | | | — | | | | 3,386,227 | | | | — | | | | 3,386,227 | |
| Turkey | | | 1,134,069 | | | | 310,175 | | | | — | | | | 1,444,244 | |
| United Arab Emirates | | | 81,411 | | | | 1,098,216 | | | | — | | | | 1,179,627 | |
| United Kingdom | | | 2,637,586 | | | | — | | | | — | | | | 2,637,586 | |
| United States | | | 1,237,753 | | | | 216,605 | | | | — | | | | 1,454,358 | |
| Uruguay | | | 3,222,819 | | | | — | | | | — | | | | 3,222,819 | |
| Total Common Stock | | | 56,033,132 | | | | 143,590,262 | | | | — | | | | 199,623,394 | |
| Preferred Stock | | | 1,158,308 | | | | 146,189 | | | | — | | | | 1,304,497 | |
| Warrants | | | 44,408 | | | | — | | | | — | | | | 44,408 | |
| Short-Term Investments | | | 2,915,952 | | | | 1,542,690 | | | | — | | | | 4,458,642 | |
| Total Investments, at fair value | | $ | 60,151,800 | | | $ | 145,279,141 | | | $ | — | | | $ | 205,430,941 | |
| Liabilities Table | | | | | | | | | | | | | | | | |
| Other Financial Instruments+ | | | | | | | | | | | | | | | | |
| Futures | | $ | (32,154 | ) | | $ | — | | | $ | — | | | $ | (32,154 | ) |
| Total Liabilities | | $ | (32,154 | ) | | $ | — | | | $ | — | | | $ | (32,154 | ) |
| ^ | See Note 2, “Significant Accounting Policies” in the Notes to Financial Statements for additional information. |
| # | The earlier close of the foreign markets gives rise to the possibility that significant events, including broad market moves, may have occurred in the interim and may materially affect the value of those securities. To account for this, the Fund may frequently value many of its foreign equity securities using fair value prices based on third party vendor modeling tools to the extent available. Accordingly, a portion of the Fund’s investments are categorized as Level 2 investments. |
See Accompanying Notes to Financial Statements
Voya Multi-Manager Emerging
Markets Equity Fund | PORTFOLIO OF INVESTMENTS
as of October 31, 2024 (continued) |
| + | Other Financial Instruments may include open forward foreign currency contracts, futures, centrally cleared swaps, OTC swaps and written options. Forward foreign currency contracts, futures and centrally cleared swaps are fair valued at the unrealized appreciation (depreciation) on the instrument. OTC swaps and written options are valued at the fair value of the instrument. |
At October 31, 2024, the following futures contracts were outstanding for Voya Multi-Manager Emerging Markets Equity Fund:
| Description | | Number
of Contracts | | Expiration
Date | | Notional
Amount | | Unrealized
Depreciation |
| Long Contracts: |
| MSCI Emerging Markets Index | | 21 | | 12/20/24 | | $ | 1,182,825 | | | $ | (32,154 | ) |
| | | | | | $ | 1,182,825 | | | $ | (32,154 | ) |
A summary of derivative instruments by primary risk exposure is outlined in the following tables.
The fair value of derivative instruments as of October 31, 2024 was as follows:
| Derivatives not accounted for as hedging instruments | | Location on Statement
of Assets and Liabilities | | Fair Value |
| Liability Derivatives | | | | | |
| Equity contracts | | Variation margin payable on futures contracts* | | $ | 32,154 |
| Total Liability Derivatives | | | | $ | 32,154 |
| * | The fair value presented above represents the cumulative unrealized appreciation (depreciation) on futures contracts as reported in the tables within the Portfolio of Investments. In the Statement of Assets and Liabilities, only current day’s unsettled variation margin is reported in receivables or payables on futures contracts and the net cumulative unrealized appreciation (depreciation) is included in total distributable earnings (loss). |
The effect of derivative instruments on the Fund's Statement of Operations for the year ended October 31, 2024 was as follows:
Amount of Realized Gain or (Loss) on Derivatives Recognized in Income
| Derivatives not accounted for as hedging instruments | | Forward
foreign
currency
contracts | | Futures | | Total |
| Equity contracts | | $ | — | | $ | 186,691 | | $ | 186,691 |
| Foreign exchange contracts | | | 4,579 | | | — | | | 4,579 |
| Total | | $ | 4,579 | | $ | 186,691 | | $ | 191,270 |
Change in Unrealized Appreciation or (Depreciation) on Derivatives Recognized in Income
| Derivatives not accounted for as hedging instruments | | Futures |
| Equity contracts | | $ | 8,623 |
| Total | | $ | 8,623 |
At October 31, 2024, the aggregate cost of securities and other investments and the composition of unrealized appreciation and depreciation of securities and other investments on a tax basis were:
| Cost for federal income tax purposes was $214,777,614. |
| Net unrealized depreciation consisted of: |
| Gross Unrealized Appreciation | | $ | 34,946,875 | |
| Gross Unrealized Depreciation | | | (44,271,255 | ) |
| Net Unrealized Depreciation | | $ | (9,324,380 | ) |
See Accompanying Notes to Financial Statements
Voya Multi-Manager
International Equity Fund | PORTFOLIO OF INVESTMENTS
as of October 31, 2024 |
| Shares | | | | | Value | | | Percentage
of Net
Assets |
| COMMON STOCK: 96.9% |
| | | Australia: 2.7% |
| 103,868 | | | Computershare Ltd. | | $ | 1,795,608 | | | 0.3 | |
| 67,244 | | | Dexus | | | 315,592 | | | 0.1 | |
| 95,226 | | | Lottery Corp. Ltd. | | | 311,149 | | | 0.0 | |
| 141,485 | | | Scentre Group | | | 324,377 | | | 0.1 | |
| 18,279 | | | Sonic Healthcare Ltd. | | | 322,081 | | | 0.1 | |
| 1,464,075 | | | Telstra Group Ltd. | | | 3,665,191 | | | 0.7 | |
| 291,596 | | | Transurban Group | | | 2,430,139 | | | 0.5 | |
| 558,243 | | | Vicinity Ltd. | | | 793,607 | | | 0.1 | |
| 14,640 | | | Washington H Soul Pattinson & Co. Ltd. | | | 320,810 | | | 0.1 | |
| 169,381 | | | Woolworths Group Ltd. | | | 3,322,095 | | | 0.7 | |
| | | | | | | 13,600,649 | | | 2.7 | |
| | | | Austria: 0.5% | | | | | | | |
| 82,344 | | | Mondi PLC MNP | | | 1,324,695 | | | 0.3 | |
| 66,156 | | | Mondi PLC QX | | | 1,071,284 | | | 0.2 | |
| | | | | | | 2,395,979 | | | 0.5 | |
| | | | Belgium: 0.6% | | | | | | | |
| 6,492 | | | Ageas SA | | | 338,807 | | | 0.1 | |
| 4,857 | | | Anheuser-Busch InBev SA | | | 287,978 | | | 0.1 | |
| 7,588 | | | D'ieteren Group | | | 1,642,777 | | | 0.3 | |
| 9,674 | | | Groupe Bruxelles Lambert NV | | | 698,991 | | | 0.1 | |
| | | | | | | 2,968,553 | | | 0.6 | |
| | | | Brazil: 0.6% | | | | | | | |
| 297,300 | | | TIM SA/Brazil | | | 852,162 | | | 0.2 | |
| 321,400 | | | Totvs SA | | | 1,659,011 | | | 0.3 | |
| 40,040 | | | XP, Inc. - Class A | | | 699,098 | | | 0.1 | |
| | | | | | | 3,210,271 | | | 0.6 | |
| | | | Canada: 5.3% | | | | | | | |
| 17,439 | | | Cameco Corp. | | | 911,309 | | | 0.2 | |
| 21,789 | | | Canadian Pacific Kansas City Ltd. | | | 1,680,868 | | | 0.3 | |
| 23,189 | | | Canadian Tire Corp. Ltd. - Class A | | | 2,467,709 | | | 0.5 | |
| 59,725 | | | Cenovus Energy, Inc. | | | 960,421 | | | 0.2 | |
| 664 | | | Constellation Software, Inc. | | | 2,002,487 | | | 0.4 | |
| 31,345 | | | Dollarama, Inc. | | | 3,261,807 | | | 0.7 | |
| 55,039 | | | Magna International, Inc. | | | 2,172,941 | | | 0.4 | |
| 59,400 | | | Methanex Corp. | | | 2,325,062 | | | 0.5 | |
| 72,100 | | | Open Text Corp. | | | 2,162,456 | | | 0.4 | |
| 17,142 | | | RB Global, Inc. | | | 1,452,395 | | | 0.3 | |
| 17,763 | | | Royal Bank of Canada | | | 2,148,247 | | | 0.4 | |
| 12,218 (1) | | | Shopify, Inc. - CAD - Class A | | | 955,783 | | | 0.2 | |
| 9,708 | | | TFI International, Inc. | | | 1,299,165 | | | 0.3 | |
| 25,947 | | | Toromont Industries Ltd. | | | 2,292,154 | | | 0.5 | |
| | | | | | | 26,092,804 | | | 5.3 | |
| | | | Chile: 0.8% | | | | | | | |
| 49,078,400 | | | Latam Airlines Group SA | | | 656,475 | | | 0.1 | |
| 335,178 | | | Lundin Mining Corp. | | | 3,259,461 | | | 0.7 | |
| | | | | | | 3,915,936 | | | 0.8 | |
| | | | China: 2.1% | | | | | | | |
| 144,607 | | | ENN Energy Holdings Ltd. | | | 1,018,799 | | | 0.2 | |
| 55,408 | | | KE Holdings, Inc., ADR | | | 1,215,097 | | | 0.2 | |
| 29,255 (1)(2) | | | Meituan - Class B | | | 691,307 | | | 0.1 | |
| 99,700 | | | Proya Cosmetics Co. Ltd. - Class A | | | 1,344,329 | | | 0.3 | |
| | | | | | | | | | | |
| Shares | | | | | Value | | | Percentage
of Net
Assets |
| COMMON STOCK: (continued) |
| | | | China (continued) |
| 121,199 | | | Tencent Holdings Ltd. | | $ | 6,319,574 | | | 1.3 | |
| | | | | | | 10,589,106 | | | 2.1 | |
| | | | Denmark: 1.2% |
| 2,817 | | | Carlsberg AS - Class B | | | 311,317 | | | 0.1 | |
| 17,230 | | | Coloplast A/S - Class B | | | 2,158,068 | | | 0.4 | |
| 28,833 | | | Novo Nordisk A/S - Class B | | | 3,234,054 | | | 0.7 | |
| | | | | | | 5,703,439 | | | 1.2 | |
| | | | Finland: 0.1% |
| 7,082 | | | Sampo Oyj - Class A | | | 314,023 | | | 0.1 | |
| | | | | | | | | | | |
| | | | France: 8.7% |
| 39,640 | | | Accor SA | | | 1,798,354 | | | 0.4 | |
| 7,218 | | | Airbus SE | | | 1,101,041 | | | 0.2 | |
| 6,852 | | | Arkema SA | | | 603,812 | | | 0.1 | |
| 59,347 | | | Bouygues SA | | | 1,907,502 | | | 0.4 | |
| 22,028 | | | Bureau Veritas SA | | | 698,616 | | | 0.1 | |
| 6,581 | | | Capgemini SE | | | 1,141,676 | | | 0.2 | |
| 68,192 | | | Cie Generale des Etablissements Michelin SCA | | | 2,304,582 | | | 0.5 | |
| 4,757 | | | Danone SA | | | 339,833 | | | 0.1 | |
| 11,457 | | | Eiffage SA | | | 1,066,344 | | | 0.2 | |
| 16,438 | | | EssilorLuxottica SA | | | 3,855,658 | | | 0.8 | |
| 2,976 | | | Gecina SA | | | 318,039 | | | 0.1 | |
| 18,012 | | | Getlink SE | | | 306,107 | | | 0.1 | |
| 671 | | | Hermes International | | | 1,525,015 | | | 0.3 | |
| 20,926 | | | IPSOS | | | 1,027,588 | | | 0.2 | |
| 18,967 | | | Klepierre SA | | | 606,405 | | | 0.1 | |
| 4,573 | | | LVMH Moet Hennessy Louis Vuitton SE | | | 3,044,336 | | | 0.6 | |
| 28,039 | | | Orange SA | | | 308,028 | | | 0.1 | |
| 13,514 | | | Pernod Ricard SA | | | 1,686,122 | | | 0.3 | |
| 25,000 | | | Publicis Groupe SA | | | 2,657,081 | | | 0.5 | |
| 32,915 | | | Renault SA | | | 1,506,006 | | | 0.3 | |
| 36,353 | | | Sanofi | | | 3,841,774 | | | 0.8 | |
| 23,100 | | | Teleperformance | | | 2,448,641 | | | 0.5 | |
| 38,700 | | | TotalEnergies SE | | | 2,428,643 | | | 0.5 | |
| 58,356 | | | Vinci SA | | | 6,537,073 | | | 1.3 | |
| | | | | | | 43,058,276 | | | 8.7 | |
| | | | Germany: 9.7% |
| 7,484 | | | Adidas AG | | | 1,792,351 | | | 0.4 | |
| 8,517 | | | Allianz SE | | | 2,681,194 | | | 0.5 | |
| 79,326 | | | BASF SE | | | 3,856,240 | | | 0.8 | |
| 10,470 | | | Bayer AG | | | 282,134 | | | 0.1 | |
| 14,296 | | | Brenntag SE | | | 932,571 | | | 0.2 | |
| 61,600 | | | Daimler Truck Holding AG | | | 2,547,198 | | | 0.5 | |
| 170,067 | | | Deutsche Telekom AG, Reg | | | 5,141,718 | | | 1.0 | |
| 15,329 | | | Evonik Industries AG | | | 337,838 | | | 0.1 | |
| 66,900 | | | flatexDEGIRO AG | | | 982,761 | | | 0.2 | |
| 56,910 (1) | | | Fresenius SE & Co. KGaA | | | 2,077,819 | | | 0.4 | |
| 15,113 | | | Hannover Rueck SE | | | 3,968,579 | | | 0.8 | |
| 3,934 | | | Henkel AG & Co. KGaA | | | 306,819 | | | 0.1 | |
| 56,727 | | | Infineon Technologies AG | | | 1,793,969 | | | 0.4 | |
| 2,870 | | | Linde PLC DE | | | 1,312,424 | | | 0.3 | |
| 41,583 | | | Mercedes-Benz Group AG | | | 2,526,193 | | | 0.5 | |
| 6,205 | | | Merck KGaA | | | 1,025,843 | | | 0.2 | |
See Accompanying Notes to Financial Statements
Voya Multi-Manager
International Equity Fund | PORTFOLIO OF INVESTMENTS
as of October 31, 2024 (continued) |
| Shares | | | | | Value | | | Percentage
of Net
Assets |
| COMMON STOCK: (continued) |
| | | | Germany (continued) |
| 4,849 | | | Muenchener Rueckversicherungs- Gesellschaft AG in Muenchen | | $ | 2,479,680 | | | 0.5 | |
| 28,690 | | | SAP SE | | | 6,698,679 | | | 1.3 | |
| 27,727 (2) | | | Scout24 SE | | | 2,395,204 | | | 0.5 | |
| 10,819 | | | Siemens AG, Reg | | | 2,104,832 | | | 0.4 | |
| 65,830 (1) | | | Siemens Energy AG | | | 2,703,839 | | | 0.5 | |
| | | | | | | 47,947,885 | | | 9.7 | |
| | | | Hong Kong: 2.7% |
| 426,314 | | | AIA Group Ltd. | | | 3,364,606 | | | 0.7 | |
| 81,000 | | | CK Asset Holdings Ltd. | | | 331,125 | | | 0.1 | |
| 379,500 | | | CK Hutchison Holdings Ltd. | | | 1,995,839 | | | 0.4 | |
| 101,444 | | | Hong Kong Exchanges & Clearing Ltd. | | | 4,061,855 | | | 0.8 | |
| 87,700 | | | Hongkong Land Holdings Ltd. | | | 376,022 | | | 0.1 | |
| 8,600 | | | Jardine Matheson Holdings Ltd. | | | 331,100 | | | 0.1 | |
| 69,100 | | | Link REIT | | | 321,966 | | | 0.0 | |
| 34,547 | | | Prudential PLC | | | 287,600 | | | 0.0 | |
| 217,500 | | | Sun Hung Kai Properties Ltd. | | | 2,355,082 | | | 0.5 | |
| | | | | | | 13,425,195 | | | 2.7 | |
| | | | India: 1.6% |
| 138,555 | | | Axis Bank Ltd. | | | 1,903,352 | | | 0.4 | |
| 50,922 | | | HDFC Bank Ltd., ADR | | | 3,209,614 | | | 0.6 | |
| 29,211 | | | Larsen & Toubro Ltd. | | | 1,254,809 | | | 0.3 | |
| 96,462 | | | Reliance Industries Ltd. | | | 1,525,255 | | | 0.3 | |
| | | | | | | 7,893,030 | | | 1.6 | |
| | | | Indonesia: 0.3% |
| 2,007,469 | | | Bank Central Asia Tbk PT | | | 1,311,026 | | | 0.3 | |
| | | | | | | | | | | |
| | | | Ireland: 1.6% |
| 10,126 | | | Accenture PLC - Class A | | | 3,491,647 | | | 0.7 | |
| 65,263 | | | Experian PLC | | | 3,185,232 | | | 0.6 | |
| 504,228 (1) | | | Greencore Group PLC | | | 1,352,376 | | | 0.3 | |
| | | | | | | 8,029,255 | | | 1.6 | |
| | | | Israel: 1.0% |
| 17,451 (1) | | | Check Point Software Technologies Ltd. | | | 3,022,688 | | | 0.6 | |
| 2,676 (1) | | | CyberArk Software Ltd. | | | 739,967 | | | 0.1 | |
| 70,281 (1) | | | Teva Pharmaceutical Industries Ltd., ADR | | | 1,295,982 | | | 0.3 | |
| | | | | | | 5,058,637 | | | 1.0 | |
| | | | Italy: 1.8% |
| 163,200 | | | Eni SpA | | | 2,486,053 | | | 0.5 | |
| 2,623 | | | Ferrari NV | | | 1,252,138 | | | 0.2 | |
| 23,323 (2) | | | Poste Italiane SpA | | | 327,952 | | | 0.1 | |
| 474,507 (1) | | | Saipem SpA | | | 1,128,185 | | | 0.2 | |
| 397,355 | | | Snam SpA | | | 1,908,855 | | | 0.4 | |
| 137,907 (1) | | | TREVI - Finanziaria Industriale SpA | | | 41,702 | | | 0.0 | |
| 45,457 | | | UniCredit SpA | | | 2,010,980 | | | 0.4 | |
| | | | | | | 9,155,865 | | | 1.8 | |
| | | | Japan: 13.8% |
| 28,900 | | | AGC, Inc. | | | 885,644 | | | 0.2 | |
| 80,200 | | | Aisin Corp. | | | 833,870 | | | 0.2 | |
| | | | | | | | | | | |
| Shares | | | | | Value | | | Percentage
of Net
Assets |
| COMMON STOCK: (continued) |
| | | | Japan (continued) |
| 98,800 | | | Asahi Group Holdings Ltd. | | $ | 1,186,121 | | | 0.2 | |
| 61,000 | | | Asahi Kasei Corp. | | | 420,820 | | | 0.1 | |
| 48,500 | | | Bandai Namco Holdings, Inc. | | | 1,016,857 | | | 0.2 | |
| 104,700 | | | Bridgestone Corp. | | | 3,730,997 | | | 0.7 | |
| 13,900 | | | Central Japan Railway Co. | | | 287,858 | | | 0.0 | |
| 147,200 | | | Daicel Corp. | | | 1,299,197 | | | 0.3 | |
| 8,300 | | | Daikin Industries Ltd. | | | 996,471 | | | 0.2 | |
| 35,300 | | | FANUC Corp. | | | 936,556 | | | 0.2 | |
| 4,200 | | | Fast Retailing Co. Ltd. | | | 1,342,830 | | | 0.3 | |
| 18,400 | | | Hoya Corp. | | | 2,461,810 | | | 0.5 | |
| 93,509 | | | ITOCHU Corp. | | | 4,625,687 | | | 0.9 | |
| 11,100 | | | Japan Tobacco, Inc. | | | 309,884 | | | 0.1 | |
| 77,100 | | | KDDI Corp. | | | 2,403,931 | | | 0.5 | |
| 9,126 | | | Keyence Corp. | | | 4,119,601 | | | 0.8 | |
| 286,600 | | | Kyocera Corp. | | | 2,906,614 | | | 0.6 | |
| 165,900 | | | M3, Inc. | | | 1,705,044 | | | 0.3 | |
| 33,300 | | | Macnica Holdings, Inc. | | | 379,831 | | | 0.1 | |
| 159,000 | | | Marubeni Corp. | | | 2,376,928 | | | 0.5 | |
| 45,500 | | | Mitsubishi HC Capital, Inc. | | | 304,679 | | | 0.1 | |
| 253,400 | | | Mitsubishi UFJ Financial Group, Inc. | | | 2,670,898 | | | 0.5 | |
| 33,300 | | | Nomura Research Institute Ltd. | | | 996,117 | | | 0.2 | |
| 164,500 | | | Ono Pharmaceutical Co. Ltd. | | | 2,054,637 | | | 0.4 | |
| 113,900 | | | ORIX Corp. | | | 2,399,859 | | | 0.5 | |
| 20,300 | | | Otsuka Holdings Co. Ltd. | | | 1,226,339 | | | 0.2 | |
| 22,500 | | | Recruit Holdings Co. Ltd. | | | 1,373,907 | | | 0.3 | |
| 69,900 | | | Renesas Electronics Corp. | | | 936,543 | | | 0.2 | |
| 6,500 | | | Shimano, Inc. | | | 954,913 | | | 0.2 | |
| 134,400 | | | SMS Co. Ltd. | | | 1,506,687 | | | 0.3 | |
| 21,600 | | | SoftBank Group Corp. | | | 1,287,759 | | | 0.3 | |
| 253,700 | | | Sony Group Corp. | | | 4,464,490 | | | 0.9 | |
| 18,600 | | | Subaru Corp. | | | 332,182 | | | 0.1 | |
| 76,000 | | | Sumitomo Corp. | | | 1,603,328 | | | 0.3 | |
| 46,600 | | | Sumitomo Mitsui Trust Holdings, Inc. | | | 1,021,953 | | | 0.2 | |
| 70,700 | | | T&D Holdings, Inc. | | | 1,128,531 | | | 0.2 | |
| 231,500 | | | Takeda Pharmaceutical Co. Ltd. | | | 6,459,131 | | | 1.3 | |
| 74,700 | | | Toei Animation Co. Ltd. | | | 1,696,597 | | | 0.3 | |
| 54,700 | | | Toray Industries, Inc. | | | 297,463 | | | 0.1 | |
| 40,600 | | | Unicharm Corp. | | | 1,309,146 | | | 0.3 | |
| | | | | | | 68,251,710 | | | 13.8 | |
| | | | Netherlands: 4.8% |
| 62,506 | | | Aegon Ltd. | | | 394,526 | | | 0.1 | |
| 7,256 | | | ASML Holding NV | | | 4,884,237 | | | 1.0 | |
| 8,775 | | | EXOR NV | | | 926,808 | | | 0.2 | |
| 13,356 | | | IMCD NV | | | 2,123,484 | | | 0.4 | |
| 75,800 | | | Koninklijke Ahold Delhaize NV | | | 2,499,100 | | | 0.5 | |
| 123,413 (1) | | | Koninklijke Philips, N.V. | | | 3,246,847 | | | 0.7 | |
| 89,789 | | | Shell PLC - EUR | | | 3,022,013 | | | 0.6 | |
| 81,956 | | | Universal Music Group NV | | | 2,062,518 | | | 0.4 | |
| 27,960 | | | Wolters Kluwer NV | | | 4,699,615 | | | 0.9 | |
| | | | | | | 23,859,148 | | | 4.8 | |
See Accompanying Notes to Financial Statements
Voya Multi-Manager
International Equity Fund | PORTFOLIO OF INVESTMENTS
as of October 31, 2024 (continued) |
| Shares | | | | | Value | | | Percentage
of Net
Assets |
| COMMON STOCK: (continued) |
| | | | New Zealand: 0.2% |
| 224,441 | | | Auckland International Airport Ltd. | | $ | 979,283 | | | 0.2 | |
| | | | | | | | | | | |
| | | | Norway: 2.4% |
| 216,092 | | | DNB Bank ASA | | | 4,478,071 | | | 0.9 | |
| 106,180 | | | Gjensidige Forsikring ASA | | | 1,916,031 | | | 0.4 | |
| 158,965 | | | SpareBank 1 SR-Bank ASA | | | 2,106,422 | | | 0.4 | |
| 79,476 | | | Sparebanken Vest | | | 976,381 | | | 0.2 | |
| 79,547 | | | Yara International ASA | | | 2,392,152 | | | 0.5 | |
| | | | | | | 11,869,057 | | | 2.4 | |
| | | | Puerto Rico: 0.5% |
| 25,666 | | | Popular, Inc. | | | 2,290,177 | | | 0.5 | |
| | | | | | | | | | | |
| | | | Russia: —% |
| 1,561,600 (3) | | | Alrosa PJSC | | | — | | | — | |
| | | | | | | | | | | |
| | | | Singapore: 1.4% |
| 153,600 | | | CapitaLand Ascendas REIT | | | 311,272 | | | 0.1 | |
| 1,061,300 | | | CapitaLand Integrated Commercial Trust | | | 1,612,412 | | | 0.3 | |
| 516,000 | | | Genting Singapore Ltd. | | | 324,981 | | | 0.1 | |
| 28,900 | | | Oversea-Chinese Banking Corp. Ltd. | | | 331,573 | | | 0.1 | |
| 532,600 | | | Singapore Telecommunications Ltd. | | | 1,256,527 | | | 0.2 | |
| 120,453 | | | United Overseas Bank Ltd. | | | 2,928,098 | | | 0.6 | |
| | | | | | | 6,764,863 | | | 1.4 | |
| | | | South Africa: 0.7% |
| 166,520 | | | Clicks Group Ltd. | | | 3,554,631 | | | 0.7 | |
| | | | | | | | | | | |
| | | | South Korea: 2.7% |
| 15,700 | | | F&F Co. Ltd. | | | 707,113 | | | 0.1 | |
| 37,721 | | | Kia Corp. | | | 2,494,450 | | | 0.5 | |
| 34,100 | | | LG Electronics, Inc. | | | 2,195,978 | | | 0.4 | |
| 52,966 | | | Samsung Electronics Co. Ltd. | | | 2,248,989 | | | 0.5 | |
| 92,026 | | | Shinhan Financial Group Co. Ltd. | | | 3,427,987 | | | 0.7 | |
| 17,500 | | | SK Hynix, Inc. | | | 2,290,992 | | | 0.5 | |
| | | | | | | 13,365,509 | | | 2.7 | |
| | | | Spain: 2.0% |
| 1,698 (2) | | | Aena SME SA | | | 376,311 | | | 0.1 | |
| 47,535 | | | Amadeus IT Group SA | | | 3,445,966 | | | 0.7 | |
| 136,990 | | | Iberdrola SA | | | 2,034,921 | | | 0.4 | |
| 65,036 | | | Industria de Diseno Textil SA | | | 3,708,002 | | | 0.7 | |
| 17,542 | | | Red Electrica Corp. SA | | | 324,802 | | | 0.1 | |
| | | | | | | 9,890,002 | | | 2.0 | |
| | | | Sweden: 2.6% |
| 96,750 | | | Assa Abloy AB - Class B | | | 3,030,475 | | | 0.6 | |
| 56,524 | | | Duni AB | | | 517,252 | | | 0.1 | |
| 184,926 | | | Hexagon AB - Class B | | | 1,728,897 | | | 0.3 | |
| 9,204 | | | L E Lundbergforetagen AB - Class B | | | 455,689 | | | 0.1 | |
| 45,613 | | | Loomis AB | | | 1,429,017 | | | 0.3 | |
| 132,060 | | | Skandinaviska Enskilda Banken AB - Class A | | | 1,865,119 | | | 0.4 | |
| 127,200 | | | SKF AB - Class B | | | 2,412,721 | | | 0.5 | |
| Shares | | | | | Value | | | Percentage
of Net
Assets |
| COMMON STOCK: (continued) |
| | | | Sweden (continued) |
| 3,251 (1) | | | Spotify Technology SA | | $ | 1,251,960 | | | 0.2 | |
| 16,469 | | | Swedbank AB - Class A | | | 334,165 | | | 0.1 | |
| | | | | | | 13,025,295 | | | 2.6 | |
| | | | Switzerland: 4.9% |
| 1,380 | | | Barry Callebaut AG | | | 2,420,366 | | | 0.5 | |
| 8,205 | | | Cie Financiere Richemont SA | | | 1,194,652 | | | 0.2 | |
| 7,859 (1) | | | Galderma Group AG | | | 735,436 | | | 0.1 | |
| 3,195 | | | Nestle SA | | | 301,904 | | | 0.1 | |
| 22,768 | | | Novartis AG, Reg | | | 2,470,471 | | | 0.5 | |
| 3,831 | | | Partners Group Holding AG | | | 5,270,800 | | | 1.1 | |
| 5,853 | | | Sandoz Group AG | | | 266,828 | | | 0.0 | |
| 5,690 | | | Sonova Holding AG, Reg | | | 2,082,185 | | | 0.4 | |
| 1,498 | | | Swatch Group AG - Class BR | | | 307,394 | | | 0.1 | |
| 30,080 | | | Swiss Re AG | | | 3,840,835 | | | 0.8 | |
| 25,336 | | | Temenos AG | | | 1,754,903 | | | 0.3 | |
| 4,509 (2) | | | VAT Group AG | | | 1,877,522 | | | 0.4 | |
| 3,171 | | | Zurich Insurance Group AG | | | 1,869,638 | | | 0.4 | |
| | | | | | | 24,392,934 | | | 4.9 | |
| | | | Taiwan: 2.6% |
| 292,000 | | | Chailease Holding Co. Ltd. | | | 1,367,373 | | | 0.3 | |
| 23,000 | | | Lotes Co. Ltd. | | | 1,169,744 | | | 0.2 | |
| 182,831 | | | Taiwan Semiconductor Manufacturing Co. Ltd. | | | 5,733,487 | | | 1.2 | |
| 22,988 | | | Taiwan Semiconductor Manufacturing Co. Ltd., ADR | | | 4,380,133 | | | 0.9 | |
| | | | | | | 12,650,737 | | | 2.6 | |
| | | | Thailand: 0.4% |
| 255,571 | | | Kasikornbank PCL | | | 1,107,695 | | | 0.2 | |
| 228,500 | | | Tisco Financial Group PCL | | | 653,437 | | | 0.2 | |
| | | | | | | 1,761,132 | | | 0.4 | |
| | | | United Kingdom: 13.7% |
| 65,457 | | | Anglo American PLC | | | 2,029,206 | | | 0.4 | |
| 12,318 | | | Ashtead Group PLC | | | 921,486 | | | 0.2 | |
| 17,904 | | | AstraZeneca PLC | | | 2,547,639 | | | 0.5 | |
| 373,301 | | | BAE Systems PLC | | | 6,016,642 | | | 1.2 | |
| 486,283 | | | Barclays PLC | | | 1,490,711 | | | 0.3 | |
| 61,443 | | | Bellway PLC | | | 2,246,910 | | | 0.5 | |
| 120,375 | | | British American Tobacco PLC | | | 4,209,431 | | | 0.9 | |
| 8,175 | | | Bunzl PLC | | | 359,903 | | | 0.1 | |
| 80,287 | | | Diageo PLC | | | 2,479,420 | | | 0.5 | |
| 33,642 | | | Diploma PLC | | | 1,849,436 | | | 0.4 | |
| 203,024 | | | GSK PLC | | | 3,666,345 | | | 0.7 | |
| 431,356 | | | Haleon PLC | | | 2,073,137 | | | 0.4 | |
| 117,186 | | | Halma PLC | | | 3,743,607 | | | 0.8 | |
| 66,919 | | | Imperial Brands PLC | | | 2,019,495 | | | 0.4 | |
| 154,319 | | | Inchcape PLC | | | 1,427,334 | | | 0.3 | |
| 48,054 | | | London Stock Exchange Group PLC | | | 6,513,079 | | | 1.3 | |
| 1,074,027 | | | M&G PLC | | | 2,690,719 | | | 0.5 | |
| 52,647 | | | Melrose Industries PLC | | | 322,433 | | | 0.1 | |
| 18,500 | | | Next PLC | | | 2,340,532 | | | 0.5 | |
| 52,000 | | | Nomad Foods Ltd. | | | 912,600 | | | 0.2 | |
See Accompanying Notes to Financial Statements
Voya Multi-Manager
International Equity Fund | PORTFOLIO OF INVESTMENTS
as of October 31, 2024 (continued) |
| Shares | | | | | Value | | | Percentage
of Net
Assets |
| COMMON STOCK: (continued) |
| | | | United Kingdom (continued) |
| 174,885 | | | Phoenix Group Holdings PLC | | $ | 1,110,990 | | | 0.2 | |
| 26,871 | | | Reckitt Benckiser Group PLC | | | 1,630,113 | | | 0.3 | |
| 76,901 | | | RELX PLC - EUR | | | 3,553,125 | | | 0.7 | |
| 23,345 | | | RELX PLC - GBP | | | 1,070,601 | | | 0.2 | |
| 246,107 | | | Schroders PLC | | | 1,090,466 | | | 0.2 | |
| 122,646 | | | Standard Chartered PLC | | | 1,422,258 | | | 0.3 | |
| 59,039 | | | Unilever PLC | | | 3,601,520 | | | 0.7 | |
| 52,821 | | | Unilever PLC - NL | | | 3,225,333 | | | 0.7 | |
| 79,484 | | | United Utilities Group PLC | | | 1,048,992 | | | 0.2 | |
| | | | | | 67,613,463 | | | 13.7 | |
| | | | United States: 2.8% |
| 9,975 | | | Aon PLC - Class A | | | 3,659,528 | | | 0.7 | |
| 23,855 | | | BRP, Inc. | | | 1,176,174 | | | 0.2 | |
| 20,574 | | | GFL Environmental, Inc. | | | 859,993 | | | 0.2 | |
| 22,800 (1) | | | Jazz Pharmaceuticals PLC | | | 2,508,684 | | | 0.5 | |
| 5,505 | | | Linde PLC US | | | 2,511,106 | | | 0.5 | |
| 57,821 | | | Smurfit WestRock PLC | | | 2,977,782 | | | 0.6 | |
| 5,600 | | | Tecnoglass, Inc. | | | 383,768 | | | 0.1 | |
| | | | | | 14,077,035 | | | 2.8 | |
| | | | Uruguay: 0.1% |
| 352 (1) | | | MercadoLibre, Inc. | | | 717,087 | | | 0.1 | |
| | | Total Common Stock
(Cost $455,504,518) | | | 479,731,992 | | | 96.9 | |
| | | | | | | | | | | |
| PREFERRED STOCK: 0.4% |
| | | | Germany: 0.4% |
| 3,417 | | | Henkel AG & Co. KGaA | | | 295,888 | | | 0.1 | |
| 6,174 | | | Sartorius AG | | | 1,599,410 | | | 0.3 | |
| | | | | | 1,895,298 | | | 0.4 | |
| | | Total Preferred Stock
(Cost $2,492,199) | | | 1,895,298 | | | 0.4 | |
| | | | | | | | | | | |
| WARRANTS: —% |
| | | | Canada: —% |
| 794 (3) | | | Constellation Software, Inc. | | | — | | | — | |
| | | Total Warrants
(Cost $–) | | | — | | | — | | |
| | | Total Long-Term Investments (Cost $457,996,717) | | | 481,627,290 | | | 97.3 | | |
| | | | | | | | | | | |
| Shares | | | | | Value | | | Percentage
of Net
Assets |
| SHORT-TERM INVESTMENTS: 1.0% |
| | | | Mutual Funds: 1.0% |
| 5,044,593 (4) | | | BlackRock Liquidity Funds, FedFund, Institutional Class, 4.760%
(Cost $5,044,593) | | $ | 5,044,593 | | | 1.0 | |
| | | | | | | | | | | |
| | | Total Short-Term Investments
(Cost $5,044,593) | | $ | 5,044,593 | | | 1.0 | | |
| | | Total Investments in Securities
(Cost $463,041,310) | | $ | 486,671,883 | | | 98.3 | | |
| | | Assets in Excess of Other Liabilities | | | 8,273,342 | | | 1.7 | | |
| | | Net Assets | | $ | 494,945,225 | | | 100.0 | | |
| ADR | | | American Depositary Receipt |
| (1) | Non-income producing security. |
| (2) | Securities with purchases pursuant to Rule 144A or section 4(a)(2), under the Securities Act of 1933 and may not be resold subject to that rule except to qualified institutional buyers. |
| (3) | For fair value measurement disclosure purposes, security is categorized as Level 3, whose value was determined using significant unobservable inputs. |
| (4) | Rate shown is the 7-day yield as of October 31, 2024. |
| Sector Diversification | | Percentage
of Net Assets |
| Financials | | 18.8 | % |
| Industrials | | 17.7 | |
| Consumer Discretionary | | 12.5 | |
| Information Technology | | 12.3 | |
| Health Care | | 10.3 | |
| Consumer Staples | | 8.3 | |
| Communication Services | | 6.5 | |
| Materials | | 5.3 | |
| Energy | | 2.5 | |
| Real Estate | | 1.8 | |
| Utilities | | 1.3 | |
| Short-Term Investments | | 1.0 | |
| Assets in Excess of Other Liabilities | | 1.7 | |
| Net Assets | | 100.0 | % |
Portfolio holdings are subject to change daily.
See Accompanying Notes to Financial Statements
Voya Multi-Manager
International Equity Fund | PORTFOLIO OF INVESTMENTS
as of October 31, 2024 (continued) |
Fair Value Measurements^
The following is a summary of the fair valuations according to the inputs used as of October 31, 2024 in valuing the assets and liabilities:
| | | Quoted Prices
in Active Markets
for Identical
Investments
(Level 1) | | | Significant Other
Observable
Inputs#
(Level 2) | | | Significant
Unobservable
Inputs
(Level 3) | | | Fair Value
at
October 31, 2024 | |
| Asset Table | | | | | | | | | | | |
| Investments, at fair value | | | | | | | | | | | |
| Common Stock | | | | | | | | | | | | | | | | |
| Australia | | $ | — | | | $ | 13,600,649 | | | $ | — | | | $ | 13,600,649 | |
| Austria | | | — | | | | 2,395,979 | | | | — | | | | 2,395,979 | |
| Belgium | | | — | | | | 2,968,553 | | | | — | | | | 2,968,553 | |
| Brazil | | | 3,210,271 | | | | — | | | | — | | | | 3,210,271 | |
| Canada | | | 26,092,804 | | | | — | | | | — | | | | 26,092,804 | |
| Chile | | | 3,915,936 | | | | — | | | | — | | | | 3,915,936 | |
| China | | | 1,215,097 | | | | 9,374,009 | | | | — | | | | 10,589,106 | |
| Denmark | | | — | | | | 5,703,439 | | | | — | | | | 5,703,439 | |
| Finland | | | — | | | | 314,023 | | | | — | | | | 314,023 | |
| France | | | — | | | | 43,058,276 | | | | — | | | | 43,058,276 | |
| Germany | | | 306,819 | | | | 47,641,066 | | | | — | | | | 47,947,885 | |
| Hong Kong | | | 331,100 | | | | 13,094,095 | | | | — | | | | 13,425,195 | |
| India | | | 3,209,614 | | | | 4,683,416 | | | | — | | | | 7,893,030 | |
| Indonesia | | | 1,311,026 | | | | — | | | | — | | | | 1,311,026 | |
| Ireland | | | 4,844,023 | | | | 3,185,232 | | | | — | | | | 8,029,255 | |
| Israel | | | 5,058,637 | | | | — | | | | — | | | | 5,058,637 | |
| Italy | | | 41,702 | | | | 9,114,163 | | | | — | | | | 9,155,865 | |
| Japan | | | — | | | | 68,251,710 | | | | — | | | | 68,251,710 | |
| Netherlands | | | 2,499,100 | | | | 21,360,048 | | | | — | | | | 23,859,148 | |
| New Zealand | | | 979,283 | | | | — | | | | — | | | | 979,283 | |
| Norway | | | 5,284,564 | | | | 6,584,493 | | | | — | | | | 11,869,057 | |
| Puerto Rico | | | 2,290,177 | | | | — | | | | — | | | | 2,290,177 | |
| Russia | | | — | | | | — | | | | — | | | | — | |
| Singapore | | | — | | | | 6,764,863 | | | | — | | | | 6,764,863 | |
| South Africa | | | 3,554,631 | | | | — | | | | — | | | | 3,554,631 | |
| South Korea | | | — | | | | 13,365,509 | | | | — | | | | 13,365,509 | |
| Spain | | | — | | | | 9,890,002 | | | | — | | | | 9,890,002 | |
| Sweden | | | 1,769,212 | | | | 11,256,083 | | | | — | | | | 13,025,295 | |
| Switzerland | | | 735,436 | | | | 23,657,498 | | | | — | | | | 24,392,934 | |
| Taiwan | | | 4,380,133 | | | | 8,270,604 | | | | — | | | | 12,650,737 | |
| Thailand | | | 653,437 | | | | 1,107,695 | | | | — | | | | 1,761,132 | |
| United Kingdom | | | 3,159,510 | | | | 64,453,953 | | | | — | | | | 67,613,463 | |
| United States | | | 14,077,035 | | | | — | | | | — | | | | 14,077,035 | |
| Uruguay | | | 717,087 | | | | — | | | | — | | | | 717,087 | |
| Total Common Stock | | | 89,636,634 | | | | 390,095,358 | | | | — | | | | 479,731,992 | |
| Preferred Stock | | | — | | | | 1,895,298 | | | | — | | | | 1,895,298 | |
| Warrants | | | — | | | | — | | | | — | | | | — | |
| Short-Term Investments | | | 5,044,593 | | | | — | | | | — | | | | 5,044,593 | |
| Total Investments, at fair value | | $ | 94,681,227 | | | $ | 391,990,656 | | | $ | — | | | $ | 486,671,883 | |
| Other Financial Instruments+ | | | | | | | | | | | | | | | | |
| Forward Foreign Currency Contracts | | | — | | | | 129 | | | | — | | | | 129 | |
| Total Assets | | $ | 94,681,227 | | | $ | 391,990,785 | | | $ | — | | | $ | 486,672,012 | |
| Liabilities Table | | | | | | | | | | | | | | | | |
| Other Financial Instruments+ | | | | | | | | | | | | | | | | |
| Futures | | $ | (100,606 | ) | | $ | — | | | $ | — | | | $ | (100,606 | ) |
| Total Liabilities | | $ | (100,606 | ) | | $ | — | | | $ | — | | | $ | (100,606 | ) |
| ^ | See Note 2, “Significant Accounting Policies” in the Notes to Financial Statements for additional information. |
| # | The earlier close of the foreign markets gives rise to the possibility that significant events, including broad market moves, may have occurred in the interim and may materially affect the value of those securities. To account for this, the Fund may frequently value many of its foreign equity securities using fair value prices based on third party vendor modeling tools to the extent available. Accordingly, a portion of the Fund’s investments are categorized as Level 2 investments. |
See Accompanying Notes to Financial Statements
Voya Multi-Manager
International Equity Fund | PORTFOLIO OF INVESTMENTS
as of October 31, 2024 (continued) |
| + | Other Financial Instruments may include open forward foreign currency contracts, futures, centrally cleared swaps, OTC swaps and written options. Forward foreign currency contracts, futures and centrally cleared swaps are fair valued at the unrealized appreciation (depreciation) on the instrument. OTC swaps and written options are valued at the fair value of the instrument. |
At October 31, 2024, the following forward foreign currency contracts were outstanding for Voya Multi-Manager International Equity Fund:
| Currency Purchased | | | Currency Sold | | | Counterparty | | Settlement Date | | Unrealized
Appreciation
(Depreciation) | |
| JPY | | 7,381,422 | | | USD | | 48,453 | | | State Street Bank and Trust Co. | | 11/05/24 | | $ | 129 | |
| | | | | | | | | | | | | | | $ | 129 | |
At October 31, 2024, the following futures contracts were outstanding for Voya Multi-Manager International Equity Fund:
| Description | | Number
of Contracts | | Expiration
Date | | Notional
Amount | | | Unrealized
Depreciation | |
| Long Contracts: | | | | | | | | | | | | |
| MSCI EAFE Index | | 23 | | 12/20/24 | | $ | 2,702,730 | | | $ | (100,606 | ) |
| | | | | | | $ | 2,702,730 | | | $ | (100,606 | ) |
Currency Abbreviations:
JPY — Japanese Yen
USD — United States Dollar
A summary of derivative instruments by primary risk exposure is outlined in the following tables.
The fair value of derivative instruments as of October 31, 2024 was as follows:
| Derivatives not accounted for as hedging instruments | | Location on Statement of Assets and Liabilities | | Fair Value |
| Asset Derivatives | | | | | |
| Foreign exchange contracts | | Unrealized appreciation on forward foreign currency contracts | | $ | 129 |
| Total Asset Derivatives | | | | $ | 129 |
| | | | | | |
| Liability Derivatives | | | | | |
| Equity contracts | | Variation margin payable on futures contracts* | | $ | 100,606 |
| Total Liability Derivatives | | | | $ | 100,606 |
| * | The fair value presented above represents the cumulative unrealized appreciation (depreciation) on futures contracts as reported in the tables within the Portfolio of Investments. In the Statement of Assets and Liabilities, only current day’s unsettled variation margin is reported in receivables or payables on futures contracts and the net cumulative unrealized appreciation (depreciation) is included in total distributable earnings (loss). |
The effect of derivative instruments on the Fund's Statement of Operations for the year ended October 31, 2024 was as follows:
Amount of Realized Gain or (Loss) on Derivatives Recognized in Income
| Derivatives not accounted for as hedging instruments | | Forward
foreign
currency
contracts | | Futures | | Total |
| Equity contracts | | $ | — | | $ | 45,007 | | $ | 45,007 |
| Foreign exchange contracts | | | 50,660 | | | — | | | 50,660 |
| Total | | $ | 50,660 | | $ | 45,007 | | $ | 95,667 |
Change in Unrealized Appreciation or (Depreciation) on Derivatives Recognized in Income
See Accompanying Notes to Financial Statements
Voya Multi-Manager
International Equity Fund | PORTFOLIO OF INVESTMENTS
as of October 31, 2024 (continued) |
| Derivatives not accounted for as hedging instruments | | Forward
foreign
currency
contracts | | Futures | | | Total | |
| Equity contracts | | $ | — | | $ | (100,606 | ) | | $ | (100,606 | ) |
| Foreign exchange contracts | | | 129 | | | — | | | | 129 | |
| Total | | $ | 129 | | $ | (100,606 | ) | | $ | (100,477 | ) |
The following is a summary by counterparty of the fair value of OTC derivative instruments subject to Master Netting Agreements and collateral pledged (received), if any, at October 31, 2024:
| | | State Street
Bank and
Trust Co. | | | Total | |
| Assets: | | | | | | | | |
| Forward foreign currency contracts | | $ | 129 | | | $ | 129 | |
| Total Assets | | $ | 129 | | | $ | 129 | |
| Liabilities: | | | | | | | | |
| Total Liabilities | | $ | — | | | $ | — | |
| Net OTC derivative instruments by counterparty, at fair value | | $ | 129 | | | $ | 129 | |
| Total collateral pledged by the Fund/(Received from counterparty) | | $ | — | | | $ | — | |
| Net Exposure(1) | | $ | 129 | | | $ | 129 | |
| (1) | Positive net exposure represents amounts due from each respective counterparty. Negative exposure represents amounts due from the Fund. Please refer to Note 2 for additional details regarding counterparty credit risk and credit related contingent features. |
At October 31, 2024, the aggregate cost of securities and other investments and the composition of unrealized appreciation and depreciation of securities and other investments on a tax basis were:
| Cost for federal income tax purposes was $467,906,461. | |
| Net unrealized appreciation consisted of: | | | |
| Gross Unrealized Appreciation | | $ | 44,237,577 | |
| Gross Unrealized Depreciation | | | (25,522,887 | ) |
| Net Unrealized Appreciation | | $ | 18,714,690 | |
See Accompanying Notes to Financial Statements
TAX INFORMATION (Unaudited)
Dividends and distributions paid during the year ended October 31, 2024 were as follows:
| Fund Name | | Type | | | | Per Share Amount | |
| Voya Multi-Manager Emerging Markets Equity Fund | | | | | | | |
| Class A | | NII | | | $ | 0.1592 | |
| Class C | | NII | | | $ | 0.0718 | |
| Class I | | NII | | | $ | 0.1929 | |
| Class R | | NII | | | $ | 0.1400 | |
| Class W | | NII | | | $ | 0.1772 | |
| Voya Multi-Manager International Equity Fund | | | | | | | |
| Class I | | NII | | | $ | 0.1776 | |
NII - Net investment income
For the year ended October 31, 2024, the following are percentages of ordinary income dividends paid by the Funds (including creditable foreign taxes paid) that are designated as qualifying dividend income (QDI) subject to reduced income tax rates for individuals:
| Voya Multi-Manager Emerging Markets Equity Fund | | 58.22% |
| Voya Multi-Manager International Equity Fund | | 100.00% |
Pursuant to Section 853 of the Internal Revenue Code, the Funds designate the following amounts as foreign taxes paid for the year ended October 31, 2024. Foreign taxes paid for purposes of Section 853 may be less than actual foreign taxes paid for financial statement purposes.
| | | Creditable Foreign
Taxes Paid | | Per Share Amount | | Portion of Ordinary
Income Derived from Foreign Sourced Income* |
| Voya Multi-Manager Emerging Markets Equity Fund | | $1,447,298 | | $0.0727 | | 21.48% |
| Voya Multi-Manager International Equity Fund | | $987,877 | | $0.0213 | | 93.70% |
*None of the Funds listed above derived any income from ineligible foreign sources as defined under Section 901(j) of the Internal Revenue Code.
Foreign taxes paid or withheld must be included in taxable income with an offsetting deduction from gross income or as a credit for taxes paid to foreign governments. Shareholders are strongly advised to consult their own tax advisors regarding the appropriate treatment of foreign taxes paid.
Above figures may differ from those cited elsewhere in this report due to differences in the calculation of income and gains under U.S. generally accepted accounting principles (book) purposes and Internal Revenue Service (tax) purposes.
Shareholders are strongly advised to consult their own tax advisers with respect to the tax consequences of their investments in the Funds. In January, shareholders, excluding corporate shareholders, receive an IRS 1099-DIV regarding the federal tax status of the dividends and distributions they received in the calendar year.
| Investment Adviser | Independent Registered Public Accounting Firm |
Voya Investments, LLC 7337
East Doubletree Ranch Road, Suite 100
Scottsdale, Arizona 85258 | Ernst & Young LLP
200 Clarendon Street
Boston, Massachusetts 02116 |
| | |
| Distributor | Custodian |
Voya Investments Distributor, LLC
7337 East Doubletree Ranch Road, Suite 100
Scottsdale, Arizona 85258 | The Bank of New York Mellon
225 Liberty Street
New York, New York 10286 |
| | |
| Transfer Agent | Legal Counsel |
BNY Mellon Investment Servicing (U.S.) Inc.
301 Bellevue Parkway
Wilmington, Delaware 19809 | Ropes & Gray LLP
Prudential Tower
800 Boylston Street
Boston, Massachusetts 02199 |
For more complete information, or to obtain a prospectus on any Voya mutual fund, please call your financial advisor or Voya Investments Distributor, LLC at (800) 992-0180 or log on to www.voyainvestments.com. The prospectus should be read carefully before investing. Consider the fund’s investment objectives, risks, charges and expenses carefully before investing. The prospectus contains this information and other information about the fund. Check with your investment professional to determine which funds are available for sale within their firm. Not all funds are available for sale at all firms.
166210 (1024)
Annual Financial Statements and Other Information
October 31, 2024
Classes A, C, I, R, R6 and W
Global and International Funds
| ■ | Voya Global Bond Fund |
| ■ | Voya Global High Dividend Low Volatility Fund |
| ■ | Voya Multi-Manager International Small Cap Fund |
| This report is submitted for general information to shareholders of the Voya mutual funds. It is not authorized for distribution to prospective shareholders unless accompanied or preceded by a prospectus which includes details regarding the funds’ investment objectives, risks, charges, expenses and other information. This information should be read carefully. |
| | E-Delivery Sign-up – details inside |
INVESTMENT MANAGEMENT
voyainvestments.com | |
[This Page Intentionally Left Blank]
TABLE OF CONTENTS
| Go Paperless with E-Delivery! |
| Sign up now for on-line prospectuses, tailored shareholder reports, and proxy statements. |
| Just go to individuals.voya.com/page/e-delivery, follow the directions and complete the quick 5 Steps to Enroll. |
| You will be notified by e-mail when these communications become available on the internet. |
PROXY VOTING INFORMATION
A description of the policies and procedures that the Funds use to determine how to vote proxies related to portfolio securities is available: (1) without charge, upon request, by calling Shareholder Services toll-free at (800) 992-0180; (2) on the Funds’ website at www.voyainvestments.com; and (3) on the U.S. Securities and Exchange Commission’s (“SEC’s”) website at www.sec.gov. Information regarding how the Funds voted proxies related to portfolio securities during the most recent 12-month period ended June 30 is available without charge on the Funds’ website at www.voyainvestments.com and on the SEC’s website at www.sec.gov.
QUARTERLY PORTFOLIO HOLDINGS
The Funds file their complete schedule of portfolio holdings with the SEC for the first and third quarters of each fiscal year on Form NPORT-P. The Funds’ Forms NPORT-P are available on the SEC’s website at www.sec.gov. Each Fund’s complete schedule of portfolio holdings is available at: https://individuals.voya.com/product/mutual-fund/prospectuses-reports and without charge upon request from the Fund by calling Shareholder Services toll-free at (800) 992-0180.
REPORT OF INDEPENDENT REGISTERED PUBLIC ACCOUNTING FIRM
To the Shareholders of Voya Global Bond Fund, Voya Global High Dividend Low Volatility Fund and Voya Multi-Manager International Small Cap Fund and the Board of Trustees of Voya Mutual Funds
Opinion on the Financial Statements
We have audited the accompanying statements of assets and liabilities of Voya Global Bond Fund, Voya Global High Dividend Low Volatility Fund and Voya Multi-Manager International Small Cap Fund (collectively referred to as the “Funds”) (three of the funds constituting Voya Mutual Funds (the “Trust”)), including the portfolios of investments, as of October 31, 2024, and the related statements of operations for the year then ended, the statements of changes in net assets for each of the two years in the period then ended, the financial highlights for each of the five years in the period then ended and the related notes (collectively referred to as the “financial statements”). In our opinion, the financial statements present fairly, in all material respects, the financial position of each of the Funds (four of the funds constituting Voya Mutual Funds) at October 31, 2024, the results of their operations for the year then ended, the changes in their net assets for each of the two years in the period then ended and their financial highlights for each of the five years in the period then ended, in conformity with U.S. generally accepted accounting principles.
Basis for Opinion
These financial statements are the responsibility of the Trust’s management. Our responsibility is to express an opinion on each of the Funds’ financial statements based on our audits. We are a public accounting firm registered with the Public Company Accounting Oversight Board (United States) ("PCAOB") and are required to be independent with respect to the Trust in accordance with the U.S. federal securities laws and the applicable rules and regulations of the Securities and Exchange Commission and the PCAOB.
We conducted our audits in accordance with the standards of the PCAOB. Those standards require that we plan and perform the audits to obtain reasonable assurance about whether the financial statements are free of material misstatement, whether due to error or fraud. The Trust is not required to have, nor were we engaged to perform, an audit of the Trust’s internal control over financial reporting. As part of our audits, we are required to obtain an understanding of internal control over financial reporting, but not for the purpose of expressing an opinion on the effectiveness of the Trust’s internal control over financial reporting. Accordingly, we express no such opinion.
Our audits included performing procedures to assess the risks of material misstatement of the financial statements, whether due to error or fraud, and performing procedures that respond to those risks. Such procedures included examining, on a test basis, evidence regarding the amounts and disclosures in the financial statements. Our procedures included confirmation of securities owned as of October 31, 2024, by correspondence with the custodian, brokers and others; when replies were not received from brokers and others, we performed other auditing procedures. Our audits also included evaluating the accounting principles used and significant estimates made by management, as well as evaluating the overall presentation of the financial statements. We believe that our audits provide a reasonable basis for our opinion.
We have served as the auditor of one or more Voya investment companies since 2019.
Boston, Massachusetts
December 23, 2024
STATEMENTS OF ASSETS AND LIABILITIES as of October 31, 2024
| | | Voya Global Bond Fund | | | Voya Global High Dividend Low Volatility Fund | | | Voya Multi-Manager International Small Cap Fund | |
| ASSETS: | | | | | | | | | | | | |
| Investments in securities at fair value+* | | $ | 174,590,605 | | | $ | 250,344,570 | | | $ | 280,668,863 | |
| Short-term investments at fair value† | | | 16,590,400 | | | | 916,894 | | | | 1,883,656 | |
| Cash | | | 208,445 | | | | 24,415 | | | | — | |
| Cash collateral for futures contracts | | | 1,366,154 | | | | — | | | | — | |
| Cash pledged for centrally cleared swaps (Note 2) | | | 2,886,000 | | | | — | | | | — | |
| Cash pledged as collateral for OTC derivatives (Note 2) | | | 60,000 | | | | — | | | | — | |
| Foreign currencies at value‡ | | | 592,478 | | | | 2,427 | | | | 354,811 | |
| Receivables: | | | | | | | | | | | | |
| Investment securities and currencies sold | | | 903,758 | | | | 37,865 | | | | 1,335,849 | |
| Investment securities sold on a delayed-delivery or when-issued basis | | | 5,559,404 | | | | — | | | | — | |
| Fund shares sold | | | 33,001 | | | | 2,710 | | | | 113,021 | |
| Dividends | | | 1,857 | | | | 452,256 | | | | 779,901 | |
| Interest | | | 1,613,678 | | | | 28 | | | | 46 | |
| Foreign tax reclaims | | | 14,507 | | | | 619,999 | | | | 393,079 | |
| Variation margin on centrally cleared swaps | | | 961 | | | | — | | | | — | |
| Unrealized appreciation on forward foreign currency contracts | | | 322,351 | | | | — | | | | 15 | |
| Unrealized appreciation on forward premium swaptions | | | 232,958 | | | | — | | | | — | |
| Unrealized appreciation on OTC swap agreements | | | 4,088 | | | | — | | | | — | |
| Prepaid expenses | | | 32,008 | | | | 19,018 | | | | 31,723 | |
| Reimbursement due from Investment Adviser | | | 29,975 | | | | 31,792 | | | | 143,658 | |
| Other assets | | | 16,122 | | | | 47,601 | | | | 13,173 | |
| Total assets | | | 205,058,750 | | | | 252,499,575 | | | | 285,717,795 | |
| | | | | | | | | | | | | |
| LIABILITIES: | | | | | | | | | | | | |
| Income distribution payable | | | 5,670 | | | | — | | | | — | |
| Payable for investment securities and currencies purchased | | | 1,823,197 | | | | 37,941 | | | | 647,977 | |
| Payable for investment securities purchased on a delayed-delivery or when-issued basis | | | 10,663,209 | | | | — | | | | — | |
| Payable for fund shares redeemed | | | 94,262 | | | | 263,630 | | | | 265,002 | |
| Payable upon receipt of securities loaned | | | 4,151,263 | | | | 260,894 | | | | 1,525,159 | |
| Unrealized depreciation on forward foreign currency contracts | | | 302,797 | | | | — | | | | — | |
| Unrealized depreciation on forward premium swaptions | | | 76,203 | | | | — | | | | — | |
| Unrealized depreciation on OTC swap agreements | | | 93,727 | | | | — | | | | — | |
| Variation margin payable on futures contracts | | | 52,170 | | | | — | | | | — | |
| Cash received as collateral for OTC derivatives (Note 2) | | | 140,000 | | | | — | | | | — | |
| Payable for investment management fees | | | 85,656 | | | | 107,297 | | | | 239,579 | |
| Payable for distribution and shareholder service fees | | | 6,545 | | | | 48,058 | | | | 13,337 | |
| Payable to custodian due to bank overdraft | | | — | | | | — | | | | 362,854 | |
| Payable to trustees under the deferred compensation plan (Note 6) | | | 16,122 | | | | 47,601 | | | | 13,173 | |
| Payable for trustee fees | | | 636 | | | | 614 | | | | 693 | |
| Other accrued expenses and liabilities | | | 152,502 | | | | 143,824 | | | | 200,141 | |
| Written options, at fair value^ | | | 307 | | | | — | | | | — | |
| Total liabilities | | | 17,664,266 | | | | 909,859 | | | | 3,267,915 | |
| NET ASSETS | | $ | 187,394,484 | | | $ | 251,589,716 | | | $ | 282,449,880 | |
See Accompanying Notes to Financial Statements
STATEMENTS OF ASSETS AND LIABILITIES as of October 31, 2024 (continued)
| | | Voya Global Bond Fund | | | Voya Global High Dividend Low Volatility Fund | | Voya Multi-Manager International Small Cap Fund | |
| NET ASSETS WERE COMPRISED OF: | | | | | | | | | |
| Paid-in capital | | $ | 228,224,962 | | | $ | 232,065,274 | | $ | 255,061,050 | |
| Total distributable earnings (loss) | | | (40,830,478 | ) | | | 19,524,442 | | | 27,388,830 | |
| NET ASSETS | | $ | 187,394,484 | | | $ | 251,589,716 | | $ | 282,449,880 | |
| | | | | | | | | | | | |
| + Including securities loaned at value | | $ | 4,026,494 | | | $ | 246,990 | | $ | 1,447,714 | |
| * Cost of investments in securities | | $ | 181,419,920 | | | $ | 215,362,131 | | $ | 253,201,840 | |
| † Cost of short-term investments | | $ | 16,591,749 | | | $ | 916,894 | | $ | 1,883,656 | |
| ‡ Cost of foreign currencies | | $ | 595,702 | | | $ | 2,436 | | $ | 360,710 | |
| ^ Premiums received on written options | | $ | 43,958 | | | $ | — | | $ | — | |
See Accompanying Notes to Financial Statements
STATEMENTS OF ASSETS AND LIABILITIES as of October 31, 2024 (continued)
| | | Voya Global Bond Fund | | | Voya Global High Dividend Low Volatility Fund | | | Voya Multi-Manager International Small Cap Fund | |
| Class A | | | | | | | | | | | | |
| Net assets | | $ | 19,297,580 | | | $ | 214,850,122 | | | $ | 53,340,757 | |
| Shares authorized | | | unlimited | | | | unlimited | | | | unlimited | |
| Par value | | | — | | | | — | | | | — | |
| Shares outstanding | | | 2,656,983 | | | | 4,686,650 | | | | 872,455 | |
| Net asset value and redemption price per share† | | $ | 7.26 | | | $ | 45.84 | | | $ | 61.14 | |
| Maximum offering price per share (5.75%)(1) | | $ | 7.45 | (2) | | $ | 48.64 | | | $ | 64.87 | |
| | | | | | | | | | | | | |
| Class C | | | | | | | | | | | | |
| Net assets | | $ | 634,539 | | | $ | 2,158,131 | | | $ | 2,468,870 | |
| Shares authorized | | | unlimited | | | | unlimited | | | | unlimited | |
| Par value | | | — | | | | — | | | | — | |
| Shares outstanding | | | 87,784 | | | | 51,012 | | | | 45,121 | |
| Net asset value and redemption price per share† | | $ | 7.23 | | | $ | 42.31 | | | $ | 54.72 | |
| | | | | | | | | | | | | |
| Class I | | | | | | | | | | | | |
| Net assets | | $ | 113,000,811 | | | $ | 31,021,677 | | | $ | 200,776,159 | |
| Shares authorized | | | unlimited | | | | unlimited | | | | unlimited | |
| Par value | | | — | | | | — | | | | — | |
| Shares outstanding | | | 15,632,322 | | | | 669,788 | | | | 3,287,768 | |
| Net asset value and redemption price per share | | $ | 7.23 | | | $ | 46.32 | | | $ | 61.07 | |
| | | | | | | | | | | | | |
| Class R | | | | | | | | | | | | |
| Net assets | | $ | 4,684,993 | | | | n/a | | | | n/a | |
| Shares authorized | | | unlimited | | | | n/a | | | | n/a | |
| Par value | | | — | | | | n/a | | | | n/a | |
| Shares outstanding | | | 643,190 | | | | n/a | | | | n/a | |
| Net asset value and redemption price per share | | $ | 7.28 | | | | n/a | | | | n/a | |
| | | | | | | | | | | | | |
| Class R6 | | | | | | | | | | | | |
| Net assets | | $ | 13,377,531 | | | $ | 142,616 | | | $ | 107,070 | |
| Shares authorized | | | unlimited | | | | unlimited | | | | unlimited | |
| Par value | | | — | | | | — | | | | — | |
| Shares outstanding | | | 1,845,667 | | | | 3,081 | | | | 1,752 | |
| Net asset value and redemption price per share | | $ | 7.25 | | | $ | 46.29 | | | $ | 61.10 | |
| | | | | | | | | | | | | |
| Class W | | | | | | | | | | | | |
| Net assets | | $ | 36,399,030 | | | $ | 3,417,170 | | | $ | 25,757,024 | |
| Shares authorized | | | unlimited | | | | unlimited | | | | unlimited | |
| Par value | | | — | | | | — | | | | — | |
| Shares outstanding | | | 5,099,145 | | | | 73,847 | | | | 328,013 | |
| Net asset value and redemption price per share | | $ | 7.14 | | | $ | 46.27 | | | $ | 78.52 | |
| (1) | Maximum offering price is computed at 100/94.25 of net asset value. On purchases of $100,000 or more, the offering price is reduced. |
| (2) | Maximum offering price is 2.50% and is computed at 100/97.50 of net asset value. On purchases of $100,000 or more, the offering price is reduced. |
| † | Redemption price per share may be reduced for any applicable contingent deferred sales charges. |
See Accompanying Notes to Financial Statements
STATEMENTS OF OPERATIONS for the year ended October 31, 2024
| | | Voya Global Bond Fund | | | | Voya Global High Dividend Low Volatility Fund | | Voya Multi-Manager International Small Cap Fund | |
| INVESTMENT INCOME: | | | | | | | | | | | |
| Dividends, net of foreign taxes withheld* | | $ | 38,415 | | | $ | 7,924,280 | | $ | 8,153,368 | |
| Interest, net of foreign taxes withheld* | | | 12,423,771 | | | | 2,320 | | | 155 | |
| Securities lending income, net | | | 17,503 | | | | 1,251 | | | 29,850 | |
| Other | | | 1,410 | | | | 1,323 | | | 1,475 | |
| Total investment income | | | 12,481,099 | | | | 7,929,174 | | | 8,184,848 | |
| | | | | | | | | | | | |
| EXPENSES: | | | | | | | | | | | |
| Investment management fees | | | 1,271,301 | | | | 1,228,001 | | | 2,771,585 | |
| Distribution and shareholder service fees: | | | | | | | | | | | |
| Class A | | | 52,283 | | | | 521,502 | | | 127,595 | |
| Class C | | | 6,331 | | | | 24,146 | | | 24,380 | |
| Class R | | | 21,579 | | | | — | | | — | |
| Transfer agent fees: | | | | | | | | | | | |
| Class A | | | 43,168 | | | | 280,530 | | | 73,660 | |
| Class C | | | 1,308 | | | | 3,256 | | | 3,521 | |
| Class I | | | 126,456 | | | | 12,784 | | | 289,920 | |
| Class R | | | 8,914 | | | | — | | | — | |
| Class R6 | | | 662 | | | | 47 | | | 223 | |
| Class W | | | 88,084 | | | | 4,450 | | | 37,843 | |
| Shareholder reporting expense | | | 76,930 | | | | 36,545 | | | 38,535 | |
| Registration fees | | | 95,757 | | | | 70,340 | | | 96,377 | |
| Professional fees | | | 67,587 | | | | 60,182 | | | 97,127 | |
| Custody and accounting expense | | | 105,691 | | | | 41,266 | | | 290,765 | |
| Trustee fees | | | 6,357 | | | | 6,142 | | | 6,932 | |
| Miscellaneous expense | | | 35,561 | | | | 35,134 | | | 39,063 | |
| Interest expense | | | — | | | | 6,723 | | | 7,415 | |
| Total expenses | | | 2,007,969 | | | | 2,331,048 | | | 3,904,941 | |
| Waived and reimbursed fees | | | (267,262 | ) | | | (288,128 | ) | | (341,749 | ) |
| Brokerage commission recapture | | | — | | | | — | | | (2,173 | ) |
| Net expenses | | | 1,740,707 | | | | 2,042,920 | | | 3,561,019 | |
| Net investment income | | | 10,740,392 | | | | 5,886,254 | | | 4,623,829 | |
| REALIZED AND UNREALIZED GAIN (LOSS): | | | | | | | | | | | |
| Net realized gain (loss) on: | | | | | | | | | | | |
| Investments (net of foreign capital gains taxes withheld) | | | (2,682,371 | ) | | | 16,513,293 | | | 12,911,501 | |
| Forward foreign currency contracts | | | (871,509 | ) | | | — | | | 212 | |
| Foreign currency related transactions | | | (306,534 | ) | | | 45,809 | | | (84,152 | ) |
| Futures | | | 2,265,991 | | | | — | | | — | |
| Swaps | | | (26,243 | ) | | | — | | | — | |
| Written options | | | 1,058,315 | | | | — | | | — | |
| Net realized gain (loss) | | | (562,351 | ) | | | 16,559,102 | | | 12,827,561 | |
| Net change in unrealized appreciation (depreciation) on: | | | | | | | | | | | |
| Investments | | | 21,598,304 | | | | 31,648,779 | | | 40,935,761 | |
| Forward foreign currency contracts | | | 990,227 | | | | — | | | 15 | |
| Foreign currency related transactions | | | (4,162 | ) | | | 12,015 | | | (1,271 | ) |
| Futures | | | (640,527 | ) | | | — | | | — | |
See Accompanying Notes to Financial Statements
STATEMENTS OF OPERATIONS for the year ended October 31, 2024 (continued)
| | | Voya Global Bond Fund | | | | Voya Global High Dividend Low Volatility Fund | | Voya Multi-Manager International Small Cap Fund | |
| Swaps | | | (897,239 | ) | | | — | | | — | |
| Written options | | | 257,247 | | | | — | | | — | |
| Net change in unrealized appreciation (depreciation) | | | 21,303,850 | | | | 31,660,794 | | | 40,934,505 | |
| Net realized and unrealized gain | | | 20,741,499 | | | | 48,219,896 | | | 53,762,066 | |
| Increase in net assets resulting from operations | | $ | 31,481,891 | | | $ | 54,106,150 | | $ | 58,385,895 | |
| * Foreign taxes withheld | | $ | 10,004 | | | $ | 341,553 | | $ | 1,065,767 | |
See Accompanying Notes to Financial Statements
STATEMENTS OF CHANGES IN NET ASSETS
| | | Voya Global Bond Fund | | | Voya Global High Dividend Low Volatility Fund | |
| | | Year Ended October 31, 2024 | | | Year Ended October 31, 2023 | | | Year Ended October 31, 2024 | | | Year Ended October 31, 2023 | |
| FROM OPERATIONS: | | | | | | | | | | | | | | | | |
| Net investment income | | $ | 10,740,392 | | | $ | 10,458,794 | | | $ | 5,886,254 | | | $ | 7,232,073 | |
| Net realized gain (loss) | | | (562,351 | ) | | | (14,962,631 | ) | | | 16,559,102 | | | | 382,352 | |
| Net change in unrealized appreciation(depreciation) | | | 21,303,850 | | | | 8,952,175 | | | | 31,660,794 | | | | (1,839,743 | ) |
| Increase in net assets resulting from operations | | | 31,481,891 | | | | 4,448,338 | | | | 54,106,150 | | | | 5,774,682 | |
| | | | | | | | | | | | | | | | |
| FROM DISTRIBUTIONS TO SHAREHOLDERS: | | | | | | | | | | | | | | | | |
| Total distributions (excluding return of capital): | | | | | | | | | | | | | | | | |
| Class A | | | (881,311 | ) | | | (671,197 | ) | | | (5,244,643 | ) | | | (6,856,674 | ) |
| Class C | | | (22,179 | ) | | | (14,462 | ) | | | (44,294 | ) | | | (117,309 | ) |
| Class I | | | (5,366,365 | ) | | | (3,605,829 | ) | | | (821,039 | ) | | | (1,648,074 | ) |
| Class P3(1) | | | — | | | | (32,016 | ) | | | — | | | | — | |
| Class R | | | (172,783 | ) | | | (120,330 | ) | | | — | | | | — | |
| Class R6 | | | (2,940,258 | ) | | | (2,487,494 | ) | | | (3,578 | ) | | | (3,940 | ) |
| Class W | | | (1,914,331 | ) | | | (1,685,779 | ) | | | (90,494 | ) | | | (113,162 | ) |
| Return of capital: | | | | | | | | | | | | | | | | |
| Class A | | | (28,576 | ) | | | (241,604 | ) | | | — | | | | — | |
| Class C | | | (879 | ) | | | (6,997 | ) | | | — | | | | — | |
| Class I | | | (164,200 | ) | | | (1,271,722 | ) | | | — | | | | — | |
| Class R | | | (5,954 | ) | | | (49,521 | ) | | | — | | | | — | |
| Class R6 | | | (80,831 | ) | | | (852,688 | ) | | | — | | | | — | |
| Class W | | | (53,921 | ) | | | (604,814 | ) | | | — | | | | — | |
| Total distributions | | | (11,631,588 | ) | | | (11,644,453 | ) | | | (6,204,048 | ) | | | (8,739,159 | ) |
| | | | | | | | | | | | | | | | | |
| FROM CAPITAL SHARE TRANSACTIONS: | | | | | | | | | | | | | | | | |
| Net proceeds from sale of shares | | | 43,496,729 | | | | 120,111,818 | | | | 21,507,593 | | | | 15,022,296 | |
| Reinvestment of distributions | | | 11,362,300 | | | | 11,581,035 | | | | 5,325,349 | | | | 7,600,904 | |
| | | | 54,859,029 | | | | 131,692,853 | | | | 26,832,942 | | | | 22,623,200 | |
| Cost of shares redeemed | | | (169,482,067 | ) | | | (111,761,425 | ) | | | (61,922,870 | ) | | | (39,090,306 | ) |
| Net increase (decrease) in net assets resulting from capital share transactions | | | (114,623,038 | ) | | | 19,931,428 | | | | (35,089,928 | ) | | | (16,467,106 | ) |
| Net increase (decrease) in net assets | | | (94,772,735 | ) | | | 12,735,313 | | | | 12,812,174 | | | | (19,431,583 | ) |
| | | | | | | | | | | | | | | | | |
| NET ASSETS: | | | | | | | | | | | | | | | | |
| Beginning of year or period | | | 282,167,219 | | | | 269,431,906 | | | | 238,777,542 | | | | 258,209,125 | |
| End of year or period | | $ | 187,394,484 | | | $ | 282,167,219 | | | $ | 251,589,716 | | | $ | 238,777,542 | |
| (1) | Class P3 was fully redeemed on close of business January 10, 2023. |
See Accompanying Notes to Financial Statements
STATEMENTS OF CHANGES IN NET ASSETS
| | | | Voya Multi-Manager International Small Cap Fund | |
| | | | Year Ended October 31, 2024 | | | | Year Ended October 31, 2023 | |
| FROM OPERATIONS: | | | | | | | | |
| Net investment income | | $ | 4,623,829 | | | $ | 4,351,978 | |
| Net realized gain (loss) | | | 12,827,561 | | | | (8,646,263 | ) |
| Net change in unrealized appreciation (depreciation) | | | 40,934,505 | | | | 20,476,703 | |
| Increase in net assets resulting from operations | | | 58,385,895 | | | | 16,182,418 | |
| | | | | | | | | |
| FROM DISTRIBUTIONS TO SHAREHOLDERS: | | | | | | | | |
| Total distributions (excluding return of capital): | | | | | | | | |
| Class A | | | (823,531 | ) | | | (1,086,329 | ) |
| Class C | | | (29,371 | ) | | | (57,732 | ) |
| Class I | | | (3,750,363 | ) | | | (3,207,907 | ) |
| Class R6(1) | | | (63 | ) | | | — | |
| Class W | | | (398,223 | ) | | | (478,762 | ) |
| Total distributions | | | (5,001,551 | ) | | | (4,830,730 | ) |
| | | | | | | | | |
| FROM CAPITAL SHARE TRANSACTIONS: | | | | | | | | |
| Net proceeds from sale of shares | | | 68,264,403 | | | | 102,221,420 | |
| Reinvestment of distributions | | | 4,792,898 | | | | 4,563,321 | |
| | | | 73,057,301 | | | | 106,784,741 | |
| Cost of shares redeemed | | | (80,548,919 | ) | | | (79,512,540 | ) |
| Net increase (decrease) in net assets resulting from capital share transactions | | | (7,491,618 | ) | | | 27,272,201 | |
| Net increase in net assets | | | 45,892,726 | | | | 38,623,889 | |
| | | | | | | | | |
| NET ASSETS: | | | | | | | | |
| Beginning of year or period | | | 236,557,154 | | | | 197,933,265 | |
| End of year or period | | $ | 282,449,880 | | | $ | 236,557,154 | |
| (1) | Commencement of operations was February 28, 2023. |
See Accompanying Notes to Financial Statements
FINANCIAL HIGHLIGHTS
Selected data for a share of beneficial interest outstanding throughout each year or period.
| | | | | | | Income (loss)
from investment
operations | | | | Less Distributions | | | | | | | | | | | | | | Ratios to average net assets | | Supplemental
Data |
| | | | Net asset value, beginning of year or period | | | Net investment income (loss) | | | Net realized and unrealized gain (loss) | | | Total from investment operations | | | From net investment income | | | From net realized gains | | | From return of capital | | | Total distributions | | | Payment by affiliate | | | Net asset value, end of year or period | | | Total Return(1) | | | Expenses
before
reductions/
additions(2)(3) | | | Expenses net of fee waivers and/or recoupments if any(2)(3) | | | Expenses
net of all
reductions/
additions(2)(3) | | | Net investment income (loss)(2)(3) | | | Net assets, end of year or period | | | Portfolio turnover rate | |
| Year or period ended | | | ($) | | | ($) | | | ($) | | | ($) | | | ($) | | | ($) | | | ($) | | | ($) | | | ($) | | | ($) | | | (%) | | | (%) | | | (%) | | | (%) | | | (%) | | | ($000's) | | | (%) | |
| | | | | | | | | | | | | | | | | | | | | | | | | | | | | | | | | | | | | | | | | | | | | | | | | | | | | |
| Voya Global Bond Fund |
| Class A |
| 10-31-24 | | | 6.81 | | | 0.29 | • | | 0.48 | | | 0.77 | | | 0.31 | | | — | | | 0.01 | | | 0.32 | | | — | | | 7.26 | | | 11.35 | | | 1.11 | | | 0.90 | | | 0.90 | | | 4.00 | | | 19,298 | | | 177 | |
| 10-31-23 | | | 6.98 | | | 0.25 | • | | (0.13 | ) | | 0.12 | | | 0.21 | | | — | | | 0.08 | | | 0.29 | | | — | | | 6.81 | | | 1.51 | | | 1.09 | | | 0.90 | | | 0.90 | | | 3.47 | | | 20,493 | | | 292 | |
| 10-31-22 | | | 9.34 | | | 0.17 | • | | (2.21 | ) | | (2.04 | ) | | 0.00 | * | | — | | | 0.32 | | | 0.32 | | | — | | | 6.98 | | | (22.22 | ) | | 1.05 | | | 0.90 | | | 0.90 | | | 2.04 | | | 23,251 | | | 218 | |
| 10-31-21 | | | 9.77 | | | 0.18 | • | | (0.19 | ) | | (0.01 | ) | | 0.04 | | | — | | | 0.38 | | | 0.42 | | | — | | | 9.34 | | | (0.18 | ) | | 1.02 | | | 0.90 | | | 0.90 | | | 1.90 | | | 34,657 | | | 191 | |
| 10-31-20 | | | 9.74 | | | 0.26 | | | 0.20 | | | 0.46 | | | 0.32 | | | 0.06 | | | 0.05 | | | 0.43 | | | — | | | 9.77 | | | 4.88 | | | 1.02 | | | 0.90 | | | 0.90 | | | 2.67 | | | 34,928 | | | 208 | |
| Class C |
| 10-31-24 | | | 6.78 | | | 0.24 | • | | 0.47 | | | 0.71 | | | 0.25 | | | — | | | 0.01 | | | 0.26 | | | — | | | 7.23 | | | 10.58 | | | 1.86 | | | 1.65 | | | 1.65 | | | 3.25 | | | 635 | | | 177 | |
| 10-31-23 | | | 6.95 | | | 0.19 | • | | (0.13 | ) | | 0.06 | | | 0.15 | | | — | | | 0.08 | | | 0.23 | | | — | | | 6.78 | | | 0.68 | | | 1.84 | | | 1.65 | | | 1.65 | | | 2.69 | | | 615 | | | 292 | |
| 10-31-22 | | | 9.29 | | | 0.10 | • | | (2.18 | ) | | (2.08 | ) | | 0.00 | * | | — | | | 0.26 | | | 0.26 | | | — | | | 6.95 | | | (22.73 | ) | | 1.80 | | | 1.65 | | | 1.65 | | | 1.27 | | | 1,139 | | | 218 | |
| 10-31-21 | | | 9.71 | | | 0.11 | • | | (0.18 | ) | | (0.07 | ) | | 0.03 | | | — | | | 0.32 | | | 0.35 | | | — | | | 9.29 | | | (0.85 | ) | | 1.77 | | | 1.65 | | | 1.65 | | | 1.18 | | | 3,262 | | | 191 | |
| 10-31-20 | | | 9.69 | | | 0.19 | • | | 0.18 | | | 0.37 | | | 0.24 | | | 0.06 | | | 0.05 | | | 0.35 | | | — | | | 9.71 | | | 4.00 | | | 1.77 | | | 1.65 | | | 1.65 | | | 1.94 | | | 4,709 | | | 208 | |
| Class I |
| 10-31-24 | | | 6.78 | | | 0.31 | • | | 0.48 | | | 0.79 | | | 0.33 | | | — | | | 0.01 | | | 0.34 | | | — | | | 7.23 | | | 11.69 | | | 0.76 | | | 0.65 | | | 0.65 | | | 4.25 | | | 113,001 | | | 177 | |
| 10-31-23 | | | 6.95 | | | 0.27 | • | | (0.14 | ) | | 0.13 | | | 0.22 | | | — | | | 0.08 | | | 0.30 | | | — | | | 6.78 | | | 1.68 | | | 0.73 | | | 0.65 | | | 0.65 | | | 3.75 | | | 117,805 | | | 292 | |
| 10-31-22 | | | 9.29 | | | 0.19 | • | | (2.19 | ) | | (2.00 | ) | | 0.00 | * | | — | | | 0.34 | | | 0.34 | | | — | | | 6.95 | | | (21.94 | ) | | 0.71 | | | 0.65 | | | 0.65 | | | 2.29 | | | 107,231 | | | 218 | |
| 10-31-21 | | | 9.72 | | | 0.20 | • | | (0.19 | ) | | 0.01 | | | 0.04 | | | — | | | 0.40 | | | 0.44 | | | — | | | 9.29 | | | 0.05 | | | 0.67 | | | 0.65 | | | 0.65 | | | 2.05 | | | 160,932 | | | 191 | |
| 10-31-20 | | | 9.69 | | | 0.28 | • | | 0.20 | | | 0.48 | | | 0.34 | | | 0.06 | | | 0.05 | | | 0.45 | | | — | | | 9.72 | | | 5.15 | | | 0.67 | | | 0.65 | | | 0.65 | | | 2.90 | | | 36,988 | | | 208 | |
| Class R |
| 10-31-24 | | | 6.83 | | | 0.27 | • | | 0.48 | | | 0.75 | | | 0.29 | | | — | | | 0.01 | | | 0.30 | | | — | | | 7.28 | | | 11.08 | | | 1.36 | | | 1.15 | | | 1.15 | | | 3.75 | | | 4,685 | | | 177 | |
| 10-31-23 | | | 7.00 | | | 0.24 | • | | (0.15 | ) | | 0.09 | | | 0.19 | | | — | | | 0.08 | | | 0.27 | | | — | | | 6.83 | | | 1.18 | | | 1.34 | | | 1.15 | | | 1.15 | | | 3.23 | | | 4,303 | | | 292 | |
| 10-31-22 | | | 9.35 | | | 0.15 | • | | (2.21 | ) | | (2.06 | ) | | 0.00 | * | | — | | | 0.29 | | | 0.29 | | | — | | | 7.00 | | | (22.39 | ) | | 1.30 | | | 1.15 | | | 1.15 | | | 1.79 | | | 4,449 | | | 218 | |
| 10-31-21 | | | 9.77 | | | 0.16 | • | | (0.20 | ) | | (0.04 | ) | | 0.03 | | | — | | | 0.35 | | | 0.38 | | | — | | | 9.35 | | | (0.44 | ) | | 1.27 | | | 1.15 | | | 1.15 | | | 1.65 | | | 6,170 | | | 191 | |
| 10-31-20 | | | 9.73 | | | 0.23 | | | 0.20 | | | 0.43 | | | 0.28 | | | 0.06 | | | 0.05 | | | 0.39 | | | — | | | 9.77 | | | 4.60 | | | 1.27 | | | 1.15 | | | 1.15 | | | 2.43 | | | 6,249 | | | 208 | |
| Class R6 |
| 10-31-24 | | | 6.80 | | | 0.31 | • | | 0.48 | | | 0.79 | | | 0.33 | | | — | | | 0.01 | | | 0.34 | | | — | | | 7.25 | | | 11.70 | | | 0.65 | | | 0.65 | | | 0.65 | | | 4.26 | | | 13,378 | | | 177 | |
| 10-31-23 | | | 6.97 | | | 0.27 | • | | (0.14 | ) | | 0.13 | | | 0.23 | | | — | | | 0.08 | | | 0.31 | | | — | | | 6.80 | | | 1.72 | | | 0.65 | | | 0.65 | | | 0.65 | | | 3.73 | | | 80,638 | | | 292 | |
| 10-31-22 | | | 9.32 | | | 0.19 | • | | (2.19 | ) | | (2.00 | ) | | 0.00 | * | | — | | | 0.35 | | | 0.35 | | | — | | | 6.97 | | | (21.94 | ) | | 0.62 | | | 0.62 | | | 0.62 | | | 2.32 | | | 76,691 | | | 218 | |
| 10-31-21 | | | 9.75 | | | 0.21 | • | | (0.20 | ) | | 0.01 | | | 0.04 | | | — | | | 0.40 | | | 0.44 | | | — | | | 9.32 | | | 0.08 | | | 0.61 | | | 0.61 | | | 0.61 | | | 2.19 | | | 103,575 | | | 191 | |
| 10-31-20 | | | 9.72 | | | 0.28 | | | 0.20 | | | 0.48 | | | 0.34 | | | 0.06 | | | 0.05 | | | 0.45 | | | — | | | 9.75 | | | 5.17 | | | 0.62 | | | 0.62 | | | 0.62 | | | 2.93 | | | 116,095 | | | 208 | |
| Class W |
| 10-31-24 | | | 6.70 | | | 0.30 | • | | 0.47 | | | 0.77 | | | 0.32 | | | — | | | 0.01 | | | 0.33 | | | — | | | 7.14 | | | 11.62 | | | 0.86 | | | 0.65 | | | 0.65 | | | 4.25 | | | 36,399 | | | 177 | |
| 10-31-23 | | | 6.86 | | | 0.27 | • | | (0.14 | ) | | 0.13 | | | 0.22 | | | — | | | 0.08 | | | 0.30 | | | — | | | 6.70 | | | 1.78 | | | 0.84 | | | 0.65 | | | 0.65 | | | 3.73 | | | 58,313 | | | 292 | |
| 10-31-22 | | | 9.17 | | | 0.19 | • | | (2.17 | ) | | (1.98 | ) | | 0.00 | * | | — | | | 0.33 | | | 0.33 | | | — | | | 6.86 | | | (22.04 | ) | | 0.80 | | | 0.65 | | | 0.65 | | | 2.30 | | | 53,389 | | | 218 | |
| 10-31-21 | | | 9.57 | | | 0.21 | • | | (0.18 | ) | | 0.03 | | | 0.04 | | | — | | | 0.39 | | | 0.43 | | | — | | | 9.17 | | | 0.18 | | | 0.77 | | | 0.65 | | | 0.65 | | | 2.19 | | | 90,343 | | | 191 | |
| 10-31-20 | | | 9.53 | | | 0.27 | • | | 0.20 | | | 0.47 | | | 0.32 | | | 0.06 | | | 0.05 | | | 0.43 | | | — | | | 9.57 | | | 5.14 | | | 0.77 | | | 0.65 | | | 0.65 | | | 2.85 | | | 133,137 | | | 208 | |
| Voya Global High Dividend Low Volatility Fund |
| Class A |
| 10-31-24 | | | 37.74 | | | 1.02 | • | | 8.17 | | | 9.19 | | | 1.09 | | | — | | | — | | | 1.09 | | | — | | | 45.84 | | | 24.55 | | | 0.99 | | | 0.86 | | | 0.86 | | | 2.37 | | | 214,850 | | | 70 | |
| 10-31-23 | | | 38.32 | | | 1.08 | • | | (0.34 | ) | | 0.74 | | | 1.32 | | | — | | | — | | | 1.32 | | | — | | | 37.74 | | | 1.84 | | | 0.97 | | | 0.85 | | | 0.85 | | | 2.74 | | | 190,280 | | | 69 | |
| 10-31-22 | | | 41.58 | | | 1.23 | • | | (3.53 | ) | | (2.30 | ) | | 0.96 | | | — | | | — | | | 0.96 | | | — | | | 38.32 | | | (5.56 | ) | | 1.00 | | | 0.85 | | | 0.85 | | | 3.06 | | | 205,989 | | | 67 | |
| 10-31-21 | | | 32.14 | | | 0.82 | • | | 9.46 | | | 10.28 | | | 0.84 | | | — | | | — | | | 0.84 | | | — | | | 41.58 | | | 32.16 | | | 1.01 | | | 0.85 | | | 0.85 | | | 2.10 | | | 230,663 | | | 75 | |
| 10-31-20 | | | 36.30 | | | 0.75 | • | | (4.16 | ) | | (3.41 | ) | | 0.73 | | | — | | | 0.02 | | | 0.75 | | | — | | | 32.14 | | | (9.35 | ) | | 1.03 | | | 0.85 | | | 0.85 | | | 2.20 | | | 191,019 | | | 61 | |
| Class C |
| 10-31-24 | | | 34.87 | | | 0.65 | • | | 7.55 | | | 8.20 | | | 0.76 | | | — | | | — | | | 0.76 | | | — | | | 42.31 | | | 23.67 | | | 1.74 | | | 1.61 | | | 1.61 | | | 1.64 | | | 2,158 | | | 70 | |
| 10-31-23 | | | 35.51 | | | 0.73 | • | | (0.32 | ) | | 0.41 | | | 1.05 | | | — | | | — | | | 1.05 | | | — | | | 34.87 | | | 1.06 | | | 1.72 | | | 1.60 | | | 1.60 | | | 1.99 | | | 3,099 | | | 69 | |
| 10-31-22 | | | 38.61 | | | 0.84 | • | | (3.25 | ) | | (2.41 | ) | | 0.69 | | | — | | | — | | | 0.69 | | | — | | | 35.51 | | | (6.28 | ) | | 1.75 | | | 1.60 | | | 1.60 | | | 2.25 | | | 4,208 | | | 67 | |
| 10-31-21 | | | 29.90 | | | 0.48 | • | | 8.81 | | | 9.29 | | | 0.58 | | | — | | | — | | | 0.58 | | | — | | | 38.61 | | | 31.17 | | | 1.76 | | | 1.60 | | | 1.60 | | | 1.33 | | | 6,174 | | | 75 | |
See Accompanying Notes to Financial Statements
FINANCIAL HIGHLIGHTS (continued)
| | | | | | | Income (loss)
from investment
operations | | | | Less Distributions | | | | | | | | | | | | | | Ratios to average net assets | | Supplemental
Data |
| | | | Net asset value, beginning of year or period | | | Net investment income (loss) | | | Net realized and unrealized gain (loss) | | | Total from investment operations | | | From net investment income | | | From net realized gains | | | From return of capital | | | Total distributions | | | Payment by affiliate | | | Net asset value, end of year or period | | | Total Return(1) | | | Expenses
before
reductions/
additions(2)(3) | | | Expenses net of fee waivers and/or recoupments if any(2)(3) | | | Expenses
net of all
reductions/
additions(2)(3) | | | Net investment income (loss)(2)(3) | | | Net assets, end of year or period | | | Portfolio turnover rate | |
| Year or period ended | | | ($) | | | ($) | | | ($) | | | ($) | | | ($) | | | ($) | | | ($) | | | ($) | | | ($) | | | ($) | | | (%) | | | (%) | | | (%) | | | (%) | | | (%) | | | ($000's) | | | (%) | |
| | | | | | | | | | | | | | | | | | | | | | | | | | | | | | | | | | | | | | | | | | | | | | | | | | | | | |
| Voya Global High Dividend Low Volatility Fund (continued) |
| Class C (continued) |
| 10-31-20 | | | 33.77 | | | 0.46 | • | | (3.84 | ) | | (3.38 | ) | | 0.47 | | | — | | | 0.02 | | | 0.49 | | | — | | | 29.90 | | | (9.99 | ) | | 1.78 | | | 1.60 | | | 1.60 | | | 1.41 | | | 5,795 | | | 61 | |
| Class I |
| 10-31-24 | | | 38.11 | | | 1.12 | • | | 8.28 | | | 9.40 | | | 1.19 | | | — | | | — | | | 1.19 | | | — | | | 46.32 | | | 24.90 | | | 0.64 | | | 0.61 | | | 0.61 | | | 2.59 | | | 31,022 | | | 70 | |
| 10-31-23 | | | 38.68 | | | 1.20 | • | | (0.35 | ) | | 0.85 | | | 1.42 | | | — | | | — | | | 1.42 | | | — | | | 38.11 | | | 2.10 | | | 0.62 | | | 0.60 | | | 0.60 | | | 2.99 | | | 42,281 | | | 69 | |
| 10-31-22 | | | 41.96 | | | 1.37 | • | | (3.59 | ) | | (2.22 | ) | | 1.06 | | | — | | | — | | | 1.06 | | | — | | | 38.68 | | | (5.33 | ) | | 0.65 | | | 0.60 | | | 0.60 | | | 3.36 | | | 44,628 | | | 67 | |
| 10-31-21 | | | 32.43 | | | 0.93 | • | | 9.54 | | | 10.47 | | | 0.94 | | | — | | | — | | | 0.94 | | | — | | | 41.96 | | | 32.47 | | | 0.67 | | | 0.60 | | | 0.60 | | | 2.36 | | | 58,145 | | | 75 | |
| 10-31-20 | | | 36.63 | | | 0.85 | | | (4.21 | ) | | (3.36 | ) | | 0.82 | | | — | | | 0.02 | | | 0.84 | | | — | | | 32.43 | | | (9.13 | ) | | 0.69 | | | 0.60 | | | 0.60 | | | 2.45 | | | 45,136 | | | 61 | |
| Class R6 |
| 10-31-24 | | | 38.09 | | | 1.15 | • | | 8.26 | | | 9.41 | | | 1.21 | | | — | | | — | | | 1.21 | | | — | | | 46.29 | | | 24.94 | | | 0.64 | | | 0.58 | | | 0.58 | | | 2.64 | | | 143 | | | 70 | |
| 10-31-23 | | | 38.66 | | | 1.20 | • | | (0.34 | ) | | 0.86 | | | 1.43 | | | — | | | — | | | 1.43 | | | — | | | 38.09 | | | 2.12 | | | 0.68 | | | 0.57 | | | 0.57 | | | 3.00 | | | 102 | | | 69 | |
| 10-31-22 | | | 41.94 | | | 1.35 | • | | (3.56 | ) | | (2.21 | ) | | 1.07 | | | — | | | — | | | 1.07 | | | — | | | 38.66 | | | (5.30 | ) | | 0.63 | | | 0.57 | | | 0.57 | | | 3.33 | | | 118 | | | 67 | |
| 10-31-21 | | | 32.41 | | | 1.01 | • | | 9.48 | | | 10.49 | | | 0.96 | | | — | | | — | | | 0.96 | | | — | | | 41.94 | | | 32.57 | | | 1.27 | | | 0.57 | | | 0.57 | | | 2.49 | | | 126 | | | 75 | |
02-28-20(4)
- 10-31-20 | | | 34.25 | | | 0.59 | • | | (1.75 | ) | | (1.16 | ) | | 0.67 | | | — | | | 0.01 | | | 0.68 | | | — | | | 32.41 | | | (3.26 | ) | | 2.03 | | | 0.57 | | | 0.57 | | | 2.68 | | | 3 | | | 61 | |
| Class W |
| 10-31-24 | | | 38.08 | | | 1.14 | • | | 8.25 | | | 9.39 | | | 1.20 | | | — | | | — | | | 1.20 | | | — | | | 46.27 | | | 24.87 | | | 0.74 | | | 0.61 | | | 0.61 | | | 2.62 | | | 3,417 | | | 70 | |
| 10-31-23 | | | 38.65 | | | 1.19 | • | | (0.34 | ) | | 0.85 | | | 1.42 | | | — | | | — | | | 1.42 | | | — | | | 38.08 | | | 2.10 | | | 0.72 | | | 0.60 | | | 0.60 | | | 2.99 | | | 3,017 | | | 69 | |
| 10-31-22 | | | 41.93 | | | 1.35 | • | | (3.57 | ) | | (2.22 | ) | | 1.06 | | | — | | | — | | | 1.06 | | | — | | | 38.65 | | | (5.33 | ) | | 0.75 | | | 0.60 | | | 0.60 | | | 3.33 | | | 3,266 | | | 67 | |
| 10-31-21 | | | 32.40 | | | 0.92 | • | | 9.55 | | | 10.47 | | | 0.94 | | | — | | | — | | | 0.94 | | | — | | | 41.93 | | | 32.51 | | | 0.76 | | | 0.60 | | | 0.60 | | | 2.35 | | | 3,745 | | | 75 | |
| 10-31-20 | | | 36.60 | | | 0.83 | • | | (4.19 | ) | | (3.36 | ) | | 0.82 | | | — | | | 0.02 | | | 0.84 | | | — | | | 32.40 | | | (9.14 | ) | | 0.78 | | | 0.60 | | | 0.60 | | | 2.42 | | | 3,117 | | | 61 | |
| Voya Multi-Manager International Small Cap Fund |
| Class A |
| 10-31-24 | | | 49.96 | | | 0.82 | • | | 11.30 | | | 12.12 | | | 0.94 | | | — | | | — | | | 0.94 | | | — | | | 61.14 | | | 24.53 | | | 1.60 | | | 1.54 | | | 1.54 | | | 1.40 | | | 53,341 | | | 85 | |
| 10-31-23 | | | 46.91 | | | 0.80 | • | | 3.40 | | | 4.20 | | | 1.15 | | | — | | | — | | | 1.15 | | | — | | | 49.96 | | | 8.93 | | | 1.57 | | | 1.53 | | | 1.53 | | | 1.51 | | | 44,397 | | | 90 | |
| 10-31-22 | | | 72.04 | | | 1.02 | • | | (18.33 | ) | | (17.31 | ) | | 0.97 | | | 6.85 | | | — | | | 7.82 | | | — | | | 46.91 | | | (26.58 | ) | | 1.57 | | | 1.53 | | | 1.53 | | | 1.82 | | | 44,707 | | | 72 | |
| 10-31-21 | | | 52.86 | | | 0.55 | • | | 19.43 | | | 19.98 | | | 0.80 | | | — | | | — | | | 0.80 | | | — | | | 72.04 | | | 38.09 | | | 1.60 | | | 1.53 | | | 1.53 | | | 0.81 | | | 65,656 | | | 79 | |
| 10-31-20 | | | 51.61 | | | 0.31 | • | | 2.06 | | | 2.37 | | | 1.12 | | | — | | | — | | | 1.12 | | | — | | | 52.86 | | | 4.56 | | | 1.67 | | | 1.53 | | | 1.53 | | | 0.62 | | | 46,220 | | | 91 | |
| Class C |
| 10-31-24 | | | 44.84 | | | 0.34 | • | | 10.16 | | | 10.50 | | | 0.62 | | | — | | | — | | | 0.62 | | | — | | | 54.72 | | | 23.60 | | | 2.35 | | | 2.29 | | | 2.29 | | | 0.65 | | | 2,469 | | | 85 | |
| 10-31-23 | | | 42.49 | | | 0.36 | • | | 3.12 | | | 3.48 | | | 1.13 | | | — | | | — | | | 1.13 | | | — | | | 44.84 | | | 8.15 | | | 2.32 | | | 2.28 | | | 2.28 | | | 0.74 | | | 2,139 | | | 90 | |
| 10-31-22 | | | 66.20 | | | 0.57 | • | | (16.72 | ) | | (16.15 | ) | | 0.71 | | | 6.85 | | | — | | | 7.56 | | | — | | | 42.49 | | | (27.12 | ) | | 2.32 | | | 2.28 | | | 2.28 | | | 1.13 | | | 2,217 | | | 72 | |
| 10-31-21 | | | 48.57 | | | 0.02 | • | | 17.93 | | | 17.95 | | | 0.32 | | | — | | | — | | | 0.32 | | | — | | | 66.20 | | | 37.07 | | | 2.35 | | | 2.28 | | | 2.28 | | | 0.03 | | | 2,864 | | | 79 | |
| 10-31-20 | | | 47.47 | | | (0.35 | )• | | 2.20 | | | 1.85 | | | 0.75 | | | — | | | — | | | 0.75 | | | — | | | 48.57 | | | 3.86 | | | 2.42 | | | 2.28 | | | 2.28 | | | (0.73 | ) | | 978 | | | 91 | |
| Class I |
| 10-31-24 | | | 49.92 | | | 1.02 | • | | 11.26 | | | 12.28 | | | 1.13 | | | — | | | — | | | 1.13 | | | — | | | 61.07 | | | 24.93 | | | 1.35 | | | 1.21 | | | 1.21 | | | 1.75 | | | 200,776 | | | 85 | |
| 10-31-23 | | | 46.73 | | | 1.00 | • | | 3.35 | | | 4.35 | | | 1.16 | | | — | | | — | | | 1.16 | | | — | | | 49.92 | | | 9.30 | | | 1.33 | | | 1.20 | | | 1.20 | | | 1.89 | | | 165,079 | | | 90 | |
| 10-31-22 | | | 71.82 | | | 1.23 | • | | (18.27 | ) | | (17.04 | ) | | 1.20 | | | 6.85 | | | — | | | 8.05 | | | — | | | 46.73 | | | (26.33 | ) | | 1.29 | | | 1.20 | | | 1.20 | | | 2.25 | | | 126,178 | | | 72 | |
| 10-31-21 | | | 52.68 | | | 0.78 | • | | 19.34 | | | 20.12 | | | 0.98 | | | — | | | — | | | 0.98 | | | — | | | 71.82 | | | 38.54 | | | 1.30 | | | 1.20 | | | 1.20 | | | 1.14 | | | 121,433 | | | 79 | |
| 10-31-20 | | | 51.44 | | | 0.44 | • | | 2.10 | | | 2.54 | | | 1.30 | | | — | | | — | | | 1.30 | | | — | | | 52.68 | | | 4.91 | | | 1.35 | | | 1.20 | | | 1.20 | | | 0.88 | | | 54,488 | | | 91 | |
| Class R6 |
| 10-31-24 | | | 49.94 | | | 1.03 | • | | 11.27 | | | 12.30 | | | 1.14 | | | — | | | — | | | 1.14 | | | — | | | 61.10 | | | 24.96 | | | 2.06 | | | 1.21 | | | 1.21 | | | 1.67 | | | 107 | | | 85 | |
02-28-23(4)
- 10-31-23 | | | 53.20 | | | 0.70 | • | | (3.96 | ) | | (3.26 | ) | | — | | | — | | | — | | | — | | | — | | | 49.94 | | | (6.13 | ) | | 2.41 | | | 1.20 | | | 1.20 | | | 1.93 | | | 3 | | | 90 | |
| Class W |
| 10-31-24 | | | 63.88 | | | 1.22 | • | | 14.49 | | | 15.71 | | | 1.07 | | | — | | | — | | | 1.07 | | | — | | | 78.52 | | | 24.82 | | | 1.35 | | | 1.29 | | | 1.29 | | | 1.63 | | | 25,757 | | | 85 | |
| 10-31-23 | | | 59.54 | | | 1.19 | • | | 4.30 | | | 5.49 | | | 1.15 | | | — | | | — | | | 1.15 | | | — | | | 63.88 | | | 9.22 | | | 1.32 | | | 1.28 | | | 1.28 | | | 1.75 | | | 24,940 | | | 90 | |
| 10-31-22 | | | 89.20 | | | 1.47 | • | | (23.16 | ) | | (21.69 | ) | | 1.12 | | | 6.85 | | | — | | | 7.97 | | | — | | | 59.54 | | | (26.40 | ) | | 1.32 | | | 1.28 | | | 1.28 | | | 2.07 | | | 24,831 | | | 72 | |
| 10-31-21 | | | 65.22 | | | 0.89 | • | | 24.00 | | | 24.89 | | | 0.91 | | | — | | | — | | | 0.91 | | | — | | | 89.20 | | | 38.44 | | | 1.35 | | | 1.28 | | | 1.28 | | | 1.06 | | | 34,019 | | | 79 | |
| 10-31-20 | | | 63.40 | | | 0.50 | • | | 2.57 | | | 3.07 | | | 1.25 | | | — | | | — | | | 1.25 | | | — | | | 65.22 | | | 4.82 | | | 1.42 | | | 1.28 | | | 1.28 | | | 0.80 | | | 25,810 | | | 91 | |
See Accompanying Notes to Financial Statements
FINANCIAL HIGHLIGHTS (continued)
| (1) | Total return is calculated assuming reinvestment of all dividends, capital gain distributions and return of capital distributions, if any, at net asset value and excluding the deduction of sales charges or contingent deferred sales charges, if applicable. Total return for periods less than one year is not annualized. |
| (2) | Annualized for periods less than one year. |
| (3) | Ratios reflect operating expenses of a Fund. Expenses before reductions/additions do not reflect amounts reimbursed or recouped by the Investment Adviser and/or Distributor or reductions from brokerage service arrangements or other expense offset arrangements and do not represent the amount paid by a Fund during periods when reimbursements or reductions occur. Expenses net of fee waivers reflect expenses after reimbursement by the Investment Adviser and/or Distributor or recoupment of previously reimbursed fees by the Investment Adviser, but prior to reductions from brokerage service arrangements or other expense offset arrangements. Expenses net of all reductions/additions represent the net expenses paid by a Fund. Net investment income (loss) is net of all such additions or reductions. |
| (4) | Commencement of operations. |
| * | Amount is less than $0.005 or 0.005% or more than $(0.005) or (0.005)%. |
| • | Calculated using average number of shares outstanding throughout the year or period. |
See Accompanying Notes to Financial Statements
NOTES TO FINANCIAL STATEMENTS as of October 31, 2024
NOTE 1 — ORGANIZATION
Voya Mutual Funds (the “Trust”) is a Delaware statutory trust organized on December 18, 1992 and is registered under the Investment Company Act of 1940, as amended (“1940 Act”), as an open-end investment management company. There are six separate active investment series, three of which are included in this report (each, a “Fund” and collectively, the “Funds”): Voya Global Bond Fund (“Global Bond”), Voya Global High Dividend Low Volatility Fund (“Global High Dividend Low Volatility”), and Voya Multi-Manager International Small Cap Fund (“Multi-Manager International Small Cap”). Each Fund is a diversified series of the Trust.
Each Fund offers at least one or more of the following classes of shares: Class A, Class C, Class I, Class R, Class R6 and Class W. The separate classes of shares differ principally in the applicable sales charges (if any), distribution fees, shareholder servicing fees and transfer agent fees, as well as differences in the amount of waiver fees and reimbursement of expenses, if any. Generally, shareholders of each class also bear certain expenses that pertain to that particular class. All shareholders are allocated the common expenses of a fund and earn income and realized gains/losses from a fund pro rata based on the daily ending net assets of each class, without distinction between share classes. Expenses that are specific to a fund or a class are charged directly to that fund or class. Other operating expenses shared by several funds are generally allocated among those funds based on average net assets. Distributions are determined separately for each class based on income and expenses allocated to each class pro rata based on the shares outstanding of each class on the date of distribution. Differences in per share dividend rates generally result from the differences in separate class expenses, including distribution and shareholder servicing fees, if applicable, as well as differences in the amount of waiver of fees and reimbursement of expenses between the separate classes, if any.
Class C shares, along with their pro rata reinvested dividend shares, automatically convert to Class A shares 8 years after purchase.
Voya Investments, LLC (“Voya Investments” or the “Investment Adviser”), an Arizona limited liability company, serves as the Investment Adviser to the Funds. Voya Investment Management Co. LLC (“Voya IM”), a Delaware limited liability company, serves as the sub-adviser to all Funds except Multi-Manager International Small Cap. Voya Investments Distributor, LLC (“VID” or the “Distributor”), a Delaware limited liability company, serves as the principal underwriter to the Funds.
The investment companies in which certain Funds invest are collectively referred to as the “Underlying Funds.”
NOTE 2 — SIGNIFICANT ACCOUNTING POLICIES
The Funds are investment companies and accordingly follow the investment company accounting and reporting guidance of the Financial Accounting Standards Board (“FASB”) Accounting Standards Board Codification Topic 946 Financial Services - Investment Companies.
The following significant accounting policies are consistently followed by the Funds in the preparation of their financial statements. Each Fund is considered an investment company under U.S. generally accepted accounting principles (“GAAP”) and follows the accounting and reporting guidance applicable to investment companies.
A. Security Valuation. Each Fund is open for business every day the New York Stock Exchange (“NYSE”) opens for regular trading (each such day, a “Business Day”). The net asset value (“NAV”) per share for each class of each Fund is determined each Business Day as of the close of the regular trading session (“Market Close”), as determined by the Consolidated Tape Association (“CTA”), the central distributor of transaction prices for exchange-traded securities (normally 4:00 p.m. Eastern Time unless otherwise designated by the CTA). The NAV per share of each class of each Fund is calculated by taking the value of the Fund’s assets attributable to that class, subtracting the Fund’s liabilities attributable to that class, and dividing by the number of shares of that class that are outstanding. On days when a Fund is closed for business, Fund shares will not be priced and the Fund does not transact purchase and redemption orders. To the extent a Fund’s assets are traded in other markets on days when a Fund does not price its shares, the value of a Fund’s assets will likely change and you will not be able to purchase or redeem shares of the Fund.
Portfolio securities for which market quotations are readily available are valued at market value. Investments in open-end registered investment companies that do not trade on an exchange are valued at the end of day NAV per share. The prospectuses of the open-end registered investment companies in which a Fund may invest explain the circumstances under which they will use fair value pricing and the effects of using fair value pricing. Foreign securities’ prices are converted into U.S. dollar amounts using the applicable exchange rates as of Market Close.
When a market quotation for a portfolio security is not readily available or is deemed unreliable (for example when trading has been halted or there are unexpected market closures or other material events that would suggest that the market quotation is unreliable) and for purposes of determining the value of other Fund assets, the asset is priced at its fair value. The Board has designated the Investment Adviser, as the valuation designee, to make fair value determinations in good faith. In determining the
NOTES TO FINANCIAL STATEMENTS as of October 31, 2024 (continued)
NOTE 2 — SIGNIFICANT ACCOUNTING POLICIES (continued)
fair value of each Fund’s assets, the Investment Adviser, pursuant to its fair valuation policy, may consider inputs from pricing service providers, broker-dealers, or each Fund’s sub-adviser(s). Issuer specific events, transaction price, position size, nature and duration of restrictions on disposition of the security, market trends, bid/ask quotes of brokers and other market data may be reviewed in the course of making a good faith determination of an asset’s fair value. Because trading hours for certain foreign securities end before Market Close, closing market quotations may become unreliable. The prices of foreign securities will generally be adjusted based on inputs from an independent pricing service that are intended to reflect valuation changes through the NYSE close. Because of the inherent uncertainties of fair valuation, the values used to determine a Fund’s NAV may materially differ from the value received upon actual sale of those investments. Thus, fair valuation may have an unintended dilutive or accretive effect on the value of shareholders’ investments in each Fund.
The Funds’ financial instruments are valued at the close of the NYSE and are reported at fair value, which GAAP defines as the price that would be received to sell an asset or paid to transfer a liability in an orderly transaction between market participants at the measurement date.
Various valuation techniques and inputs are used to determine the fair value of financial instruments. GAAP establishes the following fair value hierarchy that categorizes the inputs used to measure fair value:
Level 1 — quoted prices (unadjusted) in active markets for identical financial instruments that the fund can access at the reporting date.
Level 2 — inputs other than Level 1 quoted prices that are observable, either directly or indirectly (including, but not limited to, quoted prices for similar financial instruments in active markets, quoted prices for identical or similar financial instruments in inactive markets, interest rates and yield curves, implied volatilities, and credit spreads).
Level 3 — unobservable inputs (including the fund’s own assumptions in determining fair value).
Observable inputs are developed using market data, such as publicly available information about actual events or transactions, and reflect the assumptions that market participants would use to price the financial instrument. Unobservable inputs are those for which market data are not available and are developed using the best information available about the assumptions that market participants would use to price the financial instrument. GAAP requires valuation techniques to maximize the use of relevant observable inputs and minimize the use of unobservable
inputs. When multiple inputs are used to derive fair value, the financial instrument is assigned to the level within the fair value hierarchy based on the lowest-level input that is significant to the fair value of the financial instrument. Input levels are not necessarily an indication of the risk or liquidity associated with financial instruments at that level but rather the degree of judgment used in determining those values.
A table summarizing each Fund’s investments under these levels of classification is included within the Portfolio of Investments.
Each investment asset or liability of the Funds is assigned a level at measurement date based on the significance and source of the inputs to its valuation. Quoted prices in active markets for identical securities are classified as “Level 1,” inputs other than quoted prices for an asset or liability that are observable are classified as “Level 2” and significant unobservable inputs, including each sub-adviser’s or Pricing Committee’s judgment about the assumptions that a market participant would use in pricing an asset or liability are classified as “Level 3.” The inputs used for valuing securities are not necessarily an indication of the risks associated with investing in those securities. Short-term securities of sufficient credit quality are generally considered to be Level 2 securities under applicable accounting rules. A table summarizing each Fund’s investments under these levels of classification is included within the Portfolio of Investments.
GAAP requires a reconciliation of the beginning to ending balances for reported fair values that presents changes attributable to total realized and unrealized gains or losses, purchases and sales, and transfers in or out of the Level 3 category during the period. A reconciliation of Level 3 investments within the Portfolio of Investments is presented only when a Fund has a significant amount of Level 3 investments.
B. Securities Transactions and Revenue Recognition. Securities transactions are accounted for on the trade date. Realized gains and losses are reported on the basis of identified cost of securities sold. Interest income is recorded on an accrual basis. Dividend income is recorded, net of any applicable withholding tax, on the ex-dividend date, or for certain foreign securities, when the information becomes available to the Funds. Premium amortization and discount accretion are determined by the effective yield method. Capital gain dividends from Underlying Funds are recorded as capital gain distributions from affiliated Underlying Funds.
C. Foreign Currency Translation. The books and records of the Funds are maintained in U.S. dollars.
Any foreign currency amounts are translated into U.S. dollars on the following basis:
NOTES TO FINANCIAL STATEMENTS as of October 31, 2024 (continued)
NOTE 2 — SIGNIFICANT ACCOUNTING POLICIES (continued)
| (1) | Market value of investment securities, other assets and liabilities — at the exchange rates prevailing at Market Close. |
| (2) | Purchases and sales of investment securities, income and expenses — at the rates of exchange prevailing on the respective dates of such transactions. |
Although the net assets and the market values are presented at the foreign exchange rates at Market Close, the Funds and Underlying Funds do not isolate the portion of the results of operations resulting from changes in foreign exchange rates on investments from the fluctuations arising from changes in market prices of securities held. Such fluctuations are included with the net realized and unrealized gains or losses from investments. For securities that are subject to foreign withholding tax upon disposition, liabilities are recorded on the Statements of Assets and Liabilities for the estimated tax withholding based on the securities’ current market value. Upon disposition, realized gains or losses on such securities are recorded net of foreign withholding tax.
Reported net realized foreign exchange gains or losses arise from sales of foreign currencies, currency gains or losses realized between the trade and settlement dates on securities transactions, the difference between the amounts of dividends, interest, and foreign withholding taxes recorded on each Fund’s books, and the U.S. dollar equivalent of the amounts actually received or paid. Net unrealized foreign exchange gains and losses arise from changes in the value of assets and liabilities other than investments in securities, resulting from changes in the exchange rate. Foreign security and currency transactions may involve certain considerations and risks not typically associated with investing in U.S. companies and U.S. government securities. These risks include, but are not limited to, revaluation of currencies and future adverse political and economic developments which could cause securities and their markets to be less liquid, and prices more volatile than those of comparable U.S. companies and U.S. government securities. The foregoing risks are even greater with respect to securities of issuers in emerging markets.
D. Risk Exposures and the Use of Derivative Instruments. The Funds’ investment strategies permit them to enter into various types of derivatives contracts, including, but not limited to, forward foreign currency exchange contracts, futures, purchased options, written options, and swaps. In doing so, the Funds will employ strategies in differing combinations to permit them to increase or decrease the level of risk, or change the level or types of exposure to risk factors. This may allow the Funds
to pursue their objectives more quickly and efficiently than if they were to make direct purchases or sales of securities capable of affecting a similar response to market or credit factors.
In pursuit of their investment objectives, the Funds may seek to increase or decrease their exposure to the following market or credit risk factors:
Equity Risk. Stock prices may be volatile or have reduced liquidity in response to real or perceived impacts of factors including, but not limited to, economic conditions, changes in market interest rates, and political events. Stock markets tend to be cyclical, with periods when stock prices generally rise and periods when stock prices generally decline. Any given stock market segment may remain out of favor with investors for a short or long period of time, and stocks as an asset class may underperform bonds or other asset classes during some periods. Additionally, legislative, regulatory or tax policies or developments in these areas may adversely impact the investment techniques available to a manager, add to costs and impair the ability of a Fund to achieve its investment objectives.
Foreign Exchange Rate Risk. To the extent that a Fund invests directly in foreign (non-U.S.) currencies or in securities denominated in, or that trade in, foreign (non-U.S.) currencies, it is subject to the risk that those foreign (non-U.S.) currencies will decline in value relative to the U.S. dollar or, in the case of hedging positions, that the U.S. dollar will decline in value relative to the currency being hedged by a Fund through foreign currency exchange transactions.
Currency rates may fluctuate significantly over short periods of time. Currency rates may be affected by changes in market interest rates, intervention (or the failure to intervene) by U.S. or foreign governments, central banks or supranational entities such as the International Monetary Fund, by the imposition of currency controls, or other political or economic developments in the United States or abroad.
Interest Rate Risk. A rise in market interest rates generally results in a fall in the value of bonds and other debt instruments; conversely, values generally rise as market interest rates fall. Interest rate risk is generally greater for debt instruments than floating-rate instruments. The higher the credit quality of the instrument, and the longer its maturity or duration, the more sensitive it is to changes in market interest rates. Duration is a measure of sensitivity of the price of a debt instrument to a change in interest rate. The U.S. has experienced a rising market interest rate environment, which may increase the Funds’ exposure to risks associated with rising market interest rates. Rising market interest rates have unpredictable effects on the markets and may expose debt and related markets to
NOTES TO FINANCIAL STATEMENTS as of October 31, 2024 (continued)
NOTE 2 — SIGNIFICANT ACCOUNTING POLICIES (continued)
heightened volatility. To the extent that a mutual fund invests in debt instruments, an increase in market interest rates may lead to increased redemptions and increased portfolio turnover, which could reduce liquidity for certain investments, adversely affect values, and increase costs. Increased redemptions may cause a fund to liquidate portfolio positions when it may not be advantageous to do so and may lower returns. If dealer capacity in debt markets is insufficient for market conditions, it may further inhibit liquidity and increase volatility in debt markets. Further, recent and potential future changes in government policy may affect interest rates. Negative or very low interest rates could magnify the risks associated with changes in interest rates. In general, changing interest rates, including rates that fall below zero, could have unpredictable effects on markets and may expose debt and related markets to heightened volatility. Changes to monetary policy by the U.S. Federal Reserve Board or other regulatory actions could expose debt and related markets to heightened volatility, interest rate sensitivity, and reduced liquidity, which may impact operations and return potential.
Risks of Investing in Derivatives. The Funds’ use of derivatives can result in losses due to unanticipated changes in the market or credit risk factors and the overall market. In instances where the Funds are using derivatives to decrease or hedge exposures to market or credit risk factors for securities held by the Funds, there are also risks that those derivatives may not perform as expected resulting in losses for the combined or hedged positions.
Derivative instruments are subject to a number of risks, including the risk of changes in the market price of the underlying securities, credit risk with respect to the counterparty, risk of loss due to changes in market interest rates and liquidity and volatility risk. The amounts required to purchase certain derivatives may be small relative to the magnitude of exposure assumed by a Fund. Therefore, the purchase of certain derivatives may have an economic leveraging effect on a Fund and exaggerate any increase or decrease in the NAV. Derivatives may not perform as expected, so a Fund may not realize the intended benefits. When used for hedging purposes, the change in value of a derivative may not correlate as expected with the currency, security or other risk being hedged. When used as an alternative or substitute for direct cash investments, the return provided by the derivative may not provide the same return as direct cash investment. In addition, given their complexity, derivatives expose a Fund to the risk of improper valuation.
Generally, derivatives are sophisticated financial instruments whose performance is derived, at least in part,
from the performance of an underlying asset or assets. Derivatives include, among other things, swap agreements, options, forwards and futures. Investments in derivatives are generally negotiated over-the-counter (“OTC”), with a single counterparty and as a result are subject to credit risks related to the counterparty’s ability or willingness to perform its obligations; any deterioration in the counterparty’s creditworthiness could adversely affect the value of the derivative. In addition, derivatives and their underlying securities may experience periods of illiquidity which could cause a Fund to hold a security it might otherwise sell, or to sell a security it otherwise might hold at inopportune times or at an unanticipated price. A manager might imperfectly judge the direction of the market. For instance, if a derivative is used as a hedge to offset investment risk in another security, the hedge might not correlate to the market’s movements and may have unexpected or undesired results such as a loss or a reduction in gains.
Counterparty Credit Risk and Credit Related Contingent Features. Certain derivative positions are subject to counterparty credit risk, which is the risk that the counterparty will not fulfill its obligation to the Funds. The Funds’ derivative counterparties are financial institutions who are subject to market conditions that may weaken their financial position. The Funds intend to enter into financial transactions with counterparties that they believe to be creditworthy at the time of the transaction. To reduce this risk, the Funds generally enter into master netting arrangements, established within the Funds’ International Swap and Derivatives Association, Inc. (“ISDA”) Master Agreements (“Master Agreements”). These agreements are with select counterparties and they govern transactions, including certain OTC derivative and forward foreign currency contracts, entered into by the Funds and the counterparty. The Master Agreements maintain provisions for general obligations, representations, agreements, collateral, and events of default or termination. The occurrence of a specified event of termination may give a counterparty the right to terminate all of its contracts and affect settlement of all outstanding transactions under the applicable Master Agreement.
The Funds may also enter into collateral agreements with certain counterparties to further mitigate credit risk associated with OTC derivative and forward foreign currency contracts. Subject to established minimum levels, collateral is generally determined based on the net aggregate unrealized gain or loss on contracts with a certain counterparty. Collateral pledged to or from the Funds is held in a segregated account by a third-party agent and can be in the form of cash or debt securities issued by the U.S. government or related agencies.
At October 31, 2024, the maximum amount of loss that Global Bond and Multi-Manager International Small Cap
NOTES TO FINANCIAL STATEMENTS as of October 31, 2024 (continued)
NOTE 2 — SIGNIFICANT ACCOUNTING POLICIES (continued)
would incur if its counterparties failed to perform would be $577,018 and $15, respectively, which represents the gross payments to be received on open OTC purchased options, forward premium swaptions, cross-currency swaps, and forward foreign currency contracts were they to be unwound as of October 31, 2024. To reduce the amount of potential loss, Global Bond received $140,000 in cash collateral from certain counterparties at October 31, 2024. There was no cash collateral received for Multi-Manager International Small Cap as of October 31, 2024.
The Funds have credit related contingent features that if triggered would allow their derivatives counterparties to close out and demand payment or additional collateral to cover their exposure from the Funds. Credit related contingent features are established between the Funds and their derivatives counterparties to reduce the risk that the Funds will not fulfill their payment obligations to their counterparties. These triggering features include, but are not limited to, a percentage decrease in a Fund’s net assets and/or a percentage decrease in a Fund’s NAV, which could cause a Fund to accelerate payment of any net liability owed to the counterparty. The contingent features are established within the Funds’ Master Agreements.
Global Bond had a liability position of $473,034 on forward foreign currency contracts, forward premium swaptions, OTC total return swaps, volatility swaps and written OTC options with credit related contingent features. If a contingent feature would have been triggered as of October 31, 2024, Global Bond could have been required to pay this amount in cash to its counterparties. At October 31, 2024, Global Bond pledged $60,000 in cash collateral to certain counterparties for its open OTC derivative transactions.
E. Forward Foreign Currency Transactions and Futures Contracts. Each Fund and Underlying Fund may enter into forward foreign currency exchange transactions to convert to and from different foreign currencies and to and from the U.S. dollar, generally in connection with the planned purchases or sales of securities. The Funds and Underlying Funds either enter into these transactions on a spot basis at the spot rate prevailing in the foreign currency exchange market or may use forward foreign currency contracts to purchase or sell foreign currencies. When the contract is fulfilled or closed, gains or losses are realized. Until then, the gain or loss is included in unrealized appreciation or depreciation. Risks may arise upon entering into forward contracts from the potential inability of counterparties to meet the terms of their forward contracts and from unanticipated movements in the value of foreign currencies relative to the U.S. dollar.
Multi-Manager International Small Cap used forward foreign currency contracts primarily to protect their non-U.S. dollar denominated holdings from adverse currency movements. Global Bond used forward foreign currency contracts primarily to gain currency exposure and to protect its non-U.S. dollar denominated holdings from adverse currency movements. The Funds had an average contract amount on forward foreign currency contracts to buy and sell as follows:
| | | Buy | | | Sell | |
| Global Bond | | $ | 233,379,316 | | | $ | 121,909,576 | |
| Multi-Manager International Small Cap | | | 76,517 | | | | 10,559 | |
| | | | | | | | | |
Please refer to the tables within the Portfolio of Investments for Global Bond and Multi-Manager International Small Cap for open forward foreign currency contracts at October 31, 2024.
Each Fund and Underlying Fund may enter into futures contracts involving foreign currency, interest rates, securities and securities indices. Each Fund and Underlying Fund intends to limit its use of futures contracts and futures options to “bona fide hedging” transactions, as such term is defined in applicable regulations, interpretations and practice. A futures contract obligates the seller of the contract to deliver and the purchaser of the contract to take delivery of the type of foreign currency, financial instrument or security called for in the contract at a specified future time for a specified price.
Upon entering into such a contract, the Funds are required to deposit either cash or securities (initial margin) in an amount equal to a certain percentage of the contract value. Subsequent payments (variation margin) are made or received by the Funds each day. The variation margin payments are equal to the daily changes in the contract value and are recorded as unrealized gains and losses and, if any, shown as variation margin receivable or payable on futures contracts on the Statement of Assets and Liabilities. Open futures contracts, if any, are reported on a table within each Fund’s Portfolio of Investments. Securities held in collateralized accounts to cover initial margin requirements, if any, on open futures contracts are footnoted in the Portfolio of Investments. Cash collateral held by the broker to cover initial margin requirements on open futures contracts are noted in each Fund’s Statement of Assets and Liabilities. The net change in unrealized appreciation and depreciation is reported in each Fund’s Statement of Operations. Realized gains (losses) are reported in each Fund’s Statement of Operations at the closing or expiration of futures contracts.
Futures contracts are exposed to the market risk factor of the underlying financial instrument. During the year ended
NOTES TO FINANCIAL STATEMENTS as of October 31, 2024 (continued)
NOTE 2 — SIGNIFICANT ACCOUNTING POLICIES (continued)
October 31, 2024, Global Bond had both purchased and sold futures contracts on various bonds and notes to gain exposure to different parts of the yield curve to assist the Fund with its duration strategy. Futures contracts are purchased to provide immediate market exposure proportionate to the size of the Fund’s respective cash flows and residual cash balances in order to decrease potential tracking error if the cash remained uninvested in the market. Additional associated risks of entering into futures contracts include the possibility that there may be an illiquid market where the Fund is unable to liquidate the contract or enter into an offsetting position and, if used for hedging purposes, the risk that the price of the contract will correlate imperfectly with the prices of the Fund’s securities. With futures, there is minimal counterparty credit risk to the Fund since futures are exchange traded and the exchange’s clearinghouse, as counterparty to all exchange traded futures, guarantees the futures against default.
During the year ended October 31, 2024, Global Bond had an average notional value of $107,740,374 and $22,337,029 on futures contracts purchased and sold, respectively. Please refer to the table for Global Bond within the Portfolio of Investments for open futures contracts at October 31, 2024.
F. Options Contracts. The Funds may write call and put options on futures, interest rate caps and floors, swaps (“swaptions”), securities, commodities or foreign currencies it owns or in which it may invest. Writing put options tends to increase the Funds’ exposure to the underlying instrument. Writing call options tends to decrease the Funds’ exposure to the underlying instrument. When a Fund writes a call or put option, an amount equal to the premium received is recorded as a liability and subsequently marked to market to reflect the current value of the option written. These liabilities are reflected as written options outstanding on the Statements of Assets and Liabilities.
The Funds may also purchase put and call options. Purchasing call options tends to increase the Funds’ exposure to the underlying instrument. Purchasing put options tends to decrease the Funds’ exposure to the underlying instrument. The Funds pay a premium which is included on the Statements of Assets and Liabilities as an investment and subsequently marked to market to reflect the current value of the option. Premiums paid for purchasing options which expire are treated as realized losses. Certain options may be purchased with premiums to be determined on a future date. The premiums for these options are based upon implied volatility parameters at specified terms. The risk associated with purchasing put and call options is limited to the premium paid. Premiums paid
for purchasing options which are exercised or closed are added to the amounts paid or offset against the proceeds on the underlying investment transaction to determine the realized gain or loss
During the year ended October 31, 2024, Global Bond had purchased and written exchange-traded options to gain additional exposure to interest rates and to generate income. Global Bond had an average notional amount of $49,006,772 and $48,888,241 on purchased and written exchange-traded options, respectively. There were no open purchased or written exchange-traded options at October 31, 2024.
During the year ended October 31, 2024, Global Bond had purchased and written interest rate swaptions to gain additional exposure to interest rates and to generate income. Global Bond had an average notional amount of $11,429,412 and $39,516,158 on purchased and written interest rate swaptions, respectively. Please refer to the tables within the Portfolio of Investments for open purchased and written interest rate swaptions at October 31, 2024.
During the year ended October 31, 2024, Global Bond had purchased and written foreign currency options to gain additional exposure to foreign currencies and to generate income. Global Bond had an average notional amount of $8,804,008 and $10,358,830 on purchased and written foreign currency options, respectively. Please refer to the tables within the Portfolio of Investments for open purchased foreign currency options at October 31, 2024. There were no open written foreign currency options at October 31, 2024.
During the year ended October 31, 2024, Global Bond had purchased and written forward premium swaptions to manage duration and yield curve exposures. Global Bond had and average notional amount of $12,576,132 and $64,959,797 on purchased and written forward premium swaptions, respectively. Please refer to the tables within the Portfolio of Investments for open purchased and written forward premium swaptions at October 31, 2024.
G. Swap Agreements. Certain Funds may enter into swap agreements. A swap is an agreement between two parties pursuant to which each party agrees to make one or more payments to the other at specified future intervals based on the return of an asset (such as a stock, bond or currency) or non-asset reference (such as an interest rate or index). The swap agreement will specify the “notional” amount of the asset or non-asset reference to which the contract relates. Subsequent changes in fair value, if any, are calculated based upon changes in the performance of the asset or non-asset reference multiplied by the notional value of the contract. A Fund may enter into credit default, interest rate,
NOTES TO FINANCIAL STATEMENTS as of October 31, 2024 (continued)
NOTE 2 — SIGNIFICANT ACCOUNTING POLICIES (continued)
total return and currency swaps to manage its exposure to credit, currency and interest rate risk. All outstanding swap agreements are reported following each Fund’s Portfolio of Investments.
Swaps are marked to market daily using quotations primarily from third party pricing services, counterparties or brokers. The value of the swap contract is recorded on each Fund’s Statement of Assets and Liabilities. During the term of the swap, changes in the value of the swap, if any, are recorded as unrealized gains or losses on the Statements of Operations. Upfront payments paid or received by a Fund when entering into the agreements are reported on the Statement of Assets and Liabilities and as a component of the changes in unrealized gains or losses on the Statement of Operations. These upfront payments represent the amounts paid or received when initially entering into the swap agreement to compensate for differences between the stated terms of the swap agreement and the prevailing market conditions. The upfront payments are included as a component in the realized gains or losses on each Fund’s Statements of Operations upon termination or maturity of the swap. A Fund also records net periodic payments paid or received on the swap contract as a realized gain or loss on the Statements of Operations.
In a centrally cleared swap, immediately following execution of the swap agreement, the swap agreement is novated to a central counterparty (the “CCP”) and a Fund’s counterparty on the swap agreement becomes the CCP. A Fund is required to interface with the CCP through a broker. Upon entering into a centrally cleared swap, a Fund is required to deposit initial margin with the broker in the form of cash or securities in an amount that varies depending on the size and risk profile of the particular swap. Securities deposited as initial margin are footnoted as pledged on the Portfolio of Investments and cash deposited is recorded on the Statements of Assets and Liabilities as cash pledged for centrally cleared swaps. The daily change in valuation of centrally cleared swaps is recorded as a receivable or payable for variation margin in the Statements of Assets and Liabilities. Payments received from (paid to) the counterparty, including at termination, are recorded as realized gain (loss) on the Statements of Operations.
Entering into swap agreements involves the risk that the maximum potential loss of an investment exceeds the current value of the investment as reported on each Fund’s Statement of Assets and Liabilities. Other risks involve the possibility that the counterparty to the agreements may default on its obligation to perform, that there will be no liquid market for these investments and that unfavorable changes in the market will have a negative impact on the
value of the index or securities underlying the respective swap agreement.
Credit Default Swap Contracts. A credit default swap is a bilateral agreement between counterparties in which the buyer of the protection agrees to make a stream of periodic payments to the seller of protection in exchange for the right to receive a specified return in the event of a default or other credit event for a referenced entity, obligation or index. As a seller of protection on credit default swaps, a Fund will generally receive from the buyer a fixed payment stream based on the notional amount of the swap contract. This fixed payment stream will continue until the swap contract expires or a defined credit event occurs.
A Fund is subject to credit risk in the normal course of pursuing its investment objectives. As a seller of protection in a credit default swap, a Fund may execute these contracts to manage its exposure to the market or certain sectors of the market. A Fund may also enter into credit default swaps to speculate on changes in an issuer’s credit quality, to take advantage of perceived spread advantages, or to offset an existing short equivalent (i.e. buying protection on an equivalent reference entity).
Certain Funds may sell credit default swaps which expose these Funds to the risk of loss from credit risk-related events specified in the contract. Although contract specific, credit events are generally defined as bankruptcy, failure to pay, restructuring, obligation acceleration, obligation default or repudiation/ moratorium. If a Fund is a seller of protection, and a credit event occurs, as defined under the terms of that particular swap agreement, a Fund will generally either (i) pay to the buyer an amount equal to the notional amount of the swap and take delivery of the referenced obligation, other deliverable obligations, or underlying securities comprising a referenced index or (ii) pay a net settlement amount in the form of cash or securities equal to the notional amount of the swap less the recovery value of the referenced obligation or underlying securities comprising a referenced index. If a Fund is a buyer of protection and a credit event occurs, as defined under the terms of that particular swap agreement, a Fund will either (i) receive from the seller of protection an amount equal to the notional amount of the swap and deliver the referenced obligation, other deliverable obligations or underlying securities comprising the referenced index or (ii) receive a net settlement amount in the form of cash or securities equal to the notional amount of the swap less the recovery value of the referenced obligation or underlying securities comprising the referenced index. Recovery values are assumed by market makers considering either industry standard recovery rates or entity specific factors and considerations until a credit event occurs. If a credit event has occurred, the recovery value is determined by a facilitated auction whereby a minimum number of allowable
NOTES TO FINANCIAL STATEMENTS as of October 31, 2024 (continued)
NOTE 2 — SIGNIFICANT ACCOUNTING POLICIES (continued)
broker bids, together with a specified valuation method, are used to calculate the settlement value.
Implied credit spreads, represented in absolute terms, utilized in determining the fair value of credit default swap agreements on corporate issues or sovereign issues are disclosed in each Fund’s Portfolio of Investments and serve as an indicator of the current status of the payment/ performance risk and represent the likelihood or risk of default for the credit derivative. The implied credit spread of a particular referenced entity reflects the cost of buying/ selling protection and may include upfront payments required to be made to enter into the agreement. For credit default swaps on asset-backed securities or credit indices, the quoted market prices and resulting fair values serve as the indicator of the current status of the payment/ performance risk. Wider credit spreads and increasing fair values, in absolute terms when compared to the notional amount of the swap, represent a deterioration of the referenced entity’s credit soundness and a greater likelihood or risk of default or other credit event occurring as defined under the terms of the agreement.
The maximum amount of future payments (undiscounted) that a Fund as seller of protection could be required to make under a credit default swap agreement would be an amount equal to the notional amount of the agreement. These potential amounts would be partially offset by any recovery values of the respective referenced obligations, upfront payments received upon entering into the agreements, or net amounts received from the settlement of buy protection credit default swap agreements entered into by a Fund for the same referenced entity or entities.
For the year ended October 31, 2024, Global Bond had sold credit protection on credit default swap indices (“CDX”) with an average notional amount of $7,269,500 to gain additional exposure with various sectors within the credit market. A CDX is a basket of credit instruments or exposures designed to be representative of some part of the credit market as a whole. There were no open credit default swaps to sell protections at October 31, 2024.
Interest Rate Swap Agreements. Certain Funds may enter into interest rate swaps. An interest rate swap is an agreement between counterparties to exchange periodic payments based on interest rates. One cash flow stream will typically be a floating rate payment based upon a specified interest rate while the other is typically a fixed interest rate.
For the year ended October 31, 2024, Global Bond has entered into interest rate swaps in which it pays a floating interest rate and receives a fixed interest rate (“long interest rate swap”) in order to increase exposure to interest rate
risk. Average notional amounts on long interest rate swaps were $55,269,522.
For the year ended October 31, 2024, Global Bond has entered into interest rate swaps in which it pays a fixed interest rate and receives a floating interest rate (“short interest rate swap”) in order to decrease exposure to interest rate risk. Average notional amounts on short interest rate swaps were $132,766,952.
Global Bond entered into interest rate swaps to manage its duration. Please refer to the table within the Portfolio of Investments for Global Bond for open centrally cleared interest rate swaps at October 31, 2024.
At October 31, 2024, Global Bond had pledged $2,886,000 for open centrally cleared swaps.
Total Return Swap Agreements. Total return swaps are entered into to gain or mitigate exposure to the underlying reference asset. Total return swap agreements involve commitments where single or multiple cash flows are exchanged based on the price of an underlying reference asset and on a fixed or variable interest rate. Total return swap agreements may involve commitments to pay interest in exchange for a market-linked return. One counterparty pays out the total return of a specific underlying reference asset, which may include a single security, a basket of securities, or an index, and in return receives a fixed or variable rate. At the maturity date, a net cash flow is exchanged where the total return is equivalent to the return of the underlying reference asset less a financing rate, if any. As a receiver, a Fund would receive payments based on any net positive total return and would owe payments in the event of a net negative total return. As the payer, a Fund would owe payments on any net positive total return, and would receive payments in the event of a net negative total return. A Fund’s use of a total return swap exposes the Fund to credit loss in the event of nonperformance by the swap counterparty. Risk may also arise from the unanticipated movements in value of exchange rates, interest rates, securities, or the index.
For the year ended October 31, 2024, Global Bond had an average notional amount of $21,060,944 on receiver total return swaps. Please refer to the tables within the Portfolio of Investments for open total returns swaps at October 31, 2024.
Cross-Currency Swaps. Certain Funds may enter into cross-currency swaps. Cross-currency swaps are interest rate swaps in which interest cash flows are exchanged between two parties based on the notional amounts of two different currencies. The notional amounts are typically determined based on the spot exchange rates at the inception of the trade. Cross-currency swaps also involve the exchange of the notional amounts at the start of the
NOTES TO FINANCIAL STATEMENTS as of October 31, 2024 (continued)
NOTE 2 — SIGNIFICANT ACCOUNTING POLICIES (continued)
contract at the current spot rate with an agreement to re-exchange such amounts at a later date at either the same exchange rate, a specified rate or the then current spot rate. The entire principal value of a cross-currency swap is subject to the risk that the counterparty to the swap will default on its contractual delivery obligations.
For the year ended October 31, 2024, Global Bond had an average notional amount of $2,313,827 on cross-currency swaps in which the Fund receives the floating rate. Please refer to the table within the Portfolio of Investments for Global Bond for open cross-currency swaps at October 31, 2024.
Volatility Swap Contracts. Certain Portfolios may enter into volatility swaps. Volatility swaps are agreements in which the counterparties agree to make payments in connection with changes in the volatility (i.e., the magnitude of change over a specified period of time) of an underlying referenced instrument, such as a currency, rate, index, security or other financial instrument. Volatility swaps permit the parties to attempt to hedge volatility risk and/or take positions on the projected future volatility of an underlying referenced instrument. As a receiver of the realized price volatility, the Portfolio would receive the payoff amount when the realized price volatility of the referenced instrument is greater than the strike and would owe the payoff amount when the volatility is less than the strike. As a payer of the realized price volatility, the Portfolio would owe the payoff amount when the realized price volatility of the referenced instrument is greater than the strike and would receive the payoff amount when the volatility is less than the strike.
For the year ended October 31, 2024, Global Bond entered into receiver volatility swaps on foreign currencies with an average notional amount of $73,860. Please refer to the tables within the Portfolio of Investments for open volatility swaps at October 31, 2024.
H. Distributions to Shareholders. The Funds record distributions to their shareholders on ex-dividend date. Each Fund, except for Global Bond and Global High Dividend Low Volatility, declares and pays dividends, if any, annually. Global Bond declares dividends daily and pays dividends, if any, monthly. Global High Dividend Low Volatility declares and pays dividends, if any, quarterly. Each Fund distributes capital gains, if any, annually. The Funds may make distributions on a more frequent basis to comply with the distribution requirements of the Internal Revenue Code. The characteristics of income and gains to be distributed are determined in accordance with income tax regulations, which may differ from GAAP for investment companies.
I. Federal Income Taxes. It is the policy of each Fund to comply with the requirements of subchapter M of the Internal Revenue Code that are applicable to regulated investment companies and to distribute substantially all of its net investment income and any net realized capital gains to its shareholders. Therefore, a federal income tax or excise tax provision is not required. Management has considered the sustainability of the Funds’ tax positions taken on federal income tax returns for all open tax years in making this determination. No capital gain distributions shall be made until the capital loss carryforwards have been fully utilized.
The Funds may utilize equalization accounting for tax purposes, whereby a portion of redemption payments are treated as distributions of income or gain.
As a result of several court cases, in certain countries across the European Union, Global High Dividend Low Volatility filed additional tax reclaims for previously withheld taxes on dividends earned in those countries (“EU reclaims”). These additional filings are subject to various administrative proceedings by the local jurisdictions’ tax authorities within the European Union, as well as a number of related judicial proceedings. Income recognized, if any, for EU reclaims is reflected as other income in the Statement of Operations. When uncertainty exists as to the ultimate resolution of these proceedings, the likelihood of receipt of these EU reclaims, and the potential timing of payment, no amounts are reflected in the financial statements. For U.S. income tax purposes, EU reclaims received by Global High Dividend Low Volatility, if any, reduce the amounts of foreign taxes the Fund’s shareholders can use as tax credits in their individual income tax returns. In the event that EU reclaims received by Global High Dividend Low Volatility during the fiscal year exceed foreign withholding taxes paid, and Global High Dividend Low Volatility previously passed foreign tax credit on to its shareholders, Global High Dividend Low Volatility will enter into a closing agreement with the Internal Revenue Service (“IRS”) in order to pay the associated tax liability on behalf of the Fund’s shareholders.
J. Use of Estimates. The preparation of financial statements in conformity with GAAP requires management to make estimates and assumptions that affect the reported amounts of assets and liabilities and disclosure of contingent assets and liabilities at the date of the financial statements and the reported amounts of increases and decreases in net assets from operations during the reporting period. Actual results could differ from those estimates.
K. Securities Lending. Each Fund has the option to temporarily loan securities representing up to 33 ⅓% of its total assets (except Multi-Manager International Small Cap and Global High Dividend Low Volatility, which can each lend up to 30% of its total assets) to brokers, dealers or
NOTES TO FINANCIAL STATEMENTS as of October 31, 2024 (continued)
NOTE 2 — SIGNIFICANT ACCOUNTING POLICIES (continued)
other financial institutions in exchange for a negotiated lender’s fee. Securities lending involves two primary risks: “investment risk” and “borrower default risk.” When lending securities, the Funds will receive cash or U.S. government securities as collateral. Investment risk is the risk that the Funds will lose money from the investment of the cash collateral received from the borrower. Borrower default risk is the risk that the Funds will lose money due to the failure of a borrower to return a borrowed security. Loans are subject to termination at the option of the borrower or the Funds. Securities lending may result in leverage. The use of leverage may exaggerate any increase or decrease in the NAV, causing the Funds to be more volatile. The use of leverage may increase expenses and increase the impact of the Funds’ other risks.
L. Restricted Securities. Each Fund may invest in restricted securities which include those sold under Rule 144A of the Securities Act of 1933, as amended (“1933 Act”) or securities offered pursuant to Section 4(a)(2) of the 1933 Act, and/or are subject to legal or contractual restrictions on resale and may not be publicly sold without registration under the 1933 Act. Restricted securities are fair valued using market quotations when readily available. In the absence of market quotations, the securities are valued based upon their fair value determined in good faith under procedures approved by the Board.
Securities that are not registered for sale to the public under the 1933 Act are referred to as “restricted securities.” These securities may be sold in private placement transactions between issuers and their purchasers and may be neither listed on an exchange nor traded in other established markets. Many times these securities are subject to legal or contractual restrictions on resale. As a result of the absence of a public trading market, the prices of these securities may be more volatile, less liquid and more difficult to value than publicly traded securities. The price realized from the sale of these securities could be less than the amount originally paid or less than their fair value if they are resold in privately negotiated transactions. In addition, these securities may not be subject to disclosure and other investment protection requirements that are afforded to publicly traded securities. Certain investments may include investment in smaller, less seasoned issuers, which may involve greater risk.
M. Delayed-Delivery or When-Issued Transactions. Each Fund may purchase or sell securities on a when issued or a delayed-delivery basis. Each Fund may enter into forward commitments. The price of the underlying securities and date when the securities will be delivered and paid for are fixed at the time the transaction is negotiated. The market value
of such is identified in the Funds’ Portfolio of investments. Losses may arise due to changes in the market value of the securities or from the inability of counterparties to meet the terms of the contract. In connection with such purchases, the Funds are required to segregate liquid assets with the Funds’ custodian sufficient to cover the purchase price.
To mitigate counterparty risk, the Funds have entered into Master Securities Forward Transaction Agreements (“MSFTA”) with their respective counterparties that provide for collateral and the right to offset amounts due to or from those counterparties under specified conditions. Subject to minimum transfer amounts, collateral requirements are determined and transfers made based on the net aggregate unrealized gain or loss on all the when-issued or delayed-delivery transactions with a particular counterparty. Cash collateral, if any, is presented on the Statements of Assets and Liabilities as an asset (Cash pledged as collateral for delayed-delivery or when-issued securities) and a liability (Cash received as collateral for delayed-delivery or when-issued securities).
There was no cash collateral received or pledged for delayed-delivery or when-issued transactions as of October 31, 2024.
N. Indemnifications. In the normal course of business, the Trust may enter into contracts that provide certain indemnifications. The Trust’s maximum exposure under these arrangements is dependent on future claims that may be made against the Funds and, therefore, cannot be estimated; however, based on experience, management considers risk of loss from such claims remote.
NOTE 3 — INVESTMENT TRANSACTIONS
For the year ended October 31, 2024, the cost of purchases and the proceeds from the sales of securities, excluding short-term and U.S. government securities, were as follows:
| | | Purchases | | | Sales | |
| Global Bond | | $ | 113,140,491 | | | $ | 171,632,391 | |
| Global High Dividend Low Volatility | | | 171,409,011 | | | | 206,569,034 | |
| Multi-Manager International Small Cap | | | 232,673,527 | | | | 240,010,276 | |
U.S. government securities not included above were as follows:
| | | Purchases | | | Sales | |
| Global Bond | | $ | 320,935,042 | | | $ | 382,895,283 | |
NOTE 4 — INVESTMENT MANAGEMENT FEES
The Funds have entered into an investment management agreement (“Management Agreement”) with the Investment Adviser. The Investment Adviser has overall responsibility for the management of the Funds. The Investment Adviser
NOTES TO FINANCIAL STATEMENTS as of October 31, 2024 (continued)
NOTE 4 — INVESTMENT MANAGEMENT FEES (continued)
oversees all investment advisory and portfolio management services for the Funds and assists in managing and supervising all aspects of the general day-to-day business activities and operations of the Funds, including custodial, transfer agency, dividend disbursing, accounting, auditing, compliance and related services. Voya Investments, the Investment Adviser to Multi- Manager International Small Cap, may, from time to time, directly manage a portion of the Fund’s investment portfolio. The Management Agreement compensates the Investment Adviser with a management fee, computed daily and payable monthly, based on the average daily net assets of each Fund, at the following annual rates.
| Fund | | As a Percentage of Average
Daily Net Assets |
| Global Bond | | 0.50% |
| Global High Dividend Low Volatility | | 0.50% |
| Multi-Manager International | | 1.00% on first $500 million; |
| Small Cap | | 0.95% on next $500 million; and |
| | | 0.90% in excess of $1 billion |
The Investment Adviser has entered into a sub-advisory agreement with each respective sub-adviser. These sub-advisers provide investment advice for the various Funds and are paid by the Investment Adviser based on the average daily net assets of the respective Funds. Subject to such policies as the Board or the Investment Adviser may determine, each sub-adviser manages each respective Fund’s assets in accordance with that Fund’s investment objectives, policies, and limitations. The sub-adviser of each Fund is as follows (*denotes an affiliated sub-adviser):
| Fund | | Sub-Adviser |
| Global Bond | | Voya IM* |
| Global High Dividend Low Volatility | | Voya IM* |
| Multi-Manager International Small Cap | | Acadian Asset Management LLC and
Victory Capital Management Inc. |
NOTE 5 — DISTRIBUTION AND SERVICE FEES
Class A, Class C and Class R shares of each respective Fund has a plan (each a “Plan” and collectively, the “Plans”), whereby the Distributor is reimbursed or compensated (depending on the class of shares) by the Funds for expenses incurred in the distribution of each Fund’s shares (“Distribution Fees”). Pursuant to the Plans, the Distributor is entitled to a payment each month for expenses incurred in the distribution and promotion of each Fund’s shares, including expenses incurred in printing prospectuses and reports used for sales purposes, expenses incurred in preparing and printing sales literature and other such distribution related expenses, including any distribution or shareholder servicing fees (“Service Fees”) paid to securities dealers who have executed a distribution
agreement with the Distributor. Under the Plans, each class of shares of a Fund pays the Distributor a Distribution and/ or Service Fee based on average daily net assets at the following annual rates:
| | | Class A | | Class C | | Class R |
| Global Bond | | 0.25% | | 1.00% | | 0.50% |
| Global High Dividend Low Volatility | | 0.25% | | 1.00% | | N/A |
| Multi-Manager International Small Cap | | 0.25% | | 1.00% | | N/A |
The Distributor may also retain the proceeds of the initial sales charge paid by shareholders upon the purchase of Class A shares, and the contingent deferred sales charge paid by shareholders upon certain redemptions for Class A and Class C shares. For the year ended October 31, 2024, the Distributor retained the following amounts in sales charges from the following Funds:
| | | Class A | | | Class C | |
| Initial Sales Charges: | | | | | | | | |
| Global Bond | | $ | 234 | | | $ | — | |
| Global High Dividend Low Volatility | | | 3,630 | | | | — | |
| Multi-Manager International Small Cap | | | 1,134 | | | | — | |
| | | | | | | | | |
| Contingent Deferred Sales Charges: | | | | | | | | |
| Global Bond | | $ | — | | | $ | 3 | |
| Global High Dividend Low Volatility | | | — | | | | 37 | |
| Multi-Manager International Small Cap | | | — | | | | 39 | |
NOTE 6 — OTHER TRANSACTIONS WITH AFFILIATES AND RELATED PARTIES
At October 31, 2024, the following direct or indirect, wholly-owned subsidiary of Voya Financial, Inc. owned more than 5% of the following Fund:
| Subsidiary | | Fund | | Percentage |
| Voya Institutional Trust Company | | Global Bond | 8.82% |
The Investment Adviser may request that the Funds’ sub-advisers use their best efforts (subject to obtaining best execution of each transaction) to allocate a Fund’s equity security transactions through certain designated broker-dealers. The designated broker-dealer, in turn, will reimburse a portion of the brokerage commissions to pay certain expenses of that Fund. Any amounts credited to the Funds are reflected as brokerage commission recapture on the Statements of Operations.
The Funds have adopted a deferred compensation plan (the “DC Plan”), which allows eligible independent trustees, as described in the DC Plan, to defer the receipt of all or a portion of the trustees’ fees that they are entitled to receive from the Funds. For purposes of determining the amount owed to the trustee under the DC Plan, the amounts deferred are invested in shares of the funds selected by the trustee (the “Notional Funds”). When the Funds purchase shares of the
NOTES TO FINANCIAL STATEMENTS as of October 31, 2024 (continued)
NOTE 6 — OTHER TRANSACTIONS WITH AFFILIATES AND RELATED PARTIES (continued)
Notional Funds, which are all advised by Voya Investments, in amounts equal to the trustees’ deferred fees, this results in a Fund asset equal to the deferred compensation liability. Such assets, if applicable, are included as a component of “Other assets” on the accompanying Statements of Assets and Liabilities. Deferral of trustees’ fees under the DC Plan will not affect net assets of the Funds, and will not materially affect the Funds’ assets, liabilities or net investment income per share. Amounts will be deferred until distributed in accordance with the DC Plan.
The Funds may pay per account fees to affiliates of Voya Investments for recordkeeping services provided on certain assets. For the year ended October 31, 2024, the per account fees for affiliated recordkeeping services paid by each Fund were as follows:
| Fund | | Amount |
| Global Bond | | $21,640 |
| Global High Dividend Low Volatility | | 5,929 |
| Multi-Manager International Small Cap | | 45,913 |
NOTE 7 — EXPENSE LIMITATION AGREEMENTS
The Investment Adviser has entered into a written expense limitation agreement (“Expense Limitation Agreement”) with each Fund whereby the Investment Adviser has agreed to limit expenses, excluding interest, taxes, investment-related costs, leverage expenses, extraordinary expenses and acquired fund fees and expenses to the levels listed below:
| | | Class | | Class | | Class | | Class | | Class | | Class |
| Fund | | A | | C | | I | | R | | R6 | | W |
| Global Bond | | 0.90% | | 1.65% | | 0.65% | | 1.15% | | 0.65% | | 0.65% |
| Global High Dividend Low Volatility | | 0.85% | | 1.60% | | 0.60% | | N/A | | 0.57% | | 0.60% |
| Multi-Manager International Small Cap | | 1.95% | | 2.60% | | 1.40% | | N/A | | 1.40% | | 1.60% |
Pursuant to a side letter agreement, through March 1, 2025, the Investment Adviser has further lowered the expense limits Multi-Manager International Small Cap to the levels listed below. If the Investment Adviser elects not to renew the side letter agreement, the expense limits will revert to the limits listed in the table above. There is no guarantee that these side letter agreement will continue. Termination or modification of this obligation requires approval by the Board.
| | | Class | | Class | | Class | | Class | | Class |
| Fund | | A | | C | | I | | R6 | | W |
| Multi-Manager International Small Cap(1) | | 1.53% | | 2.28% | | 1.20% | | 1.20% | | 1.28% |
| (1) | Any fees waived pursuant to the side letter agreement shall not be eligible for recoupment. |
Unless otherwise specified above, the Investment Adviser may at a later date recoup from a Fund for class specific fees waived and/or other expenses reimbursed by the Investment Adviser during the previous 36 months, but only if, after such recoupment, a Fund’s expense ratio does not exceed the percentage described above. Waived and reimbursed fees net of any recoupment by the Investment Adviser of such waived and reimbursed fees are reflected on the accompanying Statements of Operations. Amounts payable by the Investment Adviser are reflected on the accompanying Statements of Assets and Liabilities.
As of October 31, 2024, the amounts of waived and/or reimbursed fees that are subject to possible recoupment by the Investment Adviser and the related expiration dates are as follows:
| | | October 31, | | | | |
| | | 2025 | | | 2026 | | | 2027 | | | Total | |
| Global High Dividend Low Volatility | | $ | 148,254 | | | $ | 57,160 | | | $ | 61,247 | | | $ | 266,661 | |
In addition to the above waived and/or reimbursed fees, the amount of class specific fees waived or reimbursed that are subject to possible recoupment by the Investment Adviser, and the related expiration dates as of October 31, 2024, are as follows:
| | | October 31, | | | | |
| | | 2025 | | | 2026 | | | 2027 | | | Total | |
| Global Bond | | | | | | | | | | | | | | | | |
| Class A | | $ | 42,810 | | | $ | 42,134 | | | $ | 43,168 | | | $ | 128,112 | |
| Class C | | | 1,584 | | | | 1,250 | | | | 1,313 | | | | 4,147 | |
| Class I | | | 70,042 | | | | 90,073 | | | | 126,449 | | | | 286,564 | |
| Class R | | | 7,811 | | | | 8,564 | | | | 8,914 | | | | 25,289 | |
| Class W | | | 106,241 | | | | 100,617 | | | | 87,418 | | | | 294,276 | |
| Global High Dividend Low Volatility | | | | |
| Class A | | $ | 196,196 | | | $ | 191,837 | | | $ | 217,971 | | | $ | 606,004 | |
| Class C | | | 4,018 | | | | 3,640 | | | | 2,515 | | | | 10,173 | |
| Class I | | | — | | | | — | | | | 2,888 | | | | 2,888 | |
| Class R6 | | | 13 | | | | 95 | | | | 45 | | | | 153 | |
| Class W | | | 3,164 | | | | 2,904 | | | | 3,462 | | | | 9,530 | |
The Expense Limitation Agreement is contractual through March 1, 2025, and shall renew automatically for one-year terms. Termination or modification of this obligation requires approval by the Board.
NOTE 8 — LINE OF CREDIT
Effective June 10, 2024, the Funds, in addition to certain other funds managed by the Investment Adviser, entered agreement (the “Credit Agreement”) with The Bank of New York Mellon (“BNY”) for an aggregate amount of $400,000,000 through June 9, 2025. The proceeds may be used only to finance temporarily: (1) the purchase or sale of investment securities; or (2) the repurchase or redemption of shares of the Fund or certain other funds managed by the Investment Adviser. The funds to which the line of credit is
NOTES TO FINANCIAL STATEMENTS as of October 31, 2024 (continued)
NOTE 8 — LINE OF CREDIT (continued)
available pay a commitment fee equal to 0.15% per annum on the daily unused portion of the committed line amount payable quarterly in arrears. Prior to June 10, 2024, the predecessor line of credit was for an aggregate amount of $400,000,000 and the funds to which the line of credit was available paid a commitment fee equal to 0.15% per annum on the daily unused portion of the committed line amount through June 10, 2024.
Borrowings under the Credit Agreement accrue interest at the federal funds rate plus a specified margin. Repayments generally must be made within 60 days after the date of a revolving credit advance.
The following Funds utilized the line of credit during the year ended October 31, 2024:
| Fund | | Days
Utilized | | | Approximate
Average
Daily Balance
For Days
Utilized | | | Approximate
Weighted
Average
Interest Rate
For Days
Utilized |
| Global High Dividend Low Volatility | | 12 | | | $ | 3,186,083 | | | 6.33 | % |
| Multi-Manager International Small Cap | | 24 | | | | 1,768,167 | | | 6.29 | |
NOTE 9 — CAPITAL SHARES
| | | Shares
sold | | | Shares
issued in
merger | | | Reinvestment
of
distributions | | | Shares
redeemed | | | Shares
converted | | | Net increase
(decrease) in
shares
outstanding | | | Shares
sold | | | Proceeds
from
shares
issued in
merger | | | Reinvestment
of
distributions | | | Shares
redeemed | | | Shares
converted | | | Net increase
(decrease) | |
Year or
period ended | | # | | | # | | | # | | | # | | | # | | | # | | | ($) | | | ($) | | | ($) | | | ($) | | | ($) | | | ($) | |
| | | | | | | | | | | | | | | | | | | | | | | | | | | | | | | | | | | | | |
| Global Bond | | | | | | | | | | | | | | | | |
| Class A | | | | | | | | | | | | | | | | | | | | | | | | | | | | | | | | | | | | |
| 10/31/2024 | | 276,999 | | | — | | | 117,851 | | | (746,630 | ) | | — | | | (351,780 | ) | | 2,031,079 | | | — | | | 858,860 | | | (5,432,319 | ) | | — | | | (2,542,380 | ) |
| 10/31/2023 | | 169,418 | | | — | | | 118,802 | | | (609,483 | ) | | — | | | (321,263 | ) | | 1,235,522 | | | — | | | 862,030 | | | (4,400,787 | ) | | — | | | (2,303,235 | ) |
| Class C | | | | | | | | | | | | | | | | | | | | | | | | | | | | | | | | | | | | |
| 10/31/2024 | | 2,460 | | | — | | | 3,168 | | | (8,538 | ) | | — | | | (2,910 | ) | | 18,049 | | | — | | | 23,008 | | | (62,481 | ) | | — | | | (21,424 | ) |
| 10/31/2023 | | 2,837 | | | — | | | 2,889 | | | (79,046 | ) | | — | | | (73,320 | ) | | 20,628 | | | — | | | 20,846 | | | (568,913 | ) | | — | | | (527,439 | ) |
| Class I | | | | | | | | | | | | | | | | | | | | | | | | | | | | | | | | | | | | |
| 10/31/2024 | | 2,886,901 | | | — | | | 757,836 | | | (5,387,427 | ) | | — | | | (1,742,690 | ) | | 20,850,247 | | | — | | | 5,500,784 | | | (38,993,677 | ) | | — | | | (12,642,646 | ) |
| 10/31/2023 | | 5,049,791 | | | — | | | 675,250 | | | (3,788,169 | ) | | — | | | 1,936,872 | | | 36,582,615 | | | — | | | 4,870,173 | | | (27,441,664 | ) | | — | | | 14,011,124 | |
| Class R | | | | | | | | | | | | | | | | | | | | | | | | | | | | | | | | | | | | |
| 10/31/2024 | | 114,014 | | | — | | | 24,418 | | | (125,031 | ) | | — | | | 13,401 | | | 836,565 | | | — | | | 178,661 | | | (921,834 | ) | | — | | | 93,392 | |
| 10/31/2023 | | 73,790 | | | — | | | 23,354 | | | (102,972 | ) | | — | | | (5,828 | ) | | 550,339 | | | — | | | 169,851 | | | (754,130 | ) | | — | | | (33,940 | ) |
| Class R6 | | | | | | | | | | | | | | | | | | | | | | | | | | | | | | | | | | | | |
| 10/31/2024 | | 2,252,953 | | | — | | | 390,204 | | | (12,659,106 | ) | | — | | | (10,015,949 | ) | | 16,279,222 | | | — | | | 2,833,271 | | | (92,555,878 | ) | | — | | | (73,443,385 | ) |
| 10/31/2023 | | 5,313,067 | | | — | | | 461,331 | | | (4,922,100 | ) | | — | | | 852,298 | | | 38,458,576 | | | — | | | 3,340,134 | | | (35,923,522 | ) | | — | | | 5,875,188 | |
| Class W | | | | | | | | | | | | | | | | | | | | | | | | | | | | | | | | | | | | |
| 10/31/2024 | | 487,500 | | | — | | | 274,432 | | | (4,371,343 | ) | | — | | | (3,609,411 | ) | | 3,481,567 | | | — | | | 1,967,716 | | | (31,515,878 | ) | | — | | | (26,066,595 | ) |
| 10/31/2023 | | 6,041,781 | | | — | | | 320,929 | | | (5,438,412 | ) | | — | | | 924,298 | | | 42,910,221 | | | — | | | 2,290,190 | | | (38,796,941 | ) | | — | | | 6,403,470 | |
| Global High Dividend Low Volatility | | | | | | | | | | | | | | | | |
| Class A | | | | | | | | | | | | | | | | | | | | | | | | | | | | | | | | | | | | |
| 10/31/2024 | | 119,433 | | | — | | | 102,775 | | | (578,082 | ) | | — | | | (355,874 | ) | | 5,132,513 | | | — | | | 4,443,381 | | | (24,822,677 | ) | | — | | | (15,246,783 | ) |
| 10/31/2023 | | 93,360 | | | — | | | 146,741 | | | (573,578 | ) | | — | | | (333,477 | ) | | 3,682,609 | | | — | | | 5,771,822 | | | (22,677,182 | ) | | — | | | (13,222,751 | ) |
| Class C | | | | | | | | | | | | | | | | | | | | | | | | | | | | | | | | | | | | |
| 10/31/2024 | | 2,212 | | | — | | | 1,110 | | | (41,178 | ) | | — | | | (37,856 | ) | | 89,133 | | | — | | | 44,294 | | | (1,581,122 | ) | | — | | | (1,447,695 | ) |
| 10/31/2023 | | 12,108 | | | — | | | 3,193 | | | (44,920 | ) | | — | | | (29,619 | ) | | 445,171 | | | — | | | 116,488 | | | (1,644,293 | ) | | — | | | (1,082,634 | ) |
| Class I | | | | | | | | | | | | | | | | | | | | | | | | | | | | | | | | | | | | |
| 10/31/2024 | | 378,559 | | | — | | | 17,302 | | | (835,585 | ) | | — | | | (439,724 | ) | | 16,211,975 | | | — | | | 754,874 | | | (35,147,604 | ) | | — | | | (18,180,755 | ) |
| 10/31/2023 | | 273,432 | | | — | | | 40,509 | | | (358,142 | ) | | — | | | (44,201 | ) | | 10,782,445 | | | — | | | 1,608,592 | | | (14,322,236 | ) | | — | | | (1,931,199 | ) |
| Class R6 | | | | | | | | | | | | | | | | | | | | | | | | | | | | | | | | | | | | |
| 10/31/2024 | | 429 | | | — | | | 82 | | | (97 | ) | | — | | | 414 | | | 17,735 | | | — | | | 3,578 | | | (4,208 | ) | | — | | | 17,105 | |
| 10/31/2023 | | 537 | | | — | | | 99 | | | (1,009 | ) | | — | | | (373 | ) | | 21,561 | | | — | | | 3,940 | | | (41,025 | ) | | — | | | (15,524 | ) |
| Class W | | | | | | | | | | | | | | | | | | | | | | | | | | | | | | | | | | | | |
| 10/31/2024 | | 1,272 | | | — | | | 1,815 | | | (8,463 | ) | | — | | | (5,376 | ) | | 56,237 | | | — | | | 79,222 | | | (367,259 | ) | | — | | | (231,800 | ) |
| 10/31/2023 | | 2,303 | | | — | | | 2,523 | | | (10,098 | ) | | — | | | (5,272 | ) | | 90,510 | | | — | | | 100,062 | | | (405,570 | ) | | — | | | (214,998 | ) |
| Multi-Manager International Small Cap | | | | | | | | | | | | | | | | |
| Class A | | | | | | | | | | | | | | | | | | | | | | | | | | | | | | | | | | | | |
| 10/31/2024 | | 100,049 | | | — | | | 14,398 | | | (130,575 | ) | | — | | | (16,128 | ) | | 5,820,648 | | | — | | | 772,576 | | | (7,598,198 | ) | | — | | | (1,004,974 | ) |
| 10/31/2023 | | 66,291 | | | — | | | 20,279 | | | (151,005 | ) | | — | | | (64,435 | ) | | 3,536,800 | | | — | | | 1,019,127 | | | (8,015,308 | ) | | — | | | (3,459,381 | ) |
| Class C | | | | | | | | | | | | | | | | | | | | | | | | | | | | | | | | | | | | |
| 10/31/2024 | | 3,836 | | | — | | | 559 | | | (6,975 | ) | | — | | | (2,580 | ) | | 201,619 | | | — | | | 27,008 | | | (367,956 | ) | | — | | | (139,329 | ) |
| 10/31/2023 | | 4,474 | | | — | | | 1,175 | | | (10,131 | ) | | — | | | (4,482 | ) | | 208,984 | | | — | | | 53,352 | | | (477,694 | ) | | — | | | (215,358 | ) |
NOTES TO FINANCIAL STATEMENTS as of October 31, 2024 (continued)
NOTE 9 — CAPITAL SHARES (continued)
| | | Shares
sold | | | Shares
issued in
merger | | | Reinvestment
of
distributions | | | Shares
redeemed | | | Shares
converted | | | Net increase
(decrease) in
shares
outstanding | | | Shares
sold | | | Proceeds
from
shares
issued in
merger | | | Reinvestment
of
distributions | | | Shares
redeemed | | | Shares
converted | | | Net increase
(decrease) | |
Year or
period ended | | # | | | # | | | # | | | # | | | # | | | # | | | ($) | | | ($) | | | ($) | | | ($) | | | ($) | | | ($) | |
| | | | | | | | | | | | | | | | | | | | | | | | | | | | | | | | | | | | | |
| Multi-Manager International Small Cap (continued) | | | | | | | | | | | | | | | | |
| Class I | | | | | | | | | | | | | | | | | | | | | | | | | | | | | | | | | | | | |
| 10/31/2024 | | 1,065,200 | | | — | | | 67,287 | | | (1,151,353 | ) | | — | | | (18,866 | ) | | 61,019,877 | | | — | | | 3,595,827 | | | (66,512,147 | ) | | — | | | (1,896,443 | ) |
| 10/31/2023 | | 1,805,580 | | | — | | | 60,177 | | | (1,259,237 | ) | | — | | | 606,520 | | | 96,059,785 | | | — | | | 3,012,782 | | | (66,350,416 | ) | | — | | | 32,722,151 | |
| Class R6 | | | | | | | | | | | | | | | | | | | | | | | | | | | | | | | | | | | | |
| 10/31/2024 | | 2,146 | | | — | | | 1 | | | (450 | ) | | — | | | 1,697 | | | 133,599 | | | — | | | 63 | | | (28,409 | ) | | — | | | 105,253 | |
| 2/28/2023(1)- | | | | | | | | | | | | | | | | | | | | | | | | | | | | | | | | | | | | |
| 10/31/2023 | | 55 | | | — | | | — | | | — | | | — | | | 55 | | | 3,000 | | | — | | | — | | | — | | | — | | | 3,000 | |
| Class W | | | | | | | | | | | | | | | | | | | | | | | | | | | | | | | | | | | | |
| 10/31/2024 | | 14,484 | | | — | | | 5,780 | | | (82,653 | ) | | — | | | (62,389 | ) | | 1,088,660 | | | — | | | 397,424 | | | (6,042,209 | ) | | — | | | (4,556,125 | ) |
| 10/31/2023 | | 35,530 | | | — | | | 7,457 | | | (69,622 | ) | | — | | | (26,635 | ) | | 2,412,851 | | | — | | | 478,060 | | | (4,669,122 | ) | | — | | | (1,778,211 | ) |
| (1) | Commencement of operations. |
NOTE 10 — SECURITIES LENDING
Under a Master Securities Lending Agreement (the “Agreement”) with BNY, the Funds can lend their securities to approved brokers, dealers and other financial institutions. Loans are collateralized by cash and U.S. government securities. The collateral is equal to at least 105% of the market value of non-U.S. securities loaned and 102% of the market value of U.S. securities loaned. The market value of the loaned securities is determined at the close of business of the Funds at their last sale price or official closing price on the principal exchange or system on which they are traded and any additional collateral is delivered to the Funds on the next business day. The cash collateral received is invested in approved investments as defined in the Agreement with BNY. The Funds bear the risk of loss with respect to the investment of collateral with the following exception: BNY provides the Funds indemnification from loss with respect to the investment of collateral to the extent the cash collateral is invested in overnight repurchase agreements.
Cash collateral received in connection with securities lending is invested in cash equivalents, money market funds, repurchase agreements with maturities of not more than 99 days that are collateralized with U.S. Government securities, or certain short-term investments that have a remaining maturity of 190 days or less (“Permitted Investments”). Short-term investments include: securities, units, shares or other participations in short-term investment funds, pools or trusts; commercial paper, notes, bonds or other debt obligations, certificates of deposit, time deposits and other bank obligations and asset-backed commercial paper backed by diversified receivables and repurchase-backed programs. Permitted Investments are subject to certain guidelines established by the Adviser regarding liquidity, diversification, credit quality and average credit life/duration requirements. The securities purchased with
cash collateral received are reflected in the Portfolio of Investments under Short-Term Investments.
Generally, in the event of counterparty default, the Funds have the right to use the collateral to offset losses incurred. The Agreement contains certain guarantees by BNY in the event of counterparty default and/or a borrower’s failure to return a loaned security; however, there would be a potential loss to the Funds in the event the Funds are delayed or prevented from exercising their right to dispose of the collateral. Engaging in securities lending could have a leveraging effect, which may intensify the credit, market and other risks associated with investing in a fund.
The following tables represent a summary of each respective Fund’s securities lending agreements by counterparty which are subject to offset under the Agreement as of October 31, 2024:
Global Bond
| Counterparty | | Securities
Loaned at Value | | | Cash Collateral
Received(1) | | Net
Amount | |
| Barclays Capital Inc. | | $ | 30,939 | | | $ | (30,939 | ) | | $ | — | |
| BNP Paribas | | | 298,634 | | | | (298,634 | ) | | | — | |
| Citadel Clearing LLC | | | 32,438 | | | | (32,438 | ) | | | — | |
| Citigroup Global Markets Inc. | | | 419,904 | | | | (419,904 | ) | | | — | |
| Deutsche Bank Securities Inc. | | | 111,881 | | | | (111,881 | ) | | | — | |
| Goldman, Sachs & Co. LLC | | | 1,163,964 | | | | (1,163,964 | ) | | | — | |
| HSBC Securities (USA) Inc. | | | 65,900 | | | | (65,900 | ) | | | — | |
| J.P. Morgan Securities LLC | | | 29,908 | | | | (29,908 | ) | | | — | |
| Mizuho Securities USA LLC. | | | 230,510 | | | | (230,510 | ) | | | — | |
| Morgan Stanley & Co. LLC | | | 342,745 | | | | (342,745 | ) | | | — | |
NOTES TO FINANCIAL STATEMENTS as of October 31, 2024 (continued)
NOTE 10 — SECURITIES LENDING (continued)
| Counterparty | | Securities
Loaned at Value | | | Cash Collateral
Received(1) | | Net
Amount | |
| National Bank Financial Inc | | $ | 461,769 | | | $ | (461,769 | ) | | $ | — | |
| National Financial Services LLC | | | 128,232 | | | | (128,232 | ) | | | — | |
| State Street Bank and Trust Company | | | 18,310 | | | | (18,310 | ) | | | — | |
| TD Securities (USA) Inc. | | | 297,552 | | | | (297,552 | ) | | | — | |
| TD Securities Inc | | | 209,704 | | | | (209,704 | ) | | | — | |
| Truist Securities INC | | | 101,894 | | | | (101,894 | ) | | | — | |
| US Bancorp Investments | | | 82,210 | | | | (82,210 | ) | | | — | |
| Total | | $ | 4,026,494 | | | $ | (4,026,494 | ) | | $ | — | |
| (1) | Cash collateral with a fair value of $4,151,263 has been received in connection with the above securities lending transactions. Excess cash collateral received from the individual counterparty is not shown for financial reporting purposes. |
Global High Dividend Low Volatility
| Counterparty | | Securities
Loaned at Value | | | Cash Collateral
Received(1) | | Net
Amount | |
| JP Morgan Securities Plc. | | $ | 246,990 | | | $ | (246,990 | ) | | $ | — | |
| Total | | $ | 246,990 | | | $ | (246,990 | ) | | $ | — | |
| (1) | Cash collateral with a fair value of $260,894 has been received in connection with the above securities lending transactions. Excess cash collateral received from the individual counterparty is not shown for financial reporting purposes. |
Multi-Manager International Small Cap
| Counterparty | | Securities
Loaned at Value | | | Cash Collateral
Received(1) | | Net
Amount | |
| BNP Paribas Prime Brokerage Intl Ltd | | $ | 130,969 | | | $ | (130,969 | ) | | $ | — | |
| Citigroup Global Markets Limited | | | 14,513 | | | | (14,513 | ) | | | — | |
| Goldman Sachs International | | | 64,167 | | | | (64,167 | ) | | | — | |
| Goldman, Sachs & Co. LLC | | | 114,541 | | | | (114,541 | ) | | | — | |
| JP Morgan Securities Plc. | | | 73,810 | | | | (73,810 | ) | | | — | |
| Merrill Lynch International | | | 148,525 | | | | (148,525 | ) | | | — | |
| Morgan Stanley & Co. LLC | | | 717,857 | | | | (717,857 | ) | | | — | |
| Nomura International PLC | | | 95,074 | | | | (95,074 | ) | | | — | |
| Nomura Securities International, Inc. | | | 46,980 | | | | (46,980 | ) | | | — | |
| Societe Generale | | | 28,181 | | | | (28,181 | ) | | | — | |
| UBS AG | | | 13,097 | | | | (13,097 | ) | | | — | |
| Total | | $ | 1,447,714 | | | $ | (1,447,714 | ) | | $ | — | |
| (1) | Cash collateral with a fair value of $1,525,159 has been received in connection with the above securities lending transactions. Excess cash collateral received from the individual counterparty is not shown for financial reporting purposes. |
NOTE 11 — FEDERAL INCOME TAXES
The amount of distributions from net investment income and net realized capital gains are determined in accordance with U.S. federal income tax regulations, which may differ from GAAP for investment companies. These book/ tax differences may be either temporary or permanent. Permanent differences are reclassified within the capital accounts based on their federal tax-basis treatment; temporary differences are not reclassified. Key differences include the treatment of foreign currency transactions, futures contracts, income from passive foreign investment companies (PFICs), paydowns, swaps, and wash sale deferrals. Distributions in excess of net investment income and/or net realized capital gains for tax purposes are reported as return of capital.
Dividends paid by the Funds from net investment income and distributions of net realized short-term capital gains are, for federal income tax purposes, taxable as ordinary income to shareholders.
The tax composition of dividends and distributions to shareholders was as follows:
| | | Year Ended | | | Year Ended | |
| | | October 31, 2024 | | | October 31, 2023 | |
| | | Ordinary | | | Return of | | | Ordinary | | | Return of | |
| | | Income | | | Capital | | | Income | | | Capital | |
| Global Bond | | $ | 11,297,227 | | | $ | 334,361 | | | $ | 8,617,108 | | | $ | 3,027,346 | |
| Global High Dividend Low Volatility | | | 6,204,048 | | | | — | | | | 8,739,159 | | | | — | |
| Multi-Manager International Small Cap | | | 5,001,551 | | | | — | | | | 4,830,730 | | | | — | |
| | | | | | | | | | | | | | | | | |
The tax-basis components of distributable earnings and the capital loss carryforwards which may be used to offset future realized capital gains for federal income tax purposes as of October 31, 2024 were:
NOTES TO FINANCIAL STATEMENTS as of October 31, 2024 (continued)
NOTE 11 — FEDERAL INCOME TAXES (continued)
| | | Undistributed | | | Unrealized | | | | | | | | | | | | Total | |
| | | Ordinary | | | Appreciation/ | | | Capital Loss Carryforwards | | | | | | Distributable | |
| | | Income | | | (Depreciation) | | | Amount | | | Character | | | Other | | | Earnings/(Loss) | |
| Global Bond | | $ | — | | | $ | (8,445,390 | ) | | $ | (6,633,461 | ) | | Short-term | | | $ | (5,669 | ) | | $ | (40,830,478 | ) |
| | | | | | | | | | | | (25,745,958 | ) | | Long-term | | | | | | | | | |
| | | | | | | | | | | $ | (32,379,419 | ) | | | | | | | | | | | |
| Global High Dividend Low Volatility | | | 220,499 | | | | 34,287,987 | | | | (13,343,627 | ) | | Short-term | | | | (142,056 | ) | | | 19,524,442 | |
| | | | | | | | | | | | (1,498,361 | ) | | Long-term | | | | | | | | | |
| | | | | | | | | | | $ | (14,841,988 | )* | | | | | | | | | | | |
| Multi-Manager International Small Cap | | | 6,026,547 | | | | 24,806,574 | | | | (3,244,850 | ) | | Short-term | | | | (199,441 | ) | | | 27,388,830 | |
| | | | | | | | | | | | — | | | Long-term | | | | | | | | | |
| | | | | | | | | | | $ | (3,244,850 | ) | | | | | | | | | | | |
| * | Utilization of these capital losses is subject to annual limitations under Section 382 of the Internal Revenue Code. |
The Funds’ major tax jurisdictions are U.S. federal and Arizona state.
As of October 31, 2024, no provision for income tax is required in the Funds’ financial statements as a result of tax positions taken on federal and state income tax returns for open tax years. The Funds’ federal and state income and federal excise tax returns for tax years for which the applicable statutes of limitations have not expired are subject to examination by the Internal Revenue Service and state department of revenue. Generally, the preceding four tax years remain subject to examination by these jurisdictions.
NOTE 12 — MARKET DISRUPTION AND GEOPOLITICAL RISK
A Fund is subject to the risk that geopolitical events will disrupt securities markets and adversely affect global economies and markets. Due to the increasing interdependence among global economies and markets, conditions in one country, market, or region might adversely impact markets, issuers and/or foreign exchange rates in other countries, including the United States. Wars, terrorism, global health crises and pandemics, and other geopolitical events that have led, and may continue to lead, to increased market volatility and may have adverse short- or long-term effects on U.S. and global economies and markets, generally. For example, the COVID-19 pandemic resulted in significant market volatility, exchange suspensions and closures, declines in global financial markets, higher default rates, supply chain disruptions, and a substantial economic downturn in economies throughout the world. The economic impacts of COVID-19 have created a unique challenge for real estate markets. Many businesses have either partially or fully transitioned to a remote-working environment and this transition may negatively impact the occupancy rates of commercial real estate over time. Natural and environmental disasters and systemic market dislocations are also highly disruptive to economies and markets. In addition, military
action by Russia in Ukraine has, and may continue to, adversely affect global energy and financial markets and therefore could affect the value of investments, including beyond the direct exposure to Russian issuers or nearby geographic regions. The extent and duration of the military action, sanctions, and resulting market disruptions are impossible to predict and could be substantial. A number of U.S. domestic banks and foreign (non-U.S.) banks have experienced financial difficulties and, in some cases, failures. There can be no certainty that the actions taken by regulators to limit the effect of those financial difficulties and failures on other banks or other financial institutions or on the U.S. or foreign (non-U.S.) economies generally will be successful. It is possible that more banks or other financial institutions will experience financial difficulties or fail, which may affect adversely other U.S. or foreign (non-U.S.) financial institutions and economies. These events as well as other changes in foreign (non-U.S.) and domestic economic, social, and political conditions also could adversely affect individual issuers or related groups of issuers, securities markets, interest rates, credit ratings, inflation, investor sentiment, and other factors affecting the value of a Fund’s investments. Any of these occurrences could disrupt the operations of a Fund and of a Fund’s service providers.
NOTES TO FINANCIAL STATEMENTS as of October 31, 2024 (continued)
NOTE 13 — SUBSEQUENT EVENTS
Dividends: Subsequent to October 31, 2024, the following Funds paid dividends and distributions per share of:
| | | Net | | | | |
| | | Investment | | Payable | | Record |
| | | Income | | Date | | Date |
| Global Bond | | | | | | |
| Class A | | $0.0316 | | December 2, 2024 | | Daily |
| Class C | | $0.0271 | | December 2, 2024 | | Daily |
| Class I | | $0.0330 | | December 2, 2024 | | Daily |
| Class R | | $0.0302 | | December 2, 2024 | | Daily |
| Class R6 | | $0.0332 | | December 2, 2024 | | Daily |
| Class W | | $0.0326 | | December 2, 2024 | | Daily |
| | | | | | | |
Multi-Manager International
Small Cap
| Class A | | $1.3580 | | December 13, 2024 | | December 11, 2024 |
| Class C | | $0.9711 | | December 13, 2024 | | December 11, 2024 |
| Class I | | $1.5540 | | December 13, 2024 | | December 11, 2024 |
| Class R6 | | $1.5573 | | December 13, 2024 | | December 11, 2024 |
| Class W | | $1.4926 | | December 13, 2024 | | December 11, 2024 |
The Funds have evaluated events occurring after the Statements of Assets and Liabilities date through the date that the financial statements were issued (“subsequent events”) to determine whether any subsequent events necessitated adjustment to or disclosure in the financial statements. Other than the above, no such subsequent events were identified.
| Voya Global Bond Fund | PORTFOLIO OF INVESTMENTS
as of October 31, 2024 |
Principal
Amount† | | | | | Value | | | Percentage
of Net
Assets |
| CORPORATE BONDS/NOTES: 24.2% | |
| | | | Australia: 0.2% |
| 39,000 | | | BHP Billiton Finance USA Ltd., 5.250%, 09/08/2030 | | $ | 40,012 | | | | 0.0 | |
| 18,000 | | | BHP Billiton Finance USA Ltd., 5.250%, 09/08/2033 | | | 18,310 | | | | 0.0 | |
| 10,000 (1) | | | CIMIC Finance USA Pty Ltd., 7.000%, 03/25/2034 | | | 10,505 | | | | 0.0 | |
| 271,000 (1)(2) | | | NBN Co. Ltd., 2.500%, 01/08/2032 | | | 230,838 | | | | 0.2 | |
| | | | | | | 299,665 | | | | 0.2 | |
| | | | | | | | | | | | |
| | | | Brazil: 0.1% | | | | | | | | |
| 200,000 (1) | | | Raizen Fuels Finance SA, 5.700%, 01/17/2035 | | | 191,860 | | | | 0.1 | |
| | | | | | | | | | | | |
| | | | Canada: 0.8% | | | | | | | | |
| 32,000 (3) | | | Algonquin Power & Utilities Corp., 5.365%, 06/15/2026 | | | 32,194 | | | | 0.0 | |
| 124,000 (2)(3) | | | Bank of Montreal, 4.640%, 09/10/2030 | | | 122,547 | | | | 0.1 | |
| 58,000 | | | Bank of Montreal, 5.511%, 06/04/2031 | | | 59,415 | | | | 0.0 | |
| 75,000 (2)(3) | | | Bank of Nova Scotia, 4.740%, 11/10/2032 | | | 73,185 | | | | 0.1 | |
| 29,000 | | | Bank of Nova Scotia, 4.850%, 02/01/2030 | | | 28,959 | | | | 0.0 | |
| 32,000 | | | Brookfield Finance, Inc., 5.675%, 01/15/2035 | | | 32,648 | | | | 0.0 | |
| 26,000 | | | Canadian Pacific Railway Co., 2.875%, 11/15/2029 | | | 23,779 | | | | 0.0 | |
| 120,000 (1) | | | Cascades, Inc. / Cascades USA, Inc., 5.375%, 01/15/2028 | | | 118,164 | | | | 0.1 | |
| 40,000 (1) | | | Constellation Software, Inc./Canada, 5.158%, 02/16/2029 | | | 40,497 | | | | 0.0 | |
| 75,000 (1) | | | Element Fleet Management Corp., 5.643%, 03/13/2027 | | | 76,054 | | | | 0.1 | |
| 238,000 (1)(2) | | | Federation des Caisses Desjardins du Quebec, 5.250%, 04/26/2029 | | | 240,350 | | | | 0.1 | |
| 115,000 | | | Fortis, Inc./Canada, 3.055%, 10/04/2026 | | | 111,456 | | | | 0.1 | |
| 253,000 (2) | | | National Bank of Canada, 5.600%, 12/18/2028 | | | 259,953 | | | | 0.1 | |
| 25,000 | | | Nutrien Ltd., 5.400%, 06/21/2034 | | | 25,172 | | | | 0.0 | |
| 4,000 | | | Nutrien Ltd., 5.875%, 12/01/2036 | | | 4,164 | | | | 0.0 | |
| 18,000 | | | Nutrien Ltd., 5.950%, 11/07/2025 | | | 18,237 | | | | 0.0 | |
Principal
Amount† | | | | | Value | | | Percentage
of Net
Assets |
| CORPORATE BONDS/NOTES: (continued) | |
| | | | Canada: (continued) | | | | | | | | |
| 120,000 (1) | | | Open Text Holdings, Inc., 4.125%, 12/01/2031 | | $ | 107,879 | | | | 0.1 | |
| 62,000 (3) | | | Royal Bank of Canada, 4.650%, 10/18/2030 | | | 61,360 | | | | 0.0 | |
| 28,000 (3) | | | Royal Bank of Canada, 4.969%, 08/02/2030 | | | 28,071 | | | | 0.0 | |
| 35,000 | | | Royal Bank of Canada, 5.200%, 08/01/2028 | | | 35,575 | | | | 0.0 | |
| 39,000 | | | Toronto-Dominion Bank, 5.523%, 07/17/2028 | | | 39,908 | | | | 0.0 | |
| | | | | | | 1,539,567 | | | | 0.8 | |
| | | | | | | | | | | | |
| | | | Cayman Islands: 0.1% | | | | | | | | |
| 89,750 | | | Seagate HDD Cayman, 9.625%, 12/01/2032 | | | 102,367 | | | | 0.1 | |
| | | | | | | | | | | | |
| | | | Chile: 0.3% | | | | | | | | |
| 200,000 (1)(3) | | | Banco del Estado de Chile, 7.950%, 12/31/2199 | | | 211,500 | | | | 0.1 | |
| 200,000 (1) | | | Chile Electricity Lux Mpc II Sarl, 5.580%, 10/20/2035 | | | 199,190 | | | | 0.1 | |
| 200,000 (1) | | | Sociedad Quimica y Minera de Chile SA, 5.500%, 09/10/2034 | | | 193,100 | | | | 0.1 | |
| | | | | | | 603,790 | | | | 0.3 | |
| | | | | | | | | | | | |
| | | | Colombia: 0.2% | | | | | | | | |
| 135,000 | | | Ecopetrol SA, 7.750%, 02/01/2032 | | | 132,101 | | | | 0.1 | |
| 180,000 | | | Ecopetrol SA, 8.375%, 01/19/2036 | | | 176,040 | | | | 0.1 | |
| | | | | | | 308,141 | | | | 0.2 | |
| | | | | | | | | | | | |
| | | | Denmark: 0.1% | | | | | | | | |
| 215,000 (1)(3) | | | Danske Bank A/S, 3.244%, 12/20/2025 | | | 214,301 | | | | 0.1 | |
| | | | | | | | | | | | |
| | | | Dominican Republic: 0.1% | | | | | | | | |
| 225,000 (1) | | | Aeropuertos Dominicanos Siglo XXI SA, 7.000%, 06/30/2034 | | | 230,625 | | | | 0.1 | |
| | | | | | | | | | | | |
| | | | France: 0.0% | | | | | | | | |
| 10,000 | | | TotalEnergies Capital SA, 5.150%, 04/05/2034 | | | 10,098 | | | | 0.0 | |
See Accompanying Notes to Financial Statements
| Voya Global Bond Fund | PORTFOLIO OF INVESTMENTS
as of October 31, 2024 (continued) |
Principal
Amount† | | | | | Value | | | Percentage
of Net
Assets |
| CORPORATE BONDS/NOTES: (continued) | |
| | | | Germany: 0.7% |
| 175,000 | | | Deutsche Bank AG/New York NY, 5.414%, 05/10/2029 | | $ | 177,701 | | | | 0.1 | |
| 150,000 (1) | | | Mercedes-Benz Finance North America LLC, 4.800%, 08/01/2029 | | | 149,297 | | | | 0.1 | |
| 290,000 (1) | | | Siemens Financiering Smaatschappij NV, 2.350%, 10/15/2026 | | | 278,860 | | | | 0.2 | |
| 215,000 (1) | | | Volkswagen Group of America Finance LLC, 5.250%, 03/22/2029 | | | 213,960 | | | | 0.1 | |
| 205,000 (1) | | | Volkswagen Group of America Finance LLC, 5.300%, 03/22/2027 | | | 206,147 | | | | 0.1 | |
| 200,000 (1) | | | Volkswagen Group of America Finance LLC, 6.450%, 11/16/2030 | | | 209,305 | | | | 0.1 | |
| | | | | | | 1,235,270 | | | | 0.7 | |
| | | | | | | | | | | | |
| | | | Guatemala: 0.2% | | | | | | | | |
| 325,000 | | | CT Trust, 5.125%, 02/03/2032 | | | 295,750 | | | | 0.2 | |
| | | | | | | | | | | | |
| | | | India: 0.1% | | | | | | | | |
| 200,000 (2) | | | JSW Steel Ltd., 5.050%, 04/05/2032 | | | 181,680 | | | | 0.1 | |
| | | | | | | | | | | | |
| | | | Indonesia: 0.1% | | | | | | | | |
| 250,000 | | | Medco Maple Tree Pte Ltd., 8.960%, 04/27/2029 | | | 263,281 | | | | 0.1 | |
| | | | | | | | | | | | |
| | | | Ireland: 0.3% | | | | | | | | |
| 220,000 | | | Icon Investments Six DAC, 5.849%, 05/08/2029 | | | 226,210 | | | | 0.1 | |
| 202,000 (1) | | | SMBC Aviation Capital Finance DAC, 5.700%, 07/25/2033 | | | 206,822 | | | | 0.1 | |
| 99,000 (1) | | | Smurfit Kappa Treasury ULC, 5.200%, 01/15/2030 | | | 100,023 | | | | 0.1 | |
| | | | | | | 533,055 | | | | 0.3 | |
| | | | | | | | | | | | |
| | | | Jamaica: 0.1% | | | | | | | | |
| 225,000 (1) | | | Kingston Airport Revenue Finance Ltd., 6.750%, 12/15/2036 | | | 228,627 | | | | 0.1 | |
| | | | | | | | | | | | |
| | | | Japan: 0.2% | | | | | | | | |
| 215,000 | | | Sumitomo Mitsui Financial Group, Inc., 5.424%, 07/09/2031 | | | 219,792 | | | | 0.1 | |
Principal
Amount† | | | | | Value | | | Percentage
of Net
Assets |
| CORPORATE BONDS/NOTES: (continued) | |
| | | | Japan: (continued) | | | | | | | | |
| 215,000 (1) | | | Sumitomo Mitsui Trust Bank Ltd., 4.850%, 09/10/2034 | | $ | 210,659 | | | | 0.1 | |
| | | | | | | 430,451 | | | | 0.2 | |
| | | | | | | | | | | | |
| | | | Luxembourg: 0.2% | | | | | | | | |
| 13,000 | | | Medtronic Global Holdings SCA, 4.500%, 03/30/2033 | | | 12,697 | | | | 0.0 | |
| 275,000 (1) | | | Minerva Luxembourg SA, 8.875%, 09/13/2033 | | | 288,406 | | | | 0.2 | |
| 30,000 | | | Schlumberger Investment SA, 2.650%, 06/26/2030 | | | 26,954 | | | | 0.0 | |
| 8,000 | | | Schlumberger Investment SA, 4.850%, 05/15/2033 | | | 7,911 | | | | 0.0 | |
| | | | | | | 335,968 | | | | 0.2 | |
| | | | | | | | | | | | |
| | | | Mexico: 0.4% | | | | | | | | |
| 300,000 (3) | | | Cemex SAB de CV, 5.125%, 12/31/2199 | | | 292,308 | | | | 0.2 | |
| 425,000 | | | Petroleos Mexicanos, 6.500%, 03/13/2027 | | | 417,091 | | | | 0.2 | |
| | | | | | | 709,399 | | | | 0.4 | |
| | | | | | | | | | | | |
| | | | Morocco: 0.1% | | | | | | | | |
| 250,000 (1) | | | OCP SA, 6.750%, 05/02/2034 | | | 261,563 | | | | 0.1 | |
| | | | | | | | | | | | |
| | | | Netherlands: 0.3% |
| 260,000 (1)(2)(3) | | | Cooperatieve Rabobank UA, 5.447%, 03/05/2030 | | | 264,711 | | | | 0.1 | |
| 355,000 | | | ING Groep NV, 4.050%, 04/09/2029 | | | 343,726 | | | | 0.2 | |
| | | | | | | 608,437 | | | | 0.3 | |
| | | | | | | | | | | | |
| | | | Norway: 0.0% | | | | | | | | |
| 56,000 | | | Equinor ASA, 3.125%, 04/06/2030 | | | 51,932 | | | | 0.0 | |
| | | | | | | | | | | | |
| | | | Panama: 0.1% | | | | | | | | |
| 241,283 (1) | | | AES Panama Generation Holdings SRL, 4.375%, 05/31/2030 | | | 214,111 | | | | 0.1 | |
| | | | | | | | | | | | |
| | | | Peru: 0.3% | | | | | | | | |
| 250,000 (1) | | | Hunt Oil Co. of Peru LLC Sucursal Del Peru, 8.550%, 09/18/2033 | | | 274,375 | | | | 0.2 | |
| 225,000 (1) | | | Niagara Energy SAC, 5.746%, 10/03/2034 | | | 221,625 | | | | 0.1 | |
| | | | | | | 496,000 | | | | 0.3 | |
See Accompanying Notes to Financial Statements
| Voya Global Bond Fund | PORTFOLIO OF INVESTMENTS
as of October 31, 2024 (continued) |
Principal
Amount† | | | | | Value | | | Percentage
of Net
Assets |
| CORPORATE BONDS/NOTES: (continued) | |
| | | | Singapore: 0.0% |
| 33,000 | | | Pfizer Investment Enterprises Pte Ltd., 4.650%, 05/19/2030 | | $ | 32,954 | | | | 0.0 | |
| 47,000 | | | Pfizer Investment Enterprises Pte Ltd., 4.750%, 05/19/2033 | | | 46,321 | | | | 0.0 | |
| | | | | | | 79,275 | | | | 0.0 | |
| | | | | | | | | | | | |
| | | | Switzerland: 0.3% | | | | | | | | |
| 250,000 | | | Credit Suisse AG/New York NY, 1.250%, 08/07/2026 | | | 236,039 | | | | 0.1 | |
| 200,000 | | | UBS AG/London, 5.650%, 09/11/2028 | | | 206,250 | | | | 0.1 | |
| 200,000 (1)(3) | | | UBS Group AG, 4.751%, 05/12/2028 | | | 199,015 | | | | 0.1 | |
| | | | | | | 641,304 | | | | 0.3 | |
| | | | | | | | | | | | |
| | | | United Kingdom: 1.5% | | | | | | | | |
| 200,000 (1) | | | Anglo American Capital PLC, 2.250%, 03/17/2028 | | | 182,820 | | | | 0.1 | |
| 69,000 | | | Astrazeneca Finance LLC, 4.900%, 02/26/2031 | | | 69,733 | | | | 0.1 | |
| 205,000 (1) | | | BAE Systems PLC, 5.125%, 03/26/2029 | | | 207,014 | | | | 0.1 | |
| 16,000 | | | BAT Capital Corp., 5.834%, 02/20/2031 | | | 16,513 | | | | 0.0 | |
| 46,000 (1) | | | CSL Finance PLC, 4.050%, 04/27/2029 | | | 44,748 | | | | 0.1 | |
| 217,000 (3) | | | HSBC Holdings PLC, 2.999%, 03/10/2026 | | | 215,268 | | | | 0.1 | |
| 220,000 (1) | | | Imperial Brands Finance PLC, 5.500%, 02/01/2030 | | | 222,540 | | | | 0.1 | |
| 200,000 (3) | | | Lloyds Banking Group PLC, 5.871%, 03/06/2029 | | | 205,202 | | | | 0.1 | |
| 200,000 (2)(3) | | | Lloyds Banking Group PLC, 8.000%, 12/31/2199 | | | 208,932 | | | | 0.1 | |
| 200,000 (1) | | | Lseg US Fin Corp., 5.297%, 03/28/2034 | | | 203,285 | | | | 0.1 | |
| 31,000 | | | National Grid PLC, 5.418%, 01/11/2034 | | | 31,348 | | | | 0.0 | |
| 200,000 (3) | | | NatWest Group PLC, 5.076%, 01/27/2030 | | | 199,485 | | | | 0.1 | |
| 200,000 (1) | | | NatWest Markets PLC, 5.410%, 05/17/2029 | | | 203,998 | | | | 0.1 | |
| 391,000 | | | Royalty Pharma PLC, 1.200%, 09/02/2025 | | | 379,254 | | | | 0.2 | |
| 239,000 | | | Royalty Pharma PLC, 1.750%, 09/02/2027 | | | 220,446 | | | | 0.1 | |
| 123,000 | | | Unilever Capital Corp., 4.625%, 08/12/2034 | | | 120,635 | | | | 0.1 | |
| | | | | | | 2,731,221 | | | | 1.5 | |
Principal
Amount† | | | | | Value | | | Percentage
of Net
Assets |
| CORPORATE BONDS/NOTES: (continued) | |
| | | | United States: 17.4% | | | | | | | | |
| 391,000 | | | AbbVie, Inc., 3.800%, 03/15/2025 | | $ | 389,537 | | | | 0.2 | |
| 13,000 | | | AbbVie, Inc., 4.050%, 11/21/2039 | | | 11,431 | | | | 0.0 | |
| 69,000 | | | AbbVie, Inc., 4.950%, 03/15/2031 | | | 69,728 | | | | 0.1 | |
| 20,000 | | | AbbVie, Inc., 5.050%, 03/15/2034 | | | 20,156 | | | | 0.0 | |
| 105,000 | | | Accenture Capital, Inc., 4.250%, 10/04/2031 | | | 101,803 | | | | 0.1 | |
| 18,000 | | | Adobe, Inc., 4.950%, 04/04/2034 | | | 18,134 | | | | 0.0 | |
| 199,000 (1) | | | AEP Texas, Inc., 3.850%, 10/01/2025 | | | 197,056 | | | | 0.1 | |
| 58,000 | | | AEP Texas, Inc., 5.450%, 05/15/2029 | | | 59,247 | | | | 0.0 | |
| 15,000 | | | AEP Transmission Co. LLC, 5.150%, 04/01/2034 | | | 15,076 | | | | 0.0 | |
| 78,000 | | | AES Corp., 2.450%, 01/15/2031 | | | 65,642 | | | | 0.0 | |
| 46,000 | | | AES Corp., 5.450%, 06/01/2028 | | | 46,460 | | | | 0.0 | |
| 35,000 | | | AGCO Corp., 5.450%, 03/21/2027 | | | 35,394 | | | | 0.0 | |
| 42,000 | | | Air Lease Corp., 5.200%, 07/15/2031 | | | 41,863 | | | | 0.0 | |
| 12,000 | | | Alabama Power Co., 5.850%, 11/15/2033 | | | 12,701 | | | | 0.0 | |
| 145,000 (1) | | | Albertsons Cos., Inc. / Safeway, Inc. / New Albertsons L.P. / Albertsons LLC, 3.500%, 03/15/2029 | | | 134,109 | | | | 0.1 | |
| 120,000 (1) | | | Alliant Holdings Intermediate LLC / Alliant Holdings Co-Issuer, 6.500%, 10/01/2031 | | | 118,974 | | | | 0.1 | |
| 43,000 | | | Altria Group, Inc., 6.200%, 11/01/2028 | | | 45,007 | | | | 0.0 | |
| 19,000 | | | Amcor Group Finance PLC, 5.450%, 05/23/2029 | | | 19,290 | | | | 0.0 | |
| 54,000 | | | Ameren Corp., 5.000%, 01/15/2029 | | | 54,299 | | | | 0.0 | |
| 34,687 | | | American Airlines Pass Through Trust 2016-1, AA, 3.575%, 07/15/2029 | | | 33,470 | | | | 0.0 | |
| 9,128 | | | American Airlines Pass Through Trust 2016-2, A, 3.650%, 12/15/2029 | | | 8,473 | | | | 0.0 | |
| 221,403 | | | American Airlines Pass Through Trust 2021-1, A, 2.875%, 01/11/2036 | | | 192,926 | | | | 0.1 | |
See Accompanying Notes to Financial Statements
| Voya Global Bond Fund | PORTFOLIO OF INVESTMENTS
as of October 31, 2024 (continued) |
Principal
Amount† | | | | | Value | | | Percentage
of Net
Assets |
| CORPORATE BONDS/NOTES: (continued) | |
| | | | United States: (continued) | | | | | | | | |
| 12,000 | | | American Electric Power Co., Inc., 5.625%, 03/01/2033 | | $ | 12,260 | | | | 0.0 | |
| 21,000 (3) | | | American Express Co., 4.990%, 05/01/2026 | | | 20,994 | | | | 0.0 | |
| 42,000 (3) | | | American Express Co., 5.098%, 02/16/2028 | | | 42,338 | | | | 0.0 | |
| 48,000 (3) | | | American Express Co., 5.532%, 04/25/2030 | | | 49,236 | | | | 0.0 | |
| 12,000 | | | American Homes 4 Rent L.P., 3.625%, 04/15/2032 | | | 10,844 | | | | 0.0 | |
| 42,000 | | | American Homes 4 Rent L.P., 5.500%, 02/01/2034 | | | 42,248 | | | | 0.0 | |
| 52,000 (2) | | | American Honda Finance Corp., 4.700%, 01/12/2028 | | | 52,203 | | | | 0.0 | |
| 80,000 | | | American Honda Finance Corp., 4.850%, 10/23/2031 | | | 79,037 | | | | 0.1 | |
| 6,000 | | | American Honda Finance Corp., 4.900%, 01/10/2034 | | | 5,919 | | | | 0.0 | |
| 32,000 | | | American Honda Finance Corp., 5.650%, 11/15/2028 | | | 33,108 | | | | 0.0 | |
| 53,000 | | | American International Group, Inc., 3.400%, 06/30/2030 | | | 49,162 | | | | 0.0 | |
| 70,000 | | | American International Group, Inc., 4.200%, 04/01/2028 | | | 68,886 | | | | 0.1 | |
| 315,000 | | | American Tower Corp., 2.750%, 01/15/2027 | | | 302,092 | | | | 0.2 | |
| 38,000 | | | American Tower Corp., 3.650%, 03/15/2027 | | | 37,066 | | | | 0.0 | |
| 34,000 (1) | | | American Transmission Systems, Inc., 2.650%, 01/15/2032 | | | 29,084 | | | | 0.0 | |
| 35,000 | | | Ameriprise Financial, Inc., 5.700%, 12/15/2028 | | | 36,505 | | | | 0.0 | |
| 80,000 | | | Amphenol Corp., 5.000%, 01/15/2035 | | | 79,509 | | | | 0.1 | |
| 115,000 (1) | | | Antero Midstream Partners L.P. / Antero Midstream Finance Corp., 6.625%, 02/01/2032 | | | 116,377 | | | | 0.1 | |
| 19,000 | | | Aon North America, Inc., 5.125%, 03/01/2027 | | | 19,244 | | | | 0.0 | |
| 47,000 | | | Aon North America, Inc., 5.150%, 03/01/2029 | | | 47,547 | | | | 0.0 | |
Principal
Amount† | | | | | Value | | | Percentage
of Net
Assets |
| CORPORATE BONDS/NOTES: (continued) | |
| | | | United States: (continued) | | | | | | | | |
| 82,000 | | | Arrow Electronics, Inc., 5.150%, 08/21/2029 | | $ | 81,657 | | | | 0.1 | |
| 125,000 | | | Asbury Automotive Group, Inc., 4.750%, 03/01/2030 | | | 117,735 | | | | 0.1 | |
| 124,000 (1) | | | Athene Global Funding, 5.684%, 02/23/2026 | | | 125,026 | | | | 0.1 | |
| 20,000 | | | AutoZone, Inc., 6.250%, 11/01/2028 | | | 21,044 | | | | 0.0 | |
| 18,000 (2) | | | Avnet, Inc., 5.500%, 06/01/2032 | | | 17,887 | | | | 0.0 | |
| 32,000 | | | Avnet, Inc., 6.250%, 03/15/2028 | | | 33,070 | | | | 0.0 | |
| 191,000 (3) | | | Bank of America Corp., 1.734%, 07/22/2027 | | | 181,349 | | | | 0.1 | |
| 45,000 (3) | | | Bank of America Corp., 2.087%, 06/14/2029 | | | 40,829 | | | | 0.0 | |
| 117,000 (3) | | | Bank of America Corp., 2.299%, 07/21/2032 | | | 98,321 | | | | 0.1 | |
| 63,000 (3) | | | Bank of America Corp., 2.551%, 02/04/2028 | | | 59,979 | | | | 0.0 | |
| 60,000 (3) | | | Bank of America Corp., 2.572%, 10/20/2032 | | | 51,035 | | | | 0.0 | |
| 89,000 (3) | | | Bank of America Corp., 2.592%, 04/29/2031 | | | 78,663 | | | | 0.1 | |
| 107,000 (3) | | | Bank of America Corp., 2.687%, 04/22/2032 | | | 92,816 | | | | 0.1 | |
| 74,000 (3) | | | Bank of America Corp., 2.884%, 10/22/2030 | | | 67,199 | | | | 0.1 | |
| 74,000 (3) | | | Bank of America Corp., 3.194%, 07/23/2030 | | | 68,484 | | | | 0.1 | |
| 146,000 (3) | | | Bank of America Corp., 3.419%, 12/20/2028 | | | 140,029 | | | | 0.1 | |
| 49,000 (3) | | | Bank of America Corp., 3.593%, 07/21/2028 | | | 47,477 | | | | 0.0 | |
| 24,000 (3) | | | Bank of America Corp., 5.202%, 04/25/2029 | | | 24,241 | | | | 0.0 | |
| 25,000 (3) | | | Bank of America Corp., 5.288%, 04/25/2034 | | | 25,122 | | | | 0.0 | |
| 32,000 (3) | | | Bank of America Corp., 5.468%, 01/23/2035 | | | 32,487 | | | | 0.0 | |
| 235,000 (3) | | | Bank of America Corp., 5.518%, 10/25/2035 | | | 233,331 | | | | 0.1 | |
See Accompanying Notes to Financial Statements
| Voya Global Bond Fund | PORTFOLIO OF INVESTMENTS
as of October 31, 2024 (continued) |
Principal
Amount† | | | | | Value | | | Percentage
of Net
Assets |
| CORPORATE BONDS/NOTES: (continued) | |
| | | | United States: (continued) | | | | | | | | |
| 63,000 (3) | | | Bank of America Corp., 5.872%, 09/15/2034 | | $ | 65,683 | | | | 0.0 | |
| 80,000 (3) | | | Bank of America Corp. N, 2.651%, 03/11/2032 | | | 69,347 | | | | 0.1 | |
| 8,000 (3) | | | Bank of New York Mellon Corp., 4.967%, 04/26/2034 | | | 7,930 | | | | 0.0 | |
| 58,000 (3) | | | Bank of New York Mellon Corp., 4.975%, 03/14/2030 | | | 58,443 | | | | 0.0 | |
| 55,000 (3) | | | Bank of New York Mellon Corp., 5.060%, 07/22/2032 | | | 55,250 | | | | 0.0 | |
| 7,000 (3) | | | Bank of New York Mellon Corp., 5.188%, 03/14/2035 | | | 7,025 | | | | 0.0 | |
| 9,000 (3) | | | Bank of New York Mellon Corp., 5.834%, 10/25/2033 | | | 9,478 | | | | 0.0 | |
| 22,000 | | | BAT Capital Corp., 4.390%, 08/15/2037 | | | 19,187 | | | | 0.0 | |
| 110,000 | | | Bath & Body Works, Inc., 6.750%, 07/01/2036 | | | 110,732 | | | | 0.1 | |
| 52,000 | | | Becton Dickinson & Co., 4.693%, 02/13/2028 | | | 51,992 | | | | 0.0 | |
| 289,000 | | | Berry Global, Inc., 1.650%, 01/15/2027 | | | 269,550 | | | | 0.2 | |
| 10,000 | | | Black Hills Corp., 6.000%, 01/15/2035 | | | 10,387 | | | | 0.0 | |
| 25,000 (1) | | | Blackstone Holdings Finance Co. LLC, 2.000%, 01/30/2032 | | | 20,500 | | | | 0.0 | |
| 42,000 (1) | | | Blackstone Private Credit Fund, 5.950%, 07/16/2029 | | | 42,225 | | | | 0.0 | |
| 48,000 | | | Blackstone Secured Lending Fund, 5.875%, 11/15/2027 | | | 48,606 | | | | 0.0 | |
| 26,000 (1) | | | Blue Owl Credit Income Corp., 5.800%, 03/15/2030 | | | 25,249 | | | | 0.0 | |
| 19,000 | | | Blue Owl Credit Income Corp., 6.650%, 03/15/2031 | | | 19,140 | | | | 0.0 | |
| 18,000 | | | Boeing Co., 5.705%, 05/01/2040 | | | 17,326 | | | | 0.0 | |
| 75,000 (1) | | | Booz Allen Hamilton, Inc., 3.875%, 09/01/2028 | | | 71,962 | | | | 0.1 | |
| 82,000 (1) | | | Booz Allen Hamilton, Inc., 4.000%, 07/01/2029 | | | 78,377 | | | | 0.1 | |
| 37,000 | | | BorgWarner, Inc., 5.400%, 08/15/2034 | | | 36,820 | | | | 0.0 | |
| 10,000 | | | BP Capital Markets America, Inc., 4.893%, 09/11/2033 | | | 9,836 | | | | 0.0 | |
Principal
Amount† | | | | | Value | | | Percentage
of Net
Assets |
| CORPORATE BONDS/NOTES: (continued) | |
| | | | United States: (continued) | | | | | | | | |
| 7,000 | | | BP Capital Markets America, Inc., 4.989%, 04/10/2034 | | $ | 6,919 | | | | 0.0 | |
| 55,000 (1) | | | Brink’s Co., 6.500%, 06/15/2029 | | | 56,140 | | | | 0.0 | |
| 55,000 (1) | | | Brink’s Co., 6.750%, 06/15/2032 | | | 56,059 | | | | 0.0 | |
| 29,000 | | | Bristol-Myers Squibb Co., 5.100%, 02/22/2031 | | | 29,519 | | | | 0.0 | |
| 75,000 (1) | | | Broadcom, Inc., 3.187%, 11/15/2036 | | | 60,967 | | | | 0.0 | |
| 35,000 | | | Broadcom, Inc., 4.800%, 10/15/2034 | | | 33,860 | | | | 0.0 | |
| 74,000 (1) | | | Broadcom, Inc., 4.926%, 05/15/2037 | | | 71,007 | | | | 0.1 | |
| 110,000 (1)(2) | | | Builders FirstSource, Inc., 6.375%, 03/01/2034 | | | 111,024 | | | | 0.1 | |
| 47,000 | | | Bunge Ltd. Finance Corp., 4.200%, 09/17/2029 | | | 45,786 | | | | 0.0 | |
| 62,000 | | | Cadence Design Systems, Inc., 4.300%, 09/10/2029 | | | 60,828 | | | | 0.0 | |
| 130,000 (1) | | | Calpine Corp., 5.000%, 02/01/2031 | | | 122,826 | | | | 0.1 | |
| 27,000 (2) | | | Camden Property Trust, 4.900%, 01/15/2034 | | | 26,433 | | | | 0.0 | |
| 53,000 | | | Camden Property Trust, 5.850%, 11/03/2026 | | | 54,339 | | | | 0.0 | |
| 45,000 | | | Campbell Soup Co., 5.200%, 03/21/2029 | | | 45,643 | | | | 0.0 | |
| 6,000 | | | Cardinal Health, Inc., 5.450%, 02/15/2034 | | | 6,107 | | | | 0.0 | |
| 24,000 (1) | | | Cargill, Inc., 1.700%, 02/02/2031 | | | 19,991 | | | | 0.0 | |
| 23,000 (1) | | | Cargill, Inc., 2.125%, 04/23/2030 | | | 20,257 | | | | 0.0 | |
| 43,000 (1) | | | Cargill, Inc., 2.125%, 11/10/2031 | | | 36,106 | | | | 0.0 | |
| 10,000 | | | Carrier Global Corp., 2.722%, 02/15/2030 | | | 8,992 | | | | 0.0 | |
| 8,000 | | | Carrier Global Corp., 5.900%, 03/15/2034 | | | 8,409 | | | | 0.0 | |
| 43,000 | | | Caterpillar Financial Services Corp., 4.375%, 08/16/2029 | | | 42,646 | | | | 0.0 | |
| 43,000 | | | CDW LLC / CDW Finance Corp., 5.100%, 03/01/2030 | | | 42,778 | | | | 0.0 | |
| 21,000 | | | Cencora, Inc., 5.125%, 02/15/2034 | | | 20,870 | | | | 0.0 | |
| 136,000 | | | Centene Corp., 3.000%, 10/15/2030 | | | 117,895 | | | | 0.1 | |
| 66,000 | | | Centene Corp., 4.625%, 12/15/2029 | | | 63,119 | | | | 0.0 | |
See Accompanying Notes to Financial Statements
| Voya Global Bond Fund | PORTFOLIO OF INVESTMENTS
as of October 31, 2024 (continued) |
Principal
Amount† | | | | | Value | | | Percentage
of Net
Assets |
| CORPORATE BONDS/NOTES: (continued) | |
| | | | United States: (continued) | | | | | | | | |
| 49,000 | | | CenterPoint Energy, Inc., 4.250%, 11/01/2028 | | $ | 47,667 | | | | 0.0 | |
| 23,000 | | | CenterPoint Energy, Inc., 5.400%, 06/01/2029 | | | 23,438 | | | | 0.0 | |
| 26,000 (3) | | | Charles Schwab Corp. H, 4.000%, 12/31/2199 | | | 22,684 | | | | 0.0 | |
| 44,000 | | | Charter Communications Operating LLC / Charter Communications Operating Capital, 2.250%, 01/15/2029 | | | 38,662 | | | | 0.0 | |
| 58,000 | | | Charter Communications Operating LLC / Charter Communications Operating Capital, 6.100%, 06/01/2029 | | | 59,256 | | | | 0.0 | |
| 26,000 (2) | | | Charter Communications Operating LLC / Charter Communications Operating Capital, 6.550%, 06/01/2034 | | | 26,497 | | | | 0.0 | |
| 32,000 | | | Cheniere Energy Partners L.P., 4.500%, 10/01/2029 | | | 30,831 | | | | 0.0 | |
| 139,000 | | | Cigna Group, 2.375%, 03/15/2031 | | | 118,822 | | | | 0.1 | |
| 233,000 | | | Cigna Group, 3.050%, 10/15/2027 | | | 223,131 | | | | 0.1 | |
| 20,000 | | | Cigna Group, 5.250%, 02/15/2034 | | | 19,944 | | | | 0.0 | |
| 10,000 | | | Cigna Group, 5.400%, 03/15/2033 | | | 10,127 | | | | 0.0 | |
| 47,000 | | | Cisco Systems, Inc., 4.950%, 02/26/2031 | | | 47,630 | | | | 0.0 | |
| 22,000 | | | Cisco Systems, Inc., 5.050%, 02/26/2034 | | | 22,342 | | | | 0.0 | |
| 53,000 | | | Citizens Financial Group, Inc., 2.500%, 02/06/2030 | | | 46,490 | | | | 0.0 | |
| 12,000 (3) | | | Citizens Financial Group, Inc., 5.641%, 05/21/2037 | | | 11,676 | | | | 0.0 | |
| 155,000 (1) | | | Cleveland Electric Illuminating Co., 3.500%, 04/01/2028 | | | 147,288 | | | | 0.1 | |
| 110,000 (1)(2) | | | Cleveland-Cliffs, Inc., 6.750%, 04/15/2030 | | | 110,025 | | | | 0.1 | |
| 110,000 (1)(2) | | | Cleveland-Cliffs, Inc., 7.000%, 03/15/2032 | | | 110,262 | | | | 0.1 | |
Principal
Amount† | | | | | Value | | | Percentage
of Net
Assets |
| CORPORATE BONDS/NOTES: (continued) | |
| | | | United States: (continued) | | | | | | | | |
| 55,000 (1) | | | Cloud Software Group, Inc., 8.250%, 06/30/2032 | | $ | 56,570 | | | | 0.0 | |
| 55,000 | | | CNH Industrial Capital LLC, 5.100%, 04/20/2029 | | | 55,453 | | | | 0.0 | |
| 58,000 | | | CNH Industrial Capital LLC, 5.500%, 01/12/2029 | | | 59,363 | | | | 0.0 | |
| 29,000 | | | CNO Financial Group, Inc., 6.450%, 06/15/2034 | | | 29,884 | | | | 0.0 | |
| 63,000 (1) | | | CNO Global Funding, 5.875%, 06/04/2027 | | | 64,245 | | | | 0.0 | |
| 26,000 | | | Coca-Cola Co., 4.650%, 08/14/2034 | | | 25,612 | | | | 0.0 | |
| 42,000 | | | Coca-Cola Consolidated, Inc., 5.250%, 06/01/2029 | | | 42,686 | | | | 0.0 | |
| 33,000 (1) | | | Columbia Pipelines Holding Co. LLC, 5.097%, 10/01/2031 | | | 32,276 | | | | 0.0 | |
| 78,000 (1) | | | Columbia Pipelines Holding Co. LLC, 6.042%, 08/15/2028 | | | 80,325 | | | | 0.1 | |
| 18,000 | | | Comcast Corp., 1.500%, 02/15/2031 | | | 14,788 | | | | 0.0 | |
| 17,000 | | | Comcast Corp., 1.950%, 01/15/2031 | | | 14,392 | | | | 0.0 | |
| 45,000 | | | Comcast Corp., 3.750%, 04/01/2040 | | | 37,192 | | | | 0.0 | |
| 23,000 | | | Comcast Corp., 4.250%, 01/15/2033 | | | 21,879 | | | | 0.0 | |
| 16,000 (2) | | | Comcast Corp., 5.300%, 06/01/2034 | | | 16,288 | | | | 0.0 | |
| 18,000 | | | Comcast Corp., 5.650%, 06/15/2035 | | | 18,747 | | | | 0.0 | |
| 59,000 (2) | | | Concentrix Corp., 6.600%, 08/02/2028 | | | 59,806 | | | | 0.0 | |
| 89,000 | | | Corebridge Financial, Inc., 3.900%, 04/05/2032 | | | 81,408 | | | | 0.1 | |
| 19,000 | | | Corebridge Financial, Inc., 5.750%, 01/15/2034 | | | 19,459 | | | | 0.0 | |
| 50,000 | | | Corebridge Financial, Inc., 6.050%, 09/15/2033 | | | 51,921 | | | | 0.0 | |
| 31,000 (3) | | | Corebridge Financial, Inc., 6.875%, 12/15/2052 | | | 31,745 | | | | 0.0 | |
| 120,000 (1) | | | Crescent Energy Finance LLC, 7.625%, 04/01/2032 | | | 118,579 | | | | 0.1 | |
| 119,000 (1) | | | Crestwood Midstream Partners L.P. / Crestwood Midstream Finance Corp., 5.625%, 05/01/2027 | | | 119,127 | | | | 0.1 | |
See Accompanying Notes to Financial Statements
| Voya Global Bond Fund | PORTFOLIO OF INVESTMENTS
as of October 31, 2024 (continued) |
Principal
Amount† | | | | | Value | | | Percentage
of Net
Assets |
| CORPORATE BONDS/NOTES: (continued) | |
| | | | United States: (continued) | | | | | | | | |
| 27,000 | | | Crown Castle, Inc., 2.900%, 03/15/2027 | | $ | 25,849 | | | | 0.0 | |
| 56,000 | | | Crown Castle, Inc., 3.300%, 07/01/2030 | | | 51,029 | | | | 0.0 | |
| 14,000 | | | Crown Castle, Inc., 4.800%, 09/01/2028 | | | 13,941 | | | | 0.0 | |
| 82,000 | | | Crown Castle, Inc., 4.900%, 09/01/2029 | | | 81,461 | | | | 0.1 | |
| 21,000 | | | Crown Castle, Inc., 5.200%, 09/01/2034 | | | 20,626 | | | | 0.0 | |
| 32,000 | | | Crown Castle, Inc., 5.600%, 06/01/2029 | | | 32,817 | | | | 0.0 | |
| 21,000 | | | Crown Castle, Inc., 5.800%, 03/01/2034 | | | 21,605 | | | | 0.0 | |
| 59,000 | | | Cummins, Inc., 1.500%, 09/01/2030 | | | 49,694 | | | | 0.0 | |
| 3,000 | | | CVS Health Corp., 3.250%, 08/15/2029 | | | 2,755 | | | | 0.0 | |
| 10,000 (2) | | | CVS Health Corp., 5.700%, 06/01/2034 | | | 10,050 | | | | 0.0 | |
| 130,000 (1) | | | DaVita, Inc., 3.750%, 02/15/2031 | | | 113,157 | | | | 0.1 | |
| 120,000 (1) | | | DaVita, Inc., 4.625%, 06/01/2030 | | | 110,549 | | | | 0.1 | |
| 53,000 | | | Deere & Co., 3.100%, 04/15/2030 | | | 49,028 | | | | 0.0 | |
| 40,000 | | | Dell International LLC / EMC Corp., 6.020%, 06/15/2026 | | | 40,689 | | | | 0.0 | |
| 43,000 | | | Devon Energy Corp., 5.200%, 09/15/2034 | | | 41,413 | | | | 0.0 | |
| 56,000 | | | Discovery Communications LLC, 3.625%, 05/15/2030 | | | 49,594 | | | | 0.0 | |
| 15,000 | | | Dollar General Corp., 3.500%, 04/03/2030 | | | 13,824 | | | | 0.0 | |
| 125,000 (1) | | | DT Midstream, Inc., 4.375%, 06/15/2031 | | | 115,085 | | | | 0.1 | |
| 149,000 | | | DTE Electric Co., 2.250%, 03/01/2030 | | | 131,929 | | | | 0.1 | |
| 18,000 | | | DTE Energy Co., 4.950%, 07/01/2027 | | | 18,103 | | | | 0.0 | |
| 94,000 | | | DTE Energy Co., 5.100%, 03/01/2029 | | | 94,783 | | | | 0.1 | |
| 481,000 | | | Duke Energy Corp., 2.650%, 09/01/2026 | | | 464,383 | | | | 0.3 | |
| 28,000 (3) | | | Duke Energy Corp., 6.450%, 09/01/2054 | | | 28,528 | | | | 0.0 | |
| 36,000 | | | Duke Energy Florida LLC, 2.400%, 12/15/2031 | | | 30,653 | | | | 0.0 | |
| 10,000 | | | Duke Energy Florida LLC, 5.875%, 11/15/2033 | | | 10,602 | | | | 0.0 | |
| 8,000 | | | Duke Energy Ohio, Inc., 5.250%, 04/01/2033 | | | 8,123 | | | | 0.0 | |
| 22,000 | | | Elevance Health, Inc., 4.900%, 02/08/2026 | | | 21,968 | | | | 0.0 | |
Principal
Amount† | | | | | Value | | | Percentage
of Net
Assets |
| CORPORATE BONDS/NOTES: (continued) | |
| | | | United States: (continued) | | | | | | | | |
| 80,000 | | | Elevance Health, Inc., 4.950%, 11/01/2031 | | $ | 79,456 | | | | 0.1 | |
| 45,000 (2) | | | Elevance Health, Inc., 5.200%, 02/15/2035 | | | 44,845 | | | | 0.0 | |
| 13,000 | | | Eli Lilly & Co., 4.700%, 02/09/2034 | | | 12,823 | | | | 0.0 | |
| 115,000 (1) | | | Emerald Debt Merger Sub LLC, 6.625%, 12/15/2030 | | | 117,101 | | | | 0.1 | |
| 87,000 | | | Enact Holdings, Inc., 6.250%, 05/28/2029 | | | 88,746 | | | | 0.1 | |
| 130,000 (1) | | | Energizer Holdings, Inc., 4.375%, 03/31/2029 | | | 121,719 | | | | 0.1 | |
| 56,000 | | | Energy Transfer L.P., 3.750%, 05/15/2030 | | | 52,254 | | | | 0.0 | |
| 93,000 (1) | | | EnLink Midstream LLC, 6.500%, 09/01/2030 | | | 98,021 | | | | 0.1 | |
| 88,000 | | | Entergy Corp., 2.800%, 06/15/2030 | | | 78,781 | | | | 0.1 | |
| 10,000 (3) | | | Entergy Corp., 7.125%, 12/01/2054 | | | 10,249 | | | | 0.0 | |
| 20,000 | | | Entergy Mississippi LLC, 5.000%, 09/01/2033 | | | 19,858 | | | | 0.0 | |
| 26,000 | | | Enterprise Products Operating LLC, 4.950%, 02/15/2035 | | | 25,590 | | | | 0.0 | |
| 56,000 | | | Equifax, Inc., 3.100%, 05/15/2030 | | | 51,012 | | | | 0.0 | |
| 40,000 | | | Essent Group Ltd., 6.250%, 07/01/2029 | | | 40,958 | | | | 0.0 | |
| 149,000 | | | Essential Utilities, Inc., 2.704%, 04/15/2030 | | | 133,228 | | | | 0.1 | |
| 11,000 | | | Essential Utilities, Inc., 5.375%, 01/15/2034 | | | 11,080 | | | | 0.0 | |
| 10,000 | | | Evergy Kansas Central, Inc., 5.900%, 11/15/2033 | | | 10,523 | | | | 0.0 | |
| 56,000 | | | Eversource Energy, 2.550%, 03/15/2031 | | | 48,327 | | | | 0.0 | |
| 63,000 | | | Eversource Energy, 2.900%, 03/01/2027 | | | 60,446 | | | | 0.0 | |
| 11,000 | | | Eversource Energy, 5.125%, 05/15/2033 | | | 10,857 | | | | 0.0 | |
| 35,000 | | | Eversource Energy, 5.450%, 03/01/2028 | | | 35,711 | | | | 0.0 | |
| 15,000 | | | Eversource Energy, 5.500%, 01/01/2034 | | | 15,113 | | | | 0.0 | |
| 43,000 | | | Eversource Energy, 5.950%, 02/01/2029 | | | 44,677 | | | | 0.0 | |
| 54,000 | | | Eversource Energy U, 1.400%, 08/15/2026 | | | 50,922 | | | | 0.0 | |
| 57,000 | | | Exelon Corp., 5.150%, 03/15/2028 | | | 57,629 | | | | 0.0 | |
| 46,000 | | | Exelon Corp., 5.150%, 03/15/2029 | | | 46,650 | | | | 0.0 | |
See Accompanying Notes to Financial Statements
| Voya Global Bond Fund | PORTFOLIO OF INVESTMENTS
as of October 31, 2024 (continued) |
Principal
Amount† | | | | | Value | | | Percentage
of Net
Assets |
| CORPORATE BONDS/NOTES: (continued) | |
| | | | United States: (continued) | | | | | | | | |
| 44,000 | | | Extra Space Storage L.P., 2.350%, 03/15/2032 | | $ | 36,242 | | | | 0.0 | |
| 46,000 | | | Extra Space Storage L.P., 3.900%, 04/01/2029 | | | 44,135 | | | | 0.0 | |
| 26,000 | | | Extra Space Storage L.P., 5.350%, 01/15/2035 | | | 25,840 | | | | 0.0 | |
| 15,000 | | | Exxon Mobil Corp., 2.995%, 08/16/2039 | | | 11,625 | | | | 0.0 | |
| 20,000 | | | Fifth Third Bancorp, 8.250%, 03/01/2038 | | | 24,205 | | | | 0.0 | |
| 42,000 | | | FirstEnergy Corp. B, 3.900%, 07/15/2027 | | | 41,028 | | | | 0.0 | |
| 44,000 | | | Fiserv, Inc., 5.150%, 03/15/2027 | | | 44,481 | | | | 0.0 | |
| 21,000 | | | Fiserv, Inc., 5.150%, 08/12/2034 | | | 20,880 | | | | 0.0 | |
| 54,000 | | | Flex Ltd., 5.250%, 01/15/2032 | | | 53,485 | | | | 0.0 | |
| 28,000 | | | Florida Power & Light Co., 4.625%, 05/15/2030 | | | 27,963 | | | | 0.0 | |
| 21,000 | | | FMC Corp., 5.150%, 05/18/2026 | | | 21,059 | | | | 0.0 | |
| 120,000 (1) | | | Focus Financial Partners LLC, 6.750%, 09/15/2031 | | | 119,297 | | | | 0.1 | |
| 55,000 | | | Ford Motor Co., 3.250%, 02/12/2032 | | | 46,031 | | | | 0.0 | |
| 200,000 | | | Ford Motor Credit Co. LLC, 4.125%, 08/17/2027 | | | 193,335 | | | | 0.1 | |
| 200,000 | | | Ford Motor Credit Co. LLC, 5.113%, 05/03/2029 | | | 194,737 | | | | 0.1 | |
| 200,000 | | | Ford Motor Credit Co. LLC, 5.800%, 03/08/2029 | | | 200,289 | | | | 0.1 | |
| 56,000 | | | Fortune Brands Innovations, Inc., 3.250%, 09/15/2029 | | | 52,075 | | | | 0.0 | |
| 15,000 (2) | | | Fortune Brands Innovations, Inc., 5.875%, 06/01/2033 | | | 15,764 | | | | 0.0 | |
| 127,000 | | | Freeport-McMoRan, Inc., 4.250%, 03/01/2030 | | | 121,631 | | | | 0.1 | |
| 56,000 | | | GATX Corp., 4.000%, 06/30/2030 | | | 53,027 | | | | 0.0 | |
| 115,000 (1) | | | GCI LLC, 4.750%, 10/15/2028 | | | 108,650 | | | | 0.1 | |
| 139,000 | | | General Mills, Inc., 2.875%, 04/15/2030 | | | 125,904 | | | | 0.1 | |
| 56,000 | | | General Motors Financial Co., Inc., 2.350%, 01/08/2031 | | | 47,154 | | | | 0.0 | |
Principal
Amount† | | | | | Value | | | Percentage
of Net
Assets |
| CORPORATE BONDS/NOTES: (continued) | |
| | | | United States: (continued) | | | | | | | | |
| 82,000 | | | General Motors Financial Co., Inc., 4.900%, 10/06/2029 | | $ | 80,884 | | | | 0.1 | |
| 180,000 | | | General Motors Financial Co., Inc., 5.250%, 03/01/2026 | | | 180,560 | | | | 0.1 | |
| 115,000 | | | General Motors Financial Co., Inc., 5.550%, 07/15/2029 | | | 116,551 | | | | 0.1 | |
| 14,000 | | | General Motors Financial Co., Inc., 5.950%, 04/04/2034 | | | 14,283 | | | | 0.0 | |
| 12,000 | | | General Motors Financial Co., Inc., 6.100%, 01/07/2034 | | | 12,333 | | | | 0.0 | |
| 43,000 | | | Genuine Parts Co., 4.950%, 08/15/2029 | | | 42,697 | | | | 0.0 | |
| 23,000 | | | Georgia Power Co., 4.650%, 05/16/2028 | | | 23,034 | | | | 0.0 | |
| 73,000 | | | Global Payments, Inc., 3.200%, 08/15/2029 | | | 67,212 | | | | 0.1 | |
| 42,000 (3) | | | Goldman Sachs Bank USA/New York NY, 5.283%, 03/18/2027 | | | 42,280 | | | | 0.0 | |
| 21,000 (3) | | | Goldman Sachs Bank USA/New York NY, 5.414%, 05/21/2027 | | | 21,205 | | | | 0.0 | |
| 39,000 (3) | | | Goldman Sachs Group, Inc., 3.102%, 02/24/2033 | | | 34,067 | | | | 0.0 | |
| 73,000 (3) | | | Goldman Sachs Group, Inc., 5.016%, 10/23/2035 | | | 71,305 | | | | 0.1 | |
| 137,000 (3) | | | Goldman Sachs Group, Inc., 5.330%, 07/23/2035 | | | 136,897 | | | | 0.1 | |
| 23,000 (3) | | | Goldman Sachs Group, Inc., 5.727%, 04/25/2030 | | | 23,653 | | | | 0.0 | |
| 23,000 (3) | | | Goldman Sachs Group, Inc., 6.484%, 10/24/2029 | | | 24,272 | | | | 0.0 | |
| 10,000 | | | Goldman Sachs Group, Inc., 6.750%, 10/01/2037 | | | 10,978 | | | | 0.0 | |
| 120,000 (1) | | | H&E Equipment Services, Inc., 3.875%, 12/15/2028 | | | 110,915 | | | | 0.1 | |
| 49,000 | | | Hartford Financial Services Group, Inc., 2.900%, 09/15/2051 | | | 31,489 | | | | 0.0 | |
| 5,000 | | | Hartford Financial Services Group, Inc., 3.600%, 08/19/2049 | | | 3,747 | | | | 0.0 | |
| 21,000 | | | Hartford Financial Services Group, Inc., 4.400%, 03/15/2048 | | | 18,018 | | | | 0.0 | |
| 25,000 | | | HCA, Inc., 2.375%, 07/15/2031 | | | 21,067 | | | | 0.0 | |
See Accompanying Notes to Financial Statements
| Voya Global Bond Fund | PORTFOLIO OF INVESTMENTS
as of October 31, 2024 (continued) |
Principal
Amount† | | | | | Value | | | Percentage
of Net
Assets |
| CORPORATE BONDS/NOTES: (continued) | |
| | | | United States: (continued) | | | | | | | | |
| 14,000 | | | HCA, Inc., 3.125%, 03/15/2027 | | $ | 13,471 | | | | 0.0 | |
| 149,000 | | | HCA, Inc., 4.125%, 06/15/2029 | | | 143,556 | | | | 0.1 | |
| 86,000 | | | HCA, Inc., 5.250%, 04/15/2025 | | | 86,083 | | | | 0.1 | |
| 128,000 | | | HCA, Inc., 5.375%, 09/01/2026 | | | 128,758 | | | | 0.1 | |
| 39,000 | | | HCA, Inc., 5.450%, 04/01/2031 | | | 39,446 | | | | 0.0 | |
| 58,000 (1) | | | Health Care Service Corp. A Mutual Legal Reserve Co., 5.200%, 06/15/2029 | | | 58,688 | | | | 0.0 | |
| 86,000 | | | Healthpeak OP LLC, 3.000%, 01/15/2030 | | | 78,589 | | | | 0.1 | |
| 27,000 | | | Healthpeak OP LLC, 5.250%, 12/15/2032 | | | 27,216 | | | | 0.0 | |
| 66,000 | | | HEICO Corp., 5.250%, 08/01/2028 | | | 67,039 | | | | 0.1 | |
| 76,000 | | | Hess Corp., 4.300%, 04/01/2027 | | | 75,211 | | | | 0.1 | |
| 71,000 | | | Hewlett Packard Enterprise Co., 4.850%, 10/15/2031 | | | 69,616 | | | | 0.1 | |
| 59,000 | | | Hewlett Packard Enterprise Co., 5.000%, 10/15/2034 | | | 57,276 | | | | 0.0 | |
| 115,000 (1) | | | Hilcorp Energy I L.P. / Hilcorp Finance Co., 6.000%, 02/01/2031 | | | 109,159 | | | | 0.1 | |
| 105,000 (1) | | | Hilcorp Energy I L.P. / Hilcorp Finance Co., 8.375%, 11/01/2033 | | | 109,860 | | | | 0.1 | |
| 44,000 | | | Home Depot, Inc., 2.700%, 04/15/2030 | | | 39,893 | | | | 0.0 | |
| 42,000 | | | Honeywell International, Inc., 4.750%, 02/01/2032 | | | 42,038 | | | | 0.0 | |
| 16,000 | | | Honeywell International, Inc., 5.000%, 03/01/2035 | | | 16,081 | | | | 0.0 | |
| 35,000 | | | Host Hotels & Resorts L.P., 5.500%, 04/15/2035 | | | 34,357 | | | | 0.0 | |
| 24,000 | | | HP, Inc., 2.650%, 06/17/2031 | | | 20,742 | | | | 0.0 | |
| 41,000 | | | Humana, Inc., 5.375%, 04/15/2031 | | | 41,137 | | | | 0.0 | |
| 23,000 (3) | | | Huntington Bancshares, Inc., 5.709%, 02/02/2035 | | | 23,274 | | | | 0.0 | |
| 56,000 (2) | | | Huntington Ingalls Industries, Inc., 4.200%, 05/01/2030 | | | 53,437 | | | | 0.0 | |
| 19,000 | | | Hyatt Hotels Corp., 5.250%, 06/30/2029 | | | 19,119 | | | | 0.0 | |
| 14,000 (1) | | | Hyundai Capital America, 5.400%, 01/08/2031 | | | 14,136 | | | | 0.0 | |
Principal
Amount† | | | | | Value | | | Percentage
of Net
Assets |
| CORPORATE BONDS/NOTES: (continued) | |
| | | | United States: (continued) | | | | | | | | |
| 48,000 (1) | | | Hyundai Capital America, 5.680%, 06/26/2028 | | $ | 49,027 | | | | 0.0 | |
| 128,000 (1) | | | Hyundai Capital America, 6.100%, 09/21/2028 | | | 132,661 | | | | 0.1 | |
| 49,000 (1) | | | Hyundai Capital America, 6.500%, 01/16/2029 | | | 51,524 | | | | 0.0 | |
| 147,000 | | | IBM International Capital Pte Ltd., 4.750%, 02/05/2031 | | | 146,895 | | | | 0.1 | |
| 120,000 (1) | | | Imola Merger Corp., 4.750%, 05/15/2029 | | | 116,117 | | | | 0.1 | |
| 16,000 | | | Ingersoll Rand, Inc., 5.176%, 06/15/2029 | | | 16,236 | | | | 0.0 | |
| 22,000 | | | Ingersoll Rand, Inc., 5.400%, 08/14/2028 | | | 22,504 | | | | 0.0 | |
| 8,000 | | | Ingersoll Rand, Inc., 5.450%, 06/15/2034 | | | 8,167 | | | | 0.0 | |
| 6,000 | | | Ingersoll Rand, Inc., 5.700%, 08/14/2033 | | | 6,237 | | | | 0.0 | |
| 65,000 (1) | | | Insight Enterprises, Inc., 6.625%, 05/15/2032 | | | 66,503 | | | | 0.1 | |
| 68,000 | | | Intel Corp., 2.450%, 11/15/2029 | | | 59,862 | | | | 0.0 | |
| 33,000 | | | Intercontinental Exchange, Inc., 2.100%, 06/15/2030 | | | 28,642 | | | | 0.0 | |
| 22,000 | | | Intuit, Inc., 5.200%, 09/15/2033 | | | 22,434 | | | | 0.0 | |
| 59,000 | | | Invitation Homes Operating Partnership L.P., 2.000%, 08/15/2031 | | | 48,372 | | | | 0.0 | |
| 15,000 | | | Invitation Homes Operating Partnership L.P., 4.875%, 02/01/2035 | | | 14,352 | | | | 0.0 | |
| 110,000 | | | IPALCO Enterprises, Inc., 4.250%, 05/01/2030 | | | 104,253 | | | | 0.1 | |
| 145,000 (1) | | | Jane Street Group / JSG Finance, Inc., 6.125%, 11/01/2032 | | | 145,184 | | | | 0.1 | |
| 62,000 | | | John Deere Capital Corp., 4.400%, 09/08/2031 | | | 60,543 | | | | 0.0 | |
| 103,000 | | | John Deere Capital Corp., 4.700%, 06/10/2030 | | | 103,211 | | | | 0.1 | |
| 39,000 | | | John Deere Capital Corp., 4.850%, 06/11/2029 | | | 39,380 | | | | 0.0 | |
| 70,000 | | | John Deere Capital Corp., 4.900%, 03/07/2031 | | | 70,421 | | | | 0.1 | |
| 31,000 | | | Johnson & Johnson, 3.625%, 03/03/2037 | | | 27,404 | | | | 0.0 | |
See Accompanying Notes to Financial Statements
| Voya Global Bond Fund | PORTFOLIO OF INVESTMENTS
as of October 31, 2024 (continued) |
Principal
Amount† | | | | | Value | | | Percentage
of Net
Assets |
| CORPORATE BONDS/NOTES: (continued) | |
| | | | United States: (continued) | | | | | | | | |
| 11,000 | | | Johnson & Johnson, 4.950%, 06/01/2034 | | $ | 11,253 | | | | 0.0 | |
| 93,000 | | | Jones Lang LaSalle, Inc., 6.875%, 12/01/2028 | | | 99,184 | | | | 0.1 | |
| 160,000 (3) | | | JPMorgan Chase & Co., 1.470%, 09/22/2027 | | | 150,553 | | | | 0.1 | |
| 126,000 (3) | | | JPMorgan Chase & Co., 1.578%, 04/22/2027 | | | 120,253 | | | | 0.1 | |
| 120,000 (3) | | | JPMorgan Chase & Co., 2.069%, 06/01/2029 | | | 109,096 | | | | 0.1 | |
| 120,000 (3) | | | JPMorgan Chase & Co., 2.182%, 06/01/2028 | | | 112,420 | | | | 0.1 | |
| 29,000 (3) | | | JPMorgan Chase & Co., 2.595%, 02/24/2026 | | | 28,774 | | | | 0.0 | |
| 33,000 (3) | | | JPMorgan Chase & Co., 2.739%, 10/15/2030 | | | 29,856 | | | | 0.0 | |
| 201,000 (3) | | | JPMorgan Chase & Co., 2.947%, 02/24/2028 | | | 192,987 | | | | 0.1 | |
| 479,000 | | | JPMorgan Chase & Co., 2.950%, 10/01/2026 | | | 465,325 | | | | 0.3 | |
| 56,000 (3) | | | JPMorgan Chase & Co., 3.702%, 05/06/2030 | | | 53,266 | | | | 0.0 | |
| 360,000 (3) | | | JPMorgan Chase & Co., 3.782%, 02/01/2028 | | | 352,371 | | | | 0.2 | |
| 6,000 (3) | | | JPMorgan Chase & Co., 4.005%, 04/23/2029 | | | 5,883 | | | | 0.0 | |
| 28,000 (3) | | | JPMorgan Chase & Co., 4.452%, 12/05/2029 | | | 27,555 | | | | 0.0 | |
| 60,000 (3) | | | JPMorgan Chase & Co., 4.603%, 10/22/2030 | | | 59,190 | | | | 0.0 | |
| 33,000 (3) | | | JPMorgan Chase & Co., 4.995%, 07/22/2030 | | | 33,116 | | | | 0.0 | |
| 32,000 (3) | | | JPMorgan Chase & Co., 5.294%, 07/22/2035 | | | 32,191 | | | | 0.0 | |
| 23,000 (3) | | | JPMorgan Chase & Co., 5.336%, 01/23/2035 | | | 23,207 | | | | 0.0 | |
| 59,000 (3) | | | JPMorgan Chase & Co., 5.571%, 04/22/2028 | | | 60,064 | | | | 0.0 | |
| 56,000 (3) | | | JPMorgan Chase & Co., 5.581%, 04/22/2030 | | | 57,459 | | | | 0.0 | |
Principal
Amount† | | | | | Value | | | Percentage
of Net
Assets |
| CORPORATE BONDS/NOTES: (continued) | |
| | | | United States: (continued) | | | | | | | | |
| 29,000 (3) | | | JPMorgan Chase & Co., 5.766%, 04/22/2035 | | $ | 30,192 | | | | 0.0 | |
| 36,000 (3) | | | JPMorgan Chase & Co., 6.254%, 10/23/2034 | | | 38,698 | | | | 0.0 | |
| 7,000 | | | Kentucky Utilities Co. KENT, 5.450%, 04/15/2033 | | | 7,202 | | | | 0.0 | |
| 27,000 | | | Kenvue, Inc., 4.900%, 03/22/2033 | | | 27,016 | | | | 0.0 | |
| 25,000 | | | Kenvue, Inc., 5.050%, 03/22/2028 | | | 25,450 | | | | 0.0 | |
| 21,000 | | | Keurig Dr Pepper, Inc., 5.050%, 03/15/2029 | | | 21,230 | | | | 0.0 | |
| 12,000 (3) | | | KeyCorp, 4.789%, 06/01/2033 | | | 11,450 | | | | 0.0 | |
| 42,000 | | | Kinder Morgan, Inc., 5.300%, 12/01/2034 | | | 41,456 | | | | 0.0 | |
| 10,000 (2) | | | KLA Corp., 4.700%, 02/01/2034 | | | 9,860 | | | | 0.0 | |
| 163,000 | | | Kroger Co., 4.900%, 09/15/2031 | | | 162,689 | | | | 0.1 | |
| 56,000 | | | Kyndryl Holdings, Inc., 2.700%, 10/15/2028 | | | 51,100 | | | | 0.0 | |
| 30,000 | | | L3Harris Technologies, Inc., 5.050%, 06/01/2029 | | | 30,253 | | | | 0.0 | |
| 41,000 (2) | | | Laboratory Corp. of America Holdings, 4.550%, 04/01/2032 | | | 39,387 | | | | 0.0 | |
| 120,000 (1)(2) | | | Ladder Capital Finance Holdings LLLP / Ladder Capital Finance Corp., 4.750%, 06/15/2029 | | | 114,440 | | | | 0.1 | |
| 56,000 (1) | | | Liberty Utilities Co., 5.577%, 01/31/2029 | | | 56,647 | | | | 0.0 | |
| 40,000 (1) | | | Liberty Utilities Co., 5.869%, 01/31/2034 | | | 40,552 | | | | 0.0 | |
| 115,000 (1) | | | Lightning Power LLC, 7.250%, 08/15/2032 | | | 119,739 | | | | 0.1 | |
| 15,000 | | | Lockheed Martin Corp., 4.800%, 08/15/2034 | | | 14,836 | | | | 0.0 | |
| 10,000 | | | Lockheed Martin Corp., 5.250%, 01/15/2033 | | | 10,293 | | | | 0.0 | |
| 7,000 | | | Louisville Gas and Electric Co. LOU, 5.450%, 04/15/2033 | | | 7,196 | | | | 0.0 | |
| 30,000 | | | LPL Holdings, Inc., 5.700%, 05/20/2027 | | | 30,465 | | | | 0.0 | |
| 140,000 (2) | | | Macy’s Retail Holdings LLC, 4.500%, 12/15/2034 | | | 117,105 | | | | 0.1 | |
| 51,000 | | | Marriott International, Inc., 4.800%, 03/15/2030 | | | 50,678 | | | | 0.0 | |
See Accompanying Notes to Financial Statements
| Voya Global Bond Fund | PORTFOLIO OF INVESTMENTS
as of October 31, 2024 (continued) |
Principal
Amount† | | | | | Value | | | Percentage
of Net
Assets |
| CORPORATE BONDS/NOTES: (continued) | |
| | | | United States: (continued) | | | | | | | | |
| 31,000 (2) | | | Marriott International, Inc., 5.350%, 03/15/2035 | | $ | 30,856 | | | | 0.0 | |
| 35,000 (1) | | | Mars, Inc., 2.375%, 07/16/2040 | | | 24,033 | | | | 0.0 | |
| 100,000 | | | Marsh & McLennan Cos., Inc., 4.650%, 03/15/2030 | | | 99,807 | | | | 0.1 | |
| 34,000 | | | Marsh & McLennan Cos., Inc., 4.850%, 11/15/2031 | | | 33,909 | | | | 0.0 | |
| 169,000 | | | Marsh & McLennan Cos., Inc., 5.000%, 03/15/2035 | | | 168,371 | | | | 0.1 | |
| 13,000 | | | Marsh & McLennan Cos., Inc., 5.350%, 11/15/2044 | | | 13,002 | | | | 0.0 | |
| 72,000 | | | Marsh & McLennan Cos., Inc., 5.400%, 03/15/2055 | | | 71,703 | | | | 0.1 | |
| 29,000 | | | Marvell Technology, Inc., 5.750%, 02/15/2029 | | | 29,870 | | | | 0.0 | |
| 130,000 (1)(2) | | | Match Group Holdings II LLC, 3.625%, 10/01/2031 | | | 114,011 | | | | 0.1 | |
| 45,000 | | | McKesson Corp., 4.250%, 09/15/2029 | | | 44,100 | | | | 0.0 | |
| 105,000 (1) | | | Medline Borrower L.P., 3.875%, 04/01/2029 | | | 98,310 | | | | 0.1 | |
| 8,000 (2) | | | Merck & Co., Inc., 4.500%, 05/17/2033 | | | 7,860 | | | | 0.0 | |
| 174,000 | | | Meta Platforms, Inc., 4.750%, 08/15/2034 | | | 172,177 | | | | 0.1 | |
| 224,000 (1) | | | Metropolitan Edison Co., 4.000%, 04/15/2025 | | | 222,505 | | | | 0.1 | |
| 120,000 | | | MGM Resorts International, 6.500%, 04/15/2032 | | | 120,103 | | | | 0.1 | |
| 23,000 | | | Mid-America Apartments L.P., 5.300%, 02/15/2032 | | | 23,320 | | | | 0.0 | |
| 11,000 (2) | | | Mohawk Industries, Inc., 5.850%, 09/18/2028 | | | 11,363 | | | | 0.0 | |
| 32,000 (2) | | | Mondelez International, Inc., 4.750%, 02/20/2029 | | | 32,093 | | | | 0.0 | |
| 20,000 (1) | | | Monongahela Power Co., 5.850%, 02/15/2034 | | | 20,632 | | | | 0.0 | |
| 32,000 (3) | | | Morgan Stanley, 0.985%, 12/10/2026 | | | 30,656 | | | | 0.0 | |
| 39,000 (3) | | | Morgan Stanley, 1.512%, 07/20/2027 | | | 36,911 | | | | 0.0 | |
| 227,000 (3) | | | Morgan Stanley, 1.593%, 05/04/2027 | | | 216,466 | | | | 0.1 | |
| 24,000 (3) | | | Morgan Stanley, 2.484%, 09/16/2036 | | | 19,580 | | | | 0.0 | |
Principal
Amount† | | | | | Value | | | Percentage
of Net
Assets |
| CORPORATE BONDS/NOTES: (continued) | |
| | | | United States: (continued) | | | | | | | | |
| 407,000 | | | Morgan Stanley, 3.125%, 07/27/2026 | | $ | 397,067 | | | | 0.2 | |
| 24,000 (3) | | | Morgan Stanley, 3.591%, 07/22/2028 | | | 23,268 | | | | 0.0 | |
| 33,000 (3) | | | Morgan Stanley, 5.042%, 07/19/2030 | | | 33,113 | | | | 0.0 | |
| 67,000 (3) | | | Morgan Stanley, 5.164%, 04/20/2029 | | | 67,586 | | | | 0.1 | |
| 35,000 (3) | | | Morgan Stanley, 5.250%, 04/21/2034 | | | 35,064 | | | | 0.0 | |
| 37,000 (3) | | | Morgan Stanley, 5.320%, 07/19/2035 | | | 37,153 | | | | 0.0 | |
| 12,000 (3) | | | Morgan Stanley, 5.466%, 01/18/2035 | | | 12,161 | | | | 0.0 | |
| 14,000 (3) | | | Morgan Stanley, 5.831%, 04/19/2035 | | | 14,556 | | | | 0.0 | |
| 146,000 (3) | | | Morgan Stanley, 6.296%, 10/18/2028 | | | 152,135 | | | | 0.1 | |
| 30,000 | | | Motorola Solutions, Inc., 5.000%, 04/15/2029 | | | 30,235 | | | | 0.0 | |
| 107,000 | | | MPLX L.P., 2.650%, 08/15/2030 | | | 94,198 | | | | 0.1 | |
| 86,000 | | | MPLX L.P., 4.000%, 03/15/2028 | | | 83,789 | | | | 0.1 | |
| 11,000 | | | MPLX L.P., 5.500%, 06/01/2034 | | | 10,984 | | | | 0.0 | |
| 120,000 | | | MPT Operating Partnership L.P. / MPT Finance Corp., 3.500%, 03/15/2031 | | | 85,109 | | | | 0.1 | |
| 140,000 | | | National Rural Utilities Cooperative Finance Corp., 3.900%, 11/01/2028 | | | 136,232 | | | | 0.1 | |
| 22,000 (2) | | | National Rural Utilities Cooperative Finance Corp., 4.150%, 12/15/2032 | | | 20,858 | | | | 0.0 | |
| 32,000 | | | National Rural Utilities Cooperative Finance Corp., 5.000%, 02/07/2031 | | | 32,435 | | | | 0.0 | |
| 39,000 | | | National Rural Utilities Cooperative Finance Corp., 5.000%, 08/15/2034 | | | 38,613 | | | | 0.0 | |
| 2,000 | | | National Rural Utilities Cooperative Finance Corp., 5.800%, 01/15/2033 | | | 2,104 | | | | 0.0 | |
| 120,000 (1)(2) | | | Nationstar Mortgage Holdings, Inc., 5.125%, 12/15/2030 | | | 112,463 | | | | 0.1 | |
| 115,000 (1) | | | Nationstar Mortgage Holdings, Inc., 6.500%, 08/01/2029 | | | 115,088 | | | | 0.1 | |
| 20,000 | | | Newell Brands, Inc., 6.375%, 05/15/2030 | | | 20,141 | | | | 0.0 | |
See Accompanying Notes to Financial Statements
| Voya Global Bond Fund | PORTFOLIO OF INVESTMENTS
as of October 31, 2024 (continued) |
Principal
Amount† | | | | | Value | | | Percentage
of Net
Assets |
| CORPORATE BONDS/NOTES: (continued) | |
| | | | United States: (continued) | | | | | | | | |
| 105,000 | | | Newell Brands, Inc., 6.625%, 05/15/2032 | | $ | 105,566 | | | | 0.1 | |
| 58,000 | | | Nordson Corp., 4.500%, 12/15/2029 | | | 56,850 | | | | 0.0 | |
| 15,000 | | | Norfolk Southern Corp., 2.550%, 11/01/2029 | | | 13,582 | | | | 0.0 | |
| 26,000 | | | Norfolk Southern Corp., 5.050%, 08/01/2030 | | | 26,373 | | | | 0.0 | |
| 11,000 | | | Norfolk Southern Corp., 5.550%, 03/15/2034 | | | 11,399 | | | | 0.0 | |
| 58,000 (3) | | | Northern Trust Corp., 3.375%, 05/08/2032 | | | 55,734 | | | | 0.0 | |
| 115,000 (1) | | | Novelis Corp., 4.750%, 01/30/2030 | | | 107,828 | | | | 0.1 | |
| 11,000 | | | NSTAR Electric Co., 5.400%, 06/01/2034 | | | 11,247 | | | | 0.0 | |
| 53,000 (1) | | | Nuveen LLC, 5.550%, 01/15/2030 | | | 54,313 | | | | 0.0 | |
| 14,000 | | | Occidental Petroleum Corp., 5.375%, 01/01/2032 | | | 13,833 | | | | 0.0 | |
| 51,000 (2) | | | Occidental Petroleum Corp., 6.125%, 01/01/2031 | | | 52,600 | | | | 0.0 | |
| 21,000 | | | Occidental Petroleum Corp., 6.200%, 03/15/2040 | | | 20,976 | | | | 0.0 | |
| 14,000 | | | OGE Energy Corp., 5.450%, 05/15/2029 | | | 14,292 | | | | 0.0 | |
| 5,000 | | | Old Republic International Corp., 5.750%, 03/28/2034 | | | 5,083 | | | | 0.0 | |
| 115,000 (2) | | | Olin Corp., 5.000%, 02/01/2030 | | | 109,857 | | | | 0.1 | |
| 28,000 (2) | | | ONE Gas, Inc., 5.100%, 04/01/2029 | | | 28,461 | | | | 0.0 | |
| 152,000 | | | Oracle Corp., 2.800%, 04/01/2027 | | | 145,669 | | | | 0.1 | |
| 263,000 | | | Oracle Corp., 2.950%, 05/15/2025 | | | 260,280 | | | | 0.2 | |
| 38,000 | | | Oracle Corp., 3.800%, 11/15/2037 | | | 32,272 | | | | 0.0 | |
| 13,000 | | | Oracle Corp., 5.375%, 09/27/2054 | | | 12,377 | | | | 0.0 | |
| 35,000 | | | Oracle Corp., 6.150%, 11/09/2029 | | | 37,045 | | | | 0.0 | |
| 23,000 | | | O’Reilly Automotive, Inc., 3.600%, 09/01/2027 | | | 22,378 | | | | 0.0 | |
| 54,000 (2) | | | O’Reilly Automotive, Inc., 4.350%, 06/01/2028 | | | 53,411 | | | | 0.0 | |
| 33,000 | | | O’Reilly Automotive, Inc., 5.000%, 08/19/2034 | | | 32,358 | | | | 0.0 | |
| 18,000 | | | Ovintiv, Inc., 5.650%, 05/15/2028 | | | 18,258 | | | | 0.0 | |
Principal
Amount† | | | | | Value | | | Percentage
of Net
Assets |
| CORPORATE BONDS/NOTES: (continued) | |
| | | | United States: (continued) | | | | | | | | |
| 105,000 (1)(2) | | | Owens-Brockway Glass Container, Inc., 7.250%, 05/15/2031 | | $ | 103,401 | | | | 0.1 | |
| 115,000 (1) | | | Panther Escrow Issuer LLC, 7.125%, 06/01/2031 | | | 117,844 | | | | 0.1 | |
| 3,000 (2) | | | PayPal Holdings, Inc., 4.400%, 06/01/2032 | | | 2,916 | | | | 0.0 | |
| 39,000 | | | PayPal Holdings, Inc., 5.150%, 06/01/2034 | | | 39,317 | | | | 0.0 | |
| 9,000 | | | PECO Energy Co., 4.900%, 06/15/2033 | | | 8,987 | | | | 0.0 | |
| 30,000 (1) | | | Pennsylvania Electric Co., 5.150%, 03/30/2026 | | | 30,031 | | | | 0.0 | |
| 69,000 (1) | | | Penske Truck Leasing Co. L.P. / PTL Finance Corp., 5.250%, 07/01/2029 | | | 69,708 | | | | 0.1 | |
| 126,000 (1)(2) | | | Penske Truck Leasing Co. L.P. / PTL Finance Corp., 5.350%, 03/30/2029 | | | 127,553 | | | | 0.1 | |
| 31,000 (1) | | | Penske Truck Leasing Co. L.P. / PTL Finance Corp., 6.200%, 06/15/2030 | | | 32,753 | | | | 0.0 | |
| 110,000 (1) | | | Performance Food Group, Inc., 6.125%, 09/15/2032 | | | 110,598 | | | | 0.1 | |
| 70,000 | | | Philip Morris International, Inc., 4.750%, 11/01/2031 | | | 68,953 | | | | 0.1 | |
| 46,000 | | | Philip Morris International, Inc., 4.875%, 02/13/2029 | | | 46,142 | | | | 0.0 | |
| 15,000 | | | Philip Morris International, Inc., 5.250%, 02/13/2034 | | | 15,045 | | | | 0.0 | |
| 44,000 | | | Phillips 66, 3.850%, 04/09/2025 | | | 43,802 | | | | 0.0 | |
| 157,000 | | | Plains All American Pipeline L.P. / PAA Finance Corp., 3.600%, 11/01/2024 | | | 157,000 | | | | 0.1 | |
| 2,000 (3) | | | PNC Financial Services Group, Inc., 5.068%, 01/24/2034 | | | 1,973 | | | | 0.0 | |
| 21,000 (3) | | | PNC Financial Services Group, Inc., 5.401%, 07/23/2035 | | | 21,166 | | | | 0.0 | |
| 31,000 (3) | | | PNC Financial Services Group, Inc., 6.037%, 10/28/2033 | | | 32,574 | | | | 0.0 | |
| 7,000 (3) | | | PNC Financial Services Group, Inc., 6.875%, 10/20/2034 | | | 7,782 | | | | 0.0 | |
| 105,000 (1)(2) | | | Post Holdings, Inc., 4.625%, 04/15/2030 | | | 98,219 | | | | 0.1 | |
See Accompanying Notes to Financial Statements
| Voya Global Bond Fund | PORTFOLIO OF INVESTMENTS
as of October 31, 2024 (continued) |
Principal
Amount† | | | | | Value | | | Percentage
of Net
Assets |
| CORPORATE BONDS/NOTES: (continued) | |
| | | | United States: (continued) | | | | | | | | |
| 105,000 (1)(2) | | | Post Holdings, Inc., 5.500%, 12/15/2029 | | $ | 102,499 | | | | 0.1 | |
| 25,000 (1)(2) | | | Post Holdings, Inc., 6.375%, 03/01/2033 | | | 24,796 | | | | 0.0 | |
| 115,000 (1) | | | Primo Water Holdings, Inc., 4.375%, 04/30/2029 | | | 108,460 | | | | 0.1 | |
| 14,000 | | | Prologis L.P., 2.250%, 01/15/2032 | | | 11,782 | | | | 0.0 | |
| 81,000 (1) | | | Prologis Targeted US Logistics Fund L.P., 5.250%, 04/01/2029 | | | 82,139 | | | | 0.1 | |
| 10,000 (1) | | | Prologis Targeted US Logistics Fund L.P., 5.500%, 04/01/2034 | | | 10,120 | | | | 0.0 | |
| 18,000 | | | Public Service Electric and Gas Co., 5.200%, 08/01/2033 | | | 18,370 | | | | 0.0 | |
| 13,000 | | | Public Service Electric and Gas Co., 5.200%, 03/01/2034 | | | 13,206 | | | | 0.0 | |
| 59,000 | | | Public Service Enterprise Group, Inc., 2.450%, 11/15/2031 | | | 50,383 | | | | 0.0 | |
| 88,000 | | | Public Service Enterprise Group, Inc., 5.200%, 04/01/2029 | | | 89,354 | | | | 0.1 | |
| 43,000 | | | Quanta Services, Inc., 5.250%, 08/09/2034 | | | 42,716 | | | | 0.0 | |
| 16,000 | | | Quest Diagnostics, Inc., 2.800%, 06/30/2031 | | | 14,051 | | | | 0.0 | |
| 14,000 | | | Quest Diagnostics, Inc., 2.950%, 06/30/2030 | | | 12,663 | | | | 0.0 | |
| 82,000 | | | Quest Diagnostics, Inc., 4.625%, 12/15/2029 | | | 81,189 | | | | 0.1 | |
| 31,000 | | | Quest Diagnostics, Inc., 5.000%, 12/15/2034 | | | 30,392 | | | | 0.0 | |
| 16,000 | | | Quest Diagnostics, Inc., 6.400%, 11/30/2033 | | | 17,358 | | | | 0.0 | |
| 24,000 | | | Realty Income Corp., 5.125%, 02/15/2034 | | | 23,880 | | | | 0.0 | |
| 61,000 (3) | | | Regions Financial Corp., 5.502%, 09/06/2035 | | | 60,470 | | | | 0.0 | |
| 40,000 (3) | | | Regions Financial Corp., 5.722%, 06/06/2030 | | | 40,624 | | | | 0.0 | |
| 21,000 | | | Rexford Industrial Realty L.P., 2.150%, 09/01/2031 | | | 17,337 | | | | 0.0 | |
| 11,000 (1) | | | RGA Global Funding, 5.448%, 05/24/2029 | | | 11,233 | | | | 0.0 | |
| 215,000 (1) | | | Roche Holdings, Inc., 5.489%, 11/13/2030 | | | 223,690 | | | | 0.1 | |
Principal
Amount† | | | | | Value | | | Percentage
of Net
Assets |
| CORPORATE BONDS/NOTES: (continued) | |
| | | | United States: (continued) | | | | | | | | |
| 66,000 | | | Roper Technologies, Inc., 1.750%, 02/15/2031 | | $ | 54,673 | | | | 0.0 | |
| 16,000 | | | Ross Stores, Inc., 4.700%, 04/15/2027 | | | 15,935 | | | | 0.0 | |
| 56,000 | | | Royalty Pharma PLC, 2.200%, 09/02/2030 | | | 47,850 | | | | 0.0 | |
| 28,000 | | | Royalty Pharma PLC, 5.150%, 09/02/2029 | | | 28,179 | | | | 0.0 | |
| 32,000 | | | Ryder System, Inc., 4.950%, 09/01/2029 | | | 31,986 | | | | 0.0 | |
| 37,000 | | | Ryder System, Inc., 5.250%, 06/01/2028 | | | 37,474 | | | | 0.0 | |
| 7,000 | | | Ryder System, Inc., 5.375%, 03/15/2029 | | | 7,121 | | | | 0.0 | |
| 43,000 | | | Ryder System, Inc., 5.500%, 06/01/2029 | | | 43,975 | | | | 0.0 | |
| 21,000 (2) | | | Ryder System, Inc., 6.600%, 12/01/2033 | | | 22,826 | | | | 0.0 | |
| 14,000 | | | S&P Global, Inc., 1.250%, 08/15/2030 | | | 11,611 | | | | 0.0 | |
| 53,000 | | | S&P Global, Inc., 2.700%, 03/01/2029 | | | 48,992 | | | | 0.0 | |
| 225,000 (2) | | | Sally Holdings LLC / Sally Capital, Inc., 6.750%, 03/01/2032 | | | 227,996 | | | | 0.1 | |
| 35,000 (1) | | | Schlumberger Holdings Corp., 5.000%, 11/15/2029 | | | 35,342 | | | | 0.0 | |
| 65,000 (1) | | | Sealed Air Corp., 1.573%, 10/15/2026 | | | 60,745 | | | | 0.0 | |
| 110,000 (1)(2) | | | Sealed Air Corp/Sealed Air Corp. US, 7.250%, 02/15/2031 | | | 114,343 | | | | 0.1 | |
| 59,000 (3) | | | Sempra, 6.400%, 10/01/2054 | | | 58,940 | | | | 0.0 | |
| 105,000 (1) | | | Sensata Technologies, Inc., 6.625%, 07/15/2032 | | | 106,473 | | | | 0.1 | |
| 120,000 (1) | | | Sirius XM Radio, Inc., 5.500%, 07/01/2029 | | | 116,497 | | | | 0.1 | |
| 39,000 (1) | | | Solventum Corp., 5.450%, 03/13/2031 | | | 39,339 | | | | 0.0 | |
| 21,000 (1) | | | Solventum Corp., 5.600%, 03/23/2034 | | | 21,171 | | | | 0.0 | |
| 43,000 | | | Sonoco Products Co., 4.600%, 09/01/2029 | | | 41,958 | | | | 0.0 | |
| 28,000 | | | Southern California Edison Co., 5.450%, 06/01/2031 | | | 28,708 | | | | 0.0 | |
| 23,000 | | | Southern California Gas Co., 5.200%, 06/01/2033 | | | 23,337 | | | | 0.0 | |
| 44,000 | | | Southern Co., 5.113%, 08/01/2027 | | | 44,376 | | | | 0.0 | |
| 44,000 | | | Southern Co. Gas Capital Corp., 4.950%, 09/15/2034 | | | 43,059 | | | | 0.0 | |
See Accompanying Notes to Financial Statements
| Voya Global Bond Fund | PORTFOLIO OF INVESTMENTS
as of October 31, 2024 (continued) |
Principal
Amount† | | | | | Value | | | Percentage
of Net
Assets |
| CORPORATE BONDS/NOTES: (continued) | |
| | | | United States: (continued) | | | | | | | | |
| 10,000 | | | Southwestern Electric Power Co., 5.300%, 04/01/2033 | | $ | 10,041 | | | | 0.0 | |
| 110,000 | | | Sprint Capital Corp., 6.875%, 11/15/2028 | | | 118,070 | | | | 0.1 | |
| 91,000 | | | Sprint Capital Corp., 8.750%, 03/15/2032 | | | 110,164 | | | | 0.1 | |
| 130,000 (1) | | | Standard Industries, Inc., 3.375%, 01/15/2031 | | | 112,971 | | | | 0.1 | |
| 125,000 (1) | | | Standard Industries, Inc., 4.375%, 07/15/2030 | | | 114,962 | | | | 0.1 | |
| 100,000 (2)(3) | | | State Street Corp., 4.675%, 10/22/2032 | | | 98,443 | | | | 0.1 | |
| 46,000 (3) | | | State Street Corp., 5.684%, 11/21/2029 | | | 47,528 | | | | 0.0 | |
| 51,000 (3) | | | State Street Corp., 6.123%, 11/21/2034 | | | 53,826 | | | | 0.0 | |
| 110,000 (1) | | | Summit Materials LLC / Summit Materials Finance Corp., 7.250%, 01/15/2031 | | | 114,402 | | | | 0.1 | |
| 56,000 | | | Sun Communities Operating L.P., 5.500%, 01/15/2029 | | | 56,539 | | | | 0.0 | |
| 32,000 | | | Take-Two Interactive Software, Inc., 5.400%, 06/12/2029 | | | 32,538 | | | | 0.0 | |
| 8,000 | | | Targa Resources Corp., 4.200%, 02/01/2033 | | | 7,357 | | | | 0.0 | |
| 9,000 | | | Targa Resources Corp., 5.500%, 02/15/2035 | | | 8,984 | | | | 0.0 | |
| 56,000 | | | Teledyne FLIR LLC, 2.500%, 08/01/2030 | | | 49,215 | | | | 0.0 | |
| 35,000 (1) | | | Tempur Sealy International, Inc., 3.875%, 10/15/2031 | | | 30,483 | | | | 0.0 | |
| 95,000 (1) | | | Tempur Sealy International, Inc., 4.000%, 04/15/2029 | | | 87,633 | | | | 0.1 | |
| 91,000 | | | Thermo Fisher Scientific, Inc., 4.977%, 08/10/2030 | | | 92,500 | | | | 0.1 | |
| 3,000 | | | T-Mobile USA, Inc., 2.050%, 02/15/2028 | | | 2,757 | | | | 0.0 | |
| 2,000 | | | T-Mobile USA, Inc., 2.250%, 02/15/2026 | | | 1,939 | | | | 0.0 | |
| 26,000 | | | T-Mobile USA, Inc., 3.875%, 04/15/2030 | | | 24,701 | | | | 0.0 | |
| 47,000 (2) | | | Toyota Motor Credit Corp., 4.350%, 10/08/2027 | | | 46,828 | | | | 0.0 | |
| 51,000 | | | Toyota Motor Credit Corp., 4.550%, 08/09/2029 | | | 50,666 | | | | 0.0 | |
Principal
Amount† | | | | | Value | | | Percentage
of Net
Assets |
| CORPORATE BONDS/NOTES: (continued) | |
| | | | United States: (continued) | | | | | | | | |
| 56,000 | | | Toyota Motor Credit Corp., 5.550%, 11/20/2030 | | $ | 58,166 | | | | 0.0 | |
| 14,000 | | | Transcontinental Gas Pipe Line Co. LLC, 3.250%, 05/15/2030 | | | 12,795 | | | | 0.0 | |
| 95,000 (1) | | | TransDigm, Inc., 6.000%, 01/15/2033 | | | 94,236 | | | | 0.1 | |
| 115,000 (1) | | | TransDigm, Inc., 7.125%, 12/01/2031 | | | 119,143 | | | | 0.1 | |
| 14,000 (3) | | | Truist Financial Corp., 4.916%, 07/28/2033 | | | 13,358 | | | | 0.0 | |
| 11,000 (3) | | | Truist Financial Corp., 5.122%, 01/26/2034 | | | 10,785 | | | | 0.0 | |
| 79,000 (3) | | | Truist Financial Corp., 5.435%, 01/24/2030 | | | 79,973 | | | | 0.1 | |
| 72,000 (3) | | | Truist Financial Corp., 5.867%, 06/08/2034 | | | 74,067 | | | | 0.1 | |
| 8,000 (3) | | | Truist Financial Corp., 6.123%, 10/28/2033 | | | 8,383 | | | | 0.0 | |
| 77,000 | | | Tucson Electric Power Co., 5.200%, 09/15/2034 | | | 76,650 | | | | 0.1 | |
| 35,000 | | | Tyson Foods, Inc., 5.400%, 03/15/2029 | | | 35,612 | | | | 0.0 | |
| 53,000 | | | Uber Technologies, Inc., 4.300%, 01/15/2030 | | | 51,569 | | | | 0.0 | |
| 11,000 | | | Union Pacific Corp., 3.750%, 02/05/2070 | | | 7,814 | | | | 0.0 | |
| 105,000 (1)(2) | | | United Airlines, Inc., 4.625%, 04/15/2029 | | | 100,569 | | | | 0.1 | |
| 42,000 | | | UnitedHealth Group, Inc., 2.750%, 05/15/2040 | | | 30,497 | | | | 0.0 | |
| 42,000 | | | UnitedHealth Group, Inc., 4.950%, 01/15/2032 | | | 42,110 | | | | 0.0 | |
| 16,000 | | | UnitedHealth Group, Inc., 5.000%, 04/15/2034 | | | 15,945 | | | | 0.0 | |
| 18,000 | | | UnitedHealth Group, Inc., 5.150%, 07/15/2034 | | | 18,143 | | | | 0.0 | |
| 32,000 | | | Universal Health Services, Inc., 4.625%, 10/15/2029 | | | 31,096 | | | | 0.0 | |
| 4,742 | | | US Airways Pass Through Trust 2012-2, A, 4.625%, 12/03/2026 | | | 4,722 | | | | 0.0 | |
| 90,000 (3) | | | US Bancorp, 4.839%, 02/01/2034 | | | 87,146 | | | | 0.1 | |
| 49,000 (3) | | | US Bancorp, 5.384%, 01/23/2030 | | | 49,797 | | | | 0.0 | |
| 95,000 | | | Utah Acquisition Sub, Inc., 3.950%, 06/15/2026 | | | 93,491 | | | | 0.1 | |
| 210,000 (1) | | | Venture Global LNG, Inc., 8.375%, 06/01/2031 | | | 218,283 | | | | 0.1 | |
See Accompanying Notes to Financial Statements
| Voya Global Bond Fund | PORTFOLIO OF INVESTMENTS as of October 31, 2024 (continued) |
Principal
Amount† | | | | | Value | | | Percentage
of Net
Assets |
| CORPORATE BONDS/NOTES: (continued) | |
| | | | United States: (continued) |
| 5,000 | | | Verizon Communications, Inc., 1.750%, 01/20/2031 | | $ | 4,148 | | | | 0.0 | |
| 2,000 | | | Verizon Communications, Inc., 2.550%, 03/21/2031 | | | 1,737 | | | | 0.0 | |
| 3,000 | | | Verizon Communications, Inc., 4.400%, 11/01/2034 | | | 2,819 | | | | 0.0 | |
| 35,000 | | | Verizon Communications, Inc., 4.812%, 03/15/2039 | | | 32,809 | | | | 0.0 | |
| 120,000 (1)(2) | | | Viasat, Inc., 5.625%, 04/15/2027 | | | 112,161 | | | | 0.1 | |
| 86,000 | | | Viatris, Inc., 2.700%, 06/22/2030 | | | 74,657 | | | | 0.1 | |
| 10,000 | | | Viatris, Inc., 3.850%, 06/22/2040 | | | 7,504 | | | | 0.0 | |
| 230,000 (1) | | | Vistra Operations Co. LLC, 4.375%, 05/01/2029 | | | 219,120 | | | | 0.1 | |
| 107,000 | | | VMware, Inc., 1.400%, 08/15/2026 | | | 100,901 | | | | 0.1 | |
| 54,000 | | | Walmart, Inc., 4.000%, 04/15/2030 | | | 53,145 | | | | 0.0 | |
| 87,000 | | | Warnermedia Holdings, Inc., 3.755%, 03/15/2027 | | | 83,803 | | | | 0.1 | |
| 12,000 | | | WEC Energy Group, Inc., 5.000%, 09/27/2025 | | | 12,014 | | | | 0.0 | |
| 16,000 | | | WEC Energy Group, Inc., 5.150%, 10/01/2027 | | | 16,251 | | | | 0.0 | |
| 32,000 (3) | | | Wells Fargo & Co., 2.164%, 02/11/2026 | | | 31,731 | | | | 0.0 | |
| 49,000 | | | Wells Fargo & Co., 3.000%, 10/23/2026 | | | 47,464 | | | | 0.0 | |
| 20,000 (3) | | | Wells Fargo & Co., 3.526%, 03/24/2028 | | | 19,416 | | | | 0.0 | |
| 15,000 (3) | | | Wells Fargo & Co., 3.584%, 05/22/2028 | | | 14,545 | | | | 0.0 | |
| 31,000 (3) | | | Wells Fargo & Co., 4.540%, 08/15/2026 | | | 30,881 | | | | 0.0 | |
| 33,000 (3) | | | Wells Fargo & Co., 5.389%, 04/24/2034 | | | 33,236 | | | | 0.0 | |
| 11,000 | | | Western Midstream Operating L.P., 5.450%, 11/15/2034 | | | 10,736 | | | | 0.0 | |
| 56,000 | | | Westinghouse Air Brake Technologies Corp., 4.700%, 09/15/2028 | | | 55,768 | | | | 0.0 | |
| 30,000 | | | Weyerhaeuser Co., 4.750%, 05/15/2026 | | | 30,000 | | | | 0.0 | |
| 15,000 (2) | | | Williams Cos., Inc., 4.900%, 03/15/2029 | | | 14,984 | | | | 0.0 | |
| 115,000 (1) | | | Williams Scotsman, Inc., 6.625%, 06/15/2029 | | | 116,836 | | | | 0.1 | |
Principal
Amount† | | | | | Value | | | Percentage
of Net
Assets |
| CORPORATE BONDS/NOTES: (continued) | |
| | | | United States: (continued) |
| 13,000 | | | Wisconsin Power and Light Co., 5.375%, 03/30/2034 | | $ | 13,176 | | | | 0.0 | |
| 21,000 | | | WW Grainger, Inc., 4.450%, 09/15/2034 | | | 20,380 | | | | 0.0 | |
| 120,000 (1) | | | Wynn Resorts Finance LLC / Wynn Resorts Capital Corp., 6.250%, 03/15/2033 | | | 119,525 | | | | 0.1 | |
| 125,000 (1) | | | XHR LP, 4.875%, 06/01/2029 | | | 117,448 | | | | 0.1 | |
| 50,000 (1) | | | Zebra Technologies Corp., 6.500%, 06/01/2032 | | | 51,194 | | | | 0.0 | |
| 40,000 | | | Zimmer Biomet Holdings, Inc., 5.350%, 12/01/2028 | | | 40,804 | | | | 0.0 | |
| | | | | | | 32,558,948 | | | | 17.4 | |
| | | | | | | | | | | | |
| | | | Total Corporate Bonds/Notes
(Cost $45,495,970) | | | 45,356,686 | | | | 24.2 | |
| COLLATERALIZED MORTGAGE OBLIGATIONS: 21.3% |
| | | | United States: 21.3% |
| 210,936 (3) | | | Adjustable Rate Mortgage Trust 2006-2 1A1, 4.789%, 05/25/2036 | | | 183,917 | | | | 0.1 | |
| 60,294 (3) | | | Alternative Loan Trust 2005-53T2 2A6, 5.352%, (TSFR1M + 0.614%), 11/25/2035 | | | 32,312 | | | | 0.0 | |
| 101,222 | | | Alternative Loan Trust 2006-13T1 A9, 6.000%, 05/25/2036 | | | 49,898 | | | | 0.0 | |
| 144,777 (3) | | | Alternative Loan Trust 2007-23CB A3, 5.352%, (TSFR1M + 0.614%), 09/25/2037 | | | 52,831 | | | | 0.0 | |
| 316,482 | | | CHL Mortgage Pass-Through Trust 2007-7 A7, 5.750%, 06/25/2037 | | | 151,971 | | | | 0.1 | |
| 236,939 | | | CitiMortgage Alternative Loan Trust Series 2006-A3 1A7, 6.000%, 07/25/2036 | | | 213,508 | | | | 0.1 | |
| 926,849 (1)(3) | | | COLT Mortgage Loan Trust 2021-1 A1, 0.910%, 06/25/2066 | | | 780,400 | | | | 0.4 | |
| 670,633 (1)(3) | | | COLT Mortgage Loan Trust 2021-2 A1, 0.924%, 08/25/2066 | | | 547,667 | | | | 0.3 | |
| 261,483 (1)(3) | | | COLT Mortgage Loan Trust 2021-3 A1, 0.956%, 09/27/2066 | | | 210,740 | | | | 0.1 | |
| 136,638 (1)(3) | | | CSMC Trust 2015-2 B3, 3.884%, 02/25/2045 | | | 128,394 | | | | 0.1 | |
See Accompanying Notes to Financial Statements
| Voya Global Bond Fund | PORTFOLIO OF INVESTMENTS as of October 31, 2024 (continued) |
Principal
Amount† | | | | | Value | | | Percentage
of Net
Assets |
| COLLATERALIZED MORTGAGE OBLIGATIONS: (continued) |
| | | | United States: (continued) |
| 87,848 (1)(3) | | | CSMC Trust 2015-3 B1, 3.806%, 03/25/2045 | | $ | 83,496 | | | | 0.1 | |
| 1,000,000 (1)(3) | | | Fannie Mae Connecticut Avenue Securities 2020- SBT1 2M2, 8.621%, (SOFR30A + 3.764%), 02/25/2040 | | | 1,057,567 | | | | 0.6 | |
| 80,009 | | | Fannie Mae REMIC Trust 2003-22 BZ, 6.000%, 04/25/2033 | | | 81,919 | | | | 0.1 | |
| 2,102,540 (3)(4) | | | Fannie Mae REMIC Trust 2005- 18 SC, 1.064%, (-1.000*SOFR30A + 4.536%), 03/25/2035 | | | 61,471 | | | | 0.0 | |
| 65,909 (3) | | | Fannie Mae REMIC Trust 2005- 74 DK, 4.115%, (-1.000*SOFR30A + 23.542%), 07/25/2035 | | | 65,809 | | | | 0.0 | |
| 58,317 (3) | | | Fannie Mae REMIC Trust 2006- 104 ES, 8.594%, (-1.000*SOFR30A + 32.878%), 11/25/2036 | | | 75,022 | | | | 0.1 | |
| 754,964 (3)(4) | | | Fannie Mae REMIC Trust 2007- 36 SN, 1.799%, (-1.000*SOFR30A + 6.656%), 04/25/2037 | | | 68,377 | | | | 0.0 | |
| 45,985 (3) | | | Fannie Mae REMIC Trust 2007- 55 DS, 2.572%, (-1.000*SOFR30A + 14.714%), 06/25/2037 | | | 41,025 | | | | 0.0 | |
| 319,087 (3)(4) | | | Fannie Mae REMIC Trust 2007- 9 SE, 1.109%, (-1.000*SOFR30A + 5.966%), 03/25/2037 | | | 21,328 | | | | 0.0 | |
| 489,292 (3)(4) | | | Fannie Mae REMIC Trust 2008- 41 S, 1.829%, (-1.000*SOFR30A + 6.686%), 11/25/2036 | | | 46,412 | | | | 0.0 | |
| 398,794 (3)(4) | | | Fannie Mae REMIC Trust 2008- 53 FI, 1.129%, (-1.000*SOFR30A + 5.986%), 07/25/2038 | | | 29,242 | | | | 0.0 | |
| 271,894 (3)(4) | | | Fannie Mae REMIC Trust 2008- 58 SM, 1.129%, (-1.000*SOFR30A + 5.986%), 07/25/2038 | | | 21,170 | | | | 0.0 | |
Principal
Amount† | | | | | Value | | | Percentage
of Net
Assets |
| COLLATERALIZED MORTGAGE OBLIGATIONS: (continued) |
| | | | United States: (continued) |
| 1,495,396 (3)(4) | | | Fannie Mae REMIC Trust 2009-106 SA, 1.279%, (-1.000*SOFR30A + 6.136%), 01/25/2040 | | $ | 105,527 | | | | 0.1 | |
| 147,528 (3) | | | Fannie Mae REMIC Trust 2009-66 SL, 5.407%, (-1.000*SOFR30A + 15.452%), 09/25/2039 | | | 126,581 | | | | 0.1 | |
| 93,200 (3) | | | Fannie Mae REMIC Trust 2009-66 SW, 5.574%, (-1.000*SOFR30A + 15.618%), 09/25/2039 | | | 68,861 | | | | 0.0 | |
| 1,966,575 (3)(4) | | | Fannie Mae REMIC Trust 2010-123 SL, 1.099%, (-1.000*SOFR30A + 5.956%), 11/25/2040 | | | 130,197 | | | | 0.1 | |
| 2,083,212 (3)(4) | | | Fannie Mae REMIC Trust 2011-55 SK, 1.589%, (-1.000*SOFR30A + 6.446%), 06/25/2041 | | | 202,041 | | | | 0.1 | |
| 813,364 (3)(4) | | | Fannie Mae REMIC Trust 2011-86 NS, 0.979%, (-1.000*SOFR30A + 5.836%), 09/25/2041 | | | 51,527 | | | | 0.0 | |
| 135,891 (3)(4) | | | Fannie Mae REMIC Trust 2012-10 US, 1.479%, (-1.000*SOFR30A + 6.336%), 02/25/2042 | | | 15,232 | | | | 0.0 | |
| 321,758 (3)(4) | | | Fannie Mae REMIC Trust 2012-24 HS, 1.579%, (-1.000*SOFR30A + 6.436%), 09/25/2040 | | | 6,585 | | | | 0.0 | |
| 326,136 (4) | | | Fannie Mae REMIC Trust 2013-31 PI, 4.500%, 02/25/2043 | | | 19,483 | | | | 0.0 | |
| 506,662 (4) | | | Fannie Mae REMIC Trust 2013-44 DI, 3.000%, 05/25/2033 | | | 41,192 | | | | 0.0 | |
| 3,690,276 (4) | | | Fannie Mae REMIC Trust 2015-34 DI, 6.500%, 06/25/2045 | | | 861,869 | | | | 0.5 | |
| 10,176,395 (4) | | | Fannie Mae REMIC Trust 2015-58 KI, 6.000%, 03/25/2037 | | | 1,739,403 | | | | 0.9 | |
| 5,503,608 (3)(4) | | | Fannie Mae REMIC Trust 2015-59 SK, 0.679%, (-1.000*SOFR30A + 5.536%), 08/25/2045 | | | 416,525 | | | | 0.2 | |
| | | | | | | | | | | | |
See Accompanying Notes to Financial Statements
| Voya Global Bond Fund | PORTFOLIO OF INVESTMENTS as of October 31, 2024 (continued) |
Principal
Amount† | | | | | Value | | | Percentage
of Net
Assets |
| COLLATERALIZED MORTGAGE OBLIGATIONS: (continued) |
| | | | United States: (continued) |
| 9,977,697 (3)(4) | | | Fannie Mae REMIC Trust 2016-54 SL, 1.029%, (-1.000*SOFR30A + 5.886%), 08/25/2046 | | $ | 1,059,937 | | | | 0.6 | |
| 3,807,673 (4) | | | Fannie Mae REMIC Trust 2017-15 GI, 4.500%, 03/25/2047 | | | 540,949 | | | | 0.3 | |
| 4,737,329 (4) | | | Fannie Mae REMIC Trust 2020-49 PI, 2.000%, 07/25/2050 | | | 586,132 | | | | 0.3 | |
| 66,286 (3)(4) | | | Freddie Mac REMIC Trust 2303 SY, 3.576%, (-1.000*SOFR30A + 8.586%), 04/15/2031 | | | 6,180 | | | | 0.0 | |
| 481,362 (3)(4) | | | Freddie Mac REMIC Trust 2989 GU, 1.876%, (-1.000*SOFR30A + 6.886%), 02/15/2033 | | | 29,237 | | | | 0.0 | |
| 556,435 (3)(4) | | | Freddie Mac REMIC Trust 3271 SB, 0.926%, (-1.000*SOFR30A + 5.936%), 02/15/2037 | | | 39,227 | | | | 0.0 | |
| 1,565,561 (3)(4) | | | Freddie Mac REMIC Trust 3424 HI, 0.776%, (-1.000*SOFR30A + 5.786%), 04/15/2038 | | | 110,162 | | | | 0.1 | |
| 250,990 (4) | | | Freddie Mac REMIC Trust 3632 IP, 5.000%, 02/15/2040 | | | 27,500 | | | | 0.0 | |
| 1,169,557 (3)(4) | | | Freddie Mac REMIC Trust 3693 SC, 1.376%, (-1.000*SOFR30A + 6.386%), 07/15/2040 | | | 125,000 | | | | 0.1 | |
| 1,862,190 (3)(4) | | | Freddie Mac REMIC Trust 3856 KS, 1.426%, (-1.000*SOFR30A + 6.436%), 05/15/2041 | | | 183,827 | | | | 0.1 | |
| 240,365 (3)(4) | | | Freddie Mac REMIC Trust 3925 SD, 0.926%, (-1.000*SOFR30A + 5.936%), 07/15/2040 | | | 5,400 | | | | 0.0 | |
| 4,115,140 (3)(4) | | | Freddie Mac REMIC Trust 3988 NS, 1.351%, (-1.000*SOFR30A + 6.361%), 01/15/2042 | | | 472,842 | | | | 0.3 | |
| 819,714 (3)(4) | | | Freddie Mac REMIC Trust 4040 SW, 1.506%, (-1.000*SOFR30A + 6.516%), 05/15/2032 | | | 52,465 | | | | 0.0 | |
Principal
Amount† | | | | | Value | | | Percentage
of Net
Assets |
| COLLATERALIZED MORTGAGE OBLIGATIONS: (continued) | |
| | | | United States: (continued) |
| 3,184,053 (4) | | | Freddie Mac REMIC Trust 4091 IK, 5.000%, 10/15/2041 | | $ | 659,040 | | | | 0.4 | |
| 7,632,036 (3)(4) | | | Freddie Mac REMIC Trust 4096 SB, 0.876%, (-1.000*SOFR30A + 5.886%), 08/15/2042 | | | 753,298 | | | | 0.4 | |
| 359,619 (4) | | | Freddie Mac REMIC Trust 4152 BI, 4.000%, 12/15/2041 | | | 25,853 | | | | 0.0 | |
| 576,326 (4) | | | Freddie Mac REMIC Trust 4313 MI, 5.000%, 04/15/2039 | | | 54,798 | | | | 0.0 | |
| 4,836,301 (3)(4) | | | Freddie Mac REMIC Trust 4480 WS, 1.056%, (-1.000*SOFR30A + 6.066%), 06/15/2045 | | | 551,391 | | | | 0.3 | |
| 7,525,182 (3)(4) | | | Freddie Mac REMIC Trust 4623 MS, 0.876%, (-1.000*SOFR30A + 5.886%), 10/15/2046 | | | 815,956 | | | | 0.4 | |
| 11,042,463 (4) | | | Freddie Mac REMIC Trust 4695 IO, 4.500%, 10/15/2041 | | | 2,131,076 | | | | 1.1 | |
| 1,065,733 | | | Freddie Mac REMIC Trust 4800 MZ, 4.000%, 06/15/2048 | | | 995,424 | | | | 0.5 | |
| 1,151,809 | | | Freddie Mac REMIC Trust 4879 ZA, 4.000%, 05/15/2049 | | | 1,075,160 | | | | 0.6 | |
| 8,731,469 (3)(4) | | | Freddie Mac REMIC Trust 4938 ES, 1.029%, (-1.000*SOFR30A + 5.886%), 12/25/2049 | | | 840,624 | | | | 0.5 | |
| 11,842,187 (4) | | | Freddie Mac REMIC Trust 5046 IO, 2.000%, 11/25/2040 | | | 1,130,583 | | | | 0.6 | |
| 700,000 (1)(3) | | | Freddie Mac STACR REMIC Trust 2021- HQA3 M2, 6.957%, (SOFR30A + 2.100%), 09/25/2041 | | | 706,447 | | | | 0.4 | |
| 600,000 (1)(3) | | | Freddie Mac STACR REMIC Trust 2022- DNA2 M1B, 7.257%, (SOFR30A + 2.400%), 02/25/2042 | | | 614,119 | | | | 0.3 | |
| 500,000 (1)(3) | | | Freddie Mac STACR REMIC Trust 2022- DNA2 M2, 8.607%, (SOFR30A + 3.750%), 02/25/2042 | | | 524,075 | | | | 0.3 | |
See Accompanying Notes to Financial Statements
| Voya Global Bond Fund | PORTFOLIO OF INVESTMENTS as of October 31, 2024 (continued) |
Principal
Amount† | | | | | Value | | | Percentage
of Net
Assets |
| COLLATERALIZED MORTGAGE OBLIGATIONS: (continued) |
| | | | United States: (continued) |
| 950,000 (1)(3) | | | Freddie Mac STACR REMIC Trust 2023-HQA2 M1B, 8.207%, (SOFR30A + 3.350%), 06/25/2043 | | $ | 994,226 | | | | 0.5 | |
| 6,944,992 (4) | | | Freddie Mac Strips 324 C21, 6.000%, 06/15/2039 | | | 1,466,580 | | | | 0.8 | |
| 108,682 (3)(4) | | | Freddie Mac Strips 351 103, 4.000%, 01/15/2031 | | | 8,161 | | | | 0.0 | |
| 411,606 (3)(4) | | | Freddie Mac Strips 351 200, 3.500%, 02/15/2046 | | | 54,323 | | | | 0.0 | |
| 2,214,191 (4) | | | Freddie Mac Strips 351 C14, 3.500%, 02/15/2031 | | | 153,144 | | | | 0.1 | |
| 6,885,171 (4) | | | Freddie Mac Strips 351 C22, 3.500%, 02/15/2046 | | | 1,310,236 | | | | 0.7 | |
| 5,147,077 (4) | | | Freddie Mac Strips 351 C23, 4.000%, 02/15/2046 | | | 1,103,516 | | | | 0.6 | |
| 879,469 (3)(4) | | | Freddie Mac Strips 351 C30, 2.500%, 02/15/2031 | | | 34,303 | | | | 0.0 | |
| 1,084,791 (3)(4) | | | Freddie Mac Strips 351 C31, 3.000%, 02/15/2031 | | | 57,498 | | | | 0.0 | |
| 715,782 (3)(4) | | | Freddie Mac Strips 351 C32, 3.500%, 02/15/2031 | | | 47,086 | | | | 0.0 | |
| 2,760,844 (3)(4) | | | Freddie Mac Strips 351 C33, 4.000%, 02/15/2046 | | | 466,648 | | | | 0.3 | |
| 5,507,765 (3)(4) | | | Freddie Mac Strips 351 C34, 3.500%, 02/15/2046 | | | 1,002,160 | | | | 0.5 | |
| 6,706,838 (4) | | | Freddie Mac Strips 390 C5, 2.000%, 04/15/2042 | | | 643,864 | | | | 0.4 | |
| 162,587 (1)(3) | | | Galton Funding Mortgage Trust 2018-2 A51, 4.500%, 10/25/2058 | | | 154,775 | | | | 0.1 | |
| 126,870 (3) | | | Ginnie Mae 2007-8 SP, 6.246%, (-1.000*TSFR1M + 21.677%), 03/20/2037 | | | 147,807 | | | | 0.1 | |
| 6,440,177 (3)(4) | | | Ginnie Mae 2009-106 CM, 1.700%, (-1.000*TSFR1M + 6.486%), 01/16/2034 | | | 175,075 | | | | 0.1 | |
| 618,011 (3)(4) | | | Ginnie Mae 2010-116 NS, 1.750%, (-1.000*TSFR1M + 6.536%), 09/16/2040 | | | 44,723 | | | | 0.0 | |
| 51,555 (4) | | | Ginnie Mae 2010-6 IA, 5.000%, 11/20/2039 | | | 1,685 | | | | 0.0 | |
Principal
Amount† | | | | | Value | | | Percentage
of Net
Assets |
| COLLATERALIZED MORTGAGE OBLIGATIONS: (continued) |
| | | | United States: (continued) |
| 108,711 (4) | | | Ginnie Mae 2011-116 BI, 4.000%, 08/16/2026 | | $ | 1,054 | | | | 0.0 | |
| 613,794 (4) | | | Ginnie Mae 2013-115 NI, 4.500%, 01/16/2043 | | | 67,760 | | | | 0.0 | |
| 180,320 (4) | | | Ginnie Mae 2013-5 NI, 3.000%, 01/20/2028 | | | 4,748 | | | | 0.0 | |
| 7,905,991 (4) | | | Ginnie Mae 2015-10 IX, 4.500%, 01/20/2045 | | | 1,733,162 | | | | 0.9 | |
| 641,553 (4) | | | Ginnie Mae 2015-178 GI, 4.000%, 05/20/2044 | | | 57,237 | | | | 0.0 | |
| 3,004,481 (4) | | | Ginnie Mae 2016-161 CI, 5.500%, 11/20/2046 | | | 507,722 | | | | 0.3 | |
| 5,214,636 (4) | | | Ginnie Mae 2019-89 QI, 4.000%, 04/20/2046 | | | 930,961 | | | | 0.5 | |
| 139,235 (3) | | | GreenPoint Mortgage Funding Trust 2006-AR3 4A1, 5.272%, (TSFR1M + 0.534%), 04/25/2036 | | | 121,688 | | | | 0.1 | |
| 8,590 (1)(3) | | | GS Mortgage-Backed Securities Corp. Trust 2019-PJ2 A1, 4.000%, 11/25/2049 | | | 8,015 | | | | 0.0 | |
| 7,970 (1)(3) | | | GS Mortgage-Backed Securities Corp. Trust 2019-PJ3 A1, 3.500%, 03/25/2050 | | | 7,390 | | | | 0.0 | |
| 752,296 (1)(3) | | | GS Mortgage-Backed Securities Corp. Trust 2021-PJ3 A4, 2.500%, 08/25/2051 | | | 604,944 | | | | 0.3 | |
| 339,261 (1)(3) | | | GS Mortgage-Backed Securities Trust 2022-PJ1 A4, 2.500%, 05/28/2052 | | | 271,540 | | | | 0.2 | |
| 1,322,584 (1)(3) | | | GS Mortgage-Backed Securities Trust 2022-PJ6 A24, 3.000%, 01/25/2053 | | | 1,102,729 | | | | 0.6 | |
| 425,321 (1)(3) | | | J.P. Morgan Mortgage Trust 2022-4 A17A, 3.000%, 10/25/2052 | | | 354,619 | | | | 0.2 | |
| 687,730 (1)(3) | | | J.P. Morgan Mortgage Trust 2022-6 A3, 3.000%, 11/25/2052 | | | 582,368 | | | | 0.3 | |
| 297,123 (1)(3) | | | JP Morgan Mortgage Trust 2019-8 A5, 3.500%, 03/25/2050 | | | 265,193 | | | | 0.2 | |
| 47,480 (1)(3) | | | JP Morgan Mortgage Trust 2019-INV3 A15, 3.500%, 05/25/2050 | | | 42,293 | | | | 0.0 | |
See Accompanying Notes to Financial Statements
| Voya Global Bond Fund | PORTFOLIO OF INVESTMENTS as of October 31, 2024 (continued) |
Principal
Amount† | | | | | Value | | | Percentage
of Net
Assets |
| COLLATERALIZED MORTGAGE OBLIGATIONS: (continued) |
| | | | United States: (continued) |
| 79,134 (1)(3) | | | JP Morgan Mortgage Trust 2019-INV3 A3, 3.500%, 05/25/2050 | | $ | 70,489 | | | | 0.0 | |
| 6,674 (1)(3) | | | JP Morgan Mortgage Trust 2019-LTV3 A15, 3.498%, 03/25/2050 | | | 6,482 | | | | 0.0 | |
| 63,131 (1)(3) | | | JP Morgan Mortgage Trust 2020-5 A15, 3.000%, 12/25/2050 | | | 53,187 | | | | 0.0 | |
| 153,725 (1)(3) | | | JP Morgan Trust 2015-3 A3, 3.500%, 05/25/2045 | | | 140,367 | | | | 0.1 | |
| 296,729 (1)(3) | | | Mill City Mortgage Loan Trust 2017-1 M2, 3.250%, 11/25/2058 | | | 290,656 | | | | 0.2 | |
| 300,000 (1)(3) | | | Mill City Mortgage Loan Trust 2017-2 M2, 3.250%, 07/25/2059 | | | 286,716 | | | | 0.2 | |
| 276,424 (1)(3) | | | Morgan Stanley Residential Mortgage Loan Trust 2021-2 A9, 2.500%, 05/25/2051 | | | 221,584 | | | | 0.1 | |
| 47,356 (1)(3) | | | OBX Trust 2019-INV2 A25, 4.000%, 05/27/2049 | | | 43,770 | | | | 0.0 | |
| 142,431 (1)(3) | | | OBX Trust 2020-INV1 A21, 3.500%, 12/25/2049 | | | 126,699 | | | | 0.1 | |
| 515,597 (1)(3) | | | RATE Mortgage Trust 2021-HB1 A31, 2.500%, 12/25/2051 | | | 412,677 | | | | 0.2 | |
| 15,625 (1)(3) | | | Sequoia Mortgage Trust 2018-CH1 A19, 4.000%, 03/25/2048 | | | 14,476 | | | | 0.0 | |
| 300,000 (1)(3) | | | Sequoia Mortgage Trust 2020-4 A8, 2.500%, 11/25/2050 | | | 213,156 | | | | 0.1 | |
| 1,352 (3) | | | Structured Asset Securities Corp. 2004-4XS 1A6, 4.822%, 02/25/2034 | | | 1,329 | | | | 0.0 | |
| 1,000,000 (1)(3) | | | Verus Securitization Trust 2021-1 M1, 1.968%, 01/25/2066 | | | 759,767 | | | | 0.4 | |
| 5,164,342 (3)(4) | | | WaMu Mortgage Pass-Through Certificates 2005-AR11 X, 1.410%, 08/25/2045 | | | 5,456 | | | | 0.0 | |
| 34,868 (3) | | | WaMu Mortgage Pass-Through Certificates 2006-AR12 1A1, 4.863%, 10/25/2036 | | | 31,535 | | | | 0.0 | |
| 250,443 (3) | | | WaMu Mortgage Pass-Through Certificates 2007-HY2 1A1, 4.311%, 12/25/2036 | | | 222,392 | | | | 0.1 | |
Principal
Amount† | | | | | Value | | | Percentage
of Net
Assets |
| COLLATERALIZED MORTGAGE OBLIGATIONS: (continued) |
| | | | United States: (continued) |
| 60,563 (3) | | | Wells Fargo Alternative Loan Trust 2007-PA2 2A1, 5.282%, (TSFR1M + 0.544%), 06/25/2037 | | $ | 49,680 | | | | 0.0 | |
| 348,555 (1)(3) | | | Wells Fargo Mortgage Backed Securities Trust 2021-1 A17, 2.500%, 12/25/2050 | | | 279,405 | | | | 0.2 | |
| 256,066 (1)(3) | | | WinWater Mortgage Loan Trust 2015-5 B4, 3.755%, 08/20/2045 | | | 231,772 | | | | 0.1 | |
| | | | | | | 39,897,029 | | | | 21.3 | |
| | | | Total Collateralized Mortgage Obligations
(Cost $43,374,393) | | | 39,897,029 | | | | 21.3 | |
| SOVEREIGN BONDS: 17.6% |
| | | | Australia: 0.2% |
| AUD837,000 (1) | | | Queensland Treasury Corp., 1.750%, 07/20/2034 | | | 405,762 | | | | 0.2 | |
| | | | | | | | | | | | |
| | | | Belgium: 1.0% |
| 1,954,000 (1) | | | Kingdom of Belgium Government International Bond, 4.875%, 06/10/2055 | | | 1,913,106 | | | | 1.0 | |
| | | | | | | | | | | | |
| | | | Brazil: 0.5% |
| BRL1,310,000 | | | Brazil Notas do Tesouro Nacional Serie B NTNB, 6.000%, 08/15/2050 | | | 913,520 | | | | 0.5 | |
| | | | | | | | | | | | |
| | | | Canada: 1.1% |
| CAD1,100,000 | | | Canadian Government Bond 0004, 2.000%, 12/01/2051 | | | 606,159 | | | | 0.3 | |
| 1,501,000 | | | Province of British Columbia Canada, 4.200%, 07/06/2033 | | | 1,458,700 | | | | 0.8 | |
| | | | | | | 2,064,859 | | | | 1.1 | |
| | | | | | | | | | | | |
| | | | China: 9.2% |
| CNY21,900,000 | | | China Government Bond INBK, 2.520%, 08/25/2033 | | | 3,165,265 | | | | 1.7 | |
| CNY4,050,000 | | | China Government Bond INBK, 2.690%, 08/12/2026 | | | 580,970 | | | | 0.3 | |
| CNY5,650,000 | | | China Government Bond INBK, 2.800%, 11/15/2032 | | | 834,044 | | | | 0.5 | |
| CNY31,470,000 | | | China Government Bond INBK, 2.850%, 06/04/2027 | | | 4,562,804 | | | | 2.4 | |
See Accompanying Notes to Financial Statements
| Voya Global Bond Fund | PORTFOLIO OF INVESTMENTS as of October 31, 2024 (continued) |
Principal
Amount† | | | | | Value | | | Percentage
of Net
Assets |
| SOVEREIGN BONDS: (continued) |
| | | | China: (continued) |
| CNY1,600,000 | | | China Government Bond INBK, 2.880%, 02/25/2033 | | $ | 238,704 | | | | 0.1 | |
| CNY3,400,000 | | | China Government Bond INBK, 3.120%, 10/25/2052 | | | 552,422 | | | | 0.3 | |
| CNY26,170,000 | | | China Government Bond INBK, 3.250%, 06/06/2026 | | | 3,782,255 | | | | 2.0 | |
| CNY1,010,000 | | | China Government Bond INBK, 3.290%, 05/23/2029 | | | 151,914 | | | | 0.1 | |
| CNY2,970,000 | | | China Government Bond INBK, 3.320%, 04/15/2052 | | | 498,963 | | | | 0.3 | |
| CNY9,950,000 | | | China Government Bond INBK, 4.080%, 10/22/2048 | | | 1,836,732 | | | | 1.0 | |
| CNY6,950,000 | | | China Government Bond SH, 2.690%, 08/15/2032 | | | 1,017,562 | | | | 0.5 | |
| | | | | | | 17,221,635 | | | | 9.2 | |
| | | | | | | | | | | | |
| | | | Colombia: 0.5% |
| 325,000 | | | Colombia Government International Bond, 8.375%, 11/07/2054 | | | 317,006 | | | | 0.2 | |
| COP2,551,900,000 | | | Colombian TES B, 7.750%, 09/18/2030 | | | 515,577 | | | | 0.3 | |
| | | | | | | 832,583 | | | | 0.5 | |
| | | | | | | | | | | | |
| | | | Czechia: 0.2% |
| CZK9,220,000 | | | Czech Republic Government Bond 105, 2.750%, 07/23/2029 | | | 379,250 | | | | 0.2 | |
| | | | | | | | | | | | |
| | | | Germany: 0.1% |
| EUR60,000 | | | Bundesrepublik Deutschland Bundesanleihe, 0.500%, 02/15/2028 | | | 61,935 | | | | 0.1 | |
| EUR40,000 | | | Bundesrepublik Deutschland Bundesanleihe, 1.000%, 08/15/2025 | | | 43,003 | | | | 0.0 | |
| EUR30,000 | | | Bundesrepublik Deutschland Bundesanleihe, 2.730%, 08/15/2026 | | | 31,366 | | | | 0.0 | |
| | | | | | | 136,304 | | | | 0.1 | |
| | | | | | | | | | | | |
| | | | Indonesia: 0.5% |
| IDR13,833,000,000 | | | Indonesia Treasury Bond FR79, 8.375%, 04/15/2039 | | | 994,178 | | | | 0.5 | |
Principal
Amount† | | | | | Value | | | Percentage
of Net
Assets |
| SOVEREIGN BONDS: (continued) |
| | | | Italy: 0.8% |
| EUR641,000 (1) | | | Italy Buoni Poliennali Del Tesoro 30Y, 3.850%, 09/01/2049 | | $ | 672,645 | | | | 0.4 | |
| EUR641,000 (1) | | | Italy Buoni Poliennali Del Tesoro 31Y, 5.000%, 08/01/2034 | | | 780,951 | | | | 0.4 | |
| | | | | | | 1,453,596 | | | | 0.8 | |
| | | | Malaysia: 0.4% |
| MYR3,642,000 | | | Malaysia Government Bond 0419, 3.828%, 07/05/2034 | | | 825,875 | | | | 0.4 | |
| | | | | | | | | | | | |
| | | | Peru: 0.6% |
| PEN4,000,000 | | | Peru Government Bond, 6.350%, 08/12/2028 | | | 1,106,731 | | | | 0.6 | |
| | | | | | | | | | | | |
| | | | Poland: 0.2% |
| PLN1,525,000 | | | Republic of Poland Government Bond 0728, 7.500%, 07/25/2028 | | | 407,300 | | | | 0.2 | |
| | | | | | | | | | | | |
| | | | Romania: 0.1% |
| 194,000 (1) | | | Romanian Government International Bond, 6.375%, 01/30/2034 | | | 194,121 | | | | 0.1 | |
| | | | | | | | | | | | |
| | | | Russian Federation: —% |
| RUB47,938,000 (5)(6) | | | Russian Federal Bond - OFZ 6224, 6.900%, 05/23/2029 | | | — | | | | — | |
| | | | | | | | | | | | |
| | | | South Africa: 0.1% |
| 275,000 | | | Republic of South Africa Government International Bond, 4.850%, 09/30/2029 | | | 259,703 | | | | 0.1 | |
| | | | | | | | | | | | |
| | | | Spain: 0.7% |
| EUR1,284,000 (1) | | | Spain Government Bond, 1.450%, 04/30/2029 | | | 1,327,524 | | | | 0.7 | |
| | | | | | | | | | | | |
| | | | Supranational: 0.5% |
| 800,000 (5) | | | European Bank for Reconstruction & Development, 20.000%, 03/19/2025 | | | 876,736 | | | | 0.5 | |
| | | | | | | | | | | | |
| | | | Thailand: 0.8% |
| THB41,793,000 | | | Thailand Government Bond, 2.875%, 12/17/2028 | | | 1,272,646 | | | | 0.7 | |
See Accompanying Notes to Financial Statements
| Voya Global Bond Fund | PORTFOLIO OF INVESTMENTS as of October 31, 2024 (continued) |
Principal
Amount† | | | | | Value | | | Percentage
of Net
Assets |
| SOVEREIGN BONDS: (continued) |
| | | | Thailand: (continued) |
| THB8,250,000 | | | Thailand Government Bond, 3.350%, 06/17/2033 | | $ | 262,371 | | | | 0.1 | |
| | | | | | | 1,535,017 | | | | 0.8 | |
| | | | | | | | | | | | |
| | | | Ukraine: 0.1% |
| 243,989 (1)(7) | | | Ukraine Government International Bond, 1.750% (Step Rate @ 4.500% on 01/08/2025), 02/01/2035 | | | 112,540 | | | | 0.1 | |
| 185,707 (1)(7) | | | Ukraine Government International Bond, 1.750% (Step Rate @ 4.500% on 01/08/2025), 02/01/2036 | | | 84,265 | | | | 0.0 | |
| | | | | | | 196,805 | | | | 0.1 | |
| | | | Total Sovereign Bonds
(Cost $35,120,807) | | | 33,044,605 | | | | 17.6 | |
| COMMERCIAL MORTGAGE-BACKED SECURITIES: 10.2% |
| | | | United States: 10.2% |
| 500,000 (3) | | | BANK 2017-BNK4 C, 4.372%, 05/15/2050 | | | 419,317 | | | | 0.2 | |
| 5,765,908 (3)(4) | | | BANK 2017- BNK5 XA, 0.945%, 06/15/2060 | | | 111,314 | | | | 0.1 | |
| 919,206 (3)(4) | | | BANK 2019- BN16 XA, 0.935%, 02/15/2052 | | | 29,238 | | | | 0.0 | |
| 8,660,418 (3)(4) | | | BBCMS Mortgage Trust 2022-C17 XA, 1.150%, 09/15/2055 | | | 601,709 | | | | 0.3 | |
| 280,000 (1) | | | Benchmark Mortgage Trust 2019-B9 D, 3.000%, 03/15/2052 | | | 171,068 | | | | 0.1 | |
| 1,354,396 (3)(4) | | | Benchmark Mortgage Trust 2019-B9 XA, 1.014%, 03/15/2052 | | | 48,460 | | | | 0.0 | |
| 10,300,990 (3)(4) | | | Benchmark Mortgage Trust 2020-B21 XA, 1.439%, 12/17/2053 | | | 604,468 | | | | 0.3 | |
| 6,382,563 (3)(4) | | | Benchmark Mortgage Trust 2021-B23 XA, 1.261%, 02/15/2054 | | | 335,593 | | | | 0.2 | |
| 175,000 (1)(3) | | | BX 2021-MFM1 D, 6.418%, (TSFR1M + 1.614%), 01/15/2034 | | | 173,585 | | | | 0.1 | |
| 700,000 (1)(3) | | | BX Commercial Mortgage Trust 2021-21M E, 7.089%, (TSFR1M + 2.285%), 10/15/2036 | | | 689,586 | | | | 0.4 | |
| 1,888,000 (1)(3) | | | BX Commercial Mortgage Trust 2021- IRON E, 7.268%, (TSFR1M + 2.464%), 02/15/2038 | | | 1,809,353 | | | | 1.0 | |
Principal
Amount† | | | | | Value | | | Percentage
of Net
Assets |
| COMMERCIAL MORTGAGE-BACKED SECURITIES: (continued) |
| | | | United States: (continued) |
| 875,000 (1)(3) | | | BX Commercial Mortgage Trust 2024-AIRC A, 6.495%, (TSFR1M + 1.691%), 08/15/2039 | | $ | 877,877 | | | | 0.5 | |
| 500,000 (1)(3) | | | BX Commercial Mortgage Trust 2024-KING A, 6.345%, (TSFR1M + 1.541%), 05/15/2034 | | | 500,768 | | | | 0.3 | |
| 500,000 (1)(3) | | | BX Trust 2021-LBA EJV, 6.918%, (TSFR1M + 2.114%), 02/15/2036 | | | 492,432 | | | | 0.3 | |
| 395,405 (1)(3) | | | BX Trust 2021-LBA EV, 6.918%, (TSFR1M + 2.114%), 02/15/2036 | | | 387,725 | | | | 0.2 | |
| 600,000 (1)(3) | | | BX Trust 2021-LGCY D, 6.220%, (TSFR1M + 1.416%), 10/15/2036 | | | 590,879 | | | | 0.3 | |
| 750,000 (1)(3) | | | BX Trust 2023-DELC A, 7.494%, (TSFR1M + 2.690%), 05/15/2038 | | | 757,086 | | | | 0.4 | |
| 2,636,919 (3)(4) | | | CD Mortgage Trust 2016-CD1 XA, 1.343%, 08/10/2049 | | | 35,753 | | | | 0.0 | |
| 8,581,000 (3)(4) | | | Citigroup Commercial Mortgage Trust 2016-C2 XB, 0.793%, 08/10/2049 | | | 108,785 | | | | 0.1 | |
| 1,400,000 (3) | | | Citigroup Commercial Mortgage Trust 2016-P4 C, 3.938%, 07/10/2049 | | | 1,218,787 | | | | 0.7 | |
| 2,729,898 (3)(4) | | | Citigroup Commercial Mortgage Trust 2017-C4 XA, 0.979%, 10/12/2050 | | | 60,801 | | | | 0.0 | |
| 5,109,675 (3)(4) | | | COMM Mortgage Trust 2016-CR28 XA, 0.619%, 02/10/2049 | | | 22,476 | | | | 0.0 | |
| 10,282,872 (1)(3)(4) | | | Commercial Mortgage Pass Through Certificates 2012-LTRT XA, 0.788%, 10/05/2030 | | | 38,632 | | | | 0.0 | |
| 500,000 (3) | | | CSAIL Commercial Mortgage Trust 2018-C14 B, 4.877%, 11/15/2051 | | | 459,895 | | | | 0.2 | |
| 750,000 (1) | | | ELM Trust 2024-ELM C15, 6.189%, 06/10/2039 | | | 758,174 | | | | 0.4 | |
| 7,012,033 (3)(4) | | | Freddie Mac Multifamily Structured Pass Through Certificates K122 X1, 0.875%, 11/25/2030 | | | 292,887 | | | | 0.2 | |
See Accompanying Notes to Financial Statements
| Voya Global Bond Fund | PORTFOLIO OF INVESTMENTS as of October 31, 2024 (continued) |
Principal
Amount† | | | | | Value | | | Percentage
of Net
Assets |
| COMMERCIAL MORTGAGE-BACKED SECURITIES: (continued) |
| | | | United States: (continued) |
| 24,591,036 (3)(4) | | | Freddie Mac Multifamily Structured Pass Through Certificates K151 X1, 0.347%, 04/25/2030 | | $ | 391,144 | | | | 0.2 | |
| 3,515,994 (3)(4) | | | Freddie Mac Multifamily Structured Pass Through Certificates K-1517 X1, 1.323%, 07/25/2035 | | | 344,002 | | | | 0.2 | |
| 5,472,650 (3)(4) | | | Freddie Mac Multifamily Structured Pass Through Certificates K-1518 X1, 0.862%, 10/25/2035 | | | 346,818 | | | | 0.2 | |
| 1,800,000 (1)(8) | | | FREMF Mortgage Trust 2019-KG01 C, 0.000%, 05/25/2029 | | | 1,200,036 | | | | 0.6 | |
| 50,408,079 (1)(4) | | | FREMF Mortgage Trust 2019-KG01 X2A, 0.100%, 04/25/2029 | | | 106,338 | | | | 0.1 | |
| 5,680,000 (1)(4) | | | FREMF Mortgage Trust 2019-KG01 X2B, 0.100%, 05/25/2029 | | | 19,109 | | | | 0.0 | |
| 557,000 (1) | | | GAM RE-REMIC Trust 2022-FRR3 BK71, 1.988%, 11/27/2050 | | | 467,977 | | | | 0.2 | |
| 10,043 (1)(8) | | | GAM RE-REMIC Trust 2022-FRR3 C728, 0.000%, 08/27/2050 | | | 9,988 | | | | 0.0 | |
| 220,000 (1)(8) | | | GAM RE-REMIC Trust 2022-FRR3 CK47, 0.000%, 05/27/2048 | | | 209,430 | | | | 0.1 | |
| 215,000 (1)(8) | | | GAM RE-REMIC Trust 2022-FRR3 D728, 0.000%, 08/27/2050 | | | 213,678 | | | | 0.1 | |
| 173,000 (1)(8) | | | GAM RE-REMIC Trust 2022-FRR3 DK41, 0.000%, 10/27/2047 | | | 172,112 | | | | 0.1 | |
| 220,000 (1)(8) | | | GAM RE-REMIC Trust 2022-FRR3 DK47, 0.000%, 05/27/2048 | | | 206,887 | | | | 0.1 | |
| 7,267,399 (3)(4) | | | GS Mortgage Securities Trust 2017-GS6 XA, 0.998%, 05/10/2050 | | | 140,422 | | | | 0.1 | |
| 750,000 (3) | | | GS Mortgage Securities Trust 2018-GS9 A4, 3.992%, 03/10/2051 | | | 723,267 | | | | 0.4 | |
| 300,000 (1)(3) | | | GSMS Trustair 2024-FAIR A, 5.876%, 07/15/2029 | | | 304,731 | | | | 0.2 | |
Principal
Amount† | | | | | Value | | | Percentage
of Net
Assets |
| COMMERCIAL MORTGAGE-BACKED SECURITIES: (continued) |
| | | | United States: (continued) |
| 979,514 (1)(3) | | | KSL Commercial Mortgage Trust 2023-HT A, 7.094%, (TSFR1M + 2.290%), 12/15/2036 | | $ | 982,713 | | | | 0.5 | |
| 3,485,638 (1)(3)(4) | | | LSTAR Commercial Mortgage Trust 2017-5 X, 0.834%, 03/10/2050 | | | 44,219 | | | | 0.0 | |
| 21,550,000 (1)(3)(4) | | | Morgan Stanley Bank of America Merrill Lynch Trust 2014 C19 2014-C19 XB, 0.506%, 12/15/2047 | | | 8,577 | | | | 0.0 | |
| 150,000 (1)(3) | | | RFM Reremic Trust 2022-FRR1 AB60, 2.379%, 11/08/2049 | | | 134,655 | | | | 0.1 | |
| 230,000 (1)(3) | | | RFM Reremic Trust 2022-FRR1 AB64, 2.232%, 03/01/2050 | | | 204,673 | | | | 0.1 | |
| 70,000 (1)(8) | | | RFM Reremic Trust 2022-FRR1 CK60, 0.000%, 11/08/2049 | | | 57,953 | | | | 0.0 | |
| 500,000 (1)(3) | | | WCORE Commercial Mortgage Trust 2024-CORE C, 6.941%, (TSFR1M + 2.241%), 11/15/2041 | | | 500,597 | | | | 0.3 | |
| 350,000 | | | Wells Fargo Commercial Mortgage Trust 2014-LC18 B, 3.959%, 12/15/2047 | | | 346,194 | | | | 0.2 | |
| 5,039,765 (3)(4) | | | Wells Fargo Commercial Mortgage Trust 2020-C55 XA, 1.287%, 02/15/2053 | | | 261,290 | | | | 0.1 | |
| | | | | | | 18,993,458 | | | | 10.2 | |
| | | | Total Commercial Mortgage-Backed Securities
(Cost $19,219,681) | | | 18,993,458 | | | | 10.2 | |
| ASSET-BACKED SECURITIES: 9.4% |
| | | | Cayman Islands: 2.8% |
| 750,000 (1)(3) | | | Barings Clo Ltd. 2019-4A CR, 6.856%, (TSFR3M + 2.200%), 07/15/2037 | | | 758,998 | | | | 0.4 | |
| 850,000 (1)(3) | | | Barings CLO Ltd. 2024-1A A, 6.247%, (TSFR3M + 1.630%), 01/20/2037 | | | 853,825 | | | | 0.5 | |
| 500,000 (1)(3) | | | Madison Park Funding XXXI Ltd. 2018-31A CR, 6.876%, (TSFR3M + 2.250%), 07/23/2037 | | | 502,708 | | | | 0.3 | |
See Accompanying Notes to Financial Statements
| Voya Global Bond Fund | PORTFOLIO OF INVESTMENTS as of October 31, 2024 (continued) |
Principal
Amount† | | | | | Value | | | Percentage
of Net
Assets |
| ASSET-BACKED SECURITIES: (continued) |
| | | | Cayman Islands: (continued) |
| 450,000 (1)(3) | | | Mountain View CLO XVIII Ltd. 2024-1A C, 6.737%, (TSFR3M + 2.200%), 10/16/2037 | | $ | 450,913 | | | | 0.2 | |
| 300,000 (1)(3) | | | Oaktree CLO Ltd. 2022-3A CR, 6.756%, (TSFR3M + 2.100%), 10/15/2037 | | | 300,751 | | | | 0.2 | |
| 1,350,000 (1)(3) | | | Octagon Investment Partners 43 Ltd. 2019-1A CR, 7.076%, (TSFR3M + 2.450%), 10/25/2032 | | | 1,358,128 | | | | 0.7 | |
| 460,000 (1)(3) | | | Venture 37 CLO Ltd. 2019-37A A1RR, 5.906%, (TSFR3M + 1.250%), 07/15/2032 | | | 460,175 | | | | 0.2 | |
| 500,000 (1)(3) | | | Wind River CLO Ltd. 2022-1A AR, 5.967%, (TSFR3M + 1.350%), 07/20/2035 | | | 500,173 | | | | 0.3 | |
| | | | | | | 5,185,671 | | | | 2.8 | |
| | | | | | | | | | | | |
| | | | United States: 6.6% |
| 250,000 (1)(3) | | | AIG CLO LLC 2021- 1A C, 6.643%, (TSFR3M + 2.012%), 04/22/2034 | | | 250,618 | | | | 0.1 | |
| 400,000 (1)(3) | | | Apidos CLO XXIV 2016-24A BRR, 6.929%, (TSFR3M + 2.312%), 10/20/2030 | | | 402,165 | | | | 0.2 | |
| 843,926 (1)(3) | | | Arbor Realty Commercial Real Estate Notes Ltd. 2021-FL4 A, 6.268%, (TSFR1M + 1.464%), 11/15/2036 | | | 843,276 | | | | 0.5 | |
| 500,000 (1)(3) | | | BlueMountain CLO Ltd. 2013-2A CR, 6.843%, (TSFR3M + 2.212%), 10/22/2030 | | | 501,282 | | | | 0.3 | |
| 250,000 (1)(3) | | | BlueMountain CLO XXVIII Ltd. 2021-28A C, 6.918%, (TSFR3M + 2.262%), 04/15/2034 | | | 250,187 | | | | 0.1 | |
| 500,000 (1)(3) | | | BlueMountain CLO XXXI Ltd. 2021-31A A2, 6.279%, (TSFR3M + 1.662%), 04/19/2034 | | | 500,858 | | | | 0.3 | |
| 450,000 (1)(3) | | | Cedar Funding VIII Clo Ltd. 2017-8A A2R, 6.359%, (TSFR3M + 1.712%), 10/17/2034 | | | 450,719 | | | | 0.3 | |
| 750,000 (1)(3) | | | CIFC Funding Ltd. 2013-1A BR, 7.309%, (TSFR3M + 2.662%), 07/16/2030 | | | 751,997 | | | | 0.4 | |
Principal
Amount† | | | | | Value | | | Percentage
of Net
Assets |
| ASSET-BACKED SECURITIES: (continued) |
| | | | United States: (continued) |
| 332,145 (3) | | | Citigroup Mortgage Loan Trust 2006-WF1 A2E, 4.553%, 03/25/2036 | | $ | 157,492 | | | | 0.1 | |
| 1,000,000 (1)(3) | | | Dryden 49 Senior Loan Fund 2017-49A CR, 6.944%, (TSFR3M + 2.312%), 07/18/2030 | | | 1,002,511 | | | | 0.5 | |
| 1,000,000 (1)(3) | | | Galaxy XV CLO Ltd. 2013-15A CRR, 6.768%, (TSFR3M + 2.112%), 10/15/2030 | | | 1,003,565 | | | | 0.5 | |
| 600,000 (1)(3) | | | Galaxy XXI CLO Ltd. 2015-21A CR, 6.629%, (TSFR3M + 2.012%), 04/20/2031 | | | 601,918 | | | | 0.3 | |
| 400,000 (1)(3) | | | LCM XXIV Ltd. 24A CR, 6.779%, (TSFR3M + 2.162%), 03/20/2030 | | | 401,632 | | | | 0.2 | |
| 600,000 (1)(3) | | | Neuberger Berman Loan Advisers Clo 40 Ltd. 2021-40A C, 6.659%, (TSFR3M + 2.012%), 04/16/2033 | | | 600,485 | | | | 0.3 | |
| 250,000 (1)(3) | | | OHA Credit Funding 8 Ltd. 2021-8A C, 6.794%, (TSFR3M + 2.162%), 01/18/2034 | | | 250,847 | | | | 0.1 | |
| 250,000 (1)(3) | | | Rad CLO 10 Ltd. 2021-10A C, 6.638%, (TSFR3M + 2.012%), 04/23/2034 | | | 248,759 | | | | 0.1 | |
| 650,000 (1)(3) | | | Shackleton CLO Ltd. 2019-15A CR, 7.068%, (TSFR3M + 2.412%), 01/15/2032 | | | 653,374 | | | | 0.4 | |
| 1,000,000 (1)(3) | | | Sound Point CLO IX Ltd. 2015-2A ARRR, 6.089%, (TSFR3M + 1.472%), 07/20/2032 | | | 1,001,006 | | | | 0.5 | |
| 768,153 (1)(3) | | | Sound Point Clo XV Ltd. 2017-1A CR, 6.938%, (TSFR3M + 2.312%), 01/23/2029 | | | 772,414 | | | | 0.4 | |
| 300,000 (1)(3) | | | Symphony CLO XXVI Ltd. 2021-26A CR, 6.879%, (TSFR3M + 2.262%), 04/20/2033 | | | 300,679 | | | | 0.2 | |
| 350,000 (1)(3) | | | TCI-Flatiron Clo Ltd. 2018-1A CR, 6.616%, (TSFR3M + 2.012%), 01/29/2032 | | | 350,708 | | | | 0.2 | |
| 450,000 (1)(3) | | | TCW CLO Ltd. 2021-1A C, 6.779%, (TSFR3M + 2.162%), 03/18/2034 | | | 450,768 | | | | 0.3 | |
See Accompanying Notes to Financial Statements
| Voya Global Bond Fund | PORTFOLIO OF INVESTMENTS as of October 31, 2024 (continued) |
Principal
Amount† | | | | | Value | | | Percentage of Net
Assets |
| ASSET-BACKED SECURITIES: (continued) | |
| | | | United States: (continued) |
| 600,000 (1)(3) | | | Venture XXVII CLO Ltd. 2017-27A CR, 7.179%, (TSFR3M + 2.562%), 07/20/2030 | | $ | 598,412 | | | | 0.3 | |
| | | | | | | 12,345,672 | | | | 6.6 | |
| | | | Total Asset-Backed Securities
(Cost $17,534,850) | | | 17,531,343 | | | | 9.4 | |
| U.S. GOVERNMENT AGENCY OBLIGATIONS: 7.9% |
| | | | Federal Home Loan Mortgage Corporation: 0.2%(9) |
| 391,788 (9) | | | 3.500%, 01/01/2048 | | | 355,880 | | | | 0.2 | |
| 40,014 (9) | | | 4.000%, 09/01/2045 | | | 37,624 | | | | 0.0 | |
| 41,085 (9) | | | 4.000%, 09/01/2045 | | | 38,533 | | | | 0.0 | |
| 63,628 (9) | | | 4.000%, 05/01/2046 | | | 59,932 | | | | 0.0 | |
| | | | | | | 491,969 | | | | 0.2 | |
| | | | | | | | | | | | |
| | | | Federal National Mortgage Association: 1.0%(9) |
| 2,140,000 (9)(10) | | | 3.000%, 11/01/2054 | | | 1,842,585 | | | | 1.0 | |
| | | | | | | | | | | | |
| | | | Government National Mortgage Association: 2.3% |
| 1,939,107 | | | 2.500%, 05/20/2051 | | | 1,645,552 | | | | 0.9 | |
| 331,911 | | | 2.500%, 05/20/2052 | | | 281,437 | | | | 0.2 | |
| 190,449 | | | 2.500%, 08/20/2052 | | | 161,557 | | | | 0.1 | |
| 800,000 (10) | | | 3.000%, 11/20/2054 | | | 701,567 | | | | 0.4 | |
| 68,643 | | | 4.500%, 08/20/2041 | | | 67,257 | | | | 0.0 | |
| 1,461,764 | | | 4.500%, 05/20/2053 | | | 1,397,056 | | | | 0.7 | |
| 9,073 | | | 5.500%, 03/20/2039 | | | 9,409 | | | | 0.0 | |
| | | | | | | 4,263,835 | | | | 2.3 | |
| | | | Uniform Mortgage-Backed Securities: 4.4% |
| 4,792,172 | | | 2.000%, 02/01/2052 | | | 3,828,026 | | | | 2.0 | |
| 19,737 | | | 2.500%, 06/01/2030 | | | 18,850 | | | | 0.0 | |
| 27,270 | | | 2.500%, 06/01/2030 | | | 26,028 | | | | 0.0 | |
| 11,391 | | | 2.500%, 07/01/2030 | | | 10,866 | | | | 0.0 | |
| 2,953,000 (10) | | | 2.500%, 11/01/2054 | | | 2,443,369 | | | | 1.3 | |
| 83,514 | | | 3.500%, 06/01/2034 | | | 80,140 | | | | 0.1 | |
| 819,629 | | | 3.500%, 03/01/2043 | | | 750,348 | | | | 0.4 | |
| 39,680 | | | 4.000%, 05/01/2045 | | | 37,339 | | | | 0.0 | |
| 736,699 | | | 4.000%, 04/01/2049 | | | 690,264 | | | | 0.4 | |
| 66,746 | | | 4.500%, 12/01/2040 | | | 65,308 | | | | 0.0 | |
| 122,287 | | | 4.500%, 12/01/2040 | | | 119,652 | | | | 0.1 | |
| 177,548 | | | 5.000%, 05/01/2042 | | | 178,105 | | | | 0.1 | |
| | | | | | | 8,248,295 | | | | 4.4 | |
| | | | | | | | | | | | |
| | | | Total U.S. Government Agency Obligations
(Cost $15,632,875) | | | 14,846,684 | | | | 7.9 | |
| U.S. TREASURY OBLIGATIONS: 2.6% |
| | | | United States Treasury Bonds: 0.5% |
| 1,002,100 | | | 4.125%, 08/15/2044 | | | 941,191 | | | | 0.5 | |
| | | | | | | | | | | | |
| | | | United States Treasury Notes: 2.1% |
| 445,900 | | | 3.500%, 09/30/2029 | | | 433,115 | | | | 0.2 | |
| 49,700 | | | 3.625%, 09/30/2031 | | | 47,934 | | | | 0.0 | |
| 2,036,600 | | | 3.875%, 08/15/2034 | | | 1,970,729 | | | | 1.1 | |
Principal
Amount† | | | | | Value | | | Percentage
of Net
Assets |
| U.S. TREASURY OBLIGATIONS: (continued) |
| | | | United States Treasury Notes: (continued) |
| 1,475,400 | | | 4.625%, 05/15/2054 | | $ | 1,510,210 | | | | 0.8 | |
| | | | | | | 3,961,988 | | | | 2.1 | |
| | | | | | | | | | | | |
| | | | Total U.S. Treasury Obligations
(Cost $4,969,423) | | | 4,903,179 | | | | 2.6 | |
| PURCHASED OPTIONS(11): 0.0% |
| | | | Total Purchased Options
(Cost $71,921) | | | 17,621 | | | | 0.0 | |
| | | | Total Long-Term Investments
(Cost $181,419,920) | | | 174,590,605 | | | | 93.2 | |
| |
| |
| SHORT-TERM INVESTMENTS: 8.8% |
| | | | Repurchase Agreements: 2.2% |
| 1,000,000 (12) | | | Bethesda Securities, Repurchase Agreement dated 10/31/2024, 4.950%, due 11/01/2024 (Repurchase Amount $1,000,136, collateralized by various U.S. Government Agency Obligations, 2.500%-7.311%, Market Value plus accrued interest $1,020,147, due 10/01/27-01/01/57) | | | 1,000,000 | | | | 0.5 | |
| 1,000,000 (12) | | | Cantor Fitzgerald Securities, Repurchase Agreement dated 10/31/2024, 4.930%, due 11/01/2024 (Repurchase Amount $1,000,135, collateralized by various U.S. Government/U.S. Government Agency Obligations, 0.000%- 6.500%, Market Value plus accrued interest $1,020,000, due 02/25/25-02/01/57) | | | 1,000,000 | | | | 0.5 | |
See Accompanying Notes to Financial Statements
| Voya Global Bond Fund | PORTFOLIO OF INVESTMENTS as of October 31, 2024 (continued) |
Principal
Amount† | | | | | Value | | | Percentage
of Net
Assets |
| SHORT-TERM INVESTMENTS: (continued) | |
| | | | Repurchase Agreements (continued) |
| 1,000,000 (12) | | | Citigroup Global Markets, Inc., Repurchase Agreement dated 10/31/2024, 4.860%, due 11/01/2024 (Repurchase Amount $1,000,133, collateralized by various U.S. Government Agency Obligations, 2.000%-7.964%, Market Value plus accrued interest $1,020,000, due 02/01/36-08/20/67) | | $ | 1,000,000 | | | | 0.6 | |
| 151,263 (12) | | | Daiwa Capital Markets America, Inc., Repurchase Agreement dated 10/31/2024, 4.890%, due 11/01/2024 (Repurchase Amount $151,283, collateralized by various U.S. Government/U.S. Government Agency Obligations, 0.625%-7.500%, Market Value plus accrued interest $154,288, due 05/15/25-11/01/54) | | | 151,263 | | | | 0.1 | |
| 1,000,000 (12) | | | HSBC Securities (USA), Inc., Repurchase Agreement dated 10/31/2024, 4.860%, due 11/01/2024 (Repurchase Amount $1,000,133, collateralized by various U.S. Government/U.S. Government Agency Obligations, 2.000%-7.500%, Market Value plus accrued interest $1,020,000, due 05/01/28-10/01/54) | | | 1,000,000 | | | | 0.5 | |
| | | | Total Repurchase Agreements
(Cost $4,151,263) | | | 4,151,263 | | | | 2.2 | |
| | | | Commercial Paper: 6.4% |
| 1,900,000 | | | AT&T, Inc., 5.010%, 11/06/2024 | | | 1,898,440 | | | | 1.0 | |
| 1,500,000 | | | BASF SE, 4.850%, 12/30/2024 | | | 1,488,175 | | | | 0.8 | |
Principal
Amount† | | | | | Value | | | Percentage
of Net
Assets |
| SHORT-TERM INVESTMENTS: (continued) | |
| | | | Commercial Paper (continued) |
| 1,700,000 | | | Duke Energy Corp., 4.940%, 11/01/2024 | | $ | 1,699,770 | | | | 0.9 | |
| 2,650,000 | | | Fiserv, Inc., 5.020%, 11/01/2024 | | | 2,649,637 | | | | 1.4 | |
| 1,900,000 | | | Keurig Dr Pepper, Inc., 5.010%, 11/06/2024 | | | 1,898,440 | | | | 1.0 | |
| 2,405,000 | | | Sysco Corp., 4.940%, 11/01/2024 | | | 2,404,675 | | | | 1.3 | |
| | | | Total Commercial Paper
(Cost $12,040,486) | | | 12,039,137 | | | | 6.4 | |
| Shares | | | | | Value | | | Percentage
of Net
Assets |
| | | | Mutual Funds: 0.2% |
| 400,000 (13) | | | Morgan Stanley Institutional Liquidity Funds - Government Portfolio (Institutional Share Class), 4.780%
(Cost $400,000) | | $ | 400,000 | | | | 0.2 | |
| | | | Total Short-Term Investments
(Cost $16,591,749) | | | 16,590,400 | | | | 8.8 | |
| | | | Total Investments in Securities
(Cost $198,011,669) | | $ | 191,181,005 | | | | 102.0 | |
| | | | Liabilities in Excess of Other Assets | | | (3,786,521 | ) | | | (2.0 | ) |
| | | | Net Assets | | $ | 187,394,484 | | | | 100.0 | |
See Accompanying Notes to Financial Statements
| Voya Global Bond Fund | PORTFOLIO OF INVESTMENTS as of October 31, 2024 (continued) |
| † | Unless otherwise indicated, principal amount is shown in USD. |
| (1) | Securities with purchases pursuant to Rule 144A or section 4(a)(2), under the Securities Act of 1933 and may not be resold subject to that rule except to qualified institutional buyers. |
| (2) | Security, or a portion of the security, is on loan. |
| (3) | Variable rate security. Rate shown is the rate in effect as of October 31, 2024. |
| (4) | Interest only securities represent the right to receive the monthly interest payments on an underlying pool of mortgage loans. Principal amount shown represents the notional amount on which current interest is calculated. Payments of principal on the pool reduce the value of the interest only security. |
| (5) | For fair value measurement disclosure purposes, security is categorized as Level 3, whose value was determined using significant unobservable inputs. |
| (6) | Defaulted security. |
| (7) | Step-up bond that pays an initial coupon rate for the first period and then a higher coupon rate for the following periods. Rates shown reflect the current and next coupon rate as of October 31, 2024. |
| (8) | Principal only securities represent the right to receive the monthly principal payments on an underlying pool of mortgage loans. No payments of interest on the pool are passed through the principal only security. |
| (9) | The Federal Housing Finance Agency (“FHFA”) placed the Federal Home Loan Mortgage Corporation and Federal National Mortgage Association into conservatorship with FHFA as the conservator. As such, the FHFA oversees the continuing affairs of these companies. |
| (10) | Represents or includes a TBA transaction. |
| (11) | The tables within the Portfolio of Investments detail open purchased options which are non-income producing securities. |
| (12) | All or a portion of the security represents securities purchased with cash collateral received for securities on loan. |
| (13) | Rate shown is the 7-day yield as of October 31, 2024. |
Currency Abbreviations:
| AUD | Australian Dollar |
| BRL | Brazilian Real |
| CAD | Canadian Dollar |
| CNY | China Yuan |
| COP | Colombian Peso |
| CZK | Czech Koruna |
| EUR | EU Euro |
| IDR | Indonesian Rupiah |
| MYR | Malaysian Ringgit |
| PEN | Peruvian Nuevo Sol |
| PLN | Polish Zloty |
| RUB | Russian Ruble |
| THB | Thai Baht |
Reference Rate Abbreviations:
| SOFR30A | 30-day Secured Overnight Financing Rate |
| TSFR1M | 1-month CME Term Secured Overnight Financing Rate |
| TSFR3M | 3-month CME Term Secured Overnight Financing Rate |
| Sector Diversification | | Percentage
of Net Assets |
| Collateralized Mortgage Obligations | | | 21.3 | % |
| Sovereign Bonds | | | 17.6 | |
| Commercial Mortgage-Backed Securities | | | 10.2 | |
| Asset-Backed Securities | | | 9.4 | |
| U.S. Government Agency Obligations | | | 7.9 | |
| Financial | | | 7.8 | |
| Sector Diversification | | Percentage
of Net Assets |
| Consumer, Non-cyclical | | | 3.7 | % |
| Industrial | | | 2.8 | |
| U.S. Treasury Obligations | | | 2.6 | |
| Utilities | | | 2.6 | |
| Consumer, Cyclical | | | 2.4 | |
| Energy | | | 1.9 | |
| Technology | | | 1.2 | |
| Communications | | | 1.0 | |
| Basic Materials | | | 0.8 | |
| Purchased Options | | | 0.0 | |
| Short-Term Investments | | | 8.8 | |
| Liabilities in Excess of Other Assets | | | (2.0 | ) |
| Net Assets | | | 100.0 | % |
Portfolio holdings are subject to change daily.
See Accompanying Notes to Financial Statements
| Voya Global Bond Fund | PORTFOLIO OF INVESTMENTS |
| as of October 31, 2024 (continued) |
Fair Value Measurements^
The following is a summary of the fair valuations according to the inputs used as of October 31, 2024 in valuing the assets and liabilities:
| | | Quoted Prices
in Active Markets
for Identical
Investments
(Level 1) | | | Significant Other
Observable
Inputs
(Level 2) | | | Significant
Unobservable
Inputs
(Level 3) | | | Fair Value
at
October 31, 2024 | |
| Asset Table | | | | | | | | | | | | | | | | |
| Investments, at fair value | | | | | | | | | | | | | | | | |
| Corporate Bonds/Notes | | $ | — | | | $ | 45,356,686 | | | $ | — | | | $ | 45,356,686 | |
| Collateralized Mortgage Obligations | | | — | | | | 39,897,029 | | | | — | | | | 39,897,029 | |
| Sovereign Bonds | | | — | | | | 32,167,869 | | | | 876,736 | | | | 33,044,605 | |
| Commercial Mortgage-Backed Securities | | | — | | | | 18,993,458 | | | | — | | | | 18,993,458 | |
| Asset-Backed Securities | | | — | | | | 17,531,343 | | | | — | | | | 17,531,343 | |
| U.S. Government Agency Obligations | | | — | | | | 14,846,684 | | | | — | | | | 14,846,684 | |
| U.S. Treasury Obligations | | | — | | | | 4,903,179 | | | | — | | | | 4,903,179 | |
| Purchased Options | | | — | | | | 17,621 | | | | — | | | | 17,621 | |
| Short-Term Investments | | | 400,000 | | | | 16,190,400 | | | | — | | | | 16,590,400 | |
| Total Investments, at fair value | | $ | 400,000 | | | $ | 189,904,269 | | | $ | 876,736 | | | $ | 191,181,005 | |
| Other Financial Instruments+ | | | | | | | | | | | | | | | | |
| Centrally Cleared Interest Rate Swaps | | | — | | | | 2,262,748 | | | | — | | | | 2,262,748 | |
| Forward Foreign Currency Contracts | | | — | | | | 322,351 | | | | — | | | | 322,351 | |
| Forward Premium Swaptions | | | — | | | | 232,958 | | | | — | | | | 232,958 | |
| Futures | | | 387,731 | | | | — | | | | — | | | | 387,731 | |
| OTC Cross-Currency Swaps | | | — | | | | 4,088 | | | | — | | | | 4,088 | |
| Total Assets | | $ | 787,731 | | | $ | 192,726,414 | | | $ | 876,736 | | | $ | 194,390,881 | |
| Liabilities Table | | | | | | | | | | | | | | | | |
| Other Financial Instruments+ | | | | | | | | | | | | | | | | |
| Centrally Cleared Interest Rate Swaps | | $ | — | | | $ | (2,078,904 | ) | | $ | — | | | $ | (2,078,904 | ) |
| Forward Foreign Currency Contracts | | | — | | | | (302,797 | ) | | | — | | | | (302,797 | ) |
| Forward Premium Swaptions | | | — | | | | (76,203 | ) | | | — | | | | (76,203 | ) |
| Futures | | | (1,639,303 | ) | | | — | | | | — | | | | (1,639,303 | ) |
| OTC Total Return Swaps | | | — | | | | (92,122 | ) | | | — | | | | (92,122 | ) |
| OTC volatility swaps | | | — | | | | (1,605 | ) | | | — | | | | (1,605 | ) |
| Written Options | | | — | | | | (307 | ) | | | — | | | | (307 | ) |
| Total Liabilities | | $ | (1,639,303 | ) | | $ | (2,551,938 | ) | | $ | — | | | $ | (4,191,241 | ) |
| ^ | See Note 2, “Significant Accounting Policies” in the Notes to Financial Statements for additional information. |
| + | Other Financial Instruments may include open forward foreign currency contracts, futures, centrally cleared swaps, OTC swaps and written options. Forward foreign currency contracts, futures and centrally cleared swaps are fair valued at the unrealized appreciation (depreciation) on the instrument. OTC swaps and written options are valued at the fair value of the instrument. |
At October 31, 2024, the following forward foreign currency contracts were outstanding for Voya Global Bond Fund:
| Currency Purchased | | Currency Sold | | Counterparty | | Settlement Date | | | Unrealized
Appreciation
(Depreciation) | |
| USD | | 934,898 | | CHF | | 807,275 | | Bank of America N.A. | | 12/13/24 | | $ | (4,075 | ) |
| USD | | 203,542 | | TRY | | 9,424,000 | | Bank of America N.A. | | 04/03/25 | | | (32,800 | ) |
| NOK | | 1,801,156 | | USD | | 164,948 | | Barclays Bank PLC | | 12/13/24 | | | (1,175 | ) |
| SEK | | 6,863,614 | | USD | | 653,027 | | Barclays Bank PLC | | 12/13/24 | | | (7,486 | ) |
| CAD | | 6,115,217 | | USD | | 4,430,654 | | Barclays Bank PLC | | 12/13/24 | | | (32,876 | ) |
| DKK | | 2,657,022 | | USD | | 386,115 | | BNP Paribas | | 12/13/24 | | | 2,145 | |
| SGD | | 804,587 | | USD | | 614,305 | | Brown Brothers Harriman & Co. | | 12/06/24 | | | (4,114 | ) |
| JPY | | 3,006,709 | | USD | | 19,769 | | Brown Brothers Harriman & Co. | | 12/13/24 | | | 124 | |
| JPY | | 2,712,674,288 | | USD | | 18,075,433 | | Brown Brothers Harriman & Co. | | 12/13/24 | | | (128,058 | ) |
| USD | | 466,236 | | COP | | 2,009,383,674 | | Citibank N.A. | | 12/06/24 | | | 14,255 | |
| USD | | 988,141 | | BRL | | 5,679,145 | | Citibank N.A. | | 12/06/24 | | | 9,526 | |
| CNY | | 5,111,430 | | USD | | 717,151 | | Citibank N.A. | | 12/06/24 | | | 4,565 | |
| USD | | 126,296 | | CZK | | 2,938,397 | | Deutsche Bank AG | | 12/06/24 | | | (17 | ) |
| CHF | | 803,086 | | USD | | 927,994 | | Deutsche Bank AG | | 12/13/24 | | | 6,106 | |
| NZD | | 609,194 | | USD | | 368,581 | | Deutsche Bank AG | | 12/13/24 | | | (4,341 | ) |
See Accompanying Notes to Financial Statements
| Voya Global Bond Fund | PORTFOLIO OF INVESTMENTS |
| as of October 31, 2024 (continued) |
| Currency Purchased | | Currency Sold | | Counterparty | | Settlement Date | | | Unrealized
Appreciation
(Depreciation) | |
| MXN | | 9,880,169 | | USD | | 489,695 | | Goldman Sachs International | | 12/06/24 | | $ | 1,329 | |
| CLP | | 122,648,921 | | USD | | 128,515 | | Goldman Sachs International | | 12/06/24 | | | (984 | ) |
| TRY | | 9,424,000 | | USD | | 203,323 | | Goldman Sachs International | | 04/03/25 | | | 33,020 | |
| PLN | | 169,733 | | USD | | 42,602 | | JPMorgan Chase Bank N.A. | | 12/06/24 | | | (241 | ) |
| USD | | 1,162,807 | | PEN | | 4,369,132 | | Morgan Stanley Capital Services LLC | | 12/06/24 | | | 5,436 | |
| USD | | 291,572 | | IDR | | 4,531,727,940 | | Morgan Stanley Capital Services LLC | | 12/06/24 | | | 3,377 | |
| ILS | | 1,073,195 | | USD | | 284,779 | | Morgan Stanley Capital Services LLC | | 12/06/24 | | | 2,807 | |
| HUF | | 53,585,311 | | USD | | 144,486 | | Morgan Stanley Capital Services LLC | | 12/06/24 | | | (1,932 | ) |
| EUR | | 36,251,091 | | USD | | 39,269,418 | | Morgan Stanley Capital Services LLC | | 12/13/24 | | | 228,842 | |
| RON | | 1,509,325 | | USD | | 329,040 | | Standard Chartered Bank | | 12/06/24 | | | 736 | |
| CNY | | 52,803 | | USD | | 7,426 | | State Street Bank and Trust Co. | | 12/06/24 | | | 29 | |
| CHF | | 884,950 | | USD | | 1,027,967 | | State Street Bank and Trust Co. | | 12/13/24 | | | 1,352 | |
| GBP | | 6,733,779 | | USD | | 8,732,028 | | The Bank of Montreal | | 12/13/24 | | | (49,790 | ) |
| USD | | 5,727 | | ZAR | | 101,147 | | Toronto Dominion Securities | | 12/06/24 | | | 5 | |
| USD | | 745,665 | | THB | | 24,888,520 | | UBS AG | | 12/06/24 | | | 6,574 | |
| KRW | | 2,963,912,327 | | USD | | 2,155,774 | | UBS AG | | 12/06/24 | | | 2,123 | |
| HKD | | 547,037 | | USD | | 70,434 | | UBS AG | | 12/06/24 | | | (20 | ) |
| AUD | | 3,386,080 | | USD | | 2,264,156 | | UBS AG | | 12/13/24 | | | (34,888 | ) |
| | | | | | | | | | | | | $ | 19,554 | |
At October 31, 2024, the following futures contracts were outstanding for Voya Global Bond Fund:
| Description | | Number
of Contracts | Expiration
Date | | Notional
Amount | | | Unrealized
Appreciation/
(Depreciation) | |
| Long Contracts: | | | | | | | | | | | | |
| Australia 3-Year Bond | | 27 | | 12/16/24 | | $ | 1,875,881 | | | $ | (30,394 | ) |
| Australia 10-Year Bond | | 12 | | 12/16/24 | | | 883,257 | | | | (41,847 | ) |
| Canada 10-Year Bond | | 39 | | 12/18/24 | | | 3,416,964 | | | | (53,797 | ) |
| Euro-Bobl 5-Year | | 91 | | 12/06/24 | | | 11,695,093 | | | | (80,439 | ) |
| Euro-Bund | | 3 | | 12/06/24 | | | 430,096 | | | | (5,197 | ) |
| Euro-Buxl 30-year German Government Bond | | 25 | | 12/06/24 | | | 3,599,360 | | | | (74,804 | ) |
| Euro-OAT | | 55 | | 12/06/24 | | | 7,457,931 | | | | (86,503 | ) |
| Euro-Schatz | | 98 | | 12/06/24 | | | 11,357,097 | | | | (18,794 | ) |
| Long Gilt | | 21 | | 12/27/24 | | | 2,546,472 | | | | (149,050 | ) |
| Long-Term Euro-BTP | | 30 | | 12/06/24 | | | 3,901,211 | | | | 24,364 | |
| U.S. Treasury 2-Year Note | | 324 | | 12/31/24 | | | 66,726,281 | | | | (604,541 | ) |
| U.S. Treasury 5-Year Note | | 52 | | 12/31/24 | | | 5,576,187 | | | | (62,912 | ) |
| U.S. Treasury 10-Year Note | | 3 | | 12/19/24 | | | 331,406 | | | | (100 | ) |
| U.S. Treasury Long Bond | | 13 | | 12/19/24 | | | 1,533,594 | | | | (42,403 | ) |
| U.S. Treasury Ultra Long Bond | | 48 | | 12/19/24 | | | 6,030,000 | | | | (388,515 | ) |
| | | | | | | $ | 127,360,830 | | | $ | (1,614,932 | ) |
| Short Contracts: | | | | | | | | | | | | |
| Japanese Government Bonds 10-Year Mini | | (4 | ) | 12/12/24 | | | (379,123 | ) | | | (7 | ) |
| U.S. Treasury Ultra 10-Year Note | | (80 | ) | 12/19/24 | | | (9,100,000 | ) | | | 363,367 | |
| | | | | | | $ | (9,479,123 | ) | | $ | 363,360 | |
At October 31, 2024, the following centrally cleared interest rate swaps were outstanding for Voya Global Bond Fund:
Pay/Receive
Floating Rate | | Floating Rate Index | | Floating
Rate Index
Payment
Frequency | | Fixed
Rate | | Fixed Rate
Payment
Frequency | | Maturity
Date | | | Notional
Amount | | | Fair
Value | | | Unrealized
Appreciation/
(Depreciation) | |
| Pay | | 1-day Sterling Overnight Index Average (SONIA) | | Annual | | | 3.904% | | Annual | | 10/17/27 | GBP | | | 2,000,000 | | | $ | (19,202 | ) | | $ | (19,202 | ) |
| Pay | | 1-day Sterling Overnight Index Average (SONIA) | | Annual | | | 1.649 | | Annual | | 04/14/52 | GBP | | | 2,400,000 | | | | (1,235,066 | ) | | | (1,235,066 | ) |
| Pay | | 1-day Sterling Overnight Index Average (SONIA) | | Annual | | | 2.169 | | Annual | | 04/14/25 | GBP | | | 3,500,000 | | | | (50,204 | ) | | | (50,204 | ) |
| Pay | | 3-month KRW-CD-KSDA-Bloomberg | | Quarterly | | | 2.935 | | Quarterly | | 07/31/34 | KRW | | | 3,586,082,000 | | | | (13,670 | ) | | | (13,670 | ) |
| Pay | | 28-day MXN TIIE-BANXICO | | Monthly | | | 9.320 | | Monthly | | 10/07/26 | MXN | | | 26,246,500 | | | | (11,728 | ) | | | (11,728 | ) |
| Pay | | 1-day Secured Overnight Financing Rate | | Monthly | | | 3.058 | | Monthly | | 08/08/29 | USD | | | 1,200,000 | | | | (35,617 | ) | | | (35,635 | ) |
| Pay | | 1-day Secured Overnight Financing Rate | | Monthly | | | 3.150 | | Monthly | | 10/27/47 | USD | | | 1,465,000 | | | | (124,698 | ) | | | (124,637 | ) |
See Accompanying Notes to Financial Statements
| Voya Global Bond Fund | PORTFOLIO OF INVESTMENTS |
| as of October 31, 2024 (continued) |
Pay/Receive
Floating Rate | | Floating Rate Index | | Floating
Rate Index
Payment
Frequency | | Fixed
Rate | | Fixed Rate
Payment
Frequency | | Maturity
Date | | | Notional
Amount | | | Fair
Value | | | Unrealized
Appreciation/
(Depreciation) | |
| Pay | | 1-day Secured Overnight Financing Rate | | Monthly | | 3.098% | | Monthly | | 08/08/32 | USD | | | 1,600,000 | | | $ | (66,412 | ) | | $ | (72,135 | ) |
| Pay | | 1-day Secured Overnight Financing Rate | | Monthly | | 3.040 | | Monthly | | 05/08/31 | USD | | | 2,500,000 | | | | (97,742 | ) | | | (97,051 | ) |
| Receive | | 1-day Sterling Overnight Index Average (SONIA) | | Annual | | 3.674 | | Annual | | 09/30/52 | GBP | | | 200,000 | | | | 17,811 | | | | 17,811 | |
| Receive | | 1-day Sterling Overnight Index Average (SONIA) | | Annual | | 2.999 | | Annual | | 09/13/52 | GBP | | | 500,000 | | | | 116,034 | | | | 116,034 | |
| Receive | | 1-day Sterling Overnight Index Average (SONIA) | | Annual | | 3.803 | | Annual | | 09/13/25 | GBP | | | 800,000 | | | | 6,026 | | | | 6,026 | |
| Receive | | 1-day Overnight Tokyo Average Rate | | Annual | | 1.487 | | Annual | | 08/08/54 | JPY | | | 75,000,000 | | | | 27,648 | | | | 27,648 | |
| Receive | | 1-day Overnight Tokyo Average Rate | | Annual | | 1.678 | | Annual | | 10/21/54 | JPY | | | 80,000,000 | | | | 5,801 | | | | 5,801 | |
| Receive | | 1-day Overnight Tokyo Average Rate | | Annual | | 1.440 | | Annual | | 06/19/44 | JPY | | | 90,000,000 | | | | 4,281 | | | | 4,281 | |
| Receive | | 28-day MXN TIIE-BANXICO | | Monthly | | 9.780 | | Monthly | | 10/20/26 | MXN | | | 27,317,000 | | | | 847 | | | | 847 | |
| Receive | | 1-day Secured Overnight Financing Rate | | Annual | | 3.759 | | Annual | | 08/16/44 | USD | | | 1,183,700 | | | | 5,894 | | | | 5,894 | |
| Receive | | 1-day Secured Overnight Financing Rate | | Annual | | 1.847 | | Annual | | 02/17/32 | USD | | | 2,000,000 | | | | 244,251 | | | | 244,251 | |
| Receive | | 1-day Secured Overnight Financing Rate | | Monthly | | 3.562 | | Monthly | | 11/03/26 | USD | | | 4,000,000 | | | | 24,210 | | | | 24,185 | |
| Receive | | 1-day Secured Overnight Financing Rate | | Annual | | 3.860 | | Annual | | 06/26/34 | USD | | | 4,000,000 | | | | (26,087 | ) | | | (26,087 | ) |
| Receive | | 1-day Secured Overnight Financing Rate | | Annual | | 2.188 | | Annual | | 03/24/27 | USD | | | 5,000,000 | | | | 195,105 | | | | 195,105 | |
| Receive | | 1-day Secured Overnight Financing Rate | | Annual | | 2.962 | | Annual | | 06/14/27 | USD | | | 5,000,000 | | | | 114,879 | | | | 114,879 | |
| Receive | | 1-day Secured Overnight Financing Rate | | Monthly | | 3.121 | | Monthly | | 02/08/28 | USD | | | 5,000,000 | | | | 102,352 | | | | 103,778 | |
| Receive | | 1-day Secured Overnight Financing Rate | | Annual | | 3.605 | | Annual | | 01/08/31 | USD | | | 5,000,000 | | | | 47,494 | | | | 47,494 | |
| Receive | | 1-day Secured Overnight Financing Rate | | Annual | | 4.006 | | Annual | | 06/26/29 | USD | | | 7,000,000 | | | | (60,493 | ) | | | (60,493 | ) |
| Receive | | 1-day Secured Overnight Financing Rate | | Annual | | 3.464 | | Annual | | 09/26/32 | USD | | | 7,000,000 | | | | 146,681 | | | | 146,681 | |
| Receive | | 1-day Secured Overnight Financing Rate | | Annual | | 3.956 | | Annual | | 02/01/27 | USD | | | 10,000,000 | | | | (7,172 | ) | | | (7,172 | ) |
| Receive | | 1-day Secured Overnight Financing Rate | | Annual | | 1.551 | | Annual | | 01/24/29 | USD | | | 12,000,000 | | | | 1,053,230 | | | | 1,053,230 | |
| Receive | | 1-day Secured Overnight Financing Rate | | Monthly | | 4.068 | | Monthly | | 05/03/25 | USD | | | 13,000,000 | | | | 20,067 | | | | 19,763 | |
| Receive | | 1-day Secured Overnight Financing Rate | | Annual | | 2.590 | | Annual | | 04/13/25 | USD | | | 15,000,000 | | | | 129,040 | | | | 129,040 | |
| Receive | | 1-day Secured Overnight Financing Rate | | Annual | | 4.526 | | Annual | | 06/18/26 | USD | | | 27,049,700 | | | | (215,611 | ) | | | (215,611 | ) |
| Receive | | 1-day Secured Overnight Financing Rate | | Annual | | 4.241 | | Annual | | 07/22/26 | USD | | | 27,160,000 | | | | (110,213 | ) | | | (110,213 | ) |
| | | | | | | | | | | | | | | | | | $ | 187,736 | | | $ | 183,844 | |
At October 31, 2024, Voya Global Bond Fund held the following OTC Cross-Currency Swap Contracts:
| Counterparty Pays | | Fund Receives | | Maturity
Date | | Counter
party | | | Notional
Amount of
Currency
Received(1) | | | Notional
Amount of
Currency
Delivered(1) | | | Fair
Value | | | Upfront
Payments
Paid/
(Received) | | | Unrealized
Appreciation/
(Depreciation) | |
Floating rate equal to
1-day Secured Overnight
Financing Rate based on
the notional amount of
currency received | | Floating rate equal to 28-day MXN TIIE-BANXICO based on the notional amount of currency delivered | | 12/15/2027 | | BNP
Paribas | USD | | 2,335,360 | MXN | | | 46,298,512 | | | $ | 4,088 | | | $ | — | | | $ | 4,088 | |
| | | | | | | | | | | | | | | | | $ | 4,088 | | | $ | — | | | $ | 4,088 | |
| (1) | The notional amounts to be received or delivered may be determined and exchanged at a future date, based on the effective date of the cross-currency swap. |
At October 31, 2024, the following OTC total return swaps were outstanding for Voya Global Bond Fund:
Pay/Receive
Total
Return(1) | | Reference Entity | | Reference
Entity
Payment
Frequency | | (Pay)/
Receive
Financing
Rate | | Floating
Rate
Payment
Frequency | | Counterparty | | Termination
Date | | Notional
Amount | | Fair
Value | | | Upfront
Payments
Paid/
(Received) | | | Unrealized
Appreciation/
(Depreciation) | |
| Receive | | Japanese
Government
20-Year Treasury
Bond | | At
Termination Date | | 1.90% | | At
Termination Date | | Goldman Sachs
International | | 12/12/24 | JPY | 1,000,000,000 | | $ | (12,011 | ) | | $ | — | | | $ | (12,011 | ) |
| Receive | | Japanese
Government
2-Year Treasury
Bond | | At
Termination Date | | 0.40% | | At
Termination Date | | Nomura Global | | 11/21/24 | JPY | 1,000,000,000 | | | (4,469 | ) | | | — | | | | (4,469 | ) |
| Receive | | Japanese
Government
5-Year Treasury
Bond | | At
Termination Date | | 0.60% | | At
Termination Date | | Nomura Global | | 11/21/24 | JPY | 400,000,000 | | | (7,613 | ) | | | — | | | | (7,613 | ) |
| Receive | | Japanese
Government
20-Year Treasury
Bond | | At
Termination Date | | 0.70% | | At
Termination Date | | Nomura Global | | 11/21/24 | JPY | 800,000,000 | | | (68,029 | ) | | | — | | | | (68,029 | ) |
| | | | | | | | | | | | | | | | | $ | (92,122 | ) | | $ | — | | | $ | (92,122 | ) |
See Accompanying Notes to Financial Statements
| Voya Global Bond Fund | PORTFOLIO OF INVESTMENTS |
| as of October 31, 2024 (continued) |
| (1) | The Fund will pay or receive the total return of the reference entity depending on whether the return is positive or negative. Where the Fund has elected to receive the total return of the reference entity if positive, it will be responsible for paying the floating rate and the total return of the reference entity, if negative. If the Fund has elected to pay the total return of the reference entity if positive, it will receive the floating rate and the total return of the reference entity, if negative. |
At October 31, 2024, the following OTC volatility swaps were outstanding for Voya Global Bond Fund:
Pay/
Receive
Volatility(1) | | Reference Entity | | Volatility
Strike
Rate | | Counterparty | | Maturity
Date | | Currency | | Notional
Amount | | Fair Value | | Unrealized
Appreciation
(Depreciation) |
| Receive | | EUR vs. USD Spot Exchange Rate | | 6.550% | | Deutsche Bank AG | | 02/03/25 | | USD | | 13,580 | | $ | (1,605 | ) | | $ | (1,605 | ) |
| | | | | | | | | | | | | | | $ | (1,605 | ) | | $ | (1,605 | ) |
At October 31, 2024, the following OTC purchased foreign currency options were outstanding for Voya Global Bond Fund:
| Description | | Counterparty | | Expiration
Date | | Exercise
Price | | Notional Amount | | | Cost | | Fair Value |
| Call USD vs. Put CHF | | Deutsche Bank AG | | 12/20/24 | | 0.896 | | USD | | 132,690 | | | $ | 16,918 | | | $ | 8,401 | |
| Call USD vs. Put CNH | | BNP Paribas | | 02/14/25 | | 7.500 | | USD | | 126,000 | | | | 11,045 | | | | 8,568 | |
| | | | | | | | | | | | | | $ | 27,963 | | | $ | 16,969 | |
At October 31, 2024, the following OTC purchased interest rate swaptions were outstanding for Voya Global Bond Fund:
| Description | | Counterparty | | Pay/
Receive
Exercise
Rate | | Exercise
Rate | | Floating Rate
Index | | Expiration
Date | | | Notional
Amount | | | Cost | | Fair Value |
Put on 2-Year Interest
Rate Swap(1) | | Goldman Sachs
International | | Pay | | 3.100% | | 6-month EUR-EURIBOR | | 12/20/24 | EUR | | | 13,872,000 | | | $ | 43,958 | | | $ | 652 | |
| | | | | | | | | | | | | | | | | | $ | 43,958 | | | $ | 652 | |
At October 31, 2024, the following OTC written interest rate swaptions were outstanding for Voya Global Bond Fund:
| Description | | Counterparty | | Pay/
Receive
Exercise
Rate | | Exercise
Rate | | Floating Rate
Index | | Expiration
Date | | | Notional
Amount | | | Premiums
Received | | Fair Value |
Put on 2-Year Interest
Rate Swap(2) | | Goldman Sachs
International | | Receive | | 3.280% | | 6-month EUR-EURIBOR | | 12/20/24 | EUR | | | 13,872,000 | | | $ | 27,325 | | | $ | (224 | ) |
Put on 2-Year Interest
Rate Swap(2) | | Goldman Sachs
International | | Receive | | 3.453% | | 6-month EUR-EURIBOR | | 12/20/24 | EUR | | | 13,872,000 | | | | 16,633 | | | | (83 | ) |
| | | | | | | | | | | | | | | | | | $ | 43,958 | | | $ | (307 | ) |
At October 31, 2024, the following OTC purchased forward premium swaptions were outstanding for Voya Global Bond Fund:
| Description | | Counterparty | | Exercise
Rate(3) | | Pay/
Receive
Exercise
Rate | | Floating Rate
Index | | Expiration
Date | | | Notional
Amount | | | Premium
receivable/
(payable)
at expiration(4) | | Unrealized
Appreciation/
(Depreciation) |
Call on 10-Year
Interest Rate Swap | | JPMorgan Chase
Bank N.A. | | 2.375% | | Receive | | 1-day Secured Overnight
Financing Rate | | 08/14/34 | USD | | 2,367,400 | | | $ | (99,431 | ) | | $ | (10,126 | ) |
Call on 30-Year
Interest Rate Swap | | Barclays Bank PLC | | 17.500% | | Receive | | 1-day Secured Overnight
Financing Rate | | 06/14/27 | USD | | 3,136,000 | | | | (548,800 | ) | | | 70,952 | |
Put on 30-Year
Interest Rate Swap | | Barclays Bank PLC | | 18.000% | | Pay | | 1-day Secured Overnight
Financing Rate | | 05/25/27 | USD | | 7,382,300 | | | | (1,328,814 | ) | | | 137,896 | |
| | | | | | | | | | | | | | | | | $ | (1,977,045 | ) | | $ | 198,722 | |
At October 31, 2024, the following OTC written forward premium swaptions were outstanding for Voya Global Bond Fund:
| Description | | Counterparty | | Exercise
Rate(3) | | Pay/
Receive
Exercise
Rate | | Floating Rate
Index | | Expiration
Date | | | Notional
Amount | | | Premium
receivable/
(payable)
at expiration(4) | | Unrealized
Appreciation/
(Depreciation) |
Call on 1-Year Interest
Rate Swap | | Bank of America N.A. | | 3.140% | | Pay | | 1-day Secured Overnight
Financing Rate | | 09/19/28 | USD | | 12,473,000 | | | $ | 97,367 | | | $ | 24,110 | |
Put on 10-Year
Interest Rate Swap | | JPMorgan Chase
Bank N.A. | | 5.540% | | Receive | | 1-day Secured Overnight
Financing Rate | | 08/14/34 | USD | | 2,367,400 | | | | 99,431 | | | | (12,924 | ) |
Put on 1-Year Interest
Rate Swap | | Bank of America N.A. | | 3.140% | | Receive | | 1-day Secured Overnight
Financing Rate | | 09/19/28 | USD | | 12,473,000 | | | | 97,367 | | | | (33,255 | ) |
See Accompanying Notes to Financial Statements
| Voya Global Bond Fund | PORTFOLIO OF INVESTMENTS |
| as of October 31, 2024 (continued) |
| Description | | Counterparty | | Exercise
Rate(3) | | Pay/
Receive
Exercise
Rate | | Floating Rate
Index | | Expiration
Date | | | Notional
Amount | | | Premium
receivable/
(payable)
at expiration(4) | | Unrealized
Appreciation/
(Depreciation) |
Put on 2-Year Interest
Rate Swap | | UBS AG | | 2.300% | | Receive | | 6-month EUR-EURIBOR | | 10/19/26 | EUR | | 12,473,000 | | | $ | 107,862 | | | $ | (19,898 | ) |
| | | | | | | | | | | | | | | | | $ | 402,027 | | | $ | (41,967 | ) |
| (1) | Fund receives the exercise rate semi-annually and pays the floating rate index quarterly. |
| (2) | Fund pays the exercise rate semi-annually and receives the floating rate index quarterly. |
| (3) | Forward premium swaption exercise rates represent the premium price on each respective swaption contract. Final exercise rate will be determined at the expiration of each respective swaption contract. |
| (4) | Forward premium swaptions include premiums receivable/(payable) that have extended settlement dates. Premiums are not exchanged until the expiration date of each respective forward premium swaption contract. |
| Currency Abbreviations: | Currency Abbreviations: |
| | |
| AUD | — | Australian Dollar | ILS | — | Israeli New Shekel |
| BRL | — | Brazilian Real | JPY | — | Japanese Yen |
| CAD | — | Canadian Dollar | KRW | — | South Korean Won |
| CHF | — | Swiss Franc | MXN | — | Mexican Peso |
| CLP | — | Chilean Peso | NOK | — | Norwegian Krone |
| CNY | — | Chinese Yuan | NZD | — | New Zealand Dollar |
| COP | — | Colombian Peso | PEN | — | Peruvian Nuevo Sol |
| CZK | — | Czech Koruna | PLN | — | Polish Zloty |
| DKK | — | Danish Krone | RON | — | Romanian New Leu |
| EUR | — | EU Euro | SEK | — | Swedish Krona |
| GBP | — | British Pound | SGD | — | Singapore Dollar |
| HKD | — | Hong Kong Sar Dollar | THB | — | Thai Baht |
| HUF | — | Hungarian Forint | TRY | — | Turkish Lira |
| IDR | — | Indonesian Rupiah | USD | — | United States Dollar |
| | | | ZAR | — | South African Rand |
A summary of derivative instruments by primary risk exposure is outlined in the following tables.
The fair value of derivative instruments as of October 31, 2024 was as follows:
| Derivatives not accounted for as hedging instruments | | Location on Statement
of Assets and Liabilities | | Fair Value |
| Asset Derivatives | | | | | |
| Foreign exchange contracts | | Investments in securities at value* | | $ | 16,969 |
| Interest rate contracts | | Investments in securities at value* | | | 652 |
| Foreign exchange contracts | | Unrealized appreciation on forward foreign currency contracts | | | 322,351 |
| Interest rate contracts | | Unrealized appreciation on forward premium swaptions | | | 232,958 |
| Interest rate contracts | | Variation margin receivable on futures contracts** | | | 387,731 |
| Interest rate contracts | | Variation margin receivable on centrally cleared swaps** | | | 2,262,748 |
| Foreign exchange contracts | | Unrealized appreciation on OTC swap agreements | | | 4,088 |
| Total Asset Derivatives | | | | $ | 3,227,497 |
| Liability Derivatives | | | | | |
| Foreign exchange contracts | | Unrealized depreciation on forward foreign currency contracts | | $ | 302,797 |
| Interest rate contracts | | Unrealized depreciation on forward premium swaptions | | | 76,203 |
| Interest rate contracts | | Variation margin payable on futures contracts** | | | 1,639,303 |
| Interest rate contracts | | Variation margin payable on centrally cleared swaps** | | | 2,078,904 |
| Foreign exchange contracts | | Unrealized depreciation on OTC swap agreements | | | 1,605 |
| Interest rate contracts | | Unrealized depreciation on OTC swap agreements | | | 92,122 |
| Interest rate contracts | | Written options, at fair value | | | 307 |
| Total Liability Derivatives | | | | $ | 4,191,241 |
| * | Includes purchased options. |
See Accompanying Notes to Financial Statements
| Voya Global Bond Fund | PORTFOLIO OF INVESTMENTS |
| as of October 31, 2024 (continued) |
| ** | The fair value presented above represents the cumulative unrealized appreciation (depreciation) on futures contracts and centrally cleared swaps as reported in the tables within the Portfolio of Investments. In the Statement of Assets and Liabilities, only current day’s unsettled variation margin is reported in receivables or payables on futures contracts and centrally cleared swaps and the net cumulative unrealized appreciation (depreciation) is included in total distributable earnings (loss). |
The effect of derivative instruments on the Fund's Statement of Operations for the year ended October 31, 2024 was as follows:
Amount of Realized Gain or (Loss) on Derivatives Recognized in Income
| Derivatives not accounted for as hedging instruments | | Investments* | | Forward
foreign
currency
contracts | | Futures | | Swaps | | Written
options | | Total |
| Credit contracts | | $ | — | | | $ | — | | | $ | — | | | $ | 560,592 | | | $ | — | | | $ | 560,592 | |
| Equity contracts | | | — | | | | — | | | | 47,865 | | | | — | | | | — | | | | 47,865 | |
| Foreign exchange contracts | | | (270,327 | ) | | | (871,509 | ) | | | — | | | | (131,766 | ) | | | 9,049 | | | | (1,264,553 | ) |
| Interest rate contracts | | | (251,228 | ) | | | — | | | | 2,218,126 | | | | (455,069 | ) | | | 1,049,266 | | | | 2,561,095 | |
| Total | | $ | (521,555 | ) | | $ | (871,509 | ) | | $ | 2,265,991 | | | $ | (26,243 | ) | | $ | 1,058,315 | | | $ | 1,904,999 | |
Change in Unrealized Appreciation or (Depreciation) on Derivatives Recognized in Income
| Derivatives not accounted for as hedging instruments | | Investments* | | Forward
foreign
currency
contracts | | Futures | | Swaps | | Written
options | | Total |
| Credit contracts | | $ | — | | | $ | — | | | $ | — | | | $ | 69,675 | | | $ | — | | | $ | 69,675 | |
| Foreign exchange contracts | | | 152,968 | | | | 990,227 | | | | — | | | | 2,483 | | | | 2,155 | | | | 1,147,834 | |
| Interest rate contracts | | | 247,589 | | | | — | | | | (640,527 | ) | | | (969,397 | ) | | | 255,092 | | | | (1,107,243 | ) |
| Total | | $ | 400,557 | | | $ | 990,227 | | | $ | (640,527 | ) | | $ | (897,239 | ) | | $ | 257,247 | | | $ | 110,266 | |
| * | Amounts recognized for purchased options are included in net realized gain (loss) on investments and net change in unrealized appreciation or depreciation on investments. |
The following is a summary by counterparty of the fair value of OTC derivative instruments subject to Master Netting Agreements and collateral pledged (received), if any, at October 31, 2024:
| | | Bank of
America N.A. | | | Barclays Bank
PLC | | | BNP Paribas | | | Brown
Brothers
Harriman &
Co. | | | Citibank N.A. | | | Deutsche
Bank AG | | | Goldman
Sachs
International | | | JPMorgan
Chase Bank
N.A. | | | Morgan
Stanley
Capital
Services LLC | | | Nomura
Global | | | Standard
Chartered
Bank | |
| Assets: | | | | | | | | | | | | | | | | | | | | | | | | | | | | | | | | | |
| Purchased options | | $ | — | | | $ | — | | | $ | 8,568 | | | $ | — | | | $ | — | | | $ | 8,401 | | | $ | 652 | | | $ | — | | | $ | — | | | $ | — | | | $ | — | |
| Forward foreign currency | | | | | | | | | | | | | | | | | | | | | | | | | | | | | | | | | | | | | | | | | | | | |
| contracts | | | — | | | | — | | | | 2,145 | | | | 124 | | | | 28,346 | | | | 6,106 | | | | 34,349 | | | | — | | | | 240,462 | | | | — | | | | 736 | |
| Forward premium swaptions | | | 24,110 | | | | 208,848 | | | | — | | | | — | | | | — | | | | — | | | | — | | | | — | | | | — | | | | — | | | | — | |
| Cross-Currency Swaps | | | — | | | | — | | | | 4,088 | | | | — | | | | — | | | | — | | | | — | | | | — | | | | — | | | | — | | | | — | |
| Total Assets | | $ | 24,110 | | | $ | 208,848 | | | $ | 14,801 | | | $ | 124 | | | $ | 28,346 | | | $ | 14,507 | | | $ | 35,001 | | | $ | — | | | $ | 240,462 | | | $ | — | | | $ | 736 | |
| Liabilities: | | | | | | | | | | | | | | | | | | | | | | | | | | | | | | | | | | | | | | | | | | | | |
| Forward foreign currency | | | | | | | | | | | | | | | | | | | | | | | | | | | | | | | | | | | | | | | | | | | | |
| contracts | | $ | 36,875 | | | $ | 41,537 | | | $ | — | | | $ | 132,172 | | | $ | — | | | $ | 4,358 | | | $ | 984 | | | $ | 241 | | | $ | 1,932 | | | $ | — | | | $ | — | |
| Forward premium swaptions | | | 33,255 | | | | — | | | | — | | | | — | | | | — | | | | — | | | | — | | | | 23,050 | | | | — | | | | — | | | | — | |
| OTC total return swaps | | | — | | | | — | | | | — | | | | — | | | | — | | | | — | | | | 12,011 | | | | — | | | | — | | | | 80,111 | | | | — | |
| Volatility Swaps | | | — | | | | — | | | | — | | | | — | | | | — | | | | 1,605 | | | | — | | | | — | | | | — | | | | — | | | | — | |
| Written options | | | — | | | | — | | | | — | | | | — | | | | — | | | | — | | | | 307 | | | | — | | | | — | | | | — | | | | — | |
| Total Liabilities | | $ | 70,130 | | | $ | 41,537 | | | $ | — | | | $ | 132,172 | | | $ | — | | | $ | 5,963 | | | $ | 13,302 | | | $ | 23,291 | | | $ | 1,932 | | | $ | 80,111 | | | $ | — | |
| Net OTC derivative | | | | | | | | | | | | | | | | | | | | | | | | | | | | | | | | | | | | | | | | | | | | |
| instruments by | | | | | | | | | | | | | | | | | | | | | | | | | | | | | | | | | | | | | | | | | | | | |
| counterparty, at fair value | | $ | (46,020 | ) | | $ | 167,311 | | | $ | 14,801 | | | $ | (132,048 | ) | | $ | 28,346 | | | $ | 8,544 | | | $ | 21,699 | | | $ | (23,291 | ) | | $ | 238,530 | | | $ | (80,111 | ) | | $ | 736 | |
| Total collateral pledged by | | | | | | | | | | | | | | | | | | | | | | | | | | | | | | | | | | | | | | | | | | | | |
| the Fund/(Received from | | | | | | | | | | | | | | | | | | | | | | | | | | | | | | | | | | | | | | | | | | | | |
| counterparty) | | $ | — | | | $ | — | | | $ | — | | | $ | — | | | $ | — | | | $ | — | | | $ | — | | | $ | — | | | $ | (140,000 | ) | | $ | — | | | $ | — | |
| Net Exposure(1)(2) | | $ | (46,020 | ) | | $ | 167,311 | | | $ | 14,801 | | | $ | (132,048 | ) | | $ | 28,346 | | | $ | 8,544 | | | $ | 21,699 | | | $ | (23,291 | ) | | $ | 98,530 | | | $ | (80,111 | ) | | $ | 736 | |
See Accompanying Notes to Financial Statements
| Voya Global Bond Fund | PORTFOLIO OF INVESTMENTS |
| as of October 31, 2024 (continued) |
| | | State Street
Bank and
Trust Co. | | | The Bank of
Montreal | | | Toronto
Dominion
Securities | | | UBS AG | | | Total | |
| Assets: | | | | | | | | | | | | | | | |
| Purchased options | | $ | — | | | $ | — | | | $ | — | | | $ | — | | | $ | 17,621 | |
| Forward foreign currency contracts | | | 1,381 | | | | — | | | | 5 | | | | 8,697 | | | | 322,351 | |
| Forward premium swaptions | | | — | | | | — | | | | — | | | | — | | | | 232,958 | |
| Cross-Currency Swaps | | | — | | | | — | | | | — | | | | — | | | | 4,088 | |
| Total Assets | | $ | 1,381 | | | $ | — | | | $ | 5 | | | $ | 8,697 | | | $ | 577,018 | |
| Liabilities: | | | | | | | | | | | | | | | | | | | | |
| Forward foreign currency contracts | | $ | — | | | $ | 49,790 | | | $ | — | | | $ | 34,908 | | | $ | 302,797 | |
| Forward premium swaptions | | | — | | | | — | | | | — | | | | 19,898 | | | | 76,203 | |
| OTC total return swaps | | | — | | | | — | | | | — | | | | — | | | | 92,122 | |
| Volatility Swaps | | | — | | | | — | | | | — | | | | — | | | | 1,605 | |
| Written options | | | — | | | | — | | | | — | | | | — | | | | 307 | |
| Total Liabilities | | $ | — | | | $ | 49,790 | | | $ | — | | | $ | 54,806 | | | $ | 473,034 | |
| Net OTC derivative instruments by counterparty, at fair value | | $ | 1,381 | | | $ | (49,790 | ) | | $ | 5 | | | $ | (46,109 | ) | | $ | 103,984 | |
| Total collateral pledged by the Fund/(Received from counterparty) | | $ | — | | | $ | — | | | $ | — | | | $ | 46,109 | | | $ | (93,891 | ) |
| Net Exposure(1)(2) | | $ | 1,381 | | | $ | (49,790 | ) | | $ | 5 | | | $ | — | | | $ | 10,093 | |
| (1) | Positive net exposure represents amounts due from each respective counterparty. Negative exposure represents amounts due from the Fund. Please refer to Note 2 for additional details regarding counterparty credit risk and credit related contingent features. |
| (2) | At October 31, 2024, the Fund had pledged $10,000 and $50,000 in cash collateral to State Street Bank and Trust Co. and UBS AG, respectively. In addition, the Fund had received $140,000 in cash collateral from Morgan Stanley Capital Services LLC. Excess cash collateral is not shown for financial reporting purposes. |
At October 31, 2024, the aggregate cost of securities and other investments and the composition of unrealized appreciation and depreciation of securities and other investments on a tax basis were:
| Cost for federal income tax purposes was $199,241,970. | | | |
| Net unrealized depreciation consisted of: | | | |
| Gross Unrealized Appreciation | | $ | 7,536,379 | |
| Gross Unrealized Depreciation | | | (15,981,769 | ) |
| Net Unrealized Depreciation | | $ | (8,445,390 | ) |
See Accompanying Notes to Financial Statements
Voya Global High Dividend Low
Volatility Fund |
PORTFOLIO OF INVESTMENTS
as of October 31, 2024 |
| Shares | | | | | Value | | | Percentage
of Net
Assets |
| COMMON STOCK: 98.4% | | | | | | | | |
| | | | Australia: 1.9% | | | | | | | | |
| 27,818 | | | Ampol Ltd. | | $ | 509,306 | | | | 0.2 | |
| 56,806 | | | Computershare Ltd. | | | 982,028 | | | | 0.4 | |
| 217,902 | | | Medibank Pvt Ltd. | | | 512,108 | | | | 0.2 | |
| 102,502 | | | QBE Insurance Group Ltd. | | | 1,157,257 | | | | 0.5 | |
| 104,374 | | | Scentre Group | | | 239,294 | | | | 0.1 | |
| 492,799 | | | Telstra Group Ltd. | | | 1,233,682 | | | | 0.5 | |
| | | | | | | 4,633,675 | | | | 1.9 | |
| | | | Bermuda: 0.6% | | | | | | | | |
| 17,987 | | | Axis Capital Holdings Ltd. | | | 1,407,663 | | | | 0.6 | |
| | | | | | | | | | | | |
| | | | Canada: 3.7% | | | | | | | | |
| 8,404 | | | Canadian Imperial Bank of Commerce | | | 525,782 | | | | 0.2 | |
| 44,086 | | | Cenovus Energy, Inc. | | | 708,935 | | | | 0.3 | |
| 16,151 | | | iA Financial Corp., Inc. | | | 1,315,883 | | | | 0.5 | |
| 48,238 | | | Keyera Corp. | | | 1,481,421 | | | | 0.6 | |
| 24,256 | | | Parkland Corp. | | | 564,438 | | | | 0.2 | |
| 33,836 | | | Pembina Pipeline Corp. | | | 1,415,554 | | | | 0.5 | |
| 6,140 | | | Rogers Communications, Inc. - Class B | | | 223,004 | | | | 0.1 | |
| 38,558 | | | Suncor Energy, Inc. | | | 1,455,531 | | | | 0.6 | |
| 7,550 | | | Thomson Reuters Corp. | | | 1,235,839 | | | | 0.5 | |
| 15,355 | | | TMX Group Ltd. | | | 479,613 | | | | 0.2 | |
| | | | | | | 9,406,000 | | | | 3.7 | |
| | | | Denmark: 0.8% | | | | | | | | |
| 48,040 | | | Danske Bank A/S | | | 1,420,498 | | | | 0.5 | |
| 1,447 | | | Pandora A/S | | | 218,781 | | | | 0.1 | |
| 18,609 | | | Tryg A/S | | | 439,186 | | | | 0.2 | |
| | | | | | | 2,078,465 | | | | 0.8 | |
| | | | France: 2.1% | | | | | | | | |
| 4,659 | | | BNP Paribas SA | | | 318,181 | | | | 0.1 | |
| 16,624 (1) | | | Carrefour SA | | | 264,004 | | | | 0.1 | |
| 13,746 | | | Cie Generale des Etablissements Michelin SCA | | | 464,553 | | | | 0.2 | |
| 19,231 | | | Credit Agricole SA | | | 294,774 | | | | 0.1 | |
| 11,941 | | | Danone SA | | | 853,047 | | | | 0.4 | |
| 2,658 | | | Eiffage SA | | | 247,390 | | | | 0.1 | |
| 30,147 | | | Getlink SE | | | 512,337 | | | | 0.2 | |
| 2,126 | | | Ipsen SA | | | 259,175 | | | | 0.1 | |
| 115,799 | | | Orange SA | | | 1,272,132 | | | | 0.5 | |
| 7,577 | | | Sanofi | | | 800,735 | | | | 0.3 | |
| | | | | | | 5,286,328 | | | | 2.1 | |
| | | | Germany: 1.7% | | | | | | | | |
| 3,062 | | | Allianz SE | | | 963,933 | | | | 0.4 | |
| 71,702 | | | Deutsche Telekom AG, Reg | | | 2,167,801 | | | | 0.8 | |
| 6,445 (2) | | | Scout24 SE | | | 556,753 | | | | 0.2 | |
| 5,750 | | | Symrise AG | | | 691,901 | | | | 0.3 | |
| | | | | | | 4,380,388 | | | | 1.7 | |
| | | | Hong Kong: 1.0% | | | | | | | | |
| 353,000 | | | BOC Hong Kong Holdings Ltd. | | | 1,152,450 | | | | 0.5 | |
| 46,500 | | | CK Hutchison Holdings Ltd. | | | 244,549 | | | | 0.1 | |
| 9,500 | | | Jardine Matheson Holdings Ltd. | | | 357,913 | | | | 0.1 | |
| 88,500 | | | Power Assets Holdings Ltd. | | | 589,522 | | | | 0.2 | |
| Shares | | | | | Value | | | Percentage
of Net
Assets |
| COMMON STOCK: (continued) | | | | | | | | |
| | | | Hong Kong (continued) | | | | | | | | |
| 31,500 | | | Swire Pacific Ltd. - Class A | | $ | 263,834 | | | | 0.1 | |
| | | | | | | 2,608,268 | | | | 1.0 | |
| | | | Ireland: 0.1% | | | | | | | | |
| 3,089 | | | Medtronic PLC | | | 275,693 | | | | 0.1 | |
| | | | | | | | | | | | |
| | | | Israel: 0.2% | | | | | | | | |
| 52,413 | | | Bank Leumi Le-Israel BM | | | 532,492 | | | | 0.2 | |
| | | | | | | | | | | | |
| | | | Italy: 1.7% | | | | | | | | |
| 415,806 | | | Intesa Sanpaolo SpA | | | 1,779,653 | | | | 0.7 | |
| 49,507 (2) | | | Poste Italiane SpA | | | 696,134 | | | | 0.3 | |
| 41,563 | | | UniCredit SpA | | | 1,838,712 | | | | 0.7 | |
| | | | | | | 4,314,499 | | | | 1.7 | |
| | | | Japan: 4.9% | | | | | | | | |
| 64,500 | | | Central Japan Railway Co. | | | 1,335,746 | | | | 0.5 | |
| 50,100 | | | Chubu Electric Power Co., Inc. | | | 575,907 | | | | 0.2 | |
| 23,600 | | | Dai-ichi Life Holdings, Inc. | | | 588,355 | | | | 0.2 | |
| 7,100 | | | Daito Trust Construction Co. Ltd. | | | 784,575 | | | | 0.3 | |
| 27,800 | | | Daiwa House Industry Co. Ltd. | | | 829,237 | | | | 0.3 | |
| 1,100 | | | Disco Corp. | | | 312,988 | | | | 0.1 | |
| 48,500 | | | ENEOS Holdings, Inc. | | | 244,661 | | | | 0.1 | |
| 1,900 | | | Hoya Corp. | | | 254,209 | | | | 0.1 | |
| 17,300 | | | Japan Airlines Co. Ltd. | | | 277,459 | | | | 0.1 | |
| 25,900 | | | Japan Post Holdings Co. Ltd. | | | 238,956 | | | | 0.1 | |
| 53,100 | | | Japan Tobacco, Inc. | | | 1,482,417 | | | | 0.6 | |
| 19,100 | | | JFE Holdings, Inc. | | | 229,952 | | | | 0.1 | |
| 16,600 | | | Kirin Holdings Co. Ltd. | | | 244,396 | | | | 0.1 | |
| 39,500 | | | Nitto Denko Corp. | | | 649,923 | | | | 0.3 | |
| 22,200 | | | Ono Pharmaceutical Co. Ltd. | | | 277,282 | | | | 0.1 | |
| 5,600 | | | Otsuka Holdings Co. Ltd. | | | 338,300 | | | | 0.2 | |
| 23,200 | | | Secom Co. Ltd. | | | 825,059 | | | | 0.3 | |
| 50,700 | | | Sekisui Chemical Co. Ltd. | | | 715,524 | | | | 0.3 | |
| 20,400 | | | Shionogi & Co. Ltd. | | | 291,368 | | | | 0.1 | |
| 12,300 | | | Sumitomo Corp. | | | 259,486 | | | | 0.1 | |
| 23,900 | | | Takeda Pharmaceutical Co. Ltd. | | | 666,839 | | | | 0.3 | |
| 17,400 | | | Trend Micro, Inc./Japan | | | 910,410 | | | | 0.4 | |
| | | | | | | 12,333,049 | | | | 4.9 | |
| | | | Netherlands: 1.3% | | | | | | | | |
| 2,084 | | | BE Semiconductor Industries NV | | | 221,834 | | | | 0.1 | |
| 267,564 | | | Koninklijke KPN NV | | | 1,045,715 | | | | 0.4 | |
| 30,719 | | | NN Group NV | | | 1,508,064 | | | | 0.6 | |
| 2,132 | | | Wolters Kluwer NV | | | 358,354 | | | | 0.2 | |
| | | | | | | 3,133,967 | | | | 1.3 | |
| | | | Norway: 0.7% | | | | | | | | |
| 51,301 | | | DNB Bank ASA | | | 1,063,110 | | | | 0.4 | |
| 52,291 | | | Telenor ASA | | | 642,217 | | | | 0.3 | |
| | | | | | | 1,705,327 | | | | 0.7 | |
| | | | Singapore: 0.8% | | | | | | | | |
| 42,500 | | | DBS Group Holdings Ltd. | | | 1,232,279 | | | | 0.5 | |
| 27,400 | | | Singapore Exchange Ltd. | | | 234,791 | | | | 0.1 | |
See Accompanying Notes to Financial Statements
Voya Global High Dividend Low
Volatility Fund |
PORTFOLIO OF INVESTMENTS
as of October 31, 2024 (continued) |
| Shares | | | | | Value | | | Percentage
of Net
Assets |
| COMMON STOCK: (continued) | | | | | | | | |
| | | | Singapore (continued) | | | | | | | | |
| 167,300 | | | Singapore Technologies Engineering Ltd. | | $ | 573,588 | | | | 0.2 | |
| | | | | | | 2,040,658 | | | | 0.8 | |
| | | | Spain: 1.6% | | | | | | | | |
| 17,267 | | | ACS Actividades de Construccion y Servicios SA | | | 828,045 | | | | 0.3 | |
| 3,676 (2) | | | Aena SME SA | | | 814,675 | | | | 0.3 | |
| 24,297 | | | Industria de Diseno Textil SA | | | 1,385,284 | | | | 0.6 | |
| 72,910 | | | Repsol SA | | | 912,714 | | | | 0.4 | |
| | | | | | | 3,940,718 | | | | 1.6 | |
| | | | Sweden: 0.6% | | | | | | | | |
| 23,612 | | | Essity AB - Class B | | | 666,616 | | | | 0.3 | |
| 19,121 | | | SKF AB - Class B | | | 362,686 | | | | 0.1 | |
| 28,577 | | | Swedbank AB - Class A | | | 579,842 | | | | 0.2 | |
| | | | | | | 1,609,144 | | | | 0.6 | |
| | | | Switzerland: 1.9% | | | | | | | | |
| 200 | | | Givaudan SA, Reg | | | 949,490 | | | | 0.4 | |
| 18,706 | | | Holcim AG | | | 1,836,943 | | | | 0.7 | |
| 18,046 | | | Novartis AG, Reg | | | 1,958,104 | | | | 0.8 | |
| | | | | | | 4,744,537 | | | | 1.9 | |
| | | | United Kingdom: 3.2% | | | | | | | | |
| 68,466 (2) | | | Auto Trader Group PLC | | | 739,265 | | | | 0.3 | |
| 70,504 | | | Aviva PLC | | | 413,177 | | | | 0.2 | |
| 80,294 | | | BAE Systems PLC | | | 1,294,131 | | | | 0.5 | |
| 118,147 | | | BP PLC | | | 577,839 | | | | 0.2 | |
| 49,973 | | | British American Tobacco PLC | | | 1,747,521 | | | | 0.7 | |
| 198,977 | | | Centrica PLC | | | 301,209 | | | | 0.1 | |
| 22,574 | | | Informa PLC | | | 235,829 | | | | 0.1 | |
| 85,897 | | | NatWest Group PLC | | | 407,004 | | | | 0.2 | |
| 37,470 | | | Pearson PLC | | | 550,225 | | | | 0.2 | |
| 43,276 | | | Sage Group PLC | | | 540,857 | | | | 0.2 | |
| 29,037 | | | Smiths Group PLC | | | 572,986 | | | | 0.2 | |
| 16,977 | | | Whitbread PLC | | | 660,526 | | | | 0.3 | |
| | | | | | | 8,040,569 | | | | 3.2 | |
| | | | United States: 69.6% | | | | | | | | |
| 20,620 | | | AbbVie, Inc. | | | 4,203,799 | | | | 1.7 | |
| 3,202 | | | Acuity Brands, Inc. | | | 962,809 | | | | 0.4 | |
| 8,796 | | | AECOM | | | 939,413 | | | | 0.4 | |
| 5,214 | | | Allison Transmission Holdings, Inc. | | | 557,168 | | | | 0.2 | |
| 5,389 | | | Allstate Corp. | | | 1,005,156 | | | | 0.4 | |
| 4,209 | | | Alphabet, Inc. - Class A | | | 720,202 | | | | 0.3 | |
| 35,657 | | | Altria Group, Inc. | | | 1,941,880 | | | | 0.8 | |
| 15,929 | | | Amdocs Ltd. | | | 1,397,690 | | | | 0.6 | |
| 56 | | | Amdocs Ltd. | | | 4,914 | | | | 0.0 | |
| 3,372 | | | American Financial Group, Inc. | | | 434,752 | | | | 0.2 | |
| 28,942 | | | American Homes 4 Rent - Class A | | | 1,019,916 | | | | 0.4 | |
| 714 | | | Ameriprise Financial, Inc. | | | 364,354 | | | | 0.1 | |
| 7,216 | | | AmerisourceBergen Corp. | | | 1,645,825 | | | | 0.7 | |
| 7,400 | | | AMETEK, Inc. | | | 1,356,716 | | | | 0.5 | |
| 3,748 | | | Aon PLC - Class A | | | 1,375,029 | | | | 0.5 | |
| 4,296 | | | Applied Materials, Inc. | | | 780,068 | | | | 0.3 | |
| 6,953 | | | Assurant, Inc. | | | 1,332,890 | | | | 0.5 | |
| Shares | | | | | Value | | | Percentage
of Net
Assets |
| COMMON STOCK: (continued) | | | | | | | | |
| | | | United States (continued) | | | | | | | | |
| 117,110 | | | AT&T, Inc. | | $ | 2,639,659 | | | | 1.0 | |
| 8,262 | | | Automatic Data Processing, Inc. | | | 2,389,701 | | | | 1.0 | |
| 30,675 | | | Baker Hughes Co. | | | 1,168,104 | | | | 0.5 | |
| 11,828 | | | Black Hills Corp. | | | 700,099 | | | | 0.3 | |
| 45,276 | | | Bristol-Myers Squibb Co. | | | 2,525,043 | | | | 1.0 | |
| 46,778 | | | Brixmor Property Group, Inc. | | | 1,260,667 | | | | 0.5 | |
| 7,011 | | | Broadridge Financial Solutions, Inc. | | | 1,478,339 | | | | 0.6 | |
| 8,021 | | | Brown & Brown, Inc. | | | 839,317 | | | | 0.3 | |
| 2,873 | | | Cabot Corp. | | | 309,796 | | | | 0.1 | |
| 2,121 | | | Capital One Financial Corp. | | | 345,278 | | | | 0.1 | |
| 13,819 | | | Cardinal Health, Inc. | | | 1,499,638 | | | | 0.6 | |
| 8,281 | | | Cboe Global Markets, Inc. | | | 1,768,573 | | | | 0.7 | |
| 2,556 | | | Chevron Corp. | | | 380,384 | | | | 0.2 | |
| 5,999 | | | Cigna Group | | | 1,888,545 | | | | 0.8 | |
| 7,532 | | | Cintas Corp. | | | 1,550,161 | | | | 0.6 | |
| 58,099 | | | Cisco Systems, Inc. | | | 3,182,082 | | | | 1.3 | |
| 23,306 | | | Citigroup, Inc. | | | 1,495,546 | | | | 0.6 | |
| 9,157 | | | CME Group, Inc. | | | 2,063,622 | | | | 0.8 | |
| 3,826 | | | Coca-Cola Co. | | | 249,876 | | | | 0.1 | |
| 16,615 | | | Colgate-Palmolive Co. | | | 1,556,992 | | | | 0.6 | |
| 19,506 | | | Commerce Bancshares, Inc. | | | 1,219,125 | | | | 0.5 | |
| 18,345 | | | ConocoPhillips | | | 2,009,511 | | | | 0.8 | |
| 8,433 | | | COPT Defense Properties | | | 271,543 | | | | 0.1 | |
| 65,075 | | | Coterra Energy, Inc. | | | 1,556,594 | | | | 0.6 | |
| 9,248 | | | CSX Corp. | | | 311,103 | | | | 0.1 | |
| 30,299 | | | CVS Health Corp. | | | 1,710,682 | | | | 0.7 | |
| 5,582 | | | Delta Air Lines, Inc. | | | 319,402 | | | | 0.1 | |
| 3,047 | | | Diamondback Energy, Inc. | | | 538,618 | | | | 0.2 | |
| 30,022 | | | Dow, Inc. | | | 1,482,486 | | | | 0.6 | |
| 15,706 | | | DT Midstream, Inc. | | | 1,415,896 | | | | 0.6 | |
| 10,919 | | | DTE Energy Co. | | | 1,356,358 | | | | 0.5 | |
| 20,968 | | | Edison International | | | 1,727,763 | | | | 0.7 | |
| 4,243 | | | Elevance Health, Inc. | | | 1,721,640 | | | | 0.7 | |
| 13,500 | | | Entergy Corp. | | | 2,089,530 | | | | 0.8 | |
| 19,402 | | | Equitable Holdings, Inc. | | | 879,687 | | | | 0.4 | |
| 20,274 | | | Equity Residential | | | 1,426,681 | | | | 0.6 | |
| 19,646 | | | Essent Group Ltd. | | | 1,178,956 | | | | 0.5 | |
| 2,590 | | | Essex Property Trust, Inc. | | | 735,197 | | | | 0.3 | |
| 26,755 | | | Evergy, Inc. | | | 1,617,072 | | | | 0.6 | |
| 10,919 | | | Fortive Corp. | | | 779,944 | | | | 0.3 | |
| 25,725 | | | Gaming and Leisure Properties, Inc. | | | 1,291,138 | | | | 0.5 | |
| 23,024 | | | General Mills, Inc. | | | 1,566,092 | | | | 0.6 | |
| 38,087 | | | Genpact Ltd. | | | 1,453,781 | | | | 0.6 | |
| 6,846 | | | Genuine Parts Co. | | | 785,236 | | | | 0.3 | |
| 28,981 | | | Gilead Sciences, Inc. | | | 2,574,092 | | | | 1.0 | |
| 21,601 | | | H&R Block, Inc. | | | 1,290,228 | | | | 0.5 | |
| 5,098 | | | Hancock Whitney Corp. | | | 265,504 | | | | 0.1 | |
| 2,923 | | | Hanover Insurance Group, Inc. | | | 433,569 | | | | 0.2 | |
| 15,450 | | | Hartford Financial Services Group, Inc. | | | 1,706,298 | | | | 0.7 | |
| 22,360 | | | Hewlett Packard Enterprise Co. | | | 435,796 | | | | 0.2 | |
See Accompanying Notes to Financial Statements
Voya Global High Dividend Low
Volatility Fund |
PORTFOLIO OF INVESTMENTS
as of October 31, 2024 (continued) |
| Shares | | | | | Value | | | Percentage
of Net
Assets |
| COMMON STOCK: (continued) | | | | | | | | |
| | | | United States (continued) | | | | | | | | |
| 2,868 | | | Hilton Worldwide Holdings, Inc. | | $ | 673,550 | | | | 0.3 | |
| 2,404 | | | Humana, Inc. | | | 619,823 | | | | 0.2 | |
| 10,006 | | | Ingredion, Inc. | | | 1,328,397 | | | | 0.5 | |
| 9,557 | | | International Bancshares Corp. | | | 585,462 | | | | 0.2 | |
| 31,998 | | | Invitation Homes, Inc. | | | 1,005,057 | | | | 0.4 | |
| 7,127 | | | Jack Henry & Associates, Inc. | | | 1,296,615 | | | | 0.5 | |
| 26,758 | | | Johnson & Johnson | | | 4,277,534 | | | | 1.7 | |
| 12,279 | | | Kimberly-Clark Corp. | | | 1,647,596 | | | | 0.7 | |
| 80,235 | | | Kinder Morgan, Inc. | | | 1,966,560 | | | | 0.8 | |
| 829 | | | KLA Corp. | | | 552,305 | | | | 0.2 | |
| 31,323 | | | Kraft Heinz Co. | | | 1,048,068 | | | | 0.4 | |
| 11,140 | | | Leidos Holdings, Inc. | | | 2,040,402 | | | | 0.8 | |
| 2,755 | | | Lockheed Martin Corp. | | | 1,504,368 | | | | 0.6 | |
| 19,572 | | | Loews Corp. | | | 1,545,405 | | | | 0.6 | |
| 8,556 | | | LyondellBasell Industries NV - Class A | | | 743,089 | | | | 0.3 | |
| 5,417 | | | ManpowerGroup, Inc. | | | 340,458 | | | | 0.1 | |
| 8,338 | | | Marsh & McLennan Cos., Inc. | | | 1,819,685 | | | | 0.7 | |
| 2,664 | | | McKesson Corp. | | | 1,333,572 | | | | 0.5 | |
| 21,341 | | | Merck & Co., Inc. | | | 2,183,611 | | | | 0.9 | |
| 18,004 | | | MetLife, Inc. | | | 1,411,874 | | | | 0.6 | |
| 55,764 | | | MGIC Investment Corp. | | | 1,396,331 | | | | 0.6 | |
| 6,560 | | | Molson Coors Beverage Co. - Class B | | | 357,323 | | | | 0.1 | |
| 17,266 | | | National Fuel Gas Co. | | | 1,045,111 | | | | 0.4 | |
| 12,352 | | | NetApp, Inc. | | | 1,424,309 | | | | 0.6 | |
| 13,940 | | | New Jersey Resources Corp. | | | 639,707 | | | | 0.3 | |
| 993 | | | NewMarket Corp. | | | 521,295 | | | | 0.2 | |
| 35,864 | | | NiSource, Inc. | | | 1,260,978 | | | | 0.5 | |
| 12,933 | | | NorthWestern Corp. | | | 691,398 | | | | 0.3 | |
| 5,294 | | | NVIDIA Corp. | | | 702,831 | | | | 0.3 | |
| 34,048 | | | OGE Energy Corp. | | | 1,361,580 | | | | 0.5 | |
| 5,919 | | | ONE Gas, Inc. | | | 421,847 | | | | 0.2 | |
| 9,628 | | | OneMain Holdings, Inc. | | | 478,223 | | | | 0.2 | |
| 20,418 | | | ONEOK, Inc. | | | 1,978,096 | | | | 0.8 | |
| 18,298 | | | PepsiCo, Inc. | | | 3,038,932 | | | | 1.2 | |
| 12,580 | | | PG&E Corp. | | | 254,368 | | | | 0.1 | |
| 22,502 | | | Philip Morris International, Inc. | | | 2,986,015 | | | | 1.2 | |
| 13,347 | | | Phillips 66 | | | 1,625,932 | | | | 0.6 | |
| 11,623 | | | Procter & Gamble Co. | | | 1,919,887 | | | | 0.8 | |
| 5,143 | | | Prosperity Bancshares, Inc. | | | 376,468 | | | | 0.2 | |
| 14,392 | | | Prudential Financial, Inc. | | | 1,762,732 | | | | 0.7 | |
| 7,542 | | | Qualcomm, Inc. | | | 1,227,611 | | | | 0.5 | |
| 2,070 | | | Ralph Lauren Corp. | | | 409,715 | | | | 0.2 | |
| 4,651 | | | Raytheon Technologies Corp. | | | 562,724 | | | | 0.2 | |
| 17,459 | | | Regency Centers Corp. | | | 1,247,271 | | | | 0.5 | |
| 7,150 | | | Reinsurance Group of America, Inc. | | | 1,509,222 | | | | 0.6 | |
| 7,464 | | | Republic Services, Inc. | | | 1,477,872 | | | | 0.6 | |
| 28,469 | | | Rithm Capital Corp. | | | 301,487 | | | | 0.1 | |
| 28,282 | | | Rollins, Inc. | | | 1,333,213 | | | | 0.5 | |
| 12,702 | | | RPM International, Inc. | | | 1,614,551 | | | | 0.6 | |
| Shares | | | | | Value | | | Percentage
of Net
Assets |
| COMMON STOCK: (continued) | | | | | | | | |
| | | | United States (continued) | | | | | | | | |
| 5,475 | | | Ryder System, Inc. | | $ | 800,883 | | | | 0.3 | |
| 10,653 | | | Sempra Energy | | | 888,141 | | | | 0.4 | |
| 2,427 | | | Sherwin-Williams Co. | | | 870,735 | | | | 0.3 | |
| 5,796 | | | Skyworks Solutions, Inc. | | | 507,614 | | | | 0.2 | |
| 18,716 | | | SLM Corp. | | | 412,313 | | | | 0.2 | |
| 4,991 | | | Snap-on, Inc. | | | 1,647,679 | | | | 0.7 | |
| 21,219 | | | SS&C Technologies Holdings, Inc. | | | 1,483,845 | | | | 0.6 | |
| 20,076 | | | Synchrony Financial | | | 1,106,991 | | | | 0.4 | |
| 11,071 | | | Tapestry, Inc. | | | 525,319 | | | | 0.2 | |
| 8,342 | | | Texas Roadhouse, Inc. | | | 1,594,323 | | | | 0.6 | |
| 2,098 | | | TJX Cos., Inc. | | | 237,137 | | | | 0.1 | |
| 3,715 | | | Tradeweb Markets, Inc. - Class A | | | 471,805 | | | | 0.2 | |
| 7,633 | | | Travelers Cos., Inc. | | | 1,877,260 | | | | 0.7 | |
| 7,655 | | | UnitedHealth Group, Inc. | | | 4,321,247 | | | | 1.7 | |
| 28,263 | | | Unum Group | | | 1,813,919 | | | | 0.7 | |
| 67,770 | | | Verizon Communications, Inc. | | | 2,855,150 | | | | 1.1 | |
| 4,683 | | | Visa, Inc. - Class A | | | 1,357,368 | | | | 0.5 | |
| 2,488 | | | Watts Water Technologies, Inc. - Class A | | | 474,188 | | | | 0.2 | |
| 43,606 | | | Wells Fargo & Co. | | | 2,830,902 | | | | 1.1 | |
| 78,539 | | | Wendy's Co. | | | 1,500,880 | | | | 0.6 | |
| 4,468 | | | Xcel Energy, Inc. | | | 298,507 | | | | 0.1 | |
| | | | | | | 175,210,191 | | | | 69.6 | |
| | | | Total Common Stock
(Cost $212,659,080) | | | 247,681,631 | | | | 98.4 | |
| | | | | | | | | | | | |
| EXCHANGE-TRADED FUNDS: 0.4% | | | | | | | | |
| 5,191 | | | iShares MSCI EAFE Value ETF | | | 284,882 | | | | 0.1 | |
| 3,854 | | | iShares Russell 1000 Value ETF | | | 723,319 | | | | 0.3 | |
| | | | | | | 1,008,201 | | | | 0.4 | |
| | | | Total Exchange-Traded Funds
(Cost $943,902) | | | 1,008,201 | | | | 0.4 | |
| | | | | | | | | | | | |
| PREFERRED STOCK: 0.7% | | | | | | | | |
| | | | Germany: 0.7% | | | | | | | | |
| 13,598 | | | Henkel AG & Co. KGaA | | | 1,177,490 | | | | 0.5 | |
| 11,488 | | | Porsche Automobil Holding SE | | | 477,248 | | | | 0.2 | |
| | | | | | | 1,654,738 | | | | 0.7 | |
| | | | Total Preferred Stock
(Cost $1,759,149) | | | 1,654,738 | | | | 0.7 | |
| | | | Total Long-Term Investments
(Cost $215,362,131) | | | 250,344,570 | | | | 99.5 | |
See Accompanying Notes to Financial Statements
Voya Global High Dividend Low
Volatility Fund |
PORTFOLIO OF INVESTMENTS
as of October 31, 2024 (continued) |
Principal
Amount† | | | | | Value | | | | Percentage
of Net
Assets |
| SHORT-TERM INVESTMENTS: 0.4% | | | | | | | | |
| | | | Repurchase Agreements: 0.1% | | | | | | | | |
| 260,894 (3) | | | Bank of Montreal, Repurchase Agreement dated 10/31/2024, 4.860%, due 11/01/2024 (Repurchase Amount $260,929, collateralized by various U.S. Government/ U.S. Government Agency Obligations, 1.713%- 7.623%, Market Value plus accrued interest $266,112, due 01/01/26-12/01/52) | | $ | 260,894 | | | | 0.1 | |
| | | | Total Repurchase Agreements
(Cost $260,894) | | | 260,894 | | | | 0.1 | |
| Shares | | | | | Value | | | Percentage
of Net
Assets |
| | | | Mutual Funds: 0.3% | | | | | | | | |
| 656,000 (4) | | | Morgan Stanley
Institutional Liquidity
Funds - Government
Portfolio (Institutional
Share Class), 4.780%
(Cost $656,000) | | $ | 656,000 | | | | 0.3 | |
| | | | | | | | | | | | |
| | | | Total Short-Term
Investments
(Cost $916,894) | | | 916,894 | | | | 0.4 | |
| | | | Total Investments in
Securities
(Cost $216,279,025) | | $ | 251,261,464 | | | | 99.9 | |
| | | | Assets in Excess of
Other Liabilities | | | 328,252 | | | | 0.1 | |
| | | | Net Assets | | $ | 251,589,716 | | | | 100.0 | |
| † | Unless otherwise indicated, principal amount is shown in USD. |
| (1) | Security, or a portion of the security, is on loan. |
| (2) | Securities with purchases pursuant to Rule 144A or section 4(a)(2), under the Securities Act of 1933 and may not be resold subject to that rule except to qualified institutional buyers. |
| (3) | All or a portion of the security represents securities purchased with cash collateral received for securities on loan. |
| (4) | Rate shown is the 7-day yield as of October 31, 2024. |
| Sector Diversification | | | Percentage
of Net Assets | |
| Financials | | | 22.8 | % |
| Health Care | | | 14.2 | |
| Industrials | | | 13.3 | |
| Consumer Staples | | | 9.6 | |
| Energy | | | 8.1 | |
| Information Technology | | | 6.5 | |
| Utilities | | | | 6.3 | |
| Communication Services | | | 5.7 | |
| Consumer Discretionary | | | 4.6 | |
| Real Estate | | | 4.1 | |
| Materials | | | 3.9 | |
| Exchange-Traded Funds | | | 0.4 | |
| Short-Term Investments | | | 0.4 | |
| Assets in Excess of Other Liabilities | | | 0.1 | |
| Net Assets | | | 100.0 | % |
Portfolio holdings are subject to change daily.
See Accompanying Notes to Financial Statements
Voya Global High Dividend Low
Volatility Fund |
PORTFOLIO OF INVESTMENTS
as of October 31, 2024 (continued) |
Fair Value Measurements^
The following is a summary of the fair valuations according to the inputs used as of October 31, 2024 in valuing the assets and liabilities:
| | | Quoted Prices
in Active Markets
for Identical
Investments
(Level 1) | | | Significant Other
Observable
Inputs#
(Level 2) | | | Significant
Unobservable
Inputs
(Level 3) | | | Fair Value
at
October 31, 2024 | |
| Asset Table | | | | | | | | | | | |
| Investments, at fair value | | | | | | | | | | | |
| Common Stock | | | | | | | | | | | | | | | | |
| Australia | | $ | — | | | $ | 4,633,675 | | | $ | — | | | $ | 4,633,675 | |
| Bermuda | | | 1,407,663 | | | | — | | | | — | | | | 1,407,663 | |
| Canada | | | 9,406,000 | | | | — | | | | — | | | | 9,406,000 | |
| Denmark | | | — | | | | 2,078,465 | | | | — | | | | 2,078,465 | |
| France | | | — | | | | 5,286,328 | | | | — | | | | 5,286,328 | |
| Germany | | | — | | | | 4,380,388 | | | | — | | | | 4,380,388 | |
| Hong Kong | | | 357,913 | | | | 2,250,355 | | | | — | | | | 2,608,268 | |
| Ireland | | | 275,693 | | | | — | | | | — | | | | 275,693 | |
| Israel | | | — | | | | 532,492 | | | | — | | | | 532,492 | |
| Italy | | | — | | | | 4,314,499 | | | | — | | | | 4,314,499 | |
| Japan | | | — | | | | 12,333,049 | | | | — | | | | 12,333,049 | |
| Netherlands | | | 1,045,715 | | | | 2,088,252 | | | | — | | | | 3,133,967 | |
| Norway | | | 642,217 | | | | 1,063,110 | | | | — | | | | 1,705,327 | |
| Singapore | | | — | | | | 2,040,658 | | | | — | | | | 2,040,658 | |
| Spain | | | — | | | | 3,940,718 | | | | — | | | | 3,940,718 | |
| Sweden | | | 666,616 | | | | 942,528 | | | | — | | | | 1,609,144 | |
| Switzerland | | | — | | | | 4,744,537 | | | | — | | | | 4,744,537 | |
| United Kingdom | | | — | | | | 8,040,569 | | | | — | | | | 8,040,569 | |
| United States | | | 175,210,191 | | | | — | | | | — | | | | 175,210,191 | |
| Total Common Stock | | | 189,012,008 | | | | 58,669,623 | | | | — | | | | 247,681,631 | |
| Exchange-Traded Funds | | | 1,008,201 | | | | — | | | | — | | | | 1,008,201 | |
| Preferred Stock | | | — | | | | 1,654,738 | | | | — | | | | 1,654,738 | |
| Short-Term Investments | | | 656,000 | | | | 260,894 | | | | — | | | | 916,894 | |
| Total Investments, at fair value | | $ | 190,676,209 | | | $ | 60,585,255 | | | $ | — | | | $ | 251,261,464 | |
| ^ | See Note 2, “Significant Accounting Policies” in the Notes to Financial Statements for additional information. |
| # | The earlier close of the foreign markets gives rise to the possibility that significant events, including broad market moves, may have occurred in the interim and may materially affect the value of those securities. To account for this, the Fund may frequently value many of its foreign equity securities using fair value prices based on third party vendor modeling tools to the extent available. Accordingly, a portion of the Fund’s investments are categorized as Level 2 investments. |
At October 31, 2024, the aggregate cost of securities and other investments and the composition of unrealized appreciation and depreciation of securities and other investments on a tax basis were:
| Cost for federal income tax purposes was $216,926,378. |
| Net unrealized appreciation consisted of: | | | |
| Gross Unrealized Appreciation | | $ | 40,934,895 | |
| Gross Unrealized Depreciation | | | (6,646,908 | ) |
| Net Unrealized Appreciation | | $ | 34,287,987 | |
See Accompanying Notes to Financial Statements
Voya Multi-Manager
International Small Cap Fund | PORTFOLIO OF INVESTMENTS
as of October 31, 2024 |
| Shares | | | | | Value | | | Percentage
of Net
Assets |
| COMMON STOCK: 98.4% | |
| | | | Australia: 5.8% | |
| 44,316 | | | Accent Group Ltd. | | $ | 68,498 | | | | 0.0 | |
| 152,603 (1)(2) | | | Aeris Resources Ltd. | | | 22,415 | | | | 0.0 | |
| 70,065 | | | AGL Energy Ltd. | | | 481,066 | | | | 0.2 | |
| 118,743 | | | AMP Ltd. | | | 110,923 | | | | 0.1 | |
| 36,600 | | | Australian Clinical Labs Ltd. | | | 87,024 | | | | 0.0 | |
| 1,114,951 | | | Beacon Minerals Ltd. | | | 17,610 | | | | 0.0 | |
| 10,009 | | | Bega Cheese Ltd. | | | 33,735 | | | | 0.0 | |
| 4,490 | | | Breville Group Ltd. | | | 93,327 | | | | 0.0 | |
| 95,911 (1) | | | Capricorn Metals Ltd. | | | 388,812 | | | | 0.1 | |
| 16,160 | | | Challenger Ltd. | | | 64,002 | | | | 0.0 | |
| 85,747 | | | Champion Iron Ltd. | | | 329,102 | | | | 0.1 | |
| 54,959 | | | Charter Hall Group | | | 542,324 | | | | 0.2 | |
| 7,216 | | | Clinuvel Pharmaceuticals Ltd. | | | 67,189 | | | | 0.0 | |
| 5,774 | | | Codan Ltd. | | | 59,740 | | | | 0.0 | |
| 6,962 (1) | | | DGL Group Ltd./Au | | | 2,886 | | | | 0.0 | |
| 106,485 | | | Downer EDI Ltd. | | | 390,165 | | | | 0.1 | |
| 69,787 (1) | | | Emeco Holdings Ltd. | | | 35,364 | | | | 0.0 | |
| 379,699 | | | Gold Road Resources Ltd. | | | 495,230 | | | | 0.2 | |
| 16,365 | | | GR Engineering Services Ltd. | | | 22,697 | | | | 0.0 | |
| 32,679 | | | Helia Group Ltd. | | | 86,828 | | | | 0.0 | |
| 22,825 | | | Helloworld Travel Ltd. | | | 26,907 | | | | 0.0 | |
| 156,949 | | | Horizon Oil Ltd. | | | 19,625 | | | | 0.0 | |
| 25,880 | | | HUB24 Ltd. | | | 1,164,787 | | | | 0.4 | |
| 62,362 | | | Humm Group Ltd. | | | 29,063 | | | | 0.0 | |
| 95,622 | | | Iluka Resources Ltd. | | | 367,497 | | | | 0.1 | |
| 97,586 (1) | | | Image Resources NL | | | 5,908 | | | | 0.0 | |
| 20,134 | | | Infomedia Ltd. | | | 18,815 | | | | 0.0 | |
| 14,541 | | | JB Hi-Fi Ltd. | | | 780,301 | | | | 0.3 | |
| 2,942 | | | Jumbo Interactive Ltd. | | | 24,825 | | | | 0.0 | |
| 264,387 | | | Karoon Energy Ltd. | | | 240,997 | | | | 0.1 | |
| 352,652 | | | Macmahon Holdings Ltd. | | | 88,190 | | | | 0.0 | |
| 117,656 | | | Magellan Financial Group Ltd. | | | 824,298 | | | | 0.3 | |
| 82,435 (1) | | | Metals X Ltd. | | | 26,257 | | | | 0.0 | |
| 84,053 (1) | | | Nanosonics Ltd. | | | 175,287 | | | | 0.1 | |
| 27,563 | | | Netwealth Group Ltd. | | | 497,308 | | | | 0.2 | |
| 186,118 | | | New Hope Corp. Ltd. | | | 594,237 | | | | 0.2 | |
| 18,573 (1) | | | Nuix Ltd. | | | 93,801 | | | | 0.0 | |
| 1,805 | | | Objective Corp. Ltd. | | | 19,136 | | | | 0.0 | |
| 272,830 | | | OceanaGold Corp. | | | 774,000 | | | | 0.3 | |
| 18,504 (1) | | | OFX Group Ltd. | | | 17,747 | | | | 0.0 | |
| 59,220 (1) | | | Ora Banda Mining Ltd. | | | 36,148 | | | | 0.0 | |
| 48,019 (1) | | | Paladin Energy Ltd. | | | 316,137 | | | | 0.1 | |
| 63,070 | | | Perenti Ltd. | | | 48,454 | | | | 0.0 | |
| 399,504 | | | Perseus Mining Ltd. | | | 746,925 | | | | 0.3 | |
| 55,885 | | | PointsBet Holdings Ltd. | | | 28,945 | | | | 0.0 | |
| 698,350 | | | Ramelius Resources Ltd. | | | 1,089,582 | | | | 0.4 | |
| 365,148 (1) | | | Regis Resources Ltd. | | | 643,207 | | | | 0.2 | |
| 359,555 (1) | | | Resolute Mining Ltd. | | | 192,250 | | | | 0.1 | |
| 12,107 | | | SKS Technologies Group Ltd. | | | 11,553 | | | | 0.0 | |
| 45,523 | | | SmartGroup Corp. Ltd. | | | 230,965 | | | | 0.1 | |
| 74,962 | | | Southern Cross Electrical Engineering Ltd. | | | 80,128 | | | | 0.0 | |
| 46,114 | | | Super Retail Group Ltd. | | | 437,275 | | | | 0.2 | |
| 57,882 | | | Technology One Ltd. | | | 922,521 | | | | 0.3 | |
| Shares | | | | | Value | | | Percentage
of Net
Assets |
| COMMON STOCK: (continued) | |
| | | | Australia (continued) |
| 19,105 (1) | | | Temple & Webster Group Ltd. | | $ | 144,341 | | | | 0.1 | |
| 280,023 | | | Ventia Services Group Pty Ltd. | | | 840,993 | | | | 0.3 | |
| 108,701 (1) | | | West African Resources Ltd. | | | 130,495 | | | | 0.1 | |
| 338,729 (1) | | | Westgold Resources Ltd. | | | 712,997 | | | | 0.3 | |
| 346,919 (1) | | | Zip Co. Ltd. | | | 676,313 | | | | 0.3 | |
| | | | | | | 16,477,152 | | | | 5.8 | |
| | | | Austria: 0.0% |
| 2,728 (2) | | | Kontron AG | | | 45,938 | | | | 0.0 | |
| 1,609 | | | Palfinger AG | | | 35,760 | | | | 0.0 | |
| 2,747 | | | Porr AG | | | 43,431 | | | | 0.0 | |
| | | | | | | 125,129 | | | | 0.0 | |
| | | | Belgium: 0.4% |
| 533 | | | Cie d'Entreprises CFE | | | 3,544 | | | | 0.0 | |
| 19,204 | | | Colruyt Group N.V | | | 896,143 | | | | 0.4 | |
| 11,865 | | | Deceuninck NV | | | 29,835 | | | | 0.0 | |
| 478 | | | Sipef NV | | | 29,429 | | | | 0.0 | |
| 489 | | | Wereldhave Belgium Comm VA | | | 25,266 | | | | 0.0 | |
| | | | | | | 984,217 | | | | 0.4 | |
| | | | Bermuda: 0.1% |
| 11,931 | | | DHT Holdings, Inc. | | | 123,128 | | | | 0.1 | |
| 1,809 | | | Ocean Wilsons Holdings Ltd. | | | 32,307 | | | | 0.0 | |
| | | | | | | 155,435 | | | | 0.1 | |
| | | | Brazil: 0.2% |
| 23,100 | | | Bemobi Mobile Tech S.A. | | | 61,857 | | | | 0.0 | |
| 159,200 (1) | | | C&A MODAS SA | | | 356,354 | | | | 0.1 | |
| 21,100 | | | Cury Construtora e Incorporadora SA | | | 89,314 | | | | 0.1 | |
| 32,587 | | | Guararapes Confeccoes S.A. | | | 47,802 | | | | 0.0 | |
| 6,245 (1) | | | VTEX - Class A | | | 42,216 | | | | 0.0 | |
| | | | | | | 597,543 | | | | 0.2 | |
| | | | Burkina Faso: 0.2% |
| 24,940 | | | Endeavour Mining PLC | | | 552,232 | | | | 0.2 | |
| | | | | | | | | | | | |
| | | | Canada: 9.5% |
| 7,810 | | | ADENTRA, Inc. | | | 215,338 | | | | 0.1 | |
| 15,057 | | | Aecon Group, Inc. | | | 250,779 | | | | 0.1 | |
| 4,300 | | | AGF Management Ltd. - Class B | | | 32,180 | | | | 0.0 | |
| 20,300 | | | AirBoss of America Corp. | | | 60,943 | | | | 0.0 | |
| 52,231 | | | Alamos Gold, Inc. - Class A | | | 1,055,236 | | | | 0.4 | |
| 18,000 (1) | | | Aritzia, Inc. | | | 579,553 | | | | 0.2 | |
| 148,900 (1) | | | Athabasca Oil Corp. | | | 552,888 | | | | 0.2 | |
| 11,209 | | | AtkinsRealis Group, Inc. | | | 539,378 | | | | 0.2 | |
| 19,409 | | | Bird Construction, Inc. | | | 422,514 | | | | 0.2 | |
| 22,700 | | | Black Diamond Group Ltd. | | | 147,546 | | | | 0.1 | |
| 15,381 | | | Boardwalk Real Estate Investment Trust | | | 798,683 | | | | 0.3 | |
| 14,817 (1) | | | Bombardier, Inc. - Class B | | | 1,089,925 | | | | 0.4 | |
| 22,745 | | | Boralex, Inc. - Class A | | | 546,756 | | | | 0.2 | |
| 13,100 | | | Canaccord Genuity Group, Inc. | | | 94,274 | | | | 0.0 | |
| 39,100 | | | Cascades, Inc. | | | 294,580 | | | | 0.1 | |
See Accompanying Notes to Financial Statements
Voya Multi-Manager
International Small Cap Fund | PORTFOLIO OF INVESTMENTS
as of October 31, 2024 (continued) |
| Shares | | | | | Value | | | Percentage
of Net
Assets |
| COMMON STOCK: (continued) | |
| | | | Canada (continued) |
| 40,190 (1) | | | Celestica, Inc. | | $ | 2,750,245 | | | | 1.0 | |
| 25,939 | | | Centerra Gold, Inc. | | | 183,316 | | | | 0.1 | |
| 63,178 | | | CES Energy Solutions Corp. | | | 362,093 | | | | 0.1 | |
| 33,200 (1) | | | Chorus Aviation, Inc. | | | 71,772 | | | | 0.0 | |
| 115,918 | | | CI Financial Corp. | | | 1,906,505 | | | | 0.7 | |
| 2,047 | | | Colliers International Group, Inc. | | | 312,454 | | | | 0.1 | |
| 5,500 (1) | | | Coveo Solutions, Inc. | | | 20,738 | | | | 0.0 | |
| 7,913 (1) | | | Docebo, Inc. | | | 360,428 | | | | 0.1 | |
| 7,433 | | | DREAM Unlimited Corp. - Class A | | | 152,947 | | | | 0.1 | |
| 120,523 | | | Dundee Precious Metals, Inc. | | | 1,225,702 | | | | 0.4 | |
| 7,450 | | | Enerflex Ltd. | | | 49,226 | | | | 0.0 | |
| 14,613 | | | Enghouse Systems Ltd. | | | 309,294 | | | | 0.1 | |
| 15,600 (1) | | | Ensign Energy Services, Inc. | | | 31,371 | | | | 0.0 | |
| 9,108 | | | EQB, Inc. | | | 698,759 | | | | 0.2 | |
| 10,508 | | | Exco Technologies Ltd. | | | 63,319 | | | | 0.0 | |
| 29,600 | | | Extendicare, Inc. | | | 195,583 | | | | 0.1 | |
| 16,846 | | | Fiera Capital Corp. | | | 117,481 | | | | 0.0 | |
| 38,931 | | | Finning International, Inc. | | | 1,136,320 | | | | 0.4 | |
| 91,000 (1) | | | Fortuna Mining Corp. | | | 452,925 | | | | 0.2 | |
| 2,459 | | | Hammond Power Solutions, Inc. | | | 213,113 | | | | 0.1 | |
| 125,818 | | | Headwater Exploration, Inc. | | | 619,895 | | | | 0.2 | |
| 3,614 | | | High Arctic Energy Services, Inc. | | | 2,933 | | | | 0.0 | |
| 1,852 | | | Information Services Corp. | | | 38,840 | | | | 0.0 | |
| 17,500 | | | Killam Apartment Real Estate Investment Trust | | | 235,034 | | | | 0.1 | |
| 600 (1) | | | Kinaxis, Inc. | | | 66,638 | | | | 0.0 | |
| 400 | | | Lassonde Industries, Inc. - Class A | | | 50,688 | | | | 0.0 | |
| 3,400 | | | Leon's Furniture Ltd. | | | 65,517 | | | | 0.0 | |
| 10,289 | | | Linamar Corp. | | | 420,989 | | | | 0.2 | |
| 19,475 | | | Martinrea International, Inc. | | | 144,068 | | | | 0.1 | |
| 2,200 | | | Melcor Developments Ltd. | | | 20,525 | | | | 0.0 | |
| 1,400 | | | Morguard Corp. | | | 117,683 | | | | 0.0 | |
| 10,159 | | | Mullen Group Ltd. | | | 109,882 | | | | 0.0 | |
| 4,400 | | | Neo Performance Materials, Inc. | | | 24,839 | | | | 0.0 | |
| 27,200 | | | Nexus Industrial REIT | | | 160,580 | | | | 0.1 | |
| 3,100 | | | North West Co., Inc. | | | 116,688 | | | | 0.0 | |
| 58,011 (1) | | | NuVista Energy Ltd. | | | 465,805 | | | | 0.2 | |
| 200 (1) | | | O3 Mining, Inc. | | | 158 | | | | 0.0 | |
| 29,758 | | | Paramount Resources Ltd. - Class A | | | 574,065 | | | | 0.2 | |
| 25,315 | | | Pason Systems, Inc. | | | 244,905 | | | | 0.1 | |
| 23,900 | | | PHX Energy Services Corp. | | | 160,152 | | | | 0.1 | |
| 2,200 | | | Pollard Banknote Ltd. | | | 37,542 | | | | 0.0 | |
| 7,067 (1) | | | Repare Therapeutics, Inc. | | | 23,674 | | | | 0.0 | |
| 29,234 | | | Russel Metals, Inc. | | | 814,021 | | | | 0.3 | |
| 74,263 | | | Secure Energy Services, Inc. | | | 827,248 | | | | 0.3 | |
| 23,220 | | | Silvercorp Metals, Inc. | | | 109,067 | | | | 0.0 | |
| Shares | | | | | Value | | | Percentage
of Net
Assets |
| COMMON STOCK: (continued) | |
| | | | Canada (continued) |
| 1,900 | | | Softchoice Corp. | | $ | 28,657 | | | | 0.0 | |
| 10,000 | | | Sprott, Inc. | | | 442,489 | | | | 0.2 | |
| 11,964 | | | Stella-Jones, Inc. | | | 723,331 | | | | 0.3 | |
| 2,000 | | | TECSYS, Inc. | | | 57,600 | | | | 0.0 | |
| 10,900 (1) | | | Thinkific Labs, Inc. | | | 20,197 | | | | 0.0 | |
| 40,700 (1) | | | Torex Gold Resources, Inc. | | | 877,812 | | | | 0.3 | |
| 15,400 | | | Total Energy Services, Inc. | | | 106,401 | | | | 0.0 | |
| 26,600 | | | TransAlta Corp. | | | 278,160 | | | | 0.1 | |
| 5,900 | | | Transcontinental, Inc. - Class A | | | 72,884 | | | | 0.0 | |
| 33,929 (1) | | | Valeura Energy, Inc. | | | 110,144 | | | | 0.0 | |
| 48,036 | | | Vermilion Energy, Inc. | | | 447,809 | | | | 0.2 | |
| 2,200 | | | VersaBank | | | 33,071 | | | | 0.0 | |
| 20,900 (1) | | | Vitalhub Corp. | | | 153,108 | | | | 0.1 | |
| 1,100 | | | Wajax Corp. | | | 19,522 | | | | 0.0 | |
| 78,568 | | | Whitecap Resources, Inc. | | | 586,290 | | | | 0.2 | |
| | | | | | | 26,703,075 | | | | 9.5 | |
| | | | China: 0.9% |
| 236,700 | | | Beijing WKW Automotive Parts Co. Ltd. - Class A | | | 111,756 | | | | 0.0 | |
| 78,400 | | | Central China Land Media Co. Ltd. - Class A | | | 119,040 | | | | 0.1 | |
| 55,300 | | | Changhua Holding Group Co. Ltd. - Class A | | | 63,505 | | | | 0.0 | |
| 11,693 | | | Chengdu XGimi Technology Co. Ltd. - Class A | | | 119,153 | | | | 0.1 | |
| 346,000 (1) | | | China Kepei Education Group Ltd. | | | 56,969 | | | | 0.0 | |
| 177,200 | | | Daheng New Epoch Technology, Inc. - Class A | | | 225,981 | | | | 0.1 | |
| 284,000 | | | Ever Sunshine Services Group Ltd. | | | 91,713 | | | | 0.0 | |
| 263,700 (1) | | | Fanli Digital Technology Co. Ltd. - Class A | | | 218,144 | | | | 0.1 | |
| 566,996 (1) | | | Greenland Hong Kong Holdings Ltd. | | | 22,672 | | | | 0.0 | |
| 38,913 | | | Hello Group, Inc., ADR | | | 275,115 | | | | 0.1 | |
| 90,200 | | | Joyoung Co. Ltd. - Class A | | | 127,831 | | | | 0.1 | |
| 11,000 | | | KHGEARS International Ltd. | | | 55,223 | | | | 0.0 | |
| 36,469 | | | Leedarson IoT Technology, Inc. - Class A | | | 84,822 | | | | 0.0 | |
| 31,758 | | | Pacific Online Ltd. | | | 1,368 | | | | 0.0 | |
| 300,213 | | | Ten Pao Group Holdings Ltd. | | | 55,995 | | | | 0.0 | |
| 140,800 (1) | | | Tongdao Liepin Group | | | 41,279 | | | | 0.0 | |
| 96,600 (1) | | | XD, Inc. | | | 259,350 | | | | 0.1 | |
| 70,300 | | | Xiamen Jihong Technology Co. Ltd. - Class A | | | 124,407 | | | | 0.1 | |
| 19,318 | | | Yiren Digital Ltd., ADR | | | 108,954 | | | | 0.0 | |
| 63,121 | | | Youcare Pharmaceutical Group Co. Ltd. - Class A | | | 202,357 | | | | 0.1 | |
| 30,400 | | | Zhejiang Meida Industrial Co. Ltd. - Class A | | | 30,636 | | | | 0.0 | |
See Accompanying Notes to Financial Statements
Voya Multi-Manager
International Small Cap Fund | PORTFOLIO OF INVESTMENTS
as of October 31, 2024 (continued) |
| Shares | | | | | Value | | | Percentage
of Net
Assets |
| COMMON STOCK: (continued) | |
| | | | China (continued) |
| 38,486 | | | Zhiou Home Furnishing Technology Co. Ltd. - Class A | | $ | 102,412 | | | | 0.0 | |
| | | | | | | 2,498,682 | | | | 0.9 | |
| | | | Colombia: 0.0% |
| 6,600 (1) | | | Aris Mining Corp. | | | 30,622 | | | | 0.0 | |
| | | | | | | | | | | | |
| | | | Denmark: 3.7% |
| 25,512 (1) | | | ALK-Abello A/S | | | 597,374 | | | | 0.2 | |
| 3,487 (1) | | | Ascendis Pharma A/S, ADR | | | 428,273 | | | | 0.2 | |
| 28,552 (1)(2) | | | Bavarian Nordic A/S | | | 898,939 | | | | 0.3 | |
| 20,085 | | | ISS A/S | | | 388,195 | | | | 0.1 | |
| 9,007 | | | Jyske Bank A/S, Reg | | | 631,849 | | | | 0.2 | |
| 10,904 (1)(3) | | | Netcompany Group A/S | | | 520,441 | | | | 0.2 | |
| 4,448 (1) | | | NKT A/S | | | 417,031 | | | | 0.2 | |
| 82 | | | North Media A/S | | | 653 | | | | 0.0 | |
| 20,913 | | | Pandora A/S | | | 3,161,967 | | | | 1.1 | |
| 1,801 | | | Per Aarsleff Holding A/S | | | 106,231 | | | | 0.0 | |
| 7,031 | | | Rockwool A/S - Class B | | | 3,042,667 | | | | 1.1 | |
| 1,323 | | | Skjern Bank | | | 31,253 | | | | 0.0 | |
| 4,135 | | | Sparekassen Sjaelland- Fyn A/S | | | 124,631 | | | | 0.1 | |
| | | | | | | 10,349,504 | | | | 3.7 | |
| | | | Egypt: 0.0% |
| 7,129 | | | Orascom Construction PLC | | | 43,402 | | | | 0.0 | |
| | | | | | | | | | | | |
| | | | Finland: 1.4% |
| 30 | | | Alandsbanken Abp - Class B | | | 1,093 | | | | 0.0 | |
| 4,809 | | | Cargotec Oyj - Class B | | | 290,738 | | | | 0.1 | |
| 2,791 (1) | | | Incap Oyj | | | 32,029 | | | | 0.0 | |
| 4,809 (1) | | | Kalmar Oyj - Class B | | | 149,757 | | | | 0.1 | |
| 27,385 | | | Konecranes Oyj | | | 1,890,532 | | | | 0.7 | |
| 694 | | | Olvi Oyj - Class A | | | 22,420 | | | | 0.0 | |
| 35,682 | | | Oriola Oyj - Class B | | | 35,281 | | | | 0.0 | |
| 24,118 | | | Orion Oyj - Class B | | | 1,171,363 | | | | 0.4 | |
| 39 | | | Ponsse Oyj | | | 967 | | | | 0.0 | |
| 3 | | | Relais Group Oyj | | | 46 | | | | 0.0 | |
| 4,221 | | | Scanfil Oyj | | | 36,545 | | | | 0.0 | |
| 1,217 | | | Vaisala Oyj - Class A | | | 59,107 | | | | 0.0 | |
| 13,138 | | | Valmet Oyj | | | 336,614 | | | | 0.1 | |
| | | | | | | 4,026,492 | | | | 1.4 | |
| | | | France: 6.7% |
| 17,323 | | | Accor SA | | | 785,895 | | | | 0.3 | |
| 9,804 | | | Arkema SA | | | 863,949 | | | | 0.3 | |
| 5,282 | | | CBo Territoria | | | 20,705 | | | | 0.0 | |
| 21,348 (1) | | | Criteo SA, ADR | | | 719,001 | | | | 0.3 | |
| 8,105 | | | Eiffage SA | | | 754,361 | | | | 0.3 | |
| 36,123 | | | Elis SA | | | 821,771 | | | | 0.3 | |
| 293 | | | Esso SA Francaise | | | 33,106 | | | | 0.0 | |
| 4,792 (2) | | | GL Events | | | 100,790 | | | | 0.0 | |
| 268 | | | Groupe Crit | | | 21,281 | | | | 0.0 | |
| 14,054 | | | Ipsen SA | | | 1,713,286 | | | | 0.6 | |
| 2,691 | | | Kaufman & Broad SA | | | 99,669 | | | | 0.0 | |
| 135,516 | | | Klepierre SA | | | 4,332,659 | | | | 1.5 | |
| 30,942 (3) | | | La Francaise des Jeux SAEM | | | 1,322,623 | | | | 0.5 | |
| 698 | | | Neurones | | | 35,381 | | | | 0.0 | |
| Shares | | | | | Value | | | Percentage
of Net
Assets |
| COMMON STOCK: (continued) | |
| | | | France (continued) |
| 6,343 | | | Nexans SA | | $ | 882,962 | | | | 0.3 | |
| 15,798 | | | Renault SA | | | 722,828 | | | | 0.3 | |
| 32,711 | | | Rexel SA | | | 901,235 | | | | 0.3 | |
| 446 | | | Societe BIC SA | | | 32,631 | | | | 0.0 | |
| 492 | | | Societe LDC SADIR | | | 35,894 | | | | 0.0 | |
| 3,883 | | | Sopra Steria Group SACA | | | 746,794 | | | | 0.3 | |
| 29,545 | | | SPIE SA | | | 1,069,337 | | | | 0.4 | |
| 1,221 (1) | | | Synergie SE | | | 40,508 | | | | 0.0 | |
| 47,982 | | | Technip Energies NV | | | 1,197,981 | | | | 0.4 | |
| 2,455 | | | Television Francaise 1 SA | | | 20,369 | | | | 0.0 | |
| 19,328 (1) | | | Ubisoft Entertainment SA | | | 291,264 | | | | 0.1 | |
| 41,741 (1) | | | Vallourec SA | | | 687,234 | | | | 0.2 | |
| 240 | | | Vetoquinol SA | | | 20,867 | | | | 0.0 | |
| 4,398 | | | Vicat SACA | | | 162,949 | | | | 0.1 | |
| 1,113 | | | Virbac SA | | | 423,017 | | | | 0.2 | |
| | | | | | | 18,860,347 | | | | 6.7 | |
| | | | Germany: 5.3% |
| 18,952 | | | Aixtron SE | | | 300,929 | | | | 0.1 | |
| 540 | | | Amadeus Fire AG | | | 46,120 | | | | 0.0 | |
| 1,910 | | | Atoss Software AG | | | 251,231 | | | | 0.1 | |
| 12,091 | | | Bechtle AG | | | 412,839 | | | | 0.2 | |
| 528 | | | Bijou Brigitte AG | | | 20,102 | | | | 0.0 | |
| 1,043 | | | CANCOM SE | | | 27,852 | | | | 0.0 | |
| 25,343 | | | CTS Eventim AG & Co. KGaA | | | 2,661,398 | | | | 1.0 | |
| 16,145 | | | Duerr AG | | | 374,145 | | | | 0.1 | |
| 5,151 | | | Ernst Russ AG | | | 31,489 | | | | 0.0 | |
| 18,170 | | | Evonik Industries AG | | | 400,452 | | | | 0.1 | |
| 862 | | | Fielmann AG | | | 43,358 | | | | 0.0 | |
| 1,411 | | | flatexDEGIRO AG | | | 20,728 | | | | 0.0 | |
| 23,372 | | | Freenet AG | | | 694,624 | | | | 0.3 | |
| 1,995 | | | Friedrich Vorwerk Group SE | | | 64,993 | | | | 0.0 | |
| 17,183 | | | GEA Group AG | | | 846,363 | | | | 0.3 | |
| 5,608 | | | Gerresheimer AG | | | 472,304 | | | | 0.2 | |
| 2,629 | | | HOCHTIEF AG | | | 321,957 | | | | 0.1 | |
| 3,455 | | | Hornbach Holding AG & Co. KGaA | | | 302,285 | | | | 0.1 | |
| 1,828 | | | Indus Holding AG | | | 40,699 | | | | 0.0 | |
| 1,382 (1) | | | Ionos SE | | | 37,740 | | | | 0.0 | |
| 750 | | | Krones AG | | | 97,692 | | | | 0.0 | |
| 1,363 | | | M1 Kliniken AG | | | 24,834 | | | | 0.0 | |
| 18,257 | | | Nemetschek SE | | | 1,967,230 | | | | 0.7 | |
| 26,017 (1) | | | Nordex SE | | | 370,756 | | | | 0.1 | |
| 6,251 | | | ProCredit Holding AG & Co. KGaA | | | 55,076 | | | | 0.0 | |
| 1,609 | | | Rational AG | | | 1,575,695 | | | | 0.6 | |
| 7,334 (3) | | | Scout24 SE | | | 633,550 | | | | 0.2 | |
| 9,277 | | | SUSS MicroTec SE | | | 555,090 | | | | 0.2 | |
| 59,534 (1) | | | TAG Immobilien AG | | | 989,680 | | | | 0.4 | |
| 28,146 (1)(3) | | | TeamViewer SE | | | 405,479 | | | | 0.2 | |
| 9,724 | | | Trivago NV, ADR | | | 16,045 | | | | 0.0 | |
| 75,627 (1) | | | TUI AG | | | 630,432 | | | | 0.2 | |
| 13,147 (1)(3) | | | Zalando SE | | | 397,994 | | | | 0.1 | |
| | | | | | | 15,091,161 | | | | 5.3 | |
| | | | Greece: 0.2% |
| 713 | | | Euroseas Ltd. | | | 29,525 | | | | 0.0 | |
| 4,643 | | | Kri-Kri Milk Industry SA | | | 70,415 | | | | 0.0 | |
| 3,638 | | | Piraeus Port Authority SA | | | 109,417 | | | | 0.1 | |
See Accompanying Notes to Financial Statements
Voya Multi-Manager
International Small Cap Fund | PORTFOLIO OF INVESTMENTS
as of October 31, 2024 (continued) |
| Shares | | | | | Value | | | Percentage
of Net
Assets |
| COMMON STOCK: (continued) | |
| | | | Greece (continued) |
| 3,999 | | | Sarantis SA | | $ | 47,859 | | | | 0.0 | |
| 29,864 (1) | | | StealthGas, Inc. | | | 172,017 | | | | 0.1 | |
| 7,911 | | | Thrace Plastics Holding and Co. | | | 31,667 | | | | 0.0 | |
| | | | | | | 460,900 | | | | 0.2 | |
| | | | Guatemala: 0.2% |
| 20,377 (1) | | | Millicom International Cellular SA, SDR | | | 565,340 | | | | 0.2 | |
| | | | | | | | | | | | |
| | | | Guernsey: 0.1% |
| 101,586 (1) | | | Chrysalis Investments Ltd. | | | 111,735 | | | | 0.1 | |
| 2,940 | | | Pollen Street Group Ltd. | | | 25,551 | | | | 0.0 | |
| | | | | | | 137,286 | | | | 0.1 | |
| | | | Hong Kong: 0.8% |
| 204,478 | | | Build King Holdings Ltd. | | | 25,740 | | | | 0.0 | |
| 127,600 | | | China Leon Inspection Holding Ltd. | | | 29,012 | | | | 0.0 | |
| 24,903 | | | China Merchants Land Ltd. | | | 964 | | | | 0.0 | |
| 80,000 | | | Computer & Technologies Holdings Ltd. | | | 19,038 | | | | 0.0 | |
| 1,703 | | | Computime Group Ltd. | | | 120 | | | | 0.0 | |
| 111,072 (1)(4) | | | Ever Reach Group Holdings Co. Ltd. | | | 3,715 | | | | 0.0 | |
| 691,406 | | | Fountain SET Holdings Ltd. | | | 57,922 | | | | 0.0 | |
| 9,771 (1) | | | Futu Holdings Ltd., ADR | | | 928,147 | | | | 0.3 | |
| 32,276 (1) | | | Henan Jinma Energy Co. Ltd. - Class H | | | 2,740 | | | | 0.0 | |
| 232,000 (1) | | | Hop Fung Group Holdings Ltd. | | | 2,686 | | | | 0.0 | |
| 102,000 | | | IVD Medical Holding Ltd. | | | 21,386 | | | | 0.0 | |
| 14,087 | | | Johnson Electric Holdings Ltd. | | | 21,384 | | | | 0.0 | |
| 153,500 | | | Kerry Properties Ltd. | | | 324,226 | | | | 0.1 | |
| 33,822 | | | Lung Kee Bermuda Holdings | | | 5,003 | | | | 0.0 | |
| 60,000 | | | Media Chinese International Ltd. | | | 1,814 | | | | 0.0 | |
| 223,367 (1) | | | Midland Holdings Ltd. | | | 24,997 | | | | 0.0 | |
| 66,878 | | | Niraku GC Holdings, Inc. | | | 1,591 | | | | 0.0 | |
| 94,851 (1) | | | Road King Infrastructure Ltd. | | | 14,761 | | | | 0.0 | |
| 1,211,244 | | | Singamas Container Holdings Ltd. | | | 107,256 | | | | 0.1 | |
| 321,180 | | | Tang Palace China Holdings Ltd. | | | 10,329 | | | | 0.0 | |
| 3,031,176 (1) | | | Tongda Group Holdings Ltd. | | | 36,833 | | | | 0.0 | |
| 476,000 | | | United Laboratories International Holdings Ltd. | | | 646,117 | | | | 0.3 | |
| 175,138 | | | Vedan International Holdings Ltd. | | | 11,049 | | | | 0.0 | |
| 15,840 (1) | | | Wai Kee Holdings Ltd. | | | 1,545 | | | | 0.0 | |
| 22,239 | | | Xingfa Aluminium Holdings Ltd. | | | 21,026 | | | | 0.0 | |
| 319,000 (1)(4) | | | Xiwang Special Steel Co. Ltd. | | | — | | | | — | |
| Shares | | | | | Value | | | Percentage
of Net
Assets |
| COMMON STOCK: (continued) | |
| | | | Hong Kong (continued) |
| 119,814 | | | Zengame Technology Holding Ltd. | | $ | 42,355 | | | | 0.0 | |
| | | | | | | 2,361,756 | | | | 0.8 | |
| | | | India: 0.2% |
| 25,620 (4) | | | Geodesic Ltd. | | | — | | | | — | |
| 9,641 | | | Great Eastern Shipping Co. Ltd. | | | 147,241 | | | | 0.1 | |
| 111,740 | | | Indiabulls Housing Finance Ltd. | | | 190,785 | | | | 0.1 | |
| 46,885 | | | Manappuram Finance Ltd. | | | 87,188 | | | | 0.0 | |
| 8,520 | | | Pearl Global Industries Ltd. | | | 97,671 | | | | 0.0 | |
| 31,087 | | | Pudumjee Paper Products Ltd. | | | 44,582 | | | | 0.0 | |
| 21,379 (4) | | | Varun Industries Ltd. | | | — | | | | — | |
| | | | | | | 567,467 | | | | 0.2 | |
| | | | Indonesia: 0.1% |
| 2,468,300 (1) | | | Alam Sutera Realty Tbk PT | | | 32,712 | | | | 0.0 | |
| 406,900 (1) | | | Champ Resto Indonesia Tbk PT | | | 14,389 | | | | 0.0 | |
| 672,600 | | | IMC Pelita Logistik Tbk PT | | | 18,427 | | | | 0.0 | |
| 24,432 (1) | | | Indo-Rama Synthetics Tbk PT | | | 4,670 | | | | 0.0 | |
| 270,721 (1) | | | Mitrabahtera Segara Sejati Tbk PT | | | 19,146 | | | | 0.0 | |
| 2,195,300 (1) | | | TBS Energi Utama Tbk PT | | | 79,727 | | | | 0.1 | |
| | | | | | | 169,071 | | | | 0.1 | |
| | | | Ireland: 0.8% |
| 8,768 | | | Bank of Ireland Group PLC | | | 81,263 | | | | 0.0 | |
| 2,588 | | | COSMO Pharmaceuticals NV | | | 200,329 | | | | 0.1 | |
| 101,551 | | | Dalata Hotel Group PLC | | | 476,318 | | | | 0.2 | |
| 5,342 | | | DCC PLC | | | 337,958 | | | | 0.1 | |
| 22,865 | | | Dole PLC | | | 369,270 | | | | 0.1 | |
| 42,116 | | | Glanbia PLC | | | 698,627 | | | | 0.3 | |
| | | | | | | 2,163,765 | | | | 0.8 | |
| | | | Israel: 0.8% |
| 4,917 (1) | | | Brainsway Ltd., ADR | | | 49,170 | | | | 0.0 | |
| 37,721 (1) | | | Ceragon Networks Ltd. | | | 93,548 | | | | 0.0 | |
| 62,556 (1) | | | Cognyte Software Ltd. | | | 405,988 | | | | 0.2 | |
| 148,417 (1) | | | El Al Israel Airlines | | | 288,258 | | | | 0.1 | |
| 2,327 | | | Ituran Location and Control Ltd. | | | 62,201 | | | | 0.0 | |
| 790 | | | M Yochananof & Sons Ltd. | | | 46,887 | | | | 0.0 | |
| 39,900 (1) | | | Nexxen International Ltd. | | | 156,406 | | | | 0.1 | |
| 145,725 | | | Oil Refineries Ltd. | | | 37,159 | | | | 0.0 | |
| 17,629 (1) | | | Radware Ltd. | | | 396,829 | | | | 0.1 | |
| 31,093 (1) | | | SimilarWeb Ltd. | | | 270,820 | | | | 0.1 | |
| 146,138 (1) | | | Taboola.com Ltd. | | | 485,178 | | | | 0.2 | |
| 7,854 | | | Tel Aviv Stock Exchange Ltd. | | | 78,745 | | | | 0.0 | |
| | | | | | | 2,371,189 | | | | 0.8 | |
| | | | Italy: 5.4% |
| 590,518 | | | A2A SpA | | | 1,349,831 | | | | 0.5 | |
| 28,228 | | | Arnoldo Mondadori Editore SpA | | | 74,920 | | | | 0.0 | |
| 5,271 | | | Avio SpA | | | 68,114 | | | | 0.0 | |
See Accompanying Notes to Financial Statements
Voya Multi-Manager
International Small Cap Fund | PORTFOLIO OF INVESTMENTS
as of October 31, 2024 (continued) |
| Shares | | | | | Value | | | Percentage
of Net
Assets |
| COMMON STOCK: (continued) | |
| | | | Italy (continued) |
| 17,789 | | | Azimut Holding SpA | | $ | 440,001 | | | | 0.2 | |
| 12,672 | | | Banca Generali SpA | | | 561,566 | | | | 0.2 | |
| 6,083 | | | Banca IFIS SpA | | | 145,787 | | | | 0.1 | |
| 248,441 | | | Banca Monte dei Paschi di Siena SpA | | | 1,363,446 | | | | 0.5 | |
| 83,971 | | | Banca Popolare di Sondrio SpA | | | 626,287 | | | | 0.2 | |
| 415,032 | | | BPER Banca | | | 2,526,962 | | | | 0.9 | |
| 4,135 | | | Brunello Cucinelli SpA | | | 409,037 | | | | 0.1 | |
| 35,086 | | | Buzzi Unicem SpA | | | 1,374,589 | | | | 0.5 | |
| 20,013 | | | Cairo Communication SpA | | | 47,783 | | | | 0.0 | |
| 135,364 (1) | | | CIR SpA-Compagnie Industriali | | | 85,253 | | | | 0.0 | |
| 26,281 | | | Coca-Cola HBC AG - Class DI | | | 919,658 | | | | 0.3 | |
| 25,026 | | | d'Amico International Shipping SA | | | 134,477 | | | | 0.0 | |
| 4,166 | | | Danieli & C Officine Meccaniche SpA | | | 84,213 | | | | 0.0 | |
| 18,332 | | | Datalogic SpA | | | 118,010 | | | | 0.0 | |
| 6,320 | | | De' Longhi SpA | | | 197,531 | | | | 0.1 | |
| 28,430 | | | Fiera Milano SpA | | | 127,787 | | | | 0.0 | |
| 254,754 | | | Hera SpA | | | 974,574 | | | | 0.3 | |
| 200,025 | | | Iren SpA | | | 433,219 | | | | 0.2 | |
| 37,510 | | | Iveco Group NV | | | 389,796 | | | | 0.1 | |
| 20,432 | | | Leonardo SpA | | | 487,013 | | | | 0.2 | |
| 20,107 | | | Maire Tecnimont SpA | | | 151,761 | | | | 0.1 | |
| 89,554 | | | MFE-MediaForEurope NV - Class A | | | 293,015 | | | | 0.1 | |
| 10,678 | | | Orsero SpA | | | 137,453 | | | | 0.1 | |
| 8,355 | | | Piquadro SpA | | | 18,722 | | | | 0.0 | |
| 3,087 | | | Reply SpA | | | 470,634 | | | | 0.2 | |
| 6,660 | | | SOL SpA | | | 258,308 | | | | 0.1 | |
| 22 (1) | | | Somec SpA | | | 349 | | | | 0.0 | |
| 57,261 | | | Unipol Gruppo SpA | | | 711,638 | | | | 0.3 | |
| 109,254 (2) | | | Webuild SpA | | | 309,818 | | | | 0.1 | |
| | | | | | | 15,291,552 | | | | 5.4 | |
| | | | Japan: 20.5% |
| 4,900 | | | 77 Bank Ltd. | | | 126,144 | | | | 0.1 | |
| 26,400 | | | ABC-Mart, Inc. | | | 517,276 | | | | 0.2 | |
| 24,300 | | | Adastria Co. Ltd. | | | 561,604 | | | | 0.2 | |
| 1,800 | | | Ad-sol Nissin Corp. | | | 21,262 | | | | 0.0 | |
| 5,800 | | | Adways, Inc. | | | 12,535 | | | | 0.0 | |
| 1,000 | | | Aeon Delight Co. Ltd. | | | 28,405 | | | | 0.0 | |
| 1,900 | | | AEON Financial Service Co. Ltd. | | | 15,299 | | | | 0.0 | |
| 9,100 | | | Aichi Steel Corp. | | | 256,535 | | | | 0.1 | |
| 786 | | | Aichi Tokei Denki Co. Ltd. | | | 10,207 | | | | 0.0 | |
| 700 | | | Ain Holdings, Inc. | | | 23,117 | | | | 0.0 | |
| 1,000 | | | Aiphone Co. Ltd. | | | 19,390 | | | | 0.0 | |
| 10,300 | | | Aisan Industry Co. Ltd. | | | 91,128 | | | | 0.1 | |
| 5,400 | | | AIT Corp. | | | 62,779 | | | | 0.0 | |
| 2,900 | | | Akatsuki, Inc. | | | 40,136 | | | | 0.0 | |
| 1,900 | | | Akita Bank Ltd. | | | 25,939 | | | | 0.0 | |
| 2,300 | | | Almado, Inc. | | | 15,331 | | | | 0.0 | |
| 1,200 | | | Alpha Systems, Inc. | | | 25,106 | | | | 0.0 | |
| 1,200 (1) | | | AlphaPolis Co. Ltd. | | | 17,281 | | | | 0.0 | |
| 5,100 | | | Amano Corp. | | | 147,096 | | | | 0.1 | |
| 1,800 | | | Amiyaki Tei Co. Ltd. | | | 19,598 | | | | 0.0 | |
| Shares | | | | | Value | | | Percentage
of Net
Assets |
| COMMON STOCK: (continued) | |
| | | | Japan (continued) |
| 6,300 | | | Anest Iwata Corp. | | $ | 58,025 | | | | 0.0 | |
| 6,000 | | | Anicom Holdings, Inc. | | | 26,380 | | | | 0.0 | |
| 3,900 | | | AOKI Holdings, Inc. | | | 30,237 | | | | 0.0 | |
| 2,800 | | | Aoyama Zaisan Networks Co. Ltd. | | | 24,469 | | | | 0.0 | |
| 8,000 | | | Arealink Co. Ltd. | | | 95,548 | | | | 0.1 | |
| 1,000 | | | Argo Graphics, Inc. | | | 34,386 | | | | 0.0 | |
| 2,000 | | | Artience Co. Ltd. | | | 47,936 | | | | 0.0 | |
| 5,900 | | | Artner Co. Ltd. | | | 68,104 | | | | 0.0 | |
| 9,800 | | | Asahi Diamond Industrial Co. Ltd. | | | 54,482 | | | | 0.0 | |
| 2,600 | | | ASAHI YUKIZAI Corp. | | | 69,365 | | | | 0.0 | |
| 20,300 | | | Asics Corp. | | | 354,578 | | | | 0.1 | |
| 1,400 | | | ASKA Pharmaceutical Holdings Co. Ltd. | | | 19,863 | | | | 0.0 | |
| 3,100 | | | Ateam, Inc. | | | 12,428 | | | | 0.0 | |
| 12,500 | | | Atrae, Inc. | | | 63,445 | | | | 0.0 | |
| 2,200 | | | Aucnet, Inc. | | | 34,337 | | | | 0.0 | |
| 16,600 | | | Avant Group Corp. | | | 233,804 | | | | 0.1 | |
| 6,700 | | | Avex, Inc. | | | 65,933 | | | | 0.0 | |
| 6,400 | | | Axial Retailing, Inc. | | | 37,331 | | | | 0.0 | |
| 6,000 | | | Bando Chemical Industries Ltd. | | | 71,111 | | | | 0.0 | |
| 1,500 | | | Bank of Iwate Ltd. | | | 22,500 | | | | 0.0 | |
| 1,700 | | | Bank of Saga Ltd. | | | 22,882 | | | | 0.0 | |
| 4,600 (1) | | | baudroie, Inc. | | | 139,928 | | | | 0.1 | |
| 25,400 | | | BrainPad, Inc. | | | 133,901 | | | | 0.1 | |
| 4,100 | | | Bunka Shutter Co. Ltd. | | | 49,334 | | | | 0.0 | |
| 5,200 | | | Business Brain Showa- Ota, Inc. | | | 63,447 | | | | 0.0 | |
| 3,600 | | | Business Engineering Corp. | | | 95,059 | | | | 0.1 | |
| 400 | | | C Uyemura & Co. Ltd. | | | 27,801 | | | | 0.0 | |
| 1,600 | | | Careerlink Co. Ltd. | | | 26,194 | | | | 0.0 | |
| 5,300 | | | Celsys, Inc. | | | 41,988 | | | | 0.0 | |
| 2,000 (2) | | | Central Automotive Products Ltd. | | | 60,237 | | | | 0.0 | |
| 3,300 | | | Central Glass Co. Ltd. | | | 75,172 | | | | 0.0 | |
| 1,500 | | | Central Security Patrols Co. Ltd. | | | 27,354 | | | | 0.0 | |
| 2,200 | | | Chiyoda Co. Ltd. | | | 19,171 | | | | 0.0 | |
| 1,300 | | | Chiyoda Integre Co. Ltd. | | | 28,625 | | | | 0.0 | |
| 2,200 | | | Chuetsu Pulp & Paper Co. Ltd. | | | 17,794 | | | | 0.0 | |
| 4,100 | | | Chugoku Marine Paints Ltd. | | | 58,563 | | | | 0.0 | |
| 70,000 | | | Citizen Watch Co. Ltd. | | | 416,159 | | | | 0.2 | |
| 2,100 | | | CMC Corp. | | | 16,023 | | | | 0.0 | |
| 19,200 | | | Comture Corp. | | | 290,017 | | | | 0.1 | |
| 5,500 | | | Copro-Holdings Co. Ltd. | | | 50,652 | | | | 0.0 | |
| 1,800 | | | Core Corp. | | | 21,996 | | | | 0.0 | |
| 5,300 | | | Cosmos Initia Co. Ltd. | | | 25,727 | | | | 0.0 | |
| 41,900 | | | Credit Saison Co. Ltd. | | | 942,426 | | | | 0.4 | |
| 6,600 | | | Creek & River Co. Ltd. | | | 69,248 | | | | 0.0 | |
| 7,700 | | | CTS Co. Ltd. | | | 45,845 | | | | 0.0 | |
| 2,800 (1) | | | Cyber Security Cloud, Inc. | | | 32,874 | | | | 0.0 | |
| 6,300 | | | Cybozu, Inc. | | | 86,501 | | | | 0.0 | |
| 72,900 | | | Daicel Corp. | | | 643,420 | | | | 0.2 | |
| 90,600 | | | Daido Steel Co. Ltd. | | | 701,542 | | | | 0.3 | |
See Accompanying Notes to Financial Statements
Voya Multi-Manager
International Small Cap Fund | PORTFOLIO OF INVESTMENTS
as of October 31, 2024 (continued) |
| Shares | | | | | Value | | | Percentage
of Net
Assets |
| COMMON STOCK: (continued) | |
| | | | Japan (continued) |
| 2,700 | | | Daihatsu Diesel Manufacturing Co. Ltd. | | $ | 23,139 | | | | 0.0 | |
| 1,400 | | | Daihen Corp. | | | 58,075 | | | | 0.0 | |
| 7,600 | | | Dai-Ichi Cutter Kogyo KK | | | 72,533 | | | | 0.0 | |
| 1,400 | | | Dainichiseika Color & Chemicals Manufacturing Co. Ltd. | | | 26,853 | | | | 0.0 | |
| 10,100 | | | Daishinku Corp. | | | 39,579 | | | | 0.0 | |
| 2,400 | | | Daisue Construction Co. Ltd. | | | 26,088 | | | | 0.0 | |
| 2,700 | | | Daito Pharmaceutical Co. Ltd. | | | 39,454 | | | | 0.0 | |
| 5,715 | | | Daitron Co. Ltd. | | | 104,895 | | | | 0.1 | |
| 2,400 | | | Daiwa Industries Ltd. | | | 22,700 | | | | 0.0 | |
| 3,100 | | | Densan System Holdings Co. Ltd. | | | 53,515 | | | | 0.0 | |
| 29,400 | | | Dexerials Corp. | | | 448,867 | | | | 0.2 | |
| 4,900 | | | Digital Arts, Inc. | | | 166,771 | | | | 0.1 | |
| 6,600 | | | Digital Hearts Holdings Co. Ltd. | | | 35,190 | | | | 0.0 | |
| 4,400 | | | Digital Information Technologies Corp. | | | 58,244 | | | | 0.0 | |
| 6,700 | | | dip Corp. | | | 117,773 | | | | 0.1 | |
| 1,900 | | | DMS, Inc. | | | 21,652 | | | | 0.0 | |
| 9,900 | | | Doshisha Co. Ltd. | | | 142,817 | | | | 0.1 | |
| 6,300 | | | Double Standard, Inc. | | | 66,233 | | | | 0.0 | |
| 22,382 | | | DTS Corp. | | | 579,730 | | | | 0.2 | |
| 37,600 | | | Ebara Corp. | | | 565,068 | | | | 0.2 | |
| 6,600 | | | Ebase Co. Ltd. | | | 27,854 | | | | 0.0 | |
| 1,500 | | | Eco's Co. Ltd./Japan | | | 20,137 | | | | 0.0 | |
| 3,600 | | | Ehime Bank Ltd. | | | 24,437 | | | | 0.0 | |
| 27,000 | | | Eiken Chemical Co. Ltd. | | | 437,001 | | | | 0.2 | |
| 4,600 | | | Elematec Corp. | | | 71,692 | | | | 0.0 | |
| 6,800 | | | EM Systems Co. Ltd. | | | 23,799 | | | | 0.0 | |
| 19,400 | | | en Japan, Inc. | | | 308,975 | | | | 0.1 | |
| 26,000 | | | Enigmo, Inc. | | | 51,601 | | | | 0.0 | |
| 4,700 | | | Entrust, Inc. | | | 23,446 | | | | 0.0 | |
| 4,100 | | | ERI Holdings Co. Ltd. | | | 49,645 | | | | 0.0 | |
| 4,400 | | | eSOL Co. Ltd. | | | 20,387 | | | | 0.0 | |
| 3,600 | | | Fast Fitness Japan, Inc. | | | 31,115 | | | | 0.0 | |
| 8,000 (2) | | | Fibergate, Inc./Japan | | | 52,381 | | | | 0.0 | |
| 1,600 (1) | | | FLECT Co. Ltd. | | | 19,202 | | | | 0.0 | |
| 5,000 | | | Forum Engineering, Inc. | | | 28,559 | | | | 0.0 | |
| 2,400 | | | FTGroup Co. Ltd. | | | 17,209 | | | | 0.0 | |
| 1,700 | | | Fudo Tetra Corp. | | | 23,559 | | | | 0.0 | |
| 1,900 | | | Fuji Corp./Aichi | | | 27,958 | | | | 0.0 | |
| 3,700 | | | Fuji Corp./Miyagi | | | 44,054 | | | | 0.0 | |
| 8,000 | | | Fuji Media Holdings, Inc. | | | 90,435 | | | | 0.1 | |
| 22,100 | | | Fuji Oil Co. Ltd. | | | 48,609 | | | | 0.0 | |
| 2,300 | | | Fuji Seal International, Inc. | | | 39,059 | | | | 0.0 | |
| 7,900 | | | Fujikura Kasei Co. Ltd. | | | 24,529 | | | | 0.0 | |
| 33,100 | | | Fujikura Ltd. | | | 1,216,533 | | | | 0.4 | |
| 2,000 | | | Fujimori Kogyo Co. Ltd. | | | 56,409 | | | | 0.0 | |
| 2,200 | | | Fukuda Denshi Co. Ltd. | | | 110,804 | | | | 0.1 | |
| 1,500 | | | Fukushima Galilei Co. Ltd. | | | 54,170 | | | | 0.0 | |
| 7,900 | | | FULLCAST Holdings Co. Ltd. | | | 79,451 | | | | 0.0 | |
| 1,800 | | | Furukawa Electric Co. Ltd. | | | 44,269 | | | | 0.0 | |
| 9,200 | | | Furuno Electric Co. Ltd. | | | 148,336 | | | | 0.1 | |
| 15,500 | | | Furyu Corp. | | | 111,833 | | | | 0.1 | |
| Shares | | | | | Value | | | Percentage
of Net
Assets |
| COMMON STOCK: (continued) | |
| | | | Japan (continued) |
| 5,200 | | | Fuso Pharmaceutical Industries Ltd. | | $ | 86,531 | | | | 0.0 | |
| 7,300 | | | Futaba Corp. | | | 24,342 | | | | 0.0 | |
| 8,500 | | | Futaba Industrial Co. Ltd. | | | 36,264 | | | | 0.0 | |
| 13,700 | | | Future Corp. | | | 175,419 | | | | 0.1 | |
| 5,600 | | | Fuyo General Lease Co. Ltd. | | | 396,274 | | | | 0.2 | |
| 13,200 | | | Gakken Holdings Co. Ltd. | | | 86,012 | | | | 0.0 | |
| 3,500 (2) | | | Gamecard-Joyco Holdings, Inc. | | | 45,319 | | | | 0.0 | |
| 3,200 | | | Gecoss Corp. | | | 20,209 | | | | 0.0 | |
| 3,000 | | | GLOBERIDE, Inc. | | | 38,924 | | | | 0.0 | |
| 14,000 | | | Glory Ltd. | | | 227,073 | | | | 0.1 | |
| 2,309 (2) | | | GLTECHNO HOLDINGS, Inc. | | | 41,578 | | | | 0.0 | |
| 1,500 | | | GMO GlobalSign Holdings KK | | | 27,420 | | | | 0.0 | |
| 19,700 | | | GS Yuasa Corp. | | | 348,529 | | | | 0.1 | |
| 13,900 | | | GungHo Online Entertainment, Inc. | | | 309,613 | | | | 0.1 | |
| 2,600 | | | Hanwa Co. Ltd. | | | 86,147 | | | | 0.0 | |
| 4,500 | | | Heiwa Corp. | | | 61,450 | | | | 0.0 | |
| 16,700 (1)(2) | | | Hennge KK | | | 120,545 | | | | 0.1 | |
| 1,400 | | | Hioki EE Corp. | | | 75,183 | | | | 0.0 | |
| 2,300 | | | Hirano Tecseed Co. Ltd./ Kinzoku | | | 25,203 | | | | 0.0 | |
| 10,100 | | | Hisamitsu Pharmaceutical Co., Inc. | | | 296,953 | | | | 0.1 | |
| 56,200 | | | Hitachi Zosen Corp. | | | 384,151 | | | | 0.2 | |
| 4,000 | | | Hito Communications Holdings, Inc. | | | 21,398 | | | | 0.0 | |
| 1,600 | | | Hochiki Corp. | | | 22,249 | | | | 0.0 | |
| 2,200 | | | Hodogaya Chemical Co. Ltd. | | | 62,093 | | | | 0.0 | |
| 24,500 | | | Hokkaido Gas Co. Ltd. | | | 94,075 | | | | 0.1 | |
| 2,400 | | | Hokkan Holdings Ltd. | | | 27,069 | | | | 0.0 | |
| 5,100 | | | Hokuhoku Financial Group, Inc. | | | 53,303 | | | | 0.0 | |
| 10,000 | | | Horiba Ltd. | | | 614,740 | | | | 0.2 | |
| 1,900 | | | Hyakujushi Bank Ltd. | | | 31,530 | | | | 0.0 | |
| 6,500 (2) | | | I K K Holdings, Inc. | | | 31,405 | | | | 0.0 | |
| 6,200 | | | IBJ, Inc. | | | 26,228 | | | | 0.0 | |
| 19,100 | | | Ichikoh Industries Ltd. | | | 56,768 | | | | 0.0 | |
| 3,100 | | | ID Holdings Corp. | | | 29,827 | | | | 0.0 | |
| 1,700 | | | IDEA Consultants, Inc. | | | 27,054 | | | | 0.0 | |
| 1,700 | | | I'll, Inc. | | | 34,740 | | | | 0.0 | |
| 6,000 | | | IMAGICA GROUP, Inc. | | | 21,068 | | | | 0.0 | |
| 5,300 | | | I-Net Corp./Kanagawa | | | 53,283 | | | | 0.0 | |
| 59,700 | | | INFRONEER Holdings, Inc. | | | 448,782 | | | | 0.2 | |
| 3,500 | | | Intelligent Wave, Inc. | | | 20,293 | | | | 0.0 | |
| 1,276 | | | Invincible Investment Corp. | | | 519,739 | | | | 0.2 | |
| 5,900 | | | I-PEX, Inc. | | | 60,658 | | | | 0.0 | |
| 2,100 | | | ISB Corp. | | | 19,101 | | | | 0.0 | |
| 900 | | | Itochu-Shokuhin Co. Ltd. | | | 40,506 | | | | 0.0 | |
| 2,000 | | | Itoki Corp. | | | 19,039 | | | | 0.0 | |
| 4,300 | | | IwaiCosmo Holdings, Inc. | | | 58,487 | | | | 0.0 | |
| 4,200 | | | Iwaki Co. Ltd. | | | 78,614 | | | | 0.0 | |
| 44,400 | | | J Trust Co. Ltd. | | | 131,079 | | | | 0.1 | |
See Accompanying Notes to Financial Statements
Voya Multi-Manager
International Small Cap Fund | PORTFOLIO OF INVESTMENTS
as of October 31, 2024 (continued) |
| Shares | | | | | Value | | | Percentage
of Net
Assets |
| COMMON STOCK: (continued) | |
| | | | Japan (continued) |
| 8,400 | | | JAC Recruitment Co. Ltd. | | $ | 40,250 | | | | 0.0 | |
| 11,700 | | | JAFCO Group Co. Ltd. | | | 157,223 | | | | 0.1 | |
| 2,000 | | | Japan Aviation Electronics Industry Ltd. | | | 37,102 | | | | 0.0 | |
| 2,200 | | | Japan Elevator Service Holdings Co. Ltd. | | | 42,124 | | | | 0.0 | |
| 16,000 | | | Japan Lifeline Co. Ltd. | | | 125,691 | | | | 0.1 | |
| 16,500 | | | Japan Medical Dynamic Marketing, Inc. | | | 67,311 | | | | 0.0 | |
| 8,000 | | | Japan Pulp & Paper Co. Ltd. | | | 34,960 | | | | 0.0 | |
| 18,000 | | | Japan System Techniques Co. Ltd. | | | 216,545 | | | | 0.1 | |
| 3,400 | | | JBCC Holdings, Inc. | | | 98,062 | | | | 0.1 | |
| 7,100 | | | JCR Pharmaceuticals Co. Ltd. | | | 31,749 | | | | 0.0 | |
| 2,400 | | | JCU Corp. | | | 55,320 | | | | 0.0 | |
| 14,700 | | | Jeol Ltd. | | | 545,304 | | | | 0.2 | |
| 1,400 | | | JFE Systems, Inc. | | | 27,632 | | | | 0.0 | |
| 1,200 | | | JINS Holdings, Inc. | | | 48,911 | | | | 0.0 | |
| 6,600 | | | JK Holdings Co. Ltd. | | | 44,525 | | | | 0.0 | |
| 3,200 | | | J-Lease Co. Ltd. | | | 28,933 | | | | 0.0 | |
| 1,400 | | | JSB Co. Ltd. | | | 24,742 | | | | 0.0 | |
| 5,500 | | | J-Stream, Inc. | | | 13,205 | | | | 0.0 | |
| 3,700 | | | Justsystems Corp. | | | 82,730 | | | | 0.0 | |
| 400 | | | JUTEC Holdings Corp. | | | 2,755 | | | | 0.0 | |
| 3,100 | | | Kakaku.com, Inc. | | | 47,601 | | | | 0.0 | |
| 243 | | | Kamei Corp. | | | 3,129 | | | | 0.0 | |
| 3,600 | | | Kanamoto Co. Ltd. | | | 65,064 | | | | 0.0 | |
| 13,300 | | | Kaneka Corp. | | | 325,999 | | | | 0.1 | |
| 3,100 | | | Kanematsu Corp. | | | 47,192 | | | | 0.0 | |
| 4,600 (1) | | | Kaonavi, Inc. | | | 70,976 | | | | 0.0 | |
| 2,500 | | | Katakura Industries Co. Ltd. | | | 32,599 | | | | 0.0 | |
| 5,700 | | | Kato Works Co. Ltd. | | | 45,931 | | | | 0.0 | |
| 4,800 | | | KAWADA TECHNOLOGIES, Inc. | | | 74,842 | | | | 0.0 | |
| 258 | | | Kenedix Office Investment Corp. | | | 245,424 | | | | 0.1 | |
| 3,000 | | | Kenko Mayonnaise Co. Ltd. | | | 42,763 | | | | 0.0 | |
| 1,200 | | | KFC Ltd. | | | 9,984 | | | | 0.0 | |
| 2,260 | | | Kimura Unity Co. Ltd. | | | 21,505 | | | | 0.0 | |
| 20,100 | | | Kinden Corp. | | | 416,597 | | | | 0.2 | |
| 2,200 | | | Kitagawa Corp. | | | 17,497 | | | | 0.0 | |
| 5,300 | | | Kita-Nippon Bank Ltd. | | | 87,104 | | | | 0.0 | |
| 11,100 | | | Kitz Corp. | | | 76,571 | | | | 0.0 | |
| 2,000 (1) | | | KNT-CT Holdings Co. Ltd. | | | 16,749 | | | | 0.0 | |
| 800 | | | Koike Sanso Kogyo Co. Ltd. | | | 31,610 | | | | 0.0 | |
| 2,800 | | | Komatsu Wall Industry Co. Ltd. | | | 27,561 | | | | 0.0 | |
| 4,500 | | | Komori Corp. | | | 32,544 | | | | 0.0 | |
| 123,700 | | | Konica Minolta, Inc. | | | 516,381 | | | | 0.2 | |
| 2,300 | | | Konishi Co. Ltd. | | | 19,768 | | | | 0.0 | |
| 3,900 | | | Konoike Transport Co. Ltd. | | | 63,777 | | | | 0.0 | |
| 6,500 | | | KPP Group Holdings Co. Ltd. | | | 27,896 | | | | 0.0 | |
| 16,400 | | | K's Holdings Corp. | | | 156,825 | | | | 0.1 | |
| 1,100 | | | Kurimoto Ltd. | | | 27,321 | | | | 0.0 | |
| Shares | | | | | Value | | | Percentage
of Net
Assets |
| COMMON STOCK: (continued) | |
| | | | Japan (continued) |
| 3,100 | | | Kuriyama Holdings Corp. | | $ | 24,892 | | | | 0.0 | |
| 1,100 | | | Kyodo Printing Co. Ltd. | | | 24,501 | | | | 0.0 | |
| 2,200 | | | Kyowa Electronic Instruments Co. Ltd. | | | 6,073 | | | | 0.0 | |
| 5,100 | | | Kyushu Leasing Service Co. Ltd. | | | 32,701 | | | | 0.0 | |
| 21,600 | | | Kyushu Railway Co. | | | 568,307 | | | | 0.2 | |
| 12,000 | | | LAC Co. Ltd. | | | 57,800 | | | | 0.0 | |
| 74,600 (1) | | | LIFULL Co. Ltd. | | | 71,382 | | | | 0.0 | |
| 500 | | | Linical Co. Ltd. | | | 1,182 | | | | 0.0 | |
| 7,800 | | | Link And Motivation, Inc. | | | 28,350 | | | | 0.0 | |
| 1,400 | | | Look Holdings, Inc. | | | 23,077 | | | | 0.0 | |
| 9,500 | | | M&A Capital Partners Co. Ltd. | | | 134,748 | | | | 0.1 | |
| 5,900 | | | Maezawa Industries, Inc. | | | 46,473 | | | | 0.0 | |
| 2,900 | | | Makino Milling Machine Co. Ltd. | | | 108,869 | | | | 0.1 | |
| 1,500 | | | Makiya Co. Ltd. | | | 9,683 | | | | 0.0 | |
| 13,100 | | | Management Solutions Co. Ltd. | | | 162,189 | | | | 0.1 | |
| 1,300 | | | Maruzen Showa Unyu Co. Ltd. | | | 50,138 | | | | 0.0 | |
| 2,600 | | | Marvelous, Inc. | | | 9,947 | | | | 0.0 | |
| 12,800 | | | Matching Service Japan Co. Ltd. | | | 87,294 | | | | 0.0 | |
| 2,100 | | | Matsuoka Corp. | | | 24,682 | | | | 0.0 | |
| 8,000 | | | Maxell Ltd. | | | 97,660 | | | | 0.1 | |
| 209,400 | | | Mebuki Financial Group, Inc. | | | 783,241 | | | | 0.3 | |
| 4,500 | | | Media Do Co. Ltd. | | | 39,481 | | | | 0.0 | |
| 4,800 | | | Megachips Corp. | | | 171,178 | | | | 0.1 | |
| 8,300 | | | Meidensha Corp. | | | 217,826 | | | | 0.1 | |
| 2,000 | | | Meiji Electric Industries Co. Ltd. | | | 17,847 | | | | 0.0 | |
| 9,500 | | | MEITEC Group Holdings, Inc. | | | 182,051 | | | | 0.1 | |
| 3,400 | | | Melco Holdings, Inc. | | | 54,332 | | | | 0.0 | |
| 4,000 | | | Mimaki Engineering Co. Ltd. | | | 35,244 | | | | 0.0 | |
| 9,600 | | | Mitani Sangyo Co. Ltd. | | | 19,820 | | | | 0.0 | |
| 15,800 | | | Mito Securities Co. Ltd. | | | 48,851 | | | | 0.0 | |
| 5,200 | | | Mitsuba Corp. | | | 29,621 | | | | 0.0 | |
| 21,000 | | | Mitsubishi Gas Chemical Co., Inc. | | | 364,968 | | | | 0.1 | |
| 1,200 | | | Mitsubishi Kakoki Kaisha Ltd. | | | 28,030 | | | | 0.0 | |
| 3,600 | | | Mitsubishi Logisnext Co. Ltd. | | | 26,771 | | | | 0.0 | |
| 3,100 | | | Mitsubishi Shokuhin Co. Ltd. | | | 98,361 | | | | 0.1 | |
| 17,100 | | | Miura Co. Ltd. | | | 399,297 | | | | 0.2 | |
| 1,800 | | | Mizuno Corp. | | | 95,540 | | | | 0.1 | |
| 14,600 | | | Monex Group, Inc. | | | 68,508 | | | | 0.0 | |
| 22,800 | | | Morinaga Milk Industry Co. Ltd. | | | 530,207 | | | | 0.2 | |
| 1,400 | | | Moriroku Holdings Co. Ltd. | | | 21,485 | | | | 0.0 | |
| 4,900 | | | Morita Holdings Corp. | | | 65,395 | | | | 0.0 | |
| 700 | | | Mory Industries, Inc. | | | 23,018 | | | | 0.0 | |
| 7,700 | | | Mugen Estate Co. Ltd. | | | 78,562 | | | | 0.0 | |
| 2,000 | | | Murakami Corp. | | | 65,716 | | | | 0.0 | |
See Accompanying Notes to Financial Statements
Voya Multi-Manager
International Small Cap Fund | PORTFOLIO OF INVESTMENTS
as of October 31, 2024 (continued) |
| Shares | | | | | Value | | | Percentage
of Net
Assets |
| COMMON STOCK: (continued) | |
| | | | Japan (continued) |
| 1,900 | | | Mutoh Holdings Co. Ltd. | | $ | 28,891 | | | | 0.0 | |
| 1,900 | | | Naigai Trans Line Ltd. | | | 34,683 | | | | 0.0 | |
| 7,800 | | | Nakanishi, Inc. | | | 132,638 | | | | 0.1 | |
| 10,287 | | | Nakano Corp./Tokyo | | | 32,978 | | | | 0.0 | |
| 2,400 | | | Nanyo Corp. | | | 17,160 | | | | 0.0 | |
| 2,900 | | | NEOJAPAN, Inc. | | | 35,456 | | | | 0.0 | |
| 49,500 | | | NET One Systems Co. Ltd. | | | 1,201,803 | | | | 0.4 | |
| 33,400 | | | NHK Spring Co. Ltd. | | | 408,811 | | | | 0.2 | |
| 3,000 | | | Nicca Chemical Co. Ltd. | | | 24,992 | | | | 0.0 | |
| 1,100 | | | Nichias Corp. | | | 39,395 | | | | 0.0 | |
| 5,200 | | | Nichiban Co. Ltd. | | | 66,671 | | | | 0.0 | |
| 4,400 (2) | | | Nihon Chouzai Co. Ltd. | | | 40,215 | | | | 0.0 | |
| 3,200 | | | Nihon Denkei Co. Ltd. | | | 35,468 | | | | 0.0 | |
| 1,600 | | | Nihon Falcom Corp. | | | 11,311 | | | | 0.0 | |
| 3,900 | | | Nihon Flush Co. Ltd. | | | 22,706 | | | | 0.0 | |
| 32,000 | | | Nihon M&A Center Holdings, Inc. | | | 138,523 | | | | 0.1 | |
| 2,700 | | | Nihon Trim Co. Ltd. | | | 61,977 | | | | 0.0 | |
| 78 | | | Nippon Accommodations Fund, Inc. | | | 312,354 | | | | 0.1 | |
| 5,200 | | | Nippon Ceramic Co. Ltd. | | | 87,877 | | | | 0.0 | |
| 2,000 | | | Nippon Chemical Industrial Co. Ltd. | | | 35,181 | | | | 0.0 | |
| 1,700 | | | Nippon Concept Corp. | | | 20,069 | | | | 0.0 | |
| 1,400 | | | Nippon Dry-Chemical Co. Ltd. | | | 31,088 | | | | 0.0 | |
| 15,500 | | | Nippon Electric Glass Co. Ltd. | | | 352,729 | | | | 0.1 | |
| 6,800 | | | Nippon Kayaku Co. Ltd. | | | 53,790 | | | | 0.0 | |
| 13,000 | | | Nippon Thompson Co. Ltd. | | | 40,700 | | | | 0.0 | |
| 54,818 | | | Nissan Tokyo Sales Holdings Co. Ltd. | | | 155,181 | | | | 0.1 | |
| 1,800 | | | Nissei ASB Machine Co. Ltd. | | | 54,628 | | | | 0.0 | |
| 8,531 | | | Nisshin Group Holdings Co. Ltd. | | | 27,821 | | | | 0.0 | |
| 8,000 | | | Nisshinbo Holdings, Inc. | | | 50,797 | | | | 0.0 | |
| 13,900 | | | Nisso Holdings Co. Ltd. | | | 75,049 | | | | 0.0 | |
| 108,900 | | | Nissui Corp. | | | 661,505 | | | | 0.3 | |
| 3,300 | | | Nitta Gelatin, Inc. | | | 19,785 | | | | 0.0 | |
| 10,800 | | | Nitto Boseki Co. Ltd. | | | 517,560 | | | | 0.2 | |
| 1,300 | | | Nitto Kogyo Corp. | | | 25,109 | | | | 0.0 | |
| 13,000 | | | Nitto Seiko Co. Ltd. | | | 49,850 | | | | 0.0 | |
| 6,800 | | | Nittoku Co. Ltd. | | | 75,080 | | | | 0.0 | |
| 3,400 | | | NJS Co. Ltd. | | | 90,258 | | | | 0.1 | |
| 5,000 | | | Nomura Co. Ltd. | | | 25,336 | | | | 0.0 | |
| 7,200 | | | Noritz Corp. | | | 83,428 | | | | 0.0 | |
| 2,900 | | | NSD Co. Ltd. | | | 62,634 | | | | 0.0 | |
| 2,100 | | | NSW, Inc./Japan | | | 40,757 | | | | 0.0 | |
| 26,400 | | | NTN Corp. | | | 43,496 | | | | 0.0 | |
| 1,200 | | | Ochi Holdings Co. Ltd. | | | 10,187 | | | | 0.0 | |
| 4,600 | | | Ohba Co. Ltd. | | | 30,371 | | | | 0.0 | |
| 1,600 | | | OIE Sangyo Co. Ltd. | | | 19,801 | | | | 0.0 | |
| 1,800 | | | Oiles Corp. | | | 23,427 | | | | 0.0 | |
| 1,300 | | | Oita Bank Ltd. | | | 26,390 | | | | 0.0 | |
| 14,300 | | | Okabe Co. Ltd. | | | 72,548 | | | | 0.0 | |
| 1,000 | | | Okamoto Industries, Inc. | | | 34,668 | | | | 0.0 | |
| 1,700 | | | Okinawa Financial Group, Inc. | | | 25,020 | | | | 0.0 | |
| Shares | | | | | Value | | | Percentage
of Net
Assets |
| COMMON STOCK: (continued) | |
| | | | Japan (continued) |
| 1,800 | | | OKUMA Corp. | | $ | 36,389 | | | | 0.0 | |
| 4,100 | | | Okura Industrial Co. Ltd. | | | 72,622 | | | | 0.0 | |
| 2,800 | | | Onamba Co. Ltd. | | | 21,597 | | | | 0.0 | |
| 1,300 (1) | | | One Career, Inc. | | | 35,269 | | | | 0.0 | |
| 4,700 (1) | | | Optim Corp. | | | 18,237 | | | | 0.0 | |
| 12,000 | | | Optorun Co. Ltd. | | | 149,852 | | | | 0.1 | |
| 500 | | | Origin Co. Ltd. | | | 3,900 | | | | 0.0 | |
| 7,800 | | | Oro Co. Ltd. | | | 121,741 | | | | 0.1 | |
| 5,800 | | | Osaki Electric Co. Ltd. | | | 30,014 | | | | 0.0 | |
| 6,800 | | | PAL GROUP Holdings Co. Ltd. | | | 136,785 | | | | 0.1 | |
| 1,600 | | | PALTAC Corp. | | | 43,177 | | | | 0.0 | |
| 43,700 | | | Park24 Co. Ltd. | | | 543,140 | | | | 0.2 | |
| 16,000 | | | Parker Corp. | | | 80,240 | | | | 0.0 | |
| 2,200 | | | PCA Corp. | | | 27,678 | | | | 0.0 | |
| 5,700 | | | Pegasus Co. Ltd. | | | 17,436 | | | | 0.0 | |
| 3,000 | | | Pickles Holdings Co. Ltd. | | | 20,924 | | | | 0.0 | |
| 6,900 | | | Pilot Corp. | | | 214,473 | | | | 0.1 | |
| 10,900 | | | Pole To Win Holdings, Inc. | | | 32,438 | | | | 0.0 | |
| 2,100 (1) | | | PR Times Corp. | | | 21,775 | | | | 0.0 | |
| 4,900 | | | Prestige International, Inc. | | | 21,904 | | | | 0.0 | |
| 100 | | | Pronexus, Inc. | | | 849 | | | | 0.0 | |
| 7,300 | | | QB Net Holdings Co. Ltd. | | | 48,232 | | | | 0.0 | |
| 2,600 | | | Rasa Corp. | | | 23,964 | | | | 0.0 | |
| 3,600 | | | Rasa Industries Ltd. | | | 65,006 | | | | 0.0 | |
| 91,600 | | | Rengo Co. Ltd. | | | 554,817 | | | | 0.2 | |
| 26,400 | | | Resorttrust, Inc. | | | 479,695 | | | | 0.2 | |
| 2,400 | | | Rheon Automatic Machinery Co. Ltd. | | | 22,304 | | | | 0.0 | |
| 11,500 | | | Riken Technos Corp. | | | 78,261 | | | | 0.0 | |
| 2,500 | | | Riken Vitamin Co. Ltd. | | | 43,768 | | | | 0.0 | |
| 4,100 | | | Riso Kagaku Corp. | | | 94,493 | | | | 0.1 | |
| 107,700 | | | Round One Corp. | | | 681,633 | | | | 0.3 | |
| 4,500 | | | Sac's Bar Holdings, Inc. | | | 26,782 | | | | 0.0 | |
| 1,000 | | | Saison Information Systems Co. Ltd. | | | 11,847 | | | | 0.0 | |
| 10,400 | | | Sakata INX Corp. | | | 104,551 | | | | 0.1 | |
| 2,800 | | | San Holdings, Inc. | | | 20,292 | | | | 0.0 | |
| 2,000 | | | San ju San Financial Group, Inc. | | | 22,008 | | | | 0.0 | |
| 61,200 | | | Sankyo Co. Ltd. | | | 812,880 | | | | 0.3 | |
| 3,038 | | | Sankyo Frontier Co. Ltd. | | | 39,428 | | | | 0.0 | |
| 12,400 (1) | | | Sansan, Inc. | | | 180,376 | | | | 0.1 | |
| 2,400 | | | Sansei Technologies, Inc. | | | 21,082 | | | | 0.0 | |
| 18,100 | | | Sansha Electric Manufacturing Co. Ltd. | | | 118,393 | | | | 0.1 | |
| 63,500 | | | Santen Pharmaceutical Co. Ltd. | | | 759,387 | | | | 0.3 | |
| 45,000 | | | Sanwa Holdings Corp. | | | 1,140,033 | | | | 0.4 | |
| 700 | | | Sanyo Denki Co. Ltd. | | | 40,640 | | | | 0.0 | |
| 1,800 | | | Sanyo Shokai Ltd. | | | 30,423 | | | | 0.0 | |
| 2,800 | | | Sanyo Trading Co. Ltd. | | | 26,858 | | | | 0.0 | |
| 2,400 | | | Sato Shoji Corp. | | | 21,465 | | | | 0.0 | |
| 44,100 | | | Sawai Group Holdings Co. Ltd. | | | 590,747 | | | | 0.2 | |
| 1,900 | | | Saxa Holdings, Inc. | | | 29,962 | | | | 0.0 | |
| 6,100 | | | SBI Global Asset Management Co. Ltd. | | | 24,170 | | | | 0.0 | |
| 20,500 | | | SBI RHEOS HIFUMI, Inc. | | | 23,304 | | | | 0.0 | |
| 5,400 | | | Scroll Corp. | | | 33,724 | | | | 0.0 | |
See Accompanying Notes to Financial Statements
Voya Multi-Manager
International Small Cap Fund | PORTFOLIO OF INVESTMENTS
as of October 31, 2024 (continued) |
| Shares | | | | | Value | | | Percentage
of Net
Assets |
| COMMON STOCK: (continued) | |
| | | | Japan (continued) |
| 3,600 | | | Seed Co. Ltd./Tokyo | | $ | 11,732 | | | | 0.0 | |
| 1,500 | | | Seika Corp. | | | 37,853 | | | | 0.0 | |
| 6,600 | | | Sekisui Kasei Co. Ltd. | | | 16,043 | | | | 0.0 | |
| 2,100 | | | SEMITEC Corp. | | | 24,779 | | | | 0.0 | |
| 44,700 | | | Senko Group Holdings Co. Ltd. | | | 420,239 | | | | 0.2 | |
| 16,300 | | | SERAKU Co. Ltd. | | | 141,112 | | | | 0.1 | |
| 2,100 (1) | | | Serverworks Co. Ltd. | | | 32,203 | | | | 0.0 | |
| 1,900 | | | Shibaura Machine Co. Ltd. | | | 46,251 | | | | 0.0 | |
| 1,100 | | | Shibuya Corp. | | | 26,495 | | | | 0.0 | |
| 3,100 | | | Shikoku Bank Ltd. | | | 18,977 | | | | 0.0 | |
| 2,800 | | | Shimojima Co. Ltd. | | | 24,185 | | | | 0.0 | |
| 2,100 (2) | | | Shin Maint Holdings Co. Ltd. | | | 20,345 | | | | 0.0 | |
| 5,500 | | | Shinagawa Refractories Co. Ltd. | | | 64,033 | | | | 0.0 | |
| 6,100 | | | Shinmaywa Industries Ltd. | | | 54,094 | | | | 0.0 | |
| 7,900 | | | Ship Healthcare Holdings, Inc. | | | 120,130 | | | | 0.1 | |
| 7,400 | | | Shizuoka Gas Co. Ltd. | | | 49,636 | | | | 0.0 | |
| 15,800 | | | SIGMAXYZ Holdings, Inc. | | | 176,870 | | | | 0.1 | |
| 3,700 | | | Sinfonia Technology Co. Ltd. | | | 124,942 | | | | 0.1 | |
| 5,200 | | | Sinko Industries Ltd. | | | 148,589 | | | | 0.1 | |
| 1,700 | | | SK-Electronics Co. Ltd. | | | 26,089 | | | | 0.0 | |
| 900 | | | SMK Corp. | | | 13,996 | | | | 0.0 | |
| 14,000 | | | SMS Co. Ltd. | | | 156,947 | | | | 0.1 | |
| 16,400 | | | Socionext, Inc. | | | 305,321 | | | | 0.1 | |
| 4,800 | | | Sodick Co. Ltd. | | | 24,195 | | | | 0.0 | |
| 7,700 | | | Softcreate Holdings Corp. | | | 109,111 | | | | 0.1 | |
| 5,569 | | | Soken Chemical & Engineering Co. Ltd. | | | 116,311 | | | | 0.1 | |
| 8,100 | | | Solasto Corp. | | | 25,892 | | | | 0.0 | |
| 4,600 | | | Soliton Systems KK | | | 38,386 | | | | 0.0 | |
| 4,400 | | | SPK Corp. | | | 58,771 | | | | 0.0 | |
| 45,900 | | | S-Pool, Inc. | | | 108,862 | | | | 0.1 | |
| 2,400 | | | Sprix, Inc. | | | 12,384 | | | | 0.0 | |
| 5,800 | | | Star Mica Holdings Co. Ltd. | | | 24,285 | | | | 0.0 | |
| 3,300 | | | Star Micronics Co. Ltd. | | | 42,270 | | | | 0.0 | |
| 3,200 | | | Startia Holdings, Inc. | | | 40,684 | | | | 0.0 | |
| 2,600 | | | St-Care Holding Corp. | | | 12,625 | | | | 0.0 | |
| 2,700 | | | Strike Co. Ltd. | | | 65,655 | | | | 0.0 | |
| 17,800 | | | Sumitomo Bakelite Co. Ltd. | | | 464,840 | | | | 0.2 | |
| 15,800 | | | Sumitomo Forestry Co. Ltd. | | | 608,677 | | | | 0.2 | |
| 34,700 (1) | | | Sumitomo Pharma Co. Ltd. | | | 119,034 | | | | 0.1 | |
| 4,800 | | | Sumitomo Riko Co. Ltd. | | | 48,875 | | | | 0.0 | |
| 1,800 | | | Sumitomo Seika Chemicals Co. Ltd. | | | 59,762 | | | | 0.0 | |
| 5,300 | | | Sun Frontier Fudousan Co. Ltd. | | | 62,921 | | | | 0.0 | |
| 7,100 (1) | | | Sun*, Inc. | | | 24,412 | | | | 0.0 | |
| 3,200 | | | Sun-Wa Technos Corp. | | | 45,177 | | | | 0.0 | |
| 2,200 | | | System Research Co. Ltd. | | | 20,688 | | | | 0.0 | |
| 4,200 | | | System Support, Inc. | | | 50,243 | | | | 0.0 | |
| 4,200 | | | Syuppin Co. Ltd. | | | 28,881 | | | | 0.0 | |
| 1,100 | | | T. RAD Co. Ltd. | | | 23,930 | | | | 0.0 | |
| Shares | | | | | Value | | | Percentage
of Net
Assets |
| COMMON STOCK: (continued) | |
| | | | Japan (continued) |
| 2,690 | | | Tachikawa Corp. | | $ | 23,188 | | | | 0.0 | |
| 1,000 | | | Taihei Dengyo Kaisha Ltd. | | | 33,626 | | | | 0.0 | |
| 8,500 | | | Takaoka Toko Co. Ltd. | | | 108,340 | | | | 0.1 | |
| 7,200 | | | Takara & Co. Ltd. | | | 126,419 | | | | 0.1 | |
| 1,500 | | | Takasago International Corp. | | | 50,881 | | | | 0.0 | |
| 62,400 | | | Takashimaya Co. Ltd. | | | 494,056 | | | | 0.2 | |
| 13,600 | | | Takeuchi Manufacturing Co. Ltd. | | | 423,825 | | | | 0.2 | |
| 2,400 | | | Tanabe Consulting Group Co. Ltd. | | | 18,084 | | | | 0.0 | |
| 4,200 | | | TDC Soft, Inc. | | | 33,936 | | | | 0.0 | |
| 9,100 | | | TechMatrix Corp. | | | 132,085 | | | | 0.1 | |
| 800 | | | Techno Medica Co. Ltd. | | | 9,470 | | | | 0.0 | |
| 4,300 | | | Tecnos Japan, Inc. | | | 18,085 | | | | 0.0 | |
| 2,900 | | | Teikoku Electric Manufacturing Co. Ltd. | | | 53,709 | | | | 0.0 | |
| 2,200 | | | Temairazu, Inc. | | | 46,186 | | | | 0.0 | |
| 1,800 | | | Tenma Corp. | | | 34,432 | | | | 0.0 | |
| 2,000 | | | Terasaki Electric Co. Ltd. | | | 30,647 | | | | 0.0 | |
| 99,600 | | | TOA ROAD Corp. | | | 821,785 | | | | 0.3 | |
| 3,700 | | | Tocalo Co. Ltd. | | | 43,040 | | | | 0.0 | |
| 22,900 | | | Tochigi Bank Ltd. | | | 38,724 | | | | 0.0 | |
| 2,700 | | | Togami Electric Manufacturing Co. Ltd. | | | 57,252 | | | | 0.0 | |
| 53,300 | | | Tohoku Electric Power Co., Inc. | | | 522,814 | | | | 0.2 | |
| 33,000 | | | Tokai Tokyo Financial Holdings, Inc. | | | 101,046 | | | | 0.1 | |
| 3,600 | | | Tokyo Energy & Systems, Inc. | | | 26,662 | | | | 0.0 | |
| 2,500 | | | Tokyo Rope Manufacturing Co. Ltd. | | | 18,426 | | | | 0.0 | |
| 11,100 | | | Tokyo Seimitsu Co. Ltd. | | | 597,283 | | | | 0.2 | |
| 34,900 | | | Tokyo Tatemono Co. Ltd. | | | 569,910 | | | | 0.2 | |
| 70,600 | | | Tokyu Fudosan Holdings Corp. | | | 440,573 | | | | 0.2 | |
| 11,100 | | | Toli Corp. | | | 29,924 | | | | 0.0 | |
| 15,300 | | | TOMONY Holdings, Inc. | | | 39,616 | | | | 0.0 | |
| 11,200 | | | Tomy Co. Ltd. | | | 295,666 | | | | 0.1 | |
| 1,800 | | | Tonami Holdings Co. Ltd. | | | 69,188 | | | | 0.0 | |
| 2,500 | | | Topy Industries Ltd. | | | 31,681 | | | | 0.0 | |
| 1,900 | | | Torishima Pump Manufacturing Co. Ltd. | | | 34,428 | | | | 0.0 | |
| 5,700 | | | Toshiba TEC Corp. | | | 129,627 | | | | 0.1 | |
| 13,600 | | | Towa Bank Ltd. | | | 51,286 | | | | 0.0 | |
| 10,600 | | | Towa Pharmaceutical Co. Ltd. | | | 217,231 | | | | 0.1 | |
| 3,700 | | | Toyo Denki Seizo KK | | | 26,458 | | | | 0.0 | |
| 12,300 | | | Toyo Engineering Corp. | | | 59,699 | | | | 0.0 | |
| 1,200 | | | Toyo Kanetsu KK | | | 35,041 | | | | 0.0 | |
| 11,500 | | | Toyo Suisan Kaisha Ltd. | | | 675,554 | | | | 0.3 | |
| 35,300 | | | Toyo Tire Corp. | | | 500,832 | | | | 0.2 | |
| 25,100 | | | Toyoda Gosei Co. Ltd. | | | 426,457 | | | | 0.2 | |
| 2,500 | | | TPR Co. Ltd. | | | 37,634 | | | | 0.0 | |
| 19,700 | | | Traders Holdings Co. Ltd. | | | 103,582 | | | | 0.1 | |
| 9,000 | | | Transcosmos, Inc. | | | 196,459 | | | | 0.1 | |
| 2,200 | | | TRE Holdings Corp. | | | 25,802 | | | | 0.0 | |
| 6,900 | | | Trusco Nakayama Corp. | | | 101,924 | | | | 0.1 | |
| 12,000 | | | Tsubakimoto Chain Co. | | | 151,093 | | | | 0.1 | |
See Accompanying Notes to Financial Statements
Voya Multi-Manager
International Small Cap Fund | PORTFOLIO OF INVESTMENTS
as of October 31, 2024 (continued) |
| Shares | | | | | Value | | | Percentage
of Net
Assets |
| COMMON STOCK: (continued) | |
| | | | Japan (continued) |
| 2,400 | | | Tsubakimoto Kogyo Co. Ltd. | | $ | 29,662 | | | | 0.0 | |
| 7,100 | | | Tsugami Corp. | | | 65,769 | | | | 0.0 | |
| 7,300 | | | Tsukada Global Holdings, Inc. | | | 18,814 | | | | 0.0 | |
| 16,100 | | | Tsumura & Co. | | | 526,217 | | | | 0.2 | |
| 7,800 | | | TYK Corp./Tokyo | | | 21,013 | | | | 0.0 | |
| 11,800 | | | Ubicom Holdings, Inc. | | | 102,772 | | | | 0.1 | |
| 1,100 | | | Uchida Yoko Co. Ltd. | | | 46,979 | | | | 0.0 | |
| 1,900 | | | ULS Group, Inc. | | | 67,123 | | | | 0.0 | |
| 8,500 | | | Ulvac, Inc. | | | 397,438 | | | | 0.2 | |
| 1,100 | | | Union Tool Co. | | | 51,436 | | | | 0.0 | |
| 5,500 | | | Unipres Corp. | | | 39,977 | | | | 0.0 | |
| 1,500 | | | UNIRITA, Inc. | | | 19,517 | | | | 0.0 | |
| 12,300 | | | United Arrows Ltd. | | | 175,241 | | | | 0.1 | |
| 11,200 (2) | | | UNITED, Inc./Japan | | | 55,608 | | | | 0.0 | |
| 3,300 | | | V Technology Co. Ltd. | | | 51,766 | | | | 0.0 | |
| 6,600 | | | ValueCommerce Co. Ltd. | | | 47,065 | | | | 0.0 | |
| 3,800 | | | Vector, Inc. | | | 23,631 | | | | 0.0 | |
| 2,200 | | | Vertex Corp./Japan | | | 29,234 | | | | 0.0 | |
| 7,500 | | | Vision, Inc./Tokyo Japan | | | 51,584 | | | | 0.0 | |
| 900 (1) | | | Visional, Inc. | | | 48,158 | | | | 0.0 | |
| 2,724 | | | Vital KSK Holdings, Inc. | | | 22,806 | | | | 0.0 | |
| 600 | | | WDB coco Co. Ltd. | | | 14,947 | | | | 0.0 | |
| 800 | | | Weathernews, Inc. | | | 31,535 | | | | 0.0 | |
| 5,500 | | | Will Group, Inc. | | | 35,308 | | | | 0.0 | |
| 4,600 | | | WingArc1st, Inc. | | | 97,992 | | | | 0.1 | |
| 3,000 | | | World Holdings Co. Ltd. | | | 37,445 | | | | 0.0 | |
| 3,400 | | | Wowow, Inc. | | | 22,584 | | | | 0.0 | |
| 3,500 | | | Xebio Holdings Co. Ltd. | | | 26,456 | | | | 0.0 | |
| 8,000 | | | YAMABIKO Corp. | | | 129,967 | | | | 0.1 | |
| 2,300 | | | YAMADA Consulting Group Co. Ltd. | | | 31,644 | | | | 0.0 | |
| 3,500 | | | Yamagata Bank Ltd. | | | 22,098 | | | | 0.0 | |
| 72,200 | | | Yamaguchi Financial Group, Inc. | | | 706,969 | | | | 0.3 | |
| 2,300 | | | Yamaichi Electronics Co. Ltd. | | | 38,425 | | | | 0.0 | |
| 10,700 | | | Yamashin-Filter Corp. | | | 32,593 | | | | 0.0 | |
| 17,800 | | | Yokowo Co. Ltd. | | | 177,528 | | | | 0.1 | |
| 900 | | | Yorozu Corp. | | | 6,927 | | | | 0.0 | |
| 3,000 | | | Yossix Holdings Co. Ltd. | | | 64,261 | | | | 0.0 | |
| 3,400 | | | Yushin Precision Equipment Co. Ltd. | | | 14,792 | | | | 0.0 | |
| 4,700 | | | Yutaka Giken Co. Ltd. | | | 59,349 | | | | 0.0 | |
| 1,100 | | | Zaoh Co. Ltd. | | | 17,547 | | | | 0.0 | |
| 7,100 | | | Zenrin Co. Ltd. | | | 37,585 | | | | 0.0 | |
| 4,900 | | | Zeon Corp. | | | 45,622 | | | | 0.0 | |
| 16,700 | | | ZIGExN Co. Ltd. | | | 62,969 | | | | 0.0 | |
| | | | | | | 57,921,651 | | | | 20.5 | |
| | | | Jordan: 0.4% |
| 48,211 | | | Hikma Pharmaceuticals PLC | | | 1,154,650 | | | | 0.4 | |
| | | | | | | | | | | | |
| | | | Liechtenstein: 0.0% |
| 1,145 | | | Liechtensteinische Landesbank AG | | | 93,610 | | | | 0.0 | |
| | | | | | | | | | | | |
| | | | Luxembourg: 0.0% |
| 2,165 | | | Eurofins Scientific SE | | | 106,782 | | | | 0.0 | |
| Shares | | | | | Value | | | Percentage
of Net
Assets |
| COMMON STOCK: (continued) | |
| | | | Macao: 0.2% | |
| 465,200 | | | MGM China Holdings Ltd. | | $ | 603,713 | | | | 0.2 | |
| | | | | | | | | | | | |
| | | | Malaysia: 0.1% |
| 137,300 | | | Aeon Co. M Bhd | | | 45,537 | | | | 0.0 | |
| 249,300 | | | CCK Consolidated Holdings BHD | | | 88,973 | | | | 0.1 | |
| 24,100 | | | CSC Steel Holdings Bhd | | | 6,518 | | | | 0.0 | |
| 825,500 | | | Datasonic Group Bhd | | | 72,233 | | | | 0.0 | |
| 405,700 | | | Malayan Flour Mills Bhd | | | 60,436 | | | | 0.0 | |
| 30,600 | | | MBM Resources BHD | | | 43,185 | | | | 0.0 | |
| 3,414 | | | MKH Oil Palm East Kalimantan Bhd | | | 475 | | | | 0.0 | |
| 98,300 | | | Spritzer BHD | | | 61,400 | | | | 0.0 | |
| 37,200 | | | Uchi Technologies Bhd | | | 32,791 | | | | 0.0 | |
| | | | | | | 411,548 | | | | 0.1 | |
| | | | Mexico: 0.0% |
| 353 | | | Corporativo Fragua SAB de CV | | | 15,525 | | | | 0.0 | |
| | | | | | | | | | | | |
| | | | Netherlands: 2.5% |
| 12,957 | | | Arcadis NV | | | 897,191 | | | | 0.3 | |
| 14,392 | | | ASR Nederland NV | | | 682,166 | | | | 0.3 | |
| 5,321 | | | BE Semiconductor Industries NV | | | 566,399 | | | | 0.2 | |
| 7,494 (3) | | | Euronext NV | | | 826,846 | | | | 0.3 | |
| 38,694 | | | Fugro NV | | | 889,714 | | | | 0.3 | |
| 258,307 | | | Koninklijke BAM Groep NV | | | 1,192,192 | | | | 0.4 | |
| 33,629 | | | NN Group NV | | | 1,650,923 | | | | 0.6 | |
| 1,409 | | | NSI NV | | | 30,346 | | | | 0.0 | |
| 15,162 | | | OCI NV | | | 184,599 | | | | 0.1 | |
| 8,436 (1) | | | ProQR Therapeutics NV | | | 29,526 | | | | 0.0 | |
| 2,219 | | | Van Lanschot Kempen NV | | | 101,426 | | | | 0.0 | |
| 51 | | | Vastned Retail NV | | | 1,368 | | | | 0.0 | |
| | | | | | | 7,052,696 | | | | 2.5 | |
| | | | New Zealand: 0.0% |
| 8,037 | | | Scales Corp. Ltd. | | | 19,239 | | | | 0.0 | |
| 51,430 | | | SKY Network Television Ltd. | | | 84,227 | | | | 0.0 | |
| | | | | | | 103,466 | | | | 0.0 | |
| | | | Norway: 1.0% |
| 13,511 | | | 2020 Bulkers Ltd. | | | 161,515 | | | | 0.1 | |
| 29,187 | | | ABG Sundal Collier Holding ASA | | | 18,334 | | | | 0.0 | |
| 22,613 | | | Belships ASA | | | 36,510 | | | | 0.0 | |
| 170 | | | Bouvet ASA | | | 1,049 | | | | 0.0 | |
| 85,045 | | | DNO ASA | | | 83,346 | | | | 0.0 | |
| 30,435 (1) | | | DOF Group ASA | | | 243,007 | | | | 0.1 | |
| 11,158 | | | Elopak ASA | | | 45,189 | | | | 0.0 | |
| 66,575 | | | Hoegh Autoliners ASA | | | 700,651 | | | | 0.3 | |
| 242,488 | | | MPC Container Ships ASA | | | 477,931 | | | | 0.2 | |
| 2,740 | | | Odfjell SE - Class A | | | 31,335 | | | | 0.0 | |
| 8,076 (2) | | | Opera Ltd., ADR | | | 145,126 | | | | 0.1 | |
| 1,223 | | | Protector Forsikring ASA | | | 31,832 | | | | 0.0 | |
| 50,921 | | | Reach Subsea ASA | | | 43,983 | | | | 0.0 | |
| 65,478 (1) | | | SATS ASA | | | 128,573 | | | | 0.1 | |
| 14,989 | | | Sea1 offshore, Inc. | | | 37,419 | | | | 0.0 | |
| 1,938 | | | SpareBank 1 Nord Norge | | | 20,757 | | | | 0.0 | |
| 3,785 | | | Sparebanken More | | | 30,637 | | | | 0.0 | |
| 3,897 | | | Stolt-Nielsen Ltd. | | | 110,885 | | | | 0.0 | |
| 34,760 | | | Wallenius Wilhelmsen ASA | | | 345,597 | | | | 0.1 | |
See Accompanying Notes to Financial Statements
Voya Multi-Manager
International Small Cap Fund | PORTFOLIO OF INVESTMENTS
as of October 31, 2024 (continued) |
| Shares | | | | | Value | | | Percentage
of Net
Assets |
| COMMON STOCK: (continued) | |
| | | | Norway (continued) |
| 2,084 | | | Wilh Wilhelmsen Holding ASA - Class A | | $ | 77,296 | | | | 0.0 | |
| | | | | | | 2,770,972 | | | | 1.0 | |
| | | | Papua New Guinea: 0.0% |
| 52,912 | | | Kina Securities Ltd. | | | 36,682 | | | | 0.0 | |
| | | | | | | | | | | | |
| | | | Peru: 0.0% |
| 41,854 | | | Ferreycorp SAA | | | 33,275 | | | | 0.0 | |
| | | | | | | | | | | | |
| | | | Philippines: 0.1% |
| 18,300 | | | Ginebra San Miguel, Inc. | | | 78,667 | | | | 0.1 | |
| 1,430,000 | | | Megaworld Corp. | | | 56,740 | | | | 0.0 | |
| | | | | | | 135,407 | | | | 0.1 | |
| | | | Poland: 0.4% |
| 14,461 | | | Arctic Paper SA | | | 62,886 | | | | 0.0 | |
| 19,769 | | | Asseco Poland SA | | | 443,467 | | | | 0.2 | |
| 1,875 | | | Asseco South Eastern Europe SA | | | 23,374 | | | | 0.0 | |
| 1,206 | | | BNPP Bank Polska SA | | | 26,032 | | | | 0.0 | |
| 116,962 (1) | | | Enea SA | | | 325,515 | | | | 0.1 | |
| 5,039 | | | LiveChat Software SA | | | 74,652 | | | | 0.1 | |
| 102 (1) | | | Stalprodukt SA | | | 6,116 | | | | 0.0 | |
| 3,626 (1)(2) | | | TEN Square Games SA | | | 72,214 | | | | 0.0 | |
| 8,629 | | | Wittchen SA | | | 55,619 | | | | 0.0 | |
| | | | | | | 1,089,875 | | | | 0.4 | |
| | | | Portugal: 0.5% |
| 2,515,419 | | | Banco Comercial Portugues SA - Class R | | | 1,268,898 | | | | 0.5 | |
| 56,765 | | | Sonae SGPS SA | | | 56,127 | | | | 0.0 | |
| | | | | | | 1,325,025 | | | | 0.5 | |
| | | | Singapore: 0.7% |
| 83,400 | | | Aztech Global Ltd. | | | 47,135 | | | | 0.0 | |
| 38,400 | | | China Sunsine Chemical Holdings Ltd. | | | 13,260 | | | | 0.0 | |
| 29,800 | | | CSE Global Ltd. | | | 9,659 | | | | 0.0 | |
| 553,000 | | | IGG, Inc. | | | 292,417 | | | | 0.1 | |
| 232,300 | | | Keppel DC REIT | | | 400,129 | | | | 0.1 | |
| 1,710,000 | | | Keppel Pacific Oak US REIT | | | 419,350 | | | | 0.2 | |
| 114,100 | | | Pacific Century Regional Developments Ltd. | | | 27,218 | | | | 0.0 | |
| 52,600 | | | Samudera Shipping Line Ltd. | | | 31,340 | | | | 0.0 | |
| 14,000 | | | Sarine Technologies Ltd. | | | 2,492 | | | | 0.0 | |
| 189,300 | | | Sembcorp Industries Ltd. | | | 718,175 | | | | 0.3 | |
| 22,700 | | | Sing Holdings Ltd. | | | 5,931 | | | | 0.0 | |
| 19,950 | | | Sing Investments & Finance Ltd. | | | 15,701 | | | | 0.0 | |
| 31,892 | | | Tai Sin Electric Ltd. | | | 9,781 | | | | 0.0 | |
| 53,000 | | | Tiong Woon Corp. Holding Ltd. | | | 21,072 | | | | 0.0 | |
| | | | | | | 2,013,660 | | | | 0.7 | |
| | | | South Africa: 0.3% |
| 102,043 | | | Investec PLC - ZAR | | | 793,423 | | | | 0.3 | |
| 17,785 | | | Reunert Ltd. | | | 81,260 | | | | 0.0 | |
| | | | | | | 874,683 | | | | 0.3 | |
| | | | South Korea: 4.2% |
| 10,841 | | | AfreecaTV Co. Ltd. | | | 751,004 | | | | 0.3 | |
| 1,307 | | | AK Holdings, Inc. | | | 11,803 | | | | 0.0 | |
| Shares | | | | | Value | | | Percentage
of Net
Assets |
| COMMON STOCK: (continued) | |
| | | | South Korea (continued) |
| 2 | | | ASIA Holdings Co. Ltd. | | $ | 366 | | | | 0.0 | |
| 4,710 | | | Asia Paper Manufacturing Co. Ltd. | | | 27,599 | | | | 0.0 | |
| 16,487 | | | Atinum Investment Co. Ltd. | | | 30,457 | | | | 0.0 | |
| 10,795 | | | Baiksan Co. Ltd. | | | 102,269 | | | | 0.1 | |
| 19,669 | | | Classys, Inc. | | | 717,699 | | | | 0.3 | |
| 3,629 | | | CLIO Cosmetics Co. Ltd. | | | 57,814 | | | | 0.0 | |
| 1,534 (1) | | | Com2uS Holdings Corp. | | | 25,877 | | | | 0.0 | |
| 10,119 | | | Com2uSCorp | | | 316,977 | | | | 0.1 | |
| 2,725 | | | Cuckoo Holdings Co. Ltd. | | | 47,979 | | | | 0.0 | |
| 1,482 (1) | | | D&C Media Co. Ltd. | | | 19,199 | | | | 0.0 | |
| 20,803 | | | Dae Hyun Co. Ltd. | | | 30,559 | | | | 0.0 | |
| 6,682 | | | Daesang Corp. | | | 99,479 | | | | 0.1 | |
| 6,145 | | | Daewon San Up Co. Ltd. | | | 26,447 | | | | 0.0 | |
| 2,978 | | | Daihan Pharmaceutical Co. Ltd. | | | 54,170 | | | | 0.0 | |
| 2,024 | | | Daou Technology, Inc. | | | 26,795 | | | | 0.0 | |
| 11,558 | | | DGB Financial Group, Inc. | | | 68,198 | | | | 0.0 | |
| 4,561 | | | DMS Co. Ltd. | | | 18,118 | | | | 0.0 | |
| 1,584 | | | Dongwon F&B Co. Ltd. | | | 36,328 | | | | 0.0 | |
| 3,519 (1) | | | DoubleDown Interactive Co. Ltd., ADR | | | 47,753 | | | | 0.0 | |
| 4,236 | | | DoubleUGames Co. Ltd. | | | 162,872 | | | | 0.1 | |
| 935 | | | E1 Corp. | | | 50,409 | | | | 0.0 | |
| 2,477 | | | Eugene Technology Co. Ltd. | | | 66,148 | | | | 0.0 | |
| 8,077 | | | Eusu Holdings Co. Ltd. | | | 29,920 | | | | 0.0 | |
| 3,407 | | | Fila Holdings Corp. | | | 98,332 | | | | 0.1 | |
| 1,300 | | | Fursys, Inc. | | | 39,384 | | | | 0.0 | |
| 3,062 | | | Gabia, Inc. | | | 29,854 | | | | 0.0 | |
| 9,983 | | | Golfzon Newdin Holdings Co. Ltd. | | | 27,315 | | | | 0.0 | |
| 21,215 | | | H.PIO Co. Ltd. | | | 45,224 | | | | 0.0 | |
| 1,970 | | | Hanmi Pharm Co. Ltd. | | | 454,748 | | | | 0.2 | |
| 26,682 | | | Hanwha General Insurance Co. Ltd. | | | 92,213 | | | | 0.0 | |
| 4,150 | | | Hanyang Securities Co. Ltd. | | | 37,038 | | | | 0.0 | |
| 1,886 | | | HD Hyundai Electric Co. Ltd. | | | 441,425 | | | | 0.2 | |
| 10,142 | | | HD Hyundai Infracore Co. Ltd. | | | 48,540 | | | | 0.0 | |
| 4,254 | | | Hyundai Motor Securities Co. Ltd. | | | 26,986 | | | | 0.0 | |
| 7,858 | | | HyVision System, Inc. | | | 97,632 | | | | 0.1 | |
| 2,040 | | | IDIS Holdings Co. Ltd. | | | 13,437 | | | | 0.0 | |
| 8,332 | | | Iljin Holdings Co. Ltd. | | | 24,006 | | | | 0.0 | |
| 14,039 | | | IsuPetasys Co. Ltd. | | | 357,651 | | | | 0.1 | |
| 28,970 | | | JB Financial Group Co. Ltd. | | | 375,830 | | | | 0.2 | |
| 4,964 (1) | | | Jin Air Co. Ltd. | | | 40,252 | | | | 0.0 | |
| 16,512 (1) | | | JoyCity Corp. | | | 19,307 | | | | 0.0 | |
| 4,796 | | | KC Tech Co. Ltd./New | | | 123,398 | | | | 0.1 | |
| 4,072 | | | KEPCO Plant Service & Engineering Co. Ltd. | | | 131,567 | | | | 0.1 | |
| 8,307 | | | Kolmar Korea Co. Ltd. | | | 422,386 | | | | 0.2 | |
| 19,207 | | | Korea Asset In Trust Co. Ltd. | | | 40,582 | | | | 0.0 | |
| 396 | | | KPX Chemical Co. Ltd. | | | 13,498 | | | | 0.0 | |
See Accompanying Notes to Financial Statements
Voya Multi-Manager
International Small Cap Fund | PORTFOLIO OF INVESTMENTS
as of October 31, 2024 (continued) |
| Shares | | | | | Value | | | Percentage
of Net
Assets |
| COMMON STOCK: (continued) | |
| | | | South Korea (continued) |
| 35,244 | | | KTCS Corp. | | $ | 72,626 | | | | 0.0 | |
| 2,727 | | | LEENO Industrial, Inc. | | | 355,315 | | | | 0.1 | |
| 73 | | | LF Corp. | | | 790 | | | | 0.0 | |
| 2,874 | | | LIG Nex1 Co. Ltd. | | | 511,527 | | | | 0.2 | |
| 7,130 | | | LOT Vacuum Co. Ltd. | | | 51,158 | | | | 0.0 | |
| 8,846 | | | LOTTE Fine Chemical Co. Ltd. | | | 296,115 | | | | 0.1 | |
| 3,276 | | | LOTTE Himart Co. Ltd. | | | 18,954 | | | | 0.0 | |
| 895 | | | Lotte Wellfood Co. Ltd. | | | 84,563 | | | | 0.0 | |
| 3,501 | | | LS Electric Co. Ltd. | | | 366,925 | | | | 0.1 | |
| 1,941 | | | LX Hausys Ltd. | | | 55,498 | | | | 0.0 | |
| 2,617 | | | LX Semicon Co. Ltd. | | | 115,611 | | | | 0.1 | |
| 2,831 | | | Maeil Dairies Co. Ltd. | | | 78,715 | | | | 0.0 | |
| 2,411 | | | MegaStudy Co. Ltd. | | | 19,588 | | | | 0.0 | |
| 3,939 | | | Modetour Network, Inc. | | | 28,364 | | | | 0.0 | |
| 18,130 (1) | | | MONAYONGPYONG | | | 49,284 | | | | 0.0 | |
| 3,086 | | | NeoPharm Co. Ltd. | | | 28,657 | | | | 0.0 | |
| 3,564 | | | Neowiz | | | 53,582 | | | | 0.0 | |
| 613 (1) | | | NEOWIZ HOLDINGS Corp. | | | 9,094 | | | | 0.0 | |
| 7,895 | | | NHN KCP Corp. | | | 41,327 | | | | 0.0 | |
| 2,214 | | | NICE Holdings Co. Ltd. | | | 18,059 | | | | 0.0 | |
| 349 | | | Nice Information & Telecommunication, Inc. | | | 4,722 | | | | 0.0 | |
| 13,277 | | | NICE Information Service Co. Ltd. | | | 106,582 | | | | 0.1 | |
| 979 | | | NongShim Co. Ltd. | | | 264,960 | | | | 0.1 | |
| 6,191 | | | NOROO Paint & Coatings Co. Ltd. | | | 37,561 | | | | 0.0 | |
| 3,140 | | | PHA Co. Ltd. | | | 22,380 | | | | 0.0 | |
| 3,503 | | | PharmaResearch Co. Ltd. | | | 568,866 | | | | 0.2 | |
| 16,591 | | | Poongsan Corp. | | | 709,502 | | | | 0.3 | |
| 3,023 | | | Rayence Co. Ltd. | | | 15,315 | | | | 0.0 | |
| 9,090 (1) | | | Refine Co. Ltd. | | | 89,811 | | | | 0.0 | |
| 87,913 (4) | | | S&C Engine Group Ltd. | | | — | | | | — | |
| 1,737 | | | S-1 Corp. | | | 81,245 | | | | 0.0 | |
| 8,006 | | | Sam Young Electronics Co. Ltd. | | | 56,598 | | | | 0.0 | |
| 3,844 | | | Sambo Corrugated Board Co. Ltd. | | | 25,263 | | | | 0.0 | |
| 976 | | | Samchully Co. Ltd. | | | 63,795 | | | | 0.0 | |
| 2,982 | | | Sammok S-Form Co. Ltd. | | | 46,603 | | | | 0.0 | |
| 23,656 (1) | | | Samsung Engineering Co. Ltd. | | | 304,451 | | | | 0.1 | |
| 1,134 | | | Samyang Holdings Corp. | | | 58,255 | | | | 0.0 | |
| 3,307 | | | SeAH Besteel Holdings Corp. | | | 47,334 | | | | 0.0 | |
| 127 | | | SeAH Holdings Corp. | | | 9,304 | | | | 0.0 | |
| 19,401 | | | Sebang Co. Ltd. | | | 167,474 | | | | 0.1 | |
| 1,306 | | | Seoul City Gas Co. Ltd. | | | 49,811 | | | | 0.0 | |
| 8,661 | | | Seoyon Co. Ltd. | | | 45,104 | | | | 0.0 | |
| 5,556 | | | Shinsegae International, Inc. | | | 52,537 | | | | 0.0 | |
| 1,735 | | | SJ Group Co. Ltd. | | | 7,135 | | | | 0.0 | |
| 10,720 | | | SNT Dynamics Co. Ltd. | | | 193,682 | | | | 0.1 | |
| 1,330 | | | Spigen Korea Co. Ltd. | | | 19,643 | | | | 0.0 | |
| 23,993 | | | STIC Investments, Inc. | | | 140,022 | | | | 0.1 | |
| 1,953 (1) | | | Suprema, Inc. | | | 35,906 | | | | 0.0 | |
| 126 | | | Taekwang Industrial Co. Ltd. | | | 59,429 | | | | 0.0 | |
| Shares | | | | | Value | | | Percentage
of Net
Assets |
| COMMON STOCK: (continued) | |
| | | | South Korea (continued) |
| 4,766 (1) | | | Thinkware Systems Corp. | | $ | 36,277 | | | | 0.0 | |
| 24,076 | | | Tongyang Life Insurance Co. Ltd. | | | 106,259 | | | | 0.1 | |
| 2,315 | | | Ubiquoss, Inc. | | | 23,477 | | | | 0.0 | |
| 5,491 | | | Uju Electronics Co. Ltd. | | | 57,680 | | | | 0.0 | |
| 2,342 | | | Unid Co. Ltd. | | | 118,231 | | | | 0.1 | |
| 3,416 | | | Wins Co. Ltd. | | | 30,878 | | | | 0.0 | |
| 4,222 | | | WiSoL Co. Ltd. | | | 18,656 | | | | 0.0 | |
| | | | | | | 11,757,344 | | | | 4.2 | |
| | | | Spain: 1.7% |
| 49,783 | | | Acerinox SA | | | 456,166 | | | | 0.2 | |
| 161,262 | | | Bankinter SA | | | 1,315,640 | | | | 0.5 | |
| 19,738 | | | Cia de Distribucion Integral Logista Holdings SA | | | 604,724 | | | | 0.2 | |
| 33,649 | | | Indra Sistemas SA | | | 593,214 | | | | 0.2 | |
| 346 | | | Laboratorios Farmaceuticos Rovi SA | | | 29,393 | | | | 0.0 | |
| 238,073 | | | Mapfre SA | | | 680,557 | | | | 0.2 | |
| 75,368 | | | Merlin Properties Socimi SA | | | 840,978 | | | | 0.3 | |
| 7,389 | | | Naturhouse Health SAU | | | 13,382 | | | | 0.0 | |
| 3,639 | | | Pharma Mar SA | | | 280,301 | | | | 0.1 | |
| | | | | | | 4,814,355 | | | | 1.7 | |
| | | | Sweden: 2.6% |
| 9,767 | | | AddLife AB - Class B | | | 124,118 | | | | 0.1 | |
| 29,643 | | | AFRY AB | | | 446,021 | | | | 0.2 | |
| 10,943 | | | Alleima AB | | | 66,870 | | | | 0.0 | |
| 17,284 | | | Alligo AB - Class B | | | 204,399 | | | | 0.1 | |
| 7,852 | | | Arise AB | | | 30,161 | | | | 0.0 | |
| 10,765 | | | Arjo AB - Class B | | | 35,506 | | | | 0.0 | |
| 34,559 | | | Avanza Bank Holding AB | | | 719,862 | | | | 0.3 | |
| 15,492 | | | Axfood AB | | | 345,913 | | | | 0.1 | |
| 13,455 | | | Bahnhof AB - Class B | | | 66,931 | | | | 0.0 | |
| 96 | | | Beijer Alma AB | | | 1,543 | | | | 0.0 | |
| 14,518 | | | Betsson AB - Class B | | | 193,109 | | | | 0.1 | |
| 17,650 | | | BioGaia AB - Class B | | | 174,768 | | | | 0.1 | |
| 6,335 | | | Biotage AB | | | 95,074 | | | | 0.0 | |
| 102,505 | | | Bredband2 i Skandinavien AB | | | 18,882 | | | | 0.0 | |
| 4,973 | | | Bufab AB | | | 178,205 | | | | 0.1 | |
| 7,960 | | | Byggmax Group AB | | | 33,380 | | | | 0.0 | |
| 3,910 (1) | | | Camurus AB | | | 219,876 | | | | 0.1 | |
| 2 (1) | | | Careium AB | | | 6 | | | | 0.0 | |
| 1,849 | | | Cellavision AB | | | 40,427 | | | | 0.0 | |
| 3,712 | | | Clas Ohlson AB - Class B | | | 61,481 | | | | 0.0 | |
| 21,136 | | | Dios Fastigheter AB | | | 157,647 | | | | 0.1 | |
| 23,332 | | | Electrolux Professional AB - Class B | | | 160,848 | | | | 0.1 | |
| 1,265 | | | Ependion AB | | | 12,229 | | | | 0.0 | |
| 11,403 | | | Fagerhult Group AB | | | 64,215 | | | | 0.0 | |
| 2,964 | | | G5 Entertainment AB | | | 25,801 | | | | 0.0 | |
| 10,267 | | | Granges AB | | | 121,305 | | | | 0.0 | |
| 10,656 | | | Heba Fastighets AB - Class B | | | 32,704 | | | | 0.0 | |
| 4,661 | | | Hemnet Group AB | | | 146,289 | | | | 0.1 | |
| 3,411 | | | Investment AB Oresund | | | 36,291 | | | | 0.0 | |
| 5,626 | | | Inwido AB | | | 102,122 | | | | 0.0 | |
| 7,048 | | | KAMBI GROUP PLC | | | 89,481 | | | | 0.0 | |
See Accompanying Notes to Financial Statements
Voya Multi-Manager
International Small Cap Fund | PORTFOLIO OF INVESTMENTS
as of October 31, 2024 (continued) |
| Shares | | | | | Value | | | Percentage
of Net
Assets |
| COMMON STOCK: (continued) | |
| | | | Sweden (continued) |
| 4,657 | | | Lagercrantz Group AB - Class B | | $ | 91,203 | | | | 0.0 | |
| 4,101 | | | Lindab International AB | | | 85,976 | | | | 0.0 | |
| 12,351 | | | Loomis AB | | | 386,946 | | | | 0.1 | |
| 495 (1) | | | Medcap AB | | | 25,304 | | | | 0.0 | |
| 1,570 | | | MIPS AB | | | 77,006 | | | | 0.0 | |
| 10,648 | | | Mycronic AB | | | 414,818 | | | | 0.2 | |
| 28,846 | | | NCC AB - Class B | | | 429,364 | | | | 0.2 | |
| 53,476 (1) | | | Neobo Fastigheter AB | | | 103,181 | | | | 0.0 | |
| 166,960 (1) | | | Net Insight AB - Class B | | | 123,720 | | | | 0.1 | |
| 3,124 | | | OEM International AB - Class B | | | 36,515 | | | | 0.0 | |
| 6,826 | | | Pandox AB | | | 118,651 | | | | 0.0 | |
| 58,562 | | | Ratos AB - Class B | | | 187,168 | | | | 0.1 | |
| 5,165 | | | RaySearch Laboratories AB | | | 73,685 | | | | 0.0 | |
| 8,136 | | | Scandi Standard AB | | | 62,043 | | | | 0.0 | |
| 2,703 (1) | | | Sdiptech AB - Class B | | | 61,036 | | | | 0.0 | |
| 3,204 | | | Solid Forsakring AB | | | 25,862 | | | | 0.0 | |
| 7,521 | | | Systemair AB | | | 57,601 | | | | 0.0 | |
| 14,592 (1) | | | Tobii Dynavox AB | | | 84,587 | | | | 0.0 | |
| 3,629 | | | VBG Group AB - Class B | | | 105,172 | | | | 0.0 | |
| 67,275 | | | Wihlborgs Fastigheter AB | | | 707,186 | | | | 0.3 | |
| 16,089 | | | Zinzino AB - Class B | | | 139,529 | | | | 0.1 | |
| | | | | | | 7,402,017 | | | | 2.6 | |
| | | | Switzerland: 7.0% |
| 33,949 | | | Accelleron Industries AG | | | 1,820,257 | | | | 0.7 | |
| 730 | | | Allreal Holding AG | | | 129,888 | | | | 0.1 | |
| 360 | | | ALSO Holding AG | | | 95,748 | | | | 0.0 | |
| 1,506 (1) | | | Basilea Pharmaceutica AG, Reg | | | 74,748 | | | | 0.0 | |
| 1,482 | | | Belimo Holding AG | | | 981,725 | | | | 0.4 | |
| 9,842 | | | BKW AG | | | 1,729,239 | | | | 0.6 | |
| 922 | | | Bucher Industries AG, Reg | | | 359,100 | | | | 0.1 | |
| 158 | | | Burckhardt Compression Holding AG | | | 116,159 | | | | 0.1 | |
| 558 | | | Burkhalter Holding AG | | | 57,315 | | | | 0.0 | |
| 258 | | | Cie Financiere Tradition SA - Class BR | | | 45,142 | | | | 0.0 | |
| 60,994 | | | Clariant AG | | | 847,670 | | | | 0.3 | |
| 1,203 | | | Comet Holding AG, Reg | | | 399,110 | | | | 0.2 | |
| 5,163 | | | DKSH Holding AG | | | 368,892 | | | | 0.1 | |
| 2,434 | | | Flughafen Zurich AG, Reg | | | 573,798 | | | | 0.2 | |
| 327 | | | Forbo Holding AG, Reg | | | 321,481 | | | | 0.1 | |
| 8,810 (3) | | | Galenica AG | | | 766,755 | | | | 0.3 | |
| 6,254 | | | Helvetia Holding AG | | | 1,056,370 | | | | 0.4 | |
| 1,124 | | | Hiag Immobilien Holding AG | | | 106,992 | | | | 0.0 | |
| 663 | | | Huber + Suhner AG, Reg | | | 62,750 | | | | 0.0 | |
| 203 | | | Inficon Holding AG | | | 243,225 | | | | 0.1 | |
| 336 | | | Kardex Holding AG | | | 102,500 | | | | 0.0 | |
| 7,152 (1) | | | Kudelski SA - Class BR | | | 11,670 | | | | 0.0 | |
| 4,303 | | | Landis+Gyr Group AG | | | 346,628 | | | | 0.1 | |
| 31,251 | | | Logitech International SA | | | 2,558,888 | | | | 0.9 | |
| 17 | | | Metall Zug AG, Reg | | | 23,740 | | | | 0.0 | |
| 1,707 | | | Mikron Holding AG, Reg | | | 29,651 | | | | 0.0 | |
| 30,523 (1) | | | On Holding AG - Class A | | | 1,447,401 | | | | 0.5 | |
| 47 | | | Phoenix Mecano AG | | | 24,002 | | | | 0.0 | |
| Shares | | | | | Value | | | Percentage
of Net
Assets |
| COMMON STOCK: (continued) | |
| | | | Switzerland (continued) |
| 8,701 | | | PSP Swiss Property AG, Reg | | $ | 1,235,629 | | | | 0.4 | |
| 2,802 | | | R&S Group Holding AG | | | 67,815 | | | | 0.0 | |
| 762 | | | Siegfried Holding AG, Reg | | | 995,358 | | | | 0.4 | |
| 4,214 (1) | | | Sportradar Group AG - Class A | | | 52,296 | | | | 0.0 | |
| 6,407 | | | Sulzer AG, Reg | | | 987,728 | | | | 0.4 | |
| 3,293 | | | Swissquote Group Holding SA, Reg | | | 1,120,179 | | | | 0.4 | |
| 663 | | | Tecan Group AG, Reg | | | 167,522 | | | | 0.1 | |
| 183 | | | Vaudoise Assurances Holding SA | | | 97,577 | | | | 0.0 | |
| 684 | | | VZ Holding AG | | | 110,416 | | | | 0.0 | |
| 344 | | | Ypsomed Holding AG | | | 152,578 | | | | 0.1 | |
| | | | | | | 19,687,942 | | | | 7.0 | |
| | | | Taiwan: 1.9% |
| 40,000 (1) | | | ACES Electronic Co. Ltd. | | | 67,378 | | | | 0.0 | |
| 61,000 | | | Advancetek Enterprise Co. Ltd. | | | 121,014 | | | | 0.1 | |
| 19,000 | | | Arcadyan Technology Corp. | | | 92,427 | | | | 0.0 | |
| 61,000 | | | Asia Optical Co., Inc. | | | 191,088 | | | | 0.1 | |
| 15,000 | | | ASROCK, Inc. | | | 92,641 | | | | 0.0 | |
| 28,000 | | | Azurewave Technologies, Inc. | | | 35,431 | | | | 0.0 | |
| 40,000 | | | BRIGHT LED ELECTRONICS | | | 26,174 | | | | 0.0 | |
| 20,000 | | | Cenra, Inc. | | | 24,032 | | | | 0.0 | |
| 62,000 | | | CviLux Corp. | | | 102,195 | | | | 0.0 | |
| 14,000 | | | CyberPower Systems, Inc. | | | 133,607 | | | | 0.1 | |
| 50,000 | | | Darfon Electronics Corp. | | | 75,843 | | | | 0.0 | |
| 38,000 | | | Ennoconn Corp. | | | 340,930 | | | | 0.1 | |
| 71,000 | | | Everlight Electronics Co. Ltd. | | | 184,470 | | | | 0.1 | |
| 19,000 | | | Fitipower Integrated Technology, Inc. | | | 144,684 | | | | 0.1 | |
| 70,000 | | | FocalTech Systems Co. Ltd. | | | 181,511 | | | | 0.1 | |
| 31,000 | | | Foxsemicon Integrated Technology, Inc. | | | 325,734 | | | | 0.1 | |
| 30,000 | | | FSP Technology, Inc. | | | 54,224 | | | | 0.0 | |
| 10,000 | | | FY Group Ltd. | | | 22,941 | | | | 0.0 | |
| 61,661 (1) | | | General Interface Solution Holding Ltd. | | | 108,410 | | | | 0.0 | |
| 15,000 | | | Global Lighting Technologies, Inc. | | | 33,877 | | | | 0.0 | |
| 26,000 | | | Global Mixed Mode Technology, Inc. | | | 180,829 | | | | 0.1 | |
| 28,343 | | | Himax Technologies, Inc., ADR | | | 162,405 | | | | 0.1 | |
| 11,000 | | | Insyde Software Corp. | | | 177,598 | | | | 0.1 | |
| 18,000 | | | ITE Technology, Inc. | | | 75,050 | | | | 0.0 | |
| 18,000 | | | Johnson Health Tech Co. Ltd. | | | 83,597 | | | | 0.0 | |
| 3,000 | | | Keystone Microtech Corp. | | | 30,564 | | | | 0.0 | |
| 118,000 | | | Kindom Development Co. Ltd. | | | 165,617 | | | | 0.1 | |
| 20,000 | | | Lida Holdings Ltd. | | | 16,178 | | | | 0.0 | |
| 11,000 | | | Lumax International Corp. Ltd. | | | 37,243 | | | | 0.0 | |
See Accompanying Notes to Financial Statements
Voya Multi-Manager
International Small Cap Fund | PORTFOLIO OF INVESTMENTS
as of October 31, 2024 (continued) |
| Shares | | | | | Value | | | Percentage
of Net
Assets |
| COMMON STOCK: (continued) | |
| | | | Taiwan (continued) |
| 14,000 | | | Macnica Galaxy, Inc. | | $ | 28,802 | | | | 0.0 | |
| 8,000 | | | MacroWell OMG Digital Entertainment Co. Ltd. | | | 27,881 | | | | 0.0 | |
| 4,634 | | | Major Power Technology Co. Ltd. | | | 26,836 | | | | 0.0 | |
| 41,207 | | | Merry Electronics Co. Ltd. | | | 134,539 | | | | 0.1 | |
| 17,000 | | | Niko Semiconductor Co. Ltd. | | | 23,841 | | | | 0.0 | |
| 15,000 | | | Nova Technology Corp./ Taiwan | | | 85,991 | | | | 0.0 | |
| 27,000 | | | Pixart Imaging, Inc. | | | 201,215 | | | | 0.1 | |
| 10,000 | | | Raydium Semiconductor Corp. | | | 104,874 | | | | 0.0 | |
| 50,000 | | | Rechi Precision Co. Ltd. | | | 40,005 | | | | 0.0 | |
| 19,000 | | | Rich Honour International Designs Co. Ltd. | | | 40,762 | | | | 0.0 | |
| 30,000 (1) | | | RichWave Technology Corp. | | | 154,297 | | | | 0.1 | |
| 5,000 | | | Sinmag Equipment Corp. | | | 22,130 | | | | 0.0 | |
| 69,000 | | | Sinon Corp. | | | 89,586 | | | | 0.0 | |
| 125,000 (1) | | | Sunplus Technology Co. Ltd. | | | 112,486 | | | | 0.1 | |
| 16,000 | | | Sunrex Technology Corp. | | | 27,593 | | | | 0.0 | |
| 30,000 | | | Sunspring Metal Corp. | | | 30,679 | | | | 0.0 | |
| 45,000 | | | Syscom Computer Engineering Co. | | | 75,212 | | | | 0.0 | |
| 40,000 | | | Systex Corp. | | | 163,699 | | | | 0.1 | |
| 31,000 | | | Taiwan Fire & Marine Insurance Co. Ltd. | | | 27,011 | | | | 0.0 | |
| 26,000 | | | Taiwan FU Hsing Industrial Co. Ltd. | | | 42,555 | | | | 0.0 | |
| 61,000 | | | Taiwan Paiho Ltd. | | | 152,228 | | | | 0.1 | |
| 27,000 | | | Taiwan Sakura Corp. | | | 69,727 | | | | 0.0 | |
| 7,000 | | | Tofu Restaurant Co. Ltd. | | | 55,388 | | | | 0.0 | |
| 7,000 | | | Topview Optronics Corp. | | | 20,395 | | | | 0.0 | |
| 36,000 | | | Ubright Optronics Corp. | | | 73,513 | | | | 0.0 | |
| 10,767 | | | Userjoy Technology Co. Ltd. | | | 26,912 | | | | 0.0 | |
| 23,000 | | | Utechzone Co. Ltd. | | | 93,234 | | | | 0.0 | |
| 19,000 | | | Weblink International, Inc. | | | 33,482 | | | | 0.0 | |
| 4,000 | | | WinWay Technology Co. Ltd. | | | 160,333 | | | | 0.1 | |
| | | | | | | 5,432,898 | | | | 1.9 | |
| | | | Thailand: 0.1% |
| 109,600 | | | After You PCL | | | 34,753 | | | | 0.0 | |
| 107,500 (2) | | | Bangkok Airways PCL | | | 81,027 | | | | 0.0 | |
| 204,700 | | | Ratchaphruek Hospital PCL | | | 34,273 | | | | 0.0 | |
| 132,800 | | | Regional Container Lines PCL | | | 101,762 | | | | 0.0 | |
| 171,700 | | | Rojana Industrial Park PCL | | | 37,070 | | | | 0.0 | |
| 17,700 (2) | | | Thai Stanley Electric PCL | | | 114,346 | | | | 0.1 | |
| 39,300 | | | Zen Corp. Group PCL | | | 8,843 | | | | 0.0 | |
| | | | | | | 412,074 | | | | 0.1 | |
| | | | Turkey: 0.2% |
| 29,035 (1) | | | Eldorado Gold Corp. | | | 505,065 | | | | 0.2 | |
| Shares | | | | | Value | | | Percentage
of Net
Assets |
| COMMON STOCK: (continued) | |
| | | | United Arab Emirates: 0.1% |
| 25,524 | | | Commercial Bank of Dubai PSC | | $ | 51,284 | | | | 0.0 | |
| 166,088 (1) | | | Gulf Marine Services PLC | | | 37,050 | | | | 0.0 | |
| 41,221 (1) | | | Yalla Group Ltd., ADR | | | 170,655 | | | | 0.1 | |
| | | | | | | 258,989 | | | | 0.1 | |
| | | | United Kingdom: 9.0% |
| 12,560 | | | 4imprint Group PLC | | | 827,340 | | | | 0.3 | |
| 12,301 | | | AG Barr PLC | | | 98,818 | | | | 0.0 | |
| 12,352 | | | AJ Bell PLC | | | 70,797 | | | | 0.0 | |
| 4,660 | | | Anglo-Eastern Plantations PLC | | | 39,955 | | | | 0.0 | |
| 9,959 | | | Animalcare Group PLC | | | 30,050 | | | | 0.0 | |
| 126,683 | | | Balfour Beatty PLC | | | 726,591 | | | | 0.3 | |
| 87,297 | | | Beazley PLC | | | 850,999 | | | | 0.3 | |
| 13,938 | | | Bellway PLC | | | 509,699 | | | | 0.2 | |
| 7,660 (1) | | | Birkenstock Holding PLC | | | 352,360 | | | | 0.1 | |
| 6,697 | | | Breedon Group PLC | | | 37,996 | | | | 0.0 | |
| 118,637 | | | British Land Co. PLC | | | 610,504 | | | | 0.2 | |
| 10,920 | | | Bytes Technology Group PLC | | | 63,593 | | | | 0.0 | |
| 29,445 | | | Care Reit PLC | | | 32,938 | | | | 0.0 | |
| 7,956 | | | Cerillion PLC | | | 191,842 | | | | 0.1 | |
| 5,100 | | | Chesnara PLC | | | 16,539 | | | | 0.0 | |
| 9,715 | | | City of London Investment Group PLC | | | 47,603 | | | | 0.0 | |
| 57,280 | | | CLS Holdings PLC | | | 68,468 | | | | 0.0 | |
| 2,109 | | | Cohort PLC | | | 24,149 | | | | 0.0 | |
| 21,967 | | | Computacenter PLC | | | 618,100 | | | | 0.2 | |
| 160,285 (3) | | | ConvaTec Group PLC | | | 442,138 | | | | 0.2 | |
| 76,177 | | | Costain Group PLC | | | 102,647 | | | | 0.0 | |
| 106,754 (1) | | | Currys PLC | | | 113,565 | | | | 0.0 | |
| 235,103 (1)(3) | | | Deliveroo PLC | | | 417,748 | | | | 0.2 | |
| 23,027 | | | dotdigital group PLC | | | 26,337 | | | | 0.0 | |
| 63,212 | | | Drax Group PLC | | | 509,179 | | | | 0.2 | |
| 2,897 (1) | | | Eagle Eye Solutions Group PLC | | | 17,632 | | | | 0.0 | |
| 63,964 | | | easyJet PLC | | | 421,504 | | | | 0.2 | |
| 250,298 (1) | | | EnQuest PLC | | | 39,763 | | | | 0.0 | |
| 9,755 | | | FDM Group Holdings PLC | | | 44,528 | | | | 0.0 | |
| 11,757 | | | Foresight Group Holdings Ltd. | | | 70,495 | | | | 0.0 | |
| 7,555 (1) | | | Frontier Developments PLC | | | 25,760 | | | | 0.0 | |
| 721 | | | Fuller Smith & Turner PLC - Class A | | | 6,582 | | | | 0.0 | |
| 1,030 | | | Games Workshop Group PLC | | | 159,217 | | | | 0.1 | |
| 3,379 | | | Gamma Communications PLC | | | 69,190 | | | | 0.0 | |
| 85,471 (1) | | | Gem Diamonds Ltd. | | | 12,922 | | | | 0.0 | |
| 95,321 | | | Harbour Energy PLC | | | 339,162 | | | | 0.1 | |
| 992 | | | Hargreaves Services PLC | | | 7,010 | | | | 0.0 | |
| 13,311 | | | Hill & Smith PLC | | | 348,151 | | | | 0.1 | |
| 31,286 | | | IG Group Holdings PLC | | | 362,001 | | | | 0.1 | |
| 21,148 | | | IMI PLC | | | 450,440 | | | | 0.2 | |
| 47,227 | | | Inchcape PLC | | | 436,814 | | | | 0.2 | |
| 15,809 | | | IntegraFin Holdings PLC | | | 74,651 | | | | 0.0 | |
| 25,002 | | | Intermediate Capital Group PLC | | | 664,167 | | | | 0.2 | |
See Accompanying Notes to Financial Statements
Voya Multi-Manager
International Small Cap Fund | PORTFOLIO OF INVESTMENTS
as of October 31, 2024 (continued) |
| Shares | | | | | Value | | | Percentage
of Net
Assets |
| COMMON STOCK: (continued) | |
| | | | United Kingdom (continued) |
| 97,435 | | | International Personal Finance PLC | | $ | 167,099 | | | | 0.1 | |
| 125,387 | | | Investec PLC - GBP | | | 962,003 | | | | 0.3 | |
| 9,137 | | | J D Wetherspoon PLC | | | 72,340 | | | | 0.0 | |
| 13,133 | | | James Halstead PLC | | | 33,022 | | | | 0.0 | |
| 91,952 | | | JET2 PLC | | | 1,708,982 | | | | 0.6 | |
| 5,458 | | | Johnson Matthey PLC | | | 105,028 | | | | 0.0 | |
| 112,851 | | | Just Group PLC | | | 194,992 | | | | 0.1 | |
| 10,091 | | | Kainos Group PLC | | | 97,199 | | | | 0.0 | |
| 18,667 | | | Knights Group Holdings PLC | | | 29,968 | | | | 0.0 | |
| 9,323 | | | Liontrust Asset Management PLC | | | 58,305 | | | | 0.0 | |
| 234,505 | | | LondonMetric Property PLC | | | 586,194 | | | | 0.2 | |
| 24,278 | | | Macfarlane Group PLC | | | 35,062 | | | | 0.0 | |
| 163,633 | | | Man Group PLC/Jersey | | | 418,771 | | | | 0.2 | |
| 221,077 | | | Marks & Spencer Group PLC | | | 1,072,648 | | | | 0.4 | |
| 79,548 (1) | | | Marston's PLC | | | 39,440 | | | | 0.0 | |
| 31,691 | | | Mears Group PLC | | | 139,143 | | | | 0.1 | |
| 52,452 | | | Mitie Group PLC | | | 78,686 | | | | 0.0 | |
| 1,783 | | | MJ Gleeson PLC | | | 13,947 | | | | 0.0 | |
| 26,884 | | | Moneysupermarket.com Group PLC | | | 65,109 | | | | 0.0 | |
| 5,425 | | | Morgan Sindall Group PLC | | | 262,099 | | | | 0.1 | |
| 14,527 | | | Ninety One PLC | | | 31,099 | | | | 0.0 | |
| 19,456 | | | Nomad Foods Ltd. | | | 341,453 | | | | 0.1 | |
| 18,017 | | | Norcros PLC | | | 63,656 | | | | 0.0 | |
| 98,505 | | | OSB Group PLC | | | 445,893 | | | | 0.2 | |
| 13,323 (1) | | | Oxford Biomedica PLC | | | 68,374 | | | | 0.0 | |
| 30,578 | | | Oxford Metrics PLC | | | 22,475 | | | | 0.0 | |
| 40,963 | | | Pagegroup PLC | | | 188,779 | | | | 0.1 | |
| 350,714 | | | Pan African Resources PLC | | | 163,708 | | | | 0.1 | |
| 77,708 | | | Paragon Banking Group PLC | | | 687,380 | | | | 0.3 | |
| 4,301 (1) | | | Paysafe Ltd. | | | 91,353 | | | | 0.0 | |
| 76,146 (1) | | | Playtech PLC | | | 712,838 | | | | 0.3 | |
| 27,585 | | | Polar Capital Holdings PLC | | | 170,023 | | | | 0.1 | |
| 155,403 | | | QinetiQ Group PLC | | | 917,348 | | | | 0.3 | |
| 31,855 | | | Rightmove PLC | | | 242,563 | | | | 0.1 | |
| 39,929 | | | Safestore Holdings PLC | | | 416,431 | | | | 0.2 | |
| 303,943 | | | Serco Group PLC | | | 686,767 | | | | 0.2 | |
| 69,803 | | | Severfield PLC | | | 77,407 | | | | 0.0 | |
| 9,406 | | | Spectris PLC | | | 306,251 | | | | 0.1 | |
| 226,119 | | | Speedy Hire PLC | | | 96,510 | | | | 0.0 | |
| 85,075 (1) | | | Spirent Communications PLC | | | 184,297 | | | | 0.1 | |
| 36,216 | | | St James's Place PLC | | | 379,930 | | | | 0.1 | |
| 40,308 | | | SThree PLC | | | 183,733 | | | | 0.1 | |
| 53,688 | | | Sylvania Platinum Ltd. | | | 32,191 | | | | 0.0 | |
| 263,775 | | | Taylor Wimpey PLC | | | 498,718 | | | | 0.2 | |
| 19,912 (2) | | | TORM PLC - USD - Class A | | | 517,712 | | | | 0.2 | |
| 35,599 (1)(3) | | | Trainline PLC | | | 176,880 | | | | 0.1 | |
| 318,627 | | | Tritax Big Box REIT PLC | | | 579,718 | | | | 0.2 | |
| 25,786 | | | Victorian Plumbing Group PLC | | | 36,906 | | | | 0.0 | |
| Shares | | | | | Value | | | Percentage
of Net
Assets |
| COMMON STOCK: (continued) | |
| | | | United Kingdom (continued) |
| 5,047 | | | Volution Group PLC | | $ | 37,660 | | | | 0.0 | |
| 15,122 | | | Weir Group PLC | | | 407,239 | | | | 0.2 | |
| 25,028 | | | Wickes Group PLC | | | 51,636 | | | | 0.0 | |
| 41,751 | | | XPS Pensions Group PLC | | | 192,733 | | | | 0.1 | |
| | | | | | | 25,529,642 | | | | 9.0 | |
| | | | United States: 2.1% |
| 26,717 (1) | | | Carnival PLC, ADR | | | 534,340 | | | | 0.2 | |
| 27,825 | | | Civeo Corp. | | | 713,711 | | | | 0.3 | |
| 11,481 (1)(2) | | | Fiverr International Ltd. | | | 335,934 | | | | 0.1 | |
| 6,026 | | | Global Ship Lease, Inc. - Class A | | | 143,720 | | | | 0.0 | |
| 4,417 (1) | | | Gravity Co. Ltd., ADR | | | 280,966 | | | | 0.1 | |
| 35,114 (1) | | | IMAX Corp. | | | 853,270 | | | | 0.3 | |
| 22,724 (1) | | | Kiniksa Pharmaceuticals International PLC | | | 513,335 | | | | 0.2 | |
| 35,597 | | | Navigator Holdings Ltd. | | | 548,550 | | | | 0.2 | |
| 22,100 | | | Primo Water Corp. | | | 580,297 | | | | 0.2 | |
| 16,343 (1) | | | PureTech Health PLC | | | 32,158 | | | | 0.0 | |
| 107,591 (1) | | | Riskified Ltd. - Class A | | | 480,932 | | | | 0.2 | |
| 32,483 | | | SSR Mining, Inc. | | | 200,420 | | | | 0.1 | |
| 44,856 (1) | | | Zymeworks, Inc. | | | 614,527 | | | | 0.2 | |
| | | | | | | 5,832,160 | | | | 2.1 | |
| | | | Total Common Stock
(Cost $250,464,630) | | | 277,959,025 | | | | 98.4 | |
| | | | | | | | | | | | |
| EXCHANGE-TRADED FUNDS: 0.7% |
| 12,317 | | | iShares MSCI EAFE Small-Cap ETF | | | 781,637 | | | | 0.3 | |
| 26,592 | | | Vanguard FTSE Developed Markets ETF | | | 1,332,259 | | | | 0.4 | |
| | | | | | | 2,113,896 | | | | 0.7 | |
| | | | Total Exchange-Traded Funds
(Cost $2,210,726) | | | 2,113,896 | | | | 0.7 | |
| | | | | | | | | | | | |
| PREFERRED STOCK: 0.2% |
| | | | Brazil: 0.0% |
| 51,100 | | | Metalurgica Gerdau SA | | | 90,781 | | | | 0.0 | |
| | | | | | | | | | | | |
| | | | Germany: 0.2% |
| 555 | | | Einhell Germany AG | | | 40,026 | | | | 0.0 | |
| 7,769 | | | Fuchs Petrolub SE | | | 362,594 | | | | 0.2 | |
| 88 | | | KSB SE & Co. KGaA | | | 55,710 | | | | 0.0 | |
| 182 | | | STO SE & Co. KGaA | | | 24,142 | | | | 0.0 | |
| 1,268 | | | Villeroy & Boch AG | | | 22,689 | | | | 0.0 | |
| | | | | | | 505,161 | | | | 0.2 | |
| | | | Total Preferred Stock
(Cost $526,484) | | | 595,942 | | | | 0.2 | |
| | | | | | | | | | | | |
| RIGHT: —% |
| | | | Australia: —% |
| 139,368 (4) | | | Beacon Minerals Ltd. | | | — | | | | — | |
| | | | | | | | | | | | |
| | | | Italy: —% |
| 135,364 (4) | | | COFIDE SpA | | | — | | | | — | |
| 3,087 (4) | | | Reply SpA | | | — | | | | — | |
| | | | | | | — | | | | — | |
| | | | Total Right
(Cost $–) | | | — | | | | — | |
See Accompanying Notes to Financial Statements
Voya Multi-Manager
International Small Cap Fund | PORTFOLIO OF INVESTMENTS
as of October 31, 2024 (continued) |
| Shares | | | | | Value | | | Percentage
of Net
Assets |
| RIGHT: (continued) | | | | | |
| | | | Italy (continued) |
| | | | Total Long-Term Investments
(Cost $253,201,840) | | $ | 280,668,863 | | | | 99.3 | |
Principal
Amount† | | | | | Value | | | Percentage
of Net
Assets |
| SHORT-TERM INVESTMENTS: 0.7% |
| | | | Repurchase Agreements: 0.6% |
| 1,000,000 (5) | | | Bank of Montreal, Repurchase Agreement dated 10/31/2024, 4.860%, due 11/01/2024 (Repurchase Amount $1,000,133, collateralized by various U.S. Government/U.S. Government Agency Obligations, 1.713%- 7.623%, Market Value plus accrued interest $1,020,000, due 01/01/26-12/01/52) | | | 1,000,000 | | | | 0.4 | |
| 525,159 (5) | | | Daiwa Capital Markets America, Inc., Repurchase Agreement dated 10/31/2024, 4.890%, due 11/01/2024 (Repurchase Amount $525,229, collateralized by various U.S. Government/U.S. Government Agency Obligations, 0.625%- 7.500%, Market Value plus accrued interest $535,662, due 05/15/25-11/01/54) | | | 525,159 | | | | 0.2 | |
| | | | Total Repurchase Agreements
(Cost $1,525,159) | | | 1,525,159 | | | | 0.6 | |
| Shares | | | | | Value | | | Percentage
of Net
Assets |
| | | | Mutual Funds: 0.1% |
| 358,497 (6) | | | BlackRock Liquidity Funds, FedFund, Institutional Class, 4.760%
(Cost $358,497) | | $ | 358,497 | | | | 0.1 | |
| | | | Total Short-Term Investments
(Cost $1,883,656) | | | 1,883,656 | | | | 0.7 | |
| | | | Total Investments in Securities
(Cost $255,085,496) | | $ | 282,552,519 | | | | 100.0 | |
| | | | Liabilities in Excess of Other Assets | | | (102,639 | ) | | | 0.0 | |
| | | | Net Assets | | $ | 282,449,880 | | | | 100.0 | |
| ADR | American Depositary Receipt |
| † | Unless otherwise indicated, principal amount is shown in USD. |
| (1) | Non-income producing security. |
| (2) | Security, or a portion of the security, is on loan. |
| (3) | Securities with purchases pursuant to Rule 144A or section 4(a)(2), under the Securities Act of 1933 and may not be resold subject to that rule except to qualified institutional buyers. |
| (4) | For fair value measurement disclosure purposes, security is categorized as Level 3, whose value was determined using significant unobservable inputs. |
| (5) | All or a portion of the security represents securities purchased with cash collateral received for securities on loan. |
| (6) | Rate shown is the 7-day yield as of October 31, 2024. |
| Sector Diversification | | Percentage
of Net Assets |
| Industrials | | | 23.5 | % |
| Financials | | | 13.5 | |
| Information Technology | | | 13.4 | |
| Consumer Discretionary | | | 10.7 | |
| Materials | | | 8.9 | |
| Health Care | | | 7.1 | |
| Real Estate | | | 6.3 | |
| Communication Services | | | 4.8 | |
| Energy | | | 3.9 | |
| Consumer Staples | | | 3.5 | |
| Utilities | | | 2.9 | |
| Exchange-Traded Funds | | | 0.7 | |
| Foreign Stock | | | 0.1 | |
| Electronics-Electrical | | | 0.0 | |
| Rights | | | 0.0 | |
| Short-Term Investments | | | 0.7 | |
| Liabilities in Excess of Other Assets | | | 0.0 | |
| Net Assets | | | 100.0 | % |
Portfolio holdings are subject to change daily.
See Accompanying Notes to Financial Statements
Voya Multi-Manager
International Small Cap Fund | PORTFOLIO OF INVESTMENTS
as of October 31, 2024 (continued) |
Fair Value Measurements^
The following is a summary of the fair valuations according to the inputs used as of October 31, 2024 in valuing the assets and liabilities:
| | | Quoted Prices
in Active Markets
for Identical
Investments
(Level 1) | | | Significant Other
Observable
Inputs#
(Level 2) | | | Significant
Unobservable
Inputs
(Level 3) | | | Fair Value
at
October 31, 2024 | |
| Asset Table | | | | | | | | | | | | | | | | |
| Investments, at fair value | | | | | | | | | | | | | | | | |
| Common Stock | | | | | | | | | | | | | | | | |
| Australia | | $ | 1,449,787 | | | $ | 15,027,365 | | | $ | — | | | $ | 16,477,152 | |
| Austria | | | — | | | | 125,129 | | | | — | | | | 125,129 | |
| Belgium | | | 950,838 | | | | 33,379 | | | | — | | | | 984,217 | |
| Bermuda | | | 155,435 | | | | — | | | | — | | | | 155,435 | |
| Brazil | | | 597,543 | | | | — | | | | — | | | | 597,543 | |
| Burkina Faso | | | 552,232 | | | | — | | | | — | | | | 552,232 | |
| Canada | | | 26,703,075 | | | | — | | | | — | | | | 26,703,075 | |
| China | | | 583,223 | | | | 1,915,459 | | | | — | | | | 2,498,682 | |
| Colombia | | | 30,622 | | | | — | | | | — | | | | 30,622 | |
| Denmark | | | 565,757 | | | | 9,783,747 | | | | — | | | | 10,349,504 | |
| Egypt | | | 43,402 | | | | — | | | | — | | | | 43,402 | |
| Finland | | | 1,613,044 | | | | 2,413,448 | | | | — | | | | 4,026,492 | |
| France | | | 852,065 | | | | 18,008,282 | | | | — | | | | 18,860,347 | |
| Germany | | | 212,539 | | | | 14,878,622 | | | | — | | | | 15,091,161 | |
| Greece | | | 342,626 | | | | 118,274 | | | | — | | | | 460,900 | |
| Guatemala | | | 565,340 | | | | — | | | | — | | | | 565,340 | |
| Guernsey | | | 137,286 | | | | — | | | | — | | | | 137,286 | |
| Hong Kong | | | 1,038,877 | | | | 1,319,164 | | | | 3,715 | | | | 2,361,756 | |
| India | | | — | | | | 567,467 | | | | — | | | | 567,467 | |
| Indonesia | | | 169,071 | | | | — | | | | — | | | | 169,071 | |
| Ireland | | | 1,067,897 | | | | 1,095,868 | | | | — | | | | 2,163,765 | |
| Israel | | | 1,920,140 | | | | 451,049 | | | | — | | | | 2,371,189 | |
| Italy | | | 429,618 | | | | 14,861,934 | | | | — | | | | 15,291,552 | |
| Japan | | | 53,962 | | | | 57,867,689 | | | | — | | | | 57,921,651 | |
| Jordan | | | — | | | | 1,154,650 | | | | — | | | | 1,154,650 | |
| Liechtenstein | | | 93,610 | | | | — | | | | — | | | | 93,610 | |
| Luxembourg | | | — | | | | 106,782 | | | | — | | | | 106,782 | |
| Macao | | | — | | | | 603,713 | | | | — | | | | 603,713 | |
| Malaysia | | | 76,451 | | | | 335,097 | | | | — | | | | 411,548 | |
| Mexico | | | 15,525 | | | | — | | | | — | | | | 15,525 | |
| Netherlands | | | 61,240 | | | | 6,991,456 | | | | — | | | | 7,052,696 | |
| New Zealand | | | 84,227 | | | | 19,239 | | | | — | | | | 103,466 | |
| Norway | | | 770,696 | | | | 2,000,276 | | | | — | | | | 2,770,972 | |
| Papua New Guinea | | | — | | | | 36,682 | | | | — | | | | 36,682 | |
| Peru | | | 33,275 | | | | — | | | | — | | | | 33,275 | |
| Philippines | | | 78,667 | | | | 56,740 | | | | — | | | | 135,407 | |
| Poland | | | 511,308 | | | | 578,567 | | | | — | | | | 1,089,875 | |
| Portugal | | | 56,127 | | | | 1,268,898 | | | | — | | | | 1,325,025 | |
| Singapore | | | 66,494 | | | | 1,947,166 | | | | — | | | | 2,013,660 | |
| South Africa | | | 793,423 | | | | 81,260 | | | | — | | | | 874,683 | |
| South Korea | | | 120,903 | | | | 11,636,441 | | | | — | | | | 11,757,344 | |
| Spain | | | 13,382 | | | | 4,800,973 | | | | — | | | | 4,814,355 | |
| Sweden | | | 2,096,376 | | | | 5,305,641 | | | | — | | | | 7,402,017 | |
| Switzerland | | | 2,264,780 | | | | 17,423,162 | | | | — | | | | 19,687,942 | |
| Taiwan | | | 262,280 | | | | 5,170,618 | | | | — | | | | 5,432,898 | |
| Thailand | | | 183,372 | | | | 228,702 | | | | — | | | | 412,074 | |
| Turkey | | | 505,065 | | | | — | | | | — | | | | 505,065 | |
| United Arab Emirates | | | 258,989 | | | | — | | | | — | | | | 258,989 | |
| United Kingdom | | | 9,357,880 | | | | 16,171,762 | | | | — | | | | 25,529,642 | |
| United States | | | 5,832,160 | | | | — | | | | — | | | | 5,832,160 | |
| Total Common Stock | | | 63,570,609 | | | | 214,384,701 | | | | 3,715 | | | | 277,959,025 | |
| Exchange-Traded Funds | | | 2,113,896 | | | | — | | | | — | | | | 2,113,896 | |
| Preferred Stock | | | 209,206 | | | | 386,736 | | | | — | | | | 595,942 | |
See Accompanying Notes to Financial Statements
Voya Multi-Manager
International Small Cap Fund | PORTFOLIO OF INVESTMENTS
as of October 31, 2024 (continued) |
| | | Quoted Prices
in Active Markets
for Identical
Investments
(Level 1) | | Significant Other
Observable
Inputs#
(Level 2) | | Significant
Unobservable
Inputs
(Level 3) | | Fair Value
at
October 31, 2024 |
| Short-Term Investments | | $ | 358,497 | | | $ | 1,525,159 | | | $ | — | | | $ | 1,883,656 | |
| Total Investments, at fair value | | $ | 66,252,208 | | | $ | 216,296,596 | | | $ | 3,715 | | | $ | 282,552,519 | |
| Other Financial Instruments+ | | | | | | | | | | | | | | | | |
| Forward Foreign Currency Contracts | | | — | | | | 15 | | | | — | | | | 15 | |
| Total Assets | | $ | 66,252,208 | | | $ | 216,296,611 | | | $ | 3,715 | | | $ | 282,552,534 | |
| ^ | See Note 2, “Significant Accounting Policies” in the Notes to Financial Statements for additional information. |
| # | The earlier close of the foreign markets gives rise to the possibility that significant events, including broad market moves, may have occurred in the interim and may materially affect the value of those securities. To account for this, the Fund may frequently value many of its foreign equity securities using fair value prices based on third party vendor modeling tools to the extent available. Accordingly, a portion of the Fund’s investments are categorized as Level 2 investments. |
| + | Other Financial Instruments may include open forward foreign currency contracts, futures, centrally cleared swaps, OTC swaps and written options. Forward foreign currency contracts, futures and centrally cleared swaps are fair valued at the unrealized appreciation (depreciation) on the instrument. OTC swaps and written options are valued at the fair value of the instrument. |
At October 31, 2024, the following forward foreign currency contracts were outstanding for Voya Multi-Manager International Small Cap Fund:
| Currency Purchased | | Currency Sold | | Counterparty | | Settlement Date | | Unrealized
Appreciation
(Depreciation) | |
| JPY | 5,308,217 | | USD | 34,921 | | Bank of America N.A. | | 11/05/24 | | $ | 15 | |
| | | | | | | | | | | $ | 15 | |
Currency Abbreviations:
A summary of derivative instruments by primary risk exposure is outlined in the following tables.
The fair value of derivative instruments as of October 31, 2024 was as follows:
| Derivatives not accounted for as hedging instruments | | Location on Statement
of Assets and Liabilities | | Fair Value | |
| Asset Derivatives | | | | | | |
| Foreign exchange contracts | | Unrealized appreciation on forward foreign currency contracts | | $ | 15 | |
| Total Asset Derivatives | | | | $ | 15 | |
The effect of derivative instruments on the Fund's Statement of Operations for the year ended October 31, 2024 was as follows:
Amount of Realized Gain or (Loss) on Derivatives Recognized in Income
| Derivatives not accounted for as hedging instruments | | Forward
foreign
currency
contracts | |
| Foreign exchange contracts | | $ | 212 | |
| Total | | $ | 212 | |
See Accompanying Notes to Financial Statements
Voya Multi-Manager
International Small Cap Fund | PORTFOLIO OF INVESTMENTS
as of October 31, 2024 (continued) |
Change in Unrealized Appreciation or (Depreciation) on Derivatives Recognized in Income
| Derivatives not accounted for as hedging instruments | | | Forward
foreign
currency
contracts | |
| Foreign exchange contracts | | $ | 15 | |
| Total | | $ | 15 | |
The following is a summary by counterparty of the fair value of OTC derivative instruments subject to Master Netting Agreements and collateral pledged (received), if any, at October 31, 2024:
| | | Bank of
America N.A. | | | Total | |
| Assets: | | | | | | | | |
| Forward foreign currency contracts | | $ | 15 | | | $ | 15 | |
| Total Assets | | $ | 15 | | | $ | 15 | |
| Liabilities: | | | | | | | | |
| Total Liabilities | | $ | — | | | $ | — | |
| Net OTC derivative instruments by counterparty, at fair value | | $ | 15 | | | $ | 15 | |
| Total collateral pledged by the Fund/(Received from counterparty) | | $ | — | | | $ | — | |
| Net Exposure(1) | | $ | 15 | | | $ | 15 | |
| (1) | Positive net exposure represents amounts due from each respective counterparty. Negative exposure represents amounts due from the Fund. Please refer to Note 2 for additional details regarding counterparty credit risk and credit related contingent features. |
At October 31, 2024, the aggregate cost of securities and other investments and the composition of unrealized appreciation and depreciation of securities and other investments on a tax basis were:
| Cost for federal income tax purposes was $258,064,287. | |
| Net unrealized appreciation consisted of: | | | |
| Gross Unrealized Appreciation | | $ | 44,016,487 | |
| Gross Unrealized Depreciation | | | (19,209,913 | ) |
| Net Unrealized Appreciation | | $ | 24,806,574 | |
See Accompanying Notes to Financial Statements
TAX INFORMATION (Unaudited)
Dividends and distributions paid during the year ended October 31, 2024 were as follows:
| Fund Name | | Type | | | Per Share
Amount | |
| Voya Global Bond Fund | | | | | | | | |
| Class A | | | NII | | | $ | 0.3077 | |
| Class C | | | NII | | | $ | 0.2538 | |
| Class I | | | NII | | | $ | 0.3265 | |
| Class R | | | NII | | | $ | 0.2925 | |
| Class R6 | | | NII | | | $ | 0.3296 | |
| Class W | | | NII | | | $ | 0.3223 | |
| All Classes | | | ROC | | | $ | 0.0101 | |
| Voya Global High Dividend Low Volatility Fund | | | | | | | | |
| Class A | | | NII | | | $ | 1.0887 | |
| Class C | | | NII | | | $ | 0.7627 | |
| Class I | | | NII | | | $ | 1.1922 | |
| Class R6 | | | NII | | | $ | 1.2133 | |
| Class W | | | NII | | | $ | 1.1952 | |
| Voya Multi-Manager International Small Cap Fund | | | | | | | | |
| Class A | | | NII | | | $ | 0.9436 | |
| Class C | | | NII | | | $ | 0.6185 | |
| Class I | | | NII | | | $ | 1.1341 | |
| Class R6 | | | NII | | | $ | 1.1393 | |
| Class W | | | NII | | | $ | 1.0679 | |
NII - Net investment income
ROC - Return of capital
Of the ordinary distributions made during the year ended October 31, 2024, the following percentages qualify for the dividends received deduction (DRD) available to corporate shareholders:
| Voya Global High Dividend Low Volatility Fund | 71.93% |
For the year ended October 31, 2024, the following are percentages of ordinary income dividends paid by the Funds (including creditable foreign taxes paid) that are designated as qualifying dividend income (QDI) subject to reduced income tax rates for individuals:
| Voya Global High Dividend Low Volatility Fund | 100.00% |
| Voya Multi-Manager International Small Cap Fund | 99.87% |
The Funds designate the following amount as Section 199A dividends:
| Voya Global High Dividend Low Volatility Fund | $524,783 |
Pursuant to Section 853 of the Internal Revenue Code, the Funds designate the following amounts as foreign taxes paid for the year ended October 31, 2024. Foreign taxes paid for purposes of Section 853 may be less than actual foreign taxes paid for financial statement purposes.
| | | Creditable Foreign
Taxes Paid | | Per Share
Amount | | Portion of Ordinary
Income Derived from
Foreign Sourced Income* |
| Voya Multi-Manager International Small Cap Fund | | $ 893,392 | | $ 0.1970 | | 85.56% |
*None of the Funds listed above derived any income from ineligible foreign sources as defined under Section 901(j) of the Internal Revenue Code.
Foreign taxes paid or withheld should be included in taxable income with an offsetting deduction from gross income or as a credit for taxes paid to foreign governments. Shareholders are strongly advised to consult their own tax advisors regarding the appropriate treatment of foreign taxes paid.
TAX INFORMATION (Unaudited) (continued)
Above figures may differ from those cited elsewhere in this report due to differences in the calculation of income and gains under U.S. generally accepted accounting principles (book) purposes and Internal Revenue Service (tax) purposes.
Shareholders are strongly advised to consult their own tax advisers with respect to the tax consequences of their investments in the Funds. In January, shareholders, excluding corporate shareholders, receive an IRS 1099-DIV regarding the federal tax status of the dividends and distributions they received in the calendar year.
[This Page Intentionally Left Blank]
| Investment Adviser | Independent Registered Public Accounting Firm |
Voya Investments, LLC
7337 East Doubletree Ranch Road, Suite 100
Scottsdale, Arizona 85258 | Ernst & Young LLP
200 Clarendon Street
Boston, Massachusetts 02116 |
| | |
| Distributor | Custodian |
Voya Investments Distributor, LLC
7337 East Doubletree Ranch Road, Suite 100
Scottsdale, Arizona 85258 | The Bank of New York Mellon
225 Liberty Street
New York, New York 10286 |
| | |
| Transfer Agent | Legal Counsel |
BNY Mellon Investment Servicing (U.S.) Inc.
301 Bellevue Parkway
Wilmington, Delaware 19809 | Ropes & Gray LLP
Prudential Tower
800 Boylston Street
Boston, Massachusetts 02199 |
For more complete information, or to obtain a prospectus on any Voya mutual fund, please call your financial advisor or Voya Investments Distributor, LLC at (800) 992-0180 or log on to www.voyainvestments.com. The prospectus should be read carefully before investing. Consider the fund’s investment objectives, risks, charges and expenses carefully before investing. The prospectus contains this information and other information about the fund. Check with your investment professional to determine which funds are available for sale within their firm. Not all funds are available for sale at all firms.
166211 (1024)
Annual Financial Statements and Other Information
October 31, 2024
Voya VACS Series EME Fund
| This report is submitted for general information to shareholders of the Voya mutual funds. It is not authorized for distribution to prospective shareholders unless accompanied or preceded by a prospectus which includes details regarding the funds’ investment objectives, risks, charges, expenses and other information. This information should be read carefully. |
| | E-Delivery Sign-up – details inside |
INVESTMENT MANAGEMENT
voyainvestments.com | |
TABLE OF CONTENTS
| Report of Independent Registered Public Accounting Firm | 1 |
| Statement of Assets and Liabilities | 2 |
| Statement of Operations | 3 |
| Statements of Changes in Net Assets | 4 |
| Financial Highlights | 5 |
| Notes to Financial Statements | 6 |
| Portfolio of Investments | 15 |
| Tax Information | 23 |
| Go Paperless with E-Delivery! |
| Sign up now for on-line prospectuses, tailored shareholder reports, and proxy statements. |
| Just go to individuals.voya.com/page/e-delivery, follow the directions and complete the quick 5 Steps to Enroll. |
| You will be notified by e-mail when these communications become available on the internet. |
PROXY VOTING INFORMATION
A description of the policies and procedures that the Fund uses to determine how to vote proxies related to portfolio securities is available: (1) without charge, upon request, by calling Shareholder Services toll-free at (800) 992-0180; (2) on the Fund’s website at www.voyainvestments.com; and (3) on the U.S. Securities and Exchange Commission’s (“SEC’s”) website at www.sec.gov. Information regarding how the Fund voted proxies related to portfolio securities during the most recent 12-month period ended June 30 is available without charge and upon request, by calling 1-800-992-0180 or by accessing the SEC’s website at www.sec.gov.
QUARTERLY PORTFOLIO HOLDINGS
The Fund files its complete schedule of portfolio holdings with the SEC for the first and third quarters of each fiscal year on Form NPORT-P. The Fund’s Forms NPORT-P are available on the SEC’s website at www.sec.gov.
REPORT OF INDEPENDENT REGISTERED PUBLIC ACCOUNTING FIRM
To the Shareholders and the Board of Trustees of Voya VACS Series EME Fund
Opinion on the Financial Statements
We have audited the accompanying statement of assets and liabilities of Voya VACS Series EME Fund (the “Fund”) (one of the funds constituting Voya Mutual Funds (the “Trust”)), including the portfolio of investments, as of October 31, 2024, and the related statement of operations for the year then ended, the statements of changes in net assets and the financial highlights for the year ended October 31, 2024 and the period from June 7, 2023 (commencement of operations) through October 31, 2023 and the related notes (collectively referred to as the “financial statements”). In our opinion, the financial statements present fairly, in all material respects, the financial position of the Fund (one of the funds constituting Voya Mutual Funds) at October 31, 2024, the results of its operations for the year then ended, the changes in its net assets and its financial highlights for the year ended October 31, 2024 and the period from June 7, 2023 (commencement of operations) through October 31, 2023, in conformity with U.S. generally accepted accounting principles.
Basis for Opinion
These financial statements are the responsibility of the Trust’s management. Our responsibility is to express an opinion on the Fund’s financial statements based on our audits. We are a public accounting firm registered with the Public Company Accounting Oversight Board (United States) ("PCAOB") and are required to be independent with respect to the Fund in accordance with the U.S. federal securities laws and the applicable rules and regulations of the Securities and Exchange Commission and in accordance with the relevant ethical requirements relating to our audit.
We conducted our audits in accordance with the auditing standards of the PCAOB and in accordance with auditing standards generally accepted in the United States of America. Those standards require that we plan and perform the audit to obtain reasonable assurance about whether the financial statements are free of material misstatement, whether due to error or fraud. The Trust is not required to have, nor were we engaged to perform, an audit of the Trust’s internal control over financial reporting. As part of our audit, we are required to obtain an understanding of internal control over financial reporting but not for the purpose of expressing an opinion on the effectiveness of the Trust’s internal control over financial reporting. Accordingly, we express no such opinion.
Our audits included performing procedures to assess the risks of material misstatement of the financial statements, whether due to error or fraud, and performing procedures that respond to those risks. Such procedures included examining, on a test basis, evidence regarding the amounts and disclosures in the financial statements. Our procedures included confirmation of securities owned as of October 31, 2024, by correspondence with the custodian, brokers and others; when replies were not received from brokers and others, we performed other auditing procedures. Our audits also included evaluating the accounting principles used and significant estimates made by management, as well as evaluating the overall presentation of the financial statements. We believe that our audits provide a reasonable basis for our opinion.
We have served as the auditor of one or more Voya investment companies since 2019.
Boston, Massachusetts
December 23, 2024
STATEMENT OF ASSETS AND LIABILITIES as of October 31, 2024
| ASSETS: | | | | |
| Investments in securities at fair value+* | | $ | 224,476,628 | |
| Short-term investments at fair value† | | | 4,585,504 | |
| Cash | | | 14,609 | |
| Cash collateral for futures contracts | | | 16,332 | |
| Foreign currencies at value‡ | | | 98,704 | |
| Receivables: | | | | |
| Investment securities and currencies sold | | | 132,307 | |
| Fund shares sold | | | 55,508 | |
| Dividends | | | 344,728 | |
| Foreign tax reclaims | | | 12,879 | |
| Prepaid expenses | | | 1,627 | |
| Reimbursement due from Investment Adviser | | | 12,845 | |
| Other assets | | | 578 | |
| Total assets | | | 229,752,249 | |
| | | | | |
| LIABILITIES: | | | | |
| Payable for investment securities and currencies purchased | | | 132,988 | |
| Payable for fund shares redeemed | | | 134,025 | |
| Payable upon receipt of securities loaned | | | 654,737 | |
| Variation margin payable on futures contracts | | | 1,784 | |
| Payable to trustees under the deferred compensation plan (Note 5) | | | 578 | |
| Payable for trustee fees | | | 562 | |
| Payable for foreign capital gains tax | | | 1,297,513 | |
| Other accrued expenses and liabilities | | | 154,671 | |
| Total liabilities | | | 2,376,858 | |
| NET ASSETS | | $ | 227,375,391 | |
| | | | | |
| NET ASSETS WERE COMPRISED OF: | | | | |
| Paid-in capital | | $ | 205,892,588 | |
| Total distributable earnings | | | 21,482,803 | |
| NET ASSETS | | $ | 227,375,391 | |
| | | | | |
| + Including securities loaned at value | | $ | 622,047 | |
| * Cost of investments in securities | | $ | 206,586,126 | |
| † Cost of short-term investments | | $ | 4,585,504 | |
| ‡ Cost of foreign currencies | | $ | 98,703 | |
| | | | | |
| Net assets | | $ | 227,375,391 | |
| Shares authorized | | | unlimited | |
| Par value | | | — | |
| Shares outstanding | | | 20,085,934 | |
| Net asset value and redemption price per share | | $ | 11.32 | |
See Accompanying Notes to Financial Statements
STATEMENT OF OPERATIONS for the year ended October 31, 2024
| INVESTMENT INCOME: | | | | |
| Dividends, net of foreign taxes withheld* | | $ | 5,797,721 | |
| Securities lending income, net | | | 19,914 | |
| Other | | | 1,211 | |
| Total investment income | | | 5,818,846 | |
| EXPENSES: | | | | |
| Transfer agent fees | | | 660 | |
| Shareholder reporting expense | | | 4,004 | |
| Registration fees | | | 23,067 | |
| Professional fees | | | 105,060 | |
| Custody and accounting expense | | | 198,642 | |
| Trustee fees | | | 5,617 | |
| Offering expense | | | 21,000 | |
| Miscellaneous expense | | | 31,699 | |
| Interest expense | | | 27,665 | |
| Total expenses | | | 417,414 | |
| Waived and reimbursed fees | | | (42,825 | ) |
| Net expenses | | | 374,589 | |
| Net investment income | | | 5,444,257 | |
| REALIZED AND UNREALIZED GAIN (LOSS): | | | | |
| Net realized gain (loss) on: | | | | |
| Investments (net of foreign capital gains taxes withheld^) | | | 1,156,648 | |
| Forward foreign currency contracts | | | 341 | |
| Foreign currency related transactions | | | (214,246 | ) |
| Futures | | | 70,852 | |
| Net realized gain | | | 1,013,595 | |
| Net change in unrealized appreciation (depreciation) on: | | | | |
| Investments (net of foreign capital gains taxes accrued#) | | | 36,621,085 | |
| Foreign currency related transactions | | | (5,959 | ) |
| Futures | | | (11,050 | ) |
| Net change in unrealized appreciation (depreciation) | | | 36,604,076 | |
| Net realized and unrealized gain | | | 37,617,671 | |
| Increase in net assets resulting from operations | | $ | 43,061,928 | |
| | | | | |
| * Foreign taxes withheld | | $ | 698,876 | |
| ^ Foreign capital gains taxes withheld | | $ | 806,812 | |
| # Change in foreign capital gains taxes accrued | | $ | 1,165,128 | |
See Accompanying Notes to Financial Statements
STATEMENTS OF CHANGES IN NET ASSETS
| | | Year Ended
October 31, 2024 | | | June 7, 2023(1) to
October 31, 2023 | |
| FROM OPERATIONS: | | | | | | | | |
| Net investment income | | $ | 5,444,257 | | | $ | 2,046,044 | |
| Net realized gain | | | 1,013,595 | | | | 416,790 | |
| Net change in unrealized appreciation (depreciation) | | | 36,604,076 | | | | (19,911,042 | ) |
| Increase (decrease) in net assets resulting from operations | | | 43,061,928 | | | | (17,448,208 | ) |
| | | | | | | | | |
| FROM DISTRIBUTIONS TO SHAREHOLDERS: | | | | | | | | |
| Total distributions (excluding return of capital) | | | (4,130,918 | ) | | | — | |
| Total distributions | | | (4,130,918 | ) | | | — | |
| | | | | | | | | |
| FROM CAPITAL SHARE TRANSACTIONS: | | | | | | | | |
| Net proceeds from sale of shares | | | 73,153,456 | | | | 252,114,264 | |
| Reinvestment of distributions | | | 4,130,918 | | | | — | |
| | | | | | | | | |
| | | | 77,284,374 | | | | 252,114,264 | |
| Cost of shares redeemed | | | (107,455,211 | ) | | | (16,050,838 | ) |
| Net increase (decrease) in net assets resulting from capital share transactions | | | (30,170,837 | ) | | | 236,063,426 | |
| Net increase in net assets | | | 8,760,173 | | | | 218,615,218 | |
| | | | | | | | | |
| NET ASSETS: | | | | | | | | |
| Beginning of year or period | | | 218,615,218 | | | | — | |
| End of year or period | | $ | 227,375,391 | | | $ | 218,615,218 | |
| (1) | Commencement of operations. |
See Accompanying Notes to Financial Statements
FINANCIAL HIGHLIGHTS
Selected data for a share of beneficial interest outstanding throughout each year or period.
| | | | | | | Income (loss)
from investment
operations | | | | Less Distributions | | | | | | | | | | | | | | Ratios to average net assets | | Supplemental
Data |
| | | | Net asset value, beginning of year or period | | | Net investment income (loss) | | | Net realized and unrealized gain (loss) | | | Total from investment operations | | | From net investment income | | | From net realized gains | | | From return of capital | | | Total distributions | | | Payment by affiliate | | | Net asset value, end of year or period | | | Total Return(1) | | | Expenses
before
reductions/
additions(2)(3) | | | Expenses net of fee waivers and/or recoupments if any(2)(3) | | | Expenses
net of all
reductions/
additions(2)(3) | | | Net investment income (loss)(2)(3) | | | Net assets, end of year or period | | | Portfolio turnover rate | |
Year or
period ended | | | ($) | | | ($) | | | ($) | | | ($) | | | ($) | | | ($) | | | ($) | | | ($) | | | ($) | | | ($) | | | (%) | | | (%) | | | (%) | | | (%) | | | (%) | | | ($000's) | | | (%) | |
| 10-31-24 | | | 9.47 | | | 0.27 | • | | 1.75 | | | 2.02 | | | 0.13 | | | 0.04 | | | — | | | 0.17 | | | — | | | 11.32 | | | 21.62 | | | 0.19 | | | 0.17 | | | 0.17 | | | 2.42 | | | 227,375 | | | 40 | |
| 06-07-23(4)- 10-31-23 | | | 10.00 | | | 0.11 | • | | (0.64 | ) | | (0.53 | ) | | — | | | — | | | — | | | — | | | — | | | 9.47 | | | (5.30 | ) | | 0.17 | | | 0.15 | | | 0.15 | | | 2.61 | | | 218,615 | | | 11 | |
| (1) | Total return is calculated assuming reinvestment of all dividends, capital gain distributions and return of capital distributions, if any, at net asset value and excluding the deduction of sales charges or contingent deferred sales charges, if applicable. Total return for periods less than one year is not annualized. |
| (2) | Annualized for periods less than one year. |
| (3) | Ratios reflect operating expenses of a Fund. Expenses before reductions/additions do not reflect amounts reimbursed or recouped by the Investment Adviser and/or Distributor or reductions from brokerage service arrangements or other expense offset arrangements and do not represent the amount paid by a Fund during periods when reimbursements or reductions occur. Expenses net of fee waivers reflect expenses after reimbursement by the Investment Adviser and/or Distributor or recoupment of previously reimbursed fees by the Investment Adviser, but prior to reductions from brokerage service arrangements or other expense offset arrangements. Expenses net of all reductions/additions represent the net expenses paid by a Fund. Net investment income (loss) is net of all such additions or reductions. |
| (4) | Commencement of operations. |
| • | Calculated using average number of shares outstanding throughout the year or period. |
See Accompanying Notes to Financial Statements
NOTES TO FINANCIAL STATEMENTS as of October 31, 2024
NOTE 1 — ORGANIZATION
Voya Mutual Funds (the “Trust”) is a Delaware statutory trust organized on December 18, 1992 and is registered under the Investment Company Act of 1940, as amended (“1940 Act”), as an open-end investment management company. There are six separate active investment series. This report is for Voya VACS Series EME Fund (“EME” or the “Fund”), a diversified series of the Trust.
The Fund’s shares are not registered under the Securities Act of 1933 (the “1933 Act”) because the shares are issued solely in private placement transactions that do not involve any “public offering” within the meaning of Section 4(a)(2) of the 1933 Act.
The Fund does not have a share class designation. All shareholders are allocated the common expenses of the Fund and earn income and realized gains/losses from the Fund. Expenses that are specific to the Fund are charged directly to the Fund. Other operating expenses shared by several funds are generally allocated among those funds based on average net assets.
Voya Investments, LLC (“Voya Investments” or the “Investment Adviser”), an Arizona limited liability company, serves as the Investment Adviser to the Fund. Voya Investments has engaged Voya Investment Management Co. LLC (“Voya IM” or the “Sub-Adviser”), a Delaware limited liability company, to serve as one of the multiple sub-advisers to the Fund. Voya IM serves as one of the multiple sub-advisers for the Fund. Voya Investments Distributor, LLC (“VID”), a Delaware limited liability company, serves as the principal underwriter to the Fund.
NOTE 2 — SIGNIFICANT ACCOUNTING POLICIES
The Fund is an investment company and accordingly follows the investment company accounting and reporting guidance of the Financial Accounting Standards Board (“FASB”) Accounting Standards Board Codification Topic 946 Financial Services - Investment Companies.
The following significant accounting policies are consistently followed by the Fund in the preparation of its financial statements. The Fund is considered an investment company under U.S. generally accepted accounting principles (“GAAP”) and follows the accounting and reporting guidance applicable to investment companies.
A. Security Valuation. The Fund is open for business every day the New York Stock Exchange (“NYSE”) opens for regular trading (each such day, a “Business Day”). The net asset value (“NAV”) per share of the Fund is determined each Business Day as of the close of the regular trading session (“Market Close”), as determined by the Consolidated Tape Association (“CTA”), the central distributor of transaction prices for exchange-traded securities (normally 4:00 p.m.
Eastern Time unless otherwise designated by the CTA). The NAV per share of the Fund is calculated by taking the value of the Fund’s assets, subtracting the Fund’s liabilities, and dividing by the number of shares that are outstanding. On days when the Fund is closed for business, Fund shares will not be priced and the Fund does not transact purchase and redemption orders. To the extent the Fund’s assets are traded in other markets on days when the Fund does not price its shares, the value of the Fund’s assets will likely change and you will not be able to purchase or redeem shares of the Fund.
Portfolio securities for which market quotations are readily available are valued at market value. Investments in open-end registered investment companies that do not trade on an exchange are valued at the end of day NAV per share. The prospectuses of the open-end registered investment companies in which the Fund may invest explain the circumstances under which they will use fair value pricing and the effects of using fair value pricing. Foreign securities’ prices are converted into U.S. dollar amounts using the applicable exchange rates as of Market Close.
When a market quotation for a portfolio security is not readily available or is deemed unreliable (for example when trading has been halted or there are unexpected market closures or other material events that would suggest that the market quotation is unreliable) and for purposes of determining the value of other Fund assets, the asset is priced at its fair value. The Board has designated the Investment Adviser, as the valuation designee, to make fair value determinations in good faith. In determining the fair value of the Fund’s assets, the Investment Adviser, pursuant to its fair valuation policy, may consider inputs from pricing service providers, broker-dealers, or the Fund’s sub-adviser(s). Issuer specific events, transaction price, position size, nature and duration of restrictions on disposition of the security, market trends, bid/ask quotes of brokers and other market data may be reviewed in the course of making a good faith determination of an asset’s fair value. Because trading hours for certain foreign securities end before Market Close, closing market quotations may become unreliable. The prices of foreign securities will generally be adjusted based on inputs from an independent pricing service that are intended to reflect valuation changes through the NYSE close. Because of the inherent uncertainties of fair valuation, the values used to determine the Fund’s NAV may materially differ from the value received upon actual sale of those investments. Thus, fair valuation may have an unintended dilutive or accretive effect on the value of shareholders’ investments in the Fund.
The Fund’s financial instruments are valued at the close of the NYSE and are reported at fair value, which GAAP defines as the price that would be received to sell an
NOTES TO FINANCIAL STATEMENTS as of October 31, 2024 (continued)
NOTE 2 — SIGNIFICANT ACCOUNTING POLICIES (continued)
asset or paid to transfer a liability in an orderly transaction between market participants at the measurement date.
Various valuation techniques and inputs are used to determine the fair value of financial instruments. GAAP establishes the following fair value hierarchy that categorizes the inputs used to measure fair value:
Level 1 — quoted prices (unadjusted) in active markets for identical financial instruments that the fund can access at the reporting date.
Level 2 — inputs other than Level 1 quoted prices that are observable, either directly or indirectly (including, but not limited to, quoted prices for similar financial instruments in active markets, quoted prices for identical or similar financial instruments in inactive markets, interest rates and yield curves, implied volatilities, and credit spreads).
Level 3 — unobservable inputs (including the fund’s own assumptions in determining fair value).
Observable inputs are developed using market data, such as publicly available information about actual events or transactions, and reflect the assumptions that market participants would use to price the financial instrument. Unobservable inputs are those for which market data are not available and are developed using the best information available about the assumptions that market participants would use to price the financial instrument. GAAP requires valuation techniques to maximize the use of relevant observable inputs and minimize the use of unobservable inputs. When multiple inputs are used to derive fair value, the financial instrument is assigned to the level within the fair value hierarchy based on the lowest-level input that is significant to the fair value of the financial instrument. Input levels are not necessarily an indication of the risk or liquidity associated with financial instruments at that level but rather the degree of judgment used in determining those values.
A table summarizing the Fund’s investments under these levels of classification is included within the Portfolio of Investments.
Each investment asset or liability of the Fund is assigned a level at measurement date based on the significance and source of the inputs to its valuation. Quoted prices in active markets for identical securities are classified as “Level 1,” inputs other than quoted prices for an asset or liability that are observable are classified as “Level 2” and significant unobservable inputs, including the Sub-Adviser’s or Pricing Committee’s judgment about the assumptions that a market participant would use in pricing an asset or liability are classified as “Level 3.” The inputs used for valuing securities are not necessarily an indication of the risks associated
with investing in those securities. Short-term securities of sufficient credit quality are generally considered to be Level 2 securities under applicable accounting rules. A table summarizing the Fund’s investments under these levels of classification is included within the Portfolio of Investments.
GAAP requires a reconciliation of the beginning to ending balances for reported fair values that presents changes attributable to total realized and unrealized gains or losses, purchases and sales, and transfers in or out of the Level 3 category during the period. A reconciliation of Level 3 investments within the Portfolio of Investments is presented only when the Fund has a significant amount of Level 3 investments.
B. Securities Transactions and Revenue Recognition. Securities transactions are accounted for on the trade date. Realized gains and losses are reported on the basis of identified cost of securities sold. Interest income is recorded on an accrual basis. Dividend income is recorded on the ex-dividend date, or for certain foreign securities, when the information becomes available to the Fund. Premium amortization and discount accretion are determined by the effective yield method.
C. Foreign Currency Translation. The books and records of the Fund are maintained in U.S. dollars.
Any foreign currency amounts are translated into U.S. dollars on the following basis:
(1) Market value of investment securities, other assets and liabilities — at the exchange rates prevailing at Market Close.
(2) Purchases and sales of investment securities, income and expenses — at the exchange rates prevailing on the respective dates of such transactions.
Although the net assets and the market values are presented at the foreign exchange rates at Market Close, the Fund does not isolate the portion of the results of operations resulting from changes in foreign exchange rates on investments from the fluctuations arising from changes in market prices of securities held. Such fluctuations are included with the net realized and unrealized gains or losses from investments. For securities that are subject to foreign withholding tax upon disposition, liabilities are recorded on the Statement of Assets and Liabilities for the estimated tax withholding based on the securities’ current market value. Upon disposition, realized gains or losses on such securities are recorded net of foreign withholding tax.
Reported net realized foreign exchange gains or losses arise from sales of foreign currencies, currency gains or losses realized between the trade and settlement dates on securities transactions, the difference between the amounts of dividends, interest, and foreign withholding
NOTES TO FINANCIAL STATEMENTS as of October 31, 2024 (continued)
NOTE 2 — SIGNIFICANT ACCOUNTING POLICIES (continued)
taxes recorded on each Fund’s books, and the U.S. dollar equivalent of the amounts actually received or paid. Net unrealized foreign exchange gains and losses arise from changes in the value of assets and liabilities other than investments in securities, resulting from changes in the exchange rate. Foreign security and currency transactions may involve certain considerations and risks not typically associated with investing in U.S. companies and U.S. government securities. These risks include, but are not limited to, revaluation of currencies and future adverse political and economic developments which could cause securities and their markets to be less liquid, and prices more volatile than those of comparable U.S. companies and U.S. government securities. The foregoing risks are even greater with respect to securities of issuers in emerging markets.
D. Distributions to Shareholders. The Fund records distributions to its shareholders on the ex-dividend date. The Fund declares and pays dividends and capital gain distributions, if any, at least annually to comply with the distribution requirements of the Internal Revenue Code and may make distributions on a more frequent basis. The characteristics of income and gains to be distributed are determined in accordance with income tax regulations, which may differ from GAAP for investment companies.
E. Federal Income Taxes. It is the policy of the Fund to comply with the requirements of subchapter M of the Internal Revenue Code that are applicable to regulated investment companies and to distribute substantially all of its net investment income and any net realized capital gains to its shareholders. Therefore, a federal income tax or excise tax provision is not required. Management has considered the sustainability of the Fund’s tax positions taken on federal income tax returns for all open tax years in making this determination. No capital gain distributions shall be made until the capital loss carryforwards have been fully utilized.
The Fund may utilize equalization accounting for tax purposes, whereby a portion of redemption payments are treated as distributions of income or gain.
F. Use of Estimates. The preparation of financial statements in conformity with GAAP requires management to make estimates and assumptions that affect the reported amounts of assets and liabilities and disclosure of contingent assets and liabilities at the date of the financial statements and the reported amounts of increases and decreases in net assets from operations during the reporting period. Actual results could differ from those estimates.
G. Risk Exposures and the Use of Derivative Instruments. The Fund’s investment objectives permit the Fund to enter into various types of derivatives contracts, including, but not limited to, written options. In doing so, the Fund will employ strategies in differing combinations to permit it to increase or decrease the level of risk, or change the level or types of exposure to risk factors. This may allow the Fund to pursue its objectives more quickly and efficiently than if it were to make direct purchases or sales of securities capable of affecting a similar response to market or credit factors.
In pursuit of its investment objectives, the Fund may seek to increase or decrease its exposure to the following market or credit risk factors:
Credit Risk. The price of a bond or other debt instrument is likely to fall if the issuer’s actual or perceived financial health deteriorates, whether because of broad economic or issuer-specific reasons. In certain cases, the issuer could be late in paying interest or principal, or could fail to pay its financial obligations altogether.
Equity Risk. Stock prices may be volatile or have reduced liquidity in response to real or perceived impacts of factors including, but not limited to, economic conditions, changes in market interest rates, and political events. Stock markets tend to be cyclical, with periods when stock prices generally rise and periods when stock prices generally decline. Any given stock market segment may remain out of favor with investors for a short or long period of time, and stocks as an asset class may underperform bonds or other asset classes during some periods. Additionally, legislative, regulatory or tax policies or developments in these areas may adversely impact the investment techniques available to a manager, add to costs and impair the ability of the Fund to achieve its investment objectives.
Foreign Exchange Rate Risk. To the extent that the Fund invests directly in foreign (non-U.S.) currencies or in securities denominated in, or that trade in, foreign (non-U.S.) currencies, it is subject to the risk that those foreign (non-U.S.) currencies will decline in value relative to the U.S. dollar or, in the case of hedging positions, that the U.S. dollar will decline in value relative to the currency being hedged by the Fund through foreign currency exchange transactions.
Currency rates may fluctuate significantly over short periods of time. Currency rates may be affected by changes in market interest rates, intervention (or the failure to intervene) by U.S. or foreign governments, central banks or supranational entities such as the International Monetary Fund, by the imposition of currency controls, or other political or economic developments in the United States or abroad.
NOTES TO FINANCIAL STATEMENTS as of October 31, 2024 (continued)
NOTE 2 — SIGNIFICANT ACCOUNTING POLICIES (continued)
Interest Rate Risk. A rise in market interest rates generally results in a fall in the value of bonds and other debt instruments; conversely, values generally rise as market interest rates fall. Interest rate risk is generally greater for debt instruments than floating-rate instruments. The higher the credit quality of the instrument, and the longer its maturity or duration, the more sensitive it is to changes in market interest rates. Duration is a measure of sensitivity of the price of a debt instrument to a change in interest rate. The U.S. has experienced a rising market interest rate environment, which may increase the Fund’s exposure to risks associated with rising market interest rates. Rising market interest rates have unpredictable effects on the markets and may expose debt and related markets to heightened volatility. To the extent that a mutual fund invests in debt instruments, an increase in market interest rates may lead to increased redemptions and increased portfolio turnover, which could reduce liquidity for certain investments, adversely affect values, and increase costs. Increased redemptions may cause a fund to liquidate portfolio positions when it may not be advantageous to do so and may lower returns. If dealer capacity in debt markets is insufficient for market conditions, it may further inhibit liquidity and increase volatility in debt markets. Further, recent and potential future changes in government policy may affect interest rates. Negative or very low interest rates could magnify the risks associated with changes in interest rates. In general, changing interest rates, including rates that fall below zero, could have unpredictable effects on markets and may expose debt and related markets to heightened volatility. Changes to monetary policy by the U.S. Federal Reserve Board or other regulatory actions could expose debt and related markets to heightened volatility, interest rate sensitivity, and reduced liquidity, which may impact operations and return potential.
Risks of Investing in Derivatives. The Fund’s use of derivatives can result in losses due to unanticipated changes in the market or credit risk factors and the overall market. In instances where the Fund is using derivatives to decrease or hedge exposures to market or credit risk factors for securities held by the Fund, there are also risks that those derivatives may not perform as expected resulting in losses for the combined or hedged positions.
Derivative instruments are subject to a number of risks, including the risk of changes in the market price of the underlying securities, credit risk with respect to the counterparty, risk of loss due to changes in market interest rates and liquidity and volatility risk. The amounts required to purchase certain derivatives may be small relative to the magnitude of exposure assumed by the Fund. Therefore, the purchase of certain derivatives may have an economic
leveraging effect on the Fund and exaggerate any increase or decrease in the NAV. Derivatives may not perform as expected, so the Fund may not realize the intended benefits. When used for hedging purposes, the change in value of a derivative may not correlate as expected with the currency, security or other risk being hedged. When used as an alternative or substitute for direct cash investments, the return provided by the derivative may not provide the same return as direct cash investment. In addition, given their complexity, derivatives expose the Fund to the risk of improper valuation.
Generally, derivatives are sophisticated financial instruments whose performance is derived, at least in part, from the performance of an underlying asset or assets. Derivatives include, among other things, swap agreements, options, forwards and futures. Investments in derivatives are generally negotiated over-the-counter (“OTC”), with a single counterparty and as a result are subject to credit risks related to the counterparty’s ability or willingness to perform its obligations; any deterioration in the counterparty’s creditworthiness could adversely affect the value of the derivative. In addition, derivatives and their underlying securities may experience periods of illiquidity which could cause the Fund to hold a security it might otherwise sell, or to sell a security it otherwise might hold at inopportune times or at an unanticipated price. A manager might imperfectly judge the direction of the market. For instance, if a derivative is used as a hedge to offset investment risk in another security, the hedge might not correlate to the market’s movements and may have unexpected or undesired results such as a loss or a reduction in gains.
Counterparty Credit Risk and Credit Related Contingent Features. Certain derivative positions are subject to counterparty credit risk, which is the risk that the counterparty will not fulfill its obligation to the Fund. The Fund’s derivative counterparties are financial institutions who are subject to market conditions that may weaken their financial position. The Fund intends to enter into financial transactions with counterparties that it believes to be creditworthy at the time of the transaction. To reduce this risk, the Fund generally enters into master netting arrangements, established within the Fund’s International Swap and Derivatives Association, Inc. (“ISDA”) Master Agreements (“Master Agreements”). These agreements are with select counterparties and they govern transactions, including certain OTC derivative and forward foreign currency contracts, entered into by the Fund and the counterparty. The Master Agreements maintain provisions for general obligations, representations, agreements, collateral, and events of default or termination. The occurrence of a specified event of termination may give a counterparty the right to terminate all of its contracts and
NOTES TO FINANCIAL STATEMENTS as of October 31, 2024 (continued)
NOTE 2 — SIGNIFICANT ACCOUNTING POLICIES (continued)
affect settlement of all outstanding transactions under the applicable Master Agreement.
The Fund may also enter into collateral agreements with certain counterparties to further mitigate credit risk associated with OTC derivative and forward foreign currency contracts. Subject to established minimum levels, collateral is generally determined based on the net aggregate unrealized gain or loss on contracts with a certain counterparty. Collateral pledged to or from the Fund is held in a segregated account by a third-party agent and can be in the form of cash or debt securities issued by the U.S. government or related agencies.
There were no open OTC derivatives at October 31, 2024.
H. Forward Foreign Currency Transactions and Futures Contracts. The Fund may enter into forward foreign currency exchange transactions to convert to and from different foreign currencies and to and from the U.S. dollar in connection with the planned purchases or sales of securities. The Fund either enters into these transactions on a spot basis at the spot rate prevailing in the foreign currency exchange market or uses forward foreign currency contracts to purchase or sell foreign currencies. When the contract is fulfilled or closed, gains or losses are realized. Until then, the gain or loss is included in unrealized appreciation or depreciation. Risks may arise upon entering into forward contracts from the potential inability of counterparties to meet the terms of their forward contracts and from unanticipated movements in the value of foreign currencies relative to the U.S. dollar.
For the year ended October 31, 2024, the Fund entered into forward foreign currency contracts with the obligation to buy and sell specified foreign currencies in the future at a currently negotiated forward rate in order to increase or decrease exposure to foreign exchange rate risk. The Fund used forward foreign currency contracts primarily to protect their non-U.S. dollar denominated holdings from adverse currency movements. During the year ended October 31, 2024, the Fund had an average contract amount on forward foreign currency contracts to buy and sell of $33,167 and $83,843, respectively.
The Fund may enter into futures contracts involving foreign currency, interest rates, securities and security indices. A futures contract is a commitment to buy or sell a specific amount of a financial instrument at a negotiated price on a stipulated future date. The Fund may buy and sell futures contracts. Futures contracts traded on a commodities or futures exchange will be valued at the final settlement price or official closing price on the principal exchange as reported by such principal exchange at its trading session
ending at, or most recently prior to, the time when the Fund’s assets are valued.
Upon entering into a futures contract, the Fund is required to deposit either cash or securities (initial margin) in an amount equal to a certain percentage of the contract value. Subsequent payments (variation margin) are made or received by the Fund each day. The variation margin payments are equal to the daily changes in the contract value and are recorded as unrealized gains and losses, if any, shown as variation margin receivable or payable on futures contracts on the Statement of Assets and Liabilities. Open futures contracts, if any, are reported on a table within the Fund’s Portfolio of Investments. Securities held in collateralized accounts to cover initial margin requirements, if any, on open futures contracts are footnoted in the Portfolio of Investments. Cash collateral held by the broker to cover initial margin requirements on open futures contracts are noted in the Fund’s Statement of Assets and Liabilities. The net change in unrealized appreciation and depreciation is reported in the Fund’s Statement of Operations. Realized gains (losses) are reported in the Fund’s Statement of Operations at the closing or expiration of futures contracts.
Futures contracts are exposed to the market risk factor of the underlying financial instrument. During the year ended October 31, 2024, the Fund purchased futures contracts on equity indices to “equitize” cash. Futures contracts are purchased to provide immediate market exposure proportionate to the size of the Fund’s respective cash flows and residual cash balances in order to decrease potential tracking error if the cash remained uninvested in the market. Additional associated risks of entering into futures contracts include the possibility that there may be an illiquid market where the Fund is unable to liquidate the contract or enter into an offsetting position and, if used for hedging purposes, the risk that the price of the contract will correlate imperfectly with the prices of the Fund’s securities. With futures, there is minimal counterparty credit risk to the Fund since futures are exchange traded and the exchange’s clearinghouse, as counterparty to all exchange traded futures, guarantees the futures against default.
During the year ended October 31, 2024, the Fund had an average notional value on futures contracts purchased of $742,981. Please refer to the tables within the Portfolio of Investments for open futures contracts during the year ended October 31, 2024.
I. Securities Lending. The Fund has the option to temporarily loan securities representing up to 33 1∕3% of its total assets to brokers, dealers or other financial institutions in exchange for a negotiated lender’s fee. Securities lending involves two primary risks: “investment risk” and “borrower default risk.” When lending securities, the Fund will receive cash or U.S. government securities as collateral.
NOTES TO FINANCIAL STATEMENTS as of October 31, 2024 (continued)
NOTE 2 — SIGNIFICANT ACCOUNTING POLICIES (continued)
Investment risk is the risk that the Fund will lose money from the investment of the cash collateral received from the borrower. Borrower default risk is the risk that the Fund will lose money due to the failure of a borrower to return a borrowed security. Loans are subject to termination at the option of the borrower or the Fund. Securities lending may result in leverage. The use of leverage may exaggerate any increase or decrease in the NAV, causing the Fund to be more volatile. The use of leverage may increase expenses and increase the impact of the Fund’s other risks.
J. Indemnifications. In the normal course of business, the Trust may enter into contracts that provide certain indemnifications. The Trust’s maximum exposure under these arrangements is dependent on future claims that may be made against the Fund and, therefore, cannot be estimated; however, based on experience, management considers risk of loss from such claims remote.
NOTE 3 — INVESTMENT TRANSACTIONS
For the year ended October 31, 2024, the cost of purchases and the proceeds from the sales of investments, excluding short-term securities, were as follows:
| Purchases | | | Sales | |
| $ | 87,281,962 | | | $ | 118,251,883 | |
NOTE 4 — INVESTMENT MANAGEMENT FEES
The Fund has entered into an investment management agreement (“Management Agreement”) with the Investment Adviser. The Investment Adviser has overall responsibility for the management of the Fund. The Investment Adviser oversees all investment advisory and portfolio management services for the Fund and assists in managing and supervising all aspects of the general day-to-day business activities and operations of the Fund, including custodial, transfer agency, dividend disbursing, accounting, auditing, compliance and related services. There is no management fee charged per the Management Agreement for EME.
The Investment Adviser has entered into sub-advisory agreements with Delaware Investments Fund Advisers, Sustainable Growth Advisers, LP and Voya IM. These sub-advisers provide investment advice for the Fund and are paid by the Investment Adviser based on the average daily net assets of the Fund. Subject to such policies as the Board or the Investment Adviser may determine, the sub-advisers manage the Fund’s assets in accordance with the Fund’s investment objectives, policies, and limitations.
NOTE 5 — OTHER TRANSACTIONS WITH AFFILIATES AND RELATED PARTIES
At October 31, 2024, the following direct or indirect, wholly-owned subsidiary of Voya Financial, Inc. owned more than 5% of the Fund:
| Subsidiary | | Percentage |
| Voya Investment Trust Co. | | 88.70% |
The Investment Advisor may direct the Fund’s Sub-Adviser to use its best efforts (subject to obtaining best execution of each transaction) to allocate the Fund’s equity security transactions through certain designated broker-dealers. The designated broker-dealer, in turn, will reimburse a portion of the brokerage commissions to pay certain expenses of the Fund. Any amount credited to the Fund is reflected as brokerage commission recapture on the accompanying Statement of Operations.
The Fund has adopted a deferred compensation plan (the “DC Plan”), which allows eligible independent trustees, as described in the DC Plan, to defer the receipt of all or a portion of the trustees’ fees that they are entitled to receive from the Fund. For purposes of determining the amount owed to the trustee under the DC Plan, the amounts deferred are invested in shares of the funds selected by the trustee (the “Notional Funds”). When the Fund purchases shares of the Notional Funds, which are all advised by Voya Investments, in amounts equal to the trustees’ deferred fees, this results in a Fund asset equal to the deferred compensation liability. Such assets, if applicable, are included as a component of “Other assets” on the accompanying Statement of Assets and Liabilities. Deferral of trustees’ fees under the DC Plan will not affect net assets of the Fund, and will not materially affect the Fund’s assets, liabilities or net investment income per share. Amounts will be deferred until distributed in accordance with the DC Plan.
The Fund may pay per account fees to affiliates of Voya Investments for recordkeeping services provided on certain assets. For the year ended October 31, 2024, there were no account fees for affiliated recordkeeping services paid by the Fund.
NOTE 6 — EXPENSE LIMITATION AGREEMENT
The Investment Adviser has entered into a written expense limitation agreement (“Expense Limitation Agreement”) with the Fund to limit expenses, excluding interest, taxes, investment-related costs, leverage expenses and extraordinary expenses to 0.15% of the average net assets.
The Investment Adviser may at a later date recoup from the Fund for fees waived and/or other expenses reimbursed by the Investment Adviser during the previous 36 months, but only if, after such recoupment, the Fund’s expense
NOTES TO FINANCIAL STATEMENTS as of October 31, 2024 (continued)
NOTE 6 — EXPENSE LIMITATION AGREEMENT (continued)
ratio does not exceed the percentage described above. Waived and reimbursed fees net of any recoupment by the Investment Adviser of such waived and reimbursed fees are reflected on the accompanying Statement of Operations. Amounts payable by the Investment Adviser are reflected on the accompanying Statement of Assets and Liabilities.
As of October 31, 2024, the amounts of waived and/or reimbursed fees that are subject to possible recoupment by the Investment Advisor and the related expiration dates are as follows:
| October 31, | | | | | |
| | 2025 | | | | 2026 | | | | 2027 | | | | Total | |
| $ | — | | | $ | 9,699 | | | $ | 42,825 | | | $ | 52,524 | |
The Expense Limitation Agreement is contractual through March 1, 2025 and the Expense Limitation Agreement shall renew automatically for one-year terms. Termination or modification of this obligation requires approval by the Board.
NOTE 7 — LINE OF CREDIT
Effective June 10, 2024, the Fund, in addition to certain other funds managed by the Investment Adviser, entered into a 364-day unsecured committed revolving line of credit agreement (the “Credit Agreement”) with The Bank of New York Mellon (“BNY”) for an aggregate amount of $400,000,000 through June 9, 2025. The proceeds may be used only to finance temporarily: (1) the purchase or sale of investment securities; or (2) the repurchase or redemption of shares of the Fund or certain other funds managed by the Investment Adviser. The funds to which the line of credit is available pay a commitment fee equal to 0.15% per annum on the daily unused portion of the committed line amount payable quarterly in arrears. Prior to June 10, 2024, the predecessor line of credit was for an aggregate amount of $400,000,000 and the funds to which the line of credit was available paid a commitment fee equal to 0.15% per annum on the daily unused portion of the committed line amount through June 10, 2024.
Borrowings under the Credit Agreement accrue interest at the federal funds rate plus a specified margin. Repayments generally must be made within 60 days after the date of a revolving credit advance.
The Fund utilized the line of credit during the year ended October 31, 2024:
Days
Utilized | | | Approximate
Average
Daily Balance
For Days
Utilized | | | Approximate
Weighted
Average
Interest Rate
For Days
Utilized | |
| 24 | | | $ | 6,565,958 | | | | 6.32% | |
NOTE 8 — CAPITAL SHARES
Transactions in capital shares and dollars were as follows:
| | | Shares
sold | | Shares
issued in
merger | | Reinvestment
of
distributions | | Shares
redeemed | | Shares
converted | | Net increase
(decrease) in
shares
outstanding | | Shares
sold | | Proceeds
from
shares
issued in
merger | | Reinvestment
of
distributions | | Shares
redeemed | | Shares
converted | | Net increase
(decrease) |
Year or
period ended | | # | | # | | # | | # | | # | | # | | ($) | | ($) | | ($) | | ($) | | ($) | | ($) |
| 10/31/2024 | | 6,639,768 | | — | | 412,679 | | (10,041,245) | | — | | (2,988,798) | | 73,153,456 | | — | | 4,130,918 | | (107,455,211) | | — | | (30,170,837) |
| 6/07/2023(1)- 10/31/2023 | | 24,690,627 | | — | | — | | (1,615,896) | | — | | 23,074,731 | | 252,114,264 | | — | | — | | (16,050,838) | | — | | 236,063,426 |
(1) Commencement of operations.
NOTE 9 — SECURITIES LENDING
Under a Master Securities Lending Agreement (the “Agreement”) with BNY, the Fund can lend its securities to approved brokers, dealers and other financial institutions. Loans are collateralized by cash and U.S. government securities. The collateral is equal to at least 105% of the market value of non-U.S. securities loaned and 102% of the market value of U.S. securities loaned. The market value of
the loaned securities is determined at the close of business of the Fund at its last sale price or official closing price on the principal exchange or system on which they are traded and any additional collateral is delivered to the Fund on the next business day. The cash collateral received is invested in approved investments as defined in the Agreement with BNY. The Fund bear the risk of loss with respect to the investment of collateral with the following exception: BNY
NOTES TO FINANCIAL STATEMENTS as of October 31, 2024 (continued)
NOTE 9 — SECURITIES LENDING (continued)
provides the Fund indemnification from loss with respect to the investment of collateral to the extent the cash collateral is invested in overnight repurchase agreements.
Cash collateral received in connection with securities lending is invested in cash equivalents, money market funds, repurchase agreements with maturities of not more than 99 days that are collateralized with U.S. Government securities, or certain short-term investments that have a remaining maturity of 190 days or less (“Permitted Investments”). Short-term investments include: securities, units, shares or other participations in short-term investment funds, pools or trusts; commercial paper, notes, bonds or other debt obligations, certificates of deposit, time deposits and other bank obligations and asset-backed commercial paper backed by diversified receivables and repurchase-backed programs. Permitted Investments are subject to certain guidelines established by the Adviser regarding liquidity, diversification, credit quality and average credit life/duration requirements. The securities purchased with cash collateral received are reflected in the Portfolio of Investments under Short-Term Investments.
Generally, in the event of counterparty default, the Fund has the right to use the collateral to offset losses incurred. The Agreement contains certain guarantees by BNY in the event of counterparty default and/or a borrower’s failure to return a loaned security; however, there would be a potential loss to the Fund in the event the Fund is delayed or prevented from exercising its right to dispose of the collateral. Engaging in securities lending could have a leveraging effect, which may intensify the credit, market and other risks associated with investing in a fund.
The following table represents a summary of the Fund’s securities lending agreements by counterparty which are subject to offset under the Agreement as of October 31, 2024:
| Counterparty | | Securities
Loaned at Value | | | Cash Collateral
Received(1) | | | Net
Amount | |
| J.P. Morgan Securities LLC | | $ | 506,824 | | | $ | (506,824 | ) | | $ | — | |
| Merrill Lynch International | | | 115,223 | | | | (115,223 | ) | | | — | |
| Total | | $ | 622,047 | | | $ | (622,047 | ) | | $ | — | |
(1) Cash Collateral with a fair value of $654,737 has been received in connection with the above securities lending transactions. Excess cash collateral received from the individual counterparty is not shown for financial reporting purposes.
NOTE 10 — FEDERAL INCOME TAXES
The amount of distributions from net investment income and net realized capital gains are determined in accordance with U.S federal income tax regulations, which may differ from GAAP for investment companies. These book/tax differences may be either temporary or permanent. Permanent differences are reclassified within the capital accounts based on their federal tax-basis treatment; temporary differences are not reclassified. Key differences include the treatment of foreign currency transactions, futures contracts, income from passive foreign investment companies (PFICs) and wash sale deferrals.
Dividends paid by the Fund from net investment income and distributions of net realized short-term capital gains are, for federal income tax purposes, taxable as ordinary income to shareholders.
The tax composition of dividends and distributions to shareholders was as follows:
Year Ended
October 31,
2024 | | | Period Ended
October 31,
2023 | |
Ordinary
Income | | | Ordinary
Income | |
| $ | 4,130,918 | | | $ | — | |
The tax-basis components of distributable earnings as of October 31, 2024 were:
Undistributed
Ordinary
Income | | | Unrealized
Appreciation/
(Depreciation) | | | Other | | | Total
Distributable
Earnings/(Loss) | |
| $ | 9,543,120 | | | $ | 13,104,810 | | | $ | (1,165,127 | ) | | $ | 21,482,803 | |
At October 31, 2024, the Fund did not have any capital loss carryforwards for U.S. federal income tax purposes.
The Fund’s major tax jurisdictions are U.S. federal and Arizona state.
NOTES TO FINANCIAL STATEMENTS as of October 31, 2024 (continued)
NOTE 10 — FEDERAL INCOME TAXES (continued)
As of October 31, 2024, no provision for income tax is required in the Fund’s financial statements as a result of tax positions taken on federal and state income tax returns for open tax years. The Fund’s federal and state income and federal excise tax returns for tax years for which the applicable statutes of limitations have not expired are subject to examination by the Internal Revenue Service and state department of revenue. Generally, the preceding four tax years remain subject to examination by these jurisdictions.
NOTE 11 — MARKET DISRUPTION AND GEOPOLITICAL RISK
The Fund is subject to the risk that geopolitical events will disrupt securities markets and adversely affect global economies and markets. Due to the increasing interdependence among global economies and markets, conditions in one country, market, or region might adversely impact markets, issuers and/or foreign exchange rates in other countries, including the United States. Wars, terrorism, global health crises and pandemics, and other geopolitical events that have led, and may continue to lead, to increased market volatility and may have adverse short- or long-term effects on U.S. and global economies and markets, generally. For example, the COVID-19 pandemic resulted in significant market volatility, exchange suspensions and closures, declines in global financial markets, higher default rates, supply chain disruptions, and a substantial economic downturn in economies throughout the world. The economic impacts of COVID-19 have created a unique challenge for real estate markets. Many businesses have either partially or fully transitioned to a remote-working environment and this transition may negatively impact the occupancy rates of commercial real estate over time. Natural and environmental disasters and systemic market dislocations are also highly disruptive to economies and markets. In addition, military action by Russia in Ukraine has, and may continue to, adversely affect global energy and financial markets and therefore could affect the value of investments, including beyond the direct exposure to Russian issuers or nearby geographic regions. The extent and duration of the military action, sanctions, and resulting market disruptions are impossible to predict and could be substantial. A number of U.S. domestic banks and foreign (non-U.S.) banks have experienced financial difficulties and, in some cases, failures. There can be no certainty that the actions taken by regulators to limit the effect of those financial difficulties
and failures on other banks or other financial institutions or on the U.S. or foreign (non-U.S.) economies generally will be successful. It is possible that more banks or other financial institutions will experience financial difficulties or fail, which may affect adversely other U.S. or foreign (non-U.S.) financial institutions and economies. These events as well as other changes in foreign (non-U.S.) and domestic economic, social, and political conditions also could adversely affect individual issuers or related groups of issuers, securities markets, interest rates, credit ratings, inflation, investor sentiment, and other factors affecting the value of the Fund’s investments. Any of these occurrences could disrupt the operations of the Fund and of the Fund’s service providers.
NOTE 12 — SUBSEQUENT EVENTS
Registration: The Fund’s Board approved the registration of the Fund’s shares under the 1933 Act, with a proposed effectiveness date of March 1, 2025.
Dividends: Subsequent to October 31, 2024, the Fund paid dividends and distributions per share of:
Net
Investment
Income | | Short-term
Capital
Gains | | Payable
Date | | Record
Date |
| $0.4834 | | $0.0468 | | December 13, 2024 | | December 11, 2024 |
The Fund has evaluated events occurring after the Statement of Assets and Liabilities date through the date that the financial statements were issued (“subsequent events”) to determine whether any subsequent events necessitated adjustment to or disclosure in the financial statements. Other than the above, no such subsequent events were identified.
| Voya VACS Series EME Fund | PORTFOLIO OF INVESTMENTS
as of October 31, 2024 |
| Shares | | | | Value | | | Percentage
of Net
Assets |
| COMMON STOCK: 98.0% |
| | | | Brazil: 7.0% |
| 29,602 | | | Allos SA | | $ | 113,576 | | | 0.0 | |
| 60,243 | | | Ambev SA | | | 131,305 | | | 0.1 | |
| 235,583 | | | Ambev SA, ADR | | | 513,571 | | | 0.2 | |
| 66,054 | | | B3 SA - Brasil Bolsa Balcao | | | 121,461 | | | 0.0 | |
| 301,988 | | | Banco Bradesco SA, ADR | | | 745,910 | | | 0.3 | |
| 64,528 | | | Banco Santander Brasil SA, ADR | | | 305,217 | | | 0.1 | |
| 41,159 | | | BB Seguridade Participacoes SA | | | 244,068 | | | 0.1 | |
| 132,975 (1) | | | BRF SA, ADR | | | 607,696 | | | 0.3 | |
| 8,112 | | | Cia de Saneamento Basico do Estado de Sao Paulo SABESP | | | 129,463 | | | 0.1 | |
| 11,203 | | | Energisa S/A | | | 83,525 | | | 0.0 | |
| 19,093 | | | Equatorial Energia SA | | | 106,349 | | | 0.0 | |
| 187,502 | | | Itau Unibanco Holding SA, ADR | | | 1,134,387 | | | 0.5 | |
| 36,054 | | | JBS S/A | | | 225,645 | | | 0.1 | |
| 39,469 | | | Klabin SA | | | 143,309 | | | 0.1 | |
| 15,041 | | | Petroleo Brasileiro SA | | | 101,342 | | | 0.0 | |
| 151,150 | | | Petroleo Brasileiro SA - Foreign, ADR | | | 2,032,968 | | | 0.9 | |
| 411,367 | | | Raia Drogasil SA | | | 1,739,854 | | | 0.8 | |
| 37,837 | | | Rumo SA | | | 129,791 | | | 0.1 | |
| 11,540 | | | Suzano SA | | | 119,195 | | | 0.0 | |
| 21,510 | | | Telefonica Brasil SA | | | 196,016 | | | 0.1 | |
| 59,785 | | | Telefonica Brasil SA, ADR | | | 544,641 | | | 0.2 | |
| 58,034 | | | TIM SA/Brazil | | | 166,345 | | | 0.1 | |
| 32,200 | | | TIM SA/Brazil, ADR | | | 460,460 | | | 0.2 | |
| 385,996 | | | Totvs SA | | | 1,992,444 | | | 0.9 | |
| 56,879 | | | Vale SA, ADR | | | 608,605 | | | 0.3 | |
| 41,302 | | | Vale SA - Foreign | | | 442,606 | | | 0.2 | |
| 40,252 | | | Vibra Energia SA | | | 155,552 | | | 0.1 | |
| 153,173 | | | XP, Inc. - Class A | | | 2,674,401 | | | 1.2 | |
| | | | | | | 15,969,702 | | | 7.0 | |
| | | | Chile: 0.3% |
| 47,596 | | | Cencosud SA | | | 98,715 | | | 0.1 | |
| 13,236 (2) | | | Sociedad Quimica y Minera de Chile SA, ADR | | | 508,130 | | | 0.2 | |
| | | | | | | 606,845 | | | 0.3 | |
| | | | China: 13.5% |
| 363,600 | | | Alibaba Group Holding Ltd. | | | 4,447,670 | | | 2.0 | |
| 64,450 (1) | | | Baidu, Inc. - Class A | | | 735,428 | | | 0.3 | |
| 3,105 (1) | | | BeiGene Ltd., ADR | | | 629,197 | | | 0.3 | |
| 3,000 | | | BYD Co. Ltd. - Class H | | | 108,356 | | | 0.0 | |
| 963,000 (3) | | | CGN Power Co. Ltd. - Class H | | | 346,139 | | | 0.2 | |
| 234,000 | | | China Communications Services Corp. Ltd. - Class H | | | 125,716 | | | 0.1 | |
| 188,000 | | | China Construction Bank Corp. - Class H | | | 145,932 | | | 0.1 | |
| 25,000 | | | China Shenhua Energy Co. Ltd. - Class H | | | 108,248 | | | 0.0 | |
| 312,000 | | | CSPC Pharmaceutical Group Ltd. | | | 230,984 | | | 0.1 | |
| 19,900 | | | ENN Energy Holdings Ltd. | | | 140,201 | | | 0.1 | |
| Shares | | | | Value | | | Percentage
of Net
Assets |
| COMMON STOCK: (continued) |
| | | | China (continued) |
| 379,297 | | | H World Group Ltd. | | $ | 1,396,117 | | | 0.6 | |
| 60,200 | | | Haier Smart Home Co. Ltd. - Class H | | | 218,479 | | | 0.1 | |
| 134,000 | | | Hengan International Group Co. Ltd. | | | 395,683 | | | 0.2 | |
| 95,100 | | | Inner Mongolia Yitai Coal Co. Ltd. -
Class B | | | 220,463 | | | 0.1 | |
| 76,500 (1)(3) | | | Innovent Biologics, Inc. | | | 332,559 | | | 0.1 | |
| 23,132 (1) | | | iQIYI, Inc., ADR | | | 60,375 | | | 0.0 | |
| 82,700 | | | JD.com, Inc. - Class A | | | 1,677,092 | | | 0.7 | |
| 128,000 | | | Jiangsu Expressway Co. Ltd. - Class H | | | 128,920 | | | 0.1 | |
| 68,000 | | | Jiangxi Copper Co. Ltd. - Class H | | | 114,383 | | | 0.1 | |
| 5,200 | | | Kweichow Moutai Co. Ltd. - Class A | | | 1,116,856 | | | 0.5 | |
| 41,100 | | | Lao Feng Xiang Co. Ltd. - Class B | | | 144,677 | | | 0.1 | |
| 89,400 (1)(3) | | | Meituan - Class B | | | 2,112,555 | | | 0.9 | |
| 8,900 | | | NetEase, Inc. | | | 143,190 | | | 0.1 | |
| 295,000 | | | People's Insurance Co. Group of China Ltd. - Class H | | | 148,903 | | | 0.1 | |
| 1,090,000 | | | PetroChina Co. Ltd. - Class H | | | 818,497 | | | 0.4 | |
| 142,000 | | | PICC Property & Casualty Co. Ltd. -
Class H | | | 215,410 | | | 0.1 | |
| 139,000 (3) | | | Qingdao Port International Co. Ltd. -
Class H | | | 97,267 | | | 0.0 | |
| 129,428 | | | Shenzhen International Holdings Ltd. | | | 109,881 | | | 0.0 | |
| 19,400 | | | Shenzhen Mindray Bio- Medical Electronics Co. Ltd. - Class A | | | 726,838 | | | 0.3 | |
| 105,227 | | | Tencent Holdings Ltd. | | | 5,486,760 | | | 2.4 | |
| 324,000 | | | Tingyi Cayman Islands Holding Corp. | | | 472,682 | | | 0.2 | |
| 3,150 (1) | | | Trip.com Group Ltd. | | | 202,717 | | | 0.1 | |
| 21,431 (1) | | | Trip.com Group Ltd., ADR | | | 1,380,156 | | | 0.6 | |
| 80,000 | | | Tsingtao Brewery Co. Ltd. - Class H | | | 516,073 | | | 0.2 | |
| 705,000 | | | Uni-President China Holdings Ltd. | | | 659,846 | | | 0.3 | |
| 27,500 | | | Weibo Corp. - Class A | | | 250,786 | | | 0.1 | |
| 132,000 | | | Weichai Power Co. Ltd. - Class H | | | 199,460 | | | 0.1 | |
| 59,400 | | | Wuliangye Yibin Co. Ltd. - Class A | | | 1,226,453 | | | 0.5 | |
| 169,500 | | | Yangzijiang Shipbuilding Holdings Ltd. | | | 329,304 | | | 0.1 | |
| 61,842 | | | Yum China Holdings, Inc. | | | 2,778,896 | | | 1.2 | |
| | | | | | | 30,699,149 | | | 13.5 | |
| | | | Czechia: 0.1% |
| 5,472 | | | CEZ AS | | | 212,036 | | | 0.1 | |
| | | | | | | | | | | |
| | | | Egypt: 0.1% |
| 74,666 | | | Commercial International Bank Egypt SAE | | | 122,028 | | | 0.1 | |
See Accompanying Notes to Financial Statements
| Voya VACS Series EME Fund | PORTFOLIO OF INVESTMENTS
as of October 31, 2024 (continued) |
| Shares | | | | Value | | | Percentage
of Net
Assets |
| COMMON STOCK: (continued) |
| | | | France: 0.7% |
| 4,554 | | | L'Oreal SA | | $ | 1,708,524 | | | 0.7 | |
| | | | | | | | | | | |
| | | | Germany: 0.6% |
| 5,250 | | | Adidas AG | | | 1,257,328 | | | 0.6 | |
| | | | | | | | | | | |
| | | | Greece: 0.4% |
| 5,860 | | | GEK Terna Holding Real Estate Construction SA | | | 110,599 | | | 0.1 | |
| 18,598 | | | Hellenic Telecommunications Organization SA | | | 307,315 | | | 0.1 | |
| 12,529 | | | Helleniq Energy Holdings SA | | | 94,224 | | | 0.0 | |
| 6,172 | | | Jumbo SA | | | 164,728 | | | 0.1 | |
| 10,329 | | | OPAP SA | | | 176,170 | | | 0.1 | |
| | | | | | | 853,036 | | | 0.4 | |
| | | | Hong Kong: 2.5% |
| 385,459 | | | AIA Group Ltd. | | | 3,042,165 | | | 1.3 | |
| 44,500 | | | Beijing Enterprises Holdings Ltd. | | | 145,797 | | | 0.1 | |
| 1,169,361 (3) | | | Budweiser Brewing Co. APAC Ltd. | | | 1,219,618 | | | 0.5 | |
| 246,000 | | | China Everbright Environment Group Ltd. | | | 119,126 | | | 0.1 | |
| 111,800 | | | China Gas Holdings Ltd. | | | 96,009 | | | 0.0 | |
| 56,000 | | | China Merchants Port Holdings Co. Ltd. | | | 92,093 | | | 0.0 | |
| 44,700 | | | China Resources Gas Group Ltd. | | | 172,347 | | | 0.1 | |
| 52,000 | | | China Resources Power Holdings Co. Ltd. | | | 125,086 | | | 0.1 | |
| 70,000 | | | China State Construction International Holdings Ltd. | | | 102,828 | | | 0.0 | |
| 662,000 | | | Kunlun Energy Co. Ltd. | | | 627,816 | | | 0.3 | |
| | | | | | | 5,742,885 | | | 2.5 | |
| | | | Hungary: 0.4% |
| 62,672 | | | Magyar Telekom Telecommunications PLC | | | 191,722 | | | 0.1 | |
| 53,447 | | | MOL Hungarian Oil & Gas PLC | | | 370,897 | | | 0.2 | |
| 9,491 | | | Richter Gedeon Nyrt | | | 274,156 | | | 0.1 | |
| | | | | | | 836,775 | | | 0.4 | |
| | | | Iceland: 0.1% |
| 196,444 | | | Hagar hf | | | 136,335 | | | 0.1 | |
| | | | | | | | | | | |
| | | | India: 17.4% |
| 4,684 | | | ACC Ltd. | | | 128,950 | | | 0.1 | |
| 1,715 | | | AIA Engineering Ltd. | | | 77,787 | | | 0.0 | |
| 1,818 | | | Alkem Laboratories Ltd. | | | 124,758 | | | 0.1 | |
| 12,949 | | | Ambuja Cements Ltd. | | | 89,270 | | | 0.0 | |
| 39,592 | | | Asian Paints Ltd. | | | 1,378,913 | | | 0.6 | |
| 8,258 | | | Axis Bank Ltd. | | | 113,441 | | | 0.1 | |
| 1,111 | | | Bajaj Auto Ltd. | | | 129,758 | | | 0.1 | |
| 22,994 | | | Bajaj Finance Ltd. | | | 1,878,165 | | | 0.8 | |
| 828 | | | Bajaj Holdings & Investment Ltd. | | | 100,624 | | | 0.0 | |
| 48,686 | | | Bharat Electronics Ltd. | | | 164,344 | | | 0.1 | |
| 5,764 | | | Bharat Forge Ltd. | | | 96,480 | | | 0.0 | |
| 83,681 | | | Bharat Petroleum Corp. Ltd. | | | 308,683 | | | 0.1 | |
| Shares | | | | Value | | | Percentage
of Net
Assets |
| COMMON STOCK: (continued) |
| | | | India (continued) |
| 13,280 | | | Bharti Airtel Ltd. | | $ | 220,410 | | | 0.1 | |
| 292 | | | Bosch Ltd. | | | 121,805 | | | 0.1 | |
| 2,813 | | | Britannia Industries Ltd. | | | 191,250 | | | 0.1 | |
| 14,688 | | | Cipla Ltd./India | | | 270,211 | | | 0.1 | |
| 54,904 | | | Coal India Ltd. | | | 294,503 | | | 0.1 | |
| 1,794 | | | Coforge Ltd. | | | 161,750 | | | 0.1 | |
| 4,516 | | | Colgate-Palmolive India Ltd. | | | 164,249 | | | 0.1 | |
| 10,165 | | | Container Corp. Of India Ltd. | | | 102,214 | | | 0.0 | |
| 4,817 | | | Coromandel International Ltd. | | | 95,439 | | | 0.0 | |
| 3,791 | | | Cummins India Ltd. | | | 157,251 | | | 0.1 | |
| 2,112 | | | Divi's Laboratories Ltd. | | | 147,609 | | | 0.1 | |
| 18,180 | | | Dr Reddy's Laboratories Ltd. | | | 274,987 | | | 0.1 | |
| 3,378 | | | Eicher Motors Ltd. | | | 196,051 | | | 0.1 | |
| 23,509 | | | Exide Industries Ltd. | | | 127,165 | | | 0.1 | |
| 43,772 | | | GAIL India Ltd. | | | 103,717 | | | 0.0 | |
| 5,742 | | | Havells India Ltd. | | | 111,747 | | | 0.1 | |
| 54,758 | | | HCL Technologies Ltd. | | | 1,145,791 | | | 0.5 | |
| 3,769 (3) | | | HDFC Asset Management Co. Ltd. | | | 192,337 | | | 0.1 | |
| 81,961 | | | HDFC Bank Ltd. | | | 1,684,685 | | | 0.7 | |
| 71,053 | | | HDFC Bank Ltd., ADR | | | 4,478,471 | | | 2.0 | |
| 5,812 | | | Hero MotoCorp Ltd. | | | 343,666 | | | 0.2 | |
| 29,494 | | | Hindalco Industries Ltd. | | | 239,326 | | | 0.1 | |
| 1,679 | | | Hindustan Aeronautics Ltd. | | | 84,491 | | | 0.0 | |
| 22,910 | | | Hindustan Petroleum Corp. Ltd. | | | 103,592 | | | 0.0 | |
| 15,138 | | | Hindustan Unilever Ltd. | | | 454,501 | | | 0.2 | |
| 3,759 (3) | | | ICICI Lombard General Insurance Co. Ltd. | | | 85,394 | | | 0.0 | |
| 11,618 | | | Indian Hotels Co. Ltd. | | | 93,174 | | | 0.0 | |
| 86,523 | | | Indian Oil Corp. Ltd. | | | 145,824 | | | 0.1 | |
| 21,341 | | | Indraprastha Gas Ltd. | | | 106,414 | | | 0.0 | |
| 20,870 (1) | | | Indus Towers Ltd. | | | 84,209 | | | 0.0 | |
| 62,292 | | | Infosys Ltd. | | | 1,299,700 | | | 0.6 | |
| 189,197 | | | Infosys Ltd. - Foreign, ADR | | | 3,956,109 | | | 1.7 | |
| 2,320 (1)(3) | | | InterGlobe Aviation Ltd. | | | 111,452 | | | 0.1 | |
| 3,958 | | | Larsen & Toubro Ltd. | | | 170,023 | | | 0.1 | |
| 7,830 | | | Lupin Ltd. | | | 203,163 | | | 0.1 | |
| 3,106 | | | Mahindra & Mahindra Ltd. | | | 100,300 | | | 0.0 | |
| 12,901 | | | Marico Ltd. | | | 98,023 | | | 0.0 | |
| 950 | | | Maruti Suzuki India Ltd. | | | 124,690 | | | 0.1 | |
| 11,726 | | | Max Healthcare Institute Ltd. | | | 141,549 | | | 0.1 | |
| 136 | | | MRF Ltd. | | | 197,797 | | | 0.1 | |
| 76,258 | | | NHPC Ltd. | | | 74,661 | | | 0.0 | |
| 67,190 | | | NMDC Ltd. | | | 176,455 | | | 0.1 | |
| 45,127 | | | NTPC Ltd. | | | 218,261 | | | 0.1 | |
| 45,245 | | | Oil & Natural Gas Corp. Ltd. | | | 142,690 | | | 0.1 | |
| 776 | | | Oracle Financial Services Software Ltd. | | | 100,151 | | | 0.0 | |
| 2,996 | | | Persistent Systems Ltd. | | | 190,760 | | | 0.1 | |
| 63,756 | | | Petronet LNG Ltd. | | | 251,587 | | | 0.1 | |
| 4,348 | | | Phoenix Mills Ltd. | | | 78,543 | | | 0.0 | |
| 2,884 | | | PI Industries Ltd. | | | 153,411 | | | 0.1 | |
| 2,827 | | | Pidilite Industries Ltd. | | | 105,560 | | | 0.0 | |
See Accompanying Notes to Financial Statements
| Voya VACS Series EME Fund | PORTFOLIO OF INVESTMENTS
as of October 31, 2024 (continued) |
| Shares | | | | Value | | | Percentage
of Net
Assets |
| COMMON STOCK: (continued) |
| | | | India (continued) |
| 66,444 | | | Power Grid Corp. of India Ltd. | | $ | 252,752 | | | 0.1 | |
| 512,438 | | | Reliance Industries Ltd. | | | 8,102,657 | | | 3.6 | |
| 147,226 (1) | | | Reliance Strategic Investments Ltd. | | | 563,113 | | | 0.3 | |
| 1,282 | | | Siemens Ltd. | | | 106,055 | | | 0.0 | |
| 10,092 | | | Sun Pharmaceutical Industries Ltd. | | | 221,472 | | | 0.1 | |
| 1,546 | | | Supreme Industries Ltd. | | | 78,766 | | | 0.0 | |
| 60,608 | | | Tata Consultancy Services Ltd. | | | 2,850,825 | | | 1.3 | |
| 64,958 | | | Tata Consumer Products Ltd. | | | 772,819 | | | 0.3 | |
| 15,059 | | | Tata Motors Ltd. | | | 148,949 | | | 0.1 | |
| 23,217 | | | Tata Power Co. Ltd. | | | 121,020 | | | 0.1 | |
| 75,008 | | | Tata Steel Ltd. | | | 131,828 | | | 0.1 | |
| 14,807 | | | Tech Mahindra Ltd. | | | 281,837 | | | 0.1 | |
| 2,588 | | | Titan Co. Ltd. | | | 100,246 | | | 0.0 | |
| 2,577 | | | Torrent Pharmaceuticals Ltd. | | | 97,953 | | | 0.0 | |
| 5,717 | | | Torrent Power Ltd. | | | 123,675 | | | 0.1 | |
| 1,314 | | | Trent Ltd. | | | 111,037 | | | 0.1 | |
| 1,353 | | | UltraTech Cement Ltd. | | | 177,670 | | | 0.1 | |
| 5,390 | | | United Spirits Ltd. | | | 92,747 | | | 0.0 | |
| 30,002 | | | Vedanta Ltd. | | | 165,151 | | | 0.1 | |
| 8,478 | | | Voltas Ltd. | | | 165,952 | | | 0.1 | |
| 24,747 | | | Wipro Ltd. | | | 161,089 | | | 0.1 | |
| 31,930 (1) | | | Zomato Ltd. | | | 91,607 | | | 0.0 | |
| 8,376 | | | Zydus Lifesciences Ltd. | | | 99,490 | | | 0.0 | |
| | | | | | | 39,487,001 | | | 17.4 | |
| | | | Indonesia: 2.0% |
| 478,000 | | | Adaro Energy Indonesia Tbk PT | | | 110,018 | | | 0.0 | |
| 2,205,800 | | | Astra International Tbk PT | | | 716,107 | | | 0.3 | |
| 4,466,578 | | | Bank Central Asia Tbk PT | | | 2,917,007 | | | 1.3 | |
| 275,900 | | | Bank Mandiri Persero Tbk PT | | | 117,125 | | | 0.1 | |
| 908,300 | | | Telkom Indonesia Persero Tbk PT | | | 162,352 | | | 0.1 | |
| 2,443,100 | | | Unilever Indonesia Tbk PT | | | 305,776 | | | 0.1 | |
| 102,400 | | | United Tractors Tbk PT | | | 178,741 | | | 0.1 | |
| | | | | | | 4,507,126 | | | 2.0 | |
| | | | Ireland: 0.8% |
| 15,975 (1) | | | PDD Holdings, Inc., ADR | | | 1,926,425 | | | 0.8 | |
| | | | | | | | | | | |
| | | | Japan: 1.5% |
| 10,976 | | | Fast Retailing Co. Ltd. | | | 3,509,263 | | | 1.5 | |
| | | | | | | | | | | |
| | | | Kuwait: 0.1% |
| 97,516 | | | Mobile Telecommunications Co. KSCP | | | 145,071 | | | 0.1 | |
| | | | | | | | | | | |
| | | | Luxembourg: 0.1% |
| 9,129 | | | Reinet Investments SCA | | | 253,360 | | | 0.1 | |
| | | | | | | | | | | |
| | | | Malaysia: 1.3% |
| 82,700 | | | AMMB Holdings Bhd | | | 96,009 | | | 0.0 | |
| 47,900 | | | CIMB Group Holdings Bhd | | | 86,859 | | | 0.0 | |
| 115,000 | | | Gamuda Bhd | | | 223,257 | | | 0.1 | |
| 100,100 | | | Genting Bhd | | | 89,925 | | | 0.0 | |
| | | | | | | | | | | |
| Shares | | | | Value | | | Percentage
of Net
Assets |
| COMMON STOCK: (continued) |
| | | | Malaysia (continued) |
| 213,100 | | | IJM Corp. Bhd | | $ | 146,138 | | | 0.1 | |
| 46,900 | | | Malaysia Airports Holdings Bhd | | | 108,602 | | | 0.0 | |
| 98,100 | | | MISC Bhd | | | 167,804 | | | 0.1 | |
| 199,000 (3) | | | MR DIY Group M Bhd | | | 99,172 | | | 0.0 | |
| 45,200 | | | Petronas Gas Bhd | | | 178,364 | | | 0.1 | |
| 620,400 | | | Public Bank Bhd | | | 624,298 | | | 0.3 | |
| 294,300 | | | Sime Darby Bhd | | | 155,203 | | | 0.1 | |
| 100,100 | | | Telekom Malaysia Bhd | | | 148,196 | | | 0.1 | |
| 226,900 | | | Tenaga Nasional Bhd | | | 725,885 | | | 0.3 | |
| 206,000 | | | YTL Corp. Bhd | | | 92,088 | | | 0.0 | |
| 180,900 | | | YTL Power International Bhd | | | 126,007 | | | 0.1 | |
| | | | | | | 3,067,807 | | | 1.3 | |
| | | | Mexico: 5.7% |
| 181,600 | | | Alfa SAB de CV - Class A | | | 131,053 | | | 0.1 | |
| 190,497 | | | America Movil SAB de CV | | | 150,707 | | | 0.1 | |
| 51,431 | | | America Movil SAB de CV - Foreign, ADR | | | 809,524 | | | 0.4 | |
| 16,840 | | | Arca Continental SAB de CV | | | 143,653 | | | 0.1 | |
| 322,694 | | | Cemex SAB de CV | | | 169,173 | | | 0.1 | |
| 95,115 | | | Cemex SAB de CV - Foreign, ADR | | | 496,500 | | | 0.2 | |
| 40,823 | | | Coca-Cola Femsa SAB de CV | | | 337,813 | | | 0.1 | |
| 7,555 | | | Coca-Cola Femsa SAB de CV - Foreign, ADR | | | 629,860 | | | 0.3 | |
| 39,223 | | | Corp Inmobiliaria Vesta SAB de CV | | | 102,127 | | | 0.0 | |
| 25,790 | | | El Puerto de Liverpool SAB de CV -
Class C1 | | | 135,604 | | | 0.1 | |
| 105,256 | | | Fibra Uno Administracion SA de CV | | | 121,250 | | | 0.0 | |
| 54,327 | | | Fomento Economico Mexicano SAB de CV | | | 526,314 | | | 0.2 | |
| 38,382 | | | Fomento Economico Mexicano SAB de CV - Foreign, ADR | | | 3,718,832 | | | 1.6 | |
| 10,464 | | | Gruma SAB de CV - Class B | | | 179,895 | | | 0.1 | |
| 11,368 | | | Grupo Aeroportuario del Centro Norte SAB de CV | | | 94,810 | | | 0.0 | |
| 9,824 | | | Grupo Aeroportuario del Pacifico SAB de CV - Class B | | | 171,126 | | | 0.1 | |
| 8,622 | | | Grupo Aeroportuario del Sureste SAB de CV - Class B | | | 229,960 | | | 0.1 | |
| 24,805 | | | Grupo Bimbo SAB de CV | | | 76,822 | | | 0.0 | |
| 18,674 | | | Grupo Comercial Chedraui SA de CV | | | 118,262 | | | 0.0 | |
| 122,537 | | | Grupo Financiero Banorte SAB de CV - Class O | | | 855,208 | | | 0.4 | |
| 55,474 (1) | | | Grupo Financiero Inbursa SAB de CV - Class O | | | 123,316 | | | 0.1 | |
| 33,683 | | | Grupo Mexico SAB de CV | | | 176,735 | | | 0.1 | |
| 110,222 | | | Grupo Televisa SAB, ADR | | | 275,555 | | | 0.1 | |
| 34,993 (1) | | | Ollamani SAB | | | 59,460 | | | 0.0 | |
See Accompanying Notes to Financial Statements
| Voya VACS Series EME Fund | PORTFOLIO OF INVESTMENTS
as of October 31, 2024 (continued) |
| Shares | | | | Value | | | Percentage
of Net
Assets |
| COMMON STOCK: (continued) |
| | | | Mexico (continued) |
| 84,676 | | | Prologis Property Mexico SA de CV | | $ | 283,530 | | | 0.1 | |
| 16,546 | | | Promotora y Operadora de Infraestructura SAB de CV | | | 144,163 | | | 0.1 | |
| 997,797 | | | Wal-Mart de Mexico SAB de CV | | | 2,755,106 | | | 1.2 | |
| | | | | | | 13,016,358 | | | 5.7 | |
| | | | Netherlands: 1.1% |
| 29,296 | | | Heineken NV | | | 2,402,759 | | | 1.0 | |
| 19,110 | | | NEPI Rockcastle NV | | | 149,986 | | | 0.1 | |
| | | | | | | 2,552,745 | | | 1.1 | |
| | | | Peru: 0.5% |
| 29,182 | | | Cia de Minas Buenaventura SAA, ADR | | | 381,117 | | | 0.1 | |
| 4,650 | | | Credicorp Ltd. | | | 856,204 | | | 0.4 | |
| | | | | | | 1,237,321 | | | 0.5 | |
| | | | Philippines: 0.2% |
| 524,000 | | | DMCI Holdings, Inc. | | | 100,770 | | | 0.0 | |
| 20,000 | | | International Container Terminal Services, Inc. | | | 136,293 | | | 0.0 | |
| 18,260 | | | Manila Electric Co. | | | 153,973 | | | 0.1 | |
| 7,165 | | | PLDT, Inc. | | | 176,087 | | | 0.1 | |
| | | | | | | 567,123 | | | 0.2 | |
| | | | Qatar: 0.2% |
| 35,516 | | | Ooredoo QPSC | | | 111,591 | | | 0.0 | |
| 38,959 | | | Qatar Fuel QSC | | | 164,032 | | | 0.1 | |
| 73,596 | | | Qatar Navigation QSC | | | 231,441 | | | 0.1 | |
| | | | | | | 507,064 | | | 0.2 | |
| | | | Romania: 0.2% |
| 1,668,375 | | | OMV Petrom SA | | | 270,043 | | | 0.1 | |
| 5,017 | | | Societatea De Producere A Energiei Electrice in Hidrocentrale Hidroelectrica SA | | | 132,869 | | | 0.1 | |
| | | | | | | 402,912 | | | 0.2 | |
| | | | Saudi Arabia: 0.6% |
| 2,447 | | | Astra Industrial Group | | | 115,975 | | | 0.1 | |
| 2,076 | | | Bupa Arabia for Cooperative Insurance Co. | | | 111,326 | | | 0.0 | |
| 15,437 | | | Etihad Etisalat Co. | | | 212,545 | | | 0.1 | |
| 33,856 | | | Jarir Marketing Co. | | | 119,038 | | | 0.1 | |
| 2,988 | | | Riyadh Cables Group Co. | | | 81,090 | | | 0.0 | |
| 67,000 (3) | | | Saudi Arabian Oil Co. | | | 481,265 | | | 0.2 | |
| 13,505 | | | Saudi Telecom Co. | | | 151,570 | | | 0.1 | |
| | | | | | | 1,272,809 | | | 0.6 | |
| | | | South Africa: 2.0% |
| 12,635 | | | Bid Corp. Ltd. | | | 298,961 | | | 0.1 | |
| 11,526 | | | Bidvest Group Ltd. | | | 186,515 | | | 0.1 | |
| 705 | | | Capitec Bank Holdings Ltd. | | | 127,359 | | | 0.0 | |
| 12,230 | | | Clicks Group Ltd. | | | 261,068 | | | 0.1 | |
| 18,199 | | | Exxaro Resources Ltd. | | | 171,618 | | | 0.1 | |
| 15,092 | | | Foschini Group Ltd. | | | 131,351 | | | 0.1 | |
| 17,054 | | | Mr Price Group Ltd. | | | 248,764 | | | 0.1 | |
| 51,513 | | | OUTsurance Group Ltd. | | | 175,460 | | | 0.1 | |
| 400,008 | | | Sanlam Ltd. | | | 1,990,511 | | | 0.9 | |
| 17,195 | | | Shoprite Holdings Ltd. | | | 296,965 | | | 0.1 | |
| 7,587 | | | Standard Bank Group Ltd. | | | 104,454 | | | 0.0 | |
| Shares | | | | Value | | | Percentage
of Net
Assets |
| COMMON STOCK: (continued) |
| | | | South Africa (continued) |
| 14,018 | | | Tiger Brands Ltd. | | $ | 187,991 | | | 0.1 | |
| 22,151 | | | Vodacom Group Ltd. | | | 138,681 | | | 0.1 | |
| 55,143 | | | Woolworths Holdings Ltd./ South Africa | | | 203,619 | | | 0.1 | |
| | | | | | | 4,523,317 | | | 2.0 | |
| | | | South Korea: 15.1% |
| 1,046 | | | CJ Corp. | | | 77,546 | | | 0.0 | |
| 1,971 | | | Coway Co. Ltd. | | | 90,049 | | | 0.0 | |
| 1,875 | | | DB Insurance Co. Ltd. | | | 147,786 | | | 0.1 | |
| 4,089 | | | GS Holdings Corp. | | | 121,795 | | | 0.1 | |
| 2,320 | | | Hana Financial Group, Inc. | | | 100,095 | | | 0.0 | |
| 8,388 | | | Hankook Tire & Technology Co. Ltd. | | | 213,631 | | | 0.1 | |
| 2,687 | | | HD Hyundai Co. Ltd. | | | 155,036 | | | 0.1 | |
| 1,267 (1) | | | HD Korea Shipbuilding & Offshore Engineering Co. Ltd. | | | 167,638 | | | 0.1 | |
| 2,363 | | | Hyundai Glovis Co. Ltd. | | | 207,902 | | | 0.1 | |
| 2,668 | | | Hyundai Mobis Co. Ltd. | | | 479,527 | | | 0.2 | |
| 690 | | | Hyundai Motor Co. | | | 106,281 | | | 0.0 | |
| 43,797 | | | Kakao Corp. | | | 1,165,686 | | | 0.5 | |
| 2,480 | | | KB Financial Group, Inc. | | | 161,371 | | | 0.1 | |
| 9,174 | | | Kia Corp. | | | 606,667 | | | 0.3 | |
| 6,308 (1) | | | Korea Electric Power Corp. | | | 105,461 | | | 0.0 | |
| 7,215 | | | Korean Air Lines Co. Ltd. | | | 124,544 | | | 0.1 | |
| 2,895 | | | KT&G Corp. | | | 229,962 | | | 0.1 | |
| 1,979 | | | LG Corp. | | | 108,144 | | | 0.1 | |
| 1,368 | | | LG Electronics, Inc. | | | 88,097 | | | 0.0 | |
| 71,979 | | | LG Uplus Corp. | | | 521,686 | | | 0.2 | |
| 22,739 | | | NAVER Corp. | | | 2,781,475 | | | 1.2 | |
| 2,125 | | | S-1 Corp. | | | 99,393 | | | 0.0 | |
| 10,378 | | | Samsung C&T Corp. | | | 876,281 | | | 0.4 | |
| 1,326 | | | Samsung Electro- Mechanics Co. Ltd. | | | 112,743 | | | 0.1 | |
| 132,518 | | | Samsung Electronics Co. Ltd. | | | 5,626,846 | | | 2.5 | |
| 435 | | | Samsung Fire & Marine Insurance Co. Ltd. | | | 105,462 | | | 0.0 | |
| 15,973 | | | Samsung Life Insurance Co. Ltd. | | | 1,168,816 | | | 0.5 | |
| 20,888 | | | Shinhan Financial Group Co. Ltd. | | | 778,082 | | | 0.3 | |
| 59,686 | | | SK Hynix, Inc. | | | 7,813,723 | | | 3.4 | |
| 123,163 (1) | | | SK Square Co. Ltd. | | | 7,437,794 | | | 3.3 | |
| 60,107 | | | SK Telecom Co. Ltd. | | | 2,466,748 | | | 1.1 | |
| 10,453 | | | Woori Financial Group, Inc. | | | 116,373 | | | 0.1 | |
| | | | | | | 34,362,640 | | | 15.1 | |
| | | | Taiwan: 16.8% |
| 7,000 | | | Accton Technology Corp. | | | 117,626 | | | 0.0 | |
| 12,699 | | | Advantech Co. Ltd. | | | 124,451 | | | 0.1 | |
| 88,000 | | | ASE Technology Holding Co. Ltd. | | | 414,990 | | | 0.2 | |
| 27,000 | | | Asustek Computer, Inc. | | | 476,763 | | | 0.2 | |
| 18,000 | | | Catcher Technology Co. Ltd. | | | 131,007 | | | 0.1 | |
| 94,000 | | | Cheng Shin Rubber Industry Co. Ltd. | | | 135,008 | | | 0.1 | |
See Accompanying Notes to Financial Statements
| Voya VACS Series EME Fund | PORTFOLIO OF INVESTMENTS
as of October 31, 2024 (continued) |
| Shares | | | | Value | | | Percentage
of Net
Assets |
| COMMON STOCK: (continued) |
| | | | Taiwan (continued) |
| 62,000 | | | Chicony Electronics Co. Ltd. | | $ | 312,672 | | | 0.1 | |
| 57,000 | | | Chunghwa Telecom Co. Ltd. | | | 216,368 | | | 0.1 | |
| 97,000 | | | Compal Electronics, Inc. | | | 106,482 | | | 0.0 | |
| 99,000 | | | CTBC Financial Holding Co. Ltd. | | | 109,749 | | | 0.0 | |
| 28,000 | | | Delta Electronics, Inc. | | | 345,825 | | | 0.1 | |
| 166,000 | | | Eva Airways Corp. | | | 191,714 | | | 0.1 | |
| 146,000 | | | Far Eastern New Century Corp. | | | 168,473 | | | 0.1 | |
| 34,000 | | | Far EasTone Telecommunications Co. Ltd. | | | 93,887 | | | 0.0 | |
| 694,000 (1)(2)(3) | | FIT Hon Teng Ltd. | | | 234,022 | | | 0.1 | |
| 130,000 | | | Hon Hai Precision Industry Co. Ltd. | | | 833,264 | | | 0.4 | |
| 5,000 | | | International Games System Co. Ltd. | | | 157,761 | | | 0.1 | |
| 33,000 | | | King Yuan Electronics Co. Ltd. | | | 124,374 | | | 0.1 | |
| 2,400 | | | Largan Precision Co. Ltd. | | | 168,098 | | | 0.1 | |
| 57,000 | | | Lite-On Technology Corp. | | | 178,683 | | | 0.1 | |
| 3,000 | | | Lotes Co. Ltd. | | | 152,575 | | | 0.1 | |
| 145,000 | | | MediaTek, Inc. | | | 5,644,589 | | | 2.5 | |
| 24,000 | | | Micro-Star International Co. Ltd. | | | 131,283 | | | 0.1 | |
| 23,000 | | | Novatek Microelectronics Corp. | | | 355,381 | | | 0.2 | |
| 328,000 | | | Pegatron Corp. | | | 994,551 | | | 0.4 | |
| 176,000 | | | Pou Chen Corp. | | | 205,773 | | | 0.1 | |
| 56,000 | | | Powertech Technology, Inc. | | | 218,059 | | | 0.1 | |
| 11,000 | | | President Chain Store Corp. | | | 101,000 | | | 0.0 | |
| 29,000 | | | Quanta Computer, Inc. | | | 263,359 | | | 0.1 | |
| 16,000 | | | Realtek Semiconductor Corp. | | | 234,760 | | | 0.1 | |
| 143,350 | | | SinoPac Financial Holdings Co. Ltd. | | | 101,761 | | | 0.0 | |
| 81,000 | | | Synnex Technology International Corp. | | | 177,914 | | | 0.1 | |
| 109,000 | | | Taiwan Cement Corp. | | | 108,283 | | | 0.0 | |
| 51,000 | | | Taiwan Fertilizer Co. Ltd. | | | 90,389 | | | 0.0 | |
| 20,000 | | | Taiwan Secom Co. Ltd. | | | 84,674 | | | 0.0 | |
| 758,575 | | | Taiwan Semiconductor Manufacturing Co. Ltd. | | | 23,788,524 | | | 10.5 | |
| 52,000 | | | Uni-President Enterprises Corp. | | | 145,621 | | | 0.1 | |
| 229,000 | | | United Microelectronics Corp. | | | 330,389 | | | 0.1 | |
| 2,000 | | | Voltronic Power Technology Corp. | | | 131,528 | | | 0.1 | |
| 39,000 | | | WPG Holdings Ltd. | | | 88,611 | | | 0.0 | |
| 5,000 | | | Yageo Corp. | | | 85,042 | | | 0.0 | |
| 97,980 | | | Yuanta Financial Holding Co. Ltd. | | | 98,271 | | | 0.0 | |
| 35,000 | | | Zhen Ding Technology Holding Ltd. | | | 120,691 | | | 0.1 | |
| | | | | | | 38,294,245 | | | 16.8 | |
| Shares | | | | Value | | | Percentage
of Net
Assets |
| COMMON STOCK: (continued) |
| | | | Thailand: 1.8% |
| 14,400 | | | Advanced Info Service PCL | | $ | 117,215 | | | 0.0 | |
| 191,000 | | | Bangkok Dusit Medical Services PCL - Class F | | | 155,692 | | | 0.1 | |
| 1,809,419 | | | CP ALL PCL - Foreign | | | 3,391,540 | | | 1.5 | |
| 22,400 | | | Kasikornbank PCL | | | 97,086 | | | 0.0 | |
| 39,500 | | | PTT Exploration & Production PCL | | | 148,355 | | | 0.1 | |
| 285,300 | | | PTT PCL - Foreign | | | 283,440 | | | 0.1 | |
| | | | | | | 4,193,328 | | | 1.8 | |
| | | | Turkey: 0.8% |
| 687,919 | | | Akbank TAS | | | 1,015,868 | | | 0.5 | |
| 18,362 | | | BIM Birlesik Magazalar AS | | | 249,989 | | | 0.1 | |
| 54,151 | | | Coca-Cola Icecek AS | | | 80,440 | | | 0.0 | |
| 36,769 | | | KOC Holding AS | | | 181,326 | | | 0.1 | |
| 6,016 | | | Migros Ticaret AS | | | 71,470 | | | 0.0 | |
| 12,134 (1) | | | Turk Hava Yollari AO | | | 96,508 | | | 0.0 | |
| 31,199 | | | Turkiye Petrol Rafinerileri AS | | | 131,661 | | | 0.1 | |
| | | | | | | 1,827,262 | | | 0.8 | |
| | | | United Arab Emirates: 0.6% |
| 231,978 | | | Air Arabia PJSC | | | 181,401 | | | 0.1 | |
| 71,205 | | | Aldar Properties PJSC | | | 147,594 | | | 0.1 | |
| 97,097 | | | Emaar Development PJSC | | | 244,925 | | | 0.1 | |
| 280,353 | | | Emaar Properties PJSC | | | 662,850 | | | 0.3 | |
| 19,004 | | | Emirates Telecommunications Group Co. PJSC | | | 91,681 | | | 0.0 | |
| | | | | | | 1,328,451 | | | 0.6 | |
| | | | United Kingdom: 1.2% |
| 45,057 | | | Unilever PLC, ADR | | | 2,744,422 | | | 1.2 | |
| |
| | | | United States: 0.7% |
| 12,804 | | | Micron Technology, Inc. | | | 1,275,918 | | | 0.6 | |
| 6,821 | | | Titan Cement International SA | | | 242,180 | | | 0.1 | |
| | | | | | | 1,518,098 | | | 0.7 | |
| | | | Uruguay: 1.6% |
| 1,739 (1) | | | MercadoLibre, Inc. | | | 3,542,656 | | | 1.6 | |
| | | Total Common Stock
(Cost $204,911,460) | | | 222,931,447 | | | 98.0 | |
| | | | | | | | | | | |
| PREFERRED STOCK: 0.7% |
| | | | Brazil: 0.5% |
| 160,896 | | | Cia Energetica de Minas Gerais | | | 315,897 | | | 0.1 | |
| 42,802 | | | Gerdau SA | | | 135,198 | | | 0.1 | |
| 315,007 | | | Itausa SA | | | 577,605 | | | 0.2 | |
| 28,370 | | | Petroleo Brasileiro SA | | | 175,886 | | | 0.1 | |
| | | | | | | 1,204,586 | | | 0.5 | |
| | | | Chile: 0.1% |
| 33,451 | | | Embotelladora Andina SA | | | 99,857 | | | 0.1 | |
| | | | | | | | | | | |
| | | | South Korea: 0.1% |
| 1,599 | | | LG Chem Ltd. | | | 240,738 | | | 0.1 | |
| | | Total Preferred Stock
(Cost $1,674,666) | | | 1,545,181 | | | 0.7 | |
See Accompanying Notes to Financial Statements
| Voya VACS Series EME Fund | PORTFOLIO OF INVESTMENTS
as of October 31, 2024 (continued) |
| Shares | | | | Value | | | Percentage
of Net
Assets |
| PREFERRED STOCK: (continued) |
| | | | South Korea (continued) |
| | | | Total Long-Term Investments
(Cost $206,586,126) | | $ | 224,476,628 | | | 98.7 | |
Principal
Amount† | | | | | Value | | Percentage
of Net
Assets |
| SHORT-TERM INVESTMENTS: 2.0% |
| | | | Repurchase Agreements: 0.3% |
| 654,737 (4) | | | Daiwa Capital Markets America, Inc., Repurchase Agreement dated 10/31/2024, 4.890%, due 11/01/2024 (Repurchase Amount $654,825, collateralized by various U.S. Government/U.S. Government Agency Obligations, 0.625%- 7.500%, Market Value plus accrued interest $667,832, due 05/15/25-11/01/54) | | | 654,737 | | | 0.3 | |
| | | | Total Repurchase Agreements
(Cost $654,737) | | | 654,737 | | | 0.3 | |
| Shares | | | | | Value | | | Percentage
of Net
Assets |
| | | | Mutual Funds: 1.7% |
| 3,460,767 (5) | | | BlackRock Liquidity Funds, FedFund, Institutional Class, 4.760% | | | 3,460,767 | | | 1.5 | |
| 470,000 (5) | | | Morgan Stanley Institutional Liquidity Funds - Government Portfolio (Institutional Share Class), 4.780% | | | 470,000 | | | 0.2 | |
| | | Total Mutual Funds (Cost $3,930,767) | | | 3,930,767 | | | 1.7 | |
| | | Total Short-Term Investments
(Cost $4,585,504) | | | 4,585,504 | | | 2.0 | |
| | | Total Investments in Securities
(Cost $211,171,630) | | $ | 229,062,132 | | | 100.7 | |
| | | Liabilities in Excess of Other Assets | | | (1,686,741 | ) | | (0.7 | ) |
| | | Net Assets | | $ | 227,375,391 | | | 100.0 | |
| | | | | | | | | | | |
| ADR | | | American Depositary Receipt |
| † | Unless otherwise indicated, principal amount is shown in USD. |
| (1) | Non-income producing security. |
| (2) | Security, or a portion of the security, is on loan. |
| (3) | Securities with purchases pursuant to Rule 144A or section 4(a)(2), under the Securities Act of 1933 and may not be resold subject to that rule except to qualified institutional buyers. |
| (4) | All or a portion of the security represents securities purchased with cash collateral received for securities on loan. |
| (5) | Rate shown is the 7-day yield as of October 31, 2024. |
| Sector Diversification | | Percentage
of Net Assets |
| Information Technology | | 27.7 | % |
| Consumer Staples | | 14.0 | |
| Financials | | 13.7 | |
| Consumer Discretionary | | 13.3 | |
| Communication Services | | 8.3 | |
| Industrials | | 7.1 | |
| Energy | | 6.8 | |
| Materials | | 3.1 | |
| Utilities | | 2.2 | |
| Health Care | | 1.7 | |
| Real Estate | | 0.8 | |
| Short-Term Investments | | 2.0 | |
| Liabilities in Excess of Other Assets | | (0.7 | ) |
| Net Assets | | 100.0 | % |
Portfolio holdings are subject to change daily.
See Accompanying Notes to Financial Statements
| Voya VACS Series EME Fund | PORTFOLIO OF INVESTMENTS
as of October 31, 2024 (continued) |
| Fair Value Measurements^ |
| |
| The following is a summary of the fair valuations according to the inputs used as of October 31, 2024 in valuing the assets and liabilities: |
| | | Quoted Prices
in Active Markets
for Identical
Investments
(Level 1) | | Significant Other
Observable
Inputs#
(Level 2) | | Significant
Unobservable
Inputs
(Level 3) | | Fair Value
at
October 31, 2024 |
| Asset Table | | | | | | | | | | | | | | | | |
| Investments, at fair value | | | | | | | | | | | | | | | | |
| Common Stock | | | | | | | | | | | | | | | | |
| Brazil | | $ | 15,969,702 | | | $ | — | | | $ | — | | | $ | 15,969,702 | |
| Chile | | | 606,845 | | | | — | | | | — | | | | 606,845 | |
| China | | | 2,921,869 | | | | 27,777,280 | | | | — | | | | 30,699,149 | |
| Czechia | | | 212,036 | | | | — | | | | — | | | | 212,036 | |
| Egypt | | | 122,028 | | | | — | | | | — | | | | 122,028 | |
| France | | | — | | | | 1,708,524 | | | | — | | | | 1,708,524 | |
| Germany | | | — | | | | 1,257,328 | | | | — | | | | 1,257,328 | |
| Greece | | | 176,170 | | | | 676,866 | | | | — | | | | 853,036 | |
| Hong Kong | | | 102,828 | | | | 5,640,057 | | | | — | | | | 5,742,885 | |
| Hungary | | | 465,878 | | | | 370,897 | | | | — | | | | 836,775 | |
| Iceland | | | 136,335 | | | | — | | | | — | | | | 136,335 | |
| India | | | 8,434,580 | | | | 31,052,421 | | | | — | | | | 39,487,001 | |
| Indonesia | | | 2,917,007 | | | | 1,590,119 | | | | — | | | | 4,507,126 | |
| Ireland | | | 1,926,425 | | | | — | | | | — | | | | 1,926,425 | |
| Japan | | | — | | | | 3,509,263 | | | | — | | | | 3,509,263 | |
| Kuwait | | | — | | | | 145,071 | | | | — | | | | 145,071 | |
| Luxembourg | | | 253,360 | | | | — | | | | — | | | | 253,360 | |
| Malaysia | | | 286,966 | | | | 2,780,841 | | | | — | | | | 3,067,807 | |
| Mexico | | | 13,016,358 | | | | — | | | | — | | | | 13,016,358 | |
| Netherlands | | | 149,986 | | | | 2,402,759 | | | | — | | | | 2,552,745 | |
| Peru | | | 1,237,321 | | | | — | | | | — | | | | 1,237,321 | |
| Philippines | | | 290,266 | | | | 276,857 | | | | — | | | | 567,123 | |
| Qatar | | | 507,064 | | | | — | | | | — | | | | 507,064 | |
| Romania | | | — | | | | 402,912 | | | | — | | | | 402,912 | |
| Saudi Arabia | | | 227,301 | | | | 1,045,508 | | | | — | | | | 1,272,809 | |
| South Africa | | | 3,248,961 | | | | 1,274,356 | | | | — | | | | 4,523,317 | |
| South Korea | | | — | | | | 34,362,640 | | | | — | | | | 34,362,640 | |
| Taiwan | | | — | | | | 38,294,245 | | | | — | | | | 38,294,245 | |
| Thailand | | | — | | | | 4,193,328 | | | | — | | | | 4,193,328 | |
| Turkey | | | 1,477,958 | | | | 349,304 | | | | — | | | | 1,827,262 | |
| United Arab Emirates | | | 91,681 | | | | 1,236,770 | | | | — | | | | 1,328,451 | |
| United Kingdom | | | 2,744,422 | | | | — | | | | — | | | | 2,744,422 | |
| United States | | | 1,275,918 | | | | 242,180 | | | | — | | | | 1,518,098 | |
| Uruguay | | | 3,542,656 | | | | — | | | | — | | | | 3,542,656 | |
| Total Common Stock | | | 62,341,921 | | | | 160,589,526 | | | | — | | | | 222,931,447 | |
| Preferred Stock | | | 1,304,443 | | | | 240,738 | | | | — | | | | 1,545,181 | |
| Short-Term Investments | | | 3,930,767 | | | | 654,737 | | | | — | | | | 4,585,504 | |
| Total Investments, at fair value | | $ | 67,577,131 | | | $ | 161,485,001 | | | $ | — | | | $ | 229,062,132 | |
| Liabilities Table | | | | | | | | | | | | | | | | |
| Other Financial Instruments+ | | | | | | | | | | | | | | | | |
| Futures | | $ | (24,583 | ) | | $ | — | | | $ | — | | | $ | (24,583 | ) |
| Total Liabilities | | $ | (24,583 | ) | | $ | — | | | $ | — | | | $ | (24,583 | ) |
| ^ | See Note 2, “Significant Accounting Policies” in the Notes to Financial Statements for additional information. |
| # | The earlier close of the foreign markets gives rise to the possibility that significant events, including broad market moves, may have occurred in the interim and may materially affect the value of those securities. To account for this, the Fund may frequently value many of its foreign equity securities using fair value prices based on third party vendor modeling tools to the extent available. Accordingly, a portion of the Fund’s investments are categorized as Level 2 investments. |
| + | Other Financial Instruments may include open forward foreign currency contracts, futures, centrally cleared swaps, OTC swaps and written options. Forward foreign currency contracts, futures and centrally cleared swaps are fair valued at the unrealized appreciation (depreciation) on the instrument. OTC swaps and written options are valued at the fair value of the instrument. |
See Accompanying Notes to Financial Statements
| Voya VACS Series EME Fund | PORTFOLIO OF INVESTMENTS
as of October 31, 2024 (continued) |
At October 31, 2024, the following futures contracts were outstanding for Voya VACS Series EME Fund:
| Description | | Number
of Contracts | | Expiration
Date | | Notional
Amount | | Unrealized
Depreciation |
| Long Contracts: | | | | | | | | | | | | |
| MSCI Emerging Markets Index | | 11 | | 12/20/24 | | $ | 619,575 | | | $ | (24,583 | ) |
| | | | | | | $ | 619,575 | | | $ | (24,583 | ) |
| | | | | | | | | | | | | |
A summary of derivative instruments by primary risk exposure is outlined in the following tables.
The fair value of derivative instruments as of October 31, 2024 was as follows:
| Derivatives not accounted for as hedging instruments | | Location on Statement
of Assets and Liabilities | | Fair Value | |
| Liability Derivatives | | | | | | |
| Equity contracts | | Variation margin payable on futures contracts* | | $ | 24,583 | |
| Total Liability Derivatives | | | | $ | 24,583 | |
| | | | | | | |
| * | The fair value presented above represents the cumulative unrealized appreciation (depreciation) on futures contracts as reported in the tables within the Portfolio of Investments. In the Statement of Assets and Liabilities, only current day’s unsettled variation margin is reported in receivables or payables on futures contracts and the net cumulative unrealized appreciation (depreciation) is included in total distributable earnings (loss). |
The effect of derivative instruments on the Fund's Statement of Operations for the year ended October 31, 2024 was as follows:
Amount of Realized Gain or (Loss) on Derivatives Recognized in Income
| Derivatives not accounted for as hedging instruments | | Forward
foreign
currency
contracts | | Futures | | Total |
| Equity contracts | | $ | — | | | $ | 70,852 | | | $ | 70,852 | |
| Foreign exchange contracts | | | 341 | | | | — | | | | 341 | |
| Total | | $ | 341 | | | $ | 70,852 | | | $ | 71,193 | |
Change in Unrealized Appreciation or (Depreciation) on Derivatives Recognized in Income
| Derivatives not accounted for as hedging instruments | | Futures |
| Equity contracts | | $ | (11,050 | ) |
| Total | | $ | (11,050 | ) |
At October 31, 2024, the aggregate cost of securities and other investments and the composition of unrealized appreciation and depreciation of securities and other investments on a tax basis were:
| Cost for federal income tax purposes was $216,023,685. |
| Net unrealized appreciation consisted of: |
| Gross Unrealized Appreciation | | $ | 28,963,978 | |
| Gross Unrealized Depreciation | | | (15,859,168 | ) |
| Net Unrealized Appreciation | | $ | 13,104,810 | |
See Accompanying Notes to Financial Statements
TAX INFORMATION (Unaudited)
Dividends and distributions paid during the year ended October 31, 2024 were as follows:
| Fund Name | Type | Per Share Amount |
| Voya VACS Series EME Fund |
| | NII | $ 0.1324 |
| | STCG | $ 0.0422 |
| | | |
NII - Net investment income
STCG - Short-term capital gain
For the year ended October 31, 2024, 57.48% of ordinary income dividends paid by the Fund (including creditable foreign taxes paid) are designated as qualifying dividend income (QDI) subject to reduced income tax rates for individuals.
Pursuant to Section 853 of the Internal Revenue Code, Voya VACS Series EME Fund designates the following amounts as foreign taxes paid for the period ended October 31, 2024. Foreign taxes paid for purposes of Section 853 may be less than actual foreign taxes paid for financial statement purposes.
Creditable Foreign
Taxes Paid | | Per Share
Amount | | Portion of Ordinary
Income Derived From
Foreign Sourced Income* |
| $1,349,087 | | $0.0672 | | 81.19% |
*None of the Fund's income was derived from ineligible foreign sources as defined under Section 901(j) of the Internal Revenue Code.
Foreign taxes paid or withheld should be included in taxable income with an offsetting deduction from gross income or as a credit for taxes paid to foreign governments. Shareholders are strongly advised to consult their own tax advisors regarding the appropriate treatment of foreign taxes paid.
Above figures may differ from those cited elsewhere in this report due to differences in the calculation of income and gains under U.S. generally accepted accounting principles (book) purposes and Internal Revenue Service (tax) purposes.
Shareholders are strongly advised to consult their own tax advisers with respect to the tax consequences of their investments in the Funds. In January, shareholders, excluding corporate shareholders, receive an IRS 1099-DIV regarding the federal tax status of the dividends and distributions they received in the calendar year.
[This Page Intentionally Left Blank]
[This Page Intentionally Left Blank]
| Investment Adviser | Independent Registered Public Accounting Firm |
Voya Investments, LLC 7337 East Doubletree Ranch Road, Suite 100 Scottsdale, Arizona 85258 | Ernst & Young LLP 200 Clarendon Street Boston, Massachusetts 02116 |
| | |
| Placement Agent | Custodian |
Voya Investments Distributor, LLC 7337 East Doubletree Ranch Road, Suite 100 Scottsdale, Arizona 85258 | The Bank of New York Mellon 225 Liberty Street New York, New York 10286 |
| | |
| Transfer Agent | Legal Counsel |
BNY Mellon Investment Servicing (U.S.) Inc. 301 Bellevue Parkway Wilmington, Delaware 19809 | Ropes & Gray LLP Prudential Tower 800 Boylston Street Boston, Massachusetts 02199 |
For more complete information, or to obtain a prospectus on any Voya mutual fund, please call your financial advisor or Voya Investments Distributor, LLC at (800) 992-0180 or log on to www.voyainvestments.com. The prospectus should be read carefully before investing. Consider the fund’s investment objectives, risks, charges and expenses carefully before investing. The prospectus contains this information and other information about the fund. Check with your investment professional to determine which funds are available for sale within their firm. Not all funds are available for sale at all firms.
226105 (1024)