UNITED STATES
SECURITIES AND EXCHANGE COMMISSION
Washington, D.C. 20549
FORM N-CSR
CERTIFIED SHAREHOLDER REPORT OF REGISTERED
MANAGEMENT INVESTMENT COMPANIES
Investment Company Act file number | 811-7396 |
|
Western Asset Managed High Income Fund Inc. |
(Exact name of registrant as specified in charter) |
|
620 Eight Avenue, New York, NY | | 10018 |
(Address of principal executive offices) | | (Zip code) |
|
Robert I. Frenkel, Esq. Legg Mason & Co., LLC 100 First Stamford Place Stamford, CT 06902 |
(Name and address of agent for service) |
|
Registrant’s telephone number, including area code: | (888)777-0102 | |
|
Date of fiscal year end: | February, 28 | |
|
Date of reporting period: | August 31, 2011 | |
| | | | | | | | |
ITEM 1. REPORT TO STOCKHOLDERS.
The Semi-Annual Report to Stockholders is filed herewith.
August 31, 2011 | 
|
Semi-Annual Report
Western Asset Managed High Income Fund Inc.
(MHY)
INVESTMENT PRODUCTS: NOT FDIC INSURED · NO BANK GUARANTEE · MAY LOSE VALUE |
II | | Western Asset Managed High Income Fund Inc. | | | |
Fund objectives
The Fund’s primary investment objective is high current income. Capital appreciation is a secondary objective.
What’s inside
Letter from the chairman | | II |
| | |
Investment commentary | | III |
| | |
Fund at a glance | | 1 |
| | |
Spread duration | | 2 |
| | |
Effective duration | | 3 |
| | |
Schedule of investments | | 4 |
| | |
Statement of assets and liabilities | | 21 |
| | |
Statement of operations | | 22 |
| | |
Statements of changes in net assets | | 23 |
| | |
Financial highlights | | 24 |
| | |
Notes to financial statements | | 25 |
| | |
Dividend reinvestment plan | | 38 |
| | |
Additional shareholder information | | 40 |
Letter from the chairman | 
|
Dear Shareholder,
We are pleased to provide the semi-annual report of Western Asset Managed High Income Fund Inc. for the six-month reporting period ended August 31, 2011. Please read on for Fund performance information and a detailed look at prevailing economic and market conditions during the Fund’s reporting period.
As always, we remain committed to providing you with excellent service and a full spectrum of investment choices. We also remain committed to supplementing the support you receive from your financial advisor. One way we accomplish this is through our website, www.leggmason.com/cef. Here you can gain immediate access to market and investment information, including:
· Fund prices and performance,
· Market insights and commentaries from our portfolio managers, and
· A host of educational resources.
We look forward to helping you meet your financial goals.
Sincerely,

R. Jay Gerken, CFA
Chairman, President and Chief Executive Officer
September 30, 2011
| | | Western Asset Managed High Income Fund Inc. | | III |
Investment commentary
Economic review
Although the U.S. economy continued to grow over the six months ended August 31, 2011, the pace of the expansion was disappointing, which resulted in a significant shift in investor sentiment. During much of the first half of the period, there were expectations of a strengthening economy and generally robust investor risk appetite. However, as the period progressed, weakening economic data, concerns related to the raising of the U.S. debt ceiling and the downgrading of U.S. government securities resulted in increased investor risk aversion.
U.S. gross domestic product (“GDP”)i growth, as reported by the U.S. Department of Commerce, has been less robust than during most other periods exiting a severe recession. Revised GDP growth was 2.3% during the fourth quarter of 2010 and 3.0% for calendar 2010 as a whole. The Commerce Department then reported that first and second quarter 2011 GDP growth were 0.4% and 1.3%, respectively. This moderation in growth during the first half of the calendar year was due to a variety of factors, including less robust export activity and a deceleration in consumer spending given higher oil and food prices.
Turning to the job market, while there was some improvement in early 2011, unemployment again moved higher from April through June. After being 9.0% or higher since April 2009, the unemployment rate fell to 8.9% in February and 8.8% in March 2011. The job market then weakened, as unemployment rose to 9.0% in April, 9.1% in May and 9.2% in June. The news was slightly better in July, with the unemployment rate easing back to 9.1%. While the rate held steady in August, the U.S. Department of Labor reported that there was zero net job growth during the month, the worst monthly result since September 2010. Additionally, as of the end of the reporting period, approximately fourteen million Americans looking for work had yet to find a job, and nearly 43% of these individuals have been out of work for more than six months.
The housing market continued to experience challenges during the reporting period. While existing-home sales moved somewhat higher toward the end of 2010 and in January 2011, according to the National Association of Realtors (“NAR”), existing-home sales declined a sharp 8.9% in February. After a 3.5% increase in March, existing-home sales fell 1.8% and 4.0% in April and May, respectively. Following a modest 0.6% increase in June, sales then fell 3.5% in July and moved 7.7% higher in August. At the end of August, the inventory of unsold homes was an 8.5 month supply at the current sales level, versus a 9.5 month supply in July. Existing-home prices were weak versus a year ago, with the NAR reporting that the median existing-home price for all housing types was $168,300 in August 2011, down 5.1% from August 2010.
Even the manufacturing sector, one of the stalwarts of the economy in recent years, softened toward the end of the reporting period. Based on the Institute for Supply Management’s PMIii, the manufacturing sector grew twenty-five consecutive months since it began expanding in August 2009 (a reading below 50 indicates a contraction, whereas a reading above 50 indicates an expansion). In January 2011, the manufacturing sector expanded at its fastest pace since May 2004, with a reading of 60.8 versus 58.5 for the previous month. Manufacturing activity
IV | | Western Asset Managed High Income Fund Inc. | | | |
Investment commentary (cont’d)
remained strong during the next three months and was 60.4 in April. However, May’s reading fell to 53.5, partially attributed to supply disruptions triggered by the March earthquake and tsunami in Japan. Manufacturing activity then moved modestly higher in June to 55.3, before falling to 50.9 in July and 50.6 in August — the latter being the worst reading in two years. In addition, only ten of the eighteen industries tracked by the Institute for Supply Management expanded in August.
Financial market overview
While stocks and lower-quality U.S. bonds generated positive results during the first half of the reporting period, these gains were later erased. This setback was triggered by a variety of factors, including concerns regarding the global economy, geopolitical unrest, the natural disasters in Japan, the ongoing European sovereign debt crisis and Standard & Poor’s (“S&P”) downgrade of U.S. Treasuries from AAA to AA+. Against this backdrop, investors sought refuge in higher-quality securities as their sentiment became generally more negative.
The Federal Reserve Board (“Fed”)iii took a number of actions as it sought to meet its dual mandate of fostering maximum employment and price stability. In November 2010 (prior to the beginning of the reporting period), the Fed announced a second round of quantitative easing (often referred to as “QE2”) to help stimulate the economy, entailing the purchase of $600 billion of long-term U.S. Treasury securities by the end of the second quarter of 2011.
In June, the Fed announced that QE2 would end on schedule at the end of the month. However, given ongoing strains in the economy, it made no overtures toward reversing any of its accommodative policies, and stated it would “maintain its existing policy of reinvesting principal payments from its securities holdings” rather than seeking to reduce the size of its balance sheet.
Also, as has been the case since December 2008, the Fed kept the federal funds rateiv at a historically low range between zero and 0.25%. In addition, in August 2011, the Fed declared its intention to keep the federal funds rate between zero and 0.25% until mid-2013.
At its meeting in September 2011, after the end of the reporting period, the Fed announced its intention to purchase $400 billion of longer-term Treasury securities and to sell an equal amount of shorter-term Treasury securities by June 2012. The Fed said, “This program should put downward pressure on longer-term interest rates and help make broader financial conditions more accommodative.”
Fixed-income market review
While volatility was elevated at times, most U.S. spread sectors (non-Treasuries) produced positive results during the reporting period. The spread sectors generally outperformed equal-durationv Treasuries during the first two months of the reporting period. A combination of positive economic growth, benign core inflation, rising corporate profits and overall robust investor demand supported the spread sectors in March and April 2011. Investor sentiment then began to shift in May, as optimism about the economic expansion waned and investor risk appetite was replaced with increased risk aversion. While the U.S. spread sectors generally posted positive results over the last four months
| | | Western Asset Managed High Income Fund Inc. | | V |
of the reporting period, they often underperformed equal-duration Treasuries.
Both short- and long-term Treasury yields fluctuated and ultimately moved lower during the six months ended August 31, 2011. When the period began, two- and ten-year Treasury yields were 0.69% and 3.42%, respectively. Yields initially moved higher given expectations for stronger growth in 2011 and the potential for rising inflation. In April, two-year Treasury yields peaked at 0.85%, while ten-year Treasuries peaked at 3.59%. Treasury yields then declined as investor risk aversion increased. Yields briefly moved higher toward the end of June, but then generally declined during much of the remainder of the period given disappointing economic data and several flights to quality. Two-year Treasuries hit their low for the reporting period of 0.19% on several occasions in August 2011. Ten-year Treasuries reached their reporting period trough of 2.07% on August 19, 2011. When the period ended on August 31, 2011, two-year Treasury yields were 0.20% and ten-year Treasury yields were 2.23%. For the six months ended August 31, 2011, the Barclays Capital U.S. Aggregate Indexvi returned 5.49%.
The U.S. high-yield bond market produced poor results during the reporting period. The asset class posted positive returns during the first three months of the period given generally better-than-expected corporate profits and overall strong investor demand. High-yield prices then moved lower during two of the last three months of the period, punctuated by a sharp 4.02% decline in August. All told, the Barclays Capital U.S. High Yield — 2% Issuer Cap Indexvii returned -1.57% for the six months ended August 31, 2011.
Despite periods of volatility, the emerging market debt asset class generated a strong return for the six-month reporting period. In general, emerging market debt was supported by higher commodity prices, robust growth in developing countries and solid demand. These factors more than offset periods of weakness triggered by concerns regarding interest rate hikes in China, geopolitical unrest and decelerating growth in many developed countries. Overall, the JPMorgan Emerging Markets Bond Index Global (“EMBI Global”)viii returned 7.98% over the six months ended August 31, 2011.
Performance review
For the six months ended August 31, 2011, Western Asset Managed High Income Fund Inc. returned -2.59% based on its net asset value (“NAV”)ix and -0.89% based on its New York Stock Exchange (“NYSE”) market price per share. The Fund’s unmanaged benchmark, the Barclays Capital U.S. High Yield — 2% Issuer Cap Index, returned -1.57% over the same time frame. The Lipper High Current Yield Closed-End Funds Category Averagex returned -3.33% for the same period. Please note that Lipper performance returns are based on each fund’s NAV.
During this six-month period, the Fund made distributions to shareholders totaling $0.28 per share, which may have included a return of capital. The performance table shows the Fund’s six-month total return based on its NAV and market price as of August 31, 2011. Past performance is no guarantee of future results.
VI | | Western Asset Managed High Income Fund Inc. | | | |
Investment commentary (cont’d)
Performance Snapshot
as of August 31, 2011 (unaudited)
| | 6-Month |
Price Per Share | | Total Return* |
$5.81 (NAV) | | -2.59% |
$5.94 (Market Price) | | -0.89% |
All figures represent past performance and are not a guarantee of future results. Performance figures for periods shorter than one year represent cumulative figures and are not annualized.
* Total returns are based on changes in NAV or market price, respectively. Total returns assume the reinvestment of all distributions, including returns of capital, if any, in additional shares in accordance with the Fund’s Dividend Reinvestment Plan.
Looking for additional information?
The Fund is traded under the symbol “MHY” and its closing market price is available in most newspapers under the NYSE listings. The daily NAV is available on-line under the symbol “XMHYX” on most financial websites. Barron’s and the Wall Street Journal’s Monday edition both carry closed-end fund tables that provide additional information. In addition, the Fund issues a quarterly press release that can be found on most major financial websites as well as www.leggmason.com/cef.
In a continuing effort to provide information concerning the Fund, shareholders may call 1-888-777-0102 (toll free), Monday through Friday from 8:00 a.m. to 5:30 p.m. Eastern Time, for the Fund’s current NAV, market price and other information.
As always, thank you for your confidence in our stewardship of your assets.
Sincerely,

R. Jay Gerken, CFA
Chairman, President and Chief Executive Officer
September 30, 2011
RISKS: As interest rates rise, bond prices fall, reducing the value of the fixed-income securities held by the Fund. The Fund invests in high-yield bonds, which are subject to additional risks such as the increased risk of default and greater volatility because of the lower credit quality of the issues. The Fund may use derivatives, such as options and futures, which can be illiquid, may disproportionately increase losses, and have a potentially large impact on Fund performance. In addition, the Fund may invest in foreign securities, which are subject to certain risks of overseas investing including currency fluctuations and changes in political and economic conditions, which could result in significant market fluctuations. These risks are greater in emerging markets.
All investments are subject to risk including the possible loss of principal. Past performance is no guarantee of future results. All index performance reflects no deduction for fees, expenses or taxes. Please note that an investor cannot invest directly in an index.
The information provided is not intended to be a forecast of future events, a guarantee of future results or investment advice. Views expressed may differ from those of the firm as a whole.
| | | Western Asset Managed High Income Fund Inc. | | VII |
i Gross domestic product (“GDP”) is the market value of all final goods and services produced within a country in a given period of time.
ii The Institute for Supply Management’s PMI is based on a survey of purchasing executives who buy the raw materials for manufacturing at more than 350 companies. It offers an early reading on the health of the manufacturing sector.
iii The Federal Reserve Board (“Fed”) is responsible for the formulation of policies designed to promote economic growth, full employment, stable prices and a sustainable pattern of international trade and payments.
iv The federal funds rate is the rate charged by one depository institution on an overnight sale of immediately available funds (balances at the Federal Reserve) to another depository institution; the rate may vary from depository institution to depository institution and from day to day.
v Duration is the measure of the price sensitivity of a fixed-income security to an interest rate change of 100 basis points. Calculation is based on the weighted average of the present values for all cash flows.
vi The Barclays Capital U.S. Aggregate Index is a broad-based bond index comprised of government, corporate, mortgage- and asset-backed issues, rated investment grade or higher, and having at least one year to maturity.
vii The Barclays Capital U.S. High Yield — 2% Issuer Cap Index is an index of the 2% Issuer Cap component of the Barclays Capital U.S. Corporate High Yield Index, which covers the U.S. dollar-denominated, non-investment grade, fixed-rate, taxable corporate bond market.
viii The JPMorgan Emerging Markets Bond Index Global (“EMBI Global”) tracks total returns for U.S. dollar-denominated debt instruments issued by emerging market sovereign and quasi-sovereign entities: Brady bonds, loans, Eurobonds and local market instruments.
ix Net asset value (“NAV”) is calculated by subtracting total liabilities and outstanding preferred stock (if any) from the closing value of all securities held by the Fund (plus all other assets) and dividing the result (total net assets) by the total number of the common shares outstanding. The NAV fluctuates with changes in the market prices of securities in which the Fund has invested. However, the price at which an investor may buy or sell shares of the Fund is the Fund’s market price as determined by supply of and demand for the Fund’s shares.
x Lipper, Inc., a wholly-owned subsidiary of Reuters, provides independent insight on global collective investments. Returns are based on the six-month period ended August 31, 2011, including the reinvestment of all distributions, including returns of capital, if any, calculated among the 9 funds in the Fund’s Lipper category.
| | Western Asset Managed High Income Fund Inc. 2011 Semi-Annual Report | | 1 |
Fund at a glance† (unaudited)
Investment breakdown (%) as a percent of total investments
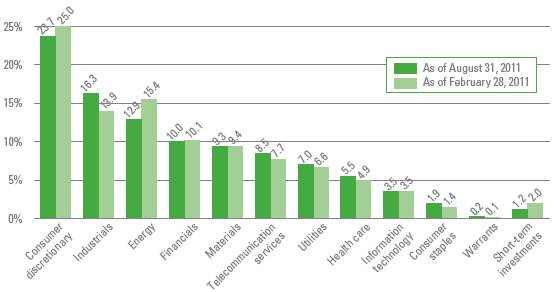
† The bar graph above represents the composition of the Fund’s investments as of August 31, 2011 and February 28, 2011 and does not include derivatives, such as futures contracts, written options and forward foreign currency contracts. The Fund is actively managed. As a result, the composition of the Fund’s investments is subject to change at any time.
2 | | Western Asset Managed High Income Fund Inc. 2011 Semi-Annual Report | | |
Spread duration (unaudited)
Economic Exposure — August 31, 2011
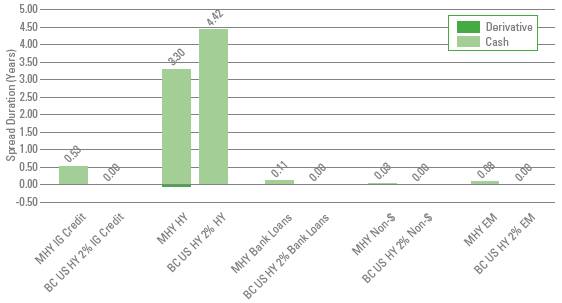
Spread duration measures the sensitivity to changes in spreads. The spread over Treasuries is the annual risk premium demanded by investors to hold non-Treasury securities. Spread duration is quantified as the % change in price resulting from a 100 basis points change in spreads. For a security with positive spread duration, an increase in spreads would result in a price decline and a decline in spreads would result in a price increase. This chart highlights the market sector exposure of the Fund’s sectors relative to the selected benchmark sectors as of the end of the reporting period.
BC US HY 2% | — Barclays Capital U.S. High Yield — 2% Issuer Cap Index |
EM | — Emerging Markets |
HY | — High Yield |
IG Credit | — Investment Grade Credit |
MHY | — Western Asset Managed High Income Fund Inc. |
Non-$ | — Non-U.S. Dollar |
| | Western Asset Managed High Income Fund Inc. 2011 Semi-Annual Report | | 3 |
Effective duration (unaudited)
Interest Rate Exposure — August 31, 2011
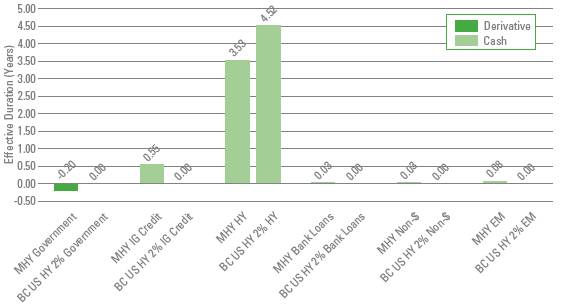
Effective duration measures the sensitivity to changes in relevant interest rates. Effective duration is quantified as the % change in price resulting from a 100 basis points change in interest rates. For a security with positive effective duration, an increase in interest rates would result in a price decline and a decline in interest rates would result in a price increase. This chart highlights the interest rate exposure of the Fund’s sectors relative to the selected benchmark sectors as of the end of the reporting period.
BC US HY 2% | — Barclays Capital U.S. High Yield — 2% Issuer Cap Index |
EM | — Emerging Markets |
HY | — High Yield |
IG Credit | — Investment Grade Credit |
MHY | — Western Asset Managed High Income Fund Inc. |
Non-$ | — Non-U.S. Dollar |
4 | | Western Asset Managed High Income Fund Inc. 2011 Semi-Annual Report | | |
Schedule of investments (unaudited)
August 31, 2011
Western Asset Managed High Income Fund Inc.
Security | | Rate | | Maturity
Date | | Face
Amount† | | Value | |
Corporate Bonds & Notes — 87.1% | | | | | | | | | |
Consumer Discretionary — 19.5% | | | | | | | | | |
Auto Components — 0.1% | | | | | | | | | |
Hertz Holdings Netherlands BV, Senior Secured Bonds | | 8.500 | % | 7/31/15 | | 170,000 | EUR | $ | 240,542 | (a) |
Automobiles — 0.7% | | | | | | | | | |
Escrow GCB General Motors | | 7.200 | % | 1/15/11 | | 760,000 | | 9,500 | (b)(c)(d) |
Escrow GCB General Motors | | 7.125 | % | 7/15/13 | | 1,325,000 | | 16,563 | (b)(d) |
Escrow GCB General Motors | | 8.375 | % | 7/15/33 | | 1,880,000 | | 23,500 | (b)(d) |
Ford Motor Credit Co., LLC, Senior Notes | | 12.000 | % | 5/15/15 | | 955,000 | | 1,153,622 | |
Ford Motor Credit Co., LLC, Senior Notes | | 8.125 | % | 1/15/20 | | 540,000 | | 605,558 | |
Total Automobiles | | | | | | | | 1,808,743 | |
Diversified Consumer Services — 0.7% | | | | | | | | | |
Service Corp. International, Senior Notes | | 7.500 | % | 4/1/27 | | 745,000 | | 700,300 | |
Sotheby’s, Senior Notes | | 7.750 | % | 6/15/15 | | 930,000 | | 990,450 | |
Stonemor Operating LLC/Cornerstone Family Services of WV/Osiris Holding, Senior Notes | | 10.250 | % | 12/1/17 | | 215,000 | | 208,550 | |
Total Diversified Consumer Services | | | | | | | | 1,899,300 | |
Hotels, Restaurants & Leisure — 6.9% | | | | | | | | | |
Boyd Gaming Corp., Senior Subordinated Notes | | 7.125 | % | 2/1/16 | | 410,000 | | 344,400 | |
Caesars Entertainment Operating Co. Inc., Senior Notes | | 10.750 | % | 2/1/16 | | 2,039,000 | | 1,748,442 | |
Caesars Entertainment Operating Co. Inc., Senior Secured Notes | | 10.000 | % | 12/15/15 | | 260,000 | | 245,050 | |
Caesars Entertainment Operating Co. Inc., Senior Secured Notes | | 11.250 | % | 6/1/17 | | 729,000 | | 789,142 | |
CityCenter Holdings LLC/CityCenter Finance Corp., Senior Secured Notes | | 10.750 | % | 1/15/17 | | 1,319,479 | | 1,253,505 | (a)(e) |
Downstream Development Quapaw, Senior Secured Notes | | 10.500 | % | 7/1/19 | | 720,000 | | 694,800 | (a) |
El Pollo Loco Inc., Secured Notes | | 17.000 | % | 1/1/18 | | 1,500,000 | | 1,455,000 | (a) |
Fiesta Restaurant Group, Secured Notes | | 8.875 | % | 8/15/16 | | 400,000 | | 399,000 | (a) |
Fontainebleau Las Vegas Holdings LLC/ Fontainebleau Las Vegas Capital Corp. | | 11.000 | % | 6/15/15 | | 270,000 | | 138 | (a)(d) |
Hoa Restaurant Group LLC/Hoa Finance Corp., Senior Secured Notes | | 11.250 | % | 4/1/17 | | 630,000 | | 611,100 | (a) |
Inn of the Mountain Gods Resort & Casino, Senior Secured Notes | | 8.750 | % | 11/30/20 | | 652,000 | | 642,220 | (a) |
Landry’s Holdings Inc., Senior Secured Notes | | 11.500 | % | 6/1/14 | | 700,000 | | 691,250 | (a) |
Landry’s Restaurants Inc., Senior Secured Notes | | 11.625 | % | 12/1/15 | | 695,000 | | 734,963 | |
Landry’s Restaurants Inc., Senior Secured Notes | | 11.625 | % | 12/1/15 | | 200,000 | | 211,500 | (a) |
MGM Resorts International, Senior Notes | | 5.875 | % | 2/27/14 | | 840,000 | | 806,400 | |
| | | | | | | | | | |
See Notes to Financial Statements.
| | Western Asset Managed High Income Fund Inc. 2011 Semi-Annual Report | | 5 |
Western Asset Managed High Income Fund Inc.
Security | | Rate | | Maturity
Date | | Face
Amount† | | Value | |
Hotels, Restaurants & Leisure — continued | | | | | | | | | |
MGM Resorts International, Senior Notes | | 6.625 | % | 7/15/15 | | 480,000 | | $ | 434,400 | |
MGM Resorts International, Senior Secured Notes | | 10.375 | % | 5/15/14 | | 90,000 | | 99,225 | |
Mohegan Tribal Gaming Authority, Senior Secured Notes | | 11.500 | % | 11/1/17 | | 450,000 | | 442,125 | (a) |
Mohegan Tribal Gaming Authority, Senior Subordinated Notes | | 8.000 | % | 4/1/12 | | 1,890,000 | | 1,379,700 | |
NCL Corp. Ltd., Senior Notes | | 9.500 | % | 11/15/18 | | 1,410,000 | | 1,466,400 | (a) |
NCL Corp. Ltd., Senior Secured Notes | | 11.750 | % | 11/15/16 | | 1,120,000 | | 1,260,000 | |
Pinnacle Entertainment Inc., Senior Notes | | 8.625 | % | 8/1/17 | | 560,000 | | 586,600 | |
Pinnacle Entertainment Inc., Senior Subordinated Notes | | 7.500 | % | 6/15/15 | | 60,000 | | 60,150 | |
Pinnacle Entertainment Inc., Senior Subordinated Notes | | 8.750 | % | 5/15/20 | | 140,000 | | 141,400 | |
Seven Seas Cruises S de RL LLC, Senior Secured Notes | | 9.125 | % | 5/15/19 | | 820,000 | | 815,900 | (a) |
Snoqualmie Entertainment Authority, Senior Secured Notes | | 4.179 | % | 2/1/14 | | 545,000 | | 485,050 | (a)(f) |
Snoqualmie Entertainment Authority, Senior Secured Notes | | 9.125 | % | 2/1/15 | | 215,000 | | 209,088 | (a) |
Station Casinos Inc., Senior Notes | | 6.000 | % | 4/1/12 | | 860,000 | | 86 | (b)(d) |
Station Casinos Inc., Senior Notes | | 7.750 | % | 8/15/16 | | 1,430,000 | | 143 | (b)(d) |
Station Casinos Inc., Senior Subordinated Notes | | 6.625 | % | 3/15/18 | | 40,000 | | 4 | (b)(d) |
Sugarhouse HSP Gaming Prop Mezz LP/ Sugarhouse HSP Gaming Finance Corp., Secured Notes | | 8.625 | % | 4/15/16 | | 781,000 | | 781,000 | (a) |
Total Hotels, Restaurants & Leisure | | | | | | | | 18,788,181 | |
Household Durables — 0.2% | | | | | | | | | |
Standard Pacific Corp., Senior Notes | | 8.375 | % | 1/15/21 | | 630,000 | | 544,950 | |
Internet & Catalog Retail — 0.8% | | | | | | | | | |
Netflix Inc., Senior Notes | | 8.500 | % | 11/15/17 | | 810,000 | | 895,050 | |
QVC Inc., Senior Secured Notes | | 7.375 | % | 10/15/20 | | 1,205,000 | | 1,301,400 | (a) |
Total Internet & Catalog Retail | | | | | | | | 2,196,450 | |
Media — 6.0% | | | | | | | | | |
Cablevision Systems Corp., Senior Notes | | 8.000 | % | 4/15/20 | | 270,000 | | 284,175 | |
CCH II LLC/CCH II Capital Corp., Senior Notes | | 13.500 | % | 11/30/16 | | 301,825 | | 350,117 | |
CCO Holdings LLC/CCO Holdings Capital Corp., Senior Notes | | 7.875 | % | 4/30/18 | | 1,140,000 | | 1,191,300 | |
CCO Holdings LLC/CCO Holdings Capital Corp., Senior Notes | | 8.125 | % | 4/30/20 | | 1,130,000 | | 1,200,625 | |
Cengage Learning Acquisitions Inc., Senior Notes | | 10.500 | % | 1/15/15 | | 2,800,000 | | 2,170,000 | (a) |
| | | | | | | | | | |
See Notes to Financial Statements.
6 | | Western Asset Managed High Income Fund Inc. 2011 Semi-Annual Report | | |
Schedule of investments (unaudited) (cont’d)
August 31, 2011
Western Asset Managed High Income Fund Inc.
Security | | Rate | | Maturity
Date | | Face
Amount† | | Value | |
Media — continued | | | | | | | | | |
Cengage Learning Acquisitions Inc., Senior Subordinated Notes | | 13.250 | % | 7/15/15 | | 550,000 | | $ | 404,250 | (a) |
Charter Communications Inc., Senior Notes | | 6.500 | % | 4/30/21 | | 780,000 | | 766,350 | |
DISH DBS Corp., Senior Notes | | 6.625 | % | 10/1/14 | | 60,000 | | 62,100 | |
DISH DBS Corp., Senior Notes | | 7.875 | % | 9/1/19 | | 700,000 | | 747,250 | |
DISH DBS Corp., Senior Notes | | 6.750 | % | 6/1/21 | | 490,000 | | 496,125 | (a) |
Good Sam Enterprises LLC, Secured Notes | | 11.500 | % | 12/1/16 | | 820,000 | | 807,700 | |
Kabel BW Erste Beteiligungs GmbH/ Kabel Baden-Wurttemberg GmbH & Co. KG, Senior Secured Notes | | 7.500 | % | 3/15/19 | | 260,000 | | 257,400 | (a) |
LBI Media Inc., Senior Secured Notes | | 9.250 | % | 4/15/19 | | 780,000 | | 706,875 | (a) |
Nielsen Finance LLC/Nielsen Finance Co., Senior Notes | | 11.500 | % | 5/1/16 | | 140,000 | | 159,950 | |
Nielsen Finance LLC/Nielsen Finance Co., Senior Notes | | 7.750 | % | 10/15/18 | | 2,500,000 | | 2,593,750 | |
Univision Communications Inc., Senior Notes | | 8.500 | % | 5/15/21 | | 690,000 | | 593,400 | (a) |
Univision Communications Inc., Senior Secured Notes | | 6.875 | % | 5/15/19 | | 720,000 | | 669,600 | (a) |
Univision Communications Inc., Senior Secured Notes | | 7.875 | % | 11/1/20 | | 860,000 | | 829,900 | (a) |
UPC Holding BV, Senior Notes | | 9.875 | % | 4/15/18 | | 410,000 | | 430,500 | (a) |
UPCB Finance III Ltd., Senior Secured Notes | | 6.625 | % | 7/1/20 | | 1,560,000 | | 1,544,400 | (a) |
Total Media | | | | | | | | 16,265,767 | |
Multiline Retail — 0.5% | | | | | | | | | |
Neiman Marcus Group Inc., Senior Secured Notes | | 7.125 | % | 6/1/28 | | 1,485,000 | | 1,343,925 | |
Specialty Retail — 2.7% | | | | | | | | | |
American Greetings Corp., Senior Notes | | 7.375 | % | 6/1/16 | | 1,770,000 | | 1,818,675 | |
American Greetings Corp., Senior Notes | | 7.375 | % | 6/1/16 | | 205,000 | | 202,437 | |
American Greetings Corp., Senior Notes | | 7.375 | % | 6/1/16 | | 160,000 | | 158,000 | |
Edcon Proprietary Ltd., Senior Secured Notes | | 9.500 | % | 3/1/18 | | 1,190,000 | | 934,150 | (a) |
Gymboree Corp., Senior Notes | | 9.125 | % | 12/1/18 | | 1,280,000 | | 1,113,600 | |
Michaels Stores Inc., Senior Subordinated Bonds | | 11.375 | % | 11/1/16 | | 670,000 | | 698,475 | |
Michaels Stores Inc., Senior Subordinated Notes, step bond | | 0.000 | % | 11/1/16 | | 1,830,000 | | 1,875,750 | |
Spencer Spirit Holdings Inc./Spencer Gifts LLC/ Spirit Halloween Superstores, Senior Notes | | 11.000 | % | 5/1/17 | | 500,000 | | 493,750 | (a) |
Total Specialty Retail | | | | | | | | 7,294,837 | |
Textiles, Apparel & Luxury Goods — 0.9% | | | | | | | | | |
Burlington Coat Factory Warehouse Corp., Senior Notes | | 10.000 | % | 2/15/19 | | 540,000 | | 506,250 | (a) |
| | | | | | | | | | |
See Notes to Financial Statements.
| | Western Asset Managed High Income Fund Inc. 2011 Semi-Annual Report | | 7 |
Western Asset Managed High Income Fund Inc.
Security | | Rate | | Maturity
Date | | Face
Amount† | | Value | |
Textiles, Apparel & Luxury Goods — continued | | | | | | | | | |
Empire Today LLC/Empire Today Finance Corp., Senior Secured Notes | | 11.375 | % | 2/1/17 | | 360,000 | | $ | 338,400 | (a) |
Oxford Industries Inc., Senior Secured Notes | | 11.375 | % | 7/15/15 | | 1,565,000 | | 1,744,975 | |
Total Textiles, Apparel & Luxury Goods | | | | | | | | 2,589,625 | |
Total Consumer Discretionary | | | | | | | | 52,972,320 | |
Consumer Staples — 1.9% | | | | | | | | | |
Food Products — 1.4% | | | | | | | | | |
Blue Merger Sub Inc., Senior Notes | | 7.625 | % | 2/15/19 | | 1,270,000 | | 1,266,825 | (a) |
Bumble Bee Acquisition Co., Senior Secured Notes | | 9.000 | % | 12/15/17 | | 480,000 | | 468,000 | (a) |
Harmony Foods Corp., Senior Secured Notes | | 10.000 | % | 5/1/16 | | 350,000 | | 349,125 | (a) |
Simmons Foods Inc., Senior Secured Notes | | 10.500 | % | 11/1/17 | | 1,810,000 | | 1,660,675 | (a) |
Smithfield Foods Inc., Senior Secured Notes | | 10.000 | % | 7/15/14 | | 138,000 | | 156,630 | |
Total Food Products | | | | | | | | 3,901,255 | |
Household Products — 0.1% | | | | | | | | | |
Reynolds Group DL Escrow Inc./Reynolds Group Escrow LLC, Senior Secured Notes | | 8.750 | % | 10/15/16 | | 100,000 | | 102,750 | (a) |
Tobacco — 0.4% | | | | | | | | | |
Alliance One International Inc., Senior Notes | | 10.000 | % | 7/15/16 | | 1,290,000 | | 1,172,287 | |
Total Consumer Staples | | | | | | | | 5,176,292 | |
Energy — 12.2% | | | | | | | | | |
Energy Equipment & Services — 1.9% | | | | | | | | | |
Complete Production Services Inc., Senior Notes | | 8.000 | % | 12/15/16 | | 690,000 | | 700,350 | |
Hercules Offshore LLC, Senior Secured Notes | | 10.500 | % | 10/15/17 | | 1,380,000 | | 1,366,200 | (a) |
Parker Drilling Co., Senior Notes | | 9.125 | % | 4/1/18 | | 900,000 | | 940,500 | |
Precision Drilling Corp., Senior Notes | | 6.625 | % | 11/15/20 | | 220,000 | | 223,300 | |
Vantage Drilling Co., Senior Secured Notes | | 11.500 | % | 8/1/15 | | 1,820,000 | | 1,947,400 | |
Total Energy Equipment & Services | | | | | | | | 5,177,750 | |
Oil, Gas & Consumable Fuels — 10.3% | | | | | | | | | |
Berry Petroleum Co., Senior Notes | | 10.250 | % | 6/1/14 | | 700,000 | | 787,500 | |
Calumet Specialty Products Partners LP/Calumet Finance Corp., Senior Notes | | 9.375 | % | 5/1/19 | | 600,000 | | 582,000 | (a) |
Chesapeake Energy Corp., Senior Notes | | 7.250 | % | 12/15/18 | | 745,000 | | 804,600 | |
Chesapeake Energy Corp., Senior Notes | | 6.625 | % | 8/15/20 | | 1,404,000 | | 1,474,200 | |
Compagnie Generale de Geophysique-Veritas, Senior Notes | | 9.500 | % | 5/15/16 | | 270,000 | | 285,525 | |
Compagnie Generale de Geophysique-Veritas, Senior Notes | | 7.750 | % | 5/15/17 | | 200,000 | | 202,000 | |
CONSOL Energy Inc., Senior Notes | | 8.250 | % | 4/1/20 | | 860,000 | | 928,800 | |
Corral Petroleum Holdings AB, Senior Bonds | | 15.000 | % | 9/18/11 | | 1,733,021 | | 1,663,700 | (a)(b)(e)(g) |
| | | | | | | | | | |
See Notes to Financial Statements.
8 | | Western Asset Managed High Income Fund Inc. 2011 Semi-Annual Report | | |
Schedule of investments (unaudited) (cont’d)
August 31, 2011
Western Asset Managed High Income Fund Inc.
Security | | Rate | | Maturity
Date | | Face
Amount† | | Value | |
Oil, Gas & Consumable Fuels — continued | | | | | | | | | |
Crosstex Energy LP/Crosstex Energy Finance Corp., Senior Notes | | 8.875 | % | 2/15/18 | | 220,000 | | $ | 228,800 | |
El Paso Corp., Medium-Term Notes | | 7.800 | % | 8/1/31 | | 680,000 | | 767,079 | |
Energy Transfer Equity LP, Senior Notes | | 7.500 | % | 10/15/20 | | 830,000 | | 854,900 | |
Enterprise Products Operating LLP, Junior Subordinated Notes | | 8.375 | % | 8/1/66 | | 840,000 | | 879,729 | (f) |
Enterprise Products Operating LLP, Subordinated Notes | | 7.034 | % | 1/15/68 | | 410,000 | | 414,625 | (f) |
EXCO Resources Inc., Senior Notes | | 7.500 | % | 9/15/18 | | 1,570,000 | | 1,479,725 | |
MarkWest Energy Partners LP/MarkWest Energy Finance Corp., Senior Notes | | 8.750 | % | 4/15/18 | | 640,000 | | 676,800 | |
MarkWest Energy Partners LP/MarkWest Energy Finance Corp., Senior Notes | | 6.500 | % | 8/15/21 | | 40,000 | | 40,900 | |
Milagro Oil & Gas Inc., Secured Notes | | 10.500 | % | 5/15/16 | | 920,000 | | 791,200 | (a) |
Offshore Group Investments Ltd., Senior Secured Notes | | 11.500 | % | 8/1/15 | | 340,000 | | 363,800 | (a) |
Overseas Shipholding Group Inc., Senior Notes | | 8.125 | % | 3/30/18 | | 1,735,000 | | 1,483,425 | |
Peabody Energy Corp., Senior Notes | | 7.875 | % | 11/1/26 | | 310,000 | | 340,225 | |
Petroplus Finance Ltd., Senior Notes | | 6.750 | % | 5/1/14 | | 670,000 | | 606,350 | (a) |
Petroplus Finance Ltd., Senior Notes | | 7.000 | % | 5/1/17 | | 470,000 | | 411,250 | (a) |
Plains Exploration & Production Co., Senior Notes | | 10.000 | % | 3/1/16 | | 685,000 | | 760,350 | |
Plains Exploration & Production Co., Senior Notes | | 8.625 | % | 10/15/19 | | 725,000 | | 790,250 | |
PT Adaro Indonesia, Senior Notes | | 7.625 | % | 10/22/19 | | 250,000 | | 277,500 | (a) |
Quicksilver Resources Inc., Senior Notes | | 11.750 | % | 1/1/16 | | 1,375,000 | | 1,522,812 | |
Quicksilver Resources Inc., Senior Notes | | 9.125 | % | 8/15/19 | | 200,000 | | 206,000 | |
Range Resources Corp., Senior Subordinated Notes | | 8.000 | % | 5/15/19 | | 170,000 | | 185,725 | |
SandRidge Energy Inc., Senior Notes | | 7.500 | % | 3/15/21 | | 280,000 | | 273,350 | (a) |
Saratoga Resources Inc., Senior Secured Notes | | 12.500 | % | 7/1/16 | | 700,000 | | 689,500 | (a) |
Teekay Corp., Senior Notes | | 8.500 | % | 1/15/20 | | 1,390,000 | | 1,358,725 | |
Tennessee Gas Pipeline Co., Senior Notes | | 8.000 | % | 2/1/16 | | 645,000 | | 781,673 | |
Tennessee Gas Pipeline Co., Senior Notes | | 8.375 | % | 6/15/32 | | 1,960,000 | | 2,582,106 | |
TNK-BP Finance SA, Senior Notes | | 7.875 | % | 3/13/18 | | 918,000 | | 1,052,212 | (a) |
Whiting Petroleum Corp., Senior Subordinated Notes | | 6.500 | % | 10/1/18 | | 710,000 | | 713,550 | |
Xinergy Ltd., Senior Secured Notes | | 9.250 | % | 5/15/19 | | 810,000 | | 765,450 | (a) |
Total Oil, Gas & Consumable Fuels | | | | | | | | 28,026,336 | |
Total Energy | | | | | | | | 33,204,086 | |
| | | | | | | | | | |
See Notes to Financial Statements.
| | Western Asset Managed High Income Fund Inc. 2011 Semi-Annual Report | | 9 |
Western Asset Managed High Income Fund Inc.
Security | | Rate | | Maturity
Date | | Face
Amount† | | Value | |
Financials — 6.9% | | | | | | | | | |
Capital Markets — 0.2% | | | | | | | | | |
Goldman Sachs Group Inc., Subordinated Notes | | 6.750 | % | 10/1/37 | | 670,000 | | $ | 637,868 | |
Commercial Banks — 1.8% | | | | | | | | | |
BAC Capital Trust VI, Capital Securities, Junior Subordinated Notes | | 5.625 | % | 3/8/35 | | 650,000 | | 516,108 | |
BankAmerica Institutional Capital A, Junior Subordinated Bonds | | 8.070 | % | 12/31/26 | | 310,000 | | 310,000 | (a) |
BankAmerica Institutional Capital B, Junior Subordinated Bonds | | 7.700 | % | 12/31/26 | | 200,000 | | 197,500 | (a) |
CIT Group Inc., Senior Secured Bonds | | 7.000 | % | 5/1/16 | | 988,739 | | 985,031 | |
CIT Group Inc., Senior Secured Bonds | | 7.000 | % | 5/1/17 | | 480,000 | | 474,600 | |
Credit Agricole SA, Subordinated Notes | | 8.375 | % | 10/13/19 | | 510,000 | | 471,750 | (a)(f)(h) |
NB Capital Trust II, Junior Subordinated Notes | | 7.830 | % | 12/15/26 | | 900,000 | | 885,375 | |
NB Capital Trust IV, Junior Subordinated Notes | | 8.250 | % | 4/15/27 | | 590,000 | | 594,425 | |
Royal Bank of Scotland Group PLC, Junior Subordinated Bonds | | 7.648 | % | 9/30/31 | | 480,000 | | 362,400 | (f)(h) |
Total Commercial Banks | | | | | | | | 4,797,189 | |
Consumer Finance — 1.2% | | | | | | | | | |
Ally Financial Inc., Senior Bonds | | 0.000 | % | 12/1/12 | | 1,160,000 | | 1,070,100 | |
Ally Financial Inc., Senior Notes | | 7.500 | % | 9/15/20 | | 260,000 | | 256,425 | |
GMAC International Finance BV, Senior Bonds | | 7.500 | % | 4/21/15 | | 460,000 | EUR | 631,055 | |
SLM Corp., Medium-Term Notes | | 8.000 | % | 3/25/20 | | 570,000 | | 587,117 | |
SLM Corp., Medium-Term Notes, Senior Notes | | 8.450 | % | 6/15/18 | | 570,000 | | 604,288 | |
Total Consumer Finance | | | | | | | | 3,148,985 | |
Diversified Financial Services — 3.0% | | | | | | | | | |
Bank of America Corp., Notes, Preferred Securities | | 8.000 | % | 1/30/18 | | 65,000 | | 61,532 | (f)(h) |
Bankrate Inc., Senior Secured Notes | | 11.750 | % | 7/15/15 | | 692,000 | | 785,420 | |
Capital One Capital V, Junior Subordinated Notes, Cumulative Trust Preferred Securities | | 10.250 | % | 8/15/39 | | 680,000 | | 710,158 | |
Countrywide Capital III, Junior Subordinated Notes | | 8.050 | % | 6/15/27 | | 180,000 | | 181,350 | |
International Lease Finance Corp., Medium-Term Notes, Senior Notes | | 5.625 | % | 9/20/13 | | 1,010,000 | | 979,700 | |
International Lease Finance Corp., Senior Notes | | 8.875 | % | 9/1/17 | | 2,520,000 | | 2,589,300 | |
International Lease Finance Corp., Senior Notes | | 8.250 | % | 12/15/20 | | 1,290,000 | | 1,315,800 | |
MBNA Capital A, Junior Subordinated Notes | | 8.278 | % | 12/1/26 | | 840,000 | | 843,150 | |
Residential Capital LLC, Junior Secured Notes | | 9.625 | % | 5/15/15 | | 910,000 | | 811,038 | |
Total Diversified Financial Services | | | | | | | | 8,277,448 | |
| | | | | | | | | | |
See Notes to Financial Statements.
10 | | Western Asset Managed High Income Fund Inc. 2011 Semi-Annual Report | | |
Schedule of investments (unaudited) (cont’d)
August 31, 2011
Western Asset Managed High Income Fund Inc.
Security | | Rate | | Maturity
Date | | Face
Amount† | | Value | |
Insurance — 0.7% | | | | | | | | | |
American International Group Inc., Senior Notes | | 8.250 | % | 8/15/18 | | 890,000 | | $ | 1,006,594 | |
Dai-ichi Life Insurance Co., Ltd., Subordinated Notes | | 7.250 | % | 7/25/21 | | 330,000 | | 336,827 | (a)(f)(h) |
ING Capital Funding Trust III, Junior Subordinated Bonds | | 3.846 | % | 12/31/11 | | 250,000 | | 216,097 | (f)(h) |
MetLife Capital Trust IV, Junior Subordinated Notes | | 7.875 | % | 12/15/37 | | 360,000 | | 369,000 | (a) |
Total Insurance | | | | | | | | 1,928,518 | |
Total Financials | | | | | | | | 18,790,008 | |
Health Care — 5.4% | | | | | | | | | |
Health Care Equipment & Supplies — 0.3% | | | | | | | | | |
Biomet Inc., Senior Notes | | 10.000 | % | 10/15/17 | | 130,000 | | 136,825 | |
Biomet Inc., Senior Toggle Notes | | 10.375 | % | 10/15/17 | | 535,000 | | 567,100 | (e) |
Total Health Care Equipment & Supplies | | | | | | | | 703,925 | |
Health Care Providers & Services — 4.9% | | | | | | | | | |
American Renal Holdings, Senior Notes | | 9.750 | % | 3/1/16 | | 860,000 | | 818,773 | (a)(e) |
American Renal Holdings, Senior Secured Notes | | 8.375 | % | 5/15/18 | | 690,000 | | 691,725 | |
CRC Health Corp., Senior Subordinated Notes | | 10.750 | % | 2/1/16 | | 2,585,000 | | 2,597,925 | |
ExamWorks Group Inc., Senior Notes | | 9.000 | % | 7/15/19 | | 510,000 | | 483,225 | (a) |
Fresenius Medical Care U.S. Finance Inc., Senior Notes | | 6.875 | % | 7/15/17 | | 1,170,000 | | 1,225,575 | |
Fresenius U.S. Finance II Inc., Senior Notes | | 9.000 | % | 7/15/15 | | 340,000 | | 380,800 | (a) |
HCA Inc., Debentures | | 7.500 | % | 11/15/95 | | 2,345,000 | | 1,829,100 | |
HCA Inc., Notes | | 7.690 | % | 6/15/25 | | 490,000 | | 443,450 | |
HCA Inc., Senior Secured Notes | | 7.875 | % | 2/15/20 | | 720,000 | | 766,800 | |
INC Research LLC, Senior Notes | | 11.500 | % | 7/15/19 | | 390,000 | | 362,700 | (a) |
InVentiv Health Inc., Senior Notes | | 10.000 | % | 8/15/18 | | 800,000 | | 726,000 | (a) |
Tenet Healthcare Corp., Senior Secured Notes | | 10.000 | % | 5/1/18 | | 717,000 | | 792,285 | �� |
Tenet Healthcare Corp., Senior Secured Notes | | 8.875 | % | 7/1/19 | | 520,000 | | 553,800 | |
Universal Hospital Services Inc., Senior Secured Notes | | 8.500 | % | 6/1/15 | | 1,190,000 | | 1,187,025 | (e) |
US Oncology Inc. | | 9.125 | % | 8/15/17 | | 615,000 | | 7,688 | (d) |
Vanguard Health Holdings Co., II LLC, Senior Notes | | 8.000 | % | 2/1/18 | | 620,000 | | 593,650 | |
Total Health Care Providers & Services | | | | | | | | 13,460,521 | |
Pharmaceuticals — 0.2% | | | | | | | | | |
Giant Funding Corp., Senior Secured Notes | | 8.250 | % | 2/1/18 | | 420,000 | | 422,100 | (a) |
Total Health Care | | | | | | | | 14,586,546 | |
| | | | | | | | | | |
See Notes to Financial Statements.
| | Western Asset Managed High Income Fund Inc. 2011 Semi-Annual Report | | 11 |
Western Asset Managed High Income Fund Inc.
Security | | Rate | | Maturity
Date | | Face
Amount† | | Value | |
Industrials — 15.0% | | | | | | | | | |
Aerospace & Defense — 2.3% | | | | | | | | | |
Ducommun Inc., Senior Notes | | 9.750 | % | 7/15/18 | | 530,000 | | $ | 535,300 | (a) |
FGI Operating Co. Inc., Senior Secured Notes | | 10.250 | % | 8/1/15 | | 1,075,000 | | 1,144,875 | |
Kratos Defense & Security Solutions Inc., Senior Notes | | 10.000 | % | 6/1/17 | | 100,000 | | 102,250 | (a) |
Kratos Defense & Security Solutions Inc., Senior Secured Notes | | 10.000 | % | 6/1/17 | | 1,240,000 | | 1,280,300 | |
Northrop Grumman Corp., Senior Notes | | 6.875 | % | 3/15/18 | | 460,000 | | 434,700 | (a) |
Northrop Grumman Corp., Senior Notes | | 7.125 | % | 3/15/21 | | 460,000 | | 434,700 | (a) |
Triumph Group Inc., Senior Notes | | 8.625 | % | 7/15/18 | | 620,000 | | 663,400 | |
Wyle Services Corp., Senior Subordinated Notes | | 10.500 | % | 4/1/18 | | 1,605,000 | | 1,598,981 | (a) |
Total Aerospace & Defense | | | | | | | | 6,194,506 | |
Airlines — 2.2% | | | | | | | | | |
American Airlines Pass-Through Trust, Secured Notes | | 7.000 | % | 1/31/18 | | 427,161 | | 367,359 | (a) |
Continental Airlines Inc., Pass-Through Certificates | | 7.373 | % | 12/15/15 | | 63,822 | | 63,822 | |
Continental Airlines Inc., Pass-Through Certificates | | 9.250 | % | 5/10/17 | | 102,860 | | 102,860 | |
Continental Airlines Inc., Pass-Through Certificates, Subordinated Secured Notes | | 7.339 | % | 4/19/14 | | 948,540 | | 924,826 | |
Continental Airlines Inc., Senior Secured Notes | | 6.750 | % | 9/15/15 | | 300,000 | | 294,000 | (a) |
DAE Aviation Holdings Inc., Senior Notes | | 11.250 | % | 8/1/15 | | 2,345,000 | | 2,409,487 | (a) |
Delta Air Lines, Secured Notes | | 6.375 | % | 1/2/16 | | 80,000 | | 72,000 | |
Delta Air Lines Inc., Pass-Through Certificates | | 8.954 | % | 8/10/14 | | 56,124 | | 56,685 | |
Delta Air Lines Inc., Pass-Through Certificates, Secured Notes | | 8.021 | % | 8/10/22 | | 659,681 | | 659,681 | |
Delta Air Lines Inc., Pass-Through Certificates, Subordinated Secured Notes | | 9.750 | % | 12/17/16 | | 264,384 | | 270,994 | |
Delta Air Lines Inc., Senior Secured Notes | | 9.500 | % | 9/15/14 | | 359,000 | | 369,770 | (a) |
United Air Lines Inc., Senior Secured Notes | | 9.875 | % | 8/1/13 | | 369,000 | | 381,915 | (a) |
Total Airlines | | | | | | | | 5,973,399 | |
Building Products — 0.7% | | | | | | | | | |
Ashton Woods USA LLC/Ashton Woods Finance Co., Senior Subordinated Notes, step bond | | 0.000 | % | 6/30/15 | | 395,200 | | 285,532 | (a)(b) |
Building Materials Corp. of America, Senior Notes | | 6.875 | % | 8/15/18 | | 240,000 | | 236,400 | (a) |
Building Materials Corp. of America, Senior Notes | | 6.750 | % | 5/1/21 | | 1,040,000 | | 998,400 | (a) |
Shea Homes LP, Senior Secured Notes | | 8.625 | % | 5/15/19 | | 540,000 | | 457,650 | (a) |
Total Building Products | | | | | | | | 1,977,982 | |
| | | | | | | | | | |
See Notes to Financial Statements.
12 | | Western Asset Managed High Income Fund Inc. 2011 Semi-Annual Report | | |
Schedule of investments (unaudited) (cont’d)
August 31, 2011
Western Asset Managed High Income Fund Inc.
Security | | Rate | | Maturity
Date | | Face
Amount† | | Value | |
Commercial Services & Supplies — 1.9% | | | | | | | | | |
ACCO Brands Corp., Senior Secured Notes | | 10.625 | % | 3/15/15 | | 1,020,000 | | $ | 1,120,725 | |
Altegrity Inc., Senior Subordinated Notes | | 10.500 | % | 11/1/15 | | 120,000 | | 116,400 | (a) |
Altegrity Inc., Senior Subordinated Notes | | 11.750 | % | 5/1/16 | | 1,570,000 | | 1,515,050 | (a) |
American Reprographics Co., Senior Notes | | 10.500 | % | 12/15/16 | | 910,000 | | 850,850 | |
Geo Group Inc., Senior Notes | | 7.750 | % | 10/15/17 | | 980,000 | | 1,033,900 | |
RSC Equipment Rental Inc./RSC Holdings III LLC, Senior Notes | | 8.250 | % | 2/1/21 | | 440,000 | | 412,500 | |
Total Commercial Services & Supplies | | | | | | | | 5,049,425 | |
Construction & Engineering — 0.3% | | | | | | | | | |
Abengoa Finance SAU, Senior Notes | | 8.875 | % | 11/1/17 | | 800,000 | | 738,000 | (a) |
Electrical Equipment — 0.3% | | | | | | | | | |
NES Rentals Holdings Inc., Senior Secured Notes | | 12.250 | % | 4/15/15 | | 980,000 | | 906,500 | (a) |
Industrial Conglomerates — 0.3% | | | | | | | | | |
Leucadia National Corp., Senior Notes | | 8.125 | % | 9/15/15 | | 850,000 | | 916,938 | |
Machinery — 0.5% | | | | | | | | | |
Dematic SA, Senior Secured Notes | | 8.750 | % | 5/1/16 | | 1,240,000 | | 1,190,400 | (a) |
Marine — 1.1% | | | | | | | | | |
Horizon Lines Inc., Senior Secured Notes | | 11.000 | % | 10/15/16 | | 530,000 | | 530,000 | (g) |
Horizon Lines Inc., Senior Secured Notes | | 13.000 | % | 10/15/16 | | 710,000 | | 710,000 | (e)(g) |
Navios Maritime Acquisition Corp., Senior Secured Notes | | 8.625 | % | 11/1/17 | | 200,000 | | 167,750 | (a) |
Navios Maritime Acquisition Corp./Navios Acquisition Finance U.S. Inc., Senior Secured Notes | | 8.625 | % | 11/1/17 | | 1,430,000 | | 1,199,412 | |
Navios Maritime Holdings Inc./Navios Maritime Finance II U.S. Inc., Senior Notes | | 8.125 | % | 2/15/19 | | 450,000 | | 369,000 | (a) |
Total Marine | | | | | | | | 2,976,162 | |
Road & Rail — 3.6% | | | | | | | | | |
Florida East Coast Holdings Corp., Senior Notes | | 10.500 | % | 8/1/17 | | 1,326,937 | | 1,274,554 | (a)(e) |
Florida East Coast Industries Inc., Senior Secured Notes | | 8.125 | % | 2/1/17 | | 1,190,000 | | 1,190,000 | (a) |
Jack Cooper Holdings Corp., Senior Secured Notes | | 13.250 | % | 12/15/15 | | 1,328,000 | | 1,354,560 | (a) |
Kansas City Southern de Mexico, Senior Notes | | 12.500 | % | 4/1/16 | | 571,000 | | 663,216 | |
Kansas City Southern de Mexico, Senior Notes | | 8.000 | % | 2/1/18 | | 2,030,000 | | 2,192,400 | |
Kansas City Southern Railway, Senior Notes | | 13.000 | % | 12/15/13 | | 136,000 | | 157,590 | |
Kansas City Southern Railway, Senior Notes | | 8.000 | % | 6/1/15 | | 140,000 | | 149,450 | |
Quality Distribution LLC/QD Capital Corp., Secured Notes | | 9.875 | % | 11/1/18 | | 1,620,000 | | 1,626,075 | |
RailAmerica Inc., Senior Secured Notes | | 9.250 | % | 7/1/17 | | 1,138,000 | | 1,234,730 | |
Total Road & Rail | | | | | | | | 9,842,575 | |
| | | | | | | | | | |
See Notes to Financial Statements.
| | Western Asset Managed High Income Fund Inc. 2011 Semi-Annual Report | | 13 |
Western Asset Managed High Income Fund Inc.
Security | | Rate | | Maturity
Date | | Face
Amount† | | Value | |
Trading Companies & Distributors — 0.3% | | | | | | | | | |
H&E Equipment Services Inc., Senior Notes | | 8.375 | % | 7/15/16 | | 835,000 | | $ | 832,913 | |
Transportation — 1.4% | | | | | | | | | |
CMA CGM, Senior Notes | | 8.500 | % | 4/15/17 | | 1,620,000 | | 745,200 | (a) |
Hapag-Lloyd AG, Senior Notes | | 9.750 | % | 10/15/17 | | 1,600,000 | | 1,312,000 | (a) |
Syncreon Global Ireland Ltd./Syncreon Global Finance US Inc., Senior Notes | | 9.500 | % | 5/1/18 | | 1,880,000 | | 1,781,300 | (a) |
Total Transportation | | | | | | | | 3,838,500 | |
Transportation Infrastructure — 0.1% | | | | | | | | | |
Aguila 3 SA, Senior Secured Notes | | 7.875 | % | 1/31/18 | | 320,000 | | 302,400 | (a) |
Total Industrials | | | | | | | | 40,739,700 | |
Information Technology — 3.2% | | | | | | | | | |
Electronic Equipment, Instruments & Components — 0.7% | | | | | | | |
NXP BV/NXP Funding LLC, Senior Secured Notes | | 9.750 | % | 8/1/18 | | 1,830,000 | | 1,935,225 | (a) |
IT Services — 1.4% | | | | | | | | | |
Ceridian Corp., Senior Notes | | 12.250 | % | 11/15/15 | | 899,925 | | 836,930 | (e) |
First Data Corp., Senior Notes | | 5.625 | % | 11/1/11 | | 150,000 | | 150,750 | |
First Data Corp., Senior Notes | | 10.550 | % | 9/24/15 | | 2,562,981 | | 2,308,128 | (e) |
First Data Corp., Senior Notes | | 11.250 | % | 3/31/16 | | 270,000 | | 228,150 | |
First Data Corp., Senior Secured Notes | | 7.375 | % | 6/15/19 | | 70,000 | | 66,150 | (a) |
Sterling Merger Inc., Senior Notes | | 11.000 | % | 10/1/19 | | 170,000 | | 166,813 | (a) |
Total IT Services | | | | | | | | 3,756,921 | |
Semiconductors & Semiconductor Equipment — 1.1% | | | | | | | | | |
CDW LLC/CDW Finance Corp., Senior Notes | | 11.000 | % | 10/12/15 | | 430,000 | | 440,750 | |
CDW LLC/CDW Finance Corp., Senior Notes | | 11.500 | % | 10/12/15 | | 360,000 | | 369,000 | (e) |
Freescale Semiconductor Inc., Senior Notes | | 10.750 | % | 8/1/20 | | 208,000 | | 218,920 | |
Freescale Semiconductor Inc., Senior Secured Notes | | 9.250 | % | 4/15/18 | | 400,000 | | 423,000 | (a) |
Freescale Semiconductor Inc., Senior Subordinated Notes | | 10.125 | % | 12/15/16 | | 1,260,000 | | 1,323,000 | |
Sensata Technologies BV, Secured Notes | | 6.500 | % | 5/15/19 | | 360,000 | | 348,300 | (a) |
Total Semiconductors & Semiconductor Equipment | | | | | | | | 3,122,970 | |
Total Information Technology | | | | | | | | 8,815,116 | |
Materials — 9.0% | | | | | | | | | |
Chemicals — 2.2% | | | | | | | | | |
Georgia Gulf Corp., Senior Secured Notes | | 9.000 | % | 1/15/17 | | 735,000 | | 753,375 | (a) |
Ineos Finance PLC, Senior Secured Notes | | 9.000 | % | 5/15/15 | | 700,000 | | 712,250 | (a) |
Kerling PLC, Senior Secured Notes | | 10.625 | % | 1/28/17 | | 582,000 | EUR | 764,980 | (a) |
LBI Escrow Corp., Senior Secured Notes | | 8.000 | % | 11/1/17 | | 841,000 | | 935,612 | (a) |
Lyondell Chemical Co., Senior Secured Notes | | 11.000 | % | 5/1/18 | | 830,000 | | 930,637 | |
| | | | | | | | | | |
See Notes to Financial Statements.
14 | | Western Asset Managed High Income Fund Inc. 2011 Semi-Annual Report | | |
Schedule of investments (unaudited) (cont’d)
August 31, 2011
Western Asset Managed High Income Fund Inc.
Security | | Rate | | Maturity
Date | | Face
Amount† | | Value | |
Chemicals — continued | | | | | | | | | |
Solutia Inc., Senior Notes | | 8.750 | % | 11/1/17 | | 585,000 | | $ | 624,488 | |
Solutia Inc., Senior Notes | | 7.875 | % | 3/15/20 | | 740,000 | | 791,800 | |
Texas Petrochemical Corp. Group LLC, Senior Secured Notes | | 8.250 | % | 10/1/17 | | 470,000 | | 482,925 | (a) |
Total Chemicals | | | | | | | | 5,996,067 | |
Containers & Packaging — 2.9% | | | | | | | | | |
ARD Finance SA, Senior Secured Notes | | 11.125 | % | 6/1/18 | | 270,000 | | 224,885 | (a)(e) |
Ardagh Packaging Finance PLC, Senior Notes | | 9.125 | % | 10/15/20 | | 1,060,000 | | 1,028,200 | (a) |
Ardagh Packaging Finance PLC, Senior Secured Notes | | 7.375 | % | 10/15/17 | | 340,000 | EUR | 459,717 | (a) |
Berry Plastics Corp., Secured Notes | | 9.750 | % | 1/15/21 | | 300,000 | | 279,750 | |
Berry Plastics Corp., Senior Secured Notes | | 9.500 | % | 5/15/18 | | 540,000 | | 499,500 | |
Longview Fibre Paper & Packaging Inc., Senior Secured Notes | | 8.000 | % | 6/1/16 | | 680,000 | | 676,600 | (a) |
Pretium Packaging LLC/Pretium Finance Inc., Senior Secured Notes | | 11.500 | % | 4/1/16 | | 1,260,000 | | 1,244,250 | (a) |
Reynolds Group Issuer Inc./Reynolds Group Issuer LLC, Senior Notes | | 9.000 | % | 4/15/19 | | 1,180,000 | | 1,067,900 | (a) |
Reynolds Group Issuer Inc./Reynolds Group Issuer LLC, Senior Notes | | 8.250 | % | 2/15/21 | | 970,000 | | 822,075 | (a) |
Reynolds Group Issuer Inc./Reynolds Group Issuer LLC, Senior Secured Notes | | 7.875 | % | 8/15/19 | | 100,000 | | 99,500 | (a) |
Viskase Cos. Inc., Senior Secured Notes | | 9.875 | % | 1/15/18 | | 1,380,000 | | 1,400,700 | (a) |
Total Containers & Packaging | | | | | | | | 7,803,077 | |
Metals & Mining — 2.2% | | | | | | | | | |
Atkore International Inc., Senior Secured Notes | | 9.875 | % | 1/1/18 | | 510,000 | | 498,525 | (a) |
FMG Resources (August 2006) Pty Ltd., Senior Notes | | 7.000 | % | 11/1/15 | | 170,000 | | 170,425 | (a) |
Midwest Vanadium Pty Ltd., Senior Secured Notes | | 11.500 | % | 2/15/18 | | 2,060,000 | | 1,957,000 | (a) |
Mirabela Nickel Ltd., Senior Notes | | 8.750 | % | 4/15/18 | | 720,000 | | 673,200 | (a) |
Novelis Inc., Senior Notes | | 8.750 | % | 12/15/20 | | 1,240,000 | | 1,311,300 | |
Ryerson Holding Corp., Senior Secured Notes | | 0.000 | % | 2/1/15 | | 1,720,000 | | 868,600 | |
Ryerson Inc., Senior Secured Notes | | 12.000 | % | 11/1/15 | | 20,000 | | 20,625 | |
Tempel Steel Co., Senior Secured Notes | | 12.000 | % | 8/15/16 | | 520,000 | | 521,300 | (a) |
Total Metals & Mining | | | | | | | | 6,020,975 | |
Paper & Forest Products — 1.7% | | | | | | | | | |
Appleton Papers Inc., Senior Secured Notes | | 11.250 | % | 12/15/15 | | 2,072,000 | | 2,030,560 | |
NewPage Corp., Senior Secured Notes | | 11.375 | % | 12/31/14 | | 890,000 | | 787,650 | (d) |
PE Paper Escrow GmbH, Senior Secured Notes | | 12.000 | % | 8/1/14 | | 340,000 | | 368,900 | (a) |
| | | | | | | | | | |
See Notes to Financial Statements.
| | Western Asset Managed High Income Fund Inc. 2011 Semi-Annual Report | | 15 |
Western Asset Managed High Income Fund Inc.
Security | | Rate | | Maturity
Date | | Face
Amount† | | Value | |
Paper & Forest Products — continued | | | | | | | | | |
Sappi Papier Holding GmbH, Senior Secured Notes | | 6.625 | % | 4/15/21 | | 360,000 | | $ | 322,200 | (a) |
Verso Paper Holdings LLC, Senior Subordinated Notes | | 11.375 | % | 8/1/16 | | 1,230,000 | | 965,550 | |
Verso Paper Holdings LLC/Verso Paper Inc., Senior Secured Notes | | 8.750 | % | 2/1/19 | | 410,000 | | 329,025 | |
Total Paper & Forest Products | | | | | | | | 4,803,885 | |
Total Materials | | | | | | | | 24,624,004 | |
Telecommunication Services — 7.3% | | | | | | | | | |
Diversified Telecommunication Services — 4.2% | | | | | | | | | |
Cincinnati Bell Telephone Co., Senior Debentures | | 6.300 | % | 12/1/28 | | 115,000 | | 92,575 | |
Cogent Communications Group Inc., Senior Secured Notes | | 8.375 | % | 2/15/18 | | 750,000 | | 784,687 | (a) |
Inmarsat Finance PLC, Senior Notes | | 7.375 | % | 12/1/17 | | 1,350,000 | | 1,410,750 | (a) |
Intelsat Jackson Holdings Ltd., Senior Notes | | 11.250 | % | 6/15/16 | | 360,000 | | 377,100 | |
Intelsat Jackson Holdings SA, Senior Notes | | 7.250 | % | 4/1/19 | | 1,420,000 | | 1,373,850 | (a) |
Level 3 Financing Inc., Senior Notes | | 9.250 | % | 11/1/14 | | 387,000 | | 393,773 | |
Primus Telecommunications Holding Inc., Senior Notes | | 10.000 | % | 4/15/17 | | 143,863 | | 138,648 | (a) |
Satelite Mexicanos SA de CV, Senior Secured Notes | | 9.500 | % | 5/15/17 | | 600,000 | | 591,750 | (a) |
TW Telecom Holdings Inc., Senior Notes | | 8.000 | % | 3/1/18 | | 1,035,000 | | 1,071,225 | |
West Corp., Senior Notes | | 8.625 | % | 10/1/18 | | 950,000 | | 931,000 | |
West Corp., Senior Notes | | 7.875 | % | 1/15/19 | | 1,120,000 | | 1,075,200 | |
West Corp., Senior Subordinated Notes | | 11.000 | % | 10/15/16 | | 470,000 | | 482,925 | |
Wind Acquisition Finance SA, Senior Notes | | 11.750 | % | 7/15/17 | | 600,000 | | 625,500 | (a) |
Wind Acquisition Finance SA, Senior Secured Notes | | 7.250 | % | 2/15/18 | | 480,000 | | 451,200 | (a) |
Wind Acquisition Holdings Finance SpA, Senior Notes | | 12.250 | % | 7/15/17 | | 695,135 | | 687,504 | (a)(e) |
Windstream Corp., Senior Notes | | 7.500 | % | 4/1/23 | | 1,170,000 | | 1,137,825 | |
Total Diversified Telecommunication Services | | | | | | | | 11,625,512 | |
Wireless Telecommunication Services — 3.1% | | | | | | | | | |
Buccaneer Merger Sub Inc., Senior Notes | | 9.125 | % | 1/15/19 | | 930,000 | | 934,650 | (a) |
MetroPCS Wireless Inc., Senior Notes | | 7.875 | % | 9/1/18 | | 660,000 | | 672,375 | |
Sprint Capital Corp., Global Notes | | 6.900 | % | 5/1/19 | | 490,000 | | 485,100 | |
Sprint Capital Corp., Senior Notes | | 6.875 | % | 11/15/28 | | 350,000 | | 315,000 | |
Sprint Capital Corp., Senior Notes | | 8.750 | % | 3/15/32 | | 4,415,000 | | 4,547,450 | |
True Move Co., Ltd., Notes | | 10.750 | % | 12/16/13 | | 1,370,000 | | 1,445,350 | (a) |
Total Wireless Telecommunication Services | | | | | | | | 8,399,925 | |
Total Telecommunication Services | | | | | | | | 20,025,437 | |
| | | | | | | | | | |
See Notes to Financial Statements.
16 | | Western Asset Managed High Income Fund Inc. 2011 Semi-Annual Report | | |
Schedule of investments (unaudited) (cont’d)
August 31, 2011
Western Asset Managed High Income Fund Inc.
Security | | Rate | | Maturity
Date | | Face
Amount† | | Value | |
Utilities — 6.7% | | | | | | | | | |
Electric Utilities — 1.5% | | | | | | | | | |
AES Red Oak LLC, Secured Notes | | 9.200 | % | 11/30/29 | | 870,000 | | $ | 893,925 | |
Astoria Depositor Corp., Pass-Through Certificates | | 8.144 | % | 5/1/21 | | 950,000 | | 883,500 | (a) |
Midwest Generation LLC, Pass-Through Certificates | | 8.560 | % | 1/2/16 | | 112,978 | | 111,284 | |
Reliant Energy Mid-Atlantic Power Holdings LLC, Senior Notes | | 9.681 | % | 7/2/26 | | 1,450,000 | | 1,457,250 | |
Texas Competitive Electric Holdings Co. LLC/TCEH Finance Inc., Senior Secured Notes | | 11.500 | % | 10/1/20 | | 890,000 | | 756,500 | (a) |
Total Electric Utilities | | | | | | | | 4,102,459 | |
Gas Utilities — 0.3% | | | | | | | | | |
Suburban Propane Partners LP/Suburban Energy Finance Corp., Senior Notes | | 7.375 | % | 3/15/20 | | 740,000 | | 756,650 | |
Independent Power Producers & Energy Traders — 4.9% | | | | | | | |
AES Corp., Senior Notes | | 7.375 | % | 7/1/21 | | 440,000 | | 444,950 | (a) |
Calpine Corp., Senior Secured Notes | | 7.875 | % | 7/31/20 | | 230,000 | | 236,900 | (a) |
Calpine Corp., Senior Secured Notes | | 7.500 | % | 2/15/21 | | 440,000 | | 446,600 | (a) |
Calpine Corp., Senior Secured Notes | | 7.875 | % | 1/15/23 | | 1,570,000 | | 1,603,362 | (a) |
Dynegy Inc., Bonds | | 7.670 | % | 11/8/16 | | 160,000 | | 108,000 | |
Edison Mission Energy, Senior Notes | | 7.625 | % | 5/15/27 | | 545,000 | | 346,075 | |
Energy Future Holdings Corp., Senior Notes | | 10.875 | % | 11/1/17 | | 3,131,000 | | 2,583,075 | |
Energy Future Holdings Corp., Senior Notes | | 11.250 | % | 11/1/17 | | 696,492 | | 564,082 | (e) |
Energy Future Intermediate Holding Co. LLC, Senior Secured Notes | | 9.750 | % | 10/15/19 | | 270,000 | | 264,411 | |
Energy Future Intermediate Holding Co. LLC/ EFIH Finance Inc., Senior Secured Notes | | 10.000 | % | 12/1/20 | | 1,009,000 | | 1,022,996 | |
First Wind Holdings Inc., Senior Secured Notes | | 10.250 | % | 6/1/18 | | 660,000 | | 633,600 | (a) |
Foresight Energy LLC/Foresight Energy Corp., Senior Notes | | 9.625 | % | 8/15/17 | | 1,930,000 | | 1,949,300 | (a) |
Mirant Americas Generation LLC, Senior Notes | | 9.125 | % | 5/1/31 | | 2,745,000 | | 2,594,025 | |
Mirant Mid Atlantic LLC, Pass-Through Certificates | | 10.060 | % | 12/30/28 | | 526,119 | | 573,470 | |
Total Independent Power Producers & Energy Traders | | | | | | 13,370,846 | |
Total Utilities | | | | | | | | 18,229,955 | |
Total Corporate Bonds & Notes (Cost — $237,110,704) | | | | | | 237,163,464 | |
Collateralized Senior Loans — 3.1% | | | | | | | | | |
Consumer Discretionary — 1.6% | | | | | | | | | |
Diversified Consumer Services — 0.5% | | | | | | | | | |
Realogy Corp., Term Loan | | 13.500 | % | 10/15/17 | | 1,500,000 | | 1,515,000 | (i) |
Hotels, Restaurants & Leisure — 0.4% | | | | | | | | | |
CityCenter Holdings LLC, Term Loan | | 7.500 | % | 1/13/15 | | 250,000 | | 245,417 | (i) |
| | | | | | | | | | |
See Notes to Financial Statements.
| | Western Asset Managed High Income Fund Inc. 2011 Semi-Annual Report | | 17 |
Western Asset Managed High Income Fund Inc.
Security | | Rate | | Maturity
Date | | Face
Amount† | | Value | |
Hotels, Restaurants & Leisure — continued | | | | | | | | | |
El Pollo Loco Inc., New Term Loan | | 9.250 | % | 7/14/17 | | 840,000 | | $ | 793,800 | (i) |
Total Hotels, Restaurants & Leisure | | | | | | | | 1,039,217 | |
Media — 0.4% | | | | | | | | | |
Newsday LLC, Term Loan B | | 10.500 | % | 8/1/13 | | 1,000,000 | | 1,037,500 | (i) |
Specialty Retail — 0.3% | | | | | | | | | |
BCBG Maxazria International, Term Loan B | | 9.720 | % | 5/19/15 | | 810,000 | | 781,650 | (i) |
Total Consumer Discretionary | | | | | | | | 4,373,367 | |
Industrials — 0.2% | | | | | | | | | |
Marine — 0.2% | | | | | | | | | |
Trico Shipping AS, Term Loan A | | 10.000 | % | 5/12/14 | | 220,026 | | 221,125 | (i) |
Trico Shipping AS, Term Loan B | | 1.000 | % | 5/12/14 | | 220,026 | | 221,126 | |
Total Industrials | | | | | | | | 442,251 | |
Information Technology — 0.2% | | | | | | | | | |
IT Services — 0.2% | | | | | | | | | |
SRA International Inc., Term Loan B | | 6.500 | % | 7/20/18 | | 600,000 | | 566,250 | (i) |
Telecommunication Services — 0.9% | | | | | | | | | |
Diversified Telecommunication Services — 0.3% | | | | | | | | | |
Level 3 Financing Inc., Term Loan B | | 11.500 | % | 3/13/14 | | 750,000 | | 784,219 | (i) |
Wireless Telecommunication Services — 0.6% | | | | | | | | | |
Vodafone Americas Finance 2 Inc., Term Loan A | | 6.875 | % | 8/11/15 | | 1,808,851 | | 1,817,895 | (i) |
Total Telecommunication Services | | | | | | | | 2,602,114 | |
Utilities — 0.2% | | | | | | | | | |
Electric Utilities — 0.2% | | | | | | | | | |
Texas Competitive Electric Holdings Co. LLC, Term Loan | | 4.706 - 4.772 | % | 10/10/17 | | 637,541 | | 470,187 | (i) |
Total Collateralized Senior Loans (Cost — $8,418,224) | | | | | | 8,454,169 | |
Convertible Bonds & Notes — 1.2% | | | | | | | | | |
Consumer Discretionary — 0.6% | | | | | | | | | |
Diversified Consumer Services — 0.6% | | | | | | | | | |
Realogy Corp., Senior Subordinated Bonds | | 11.000 | % | 4/15/18 | | 2,000,000 | | 1,680,000 | (a) |
Energy — 0.0% | | | | | | | | | |
Oil, Gas & Consumable Fuels — 0.0% | | | | | | | | | |
James River Coal Co., Senior Notes | | 3.125 | % | 3/15/18 | | 70,000 | | 52,500 | (a) |
Industrials — 0.5% | | | | | | | | | |
Marine — 0.5% | | | | | | | | | |
Horizon Lines Inc., Senior Notes | | 4.250 | % | 8/15/12 | | 1,670,000 | | 1,185,700 | (b) |
Materials — 0.1% | | | | | | | | | |
Chemicals — 0.1% | | | | | | | | | |
Hercules Inc. | | 6.500 | % | 6/30/29 | | 250,000 | | 194,375 | |
Total Convertible Bonds & Notes (Cost — $3,051,902) | | | | | | 3,112,575 | |
| | | | | | | | | | |
See Notes to Financial Statements.
18 | | Western Asset Managed High Income Fund Inc. 2011 Semi-Annual Report | | |
Schedule of investments (unaudited) (cont’d)
August 31, 2011
Western Asset Managed High Income Fund Inc.
Security | | | | | | Shares | | Value | |
Common Stocks — 2.6% | | | | | | | | | |
Consumer Discretionary — 1.7% | | | | | | | | | |
Automobiles — 0.2% | | | | | | | | | |
General Motors Co. | | | | | | 15,842 | | $ | 380,683 | * |
Media — 1.5% | | | | | | | | | |
Charter Communications Inc., Class A Shares | | | | | | 82,229 | | 4,101,583 | * |
Total Consumer Discretionary | | | | | | | | 4,482,266 | |
Energy — 0.5% | | | | | | | | | |
Energy Equipment & Services — 0.5% | | | | | | | | | |
KCAD Holdings I Ltd. | | | | | | 127,399,440 | | 1,283,931 | *(b)(g) |
Oil, Gas & Consumable Fuels — 0.0% | | | | | | | | | |
SemGroup Corp., Class A Shares | | | | | | 5,433 | | 124,579 | * |
Total Energy | | | | | | | | 1,408,510 | |
Industrials — 0.4% | | | | | | | | | |
Building Products — 0.1% | | | | | | | | | |
Ashton Woods USA LLC, Class B Membership | | | | | | 122 | | 78,690 | *(b)(g) |
Nortek Inc. | | | | | | 1,738 | | 46,926 | * |
Total Building Products | | | | | | | | 125,616 | |
Marine — 0.3% | | | | | | | | | |
DeepOcean Group Holding AS | | | | | | 58,920 | | 913,260 | * |
Total Industrials | | | | | | | | 1,038,876 | |
Total Common Stocks (Cost — $6,103,367) | | | | | | | | 6,929,652 | |
| | | | | | | | | |
| | Rate | | | | | | | |
Convertible Preferred Stocks — 0.7% | | | | | | | | | |
Financials — 0.7% | | | | | | | | | |
Diversified Financial Services — 0.7% | | | | | | | | | |
Bank of America Corp. | | 7.250 | % | | | 1,820 | | 1,621,620 | |
Citigroup Inc. | | 7.500 | % | | | 4,200 | | 397,362 | |
Total Convertible Preferred Stocks (Cost — $2,303,720) | | | | | | 2,018,982 | |
Preferred Stocks — 2.3% | | | | | | | | | |
Financials — 2.2% | | | | | | | | | |
Commercial Banks — 0.4% | | | | | | | | | |
Banesto Holdings Ltd. | | 10.500 | % | | | 47,050 | | 1,204,188 | (a) |
Consumer Finance — 0.7% | | | | | | | | | |
GMAC Capital Trust I | | 8.125 | % | | | 82,348 | | 1,758,130 | (f) |
Diversified Financial Services — 1.1% | | | | | | | | | |
Citigroup Capital XII | | 8.500 | % | | | 73,700 | | 1,887,457 | (f) |
Citigroup Capital XIII | | 7.875 | % | | | 46,675 | | 1,215,417 | (f) |
Total Diversified Financial Services | | | | | | | | 3,102,874 | |
Total Financials | | | | | | | | 6,065,192 | |
Industrials — 0.1% | | | | | | | | | |
Road & Rail — 0.1% | | | | | | | | | |
Jack Cooper Holdings Corp. | | 20.000 | % | | | 2,487 | | 236,265 | *(a)(f) |
Total Preferred Stocks (Cost — $6,588,645) | | | | | | | | 6,301,457 | |
| | | | | | | | | | |
See Notes to Financial Statements.
| | Western Asset Managed High Income Fund Inc. 2011 Semi-Annual Report | | 19 |
Western Asset Managed High Income Fund Inc.
Security | | | | Expiration
Date | | Notional
Amount† | | Value | |
Purchased Options — 0.0% | | | | | | | | | |
Credit default swaption with BNP Paribas to sell protection on Markit CDX.NA.HY.16 Index, Call @ $102.50 | | | | 9/21/11 | | 44,460,000 | | $ 13,173 | |
Credit default swaption with BNP Paribas to sell protection on Markit CDX.NA.HY.16 Index, Call @ $102.50 | | | | 9/21/11 | | 13,890,000 | | 4,116 | |
Total Purchased Options (Cost — $605,178) | | | | | | | | 17,289 | |
| | | | | | | | | |
| | | | | | Warrants | | | |
Warrants — 0.2% | | | | | | | | | |
Buffets Restaurant Holdings | | | | 4/28/14 | | 891 | | 9 | *(b)(g) |
Charter Communications Inc. | | | | 11/30/14 | | 1,790 | | 19,749 | * |
General Motors Co. | | | | 7/10/16 | | 14,402 | | 220,207 | * |
General Motors Co. | | | | 7/10/19 | | 14,402 | | 152,085 | * |
Jack Cooper Holdings Corp. | | | | 12/15/17 | | 1,198 | | 74,875 | * |
Jack Cooper Holdings Corp. | | | | 5/6/18 | | 558 | | 34,875 | * |
Nortek Inc. | | | | 12/7/14 | | 3,364 | | 6,728 | *(b)(g) |
SemGroup Corp. | | | | 11/30/14 | | 5,719 | | 31,454 | *(b) |
Total Warrants (Cost — $1,767,666) | | | | | | | | 539,982 | |
Total Investments before Short-Term Investments
(Cost — $265,949,406) | | | | | | | | 264,537,570 | |
| | | | | | | | | |
| | Rate | | Maturity
Date | | Face
Amount† | | | |
Short-Term Investments — 1.1% | | | | | | | | | |
U.S. Government Agencies — 0.1% | | | | | | | | | |
Federal Home Loan Mortgage Corp. (FHLMC), Discount Notes (Cost — $176,930) | 0.100 - 0.120 | % | 1/10/12 | | 177,000 | | 176,987 | (j)(k) |
Repurchase Agreements — 1.0% | | | | | | | | | |
Morgan Stanley tri-party repurchase agreement dated 8/31/11; Proceeds at maturity — $2,990,005; (Fully collateralized by U.S. government agency obligations, 0.750% due 12/18/13; Market value — $3,049,800) (Cost — $2,990,000) | | 0.060 | % | 9/1/11 | | 2,990,000 | | 2,990,000 | |
Total Short-Term Investments (Cost — $3,166,930) | | | | | | | | 3,166,987 | |
Total Investments — 98.3% (Cost — $269,116,336#) | | | | | | 267,704,557 | |
Other Assets in Excess of Liabilities — 1.7% | | | | | | | | 4,546,796 | |
Total Net Assets — 100.0% | | | | | | | | $272,251,353 | |
† Face amount denominated in U.S. dollars, unless otherwise noted.
* Non-income producing security.
See Notes to Financial Statements.
20 | | Western Asset Managed High Income Fund Inc. 2011 Semi-Annual Report | | |
Schedule of investments (unaudited) (cont’d)
August 31, 2011
Western Asset Managed High Income Fund Inc.
(a) Security is exempt from registration under Rule 144A of the Securities Act of 1933. This security may be resold in transactions that are exempt from registration, normally to qualified institutional buyers. This security has been deemed liquid pursuant to guidelines approved by the Board of Directors, unless otherwise noted.
(b) Illiquid security.
(c) The maturity principal is currently in default as of August 31, 2011.
(d) The coupon payment on these securities is currently in default as of August 31, 2011.
(e) Payment-in-kind security for which part of the income earned may be paid as additional principal.
(f) Variable rate security. Interest rate disclosed is as of the most recent information available.
(g) Security is valued in good faith in accordance with procedures approved by the Board of Directors (See Note 1).
(h) Security has no maturity date. The date shown represents the next call date.
(i) Interest rates disclosed represent the effective rates on collateralized senior loans. Ranges in interest rates are attributable to multiple contracts under the same loan.
(j) Rate shown represents yield-to-maturity.
(k) All or a portion of this security is held at the broker as collateral for open futures contracts.
# Aggregate cost for federal income tax purposes is substantially the same.
Abbreviation used in this schedule:
EUR — Euro
Schedule of Written Options
Security | | Expiration
Date | | | Strike
Price | | | Notional
Amount | | | Value | |
Credit default swaption with BNP Paribas to buy protection on Markit CDX.NA.HY.16 Index, Call | | 9/21/11 | | | $ 99.00 | | $33,760,000 | | $ 97,843 | |
Credit default swaption with BNP Paribas to buy protection on Markit CDX.NA.HY.16 Index, Call | | 9/21/11 | | | 104.00 | | 44,460,000 | | 3,493 | |
Credit default swaption with BNP Paribas to buy protection on Markit CDX.NA.HY.16 Index, Call | | 9/21/11 | | | 99.00 | | 10,590,000 | | 30,692 | |
Credit default swaption with Morgan Stanley & Co. Inc. to buy protection on Markit CDX.NA.HY.16 Index, Call | | 9/21/11 | | | 103.50 | | 13,890,000 | | 1,747 | |
Total Written Options
(Premiums Received — $1,552,848) | | | | | | | | | $133,775 | |
See Notes to Financial Statements.
| | Western Asset Managed High Income Fund Inc. 2011 Semi-Annual Report | | 21 |
Statement of assets and liabilities (unaudited)
August 31, 2011
Assets: | | | |
Investments, at value (Cost — $269,116,336) | | $ 267,704,557 | |
Foreign currency, at value (Cost — $153,386) | | 154,046 | |
Cash | | 147,182 | |
Interest receivable | | 5,954,662 | |
Receivable for securities sold | | 102,288 | |
Deposits with brokers for swaption contracts | | 90,000 | |
Receivable from broker — variation margin on open futures contracts | | 13,281 | |
Unrealized appreciation on forward foreign currency contracts | | 8,264 | |
Prepaid expenses | | 28,751 | |
Total Assets | | 274,203,031 | |
| | | |
Liabilities: | | | |
Payable for securities purchased | | 1,562,453 | |
Investment management fee payable | | 185,960 | |
Written options, at value (premiums received $1,552,848) | | 133,775 | |
Unrealized depreciation on forward foreign currency contracts | | 2,420 | |
Accrued expenses | | 67,070 | |
Total Liabilities | | 1,951,678 | |
Total Net Assets | | $ 272,251,353 | |
| | | |
Net Assets: | | | |
Par value ($0.001 par value; 46,838,142 shares issued and outstanding; 500,000,000 shares authorized) (Note 5) | | $ 46,838 | |
Paid-in capital in excess of par value | | 332,080,798 | |
Undistributed net investment income | | 1,047,414 | |
Accumulated net realized loss on investments, futures contracts, written options and foreign currency transactions | | (60,925,418) | |
Net unrealized appreciation on investments, futures contracts, written options and foreign currencies | | 1,721 | |
Total Net Assets | | $272,251,353 | |
| | | |
Shares Outstanding | | 46,838,142 | |
| | | |
Net Asset Value | | $5.81 | |
See Notes to Financial Statements.
22 | | Western Asset Managed High Income Fund Inc. 2011 Semi-Annual Report | | |
Statement of operations (unaudited)
For the Six Months Ended August 31, 2011
Investment Income: | | | |
Interest | | $ 12,496,989 | |
Dividends | | 343,546 | |
Total Investment Income | | 12,840,535 | |
| | | |
Expenses: | | | |
Investment management fee (Note 2) | | 1,157,761 | |
Transfer agent fees | | 39,607 | |
Directors’ fees | | 27,864 | |
Audit and tax | | 26,052 | |
Shareholder reports | | 23,885 | |
Legal fees | | 20,212 | |
Stock exchange listing fees | | 18,483 | |
Fund accounting fees | | 14,604 | |
Custody fees | | 3,185 | |
Insurance | | 2,332 | |
Miscellaneous expenses | | 2,408 | |
Total Expenses | | 1,336,393 | |
Net Investment Income | | 11,504,142 | |
| | | |
Realized and Unrealized Gain (Loss) on Investments, Futures Contracts, Written Options and Foreign Currency Transactions (Notes 1, 3 and 4): | | | |
Net Realized Gain (Loss) From: | | | |
Investment transactions | | (212,281) | |
Futures contracts | | (622,079) | |
Written options | | 207,170 | |
Foreign currency transactions | | (12,123) | |
Net Realized Loss | | (639,313) | |
Change in Net Unrealized Appreciation (Depreciation) From: | | | |
Investments | | (19,312,727) | |
Futures contracts | | (27,801) | |
Written options | | 1,419,073 | |
Foreign currencies | | (13,448) | |
Change in Net Unrealized Appreciation (Depreciation) | | (17,934,903) | |
Net Loss on Investments, Futures Contracts, Written Options and Foreign Currency Transactions | | (18,574,216) | |
Decrease in Net Assets from Operations | | $ (7,070,074) | |
See Notes to Financial Statements.
| | Western Asset Managed High Income Fund Inc. 2011 Semi-Annual Report | | 23 |
Statements of changes in net assets
For the Six Months Ended August 31, 2011 (unaudited)
and the Year Ended February 28, 2011 | | August 31 | | February 28 | |
| | �� | | | |
Operations: | | | | | |
Net investment income | | $ 11,504,142 | | $ 24,308,826 | |
Net realized gain (loss) | | (639,313) | | 10,997,246 | |
Change in net unrealized appreciation (depreciation) | | (17,934,903) | | 13,908,688 | |
Increase (Decrease) in Net Assets From Operations | | (7,070,074) | | 49,214,760 | |
| | | | | |
Distributions to Shareholders From (Note 1): | | | | | |
Net investment income | | (12,970,017) | | (27,536,504) | |
Decrease in Net Assets From Distributions to Shareholders | | (12,970,017) | | (27,536,504) | |
| | | | | |
Fund Share Transactions: | | | | | |
Reinvestment of distributions (168,220 and 350,406 shares issued, respectively) | | 1,030,896 | | 2,116,318 | |
Increase in Net Assets From Fund Share Transactions | | 1,030,896 | | 2,116,318 | |
Increase (Decrease) in Net Assets | | (19,009,195) | | 23,794,574 | |
| | | | | |
Net Assets: | | | | | |
Beginning of period | | 291,260,548 | | 267,465,974 | |
End of period* | | $272,251,353 | | $291,260,548 | |
* Includes undistributed net investment income of: | | $1,047,414 | | $2,513,289 | |
See Notes to Financial Statements.
24 | | Western Asset Managed High Income Fund Inc. 2011 Semi-Annual Report | | |
Financial highlights
For a share of capital stock outstanding throughout each year ended February 28, unless otherwise noted:
| | 20111,2 | | 20111 | | 2010 | | 2009 | | 20083 | | 2007 | |
Net asset value, beginning of period | | $6.24 | | $5.77 | | $4.08 | | $6.21 | | $7.19 | | $6.94 | |
Income (loss) from operations: | | | | | | | | | | | | | |
Net investment income | | 0.25 | | 0.52 | | 0.61 | | 0.59 | | 0.55 | | 0.54 | |
Net realized and unrealized gain (loss) | | (0.40) | | 0.54 | | 1.67 | | (2.16) | | (0.99) | | 0.21 | |
Total income (loss) from operations | | (0.15) | | 1.06 | | 2.28 | | (1.57) | | (0.44) | | 0.75 | |
| | | | | | | | | | | | | |
Less distributions from: | | | | | | | | | | | | | |
Net investment income | | (0.28) | | (0.59) | | (0.59) | | (0.56) | | (0.54) | | (0.50) | |
Total distributions | | (0.28) | | (0.59) | | (0.59) | | (0.56) | | (0.54) | | (0.50) | |
Net asset value, end of period | | $5.81 | | $6.24 | | $5.77 | | $4.08 | | $6.21 | | $7.19 | |
Market price, end of period | | $5.94 | | $6.27 | | $6.02 | | $4.11 | | $5.60 | | $6.96 | |
Total return, based on NAV4,5 | | (2.59) | % | 19.31 | % | 58.43 | % | (26.43) | % | (5.86) | % | 12.11 | % |
Total return, based on Market Price5 | | (0.89) | % | 14.91 | % | 64.09 | % | (17.81) | % | (12.30) | % | 22.27 | % |
Net assets, end of period (millions) | | $272 | | $291 | | $267 | | $187 | | $283 | | $328 | |
| | | | | | | | | | | | | |
Ratios to average net assets: | | | | | | | | | | | | | |
Gross expenses | | 0.92 | %6 | 0.92 | % | 0.98 | % | 0.96 | % | 0.90 | % | 0.97 | %7 |
Net expenses8 | | 0.92 | 6 | 0.92 | | 0.98 | | 0.96 | | 0.90 | | 0.94 | 7,9 |
Net investment income | | 7.95 | 6 | 8.75 | | 11.68 | | 10.92 | | 8.04 | | 7.56 | |
| | | | | | | | | | | | | |
Portfolio turnover rate | | 27 | % | 96 | % | 87 | % | 54 | % | 58 | % | 67 | % |
1 | Per share amounts have been calculated using the average shares method. |
2 | For the six months ended August 31, 2011 (unaudited). |
3 | For the year ended February 29, 2008. |
4 | Performance figures may reflect compensating balance arrangements, fee waivers and/or expense reimbursements. In the absence of compensating balance arrangements, fee waivers and/or expense reimbursements, the total return would have been lower. Past performance is no guarantee of future results. Total returns for periods of less than one year are not annualized. |
5 | The total return calculation assumes that distributions are reinvested in accordance with the Fund’s dividend reinvestment plan. Past performance is no guarantee of future results. Total returns for periods of less than one year are not annualized. |
6 | Annualized. |
7 | Included in the expense ratios are certain non-recurring restructuring (and reorganization, if applicable) fees that were incurred by the Fund during the period. Without these fees, the gross and net expense ratios would have been 0.91%. |
8 | The impact of compensating balance arrangements, if any, was less than 0.01%. |
9 | Reflects fee waivers and/or expense reimbursements. |
See Notes to Financial Statements.
| | Western Asset Managed High Income Fund Inc. 2011 Semi-Annual Report | | 25 |
Notes to financial statements (unaudited)
1. Organization and significant accounting policies
Western Asset Managed High Income Fund Inc. (the “Fund”) was incorporated in Maryland on December 24, 1992 and is registered as a diversified, closed-end management investment company under the Investment Company Act of 1940, as amended (the “1940 Act”). The Fund’s primary investment objective is high current income. Capital appreciation is a secondary objective.
The following are significant accounting policies consistently followed by the Fund and are in conformity with U.S. generally accepted accounting principles (“GAAP”). Estimates and assumptions are required to be made regarding assets, liabilities and changes in net assets resulting from operations when financial statements are prepared. Changes in the economic environment, financial markets and any other parameters used in determining these estimates could cause actual results to differ. Subsequent events have been evaluated through the date the financial statements were issued.
(a) Investment valuation. The valuations for fixed income securities and certain derivative instruments are typically the prices supplied by independent third party pricing services, which may use market prices or broker/dealer quotations or a variety of fair valuation techniques and methodologies. Short-term fixed income securities that will mature in 60 days or less are valued at amortized cost, unless it is determined that using this method would not reflect an investment’s fair value. Futures contracts are valued daily at the settlement price established by the board of trade or exchange on which they are traded. Equity securities for which market quotations are available are valued at the last reported sales price or official closing price on the primary market or exchange on which they trade. If independent third party pricing services are unable to supply prices for a portfolio investment, or if the prices supplied are deemed by the manager to be unreliable, the market price may be determined by the manager using quotations from one or more broker/dealers. When the Fund holds securities or other assets that are denominated in a foreign currency, the Fund will normally use the currency exchange rates as of 4:00 p.m. (Eastern time). When reliable prices are not readily available, such as when the value of a security has been significantly affected by events after the close of the exchange or market on which the security is principally traded, but before the Fund calculates its net asset value, the Fund values these securities as determined in accordance with procedures approved by the Fund’s Board of Directors.
The Fund has adopted Financial Accounting Standards Board Codification Topic 820 (“ASC Topic 820”). ASC Topic 820 establishes a single definition of fair value, creates a three-tier hierarchy as a framework for measuring fair value based on inputs used to value the Fund’s investments, and requires additional disclosure about fair value. The hierarchy of inputs is summarized below.
· Level 1 — quoted prices in active markets for identical investments
26 | | Western Asset Managed High Income Fund Inc. 2011 Semi-Annual Report | | |
Notes to financial statements (unaudited) (cont’d)
· Level 2 — other significant observable inputs (including quoted prices for similar investments, interest rates, prepayment speeds, credit risk, etc.)
· Level 3 — significant unobservable inputs (including the Fund’s own assumptions in determining the fair value of investments)
The inputs or methodology used for valuing securities are not necessarily an indication of the risk associated with investing in those securities.
The Fund uses valuation techniques to measure fair value that are consistent with the market approach and/or income approach, depending on the type of security and the particular circumstance. The market approach uses prices and other relevant information generated by market transactions involving identical or comparable securities. The income approach uses valuation techniques to discount estimated future cash flows to present value.
The following is a summary of the inputs used in valuing the Fund’s assets and liabilities carried at fair value:
ASSETS |
| | | | | | | | | | |
Description | | Quoted Prices
(Level 1) | | Other Significant
Observable Inputs
(Level 2) | | Significant
Unobservable
Inputs
(Level 3) | | Total | | |
Long-term investments†: | | | | | | | | | | | | | |
Corporate bonds & notes | | — | | | $234,259,764 | | | $2,903,700 | | | $237,163,464 | | |
Collateralized senior loans | | — | | | 8,454,169 | | | — | | | 8,454,169 | | |
Convertible bonds & notes | | — | | | 3,112,575 | | | — | | | 3,112,575 | | |
Common stocks: | | | | | | | | | | | | | |
Consumer discretionary | | $ 4,482,266 | | | — | | | — | | | 4,482,266 | | |
Energy | | 124,579 | | | — | | | 1,283,931 | | | 1,408,510 | | |
Industrials | | 46,926 | | | 913,260 | | | 78,690 | | | 1,038,876 | | |
Convertible preferred stocks | | 2,018,982 | | | — | | | — | | | 2,018,982 | | |
Preferred stocks: | | | | | | | | | | | | | |
Financials | | 4,861,004 | | | 1,204,188 | | | — | | | 6,065,192 | | |
Industrials | | — | | | 236,265 | | | — | | | 236,265 | | |
Purchased options | | — | | | 17,289 | | | — | | | 17,289 | | |
Warrants | | 372,292 | | | 160,953 | | | 6,737 | | | 539,982 | | |
Total long-term investments | | $11,906,049 | | | $248,358,463 | | | $4,273,058 | | | $264,537,570 | | |
Short-term investments† | | — | | | 3,166,987 | | | — | | | 3,166,987 | | |
Total investments | | $11,906,049 | | | $251,525,450 | | | $4,273,058 | | | $267,704,557 | | |
Other financial instruments: | | | | | | | | | | | | | |
Forward foreign currency contracts | | — | | | $ 8,264 | | | — | | | $ 8,264 | | |
Total | | $11,906,049 | | | $251,533,714 | | | $4,273,058 | | | $267,712,821 | | |
| | Western Asset Managed High Income Fund Inc. 2011 Semi-Annual Report | | 27 |
LIABILITIES |
| | | | | | | | | | |
Description | | Quoted Prices
(Level 1) | | Other Significant
Observable Inputs
(Level 2) | | Significant
Unobservable
Inputs
(Level 3) | | Total | | |
Other financial instruments: | | | | | | | | | | | | | |
Written options | | — | | | $133,775 | | | — | | | $133,775 | | |
Futures contracts | | $12,106 | | | — | | | — | | | 12,106 | | |
Forward foreign currency contracts | | — | | | 2,420 | | | — | | | 2,420 | | |
Total | | $12,106 | | | $136,195 | | | — | | | $148,301 | | |
† See Schedule of Investments for additional detailed categorizations.
The following is a reconciliation of investments in which significant unobservable inputs (Level 3) were used in determining fair value:
| | Corporate
Bonds & | | Convertible
Bonds & | | Common Stocks | | | | | |
Investments in Securities | | Notes | | Notes | | Energy | | Industrials | | Warrants | | Total | |
Balance as of February 28, 2011 | | $1,245,920 | | $ 2,040,000 | | — | | $54,906 | | $ 79,149 | | $ 3,419,975 | |
Accrued premiums/discounts | | 842 | | 21,134 | | — | | — | | — | | 21,976 | |
Realized gain(loss)1 | | (425,000 | ) | — | | — | | — | | — | | (425,000 | ) |
Change in unrealized appreciation (depreciation)2 | | 398,898 | | (381,134 | ) | $ 162,816 | | 23,784 | | 2,463 | | 206,827 | |
Net purchases (sales) | | 1,373,900 | | — | | 1,121,115 | | — | | — | | 2,495,015 | |
Transfers into Level 3 | | 1,663,700 | | — | | — | | — | | — | | 1,663,700 | |
Transfers out of Level 3 | | (1,354,560 | ) | (1,680,000 | ) | — | | — | | (74,875 | ) | (3,109,435 | ) |
Balance as of August 31, 2011 | | $2,903,700 | | — | | $1,283,931 | | $78,690 | | $ 6,737 | | $ 4,273,058 | |
Net change in unrealized appreciation (depreciation) for investments in securities still held at August 31, 20112 | | — | | — | | $ 162,816 | | $23,784 | | $(18,502 | ) | $ 168,098 | |
1 | This amount is included in net realized gain (loss) from investment transactions in the accompanying Statement of Operations. |
| |
2 | This amount is included in the change in net unrealized appreciation (depreciation) in the accompanying Statement of Operations. Change in unrealized appreciation (depreciation) includes net unrealized appreciation (depreciation) resulting from changes in investment values during the reporting period and the reversal of previously recorded unrealized appreciation (depreciation) when gains or losses are realized. |
(b) Repurchase agreements. The Fund may enter into repurchase agreements with institutions that its investment adviser has determined are creditworthy. Each repurchase agreement is recorded at cost. Under the terms of a typical repurchase agreement, the Fund acquires a debt security subject to an obligation of the seller to repurchase, and of the Fund to resell, the security at an agreed-upon price and time, thereby determining the yield during the Fund’s holding period. When entering into repurchase agreements, it is the Fund’s policy that its custodian or a third party custodian, acting on the Fund’s behalf, take possession of the underlying collateral securities, the market value of which, at all times, at least equals the principal amount of the repurchase transaction, including accrued interest. To the extent that any repurchase transaction maturity exceeds one business day, the value of the collateral is marked-to-market and measured against the value of the agreement
28 | | Western Asset Managed High Income Fund Inc. 2011 Semi-Annual Report | | |
Notes to financial statements (unaudited) (cont’d)
in an effort to ensure the adequacy of the collateral. If the counterparty defaults, the Fund generally has the right to use the collateral to satisfy the terms of the repurchase transaction. However, if the market value of the collateral declines during the period in which the Fund seeks to assert its rights or if bankruptcy proceedings are commenced with respect to the seller of the security, realization of the collateral by the Fund may be delayed or limited.
(c) Futures contracts. The Fund uses futures contracts generally to gain exposure to, or hedge against, changes in interest rates or gain exposure to, or hedge against changes in certain asset classes. A futures contract represents a commitment for the future purchase or sale of an asset at a specified price on a specified date.
Upon entering into a futures contract, the Fund is required to deposit cash or cash equivalents with a broker in an amount equal to a certain percentage of the contract amount. This is known as the ‘‘initial margin’’ and subsequent payments (‘‘variation margin’’) are made or received by the Fund each day, depending on the daily fluctuation in the value of the contract. For certain futures, including foreign denominated futures, variation margin is not settled daily, but is recorded as a net variation margin payable or receivable. Futures contracts are valued daily at the settlement price established by the board of trade or exchange on which they are traded. The daily changes in contract value are recorded as unrealized gains or losses in the Statement of Operations and the Fund recognizes a realized gain or loss when the contract is closed.
Futures contracts involve, to varying degrees, risk of loss in excess of the amounts reflected in the financial statements. In addition, there is the risk that the Fund may not be able to enter into a closing transaction because of an illiquid secondary market.
(d) Written options. When the Fund writes an option, an amount equal to the premium received by the Fund is recorded as a liability, the value of which is marked-to-market daily to reflect the current market value of the option written. If the option expires, the premium received is recorded as a realized gain. When a written call option is exercised, the difference between the premium received plus the option exercise price and the Fund’s basis in the underlying security (in the case of a covered written call option), or the cost to purchase the underlying security (in the case of an uncovered written call option), including brokerage commission, is recognized as a realized gain or loss. When a written put option is exercised, the amount of the premium received is subtracted from the cost of the security purchased by the Fund from the exercise of the written put option to form the Fund’s basis in the underlying security purchased. The writer or buyer of an option traded on an exchange can liquidate the position before the exercise of the option by entering into a closing transaction. The cost of a closing transaction is deducted from the original premium received resulting in a realized gain or loss to the Fund.
| | Western Asset Managed High Income Fund Inc. 2011 Semi-Annual Report | | 29 |
The risk in writing a covered call option is that the Fund may forego the opportunity of profit if the market price of the underlying security increases and the option is exercised. The risk in writing a put option is that the Fund may incur a loss if the market price of the underlying security decreases and the option is exercised. The risk in writing an uncovered call option is that the Fund is exposed to the risk of loss if the market price of the underlying security increases. In addition, there is the risk that the Fund may not be able to enter into a closing transaction because of an illiquid secondary market.
(e) Swaptions. The Fund purchases and writes swaption contracts to manage exposure to an underlying instrument. The Fund may also purchase or write options to manage exposure to fluctuations in interest rates or to enhance yield. Swaption contracts written by the Fund represent an option that gives the purchaser the right, but not the obligation, to enter into a previously agreed upon swap contract at a future date. Swaption contracts purchased by the Fund represent an option that gives the Fund the right, but not the obligation, to enter into a previously agreed upon swap contract at a future date.
When the Fund writes a swaption, an amount equal to the premium received by the Fund is recorded as a liability, the value of which is marked-to-market daily to reflect the current market value of the swaption written. If the swaption expires, the Fund realizes a gain equal to the amount of the premium received.
When the Fund purchases a swaption, an amount equal to the premium paid by the Fund is recorded as an investment on the statement of assets and liabilities, the value of which is marked-to-market daily to reflect the current market value of the swaption purchased. If the swaption expires, the Fund realizes a loss equal to the amount of the premium paid.
Swaptions are marked-to-market daily based upon quotations from market makers. Changes in the value of the swaption are reported as unrealized gains or losses in the Statement of Operations.
(f) Swap agreements. The Fund may invest in swaps for the purpose of managing its exposure to interest rate, credit or market risk, or for other purposes. The use of swaps involves risks that are different from those associated with ordinary portfolio transactions.
Swap contracts are marked-to-market daily and changes in value are recorded as unrealized appreciation (depreciation). Gains or losses are realized upon termination of the swap agreement. Collateral, in the form of restricted cash or securities, may be required to be held in segregated accounts with the Fund’s custodian in compliance with the terms of the swap contracts. Securities posted as collateral for swap contracts are identified in the Schedule of Investments and restricted cash, if any, is identified on the Statement of Assets and Liabilities. Risks may exceed amounts recorded in the Statement of Assets and Liabilities. These risks include changes in the returns of the underlying instruments, failure of the counterparties to
30 | | Western Asset Managed High Income Fund Inc. 2011 Semi-Annual Report | | |
Notes to financial statements (unaudited) (cont’d)
perform under the contracts’ terms, and the possible lack of liquidity with respect to the swap agreements.
Payments received or made at the beginning of the measurement period are reflected as a premium or deposit, respectively, on the Statement of Assets and Liabilities. These upfront payments are amortized over the life of the swap and are recognized as realized gain or loss in the Statement of Operations. Net periodic payments received or paid by the Fund are recognized as a realized gain or loss in the Statement of Operations.
Credit Default Swaps
The Fund may enter into credit default swap (“CDS”) contracts for investment purposes, to manage its credit risk or to add leverage. CDS agreements involve one party making a stream of payments to another party in exchange for the right to receive a specified return in the event of a default by a third party, typically corporate or sovereign issuers, on a specified obligation, or in the event of a write-down, principal shortfall, interest shortfall or default of all or part of the referenced entities comprising a credit index. The Fund may use a CDS to provide protection against defaults of the issuers (i.e., to reduce risk where the Fund has exposure to an issuer) or to take an active long or short position with respect to the likelihood of a particular issuer’s default. As a seller of protection, the Fund generally receives an upfront payment or a stream of payments throughout the term of the swap provided that there is no credit event. If the Fund is a seller of protection and a credit event occurs, as defined under the terms of that particular swap agreement, the maximum potential amount of future payments (undiscounted) that the Fund could be required to make under a credit default swap agreement would be an amount equal to the notional amount of the agreement. These amounts of potential payments will be partially offset by any recovery of values from the respective referenced obligations. As a seller of protection, the Fund effectively adds leverage to its portfolio because, in addition to its total net assets, the Fund is subject to investment exposure on the notional amount of the swap. As a buyer of protection, the Fund generally receives an amount up to the notional value of the swap if a credit event occurs.
Implied spreads are the theoretical prices a lender receives for credit default protection. When spreads rise, market perceived credit risk rises and when spreads fall, market perceived credit risk falls. The implied credit spread of a particular referenced entity reflects the cost of buying/selling protection and may include upfront payments required to enter into the agreement. Wider credit spreads and decreasing market values, when compared to the notional amount of the swap, represent a deterioration of the referenced entity’s credit soundness and a greater likelihood or risk of default or other credit event occurring as defined under the terms of the agreement. Credit spreads utilized in determining the period end market value of credit default swap agreements on corporate or sovereign issues are disclosed in the Notes to Financial Statements and serve as an indicator of the current status of the
| | Western Asset Managed High Income Fund Inc. 2011 Semi-Annual Report | | 31 |
payment/performance risk and represent the likelihood or risk of default for credit derivatives. For credit default swap agreements on asset-backed securities and credit indices, the quoted market prices and resulting values, particularly in relation to the notional amount of the contract as well as the annual payment rate, serve as an indication of the current status of the payment/performance risk.
The Fund’s maximum risk of loss from counterparty risk, as the protection buyer, is the fair value of the contract (this risk is mitigated by the posting of collateral by the counterparty to the Fund to cover the Fund’s exposure to the counterparty). As the protection seller, the Fund’s maximum risk is the notional amount of the contract. Credit default swaps are considered to have credit risk-related contingent features since they require payment by the protection seller to the protection buyer upon the occurrence of a defined credit event.
Entering into a CDS agreement involves, to varying degrees, elements of credit, market and documentation risk in excess of the related amounts recognized on the Statement of Assets and Liabilities. Such risks involve the possibility that there will be no liquid market for these agreements, that the counterparty to the agreement may default on its obligation to perform or disagree as to the meaning of the contractual terms in the agreement, and that there will be unfavorable changes in net interest rates.
(g) Forward foreign currency contracts. The Fund enters into a forward foreign currency contract to hedge against foreign currency exchange rate risk on its non-U.S. dollar denominated securities or to facilitate settlement of a foreign currency denominated portfolio transaction. A forward foreign currency contract is an agreement between two parties to buy and sell a currency at a set price with delivery and settlement at a future date. The contract is marked-to-market daily and the change in value is recorded by the Fund as an unrealized gain or loss. When a forward foreign currency contract is closed, through either delivery or offset by entering into another forward foreign currency contract, the Fund recognizes a realized gain or loss equal to the difference between the value of the contract at the time it was opened and the value of the contract at the time it is closed.
Forward foreign currency contracts involve elements of market risk in excess of the amounts reflected on the Statement of Assets and Liabilities. The Fund bears the risk of an unfavorable change in the foreign exchange rate underlying the forward foreign currency contract. Risks may also arise upon entering into these contracts from the potential inability of the counterparties to meet the terms of their contracts.
(h) Foreign currency translation. Investment securities and other assets and liabilities denominated in foreign currencies are translated into U.S. dollar amounts based upon prevailing exchange rates on the date of valuation. Purchases and sales of investment securities and income and expense items denominated in foreign currencies are translated into U.S. dollar
32 | | Western Asset Managed High Income Fund Inc. 2011 Semi-Annual Report | | |
Notes to financial statements (unaudited) (cont’d)
amounts based upon prevailing exchange rates on the respective dates of such transactions.
The Fund does not isolate that portion of the results of operations resulting from fluctuations in foreign exchange rates on investments from the fluctuations arising from changes in market prices of securities held. Such fluctuations are included with the net realized and unrealized gain or loss on investments.
Net realized foreign exchange gains or losses arise from sales of foreign currencies, including gains and losses on forward foreign currency contracts, currency gains or losses realized between the trade and settlement dates on securities transactions, and the difference between the amounts of dividends, interest, and foreign withholding taxes recorded on the Fund’s books and the U.S. dollar equivalent of the amounts actually received or paid. Net unrealized foreign exchange gains and losses arise from changes in the values of assets and liabilities, other than investments in securities, on the date of valuation, resulting from changes in exchange rates.
Foreign security and currency transactions may involve certain considerations and risks not typically associated with those of U.S. dollar denominated transactions as a result of, among other factors, the possibility of lower levels of governmental supervision and regulation of foreign securities markets and the possibility of political or economic instability.
(i) Credit and market risk. The Fund invests in high-yield instruments that are subject to certain credit and market risks. The yields of high-yield obligations reflect, among other things, perceived credit and market risks. The Fund’s investment in securities rated below investment grade typically involves risks not associated with higher rated securities including, among others, greater risk related to timely and ultimate payment of interest and principal, greater market price volatility and less liquid secondary market trading.
(j) Counterparty risk and credit-risk-related contingent features of derivative instruments. The Fund may invest in certain securities or engage in other transactions, where the Fund is exposed to counterparty credit risk in addition to broader market risks. The Fund may invest in securities of issuers, which may also be considered counterparties as trading partners in other transactions. This may increase the risk of loss in the event of default or bankruptcy by the counterparty or if the counterparty otherwise fails to meet its contractual obligations. The Fund’s investment manager attempts to mitigate counterparty risk by (i) periodically assessing the creditworthiness of its trading partners, (ii) monitoring and/or limiting the amount of its net exposure to each individual counterparty based on its assessment and (iii) requiring collateral from the counterparty for certain transactions. Market events and changes in overall economic conditions may impact the assessment of such counterparty risk by the investment manager. In addition, declines in the values of underlying collateral received may expose the Fund to increased risk of loss.
| | Western Asset Managed High Income Fund Inc. 2011 Semi-Annual Report | | 33 |
The Fund has entered into master agreements with certain of its derivative counterparties that provide for general obligations, representations, agreements, collateral, events of default or termination and credit related contingent features. The credit related contingent features include, but are not limited to, a percentage decrease in the Fund’s net assets or NAV over a specified period of time. If these credit related contingent features were triggered, the derivatives counterparty could terminate the positions and demand payment or require additional collateral.
As of August 31, 2011, the Fund held written options and forward foreign currency contracts with credit related contingent features which had a liability position of $136,195. If a contingent feature in the master agreements would have been triggered, the Fund would have been required to pay this amount to its derivatives counterparties. As of August 31, 2011, the Fund had posted with its counterparties cash and/or securities as collateral to cover the net liability of these derivatives amounting to $90,000, which could be used to reduce the required payment.
(k) Security transactions and investment income. Security transactions are accounted for on a trade date basis. Interest income, adjusted for amortization of premium and accretion of discount, is recorded on the accrual basis. Dividend income is recorded on the ex-dividend date. The cost of investments sold is determined by use of the specific identification method. To the extent any issuer defaults or a credit event occurs that impacts the issuer, the Fund may halt any additional interest income accruals and consider the realizability of interest accrued up to the date of default or credit event.
(l) Distributions to shareholders. Distributions from net investment income for the Fund, if any, are declared quarterly and paid on a monthly basis. Distributions of net realized gains, if any, are declared at least annually. Distributions to shareholders of the Fund are recorded on the ex-dividend date and are determined in accordance with income tax regulations, which may differ from GAAP.
(m) Compensating balance arrangements. The Fund has an arrangement with its custodian bank whereby a portion of the custodian’s fees is paid indirectly by credits earned on the Fund’s cash on deposit with the bank.
(n) Federal and other taxes. It is the Fund’s policy to comply with the federal income and excise tax requirements of the Internal Revenue Code of 1986 (the “Code”), as amended, applicable to regulated investment companies. Accordingly, the Fund intends to distribute its taxable income and net realized gains, if any, to shareholders in accordance with timing requirements imposed by the Code. Therefore, no federal or state income tax provision is required in the Fund’s financial statements.
Management has analyzed the Fund’s tax positions taken on income tax returns for all open tax years and has concluded that as of August 31, 2011, no provision for income tax is required in the Fund’s financial statements.
34 | | Western Asset Managed High Income Fund Inc. 2011 Semi-Annual Report | | |
Notes to financial statements (unaudited) (cont’d)
The Fund’s federal and state income and federal excise tax returns for tax years for which the applicable statutes of limitations have not expired are subject to examination by Internal Revenue Service and state departments of revenue.
(o) Reclassification. GAAP requires that certain components of net assets be reclassified to reflect permanent differences between financial and tax reporting. These reclassifications have no effect on net assets or net asset value per share.
2. Investment management agreement and other transactions with affiliates
Legg Mason Partners Fund Advisor, LLC (“LMPFA”) is the Fund’s investment manager. Western Asset Management Company (“Western Asset”) and Western Asset Management Company Limited (“Western Asset Limited”) are the Fund’s subadvisers. LMPFA, Western Asset and Western Asset Limited are wholly-owned subsidiaries of Legg Mason, Inc. (“Legg Mason”).
LMPFA provides administrative and certain oversight services to the Fund. The Fund pays an investment management fee, calculated daily and paid monthly, at an annual rate of 0.80% of the Fund’s average daily net assets.
LMPFA delegates to Western Asset the day-to-day portfolio management of the Fund. Western Asset Limited provides certain advisory services to the Fund relating to currency transactions and investments in non-U.S. dollar denominated securities. Western Asset Limited does not receive any compensation from the Fund and is paid by Western Asset for its services to the Fund. For its services, LMPFA pays Western Asset 70% of the net management fee it receives from the Fund. In turn, Western Asset pays Western Asset Limited a subadvisory fee of 0.30% on the assets managed by Western Asset Limited.
All officers and one Director of the Fund are employees of Legg Mason or its affiliates and do not receive compensation from the Fund.
3. Investments
During the six months ended August 31, 2011, the aggregate cost of purchases and proceeds from sales of investments (excluding short-term investments) were as follows:
Purchases | | $77,234,387 | |
Sales | | 74,037,232 | |
| | Western Asset Managed High Income Fund Inc. 2011 Semi-Annual Report | | 35 |
At August 31, 2011, the aggregate gross unrealized appreciation and depreciation of investments for federal income tax purposes were substantially as follows:
Gross unrealized appreciation | | $ 14,002,466 | |
Gross unrealized depreciation | | (15,414,245 | ) |
Net unrealized depreciation | | $ (1,411,779 | ) |
At August 31, 2011, the Fund had the following open futures contracts:
| | Number of
Contracts | | Expiration
Date | | Basis
Value | | Market
Value | | Unrealized
Loss | |
Contracts to Sell: | | | | | | | | | | | |
U.S. Treasury 5-Year Notes | | 100 | | 12/11 | | $12,242,581 | | $12,254,687 | | $(12,106) | |
During the six months ended August 31, 2011, written option transactions for the Fund were as follows:
| | Notional Amount | | | Premiums | |
Written options, outstanding as of February 28, 2011 | | — | | | | — | |
Options written | | $116,700,000 | | | | $1,969,458 | |
Options closed | | (14,000,000 | ) | | | (416,610 | ) |
Options expired | | — | | | | — | |
Written options, outstanding as of August 31, 2011 | | $102,700,000 | | | | $1,552,848 | |
At August 31, 2011, the Fund had the following open forward foreign currency contracts:
Foreign Currency | | Counterparty | | Local
Currency | | Market
Value | | Settlement
Date | | Unrealized
Gain (Loss) | |
Contracts to Buy: | | | | | | | | | | | | |
Euro | | Royal Bank of Scotland PLC | | 334,519 | | $480,109 | | 11/16/11 | | $ 6,859 | | |
Contracts to Sell: | | | | | | | | | | | | |
Euro | | Citibank, N.A. | | 217,146 | | 311,652 | | 11/16/11 | | (2,420 | ) | |
Euro | | Royal Bank of Scotland PLC | | 600,000 | | 861,133 | | 11/16/11 | | 1,405 | | |
| | | | | | | | | | (1,015 | ) | |
Net unrealized gain on open forward foreign currency contracts | | | | $ 5,844 | | |
4. Derivative Instruments and Hedging Activities
Financial Accounting Standards Board Codification Topic 815 requires enhanced disclosure about an entity’s derivative and hedging activities.
Below is a table, grouped by derivative type, that provides information about the fair value and the location of derivatives within the Statement of Assets and Liabilities at August 31, 2011.
36 | | Western Asset Managed High Income Fund Inc. 2011 Semi-Annual Report | | |
Notes to financial statements (unaudited) (cont’d)
ASSET DERIVATIVES1
| | Interest Rate
Contracts Risk | | Foreign
Exchange
Contracts Risk | | Credit
Contracts Risk | | Total | |
Purchased options2 | | — | | — | | $17,289 | | $17,289 | |
Forward foreign currency contracts | | — | | $8,264 | | — | | 8,264 | |
Total | | — | | $8,264 | | $17,289 | | $25,553 | |
LIABILITY DERIVATIVES1
| | Interest Rate
Contracts Risk | | Foreign
Exchange
Contracts Risk | | Credit
Contracts Risk | | Total | |
Written options | | — | | — | | $133,775 | | $133,775 | |
Futures contracts3 | | $12,106 | | — | | — | | 12,106 | |
Forward foreign currency contracts | | — | | $2,420 | | — | | 2,420 | |
Total | | $12,106 | | $2,420 | | $133,775 | | $148,301 | |
1 Generally, the balance sheet location for asset derivatives is receivables/net unrealized appreciation (depreciation) and for liability derivatives is payables/net unrealized appreciation (depreciation).
2 Market value of purchased options is reported in Investments at value in the Statement of Assets and Liabilities.
3 Includes cumulative appreciation (depreciation) of futures contracts as reported in the footnotes. Only variation margin is reported within the receivables and/or payables of the Statement of Assets and Liabilities.
The following tables provide information about the effect of derivatives and hedging activities on the Fund’s Statement of Operations for the six months ended August 31, 2011. The first table provides additional detail about the amounts and sources of gains (losses) realized on derivatives during the period. The second table provides additional information about the change in unrealized appreciation (depreciation) resulting from the Fund’s derivatives and hedging activities during the period.
AMOUNT OF REALIZED GAIN (LOSS) ON DERIVATIVES RECOGNIZED
| | Interest Rate
Contracts
Risk | | Foreign
Exchange
Contracts Risk | | Credit
Contracts Risk | | Total | |
Written options | | — | | — | | | $207,170 | | | $ 207,170 | | |
Futures contracts | | $ (622,079) | | — | | | — | | | (622,079 | ) | |
Forward foreign currency contracts | | — | | $ (99,304 | ) | | — | | | (99,304 | ) | |
Total | | $ (622,079) | | $ (99,304 | ) | | $207,170 | | | $(514,213 | ) | |
CHANGE IN UNREALIZED APPRECIATION (DEPRECIATION) ON DERIVATIVES RECOGNIZED
| | Interest Rate
Contracts
Risk | | Foreign
Exchange
Contracts Risk | | Credit
Contracts Risk | | Total | |
Purchased options | | — | | — | | | $ (587,889 | ) | | $ (587,889 | ) | |
Written options | | — | | — | | | 1,419,073 | | | 1,419,073 | | |
Futures contracts | | $(27,801) | | — | | | — | | | (27,801 | ) | |
Forward foreign currency contracts | | — | | $16,915 | | | — | | | 16,915 | | |
Total | | $(27,801) | | $16,915 | | | $ 831,184 | | | $ 820,298 | | |
| | Western Asset Managed High Income Fund Inc. 2011 Semi-Annual Report | | 37 |
During the six months ended August 31, 2011, the volume of derivative activity for the Fund was as follows:
| | Average
market value | |
Purchased options | | $ 176,352 | |
Written options | | 751,671 | |
Futures contracts (to buy)† | | 1,332,254 | |
Futures contracts (to sell) | | 11,921,763 | |
Forward foreign currency contracts (to buy) | | 467,452 | |
Forward foreign currency contracts (to sell) | | 1,495,753 | |
† At August 31, 2011, there were no open positions held in this derivative.
5. Capital Shares
On November 16, 1999, the Fund commenced a share repurchase plan. Since the inception of the repurchase plan, the Fund repurchased (and retired) 1,213,500 shares with a total cost of $10,210,959. For the six months ended August 31, 2011, the Fund did not repurchase shares.
6. Distributions Subsequent to August 31, 2011
On August 11, 2011, the Fund’s Board declared three distributions, each in the amount of $0.0425 per share, payable on September 30, 2011, October 28, 2011 and November 25, 2011 to shareholders of record on September 23, 2011, October 21, 2011 and November 18, 2011, respectively.
7. Capital Loss Carryforward
As of February 28, 2011, the Fund had a net capital loss carryforward of approximately $59,953,600, of which $4,980,975 expires in 2012, $14,045,166 expires in 2017, $35,714,593 expires in 2018 and $5,212,866 expires in 2019. These amounts will be available to offset any future taxable capital gains.
Under the recently enacted Regulated Investment Company Modernization Act of 2010, the Fund will be permitted to carry forward capital losses incurred in taxable years beginning after December 22, 2010 for an unlimited period. However, any losses incurred during those future years will be required to be utilized prior to the losses incurred in pre-enactment taxable years. As a result of this ordering rule, pre-enactment capital loss carryforwards may be more likely to expire unused. Additionally, post-enactment capital losses that are carried forward will retain their character as either short-term or long-term capital losses rather than being considered all short-term as under previous law.
38 | | Western Asset Managed High Income Fund Inc. | | |
Dividend reinvestment plan (unaudited)
Under the Fund’s Dividend Reinvestment Plan (“Plan”), a shareholder whose shares of Common Stock are registered in his own name will have all distributions from the Fund reinvested automatically by American Stock Transfer & Trust Company (“AST”), as agent under the Plan, unless the shareholder elects to receive cash. Distributions with respect to shares registered in the name of a broker-dealer or other nominee (that is, in “street name”) will be reinvested by the broker or nominee in additional shares under the Plan, unless the service is not provided by the broker or nominee or the shareholder elects to receive distributions in cash. Investors who own Common Stock registered in street name should consult their broker-dealers for details regarding reinvestment. All distributions to Fund shareholders who do not participate in the Plan will be paid by check mailed directly to the record holder by or under the direction of AST as dividend-paying agent.
If the Fund declares a dividend or capital gains distribution payable either in shares of Common Stock or in cash, shareholders who are not Plan participants will receive cash, and Plan participants will receive the equivalent amount in shares of Common Stock. When the market price of the Common Stock is equal to or exceeds the net asset value per share of the Common Stock on the Valuation Date (as defined below), Plan participants will be issued shares of Common Stock valued at the net asset value most recently determined or, if net asset value is less than 95% of the then current market price of the Common Stock, then at 95% of the market value. The Valuation Date is the dividend or capital gains distribution record date or, if that date is not a New York Stock Exchange (“NYSE”) trading day, the immediately preceding trading day.
If the market price of the Common Stock is less than the net asset value of the Common Stock, a broker-dealer not affiliated with Legg Mason, Inc., as purchasing agent for Plan participants (“Purchasing Agent”), will buy Common Stock in the open market, on the NYSE or elsewhere, for the participants’ accounts. If, following the commencement of the purchases and before the Purchasing Agent has completed its purchases, the market price exceeds the net asset value of the Common Stock, the average per share purchase price paid by the Purchasing Agent may exceed the net asset value of the Common Stock, resulting in the acquisition of fewer shares than if the dividend or capital gains distribution had been paid in Common Stock issued by the Fund at net asset value. Additionally, if the market price exceeds the net asset value of shares before the Purchasing Agent has completed its purchases, the Purchasing Agent is permitted to cease purchasing shares and the Fund may issue the remaining shares at a price equal to the greater of (a) net asset value or (b) 95% of the then current market price. In a case where the Purchasing Agent has terminated open market purchases and the Fund has issued the remaining shares, the number of shares received by the participant in respect of the cash dividend or distribution will be based on the weighted average of prices paid for shares purchased in the open market
| | Western Asset Managed High Income Fund Inc. | | 39 |
and the price at which the Fund issues the remaining shares. AST will apply all cash received as a dividend or capital gains distribution to purchase Common Stock on the open market as soon as practicable after the payable date of the dividend or capital gains distribution, but in no event later than 30 days after that date, except when necessary to comply with applicable provisions of the federal securities laws.
AST will maintain all shareholder accounts in the Plan and will furnish written confirmations of all transactions in each account, including information needed by a shareholder for personal and tax records. The automatic reinvestment of dividends and capital gains distributions will not relieve Plan participants of any income tax that may be payable on the dividends or capital gains distributions. Common Stock in the account of each Plan participant will be held by AST on behalf of the Plan participant, and each shareholder’s proxy will include those shares purchased pursuant to the Plan.
Plan participants are subject to no charge for reinvesting dividends and capital gains distributions. AST’s fees for handling the reinvestment of dividends and capital gains distributions will be paid by the Fund. No brokerage charges apply with respect to shares of Common Stock issued directly by the Fund as a result of dividends or capital gains distributions payable either in Common Stock or in cash. Each Plan participant will, however, bear a proportionate share of brokerage commissions incurred with respect to open market purchases made in connection with the reinvestment of dividends or capital gains distributions.
Experience under the Plan may indicate that changes to it are desirable. The Fund reserves the right to amend or terminate the Plan as applied to any dividend or capital gains distribution paid subsequent to written notice of the change sent to participants at least 30 days before the record date for the dividend or capital gains distribution. The Plan also may be amended or terminated by AST, with the Fund’s prior written consent, on at least 30 days’ written notice to Plan participants. All correspondence concerning the Plan should be directed by mail to American Stock Transfer & Trust Company, 59 Maiden Lane, New York, New York 10038 or by telephone at 1-888-888-0151.
40 | | Western Asset Managed High Income Fund Inc. |
Additional shareholder information (unaudited)
Results of annual meeting of shareholders
The Annual Meeting of Shareholders of Western Asset Managed High Income Fund Inc. was held on June 24, 2011, for the purpose of considering and voting upon the election of Directors. The following table provides information concerning the matter voted upon at the meeting:
Election of directors
Nominees | | Votes For | | Votes Withheld |
Carol L. Colman | | 40,953,458 | | 3,355,959 |
Leslie H. Gelb | | 40,891,375 | | 3,418,042 |
Riordan Roett | | 40,865,760 | | 3,443,657 |
At August 31, 2011, in addition to Carol L. Colman, Leslie H. Gelb and Riordan Roett, the Directors of the Fund were as follows:
Daniel P. Cronin
Paolo M. Cucchi
R. Jay Gerken
William R. Hutchinson
Jeswald W. Salacuse
Western Asset
Managed High Income Fund Inc.
Directors | | Western Asset Managed High Income Fund Inc. | | Independent registered public accounting firm |
Carol L. Colman | | 620 Eighth Avenue | | KPMG LLP |
Daniel P. Cronin | | 49th Floor | | 345 Park Avenue |
Paolo M. Cucchi | | New York, NY 10018 | | New York, NY 10154 |
Leslie H. Gelb | | | | |
R. Jay Gerken | | Investment manager | | Legal counsel |
Chairman | | Legg Mason Partners Fund Advisor, LLC | | Simpson Thacher & Bartlett LLP |
William R. Hutchinson | | | | 425 Lexington Avenue |
Riordan Roett | | | | New York, NY 10017 |
Jeswald W. Salacuse | | Subadvisers | | |
| | Western Asset Management Company | | New York Stock Exchange Symbol |
Officers | | Western Asset Management Company Limited | | MHY |
R. Jay Gerken | | | | |
President and Chief Executive Officer | | Custodian | | |
Kaprel Ozsolak | | State Street Bank and | | |
Chief Financial Officer | | Trust Company | | |
Ted P. Becker | | 1 Lincoln Street | | |
Chief Compliance Officer | | Boston, MA 02111 | | |
Vanessa A. Williams | | | | |
Identity Theft | | Transfer agent | | |
Protection Officer | | American Stock Transfer & Trust Company | | |
Robert I. Frenkel | | 59 Maiden Lane | | |
Secretary and Chief Legal Officer | | New York, NY 10038 | | |
Thomas Mandia | | | | |
Assistant Secretary | | | | |
Steven Frank | | | | |
Treasurer | | | | |
Jeanne M. Kelly | | | | |
Senior Vice President | | | | |
Legg Mason Funds Privacy and
Security Notice
Your Privacy and the Security of Your Personal Information is Very Important to the Legg Mason Funds
This Privacy and Security Notice (the “Privacy Notice”) addresses the Legg Mason Funds’ privacy and data protection practices with respect to nonpublic personal information the Funds receive. The Legg Mason Funds include any funds sold by the Funds’ distributor, Legg Mason Investor Services, LLC, as well as Legg Mason-sponsored closed-end funds and certain closed-end funds managed or sub-advised by Legg Mason or its affiliates. The provisions of this Privacy Notice apply to your information both while you are a shareholder and after you are no longer invested with the Funds.
The Type of Nonpublic Personal Information the Funds Collect About You
The Funds collect and maintain nonpublic personal information about you in connection with your shareholder account. Such information may include, but is not limited to:
· Personal information included on applications or other forms;
· Account balances, transactions, and mutual fund holdings and positions;
· Online account access user IDs, passwords, security challenge question responses; and
· Information received from consumer reporting agencies regarding credit history and creditworthiness (such as the amount of an individual’s total debt, payment history, etc.).
How the Funds Use Nonpublic Personal Information About You
The Funds do not sell or share your nonpublic personal information with third parties or with affiliates for their marketing purposes, or with other financial institutions or affiliates for joint marketing purposes, unless you have authorized the Funds to do so. The Funds do not disclose any nonpublic personal information about you except as may be required to perform transactions or services you have authorized or as permitted or required by law. The Funds may disclose information about you to:
· Employees, agents, and affiliates on a “need to know” basis to enable the Funds to conduct ordinary business or comply with obligations to government regulators;
· Service providers, including the Funds’ affiliates, who assist the Funds as part of the ordinary course of business (such as printing, mailing services, or processing or servicing your account with us) or otherwise perform services on the Funds’ behalf, including companies that may perform marketing services solely for the Funds;
· The Funds’ representatives such as legal counsel, accountants and auditors; and
· Fiduciaries or representatives acting on your behalf, such as an IRA custodian or trustee of a grantor trust.
| | | | |
| | NOT PART OF THE SEMI-ANNUAL REPORT | | |
| | | | |
Legg Mason Funds Privacy and
Security Notice (cont’d)
Except as otherwise permitted by applicable law, companies acting on the Funds’ behalf are contractually obligated to keep nonpublic personal information the Funds provide to them confidential and to use the information the Funds share only to provide the services the Funds ask them to perform.
The Funds may disclose nonpublic personal information about you when necessary to enforce their rights or protect against fraud, or as permitted or required by applicable law, such as in connection with a law enforcement or regulatory request, subpoena, or similar legal process. In the event of a corporate action or in the event a Fund service provider changes, the Funds may be required to disclose your nonpublic personal information to third parties. While it is the Funds’ practice to obtain protections for disclosed information in these types of transactions, the Funds cannot guarantee their privacy policy will remain unchanged.
Keeping You Informed of the Funds’ Privacy and Security Practices
The Funds will notify you annually of their privacy policy as required by federal law. While the Funds reserve the right to modify this policy at any time they will notify you promptly if this privacy policy changes.
The Funds’ Security Practices
The Funds maintain appropriate physical, electronic and procedural safeguards designed to guard your nonpublic personal information. The Funds’ internal data security policies restrict access to your nonpublic personal information to authorized employees, who may use your nonpublic personal information for Fund business purposes only.
Although the Funds strive to protect your nonpublic personal information, they cannot ensure or warrant the security of any information you provide or transmit to them, and you do so at your own risk. In the event of a breach of the confidentiality or security of your nonpublic personal information, the Funds will attempt to notify you as necessary so you can take appropriate protective steps. If you have consented to the Funds using electronic communications or electronic delivery of statements, they may notify you under such circumstances using the most current email address you have on record with them.
In order for the Funds to provide effective service to you, keeping your account information accurate is very important. If you believe that your account information is incomplete, not accurate or not current, or if you have questions about the Funds’ privacy practices, write the Funds using the contact information on your account statements, email the Funds by clicking on the Contact Us section of the Funds’ website at www.leggmason.com, or contact the Fund at 1-888-777-0102.
Revised April 2011
| | | | |
| | NOT PART OF THE SEMI-ANNUAL REPORT | | |
| | | | |
Western Asset Managed High Income Fund Inc.
Western Asset Managed High Income Fund Inc.
620 Eighth Avenue
49th Floor
New York, NY 10018
Notice is hereby given in accordance with Section 23(c) of the Investment Company Act of 1940, as amended, that from time to time the Fund may purchase at market price shares of its common stock in the open market.
The Fund files its complete schedule of portfolio holdings with the Securities and Exchange Commission (“SEC”) for the first and third quarters of each fiscal year on Form N-Q. The Fund’s Forms N-Q are available on the SEC website at www.sec.gov. The Fund’s Forms N-Q may be reviewed and copied at the SEC Public Reference Room in Washington, D.C., and information on the operation of the Public Reference Room may be obtained by calling 1-800-SEC-0330. To obtain information on Form N-Q from the Fund, shareholders can call 1-888-777-0102.
Information on how the Fund voted proxies relating to portfolio securities during the prior 12-month period ended June 30th of each year and a description of the policies and procedures that the Fund uses to determine how to vote proxies related to portfolio transactions are available (1) without charge, upon request, by calling 1-888-777-0102, (2) on the Fund’s website at www.leggmason.com/cef and (3) on the SEC’s website at www.sec.gov.
This report is transmitted to the shareholders of Western Asset Managed High Income Fund Inc. for their information. This is not a prospectus, circular or representation intended for use in the purchase of shares of the Fund or any securities mentioned in this report.
American Stock
Transfer & Trust Company
59 Maiden Lane
New York, NY 10038
WASX010337 10/11 SR11-1477
ITEM 2. | | CODE OF ETHICS. |
| | |
| | Not applicable. |
| | |
ITEM 3. | | AUDIT COMMITTEE FINANCIAL EXPERT. |
| | |
| | Not applicable. |
| | |
ITEM 4. | | PRINCIPAL ACCOUNTANT FEES AND SERVICES. |
| | |
| | Not applicable. |
| | |
ITEM 5. | | AUDIT COMMITTEE OF LISTED REGISTRANTS. |
| | |
| | Not applicable. |
| | |
ITEM 6. | | SCHEDULE OF INVESTMENTS. |
| | |
| | Included herein under Item 1. |
| | |
ITEM 7. | | DISCLOSURE OF PROXY VOITNG POLIIES AND PROCEDURES FOR CLOSED-END MANAGEMENT INVESTMENT COMPANIES. |
| | |
| | Not applicable. |
| | |
ITEM 8. | | PORTFOLIO MANAGERS OF CLOSED-END MANAGEMENT INVESTMENT COMPANIES. |
| | |
| | Not applicable. |
| | |
ITEM 9. | | PURCHASES OF EQUITY SECURITIES BY CLOSED-END MANAGEMENT INVESTMENT COMPANY AND AFFILIATED PURCHASERS. |
| | |
| | Not applicable. |
| | |
ITEM 10. | | SUBMISSION OF MATTERS TO A VOTE OF SECURITY HOLDERS. |
| | |
| | Not applicable. |
| | |
ITEM 11. | | CONTROLS AND PROCEDURES. |
| | |
| | (a) | The registrant’s principal executive officer and principal financial officer have concluded that the registrant’s disclosure controls and procedures (as defined in Rule 30a- 3(c) under the Investment Company Act of 1940, as amended (the “1940 Act”)) are effective as of a date within 90 days of the filing date of this report that includes the disclosure required by this paragraph, based on their evaluation of the disclosure controls and procedures required by Rule 30a-3(b) under the 1940 Act and 15d-15(b) under the Securities Exchange Act of 1934. |
| | | |
| | (b) | There were no changes in the registrant’s internal control over financial reporting (as defined in Rule 30a-3(d) under the 1940 Act) that occurred during the registrant’s last fiscal half-year (the registrant’s second fiscal half-year in the case of an annual report) that have materially affected, |
| | | or are likely to materially affect the registrant’s internal control over financial reporting. |
| | | |
ITEM 12. | | EXHIBITS. |
| | |
| | (a) (1) Not applicable. |
| | Exhibit 99.CODE ETH |
| | |
| | (a) (2) Certifications pursuant to section 302 of the Sarbanes-Oxley Act of 2002 attached hereto. |
| | Exhibit 99.CERT |
| | |
| | (b) Certifications pursuant to Section 906 of the Sarbanes-Oxley Act of 2002 attached hereto. |
| | Exhibit 99.906CERT |
SIGNATURES
Pursuant to the requirements of the Securities Exchange Act of 1934 and the Investment Company Act of 1940, the registrant has duly caused this Report to be signed on its behalf by the undersigned, there unto duly authorized.
Western Asset Managed High Income Fund Inc.
By: | /s/ R. Jay Gerken | |
| R. Jay Gerken | |
| Chief Executive Officer | |
| Western Asset Managed High Income Inc. | |
| | |
Date: | October 24, 2011 | |
Pursuant to the requirements of the Securities Exchange Act of 1934 and the Investment Company Act of 1940, this report has been signed below by the following persons on behalf of the registrant and in the capacities and on the dates indicated.
By: | /s/ R. Jay Gerken | |
| (R. Jay Gerken) | |
| Chief Executive Officer | |
| Western Asset Managed High Income Fund Inc. | |
| | |
Date: | October 24, 2011 | |
| | |
| | |
By: | /s/ Kaprel Ozsolak | |
| (Kaprel Ozsolak) | |
| Chief Financial Officer | |
| Western Asset Managed High Income Fund Inc. | |
| | |
Date: | October 24, 2011 | |