UNITED STATES
SECURITIES AND EXCHANGE COMMISSION
Washington, D.C. 20549
FORM N-CSR
CERTIFIED SHAREHOLDER REPORT OF REGISTERED MANAGEMENT INVESTMENT COMPANIES
Investment Company Act file number 811-7396
Managed High Income Portfolio Inc.
(Exact name of registrant as specified in charter)
125 Broad Street, New York, NY 10004
(Address of principal executive offices) (Zip code)
Robert I. Frenkel, Esq.
Smith Barney Fund Management LLC
300 First Stamford Place
Stamford, CT 06902
(Name and address of agent for service)
Registrant’s telephone number, including area code: (800) 451-2010
Date of fiscal year end: February 29
Date of reporting period: August 31, 2004
| ITEM 1. | REPORT TO STOCKHOLDERS. |
The Semi-Annual Report to Stockholders is filed herewith.


Dear Shareholder,
The bond markets generated positive returns over the six-month period ended August 31, 2004. Although prices declined significantly in April, they stabilized over recent months. The pullback in bond prices, which tend to move opposite anticipated interest rate movements, was triggered by heightened concern about resurgent inflation, rising rates, and anticipation that the Federal Reserve Bank (“Fed”) would begin to push key short-term rates higher. Rising interest rates can act as a brake on robust economic growth, helping to maintain a balance between steady growth and the inflation that generally can accompany it.
As was widely expected, the Fed raised its target for the federal funds rate (i) from a four-decade low of 1.00% at the start of the period to 1.25% in June, and then increased it again by another quarter-of-a-percentage point on August 10, 2004. Following the end of the fund’s reporting period, at its September meeting, the Fed once again increased its target for the federal funds rate to 1.75%.
The U.S. high-yield bond market took a more tempered tone this year versus 2003, as signs of economic recovery increased and statements by the Fed indicated that it might begin raising interest rates sooner than anticipated. However, recent improvement in the U.S. economy has proved favorable for corporate earnings and the corporate bond credit environment. While markets will fluctuate, the high-yield market has remained healthy from a fundamental perspective, as many companies generated better-than-expected earnings and default rates continued to decline.
During the six months ended August 31, 2004, the Managed High Income Portfolio Inc. returned 2.11%, based on its New York Stock Exchange (“NYSE”) market price and 3.48% based on its net asset value (“NAV”) (ii) per share. In comparison, its benchmark, the unmanaged Citigroup High Yield Market Index, (iii) returned 3.15% and its Lipper high current yield closed-end funds category average (iv) returned 3.88% over the same time frame. Please note that Lipper performance returns are based on each fund’s NAV.
1
FUND PERFORMANCE AS OF AUGUST 31, 2004
Price Per Share
| 30-Day
SEC Yield
| Six-Month
Total Return
|
|---|
| $7.04 (NAV) | 7.36% | | 3.48% |
| $6.81 (NYSE) | 7.61% | | 2.11% |
All figures represent past performance and are not a guarantee of future results. The fund’s yields will vary.
Total returns are based on changes in NAV or market price, respectively. Total returns assume the reinvestment of all dividends and/or capital gains distributions, if any, in additional shares. The “SEC yield” is a return figure often quoted by bond and other fixed-income mutual funds. This quotation is based on the most recent 30-day (or one-month) period covered by the fund’s filings with the SEC.
During this six-month period, the fund made distributions to shareholders totaling $0.30 per share. The performance table shows the fund’s 30-day SEC yield as well as its six-month total return based on its NAV and market price as of August 31, 2004. Past performance is no guarantee of future results. The fund’s yields will vary.
Information About Your Fund
In recent months several issues in the mutual fund industry have come under the scrutiny of federal and state regulators. The fund’s Adviser and some of its affiliates have received requests for information from various government regulators regarding market timing, late trading, fees, and other mutual fund issues in connection with various investigations. The fund has been informed that the Adviser and its affiliates are responding to those information requests, but are not in a position to predict the outcome of these requests and investigations.
In November 2003, Citigroup Asset Management (“CAM”) disclosed an investigation by the Securities and Exchange Commission (“SEC”) and the U.S. Attorney relating to CAM’s entry into the transfer agency business during 1997-1999. Citigroup has disclosed that the Staff of the SEC is considering recommending a civil injunctive action and/or an administrative proceeding against certain advisory and transfer agent entities affiliated with Citigroup, the former CEO of CAM, a former employee and a current employee of CAM, relating to the creation, operation and fees of its internal transfer agent unit that serves various CAM-managed funds. This internal transfer agent did not provide services to the fund. Citigroup is cooperating with the SEC and will seek to resolve this matter in discussion with the SEC Staff. Although there can be no assurance, Citigroup does not believe that this matter will have a material adverse effect on the fund.
2
The fund is traded under the symbol “MHY” and its closing market price is available in most newspapers under the NYSE listings. The daily NAV is available on-line under symbol XMHYX. Barron’s and The Wall Street Journal’s Monday editions carry closed-end fund tables that will provide additional information. In addition, the fund issues a quarterly press release that can be found on most major financial websites as well as www.citigroupassetmanagement.com.
In a continuing effort to provide information concerning the fund, shareholders may call 1-888-735-6507, Monday through Friday from 8:00 a.m. to 6:00 p.m. Eastern Time, for the fund’s current net asset value, market price, and other information regarding the fund’s portfolio holdings and allocations.
As always, thank you for your confidence in our stewardship of your assets. We look forward to helping you continue to meet your financial needs.
Sincerely,

R. Jay Gerken, CFA
Chairman, President and Chief Executive Officer
September 17, 2004
3
The information provided is not intended to be a forecast of future events, a guarantee of future results or investment advice. Views expressed may differ from those of the firm as a whole.
RISKS: The fund invests in high yield bonds, which are subject to additional risks such as the increased risk of default and greater volatility because of the lower credit quality of the issues. The fund may use derivatives, such as options and futures, which can be illiquid, may disproportionately increase losses, and have a potentially large impact on fund performance. In addition, the fund may invest in foreign securities, which are subject to certain risks of overseas investing including currency fluctuations and changes in political and economic conditions, which could result in significant market fluctuations.
All index performance reflects no deduction for fees, expenses or taxes. Please note that an investor cannot invest directly in an index.
| i | The federal funds rate is the interest rate that banks with excess reserves at a Federal Reserve district bank charge other banks that need overnight loans. |
| ii | NAV is calculated by subtracting total liabilities and outstanding preferred stock from the closing value of all securities held by the fund (plus all other assets) and dividing the result (total net assets) by the total number of the common shares outstanding. The NAV fluctuates with changes in the market prices of securities in which the fund has invested. However, the price at which an investor may buy or sell shares of the fund is at the fund’s market price as determined by supply of and demand for the fund’s shares. |
| iii | The Citigroup High Yield Market Index is a broad-based unmanaged index of high yield securities. |
| iv | Lipper, Inc. is a major independent mutual-fund tracking organization. Returns are based on the 6-month period ended August 31, 2004, calculated among the 8 funds in the fund’s Lipper category, including the reinvestment of dividends and capital gains, if any. |
4
Take Advantage of the Fund’s Dividend Reinvestment Plan!
As an investor in the Fund, you can participate in its Dividend Reinvestment Plan (“Plan”), a convenient, simple and efficient way to reinvest your dividends and capital gains, if any, in additional shares of the Fund. A description of the Fund’s Plan begins on page 37. Below is a short summary of how the Plan works.
Plan Summary
If you are a Plan participant who has not elected to receive your dividends in the form of a cash payment, then your dividend and capital gain distributions will be reinvested automatically in additional shares of the Fund.
The number of shares of common stock of the Fund that you will receive in lieu of a cash dividend is determined in the following manner. If the market price of the common stock is equal to or exceeds the net asset value (“NAV”) per share on the date of valuation, you will be issued shares for the equivalent of the most recently determined NAV per share, or 95% of the market price, whichever is greater.
If the NAV per share at the time of valuation is greater than the market price of the common stock, the Purchasing Agent will buy common stock for your account in the open market or on the New York Stock Exchange.
If the Purchasing Agent begins to purchase additional shares in the open market and the market price of the shares subsequently rises above the NAV before the purchases are completed, the Purchasing Agent will attempt to cancel any remaining orders and the Fund will issue the remaining dividend or distribution in shares at the greater of the Fund’s NAV per share or 95% of the then current market price. In that case, the number of Fund shares you receive will be based on the weighted average of prices paid for shares purchased in the open market and the price at which the Fund issues the remaining shares.
To find out more detailed information about the Plan and about how you can participate, please call PFPC Inc. at 1 (800) 331-1710.
5
FUND AT A GLANCE (unaudited)
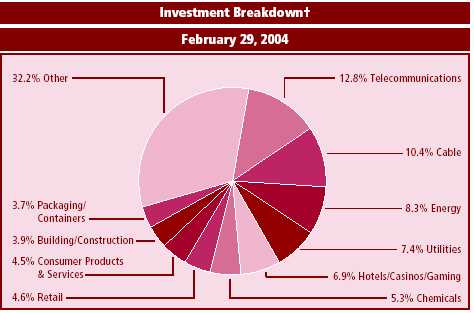

| + | As a percentage of total investments. Please note that Fund holdings are subject to change. |
See Notes to Financial Statements.
6
SCHEDULE OF INVESTMENTS
August 31, 2004 (unaudited)
| | Face
Amount |
| Rating(a) | | Security |
|
|
| Value |
|
| CORPORATE BONDS AND NOTES — 93.1% | | | | |
| |
| Aerospace/Defense — 0.4% | | | | |
| $ | 908,000 | | B3* | | Dunlop Standard Aerospace Holdings PLC, | | | | |
| | | | | | Sr. Notes, 11.875% due 5/15/09 | | $ | | 967,020 |
| | 400,000 | | BB- | | Sequa Corp., Sr. Notes, 9.000% due 8/1/09 | | | | 438,000 |
|
| | | | | | | | | | 1,405,020 |
|
| Airlines — 0.8% | | | | | | |
| | | | | | Continental Airlines, Inc., Pass-Through | | | | |
| | | | | | Trust Certificates: | | | | |
| | 940,000 | | BB- | | Series 1999-2, Class C-2, | | | | |
| | | | | | 7.434% due 9/15/04 | | | | 940,000 |
| | 1,435,000 | | B | | Series 2001-2, Class D, 7.568% due 12/1/06 | | | | 1,042,842 |
| | | | | | United Airlines, Inc., Pass-Through Certificates: | | | | |
| | 1,443,359 | | NR | | Series 2000-2, Class B, 7.811% due 10/1/09 (b) | | | | 334,332 |
| | | | | | Series 2001-1: | | | | |
| | 275,000 | | NR | | Class B, 6.932% due 9/1/11(b) | | | | 66,332 |
| | 630,000 | | NR | | Class C, 6.831% due 9/1/08 (b) | | | | 62,956 |
|
| | | | | | | | | | 2,446,462 |
|
| Automotive — 2.2% | | | | | | |
| | 415,000 | | B+ | | Arvin Capital Trust I, Capital Securities, | | | | |
| | | | | | 9.500% due 2/1/27 | | | | 429,525 |
| | | | | | Dana Corp., Notes: | | | | |
| | 1,160,000 | | BB | | 6.500% due 3/1/09 | | | | 1,238,300 |
| | 525,000 | | BB | | 10.125% due 3/15/10 | | | | 603,750 |
| | 1,300,000 | | B- | | EaglePicher Inc., Sr. Notes, 9.750% due 9/1/13 | | | | 1,407,250 |
| | 450,000 | | Baa1* | | Ford Motor Co., Notes, 7.450% due 7/16/31 | | | | 442,508 |
| | | | | | General Motors Corp.: | | | | |
| | 250,000 | | Baa1* | | Sr. Debentures, 8.375% due 7/15/33 | | | | 266,517 |
| | 1,325,000 | | Baa1* | | Sr. Notes, 7.125% due 7/15/13 | | | | 1,384,993 |
| | 375,000 | | B- | | Rexnord Corp., Sr. Sub. Notes, | | | | |
| | | | | | 10.125% due 12/15/12 | | | | 425,625 |
| | 600,000 | | B2* | | Tenneco Automotive Inc., Sr. Secured 2nd Lien | | | | |
| | | | | | Notes, Series B, 10.250% 7/15/13 | | | | 697,500 |
| | 163,000 | | BB- | | TRW Automotive Inc., Sr. Sub. Notes, | | | | |
| | | | | | 11.000% due 2/15/13 | | | | 198,045 |
|
| | | | | | | | | | 7,094,013 |
|
See Notes to Financial Statements.
7
SCHEDULE OF INVESTMENTS
August 31, 2004 (unaudited) (continued)
| | Face
Amount | | Rating(a) | | Security | | | | Value |
|
| Broadcasting — 0.9% | | | | | | |
| $ | 225,000 | | B- | | NextMedia Operating, Inc., Sr. Sub. Notes, | | | | |
| | | | | | 10.750% due 7/1/11 | | $ | | 253,125 |
| | | | | | Paxson Communications Corp.: | | | | |
| | 825,000 | | Caa1* | | Sr. Sub. Discount Notes, step bond to yield | | | | |
| | | | | | 12.309% due 1/15/09 | | | | 702,281 |
| | 355,000 | | Caa1* | | Sr. Sub. Notes, 10.750% due 7/15/08 | | | | 358,550 |
| | 895,000 | | B2* | | Radio One, Inc., Sr. Sub. Notes, Series B, | | | | |
| | | | | | 8.875% due 7/1/11 | | | | 996,806 |
| | 515,000 | | Caa1* | | Spanish Broadcasting System Inc., Sub. Notes, | | | | |
| | | | | | 9.625% due 11/1/09 | | | | 545,256 |
|
| | | | | | | | | | 2,856,018 |
|
| Building/Construction — 3.0% | | | | |
| | | | | | Associated Materials Inc.: | | | | |
| | 2,300,000 | | B- | | Sr. Discount Notes, step bond to yield | | | | |
| | | | | | 11.244% due 3/1/14 (c) | | | | 1,638,750 |
| | 265,000 | | B- | | Sr. Sub. Notes, 9.750% due 4/15/12 | | | | 302,100 |
| | 1,050,000 | | B- | | Atrium Cos., Inc., Sr. Sub. Notes, Series B, | | | | |
| | | | | | 10.500% due 5/1/09 | | | | 1,107,750 |
| | | | | | D.R. Horton, Inc. | | | | |
| | 685,000 | | BB+ | | Sr. Notes, 8.000% due 2/1/09 | | | | 780,900 |
| | 545,000 | | Ba2* | | Sr. Sub. Notes, 9.375% due 3/15/11 | | | | 614,488 |
| | 815,000 | | Ba2* | | KB HOME, Sr. Sub. Notes, 9.500% due 2/15/11 | | | | 912,800 |
| | 895,000 | | BBB- | | Lennar Corp., Sr. Notes, Series B, | | | | |
| | | | | | 9.950% due 5/1/10 | | | | 986,660 |
| | 490,000 | | BBB- | | The Ryland Group, Inc., Sr. Notes, | | | | |
| | | | | | 9.750% due 9/1/10 | | | | 548,800 |
| | 1,035,000 | | Ba2* | | Schuler Homes, Inc., Sr. Sub. Notes, | | | | |
| | | | | | 10.500% due 7/15/11 | | | | 1,192,837 |
| | 525,000 | | Ba3* | | Standard Pacific Corp., Sr. Sub. Notes, | | | | |
| | | | | | 9.250% due 4/15/12 | | | | 599,813 |
| | 900,000 | | B- | | THL Buildco Inc., Sr. Sub. Notes, | | | | |
| | | | | | 8.500% due 9/1/14 (c) | | | | 942,750 |
|
| | | | | | | | | | 9,627,648 |
|
| Business Services — 1.5% | | | | |
| | 990,000 | | B- | | Advanstar Communications Inc., 2nd Priority | | | | |
| | | | | | Sr. Secured Notes, 9.220% due 8/15/08 (d) | | | | 1,028,362 |
| | 475,000 | | B- | | Allied Security Escrow Corp., Sr. Sub. Notes, | | | | |
| | | | | | 11.375% due 7/15/11 (c) | | | | 503,500 |
See Notes to Financial Statements.
8
SCHEDULE OF INVESTMENTS
August 31, 2004 (unaudited) (continued)
| | Face
Amount | | Rating(a) | | Security | | Value |
|
| Business Services — 1.5% (continued) | | |
| $ | 950,000 | | B3* | | Brand Services, Inc., Sr. Notes, | | |
| | | | | | 12.000% due 10/15/12 | $ | 1,087,750 |
| | | | | | Iron Mountain Inc., Sr. Sub. Notes: | | |
| | 1,100,000 | | B | | 8.625% due 4/1/13 | | 1,193,500 |
| | 350,000 | | B | | 7.750% due 1/15/15 | | 365,750 |
| | 600,000 | | Caa1* | | Muzak LLC/Muzak Finance Corp., Sr. Notes, | | |
| | | | | | 10.000% due 2/15/09 | | 537,000 |
|
| | | | | | | | 4,715,862 |
|
| Cable — 8.9% | | | | |
| | | | | | Charter Communications Holdings, LLC, | | |
| | | | | | Sr. Discount Notes: | | |
| | 5,055,000 | | Ca* | | Step bond to yield 14.135% due 1/15/10 | | 4,094,550 |
| | 1,650,000 | | Ca* | | Step bond to yield 13.335% due 1/15/11 | | 1,212,750 |
| | 2,250,000 | | Ca* | | Step bond to yield 17.089% due 5/15/11 | | 1,440,000 |
| | | | | | CSC Holdings, Inc.: | | |
| | 1,475,000 | | BB- | | Sr. Debentures, 7.625% due 7/15/18 | | 1,489,750 |
| | | | | | Sr. Notes: | | |
| | 625,000 | | BB- | | 7.875% due 12/15/07 | | 667,188 |
| | | | | | Series B: | | |
| | 725,000 | | BB- | | 8.125% due 7/15/09 | | 781,188 |
| | 420,000 | | BB- | | 7.625% due 4/1/11 | | 437,850 |
| | 2,345,000 | | B+ | | Sr. Sub. Debentures, 10.500% due 5/15/16 | | 2,679,162 |
| | 1,450,000 | | BB- | | DIRECTV Holdings LLC/DIRECTV Financing | | |
| | | | | | Co., Inc., Sr. Notes, 8.375% due 3/15/13 | | 1,656,625 |
| | | | | | Echostar DBS Corp., Sr. Notes: | | |
| | 2,105,000 | | BB- | | 10.375% due 10/1/07. | | 2,231,300 |
| | 1,193,000 | | BB- | | 9.125% due 1/15/09 | | 1,318,265 |
| | 1,550,000 | | BBB+ | | Historic TW Inc., Debentures, | | |
| | | | | | 6.625% due 5/15/29. | | 1,585,221 |
| | 1,585,000 | | B- | | Insight Communications Co., Inc., Sr. Discount | | |
| | | | | | Notes, step bond to yield 13.753% due 2/15/11 | | 1,430,462 |
| | 400,000 | | B+ | | Insight Midwest, L.P./Insight Capital, Inc., | | |
| | | | | | Sr. Notes, 10.500% due 11/1/10 | | 435,000 |
| | 1,500,000 | | B+ | | Mediacom Broadband LLC, Sr. Notes, | | |
| | | | | | 11.000% due 7/15/13 | | 1,631,250 |
| | 600,000 | | B+ | | Mediacom LLC/Mediacom Capital Corp., | | |
| | | | | | Sr. Notes, 9.500% due 1/15/13 | | 591,000 |
See Notes to Financial Statements.
9
SCHEDULE OF INVESTMENTS
August 31, 2004 (unaudited) (continued)
| | Face
Amount | | Rating(a) | | Security | | | | Value |
|
| Cable — 8.9% (continued) | | | | |
| $ | 250,000 | | B- | | NTL Cable PLC, Sr. Notes, | | | | |
| | | | | | 8.750% due 4/15/14 (c) | | | $ | 261,250 |
| | 2,710,000 | | BB- | | Rogers Cablesystems Ltd., Sr. Sub. Debentures, | | | | |
| | | | | | 11.000% due 12/1/15 | | | | 3,075,850 |
| | 1,300,000 | | BBB+ | | Time Warner Inc., Sr. Notes, 7.625% due 4/15/31. . | | | | 1,487,674 |
|
| | | | | | | | | | 28,506,335 |
|
| Chemicals — 6.1% | | | | | | |
| | 615,000 | | Ba2* | | Airgas, Inc., Sr. Sub. Notes, 9.125% due 10/1/11 | | | | 696,488 |
| | 1,450,000 | | B+ | | Equistar Chemicals, L.P./Equistar Funding Corp., | | | | |
| | | | | | Sr. Notes, 10.625% due 5/1/11 | | | | 1,638,500 |
| | 425,000 | | BB+ | | FMC Corp., Medium-Term Notes, Series A, | | | | |
| | | | | | 6.750% due 5/5/05. | | | | 435,094 |
| | 825,000 | | Ba3* | | Hercules Inc., Sr. Sub. Notes, | | | | |
| | | | | | 6.750% due 10/15/29 (c) | | | | 822,938 |
| | | | | | Huntsman ICI Holdings LLC: | | | | |
| | 9,540,000 | | Caa2* | | Sr. Discount Notes, zero coupon bond to yield | | | | |
| | | | | | 13.188% due 12/31/09 | | | | 4,913,100 |
| | 525,000 | | B- | | Sr. Notes, 9.875% due 3/1/09 | | | | 569,625 |
| | 1,055,000 | | B+ | | IMC Global Inc., Sr. Notes, Series B, | | | | |
| | | | | | 11.250% due 6/1/11 | | | | 1,242,262 |
| | 1,035,000 | | B+ | | International Specialty Holdings Inc., Sr. Secured | | | | |
| | | | | | Notes, Series B, 10.625% due 12/15/09 | | | | 1,143,675 |
| | 1,055,000 | | BB- | | ISP Chemco Inc., Sr. Sub. Notes, Series B, | | | | |
| | | | | | 10.250% due 7/1/11 | | | | 1,178,962 |
| | 1,425,000 | | B+ | | Lyondell Chemical Co., Sr. Secured Notes, | | | | |
| | | | | | 11.125% due 7/15/12 | | | | 1,628,062 |
| | 420,000 | | BBB- | | Methanex Corp., Sr. Notes, 8.750% due 8/15/12 | | | | 480,900 |
| | 390,000 | | B- | | OM Group, Inc., Sr. Sub. Notes, | | | | |
| | | | | | 9.250% due 12/15/11 | | | | 403,650 |
| | 1,675,000 | | Caa2* | | Resolution Performance Products LLC/ | | | | |
| | | | | | RPP Capital Corp., Sr. Sub. Notes, | | | | |
| | | | | | 13.500% due 11/15/10 | | | | 1,633,125 |
| | | | | | Rhodia SA: | | | | |
| | | | | | Sr. Notes: | | | | |
| | 25,000 | | B3* | | 7.625% due 6/1/10 | | | | 23,125 |
| | 300,000 | | B3* | | 10.250% due 6/1/10 | | | | 307,500 |
| | 1,750,000 | | Caa1* | | Sr. Sub. Notes, 8.875% due 6/1/11 | | | | 1,487,500 |
See Notes to Financial Statements.
10
SCHEDULE OF INVESTMENTS
August 31, 2004 (unaudited) (continued)
| | Face
Amount | | Rating(a) | | Security | | | | Value |
|
| Chemicals — 6.1% (continued) | | | | |
| $ | 105,000 | | B+ | | Terra Capital Inc., Sr. Secured Notes, | | | | |
| | | | | | 12.875% due 10/15/08 | | | $ | 129,675 |
| | 875,000 | | BB- | | Westlake Chemical Corp., Sr. Notes, | | | | |
| | | | | | 8.750% due 7/15/11 | | | | 977,812 |
|
| | | | | | | | | | 19,711,993 |
|
| Consumer Products & Services — 5.0% | | | | |
| | 1,270,000 | | B+ | | AKI, Inc., Sr. Notes, 10.500% due 7/1/08 | | | | 1,312,862 |
| | 740,000 | | BBB- | | American Greetings Corp., Notes, | | | | |
| | | | | | 6.600 due 8/1/28 | | | | 789,025 |
| | | | | | Doane Pet Care Co.: | | | | |
| | 1,075,000 | | B2* | | Sr. Notes, 10.750% due 3/1/10 | | | | 1,144,875 |
| | 105,000 | | Caa1* | | Sr. Sub. Notes, 9.750% due 5/15/07 | | | | 98,438 |
| | 525,000 | | B- | | FTD, Inc., Sr. Sub. Notes, Series B, | | | | |
| | | | | | 7.750% due 2/15/14 | | | | 514,500 |
| | 1,175,000 | | B | | Hines Nurseries Inc., Sr. Sub. Notes, | | | | |
| | | | | | 10.250% due 10/1/11 | | | | 1,239,625 |
| | 1,525,000 | | Caa1* | | Home Interiors & Gifts, Inc., Sr. Sub. Notes, | | | | |
| | | | | | 10.125% due 6/1/08 | | | | 1,319,125 |
| | 1,200,000 | | B- | | Interface, Inc., Sr. Notes, 10.375% due 2/1/10 | | | | 1,356,000 |
| | 1,350,000 | | B3* | | Leiner Health Products Inc., Sr. Sub. Notes, | | | | |
| | | | | | 11.000% due 6/1/12 (c) | | | | 1,417,500 |
| | 543,000 | | Aa3* | | Pennzoil-Quaker State Co., Sr. Notes, | | | | |
| | | | | | 10.000% due 11/1/08 | | | | 614,208 |
| | 1,300,000 | | B | | Playtex Products, Inc., | | | | |
| | | | | | Sr. Secured Notes, 8.000% due 3/1/11 (c) | | | | 1,361,750 |
| | 800,000 | | B- | | Sealy Mattress Co., Sr. Sub. Notes, | | | | |
| | | | | | 8.250% due 6/15/14 (c) | | | | 830,000 |
| | | | | | Service Corp. International: | | | | |
| | 740,000 | | BB | | Debentures, 7.875% due 2/1/13 | | | | 767,750 |
| | | | | | Sr. Notes: | | | | |
| | 820,000 | | BB | | 6.875% due 10/1/07 | | | | 852,800 |
| | 1,030,000 | | BB | | 6.500% due 3/15/08 | | | | 1,068,625 |
| | 1,135,000 | | B+ | | Stewart Enterprises, Inc., Sr. Sub. Notes, | | | | |
| | | | | | 10.750% due 7/1/08 | | | | 1,259,850 |
|
| | | | | | | | | | 15,946,933 |
|
| Energy — 7.4% | | | | | | |
| | 4,800,000 | | B- | | Dynegy Holdings Inc., 2nd Priority Sr. Secured | | | | |
| | | | | | Notes, 8.600 due 7/15/08 (c)(d) | | | | 5,160,000 |
See Notes to Financial Statements.
11
SCHEDULE OF INVESTMENTS
August 31, 2004 (unaudited) (continued)
| | Face
Amount | | Rating(a) | | Security | | Value |
|
| Energy — 7.4% (continued) | | |
| $ | 4,175,000 | | Caa1* | | El Paso Corp., Global Sr. Medium-Term Notes, | | |
| | | | | | 7.750% due 1/15/32 | $ | 3,564,406 |
| | 566,000 | | BB- | | El Paso Energy Partners, L.P./El Paso Energy | | |
| | | | | | Partners Finance Corp., Sr. Sub. Notes, | | |
| | | | | | Series B, 8.500% due 6/1/11 | | 642,410 |
| | 1,275,000 | | BB- | | Forest Oil Corp., Sr. Notes, 8.000% due 12/15/11 | | 1,405,687 |
| | 1,025,000 | | B | | Hanover Compressor Co., Sr. Notes, | | |
| | | | | | 9.000% due 6/1/14 | | 1,104,437 |
| | 820,000 | | BB | | Luscar Coal Ltd., Sr. Notes, | | |
| | | | | | 9.750% due 10/15/11 | | 928,650 |
| | 682,000 | | B+ | | Magnum Hunter Resources, Inc., Sr. Notes, | | |
| | | | | | 9.600% due 3/15/12 | | 772,365 |
| | | | | | Plains Exploration & Production Co., | | |
| | | | | | Sr. Sub. Notes: | | |
| | 800,000 | | Ba3* | | 8.750% due 7/1/12 | | 896,000 |
| | 525,000 | | Ba3* | | Series B, 8.750% due 7/1/12 | | 588,000 |
| | 310,000 | | BB | | Pogo Producing Co., Sr. Sub. Notes, Series B, | | |
| | | | | | 8.250% due 4/15/11 | | 341,775 |
| | 520,000 | | BB- | | SESI, LLC, Sr. Notes, 8.875% due 5/15/11 | | 572,000 |
| | 1,420,000 | | B | | Swift Energy Co., Sr. Sub. Notes, | | |
| | | | | | 9.375% due 5/1/12 | | 1,569,100 |
| | | | | | Vintage Petroleum, Inc.: | | |
| | 725,000 | | BB- | | Sr. Notes, 8.250% due 5/1/12 | | 793,875 |
| | 200,000 | | B1* | | Sr. Sub. Notes, 7.875% due 5/15/11 | | 210,000 |
| | | | | | The Williams Cos., Inc.: | | |
| | | | | | Notes: | | |
| | 1,025,000 | | B+ | | 7.625% due 7/15/19 | | 1,112,125 |
| | 1,825,000 | | B+ | | 7.875% due 9/1/21 | | 1,986,969 |
| | 450,000 | | B+ | | 8.750% due 3/15/32 | | 507,375 |
| | 1,500,000 | | B+ | | Sr. Notes, 8.625% due 6/1/10 | | 1,747,500 |
|
| | | | | | | | 23,902,674 |
|
| Environmental Services — 1.4% | | |
| | | | | | Allied Waste North America, Inc., Sr. Notes, | | |
| | | | | | Series B: | | |
| | 1,555,000 | | BB- | | 8.500% due 12/1/08 | | 1,714,387 |
| | 1,250,000 | | B+ | | 7.375% due 4/15/14 | | 1,220,312 |
| | 1,600,000 | | B- | | IMCO Recycling Inc., Sr. Secured Notes, Series B, | | |
| | | | | | 10.375% due 10/15/10 | | 1,720,000 |
|
| | | | | | | | 4,654,699 |
|
See Notes to Financial Statements.
12
SCHEDULE OF INVESTMENTS
August 31, 2004 (unaudited) (continued)
| | Face
Amount | | Rating(a) | | Security | | | | Value |
|
| Financial Services — 2.7% | | | | |
| $ | 265,000 | | BB- | | Case Credit Corp., Notes, 6.750% due 10/21/07 | | | $ | 269,638 |
| | 1,550,000 | | B- | | BCP Caylux Holdings Luxembourg SCA, | | | | |
| | | | | | Sr. Sub. Notes, 9.625% due 6/15/14 (c) | | | | 1,672,062 |
| | 600,000 | | B- | | Borden US Finance Corp./Nova Scotia | | | | |
| | | | | | Finance ULC, Sr. Secured Notes, | | | | |
| | | | | | 9.000% due 7/15/14 (c) | | | | 621,000 |
| | 775,000 | | A3* | | Ford Motor Credit Co., Notes, | | | | |
| | | | | | 7.250% due 10/25/11 | | | | 836,229 |
| | 775,000 | | A3* | | General Motors Acceptance Corp., | | | | |
| | | | | | Notes, 6.875% due 8/28/12 | | | | 804,907 |
| | 1,015,000 | | Ba1* | | Markel Capital Trust I, Capital Securities, | | | | |
| | | | | | Series B, 8.710% due 1/1/46. | | | | 1,100,183 |
| | 3,200,000 | | B3* | | Ocwen Capital Trust I, Capital Securities, | | | | |
| | | | | | 10.875% due 8/1/27 | | | | 3,280,000 |
|
| | | | | | | | | | 8,584,019 |
|
| Food & Beverage — 1.2% | | | | |
| | 530,000 | | Ba3* | | Cott Beverages Inc., Sr. Sub. Notes, | | | | |
| | | | | | 8.000% due 12/15/11 | | | | 577,038 |
| | 600,000 | | Ba2* | | Dean Foods Co., Sr. Notes, | | | | |
| | | | | | 6.900% due 10/15/17 | | | | 621,000 |
| | 675,000 | | B | | Del Monte Corp., Sr. Sub. Notes, Series B, | | | | |
| | | | | | 8.625% due 12/15/12 | | | | 754,313 |
| | 375,000 | | B | | Land O’ Lakes, Inc., Sr. Secured Notes, | | | | |
| | | | | | 9.000% due 12/15/10 (c) | | | | 390,938 |
| | 1,600,000 | | B | | Pinnacle Foods Holding Corp., Sr. Sub. Notes, | | | | |
| | | | | | 8.250% due 12/1/13 (c) | | | | 1,532,000 |
|
| | | | | | | | | | 3,875,289 |
|
| Healthcare — 5.2% | | | | | | |
| | 800,000 | | Ca* | | aaiPharma Inc., Sr. Sub. Notes, step bond to yield | | |
| | | | | | 16.099% due 4/1/10 | | | | 558,000 |
| | 1,450,000 | | B- | | Ameripath, Inc. Sr. Sub. Notes, | | | | |
| | | | | | 10.500% due 4/1/13 | | | | 1,493,500 |
| | 1,775,000 | | B- | | Athena Neurosciences Finance LLC, Sr. Notes, | | | | |
| | | | | | 7.250% due 2/21/08 | | | | 1,775,000 |
| | 1,600,000 | | B- | | Curative Health Services, Inc., Sr. Notes, | | | | |
| | | | | | 10.750% due 5/1/11 (c) | | | | 1,480,000 |
| | 1,221,773 | | B+ | | Dade Behring Inc., Sr. Sub. Notes, | | | | |
| | | | | | 11.910% due 10/3/10 | | | | 1,398,930 |
See Notes to Financial Statements.
13
SCHEDULE OF INVESTMENTS
August 31, 2004 (unaudited) (continued)
| Face
Amount | | Rating(a) | | Security | | | | Value |
|
| Healthcare — 5.2% (continued) | | | | |
| | | | | | Extendicare Health Services, Inc., Sr. Sub. Notes: | | |
| $ | 465,000 | | B1* | | 9.500% due 7/1/10 | | | $ | 521,963 |
| | 700,000 | | B2* | | 6.875% due 5/1/14 | | | | 696,500 |
| | 1,550,000 | | B- | | IASIS Healthcare LLC/IASIS Capital Corp., | | | | |
| | | | | | Sr. Sub. Notes, 8.750% due 6/15/14 (c) | | | | 1,635,250 |
| | 825,000 | | B- | | Insight Health Services Corp., Sr. Sub. | | | | |
| | | | | | Notes, Series B, 9.875% due 11/1/11 | | | | 839,438 |
| | 575,000 | | B- | | Medical Device Manufacturing Inc., | | | | |
| | | | | | Sr. Sub. Notes, 10.000% due 7/15/12 (c) | | | | 609,500 |
| | 225,000 | | B- | | Psychiatric Solutions, Inc., Sr. Sub. Notes, | | | | |
| | | | | | 10.625% due 6/15/13 | | | | 254,250 |
| | 840,000 | | B1* | | Sola International Inc., Sr. Notes, | | | | |
| | | | | | 6.875% due 3/15/08 | | | | 870,224 |
| | | | | | Tenet Healthcare Corp.: | | | | |
| | 1,775,000 | | B- | | Notes, 7.375% due 2/1/13 | | | | 1,650,750 |
| | | | | | Sr. Notes: | | | | |
| | 350,000 | | B- | | 5.375% due 11/15/06 | | | | 354,375 |
| | 825,000 | | B- | | 6.500% due 6/1/12 | | | | 734,250 |
| | 50,000 | | B- | | 9.875% due 7/1/14 (c) | | | | 52,375 |
| | 1,475,000 | | B3* | | Vanguard Health Systems, Inc., Sr. Sub. Notes, | | |
| | | | | | 9.750% due 8/1/11 | | | | 1,718,375 |
|
| | | | | | | | | | 16,642,680 |
|
| Hotels/Casinos/Gaming — 6.7% | | | | |
| | 1,325,000 | | B | | Ameristar Casinos, Inc., Sr. Sub. Notes, | | | | |
| | | | | | 10.750% due 2/15/09 | | | | 1,500,562 |
| | | | | | Caesars Entertainment, Inc., Sr. Sub. Notes: | | | | |
| | 800,000 | | Ba2* | | 9.375% due 2/15/07 | | | | 888,000 |
| | 800,000 | | Ba2* | | 8.875% due 9/15/08 | | | | 908,000 |
| | 1,530,000 | | Ba2* | | 8.125% due 5/15/11 | | | | 1,740,375 |
| | 935,000 | | B2* | | Courtyard By Marriott II L.P., Sr. Notes, | | | | |
| | | | | | Series B, 10.750% due 2/1/08 | | | | 949,025 |
| | 345,000 | | B1* | | Felcor Lodging, L.P., Sr. Notes, | | | | |
| | | | | | 10.000% due 9/15/08 | | | | 364,406 |
| | | | | | Hilton Hotels Corp., Sr. Notes: | | | | |
| | 890,000 | | BBB- | | 7.950% due 4/15/07 | | | | 985,675 |
| | 425,000 | | BBB- | | 7.625% due 12/1/12 | | | | 487,688 |
| | 1,760,000 | | Ba3* | | Host Marriott, L.P., Notes, Series 1, | | | | |
| | | | | | 9.500% due 1/15/07 | | | | 1,971,200 |
See Notes to Financial Statements.
14
SCHEDULE OF INVESTMENTS
August 31, 2004 (unaudited) (continued)
| | Face
Amount | | Rating(a) | | Security | | | | Value |
|
| Hotels/Casinos/Gaming — 6.7% (continued) | | | | |
| $ | 850,000 | | B | | Kerzner International Ltd., Sr. Sub. Notes, | | | | |
| | | | | | 8.875% due 8/15/11 | | | $ | 937,125 |
| | | | | | Mandalay Resort Group: | | | | |
| | 415,000 | | BB- | | Sr. Sub. Debentures, 7.625% due 7/15/13 | | | | 429,525 |
| | 1,040,000 | | BB- | | Sr. Sub. Notes, Series B, 10.250% due 8/1/07 | | | | 1,171,300 |
| | | | | | MeriStar Hospitality Operating Partnership, | | | | |
| | | | | | L.P./MeriStar Hospitality Finance Corp., | | | | |
| | | | | | Sr. Notes: | | | | |
| | 150,000 | | B2* | | 9.000% due 1/15/08 | | | | 155,250 |
| | 1,250,000 | | B2* | | 10.500% due 6/15/09 | | | | 1,357,812 |
| | 50,000 | | B2* | | 9.125% due 1/15/11 | | | | 51,750 |
| | | | | | MGM MIRAGE: | | | | |
| | 1,200,000 | | BB+ | | Sr. Notes, 6.750% due 9/1/12 (c) | | | | 1,230,000 |
| | | | | | Sr. Sub. Notes: | | | | |
| | 525,000 | | Ba2* | | 9.750% due 6/1/07 | | | | 584,063 |
| | 1,285,000 | | Ba2* | | 8.375% due 2/1/11 | | | | 1,400,650 |
| | 750,000 | | BB+ | | Starwood Hotels & Resorts Worldwide, Inc., | | | | |
| | | | | | Notes, 7.875% due 5/1/12 | | | | 843,750 |
| | 450,000 | | B+ | | Station Casinos, Inc., Sr. Sub. Notes, | | | | |
| | | | | | 6.875% due 3/1/16 | | | | 451,688 |
| | 1,100,000 | | B+ | | Turning Stone Casino Resort Enterprise, | | | | |
| | | | | | Sr. Notes, 9.125% due 12/15/10 (c) | | | | 1,178,375 |
| | 1,580,000 | | B | | Venetian Casino Resort LLC/Las Vegas | | | | |
| | | | | | Sands, Inc., Mortgage Secured Notes, | | | | |
| | | | | | 11.000% due 6/15/10 | | | | 1,807,125 |
|
| | | | | | | | | | 21,393,344 |
|
| Leisure — 1.3% | | | | | | |
| | 515,000 | | B3* | | AMC Entertainment Inc., Sr. Sub. Notes, | | | | |
| | | | | | 9.500% due 2/1/11 | | | | 527,875 |
| | 1,600,000 | | B- | | Cinemark, Inc., Sr. Discount Notes, | | | | |
| | | | | | step bond to yield 9.743% due 3/15/14 | | | | 1,110,000 |
| | 1,325,000 | | B- | | Icon Health & Fitness, Inc., Sr. Sub. Notes, | | | | |
| | | | | | 11.250% due 4/1/12 | | | | 1,450,875 |
| | 150,000 | | B3* | | LCE Acquisition Corp., Sr. Sub. Notes, | | | | |
| | | | | | 9.000% due 8/1/14 (c) | | | | 153,000 |
| | | | | | Six Flags, Inc., Sr. Notes: | | | | |
| | 525,000 | | B3* | | 9.750% due 4/15/13 | | | | 490,875 |
| | 400,000 | | B3* | | 9.625% due 6/1/14 | | | | 373,000 |
|
| | | | | | | | | | 4,105,625 |
|
See Notes to Financial Statements.
15
SCHEDULE OF INVESTMENTS
August 31, 2004 (unaudited) (continued)
| Face
Amount | | Rating(a) | | Security | | | | Value |
|
| Machinery — 1.1% | | | | | | |
| $ | 225,000 | | BB- | | Case New Holland Inc., Sr. Notes, | | | | |
| | | | | | 9.250% due 8/1/11 (c) | | | $ | 249,750 |
| | 675,000 | | B- | | Columbus McKinnon Corp., Sr. Secured Notes, | | | | |
| | | | | | 10.000% due 8/1/10 | | | | 739,125 |
| | 1,185,000 | | B | | Flowserve Corp., Sr. Sub. Notes, | | | | |
| | | | | | 12.250% due 8/15/10 | | | | 1,350,900 |
| | 415,000 | | B+ | | NMHG Holding Co., Sr. Notes, | | | | |
| | | | | | 10.000% due 5/15/09 | | | | 458,575 |
| | 700,000 | | B | | Terex Corp., Sr. Sub. Notes, Series B, | | | | |
| | | | | | 10.375% due 4/1/11 | | | | 792,750 |
|
| | | | | | | | | | 3,591,100 |
|
| Manufacturing — 1.1% | | | | |
| | 745,000 | | NR | | Aqua-Chem, Inc., Sr. Sub. Notes, | | | | |
| | | | | | 11.250% due 7/1/08 | | | | 562,475 |
| | 700,000 | | B- | | Blount Inc., Sr. Sub. Notes, 8.875% due 8/1/12 | | | | 735,000 |
| | 950,000 | | B- | | Invensys PLC, Sr. Notes, 9.875% due 3/15/11 (c) | | | | 969,000 |
| | 1,365,000 | | Caa1* | | Park-Ohio Industries, Inc., Sr. Sub. Notes, | | | | |
| | | | | | 9.250% due 12/1/07 | | | | 1,392,300 |
|
| | | | | | | | | | 3,658,775 |
|
| Metals/Mining — 2.0% | | | | |
| | 1,650,000 | | B+ | | AK Steel Corp., Sr. Notes, 7.875% due 2/15/09 | | | | 1,600,500 |
| | 950,000 | | B- | | Mueller Group, Inc., Sr. Sub. Notes, | | | | |
| | | | | | 10.000% due 5/1/12 (c) | | | | 1,028,375 |
| | 650,000 | | B- | | Mueller Holdings Inc., Sr. Discount Notes, | | | | |
| | | | | | step bond to yield 14.734% due 4/15/14 (c) | | | | 416,000 |
| | 1,500,000 | | B | | Ispat Inland ULC, Sr. Secured Notes, | | | | |
| | | | | | 9.750% due 4/1/14 (c) | | | | 1,608,750 |
| | 1,030,000 | | BBB- | | Phelps Dodge Corp., Sr. Notes, | | | | |
| | | | | | 8.750% due 6/1/11 | | | | 1,252,995 |
| | 585,000 | | B+ | | Wolverine Tube, Inc., Sr. Notes, | | | | |
| | | | | | 10.500% due 4/1/09 | | | | 643,500 |
|
| | | | | | | | | | 6,550,120 |
|
| Packaging/Containers — 3.5% | | | | |
| | 1,350,000 | | B+ | | Anchor Glass Container Corp., Sr. Secured | | | | |
| | | | | | Notes, 11.000% due 2/15/13 | | | | 1,545,750 |
| | 500,000 | | B | | JSG Funding PLC, Sr. Notes, 9.625% 10/1/12 | | | | 565,000 |
| | 2,060,000 | | BB- | | Owens-Brockway Glass Container Inc., | | | | |
| | | | | | Sr. Secured Notes, 8.875% due 2/15/09 | | | | 2,250,550 |
See Notes to Financial Statements.
16
SCHEDULE OF INVESTMENTS
August 31, 2004 (unaudited) (continued)
| Face
Amount | | Rating(a) | | Security | | | | Value |
|
| Packaging/Containers — 3.5% (continued) | | | | |
| $ | 375,000 | | B | | Owens-Illinois, Inc., Sr. Notes, | | | | |
| | | | | | 7.150% due 5/15/05 | | | $ | 385,313 |
| | 1,190,000 | | B+ | | Plastipak Holdings, Inc., Sr. Notes, | | | | |
| | | | | | 10.750% due 9/1/11 | | | | 1,291,150 |
| | | | | | Pliant Corp.: | | | | |
| | 650,000 | | B- | | Sr. Secured 2nd Lien Notes, | | | | |
| | | | | | 11.125% due 9/1/09 | | | | 700,375 |
| | 150,000 | | B- | | Sr. Sub. Notes, 13.000% due 6/1/10 | | | | 138,750 |
| | 425,000 | | Caa1* | | Radnor Holdings Corp., Sr. Notes, | | | | |
| | | | | | 11.000% due 3/15/10 | | | | 359,125 |
| | 935,000 | | BBB | | Sealed Air Corp., Notes, 6.950% due 5/15/09 (c) | | | | 1,039,558 |
| | 1,525,000 | | B | | Stone Container Finance Co. of Canada II, | | | | |
| | | | | | Sr. Notes, 7.375% due 7/15/14 (c) | | | | 1,582,187 |
| | | | | | Tekni-Plex, Inc.: | | | | |
| | 650,000 | | B2* | | Sr. Secured Notes, 8.750% due 11/15/13 (c) | | | | 627,250 |
| | 835,000 | | B- | | Sr. Sub. Notes, Series B, 12.750% due 6/15/10 | | | | 809,950 |
|
| | | | | | | | | | 11,294,958 |
|
| Paper/Forestry Products — 2.8% | | | | |
| | 1,400,000 | | BB | | Abitibi-Consolidated Inc., Debentures, | | | | |
| | | | | | 8.850% due 8/1/30 | | | | 1,396,500 |
| | 1,525,000 | | B+ | | Appleton Papers Inc., Sr. Sub. Notes, | | | | |
| | | | | | 9.750% due 6/15/14 (c) | | | | 1,547,875 |
| | 650,000 | | B2* | | Blue Ridge Paper Products Inc., Sr. Secured | | | | |
| | | | | | Exchange Notes, 9.500% due 12/15/08 | | | | 581,750 |
| | | | | | Buckeye Technologies Inc., Sr. Sub. Notes: | | | | |
| | 525,000 | | B | | 9.250% due 9/15/08 | | | | 527,625 |
| | 1,745,000 | | B | | 8.000% due 10/15/10 | | | | 1,731,912 |
| | 1,600,000 | | B- | | Newark Group Inc., Sr. Sub. Notes, | | | | |
| | | | | | 9.750% due 3/15/14 (c) | | | | 1,560,000 |
| | 1,500,000 | | BB- | | Tembec Industries Inc., Sr. Notes, | | | | |
| | | | | | 8.625% due 6/30/09 | | | | 1,571,250 |
|
| | | | | | | | | | 8,916,912 |
|
| Printing/Publishing — 2.6% | | | | |
| | 730,000 | | BB- | | Cenveo Corp., Sr. Notes, 9.625% due 3/15/12 | | | | 804,825 |
| | 422,000 | | B | | Dex Media East LLC/Dex Media East | | | | |
| | | | | | Finance Co., Notes, 12.125% due 11/15/12 | | | | 522,225 |
| | | | | | Dex Media, Inc., Discount Notes: | | | | |
| | 800,000 | | B | | Step bond to yield 8.910% due 11/15/13 (c) | | | | 590,000 |
| | 1,100,000 | | B | | Step bond to yield 8.372% due 11/15/13 (c) | | | | 811,250 |
See Notes to Financial Statements.
17
SCHEDULE OF INVESTMENTS
August 31, 2004 (unaudited) (continued)
| | Face
Amount | | Rating(a) | | Security | | | | Value |
|
| Printing/Publishing — 2.6% (continued) | | | | |
| $ | 855,000 | | B | | Dex Media West LLC/Media West Finance Co., | | |
| | | | | | Sr. Sub. Notes, Series B, 9.875% 8/15/13 | | | $ | 987,525 |
| | 1,425,000 | | B | | HM Publishing Corp., Sr. Discount Notes, | | | | |
| | | | | | step bond to yield 11.234% due 10/15/13 | | | | 849,656 |
| | 1,919,920 | | B- | | Hollinger Participation Trust, Sr. Notes, | | | | |
| | | | | | Payment-In-Kind, 12.125% due 11/15/10 (c) | | | | 2,174,309 |
| | 365,000 | | B1* | | PEI Holdings, Inc., Sr. Notes, | | | | |
| | | | | | 11.000% due 3/15/10 | | | | 425,225 |
| | 300,000 | | B+ | | R.H. Donnelley Finance Corp. I, Sr. Sub. Notes, | | |
| | | | | | 10.875% due 12/15/12 (c) | | | | 356,250 |
| | 375,000 | | B2* | | Vertis, Inc., Sr. Secured 2nd Lien Notes, Series B, | | |
| | | | | | 9.750% due 4/1/09 | | | | 408,750 |
| | 358,000 | | BB- | | Yell Finance BV, Sr. Discount Notes, | | | | |
| | | | | | step bond to yield 12.263% due 8/1/11 | | | | 343,680 |
|
| | | | | | | | | | 8,273,695 |
|
| Retail — 3.9% | | | | | | |
| | 250,000 | | BB- | | Ahold Finance USA, Inc., Sr. Notes, | | | | |
| | | | | | 8.250% due 7/15/10 | | | | 275,625 |
| | 1,725,956 | | BB | | Ahold Lease USA, Inc., Pass-Through Certificates, | | |
| | | | | | Series 2001-A-1, 7.820% due 1/2/20 | | | | 1,778,814 |
| | 250,000 | | B | | Cole National Group, Inc., Sr. Sub. Notes, | | | | |
| | | | | | 8.625% due 8/15/07 | | | | 255,313 |
| | 525,000 | | Caa3* | | Denny’s Corp., Sr. Notes, 11.250% due 1/15/08 | | | | 548,625 |
| | 1,100,000 | | BB+ | | The Gap, Inc., Notes, 10.550% due 12/15/08 | | | | 1,353,000 |
| | | | | | J.C. Penney Co., Inc.: | | | | |
| | 1,323,000 | | BB+ | | Notes, 9.000% due 8/1/12 | | | | 1,594,215 |
| | 1,400,000 | | BB+ | | Sr. Notes, 8.000% due 3/1/10 | | | | 1,585,500 |
| | 950,000 | | B | | Jean Coutu Group (PJC) Inc., Sr. Sub. Notes, | | | | |
| | | | | | 8.500% due 8/1/14 (c) | | | | 961,875 |
| | | | | | Rite Aid Corp., Sr. Notes: | | | | |
| | 905,000 | | B- | | 7.625% due 4/15/05 | | | | 936,675 |
| | 1,105,000 | | B- | | 7.125% due 1/15/07 | | | | 1,132,625 |
| | 125,000 | | B- | | 11.250% due 7/1/08 | | | | 138,750 |
| | 1,122,000 | | BB | | Saks Inc., Notes, 9.875% due 10/1/11 | | | | 1,340,790 |
| | 700,000 | | B | | VICORP Restaurants, Inc., Sr. Notes, | | | | |
| | | | | | 10.500% due 4/15/11 (c) | | | | 710,500 |
|
| | | | | | | | | | 12,612,307 |
|
See Notes to Financial Statements.
18
SCHEDULE OF INVESTMENTS
August 31, 2004 (unaudited) (continued)
| | Face
Amount | | Rating(a) | | Security | | Value |
|
| Technology — 1.2% | | | | |
| $ | 1,335,000 | | B3* | | Amkor Technology, Inc., Sr. Sub. Notes, | | |
| | | | | | 10.500% due 5/1/09 | $ | 1,214,850 |
| | 2,400,000 | | B1* | | Sanmina — SCI Corp., Sub. Debentures, zero | | |
| | | | | | coupon bond to yield 10.702% due 9/12/20 (e) | | 1,269,000 |
| | 1,240,000 | | BBB- | | Thomas & Betts Corp., Medium-Term Notes, | | |
| | | | | | 6.625% due 5/7/08 | | 1,327,450 |
|
| | | | | | | | 3,811,300 |
|
| Telecommunications — 11.9% | | |
| | 701,300 | | Caa1* | | AirGate PCS, Inc., Sr. Sub. Secured Notes, | | |
| | | | | | 9.375% due 9/1/09 | | 704,807 |
| | | | | | Alamosa (Delaware), Inc.: | | |
| | 584,000 | | Caa1* | | Sr. Discount Notes, step bond to yield | | |
| | | | | | 11.437% due 7/31/09 | | 584,000 |
| | 975,000 | | Caa1* | | Sr. Notes, 11.000% due 7/31/10 | | 1,072,500 |
| | 2,375,000 | | Caa1* | | American Tower Corp., Sr. Notes, | | |
| | | | | | 9.375% due 2/1/09 | | 2,547,187 |
| | 600,000 | | B3* | | American Tower Escrow Corp., Sr. Sub. | | |
| | | | | | Discount Notes, zero coupon bond to yield | | |
| | | | | | 14.314% due 8/1/08 | | 450,750 |
| | 1,350,000 | | BB+ | | AT&T Corp., Sr. Notes, 8.050% due 11/15/11 | | 1,474,875 |
| | | | | | AT&T Wireless Services, Inc., Sr. Notes: | | |
| | 2,700,000 | | BBB | | 7.875% due 3/1/11 | | 3,186,440 |
| | 2,350,000 | | BBB | | 8.125% due 5/1/12 | | 2,832,180 |
| | 393,000 | | B+ | | Avaya, Inc., Sr. Secured Notes, | | |
| | | | | | 11.125% due 4/1/09 | | 460,793 |
| | | | | | Crown Castle International Corp., Sr. Notes: | | |
| | 1,430,000 | | B3* | | 10.750% due 8/1/11 | | 1,612,325 |
| | 750,000 | | B3* | | 7.500% due 12/1/13 | | 753,750 |
| | 940,000 | | NR | | GT Group Telecom Inc., Sr. Discount Notes, | | |
| | | | | | step bond to yield 16.470% due 2/1/10 (b) | | 94 |
| | 4,075,000 | | B | | Lucent Technologies Inc., Debentures, | | |
| | | | | | 6.450% due 3/15/29 | | 3,219,250 |
| | 1,125,000 | | BB | | Nextel Communications, Inc., Sr. Serial | | |
| | | | | | Redeemable Notes, 7.375% due 8/1/15 | | 1,181,250 |
| | 602,000 | | B- | | Nextel Partners, Inc., Sr. Notes, | | |
| | | | | | 12.500% due 11/15/09 | | 701,330 |
| | 1,225,000 | | B- | | Nortel Networks Corp., Notes, | | |
| | | | | | 6.875% due 9/1/23 | | 1,102,500 |
See Notes to Financial Statements.
19
SCHEDULE OF INVESTMENTS
August 31, 2004 (unaudited) (continued)
| | Face
Amount | | Rating(a) | | Security | | | | Value |
|
| Telecommunications — 11.9% (continued) | | | | |
| $ | 225,000 | | B- | | Nortel Networks Ltd., Sr. Notes, | | | | |
| | | | | | 6.125% due 2/15/06 | | $ | | 229,500 |
| | 525,000 | | B- | | Northern Telecom Capital Corp., Notes, | | | | |
| | | | | | 7.875% due 6/15/26 | | | | 490,875 |
| | 775,000 | | B+ | | PanAmSat Corp., Sr. Notes, | | | | |
| | | | | | 9.000% due 8/15/14 (c) | | | | 811,813 |
| | | | | | Qwest Corp.: | | | | |
| | 250,000 | | BB- | | Debentures, 6.875% due 9/15/33 | | | | 206,250 |
| | 2,425,000 | | BB- | | Notes, 9.125% due 3/15/12 (c) | | | | 2,612,937 |
| | | | | | Qwest Services Corp.: | | | | |
| | 953,000 | | B | | Notes, 14.500% due 12/15/14 (c) | | | | 1,136,452 |
| | 2,080,000 | | B | | Sr. Deb. Notes, 14.000% due 12/15/10 (c) | | | | 2,428,400 |
| | 650,000 | | Caa2* | | SBA Communications Corp., Sr. Notes, | | | | |
| | | | | | 10.250% due 2/1/09 | | | | 687,375 |
| | 1,250,000 | | B3* | | SpectraSite, Inc., Sr. Notes, 8.250% due 5/15/10 | | | | 1,312,500 |
| | | | | | Sprint Capital Corp.: | | | | |
| | 3,400,000 | | BBB- | | Notes, 8.750% due 3/15/32 | | | | 4,317,439 |
| | 1,975,000 | | BBB- | | Sr. Notes, 6.875% due 11/15/28 | | | | 2,064,697 |
|
| | | | | | | | | | 38,182,269 |
|
| Textiles/Apparel — 0.9% | | | | |
| | | | | | Levi Strauss & Co.: | | | | |
| | 690,000 | | Ca* | | Notes, 7.000%, due 11/1/06 | | | | 683,100 |
| | | | | | Sr. Notes: | | | | |
| | 1,050,000 | | Ca* | | 11.625% due 1/15/08 | | | | 1,092,000 |
| | 600,000 | | Ca* | | 12.250% due 12/15/12 | | | | 625,500 |
| | 468,000 | | B+ | | The William Carter Co., Sr. Sub. Notes, | | | | |
| | | | | | Series B, 10.875% due 8/15/11 | | | | 528,840 |
|
| | | | | | | | | | 2,929,440 |
|
| Transportation — 0.5% | | | | |
| | 875,000 | | B+ | | General Maritime Corp., Sr. Notes, | | | | |
| | | | | | 10.000% due 3/15/13 | | | | 985,469 |
| | 580,000 | | Baa2* | | Windsor Petroleum Transport Corp., | | | | |
| | | | | | Secured Notes, 7.840% due 1/15/21 (c) | | | | 590,150 |
|
| | | | | | | | | | 1,575,619 |
|
| Utilities — 6.9% | | | | | | |
| | | | | | The AES Corp., Sr. Notes: | | | | |
| | 2,330,000 | | B2* | | 9.500% due 6/1/09 | | | | 2,603,775 |
| | 75,000 | | B2* | | 7.750% due 3/1/14 | | | | 75,938 |
See Notes to Financial Statements.
20
SCHEDULE OF INVESTMENTS
August 31, 2004 (unaudited) (continued)
| Face
Amount | | Rating(a) | | Security | | | | Value |
| Utilities — 6.9% (continued) |
|
| $ | 1,550,000 | | B+ | | Allegheny Energy Supply Statutory Trust, | | | | |
| | | | | | Secured Notes, Series 2001-A, | | | | |
| | | | | | 10.250% due 11/15/07 (c) | | | $ | 1,712,750 |
| | 330,000 | | BB+ | | Avista Corp., Sr. Notes, 9.750% due 6/1/08 | | | | 391,050 |
| | 2,345,000 | | Caa1* | | Calpine Canada Energy Finance ULC, Sr. Notes, | | |
| | | | | | 8.500% due 5/1/08 | | | | 1,506,662 |
| | | | | | Calpine Corp.: | | | | |
| | 1,930,000 | | B | | 2nd Priority Sr. Secured Notes, | | | | |
| | | | | | 8.500% due 7/15/10 (c) | | | | 1,524,700 |
| | 975,000 | | Caa1* | | Sr. Notes, 8.625% due 8/15/10 | | | | 611,813 |
| | 525,000 | | B+ | | CMS Energy Corp., Sr. Notes, | | | | |
| | | | | | 7.625% due 11/15/04 | | | | 531,563 |
| | | | | | Edison Mission Energy, Sr. Notes: | | | | |
| | 1,055,000 | | B1* | | 10.000% due 8/15/08 | | | | 1,229,075 |
| | 475,000 | | B1* | | 7.730% due 6/15/09 | | | | 499,938 |
| | 1,775,000 | | B1* | | 9.875% due 4/15/11 | | | | 2,045,687 |
| | 625,000 | | D | | Mirant Americas Generation, LLC., Sr. Notes, | | | | |
| | | | | | 9.125% due 5/1/31 (b) | | | | 520,313 |
| | 3,075,000 | | B+ | | NRG Energy, Inc., 2nd Priority | | | | |
| | | | | | Sr. Secured Notes, 8.000% due 12/15/13 (c) | | | | 3,244,125 |
| | 1,395,000 | | B2* | | Orion Power Holdings, Inc., Sr. Notes, | | | | |
| | | | | | 12.000% due 5/1/10 | | | | 1,750,725 |
| | | | | | Reliant Resources, Inc., Sr. Secured Notes: | | | | |
| | 1,725,000 | | B1* | | 9.250% due 7/15/10 | | | | 1,897,500 |
| | 1,675,000 | | B1* | | 9.500% due 7/15/13 | | | | 1,859,250 |
|
| | | | | | | | | | 22,004,864 |
|
| | | | | | TOTAL CORPORATE BONDS & NOTES | | | | |
| | | | | | (Cost — $273,378,492) | | | | 298,869,973 |
|
|
| ASSET-BACKED SECURITIES — 0.2% |
|
| Airlines — 0.1% |
| | 284,077 | | BB | | Continental Airlines, Inc., Pass-Through | | | | |
| | | | | | Trust Certificates, Series 2000-2, Class C, | | | | |
| | | | | | 8.312% due 4/2/11 | | | | 209,101 |
| | 581,503 | | NR | | United Airlines, Inc., Pass-Through Certificates, | | | | |
| | | | | | Series 2000-1, Class B, 8.030% due 7/1/11 (b) | | | | 116,084 |
| | | | | | | | | | 325,185 |
See Notes to Financial Statements.
21
SCHEDULE OF INVESTMENTS
August 31, 2004 (unaudited) (continued)
| | Face
Amount | | Rating(a) | | Security | | | | Value |
|
| Financial Services — 0.0% |
| $ | 6,296,588 | | C* | | Airplanes Pass-Through Trust, Series 1, Class D, | | |
| | | | | | 10.875% due 3/15/12 | | | $ | 0 |
|
| Retail — 0.1% |
| | 175,000 | | BB | | Ahold Lease USA, Inc., Exchange Pass- | | |
| | | | | | Through Certificates, Series 2001-A-2, | | | | |
| | | | | | 8.620% due 1/2/25 | | | | 177,734 |
|
| | | | | | TOTAL ASSET-BACKED SECURITIES | | | | |
| | | | | | (Cost — $7,951,465) | | | | 502,919 |
|
| | Shares | | | | Security | | | | Value |
| |
| COMMON STOCK (f) — 0.5% |
| Business Services — 0.0% |
| | 3,348 | | | | Outsourcing Solutions Inc. | | | | 93,555 |
|
| Food & Beverage — 0.0% |
| | 38,785 | | | | Aurora Foods Inc. | | | | 0 |
|
| Telecommunications — 0.5% |
| | 28,966 | | | | AirGate PCS, Inc. | | | | 501,112 |
| | 20,711 | | | | Crown Castle International Corp. | | | | 296,379 |
| | 2,169 | | | | McLeodUSA, Inc., Class A Shares | | | | 933 |
| | 53,428 | | | | Telewest Global Inc. | | | | 617,098 |
| | 12,250 | | | | Weblink Wireless Inc., Class A Shares | | | | 122 |
|
| | | | | | | | | | 1,415,644 |
|
| | | | | | TOTAL COMMON STOCK | | | | |
| | | | | | (Cost — $4,064,056) | | | | 1,509,199 |
|
| PREFERRED STOCK — 0.7% |
| Aerospace/Defense — 0.0% |
| | 1,050 | | | | Northrop Grumman Corp., | | | | |
| | | | | | 7.250% Equity Security Units (g) | | | | 107,699 |
|
| Telecommunications — 0.7% |
| | 2,234 | | | | Alamosa Holdings, Inc., 7.500% Cumulative, | | |
| | | | | | Series B (h) | | | | 1,402,393 |
| | 12,000 | | | | Crown Castle International Corp., | | | | |
| | | | | | 6.250% Cumulative (h) | | | | 553,500 |
See Notes to Financial Statements.
22
SCHEDULE OF INVESTMENTS
August 31, 2004 (unaudited) (continued)
Shares | | Security | | | | Value |
|
| Telecommunications — 0.7% (continued) | | | | |
| 2,600 | | Motorola, Inc., 7.000% Equity Security Units (g) | | $ | | 119,600 |
|
| | | | | | | 2,075,493 |
|
| | | TOTAL PREFERRED STOCK | | | | |
| | | (Cost — $1,248,147) | | | | 2,183,192 |
|
Warrants | | Security | | | | Value |
|
| WARRANTS (f) — 0.0% | | | | |
| Internet Software/Services — 0.0% | | | | |
| 3,630 | | WAM!NET Inc., Expire 3/1/05 (c) | | | | 36 |
|
| Metals/Mining — 0.0% | | | | |
| 650 | | Mueller Holdings Inc., Expire 4/15/14 | | | | 39,000 |
|
| Packaging/Containers — 0.0% | | | | |
| 150 | | Pliant Corp., Expire 6/1/10 (c) | | | | 2 |
|
| Technology — 0.0% | | | | |
| 2,460 | | Viasystems Group, Inc., Expire 1/31/10 | | | | 0 |
|
| Telecommunications — 0.0% | | | | |
| 600 | | American Tower Corp., Expire 8/1/08 (c) | | | | 111,300 |
| 940 | | GT Group Telecom Inc., Expire 2/1/10 (c) | | | | 0 |
| 695 | | Horizon PCS Inc., Expire 10/1/10 (c) | | | | 0 |
| 4,125 | | Iridium World Communications Inc., | | | | |
| | Expire 7/15/05 (c) | | | | 41 |
| 720 | | IWO Holdings Inc., Expire 1/15/11 (c) | | | | 7 |
| 4,125 | | RSL Communications Ltd., Class A Shares, | | | | |
| | | Expire 11/15/06 | | | | 0 |
|
| | | | | | | 111,348 |
|
| | | TOTAL WARRANTS | | | | |
| | | (Cost — $768,091) | | | | 150,386 |
|
See Notes to Financial Statements.
23
SCHEDULE OF INVESTMENTS
August 31, 2004 (unaudited) (continued)
| | Face
Amount | | Security | | Value |
|
| REPURCHASE AGREEMENT — 3.8% | | |
| |
| $ | 12,305,000 | | UBS Securities LLC dated 8/31/04, | | |
| | | | 1.580% due 9/1/04; Proceeds at maturity — | | |
| | | | $12,305,540; (Fully collateralized by various |
| | | | U.S. Government Agency Obligations, | | |
| | | | 0.000% to 9.800% due 10/22/04 to 3/1/26; | | |
| | | | Market value — $12,551,136) | | |
| | | | (Cost — $12,305,000) | $ | 12,305,000 |
|
| | | | TOTAL INVESTMENTS — 98.3% | | |
| | | | (Cost — $299,715,251**) | | 315,520,669 |
| | | | Other Assets in Excess of Liabilities — 1.7% | | 5,616,173 |
|
| | | | TOTAL NET ASSETS — 100.0% | | $321,136,842 |
|
| (a) | All ratings are by Standard & Poor’s Rating Services, except for those identified by an asterisk (*) which are rated by Moody’s Investors Service. |
| (b) | Security is currently in default. |
| (c) | Security is exempt from registration under Rule 144A of the Securities Act of 1933. This security may be resold in transactions that are exempt from registration, normally to qualified institutional buyers. This security has been deemed liquid pursuant to guidelines approved by the Board of Directors. |
| (d) | Variable rate security. |
| (e) | Convertible bonds exchangeable for shares of common stock. |
| (f) | Non-income producing security. |
| (g) | Each equity security unit consists of a contract to purchase common stock and senior notes at a specific price. |
| (h) | Preferred stock convertible into shares of common stock. |
| ** | Aggregate cost for Federal income tax purposes is substantially the same. |
See pages 25 and 26 for definitions of ratings.
See Notes to Financial Statements.
24
BOND RATINGS (UNAUDITED)
The definitions of the applicable rating symbols are set forth below:
Standard & Poor’s Ratings Service (“Standard & Poor’s”) — Ratings from “AA” to “CCC” may be modified by the addition of a plus (+) or minus (-) sign to show relative standings within the major rating categories.
| AAA | — | Bonds rated “AAA” have the highest rating assigned by Standard & Poor’s. Capacity to pay interest and repay principal is extremely strong. |
| | |
| AA | — | Bonds rated “AA” have a very strong capacity to pay interest and repay principal and differ from the highest rated issue only in a small degree. |
| | |
| A | — | Bonds rated “A” have a strong capacity to pay interest and repay principal although they are somewhat more susceptible to the adverse effects of changes in circumstances and economic conditions than bonds in higher rated categories. |
| | |
| BBB | — | Bonds rated “BBB” are regarded as having an adequate capacity to pay interest and repay principal. Whereas they normally exhibit adequate protection parameters, adverse economic conditions or changing circumstances are more likely to lead to a weakened capacity to pay interest and repay principal for bonds in this category than for bonds in higher rated categories. |
| | |
BB, B,
CCC,
CC,
and C | — | Bonds rated “BB”, “B”, “CCC”, “CC” and “C” are regarded, on balance, as predominantly speculative with respect to capacity to pay interest and repay principal in accordance with the terms of the obligation. “BB” represents the lowest degree of speculation and “C” the highest degree of speculation. While such bonds will likely have some quality and protective characteristics, they are outweighed by large uncertainties or major risk exposures to adverse conditions. |
| | |
| D | — | Bonds rated “D” are in default, and payment of interest and/or repayment of principal is in arrears. |
| | |
Moody’s Investors Service (“Moody’s”) — Numerical modifiers 1, 2 and 3 may be applied to each generic rating from “Aa” to “Caa,” where 1 is the highest and 3 the lowest ranking within its generic category. |
|
| Aa | — | Bonds rated “Aa” are judged to be of high quality by all standards. Together with the “Aaa” group they comprise what are generally known as high grade bonds. They are rated lower than the best bonds because margins of protection may not be as large as in “Aaa” securities or fluctuation of protective elements may be of greater amplitude or there may be other elements present which make the long-term risks appear somewhat larger than in “Aaa” securities. |
| | |
| A | — | Bonds rated “A” possess many favorable investment attributes and are to be considered as upper medium grade obligations. Factors giving security to principal and interest are considered adequate but elements may be present which suggest a susceptibility to impairment some time in the future. |
| | |
25
BOND RATINGS (UNAUDITED) (CONTINUED)
| Baa | — | Bonds rated “Baa” are considered as medium grade obligations; that is, they are neither highly protected nor poorly secured. Interest payment and principal security appear adequate for the present but certain protective elements may be lacking or may be characteristically unreliable over any great length of time. These bonds lack outstanding investment characteristics and may have speculative characteristics as well. |
| | |
| Ba | — | Bonds rated “Ba” are judged to have speculative elements; their future cannot be considered as well assured. Often the protection of interest and principal payments may be very moderate and therefore not well safeguarded during both good and bad times over the future. Uncertainty of position characterizes bonds in this class. |
| | |
| B | — | Bonds rated “B” generally lack characteristics of desirable investments. Assurance of interest and principal payments or of maintenance of other terms of the contract over any long period of time may be small. |
| | |
| Caa | — | Bonds rated “Caa” are of poor standing. These issues may be in default, or present elements of danger with respect to principal or interest. |
| | |
| Ca | — | Bonds rated “Ca” represent obligations which are speculative in a high degree. Such issues are often in default or have other marked shortcomings. |
| | |
| C | — | Bonds rated “C” are the lowest rated class of bonds, and issues so rated can be regarded as having extremely poor prospects of ever attaining any real investment standing. |
| | |
| NR | — | Indicates that the bond is not rated by Standard & Poor’s or Moody’s. |
26
STATEMENT OF ASSETS AND LIABILITIES
August 31, 2004 (unaudited)
| ASSETS: | | | |
| Investments, at value (Cost — $299,715,251) | $ | 315,520,669 | |
| Cash | | 356 | |
| Interest receivable | | 6,063,832 | |
| Receivable for securities sold | | 321,406 | |
| Prepaid expenses | | 19,624 | |
| Other receivables | | 159,235 | |
|
| Total Assets | | 322,085,122 | |
|
| LIABILITIES: | | | |
| Payable for securities purchased | | 322,065 | |
| Investment advisory fees payable | | 244,142 | |
| Dividends payable | | 213,672 | |
| Administration fees payable | | 54,253 | |
| Accrued expenses | | 114,148 | |
|
| Total Liabilities | | 948,280 | |
|
| Total Net Assets | $ | 321,136,842 | |
|
| NET ASSETS: | | | |
| Par value of capital shares | $ | 45,638 | |
| Capital paid in excess of par value | | 503,468,668 | |
| Overdistributed net investment income | | (1,746,405 | ) |
| Accumulated net realized loss from investment transactions | | | |
| and foreign currencies | | (196,436,477 | ) |
| Net unrealized appreciation of investments and foreign currencies | | 15,805,418 | |
|
| Total Net Assets | | | |
| (Equivalent to $7.04 per share on 45,637,929 shares of $0.001 | | | |
| par value outstanding; 500,000,000 shares authorized) | $ | 321,136,842 | |
|
| See Notes to Financial Statements. |
|
27 |
STATEMENT OF OPERATIONS
For the Six Months Ended August 31, 2004 (unaudited)
| INVESTMENT INCOME: | | | |
| Interest | $ | 14,333,859 | |
| Dividends | | 48,327 | |
|
| Total Investment Income | | 14,382,186 | |
|
| EXPENSES: | | | |
| Investment advisory fee (Note 2) | | 1,451,493 | |
| Administration fee (Note 2) | | 322,554 | |
| Shareholder communications | | 61,587 | |
| Audit and legal | | 40,252 | |
| Custody | | 30,328 | |
| Directors’ fees | | 28,558 | |
| Transfer agency services | | 24,551 | |
| Stock exchange listing fees | | 19,690 | |
| Other | | 8,430 | |
|
| Total Expenses | | 1,987,443 | |
|
| Net Investment Income | | 12,394,743 | |
|
| REALIZED AND UNREALIZED GAIN (LOSS) ON INVESTMENTS | | | |
| AND FOREIGN CURRENCIES (NOTE 3): | | | |
| Realized Gain From: | | | |
| Investment transactions | | 2,619,329 | |
| Foreign currency transactions | | 419,476 | |
|
| Net Realized Gain | | 3,038,805 | |
|
| Change in Net Unrealized Appreciation From: | | | |
| Investments | | (5,726,632 | ) |
| Foreign currencies | | (2,359 | ) |
|
| Decrease in Net Unrealized Appreciation | | (5,728,991 | ) |
|
| Net Loss on Investments and Foreign Currencies | | (2,690,186 | ) |
|
| Increase in Net Assets From Operations | $ | 9,704,557 | |
|
| See Notes to Financial Statements. |
| |
| 28 |
STATEMENTS OF CHANGES IN NET ASSETS
For the Six Months Ended August 31, 2004 (unaudited)
and the Year Ended February 29, 2004
| | August 31 | | February 29 | |
| |
| |
| |
| OPERATIONS: | | | | | | |
| Net investment income | $ | 12,394,743 | | $ | 26,364,692 | |
| Net realized gain (loss) | | 3,038,805 | | | (1,800,608 | ) |
| Increase (decrease) in net unrealized appreciation | | (5,728,991 | ) | | 41,844,273 | |
|
| Increase in Net Assets From Operations | | 9,704,557 | | | 66,408,357 | |
|
| DISTRIBUTIONS TO SHAREHOLDERS FROM: | | | | | | |
| Net investment income | | (13,691,379 | ) | | (27,038,516 | ) |
| Capital | | — | | | (1,870,208 | ) |
|
| Decrease in Net Assets From | | | | | | |
| Distributions to Shareholders | | (13,691,379 | ) | | (28,908,724 | ) |
|
| FUND SHARE TRANSACTIONS (NOTE 4): | | | | | | |
| Net asset value of shares issued for | | | | | | |
| reinvestment of dividends | | — | | | 3,567,971 | |
|
| Increase in Net Assets From | | | | | | |
| Fund Share Transactions | | — | | | 3,567,971 | |
|
| Increase (Decrease) in Net Assets | | (3,986,822 | ) | | 41,067,604 | |
| | | | | | | |
| NET ASSETS: | | | | | | |
| Beginning of period | | 325,123,664 | | | 284,056,060 | |
|
| End of period* | $ | 321,136,842 | | $ | 325,123,664 | |
|
| * Includes overdistributed net investment income of: | $ | (1,746,405 | ) | $ | (869,245 | ) |
|
| See Notes to Financial Statements. |
|
29 |
FINANCIAL HIGHLIGHTS
For a share of capital stock outstanding throughout each year ended February 28, unless otherwise noted:
| 2004(1) | | 2004(2)(3) | | 2003(3) | | 2002(3) | | 2001 | | 2000(4) | |
|
| Net Asset Value, | | | | | | | | | | | | | | | | | | |
| Beginning of Period | $ | 7.12 | | $ | 6.30 | | $ | 6.84 | | $ | 8.84 | | $ | 10.02 | | $ | 10.73 | |
|
| Income (Loss) From Operations: | | | | | | | | | | | | | | | | | | |
| Net investment income(5)(6) | | 0.28 | | | 0.58 | | | 0.65 | | | 0.82 | | | 0.97 | | | 1.00 | |
| Net realized and | | | | | | | | | | | | | | | | | | |
| unrealized gain (loss)(5) | | (0.06 | ) | | 0.88 | | | (0.51 | ) | | (1.96 | ) | | (1.18 | ) | | (0.76 | ) |
|
| Total Income (Loss) | | | | | | | | | | | | | | | | | | |
| From Operations | | 0.22 | | | 1.46 | | | 0.14 | | | (1.14 | ) | | (0.21 | ) | | 0.24 | |
|
| Gain From Repurchase of | | | | | | | | | | | | | | | | | | |
| Treasury Stock | | — | | | — | | | — | | | — | | | 0.01 | | | 0.03 | |
|
| Less Distributions From: | | | | | | | | | | | | | | | | | | |
| Net investment income | | (0.30 | ) | | (0.60 | ) | | (0.65 | ) | | (0.82 | ) | | (0.98 | ) | | (0.98 | ) |
| Capital | | — | | | (0.04 | ) | | (0.03 | ) | | (0.04 | ) | | — | | | — | |
|
| Total Distributions | | (0.30 | ) | | (0.64 | ) | | (0.68 | ) | | (0.86 | ) | | (0.98 | ) | | (0.98 | ) |
|
| Net Asset Value, | | | | | | | | | | | | | | | | | | |
| End of Period | $ | 7.04 | | $ | 7.12 | | $ | 6.30 | | $ | 6.84 | | $ | 8.84 | | $ | 10.02 | |
|
| Total Return, Based on | | | | | | | | | | | | | | | | | | |
| Market Price(7) | | 2.11 | %‡ | | 11.78 | % | | 7.86 | % | | (11.87 | )% | | 24.22 | % | | (13.40 | )% |
|
| Total Return, Based on | | | | | | | | | | | | | | | | | | |
| Net Asset Value(7) | | 3.48 | %‡ | | 23.98 | % | | 2.68 | % | | (13.32 | )% | | (1.06 | )% | | 3.89 | % |
|
| Net Assets, | | | | | | | | | | | | | | | | | | |
| End of Period (millions) | $ | 321 | | $ | 325 | | $ | 284 | | $ | 305 | | $ | 383 | | $ | 435 | |
|
| Ratios to Average Net Assets: | | | | | | | | | | | | | | | | | | |
| Expenses(6) | | 1.23 | %† | | 1.24 | % | | 1.26 | % | | 1.24 | % | | 1.20 | % | | 1.15 | % |
| Net investment income(5) | | 7.69 | † | | 8.45 | | | 10.27 | | | 10.86 | | | 10.59 | | | 9.62 | |
|
| Portfolio Turnover Rate | | 16 | % | | 31 | % | | 71 | % | | 81 | % | | 65 | % | | 80 | % |
|
| Market Price, End of Period | $ | 6.81 | | $ | 6.98 | | $ | 6.85 | | $ | 7.080 | | $ | 9.000 | | $ | 8.125 | |
|
| (1) | For the six months ended August 31, 2004 (unaudited). |
| (2) | For the year ended February 29, 2004. |
| (3) | Per share amounts have been calculated using the monthly average shares method. |
| (4) | For the year ended February 29, 2000. |
| (5) | Effective March 1, 2001, the Fund adopted a change in accounting method that requires the Fund to amortize premiums and accrete all discounts. Without the adoption of this change, for the year ended February 28, 2002, net investment income, net realized and unrealized loss and the ratio of net investment income to average net assets would have been $0.83, $1.97 and 10.96%, respectively. Per share information, ratios and supplemental data for the periods prior to March 1, 2001 have not been restated to reflect this change in presentation. |
| (6) | The investment adviser waived a portion of its fees for the year ended February 29, 2000. If such fees had not been waived, the per share decrease to net investment income and actual expense ratio would have been less than $0.01 and 1.18%, respectively. |
| (7) | The total return calculation assumes that dividends are reinvested in accordance with the Fund’s dividend reinvestment plan. Performance figures may reflect fee waivers and/or expense reimbursements. Past performance is no guarantee of future results. In the absence of fee waivers and/or expense reimbursements, the total return would be reduced. |
| ‡ | Total return is not annualized, as it may not be representative of the total return for the year. |
30
NOTES TO FINANCIAL STATEMENTS (UNAUDITED)
| 1. | Organization and Significant Accounting Policies |
Managed High Income Portfolio Inc. (“Fund”), a Maryland corporation, is registered under the Investment Company Act of 1940, as amended, as a non-diversified, closed-end management investment company.
The following are significant accounting policies consistently followed by the Fund and are in conformity with U.S. generally accepted accounting principles (“GAAP”). Estimates and assumptions are required to be made regarding assets, liabilities and changes in net assets resulting from operations when financial statements are prepared. Changes in the economic environment, financial markets and any other parameters used in determining these estimates could cause actual results to differ.
(a) Investment Valuation. Securities are valued at the mean between bid and asked prices provided by an independent pricing service that are based on transactions in municipal obligations, quotations from municipal bond dealers, market transactions in comparable securities and various relationships between securities. When market quotations or official closing prices are not readily available, or are determined not to reflect accurately fair value, such as when the value of a security has been significantly affected by events after the close of the exchange or market on which the security is principally traded (for example, a foreign exchange or market), but before the fund calculates its net asset value, the fund may value these investments at fair value as determined in accordance with the procedures approved by the fund’s Board. Securities maturing within 60 days or less are valued at cost plus accreted discount, or minus amortized premium, which approximates value.
(b) Repurchase Agreements. When entering into repurchase agreements, it is the Fund’s policy that a custodian takes possession of the underlying collateral securities, the value of which at least equals the principal amount of the repurchase transaction, including accrued interest. To the extent that any repurchase transaction exceeds one business day, the value of the collateral is marked-to-market to ensure the adequacy of the collateral. If the seller defaults and the value of the collateral declines or if bankruptcy proceedings are commenced with respect to the seller of the security, realization of the collateral by the Fund may be delayed or limited.
(c) Foreign Currency Translation. The accounting records of the Fund are maintained in U.S. dollars. All assets and liabilities denominated in foreign currencies are translated into U.S. dollars based on the rate of exchange of such currencies against U.S. dollars on the date of valuation. Purchases and sales of securities, and income and expenses are translated at the rate of exchange quoted on the respective date that such transactions are recorded. The Fund does not isolate that portion of the results of operations resulting from changes in foreign exchange rates on investments from the fluctuations arising from changes in
31
NOTES TO FINANCIAL STATEMENTS (UNAUDITED) (CONTINUED)
market prices of securities held at the date of the financial statements. Net unrealized appreciation or depreciation on investments and foreign currency translation arise from changes in the value of assets and liabilities, including investments in securities at the date of the financial statements, resulting from changes in the exchange rates and changes in market prices of securities held. Differences between income and expense amounts recorded and collected or paid are adjusted when reported by the custodian bank.
(d) Investment Transactions and Investment Income. Security transactions are accounted for on trade date. Gains or losses on the sale of securities are calculated by using the specific identification method. Interest income, adjusted for amortization of premium and accretion of discount, is recorded on an accrual basis.
(e) Off Balance Sheet Risk. The Fund invests in high-yield instruments that are subject to certain credit and market risks. The yields of high-yield debt obligations reflect, among other things, perceived credit risk. The Fund’s investment in securities rated below investment-grade typically involves risks not associated with higher rated securities including, among others, greater risk of timely and ultimate payment of interest and principal, greater market price volatility and less liquid secondary market trading. The Fund may enter into forward exchange contracts in order to hedge against foreign currency risk. These contracts are marked to market daily by recognizing the difference between the contract exchange rate and the current market rate as an unrealized gain or loss. Realized gains or losses are recognized when contracts are settled or offset by entering into another forward exchange contract.
(f) Dividends and Distributions to Shareholders. Dividends and distributions to shareholders are recorded on the ex-dividend date. The fund distributes dividends monthly and capital gains, if any, at least annually.
(g) Federal Income Taxes. The Fund intends to comply with the applicable provisions of the Internal Revenue Code of 1986, as amended, pertaining to regulated investment companies and to make distributions of taxable income and capital gains sufficient to relieve it from substantially all Federal income and excise taxes.
(h) Year End Tax Reclassifications. The character of income and gains to be distributed is determined in accordance with income tax regulations, which may differ from GAAP.
32
NOTES TO FINANCIAL STATEMENTS (UNAUDITED) (CONTINUED)
| 2. | Investment Advisory Agreement, Administration Agreement and Other Transactions |
Smith Barney Fund Management LLC (“SBFM”), an indirect wholly-owned subsidiary of Citigroup Inc. (“Citigroup”), acts as investment adviser to the Fund. The Fund pays SBFM an advisory fee calculated at an annual rate of 0.90% of the Fund’s average daily net assets. This fee is calculated daily and paid monthly.
SBFM also acts as the Fund’s administrator for which the Fund pays a fee calculated at an annual rate of 0.20% of the Fund’s average daily net assets. This fee is calculated daily and paid monthly.
All officers and one Director of the Fund are employees of Citigroup or its affiliates.
During the six months ended August 31, 2004, the aggregate cost of purchases and proceeds from sales of investments (including maturities of long-term investments, but excluding short-term investments) were:
|
| Purchases | $ | 47,147,932 | |
|
| Sales | | 54,898,918 | |
|
At August 31, 2004, the aggregate gross unrealized appreciation and depreciation of investments for Federal income tax purposes were substantially as follows:
|
| Gross unrealized appreciation | $ | 32,680,057 | |
| Gross unrealized depreciation | | (16,874,639 | ) |
|
| Net unrealized appreciation | $ | 15,805,418 | |
|
Capital stock transactions were as follows:
| | Six Months Ended
August 31, 2004
| | Year Ended
February 29, 2004
| |
|
|
| Shares | | Amount | Shares | | Amount |
|
| Shares issued on reinvestment | — | | — | | | 528,592 | | $ | 3,567,971 | |
|
On November 16, 1999, the Fund commenced a share repurchase plan. Since the inception of the repurchase plan, the Fund repurchased (and retired) 1,213,500 shares with a total cost of $10,210,959. For the six months ended August 31, 2004, the Fund did not repurchase shares.
33
NOTES TO FINANCIAL STATEMENTS (UNAUDITED) (CONTINUED)
In connection with an investigation previously disclosed by Citigroup, the Staff of the Securities and Exchange Commission (“SEC”) has notified Citigroup Asset Management (“CAM”), the Citigroup business unit that includes the funds’ investment manager and other investment advisory companies; Citicorp Trust Bank (“CTB”), an affiliate of CAM; Thomas W. Jones, the former CEO of CAM; and two other individuals, one of whom is an employee and the other of whom is a former employee of CAM, that the SEC Staff is considering recommending a civil injunctive action and/or an administrative proceeding against each of them relating to the creation and operation of an internal transfer agent unit to serve various CAM-managed funds.
In 1999, CTB entered the transfer agent business. CTB hired an unaffiliated subcontractor to perform some of the transfer agent services. The subcontractor, in exchange, had a separate agreement with CAM in 1998 that guaranteed investment management revenue to CAM and investment banking revenue to a CAM affiliate. The sub-contractor’s business was later taken over by PFPC Inc., and at that time the revenue guarantee was eliminated and a one-time payment was made by the subcontractor to a CAM affiliate.
CAM did not disclose the revenue guarantee when the boards of various CAM-managed funds hired CTB as transfer agent. Nor did CAM disclose to the boards of the various CAM-managed funds the one-time payment received by the CAM affiliate when it was made.
In addition, the SEC staff has indicated that it is considering recommending action based on the adequacy of the disclosure made to the fund boards that approved the transfer agency arrangement, CAM’s initiation and operation of, and compensation for, the transfer agent business and CAM’s retention of, and agreements with, the subcontractor.
Citigroup is cooperating fully in the investigation and will seek to resolve the matter in discussions with the SEC staff. Although there can be no assurance, Citigroup does not believe that this matter will have a material effect on the funds. As previously disclosed, CAM has already agreed to pay the applicable funds, primarily thru fee waivers, a total of approximately $17 million (plus interest) that is the amount of the revenue received by Citigroup relating to the revenue guarantee.
The fund did not implement the contractual arrangement described above and therefore will not receive any portion of such payment.
34
FINANCIAL DATA (UNAUDITED)
For a share of capital stock outstanding throughout each period:
Record
Date
| | Payable
Date
| | NYSE
Closing
Price† | | Net Asset
Value† | | Dividend
Paid
| | Dividend
Reinvestment
Price |
|
| Fiscal Year 2003 | | | | | | | | | | | | | | |
| 3/19/02 | | 3/22/02 | | $ | 7.35 | | $ | 6.93 | | $ | 0.063 | | $ | 6.98 |
| 4/23/02 | | 4/26/02 | | | 7.09 | | | 6.93 | | | 0.056 | | | 6.93 |
| 5/28/02 | | 5/31/02 | | | 6.97 | | | 6.82 | | | 0.056 | | | 6.82 |
| 6/25/02 | | 6/28/02 | | | 6.19 | | | 6.52 | | | 0.056 | | | 6.08 |
| 7/23/02 | | 7/26/02 | | | 5.51 | | | 6.14 | | | 0.056 | | | 5.69 |
| 8/27/02 | | 8/30/02 | | | 6.01 | | | 6.08 | | | 0.056 | | | 6.04 |
| 9/24/02 | | 9/27/02 | | | 5.73 | | | 5.95 | | | 0.056 | | | 5.88 |
| 10/22/02 | | 10/25/02 | | | 5.51 | | | 5.71 | | | 0.056 | | | 5.63 |
| 11/25/02 | | 11/29/02 | | | 6.12 | | | 6.10 | | | 0.056 | | | 6.10 |
| 12/23/02 | | 12/27/02 | | | 6.01 | | | 6.13 | | | 0.056 | | | 6.09 |
| 1/28/03 | | 1/31/03 | | | 6.50 | | | 6.24 | | | 0.056 | | | 6.24 |
| 2/25/03 | | 2/28/03 | | | 6.75 | | | 6.24 | | | 0.056 | | | 6.41 |
| Fiscal Year 2004 | | | | | | | | | | | | | | |
| 3/25/03 | | 3/28/03 | | | 6.78 | | | 6.34 | | | 0.056 | | | 6.44 |
| 4/22/03 | | 4/25/03 | | | 6.92 | | | 6.56 | | | 0.056 | | | 6.57 |
| 5/27/03 | | 5/30/03 | | | 7.27 | | | 6.71 | | | 0.056 | | | 6.91 |
| 6/24/03 | | 6/27/03 | | | 7.23 | | | 6.89 | | | 0.056 | | | 6.89 |
| 7/22/03 | | 7/25/03 | | | 6.87 | | | 6.86 | | | 0.056 | | | 6.86 |
| 8/26/03 | | 8/29/03 | | | 6.83 | | | 6.72 | | | 0.056 | | | 6.72 |
| 9/23/03 | | 9/26/03 | | | 6.80 | | | 6.87 | | | 0.050 | | | 6.85 |
| 10/28/03 | | 10/31/03 | | | 6.94 | | | 6.94 | | | 0.050 | | | 6.94 |
| 11/24/03 | | 11/28/03 | | | 6.90 | | | 6.98 | | | 0.050 | | | 6.97 |
| 12/22/03 | | 12/26/03 | | | 6.94 | | | 7.11 | | | 0.050 | | | 7.00 |
| 1/27/04 | | 1/30/04 | | | 7.07 | | | 7.24 | | | 0.050 | | | 7.10 |
| 2/24/04 | | 2/27/04 | | | 6.90 | | | 7.10 | | | 0.050 | | | 7.00 |
| Fiscal Year 2005 | | | | | | | | | | | | | | |
| 3/23/04 | | 3/26/04 | | | 6.89 | | | 7.09 | | | 0.050 | | | 6.95 |
| 4/27/04 | | 4/30/04 | | | 6.38 | | | 7.07 | | | 0.050 | | | 6.48 |
| 5/25/04 | | 5/28/04 | | | 6.33 | | | 6.87 | | | 0.050 | | | 6.42 |
| 6/22/04 | | 6/25/04 | | | 6.25 | | | 6.93 | | | 0.050 | | | 6.34 |
| 7/27/04 | | 7/30/04 | | | 6.45 | | | 6.94 | | | 0.050 | | | 6.50 |
| 8/24/04 | | 8/27/04 | | | 6.65 | | | 7.00 | | | 0.050 | | | 6.77 |
|
35
ADDITIONAL SHAREHOLDER INFORMATION (UNAUDITED)
Result of Annual Meeting of Shareholders
The Annual Meeting of Shareholders of Managed High Income Fund Inc. was held on June 17, 2004, for the purpose of considering and voting upon the election of Directors. The following table provides information concerning the matter voted upon at the Meeting:
1. Election of Directors*
| Nominees | Common
Shares Voted
For Election | | Common
Shares
Withheld | |
|
|
| |
| |
| | | | | |
| | Dwight B. Crane | 41,782,979 | | 318,414 | |
| | | | | |
| Paolo Cucchi | 41,771,716 | | 329,677 | |
| | | | | |
| William R. Hutchinson | 41,778,525 | | 322,868 | |
| * | The following Directors, representing the balance of the Board of Directors, continue to serve as Directors: Allan J. Bloostein, Robert Frankel, R. Jay Gerken, Paul Hardin and George M. Pavia. |
36
DIVIDEND REINVESTMENT PLAN (UNAUDITED)
Under the Fund’s Dividend Reinvestment Plan (“Plan”), a shareholder whose shares of Common Stock are registered in his own name will have all distributions from the Fund reinvested automatically by PFPC Inc. (“PFPC”), as agent under the Plan, unless the shareholder elects to receive cash. Distributions with respect to shares registered in the name of a broker-dealer or other nominee (that is, in “street name”) will be reinvested by the broker or nominee in additional shares under the Plan, unless the service is not provided by the broker or nominee or the shareholder elects to receive distributions in cash. Investors who own Common Stock registered in street name should consult their broker-dealers for details regarding reinvestment. All distributions to Fund shareholders who do not participate in the Plan will be paid by check mailed directly to the record holder by or under the direction of PFPC as dividend-paying agent.
If the Fund declares a dividend or capital gains distribution payable either in shares of Common Stock or in cash, shareholders who are not Plan participants will receive cash, and Plan participants will receive the equivalent amount in shares of Common Stock. When the market price of the Common Stock is equal to or exceeds the net asset value per share of the Common Stock on the Valuation Date (as defined below), Plan participants will be issued shares of Common Stock valued at the net asset value most recently determined or, if net asset value is less than 95% of the then current market price of the Common Stock, then at 95% of the market value. The Valuation Date is the dividend or capital gains distribution payment date or, if that date is not a New York Stock Exchange (“NYSE”) trading day, the immediately preceding trading day.
If the market price of the Common Stock is less than the net asset value of the Common Stock, a broker-dealer not affiliated with Citigroup Global Markets Inc., as purchasing agent for Plan participants (“Purchasing Agent”), will buy Common Stock in the open market, on the NYSE or elsewhere, for the participants’ accounts (effective June 1, 1996, the Plan’s Valuation Date changed from the payable date to the record date). If, following the commencement of the purchases and before the Purchasing Agent has completed its purchases, the market price exceeds the net asset value of the Common Stock, the average per share purchase price paid by the Purchasing Agent may exceed the net asset value of the Common Stock, resulting in the acquisition of fewer shares than if the dividend or capital gains distribution had been paid in Common Stock issued by the Fund at net asset value. Additionally, if the market price exceeds the net asset value of shares before the Purchasing Agent has completed its purchases, the Purchasing Agent is permitted to cease purchasing shares and the Fund may issue the remaining shares at a price equal to the greater of (a) net asset value or (b) 95% of the then current market price. In a case where the Purchasing Agent has terminated open market purchases and the Fund has issued the remaining shares, the number of shares received by the participant in respect of the cash dividend or distribution will be based on the
37
DIVIDEND REINVESTMENT PLAN (UNAUDITED) (CONTINUED)
weighted average of prices paid for shares purchased in the open market and the price at which the Fund issues the remaining shares. PFPC will apply all cash received as a dividend or capital gains distribution to purchase Common Stock on the open market as soon as practicable after the payable date of the dividend or capital gains distribution, but in no event later than 30 days after that date, except when necessary to comply with applicable provisions of the federal securities laws.
PFPC will maintain all shareholder accounts in the Plan and will furnish written confirmations of all transactions in each account, including information needed by a shareholder for personal and tax records. The automatic reinvestment of dividends and capital gains distributions will not relieve Plan participants of any income tax that may be payable on the dividends or capital gains distributions. Common Stock in the account of each Plan participant will be held by PFPC on behalf of the Plan participant, and each shareholder’s proxy will include those shares purchased pursuant to the Plan.
Plan participants are subject to no charge for reinvesting dividends and capital gains distributions. PFPC’s fees for handling the reinvestment of dividends and capital gains distributions will be paid by the Fund. No brokerage charges apply with respect to shares of Common Stock issued directly by the Fund as a result of dividends or capital gains distributions payable either in Common Stock or in cash. Each Plan participant will, however, bear a proportionate share of brokerage commissions incurred with respect to open market purchases made in connection with the reinvestment of dividends or capital gains distributions.
Experience under the Plan may indicate that changes to it are desirable. The Fund reserves the right to amend or terminate the Plan as applied to any dividend or capital gains distribution paid subsequent to written notice of the change sent to participants at least 30 days before the record date for the dividend or capital gains distribution. The Plan also may be amended or terminated by PFPC, with the Fund’s prior written consent, on at least 30 days’ written notice to Plan participants. All correspondence concerning the Plan should be directed by mail to PFPC Inc., P.O. Box 43027, Providence, Rhode Island 02940-3027 or by telephone at 1 (800) 331-1710.
Notice is hereby given in accordance with Section 23(c) of the Investment Company Act of 1940, as amended, that from time to time the Fund may purchase shares of its common stock in the open market.
38
(This page intentionally left blank.)
(This page intentionally left blank.)

Directors
Allan J. Bloostein
Dwight B. Crane
Paolo M. Cucchi
Robert A. Frankel
R. Jay Gerken, CFA
Chairman
Paul Hardin
William R. Hutchinson
George M. Pavia
Officers
R. Jay Gerken, CFA
President and
Chief Executive Officer
Andrew B. Shoup
Senior Vice President and
Chief Administrative Officer
James M. Giallanza, CPA
Treasurer and
Chief Financial Officer
Beth A. Semmel, CFA
Vice President and
Investment Officer
Peter J. Wilby, CFA
Vice President and
Investment Officer
Andrew Beagley
Chief Compliance Officer
Kaprel Ozsolak
Controller
| Officers (continued)
Robert I. Frenkel
Secretary and
Chief Legal Officer
Investment Adviser and
Administrator
Smith Barney Fund Management LLC
399 Park Avenue
New York, New York 10022
Transfer Agent
PFPC Inc.
P.O. Box 43027
Providence, Rhode Island 02940-3027
Custodian
State Street Bank and Trust Company
225 Franklin Street
Boston, Massachusetts 02110
|
This report is intended only for the shareholders of Managed High Income Portfolio Inc. It is not a prospectus, circular or representation intended for use in the purchase or sale of shares of the Fund or of any securities mentioned in the report.
The Fund files its complete schedule of portfolio holdings with Securities and Exchange Commission for the first and third quarters of each fiscal year on Form N-Q. The Fund’s Forms N-Q are available on the Commission’s website at www.sec.gov. The Fund’s Forms N-Q may be reviewed and copied at the Commission’s Public Reference Room in Washington, D.C., and information on the operation of the Public Reference Room may be obtained by calling 1-800-SEC-0330. To obtain information on Form N-Q from the Fund, shareholders can call 1-800-451-2010.
Information on how the fund voted proxies relating to portfolio securities during the 12-month period ended June 30, 2004 and a description of the policies and procedures that the fund uses to determine how to vote proxies relating to portfolio securities is available (1) without charge, upon request, by calling 1-800-451-2010, (2) on the fund’s website at www.citigroupAM.com and (3) on the SEC’s website at www.sec.gov.
FD0777 10/04 04-7253
| ITEM 3. | AUDIT COMMITTEE FINANCIAL EXPERT. |
| ITEM 4. | PRINCIPAL ACCOUNTANT FEES AND SERVICES. |
| ITEM 5. | AUDIT COMMITTEE OF LISTED REGISTRANTS. |
| ITEM 7. | DISCLOSURE OF PROXY VOTING POLICIES AND PROCEDURES FOR CLOSED-END MANAGEMENT INVESTMENT COMPANIES. |
| | The Board of Directors of the Fund has delegated the authority to develop policies and procedures relating to proxy voting to the Manager. The Manager is part of Citigroup Asset Management (“CAM”), a group of investment adviser affiliates of Citigroup, Inc. (“Citigroup”). Along with the other investment advisers that comprise CAM, the Manager has adopted a set of proxy voting policies and procedures (the “Policies”) to ensure that the Manager votes proxies relating to equity securities in the best interest of clients. |
| | In voting proxies, the Manager is guided by general fiduciary principles and seeks to act prudently and solely in the best interest of clients. The Manager attempts to consider all factors that could affect the value of the investment and will vote proxies in the manner that it believes will be consistent with efforts to maximize shareholder values. The Manager may utilize an external service provider to provide it with information and/or a recommendation with regard to proxy votes. However, such recommendations do not relieve the Manager of its responsibility for the proxy vote. |
| | In the case of a proxy issue for which there is a stated position in the Policies, CAM generally votes in accordance with such stated position. In the case of a proxy issue for which there is a list of factors set forth in the Policies that CAM considers in voting on such issue, CAM votes on a case-by-case basis in accordance with the general principles set forth above and considering such enumerated factors. In the case of a proxy issue for which there is no stated position or list of factors that CAM considers in voting on such issue, CAM votes on a case-by-case basis in accordance with the general principles set forth above. Issues for which there is a stated position set forth in the Policies or for which there is a list of factors set forth in the Policies that CAM considers in voting on such issues fall into a variety of categories, including election of directors, ratification of auditors, proxy and tender offer defenses, capital structure issues, executive and director |
| |
compensation, mergers and corporate restructurings, and social and environmental issues. The stated position on an issue set forth in the Policies can always be superseded, subject to the duty to act solely in the best interest of the beneficial owners of accounts, by the investment management professionals responsible for the account whose shares are being voted. Issues applicable to a particular industry may cause CAM to abandon a policy that would have otherwise applied to issuers generally. As a result of the independent investment advisory services provided by distinct CAM business units, there may be occasions when different business units or different portfolio managers within the same business unit vote differently on the same issue. |
| | In furtherance of the Manager’s goal to vote proxies in the best interest of clients, the Manager follows procedures designed to identify and address material conflicts that may arise between the Manager’s interests and those of its clients before voting proxies on behalf of such clients. To seek to identify conflicts of interest, CAM periodically notifies CAM employees (including employees of the Manager) in writing that they are under an obligation (i) to be aware of the potential for conflicts of interest with respect to voting proxies on behalf of client accounts both as a result of their personal relationships and due to special circumstances that may arise during the conduct of CAM’s and the Manager’s business, and (ii) to bring conflicts of interest of which they become aware to the attention of compliance personnel. The Manager also maintains and considers a list of significant relationships that could present a conflict of interest for the Manager in voting proxies. The Manager is also sensitive to the fact that a significant, publicized relationship between an issuer and a non-CAM affiliate might appear to the public to influence the manner in which the Manager decides to vote a proxy with respect to such issuer. Absent special circumstances or a significant, publicized non-CAM affiliate relationship that CAM or the Manager for prudential reasons treats as a potential conflict of interest because such relationship might appear to the public to influence the manner in which the Manager decides to vote a proxy, the Manager generally takes the position that non-CAM relationships between Citigroup and an issuer (e.g. investment banking or banking) do not present a conflict of interest for the Manager in voting proxies with respect to such issuer. Such position is based on the fact that the Manager is operated as an independent business unit from other Citigroup business units as well as on the existence of information barriers between the Manager and certain other Citigroup business units. |
| | CAM maintains a Proxy Voting Committee, of which the Manager personnel are members, to review and address conflicts of interest brought to its attention by compliance personnel. A proxy issue that will be voted in accordance with a stated position on an issue or in accordance with the recommendation of an independent third party is not brought to the attention of the Proxy Voting Committee for a conflict of interest review because the Manager’s position is that to the extent a conflict of interest issue exists, it is resolved by voting in accordance with a pre-determined policy or in accordance with the recommendation of an independent third party. With respect to a conflict of interest brought to its attention, the |
| | Proxy Voting Committee first determines whether such conflict of interest is material. A conflict of interest is considered material to the extent that it is determined that such conflict is likely to influence, or appear to influence, the Manager’s decision-making in voting proxies. If it is determined by the Proxy Voting Committee that a conflict of interest is not material, the Manager may vote proxies notwithstanding the existence of the conflict. |
| | If it is determined by the Proxy Voting Committee that a conflict of interest is material, the Proxy Voting Committee is responsible for determining an appropriate method to resolve such conflict of interest before the proxy affected by the conflict of interest is voted. Such determination is based on the particular facts and circumstances, including the importance of the proxy issue and the nature of the conflict of interest. Methods of resolving a material conflict of interest may include, but are not limited to, disclosing the conflict to clients and obtaining their consent before voting, or suggesting to clients that they engage another party to vote the proxy on their behalf. |
| ITEM 9. | SUBMISSION OF MATTERS TO A VOTE OF SECURITY HOLDERS.
Not applicable. |
| ITEM 10. | CONTROLS AND PROCEDURES. |
| | (a) | The registrant’s principal executive officer and principal financial officer have concluded that the registrant’s disclosure controls and procedures (as defined in Rule 30a- 3(c) under the Investment Company Act of 1940, as amended (the “1940 Act”)) are effective as of a date within 90 days of the filing date of this report that includes the disclosure required by this paragraph, based on their evaluation of the disclosure controls and procedures required by Rule 30a-3(b) under the 1940 Act and 15d-15(b) under the Securities Exchange Act of 1934. |
| | (b) | There were no changes in the registrant’s internal control over financial reporting (as defined in Rule 30a-3(d) under the 1940 Act) that occurred during the registrant’s last fiscal half-year (the registrant’s second fiscal half-year in the case of an annual report) that have materially affected, or are likely to materially affect the registrant’s internal control over financial reporting. |
| Exhibit 99.CERT | Certifications pursuant to section 302 of the Sarbanes-Oxley Act of 2002 |
| Exhibit 99.906CERT | Certifications pursuant to Section 906 of the Sarbanes-Oxley Act of 2002 |
SIGNATURES
Pursuant to the requirements of the Securities Exchange Act of 1934 and the Investment Company Act of 1940, the registrant has duly caused this Report to be signed on its behalf by the undersigned, there unto duly authorized.
Managed High Income Portfolio Inc.
| |
|---|
| By: | /s/ R. Jay Gerken
R. Jay Gerken
Chief Executive Officer of
Managed High Income Portfolio Inc. |
Date: | November 10, 2004 |
Pursuant to the requirements of the Securities Exchange Act of 1934 and the Investment Company Act of 1940, this report has been signed below by the following persons on behalf of the registrant and in the capacities and on the dates indicated.
| |
|---|
| By: | /s/ R. Jay Gerken
R. Jay Gerken
Chief Executive Officer of
Managed High Income Portfolio Inc. |
Date: | November 10, 2004 |
| | |
|---|
| By: | /s/ James M. Giallanza
(James M. Giallanza)
Chief Financial Officer of
Managed High Income Portfolio Inc. |
Date: | November 10, 2004 |