UNITED STATES
SECURITIES AND EXCHANGE COMMISSION
Washington, D.C. 20549
FORM N-CSR
CERTIFIED SHAREHOLDER REPORT OF REGISTERED
MANAGEMENT INVESTMENT COMPANIES
Investment Company Act file number 811-07396
Western Asset Managed High Income Fund Inc.
(Exact name of registrant as specified in charter)
620 Eighth Avenue, 49th Floor, New York, NY 10018
(Address of principal executive offices) (Zip code)
Robert I. Frenkel, Esq.
Legg Mason & Co., LLC
100 First Stamford Place,
Stamford, CT 06902
(Name and address of agent for service)
Registrant’s telephone number, including area code: (888) 777-0102
Date of fiscal year end: February 28
Date of reporting period: August 31, 2015
| ITEM 1. | REPORT TO STOCKHOLDERS. |
The Semi-Annual Report to Stockholders is filed herewith.

| | |
| Semi-Annual Report | | August 31, 2015 |
WESTERN ASSET
MANAGED HIGH INCOME FUND INC. (MHY)

|
| INVESTMENT PRODUCTS: NOT FDIC INSURED • NO BANK GUARANTEE • MAY LOSE VALUE |
Fund objectives
The Fund’s primary investment objective is high current income. Capital appreciation is a secondary objective.
The Fund invests primarily in high-yield corporate bonds, debentures and notes.
Letter from the chairman

Dear Shareholder,
We are pleased to provide the semi-annual report of Western Asset Managed High Income Fund Inc. for the six-month reporting period ended August 31, 2015. Please read on for Fund performance information and a detailed look at prevailing economic and market conditions during the Fund’s reporting period.
I am pleased to introduce myself as the new Chairman, President and Chief Executive Officer of the Fund, succeeding Kenneth D. Fuller. I am honored to have been appointed to my new role. During my 27 year career with Legg Mason, I have seen the investment management industry evolve and expand. Throughout these changes, maintaining an unwavering focus on our shareholders and their needs has remained paramount.
As always, we remain committed to providing you with excellent service and a full spectrum of investment choices. We also remain committed to supplementing the support you receive from your financial advisor. One way we accomplish this is through our website, www.lmcef.com. Here you can gain immediate access to market and investment information, including:
| • | | Fund prices and performance, |
| • | | Market insights and commentaries from our portfolio managers, and |
| • | | A host of educational resources. |
We look forward to helping you meet your financial goals.
Sincerely,

Jane Trust, CFA
Chairman, President and Chief Executive Officer
September 25, 2015
| | |
| II | | Western Asset Managed High Income Fund Inc. |
Investment commentary
Economic review
After a tepid start, the pace of U.S. economic activity improved during the six months ended August 31, 2015 (the “reporting period”). Looking back, the U.S. Department of Commerce’s revised figures showed that fourth quarter 2014 U.S. gross domestic product (“GDP”)i growth was 2.1%. First quarter 2015 GDP growth then moderated to 0.6%. This was attributed to a number of factors, including a deceleration in personal consumption expenditures (“PCE”), along with negative contributions from exports, nonresidential fixed investment, and state and local government spending. However, the economy then gained some traction, as the U.S. Department of Commerce’s final reading for second quarter 2015 GDP growth — released after the reporting period ended — was 3.9%. The upturn was driven by increasing exports, accelerating PCE, declining imports, expanding state and local government spending, and rising nonresidential fixed investment.
The labor market was a tailwind for the economy during the reporting period. When the period began, unemployment was 5.5%, as reported by the U.S. Department of Labor. By August 2015, unemployment was 5.1%, its lowest level since April 2008.
| | |
| Western Asset Managed High Income Fund Inc. | | III |
Investment commentary (cont’d)
Market review
Q. How did the Federal Reserve Board (“Fed”)ii respond to the economic environment?
A. The Fed took a number of actions as it sought to meet its dual mandate of fostering maximum employment and price stability. As it has since December 2008, the Fed maintained the federal funds rateiii at a historically low range between zero and 0.25% during the reporting period. At its meeting that concluded on July 29, 2015, the Fed said “The Committee currently anticipates that, even after employment and inflation are near mandate-consistent levels, economic conditions may, for some time, warrant keeping the target federal funds rate below levels the Committee views as normal in the longer run.” Finally, at its meeting that ended on September 17, 2015, after the close of the reporting period, the Fed decided to maintain the target between zero and 0.25%.
Q. Did Treasury yields trend higher or lower during the six months ended August 31, 2015?
A. Both short- and long-term Treasury yields moved higher during the reporting period. When the period began, the yield on the two-year Treasury note was 0.63%. Its low for the period was 0.49% on April 3, 2015 and it peaked at 0.75% on June 10, 2015 and again on July 22, 2015. When the reporting period ended the yield on the two-year Treasury note was 0.74%. The yield on the ten-year Treasury note began the period at 2.00%. Its low for the period of 1.85% occurred on April 3, 2015. Its peak of 2.50% was on June 10, 2015 and the ten-year Treasury note concluded the reporting period at 2.21%.
Q. What factors impacted the spread sectors (non-Treasuries) during the reporting period?
A. The spread sectors posted mixed results during the reporting period. Due to weakness toward the end of the reporting period, high-yield and investment grade corporate bonds were among the weakest performers over the six months ended August 31, 2015. In contrast, sectors that are generally less sensitive to rising interest rates, such as asset-backed securities, posted positive results. Performance fluctuated with investor sentiment given the uncertainties regarding future Fed monetary policy, along with concerns over global growth and geopolitical issues. The broad U.S. bond market, as measured by the Barclays U.S. Aggregate Indexiv, returned -0.68% during the six months ended August 31, 2015.
Q. How did the high-yield bond market perform over the six months ended August 31, 2015?
A. The U.S. high-yield bond market, as measured by the Barclays U.S. Corporate High Yield — 2% Issuer Cap Indexv, returned -2.85% for the six months ended August 31, 2015. High yield bonds were volatile during the reporting period. While the underlying fundamentals in the high-yield market remained generally solid and default rates were well below their long-term average, the asset class faltered during the second half of the reporting period as investor risk aversion increased.
Q. How did the emerging markets debt asset class perform over the reporting period?
A. The JPMorgan Emerging Markets Bond Index Global (“EMBI Global”)vi returned -0.51% during the six months ended
| | |
| IV | | Western Asset Managed High Income Fund Inc. |
August 31, 2015. The asset class rose during the first two months of the reporting period — and again in July 2015 — but those gains were offset by weakness in May, June and August 2015. These setbacks were triggered by a number of factors, including concerns over economic growth in China, expectations for future Fed rate hikes and geopolitical issues.
Performance review
For the six months ended August 31, 2015, Western Asset Managed High Income Fund Inc. returned -3.22% based on its net asset value (“NAV”)vii and -9.85% based on its New York Stock Exchange (“NYSE”) market price per share. The Fund’s unmanaged benchmark, the Barclays U.S. Corporate High Yield — 2% Issuer Cap Index, returned -2.85% over the same time frame. The Lipper High Yield Closed-End Funds Category Averageviii returned -3.10% for the same period. Please note that Lipper performance returns are based on each fund’s NAV.
During this six-month period, the Fund made distributions to shareholders totaling $0.21 per share. As of August 31, 2015, the Fund estimates that all of the distributions were sourced from net investment income.* The performance table shows the Fund’s six-month total return based on its NAV and market price as of August 31, 2015. Past performance is no guarantee of future results.
| | | | |
Performance Snapshot as of August 31, 2015
(unaudited) | |
| Price Per Share | | 6-Month
Total Return** | |
| $5.48 (NAV) | | | -3.22 | %† |
| $4.55 (Market Price) | | | -9.85 | %‡ |
All figures represent past performance and are not a guarantee of future results. Performance figures for periods shorter than one year represent cumulative figures and are not annualized.
** Total returns are based on changes in NAV or market price, respectively. Returns reflect the deduction of all Fund expenses, including management fees, operating expenses, and other Fund expenses. Returns do not reflect the deduction of brokerage commissions or taxes that investors may pay on distributions or the sale of shares.
† Total return assumes the reinvestment of all distributions, including returns of capital, if any, at NAV.
‡ Total return assumes the reinvestment of all distributions, including returns of capital, if any, in additional shares in accordance with the Fund’s Dividend Reinvestment Plan.
Looking for additional information?
The Fund is traded under the symbol “MHY” and its closing market price is available in most newspapers under the NYSE listings. The daily NAV is available on-line under the symbol “XMHYX” on most financial websites. Barron’s and the Wall Street Journal’s Monday edition both carry closed-end fund tables that provide additional
| * | This estimate is not for tax purposes. The Fund will issue a Form 1099 with final composition of the distributions for tax purposes after year-end. A return of capital is not taxable and results in a reduction in the tax basis of a shareholder’s investment. For more information about a distribution’s composition, please refer to the Fund’s distribution press release or, if applicable, the Section 19 notice located in the press release section of our website, www.lmcef.com. |
| | |
| Western Asset Managed High Income Fund Inc. | | V |
Investment commentary (cont’d)
information. In addition, the Fund issues a quarterly press release that can be found on most major financial websites as well as www.lmcef.com.
In a continuing effort to provide information concerning the Fund, shareholders may call 1-888-777-0102 (toll free), Monday through Friday from 8:00 a.m. to 5:30 p.m. Eastern Time, for the Fund’s current NAV, market price and other information.
As always, thank you for your confidence in our stewardship of your assets.
Sincerely,
Jane Trust, CFA
Chairman, President and Chief Executive Officer
September 25, 2015
RISKS: The Fund’s investments are subject to liquidity risk, credit risk, inflation risk and interest rate risk. As interest rates rise, bond prices fall, reducing the value of the fixed income securities held by the Fund. The Fund invests in high-yield bonds, or “junk bonds,” which are subject to additional risks such as the increased risk of default and greater volatility because of the lower credit quality of the issues. The Fund may use derivatives, such as options and futures, which can be illiquid, may disproportionately increase losses, and have a potentially large impact on Fund performance. In addition, the Fund may invest in foreign securities, which are subject to certain risks of overseas investing including currency fluctuations and social, political and economic uncertainties, which could result in significant market fluctuations. These risks are magnified in emerging markets.
All investments are subject to risk including the possible loss of principal. Past performance is no guarantee of future results. All index performance reflects no deduction for fees, expenses or taxes. Please note that an investor cannot invest directly in an index.
The information provided is not intended to be a forecast of future events, a guarantee of future results or investment advice. Views expressed may differ from those of the firm as a whole.
| | |
| VI | | Western Asset Managed High Income Fund Inc. |
| i | Gross domestic product (“GDP”) is the market value of all final goods and services produced within a country in a given period of time. |
| ii | The Federal Reserve Board (“Fed”) is responsible for the formulation of policies designed to promote economic growth, full employment, stable prices and a sustainable pattern of international trade and payments. |
| iii | The federal funds rate is the rate charged by one depository institution on an overnight sale of immediately available funds (balances at the Federal Reserve) to another depository institution; the rate may vary from depository institution to depository institution and from day to day. |
| iv | The Barclays U.S. Aggregate Index is a broad-based bond index comprised of government, corporate, mortgage- and asset-backed issues, rated investment grade or higher, and having at least one year to maturity. |
| v | The Barclays U.S. Corporate High Yield — 2% Issuer Cap Index is an index of the 2% Issuer Cap component of the Barclays U.S. Corporate High Yield Index, which covers the U.S. dollar-denominated, non-investment grade, fixed-rate, taxable corporate bond market. |
| vi | The JPMorgan Emerging Markets Bond Index Global (“EMBI Global”) tracks total returns for U.S. dollar-denominated debt instruments issued by emerging market sovereign and quasi-sovereign entities: Brady bonds, loans, Eurobonds and local market instruments. |
| vii | Net asset value (“NAV”) is calculated by subtracting total liabilities, including liabilities associated with financial leverage (if any) from the closing value of all securities held by the Fund (plus all other assets) and dividing the result (total net assets) by the total number of the common shares outstanding. The NAV fluctuates with changes in the market prices of securities in which the Fund has invested. However, the price at which an investor may buy or sell shares of the Fund is the Fund’s market price as determined by supply of and demand for the Fund’s shares. |
| viii | Lipper, Inc., a wholly-owned subsidiary of Reuters, provides independent insight on global collective investments. Returns are based on the six-month period ended August 31, 2015, including the reinvestment of all distributions, including returns of capital, if any, calculated among the 8 funds in the Fund’s Lipper category. |
| | |
| Western Asset Managed High Income Fund Inc. | | VII |
Fund at a glance† (unaudited)
Investment breakdown (%) as a percent of total investments
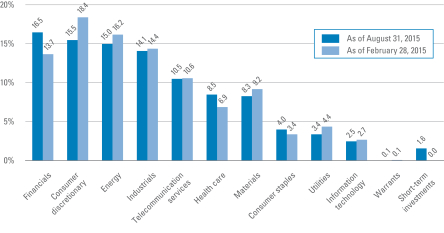
| † | The bar graph above represents the composition of the Fund’s investments as of August 31, 2015 and February 28, 2015 and does not include derivatives, such as futures contracts and forward foreign currency contracts. The Fund is actively managed. As a result, the composition of the Fund’s investments is subject to change at any time. |
| | |
| Western Asset Managed High Income Fund Inc. 2015 Semi-Annual Report | | 1 |
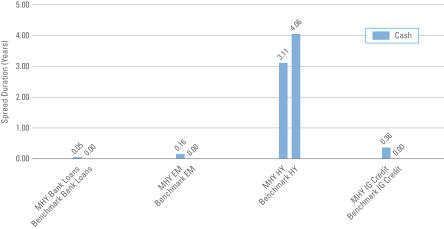
Spread duration (unaudited)
Economic exposure — August 31, 2015
| | |
Total Spread Duration |
| MHY | | — 3.68 years |
| Benchmark | | — 4.06 years |
Spread duration measures the sensitivity to changes in spreads. The spread over Treasuries is the annual risk-premium demanded by investors to hold non-Treasury securities. Spread duration is quantified as the % change in price resulting from a 100 basis points change in spreads. For a security with positive spread duration, an increase in spreads would result in a price decline and a decline in spreads would result in a price increase. This chart highlights the market sector exposure of the Fund’s sectors relative to the selected benchmark sectors as of the end of the reporting period.
| | |
| Benchmark | | — Barclays U.S. Corporate High Yield — 2% Issuer Cap Index |
| EM | | — Emerging Markets |
| HY | | — High Yield |
| IG Credit | | — Investment Grade Credit |
| MHY | | — Western Asset Managed High Income Fund Inc. |
| | |
| 2 | | Western Asset Managed High Income Fund Inc. 2015 Semi-Annual Report |
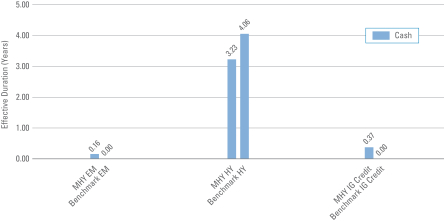
Effective duration (unaudited)
Interest rate exposure — August 31, 2015
| | |
Total Effective Duration |
| MHY | | — 3.76 years |
| Benchmark | | — 4.06 years |
Effective duration measures the sensitivity to changes in relevant interest rates. Effective duration is quantified as the % change in price resulting from a 100 basis points change in interest rates. For a security with positive effective duration, an increase in interest rates would result in a price decline and a decline in interest rates would result in a price increase. This chart highlights the interest rate exposure of the Fund’s sectors relative to the selected benchmark sectors as of the end of the reporting period.
| | |
| Benchmark | | — Barclays U.S. Corporate High Yield — 2% Issuer Cap Index |
| EM | | — Emerging Markets |
| HY | | — High Yield |
| IG Credit | | — Investment Grade Credit |
| MHY | | — Western Asset Managed High Income Fund Inc. |
| | |
| Western Asset Managed High Income Fund Inc. 2015 Semi-Annual Report | | 3 |
Schedule of investments (unaudited)
August 31, 2015
Western Asset Managed High Income Fund Inc.
| | | | | | | | | | | | | | | | |
| Security | | Rate | | | Maturity
Date | | | Face
Amount† | | | Value | |
| Corporate Bonds & Notes — 87.1% | | | | | | | | | | | | | | | | |
| Consumer Discretionary — 13.8% | | | | | | | | | | | | | | | | |
Automobiles — 0.3% | | | | | | | | | | | | | | | | |
Chrysler Group LLC/CG Co.-Issuer Inc., Secured Notes | | | 8.250 | % | | | 6/15/21 | | | | 690,000 | | | $ | 741,888 | |
Diversified Consumer Services — 0.5% | | | | | | | | | | | | | | | | |
Service Corp. International, Senior Notes | | | 7.500 | % | | | 4/1/27 | | | | 695,000 | | | | 805,866 | |
StoneMor Partners LP/Cornerstone Family Services of WV, Senior Bonds | | | 7.875 | % | | | 6/1/21 | | | | 500,000 | | | | 517,500 | |
Total Diversified Consumer Services | | | | | | | | | | | | | | | 1,323,366 | |
Hotels, Restaurants & Leisure — 2.8% | | | | | | | | | | | | | | | | |
Bossier Casino Venture Holdco Inc., Senior Secured Bonds | | | 14.000 | % | | | 2/9/18 | | | | 659,000 | | | | 620,448 | (a)(b)(c)(d) |
Carrols Restaurant Group Inc., Secured Notes | | | 8.000 | % | | | 5/1/22 | | | | 540,000 | | | | 571,050 | |
CCM Merger Inc., Senior Notes | | | 9.125 | % | | | 5/1/19 | | | | 930,000 | | | | 995,100 | (a) |
CEC Entertainment Inc., Senior Notes | | | 8.000 | % | | | 2/15/22 | | | | 1,140,000 | | | | 1,145,700 | |
Downstream Development Authority of the Quapaw Tribe of Oklahoma, Senior Secured Notes | | | 10.500 | % | | | 7/1/19 | | | | 720,000 | | | | 743,400 | (a) |
Fontainebleau Las Vegas Holdings LLC, Senior Secured Notes | | | 10.250 | % | | | 6/15/15 | | | | 270,000 | | | | 1,364 | *(a)(e) |
Greektown Holdings LLC/Greektown Mothership Corp., Senior Secured Notes | | | 8.875 | % | | | 3/15/19 | | | | 650,000 | | | | 682,500 | (a) |
Landry’s Holdings II Inc., Senior Notes | | | 10.250 | % | | | 1/1/18 | | | | 400,000 | | | | 415,000 | (a) |
Landry’s Inc., Senior Notes | | | 9.375 | % | | | 5/1/20 | | | | 1,976,000 | | | | 2,121,730 | (a) |
Total Hotels, Restaurants & Leisure | | | | | | | | | | | | | | | 7,296,292 | |
Household Durables — 1.8% | | | | | | | | | | | | | | | | |
Century Intermediate Holding Co. 2, Senior Notes | | | 9.750 | % | | | 2/15/19 | | | | 1,090,000 | | | | 1,134,963 | (a)(b) |
Shea Homes LP/Shea Homes Funding Corp., Senior Notes | | | 6.125 | % | | | 4/1/25 | | | | 900,000 | | | | 924,750 | (a) |
William Lyon Homes Inc., Senior Notes | | | 8.500 | % | | | 11/15/20 | | | | 830,000 | | | | 900,550 | |
William Lyon Homes Inc., Senior Notes | | | 7.000 | % | | | 8/15/22 | | | | 650,000 | | | | 674,375 | |
Woodside Homes Co., LLC/Woodside Homes Finance Inc., Senior Notes | | | 6.750 | % | | | 12/15/21 | | | | 1,090,000 | | | | 1,013,700 | (a) |
Total Household Durables | | | | | | | | | | | | | | | 4,648,338 | |
Media — 6.8% | | | | | | | | | | | | | | | | |
AMC Entertainment Inc., Senior Subordinated Notes | | | 5.750 | % | | | 6/15/25 | | | | 560,000 | | | | 558,600 | |
CCO Safari II LLC, Senior Secured Notes | | | 4.908 | % | | | 7/23/25 | | | | 1,060,000 | | | | 1,051,552 | (a) |
CCO Safari II LLC, Senior Secured Notes | | | 6.484 | % | | | 10/23/45 | | | | 430,000 | | | | 438,575 | (a) |
CSC Holdings LLC, Senior Notes | | | 6.750 | % | | | 11/15/21 | | | | 410,000 | | | | 431,013 | |
DISH DBS Corp., Senior Notes | | | 7.875 | % | | | 9/1/19 | | | | 580,000 | | | | 630,112 | |
DISH DBS Corp., Senior Notes | | | 6.750 | % | | | 6/1/21 | | | | 1,110,000 | | | | 1,117,104 | |
DISH DBS Corp., Senior Notes | | �� | 5.875 | % | | | 7/15/22 | | | | 270,000 | | | | 255,995 | |
DISH DBS Corp., Senior Notes | | | 5.000 | % | | | 3/15/23 | | | | 330,000 | | | | 292,258 | |
See Notes to Financial Statements.
| | |
| 4 | | Western Asset Managed High Income Fund Inc. 2015 Semi-Annual Report |
Western Asset Managed High Income Fund Inc.
| | | | | | | | | | | | | | | | |
| Security | | Rate | | | Maturity
Date | | | Face
Amount† | | | Value | |
Media — continued | | | | | | | | | | | | | | | | |
DISH DBS Corp., Senior Notes | | | 5.875 | % | | | 11/15/24 | | | | 1,000,000 | | | $ | 913,750 | |
Gibson Brands Inc., Senior Secured Notes | | | 8.875 | % | | | 8/1/18 | | | | 750,000 | | | | 716,250 | (a) |
iHeartCommunications Inc., Senior Notes | | | 10.000 | % | | | 1/15/18 | | | | 840,000 | | | | 613,200 | |
New Cotai LLC/New Cotai Capital Corp., Senior Secured Notes | | | 10.625 | % | | | 5/1/19 | | | | 928,879 | | | | 798,836 | (a)(b) |
Numericable-SFR SAS, Senior Secured Bonds | | | 6.000 | % | | | 5/15/22 | | | | 1,390,000 | | | | 1,393,475 | (a) |
Numericable-SFR SAS, Senior Secured Bonds | | | 6.250 | % | | | 5/15/24 | | | | 1,360,000 | | | | 1,362,978 | (a) |
Time Warner Cable Inc., Senior Notes | | | 8.750 | % | | | 2/14/19 | | | | 821,000 | | | | 970,912 | |
Time Warner Cable Inc., Senior Notes | | | 8.250 | % | | | 4/1/19 | | | | 361,000 | | | | 422,535 | |
Tribune Media Co., Senior Notes | | | 5.875 | % | | | 7/15/22 | | | | 410,000 | | | | 414,100 | (a) |
Univision Communications Inc., Senior Notes | | | 8.500 | % | | | 5/15/21 | | | | 780,000 | | | | 817,144 | (a) |
Univision Communications Inc., Senior Secured Notes | | | 6.750 | % | | | 9/15/22 | | | | 81,000 | | | | 85,961 | (a) |
UPC Holding BV, Junior Secured Subordinated Notes | | | 6.375 | % | | | 9/15/22 | | | | 1,200,000 | EUR | | | 1,458,589 | (a) |
Virgin Media Finance PLC, Senior Notes | | | 6.375 | % | | | 4/15/23 | | | | 1,510,000 | | | | 1,575,111 | (a) |
Virgin Media Finance PLC, Senior Notes | | | 6.000 | % | | | 10/15/24 | | | | 1,030,000 | | | | 1,060,900 | (a) |
Virgin Media Finance PLC, Senior Notes | | | 5.750 | % | | | 1/15/25 | | | | 200,000 | | | | 201,375 | (a) |
Total Media | | | | | | | | | | | | | | | 17,580,325 | |
Multiline Retail — 0.3% | | | | | | | | | | | | | | | | |
Neiman Marcus Group LLC, Senior Secured Notes | | | 7.125 | % | | | 6/1/28 | | | | 185,000 | | | | 185,000 | |
Neiman Marcus Group Ltd. LLC, Senior Notes | | | 8.000 | % | | | 10/15/21 | | | | 500,000 | | | | 530,000 | (a) |
Total Multiline Retail | | | | | | | | | | | | | | | 715,000 | |
Specialty Retail — 1.2% | | | | | | | | | | | | | | | | |
American Greetings Corp., Senior Notes | | | 7.375 | % | | | 12/1/21 | | | | 700,000 | | | | 739,375 | |
Guitar Center Inc., Senior Secured Bonds | | | 6.500 | % | | | 4/15/19 | | | | 1,920,000 | | | | 1,810,560 | (a) |
Hot Topic Inc., Senior Secured Notes | | | 9.250 | % | | | 6/15/21 | | | | 440,000 | | | | 446,600 | (a) |
Total Specialty Retail | | | | | | | | | | | | | | | 2,996,535 | |
Textiles, Apparel & Luxury Goods — 0.1% | | | | | | | | | | | | | | | | |
Empire Today LLC/Empire Today Finance Corp., Senior Secured Notes | | | 11.375 | % | | | 2/1/17 | | | | 440,000 | | | | 391,600 | (a) |
Total Consumer Discretionary | | | | | | | | | | | | | | | 35,693,344 | |
| Consumer Staples — 3.7% | | | | | | | | | | | | | | | | |
Beverages — 0.6% | | | | | | | | | | | | | | | | |
Carolina Beverage Group LLC/Carolina Beverage Group Finance Inc., Secured Notes | | | 10.625 | % | | | 8/1/18 | | | | 740,000 | | | | 732,600 | (a) |
DS Services of America Inc., Secured Notes | | | 10.000 | % | | | 9/1/21 | | | | 670,000 | | | | 781,387 | (a) |
Total Beverages | | | | | | | | | | | | | | | 1,513,987 | |
Food & Staples Retailing — 0.6% | | | | | | | | | | | | | | | | |
Beverages & More Inc., Senior Secured Notes | | | 10.000 | % | | | 11/15/18 | | | | 880,000 | | | | 865,700 | (a) |
Dollar Tree Inc., Senior Notes | | | 5.750 | % | | | 3/1/23 | | | | 650,000 | | | | 684,125 | (a) |
Total Food & Staples Retailing | | | | | | | | | | | | | | | 1,549,825 | |
See Notes to Financial Statements.
| | |
| Western Asset Managed High Income Fund Inc. 2015 Semi-Annual Report | | 5 |
Schedule of investments (unaudited) (cont’d)
August 31, 2015
Western Asset Managed High Income Fund Inc.
| | | | | | | | | | | | | | | | |
| Security | | Rate | | | Maturity
Date | | | Face
Amount† | | | Value | |
Food Products — 1.3% | | | | | | | | | | | | | | | | |
Dole Food Co. Inc., Senior Secured Notes | | | 7.250 | % | | | 5/1/19 | | | | 700,000 | | | $ | 708,750 | (a) |
Hearthside Group Holdings LLC/Hearthside Finance Co., Senior Notes | | | 6.500 | % | | | 5/1/22 | | | | 570,000 | | | | 538,650 | (a) |
Pilgrim’s Pride Corp., Senior Notes | | | 5.750 | % | | | 3/15/25 | | | | 890,000 | | | | 912,250 | (a) |
Simmons Foods Inc., Secured Notes | | | 7.875 | % | | | 10/1/21 | | | | 1,430,000 | | | | 1,337,050 | (a) |
Total Food Products | | | | | | | | | | | | | | | 3,496,700 | |
Household Products — 0.8% | | | | | | | | | | | | | | | | |
Kronos Acquisition Holdings Inc., Senior Notes | | | 9.000 | % | | | 8/15/23 | | | | 210,000 | | | | 191,100 | (a) |
Spectrum Brands Inc., Senior Notes | | | 6.625 | % | | | 11/15/22 | | | | 360,000 | | | | 388,343 | |
Spectrum Brands Inc., Senior Notes | | | 6.125 | % | | | 12/15/24 | | | | 210,000 | | | | 219,450 | (a) |
Spectrum Brands Inc., Senior Notes | | | 5.750 | % | | | 7/15/25 | | | | 800,000 | | | | 828,000 | (a) |
Sun Products Corp., Senior Notes | | | 7.750 | % | | | 3/15/21 | | | | 420,000 | | | | 380,100 | (a) |
Total Household Products | | | | | | | | | | | | | | | 2,006,993 | |
Tobacco — 0.4% | | | | | | | | | | | | | | | | |
Alliance One International Inc., Secured Notes | | | 9.875 | % | | | 7/15/21 | | | | 1,290,000 | | | | 1,093,275 | |
Total Consumer Staples | | | | | | | | | | | | | | | 9,660,780 | |
| Energy — 13.4% | | | | | | | | | | | | | | | | |
Energy Equipment & Services — 1.6% | | | | | | | | | | | | | | | | |
Atwood Oceanics Inc., Senior Notes | | | 6.500 | % | | | 2/1/20 | | | | 560,000 | | | | 481,600 | |
CGG, Senior Notes | | | 7.750 | % | | | 5/15/17 | | | | 67,000 | | | | 53,432 | |
CGG, Senior Notes | | | 6.500 | % | | | 6/1/21 | | | | 550,000 | | | | 312,125 | |
CGG, Senior Notes | | | 6.875 | % | | | 1/15/22 | | | | 370,000 | | | | 214,600 | |
FTS International Inc., Senior Secured Bonds | | | 6.250 | % | | | 5/1/22 | | | | 620,000 | | | | 235,600 | |
Hercules Offshore Inc., Senior Notes | | | 7.500 | % | | | 10/1/21 | | | | 600,000 | | | | 138,000 | (a) |
Hercules Offshore Inc., Senior Notes | | | 6.750 | % | | | 4/1/22 | | | | 1,350,000 | | | | 310,500 | (a) |
Key Energy Services Inc., Senior Notes | | | 6.750 | % | | | 3/1/21 | | | | 280,000 | | | | 119,000 | |
McDermott International Inc., Secured Notes | | | 8.000 | % | | | 5/1/21 | | | | 280,000 | | | | 237,415 | (a) |
Parker Drilling Co., Senior Notes | | | 7.500 | % | | | 8/1/20 | | | | 920,000 | | | | 772,800 | |
SESI LLC, Senior Notes | | | 7.125 | % | | | 12/15/21 | | | | 790,000 | | | | 792,101 | |
Sierra Hamilton LLC/Sierra Hamilton Finance Inc., Senior Secured Notes | | | 12.250 | % | | | 12/15/18 | | | | 760,000 | | | | 524,400 | (a) |
Total Energy Equipment & Services | | | | | | | | | | | | | | | 4,191,573 | |
Oil, Gas & Consumable Fuels — 11.8% | | | | | | | | | | | | | | | | |
American Energy-Permian Basin LLC/AEPB Finance Corp., Secured Notes | | | 8.000 | % | | | 6/15/20 | | | | 570,000 | | | | 518,700 | (a) |
Approach Resources Inc., Senior Notes | | | 7.000 | % | | | 6/15/21 | | | | 590,000 | | | | 398,250 | |
Arch Coal Inc., Senior Notes | | | 7.250 | % | | | 6/15/21 | | | | 1,010,000 | | | | 143,925 | |
Berry Petroleum Co., Senior Notes | | | 6.375 | % | | | 9/15/22 | | | | 430,000 | | | | 221,450 | |
See Notes to Financial Statements.
| | |
| 6 | | Western Asset Managed High Income Fund Inc. 2015 Semi-Annual Report |
Western Asset Managed High Income Fund Inc.
| | | | | | | | | | | | | | | | |
| Security | | Rate | | | Maturity
Date | | | Face
Amount† | | | Value | |
Oil, Gas & Consumable Fuels — continued | | | | | | | | | | | | | | | | |
California Resources Corp., Senior Notes | | | 5.500 | % | | | 9/15/21 | | | | 2,680,000 | | | $ | 2,091,418 | |
Calumet Specialty Products Partners LP/Calumet Finance Corp., Senior Notes | | | 6.500 | % | | | 4/15/21 | | | | 300,000 | | | | 285,000 | |
Calumet Specialty Products Partners LP/Calumet Finance Corp., Senior Notes | | | 7.625 | % | | | 1/15/22 | | | | 590,000 | | | | 578,200 | |
Carrizo Oil & Gas Inc., Senior Notes | | | 7.500 | % | | | 9/15/20 | | | | 520,000 | | | | 494,000 | |
Chesapeake Energy Corp., Senior Notes | | | 6.875 | % | | | 11/15/20 | | | | 200,000 | | | | 161,500 | |
Chesapeake Energy Corp., Senior Notes | | | 6.125 | % | | | 2/15/21 | | | | 1,170,000 | | | | 911,875 | |
Comstock Resources Inc., Senior Notes | | | 9.500 | % | | | 6/15/20 | | | | 1,420,000 | | | | 469,523 | |
Crestwood Midstream Partners LP/Crestwood Midstream Finance Corp., Senior Notes | | | 6.125 | % | | | 3/1/22 | | | | 850,000 | | | | 777,750 | |
Endeavor Energy Resources LP/EER Finance Inc., Senior Notes | | | 8.125 | % | | | 9/15/23 | | | | 330,000 | | | | 321,750 | (a) |
Enterprise Products Operating LLC, Junior Subordinated Notes | | | 8.375 | % | | | 8/1/66 | | | | 470,000 | | | | 461,775 | (f) |
EP Energy LLC/Everest Acquisition Finance Inc., Senior Notes | | | 9.375 | % | | | 5/1/20 | | | | 790,000 | | | | 769,065 | |
Freeport-McMoran Oil & Gas LLC/FCX Oil & Gas Inc., Senior Notes | | | 6.750 | % | | | 2/1/22 | | | | 91,000 | | | | 83,037 | |
Genesis Energy LP/Genesis Energy Finance Corp., Senior Notes | | | 6.750 | % | | | 8/1/22 | | | | 470,000 | | | | 458,250 | |
Globe Luxembourg SCA, Senior Secured Notes | | | 9.625 | % | | | 5/1/18 | | | | 2,190,000 | | | | 1,817,700 | (a) |
Halcon Resources Corp., Secured Notes | | | 8.625 | % | | | 2/1/20 | | | | 680,000 | | | | 599,250 | (a) |
Halcon Resources Corp., Senior Notes | | | 9.750 | % | | | 7/15/20 | | | | 1,730,000 | | | | 640,100 | |
Halcon Resources Corp., Senior Notes | | | 8.875 | % | | | 5/15/21 | | | | 1,810,000 | | | | 606,350 | |
Kinder Morgan Inc., Medium-Term Notes | | | 7.800 | % | | | 8/1/31 | | | | 680,000 | | | | 740,914 | |
Linn Energy LLC/Linn Energy Finance Corp., Senior Notes | | | 8.625 | % | | | 4/15/20 | | | | 1,500,000 | | | | 611,250 | |
Lonestar Resources America Inc., Senior Notes | | | 8.750 | % | | | 4/15/19 | | | | 300,000 | | | | 211,500 | (a) |
Magnum Hunter Resources Corp., Senior Notes | | | 9.750 | % | | | 5/15/20 | | | | 2,020,000 | | | | 1,398,850 | |
MEG Energy Corp., Senior Notes | | | 6.375 | % | | | 1/30/23 | | | | 1,430,000 | | | | 1,158,300 | (a) |
MEG Energy Corp., Senior Notes | | | 7.000 | % | | | 3/31/24 | | | | 250,000 | | | | 204,375 | (a) |
Milagro Oil & Gas Inc., Secured Notes | | | 10.500 | % | | | 5/15/16 | | | | 920,000 | | | | 289,800 | *(d)(g) |
Murray Energy Corp., Senior Secured Notes | | | 11.250 | % | | | 4/15/21 | | | | 2,550,000 | | | | 1,192,125 | (a) |
Natural Resource Partners LP/Natural Resource Partners Finance Corp., Senior Notes | | | 9.125 | % | | | 10/1/18 | | | | 850,000 | | | | 631,125 | |
New Gulf Resources LLC/NGR Finance Corp., Senior Secured Notes | | | 12.250 | % | | | 5/15/19 | | | | 190,000 | | | | 57,950 | |
Oasis Petroleum Inc., Senior Notes | | | 6.500 | % | | | 11/1/21 | | | | 280,000 | | | | 226,800 | |
Oasis Petroleum Inc., Senior Notes | | | 6.875 | % | | | 3/15/22 | | | �� | 580,000 | | | | 484,300 | |
Petrobras Global Finance BV, Senior Notes | | | 7.250 | % | | | 3/17/44 | | | | 1,000,000 | | | | 810,000 | |
Petrobras Global Finance BV, Senior Notes | | | 6.850 | % | | | 6/5/2115 | | | | 380,000 | | | | 286,862 | |
Quicksilver Resources Inc., Senior Notes | | | 11.000 | % | | | 7/1/21 | | | | 510,000 | | | | 34,425 | *(g) |
See Notes to Financial Statements.
| | |
| Western Asset Managed High Income Fund Inc. 2015 Semi-Annual Report | | 7 |
Schedule of investments (unaudited) (cont’d)
August 31, 2015
Western Asset Managed High Income Fund Inc.
| | | | | | | | | | | | | | | | |
| Security | | Rate | | | Maturity
Date | | | Face
Amount† | | | Value | |
Oil, Gas & Consumable Fuels — continued | | | | | | | | | | | | | | | | |
Rice Energy Inc., Senior Notes | | | 7.250 | % | | | 5/1/23 | | | | 790,000 | | | $ | 738,650 | (a) |
RSP Permian Inc., Senior Notes | | | 6.625 | % | | | 10/1/22 | | | | 1,490,000 | | | | 1,467,650 | (a) |
Samson Investment Co., Senior Notes | | | 9.750 | % | | | 2/15/20 | | | | 780,000 | | | | 2,925 | *(g) |
Sanchez Energy Corp., Senior Notes | | | 7.750 | % | | | 6/15/21 | | | | 2,830,000 | | | | 2,405,500 | |
Shelf Drilling Holdings Ltd., Senior Secured Notes | | | 8.625 | % | | | 11/1/18 | | | | 510,000 | | | | 395,250 | (a) |
Targa Resources Partners LP/Targa Resources Partners Finance Corp., Senior Notes | | | 6.625 | % | | | 10/1/20 | | | | 280,000 | | | | 278,600 | (a) |
Tennessee Gas Pipeline Co., LLC, Senior Notes | | | 8.000 | % | | | 2/1/16 | | | | 645,000 | | | | 662,185 | |
Tennessee Gas Pipeline Co., LLC, Senior Notes | | | 8.375 | % | | | 6/15/32 | | | | 1,960,000 | | | | 2,272,785 | |
Whiting Canadian Holding Co. ULC, Senior Notes | | | 8.125 | % | | | 12/1/19 | | | | 760,000 | | | | 733,400 | |
WPX Energy Inc., Senior Notes | | | 7.500 | % | | | 8/1/20 | | | | 120,000 | | | | 115,846 | |
WPX Energy Inc., Senior Notes | | | 8.250 | % | | | 8/1/23 | | | | 350,000 | | | | 337,750 | |
Total Oil, Gas & Consumable Fuels | | | | | | | | | | | | | | | 30,557,985 | |
Total Energy | | | | | | | | | | | | | | | 34,749,558 | |
| Financials — 13.1% | | | | | | | | | | | | | | | | |
Banks — 5.0% | | | | | | | | | | | | | | | | |
Bank of America Corp., Junior Subordinated Notes | | | 6.500 | % | | | 10/23/24 | | | | 440,000 | | | | 453,750 | (f)(h) |
Barclays Bank PLC, Subordinated Notes | | | 10.179 | % | | | 6/12/21 | | | | 1,060,000 | | | | 1,402,746 | (a) |
Barclays Bank PLC, Subordinated Notes | | | 7.625 | % | | | 11/21/22 | | | | 1,000,000 | | | | 1,141,875 | |
Barclays PLC, Junior Subordinated Bonds | | | 8.250 | % | | | 12/15/18 | | | | 230,000 | | | | 244,431 | (f)(h) |
BNP Paribas SA, Junior Subordinated Notes | | | 7.375 | % | | | 8/19/25 | | | | 390,000 | | | | 399,847 | (a)(f)(h) |
Citigroup Inc., Junior Subordinated Bonds | | | 6.300 | % | | | 5/15/24 | | | | 620,000 | | | | 602,175 | (f)(h) |
Citigroup Inc., Junior Subordinated Bonds | | | 5.950 | % | | | 5/15/25 | | | | 150,000 | | | | 143,625 | (f)(h) |
Cooperatieve Centrale Raiffeisen-Boerenleenbank BA of Netherlands, Junior Subordinated Notes | | | 11.000 | % | | | 6/30/19 | | | | 170,000 | | | | 212,220 | (a)(f)(h) |
Credit Agricole SA, Junior Subordinated Notes | | | 8.375 | % | | | 10/13/19 | | | | 880,000 | | | | 1,010,900 | (a)(f)(h) |
Credit Agricole SA, Junior Subordinated Notes | | | 7.875 | % | | | 1/23/24 | | | | 400,000 | | | | 408,462 | (a)(f)(h) |
HSBC Holdings PLC, Junior Subordinated Bonds | | | 6.375 | % | | | 9/17/24 | | | | 430,000 | | | | 425,700 | (f)(h) |
HSBC Holdings PLC, Junior Subordinated Bonds | | | 6.375 | % | | | 3/30/25 | | | | 590,000 | | | | 587,787 | (f)(h) |
JPMorgan Chase & Co., Junior Subordinated Bonds | | | 6.000 | % | | | 8/1/23 | | | | 350,000 | | | | 347,375 | (f)(h) |
JPMorgan Chase & Co., Junior Subordinated Notes | | | 6.100 | % | | | 10/1/24 | | | | 370,000 | | | | 369,882 | (f)(h) |
M&T Bank Corp., Junior Subordinated Bonds | | | 6.875 | % | | | 6/15/16 | | | | 980,000 | | | | 992,250 | (h) |
Novo Banco SA, Senior Notes | | | 5.875 | % | | | 11/9/15 | | | | 300,000 | EUR | | | 336,972 | (i) |
Royal Bank of Scotland Group PLC, Junior Subordinated Bonds | | | 7.648 | % | | | 9/30/31 | | | | 670,000 | | | | 840,850 | (f)(h) |
Royal Bank of Scotland Group PLC, Subordinated Notes | | | 6.100 | % | | | 6/10/23 | | | | 730,000 | | | | 785,006 | |
Royal Bank of Scotland NV, Subordinated Bonds | | | 7.750 | % | | | 5/15/23 | | | | 230,000 | | | | 267,188 | |
Royal Bank of Scotland PLC, Subordinated Notes | | | 13.125 | % | | | 3/19/22 | | | | 1,350,000 | AUD | | | 1,077,308 | (f)(i) |
Santander Issuances SAU, Notes | | | 5.911 | % | | | 6/20/16 | | | | 600,000 | | | | 616,242 | (a) |
See Notes to Financial Statements.
| | |
| 8 | | Western Asset Managed High Income Fund Inc. 2015 Semi-Annual Report |
Western Asset Managed High Income Fund Inc.
| | | | | | | | | | | | | | | | |
| Security | | Rate | | | Maturity
Date | | | Face
Amount† | | | Value | |
Banks — continued | | | | | | | | | | | | | | | | |
Wells Fargo & Co., Junior Subordinated Bonds | | | 5.875 | % | | | 6/15/25 | | | | 310,000 | | | $ | 317,750 | (f)(h) |
Total Banks | | | | | | | | | | | | | | | 12,984,341 | |
Capital Markets — 1.8% | | | | | | | | | | | | | | | | |
Credit Suisse Group AG, Junior Subordinated Notes | | | 6.250 | % | | | 12/18/24 | | | | 2,150,000 | | | | 2,070,854 | (a)(f)(h) |
Goldman Sachs Group Inc., Subordinated Notes | | | 6.750 | % | | | 10/1/37 | | | | 670,000 | | | | 801,806 | |
Goldman Sachs Group Inc., Subordinated Notes | | | 5.150 | % | | | 5/22/45 | | | | 710,000 | | | | 704,529 | |
Pershing Square Holdings Ltd., Senior Notes | | | 5.500 | % | | | 7/15/22 | | | | 1,000,000 | | | | 986,976 | (a) |
Total Capital Markets | | | | | | | | | | | | | | | 4,564,165 | |
Consumer Finance — 0.9% | | | | | | | | | | | | | | | | |
Ally Financial Inc., Senior Notes | | | 8.000 | % | | | 3/15/20 | | | | 611,000 | | | | 716,397 | |
Navient Corp., Medium-Term Notes, Senior Notes | | | 8.450 | % | | | 6/15/18 | | | | 620,000 | | | | 658,750 | |
Navient Corp., Medium-Term Notes, Senior Notes | | | 8.000 | % | | | 3/25/20 | | | | 610,000 | | | | 619,150 | |
TMX Finance LLC/TitleMax Finance Corp., Senior Secured Notes | | | 8.500 | % | | | 9/15/18 | | | | 390,000 | | | | 318,338 | (a) |
Total Consumer Finance | | | | | | | | | | | | | | | 2,312,635 | |
Diversified Financial Services — 2.6% | | | | | | | | | | | | | | | | |
Argos Merger Sub Inc., Senior Notes | | | 7.125 | % | | | 3/15/23 | | | | 1,370,000 | | | | 1,438,500 | (a) |
International Lease Finance Corp., Senior Notes | | | 8.875 | % | | | 9/1/17 | | | | 2,520,000 | | | | 2,781,450 | |
International Lease Finance Corp., Senior Notes | | | 8.250 | % | | | 12/15/20 | | | | 1,815,000 | | | | 2,155,312 | |
ZFS Finance USA Trust II, Bonds | | | 6.450 | % | | | 12/15/65 | | | | 500,000 | | | | 510,000 | (a)(f) |
Total Diversified Financial Services | | | | | | | | | | | | | | | 6,885,262 | |
Insurance — 1.2% | | | | | | | | | | | | | | | | |
CNO Financial Group Inc., Senior Notes | | | 4.500 | % | | | 5/30/20 | | | | 120,000 | | | | 123,900 | |
CNO Financial Group Inc., Senior Notes | | | 5.250 | % | | | 5/30/25 | | | | 930,000 | | | | 962,550 | |
Fidelity & Guaranty Life Holdings Inc., Senior Notes | | | 6.375 | % | | | 4/1/21 | | | | 460,000 | | | | 480,700 | (a) |
Genworth Holdings Inc., Senior Notes | | | 4.900 | % | | | 8/15/23 | | | | 510,000 | | | | 419,475 | |
Liberty Mutual Group Inc., Junior Subordinated Bonds | | | 7.800 | % | | | 3/15/37 | | | | 490,000 | | | | 572,075 | (a) |
MetLife Capital Trust IV, Junior Subordinated Notes | | | 7.875 | % | | | 12/15/37 | | | | 360,000 | | | | 450,000 | (a) |
Total Insurance | | | | | | | | | | | | | | | 3,008,700 | |
Real Estate Management & Development — 1.6% | | | | | | | | | | | | | | | | |
Communications Sales & Leasing Inc., Senior Notes | | | 8.250 | % | | | 10/15/23 | | | | 480,000 | | | | 438,000 | (a) |
Greystar Real Estate Partners LLC, Senior Secured Notes | | | 8.250 | % | | | 12/1/22 | | | | 880,000 | | | | 921,800 | (a) |
Howard Hughes Corp., Senior Notes | | | 6.875 | % | | | 10/1/21 | | | | 1,160,000 | | | | 1,215,100 | (a) |
Paris Las Vegas Holding LLC/Harrah’s Las Vegas LLC/Flamingo Las Vegas Holding LLC, Secured Notes | | | 11.000 | % | | | 10/1/21 | | | | 440,000 | | | | 410,850 | |
Paris Las Vegas Holding LLC/Harrah’s Las Vegas LLC/Flamingo Las Vegas Holding LLC, Senior Secured Notes | | | 8.000 | % | | | 10/1/20 | | | | 1,240,000 | | | | 1,230,700 | |
Total Real Estate Management & Development | | | | | | | | | | | | | | | 4,216,450 | |
Total Financials | | | | | | | | | | | | | | | 33,971,553 | |
See Notes to Financial Statements.
| | |
| Western Asset Managed High Income Fund Inc. 2015 Semi-Annual Report | | 9 |
Schedule of investments (unaudited) (cont’d)
August 31, 2015
Western Asset Managed High Income Fund Inc.
| | | | | | | | | | | | | | | | |
| Security | | Rate | | | Maturity
Date | | | Face
Amount† | | | Value | |
| Health Care — 7.3% | | | | | | | | | | | | | | | | |
Biotechnology — 0.2% | | | | | | | | | | | | | | | | |
AMAG Pharmaceuticals Inc., Senior Notes | | | 7.875 | % | | | 9/1/23 | | | | 440,000 | | | $ | 452,650 | (a) |
Health Care Equipment & Supplies — 0.9% | | | | | | | | | | | | | | | | |
ConvaTec Finance International SA, Senior Notes | | | 8.250 | % | | | 1/15/19 | | | | 1,260,000 | | | | 1,245,825 | (a)(b) |
DJO Finance LLC/DJO Finance Corp., Secured Notes | | | 10.750 | % | | | 4/15/20 | | | | 170,000 | | | | 173,400 | (a) |
DJO Finco Inc./DJO Finance LLC/DJO Finance Corp., Secured Notes | | | 8.125 | % | | | 6/15/21 | | | | 910,000 | | | | 943,670 | (a) |
Total Health Care Equipment & Supplies | | | | | | | | | | | | | | | 2,362,895 | |
Health Care Providers & Services — 4.1% | | | | | | | | | | | | | | | | |
Acadia Healthcare Co. Inc., Senior Notes | | | 12.875 | % | | | 11/1/18 | | | | 468,000 | | | | 505,440 | |
Acadia Healthcare Co. Inc., Senior Notes | | | 6.125 | % | | | 3/15/21 | | | | 390,000 | | | | 404,625 | |
BioScrip Inc., Senior Notes | | | 8.875 | % | | | 2/15/21 | | | | 410,000 | | | | 308,525 | |
CHS/Community Health Systems Inc., Senior Notes | | | 8.000 | % | | | 11/15/19 | | | | 1,310,000 | | | | 1,372,225 | |
HCA Inc., Debentures | | | 7.500 | % | | | 11/15/95 | | | | 2,345,000 | | | | 2,309,825 | |
HCA Inc., Notes | | | 7.690 | % | | | 6/15/25 | | | | 490,000 | | | | 558,600 | |
IASIS Healthcare LLC/IASIS Capital Corp., Senior Notes | | | 8.375 | % | | | 5/15/19 | | | | 1,410,000 | | | | 1,464,835 | |
Tenet Healthcare Corp., Senior Notes | | | 8.125 | % | | | 4/1/22 | | | | 810,000 | | | | 899,100 | |
Tenet Healthcare Corp., Senior Notes | | | 6.750 | % | | | 6/15/23 | | | | 850,000 | | | | 879,750 | |
Tenet Healthcare Corp., Senior Secured Notes | | | 6.000 | % | | | 10/1/20 | | | | 720,000 | | | | 772,200 | |
Universal Hospital Services Inc., Secured Notes | | | 7.625 | % | | | 8/15/20 | | | | 1,180,000 | | | | 1,143,862 | |
Total Health Care Providers & Services | | | | | | | | | | | | | | | 10,618,987 | |
Pharmaceuticals — 2.1% | | | | | | | | | | | | | | | | |
Concordia Healthcare Corp., Senior Notes | | | 7.000 | % | | | 4/15/23 | | | | 460,000 | | | | 476,146 | (a) |
DPx Holdings BV, Senior Notes | | | 7.500 | % | | | 2/1/22 | | | | 550,000 | | | | 575,438 | (a) |
Endo Finance LLC/Endo Ltd./Endo Finco Inc., Senior Notes | | | 6.000 | % | | | 7/15/23 | | | | 1,030,000 | | | | 1,073,775 | (a) |
JLL/Delta Dutch Pledgeco BV, Senior Notes | | | 8.750 | % | | | 5/1/20 | | | | 1,420,000 | | | | 1,459,050 | (a)(b) |
Valeant Pharmaceuticals International Inc., Senior Notes | | | 6.125 | % | | | 4/15/25 | | | | 1,810,000 | | | | 1,868,825 | (a) |
Total Pharmaceuticals | | | | | | | | | | | | | | | 5,453,234 | |
Total Health Care | | | | | | | | | | | | | | | 18,887,766 | |
| Industrials — 12.9% | | | | | | | | | | | | | | | | |
Aerospace & Defense — 0.8% | | | | | | | | | | | | | | | | |
Aerojet Rocketdyne Holdings Inc., Secured Notes | | | 7.125 | % | | | 3/15/21 | | | | 410,000 | | | | 433,575 | |
CBC Ammo LLC/CBC FinCo Inc., Senior Notes | | | 7.250 | % | | | 11/15/21 | | | | 1,270,000 | | | | 1,196,975 | (a) |
LMI Aerospace Inc., Secured Notes | | | 7.375 | % | | | 7/15/19 | | | | 390,000 | | | | 378,300 | |
Total Aerospace & Defense | | | | | | | | | | | | | | | 2,008,850 | |
Air Freight & Logistics — 0.9% | | | | | | | | | | | | | | | | |
Air Medical Merger Sub Corp., Senior Notes | | | 6.375 | % | | | 5/15/23 | | | | 540,000 | | | | 504,900 | (a) |
XPO Logistics Inc., Senior Notes | | | 7.875 | % | | | 9/1/19 | | | | 1,040,000 | | | | 1,106,300 | (a) |
See Notes to Financial Statements.
| | |
| 10 | | Western Asset Managed High Income Fund Inc. 2015 Semi-Annual Report |
Western Asset Managed High Income Fund Inc.
| | | | | | | | | | | | | | | | |
| Security | | Rate | | | Maturity
Date | | | Face
Amount† | | | Value | |
Air Freight & Logistics — continued | | | | | | | | | | | | | | | | |
XPO Logistics Inc., Senior Notes | | | 5.750 | % | | | 6/15/21 | | | | 110,000 | EUR | | $ | 119,620 | (a) |
XPO Logistics Inc., Senior Notes | | | 6.500 | % | | | 6/15/22 | | | | 560,000 | | | | 553,000 | (a) |
Total Air Freight & Logistics | | | | | | | | | | | | | | | 2,283,820 | |
Airlines — 0.6% | | | | | | | | | | | | | | | | |
Air Canada, Pass-Through Trust, Secured Notes | | | 6.625 | % | | | 5/15/18 | | | | 310,000 | | | | 323,144 | (a) |
American Airlines, Pass-Through Trust, Secured Notes | | | 7.000 | % | | | 1/31/18 | | | | 288,651 | | | | 307,052 | (a) |
Continental Airlines Inc., Pass-Through Certificates, Secured Bonds | | | 7.373 | % | | | 12/15/15 | | | | 63,822 | | | | 64,540 | |
Continental Airlines Inc., Pass-Through Certificates, Secured Notes | | | 9.250 | % | | | 5/10/17 | | | | 49,808 | | | | 54,353 | |
Continental Airlines Inc., Pass-Through Certificates, Secured Notes | | | 5.500 | % | | | 10/29/20 | | | | 344,346 | | | | 356,829 | |
Delta Air Lines Inc., Pass-Through Certificates, Secured Notes | | | 6.375 | % | | | 1/2/16 | | | | 80,000 | | | | 81,100 | (a) |
Delta Air Lines Inc., Pass-Through Certificates, Secured Notes | | | 8.021 | % | | | 8/10/22 | | | | 219,498 | | | | 250,228 | |
Delta Air Lines Inc., Pass-Through Certificates, Subordinated Secured Notes | | | 9.750 | % | | | 12/17/16 | | | | 157,846 | | | | 169,487 | |
Total Airlines | | | | | | | | | | | | | | | 1,606,733 | |
Building Products — 0.3% | | | | | | | | | | | | | | | | |
Ashton Woods USA LLC/Ashton Woods Finance Co., Senior Notes | | | 6.875 | % | | | 2/15/21 | | | | 790,000 | | | | 742,600 | (a) |
Building Materials Corp. of America, Senior Notes | | | 6.750 | % | | | 5/1/21 | | | | 90,000 | | | | 94,500 | (a) |
Total Building Products | | | | | | | | | | | | | | | 837,100 | |
Commercial Services & Supplies — 2.1% | | | | | | | | | | | | | | | | |
Garda World Security Corp., Senior Notes | | | 7.250 | % | | | 11/15/21 | | | | 440,000 | | | | 413,600 | (a) |
JM Huber Corp., Senior Notes | | | 9.875 | % | | | 11/1/19 | | | | 470,000 | | | | 499,375 | (a) |
Monitronics International Inc., Senior Notes | | | 9.125 | % | | | 4/1/20 | | | | 1,790,000 | | | | 1,682,600 | |
United Rentals North America Inc., Senior Notes | | | 8.250 | % | | | 2/1/21 | | | | 203,000 | | | | 215,688 | |
United Rentals North America Inc., Senior Notes | | | 7.625 | % | | | 4/15/22 | | | | 1,416,000 | | | | 1,532,820 | |
West Corp., Senior Notes | | | 5.375 | % | | | 7/15/22 | | | | 1,130,000 | | | | 1,066,437 | (a) |
Total Commercial Services & Supplies | | | | | | | | | | | | | | | 5,410,520 | |
Construction & Engineering — 1.4% | | | | | | | | | | | | | | | | |
Ausdrill Finance Pty Ltd., Senior Notes | | | 6.875 | % | | | 11/1/19 | | | | 670,000 | | | | 500,825 | (a) |
Brundage-Bone Concrete Pumping Inc., Senior Secured Notes | | | 10.375 | % | | | 9/1/21 | | | | 680,000 | | | | 707,200 | (a) |
Michael Baker Holdings LLC/Michael Baker Finance Corp., Senior Notes | | | 8.875 | % | | | 4/15/19 | | | | 860,000 | | | | 748,200 | (a)(b) |
Michael Baker International LLC/CDL Acquisition Co. Inc., Senior Secured Notes | | | 8.250 | % | | | 10/15/18 | | | | 1,020,000 | | | | 999,600 | (a) |
Modular Space Corp., Secured Notes | | | 10.250 | % | | | 1/31/19 | | | | 820,000 | | | | 602,700 | (a) |
Total Construction & Engineering | | | | | | | | | | | | | | | 3,558,525 | |
See Notes to Financial Statements.
| | |
| Western Asset Managed High Income Fund Inc. 2015 Semi-Annual Report | | 11 |
Schedule of investments (unaudited) (cont’d)
August 31, 2015
Western Asset Managed High Income Fund Inc.
| | | | | | | | | | | | | | | | |
| Security | | Rate | | | Maturity
Date | | | Face
Amount† | | | Value | |
Electrical Equipment — 0.6% | | | | | | | | | | | | | | | | |
Interface Grand Master Holdings Inc., Senior Notes | | | 17.000 | % | | | 8/15/19 | | | | 460,971 | | | $ | 447,142 | (b) |
International Wire Group Holdings Inc., Senior Secured Notes | | | 8.500 | % | | | 10/15/17 | | | | 560,000 | | | | 578,200 | (a) |
NES Rentals Holdings Inc., Senior Secured Notes | | | 7.875 | % | | | 5/1/18 | | | | 510,000 | | | | 508,725 | (a) |
Total Electrical Equipment | | | | | | | | | | | | | | | 1,534,067 | |
Industrial Conglomerates — 0.3% | | | | | | | | | | | | | | | | |
Leucadia National Corp., Senior Notes | | | 8.125 | % | | | 9/15/15 | | | | 850,000 | | | | 852,125 | |
Machinery — 1.4% | | | | | | | | | | | | | | | | |
CTP Transportation Products LLC/CTP Finance Inc., Senior Secured Notes | | | 8.250 | % | | | 12/15/19 | | | | 340,000 | | | | 362,950 | (a) |
DH Services Luxembourg Sarl, Senior Notes | | | 7.750 | % | | | 12/15/20 | | | | 1,540,000 | | | | 1,578,500 | (a) |
Global Brass and Copper Inc., Senior Secured Notes | | | 9.500 | % | | | 6/1/19 | | | | 690,000 | | | | 744,337 | |
SIG Combibloc Holdings SCA, Senior Bonds | | | 7.750 | % | | | 2/15/23 | | | | 310,000 | EUR | | | 359,903 | (a) |
SPL Logistics Escrow LLC/SPL Logistics Finance Corp., Senior Secured Notes | | | 8.875 | % | | | 8/1/20 | | | | 490,000 | | | | 524,300 | (a) |
Total Machinery | | | | | | | | | | | | | | | 3,569,990 | |
Marine — 0.6% | | | | | | | | | | | | | | | | |
Navios Maritime Acquisition Corp./Navios Acquisition Finance U.S. Inc., Senior Secured Notes | | | 8.125 | % | | | 11/15/21 | | | | 1,180,000 | | | | 1,131,325 | (a) |
Ultrapetrol Bahamas Ltd., Senior Secured Notes | | | 8.875 | % | | | 6/15/21 | | | | 670,000 | | | | 525,950 | |
Total Marine | | | | | | | | | | | | | | | 1,657,275 | |
Road & Rail — 2.2% | | | | | | | | | | | | | | | | |
Flexi-Van Leasing Inc., Senior Notes | | | 7.875 | % | | | 8/15/18 | | | | 700,000 | | | | 712,250 | (a) |
Florida East Coast Holdings Corp., Senior Notes | | | 9.750 | % | | | 5/1/20 | | | | 140,000 | | | | 126,700 | (a) |
Florida East Coast Holdings Corp., Senior Secured Notes | | | 6.750 | % | | | 5/1/19 | | | | 1,860,000 | | | | 1,878,600 | (a) |
Jack Cooper Holdings Corp., Senior Secured Notes | | | 10.250 | % | | | 6/1/20 | | | | 1,340,000 | | | | 1,226,100 | (a) |
Jurassic Holdings III Inc., Secured Notes | | | 6.875 | % | | | 2/15/21 | | | | 700,000 | | | | 495,250 | (a) |
Quality Distribution LLC/QD Capital Corp., Secured Notes | | | 9.875 | % | | | 11/1/18 | | | | 1,224,000 | | | | 1,271,216 | |
Total Road & Rail | | | | | | | | | | | | | | | 5,710,116 | |
Trading Companies & Distributors — 0.7% | | | | | | | | | | | | | | | | |
Ashtead Capital Inc., Senior Secured Notes | | | 6.500 | % | | | 7/15/22 | | | | 790,000 | | | | 825,550 | (a) |
H&E Equipment Services Inc., Senior Notes | | | 7.000 | % | | | 9/1/22 | | | | 880,000 | | | | 880,000 | |
Total Trading Companies & Distributors | | | | | | | | | | | | | | | 1,705,550 | |
Transportation — 0.8% | | | | | | | | | | | | | | | | |
Hapag-Lloyd AG, Senior Notes | | | 9.750 | % | | | 10/15/17 | | | | 900,000 | | | | 931,500 | (a) |
Neovia Logistics Intermediate Holdings LLC/Logistics Intermediate Finance Corp., Senior Notes | | | 10.000 | % | | | 2/15/18 | | | | 1,080,000 | | | | 1,085,400 | (a)(b) |
Total Transportation | | | | | | | | | | | | | | | 2,016,900 | |
Transportation Infrastructure — 0.2% | | | | | | | | | | | | | | | | |
Aguila 3 SA, Senior Secured Notes | | | 7.875 | % | | | 1/31/18 | | | | 480,000 | | | | 489,000 | (a) |
Total Industrials | | | | | | | | | | | | 33,240,571 | |
See Notes to Financial Statements.
| | |
| 12 | | Western Asset Managed High Income Fund Inc. 2015 Semi-Annual Report |
Western Asset Managed High Income Fund Inc.
| | | | | | | | | | | | | | | | |
| Security | | Rate | | | Maturity
Date | | | Face
Amount† | | | Value | |
| Information Technology — 2.4% | | | | | | | | | | | | | | | | |
Communications Equipment — 0.3% | | | | | | | | | | | | | | | | |
CommScope Technologies Finance LLC, Senior Notes | | | 6.000 | % | | | 6/15/25 | | | | 690,000 | | | $ | 672,750 | (a) |
Electronic Equipment, Instruments & Components — 0.3% | | | | | | | | | | | | | | | | |
Interface Security Systems Holdings Inc./Interface Security Systems LLC, Senior Secured Notes | | | 9.250 | % | | | 1/15/18 | | | | 760,000 | | | | 775,200 | |
Internet Software & Services — 0.4% | | | | | | | | | | | | | | | | |
Ancestry.com Holdings LLC, Senior Notes | | | 9.625 | % | | | 10/15/18 | | | | 380,000 | | | | 385,225 | (a)(b) |
Ancestry.com Inc., Senior Notes | | | 11.000 | % | | | 12/15/20 | | | | 590,000 | | | | 658,588 | |
Total Internet Software & Services | | | | | | | | | | | | | | | 1,043,813 | |
IT Services — 1.4% | | | | | | | | | | | | | | | | |
Compiler Finance Subordinated Inc., Senior Notes | | | 7.000 | % | | | 5/1/21 | | | | 1,030,000 | | | | 705,550 | (a) |
First Data Corp., Secured Notes | | | 8.250 | % | | | 1/15/21 | | | | 510,000 | | | | 538,050 | (a) |
First Data Corp., Senior Notes | | | 12.625 | % | | | 1/15/21 | | | | 1,250,000 | | | | 1,439,062 | |
First Data Corp., Senior Subordinated Notes | | | 11.750 | % | | | 8/15/21 | | | | 812,000 | | | | 916,748 | |
Total IT Services | | | | | | | | | | | | | | | 3,599,410 | |
Total Information Technology | | | | | | | | 6,091,173 | |
| Materials — 7.6% | | | | | | | | | | | | | | | | |
Chemicals — 0.7% | | | | | | | | | | | | | | | | |
Eco Services Operations LLC/Eco Finance Corp., Senior Notes | | | 8.500 | % | | | 11/1/22 | | | | 260,000 | | | | 249,600 | (a) |
Hexion Inc., Senior Secured Notes | | | 8.875 | % | | | 2/1/18 | | | | 640,000 | | | | 560,000 | |
HIG BBC Intermediate Holdings LLC/HIG BBC Holdings Corp., Senior Notes | | | 10.500 | % | | | 9/15/18 | | | | 420,000 | | | | 411,600 | (a)(b) |
Kerling PLC, Senior Secured Notes | | | 10.625 | % | | | 2/1/17 | | | | 582,000 | EUR | | | 667,904 | (a) |
Total Chemicals | | | | | | | | | | | | | | | 1,889,104 | |
Construction Materials — 0.3% | | | | | | | | | | | | | | | | |
Hardwoods Acquisition Inc., Senior Secured Notes | | | 7.500 | % | | | 8/1/21 | | | | 700,000 | | | | 668,500 | (a) |
NWH Escrow Corp., Senior Secured Notes | | | 7.500 | % | | | 8/1/21 | | | | 260,000 | | | | 241,800 | (a) |
Total Construction Materials | | | | | | | | | | | | | | | 910,300 | |
Containers & Packaging — 2.7% | | | | | | | | | | | | | | | | |
Ardagh Finance Holdings SA, Senior Notes | | | 8.625 | % | | | 6/15/19 | | | | 740,423 | | | | 784,848 | (a)(b) |
Ardagh Packaging Finance PLC, Senior Notes | | | 9.125 | % | | | 10/15/20 | | | | 1,060,000 | | | | 1,115,650 | (a) |
Ardagh Packaging Finance PLC/Ardagh MP Holdings USA Inc., Senior Notes | | | 6.250 | % | | | 1/31/19 | | | | 260,000 | | | | 266,500 | (a) |
Ardagh Packaging Finance PLC/Ardagh MP Holdings USA Inc., Senior Notes | | | 9.125 | % | | | 10/15/20 | | | | 680,000 | | | | 712,640 | (a) |
BWAY Holding Co., Senior Notes | | | 9.125 | % | | | 8/15/21 | | | | 1,170,000 | | | | 1,193,400 | (a) |
Coveris Holdings SA, Senior Notes | | | 7.875 | % | | | 11/1/19 | | | | 700,000 | | | | 682,500 | (a) |
Pactiv LLC, Senior Bonds | | | 8.375 | % | | | 4/15/27 | | | | 1,790,000 | | | | 1,754,200 | |
PaperWorks Industries Inc., Senior Secured Notes | | | 9.500 | % | | | 8/15/19 | | | | 560,000 | | | | 551,040 | (a) |
Total Containers & Packaging | | | | | | | | | | | | | | | 7,060,778 | |
See Notes to Financial Statements.
| | |
| Western Asset Managed High Income Fund Inc. 2015 Semi-Annual Report | | 13 |
Schedule of investments (unaudited) (cont’d)
August 31, 2015
Western Asset Managed High Income Fund Inc.
| | | | | | | | | | | | | | | | |
| Security | | Rate | | | Maturity
Date | | | Face
Amount† | | | Value | |
Metals & Mining — 3.3% | | | | | | | | | | | | | | | | |
ArcelorMittal, Senior Notes | | | 7.000 | % | | | 2/25/22 | | | | 140,000 | | | $ | 140,350 | |
ArcelorMittal, Senior Notes | | | 7.750 | % | | | 10/15/39 | | | | 970,000 | | | | 904,525 | |
Barminco Finance Pty Ltd., Senior Notes | | | 9.000 | % | | | 6/1/18 | | | | 910,000 | | | | 714,350 | (a) |
Coeur Mining Inc., Senior Notes | | | 7.875 | % | | | 2/1/21 | | | | 700,000 | | | | 449,750 | |
FMG Resources (August 2006) Pty Ltd., Senior Secured Notes | | | 9.750 | % | | | 3/1/22 | | | | 1,420,000 | | | | 1,301,075 | (a) |
Midwest Vanadium Pty Ltd., Senior Secured Notes | | | 11.500 | % | | | 2/15/18 | | | | 860,000 | | | | 43,000 | *(a)(d)(g) |
Mirabela Nickel Ltd., Subordinated Notes | | | 1.000 | % | | | 9/10/44 | | | | 9,114 | | | | 0 | (a)(c)(d)(j) |
Prince Mineral Holding Corp., Senior Secured Notes | | | 11.500 | % | | | 12/15/19 | | | | 200,000 | | | | 174,000 | (a) |
Rain CII Carbon LLC/CII Carbon Corp., Senior Secured Notes | | | 8.250 | % | | | 1/15/21 | | | | 1,240,000 | | | | 1,178,000 | (a) |
Ryerson Inc./Joseph T. Ryerson & Son Inc., Senior Secured Notes | | | 9.000 | % | | | 10/15/17 | | | | 1,110,000 | | | | 1,015,650 | |
Schaeffler Holding Finance BV, Senior Secured Bonds | | | 6.875 | % | | | 8/15/18 | | | | 480,000 | | | | 496,560 | (a)(b) |
Schaeffler Holding Finance BV, Senior Secured Notes | | | 6.875 | % | | | 8/15/18 | | | | 570,000 | EUR | | | 663,116 | (a)(b) |
Schaeffler Holding Finance BV, Senior Secured Notes | | | 6.750 | % | | | 11/15/22 | | | | 940,000 | | | | 1,008,150 | (a)(b) |
Thompson Creek Metals Co. Inc., Senior Notes | | | 12.500 | % | | | 5/1/19 | | | | 570,000 | | | | 349,667 | |
Total Metals & Mining | | | | | | | | | | | | | | | 8,438,193 | |
Paper & Forest Products — 0.6% | | | | | | | | | | | | | | | | |
Appvion Inc., Secured Notes | | | 9.000 | % | | | 6/1/20 | | | | 1,640,000 | | | | 934,800 | (a) |
Resolute Forest Products Inc., Senior Notes | | | 5.875 | % | | | 5/15/23 | | | | 580,000 | | | | 478,500 | |
Verso Paper Holdings LLC/Verso Paper Inc., Senior Secured Bonds | | | 11.750 | % | | | 1/15/19 | | | | 290,000 | | | | 68,875 | |
Verso Paper Holdings LLC/Verso Paper Inc., Senior Secured Notes | | | 11.750 | % | | | 1/15/19 | | | | 30,000 | | | | 8,550 | |
Total Paper & Forest Products | | | | | | | | | | | | | | | 1,490,725 | |
Total Materials | | | | | | | | 19,789,100 | |
| Telecommunication Services — 10.1% | | | | | | | | | | | | | | | | |
Diversified Telecommunication Services — 5.3% | | | | | | | | | | | | | | | | |
CenturyLink Inc., Senior Notes | | | 5.800 | % | | | 3/15/22 | | | | 870,000 | | | | 828,675 | |
CenturyLink Inc., Senior Notes | | | 7.600 | % | | | 9/15/39 | | | | 1,320,000 | | | | 1,135,200 | |
CenturyLink Inc., Senior Notes | | | 7.650 | % | | | 3/15/42 | | | | 580,000 | | | | 498,800 | |
Cincinnati Bell Telephone Co., LLC, Senior Debentures | | | 6.300 | % | | | 12/1/28 | | | | 115,000 | | | | 107,525 | |
Intelsat Jackson Holdings SA, Senior Notes | | | 7.250 | % | | | 10/15/20 | | | | 1,500,000 | | | | 1,447,500 | |
Intelsat Jackson Holdings SA, Senior Notes | | | 7.500 | % | | | 4/1/21 | | | | 1,940,000 | | | | 1,886,650 | |
Intelsat Luxembourg SA, Senior Bonds | | | 7.750 | % | | | 6/1/21 | | | | 750,000 | | | | 564,750 | |
Level 3 Financing Inc., Senior Notes | | | 7.000 | % | | | 6/1/20 | | | | 70,000 | | | | 73,850 | |
Level 3 Financing Inc., Senior Notes | | | 8.625 | % | | | 7/15/20 | | | | 1,280,000 | | | | 1,359,360 | |
Level 3 Financing Inc., Senior Notes | | | 6.125 | % | | | 1/15/21 | | | | 350,000 | | | | 367,500 | |
Oi SA, Senior Notes | | | 5.750 | % | | | 2/10/22 | | | | 1,160,000 | | | | 841,000 | (a) |
See Notes to Financial Statements.
| | |
| 14 | | Western Asset Managed High Income Fund Inc. 2015 Semi-Annual Report |
Western Asset Managed High Income Fund Inc.
| | | | | | | | | | | | | | | | |
| Security | | Rate | | | Maturity
Date | | | Face
Amount† | | | Value | |
Diversified Telecommunication Services — continued | | | | | | | | | | | | | | | | |
Verizon Communications Inc., Senior Notes | | | 5.150 | % | | | 9/15/23 | | | | 990,000 | | | $ | 1,087,146 | |
Windstream Services LLC, Senior Notes | | | 7.750 | % | | | 10/1/21 | | | | 460,000 | | | | 377,204 | |
Windstream Services LLC, Senior Notes | | | 7.500 | % | | | 6/1/22 | | | | 2,650,000 | | | | 2,103,464 | |
Windstream Services LLC, Senior Notes | | | 7.500 | % | | | 4/1/23 | | | | 1,070,000 | | | | 842,636 | |
Total Diversified Telecommunication Services | | | | | | | | | | | | | | | 13,521,260 | |
Wireless Telecommunication Services — 4.8% | | | | | | | | | | | | | | | | |
Altice Financing SA, Senior Secured Notes | | | 5.250 | % | | | 2/15/23 | | | | 100,000 | EUR | | | 113,876 | (a) |
Altice Financing SA, Senior Secured Notes | | | 6.625 | % | | | 2/15/23 | | | | 1,600,000 | | | | 1,596,000 | (a) |
Sprint Capital Corp., Senior Notes | | | 6.875 | % | | | 11/15/28 | | | | 400,000 | | | | 345,000 | |
Sprint Capital Corp., Senior Notes | | | 8.750 | % | | | 3/15/32 | | | | 4,415,000 | | | | 4,188,731 | |
Sprint Communications Inc., Senior Notes | | | 6.000 | % | | | 12/1/16 | | | | 60,000 | | | | 61,462 | |
Sprint Communications Inc., Senior Notes | | | 9.000 | % | | | 11/15/18 | | | | 1,480,000 | | | | 1,652,050 | (a) |
Sprint Corp., Senior Notes | | | 7.625 | % | | | 2/15/25 | | | | 1,150,000 | | | | 1,075,969 | |
T-Mobile USA Inc., Senior Notes | | | 6.542 | % | | | 4/28/20 | | | | 300,000 | | | | 313,500 | |
T-Mobile USA Inc., Senior Notes | | | 6.000 | % | | | 3/1/23 | | | | 1,100,000 | | | | 1,124,189 | |
Vimpel Communications Via VIP Finance Ireland Ltd. OJSC, Senior Notes | | | 7.748 | % | | | 2/2/21 | | | | 1,160,000 | | | | 1,155,889 | (a) |
VimpelCom Holdings BV, Senior Notes | | | 7.504 | % | | | 3/1/22 | | | | 530,000 | | | | 513,899 | (i) |
VimpelCom Holdings BV, Senior Notes | | | 7.504 | % | | | 3/1/22 | | | | 350,000 | | | | 339,367 | (a) |
Total Wireless Telecommunication Services | | | | | | | | | | | | | | | 12,479,932 | |
Total Telecommunication Services | | | | | | | | 26,001,192 | |
| Utilities — 2.8% | | | | | | | | | | | | | | | | |
Electric Utilities — 1.1% | | | | | | | | | | | | | | | | |
Midwest Generation LLC, Pass-Through Certificates, Secured Bonds | | | 8.560 | % | | | 1/2/16 | | | | 61,689 | | | | 61,689 | |
NRG REMA LLC, Pass-Through Certificates, Senior Secured Bonds | | | 9.237 | % | | | 7/2/17 | | | | 148,687 | | | | 155,378 | |
NRG REMA LLC, Pass-Through Certificates, Senior Secured Bonds | | | 9.681 | % | | | 7/2/26 | | | | 1,210,000 | | | | 1,234,200 | |
Red Oak Power LLC, Secured Notes | | | 9.200 | % | | | 11/30/29 | | | | 1,290,000 | | | | 1,451,250 | |
Total Electric Utilities | | | | | | | | | | | | | | | 2,902,517 | |
Independent Power and Renewable Electricity Producers — 1.7% | | | | | | | | | | | | | |
Calpine Corp., Senior Secured Notes | | | 7.875 | % | | | 1/15/23 | | | | 572,000 | | | | 614,900 | (a) |
Foresight Energy LLC/Foresight Energy Finance Corp., Senior Notes | | | 7.875 | % | | | 8/15/21 | | | | 620,000 | | | | 483,600 | (a) |
Mirant Mid Atlantic LLC, Pass-Through Certificates, Secured Bonds | | | 10.060 | % | | | 12/30/28 | | | | 2,572,137 | | | | 2,654,124 | |
Mirant Mid Atlantic LLC, Pass-Through Certificates, Senior Secured Bonds | | | 9.125 | % | | | 6/30/17 | | | | 37,613 | | | | 39,165 | |
See Notes to Financial Statements.
| | |
| Western Asset Managed High Income Fund Inc. 2015 Semi-Annual Report | | 15 |
Schedule of investments (unaudited) (cont’d)
August 31, 2015
Western Asset Managed High Income Fund Inc.
| | | | | | | | | | | | | | | | |
| Security | | Rate | | | Maturity
Date | | | Face
Amount† | | | Value | |
Independent Power and Renewable Electricity Producers — continued | |
TerraForm Power Operating LLC, Senior Notes | | | 5.875 | % | | | 2/1/23 | | | | 570,000 | | | $ | 544,350 | (a) |
Total Independent Power and Renewable Electricity Producers | | | | | | | | | | | | 4,336,139 | |
Total Utilities | | | | | | | | 7,238,656 | |
Total Corporate Bonds & Notes (Cost — $235,191,902) | | | | | | | | 225,323,693 | |
| Convertible Bonds & Notes — 0.3% | | | | | | | | | | | | | | | | |
| Materials — 0.3% | | | | | | | | | | | | | | | | |
Chemicals — 0.1% | | | | | | | | | | | | | | | | |
Hercules Inc., Junior Subordinated Bonds | | | 6.500 | % | | | 6/30/29 | | | | 230,000 | | | | 204,269 | |
Metals & Mining — 0.2% | | | | | | | | | | | | | | | | |
Mirabela Nickel Ltd., Senior Secured Bonds | | | 9.500 | % | | | 6/24/19 | | | | 641,895 | | | | 449,326 | (a)(b)(d) |
Total Convertible Bonds & Notes (Cost — $853,729) | | | | | | | | | | | | 653,595 | |
| Senior Loans — 2.2% | | | | | | | | | | | | | | | | |
| Consumer Discretionary — 0.7% | | | | | | | | | | | | | | | | |
Hotels, Restaurants & Leisure — 0.3% | | | | | | | | | | | | | | | | |
Equinox Holdings Inc., Second Lien Term Loan | | | 9.750 | % | | | 7/31/20 | | | | 710,000 | | | | 723,016 | (k)(l) |
Specialty Retail — 0.2% | | | | | | | | | | | | | | | | |
Spencer Gifts LLC, Second Lien Term Loan | | | 9.250 | % | | | 11/12/21 | | | | 610,000 | | | | 619,150 | (k)(l) |
Textiles, Apparel & Luxury Goods — 0.2% | | | | | | | | | | | | | | | | |
TOMS Shoes LLC, Term Loan B | | | 6.500 | % | | | 10/28/20 | | | | 448,875 | | | | 419,979 | (k)(l) |
Total Consumer Discretionary | | | | | | | | | | | | 1,762,145 | |
| Consumer Staples — 0.1% | | | | | | | | | | | | | | | | |
Food Products — 0.1% | | | | | | | | | | | | | | | | |
AdvancePierre Foods Inc., Second Lien Term Loan | | | 9.500 | % | | | 10/10/17 | | | | 300,000 | | | | 302,438 | (k)(l) |
| Energy — 0.2% | | | | | | | | | | | | | | | | |
Oil, Gas & Consumable Fuels — 0.2% | | | | | | | | | | | | | | | | |
Westmoreland Coal Co., Term Loan B | | | 7.500 | % | | | 12/16/20 | | | | 456,473 | | | | 410,826 | (k)(l) |
| Health Care — 0.5% | | | | | | | | | | | | | | | | |
Health Care Equipment & Supplies — 0.2% | | | | | | | | | | | | | | | | |
Lantheus Medical Imaging Inc., Term Loan | | | 7.000 | % | | | 6/30/22 | | | | 560,000 | | | | 552,300 | (k)(l) |
Health Care Providers & Services — 0.3% | | | | | | | | | | | | | | | | |
Radnet Management Inc., Second Lien Term Loan | | | 8.000 | % | | | 3/25/21 | | | | 730,000 | | | | 721,331 | (k)(l) |
Total Health Care | | | | | | | | | | | | 1,273,631 | |
| Industrials — 0.2% | | | | | | | | | | | | | | | | |
Commercial Services & Supplies — 0.2% | | | | | | | | | | | | | | | | |
Kronos Inc., Second Lien Term Loan | | | 9.750 | % | | | 4/30/20 | | | | 539,577 | | | | 555,315 | (k)(l) |
| Materials — 0.0% | | | | | | | | | | | | | | | | |
Metals & Mining — 0.0% | | | | | | | | | | | | | | | | |
FMG Resources (August 2006) Pty Ltd., New Term Loan B | | | 3.750 | % | | | 6/30/19 | | | | 50,000 | | | | 40,604 | (k)(l) |
See Notes to Financial Statements.
| | |
| 16 | | Western Asset Managed High Income Fund Inc. 2015 Semi-Annual Report |
Western Asset Managed High Income Fund Inc.
| | | | | | | | | | | | | | | | |
| Security | | Rate | | | Maturity
Date | | | Face
Amount† | | | Value | |
| Utilities — 0.5% | | | | | | | | | | | | | | | | |
Electric Utilities — 0.3% | | | | | | | | | | | | | | | | |
Panda Temple Power LLC, 2015 Term Loan B | | | 7.250 | % | | | 3/4/22 | | | | 658,350 | | | $ | 635,308 | (k)(l) |
Independent Power and Renewable Electricity Producers — 0.2% | | | | | | | | | |
Energy Future Intermediate Holding Co., LLC, DIP Term Loan | | | 4.250 | % | | | 6/19/16 | | | | 630,000 | | | | 630,787 | (k)(l) |
Total Utilities | | | | | | | | | | | | 1,266,095 | |
Total Senior Loans (Cost — $5,591,608) | | | | | | | | | | | | 5,611,054 | |
| | | | |
| | | | | | | | | Shares | | | | |
| Common Stocks — 2.5% | | | | | | | | | | | | | | | | |
| Consumer Discretionary — 0.3% | | | | | | | | | | | | | | | | |
Automobiles — 0.3% | | | | | | | | | | | | | | | | |
Ford Motor Co. | | | | | | | | | | | 48,092 | | | | 667,036 | |
Hotels, Restaurants & Leisure — 0.0% | | | | | | | | | | | | | | | | |
Bossier Casino Venture Holdco Inc. | | | | | | | | | | | 46,919 | | | | 0 | *(c)(d)(j) |
Total Consumer Discretionary | | | | | | | | | | | | | | | 667,036 | |
| Energy — 0.5% | | | | | | | | | | | | | | | | |
Energy Equipment & Services — 0.5% | | | | | | | | | | | | | | | | |
KCAD Holdings I Ltd. | | | | | | | | | | | 151,493,610 | | | | 1,371,775 | *(c)(d) |
| Financials — 0.9% | | | | | | | | | | | | | | | | |
Banks — 0.9% | | | | | | | | | | | | | | | | |
Citigroup Inc. | | | | | | | | | | | 29,040 | | | | 1,553,059 | |
JPMorgan Chase & Co. | | | | | | | | | | | 13,508 | | | | 865,863 | |
Total Financials | | | | | | | | | | | | | | | 2,418,922 | |
| Health Care — 0.3% | | | | | | | | | | | | | | | | |
Health Care Providers & Services — 0.3% | | | | | | | | | | | | | | | | |
Physiotherapy Associates Holdings Inc. | | | | | | | | | | | 8,800 | | | | 730,400 | *(c)(d) |
| Industrials — 0.4% | | | | | | | | | | | | | | | | |
Marine — 0.1% | | | | | | | | | | | | | | | | |
DeepOcean Group Holding AS | | | | | | | | | | | 58,920 | | | | 379,798 | *(c)(d) |
Trading Companies & Distributors — 0.3% | | | | | | | | | | | | | | | | |
H&E Equipment Services Inc. | | | | | | | | | | | 32,476 | | | | 672,578 | |
Total Industrials | | | | | | | | | | | | | | | 1,052,376 | |
| Materials — 0.1% | | | | | | | | | | | | | | | | |
Metals & Mining — 0.1% | | | | | | | | | | | | | | | | |
Mirabela Nickel Ltd. | | | | | | | | | | | 1,863,035 | | | | 109,918 | *(c)(d) |
Total Common Stocks (Cost — $6,772,605) | | | | | | | | | | | | | | | 6,350,427 | |
| Convertible Preferred Stocks — 0.1% | | | | | | | | | | | | | | | | |
| Energy — 0.1% | | | | | | | | | | | | | | | | |
Oil, Gas & Consumable Fuels — 0.1% | | | | | | | | | | | | | | | | |
Rex Energy Corp. (Cost — $649,300) | | | 6.000 | % | | | | | | | 9,100 | | | | 353,763 | |
See Notes to Financial Statements.
| | |
| Western Asset Managed High Income Fund Inc. 2015 Semi-Annual Report | | 17 |
Schedule of investments (unaudited) (cont’d)
August 31, 2015
Western Asset Managed High Income Fund Inc.
| | | | | | | | | | | | | | | | |
| Security | | Rate | | | | | | Shares | | | Value | |
| Preferred Stocks — 1.6% | | | | | | | | | | | | | | | | |
| Financials — 1.6% | | | | | | | | | | | | | | | | |
Consumer Finance — 1.2% | | | | | | | | | | | | | | | | |
GMAC Capital Trust I | | | 8.125 | % | | | | | | | 118,121 | | | $ | 3,015,629 | (f) |
Diversified Financial Services — 0.4% | | | | | | | | | | | | | | | | |
Citigroup Capital XIII | | | 7.875 | % | | | | | | | 46,675 | | | | 1,192,546 | (f) |
Total Preferred Stocks (Cost — $4,131,949) | | | | | | | | | | | | | | | 4,208,175 | |
| | | | |
| | | | | | Expiration
Date | | | Warrants | | | | |
| Warrants — 0.1% | | | | | | | | | | | | | | | | |
Jack Cooper Holdings Corp. | | | | | | | 12/15/17 | | | | 1,198 | | | | 167,720 | *(a) |
Jack Cooper Holdings Corp. | | | | | | | 5/6/18 | | | | 558 | | | | 78,120 | *(a) |
Total Warrants (Cost — $30,507) | | | | 245,840 | |
Total Investments before Short-Term Investments (Cost — $253,221,600) | | | | 242,746,547 | |
| | | | |
| | | | | | Maturity
Date | | | Face
Amount† | | | | |
| Short-Term Investments — 1.5% | | | | | | | | | | | | | | | | |
Repurchase Agreements — 1.5% | | | | | | | | | | | | | | | | |
Barclays Capital Inc. repurchase agreement dated 8/31/15; Proceeds at maturity — $4,000,011; (Fully collateralized by U.S. government obligations, 1.625% due 7/31/19;
Market value — $4,080,000)
(Cost — $4,000,000) | | | 0.100 | % | | | 9/1/15 | | | | 4,000,000 | | | | 4,000,000 | |
Total Investments — 95.4% (Cost — $257,221,600#) | | | | | | | | | | | | 246,746,547 | |
Other Assets in Excess of Liabilities — 4.6% | | | | | | | | | | | | | | | 11,821,367 | |
Total Net Assets — 100.0% | | | | | | | | | | | | | | $ | 258,567,914 | |
| † | Face amount denominated in U.S. dollars, unless otherwise noted. |
| * | Non-income producing security. |
| (a) | Security is exempt from registration under Rule 144A of the Securities Act of 1933. This security may be resold in transactions that are exempt from registration, normally to qualified institutional buyers. This security has been deemed liquid pursuant to guidelines approved by the Board of Directors, unless otherwise noted. |
| (b) | Payment-in-kind security for which the issuer has the option at each interest payment date of making interest payments in cash or additional debt securities. |
| (c) | Security is valued in good faith in accordance with procedures approved by the Board of Directors (See Note 1). |
| (e) | The maturity principal is currently in default as of August 31, 2015. |
| (f) | Variable rate security. Interest rate disclosed is as of the most recent information available. |
| (g) | The coupon payment on these securities is currently in default as of August 31, 2015. |
| (h) | Security has no maturity date. The date shown represents the next call date. |
See Notes to Financial Statements.
| | |
| 18 | | Western Asset Managed High Income Fund Inc. 2015 Semi-Annual Report |
Western Asset Managed High Income Fund Inc.
| (i) | Security is exempt from registration under Regulation S of the Securities Act of 1933. Regulation S applies to securities offerings that are made outside of the United States and do not involve direct selling efforts in the United States. This security has been deemed liquid pursuant to guidelines approved by the Board of Directors, unless otherwise noted. |
| (j) | Value is less than $1. |
| (k) | Interest rates disclosed represent the effective rates on senior loans. Ranges in interest rates are attributable to multiple contracts under the same loan. |
| (l) | Senior loans may be considered restricted in that the Fund ordinarily is contractually obligated to receive approval from the agent bank and/or borrower prior to the disposition of a senior loan. |
| # | Aggregate cost for federal income tax purposes is substantially the same. |
| | |
Abbreviations used in this schedule: |
| AUD | | — Australian Dollar |
| DIP | | — Debtor-in-Possession |
| EUR | | — Euro |
| OJSC | | — Open Joint Stock Company |
See Notes to Financial Statements.
| | |
| Western Asset Managed High Income Fund Inc. 2015 Semi-Annual Report | | 19 |
Statement of assets and liabilities (unaudited)
August 31, 2015
| | | | |
| |
| Assets: | | | | |
Investments, at value (Cost — $257,221,600) | | $ | 246,746,547 | |
Foreign currency, at value (Cost — $200,210) | | | 191,904 | |
Cash | | | 6,942,849 | |
Interest and dividends receivable | | | 5,475,199 | |
Receivable for securities sold | | | 1,146,370 | |
Deposits with brokers for centrally cleared swap contracts | | | 1,577 | |
Prepaid expenses | | | 24,897 | |
Total Assets | | | 260,529,343 | |
| |
| Liabilities: | | | | |
Payable for securities purchased | | | 1,606,489 | |
Investment management fee payable | | | 177,403 | |
Unrealized depreciation on forward foreign currency contracts | | | 95,698 | |
Directors’ fees payable | | | 3,084 | |
Accrued expenses | | | 78,755 | |
Total Liabilities | | | 1,961,429 | |
| Total Net Assets | | $ | 258,567,914 | |
| |
| Net Assets: | | | | |
Par value ($0.001 par value; 47,203,436 shares issued and outstanding; 500,000,000 shares authorized) | | $ | 47,203 | |
Paid-in capital in excess of par value | | | 328,720,648 | |
Overdistributed net investment income | | | (129,767) | |
Accumulated net realized loss on investments, futures contracts and foreign currency transactions | | | (59,487,609) | |
Net unrealized depreciation on investments and foreign currencies | | | (10,582,561) | |
| Total Net Assets | | $ | 258,567,914 | |
| |
| Shares Outstanding | | | 47,203,436 | |
| |
| Net Asset Value | | | $5.48 | |
See Notes to Financial Statements.
| | |
| 20 | | Western Asset Managed High Income Fund Inc. 2015 Semi-Annual Report |
Statement of operations (unaudited)
For the Six Months Ended August 31, 2015
| | | | |
| |
| Investment Income: | | | | |
Interest | | $ | 10,450,258 | |
Dividends | | | 228,181 | |
Total Investment Income | | | 10,678,439 | |
| |
| Expenses: | | | | |
Investment management fee (Note 2) | | | 1,094,075 | |
Transfer agent fees | | | 48,999 | |
Audit and tax fees | | | 27,675 | |
Directors’ fees | | | 24,938 | |
Stock exchange listing fees | | | 20,172 | |
Shareholder reports | | | 17,352 | |
Fund accounting fees | | | 14,088 | |
Legal fees | | | 13,994 | |
Insurance | | | 2,975 | |
Custody fees | | | 1,396 | |
Miscellaneous expenses | | | 4,880 | |
Total Expenses | | | 1,270,544 | |
| Net Investment Income | | | 9,407,895 | |
| |
Realized and Unrealized Gain (Loss) on Investments, Futures Contracts
and Foreign Currency Transactions (Notes 1, 3 and 4): | | | | |
Net Realized Gain (Loss) From: | | | | |
Investment transactions | | | (7,131,815) | |
Futures contracts | | | (58,751) | |
Foreign currency transactions | | | 265,824 | |
Net Realized Loss | | | (6,924,742) | |
Change in Net Unrealized Appreciation (Depreciation) From: | | | | |
Investments | | | (10,857,644) | |
Futures contracts | | | 21,262 | |
Foreign currencies | | | (205,466) | |
Change in Net Unrealized Appreciation (Depreciation) | | | (11,041,848) | |
| Net Loss on Investments, Futures Contracts and Foreign Currency Transactions | | | (17,966,590) | |
| Decrease in Net Assets from Operations | | $ | (8,558,695) | |
See Notes to Financial Statements.
| | |
| Western Asset Managed High Income Fund Inc. 2015 Semi-Annual Report | | 21 |
Statements of changes in net assets
| | | | | | | | |
For the Six Months Ended August 31, 2015 (unaudited)
and the Year Ended February 28, 2015 | | August 31 | | | February 28 | |
| | |
| Operations: | | | | | | | | |
Net investment income | | $ | 9,407,895 | | | $ | 19,331,501 | |
Net realized loss | | | (6,924,742) | | | | (2,917,423) | |
Change in net unrealized appreciation (depreciation) | | | (11,041,848) | | | | (17,123,748) | |
Decrease in Net Assets from Operations | | | (8,558,695) | | | | (709,670) | |
| | |
| Distributions to Shareholders From (Note 1): | | | | | | | | |
Net investment income | | | (9,771,112) | | | | (19,683,834) | |
Decrease in Net Assets from Distributions to Shareholders | | | (9,771,112) | | | | (19,683,834) | |
Decrease in Net Assets | | | (18,329,807) | | | | (20,393,504) | |
| | |
| Net Assets: | | | | | | | | |
Beginning of period | | | 276,897,721 | | | | 297,291,225 | |
End of period* | | $ | 258,567,914 | | | $ | 276,897,721 | |
*Includes(overdistributed) undistributed net investment income, respectively, of: | | | $(129,767) | | | | $233,450 | |
See Notes to Financial Statements.
| | |
| 22 | | Western Asset Managed High Income Fund Inc. 2015 Semi-Annual Report |
Financial highlights
| | | | | | | | | | | | | | | | | | | | | | | | |
| For a share of capital stock outstanding throughout each year ended February 28, unless otherwise noted: | |
| | | 20151,2 | | | 20152 | | | 20142 | | | 20132 | | | 20122,3 | | | 20112 | |
| | | | | | |
| Net asset value, beginning of period | | | $5.87 | | | | $6.30 | | | | $6.24 | | | | $5.94 | | | | $6.24 | | | | $5.77 | |
| | | | | | |
| Income (loss) from operations: | | | | | | | | | | | | | | | | | | | | | | | | |
Net investment income | | | 0.20 | | | | 0.41 | | | | 0.44 | | | | 0.47 | | | | 0.48 | | | | 0.52 | |
Net realized and unrealized gain (loss) | | | (0.38) | | | | (0.42) | | | | 0.07 | | | | 0.32 | | | | (0.25) | | | | 0.54 | |
Total income (loss) from operations | | | (0.18) | | | | (0.01) | | | | 0.51 | | | | 0.79 | | | | 0.23 | | | | 1.06 | |
| | | | | | |
| Less distributions from: | | | | | | | | | | | | | | | | | | | | | | | | |
Net investment income | | | (0.21) | 4 | | | (0.42) | | | | (0.45) | | | | (0.49) | | | | (0.53) | | | | (0.59) | |
Total distributions | | | (0.21) | | | | (0.42) | | | | (0.45) | | | | (0.49) | | | | (0.53) | | | | (0.59) | |
| | | | | | |
| Net asset value, end of period | | | $5.48 | | | | $5.87 | | | | $6.30 | | | | $6.24 | | | | $5.94 | | | | $6.24 | |
| | | | | | |
| Market price, end of period | | | $4.55 | | | | $5.26 | | | | $5.83 | | | | $6.30 | | | | $6.21 | | | | $6.27 | |
Total return, based on NAV5,6 | | | (3.22) | % | | | (0.24) | % | | | 8.47 | % | | | 13.94 | % | | | 4.12 | % | | | 19.31 | % |
Total return, based on Market Price7 | | | (9.85) | % | | | (2.74) | % | | | (0.05) | % | | | 9.93 | % | | | 8.32 | % | | | 14.91 | % |
| | | | | | |
| Net assets, end of period (millions) | | | $259 | | | | $277 | | | | $297 | | | | $294 | | | | $279 | | | | $291 | |
| | | | | |
| Ratios to average net assets: | | | | | | | | | | | | | | | | | | | | | |
Gross expenses | | | 0.93 | %8 | | | 0.92 | % | | | 0.93 | % | | | 0.91 | % | | | 0.92 | % | | | 0.92 | % |
Net expenses | | | 0.93 | 8 | | | 0.92 | | | | 0.93 | | | | 0.91 | | | | 0.92 | | | | 0.92 | |
Net investment income | | | 6.88 | 8 | | | 6.69 | | | | 7.03 | | | | 7.76 | | | | 8.15 | | | | 8.75 | |
| | | | | | |
| Portfolio turnover rate | | | 29 | % | | | 39 | % | | | 48 | % | | | 50 | % | | | 54 | % | | | 96 | % |
| 1 | For the six months ended August 31, 2015 (unaudited). |
| 2 | Per share amounts have been calculated using the average shares method. |
| 3 | For the year ended February 29. |
| 4 | The actual source of the Fund’s current fiscal year distributions may be from net investment income, return of capital or a combination of both. Shareholders will be informed of the tax characteristics of the distributions after the close of the fiscal year. |
| 5 | Performance figures may reflect compensating balance arrangements, fee waivers and/or expense reimbursements. In the absence of compensating balance arrangements, fee waivers and/or expense reimbursements, the total return would have been lower. Past performance is no guarantee of future results. Total returns for periods of less than one year are not annualized. |
| 6 | The total return calculation assumes that distributions are reinvested at NAV. Prior to January 1, 2012, the total return calculation assumed the reinvestment of all distributions in accordance with the Fund’s dividend reinvestment plan. Past performance is no guarantee of future results. Total returns for periods of less than one year are not annualized. |
| 7 | The total return calculation assumes that distributions are reinvested in accordance with the Fund’s dividend reinvestment plan. Past performance is no guarantee of future results. Total returns for periods of less than one year are not annualized. |
See Notes to Financial Statements.
| | |
| Western Asset Managed High Income Fund Inc. 2015 Semi-Annual Report | | 23 |
Notes to financial statements (unaudited)
1. Organization and significant accounting policies
Western Asset Managed High Income Fund Inc. (the “Fund”) was incorporated in Maryland on December 24, 1992 and is registered as a diversified, closed-end management investment company under the Investment Company Act of 1940, as amended (the “1940 Act”). The Fund’s primary investment objective is high current income. Capital appreciation is a secondary objective. The Fund invests primarily in high-yield corporate bonds, debentures and notes.
The following are significant accounting policies consistently followed by the Fund and are in conformity with U.S. generally accepted accounting principles (“GAAP”). Estimates and assumptions are required to be made regarding assets, liabilities and changes in net assets resulting from operations when financial statements are prepared. Changes in the economic environment, financial markets and any other parameters used in determining these estimates could cause actual results to differ. Subsequent events have been evaluated through the date the financial statements were issued.
(a) Investment valuation. The valuations for fixed income securities (which may include, but are not limited to, corporate, government, municipal, mortgage-backed, collateralized mortgage obligations and asset-backed securities) and certain derivative instruments are typically the prices supplied by independent third party pricing services, which may use market prices or broker/dealer quotations or a variety of valuation techniques and methodologies. The independent third party pricing services use inputs that are observable such as issuer details, interest rates, yield curves, prepayment speeds, credit risks/spreads, default rates and quoted prices for similar securities. Short-term fixed income securities that will mature in 60 days or less are valued at amortized cost, unless it is determined that using this method would not reflect an investment’s fair value. Futures contracts are valued daily at the settlement price established by the board of trade or exchange on which they are traded. Equity securities for which market quotations are available are valued at the last reported sales price or official closing price on the primary market or exchange on which they trade. When the Fund holds securities or other assets that are denominated in a foreign currency, the Fund will normally use the currency exchange rates as of 4:00 p.m. (Eastern Time). If independent third party pricing services are unable to supply prices for a portfolio investment, or if the prices supplied are deemed by the manager to be unreliable, the market price may be determined by the manager using quotations from one or more broker/dealers or at the transaction price if the security has recently been purchased and no value has yet been obtained from a pricing service or pricing broker. When reliable prices are not readily available, such as when the value of a security has been significantly affected by events after the close of the exchange or market on which the security is principally traded, but before the Fund calculates its net asset value, the Fund values these securities as determined in accordance with procedures approved by the Fund’s Board of Directors.
The Board of Directors is responsible for the valuation process and has delegated the supervision of the daily valuation process to the Legg Mason North Atlantic Fund Valuation Committee (the “Valuation Committee”). The Valuation Committee, pursuant to the policies
| | |
| 24 | | Western Asset Managed High Income Fund Inc. 2015 Semi-Annual Report |
adopted by the Board of Directors, is responsible for making fair value determinations, evaluating the effectiveness of the Fund’s pricing policies, and reporting to the Board of Directors. When determining the reliability of third party pricing information for investments owned by the Fund, the Valuation Committee, among other things, conducts due diligence reviews of pricing vendors, monitors the daily change in prices and reviews transactions among market participants.
The Valuation Committee will consider pricing methodologies it deems relevant and appropriate when making fair value determinations. Examples of possible methodologies include, but are not limited to, multiple of earnings; discount from market of a similar freely traded security; discounted cash-flow analysis; book value or a multiple thereof; risk premium/yield analysis; yield to maturity; and/or fundamental investment analysis. The Valuation Committee will also consider factors it deems relevant and appropriate in light of the facts and circumstances. Examples of possible factors include, but are not limited to, the type of security; the issuer’s financial statements; the purchase price of the security; the discount from market value of unrestricted securities of the same class at the time of purchase; analysts’ research and observations from financial institutions; information regarding any transactions or offers with respect to the security; the existence of merger proposals or tender offers affecting the security; the price and extent of public trading in similar securities of the issuer or comparable companies; and the existence of a shelf registration for restricted securities.
For each portfolio security that has been fair valued pursuant to the policies adopted by the Board of Directors, the fair value price is compared against the last available and next available market quotations. The Valuation Committee reviews the results of such back testing monthly and fair valuation occurrences are reported to the Board of Directors quarterly.
The Fund uses valuation techniques to measure fair value that are consistent with the market approach and/or income approach, depending on the type of security and the particular circumstance. The market approach uses prices and other relevant information generated by market transactions involving identical or comparable securities. The income approach uses valuation techniques to discount estimated future cash flows to present value.
GAAP establishes a disclosure hierarchy that categorizes the inputs to valuation techniques used to value assets and liabilities at measurement date. These inputs are summarized in the three broad levels listed below:
| • | | Level 1 — quoted prices in active markets for identical investments |
| • | | Level 2 — other significant observable inputs (including quoted prices for similar investments, interest rates, prepayment speeds, credit risk, etc.) |
| • | | Level 3 — significant unobservable inputs (including the Fund’s own assumptions in determining the fair value of investments) |
| | |
| Western Asset Managed High Income Fund Inc. 2015 Semi-Annual Report | | 25 |
Notes to financial statements (unaudited) (cont’d)
The inputs or methodologies used to value securities are not necessarily an indication of the risk associated with investing in those securities.
The following is a summary of the inputs used in valuing the Fund’s assets and liabilities carried at fair value:
| | | | | | | | | | | | | | | | |
| ASSETS | |
| Description | | Quoted Prices
(Level 1) | | | Other Significant
Observable Inputs
(Level 2) | | | Significant
Unobservable
Inputs
(Level 3) | | | Total | |
| Long-term investments†: | | | | | | | | | | | | | | | | |
Corporate bonds & notes: | | | | | | | | | | | | | | | | |
Consumer discretionary | | | — | | | $ | 35,072,896 | | | $ | 620,448 | | | $ | 35,693,344 | |
Materials | | | — | | | | 19,789,100 | | | | 0 | * | | | 19,789,100 | |
Utilities | | | — | | | | 5,942,767 | | | | 1,295,889 | | | | 7,238,656 | |
Other corporate bonds & notes | | | — | | | | 162,602,593 | | | | — | | | | 162,602,593 | |
Convertible bonds & notes | | | — | | | | 653,595 | | | | — | | | | 653,595 | |
Senior loans: | | | | | | | | | | | | | | | | |
Consumer discretionary | | | — | | | | 1,142,995 | | | | 619,150 | | | | 1,762,145 | |
Energy | | | — | | | | — | | | | 410,826 | | | | 410,826 | |
Utilities | | | — | | | | 630,787 | | | | 635,308 | | | | 1,266,095 | |
Other senior loans | | | — | | | | 2,171,988 | | | | — | | | | 2,171,988 | |
Common stocks: | | | | | | | | | | | | | | | | |
Consumer discretionary | | $ | 667,036 | | | | — | | | | 0 | * | | | 667,036 | |
Energy | | | — | | | | — | | | | 1,371,775 | | | | 1,371,775 | |
Health care | | | — | | | | — | | | | 730,400 | | | | 730,400 | |
Industrials | | | 672,578 | | | | — | | | | 379,798 | | | | 1,052,376 | |
Materials | | | — | | | | — | | | | 109,918 | | | | 109,918 | |
Other common stocks | | | 2,418,922 | | | | — | | | | — | | | | 2,418,922 | |
Convertible preferred stocks | | | — | | | | 353,763 | | | | — | | | | 353,763 | |
Preferred stocks | | | 4,208,175 | | | | — | | | | — | | | | 4,208,175 | |
Warrants | | | — | | | | — | | | | 245,840 | | | | 245,840 | |
| Total long-term investments | | $ | 7,966,711 | | | $ | 228,360,484 | | | $ | 6,419,352 | | | $ | 242,746,547 | |
| Short-term investments† | | | — | | | | 4,000,000 | | | | — | | | | 4,000,000 | |
| Total investments | | $ | 7,966,711 | | | $ | 232,360,484 | | | $ | 6,419,352 | | | $ | 246,746,547 | |
|
| LIABILITIES | |
| Description | | Quoted Prices
(Level 1) | | | Other Significant
Observable Inputs
(Level 2) | | | Significant
Unobservable
Inputs
(Level 3) | | | Total | |
| Other financial instruments: | | | | | | | | | | | | | | | | |
Forward foreign currency contracts | | | — | | | $ | 95,698 | | | | — | | | $ | 95,698 | |
| † | See Schedule of Investments for additional detailed categorizations. |
| * | Amount represents less than $1. |
| | |
| 26 | | Western Asset Managed High Income Fund Inc. 2015 Semi-Annual Report |
The following is a reconciliation of investments in which significant unobservable inputs (Level 3) were used in determining fair value:
| | | | | | | | | | | | |
| | | Corporate Bonds & Notes | |
| Investments in Securities | | Consumer
Discretionary | | | Materials | | | Utilities | |
| Balance as of February 28, 2015 | | $ | 958,848 | | | $ | 0 | * | | | — | |
| Accrued premiums/discounts | | | 8,015 | | | | — | | | | — | |
| Realized gain (loss)1 | | | 87 | | | | — | | | | — | |
| Change in unrealized appreciation (depreciation)2 | | | 61,780 | | | | — | | | | — | |
| Purchases | | | 66,370 | | | | — | | | | — | |
| Sales | | | (474,652) | | | | — | | | | — | |
| Transfers into Level 33 | | | — | | | | — | | | $ | 1,295,889 | |
| Transfers out of Level 3 | | | — | | | | — | | | | — | |
| Balance as of August 31, 2015 | | $ | 620,448 | | | $ | 0 | * | | $ | 1,295,889 | |
| Net change in unrealized appreciation (depreciation) for investments in securities still held at August 31, 20152 | | $ | 65,642 | | | | — | | | | — | |
| |
| | | Senior Loans | |
| Investments in Securities (cont’d) | | Consumer
Discretionary | | | Energy | | | Utilities | |
| Balance as of February 28, 2015 | | | — | | | | — | | | | — | |
| Accrued premiums/discounts | | $ | 64 | | | | — | | | $ | 616 | |
| Realized gain (loss)1 | | | — | | | | — | | | | 32 | |
| Change in unrealized appreciation (depreciation)2 | | | 12,136 | | | | — | | | | (10,490) | |
| Purchases | | | 606,950 | | | | — | | | | 646,800 | |
| Sales | | | — | | | | — | | | | (1,650) | |
| Transfers into Level 33 | | | — | | | $ | 410,826 | | | | — | |
| Transfers out of Level 3 | | | — | | | | — | | | | — | |
| Balance as of August 31, 2015 | | $ | 619,150 | | | $ | 410,826 | | | $ | 635,308 | |
| Net change in unrealized appreciation (depreciation) for investments in securities still held at August 31, 20152 | | $ | 12,136 | | | | — | | | $ | (10,490) | |
| | | | | | | | | | | | | | | | | | | | | | | | | | | | |
| | | Common Stocks | | | Warrants | | | | |
Investments in Securities
(cont’d) | | Consumer
Discretionary | | | Energy | | | Health Care | | | Industrials | | | Materials | | | | | | Total | |
| Balance as of February 28, 2015 | | $ | 0 | * | | $ | 928,656 | | | $ | 730,400 | | | $ | 768,435 | | | | — | | | | — | | | $ | 3,386,339 | |
| Accrued premiums/discounts | | | — | | | | — | | | | — | | | | — | | | | — | | | | — | | | | 8,695 | |
| Realized gain (loss)1 | | | — | | | | — | | | | — | | | | — | | | | — | | | | — | | | | 119 | |
| Change in unrealized appreciation (depreciation)2 | | | — | | | | 443,119 | | | | — | | | | (388,637) | | | | — | | | | — | | | | 117,908 | |
| Purchases | | | — | | | | — | | | | — | | | | — | | | | — | | | | — | | | | 1,320,120 | |
| Sales | | | — | | | | — | | | | — | | | | — | | | | — | | | | — | | | | (476,302) | |
| Transfers into Level 33 | | | — | | | | — | | | | — | | | | — | | | $ | 109,918 | | | $ | 245,840 | | | | 2,062,473 | |
| Transfers out of Level 3 | | | — | | | | — | | | | — | | | | — | | | | — | | | | — | | | | — | |
| Balance as of August 31, 2015 | | $ | 0 | * | | $ | 1,371,775 | | | $ | 730,400 | | | $ | 379,798 | | | $ | 109,918 | | | $ | 245,840 | | | $ | 6,419,352 | |
| Net change in unrealized appreciation (depreciation) for investments in securities still held at August 31, 20152 | | | — | | | $ | 443,119 | | | | — | | | $ | (388,637) | | | | — | | | | — | | | $ | 121,770 | |
| | |
| Western Asset Managed High Income Fund Inc. 2015 Semi-Annual Report | | 27 |
Notes to financial statements (unaudited) (cont’d)
The Fund’s policy is to recognize transfers between levels as of the end of the reporting period.
| * | Amount represents less than $1. |
| 1 | This amount is included in net realized gain (loss) from investment transactions in the accompanying Statement of Operations. |
| 2 | This amount is included in the change in net unrealized appreciation (depreciation) in the accompanying Statement of Operations. Change in unrealized appreciation (depreciation) includes net unrealized appreciation (depreciation) resulting from changes in investment values during the reporting period and the reversal of previously recorded unrealized appreciation (depreciation) when gains or losses are realized. |
| 3 | Transferred into Level 3 as a result of the unavailability of a quoted price in an active market for an identical investment or the unavailability of other significant observable inputs. |
(b) Repurchase agreements. The Fund may enter into repurchase agreements with institutions that its subadviser has determined are creditworthy. Each repurchase agreement is recorded at cost. Under the terms of a typical repurchase agreement, the Fund acquires a debt security subject to an obligation of the seller to repurchase, and of the Fund to resell, the security at an agreed-upon price and time, thereby determining the yield during the Fund’s holding period. When entering into repurchase agreements, it is the Fund’s policy that its custodian or a third party custodian, acting on the Fund’s behalf, take possession of the underlying collateral securities, the market value of which, at all times, at least equals the principal amount of the repurchase transaction, including accrued interest. To the extent that any repurchase transaction maturity exceeds one business day, the value of the collateral is marked-to-market and measured against the value of the agreement in an effort to ensure the adequacy of the collateral. If the counterparty defaults, the Fund generally has the right to use the collateral to satisfy the terms of the repurchase transaction. However, if the market value of the collateral declines during the period in which the Fund seeks to assert its rights or if bankruptcy proceedings are commenced with respect to the seller of the security, realization of the collateral by the Fund may be delayed or limited.
(c) Futures contracts. The Fund uses futures contracts generally to gain exposure to, or hedge against, changes in interest rates or gain exposure to, or hedge against, changes in certain asset classes. A futures contract represents a commitment for the future purchase or sale of an asset at a specified price on a specified date.
Upon entering into a futures contract, the Fund is required to deposit cash or cash equivalents with a broker in an amount equal to a certain percentage of the contract amount. This is known as the ‘‘initial margin’’ and subsequent payments (‘‘variation margin’’) are made or received by the Fund each day, depending on the daily fluctuation in the value of the contract. For certain futures, including foreign denominated futures, variation margin is not settled daily, but is recorded as a net variation margin payable or receivable. The daily changes in contract value are recorded as unrealized gains or losses in the Statement of Operations and the Fund recognizes a realized gain or loss when the contract is closed.
Futures contracts involve, to varying degrees, risk of loss in excess of the amounts reflected in the financial statements. In addition, there is the risk that the Fund may not be able to enter into a closing transaction because of an illiquid secondary market.
| | |
| 28 | | Western Asset Managed High Income Fund Inc. 2015 Semi-Annual Report |
(d) Forward foreign currency contracts. The Fund enters into a forward foreign currency contract to hedge against foreign currency exchange rate risk on its non-U.S. dollar denominated securities or to facilitate settlement of a foreign currency denominated portfolio transaction. A forward foreign currency contract is an agreement between two parties to buy and sell a currency at a set price with delivery and settlement at a future date. The contract is marked-to-market daily and the change in value is recorded by the Fund as an unrealized gain or loss. When a forward foreign currency contract is closed, through either delivery or offset by entering into another forward foreign currency contract, the Fund recognizes a realized gain or loss equal to the difference between the value of the contract at the time it was opened and the value of the contract at the time it is closed.
Forward foreign currency contracts involve elements of market risk in excess of the amounts reflected on the Statement of Assets and Liabilities. The Fund bears the risk of an unfavorable change in the foreign exchange rate underlying the forward foreign currency contract. Risks may also arise upon entering into these contracts from the potential inability of the counterparties to meet the terms of their contracts.
(e) Foreign currency translation. Investment securities and other assets and liabilities denominated in foreign currencies are translated into U.S. dollar amounts based upon prevailing exchange rates on the date of valuation. Purchases and sales of investment securities and income and expense items denominated in foreign currencies are translated into U.S. dollar amounts based upon prevailing exchange rates on the respective dates of such transactions.
The Fund does not isolate that portion of the results of operations resulting from fluctuations in foreign exchange rates on investments from the fluctuations arising from changes in market prices of securities held. Such fluctuations are included with the net realized and unrealized gain or loss on investments.
Net realized foreign exchange gains or losses arise from sales of foreign currencies, including gains and losses on forward foreign currency contracts, currency gains or losses realized between the trade and settlement dates on securities transactions, and the difference between the amounts of dividends, interest, and foreign withholding taxes recorded on the Fund’s books and the U.S. dollar equivalent of the amounts actually received or paid. Net unrealized foreign exchange gains and losses arise from changes in the values of assets and liabilities, other than investments in securities, on the date of valuation, resulting from changes in exchange rates.
Foreign security and currency transactions may involve certain considerations and risks not typically associated with those of U.S. dollar denominated transactions as a result of, among other factors, the possibility of lower levels of governmental supervision and regulation of foreign securities markets and the possibility of political or economic instability.
(f) Loan participations. The Fund may invest in loans arranged through private negotiation between one or more financial institutions. The Fund’s investment in any such
| | |
| Western Asset Managed High Income Fund Inc. 2015 Semi-Annual Report | | 29 |
Notes to financial statements (unaudited) (cont’d)
loan may be in the form of a participation in or an assignment of the loan. In connection with purchasing participations, the Fund generally will have no right to enforce compliance by the borrower with the terms of the loan agreement related to the loan, or any rights of off-set against the borrower and the Fund may not benefit directly from any collateral supporting the loan in which it has purchased the participation.
The Fund assumes the credit risk of the borrower, the lender that is selling the participation and any other persons interpositioned between the Fund and the borrower. In the event of the insolvency of the lender selling the participation, the Fund may be treated as a general creditor of the lender and may not benefit from any off-set between the lender and the borrower.
(g) Unfunded loan commitments. The Fund may enter into certain credit agreements where all or a portion of which may be unfunded. The Fund is obligated to fund these commitments at the borrower’s discretion. The commitments are disclosed in the accompanying Schedule of Investments. At August 31, 2015, the Fund had sufficient cash and/or securities to cover these commitments.
(h) Credit and market risk. The Fund invests in high-yield instruments that are subject to certain credit and market risks. The yields of high-yield obligations reflect, among other things, perceived credit and market risks. The Fund’s investments in securities rated below investment grade typically involve risks not associated with higher rated securities including, among others, greater risk related to timely and ultimate payment of interest and principal, greater market price volatility and less liquid secondary market trading.
(i) Foreign investment risks. The Fund’s investments in foreign securities may involve risks not present in domestic investments. Since securities may be denominated in foreign currencies, may require settlement in foreign currencies or pay interest or dividends in foreign currencies, changes in the relationship of these foreign currencies to the U.S. dollar can significantly affect the value of the investments and earnings of the Fund. Foreign investments may also subject the Fund to foreign government exchange restrictions, expropriation, taxation or other political, social or economic developments, all of which affect the market and/or credit risk of the investments.
(j) Counterparty risk and credit-risk-related contingent features of derivative instruments. The Fund may invest in certain securities or engage in other transactions, where the Fund is exposed to counterparty credit risk in addition to broader market risks. The Fund may invest in securities of issuers, which may also be considered counterparties as trading partners in other transactions. This may increase the risk of loss in the event of default or bankruptcy by the counterparty or if the counterparty otherwise fails to meet its contractual obligations. The Fund’s investment manager attempts to mitigate counterparty risk by (i) periodically assessing the creditworthiness of its trading partners, (ii) monitoring and/or limiting the amount of its net exposure to each individual counterparty based on its assessment and (iii) requiring collateral from the counterparty for certain transactions. Market events and changes in overall economic conditions may impact the assessment of
| | |
| 30 | | Western Asset Managed High Income Fund Inc. 2015 Semi-Annual Report |
such counterparty risk by the investment manager. In addition, declines in the values of underlying collateral received may expose the Fund to increased risk of loss.
The Fund has entered into master agreements with certain of its derivative counterparties that provide for general obligations, representations, agreements, collateral, events of default or termination and credit related contingent features. The credit related contingent features include, but are not limited to, a percentage decrease in the Fund’s net assets or NAV over a specified period of time. If these credit related contingent features were triggered, the derivatives counterparty could terminate the positions and demand payment or require additional collateral.
Collateral requirements differ by type of derivative. Collateral or margin requirements are set by the broker or exchange clearinghouse for exchange traded derivatives while collateral terms are contract specific for over-the-counter traded derivatives. Cash collateral that has been pledged to cover obligations of the Fund under derivative contracts, if any, will be reported separately in the Statement of Assets and Liabilities. Securities pledged as collateral, if any, for the same purpose are noted in the Schedule of Investments.
Absent an event of default by the counterparty or a termination of the agreement, the terms of the master agreements do not result in an offset of reported amounts of financial assets and financial liabilities in the Statement of Assets and Liabilities across transactions between the Fund and the applicable counterparty. The enforceability of the right to offset may vary by jurisdiction.
As of August 31, 2015, the Fund held forward foreign currency contracts with credit related contingent features which had a liability position of $95,698. If a contingent feature in the master agreements would have been triggered, the Fund would have been required to pay this amount to its derivatives counterparties.
(k) Security transactions and investment income. Security transactions are accounted for on a trade date basis. Interest income, adjusted for amortization of premium and accretion of discount, is recorded on the accrual basis. Dividend income is recorded on the ex-dividend date. Foreign dividend income is recorded on the ex-dividend date or as soon as practicable after the Fund determines the existence of a dividend declaration after exercising reasonable due diligence. The cost of investments sold is determined by use of the specific identification method. To the extent any issuer defaults or a credit event occurs that impacts the issuer, the Fund may halt any additional interest income accruals and consider the realizability of interest accrued up to the date of default or credit event.
(l) Distributions to shareholders. Distributions from net investment income of the Fund, if any, are declared quarterly and paid on a monthly basis. The actual source of the Fund’s monthly distributions may be from net investment income, return of capital or a combination of both. Shareholders will be informed of the tax characteristics of the distributions after the close of the fiscal year. Distributions of net realized gains, if any, are declared at least annually. Distributions to shareholders of the Fund are recorded on the ex-dividend date and are determined in accordance with income tax regulations, which may differ from GAAP.
| | |
| Western Asset Managed High Income Fund Inc. 2015 Semi-Annual Report | | 31 |
Notes to financial statements (unaudited) (cont’d)
(m) Compensating balance arrangements. The Fund has an arrangement with its custodian bank whereby a portion of the custodian’s fees is paid indirectly by credits earned on the Fund’s cash on deposit with the bank.
(n) Federal and other taxes. It is the Fund’s policy to comply with the federal income and excise tax requirements of the Internal Revenue Code of 1986 (the “Code”), as amended, applicable to regulated investment companies. Accordingly, the Fund intends to distribute its taxable income and net realized gains, if any, to shareholders in accordance with timing requirements imposed by the Code. Therefore, no federal or state income tax provision is required in the Fund’s financial statements.
Management has analyzed the Fund’s tax positions taken on income tax returns for all open tax years and has concluded that as of August 31, 2015, no provision for income tax is required in the Fund’s financial statements. The Fund’s federal and state income and federal excise tax returns for tax years for which the applicable statutes of limitations have not expired are subject to examination by the Internal Revenue Service and state departments of revenue.
(o) Reclassification. GAAP requires that certain components of net assets be reclassified to reflect permanent differences between financial and tax reporting. These reclassifications have no effect on net assets or net asset value per share.
2. Investment management agreement and other transactions with affiliates
Legg Mason Partners Fund Advisor, LLC (“LMPFA”) is the Fund’s investment manager. Western Asset Management Company (“Western Asset”) and Western Asset Management Company Limited (“Western Asset Limited”) are the Fund’s subadvisers. LMPFA, Western Asset and Western Asset Limited are wholly-owned subsidiaries of Legg Mason, Inc. (“Legg Mason”).
LMPFA provides administrative and certain oversight services to the Fund. The Fund pays an investment management fee, calculated daily and paid monthly, at an annual rate of 0.80% of the Fund’s average daily net assets.
LMPFA delegates to Western Asset the day-to-day portfolio management of the Fund. Western Asset Limited provides certain subadvisory services to the Fund relating to currency transactions and investments in non-U.S. dollar denominated debt securities. Western Asset Limited does not receive any compensation from the Fund and is paid by Western Asset for its services to the Fund. For its services, LMPFA pays Western Asset 70% of the net management fee it receives from the Fund. In turn, Western Asset pays Western Asset Limited a sub-advisory fee of 0.30% on the assets managed by Western Asset Limited.
All officers and one Director of the Fund are employees of Legg Mason or its affiliates and do not receive compensation from the Fund.
| | |
| 32 | | Western Asset Managed High Income Fund Inc. 2015 Semi-Annual Report |
3. Investments
During the six months ended August 31, 2015, the aggregate cost of purchases and proceeds from sales of investments (excluding short-term investments) were as follows:
| | | | |
| Purchases | | $ | 74,461,328 | |
| Sales | | | 87,409,953 | |
At August 31, 2015, the aggregate gross unrealized appreciation and depreciation of investments for federal income tax purposes were substantially as follows:
| | | | |
| Gross unrealized appreciation | | $ | 9,798,226 | |
| Gross unrealized depreciation | | | (20,273,279) | |
| Net unrealized depreciation | | $ | (10,475,053) | |
At August 31, 2015, the Fund had the following open forward foreign currency contracts:
| | | | | | | | | | | | | | | | | | | | |
Currency
Purchased | | | Currency
Sold | | | Counterparty | | Settlement
Date | | | Unrealized
Depreciation | |
| USD | | | 2,636,533 | | | EUR | | | 2,426,406 | | | Citibank N.A. | | | 11/13/15 | | | $ | (89,366) | |
| USD | | | 291,917 | | | EUR | | | 265,481 | | | Royal Bank of Scotland PLC | | | 11/13/15 | | | | (6,332) | |
| Total | | | | | | | | | | | | | | | $ | (95,698) | |
| | |
Abbreviations used in this table: |
| EUR | | — Euro |
| USD | | — United States Dollar |
4. Derivative instruments and hedging activities
Below is a table, grouped by derivative type, that provides information about the fair value and the location of derivatives within the Statement of Assets and Liabilities at August 31, 2015.
| | | | |
| LIABILITY DERIVATIVES1 | |
| | | Foreign
Exchange Risk | |
| Forward foreign currency contracts | | $ | 95,698 | |
| 1 | Generally, the balance sheet location for asset derivatives is receivables/net unrealized appreciation (depreciation) and for liability derivatives is payables/net unrealized appreciation (depreciation). |
The following tables provide information about the effect of derivatives and hedging activities on the Fund’s Statement of Operations for the six months ended August 31, 2015. The first table provides additional detail about the amounts and sources of gains (losses) realized on derivatives during the period. The second table provides additional information about the change in unrealized appreciation (depreciation) resulting from the Fund’s derivatives and hedging activities during the period.
| | | | | | | | | | | | |
| AMOUNT OF REALIZED GAIN (LOSS) ON DERIVATIVES RECOGNIZED | |
| | | Interest
Rate Risk | | | Foreign
Exchange Risk | | | Total | |
| Futures contracts | | $ | (58,751) | | | | — | | | $ | (58,751) | |
| Forward foreign currency contracts1 | | | — | | | $ | 312,160 | | | | 312,160 | |
| Total | | $ | (58,751) | | | $ | 312,160 | | | $ | 253,409 | |
| 1 | Net realized gain (loss) from forward foreign currency contracts is reported in net realized gain (loss) from foreign currency transactions in the Statement of Operations. |
| | |
| Western Asset Managed High Income Fund Inc. 2015 Semi-Annual Report | | 33 |
Notes to financial statements (unaudited) (cont’d)
| | | | | | | | | | | | |
| CHANGE IN UNREALIZED APPRECIATION (DEPRECIATION) ON DERIVATIVES RECOGNIZED | |
| | | Interest
Rate Risk | | | Foreign
Exchange Risk | | | Total | |
| Futures contracts | | $ | 21,262 | | | | — | | | $ | 21,262 | |
| Forward foreign currency contracts1 | | | — | | | $ | (209,959) | | | | (209,959) | |
| Total | | $ | 21,262 | | | $ | (209,959) | | | $ | (188,697) | |
| 1 | The change in unrealized appreciation (depreciation) from forward foreign currency contracts is reported in the change in net unrealized appreciation (depreciation) from foreign currencies in the Statement of Operations. |
During the six months ended August 31, 2015, the volume of derivative activity for the Fund was as follows:
| | | | |
| | | Average Market
Value | |
| Futures contracts (to sell)† | | $ | 1,283,516 | |
| Forward foreign currency contracts (to buy)† | | | 511,695 | |
| Forward foreign currency contracts (to sell) | | | 4,374,207 | |
| † | At August 31, 2015, there were no open positions held in this derivative. |
The following table presents by financial instrument, the Fund’s derivative liabilities net of the related collateral pledged by the Fund at August 31, 2015:
| | | | | | | | | | |
| | | Gross Amount of Derivative
Liabilities in the Statement of
Assets and Liabilities1 | | | Collateral
Pledged | | Net
Amount | |
| Forward foreign currency contracts | | $ | 95,698 | | | — | | $ | 95,698 | |
| 1 | Absent an event of default or early termination, derivative assets and liabilities are presented gross and not offset in the Statement of Assets and Liabilities. |
5. Distributions subsequent to August 31, 2015
The following distributions have been declared by the Fund’s Board of Directors and are payable subsequent to the period end of this report:
| | | | | | | | |
| Record Date | | Payable Date | | | Amount | |
| 9/18/2015 | | | 9/25/2015 | | | $ | 0.0345 | |
| 10/23/2015 | | | 10/30/2015 | | | $ | 0.0345 | |
| 11/20/2015 | | | 11/27/2015 | | | $ | 0.0345 | |
6. Capital loss carryforward
As of February 28, 2015, the Fund had the following net capital loss carryforwards remaining:
| | | | |
| Year of Expiration | | Amount | |
| 2/28/2017 | | $ | (6,640,949) | |
| 2/28/2018 | | | (35,714,593) | |
| 2/28/2019 | | | (5,212,866) | |
| | | $ | (47,568,408) | |
These amounts will be available to offset any future taxable capital gains, except that under applicable tax rules, deferred capital losses of $3,750,476, which have no expiration date, must be used first to offset any such gains.
| | |
| 34 | | Western Asset Managed High Income Fund Inc. 2015 Semi-Annual Report |
Additional shareholder information (unaudited)
Results of annual meeting of shareholders
The Annual Meeting of Shareholders of Western Asset Managed High Income Fund Inc. was held on August 21, 2015, for the purpose of considering and voting upon the election of Directors. The following table provides information concerning the matter voted upon at the meeting:
Election of directors
| | | | | | | | |
| Nominees | | Votes For | | | Votes
Withheld | |
| Robert D. Agdern | | | 39,573,902 | | | | 2,210,305 | |
| Daniel P. Cronin | | | 39,696,702 | | | | 2,087,505 | |
| Jane Trust* | | | 39,595,532 | | | | 2,188,675 | |
At August 31, 2015, in addition to Robert D. Agdern, Daniel P. Cronin and Jane Trust, the other Directors of the Fund were as follows:
Carol L. Colman
Paolo M. Cucchi
Leslie H. Gelb
William R. Hutchinson
Eileen A. Kamerick
Riordan Roett
| * | Effective August 1, 2015, Jane Trust was appointed by the Board to the position of Chairman, President and Chief Executive of the Fund. |
| | |
| Western Asset Managed High Income Fund Inc. | | 35 |
Dividend reinvestment plan (unaudited)
Under the Fund’s Dividend Reinvestment Plan (“Plan”), a shareholder whose shares of Common Stock are registered in his own name will have all distributions from the Fund reinvested automatically by American Stock Transfer & Trust Company (“AST”), as agent under the Plan, unless the shareholder elects to receive cash. Distributions with respect to shares registered in the name of a broker-dealer or other nominee (that is, in “street name”) will be reinvested by the broker or nominee in additional shares under the Plan, unless the service is not provided by the broker or nominee or the shareholder elects to receive distributions in cash. Investors who own Common Stock registered in street name should consult their broker-dealers for details regarding reinvestment. All distributions to Fund shareholders who do not participate in the Plan will be paid by check mailed directly to the record holder by or under the direction of AST as dividend-paying agent.
If the Fund declares a dividend or capital gains distribution payable either in shares of Common Stock or in cash, shareholders who are not Plan participants will receive cash, and Plan participants will receive the equivalent amount in shares of Common Stock. When the market price of the Common Stock is equal to or exceeds the net asset value per share of the Common Stock on the Valuation Date (as defined below), Plan participants will be issued shares of Common Stock valued at the net asset value most recently determined or, if net asset value is less than 95% of the then current market price of the Common Stock, then at 95% of the market value. The Valuation Date is the dividend or capital gains distribution record date or, if that date is not a New York Stock Exchange (“NYSE”) trading day, the immediately preceding trading day.
If the market price of the Common Stock is less than the net asset value of the Common Stock, a broker-dealer not affiliated with Legg Mason, Inc., as purchasing agent for Plan participants (“Purchasing Agent”), will buy Common Stock in the open market, on the NYSE or elsewhere, for the participants’ accounts. If, following the commencement of the purchases and before the Purchasing Agent has completed its purchases, the market price exceeds the net asset value of the Common Stock, the average per share purchase price paid by the Purchasing Agent may exceed the net asset value of the Common Stock, resulting in the acquisition of fewer shares than if the dividend or capital gains distribution had been paid in Common Stock issued by the Fund at net asset value. Additionally, if the market price exceeds the net asset value of shares before the Purchasing Agent has completed its purchases, the Purchasing Agent is permitted to cease purchasing shares and the Fund may issue the remaining shares at a price equal to the greater of (a) net asset value or (b) 95% of the then current market price. In a case where the Purchasing Agent has terminated open market purchases and the Fund has issued the remaining shares, the number of shares received by the participant in respect of the cash dividend or distribution will be based on the weighted average of prices paid for shares purchased in the open market and the price at which the Fund issues the remaining shares. AST will apply all cash received as a dividend or capital gains distribution to purchase Common Stock on the open market as soon as practicable after the payable date of the dividend or capital gains distribution, but in no event later than 30 days after that date, except when necessary to comply with applicable provisions of the federal securities laws.
| | |
| 36 | | Western Asset Managed High Income Fund Inc. |
AST will maintain all shareholder accounts in the Plan and will furnish written confirmations of all transactions in each account, including information needed by a shareholder for personal and tax records. The automatic reinvestment of dividends and capital gains distributions will not relieve Plan participants of any income tax that may be payable on the dividends or capital gains distributions. Common Stock in the account of each Plan participant will be held by AST on behalf of the Plan participant, and each shareholder’s proxy will include those shares purchased pursuant to the Plan.
Plan participants are subject to no charge for reinvesting dividends and capital gains distributions. AST’s fees for handling the reinvestment of dividends and capital gains distributions will be paid by the Fund. No brokerage charges apply with respect to shares of Common Stock issued directly by the Fund as a result of dividends or capital gains distributions payable either in Common Stock or in cash. Each Plan participant will, however, bear a proportionate share of brokerage commissions incurred with respect to open market purchases made in connection with the reinvestment of dividends or capital gains distributions.
Experience under the Plan may indicate that changes to it are desirable. The Fund reserves the right to amend or terminate the Plan as applied to any dividend or capital gains distribution paid subsequent to written notice of the change sent to participants at least 30 days before the record date for the dividend or capital gains distribution. The Plan also may be amended or terminated by AST, with the Fund’s prior written consent, on at least 30 days’ written notice to Plan participants. All correspondence concerning the Plan should be directed by mail to American Stock Transfer & Trust Company, 6201 15th Avenue, Brooklyn, New York 11219 or by telephone at 1-888-888-0151.
| | |
| Western Asset Managed High Income Fund Inc. | | 37 |
Western Asset
Managed High Income Fund Inc.
Directors
Robert D. Agdern
Carol L. Colman
Daniel P. Cronin
Paolo M. Cucchi
Leslie H. Gelb
William R. Hutchinson
Eileen A. Kamerick
Riordan Roett
Jane Trust*
Chairman
Officers
Jane Trust*
President and Chief Executive Officer
Richard F. Sennett
Principal Financial Officer
Ted P. Becker
Chief Compliance Officer
Vanessa A. Williams
Identity Theft Prevention Officer
Robert I. Frenkel
Secretary and Chief Legal Officer
Thomas Mandia
Assistant Secretary
Steven Frank
Treasurer
Jeanne M. Kelly
Senior Vice President
| * | Effective August 1, 2015, Ms. Trust became Chairman, President and Chief Executive Officer. |
Western Asset Managed High Income Inc.
620 Eighth Avenue
49th Floor
New York, NY 10018
Investment manager
Legg Mason Partners Fund Advisor, LLC
Subadvisers
Western Asset Management Company Western Asset Management Company Limited
Custodian
State Street Bank and Trust Company
1 Lincoln Street
Boston, MA 02111
Transfer agent
American Stock Transfer & Trust Company
6201 15th Avenue
Brooklyn, NY 11219
Independent registered public accounting firm
KPMG LLP
345 Park Avenue
New York, NY 10154
Legal counsel
Simpson Thacher & Bartlett LLP
425 Lexington Avenue
New York, NY 10017
New York Stock Exchange Symbol
MHY
Legg Mason Funds Privacy and Security Notice
Your Privacy and the Security of Your Personal Information is Very Important to the Legg Mason Funds
This Privacy and Security Notice (the “Privacy Notice”) addresses the Legg Mason Funds’ privacy and data protection practices with respect to nonpublic personal information the Funds receive. The Legg Mason Funds include any funds sold by the Funds’ distributor, Legg Mason Investor Services, LLC, as well as Legg Mason-sponsored closed-end funds and certain closed-ends funds managed or sub-advised by Legg Mason or its affiliates. The provisions of this Privacy Notice apply to your information both while you are a shareholder and after you are no longer invested with the Funds.
The Type of Nonpublic Personal Information the Funds Collect About You
The Funds collect and maintain nonpublic personal information about you in connection with your shareholder account. Such information may include, but is not limited to:
| • | | Personal information included on applications or other forms; |
| • | | Account balances, transactions, and mutual fund holdings and positions; |
| • | | Online account access user IDs, passwords, security challenge question responses; and |
| • | | Information received from consumer reporting agencies regarding credit history and creditworthiness (such as the amount of an individual’s total debt, payment history, etc.). |
How the Funds Use Nonpublic Personal Information About You
The Funds do not sell or share your nonpublic personal information with third parties or with affiliates for their marketing purposes, or with other financial institutions or affiliates for joint marketing purposes, unless you have authorized the Funds to do so. The Funds do not disclose any nonpublic personal information about you except as may be required to perform transactions or services you have authorized or as permitted or required by law. The Funds may disclose information about you to:
| • | | Employees, agents, and affiliates on a “need to know” basis to enable the Funds to conduct ordinary business or comply with obligations to government regulators; |
| • | | Service providers, including the Funds’ affiliates, who assist the Funds as part of the ordinary course of business (such as printing, mailing services, or processing or servicing your account with us) or otherwise perform services on the Funds’ behalf, including companies that may perform marketing services solely for the Funds; |
| • | | The Funds’ representatives such as legal counsel, accountants and auditors; and |
| • | | Fiduciaries or representatives acting on your behalf, such as an IRA custodian or trustee of a grantor trust. |
|
| NOT PART OF THE SEMI-ANNUAL REPORT |
Legg Mason Funds Privacy and Security Notice (cont’d)
Except as otherwise permitted by applicable law, companies acting on the Funds’ behalf are contractually obligated to keep nonpublic personal information the Funds provide to them confidential and to use the information the Funds share only to provide the services the Funds ask them to perform.
The Funds may disclose nonpublic personal information about you when necessary to enforce their rights or protect against fraud, or as permitted or required by applicable law, such as in connection with a law enforcement or regulatory request, subpoena, or similar legal process. In the event of a corporate action or in the event a Fund service provider changes, the Funds may be required to disclose your nonpublic personal information to third parties. While it is the Funds’ practice to obtain protections for disclosed information in these types of transactions, the Funds cannot guarantee their privacy policy will remain unchanged.
Keeping You Informed of the Funds’ Privacy and Security Practices
The Funds will notify you annually of their privacy policy as required by federal law. While the Funds reserve the right to modify this policy at any time they will notify you promptly if this privacy policy changes.
The Funds’ Security Practices
The Funds maintain appropriate physical, electronic and procedural safeguards designed to guard your nonpublic personal information. The Funds’ internal data security policies restrict access to your non-public personal information to authorized employees, who may use your nonpublic personal information for Fund business purposes only.
Although the Funds strive to protect your nonpublic personal information, they cannot ensure or warrant the security of any information you provide or transmit to them, and you do so at your own risk. In the event of a breach of the confidentiality or security of your nonpublic personal information, the Funds will attempt to notify you as necessary so you can take appropriate protective steps. If you have consented to the Funds using electronic communications or electronic delivery of statements, they may notify you under such circumstances using the most current email address you have on record with them.
In order for the Funds to provide effective service to you, keeping your account information accurate is very important. If you believe that your account information is incomplete, not accurate or not current, or if you have questions about the Funds’ privacy practices, write the Funds using the contact information on your account statements, email the Funds by clicking on the Contact Us section of the Funds’ website at www.leggmason.com, or contact the Fund at 1-888-777-0102.
|
| NOT PART OF THE SEMI-ANNUAL REPORT |
Western Asset Managed High Income Fund Inc.
Western Asset Managed High Income Fund Inc.
620 Eighth Avenue
49th Floor
New York, NY 10018
Notice is hereby given in accordance with Section 23(c) of the Investment Company Act of 1940, as amended, that from time to time the Fund may purchase at market price shares of its common stock in the open market.
The Fund files its complete schedule of portfolio holdings with the Securities and Exchange Commission (“SEC”) for the first and third quarters of each fiscal year on Form N-Q. The Fund’s Forms N-Q are available on the SEC’s website at www.sec.gov. The Fund’s Forms N-Q may be reviewed and copied at the SEC’s Public Reference Room in Washington, D.C., and information on the operation of the Public Reference Room may be obtained by calling 1-800-SEC-0330. To obtain information on Form N-Q from the Fund, shareholders can call 1-888-777-0102.
Information on how the Fund voted proxies relating to portfolio securities during the prior 12-month period ended June 30th of each year and a description of the policies and procedures that the Fund uses to determine how to vote proxies related to portfolio transactions are available (1) without charge, upon request, by calling 1-888-777-0102, (2) on the Fund’s website at www.lmcef.com and (3) on the SEC’s website at www.sec.gov.
This report is transmitted to the shareholders of Western Asset Managed High Income Fund Inc. for their information. This is not a prospectus, circular or representation intended for use in the purchase of shares of the Fund or any securities mentioned in this report.
American Stock Transfer & Trust Company
6201 15th Avenue
Brooklyn, NY 11219
WASX010337 10/15 SR15-2584
Not Applicable.
| ITEM 3. | AUDIT COMMITTEE FINANCIAL EXPERT. |
Not Applicable.
| ITEM 4. | PRINCIPAL ACCOUNTANT FEES AND SERVICES. |
Not Applicable.
| ITEM 5. | AUDIT COMMITTEE OF LISTED REGISTRANTS. |
Not Applicable.
| ITEM 6. | SCHEDULE OF INVESTMENTS. |
Included herein under Item 1.
| ITEM 7. | DISCLOSURE OF PROXY VOTING POLOCIES AND PROCEDURES FOR CLOSED-END MANAGEMENT INVESTMENT COMPANIES. |
Not Applicable.
| ITEM 8 | INVESTMENT PROFESSIONALS OF CLOSED-END MANAGEMENT INVESTMENT COMPANIES. |
Not Applicable.
| ITEM 9. | PURCHASES OF EQUITY SECURITIES BY CLOSED-END MANAGEMENT INVESTMENT COMPANY AND AFFILIATED PURCHASERS. |
Not Applicable.
| ITEM 10. | SUBMISSION OF MATTERS TO A VOTE OF SECURITY HOLDERS. |
Not Applicable.
| ITEM 11. | CONTROLS AND PROCEDURES. |
| | (a) | The registrant’s principal executive officer and principal financial officer have concluded that the registrant’s disclosure controls and procedures (as defined in Rule 30a- 3(c) under the Investment Company Act of 1940, as amended (the “1940 Act”)) are effective as of a date within 90 days of the filing date of this report that includes the disclosure required by this paragraph, based on their evaluation of the disclosure controls and procedures required by Rule 30a-3(b) under the 1940 Act and 15d-15(b) under the Securities Exchange Act of 1934. |
| | (b) | There were no changes in the registrant’s internal control over financial reporting (as defined in Rule 30a-3(d) under the 1940 Act) that occurred during the second fiscal quarter of the period covered by this report that have materially affected, or are likely to materially affect the registrant’s internal control over financial reporting. |
(a) (1) Not Applicable.
Exhibit 99.CODE ETH
(a) (2) Certifications pursuant to section 302 of the Sarbanes-Oxley Act of 2002 attached hereto.
Exhibit 99.CERT
(b) Certifications pursuant to Section 906 of the Sarbanes-Oxley Act of 2002 attached hereto.
Exhibit 99.906CERT
SIGNATURES
Pursuant to the requirements of the Securities Exchange Act of 1934 and the Investment Company Act of 1940, the registrant has duly caused this Report to be signed on its behalf by the undersigned, there unto duly authorized.
Western Asset Managed High Income Fund Inc.
| | |
| By: | | /s/ Jane Trust |
| | Jane Trust |
| | Chief Executive Officer |
| |
| Date: | | October 22, 2015 |
Pursuant to the requirements of the Securities Exchange Act of 1934 and the Investment Company Act of 1940, this report has been signed below by the following persons on behalf of the registrant and in the capacities and on the dates indicated.
| | |
| By: | | /s/ Jane Trust |
| | Jane Trust |
| | Chief Executive Officer |
| |
| Date: | | October 22, 2015 |
| |
| By: | | /s/ Richard F. Sennett |
| | Richard F. Sennett |
| | Principal Financial Officer |
| |
| Date: | | October 22, 2015 |