UNITED STATES
SECURITIES AND EXCHANGE COMMISSION
Washington, D.C. 20549
FORM N-CSR
CERTIFIED SHAREHOLDER REPORT OF REGISTERED
MANAGEMENT INVESTMENT COMPANIES
Investment Company Act file number 811-1940
Smith Barney Appreciation Fund Inc.
(Exact name of registrant as specified in charter)
| 125 Broad Street, New York, NY | 10004 | |
| (Address of principal executive offices) | (Zip code) | |
Robert I. Frenkel, Esq.
c/o Citigroup Asset Management
300 First Stamford Place, 4th Floor
Stamford, CT 06902
(Name and address of agent for service)
Registrant’s telephone number, including area code: (800) 451-2010
Date of fiscal year end: December 31
Date of reporting period: June 30, 2005
ITEM 1. REPORT TO STOCKHOLDERS.
The Semi-Annual Report to Stockholders is filed herewith.
SMITH BARNEY
APPRECIATION FUND INC.
CLASSIC SERIES | SEMI-ANNUAL REPORT | JUNE 30, 2005

NOT FDIC INSURED • NOT BANK GUARANTEED • MAY LOSE VALUE
|
|

Semi-Annual Report • June 30, 2005
SMITH BARNEY
APPRECIATION FUND INC.
HERSH COHEN
Hersh Cohen has 36 years of securities business experience.
Education: BA from Case Western Reserve University; Ph.D. in Psychology from Tufts University
SCOTT K. GLASSER
Scott K. Glasser has 14 years of securities business experience and has been working with the Fund since 1995.
Education: BA from Middlebury College; MBA in Finance from Pennsylvania State University
FUND OBJECTIVE
The Fund seeks long-term appreciation of shareholders’ capital by investing primarily in equity securities of U.S. companies. The Fund typically invests in medium and large capitalization companies but may also invest in small capitalization companies.

HERSH COHEN
PORTFOLIO MANAGER

SCOTT K. GLASSER
PORTFOLIO MANAGER
| 1 | ||
| 4 | ||
| 5 | ||
| 7 | ||
| 12 | ||
| 13 | ||
| 14 | ||
| 15 | ||
| 19 |

R. JAY GERKEN, CFA
Chairman, President and
Chief Executive Officer
Dear Shareholder,
The U.S. economy overcame a number of obstacles and continued to expand during the six month reporting period. Rising interest rates, record high oil prices, and geopolitical issues threatened to send the economy into a “soft patch.” However, when all was said and done, first quarter 2005 gross domestic product (“GDP”)i growth was 3.8%, mirroring the solid gain that occurred during the fourth quarter of 2004.
Given the overall strength of the economy, the Federal Reserve Board (“Fed”)ii continued to raise interest rates over the period in an attempt to ward off inflation. Following five rate hikes from June 2004 through December 2004, the Fed again increased its target for the federal funds rateiii in 0.25% increments four additional times during the reporting period. All told, the Fed’s nine rate hikes brought the target for the federal funds rate from 1.00% to 3.25%.
During the six months covered by this report, the U.S. stock market was relatively flat, with the S&P 500 Indexiv returning -0.81%. Stocks were weak early in the reporting period, as the issues discussed above caused investors to remain on the sidelines. Equities then rallied in the second quarter of 2005, as the economy appeared to be on solid footing and inflation was largely under control. Looking at the reporting period as a whole, mid-cap stocks generated superior returns, with the Russell Midcap,v Russell 1000,vi and Russell 2000vii Indexes returning 3.92%, 0.11%, and -1.25%, respectively. From a market style perspective, value-oriented stocks outperformed their growth counterparts.
Performance Review
For the six months ended June 30, 2005, Class A shares of the Smith Barney Appreciation Fund Inc., excluding sales charges, returned -1.20%. In comparison, the Lipper Large-Cap Core Funds Category Average1 decreased 1.20% for the same period. The Fund’s unmanaged benchmark, the S&P 500 Index, returned -0.81% for the same time frame.
PERFORMANCE SNAPSHOT
AS OF JUNE 30, 2005
(excluding sales charges)
(unaudited)
| 6 Months | |||
Appreciation Fund — Class A Shares | -1.20 | % | |
S&P 500 Index | -0.81 | % | |
Lipper Large-Cap Core Funds Category Average | -1.20 | % |
The performance shown represents past performance. Past performance is no guarantee of future results and current performance may be higher or lower than the performance shown above. Principal value and investment returns will fluctuate and investors’ shares, when redeemed, may be worth more or less than their original cost. To obtain performance data current to the most recent month-end, please visit our website at www.citigroupam.com.
All class share returns assume the reinvestment of all distributions at net asset value and the deduction of all Fund expenses. Returns have not been adjusted to include sales charges that may apply when shares are purchased or the deduction of taxes that a shareholder would pay on Fund distributions. Excluding sales charges, Class B shares returned -1.57%, Class C shares returned -1.57% and Class Y shares returned -0.94% over the six months ended June 30, 2005.
| 1 | Lipper, Inc. is a major independent mutual-fund tracking organization. Returns are based on the 6-month period ended June 30, 2005, including the reinvestment of dividends and capital gains distributions, if any, calculated among the 933 funds in the Fund’s Lipper category, and excluding sales charges. |
1 Smith Barney Appreciation Fund Inc. | 2005 Semi-Annual Report
Special Shareholder Notice
On June 24, 2005, Citigroup Inc. (“Citigroup”) announced that it has signed a definitive agreement under which Citigroup will sell substantially all of its worldwide asset management business to Legg Mason, Inc. (“Legg Mason”).
As part of this transaction, Smith Barney Fund Management LLC (the “Adviser”), currently an indirect wholly owned subsidiary of Citigroup, would become an indirect wholly owned subsidiary of Legg Mason. The Adviser is the investment adviser to the Fund.
The transaction is subject to certain regulatory approvals, as well as other customary conditions to closing. Subject to such approvals and the satisfaction of the other conditions, Citigroup expects the transaction to be completed later this year.
Under the Investment Company Act of 1940, consummation of the transaction will result in the automatic termination of the investment advisory contract between the Fund and the Adviser. Therefore, the Fund’s Board of Directors will be asked to approve a new investment advisory contract between the Fund and the Adviser. If approved by the Board, the new investment advisory contract will be presented to the shareholders of the Fund for their approval. Subsequently, on August 1, 2005, the Board approved the new investment advisory contract between the Fund and the Adviser.
Information About Your Fund
As you may be aware, several issues in the mutual fund industry have recently come under the scrutiny of federal and state regulators. The Fund’s Adviser and some of its affiliates have received requests for information from various government regulators regarding market timing, late trading, fees, and other mutual fund issues in connection with various investigations. The regulators appear to be examining, among other things, the Fund’s response to market timing and shareholder exchange activity, including compliance with prospectus disclosure related to these subjects. The Fund has been informed that the Adviser and its affiliates are responding to those information requests, but are not in a position to predict the outcome of these requests and investigations.
Important information concerning the Fund and its Adviser with regard to recent regulatory developments is contained in the “Additional Information” note in the Notes to the Financial Statements included in this report.
As always, thank you for your confidence in our stewardship of your assets. We look forward to helping you continue to meet your financial goals.
Sincerely,

R. Jay Gerken, CFA
Chairman, President and Chief Executive Officer
August 2, 2005
2 Smith Barney Appreciation Fund Inc. | 2005 Semi-Annual Report
The information provided is not intended to be a forecast of future events, a guarantee of future results or investment advice. Views expressed may differ from those of the firm as a whole.
RISKS: Keep in mind, stock prices are subject to market fluctuations. The Fund may invest in small- and mid-cap companies that may involve a higher degree of risk and volatility than investments in large-cap companies. This Fund may invest in foreign stocks, which are subject to certain risks of overseas investing not associated with domestic investing, such as currency fluctuations and changes in political and economic conditions, which could result in significant market fluctuations. These risks are magnified in emerging markets. The Fund may use derivatives, such as options and futures, which can be illiquid, may disproportionately increase losses, and have a potentially large impact on Fund performance. Please see the Fund’s prospectus for more information on these and other risks.
All index performance reflects no deduction for fees, expenses or taxes. Please note an investor cannot invest directly in an index.
| i | Gross domestic product is a market value of goods and services produced by labor and property in a given country. |
| ii | The Federal Reserve Board is responsible for the formulation of a policy designed to promote economic growth, full employment, stable prices, and a sustainable pattern of international trade and payments. |
| iii | The federal funds rate is the interest rate that banks with excess reserves at a Federal Reserve district bank charge other banks that need overnight loans. |
| iv | The S&P 500 Index is an unmanaged index of 500 stocks that is generally representative of the performance of larger companies in the U.S. |
| v | The Russell Midcap Index measures the performance of the 800 smallest companies in the Russell 1000 Index whose average market capitalization was approximately $4.7 billion as of 6/24/05. |
| vi | The Russell 1000 Index measures the performance of the 1,000 largest companies in the Russell 3000 Index, which represents approximately 92% of the total market capitalization of the Russell 3000 Index. |
| vii | The Russell 2000 Index measures the performance of the 2,000 smallest companies in the Russell 3000 Index, which represents approximately 8% of the total market capitalization of the Russell 3000 Index. |
3 Smith Barney Appreciation Fund Inc. | 2005 Semi-Annual Report
4 Smith Barney Appreciation Fund Inc. | 2005 Semi-Annual Report
| Fund Expenses (unaudited) |
Example
As a shareholder of the Fund, you may incur two types of costs: (1) transaction costs, including front-end and back-end sales charges (loads) on purchase payments, reinvested dividends, or other distributions; and (2) ongoing costs, including management fees; distribution and/or service (12b-1) fees; and other Fund expenses. This example is intended to help you understand your ongoing costs (in dollars) of investing in the Fund and to compare these costs with the ongoing costs of investing in other mutual funds.
This example is based on an investment of $1,000 invested on January 1, 2005 and held for the six months ended June 30, 2005.
Actual Expenses
The table below titled “Based on Actual Total Return” provides information about actual account values and actual expenses. You may use the information provided in this table, together with the amount you invested, to estimate the expenses that you paid over the period. To estimate the expenses you paid on your account, divide your ending account value by $1,000 (for example, an $8,600 ending account value divided by $1,000 = 8.6), then multiply the result by the number under the heading entitled “Expenses Paid During the Period”.
Based on Actual Total Return(1)
| Actual Total Return Without Sales Charges(2) | Beginning Account Value | Ending Account Value | Annualized Expense Ratio | Expenses Paid During the Period(3) | |||||||||||
Class A | (1.20 | )% | $ | 1,000.00 | $ | 988.00 | 0.96 | % | $ | 4.73 | |||||
Class B | (1.57 | ) | 1,000.00 | 984.30 | 1.81 | 8.91 | |||||||||
Class C | (1.57 | ) | 1,000.00 | 984.30 | 1.78 | 8.76 | |||||||||
Class Y | (0.94 | ) | 1,000.00 | 990.60 | 0.57 | 2.81 | |||||||||
| (1) | For the six months ended June 30, 2005. |
| (2) | Assumes reinvestment of all dividends and capital gain distributions, if any, at net asset value and does not reflect the deduction of the applicable sales charges with respect to Class A shares or the applicable contingent deferred sales charges (“CDSC”) with respect to Class B and C shares. Total return is not annualized, as it may not be representative of the total return for the year. Performance figures may reflect voluntary fee waivers. Past performance is no guarantee of future results. In the absence of voluntary fee waivers, the total return would have been lower. |
| (3) | Expenses are equal to each class’ respective annualized expense ratio multiplied by the average account value over the period, multiplied by the number of days in the most recent fiscal half-year, then divided by 365. |
5 Smith Barney Appreciation Fund Inc. | 2005 Semi-Annual Report
| Fund Expenses (unaudited) (continued) |
Hypothetical Example for Comparison Purposes
The table below titled “Based on Hypothetical Total Return” provides information about hypothetical account values and hypothetical expenses based on the actual expense ratio and an assumed rate of return of 5.00% per year before expenses, which is not the Fund’s actual return. The hypothetical account values and expenses may not be used to estimate the actual ending account balance or expenses you paid for the period. You may use the information provided in this table to compare the ongoing costs of investing in the Fund and other funds. To do so, compare the 5.00% hypothetical example relating to the Fund with the 5.00% hypothetical examples that appear in the shareholder reports of the other funds.
Please note that the expenses shown in the table below are meant to highlight your ongoing costs only and do not reflect any transactional costs, such as front-end or back-end sales charges (loads). Therefore, the table is useful in comparing ongoing costs only, and will not help you determine the relative total costs of owning different funds. In addition, if these transaction costs were included, your costs would have been higher.
Based on Hypothetical Total Return(1)
| Hypothetical Annualized Total Return | Beginning Account Value | Ending Account Value | Annualized Expense Ratio | Expenses Paid During the Period(2) | |||||||||||
Class A | 5.00 | % | $ | 1,000.00 | $ | 1,020.03 | 0.96 | % | $ | 4.81 | |||||
Class B | 5.00 | 1,000.00 | 1,015.82 | 1.81 | 9.05 | ||||||||||
Class C | 5.00 | 1,000.00 | 1,015.97 | 1.78 | 8.90 | ||||||||||
Class Y | 5.00 | 1,000.00 | 1,021.97 | 0.57 | 2.86 | ||||||||||
| (1) | For the six months ended June 30, 2005. |
| (2) | Expenses are equal to each class’ respective annualized expense ratio multiplied by the average account value over the period, multiplied by the number of days in the most recent fiscal half-year, then divided by 365. |
6 Smith Barney Appreciation Fund Inc. | 2005 Semi-Annual Report
| Schedule of Investments (unaudited) | June 30, 2005 |
| SHARES | SECURITY | VALUE | |||
| COMMON STOCK — 90.8% | |||||
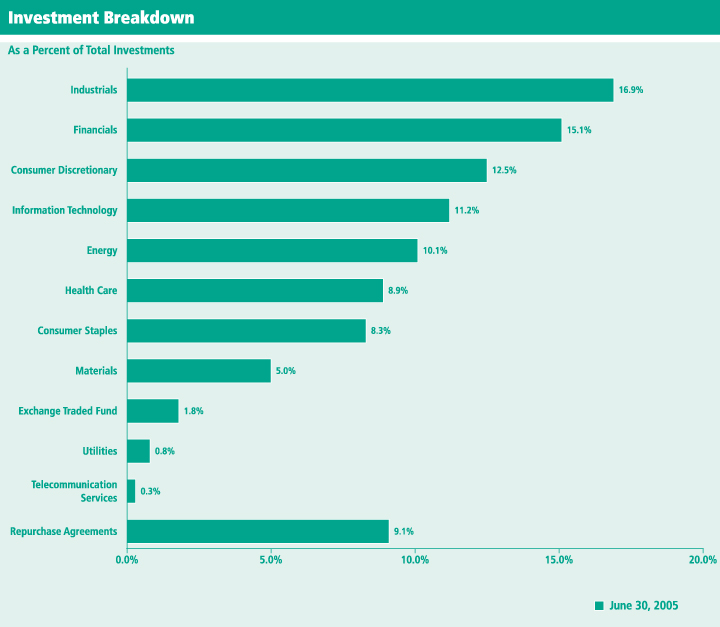
| CONSUMER DISCRETIONARY — 12.5% | |||||
| Hotels, Restaurants & Leisure — 1.0% | |||||
| 1,000,000 | Fairmont Hotels & Resorts, Inc. | $ | 34,830,000 | ||
| 400,000 | International Game Technology | 11,260,000 | |||
| 700,000 | Marcus Corp. | 14,854,000 | |||
| 60,944,000 | |||||
| Leisure Equipment & Products — 0.3% | |||||
| 802,092 | Hasbro, Inc. | 16,675,492 | |||
| Media — 7.3% | |||||
| 1,500,000 | Comcast Corp., Special Class A Shares* | 44,925,000 | |||
| 500,000 | DIRECTV Group, Inc.* | 7,750,000 | |||
| 900,000 | Gannett Co., Inc. | 64,017,000 | |||
| 1,000,000 | Liberty Media Corp., Class A Shares* | 10,190,000 | |||
| 700,000 | Meredith Corp. | 34,342,000 | |||
| 1,000,000 | SBS Broadcasting SA* | 47,130,000 | |||
| 5,000,000 | Time Warner, Inc.* | 83,550,000 | |||
| 1,200,000 | Viacom, Inc., Class B Shares | 38,424,000 | |||
| 4,000,000 | Walt Disney Co. | 100,720,000 | |||
| 431,048,000 | |||||
| Multiline Retail — 1.8% | |||||
| 400,000 | Costco Wholesale Corp. | 17,928,000 | |||
| 1,800,000 | Wal-Mart Stores, Inc. | 86,760,000 | |||
| 104,688,000 | |||||
| Specialty Retail — 2.1% | |||||
| 1,100,000 | Bed Bath & Beyond, Inc.* | 45,958,000 | |||
| 1,000,000 | Gap, Inc. | 19,750,000 | |||
| 1,400,000 | Home Depot, Inc. | 54,460,000 | |||
| 120,168,000 | |||||
| TOTAL CONSUMER DISCRETIONARY | 733,523,492 | ||||
| CONSUMER STAPLES — 8.2% | |||||
| Beverages — 2.0% | |||||
| 692,430 | Coca-Cola Co. | 28,908,952 | |||
| 1,700,000 | PepsiCo, Inc. | 91,681,000 | |||
| 120,589,952 | |||||
| Food & Staples Retailing — 0.5% | |||||
| 600,000 | Walgreen Co. | 27,594,000 | |||
| Food Products — 3.2% | |||||
| 800,000 | Archer-Daniels-Midland Co. | 17,104,000 | |||
| 600,000 | Dean Foods Co.* | 21,144,000 | |||
| 800,000 | General Mills, Inc. | 37,432,000 | |||
| 1,004,931 | H.J. Heinz Co. | 35,594,656 | |||
| 200,000 | Hershey Co. | 12,420,000 | |||
| 120,000 | TreeHouse Foods, Inc.* | 3,421,200 | |||
| 903,168 | Wm. Wrigley Jr. Co. | 62,174,085 | |||
| 189,289,941 | |||||
See Notes to Financial Statements.
7 Smith Barney Appreciation Fund Inc. | 2005 Semi-Annual Report
| Schedule of Investments (unaudited) (continued) | June 30, 2005 |
| SHARES | SECURITY | VALUE | |||
| Household Products — 1.8% | |||||
| 700,000 | Kimberly-Clark Corp. | $ | 43,813,000 | ||
| 1,200,000 | Procter & Gamble Co. | 63,300,000 | |||
| 107,113,000 | |||||
| Personal Products — 0.7% | |||||
| 809,355 | Gillette Co. | 40,977,644 | |||
| TOTAL CONSUMER STAPLES | 485,564,537 | ||||
| ENERGY — 10.1% | |||||
| Energy Equipment & Services — 1.5% | |||||
| 1,100,000 | ENSCO International, Inc. | 39,325,000 | |||
| 650,000 | Schlumberger Ltd. | 49,361,000 | |||
| 88,686,000 | |||||
| Oil, Gas & Consumable Fuels — 8.6% | |||||
| 66,470 | Apache Corp. | 4,293,962 | |||
| 1,000,000 | BP PLC, Sponsored ADR | 62,380,000 | |||
| 1,800,000 | Canadian Natural Resources Ltd. | 65,484,000 | |||
| 400,000 | Cimarex Energy Co.* | 15,564,000 | |||
| 2,800,000 | EnCana Corp. | 110,852,000 | |||
| 3,400,000 | Exxon Mobil Corp. | 195,398,000 | |||
| 700,000 | Suncor Energy, Inc. | 33,124,000 | |||
| 1,050,000 | Western Oil Sands, Inc., Class A Shares* | 20,379,783 | |||
| 507,475,745 | |||||
| TOTAL ENERGY | 596,161,745 | ||||
| EXCHANGE TRADED FUNDS — 1.8% | |||||
| Exchange Traded — 1.8% | |||||
| 6,000,000 | iShares MSCI Japan Index Fund | 60,840,000 | |||
| 1,000,000 | streetTRACKS Gold Trust* | 43,440,000 | |||
| TOTAL EXCHANGE TRADED FUNDS | 104,280,000 | ||||
| FINANCIALS — 15.0% | |||||
| Commercial Banks — 2.2% | |||||
| 500,000 | Bank of America Corp. | 22,805,000 | |||
| 1,700,000 | Wells Fargo & Co. | 104,686,000 | |||
| 127,491,000 | |||||
| Diversified Financial Services — 3.2% | |||||
| 1,300,000 | Bank of New York Co., Inc. | 37,414,000 | |||
| 203,885 | Goldman Sachs Group, Inc. | 20,800,348 | |||
| 1,500,000 | JPMorgan Chase & Co. | 52,980,000 | |||
| 1,400,000 | Merrill Lynch & Co., Inc. | 77,014,000 | |||
| 188,208,348 | |||||
| Insurance — 7.3% | |||||
| 4,100 | Berkshire Hathaway, Inc., Class A Shares* | 342,350,000 | |||
| 400,000 | Lincoln National Corp. | 18,768,000 | |||
| 1,700,000 | St. Paul Travelers Cos., Inc. | 67,201,000 | |||
| 428,319,000 | |||||
| Real Estate — 2.2% | |||||
| 1,100,000 | Forest City Enterprises, Inc., Class A Shares | 78,100,000 | |||
| 550,000 | St. Joe Co. | 44,847,000 | |||
| 200,000 | Tejon Ranch Co.* | 10,294,000 | |||
| 133,241,000 | |||||
See Notes to Financial Statements.
8 Smith Barney Appreciation Fund Inc. | 2005 Semi-Annual Report
| Schedule of Investments (unaudited) (continued) | June 30, 2005 |
| SHARES | SECURITY | VALUE | |||
| Thrifts & Mortgages — 0.1% | |||||
| 500,000 | Brookline Bancorp, Inc. | $ | 8,130,000 | ||
| TOTAL FINANCIALS | 885,389,348 | ||||
| HEALTH CARE — 8.9% | |||||
| Biotechnology — 2.6% | |||||
| 1,100,000 | Amgen, Inc.* | 66,506,000 | |||
| 500,000 | Biogen Idec, Inc.* | 17,225,000 | |||
| 250,000 | Genentech, Inc.* | 20,070,000 | |||
| 800,000 | IDEXX Laboratories, Inc.* | 49,864,000 | |||
| 153,665,000 | |||||
| Health Care Equipment & Supplies — 1.0% | |||||
| 700,000 | Aradigm Corp.* | 742,000 | |||
| 301,192 | C.R. Bard, Inc. | 20,032,280 | |||
| 700,000 | Medtronic, Inc. | 36,253,000 | |||
| 57,027,280 | |||||
| Pharmaceuticals — 5.3% | |||||
| 650,000 | Eli Lilly & Co. | 36,211,500 | |||
| 301,778 | Hospira, Inc.* | 11,769,342 | |||
| 1,700,000 | Johnson & Johnson | 110,500,000 | |||
| 200,000 | Novartis AG, ADR | 9,488,000 | |||
| 3,800,000 | Pfizer, Inc. | 104,804,000 | |||
| 500,000 | Teva Pharmaceutical Industries Ltd., Sponsored ADR | 15,570,000 | |||
| 600,000 | Wyeth | 26,700,000 | |||
| 315,042,842 | |||||
| TOTAL HEALTH CARE | 525,735,122 | ||||
| INDUSTRIALS — 16.9% | |||||
| Aerospace & Defense — 1.1% | |||||
| 1,700,000 | Raytheon Co. | 66,504,000 | |||
| Air Freight & Logistics — 0.9% | |||||
| 800,000 | United Parcel Service, Inc., Class B Shares | 55,328,000 | |||
| Building Products — 0.4% | |||||
| 706,136 | Masco Corp. | 22,426,879 | |||
| Commercial Services & Supplies — 2.2% | |||||
| 1,200,000 | Automatic Data Processing, Inc. | 50,364,000 | |||
| 300,000 | Pitney Bowes, Inc. | 13,065,000 | |||
| 2,300,000 | Waste Management, Inc. | 65,182,000 | |||
| 128,611,000 | |||||
| Electrical Equipment — 0.8% | |||||
| 800,000 | American Power Conversion Corp. | 18,872,000 | |||
| 400,000 | Cooper Industries Ltd., Class A Shares | 25,560,000 | |||
| 44,432,000 | |||||
See Notes to Financial Statements.
9 Smith Barney Appreciation Fund Inc. | 2005 Semi-Annual Report
| Schedule of Investments (unaudited) (continued) | June 30, 2005 |
| SHARES | SECURITY | VALUE | |||
| Industrial Conglomerates — 10.6% | |||||
| 2,600,000 | 3M Co. | $ | 187,980,000 | ||
| 7,000,000 | General Electric Co. | 242,550,000 | |||
| 1,200,000 | Honeywell International, Inc. | 43,956,000 | |||
| 2,100,000 | Tyco International Ltd. | 61,320,000 | |||
| 1,700,000 | United Technologies Corp. | 87,295,000 | |||
| 623,101,000 | |||||
| Road & Rail — 0.9% | |||||
| 1,231,033 | Florida East Coast Industries, Inc. | 53,303,729 | |||
| TOTAL INDUSTRIALS | 993,706,608 | ||||
| INFORMATION TECHNOLOGY — 11.2% | |||||
| Communications Equipment — 1.9% | |||||
| 3,500,000 | Cisco Systems, Inc.* | 66,885,000 | |||
| 2,500,000 | JDS Uniphase Corp.* | 3,800,000 | |||
| 4,500,000 | Lucent Technologies, Inc.* | 13,095,000 | |||
| 1,300,000 | Motorola, Inc. | 23,738,000 | |||
| 107,518,000 | |||||
| Computers & Peripherals — 2.7% | |||||
| 3,600,000 | EMC Corp.* | 49,356,000 | |||
| 2,500,000 | Hewlett-Packard Co. | 58,775,000 | |||
| 700,000 | International Business Machines Corp. | 51,940,000 | |||
| 160,071,000 | |||||
| Internet Software & Services — 1.2% | |||||
| 30,000 | Google, Inc., Class A Shares* | 8,824,500 | |||
| 700,000 | IAC/InterActiveCorp* | 16,835,000 | |||
| 1,300,000 | Yahoo!, Inc.* | 45,045,000 | |||
| 70,704,500 | |||||
| Semiconductors & Semiconductor Equipment — 1.6% | |||||
| 1,000,000 | Freescale Semiconductor, Inc., Class B Shares* | 21,180,000 | |||
| 2,400,000 | Intel Corp. | 62,544,000 | |||
| 400,000 | Texas Instruments, Inc. | 11,228,000 | |||
| 94,952,000 | |||||
| Software — 3.8% | |||||
| 9,000,000 | Microsoft Corp. | 223,560,000 | |||
| TOTAL INFORMATION TECHNOLOGY | 656,805,500 | ||||
| MATERIALS — 5.0% | |||||
| Chemicals — 2.8% | |||||
| 850,000 | Dow Chemical Co. | 37,850,500 | |||
| 1,500,000 | E.I. du Pont de Nemours & Co. | 64,515,000 | |||
| 950,000 | PPG Industries, Inc. | 59,622,000 | |||
| 161,987,500 | |||||
| Metals & Mining — 1.8% | |||||
| 1,000,000 | Alcoa, Inc. | 26,130,000 | |||
| 1,200,000 | Newmont Mining Corp. | 46,836,000 | |||
| 275,000 | Rio Tinto PLC, Sponsored ADR | 33,528,000 | |||
| 106,494,000 | |||||
See Notes to Financial Statements.
10 Smith Barney Appreciation Fund Inc. | 2005 Semi-Annual Report
| Schedule of Investments (unaudited) (continued) | June 30, 2005 |
| SHARES | SECURITY | VALUE | |||
| Paper & Forest Products — 0.4% | |||||
| 400,000 | Weyerhaeuser Co. | $ | 25,460,000 | ||
| TOTAL MATERIALS | 293,941,500 | ||||
| TELECOMMUNICATION SERVICES — 0.4% | |||||
| Diversified Telecommunication Services — 0.3% | |||||
| 400,000 | Verizon Communications, Inc. | 13,820,000 | |||
| Wireless Telecommunication Services — 0.1% | |||||
| 300,000 | Vodafone Group PLC, Sponsored ADR | 7,296,000 | |||
| TOTAL TELECOMMUNICATION SERVICES | 21,116,000 | ||||
| UTILITIES — 0.8% | |||||
| Electric Utilities — 0.7% | |||||
| 904,407 | Cinergy Corp. | 40,535,522 | |||
| Gas Utilities — 0.1% | |||||
| 200,000 | KeySpan Corp. | 8,140,000 | |||
| TOTAL UTILITIES | 48,675,522 | ||||
| TOTAL COMMON STOCK (Cost — $4,012,422,730) | 5,344,899,374 | ||||
| WARRANTS | |||||
| WARRANTS — 0.0% | |||||
| Communications Equipment — 0.0% | |||||
| 255,775 | Lucent Technologies, Inc., expires 12/10/07* (Cost — $0) | 196,947 | |||
| TOTAL INVESTMENTS BEFORE SHORT-TERM INVESTMENTS (Cost — $4,012,422,730) | 5,345,096,321 | ||||
| FACE AMOUNT | |||||
| SHORT-TERM INVESTMENTS — 9.1% | |||||
| Repurchase Agreements — 9.1% | |||||
| $175,000,000 | Interest in $1,006,158,000 joint tri-party repurchase agreement dated 6/30/05 with Goldman Sachs Group, Inc., 3.350% due 7/1/05; Proceeds at maturity — $175,016,285; (Fully collateralized by various U.S. Treasury obligations, 0.000% to 13.250% due 8/15/05 to 2/15/27; Market value — $178,500,028) | 175,000,000 | |||
| 358,442,000 | Interest in $1,009,251,000 joint tri-party repurchase agreement dated 6/30/05 with Bank of America, 3.350% due 7/1/05; Proceeds at maturity — $358,475,355; (Fully collateralized by various U.S. government agency obligations, 0.000% to 7.000% due 7/15/05 to 2/26/24; Market Value — $365,611,090) | 358,442,000 | |||
| TOTAL SHORT-TERM INVESTMENTS (Cost — $533,442,000) | 533,442,000 | ||||
| TOTAL INVESTMENTS — 99.9% (Cost — $4,545,864,730#) | 5,878,538,321 | ||||
Other Assets in Excess of Liabilities — 0.1% | 7,828,184 | ||||
| TOTAL NET ASSETS — 100.0% | $ | 5,886,366,505 | |||
| * | Non-income producing security. |
| # | Aggregate cost for Federal income tax purposes is substantially the same. |
Abbreviation used in this schedule:
ADR — American Depositary Receipt
See Notes to Financial Statements.
11 Smith Barney Appreciation Fund Inc. | 2005 Semi-Annual Report
| Statement of Assets and Liabilities (unaudited) | June 30, 2005 |
| ASSETS: | |||
Investments, at value (Cost — $4,545,864,730) | $ | 5,878,538,321 | |
Cash | 621 | ||
Receivable for securities sold | 9,827,944 | ||
Receivable for Fund shares sold | 5,342,232 | ||
Dividends and interest receivable | 4,801,314 | ||
Prepaid expenses | 98,278 | ||
Total Assets | 5,898,608,710 | ||
| LIABILITIES: | |||
Payable for Fund shares repurchased | 3,544,452 | ||
Payable for securities purchased | 3,109,810 | ||
Investment advisory fee payable | 1,995,666 | ||
Transfer agent fees payable | 1,801,795 | ||
Distribution fees payable | 1,002,883 | ||
Administration fee payable | 734,323 | ||
Directors’ fees payable | 22,786 | ||
Accrued expenses | 30,490 | ||
Total Liabilities | 12,242,205 | ||
Total Net Assets | $ | 5,886,366,505 | |
| NET ASSETS: | |||
Par value (Note 6) | $ | 413,243 | |
Paid-in capital in excess of par value | 4,399,151,759 | ||
Undistributed net investment income | 5,225,502 | ||
Accumulated net realized gain on investments, futures contracts and foreign currency transactions | 148,901,564 | ||
Net unrealized appreciation of investments and foreign currencies | 1,332,674,437 | ||
Total Net Assets | $ | 5,886,366,505 | |
Shares Outstanding: | |||
Class A | 245,484,238 | ||
Class B | 73,333,363 | ||
Class C | 47,269,667 | ||
Class Y | 47,156,126 | ||
Net Asset Value: | |||
Class A (and redemption price) | $14.33 | ||
Class B * | $14.03 | ||
Class C * | $14.05 | ||
Class Y (and redemption price) | $14.32 | ||
Maximum Public Offering Price Per Share: | |||
Class A (based on maximum sales charge of 5.00%) | $15.08 | ||
| * | Redemption price is NAV of Class B and C shares reduced by a 5.00% and 1.00% CDSC, respectively, if shares are redeemed within one year from purchase payment (See Note 2). |
See Notes to Financial Statements.
12 Smith Barney Appreciation Fund Inc. | 2005 Semi-Annual Report
| Statement of Operations (unaudited) | For the Six Months Ended June 30, 2005 |
| INVESTMENT INCOME: | ||||
Dividends | $ | 38,208,019 | ||
Interest | 7,172,047 | |||
Less: Foreign taxes withheld | (104,909 | ) | ||
Total Investment Income | 45,275,157 | |||
| EXPENSES: | ||||
Distribution fees (Notes 2 and 4) | 12,839,594 | |||
Investment advisory fee (Note 2) | 11,926,669 | |||
Administration fees (Note 2) | 4,388,307 | |||
Transfer agent fees (Notes 2 and 4) | 4,322,649 | |||
Custody | 130,795 | |||
Shareholder reports (Note 4) | 127,005 | |||
Registration fees | 62,323 | |||
Insurance | 38,097 | |||
Legal fees | 26,551 | |||
Directors’ fees | 26,192 | |||
Audit and tax | 19,744 | |||
Miscellaneous expenses | 11,990 | |||
Total Expenses | 33,919,916 | |||
Net Investment Income | 11,355,241 | |||
REALIZED AND UNREALIZED GAIN (LOSS) ON INVESTMENTS, FUTURES CONTRACTS AND FOREIGN CURRENCY TRANSACTIONS (NOTES 1 AND 3): | ||||
Net Realized Gain (Loss) From: | ||||
Investment transactions | 153,029,533 | |||
Futures contracts | 583,944 | |||
Foreign currency transactions | (468 | ) | ||
Net Realized Gain | 153,613,009 | |||
Change in Net Unrealized Appreciation/Depreciation From: | ||||
Investments | (242,783,157 | ) | ||
Foreign currencies | (1,535 | ) | ||
Change in Net Unrealized Appreciation/Depreciation | (242,784,692 | ) | ||
Net Loss on Investments, Futures Contracts and Foreign Currency Transactions | (89,171,683 | ) | ||
Decrease in Net Assets From Operations | $ | (77,816,442 | ) | |
See Notes to Financial Statements.
13 Smith Barney Appreciation Fund Inc. | 2005 Semi-Annual Report
| Statements of Changes in Net Assets |
For the Six Months Ended June 30, 2005 (unaudited) and the Year Ended December 31, 2004
| 2005 | 2004 | |||||||
| OPERATIONS: | ||||||||
Net investment income | $ | 11,355,241 | $ | 41,731,950 | ||||
Net realized gain | 153,613,009 | 159,273,111 | ||||||
Change in net unrealized appreciation/depreciation | (242,784,692 | ) | 265,448,429 | |||||
Increase (Decrease) in Net Assets From Operations | (77,816,442 | ) | 466,453,490 | |||||
| DISTRIBUTIONS TO SHAREHOLDERS FROM (NOTES 1 AND 5): | ||||||||
Net investment income | (6,808,660 | ) | (43,156,200 | ) | ||||
Net realized gains | (59,045,165 | ) | (82,029,346 | ) | ||||
Decrease in Net Assets From Distributions to Shareholders | (65,853,825 | ) | (125,185,546 | ) | ||||
| FUND SHARE TRANSACTIONS (NOTE 6): | ||||||||
Net proceeds from sale of shares | 460,437,601 | 965,446,223 | ||||||
Net asset value of shares issued in connection with the transfer of the Smith Barney Group Spectrum Fund’s net assets (Note 7) | 87,480,709 | — | ||||||
Reinvestment of distributions | 61,420,257 | 116,115,224 | ||||||
Cost of shares repurchased | (488,023,155 | ) | (803,571,601 | ) | ||||
Increase in Net Assets From Fund Share Transactions | 121,315,412 | 277,989,846 | ||||||
Increase (Decrease) in Net Assets | (22,354,855 | ) | 619,257,790 | |||||
| NET ASSETS: | ||||||||
Beginning of period | 5,908,721,360 | 5,289,463,570 | ||||||
End of period* | $ | 5,886,366,505 | $ | 5,908,721,360 | ||||
* Includes undistributed net investment income of: | $5,225,502 | $678,921 | ||||||
See Notes to Financial Statements.
14 Smith Barney Appreciation Fund Inc. | 2005 Semi-Annual Report
| Financial Highlights |
For a share of each class of capital stock outstanding throughout each year ended December 31, unless otherwise noted:
| Class A Shares(1) | 2005(2) | 2004 | 2003 | 2002 | 2001 | 2000 | ||||||||||||
Net Asset Value, Beginning of Period | $14.67 | $13.79 | $11.13 | $13.69 | $14.55 | $15.73 | ||||||||||||
Income (Loss) From Operations: | ||||||||||||||||||
Net investment income | 0.04 | 0.14 | 0.07 | 0.06 | 0.10 | 0.16 | ||||||||||||
Net realized and unrealized gain (loss) | (0.21 | ) | 1.09 | 2.67 | (2.39 | ) | (0.59 | ) | (0.04 | ) | ||||||||
Total Income (Loss) From Operations | (0.17 | ) | 1.23 | 2.74 | (2.33 | ) | (0.49 | ) | 0.12 | |||||||||
Less Distributions From: | ||||||||||||||||||
Net investment income | (0.02 | ) | (0.14 | ) | (0.08 | ) | (0.01 | ) | (0.08 | ) | (0.15 | ) | ||||||
Net realized gains | (0.15 | ) | (0.21 | ) | — | (0.22 | ) | (0.29 | ) | (1.15 | ) | |||||||
Total Distributions | (0.17 | ) | (0.35 | ) | (0.08 | ) | (0.23 | ) | (0.37 | ) | (1.30 | ) | ||||||
Net Asset Value, End of Period | $14.33 | $14.67 | $13.79 | $11.13 | $13.69 | $14.55 | ||||||||||||
Total Return(3) | (1.20 | )% | 8.92 | % | 24.70 | % | (17.00 | )% | (3.44 | )% | 0.73 | % | ||||||
Net Assets, End of Period (millions) | $3,518 | $3,575 | $3,210 | $2,476 | $3,140 | $3,212 | ||||||||||||
Ratios to Average Net Assets: | ||||||||||||||||||
Gross expenses | 0.96 | %(4) | 0.95 | % | 0.96 | % | 0.95 | % | 0.92 | % | 0.90 | % | ||||||
Net expenses | 0.96 | (4) | 0.93 | (5) | 0.96 | 0.95 | 0.92 | 0.90 | ||||||||||
Net investment income | 0.59 | (4) | 0.96 | 0.55 | 0.48 | 0.68 | 1.02 | |||||||||||
Portfolio Turnover Rate | 24 | % | 40 | % | 42 | % | 74 | % | 62 | % | 61 | % | ||||||
| (1) | Per share amounts have been calculated using the average shares method. |
| (2) | For the six months ended June 30, 2005 (unaudited). |
| (3) | Performance figures may reflect voluntary fee waivers and/or expense reimbursements. Past performance is no guarantee of future results. In the absence of voluntary fee waivers and/or expense reimbursements, the total return would have been lower. Total returns for periods of less than one year are not annualized. |
| (4) | Annualized. |
| (5) | The investment adviser has voluntarily waived a portion of its fees. |
See Notes to Financial Statements.
15 Smith Barney Appreciation Fund Inc. | 2005 Semi-Annual Report
| Financial Highlights (continued) |
For a share of each class of capital stock outstanding throughout each year ended December 31, unless otherwise noted:
| Class B Shares(1) | 2005(2) | 2004 | 2003 | 2002 | 2001 | 2000 | ||||||||||||
Net Asset Value, Beginning of Period | $14.40 | $13.54 | $10.95 | $13.58 | $14.47 | $15.66 | ||||||||||||
Income (Loss) From Operations: | ||||||||||||||||||
Net investment income (loss) | (0.02 | ) | 0.02 | (0.03 | ) | (0.05 | ) | (0.02 | ) | 0.03 | ||||||||
Net realized and unrealized gain (loss) | (0.20 | ) | 1.06 | 2.62 | (2.36 | ) | (0.58 | ) | (0.04 | ) | ||||||||
Total Income (Loss) From Operations | (0.22 | ) | 1.08 | 2.59 | (2.41 | ) | (0.60 | ) | (0.01 | ) | ||||||||
Less Distributions From: | ||||||||||||||||||
Net investment income | (0.00 | )(3) | (0.01 | ) | — | — | — | (0.03 | ) | |||||||||
Net realized gains | (0.15 | ) | (0.21 | ) | — | (0.22 | ) | (0.29 | ) | (1.15 | ) | |||||||
Total Distributions | (0.15 | ) | (0.22 | ) | — | (0.22 | ) | (0.29 | ) | (1.18 | ) | |||||||
Net Asset Value, End of Period | $14.03 | $14.40 | $13.54 | $10.95 | $13.58 | $14.47 | ||||||||||||
Total Return(4) | (1.57 | )% | 7.99 | % | 23.65 | % | (17.70 | )% | (4.20 | )% | (0.12 | )% | ||||||
Net Assets, End of Period (millions) | $1,029 | $1,078 | $1,075 | $871 | $1,081 | $1,305 | ||||||||||||
Ratios to Average Net Assets: | ||||||||||||||||||
Gross expenses | 1.81 | %(5) | 1.78 | % | 1.76 | % | 1.82 | % | 1.76 | % | 1.69 | % | ||||||
Net expenses | 1.81 | (5) | 1.76 | (6) | 1.76 | 1.82 | 1.76 | 1.69 | ||||||||||
Net investment income (loss) | (0.26 | )(5) | 0.11 | (0.26 | ) | (0.38 | ) | (0.17 | ) | 0.23 | ||||||||
Portfolio Turnover Rate | 24 | % | 40 | % | 42 | % | 74 | % | 62 | % | 61 | % | ||||||
| (1) | Per share amounts have been calculated using the average shares method. |
| (2) | For the six months ended June 30, 2005 (unaudited). |
| (3) | Amount represents less than $(0.01) per share. |
| (4) | Performance figures may reflect voluntary fee waivers and/or expense reimbursements. Past performance is no guarantee of future results. In the absence of voluntary fee waivers and/or expense reimbursements, the total return would have been lower. Total returns for periods of less than one year are not annualized. |
| (5) | Annualized. |
| (6) | The investment adviser has voluntarily waived a portion of its fees. |
See Notes to Financial Statements.
16 Smith Barney Appreciation Fund Inc. | 2005 Semi-Annual Report
| Financial Highlights (continued) |
For a share of each class of capital stock outstanding throughout each year ended December 31, unless otherwise noted:
| Class C Shares(1)(2) | 2005(3) | 2004 | 2003 | 2002 | 2001 | 2000 | ||||||||||||
Net Asset Value, Beginning of Period | $14.42 | $13.55 | $10.96 | $13.58 | $14.47 | $15.65 | ||||||||||||
Income (Loss) From Operations: | ||||||||||||||||||
Net investment income (loss) | (0.02 | ) | 0.02 | (0.03 | ) | (0.04 | ) | (0.02 | ) | 0.03 | ||||||||
Net realized and unrealized gain (loss) | (0.20 | ) | 1.08 | 2.62 | (2.36 | ) | (0.58 | ) | (0.03 | ) | ||||||||
Total Income (Loss) From Operations | (0.22 | ) | 1.10 | 2.59 | (2.40 | ) | (0.60 | ) | — | |||||||||
Less Distributions From: | ||||||||||||||||||
Net investment income | (0.00 | )(4) | (0.02 | ) | — | (0.00 | )(4) | — | (0.03 | ) | ||||||||
Net realized gains | (0.15 | ) | (0.21 | ) | — | (0.22 | ) | (0.29 | ) | (1.15 | ) | |||||||
Total Distributions | (0.15 | ) | (0.23 | ) | — | (0.22 | ) | (0.29 | ) | (1.18 | ) | |||||||
Net Asset Value, End of Period | $14.05 | $14.42 | $13.55 | $10.96 | $13.58 | $14.47 | ||||||||||||
Total Return(5) | (1.57 | )% | 8.08 | % | 23.63 | % | (17.62 | )% | (4.20 | )% | (0.07 | )% | ||||||
Net Assets, End of Period (millions) | $664 | $614 | $531 | $318 | $266 | $190 | ||||||||||||
Ratios to Average Net Assets: | ||||||||||||||||||
Gross expenses | 1.78 | %(6) | 1.76 | % | 1.80 | % | 1.75 | % | 1.72 | % | 1.72 | % | ||||||
Net expenses | 1.78 | (6) | 1.74 | (7) | 1.80 | 1.75 | 1.72 | 1.72 | ||||||||||
Net investment income (loss) | (0.24 | )(6) | 0.16 | (0.28 | ) | (0.30 | ) | (0.13 | ) | 0.20 | ||||||||
Portfolio Turnover Rate | 24 | % | 40 | % | 42 | % | 74 | % | 62 | % | 61 | % | ||||||
| (1) | Per share amounts have been calculated using the average shares method. |
| (2) | On April 29, 2004, Class L shares were renamed as Class C shares. |
| (3) | For the six months ended June 30, 2005 (unaudited). |
| (4) | Amount represents less than $(0.01) per share. |
| (5) | Performance figures may reflect voluntary fee waivers and/or expense reimbursements. Past performance is no guarantee of future results. In the absence of voluntary fee waivers and/or expense reimbursements, the total return would have been lower. Total returns for periods of less than one year are not annualized. |
| (6) | Annualized. |
| (7) | The investment adviser has voluntarily waived a portion of its fees. |
See Notes to Financial Statements.
17 Smith Barney Appreciation Fund Inc. | 2005 Semi-Annual Report
| Financial Highlights (continued) |
For a share of each class of capital stock outstanding throughout each year ended December 31, unless otherwise noted:
| Class Y Shares(1) | 2005(2) | 2004 | 2003 | 2002 | 2001 | 2000 | ||||||||||||
Net Asset Value, Beginning of Period | $14.63 | $13.76 | $11.15 | $13.67 | $14.52 | $15.69 | ||||||||||||
Income (Loss) From Operations: | ||||||||||||||||||
Net investment income | 0.07 | 0.19 | 0.12 | 0.10 | 0.14 | 0.20 | ||||||||||||
Net realized and unrealized gain (loss) | (0.20 | ) | 1.09 | 2.67 | (2.39 | ) | (0.58 | ) | (0.02 | ) | ||||||||
Total Income (Loss) From Operations | (0.13 | ) | 1.28 | 2.79 | (2.29 | ) | (0.44 | ) | 0.18 | |||||||||
Less Distributions From: | ||||||||||||||||||
Net investment income | (0.03 | ) | (0.20 | ) | (0.18 | ) | (0.01 | ) | (0.12 | ) | (0.20 | ) | ||||||
Net realized gains | (0.15 | ) | (0.21 | ) | — | (0.22 | ) | (0.29 | ) | (1.15 | ) | |||||||
Total Distributions | (0.18 | ) | (0.41 | ) | (0.18 | ) | (0.23 | ) | (0.41 | ) | (1.35 | ) | ||||||
Net Asset Value, End of Period | $14.32 | $14.63 | $13.76 | $11.15 | $13.67 | $14.52 | ||||||||||||
Total Return(3) | (0.94 | )% | 9.30 | % | 25.11 | % | (16.71 | )% | (3.07 | )% | 1.07 | % | ||||||
Net Assets, End of Period (millions) | $675 | $642 | $474 | $85 | $87 | $89 | ||||||||||||
Ratios to Average Net Assets: | ||||||||||||||||||
Gross expenses | 0.57 | %(4) | 0.57 | % | 0.59 | % | 0.59 | % | 0.58 | % | 0.58 | % | ||||||
Net expenses | 0.57 | (4) | 0.55 | (5) | 0.59 | 0.59 | 0.58 | 0.58 | ||||||||||
Net investment income | 0.98 | (4) | 1.35 | 0.96 | 0.85 | 1.02 | 1.34 | |||||||||||
Portfolio Turnover Rate | 24 | % | 40 | % | 42 | % | 74 | % | 62 | % | 61 | % | ||||||
| (1) | Per share amounts have been calculated using the average shares method. |
| (2) | For the six months ended June 30, 2005 (unaudited). |
| (3) | Performance figures may reflect voluntary fee waivers and/or expense reimbursements. Past performance is no guarantee of future results. In the absence of voluntary fee waivers and/or expense reimbursements, the total return would have been lower. Total returns for periods of less than one year are not annualized. |
| (4) | Annualized. |
| (5) | The investment adviser has voluntarily waived a portion of its fees. |
See Notes to Financial Statements.
18 Smith Barney Appreciation Fund Inc. | 2005 Semi-Annual Report
Notes to Financial Statements (unaudited)
| 1. | Organization and Significant Accounting Policies |
The Smith Barney Appreciation Fund Inc. (the “Fund”), a Maryland corporation, is registered under the Investment Company Act of 1940 (“1940 Act”), as amended, as a diversified, open-end management investment company.
The following are significant accounting policies consistently followed by the Fund. These policies are in conformity with U.S. generally accepted accounting principles (“GAAP”). Estimates and assumptions are required to be made regarding assets, liabilities and changes in net assets resulting from operations when financial statements are prepared. Changes in the economic environment, financial markets and any other parameters used in determining these estimates could cause actual results to differ.
(a) Investment Valuation. Equity securities for which market quotations are available are valued at the last sale price or official closing price on the primary market or exchange on which they trade. Debt securities are valued at the mean between the bid and asked prices provided by an independent pricing service that are based on transactions in debt obligations, quotations from bond dealers, market transactions in comparable securities and various relationships between securities. When prices are not readily available, or are determined not to reflect fair value, such as when the value of a security has been significantly affected by events after the close of the exchange or market on which the security is principally traded, but before the Fund calculates its net asset value, the Fund may value these investments at fair value as determined in accordance with the procedures approved by the Fund’s Board of Directors. Short-term obligations with maturities of 60 days or less are valued at amortized cost, which approximates market value.
(b) Repurchase Agreements. When entering into repurchase agreements, it is the Fund’s policy that its custodian or a third party custodian takes possession of the underlying collateral securities, the market value of which at least equals the principal amount of the repurchase transaction, including accrued interest. To the extent that any repurchase transaction exceeds one business day, the value of the collateral is marked-to-market to ensure the adequacy of the collateral. If the seller defaults and the market value of the collateral declines or if bankruptcy proceedings are commenced with respect to the seller of the security, realization of the collateral by the Fund may be delayed or limited.
(c) Financial Futures Contracts. The Fund may enter into financial futures contracts typically to hedge a portion of the portfolio. Upon entering into a financial futures contract, the Fund is required to deposit cash or securities as initial margin. Additional securities are also segregated up to the current market value of the financial futures contracts. Subsequent payments, known as variation margin, are made or received by the Fund each day, depending on the daily fluctuation in the value of the underlying financial instruments. The Fund recognizes an unrealized gain or loss equal to the daily variation margin. When the financial futures contracts are closed, a realized gain or loss is recognized equal to the difference between the proceeds from (or cost of) the closing transactions and the Fund’s basis in the contracts.
The risks associated with entering into financial futures contracts include the possibility that a change in the value of the contract may not correlate with the changes in the value of the underlying instruments. In addition, investing in financial futures contracts involves the risk that the Fund could lose more than the original margin deposit and subsequent payments required for a futures transaction. Risk may also arise upon entering into these contracts from the potential inability of the counterparties to meet the terms of their contracts.
(d) Security Transactions and Investment Income. Security transactions are accounted for on a trade date basis. Interest income, adjusted for amortization of premium and accretion of discount, is recorded on the accrual basis. Dividend income is recorded on the ex-dividend date. Foreign dividend income is recorded on the ex-dividend date or as soon as practical after the Fund determines the existence of a dividend declaration after exercising reasonable due diligence. The cost of investments sold is determined by use of the specific identification method.
19 Smith Barney Appreciation Fund Inc. | 2005 Semi-Annual Report
Notes to Financial Statements (unaudited) (continued)
(e) Foreign Currency Translation. Investment securities and other assets and liabilities denominated in foreign currencies are translated into U.S. dollar amounts based upon prevailing exchange rates on the date of valuation. Purchases and sales of investment securities and income and expense items denominated in foreign currencies are translated into U.S. dollar amounts based upon prevailing exchange rates on the respective dates of such transactions.
The Fund does not isolate that portion of the results of operations resulting from changes in foreign exchange rates on investments from the fluctuations arising from changes in market prices of securities held. Such fluctuations are included with the net realized and unrealized gain or loss on investments.
Net realized foreign exchange gains or losses arise from sales of foreign currencies, including gains and losses on forward foreign currency contracts, currency gains or losses realized between the trade and settlement dates on securities transactions and the difference between the amounts of dividends, interest and foreign withholding taxes recorded on the Fund’s books and the U.S. dollar equivalent of the amounts actually received or paid. Net unrealized foreign exchange gains and losses arise from changes in the fair values of assets and liabilities, other than investments in securities, at the date of valuation, resulting from changes in exchange rates.
Foreign security and currency transactions may involve certain considerations and risks not typically associated with those of U.S. dollar denominated transactions as a result of, among other factors, the possibility of lower levels of governmental supervision and regulation of foreign securities markets and the possibility of political or economic instability.
(f) Distributions to Shareholders. Distributions from net investment income and net realized gains, if any, are declared at least annually. Distributions to shareholders of the Fund are recorded on the ex-dividend date and are determined in accordance with income tax regulations, which may differ from GAAP.
(g) Class Accounting. Investment income, common expenses and realized/unrealized gain (loss) on investments are allocated to the various classes of the Fund on the basis of daily net assets of each class. Fees relating to a specific class are charged directly to that class.
(h) Federal and Other Taxes. It is the Fund’s policy to comply with the federal income and excise tax requirements of the Internal Revenue Code of 1986, as amended, applicable to regulated investment companies. Accordingly, the Fund intends to distribute substantially all of its taxable income and net realized gains on investments, if any, to shareholders each year. Therefore, no federal income tax provision is required in the Fund’s financial statements. Under the applicable foreign tax laws, a withholding tax may be imposed on interest, dividends and capital gains at various rates.
(i) Reclassification. GAAP requires that certain components of net assets be adjusted to reflect permanent differences between financial and tax reporting. These reclassifications have no effect on net assets or net asset values per share.
| 2. | Investment Advisory Agreement, Administration Agreement and Other Transactions with Affiliates |
Smith Barney Fund Management LLC (“SBFM”), an indirect wholly-owned subsidiary of Citigroup Inc. (“Citigroup”), acts as investment adviser to the Fund. The Fund pays SBFM an investment advisory fee which is calculated daily and paid monthly at the annual rate of the Fund’s average daily net assets as follows:
| Average Daily Net Assets | Annual Rate | ||
First $250 million | 0.550 | % | |
Next $250 million | 0.513 | ||
Next $500 million | 0.476 | ||
Next $1 billion | 0.439 | ||
Next $1 billion | 0.402 | ||
Over $3 billion | 0.365 | ||
20 Smith Barney Appreciation Fund Inc. | 2005 Semi-Annual Report
Notes to Financial Statements (unaudited) (continued)
SBFM also acts as the Fund’s administrator for which the Fund pays a fee which is calculated daily and paid monthly at the annual rate of the Fund’s average daily net assets as follows:
| Average Daily Net Assets | Annual Rate | ||
First $250 million | 0.200 | % | |
Next $250 million | 0.187 | ||
Next $500 million | 0.174 | ||
Next $1 billion | 0.161 | ||
Next $1 billion | 0.148 | ||
Over $3 billion | 0.135 | ||
Citicorp Trust Bank, fsb. (“CTB”), another subsidiary of Citigroup, acts as the Fund’s transfer agent. PFPC Inc. (“PFPC”) and Primerica Shareholder Services (“PSS”), another subsidiary of Citigroup, acts as the Fund’s sub-transfer agents. CTB receives account fees and asset-based fees that vary according to the size and type of account. PFPC and PSS are responsible for shareholder record keeping and financial processing for all shareholder accounts and are paid by CTB. During the six months ended June 30, 2005, the Fund paid transfer agent fees of $3,050,974 to CTB. In addition, for the six months ended June 30, 2005, the Fund also paid $33,841 to other Citigroup affiliates for shareholder recordkeeping services.
Citigroup Global Markets Inc. (“CGM”) and PFS Distributors, Inc., both of which are subsidiaries of Citigroup, act as the Fund’s distributors.
There is a maximum initial sales charge of 5.00% for Class A shares. There is a contingent deferred sales charge (“CDSC”) of 5.00% on Class B shares, which applies if redemption occurs within one year from purchase payment and declines thereafter by 1.00% per year until no CDSC is incurred. Class C shares also have a 1.00% CDSC, which applies if redemption occurs within one year from purchase payment. In certain cases, Class A shares have a 1.00% CDSC, which applies if redemption occurs within one year from purchase payment. This CDSC only applies to those purchases of Class A shares which, when combined with current holdings of Class A shares, equal or exceed $1,000,0000 in the aggregate. These purchases do not incur an initial sales charge.
For the six months ended June 30, 2005, sales charges and CDSCs received by CGM and its affiliates were approximately:
| Class A | Class B | Class C | |||||||
CDSCs | $ | 2,000 | $ | 946,000 | $ | 23,000 | |||
Sales Charges | 4,627,000 | — | — | ||||||
During the six months ended June 30, 2005, CGM and its affiliates received brokerage commissions in the amount of $89,116 for the Fund.
All officers and one Director of the Fund are employees of Citigroup or its affiliates and do not receive compensation from the Fund.
| 3. | Investments |
During the six months ended June 30, 2005, the aggregate cost of purchases and proceeds from sales of investments (excluding short-term investments) were as follows:
Purchases | $ | 1,478,862,570 | |
Sales | 1,275,926,724 | ||
At June 30, 2005, the aggregate gross unrealized appreciation and depreciation of investments for federal income tax purposes were substantially as follows:
Gross unrealized appreciation | $ | 1,362,238,434 | ||
Gross unrealized depreciation | (29,564,843 | ) | ||
Net unrealized appreciation | $ | 1,332,673,591 | ||
21 Smith Barney Appreciation Fund Inc. | 2005 Semi-Annual Report
Notes to Financial Statements (unaudited) (continued)
| 4. | Class Specific Expenses |
Pursuant to a Distribution Plan, the Fund pays a service fee with respect to its Class A, B and C shares calculated at the annual rate of 0.25% of the average daily net assets of each respective class. The Fund also pays a distribution fee with respect to its Class B and C shares calculated at the annual rate of 0.75% of the average daily net assets of each class, respectively. For the six months ended June 30, 2005, total Distribution fees, which are accrued daily and paid monthly, were as follows:
| Class A | Class B | Class C | |||||||
Distribution Fees | $ | 4,399,735 | $ | 5,221,524 | $ | 3,218,335 | |||
For the six months ended June 30, 2005, total Transfer Agent fees were as follows:
| Class A | Class B | Class C | Class Y | |||||||||
Transfer Agent Fees | $ | 2,449,111 | $ | 1,205,098 | $ | 668,252 | $ | 188 | ||||
For the six months ended June 30, 2005, total Shareholder Reports expenses were as follows:
| Class A | Class B | Class C | Class Y | |||||||||
Shareholder Reports Expenses | $ | 64,965 | $ | 44,201 | $ | 17,260 | $ | 579 | ||||
| 5. | Distributions to Shareholders by Class |
| Six Months Ended June 30, 2005 | Year Ended December 31, 2004 | |||||
Class A | ||||||
Net Investment Income | $ | 5,228,830 | $ | 33,155,145 | ||
Net realized gain | 35,673,322 | 49,301,619 | ||||
Total | $ | 40,902,152 | $ | 82,456,764 | ||
Class B | ||||||
Net investment income | $ | 131,491 | $ | 915,125 | ||
Net realized gain | 10,665,343 | 15,239,783 | ||||
Total | $ | 10,796,834 | $ | 16,154,908 | ||
Class C† | ||||||
Net Investment Income | $ | 85,876 | $ | 635,789 | ||
Net realized gain | 6,268,971 | 8,637,529 | ||||
Total | $ | 6,354,847 | $ | 9,273,318 | ||
Class Y | ||||||
Net investment income | $ | 1,362,463 | $ | 8,450,141 | ||
Net realized gain | 6,437,529 | 8,850,415 | ||||
Total | $ | 7,799,992 | $ | 17,300,556 | ||
| † | On April 29, 2004, Class L shares were renamed as Class C shares. |
22 Smith Barney Appreciation Fund Inc. | 2005 Semi-Annual Report
Notes to Financial Statements (unaudited) (continued)
| 6. | Capital Shares |
At June 30, 2005, the Company had one billion shares of capital stock authorized with a par value of $0.001 per share. The Fund has the ability to issue multiple classes of shares. Each share of a class represents an identical interest in the Fund and has the same rights, except that each class bears certain expenses, those specifically related to the distribution of its shares.
| Six Months Ended June 30, 2005 | Year Ended December 31, 2004 | |||||||||||||
| Shares | Amount | Shares | Amount | |||||||||||
Class A | ||||||||||||||
Shares sold | 16,980,719 | $ | 237,509,131 | 35,351,754 | $ | 498,635,254 | ||||||||
Net asset value of shares issued in connection with the transfer of the Smith Barney Group Spectrum Fund’s net assets (Note 7) | 754,656 | 11,167,932 | — | — | ||||||||||
Shares issued on reinvestment | 2,638,650 | 38,708,998 | 5,365,607 | 77,725,534 | ||||||||||
Shares repurchased | (18,587,430 | ) | (268,149,153 | ) | (29,771,134 | ) | (419,571,631 | ) | ||||||
Net Increase | 1,786,595 | $ | 19,236,908 | 10,946,227 | $ | 156,789,157 | ||||||||
Class B | ||||||||||||||
Shares sold | 5,674,967 | $ | 82,142,703 | 11,228,439 | $ | 154,824,428 | ||||||||
Net asset value of shares issued in connection with the transfer of the Smith Barney Group Spectrum Fund’s net assets (Note 7) | 1,267,551 | 18,414,370 | — | — | ||||||||||
Shares issued on reinvestment | 714,683 | 10,291,417 | 1,079,859 | 15,377,185 | ||||||||||
Shares repurchased | (9,179,018 | ) | (130,273,570 | ) | (16,828,304 | ) | (232,065,414 | ) | ||||||
Net Decrease | (1,521,817 | ) | $ | (19,425,080 | ) | (4,520,006 | ) | $ | (61,863,801 | ) | ||||
Class C† | ||||||||||||||
Shares sold | 4,452,509 | $ | 69,576,659 | 9,487,857 | $ | 130,928,824 | ||||||||
Net asset value of shares issued in connection with the transfer of the Smith Barney Group Spectrum Fund’s net assets (Note 7) | 3,981,282 | 57,898,407 | — | — | ||||||||||
Shares issued on reinvestment | 414,126 | 5,971,695 | 612,773 | 8,732,009 | ||||||||||
Shares repurchased | (4,167,492 | ) | (59,117,499 | ) | (6,671,683 | ) | (91,944,618 | ) | ||||||
Net Increase | 4,680,425 | $ | 74,329,262 | 3,428,947 | $ | 47,716,215 | ||||||||
Class Y | ||||||||||||||
Shares sold | 4,964,306 | $ | 71,209,108 | 12,734,945 | $ | 181,057,717 | ||||||||
Shares issued on reinvestment | 440,748 | 6,448,147 | 988,774 | 14,280,496 | ||||||||||
Shares repurchased | (2,113,274 | ) | (30,482,933 | ) | (4,299,046 | ) | (59,989,938 | ) | ||||||
Net Increase | 3,291,780 | $ | 47,174,322 | 9,424,673 | $ | 135,348,275 | ||||||||
| † | On April 29, 2004, Class L shares were renamed as Class C shares. |
| 7. | Transfer of Net Assets |
On March 4, 2005, the Fund acquired the assets and certain liabilities of the Smith Barney Group Spectrum Fund (“Group Spectrum Fund”) pursuant to a plan of reorganization approved by Group Spectrum Fund shareholders on February 25, 2005. Total shares issued by the Fund, the total net assets of the Group Spectrum Fund and total net assets of the Fund on the date of transfer were as follows:
| Acquired Fund | Shares issued by the Fund | Total Net Assets of Group Spectrum Fund | Total Net Assets of the Fund | |||||
Smith Barney Group Spectrum Fund | 6,003,489 | $ | 87,480,709 | $ | 6,014,143,916 | |||
The total assets of the Group Spectrum Fund before acquisition included unrealized appreciation of $9,078,269 and accumulated net realized loss of $103,082,333. The accumulated net realized loss from the Group Spectrum Fund is subject to various tax
23 Smith Barney Appreciation Fund Inc. | 2005 Semi-Annual Report
Notes to Financial Statements (unaudited) (continued)
limitations that will result in $81,182,466 of these losses expiring unutilized. Therefore, only $21,899,867 will be available to offset future gains of the Fund. Total net assets of the Fund immediately after the transfer were $6,101,624,625. The transaction was structured to qualify as a tax-free reorganization under the Internal Revenue Code of 1986, as amended.
| 8. | Income Tax Information |
As a result of the reorganization described in Note 7, the Fund has a capital loss carryforward of $21,899,867, all of which expires in 2010. This amount is subject to various tax limitations that will limit the Fund’s ability to offset future gains.
| 9. | Additional Information |
On May 31, 2005, the U.S. Securities and Exchange Commission (“SEC”) issued an order in connection with the settlement of an administrative proceeding against SBFM and Citigroup Global Markets Inc. (“CGMI”) relating to the appointment of an affiliated transfer agent for the Smith Barney family of mutual funds (the “Funds”).
The SEC order finds that SBFM and CGMI willfully violated Section 206(1) of the Investment Advisers Act of 1940 (“Advisers Act”). Specifically, the order finds that SBFM and CGMI knowingly or recklessly failed to disclose to the boards of the Funds in 1999 when proposing a new transfer agent arrangement with an affiliated transfer agent that: First Data Investors Services Group (“First Data”), the Funds’ then-existing transfer agent, had offered to continue as transfer agent and do the same work for substantially less money than before; and that Citigroup Asset Management (“CAM”), the Citigroup business unit that includes the fund’s investment manager and other investment advisory companies, had entered into a side letter with First Data under which CAM agreed to recommend the appointment of First Data as sub-transfer agent to the affiliated transfer agent in exchange, among other things, for a guarantee by First Data of specified amounts of asset management and investment banking fees to CAM and CGMI. The order also finds that SBFM and CGMI willfully violated Section 206(2) of the Advisers Act by virtue of the omissions discussed above and other misrepresentations and omissions in the materials provided to the Funds’ boards, including the failure to make clear that the affiliated transfer agent would earn a high profit for performing limited functions while First Data continued to perform almost all of the transfer agent functions, and the suggestion that the proposed arrangement was in the Funds’ best interests and that no viable alternatives existed. SBFM and CGMI do not admit or deny any wrongdoing or liability. The settlement does not establish wrongdoing or liability for purposes of any other proceeding.
The SEC censured SBFM and CGMI and ordered them to cease and desist from violations of Sections 206(1) and 206(2) of the Advisers Act. The order requires Citigroup to pay $208.1 million, including $109 million in disgorgement of profits, $19.1 million in interest, and a civil money penalty of $80 million. Approximately $24.4 million has already been paid to the Funds, primarily through fee waivers. The remaining $183.7 million, including the penalty, has been paid to the U.S. Treasury and will be distributed pursuant to a plan to be prepared by Citigroup and submitted within 90 days of the entry of the order for approval by the SEC. The order also requires that transfer agency fees received from the Funds since December 1, 2004 less certain expenses be placed in escrow and provides that a portion of such fees may be subsequently distributed in accordance with the terms of the order.
The order requires SBFM to recommend a new transfer agent contract to the Funds’ boards within 180 days of the entry of the order; if a Citigroup affiliate submits a proposal to serve as transfer agent or sub-transfer agent, an independent monitor must be engaged at the expense of SBFM and CGMI to oversee a competitive bidding process. Under the order, Citigroup also must comply with an amended version of a vendor policy that Citigroup instituted in August 2004. That policy, as amended, among other things, requires that when requested by a Fund board, CAM will retain at its own expense an independent consulting expert to advise and assist the board on the selection of certain service providers affiliated with Citigroup.
24 Smith Barney Appreciation Fund Inc. | 2005 Semi-Annual Report
Notes to Financial Statements (unaudited) (continued)
At this time, there is no certainty as to how the proceeds of the settlement will be distributed, to whom such distributions will be made, the methodology by which such distributions will be allocated, and when such distributions will be made. Although there can be no assurance, Citigroup does not believe that this matter will have a material adverse effect on the Funds.
| 10. | Legal Matters |
Beginning in June 2004, class action lawsuits alleging violations of the federal securities laws were filed against Citigroup Global Markets Inc. (the “Distributor”) and a number of its affiliates, including Smith Barney Fund Management LLC and Salomon Brothers Asset Management Inc (the “Advisers”), substantially all of the mutual funds managed by the Advisers, including the Fund (the “Funds”), and directors or trustees of the Funds (collectively, the “Defendants”). The complaints alleged, among other things, that the Distributor created various undisclosed incentives for its brokers to sell Smith Barney and Salomon Brothers funds. In addition, according to the complaints, the Advisers caused the Funds to pay excessive brokerage commissions to the Distributor for steering clients towards proprietary funds. The complaints also alleged that the defendants breached their fiduciary duty to the Funds by improperly charging Rule 12b-1 fees and by drawing on fund assets to make undisclosed payments of soft dollars and excessive brokerage commissions. The complaints also alleged that the Funds failed to adequately disclose certain of the allegedly wrongful conduct. The complaints sought injunctive relief and compensatory and punitive damages, rescission of the Funds’ contracts with the Advisers, recovery of all fees paid to the Advisers pursuant to such contracts and an award of attorneys’ fees and litigation expenses.
On December 15, 2004, a consolidated amended complaint (the “Complaint”) was filed alleging substantially similar causes of action. While the lawsuit is in its earliest stages, to the extent that the Complaint purports to state causes of action against the Funds, Citigroup Asset Management believes the Funds have significant defenses to such allegations, which the Funds intend to vigorously assert in responding to the Complaint.
Additional lawsuits arising out of these circumstances and presenting similar allegations and requests for relief may be filed against the Defendants in the future.
As of the date of this report, Citigroup Asset Management and the Funds believe that the resolution of the pending lawsuit will not have a material effect on the financial position or results of operations of the Funds or the ability of the Advisers and their affiliates to continue to render services to the Funds under their respective contracts.
| 11. | Other Matters |
On June 24, 2005, Citigroup announced that it has signed a definitive agreement under which Citigroup will sell substantially all of its worldwide asset management business to Legg Mason, Inc. (“Legg Mason”).
As part of this transaction, SBFM (the “Adviser”), currently an indirect wholly owned subsidiary of Citigroup, would become an indirect wholly owned subsidiary of Legg Mason. The Adviser is the investment adviser to the Fund.
The transaction is subject to certain regulatory approvals, as well as other customary conditions to closing. Subject to such approvals and the satisfaction of the other conditions, Citigroup expects the transaction to be completed later this year.
Under the 1940 Act, consummation of the transaction will result in the automatic termination of the investment advisory contract between the Fund and the Adviser. Therefore, the Fund’s Board of Directors will be asked to approve a new investment advisory contract between the Fund and the Adviser. If approved by the Board, the new investment advisory contract will be presented to the shareholders of the Fund for their approval. Subsequently, on August 1, 2005, the Board approved the new investment advisory contract between the Fund and the Adviser.
25 Smith Barney Appreciation Fund Inc. | 2005 Semi-Annual Report
SMITH BARNEY
APPRECIATION FUND INC.
DIRECTORS Dwight B. Crane Burt N. Dorsett R. Jay Gerken, CFA Elliot S. Jaffe Stephen E. Kaufman Cornelius C. Rose, Jr.
OFFICERS R. Jay Gerken, CFA President and Chief Executive Officer
Andrew B. Shoup Senior Vice President and Chief Administrative Officer
Kaprel Ozsolak Chief Financial Officer and Treasurer
Harry D. Cohen Vice President and Investment Officer
Scott K. Glasser Vice President and Investment Officer
Andrew Beagley Chief Anti-Money Laundering Compliance Officer
Robert I. Frenkel Secretary and Chief Legal Officer | INVESTMENT ADVISER Smith Barney Fund Management LLC
DISTRIBUTORS Citigroup Global Markets Inc. PFS Distributors, Inc.
CUSTODIAN State Street Bank and Trust Company
TRANSFER AGENT Citicorp Trust Bank, fsb. 125 Broad Street, 11th Floor New York, New York 10004
SUB-TRANSFER AGENTS PFPC Inc. P.O. Box 9699 Providence, Rhode Island 02940-9699
Primerica Shareholder Services P.O. Box 9662 Providence, Rhode Island 02940-9662 |
Smith Barney Appreciation Fund Inc.
The Fund files its complete schedule of portfolio holdings with Securities and Exchange Commission for the first and third quarters of each fiscal year on Form N-Q. The Fund’s Forms N-Q are available on the Commission’s website at www.sec.gov. The Fund’s Forms N-Q may be reviewed and copied at the Commission’s Public Reference Room in Washington D.C., and information on the operation of the Public Reference Room may be obtained by calling 1-800-SEC-0330. To obtain information on Form N-Q from the Fund, shareholders can call 1-800-451-2010.
Information on how the Fund voted proxies relating to portfolio securities during the most recent 12-month period ended June 30 and a description of the policies and procedures that the Fund uses to determine how to vote proxies relating to portfolio securities is available (1) without charge, upon request, by calling 1-800-451-2010, (2) on the Fund’s website at www.citigroupam.com and (3) on the SEC’s website at www.sec.gov.
This report is submitted for the general information of the shareholders of Smith Barney Appreciation Fund Inc., but it also may be used as sales literature when preceded or accompanied by the current Prospectus.
SMITH BARNEY APPRECIATION FUND INC.
Smith Barney Mutual Funds
125 Broad Street
10th Floor, MF-2
New York, New York 10004
This report must be preceded or accompanied by a free prospectus. Investors should consider the Fund’s investment objectives, risks, charges and expenses carefully before investing. The prospectus contains this and other important information about the Fund. Please read the prospectus carefully before investing.
www.citigroupam.com
©2005 Citigroup Global Markets Inc.
Member NASD, SIPC
| FD0404 8/05 | 05-8944 |
ITEM 2. CODE OF ETHICS.
Not applicable.
ITEM 3. AUDIT COMMITTEE FINANCIAL EXPERT.
Not applicable.
ITEM 4. PRINCIPAL ACCOUNTANT FEES AND SERVICES.
Not applicable.
ITEM 5. AUDIT COMMITTEE OF LISTED REGISTRANTS.
Not applicable.
ITEM 6. SCHEDULE OF INVESTMENTS.
Not applicable.
ITEM 7. DISCLOSURE OF PROXY VOTING POLICIES AND PROCEDURES FOR CLOSED-END MANAGEMENT INVESTMENT COMPANIES.
Not applicable.
ITEM 8. [RESERVED]
ITEM 9. PURCHASES OF EQUITY SECURITIES BY CLOSED-END MANAGEMENT INVESTMENT COMPANY AND AFFILIATED PURCHASERS.
Not applicable.
ITEM 10. SUBMISSION OF MATTERS TO A VOTE OF SECURITY HOLDERS.
Not applicable.
ITEM 11. CONTROLS AND PROCEDURES.
| (a) | The registrant’s principal executive officer and principal financial officer have concluded that the registrant’s disclosure controls and procedures (as defined in Rule 30a- 3(c) under the Investment Company Act of 1940, as amended (the “1940 Act”)) are effective as of a date within 90 days of the filing date of this report that includes the disclosure required by this paragraph, based on their evaluation of the disclosure controls and procedures required by Rule 30a-3(b) under the 1940 Act and 15d-15(b) under the Securities Exchange Act of 1934. |
| (b) | There were no changes in the registrant’s internal control over financial reporting (as defined in Rule 30a-3(d) under the 1940 Act) that occurred during the registrant’s last fiscal half-year (the registrant’s second fiscal half-year in the case of an annual report) that have materially affected, or are likely to materially affect the registrant’s internal control over financial reporting. |
ITEM 12. EXHIBITS.
| (a) | Not applicable. |
| (b) | Attached hereto. |
| Exhibit 99.CERT | Certifications pursuant to section 302 of the Sarbanes-Oxley Act of 2002 | |
| Exhibit 99.906CERT | Certifications pursuant to Section 906 of the Sarbanes-Oxley Act of 2002 | |
SIGNATURES
Pursuant to the requirements of the Securities Exchange Act of 1934 and the Investment Company Act of 1940, the registrant has duly caused this Report to be signed on its behalf by the undersigned, there unto duly authorized.
Smith Barney Appreciation Fund Inc.
By: | /s/ R. Jay Gerken | |
| R. Jay Gerken | ||
| Chief Executive Officer of | ||
| Smith Barney Appreciation Fund Inc. |
Date: September 7, 2005
Pursuant to the requirements of the Securities Exchange Act of 1934 and the Investment Company Act of 1940, this report has been signed below by the following persons on behalf of the registrant and in the capacities and on the dates indicated.
By: | /s/ R. Jay Gerken | |
| R. Jay Gerken | ||
| Chief Executive Officer of | ||
| Smith Barney Appreciation Fund Inc. |
Date: September 7, 2005
By: | /s/ Kaprel Ozsolak | |
| Kaprel Ozsolak | ||
| Chief Financial Officer of | ||
| Smith Barney Appreciation Fund Inc. |
Date: September 7, 2005