Exhibit 99.2
REPORT OF INDEPENDENT REGISTERED PUBLIC ACCOUNTING FIRM
To the Board of Directors and Member of
YCC Holdings LLC
South Deerfield, Massachusetts
We have audited the accompanying consolidated balance sheets of YCC Holdings LLC and subsidiaries (the “Company”) as of December 29, 2012 and December 31, 2011, and the related consolidated statements of operations, comprehensive income, changes in member’s equity (deficit), and cash flows for each of the three years in the period ended December 29, 2012. These financial statements are the responsibility of the Company’s management. Our responsibility is to express an opinion on these financial statements based on our audits.
We conducted our audits in accordance with the standards of the Public Company Accounting Oversight Board (United States). Those standards require that we plan and perform the audit to obtain reasonable assurance about whether the financial statements are free of material misstatement. The Company is not required to have, nor were we engaged to perform, an audit of its internal control over financial reporting. Our audits included consideration of internal control over financial reporting as a basis for designing audit procedures that are appropriate in the circumstances, but not for the purpose of expressing an opinion on the effectiveness of the Company’s internal control over financial reporting. Accordingly, we express no such opinion. An audit also includes examining, on a test basis, evidence supporting the amounts and disclosures in the financial statements, assessing the accounting principles used and significant estimates made by management, as well as evaluating the overall financial statement presentation. We believe that our audits provide a reasonable basis for our opinion.
In our opinion, such consolidated financial statements present fairly, in all material respects, the financial position of YCC Holdings LLC and subsidiaries as of December 29, 2012 and December, 31, 2011, and the results of their operations and their cash flows for each of the three years in the period ended December 29, 2012, in conformity with accounting principles generally accepted in the United States of America.
|
| /s/ Deloitte & Touche LLP |
| Hartford, Connecticut |
March 29, 2013 |
REPORT OF INDEPENDENT REGISTERED PUBLIC ACCOUNTING FIRM
To the Board of Directors and Stockholder
of Yankee Holding Corp.
South Deerfield, Massachusetts
We have audited the accompanying consolidated balance sheets of Yankee Holding Corp. and subsidiaries (the “Company”) as of December 29, 2012 and December 31, 2011, and the related consolidated statements of operations, comprehensive income, changes in stockholder’s equity, and cash flows for each of the three years in the period ended December 29, 2012. These financial statements are the responsibility of the Company’s management. Our responsibility is to express an opinion on these financial statements based on our audits.
We conducted our audits in accordance with the standards of the Public Company Accounting Oversight Board (United States). Those standards require that we plan and perform the audit to obtain reasonable assurance about whether the financial statements are free of material misstatement. An audit includes examining, on a test basis, evidence supporting the amounts and disclosures in the financial statements. An audit also includes assessing the accounting principles used and significant estimates made by management, as well as evaluating the overall financial statement presentation. We believe that our audits provide a reasonable basis for our opinion.
In our opinion, such consolidated financial statements present fairly, in all material respects, the financial position of Yankee Holding Corp. and subsidiaries as of December 29, 2012 and December 31, 2011, and the results of their operations and their cash flows for each of the three years in the period ended December 29, 2012, in conformity with accounting principles generally accepted in the United States of America.
We have also audited, in accordance with the standards of the Public Company Accounting Oversight Board (United States), the Company’s internal control over financial reporting as of December 29, 2012, based on the criteria established inInternal Control—Integrated Framework issued by the Committee of Sponsoring Organizations of the Treadway Commission and our report dated March 29, 2013 (not presented herein) expressed unqualified opinion on the Company’s internal control over financial reporting.
|
| /s/ Deloitte & Touche LLP |
| Hartford, Connecticut |
March 29, 2013 |
YCC HOLDINGS LLC AND SUBSIDIARIES
CONSOLIDATED BALANCE SHEETS
(in thousands)
| | | | | | | | |
| | | December 29, | | | December 31, | |
| | | 2012 | | | 2011 | |
| ASSETS | | | | | | | | |
CURRENT ASSETS: | | | | | | | | |
Cash | | $ | 39,979 | | | $ | 50,833 | |
Accounts receivable, net | | | 63,572 | | | | 57,013 | |
Inventory | | | 77,969 | | | | 75,563 | |
Prepaid expenses and other current assets | | | 4,882 | | | | 4,924 | |
Deferred tax assets | | | 6,814 | | | | 8,724 | |
| | | | | | | | |
| | |
TOTAL CURRENT ASSETS | | | 193,216 | | | | 197,057 | |
| | |
PROPERTY AND EQUIPMENT, NET | | | 121,553 | | | | 118,402 | |
MARKETABLE SECURITIES | | | 1,971 | | | | 1,670 | |
GOODWILL | | | 643,570 | | | | 643,570 | |
INTANGIBLE ASSETS | | | 268,033 | | | | 269,405 | |
DEFERRED FINANCING COSTS | | | 19,684 | | | | 19,624 | |
OTHER ASSETS | | | 355 | | | | 394 | |
| | | | | | | | |
| | |
TOTAL ASSETS | | $ | 1,248,382 | | | $ | 1,250,122 | |
| | | | | | | | |
| | |
| LIABILITIES AND MEMBER’S DEFICIT | | | | | | | | |
| | |
CURRENT LIABILITIES: | | | | | | | | |
Accounts payable | | $ | 25,309 | | | $ | 21,109 | |
Accrued payroll | | | 13,680 | | | | 6,910 | |
Accrued interest | | | 22,547 | | | | 29,485 | |
Accrued income taxes | | | 7,110 | | | | 7,269 | |
Accrued purchases of property and equipment | | | 3,434 | | | | 2,606 | |
Current portion of long-term debt | | | — | | | | 12,042 | |
Current portion of capital leases | | | 1,661 | | | | 975 | |
Other accrued liabilities | | | 39,686 | | | | 38,689 | |
| | | | | | | | |
| | |
TOTAL CURRENT LIABILITIES | | | 113,427 | | | | 119,085 | |
| | |
DEFERRED TAX LIABILITIES | | | 117,135 | | | | 107,123 | |
LONG-TERM DEBT, NET OF CURRENT PORTION | | | 1,156,840 | | | | 1,198,659 | |
DEFERRED RENT | | | 12,886 | | | | 12,833 | |
CAPITAL LEASES, NET OF CURRENT PORTION | | | 3,767 | | | | 2,597 | |
OTHER LONG-TERM LIABILITIES | | | 5,911 | | | | 3,980 | |
COMMITMENTS AND CONTINGENCIES (See Note 14) | | | | | | | | |
MEMBER’S DEFICIT | | | | | | | | |
Common Units | | | 120,204 | | | | 122,038 | |
Accumulated deficit | | | (280,086 | ) | | | (313,009 | ) |
Accumulated other comprehensive loss | | | (1,702 | ) | | | (3,184 | ) |
| | | | | | | | |
| | |
Total member’s deficit | | | (161,584 | ) | | | (194,155 | ) |
| | | | | | | | |
| | |
TOTAL LIABILITIES AND MEMBER’S DEFICIT | | $ | 1,248,382 | | | $ | 1,250,122 | |
| | | | | | | | |
See notes to consolidated financial statements.
YCC HOLDINGS LLC AND SUBSIDIARIES
CONSOLIDATED STATEMENTS OF OPERATIONS
(in thousands)
| | | | | | | | | | | | |
| | | Fifty-Two
Weeks Ended
December 29, 2012 | | | Fifty-Two
Weeks Ended
December 31, 2011 | | | Fifty-Two
Weeks Ended
January 1, 2011 | |
Sales | | $ | 844,186 | | | $ | 785,762 | | | $ | 733,717 | |
Cost of sales | | | 363,839 | | | | 340,336 | | | | 307,103 | |
| | | | | | | | | | | | |
| | | |
Gross profit | | | 480,347 | | | | 445,426 | | | | 426,614 | |
Selling expenses | | | 238,035 | | | | 234,982 | | | | 212,580 | |
General and administrative expenses | | | 72,184 | | | | 62,451 | | | | 62,609 | |
Restructuring charges | | | 1,725 | | | | — | | | | 829 | |
| | | | | | | | | | | | |
| | | |
Operating income | | | 168,403 | | | | 147,993 | | | | 150,596 | |
Interest expense | | | 106,889 | | | | 101,598 | | | | 75,648 | |
Loss on extinguishment of debt | | | 13,376 | | | | — | | | | — | |
Other (income) expense, net | | | (6,815 | ) | | | (7,414 | ) | | | 8,972 | |
| | | | | | | | | | | | |
| | | |
Income from continuing operations before provision for income taxes | | | 54,953 | | | | 53,809 | | | | 65,976 | |
Provision for income taxes | | | 21,896 | | | | 20,040 | | | | 23,688 | |
| | | | | | | | | | | | |
| | | |
Income from continuing operations | | | 33,057 | | | | 33,769 | | | | 42,288 | |
Loss from discontinued operations, net of income taxes | | | (134 | ) | | | (262 | ) | | | (379 | ) |
| | | | | | | | | | | | |
| | | |
Net income | | $ | 32,923 | | | $ | 33,507 | | | $ | 41,909 | |
| | | | | | | | | | | | |
See notes to consolidated financial statements.
YCC HOLDINGS LLC AND SUBSIDIARIES
CONSOLIDATED STATEMENTS OF COMPREHENSIVE INCOME
(in thousands)
| | | | | | | | | | | | |
| | | Fifty-Two
Weeks Ended
December 29, 2012 | | | Fifty-Two
Weeks Ended
December 31, 2011 | | | Fifty-Two
Weeks Ended
January 1, 2011 | |
| | | |
Net income | | $ | 32,923 | | | $ | 33,507 | | | $ | 41,909 | |
Other comprehensive income (loss), net of tax: | | | | | | | | | | | | |
Foreign currency translation adjustments | | | 1,482 | | | | (535 | ) | | | (462 | ) |
Unrealized gain on interest rate swaps, net of tax | | | — | | | | 712 | | | | 5,249 | |
| | | | | | | | | | | | |
Other comprehensive income, net of tax | | | 1,482 | | | | 177 | | | | 4,787 | |
| | | | | | | | | | | | |
| | | |
Comprehensive income | | $ | 34,405 | | | $ | 33,684 | | | $ | 46,696 | |
| | | | | | | | | | | | |
See notes to consolidated financial statements.
YCC HOLDINGS LLC AND SUBSIDIARIES
CONSOLIDATED STATEMENTS OF CHANGES IN MEMBER’S EQUITY (DEFICIT)
(in thousands, except units)
| | | | | | | | | | | | | | | | | | | | | | | | | | | | | | | | | | | | | | | | | | | | | | | | |
| | | Common Units | | | Class A | | | Class B | | | Class C | | | Total A, B
and C
Common
Units | | | | | | | | | | |
| | | Units | | | Amount | | | Common
Units | | | Amount | | | Common
Units | | | Amount | | | Common
Units | | | Amount | | | | Accumulated
Deficit | | | Accumulated
Other Loss | | | Total Member’s
Equity
(Deficit) | |
| | | | | | | | | | | | |
BALANCE, JANUARY 2, 2010 | | | — | | | $ | — | | | | 4,268,723 | | | $ | 417,127 | | | | 363,080 | | | $ | 2,407 | | | | 97,564 | | | $ | 282 | | | $ | 419,816 | | | $ | (388,425 | ) | | $ | (8,148 | ) | | $ | 23,243 | |
Issuance of Class A and C common units | | | — | | | | — | | | | 286 | | | | 40 | | | | — | | | | — | | | | 44,712 | | | | — | | | | 40 | | | | — | | | | — | | | | 40 | |
Repurchase of Class A, B and C common units | | | — | | | | — | | | | (1,781 | ) | | | (211 | ) | | | (29,614 | ) | | | (410 | ) | | | (55,450 | ) | | | (312 | ) | | | (933 | ) | | | — | | | | — | | | | (933 | ) |
Equity-based compensation | | | — | | | | — | | | | — | | | | — | | | | — | | | | 640 | | | | — | | | | 322 | | | | 962 | | | | — | | | | — | | | | 962 | |
Net income | | | — | | | | — | | | | — | | | | — | | | | — | | | | — | | | | — | | | | — | | | | — | | | | 41,909 | | | | — | | | | 41,909 | |
Other comprehensive income, net of tax | | | — | | | | — | | | | — | | | | — | | | | — | | | | — | | | | — | | | | — | | | | — | | | | — | | | | 4,787 | | | | 4,787 | |
| | | | | | | | | | | | | | | | | | | | | | | | | | | | | | | | | | | | | | | | | | | | | | | | |
| | | | | | | | | | | | |
BALANCE, JANUARY 1, 2011 | | | — | | | | — | | | | 4,267,228 | | | | 416,956 | | | | 333,466 | | | | 2,637 | | | | 86,826 | | | | 292 | | | | 419,885 | | | | (346,516 | ) | | | (3,361 | ) | | | 70,008 | |
| | | | | | | | | | | | |
Issuance of Class A common units | | | — | | | | — | | | | — | | | | 3 | | | | — | | | | — | | | | — | | | | — | | | | 3 | | | | — | | | | — | | | | 3 | |
Repurchase of Class B and C common units | | | — | | | | — | | | | — | | | | — | | | | (21,423 | ) | | | (47 | ) | | | (900 | ) | | | (39 | ) | | | (86 | ) | | | — | | | | — | | | | (86 | ) |
Conversion of Class A, B and C common units to Common Units | | | 1,000 | | | | 419,888 | | | | (4,267,228 | ) | | | (416,959 | ) | | | (312,043 | ) | | | (2,648 | ) | | | (85,926 | ) | | | (281 | ) | | | (419,888 | ) | | | — | | | | — | | | | — | |
Return of capital to Common Units | | | — | | | | (297,825 | ) | | | — | | | | — | | | | — | | | | — | | | | — | | | | — | | | | — | | | | — | | | | — | | | | (297,825 | ) |
Issuance of Common Units | | | — | | | | 17 | | | | — | | | | — | | | | — | | | | — | | | | — | | | | — | | | | — | | | | — | | | | — | | | | 17 | |
Repurchase of Common Units | | | — | | | | (776 | ) | | | — | | | | — | | | | — | | | | — | | | | — | | | | — | | | | — | | | | — | | | | — | | | | (776 | ) |
Equity-based compensation expense | | | — | | | | 734 | | | | — | | | | — | | | | — | | | | 58 | | | | — | | | | 28 | | | | 86 | | | | — | | | | — | | | | 820 | |
Net income | | | — | | | | — | | | | — | | | | — | | | | — | | | | — | | | | — | | | | — | | | | — | | | | 33,507 | | | | — | | | | 33,507 | |
Other comprehensive income, net of tax | | | — | | | | — | | | | — | | | | — | | | | — | | | | — | | | | — | | | | — | | | | — | | | | — | | | | 177 | | | | 177 | |
| | | | | | | | | | | | | | | | | | | | | | | | | | | | | | | | | | | | | | | | | | | | | | | | |
| | | | | | | | | | | | |
BALANCE, DECEMBER 31, 2011 | | | 1,000 | | | | 122,038 | | | | — | | | | — | | | | — | | | | — | | | | — | | | | — | | | | — | | | | (313,009 | ) | | | (3,184 | ) | | | (194,155 | ) |
| | | | | | | | | | | | |
Issuance of Common Units | | | — | | | | 36 | | | | — | | | | — | | | | — | | | | — | | | | — | | | | — | | | | — | | | | — | | | | — | | | | 36 | |
Repurchase of Common Units | | | — | | | | (2,623 | ) | | | — | | | | — | | | | — | | | | — | | | | — | | | | — | | | | — | | | | — | | | | — | | | | (2,623 | ) |
Equity-based compensation expense | | | — | | | | 753 | | | | — | | | | — | | | | — | | | | — | | | | — | | | | — | | | | — | | | | — | | | | — | | | | 753 | |
Net income | | | — | | | | — | | | | — | | | | — | | | | — | | | | — | | | | — | | | | — | | | | — | | | | 32,923 | | | | — | | | | 32,923 | |
Other comprehensive income, net of tax | | | — | | | | — | | | | — | | | | — | | | | — | | | | — | | | | — | | | | — | | | | — | | | | — | | | | 1,482 | | | | 1,482 | |
| | | | | | | | | | | | | | | | | | | | | | | | | | | | | | | | | | | | | | | | | | | | | | | | |
| | | | | | | | | | | | |
BALANCE, DECEMBER 29, 2012 | | | 1,000 | | | $ | 120,204 | | | | — | | | $ | — | | | | — | | | $ | — | | | | — | | | $ | — | | | $ | — | | | $ | (280,086 | ) | | $ | (1,702 | ) | | $ | (161,584 | ) |
| | | | | | | | | | | | | | | | | | | | | | | | | | | | | | | | | | | | | | | | | | | | | | | | |
See notes to consolidated financial statements.
YCC HOLDINGS LLC AND SUBSIDIARIES
CONSOLIDATED STATEMENTS OF CASH FLOWS
(in thousands)
| | | | | | | | | | | | |
| | | Fifty-Two
Weeks Ended
December 29, 2012 | | | Fifty-Two
Weeks Ended
December 31, 2011 | | | Fifty-Two
Weeks Ended
January 1, 2011 | |
CASH FLOWS PROVIDED BY OPERATING ACTIVITIES: | | | | | | | | | | | | |
Net income | | $ | 32,923 | | | $ | 33,507 | | | $ | 41,909 | |
Adjustments to reconcile net income to net cash provided by operating activities: | | | | | | | | | | | | |
Realized (gain) loss on derivative contracts | | | (7,652 | ) | | | (6,403 | ) | | | 9,166 | |
Depreciation and amortization | | | 34,721 | | | | 43,934 | | | | 42,978 | |
Unrealized (gain) loss on marketable securities | | | (171 | ) | | | 50 | | | | (83 | ) |
Equity-based compensation expense | | | 753 | | | | 820 | | | | 962 | |
Deferred taxes | | | 11,506 | | | | 10,321 | | | | 3,931 | |
Loss on extinguishment of debt | | | 13,376 | | | | — | | | | — | |
Non-cash adjustments related to restructuring | | | — | | | | — | | | | 10 | |
Loss on disposal and impairment of property and equipment | | | 382 | | | | 1,411 | | | | 213 | |
Restructuring charges | | | 1,070 | | | | — | | | | — | |
Marketable securities | | | — | | | | — | | | | 22 | |
Changes in assets and liabilities: | | | | | | | | | | | | |
Accounts receivable | | | (5,569 | ) | | | (10,076 | ) | | | (3,482 | ) |
Inventory | | | (1,696 | ) | | | (8,175 | ) | | | (8,450 | ) |
Prepaid expenses and other assets | | | (405 | ) | | | 4,757 | | | | (617 | ) |
Accounts payable | | | 4,064 | | | | (5,182 | ) | | | 4,682 | |
Income taxes | | | 1,517 | | | | (10,289 | ) | | | 18,175 | |
Accrued expenses and other liabilities | | | 8,086 | | | | 8,991 | | | | 989 | |
| | | | | | | | | | | | |
| | | |
NET CASH PROVIDED BY OPERATING ACTIVITIES | | | 92,905 | | | | 63,666 | | | | 110,405 | |
| | | | | | | | | | | | |
| | | |
CASH FLOWS USED IN INVESTING ACTIVITIES: | | | | | | | | | | | | |
Purchases of property and equipment | | | (25,516 | ) | | | (24,295 | ) | | | (17,651 | ) |
Proceeds from sale of property and equipment | | | — | | | | 47 | | | | 202 | |
| | | | | | | | | | | | |
| | | |
NET CASH USED IN INVESTING ACTIVITIES | | | (25,516 | ) | | | (24,248 | ) | | | (17,449 | ) |
| | | | | | | | | | | | |
| | | |
CASH FLOWS USED IN FINANCING ACTIVITIES: | | | | | | | | | | | | |
Borrowings under Senior Secured Credit Facility | | | 15,000 | | | | 150,000 | | | | 76,000 | |
Borrowings under Senior Secured Asset-Based Credit Facility | | | 81,000 | | | | — | | | | — | |
Borrowings under Term Loan Facility | | | 717,750 | | | | — | | | | — | |
Repayments under Senior Secured Credit Facility and Senior Notes | | | (718,125 | ) | | | (150,000 | ) | | | (164,000 | ) |
Payments of call premiums and fees for extinguishment of debt | | | (6,763 | ) | | | — | | | | — | |
Repayments under Term Loan Facility | | | (70,625 | ) | | | — | | | | — | |
Repayments under Senior Secured Asset-Based Credit Facility | | | (81,000 | ) | | | — | | | | — | |
Borrowings under Senior PIK Notes | | | — | | | | 308,700 | | | | — | |
Financing costs | | | (11,579 | ) | | | (10,478 | ) | | | — | |
Return of capital | | | — | | | | (297,825 | ) | | | — | |
Proceeds from issuance of Class A and C common units | | | — | | | | 3 | | | | 40 | |
Proceeds from issuance of Common Units | | | 36 | | | | 17 | | | | — | |
Repurchase of Class A, B and C common units | | | — | | | | (86 | ) | | | (933 | ) |
Repurchase of Common Units | | | (2,623 | ) | | | (776 | ) | | | — | |
Principal payments on capital lease obligations | | | (1,452 | ) | | | (853 | ) | | | (349 | ) |
| | | | | | | | | | | | |
| | | |
NET CASH USED IN FINANCING ACTIVITIES | | | (78,381 | ) | | | (1,298 | ) | | | (89,242 | ) |
| | | | | | | | | | | | |
| | | |
EFFECT OF EXCHANGE RATE CHANGES ON CASH | | | 138 | | | | — | | | | (96 | ) |
| | | | | | | | | | | | |
| | | |
NET (DECREASE) INCREASE IN CASH | | | (10,854 | ) | | | 38,120 | | | | 3,618 | |
CASH, BEGINNING OF YEAR | | | 50,833 | | | | 12,713 | | | | 9,095 | |
| | | | | | | | | | | | |
| | | |
CASH, END OF YEAR | | $ | 39,979 | | | $ | 50,833 | | | $ | 12,713 | |
| | | |
SUPPLEMENTAL DISCLOSURES OF CASH FLOW INFORMATION: | | | | | | | | | | | | |
Cash paid during the year for: | | | | | | | | | | | | |
Interest | | $ | 106,438 | | | $ | 83,273 | | | $ | 71,016 | |
| | | | | | | | | | | | |
Income taxes | | $ | 8,754 | | | $ | 19,832 | | | $ | 1,345 | |
| | | | | | | | | | | | |
| | | |
Net change in accrued purchases of property and equipment | | $ | (828 | ) | | $ | (337 | ) | | $ | (368 | ) |
| | | | | | | | | | | | |
Noncash Financing Activities: | | | | | | | | | | | | |
Conversion of Class A, B and C common units to Common Units | | $ | — | | | $ | 419,888 | | | $ | — | |
| | | | | | | | | | | | |
Capital lease obligations related to equipment purchase | | $ | 3,321 | | | $ | 2,097 | | | $ | 2,694 | |
| | | | | | | | | | | | |
See notes to consolidated financial statements.
YANKEE HOLDING CORP. AND SUBSIDIARIES
CONSOLIDATED BALANCE SHEETS
(in thousands except share data)
| | | | | | | | |
| | | December 29, | | | December 31, | |
| | | 2012 | | | 2011 | |
| ASSETS | | | | | | | | |
CURRENT ASSETS: | | | | | | | | |
Cash | | $ | 39,979 | | | $ | 50,833 | |
Accounts receivable, net | | | 63,572 | | | | 57,013 | |
Inventory | | | 77,969 | | | | 75,563 | |
Prepaid expenses and other current assets | | | 4,882 | | | | 4,924 | |
Deferred tax assets | | | 6,814 | | | | 8,724 | |
| | | | | | | | |
| | |
TOTAL CURRENT ASSETS | | | 193,216 | | | | 197,057 | |
| | |
PROPERTY AND EQUIPMENT, NET | | | 121,553 | | | | 118,402 | |
MARKETABLE SECURITIES | | | 1,971 | | | | 1,670 | |
GOODWILL | | | 643,570 | | | | 643,570 | |
INTANGIBLE ASSETS | | | 268,033 | | | | 269,405 | |
DEFERRED FINANCING COSTS | | | 12,799 | | | | 11,006 | |
OTHER ASSETS | | | 355 | | | | 394 | |
| | | | | | | | |
| | |
TOTAL ASSETS | | $ | 1,241,497 | | | $ | 1,241,504 | |
| | | | | | | | |
| | |
| LIABILITIES AND STOCKHOLDER’S EQUITY | | | | | | | | |
| | |
CURRENT LIABILITIES: | | | | | | | | |
Accounts payable | | $ | 25,309 | | | $ | 21,109 | |
Accrued payroll | | | 13,680 | | | | 6,910 | |
Accrued interest | | | 10,614 | | | | 17,377 | |
Accrued income taxes | | | 7,110 | | | | 7,269 | |
Accrued purchases of property and equipment | | | 3,434 | | | | 2,606 | |
Current portion of long-term debt | | | — | | | | 12,042 | |
Current portion of capital leases | | | 1,661 | | | | 975 | |
Other accrued liabilities | | | 39,686 | | | | 38,689 | |
| | | | | | | | |
| | |
TOTAL CURRENT LIABILITIES | | | 101,494 | | | | 106,977 | |
| | |
DEFERRED TAX LIABILITIES | | | 117,135 | | | | 107,123 | |
LONG-TERM DEBT, NET OF CURRENT PORTION | | | 846,174 | | | | 889,083 | |
DEFERRED RENT | | | 12,886 | | | | 12,833 | |
CAPITAL LEASES, NET OF CURRENT PORTION | | | 3,767 | | | | 2,597 | |
OTHER LONG-TERM LIABILITIES | | | 5,911 | | | | 3,980 | |
COMMITMENTS AND CONTINGENCIES (See Note 14) | | | | | | | | |
STOCKHOLDER’S EQUITY: | | | | | | | | |
| | |
Common stock: $.01 par value; 500,000 issued and 497,981 outstanding at December 29, 2012 and December 31, 2011 | | | 414,788 | | | | 417,411 | |
Additional paid-in capital | | | 30,144 | | | | 17,718 | |
| | |
Treasury stock: at cost, 2,019 shares at December 29, 2012 and December 31, 2011 | | | (1,809 | ) | | | (1,809 | ) |
Accumulated deficit | | | (287,291 | ) | | | (311,225 | ) |
Accumulated other comprehensive loss | | | (1,702 | ) | | | (3,184 | ) |
| | | | | | | | |
| | |
Total stockholder’s equity | | | 154,130 | | | | 118,911 | |
| | | | | | | | |
| | |
TOTAL LIABILITIES AND STOCKHOLDER’S EQUITY | | $ | 1,241,497 | | | $ | 1,241,504 | |
| | | | | | | | |
See notes to consolidated financial statements
YANKEE HOLDING CORP. AND SUBSIDIARIES
CONSOLIDATED STATEMENTS OF OPERATIONS
(in thousands)
| | | | | | | | | | | | |
| | | Fifty-Two
Weeks Ended
December 29, 2012 | | | Fifty-Two
Weeks Ended
December 31, 2011 | | | Fifty-Two
Weeks Ended
January 1, 2011 | |
Sales | | $ | 844,186 | | | $ | 785,762 | | | $ | 733,717 | |
Cost of sales | | | 363,839 | | | | 340,336 | | | | 307,103 | |
| | | | | | | | | | | | |
| | | |
Gross profit | | | 480,347 | | | | 445,426 | | | | 426,614 | |
Selling expenses | | | 238,035 | | | | 234,982 | | | | 212,580 | |
General and administrative expenses | | | 72,089 | | | | 62,009 | | | | 62,609 | |
Restructuring charges | | | 1,725 | | | | — | | | | 829 | |
| | | | | | | | | | | | |
| | | |
Operating income | | | 168,498 | | | | 148,435 | | | | 150,596 | |
Interest expense | | | 71,947 | | | | 70,543 | | | | 75,648 | |
Loss on extinguishment of debt | | | 13,376 | | | | — | | | | — | |
Other (income) expense, net | | | (6,815 | ) | | | (7,414 | ) | | | 8,972 | |
| | | | | | | | | | | | |
| | | |
Income from continuing operations before provision for income taxes | | | 89,990 | | | | 85,306 | | | | 65,976 | |
Provision for income taxes | | | 33,533 | | | | 30,497 | | | | 23,688 | |
| | | | | | | | | | | | |
| | | |
Income from continuing operations | | | 56,457 | | | | 54,809 | | | | 42,288 | |
Loss from discontinued operations, net of income taxes | | | (134 | ) | | | (262 | ) | | | (379 | ) |
| | | | | | | | | | | | |
| | | |
Net income | | $ | 56,323 | | | $ | 54,547 | | | $ | 41,909 | |
| | | | | | | | | | | | |
See notes to consolidated financial statements.
YANKEE HOLDING CORP. AND SUBSIDIARIES
CONSOLIDATED STATEMENTS OF COMPREHENSIVE INCOME
(in thousands)
| | | | | | | | | | | | |
| | | Fifty-Two
Weeks Ended
December 29, 2012 | | | Fifty-Two
Weeks Ended
December 31, 2011 | | | Fifty-Two
Weeks Ended
January 1, 2011 | |
| | | |
Net income | | $ | 56,323 | | | $ | 54,547 | | | $ | 41,909 | |
Other comprehensive income (loss), net of tax: | | | | | | | | | | | | |
Foreign currency translation adjustments | | | 1,482 | | | | (535 | ) | | | (462 | ) |
Unrealized gain on interest rate swaps, net of tax | | | — | | | | 712 | | | | 5,249 | |
| | | | | | | | | | | | |
Other comprehensive income, net of tax | | | 1,482 | | | | 177 | | | | 4,787 | |
| | | | | | | | | | | | |
| | | |
Comprehensive income | | $ | 57,805 | | | $ | 54,724 | | | $ | 46,696 | |
| | | | | | | | | | | | |
See notes to consolidated financial statements.
YANKEE HOLDING CORP. AND SUBSIDIARIES
CONSOLIDATED STATEMENTS OF CHANGES IN STOCKHOLDER’S EQUITY
(in thousands, except treasury shares)
| | | | | | | | | | | | | | | | | | | | | | | | | | | | | | | | |
| | | Common Stock | | | Additional
Paid in
Capital | | | Treasury Stock | | | Accumulated
Deficit | | | Accumulated
Other
Comprehensive
Loss | | | Total | |
| | | Shares | | | Amount | | | | Shares | | | Amount | | | | |
| | | | | | | | |
BALANCE, JANUARY 2, 2010 | | | 500 | | | | 418,187 | | | | 2,419 | | | | 1,120 | | | | (790 | ) | | | (388,425 | ) | | | (8,148 | ) | | | 23,243 | |
Issuance of common stock | | | — | | | | — | | | | 40 | | | | — | | | | — | | | | — | | | | — | | | | 40 | |
Repurchase of common stock | | | — | | | | — | | | | — | | | | 838 | | | | (933 | ) | | | — | | | | — | | | | (933 | ) |
Equity-based compensation expense | | | — | | | | — | | | | 962 | | | | — | | | | — | | | | — | | | | — | | | | 962 | |
Net income | | | — | | | | — | | | | — | | | | — | | | | — | | | | 41,909 | | | | — | | | | 41,909 | |
Other comprehensive income, net of tax | | | — | | | | — | | | | — | | | | — | | | | — | | | | — | | | | 4,787 | | | | 4,787 | |
| | | | | | | | | | | | | | | | | | | | | | | | | | | | | | | | |
| | | | | | | | |
BALANCE, JANUARY 1, 2011 | | | 500 | | | | 418,187 | | | | 3,421 | | | | 1,958 | | | | (1,723 | ) | | | (346,516 | ) | | | (3,361 | ) | | | 70,008 | |
| | | | | | | | |
Issuance of common stock | | | — | | | | — | | | | 20 | | | | — | | | | — | | | | — | | | | — | | | | 20 | |
Repurchase of common stock | | | — | | | | (776 | ) | | | — | | | | 61 | | | | (86 | ) | | | — | | | | — | | | | (862 | ) |
Equity-based compensation expense | | | — | | | | — | | | | 820 | | | | — | | | | — | | | | — | | | | — | | | | 820 | |
Contributions by YCC Holdings LLC | | | — | | | | — | | | | 13,457 | | | | — | | | | — | | | | — | | | | — | | | | 13,457 | |
Dividend to YCC Holdings LLC | | | — | | | | — | | | | — | | | | — | | | | — | | | | (19,256 | ) | | | — | | | | (19,256 | ) |
Net income | | | — | | | | — | | | | — | | | | — | | | | — | | | | 54,547 | | | | — | | | | 54,547 | |
Other comprehensive income, net of tax | | | — | | | | — | | | | — | | | | — | | | | — | | | | — | | | | 177 | | | | 177 | |
| | | | | | | | | | | | | | | | | | | | | | | | | | | | | | | | |
| | | | | | | | |
BALANCE, DECEMBER 31, 2011 | | | 500 | | | | 417,411 | | | | 17,718 | | | | 2,019 | | | | (1,809 | ) | | | (311,225 | ) | | | (3,184 | ) | | | 118,911 | |
| | | | | | | | |
Issuance of common stock | | | — | | | | — | | | | 36 | | | | — | | | | — | | | | — | | | | — | | | | 36 | |
Repurchase of common stock | | | — | | | | (2,623 | ) | | | — | | | | — | | | | — | | | | — | | | | — | | | | (2,623 | ) |
Equity-based compensation expense | | | — | | | | — | | | | 753 | | | | — | | | | — | | | | — | | | | — | | | | 753 | |
Contributions by YCC Holdings LLC | | | — | | | | — | | | | 11,637 | | | | — | | | | — | | | | — | | | | — | | | | 11,637 | |
Dividend to YCC Holdings LLC | | | — | | | | — | | | | — | | | | — | | | | — | | | | (32,389 | ) | | | — | | | | (32,389 | ) |
Net income | | | — | | | | — | | | | — | | | | — | | | | — | | | | 56,323 | | | | — | | | | 56,323 | |
Other comprehensive income, net of tax | | | — | | | | — | | | | — | | | | — | | | | — | | | | — | | | | 1,482 | | | | 1,482 | |
| | | | | | | | | | | | | | | | | | | | | | | | | | | | | | | | |
| | | | | | | | |
BALANCE, DECEMBER 29, 2012 | | | 500 | | | $ | 414,788 | | | $ | 30,144 | | | | 2,019 | | | $ | (1,809 | ) | | $ | (287,291 | ) | | $ | (1,702 | ) | | $ | 154,130 | |
| | | | | | | | | | | | | | | | | | | | | | | | | | | | | | | | |
See notes to consolidated financial statements
YANKEE HOLDING CORP. AND SUBSIDIARIES
CONSOLIDATED STATEMENTS OF CASH FLOWS
(in thousands)
| | | | | | | | | | | | |
| | | Fifty-Two
Weeks Ended
December 29,
2012 | | | Fifty-Two
Weeks Ended
December 31,
2011 | | | Fifty-Two
Weeks Ended
January 1,
2011 | |
CASH FLOWS PROVIDED BY OPERATING ACTIVITIES: | | | | | | | | | | | | |
Net income | | $ | 56,323 | | | $ | 54,547 | | | $ | 41,909 | |
Adjustments to reconcile net income to net cash provided by operating activities: | | | | | | | | | | | | |
Realized (gain) loss on derivative contracts | | | (7,652 | ) | | | (6,403 | ) | | | 9,166 | |
Depreciation and amortization | | | 31,898 | | | | 41,669 | | | | 42,978 | |
Unrealized (gain) loss on marketable securities | | | (171 | ) | | | 50 | | | | (83 | ) |
Equity-based compensation expense | | | 753 | | | | 820 | | | | 962 | |
Deferred taxes | | | 11,506 | | | | 10,321 | | | | 3,931 | |
Loss on extinguishment of debt | | | 13,376 | | | | — | | | | — | |
Restructuring charges | | | 1,070 | | | | — | | | | — | |
Non-cash adjustments related to restructuring | | | — | | | | — | | | | 10 | |
Loss on disposal and impairment of property and equipment | | | 382 | | | | 1,411 | | | | 213 | |
Marketable securities | | | — | | | | — | | | | 22 | |
Changes in assets and liabilities: | | | | | | | | | | | | |
Accounts receivable | | | (5,569 | ) | | | (10,076 | ) | | | (3,482 | ) |
Inventory | | | (1,696 | ) | | | (8,175 | ) | | | (8,450 | ) |
Prepaid expenses and other assets | | | (405 | ) | | | 4,757 | | | | (617 | ) |
Accounts payable | | | 4,064 | | | | (5,182 | ) | | | 4,682 | |
Income taxes | | | 13,154 | | | | 168 | | | | 18,175 | |
Accrued expenses and other liabilities | | | 8,261 | | | | (3,120 | ) | | | 989 | |
| | | | | | | | | | | | |
| | | |
NET CASH PROVIDED BY OPERATING ACTIVITIES | | | 125,294 | | | | 80,787 | | | | 110,405 | |
| | | | | | | | | | | | |
| | | |
CASH FLOWS USED IN INVESTING ACTIVITIES: | | | | | | | | | | | | |
Purchases of property and equipment | | | (25,516 | ) | | | (24,295 | ) | | | (17,651 | ) |
Proceeds from sale of property and equipment | | | — | | | | 47 | | | | 202 | |
| | | | | | | | | | | | |
| | | |
NET CASH USED IN INVESTING ACTIVITIES | | | (25,516 | ) | | | (24,248 | ) | | | (17,449 | ) |
| | | | | | | | | | | | |
| | | |
CASH FLOWS USED IN FINANCING ACTIVITIES: | | | | | | | | | | | | |
Borrowings under Senior Secured Credit Facility | | | 15,000 | | | | 150,000 | | | | 76,000 | |
Borrowings under Senior Secured Asset-Based Credit Facility | | | 81,000 | | | | — | | | | — | |
Borrowings under Term Loan Facility | | | 717,750 | | | | — | | | | — | |
Repayments under Senior Secured Credit Facility and Senior Notes | | | (718,125 | ) | | | (150,000 | ) | | | (164,000 | ) |
Payments of call premiums and fees for extinguishment of debt | | | (6,763 | ) | | | — | | | | — | |
Repayments under Term Loan Facility | | | (70,625 | ) | | | — | | | | — | |
Repayments under Senior Secured Asset-Based Credit Facility | | | (81,000 | ) | | | | | | | | |
Financing costs | | | (11,579 | ) | | | (468 | ) | | | — | |
Contributions by YCC Holdings LLC | | | — | | | | 3,000 | | | | — | |
Dividend to YCC Holdings LLC | | | (32,389 | ) | | | (19,256 | ) | | | — | |
Proceeds from issuance of common stock | | | 36 | | | | 20 | | | | 40 | |
Repurchase of common stock | | | (2,623 | ) | | | (862 | ) | | | (933 | ) |
Principal payments on capital lease obligations | | | (1,452 | ) | | | (853 | ) | | | (349 | ) |
| | | | | | | | | | | | |
| | | |
NET CASH USED IN FINANCING ACTIVITIES | | | (110,770 | ) | | | (18,419 | ) | | | (89,242 | ) |
| | | | | | | | | | | | |
| | | |
EFFECT OF EXCHANGE RATE CHANGES ON CASH | | | 138 | | | | — | | | | (96 | ) |
| | | | | | | | | | | | |
| | | |
NET (DECREASE) INCREASE IN CASH | | | (10,854 | ) | | | 38,120 | | | | 3,618 | |
CASH, BEGINNING OF YEAR | | | 50,833 | | | | 12,713 | | | | 9,095 | |
| | | | | | | | | | | | |
| | | |
CASH, END OF YEAR | | $ | 39,979 | | | $ | 50,833 | | | $ | 12,713 | |
| | | |
SUPPLEMENTAL DISCLOSURES OF CASH FLOW INFORMATION: | | | | | | | | | | | | |
Cash paid during the year for: | | | | | | | | | | | | |
Interest | | $ | 74,149 | | | $ | 66,591 | | | $ | 71,016 | |
| | | | | | | | | | | | |
| | | |
Income taxes | | $ | 8,754 | | | $ | 19,832 | | | $ | 1,345 | |
| | | | | | | | | | | | |
| | | |
Net change in accrued purchases of property and equipment | | $ | (828 | ) | | $ | (337 | ) | | $ | (368 | ) |
| | | | | | | | | | | | |
Noncash Financing Activities: | | | | | | | | | | | | |
Noncash contribution by YCC Holdings LLC | | $ | 11,637 | | | $ | 10,457 | | | $ | — | |
| | | | | | | | | | | | |
Capital lease obligations related to equipment purchase | | $ | 3,321 | | | $ | 2,097 | | | $ | 2,694 | |
| | | | | | | | | | | | |
See notes to consolidated financial statements.
YCC HOLDINGS LLC AND SUBSIDIARIES
YANKEE HOLDING CORP. AND SUBSIDIARIES
NOTES TO CONSOLIDATED FINANCIAL STATEMENTS
FOR THE FIFTY-TWO WEEKS ENDED DECEMBER 29, 2012, DECEMBER 31, 2011
AND JANUARY 1, 2011
1. NATURE OF BUSINESS
This Annual Report on Form 10-K is a combined report of YCC Holdings LLC (“YCC Holdings”) and Yankee Holding Corp. (“Holding Corp.”), a direct 100% owned subsidiary of YCC Holdings. Unless the context indicates otherwise, references to the “Companies” and “Company” refers to YCC Holdings together with its direct and indirect subsidiaries, including Holding Corp.
YCC Holdings and subsidiaries (“Yankee Candle” or the “Company”) is a leading designer, manufacturer and branded marketer of premium scented candles in the giftware industry. The strong brand equity of the Yankee Candle brand, coupled with its vertically integrated multi-channel business model, have enabled the Company to be a market leader in the premium scented candle market for many years. The Company designs, develops, manufactures, and distributes the majority of the products it sells which allows the Company to offer distinctive, trend-appropriate products for every season, every customer, and every room in your home. The Company has a 43-year history of offering its distinctive products and marketing them as affordable luxuries for everyone on your list. The Company offers a broad assortment of highly scented candles, innovative home fragrance products, and candle related home décor accessories in a variety of compelling fragrances, colors, styles, and price points.
The Company sells its products through several channels including wholesale customers who operate approximately 27,800 locations in North America, 568 Company-owned and operated Yankee Candle retail stores in 46 states and in one province in Canada as of December 29, 2012, a direct mail catalog, an Internet web site ( www.yankeecandle.com ) and the Company’s subsidiary Yankee Candle Company (Europe) LTD (“YCE”), which has an international wholesale customer network of approximately 5,900 locations and distributors covering 55 countries.
2. ORGANIZATION AND SUMMARY OF SIGNIFICANT ACCOUNTING POLICIES
Organization
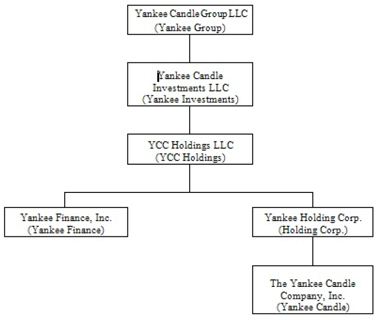
YCC Holdings and Holding Corp. are holding companies with no direct operations. Their principal assets are the indirect equity interests in The Yankee Candle Company, Inc. (“Yankee Candle”), and all of their operations are conducted through Yankee Candle, the wholly owned operating subsidiary of Holding Corp. Holding Corp. is a wholly owned subsidiary of YCC Holdings. YCC Holdings is a wholly owned subsidiary of Yankee Candle Investments LLC (“Yankee Investments”), which is in turn a wholly owned subsidiary of Yankee Candle Group LLC (“Yankee Group”). See the entity chart below:
In February 2011, Yankee Investments and Yankee Finance, Inc. (“Yankee Finance”) were formed in connection with the co-issuance of $315.0 million Senior PIK Notes (as defined below) by YCC Holdings and Yankee Finance. In connection with the issuance of the Senior PIK Notes, the equity interests in YCC Holdings were exchanged for new equity interests in its newly formed parent, Yankee Investments. Pursuant to this exchange, holders of Class A, Class B and Class C common units in YCC Holdings exchanged such units on a one for one basis for an identical interest in Class A, Class B, and Class C common units of Yankee Investments. After the exchange, each unit holder had the same ownership interest with the same rights and features in Yankee Investments that it previously had in YCC Holdings. Subsequent to the exchange, all outstanding Class A, B and C common units in YCC Holdings were converted to 1,000 Common Units in YCC Holdings, all of which are now held by its parent and sole member, Yankee Investments.
In February 2011, YCC Holdings and Yankee Finance co-issued $315.0 million of 10.25%/11.00% Senior Notes due 2016 (the “Senior PIK Notes”) pursuant to an Indenture at a discount of $6.3 million for net proceeds of $308.7 million. Issuance costs related to the Senior PIK Notes were $9.7 million, of which $7.8 million were paid for by YCC Holdings and $1.9 million were paid for by Holding Corp. The costs paid for by Holding Corp. have been reflected as a dividend to YCC Holdings in the accompanying Holding Corp.’s consolidated statement of stockholder’s equity.
The proceeds from the Senior PIK Notes were used to pay transaction costs (exclusive of the amounts paid by Holding Corp.) and make a payment of $300.8 million to Yankee Investments which in turn made payments of $297.8 million to holders of Yankee Investments’ Class A common units and payments of $3.0 million in aggregate to holders of Yankee Investments’ Class B and Class C common units. The payments to the Class A common unit holders represent a partial return of their original investment and are reflected as an equity transaction by Yankee Investments. The payments to the Class B and Class C common unit holders who are members of management and directors of Holding Corp. did not affect the liquidation amounts for such units and accordingly are reflected as general and administrative expense in both YCC Holdings’ and Holding Corp.’s accompanying consolidated statements of operations for the fifty-two weeks ended December 31, 2011 and as a contribution by YCC Holdings in Holding Corp.’s accompanying consolidated statement of stockholder’s equity for the fifty-two weeks ended December 31, 2011.
In the fiscal second quarter of 2011, the Companies formed Yankee Group, a Delaware limited liability company. Yankee Group is the parent of Yankee Investments. The members of Yankee Group include certain funds affiliated with Madison Dearborn Partners, LLC (“Madison Dearborn”), as well as certain management and directors of Holding Corp. In connection with the formation of Yankee Group, a second exchange of equity interests occurred, whereby holders of Class A, Class B and Class C common units in Yankee Investments exchanged such units on a one for one basis for an identical interest in Class A, Class B, and Class C common units of Yankee Group. After the exchange, each unit holder had the same ownership interest with the same rights and features in Yankee Group that it previously had in Yankee Investments. As of December 31, 2011, all outstanding common units of Yankee Investments were owned by Yankee Group.
Summary of Significant Accounting Policies
FISCAL YEAR—The Company’s fiscal year is the fifty-two or fifty-three weeks ending the Saturday closest to December 31.
PRINCIPLES OF CONSOLIDATION—The accompanying consolidated financial statements include the accounts of the Company and its wholly owned subsidiaries. All intercompany accounts and transactions have been eliminated.
ACCOUNTING ESTIMATES—The preparation of financial statements in conformity with accounting principles generally accepted in the United States of America requires management to make estimates and assumptions that affect the reported amounts of assets and liabilities and disclosure of contingent assets and liabilities at the date of the financial statements and the reported amounts of revenues and expenses during the reporting period. Actual results could differ from those estimates.
SALES RECOGNITION—The Company sells its products both directly to retail customers and through wholesale channels. Merchandise sales are recognized upon transfer of ownership, including passage of title to the customer and transfer of the risk of loss related to those goods. In the wholesale segment, products are shipped “free on board” shipping point. In cases where the customer bears the risk of loss during shipment, the Company recognizes revenue upon shipment. In some cases the Company has a policy of absorbing losses in the event of damaged and lost shipments. For these customers the Company recognizes revenue based on the receipt date by the customer. In the retail stores, transfer of title takes place at the point of sale and in respect to Consumer Direct and Fundraising when the risk of loss transfers. There are no situations, either in the wholesale or retail segments, where legal risk of loss does not transfer immediately upon receipt by customers. Although the Company does not provide a contractual right of return, in the course of arriving at practical business solutions to various claims, the Company has allowed sales returns and allowances. In these situations, customer claims for credit or return due to damage, defect, shortage or other reason must be pre-approved by the Company before credit is issued or such product is accepted for return. Such returns have not precluded sales recognition because the Company has a long history with such return activity, which is used in estimating a reserve. This accrual, however, is subject to change if actual returns differ from historical and expected return rates. In the wholesale and international segments, the Company has included an allowance in its financial statements representing its estimated obligation related to promotional marketing activities. In addition to returns, the Company bears credit risk relative to wholesale customers. The Company has provided an allowance for bad debts in the financial statements based on estimates of the creditworthiness of customers. Actual results could differ from these estimates and could affect operating results.
The Company sells gift cards to customers in both Yankee Candle and other third party retail stores and through consumer direct operations. The gift cards do not have an expiration date. At the point of sale of a gift card, the Company records deferred revenue. The Company recognizes income from gift cards when the gift card is redeemed by the customer. Gift card breakage income is recorded based on the Company’s historical redemption pattern (which is subject to change if or when actual patterns of redemptions change). Based on historical information, the Company determined that redemptions decreased to a de minimis amount 36 months after issuance and that approximately 8% of the gift cards value will never be redeemed. Gift card breakage income is recorded monthly in proportion to the actual redemption of gift cards in that month based on the Company’s historical redemption pattern. Gift card breakage income is included in sales in the consolidated statements of operations.
SALES INCENTIVES AND TRADE PROMOTIONAL ALLOWANCES—The Company offers a variety of incentives and discounts to retail, wholesale and international customers through various programs to support the sales of its products. In our wholesale and international segments, these incentives and discounts include cash discounts, price allowances, volume-based rebates, slotting fees and cooperative advertising. In retail, discounts include direct to consumer incentives such as coupons and temporary price reductions. These incentives and discounts are reflected as a reduction of gross sales to arrive at net sales, with the exception of some cooperative advertising expenses, which are recorded in advertising expense. Estimates of trade promotion liabilities for promotional program costs incurred, but unpaid, are generally based on estimates of the quantity of customer sales, timing of promotional activities and forecasted costs for activities within the promotional programs. Settlement of these liabilities sometimes occurs in periods subsequent to the date of the promotion activity.
SHIPPING AND HANDLING COSTS—The Company classifies shipping and handling costs associated with moving merchandise to our retail and wholesale facilities in costs of sales on the consolidated statements of operations.
CASH AND CASH EQUIVALENTS—The Company considers all short-term investments with maturities of three months or less at the date of purchase to be cash equivalents. The Company had no cash equivalents as of December 29, 2012 and December 31, 2011. The Company’s cash includes interest-bearing and non-interest bearing accounts.
INVENTORY—The Company values its inventories using the first-in first-out (“FIFO”) basis. Inventory quantities on hand are regularly reviewed, and where necessary provisions for excess and obsolete inventory are recorded based primarily on the Company’s forecast of product demand and production requirements.
PROPERTY AND EQUIPMENT—Property and equipment are stated at cost and are depreciated on the straight-line method based on the estimated useful lives of the various assets. The estimated useful lives are as follows:
| | |
| | | Years |
Buildings and improvements | | 5-40 |
Computer equipment | | 2-6 |
Furniture and fixtures | | 5-10 |
Equipment | | 2-10 |
Vehicles | | 3-5 |
Leasehold improvements are amortized using the straight-line method over the lesser of the estimated life of the improvement or the remaining life of the lease. Expenditures for normal maintenance and repairs are charged to expense as incurred
MARKETABLE SECURITIES—The Company classifies the marketable securities held in its deferred compensation plan as trading securities under Accounting Standards Codification (“ASC”) Topic 320 “Investments—Debt and Equity Securities.” In accordance with the provisions of this topic, the investment balance is stated at fair market value, which is based on observable market prices. Unrealized gains and losses are reflected in earnings; realized gains and losses are also reflected in earnings and are computed using the specific-identification method. The assets held in the deferred compensation plan reflect amounts due to employees, but are available for general creditors of the Company in the event the Company becomes insolvent. The Company has recorded the investment balance as a non-current asset within “other assets” and a long-term liability within “other long-term liabilities” on the accompanying consolidated balance sheets.
SEGMENT REPORTING—The Company has segmented its operations in a manner that reflects how its chief operating decision-maker (the “CEO”) currently reviews the results of the Company and its subsidiaries’ businesses. The CEO evaluates the Company’s retail, wholesale, and international operations based on an “operating earnings” measure. Such measure gives recognition to specifically identifiable operating costs such as cost of sales and selling expenses. Costs and income not specifically identifiable are included within the unallocated/corporate/other column and include administrative costs, interest expense, fair value changes of derivative contracts, restructuring charges for continuing operations and other costs not allocated to specific operating segments and are accordingly reflected in the unallocated/corporate/other column of the Company’s segment footnote. The Company does not account for or report assets, capital expenditures or depreciation and amortization by segment to the CEO.
GOODWILL AND INTANGIBLE ASSETS—The Company accounts for goodwill and intangible assets in accordance with ASC Topic 350 “Intangibles —Goodwill and Other.” Under this guidance, goodwill and certain intangible assets with indefinite lives are not amortized but are subject to an annual impairment test which is conducted in the Company’s fourth fiscal quarter. For goodwill, the annual impairment evaluation compares the fair value of each of the Company’s reporting units to their respective carrying values. Fair values of the reporting units are derived through a combination of market-based and income-based approaches, each of which were weighted at 50% for the impairment test performed as of November 3, 2012.
IMPAIRMENT OF OTHER LONG-LIVED ASSETS—The Company reviews its other long-lived assets (property and equipment and customer lists) periodically for impairment whenever events or changes in circumstances occur that indicate that the carrying value of the assets may not be recoverable. This review is based on the Company’s ability to recover the carrying value of the assets from expected undiscounted future cash flows. If an impairment is indicated, the Company measures the loss based on the fair value of the assets using various valuation techniques. If an impairment loss exists, the amount of the loss is recorded in the consolidated statements of operations.
RESTRUCTURING CHARGES—The Company accounts for its restructuring plans in accordance with the ASC Topic 420 “Exit or Disposal Cost Obligations.” Under this guidance, a liability for costs associated with an exit or disposal activity is recognized and measured at fair value when the liability is incurred.
ADVERTISING—The Company expenses advertising costs as they are incurred. Advertising expense, which includes cooperative advertising programs, was $18.8 million, $20.6 million and $15.6 million for the fifty-two weeks ended December 29, 2012, December 31, 2011, and January 1, 2011, respectively. Cooperative advertising expense, included in advertising expense, was $0.7 million, $1.0 million and $0.7 million for the fifty-two weeks ended December 29, 2012, December 31, 2011, and January 1, 2011, respectively. Advertising expenses are presented in selling expenses in the consolidated statements of operations.
INCOME TAXES—Holding Corp. and YCC Holdings recognize deferred tax liabilities and assets for the expected future tax consequences of temporary differences between the carrying amounts and the tax basis of assets and liabilities using enacted tax rates in effect in the years in which the differences are expected to reverse. Holding Corp. and YCC Holdings recognize the expected future tax consequences of uncertain tax positions in accordance with ASC 740-10 (FIN 48). Uncertain tax position reserves are subject to change in subsequent periods to reflect audit settlements, expired statutes of limitation for assessing additional taxes, relevant case law developments, and changes in tax law. The Company recognizes accrued interest and penalties, if any, related to unrecognized tax benefits in the provision for income taxes. Valuation allowances are established when necessary to reduce deferred tax assets to the amount that is more likely than not to be realized.
Holding Corp. and YCC Holdings are included in the consolidated federal income tax return of parent company, Yankee Investments. Yankee Investments has elected to be taxed as a corporation for federal income tax purposes. Holding Corp. and YCC Holdings, a single-member limited liability company of Yankee Investments, account for income taxes under the separate return method, as if Holding Corp. and YCC Holdings filed separate federal corporate income tax returns.
Holding Corp.’s income taxes payable balance as of December 29, 2012, is reduced by the tax benefit of interest and other expense deductions related to the February 2011 debt offering by YCC Holdings. The tax benefit of the deductions is treated as a capital contribution from YCC Holdings to Holding Corp. Thus, the net income taxes payable balance for the consolidated group is recorded at the Holding Corp. level.
FAIR VALUE OF FINANCIAL INSTRUMENTS—The Company follows the guidance prescribed by ASC Topic 820 “Fair Value Measurement.” The Fair Value Measurements and Disclosures Topic defines fair value and provides a consistent framework for measuring fair value under generally accepted accounting principles (“GAAP”), including financial statement disclosure requirements. As specified under this Topic, valuation techniques are based on observable and unobservable inputs. Observable inputs reflect readily obtainable data from independent sources, while unobservable inputs reflect market assumptions.
FOREIGN OPERATIONS—Assets and liabilities of foreign operations are translated into U.S. dollars at the exchange rate on the balance sheet date. The results of foreign subsidiary operations are translated using average rates of exchange during each reporting period. Gains and losses upon translation are deferred and reported as a component of accumulated other comprehensive loss. Foreign currency transaction gains or losses, whether realized or unrealized, are recorded directly in the consolidated statements of operations and are generally not material.
Recent Accounting Pronouncements
Disclosures Relating To Comprehensive Income (Loss)
In December 2011, the FASB issued ASU No. 2011-12, Comprehensive Income (Topic 220): Deferral of the Effective Date for Amendments to the Presentation of Reclassifications of Items Out of Accumulated Other Comprehensive Income in Accounting Standards Update No. 2011-05 (“ASU 2011-12”) .ASU 2011-12 defers the presentation of the reclassification adjustments in the income statement but does not defer the presentation of the reclassification adjustments in other comprehensive income. The Companies have presented the reclassification adjustments in other comprehensive income in the Condensed Consolidated Statements of Comprehensive Income herein in accordance with ASU 2011-12.
In February 2013, the FASB issued ASU No. 2013-02, Comprehensive Income (Topic 220): Reporting of Amounts Reclassified Out of Accumulated Other Comprehensive Income (“ASU 2013-02”) to improve the reporting of reclassifications out of Accumulated Other Comprehensive Income (“AOCI”). ASU 2013-12 does not change the current requirements for reporting net income or other comprehensive income in the financial statements. Under ASU 2013-02, an entity is required to provide information about the amounts reclassified out of AOCI by component. In addition, an entity is required to present, either on the face of the financial statements or in the notes, significant amounts reclassified out of AOCI by the respective line items of net income, but only if the amount reclassified is required under U.S. GAAP to be reclassified in its entirety in the same reporting period. For amounts that are not required under U.S. GAAP to be reclassified in their entirety to net income, an entity is required to cross-reference to other disclosures that provide additional details about those amounts. The adoption of ASU 2013-02 is effective for the Companies on December 30, 2012 and will affect disclosures only. Therefore the adoption of this accounting standard is not expected to have a material impact of the Companies’ consolidated financial statements.
Recently Adopted Accounting Pronouncements
Goodwill
The FASB issued updated authoritative guidance in September 2011 to amend previous guidance on the testing of goodwill for impairment; the guidance is effective for annual and interim goodwill impairment tests performed for fiscal years beginning after December 15, 2011, with early adoption permitted. The guidance provides entities with the option of first assessing qualitative factors to determine whether it is more likely than not that the fair value of a reporting unit is less than its carrying amount. If it is determined, on the basis of qualitative factors, that the fair value of the reporting unit is more likely than not less than the carrying amount, the two-step impairment test would be required. The Companies adopted this new accounting standard during 2012 choosing not to elect the qualitative option for purposes of 2012 impairment testing.
Fair Value Measurements
The FASB issued updated authoritative guidance in May 2011 to amend fair value measurements and related disclosures; the guidance became effective for the Company on a prospective basis at the beginning of its 2012 fiscal year. This guidance relates to a major convergence project of the FASB and the International Accounting Standards Board to improve International Financial Reporting Standards (“IFRS”) and U.S. GAAP. This guidance results in a consistent definition of fair value and common requirements for measurement of and disclosure about fair value between IFRS and U.S. GAAP. The guidance also changes some fair value measurement principles and enhances disclosure requirements related to activities in Level 3 of the fair value hierarchy. The Companies adopted this new accounting standard on January 1, 2012 and the adoption of this new accounting standard did not have an impact on the Companies’ consolidated financial statements.
3. LONG-TERM DEBT
Long-term debt consisted of the following at December 29, 2012 and December 31, 2011 (in thousands):
| | | | | | | | |
| | | December 29, | | | December 31, | |
| | | 2012 | | | 2011 | |
Holding Corp. | | | | | | | | |
Senior secured term loan facility | | $ | — | | | $ | 388,125 | |
Senior secured term loan facility, net of unamortized discount of $6,201 at December 29, 2012 | | | 648,174 | | | | — | |
Senior notes due 2015 | | | 10,000 | | | | 325,000 | |
Senior subordinated notes due 2017 | | | 188,000 | | | | 188,000 | |
Less current portion | | | — | | | | (12,042 | ) |
| | | | | | | | |
Total Holding Corp. | | | 846,174 | | | | 889,083 | |
Senior PIK notes due 2016, net of unamortized discount of $4,334 at December 29, 2012 and $5,424 at December 31, 2011 | | | 310,666 | | | | 309,576 | |
| | | | | | | | |
Total YCC Holdings | | $ | 1,156,840 | | | $ | 1,198,659 | |
| | | | | | | | |
Senior Secured Credit Facility
As of December 31, 2011, Yankee Candle’s senior secured credit facility (the “Senior Secured Credit Facility”) consisted of a $650.0 million senior secured term loan facility (the “Prior Term Facility”) with outstanding borrowings of $388.1 million and a senior secured revolving credit facility (“Prior Revolving Facility”) of $140.0 million with no outstanding borrowings.
Refinancing of the Senior Secured Credit Facility and Repurchase of $315 million of Yankee Candle’s 8 1⁄2% Senior Notes Due 2015
On April 2, 2012, Yankee Candle refinanced its Senior Secured Credit Facility and $315.0 million of its Senior Notes due 2015 by entering into a senior secured term loan facility (the “Term Loan Facility”) and by entering into a senior secured asset-based credit facility (the “ABL Facility”).
Under the Term Loan Facility, Yankee Candle borrowed $725.0 million resulting in proceeds of $717.8 million, net of original issue discount. At closing, on April 2, 2012, a portion of the proceeds from the Term Loan Facility were used to (i) redeem $180.0 million of Yankee Candle’s Senior Notes due 2015 at a call premium of 2.125%, (ii) repay $403.1 million of outstanding debt on the Company’s old Senior Secured Credit Facility (consisting of $388.1 million outstanding under the Prior Term Facility and $15.0 outstanding under the Prior Revolving Facility), and (iii) pay fees and expenses of $11.5 million related to the foregoing. On April 13, 2012, the Company used the remaining proceeds and borrowings under the ABL Facility to redeem an additional $135.0 million of the Senior Notes due 2015 at a call premium of 2.125%. As a result of the refinancing the Company recorded a loss on extinguishment of debt of $13.4 million during the fifty-two weeks ended December 29, 2012, comprised of the write-off of unamortized deferred financing fees of $6.7 million and call premiums of $6.7 million. The Company also recorded total deferred financing costs of $11.6 million, including $9.0 million related to the Term Loan Facility and $2.6 million related to the ABL Facility. The costs associated with the Term Loan Facility are being amortized using the interest method through the expiration date of the Term Loan Facility and the costs associated with the ABL Facility are being amortized on a straight line basis through the expiration date of the ABL Facility. Amortization of the discount is recorded as interest expense using the interest method.
Term Loan Facility
The Term Loan Facility matures on April 2, 2019; however, the maturity date of the Term Loan Facility will accelerate if the Senior Subordinated Notes and the Senior PIK Notes are not defeased, repurchased, refinanced or redeemed 91 days prior to their respective maturity dates. The Term Loan Facility is repayable in quarterly principal payments of $1.8 million with the balance due at maturity. However, in December 2012 the Company made a principal payment of $67.0 million, a portion of which was related to the excess cash flow provisions of the Term Loan Facility, as discussed below. As a result of the $67.0 million payment, no quarterly principal payments are due on the Term Loan Facility through its maturity and no amounts are classified as current in the accompanying consolidated balance sheet. Amounts repaid under the Term Loan Facility cannot be reborrowed. As of December 29, 2012, Yankee Candle’s Term Loan Facility had outstanding borrowings of $654.4 million.
Interest is payable on the Term Loan Facility at either (i) the Eurodollar Rate (subject to a 1.25% floor) plus 4.00% or (ii) the ABR (subject to a 2.25% floor) plus 3.00%. The default rate of interest will accrue (i) on the overdue principal amount of any loan at a rate of 2% in excess of the rate otherwise applicable to such loan and (ii) on any overdue interest or any other outstanding overdue amount at a rate of 2% in excess of the non-default interest rate then applicable to ABR loans. As of December 29, 2012, the interest rate applicable to the Term Loan Facility was 5.25%.
Yankee Candle’s Term Loan Facility contains a financial covenant which requires that Yankee Candle maintain at the end of each fiscal quarter, commencing with the quarter ended December 29, 2012 through the quarter ending September 28, 2013, a consolidated net debt (net of cash and cash equivalents not to exceed $75.0 million) to Consolidated EBITDA ratio of no more than 7.00 to 1.00. As of December 29, 2012, Yankee Candle’s actual net total leverage ratio was 4.06 to 1.00, as defined in the Term Loan Facility. As of December 29, 2012, total Holding Corp. debt (including Yankee Candle’s capital lease obligations of $5.4 million and net of $40.0 million in cash) was approximately $817.8 million. Under Yankee Candle’s Term Loan Facility, Consolidated EBITDA is defined as net income plus, interest, taxes, depreciation and amortization, further adjusted to add back extraordinary, unusual or non-recurring losses, non-cash stock option expense, fees and expenses related to the Merger, fees and expenses under the Management Agreement with our equity sponsor, restructuring charges or reserves, as well as other non-cash charges, expenses or losses, and further adjusted to subtract extraordinary, unusual or non-recurring gains, other non-cash income or gains, and certain cash contributions to our common equity.
In addition, the Term Loan Facility contains customary covenants and restrictions on Holding Corp. and its subsidiaries’ activities, including but not limited to, limitations on the incurrence of additional indebtedness, liens, negative pledges, guarantees, investments, loans, asset sales, mergers, acquisitions, prepayment of other debt, distributions, dividends, the repurchase of capital stock, transactions with affiliates and the ability to change the nature of its business or its fiscal year. All obligations under the Term Loan Facility are guaranteed by Holding Corp.’s and Yankee Candle’s domestic subsidiaries and are secured by a lien on substantially all of the assets of Holding Corp. and its domestic subsidiaries.
Asset-Based Credit Facility
On April 2, 2012, Yankee Candle, together with certain of its foreign subsidiaries, also entered into the ABL Facility with BofA, as agent, the other lenders party thereto.
The ABL Facility expires on April 2, 2017; however, the expiration date of the ABL Facility will accelerate if the Senior Subordinated Notes and the Senior PIK Notes are not defeased, repurchased, refinanced or redeemed 91 days prior to their respective maturity dates. The ABL Facility permits revolving borrowings of up to $175.0 million subject to eligible inventory and eligible accounts receivable balances. The ABL Facility is inclusive of sub-facilities for up to $25.0 million in swing line advances, up to $25.0 million for letters of credit, up to $10.0 million for borrowings by Yankee Candle’s Canadian subsidiary, up to $10.0 million for borrowings by Yankee Candle’s German subsidiary and up to $75.0 million for borrowing by YCE. Borrowings under the ABL Facility bear interest at a rate equal to either (i) LIBOR or the BofA rate plus the applicable margin or (ii) the prime rate plus the applicable margin. The applicable margin ranges from 0.50% to 2.00%, dependent on the currency of the borrowing. For purposes of determining interest rates, the applicable margin is subject to a variable grid, dependent on average daily excess availability calculated as of the immediately preceding fiscal quarter. As of December 29, 2012 the interest rate applicable to the ABL Facility was 2.0%.
The unused line fee payable under the ABL Facility is equal to (i) 0.50% per annum if less than 50% of the ABL Facility has been used on average during the immediately preceding fiscal quarter or (ii) 0.375% per annum if 50% or more of the ABL Facility has been utilized on average during the immediately preceding fiscal quarter.
The ABL Facility requires Yankee Candle and its subsidiaries to maintain a consolidated fixed charge coverage ratio of at least 1.0:1.0 during a covenant compliance event, which occurs if unused borrowing availability is less than the greater of (x) 10% of the maximum amount that can be borrowed under the ABL Facility, which amount is the lesser of $175.0 million and a borrowing formula based on eligible receivables and inventory (the “ABL Loan Cap”) and (y) $15.0 million and continues until excess availability has exceeded the amounts set forth herein for 30 consecutive days. As of December 29, 2012, the ABL Loan Cap was $141.3 million. As of December 29, 2012 Yankee Candle had outstanding letters of credit of $2.2 million resulting in available borrowing capacity of $139.1 million, or 98.5% of the Loan Cap. As such, Yankee Candle was not subject to the fixed charge coverage ratio.
In addition, the ABL Facility contains customary covenants and restrictions on Yankee Candle and its subsidiaries’ activities, including but not limited to, limitations on the incurrence of additional indebtedness, liens, negative pledges, guarantees, investments, loans, asset sales, mergers, acquisitions, prepayment of other debt, distributions, dividends, the repurchase of capital stock, transactions with affiliates, the ability to change the nature of its business or its fiscal year, enter into certain hedging agreements and enter into certain burdensome agreements. All obligations under the ABL Facility are guaranteed by Yankee Candle’s domestic subsidiaries and secured by a lien on substantially all of the assets of Yankee Candle and its domestic subsidiaries. Certain of the obligations under the ABL Facility are guaranteed by Yankee Candle’s foreign subsidiaries and are secured by a lien on substantially all of the assets of such foreign subsidiaries, which consist primarily of inventory and receivables.
Senior Notes and Senior Subordinated Notes
Yankee Candle’s senior notes due 2015 bear interest at a per annum rate equal to 8.50%. Interest is paid every six months on February 15 and August 15. Yankee Candle’s senior subordinated notes due 2017 bear interest at a per annum rate equal to 9.75%. Interest is paid every six months on February 15 and August 15. The senior notes mature on February 15, 2015 and the senior subordinated notes mature on February 15, 2017. In April 2012, $315.0 million of the Senior Notes were redeemed in connection with the refinancing of the Senior Secured Credit Facility detailed above. As of December 29, 2012, the Company had $10.0 million outstanding under the Senior Notes and $188.0 million outstanding under the Senior Subordinated Notes. See Subsequent Event footnote for repayment of Senior Notes.
The indentures governing the senior notes and senior subordinated notes restrict the ability of Yankee Holding Corp., Yankee Candle and most or all of Yankee Candle’s subsidiaries to: incur additional debt; pay dividends or make other distributions on the Company’s capital stock or repurchase capital stock or subordinated indebtedness; make investments or other specified restricted payments; create liens; sell assets and subsidiary stock; enter into transactions with affiliates; and enter into mergers, consolidations and sales of substantially all assets.
Obligations under the senior notes are guaranteed on an unsecured senior basis and obligations under the senior subordinated notes are guaranteed on an unsecured senior subordinated basis, by Yankee Holding Corp. and Yankee Candle’s existing and future domestic subsidiaries. If Yankee Candle cannot make any payment on either or both series of notes, the guarantors must make the payment instead.
In the event of certain change in control events specified in the indentures governing these notes, Yankee Candle must offer to repurchase all or a portion of such notes at 101% of the principal amount of the such notes on the date of purchase, plus any accrued and unpaid interest to the date of repurchase.
Senior PIK Notes - YCC Holdings
In February 2011, YCC Holdings and Yankee Finance co-issued $315.0 million of Senior PIK Notes pursuant to an Indenture at a discount of $6.3 million for net proceeds of $308.7 million. Issuance costs related to the Senior PIK Notes were $9.7 million, of which $7.8 million were paid for by YCC Holdings and $1.9 million were paid for by Holding Corp.
Cash interest on the Senior PIK Notes accrues at a rate of 10.25% per annum, and PIK Interest (defined below) accrues at the cash interest rate plus 0.75%. YCC Holdings is required to pay interest on the Senior PIK Notes entirely in cash interest, unless the conditions described in the indenture are satisfied with respect to the related interest period, in which case, YCC Holdings may pay interest on the Senior PIK Notes for such interest period by increasing the principal amount of the Senior PIK Notes or by issuing new PIK Notes for up to the entire amount of the interest payment (in each case, “PIK Interest”) to the extent described in the related indenture.
YCC Holdings is indirectly dependent upon dividends from Yankee Candle to generate the funds necessary to meet its outstanding debt service obligations. Neither Yankee Candle nor Holding Corp. guarantees the Senior PIK Notes. Yankee Candle is not obligated to pay dividends to Holding Corp. and Holding Corp. is not obligated to pay dividends to YCC Holdings. Yankee Candle’s ability to pay dividends to Holding Corp. to permit Holding Corp. to pay dividends to YCC Holdings was restricted at December 29, 2012 by A) Yankee Candle’s Term Loan Facility, B) Yankee Candle’s ABL Facility and C) the indentures governing the Senior Notes and Senior Subordinated Notes. Because the Term Loan Facility, ABL Facility and the indentures governing Yankee Candle’s senior notes and senior subordinated notes each contain limitations on dividends, Yankee Candle is permitted to make dividends only to the extent it is permitted to do so at the time the dividend is made under each of these agreements. Yankee Candle redeemed the remaining $10.0 million in aggregate principal amount of the Senior Notes on February 15, 2013, at which time the obligations of Yankee Candle and the guarantors under the related indenture were discharged.
A) The ability of Yankee Candle to declare dividends to Holding Corp. is limited under the Term Loan Facility. Under the Term Loan Facility, Yankee Candle is permitted to make dividends to YCC Holdings, provided there is no default or event of default and the dividend payment would not cause the applicable Consolidated Net Interest Coverage Ratio (as defined in the agreement governing the Term Loan Facility) to be less than 2.0 to 1.0, in an amount equal to the sum of (a) $10.0 million and (b) the available excess cash flow based on provisions determined in Yankee Candle’s Term Loan Facility, together with certain equity and debt issuances which, to date, have not occurred and together with the receipt of certain cash and cash equivalents and certain investments. Available excess cash flow for Yankee Candle’s Term Loan Facility is defined as the aggregate cumulative amount of excess cash flow for all fiscal years commencing with the fiscal year ending December 29, 2012 and for all fiscal years ending after December 29, 2012 that is not required to prepay the term debt. On an annual basis, Yankee Candle is required to prepay the term debt by 50% of excess cash flow, which percentage is reduced to 25% if the Consolidated Net Total Leverage Ratio (as defined in the Term Loan Facility) is not greater than 4.0 to 1.0. Yankee Candle is not required to make a payment if the consolidated net total leverage ratio is not greater than 3.0 to 1.0. Excess cash flow is defined in the Term Loan Facility as consolidated net income of Holding Corp. and its restricted subsidiaries plus all non-cash charges (including depreciation, amortization, and deferred tax expense), non-cash losses on disposition of certain property, decreases in working capital and the net increase in deferred tax liabilities or net decrease in deferred tax assets, decreased by non-cash gains including gains or credits, cash paid for capital expenditures, acquisitions, certain other investments, regularly scheduled principal payments, voluntary prepayments and certain mandatory prepayments of principal on debt, transaction costs for certain debt, equity, recapitalization, acquisition and investment transactions, purchase price adjustments in connection with acquisitions and certain payments to the Company’s equity sponsor, increases in working capital and the net decrease in deferred tax liabilities or net increase in deferred tax assets, call premiums in connection with cancellation of indebtedness, and certain amounts paid in connection with an asset sale or recovery event.
Additionally, a basket of $137.1 million consisting of the cumulative retained (and not yet applied) available excess amount from the former Senior Secured Credit Facility was made available for dividends from Yankee Candle to YCC Holdings to be applied to cash interest payments on the Senior PIK Notes. As of December 29, 2012, a total basket of $168.2 million was available for dividends from Yankee Candle to YCC Holdings to be applied to cash interest payments on the Senior PIK Notes.
The calculation to determine if the Company has excess cash flow per the Term Loan Facility is prepared on an annual basis at the end of each fiscal year. The Company generated excess cash flow during 2012 of $74.6 million, of which 50% was required to prepay the term loan facility in accordance with the agreement. During the fourth quarter of 2012, the Company repaid $67.0 million of the Term Loan Facility which satisfied the excess cash flow payment.
For the fifty-two weeks ended December 31, 2011, Yankee Candle’s required excess cash flow payment was $12.0 million. This amount was classified as short-term debt on the accompanying condensed consolidated balance sheet at December 31, 2011 and was subsequently refinanced on a long term basis in April 2012.
B) Under the ABL Facility, Yankee Candle is permitted to make dividends to Holding Corp. (1) on an unlimited basis if certain tests are met and (2) also solely to fund interest payments on the Senior PIK notes subject to the restrictions described below.
(1) Yankee Candle is permitted to make dividends to Holding Corp. in an unlimited amount so long as (a) unused borrowing availability is greater than or equal to 15% of the ABL Loan Cap at the time of the making of such dividend and projected on a pro forma basis for the immediately succeeding six months following such dividend, except that, to the extent that the dividend is made during the “August Period”, or the August Period is included in such six month projections, then unused borrowing availability shall only be required to be greater than or equal to 10% of the ABL Loan Cap and (b) to the extent unused borrowing availability is less than 25% of the ABL Loan Cap and is projected to be less than 25% of the ABL Loan Cap for the immediately succeeding six months following such dividend (or 10%, in the case that the dividend is made in the August Period or the August Period is included in such six month projections), the consolidated fixed charge coverage ratio for the most recently ended period of twelve fiscal months preceding such dividend on a pro forma basis is greater than or equal to 1.1 to 1.0.
“August Period”, as used herein, means August 1st through the earlier of the date that the borrowing base certificate is filed for the month of August and the fifteenth business day after the end of the August fiscal month.
(2) Yankee Candle is permitted to make dividends to Holding Corp. and Holding Corp. is permitted to make dividends to YCC Holdings solely for the purpose of funding interest payments due on the Senior PIK Notes if (a) except for payments to be made during the August Period as to which there is no minimum unused borrowing availability requirement, unused borrowing availability is greater than or equal to 15% of the ABL Loan Cap at the time of the making of such dividend and projected on a pro forma basis for the immediately succeeding six months following such dividend and (b) to the extent unused borrowing availability is less than 25% of the ABL Loan Cap and is projected to be less than 25% of the ABL Loan Cap for the immediately succeeding six months following such dividend (or 10%, in the case that the August Period is included in such projected six month period), the consolidated fixed charge coverage ratio for the most recently ended period of twelve fiscal months preceding such dividend on a pro forma basis is greater than or equal to 1.1 to 1.0; provided that for purposes of satisfying the test in this clause (b), no dividend made during the month of August for the purpose of funding, in whole or in part, an interest payment on the Senior PIK Notes shall be included in the calculation of consolidated fixed charge coverage ratio.
C) The indentures governing Yankee Candle’s Senior Notes and Senior Subordinated Notes permit Yankee Candle to pay dividends to Holding Corp. if: (i) there is no default or event of default under the indentures governing Yankee Candle’s notes; (ii) Yankee Candle would have a fixed charge coverage ratio of at least 2.0 to 1.0; and (iii) such dividend, together with the aggregate amount of all other “restricted payments” (as defined in such indentures) made by Yankee Candle and its restricted subsidiaries after February 6, 2007 (excluding certain restricted payments), is less than the sum (a) 50% of the Consolidated Net Income (as defined in such indentures) of Yankee Candle for the period (taken as one accounting period) from December 31, 2006 to the end of Yankee Candle’s most recently ended fiscal quarter for which internal financial statements are available at the time of such dividend (or, in the case such Consolidated Net Income for such period is a deficit, minus 100% of such deficit), plus (b) the proceeds from specified equity contributions or issuances of equity. In addition to the capacity described above, Yankee Candle has a “basket” of $35.0 million under the indentures from which it may make dividends in amount not to exceed $35.0 million (since the date of the issuance of Yankee Candle’s notes), so long as there is no default or event of defaults under the indentures. The ability of Yankee Candle and Holding Corp. to pay dividends to YCC Holdings and thus pay cash interest on the Senior PIK Notes is limited by Delaware law.
During the fifty-two weeks ended December 29, 2012 and December 31, 2011, Holding Corp. declared and paid dividends of $32.4 million and $19.3 million, respectively, to YCC Holdings to fund interest payments for the Senior PIK Notes, which decreased the amount available for future dividends. At December 29, 2012, the amount available for dividends from Yankee Candle to YCC Holdings was approximately $168.2 million.
Holding Corp. receives the tax benefit of the interest expense for YCC Holdings’ Senior PIK Notes. As such, in fiscal 2012 and fiscal 2011 Holding Corp. recorded non-cash contributions of $11.6 million and $10.5 million, respectively, from YCC Holdings. The contributions for fiscal 2012 and fiscal 2011 are shown as a contribution by YCC Holdings LLC in Holding Corp.’s respective consolidated statement of changes in stockholder’s equity and in Holding Corp.’s non-cash financing section of the respective consolidated statements of cash flows.
4. MEMBER’S DEFICIT, STOCKHOLDER’S EQUITY AND EQUITY-BASED COMPENSATION
On February 6, 2007, Yankee Candle, our “Predecessor” public company, merged (the “Merger”) with an affiliate of Madison Dearborn Partners, LLC (“MDP” or “Madison Dearborn”). In connection with the Merger, YCC Holdings acquired all of the outstanding capital stock of the Predecessor for approximately $1,413.5 million in cash. YCC Holdings was owned by affiliates of MDP and certain members of our senior management subsequent to the merger. YCC Holdings owns 100% of the stock of Holding Corp., together the “Successor” companies, which in turn owns 100% of the stock of The Yankee Candle Company, Inc. Effective as of the closing of the Merger, all of the prior equity plans of the Predecessor Company ceased to be effective and all existing equity grants and awards were paid out.
Class A Common Units
At the time of the Merger, an affiliate of Madison Dearborn purchased 4,233,353 Class A common units and certain eligible members of senior management of Yankee Holding Corp. (the “Management Investors”) purchased 40,933 Class A common units for $101.22 per unit. The Class A common units are not subject to vesting. The Class A common units are first entitled to a return of capital. Then the class B common units are entitled to a return of capital. Thereafter, all A, B and C units participate in any residual distributions on a pro rata basis.
Class B Common Units
Class B common units, and commencing in October 2007 Class C common units, constitute the Company’s long-term equity incentive program. At the time of the Merger, the Board of Managers of the Company (the “Board of Managers”) authorized 474,897 shares of Class B common units of which the Management Investors purchased 427,643 Class B common units for $1 per share, the estimated fair value as of such date. The number of authorized Class B common units is reduced by subsequent Class B issuances and any Class C common units and the aggregate of Class B and Class C issuances cannot exceed the 474,897 shares authorized. As of December 29, 2012, an aggregate of 66,256 Class B and Class C common units were available for issuance.
The Class B common units are subject to a five-year vesting period, with 10% of the units vesting immediately upon the date of purchase and the remainder vesting daily beginning on the sixth month anniversary of the purchase date, continuing over the subsequent 54 month period. If any Management Investor dies or becomes permanently disabled, such Management Investor will be credited with an additional 12 months of vesting for his or her Class B common units. All unvested Class B common units will vest upon a sale of all or substantially all of the Company so long as the employee holding such units continues to be an employee of the Company at the closing of the sale. YCC Holdings or MDP has the right to repurchase unvested class B units for $1 per unit upon a termination of employment.
Class C Common Units
In October 2007, the Board of Managers approved the creation of a new class of equity interest, Class C common units, for issuance under the Company’s long-term equity incentive program. Class C units are issued for no consideration. Class C common units typically have the same vesting provisions as Class B common units. Unvested Class C common units are forfeited in the event of a termination of employment. Recipients of Class C common units are required to simultaneously purchase a corresponding number of Class A common units, at then fair market value of the Class A common units.
In February 2012, the Board of Managers approved the issuance of 13,650 Class C performance based common units to Vice Presidents and above. Typically, the Company’s Class C units vest daily over five years. However, the March 2012 Class C common units (“Class C performance units”) are partially performance based and generally vest as follows, subject to the terms of the applicable agreements: (i) 25% of the units granted shall vest on a daily basis over five years, (ii) 25% of the units granted shall vest in the event that the Company’s Adjusted EBITDA performance in fiscal 2012 meets or exceeds a pre-approved target established by the Compensation Committee of the Board of Managers (the “2012 units”) and (iii) 50% of the units granted shall vest following the end of any fiscal year during which the Company attains an additional Adjusted EBITDA target established by the Compensation Committee of the Board of Managers. The Company did not achieve the 2012 Adjusted EBITDA target referenced in clause (ii) above, therefore the 2012 units remain eligible for vesting under clause (iii) above in the event the Company subsequently achieves the applicable Adjusted EBITDA target. References to “Class C common units” herein shall include these Class C performance units unless otherwise indicated.
Voting Rights and Transfers
Holders of Class A common units, vested Class B common units and vested Class C common units are entitled to one vote per unit, on all matters voted on by the members. All Class A common units, vested Class B common units and vested Class C common units’ votes count the same.
Class A, Class B and Class C common units are all subject to various restrictions on transfer and other conditions, all as more fully set forth in the equity agreements. YCC Holdings may issue additional units subject to the terms and conditions of certain of the equity agreements.
Prior to February 2011, member’s equity was held in the form of Class A, Class B and Class C common units in YCC Holdings. As discussed in Note 2, in February 2011 equity interests in YCC Holdings were exchanged for new equity interests in its newly formed parent, Yankee Investments. Pursuant to this exchange, holders of Class A, Class B and Class C common units in YCC Holdings exchanged such units on a one for one basis for an identical interest in Class A, Class B, and Class C common units of Yankee Investments. After the exchange, each unit holder had the same ownership interest with the same rights and features in Yankee Investments that it previously had in YCC Holdings. Subsequent to the exchange, all outstanding Class A, B and C common units in YCC Holdings were converted to 1,000 Common Units in YCC Holdings, all of which are now held by its parent and sole member, Yankee Investments.
Subsequently, in the second fiscal quarter of 2011, in connection with the formation of Yankee Candle Group LLC (“Yankee Group”) a second exchange of equity interests occurred, whereby holders of Class A, Class B and Class C common units in Yankee Investments exchanged such units on a one for one basis for an identical interest in Class A, Class B, and Class C common units of Yankee Group. After the exchange, each unit holder had the same ownership interest with the same rights and features in Yankee Group that it previously had in Yankee Investments. All outstanding interests in Yankee Investments were exchanged pursuant to this transaction. As of December 31, 2011, all outstanding common units of Yankee Investments were owned by Yankee Group.
A summary of nonvested units for Yankee Group as of December 29, 2012 and December 31, 2011 and the activity for the fifty-two weeks ended December 29, 2012 is presented below (there are no units remaining in Yankee Investments):
| | | | | | | | | | | | | | | | | | | | | | | | |
| | | Class A
Common
Units | | | Weighted
Average
Calculated
Value | | | Class B
Common
Units | | | Weighted
Average
Calculated
Value | | | Class C
Common
Units | | | Weighted
Average
Calculated
Value | |
Nonvested stock at December 31, 2011 | | | — | | | | — | | | | 4,577 | | | $ | 9.39 | | | | 54,614 | | | $ | 24.99 | |
Granted | | | 356 | | | | — | | | | — | | | | — | | | | 89,409 | | | $ | 26.63 | |
Forfeited | | | — | | | | — | | | | (13 | ) | | $ | 9.39 | | | | (23,125 | ) | | $ | 34.75 | |
Vested | | | (356 | ) | | | — | | | | (4,564 | ) | | $ | 9.39 | | | | (25,743 | ) | | $ | 21.53 | |
| | | | | | | | | | | | | | | | | | | | | | | | |
| | | | | | |
Nonvested stock at December 29, 2012 | | | — | | | | — | | | | — | | | $ | 9.39 | | | | 95,155 | | | $ | 25.42 | |
| | | | | | | | | | | | | | | | | | | | | | | | |
During fiscal 2012, 692 Class A common units, 34,892 vested Class B common units and 15,767 vested Class C common units were repurchased for $2.6 million. The weighted average calculated value for equity awards vested during the fifty-two weeks ended December 29, 2012, December 31, 2011 and January 1, 2011 was $19.70, $12.82 and $11.25, respectively. Yankee Group anticipates that all of its nonvested common units will vest with the exception of performance shares for which an estimated forfeiture rate has been applied.
The total estimated fair value of equity awards vested during the fifty-two weeks ended December 29, 2012, December 31, 2011 and January 1, 2011 was $0.8 million, $0.8 million and $1.0 million, respectively. Equity-based compensation expense for the fifty-two weeks ended December 29, 2012, December 31, 2011 and January 1, 2011 was $0.8 million, $3.9 million and $1.0 million, respectively. Included in the $3.9 million of equity-based compensation for the fifty-two weeks ended December 31, 2011 was the $3.0 million payment to the holders of Class B common units and Class C common units. The $3.0 million payment was recorded as additional paid in capital and is shown as a contribution by YCC Holdings LLC in Holding Corp.’s consolidated statement of changes in stockholder’s equity and in Holding Corp.’s consolidated statements of cash flows.
As of December 29, 2012, there was approximately $2.2 million of total unrecognized compensation cost related to Yankee Group’s Class C common unit equity awards and there was no unrecognized expense related to Yankee Group’s Class A common unit equity awards. This cost is expected to be recognized over the remaining vesting period, of approximately 4.5 years (January 2013 to October 2017).
Presented below is a summary of assumptions for the indicated periods. During the fifty-two weeks ended December 29, 2012, there were 89,409 Class C grants and no Class B grants. During the fifty-two weeks ended December 31, 2011, there were 11,650 Class C grants and no Class B grants. There were 44,712 Class C grants and no Class B grants for the fifty-two weeks ended January 1, 2011.
| | | | | | | | | | | | |
Assumptions | | Fifty-Two
Weeks Ended
December 29, 2012
Option Pricing
Method
Black-Scholes | | | Fifty-Two
Weeks Ended
December 31, 2011
Option Pricing
Method
Black-Scholes | | | Fifty-Two
Weeks Ended
January 1, 2011
Option Pricing
Method
Black-Scholes | |
Weighted average calculated value of awards granted | | $ | 26.63 | | | $ | 28.97 | | | $ | 34.34 | |
Weighted average volatility | | | 77.7 | % | | | 76.1 | % | | | 39.8 | % |
Weighted average expected term (in years) | | | 5.0 | | | | 5.0 | | | | 5.0 | |
Dividend yield | | | — | | | | — | | | | — | |
Weighted average risk-free interest rate | | | 0.9 | % | | | 2.2 | % | | | 2.6 | % |
With respect to the Class B and Class C common units, since YCC Holdings and Yankee Group are not publicly traded, the estimate of expected volatility is based on the median historical volatility of a group of eight comparable public companies, adjusted for differences in leverage. The historical volatilities of the comparable companies were measured over a 5-year historical period. The expected term of the Class B and Class C common units granted represents the period of time that the units are expected to be outstanding and is assumed to be approximately five years based on management’s estimate of the time to a liquidity event. Yankee Group does not expect to pay dividends, and accordingly, the dividend yield is zero. The risk free interest rate reflects a five-year period commensurate with the expected time to a liquidity event and was based on the U.S. Treasury yield curve.
5. INVENTORY
The components of inventory were as follows (in thousands):
| | | | | | | | |
| | | December 29,
2012 | | | December 31,
2011 | |
Finished goods | | $ | 69,293 | | | $ | 64,195 | |
Work-in-process | | | 678 | | | | 319 | |
Raw materials and packaging | | | 7,998 | | | | 11,049 | |
| | | | | | | | |
| | |
Total inventory | | $ | 77,969 | | | $ | 75,563 | |
| | | | | | | | |
6. PROPERTY AND EQUIPMENT
The components of property and equipment were as follows (in thousands):
| | | | | | | | |
| | | December 29,
2012 | | | December 31,
2011 | |
Land and improvements | | $ | 8,788 | | | $ | 8,679 | |
Buildings and improvements | | | 124,077 | | | | 115,969 | |
Computer equipment | | | 39,937 | | | | 32,427 | |
Furniture and fixtures | | | 44,687 | | | | 43,135 | |
Equipment | | | 32,493 | | | | 29,482 | |
Vehicles | | | 1,494 | | | | 1,159 | |
Construction in progress | | | 9,286 | | | | 5,714 | |
| | | | | | | | |
| | |
Total | | | 260,762 | | | | 236,565 | |
Less: accumulated depreciation and amortization | | | (139,209 | ) | | | (118,163 | ) |
| | | | | | | | |
| | $ | 121,553 | | | $ | 118,402 | |
| | | | | | | | |
Depreciation and amortization expense related to property and equipment was $26.2 million, $25.6 million and $26.2 million for the fifty-two weeks ended December 29, 2012, December 31, 2011, and January 1, 2011, respectively. For the fifty-two weeks ended December 29, 2012, December 31, 2011, and January 1, 2011, $0.3 million, $0.2 million and $0.2 million of interest was capitalized, respectively.
7. FAIR VALUE MEASUREMENTS
The Company follows the guidance prescribed by ASC Topic 820 “Fair Value Measurement.” The Fair Value Measurements and Disclosures Topic defines fair value and provides a consistent framework for measuring fair value under GAAP, including financial statement disclosure requirements. As specified under this Topic, valuation techniques are based on observable and unobservable inputs. Observable inputs reflect readily obtainable data from independent sources, while unobservable inputs reflect market assumptions. The Fair Value Measurements and Disclosures Topic classifies these inputs into the following hierarchy:
Level 1 Inputs—Quoted prices for identical instruments in active markets.
Level 2 Inputs—Quoted prices for similar instruments in active markets; quoted prices for identical or similar instruments in markets that are not active; and model-derived valuations whose inputs are observable or whose significant value drivers are observable.
Level 3 Inputs—Instruments with primarily unobservable value drivers.
The following tables represent the fair value hierarchy for those financial assets and liabilities measured at fair value on a recurring basis as of December 29, 2012 and December 31, 2011 (in thousands):
| | | | | | | | | | | | | | | | |
| | | Fair Value Measurements on a Recurring Basis | |
| | | as of December 29, 2012 | |
| | | Level 1 | | | Level 2 | | | Level 3 | | | Total | |
Assets | | | | | | | | | | | | | | | | |
Marketable securities | | $ | 1,971 | | | $ | — | | | $ | — | | | $ | 1,971 | |
| | | | | | | | | | | | | | | | |
| | | | |
Total Assets | | $ | 1,971 | | | $ | — | | | $ | — | | | $ | 1,971 | |
| | | | | | | | | | | | | | | | |
| | | | |
Liabilities | | | | | | | | | | | | | | | | |
Interest rate swap agreements | | $ | — | | | $ | 1,757 | | | $ | — | | | $ | 1,757 | |
| | | | | | | | | | | | | | | | |
| | | | |
Total Liabilities | | $ | — | | | $ | 1,757 | | | $ | — | | | $ | 1,757 | |
| | | | | | | | | | | | | | | | |
| | | | | | | | | | | | | | | | |
| | | Fair Value Measurements on a Recurring Basis | |
| | | as of December 31, 2011 | |
| | | Level 1 | | | Level 2 | | | Level 3 | | | Total | |
Assets | | | | | | | | | | | | | | | | |
Marketable securities | | $ | 1,670 | | | $ | — | | | $ | — | | | $ | 1,670 | |
| | | | | | | | | | | | | | | | |
| | | | |
Total Assets | | $ | 1,670 | | | $ | — | | | $ | — | | | $ | 1,670 | |
| | | | | | | | | | | | | | | | |
| | | | |
Liabilities | | | | | | | | | | | | | | | | |
Interest rate swap agreements | | $ | — | | | $ | 9,409 | | | $ | | | | $ | 9,409 | |
| | | | | | | | | | | | | | | | |
| | | | |
Total Liabilities | | $ | — | | | $ | 9,409 | | | $ | — | | | $ | 9,409 | |
| | | | | | | | | | | | | | | | |
The Company holds marketable securities in Yankee Candle’s deferred compensation plan. The marketable securities consist of investments in mutual funds and are recorded at fair value based on observable market prices. The Company uses an income approach to value the asset and liability for its interest rate swaps using a discounted cash flow model that takes into account the present value of future cash flows under the terms of the contract using current market information as of the reporting date such as the one month LIBOR curve and the creditworthiness of the Company and its counterparties.
Financial Instruments Not Measured at Fair Value
The Company’s long-term debt is recorded at historical amounts. The Company estimates the fair value of its long-term debt based on current quoted market prices. The following table represents the carrying value and fair value of Yankee Candle’s senior notes, senior subordinated notes and Term Loan Facility and YCC Holdings’ Senior PIK Notes as of December 29, 2012 and December 31, 2011 (in thousands):
| | | | | | | | |
| | | December 29, 2012 | |
| | | Carrying Value | | | Fair Value | |
Holding Corp.: | | | | | | | | |
Term loan facility, net of unamortized discount of $6,201 | | $ | 648,174 | | | $ | 661,573 | |
Senior notes due 2015 | | $ | 10,000 | | | $ | 10,025 | |
Senior subordinated notes due 2017 | | $ | 188,000 | | | $ | 195,285 | |
YCC Holdings: | | | | | | | | |
Senior PIK notes due 2016, net of unamortized discount of $4,334 | | $ | 310,666 | | | $ | 324,450 | |
| | | | | | | | |
| | | December 31, 2011 | |
| | | Carrying Value | | | Fair Value | |
Holding Corp.: | | | | | | | | |
Senior secured term loan facility | | $ | 388,125 | | | $ | 381,605 | |
Senior notes due 2015 | | $ | 325,000 | | | $ | 327,031 | |
Senior subordinated notes due 2017 | | $ | 188,000 | | | $ | 182,125 | |
YCC Holdings: | | | | | | | | |
Senior PIK notes due 2016, net of unamortized discount of $5,424 | | $ | 309,576 | | | $ | 274,444 | |
8. GOODWILL AND INTANGIBLE ASSETS
Goodwill
As of December 29, 2012, the carrying amount of goodwill totaled $643.6 million, of which $286.3 million was allocated to retail and $357.3 million was allocated to wholesale. There is no goodwill associated with our international reporting unit. There were no changes in the carrying amount of goodwill during the fifty-two weeks ended December 29, 2012 and December 31, 2011. As of December 29, 2012, there were accumulated impairment losses of $375.4 million, with $68.2 million attributable to retail and $307.2 million attributable to wholesale.
The Company has determined that its tradenames have an indefinite useful life and, therefore, are not being amortized. In accordance with Accounting Standards Codification (“ASC”) Topic 350 “Intangibles - Goodwill and Other,” goodwill and indefinite lived intangible assets are not amortized but are subject to an annual impairment test.
Annual Impairment Testing
The Company performs its annual goodwill and indefinite lived intangible assets impairment testing at the reporting unit level. For the impairment testing as of November 3, 2012, and November 5, 2011, the Company had three reporting units: retail, wholesale and international.
Fair values of the reporting units are derived through a combination of market-based and income-based approaches, each of which were weighted at 50% for the impairment test performed as of November 3, 2012, and November 5, 2011. The market-based approach estimates fair value by applying multiples of potential earnings, such as EBITDA and revenue, of publicly traded comparable companies. The Company believes this approach is appropriate because it provides a fair value using multiples from companies with operations and economic characteristics similar to our reporting units.
The income-based approach is based on projected future debt-free cash flow that is discounted to present value using factors that consider the timing and risk of the future cash flows. The Company believes this approach is appropriate because it provides a fair value estimate based upon the reporting units expected long-term operations and cash flow performance. The income-based approach is based on a reporting unit’s future projections of operating results and cash flows. These projections are discounted to present value using a weighted average cost of capital for market participants, who are generally thought to be industry participants.
The Company completed its annual impairment testing of goodwill and indefinite lived intangible assets as of November 3, 2012, and November 5, 2011 and determined that the fair value of each reporting unit exceeded its carrying value.
Intangible Assets
The carrying amount and accumulated amortization of intangible assets consisted of the following (in thousands):
| | | | | | | | | | | | | | | | |
| | | Weighted
Average
Useful Life
(in years) | | | Gross
Carrying
Amount | | | Accumulated
Amortization | | | Net Book
Value | |
December 29, 2012 | | | | | | | | | | | | | | | | |
Indefinite life: | | | | | | | | | | | | | | | | |
Tradenames | | | N/A | | | $ | 267,700 | | | $ | — | | | $ | 267,700 | |
| | | | | | | | | | | | | | | | |
| | | | |
Finite-lived intangible assets: | | | | | | | | | | | | | | | | |
Customer lists | | | 5 | | | | 63,788 | | | | (63,663 | ) | | | 125 | |
Favorable lease agreements | | | 5 | | | | 2,330 | | | | (2,122 | ) | | | 208 | |
Other | | | 3 | | | | 36 | | | | (36 | ) | | | — | |
| | | | | | | | | | | | | | | | |
| | | | |
Total finite-lived intangible assets | | | | | | | 66,154 | | | | (65,821 | ) | | | 333 | |
| | | | | | | | | | | | | | | | |
| | | | |
Total intangible assets | | | | | | $ | 333,854 | | | $ | (65,821 | ) | | $ | 268,033 | |
| | | | |
December 31, 2011 | | | | | | | | | | | | | | | | |
Indefinite life: | | | | | | | | | | | | | | | | |
Tradenames | | | N/A | | | $ | 267,700 | | | $ | — | | | $ | 267,700 | |
| | | | | | | | | | | | | | | | |
| | | | |
Finite-lived intangible assets: | | | | | | | | | | | | | | | | |
Customer lists | | | 5 | | | | 63,650 | | | | (62,324 | ) | | | 1,326 | |
Favorable lease agreements | | | 5 | | | | 2,330 | | | | (1,952 | ) | | | 378 | |
Other | | | 3 | | | | 36 | | | | (35 | ) | | | 1 | |
| | | | | | | | | | | | | | | | |
| | | | |
Total finite-lived intangible assets | | | | | | | 66,016 | | | | (64,311 | ) | | | 1,705 | |
| | | | | | | | | | | | | | | | |
| | | | |
Total intangible assets | | | | | | $ | 333,716 | | | $ | (64,311 | ) | | $ | 269,405 | |
| | | | | | | | | | | | | | | | |
Total amortization expense from finite-lived intangible assets was $1.5 million, $12.3 million and $12.4 million for the fifty-two weeks ended December 29, 2012, December 31, 2011 and January 1, 2011, respectively. The intangible assets are amortized on a straight line basis. Favorable lease agreements are amortized over the remaining lease term of each respective lease.
Aggregate amortization expense related to intangible assets at December 29, 2012 is expected to be as follows (in thousands):
| | | | |
2013 | | $ | 268 | |
2014 | | | 61 | |
2015 | | | 4 | |
| | | | |
Total | | $ | 333 | |
| | | | |
9. CONCENTRATION OF CREDIT RISK
The Company maintains cash balances at several domestic and foreign financial institutions. At December 29, 2012 accounts at each institution are insured by the Federal Deposit Insurance Corporation (“FDIC”) up to $250 thousand, and by equivalent regulatory agencies in foreign countries. Uninsured balances aggregated to $5.4 million and $3.5 million at December 29, 2012 and December 31, 2011, respectively.
The Company extends credit to its wholesale customers. No single customer accounted for more than 10% of total sales for any period presented herein.
10. DERIVATIVE FINANCIAL INSTRUMENTS
The Company follows the guidance under ASC Topic 815 “Derivatives and Hedging,” which establishes accounting and reporting standards for derivative instruments. Specifically, the guidance requires an entity to recognize all derivatives as either assets or liabilities in the statement of financial condition and to measure those instruments at fair value. Additionally, the fair value adjustments affect either stockholder’s equity or member’s deficit as accumulated other comprehensive loss (“OCI”) or net income depending on whether the derivative instrument qualifies as a hedge for accounting purposes and, if so, the nature of the hedging activity.
Interest Rate Swaps
Yankee Candle uses interest rate swaps to eliminate the variability of a portion of cash flows associated with the forecasted interest payments on its Term Loan Facility. This is achieved through converting a portion of the floating rate Term Loan Facility to a fixed rate by entering into pay-fixed interest rate swaps.
During the second quarter of 2009 Yankee Candle changed the interest rate election on its Term Facility from the three-month LIBOR rate to the one-month LIBOR rate. As a result, Yankee Candle’s existing interest rate swaps were de-designated as cash flow hedges and Yankee Candle no longer accounts for these instruments using hedge accounting. Accordingly, changes in fair value are now recognized in the consolidated statements of operations as a component of other (income) expense. The unrealized loss of $21.7 million which was included in OCI on the date Yankee Candle changed its interest rate election was amortized to other expense over the remaining term of the respective interest rate swap agreements. The unrealized loss was fully amortized during the fifty-two weeks ended December 31, 2011.
During the second and third quarters of 2009, Yankee Candle entered into interest rate swaps to eliminate the variability in future interest payments by having Yankee Candle pay fixed-rate amounts in exchange for receipt of floating-rate interest payments. The effective date of these swaps was March 31, 2011. The aggregate notional value amortizes over the life of the swaps. As of December 29, 2012, the aggregate notional value of the swaps was $219.8 million resulting in a blended fixed rate of 3.49%. These swaps are not designated as cash flow hedges and, are measured at fair value with changes in fair value recognized in the consolidated statements of operations as a component of other income (expense). These swap agreements terminate in March 2013.
The fair values of the Company’s derivative instruments as of December 29, 2012 and December 31, 2011, were as follows (in thousands):
| | | | | | | | | | |
| | | Fair Value of Derivative Instruments
Liability Derivatives | |
| | | Balance Sheet Location | | December 29,
2012 | | | December 31,
2011 | |
Derivatives not designated as hedging instruments | | | | | | | | | | |
Interest rate swap agreements | | Other accrued liabilities | | $ | 1,757 | | | $ | 9,409 | |
| | | | | | | | | | |
| | | |
Total Derivative Liabilities | | | | $ | 1,757 | | | $ | 9,409 | |
| | | | | | | | | | |
The effect of derivative instruments on the consolidated statements of operations for the fifty-two weeks ended December 29, 2012, December 31, 2011 and January 1, 2011, was as follows (in thousands):
| | | | | | | | | | | | | | |
| | | | | Amount of
Realized
(Gain)
Recognized on
Derivatives | | | Amount of
Realized
(Gain)
Recognized on
Derivatives | | | Amount of
Realized Loss
Recognized on
Derivatives | |
| | | Location of Realized
(Gain) Loss Recognized
on Derivatives | | Fifty-Two
Weeks Ended
December 29,
2012 | | | Fifty-Two
Weeks Ended
December 31,
2011 | | | Fifty-Two
Weeks Ended
January 1,
2011 | |
Derivatives not designated as hedging instruments | | | | | | | | | | | | | | |
Interest rate swap agreements | | Other expense | | $ | (7,652 | ) | | $ | (6,403 | ) | | $ | 9,166 | |
| | | | | | | | | | | | | | |
Total | | | | $ | (7,652 | ) | | $ | (6,403 | ) | | $ | 9,166 | |
| | | | | | | | | | | | | | |
| | | | | | | | | | | | | | |
| | | | | Amount of Loss
Reclassified from
Accumulated OCI
Into Income
(Effective Portion) | | | Amount of Loss
Reclassified from
Accumulated OCI
Into Income
(Effective Portion) | | | Amount of Loss
Reclassified from
Accumulated OCI
Into Income
(Effective Portion) | |
| | | Location of loss Reclassified from
Accumulated OCI into Income
(Effective Portion) | | Fifty-Two
Weeks Ended
December 29,
2012 | | | Fifty-Two
Weeks Ended
December 31,
2011 | | | Fifty-Two
Weeks Ended
January 1,
2011 | |
Cash Flow Hedges | | | | | | | | | | | | | | |
Interest rate swap agreements | | Other expense | | $ | — | | | $ | 1,169 | | | $ | 8,623 | |
| | | | | | | | | | | | | | |
| | | | |
Total | | | | $ | — | | | $ | 1,169 | | | $ | 8,623 | |
| | | | | | | | | | | | | | |
11. INCOME TAXES
The provision for income tax expense consists of the following (in thousands):
| | | | | | | | | | | | |
| YCC Holdings | | Fifty-Two
Weeks Ended
December 29, 2012 | | | Fifty-Two
Weeks Ended
December 31, 2011 | | | Fifty-Two
Weeks Ended
January 1, 2011 | |
Federal: | | | | | | | | | | | | |
Current | | $ | 8,194 | | | $ | 7,313 | | | $ | 17,434 | |
Deferred | | | 10,207 | | | | 9,910 | | | | 3,554 | |
| | | | | | | | | | | | |
Total federal | | | 18,401 | | | | 17,223 | | | | 20,988 | |
| | | | | | | | | | | | |
State: | | | | | | | | | | | | |
Current | | | 1,916 | | | | 1,671 | | | | 2,122 | |
Deferred | | | 1,141 | | | | 607 | | | | 285 | |
| | | | | | | | | | | | |
Total state | | | 3,057 | | | | 2,278 | | | | 2,407 | |
| | | | | | | | | | | | |
Foreign: | | | | | | | | | | | | |
Current | | | 280 | | | | 735 | | | | 201 | |
Deferred | | | 158 | | | | (196 | ) | | | 92 | |
| | | | | | | | | | | | |
Total foreign | | | 438 | | | | 539 | | | | 293 | |
| | | | | | | | | | | | |
Total income tax provision | | $ | 21,896 | | | $ | 20,040 | | | $ | 23,688 | |
| | | | | | | | | | | | |
| | | | | | | | | | | | |
| Holding Corp. | | Fifty-Two
Weeks Ended
December 29, 2012 | | | Fifty-Two
Weeks Ended
December 31, 2011 | | | Fifty-Two
Weeks Ended
January 1, 2011 | |
Federal: | | | | | | | | | | | | |
Current | | $ | 19,376 | | | $ | 17,364 | | | $ | 17,434 | |
Deferred | | | 10,207 | | | | 9,910 | | | | 3,554 | |
| | | | | | | | | | | | |
Total federal | | | 29,583 | | | | 27,274 | | | | 20,988 | |
| | | | | | | | | | | | |
State: | | | | | | | | | | | | |
Current | | | 2,371 | | | | 2,077 | | | | 2,122 | |
Deferred | | | 1,141 | | | | 607 | | | | 285 | |
| | | | | | | | | | | | |
Total state | | | 3,512 | | | | 2,684 | | | | 2,407 | |
| | | | | | | | | | | | |
Foreign: | | | | | | | | | | | | |
Current | | | 280 | | | | 735 | | | | 201 | |
Deferred | | | 158 | | | | (196 | ) | | | 92 | |
| | | | | | | | | | | | |
Total foreign | | | 438 | | | | 539 | | | | 293 | |
| | | | | | | | | | | | |
Total income tax provision | | $ | 33,533 | | | $ | 30,497 | | | $ | 23,688 | |
| | | | | | | | | | | | |
In connection with the recapitalization of the Company in 1998, an election was made for federal and state income tax purposes to value the assets and liabilities of the Company at fair value. As a result of such election, there is a difference between the financial reporting and tax bases of the Company’s assets and liabilities. This difference was accounted for by recording a deferred tax asset of approximately $175.7 million with a corresponding credit to additional paid-in capital. The deferred tax asset is being realized as these differences, including tax goodwill, are deducted, principally over a period of 15 years. In the opinion of management, the Company will have sufficient profits in the future to realize the remaining unrecognized deferred tax asset.
The tax effect of significant items comprising the Company’s net deferred tax assets (liabilities) were as follows (in thousands):
| | | | | | | | | | | | | | | | |
| | | December 29, 2012 | | | December 31, 2011 | |
| YCC Holdings and Holding Corp. | | Current | | | Non-current | | | Current | | | Non-current | |
| | | | |
Deferred tax assets: | | | | | | | | | | | | | | | | |
Basis differential as a result of a basis step-up for tax | | $ | — | | | $ | 2,729 | | | $ | — | | | $ | 14,554 | |
Interest rate swaps | | | 689 | | | | — | | | | 3,688 | | | | — | |
Foreign net operating loss carryforwards | | | — | | | | 724 | | | | — | | | | 685 | |
Deferred compensation arrangements | | | 825 | | | | — | | | | 725 | | | | — | |
Other | | | 5,300 | | | | 3,684 | | | | 4,311 | | | | 2,882 | |
Valuation allowance | | | — | | | | (447 | ) | | | — | | | | — | |
Deferred tax liabilities: | | | | | | | | | | | | | | | | |
Fixed assets | | | — | | | | (17,272 | ) | | | — | | | | (19,094 | ) |
Intangible assets | | | — | | | | (106,553 | ) | | | — | | | | (106,150 | ) |
| | | | | | | | | | | | | | | | |
| | $ | 6,814 | | | $ | (117,135 | ) | | $ | 8,724 | | | $ | (107,123 | ) |
| | | | | | | | | | | | | | | | |
A reconciliation of the statutory federal income tax rate and the effective rate of the provision for income taxes consisted of the following:
| | | | | | | | | | | | |
| YCC Holdings | | Fifty-Two
Weeks Ended
December 29, 2012 | | | Fifty-Two
Weeks Ended
December 31, 2011 | | | Fifty-Two
Weeks Ended
January 1, 2011 | |
Statutory federal income tax rate | | | 35.0 | % | | | 35.0 | % | | | 35.0 | % |
State income taxes net of federal benefit | | | 3.8 | | | | 4.2 | | | | 3.3 | |
| | | | | | | | | | | | |
Combined federal and state statutory income tax rates | | | 38.8 | | | | 39.2 | | | | 38.3 | |
Domestic production activities deduction | | | (1.2 | ) | | | (1.4 | ) | | | (2.7 | ) |
Non-deductible stock compensation expense | | | 0.5 | | | | 0.5 | | | | 0.5 | |
Other, including change in valulation allowance | | | 1.7 | | | | (1.1 | ) | | | (0.2 | ) |
| | | | | | | | | | | | |
| | | 39.8 | % | | | 37.2 | % | | | 35.9 | % |
| | | | | | | | | | | | |
| | | | | | | | | | | | |
| Holding Corp. | | Fifty-Two
Weeks Ended
December 29, 2012 | | | Fifty-Two
Weeks Ended
December 31, 2011 | | | Fifty-Two
Weeks Ended
January 1, 2011 | |
Statutory federal income tax rate | | | 35.0 | % | | | 35.0 | % | | | 35.0 | % |
State income taxes net of federal benefit | | | 2.9 | | | | 3.1 | | | | 3.3 | |
| | | | | | | | | | | | |
Combined federal and state statutory income tax rates | | | 37.9 | | | | 38.1 | | | | 38.3 | |
Domestic production activities deduction | | | (1.9 | ) | | | (2.0 | ) | | | (2.7 | ) |
Non-deductible stock compensation expense | | | 0.3 | | | | 0.3 | | | | 0.5 | |
Other, including change in valulation allowance | | | 1.0 | | | | (0.6 | ) | | | (0.2 | ) |
| | | | | | | | | | | | |
| | | 37.3 | % | | | 35.8 | % | | | 35.9 | % |
| | | | | | | | | | | | |
The Company asserts that any earnings of its foreign subsidiaries are indefinitely reinvested. Consideration has been given to the Company’s U.S. and foreign financial requirements, short-term and long-term operational and fiscal objectives, and tax consequences associated with the repatriation of earnings. Accordingly, the Company does not accrue the tax cost (nor recognize any potential tax benefit) of repatriating the earnings from its foreign subsidiaries until there is a plan and intention to actually repatriate such earnings. As of December 29, 2012, there are unremitted foreign earnings of $2.4 million.
The Company files income tax returns in the U.S. federal jurisdiction, various states, the United Kingdom, Germany, Canada and Italy. The Company’s earliest open U.S. federal tax year, United Kingdom tax year and German tax year is 2009, 2010 and 2009, respectively. The Company’s earliest open Canadian and Italian tax years are 2011 and 2012, respectively.
The Company recognizes accrued interest and penalties, if any, related to unrecognized tax benefits in the provision for income taxes.
As of December 29, 2012, the Company had uncertain tax positions of $3.5 million and accrued interest and penalties of $0.3 million. As of December 29, 2012, the amount of unrecognized tax benefits that, if recognized, would affect the effective tax rate is $3.5 million.
As of December 31, 2011, the Company had uncertain tax positions of $2.1 million and accrued interest and penalties of $33 thousand. As of December 31, 2011, the amount of unrecognized tax benefits that, if recognized, would affect the effective tax rate is $2.1 million.
A reconciliation of the beginning and ending amount of the uncertain tax positions was as follows (in thousands):
| | | | | | | | | | | | |
| YCC Holdings and Holding Corp. | | Fifty-Two
Weeks Ended
December 29, 2012 | | | Fifty-Two
Weeks Ended
December 31, 2011 | | | Fifty-Two
Weeks Ended
January 1, 2011 | |
Balance—beginning of year | | $ | 2,096 | | | $ | 806 | | | $ | 2,147 | |
Increases related to prior periods | | | — | | | | 137 | | | | 106 | |
Increases related to current period | | | 1,642 | | | | 1,428 | | | | 344 | |
Decreases due to settlements with authorities | | | (23 | ) | | | — | | | | (1,691 | ) |
Decreases due to lapse of statutes | | | (187 | ) | | | (275 | ) | | | (100 | ) |
| | | | | | | | | | | | |
Balance—end of year | | $ | 3,528 | | | $ | 2,096 | | | $ | 806 | |
| | | | | | | | | | | | |
12. PROFIT SHARING PLAN
The Company maintains a profit sharing plan (the “Plan”) under section 401(k) of the Internal Revenue Code of 1986, as amended (the “Internal Revenue Code”). Under the plan the Company makes a discretionary matching payment consisting of a weekly match of 25% of the first 4% of eligible compensation, with an additional discretionary match of 25% of the first 4% of eligible compensation to be made at the end of the year at the discretion of the Company’s Compensation Committee.
The employer matching contributions amounted to $0.7 million for each of the fifty-two weeks ended December 29, 2012, December 31, 2011 and January 1, 2011. In addition, under the Plan the Company made discretionary matching contributions, which were determined annually based on a percentage of the employee’s pretax contributions, of $0.7 million for both the fifty-two weeks December 29, 2012 and December 31, 2011, and $0.6 million during the fifty-two weeks ended January 1, 2011. Matching contributions were subject to a cap based on a percentage of the employee’s eligible compensation, as defined in the Plan.
13. EXECUTIVE DEFERRED COMPENSATION PLAN
The Company has an executive deferred compensation agreement with certain key employees. Under this agreement, the Company at its election may match certain elective salary deferrals of eligible employees’ compensation up to a maximum of $20 thousand per employee per year.
For the fifty-two weeks ended December 29, 2012, December 31, 2011 and January 1, 2011 employer contributions totaled $0.1 million, $0.2 million and $0.1 million, respectively. Benefits paid to retired or terminated employees for the fifty-two weeks ended December 29, 2012 and January 1, 2011 totaled $0.4 million and $0.3 million, respectively. There were no benefits paid to retired or terminated employees for the fifty-two weeks ended December 31, 2011.
14. COMMITMENTS AND CONTINGENCIES
Leases
The Company leases most store locations, its corporate office building, a distribution facility, equipment and vehicles. The operating leases, which expire in various years through 2024, contain renewal options ranging from six months to five years and provide for base rentals plus contingent rentals, which are a function of sales volume. In addition, the Company is required to pay real estate taxes, maintenance and other operating expenses applicable to the leased premises. Furthermore, several leases contain rent escalation clauses, capital improvement funding or other lease concessions which are accounted for on a straight-line basis as a reduction of rent expense over the applicable lease term as accounted for under ASC Topic 840 “Leases.”
The aggregate annual future minimum lease commitments under operating leases as of December 29, 2012 are as follows (in thousands):
| | | | |
| | | Operating
Leases | |
2013 | | $ | 38,921 | |
2014 | | | 34,218 | |
2015 | | | 30,742 | |
2016 | | | 25,224 | |
2017 | | | 21,841 | |
Thereafter | | | 73,477 | |
| | | | |
Total minimum lease payments | | $ | 224,423 | |
| | | | |
Rent expense, including contingent rentals, for the fifty-two weeks ended December 29, 2012, December 31, 2011 and January 1, 2011 was $42.7 million, $40.1 million and $39.5 million, respectively. Included in rent expense were contingent rental payments of approximately $0.4 million, $0.5 million and $0.5 million for the fifty-two weeks ended December 29, 2012, December 31, 2011 and January 1, 2011, respectively. Contingent rental payments are based primarily on sales at respective retail locations.
Contingencies
The Company is engaged in various claims and litigation relating to matters incidental to the Company’s business, either as plaintiff or defendant. In the opinion of management, the ultimate outcome of these lawsuits will not have a material adverse effect on the Company’s financial position, results of operations or cash flows.
15. CAPITAL LEASES
During the fifty-two weeks ended December 29, 2012 and December 31, 2011, the Company entered into various capital leases for computer and warehouse equipment, and vehicles. As of December 29, 2012 and December 31, 2011, the recorded value of the leased property under capital leases was $5.4 million and $3.4 million, respectively, and is included in property and equipment in the consolidated balance sheet. Accumulated amortization on the property under capital lease was $2.8 million and $1.4 million as of December 29, 2012 and December 31, 2011. The related amortization is included in general and administrative expense.
Future minimum lease payments under the capital lease obligations as of December 29, 2012 are as follows (in thousands):
| | | | |
2013 | | $ | 1,872 | |
2014 | | | 1,701 | |
2015 | | | 1,016 | |
2016 | | | 777 | |
2017 | | | 126 | |
Lessee guarantee of residual value at the end of lease term | | | 354 | |
| | | | |
Total minimum lease payments | | | 5,846 | |
Less amounts representing interest | | | (418 | ) |
| | | | |
Total | | $ | 5,428 | |
| | | | |
16. RELATED PARTY TRANSACTIONS
Upon closing of the Merger, the Company entered into a management services contract with an affiliate of Madison Dearborn Partners (“MDP”) pursuant to which MDP provides the Company with management and consulting services and financial and advisory services on an ongoing basis for a fee of $1.5 million per year, payable in equal quarterly installments, and reimbursement of out-of-pocket expenses incurred in connection with the provision of such services. For each of the fifty-two weeks ended December 29, 2012, December 31, 2011, and January 1, 2011, the Company recorded $1.5 million associated with the annual management fee. Under this management services agreement, the Company also agreed to provide customary indemnification.
17. DISCONTINUED OPERATIONS
During 2009, the Board of Directors of Yankee Holding Corp. (the “Board of Directors”) approved the decisions to discontinue the Company’s Aroma Naturals division, and to discontinue the Illuminations division. Accordingly, the Company has classified the results of the Aroma Naturals division and the Illuminations division as discontinued operations on the consolidated statement of operations for all periods presented.
18. RESTRUCTURING CHARGES
During the first quarter of 2012, the Company restructured its Wholesale and Retail operations. The Company also initiated a change in reporting structure and changes of roles and responsibilities within the organization that resulted in workforce reductions. These changes included changes to the executive committee, changes to the reporting structure and operational focus within the retail segment, alignment of the brand innovation and merchandising teams across all channels of the business, and other administrative changes. As a result of these changes the Company incurred restructuring charges of $0.7 million during 2012 for employee related severance costs. During the second quarter of 2012, the Company’s wholly-owned subsidiary YCE, relocated its corporate headquarters and distribution center in England. As a result of these changes the Company incurred restructuring charges of $1.1 million during 2012 related to exiting the old facility and non-cash writeoffs for the impairment of equipment and deferred rent.
During 2010, the company initiated a restructuring plan primarily related to the elimination of a facility and certain employee positions as a result of the restructuring of the Company’s shipping and warehousing activities. During 2008 and 2009, the Company initiated restructuring plans related to its Aroma Naturals and Illuminations businesses and certain corporate workforce restructuring activities.
The Company made payments of $1.1 million, $0.2 million and $2.7 million during 2012, 2011 and 2010, respectively related to these plans. As of December 29, 2012, the balance of $1.5 million in the restructuring accrual was related to (i) continuing operations employee related expenses of $0.1 million as a result of the first quarter of 2012 organization changes detailed above, (ii) continuing operations occupancy related expenses of $0.7 million related to YCE exiting the old facility prior to the termination of the lease agreement and (iii) discontinued operations of $0.7 million primarily related to lease agreements for one Illuminations retail store and a lease related the former Illuminations corporate headquarters in Petaluma, California. The lease at the old YCE facility expires in May of 2014, the lease for the Illuminations retail store expires in January 2017 and the lease for the property in Petaluma California expires in March 2013. These leases will continue to be paid through their lease termination dates unless the Company is able to structure buyout agreements with the landlords or find replacement tenants.
19. SEGMENTS OF ENTERPRISE AND RELATED INFORMATION
The Company has segmented its operations in a manner that reflects how their chief operating decision–maker (the “CEO”) currently reviews the results of the Company and its subsidiaries’ businesses. The CEO evaluates its retail, wholesale, and international operations based on an “operating earnings” measure. Such measure gives recognition to specifically identifiable operating costs such as cost of sales and selling expenses. Costs and income not specifically identifiable are included within the unallocated/corporate/other column and include administrative charges, interest expense, fair value changes of derivative contracts, restructuring charges for continuing operations and other costs not allocated to specific operating segments and are accordingly reflected in the unallocated/corporate/other column. The Company does not account for or report assets, capital expenditures or depreciation and amortization by segment to the CEO.
The following were the relevant data for the fifty-two weeks ended December 29, 2012, December 31, 2011 and January 1, 2011 (in thousands):
| | | | | | | | | | | | | | | | | | | | |
YCC Holdings | |
| Fifty-Two Weeks Ended December 29, 2012 | | Retail | | | Wholesale | | | International | | | Unallocated/
Corporate/
Other | | | Balance per
Consolidated
Statement of
Operations | |
Sales | | $ | 490,244 | | | $ | 238,253 | | | $ | 115,689 | | | $ | — | | | $ | 844,186 | |
Gross profit | | | 320,532 | | | | 113,291 | | | | 47,960 | | | | (1,436 | ) | | | 480,347 | |
Selling expenses | | | 192,912 | | | | 12,757 | | | | 29,423 | | | | 2,943 | | | | 238,035 | |
Operating income | | | 127,620 | | | | 100,534 | | | | 18,537 | | | | (78,288 | ) | | | 168,403 | |
Interest and other expense, net | | | — | | | | — | | | | — | | | | (113,450 | ) | | | (113,450 | ) |
| | | | | | | | | | | | | | | | | | | | |
| | | | | |
Income from continuing operations before provision for income taxes | | | | | | | | | | | | | | | | | | $ | 54,953 | |
| | | | | | | | | | | | | | | | | | | | |
| | | | | |
| | | Retail | | | Wholesale | | | International | | | Unallocated/
Corporate/
Other | | | Balance per
Consolidated
Statement of
Operations | |
Sales | | $ | 449,176 | | | $ | 235,247 | | | $ | 101,339 | | | $ | — | | | $ | 785,762 | |
Gross profit | | | 293,058 | | | | 110,073 | | | | 42,816 | | | | (521 | ) | | | 445,426 | |
Selling expenses | | | 185,041 | | | | 13,278 | | | | 22,933 | | | | 13,730 | | | | 234,982 | |
Operating income | | | 108,017 | | | | 96,795 | | | | 19,883 | | | | (76,702 | ) | | | 147,993 | |
Interest and other expense, net | | | — | | | | — | | | | — | | | | (94,184 | ) | | | (94,184 | ) |
| | | | | | | | | | | | | | | | | | | | |
| | | | | |
Income from continuing operations before provision for income taxes | | | | | | | | | | | | | | | | | | $ | 53,809 | |
| | | | | | | | | | | | | | | | | | | | |
| | | | | | | | | | | | | | | | | | | | |
| Fifty-Two Weeks Ended January 1, 2011 | | Retail | | | Wholesale | | | International | | | Unallocated/
Corporate/
Other | | | Balance per
Consolidated
Statement of
Operations | |
Sales | | $ | 426,325 | | | $ | 232,544 | | | $ | 74,848 | | | $ | — | | | $ | 733,717 | |
Gross profit | | | 281,018 | | | | 115,975 | | | | 29,965 | | | | (344 | ) | | | 426,614 | |
Selling expenses | | | 170,028 | | | | 11,984 | | | | 16,361 | | | | 14,207 | | | | 212,580 | |
Operating income | | | 110,990 | | | | 103,991 | | | | 13,604 | | | | (77,989 | ) | | | 150,596 | |
Interest and other expense, net | | | — | | | | — | | | | — | | | | (84,620 | ) | | | (84,620 | ) |
| | | | | | | | | | | | | | | | | | | | |
| | | | | |
Income from continuing operations before benefit from income taxes | | | | | | | | | | | | | | | | | | $ | 65,976 | |
| | | | | | | | | | | | | | | | | | | | |
| | | | | | | | | | | | | | | | | | | | |
Holding Corp. | |
| Fifty-Two Weeks Ended December 29, 2012 | | Retail | | | Wholesale | | | International | | | Unallocated/
Corporate/
Other | | | Balance per
Consolidated
Statement of
Operations | |
Sales | | $ | 490,244 | | | $ | 238,253 | | | $ | 115,689 | | | $ | — | | | $ | 844,186 | |
Gross profit | | | 320,532 | | | | 113,291 | | | | 47,960 | | | | (1,436 | ) | | | 480,347 | |
Selling expenses | | | 192,912 | | | | 12,757 | | | | 29,423 | | | | 2,943 | | | | 238,035 | |
Operating income | | | 127,620 | | | | 100,534 | | | | 18,537 | | | | (78,193 | ) | | | 168,498 | |
Interest and other expense, net | | | — | | | | — | | | | — | | | | (78,508 | ) | | | (78,508 | ) |
| | | | | | | | | | | | | | | | | | | | |
| | | | | |
Income from continuing operations before provision for income taxes | | | | | | | | | | | | | | | | | | $ | 89,990 | |
| | | | | | | | | | | | | | | | | | | | |
| | | | | | | | | | | | | | | | | | | | |
| Fifty-Two Weeks Ended December 31, 2011 | | Retail | | | Wholesale | | | International | | | Unallocated/
Corporate/
Other | | | Balance per
Consolidated
Statement of
Operations | |
Sales | | $ | 449,176 | | | $ | 235,247 | | | $ | 101,339 | | | $ | — | | | $ | 785,762 | |
Gross profit | | | 293,058 | | | | 110,073 | | | | 42,816 | | | | (521 | ) | | | 445,426 | |
Selling expenses | | | 185,041 | | | | 13,278 | | | | 22,933 | | | | 13,730 | | | | 234,982 | |
Operating income | | | 108,017 | | | | 96,795 | | | | 19,883 | | | | (76,260 | ) | | | 148,435 | |
Interest and other expense, net | | | — | | | | — | | | | — | | | | (63,129 | ) | | | (63,129 | ) |
| | | | | | | | | | | | | | | | | | | | |
| | | | | |
Income from continuing operations before provision for income taxes | | | | | | | | | | | | | | | | | | $ | 85,306 | |
| | | | | | | | | | | | | | | | | | | | |
| | | | | | | | | | | | | | | | | | | | |
| Fifty-Two Weeks Ended January 1, 2011 | | Retail | | | Wholesale | | | International | | | Unallocated/
Corporate/
Other | | | Balance per
Consolidated
Statement of
Operations | |
Sales | | $ | 426,325 | | | $ | 232,544 | | | $ | 74,848 | | | $ | — | | | $ | 733,717 | |
Gross profit | | | 281,018 | | | | 115,975 | | | | 29,965 | | | | (344 | ) | | | 426,614 | |
Selling expenses | | | 170,028 | | | | 11,984 | | | | 16,361 | | | | 14,207 | | | | 212,580 | |
Operating income | | | 110,990 | | | | 103,991 | | | | 13,604 | | | | (77,989 | ) | | | 150,596 | |
Interest and other expense, net | | | — | | | | — | | | | — | | | | (84,620 | ) | | | (84,620 | ) |
| | | | | | | | | | | | | | | | | | | | |
| | | | | |
Income from continuing operations before benefit from income taxes | | | | | | | | | | | | | | | | | | $ | 65,976 | |
| | | | | | | | | | | | | | | | | | | | |
Sales by geographic location are based on the location of the customer. The following tables set forth sales by geographic location:
| | | | | | | | | | | | |
| | | Fifty-Two
Weeks Ended
December 29, 2012 | | | Fifty-Two
Weeks Ended
December 31, 2011 | | | Fifty-Two
Weeks Ended
January 1, 2011 | |
United States | | $ | 723,037 | | | $ | 681,294 | | | $ | 656,780 | |
United Kingdom | | | 89,725 | | | | 69,404 | | | | 52,487 | |
Other foreign countries | | | 31,424 | | | | 35,064 | | | | 24,450 | |
| | | | | | | | | | | | |
| | $ | 844,186 | | | $ | 785,762 | | | $ | 733,717 | |
| | | | | | | | | | | | |
Long lived assets of the Companies’ foreign operations were approximately $9.8 million and $3.9 million as of December 29, 2012 and December 31, 2011, respectively.
20. VALUATION AND QUALIFYING ACCOUNTS
| | | | | | | | | | | | | | | | |
Allowance for Doubtful Accounts | | Balance at
Beginning of
Fiscal Year | | | Charged to
Costs and
Expenses | | | Deductions
From
Reserves | | | Balance at
End of
Fiscal Year | |
Year Ended December 29, 2012: | | | | | | | | | | | | | | | | |
Allowance for doubtful accounts | | $ | 2,166 | | | $ | 1,657 | | | $ | (2,894 | ) | | $ | 929 | |
Year Ended December 31, 2011: | | | | | | | | | | | | | | | | |
Allowance for doubtful accounts | | $ | 2,001 | | | $ | 290 | | | $ | (125 | ) | | $ | 2,166 | |
Year Ended January 1, 2011: | | | | | | | | | | | | | | | | |
Allowance for doubtful accounts | | $ | 1,882 | | | $ | 387 | | | $ | (268 | ) | | $ | 2,001 | |
Amounts charged to deductions from reserves represent the write-off of uncollectible balances.
21. FINANCIAL INFORMATION RELATED TO GUARANTOR SUBSIDIARIES UNDER YANKEE CANDLE’S SENIOR NOTES AND SENIOR SUBORDINATED NOTES
Obligations under the senior notes of Yankee Candle are guaranteed on an unsecured senior basis and obligations under the senior subordinated notes are guaranteed on an unsecured senior subordinated basis by Holding Corp. and 100% of Yankee Candle’s existing and future domestic subsidiaries. The senior notes are fully and unconditionally guaranteed by all of Yankee Candle’s 100% owned U.S. subsidiaries (the “Guarantor Subsidiaries” and collectively with the Holding Corp., the “Guarantors”) on a senior unsecured basis. These guarantees are joint and several obligations of the Guarantors. Yankee Candle’s foreign subsidiary does not guarantee these notes.
The following tables present condensed consolidating supplementary financial information for Yankee Candle, as the issuer of the senior and senior subordinated notes, Holding Corp., Yankee Candle’s domestic guarantor subsidiaries and the non guarantor subsidiaries together with eliminations as of and for the periods indicated. Holding Corp. is also a guarantor of the notes. Separate complete financial statements of the respective Guarantors would not provide additional material information that would be useful in assessing the financial composition of the Guarantors.
Condensed consolidating financial information is as follows:
YANKEE HOLDING CORP. AND SUBSIDIARIES
CONDENSED CONSOLIDATING BALANCE SHEET
December 29, 2012
(in thousands)
| | | | | | | | | | | | | | | | | | | | | | | | |
| | | Holding
Corp. | | | Issuer | | | Guarantor
Subsidiaries | | | Non
Guarantor
Subsidiaries | | | Intercompany
Eliminations | | | Consolidated | |
| ASSETS | | | | | | | | | | | | | | | | | | | | | | | | |
CURRENT ASSETS: | | | | | | | | | | | | | | | | | | | | | | | | |
Cash | | $ | — | | | $ | 32,678 | | | $ | 2,122 | | | $ | 5,179 | | | $ | — | | | $ | 39,979 | |
Accounts receivable, net | | | — | | | | 32,767 | | | | 48 | | | | 30,757 | | | | — | | | | 63,572 | |
Inventory | | | — | | | | 61,566 | | | | 95 | | | | 16,308 | | | | — | | | | 77,969 | |
Prepaid expenses and other current assets | | | — | | | | 3,714 | | | | 47 | | | | 1,121 | | | | — | | | | 4,882 | |
Deferred tax assets | | | — | | | | 6,518 | | | | 33 | | | | 263 | | | | — | | | | 6,814 | |
| | | | | | | | | | | | | | | | | | | | | | | | |
| | | | | | |
TOTAL CURRENT ASSETS | | | — | | | | 137,243 | | | | 2,345 | | | | 53,628 | | | | — | | | | 193,216 | |
| | | | | | |
PROPERTY AND EQUIPMENT, NET | | | — | | | | 111,604 | | | | 135 | | | | 9,814 | | | | — | | | | 121,553 | |
MARKETABLE SECURITIES | | | — | | | | 1,971 | | | | — | | | | — | | | | — | | | | 1,971 | |
GOODWILL | | | — | | | | 643,570 | | | | — | | | | — | | | | — | | | | 643,570 | |
INTANGIBLE ASSETS | | | — | | | | 267,966 | | | | — | | | | 67 | | | | — | | | | 268,033 | |
DEFERRED FINANCING COSTS | | | — | | | | 12,799 | | | | — | | | | — | | | | — | | | | 12,799 | |
OTHER ASSETS | | | — | | | | 349 | | | | — | | | | 6 | | | | — | | | | 355 | |
INTERCOMPANY RECEIVABLES | | | — | | | | 42,822 | | | | — | | | | — | | | | (42,822 | ) | | | — | |
INVESTMENT IN SUBSIDIARIES | | | 154,130 | | | | 4,730 | | | | — | | | | — | | | | (158,860 | ) | | | — | |
| | | | | | | | | | | | | | | | | | | | | | | | |
| | | | | | |
TOTAL ASSETS | | $ | 154,130 | | | $ | 1,223,054 | | | $ | 2,480 | | | $ | 63,515 | | | $ | (201,682 | ) | | $ | 1,241,497 | |
| | | | | | | | | | | | | | | | | | | | | | | | |
| | | | | | |
| LIABILITIES AND STOCKHOLDER’S EQUITY | | | | | | | | | | | | | | | | | | | | | | | | |
| | | | | | |
CURRENT LIABILITIES: | | | | | | | | | | | | | | | | | | | | | | | | |
Accounts payable | | $ | — | | | $ | 20,787 | | | $ | 34 | | | $ | 4,488 | | | $ | — | | | $ | 25,309 | |
Accrued payroll | | | — | | | | 12,824 | | | | 26 | | | | 830 | | | | — | | | | 13,680 | |
Accrued interest | | | — | | | | 10,614 | | | | — | | | | — | | | | — | | | | 10,614 | |
Accrued income taxes | | | — | | | | 6,457 | | | | — | | | | 653 | | | | — | | | | 7,110 | |
Accrued purchases of property and equipment | | | — | | | | 3,434 | | | | — | | | | — | | | | — | | | | 3,434 | |
Current portion of capital leases | | | — | | | | 1,222 | | | | — | | | | 439 | | | | — | | | | 1,661 | |
Other accrued liabilities | | | — | | | | 29,470 | | | | 2,233 | | | | 7,983 | | | | — | | | | 39,686 | |
| | | | | | | | | | | | | | | | | | | | | | | | |
| | | | | | |
TOTAL CURRENT LIABILITIES | | | — | | | | 84,808 | | | | 2,293 | | | | 14,393 | | | | — | | | | 101,494 | |
| | | | | | |
DEFERRED TAX LIABILITIES | | | — | | | | 117,135 | | | | — | | | | — | | | | — | | | | 117,135 | |
LONG-TERM DEBT, NET OF CURRENT PORTION | | | — | | | | 846,174 | | | | — | | | | — | | | | — | | | | 846,174 | |
DEFERRED RENT | | | — | | | | 12,748 | | | | — | | | | 138 | | | | — | | | | 12,886 | |
CAPITAL LEASES, NET OF CURRENT PORTION | | | — | | | | 2,148 | | | | — | | | | 1,619 | | | | — | | | | 3,767 | |
OTHER LONG-TERM LIABILITIES | | | — | | | | 5,911 | | | | — | | | | — | | | | — | | | | 5,911 | |
INTERCOMPANY PAYABLES | | | — | | | | — | | | | 92 | | | | 42,730 | | | | (42,822 | ) | | | — | |
STOCKHOLDER’S EQUITY | | | 154,130 | | | | 154,130 | | | | 95 | | | | 4,635 | | | | (158,860 | ) | | | 154,130 | |
| | | | | | | | | | | | | | | | | | | | | | | | |
| | | | | | |
TOTAL LIABILITIES AND STOCKHOLDER’S EQUITY | | $ | 154,130 | | | $ | 1,223,054 | | | $ | 2,480 | | | $ | 63,515 | | | $ | (201,682 | ) | | $ | 1,241,497 | |
| | | | | | | | | | | | | | | | | | | | | | | | |
YANKEE HOLDING CORP. AND SUBSIDIARIES
CONDENSED CONSOLIDATING BALANCE SHEET
December 31, 2011
(in thousands)
| | | | | | | | | | | | | | | | | | | | | | | | |
| | | Holding
Corp. | | | Issuer | | | Guarantor
Subsidiaries | | | Non
Guarantor
Subsidiaries | | | Intercompany
Eliminations | | | Consolidated | |
| ASSETS | | | | | | | | | | | | | | | | | | | | | | | | |
CURRENT ASSETS: | | | | | | | | | | | | | | | | | | | | | | | | |
Cash | | $ | — | | | $ | 45,777 | | | $ | 1,830 | | | $ | 3,226 | | | $ | — | | | $ | 50,833 | |
Accounts receivable, net | | | — | | | | 34,641 | | | | 79 | | | | 22,293 | | | | — | | | | 57,013 | |
Inventory | | | — | | | | 63,710 | | | | 94 | | | | 11,759 | | | | — | | | | 75,563 | |
Prepaid expenses and other current assets | | | — | | | | 4,037 | | | | 69 | | | | 818 | | | | — | | | | 4,924 | |
Deferred tax assets | | | — | | | | 8,585 | | | | 40 | | | | 99 | | | | — | | | | 8,724 | |
| | | | | | | | | | | | | | | | | | | | | | | | |
| | | | | | |
TOTAL CURRENT ASSETS | | | — | | | | 156,750 | | | | 2,112 | | | | 38,195 | | | | — | | | | 197,057 | |
| | | | | | |
PROPERTY AND EQUIPMENT, NET | | | — | | | | 114,447 | | | | 78 | | | | 3,877 | | | | — | | | | 118,402 | |
MARKETABLE SECURITIES | | | — | | | | 1,670 | | | | — | | | | — | | | | — | | | | 1,670 | |
GOODWILL | | | — | | | | 643,570 | | | | — | | | | — | | | | — | | | | 643,570 | |
INTANGIBLE ASSETS | | | — | | | | 269,230 | | | | — | | | | 175 | | | | — | | | | 269,405 | |
DEFERRED FINANCING COSTS | | | — | | | | 11,006 | | | | — | | | | — | | | | — | | | | 11,006 | |
OTHER ASSETS | | | — | | | | 390 | | | | — | | | | 4 | | | | — | | | | 394 | |
INTERCOMPANY RECEIVABLES | | | — | | | | 31,160 | | | | 164 | | | | — | | | | (31,324 | ) | | | — | |
INVESTMENT IN SUBSIDIARIES | | | 118,911 | | | | 3,886 | | | | — | | | | — | | | | (122,797 | ) | | | — | |
| | | | | | | | | | | | | | | | | | | | | | | | |
| | | | | | |
TOTAL ASSETS | | $ | 118,911 | | | $ | 1,232,109 | | | $ | 2,354 | | | $ | 42,251 | | | $ | (154,121 | ) | | $ | 1,241,504 | |
| | | | | | | | | | | | | | | | | | | | | | | | |
| | | | | | |
| LIABILITIES AND STOCKHOLDER’S EQUITY | | | | | | | | | | | | | | | | | | | | | | | | |
| | | | | | |
CURRENT LIABILITIES: | | | | | | | | | | | | | | | | | | | | | | | | |
Accounts payable | | $ | — | | | $ | 18,259 | | | $ | 104 | | | $ | 2,746 | | | $ | — | | | $ | 21,109 | |
Accrued payroll | | | — | | | | 6,523 | | | | 25 | | | | 362 | | | | — | | | | 6,910 | |
Accrued interest | | | — | | | | 17,377 | | | | — | | | | — | | | | — | | | | 17,377 | |
Accrued income taxes | | | — | | | | 6,727 | | | | — | | | | 542 | | | | — | | | | 7,269 | |
Accrued purchases of property and equipment | | | — | | | | 2,310 | | | | — | | | | 296 | | | | — | | | | 2,606 | |
Current portion of long-term debt | | | — | | | | 12,042 | | | | — | | | | — | | | | — | | | | 12,042 | |
Current portion of capital leases | | | — | | | | 975 | | | | — | | | | — | | | | — | | | | 975 | |
Other accrued liabilities | | | — | | | | 33,433 | | | | 1,856 | | | | 3,400 | | | | — | | | | 38,689 | |
| | | | | | | | | | | | | | | | | | | | | | | | |
| | | | | | |
TOTAL CURRENT LIABILITIES | | | — | | | | 97,646 | | | | 1,985 | | | | 7,346 | | | | — | | | | 106,977 | |
| | | | | | |
DEFERRED TAX LIABILITIES | | | — | | | | 107,123 | | | | — | | | | — | | | | — | | | | 107,123 | |
LONG-TERM DEBT, NET OF CURRENT PORTION | | | — | | | | 889,083 | | | | — | | | | — | | | | — | | | | 889,083 | |
DEFERRED RENT | | | — | | | | 12,769 | | | | — | | | | 64 | | | | — | | | | 12,833 | |
CAPITAL LEASES, NET OF CURRENT PORTION | | | — | | | | 2,597 | | | | — | | | | — | | | | — | | | | 2,597 | |
OTHER LONG-TERM LIABILITIES | | | — | | | | 3,980 | | | | — | | | | — | | | | — | | | | 3,980 | |
INTERCOMPANY PAYABLES | | | — | | | | — | | | | — | | | | 31,324 | | | | (31,324 | ) | | | — | |
STOCKHOLDER’S EQUITY | | | 118,911 | | | | 118,911 | | | | 369 | | | | 3,517 | | | | (122,797 | ) | | | 118,911 | |
| | | | | | | | | | | | | | | | | | | | | | | | |
| | | | | | |
TOTAL LIABILITIES AND STOCKHOLDER’S EQUITY | | $ | 118,911 | | | $ | 1,232,109 | | | $ | 2,354 | | | $ | 42,251 | | | $ | (154,121 | ) | | $ | 1,241,504 | |
| | | | | | | | | | | | | | | | | | | | | | | | |
YANKEE HOLDING CORP. AND SUBSIDIARIES
CONDENSED CONSOLIDATING STATEMENTS OF OPERATIONS
For the Fifty-Two Weeks Ended December 29, 2012
(in thousands)
| | | | | | | | | | | | | | | | | | | | | | | | |
| | | Holding
Corp. | | | Issuer | | | Guarantor
Subsidiaries | | | Non
Guarantor
Subsidiaries | | | Intercompany
Eliminations | | | Consolidated | |
| | | | | | |
Sales | | $ | — | | | $ | 786,857 | | | $ | 2,684 | | | $ | 115,308 | | | $ | (60,663 | ) | | $ | 844,186 | |
Cost of sales | | | — | | | | 329,678 | | | | 812 | | | | 92,998 | | | | (59,649 | ) | | | 363,839 | |
| | | | | | | | | | | | | | | | | | | | | | | | |
| | | | | | |
Gross profit | | | — | | | | 457,179 | | | | 1,872 | | | | 22,310 | | | | (1,014 | ) | | | 480,347 | |
Selling expenses | | | — | | | | 205,291 | | | | 2,082 | | | | 30,902 | | | | (240 | ) | | | 238,035 | |
General and administrative expenses | | | — | | | | 71,783 | | | | — | | | | 144 | | | | 162 | | | | 72,089 | |
Restructuring charges | | | — | | | | 655 | | | | — | | | | 1,070 | | | | — | | | | 1,725 | |
| | | | | | | | | | | | | | | | | | | | | | | | |
| | | | | | |
Operating income (loss) | | | — | | | | 179,450 | | | | (210 | ) | | | (9,806 | ) | | | (936 | ) | | | 168,498 | |
| | | | | | |
Interest expense | | | — | | | | 71,850 | | | | — | | | | 97 | | | | — | | | | 71,947 | |
Loss on extinguishment of debt | | | — | | | | 13,376 | | | | — | | | | — | | | | — | | | | 13,376 | |
Other expense (income) | | | — | | | | 3,160 | | | | — | | | | (9,975 | ) | | | — | | | | (6,815 | ) |
| | | | | | | | | | | | | | | | | | | | | | | | |
| | | | | | |
Income (loss) from continuing operations before provision for (benefit from) income taxes | | | — | | | | 91,064 | | | | (210 | ) | | | 72 | | | | (936 | ) | | | 89,990 | |
| | | | | | |
Provision for (benefit from) income taxes | | | — | | | | 33,607 | | | | (77 | ) | | | 350 | | | | (347 | ) | | | 33,533 | |
| | | | | | | | | | | | | | | | | | | | | | | | |
| | | | | | |
Income (loss) from continuing operations | | | — | | | | 57,457 | | | | (133 | ) | | | (278 | ) | | | (589 | ) | | | 56,457 | |
| | | | | | |
Loss from discontinued operations, net of income taxes | | | — | | | | (134 | ) | | | — | | | | — | | | | — | | | | (134 | ) |
| | | | | | | | | | | | | | | | | | | | | | | | |
Income (loss) before equity in (earnings) losses of subsidiaries, net of income tax | | | — | | | | 57,323 | | | | (133 | ) | | | (278 | ) | | | (589 | ) | | | 56,323 | |
| | | | | | |
Equity in (earnings) losses of subsidiaries, net of income tax | | | (56,323 | ) | | | 411 | | | | — | | | | — | | | | 55,912 | | | | — | |
| | | | | | | | | | | | | | | | | | | | | | | | |
| | | | | | |
Net income (loss) | | $ | 56,323 | | | $ | 56,912 | | | $ | (133 | ) | | $ | (278 | ) | | $ | (56,501 | ) | | $ | 56,323 | |
| | | | | | | | | | | | | | | | | | | | | | | | |
YANKEE HOLDING CORP. AND SUBSIDIARIES
CONDENSED CONSOLIDATING STATEMENTS OF OPERATIONS
For the Fifty-Two Weeks Ended December 31, 2011
(in thousands)
| | | | | | | | | | | | | | | | | | | | | | | | |
| | | Holding
Corp. | | | Issuer | | | Guarantor
Subsidiaries | | | Non
Guarantor
Subsidiaries | | | Intercompany
Eliminations | | | Consolidated | |
| | | | | | |
Sales | | $ | — | | | $ | 732,421 | | | $ | 2,787 | | | $ | 100,091 | | | $ | (49,537 | ) | | $ | 785,762 | |
Cost of sales | | | — | | | | 309,396 | | | | 851 | | | | 79,456 | | | | (49,367 | ) | | | 340,336 | |
| | | | | | | | | | | | | | | | | | | | | | | | |
| | | | | | |
Gross profit | | | — | | | | 423,025 | | | | 1,936 | | | | 20,635 | | | | (170 | ) | | | 445,426 | |
Selling expenses | | | — | | | | 209,531 | | | | 2,255 | | | | 23,436 | | | | (240 | ) | | | 234,982 | |
General and administrative expenses | | | — | | | | 61,852 | | | | — | | | | — | | | | 157 | | | | 62,009 | |
| | | | | | | | | | | | | | | | | | | | | | | | |
| | | | | | |
Operating income (loss) | | | — | | | | 151,642 | | | | (319 | ) | | | (2,801 | ) | | | (87 | ) | | | 148,435 | |
| | | | | | |
Interest expense | | | — | | | | 70,543 | | | | — | | | | — | | | | — | | | | 70,543 | |
Other income | | | — | | | | (2,561 | ) | | | — | | | | (4,853 | ) | | | — | | | | (7,414 | ) |
| | | | | | | | | | | | | | | | | | | | | | | | |
| | | | | | |
Income (loss) before provision for (benefit from) income taxes | | | — | | | | 83,660 | | | | (319 | ) | | | 2,052 | | | | (87 | ) | | | 85,306 | |
| | | | | | |
Provision for (benefit from) income taxes | | | — | | | | 30,131 | | | | (115 | ) | | | 512 | | | | (31 | ) | | | 30,497 | |
| | | | | | | | | | | | | | | | | | | | | | | | |
| | | | | | |
Income (loss) from continuing operations | | | — | | | | 53,529 | | | | (204 | ) | | | 1,540 | | | | (56 | ) | | | 54,809 | |
| | | | | | |
Loss from discontinued operations, net of income taxes | | | — | | | | (262 | ) | | | — | | | | — | | | | — | | | | (262 | ) |
| | | | | | | | | | | | | | | | | | | | | | | | |
Income (loss) before equity in (earnings) losses of subsidiaries, net of income tax | | | — | | | | 53,267 | | | | (204 | ) | | | 1,540 | | | | (56 | ) | | | 54,547 | |
| | | | | | |
Equity in (earnings) losses of subsidiaries, net of income tax | | | (54,547 | ) | | | (1,336 | ) | | | — | | | | — | | | | 55,883 | | | | — | |
| | | | | | | | | | | | | | | | | | | | | | | | |
| | | | | | |
Net income (loss) | | $ | 54,547 | | | $ | 54,603 | | | $ | (204 | ) | | $ | 1,540 | | | $ | (55,939 | ) | | $ | 54,547 | |
| | | | | | | | | | | | | | | | | | | | | | | | |
YANKEE HOLDING CORP. AND SUBSIDIARIES
CONDENSED CONSOLIDATING STATEMENTS OF OPERATIONS
For the Fifty-Two Weeks Ended January 1, 2011
(in thousands)
| | | | | | | | | | | | | | | | | | | | | | | | |
| | | Holding
Corp. | | | Issuer | | | Guarantor
Subsidiaries | | | Non
Guarantor
Subsidiary | | | Intercompany
Eliminations | | | Consolidated | |
| | | | | | |
Sales | | $ | — | | | $ | 702,280 | | | $ | 2,856 | | | $ | 72,432 | | | $ | (43,851 | ) | | $ | 733,717 | |
Cost of sales | | | — | | | | 286,485 | | | | 832 | | | | 60,988 | | | | (41,202 | ) | | | 307,103 | |
| | | | | | | | | | | | | | | | | | | | | | | | |
| | | | | | |
Gross profit | | | — | | | | 415,795 | | | | 2,024 | | | | 11,444 | | | | (2,649 | ) | | | 426,614 | |
Selling expenses | | | — | | | | 194,571 | | | | 2,165 | | | | 16,084 | | | | (240 | ) | | | 212,580 | |
General and administrative expenses | | | — | | | | 62,433 | | | | — | | | | — | | | | 176 | | | | 62,609 | |
Restructuring charges | | | — | | | | 829 | | | | — | | | | — | | | | — | | | | 829 | |
| | | | | | | | | | | | | | | | | | | | | | | | |
| | | | | | |
Operating income (loss) | | | — | | | | 157,962 | | | | (141 | ) | | | (4,640 | ) | | | (2,585 | ) | | | 150,596 | |
| | | | | | |
Interest expense | | | — | | | | 75,648 | | | | — | | | | — | | | | — | | | | 75,648 | |
Other expense (income) | | | — | | | | 14,609 | | | | 3 | | | | (5,640 | ) | | | — | | | | 8,972 | |
| | | | | | | | | | | | | | | | | | | | | | | | |
| | | | | | |
Income (loss) before provision for (benefit from) income taxes | | | — | | | | 67,705 | | | | (144 | ) | | | 1,000 | | | | (2,585 | ) | | | 65,976 | |
| | | | | | |
Provision for (benefit from) income taxes | | | — | | | | 24,388 | | | | (52 | ) | | | 280 | | | | (928 | ) | | | 23,688 | |
| | | | | | | | | | | | | | | | | | | | | | | | |
| | | | | | |
Income (loss) from continuing operations | | | — | | | | 43,317 | | | | (92 | ) | | | 720 | | | | (1,657 | ) | | | 42,288 | |
| | | | | | |
Loss from discontinued operations, net of income taxes | | | — | | | | (379 | ) | | | — | | | | — | | | | — | | | | (379 | ) |
| | | | | | | | | | | | | | | | | | | | | | | | |
| | | | | | |
Income (loss) before equity in (earnings) losses of subsidiaries, net of income tax | | | — | | | | 42,938 | | | | (92 | ) | | | 720 | | | | (1,657 | ) | | | 41,909 | |
| | | | | | |
Equity in (earnings) losses of subsidiaries, net of income tax | | | (41,909 | ) | | | (628 | ) | | | — | | | | — | | | | 42,537 | | | | — | |
| | | | | | | | | | | | | | | | | | | | | | | | |
| | | | | | |
Net income (loss) | | $ | 41,909 | | | $ | 43,566 | | | $ | (92 | ) | | $ | 720 | | | $ | (44,194 | ) | | $ | 41,909 | |
| | | | | | | | | | | | | | | | | | | | | | | | |
YANKEE HOLDING CORP. AND SUBSIDIARIES
CONDENSED CONSOLIDATING STATEMENTS OF COMPREHENSIVE INCOME (LOSS)
For the Fifty-Two Weeks December 29, 2012
(in thousands)
| | | | | | | | | | | | | | | | | | | | | | | | |
| | | Holding
Corp. | | | Issuer | | | Guarantor
Subsidiaries | | | Non
Guarantor
Subsidiaries | | | Intercompany
Eliminations | | | Consolidated | |
Net income (loss) | | $ | 56,323 | | | $ | 56,912 | | | $ | (133 | ) | | $ | (278 | ) | | $ | (56,501 | ) | | $ | 56,323 | |
Other comprehensive income, net of tax: | | | | | | | | | | | | | | | | | | | | | | | | |
Foreign currency translation adjustments | | | — | | | | — | | | | — | | | | 1,482 | | | | — | | | | 1,482 | |
| | | | | | | | | | | | | | | | | | | | | | | | |
Other comprehensive income, net of tax | | | — | | | | — | | | | — | | | | 1,482 | | | | — | | | | 1,482 | |
Equity in other comprehensive income of subsidiaries, net of tax | | | 1,482 | | | | — | | | | — | | | | — | | | | (1,482 | ) | | | — | |
| | | | | | | | | | | | | | | | | | | | | | | | |
| | | | | | |
Comprehensive income (loss) | | $ | 57,805 | | | $ | 56,912 | | | $ | (133 | ) | | $ | 1,204 | | | $ | (57,983 | ) | | $ | 57,805 | |
| | | | | | | | | | | | | | | | | | | | | | | | |
YANKEE HOLDING CORP. AND SUBSIDIARIES
CONDENSED CONSOLIDATING STATEMENTS OF COMPREHENSIVE INCOME (LOSS)
For the Fifty-Two Weeks December 31, 2011
(in thousands)
| | | | | | | | | | | | | | | | | | | | | | | | |
| | | Holding
Corp. | | | Issuer | | | Guarantor
Subsidiaries | | | Non
Guarantor
Subsidiaries | | | Intercompany
Eliminations | | | Consolidated | |
Net income (loss) | | $ | 54,547 | | | $ | 54,603 | | | $ | (204 | ) | | $ | 1,540 | | | $ | (55,939 | ) | | $ | 54,547 | |
Other comprehensive income (loss), net of tax: | | | | | | | | | | | | | | | | | | | | | | | | |
Foreign currency translation adjustments | | | — | | | | — | | | | — | | | | (535 | ) | | | — | | | | (535 | ) |
Unrealized gain on interest rate swaps | | | — | | | | 712 | | | | — | | | | — | | | | — | | | | 712 | |
| | | | | | | | | | | | | | | | | | | | | | | | |
Other comprehensive income (loss), net of tax | | | — | | | | 712 | | | | — | | | | (535 | ) | | | — | | | | 177 | |
Equity in other comprehensive income of subsidiaries, net of tax | | | 177 | | | | — | | | | — | | | | — | | | | (177 | ) | | | — | |
| | | | | | | | | | | | | | | | | | | | | | | | |
| | | | | | |
Comprehensive income (loss) | | $ | 54,724 | | | $ | 55,315 | | | $ | (204 | ) | | $ | 1,005 | | | $ | (56,116 | ) | | $ | 54,724 | |
| | | | | | | | | | | | | | | | | | | | | | | | |
YANKEE HOLDING CORP. AND SUBSIDIARIES
CONDENSED CONSOLIDATING STATEMENTS OF COMPREHENSIVE INCOME (LOSS)
For the Fifty-Two Weeks January 1, 2011
(in thousands)
| | | | | | | | | | | | | | | | | | | | | | | | |
| | | Holding
Corp. | | | Issuer | | | Guarantor
Subsidiaries | | | Non
Guarantor
Subsidiary | | | Intercompany
Eliminations | | | Consolidated | |
Net income (loss) | | $ | 41,909 | | | $ | 43,566 | | | $ | (92 | ) | | $ | 720 | | | $ | (44,194 | ) | | $ | 41,909 | |
Other comprehensive income (loss), net of tax: | | | | | | | | | | | | | | | | | | | | | | | | |
Foreign currency translation adjustments | | | — | | | | — | | | | — | | | | (462 | ) | | | — | | | | (462 | ) |
Unrealized gain on interest rate swaps | | | — | | | | 5,249 | | | | — | | | | — | | | | — | | | | 5,249 | |
| | | | | | | | | | | | | | | | | | | | | | | | |
Other comprehensive income (loss), net of tax | | | — | | | | 5,249 | | | | — | | | | (462 | ) | | | — | | | | 4,787 | |
Equity in other comprehensive income of subsidiaries, net of tax | | | 4,787 | | | | — | | | | — | | | | — | | | | (4,787 | ) | | | — | |
| | | | | | | | | | | | | | | | | | | | | | | | |
| | | | | | |
Comprehensive income (loss) | | $ | 46,696 | | | $ | 48,815 | | | $ | (92 | ) | | $ | 258 | | | $ | (48,981 | ) | | $ | 46,696 | |
| | | �� | | | | | | | | | | | | | | | | | | | | | |
YANKEE HOLDING CORP. AND SUBSIDIARIES
CONDENSED CONSOLIDATING STATEMENTS OF CASH FLOWS
For the Fifty-Two Weeks December 29, 2012
(in thousands)
| | | | | | | | | | | | | | | | | | | | | | | | |
| | | Holding
Corp. | | | Issuer | | | Guarantor
Subsidiaries | | | Non
Guarantor
Subsidiaries | | | Intercompany
Eliminations | | | Consolidated | |
CASH FLOWS PROVIDED BY (USED IN) OPERATING ACTIVITIES: | | | | | | | | | | | | | | | | | | | | | | | | |
Net income (loss) | | $ | 56,323 | | | $ | 56,912 | | | $ | (133 | ) | | $ | (278 | ) | | $ | (56,501 | ) | | $ | 56,323 | |
Adjustments to reconcile net income (loss) to net cash provided by (used in) operating activities: | | | | | | | | | | | | | | | | | | | | | | | | |
Realized gain on derivative contracts | | | — | | | | (7,652 | ) | | | — | | | | — | | | | — | | | | (7,652 | ) |
Depreciation and amortization | | | — | | | | 30,298 | | | | 25 | | | | 1,575 | | | | — | | | | 31,898 | |
Unrealized gain on marketable securities | | | — | | | | (171 | ) | | | — | | | | — | | | | — | | | | (171 | ) |
Equity-based compensation expense | | | — | | | | 753 | | | | — | | | | — | | | | — | | | | 753 | |
Deferred taxes | | | — | | | | 11,663 | | | | 7 | | | | (164 | ) | | | — | | | | 11,506 | |
Loss on extinguishment of debt | | | — | | | | 13,376 | | | | — | | | | — | | | | — | | | | 13,376 | |
Loss on disposal and impairment of property and equipment | | | — | | | | 380 | | | | — | | | | 2 | | | | — | | | | 382 | |
Restructuring charges | | | — | | | | — | | | | — | | | | 1,070 | | | | — | | | | 1,070 | |
Equity in (earnings) losses of subsidiaries | | | (56,323 | ) | | | 411 | | | | — | | | | (589 | ) | | | 56,501 | | | | — | |
Changes in assets and liabilities: | | | | | | | | | | | | | | | | | | | | | | | | |
Accounts receivable | | | — | | | | 1,874 | | | | 31 | | | | (7,474 | ) | | | — | | | | (5,569 | ) |
Inventory | | | — | | | | 2,145 | | | | (1 | ) | | | (3,840 | ) | | | — | | | | (1,696 | ) |
Prepaid expenses and other assets | | | — | | | | (152 | ) | | | 22 | | | | (275 | ) | | | — | | | | (405 | ) |
Accounts payable | | | — | | | | 2,528 | | | | (70 | ) | | | 1,606 | | | | — | | | | 4,064 | |
Income taxes | | | — | | | | 13,043 | | | | — | | | | 111 | | | | — | | | | 13,154 | |
Accrued expenses and other liabilities | | | — | | | | 3,714 | | | | 378 | | | | 4,169 | | | | — | | | | 8,261 | |
| | | | | | | | | | | | | | | | | | | | | | | | |
| | | | | | |
NET CASH PROVIDED BY (USED IN) OPERATING ACTIVITIES | | | — | | | | 129,122 | | | | 259 | | | | (4,087 | ) | | | — | | | | 125,294 | |
| | | | | | | | | | | | | | | | | | | | | | | | |
CASH FLOWS (USED IN) PROVIDED BY INVESTING ACTIVITIES: | | | | | | | | | | | | | | | | | | | | | | | | |
Purchases of property and equipment | | | — | | | | (20,191 | ) | | | (89 | ) | | | (5,236 | ) | | | — | | | | (25,516 | ) |
Intercompany payables/receivables | | | — | | | | (11,621 | ) | | | — | | | | — | | | | 11,621 | | | | — | |
| | | | | | | | | | | | | | | | | | | | | | | | |
NET CASH (USED IN) PROVIDED BY INVESTING ACTIVITIES | | | — | | | | (31,812 | ) | | | (89 | ) | | | (5,236 | ) | | | 11,621 | | | | (25,516 | ) |
| | | | | | | | | | | | | | | | | | | | | | | | |
CASH FLOWS (USED IN) PROVIDED BY FINANCING ACTIVITIES: | | | | | | | | | | | | | | | | | | | | | | | | |
Borrowings under Senior Secured Credit Facility | | | — | | | | 15,000 | | | | — | | | | — | | | | — | | | | 15,000 | |
Borrowings under Senior Secured Asset-Based Credit Facility | | | — | | | | 81,000 | | | | — | | | | — | | | | — | | | | 81,000 | |
Borrowings under Term Loan Facility | | | | | | | 717,750 | | | | — | | | | — | | | | — | | | | 717,750 | |
Repayments under Senior Secured Credit Facility | | | — | | | | (718,125 | ) | | | — | | | | — | | | | — | | | | (718,125 | ) |
Payments of call premiums and fees for extinguishment of debt | | | | | | | (6,763 | ) | | | — | | | | — | | | | — | | | | (6,763 | ) |
Repayments under Term Loan Facility | | | — | | | | (70,625 | ) | | | — | | | | — | | | | — | | | | (70,625 | ) |
Repayments under Senior Secured Asset-Based Credit Facility | | | — | | | | (81,000 | ) | | | — | | | | — | | | | — | | | | (81,000 | ) |
Financing costs | | | — | | | | (11,579 | ) | | | — | | | | — | | | | — | | | | (11,579 | ) |
Dividend to YCC Holdings LLC | | | — | | | | (32,389 | ) | | | — | | | | — | | | | — | | | | (32,389 | ) |
Proceeds from issuance of common stock | | | — | | | | 36 | | | | — | | | | — | | | | — | | | | 36 | |
Repurchase of common stock | | | — | | | | (2,623 | ) | | | — | | | | — | | | | — | | | | (2,623 | ) |
Principal payments on capital lease obligations | | | — | | | | (1,091 | ) | | | — | | | | (361 | ) | | | — | | | | (1,452 | ) |
Intercompany payables/receivables | | | — | | | | — | | | | 122 | | | | 11,499 | | | | (11,621 | ) | | | — | |
| | | | | | | | | | | | | | | | | | | | | | | | |
NET CASH (USED IN) PROVIDED BY FINANCING ACTIVITIES | | | — | | | | (110,409 | ) | | | 122 | | | | 11,138 | | | | (11,621 | ) | | | (110,770 | ) |
| | | | | | | | | | | | | | | | | | | | | | | | |
| | | | | | |
EFFECT OF EXCHANGE RATE CHANGES ON CASH | | | — | | | | — | | | | — | | | | 138 | | | | — | | | | 138 | |
| | | | | | | | | | | | | | | | | | | | | | | | |
| | | | | | |
NET (DECREASE) INCREASE IN CASH | | | — | | | | (13,099 | ) | | | 292 | | | | 1,953 | | | | — | | | | (10,854 | ) |
| | | | | | | | | | | | | | | | | | | | | | | | |
| | | | | | |
CASH, BEGINNING OF YEAR | | | — | | | | 45,777 | | | | 1,830 | | | | 3,226 | | | | — | | | | 50,833 | |
| | | | | | | | | | | | | | | | | | | | | | | | |
| | | | | | |
CASH, END OF YEAR | | $ | — | | | $ | 32,678 | | | $ | 2,122 | | | $ | 5,179 | | | $ | — | | | $ | 39,979 | |
| | | | | | | | | | | | | | | | | | | | | | | | |
YANKEE HOLDING CORP. AND SUBSIDIARIES
CONDENSED CONSOLIDATING STATEMENTS OF CASH FLOWS
For the Fifty-Two Weeks December 31, 2011
(in thousands)
| | | | | | | | | | | | | | | | | | | | | | | | |
| | | Holding
Corp. | | | Issuer | | | Guarantor
Subsidiaries | | | Non
Guarantor
Subsidiaries | | | Intercompany
Eliminations | | | Consolidated | |
CASH FLOWS PROVIDED BY (USED IN) OPERATING ACTIVITIES: | | | | | | | | | | | | | | | | | | | | | | | | |
Net income (loss) | | $ | 54,547 | | | $ | 54,603 | | | $ | (204 | ) | | $ | 1,540 | | | $ | (55,939 | ) | | $ | 54,547 | |
Adjustments to reconcile net income (loss) to net cash provided by (used in) operating activities: | | | | | | | | | | | | | | | | | | | | | | | | |
Realized gain on derivative contracts | | | — | | | | (6,403 | ) | | | — | | | | — | | | | — | | | | (6,403 | ) |
Depreciation and amortization | | | — | | | | 40,738 | | | | 22 | | | | 909 | | | | — | | | | 41,669 | |
Unrealized loss on marketable securities | | | — | | | | 50 | | | | — | | | | — | | | | — | | | | 50 | |
Equity-based compensation expense | | | — | | | | 820 | | | | — | | | | — | | | | — | | | | 820 | |
Deferred taxes | | | — | | | | 10,395 | | | | 25 | | | | (99 | ) | | | — | | | | 10,321 | |
Loss on disposal of property and equipment | | | — | | | | 1,411 | | | | — | | | | — | | | | — | | | | 1,411 | |
Equity in losses (earnings) of subsidiaries | | | (54,547 | ) | | | (1,336 | ) | | | — | | | | (56 | ) | | | 55,939 | | | | — | |
Changes in assets and liabilities: | | | | | | | | | | | | | | | | | | | | | | | | |
Accounts receivable | | | — | | | | (2,681 | ) | | | 97 | | | | (7,492 | ) | | | — | | | | (10,076 | ) |
Inventory | | | — | | | | (6,281 | ) | | | (7 | ) | | | (1,887 | ) | | | — | | | | (8,175 | ) |
Prepaid expenses and other assets | | | — | | | | 4,872 | | | | 126 | | | | (241 | ) | | | — | | | | 4,757 | |
Accounts payable | | | — | | | | (6,766 | ) | | | 58 | | | | 1,526 | | | | — | | | | (5,182 | ) |
Income taxes | | | — | | | | (173 | ) | | | — | | | | 341 | | | | — | | | | 168 | |
Accrued expenses and other liabilities | | | — | | | | (3,946 | ) | | | (110 | ) | | | 936 | | | | — | | | | (3,120 | ) |
| | | | | | | | | | | | | | | | | | | | | | | | |
| | | | | | |
NET CASH PROVIDED BY (USED IN) OPERATING ACTIVITIES | | | — | | | | 85,303 | | | | 7 | | | | (4,523 | ) | | | — | | | | 80,787 | |
| | | | | | | | | | | | | | | | | | | | | | | | |
| | | | | | |
CASH FLOWS (USED IN) PROVIDED BY INVESTING ACTIVITIES: | | | | | | | | | | | | | | | | | | | | | | | | |
Purchases of property and equipment | | | — | | | | (22,221 | ) | | | (47 | ) | | | (2,027 | ) | | | — | | | | (24,295 | ) |
Proceeds from the sale of property and equipment | | | — | | | | 47 | | | | — | | | | — | | | | — | | | | 47 | |
Intercompany payables/receivables | | | — | | | | (7,275 | ) | | | — | | | | — | | | | 7,275 | | | | — | |
| | | | | | | | | | | | | | | | | | | | | | | | |
| | | | | | |
NET CASH (USED IN) PROVIDED BY INVESTING ACTIVITIES | | | — | | | | (29,449 | ) | | | (47 | ) | | | (2,027 | ) | | | 7,275 | | | | (24,248 | ) |
| | | | | | | | | | | | | | | | | | | | | | | | |
| | | | | | |
CASH FLOWS (USED IN) PROVIDED BY FINANCING ACTIVITIES: | | | | | | | | | | | | | | | | | | | | | | | | |
Borrowings under Senior Secured Credit Facility | | | — | | | | 150,000 | | | | — | | | | — | | | | — | | | | 150,000 | |
Repayments under Senior Secured Credit Facility | | | — | | | | (150,000 | ) | | | — | | | | — | | | | — | | | | (150,000 | ) |
Financing costs | | | — | | | | (468 | ) | | | — | | | | — | | | | — | | | | (468 | ) |
Contributions by YCC Holdings LLC | | | — | | | | 3,000 | | | | — | | | | — | | | | — | | | | 3,000 | |
Investment in subsidiary | | | — | | | | (360 | ) | | | — | | | | — | | | | 360 | | | | — | |
Contributions by YCC Holdings LLC | | | — | | | | — | | | | — | | | | 360 | | | | (360 | ) | | | — | |
Dividend to YCC Holdings LLC | | | — | | | | (19,256 | ) | | | — | | | | — | | | | — | | | | (19,256 | ) |
Proceeds from issuance of common stock | | | — | | | | 20 | | | | — | | | | — | | | | — | | | | 20 | |
Repurchase of common stock | | | — | | | | (862 | ) | | | — | | | | — | | | | — | | | | (862 | ) |
Principal payments on capital lease obligations | | | — | | | | (853 | ) | | | — | | | | — | | | | — | | | | (853 | ) |
Intercompany payables/receivables | | | — | | | | — | | | | 2 | | | | 7,273 | | | | (7,275 | ) | | | — | |
| | | | | | | | | | | | | | | | | | | | | | | | |
NET CASH (USED IN) PROVIDED BY FINANCING ACTIVITIES | | | — | | | | (18,779 | ) | | | 2 | | | | 7,633 | | | | (7,275 | ) | | | (18,419 | ) |
| | | | | | | | | | | | | | | | | | | | | | | | |
| | | | | | |
EFFECT OF EXCHANGE RATE CHANGES ON CASH | | | — | | | | — | | | | — | | | | — | | | | — | | | | — | |
| | | | | | | | | | | | | | | | | | | | | | | | |
| | | | | | |
NET INCREASE (DECREASE) IN CASH | | | — | | | | 37,075 | | | | (38 | ) | | | 1,083 | | | | — | | | | 38,120 | |
| | | | | | | | | | | | | | | | | | | | | | | | |
| | | | | | |
CASH, BEGINNING OF YEAR | | | — | | | | 8,702 | | | | 1,868 | | | | 2,143 | | | | — | | | | 12,713 | |
| | | | | | | | | | | | | | | | | | | | | | | | |
| | | | | | |
CASH, END OF YEAR | | $ | — | | | $ | 45,777 | | | $ | 1,830 | | | $ | 3,226 | | | $ | — | | | $ | 50,833 | |
| | | | | | | | | | | | | | | | | | | | | | | | |
YANKEE HOLDING CORP. AND SUBSIDIARIES
CONDENSED CONSOLIDATING STATEMENTS OF CASH FLOWS
For the Fifty-Two Weeks Ended January 1, 2011
(in thousands)
| | | | | | | | | | | | | | | | | | | | | | | | |
| | | Holding
Corp. | | | Issuer | | | Guarantor
Subsidiaries | | | Non
Guarantor
Subsidiary | | | Intercompany
Eliminations | | | Consolidated | |
CASH FLOWS PROVIDED BY (USED IN) OPERATING ACTIVITIES: | | | | | | | | | | | | | | | | | | | | | | | | |
Net income (loss) | | $ | 41,909 | | | $ | 43,566 | | | $ | (92 | ) | | $ | 720 | | | $ | (44,194 | ) | | $ | 41,909 | |
Adjustments to reconcile net income (loss) to net cash provided by (used in) operating activities: | | | | | | | | | | | | | | | | | | | | | | | | |
Realized loss on derivative contracts | | | — | | | | 9,166 | | | | — | | | | — | | | | — | | | | 9,166 | |
Depreciation and amortization | | | — | | | | 42,403 | | | | 16 | | | | 559 | | | | — | | | | 42,978 | |
Unrealized gain on marketable securities | | | — | | | | (83 | ) | | | — | | | | — | | | | — | | | | (83 | ) |
Equity-based compensation expense | | | — | | | | 962 | | | | — | | | | — | | | | — | | | | 962 | |
Deferred taxes | | | — | | | | 3,809 | | | | 122 | | | | — | | | | — | | | | 3,931 | |
Non-cash adjustments relating to restructuring | | | — | | | | 10 | | | | — | | | | — | | | | — | | | | 10 | |
Loss on disposal of property and equipment | | | — | | | | 213 | | | | — | | | | — | | | | — | | | | 213 | |
Marketable securities | | | — | | | | 22 | | | | — | | | | — | | | | — | | | | 22 | |
Equity in earnings of subsidiaries | | | (41,909 | ) | | | (628 | ) | | | — | | | | (1,657 | ) | | | 44,194 | | | | — | |
Changes in assets and liabilities: | | | | | | | | | | | | | | | | | | | | | | | | |
Accounts receivable | | | — | | | | 2,342 | | | | 51 | | | | (5,875 | ) | | | — | | | | (3,482 | ) |
Inventory | | | — | | | | (6,049 | ) | | | (8 | ) | | | (2,393 | ) | | | — | | | | (8,450 | ) |
Prepaid expenses and other assets | | | — | | | | (710 | ) | | | 67 | | | | 26 | | | | — | | | | (617 | ) |
Accounts payable | | | — | | | | 4,082 | | | | (42 | ) | | | 642 | | | | — | | | | 4,682 | |
Income taxes | | | — | | | | 17,974 | | | | — | | | | 201 | | | | — | | | | 18,175 | |
Accrued expenses and other liabilities | | | — | | | | 428 | | | | (77 | ) | | | 638 | | | | — | | | | 989 | |
| | | | | | | | | | | | | | | | | | | | | | | | |
| | | | | | |
NET CASH PROVIDED BY (USED IN) OPERATING ACTIVITIES | | | — | | | | 117,507 | | | | 37 | | | | (7,139 | ) | | | — | | | | 110,405 | |
| | | | | | | | | | | | | | | | | | | | | | | | |
| | | | | | |
CASH FLOWS (USED IN) PROVIDED BY INVESTING ACTIVITIES: | | | | | | | | | | | | | | | | | | | | | | | | |
Purchases of property and equipment | | | — | | | | (16,306 | ) | | | (21 | ) | | | (1,324 | ) | | | — | | | | (17,651 | ) |
Proceeds from the sale of property and equipment | | | — | | | | 202 | | | | — | | | | — | | | | — | | | | 202 | |
Intercompany payables/receivables | | | | | | | (8,047 | ) | | | | | | | | | | | 8,047 | | | | — | |
| | | | | | | | | | | | | | | | | | | | | | | | |
| | | | | | |
NET CASH (USED IN) PROVIDED BY INVESTING ACTIVITIES | | | — | | | | (24,151 | ) | | | (21 | ) | | | (1,324 | ) | | | 8,047 | | | | (17,449 | ) |
| | | | | | | | | | | | | | | | | | | | | | | | |
| | | | | | |
CASH FLOWS (USED IN) PROVIDED BY FINANCING ACTIVITIES: | | | | | | | | | | | | | | | | | | | | | | | | |
Borrowings under Senior Secured Credit Facility | | | — | | | | 76,000 | | | | — | | | | — | | | | — | | | | 76,000 | |
Repayments under Senior Secured Credit Facility | | | — | | | | (164,000 | ) | | | — | | | | — | | | | — | | | | (164,000 | ) |
Proceeds from issuance of common stock | | | — | | | | 40 | | | | — | | | | — | | | | — | | | | 40 | |
Repurchase of common stock | | | — | | | | (933 | ) | | | — | | | | — | | | | — | | | | (933 | ) |
Principal payments on capital lease obligations | | | — | | | | (349 | ) | | | — | | | | — | | | | — | | | | (349 | ) |
Intercompany payables/receivables | | | — | | | | — | | | | (299 | ) | | | 8,346 | | | | (8,047 | ) | | | — | |
| | | | | | | | | | | | | | | | | | | | | | | | |
NET CASH (USED IN) PROVIDED BY FINANCING ACTIVITIES | | | — | | | | (89,242 | ) | | | (299 | ) | | | 8,346 | | | | (8,047 | ) | | | (89,242 | ) |
| | | | | | | | | | | | | | | | | | | | | | | | |
| | | | | | |
EFFECT OF EXCHANGE RATE CHANGES ON CASH | | | — | | | | — | | | | — | | | | (96 | ) | | | — | | | | (96 | ) |
| | | | | | | | | | | | | | | | | | | | | | | | |
| | | | | | |
NET INCREASE (DECREASE) IN CASH | | | — | | | | 4,114 | | | | (283 | ) | | | (213 | ) | | | — | | | | 3,618 | |
| | | | | | | | | | | | | | | | | | | | | | | | |
| | | | | | |
CASH, BEGINNING OF YEAR | | | — | | | | 4,588 | | | | 2,151 | | | | 2,356 | | | | — | | | | 9,095 | |
| | | | | | | | | | | | | | | | | | | | | | | | |
| | | | | | |
CASH, END OF YEAR | | $ | — | | | $ | 8,702 | | | $ | 1,868 | | | $ | 2,143 | | | $ | — | | | $ | 12,713 | |
| | | | | | | | | | | | | | | | | | | | | | | | |
22. QUARTERLY FINANCIAL DATA (UNAUDITED)
| | | | | | | | | | | | | | | | |
YCC Holdings | |
| | | Thirteen Weeks
Ended
March 31, 2012 | | | Thirteen Weeks
Ended
June 30, 2012 | | | Thirteen Weeks
Ended
September 29, 2012 | | | Thirteen Weeks
Ended
December 29, 2012 | |
Sales | | $ | 155,067 | | | $ | 145,327 | | | $ | 201,661 | | | $ | 342,131 | |
Cost of sales | | | 71,277 | | | | 63,906 | | | | 92,305 | | | | 136,351 | |
| | | | | | | | | | | | | | | | |
Gross profit | | | 83,790 | | | | 81,421 | | | | 109,356 | | | | 205,780 | |
Selling expenses | | | 55,482 | | | | 53,231 | | | | 56,643 | | | | 72,679 | |
General and administrative expenses | | | 16,946 | | | | 17,951 | | | | 16,875 | | | | 20,412 | |
Restructuring charges | | | 655 | | | | 1,070 | | | | — | | | | — | |
| | | | | | | | | | | | | | | | |
Income from operations | | | 10,707 | | | | 9,169 | | | | 35,838 | | | | 112,689 | |
Interest expense | | | 25,945 | | | | 27,320 | | | | 27,010 | | | | 26,614 | |
Loss on extinguishment of debt | | | — | | | | 13,376 | | | | — | | | | — | |
Other income | | | (1,092 | ) | | | (1,735 | ) | | | (2,097 | ) | | | (1,891 | ) |
| | | | | | | | | | | | | | | | |
(Loss) income before (benefit from) provision for income taxes | | | (14,146 | ) | | | (29,792 | ) | | | 10,925 | | | | 87,966 | |
(Benefit from) provision for income taxes | | | (5,217 | ) | | | (11,105 | ) | | | 4,226 | | | | 33,992 | |
| | | | | | | | | | | | | | | | |
(Loss) income from continuing operations | | | (8,929 | ) | | | (18,687 | ) | | | 6,699 | | | | 53,974 | |
Loss from discontinued operations, net of income taxes | | | (43 | ) | | | (31 | ) | | | (31 | ) | | | (29 | ) |
| | | | | | | | | | | | | | | | |
Net (loss) income | | $ | (8,972 | ) | | $ | (18,718 | ) | | $ | 6,668 | | | $ | 53,945 | |
| | | | | | | | | | | | | | | | |
| | | | |
| | | Thirteen Weeks
Ended
April 2, 2011 | | | Thirteen Weeks
Ended
July 2, 2011 | | | Thirteen Weeks
Ended
October 1, 2011 | | | Thirteen Weeks
Ended
December 31, 2011 | |
Sales | | $ | 144,114 | | | $ | 129,913 | | | $ | 195,109 | | | $ | 316,627 | |
Cost of sales | | | 64,863 | | | | 58,291 | | | | 87,958 | | | | 129,225 | |
| | | | | | | | | | | | | | | | |
Gross profit | | | 79,251 | | | | 71,622 | | | | 107,151 | | | | 187,402 | |
Selling expenses | | | 53,059 | | | | 52,130 | | | | 57,865 | | | | 71,927 | |
General and administrative expenses | | | 18,794 | | | | 14,029 | | | | 15,486 | | | | 14,143 | |
| | | | | | | | | | | | | | | | |
Income from operations | | | 7,398 | | | | 5,463 | | | | 33,800 | | | | 101,332 | |
Interest expense | | | 22,745 | | | | 26,308 | | | | 26,665 | | | | 25,879 | |
Other income | | | (1,875 | ) | | | (1,085 | ) | | | (2,372 | ) | | | (2,082 | ) |
| | | | | | | | | | | | | | | | |
(Loss) income before (benefit from) provision for income taxes | | | (13,472 | ) | | | (19,760 | ) | | | 9,507 | | | | 77,535 | |
(Benefit from) provision for income taxes | | | (4,999 | ) | | | (7,196 | ) | | | 3,090 | | | | 29,145 | |
| | | | | | | | | | | | | | | | |
(Loss) income from continuing operations | | | (8,473 | ) | | | (12,564 | ) | | | 6,417 | | | | 48,390 | |
Loss from discontinued operations, net of income taxes | | | (54 | ) | | | (132 | ) | | | (42 | ) | | | (35 | ) |
| | | | | | | | | | | | | | | | |
Net (loss) income | | $ | (8,527 | ) | | $ | (12,696 | ) | | $ | 6,375 | | | $ | 48,355 | |
| | | | | | | | | | | | | | | | |
| | | | | | | | | | | | | | | | |
| | | Thirteen Weeks
Ended
April 3, 2010 | | | Thirteen Weeks
Ended
July 3, 2010 | | | Thirteen Weeks
Ended
October 2, 2010 | | | Thirteen Weeks
Ended
January 1, 2011 | |
Sales | | $ | 140,975 | | | $ | 125,368 | | | $ | 175,750 | | | $ | 291,624 | |
Cost of sales | | | 62,312 | | | | 55,687 | | | | 74,103 | | | | 115,001 | |
| | | | | | | | | | | | | | | | |
Gross profit | | | 78,663 | | | | 69,681 | | | | 101,647 | | | | 176,623 | |
Selling expenses | | | 49,568 | | | | 48,258 | | | | 51,842 | | | | 62,912 | |
General and administrative expenses | | | 16,679 | | | | 13,952 | | | | 15,676 | | | | 16,302 | |
Restructuring charges | | | 800 | | | | 29 | | | | — | | | | — | |
| | | | | | | | | | | | | | | | |
Income from operations | | | 11,616 | | | | 7,442 | | | | 34,129 | | | | 97,409 | |
Interest expense | | | 19,807 | | | | 18,462 | | | | 20,525 | | | | 16,854 | |
Other expense (income) | | | 4,732 | | | | 4,751 | | | | 484 | | | | (995 | ) |
| | | | | | | | | | | | | | | | |
(Loss) income before (benefit from) provision for income taxes | | | (12,923 | ) | | | (15,771 | ) | | | 13,120 | | | | 81,550 | |
(Benefit from) provision for income taxes | | | (4,676 | ) | | | (5,621 | ) | | | 4,247 | | | | 29,738 | |
| | | | | | | | | | | | | | | | |
(Loss) income from continuing operations | | | (8,247 | ) | | | (10,150 | ) | | | 8,873 | | | | 51,812 | |
Loss from discontinued operations, net of income taxes | | | (255 | ) | | | (38 | ) | | | (49 | ) | | | (37 | ) |
| | | | | | | | | | | | | | | | |
Net (loss) income | | $ | (8,502 | ) | | $ | (10,188 | ) | | $ | 8,824 | | | $ | 51,775 | |
| | | | | | | | | | | | | | | | |
|
Holding Corp. | |
| | | Thirteen Weeks
Ended
March 31, 2012 | | | Thirteen Weeks
Ended
June 30, 2012 | | | Thirteen Weeks
Ended
September 29, 2012 | | | Thirteen Weeks
Ended
December 29, 2012 | |
Sales | | $ | 155,067 | | | $ | 145,327 | | | $ | 201,661 | | | $ | 342,131 | |
Cost of sales | | | 71,277 | | | | 63,906 | | | | 92,305 | | | | 136,351 | |
| | | | | | | | | | | | | | | | |
Gross profit | | | 83,790 | | | | 81,421 | | | | 109,356 | | | | 205,780 | |
Selling expenses | | | 55,482 | | | | 53,231 | | | | 56,643 | | | | 72,679 | |
General and administrative expenses | | | 16,902 | | | | 17,951 | | | | 16,862 | | | | 20,374 | |
Restructuring charges | | | 655 | | | | 1,070 | | | | — | | | | — | |
| | | | | | | | | | | | | | | | |
Income from operations | | | 10,751 | | | | 9,169 | | | | 35,851 | | | | 112,727 | |
Interest expense | | | 17,234 | | | | 18,553 | | | | 18,266 | | | | 17,894 | |
Loss on extinguishment of debt | | | — | | | | 13,376 | | | | — | | | | — | |
Other income | | | (1,092 | ) | | | (1,735 | ) | | | (2,097 | ) | | | (1,891 | ) |
| | | | | | | | | | | | | | | | |
(Loss) income before (benefit from) provision for income taxes | | | (5,391 | ) | | | (21,025 | ) | | | 19,682 | | | | 96,724 | |
(Benefit from) provision for income taxes | | | (1,921 | ) | | | (7,515 | ) | | | 7,389 | | | | 35,580 | |
| | | | | | | | | | | | | | | | |
(Loss) income from continuing operations | | | (3,470 | ) | | | (13,510 | ) | | | 12,293 | | | | 61,144 | |
Loss from discontinued operations, net of income taxes | | | (43 | ) | | | (31 | ) | | | (31 | ) | | | (29 | ) |
| | | | | | | | | | | | | | | | |
Net (loss) income | | $ | (3,513 | ) | | $ | (13,541 | ) | | $ | 12,262 | | | $ | 61,115 | |
| | | | | | | | | | | | | | | | |
| | | | | | | | | | | | | | | | |
| | | Thirteen Weeks
Ended
April 2, 2011 | | | Thirteen Weeks
Ended
July 2, 2011 | | | Thirteen Weeks
Ended
October 1, 2011 | | | Thirteen Weeks
Ended
December 31, 2011 | |
Sales | | $ | 144,114 | | | $ | 129,913 | | | $ | 195,109 | | | $ | 316,627 | |
Cost of sales | | | 64,863 | | | | 58,291 | | | | 87,958 | | | | 129,225 | |
| | | | | | | | | | | | | | | | |
Gross profit | | | 79,251 | | | | 71,622 | | | | 107,151 | | | | 187,402 | |
Selling expenses | | | 53,059 | | | | 52,130 | | | | 57,865 | | | | 71,927 | |
General and administrative expenses | | | 18,594 | | | | 14,024 | | | | 15,273 | | | | 14,118 | |
Income from operations | | | 7,598 | | | | 5,468 | | | | 34,013 | | | | 101,357 | |
Interest expense | | | 17,679 | | | | 17,777 | | | | 17,847 | | | | 17,240 | |
Other income | | | (1,875 | ) | | | (1,085 | ) | | | (2,372 | ) | | | (2,082 | ) |
| | | | | | | | | | | | | | | | |
(Loss) income before (benefit from) provision for income taxes | | | (8,206 | ) | | | (11,224 | ) | | | 18,538 | | | | 86,199 | |
(Benefit from) provision for income taxes | | | (2,912 | ) | | | (3,980 | ) | | | 6,044 | | | | 31,345 | |
| | | | | | | | | | | | | | | | |
(Loss) income from continuing operations | | | (5,294 | ) | | | (7,244 | ) | | | 12,494 | | | | 54,854 | |
Loss from discontinued operations, net of income taxes | | | (54 | ) | | | (132 | ) | | | (42 | ) | | | (35 | ) |
| | | | | | | | | | | | | | | | |
Net (loss) income | | $ | (5,348 | ) | | $ | (7,376 | ) | | $ | 12,452 | | | $ | 54,819 | |
| | | | | | | | | | | | | | | | |
| | | | |
| | | Thirteen Weeks
Ended
April 3, 2010 | | | Thirteen Weeks
Ended
July 3, 2010 | | | Thirteen Weeks
Ended
October 2, 2010 | | | Thirteen Weeks
Ended
January 1, 2011 | |
Sales | | $ | 140,975 | | | $ | 125,368 | | | $ | 175,750 | | | $ | 291,624 | |
Cost of sales | | | 62,312 | | | | 55,687 | | | | 74,103 | | | | 115,001 | |
| | | | | | | | | | | | | | | | |
Gross profit | | | 78,663 | | | | 69,681 | | | | 101,647 | | | | 176,623 | |
Selling expenses | | | 49,568 | | | | 48,258 | | | | 51,842 | | | | 62,912 | |
General and administrative expenses | | | 16,679 | | | | 13,952 | | | | 15,676 | | | | 16,302 | |
Restructuring charges | | | 800 | | | | 29 | | | | — | | | | — | |
| | | | | | | | | | | | | | | | |
Income from operations | | | 11,616 | | | | 7,442 | | | | 34,129 | | | | 97,409 | |
Interest expense | | | 19,807 | | | | 18,462 | | | | 20,525 | | | | 16,854 | |
Other expense (income) | | | 4,732 | | | | 4,751 | | | | 484 | | | | (995 | ) |
| | | | | | | | | | | | | | | | |
(Loss) income before (benefit from) provision for income taxes | | | (12,923 | ) | | | (15,771 | ) | | | 13,120 | | | | 81,550 | |
(Benefit from) provision for income taxes | | | (4,676 | ) | | | (5,621 | ) | | | 4,247 | | | | 29,738 | |
| | | | | | | | | | | | | | | | |
(Loss) income from continuing operations | | | (8,247 | ) | | | (10,150 | ) | | | 8,873 | | | | 51,812 | |
Loss from discontinued operations, net of income taxes | | | (255 | ) | | | (38 | ) | | | (49 | ) | | | (37 | ) |
| | | | | | | | | | | | | | | | |
Net (loss) income | | $ | (8,502 | ) | | $ | (10,188 | ) | | $ | 8,824 | | | $ | 51,775 | |
| | | | | | | | | | | | | | | | |
23. SUBSEQUENT EVENT
During the first quarter of 2013, Yankee Candle redeemed the remaining $10.0 million in aggregate principal amount of its Senior Notes due 2015 at par. Because all of the Senior Notes have been redeemed, the obligations of Yankee Candle and the guarantors under the related indenture have been discharged.