UNITED STATES
SECURITIES AND EXCHANGE COMMISSION
Washington, D.C. 20549
FORM
10-K/A
Amendment No. 1
☒ | ANNUAL REPORT PURSUANT TO SECTION 13 OR 15(d) OF THE SECURITIES EXCHANGE ACT OF 1934 |
For the fiscal year ended December 31, 2019
or
| ☐ | TRANSITION REPORT PURSUANT TO SECTION 13 OR 15(d) OF THE SECURITIES EXCHANGE ACT OF 1934 |
For the transition period from to
Commission file number
1-10934

ENBRIDGE INC.
(Exact Name of Registrant as Specified in Its Charter)
Canada | 98-0377957 | |
(State or Other Jurisdiction of Incorporation or Organization) | (I.R.S. Employer Identification No.) |
200, 425 - 1st Street S.W.
Calgary, Alberta, Canada T2P 3L8
(Address of Principal Executive Offices) (Zip Code)
Registrant’s telephone number, including area code
(403) 231-3900
Securities registered pursuant to Section 12(b) of the Act:
Title of each class | Trading Symbol(s) | Name of each exchange on which registered | ||
Common Shares | ENB | New York Stock Exchange | ||
| 6.375% Fixed-to-Floating Rate Subordinated Notes Series 2018-B due 2078 | ENBA | New York Stock Exchange |
Securities registered pursuant to Section 12(g) of the Act:
None
Indicate by check mark if the registrant is a well-known seasoned issuer, as defined in Rule 405 of the Securities Act. Yes
☒
No☐
Indicate by check mark if the registrant is not required to file reports pursuant to Section 13 or Section 15(d) of the Act. Yes
☐
No☒
Indicate by check mark whether the registrant (1) has filed all reports required to be filed by Section 13 or 15(d) of the Securities Exchange Act of 1934 during the preceding 12 months (or for such shorter period that the registrant was required to file such reports), and (2) has been subject to such filing requirements for the past 90 days. Yes
☒
No☐
Indicate by check mark whether the registrant has submitted electronically every Interactive Data File required to be submitted pursuant to Rule 405 of Regulation
S-T
(§232.405 of this chapter) during the preceding 12 months (or for such shorter period that the registrant was required to submit such files). Yes☒
No☐
Indicate by check mark whether the registrant is a large accelerated filer, an accelerated filer, a
non-accelerated
filer, or a smaller reporting company. See the definitions of “large accelerated filer,” “accelerated filer”, “smaller reporting company” and “emerging growth company” in Rule12b-2
of the Exchange Act.Large Accelerated Filer | ☒ | Accelerated Filer | ☐ | |||
Non-Accelerated Filer | ☐ | Smaller reporting company | ☐ | |||
Emerging growth company | ☐ |
If an emerging growth company, indicate by check mark if the registrant has elected not to use the extended transition period for complying with any new or revised financial accounting standards provided pursuant to Section 13(a) of the Exchange Act.
☐
Indicate by check mark whether the registrant is a shell company (as defined in Rule
12b-2
of the Exchange Act). Yes☐
No☒
The aggregate market value of the registrant’s common shares held by
non-affiliates
computed by reference to the price at which the common equity was last sold on June 30, 2019, was approximately US$73.1 billion.As at February 7, 2020, the registrant had 2,024,814,011 common shares outstanding.
EXPLANTORY NOTE
A
Enbridge Inc., a corporation existing under the
Canada Business Corporations Act
, qualifies as a foreign private issuer in the United States for purposes of the Securities Exchange Act of 1934, as amended (the “Exchange Act”). Although, as a foreign private issuer, Enbridge Inc. is not required to do so, Enbridge Inc. currently continues to file annual reports on Form10-K,
quarterly reports onForm 10-Q,
and current reports on Form8-K
with the Securities and Exchange Commission (“SEC”) instead of filing the reporting forms available to foreign private issuers. Enbridge Inc. prepares and files a management proxy circular and related material under Canadian requirements. As Enbridge Inc.’s management proxy circular is not filed pursuant to Regulation 14A, Enbridge Inc. may not incorporate by reference information required by Part III of its Form10-K
from its management proxy circular.Enbridge Inc. filed its Annual Report on Form
10-K
for the fiscal year ended December 31, 2019 (the “Original Filing”) on February 14, 2020. In reliance upon and as permitted by Instruction G(3) toForm 10-K,
Enbridge Inc. is filing this Amendment No. 1 on Form10-K/A
in order to include in the Original Filing the Part III information not previously included in the Original Filing.Except as stated herein, no other changes have been made to the Original Filing. The Original Filing continues to speak as of the date of the Original Filing, and, other than the information provided in Parts III and IV hereof, we have not updated the disclosures contained in the Original Filing to reflect any events which occurred at a date subsequent to the filing of the Original Filing.
In this Amendment No. 1 on Form
10-K/A,
the terms “Enbridge,” “we,” “us,” “our” and “company” mean Enbridge Inc. “Board of Directors” or “Board” means the Board of Directors of Enbridge. All dollar amounts are in Canadian dollars (“C$” or “$”) unless stated otherwise.All references to our websites and to our Canadian management proxy circular, dated March 2, 2020 and filed with the SEC on March 9, 2020 as Exhibit 99.1 to our Current Report on
Form 8-K
(the “Circular”), contained herein do not constitute incorporation by reference of information contained on such websites and the Circular and such information should not be considered part of this document.Page | ||||
Item 10. | 4 | |||
Item 11. | 14 | |||
Item 12. | 61 | |||
Item 13. | 62 | |||
Item 14. | 63 | |||
Item 15. | 65 | |||
Item 16. | 65 | |||
66 | ||||
67 |
3
DIRECTORS OF REGISTRANT
Director profiles
The profiles that follow provide information about the nominated directors, including their backgrounds, experience, current directorships, Enbridge securities held and the Board committees they sit on.
Pamela L. Carter  Age 70 Franklin, Tennessee, USA Independent Director since February 27, 2017 Latest date of retirement May 2025 2019 annual meeting votes for: 93.80% | Ms. Carter was the Vice President of Cummins Inc. and President of Cummins Distribution Business, a division of Cummins Inc., a designer, manufacturer and marketer of diesel engines and related components and power systems, from 2008 until her retirement in 2015. Ms. Carter joined Cummins Inc. in 1997 as Vice President – General Counsel and Corporate Secretary and held various management positions within Cummins. Prior to joining Cummins Inc., Ms. Carter served in the private practice of law as partner and associate and in various capacities with the State of Indiana, including Parliamentarian in the Indiana House of Representatives, Deputy Chief-of-Staff to governor Evan Bayh, Executive Assistant for Health Policy & Human Services and Securities Enforcement Attorney for the Office of the Secretary of State. She served as the Attorney General for the State of Indiana from 1993 to 1997 and was the first African-American woman to be elected state attorney general in the U.S.A. Ms. Carter holds a BA (Bachelor of Arts) from the University of Detroit, MSW (Master of Social Work) from the University of Michigan, J.D. (Doctor of Jurisprudence) from McKinney School of Law, Indiana University, Public Administration from Harvard Kennedy School. Ms. Carter received a 2018 Sandra Day O’Connor Board Excellence Award honoring her for her demonstrated commitment to board excellence and diversity. She also received an award as one of the top 100 board members from NACD in 2018 and top 25 director from Black Enterprise, 2018. | |||||||||||||||||
Enbridge Board/Board committee memberships | 2019 meeting attendance 1 | |||||||||||||||||
| Board of Directors | 7 out of 7 | 100% | ||||||||||||||||
| Corporate Social Responsibility | 4 out of 4 | 100% | ||||||||||||||||
| Governance (chair) 2 | 4 out of 4 | 100% | ||||||||||||||||
| Safety & Reliability 2 | 2 out of 2 | 100% | ||||||||||||||||
Total | 17 out of 17 | | 100% | | ||||||||||||||
Enbridge securities held 3 | ||||||||||||||||||
| Enbridge shares | DSUs 4 | Total market value of Enbridge shares & DSUs 5 | Minimum required 6 | |||||||||||||||
| | 42,559 | | | 8,056 | | $2,576,810 | | $1,108,679 | | |||||||||
Other board/board committee memberships 7 | ||||||||||||||||||
Public 7 | ||||||||||||||||||
CSX Corporation (public transportation company) | Director Chair, finance committee Member, governance committee and public affairs committee | |||||||||||||||||
Hewlett Packard Enterprise Company (public technology company) | Director Chair, human resources and compensation committee | |||||||||||||||||
| Broadridge Financial Solutions, Inc. (public financial services company) | Director Chair, audit committee Member, governance and nominating committee | |||||||||||||||||
Former US-listed company directorships (last 5 years) | ||||||||||||||||||
Spectra Energy Corp | ||||||||||||||||||
4
Marcel R. Coutu  Age 66 Calgary, Alberta, Canada Independent Director since July 28, 2014 Latest date of retirement May 2029 2019 annual meeting votes for: 87.86% | Mr. Coutu was the Chairman of Syncrude Canada Ltd. (integrated oil sands project) from 2003 to 2014 and was the President and Chief Executive Officer of Canadian Oil Sands Limited from 2001 until January 2014. From 1999 to 2001, he was Senior Vice President and Chief Financial Officer of Gulf Canada Resources Limited. Prior to 1999, Mr. Coutu held various executive positions with TransCanada PipeLines Limited and various positions in the areas of corporate finance, investment banking and mining and oil and gas exploration and development. Mr. Coutu holds an HBSc (Bachelor of Science, Honours Earth Science) from the University of Waterloo and an MBA (Master of Business Administration) from the University of Western Ontario. | |||||||||||||||||||||
Enbridge Board/Board committee memberships | 2019 meeting attendance 1 | |||||||||||||||||||||
Board of Directors | 7 out of 7 | 100% | ||||||||||||||||||||
| Audit, Finance & Risk | 3 out of 4 | 75% | ||||||||||||||||||||
| Governance 8 | 2 out of 2 | 100% | ||||||||||||||||||||
| Human Resources & Compensation | 4 out of 5 | 80% | ||||||||||||||||||||
| Total | 16 out of 18 | 89% | ||||||||||||||||||||
Enbridge securities held 3 | ||||||||||||||||||||||
Enbridge shares | DSUs 4 | Total market value of Enbridge shares and DSUs 5 | Minimum required 6 | |||||||||||||||||||
| | 29,400 | | | 28,595 | | | $2,952,525 | | | $1,108,679 | | |||||||||||
Other board/board committee memberships 7 | ||||||||||||||||||||||
Public 7 | ||||||||||||||||||||||
Brookfield Asset Management Inc. (public global asset management company) | Director Chair, audit committee Member, management, resources and compensation committee | |||||||||||||||||||||
Power Corporation of Canada (public international management and holding company) | Director Member, audit committee and compensation committee | |||||||||||||||||||||
The Great-West Lifeco Inc. (public international financial services holding company that is an indirect subsidiary of Power Corporation of Canada) | Director Member, executive committee, governance and nominating committee, human resources committee, investment committee and risk committee | |||||||||||||||||||||
IGM Financial Inc. (public personal financial services company that is an indirect subsidiary of Power Corporation of Canada) | Director Member, executive committee, investment committee and human resources committee | |||||||||||||||||||||
Not-for-profit 7 | ||||||||||||||||||||||
Calgary Exhibition and Stampede Board | Director | |||||||||||||||||||||
Susan M. Cunningham  Age 64 Houston, Texas, USA Independent Director since February 13, 2019 Latest date of retirement May 2031 2019 annual meeting votes for: 96.58% | Ms. Cunningham has been an Advisor for Darcy Partners (consulting firm) since 2017. From 2014 to 2017, Ms. Cunningham was Executive Vice President, EHSR (Environment, Health, Safety, Regulatory) and New Frontiers (global exploration, new ventures, geoscience and business innovation) at Noble Energy, Inc. From 2001 to 2013, she held various senior management roles with Noble Energy, Inc. Prior thereto, Ms. Cunningham held positions with Texaco U.S.A., Statoil Energy, Inc. and Amoco Corporation. Ms. Cunningham holds a BA in Geology and Geography from McMaster University and is a graduate of Rice University’s Executive Management Program. She was also Chairman of the OTC (Offshore Technology Conference) from 2010 to 2011. | |||||||||||||||||||||
Enbridge Board/Board committee memberships | 2019 meeting attendance 1 | |||||||||||||||||||||
Board of Directors | 5 out of 6 | 83% | ||||||||||||||||||||
Human Resources & Compensation | 2 out of 3 | 67% | ||||||||||||||||||||
Safety & Reliability | 2 out of 3 | 67% | ||||||||||||||||||||
Total | 9 out of 12 | 75% | ||||||||||||||||||||
Enbridge securities held 3 | ||||||||||||||||||||||
| Enbridge shares | DSUs 4 | Total market value of Enbridge shares and DSUs 5 | Minimum required 6 | |||||||||||||||||||
| | 947 | | | 3,281 | | $215,247 | | $1,108,679 | | |||||||||||||
Other board/board committee memberships 7 | ||||||||||||||||||||||
Other foreign | ||||||||||||||||||||||
Oil Search Limited (public oil and gas exploration and production) | Director Member, people and nominations committee | |||||||||||||||||||||
Former US-listed company directorships (last 5 years) | ||||||||||||||||||||||
Cliffs Natural Resources Inc. | ||||||||||||||||||||||
5
Gregory L. Ebel  Age 55 Houston, Texas, USA Not Independent 9 Director since February 27, 2017 Latest date of retirement May 2032 2019 annual meeting votes for: 88.58% | Mr. Ebel served as Chairman, President and CEO of Spectra Energy from January 1, 2009 to February 27, 2017 at which time he became a Director of Enbridge and Chair of the Enbridge Board. Prior to that time, Mr. Ebel served as Spectra Energy’s Group Executive and Chief Financial Officer beginning in January 2007. He served as President of Union Gas Limited from January 2005 until January 2007, and Vice President, Investor & Shareholder Relations of Duke Energy Corporation from November 2002 until January 2005. Mr. Ebel joined Duke Energy in March 2002 as Managing Director of Mergers and Acquisitions in connection with Duke Energy’s acquisition of Westcoast Energy Inc. Mr. Ebel holds a BA (Bachelor of Arts, Honours) from York University. | |||||||||||||||||||||||||
Enbridge Board/Board committee memberships | 2019 meeting attendance 1 | |||||||||||||||||||||||||
Board of Directors | 7 out of 7 | 100% | ||||||||||||||||||||||||
Audit, Finance & Risk 9 | 4 out of 4 | 100% | ||||||||||||||||||||||||
Corporate Social Responsibility 9 | 4 out of 4 | 100% | ||||||||||||||||||||||||
Governance 9 | 4 out of 4 | 100% | ||||||||||||||||||||||||
Human Resources & Compensation 9 | 5 out of 5 | 100% | ||||||||||||||||||||||||
Safety & Reliability 9 | 4 out of 4 | 100% | ||||||||||||||||||||||||
Total | 28 out of 28 | 100% | ||||||||||||||||||||||||
Enbridge securities held 3 | ||||||||||||||||||||||||||
| Enbridge shares | DSUs 4 | Stock Options 10 | | Total market value of Enbridge shares and DSUs (excluding stock options) 5 | Minimum required 6 | |||||||||||||||||||||
| | 651,845 | | | 22,489 | | | 405,408 | | $34,330,344 | | $1,108,679 | | ||||||||||||||
Other board/board committee memberships 7 | ||||||||||||||||||||||||||
Public 7 | ||||||||||||||||||||||||||
The Mosaic Company (public producer and marketer of concentrated phosphate and potash) | Chairman of the board Member, audit committee & corporate governance and nominating committee | |||||||||||||||||||||||||
Baker Hughes Incorporated (public supplier of oilfield services and products) | Director Chair, audit committee Member, governance & nominating committee | |||||||||||||||||||||||||
Former US-listed company directorships (last 5 years) | ||||||||||||||||||||||||||
Spectra Energy Corp | ||||||||||||||||||||||||||
6
J. Herb England  Age 73 Naples, Florida, USA Independent Director since January 1, 2007 Latest date of retirement May 2022 11 2019 annual meeting votes for: 96.84% | Mr. England has been Chair & Chief Executive Officer of Stahlman-England Irrigation Inc. (contracting company) in southwest Florida since 2000. From 1993 to 1997, Mr. England was the Chair, President & Chief Executive Officer of Sweet Ripe Drinks Ltd. (fruit beverage manufacturing company). Prior to 1993, Mr. England held various executive positions with John Labatt Limited (brewing company) and its operating companies, including the position of Chief Executive Officer of Labatt Brewing Company – Prairie Region (brewing company), Catelli Inc. (food manufacturing company) and Johanna Dairies Inc. (dairy company). In 1993, Mr. England retired as Senior Vice President, Finance and Corporate Development & Chief Financial Officer of John Labatt Limited. Mr. England holds a BA (Bachelor of Arts) from the Royal Military College of Canada and an MBA (Master of Business Administration) from York University. He also has a CA (Chartered Accountant) designation. | |||||||||||||||||||
Enbridge Board/Board committee memberships | 2019 meeting attendance 1 | |||||||||||||||||||
Board of Directors | 7 out of 7 | 100% | ||||||||||||||||||
Audit, Finance & Risk (chair) | 4 out of 4 | 100% | ||||||||||||||||||
Governance Committee 11 | 2 out of 2 | 100% | ||||||||||||||||||
Total | 13 out of 13 | 100% | ||||||||||||||||||
Enbridge securities held 3 | ||||||||||||||||||||
| Enbridge shares | DSUs 4 | Total market value of Enbridge shares and DSUs 5 | Minimum required 6 | |||||||||||||||||
| | 32,032 | | | 77,530 | | $5,577,801 | | $1,108,679 | | |||||||||||
Other board/board committee memberships | ||||||||||||||||||||
Public 7 | ||||||||||||||||||||
FuelCell Energy, Inc. (public fuel cell company in which Enbridge holds a small interest) | Chairman of the board Member, audit and finance committee | |||||||||||||||||||
Private 7 | ||||||||||||||||||||
Stahlman-England Irrigation Inc. (private contracting company) | Chair, board of directors Chief executive officer | |||||||||||||||||||
USA Grading Inc. (private excavating, grading and underground utilities company) | Director | |||||||||||||||||||
Former US public company directorships (last 5 years) | ||||||||||||||||||||
Enbridge Energy Management, LLC | ||||||||||||||||||||
Charles W. Fischer, CM  Age 69 Calgary, Alberta, Canada Independent Director since July 28, 2009 Latest date of retirement May 2025 2019 annual meeting votes for: 98.81% | Mr. Fischer was the President & Chief Executive Officer of Nexen Inc. (oil and gas company) from 2001 to 2008. From 1994 to 2001, Mr. Fischer held various executive positions within Nexen Inc., including the positions of Executive Vice President & Chief Operating Officer in which he was responsible for all Nexen’s conventional oil and gas business in Western Canada, the US Gulf Coast and all international locations, as well as oil sands, marketing and information systems activities worldwide. Prior thereto, Mr. Fischer held positions with Dome Petroleum Ltd. (oil and gas company), Hudson’s Bay Oil & Gas Ltd. (oil and gas company), Bow Valley Industries Ltd. (oil and gas company), Sproule Associates Ltd. (petroleum consulting firm) and Encor Energy Ltd. (oil and gas company). Mr. Fischer holds a BSc (Bachelor of Science in Chemical Engineering) and an MBA (Master of Business Administration), both from the University of Calgary. | |||||||||||||||||||
Enbridge Board/Board committee memberships | 2019 meeting attendance 1 | |||||||||||||||||||
Board of Directors | 7 out of 7 | 100% | ||||||||||||||||||
Audit, Finance & Risk | 4 out of 4 | 100% | ||||||||||||||||||
Corporate Social Responsibility | 4 out of 4 | 100% | ||||||||||||||||||
Safety & Reliability (chair) | 4 out of 4 | 100% | ||||||||||||||||||
Total | 19 out of 19 | 100% | ||||||||||||||||||
Enbridge securities held 3 | ||||||||||||||||||||
| Enbridge shares | DSUs 4 | Total market value of Enbridge shares and DSUs 5 | Minimum required 6 | |||||||||||||||||
| | 31,169 | | | 41,602 | | $3,704,772 | | $1,108,679 | | |||||||||||
Other public board/board committee memberships 7 | ||||||||||||||||||||
| — | ||||||||||||||||||||
7
Gregory J. Goff  Age 63 San Antonio, Texas, USA Independent Director since February 11, 2020 Latest date of retirement May 2032 2019 annual meeting votes for: N/A | Mr. Goff was Executive Vice Chairman of Marathon Petroleum Corporation (an integrated downstream energy company) from October 2018 until his retirement in December 2019. He was President and Chief Executive Officer of Andeavor (a petroleum refiner) from 2010 to 2018 and Chairman from December 2014 to 2018. Prior thereto, Mr. Goff held a number of senior leadership positions with ConocoPhillips Corporation (an oil and gas exploration and production company). Mr. Goff holds a BS (Bachelor of Science) and an MBA (Master of Business Administration) from the University of Utah. | |||||||||||||||||||||
Enbridge Board/Board committee memberships | 2019 meeting attendance | |||||||||||||||||||||
| Board of Directors | N/A | N/A | ||||||||||||||||||||
| Total | N/A | N/A | ||||||||||||||||||||
Enbridge securities held 3 | ||||||||||||||||||||||
| Enbridge shares | DSUs 4 | Total market value of Enbridge shares and DSUs 5 | Minimum required 6 | |||||||||||||||||||
| | – | | | – | | $– | | $1,108,679 | | |||||||||||||
Other board/board committee memberships 7 | ||||||||||||||||||||||
Public 7 | ||||||||||||||||||||||
PolyOne Corporation (public polymer company) | Chair, EHS committe Member, nominating committee | |||||||||||||||||||||
V. Maureen Kempston Darkes  Age 71 Toronto, Ontario, Canada Lauderdale-by-the-Sea, Independent Director since November 2, 2010 Latest date of retirement May 2024 2019 annual meeting votes for: 96.46% | Ms. Kempston Darkes is the retired Group Vice President and President Latin America, Africa and Middle East, General Motors Corporation (automotive corporation and vehicle manufacturer). From 1994 to 2001, she was the President and General Manager of General Motors of Canada Limited and Vice President of General Motors Corporation. Ms. Kempston Darkes holds a BA (Bachelor of Arts) and an LLB (Bachelor of Laws), both from the University of Toronto. 12 | |||||||||||||||||||||||
Enbridge Board/Board committee memberships | 2019 meeting attendance 1 | |||||||||||||||||||||||
| Board of Directors | 7 out of 7 | 100% | ||||||||||||||||||||||
| Corporate Social Responsibility (chair) | 4 out of 4 | 100% | ||||||||||||||||||||||
| Human Resources & Compensation | 5 out of 5 | 100% | ||||||||||||||||||||||
| Safety & Reliability | 4 out of 4 | 100% | ||||||||||||||||||||||
| Total | 20 out of 20 | 100% | ||||||||||||||||||||||
Enbridge securities held 3 | ||||||||||||||||||||||||
| Enbridge shares | DSUs 4 | Total market value of Enbridge shares and DSUs 5 | Minimum required 6 | |||||||||||||||||||||
21,735 | 45,396 | $3,417,639 | $1,108,679 | |||||||||||||||||||||
Other board/board committee memberships | ||||||||||||||||||||||||
Public 7 | ||||||||||||||||||||||||
Brookfield Asset Management Inc. (public global asset management company) | Director Chair, risk management committee Member, management resources and compensation committee | | ||||||||||||||||||||||
Canadian National Railway Company (public railway company) | Director Member, audit committee, corporate governance and nominating committee, finance committee, strategic planning committee and pension and investment committee | | ||||||||||||||||||||||
8
Teresa S. Madden  Age 64 Boulder, Colorado, USA Independent Director since February 12, 2019 Latest date of retirement May 2031 2019 annual meeting votes for: 98.98% | Ms. Madden was the Executive Vice President and Chief Financial Officer of Xcel Energy, Inc., an electric and natural gas utility, from 2011 until her retirement in 2016. She joined Xcel in 2003 as Vice President, Finance, Customer & Field Operations and was named Vice President and Controller in 2004. Prior thereto, Ms. Madden held positions with Rogue Wave Software, Inc. as well as New Century Energies and Public Service Company of Colorado, predecessor companies of Xcel Energy. Ms. Madden holds a BS (Bachelor of Science) in Accounting from Colorado State University and an MBA (Master of Business Administration) from Regis University. | |||||||||||||||||||||
Enbridge Board/Board committee memberships | 2019 meeting attendance 1 | |||||||||||||||||||||
| Board of Directors | 6 out of 7 | 83% | ||||||||||||||||||||
| Audit, Finance & Risk | 3 out of 3 | 100% | ||||||||||||||||||||
| Governance | 3 out of 3 | 100% | ||||||||||||||||||||
| Total | 12 out of 13 | 92% | ||||||||||||||||||||
Enbridge securities held 3 | ||||||||||||||||||||||
| Enbridge shares | DSUs 4 | Total market value of Enbridge shares and DSUs 5 | Minimum required 6 | |||||||||||||||||||
– | 3,281 | $167,036 | $1,108,679 | |||||||||||||||||||
Other board/board committee memberships 7 | ||||||||||||||||||||||
Public 7 | ||||||||||||||||||||||
Peabody Energy Corp. (public pure-play coal company) | Director Chair, audit committee Member, health, safety, security & environmental committee and executive committee | |||||||||||||||||||||
Al Monaco  Age 60 Calgary, Alberta, Canada Not independent Director since February 27, 2012 Latest date of retirement May 2027 2019 annual meeting votes for: 98.86% | Mr. Monaco joined Enbridge in 1995 and has held increasingly senior positions. He has been President & Chief Executive Officer of Enbridge since October 1, 2012 and served as Director and President of Enbridge from February 27, 2012 to September 30, 2012. Mr. Monaco holds an MBA (Master of Business Administration) from the University of Calgary and has a Chartered Professional Accountant designation. | |||||||||||||||||||||
Enbridge Board/Board committee memberships 13 | 2019 meeting attendance 1 | |||||||||||||||||||||
Board of Directors | 7 out of 7 | 100% | ||||||||||||||||||||
Enbridge securities held 3 | ||||||||||||||||||||||
| Enbridge shares | Stock options | Total market value of Enbridge shares (excluding stock options) 5 | Minimum required 14 | |||||||||||||||||||
| 876,512 | 3,987,520 | $44,623,226 | – | |||||||||||||||||||
Other board/board committee memberships | ||||||||||||||||||||||
Public 7 | ||||||||||||||||||||||
Weyerhaeuser Company (public timberlands company and wood products manufacturer) | Director | |||||||||||||||||||||
Private 7 | ||||||||||||||||||||||
DCP Midstream, LLC (a private 50/50 joint venture between Enbridge and Phillips 66 and the general partner of DCP Midstream GP, LLC, the general partner of DCP Midstream GP, LP, the general partner of DCP Midstream Partners, LP, a midstream master limited partnership with public unitholders) | Director Member, human resources and compensation committee | |||||||||||||||||||||
Not-for-profit 7 | ||||||||||||||||||||||
American Petroleum Institute (not-for-profit trade association) | Director Member, executive committee and finance committee | |||||||||||||||||||||
Business Council of Canada (not-for-profit, non-partisan organization composed of CEOs of Canada’s leading enterprises) | Member | |||||||||||||||||||||
U.S. National Petroleum Council | Member | |||||||||||||||||||||
Catalyst Canada Advisory Board | Member | |||||||||||||||||||||
9
Dan C. Tutcher  Age 70 Houston, Texas, USA Not Independent Director since May 3, 2006 Latest date of retirement May 2024 2019 annual meeting votes in favor: 98.55% | Mr. Tutcher is a Managing Director and Portfolio Manager on the Energy Infrastructure Equities team for Brookfield’s Public Securities Group. Mr. Tutcher is also on the Board of Directors of Gulf Capital Bank, where he is Chairman of the Governance Committee. Prior to joining Brookfield in 2018, Mr. Tutcher was President & Chair of the Board of Trustees of Center Coast MLP & Infrastructure Fund since 2013 and a Principal in Center Coast Capital Advisors L.P. since its inception in 2007. He was the Group Vice President, Transportation South of Enbridge, as well as President of Enbridge Energy Company, Inc. (general partner of former Enbridge sponsored affiliate Enbridge Energy Partners, L.P.) and Enbridge Energy Management, L.L.C. (another former Enbridge sponsored vehicle) from May 2001 until May 1, 2006. From 1992 to May 2001, he was the Chair of the Board of Directors, President & Chief Executive Officer of Midcoast Energy Resources, Inc. Mr. Tutcher holds a BBA (Bachelor of Business Administration) from Washburn University. | |||||||||||||||
Enbridge Board/Board committee memberships | 2019 meeting attendance 1 | |||||||||||||||
| Board of Directors | 7 out of 7 | 100% | ||||||||||||||
| Corporate Social Responsibility | 3 out of 4 | 75% | ||||||||||||||
| Safety & Reliability | 3 out of 4 | 75% | ||||||||||||||
| Total | 13 out of 15 | 87% | ||||||||||||||
Enbridge securities held 3 | ||||||||||||||||
| Enbridge shares | DSUs 4 | Total market value of Enbridge shares & DSUs 5 | Minimum required 6 | |||||||||||||
637,523 | 120,743 | $38,603,322 | $1,108,679 | |||||||||||||
Other board/board committee memberships 7 | ||||||||||||||||
Private 7 | ||||||||||||||||
Gulf Capital Bank (private financial institution) | Director Chair, governance committee | |||||||||||||||
Former US-listed company directorships (last 5 years) | ||||||||||||||||
Centre Coast MLP & Infrastructure Fund | ||||||||||||||||
| 1. | Percentages are rounded to the nearest whole number. |
| 2. | Ms. Carter was appointed as Chair of the Governance Committee on February 13, 2019 and ceased being a member of the Safety & Reliability Committee on May 8, 2019. |
| 3. | Information about beneficial ownership and about securities controlled or directed was provided by the director nominees and is as at March 2, 2020. |
| 4. | DSUs refer to deferred share units and are defined on page 55 of this Amendment No. 1 on Form 10-K/A. |
| 5. | Total market value = number of common shares or deferred share units × closing price of Enbridge shares on the Toronto Stock Exchange (“TSX”) on March 2, 2020 of $50.91, rounded to the nearest dollar. |
| 6. | Directors must hold at least three times their annual Board retainer in DSUs or Enbridge shares within five years of becoming a director on our Board. Amounts are converted to C$ using US$1 = C$1.2967, the published WM/Reuters 4 pm London exchange rate for December 31, 2019. All director nominees meet or exceed this requirement except Mses. Madden and Cunningham, who have until February 12, 2024 and February 13, 2024, respectively, and Mr. Goff, who has until February 11, 2025. |
| 7. | Public means a corporation or trust that is a reporting issuer in Canada, a registrant in the US, or both, and that has publicly listed equity securities. |
Private
means a corporation or trust that is not a reporting issuer or registrant.Not
-for
-profit
| 8. | Mr. Coutu ceased being a member of the Governance Committee on May 8, 2019. |
| 9. | The Board will re-evaluate Mr. Ebel’s independence after the NYSE three-year look-back rule for independence ends on April 15, 2020 and is expected to determine that Mr. Ebel is independent, subject to no new material relationships affecting his independence at that time. Mr. Ebel is not a member of any Board committee, but as Chair of the Board he attends their meetings. |
| 10. | Mr. Ebel’s stock options were Spectra Energy options that converted into options to purchase Enbridge shares upon the closing of the Merger Transaction (as defined on page 62). No new Enbridge stock options were granted to Mr. Ebel in his capacity as a Director of Enbridge or Chair of the Enbridge Board. |
| 11. | Mr. England was appointed to the Governance Committee on May 8, 2019. In February 2020, the Board unanimously approved the extension of the term limit for Mr. England as a director for an additional two years following the Meeting. |
10
| 12. | Ms. Kempston Darkes was an executive officer of General Motors Corporation (“GM”) from January 1, 2002 to December 1, 2009. GM filed for bankruptcy protection under Chapter 11 of the U.S. Bankruptcy Code on June 1, 2009. None of the operations for which she was directly responsible in Latin America, Africa and the Middle East were included in the bankruptcy filing. GM emerged from bankruptcy protection on July 10, 2009 in a reorganization in which a new entity acquired GM’s most valuable assets. |
| 13. | Mr. Monaco is not a member of any Board committee, but as President & Chief Executive Officer he attends their meetings at the request of such committees. |
| 14. | As President & CEO, Mr. Monaco is required to hold Enbridge shares equal to six times his base salary (see page 40). Mr. Monaco is not required to hold Enbridge shares as a director. |
| 15. | Ms. Williams ceased being a member of the Audit, Finance & Risk Committee and was appointed to the Governance Committee on May 8, 2019. |
Retiring director
Catherine L. Williams is not standing for re-election as a director of Enbridge and will retire at the end of the Meeting. Ms. Williams has served on our Board since November 1, 2007 and is 69 years old. Ms. Williams was the Chief Financial Officer for Shell Canada Limited (oil and gas company) from 2003 to 2007. Prior thereto, she held various positions with Shell Canada Limited, Shell Europe Oil Products, Shell Canada Oil Products and Shell International (oil and gas companies) from 1984 to 2003. Ms. Williams holds a BA (Bachelor of Arts) from the University of Western Ontario and an MBA (Master of Business Administration, Finance) from Queen’s School of Business (now Smith School of Business at Queen’s University). Ms. Williams’ other public company board and committee memberships are as follows:
Public | ||||||||||||||
Vermilion Energy Inc. (public oil and gas company) | Director Chair, audit committee Member, governance and human resources committee | |||||||||||||
Director independence
Director | Independent | Non-Independent | Reason for non-independence | |||
Pamela L. Carter | ✓ | |||||
Marcel R. Coutu | ✓ | |||||
Susan M. Cunningham | ✓ | |||||
Gregory L. Ebel | ✓ | Former Chairman, President and CEO of Spectra Energy and a non-executive Spectra Energy employee until April 15, 2017. The Board will re-evaluate Mr. Ebel’s independence after the NYSE three-year look-back rule for independence ends on April 15, 2020 and is expected to determine that Mr. Ebel is independent, subject to no new material relationships affecting his independence at that time. | ||||
J. Herb England | ✓ | |||||
Charles W. Fischer | ✓ | |||||
Gregory J. Goff | ✓ | |||||
V. Maureen Kempston Darkes | ✓ | |||||
Teresa S. Madden | ✓ | |||||
Al Monaco | ✓ | President & CEO of the company | ||||
Dan C. Tutcher | ✓ | Employee of Brookfield, whose subsidiary and institutional partners made payments to Enbridge for property or services in an amount which exceeds 2% of Brookfield’s consolidated gross revenues | ||||
Catherine L. Williams | ✓ |
11
Current Board committee participation
Director | Audit, Finance & Risk Committee | Corporate Social Responsibility Committee | Governance Committee | Human Resources & Compensation Committee | Safety & Reliability Committee | |||||||||||||||
Not independent | ||||||||||||||||||||
Gregory L. Ebel 1 | ||||||||||||||||||||
Al Monaco 1 | ||||||||||||||||||||
Dan C. Tutcher | ✓ | ✓ | ||||||||||||||||||
Independent | ||||||||||||||||||||
Pamela L. Carter | ✓ | committee chair | ||||||||||||||||||
Marcel R. Coutu 2 | ✓ | ✓ | ||||||||||||||||||
Susan M. Cunningham | ✓ | ✓ | ||||||||||||||||||
J. Herb England 2 | committee chair | ✓ | ||||||||||||||||||
Charles W. Fischer | ✓ | ✓ | committee chair | |||||||||||||||||
Gregory J. Goff 3 | ||||||||||||||||||||
V. Maureen Kempston Darkes | committee chair | ✓ | ✓ | |||||||||||||||||
Teresa S. Madden 2 | ✓ | ✓ | ||||||||||||||||||
Catherine L. Williams 2 | ✓ | committee chair | ||||||||||||||||||
| 1. | Messrs. Ebel and Monaco are not members of any of the committees of the Board. They attend committee meetings in their capacities as Chair of the Board and President & CEO, respectively. |
| 2. | Mses. Madden and Williams and Messrs. Coutu and England each qualify as an audit committee financial expert, as defined under the U.S. Securities Exchange Act of 1934 , as amended. The Board has also determined that all the members of the Audit, Finance & Risk Committee are financially literate according to the meaning of National Instrument52-110 –Audit Committees and the rules of the NYSE. |
| 3. | Mr. Goff has not yet been appointed to any Board committees. |
EXECUTIVE OFFICERS OF REGISTRANT
The information regarding executive officers is included in
Part I.
Item 1. Business—Executive Officers
of the Original FilingCORPORATE GOVERNANCE
As of June 30, 2019, Enbridge regained its status as a “foreign private issuer” pursuant to applicable U.S. securities laws. Accordingly, Enbridge is permitted to follow home country practice instead of certain governance requirements set out in the New York Stock Exchange (the “NYSE”) rules, provided we disclose any significant differences between our governance practices and those required by the NYSE. Further information regarding those differences is available on our website (www.enbridge.com).
We have a comprehensive system of stewardship and accountability that meets applicable Canadian and U.S. requirements, including: Canadian Securities Administrators (CSA) National Policy 58-201
Corporate Governance Guidelines;
National Instrument 58-101Disclosure of Corporate Governance Practices
; National Instrument 52-110Audit Committees;
requirements of theCanada Business Corporations Act
; and the corporate governance guidelines of the NYSE.STATEMENT ON BUSINESS CONDUCT
Our Statement on Business Conduct (available on our website at www.enbridge.com) is our formal statement of expectations for all individuals engaged by Enbridge. It applies to everyone at Enbridge and our subsidiaries, including our directors, officers, employees, contingent workers as well as consultants and contractors retained by Enbridge.
12
It discusses what we expect in areas like:
| • | complying with the law, applicable rules and all policies; |
| • | how to avoid conflicts of interest, including examples of acceptable forms of gifts and entertainment; |
| • | anti-corruption and money laundering; |
| • | acquiring, using and maintaining assets (including computers and communication devices) appropriately; |
| • | data privacy, records management, and proprietary, confidential and insider information; |
| • | protecting health, safety and the environment; |
| • | interacting with landowners, customers, shareholders, employees and others; and |
| • | respectful workplace/no harassment. |
The Board approved a revised Statement on Business Conduct in 2017 and the revised Statement on Business Conduct became effective on September 29, 2017. We intend to post any amendment or waiver to the Statement on Business Conduct on our website within the time period required by the SEC.
On the commencement of employment with Enbridge and annually thereafter, all Enbridge employees and contingent workers active in the Company’s human resources information system are required to complete a Statement on Business Conduct training and certify compliance with the Statement on Business Conduct. In addition, employees and contingent workers are also required to disclose any actual or potential conflicts of interest.
Directors must also certify their compliance with the Statement on Business Conduct on an annual basis.
During January 2020, all employees and contingent workers active in the company’s human resources information system were required to complete online Statement on Business Conduct training and applicable compliance certification, and were required to declare any real or potential conflicts of interest. As of the date of the Circular, approximately 98% of these Enbridge employees had certified compliance with the Statement on Business Conduct for the year ended December 31, 2019. All 11 current directors on the Board who were directors in 2019 have also certified their compliance with the Statement on Business Conduct for the year ended December 31, 2019.
AUDIT FINANCE & RISK COMMITTEE
The Audit, Finance & Risk Committee fulfills public company audit committee obligations and assists the Board with oversight of: the integrity of the company’s financial statements; the company’s compliance with legal and regulatory requirements; the independent auditor’s qualifications and independence; and the performance of the company’s internal audit function and external auditors. The committee also assists the Board with the company’s risk identification, assessment and management program.
Financial literacy
The Board defines an individual as financially literate if he or she can read and understand financial statements that are generally comparable to ours in breadth and complexity of issues. The Board has determined that all of the members of the Audit, Finance & Risk Committee are financially literate according to the meaning of NI 52-110 and the rules of the NYSE. It has also determined that Mses. Madden and Williams and Messrs. Coutu and England each qualify as “audit committee financial experts” as defined by the Exchange Act. The Board bases this determination on each director’s education, skills and experience.
13
As a foreign private issuer in the United States, we are deemed to comply with this Item if we provide information required by Items 6.B and 6.E.2 of Form
20-F,
with more detailed information provided if otherwise made publicly available or required to be disclosed in Canada. We have provided information required by Items 6.B and 6.E.2 of Form20-F
in the Circular. As a foreign private issuer in the United States we are not required to disclose executive compensation according to the requirements of RegulationS-K
that apply to U.S. domestic issuers, and we are not otherwise required to adhere to the U.S. requirements relative to certain other proxy disclosures and requirements. Our executive compensation disclosure complies with Canadian requirements, which are, in many respects, substantially similar to U.S. rules.Compensation committee interlocks and insider participation
The table below sets out the board interlocks in 2019. The Board has determined that the board interlocks set out below do not impair the ability of these directors to exercise independent judgment as members of our Board.
| Directors | Serve together on this board of a public company | Serve on these committees | ||
Marcel R. Coutu | Brookfield Asset Management Inc. | Chair, audit committee Member, management, resources and compensation committee | ||
V. Maureen Kempston Darkes | Chair, risk management committee Member, management, resources and compensation committee |
14
Executive compensation
| 16 | ||||
| 17 | ||||
| 17 | ||||
| 18 | ||||
| 20 | ||||
| 20 | ||||
| 20 | ||||
| 23 | ||||
| 27 | ||||
| 28 | ||||
| 33 | ||||
| 33 | ||||
| 34 | ||||
| 35 | ||||
| 38 | ||||
| 39 | ||||
| 40 | ||||
The following Compensation Discussion and Analysis describes the 2019 compensation program for our Named Executive Officers (NEOs). For 2019, our NEOs were:
 |  |  | ||
Al Monaco President & Chief Executive Officer (CEO) | Colin K. Gruending 1 Executive Vice President & Chief Financial Officer (CFO) | John K. Whelen 2 Executive Vice President & Chief Development Officer (CDO) | ||
 |  |  | ||
William T. Yardley Executive Vice President & President, Gas Transmission & Midstream | D. Guy Jarvis Former Executive Vice President, Liquids Pipelines | Vern D. Yu Executive Vice President & President, Liquids Pipelines |
| 1. | Mr. Gruending served as Executive Vice President & CFO from June 1 to December 31, 2019. |
| 2. | Mr. Whelen served as Executive Vice President & CFO from January 1 to June 1, 2019. |
15
Strategic focus
Enbridge’s strategic priorities remain focused on growing our three core lines of business – Liquids Pipelines, Natural Gas Pipelines and Gas Distribution – within a regulated pipeline and utility model, while improving our competitive position by optimizing our operations, strengthening our financial position, and seeking efficiencies through continuous process improvement and the application of technology solutions. The safety and reliability of our systems is our number one priority.
Compensation philosophy
Our executive compensation program is grounded in aphilosophy. Accordingly, base salary is the sole fixed source of our NEOs’ cash compensation and variable compensation amounts earned by our NEOs are strongly aligned to the achievement of Enbridge’s strategic priorities. Compensation is targeted at median within the markets where Enbridge competes, with performance driving “at risk” incentive payouts up or down accordingly. The vast majority of executive compensation is considered “at risk” because its value is based on specific performance criteria and/or share price and payout is not guaranteed.
pay-for-performance
Performance highlights for 2019
| Priorities | Actions | |||
| 1. | Deliver distributable cash flow (“DCF”) and dividend growth | • Strong financial and operating performance• Executed projects with an aggregate value of $9B• Increased dividend for the 24th consecutive year, with a 10% increase over2018 • Implemented cost management and optimization measures | ||
| 2. | Advance Line 3 replacement | • Placed Canadian segment into service December 1, 2019• Obtained Minnesota Public Utilities Commission approval• Minnesota Department of Commerce completed amended Environmental Impact Statement | ||
| 3. | Advance priority access on Mainline | • Filed regulatory application in support of contracting the mainline with Canada Energy Regulator; achieved significant customer support | ||
| 4. | Extend secured growth | • Secured $2.5B of new growth capital projects | ||
| 5. | Maintain balance sheet strength and flexibility | • 4.5xDebt-to-EBITBA • Completed sale of Canadian gathering and processing assets | ||
Compensation highlights for 2019
In 2019, considering company performance, the following key compensation decisions were made for the NEOs, in each case as a percentage of base salary:
| Executive | Base pay adjustment | Short-term incentive payment | Medium-term incentive award | Long-term incentive award | Special award | |||||||||||||
Al Monaco | | 10% (1) | | 226% | | 360% | | | 240% | | | – | | |||||
Colin K. Gruending | | 40% (2) | | 111% | | 284% (3) | | | 90% (3) | | | – | | |||||
John K. Whelen | | 4% | | 128% | | 225% | | | 150% | | | – | | |||||
William T. Yardley | | 4% | | 104% | | 225% | | | 150% | | | 274% (4) | | |||||
D. Guy Jarvis | | 7% | | 122% | | 225% | | | 150% | | | – | | |||||
Vern D. Yu | | 4% | | 125% | | 225% | | | 150% | | | – | | |||||
| 1. | Mr. Monaco received a base salary increase to better align his positioning relative to the competitive market. |
| 2. | Mr. Gruending received a base salary increase upon promotion to Executive Vice President & CFO to recognize the significant increase in scope and responsibilities. |
| 3. | Mr. Gruending received an annual grant based on the incentive targets of his prior role and received a top-up in PSUs upon his promotion to Executive Vice President & CFO to offset the difference in targets and reflect his new role and responsibilities. |
| 4. | On May 8, 2019, Mr. Yardley was awarded a retention award in the form of restricted stock units, 20% of which vest on each of the first and second anniversaries of the grant date and 60% of which vest on the third anniversary of the grant date. |
16
| What we do | What we don’t do | |
• Use a pay-for-performance philosophy whereby the majority of compensation provided to executives is “at risk”• Use a blend of short-, medium- and long-term incentive awards that are linked to business plans for the respective timeframe• Incorporate risk management principles into all decision-making processes to ensure compensation programs do not encourage inappropriate or excessiverisk-taking by executives • Regularly review executive compensation programs through third-party experts to ensure the ongoing alignment with shareholders and regulatory compliance• Use both preventative and incident-based safety, environmental and operational metrics that are directly linked to short-term incentive awards• Have meaningful stock ownership requirements that align the interests of executives with those of Enbridge shareholders• Benchmark executive compensation programs against a group of similar companies in Canada and the U.S. to ensure that executives are rewarded at competitive levels• Have an incentive compensation clawback policy• Use double-trigger change-in-control provisions within all incentive plan agreements from 2017 onward | • Pay out incentive awards when unwarranted by performance• Count performance stock units, restricted stock units or unexercised stock options toward stock ownership requirements• Grant stock options with exercise prices below 100% fair market value orre-price out-of-the-money options • Use employment agreements with single-trigger voluntary termination rights in favor of executives• Permit hedging of Enbridge securities• Grant loans to directors or senior executives• Provide stock options to non-employee directors• Guarantee bonuses• Apply tax gross-ups to awards | |
Corporate actions
Delivered strong financial results • Achieved DCF/share(1) at top end of guidance range• Solid operational performance across all business lines• Completed final phase of $8Bnon-core asset sales• 4.5xDebt-to-EBITDA | Optimized the base business • Delivered 100 kbpd Mainline throughput optimizations• Filed Mainline term contract application with Canada Energy Regulator• Reached Texas Eastern rate settlement with customers• Captured synergies through amalgamated utilities | |
Growing organically • Secured $2.5B of new growth capital projects in 2019• Advanced U.S. Gulf Coast liquified natural gas supply strategy and liquids export strategy• Announced $0.8B Gas Transmission 2020 modernization program | Executed capital program • Placed $9B of secured growth capital into service, including Gray Oak, Hohe See and Canadian segment of Line 3 Replacement | |
| 1. | DCF per share is a non-GAAP measure; this measure is defined and reconciled inItem 11 —“Non-GAAP Reconciliation”. |
17
2019 project execution
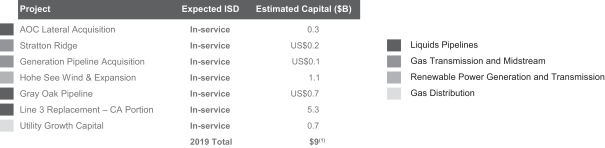
| 1. | U.S. dollars have been converted to Canadian dollars using an exchange rate of US$1 = C$1.30. |
Distributable cash flow
(1)
(millions of Canadian dollars)
 | • • • |
| 1. | DCF and DCF per share are non-GAAP measure; these measures are defined and reconciled in Item 11 —“Non-GAAP Reconciliation”. |
Enbridge’s approach to executive compensation is set by the HRC Committee and approved by the Board. These programs are designed to accomplish three objectives:
| • | attract and retain a highly effective executive team; |
| • | align executives’ actions with Enbridge’s business strategy and the interests of Enbridge shareholders and other stakeholders; and |
| • | reward executives for short-, medium- and long-term performance. |
Alignment with company strategy
Enbridge’s vision is to be the leading energy delivery company in North America. To achieve this goal, we are committed to delivering the energy people need and want, and creating value for our shareholders. We aim to be the first choice of our customers, attract and retain energized employees and maintain the trust of our stakeholders.
| Central to achieving this vision is a relentless focus on safety, operational reliability and protection of the environment to ensure that the needs of all stakeholders are met, and that Enbridge continues to be a good citizen within the communities in which we live and operate. | Safety and operational reliability is Enbridge’s number one priority. |
Enbridge’s executive compensation programs are aligned with the achievement of our strategic priorities and are designed to link payouts to those outcomes. They motivate management to deliver exceptional value to Enbridge shareholders through strong corporate performance and investing capital in ways that minimize risk and maximize return, while always supporting the core business goal of delivering energy safely and reliably.
Management is committed to delivering steady, visible and predictable results, and operating assets in an ethical and responsible manner.
18
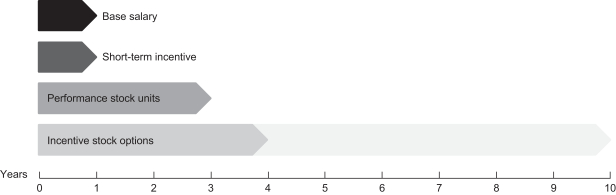
Enbridge’s executive compensation program is made up of several components that balance the use of short- (STIP), medium- (performance stock units) and long-term vehicles (stock options). The following chart describes the NEOs’ compensation components, and the time horizon for vesting and/or realized value.
Pay-for-performance
| Performance is the cornerstone of Enbridge’s executive compensation program. The Board reviews Enbridge’s business plans over the short-, medium- and long- term and the HRC Committee ensures the compensation programs are linked to these time frames. This focuses management on delivering value to Enbridge shareholders not only in the short term, but also continued performance over the long term. | Performance is foundational to Enbridge’s executive compensation program; incentive compensation plans incorporate operational and financial performance conditions. |
Relevant corporate and business unit performance measures are established for the STIP that focus on the critical safety, system reliability, environmental, customer, employee and financial aspects of the business.
The performance measures for the medium- and long-term incentive plans focus on overall corporate performance aligned with Enbridge shareholder expectations for cash flow growth and total shareholder return.
When assessing performance, the HRC Committee considers performance results in the context of other qualitative factors not captured in the formal metrics, including key performance indicators relative to peers and the qualitative aspects of management’s responsibilities.
At-risk
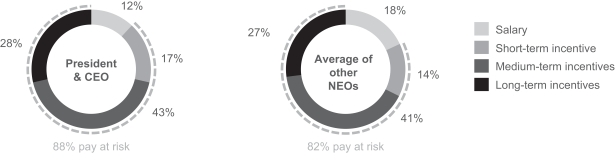
compensation| The chart below shows the target compensation mix for the President & CEO and the average for the other NEOs. The short-, medium- and long-term incentives are considered to be “at risk” because their value is based on specific performance criteria and payout is not guaranteed. | The vast majority of compensation for Enbridge’s President & CEO and other NEOs is considered “at risk”. |
In 2019, 88% of the target total direct compensation for the President & CEO, and an average of 82% for the other NEOs, was at risk, directly aligning corporate, business unit and individual performance with the interests of Enbridge shareholders.
19
Base salary adjustments, as shown below, were provided to the President & CEO and other NEOs (with the exception of Mr. Gruending) to better align positioning relative to the competitive market. Mr. Gruending received a base salary increase upon his promotion to Executive Vice President & CFO to recognize the significant increase in scope and responsibilities. As Mr. Whelen’s new role was considered a lateral change, no compensation adjustments were provided related to this change.
| Executive | Base Pay at January 1, 2019 (1) | Change in 2019 (%) | Base Pay at December 31, 2019 (1) | |||
| Al Monaco | $1,479,450 | 10% | $1,630,000 | |||
| Colin K. Gruending | $375,000 | 40% | $525,000 | |||
| John K. Whelen | $619,500 | 4% | $641,200 | |||
| William T. Yardley | $713,174 | 4% | $738,174 | |||
| D. Guy Jarvis | $630,000 | 7% | $674,100 | |||
| Vern D. Yu | $550,000 | 4% | $569,300 | |||
| 1. | U.S. dollars have been converted to Canadian dollars using the published WM/Reuters 4 pm London year-end exchange rate of US$1 = C$1.2967. |
It is critically important to ensure all Enbridge executives are incentivized to achieve not only financial results but also operational results in areas such as safety and environmental performance. For this reason, our Short Term Incentive Plan (“STIP”) awards are designed to be a comprehensive analysis of corporate, business unit and individual performance, as determined in the discretion of our HRC Committee.
| • | Corporate performance. The corporate component of the performance metrics is based on a single, objective company-wide performance metric that is designed to drive achievement of near-term business strategies and financial results for the organization. |
| • | Business unit performance. Business unit performance is assessed relative to a scorecard of metrics and targets established for each business and their senior management teams, as applicable to those objectives relating to the business unit. |
| • | Individual performance. Individual performance metrics for each of our NEOs are established to align with financial, strategic and operational priorities related to each executive’s portfolio and their contributions to the overall organization in consultation with the President and CEO, in order to recognize and differentiate individual actions and contributions in final pay decisions. |
Performance metrics and ranges for threshold, target and maximum incentive opportunities for the corporate component of the STIP award are determined by the HRC Committee at the beginning of the year. Each executive’s target award and payout range reflect the level of responsibility associated with their role, as well as competitive practice, and is established as a percentage of base salary. For 2019, each NEO’s target STIP award and corresponding weighting of corporate, business unit and individual performance metrics were as follows:
| Executive | 2019 target STIP (as % base salary) | 2019 target STIP (1) | Performance Measure Weighting | |||||||||
| Corporate | Business Unit | Individual | 2018 target STIP (as % base salary) | |||||||||
| Al Monaco | 140% | $2,282,000 | 60% | 20% | 20% | 130% | ||||||
| Colin K. Gruending (2) | 68% | $354,410 | 60% | 20% | 20% | 50% | ||||||
| John K. Whelen | 80% | $512,960 | 60% | 20% | 20% | 80% | ||||||
| William T. Yardley | 80% | $590,540 | 40% | 40% | 20% | 80% | ||||||
| D. Guy Jarvis | 80% | $539,280 | 40% | 40% | 20% | 80% | ||||||
| Vern D. Yu (3) | 80% | $455,440 | 48% | 32% | 20% | 77% | ||||||
| 1. | U.S. dollars have been converted to Canadian dollars using the published WM/Reuters 4 pm London year-end exchange rate of US$1 = C$1.2967. |
| 2. | Mr. Gruending’s incentive target increased from 50% to 80% upon his promotion to Executive Vice President & CFO. His 2019 short-term incentive award was calculated on a prorated basis with a target of 50% from January 1 to June 1, 2019, and a target of 80% from June 2 to December 31, 2019. His performance weightings remained unchanged. |
20
| 3. | Mr. Yu’s performance weightings changed from 60%/20%/20% to 40%/40%/20% Corporate/Business Unit/Individual, respectively, upon his appointment to President & Chief Operating Officer, Liquids Pipelines. His short-term incentive award was calculated on a prorated basis with performance weightings of 60%/20%/20% Corporate/Business Unit/Individual from January 1 to June 1, 2019, and performance weightings of 40%/40%/20% from June 2 to December 31, 2019. |
The HRC Committee retains discretion to change performance measures, scorecards and the award levels when it believes it is reasonable to do so, considering matters such as key performance indicators and the business environment in which the performance was achieved. In addition, the HRC Committee retains discretion to approve adjustments to the calculated STIP award to reflect extraordinary events and other factors not contemplated in the original measures or targets.
As illustrated below, STIP awards are earned between
0-200%
of the target award based on achievement of the applicable corporate, business unit and individual performance metrics and giving effect to the applicable weighting of each metric.
Corporate performance
The corporate performance metric is reviewed annually to select measures that align with our strategy and are appropriate for measuring annual performance. The same corporate component metrics and goals apply to each NEO. In February 2019, the HRC Committee approved Management’s recommendation to use DCF per share. The HRC retains discretion to consider other factors (including our performance relative to our peers, other key performance indicators and market conditions) in assessing the strength of the corporate performance metrics and also retains discretion to determine the overall corporate performance payout.
The HRC Committee agreed to the use of DCF per share as the corporate performance metric because it believes DCF per share is an appropriate measure of financial performance for the enterprise. Focusing management on this metric will enhance transparency of Enbridge’s cash flow growth, increase comparability of results relative to peers and help ensure full value recognition for Enbridge’s superior assets and commercial and growth arrangements, which provides a low risk value proposition for shareholders.
For 2019, DCF per share targets were set using the external financial guidance range to determine threshold and target payments. For any payout to occur, Enbridge must achieve threshold performance. For a maximum payout to occur, Enbridge must achieve the top of the guidance range, which ensures there is appropriate stretch in the plan.
For purposes of Enbridge’s 2019 STIP awards, 2019 DCF per share was determined to be $4.54 and resulted in a performance multiplier of 1.60x representing 100% of the corporate performance metric.
| 2019 corporate STIP metric | DCF per share (1) performance anchors | Performance multiplier (2) | ||||||||
| Threshold (guidance minimum) | $4.30 | 0.5x | ||||||||
| Target (guidance mid-point) | $4.45 | 1.0x | ||||||||
| Maximum (guidance maximum) | $4.60 | 2.0x | ||||||||
| Actual | $4.54 | 1.60x | ||||||||
| 1. | DCF per share is a non-GAAP measure; this measure is defined and reconciled inItem 11 —“Non-GAAP Reconciliation”. |
| 2. | DCF per share between the thresholds in this table results in a performance multiplier calculated on a linear basis. |
21
Business unit performance
The HRC Committee approved the application of the following scorecards for each of the NEOs. While the specific metrics used vary by business unit, each scorecard includes objectives relating to operational performance and reliability, financial performance and project execution as outlined below:
| Executive | Business unit metrics (1) | Description | ||
| Al Monaco | Composite measure | • Non-financial operating measures for the combined enterprise (including enterprise safety and environment) | ||
| Colin K. Gruending | Corporate Office | • Weighted-average of overall business unit results• Financial (corporate cost containment) | ||
| John K. Whelen (2) | Corporate Office (82%) | • Weighted-average of overall business unit results• Financial (corporate cost containment) | ||
| Energy Marketing (12%) | • Financial, operating and commercial measures for the Energy Marketing business unit | |||
| Power Operations (6%) | • Financial, operating and commercial measures for the Power Operations business unit | |||
| William T. Yardley | Gas Transmission and Midstream | • Financial, operating and commercial measures for the Gas Transmission and Midstream business unit | ||
| D. Guy Jarvis | Liquids Pipelines (90%) | • Financial, operating and commercial measures for the Liquids Pipelines business unit | ||
| Projects (10%) | • Safety, quality, execution and environmental measures for the Projects business unit | |||
| Vern D. Yu (2) | Corporate Office (33%) | • Weighted-average of overall business unit results• Financial (corporate cost containment) | ||
| Liquids Pipelines (59%) | • Financial, operating and commercial measures for the Liquids Pipelines business unit | |||
| Energy Marketing (8%) | • Financial, operating and commercial measures for the Energy Marketing business unit | |||
| 1. | The business unit metric for Mr. Monaco is a composite measure, representing enterprise-wide performance as, in his capacity as President and CEO, he oversees the overall organization. |
| 2. | The weightings on each business unit scorecard is based on time spent in different roles throughout the year. |
Individual performance
In the first quarter of 2019, after discussion with the Board, the HRC Committee approved individual performance objectives for Mr. Monaco, taking into consideration the company’s financial and strategic priorities. For our other NEOs, Mr. Monaco established individual objectives for 2019 at the start of the year, basing them on strategic and operational priorities related to each executive’s portfolio and other factors.
Short-term incentive award outcomes
Each NEO’s calculated STIP award, as well as the actual award, is as follows:
| Executive | Corporate multiplier | x | Weight | + | Business unit multiplier | x | Weight | + | Individual multiplier | x | Weight | = | Overall multiplier | |||||||||||||
| Al Monaco | 1.60 | x | 60% | + | 1.28 | x | 20% | + | 2.00 | x | 20% | = | 1.62 | |||||||||||||
| Colin K. Gruending | 1.60 | x | 60% | + | 1.43 | x | 20% | + | 2.00 | x | 20% | = | 1.65 | |||||||||||||
| John K. Whelen | 1.60 | x | 60% | + | 1.45 | x | 20% | + | 1.75 | x | 20% | = | 1.60 | |||||||||||||
| William T. Yardley | 1.60 | x | 40% | + | 0.80 | x | 40% | + | 1.70 | x | 20% | = | 1.30 | |||||||||||||
| D. Guy Jarvis | 1.60 | x | 40% | + | 1.37 | x | 40% | + | 1.70 | x | 20% | = | 1.53 | |||||||||||||
| Vern D. Yu | 1.60 | x | 48% | + | 1.41 | x | 32% | + | 1.75 | x | 20% | = | 1.56 |
22
Short-term incentive award calculations
| Executive | Base salary (1) ($) | x | STIP target (%) | x | Overall multiplier | = | Calculated award ($) | Actual award ($) | ||||||||||||||||||||||||
| Al Monaco | 1,630,000 | x | 140 | % | x | 1.62 | = | 3,687,712 | 3,687,712 | |||||||||||||||||||||||
| Colin K. Gruending | 525,000 | x | 68 | % | x | 1.65 | = | 583,360 | 583,360 | |||||||||||||||||||||||
| John K. Whelen | 641,200 | x | 80 | % | x | 1.60 | = | 821,199 | 821,199 | |||||||||||||||||||||||
| William T. Yardley | 738,174 | x | 80 | % | x | 1.30 | = | 767,701 | 767,701 | |||||||||||||||||||||||
| D. Guy Jarvis | 674,100 | x | 80 | % | x | 1.53 | = | 822,941 | 822,941 | |||||||||||||||||||||||
| Vern D. Yu | 569,300 | x | 80 | % | x | 1.56 | = | 711,996 | 711,996 | |||||||||||||||||||||||
| 1. | U.S. dollars have been converted to Canadian dollars using the published WM/Reuters 4 pm London year-end exchange rate of US$1 = C$1.2967. |
Enbridge adopted the Enbridge Inc. 2019 Long Term Incentive Plan (“2019 LTIP”) effective February 13, 2019, under which medium- and long-term awards were granted in 2019.
Enbridge’s medium- and long-term incentive awards for executives include two primary vehicles: performance stock units (“PSUs”) and incentive stock options (“ISOs”).
Enbridge views medium- and long-term incentives as forward-looking compensation vehicles, and as such, grants are considered as part of the compensation for the year of grant and onwards instead of in recognition of prior performance.
The various awards that apply to executives have different terms, vesting conditions and performance criteria, mitigating the risk that executives produce only short-term results for individual profit. This approach also benefits shareholders and helps maximize the ongoing retentive value of the medium- and long-term incentives granted to executives.
Medium- and long-term incentive grants are determined as follows:

The table below outlines the medium- and long-term incentive awards used in 2019.
| Medium-term incentive (PSU) | Long-term incentive (ISO) | |||
Term | Three years | 10 years | ||
| Description | Phantom share/units with performance conditions that affect the payout | Options to acquire Enbridge shares For U.S. participants, awards are granted in non-qualified options that do not meet the requirements of section 422 of the U.S. Internal Revenue Code | ||
Frequency | Granted annually | Granted annually | ||
Performance conditions | 50% DCF per share growth relative to a target set at the beginning of the term | n/a | ||
50% total shareholder return (TSR) performance relative to peers | ||||
| Vesting | Units cliff vest at end of term | Options vest 25% per year over four years, starting on the first anniversary of the grant date | ||
| Payout | Paid out in cash at the end of the term based on market value of an Enbridge share, subject to adjustment from 0-200% based on achievement of the performance conditions above | Participant acquires Enbridge shares at the exercise price defined as fair market value at the time of grant |
23
Medium- & long-term incentive targets (as a % of base salary)
The table below shows the target medium- and long-term incentive awards for each NEO in 2019, as well as the amount each plan contributes to that total, in each case as a percentage of base salary.
| Executive | Total 2019 target medium- and long- term incentives | Annual grant | |||||||||||||||
| PSUs | ISOs | ||||||||||||||||
Al Monaco | 600 | % | 360 | % | 240 | % | |||||||||||
Colin K. Gruending (1) | 374 | % | 284 | % | 90 | % | |||||||||||
John K. Whelen | 375 | % | 225 | % | 150 | % | |||||||||||
William T. Yardley | 375 | % | 225 | % | 150 | % | |||||||||||
D. Guy Jarvis | 375 | % | 225 | % | 150 | % | |||||||||||
Vern D. Yu | 375 | % | 225 | % | 150 | % | |||||||||||
| 1. | Mr. Gruending received an annual grant based on the incentive targets of his prior role and received a top-up in PSUs upon his promotion to Executive Vice President & CFO to offset the difference in targets and reflect his new role and responsibilities. |
Performance stock units
PSUs are granted annually, in the first quarter of the year, and vest after three years based on the achievement of
pre-set
hurdles on specific performance measures; the executives’ potential payout upon achievement of the performance measures can range from 0 to 200%.For grants in 2019, the following two performance measures were used, each weighted at 50%:
| • | DCF per share growth: this measure represents a commitment to Enbridge shareholders to achieve distributable cash flow growth that demonstrates Enbridge’s ability to deliver on its growth plan and continued dividend increases. Measurement against Enbridge’s long-range plan, as well as against industry growth rates, differentiates this metric compared to its use in the STIP, which is based on the external guidance range. The different measurement standards are designed to avoid excessive overlap between Enbridge’s incentive compensation programs. Furthermore, DCF per share growth is only one of two equally weighted metrics used within the PSU plan. |
| • | Relative TSR: this measure is used to compare Enbridge against its performance peers. For this measure, Enbridge compares itself against the following group of companies, chosen because they are all capital market competitors, operating in a comparable industry sector. |
Performance comparator group: relative-TSR | ||
Canadian Utilities Limited | NextEra Energy Inc. | |
CenterPoint Energy, Inc. | NiSource Inc. | |
Dominion Resources | ONEOK, Inc. | |
DTE Energy Company | Pembina Pipeline Corporation | |
Duke Energy Corporation | PG&E Corporation | |
Energy Transfer Equity | Plains All American Pipeline, L.P. | |
Enterprise Products Partners, L.P. | Sempra Energy | |
Fortis Inc. | The Southern Company | |
Inter Pipeline Ltd. | TC Energy Corporation | |
Kinder Morgan, Inc. | The Williams Companies, Inc. | |
Magellan Midstream Partners, L.P. | ||
Payout is determined at the end of the three-year term using an actual performance multiplier that ranges from 0.0x to 2.0x depending on whether the performance conditions were met. The final Enbridge share price at the end of the term is the volume weighted average trading price of Enbridge shares on the TSX or NYSE for the last 20 days before the end of the term. Payout is made in cash.
24
2019 performance stock unit grant
The mechanics of the 2019 PSU grant are illustrated below.
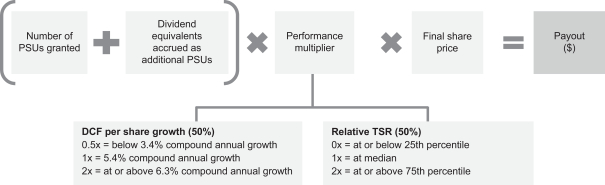
The following PSUs were granted to the NEOs in 2019:
Executive | Number of PSUs granted (#) | Grant Value (as % base salary) (1) | ||||||
| Al Monaco | 125,580 | 360% | ||||||
| Colin K. Gruending (2) | 25,116 | 284% | ||||||
| John K. Whelen | 32,870 | 225% | ||||||
| William T. Yardley | 39,290 | 225% | ||||||
| D. Guy Jarvis | 33,420 | 225% | ||||||
| Vern D. Yu | 29,180 | 225% | ||||||
| 1. | PSU grant sizes were based on the 20-day volume-weighted average trading price of an Enbridge share immediately preceding January 1, 2019. Differences in value as reported in the Summary Compensation table are not reflective of discretionary adjustments but rather are due to differences in Enbridge’s grant calculation methodology compared to FASB ASC Topic 718. |
| 2. | Mr. Gruending received an annual grant based on the incentive targets of his prior role and received a top-up in PSUs upon his promotion to Executive Vice President & CFO to offset the difference in targets and reflect his new role and responsibilities. |
Incentive stock options
ISOs provide executives an opportunity to buy Enbridge shares at some point in the future at the exercise price defined at the time of grant. Members of Enbridge’s senior management are eligible to receive ISOs.
ISOs are typically granted in February or March every year to both Canadian and U.S. members of senior management who are eligible to participate in the ISO plan. ISOs vest in equal installments over a four-year period. The maximum term of a stock option is 10 years, but the term can be reduced if the executive leaves Enbridge as described in the “Termination provisions of stock option plans” section. The exercise price of an ISO is the closing price of an Enbridge share on the listed exchange the day before the grant date. The grant date will be no earlier than the third trading day after a trading blackout period ends. ISOs are never backdated or
re-priced.
ISOs may be granted to executives when they join Enbridge, normally effective on the executive’s date of hire. If the hire date falls within a blackout period, the grant is delayed until after the end of the blackout period.25
2019 ISO grant
The table below shows the ISOs granted to each of the NEOs in 2019.
| Executive | Number of ISOs granted (#) | Grant Value (as % base salary) (1) | ||||||
| Al Monaco | 825,740 | 240% | ||||||
| Colin K. Gruending (2) | 78,490 | 90% | ||||||
| John K. Whelen | 216,100 | 150% | ||||||
| William T. Yardley | 202,700 | 150% | ||||||
| D. Guy Jarvis | 219,770 | 150% | ||||||
| Vern D. Yu | 191,860 | 150% | ||||||
| 1. | Differences in value as reported in the Summary Compensation table are not reflective of discretionary adjustments but rather are due to differences in valuations using the Black-Scholes model at the time of approval and grant date. |
| 2. | Mr. Gruending received an annual grant based on the incentive targets of his prior role. |
Special award
On May 8, 2019, Mr. Yardley was awarded a retention award given his critical role in delivering Gas Transmission and Midstream strategic priorities. This award consists of restricted stock units (“RSUs”), 20% of which vest on each of the first and second anniversaries of the grant date and 60% of which vest on the third anniversary of the grant date.
| Executive | Number of RSUs granted (#) | Grant Value (as % base salary) | ||||||
| William T. Yardley | 40,421 | 273% | ||||||
Awards vesting in 2019
2017 performance stock unit payout
The PSUs granted January 1, 2017 vested on December 31, 2019. The performance multiplier of 1.22x was calculated based on the following metrics:
Multiplier | DCF per share (1) compound growth | TSR | ||||
Threshold | 0.0x | 2.0% | at or below 25 th percentile | |||
Target | 1.0x | 8.4% | at median | |||
Maximum | 2.0x | 10.9% | at or above 75 th percentile | |||
Actual | 1.22x multiplier | 11.0% | 36 th percentile | |||
2.00x multiplier | 0.44x multiplier |
| 1. | Performance between the thresholds in this table results in a performance multiplier calculated on a linear basis. |
Adjusted DCF per share is based on operating cash flows and is a
non-GAAP
measure, which is defined and reconciled inItem 11
—“Non-GAAP Reconciliation”.For incentive compensation purposes, adjusted DCF per share also includes certain further adjustments for events or circumstances not contemplated at the time the performance metrics were originally established. For 2019, further adjustments were applied for a total net adjustment of approximately $26 million.
The performance peer group for the 2017 PSU payout was as follows:
Performance comparator group: risk-adjusted TSR | ||
Canadian Utilities Limited | NiSource Inc. | |
Dominion Resources | ONEOK, Inc. | |
DTE Energy Company | Pembina Pipeline Corporation | |
Energy Transfer Equity | PG&E Corporation | |
Enterprise Products Partners, L.P. | Plains All American Pipeline, L.P. | |
Fortis Inc. | Sempra Energy | |
Inter Pipeline Ltd. | TC Energy Corporation | |
Kinder Morgan, Inc. | The Williams Companies, Inc. | |
Magellan Midstream Partners, L.P. | ||
26
This resulted in the following payouts for the NEOs in early 2020:
| Executive | PSUs granted (#) | + | Notionally Reinvested Dividends (#) | = | Total PSUs (#) | x | Performance multiplier | x | Final share price (1)(2) ($) | = | Payout ($) | |||||||||||||||||||||||||||||||||
Al Monaco | 35,100 | + | 6,652 | = | 41,752 | x | 1.22 | x | 51.03 | = | 2,599,312 | |||||||||||||||||||||||||||||||||
Colin K. Gruending | 2,520 | + | 478 | = | 2,998 | x | 1.22 | x | 51.03 | = | 186,617 | |||||||||||||||||||||||||||||||||
John K. Whelen | 9,170 | + | 1,738 | = | 10,908 | x | 1.22 | x | 51.03 | = | 679,079 | |||||||||||||||||||||||||||||||||
William T. Yardley (3) | 4,670 | + | 886 | = | 5,556 | x | 1.22 | x | 50.18 | = | 340,131 | |||||||||||||||||||||||||||||||||
D. Guy Jarvis | 9,330 | + | 1,768 | = | 11,098 | x | 1.22 | x | 51.03 | = | 690,928 | |||||||||||||||||||||||||||||||||
Vern D. Yu | 5,600 | + | 1,061 | = | 6,661 | x | 1.22 | x | 51.03 | = | 414,705 | |||||||||||||||||||||||||||||||||
| 1. | The volume-weighted average trading price of an Enbridge share on the TSX or the NYSE for the 20 trading days immediately preceding December 31, 2019. |
| 2. | U.S. dollars have been converted to Canadian dollars using the published WM/Reuters 4 pm London year-end exchange rate of US$1 = C$1.2967. |
| 3. | Mr. Yardley received a partial grant in 2017 as a top-up to thepre-merger Spectra Energy awards received. |
2016 Spectra Energy phantom stock unit payout
The 2016 Spectra Energy phantom stock units granted to Mr. Yardley on February 16, 2016 vested on February 16, 2019.
| Executive | Total phantom stock units (#) | x | Final share price (1)(2) ($) | = | Payout ($) | |||||||||||||||
William T. Yardley | 8,118 | x | 46.45 | = | 377,058 | (3) | ||||||||||||||
| 1. | The closing price on the NYSE on February 15, 2019. |
| 2. | U.S. dollars have been converted to Canadian dollars using the published WM/Reuters 4 pm London year-end exchange rate of US$1 = C$1.2967. |
| 3. | In addition to the amount above, a dividend payout in cash of $46,381 was made. |
2017 restricted stock unit payout
The 2017 RSUs granted to Messrs. Monaco, Whelen and Yu were related to the merger with Spectra Energy to recognize the transformational nature of the deal, and the leadership that was required to bring the deal to closing. Mr. Monaco also received 2017 RSUs linked to integration-related performance and achievement of cost synergy targets.
| Executive | RSUs granted (#) | + | Notionally Reinvested Dividends (#) | = | Total RSUs (#) | x | Final share price (1) ($) | = | Payout ($) | |||||||||||||||||||||||||||
Al Monaco | 10,830 | + | 2,052 | = | 12,882 | x | 49.89 | = | 642,699 | (2) | ||||||||||||||||||||||||||
John K. Whelen | 3,250 | + | 616 | = | 3,886 | x | 49.89 | = | 192,850 | |||||||||||||||||||||||||||
Vern D. Yu | 4,330 | + | 821 | = | 5,151 | x | 49.89 | = | 256,936 | |||||||||||||||||||||||||||
| 1. | The volume-weighted average trading price of an Enbridge share on the TSX for the 20 trading days immediately preceding December 1, 2019. |
| 2. | Mr. Monaco’s award was delivered in shares for a total of 6,542 shares (net of taxes) and residual cash payment of $42.79 for a total payout of $642,699. |
The following table outlines the programmatic changes, approved for 2020, to better align executive pay levels relative to the competitive market:
Change | President and CEO | Other NEOs | ||
Revised STIP target (as a % of base salary) | 145% | 90% | ||
Revised LTIP target (as a % of base salary) | 650% | 400% | ||
LTI mix | 60% PSU / 20% stock options / 20% restricted stock units for senior management | |||
Share-settlement for RSUs | RSUs will be share-settled | |||
27
The adjustments to STIP and LTIP targets are part of a phased-in approach to align overall compensation to the competitive market, recognizing the increasing complexity of the business.
The change in LTI mix ensures continued alignment with our strategy and shareholders, as well as our positioning in the competitive market. The mix of vehicles used continues to cover medium- and long-term time horizons. The introduction of RSUs into the LTI mix provides stable retentive value while maintaining the majority of the LTI mix in performance-based vehicles. This continues to align with our strongphilosophy. All RSUs provided to the NEOs will be share-settled.
pay-for-performance
In addition, the retirement provision associated with ISOs was changed to extend the vesting and exercisability window from 3 years to 5 years.
Profiles have been prepared for each of the NEOs that provide:
| • | A summary of individual accomplishments in 2019; and |
| • | 2019 pay mix (2019 base pay, STIP with respect to 2019 and medium- and long-term incentives granted in 2019.) |
The values provided in the NEOs’ profiles are taken from the Summary Compensation Table.
Several of the NEOs experienced job changes in 2019. As such, there is some overlap between certain NEOs on goals driving performance-based compensation outcomes.
28
Al Monaco
President & CEO Mr. Monaco is responsible for setting and executing Enbridge’s strategic priorities and serves on the company’s Board of Directors. |
In 2019, Mr. Monaco provided strategic and executive leadership in the following areas: • 3-year post-Spectra plan achievement of key objectives¡ ¡ ¡ • Organization exceeded DCF/share budget and offset 2019 Line 3 delay DCF/share loss through operational improvements and cost management• Execution of $9B of capital projects put into service• Balance sheet strengthening through the sale of ~$8B in non-core assets and with Debt-to-EBITDA at 4.5x• Mainline contracting application filed with the Canada Energy Regulator• Increased dividend for the 24th consecutive year, with a 10% increase over 2018• New 3-year plan focused on financial and capital discipline and sustainable low-cost operations | • Comprehensive review of Gas Transmission and Midstream integrity management including:¡ ¡ ¡ • Continued growth in renewables business – projects sanctioned, projects into service and new development• Independent integrity reviews across all Business Units• Line 3 Canada was put into service while gaining shipper commercial agreement• Significant engagement with major shareholders and moving to best-in-class investor relations program• Establishment of new technology and innovation labs• Organizational changes and expanded Executive Leadership Team to improve development and long-term succession planning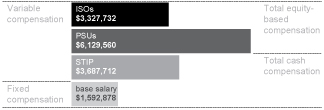 | |
President & CEO compensation Our President & CEO is primarily responsible for executing our long-term business strategy as well as shorter-term strategies that support our long-term objectives. The HRC Committee recognizes that Mr. Monaco is managing a changing and increasingly complex business and that it is important to reward these efforts. The HRC Committee believes Mr. Monaco’s compensation should be consistent with this level of responsibility and thus evaluates and adjusts his pay annually to align it with the market and our strategic goals. Recent adjustments to certain elements of Mr. Monaco’s pay have resulted in an increase in his target total direct compensation. These adjustments demonstrate the HRC Committee’s efforts to bring his pay more in line with the market, using a phased-in approach, and to recognize his role in the company’s success. Consistent with our philosophy, a significant portion of the overall increase was delivered through a combination of STIP and LTIP, which are aligned to the achievement of our strategic priorities. |
29
Colin K. Gruending
Executive Vice President & Chief Financial Officer Mr. Gruending is responsible for all corporate financial affairs of the company, including financial planning and reporting, tax, treasury and financial risk management. |
In 2019, Mr. Gruending spent time in the role of Senior Vice President, Corporate Development & Investment Review as well as Executive Vice President & CFO.
As Senior Vice President, Mr. Gruending: • Refreshed and enhanced the company’s capital investment evaluation framework• Evaluated capital investment alternatives to further the company’s Liquified Natural Gas & U.S. Gulf Coast strategies• Led the company’s participation in its affiliate’s acquisition of Valener Inc.As Executive Vice President and CFO, Mr. Gruending: • Helped strengthen the company’s financial position – Debt-to-EBITDA at year end 2019 was 4.5x, towards the low end of its stated 4.5-5.0x target range• Oversawthe development of the company’s 2020 Budget and 3-year financial outlook that supports average compound growth in distributable cash flow of | 5-7% and specifically the 10% common dividend increase to $3.24 per share • Effectively oversaw the company’s accounting, treasury, risk management, taxation, audit and investor relations functions including recruiting and development of top talent• Advanced non-core asset divestitures including Canadian gathering and processing carve-out |
John K. Whelen
Executive Vice President & Chief Development Officer Mr. Whelen is responsible for all corporate development affairs of the company, strategy and planning, Energy Services and the Power business. |
In 2019, Mr. Whelen spent time in the role of Executive Vice President & CFO as well as Executive Vice President & CDO.
As Executive Vice President & CFO, Mr. Whelen: • Completed a corporate restructuring post buy-in of Enbridge’s sponsored vehicles to optimize the company’s funding structure and financial strategy• Continued to optimize and streamline the delivery of financial services to the broader organizationAs Executive Vice President & CDO, Mr. Whelen: • Oversaw the successful closing of previously announced non-core asset sales including Enbridge Gas New Brunswick, St. Lawrence Gas and natural gas gathering and processing assets in Western Canada• Secured additional opportunities to develop approximately 480 MW of offshore wind power projects | • Evaluated and progressed numerous potential acquisition and divestiture opportunities• Delivered an updated strategic plan to Directors in response to evolving energy fundamentals and changes in the company’s business environment |
30
William T. Yardley
Executive Vice President & President, Gas Transmission & Midstream Mr. Yardley is responsible for Enbridge’s midstream natural gas gathering and processing business across North America. |
In 2019, Mr. Yardley: • Oversaw the implementation of a system-wide asset integrity and modernization program to make our systems the safest in the industry• Led the GTM team through a transformational year, with the settlement filing on the Texas Eastern rate case, the first in almost 30 years. This is the first of several years of proceedings on all our regulated assets to recover the cost of system modernization investments• Placed over C$700 million of projects into service on schedule and on budget, including the Atlantic Bridge Phase One project that will be placed into full service in 2020• Led customer service, achieving a contract renewal rate of over 99% with customers on our major pipelines• Seized opportunities with key market access projects such as the acquisition of the Generation Pipeline in Ohio• Secured a portfolio of over C$600 million of projects that will be constructed over the next few years | • Identified C$2 billion per year of future development opportunities• Advanced Liquified Natural Gas export strategy, both through the execution of already secured projects and the development of new projects• Oversaw the completion of the restructuring of the Alliance and Aux Sable partnerships• Closed the sale of the federally regulated British Columbia midstream assets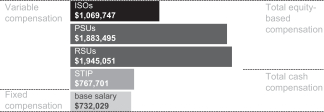 |
D. Guy Jarvis
Former Executive Vice President, Liquids Pipelines Mr. Jarvis was responsible for Enbridge’s crude oil and liquids pipeline businesses across North America. |
In 2019, Mr. Jarvis:
• Achieved record high volumes throughout the system• Achieved employee & contractor safety and reliability metrics ahead of target• Despite the delay on Line 3 US, exceeded the Liquids Pipelines financial target through system optimization• Excellent Mainline reliability with planned maintenance averaging 1% and unplanned outages totaling 2.8%• Brought Line 3 into service in Canada• Delivered strong plan for revenue and operating/capital cost efficiencies in 2020/2021• Diversity plans established by each Vice President group | • Proceeded with Line 5 tunnel, geotechnical and permit preparation work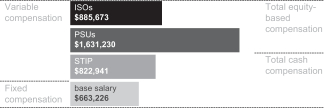 |
31
Vern D. Yu
Executive Vice President & President, Liquids Pipelines Mr. Yu is responsible for Enbridge’s crude oil and liquids pipeline business across North America. |
In 2019, Mr. Yu spent time in the role of Executive Vice President & CDO as well as President & Chief Operating Officer, Liquids Pipelines. | ||
As Executive Vice President & CDO, Mr. Yu: • Delivered record financial performance at Tidal Energy• Secured a long-term power purchase price agreement for 600 MW Dunkirk offshore wind project in France• Secured $200 million investment in the East-West tie electric transmission line in Ontario• Secured investment in the $1.8B – 480 MW St. Nazaire offshore wind farm in FranceAs President & Chief Operating Officer, Liquids Pipelines, Mr. Yu: • Oversaw the Liquids Pipelines safety and reliability program which continued to invest in infrastructure renewal and integrity management innovation | • Conducted an integrity management program that included 177 in-line inspections, 873 verification digs and 997 facility inspections• Achieved record mainline throughput levels resulting in mainline system reliability equal to 99.6% of expected available capacity and 95.4% utilization of maximum capacity | |
32
The NEOs participate in the Senior Management Pension Plan (SMPP), a
non-contributory
defined benefit plan that provides market-competitive retirement income to all Canadian and U.S. senior management employees. Before becoming members of the SMPP, certain NEOs participated in anon-contributory
defined benefit or defined contribution pension plan.Defined benefit plan
The following graphic shows how the SMPP retirement benefit payable at normal retirement age is calculated:
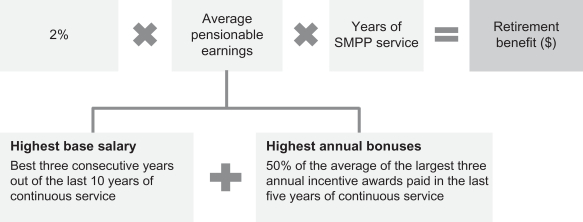
Key terms of the SMPP:
| • | Eligibility: senior management employees join the SMPP on the later of their date of hire or promotion to a senior management position; |
| • | Vesting: plan participants are fully vested immediately; |
| • | Retirement age: normal retirement date is age 65. Participants can retire with an unreduced pension at age 60, or as early as age 55 if they have 30 years of service. If they have less than 30 years of service, they can still retire as early as age 55, but their retirement benefit is reduced by 3% per year before age 60; |
| • | Adjustment for inflation: retirement benefits are indexed at 50% of the annual increase in the consumer price index; and |
| • | Survivor benefits: the pension is payable for the life of the member. If the member is single at retirement, 15 years of pension payments are guaranteed. If the member is married at retirement and dies before their spouse, 60% of the pension will continue to be paid to the spouse for his/her lifetime. |
The SMPP consists of benefits paid from the following
tax-qualified
and supplemental pension plans, collectively referred to as the SMPP:| • | Retirement Plan for Employees of Enbridge Inc. and Affiliates; |
| • | Enbridge Employee Services, Inc. Employees’ Pension Plan; |
| • | Enbridge Supplemental Pension Plan; and |
| • | Enbridge Employee Services, Inc. Supplemental Pension Plan for United States Employees |
Prior to the merger of Enbridge Inc. and Spectra Energy Corp., Mr. Yardley participated in a qualified and a
non-qualified
cash balance arrangement, to which there are no further contributions or service accruals.33
Summary of defined benefits
The following table outlines estimated annual retirement benefits, accrued pension obligations and compensatory and
non-compensatory
changes for the NEOs under the defined benefit pension plans. All information is based on the assumptions and methods used for the purposes of reporting the company’s financial statements and which are described in the company’s financial statements.| Annual benefits payable | Accrued obligation at January 1, 2019 ($) | Compensatory change (1) ($) | Non- compensatory change (2) ($) | Accrued obligation at December 31, 2019 ($) | |||||||||||||||||||||||||||||||
Credited service (years) | At year end ($) | At age 65 ($) | |||||||||||||||||||||||||||||||||
| Executive | A | B | C | A + B + C | |||||||||||||||||||||||||||||||
Al Monaco (3) | 21.08 | 1,235,000 | 1,488,000 | 19,753,000 | 3,195,000 | 3,234,000 | 26,182,000 | ||||||||||||||||||||||||||||
Colin K. Gruending (4) | 16.25 | 166,000 | 455,000 | 2,382,000 | 1,498,000 | 801,000 | 4,681,000 | ||||||||||||||||||||||||||||
John K. Whelen | 22.16 | 402,000 | 454,000 | 6,539,000 | 645,000 | 855,000 | 8,039,000 | ||||||||||||||||||||||||||||
William T. Yardley (5)(6) | 19.13 | 199,689 | 399,378 | 1,955,394 | 351,400 | 470,695 | 2,777,490 | ||||||||||||||||||||||||||||
D. Guy Jarvis (7) | 19.50 | 387,000 | 392,000 | 6,147,000 | 732,000 | 1,462,000 | 8,341,000 | ||||||||||||||||||||||||||||
Vern D. Yu | 18.75 | 278,000 | 470,000 | 3,939,000 | 1,478,000 | 951,000 | 6,368,000 | ||||||||||||||||||||||||||||
| 1. | The components of compensatory change are current service cost and the difference between actual and estimated pensionable earnings. |
| 2. | The non-compensatory change includes interest on the accrued obligation at the start of the year, changes in actuarial assumptions and other experience gains and losses not related to compensation. |
| 3. | Mr. Monaco’s retirement benefit is calculated using a 2.5% accrual rate for each year of credited service between 2008 and 2013. The higher accrual rate is equivalent to approximately 1.50 years of credited service. Upon Mr. Monaco’s appointment to President & Chief Executive Officer, a cap to the annual pension payable of $1,750,000 was implemented. |
| 4. | Mr. Gruending’s SMPP retirement benefits earned after December 31, 2017 are not indexed to inflation. |
| 5. | The impact of changes to exchange rates on Mr. Yardley’s accrued obligation is reflected in the non-compensatory change. The accrued obligation for Mr. Yardley’s cash balance retirement benefits earned prior to joining the SMPP are $979,336 at the start of the year and $1,321,997 at year end. |
| 6. | U.S. dollars have been converted to Canadian dollars using the published WM/Reuters 4 pm London year-end exchange rate of US$1 = C$1.2967. |
| 7. | Mr. Jarvis’ annual benefits payable and accrued obligation at year end reflects his retirement in 2020. |
Defined contribution plan
The defined contribution pension plan is a
non-contributory
pension plan. The level of contribution varies, depending on age and years of service. None of the NEOs are currently participating in the defined contribution pension plan.Mr. Monaco, Mr. Gruending, Mr. Whelen and Mr. Yu participated in the defined contribution plan for three years, four years, three years and six years, respectively, prior to joining the SMPP. The values shown below reflect market value of assets of the defined contribution plan.
| Executive | Accumulated value at January 1, 2019 ($) | Compensatory change (1) ($) | Accumulated value at December 31, 2019 ($) | |||||||||
Al Monaco | 61,191 | – | 72,413 | |||||||||
Colin K. Gruending | 65,029 | – | 79,400 | |||||||||
John K. Whelen | 65,652 | – | 79,579 | |||||||||
Vern D. Yu | 66,872 | – | 79,916 | |||||||||
| 1. | The compensatory change is equal to contributions made by the company during 2019. |
Enbridge’s savings plan and benefits plans are key elements of the total compensation package for our employees, including NEOs.
34
Savings plan
Enbridge provides a savings plan for Canadian employees and a 401(k) savings plan for U.S. employees. All NEOs participate in the savings plan on the same terms as eligible employees. The savings plans assist and encourage employees to save by matching 100% of employee contributions up to plan limits (maximum 2.5% and 6% of base pay for Canadian employees and U.S. employees, respectively) and subject to applicable tax limits. In Canada, matching contributions are provided as flex credits which may be used to purchase additional benefits or taken as
after-tax
cash; in the U.S., matching contributions are invested in the savings plan.Life and health benefits
Medical, dental, life insurance and disability insurance benefits are available to meet the specific needs of individuals and their families. The NEOs participate in the same plan as all other employees. The plans are structured to provide minimum basic coverage with the option of enhanced coverage at a level that is competitive and affordable.
The HRC Committee reviews the retirement and other benefits regularly. These benefits are a key element of a total compensation package and are designed to be competitive and reasonably meet the needs of executives in their current roles.
Enbridge’s compensation governance structure consists of the Board and the HRC Committee, with Mercer (Canada) Limited (“Mercer”), and others from time to time, providing independent advisory support to the HRC Committee. The HRC Committee reviews the governance structure annually against best practices and regulatory guidance.
Board and HRC Committee
The Board is responsible for the oversight of the compensation principles and programs at Enbridge. The HRC Committee approves major compensation programs and payouts, including reviewing and recommending the compensation for the President & CEO to the Board. The HRC Committee also approves the compensation for the other NEOs.
The HRC Committee assists the Board in carrying out its responsibilities with respect to compensation matters by providing oversight and direction on human resources strategy, policies and programs for the NEOs, senior management and the broader employee base, including compensation, equity incentive plans, pension and benefits as well as talent management, succession planning, workforce recruitment and retention. The HRC Committee provides oversight regarding the management of broader people-related risk and, in addition, specifically reviews the compensation programs from a risk perspective.
All members of the HRC Committee are independent under the independence standard discussed in this Amendment No. 1 on Form 10-K/A. The members of the HRC Committee are Catherine L. Williams (chair), Marcel R. Coutu, Susan M. Cunningham, and V. Maureen Kempston Darkes.
The members of the HRC Committee have experience as members of the compensation committees of other public companies. In addition, the members of the HRC Committee have experience in top leadership roles, strong knowledge of the energy industry, experience as directors of other public companies, and a mix of other relevant skills and experience. This background provides the HRC Committee members with the collective experience, knowledge and skills to effectively carry out their responsibilities. For information on each HRC Committee member’s experience and current service on other public company boards and committees, see the director profiles, beginning on page 4. For information on each HRC Committee member’s participation on other Enbridge Board committees, see page 12.
Independent advice
The HRC Committee is directly responsible for the appointment, compensation and oversight of the work of any compensation consultants, outside legal counsel or other advisors it retains (each, an “Advisor”). The HRC Committee may select or receive advice from an Advisor only after taking into consideration all factors relevant to the Advisor’s independence from management including:
| • | the provision of other services to Enbridge by the Advisor; |
| • | the amount of fees received from Enbridge by the Advisor as a percentage of the Advisor’s total revenue; |
| • | the policies and procedures of the Advisor that are designed to prevent conflicts of interest; |
| • | any shares owned by the Advisor; and |
| • | any business or personal relationship of the Advisor with a member of the HRC Committee or with an executive officer at Enbridge. |
35
Although the HRC Committee is required to consider these factors, it is free to select or receive advice from an Advisor that is not independent. The HRC Committee has determined that the Advisor is independent.
Since 2002, Mercer, an independent Advisor, has provided guidance to the HRC Committee on compensation matters to ensure Enbridge’s programs are appropriate, market competitive and continue to meet intended goals. Advisory services include reviewing:
| • | the competitiveness and appropriateness of executive compensation programs; |
| • | annual total direct compensation for the President & CEO and the executive leadership team; |
| • | executive compensation governance; and |
| • | the HRC Committee’s mandate and related Board committee processes. |
While the HRC Committee considers the information and recommendations Mercer provides, it has full responsibility for its own decisions, which may reflect other factors and considerations.
The HRC Committee chair reviews and approves the terms of engagement with Mercer every year. The terms specify the work to be done in the year, Mercer’s responsibilities and its fees. Management can also retain Mercer on compensation matters from time to time or for prescribed compensation services. The HRC Committee chair must, however, approve all services that are not standard in nature, taking into account whether or not the work would compromise Mercer’s independence.
Management and the HRC Committee engaged Mercer in 2019 to provide analysis and advice on various compensation matters. The following table provides a breakdown of services provided by and fees paid to Mercer and its affiliates (a significant portion of which relate to risk brokerage service fees paid to Marsh Inc., a Mercer affiliate) by Enbridge and its affiliates in 2019 and 2018:
Nature of work | Approximate fees 2019 ($) | Approximate fees 2018 ($) | ||||||
Executive compensation-related fees (1) | 296,632 | 481,729 | ||||||
All other fees (2) | 6,148,371 | 5,731,090 | ||||||
Total | 6,445,003 | 6,212,819 | ||||||
| 1. | Includes all fees related to executive compensation associated with the President & CEO and the executive leadership team. |
| 2. | Includes fees paid for other matters that apply to Enbridge as a whole, such as pension actuarial valuations, renewal and pricing of benefit plans, evaluation of geographic market differences and regulatory proceedings support. Also includes risk brokerage service fees ($2,253,716 in 2019 and $1,889,701 in 2018) paid to Marsh for services provided to our operating affiliates. |
Compensation services received by Enbridge from Advisors are not sole-sourced from one provider; each situation and need is assessed independently, and other providers are used depending on the nature of the service required, and the qualifications of the provider. In 2019, Enbridge did not engage the services of other compensation consultants.
Compensation risk management
The HRC Committee oversees Enbridge’s compensation programs from the perspective of whether the programs encourage individuals to take inappropriate or excessive risks that are reasonably likely to have a material adverse impact on Enbridge.
Compensation risk mitigation practices
Enbridge uses the following compensation practices to mitigate risk:
| • | a pay-for-performance |
| • | a mix of pay programs benchmarked against a relevant peer group in terms of both relative proportion and prevalence; |
| • | a rigorous approach to goal-setting and a process of establishing targets with multiple levels of performance, which mitigate excessive risk-taking that could harm Enbridge’s value or reward poor judgment of executives; |
| • | compensation programs that include a combination of short-, medium- and long-term elements that ensure executives are incentivized to consider both the immediate and long-term implications of their decisions; |
| • | program provisions where executives are compensated for their short-term performance using a combination of safety, system reliability, environmental, financial, and customer and employee metrics that ensure a balanced perspective and are a mix of both leading (proactive/preventative) and lagging (incident-based) indicators; |
36
| • | performance thresholds that include both minimum and maximum payouts; |
| • | stock award programs that vest over multiple years and are aligned with overall corporate performance that drives superior value to Enbridge shareholders; |
| • | share ownership guidelines that ensure executives have a meaningful equity stake in Enbridge to align their interests with those of Enbridge shareholders; |
| • | an anti-hedging policy to prevent activities that would weaken the intended pay-for-performance |
| • | an incentive compensation clawback policy that allows Enbridge to recoup overpayments made to executives in the event of fraudulent or willful misconduct. |
The HRC Committee has considered the concept of risk as it relates to the compensation programs and has concluded that the programs do not encourage excessive or inappropriate risk-taking and are aligned with the long-term interests of shareholders.
Anti-hedging policy
Enbridge’s insider trading and reporting guidelines, among other things, prohibit directors, officers, employees and contractors (of Enbridge and its subsidiaries) from purchasing financial instruments that are designed to hedge or offset a decrease in market value of equity securities granted as compensation or held by the NEO, as such positions delink the intended alignment of employee and shareholder interests. The following activities are specifically prohibited:
| • | any form of hedging activity; |
| • | any form of transaction involving stock options (other than exercising options in accordance with the incentive plans); |
| • | any other form of derivative trading (including “puts” and “calls”); and |
| • | “short-selling” (selling securities that the individual does not own). |
Clawback policy
The incentive compensation clawback policy allows Enbridge to recover, from current and former executives, certain incentive compensation amounts awarded or paid to individuals if the individuals engaged in fraud or willful misconduct that led to inaccurate financial results reporting, regardless of whether the misconduct resulted in a restatement of all or a part of Enbridge’s financial statements.
37
The HRC Committee reviews and approves the compensation plans and pay levels for all the NEOs except the President & CEO. The HRC Committee reviews and recommends the compensation plans and pay level for the President & CEO to the Board.
The table below shows the process by which compensation decisions are made.

Benchmarking to peers
Total direct compensation for the NEOs is managed within a framework that involves input from and consideration by the President & CEO and the HRC Committee, with Mercer providing independent advisory support. The competitiveness of this framework is based on peer group market data extracted from third-party compensation surveys and publicly disclosed executive compensation information for comparable benchmark roles at peer companies. The market data is considered from several perspectives including organization size and industry sector (pipeline, energy and utility criteria).
As the responsibilities of Enbridge’s NEOs are primarily North American in scope, a North American peer group is determined and used for executive compensation benchmarking.
Peer group determination
The following outlines Enbridge’s compensation benchmarking peer group determination criteria:
| • | Industry (typically defined aslow-risk regulated operations in the energy sector) remains a key criterion for identifying peers, as that will help to ensure Enbridge can pay competitively against“best-in-class” |
38
| • | Size/complexity remains important but is more broadly defined to consider multiple dimensions, including financial (e.g., market capitalization, cash flow, capital employed) and nonfinancial measures (e.g., geography and breadth of operations). |
| • | Geography is not a major factor; in particular, Enbridge believes it is less important to focus on Canadian companies if they are not sufficiently comparable to Enbridge in terms of industry and/or size/complexity. |
Based on these criteria, Enbridge uses a single peer group of Canadian and U.S. companies to reflect Enbridge’s identity as a North American leader that happens to be based in Canada. Our peer group of energy and infrastructure companies is weighted heavily towards the U.S. as the U.S. market offers more comparable peers from an industry and/or size/complexity perspective. It is important to note that Enbridge limits the peer group to those in the energy and infrastructure space, rather than extending to other capital intensive sectors, as these companies are subject to the same external industry pressures and macroeconomic factors as Enbridge.
Our peer group contains companies that are generally similar in size to Enbridge, primarily in terms of enterprise value, and secondarily market capitalization and assets; size constraints were relaxed in certain instances to include those similar to Enbridge in terms of operational profile.
Enbridge’s compensation benchmarking peer group is reviewed annually by the HRC Committee. The peer group used for determining compensation in 2019 was unchanged from 2018.
2019 compensation peer group | ||
Canadian National Railway Company | NextEra Energy Inc. | |
Canadian Natural Resources Limited | Occidental Petroleum Corporation | |
Chevron Corporation | Phillips 66 | |
Conoco Phillips | Schlumberger Limited | |
Dominion Resources Inc. | Suncor Energy Inc. | |
Duke Energy Corporation | The Southern Company | |
Energy Transfer Partners, L.P. | The Williams Companies Inc. | |
Enterprise Products Partners L.P. | TC Energy Corporation | |
Halliburton Company | Union Pacific Corporation | |
Kinder Morgan Inc. |
Setting compensation targets
Enbridge targets overall total direct compensation at the median (including the President & CEO position), considering the skills, competencies and experience of each senior executive.
It is important for the NEOs to have a meaningful equity stake in Enbridge. Owning Enbridge shares is a tangible way to align the interests of executives with those of Enbridge shareholders.
Executives can acquire Enbridge shares by participating in the employee savings plan, exercising stock options or by making personal investments in Enbridge shares. Personal holdings, and Enbridge shares held in the name of a spouse, dependent child or trust, all count toward meeting the guidelines. PSUs, RSUs and unexercised stock options do not count toward meeting the guidelines (resulting in a more stringent threshold than typical practice).
39
The share ownership requirement is six times base salary for the President and CEO and three times base salary for the other NEOs. The NEOs have until January 1, 2022 to comply with their increased target, with the exception of Mr. Gruending who has four years from his appointment to Executive Vice President and CFO. All have already met or exceeded the requirement, as noted in the following graph.
Target and actual share ownership as of December 31, 2019

2019 Summary compensation table
The table below shows the total amounts that Enbridge and its subsidiaries paid and granted to the NEOs for the years ended December 31, 2019, 2018 and 2017. Amounts represented below for Mr. Yardley were originally paid in U.S. dollars and have been converted to Canadian dollars using the published WM/Reuters 4 pm London
year-end
exchange rate of US$1 = C$1.2967, US$1 = C$1.3657, and US$1 = C$1.2530 for 2019, 2018 and 2017, respectively. Name Principal Position | Year | Salary ($) | Stock- based awards (1) ($) | Option- based awards (2) ($) | Non- equity incentive plan compen- sation (3) ($) | Pension value (4) ($) | All other compen- sation (5) ($) | Total ($) | ||||||||||||||||||||||||
Al Monaco President & Chief Executive Officer | 2019 | 1,592,878 | 6,129,560 | 3,327,732 | 3,687,712 | 3,195,000 | 60,502 | 17,993,384 | ||||||||||||||||||||||||
| 2018 | 1,479,450 | 4,439,868 | 2,777,446 | 3,473,453 | 1,141,000 | 68,509 | 13,379,726 | |||||||||||||||||||||||||
| 2017 | 1,461,868 | 2,567,540 | 3,363,909 | 2,770,588 | 1,113,000 | 120,401 | 11,397,306 | |||||||||||||||||||||||||
Colin K. Gruending Executive Vice President & Chief Financial Officer | 2019 | 467,122 | 1,225,912 | 316,315 | 583,360 | 1,498,000 | 25,460 | 4,116,169 | ||||||||||||||||||||||||
| 2018 | 361,656 | 496,675 | 172,549 | 338,078 | 421,000 | 231,272 | 2,021,230 | |||||||||||||||||||||||||
| 2017 | 325,212 | 141,800 | 280,339 | 155,627 | 167,000 | 363,911 | 1,433,889 | |||||||||||||||||||||||||
John K. Whelen Executive Vice President & Chief Development Officer | 2019 | 635,849 | 1,604,385 | 870,883 | 821,199 | 645,000 | 17,568 | 4,594,883 | ||||||||||||||||||||||||
| 2018 | 619,500 | 1,244,477 | 758,499 | 886,132 | 126,000 | 33,466 | 3,668,074 | |||||||||||||||||||||||||
| 2017 | 612,138 | 694,293 | 880,779 | 763,447 | 482,000 | 67,679 | 3,500,336 | |||||||||||||||||||||||||
William T. Yardley (6) Executive Vice President & President, Gas Transmission & Midstream | 2019 | 732,029 | 3,828,546 | 1,069,747 | 767,701 | 351,400 | 32,993 | 6,782,812 | ||||||||||||||||||||||||
| 2018 | 751,161 | 1,570,650 | 847,539 | 968,697 | 359,000 | 32,958 | 4,530,005 | |||||||||||||||||||||||||
| 2017 | 574,280 | 693,794 | 429,614 | 632,423 | 372,000 | 37,107 | 2,739,218 | |||||||||||||||||||||||||
D. Guy Jarvis Former Executive Vice President, Liquids Pipelines | 2019 | 663,226 | 1,631,230 | 885,673 | 822,941 | 732,000 | 52,845 | 4,787,915 | ||||||||||||||||||||||||
| 2018 | 630,000 | 1,265,593 | 771,334 | 876,759 | 162,000 | 83,337 | 3,789,023 | |||||||||||||||||||||||||
| 2017 | 622,512 | 521,557 | 895,699 | 566,444 | 470,000 | 103,364 | 3,179,576 | |||||||||||||||||||||||||
Vern D. Yu Executive Vice President & President, Liquids Pipelines | 2019 | 564,541 | 1,424,276 | 773,196 | 711,996 | 1,478,000 | 22,648 | 4,974,657 | ||||||||||||||||||||||||
| 2018 | 450,000 | 723,196 | 440,752 | 900,000 | 122,000 | 29,030 | 2,664,978 | |||||||||||||||||||||||||
| 2017 | 450,000 | 558,761 | 537,408 | 693,333 | 228,000 | 65,723 | 2,533,225 | |||||||||||||||||||||||||
40
| 1. | The amounts disclosed in this column include the aggregate grant date fair value of PSUs and RSUs granted in 2019, 2018 and 2017, as applicable, in each case, computed in accordance with the provisions of FASB ASC Topic 718. These amounts are calculated by multiplying the number of performance and restricted stock units by the unit values in the table below: |
Year granted | C$ | US$ | ||||||||||||
2019 | $48.81 | $36.97 | ||||||||||||
2018 | $43.99 | $38.59 | ||||||||||||
2017 | $56.27 | $42.24 | ||||||||||||
In May 2019, Mr. Yardley was granted 40,421 RSUs with grant date fair value of US$37.11.
| 2. | The amounts in this column represent the grant date fair value of stock option awards granted to each of the NEOs, calculated in accordance with FASB ASC Topic 718. The grant date fair value of stock option awards is measured using the Black-Scholes option-pricing model, based on the following assumptions. |
February 2019 | February 2018 | February 2017 | ||||||||||||||||||||||
Assumptions | C$ | US$ | C$ | US$ | C$ | US$ | ||||||||||||||||||
Expected option term | 6 years | 6 years | 6 years | 6 years | 6 years | 6 years | ||||||||||||||||||
Expected volatility | 18.318% | 21.802% | 21.077% | 21.893% | 19.16% | 22.055% | ||||||||||||||||||
Expected dividend yield | 5.961% | 5.961% | 6.377% | 6.377% | 4.17% | 4.172% | ||||||||||||||||||
Risk free interest rate | 1.615% | 2.333% | 2.088% | 2.694% | 1.164% | 2.228% | ||||||||||||||||||
Exercise price | $48.30 | $36.71 | $43.02 | $33.97 | $55.84 | $41.64 | ||||||||||||||||||
Option value | $4.03 | $4.07 | $3.82 | $3.40 | $5.76 | $6.06 | ||||||||||||||||||
| 3. | The amounts disclosed in this column represent amounts paid under the Enbridge Inc. STIP with respect to the 2019, 2018 and 2017 performance years, as well as special awards for Messrs. Monaco, Whelen and Yu for 2017 earned in connection with the merger with Spectra Energy. |
| 4. | The pension values are equal to the compensatory change shown in the defined benefit plan table. |
| 5. | The table below describes the elements comprising the amounts presented in this column for 2019. |
Name | Matching contribution under the retirement savings plan ($) | Excess flexible benefit credit (a) ($) | Executive medical benefit ($) | Relocation expenses (b) ($) | Flexible perquisite ($) | Other benefits (c) ($) | Total ($) | |||||||||||||||||||||
Al Monaco | – | 45,258 | 4,345 | – | – | 10,899 | 60,502 | |||||||||||||||||||||
Colin K. Gruending | – | 6,287 | 1,495 | 8,462 | (d) | 9,216 | 25,460 | |||||||||||||||||||||
John K. Whelen | – | 7,513 | 4,345 | – | – | 5,710 | 17,568 | |||||||||||||||||||||
William T. Yardley | 21,784 | – | – | – | – | 11,209 | 32,993 | |||||||||||||||||||||
D. Guy Jarvis | – | 10,560 | 4,345 | 26,319 | – | 11,621 | 52,845 | |||||||||||||||||||||
Vern D. Yu | – | 11,926 | 4,940 | – | – | 5,782 | 22,648 | |||||||||||||||||||||
| a) | For the NEOs domiciled in Canada, flexible benefit credits are provided based on their family status and base salary. These credits can be used to purchase benefits or can be paid in cash. Participants could receive up to 2.5% of base salary in matching contributions towards their flexible benefit credits if they made contributions into their Savings Plan. This amount represents the excess flexible benefit credits paid to the NEO. |
| b) | Includes relocation subsidies related to mortgage interest payments. |
| c) | Other benefits include parking, personal use of company aircraft and other incidental compensation. |
| d) | Mr. Gruending received an annual perquisite allowance prior to his appointment to Executive Vice President & Chief Financial Officer. The President & CEO and Executive Vice Presidents are not eligible for this benefit, and therefore Mr. Gruending will not receive this going forward. |
| 6. | Mr. Yardley commenced employment with Enbridge in connection with the completion of the Merger Transaction on February 27, 2017. Amounts set forth in this table do not reflect any compensation paid by Spectra Energy to Mr. Yardley prior to completion of the Merger Transaction. |
41
Executive compensation and shareholder return
The chart below shows the value of a $100 investment made January 1, 2015 in both Enbridge common shares and the S&P/TSX Composite Index and the S&P 500 index, at the end of each of the last five years (assuming reinvestment of dividends throughout the term). It also shows the growth in average total direct compensation for the NEOs reported in the summary compensation table over the same period. Total direct compensation includes base salary, short-term incentive award paid, and the grant value of medium- and long-term incentive awards. Average total direct compensation is taken by dividing total direct compensation from the summary compensation table by the number of named executives in any given year.
Total return vs. growth in total compensation
 | The total return on Enbridge common shares has been positive from 2015 to 2019. Average compensation paid to the NEOs has also increased over the same period. |
42
Outstanding option-based and share-based awards
The table below shows the option-based and share-based awards that were outstanding on December 31, 2019. The market value of unvested or unearned awards is calculated based on C$51.63 per share for awards denominated in Canadian dollars and US$39.77 for awards denominated in U.S. dollars, the closing prices of our shares on the TSX and NYSE on December 31, 2019. The grant date fair value for U.S. option grants and the market value of unvested or unearned awards denominated in U.S. dollars were each converted from U.S. dollars to Canadian dollars using the published WM/Reuters 4 pm London
year-end
exchange rate of US$1 = C$1.2967.Option-based awards (1) | Share-based awards | |||||||||||||||||||||||||||||||
Named executive officer | Number of securities underlying unexercised options (#) | Option exercise price (2) ($) | Option expiry date | Value of in-the-money unexercised options (3) | Number of units that have not vested (#) | Market or payout value of units not vested (3)(4) ($) | Market or value of vested share-based awards not paid out or distributed (3)(5) ($) | |||||||||||||||||||||||||
Vested ($) | Unvested ($) | |||||||||||||||||||||||||||||||
Al Monaco | 825,740 | 48.30 | 2/21/2029 | 0 | 2,749,714 | 131,585 | 6,793,711 | |||||||||||||||||||||||||
| 727,080 | 43.02 | 2/27/2028 | 1,565,040 | 4,695,119 | 117,467 | 6,064,838 | ||||||||||||||||||||||||||
| 584,000 | 55.84 | 2/28/2027 | 0 | 0 | – | – | 2,599,312 | |||||||||||||||||||||||||
| 365,000 | 44.06 | 3/1/2026 | 2,072,288 | 690,763 | ||||||||||||||||||||||||||||
| 196,000 | 59.08 | 3/2/2025 | 0 | 0 | ||||||||||||||||||||||||||||
| 199,000 | 48.81 | 3/13/2024 | 561,180 | 0 | ||||||||||||||||||||||||||||
| 229,000 | 44.83 | 2/27/2023 | 1,557,200 | 0 | ||||||||||||||||||||||||||||
| 147,500 | 38.34 | 3/2/2022 | 1,960,275 | 0 | ||||||||||||||||||||||||||||
| | 100,000 | | | 28.78 | | | 2/14/2021 | | | 2,285,500 | | | 0 | | | | | | | | ||||||||||||
Colin K. Gruending | 78,490 | 48.30 | 2/21/2029 | 0 | 261,372 | 26,113 | 1,348,219 | |||||||||||||||||||||||||
| 45,170 | 43.02 | 2/27/2028 | 97,233 | 291,681 | 7,303 | 377,040 | ||||||||||||||||||||||||||
| 48,670 | 55.84 | 2/28/2027 | 0 | 0 | 5,535 | (6) | 285,763 | |||||||||||||||||||||||||
| 64,600 | 44.06 | 3/1/2026 | 366,767 | 122,256 | – | – | 186,617 | |||||||||||||||||||||||||
| 64,780 | 59.08 | 3/2/2025 | 0 | 0 | ||||||||||||||||||||||||||||
| 66,500 | 48.81 | 3/13/2024 | 187,530 | 0 | ||||||||||||||||||||||||||||
| 72,000 | 44.83 | 2/27/2023 | 489,600 | 0 | ||||||||||||||||||||||||||||
| 69,750 | 38.34 | 3/2/2022 | 926,978 | 0 | ||||||||||||||||||||||||||||
| | 45,000 | | | 28.78 | | | 2/14/2021 | | | 1,028,475 | | | 0 | | ||||||||||||||||||
John K. Whelen | 216,100 | 48.30 | 2/21/2029 | 0 | 719,613 | 34,442 | 1,778,223 | |||||||||||||||||||||||||
| 198,560 | 43.02 | 2/27/2028 | 427,400 | 1,282,201 | 32,080 | 1,656,282 | ||||||||||||||||||||||||||
| 152,910 | 55.84 | 2/28/2027 | 0 | 0 | – | – | 697,079 | |||||||||||||||||||||||||
| 82,430 | 44.06 | 3/1/2026 | 468,000 | 155,995 | ||||||||||||||||||||||||||||
| 109,670 | 59.08 | 3/2/2025 | 0 | 0 | ||||||||||||||||||||||||||||
| 92,700 | 48.81 | 3/13/2024 | 261,414 | 0 | ||||||||||||||||||||||||||||
| 78,550 | 44.83 | 2/27/2023 | 534,140 | 0 | ||||||||||||||||||||||||||||
| 77,050 | 38.34 | 3/2/2022 | 1,023,995 | 0 | ||||||||||||||||||||||||||||
| | 84,000 | | | 28.78 | | | 2/14/2021 | | | 1,919,820 | | | 0 | | ||||||||||||||||||
William T. Yardley | 202,700 | US36.71 | 2/21/2029 | 0 | 804,282 | 42,354 | (7) | 2,184,144 | ||||||||||||||||||||||||
| 182,520 | US33.97 | 2/27/2028 | 343,172 | 1,029,515 | 41,169 | 2,123,031 | ||||||||||||||||||||||||||
| 56,580 | US41.64 | 2/28/2027 | 0 | 0 | 36,384 | 1,876,274 | ||||||||||||||||||||||||||
| 58,941 | US28.87 | 2/16/2026 | 833,061 | 0 | 17,908 | 923,497 | ||||||||||||||||||||||||||
| | – | | | – | | | 340,131 | | ||||||||||||||||||||||||
D. Guy Jarvis | 219,770 | 48.30 | 2/21/2029 | 0 | 731,834 | 35,018 | 1,807,977 | |||||||||||||||||||||||||
| 201,920 | 43.02 | 2/27/2028 | 434,633 | 1,303,898 | 32,624 | 1,684,384 | ||||||||||||||||||||||||||
| 155,500 | 55.84 | 2/28/2027 | 0 | 0 | – | – | 690,928 | |||||||||||||||||||||||||
| 103,800 | 44.06 | 3/1/2026 | 589,325 | 196,442 | ||||||||||||||||||||||||||||
| 68,050 | 59.08 | 3/2/2025 | 0 | 0 | ||||||||||||||||||||||||||||
| 78,350 | 48.81 | 3/13/2024 | 220,947 | 0 | ||||||||||||||||||||||||||||
| | 15,087 | | | 44.83 | | | 2/27/2023 | | | 102,592 | | | 0 | | ||||||||||||||||||
Vern D. Yu | 191,860 | 48.30 | 2/21/2029 | 0 | 638,894 | 30,575 | 1,578,599 | |||||||||||||||||||||||||
| 115,380 | 43.02 | 2/27/2028 | 248,355 | 745,066 | 18,642 | 962,505 | ||||||||||||||||||||||||||
| 93,300 | 55.84 | 2/28/2027 | 0 | 0 | – | – | 414,705 | |||||||||||||||||||||||||
| 96,750 | 44.06 | 3/1/2026 | 549,302 | 183,096 | ||||||||||||||||||||||||||||
| 82,340 | 59.08 | 3/2/2025 | 0 | 0 | ||||||||||||||||||||||||||||
| 83,350 | 48.81 | 3/13/2024 | 235,047 | 0 | ||||||||||||||||||||||||||||
| 83,250 | 44.83 | 2/27/2023 | 566,100 | 0 | ||||||||||||||||||||||||||||
| 64,350 | 38.34 | 3/2/2022 | 855,212 | 0 | ||||||||||||||||||||||||||||
| 73,600 | 28.78 | 2/14/2021 | 1,682,128 | 0 | ||||||||||||||||||||||||||||
| 1. | Each ISO award has a 10-year term and vestspro-rata as to one fourth of the option award beginning on the first anniversary of the grant date. |
43
| 2. | Option exercise prices are reflected in the currency granted. |
| 3. | U.S. dollars have been converted to Canadian dollars using the published WM/Reuters 4 pm London year-end exchange rate of US$1 = C$1.2967. |
| 4. | A performance multiplier of 1.0x has been used (PSUs only), based on achieving the Target Performance Level as defined in the plan. |
| 5. | Reflects the payout value of the 2017 PSU grant, which vested on December 31, 2019 but will not be paid until March 2020. A performance multiplier of 1.22x is used. |
| 6. | Reflects RSUs granted on January 1, 2018, which cliff vest 35 months following grant. |
| 7. | Reflects RSUs granted on May 8, 2019, 20% of which vest on each of the first and second anniversaries of the grant date and 60% of which vest on the third anniversary of the grant date. |
Value vested or earned in 2019
| Value vested during the year | Value earned during the year | |||||||||||||||
| Executive | Option-based awards (1)(2) ($) | Share-based awards (1)(3) ($) | Non-equity incentive plan (1)(4) ($) | |||||||||||||
Al Monaco | 1,515,830 | 3,241,948 | (5) | 3,687,712 | ||||||||||||
Colin K. Gruending | 142,597 | 186,617 | 583,360 | |||||||||||||
John K. Whelen | 394,042 | 871,930 | (5) | 821,199 | ||||||||||||
William T. Yardley | 194,661 | 717,188 | (6) | 767,701 | ||||||||||||
D. Guy Jarvis | 423,779 | 690,928 | 822,941 | |||||||||||||
Vern D. Yu | 285,395 | 671,641 | (5) | 711,996 | ||||||||||||
| 1. | U.S. dollars have been converted to Canadian dollars using the published WM/Reuters 4 pm London year-end exchange rate of US$1 = C$1.2967. |
| 2. | The values of the option-based awards listed above are based on the following: |
| Grant date | Grant price | 2019 vesting date | Closing price on 2019 vesting date | | ||||||||||
2/3/2015 | $59.08 | 2/3/2019 | $49.51 | |||||||||||
2/29/2016 | $44.06 | 2/29/2019 | $48.68 | |||||||||||
2/28/2017 | $55.84 | 2/28/2019 | $48.68 | |||||||||||
2/28/2017 | US$41.64 | 2/28/2019 | US$36.99 | |||||||||||
2/27/2018 | $43.02 | 2/27/2019 | $49.04 | |||||||||||
2/27/2018 | US$33.97 | 2/27/2019 | US$37.26 |
| 3. | Includes the 2017 PSUs that matured on December 31, 2019. |
| 4. | Based on corporate, business unit and individual performance for the 2019 performance year. |
| 5. | Includes the 2017 RSUs that matured on December 1, 2019. |
| 6. | Includes 2016 Spectra Energy phantom stock units. |
Termination of employment andarrangements
change-in-control
Employment agreements
Enbridge has entered into employment agreements with each of the NEOs. The terms in the employment agreements are competitive and part of a comprehensive compensation package that assists in recruiting and retaining top executive talent.
The agreements generally provide payments for executives in the case of involuntary termination for any reason (other than for cause) or voluntary termination within 150 days after constructive dismissal, as defined in each agreement, and do not provide for any “single-trigger” severance payments upon a change in control of the company. As a condition to receiving payments under the employment agreements upon a qualifying termination of employment, the executive must execute a general release of claims in favor of Enbridge and comply with the following restrictive covenants:
Confidentiality provision | Non-competition/solicitation | No recruitment | ||
2 years after departure | 1 year after departure | 2 years after departure |
44
Termination of employment scenarios
Compensation that would be paid to the NEOs pursuant to the terms of their existing employment agreements under various termination scenarios is described below.
Type of termination | Base salary | Short-term incentive | Medium- and long-term incentive | Pension | Benefits | |||||||
 | Resignation | None | Payable in full if executive has worked the entire calendar year. Otherwise, none. | • PSUs and RSUs forfeited.• Vested stock options must be exercised within 30 days of resignation or by the end of the original term (if sooner).(1) • Unvested stock options are cancelled. | No longer earns service credits. | None | ||||||
| Retirement | Current year’s incentive is prorated based on retirement date. | • PSUs and RSUs prorated for retirement date and value is assessed and paid at end of usual term.• Stock options continue to vest and can be exercised for three years after retirement (or option expiry, if sooner). | Post- retirement benefits begin. | |||||||||
 | Termination not for cause or constructive dismissal | Current salary is paid out in a lump sum (3x for CEO and 2x for other NEOs). | The average short-term incentive award over the past two years is paid out in a lump sum (3x for CEO and 2x for other NEOs) plus the current year’s short-term incentive, prorated based on active service during the year of termination based on target performance. | • PSUs and RSUs are prorated to date of termination (plus any applicable notice period) and value is assessed and paid at end of usual term.• Vested stock options must be exercised according to stock option terms.• The in-the-money spread value of unvested stock options is paid in cash. | Additional years of pension credit are added to the final pension calculation (three years for CEO and two years for other NEOs). | Value of future benefits paid out in a lump sum (3x for CEO and 2x for other NEOs). | ||||||
| Termination following change of control (CIC) | • PSUs vest and value is assessed and paid based on performance measures achieved prior to or to the change in control. RSUs vest and are paid out.• All stock options vest. |
| 1. | Where applicable, both time and performance vesting conditions must have been met in order to be considered exercisable. |
45
The amounts shown in the table below include the estimated potential payments and benefits that would be payable to each of our NEOs as a result of the specified triggering event, assumed to occur as of December 31, 2019. The actual amounts that would be payable in these circumstances can be determined only at the time of the executive’s separation, would include payments or benefits already earned or vested and may differ from the amounts set forth in the table below. Amounts in U.S. dollars have been converted to Canadian dollars using the published WM/Reuters 4 pm London year-end exchange rate of US$1 = C$1.2967.
Named executive officer (1) | Triggering event (2) | Base salary (3) ($) | Short-term incentive (4) ($) | Medium- term incentive (5) ($) | Long-term incentive (6) ($) | Pension (7) ($) | Benefits (8) ($) | Total payout ($) | ||||||||||||||||||||||
Al Monaco | CIC | – | – | – | 690,763 | – | – | 690,763 | ||||||||||||||||||||||
| Death | – | – | 10,746,530 | 8,135,596 | – | 62,692 | 18,944,819 | |||||||||||||||||||||||
| Retirement | – | – | 5,892,995 | 7,448,167 | – | 62,692 | 13,403,854 | |||||||||||||||||||||||
| Voluntary or for cause termination | – | – | – | – | – | 62,692 | 62,692 | |||||||||||||||||||||||
| Involuntary termination without cause | 4,890,000 | 8,015,993 | 12,858,548 | 8,135,596 | 6,823,000 | 263,457 | 40,986,594 | |||||||||||||||||||||||
| Involuntary or good reason termination after a CIC | 4,890,000 | 8,015,993 | 12,858,548 | 8,135,596 | 6,823,000 | 263,457 | 40,986,594 | |||||||||||||||||||||||
Colin K. Gruending | CIC | – | – | – | 122,256 | – | – | 122,256 | ||||||||||||||||||||||
| Death | – | – | 1,791,169 | 675,308 | – | 20,192 | 2,486,669 | |||||||||||||||||||||||
| Voluntary or for cause termination | – | – | – | – | – | 20,192 | 20,192 | |||||||||||||||||||||||
| Involuntary termination without cause | 1,050,000 | 493,705 | 1,945,824 | 675,308 | 1,235,000 | 80,944 | 5,480,782 | |||||||||||||||||||||||
| Involuntary or good reason termination after a CIC | 1,050,000 | 493,705 | 1,945,824 | 675,308 | 1,235,000 | 80,944 | 5,480,782 | |||||||||||||||||||||||
John K. Whelen | CIC | – | – | – | 155,995 | – | – | 155,995 | ||||||||||||||||||||||
| Death | – | – | 2,864,769 | 2,157,809 | – | 24,662 | 5,047,240 | |||||||||||||||||||||||
| Retirement | – | – | 1,594,378 | 1,477,452 | – | 24,662 | 3,096,492 | |||||||||||||||||||||||
| Voluntary or for cause termination | – | – | – | – | – | 24,662 | 24,662 | |||||||||||||||||||||||
| Involuntary termination without cause | 1,282,400 | 1,379,574 | 3,348,514 | 2,157,809 | 1,388,000 | 102,594 | 9,658,891 | |||||||||||||||||||||||
| Involuntary or good reason termination after a CIC | 1,282,400 | 1,379,574 | 3,348,514 | 2,157,809 | 1,388,000 | 102,594 | 9,658,891 | |||||||||||||||||||||||
William T. Yardley | CIC | – | – | – | – | – | – | – | ||||||||||||||||||||||
| Death | – | – | 6,423,584 | 1,833,797 | – | 28,391 | 8,285,772 | |||||||||||||||||||||||
| Retirement | – | – | 3,195,014 | 1,174,277 | – | 28,391 | 4,397,683 | |||||||||||||||||||||||
| Voluntary or for cause termination | – | – | – | – | – | 28,391 | 28,391 | |||||||||||||||||||||||
| Involuntary termination without cause | 1,476,349 | 2,076,142 | 6,747,206 | 1,833,797 | 689,834 | 97,893 | 12,921,220 | |||||||||||||||||||||||
| Involuntary or good reason termination after a CIC | 1,476,349 | 2,076,142 | 6,747,206 | 1,833,797 | 689,834 | 97,893 | 12,921,220 | |||||||||||||||||||||||
D. Guy Jarvis | CIC | – | – | – | 196,442 | – | – | 196,442 | ||||||||||||||||||||||
| Death | – | – | 2,912,959 | 2,232,174 | – | 25,927 | 5,171,060 | |||||||||||||||||||||||
| Retirement | – | – | 1,621,311 | 1,540,282 | – | 25,927 | 3,187,520 | |||||||||||||||||||||||
| Voluntary or for cause termination | – | – | – | – | – | 25,927 | 25,927 | |||||||||||||||||||||||
| Involuntary termination without cause | 1,348,200 | 1,443,203 | 3,404,932 | 2,232,174 | 1,520,000 | 103,617 | 10,052,126 | |||||||||||||||||||||||
| Involuntary or good reason termination after a CIC | 1,348,200 | 1,443,203 | 3,404,932 | 2,232,174 | 1,520,000 | 103,617 | 10,052,126 | |||||||||||||||||||||||
Vern D. Yu | CIC | – | – | – | 183,096 | – | – | 183,096 | ||||||||||||||||||||||
| Death | – | – | 2,210,017 | 1,567,056 | – | 21,896 | 3,798,969 | |||||||||||||||||||||||
| Voluntary or for cause termination | – | – | – | – | – | 21,896 | 21,896 | |||||||||||||||||||||||
| Involuntary termination without cause | 1,138,600 | 1,233,333 | 2,464,767 | 1,567,056 | 1,787,000 | 96,198 | 8,286,954 | |||||||||||||||||||||||
| Involuntary or good reason termination after a CIC | 1,138,600 | 1,233,333 | 2,464,767 | 1,567,056 | 1,787,000 | 96,198 | 8,286,954 | |||||||||||||||||||||||
| 1. | Mr. Jarvis announced his retirement, effective February 28, 2020. |
| 2. | Messrs. Monaco, Whelen, Yardley and Jarvis are the only NEOs who are retirement eligible as of December 31, 2019. Retirement eligibility under Enbridge programs means age 55 or older. |
| 3. | Reflects a lump sum payment equal to three times (for Mr. Monaco) and two times (for Messers. Gruending, Whelen, Jarvis, Yardley and Yu) the NEO’s base salary in effect as at December 31, 2019. |
| 4. | Reflects a lump sum payment equal to three times (for Mr. Monaco) and two times (for Messers. Gruending, Whelen, Jarvis, Yardley and Yu) the average of the short-term incentive award paid to the NEO in the two years preceding the year in which the termination occurs. In addition, the amount the NEO would receive as short-term incentive payment for the current year is reflected in the Summary Compensation Table. |
| 5. | Represents the value of RSUs and PSUs that would vest and be settled in cash upon the triggering event, based on C$51.63 for awards granted in Canadian dollars and US$39.77 for awards granted in U.S. dollars, the closing price of an Enbridge share on the TSX and NYSE, respectively, on December 31, 2019 and assuming in the case of PSUs, target performance. For PSUs and RSUs, severance period, as outlined in the executive employment agreement, counts towards active service when prorating for termination without cause. |
| 6. | Represents the “in-the-money |
46
| involuntary or good reason termination after a Change in Control or retirement). In-the-money |
| 7. | Reflects the value of three additional years of pension credit for Mr. Monaco and two additional years of pension credit for each of Messrs. Gruending, Whelen, Jarvis, Yardley and Yu. |
| 8. | Reflects a lump sum cash payment in respect of the flex credit allowance, vacation carryover and savings plan matching contributions that would have been paid by Enbridge in respect of the NEO over a period of three years (for Mr. Monaco) or two years (for each of Messrs. Gruending, Whelen, Jarvis, Yardley and Yu) following the executive’s termination, plus an allowance for financial and career counselling. |
Additional stock option information
Enbridge shares used for purposes of equity compensation
Enbridge has two “prior stock option plans” which were approved by Enbridge shareholders in 2007, as follows:
| • | Enbridge Inc. Incentive Stock Option Plan (2007), as revised (“Incentive stock option plan”); and |
| • | Enbridge Inc. Performance Stock Option Plan (2007), as amended and restated (2011) and further amended (2012 and 2014) (“Performance stock option plan”). |
The Performance Stock Option Plan was historically used to grant options but no options have been granted under it since 2014.
Enbridge adopted the 2019 LTIP (also referred to herein as the “current stock option plan”) effective February 13, 2019, under which stock options were granted in 2019. The 2019 LTIP was approved by our shareholders at our 2019 annual general meeting of shareholders. No further awards have been or will be granted under the Incentive stock option plan or Performance stock option plan after February 13, 2019, and all shares still available to be issued and not subject to awards under these prior stock option plans became available under the 2019 LTIP.
Shares reserved for equity compensation as of December 31, 2019
A | B | C | ||||||||||
Plans approves by security holders | Number of securities to be issued upon exercise of outstanding options, warrants and rights (#) | Weighted-average exercise price of outstanding options, warrants and rights ($) | Number of securities remaining available for future issue under equity compensation plans (excluding securities reflected in column A) (#) | |||||||||
2019 LTIP | 6,671,810 | 48.13 | (3) | 43,028,190 | ||||||||
Prior stock option plans (1) | 28,544,413 | 48.24 | (3) | – | ||||||||
Spectra 2007 LTIP (2) | 1,013,044 | 28.87 | (4) | – | ||||||||
| 2.1253% of total issued and outstanding Enbridge shares | | |||||||||||
| 1. | Includes 28,375,013 options outstanding under the Incentive Stock Option Plan and 169,400 options outstanding under the Performance Stock Option Plan. |
| 2. | Awards granted under the Spectra 2007 LTIP were assumed by Enbridge at the closing of the Merger Transaction, as described in the “Assumed equity-based compensation awards from Spectra Energy” section. No further awards have been or will be granted under the Spectra 2007 LTIP following the closing of the Merger Transaction. |
| 3. | U.S. dollars have been converted to Canadian dollars using the published WM/Reuters 4 pm London year-end exchange rate of US$1 = C$1.2967. |
| 4. | This weighted-average exercise price relates only to options granted under the Spectra 2007 LTIP. All other awards granted under the Spectra 2007 LTIP are deliverable without the payment of any consideration, and therefore these awards have not been considered in calculating the weighted average exercise price. |
47
Stock options granted and outstanding as of December 31, 2019
| Stock options outstanding | # options outstanding | % of total issued and outstanding Enbridge shares | ||||||
2019 LTIP | 6,671,810 | 0.3295% | ||||||
Incentive stock option plan | 28,375,013 | 1.4015% | ||||||
Performance stock option plan | 169,400 | 0.0084% | ||||||
Spectra 2007 LTIP – stock options (1) | 805,806 | 0.0398% | ||||||
| 1. | Awards granted under the Spectra 2007 LTIP plan as described in the “Assumed equity-based compensation awards from Spectra Energy” section. |
Plan restrictions – current stock option plan
Enbridge shares reserved for issue under 2019 LTIP | 49,700,000 in total, or 2.45% of Enbridge’s total issued and outstanding Enbridge shares as of December 31, 2019 The total number of Enbridge shares reserved for issuance to Insiders pursuant to all security based compensation arrangements of the company shall not exceed 10% of the number of Enbridge shares outstanding at the time of reservation. | |
Enbridge shares that can be issued in a one-year period | The total number of Enbridge shares issued to Insiders pursuant to all security based compensation arrangements of the company shall not exceed 10% of the number of Enbridge shares outstanding at the time of issuance (excluding any other Enbridge shares issued under all security based compensation arrangements of the company during such one-year period) | |
The number of Enbridge shares that can be issued as incentive stock options (within the meaning of the U.S. Internal Revenue Code) | Up to 2,000,000 Enbridge shares can be issued under the 2019 LTIP as incentive stock options. | |
Stock options delivered to a greater than 10% shareholder | If an Incentive Stock Option is granted to a greater than 10% shareholder, the grant price will not be less than 110% of the fair market value on the grant date of the Incentive Stock Option, and in no event will such Incentive Stock Option be exercisable after the expiration of five years from the date on which the Incentive Stock Option is granted. | |
Minimum vesting | All awards shall be subject to a minimum vesting schedule of at least twelve months following the date of grant of the award, provided that vesting may accelerate in connection with death, retirement, a change in control or other termination of service. Notwithstanding the foregoing, up to 5% of the Enbridge shares available for grant under the 2019 LTIP may be granted with a minimum vesting schedule that is shorter than twelve months. |
Annual burn rate
Stock options outstanding | 2019 | 2018 | 2017 | |||||||||
2019 LTIP | 0.3348% | – | – | |||||||||
Incentive stock option plan (1) | – | 0.3350% | 0.3912% | |||||||||
Performance stock option plan (2) | – | – | – | |||||||||
Spectra 2007 LTIP – stock options (3) | – | – | – | |||||||||
| 1. | No grants have been made under this plan since 2018. |
| 2. | No grants have been made under this plan since 2014. |
| 3. | All grants under the Spectra 2007 LTIP were made by Spectra Energy prior to the Merger Transaction. No further awards have been or will be granted under the Spectra 2007 LTIP following the closing of the Merger Transaction. |
Making changes to the 2019 LTIP
To the extent permitted by applicable laws, the Board may amend, suspend or terminate the 2019 LTIP at any time without shareholder approval, provided that no amendment, other than an increase to the overall share limit, may materially and adversely affect any award outstanding at the time of the amendment without the affected participant’s consent.
Enbridge shareholder approval is required to implement any of the following changes:
| • | increasing the overall share limit; |
| • | reducing the grant, exercise or purchase price for any awards; |
48
| • | the cancellation of any awards and the reissue of or replacement of such awards with awards having a lower grant, exercise or purchase price; |
| • | removing or exceeding the limits of the 2019 LTIP on participation by insiders; |
| • | the extension of the term of any award; |
| • | allowing other than employees or non-employee directors of the company or a subsidiary to become participants in the 2019 LTIP; |
| • | allowing awards to become transferable or assignable other than by will or according to the laws of descent and distribution; and |
| • | changing the amendment provisions of the 2019 LTIP. |
Termination provisions of stock option plans
The termination provisions for options granted under the 2019 LTIP (as governed by the 2019 incentive stock option grant agreements), the incentive stock option plan (2007), as revised, and the performance stock option plan, are summarized below.
| Reason for termination | Provision (1) | |||
Resignation | Can exercise vested options up to 30 days from the date of termination or until the option term expires (if sooner). | |||
Retirement | Incentive stock options continue to vest. Vested options can be exercised up to three years from retirement or until the stock option term expires (if sooner). Conditions for performance stock options are mentioned below. | |||
Death | All options vest and can be exercised up to 12 months from the date of death or until the option term expires (if sooner). | |||
Disability | Options continue to vest based on the regular provisions of the plan. | |||
Involuntary termination | not for cause | Unvested options continue to vest during the notice period, and options that are vested or become vested can be exercised up to 30 days after the notice period expires or until the option term expires (if sooner). | ||
for cause | All options are cancelled on the date of termination. | |||
Change of control or reorganization | Beginning with the 2017 grants, if the employment of a participant is terminated without cause (including constructive dismissal) by the company or a subsidiary within two years after a change of control, then all unvested options of the participant vest on that double-trigger date. For 2016 and prior grants, for a change of control, options vest on a date determined by the HRC Committee before the change of control. For any other kind of reorganization, options are to be assumed by the successor company. If they are not assumed, they will vest and the value will be paid in cash. Performance stock option plan : For a change of control, options vest on a date determined by the HRC Committee before the change of control. | |||
Other transfer or assignment of stock options | The holder of an option may not transfer or assign it other than by will, or as allowed by the laws of descent and distribution. | |||
| 1. | Differences in termination provisions apply for US$ options where the executive has elected treatment as incentive stock options within the meaning of U.S. Internal Revenue Code Section 422. |
Options granted under the Performance stock option plan have the same termination provisions as options granted under the Incentive stock option plan, except for the following differences:
| • | for retirement, performance stock options are prorated for the period of active employment in the five-year period starting January 1 of the year of grant. These options can be exercised until the later of three years after retirement, or 30 days after the date by which the share price targets must be met (or the date the option expires, if earlier), as long as the share price targets are met; |
| • | for death, unvested performance stock options are prorated and the plan assumes performance requirements have been met; |
| • | for involuntary termination not-for-cause, |
| • | for change of control, the plan assumes the performance requirements have been met and the plan was not amended in 2018 to implement a double trigger change of control as there are currently no plans to grant further awards under the plan. |
49
Assumed equity-based compensation awards from Spectra Energy
Pursuant to the terms of the merger agreement, Enbridge assumed all awards outstanding under the Spectra 2007 LTIP at the closing of the Merger Transaction (“Assumed Spectra LTIP Awards”). The Assumed Spectra LTIP Awards, including the shares of Enbridge issuable thereunder, were approved by Enbridge shareholders as part of the Merger Transaction on December 15, 2016. No further awards have been or will be granted under the Spectra 2007 LTIP following the closing of the Merger Transaction.
Spectra 2007 LTIP
The Assumed Spectra LTIP Awards remain subject to and will continue to be administered by Enbridge pursuant to the terms of Spectra 2007 LTIP. The following summarizes the material provisions of the Spectra 2007 LTIP to the extent applicable to the Assumed Spectra LTIP Awards. The summary is qualified in its entirety by the full text of the amended and restated Spectra 2007 LTIP, which is available on Enbridge’s profile on the SEC’s website at www.sec.gov.
General provisions
| • | Number of shares. |
| • | Reservation of Shares. |
| • | Administration. |
| • | Eligibility. non-employee directors were eligible for awards granted under the Spectra 2007 LTIP, as selected from time to time by the Compensation Committee of Spectra Energy in its sole discretion. As noted above, only those shares issuable under the Assumed Spectra LTIP Awards were assumed by Enbridge in connection with the Merger Transaction and as a result, no additional awards will be granted by Enbridge to any individual under the Spectra 2007 LTIP. |
| • | Awards. |
| • | Spectra Energy options; |
| • | Spectra Energy phantom units; |
| • | Spectra Energy PSUs; and |
| • | Dividend equivalent awards. |
| • | Adjustments to awards. |
| • | Term and amendment. |
50
| • | Assignability. |
Stock options
| • | Nonqualified stock options and incentive stock options. |
| • | Exercise price. |
| • | Vesting and term of stock options. |
| • | Treatment upon closing of the Merger Transaction. |
Phantom Stock Units
| • | Grant, price and vesting. |
| • | Treatment upon closing of the Merger Transaction. |
51
Performance Awards
| • | Grant. |
| • | Treatment upon closing of the Merger Transaction – 2015 Spectra Energy PSUs. |
| • | Treatment upon closing of the Merger Transaction – 2016 Spectra Energy PSUs. |
Other stock-based awards
| • | Other stock-based awards. |
| • | Treatment upon closing of the Merger Transaction. |
Dividend equivalent awards
| • | Dividend equivalent awards. |
Quantification of equity-based compensation
As of December 31, 2019, there is an aggregate of 909,425 Enbridge shares issuable in connection with the outstanding Assumed Spectra LTIP Awards, representing approximately 0.045% of Enbridge’s issued and
52
outstanding shares. Set forth below are the number of Enbridge shares issuable under the Spectra 2007 LTIP in connection with the exercise or settlement of the Assumed Spectra Energy Awards outstanding as of December 31, 2019.
Spectra Energy options | Spectra Energy phantom units | Total Enbridge shares issuable under Spectra 2007 LTIP | Percentage of issued and outstanding Enbridge shares | |||
805,806 | 103,619 | 909,425 | 0.045% |
Termination provisions of Spectra Energy options, Spectra Energy phantom units, and Spectra Energy PSUs
The termination provisions for the Spectra Energy options, Spectra Energy phantom units, and Spectra Energy PSUs are described below.
Reason for termination | Provision | |
Voluntary termination (not retirement eligible) | The unvested portion of such an award terminates immediately. Vested Spectra Energy options can be exercised through the earlier of 3 months following termination of employment or the 10 th anniversary of the grant date. | |
Voluntary termination (retirement eligible) | The award is pro-rated based on full and partial months of service during the vesting period, and thepro-rated award becomes payable on the original vesting date.Vested Spectra Energy options can be exercised through the 10 th anniversary of the grant date. | |
Involuntary termination, for cause | The unvested portion of such an award terminates immediately. Vested Spectra Energy options can be exercised through the earlier of 3 months following termination of employment or the 10 th anniversary of the grant date. | |
Involuntary termination, without cause or for good reason before 2 year anniversary of change in control (the 2-Year CIC Period) | The unvested portion of such an award vests upon such termination from employment. Vested Spectra Energy options can be exercised through the 10 th anniversary of the grant date. | |
Involuntary termination, without cause after 2-Year CIC Period | The award is pro-rated based on full and partial months of service during the vesting period.Spectra Energy PSUs – The pro-rated award becomes payable on the original vesting date.Spectra Energy phantom units – The pro-rated award becomes payable upon such termination from employment.Vested Spectra Energy options can be exercised through the earlier of 3 months following termination of employment or the 10 th anniversary of the grant date. | |
Employment termination as a result of death or disability | The unvested portion of such an award vests. Vested Spectra Energy options can be exercised through the earlier of 36 months following such termination of employment or the 10 th anniversary of the grant date. | |
Other transfer or assignment of stock options | The holder of an option may not transfer or assign it other than by will, or as allowed by the laws of descent and distribution. The Spectra Energy phantom units and Spectra Energy PSUs are not assignable or transferable by the holder of the award. |
Treatment of Assumed Spectra LTIP Awards post-Merger Transaction
Pursuant to the terms of the Spectra 2007 LTIP, the Assumed Spectra LTIP Awards will vest in the event that, the holder of such award experiences a qualifying termination within 24 months following the completion of the Merger Transaction. Under the Spectra 2007 LTIP, a qualifying termination generally includes an involuntary termination of the holder of such award by Enbridge without cause or by the holder with good reason.
Report of the Human Resources and Compensation Committee
The Human Resources and Compensation Committee has reviewed and discussed the preceding Compensation Discussion and Analysis with management. Based on the review and discussion, the Human Resources and Compensation Committee recommended to the Board that the Compensation Discussion and Analysis be included in the Circular. This report is provided by the following independent directors who comprise the Human Resources and Compensation Committee:
Catherine L. Williams (Chair)
Marcel R. Coutu
Susan M. Cunningham
V. Maureen Kempston Darkes
53
Philosophy and approach
The Board is responsible for developing and implementing the Directors’ Compensation Plan and has delegated theresponsibility for director compensation to the Governance Committee.
day-to-day
Our Directors’ Compensation Plan is designed with four key objectives in mind:
| • | to attract and retain the most qualified individuals to serve as directors; |
| • | to compensate our directors to reflect the risks, responsibilities and time commitment they assume when serving on our Board and Board committees; |
| • | to offer directors compensation that is competitive with other public companies that are comparable to Enbridge and to deliver such compensation in a tax effective manner; and |
| • | to align the interests of directors with those of our shareholders. |
While our executive compensation program is designed around pay for performance, director compensation is based on annual retainers. This is to meet the compensation objectives and to help ensure our directors are unbiased when making decisions and carrying out their duties while serving on our Board.
The Governance Committee uses a peer group of companies to set the annual retainers for our Board and targets director compensation at or about the 50th percentile. See “Benchmarking to peers” beginning on page 38 for more information about our peer group and how we benchmark executive compensation.
The Governance Committee reviews the Directors’ Compensation Plan every year, with assistance from management. Every second year a formal review by an external consultant is undertaken. In 2020, the Governance Committee engaged Mercer (Canada) Limited for a formal review of directors’ compensation, including peer analysis and benchmarking to the peer group. Following this review, effective January 1, 2020, the Directors’ Compensation Plan was amended to increase: the Board retainer from US$260,000 to US$285,000, the Chair of the Board retainer (including the Board annual retainer) from US$520,000 to US$550,000, the Governance Committee chair retainer from US$10,000 to US$15,000 and the Corporate Social Responsibility Committee chair retainer from US$10,000 to US$15,000. All retainers are payable in U.S. dollars regardless of director residency.
Each year, as part of this review, the Governance Committee considers the time commitment and experience required of members of our Board and the director compensation paid by a group of comparable public companies when it sets the compensation. The Governance Committee also reviews the directors’ compensation plan to make sure the overall program is still appropriate and reports its findings to the Board.
All
non-employee
director compensation in 2019 was paid under the Directors’ Compensation Plan. We do not compensatenon-employee
directors under our 2019 Long Term Incentive Plan.54
2019 director share ownership requirements
We expect directors to own Enbridge shares so they have an ongoing stake in the company and are aligned with the interests of shareholders. Directors must, within five years of becoming a director, hold at least three times their annual Board retainer in DSUs or Enbridge shares. The annual Board retainer for 2019 was US$260,000 and the director share ownership requirement in 2019 was increased to US$780,000 . Effective January 1, 2020, the annual Board retainer is US$285,000 and the director shareholder ownership requirement in 2020 is increased to US$855,000.If a decrease in the market value of Enbridge shares results in a director no longer meeting the share ownership requirements, we expect him or her to buy additional Enbridge shares in order to satisfy the minimum threshold. DSUs are paid out when a director retires from the Board. They are settled in cash, based on the weighted average of the trading price of common shares on the TSX for the last five trading days before the date that is three trading days before the payment date, multiplied by the number of DSUs the director holds. Directors may not engage in equity monetization transactions or hedges involving securities of Enbridge (see “Anti-hedging policy” on page 37). | About DSUs A deferred share unit (“DSU”) is a notional share that has the same value as one Enbridge common share. Its value fluctuates with variations in the market price of Enbridge shares. DSUs do not have voting rights but they accrue dividends as additional DSUs, at the same rate as dividends paid on our common shares. |
2019 compensation components
Our Directors’ Compensation Plan has four components:
| • | an annual retainer; |
| • | an annual retainer if he or she serves as the Chair of the Board or chair of a Board committee; |
| • | a travel fee for attending Board and Board committee meetings; and |
| • | reimbursement for reasonable travel and other out-of-pocket |
We do not have meeting attendance fees.
Our Directors’ Compensation Plan has been in effect since 2004 and was revised in 2010, 2013, 2015, 2016, 2018, 2019 and 2020. The table below shows the fee schedule for directors in 2019. Directors are paid quarterly. Mr. Monaco does not receive any director compensation because he is our President & Chief Executive Officer and is compensated in that role.
We have not granted stock options to directors since 2002. Mr. Ebel held certain Spectra Energy equity awards at the closing of the Merger Transaction that were generally treated in the same manner as those held by other employees of Spectra Energy.
Directors who also serve as a director or trustee of one of our subsidiaries or affiliates may also receive an annual retainer and meeting and travel fees for attending those meetings.
Directors can receive their retainer in a combination of cash, Enbridge shares and DSUs, but they must receive a minimum amount in DSUs, described under “Director compensation – Philosophy and approach”. Travel fees are always paid in cash.
55
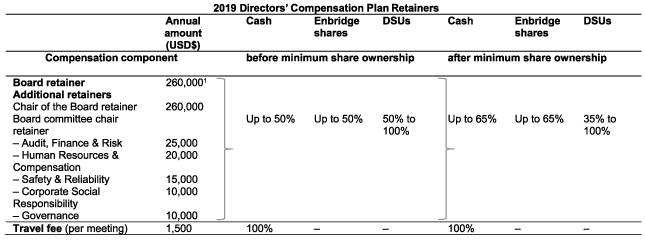
2019 directors’ compensation plan retainers Annual amount (USD$)CashEnbridge sharesDSUsCashEnbridge sharesDSUsCompensation component before minimum share ownership after minimum share ownershipBoard retainer 260,0001 Additional retainersChair of the Board retainer 260,000Board committee chair retainer Up to 50% Up to 50% 50% to 100% Up to 65% Up to 65%35% to 100%Audit, Finance & Risk 25,000Human Resources & Compensation 20,000Safety & Reliability 15,000Corporate Social Responsibility 10,000Governance 10,000Travel fee (per meeting) 1,500 100% - - 100% - -
| 1. | The Board retainer during 2019 was US$260,000. Effective January 1, 2020, Board retainer increased to US$285,000, the Chair of the Board retainer (excluding Board retainer) was increased to US$265,000, the Governance Committee chair retainer was increased to US$15,000 and the Corporate Social Responsibility Committee chair retainer was increased US$15,000. |
For purposes of the explanation that follows in this paragraph, all reference to “retainer” shall include the “Board retainer” and “additional retainers” described in the table above. Before a director reaches the minimum share ownership level, at least one half of their retainer will be paid in the form of DSUs, with the balance paid in cash, Enbridge shares or DSUs, according to a percentage mix they choose. Once a director reaches the minimum share ownership level, they can choose to receive between 35% and their entire retainer in DSUs, with the balance in cash, Enbridge shares or a combination of both, according to a percentage mix they choose. Directors are allocated the DSUs and Enbridge shares based on the weighted average of the trading price of the Enbridge shares on the TSX for the five trading days immediately preceding the date that is two weeks prior to the date of payment.
Directors who do not make a timely election as to the form in which they wish to receive their retainer will receive the applicable minimum amount in DSUs (in 2019, 35% if they have met the share ownership requirement and 50% if they have not) and the balance in cash.
The table below shows the compensation components in which each director’s annual retainer for the year ended December 31, 2019 was delivered.
| Director | Cash (%) | Enbridge shares (%) | DSUs (%) | |||||||||
Pamela L. Carter | 65 | – | 35 | |||||||||
Marcel R. Coutu | – | – | 100 | |||||||||
Susan M. Cunningham | 35 | 15 | 50 | |||||||||
Gregory L. Ebel | 50 | – | 50 | |||||||||
J. Herb England | – | 65 | 35 | |||||||||
Charles W. Fischer | 50 | – | 50 | |||||||||
V. Maureen Kempston Darkes | – | – | 100 | |||||||||
Teresa Madden | 50 | – | 50 | |||||||||
| Al Monaco 1 | – | – | – | |||||||||
Dan C. Tutcher | – | – | 100 | |||||||||
Catherine L. Williams | 25 | 40 | 35 | |||||||||
Former Directors | ||||||||||||
Clarence P. Cazalot, Jr. 2 | | 50 | | | – | | | 50 | | |||
Michael E. Phelps 3 | | 65 | | | – | | | 35 | | |||
| 1. | Mr. Monaco does not receive any compensation as a director of Enbridge because he is our President & Chief Executive Officer. |
| 2. | Mr. Cazalot retired from the Board effective May 8, 2019. |
| 3. | Mr. Phelps passed away on April 20, 2019. |
56
The table below provides information concerning the compensation of each
non-employee
director who served at any time in 2019. Mr. Monaco does not receive any compensation as a director of Enbridge because he is our President & Chief Executive Officer. For information on Mr. Monaco’s compensation, see page 40.Share-based awards2 | All other compensation | Total | ||||||||||||||||||||||||||||||||||
Fees earned 1 (cash) ($) | Enbridge shares 3 | DSUs 3 | Travel fees ($) | Dividends on DSUs 4 | ($) | |||||||||||||||||||||||||||||||
| Director | (#) | ($) | (#) | ($) | (#) | ($) | ||||||||||||||||||||||||||||||
| Pamela L. Carter | 232,906 | – | – | 2,607 | 125,411 | 7,970 | 61 | 2,935 | 369,222 | |||||||||||||||||||||||||||
| Marcel R. Coutu | – | – | – | 7,173 | 345,046 | 3,957 | 168 | 8,074 | 357,077 | |||||||||||||||||||||||||||
| Susan M. Cunningham | 106,773 | 947 | 45,760 | 3,167 | 152,533 | 5,938 | 64 | 3,094 | 314,097 | |||||||||||||||||||||||||||
| Gregory L. Ebel | 345,046 | – | – | 7,173 | 345,046 | 7,967 | 168 | 8,074 | 706,133 | |||||||||||||||||||||||||||
| J. Herb England | – | 5,109 | 245,845 | 2,752 | 132,378 | 9,943 | 64 | 3,098 | 391,265 | |||||||||||||||||||||||||||
| Charles W. Fischer | 182,476 | – | – | 3,793 | 182,476 | – | 89 | 4,270 | 369,223 | |||||||||||||||||||||||||||
| V. Maureen Kempston Darkes | – | – | – | 7,449 | 358,317 | 9,943 | 175 | 8,385 | 376,645 | |||||||||||||||||||||||||||
| Teresa Madden | 152,533 | – | – | 3,167 | 152,533 | 11,919 | 64 | 3,094 | 320,079 | |||||||||||||||||||||||||||
| Al Monaco 5 | – | – | – | – | – | – | – | – | – | |||||||||||||||||||||||||||
| Dan C. Tutcher | – | – | – | 7,173 | 345,046 | 3,962 | 168 | 8,074 | 357,082 | |||||||||||||||||||||||||||
Catherine L. Williams | 112,803 | 2,868 | 138,018 | 2,510 | 120,766 | 3,957 | 59 | 2,826 | 378,371 | |||||||||||||||||||||||||||
Former Directors | ||||||||||||||||||||||||||||||||||||
| Clarence P. Cazalot, Jr. 6 | 63,380 | – | – | 1,286 | 63,380 | 4,006 | 13 | 655 | 131,421 | |||||||||||||||||||||||||||
| Michael E.J. Phelps 7 | 69,326 | – | – | 777 | 37,329 | – | – | – | 106,655 | |||||||||||||||||||||||||||
| 1. | The cash portion of the retainers paid to the directors. Directors are paid quarterly in US$. The values presented in this table are in C$ and reflect U.S./Canadian exchange rates from the Bank of Canada of 1.3327 as at March 14, 2019, 1.3378 as at June 6, 2019 (or 1.3353 as at April 22, 2019 in the case of Mr. Phelps), 1.3205 as at September 12, 2019, and 1.3174 as at December 5, 2019. |
| 2. | The portion of the retainer received as DSUs and Enbridge shares. |
| 3. | We pay directors quarterly. The value of the Enbridge shares and DSUs is based on the weighted average of the trading price of Enbridge shares on the TSX for the five trading days prior to the date that is two weeks prior to the applicable payment date. The weighted average Enbridge share prices were $47.66, $50.39, $44.62 and $50.20 for the first, second, third and fourth quarters, respectively, of 2019. |
| 4. | Includes dividend equivalents granted in 2019 on DSUs granted in 2019 based on the 2019 quarterly dividend rate of $0.738. Dividend equivalents vest at the time of grant. |
| 5. | Mr. Monaco does not receive any compensation as a director of Enbridge because he is our President & Chief Executive Officer. |
| 6. | Mr. Cazalot retired from the Board on May 8, 2019. |
| 7. | Mr. Phelps passed away on April 20, 2019. |
57
Change in director equity ownership
The table below shows the change in each director nominee’s equity ownership from March 4, 2019 to March 2, 2020, the dates of the proxy statement for the 2019 annual meeting of shareholders and of the Circular, respectively, and his or her status in meeting the share ownership requirements.
| Director | Enbridge shares (#) | Enbridge stock options (#) | DSUs(#) | Total Enbridge shares + DSUs (#) | Market (at-risk) value of equity holdings (C$) 1,2 | |||||||||||||||
Pamela L. Carter 2020 2019 Change | ||||||||||||||||||||
| 42,559 | – | 8,056 | 50,615 | 2,576,810 | ||||||||||||||||
| 42,559 | – | 5,029 | 47,588 | 2,219,980 | ||||||||||||||||
| – | – | 3,027 | 3,027 | 356,829 | ||||||||||||||||
Marcel R. Coutu 2020 2019 Change | ||||||||||||||||||||
| 29,400 | – | 28,595 | 57,995 | 2,952,525 | ||||||||||||||||
| 29,400 | – | 19,882 | 49,282 | 2,299,005 | ||||||||||||||||
| – | – | 8,713 | 8,713 | 653,520 | ||||||||||||||||
Susan M. Cunningham 2020 2019 Change | ||||||||||||||||||||
| 947 | – | 3,281 | 4,228 | 215,247 | ||||||||||||||||
| – | – | – | – | – | ||||||||||||||||
| 947 | – | 3,281 | 4,228 | 215,247 | ||||||||||||||||
Gregory L. Ebel 3 2020 2019 Change | ||||||||||||||||||||
| 651,845 | 405,408 | 22,489 | 674,334 | 34,330,344 | ||||||||||||||||
| 651,845 | 405,408 | 14,139 | 665,984 | 31,068,154 | ||||||||||||||||
| – | – | 8,350 | 8,350 | 3,262,190 | ||||||||||||||||
J. Herb England 2020 2019 Change | ||||||||||||||||||||
| 32,032 | – | 77,530 | 109,562 | 5,577,801 | ||||||||||||||||
| 26,923 | – | 70,227 | 97,150 | 4,532,048 | ||||||||||||||||
| 5,109 | – | 7,303 | 12,412 | 1,045,754 | ||||||||||||||||
Charles W. Fischer 2020 2019 Change | ||||||||||||||||||||
| 31,169 | – | 41,602 | 72,771 | 3,704,772 | ||||||||||||||||
| 31,169 | – | 35,419 | 66,588 | 3,106,330 | ||||||||||||||||
| – | – | 6,183 | 6,183 | 598,441 | ||||||||||||||||
Gregory J. Goff 2020 2019 Change | ||||||||||||||||||||
| – | – | – | – | – | ||||||||||||||||
| – | – | – | – | – | ||||||||||||||||
| – | – | – | – | – | ||||||||||||||||
V. Maureen Kempston Darkes 2020 2019 Change | ||||||||||||||||||||
| 21,735 | – | 45,396 | 67,131 | 3,417,639 | ||||||||||||||||
| 21,735 | – | 35,414 | 57,149 | 2,666,001 | ||||||||||||||||
| – | – | 9,982 | 9,982 | 751,638 | ||||||||||||||||
Teresa S. Madden 2020 2019 Change | ||||||||||||||||||||
| – | – | 3,281 | 3,281 | 167,036 | ||||||||||||||||
| – | – | – | – | – | ||||||||||||||||
| – | – | 3,281 | 3,281 | 167,036 | ||||||||||||||||
Al Monaco 4 2020 2019 Change | ||||||||||||||||||||
| 876,512 | 3,987,520 | – | 876,512 | 44,623,226 | ||||||||||||||||
| 805,295 | 3,453,320 | – | 805,295 | 37,567,012 | ||||||||||||||||
| 71,217 | 534,200 | – | 71,217 | 7,056,214 | ||||||||||||||||
Dan C. Tutcher 2020 2019 Change | ||||||||||||||||||||
| 637,523 | – | 120,743 | 758,226 | 38,603,322 | ||||||||||||||||
| 697,523 | – | 106,547 | 804,070 | 37,509,866 | ||||||||||||||||
| (60,000 | ) | – | 14,196 | (45,804 | ) | 1,093,457 | ||||||||||||||
Total 2020 2019 Change | ||||||||||||||||||||
| 2,323,722 | 4,392,928 | 350,973 | 2,674,695 | 136,168,722 | ||||||||||||||||
| 2,306,449 | 3,858,728 | 286,657 | 2,593,106 | 120,968,395 | ||||||||||||||||
| 17,273 | 534,200 | 64,316 | 81,589 | 15,200,328 | ||||||||||||||||
| 1. | Based on the total market value of the Enbridge shares and/or DSUs owned by the director, based on the closing prices of $50.91 on the TSX on March 2, 2020 and $46.65 on March 4, 2019. These amounts have been rounded to the nearest dollar in Canadian dollars. Excludes stock options. |
| 2. | Directors must hold at least three times the annual Board retainer in DSUs or Enbridge shares within five years of becoming a director on our Board. All director nominees currently meet or exceed this requirement other than |
58
| Mses. Madden and Cunningham, who have until February 12, 2024 and February 13, 2024, respectively, and Mr. Goff, who has until February 11, 2025. |
| 3. | Mr. Ebel’s stock options were Spectra Energy options that converted into options to purchase Enbridge common shares upon the closing of the Merger Transaction. No new Enbridge stock options were granted to Mr. Ebel in his capacity as a Director of Enbridge or Chair of the Enbridge Board. |
| 4. | Mr. Monaco does not receive any compensation as a director of Enbridge. He is only compensated for his role as President & CEO. As President & CEO, he is subject to a share ownership requirement of six times base salary. Please see page 40 of this Amendment No. 1 on Form 10-K/A for information on his Enbridge share ownership as a multiple of his base salary. |
59
Non-GAAP
ReconciliationThis Amendment No. 1 on Form 10-K/A contains references to DCF and DCF per common share, which are measures used for purposes of Enbridge’s executive compensation programs. Management believes the presentation of DCF gives useful information to investors and shareholders as they provide increased transparency and insight into the performance of the company.
Our non-GAAP measures described above are not measures that have standardized meaning prescribed by generally accepted accounting principles in the United States of America (U.S. GAAP) and are not U.S. GAAP measures. Therefore, these measures may not be comparable with similar measures presented by other issuers.
The table below provides a reconciliation of the non-GAAP measures to comparable GAAP measures.
Distributable Cash Flow
The following table presents the reconciliation of cash provided by operating activities to DCF. DCF is defined as cash flow provided by operating activities before changes in operating assets and liabilities (including changes in environmental liabilities) less distributions to noncontrolling interests and redeemable noncontrolling interests, preference share dividends and maintenance capital expenditures, and further adjusted for unusual, non-recurring or non-operating factors. Management also uses DCF to assess the performance of the company and to set its dividend payout target.
DCF for the year ended December 31, 2019 has been converted to DCF per share by taking DCF of C$9,224 million and dividing by 2,017 million, the weighted average number of Enbridge shares outstanding as of December 31, 2019.
For purposes of the 2019 STIP award determinations as described on page 21, DCF was converted to DCF per share by taking DCF of C$9,157 million and dividing by 2,017 million, the weighted average number of Enbridge shares outstanding as of December 31, 2019. For purposes of 2017 PSU payout determinations as described on page 26, DCF was converted to DCF per share by taking DCF of C$9,198 million and dividing by 2,017 million, the weighted average number of Enbridge shares outstanding as of December 31, 2019.
Year ended December 31, 2019 | |||||
(unaudited, millions of Canadian dollars) | |||||
Cash provided by operating activities | 9,398 | ||||
Adjusted for changes in operating assets and liabilities (1) | 259 | ||||
9,657 | |||||
Distributions to noncontrolling interests and redeemable noncontrolling interests (4) | (204 | ) | |||
Preference share dividends | (383 | ) | |||
Maintenance capital expenditures (2) | (1,083 | ) | |||
Significant adjustment items: | |||||
Other receipts of cash not recognized in revenue (3) | 169 | ||||
Employee severance, transition and transformation costs | 143 | ||||
Asset monetization costs | – | ||||
Distributions from equity investments in excess of cumulative earnings (4) | 361 | ||||
Regulatory liability adjustment | – | ||||
Hedging program pre-settlement payment | 310 | ||||
Other items | 254 | ||||
DCF | 9,224 | ||||
Further adjusting items in respect of: | |||||
For STIP calculation purposes, normalizations including (but not limited to) the net accretive impact of financing and strategic actions not contemplated at the time of target setting expressed in DCF | | (67 | ) | ||
Total DCF adjusted for 2019 STIP award determinations | 9,157 | ||||
Further adjusting items in respect of: | |||||
For 2017 PSU calculation purposes, normalizations including (but not limited to) the net accretive impact of financing and strategic actions not contemplated at the time of the grant expressed in DCF | | (26 | ) | ||
Total DCF adjusted for 2017 PSU payout determinations | 9,198 | ||||
| 1. | Changes in operating assets and liabilities, net of recoveries. |
60
| 2. | Maintenance capital expenditures are expenditures that are required for the ongoing support and maintenance of the existing pipeline system or that are necessary to maintain the service capability of the existing assets (including the replacement of components that are worn, obsolete or completing their useful lives). For the purpose of DCF, maintenance capital excludes expenditures that extend asset useful lives, increase capacities from existing levels or reduce costs to enhance revenues or provide enhancements to the service capability of the existing assets. |
| 3. | Consists of cash received net of revenue recognized for contracts under make-up rights and similar deferred revenue arrangements. |
| 4. | Presented net of adjusting items. |
ITEM 12. SECURITY OWNERSHIP OF CERTAIN BENEFICIAL OWNERS AND MANAGEMENT AND RELATED STOCKHOLDER MATTERS
EQUITY COMPENSATION PLAN INFORMATION
See
Item 11
—“Shares reserved for equity compensation as of December 31, 2019” for information regarding our equity plan compensation on page 47.Beneficial ownership table
The table below sets forth the number and percentage of outstanding Enbridge shares beneficially owned by each of our Directors, each of our NEOs and all Directors and executive officers as a group, as of March 2, 2020. Unless otherwise indicated in the table, the address of each of the individuals below is c/o Enbridge Inc., 200-425 1
st
Street SW, Calgary, Alberta, T2P 3L8. Name of beneficial owner | Number of Enbridge shares Held | Number of Enbridge shares acquirable within 60 days | Total Shares Beneficially Owned | Percent of common shares outstanding | ||||||||||||
Pamela L. Carter | 42,559 | – | 1 | 42,559 | * | |||||||||||
Marcel R. Coutu | 29,400 | – | 29,400 | * | ||||||||||||
Susan M. Cunningham | 947 | – | 1 | 947 | * | |||||||||||
Gregory L. Ebel | 651,845 | 405,408 | 1,057,253 | * | ||||||||||||
J. Herb England | 32,032 | – | 1 | 32,032 | * | |||||||||||
Charles W. Fischer | 31,169 | – | 31,169 | * | ||||||||||||
Gregory J. Goff | – | – | – | * | ||||||||||||
V. Maureen Kempston Darkes | 21,735 | – | 21,735 | * | ||||||||||||
Teresa S. Madden | – | – | – | * | ||||||||||||
Al Monaco | 876,512 | 2,244,475 | 3,120,987 | * | ||||||||||||
Dan C. Tutcher | 637,523 | – | 637,523 | * | ||||||||||||
Catherine L. Williams | 54,972 | – | 1 | 54,972 | * | |||||||||||
Colin K. Gruending | 47,756 | 461,340 | 509,097 | * | ||||||||||||
John K. Whelen | 203,619 | 792,388 | 996,007 | * | ||||||||||||
William T. Yardley | 120,353 | 243,311 | 363,664 | * | ||||||||||||
D. Guy Jarvis | 72,166 | 537,815 | 609,981 | * | ||||||||||||
Vern D. Yu | 113,101 | 659,270 | 772,371 | * | ||||||||||||
All current executive officers and directors as a group | 3,192,200 | 6,892,967 | 10,085,167 | * | ||||||||||||
| 1. | Mses. Carter, Cunningham and Williams and Mr. England will be paid a portion of their directors’ compensation in Enbridge shares on March 20, 2020. Under our Directors’ Compensation Plan, the number of Enbridge shares will be calculated by dividing the applicable amount of compensation in Canadian dollars payable in Enbridge shares on the payment date by the weighted average the closing price per Enbridge share on the TSX for the five trading days prior to the date that is two weeks prior to the payment date. |
* Represents less than 1% of the outstanding Enbridge shares.
61
Principal shareholders
The table below sets forth information about the number of Enbridge shares held by persons known by the company to be the beneficial owners of more than five percent of issued and outstanding Enbridge shares, as of March 2, 2020. This information is based on the most recently available reports filed with the SEC.
| Name and address of beneficial owner | Aggregate number of Enbridge shares beneficially owned | Percent of Enbridge shares outstanding | ||||||
Capital International Investors 1 a division of Capital Research and Management Company 11100 Santa Monica Boulevard 16th Floor Los Angeles, CA 90025 | 135,674,856 | 6.7% | ||||||
| 1. | The information for this beneficial owner is based on Schedule 13G/A filing on February 14, 2020, which can be retrieved at www.sec.gov. |
Handling conflicts of interest and related person transactions
If a director or officer has a material interest in a transaction or agreement involving Enbridge, or otherwise identifies a potential personal conflict, he or she must:
| • | declare the conflict or potential conflict; and |
| • | abstain from voting on the matter at any Board meeting where it is being discussed or considered. |
This approach is consistent with the requirements of the
Canada Business Corporations Act
. In addition, the Board would review related person transactions in conjunction with making director independence determinations. Completion of annual questionnaires by directors and officers of the company assists in identifying possible related person transactions. Further, as set forth above, pursuant to our Statement on Business Conduct, all officers and directors are required to avoid conflicts of interest and to disclose any actual or potential conflicts of interest. They must also annually certify their compliance with the Statement on Business Conduct. Disclosures of an actual or potential conflict of interest are reviewed by the company’s Ethics & Compliance Department to ensure appropriate follow-up and reporting. Any waiver from any part of the Statement on Business Conduct requires the approval of the CEO. For executive officers, senior financial officers and members of the Board, a waiver requires the express approval of Enbridge’s Board. Since the beginning of 2019, neither the CEO nor the Board has waived any aspect of the Statement on Business Conduct.For purposes of the foregoing, a “related person transaction” is a transaction in which the company was or is to be a participant and the amount involved exceeds US$120,000, and in which any related person had or will have a direct or indirect material interest, and a “related person” means (i) a director, nominee director or executive officer of the company; (ii) an immediate family member of a director, nominee director or executive officer, or (iii) a beneficial holder of greater than five per cent of the company’s shares or an immediate family member of such holder.
On February 27, 2017, Enbridge and Spectra Energy combined through a stock-for-stock merger transaction (the “Merger Transaction”). Upon the closing of the Merger Transaction, Gregory L. Ebel (Spectra Energy’s former Chairman, President and CEO) became the non-executive Chair of the Enbridge Board of Directors. Enbridge is required, until the first meeting of the Board of Directors following the 2020 annual shareholders meeting of Enbridge, to provide, without charge, to Mr. Ebel as non-executive Chair: (i) use of Enbridge’s aircraft for business flights to board meetings and for other business conducted on behalf of Enbridge, (ii) information technology support and (iii) administrative support.
Enbridge is also required to secure office space in the Houston area on behalf of Mr. Ebel and to reimburse the
non-executive
Chair for expenses incurred for tax return preparation services (in an aggregate amount not to exceed US$100,000 per year for such office and tax return preparation services). Following the closing of the Merger Transaction, Mr. Ebel remained a non-executive employee of Spectra Energy until April 15, 2017, at which time he experienced a qualifying termination under his change in control agreement with Spectra Energy and became entitled62
to receive certain payments and benefits which were paid in 2017 and 2018 as well as the following payments and benefits which, except as indicated below, were paid in 2019:
| • | continued welfare benefits for a period of two years following Mr. Ebel’s qualifying termination (such benefits are valued at approximately US$45,521, with those provided in 2019 valued at US$8,750). |
Independence
The Governance Committee is responsible for making sure the Board functions independently of management.
The majority of our directors must be independent, as defined by Canadian securities regulators in NI 52-110, NYSE rules and the rules and regulations of the SEC. The Governance Guidelines provide that the Board shall consist of a substantial majority of independent directors. The Board uses a detailed annual questionnaire to assist in determining if a director is independent.
The Board has determined that 9 of our 12 directors are independent.
Mr. Monaco is not independent because he is our President & CEO and a member of management.
As at March 2, 2020, Mr. Ebel is not independent because he was the Chairman, President and CEO of Spectra Energy until the Merger Transaction and he remained a non-executive employee of Spectra Energy until April 15, 2017. The Board will re-evaluate Mr. Ebel’s independence after the NYSE three-year look-back rule for independence ends on April 15, 2020 and is expected to determine that Mr. Ebel is independent, subject to no new material relationships affecting his independence at that time.
Mr. Tutcher is not independent because he is an employee of Brookfield, whose subsidiary and institutional partners made payments to Enbridge in 2018 for property or services in an amount which exceeds 2% of Brookfield’s consolidated gross revenues. See “Director independence” on page 11 for more information.
The Governance Committee has developed guidelines to ensure each director is aware of the expectations placed on him or her as a director. Key expectations include meeting attendance, financial literacy and ethical conduct.
External auditor services - fees
The following table sets forth all services rendered by the company’s auditors, PwC, by category, together with the corresponding fees billed by the auditors for each category of service for the financial years ended December 31, 2019 and 2018.
2019 (C$) | 2018 (C$) | Description of fee category | ||||||||
Audit fees | 16,928,000 | 17,715,900 | Represents the aggregate fees for audit services. | |||||||
Audit-related fees | 431,000 | 1,385,000 | Represents the aggregate fees for assurance and related services by the company’s auditors that are reasonably related to the performance of the audit or review of the company’s financial statements and are not included under “Audit fees”. During fiscal 2019 and 2018, the services provided in this category includes due diligence related to prospectus offerings and purchase price allocations. | |||||||
Tax fees | 1,993,000 | 3,749,500 | Represents the aggregate fees for professional services rendered by the company’s auditors for tax compliance, tax advice and tax planning. | |||||||
All other fees | 320,000 | 152,000 | Represents the aggregate fees for products and services provided by the company’s auditors other than those services reported under “Audit fees”, “Audit-related fees” and “Tax fees”. During fiscal 2019 and 2018, these fees include those related to French translation work. | |||||||
Total fees | 19,672,000 | 23,002,400 | ||||||||
Pre-approval
policies and proceduresThe Audit, Finance & Risk Committee has adopted a policy that requires
pre-approval
by the Audit, Finance & Risk Committee of any services to be provided by the company’s external auditors, PwC, whether audit ornon-audit
services. The policy prohibits the company from engaging the auditors to provide the followingnon-audit
services:| • | bookkeeping or other services related to accounting records and financial statements; |
| • | financial information systems design and implementation; |
| • | appraisal or valuation services, fairness opinions or contribution in kind reports; |
63
| • | actuarial services; |
| • | internal audit outsourcing services; |
| • | management functions or human resources; |
| • | broker or dealer, investment adviser or investment banking services; |
| • | legal services; and |
| • | expert services unrelated to the audit. |
The Audit, Finance & Risk Committee believes that the policy will protect the company from the potential loss of independence of the external auditors. The Audit, Finance & Risk Committee has also adopted a policy which prohibits the company from hiring (as a full time employee, contractor or otherwise) into a financial reporting oversight role any current or former employee or partner of its external auditor who provided audit, review or attest service in respect of the company’s financial statements (including financial statements of its reporting issuer subsidiaries and significant investees) during the 12 month period preceding the date of the initiation of the current annual audit. The policy further prohibits the hiring of a former partner of the company’s external auditor who receives pension benefits from the firm, unless such pension benefits are of a fixed amount, not dependent upon firm earnings and fully funded. In all cases, the hiring of any partner or employee or former partner or employee of the independent auditor is subject to joint approval by the lead engagement partner and the company’s Senior Vice President and Chief Accounting Officer.
64
Part IV (Item 15) of the Original Filing is hereby amended solely to add the following exhibits required to be filed in connection with this Amendment No. 1.
(b) Exhibits:
Reference is made to the “Index of Exhibits” following Item 16.
Form
, which is hereby incorporated into this Item.10-K
SummaryNot applicable.
65
Each exhibit identified below is included as a part of this Amendment No. 1. Exhibits included in this filing are designated by an asterisk (“*”).
Exhibit No. | Name of Exhibit | |||||
| | 31.1 | | * | |||
| | 31.2 | | * | |||
| | 101.INS | | * | XBRL Instance Document. | ||
| | 101.SCH | | * | XBRL Taxonomy Extension Schema. | ||
| | 101.CAL | | * | XBRL Taxonomy Extension Calculation Linkbase. | ||
| | 101.DEF | | * | XBRL Taxonomy Extension Definition Linkbase. | ||
| | 101.LAB | | * | XBRL Taxonomy Extension Label Linkbase. | ||
| | 101.PRE | | * | XBRL Taxonomy Extension Presentation Linkbase. | ||
66
Pursuant to the requirements of Section 13 or 15(d) of the Securities Exchange Act of 1934, the registrant has duly caused this report to be signed on its behalf by the undersigned, thereunto duly authorized.
ENBRIDGE INC. (Registrant) | ||||||
| Date: March 9, 2020 | By: | /s/ Colin K. Gruending | ||||
| Colin K. Gruending | ||||||
| Executive Vice President and Chief Financial Officer Enbridge Inc. | ||||||
67