Washington, D.C. 20549
Nuveen Premium Income Municipal Fund 4, Inc.
Kevin J. McCarthy
Form N-CSR is to be used by management investment companies to file reports with the Commission not later than 10 days after the transmission to stockholders of any report that is required to be transmitted to stockholders under Rule 30e-1 under the Investment Company Act of 1940 (17 CFR 270.30e-1). The Commission may use the information provided on Form N-CSR in its regulatory, disclosure review, inspection, and policymaking roles.
A registrant is required to disclose the information specified by Form N-CSR, and the Commission will make this information public. A registrant is not required to respond to the collection of information contained in Form N-CSR unless the Form displays a currently valid Office of Management and Budget ("OMB") control number. Please direct comments concerning the accuracy of the information collection burden estimate and any suggestions for reducing the burden to Secretary, Securities and Exchange Commission, 450 Fifth Street, NW, Washington, DC 20549-0609. The OMB has reviewed this collection of information under the clearance requirements of 44 U.S.C. ss. 3507.
ITEM 1. REPORTS TO STOCKHOLDERS.
LIFE IS COMPLEX.
Nuveen makes things e-simple.
It only takes a minute to sign up for e-Reports. Once enrolled, you’ll receive an e-mail as soon as your Nuveen Fund information is ready. No more waiting for delivery by regular mail. Just click on the link within the e-mail to see the report and save it on your computer if you wish.
Free e-Reports right to your e-mail!
www.investordelivery.com
If you receive your Nuveen Fund distributions and statements from your financial advisor or brokerage account.
OR
www.nuveen.com/accountaccess
If you receive your Nuveen Fund distributions and statements directly from Nuveen.
Table of Contents
| Chairman’s Letter to Shareholders | 4 |
| | |
| Portfolio Managers’ Comments | 5 |
| | |
| Fund Leverage | 8 |
| | |
| Common Share Information | 10 |
| | |
| Risk Considerations | 12 |
| | |
| Performance Overview and Holding Summaries | 13 |
| | |
| Portfolios of Investments | 16 |
| | |
| Statement of Assets and Liabilities | 65 |
| | |
| Statement of Operations | 66 |
| | |
| Statement of Changes in Net Assets | 67 |
| | |
| Statement of Cash Flows | 68 |
| | |
| Financial Highlights | 70 |
| | |
| Notes to Financial Statements | 75 |
| | |
| Reinvest Automatically, Easily and Conveniently | 84 |
| | |
| Glossary of Terms Used in this Report | 86 |
| | |
| Additional Fund Information | 91 |
Chairman’s
Letter to Shareholders
Dear Shareholders,
After nine years of serving as lead director and independent chairman of the Nuveen Fund Board, my term of office is coming to an end. It has been a privilege to use this space to communicate with you on some of the broad economic trends in the U.S. and abroad and how they are impacting the investment environment in which your funds operate. In addition, I have enjoyed offering some perspective on how your Board views the various Nuveen investment teams as they apply their investment disciplines in that investment environment.
My term has coincided with a particularly challenging period for both mutual fund sponsors and investors. Since 2000 there have been three periods of unusually strong stock market growth and two major market declines. Recent years have been characterized by a search for yield in fixed income securities to compensate for an extended period of very low interest rates. Funds are investing more in foreign and emerging markets that require extensive research capabilities to overcome the more limited transparency and higher volatility in those markets. New fund concepts often incorporate derivative financial instruments that offer efficient ways to hedge investment risk or gain exposure to selected markets. Fund trading teams operate in many new domestic and international venues with quite different characteristics. Electronic trading and global communication networks mean that fund managers must be able to thrive in financial markets that react instantaneously to newsworthy events and are more interconnected than ever.
Nuveen has committed additional resources to respond to these changes in the fund industry environment. It has added IT and research resources to assemble and evaluate the increased flow of detailed information on economies, markets and individual companies. Based on its experience during the financial crisis of 2008-09, Nuveen has expanded its resources dedicated to valuing and trading portfolio securities with a particular focus on stressed financial market conditions. It has added systems and experienced risk management professionals to work with investment teams to better help evaluate whether their funds’ risk exposures are appropriate in view of the return targets. The investment teams have also reflected on recent experience to reaffirm or modify their investment disciplines. Finally, experienced professionals and IT resources have been added to address new regulatory requirements designed to better inform and protect investors. The Board has enthusiastically encouraged these initiatives.
The Nuveen Fund Board has always viewed itself as your representatives to assure that Nuveen brings together experienced people, proven technologies and effective processes designed to produce results that meet investor expectations. It is important to note that our activities are highlighted by the annual contract renewal process. Despite its somewhat formal language, I strongly encourage you to read the summary because it offers an insight into our oversight process. The report is included in the back of this or a subsequent shareholder report. The renewal process is very comprehensive and includes a number of evaluations and discussions between the Board and Nuveen during the year. The summary also describes what has been achieved across the Nuveen fund complex and at individual funds such as yours.
As I leave the chairmanship and resume my role as a member of the Board, please be assured that I and my fellow Board members will continue to hold your interests uppermost in our minds as we oversee the management of your funds and that we greatly appreciate your confidence in your Nuveen fund.
Very sincerely,
Robert P. Bremner
Chairman of the Board
June 21, 2013
Portfolio Managers’ Comments
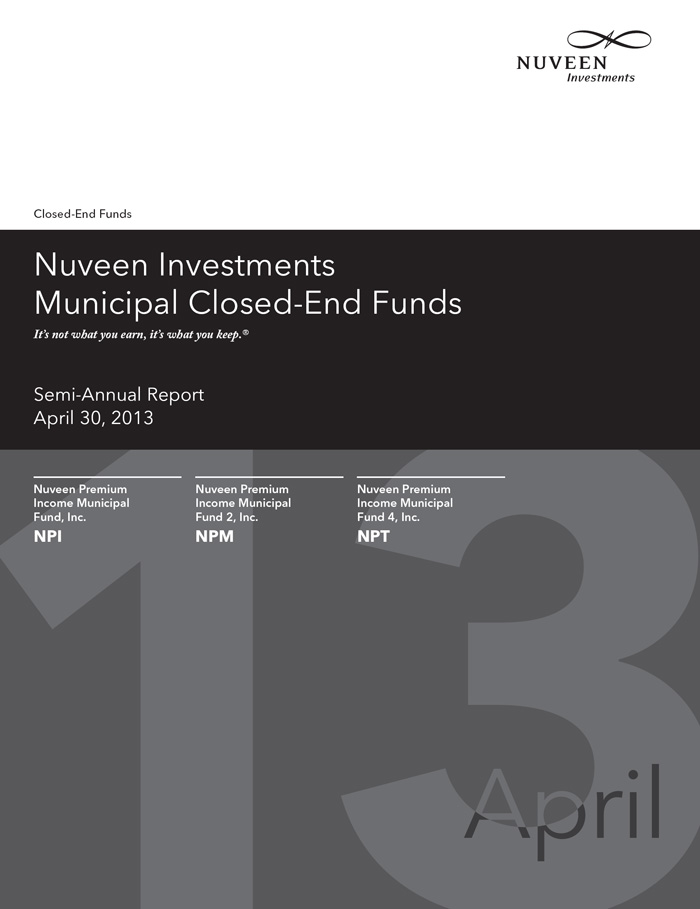
Nuveen Premium Income Municipal Fund, Inc. (NPI)
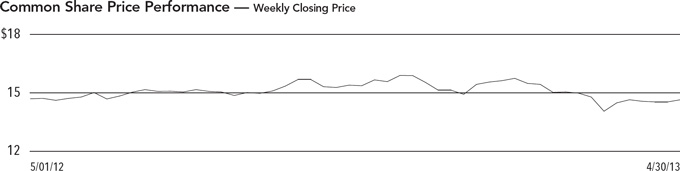
Nuveen Premium Income Municipal Fund 2, Inc. (NPM)
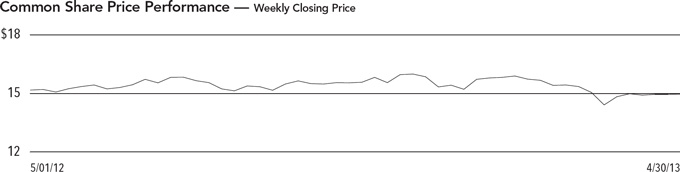
Nuveen Premium Income Municipal Fund 4, Inc. (NPT)
Portfolio managers Paul Brennan and Chris Drahn discuss key investment strategies and the six-month performance of these three national Funds. Paul has managed NPI and NPM since 2006 and Chris assumed portfolio management responsibility for NPT in January 2011.
What key strategies were used to manage these Funds during the six-month reporting period ended April 30, 2013?
In an environment characterized by tight supply, strong demand and lower yields, we continued to take a bottom-up approach to discovering sectors that appeared undervalued as well as individual credits that had the potential to perform well over the long term. However, the municipal market also encountered some additional volatility generated by the political environment, particularly the “fiscal cliff” at the end of 2012 and the approach of federal tax season. On the revenue side, state tax collections have grown for eleven straight quarters, exceeding pre-recession levels beginning in September 2011, while on the expense side, the states made headway in cutting and controlling costs. The current low level of municipal issuance reflects the current political distaste for additional borrowing by state and local governments facing fiscal constraints and the prevalent atmosphere of municipal budget austerity. During this period, we continued to see municipal yields remain relatively low. Borrowers seeking to take advantage of the low rate environment sparked an increase in refunding activity, with approximately 50% of municipal paper issued by borrowers that were calling existing debt and refinancing at lower rates.
During this period, all three Funds found value in health care, transportation, infrastructure and broad based essential services bonds backed by taxes or other revenues. In NPT, we added dedicated tax bonds secured by governmental tax or fee revenues such as sales, excise or gas taxes. Also in NPT, we added exposure to prepaid gas debt, a category of bond issuance that rallied during the period. These securities are used by municipalities to prepay natural gas costs and control energy spending.
In general during this period, we emphasized bonds with longer maturities. This enabled us to take advantage of more attractive yields at the longer end of the municipal yield curve and also provided some protection for the Funds’ duration and yield curve positioning. In NPI and NPM, we also purchased lower rated bonds when we
Certain statements in this report are forward-looking statements. Discussions of specific investments are for illustration only and are not intended as recommendations of individual investments. The forward-looking statements and other views expressed herein are those of the portfolio managers as of the date of this report. Actual future results or occurrences may differ significantly from those anticipated in any forward-looking statements, and the views expressed herein are subject to change at any time, due to numerous market and other factors. The Funds disclaim any obligation to update publicly or revise any forward-looking statements or views expressed herein.
Ratings shown are the highest rating given by one of the following national rating agencies: Standard & Poor’s, Moody’s Investors Service, Inc., or Fitch, Inc. Credit ratings are subject to change. AAA, AA, A, and BBB are investment grade ratings; BB, B, CCC, CC, C and D are below investment grade ratings. Certain bonds backed by U.S. Government or agency securities are regarded as having an implied rating equal to the rating of such securities. Holdings designated N/R are not rated by these national rating agencies.
found attractive opportunities, as we believed these bonds continued to offer relative value. In NPT, our purchases were diversified across bonds with ratings ranging from AA to BBB- ratings. Our opportunities in these areas were somewhat constrained by the structure of bonds typically issued as part of refinancing deals, which tend to be characterized by shorter maturities and higher credit quality.
As of April 30, 2013, all three of these Funds continued to use inverse floating rate securities. We employ inverse floaters for a variety of reasons, including duration management, income enhancement and total return enhancement.
How did the Funds perform during the six-month reporting period ended April 30, 2013?
The tables in each Fund’s Performance Overview and Holding Summaries section of this report provide total returns for the Funds for the six-month, one-year, five-year and ten-year periods ended April 30, 2013. Each Fund’s total returns are compared with the performance of a corresponding market index and Lipper classification average.
For the six-months ended April 30, 2013, the total returns on common share net asset value (NAV) for all three of these Nuveen Funds exceeded the return for the S&P Municipal Bond Index. For this same period, the NPI and NPT performed in line with the Lipper General & Insured Leveraged Municipal Debt Funds Classification Average, while NPM lagged the average return for the Lipper General & Insured Leveraged Municipal Debt Funds Classification Average.
Key management factors that influenced the Funds’ returns during this period included duration and yield curve positioning and credit exposure. While sector allocation positively impacted NPI and NPM, it had a more neutral impact on NPT. In addition, the use of regulatory leverage was an important positive factor affecting the Funds’ performance over this period. Leverage is discussed in more detail later in this report.
Municipal bonds with longer maturities generally outperformed those with shorter maturities during this period. Overall, credits at the longest end of the municipal yield curve posted the strongest returns, while bonds at the shortest end produced the weakest results. For this period, duration and yield curve positioning was a major positive contributor to the performance of these Funds, with the net impact varying according to each Fund’s individual weightings along the yield curve. In particular, the Funds benefited from their holdings of long duration bonds, many of which had zero percent coupons, which generally outperformed the market during this period. NPI’s shorter duration detracted from its performance for the period.
Credit exposure was another important factor in the Funds’ performance during this six-month reporting period as lower quality bonds generally outperformed higher quality bonds. This outperformance was due in part to the greater demand for lower rated bonds as investors looked for investment vehicles offering higher yields. As investors became more comfortable taking on additional investment risk, credit spreads, or the difference in yield spreads between U.S. Treasury securities and comparable investments such as municipal bonds, narrowed through a variety of rating categories. As a result of this spread compression, these Funds benefited from their holdings of lower rated credits, especially NPT, which was overweight in BBB and A rated bonds. NPM, on the other hand, had the smallest weighting of BBB-rated bonds, which detracted from its performance.
During this period, revenue bonds as a whole outperformed the general municipal market. Holdings that generally made positive contributions to the Funds’ return included industrial development revenue (IDR) credits, health care (together with hospitals), transportation and housing bonds. In particular, the Funds’ health care exposure was positive for performance. Tobacco credits backed by the 1998 master tobacco settlement agreement also were one of the top performing market sectors, helped by their longer effective durations and the increased demand for higher yielding investments by investors who had become less risk-averse. In addition, based on recent data showing that cigarette sales had fallen less steeply than anticipated, the 46 states participating in the agreement stand to receive increased payments from the tobacco companies. As of April 30, 2013, all three Funds were slightly overweight in tobacco bonds, which benefited their performance as tobacco credits rallied.
Fund Leverage
IMPACT OF THE FUNDS’ LEVERAGE STRATEGIES ON PERFORMANCE
One important factor impacting the returns of all these Funds relative to the comparative indexes was the Funds’ use of leverage. The Funds use leverage because their managers believe that, over time, leveraging provides opportunities for additional income and total return for common shareholders. However, use of leverage also can expose common shareholders to additional volatility. For example, as the prices of securities held by a Fund decline, the negative impact of these valuation changes on common share net asset value and common shareholder total return is magnified by the use of leverage. Conversely, leverage may enhance common share returns during periods when the prices of securities held by a Fund generally are rising. Leverage made a positive contribution to the performance of these Funds over this reporting period.
As of April 30, 2013, the Funds’ percentages of effective and regulatory leverage are shown in the accompanying table.
| | | | | |
| | Effective | | Regulatory | |
| | Leverage | * | Leverage | * |
| NPI | 36.35% | | 29.09% | |
| NPM | 37.20% | | 30.23% | |
| NPT | 35.74% | | 29.29% | |
| * | Effective Leverage is a Fund’s effective economic leverage, and includes both regulatory leverage and the leverage effects of certain derivative and other investments in a Fund’s portfolio that increase the Fund’s investment exposure. Currently, the leverage effects of Tender Option Bond (TOB) inverse floater holdings are included in effective leverage values, in addition to any regulatory leverage. Regulatory leverage consists of preferred shares issued or borrowings of a Fund. Both of these are part of a Fund’s capital structure. Regulatory leverage is sometimes referred to as “‘40 Act Leverage” and is subject to asset coverage limits set forth in the Investment Company Act of 1940. |
THE FUNDS’ REGULATORY LEVERAGE
As of April 30, 2013, the Funds have issued and outstanding Variable Rate MuniFund Term Preferred (VMTP) Shares and Variable Rate Demand Preferred (VRDP) Shares as shown in the accompanying tables.
VMTP Shares
| | | | | |
| | | | VMTP Shares Issued | |
| Fund | Series | | at Liquidation Value | |
| NPI | 2015 | | $ 407,000,000 | |
During the current reporting period, NPI successfully exchanged all of its outstanding 4,024 Shares of Series 2014 VMTP for 4,024 Shares of Series 2015 VMTP. Concurrent with this exchange, the Fund also issued an additional $4,600,000 at liquidation value, of Series 2015 VMTP Shares. 3Both of these transactions were completed in privately negotiated offerings.
The Fund completed the exchange offer in which it refinanced its existing VMTP Shares with new VMTP Shares at a reduced cost and with a term redemption date of December 1, 2015. The proceeds from the additional VMTP Shares will be used to take advantage of opportunities in the current municipal market. Dividends on the VMTP Shares are set weekly at a fixed spread to the Securities Industry and Financial Markets Association Municipal Swap Index (SIFMA).
VRDP Shares
| | | | |
| | VRDP Shares Issued | |
| Fund | at Liquidation Value | |
| NPM | $ | 489,500,000 | |
| NPT | $ | 262,200,000 | |
Refer to Notes to Financial Statements, Footnote 1 – General Information and Significant Accounting Policies for further details on VMTP Shares and VRDP Shares.
Common Share Information
COMMON SHARE DIVIDEND INFORMATION
During the current reporting period ended April 30, 2013, the Funds’ monthly dividends to shareholders were as shown in the accompanying table.
| | | | | |
| | | Per Common Share Amounts | |
| | | | NPI | | | NPM | | | NPT | |
| November | | $ | 0.0765 | | $ | 0.0745 | | $ | 0.0710 | |
| December | | | 0.0720 | | | 0.0720 | | | 0.0680 | |
| January | | | 0.0720 | | | 0.0720 | | | 0.0680 | |
| February | | | 0.0720 | | | 0.0720 | | | 0.0680 | |
| March | | | 0.0720 | | | 0.0720 | | | 0.0680 | |
| April | | | 0.0720 | | | 0.0720 | | | 0.0680 | |
| Ordinary Income Distribution** | | $ | — | | $ | 0.0009 | | $ | — | |
| | | | | | | | | | | |
| Market Yield*** | | | 5.90% | | | 5.81% | | | 5.71% | |
| Taxable-Equivalent Yield*** | | | 8.19% | | | 8.07% | | | 7.93% | |
| ** | Distribution paid in December 2012. |
| *** | Market Yield is based on the Fund’s current annualized monthly dividend divided by the Fund’s current market price as of the end of the reporting period. Taxable-Equivalent Yield represents the yield that must be earned on a fully taxable investment in order to equal the yield of the Fund on an after-tax basis. It is based on a federal income tax rate of 28.0%. When comparing a Fund to investments that generate qualified dividend income, the Taxable-Equivalent Yield is lower. |
All of the Funds in this report seek to pay stable dividends at rates that reflect each Fund’s past results and projected future performance. During certain periods, each Fund may pay dividends at a rate that may be more or less than the amount of net investment income actually earned by the Fund during the period. If a Fund has cumulatively earned more than it has paid in dividends, it holds the excess in reserve as undistributed net investment income (UNII) as part of the Fund’s NAV. Conversely, if a Fund has cumulatively paid dividends in excess of its earnings, the excess constitutes negative UNII that is likewise reflected in the Fund’s NAV. Each Fund will, over time, pay all of its net investment income as dividends to shareholders. As of April 30, 2013, all of the Funds in this report had positive UNII balances, based on our best estimate, for tax purposes and positive UNII balances for financial reporting purposes.
COMMON SHARE REPURCHASES
During November 2012, the Nuveen Funds’ Board of Directors/Trustees reauthorized the Funds’ open-market share repurchase program, allowing each Fund to repurchase an aggregate of up to approximately 10% of its outstanding common shares.
As of April 30, 2013, and since the inception of the Funds’ repurchase programs, NPM has cumulatively repurchased and retired its outstanding common shares as shown in the accompanying table. Since the inception of the Funds’ repurchase programs, NPI and NPT have not repurchased any of their outstanding common shares.
| | | | | | |
| | | Common Shares | | % of Common Shares | |
| Fund | | Repurchased and Retired | | Authorized for Repurchase | |
| NPM | | 422,900 | | 6.0% | |
During the current reporting period, NPM did not repurchase any of its outstanding common shares.
COMMON SHARE OTHER INFORMATION
As of April 30, 2013, and during the current reporting period, the Funds’ common share prices were trading at a premium/(discount) to their NAV as shown in the accompanying table.
| | | | | | | | | | | |
| | | | NPI | | | NPM | | | NPT | |
| Common Share NAV | | $ | 15.49 | | $ | 15.98 | | $ | 14.60 | |
| Common Share Price | | $ | 14.65 | | $ | 14.88 | | $ | 14.30 | |
| Premium/(Discount) to NAV | | | -5.42 | % | | -6.88 | % | | -2.05 | % |
| 6-Month Average Premium/(Discount) to NAV | | | -2.39 | % | | -3.92 | % | | -0.27 | % |
| Nuveen Investments | | | 11 | | | | | | | |
Risk Considerations
Fund shares are not guaranteed or endorsed by any bank or other insured depository institution, and are not federally insured by the Federal Deposit Insurance Corporation. Past performance is no guarantee of future results. Fund common shares are subject to a variety of risks, including:
Investment, Market and Price Risk. An investment in common shares is subject to investment risk, including the possible loss of the entire principal amount that you invest. Your investment in common shares represents an indirect investment in the municipal securities owned by the Fund, which generally trade in the over-the-counter markets. Shares of closed-end investment companies like these Funds frequently trade at a discount to their net asset value (NAV). Your common shares at any point in time may be worth less than your original investment, even after taking into account the reinvestment of Fund dividends and distributions.
Tax Risk. The tax treatment of Fund distributions may be affected by new IRS interpretations of the Internal Revenue Code and future changes in tax laws and regulations.
Issuer Credit Risk. This is the risk that a security in a Fund’s portfolio will fail to make dividend or interest payments when due.
Interest Rate Risk. Fixed-income securities such as bonds, preferred, convertible and other debt securities will decline in value if market interest rates rise.
Reinvestment Risk. If market interest rates decline, income earned from a Fund’s portfolio may be reinvested at rates below that of the original bond that generated the income.
Call Risk or Prepayment Risk. Issuers may exercise their option to prepay principal earlier than scheduled, forcing a Fund to reinvest in lower-yielding securities.
Inverse Floater Risk. The Funds may invest in inverse floaters. Due to their leveraged nature, these investments can greatly increase a Fund’s exposure to interest rate risk and credit risk. In addition, investments in inverse floaters involve the risk that the Fund could lose more than its original principal investment.
Leverage Risk. Each Fund’s use of leverage creates the possibility of higher volatility for the Fund’s per share NAV, market price, distributions and returns. There is no assurance that a Fund’s leveraging strategy will be successful.
Nuveen Premium Income Municipal Fund, Inc. (NPI)
Performance Overview and Holding Summaries as of April 30, 2013
Average Annual Total Returns as of April 30, 2013
| | | | Cumulative | | | Average Annual | |
| | | | 6-Month | | | 1-Year | | | 5-Year | | | 10-Year | |
| NPI at Common Share NAV | | | 3.25% | | 9.58% | | 8.32% | | 6.30% |
| NPI at Common Share Price | | | (3.09)% | | 6.53% | | 8.93% | | 6.38% |
| S&P Municipal Bond Index | | | 2.01% | | 5.74% | | 6.08% | | 5.16% |
| Lipper General & Insured Leveraged Municipal Debt Funds Classification Average | | | 3.21% | | 10.58% | | 8.88% | | 6.74% |
Past performance is not predictive of future results. Current performance may be higher or lower than the data shown. Returns do not reflect the deduction of taxes that shareholders may have to pay on Fund distributions or upon the sale of Fund shares. Comparative index and Lipper return information is provided for the Fund’s shares at NAV only. Indexes and Lipper averages are not available for direct investment.
| | | | | |
Portfolio Composition1 | | | | |
| (as a % of total investments) | | | | |
| Tax Obligation/Limited | | | 17.0 | % |
| Health Care | | | 17.0 | % |
| Transportation | | | 16.5 | % |
| U.S. Guaranteed | | | 14.7 | % |
| Tax Obligation/General | | | 11.2 | % |
| Water and Sewer | | | 6.0 | % |
| Utilities | | | 5.4 | % |
| Other | | | 12.2 | % |
Credit Quality1,2,3 | | | | |
| (as a % of total investment exposure) | | | | |
| AAA/U.S. Guaranteed | | | 20.6 | % |
| AA | | | 34.7 | % |
| A | | | 26.9 | % |
| BBB | | | 11.2 | % |
| BB or Lower | | | 4.1 | % |
| N/R | | | 1.1 | % |
States1 | | | | |
| (as a % of total investments) | | | | |
| California | | | 14.9 | % |
| Texas | | | 10.3 | % |
| New York | | | 9.7 | % |
| Illinois | | | 8.3 | % |
| Florida | | | 7.1 | % |
| New Jersey | | | 4.6 | % |
| Massachusetts | | | 3.0 | % |
| Pennsylvania | | | 3.0 | % |
| Louisiana | | | 2.9 | % |
| South Carolina | | | 2.8 | % |
| Minnesota | | | 2.7 | % |
| Alabama | | | 2.5 | % |
| Ohio | | | 2.4 | % |
| Michigan | | | 2.2 | % |
| Wisconsin | | | 2.2 | % |
| Washington | | | 1.8 | % |
| Other | | | 19.6 | % |
Refer to the Glossary of Terms Used in this Report for further definition of the terms used within this page.
| 1 | Holdings are subject to change. |
| 2 | Ratings shown are the highest rating given by one of the following national rating agencies: Standard & Poor’s Group, Moody’s Investors Service, Inc. or Fitch, Inc. Credit ratings are subject to change. AAA, AA, A and BBB are investment grade ratings; BB, B, CCC, CC, C and D are below-investment grade ratings. Certain bonds backed by U.S. Government or agency securities are regarded as having an implied rating equal to the rating of such securities. Holdings designated N/R are not rated by these national rating agencies. |
| 3 | Percentage may not add to 100% due to the exclusion of Other Assets Less Liabilities from the table. |
Nuveen Premium Income Municipal Fund 2, Inc. (NPM)
Performance Overview and Holding Summaries as of April 30, 2013
Average Annual Total Returns as of April 30, 2013
| | | | Cumulative | | | Average Annual | |
| | | | 6-Month | | | 1-Year | | | 5-Year | | | 10-Year | |
| NPM at Common Share NAV | | | 2.68% | | 8.74% | | 8.67% | | 6.43% |
| NPM at Common Share Price | | | (1.63)% | | 4.66% | | 9.03% | | 6.52% |
| S&P Municipal Bond Index | | | 2.01% | | 5.74% | | 6.08% | | 5.16% |
| Lipper General & Insured Leveraged Municipal Debt Funds Classification Average | | | 3.21% | | 10.58% | | 8.88% | | 6.74% |
Past performance is not predictive of future results. Current performance may be higher or lower than the data shown. Returns do not reflect the deduction of taxes that shareholders may have to pay on Fund distributions or upon the sale of Fund shares. Comparative index and Lipper return information is provided for the Fund’s shares at NAV only. Indexes and Lipper averages are not available for direct investment.
| | | | | |
Portfolio Composition1 | | | | |
| (as a % of total investments) | | | | |
| Tax Obligation/Limited | | | 18.3 | % |
| Health Care | | | 16.9 | % |
| Tax Obligation/General | | | 14.7 | % |
| U.S. Guaranteed | | | 12.5 | % |
| Transportation | | | 11.3 | % |
| Water and Sewer | | | 7.3 | % |
| Education and Civic Organizations | | | 6.1 | % |
| Utilities | | | 5.7 | % |
| Other | | | 7.2 | % |
Credit Quality1,2,3 | | | | |
| (as a % of total investment exposure) | | | | |
| AAA/U.S. Guaranteed | | | 19.5 | % |
| AA | | | 38.6 | % |
| A | | | 26.9 | % |
| BBB | | | 8.4 | % |
| BB or Lower | | | 2.9 | % |
| N/R | | | 2.2 | % |
States1 | | | | |
| (as a % of total investments) | | | | |
| Florida | | | 17.6 | % |
| California | | | 11.6 | % |
| Illinois | | | 9.5 | % |
| Texas | | | 7.3 | % |
| New York | | | 6.5 | % |
| Nevada | | | 4.1 | % |
| Louisiana | | | 4.0 | % |
| New Jersey | | | 3.5 | % |
| Michigan | | | 3.5 | % |
| Washington | | | 3.3 | % |
| Ohio | | | 3.1 | % |
| Massachusetts | | | 2.2 | % |
| Alabama | | | 2.1 | % |
| Pennsylvania | | | 2.0 | % |
| Other | | | 19.7 | % |
Refer to the Glossary of Terms Used in this Report for further definition of the terms used within this page.
| 1 | Holdings are subject to change. |
| 2 | Ratings shown are the highest rating given by one of the following national rating agencies: Standard & Poor’s Group, Moody’s Investors Service, Inc. or Fitch, Inc. Credit ratings are subject to change. AAA, AA, A and BBB are investment grade ratings; BB, B, CCC, CC, C and D are below-investment grade ratings. Certain bonds backed by U.S. Government or agency securities are regarded as having an implied rating equal to the rating of such securities. Holdings designated N/R are not rated by these national rating agencies. |
| 3 | Percentage may not add to 100% due to the exclusion of Other Assets Less Liabilities from the table. |
Nuveen Premium Income Municipal Fund 4, Inc. (NPT)
Performance Overview and Holding Summaries as of April 30, 2013
Average Annual Total Returns as of April 30, 2013
| | | | Cumulative | | | Average Annual | |
| | | | 6-Month | | | 1-Year | | | 5-Year | | | 10-Year | |
| NPT at Common Share NAV | | | 3.49% | | 10.48% | | 9.25% | | 6.81% |
| NPT at Common Share Price | | | 1.59% | | 9.82% | | 11.38% | | 7.30% |
| S&P Municipal Bond Index | | | 2.01% | | 5.74% | | 6.08% | | 5.16% |
| Lipper General & Insured Leveraged Municipal Debt Funds Classification Average | | | 3.21% | | 10.58% | | 8.88% | | 6.74% |
Past performance is not predictive of future results. Current performance may be higher or lower than the data shown. Returns do not reflect the deduction of taxes that shareholders may have to pay on Fund distributions or upon the sale of Fund shares. Comparative index and Lipper return information is provided for the Fund’s shares at NAV only. Indexes and Lipper averages are not available for direct investment.
| | | | | |
Portfolio Composition1 | | | | |
| (as a % of total investments) | | | | |
| Health Care | | | 22.5 | % |
| Tax Obligation/Limited | | | 17.1 | % |
| Tax Obligation/General | | | 14.1 | % |
| U.S. Guaranteed | | | 11.7 | % |
| Transportation | | | 9.3 | % |
| Water and Sewer | | | 7.3 | % |
| Education and Civic Organizations | | | 4.6 | % |
| Other | | | 13.4 | % |
Credit Quality1,2,3 | | | | |
| (as a % of total investment exposure) | | | | |
| AAA/U.S. Guaranteed | | | 17.8 | % |
| AA | | | 27.0 | % |
| A | | | 29.4 | % |
| BBB | | | 19.6 | % |
| BB or Lower | | | 2.1 | % |
| N/R | | | 2.9 | % |
States1 | | | | |
| (as a % of total investments) | | | | |
| California | | | 14.0 | % |
| Texas | | | 12.6 | % |
| Illinois | | | 12.4 | % |
| Colorado | | | 5.7 | % |
| Florida | | | 4.8 | % |
| Louisiana | | | 4.3 | % |
| Arizona | | | 3.1 | % |
| Michigan | | | 3.0 | % |
| Pennsylvania | | | 2.5 | % |
| Alabama | | | 2.5 | % |
| New York | | | 2.5 | % |
| Georgia | | | 2.4 | % |
| Wisconsin | | | 2.3 | % |
| Ohio | | | 2.3 | % |
| Indiana | | | 2.3 | % |
| Washington | | | 2.0 | % |
| Puerto Rico | | | 1.9 | % |
| Other | | | 19.4 | % |
Refer to the Glossary of Terms Used in this Report for further definition of the terms used within this page.
| 1 | Holdings are subject to change. |
| 2 | Ratings shown are the highest rating given by one of the following national rating agencies: Standard & Poor’s Group, Moody’s Investors Service, Inc. or Fitch, Inc. Credit ratings are subject to change. AAA, AA, A and BBB are investment grade ratings; BB, B, CCC, CC, C and D are below-investment grade ratings. Certain bonds backed by U.S. Government or agency securities are regarded as having an implied rating equal to the rating of such securities. Holdings designated N/R are not rated by these national rating agencies. |
| 3 | Percentage may not add to 100% due to the exclusion of Other Assets Less Liabilities from the table. |
| | | Nuveen Premium Income Municipal Fund, Inc. |
| NPI | | Portfolio of Investments |
| | | April 30, 2013 (Unaudited) |
| | Principal | | | Optional Call | | | | | |
| | Amount (000) | | Description (1) | Provisions (2) | Ratings (3) | | | Value | |
| | | | Municipal Bonds – 148.4% (100.0% of Total Investments) | | | | | | |
| | | | Alabama – 3.7% (2.5% of Total Investments) | | | | | | |
| | | | Alabama Special Care Facilities Financing Authority, Revenue Bonds, Ascension Health, Series 2006C-2: | | | | | | |
| $ | 1,435 | | 5.000%, 11/15/36 (UB) | 11/16 at 100.00 | AA+ | | $ | 1,587,239 | |
| | 4,000 | | 5.000%, 11/15/39 (UB) | 11/16 at 100.00 | AA+ | | | 4,424,360 | |
| | 6,000 | | Alabama Special Care Facilities Financing Authority, Revenue Bonds, Ascension Health, Series 2006D, 5.000%, 11/15/39 (UB) | 11/16 at 100.00 | AA+ | | | 6,636,540 | |
| | | | Birmingham Special Care Facilities Financing Authority, Alabama, Revenue Bonds, Baptist Health System Inc., Series 2005A: | | | | | | |
| | 6,000 | | 5.250%, 11/15/20 | 11/15 at 100.00 | Baa2 | | | 6,483,600 | |
| | 1,300 | | 5.000%, 11/15/30 | 11/15 at 100.00 | Baa2 | | | 1,351,987 | |
| | 12,000 | | Birmingham Waterworks and Sewerage Board, Alabama, Water and Sewerage Revenue Bonds, Series 2007A, 4.500%, 1/01/43 – BHAC Insured | 1/17 at 100.00 | AA+ | | | 12,554,640 | |
| | 2,890 | | Courtland Industrial Development Board, Alabama, Pollution Control Revenue Bonds, International Paper Company, Series 2005A, 5.000%, 6/01/25 | 6/15 at 100.00 | BBB | | | 3,004,184 | |
| | 1,000 | | Montgomery BMC Special Care Facilities Financing Authority, Alabama, Revenue Bonds, Baptist Medical Center, Series 2004C, 5.250%, 11/15/29 (Pre-refunded 11/15/14) | 11/14 at 100.00 | A3 (4) | | | 1,075,110 | |
| | 34,625 | | Total Alabama | | | | | 37,117,660 | |
| | | | Alaska – 1.4% (1.0% of Total Investments) | | | | | | |
| | | | Anchorage, Alaska, General Obligation Refunding Bonds, Series 2003A: | | | | | | |
| | 2,000 | | 5.250%, 9/01/17 (Pre-refunded 9/01/13) – FGIC Insured | 9/13 at 100.00 | AA+ (4) | | | 2,033,760 | |
| | 2,035 | | 5.250%, 9/01/18 (Pre-refunded 9/01/13) – FGIC Insured | 9/13 at 100.00 | AA+ (4) | | | 2,069,351 | |
| | 10,500 | | Northern Tobacco Securitization Corporation, Alaska, Tobacco Settlement Asset-Backed Bonds, Series 2006A, 5.000%, 6/01/32 | 6/14 at 100.00 | B+ | | | 9,824,955 | |
| | 14,535 | | Total Alaska | | | | | 13,928,066 | |
| | | | Arizona – 1.7% (1.1% of Total Investments) | | | | | | |
| | | | Glendale Industrial Development Authority, Arizona, Revenue Bonds, John C. Lincoln Health Network, Series 2005B: | | | | | | |
| | 500 | | 5.250%, 12/01/24 | 12/15 at 100.00 | BBB+ | | | 527,130 | |
| | 660 | | 5.250%, 12/01/25 | 12/15 at 100.00 | BBB+ | | | 693,416 | |
| | 9,720 | | Phoenix Civic Improvement Corporation, Arizona, Junior Lien Airport Revenue Bonds, Series 2010A, 5.000%, 7/01/40 | 7/20 at 100.00 | A+ | | | 10,678,975 | |
| | 4,100 | | Salt Verde Financial Corporation, Arizona, Senior Gas Revenue Bonds, Citigroup Energy Inc Prepay Contract Obligations, Series 2007, 5.000%, 12/01/37 | No Opt. Call | A– | | | 4,606,145 | |
| | 14,980 | | Total Arizona | | | | | 16,505,666 | |
| | | | Arkansas – 0.2% (0.1% of Total Investments) | | | | | | |
| | 2,000 | | Washington County, Arkansas, Hospital Revenue Bonds, Washington Regional Medical Center, Series 2005B, 5.000%, 2/01/25 | 2/15 at 100.00 | Baa1 | | | 2,060,560 | |
| | | | California – 22.1% (14.9% of Total Investments) | | | | | | |
| | 9,200 | | Alameda Corridor Transportation Authority, California, Revenue Bonds, Refunding Subordinate Lien Series 2004A, 0.000%, 10/01/20 – AMBAC Insured | No Opt. Call | BBB+ | | | 7,257,328 | |
| | 10,000 | | Anaheim Public Finance Authority, California, Senior Lease Bonds, Public Improvement Project, Refunding Series 2007A-1, 4.375%, 3/01/37 – FGIC Insured | 9/17 at 100.00 | A1 | | | 10,340,600 | |
| | 5,400 | | California Educational Facilities Authority, Revenue Bonds, University of Southern California, Series 2005, 4.750%, 10/01/28 (UB) | 10/15 at 100.00 | Aa1 | | | 5,863,158 | |
| | 1,500 | | California Educational Facilities Authority, Revenue Bonds, University of the Pacific, Series 2006, 5.000%, 11/01/30 | 11/15 at 100.00 | A2 | | | 1,619,940 | |
| | 5,425 | | California Health Facilities Financing Authority, Revenue Bonds, Catholic Healthcare West, Series 2004I, 4.950%, 7/01/26 (Mandatory put 7/01/14) | No Opt. Call | A | | | 5,705,147 | |
| | Principal | | | Optional Call | | | | | |
| | Amount (000) | | Description (1) | Provisions (2) | Ratings (3) | | | Value | |
| | | | California (continued) | | | | | | |
| $ | 8,560 | | California Health Facilities Financing Authority, Revenue Bonds, Cedars-Sinai Medical Center, Series 2005, 5.000%, 11/15/27 | 11/15 at 100.00 | A+ | | $ | 9,256,442 | |
| | 8,570 | | California Health Facilities Financing Authority, Revenue Bonds, Kaiser Permanante System, Series 2006, 5.000%, 4/01/37 | 4/16 at 100.00 | A+ | | | 9,331,702 | |
| | 4,250 | | California Health Facilities Financing Authority, Revenue Bonds, Providence Health & Services, Series 2009B, 5.500%, 10/01/39 | 10/19 at 100.00 | AA | | | 5,005,905 | |
| | | | California Health Facilities Financing Authority, Revenue Bonds, Stanford Hospitals and Clinics, Tender Option Bond Trust 3294: | | | | | | |
| | 2,140 | | 9.308%, 2/15/20 (IF) (5) | No Opt. Call | AA– | | | 2,654,285 | |
| | 825 | | 9.308%, 2/15/20 (IF) | No Opt. Call | AA– | | | 1,023,264 | |
| | 790 | | 9.301%, 2/15/20 (IF) | No Opt. Call | AA– | | | 979,679 | |
| | 3,015 | | California Health Facilities Financing Authority, Revenue Bonds, Sutter Health, Series 2007A, 5.000%, 11/15/42 (UB) | 11/16 at 100.00 | AA– | | | 3,325,786 | |
| | 7,205 | | California State Public Works Board, Lease Revenue Bonds, Department of Corrections, Series 1993E, 5.500%, 6/01/15 | No Opt. Call | A2 | | | 7,501,198 | |
| | 1,000 | | California State Public Works Board, Lease Revenue Bonds, Various Capital Projects, Series 2010A-1, 6.000%, 3/01/35 | 3/20 at 100.00 | A2 | | | 1,228,170 | |
| | 3,130 | | California State, Economic Recovery Revenue Bonds, Series 2004A, 5.250%, 7/01/14 | No Opt. Call | Aa3 | | | 3,312,041 | |
| | 905 | | California State, Economic Recovery Revenue Bonds, Series 2004A, 5.250%, 7/01/14 (ETM) | No Opt. Call | Aaa | | | 957,970 | |
| | | | California State, General Obligation Bonds, Series 2004: | | | | | | |
| | 1,160 | | 5.125%, 2/01/25 | 2/14 at 100.00 | A1 | | | 1,199,243 | |
| | 10,000 | | 5.125%, 2/01/26 | 2/14 at 100.00 | A1 | | | 10,330,600 | |
| | | | California Statewide Community Development Authority, Revenue Bonds, Daughters of Charity Health System, Series 2005A: | | | | | | |
| | 1,640 | | 5.250%, 7/01/30 | 7/15 at 100.00 | BBB– | | | 1,726,953 | |
| | 4,730 | | 5.000%, 7/01/39 | 7/15 at 100.00 | BBB– | | | 4,907,375 | |
| | 5,000 | | California Statewide Community Development Authority, Revenue Bonds, St. Joseph Health System, Series 2007A, 5.750%, 7/01/47 – FGIC Insured | 7/18 at 100.00 | AA– | | | 5,784,650 | |
| | 7,130 | | California Statewide Community Development Authority, Revenue Bonds, Sutter Health, Tender Option Bond Trust 3175, 13.651%, 5/15/14 (IF) | No Opt. Call | AA– | | | 11,048,220 | |
| | 3,575 | | Chula Vista, California, Industrial Development Revenue Bonds, San Diego Gas and Electric Company, Series 1996A, 5.300%, 7/01/21 | 6/14 at 102.00 | A+ | | | 3,822,426 | |
| | 4,890 | | Clovis Unified School District, Fresno County, California, General Obligation Bonds, Series 2006B, 0.000%, 8/01/26 – NPFG Insured | No Opt. Call | AA+ | | | 3,043,243 | |
| | | | Golden State Tobacco Securitization Corporation, California, Tobacco Settlement Asset-Backed Bonds, Series 2007A-1: | | | | | | |
| | 7,520 | | 5.000%, 6/01/33 | 6/17 at 100.00 | B | | | 6,937,050 | |
| | 2,000 | | 5.750%, 6/01/47 | 6/17 at 100.00 | B | | | 1,910,940 | |
| | 3,000 | | 5.125%, 6/01/47 | 6/17 at 100.00 | B | | | 2,612,880 | |
| | 5,000 | | Kern Community College District, California, General Obligation Bonds, Series 2006, 0.000%, 11/01/24 – AGM Insured | No Opt. Call | Aa2 | | | 3,335,650 | |
| | 15,000 | | Los Angeles Department of Water and Power, California, Waterworks Revenue Bonds, Series 2011A, 5.000%, 7/01/41 | 1/21 at 100.00 | AA | | | 16,915,200 | |
| | 465 | | Martinez, California, Home Mortgage Revenue Bonds, Series 1983A, 10.750%, 2/01/16 (ETM) | No Opt. Call | Aaa | | | 535,029 | |
| | 14,430 | | Pomona, California, GNMA/FNMA Collateralized Securities Program Single Family Mortgage Revenue Bonds, Series 1990A, 7.600%, 5/01/23 (ETM) | No Opt. Call | Aaa | | | 19,045,436 | |
| | 5,000 | | Rancho Mirage Joint Powers Financing Authority, California, Revenue Bonds, Eisenhower Medical Center, Series 2004, 5.875%, 7/01/26 (Pre-refunded 7/01/14) | 7/14 at 100.00 | Baa2 (4) | | | 5,326,050 | |
| | 2,570 | | Sacramento Municipal Utility District, California, Electric Revenue Bonds, Series 2003R, 5.000%, 8/15/22 (Pre-refunded 8/15/13) – NPFG Insured | 8/13 at 100.00 | A1 (4) | | | 2,606,777 | |
| | | Nuveen Premium Income Municipal Fund, Inc. (continued) |
| NPI | | Portfolio of Investments |
| | | April 30, 2013 (Unaudited) |
| | Principal | | | Optional Call | | | | | |
| | Amount (000) | | Description (1) | Provisions (2) | Ratings (3) | | | Value | |
| | | | California (continued) | | | | | | |
| $ | 1,130 | | Sacramento Municipal Utility District, California, Electric Revenue Bonds, Series 2003R, 5.000%, 8/15/22 – NPFG Insured | 8/13 at 100.00 | AA– | | $ | 1,145,888 | |
| | | | San Diego County, California, Certificates of Participation, Burnham Institute, Series 2006: | | | | | | |
| | 400 | | 5.000%, 9/01/21 | 9/15 at 102.00 | Baa2 | | | 423,276 | |
| | 445 | | 5.000%, 9/01/23 | 9/15 at 102.00 | Baa2 | | | 466,698 | |
| | 3,500 | | San Diego Unified Port District, California, Revenue Bonds, Series 2004B, 5.000%, 9/01/29 – NPFG Insured | 9/14 at 100.00 | A+ | | | 3,685,710 | |
| | | | San Joaquin Hills Transportation Corridor Agency, Orange County, California, Toll Road Revenue Refunding Bonds, Series 1997A: | | | | | | |
| | 10,450 | | 0.000%, 1/15/31 – NPFG Insured | No Opt. Call | Baa2 | | | 4,418,887 | |
| | 7,150 | | 0.000%, 1/15/32 – NPFG Insured | No Opt. Call | Baa2 | | | 2,853,851 | |
| | 50,400 | | 0.000%, 1/15/34 – NPFG Insured | No Opt. Call | Baa2 | | | 17,979,192 | |
| | 24,025 | | 0.000%, 1/15/36 – NPFG Insured | No Opt. Call | Baa2 | | | 7,622,172 | |
| | | | Union City Community Redevelopment Agency, California, Tax Allocation Revenue Bonds, Redevelopment Project, Subordinate Lien Series 2011: | | | | | | |
| | 1,000 | | 6.500%, 12/01/24 | 12/21 at 100.00 | A | | | 1,286,410 | |
| | 1,000 | | 6.625%, 12/01/25 | 12/21 at 100.00 | A | | | 1,285,320 | |
| | 1,325 | | 6.750%, 12/01/26 | 12/21 at 100.00 | A | | | 1,701,207 | |
| | 265,850 | | Total California | | | | | 219,318,948 | |
| | | | Colorado – 1.8% (1.2% of Total Investments) | | | | | | |
| | 2,500 | | Centennial Water and Sanitation District, Colorado, Water and Sewerage Revenue Bonds, Series 2004, 5.000%, 12/01/21 (Pre-refunded 12/01/14) – FGIC Insured | 12/14 at 100.00 | AA+ (4) | | | 2,685,300 | |
| | 690 | | Colorado Educational and Cultural Facilities Authority, Charter School Revenue Bonds, Bromley School, Series 2005, 5.125%, 9/15/20 – SYNCORA GTY Insured | 9/15 at 100.00 | A | | | 731,904 | |
| | 2,125 | | Colorado Health Facilities Authority, Revenue Bonds, Evangelical Lutheran Good Samaritan Society, Series 2005, 5.000%, 6/01/29 | 6/16 at 100.00 | A– | | | 2,220,264 | |
| | 1,000 | | Colorado Health Facilities Authority, Revenue Bonds, Parkview Medical Center, Series 2004, 5.000%, 9/01/25 | 9/14 at 100.00 | A3 | | | 1,006,010 | |
| | 800 | | Colorado Health Facilities Authority, Revenue Bonds, Poudre Valley Health Care, Series 2005F, 5.000%, 3/01/25 | 3/15 at 100.00 | A+ | | | 830,840 | |
| | 1,670 | | Denver City and County, Colorado, Airport System Revenue Bonds, Series 1991D, 7.750%, 11/15/13 (Alternative Minimum Tax) | No Opt. Call | A+ | | | 1,736,666 | |
| | 20,500 | | E-470 Public Highway Authority, Colorado, Senior Revenue Bonds, Series 2000B, 0.000%, 9/01/32 – NPFG Insured | No Opt. Call | Baa2 | | | 7,986,595 | |
| | 250 | | Regional Transportation District, Colorado, Denver Transit Partners Eagle P3 Project Private Activity Bonds, Series 2010, 6.000%, 1/15/41 | 7/20 at 100.00 | Baa3 | | | 291,833 | |
| | 29,535 | | Total Colorado | | | | | 17,489,412 | |
| | | | Connecticut – 0.5% (0.3% of Total Investments) | | | | | | |
| | 1,930 | | Connecticut, General Obligation Bonds, Series 2001C, 5.500%, 12/15/16 | No Opt. Call | AA | | | 2,266,592 | |
| | 2,310 | | Greater New Haven Water Pollution Control Authority, Connecticut, Regional Wastewater System Revenue Bonds, Series 2005A, 5.000%, 11/15/30 – NPFG Insured | 11/15 at 100.00 | A1 | | | 2,503,047 | |
| | 4,240 | | Total Connecticut | | | | | 4,769,639 | |
| | | | Delaware – 0.1% (0.1% of Total Investments) | | | | | | |
| | 1,000 | | Delaware Health Facilities Authority, Revenue Bonds, Christiana Care Health Services Inc., Series 2010A, 5.000%, 10/01/40 – NPFG Insured | 10/20 at 100.00 | AA | | | 1,115,570 | |
| | | | District of Columbia – 2.1% (1.4% of Total Investments) | | | | | | |
| | 2,640 | | District of Columbia Housing Finance Agency, GNMA Collateralized Single Family Mortgage Revenue Bonds, Series 1988E-4, 6.375%, 6/01/26 (Alternative Minimum Tax) | 6/13 at 100.00 | AA+ | | | 2,646,442 | |
| | 9,505 | | District of Columbia, General Obligation Bonds, Series 1998B, 6.000%, 6/01/20 – NPFG Insured | No Opt. Call | Aa2 | | | 12,336,064 | |
| | Principal | | | Optional Call | | | | | |
| | Amount (000) | | Description (1) | Provisions (2) | Ratings (3) | | | Value | |
| | | | District of Columbia (continued) | | | | | | |
| $ | 2,130 | | Washington Convention Center Authority, District of Columbia, Dedicated Tax Revenue Bonds, Tender Option Bond Trust 1606, 11.456%, 10/01/30 – AMBAC Insured (IF) (5) | 10/16 at 100.00 | AA+ | | $ | 2,444,409 | |
| | 3,335 | | Washington Convention Center Authority, District of Columbia, Dedicated Tax Revenue Bonds, Tender Option Bond Trust 1730, 11.452%, 10/01/30 – AMBAC Insured (IF) (5) | 10/16 at 100.00 | AA+ | | | 3,827,079 | |
| | 17,610 | | Total District of Columbia | | | | | 21,253,994 | |
| | | | Florida – 10.5% (7.1% of Total Investments) | | | | | | |
| | 2,875 | | Brevard County Health Facilities Authority, Florida, Revenue Bonds, Health First Inc. Project, Series 2005, 5.000%, 4/01/24 | 4/16 at 100.00 | A– | | | 3,045,459 | |
| | 2,000 | | Florida Ports Financing Commission, Revenue Bonds, State Transportation Trust Fund, Refunding Series 2011B, 5.375%, 10/01/29 (Alternative Minimum Tax) | 10/21 at 100.00 | AA+ | | | 2,356,680 | |
| | 8,000 | | Hillsborough County Aviation Authority, Florida, Revenue Bonds, Tampa International Airport, Series 2003A, 5.375%, 10/01/16 – NPFG Insured (Alternative Minimum Tax) | 10/13 at 100.00 | A+ | | | 8,166,320 | |
| | 5,400 | | Hillsborough County Industrial Development Authority, Florida, Exempt Facilities Remarketed Revenue Bonds, National Gypsum Company, Apollo Beach Project, Series 2000B, 7.125%, 4/01/30 (Alternative Minimum Tax) | 10/13 at 100.00 | N/R | | | 5,402,970 | |
| | 8,000 | | JEA, Florida, Water and Sewer System Revenue Bonds, Series 2010D, 5.000%, 10/01/39 | 4/20 at 100.00 | AA | | | 9,038,240 | |
| | 2,930 | | Miami-Dade County Educational Facilities Authority, Florida, Revenue Bonds, University of Miami Issue, Series 2012A, 5.000%, 4/01/42 | No Opt. Call | A– | | | 3,289,042 | |
| | 19,750 | | Miami-Dade County Expressway Authority, Florida, Toll System Revenue Bonds, Series 2006, 4.500%, 7/01/33 – AMBAC Insured | 7/16 at 100.00 | A– | | | 20,647,045 | |
| | | | Miami-Dade County, Florida, Aviation Revenue Bonds, Miami International Airport, Refunding Series 2012A: | | | | | | |
| | 1,000 | | 5.000%, 10/01/29 (Alternative Minimum Tax) | No Opt. Call | A | | | 1,127,580 | |
| | 1,800 | | 5.000%, 10/01/30 (Alternative Minimum Tax) | No Opt. Call | A | | | 2,020,392 | |
| | 7,840 | | Miami-Dade County, Florida, Aviation Revenue Bonds, Miami International Airport, Series 2010B, 5.000%, 10/01/41 | 10/20 at 100.00 | A | | | 8,784,485 | |
| | 1,800 | | Miami-Dade County, Florida, Subordinate Special Obligation Refunding Bonds Series 2012B, 5.000%, 10/01/37 | 10/22 at 100.00 | A+ | | | 2,014,254 | |
| | 11,100 | | Miami-Dade County, Florida, Transit System Sales Surtax Revenue Bonds, Series 2012, 5.000%, 7/01/42 | 7/22 at 100.00 | AA | | | 12,530,568 | |
| | 6,910 | | South Miami Health Facilities Authority, Florida, Hospital Revenue, Baptist Health System Obligation Group, Series 2007, 5.000%, 8/15/42 (UB) (5) | 8/17 at 100.00 | AA | | | 7,571,702 | |
| | 1,785 | | Tallahassee, Florida, Energy System Revenue Bonds, Series 2005, 5.000%, 10/01/28 – NPFG Insured | 10/15 at 100.00 | AA | | | 1,938,439 | |
| | 12,690 | | Tampa-Hillsborough County Expressway Authority, Florida, Revenue Bonds, Refunding Series 2012B, 5.000%, 7/01/42 | No Opt. Call | A– | | | 14,166,228 | |
| | 2,375 | | Volusia County School Board, Florida, Certificates of Participation, Series 2005B, 5.000%, 8/01/22 – AGM Insured | 8/15 at 100.00 | Aa3 | | | 2,502,846 | |
| | 96,255 | | Total Florida | | | | | 104,602,250 | |
| | | | Georgia – 1.5% (1.0% of Total Investments) | | | | | | |
| | 2,625 | | Fulton County Development Authority, Georgia, Revenue Bonds, Georgia Tech Molecular Science Building, Series 2004, 5.250%, 5/01/24 – NPFG Insured | 5/14 at 100.00 | Aa3 | | | 2,741,393 | |
| | 1,900 | | Fulton-DeKalb Hospital Authority, Georgia, Revenue Refunding Certificates, Series 2003, 5.250%, 1/01/20 – AGM Insured | No Opt. Call | Aa2 | | | 1,962,377 | |
| | 4,125 | | Fulton-DeKalb Hospital Authority, Georgia, Revenue Refunding Certificates, Series 2003, 5.250%, 1/01/20 (Pre-refunded 1/01/14) – AGM Insured | 1/14 at 100.00 | Aa2 (4) | | | 4,264,136 | |
| | 5,010 | | Metropolitan Atlanta Rapid Transit Authority, Georgia, Sales Tax Revenue Refunding Bonds, Series 1992P, 6.250%, 7/01/20 – AMBAC Insured | No Opt. Call | Aa2 | | | 5,790,007 | |
| | 13,660 | | Total Georgia | | | | | 14,757,913 | |
| | | Nuveen Premium Income Municipal Fund, Inc. (continued) |
| NPI | | Portfolio of Investments |
| | | April 30, 2013 (Unaudited) |
| | Principal | | | Optional Call | | | | | |
| | Amount (000) | | Description (1) | Provisions (2) | Ratings (3) | | | Value | |
| | | | Hawaii – 1.0% (0.7% of Total Investments) | | | | | | |
| $ | 5,000 | | Hawaii State, General Obligation Bonds, Series 2003DA, 5.250%, 9/01/21 – NPFG Insured | 9/13 at 100.00 | AA | | $ | 5,083,300 | |
| | 5,000 | | Hawaii State, General Obligation Bonds, Series 2003DA, 5.250%, 9/01/21 (Pre-refunded 9/01/13) – NPFG Insured | 9/13 at 100.00 | Aa2 (4) | | | 5,084,400 | |
| | 10,000 | | Total Hawaii | | | | | 10,167,700 | |
| | | | Idaho – 0.3% (0.2% of Total Investments) | | | | | | |
| | | | Madison County, Idaho, Hospital Revenue Certificates of Participation, Madison Memorial Hospital, Series 2006: | | | | | | |
| | 2,185 | | 5.250%, 9/01/30 | 9/16 at 100.00 | BB+ | | | 2,260,077 | |
| | 600 | | 5.250%, 9/01/37 | 9/16 at 100.00 | BB+ | | | 617,220 | |
| | 2,785 | | Total Idaho | | | | | 2,877,297 | |
| | | | Illinois – 12.4% (8.3% of Total Investments) | | | | | | |
| | | | Chicago Board of Education, Illinois, Unlimited Tax General Obligation Bonds, Dedicated Tax Revenues, Series 1998B-1: | | | | | | |
| | 8,890 | | 0.000%, 12/01/16 – FGIC Insured | No Opt. Call | A+ | | | 8,467,103 | |
| | 10,000 | | 0.000%, 12/01/20 – FGIC Insured | No Opt. Call | A+ | | | 8,126,000 | |
| | 10,130 | | 0.000%, 12/01/24 – FGIC Insured | No Opt. Call | A+ | | | 6,690,460 | |
| | | | Chicago Board of Education, Illinois, Unlimited Tax General Obligation Bonds, Dedicated Tax Revenues, Series 1999A: | | | | | | |
| | 15,000 | | 0.000%, 12/01/21 – FGIC Insured | No Opt. Call | A+ | | | 11,522,850 | |
| | 10,000 | | 0.000%, 12/01/23 – FGIC Insured | No Opt. Call | A+ | | | 6,913,300 | |
| | 3,800 | | Chicago Transit Authority, Illinois, Sales Tax Receipts Revenue Bonds, Series 2011, 5.250%, 12/01/40 | 12/21 at 100.00 | AA | | | 4,354,610 | |
| | 3,130 | | Chicago, Illinois, Sales Tax Revenue Bonds, Series 2011A, 5.000%, 1/01/41 | 1/22 at 100.00 | AAA | | | 3,499,434 | |
| | 13,310 | | Cook County, Illinois, General Obligation Bonds, Refunding Series 2010A, 5.250%, 11/15/33 | 11/20 at 100.00 | AA | | | 15,177,925 | |
| | 8,810 | | Illinois Development Finance Authority, Pollution Control Revenue Refunding Bonds, Illinois Power Company, Series 1994A, 5.700%, 2/01/24 – NPFG Insured | 8/13 at 100.00 | A– | | | 8,828,061 | |
| | | | Illinois Finance Authority, Revenue Bonds, OSF Healthcare System, Series 2004: | | | | | | |
| | 1,050 | | 5.250%, 11/15/22 (Pre-refunded 5/15/14) | 5/14 at 100.00 | A (4) | | | 1,103,624 | |
| | 3,000 | | 5.250%, 11/15/23 (Pre-refunded 5/15/14) | 5/14 at 100.00 | A (4) | | | 3,153,210 | |
| | 985 | | Illinois Finance Authority, Revenue Bonds, Proctor Hospital, Series 2006, 5.125%, 1/01/25 | 1/16 at 100.00 | BB+ | | | 973,860 | |
| | 2,880 | | Illinois Finance Authority, Revenue Bonds, Provena Health, Series 2009A, 7.750%, 8/15/34 | 8/19 at 100.00 | BBB+ | | | 3,701,779 | |
| | 1,970 | | Illinois Finance Authority, Revenue Bonds, The University of Chicago, Series 2012A, 5.000%, 10/01/51 | 10/21 at 100.00 | Aa1 | | | 2,192,177 | |
| | 10,280 | | Illinois Health Facilities Authority, Revenue Bonds, Sherman Health Systems, Series 1997, 5.250%, 8/01/27 – AMBAC Insured | 8/13 at 100.00 | BBB | | | 10,290,794 | |
| | 1,115 | | Illinois Toll Highway Authority, Toll Highway Revenue Bonds, Tender Option Bond Trust 4304, 17.980%, 1/01/21 (WI/DD, Settling 5/16/13) (IF) | No Opt. Call | AA– | | | 1,708,738 | |
| | 1,000 | | Lombard Public Facilities Corporation, Illinois, Second Tier Conference Center and Hotel Revenue Bonds, Series 2005B, 5.250%, 1/01/30 | 1/16 at 100.00 | CCC | | | 470,990 | |
| | 10,000 | | Metropolitan Pier and Exposition Authority, Illinois, McCormick Place Expansion Project Refunding Bonds, Series 2010A, 5.500%, 6/15/50 | 6/20 at 100.00 | AAA | | | 11,201,000 | |
| | 5,290 | | Metropolitan Pier and Exposition Authority, Illinois, Revenue Bonds, McCormick Place Expansion Project, Series 1993A, 0.000%, 6/15/15 – FGIC Insured | No Opt. Call | A3 | | | 5,186,792 | |
| | | | Metropolitan Pier and Exposition Authority, Illinois, Revenue Bonds, McCormick Place Expansion Project, Series 1993A: | | | | | | |
| | 3,590 | | 0.000%, 6/15/15 – FGIC Insured (ETM) | No Opt. Call | A3 (4) | | | 3,551,479 | |
| | 1,160 | | 0.000%, 6/15/15 – FGIC Insured (ETM) | No Opt. Call | A3 (4) | | | 1,147,553 | |
| | 3,000 | | Metropolitan Pier and Exposition Authority, Illinois, Revenue Bonds, McCormick Place Hospitality Facility, Series 1996A, 7.000%, 7/01/26 (ETM) | No Opt. Call | Aaa | | | 4,310,850 | |
| | 128,390 | | Total Illinois | | | | | 122,572,589 | |
| | Principal | | | Optional Call | | | | | |
| | Amount (000) | | Description (1) | Provisions (2) | Ratings (3) | | | Value | |
| | | | Indiana – 0.6% (0.4% of Total Investments) | | | | | | |
| $ | 2,005 | | Hamilton County Public Building Corporation, Indiana, First Mortgage Bonds, Series 2004, 5.000%, 8/01/22 (Pre-refunded 8/01/14) – AGM Insured | 8/14 at 100.00 | Aaa | | $ | 2,123,556 | |
| | 1,260 | | Indiana Finance Authority, Hospital Revenue Bonds, Community Health Network Project, Series 2012A, 5.000%, 5/01/42 | 5/23 at 100.00 | A | | | 1,397,579 | |
| | 2,500 | | Indiana Finance Authority, Revenue Bonds, Trinity Health Care Group, Refunding Series 2010B., 5.000%, 12/01/37 | 12/20 at 100.00 | AA | | | 2,747,000 | |
| | 5,765 | | Total Indiana | | | | | 6,268,135 | |
| | | | Iowa – 1.4% (1.0% of Total Investments) | | | | | | |
| | 2,105 | | Iowa Finance Authority, Industrial Remarketed Revenue Refunding Bonds, Urbandale Hotel Corporation, Series 1989A, 8.500%, 8/01/16 (Alternative Minimum Tax) (ETM) | No Opt. Call | AA+ (4) | | | 2,254,329 | |
| | | | Iowa Tobacco Settlement Authority, Asset Backed Settlement Revenue Bonds, Series 2005C: | | | | | | |
| | 10,000 | | 5.500%, 6/01/42 | 6/15 at 100.00 | B+ | | | 9,712,800 | |
| | 2,000 | | 5.625%, 6/01/46 | 6/15 at 100.00 | B+ | | | 1,961,620 | |
| | 14,105 | | Total Iowa | | | | | 13,928,749 | |
| | | | Kansas – 0.6% (0.4% of Total Investments) | | | | | | |
| | 6,000 | | Kansas Department of Transportation, Highway Revenue Bonds, Series 2004A, 5.000%, 3/01/21 (Pre-refunded 3/01/14) | 3/14 at 100.00 | AAA | | | 6,238,500 | |
| | | | Kentucky – 2.0% (1.3% of Total Investments) | | | | | | |
| | 3,800 | | Kentucky Economic Development Finance Authority, Hospital Facilities Revenue Bonds, Owensboro Medical Health System, Series 2010A, 6.500%, 3/01/45 | 6/20 at 100.00 | BBB+ | | | 4,582,610 | |
| | 9,195 | | Lexington-Fayette Urban County Government Public Facilities Corporation, Kentucky State Lease Revenue Bonds, Eastern State Hospital Project, Series 2011A, 5.250%, 6/01/30 | 6/21 at 100.00 | Aa3 | | | 10,717,140 | |
| | | | Marshall County School District Finance Corporation, Kentucky, School Building Revenue Bonds, Series 2004: | | | | | | |
| | 1,210 | | 5.000%, 6/01/19 (Pre-refunded 6/01/14) – AMBAC Insured | 6/14 at 100.00 | Aa3 (4) | | | 1,272,182 | |
| | 1,270 | | 5.000%, 6/01/20 (Pre-refunded 6/01/14) – AMBAC Insured | 6/14 at 100.00 | Aa3 (4) | | | 1,335,265 | |
| | 1,335 | | 5.000%, 6/01/21 (Pre-refunded 6/01/14) – AMBAC Insured | 6/14 at 100.00 | Aa3 (4) | | | 1,403,606 | |
| | 16,810 | | Total Kentucky | | | | | 19,310,803 | |
| | | | Louisiana – 4.3% (2.9% of Total Investments) | | | | | | |
| | | | Louisiana Public Facilities Authority, Extended Care Facilities Revenue Bonds, Comm-Care Corporation Project, Series 1994: | | | | | | |
| | 115 | | 11.000%, 2/01/14 (ETM) | No Opt. Call | N/R (4) | | | 123,634 | |
| | 1,055 | | 11.000%, 2/01/14 (ETM) | No Opt. Call | N/R (4) | | | 1,133,787 | |
| | 2,000 | | Louisiana Public Facilities Authority, Hospital Revenue Bonds, Franciscan Missionaries of Our Lady Health System, Series 2005A, 5.250%, 8/15/31 | 8/15 at 100.00 | A+ | | | 2,076,100 | |
| | 5,800 | | Louisiana Public Facilities Authority, Revenue Bonds, Ochsner Clinic Foundation Project, Series 2007A, 5.500%, 5/15/47 | 5/17 at 100.00 | Baa1 | | | 6,167,894 | |
| | 4,305 | | Louisiana Public Facilities Authority, Revenue Bonds, Ochsner Clinic Foundation Project, Series 2011, 6.750%, 5/15/41 | 5/21 at 100.00 | Baa1 | | | 5,206,037 | |
| | | | Louisiana State, Gasoline and Fuels Tax Revenue Bonds, Series 2005A: | | | | | | |
| | 1,200 | | 5.000%, 5/01/25 (Pre-refunded 5/01/15) – FGIC Insured | 5/15 at 100.00 | Aa1 (4) | | | 1,311,900 | |
| | 2,210 | | 5.000%, 5/01/26 (Pre-refunded 5/01/15) – FGIC Insured | 5/15 at 100.00 | Aa1 (4) | | | 2,416,083 | |
| | 2,500 | | 5.000%, 5/01/27 (Pre-refunded 5/01/15) – FGIC Insured | 5/15 at 100.00 | Aa1 (4) | | | 2,733,125 | |
| | | | Louisiana State, Gasoline and Fuels Tax Revenue Bonds, Series 2006A: | | | | | | |
| | 930 | | 4.750%, 5/01/39 – AGM Insured (UB) | 5/16 at 100.00 | Aa1 | | | 1,013,793 | |
| | 10,105 | | 4.500%, 5/01/41 – FGIC Insured (UB) | 5/16 at 100.00 | Aa1 | | | 10,905,519 | |
| | | | Tobacco Settlement Financing Corporation, Louisiana, Tobacco Settlement Asset-Backed Bonds, Series 2001B: | | | | | | |
| | 270 | | 5.500%, 5/15/30 | 5/13 at 100.00 | A1 | | | 271,488 | |
| | 8,785 | | 5.875%, 5/15/39 | 5/13 at 100.00 | A– | | | 8,833,405 | |
| | 39,275 | | Total Louisiana | | | | | 42,192,765 | |
| | | Nuveen Premium Income Municipal Fund, Inc. (continued) |
| NPI | | Portfolio of Investments |
| | | April 30, 2013 (Unaudited) |
| | Principal | | | Optional Call | | | | | |
| | Amount (000) | | Description (1) | Provisions (2) | Ratings (3) | | | Value | |
| | | | Maryland – 0.9% (0.6% of Total Investments) | | | | | | |
| $ | 2,200 | | Baltimore, Maryland, Senior Lien Convention Center Hotel Revenue Bonds, Series 2006A, 5.250%, 9/01/27 – SYNCORA GTY Insured | 9/16 at 100.00 | BB+ | | $ | 2,267,980 | |
| | 450 | | Maryland Health and Higher Educational Facilities Authority, Revenue Bonds, Mercy Medical Center, Series 2011, 6.000%, 7/01/25 | 7/21 at 100.00 | BBB | | | 545,877 | |
| | 2,000 | | Maryland Health and Higher Educational Facilities Authority, Revenue Bonds, Washington County Hospital, Series 2008, 5.750%, 1/01/33 | 1/18 at 100.00 | BBB | | | 2,181,838 | |
| | 3,465 | | Maryland Health and Higher Educational Facilities Authority, Revenue Bonds, Western Maryland Health, Series 2006A, 4.750%, 7/01/36 – NPFG Insured | 7/16 at 100.00 | Baa2 | | | 3,605,850 | |
| | 735 | | Montgomery County Housing Opportunities Commission, Maryland, Multifamily Housing Development Bonds, Series 2000B, 6.200%, 7/01/30 (Alternative Minimum Tax) | 7/13 at 100.00 | Aaa | | | 736,470 | |
| | 8,850 | | Total Maryland | | | | | 9,338,015 | |
| | | | Massachusetts – 4.5% (3.0% of Total Investments) | | | | | | |
| | 805 | | Massachusetts Development Finance Agency, Revenue Bonds, Boston University, Series 2013X, 5.000%, 10/01/48 | 10/23 at 100.00 | A1 | | | 910,487 | |
| | 2,300 | | Massachusetts Development Finance Agency, Revenue Bonds, Olin College, Series 2013E, 5.000%, 11/01/43 (WI/DD, Settling 5/09/13) | 11/23 at 100.00 | A+ | | | 2,589,179 | |
| | 2,025 | | Massachusetts Health and Educational Facilities Authority, Revenue Refunding Bonds, Suffolk University Issue, Series 2009A, 5.750%, 7/01/39 | 7/19 at 100.00 | BBB | | | 2,290,741 | |
| | 700 | | Massachusetts Port Authority, Special Facilities Revenue Bonds, ConRac Project, Series 2011A, 5.125%, 7/01/41 | 7/21 at 100.00 | A | | | 784,672 | |
| | 3,820 | | Massachusetts State, Special Obligation Dedicated Tax Revenue Bonds, Series 2004, 5.250%, 1/01/24 (Pre-refunded 1/01/14) – FGIC Insured | 1/14 at 100.00 | A1 (4) | | | 3,946,213 | |
| | 13,000 | | Massachusetts Water Pollution Abatement Trust, Pooled Loan Program Bonds, Series 2006, 4.375%, 8/01/36 (UB) | 8/16 at 100.00 | AAA | | | 13,646,360 | |
| | 5,590 | | Massachusetts Water Resources Authority, General Revenue Bonds, Series 2005A, 5.250%, 8/01/25 – NPFG Insured | 8/17 at 100.00 | AA+ | | | 6,545,555 | |
| | 370 | | Massachusetts Water Resources Authority, General Revenue Bonds, Series 2005A, 5.250%, 8/01/25 (Pre-refunded 8/01/17) – NPFG Insured | 8/17 at 100.00 | Aa1 (4) | | | 441,976 | |
| | 5,535 | | Massachusetts Water Resources Authority, General Revenue Bonds, Series 2007A, 4.500%, 8/01/46 – AGM Insured (UB) (5) | 2/17 at 100.00 | AA+ | | | 5,841,307 | |
| | 6,700 | | Metropolitan Boston Transit Parking Corporation, Massachusetts, Systemwide Senior Lien Parking Revenue Bonds, Series 2011, 5.000%, 7/01/41 | 7/21 at 100.00 | A+ | | | 7,517,132 | |
| | 40,845 | | Total Massachusetts | | | | | 44,513,622 | |
| | | | Michigan – 3.3% (2.2% of Total Investments) | | | | | | |
| | 2,650 | | Detroit Water and Sewerage Department, Michigan, Sewage Disposal System Revenue Bonds, Refunding Senior Lien Series 2012A, 5.250%, 7/01/39 | 7/22 at 100.00 | A+ | | | 2,896,715 | |
| | 3,000 | | Kent Hospital Finance Authority, Michigan, Revenue Bonds, Metropolitan Hospital, Series 2005A, 6.000%, 7/01/35 | 7/15 at 100.00 | BB+ | | | 3,187,530 | |
| | 3,665 | | Lansing Board of Water and Light, Michigan, Utility System Revenue Bonds, Series 2011A, 5.500%, 7/01/41 | 7/21 at 100.00 | AA– | | | 4,343,282 | |
| | 10,000 | | Michigan State Building Authority, Revenue Refunding Bonds, Facilities Program, Series 2003II, 5.000%, 10/15/23 – NPFG Insured | 10/13 at 100.00 | Aa3 | | | 10,208,100 | |
| | 1,000 | | Michigan State Building Authority, Revenue Refunding Bonds, Facilities Program, Series 2011-I-A, 5.375%, 10/15/41 | 10/21 at 100.00 | Aa3 | | | 1,153,240 | |
| | 5,200 | | Michigan State Hospital Finance Authority, Revenue Bonds, Trinity Health Care Group, Series 2009C, 5.000%, 12/01/48 | 6/22 at 100.00 | AA | | | 5,753,384 | |
| | | | Michigan State Hospital Finance Authority, Revenue Bonds, Trinity Health Care Group, Series 2006A: | | | | | | |
| | 725 | | 5.000%, 12/01/31 (Pre-refunded 12/01/16) (UB) | 12/16 at 100.00 | N/R (4) | | | 836,650 | |
| | 3,275 | | 5.000%, 12/01/31 (UB) | 12/16 at 100.00 | AA | | | 3,613,209 | |
| | 850 | | Monroe County Hospital Finance Authority, Michigan, Mercy Memorial Hospital Corporation Revenue Bonds, Series 2006, 5.500%, 6/01/35 | 6/16 at 100.00 | BBB | | | 908,149 | |
| | 30,365 | | Total Michigan | | | | | 32,900,259 | |
| | Principal | | | Optional Call | | | | | |
| | Amount (000) | | Description (1) | Provisions (2) | Ratings (3) | | | Value | |
| | | | Minnesota – 3.9% (2.7% of Total Investments) | | | | | | |
| $ | 13,650 | | Cohasset, Minnesota, Pollution Control Revenue Bonds, Allete Inc., Series 2004, 4.950%, 7/01/22 | 7/14 at 100.00 | A | | $ | 14,023,874 | |
| | 2,000 | | Duluth Economic Development Authority, Minnesota, Healthcare Facilities Revenue Bonds, Benedictine Health System – St. Mary’s Duluth Clinic, Series 2004, 5.375%, 2/15/22 (Pre-refunded 2/15/14) | 2/14 at 100.00 | N/R (4) | | | 2,079,940 | |
| | 3,000 | | Minneapolis-St. Paul Metropolitan Airports Commission, Minnesota, Airport Revenue Bonds, Senior Lien Series 2010A, 5.000%, 1/01/35 | 1/20 at 100.00 | AA– | | | 3,388,170 | |
| | 90 | | Minnesota Agricultural and Economic Development Board, Healthcare System Revenue Bonds, Fairview Hospital and Healthcare Services, Series 1997A, 5.750%, 11/15/26 – NPFG Insured | 5/13 at 100.00 | A | | | 90,173 | |
| | 1,500 | | Minnesota Municipal Power Agency, Electric Revenue Bonds, Series 2004A, 5.250%, 10/01/24 | 10/14 at 100.00 | A3 | | | 1,597,440 | |
| | 1,545 | | St. Paul Housing and Redevelopment Authority, Minnesota, Revenue Bonds, Healtheast Inc., Series 2005, 6.000%, 11/15/25 | 11/15 at 100.00 | BBB– | | | 1,672,076 | |
| | 13,815 | | St. Paul Housing and Redevelopment Authority, Minnesota, Sales Tax Revenue Refunding Bonds, Civic Center Project, Series 1996, 7.100%, 11/01/23 – AGM Insured | 11/15 at 103.00 | AA– | | | 16,152,084 | |
| | 35,600 | | Total Minnesota | | | | | 39,003,757 | |
| | | | Mississippi – 0.7% (0.5% of Total Investments) | | | | | | |
| | 6,875 | | Mississippi Hospital Equipment and Facilities Authority, Revenue Bonds, Baptist Memorial Healthcare, Series 2004B-1, 5.000%, 9/01/24 (UB) | 9/14 at 100.00 | AA– | | | 7,244,806 | |
| | | | Missouri – 0.6% (0.4% of Total Investments) | | | | | | |
| | 2,000 | | Cole County Industrial Development Authority, Missouri, Revenue Bonds, Lutheran Senior Services – Heisinger Project, Series 2004, 5.250%, 2/01/24 | 2/14 at 100.00 | BBB+ | | | 2,023,000 | |
| | 500 | | Hannibal Industrial Development Authority, Missouri, Health Facilities Revenue Bonds, Hannibal Regional Hospital, Series 2006, 5.000%, 3/01/22 | 3/16 at 100.00 | BBB+ | | | 520,820 | |
| | | | Missouri Development Finance Board, Infrastructure Facilities Revenue Bonds, Branson Landing Project, Series 2005A: | | | | | | |
| | 1,565 | | 6.000%, 6/01/20 | No Opt. Call | A | | | 1,792,128 | |
| | 1,660 | | 5.000%, 6/01/35 | 6/15 at 100.00 | A | | | 1,704,073 | |
| | 5,725 | | Total Missouri | | | | | 6,040,021 | |
| | | | Nebraska – 0.3% (0.2% of Total Investments) | | | | | | |
| | 1,620 | | Omaha Public Power District, Nebraska, Separate Electric System Revenue Bonds, Nebraska City 2, Series 2006A, 19.934%, 8/01/40 – AMBAC Insured (IF) | 2/17 at 100.00 | AA+ | | | 2,798,809 | |
| | | | Nevada – 1.7% (1.1% of Total Investments) | | | | | | |
| | 8,800 | | Clark County, Nevada, Airport Revenue Bonds, Subordinate Lien Series 2010B, 5.750%, 7/01/42 | 1/20 at 100.00 | A+ | | | 10,354,344 | |
| | 2,700 | | Las Vegas Redevelopment Agency, Nevada, Tax Increment Revenue Bonds, Series 2009A, 8.000%, 6/15/30 | 6/19 at 100.00 | BBB– | | | 3,095,037 | |
| | 2,600 | | Las Vegas Valley Water District, Nevada, General Obligation Bonds, Water Series 2012B, 5.000%, 6/01/42 | 6/22 at 100.00 | AA+ | | | 2,947,750 | |
| | 14,100 | | Total Nevada | | | | | 16,397,131 | |
| | | | New Jersey – 6.9% (4.6% of Total Investments) | | | | | | |
| | 190 | | Middlesex County Improvement Authority, New Jersey, Senior Revenue Bonds, Heldrich Center Hotel/Conference Center Project, Series 2005A, 5.000%, 1/01/15 | No Opt. Call | Caa1 | | | 132,998 | |
| | | | New Jersey Economic Development Authority, School Facilities Construction Bonds, Series 2005P: | | | | | | |
| | 3,655 | | 5.250%, 9/01/24 (Pre-refunded 9/01/15) | 9/15 at 100.00 | A+ (4) | | | 4,073,242 | |
| | 2,000 | | 5.250%, 9/01/26 (Pre-refunded 9/01/15) | 9/15 at 100.00 | A+ (4) | | | 2,228,860 | |
| | 300 | | New Jersey Educational Facilities Authority, Revenue Refunding Bonds, University of Medicine and Dentistry of New Jersey, Series 2009B, 7.500%, 12/01/32 | 6/19 at 100.00 | A– | | | 373,728 | |
| | 800 | | New Jersey Health Care Facilities Financing Authority, New Jersey, Revenue Bonds, Saint Peters University Hospital, Series 2007, 5.750%, 7/01/37 | 7/18 at 100.00 | BB+ | | | 871,176 | |
| | 3,850 | | New Jersey Transportation Trust Fund Authority, Transportation System Bonds, Refunding Series 2006A, 5.250%, 12/15/20 | No Opt. Call | A+ | | | 4,780,699 | |
| | | Nuveen Premium Income Municipal Fund, Inc. (continued) |
| NPI | | Portfolio of Investments |
| | | April 30, 2013 (Unaudited) |
| | Principal | | | Optional Call | | | | | |
| | Amount (000) | | Description (1) | Provisions (2) | Ratings (3) | | | Value | |
| | | | New Jersey (continued) | | | | | | |
| | | | New Jersey Transportation Trust Fund Authority, Transportation System Bonds, Series 2003C: | | | | | | |
| $ | 5,410 | | 5.500%, 6/15/20 (Pre-refunded 6/15/13) | 6/13 at 100.00 | Aaa | | $ | 5,445,977 | |
| | 9,250 | | 5.500%, 6/15/23 (Pre-refunded 6/15/13) | 6/13 at 100.00 | Aaa | | | 9,311,513 | |
| | 7,330 | | New Jersey Transportation Trust Fund Authority, Transportation System Bonds, Series 2011B, 5.500%, 6/15/31 | 6/21 at 100.00 | A+ | | | 8,709,213 | |
| | | | New Jersey Turnpike Authority, Revenue Bonds, Series 2000A: | | | | | | |
| | 3,915 | | 6.000%, 1/01/14 – NPFG Insured (ETM) | No Opt. Call | A+ (4) | | | 4,065,884 | |
| | 7,585 | | 6.000%, 1/01/14 – NPFG Insured (ETM) | No Opt. Call | A+ (4) | | | 7,877,326 | |
| | 2,500 | | New Jersey Turnpike Authority, Revenue Bonds, Series 2003A, 5.000%, 1/01/19 (Pre-refunded 7/01/13) – FGIC Insured | 7/13 at 100.00 | A+ (4) | | | 2,520,250 | |
| | 9,130 | | New Jersey Turnpike Authority, Revenue Bonds, Series 2005A, 5.000%, 1/01/25 – AGM Insured | 1/15 at 100.00 | AA– | | | 9,749,562 | |
| | 1,315 | | New Jersey Turnpike Authority, Revenue Bonds, Tender Option Bond Trust 1154, 17.041%, 1/01/43 (IF) (5) | 7/22 at 100.00 | A+ | | | 1,921,123 | |
| | | | Tobacco Settlement Financing Corporation, New Jersey, Tobacco Settlement Asset-Backed Bonds, Series 2007-1A: | | | | | | |
| | 4,455 | | 4.500%, 6/01/23 | 6/17 at 100.00 | B1 | | | 4,458,119 | |
| | 2,000 | | 4.750%, 6/01/34 | 6/17 at 100.00 | B2 | | | 1,761,780 | |
| | 63,685 | | Total New Jersey | | | | | 68,281,450 | |
| | | | New Mexico – 0.7% (0.5% of Total Investments) | | | | | | |
| | 5,585 | | Santa Fe County, New Mexico, Correctional System Gross Receipts Tax Revenue Bonds, Series 1997, 6.000%, 2/01/27 – AGM Insured | No Opt. Call | AA– | | | 6,992,532 | |
| | | | New York – 14.5% (9.7% of Total Investments) | | | | | | |
| | | | Brooklyn Arena Local Development Corporation, New York, Payment in Lieu of Taxes Revenue Bonds, Barclays Center Project, Series 2009: | | | | | | |
| | 2,000 | | 6.000%, 7/15/30 | 1/20 at 100.00 | BBB– | | | 2,389,520 | |
| | 5,000 | | 0.000%, 7/15/44 | No Opt. Call | BBB– | | | 1,185,650 | |
| | 4,800 | | Dormitory Authority of the State of New York, Revenue Bonds, New York University, Series 2012A, 5.000%, 7/01/42 | 7/22 at 100.00 | AA– | | | 5,524,944 | |
| | | | Dormitory Authority of the State of New York, Revenue Bonds, University of Rochester, Series 2004A: | | | | | | |
| | 1,000 | | 5.250%, 7/01/22 | 7/14 at 100.00 | AA– | | | 1,051,630 | |
| | 500 | | 5.250%, 7/01/24 | 7/14 at 100.00 | AA– | | | 525,815 | |
| | 1,025 | | Dormitory Authority of the State of New York, Revenue Bonds, University of Rochester, Series 2004A, 5.250%, 7/01/20 (Pre-refunded 7/01/14) | 7/14 at 100.00 | AA+ (4) | | | 1,083,743 | |
| | 1,995 | | Dormitory Authority of the State of New York, State and Local Appropriation Lease Bonds, Upstate Community Colleges, Series 2004B, 5.250%, 7/01/20 | 7/14 at 100.00 | AA– | | | 2,111,528 | |
| | 5,325 | | Dormitory Authority of the State of New York, State Personal Income Tax Revenue Bonds, General Purpose Series 2011C, 5.000%, 3/15/41 | 3/21 at 100.00 | AAA | | | 6,044,887 | |
| | 2,335 | | Dormitory Authority of the State of New York, State Personal Income Tax Revenue Bonds, Series 2005F, 5.000%, 3/15/24 – AMBAC Insured | 3/15 at 100.00 | AAA | | | 2,530,323 | |
| | | | Dormitory Authority of the State of NY, Rochester Institute of Technology Revenue Bond, Series 2012: | | | | | | |
| | 1,100 | | 5.000%, 7/01/38 | No Opt. Call | A1 | | | 1,263,295 | |
| | 1,500 | | 5.000%, 7/01/42 | No Opt. Call | A1 | | | 1,722,675 | |
| | 6,915 | | Hudson Yards Infrastructure Corporation, New York, Revenue Bonds, Series 2006A, 4.500%, 2/15/47 – NPFG Insured | 2/17 at 100.00 | A | | | 7,156,264 | |
| | 6,000 | | Liberty Development Corporation, New York, Goldman Sachs Headquarter Revenue Bonds, Series 2005, 5.250%, 10/01/35 | No Opt. Call | A | | | 7,137,960 | |
| | | | Long Island Power Authority, New York, Electric System General Revenue Bonds, Series 2006A: | | | | | | |
| | 7,000 | | 5.000%, 12/01/23 – FGIC Insured | 6/16 at 100.00 | A | | | 7,762,650 | |
| | 5,000 | | 5.000%, 12/01/24 – FGIC Insured | 6/16 at 100.00 | A | | | 5,531,950 | |
| | Principal | | | Optional Call | | | | | |
| | Amount (000) | | Description (1) | Provisions (2) | Ratings (3) | | | Value | |
| | | | New York (continued) | | | | | | |
| $ | 5,000 | | Long Island Power Authority, New York, Electric System Revenue Bonds, Series 2006F, 4.250%, 5/01/33 – NPFG Insured | 11/16 at 100.00 | A | | $ | 5,134,050 | |
| | 15,605 | | Metropolitan Transportation Authority, New York, Dedicated Tax Fund Bonds, Refunding Series 2012A, 0.000%, 11/15/32 | No Opt. Call | AA | | | 7,826,064 | |
| | 3,900 | | Metropolitan Transportation Authority, New York, Transportation Revenue Bonds, Series 2005B, 5.000%, 11/15/30 – AMBAC Insured | 11/15 at 100.00 | A | | | 4,207,671 | |
| | 5,780 | | Metropolitan Transportation Authority, New York, Transportation Revenue Bonds, Series 2005F, 5.000%, 11/15/30 | 11/15 at 100.00 | A | | | 6,235,984 | |
| | 750 | | Metropolitan Transportation Authority, New York, Transportation Revenue Bonds, Series 2011A, 5.000%, 11/15/41 | 11/21 at 100.00 | A | | | 837,420 | |
| | | | New York City Industrial Development Agency, New York, Civic Facility Revenue Bonds, United Jewish Appeal – Federation of Jewish Philanthropies of New York Inc., Series 2004A: | | | | | | |
| | 2,185 | | 5.250%, 7/01/20 | 7/14 at 100.00 | Aa1 | | | 2,306,246 | |
| | 2,050 | | 5.250%, 7/01/21 | 7/14 at 100.00 | Aa1 | | | 2,162,279 | |
| | 2,420 | | 5.250%, 7/01/22 | 4/14 at 100.00 | Aa1 | | | 2,550,777 | |
| | 1,370 | | 5.250%, 7/01/24 | 4/14 at 100.00 | Aa1 | | | 1,440,733 | |
| | 3,125 | | New York City Municipal Water Finance Authority, New York, Water and Sewer System Revenue Bonds, Second Generation Resolution, Fiscal 2011 Series EE, 5.375%, 6/15/43 | 12/20 at 100.00 | AA+ | | | 3,695,125 | |
| | | | New York City, New York, General Obligation Bonds, Fiscal Series 2003D: | | | | | | |
| | 5,325 | | 5.250%, 10/15/22 (Pre-refunded 10/15/13) | 10/13 at 100.00 | Aa2 (4) | | | 5,447,475 | |
| | 7,175 | | 5.250%, 10/15/22 (Pre-refunded 10/15/13) | 10/13 at 100.00 | AA (4) | | | 7,340,025 | |
| | | | New York City, New York, General Obligation Bonds, Fiscal Series 2003J: | | | | | | |
| | 95 | | 5.500%, 6/01/23 | 6/13 at 100.00 | AA | | | 95,433 | |
| | 4,905 | | 5.500%, 6/01/23 (Pre-refunded 6/01/13) | 6/13 at 100.00 | AAA | | | 4,927,367 | |
| | 7,960 | | New York City, New York, General Obligation Bonds, Fiscal Series 2005M, 5.000%, 4/01/24 (UB) | 4/15 at 100.00 | AA | | | 8,640,978 | |
| | 6,000 | | New York City, New York, General Obligation Bonds, Series 2004C-1, 5.250%, 8/15/20 (UB) | 8/14 at 100.00 | AA | | | 6,380,160 | |
| | | | New York Convention Center Development Corporation, Hotel Unit Fee Revenue Bonds, Series 2005: | | | | | | |
| | 5,000 | | 5.000%, 11/15/44 – AMBAC Insured | 11/15 at 100.00 | AA+ | | | 5,233,500 | |
| | 1,630 | | 17.046%, 11/15/44 – AMBAC Insured (IF) | 11/15 at 100.00 | AA+ | | | 1,934,484 | |
| | 650 | | New York Counties Tobacco Trust I, Tobacco Settlement Pass-Through Bonds, Series 2000B, 6.500%, 6/01/35 | 6/13 at 100.00 | Baa1 | | | 649,955 | |
| | 6,460 | | New York State Urban Development Corporation, State Personal Income Tax Revenue Bonds, Series 2004A-1, 5.000%, 3/15/26 (Pre-refunded 3/15/14) – FGIC Insured | 3/14 at 100.00 | AAA | | | 6,721,563 | |
| | 4,750 | | Port Authority of New York and New Jersey, Consolidated Revenue Bonds, One Hundred Thirty-Fifth Series 2004, 5.000%, 9/15/28 – SYNCORA GTY Insured | 3/14 at 101.00 | AA– | | | 4,969,923 | |
| | 1,325 | | Port Authority of New York and New Jersey, Special Project Bonds, JFK International Air Terminal LLC Project, Eighth Series 2010, 6.000%, 12/01/42 | 12/20 at 100.00 | BBB– | | | 1,555,257 | |
| | 144,955 | | Total New York | | | | | 143,315,303 | |
| | | | North Carolina – 1.5% (1.0% of Total Investments) | | | | | | |
| | | | Charlotte, North Carolina, Certificates of Participation, Governmental Facilities Projects, Series 2003G: | | | | | | |
| | 5,785 | | 5.250%, 6/01/22 (Pre-refunded 6/01/13) | 6/13 at 100.00 | AA+ (4) | | | 5,809,818 | |
| | 3,475 | | 5.250%, 6/01/23 (Pre-refunded 6/01/13) | 6/13 at 100.00 | AA+ (4) | | | 3,489,804 | |
| | 2,850 | | Charlotte-Mecklenburg Hospital Authority, North Carolina, Carolinas HealthCare System Revenue Bonds, Series 2008, Trust 1149, 15.092%, 7/15/32 (IF) (5) | 1/18 at 100.00 | AA– | | | 3,481,418 | |
| | 1,050 | | Charlotte-Mecklenburg Hospital Authority, North Carolina, Health Care System Revenue Bonds, Carolinas Health Care, Series 2007A, 5.000%, 1/15/31 | 1/17 at 100.00 | AA– | | | 1,155,735 | |
| | 1,000 | | Gaston County Industrial Facilities and Pollution Control Financing Authority, North Carolina, National Gypsum Company Project Exempt Facilities Revenue Bonds, Series 2005, 5.750%, 8/01/35 (Alternative Minimum Tax) | 8/15 at 100.00 | N/R | | | 937,380 | |
| | 14,160 | | Total North Carolina | | | | | 14,874,155 | |
| | | Nuveen Premium Income Municipal Fund, Inc. (continued) |
| NPI | | Portfolio of Investments |
| | | April 30, 2013 (Unaudited) |
| | Principal | | | Optional Call | | | | | |
| | Amount (000) | | Description (1) | Provisions (2) | Ratings (3) | | | Value | |
| | | | Ohio – 3.6% (2.4% of Total Investments) | | | | | | |
| | | | Buckeye Tobacco Settlement Financing Authority, Ohio, Tobacco Settlement Asset-Backed Revenue Bonds, Senior Lien, Series 2007A-2: | | | | | | |
| $ | 250 | | 5.125%, 6/01/24 | 6/17 at 100.00 | B– | | $ | 232,075 | |
| | 2,850 | | 5.875%, 6/01/30 | 6/17 at 100.00 | B | | | 2,556,650 | |
| | 4,745 | | 5.750%, 6/01/34 | 6/17 at 100.00 | B | | | 4,162,077 | |
| | 6,285 | | 5.875%, 6/01/47 | 6/17 at 100.00 | B | | | 5,615,459 | |
| | 16,820 | | JobsOhio Beverage System, Ohio, Statewide Senior Lien Liquor Profits Revenue Bonds, Tax Exempt Series 2013A, 5.000%, 1/01/38 (UB) (5) | 1/23 at 100.00 | AA | | | 19,102,810 | |
| | 1,000 | | Ohio Higher Educational Facilities Commission, Revenue Bonds, University of Dayton, Refunding Series 2011A, 5.375%, 12/01/30 | 12/20 at 100.00 | A | | | 1,167,060 | |
| | | | Ohio State University, General Receipts Bonds, Series 2003B: | | | | | | |
| | 2,225 | | 5.250%, 6/01/20 (Pre-refunded 6/01/13) | 6/13 at 100.00 | N/R (4) | | | 2,234,367 | |
| | 495 | | 5.250%, 6/01/20 (Pre-refunded 6/01/13) | 6/13 at 100.00 | AA (4) | | | 497,084 | |
| | 34,670 | | Total Ohio | | | | | 35,567,582 | |
| | | | Oklahoma – 2.5% (1.7% of Total Investments) | | | | | | |
| | 1,050 | | Norman Regional Hospital Authority, Oklahoma, Hospital Revenue Bonds, Series 2005, 5.375%, 9/01/36 | 9/16 at 100.00 | BB+ | | | 1,087,643 | |
| | 3,500 | | Oklahoma Capitol Improvement Authority, State Facilities Revenue Bonds, Series 2005F, 5.000%, 7/01/24 – AMBAC Insured | 7/15 at 100.00 | AA | | | 3,811,150 | |
| | | | Oklahoma Development Finance Authority, Revenue Bonds, Saint John Health System, Series 2007: | | | | | | |
| | 6,840 | | 5.000%, 2/15/37 | 2/17 at 100.00 | A | | | 7,274,750 | |
| | 1,335 | | 5.000%, 2/15/42 | 2/17 at 100.00 | A | | | 1,416,916 | |
| | 10,035 | | Tulsa County Industrial Authority, Oklahoma, Health Care Revenue Bonds, Saint Francis Health System, Series 2006, 5.000%, 12/15/36 (UB) | 12/16 at 100.00 | AA+ | | | 10,938,251 | |
| | 143 | | Tulsa County Industrial Authority, Oklahoma, Health Care Revenue Bonds, Saint Francis Health System, Series 2008, Trust 3500, 8.446%, 6/15/30 (IF) | 12/16 at 100.00 | AA+ | | | 166,402 | |
| | 22,903 | | Total Oklahoma | | | | | 24,695,112 | |
| | | | Oregon – 0.4% (0.3% of Total Investments) | | | | | | |
| | 1,060 | | Oregon Department of Administrative Services, Certificates of Participation, Series 2005A, 5.000%, 5/01/24 (Pre-refunded 5/01/15) – AGM Insured | 5/15 at 100.00 | AA (4) | | | 1,157,509 | |
| | 2,500 | | Oregon State Department of Transportation, Highway User Tax Revenue Bonds, Series 2004A, 5.000%, 11/15/21 (Pre-refunded 11/15/14) | 11/14 at 100.00 | AAA | | | 2,680,175 | |
| | 3,560 | | Total Oregon | | | | | 3,837,684 | |
| | | | Pennsylvania – 4.5% (3.0% of Total Investments) | | | | | | |
| | 4,530 | | Allegheny County, Pennsylvania, General Obligation Bonds, Series 2011C-65, 5.375%, 5/01/31 | 5/21 at 100.00 | A+ | | | 5,176,114 | |
| | 980 | | Bucks County Industrial Development Authority, Pennsylvania, Charter School Revenue Bonds, School Lane Charter School, Series 2007A, 5.000%, 3/15/37 | 3/17 at 100.00 | BBB | | | 999,992 | |
| | | | Lancaster Higher Education Authority, Pennsylvania, Revenue Bonds, Franklin and Marshall College, Series 2003C: | | | | | | |
| | 1,340 | | 5.250%, 4/15/15 | 10/13 at 100.00 | AA– | | | 1,345,655 | |
| | 1,960 | | 5.250%, 4/15/17 | 10/13 at 100.00 | AA– | | | 1,968,173 | |
| | 1,670 | | Montgomery County Industrial Development Authority, Pennsylvania, FHA Insured Mortgage Revenue Bonds, New Regional Medical Center Project, Series 2010, 5.375%, 8/01/38 | 8/20 at 100.00 | AA | | | 1,927,297 | |
| | 1,000 | | Pennsylvania State University, General Revenue Bonds, Series 2005, 5.000%, 9/01/29 | 9/15 at 100.00 | AA | | | 1,091,100 | |
| | 5,250 | | Pennsylvania Turnpike Commission, Motor License Fund-Enhanced Subordinate Special Revenue Bonds, Series 2010A, 0.000%, 12/01/34 | 12/20 at 100.00 | AA | | | 5,212,515 | |
| | 2,625 | | Pennsylvania Turnpike Commission, Turnpike Revenue Bonds, Series 2006A, 5.000%, 12/01/26 – AMBAC Insured | 6/16 at 100.00 | A+ | | | 2,870,123 | |
| | | | Philadelphia Gas Works, Pennsylvania, Revenue Bonds, General Ordinance, Fifth Series 2004A-1: | | | | | | |
| | 4,505 | | 5.000%, 9/01/21 – AGM Insured | 9/14 at 100.00 | AA– | | | 4,741,152 | |
| | 4,735 | | 5.000%, 9/01/22 – AGM Insured | 9/14 at 100.00 | AA– | | | 4,976,722 | |
| | Principal | | | Optional Call | | | | | |
| | Amount (000) | | Description (1) | Provisions (2) | Ratings (3) | | | Value | |
| | | | Pennsylvania (continued) | | | | | | |
| $ | 14,000 | | State Public School Building Authority, Pennsylvania, Lease Revenue Bonds, Philadelphia School District, Series 2003, 5.250%, 6/01/24 (Pre-refunded 6/01/13) – AGM Insured | 6/13 at 100.00 | AA+ (4) | | $ | 14,060,760 | |
| | 42,595 | | Total Pennsylvania | | | | | 44,369,603 | |
| | | | Puerto Rico – 0.3% (0.2% of Total Investments) | | | | | | |
| | 500 | | Puerto Rico Sales Tax Financing Corporation, Sales Tax Revenue Bonds, Senior Series 2011C, 0.000%, 8/01/38 | No Opt. Call | AA– | | | 127,820 | |
| | | | Puerto Rico Sales Tax Financing Corporation, Sales Tax Revenue Bonds, Series 2007A: | | | | | | |
| | 300 | | 0.000%, 8/01/44 – NPFG Insured | No Opt. Call | AA– | | | 52,425 | |
| | 75 | | 0.000%, 8/01/45 – NPFG Insured | No Opt. Call | AA– | | | 12,323 | |
| | 175 | | 0.000%, 8/01/47 – AMBAC Insured | No Opt. Call | AA– | | | 25,310 | |
| | 2,725 | | 0.000%, 8/01/54 – AMBAC Insured | No Opt. Call | AA– | | | 236,067 | |
| | 100 | | 0.000%, 8/01/56 | No Opt. Call | AA– | | | 7,623 | |
| | 2,500 | | 5.250%, 8/01/57 | 8/17 at 100.00 | AA– | | | 2,600,300 | |
| | 6,375 | | Total Puerto Rico | | | | | 3,061,868 | |
| | | | Rhode Island – 0.5% (0.4% of Total Investments) | | | | | | |
| | | | Rhode Island Tobacco Settlement Financing Corporation, Tobacco Settlement Asset-Backed Bonds, Series 2002A: | | | | | | |
| | 1,020 | | 6.125%, 6/01/32 | 6/13 at 100.00 | BBB+ | | | 1,030,098 | |
| | 4,065 | | 6.250%, 6/01/42 | 6/13 at 100.00 | BBB– | | | 4,161,584 | |
| | 5,085 | | Total Rhode Island | | | | | 5,191,682 | |
| | | | South Carolina – 4.1% (2.8% of Total Investments) | | | | | | |
| | 8,610 | | Dorchester County School District 2, South Carolina, Installment Purchase Revenue Bonds, GROWTH, Series 2004, 5.250%, 12/01/24 | 12/14 at 100.00 | AA– | | | 9,218,469 | |
| | | | Greenville County School District, South Carolina, Installment Purchase Revenue Bonds, Series 2003: | | | | | | |
| | 5,090 | | 5.250%, 12/01/18 (Pre-refunded 12/01/13) | 12/13 at 100.00 | AA (4) | | | 5,240,410 | |
| | 3,595 | | 5.250%, 12/01/20 (Pre-refunded 12/01/13) | 12/13 at 100.00 | AA (4) | | | 3,701,232 | |
| | 1,865 | | 5.250%, 12/01/21 (Pre-refunded 12/01/13) | 12/13 at 100.00 | AA (4) | | | 1,920,111 | |
| | | | Lexington County Health Service District, South Carolina, Hospital Revenue Bonds, Series 2004: | | | | | | |
| | 1,805 | | 6.000%, 5/01/19 (Pre-refunded 5/01/14) | 5/14 at 100.00 | AA– (4) | | | 1,909,221 | |
| | 2,400 | | 5.500%, 5/01/24 (Pre-refunded 5/01/14) | 5/14 at 100.00 | AA– (4) | | | 2,526,576 | |
| | | | South Carolina JOBS Economic Development Authority, Hospital Refunding and Improvement Revenue Bonds, Palmetto Health Alliance, Series 2003C: | | | | | | |
| | 13,345 | | 6.375%, 8/01/34 (Pre-refunded 8/01/13) | 8/13 at 100.00 | BBB+ (4) | | | 13,552,515 | |
| | 1,655 | | 6.375%, 8/01/34 (Pre-refunded 8/01/13) | 8/13 at 100.00 | BBB+ (4) | | | 1,680,735 | |
| | 875 | | South Carolina Jobs-Economic Development Authority, Hospital Revenue Bonds, Palmetto Health, Refunding Series 2011A, 6.500%, 8/01/39 – AGM Insured | 8/21 at 100.00 | AA– | | | 1,069,766 | |
| | 39,240 | | Total South Carolina | | | | | 40,819,035 | |
| | | | Tennessee – 1.7% (1.2% of Total Investments) | | | | | | |
| | 2,565 | | Harpeth Valley Utilities District, Davidson and Williamson Counties, Tennessee, Utilities Revenue Bonds, Series 2012A, 4.000%, 9/01/42 | 9/22 at 100.00 | AA | | | 2,641,745 | |
| | 6,400 | | Johnson City Health and Educational Facilities Board, Tennessee, Revenue Bonds, Mountain States Health Alliance, Series 2006A, 5.500%, 7/01/36 | 7/16 at 100.00 | BBB+ | | | 6,771,648 | |
| | 6,100 | | Knox County Health, Educational and Housing Facilities Board, Tennessee, Hospital Revenue Refunding Bonds, Covenant Health, Series 2006, 0.000%, 1/01/40 | 1/17 at 31.68 | A | | | 1,634,251 | |
| | 5,000 | | Metropolitan Government of Nashville-Davidson County Health and Educational Facilities Board, Tennessee, Revenue Refunding Bonds, Vanderbilt University, Series 2009B, 5.000%, 10/01/39 | 10/19 at 100.00 | AA+ | | | 5,697,250 | |
| | 410 | | Sullivan County Health Educational and Housing Facilities Board, Tennessee, Revenue Bonds, Wellmont Health System, Series 2006C, 5.250%, 9/01/36 | 9/16 at 100.00 | BBB+ | | | 437,917 | |
| | | Nuveen Premium Income Municipal Fund, Inc. (continued) |
| NPI | | Portfolio of Investments |
| | | April 30, 2013 (Unaudited) |
| | Principal | | | Optional Call | | | | | |
| | Amount (000) | | Description (1) | Provisions (2) | Ratings (3) | | | Value | |
| | | | Tennessee (continued) | | | | | | |
| | | | Sumner County Health, Educational, and Housing Facilities Board, Tennessee, Revenue Refunding Bonds, Sumner Regional Health System Inc., Series 2007: | | | | | | |
| $ | 1,300 | | 5.500%, 11/01/37 (6) | 11/17 at 100.00 | N/R | | $ | 3,237 | |
| | 3,000 | | 5.500%, 11/01/46 (6) | 11/17 at 100.00 | N/R | | | 7,470 | |
| | 24,775 | | Total Tennessee | | | | | 17,193,518 | |
| | | | Texas – 15.3% (10.3% of Total Investments) | | | | | | |
| | 5,000 | | Alliance Airport Authority, Texas, Special Facilities Revenue Bonds, American Airlines Inc., Series 2007, 5.250%, 12/01/29 (Alternative Minimum Tax) (6) | 6/13 at 100.00 | N/R | | | 5,512,500 | |
| | 8,840 | | Board of Regents, University of Texas System, Financing System Revenue Bonds, Series 2006F, 4.250%, 8/15/36 (UB) | 2/17 at 100.00 | AAA | | | 9,253,889 | |
| | 2,150 | | Brazos River Authority, Texas, Pollution Control Revenue Bonds, TXU Energy Company LLC Project, Series 2003C, 6.750%, 10/01/38 (Alternative Minimum Tax) | 10/13 at 101.00 | CC | | | 161,272 | |
| | 2,500 | | Capital Area Cultural Education Facilities Finance Corporation, Texas, Revenue Bonds, The Roman Catholic Diocese of Austin, Series 2005B. Remarketed, 6.125%, 4/01/45 | 4/20 at 100.00 | Baa2 | | | 2,840,075 | |
| | 765 | | Central Texas Regional Mobility Authority, Revenue Bonds, Senior Lien Refunding Series 2013A, 5.000%, 1/01/43 (WI/DD, Settling 5/16/13) | 1/23 at 100.00 | Baa2 | | | 828,357 | |
| | 3,380 | | Central Texas Regional Mobility Authority, Revenue Bonds, Senior Lien Series 2011, 6.250%, 1/01/46 | 1/21 at 100.00 | Baa2 | | | 4,002,799 | |
| | 2,500 | | Colorado River Municipal Water District, Texas, Water System Revenue Bonds, Series 2011, 5.000%, 1/01/36 | 1/21 at 100.00 | AA– | | | 2,815,550 | |
| | 3,500 | | Dallas-Fort Worth International Airport, Texas, Joint Revenue Bonds, Refunding Series 2010A, 5.000%, 11/01/42 | 11/20 at 100.00 | A+ | | | 3,862,005 | |
| | 9,000 | | Dallas-Fort Worth International Airport, Texas, Joint Revenue Bonds, Series 2012H, 5.000%, 11/01/42 (Alternative Minimum Tax) | No Opt. Call | A+ | | | 9,586,530 | |
| | 4,000 | | Harris County-Houston Sports Authority, Texas, Junior Lien Revenue Refunding Bonds, Series 2001B, 5.250%, 11/15/40 – NPFG Insured | 5/13 at 100.00 | Baa2 | | | 4,008,560 | |
| | 5,000 | | Houston, Texas, First Lien Combined Utility System Revenue Bonds, First Lien Series 2004A, 5.250%, 5/15/25 – NPFG Insured | 5/14 at 100.00 | AA | | | 5,249,400 | |
| | 4,000 | | Houston, Texas, First Lien Combined Utility System Revenue Bonds, Series 2011D, 5.000%, 11/15/40 | 11/21 at 100.00 | AA | | | 4,542,360 | |
| | 13,975 | | Hutto Independent School District, Williamson County, Texas, General Obligation Bonds, Series 2007A, 4.750%, 8/01/43 (UB) | 8/16 at 100.00 | AAA | | | 15,044,367 | |
| | | | Kerrville Health Facilities Development Corporation, Texas, Revenue Bonds, Sid Peterson Memorial Hospital Project, Series 2005: | | | | | | |
| | 2,000 | | 5.250%, 8/15/21 | 2/16 at 100.00 | BBB– | | | 2,112,020 | |
| | 2,800 | | 5.125%, 8/15/26 | 2/16 at 100.00 | BBB– | | | 2,898,756 | |
| | 4,000 | | Love Field Airport Modernization Corporation, Texas, Special Facilities Revenue Bonds, Southwest Airlines Company, Series 2010, 5.250%, 11/01/40 | 11/20 at 100.00 | BBB– | | | 4,368,440 | |
| | 810 | | Lower Colorado River Authority, Texas, Revenue Refunding and Improvement Bonds, Series 2003, 5.250%, 5/15/24 – AMBAC Insured | No Opt. Call | A1 | | | 813,127 | |
| | 5,420 | | Lower Colorado River Authority, Texas, Revenue Refunding Bonds, Series 2012A, 5.000%, 5/15/39 | No Opt. Call | A1 | | | 6,092,351 | |
| | 5,650 | | North Texas Tollway Authority, Second Tier System Revenue Refunding Bonds, Series 2008F, 5.750%, 1/01/38 | 1/18 at 100.00 | A3 | | | 6,362,691 | |
| | | | North Texas Tollway Authority, Special Projects System Revenue Bonds, Series 2011A: | | | | | | |
| | 2,070 | | 0.000%, 9/01/43 | 9/31 at 100.00 | AA | | | 1,603,174 | |
| | 8,470 | | 0.000%, 9/01/45 | 9/31 at 100.00 | AA | | | 7,155,963 | |
| | Principal | | | Optional Call | | | | | |
| | Amount (000) | | Description (1) | Provisions (2) | Ratings (3) | | | Value | |
| | | | Texas (continued) | | | | | | |
| $ | 11,000 | | Pearland Independent School District, Brazoria County, Texas, General Obligation Bonds, Tender Option Bond Trust 1124, 7.554%, 8/15/26 (IF) | 2/17 at 100.00 | AAA | | $ | 12,254,990 | |
| | 2,000 | | Sabine River Authority, Texas, Pollution Control Revenue Bonds, TXU Electric Company, Series 2001C, 5.200%, 5/01/28 | 11/15 at 100.00 | CCC | | | 145,020 | |
| | 12,130 | | Tarrant County Cultural Education Facilities Finance Corporation, Texas, Revenue Bonds, Texas Health Resources, Series 2007A, 5.000%, 2/15/36 (UB) | 2/17 at 100.00 | AA– | | | 13,199,866 | |
| | 1,840 | | Tarrant County Health Facilities Development Corporation, Texas, GNMA Collateralized Mortgage Loan Revenue Bonds, Eastview Nursing Home, Ebony Lake Nursing Center, Ft. Stockton Nursing Center, Lynnhaven Nursing Center and Mission Oaks Manor, Series 2000A-1, 7.625%, 12/20/32 | 6/13 at 103.00 | Aa1 | | | 1,900,535 | |
| | 1,000 | | Texas Municipal Gas Acquisition and Supply Corporation III, Gas Supply Revenue Bonds, Series 2012, 5.000%, 12/15/31 | No Opt. Call | A3 | | | 1,076,389 | |
| | 2,985 | | Texas State, General Obligation Bonds, Series 2008, Trust 3213, 13.591%, 4/01/28 (IF) | 4/17 at 100.00 | Aaa | | | 4,995,875 | |
| | 25,000 | | Texas Turnpike Authority, Central Texas Turnpike System Revenue Bonds, First Tier Series 2002A, 0.000%, 8/15/24 – AMBAC Insured | No Opt. Call | A– | | | 16,833,249 | |
| | 2,200 | | Tomball Hospital Authority, Texas, Hospital Revenue Bonds, Tomball Regional Hospital, Series 2005, 5.000%, 7/01/20 (Pre-refunded 7/01/15) | 7/15 at 100.00 | Aaa | | | 2,421,143 | |
| | 153,985 | | Total Texas | | | | | 151,941,253 | |
| | | | Virginia – 1.5% (1.0% of Total Investments) | | | | | | |
| | 5,000 | | Metropolitan Washington D.C. Airports Authority, Virginia, Airport System Revenue Bonds, Series 2010A, 5.000%, 10/01/39 | 10/20 at 100.00 | AA– | | | 5,658,850 | |
| | 4,530 | | Virginia Beach Development Authority, Virginia, Multifamily Residential Rental Housing Revenue Bonds, Mayfair Apartments I and II, Series 1999, 7.500%, 10/01/39 (Alternative Minimum Tax) | 10/14 at 100.00 | N/R | | | 4,699,105 | |
| | 1,070 | | Virginia Small Business Financing Authority, Senior Lien Revenue Bonds, 95 Express Lanes LLC Project, Series 2012, 5.000%, 1/01/40 (Alternative Minimum Tax) | 1/22 at 100.00 | BBB– | | | 1,115,796 | |
| | 3,020 | | Virginia Small Business Financing Authority, Senior Lien Revenue Bonds, Elizabeth River Crossing, Opco LLC Project, Series 2012, 5.500%, 1/01/42 (Alternative Minimum Tax) | 7/22 at 100.00 | BBB– | | | 3,296,812 | |
| | 13,620 | | Total Virginia | | | | | 14,770,563 | |
| | | | Washington – 2.7% (1.8% of Total Investments) | | | | | | |
| | 3,125 | | Skagit County Public Hospital District 1, Washington, General Obligation Bonds, Series 2004A, 5.375%, 12/01/20 (Pre-refunded 12/01/14) – NPFG Insured | 12/14 at 100.00 | A1 (4) | | | 3,377,750 | |
| | 4,195 | | Washington Health Care Facilities Authority, Revenue Bonds, Kadlec Regional Medical Center, Series 2010, 5.500%, 12/01/39 | 12/20 at 100.00 | Baa3 | | | 4,544,569 | |
| | | | Washington State Tobacco Settlement Authority, Tobacco Settlement Asset-Backed Revenue Bonds, Series 2002: | | | | | | |
| | 1,525 | | 6.500%, 6/01/26 | 6/13 at 100.00 | A3 | | | 1,555,470 | |
| | 2,715 | | 6.625%, 6/01/32 | 6/13 at 100.00 | Baa1 | | | 2,769,246 | |
| | 6,480 | | Washington State, Motor Vehicle Fuel Tax General Obligation Bonds, Series 2002-03C, 0.000%, 6/01/24 – NPFG Insured | No Opt. Call | AA+ | | | 4,953,701 | |
| | 11,050 | | Washington, General Obligation Bonds, Series 2000S-5, 0.000%, 1/01/20 – FGIC Insured | No Opt. Call | AA+ | | | 9,873,507 | |
| | 29,090 | | Total Washington | | | | | 27,074,243 | |
| | | | Wisconsin – 3.2% (2.2% of Total Investments) | | | | | | |
| | | | Milwaukee Redevelopment Authority, Wisconsin, Lease Revenue Bonds, Public Schools, Series 2003A: | | | | | | |
| | 1,000 | | 5.125%, 8/01/22 (Pre-refunded 8/01/13) – AMBAC Insured | 8/13 at 100.00 | Aa3 (4) | | | 1,012,260 | |
| | 750 | | 5.125%, 8/01/23 (Pre-refunded 8/01/13) – AMBAC Insured | 8/13 at 100.00 | Aa3 (4) | | | 759,195 | |
| | 1,415 | | Monroe Redevelopment Authority, Wisconsin, Development Revenue Bonds, The Monroe Clinic, Inc., Series 2009, 5.875%, 2/15/39 | 2/19 at 100.00 | A3 | | | 1,598,809 | |
| | | Nuveen Premium Income Municipal Fund, Inc. (continued) |
| NPI | | Portfolio of Investments |
| | | April 30, 2013 (Unaudited) |
| | Principal | | | Optional Call | | | | | |
| | Amount (000) | | Description (1) | Provisions (2) | Ratings (3) | | | Value | |
| | | | Wisconsin (continued) | | | | | | |
| $ | 9,000 | | Wisconsin Health and Educational Facilities Authority, Revenue Bonds, Aurora Healthcare Inc., Series 2003, 6.400%, 4/15/33 | 10/13 at 100.00 | A | | $ | 9,022,950 | |
| | 890 | | Wisconsin Health and Educational Facilities Authority, Revenue Bonds, Divine Savior Healthcare, Series 2006, 5.000%, 5/01/32 | 5/16 at 100.00 | BBB | | | 916,344 | |
| | 6,025 | | Wisconsin Health and Educational Facilities Authority, Revenue Bonds, Franciscan Sisters of Christian Charity Healthcare Ministry, Series 2003A, 6.000%, 9/01/22 (Pre-refunded 9/01/13) | 9/13 at 100.00 | BBB+ (4) | | | 6,138,752 | |
| | 4,995 | | Wisconsin Health and Educational Facilities Authority, Revenue Bonds, Franciscan Sisters of Christian Charity HealthCare Ministry, Series 2007, 5.000%, 9/01/33 | 9/17 at 100.00 | BBB+ | | | 5,182,712 | |
| | 2,000 | | Wisconsin Health and Educational Facilities Authority, Revenue Bonds, Wheaton Franciscan Healthcare System, Series 2006A, 5.250%, 8/15/34 | 8/16 at 100.00 | A– | | | 2,124,139 | |
| | 2,000 | | Wisconsin Health and Educational Facilities Authority, Revenue Bonds, Wheaton Franciscan Services Inc., Series 2003A, 5.250%, 8/15/25 | 8/13 at 100.00 | A– | | | 2,023,919 | |
| | | | Wisconsin State, General Obligation Bonds, Series 2004-3: | | | | | | |
| | 175 | | 5.250%, 5/01/19 – FGIC Insured | 5/14 at 100.00 | AA | | | 183,779 | |
| | 130 | | 5.250%, 5/01/21 – FGIC Insured | 5/14 at 100.00 | AA | | | 136,494 | |
| | | | Wisconsin State, General Obligation Bonds, Series 2004-3: | | | | | | |
| | 1,545 | | 5.250%, 5/01/19 (Pre-refunded 5/01/14) – FGIC Insured | 5/14 at 100.00 | Aa2 (4) | | | 1,621,013 | |
| | 1,135 | | 5.250%, 5/01/21 (Pre-refunded 5/01/14) – FGIC Insured | 5/14 at 100.00 | Aa2 (4) | | | 1,190,841 | |
| | 31,060 | | Total Wisconsin | | | | | 31,911,207 | |
| | | | Wyoming – 0.4% (0.3% of Total Investments) | | | | | | |
| | 3,400 | | Sweetwater County, Wyoming, Solid Waste Disposal Revenue Bonds, FMC Corporation, Series 2005, 5.600%, 12/01/35 (Alternative Minimum Tax) | 12/15 at 100.00 | A– | | | 3,696,616 | |
| $ | 1,500,143 | | Total Municipal Bonds (cost $1,351,497,357) | | | | | 1,472,306,042 | |
| | Principal | | | | | | | | | |
| | Amount (000) | | Description (1) | Coupon | Maturity | Ratings (3) | | | Value | |
| | | | Corporate Bonds – 0.0% (0.0% of Total Investments) | | | | | | | |
| | | | Transportation – 0.0% (0.0% of Total Investments) | | | | | | | |
| $ | 261 | | Las Vegas Monorail Company, Senior Interest Bonds (7), (8) | 5.500% | 7/15/19 | N/R | | $ | 65,193 | |
| | 76 | | Las Vegas Monorail Company, Senior Interest Bonds (7), (8) | 3.000% | 7/15/55 | N/R | | | 15,262 | |
| $ | 337 | | Total Corporate Bonds (cost $6,411) | | | | | | 80,455 | |
| | | | Total Investments (cost $1,351,503,768) – 148.4% | | | | | | 1,472,386,497 | |
| | | | Floating Rate Obligations – (9.6)% | | | | | | (95,614,000 | ) |
| | | | Variable Rate MuniFund Term Preferred Shares, at Liquidation Value – (41.0)% (9) | | | | | | (407,000,000 | ) |
| | | | Other Assets Less Liabilities – 2.2% | | | | | | 22,341,732 | |
| | | | Net Assets Applicable to Common Shares – 100% | | | | | $ | 992,114,229 | |
| (1) | | All percentages shown in the Portfolio of Investments are based on net assets applicable to Common shares unless otherwise noted. |
| (2) | | Optional Call Provisions: Dates (month and year) and prices of the earliest optional call or redemption. There may be other call provisions at varying prices at later dates. Certain mortgage-backed securities may be subject to periodic principal paydowns. |
| (3) | | Ratings: Using the highest of Standard & Poor’s Group (“Standard & Poor’s”), Moody’s Investors Service, Inc. (“Moody’s”) or Fitch, Inc. (“Fitch”) rating. Ratings below BBB by Standard & Poor’s, Baa by Moody’s or BBB by Fitch are considered to be below investment grade. Holdings designated N/R are not rated by any of these national rating agencies. |
| (4) | | Backed by an escrow or trust containing sufficient U.S. Government or U.S. Government agency securities, which ensure the timely payment of principal and interest. Certain bonds backed by U.S. Government or agency securities are regarded as having an implied rating equal to the rating of such securities. |
| (5) | | Investment, or portion of investment, has been pledged to collateralize the net payment obligations for investments in inverse floating rate transactions. |
| (6) | | At or subsequent to the end of the reporting period, this security is non-income producing. Non-income producing security, in the case of a fixed-income security, generally denotes that the issuer has (1) defaulted on the payment of principal or interest, (2) is under the protection of the Federal Bankruptcy Court or (3) the Fund’s Adviser has concluded that the issue is not likely to meet its future interest payment obligations and has directed the Fund’s custodian to cease accruing additional income on the Fund’s records. |
| (7) | | Investment valued at fair value using methods determined in good faith by, or at the discretion of, the Board of Directors. For fair value measurement disclosure purposes, investment classified as Level 3. See Notes to Financial Statements, Footnote 1 – General Information and Significant accounting Policies, Investment Valuation for more information. |
| (8) | | During January 2010, Las Vegas Monorail Company (“Las Vegas Monorail”) filed for federal bankruptcy protection. During March 2012, Las Vegas Monorail emerged from federal bankruptcy with the acceptance of a reorganization plan assigned by the federal bankruptcy court. Under the reorganization plan, the Fund surrendered its Las Vegas Monorail Project Revenue Bonds, First Tier, Series 2000 and in turn received two senior interest corporate bonds: the first with an coupon rate of 5.500% maturing on July 15, 2019 and the second with an coupon rate of 3.000% (5.500% after December 31, 2015) maturing on July 15, 2055. The Fund’s custodian is not accruing income on the Fund’s records for either senior interest corporate bond. |
| (9) | | Variable Rate MuniFund Term Preferred Shares, at Liquidation Value as a percentage of Total Investments is 27.6%. |
| N/R | | Not rated. |
| WI/DD | | Investment, or portion of investment, purchased on a when-issued or delayed delivery basis. |
| (ETM) | | Escrowed to maturity. |
| (IF) | | Inverse floating rate investment. |
| (UB) | | Underlying bond of an inverse floating rate trust reflected as a financing transaction. See Notes to Financial Statements, Footnote 1 – General Information and Significant Accounting Policies, Inverse Floating Rate Securities for more information. |
See accompanying notes to financial statements.
| | | Nuveen Premium Income Municipal Fund 2, Inc. |
| NPM | | Portfolio of Investments |
| | | April 30, 2013 (Unaudited) |
| | Principal | | | Optional Call | | | | | |
| | Amount (000) | | Description (1) | Provisions (2) | Ratings (3) | | | Value | |
| | | | Municipal Bonds – 149.2% (100.0% of Total Investments) | | | | | | |
| | | | Alabama – 3.1% (2.1% of Total Investments) | | | | | | |
| $ | 6,995 | | Alabama Special Care Facilities Financing Authority, Revenue Bonds, Ascension Health, Series 2006C-2, 5.000%, 11/15/39 (UB) | 11/16 at 100.00 | AA+ | | $ | 7,737,100 | |
| | | | Birmingham Special Care Facilities Financing Authority, Alabama, Revenue Bonds, Baptist Health System Inc., Series 2005A: | | | | | | |
| | 3,500 | | 5.250%, 11/15/20 | 11/15 at 100.00 | Baa2 | | | 3,782,100 | |
| | 1,000 | | 5.000%, 11/15/30 | 11/15 at 100.00 | Baa2 | | | 1,039,990 | |
| | 12,000 | | Birmingham Waterworks and Sewerage Board, Alabama, Water and Sewerage Revenue Bonds, Series 2007A, 4.500%, 1/01/39 – AMBAC Insured (UB) | 1/17 at 100.00 | AA+ | | | 12,552,960 | |
| | 1,960 | | Courtland Industrial Development Board, Alabama, Pollution Control Revenue Bonds, International Paper Company, Series 2005A, 5.000%, 6/01/25 | 6/15 at 100.00 | BBB | | | 2,037,440 | |
| | 1,690 | | Montgomery BMC Special Care Facilities Financing Authority, Alabama, Revenue Bonds, Baptist Medical Center, Series 2004C, 5.250%, 11/15/29 (Pre-refunded 11/15/14) | 11/14 at 100.00 | A3 (4) | | | 1,816,936 | |
| | 6,255 | | University of South Alabama, Student Tuition Revenue Bonds, Series 2004, 5.000%, 3/15/24 – FGIC Insured | 3/14 at 100.00 | A1 | | | 6,498,069 | |
| | 33,400 | | Total Alabama | | | | | 35,464,595 | |
| | | | Alaska – 0.1% (0.1% of Total Investments) | | | | | | |
| | 1,000 | | Northern Tobacco Securitization Corporation, Alaska, Tobacco Settlement Asset-Backed Bonds, Series 2006A, 5.000%, 6/01/32 | 6/14 at 100.00 | B+ | | | 935,710 | |
| | | | Arizona – 1.0% (0.6% of Total Investments) | | | | | | |
| | | | Glendale Industrial Development Authority, Arizona, Revenue Bonds, John C. Lincoln Health Network, Series 2005B: | | | | | | |
| | 200 | | 5.250%, 12/01/24 | 12/15 at 100.00 | BBB+ | | | 210,852 | |
| | 265 | | 5.250%, 12/01/25 | 12/15 at 100.00 | BBB+ | | | 278,417 | |
| | 5,000 | | Phoenix, Arizona, Civic Improvement Revenue Bonds, Civic Plaza, Series 2005B, 0.000%, 7/01/40 – FGIC Insured | No Opt. Call | AA | | | 6,291,800 | |
| | 800 | | Pima County Industrial Development Authority, Arizona, Revenue Bonds, Tucson Electric Power Company, Refunding Series 2008, 5.750%, 9/01/29 | 1/15 at 100.00 | BBB– | | | 843,392 | |
| | 2,750 | | Salt Verde Financial Corporation, Arizona, Senior Gas Revenue Bonds, Citigroup Energy Inc Prepay Contract Obligations, Series 2007, 5.000%, 12/01/37 | No Opt. Call | A– | | | 3,089,488 | |
| | 9,015 | | Total Arizona | | | | | 10,713,949 | |
| | | | Arkansas – 0.1% (0.1% of Total Investments) | | | | | | |
| | 1,000 | | Washington County, Arkansas, Hospital Revenue Bonds, Washington Regional Medical Center, Series 2005B, 5.000%, 2/01/25 | 2/15 at 100.00 | Baa1 | | | 1,030,280 | |
| | | | California – 17.2% (11.6% of Total Investments) | | | | | | |
| | | | California Educational Facilities Authority, Revenue Refunding Bonds, Loyola Marymount University, Series 2001A: | | | | | | |
| | 3,255 | | 0.000%, 10/01/23 – NPFG Insured | No Opt. Call | A2 | | | 2,207,378 | |
| | 5,890 | | 0.000%, 10/01/24 – NPFG Insured | No Opt. Call | A2 | | | 3,773,429 | |
| | 7,615 | | 0.000%, 10/01/25 – NPFG Insured | No Opt. Call | A2 | | | 4,635,174 | |
| | 3,330 | | California Health Facilities Financing Authority, Refunding Revenue Bonds, Stanford Hospital and Clinics, Series 2008A-2. RMKT, 5.250%, 11/15/40 | 11/21 at 100.00 | AA– | | | 3,829,933 | |
| | 3,740 | | California Health Facilities Financing Authority, Revenue Bonds, Cedars-Sinai Medical Center, Series 2005, 5.000%, 11/15/27 | 11/15 at 100.00 | A+ | | | 4,044,286 | |
| | 15,000 | | California Health Facilities Financing Authority, Revenue Bonds, Lucile Salter Packard Children’s Hospital, Series 2012A, 5.000%, 8/15/51 | 8/22 at 100.00 | AA | | | 16,865,850 | |
| | 2,550 | | California Health Facilities Financing Authority, Revenue Bonds, Providence Health & Services, Series 2009B, 5.500%, 10/01/39 | 10/19 at 100.00 | AA | | | 3,003,543 | |
| | 2,500 | | California Health Facilities Financing Authority, Revenue Bonds, Sutter Health, Series 2007A, 5.000%, 11/15/42 (UB) | 11/16 at 100.00 | AA– | | | 2,757,700 | |
| | Principal | | | Optional Call | | | | | |
| | Amount (000) | | Description (1) | Provisions (2) | Ratings (3) | | | Value | |
| | | | California (continued) | | | | | | |
| $ | 2,055 | | California Infrastructure and Economic Development Bank, Infrastructure State Revolving Fund Revenue Bonds, Series 2004, 5.000%, 10/01/21 | 10/14 at 100.00 | AA+ | | $ | 2,192,459 | |
| | 4,000 | | California State, Economic Recovery Revenue Bonds, Refunding Series 2009A, 5.250%, 7/01/21 | 7/19 at 100.00 | Aa3 | | | 4,900,560 | |
| | 1,935 | | California State, Economic Recovery Revenue Bonds, Series 2004A, 5.250%, 7/01/14 | No Opt. Call | Aa3 | | | 2,047,540 | |
| | 565 | | California State, Economic Recovery Revenue Bonds, Series 2004A, 5.250%, 7/01/14 (ETM) | No Opt. Call | Aaa | | | 598,069 | |
| | 7,440 | | California State, General Obligation Bonds, Series 2004, 5.125%, 2/01/25 | 2/14 at 100.00 | A1 | | | 7,691,695 | |
| | 20,000 | | California State, General Obligation Bonds, Various Purpose Series 2009, 6.000%, 11/01/39 | 11/19 at 100.00 | A1 | | | 24,331,200 | |
| | 1,000 | | California Statewide Community Development Authority, Revenue Bonds, Daughters of Charity Health System, Series 2005A, 5.000%, 7/01/39 | 7/15 at 100.00 | BBB– | | | 1,037,500 | |
| | 5,355 | | California Statewide Community Development Authority, Revenue Bonds, Sutter Health, Tender Option Bond Trust 3175, 13.5651%, 5/15/14 (IF) | No Opt. Call | AA– | | | 8,297,787 | |
| | 1,900 | | Chula Vista, California, Industrial Development Revenue Bonds, San Diego Gas and Electric Company, Series 1996A, 5.300%, 7/01/21 | 6/14 at 102.00 | A+ | | | 2,031,499 | |
| | 2,500 | | Fontana Public Financing Authority, California, Tax Allocation Revenue Bonds, North Fontana Redevelopment Project, Series 2005A, 5.000%, 10/01/23 – AMBAC Insured | 10/15 at 100.00 | A | | | 2,704,325 | |
| | 30,000 | | Foothill/Eastern Transportation Corridor Agency, California, Toll Road Revenue Bonds, Series 1995A, 0.000%, 1/01/21 (ETM) | No Opt. Call | Aaa | | | 26,417,700 | |
| | 1,385 | | Fullerton Public Financing Authority, California, Tax Allocation Revenue Bonds, Series 2005, 5.000%, 9/01/27 – AMBAC Insured | 9/15 at 100.00 | A | | | 1,456,009 | |
| | | | Golden State Tobacco Securitization Corporation, California, Tobacco Settlement Asset-Backed Bonds, Series 2007A-1: | | | | | | |
| | 2,795 | | 4.500%, 6/01/27 | 6/17 at 100.00 | B | | | 2,726,523 | |
| | 1,345 | | 5.000%, 6/01/33 | 6/17 at 100.00 | B | | | 1,240,736 | |
| | 1,000 | | 5.750%, 6/01/47 | 6/17 at 100.00 | B | | | 955,470 | |
| | 3,850 | | Grossmont Healthcare District, California, General Obligation Bonds, Series 2011B, 6.125%, 7/15/40 | 7/21 at 100.00 | Aa2 | | | 4,759,678 | |
| | 10,000 | | Los Angeles Department of Water and Power, California, Waterworks Revenue Bonds, Series 2011A, 5.000%, 7/01/41 | 1/21 at 100.00 | AA | | | 11,276,800 | |
| | | | Perris, California, Special Tax Bonds, Community Facilities District 2001-1, May Farms Improvement Area 4, Series 2005A: | | | | | | |
| | 1,420 | | 5.000%, 9/01/25 | 9/15 at 102.00 | N/R | | | 1,463,395 | |
| | 435 | | 5.100%, 9/01/30 | 9/15 at 102.00 | N/R | | | 445,323 | |
| | | | San Diego County, California, Certificates of Participation, Burnham Institute, Series 2006: | | | | | | |
| | 250 | | 5.000%, 9/01/21 | 9/15 at 102.00 | Baa2 | | | 264,548 | |
| | 275 | | 5.000%, 9/01/23 | 9/15 at 102.00 | Baa2 | | | 288,409 | |
| | 2,220 | | San Diego Redevelopment Agency, California, Subordinate Lien Tax Allocation Bonds, Centre City Project, Series 2004A, 5.000%, 9/01/20 – SYNCORA GTY Insured | 9/14 at 100.00 | AA– | | | 2,329,069 | |
| | | | San Joaquin Hills Transportation Corridor Agency, Orange County, California, Toll Road Revenue Refunding Bonds, Series 1997A: | | | | | | |
| | 4,595 | | 0.000%, 1/15/32 – NPFG Insured | No Opt. Call | Baa2 | | | 1,834,048 | |
| | 32,400 | | 0.000%, 1/15/34 – NPFG Insured | No Opt. Call | Baa2 | | | 11,558,052 | |
| | 6,000 | | San Jose Redevelopment Agency, California, Tax Allocation Bonds, Merged Area Redevelopment Project, Series 2004A, 5.250%, 8/01/19 – NPFG Insured | 8/14 at 100.00 | BBB | | | 6,133,200 | |
| | 18,750 | | University of California, General Revenue Bonds, Limited Project Series 2012G, 5.000%, 5/15/37 | 5/22 at 100.00 | Aa2 | | | 21,579,938 | |
| | 3,000 | | Walnut Energy Center Authority, California, Electric Revenue Bonds, Turlock Irrigation District, Series 2004A, 5.000%, 1/01/34 – AMBAC Insured | 1/14 at 100.00 | A+ | | | 3,076,259 | |
| | 210,350 | | Total California | | | | | 194,755,084 | |
| | | | Colorado – 2.3% (1.5% of Total Investments) | | | | | | |
| | 1,700 | | Centennial Water and Sanitation District, Colorado, Water and Sewerage Revenue Bonds, Series 2004, 5.000%, 12/01/22 (Pre-refunded 12/01/14) – FGIC Insured | 12/14 at 100.00 | AA+ (4) | | | 1,826,004 | |
| | | | Colorado Health Facilities Authority, Revenue Bonds, Evangelical Lutheran Good Samaritan Society, Series 2005: | | | | | | |
| | 1,745 | | 5.250%, 6/01/23 | 6/16 at 100.00 | A– | | | 1,874,933 | |
| | 475 | | 5.000%, 6/01/29 | 6/16 at 100.00 | A– | | | 496,294 | |
| | | Nuveen Premium Income Municipal Fund 2, Inc. (continued) |
| NPM | | Portfolio of Investments |
| | | April 30, 2013 (Unaudited) |
| | Principal | | | Optional Call | | | | | |
| | Amount (000) | | Description (1) | Provisions (2) | Ratings (3) | | | Value | |
| | | | Colorado (continued) | | | | | | |
| $ | 400 | | Colorado Health Facilities Authority, Revenue Bonds, Poudre Valley Health Care, Series 2005F, 5.000%, 3/01/25 | 3/15 at 100.00 | A+ | | $ | 415,420 | |
| | 75 | | Denver City and County, Colorado, Airport System Revenue Bonds, Series 1991D, 7.750%, 11/15/13 (Alternative Minimum Tax) | No Opt. Call | A+ | | | 77,994 | |
| | 11,140 | | Denver City and County, Colorado, Airport System Revenue Bonds, Series 2012B, 5.000%, 11/15/37 | 11/22 at 100.00 | A+ | | | 12,684,114 | |
| | 6,925 | | Denver Convention Center Hotel Authority, Colorado, Revenue Bonds, Convention Center Hotel, Senior Lien Series 2006, 5.125%, 12/01/25 – SYNCORA GTY Insured | 11/16 at 100.00 | BBB– | | | 7,398,531 | |
| | 630 | | Regional Transportation District, Colorado, Certificates of Participation, Series 2010A, 5.375%, 6/01/31 | 6/20 at 100.00 | Aa3 | | | 717,526 | |
| | 400 | | Regional Transportation District, Colorado, Denver Transit Partners Eagle P3 Project Private Activity Bonds, Series 2010, 6.000%, 1/15/41 | 7/20 at 100.00 | Baa3 | | | 466,932 | |
| | 23,490 | | Total Colorado | | | | | 25,957,748 | |
| | | | Connecticut – 0.5% (0.3% of Total Investments) | | | | | | |
| | 5,000 | | Connecticut, Special Tax Obligation Transportation Infrastructure Purpose Bonds, Series 2003B, 5.000%, 1/01/21 (Pre-refunded 1/01/14) – FGIC Insured | 1/14 at 100.00 | AA (4) | | | 5,158,550 | |
| | | | Delaware – 0.1% (0.1% of Total Investments) | | | | | | |
| | 1,000 | | Delaware Health Facilities Authority, Revenue Bonds, Christiana Care Health Services Inc., Series 2010A, 5.000%, 10/01/40 – NPFG Insured | 10/20 at 100.00 | AA | | | 1,115,570 | |
| | | | District of Columbia – 0.5% (0.3% of Total Investments) | | | | | | |
| | 5,000 | | District of Columbia, Revenue Bonds, Georgetown University, Series 2007A, 0.000%, 4/01/40 – AMBAC Insured | 4/21 at 100.00 | A– | | | 4,065,400 | |
| | 1,335 | | Washington Convention Center Authority, District of Columbia, Dedicated Tax Revenue Bonds, Tender Option Bond Trust 1606, 11.456%, 10/01/30 – AMBAC Insured (IF) (5) | 10/16 at 100.00 | AA+ | | | 1,532,059 | |
| | 6,335 | | Total District of Columbia | | | | | 5,597,459 | |
| | | | Florida – 26.3% (17.6% of Total Investments) | | | | | | |
| | 1,055 | | Bay County School Board, Florida, Certificates of Participation, Series 2004, 5.000%, 7/01/24 – AMBAC Insured | 7/14 at 100.00 | A+ | | | 1,076,585 | |
| | 1,700 | | Beacon Tradeport Community Development District, Miami-Dade County, Florida, Special Assessment Bonds, Commercial Project, Series 2002A, 5.625%, 5/01/32 – RAAI Insured | 5/14 at 100.00 | N/R | | | 1,717,255 | |
| | 930 | | Bradford County Health Facility Authority, Florida, Revenue Refunding Bonds, Santa Fe Healthcare Inc., Series 1993, 6.050%, 11/15/16 (ETM) | No Opt. Call | AA+ (4) | | | 1,026,069 | |
| | 2,500 | | Broward County Educational Facilities Authority, Florida, Revenue Bonds, Nova Southeastern University, Series 2004B, 5.625%, 4/01/34 | 4/14 at 100.00 | BBB+ | | | 2,538,325 | |
| | 725 | | Broward County Housing Finance Authority, Florida, Multifamily Housing Revenue Bonds, Emerald Palms Apartments, Series 2001A, 5.600%, 7/01/21 (Alternative Minimum Tax) | 6/13 at 100.00 | Aaa | | | 726,559 | |
| | 1,870 | | Broward County School Board, Florida, Certificates of Participation, Series 2004C, 5.250%, 7/01/20 (Pre-refunded 7/01/14) – AGM Insured | 7/14 at 100.00 | AA- (4) | | | 1,978,086 | |
| | 1,275 | | Broward County, Florida, Airport System Revenue Bonds, Series 2004L, 5.000%, 10/01/23 – AMBAC Insured | 10/14 at 100.00 | A+ | | | 1,351,449 | |
| | 875 | | Broward County, Florida, Airport System Revenue Bonds, Series 2004L, 5.000%, 10/01/23 (Pre-refunded 10/01/14) – AMBAC Insured | 10/14 at 100.00 | A1 (4) | | | 932,496 | |
| | 2,000 | | Broward County, Florida, Water and Sewer System Revenue Bonds, Series 2009A, 5.250%, 10/01/34 | 10/18 at 100.00 | AA+ | | | 2,305,580 | |
| | 650 | | Cape Coral, Florida, Water and Sewer Revenue Bonds, Series 2006, 5.000%, 10/01/36 – AMBAC Insured | 10/16 at 100.00 | A1 | | | 715,260 | |
| | 1,500 | | Citrus County Hospital Board, Florida, Revenue Bonds, Citrus Memorial Hospital, Refunding Series 2002, 6.375%, 8/15/32 | 8/13 at 100.00 | BB– | | | 1,502,595 | |
| | 3,010 | | Cocoa, Florida, Water and Sewerage System Revenue Refunding Bonds, Series 2003, 5.500%, 10/01/23 – AMBAC Insured | No Opt. Call | AA– | | | 3,681,411 | |
| | 2,815 | | Collier County, Florida, Capital Improvement Revenue Bonds, Series 2005, 5.000%, 10/01/23 (Pre-refunded 10/01/14) – NPFG Insured | 10/14 at 100.00 | AA- (4) | | | 3,002,029 | |
| | Principal | | | Optional Call | | | | | |
| | Amount (000) | | Description (1) | Provisions (2) | Ratings (3) | | | Value | |
| | | | Florida (continued) | | | | | | |
| $ | 4,230 | | Flagler County, Florida, Capital Improvement Revenue Bonds, Series 2005, 5.000%, 10/01/30 – NPFG Insured | 10/15 at 100.00 | A | | $ | 4,414,343 | |
| | 65 | | Florida Housing Finance Agency, GNMA Collateralized Home Ownership Revenue Refunding Bonds, Series 1987G-1, 8.595%, 11/01/17 | No Opt. Call | AA+ | | | 70,296 | |
| | 445 | | Florida Housing Finance Agency, Homeowner Mortgage Revenue Bonds, Series 1997-2, 5.900%, 7/01/29 – NPFG Insured (Alternative Minimum Tax) | 7/13 at 100.00 | AA+ | | | 449,762 | |
| | 755 | | Florida Housing Finance Corporation, Homeowner Mortgage Revenue Bonds, Series 2006-6, 4.625%, 7/01/31 (Alternative Minimum Tax) | 1/16 at 100.00 | AA+ | | | 774,977 | |
| | | | Florida Municipal Loan Council, Revenue Bonds, Series 2000B: | | | | | | |
| | 1,040 | | 0.000%, 11/01/25 – NPFG Insured | No Opt. Call | Baa2 | | | 630,739 | |
| | 1,590 | | 0.000%, 11/01/26 – NPFG Insured | No Opt. Call | Baa2 | | | 911,499 | |
| | 110 | | Florida Municipal Loan Council, Revenue Bonds, Series 2003A, 5.000%, 5/01/22 – NPFG Insured | No Opt. Call | A | | | 110,271 | |
| | 260 | | Florida Municipal Loan Council, Revenue Bonds, Series 2003A, 5.000%, 5/01/22 (Pre-refunded 5/15/13) | 5/13 at 100.00 | A (4) | | | 260,515 | |
| | 14,985 | | Florida State Board of Education, State University System Revenue Bonds, Series 2006A, 5.000%, 7/01/30 – FGIC Insured (UB) | 7/15 at 101.00 | AA | | | 16,263,820 | |
| | 5,980 | | Florida State Department of Management Services, Certificates of Participation, Series 2006A, 5.000%, 8/01/23 – NPFG Insured | 8/15 at 101.00 | AA+ | | | 6,648,086 | |
| | 2,580 | | Florida State Education System, Housing Facility Revenue Bonds, Florida International University, Series 2004A, 5.000%, 7/01/14 – NPFG Insured | No Opt. Call | Baa2 | | | 2,694,578 | |
| | 4,000 | | Florida State Turnpike Authority, Turnpike Revenue Bonds, Department of Transportation, Series 2003C, 5.000%, 7/01/33 (Pre-refunded 7/01/13) | 7/13 at 101.00 | AA- (4) | | | 4,072,400 | |
| | 1,500 | | Florida Water Pollution Control Financing Corporation, Revolving Fund Revenue Bonds, Series 2009A, 5.000%, 1/15/29 | 1/19 at 100.00 | AAA | | | 1,720,200 | |
| | 2,345 | | FSU Financial Assistance Inc., Florida, General Revenue Bonds, Educational and Athletic Facilities Improvements, Series 2004, 5.000%, 10/01/16 – AMBAC Insured | 10/14 at 100.00 | A1 | | | 2,479,345 | |
| | 750 | | Gainesville, Florida, Utilities System Revenue Bonds, Series 2003A, 5.250%, 10/01/21 (Pre-refunded 10/01/13) | 10/13 at 100.00 | AA (4) | | | 765,788 | |
| | | | Halifax Hospital Medical Center, Florida, Revenue Bonds, Series 2006: | | | | | | |
| | 1,720 | | 5.500%, 6/01/38 – AGM Insured | 6/18 at 100.00 | AA– | | | 1,866,011 | |
| | 1,830 | | 5.375%, 6/01/46 | 6/16 at 100.00 | A– | | | 1,938,446 | |
| | 5,000 | | Hernando County, Florida, Revenue Bonds, Criminal Justice Complex Financing Program, Series 1986, 7.650%, 7/01/16 – FGIC Insured | No Opt. Call | N/R | | | 5,899,950 | |
| | 3,600 | | Hillsborough County Industrial Development Authority, Florida, Exempt Facilities Remarketed Revenue Bonds, National Gypsum Company, Apollo Beach Project, Series 2000B, 7.125%, 4/01/30 (Alternative Minimum Tax) | 10/13 at 100.00 | N/R | | | 3,601,980 | |
| | 1,570 | | Hillsborough County Industrial Development Authority, Florida, Hospital Revenue Refunding Bonds, Tampa General Hospital, Series 2003A, 5.250%, 10/01/24 | No Opt. Call | A3 | | | 1,622,108 | |
| | 430 | | Hillsborough County Industrial Development Authority, Florida, Hospital Revenue Refunding Bonds, Tampa General Hospital, Series 2003A, 5.250%, 10/01/24 (Pre-refunded 10/01/13) | 10/13 at 100.00 | N/R (4) | | | 438,961 | |
| | 1,535 | | Hillsborough County, Florida, Community Investment Tax Revenue Bonds, Series 2004, 5.000%, 5/01/24 (Pre-refunded 11/01/13) – AMBAC Insured | 11/13 at 101.00 | AA (4) | | | 1,587,113 | |
| | 2,170 | | Hillsborough County, Florida, Revenue Refunding Bonds, Tampa Bay Arena, Series 2005, 5.000%, 10/01/25 – FGIC Insured | 10/15 at 100.00 | AA+ | | | 2,405,358 | |
| | 1,500 | | Hollywood, Florida, Water and Sewer Revenue Refunding and Improvement Bonds, Series 2003, 5.000%, 10/01/20 – AGM Insured | 10/13 at 100.00 | Aa2 | | | 1,529,085 | |
| | | | Jacksonville, Florida, Better Jacksonville Sales Tax Revenue Bonds, Series 2003: | | | | | | |
| | 4,990 | | 5.250%, 10/01/21 (Pre-refunded 10/01/13) – NPFG Insured | 10/13 at 100.00 | A1 (4) | | | 5,095,688 | |
| | 2,090 | | 5.000%, 10/01/22 (Pre-refunded 10/01/13) – NPFG Insured | 10/13 at 100.00 | A1 (4) | | | 2,132,072 | |
| | 3,145 | | Jacksonville, Florida, Excise Taxes Revenue Refunding Bonds, Series 2003C, 5.250%, 10/01/18 (Pre-refunded 10/01/13) – NPFG Insured (Alternative Minimum Tax) | 10/13 at 100.00 | AA+ (4) | | | 3,201,767 | |
| | | Nuveen Premium Income Municipal Fund 2, Inc. (continued) |
| NPM | | Portfolio of Investments |
| | | April 30, 2013 (Unaudited) |
| | Principal | | | Optional Call | | | | | |
| | Amount (000) | | Description (1) | Provisions (2) | Ratings (3) | | | Value | |
| | | | Florida (continued) | | | | | | |
| | | | JEA, Florida, Water and Sewerage System Revenue Bonds, Series 2004A: | | | | | | |
| $ | 3,235 | | 5.000%, 10/01/18 – FGIC Insured | 10/13 at 100.00 | AA | | $ | 3,300,509 | |
| | 5,090 | | 5.000%, 10/01/19 – FGIC Insured | 10/13 at 100.00 | AA | | | 5,192,665 | |
| | | | Lake County School Board, Florida, Certificates of Participation, Series 2004A: | | | | | | |
| | 1,190 | | 5.000%, 7/01/20 (Pre-refunded 7/01/14) – AMBAC Insured | 7/14 at 100.00 | A+ (4) | | | 1,254,593 | |
| | 1,470 | | 5.000%, 7/01/24 (Pre-refunded 7/01/14) – AMBAC Insured | 7/14 at 100.00 | A+ (4) | | | 1,549,792 | |
| | 1,000 | | Lee County, Florida, Transportation Facilities Revenue Bonds, Series 2004B, 5.000%, 10/01/14 – AMBAC Insured | No Opt. Call | A– | | | 1,061,360 | |
| | 3,500 | | Lee Memorial Health System, Florida, Hospital Revenue Bonds, Series 2007A, 5.000%, 4/01/32 – NPFG Insured | 4/17 at 100.00 | A | | | 3,716,335 | |
| | 2,345 | | Leesburg, Florida, Hospital Revenue Bonds, Leesburg Regional Medical Center Project, Series 2002, 5.375%, 7/01/22 | 7/13 at 100.00 | BBB+ | | | 2,348,611 | |
| | 5,130 | | Manatee County School District, Florida, Sales Tax Revenue Bonds, Series 2003, 5.000%, 10/01/17 (Pre-refunded 10/01/13) – AMBAC Insured | 10/13 at 100.00 | A (4) | | | 5,233,729 | |
| | | | Miami-Dade County Educational Facilities Authority, Florida, Revenue Bonds, University of Miami, Series 2004A: | | | | | | |
| | 2,290 | | 5.000%, 4/01/19 (Pre-refunded 4/01/14) – AMBAC Insured | 4/14 at 100.00 | N/R (4) | | | 2,389,294 | |
| | 3,305 | | 5.000%, 4/01/22 (Pre-refunded 4/01/14) – AMBAC Insured | 4/14 at 100.00 | N/R (4) | | | 3,448,305 | |
| | | | Miami-Dade County Expressway Authority, Florida, Toll System Revenue Bonds, Series 2004B: | | | | | | |
| | 2,000 | | 5.250%, 7/01/18 (Pre-refunded 7/01/14) – FGIC Insured | 7/14 at 100.00 | A- (4) | | | 2,114,380 | |
| | 2,000 | | 5.000%, 7/01/23 (Pre-refunded 7/01/14) – FGIC Insured | 7/14 at 100.00 | A- (4) | | | 2,108,560 | |
| | 1,970 | | Miami-Dade County School Board, Florida, Certificates of Participation, Series 2006B, 5.000%, 11/01/31 – AMBAC Insured | 11/16 at 100.00 | A1 | | | 2,168,497 | |
| | 5,000 | | Miami-Dade County, Florida, Aviation Revenue Bonds, Miami International Airport, Series 2009A, 5.500%, 10/01/41 | 10/19 at 100.00 | A | | | 5,776,950 | |
| | 4,000 | | Miami-Dade County, Florida, General Obligation Bonds, Build Better Communities Program, Series 2009-B1, 5.625%, 7/01/38 | 7/18 at 100.00 | Aa2 | | | 4,630,920 | |
| | 11,300 | | Miami-Dade County, Florida, Transit System Sales Surtax Revenue Bonds, Series 2008, 5.000%, 7/01/35 – AGM Insured | 7/18 at 100.00 | AA | | | 12,539,949 | |
| | 3,300 | | Miami-Dade County, Florida, Water and Sewer System Revenue Bonds, Series 1999A, 5.000%, 10/01/29 – FGIC Insured | 10/13 at 100.00 | Aa2 | | | 3,311,220 | |
| | 2,440 | | Orange County School Board, Florida, Certificates of Participation, Series 2004A, 5.000%, 8/01/22 – AMBAC Insured | 8/14 at 100.00 | AA | | | 2,582,374 | |
| | 575 | | Osceola County Industrial Development Authority, Florida, Industrial Development Revenue Bonds, P.M. Wells Charter School Project, Series 2001A, 5.000%, 8/01/23 – NPFG | 8/13 at 100.00 | Baa2 | | | 575,978 | |
| | | | Insured Osceola County, Florida, Transportation Revenue Bonds, Osceola Parkway, Series 2004: | | | | | | |
| | 3,745 | | 5.000%, 4/01/22 – NPFG Insured | 4/14 at 100.00 | Aa3 | | | 3,892,141 | |
| | 2,000 | | 5.000%, 4/01/23 – NPFG Insured | 4/14 at 100.00 | Aa3 | | | 2,074,820 | |
| | | | Palm Beach County Health Facilities Authority, Florida, Hospital Revenue Refunding Bonds, BRCH Corporation Obligated Group, Series 2001: | | | | | | |
| | 1,895 | | 5.500%, 12/01/21 | 6/13 at 100.00 | BBB– | | | 1,899,738 | |
| | 6,470 | | 5.625%, 12/01/31 | 6/13 at 100.00 | BBB– | | | 6,480,870 | |
| | 1,500 | | Palm Beach County School Board, Florida, Certificates of Participation, Series 2004A, 5.000%, 8/01/22 (Pre-refunded 8/01/14) – FGIC Insured | 8/14 at 100.00 | AA- (4) | | | 1,588,110 | |
| | 3,000 | | Palm Beach County School Board, Florida, Certificates of Participation, Series 2007E, 5.000%, 8/01/27 – NPFG Insured | 8/17 at 100.00 | AA– | | | 3,398,940 | |
| | 6,090 | | Palm Beach County School Board, Florida, Certificates of Participation, Tender Option Bond Trust 2089, 12.902%, 8/01/14 – AGM Insured (IF) | No Opt. Call | AA– | | | 7,966,207 | |
| | 4,490 | | Palm Beach County, Florida, Public Improvement Revenue Bonds, Biomedical Research Park Project, Series 2005A, 5.000%, 6/01/25 (Pre-refunded 6/01/15) – AMBAC Insured | 6/15 at 100.00 | AA+ (4) | | | 4,925,530 | |
| | 4,000 | | Palm Beach County, Florida, Water and Sewer Revenue Bonds, FPL Reclaimed Water Project, Series 2009, 5.250%, 10/01/33 | 10/19 at 100.00 | AAA | | | 4,678,280 | |
| | 6,545 | | Palm Beach County, Florida, Water and Sewer Revenue Bonds, Series 2006A, Trust 2622, 11.205%, 10/01/14 (IF) | No Opt. Call | AAA | | | 8,426,164 | |
| | Principal | | | Optional Call | | | | | |
| | Amount (000) | | Description (1) | Provisions (2) | Ratings (3) | | | Value | |
| | | | Florida (continued) | | | | | | |
| $ | 10,000 | | Palm Beach County, Florida, Water and Sewer Revenue Bonds, Series 2006A, 5.000%, 10/01/31 (UB) | 10/16 at 100.00 | AAA | | $ | 11,488,800 | |
| | 2,500 | | Polk County School District, Florida, Sales Tax Revenue Bonds, Series 2004, 5.250%, 10/01/18 – AGM Insured | 10/14 at 100.00 | AA– | | | 2,640,425 | |
| | 2,060 | | Polk County, Florida, Utility System Revenue Bonds, Series 2003, 5.250%, 10/01/22 (Pre-refunded 10/01/13) – FGIC Insured | 10/13 at 100.00 | Aa3 (4) | | | 2,103,631 | |
| | 2,000 | | Port Saint Lucie, Florida, Special Assessment Revenue Bonds, Southwest Annexation District 1B, Series 2007, 5.000%, 7/01/33 – NPFG Insured | 7/17 at 100.00 | Baa2 | | | 2,118,140 | |
| | 650 | | Reedy Creek Improvement District, Florida, Utility Revenue Bonds, Series 2005-1, 5.000%, 10/01/25 – AMBAC Insured | 10/15 at 100.00 | A1 | | | 711,744 | |
| | 3,240 | | Reedy Creek Improvement District, Orange and Osceola Counties, Florida, General Obligation Bonds, Series 2004A, 5.000%, 6/01/22 – NPFG Insured | 4/14 at 100.00 | Aa3 | | | 3,375,270 | |
| | 1,635 | | Rivercrest Community Development District, Florida, Special Assessment Bonds, Series 2007, 5.000%, 5/01/30 – RAAI Insured | 5/18 at 100.00 | BB | | | 1,654,816 | |
| | 2,750 | | Saint Johns County, Florida, Transportation Improvement Revenue Bonds, Series 2003, 5.000%, 10/01/23 (Pre-refunded 10/01/13) – AMBAC Insured | 10/13 at 100.00 | Aa3 (4) | | | 2,805,028 | |
| | 3,570 | | Seminole County, Florida, Water and Sewer Revenue Refunding and Improvement Bonds, Series 1992, 6.000%, 10/01/19 – NPFG Insured (ETM) | No Opt. Call | Aa2 (4) | | | 4,303,921 | |
| | 1,680 | | Seminole County, Florida, Water and Sewer Revenue Refunding and Improvement Bonds, Series 1992, 6.000%, 10/01/19 – NPFG Insured | No Opt. Call | Aa2 | | | 1,774,786 | |
| | 625 | | Sonoma Bay Community Development District, Florida, Special Assessment Bonds, Series 2005A, 5.450%, 5/01/36 | 5/15 at 100.00 | N/R | | | 660,675 | |
| | 7,500 | | South Florida Water Management District, Certificates of Participation, Series 2007, Trust 1036, 9.112%, 10/01/14 – AMBAC Insured (IF) | No Opt. Call | AA | | | 9,030,900 | |
| | 5,000 | | South Florida Water Management District, Certificates of Participation, Series 2006, 5.000%, 10/01/36 – AMBAC Insured | 10/16 at 100.00 | AA | | | 5,510,300 | |
| | 2,455 | | South Miami Health Facilities Authority, Florida, Hospital Revenue, Baptist Health System Obligation Group, Series 2007, 5.000%, 8/15/42 (UB) (5) | 8/17 at 100.00 | AA | | | 2,690,091 | |
| | | | St. John’s County Industrial Development Authority, Florida, First Mortgage Revenue Bonds, Presbyterian Retirement Communities, Series 2004A: | | | | | | |
| | 2,250 | | 5.850%, 8/01/24 | 8/14 at 101.00 | A– | | | 2,350,665 | |
| | 3,135 | | 5.625%, 8/01/34 | 8/14 at 101.00 | A– | | | 3,238,455 | |
| | 5,000 | | Sumter County, Florida, Capital Improvement Revenue Bonds, Series 2006, 5.000%, 6/01/36 – AMBAC Insured | 6/16 at 100.00 | A | | | 5,464,600 | |
| | 620 | | Tallahassee, Florida, Consolidated Utility System Revenue Bonds, Series 2005, 5.000%, 10/01/25 – AMBAC Insured | 10/15 at 100.00 | AA+ | | | 687,245 | |
| | 5,000 | | Tallahassee, Florida, Energy System Revenue Bonds, Series 2005, 5.000%, 10/01/35 – NPFG Insured | 10/15 at 100.00 | AA | | | 5,388,798 | |
| | 5,000 | | Tampa Bay, Florida, Regional Water Supply Authority Utility System Revenue Bonds, Series 2008, 5.000%, 10/01/34 | 10/18 at 100.00 | AA+ | | | 5,700,498 | |
| | | | Tampa Sports Authority, Hillsborough County, Florida, Sales Tax Payments Special Purpose Bonds, Stadium Project, Series 1995: | | | | | | |
| | 1,250 | | 5.750%, 10/01/20 – NPFG Insured | No Opt. Call | Baa2 | | | 1,386,913 | |
| | 2,785 | | 5.750%, 10/01/25 – NPFG Insured | No Opt. Call | Baa2 | | | 3,127,471 | |
| | | | Tampa-Hillsborough County Expressway Authority, Florida, Revenue Bonds, Series 2005: | | | | | | |
| | 7,285 | | 5.000%, 7/01/16 (Pre-refunded 7/01/15) – AMBAC Insured | 7/15 at 101.00 | Aaa | | | 8,091,303 | |
| | 2,250 | | 5.000%, 7/01/16 (Pre-refunded 7/01/15) – AMBAC Insured | 7/15 at 101.00 | Aaa | | | 2,495,903 | |
| | 1,000 | | Volusia County, Florida, Tax Revenue Bonds, Tourist Development, Series 2004, 5.000%, 12/01/24 – AGM Insured | 12/14 at 100.00 | A2 | | | 1,070,370 | |
| | 273,235 | | Total Florida | | | | | 296,644,426 | |
| | | | Georgia – 2.1% (1.4% of Total Investments) | | | | | | |
| | 7,230 | | Atlanta, Georgia, Airport General Revenue Bonds, Series 2012B, 5.000%, 1/01/42 | 1/22 at 100.00 | A+ | | | 8,141,125 | |
| | 500 | | Chatham County Hospital Authority, Savannah, Georgia, Hospital Revenue Bonds, Memorial Health University Medical Center Inc., Series 2004A, 5.375%, 1/01/26 (Pre-refunded 1/01/14) | 1/14 at 100.00 | BB+ (4) | | | 517,110 | |
| | | Nuveen Premium Income Municipal Fund 2, Inc. (continued) |
| NPM | | Portfolio of Investments |
| | | April 30, 2013 (Unaudited) |
| | Principal | | | Optional Call | | | | | |
| | Amount (000) | | Description (1) | Provisions (2) | Ratings (3) | | | Value | |
| | | | Georgia (continued) | | | | | | |
| $ | 2,000 | | Franklin County Industrial Building Authority, Georgia, Revenue Bonds, Ty Cobb Regional Medical Center Project, Series 2010, 8.125%, 12/01/45 | 12/20 at 100.00 | N/R | | $ | 2,242,880 | |
| | 3,940 | | Greene County Development Authority, Georgia, Health System Revenue Bonds, Catholic Health East Issue, Series 2012, 4.250%, 11/15/42 | No Opt. Call | A+ | | | 4,056,860 | |
| | 10 | | Municipal Electric Authority of Georgia, Combustion Turbine Revenue Bonds, Series 2003A, 5.250%, 11/01/15 (Pre-refunded 11/01/13) – NPFG Insured | 11/13 at 100.00 | A1 (4) | | | 10,252 | |
| | | | Municipal Electric Authority of Georgia, Combustion Turbine Revenue Bonds, Series 2003A: | | | | | | |
| | 3,405 | | 5.250%, 11/01/15 – NPFG Insured | 11/13 at 100.00 | A1 | | | 3,487,163 | |
| | 3,365 | | 5.000%, 11/01/18 – NPFG Insured | 11/13 at 100.00 | A1 | | | 3,438,862 | |
| | 2,235 | | Richmond County Development Authority, Georgia, Revenue Bonds, Medical College of Georgia, Cancer Research Center Project, Series 2004A, 5.000%, 12/15/24 – AMBAC Insured | 12/14 at 100.00 | A1 | | | 2,309,247 | |
| | 22,685 | | Total Georgia | | | | | 24,203,499 | |
| | | | Guam – 0.1% (0.0% of Total Investments) | | | | | | |
| | 605 | | Guam Power Authority, Revenue Bonds, Series 2012A, 5.000%, 10/01/34 | 10/22 at 100.00 | BBB | | | 671,629 | |
| | | | Idaho – 0.4% (0.3% of Total Investments) | | | | | | |
| | 2,970 | | Idaho Housing and Finance Association, GNMA Housing Revenue Refunding Bonds, Wedgewood Terrace Project, Series 2002A-1, 7.250%, 3/20/37 | 3/16 at 101.00 | Aaa | | | 3,095,898 | |
| | 40 | | Idaho Housing and Finance Association, Single Family Mortgage Bonds, Series 1996G, 6.350%, 7/01/26 (Alternative Minimum Tax) | 7/13 at 100.00 | AAA | | | 40,146 | |
| | 110 | | Idaho Housing and Finance Association, Single Family Mortgage Bonds, Series 2000B, 6.250%, 7/01/22 (Alternative Minimum Tax) | 7/13 at 100.00 | AAA | | | 110,928 | |
| | 155 | | Idaho Housing and Finance Association, Single Family Mortgage Bonds, Series 2000E, 5.950%, 7/01/20 (Alternative Minimum Tax) | 7/13 at 100.00 | Aaa | | | 155,391 | |
| | | | Madison County, Idaho, Hospital Revenue Certificates of Participation, Madison Memorial Hospital, Series 2006: | | | | | | |
| | 1,000 | | 5.250%, 9/01/30 | 9/16 at 100.00 | BB+ | | | 1,034,360 | |
| | 470 | | 5.250%, 9/01/37 | 9/16 at 100.00 | BB+ | | | 483,489 | |
| | 4,745 | | Total Idaho | | | | | 4,920,212 | |
| | | | Illinois – 14.1% (9.5% of Total Investments) | | | | | | |
| | 5,000 | | Chicago Board of Education, Illinois, Unlimited Tax General Obligation Bonds, Dedicated Tax Revenues, Series 1999A, 0.000%, 12/01/20 – FGIC Insured | No Opt. Call | A+ | | | 4,063,000 | |
| | 5,700 | | Chicago Transit Authority, Illinois, Sales Tax Receipts Revenue Bonds, Series 2011, 5.250%, 12/01/40 | 12/21 at 100.00 | AA | | | 6,531,915 | |
| | 22,670 | | Chicago, Illinois, General Obligation Bonds, City Colleges, Series 1999, 0.000%, 1/01/25 – FGIC Insured | No Opt. Call | Aa3 | | | 14,619,203 | |
| | 5,000 | | Chicago, Illinois, Sales Tax Revenue Bonds, Series 2011A, 5.000%, 1/01/41 | 1/22 at 100.00 | AAA | | | 5,590,150 | |
| | 850 | | Chicago, Illinois, Tax Increment Allocation Bonds, Read-Dunning Redevelopment Project, Series 1996B, 7.250%, 1/01/14 | 7/13 at 100.00 | N/R | | | 852,516 | |
| | 845 | | Chicago, Illinois, Tax Increment Allocation Bonds, Sanitary Drainage and Ship Canal Redevelopment Project, Series 1997A, 7.750%, 1/01/14 | 7/13 at 100.00 | N/R | | | 847,848 | |
| | 4,865 | | Cook County Community Consolidated School District 15, Palatine, Illinois, General Obligation Bonds, Series 2001, 0.000%, 12/01/20 – FGIC Insured (ETM) | No Opt. Call | Aa2 (4) | | | 4,012,944 | |
| | 2,575 | | Cook County Community High School District 219, Niles Township, Illinois, General Obligation Capital Appreciation Bonds, Series 2001, 0.000%,
12/01/20 – NPFG Insured | No Opt. Call | Baa2 | | | 1,965,214 | |
| | 3,615 | | Cook County Community High School District 219, Niles Township, Illinois, General Obligation Capital Appreciation Bonds, Series 2001, 0.000%,
12/01/20 – NPFG Insured (ETM) | No Opt. Call | N/R (4) | | | 3,199,890 | |
| | 3,500 | | Cook County, Illinois, General Obligation Bonds, Refunding Series 2010A, 5.250%, 11/15/22 | 11/20 at 100.00 | AA | | | 4,223,940 | |
| | 1,100 | | Illinois Finance Authority, Revenue Bonds, Northwestern Memorial HealthCare, Tender Option Bond Trust 4285, 17.853%, 8/15/20 (IF) (5) | No Opt. Call | AA+ | | | 1,684,760 | |
| | | | Illinois Finance Authority, Revenue Bonds, OSF Healthcare System, Series 2004: | | | | | | |
| | 2,000 | | 5.250%, 11/15/14 (Pre-refunded 5/15/14) | 5/14 at 100.00 | A (4) | | | 2,102,140 | |
| | 4,420 | | 5.250%, 11/15/15 (Pre-refunded 5/15/14) | 5/14 at 100.00 | A (4) | | | 4,645,729 | |
| | Principal | | | Optional Call | | | | | | |
| | Amount (000) | | Description (1) | Provisions (2) | | Ratings (3) | | | Value | |
| | | | Illinois (continued) | | | | | | | |
| $ | 395 | | Illinois Finance Authority, Revenue Bonds, Proctor Hospital, Series 2006, 5.125%, 1/01/25 | 1/16 at 100.00 | | BB+ | | $ | 390,533 | |
| | 1,900 | | Illinois Finance Authority, Revenue Bonds, Provena Health, Series 2009A, 7.750%, 8/15/34 | 8/19 at 100.00 | | BBB+ | | | 2,442,146 | |
| | 4,480 | | Illinois Finance Authority, Revenue Bonds, The Carle Foundation, Series 2011A, 6.000%, 8/15/41 – AGM Insured | 8/21 at 100.00 | | AA– | | | 5,295,674 | |
| | 6,000 | | Illinois Finance Authority, Revenue Bonds, The University of Chicago, Series 2012A, 5.000%, 10/01/51 | 10/21 at 100.00 | | Aa1 | | | 6,676,680 | |
| | 3,540 | | Illinois Finance Authority, Student Housing Revenue Bonds, Educational Advancement Fund Inc., University Center Project, Series 2006B, 5.000%, 5/01/25 | 11/16 at 100.00 | | BBB+ | | | 3,771,339 | |
| | 3,090 | | Illinois Health Facilities Authority, Revenue Bonds, Lake Forest Hospital, Series 2003, 6.000%, 7/01/33 (Pre-refunded 7/01/13) | 7/13 at 100.00 | | AA+ (4) | | | 3,120,251 | |
| | 3,000 | | Illinois Health Facilities Authority, Revenue Refunding Bonds, Lutheran General Health System, Series 1993C, 6.000%, 4/01/18 | No Opt. Call | | Aa2 | | | 3,456,870 | |
| | 10,000 | | Illinois State, General Obligation Bonds, Refunding Series 2010, 5.000%,
1/01/21 – AGM Insured | 1/20 at 100.00 | | AA– | | | 11,549,900 | |
| | 2,000 | | Illinois State, General Obligation Bonds, Series 2009A, 5.000%, 9/01/34 | 9/18 at 100.00 | | A2 | | | 2,152,940 | |
| | 1,115 | | Illinois Toll Highway Authority, Toll Highway Revenue Bonds, Tender Option Bond Trust 4304, 17.980%, 1/01/21 (WI/DD, Settling 5/16/13) (IF) | No Opt. Call | | AA– | | | 1,708,738 | |
| | 11,050 | | Illinois, General Obligation Bonds, Illinois FIRST Program, Series 2001, 6.000%, 11/01/26 – FGIC Insured | No Opt. Call | | A2 | | | 13,504,647 | |
| | | | Lake County Community Unit School District 60, Waukegan, Illinois, General Obligation Refunding Bonds, Series 2001B: | | | | | | | |
| | 3,230 | | 0.000%, 11/01/19 – AGM Insured | No Opt. Call | | A2 | | | 2,754,867 | |
| | 1,740 | | 0.000%, 11/01/21 – AGM Insured | No Opt. Call | | A2 | | | 1,352,467 | |
| | 4,020 | | Lake, Cook, Kane and McHenry Counties Community Unit School District 220, Barrington, Illinois, General Obligation Bonds, Refunding Series 2002, 5.250%, 12/01/20 – AGM Insured (UB) | No Opt. Call | | AAA | | | 5,126,224 | |
| | | | Lombard Public Facilities Corporation, Illinois, Second Tier Conference Center and Hotel Revenue Bonds, Series 2005B: | | | | | | | |
| | 855 | | 5.250%, 1/01/25 | 1/16 at 100.00 | | CCC | | | 408,519 | |
| | 1,750 | | 5.250%, 1/01/30 | 1/16 at 100.00 | | CCC | | | 824,233 | |
| | 17,945 | | McHenry and Kane Counties Community Consolidated School District 158, Huntley, Illinois, General Obligation Bonds, Series 2003, 0.000%, 1/01/22 – FGIC Insured | No Opt. Call | | N/R | | | 13,164,990 | |
| | 2,910 | | McHenry County Community High School District 154, Marengo, Illinois, Capital Appreciation School Bonds, Series 2001, 0.000%, 1/01/21 – FGIC Insured | No Opt. Call | | Aa2 | | | 2,386,084 | |
| | 15,595 | | Metropolitan Pier and Exposition Authority, Illinois, McCormick Place Expansion Project Refunding Bonds, Series 2010A, 5.500%, 6/15/50 | 6/20 at 100.00 | | AAA | | | 17,467,960 | |
| | 8,000 | | Metropolitan Pier and Exposition Authority, Illinois, Revenue Bonds, McCormick Place Expansion Project, Series 2002A, 0.000%, 6/15/26 – NPFG Insured | 6/22 at 101.00 | | AAA | | | 7,536,720 | |
| | 164,755 | | Total Illinois | | | | | | 159,431,031 | |
| | | | Indiana – 2.5% (1.7% of Total Investments) | | | | | | | |
| | 3,880 | | Indiana Finance Authority Health System Revenue Bonds, Sisters of St. Francis Health Services, Inc. Obligated Group, Series 2009, 5.250%, 11/01/39 | 11/19 at 100.00 | | AA | | | 4,405,779 | |
| | 2,500 | | Indiana Finance Authority, Revenue Bonds, Trinity Health Care Group, Refunding Series 2010B., 5.000%, 12/01/37 | 12/20 at 100.00 | | AA | | | 2,747,000 | |
| | 3,075 | | Indiana Finance Authority, Wastewater Utility Revenue Bonds, CWA Authority Project, Series 2012A, 5.000%, 10/01/37 | 10/22 at 100.00 | | AA | | | 3,504,547 | |
| | 7,350 | | Indiana Municipal Power Agency, Power Supply System Revenue Bonds, Series 2004A, 5.000%, 1/01/32 – FGIC Insured | 1/15 at 100.00 | | A+ | | | 7,755,500 | |
| | | | Indiana University, Student Fee Revenue Bonds, Series 2004P: | | | | | | | |
| | 2,750 | | 5.000%, 8/01/22 (Pre-refunded 8/01/14) – AMBAC Insured | 8/14 at 100.00 | | Aaa | | | 2,912,608 | |
| | 1,600 | | 5.000%, 8/01/24 (Pre-refunded 8/01/14) – AMBAC Insured | 8/14 at 100.00 | | Aaa | | | 1,694,608 | |
| | 4,300 | | Saint Joseph County, Indiana, Educational Facilities Revenue Bonds, University of Notre Dame du Lac Project, Refunding Series 2009, 5.000%, 3/01/36 | 3/18 at 100.00 | | Aaa | | | 4,940,657 | |
| | 1,550 | | St. Joseph County Hospital Authority, Indiana, Revenue Bonds, Madison Center Inc., Series 2005, 5.250%, 2/15/23 (6) | 2/15 at 100.00 | | N/R | | | 173,414 | |
| | 27,005 | | Total Indiana | | | | | | 28,134,113 | |
| | | Nuveen Premium Income Municipal Fund 2, Inc. (continued) |
| NPM | | Portfolio of Investments |
| | | April 30, 2013 (Unaudited) |
| | Principal | | | Optional Call | | | | | |
| | Amount (000) | | Description (1) | Provisions (2) | Ratings (3) | | | Value | |
| | | | Iowa – 0.7% (0.5% of Total Investments) | | | | | | |
| | | | Iowa Tobacco Settlement Authority, Asset Backed Settlement Revenue Bonds, Series 2005C: | | | | | | |
| $ | 8,365 | | 5.500%, 6/01/42 | 6/15 at 100.00 | B+ | | $ | 8,124,757 | |
| | 35 | | 5.625%, 6/01/46 | 6/15 at 100.00 | B+ | | | 34,328 | |
| | 8,400 | | Total Iowa | | | | | 8,159,085 | |
| | | | Kansas – 0.0% (0.0% of Total Investments) | | | | | | |
| | 90 | | Sedgwick and Shawnee Counties, Kansas, GNMA Collateralized Single Family Mortgage Revenue Refunding Bonds, Series 1994A-1, 7.900%, 5/01/24 (Alternative Minimum Tax) | No Opt. Call | Aaa | | | 91,419 | |
| | | | Kentucky – 1.1% (0.8% of Total Investments) | | | | | | |
| | 4,300 | | Kentucky Economic Development Finance Authority, Hospital Facilities Revenue Bonds, Owensboro Medical Health System, Series 2010A, 6.500%, 3/01/45 | 6/20 at 100.00 | BBB+ | | | 5,185,585 | |
| | 2,000 | | Kentucky Economic Development Finance Authority, Hospital Revenue Bonds, Baptist Healthcare System Obligated Group, Series 2011, 5.000%, 8/15/42 | 8/21 at 100.00 | AA– | | | 2,181,860 | |
| | 4,630 | | Lexington-Fayette Urban County Government Public Facilities Corporation, Kentucky State Lease Revenue Bonds, Eastern State Hospital Project, Series 2011A, 5.250%, 6/01/31 | 6/21 at 100.00 | Aa3 | | | 5,384,088 | |
| | 10,930 | | Total Kentucky | | | | | 12,751,533 | |
| | | | Louisiana – 6.0% (4.0% of Total Investments) | | | | | | |
| | 4,350 | | Louisiana Citizens Property Insurance Corporation, Assessment Revenue Bonds, Series 2006B, 5.000%, 6/01/22 – AMBAC Insured | 6/16 at 100.00 | A– | | | 4,767,165 | |
| | 4,000 | | Louisiana Public Facilities Authority, Hospital Revenue Bonds, Franciscan Missionaries of Our Lady Health System, Series 2005A, 5.250%, 8/15/31 | 8/15 at 100.00 | A+ | | | 4,152,200 | |
| | 2,700 | | Louisiana Public Facilities Authority, Revenue Bonds, Ochsner Clinic Foundation Project, Series 2007A, 5.500%, 5/15/47 | 5/17 at 100.00 | Baa1 | | | 2,871,261 | |
| | 5,750 | | Louisiana Public Facilities Authority, Revenue Bonds, Ochsner Clinic Foundation Project, Series 2011, 6.750%, 5/15/41 | 5/21 at 100.00 | Baa1 | | | 6,953,475 | |
| | 10,720 | | Louisiana Stadium and Exposition District, Revenue Refunding Bonds, Senior Lien Series 2013A, 5.000%, 7/01/36 | 7/23 at 100.00 | A | | | 12,060,965 | |
| | 3,000 | | Louisiana State, Gasoline and Fuels Tax Revenue Bonds, Second Lien Series 2010B, 5.000%, 5/01/45 | 5/20 at 100.00 | AA | | | 3,448,710 | |
| | | | Louisiana State, Gasoline and Fuels Tax Revenue Bonds, Series 2006A: | | | | | | |
| | 14,550 | | 4.750%, 5/01/39 – AGM Insured (UB) | 5/16 at 100.00 | Aa1 | | | 15,860,955 | |
| | 5,920 | | 4.500%, 5/01/41 – FGIC Insured (UB) | 5/16 at 100.00 | Aa1 | | | 6,388,982 | |
| | | | Tobacco Settlement Financing Corporation, Louisiana, Tobacco Settlement Asset-Backed Bonds, Series 2001B: | | | | | | |
| | 95 | | 5.500%, 5/15/30 | 5/13 at 100.00 | A1 | | | 95,523 | |
| | 11,360 | | 5.875%, 5/15/39 | 5/13 at 100.00 | A– | | | 11,422,594 | |
| | 62,445 | | Total Louisiana | | | | | 68,021,830 | |
| | | | Maryland – 0.5% (0.3% of Total Investments) | | | | | | |
| | 1,865 | | Baltimore, Maryland, Senior Lien Convention Center Hotel Revenue Bonds, Series 2006A, 5.250%, 9/01/26 – SYNCORA GTY Insured | 9/16 at 100.00 | BB+ | | | 1,925,557 | |
| | 1,205 | | Maryland Economic Development Corporation, Student Housing Revenue Refunding Bonds, University of Maryland College Park Projects, Series 2006, 5.000%, 6/01/28 – CIFG Insured | 6/16 at 100.00 | AA– | | | 1,262,262 | |
| | 1,390 | | Maryland Health and Higher Educational Facilities Authority, Revenue Bonds, LifeBridge Health System, Series 2004A, 5.250%, 7/01/19 (Pre-refunded 7/01/14) | 7/14 at 100.00 | N/R (4) | | | 1,468,646 | |
| | 1,000 | | Maryland Health and Higher Educational Facilities Authority, Revenue Bonds, Mercy Medical Center, Series 2011, 6.250%, 7/01/31 | 7/21 at 100.00 | BBB | | | 1,194,270 | |
| | 5,460 | | Total Maryland | | | | | 5,850,735 | |
| | | | Massachusetts – 3.3% (2.2% of Total Investments) | | | | | | |
| | 675 | | Massachusetts Development Finance Agency, Revenue Bonds, Boston University, Series 2013X, 5.000%, 10/01/48 | 10/23 at 100.00 | A1 | | | 763,452 | |
| | 8,125 | | Massachusetts Department of Transportation, Metropolitan Highway System Revenue Bonds, Senior Lien Series 2010B, 5.000%, 1/01/37 | 1/20 at 100.00 | A+ | | | 9,076,925 | |
| | 695 | | Massachusetts Development Finance Agency, Pioneer Valley Resource Recovery Revenue Bonds, Eco/Springfield LLC, Series 2000A, 8.375%, 7/01/14 (Alternative Minimum Tax) | No Opt. Call | N/R | | | 711,631 | |
| | Principal | | | Optional Call | | | | | |
| | Amount (000) | | Description (1) | Provisions (2) | Ratings (3) | | | Value | |
| | | | Massachusetts (continued) | | | | | | |
| $ | 780 | | Massachusetts Development Finance Agency, Pioneer Valley Resource Recovery Revenue Bonds, Eco/Springfield LLC, Series 2006, 5.875%, 7/01/14 (Alternative Minimum Tax) | No Opt. Call | N/R | | $ | 777,364 | |
| | 2,700 | | Massachusetts Development Finance Agency, Revenue Bonds, Olin College, Series 2013E, 5.000%, 11/01/43 (WI/DD, Settling 5/09/13) | 11/23 at 100.00 | A+ | | | 3,039,471 | |
| | 1,000 | | Massachusetts Development Finance Authority, Revenue Bonds, Hampshire College, Series 2004, 5.700%, 10/01/34 | 10/14 at 100.00 | BBB | | | 1,027,480 | |
| | 1,500 | | Massachusetts Health and Educational Facilities Authority, Revenue Bonds, Massachusetts Eye and Ear Infirmary, Series 2010C, 5.375%, 7/01/35 | 7/20 at 100.00 | BBB– | | | 1,628,835 | |
| | 900 | | Massachusetts Port Authority, Special Facilities Revenue Bonds, ConRac Project, Series 2011A, 5.125%, 7/01/41 | 7/21 at 100.00 | A | | | 1,008,864 | |
| | | | Massachusetts State, Special Obligation Dedicated Tax Revenue Bonds, Series 2004: | | | | | | |
| | 2,250 | | 5.250%, 1/01/21 (Pre-refunded 1/01/14) – FGIC Insured | 1/14 at 100.00 | A1 (4) | | | 2,324,340 | |
| | 4,000 | | 5.250%, 1/01/24 (Pre-refunded 1/01/14) – FGIC Insured | 1/14 at 100.00 | A1 (4) | | | 4,132,160 | |
| | 3,795 | | Massachusetts Water Resources Authority, General Revenue Bonds, Series 2007A, 4.500%, 8/01/46 – AGM Insured (UB) (5) | 2/17 at 100.00 | AA+ | | | 4,005,015 | |
| | 8,050 | | Metropolitan Boston Transit Parking Corporation, Massachusetts, Systemwide Senior Lien Parking Revenue Bonds, Series 2011, 5.000%, 7/01/41 | 7/21 at 100.00 | A+ | | | 9,031,778 | |
| | 34,470 | | Total Massachusetts | | | | | 37,527,315 | |
| | | | Michigan – 5.2% (3.5% of Total Investments) | | | | | | |
| | 3,055 | | Detroit Water and Sewerage Department, Michigan, Sewage Disposal System Revenue Bonds, Refunding Senior Lien Series 2012A, 5.250%, 7/01/39 | 7/22 at 100.00 | A+ | | | 3,339,421 | |
| | 7,000 | | Detroit, Michigan, Distributable State Aid General Obligation Bonds, Limited Tax Series 2010, 5.250%, 11/01/35 | 11/20 at 100.00 | AA | | | 7,736,540 | |
| | | | Grand Rapids and Kent County Joint Building Authority, Michigan, Limited Tax General Obligation Bonds, Devos Place Project, Series 2001: | | | | | | |
| | 7,660 | | 0.000%, 12/01/21 | No Opt. Call | AAA | | | 6,361,477 | |
| | 7,955 | | 0.000%, 12/01/22 | No Opt. Call | AAA | | | 6,331,703 | |
| | 8,260 | | 0.000%, 12/01/23 | No Opt. Call | AAA | | | 6,338,063 | |
| | 8,575 | | 0.000%, 12/01/24 | No Opt. Call | AAA | | | 6,355,104 | |
| | 1,200 | | Kent Hospital Finance Authority, Michigan, Revenue Bonds, Metropolitan Hospital, Series 2005A, 6.000%, 7/01/35 | 7/15 at 100.00 | BB+ | | | 1,275,012 | |
| | 10,000 | | Michigan Finance Authority, Revenue Bonds, Trinity Health Credit Group, Refunding Series 2011, 5.000%, 12/01/39 | 12/21 at 100.00 | AA | | | 11,139,200 | |
| | 6,345 | | Michigan State Hospital Finance Authority, Hospital Revenue Bonds, Henry Ford Health System, Refunding Series 2009, 5.750%, 11/15/39 | 11/19 at 100.00 | A | | | 7,238,820 | |
| | | | Michigan State Hospital Finance Authority, Revenue Bonds, Trinity Health Care Group, Series 2006A: | | | | | | |
| | 275 | | 5.000%, 12/01/31 (Pre-refunded 12/01/16) (UB) | 12/16 at 100.00 | N/R (4) | | | 317,350 | |
| | 1,225 | | 5.000%, 12/01/31 (UB) | 12/16 at 100.00 | AA | | | 1,351,506 | |
| | 340 | | Monroe County Hospital Finance Authority, Michigan, Mercy Memorial Hospital Corporation Revenue Bonds, Series 2006, 5.500%, 6/01/35 | 6/16 at 100.00 | BBB | | | 363,259 | |
| | 61,890 | | Total Michigan | | | | | 58,147,455 | |
| | | | Minnesota – 1.3% (0.9% of Total Investments) | | | | | | |
| | 8,165 | | Cohasset, Minnesota, Pollution Control Revenue Bonds, Allete Inc., Series 2004, 4.950%, 7/01/22 | 7/14 at 100.00 | A | | | 8,388,639 | |
| | | | Minneapolis-St. Paul Housing and Redevelopment Authority, Minnesota, Revenue Bonds, HealthPartners Inc., Series 2003: | | | | | | |
| | 1,000 | | 6.000%, 12/01/18 | 12/13 at 100.00 | A– | | | 1,031,470 | |
| | 1,050 | | 5.875%, 12/01/29 | 12/13 at 100.00 | A– | | | 1,080,450 | |
| | 1,000 | | Minnesota Municipal Power Agency, Electric Revenue Bonds, Series 2004A, 5.250%, 10/01/19 | 10/14 at 100.00 | A3 | | | 1,065,840 | |
| | 1,620 | | St. Louis Park, Minnesota, Revenue Bonds, Park Nicollet Health Services, Series 2003B, 5.500%, 7/01/25 (Pre-refunded 7/01/14) | 7/14 at 100.00 | N/R (4) | | | 1,717,378 | |
| | 1,000 | | St. Paul Housing and Redevelopment Authority, Minnesota, Revenue Bonds, Healtheast Inc., Series 2005, 6.000%, 11/15/25 | 11/15 at 100.00 | BBB– | | | 1,082,250 | |
| | 13,835 | | Total Minnesota | | | | | 14,366,027 | |
| | | Nuveen Premium Income Municipal Fund 2, Inc. (continued) |
| NPM | | Portfolio of Investments |
| | | April 30, 2013 (Unaudited) |
| | Principal | | | Optional Call | | | | | |
| | Amount (000) | | Description (1) | Provisions (2) | Ratings (3) | | | Value | |
| | | | Mississippi – 0.3% (0.2% of Total Investments) | | | | | | |
| $ | 3,675 | | Mississippi Hospital Equipment and Facilities Authority, Revenue Bonds, Baptist Memorial Healthcare, Series 2004B-1, 5.000%, 9/01/24 (UB) | 9/14 at 100.00 | AA– | | $ | 3,872,678 | |
| | | | Missouri – 1.6% (1.1% of Total Investments) | | | | | | |
| | 2,000 | | Cole County Industrial Development Authority, Missouri, Revenue Bonds, Lutheran Senior Services – Heisinger Project, Series 2004, 5.250%, 2/01/24 | 2/14 at 100.00 | BBB+ | | | 2,023,000 | |
| | 200 | | Hannibal Industrial Development Authority, Missouri, Health Facilities Revenue Bonds, Hannibal Regional Hospital, Series 2006, 5.000%, 3/01/22 | 3/16 at 100.00 | BBB+ | | | 208,328 | |
| | 2,885 | | Joplin Industrial Development Authority, Missouri, Health Facilities Revenue Bonds, Freeman Health System, Series 2004, 5.500%, 2/15/24 | 2/15 at 102.00 | BBB+ | | | 3,044,569 | |
| | 9,000 | | Kansas City, Missouri, Airport Revenue Bonds, General Improvement Projects, Series 2003B, 5.250%, 9/01/17 – FGIC Insured | 9/13 at 100.00 | A+ | | | 9,148,770 | |
| | | | Missouri Development Finance Board, Infrastructure Facilities Revenue Bonds, Branson Landing Project, Series 2005A: | | | | | | |
| | 780 | | 6.000%, 6/01/20 | No Opt. Call | A | | | 893,201 | |
| | 1,525 | | 5.000%, 6/01/35 | 6/15 at 100.00 | A | | | 1,565,489 | |
| | 1,200 | | Missouri Health and Educational Facilities Authority, Revenue Bonds, Lake Regional Health System, Series 2003, Reg S, 5.125%, 2/15/18 (Pre-refunded 2/15/14) | 2/14 at 100.00 | BBB+ (4) | | | 1,245,108 | |
| | 17,590 | | Total Missouri | | | | | 18,128,465 | |
| | | | Nebraska – 2.1% (1.4% of Total Investments) | | | | | | |
| | 4,000 | | Lincoln, Nebraska, Electric System Revenue Bonds, Refunding Series 2012, 5.000%, 9/01/37 | 9/22 at 100.00 | AA | | | 4,655,920 | |
| | 5,130 | | Omaha Public Power District, Nebraska, Electric System Revenue Bonds, Series 2007A, 5.000%, 2/01/43 | 2/17 at 100.00 | Aa1 | | | 5,710,460 | |
| | 10,000 | | Omaha Public Power District, Nebraska, Electric System Revenue Bonds, Series 2012A, 5.000%, 2/01/42 | 2/22 at 100.00 | Aa1 | | | 11,491,800 | |
| | 1,050 | | Omaha Public Power District, Nebraska, Separate Electric System Revenue Bonds, Nebraska City 2, Series 2006A, 19.934%, 8/01/40 – AMBAC Insured (IF) | 2/17 at 100.00 | AA+ | | | 1,814,043 | |
| | 20,180 | | Total Nebraska | | | | | 23,672,223 | |
| | | | Nevada – 6.1% (4.1% of Total Investments) | | | | | | |
| | 10,000 | | Clark County, Nevada, Airport Revenue Bonds, Subordinate Lien Series 2010B, 5.750%, 7/01/42 | 1/20 at 100.00 | A+ | | | 11,766,300 | |
| | | | Clark County, Nevada, General Obligation Bonds, Bond Bank Refunding Series 2009: | | | | | | |
| | 3,520 | | 5.000%, 6/01/27 | 6/19 at 100.00 | AA+ | | | 3,972,918 | |
| | 3,695 | | 5.000%, 6/01/28 | 6/19 at 100.00 | AA+ | | | 4,156,801 | |
| | 3,880 | | 5.000%, 6/01/29 | 6/19 at 100.00 | AA+ | | | 4,346,454 | |
| | | | Clark County, Nevada, General Obligation Transportation Bonds, Refunding Series 2010B: | | | | | | |
| | 4,915 | | 5.000%, 7/01/25 | 1/20 at 100.00 | AA+ | | | 5,680,118 | |
| | 4,160 | | 5.000%, 7/01/26 | 1/20 at 100.00 | AA+ | | | 4,771,728 | |
| | 5,795 | | Clark County, Nevada, Motor Vehicle Fuel Tax Highway Improvement Revenue Bonds, Series 2003, 5.000%, 7/01/23 (Pre-refunded 7/01/13) – AMBAC Insured | 7/13 at 100.00 | AA- (4) | | | 5,842,461 | |
| | 4,000 | | Clark County, Nevada, Subordinate Lien Airport Revenue Bonds, Series 2004A-2, 5.125%, 7/01/25 – FGIC Insured | 7/14 at 100.00 | A+ | | | 4,193,960 | |
| | 3,150 | | Las Vegas Valley Water District, Nevada, General Obligation Bonds, Water Series 2012B, 5.000%, 6/01/42 | 6/22 at 100.00 | AA+ | | | 3,571,313 | |
| | 10,000 | | Las Vegas Valley Water District, Nevada, Limited Tax General Obligation Bonds, Water & Refunding Series 2011C, 5.000%, 6/01/38 | 6/21 at 100.00 | AA+ | | | 11,246,700 | |
| | 8,540 | | Washoe County, Nevada, General Obligation Bonds, Reno-Sparks Convention & Visitors Authority, Refunding Series 2011, 5.000%, 7/01/32 | 7/21 at 100.00 | AA | | | 9,601,095 | |
| | 61,655 | | Total Nevada | | | | | 69,149,848 | |
| | | | New Jersey – 5.3% (3.5% of Total Investments) | | | | | | |
| | 5,480 | | Essex County Improvement Authority, New Jersey, Lease Revenue Bonds, Series 2003, 5.125%, 12/15/20 – AGM Insured | 12/13 at 100.00 | Aa2 | | | 5,642,372 | |
| | 135 | | Essex County Improvement Authority, New Jersey, Lease Revenue Bonds, Series 2003, 5.125%, 12/15/20 (Pre-refunded 12/15/13) – AGM Insured | 12/13 at 100.00 | Aa2 (4) | | | 139,165 | |
| | Principal | | | Optional Call | | | | | |
| | Amount (000) | | Description (1) | Provisions (2) | Ratings (3) | | | Value | |
| | | | New Jersey (continued) | | | | | | |
| | | | New Jersey Economic Development Authority, School Facilities Construction Bonds, Series 2005P: | | | | | | |
| $ | 1,325 | | 5.250%, 9/01/24 (Pre-refunded 9/01/15) | 9/15 at 100.00 | A+ (4) | | $ | 1,476,620 | |
| | 1,000 | | 5.250%, 9/01/26 (Pre-refunded 9/01/15) | 9/15 at 100.00 | A+ (4) | | | 1,114,430 | |
| | 520 | | New Jersey Health Care Facilities Financing Authority, New Jersey, Revenue Bonds, Saint Peters University Hospital, Series 2007, 5.750%, 7/01/37 | 7/18 at 100.00 | BB+ | | | 566,264 | |
| | 17,300 | | New Jersey Transportation Trust Fund Authority, Transportation System Bonds, Capital Appreciation Series 2010A, 0.000%, 12/15/33 | No Opt. Call | A+ | | | 7,028,817 | |
| | 3,425 | | New Jersey Transportation Trust Fund Authority, Transportation System Bonds, Refunding Series 2006A, 5.250%, 12/15/20 | No Opt. Call | A+ | | | 4,252,960 | |
| | 3,400 | | New Jersey Transportation Trust Fund Authority, Transportation System Bonds, Series 2003C, 5.500%, 6/15/22 (Pre-refunded 6/15/13) | 6/13 at 100.00 | Aaa | | | 3,422,610 | |
| | 5,000 | | New Jersey Transportation Trust Fund Authority, Transportation System Bonds, Series 2010D, 5.000%, 12/15/23 | No Opt. Call | A+ | | | 6,196,000 | |
| | 4,000 | | New Jersey Turnpike Authority, Revenue Bonds, Series 2003A, 5.000%, 1/01/19 (Pre-refunded 7/01/13) – FGIC Insured | 7/13 at 100.00 | A+ (4) | | | 4,032,400 | |
| | 3,000 | | New Jersey Turnpike Authority, Revenue Bonds, Series 2005A, 5.000%, 1/01/24 – AGM Insured | 1/15 at 100.00 | AA– | | | 3,207,720 | |
| | 5,000 | | New Jersey Turnpike Authority, Revenue Bonds, Series 2009H, 5.000%, 1/01/36 | 1/19 at 100.00 | A+ | | | 5,497,050 | |
| | 985 | | New Jersey Turnpike Authority, Revenue Bonds, Tender Option Bond Trust 1154, 17.041%, 1/01/43 (IF) (5) | 7/22 at 100.00 | A+ | | | 1,439,016 | |
| | | | Tobacco Settlement Financing Corporation, New Jersey, Tobacco Settlement Asset-Backed Bonds, Series 2007-1A: | | | | | | |
| | 10,555 | | 5.000%, 6/01/29 | 6/17 at 100.00 | B2 | | | 10,082,558 | |
| | 6,125 | | 4.750%, 6/01/34 | 6/17 at 100.00 | B2 | | | 5,395,451 | |
| | 67,250 | | Total New Jersey | | | | | 59,493,433 | |
| | | | New York – 9.7% (6.5% of Total Investments) | | | | | | |
| | 5,000 | | Dormitory Authority of the State of New York, FHA-Insured Revenue Bonds, Montefiore Medical Center, Series 2005, 5.000%, 2/01/28 – FGIC Insured | 2/15 at 100.00 | N/R | | | 5,337,650 | |
| | 1,500 | | Dormitory Authority of the State of New York, State and Local Appropriation Lease Bonds, Upstate Community Colleges, Series 2004B, 5.250%, 7/01/19 | 7/14 at 100.00 | AA– | | | 1,587,615 | |
| | 1,250 | | Hempstead Town Industrial Development Agency, New York, Revenue Bonds, Adelphi University, Civic Facility Project, Series 2005, 5.000%, 10/01/30 | 10/15 at 100.00 | A | | | 1,344,113 | |
| | 2,100 | | Hudson Yards Infrastructure Corporation, New York, Revenue Bonds, Senior Fiscal 2012 Series 2011A, 5.750%, 2/15/47 | 2/21 at 100.00 | A | | | 2,497,236 | |
| | 5,025 | | Hudson Yards Infrastructure Corporation, New York, Revenue Bonds, Series 2006A, 4.500%, 2/15/47 – NPFG Insured | 2/17 at 100.00 | A | | | 5,200,322 | |
| | 2,575 | | Long Island Power Authority, New York, Electric System Revenue Bonds, Series 2006F, 4.250%, 5/01/33 – NPFG Insured | 11/16 at 100.00 | A | | | 2,644,036 | |
| | 10,000 | | Long Island Power Authority, New York, Electric System Revenue Bonds, Series 2012A, 5.000%, 9/01/42 | 9/22 at 100.00 | A | | | 11,164,300 | |
| | 5,000 | | Metropolitan Transportation Authority, New York, Transportation Revenue Bonds, Refunding Series 2012H, 5.000%, 11/15/42 | No Opt. Call | A | | | 5,584,500 | |
| | 2,100 | | New York City Municipal Water Finance Authority, New York, Water and Sewer System Revenue Bonds, Second Generation Resolution, Fiscal 2011 Series EE, 5.375%, 6/15/43 | 12/20 at 100.00 | AA+ | | | 2,483,124 | |
| | | | New York City Transitional Finance Authority, New York, Future Tax Secured Bonds, Fiscal Series 2004B: | | | | | | |
| | 6,875 | | 5.000%, 8/01/23 (Pre-refunded 8/01/13) | 8/13 at 100.00 | AAA | | | 6,957,981 | |
| | 7,260 | | 5.000%, 8/01/24 (Pre-refunded 8/01/13) | 8/13 at 100.00 | AAA | | | 7,347,628 | |
| | 2,500 | | New York City Transitional Finance Authority, New York, Future Tax Secured Bonds, Fiscal Series 2004C, 5.000%, 2/01/22 (UB) | 2/14 at 100.00 | AAA | | | 2,586,100 | |
| | 10 | | New York City, New York, General Obligation Bonds, Fiscal Series 1996J, 5.500%, 2/15/26 | 8/13 at 100.00 | AA | | | 10,044 | |
| | 785 | | New York City, New York, General Obligation Bonds, Fiscal Series 2005J, 5.000%, 3/01/25 | 3/15 at 100.00 | Aa2 | | | 847,251 | |
| | 1,365 | | New York City, New York, General Obligation Bonds, Fiscal Series 2005J, 5.000%, 3/01/25 (Pre-refunded 3/01/15) | 3/15 at 100.00 | Aa2 (4) | | | 1,481,994 | |
| | | Nuveen Premium Income Municipal Fund 2, Inc. (continued) |
| NPM | | Portfolio of Investments |
| | | April 30, 2013 (Unaudited) |
| | Principal | | | Optional Call | | | | | |
| | Amount (000) | | Description (1) | Provisions (2) | Ratings (3) | | | Value | |
| | | | New York (continued) | | | | | | |
| $ | 5,000 | | New York City, New York, General Obligation Bonds, Fiscal Series 2005M, 5.000%, 4/01/24 (UB) | 4/15 at 100.00 | AA | | $ | 5,427,750 | |
| | 4,000 | | New York City, New York, General Obligation Bonds, Series 2004C-1, 5.250%, 8/15/20 (UB) | 8/14 at 100.00 | AA | | | 4,253,440 | |
| | | | New York Convention Center Development Corporation, Hotel Unit Fee Revenue Bonds, Series 2005: | | | | | | |
| | 2,475 | | 5.000%, 11/15/44 – AMBAC Insured | 11/15 at 100.00 | AA+ | | | 2,590,583 | |
| | 1,235 | | 17.046%, 11/15/44 – AMBAC Insured (IF) | 11/15 at 100.00 | AA+ | | | 1,465,698 | |
| | | | New York State Municipal Bond Bank Agency, Special School Purpose Revenue Bonds, Series 2003C: | | | | | | |
| | 6,000 | | 5.250%, 6/01/20 (Pre-refunded 6/01/13) | 6/13 at 100.00 | AA– (4) | | | 6,026,100 | |
| | 5,100 | | 5.250%, 6/01/21 (Pre-refunded 6/01/13) | 6/13 at 100.00 | AA– (4) | | | 5,122,185 | |
| | 2,000 | | New York State Tobacco Settlement Financing Corporation, Tobacco Settlement Asset-Backed and State Contingency Contract-Backed Bonds, Series 2003A-1, 5.500%, 6/01/19 | 6/13 at 100.00 | AA– | | | 2,009,060 | |
| | 1,060 | | Port Authority of New York and New Jersey, Special Project Bonds, JFK International Air Terminal LLC Project, Eighth Series 2010, 6.000%, 12/01/42 | 12/20 at 100.00 | BBB– | | | 1,244,207 | |
| | 6,250 | | Port Authority of New York and New Jersey, Special Project Bonds, JFK International Air Terminal LLC, Sixth Series 1997, 6.250%, 12/01/15 – NPFG Insured (Alternative Minimum Tax) | No Opt. Call | Baa2 | | | 6,793,563 | |
| | 9,950 | | Triborough Bridge and Tunnel Authority, New York, General Purpose Revenue Bonds, Refunding Bonds, Tender Option Bond Trust 2012-10W, 7.286%, 11/15/21 (IF) (5) | No Opt. Call | AA– | | | 13,663,937 | |
| | | | Triborough Bridge and Tunnel Authority, New York, General Purpose Revenue Bonds, Refunding Subordinate Lien Series 2013A: | | | | | | |
| | 1,055 | | 5.000%, 11/15/28 | No Opt. Call | A+ | | | 1,257,444 | |
| | 2,550 | | 0.000%, 11/15/31 | No Opt. Call | A+ | | | 1,271,022 | |
| | 455 | | 3.125%, 11/15/32 | No Opt. Call | A+ | | | 436,295 | |
| | 1,345 | | 0.000%, 11/15/32 | No Opt. Call | A+ | | | 638,552 | |
| | 101,820 | | Total New York | | | | | 109,273,730 | |
| | | | North Carolina – 1.1% (0.7% of Total Investments) | | | | | | |
| | 1,775 | | Charlotte-Mecklenburg Hospital Authority, North Carolina, Carolinas HealthCare System Revenue Bonds, Series 2008, Trust 1149, 15.092%, 7/15/32 (IF) (5) | 1/18 at 100.00 | AA– | | | 2,168,251 | |
| | 1,000 | | Charlotte-Mecklenburg Hospital Authority, North Carolina, Health Care Revenue Bonds, DBA Carolinas HealthCare System, Series 2011A, 5.250%, 1/15/42 | 1/21 at 100.00 | AA– | | | 1,144,520 | |
| | 1,755 | | Durham Urban Redevelopment Authority, North Carolina, FHA-Insured Mortgage Loan Revenue Bonds, Durham Hosiery Mill, Series 1987, 7.500%, 8/01/29 (Alternative Minimum Tax) | 8/13 at 100.00 | AA+ | | | 1,766,864 | |
| | | | North Carolina Infrastructure Finance Corporation, Certificates of Participation, Correctional Facilities, Series 2004A: | | | | | | |
| | 1,250 | | 5.000%, 2/01/21 (Pre-refunded 2/01/14) | 2/14 at 100.00 | AA+ (4) | | | 1,294,513 | |
| | 2,445 | | 5.000%, 2/01/22 (Pre-refunded 2/01/14) | 2/14 at 100.00 | AA+ (4) | | | 2,532,066 | |
| | 3,540 | | University of North Carolina, Charlotte, General Revenue Bonds, Series 2013A, 3.625%, 4/01/43 | 4/23 at 100.00 | AA– | | | 3,533,486 | |
| | 11,765 | | Total North Carolina | | | | | 12,439,700 | |
| | | | Ohio – 4.6% (3.1% of Total Investments) | | | | | | |
| | | | Buckeye Tobacco Settlement Financing Authority, Ohio, Tobacco Settlement Asset-Backed Revenue Bonds, Senior Lien, Series 2007A-2: | | | | | | |
| | 1,700 | | 5.125%, 6/01/24 | 6/17 at 100.00 | B– | | | 1,578,110 | |
| | 900 | | 5.875%, 6/01/30 | 6/17 at 100.00 | B | | | 807,363 | |
| | 7,030 | | 5.750%, 6/01/34 | 6/17 at 100.00 | B | | | 6,166,365 | |
| | 2,245 | | 5.875%, 6/01/47 | 6/17 at 100.00 | B | | | 2,005,840 | |
| | 3,000 | | Columbus City School District, Franklin County, Ohio, General Obligation Bonds, Series 2004, 5.250%, 12/01/24 (Pre-refunded 12/01/14) – AGM Insured | 12/14 at 100.00 | AA (4) | | | 3,234,630 | |
| | 6,345 | | Franklin County, Ohio, Hospital Revenue Bonds, OhioHealth Corporation, Series 2011A, 5.000%, 11/15/41 | 11/21 at 100.00 | AA+ | | | 7,084,573 | |
| | 10,000 | | Greene County, Ohio, Hospital Facilities Revenue Bonds, Kettering Health Network Series 2009, 5.500%, 4/01/39 | 4/19 at 100.00 | A | | | 10,945,900 | |
| | 14,850 | | JobsOhio Beverage System, Ohio, Statewide Senior Lien Liquor Profits Revenue Bonds, Tax Exempt Series 2013A, 5.000%, 1/01/38 (UB) (5) | 1/23 at 100.00 | AA | | | 16,865,442 | |
| | 875 | | JobsOhio Beverage System, Ohio, Statewide Senior Lien Liquor Profits Revenue Bonds, Tender Option Bond Trust 1157, 17.137%, 1/01/38 (IF) (5) | 1/23 at 100.00 | AA | | | 1,350,020 | |
| | Principal | | | Optional Call | | | | | |
| | Amount (000) | | Description (1) | Provisions (2) | Ratings (3) | | | Value | |
| | | | Ohio (continued) | | | | | | |
| $ | 1,980 | | Ohio Housing Finance Agency, FHA-Insured Multifamily Housing Mortgage Revenue Bonds, Courtyards of Kettering, Series 1998B-1, 5.550%, 1/01/40 (Alternative Minimum Tax) | 7/13 at 100.00 | Aa2 | | $ | 1,982,396 | |
| | 48,925 | | Total Ohio | | | | | 52,020,639 | |
| | | | Oklahoma – 1.9% (1.3% of Total Investments) | | | | | | |
| | 750 | | Norman Regional Hospital Authority, Oklahoma, Hospital Revenue Bonds, Series 2005, 5.375%, 9/01/36 | 9/16 at 100.00 | BB+ | | | 776,888 | |
| | | | Oklahoma Development Finance Authority, Revenue Bonds, Saint John Health System, Series 2007: | | | | | | |
| | 2,690 | | 5.000%, 2/15/37 | 2/17 at 100.00 | A | | | 2,860,976 | |
| | 1,020 | | 5.000%, 2/15/42 | 2/17 at 100.00 | A | | | 1,082,587 | |
| | 10,000 | | Oklahoma Municipal Power Authority, Power Supply System Revenue Bonds, Series 2007, 4.500%, 1/01/47 – FGIC Insured | 1/17 at 100.00 | A | | | 10,326,200 | |
| | 5,460 | | Tulsa County Industrial Authority, Oklahoma, Health Care Revenue Bonds, Saint Francis Health System, Series 2006, 5.000%, 12/15/36 (UB) | 12/16 at 100.00 | AA+ | | | 5,951,455 | |
| | 99 | | Tulsa County Industrial Authority, Oklahoma, Health Care Revenue Bonds, Saint Francis Health System, Series 2008, Trust 3500, 8.446%, 6/15/30 (IF) | 12/16 at 100.00 | AA+ | | | 115,201 | |
| | 20,019 | | Total Oklahoma | | | | | 21,113,307 | |
| | | | Oregon – 0.8% (0.5% of Total Investments) | | | | | | |
| | 7,860 | | Multnomah County Hospital Facilities Authority, Oregon, Revenue Bonds, Sisters of Providence Health System, Series 2004, 5.500%, 10/01/21 (UB) | 10/14 at 100.00 | AA | | | 8,434,409 | |
| | | | Pennsylvania – 3.0% (2.0% of Total Investments) | | | | | | |
| | 3,500 | | Allegheny County Sanitary Authority, Pennsylvania, Sewerage Revenue Bonds, Series 2005A, 5.000%, 12/01/23 – NPFG Insured | 12/15 at 100.00 | A1 | | | 3,846,255 | |
| | 270 | | Annville-Cleona School District, Lebanon County, Pennsylvania, General Obligation Bonds, Series 2005, 6.000%, 3/01/28 – AGM Insured | 3/15 at 100.00 | A1 | | | 294,959 | |
| | 1,230 | | Annville-Cleona School District, Lebanon County, Pennsylvania, General Obligation Bonds, Series 2005, 6.000%, 3/01/28 (Pre-refunded 3/01/15) – AGM Insured | 3/15 at 100.00 | A1 (4) | | | 1,357,440 | |
| | 500 | | Bucks County Industrial Development Authority, Pennsylvania, Charter School Revenue Bonds, School Lane Charter School, Series 2007A, 5.000%, 3/15/37 | 3/17 at 100.00 | BBB | | | 510,200 | |
| | 1,050 | | Delaware Valley Regional Finance Authority, Pennsylvania, Local Government Revenue Bonds, Series 1997B, 5.700%, 7/01/27 – AMBAC Insured | No Opt. Call | A2 | | | 1,263,759 | |
| | 50 | | Luzerne County, Pennsylvania, General Obligation Bonds, Series 2003C, 5.250%, 12/15/16 – FGIC Insured | No Opt. Call | N/R | | | 55,138 | |
| | 2,575 | | Pennsylvania Higher Educational Facilities Authority, Revenue Bonds, AICUP Financing Program-Delaware Valley College of Science and Agriculture Project, Series 2012 LL1, 4.000%, 11/01/32 | 11/22 at 100.00 | Baa3 | | | 2,561,198 | |
| | 5,850 | | Pennsylvania Public School Building Authority, Lease Revenue Bonds, School District of Philadelphia, Series 2006B, 4.500%, 6/01/32 – AGM Insured | 12/16 at 100.00 | AA | | | 6,202,580 | |
| | 1,000 | | Pennsylvania State University, General Revenue Bonds, Series 2005, 5.000%, 9/01/29 | 9/15 at 100.00 | AA | | | 1,091,100 | |
| | 15,000 | | Pennsylvania Turnpike Commission, Turnpike Revenue Bonds, Capital Appreciation Series 2009E, 0.000%, 12/01/38 | 12/27 at 100.00 | A– | | | 15,394,200 | |
| | 1,050 | | Pennsylvania Turnpike Commission, Turnpike Revenue Bonds, Series 2006A, 5.000%, 12/01/26 – AMBAC Insured | 6/16 at 100.00 | A+ | | | 1,148,049 | |
| | 32,075 | | Total Pennsylvania | | | | | 33,724,878 | |
| | | | Puerto Rico – 0.6% (0.4% of Total Investments) | | | | | | |
| | 8,750 | | Puerto Rico Sales Tax Financing Corporation, Sales Tax Revenue Bonds, First Subordinate Series 2010A, 0.000%, 8/01/33 | 8/29 at 100.00 | A+ | | | 7,089,075 | |
| | | Nuveen Premium Income Municipal Fund 2, Inc. (continued) |
| NPM | | Portfolio of Investments |
| | | April 30, 2013 (Unaudited) |
| | Principal | | | Optional Call | | | | | |
| | Amount (000) | | Description (1) | Provisions (2) | Ratings (3) | | | Value | |
| | | | Rhode Island – 1.4% (0.9% of Total Investments) | | | | | | |
| | | | Rhode Island Tobacco Settlement Financing Corporation, Tobacco Settlement Asset-Backed Bonds, Series 2002A: | | | | | | |
| $ | 3,870 | | 6.000%, 6/01/23 | 6/13 at 100.00 | Baa1 | | $ | 3,921,935 | |
| | 6,425 | | 6.125%, 6/01/32 | 6/13 at 100.00 | BBB+ | | | 6,488,608 | |
| | 5,260 | | 6.250%, 6/01/42 | 6/13 at 100.00 | BBB– | | | 5,384,978 | |
| | 15,555 | | Total Rhode Island | | | | | 15,795,521 | |
| | | | South Carolina – 1.6% (1.1% of Total Investments) | | | | | | |
| | 9,000 | | Berkeley County School District, South Carolina, Installment Purchase Revenue Bonds, Securing Assets for Education, Series 2003, 5.250%, 12/01/24 | 12/13 at 100.00 | Aa3 | | | 9,250,290 | |
| | 2,500 | | Greenville, South Carolina, Hospital Facilities Revenue Refunding Bonds, Series 2003A, 5.000%, 5/01/25 – AMBAC Insured | 5/13 at 100.00 | AA– | | | 2,508,675 | |
| | | | South Carolina JOBS Economic Development Authority, Hospital Refunding and Improvement Revenue Bonds, Palmetto Health Alliance, Series 2003C: | | | | | | |
| | 1,335 | | 6.875%, 8/01/27 (Pre-refunded 8/01/13) | 8/13 at 100.00 | BBB+ (4) | | | 1,357,414 | |
| | 165 | | 6.875%, 8/01/27 (Pre-refunded 8/01/13) | 8/13 at 100.00 | BBB+ (4) | | | 167,769 | |
| | 4,450 | | 6.375%, 8/01/34 (Pre-refunded 8/01/13) | 8/13 at 100.00 | BBB+ (4) | | | 4,519,196 | |
| | 550 | | 6.375%, 8/01/34 (Pre-refunded 8/01/13) | 8/13 at 100.00 | BBB+ (4) | | | 558,552 | |
| | 18,000 | | Total South Carolina | | | | | 18,361,896 | |
| | | | Tennessee – 0.6% (0.4% of Total Investments) | | | | | | |
| | | | Harpeth Valley Utilities District, Davidson and Williamson Counties, Tennessee, Utilities Revenue Bonds, Series 2012A: | | | | | | |
| | 1,645 | | 4.000%, 9/01/40 | 9/22 at 100.00 | AA | | | 1,700,650 | |
| | 1,690 | | 4.000%, 9/01/42 | 9/22 at 100.00 | AA | | | 1,740,565 | |
| | 3,200 | | Johnson City Health and Educational Facilities Board, Tennessee, Revenue Bonds, Mountain States Health Alliance, Series 2006A, 5.500%, 7/01/36 | 7/16 at 100.00 | BBB+ | | | 3,385,824 | |
| | | | Sumner County Health, Educational, and Housing Facilities Board, Tennessee, Revenue Refunding Bonds, Sumner Regional Health System Inc., Series 2007: | | | | | | |
| | 800 | | 5.500%, 11/01/37 (6) | 11/17 at 100.00 | N/R | | | 1,992 | |
| | 1,000 | | 5.500%, 11/01/46 (6) | 11/17 at 100.00 | N/R | | | 2,490 | |
| | 8,335 | | Total Tennessee | | | | | 6,831,521 | |
| | | | Texas – 10.9% (7.3% of Total Investments) | | | | | | |
| | 5,810 | | Board of Regents, University of Texas System, Financing System Revenue Bonds, Series 2006F, 4.250%, 8/15/36 (UB) | 2/17 at 100.00 | AAA | | | 6,082,024 | |
| | 5,110 | | Brazos River Authority, Texas, Pollution Control Revenue Refunding Bonds, TXU Electric Company, Series 1999C, 7.700%, 3/01/32 (Alternative Minimum Tax) | 4/14 at 100.00 | C | | | 408,851 | |
| | 10,000 | | Brazos River Harbor Navigation District, Brazoria County, Texas, Environmental Facilities Revenue Bonds, Dow Chemical Company Project, Series 2002A-6, 6.250%, 5/15/33 (Pre-refunded 5/01/13) (Alternative Minimum Tax) | 5/13 at 100.00 | BBB (4) | | | 10,044,400 | |
| | 1,000 | | Bryan, Brazos County, Texas, Electric System Revenue Bonds, Series 2009, 5.000%, 7/01/34 | 7/17 at 100.00 | A+ | | | 1,114,540 | |
| | 965 | | Central Texas Regional Mobility Authority, Revenue Bonds, Senior Lien Refunding Series 2013A, 5.000%, 1/01/43 (WI/DD, Settling 5/16/13) | 1/23 at 100.00 | Baa2 | | | 1,044,921 | |
| | 5,240 | | Central Texas Regional Mobility Authority, Revenue Bonds, Senior Lien Series 2011, 6.250%, 1/01/46 | 1/21 at 100.00 | Baa2 | | | 6,205,522 | |
| | 6,100 | | Dallas-Fort Worth International Airport, Texas, Joint Revenue Bonds, Refunding and Improvement Bonds, Series 2012C, 5.000%, 11/01/45 – AGM Insured | 11/21 at 100.00 | A+ | | | 6,784,481 | |
| | 11,000 | | Dallas-Fort Worth International Airport, Texas, Joint Revenue Bonds, Series 2012H, 5.000%, 11/01/42 (Alternative Minimum Tax) | No Opt. Call | A+ | | | 11,716,870 | |
| | | | Harris County Health Facilities Development Corporation, Texas, Hospital Revenue Bonds, Memorial Hermann Healthcare System, Series 2004A: | | | | | | |
| | 1,000 | | 5.000%, 12/01/20 (Pre-refunded 12/01/14) | 12/14 at 100.00 | A+ (4) | | | 1,073,430 | |
| | 1,000 | | 5.000%, 12/01/21 (Pre-refunded 12/01/14) | 12/14 at 100.00 | A+ (4) | | | 1,073,430 | |
| | 2,500 | | 5.125%, 12/01/22 (Pre-refunded 12/01/14) | 12/14 at 100.00 | A+ (4) | | | 2,688,500 | |
| | 2,925 | | Harris County-Houston Sports Authority, Texas, Revenue Bonds, Senior Lien Series 2001G, 5.250%, 11/15/30 – NPFG Insured | 5/13 at 100.00 | A | | | 2,943,223 | |
| | Principal | | | Optional Call | | | | | |
| | Amount (000) | | Description (1) | Provisions (2) | Ratings (3) | | | Value | |
| | | | Texas (continued) | | | | | | |
| $ | 4,000 | | Houston, Texas, First Lien Combined Utility System Revenue Bonds, First Lien Series 2004A, 5.250%, 5/15/24 – FGIC Insured | 5/14 at 100.00 | AA | | $ | 4,201,280 | |
| | 6,000 | | Houston, Texas, First Lien Combined Utility System Revenue Bonds, Series 2011D, 5.000%, 11/15/40 | 11/21 at 100.00 | AA | | | 6,813,540 | |
| | 10,850 | | Houston, Texas, Hotel Occupancy Tax and Special Revenue Bonds, Convention and Entertainment Project, Series 2001B, 0.000%, 9/01/25 – AMBAC Insured | No Opt. Call | A2 | | | 6,588,337 | |
| | | | Kerrville Health Facilities Development Corporation, Texas, Revenue Bonds, Sid Peterson Memorial Hospital Project, Series 2005: | | | | | | |
| | 800 | | 5.250%, 8/15/21 | 2/16 at 100.00 | BBB– | | | 844,808 | |
| | 1,250 | | 5.125%, 8/15/26 | 2/16 at 100.00 | BBB– | | | 1,294,088 | |
| | 3,000 | | Love Field Airport Modernization Corporation, Texas, Special Facilities Revenue Bonds, Southwest Airlines Company, Series 2010, 5.250%, 11/01/40 | 11/20 at 100.00 | BBB– | | | 3,276,330 | |
| | 4,715 | | Lower Colorado River Authority, Texas, Revenue Refunding Bonds, Series 2012A, 5.000%, 5/15/39 | No Opt. Call | A1 | | | 5,299,896 | |
| | 6,025 | | North Central Texas Health Facilities Development Corporation, Texas, Revenue Bonds, Children’s Medical Center Dallas Project, Series 2012, 5.000%, 8/15/32 | 8/22 at 100.00 | AA | | | 6,913,929 | |
| | 3,100 | | North Texas Tollway Authority, Second Tier System Revenue Refunding Bonds, Series 2008F, 5.750%, 1/01/38 | 1/18 at 100.00 | A3 | | | 3,491,034 | |
| | | | North Texas Tollway Authority, Special Projects System Revenue Bonds, Series 2011A: | | | | | | |
| | 1,880 | | 0.000%, 9/01/43 | 9/31 at 100.00 | AA | | | 1,456,022 | |
| | 7,990 | | 0.000%, 9/01/45 | 9/31 at 100.00 | AA | | | 6,750,431 | |
| | 1,000 | | Sabine River Authority, Texas, Pollution Control Revenue Bonds, TXU Electric Company, Series 2001C, 5.200%, 5/01/28 | 11/15 at 100.00 | CCC | | | 72,510 | |
| | 2,500 | | Southwest Higher Education Authority Inc, Texas, Revenue Bonds, Southern Methodist University, Series 2010, 5.000%, 10/01/41 | 10/20 at 100.00 | AA– | | | 2,890,575 | |
| | 1,000 | | Tarrant County Cultural Education Facilities Finance Corporation, Texas, Hospital Revenue Bonds, Scott & White Healthcare Project, Tender Option Bond Trust 1149, 17.223%, 8/15/43 (IF) (5) | 8/23 at 100.00 | AA– | | | 1,465,080 | |
| | 7,100 | | Tarrant County Cultural Education Facilities Finance Corporation, Texas, Revenue Bonds, Texas Health Resources, Series 2007A, 5.000%, 2/15/36 (UB) | 2/17 at 100.00 | AA– | | | 7,726,220 | |
| | 1,100 | | Texas Municipal Gas Acquisition and Supply Corporation III, Gas Supply Revenue Bonds, Series 2012, 5.000%, 12/15/30 | No Opt. Call | A3 | | | 1,188,583 | |
| | 3,755 | | Texas State, General Obligation Bonds, Series 2008, Trust 3213, 13.591%, 4/01/28 (IF) | 4/17 at 100.00 | Aaa | | | 6,284,593 | |
| | 5,000 | | Texas Transportation Commission, Central Texas Turnpike System Revenue Bonds, First Tier Refunding Series 2012A, 5.000%, 8/15/41 | 8/22 at 100.00 | A– | | | 5,459,600 | |
| | 123,715 | | Total Texas | | | | | 123,197,048 | |
| | | | Utah – 1.5% (1.0% of Total Investments) | | | | | | |
| | 6,335 | | Riverton, Utah, Hospital Revenue Bonds, IHC Health Services, Inc., Series 2009, 5.000%, 8/15/41 | 8/19 at 100.00 | AA+ | | | 7,133,210 | |
| | 9,045 | | Utah Transit Authority, Sales Tax Revenue and Refunding Bonds, Series 2012, 5.000%, 6/15/42 | 6/22 at 100.00 | A1 | | | 10,251,513 | |
| | 15,380 | | Total Utah | | | | | 17,384,723 | |
| | | | Virginia – 0.1% (0.1% of Total Investments) | | | | | | |
| | 1,250 | | Virginia Small Business Financing Authority, Senior Lien Revenue Bonds, 95 Express Lanes LLC Project, Series 2012, 5.000%, 1/01/40 (Alternative Minimum Tax) | 1/22 at 100.00 | BBB– | | | 1,303,500 | |
| | | | Washington – 4.9% (3.3% of Total Investments) | | | | | | |
| | 5,000 | | Energy Northwest, Washington, Electric Revenue Refunding Bonds, Nuclear Project 1, Series 2003A, 5.500%, 7/01/16 (Pre-refunded 7/01/13) | 7/13 at 100.00 | Aa1 (4) | | | 5,045,150 | |
| | 10,000 | | King County, Washington, Sewer Revenue Bonds, Refunding Series 2012, 5.000%, 1/01/52 | 1/22 at 100.00 | AA+ | | | 11,156,400 | |
| | 2,500 | | King County, Washington, Sewer Revenue Bonds, Series 2009, 5.250%, 1/01/42 | 1/19 at 100.00 | AA+ | | | 2,902,100 | |
| | 4,160 | | Port of Seattle, Washington, Revenue Bonds, Intermediate Lien Refunding Series 2012A, 5.000%, 8/01/30 | 8/22 at 100.00 | Aa3 | | | 4,884,630 | |
| | 2,820 | | Skagit County Public Hospital District 1, Washington, General Obligation Bonds, Series 2004A, 5.375%, 12/01/19 (Pre-refunded 12/01/14) – NPFG Insured | 12/14 at 100.00 | A1 (4) | | | 3,048,082 | |
| | | Nuveen Premium Income Municipal Fund 2, Inc. (continued) |
| NPM | | Portfolio of Investments |
| | | April 30, 2013 (Unaudited) |
| | Principal | | | Optional Call | | | | | |
| | Amount (000) | | Description (1) | Provisions (2) | Ratings (3) | | | Value | |
| | | | Washington (continued) | | | | | | |
| $ | 3,410 | | Washington Health Care Facilities Authority, Revenue Bonds, Fred Hutchinson Cancer Research Center, Series 2011A, 5.625%, 1/01/35 | 1/21 at 100.00 | A | | $ | 3,828,919 | |
| | 4,415 | | Washington Health Care Facilities Authority, Revenue Bonds, Kadlec Regional Medical Center, Series 2010, 5.500%, 12/01/39 | 12/20 at 100.00 | Baa3 | | | 4,782,902 | |
| | 1,885 | | Washington Health Care Facilities Authority, Revenue Bonds, Seattle Children’s Hospital, Refunding Series 2012B, 5.000%, 10/01/30 | 10/22 at 100.00 | AA | | | 2,174,743 | |
| | 4,940 | | Washington Health Care Facilities Authority, Revenue Bonds, Seattle Children’s Hospital, Series 2012A, 5.000%, 10/01/42 | 10/22 at 100.00 | AA | | | 5,511,212 | |
| | 5,000 | | Washington State Health Care Facilities Authority, Revenue Bonds, Fred Hutchinson Cancer Research Center, Series 2009A, 6.000%, 1/01/33 | 7/19 at 100.00 | A | | | 5,633,250 | |
| | 1,000 | | Washington State Health Care Facilities Authority, Revenue Bonds, Northwest Hospital and Medical Center of Seattle, Series 2007, 5.700%, 12/01/32 | 12/17 at 100.00 | N/R | | | 1,052,139 | |
| | | | Washington State Tobacco Settlement Authority, Tobacco Settlement Asset-Backed Revenue Bonds, Series 2002: | | | | | | |
| | 2,930 | | 6.500%, 6/01/26 | 6/13 at 100.00 | A3 | | | 2,988,540 | |
| | 2,435 | | 6.625%, 6/01/32 | 6/13 at 100.00 | Baa1 | | | 2,483,650 | |
| | 50,495 | | Total Washington | | | | | 55,491,717 | |
| | | | West Virginia – 0.2% (0.1% of Total Investments) | | | | | | |
| | 2,355 | | West Virginia University, Revenue Bonds, West Virginia University Projects, Improvement Series 2004C, 5.000%, 10/01/24 (Pre-refunded 10/01/14) – FGIC Insured | 10/14 at 100.00 | Aa3 (4) | | | 2,511,466 | |
| | | | Wisconsin – 2.2% (1.5% of Total Investments) | | | | | | |
| | 1,135 | | Wisconsin Health and Educational Facilities Authority, Revenue Bonds, Aurora Health Care, Inc., Series 2010A, 5.625%, 4/15/39 | 4/20 at 100.00 | A | | | 1,292,186 | |
| | 6,775 | | Wisconsin Health and Educational Facilities Authority, Revenue Bonds, Aurora Health Care, Inc., Series 2012A, 5.000%, 7/15/25 | 7/21 at 100.00 | A | | | 7,756,359 | |
| | 365 | | Wisconsin Health and Educational Facilities Authority, Revenue Bonds, Divine Savior Healthcare, Series 2006, 5.000%, 5/01/32 | 5/16 at 100.00 | BBB | | | 375,804 | |
| | 1,000 | | Wisconsin Health and Educational Facilities Authority, Revenue Bonds, Fort Healthcare Inc., Series 2004, 5.750%, 5/01/24 | 5/14 at 100.00 | BBB+ | | | 1,042,810 | |
| | 2,955 | | Wisconsin Health and Educational Facilities Authority, Revenue Bonds, Marshfield Clinic, Series 2012B, 5.000%, 2/15/40 | 2/22 at 100.00 | A– | | | 3,205,111 | |
| | 4,530 | | Wisconsin Health and Educational Facilities Authority, Revenue Bonds, Wheaton Franciscan Healthcare System, Series 2006A, 5.250%, 8/15/34 | 8/16 at 100.00 | A– | | | 4,811,177 | |
| | 5,300 | | Wisconsin State, General Obligation Bonds, Series 2006A, 4.750%, 5/01/25 – FGIC Insured (UB) (5) | 5/16 at 100.00 | AA | | | 5,934,357 | |
| | 22,060 | | Total Wisconsin | | | | | 24,417,804 | |
| | | | Wyoming – 0.2% (0.1% of Total Investments) | | | | | | |
| | 2,250 | | Sweetwater County, Wyoming, Solid Waste Disposal Revenue Bonds, FMC Corporation, Series 2005, 5.600%, 12/01/35 (Alternative Minimum Tax) | 12/15 at 100.00 | A– | | | 2,446,290 | |
| $ | 1,642,099 | | Total Municipal Bonds (cost $1,537,344,763) | | | | | 1,685,803,125 | |
| | Principal | | | | | | | | | |
| | Amount (000) | | Description (1) | Coupon | Maturity | Ratings (3) | | | Value | |
| | | | Corporate Bonds – 0.0% (0.0% of Total Investments) | | | | | | | |
| | | | Transportation – 0.0% (0.0% of Total Investments) | | | | | | | |
| $ | 21 | | Las Vegas Monorail Company, Senior Interest Bonds (7), (8) | 5.500% | 7/15/19 | N/R | | $ | 5,133 | |
| | 6 | | Las Vegas Monorail Company, Senior Interest Bonds (7), (8) | 3.000% | 7/15/55 | N/R | | | 1,202 | |
| $ | 27 | | Total Corporate Bonds (cost $504) | | | | | | 6,335 | |
| | | | Total Investments (cost $1,537,345,267) – 149.2% | | | | | | 1,685,809,460 | |
| | | | Floating Rate Obligations – (8.5)% | | | | | | (96,294,000 | ) |
| | | | Variable Rate Demand Preferred Shares, at Liquidation Value – (43.3)% (9) | | | | | | (489,500,000 | ) |
| | | | Other Assets Less Liabilities – 2.6% | | | | | | 29,612,584 | |
| | | | Net Assets Applicable to Common Shares – 100% | | | | | | $1,129,628,044 | |
| (1) | | All percentages shown in the Portfolio of Investments are based on net assets applicable to Common shares unless otherwise noted. |
| (2) | | Optional Call Provisions: Dates (month and year) and prices of the earliest optional call or redemption. There may be other call provisions at varying prices at later dates. Certain mortgage-backed securities may be subject to periodic principal paydowns. |
| (3) | | Ratings: Using the highest of Standard & Poor’s Group (“Standard & Poor’s”), Moody’s Investors Service, Inc. (“Moody’s”) or Fitch, Inc. (“Fitch”) rating. Ratings below BBB by Standard & Poor’s, Baa by Moody’s or BBB by Fitch are considered to be below investment grade. Holdings designated N/R are not rated by any of these national rating agencies. |
| (4) | | Backed by an escrow or trust containing sufficient U.S. Government or U.S. Government agency securities, which ensure the timely payment of principal and interest. Certain bonds backed by U.S. Government or agency securities are regarded as having an implied rating equal to the rating of such securities. |
| (5) | | Investment, or portion of investment, has been pledged to collateralize the net payment obligations for investments in inverse floating rate transactions. |
| (6) | | At or subsequent to the end of the reporting period, this security is non-income producing. Non-income producing security, in the case of a fixed-income security, generally denotes that the issuer has (1) defaulted on the payment of principal or interest, (2) is under the protection of the Federal Bankruptcy Court or (3) the Fund’s Adviser has concluded that the issue is not likely to meet its future interest payment obligations and has directed the Fund’s custodian to cease accruing additional income on the Fund’s records. |
| (7) | | Investment valued at fair value using methods determined in good faith by, or at the discretion of, the Board of Directors. For fair value measurement disclosure purposes, investment classified as Level 3. See Notes to Financial Statements, Footnote 1 – General Information and Significant accounting Policies, Investment Valuation for more information. |
| (8) | | During January 2010, Las Vegas Monorail Company (“Las Vegas Monorail”) filed for federal bankruptcy protection. During March 2012, Las Vegas Monorail emerged from federal bankruptcy with the acceptance of a reorganization plan assigned by the Federal Bankruptcy Court. Under the reorganization plan, the Fund surrendered its Las Vegas Monorail Project Revenue Bonds, First Tier, Series 2000 and in turn received two senior interest corporate bonds: the first with an annual coupon rate of 5.500% maturing on July 15, 2019 and the second with an annual coupon rate of 3.000% (5.500% after December 31, 2015) maturing on July 15, 2055. The Fund’s custodian is not accruing income on the Fund’s records for either senior interest corporate bond. |
| (9) | | Variable Rate Demand Preferred Shares, at Liquidation Value as a percentage of Total Investments is 29.0%. |
| N/R | | Not rated. |
| WI/DD | | Investment, or portion of investment, purchased on a when-issued or delayed delivery basis. |
| (ETM) | | Escrowed to maturity. |
| (IF) | | Inverse floating rate investment. |
| (UB) | | Underlying bond of an inverse floating rate trust reflected as a financing transaction. See Notes to Financial Statements, Footnote 1 – General Information and Significant Accounting Policies, Inverse Floating Rate Securities for more information. |
See accompanying notes to financial statements.
| | | Nuveen Premium Income Municipal Fund 4, Inc. |
| NPT | | Portfolio of Investments |
| | | April 30, 2013 (Unaudited) |
| | Principal | | | Optional Call | | | | | |
| | Amount (000) | | Description (1) | Provisions (2) | Ratings (3) | | | Value | |
| | | | Municipal Bonds – 149.7% (100.0% of Total Investments) | | | | | | |
| | | | Alabama – 3.7% (2.5% of Total Investments) | | | | | | |
| $ | 11,895 | | Alabama Special Care Facilities Financing Authority, Birmingham, Hospital Revenue Bonds, Daughters of Charity National Health System – Providence Hospital and St. Vincent’s Hospital, Series 1995, 5.000%, 11/01/25 (ETM) | 5/13 at 100.00 | Aaa | | $ | 11,942,580 | |
| | 5,000 | | Alabama Special Care Facilities Financing Authority, Revenue Bonds, Ascension Health, Series 2006C-2, 5.000%, 11/15/39 (UB) | 11/16 at 100.00 | AA+ | | | 5,530,450 | |
| | 1,000 | | Birmingham Special Care Facilities Financing Authority, Alabama, Revenue Bonds, Baptist Health System Inc., Series 2005A, 5.000%, 11/15/30 | 11/15 at 100.00 | Baa2 | | | 1,039,990 | |
| | 1,000 | | Courtland Industrial Development Board, Alabama, Pollution Control Revenue Bonds, International Paper Company, Series 2005A, 5.000%, 6/01/25 | 6/15 at 100.00 | BBB | | | 1,039,510 | |
| | 1,500 | | Jefferson County, Alabama, Limited Obligation School Warrants, Education Tax Revenue Bonds, Series 2004A, 5.250%, 1/01/23 – AGM Insured | 1/14 at 100.00 | AA | | | 1,508,055 | |
| | 2,325 | | Selma Industrial Development Board, Alabama, Gulf Opportunity Zone Revenue Bonds, International Paper Company Project, Series 2010A, 5.800%, 5/01/34 | 5/20 at 100.00 | BBB | | | 2,644,525 | |
| | 22,720 | | Total Alabama | | | | | 23,705,110 | |
| | | | Alaska – 0.8% (0.5% of Total Investments) | | | | | | |
| | 1,665 | | Alaska Housing Finance Corporation, General Housing Purpose Bonds, Series 2005A, 5.000%, 12/01/30 – FGIC Insured (UB) | 12/14 at 100.00 | AA+ | | | 1,764,767 | |
| | 3,065 | | Alaska Municipal Bond Bank Authority, General Obligation Bonds, Series 2003E, 5.250%, 12/01/26 (Pre-refunded 12/01/13) – NPFG Insured | 12/13 at 100.00 | AA (4) | | | 3,155,939 | |
| | 4,730 | | Total Alaska | | | | | 4,920,706 | |
| | | | Arizona – 4.6% (3.1% of Total Investments) | | | | | | |
| | 1,300 | | Apache County Industrial Development Authority, Arizona, Pollution Control Revenue Bonds, Tucson Electric Power Company, Series 20102A, 4.500%, 3/01/30 | 3/22 at 100.00 | BBB | | | 1,355,796 | |
| | 10,350 | | Arizona Sports and Tourism Authority, Senior Revenue Refunding Bonds, Multipurpose Stadium Facility Project, Series 2012A, 5.000%, 7/01/30 | 7/22 at 100.00 | A1 | | | 11,666,417 | |
| | 5,000 | | Arizona Tourism and Sports Authority, Tax Revenue Bonds, Multipurpose Stadium Facility Project, Series 2003A, 5.000%, 7/01/31 (Pre-refunded 7/01/13) – NPFG Insured | 7/13 at 100.00 | A1 (4) | | | 5,040,500 | |
| | 1,665 | | Oro Valley, Arizona, Water Project Revenue Obligations, Refunding Senior Lien Series 2012, 4.000%, 7/01/20 | No Opt. Call | AA | | | 1,926,105 | |
| | | | Phoenix Mesa Gateway Airport Authority, Arizona, Special Facility Revenue Bonds, Mesa Project, Series 2012: | | | | | | |
| | 400 | | 5.000%, 7/01/27 (Alternative Minimum Tax) | 7/22 at 100.00 | AA+ | | | 443,552 | |
| | 950 | | 5.000%, 7/01/32 (Alternative Minimum Tax) | 7/22 at 100.00 | AA+ | | | 1,029,477 | |
| | 3,710 | | Pinal County Electrical District 3, Arizona, Electric System Revenue Bonds, Refunding Series 2011, 5.250%, 7/01/41 | 7/21 at 100.00 | A | | | 4,178,907 | |
| | 3,000 | | Salt Verde Financial Corporation, Arizona, Senior Gas Revenue Bonds, Citigroup Energy Inc Prepay Contract Obligations, Series 2007, 5.000%, 12/01/37 | No Opt. Call | A– | | | 3,370,350 | |
| | 26,375 | | Total Arizona | | | | | 29,011,104 | |
| | | | California – 20.9% (14.0% of Total Investments) | | | | | | |
| | 1,500 | | ABAG Finance Authority for Non-Profit Corporations, California, Cal-Mortgage Insured Revenue Bonds, Channing House, Series 2010, 6.000%, 5/15/30 | 5/20 at 100.00 | A | | | 1,737,795 | |
| | 8,000 | | Anaheim Public Finance Authority, California, Senior Lease Bonds, Public Improvement Project, Refunding Series 2007A-1, 4.375%, 3/01/37 – FGIC Insured | 9/17 at 100.00 | A1 | | | 8,272,480 | |
| | 5,000 | | California Health Facilities Financing Authority, Revenue Bonds, Kaiser Permanante System, Series 2006, 5.000%, 4/01/37 | 4/16 at 100.00 | A+ | | | 5,444,400 | |
| | 2,900 | | California Health Facilities Financing Authority, Revenue Bonds, Sutter Health, Series 2007A, 5.000%, 11/15/42 (UB) | 11/16 at 100.00 | AA– | | | 3,198,932 | |
| | 1,385 | | California Municipal Finance Authority, Mobile Home Park Revenue Bonds, Caritas Projects Series 2010A, 6.400%, 8/15/45 | 8/20 at 100.00 | BBB | | | 1,544,926 | |
| | Principal | | | Optional Call | | | | | |
| | Amount (000) | | Description (1) | Provisions (2) | Ratings (3) | | | Value | |
| | | | California (continued) | | | | | | |
| $ | 2,000 | | California State Public Works Board, Lease Revenue Bonds, Judicial Council of California, Various Projects Series 2013A, 5.000%, 3/01/38 | 3/23 at 100.00 | A2 | | $ | 2,208,300 | |
| | 1,220 | | California State Public Works Board, Lease Revenue Bonds, Various Capital Projects, Series 2009-I, 6.375%, 11/01/34 | 11/19 at 100.00 | A2 | | | 1,516,460 | |
| | 1,500 | | California State Public Works Board, Lease Revenue Bonds, Various Capital Projects, Series 2010A-1, 5.750%, 3/01/30 | 3/20 at 100.00 | A2 | | | 1,775,040 | |
| | 4,500 | | California State Public Works Board, Lease Revenue Bonds, Various Capital Projects, Series 2011A, 5.125%, 10/01/31 | 10/21 at 100.00 | A2 | | | 5,065,830 | |
| | 19,095 | | California State, General Obligation Bonds, Series 2005, 5.000%, 6/01/33 – CIFG Insured | 6/15 at 100.00 | A1 | | | 20,463,157 | |
| | 1,000 | | California State, General Obligation Bonds, Various Purpose Series 2010, 5.500%, 3/01/40 | 3/20 at 100.00 | A1 | | | 1,173,340 | |
| | 1,030 | | California Statewide Communities Development Authority, Revenue Bonds, American Baptist Homes of the West, Series 2010, 6.250%, 10/01/39 | 10/19 at 100.00 | BBB+ | | | 1,171,574 | |
| | 1,050 | | California Statewide Communities Development Authority, School Facility Revenue Bonds, Aspire Public Schools, Series 2010, 6.000%, 7/01/40 | 1/19 at 100.00 | BB | | | 1,109,682 | |
| | 1,000 | | California Statewide Community Development Authority, Revenue Bonds, Daughters of Charity Health System, Series 2005A, 5.000%, 7/01/39 | 7/15 at 100.00 | BBB– | | | 1,037,500 | |
| | 1,685 | | California Statewide Community Development Authority, Revenue Bonds, Sutter Health, Tender Option Bond Trust 3175, 13.651%, 5/15/14 (IF) | No Opt. Call | AA– | | | 2,610,975 | |
| | 4,780 | | Foothill/Eastern Transportation Corridor Agency, California, Toll Road Revenue Bonds, Series 1995A, 0.000%, 1/01/14 (ETM) | No Opt. Call | Aaa | | | 4,773,786 | |
| | 1,000 | | Golden State Tobacco Securitization Corporation, California, Tobacco Settlement Asset-Backed Bonds, Series 2003A-1, 6.750%, 6/01/39 (Pre-refunded 6/01/13) | 6/13 at 100.00 | Aaa | | | 1,005,590 | |
| | 1,000 | | Gavilan Joint Community College District, Santa Clara and San Benito Counties, California, General Obligation Bonds, Election of 2004 Series 2011D, 5.750%, 8/01/35 | 8/21 at 100.00 | Aa2 | | | 1,230,480 | |
| | 2,000 | | Glendale Redevelopment Agency, California, Central Glendale Redevelopment Project, Tax Allocation Bonds, Series 2010, 5.500%, 12/01/24 | 12/16 at 100.00 | A | | | 2,113,940 | |
| | | | Golden State Tobacco Securitization Corporation, California, Tobacco Settlement Asset-Backed Bonds, Series 2007A-1: | | | | | | |
| | 3,000 | | 5.750%, 6/01/47 | 6/17 at 100.00 | B | | | 2,866,410 | |
| | 610 | | 5.125%, 6/01/47 | 6/17 at 100.00 | B | | | 531,286 | |
| | 3,190 | | Hillsborough City School District, San Mateo County, California, General Obligation Bonds, Series 2006B, 0.000%, 9/01/27 | No Opt. Call | AAA | | | 1,879,325 | |
| | 360 | | Jurupa Public Financing Authority, California, Superior Lien Revenue Bonds, Series 2010A, 5.000%, 9/01/33 | 9/20 at 100.00 | AA– | | | 391,860 | |
| | 540 | | Madera County, California, Certificates of Participation, Children’s Hospital Central California, Series 2010, 5.375%, 3/15/36 | 3/20 at 100.00 | A+ | | | 595,647 | |
| | 2,000 | | Martinez Unified School District, Contra Costa County, California, General Obligation Bonds, Series 2011, 0.000%, 8/01/31 | 8/24 at 100.00 | Aa2 | | | 2,254,840 | |
| | 1,000 | | Mendocino-Lake Community College District, California, General Obligation Bonds, Election 2006, Series 2011B, 0.000%, 8/01/31 – AGM Insured | 8/26 at 100.00 | AA– | | | 979,980 | |
| | 2,700 | | M-S-R Energy Authority, California, Gas Revenue Bonds, Series 2009C, 7.000%, 11/01/34 | No Opt. Call | A | | | 3,816,207 | |
| | 3,000 | | Palomar Pomerado Health Care District, California, Certificates of Participation, Series 2009, 6.625%, 11/01/29 | 11/19 at 100.00 | Baa3 | | | 3,416,640 | |
| | 1,250 | | Palomar Pomerado Health Care District, California, Certificates of Participation, Series 2010, 5.250%, 11/01/21 | 11/20 at 100.00 | Baa3 | | | 1,399,500 | |
| | 2,500 | | Petaluma, Sonoma County, California, Wastewater Revenue Bonds, Refunding Series 2011, 5.500%, 5/01/32 | 5/21 at 100.00 | AA– | | | 2,950,500 | |
| | 2,000 | | Ridgecrest Redevelopment Agency, California, Ridgecrest Redevelopment Project Tax Allocation Bonds, Refunding Series 2010, 6.125%, 6/30/37 | 6/20 at 100.00 | A– | | | 2,272,420 | |
| | 11,310 | | San Francisco Bay Area Rapid Transit District, California, Sales Tax Revenue Bonds, Refunding Series 2006A, 4.250%, 7/01/31 – AGM Insured (UB) | 7/16 at 100.00 | AA+ | | | 11,704,493 | |
| | 670 | | San Francisco Redevelopment Finance Authority, California, Tax Allocation Revenue Bonds, Mission Bay North Redevelopment Project, Series 2009C, 6.500%, 8/01/39 | 8/19 at 100.00 | A– | | | 792,067 | |
| | | Nuveen Premium Income Municipal Fund 4, Inc. (continued) |
| NPT | | Portfolio of Investments |
| | | April 30, 2013 (Unaudited) |
| | Principal | | | Optional Call | | | | | |
| | Amount (000) | | Description (1) | Provisions (2) | Ratings (3) | | | Value | |
| | | | California (continued) | | | | | | |
| | | | San Joaquin Hills Transportation Corridor Agency, Orange County, California, Toll Road Revenue Refunding Bonds, Series 1997A: | | | | | | |
| $ | 4,430 | | 0.000%, 1/15/32 – NPFG Insured | No Opt. Call | Baa2 | | $ | 1,768,190 | |
| | 31,300 | | 0.000%, 1/15/34 – NPFG Insured | No Opt. Call | Baa2 | | | 11,165,649 | |
| | 4,000 | | San Luis Obispo County Financing Authority, California, Revenue Bonds, Nacimiento Water Project, Tender Option Bond Trust 3030, 17.207%, 9/01/38 – NPFG Insured (IF) | 9/17 at 100.00 | AA+ | | | 5,396,160 | |
| | 440 | | Semitrophic Improvement District of Semitrophic Water Storage District, Kern County, California, Revenue Bonds, Refunding Series 2009A, 5.000%, 12/01/38 | 12/19 at 100.00 | AA– | | | 492,087 | |
| | | | Wiseburn School District, Los Angeles County, California, General Obligation Bonds, Series 2011B: | | | | | | |
| | 4,005 | | 0.000%, 8/01/36 – AGM Insured | 8/31 at 100.00 | AA– | | | 2,432,557 | |
| | 3,900 | | 5.625%, 5/01/41 – AGM Insured | 8/21 at 100.00 | AA– | | | 4,560,933 | |
| | 3,000 | | Yuba Community College District, California, General Obligation Bonds, Election 2006 Series 2011C, 5.250%, 8/01/47 | 8/21 at 100.00 | Aa2 | | | 3,401,160 | |
| | 146,850 | | Total California | | | | | 132,522,098 | |
| | | | Colorado – 8.6% (5.7% of Total Investments) | | | | | | |
| | 1,250 | | Adams County School District 1, Mapleton Public Schools, Colorado, General Obligation Bonds, Series 2010, 6.250%, 12/01/35 | 12/20 at 100.00 | Aa2 | | | 1,547,688 | |
| | 4,735 | | Broomfield, Colorado, Water Activity Enterprise, Water Revenue Bonds, Series 2012, 5.000%, 12/01/20 | No Opt. Call | A1 | | | 5,812,023 | |
| | 1,240 | | Colorado City Metropolitan District, Pueblo county, Colorado, Water and Wastewater Enterprise Revenue Bonds, Refunding & Improvement Series 2012, 4.500%, 12/01/34 | No Opt. Call | A– | | | 1,276,630 | |
| | 2,000 | | Colorado Health Facilities Authority, Revenue Bonds, Craig Hospital Project, Series 2012, 4.000%, 12/01/42 (UB) (5) | 12/22 at 100.00 | A– | | | 2,011,840 | |
| | 945 | | Colorado Springs, Colorado, Utility System Revenue Bonds, Improvement Series 2008C, 5.500%, 11/15/48 | 11/18 at 100.00 | AA | | | 1,092,845 | |
| | 1,200 | | Colorado State Board of Governors, Colorado State University Auxiliary Enterprise System Revenue Bonds, Series 2009A, 5.000%, 3/01/34 | 3/19 at 100.00 | Aa2 | | | 1,358,796 | |
| | 1,210 | | Colorado Water Resources and Power Development Authority, Water Resources Revenue Bonds, City of Fountain, Electric, Water & Wastewater Utility Enterprise Project, Series 2013A, 5.000%, 9/01/38 – AGM Insured | 9/22 at 100.00 | AA– | | | 1,375,637 | |
| | | | Commerce City Northern Infrastructure General Improvement District, Colorado, General Obligation Bonds, Series 2013: | | | | | | |
| | 1,070 | | 5.000%, 12/01/29 – AGM Insured | 12/22 at 100.00 | AA– | | | 1,250,509 | |
| | 1,185 | | 5.000%, 12/01/30 – AGM Insured | 12/22 at 100.00 | AA– | | | 1,381,674 | |
| | 1,000 | | 5.000%, 12/01/31 – AGM Insured | 12/22 at 100.00 | AA– | | | 1,151,570 | |
| | 1,000 | | Concord Metropolitan District, Douglas County, Colorado, General Obligation Bonds, Refunding Series 2010, 5.375%, 12/01/40 | 12/20 at 100.00 | BBB | | | 1,112,330 | |
| | 535 | | Denver City and County, Colorado, Airport System Revenue Bonds, Series 1991D, 7.750%, 11/15/13 (Alternative Minimum Tax) | No Opt. Call | A+ | | | 556,357 | |
| | 3,150 | | Denver City and County, Colorado, Airport System Revenue Bonds, Series 2012B, 4.000%, 11/15/43 | 11/22 at 100.00 | A+ | | | 3,244,532 | |
| | | | Denver Convention Center Hotel Authority, Colorado, Revenue Bonds, Convention Center Hotel, Senior Lien Series 2003A: | | | | | | |
| | 2,940 | | 5.000%, 12/01/20 (Pre-refunded 12/01/13) – SYNCORA GTY Insured | 12/13 at 100.00 | N/R (4) | | | 3,020,291 | |
| | 10,185 | | 5.000%, 12/01/33 (Pre-refunded 12/01/13) – SYNCORA GTY Insured | 12/13 at 100.00 | N/R (4) | | | 10,463,152 | |
| | 4,000 | | Eagle River Water and Sanitation District, Eagle County, Colorado, Enterprise Wastewater Revenue Bonds, Series 2012, 5.000%, 12/01/42 | No Opt. Call | A+ | | | 4,588,480 | |
| | 755 | | Jefferson County School District R1, Colorado, General Obligation Bonds, Series 2004, 5.000%, 12/15/22 (Pre-refunded 12/15/14) – AGM Insured | 12/14 at 100.00 | Aa2 (4) | | | 812,690 | |
| | 1,000 | | Meridian Metropolitan District, Douglas County, Colorado, General Obligation Refunding Bonds, Series 2011A, 5.000%, 12/01/41 | 12/21 at 100.00 | A | | | 1,088,330 | |
| | 1,765 | | Park Creek Metropolitan District, Colorado, Senior Limited Property Tax Supported Revenue Refunding Bonds, Series 2011, 6.125%, 12/01/41 – AGM Insured | 12/20 at 100.00 | AA– | | | 2,074,493 | |
| | Principal | | | Optional Call | | | | | |
| | Amount (000) | | Description (1) | Provisions (2) | Ratings (3) | | | Value | |
| | | | Colorado (continued) | | | | | | |
| $ | 2,605 | | Parker Water and Sanitation District, Douglas County, Colorado, General Obligation Bonds, Refunding Series 2012, 4.500%, 8/01/37 | No Opt. Call | AA– | | $ | 2,873,159 | |
| | | | Regional Transportation District, Colorado, Denver Transit Partners Eagle P3 Project Private Activity Bonds, Series 2010: | | | | | | |
| | 1,245 | | 6.000%, 1/15/34 | 7/20 at 100.00 | Baa3 | | | 1,446,441 | |
| | 2,365 | | 6.000%, 1/15/41 | 7/20 at 100.00 | Baa3 | | | 2,760,735 | |
| | 1,965 | | SBC Metropolitan District, Colorado, General Obligation Bonds, Series 2012, 4.000%, 12/01/37 | No Opt. Call | BBB+ | | | 1,972,015 | |
| | 49,345 | | Total Colorado | | | | | 54,272,217 | |
| | | | Florida – 7.1% (4.8% of Total Investments) | | | | | | |
| | 1,250 | | Bay County, Florida, Educational Facilities Revenue Refunding Bonds, Bay Haven Charter Academy, Inc. Project, Series 2010A, 6.000%, 9/01/40 | 9/20 at 100.00 | BBB– | | | 1,364,338 | |
| | | | Bay County, Florida, Educational Facilities Revenue Refunding Bonds, Bay Haven Charter Academy, Inc. Project, Series 2013A: | | | | | | |
| | 1,005 | | 5.000%, 9/01/43 | 9/23 at 100.00 | BBB– | | | 1,011,382 | |
| | 865 | | 5.000%, 9/01/45 | 9/23 at 100.00 | BBB– | | | 867,015 | |
| | 250 | | Brevard County Health Facilities Authority, Florida, Revenue Bonds, Health First Inc. Project, Series 2009B, 7.000%, 4/01/39 | 4/19 at 100.00 | A– | | | 307,133 | |
| | 5,050 | | Broward County School Board, Florida, Certificates of Participation, Series 2003, 5.000%, 7/01/28 (Pre-refunded 7/01/13) – NPFG Insured | 7/13 at 100.00 | Aa3 (4) | | | 5,090,905 | |
| | 3,000 | | Cape Coral, Florida, Water and Sewer Revenue Bonds, Refunding Series 2011, 5.000%, 10/01/41 – AGM Insured | 10/21 at 100.00 | AA– | | | 3,385,080 | |
| | 1,100 | | Florida Higher Educational Facilities Financing Authority, Revenue Bonds, Nova Southeastern University, Refunding Series 2011, 6.375%, 4/01/31 | 4/21 at 100.00 | BBB+ | | | 1,303,676 | |
| | 5,000 | | Hillsborough County Aviation Authority, Florida, Revenue Bonds, Tampa International Airport, Series 2003A, 5.250%, 10/01/18 – NPFG Insured (Alternative Minimum Tax) | 10/13 at 100.00 | A+ | | | 5,099,650 | |
| | 1,795 | | Jacksonville, Florida, Transportation Revenue Bonds, Refunding Series 2012A, 5.000%, 10/01/24 | 10/22 at 100.00 | AA– | | | 2,184,210 | |
| | 2,050 | | Miami-Dade County, Florida, Aviation Revenue Bonds, Miami International Airport, Series 2005A, 5.000%, 10/01/37 – SYNCORA GTY Insured (Alternative Minimum Tax) | 10/15 at 100.00 | A | | | 2,201,311 | |
| | 1,170 | | Miami-Dade County, Florida, Transit System Sales Surtax Revenue Bonds, Series 2012, 5.000%, 7/01/42 | 7/22 at 100.00 | AA | | | 1,320,790 | |
| | 1,000 | | Northern Palm Beach County Improvement District, Florida, Revenue Bonds, Water Control and Improvement Development Unit 46B, Series 2007A, 5.350%, 8/01/41 | 8/17 at 100.00 | N/R | | | 1,006,710 | |
| | 1,885 | | Old Palm Community Development District, Florida, Special Assessment Bonds, Palm Beach Gardens, Series 2004A, 5.900%, 5/01/35 | 5/15 at 101.00 | N/R | | | 1,950,787 | |
| | 5,455 | | South Miami Health Facilities Authority, Florida, Hospital Revenue, Baptist Health System Obligation Group, Series 2007, 5.000%, 8/15/42 (UB) (5) | 8/17 at 100.00 | AA | | | 5,977,371 | |
| | 11,000 | | Sunrise, Florida, Utility System Revenue Refunding Bonds, Series 1998, 5.000%, 10/01/28 – AMBAC Insured | 10/18 at 100.00 | AA– | | | 12,107,040 | |
| | 41,875 | | Total Florida | | | | | 45,177,398 | |
| | | | Georgia – 3.6% (2.4% of Total Investments) | | | | | | |
| | 4,400 | | Atlanta, Georgia, Water and Wastewater Revenue Bonds, Series 1999A, 5.500%, 11/01/22 – FGIC Insured | No Opt. Call | A1 | | | 5,441,084 | |
| | 1,500 | | Atlanta, Georgia, Water and Wastewater Revenue Bonds, Series 2009B, 5.250%, 11/01/34 – AGM Insured | 11/19 at 100.00 | AA– | | | 1,706,115 | |
| | 2,500 | | Gainesville and Hall County Hospital Authority, Georgia, Revenue Anticipation Certificates, Northeast Georgia Health Services Inc., Series 2010A, 5.000%, 2/15/30 | 2/20 at 100.00 | A | | | 2,727,175 | |
| | 5,295 | | Georgia Municipal Electric Authority, General Power Revenue Bonds, Series 1993B, 5.700%, 1/01/19 – FGIC Insured (ETM) | No Opt. Call | A1 (4) | | | 6,487,646 | |
| | 6,000 | | Medical Center Hospital Authority, Georgia, Revenue Anticipation Certificates, Columbus Regional Healthcare System, Inc. Project, Series 2010, 5.000%, 8/01/41 | 8/20 at 100.00 | AA– | | | 6,517,740 | |
| | 19,695 | | Total Georgia | | | | | 22,879,760 | |
| | | Nuveen Premium Income Municipal Fund 4, Inc. (continued) |
| NPT | | Portfolio of Investments |
| | | April 30, 2013 (Unaudited) |
| | Principal | | | Optional Call | | | | | |
| | Amount (000) | | Description (1) | Provisions (2) | Ratings (3) | | | Value | |
| | | | Guam – 0.7% (0.5% of Total Investments) | | | | | | |
| $ | 4,000 | | Guam Government Waterworks Authority, Water and Wastewater System Revenue Bonds, Series 2010, 5.500%, 7/01/30 | 7/20 at 100.00 | Ba2 | | $ | 4,367,960 | |
| | | | Hawaii – 0.8% (0.5% of Total Investments) | | | | | | |
| | 1,000 | | Hawaii Department of Budget and Finance, Special Purpose Revenue Bonds, Hawaii Pacific Health Obligated Group, Series 2010A, 5.500%, 7/01/40 | 7/20 at 100.00 | A– | | | 1,105,430 | |
| | 2,050 | | Honolulu City and County, Hawaii, General Obligation Refunding and Improvement Bonds, Series 1993B, 5.000%, 10/01/13 | No Opt. Call | Aa1 | | | 2,091,533 | |
| | 1,580 | | Honolulu City and County, Hawaii, General Obligation Refunding and Improvement Bonds, Series 1993B, 5.000%, 10/01/13 (ETM) | No Opt. Call | Aaa | | | 1,611,948 | |
| | 4,630 | | Total Hawaii | | | | | 4,808,911 | |
| | | | Idaho – 0.2% (0.1% of Total Investments) | | | | | | |
| | 575 | | Idaho Housing and Finance Association, Single Family Mortgage Revenue Bonds, Series 2009BI, 5.650%, 7/01/26 | 7/19 at 100.00 | A1 | | | 606,562 | |
| | 595 | | Idaho Water Resource Board, Water Resource Loan Program Revenue, Ground Water Rights Mitigation Series 2012A, 5.000%, 9/01/32 | 9/22 at 100.00 | Baa1 | | | 652,852 | |
| | 1,170 | | Total Idaho | | | | | 1,259,414 | |
| | | | Illinois – 18.5% (12.4% of Total Investments) | | | | | | |
| | 1,180 | | Chicago Board of Education, Cook County, Illinois, General Obligation Bonds, Dedicated Revenues Series 2011A, 5.000%, 12/01/41 | 12/21 at 100.00 | A+ | | | 1,276,135 | |
| | 2,120 | | Chicago Board of Education, Illinois, General Obligation Lease Certificates, Series 1992A, 6.250%, 1/01/15 – NPFG Insured | No Opt. Call | A2 | | | 2,229,498 | |
| | 5,550 | | Chicago, Illinois, Revenue Bonds, Midway Airport, Series 2001A, 5.125%, 1/01/26 – AGM Insured (Alternative Minimum Tax) | 7/13 at 100.00 | AA– | | | 5,568,426 | |
| | 415 | | Chicago, Illinois, Third Lien General Airport Revenue Bonds, O’Hare International Airport, Series 2005A, 5.000%, 1/01/33 – FGIC Insured | 1/16 at 100.00 | A2 | | | 446,801 | |
| | 1,250 | | Cook County Forest Preserve District, Illinois, General Obligation Bonds, Personal Property Replacement Tax Alternate Source, Series 2012C, 5.000%, 12/15/37 – AGM Insured | 6/22 at 100.00 | AA | | | 1,431,588 | |
| | | | Cook County School District 99, Cicero, Illinois, General Obligation School Bonds, Series 1997: | | | | | | |
| | 1,455 | | 8.500%, 12/01/13 – FGIC Insured | No Opt. Call | N/R | | | 1,520,082 | |
| | 1,685 | | 8.500%, 12/01/15 – FGIC Insured | No Opt. Call | N/R | | | 1,992,580 | |
| | 500 | | Illinois Finance Authority, Revenue Bonds, Admiral at Lake Project, Series 2010A, 7.750%, 5/15/30 | 5/20 at 100.00 | N/R | | | 602,315 | |
| | 500 | | Illinois Finance Authority, Revenue Bonds, Admiral at Lake Project, Temps 75 Series 2010D-1, 7.000%, 5/15/18 | 5/13 at 100.00 | N/R | | | 501,160 | |
| | 1,000 | | Illinois Finance Authority, Revenue Bonds, Central DuPage Health, Series 2009, 5.250%, 11/01/39 | 11/19 at 100.00 | AA | | | 1,128,690 | |
| | 5,220 | | Illinois Finance Authority, Revenue Bonds, DePaul University, Series 2011A, 5.750%, 10/01/27 | 4/21 at 100.00 | A | | | 6,200,786 | |
| | 3,000 | | Illinois Finance Authority, Revenue Bonds, Elmhurst Memorial Healthcare, Series 2008A, 5.625%, 1/01/37 | 1/18 at 100.00 | Baa2 | | | 3,359,340 | |
| | 5,015 | | Illinois Finance Authority, Revenue Bonds, Ingalls Health System, Series 2013, 5.000%, 5/15/43 | 5/22 at 100.00 | Baa1 | | | 5,351,105 | |
| | 1,500 | | Illinois Finance Authority, Revenue Bonds, Little Company of Mary Hospital and Health Care Centers, Series 2010, 5.375%, 8/15/40 | 8/15 at 105.00 | A+ | | | 1,623,765 | |
| | 2,515 | | Illinois Finance Authority, Revenue Bonds, Northwestern Memorial Hospital, Series 2004A, 5.250%, 8/15/34 (Pre-refunded 8/15/14) | 8/14 at 100.00 | N/R (4) | | | 2,673,671 | |
| | 3,160 | | Illinois Finance Authority, Revenue Bonds, OSF Healthcare System, Refunding Series 2010A, 6.000%, 5/15/39 | 5/20 at 100.00 | A | | | 3,671,667 | |
| | 500 | | Illinois Finance Authority, Revenue Bonds, Provena Health, Series 2009A, 7.750%, 8/15/34 | 8/19 at 100.00 | BBB+ | | | 642,670 | |
| | 1,665 | | Illinois Finance Authority, Revenue Bonds, Rush University Medical Center Obligated Group, Series 2009C, 6.625%, 11/01/39 | 5/19 at 100.00 | A | | | 2,033,681 | |
| | 5,565 | | Illinois Finance Authority, Revenue Bonds, Sherman Health Systems, Series 2007A, 5.500%, 8/01/37 | 8/17 at 100.00 | BBB | | | 6,089,557 | |
| | Principal | | | Optional Call | | | | | |
| | Amount (000) | | Description (1) | Provisions (2) | Ratings (3) | | | Value | |
| | | | Illinois (continued) | | | | | | |
| | | | Illinois Finance Authority, Revenue Bonds, Silver Cross Hospital and Medical Centers, Series 2009: | | | | | | |
| $ | 2,000 | | 6.875%, 8/15/38 | 8/19 at 100.00 | BBB+ | | $ | 2,369,400 | |
| | 2,000 | | 7.000%, 8/15/44 | 8/19 at 100.00 | BBB+ | | | 2,380,280 | |
| | 500 | | Illinois Finance Authority, Revenue Bonds, Southern Illinois Healthcare Enterprises, Inc., Series 2005 Remarketed, 5.250%, 3/01/30 – AGM Insured | 3/20 at 100.00 | AA– | | | 558,725 | |
| | 3,000 | | Illinois Finance Authority, Revenue Refunding Bonds, Resurrection Health Care Corporation, Series 2009, 6.125%, 5/15/25 | 5/19 at 100.00 | BBB+ | | | 3,451,440 | |
| | 1,000 | | Illinois Finance Authority, Student Housing Revenue Bonds, Educational Advancement Fund Inc., Refunding Series 2007A, 5.250%, 5/01/34 | 5/17 at 100.00 | BBB+ | | | 1,056,800 | |
| | 4,000 | | Illinois Health Facilities Authority, FHA-Insured Mortgage Revenue Refunding Bonds, Sinai Health System, Series 2003, 5.150%, 2/15/37 | 8/13 at 100.00 | Aa2 | | | 4,018,080 | |
| | | | Illinois Health Facilities Authority, Revenue Refunding Bonds, Elmhurst Memorial Healthcare, Series 2002: | | | | | | |
| | 3,000 | | 5.500%, 1/01/22 | 7/13 at 100.00 | Baa2 | | | 3,010,680 | |
| | 1,000 | | 5.625%, 1/01/28 | 7/13 at 100.00 | Baa2 | | | 1,003,370 | |
| | 1,375 | | Illinois Health Facilities Authority, Revenue Refunding Bonds, Lutheran General Health System, Series 1993C, 7.000%, 4/01/14 | No Opt. Call | Aa2 | | | 1,446,184 | |
| | 275 | | Illinois State, General Obligation Bonds, Refunding Series 2012, 5.000%, 8/01/25 | 8/22 at 100.00 | A2 | | | 312,513 | |
| | 2,250 | | Illinois State, General Obligation Bonds, Series 2012A, 4.000%, 1/01/26 | 1/22 at 100.00 | A2 | | | 2,334,263 | |
| | 700 | | Illinois Toll Highway Authority, Toll Highway Revenue Bonds, Tender Option Bond Trust 4304, 17.980%, 1/01/21 (WI/DD, Settling 5/16/13) (IF) | No Opt. Call | AA– | | | 1,072,750 | |
| | 625 | | Illinois Toll Highway Authority, Toll Highway Revenue Bonds, Tender Option Bonds Trust 4306, 17.973%, 1/01/21 (WI/DD, Settling 5/16/13) (IF) | No Opt. Call | AA– | | | 957,675 | |
| | 9,795 | | Lake, Cook, Kane and McHenry Counties Community Unit School District 220, Barrington, Illinois, General Obligation Bonds, Refunding Series 2002, 5.250%, 12/01/19 – AGM Insured (UB) | No Opt. Call | AAA | | | 12,277,347 | |
| | 1,245 | | Mc Henry and Lake Counties Community Consolidated School District 26, Cary, Illinois, General Obligation Bonds, Series 2011B, 6.250%, 2/01/21 – AGM Insured | 2/20 at 100.00 | A2 | | | 1,514,007 | |
| | | | McHenry and Lake Counties Community Consolidated School District 26, Cary, Illinois, General Obligation Bonds, Series 2011A: | | | | | | |
| | 825 | | 6.000%, 2/01/24 – AGM Insured | 2/20 at 100.00 | A2 | | | 973,979 | |
| | 1,030 | | 6.000%, 2/01/25 – AGM Insured | 2/20 at 100.00 | A2 | | | 1,203,267 | |
| | 2,500 | | Metropolitan Pier and Exposition Authority, Illinois, McCormick Place Expansion Project Refunding Bonds, Series 2012B, 5.000%, 6/15/52 (UB) (5) | 6/22 at 100.00 | AAA | | | 2,750,525 | |
| | | | Metropolitan Pier and Exposition Authority, Illinois, Revenue Bonds, McCormick Place Expansion Project, Series 2002A: | | | | | | |
| | 9,500 | | 0.000%, 6/15/24 – NPFG Insured | 6/22 at 101.00 | AAA | | | 9,126,270 | |
| | 36,040 | | 0.000%, 6/15/40 – NPFG Insured | No Opt. Call | AAA | | | 10,020,562 | |
| | | | Quad Cities Regional Economic Development Authority, Illinois, Revenue Bonds, Augustana College, Series 2012: | | | | | | |
| | 445 | | 5.000%, 10/01/25 | 10/22 at 100.00 | Baa1 | | | 507,162 | |
| | 400 | | 5.000%, 10/01/26 | 10/22 at 100.00 | Baa1 | | | 451,292 | |
| | | | Railsplitter Tobacco Settlement Authority, Illinois, Tobacco Settlement Revenue Bonds, Series 2010: | | | | | | |
| | 780 | | 5.250%, 6/01/21 | No Opt. Call | A | | | 955,562 | |
| | 2,000 | | 6.250%, 6/01/24 | 6/16 at 100.00 | A– | | | 2,250,820 | |
| | 2,435 | | Regional Transportation Authority, Cook, DuPage, Kane, Lake, McHenry and Will Counties, Illinois, General Obligation Bonds, Series 1990A, 7.200%, 11/01/20 – AMBAC Insured | No Opt. Call | AA | | | 2,928,404 | |
| | 132,515 | | Total Illinois | | | | | 117,274,874 | |
| | | | Indiana – 3.4% (2.3% of Total Investments) | | | | | | |
| | | | Carmel Redevelopment Authority, Indiana, Lease Rent Revenue Bonds, Series 2005: | | | | | | |
| | 1,950 | | 0.000%, 2/01/24 | No Opt. Call | AA+ | | | 1,414,589 | |
| | 2,705 | | 0.000%, 2/01/25 | No Opt. Call | AA+ | | | 1,876,134 | |
| | | Nuveen Premium Income Municipal Fund 4, Inc. (continued) |
| NPT | | Portfolio of Investments |
| | | April 30, 2013 (Unaudited) |
| | Principal | | | Optional Call | | | | | |
| | Amount (000) | | Description (1) | Provisions (2) | Ratings (3) | | | Value | |
| | | | Indiana (continued) | | | | | | |
| $ | 3,000 | | Delaware County Hospital Authority, Indiana, Hospital Revenue Bonds, Cardinal Health System, Series 2006, 5.250%, 8/01/36 | 8/16 at 100.00 | Baa2 | | $ | 3,199,410 | |
| | 680 | | Indiana Finance Authority, Educational Facilities Refunding Revenue Bonds, Butler University Project, Series 2012B, 5.000%, 2/01/29 | 2/22 at 100.00 | BBB+ | | | 746,878 | |
| | 1,050 | | Indiana Finance Authority, Educational Facilities Revenue Bonds, Drexel Foundation For Educational Excellence, Inc., Series 2009A, 7.000%, 10/01/39 | 10/19 at 100.00 | BB+ | | | 1,170,141 | |
| | 1,500 | | Indiana Finance Authority, Hospital Revenue Bonds, Floyd Memorial Hospital and Health Services Project, Refunding Series 2010, 5.125%, 3/01/30 | 3/20 at 100.00 | A– | | | 1,622,820 | |
| | 5,380 | | Indiana Finance Authority, Private Activity Bonds, Ohio River Bridges East End Crossing Project, Series 2013A, 5.000%, 7/01/44 (Alternative Minimum Tax) | 7/23 at 100.00 | BBB | | | 5,728,355 | |
| | 1,460 | | Indiana Health Facility Financing Authority, Hospital Revenue Refunding Bonds, Columbus Regional Hospital, Series 1993, 7.000%, 8/15/15 – AGM Insured | No Opt. Call | AA– | | | 1,557,134 | |
| | 4,000 | | Indiana Transportation Finance Authority, Highway Revenue Bonds, Series 2003A, 5.000%, 6/01/23 (Pre-refunded 6/01/13) – AGM Insured | 6/13 at 100.00 | AA+ (4) | | | 4,016,520 | |
| | 21,725 | | Total Indiana | | | | | 21,331,981 | |
| | | | Iowa – 0.8% (0.5% of Total Investments) | | | | | | |
| | 1,000 | | Iowa Finance Authority, Health Facility Revenue Bonds, Care Initiatives Project, Series 2006A, 5.000%, 7/01/20 | 7/16 at 100.00 | BB+ | | | 1,055,810 | |
| | 1,630 | | Iowa Higher Education Loan Authority, Private College Facility Revenue Bonds, University of Dubuque Project, Refunding Series 2011, 6.000%, 10/01/31 | 10/21 at 100.00 | BBB– | | | 1,787,735 | |
| | 2,000 | | Iowa Student Loan Liquidity Corporation, Student Loan Revenue Bonds, Refunding Series 2009-2, 5.500%, 12/01/25 | 12/19 at 100.00 | A1 | | | 2,130,400 | |
| | 4,630 | | Total Iowa | | | | | 4,973,945 | |
| | | | Kansas – 1.9% (1.3% of Total Investments) | | | | | | |
| | | | Johnson and Miami Counties Unified School District 230, Kansas, General Obligation Bonds, Series 2011A: | | | | | | |
| | 2,000 | | 5.000%, 9/01/26 | 9/21 at 100.00 | Aa3 | | | 2,385,960 | |
| | 1,400 | | 5.000%, 9/01/27 | 9/21 at 100.00 | Aa3 | | | 1,657,418 | |
| | 2,000 | | Kansas Development Finance Authority, Revenue Bonds, Sisters of Charity of Leavenworth Health Services Corporation, Series 2010A, 5.000%, 1/01/40 | 1/20 at 100.00 | AA | | | 2,185,060 | |
| | 1,485 | | Kansas State Power Pool, Electric Utility Revenue Bonds, Dogwood Energy Facility, Series 2012A, 5.000%, 12/01/31 | 12/20 at 100.00 | Baa1 | | | 1,600,934 | |
| | 600 | | Overland Park Transportation Development District, Kansas, Sales Tax Revenue Bonds, Oak Park Mall Project, Series 2010, 5.900%, 4/01/32 | 4/20 at 100.00 | BBB | | | 673,494 | |
| | 1,750 | | Wamego, Kansas, Pollution Control Revenue Bonds, Kansas Gas and Electric Company, Series 2004, 5.300%, 6/01/31 – NPFG Insured | 6/14 at 100.00 | A– | | | 1,789,270 | |
| | 2,845 | | Wyandotte County-Kansas City Unified Government, Kansas, Sales Tax Special Obligation Capital Appreciation Revenue Bonds Redevelopment Project Area B – Major Multi-Sport Athletic Complex Project, Subordinate Lien Series 2010B, 0.000%, 6/01/21 | No Opt. Call | BBB+ | | | 1,915,652 | |
| | 12,080 | | Total Kansas | | | | | 12,207,788 | |
| | | | Kentucky – 1.1% (0.8% of Total Investments) | | | | | | |
| | 1,000 | | Kentucky Economic Development Finance Authority, Hospital Facilities Revenue Bonds, Owensboro Medical Health System, Series 2010A, 6.000%, 6/01/30 | 6/20 at 100.00 | BBB+ | | | 1,191,960 | |
| | 5,000 | | Pikeville, Kentucky, Hospital Revenue Bonds, Pikeville Medical Center, Inc. Project, Improvement and Refunding Series 2011, 6.250%, 3/01/31 | 3/21 at 100.00 | A3 | | | 5,974,700 | |
| | 6,000 | | Total Kentucky | | | | | 7,166,660 | |
| | | | Louisiana – 6.4% (4.3% of Total Investments) | | | | | | |
| | 165 | | DeSoto Parish, Louisiana, Environmental Improvement Revenue Bonds, International Paper Company Project, Series 2004A, 5.000%, 11/01/18 (Alternative Minimum Tax) | 11/14 at 100.00 | BBB | | | 173,474 | |
| | 1,750 | | Louisiana Local Government Environmental Facilities and Community Development Authority, GNMA Collateralized Mortgage Revenue Refunding Bonds, Sharlo Apartments, Series 2002A, 6.500%, 6/20/37 | 6/36 at 101.00 | Aa1 | | | 1,841,070 | |
| | Principal | | | Optional Call | | | | | |
| | Amount (000) | | Description (1) | Provisions (2) | Ratings (3) | | | Value | |
| | | | Louisiana (continued) | | | | | | |
| $ | 5,150 | | Louisiana Public Facilities Authority, Hospital Revenue Bonds, Franciscan Missionaries of Our Lady Health System, Series 2005A, 5.250%, 8/15/32 | 8/15 at 100.00 | A+ | | $ | 5,340,190 | |
| | 3,800 | | Louisiana Public Facilities Authority, Revenue Bonds, Ochsner Clinic Foundation Project, Series 2007A, 5.500%, 5/15/47 | 5/17 at 100.00 | Baa1 | | | 4,041,034 | |
| | 625 | | Louisiana Public Facilities Authority, Revenue Bonds, Tulane University, Series 2013B, 5.000%, 10/01/37 | 4/23 at 100.00 | A | | | 712,825 | |
| | | | Louisiana Stadium and Exposition District, Revenue Refunding Bonds, Senior Lien Series 2013A: | | | | | | |
| | 3,375 | | 5.000%, 7/01/30 | 7/23 at 100.00 | A | | | 3,881,250 | |
| | 4,580 | | 5.000%, 7/01/31 | 7/23 at 100.00 | A | | | 5,237,138 | |
| | 300 | | 5.000%, 7/01/36 | 7/23 at 100.00 | A | | | 337,527 | |
| | | | Louisiana State, Gasoline and Fuels Tax Revenue Bonds, Series 2006A: | | | | | | |
| | 1,480 | | 4.750%, 5/01/39 – AGM Insured (UB) | 5/16 at 100.00 | Aa1 | | | 1,613,348 | |
| | 15,820 | | 4.500%, 5/01/41 – FGIC Insured (UB) | 5/16 at 100.00 | Aa1 | | | 17,073,260 | |
| | 170 | | Louisiana State, Gasoline and Fuels Tax Revenue Bonds, Series 2006A, Residuals 660, 15.895%, 5/01/34 – FGIC Insured (IF) | 5/16 at 100.00 | Aa1 | | | 223,849 | |
| | 37,215 | | Total Louisiana | | | | | 40,474,965 | |
| | | | Maine – 0.7% (0.5% of Total Investments) | | | | | | |
| | 505 | | Maine Health and Higher Educational Facilities Authority Revenue Bonds, Eastern Maine Medical Center Obligated Group Issue, Series 2013, 5.000%, 7/01/43 | 7/23 at 100.00 | Baa1 | | | 548,809 | |
| | 2,000 | | Maine Health and Higher Educational Facilities Authority, Revenue Bonds, MaineGeneral Medical Center, Series 2011, 6.750%, 7/01/36 | 7/21 at 100.00 | Baa3 | | | 2,446,320 | |
| | 1,250 | | Maine Health and Higher Educational Facilities Authority, Revenue Bonds, Series 2010A, 5.000%, 7/01/40 | 7/20 at 100.00 | AA | | | 1,378,338 | |
| | 3,755 | | Total Maine | | | | | 4,373,467 | |
| | | | Maryland – 0.2% (0.1% of Total Investments) | | | | | | |
| | 685 | | Maryland Community Development Administration, Housing Revenue Bonds, Series 1996A, 5.875%, 7/01/16 | 7/13 at 100.00 | Aa2 | | | 687,096 | |
| | 50 | | Maryland Health and Higher Educational Facilities Authority, Revenue Bonds, MedStar Health, Series 2004, 5.375%, 8/15/24 | 8/14 at 100.00 | A2 | | | 52,651 | |
| | 345 | | Montgomery County Housing Opportunities Commission, Maryland, Multifamily Housing Development Bonds, Series 2000B, 6.125%, 7/01/20 (Alternative Minimum Tax) | 7/13 at 100.00 | Aaa | | | 345,904 | |
| | 1,080 | | Total Maryland | | | | | 1,085,651 | |
| | | | Massachusetts – 1.5% (1.0% of Total Investments) | | | | | | |
| | 2,805 | | Massachusetts Development Finance Agency, Revenue Bonds, Curry College, Series 2005A, 5.000%, 3/01/35 – ACA Insured | 3/15 at 100.00 | BBB | | | 2,855,041 | |
| | 1,000 | | Massachusetts Development Finance Agency, Revenue Bonds, Orchard Cove, Series 2007, 5.250%, 10/01/26 | 10/13 at 102.00 | N/R | | | 1,020,310 | |
| | 1,900 | | Massachusetts Health and Educational Facilities Authority, Revenue Refunding Bonds, Suffolk University Issue, Series 2009A, 5.750%, 7/01/39 | 7/19 at 100.00 | BBB | | | 2,149,337 | |
| | 3,465 | | Massachusetts Water Resources Authority, General Revenue Bonds, Series 2007A, 4.500%, 8/01/46 – AGM Insured (UB) (5) | 2/17 at 100.00 | AA+ | | | 3,656,753 | |
| | 9,170 | | Total Massachusetts | | | | | 9,681,441 | |
| | | | Michigan – 4.5% (3.0% of Total Investments) | | | | | | |
| | 355 | | Detroit Water and Sewerage Department, Michigan, Sewage Disposal System Revenue Bonds, Refunding Senior Lien Series 2012A, 5.250%, 7/01/39 | 7/22 at 100.00 | A+ | | | 388,051 | |
| | 625 | | Detroit, Michigan, Distributable State Aid General Obligation Bonds, Limited Tax Series 2010, 5.000%, 11/01/30 | 11/20 at 100.00 | AA | | | 693,131 | |
| | 6,000 | | Detroit, Michigan, Second Lien Sewerage Disposal System Revenue Bonds, Series 2005A, 5.000%, 7/01/35 – NPFG Insured | 7/15 at 100.00 | A | | | 6,067,800 | |
| | 5,400 | | Detroit, Michigan, Sewer Disposal System Revenue Bonds, Second Lien, Series 2006B, 4.625%, 7/01/34 – FGIC Insured | 7/16 at 100.00 | A | | | 5,466,366 | |
| | | Nuveen Premium Income Municipal Fund 4, Inc. (continued) |
| NPT | | Portfolio of Investments |
| | | April 30, 2013 (Unaudited) |
| | Principal | | | Optional Call | | | | | |
| | Amount (000) | | Description (1) | Provisions (2) | Ratings (3) | | | Value | |
| | | | Michigan (continued) | | | | | | |
| $ | 2,000 | | Detroit, Michigan, Water Supply System Revenue Bonds, Senior Lien Series 2011A, 5.250%, 7/01/41 | 7/21 at 100.00 | A+ | | $ | 2,171,920 | |
| | 1,500 | | Jackson County Hospital Finance Authority, Michigan, Hospital Revenue Bonds, W.A. Foote Memorial Hospital, Refunding Series 2006B-2, 5.000%, 6/01/27 – AGM Insured | 6/20 at 100.00 | AA– | | | 1,685,610 | |
| | 5,000 | | Michigan State Building Authority, Revenue Refunding Bonds, Facilities Program, Series 2003II, 5.000%, 10/15/29 – NPFG Insured | 10/13 at 100.00 | Aa3 | | | 5,093,150 | |
| | 3,220 | | Michigan State Hospital Finance Authority, Hospital Revenue Bonds, Henry Ford Health System, Refunding Series 2009, 5.750%, 11/15/39 | 11/19 at 100.00 | A | | | 3,673,601 | |
| | 1,000 | | Michigan State Hospital Finance Authority, Revenue Bonds, Chelsea Community Hospital, Series 2005, 5.000%, 5/15/30 (Pre-refunded 5/15/15) | 5/15 at 100.00 | AA+ (4) | | | 1,092,850 | |
| | | | Michigan State Hospital Finance Authority, Revenue Bonds, Trinity Health Care Group, Series 2006A: | | | | | | |
| | 365 | | 5.000%, 12/01/31 (Pre-refunded 12/01/16) (UB) | 12/16 at 100.00 | N/R (4) | | | 421,210 | |
| | 1,635 | | 5.000%, 12/01/31 (UB) | 12/16 at 100.00 | AA | | | 1,803,846 | |
| | 27,100 | | Total Michigan | | | | | 28,557,535 | |
| | | | Minnesota – 1.3% (0.9% of Total Investments) | | | | | | |
| | 1,000 | | Duluth Housing & Redevelopment Authority, Minnesota, Lease Revenue Bonds, Duluth Public Schools Academy, Series 2010A, 5.875%, 11/01/40 | 11/20 at 100.00 | BBB– | | | 1,069,360 | |
| | 3,000 | | Rochester, Minnesota, Health Care Facilities Revenue Bonds, Mayo Clinic, Series 2012, 4.000%, 11/15/41 | 5/22 at 100.00 | AA | | | 3,178,650 | |
| | 2,875 | | Saint Paul Port Authority, Minnesota, Lease Revenue Bonds, Regions Hospital Parking Ramp Project, Series 2007-1, 5.000%, 8/01/36 | 8/16 at 100.00 | N/R | | | 2,926,980 | |
| | 870 | | Wayzata, Minnesota, Senior Housing Entrance Deposit Revenue Bonds, Folkestone Senior Living Community, Series 2012B, 4.875%, 5/01/19 | 5/14 at 100.00 | N/R | | | 883,859 | |
| | 7,745 | | Total Minnesota | | | | | 8,058,849 | |
| | | | Mississippi – 1.9% (1.2% of Total Investments) | | | | | | |
| | 1,000 | | Mississippi Business Finance Corporation, Pollution Control Revenue Refunding Bonds, System Energy Resources Inc. Project, Series 1998, 5.875%, 4/01/22 | 10/13 at 100.00 | BBB | | | 1,003,130 | |
| | 2,975 | | Mississippi Hospital Equipment and Facilities Authority, Revenue Bonds, Baptist Memorial Healthcare, Series 2004B-1, 5.000%, 9/01/24 (UB) | 9/14 at 100.00 | AA– | | | 3,135,025 | |
| | 5,215 | | Mississippi, General Obligation Bonds, Refunding Series 2002A, 5.500%, 12/01/18 | No Opt. Call | AA+ | | | 6,492,154 | |
| | 1,000 | | Warren County, Mississippi, Gulf Opportunity Zone Revenue Bonds, International Paper Company Project, Series 2008A, 6.500%, 9/01/32 | 9/18 at 100.00 | BBB | | | 1,149,270 | |
| | 10,190 | | Total Mississippi | | | | | 11,779,579 | |
| | | | Missouri – 1.5% (1.0% of Total Investments) | | | | | | |
| | 1,745 | | Cape Girardeau County Industrial Development Authority, Missouri, Health Facilities Revenue Bonds, Saint Francis Medical Center, Series 2013A, 3.375%, 6/01/28 (WI/DD, Settling 5/01/13) | 6/22 at 100.00 | AA– | | | 1,719,558 | |
| | 1,450 | | Cape Girardeau County Industrial Development Authority, Missouri, Health Facilities Revenue Bonds, Southeast Missouri Hospital Association, Series 2007, 5.000%, 6/01/36 | 6/17 at 100.00 | BBB+ | | | 1,485,148 | |
| | 1,000 | | Cole County Industrial Development Authority, Missouri, Revenue Bonds, Lutheran Senior Services – Heisinger Project, Series 2004, 5.500%, 2/01/35 | 2/14 at 100.00 | BBB+ | | | 1,010,540 | |
| | 1,000 | | Hanley Road Corridor Transportation Development District, Brentwood and Maplewood, Missouri, Transportation Sales Revenue Bonds, Refunding Series 2009A, 5.875%, 10/01/36 | 10/19 at 100.00 | A– | | | 1,115,380 | |
| | | | Missouri Joint Municipal Electric Utility Commission, Power Supply System Revenue Bonds, MoPEP Facilities, Series 2012: | | | | | | |
| | 1,080 | | 5.000%, 1/01/22 | 1/21 at 100.00 | A2 | | | 1,265,285 | |
| | 1,110 | | 5.000%, 1/01/23 | 1/21 at 100.00 | A2 | | | 1,286,168 | |
| | 1,250 | | 5.000%, 1/01/25 | 1/21 at 100.00 | A2 | | | 1,429,763 | |
| | 8,635 | | Total Missouri | | | | | 9,311,842 | |
| | Principal | | | Optional Call | | | | | |
| | Amount (000) | | Description (1) | Provisions (2) | Ratings (3) | | | Value | |
| | | | Nebraska – 0.2% (0.1% of Total Investments) | | | | | | |
| $ | 1,110 | | Lincoln County Hospital Authority 1, Nebraska, Hospital Revenue and Refunding Bonds, Great Plains Regional Medical Center Project, Series 2012, 5.000%, 11/01/42 | No Opt. Call | A– | | $ | 1,208,113 | |
| | | | Nevada – 2.2% (1.4% of Total Investments) | | | | | | |
| | 4,000 | | Clark County, Nevada, Airport Revenue Bonds, Subordinate Lien Series 2010B, 5.750%, 7/01/42 | 1/20 at 100.00 | A+ | | | 4,706,520 | |
| | 7,000 | | Clark County, Nevada, Motor Vehicle Fuel Tax Highway Improvement Revenue Bonds, Series 2003, 5.000%, 7/01/23 (Pre-refunded 7/01/13) – AMBAC Insured | 7/13 at 100.00 | AA– (4) | | | 7,057,330 | |
| | 1,700 | | Las Vegas Redevelopment Agency, Nevada, Tax Increment Revenue Bonds, Series 2009A, 8.000%, 6/15/30 | 6/19 at 100.00 | BBB– | | | 1,948,727 | |
| | 12,700 | | Total Nevada | | | | | 13,712,577 | |
| | | | New Jersey – 2.2% (1.4% of Total Investments) | | | | | | |
| | | | New Jersey Economic Development Authority, Student Housing Revenue Bonds, Provident Group-Montclair Properties LLC, Montclair State University Student Housing Project, Series 2010A: | | | | | | |
| | 835 | | 5.750%, 6/01/31 | 6/20 at 100.00 | Baa3 | | | 956,200 | |
| | 3,000 | | 5.875%, 6/01/42 | 6/20 at 100.00 | Baa3 | | | 3,417,390 | |
| | 575 | | New Jersey Turnpike Authority, Revenue Bonds, Series 1991C, 6.500%, 1/01/16 – NPFG Insured | No Opt. Call | A+ | | | 662,377 | |
| | | | New Jersey Turnpike Authority, Revenue Bonds, Series 1991C: | | | | | | |
| | 305 | | 6.500%, 1/01/16 – NPFG Insured (ETM) | No Opt. Call | A (4) | | | 354,038 | |
| | 300 | | 6.500%, 1/01/16 – NPFG Insured (ETM) | No Opt. Call | A+ (4) | | | 348,498 | |
| | 1,455 | | 6.500%, 1/01/16 – NPFG Insured (ETM) | No Opt. Call | A+ (4) | | | 1,567,428 | |
| | 4,005 | | Tobacco Settlement Financing Corporation, New Jersey, Tobacco Settlement Asset-Backed Bonds, Series 2003, 6.750%, 6/01/39 (Pre-refunded 6/01/13) | 6/13 at 100.00 | Aaa | | | 4,027,548 | |
| | 2,710 | | Tobacco Settlement Financing Corporation, New Jersey, Tobacco Settlement Asset-Backed Bonds, Series 2007-1A, 4.750%, 6/01/34 | 6/17 at 100.00 | B2 | | | 2,387,212 | |
| | 13,185 | | Total New Jersey | | | | | 13,720,691 | |
| | | | New Mexico – 0.3% (0.2% of Total Investments) | | | | | | |
| | 1,500 | | New Mexico Hospital Equipment Loan Council, First Mortgage Revenue Bonds, La Vida LLena Project, Series 2010A, 6.125%, 7/01/40 | 7/20 at 100.00 | BBB– | | | 1,657,995 | |
| | | | New York – 3.7% (2.5% of Total Investments) | | | | | | |
| | 855 | | Albany Industrial Development Agency, New York, Revenue Bonds, Brighter Choice Charter Schools, Series 2007A, 5.000%, 4/01/32 | 4/17 at 100.00 | BB+ | | | 857,078 | |
| | | | Brooklyn Arena Local Development Corporation, New York, Payment in Lieu of Taxes Revenue Bonds, Barclays Center Project, Series 2009: | | | | | | |
| | 1,945 | | 6.000%, 7/15/30 | 1/20 at 100.00 | BBB– | | | 2,323,808 | |
| | 3,065 | | 6.250%, 7/15/40 | 1/20 at 100.00 | BBB– | | | 3,667,089 | |
| | 4,070 | | Hudson Yards Infrastructure Corporation, New York, Revenue Bonds, Series 2006A, 4.500%, 2/15/47 – NPFG Insured | 2/17 at 100.00 | A | | | 4,212,002 | |
| | 1,000 | | Metropolitan Transportation Authority, New York, Dedicated Tax Fund Bonds, Series 2009B, 5.000%, 11/15/34 | 11/19 at 100.00 | AA | | | 1,127,160 | |
| | 1,250 | | New York City Municipal Water Finance Authority, New York, Water and Sewer System Revenue Bonds, Second Generation Resolution, Fiscal 2011 Series EE, 5.375%, 6/15/43 | 12/20 at 100.00 | AA+ | | | 1,478,050 | |
| | 1,870 | | New York Liberty Development Corporation, Liberty Revenue Bonds, 4 World Trade Center Project, Series 2011, 5.000%, 11/15/44 | 11/21 at 100.00 | A+ | | | 2,058,851 | |
| | 170 | | New York State Tobacco Settlement Financing Corporation, Tobacco Settlement Asset-Backed and State Contingency Contract-Backed Bonds, Series 2003A-1C, 5.500%, 6/01/18 (Pre-refunded 6/01/13) | 6/13 at 100.00 | AA– (4) | | | 170,750 | |
| | 795 | | Port Authority of New York and New Jersey, Special Project Bonds, JFK International Air Terminal LLC Project, Eighth Series 2010, 6.000%, 12/01/42 | 12/20 at 100.00 | BBB– | | | 933,155 | |
| | 6,250 | | Port Authority of New York and New Jersey, Special Project Bonds, JFK International Air Terminal LLC, Sixth Series 1997, 6.250%, 12/01/15 – NPFG Insured (Alternative Minimum Tax) | No Opt. Call | Baa2 | | | 6,793,563 | |
| | 21,270 | | Total New York | | | | | 23,621,506 | |
| | | Nuveen Premium Income Municipal Fund 4, Inc. (continued) |
| NPT | | Portfolio of Investments |
| | | April 30, 2013 (Unaudited) |
| | Principal | | | Optional Call | | | | | |
| | Amount (000) | | Description (1) | Provisions (2) | Ratings (3) | | | Value | |
| | | | North Carolina – 0.5% (0.4% of Total Investments) | | | | | | |
| $ | 750 | | Charlotte-Mecklenburg Hospital Authority, North Carolina, Health Care System Revenue Bonds, Carolinas Health Care, Series 2007A, 5.000%, 1/15/31 | 1/17 at 100.00 | AA– | | $ | 825,525 | |
| | 2,460 | | North Carolina Infrastructure Finance Corporation, Certificates of Participation, Correctional Facilities, Series 2004A, 5.000%, 2/01/21 (Pre-refunded 2/01/14) | 2/14 at 100.00 | AA+ (4) | | | 2,547,601 | |
| | 3,210 | | Total North Carolina | | | | | 3,373,126 | |
| | | | North Dakota – 0.6% (0.4% of Total Investments) | | | | | | |
| | 2,190 | | Fargo, North Dakota, Health System Revenue Bonds, Sanford Health, Refunding Series 2011, 6.250%, 11/01/31 | 11/21 at 100.00 | A+ | | | 2,742,165 | |
| | 1,125 | | Grand Forks, North Dakota, Health Care System Revenue Bonds, Altru Health System Obligated Group, Series 2012, 5.000%, 12/01/32 | 12/21 at 100.00 | A– | | | 1,226,093 | |
| | 3,315 | | Total North Dakota | | | | | 3,968,258 | |
| | | | Ohio – 3.4% (2.3% of Total Investments) | | | | | | |
| | 5,370 | | Buckeye Tobacco Settlement Financing Authority, Ohio, Tobacco Settlement Asset-Backed Revenue Bonds, Senior Lien, Series 2007A-2, 5.125%, 6/01/24 | 6/17 at 100.00 | B– | | | 4,984,971 | |
| | | | Butler County, Ohio, Hospital Facilities Revenue Bonds, UC Health, Series 2010: | | | | | | |
| | 2,000 | | 5.250%, 11/01/29 | 11/20 at 100.00 | BBB+ | | | 2,199,420 | |
| | 3,000 | | 5.750%, 11/01/40 | 11/20 at 100.00 | BBB+ | | | 3,411,270 | |
| | 3,040 | | Franklin County, Ohio, Healthcare Facilities Revenue Bonds, Ohio Presbyterian Retirement Services, Improvement Series 2010A, 5.625%, 7/01/26 | 7/21 at 100.00 | BBB | | | 3,412,552 | |
| | 700 | | Lorain County Port Authority, Ohio, Recovery Zone Facility Economic Development Revenue Bonds, United State Steel Corporation Project, Series 2010, 6.750%, 12/01/40 | 12/20 at 100.00 | BB | | | 781,893 | |
| | 4,615 | | Lucas County, Ohio, Hospital Revenue Bonds, ProMedica Healthcare Obligated Group, Series 2011A, 6.000%, 11/15/41 | 11/21 at 100.00 | AA | | | 5,614,471 | |
| | 800 | | Ohio Air Quality Development Authority, Ohio, Revenue Bonds, Ohio Valley Electric Corporation Project, Series 2009E, 5.625%, 10/01/19 | No Opt. Call | BBB– | | | 950,016 | |
| | 19,525 | | Total Ohio | | | | | 21,354,593 | |
| | | | Oklahoma – 1.0% (0.7% of Total Investments) | | | | | | |
| | 5,615 | | Tulsa County Industrial Authority, Oklahoma, Health Care Revenue Bonds, Saint Francis Health System, Series 2006, 5.000%, 12/15/36 (UB) | 12/16 at 100.00 | AA+ | | | 6,120,406 | |
| | 88 | | Tulsa County Industrial Authority, Oklahoma, Health Care Revenue Bonds, Saint Francis Health System, Series 2008, Trust 3500, 8.446%, 6/15/30 (IF) | 12/16 at 100.00 | AA+ | | | 102,401 | |
| | 5,703 | | Total Oklahoma | | | | | 6,222,807 | |
| | | | Oregon – 0.2% (0.1% of Total Investments) | | | | | | |
| | 1,000 | | Portland, Oregon, River District Urban Renewal and Redevelopment Bonds, Series 2012C, 5.000%, 6/15/28 | 6/22 at 100.00 | A1 | | | 1,166,840 | |
| | | | Pennsylvania – 3.8% (2.5% of Total Investments) | | | | | | |
| | 1,000 | | Bucks County Industrial Development Authority, Pennsylvania, Charter School Revenue Bonds, School Lane Charter School, Series 2007A, 5.000%, 3/15/37 | 3/17 at 100.00 | BBB | | | 1,020,400 | |
| | 1,020 | | Centre County Hospital Authority, Pennsylvania, Hospital Revenue Bonds, Mount Nittany Medical Center Project, Series 2012A, 5.000%, 11/15/47 | No Opt. Call | A– | | | 1,079,721 | |
| | 1,000 | | Cumberland County Municipal Authority Revenue Bonds, Pennsylvania, Diakon Lutheran Social Ministries Project, Series 2009, 6.125%, 1/01/29 | 1/19 at 100.00 | BBB+ | | | 1,133,320 | |
| | 600 | | Pennsylvania Higher Educational Facilities Authority, Revenue Bonds, Edinboro University Foundation Student Housing Project, Series 2010, 6.000%, 7/01/43 | 7/20 at 100.00 | Baa3 | | | 678,510 | |
| | 5,490 | | Pennsylvania Public School Building Authority, Lease Revenue Bonds, School District of Philadelphia, Series 2006B, 4.500%, 6/01/32 – AGM Insured (UB) (5) | 12/16 at 100.00 | AA | | | 5,820,883 | |
| | 2,230 | | Pennsylvania Turnpike Commission, Motor License Fund-Enhanced Turnpike Subordinate Special Revenue, Series 2013A, 5.000%, 12/01/38 | 12/22 at 100.00 | AA | | | 2,511,002 | |
| | 1,595 | | Philadelphia Hospitals and Higher Education Facilities Authority, Pennsylvania, Health System Revenue Bonds, Jefferson Health System, Series 2010B, 5.000%, 5/15/40 | 5/20 at 100.00 | AA | | | 1,747,849 | |
| | Principal | | | Optional Call | | | | | |
| | Amount (000) | | Description (1) | Provisions (2) | Ratings (3) | | | Value | |
| | | | Pennsylvania (continued) | | | | | | |
| | | | Philadelphia, Pennsylvania, General Obligation Bonds, Refunding Series 2011: | | | | | | |
| $ | 5,445 | | 6.000%, 8/01/36 | 8/20 at 100.00 | A2 | | $ | 6,414,917 | |
| | 1,425 | | 6.500%, 8/01/41 | 8/20 at 100.00 | A2 | | | 1,733,839 | |
| | 1,670 | | Union County Hospital Authority, Pennsylvania, Hospital Revenue Bonds, Evangelical Community Hospital Project, Refunding and Improvement Series 2011, 5.250%, 8/01/19 | No Opt. Call | BBB+ | | | 1,919,480 | |
| | 21,475 | | Total Pennsylvania | | | | | 24,059,921 | |
| | | | Puerto Rico – 2.8% (1.9% of Total Investments) | | | | | | |
| | 4,810 | | Puerto Rico Sales Tax Financing Corporation, Sales Tax Revenue Bonds, First Subordinate Series 2010C, 6.000%, 8/01/39 | 8/20 at 100.00 | A+ | | | 5,303,458 | |
| | 12,390 | | Puerto Rico, General Obligation and Public Improvement Refunding Bonds, Series 1997, 6.500%, 7/01/13 – NPFG Insured | No Opt. Call | Baa2 | | | 12,486,642 | |
| | 17,200 | | Total Puerto Rico | | | | | 17,790,100 | |
| | | | Rhode Island – 2.4% (1.6% of Total Investments) | | | | | | |
| | 15,000 | | Rhode Island Tobacco Settlement Financing Corporation, Tobacco Settlement Asset-Backed Bonds, Series 2002A, 6.250%, 6/01/42 | 6/13 at 100.00 | BBB– | | | 15,356,400 | |
| | | | South Carolina – 1.7% (1.1% of Total Investments) | | | | | | |
| | 4,120 | | Medical University Hospital Authority, South Carolina, FHA-Insured Mortgage Revenue Bonds, Series 2004A, 5.250%, 2/15/23 (Pre-refunded 8/15/14) – NPFG Insured | 8/14 at 100.00 | Baa2 (4) | | | 4,373,957 | |
| | 5,000 | | Piedmont Municipal Power Agency, South Carolina, Electric Revenue Bonds, Series 1991, 6.250%, 1/01/21 – FGIC Insured | No Opt. Call | A– | | | 6,497,600 | |
| | 9,120 | | Total South Carolina | | | | | 10,871,557 | |
| | | | South Dakota – 0.3% (0.2% of Total Investments) | | | | | | |
| | 1,750 | | South Dakota Health and Educational Facilities Authority, Revenue Bonds, Sioux Valley Hospitals, Series 2004A, 5.500%, 11/01/31 | 11/14 at 100.00 | A+ | | | 1,813,945 | |
| | | | Tennessee – 0.5% (0.4% of Total Investments) | | | | | | |
| | 5,075 | | Knox County Health, Educational and Housing Facilities Board, Tennessee, Hospital Revenue Refunding Bonds, Covenant Health, Series 2006, 0.000%, 1/01/41 | 1/17 at 30.07 | A | | | 1,288,999 | |
| | 1,220 | | Shelby County Health, Educational and Housing Facilities Board, Tennessee, Revenue Bonds, Methodist Le Bonheur Healthcare, Series 2012, 5.000%, 5/01/36 | 5/22 at 100.00 | A+ | | | 1,365,778 | |
| | 680 | | Sullivan County Health Educational and Housing Facilities Board, Tennessee, Revenue Bonds, Wellmont Health System, Series 2006C, 5.250%, 9/01/36 | 9/16 at 100.00 | BBB+ | | | 726,301 | |
| | | | Sumner County Health, Educational, and Housing Facilities Board, Tennessee, Revenue Refunding Bonds, Sumner Regional Health System Inc., Series 2007: | | | | | | |
| | 860 | | 5.500%, 11/01/37 (6) | 11/17 at 100.00 | N/R | | | 2,141 | |
| | 1,000 | | 5.500%, 11/01/46 (6) | 11/17 at 100.00 | N/R | | | 2,490 | |
| | 8,835 | | Total Tennessee | | | | | 3,385,709 | |
| | | | Texas – 18.8% (12.6% of Total Investments) | | | | | | |
| | 3,000 | | Alliance Airport Authority, Texas, Special Facilities Revenue Bonds, American Airlines Inc., Series 2007, 5.250%, 12/01/29 (Alternative Minimum Tax) (6) | 6/13 at 100.00 | N/R | | | 3,307,500 | |
| | 5,440 | | Board of Regents, University of Texas System, Financing System Revenue Bonds, Series 2006F, 4.250%, 8/15/36 (UB) | 2/17 at 100.00 | AAA | | | 5,694,701 | |
| | 525 | | Central Texas Regional Mobility Authority, Revenue Bonds, Senior Lien Refunding Series 2013A, 5.000%, 1/01/43 (WI/DD, Settling 5/16/13) | 1/23 at 100.00 | Baa2 | | | 568,481 | |
| | 1,000 | | Central Texas Regional Mobility Authority, Revenue Bonds, Senior Lien Series 2011, 6.000%, 1/01/41 | 1/21 at 100.00 | Baa2 | | | 1,171,230 | |
| | 2,600 | | Dallas-Fort Worth International Airport, Texas, Joint Revenue Bonds, Refunding and Improvement Bonds, Series 2012C, 5.000%, 11/01/45 – AGM Insured | 11/21 at 100.00 | A+ | | | 2,891,746 | |
| | 2,275 | | Dallas-Fort Worth International Airport, Texas, Joint Revenue Bonds, Series 2004B, 5.000%, 11/01/27 – AGM Insured (Alternative Minimum Tax) | 11/14 at 100.00 | AA– | | | 2,398,692 | |
| | 6,000 | | Garland Housing Finance Corporation, Texas, Multifamily Housing Revenue Bonds, Legacy Pointe Apartments, Series 2000, 7.500%, 6/01/40 (Alternative Minimum Tax) | 6/13 at 100.50 | N/R | | | 6,036,840 | |
| | | Nuveen Premium Income Municipal Fund 4, Inc. (continued) |
| NPT | | Portfolio of Investments |
| | | April 30, 2013 (Unaudited) |
| | Principal | | | Optional Call | | | | | |
| | Amount (000) | | Description (1) | Provisions (2) | Ratings (3) | | | Value | |
| | | | Texas (continued) | | | | | | |
| $ | 7,000 | | Harris County Health Facilities Development Corporation, Texas, Thermal Utility Revenue Bonds, TECO Project, Series 2003, 5.000%, 11/15/30 (Pre-refunded 11/15/13) – NPFG Insured | 11/13 at 100.00 | AA (4) | | $ | 7,178,710 | |
| | 28,305 | | Houston, Texas, Hotel Occupancy Tax and Special Revenue Bonds, Convention and Entertainment Project, Series 2001B, 0.000%, 9/01/28 – AMBAC Insured | No Opt. Call | A2 | | | 14,401,301 | |
| | 7,500 | | Houston, Texas, Junior Lien Water and Sewerage System Revenue Refunding Bonds, Series 2002A, 5.750%, 12/01/32 – AGM Insured (ETM) | No Opt. Call | AA (4) | | | 11,175,600 | |
| | 3,790 | | Houston, Texas, Subordinate Lien Airport System Revenue Refunding Bonds, Series 2012A, 5.000%, 7/01/32 (Alternative Minimum Tax) | 7/22 at 100.00 | A+ | | | 4,249,841 | |
| | 33,505 | | Leander Independent School District, Williamson and Travis Counties, Texas, General Obligation Bonds, Series 2006, 0.000%, 8/15/39 | 8/14 at 25.08 | AAA | | | 8,199,344 | |
| | 2,000 | | Lubbock, Texas, General Obligation Bonds, Series 2012, 5.000%, 2/15/27 | 2/22 at 100.00 | AA+ | | | 2,394,760 | |
| | 1,100 | | North Texas Tollway Authority, First Tier System Revenue Refunding Bonds, Series 2008A, 5.750%, 1/01/40 – AGC Insured | 1/18 at 100.00 | AA– | | | 1,268,388 | |
| | 2,500 | | North Texas Tollway Authority, Second Tier System Revenue Refunding Bonds, Series 2008F, 5.750%, 1/01/38 | 1/18 at 100.00 | A3 | | | 2,815,350 | |
| | 1,960 | | North Texas Tollway Authority, Special Projects System Revenue Bonds, Series 2011A, 0.000%, 9/01/43 | 9/31 at 100.00 | AA | | | 1,517,981 | |
| | 1,100 | | North Texas Tollway Authority, System Revenue Bonds, First Tier Series 2009A, 6.250%, 1/01/39 | 1/19 at 100.00 | A2 | | | 1,281,940 | |
| | 250 | | Tarrant County Cultural and Educational Facilities Finance Corporation, Texas, Revenue Bonds, Texas Health Resources Project, Trust 1031, 17.712%, 2/15/30 (IF) (5) | 2/17 at 100.00 | AA– | | | 338,200 | |
| | 2,945 | | Tarrant County Cultural Education Facilities Finance Corporation, Texas, Hospital Revenue Bonds, Scott & White Healthcare Project, Series 2010, 5.500%, 8/15/45 | 8/20 at 100.00 | AA– | | | 3,385,366 | |
| | 5,000 | | Tarrant County Cultural Education Facilities Finance Corporation, Texas, Hospital Revenue Bonds, Scott & White Healthcare Project, Series 2013A, 4.000%, 8/15/43 | 8/23 at 100.00 | AA– | | | 5,031,250 | |
| | 5,200 | | Tarrant County Cultural Education Facilities Finance Corporation, Texas, Revenue Bonds, Texas Health Resources, Series 2007A, 5.000%, 2/15/36 (UB) | 2/17 at 100.00 | AA– | | | 5,658,640 | |
| | 1,505 | | Texas Municipal Gas Acquisition and Supply Corporation I, Gas Supply Revenue Bonds, Senior Lien Series 2008D, 6.250%, 12/15/26 | No Opt. Call | A– | | | 1,896,511 | |
| | 3,960 | | Texas Municipal Gas Acquisition and Supply Corporation III, Gas Supply Revenue Bonds, Series 2012, 5.000%, 12/15/28 | No Opt. Call | A3 | | | 4,311,965 | |
| | | | Texas Private Activity Bond Surface Transportation Corporation, Senior Lien Revenue Bonds, LBJ Infrastructure Group LLC IH-635 Managed Lanes Project, Series 2010: | | | | | | |
| | 2,000 | | 7.000%, 6/30/34 | 6/20 at 100.00 | Baa3 | | | 2,474,500 | |
| | 500 | | 7.000%, 6/30/40 | 6/20 at 100.00 | Baa3 | | | 613,245 | |
| | 1,620 | | Texas Private Activity Bond Surface Transportation Corporation, Senior Lien Revenue Bonds, NTE Mobility Partners LLC North Tarrant Express Managed Lanes Project, Series 2009, 6.875%, 12/31/39 | 12/19 at 100.00 | Baa2 | | | 1,952,115 | |
| | 1,000 | | Texas Public Finance Authority, Charter School Finance Corporation Revenue Bonds, Idea Public School Project, Series 2007A, 5.000%, 8/15/37 – ACA Insured | 8/17 at 100.00 | BBB | | | 1,043,429 | |
| | 3,395 | | Texas State, General Obligation Bonds, Series 2008, Trust 3213, 13.591%, 4/01/28 (IF) | 4/17 at 100.00 | Aaa | | | 5,682,076 | |
| | 1,320 | | Texas Turnpike Authority, Central Texas Turnpike System Revenue Bonds, First Tier Series 2002A, 0.000%, 8/15/21 – AMBAC Insured | No Opt. Call | A– | | | 1,033,783 | |
| | 8,500 | | Travis County Health Facilities Development Corporation, Texas, Hospital Revenue Bonds, Daughters of Charity National Health System, Series 1993B, 6.000%, 11/15/22 (ETM) | 5/13 at 100.00 | Aaa | | | 9,237,714 | |
| | 146,795 | | Total Texas | | | | | 119,211,199 | |
| | | | Utah – 1.6% (1.1% of Total Investments) | | | | | | |
| | 3,965 | | Bountiful, Davis County, Utah, Hospital Revenue Refunding Bonds, South Davis Community Hospital Project, Series 1998, 5.750%, 12/15/18 | 6/13 at 100.00 | N/R | | | 3,971,265 | |
| | 2,520 | | Intermountain Power Agency, Utah, Power Supply Revenue Bonds, Series 1996A, 6.150%, 7/01/14 (ETM) | 7/13 at 100.00 | Aa3 (4) | | | 2,617,373 | |
| | 380 | | Utah Housing Finance Agency, Single Family Mortgage Bonds, Series 2000G, 5.875%, 7/01/27 (Alternative Minimum Tax) | 7/13 at 100.00 | AA | | | 383,948 | |
| | Principal | | | Optional Call | | | | | |
| | Amount (000) | | Description (1) | Provisions (2) | Ratings (3) | | | Value | |
| | | | Utah (continued) | | | | | | |
| | | | Utah Housing Finance Agency, Single Family Mortgage Bonds, Series 2001C: | | | | | | |
| $ | 500 | | 5.500%, 1/01/18 (Alternative Minimum Tax) | 7/13 at 100.00 | AA– | | $ | 501,130 | |
| | 305 | | 5.650%, 1/01/21 (Alternative Minimum Tax) | 7/13 at 100.00 | Aaa | | | 305,607 | |
| | 810 | | Utah State Charter School Finance Authority, Charter School Revenue Bonds, North Davis Preparatory Academy, Series 2010, 6.375%, 7/15/40 | 7/20 at 100.00 | BBB– | | | 885,087 | |
| | 1,555 | | Utah State Charter School Finance Authority, Charter School Revenue Bonds, Paradigm High School, Series 2010A, 6.375%, 7/15/40 | 7/20 at 100.00 | BBB– | | | 1,679,509 | |
| | 10,035 | | Total Utah | | | | | 10,343,919 | |
| | | | Virgin Islands – 0.5% (0.3% of Total Investments) | | | | | | |
| | 250 | | Virgin Islands Public Finance Authority, Matching Fund Loan Notes Revenue Bonds, Subordinate Lien Series 2009A, 6.000%, 10/01/39 | 10/19 at 100.00 | Baa3 | | | 277,380 | |
| | 2,480 | | Virgin Islands Public Finance Authority, Matching Fund Revenue Loan Note – Diageo Project, Series 2009A, 6.750%, 10/01/37 | 10/19 at 100.00 | BBB | | | 2,917,125 | |
| | 2,730 | | Total Virgin Islands | | | | | 3,194,505 | |
| | | | Virginia – 1.4% (0.9% of Total Investments) | | | | | | |
| | 3,045 | | Route 460 Funding Corporation, Virginia, Toll Road Revenue Bonds, Series 2012B, 0.000%, 7/01/38 | No Opt. Call | BBB– | | | 886,125 | |
| | 1,000 | | Tobacco Settlement Financing Corporation of Virginia, Tobacco Settlement Asset Backed Bonds, Series 2007B1, 5.000%, 6/01/47 | 6/17 at 100.00 | B2 | | | 846,630 | |
| | 1,765 | | Virginia Small Business Financing Authority, Senior Lien Revenue Bonds, 95 Express Lanes LLC Project, Series 2012, 5.000%, 1/01/40 (Alternative Minimum Tax) | 1/22 at 100.00 | BBB– | | | 1,840,542 | |
| | 4,640 | | Virginia Small Business Financing Authority, Senior Lien Revenue Bonds, Elizabeth River Crossing, Opco LLC Project, Series 2012, 6.000%, 1/01/37 (Alternative Minimum Tax) | 7/22 at 100.00 | BBB– | | | 5,357,344 | |
| | 10,450 | | Total Virginia | | | | | 8,930,641 | |
| | | | Washington – 3.1% (2.0% of Total Investments) | | | | | | |
| | 220 | | Grant County Public Utility District 2, Washington, Revenue Bonds, Wanapum Hydroelectric Development, Series 2005A, 5.000%, 1/01/34 (Pre-refunded 1/01/15) – FGIC Insured | 1/15 at 100.00 | Aa3 (4) | | | 237,186 | |
| | 5,780 | | Grant County Public Utility District 2, Washington, Revenue Bonds, Wanapum Hydroelectric Development, Series 2005A, 5.000%, 1/01/34 – FGIC Insured | 1/15 at 100.00 | AA | | | 6,091,022 | |
| | 2,185 | | Washington Health Care Facilities Authority, Revenue Bonds, Seattle Children’s Hospital, Series 2012A, 5.000%, 10/01/42 | 10/22 at 100.00 | AA | | | 2,437,652 | |
| | 2,000 | | Washington State Health Care Facilities Authority, Revenue Bonds, Fred Hutchinson Cancer Research Center, Series 2009A, 6.000%, 1/01/33 | 7/19 at 100.00 | A | | | 2,253,300 | |
| | 1,130 | | Washington State Health Care Facilities Authority, Revenue Bonds, Harrison Memorial Hospital, Series 1998, 5.000%, 8/15/28 – AMBAC Insured | 8/13 at 102.00 | N/R | | | 1,151,345 | |
| | 2,000 | | Washington State Health Care Facilities Authority, Revenue Bonds, Northwest Hospital and Medical Center of Seattle, Series 2007, 5.700%, 12/01/32 | 12/17 at 100.00 | N/R | | | 2,104,279 | |
| | 1,460 | | Washington State Health Care Facilities Authority, Revenue Bonds, Virginia Mason Medical Center, Series 2007B, 5.750%, 8/15/37 – ACA Insured | 8/17 at 100.00 | BBB | | | 1,574,974 | |
| | 3,405 | | Washington State Tobacco Settlement Authority, Tobacco Settlement Asset-Backed Revenue Bonds, Series 2002, 6.500%, 6/01/26 | 6/13 at 100.00 | A3 | | | 3,473,031 | |
| | 18,180 | | Total Washington | | | | | 19,322,789 | |
| | | | West Virginia – 0.4% (0.2% of Total Investments) | | | | | | |
| | 1,950 | | West Virginia Hospital Finance Authority , Hospital Revenue Bonds, Charleston Area Medical Center, Series 2009A, 5.625%, 9/01/32 | 9/19 at 100.00 | A3 | | | 2,191,215 | |
| | | | Wisconsin – 3.4% (2.3% of Total Investments) | | | | | | |
| | 815 | | Monroe Redevelopment Authority, Wisconsin, Development Revenue Bonds, The Monroe Clinic, Inc., Series 2009, 5.875%, 2/15/39 | 2/19 at 100.00 | A3 | | | 920,869 | |
| | 4,200 | | Wisconsin Health and Educational Facilities Authority, Revenue Bonds, Agnesian HealthCare, Inc., Series 2013B, 5.000%, 7/01/36 | 7/23 at 100.00 | A– | | | 4,717,775 | |
| | 1,400 | | Wisconsin Health and Educational Facilities Authority, Revenue Bonds, Beloit Health System, Inc., Series 2010B, 5.000%, 4/01/30 | 4/20 at 100.00 | A– | | | 1,489,501 | |
| | | Nuveen Premium Income Municipal Fund 4, Inc. (continued) |
| NPT | | Portfolio of Investments |
| | | April 30, 2013 (Unaudited) |
| | Principal | | | Optional Call | | | | | |
| | Amount (000) | | Description (1) | Provisions (2) | Ratings (3) | | | Value | |
| | | | Wisconsin (continued) | | | | | | |
| $ | 2,105 | | Wisconsin Health and Educational Facilities Authority, Revenue Bonds, Mercy Alliance, Inc., Series 2012, 5.000%, 6/01/32 | 6/22 at 100.00 | A2 | | $ | 2,348,000 | |
| | | | Wisconsin Health and Educational Facilities Authority, Revenue Bonds, Wheaton Franciscan Healthcare System, Series 2006A: | | | | | | |
| | 5,000 | | 5.250%, 8/15/21 | 8/16 at 100.00 | A– | | | 5,603,450 | |
| | 1,000 | | 5.250%, 8/15/34 | 8/16 at 100.00 | A– | | | 1,062,070 | |
| | 5,000 | | Wisconsin State, General Obligation Bonds, Series 2006A, 4.750%, 5/01/25 – FGIC Insured (UB) (5) | 5/16 at 100.00 | AA | | | 5,598,450 | |
| | 19,520 | | Total Wisconsin | | | | | 21,740,115 | |
| $ | 968,788 | | Total Municipal Bonds (cost $857,669,854) | | | | | 947,421,776 | |
| | Principal | | | | | | | | | |
| | Amount (000) | | Description (1) | Coupon | Maturity | Ratings (3) | | | Value | |
| | | | Corporate Bonds – 0.0% (0.0% of Total Investments) | | | | | | | |
| | | | Transportation – 0.0% (0.0% of Total Investments) | | | | | | | |
| $ | 46 | | Las Vegas Monorail Company, Senior Interest Bonds (7), (8) | 5.500% | 7/15/19 | N/R | | $ | 11,557 | |
| | 14 | | Las Vegas Monorail Company, Senior Interest Bonds (7), (8) | 3.000% | 7/15/55 | N/R | | | 2,706 | |
| $ | 60 | | Total Corporate Bonds (cost $1,136) | | | | | | 14,263 | |
| | | | Total Investments (cost $857,670,990) – 149.7% | | | | | | 947,436,039 | |
| | | | Floating Rate Obligations – (10.0)% | | | | | | (63,078,000 | ) |
| | | | Variable Rate Demand Preferred Shares, at Liquidation Value – (41.4)% (9) | | | | | | (262,200,000 | ) |
| | | | Other Assets Less Liabilities – 1.7% | | | | | | 10,778,072 | |
| | | | Net Assets Applicable to Common Shares – 100% | | | | | $ | 632,936,111 | |
| (1) | | All percentages shown in the Portfolio of Investments are based on net assets applicable to Common shares unless otherwise noted. |
| (2) | | Optional Call Provisions: Dates (month and year) and prices of the earliest optional call or redemption. There may be other call provisions at varying prices at later dates. Certain mortgage-backed securities may be subject to periodic principal paydowns. |
| (3) | | Ratings: Using the highest of Standard & Poor’s Group (“Standard & Poor’s”), Moody’s Investors Service, Inc. (“Moody’s”) or Fitch, Inc. (“Fitch”) rating. Ratings below BBB by Standard & Poor’s, Baa by Moody’s or BBB by Fitch are considered to be below investment grade. Holdings designated N/R are not rated by any of these national rating agencies. |
| (4) | | Backed by an escrow or trust containing sufficient U.S. Government or U.S. Government agency securities, which ensure the timely payment of principal and interest. Certain bonds backed by U.S. Government or agency securities are regarded as having an implied rating equal to the rating of such securities. |
| (5) | | Investment, or portion of investment, has been pledged to collateralize the net payment obligations for investments in inverse floating rate transactions. |
| (6) | | At or subsequent to the end of the reporting period, this security is non-income producing. Non-income producing security, in the case of a fixed-income security, generally denotes that the issuer has (1) defaulted on the payment of principal or interest, (2) is under the protection of the Federal Bankruptcy Court or (3) the Fund’s Adviser has concluded that the issue is not likely to meet its future interest payment obligations and has directed the Fund’s custodian to cease accruing additional income on the Fund’s records. |
| (7) | | Investment valued at fair value using methods determined in good faith by, or at the discretion of, the Board of Directors. For fair value measurement disclosure purposes, investment classified as Level 3. See Notes to Financial Statements, Footnote 1 – General Information and Significant accounting Policies, Investment Valuation for more information. |
| (8) | | During January 2010, Las Vegas Monorail Company (“Las Vegas Monorail”) filed for federal bankruptcy protection. During March 2012, Las Vegas Monorail emerged from federal bankruptcy with the acceptance of a reorganization plan assigned by the Federal Bankruptcy Court. Under the reorganization plan, the Fund surrendered its Las Vegas Monorail Project Revenue Bonds, First Tier, Series 2000 and in turn received two senior interest corporate bonds: the first with an annual coupon rate of 5.500% maturing on July 15, 2019 and the second with an annual coupon rate of 3.000% (5.500% after December 31, 2015) maturing on July 15, 2055. The Fund’s custodian is not accruing income on the Fund’s records for either senior interest corporate bond. |
| (9) | | Variable Rate Demand Preferred Shares, at Liquidation Value as a percentage of Total Investments is 27.7%. |
| N/R | | Not rated. |
| WI/DD | | Investment, or portion of investment, purchased on a when-issued or delayed delivery basis. |
| (ETM) | | Escrowed to maturity. |
| (IF) | | Inverse floating rate investment. |
| (UB) | | Underlying bond of an inverse floating rate trust reflected as a financing transaction. See Notes to Financial Statements, Footnote 1 – General Information and Significant Accounting Policies, Inverse Floating Rate Securities for more information. |
See accompanying notes to financial statements.
| | | Statement of |
| | | Assets & Liabilities |
| | | April 30, 2013 (Unaudited) |
| | | | Premium | | | Premium | | | Premium | |
| | | | Income | | | Income 2 | | | Income 4 | |
| | | | (NPI | ) | | (NPM | ) | | (NPT | ) |
| Assets | | | | | | | | | | |
| Investments, at value (cost $1,351,503,768, $1,537,345,267 and $857,670,990, respectively) | | $ | 1,472,386,497 | | $ | 1,685,809,460 | | $ | 947,436,039 | |
| Cash | | | 12,022,535 | | | 5,823,195 | | | 1,861,045 | |
| Receivables: | | | | | | | | | | |
| Interest | | | 20,575,193 | | | 23,342,567 | | | 13,812,236 | |
| Investments sold | | | 3,075,856 | | | 12,497,481 | | | 420,000 | |
| Deferred offering costs | | | 130,084 | | | 2,230,113 | | | 2,015,343 | |
| Other assets | | | 185,417 | | | 737,273 | | | 386,566 | |
| Total assets | | | 1,508,375,582 | | | 1,730,440,089 | | | 965,931,229 | |
| Liabilities | | | | | | | | | | |
| Floating rate obligations | | | 95,614,000 | | | 96,294,000 | | | 63,078,000 | |
| Payables: | | | | | | | | | | |
| Common share dividends | | | 4,065,710 | | | 4,715,374 | | | 2,731,207 | |
| Interest | | | 442,459 | | | — | | | — | |
| Investments purchased | | | 7,749,262 | | | 8,998,295 | | | 4,249,917 | |
| Offering Costs | | | 102,357 | | | — | | | — | |
| Variable Rate MuniFund Term Preferred (VMTP) Shares, at liquidation value | | | 407,000,000 | | | — | | | — | |
| Variable Rate Demand Preferred (VRDP) Shares, at liquidation value | | | — | | | 489,500,000 | | | 262,200,000 | |
| Accrued expenses: | | | | | | | | | | |
| Management fees | | | 728,554 | | | 812,602 | | | 458,142 | |
| Directors fees | | | 177,840 | | | 213,835 | | | 110,333 | |
| Other | | | 381,171 | | | 277,939 | | | 167,519 | |
| Total liabilities | | | 516,261,353 | | | 600,812,045 | | | 332,995,118 | |
| Net assets applicable to Common shares | | $ | 992,114,229 | | $ | 1,129,628,044 | | $ | 632,936,111 | |
| Common shares outstanding | | | 64,060,043 | | | 70,692,851 | | | 43,338,451 | |
| Net asset value per Common share outstanding (net assets applicable to Common shares, divided by Common shares outstanding) | | $ | 15.49 | | $ | 15.98 | | $ | 14.60 | |
| Net assets applicable to Common shares consist of: | | | | | | | | | | |
| Common shares, $.01 par value per share | | $ | 640,600 | | $ | 706,929 | | $ | 433,385 | |
| Paid-in surplus | | | 903,411,633 | | | 999,473,733 | | | 550,472,383 | |
| Undistributed (Over-distribution of) net investment income | | | 7,940,496 | | | 9,515,037 | | | 7,096,265 | |
| Accumulated net realized gain (loss) | | | (40,761,229 | ) | | (28,531,848 | ) | | (14,830,971 | ) |
| Net unrealized appreciation (depreciation) | | | 120,882,729 | | | 148,464,193 | | | 89,765,049 | |
| Net assets applicable to Common shares | | $ | 992,114,229 | | $ | 1,129,628,044 | | $ | 632,936,111 | |
| Authorized shares: | | | | | | | | | | |
| Common | | | 200,000,000 | | | 200,000,000 | | | 200,000,000 | |
| Preferred | | | 1,000,000 | | | 1,000,000 | | | 1,000,000 | |
See accompanying notes to financial statements.
| | Six Months Ended April 30, 2013 |
| | (Unaudited) |
| | | | Premium | | | Premium | | | Premium | |
| | | | Income | | | Income 2 | | | Income 4 | |
| | | | (NPI | ) | | (NPM | ) | | (NPT | ) |
| Investment Income | | $ | 34,385,476 | | $ | 38,512,112 | | $ | 22,738,594 | |
| Expenses | | | | | | | | | | |
| Management fees | | | 4,404,985 | | | 4,921,287 | | | 2,774,755 | |
| Shareholder servicing agent fees and expenses | | | 63,667 | | | 27,530 | | | 24,673 | |
| Interest expense and amortization of offering costs | | | 4,003,215 | | | 879,454 | | | 467,854 | |
| Liquidity fees | | | — | | | 2,506,628 | | | 1,544,072 | |
| Remarketing fees | | | — | | | 246,110 | | | 131,100 | |
| Custodian fees and expenses | | | 97,824 | | | 115,577 | | | 71,186 | |
| Directors fees and expenses | | | 16,602 | | | 19,092 | | | 10,614 | |
| Professional fees | | | 57,531 | | | 55,846 | | | 33,566 | |
| Shareholder reporting expenses | | | 45,170 | | | 28,609 | | | 24,196 | |
| Stock exchange listing fees | | | 10,232 | | | 11,127 | | | 6,863 | |
| Investor relations expenses | | | 51,614 | | | 58,043 | | | 32,714 | |
| Other expenses | | | 42,984 | | | 784,937 | | | 33,844 | |
| Total expenses | | | 8,793,824 | | | 9,654,240 | | | 5,155,437 | |
| Net investment income (loss) | | | 25,591,652 | | | 28,857,872 | | | 17,583,157 | |
| Realized and Unrealized Gain (Loss) | | | | | | | | | | |
| Net realized gain (loss) from investments | | | 267,475 | | | 201,027 | | | 698,258 | |
| Change in net unrealized appreciation (depreciation) of investments | | | 5,849,462 | | | 718,018 | | | 3,741,428 | |
| Net realized and unrealized gain (loss) | | | 6,116,937 | | | 919,045 | | | 4,439,686 | |
| Net increase (decrease) in net assets applicable to Common shares from operations | | $ | 31,708,589 | | $ | 29,776,917 | | $ | 22,022,843 | |
See accompanying notes to financial statements.
| | | Statement of |
| | | Changes in Net Assets (Unaudited) |
| | | Premium Income (NPI) | | Premium Income 2 (NPM) | | Premium Income 4 (NPT) | |
| | | | Six Months | | | Year | | | Six Months | | | Year | | | Six Months | | | Year | |
| | | | Ended | | | Ended | | | Ended | | | Ended | | | Ended | | | Ended | |
| | | | 4/30/13 | | | 10/31/12 | | | 4/30/13 | | | 10/31/12 | | | 4/30/13 | | | 10/31/12 | |
| Operations | | | | | | | | | | | | | | | | | | | |
| Net investment income (loss) | | $ | 25,591,652 | | $ | 54,012,962 | | $ | 28,857,872 | | $ | 61,926,231 | | $ | 17,583,157 | | $ | 35,832,536 | |
| Net realized gain (loss) from investments | | | 267,475 | | | (7,996,822 | ) | | 201,027 | | | 3,250,555 | | | 698,258 | | | 111,074 | |
| Change in net unrealized appreciation (depreciation) of investments | | | 5,849,462 | | | 98,394,165 | | | 718,018 | | | 92,465,232 | | | 3,741,428 | | | 63,318,471 | |
| Net increase (decrease) in net assets applicable to Common shares from operations | | | 31,708,589 | | | 144,410,305 | | | 29,776,917 | | | 157,642,018 | | | 22,022,843 | | | 99,262,081 | |
| Distributions to Common Shareholders | | | | | | | | | | | | | | | | | | | |
| From net investment income | | | (27,960,539 | ) | | (58,724,314 | ) | | (30,779,667 | ) | | (66,734,054 | ) | | (17,808,244 | ) | | (36,885,240 | ) |
| Decrease in net assets applicable to Common shares from distributions to Common shareholders | | | (27,960,539 | ) | | (58,724,314 | ) | | (30,779,667 | ) | | (66,734,054 | ) | | (17,808,244 | ) | | (36,885,240 | ) |
| Capital Share Transactions | | | | | | | | | | | | | | | | | | | |
| Net proceeds from Common shares issued to shareholders due to reinvestment of distributions | | | 702,545 | | | 1,517,037 | | | — | | | — | | | 354,182 | | | 461,383 | |
| Net increase (decrease) in net assets applicable to Common shares from capital share transactions | | | 702,545 | | | 1,517,037 | | | — | | | — | | | 354,182 | | | 461,383 | |
| Net increase (decrease) in net assets applicable to Common shares | | | 4,450,595 | | | 87,203,028 | | | (1,002,750 | ) | | 90,907,964 | | | 4,568,781 | | | 62,838,224 | |
| Net assets applicable to Common shares at the beginning of period | | | 987,663,634 | | | 900,460,606 | | | 1,130,630,794 | | | 1,039,722,830 | | | 628,367,330 | | | 565,529,106 | |
| Net assets applicable to Common shares at the end of period | | $ | 992,114,229 | | $ | 987,663,634 | | $ | 1,129,628,044 | | $ | 1,130,630,794 | | $ | 632,936,111 | | $ | 628,367,330 | |
| Undistributed (Over-distribution of) net investment income at the end of period | | $ | 7,940,496 | | $ | 10,309,383 | | $ | 9,515,037 | | $ | 11,436,832 | | $ | 7,096,265 | | $ | 7,321,352 | |
See accompanying notes to financial statements.
| | Six Months Ended April 30, 2013 |
| | (Unaudited) |
| | | | Premium | | | Premium | | | Premium | |
| | | | Income | | | Income 2 | | | Income 4 | |
| | | | (NPI | ) | | (NPM | ) | | (NPT | ) |
| Cash Flows from Operating Activities: | | | | | | | | | | |
| Net Increase (Decrease) In Net Assets Applicable to Common Shares from Operations | | $ | 31,708,589 | | $ | 29,776,917 | | $ | 22,022,843 | |
| Adjustments to reconcile the net increase (decrease) in net assets applicable to Common shares from operations to net cash provided by (used in) operating activities: | | | | | | | | | | |
| Purchases of investments | | | (89,226,606 | ) | | (109,034,789 | ) | | (69,439,745 | ) |
| Proceeds from sales of and maturities of investments | | | 69,651,657 | | | 95,651,648 | | | 60,245,577 | |
| Proceeds from (Purchases of) short-term investments, net | | | 5,435,000 | | | — | | | — | |
| Amortization (Accretion) of premiums and discount, net | | | (1,190,887 | ) | | (1,122,219 | ) | | (1,056,690 | ) |
| (Increase) Decrease in: | | | | | | | | | | |
| Receivable for interest | | | (43,013 | ) | | (817,327 | ) | | 533,583 | |
| Receivable for investments sold | | | 2,749,144 | | | (4,862,481 | ) | | 4,903,890 | |
| Other assets | | | (19,265 | ) | | 735,017 | | | (24,269 | ) |
| Increase (Decrease) in: | | | | | | | | | | |
| Payable for investments purchased | | | 4,409,990 | | | 8,998,295 | | | 4,249,917 | |
| Payable for interest | | | (47,238 | ) | | — | | | — | |
| Accrued management fees | | | (19,796 | ) | | (28,420 | ) | | (14,781 | ) |
| Accrued Directors fees | | | 8,969 | | | 10,538 | | | 5,524 | |
| Accrued other expenses | | | 6,943 | | | (20,958 | ) | | (12,460 | ) |
| Net realized (gain) loss from investments | | | (267,475 | ) | | (201,027 | ) | | (698,258 | ) |
| Change in net unrealized (appreciation) depreciation of investments | | | (5,849,462 | ) | | (718,018 | ) | | (3,741,428 | ) |
| Taxes paid on undistributed capital gains | | | (5,241 | ) | | (254 | ) | | (2,978 | ) |
| Net cash provided by (used in) operating activities | | | 17,301,309 | | | 18,366,922 | | | 16,970,725 | |
| Cash Flows from Financing Activities | | | | | | | | | | |
| (Increase) Decrease in deferred offering costs | | | 1,023,332 | | | 39,465 | | | 37,215 | |
| Increase (Decrease) in: | | | | | | | | | | |
| Cash overdraft | | | — | | | — | | | (951,057 | ) |
| Floating rate obligations | | | 12,615,000 | | | 11,135,000 | | | 3,375,000 | |
| Payable for offering costs | | | 102,357 | | | — | | | — | |
| VMTP Shares, at liquidation value | | | 4,600,000 | | | — | | | — | |
| Cash distributions paid to Common shareholders | | | (27,475,027 | ) | | (30,917,373 | ) | | (17,570,838 | ) |
| Net cash provided by (used in) financing activities | | | (9,134,338 | ) | | (19,742,908 | ) | | (15,109,680 | ) |
| Net Increase (Decrease) in Cash | | | 8,166,971 | | | (1,375,986 | ) | | 1,861,045 | |
| Cash at the beginning of period | | | 3,855,564 | | | 7,199,181 | | | — | |
| Cash at the End of Period | | $ | 12,022,535 | | $ | 5,823,195 | | $ | 1,861,045 | |
Supplemental Disclosure of Cash Flow Information
Non-cash financing activities not included herein consist of reinvestments of Common share distributions of $702,545 and $354,182 for Premium Income (NPI) and Premium Income 4 (NPT), respectively.
| | | | | | | | | | | |
| | | | Premium | | | Premium | | | Premium | |
| | | | Income | | | Income 2 | | | Income 4 | |
| | | | (NPI | ) | | (NPM | ) | | (NPT | ) |
| Cash paid for interest (excluding amortization of offering costs) | | $ | 2,872,121 | | $ | 839,989 | | $ | 430,639 | |
See accompanying notes to financial statements.
THIS PAGE INTENTIONALLY LEFT BLANK
| | | Financial |
| | | Highlights (Unaudited) |
| | | |
| | Selected data for a Common share outstanding throughout each period: |
| | | | | Investment Operations | | Less Distributions | | | | | | | |
| | | Beginning Common Share Net Asset Value | | Net Investment Income (Loss) | | Net Realized/ Unrealized Gain (Loss) | | Distributions from Net Investment Income to Auction Rate Preferred Share- holders | (a) | Distributions from Accumu- lated Net Realized Gains to Auction Rate Preferred Share- holders | (a) | Total | | From Net Investment Income to Common Share- holders | | From Accumu- lated Net Realized Gains to Common Share- holders | | Total | | Discount from Common Shares Repurchased and Retired | | Ending Common Share Net Asset Value | | Ending Market Value | |
| Premium Income (NPI) | | | | | | | | | | | | | | | | | | | | | | | | | | | | | | | |
| Year Ended 10/31: | | | | | | | | | | | | | | | | | | | | | | | | | | | | | | | | | | |
| 2013(e) | | $ | 15.43 | | $ | .40 | | $ | .10 | | $ | — | | $ | — | | $ | .50 | | $ | (.44 | ) | $ | — | | $ | (.44 | ) | $ | — | | $ | 15.49 | | $ | 14.65 | |
| 2012 | | | 14.09 | | | .84 | | | 1.42 | | | — | | | — | | | 2.26 | | | (.92 | ) | | — | | | (.92 | ) | | — | | | 15.43 | | | 15.56 | |
| 2011 | | | 14.47 | | | .90 | | | (.35 | ) | | (.01 | ) | | — | | | .54 | | | (.92 | ) | | — | | | (.92 | ) | | — | | | 14.09 | | | 13.56 | |
| 2010 | | | 13.72 | | | .99 | | | .67 | | | (.03 | ) | | — | | | 1.63 | | | (.88 | ) | | — | | | (.88 | ) | | — | | | 14.47 | | | 14.34 | |
| 2009 | | | 11.86 | | | .99 | | | 1.70 | | | (.05 | ) | | — | | | 2.64 | | | (.78 | ) | | — | | | (.78 | ) | | — | | | 13.72 | | | 12.77 | |
| 2008 | | | 14.76 | | | .97 | | | (2.88 | ) | | (.28 | ) | | — | | | (2.19 | ) | | (.71 | ) | | — | | | (.71 | ) | | — | | | 11.86 | | | 10.93 | |
| | | | | | | | | | | | | | | | | | | | | | | | | | | | | | | | | | | | | | |
| Premium Income 2 (NPM) | | | | | | | | | | | | | | | | | | | | | | | | | | | | | | | |
| Year Ended 10/31: | | | | | | | | | | | | | | | | | | | | | | | | | | | | | | | | | | |
| 2013(e) | | | 15.99 | | | .41 | | | .02 | | | — | | | — | | | .43 | | | (.44 | ) | | — | | | (.44 | ) | | — | | | 15.98 | | | 14.88 | |
| 2012 | | | 14.71 | | | .88 | | | 1.34 | | | — | | | — | | | 2.22 | | | (.94 | ) | | — | | | (.94 | ) | | — | | | 15.99 | | | 15.56 | |
| 2011 | | | 14.98 | | | .95 | | | (.28 | ) | | (.02 | ) | | — | | | .65 | | | (.92 | ) | | — | | | (.92 | ) | | — | | | 14.71 | | | 14.27 | |
| 2010 | | | 14.17 | | | 1.01 | | | .71 | | | (.03 | ) | | — | | | 1.69 | | | (.88 | ) | | — | | | (.88 | ) | | — | * | | 14.98 | | | 14.54 | |
| 2009 | | | 11.71 | | | .95 | | | 2.34 | | | (.05 | ) | | — | | | 3.24 | | | (.78 | ) | | — | | | (.78 | ) | | — | * | | 14.17 | | | 13.02 | |
| 2008 | | | 14.85 | | | .97 | | | (3.10 | ) | | (.29 | ) | | (.01 | ) | | (2.43 | ) | | (.69 | ) | | (.02 | ) | | (.71 | ) | | — | * | | 11.71 | | | 10.28 | |
| (a) | The amounts shown are based on Common share equivalents. |
| (b) | Total Return Based on Market Value is the combination of changes in the market price per share and the effect of reinvested dividend income and reinvested capital gains distributions, if any, at the average price paid per share at the time of reinvestment. The last dividend declared in the period, which is typically paid on the first business day of the following month, is assumed to be reinvested at the ending market price. The actual reinvestment for the last dividend declared in the period may take place over several days, and in some instances may not be based on the market price, so the actual reinvestment price may be different from the price used in the calculation. Total returns are not annualized. |
| | |
| | Total Return Based on Common Share Net Asset Value is the combination of changes in Common share net asset value, reinvested dividend income at net asset value and reinvested capital gains distributions at net asset value, if any. The last dividend declared in the period, which is typically paid on the first business day of the following month, is assumed to be reinvested at the ending net asset value. The actual reinvest price for the last dividend declared in the period may often be based on the Fund’s market price (and not its net asset value), and therefore may be different from the price used in the calculation. Total returns are not annualized. |
| | | | | Ratios/Supplemental Data | |
| | | Total Returns | | | | Ratios to Average Net Assets Applicable to Common Shares(c) | | | |
| | | | | | | | | | |
| | | Based on Market Value | (b) | Based on Common Share Net Asset Value | (b) | Ending Net Assets Applicable to Common Shares (000) | | Expenses | (d) | Net Investment Income (Loss) | | Portfolio Turnover Rate | |
| | | | | | | | | | | | | | | | | | | | |
| | | | | | | | | | | | | | | | | | | | |
| | | | (3.09 | )% | | 3.25 | % | $ | 992,114 | | | 1.67 | %** | | 5.32 | %** | | 5 | % |
| | | | 22.06 | | | 16.41 | | | 987,664 | | | 1.71 | | | 5.65 | | | 8 | |
| | | | 1.37 | | | 4.18 | | | 900,461 | | | 1.66 | | | 6.60 | | | 9 | |
| | | | 19.68 | | | 12.26 | | | 924,129 | | | 1.21 | | | 7.05 | | | 6 | |
| | | | 24.61 | | | 22.89 | | | 875,341 | | | 1.31 | | | 7.79 | | | 4 | |
| | | | (13.10 | ) | | (15.39 | ) | | 756,782 | | | 1.49 | | | 6.95 | | | 11 | |
| | | | | | | | | | | | | | | | | | | | |
| | | | | | | | | | | | | | | | | | | | |
| | | | (1.63 | ) | | 2.68 | | | 1,129,628 | | | 1.72 | ** | | 5.14 | ** | | 6 | |
| | | | 15.97 | | | 15.48 | | | 1,130,611 | | | 1.70 | | | 5.65 | | | 15 | |
| | | | 4.95 | | | 4.74 | | | 1,039,723 | | | 1.48 | | | 6.74 | | | 8 | |
| | | | 18.89 | | | 12.25 | | | 1,058,891 | | | 1.16 | | | 6.89 | | | 7 | |
| | | | 35.00 | | | 28.38 | | | 1,003,366 | | | 1.36 | | | 7.71 | | | 9 | |
| | | | (17.95 | ) | | (16.96 | ) | | 477,603 | | | 1.56 | | | 6.93 | | | 8 | |
| (c) | Ratios do not reflect the effect of dividend payments to Auction Rate Preferred shareholders where applicable; Net Investment Income (Loss) ratios reflect income earned and expenses incurred on assets attributable to Auction Rate Preferred Shares (“ARPS”), VMTP Shares and/or VRDP Shares, where applicable. |
| (d) | The expense ratios reflect, among other things, all interest expense and other costs related to VMTP Shares, VRDP Shares and/or the interest expense deemed to have been paid by the Fund on the floating rate certificates issued by the special purpose trusts for the self-deposited inverse floaters held by the Fund, where applicable, each as described in Footnote 1 - General Information and Significant Accounting Policies, Variable Rate MuniFund Term Preferred Shares, Variable Rate Demand Preferred Shares and Inverse Floating Rate Securities, respectively as follows: |
| Premium Income (NPI) | | | | |
| Year Ended 10/31: | | | | |
| 2013(e) | | | .70 | %** |
| 2012 | | | .71 | |
| 2011 | | | .58 | |
| 2010 | | | .09 | |
| 2009 | | | .14 | |
| 2008 | | | .31 | |
| Premium Income 2 (NPM) | | | | |
| Year Ended 10/31: | | | | |
| 2013(e) | | | .65 | %** |
| 2012 | | | .69 | |
| 2011 | | | .42 | |
| 2010 | | | .07 | |
| 2009 | | | .16 | |
| 2008 | | | .34 | |
| (e) | For the six months ended April 30, 2013. |
| * | Rounds to less than $.01 per share. |
| ** | Annualized. |
See accompanying notes to financial statements.
| | | Financial |
| | | Highlights (Unaudited) (continued) |
| | | |
| | Selected data for a Common share outstanding throughout each period: |
| | | | | Investment Operations | | Less Distributions | | | | | | | |
| | | Beginning Common Share Net Asset Value | | Net Investment Income (Loss) | | Net Realized/ Unrealized Gain (Loss) | | Distributions from Net Investment Income to Auction Rate Preferred Share- holders | (a) | Distributions from Accumu- lated Net Realized Gains to Auction Rate Preferred Share- holders | (a) | Total | | From Net Investment Income to Common Share- holders | | From Accumu- lated Net Realized Gains to Common Share- holders | | Total | | Discount from Common Shares Repurchased and Retired | | Ending Common Share Net Asset Value | | Ending Market Value | |
| Premium Income 4 (NPT) | | | | | | | | | | | | | | | | | | | | | | | | | | | | | | | |
| Year Ended 10/31: | | | | | | | | | | | | | | | | | | | | | | | | | | | | | | | | | | |
| 2013(e) | | $ | 14.51 | | $ | .41 | | $ | .09 | | $ | — | | $ | — | | $ | .50 | | $ | (.41 | ) | $ | — | | $ | (.41 | ) | $ | — | | $ | 14.60 | | $ | 14.30 | |
| 2012 | | | 13.07 | | | .83 | | | 1.46 | | | — | | | — | | | 2.29 | | | (.85 | ) | | — | | | (.85 | ) | | — | | | 14.51 | | | 14.48 | |
| 2011 | | | 13.31 | | | .82 | | | (.21 | ) | | — | | | — | | | .61 | | | (.85 | ) | | — | | | (.85 | ) | | — | | | 13.07 | | | 12.76 | |
| 2010 | | | 12.58 | | | .87 | | | .70 | | | (.01 | ) | | — | | | 1.56 | | | (.83 | ) | | — | | | (.83 | ) | | — | | | 13.31 | | | 13.34 | |
| 2009 | | | 10.59 | | | .91 | | | 1.83 | | | (.05 | ) | | — | | | 2.69 | | | (.70 | ) | | — | | | (.70 | ) | | — | | | 12.58 | | | 11.69 | |
| 2008 | | | 13.22 | | | .91 | | | (2.67 | ) | | (.28 | ) | | — | | | (2.04 | ) | | (.59 | ) | | — | | | (.59 | ) | | — | | | 10.59 | | | 9.24 | |
| (a) | The amounts shown are based on Common share equivalents. |
| (b) | Total Return Based on Market Value is the combination of changes in the market price per share and the effect of reinvested dividend income and reinvested capital gains distributions, if any, at the average price paid per share at t he time of reinvestment. The last dividend declared in the period, which is typically paid on the first business day of the following month, is assumed to be reinvested at the ending market price. The actual reinvestment for the last dividend declared in the period may take place over several days, and in some instances may not be based on the market price, so the actual reinvestment price may be different from the price used in the calculation. Total returns are not annualized. |
| | |
| | Total Return Based on Common Share Net Asset Value is the combination of changes in Common share net asset value, reinvested dividend income at net asset value and reinvested capital gains distributions at net asset value, if any. The last dividend declared in the period, which is typically paid on the first business day of the following month, is assumed to be reinvested at the ending net asset value. The actual reinvest price for the last dividend declared in the period may often be based on the Fund’s market price (and not its net asset value), and therefore may be different from the price used in the calculation. Total returns are not annualized. |
| | | | | Ratios/Supplemental Data | |
| | | Total Returns | | | | Ratios to Average Net Assets Applicable to Common Shares(c) | | | |
| | | | | | | | | | | | | | |
| | | Based on Market Value | (b) | Based on Common Share Net Asset Value | (b) | Ending Net Assets Applicable to Common Shares (000) | | Expenses | (d) | Net Investment Income (Loss) | | Portfolio Turnover Rate | |
| | | | | | | | | | | | | | | | | | | | |
| | | | | | | | | | | | | | | | | | | | |
| | | | 1.59 | % | | 3.49 | % | $ | 632,936 | | | 1.65 | %** | | 5.61 | %** | | 6 | % |
| | | | 20.63 | | | 17.96 | | | 628,367 | | | 1.75 | | | 5.93 | | | 9 | |
| | | | 2.63 | | | 5.13 | | | 565,529 | | | 1.99 | | | 6.71 | | | 11 | |
| | | | 21.76 | | | 12.77* | | | 575,949 | | | 1.67 | | | 6.76 | | | 16 | |
| | | | 35.01 | | | 26.11 | | | 543,812 | | | 1.33 | | | 7.89 | | | 6 | |
| | | | (17.19 | ) | | (15.97 | ) | | 457,866 | | | 1.62 | | | 7.19 | | | 10 | |
| (c) | Ratios do not reflect the effect of dividend payments to Auction Rate Preferred shareholders, where applicable; Net Investment Income (Loss) ratios reflect income earned and expenses incurred on assets attributable to ARPS and/or VRDP Shares, where applicable. |
| (d) | The expense ratios reflect, among other things, all interest expense and other costs related to VRDP Shares and/or the interest expense deemed to have been paid by the Fund on the floating rate certificates issued by the special purpose trusts for the self-deposited inverse floaters held by the Fund, where applicable, each as described in Footnote 1 – General Information and Significant Accounting Policies, Variable Rate Demand Preferred Shares and Inverse Floating Rate Securities, respectively as follows: |
| Premium Income 4 (NPT) | | | | |
| Year Ended 10/31: | | | | |
| 2013(e) | | | .68 | %** |
| 2012 | | | .75 | |
| 2011 | | | .94 | |
| 2010 | | | .59 | |
| 2009 | | | .10 | |
| 2008 | | | .37 | |
| (e) | For the six months ended April 30, 2013. |
| * | During the fiscal year ended October 31, 2010, Premium Income 4 (NPT) received payments from the Adviser of $240 to offset losses realized on the disposal of investments purchased in violation of the Fund’s investment restrictions. This reimbursement did not have an impact on the Fund’s Total Return Based on Common Share Net Asset Value. |
| ** | Annualized. |
See accompanying notes to financial statements.
| | | Financial |
| | | Highlights (Unaudited) (continued) |
| | | ARPS at the End of Period | | VMTP Shares at the End of Period | | VRDP Shares at the End of Period | |
| | | | Aggregate | | | Asset | | | Aggregate | | | Asset | | | Aggregate | | | Asset | |
| | | | Amount | | | Coverage | | | Amount | | | Coverage | | | Amount | | | Coverage | |
| | | Outstanding | | Per $25,000 | | Outstanding | | Per $100,000 | | Outstanding | | Per $100,000 | |
| | | | (000 | ) | | Share | | | (000 | ) | | Share | | | (000 | ) | | Share | |
| Premium Income (NPI) | | | | | | | | | | | | | | | | | | | |
| Year Ended 10/31: | | | | | | | | | | | | | | | | | | | |
| 2013(a) | | $ | — | | $ | — | | $ | 407,000 | | $ | 343,763 | | $ | — | | $ | — | |
| 2012 | | | — | | | — | | | 402,400 | | | 345,443 | | | — | | | — | |
| 2011 | | | — | | | — | | | 402,400 | | | 323,773 | | | — | | | — | |
| 2010 | | | 400,650 | | | 82,664 | | | — | | | — | | | — | | | — | |
| 2009 | | | 400,650 | | | 79,620 | | | — | | | — | | | — | | | — | |
| 2008 | | | 415,450 | | | 70,540 | | | — | | | — | | | — | | | — | |
| | | | | | | | | | | | | | | | | | | | |
| Premium Income 2 (NPM) | | | | | | | | | | | | | | | | | | | |
| Year Ended 10/31: | | | | | | | | | | | | | | | | | | | |
| 2013(a) | | | — | | | — | | | — | | | — | | | 489,500 | | | 330,772 | |
| 2012 | | | — | | | — | | | — | | | — | | | 489,500 | | | 330,977 | |
| 2011 | | | — | | | — | | | — | | | — | | | 489,500 | | | 312,405 | |
| 2010 | | | 487,525 | | | 79,299 | | | — | | | — | | | — | | | — | |
| 2009 | | | 487,525 | | | 76,452 | | | — | | | — | | | — | | | — | |
| 2008 | | | 283,550 | | | 67,109 | | | — | | | — | | | — | | | — | |
| | | | | | | | | | | | | | | | | | | | |
| Premium Income 4 (NPT) | | | | | | | | | | | | | | | | | | | |
| Year Ended 10/31: | | | | | | | | | | | | | | | | | | | |
| 2013(a) | | $ | — | | $ | — | | | — | | | — | | $ | 262,200 | | $ | 341,394 | |
| 2012 | | | — | | | — | | | — | | | — | | | 262,200 | | | 339,652 | |
| 2011 | | | — | | | — | | | — | | | — | | | 262,200 | | | 315,686 | |
| 2010 | | | — | | | — | | | — | | | — | | | 262,200 | | | 319,660 | |
| 2009 | | | 259,050 | | | 77,481 | | | — | | | — | | | — | | | — | |
| 2008 | | | 302,200 | | | 62,878 | | | — | | | — | | | — | | | — | |
| (a) | For the six months ended April 30, 2013. |
See accompanying notes to financial statements.
| | | Notes to |
| | | Financial Statements (Unaudited) |
1. General Information and Significant Accounting Policies
General Information
The funds covered in this report and their corresponding New York Stock Exchange (“NYSE”) symbols are Nuveen Premium Income Municipal Fund, Inc. (NPI), Nuveen Premium Income Municipal Fund 2, Inc. (NPM) and Nuveen Premium Income Municipal Fund 4, Inc. (NPT) (each a “Fund” and collectively the “Funds”). The Funds are registered under the Investment Company Act of 1940, as amended, as diversified closed-end registered investment companies.
On December 31, 2012, the Funds’ investment adviser converted from a Delaware Corporation to a Delaware limited liability company. As a result, Nuveen Fund Advisors, Inc., a wholly-owned subsidiary of Nuveen Investments, Inc. (“Nuveen”), changed its name to Nuveen Fund Advisors, LLC (the “Adviser”). There were no changes to the identities or roles of any personnel as a result of the change.
Each Fund seeks to provide current income exempt from regular federal income tax by investing primarily in a portfolio of municipal obligations issued by state and local government authorities or certain U.S. territories.
Significant Accounting Policies
The following is a summary of significant accounting policies followed by the Funds in the preparation of their financial statements in accordance with U.S. generally accepted accounting principles (“U.S. GAAP”).
Investment Valuation
Prices of municipal bonds and other fixed income securities are provided by a pricing service approved by the Funds’ Board of Directors. These securities are generally classified as Level 2 for fair value measurement purposes. The pricing service establishes a security’s fair value using methods that may include consideration of the following: yields or prices of investments of comparable quality, type of issue, coupon, maturity and rating, market quotes or indications of value from security dealers, evaluations of anticipated cash flows or collateral, general market conditions and other information and analysis, including the obligor’s credit characteristics considered relevant. In pricing certain securities, particularly less liquid and lower quality securities, the pricing service may consider information about a security, its issuer, or market activity, provided by the Adviser. These securities are generally classified as Level 2 or Level 3 depending on the priority of the significant inputs.
Certain securities may not be able to be priced by the pre-established pricing methods as described above. Such securities may be valued by the Funds’ Board of Directors or its designee at fair value. These securities generally include, but are not limited to, restricted securities (securities which may not be publicly sold without registration under the Securities Act of 1933, as amended) for which a pricing service is unable to provide a market price; securities whose trading has been formally suspended; debt securities that have gone into default and for which there is no current market quotation; a security whose market price is not available from a pre-established pricing source; a security with respect to which an event has occurred that is likely to materially affect the value of the security after the market has closed but before the calculation of a Fund’s net asset value (as may be the case in non-U.S. markets on which the security is primarily traded) or make it difficult or impossible to obtain a reliable market quotation; and a security whose price, as provided by the pricing service, is not deemed to reflect the security’s fair value. As a general principle, the fair value of a security would appear to be the amount that the owner might reasonably expect to receive for it in a current sale. A variety of factors may be considered in determining the fair value of such securities, which may include consideration of the following: yields or prices of investments of comparable quality, type of issue, coupon, maturity and rating, market quotes or indications of value from security dealers, evaluations of anticipated cash flows or collateral, general market conditions and other information and analysis, including the obligor’s credit characteristics considered relevant. These securities are generally classified as Level 2 or Level 3 depending on the priority of the significant inputs. Regardless of the method employed to value a particular security, all valuations are subject to review by the Funds’ Board of Directors or its designee.
Refer to Footnote 2 – Fair Value Measurements for further details on the leveling of securities held by the Funds as of the end of the reporting period.
Investment Transactions
Investment transactions are recorded on a trade date basis. Realized gains and losses from investment transactions are determined on the specific identification method, which is the same basis used for federal income tax purposes. Investments purchased on a when-issued/delayed delivery basis may have extended settlement periods. Any investments so purchased are subject to market fluctuation during this period. The Funds have instructed the custodian to earmark securities in the Funds’ portfolios with a current value at least equal to the amount of the when-issued/delayed delivery
| | | Notes to |
| | | Financial Statements (Unaudited) (continued) |
purchase commitments. As of April 30, 2013, Premium Income (NPI), Premium Income 2 (NPM) and Premium Income 4 (NPT) had outstanding when issued/delayed delivery purchase commitments of $5,033,347, $5,693,869 and $4,221,867, respectively.
Investment Income
Investment income, which reflects the amortization of premiums and includes accretion of discounts for financial reporting purposes, is recorded on an accrual basis. Investment income also reflects paydown gains and losses, if any.
Professional Fees
Professional fees presented on the Statement of Operations consist of legal fees incurred in the normal course of operations, audit fees, tax consulting fees and, in some cases, workout expenditures. Workout expenditures are incurred in an attempt to protect or enhance an investment, or to pursue other claims or legal actions on behalf of Fund shareholders. Legal fee refund presented on the Statement of Operations reflects a refund of workout expenditures paid in a prior reporting period, when applicable.
Income Taxes
Each Fund is a separate taxpayer for federal income tax purposes. Each Fund intends to distribute substantially all of its net investment income and net capital gains to shareholders and to otherwise comply with the requirements of Subchapter M of the Internal Revenue Code applicable to regulated investment companies. Therefore, no federal income tax provision is required. Furthermore, each Fund intends to satisfy conditions that will enable interest from municipal securities, which is exempt from regular federal and designated state income taxes, to retain such tax-exempt status when distributed to shareholders of the Funds. Net realized capital gains and ordinary income distributions paid by the Funds are subject to federal taxation.
For all open tax years and all major taxing jurisdictions, management of the Funds has concluded that there are no significant uncertain tax positions that would require recognition in the financial statements. Open tax years are those that are open for examination by taxing authorities (i.e., generally the last four tax year ends and the interim tax period since then). Furthermore, management of the Funds is also not aware of any tax positions for which it is reasonably possible that the total amounts of unrecognized tax benefits will significantly change in the next twelve months.
Dividends and Distributions to Common Shareholders
Dividends from net investment income are declared monthly. Net realized capital gains and/or market discount from investment transactions, if any, are distributed to shareholders at least annually. Furthermore, capital gains are distributed only to the extent they exceed available capital loss carryforwards.
Distributions to Common shareholders of net investment income, net realized capital gains and/or market discount, if any, are recorded on the ex-dividend date. The amount and timing of distributions are determined in accordance with federal income tax regulations, which may differ from U.S. GAAP.
Auction Rate Preferred Shares
Each Fund is authorized to issue Auction Rate Preferred Shares (“ARPS”). During prior fiscal periods, the Funds redeemed all of their outstanding ARPS, at liquidation value.
Variable Rate MuniFund Term Preferred Shares
The following Fund has issued and outstanding Variable Rate MuniFund Term Preferred (“VMTP”) Shares, with a $100,000 liquidation value per share.
Premium Income (NPI) issued its VMTP Shares in a privately negotiated offering, which were offered to qualified institutional buyers pursuant to Rule 144A under the Securities Act of 1933.
During the current fiscal period, Premium Income (NPI) exchanged all 4,024 shares of its outstanding Series 2014 VMTP for 4,024 shares of Series 2015 VMTP. Concurrent with the exchange, Premium Income (NPI) issued an additional $4,600,000 at liquidation value, of Series 2015 VMTP Shares through a privately negotiated offering, which were offered to qualified institutional buyers pursuant to Rule 144A under the Securities act of 1933. The Fund completed the exchange offer in which it refinanced its existing VMTP Shares with new VMTP Shares at a reduced cost and with a term redemption date of December 1, 2015.
As of April 30, 2013, the number of VMTP Shares outstanding, at liquidation value, for the Fund is as follows:
| | | | Premium | |
| | | | Income | |
| | | | (NPI | ) |
| Series 2015 | | $ | 407,000,000 | |
The Fund is obligated to redeem its VMTP Shares by the date as specified in its offering document (“Term Redemption Date”), unless earlier redeemed or repurchased by the Fund. VMTP Shares are subject to optional and mandatory redemption in certain circumstances. The VMTP Shares are subject to redemption at the option of each Fund (“Optional Redemption Date”), subject to payment of premium for one year following the Optional Redemption Date (“Premium Expiration Date”), and at par thereafter. The Fund may be obligated to redeem certain of the VMTP Shares if the Fund fails to maintain certain asset coverage and leverage ratio requirements and such failures are not cured by the applicable cure date.
The redemption price per share is equal to the sum of the liquidation value per share plus any accumulated but unpaid dividends. The Term Redemption Date, Optional Redemption Date and Premium Expiration Date for the Fund’s VMTP Shares are as follows:
| | | | Premium | |
| | | | Income | |
| | | | (NPI | ) |
| Term Redemption Date | | | December 1, 2015 | |
| Optional Redemption Date | | | December 1, 2013 | |
| Premium Expiration Date | | | November 30, 2013 | |
The average liquidation value of VMTP Shares outstanding and annualized dividend rate for the Fund during the six months ended April 30, 2013, were as follows:
| | | | | |
| | | | Premium | |
| | | | Income | |
| | | | (NPI | ) |
| Average liquidation value of VMTP Shares outstanding | | $ | 407,000,000 | |
| Annualized dividend rate | | | 1.28 | % |
Dividends on the VMTP Shares (which are treated as interest payments for financial reporting purposes) are set weekly.
For financial reporting purposes only, the liquidation value of VMTP Shares is recorded as a liability and recognized as “Variable Rate MuniFund Term Preferred (VMTP) Shares, at liquidation value” on the Statement of Assets and Liabilities. Unpaid dividends on VMTP Shares are recognized as a component of “Interest payable” on the Statement of Assets and Liabilities. Dividends paid on VMTP Shares are recognized as a component of “Interest expense and amortization of offering costs” on the Statement of Operations. Costs incurred by the Fund in connection with its offering of VMTP Shares were recorded as a deferred charge, which are amortized over the life of the shares and are recognized as components of “Deferred offering costs” on the Statement of Assets and Liabilities and “Interest expense and amortization of offering costs” on the Statement of Operations.
In conjunction with the Fund’s exchange of VMTP Shares, the remaining deferred offering costs of $1,153,416 for the Fund’s issuance of Series 2014 VMTP Shares were fully expensed during the current fiscal period, as the exchange was deemed and extinguishment of debt. Offering costs of $155,000 were incurred with the Fund’s issuance of Series 2015 VMTP Shares, which were recorded as a deferred charge and are being amortized over the life of the shares.
Variable Rate Demand Preferred Shares
The following Funds have issued and outstanding Variable Rate Demand Preferred (“VRDP”) Shares, with a $100,000 liquidation value per share. Premium Income 2 (NPM) and Premium Income 4 (NPT) issued their VRDP Shares in privately negotiated offerings. The VRDP Shares were offered to qualified institutional buyers pursuant to Rule 144A under the Securities Act of 1933.
As of April 30, 2013, the number of VRDP Shares outstanding and maturity date for each Fund are as follows:
| | | | Premium | | | Premium | |
| | | | Income 2 | | | Income 4 | |
| | | | (NPM | ) | | (NPT | ) |
| Series | | | 1 | | | 1 | |
| VRDP Shares outstanding | | | 4,895 | | | 2,622 | |
| Maturity | | | May 1, 2041 | | | March 1, 2040 | |
VRDP Shares include a liquidity feature that allows VRDP shareholders to have their shares purchased by a liquidity provider with whom each Fund has contracted in the event that purchase orders for VRDP Shares in a remarketing are not sufficient in number to be matched with the sale orders in that remarketing. Each Fund is required to redeem any VRDP Shares that are still owned by the liquidity provider after six months of continuous, unsuccessful remarketing. Each Fund pays an annual remarketing fee of .10% on the aggregate principal amount of all VRDP Shares outstanding. Each Fund’s VRDP Shares have successfully remarketed since issuance.
Dividends on VRDP Shares (which are treated as interest payments for financial reporting purposes) are set weekly at a rate established by a remarketing agent; therefore, the market value of the VRDP Shares is expected to approximate its liquidation value. If remarketings for VRDP Shares are continuously unsuccessful for six months, the maximum rate is designed to escalate according to a specified schedule in order to enhance the remarketing agent’s ability to successfully remarket the VRDP Shares.
Subject to certain conditions, VRDP Shares may be redeemed, in whole or in part, at any time at the option of each Fund. Each Fund may also redeem certain of the VRDP Shares if the Fund fails to maintain certain asset coverage requirements and such failures are not cured by the applicable cure date. The redemption price per share is equal to the sum of the liquidation value per share plus any accumulated but unpaid dividends.
| | | Notes to |
| | | Financial Statements (Unaudited) (continued) |
The average liquidation value of VRDP Shares outstanding and annualized dividend rate for each Fund during the six months ended April 30, 2013, were as follows:
| | | | Premium | | | Premium | |
| | | | Income 2 | | | Income 4 | |
| | | | (NPM | ) | | (NPT | ) |
| Average liquidation value of VRDP Shares outstanding | | $ | 489,500,000 | | $ | 262,200,000 | |
| Annualized dividend rate | | | 0.24 | % | | 0.21 | % |
For financial reporting purposes only, the liquidation value of VRDP Shares is recorded as a liability and recognized as “Variable Rate Demand Preferred (VRDP) Shares, at liquidation value” on the Statement of Assets and Liabilities. Unpaid dividends on VRDP Shares are recognized as a component of “Interest payable” on the Statement of Assets and Liabilities, when applicable. Dividends paid on VRDP Shares are recognized as a component of “Interest expense and amortization of offering costs” on the Statement of Operations. Costs incurred by the Funds in connection with their offerings of VRDP Shares were recorded as a deferred charge, which are amortized over the life of the shares and are recognized as a component of “Deferred offering costs” on the Statement of Assets and Liabilities and “Interest expense and amortization of offering costs” on the Statement of Operations. In addition to interest expense, each Fund also pays a per annum liquidity fee to the liquidity provider, as well as a remarketing fee, which are recognized as “Liquidity fees” and “Remarketing fees,” respectively, on the Statement of Operations.
Inverse Floating Rate Securities
Each Fund is authorized to invest in inverse floating rate securities. An inverse floating rate security is created by depositing a municipal bond, typically with a fixed interest rate, into a special purpose trust created by a broker-dealer. In turn, this trust (a) issues floating rate certificates, in face amounts equal to some fraction of the deposited bond’s par amount or market value, that typically pay short-term tax-exempt interest rates to third parties, and (b) issues to a long-term investor (such as one of the Funds) an inverse floating rate certificate (sometimes referred to as an “inverse floater”) that represents all remaining or residual interest in the trust. The income received by the inverse floater holder varies inversely with the short-term rate paid to the floating rate certificates’ holders, and in most circumstances the inverse floater holder bears substantially all of the underlying bond’s downside investment risk and also benefits disproportionately from any potential appreciation of the underlying bond’s value. The price of an inverse floating rate security will be more volatile than that of the underlying bond because the interest rate is dependent on not only the fixed coupon rate of the underlying bond but also on the short-term interest paid on the floating rate certificates, and because the inverse floating rate security essentially bears the risk of loss of the greater face value of the underlying bond.
A Fund may purchase an inverse floating rate security in a secondary market transaction without first owning the underlying bond (referred to as an “externally-deposited inverse floater”), or instead by first selling a fixed-rate bond to a broker-dealer for deposit into the special purpose trust and receiving in turn the residual interest in the trust (referred to as a “self-deposited inverse floater”). The inverse floater held by a Fund gives the Fund the right (a) to cause the holders of the floating rate certificates to tender their notes at par, and (b) to have the broker transfer the fixed-rate bond held by the trust to the Fund, thereby collapsing the trust. An investment in an externally-deposited inverse floater is identified in the Portfolio of Investments as “(IF) – Inverse floating rate investment.” An investment in a self-deposited inverse floater is accounted for as a financing transaction. In such instances, a fixed-rate bond deposited into a special purpose trust is identified in the Portfolio of Investments as “(UB) – Underlying bond of an inverse floating rate trust reflected as a financing transaction,” with the Fund accounting for the short-term floating rate certificates issued by the trust, at their liquidation value, as “Floating rate obligations” on the Statement of Assets and Liabilities. In addition, the Fund reflects in “Investment Income” the entire earnings of the underlying bond and recognizes the related interest paid to the holders of the short-term floating rate certificates as a component of “Interest expense and amortization of offering costs” on the Statement of Operations.
During the six months ended April 30, 2013, each Fund invested in externally-deposited inverse floaters and/or self-deposited inverse floaters.
Each Fund may also enter into shortfall and forbearance agreements (sometimes referred to as a “recourse trust” or “credit recovery swap”) (such agreements referred to herein as “Recourse Trusts”) with a broker-dealer by which a Fund agrees to reimburse the broker-dealer, in certain circumstances, for the difference between the liquidation value of the fixed-rate bond held by the trust and the liquidation value of the floating rate certificates issued by the trust plus any shortfalls in interest cash flows. Under these agreements, a Fund’s potential exposure to losses related to or on inverse floaters may increase beyond the value of a Fund’s inverse floater investments as a Fund may potentially be liable to fulfill all amounts owed to holders of the floating rate certificates. At period end, any such shortfall is recognized as “Unrealized depreciation on Recourse Trusts” on the Statement of Assets and Liabilities.
As of April 30, 2013, each Fund’s maximum exposure to the floating rate obligations issued by externally-deposited Recourse Trusts was as follows:
| | | | Premium | | | Premium | | | Premium | |
| | | | Income | | | Income 2 | | | Income 4 | |
| | | | (NPI | ) | | (NPM | ) | | (NPT | ) |
| Maximum exposure to Recourse Trusts | | $ | 15,930,000 | | $ | 28,890,000 | | $ | 14,095,000 | |
The average floating rate obligations outstanding and average annual interest rate and fees related to self-deposited inverse floaters during the six months ended April 30, 2013, were as follows:
| | | | Premium | | | Premium | | | Premium | |
| | | | Income | | | Income 2 | | | Income 4 | |
| | | | (NPI | ) | | (NPM | ) | | (NPT | ) |
| Average floating rate obligations outstanding | | $ | 83,905,050 | | $ | 85,958,751 | | $ | 60,931,591 | |
| Average annual interest rate and fees | | | 0.56 | % | | 0.62 | % | | 0.53 | % |
Market and Counterparty Credit Risk
In the normal course of business each Fund may invest in financial instruments and enter into financial transactions where risk of potential loss exists due to changes in the market (market risk) or failure of the other party to the transaction to perform (counterparty credit risk). The potential loss could exceed the value of the financial assets recorded on the financial statements. Financial assets, which potentially expose each Fund to counterparty credit risk, consist principally of cash due from counterparties on forward, option and swap transactions, when applicable. The extent of each Fund’s exposure to counterparty credit risk in respect to these financial assets approximates their carrying value as recorded on the Statement of Assets and Liabilities. Futures contracts, when applicable, expose a Fund to minimal counterparty credit risk as they are exchange traded and the exchange’s clearinghouse, which is counterparty to all exchange traded futures, guarantees the futures contracts against default.
Each Fund helps manage counterparty credit risk by entering into agreements only with counterparties the Adviser believes have the financial resources to honor their obligations and by having the Adviser monitor the financial stability of the counterparties. Additionally, counterparties may be required to pledge collateral daily (based on the daily valuation of the financial asset) on behalf of each Fund with a value approximately equal to the amount of any unrealized gain above a pre-determined threshold. Reciprocally, when each Fund has an unrealized loss, the Funds have instructed the custodian to pledge assets of the Funds as collateral with a value approximately equal to the amount of the unrealized loss above a pre-determined threshold. Collateral pledges are monitored and subsequently adjusted if and when the valuations fluctuate, either up or down, by at least the pre-determined threshold amount.
Zero Coupon Securities
Each Fund is authorized to invest in zero coupon securities. A zero coupon security does not pay a regular interest coupon to its holders during the life of the security. Income to the holder of the security comes from accretion of the difference between the original purchase price of the security at issuance and the par value of the security at maturity and is effectively paid at maturity. The market prices of zero coupon securities generally are more volatile than the market prices of securities that pay interest periodically.
Indemnifications
Under the Funds’ organizational documents, their officers and directors are indemnified against certain liabilities arising out of the performance of their duties to the Funds. In addition, in the normal course of business, the Funds enter into contracts that provide general indemnifications to other parties. The Funds’ maximum exposure under these arrangements is unknown as this would involve future claims that may be made against the Funds that have not yet occurred. However, the Funds have not had prior claims or losses pursuant to these contracts and expect the risk of loss to be remote.
Use of Estimates
The preparation of financial statements in conformity with U.S. GAAP requires management to make estimates and assumptions that affect the reported amounts of assets and liabilities at the date of the financial statements and the reported amounts of increases and decreases in net assets applicable to Common shares from operations during the reporting period. Actual results may differ from those estimates.
2. Fair Value Measurements
Fair value is defined as the price that the Funds would receive upon selling an investment or transferring a liability in an orderly transaction to an independent buyer in the principal or most advantageous market for the investment. A three-tier hierarchy is used to maximize the use of observable market data and minimize the use of unobservable inputs and to establish classification of fair value measurements for disclosure purposes. Observable inputs reflect the assumptions market participants would use in pricing the asset or liability. Observable inputs are based on market data obtained from sources independent of the reporting entity. Unobservable inputs reflect the reporting entity’s own assumptions about the assumptions market participants would use in pricing the asset or liability. Unobservable inputs are based on the best information available in the circumstances.
The following is a summary of the three-tiered hierarchy of valuation input levels.
| Level 1 – | Inputs are unadjusted and prices are determined using quoted prices in active markets for identical securities. |
| Level 2 – | Prices are determined using other significant observable inputs (including quoted prices for similar securities, interest rates, prepayment speeds, credit risk, etc.). |
| Level 3 – | Prices are determined using significant unobservable inputs (including management’s assumptions in determining the fair value of investments). |
| | | Notes to |
| | | Financial Statements (Unaudited) (continued) |
The inputs or methodologies used for valuing securities are not an indication of the risks associated with investing in those securities. The following is a summary of each Fund’s fair value measurements as of the end of the reporting period:
| Premium Income (NPI) | | | Level 1 | | | Level 2 | | | Level 3 | | | Total | |
| Long-Term Investments*: | | | | | | | | | | | | | |
| Municipal Bonds | | $ | — | | $ | 1,472,306,042 | | $ | — | | $ | 1,472,306,042 | |
| Corporate Bonds | | | — | | | — | | | 80,455 | | | 80,455 | |
| Total | | $ | — | | $ | 1,472,306,042 | | $ | 80,455 | | $ | 1,472,386,497 | |
| | | | | | | | | | | | | | |
| Premium Income 2 (NPM) | | | Level 1 | | | Level 2 | | | Level 3 | | | Total | |
| Long-Term Investments*: | | | | | | | | | | | | | |
| Municipal Bonds | | $ | — | | $ | 1,685,803,125 | | $ | — | | $ | 1,685,803,125 | |
| Corporate Bonds | | | — | | | — | | | 6,335 | | | 6,335 | |
| Total | | $ | — | | $ | 1,685,803,125 | | $ | 6,335 | | $ | 1,685,809,460 | |
| | | | | | | | | | | | | | |
| Premium Income 4 (NPT) | | | Level 1 | | | Level 2 | | | Level 3 | | | Total | |
| Long-Term Investments*: | | | | | | | | | | | | | |
| Municipal Bonds | | $ | — | | $ | 947,421,776 | | $ | — | | $ | 947,421,776 | |
| Corporate Bonds | | | — | | | — | | | 14,263 | | | 14,263 | |
| Total | | $ | — | | $ | 947,421,776 | | $ | 14,263 | | $ | 947,436,039 | |
| * | Refer to the Fund’s Portfolio of Investments for state classifications of Municipal Bonds and breakdown of Corporate Bonds classified as Level 3. |
| | |
The Nuveen funds’ Board of Directors/Trustees is responsible for the valuation process and has delegated the oversight of the daily valuation process to the Adviser’s Valuation Committee. The Valuation Committee, pursuant to the valuation policies and procedures adopted by the Board of Directors/Trustees, is responsible for making fair value determinations, evaluating the effectiveness of the funds’ pricing policies and reporting to the Board of Directors/Trustees. The Valuation Committee is aided in its efforts by the Adviser’s dedicated Securities Valuation Team, which is responsible for administering the daily valuation process and applying fair value methodologies as approved by the Valuation Committee. When determining the reliability of independent pricing services for investments owned by the funds, the Valuation Committee, among other things, conducts due diligence reviews of the pricing services and monitors the quality of security prices received through various testing reports conducted by the Securities Valuation Team.
The Valuation Committee will consider pricing methodologies it deems relevant and appropriate when making a fair value determination, based on the facts and circumstances specific to the portfolio instrument. Fair value determinations generally will be derived as follows, using public or private market information:
| | (i.) | If available, fair value determinations shall be derived by extrapolating from recent transactions or quoted prices for identical or comparable securities. |
| | | |
| | (ii.) | If such information is not available, an analytical valuation methodology may be used based on other available information including, but not limited to: analyst appraisals, research reports, corporate action information, issuer financial statements and shelf registration statements. Such analytical valuation methodologies may include, but are not limited to: multiple of earnings, discount from market value of a similar freely-traded security, discounted cash flow analysis, book value or a multiple thereof, risk premium/yield analysis, yield to maturity and/or fundamental investment analysis. |
The purchase price of a portfolio instrument will be used to fair value the instrument only if no other valuation methodology is available or deemed appropriate, and it is determined that the purchase price fairly reflects the instrument’s current value.
For each portfolio security that has been fair valued pursuant to the policies adopted by the Board of Directors/Trustees, the fair value price is compared against the last available and next available market quotations. The Valuation Committee reviews the results of such testing and fair valuation occurrences are reported to the Board of Directors/Trustees.
3. Derivative Instruments and Hedging Activities
Each Fund is authorized to invest in certain derivative instruments, including futures, options, swap contracts and other derivatives.The Funds record derivative instruments at fair value, with changes in fair value recognized on the Statement of Operations, when applicable. Even though the Funds’ investments in derivatives may represent economic hedges, they are not considered to be hedge transactions for financial reporting purposes. Although the Funds are authorized to invest in derivative instruments, and may do so in the future, they did not make any such investments during the six months ended April 30, 2013.
4. Fund Shares
Common Shares
The Funds did not repurchase any of their outstanding Common shares during the six months ended April 30, 2013 or the fiscal year ended October 31, 2012.
Transactions in Common shares were as follows:
| | | Premium | | Premium | | Premium | |
| | | Income (NPI) | | Income 2 (NPM) | | Income 4 (NPT) | |
| | | | Six Months | | | | | | Six Months | | | | | | Six Months | | | | |
| | | | Ended | | | Year Ended | | | Ended | | | Year Ended | | | Ended | | | Year Ended | |
| | | | 4/30/13 | | | 10/31/12 | | | 4/30/13 | | | 10/31/12 | | | 4/30/13 | | | 10/31/12 | |
| Common shares issued to shareholders due to reinvestment of distributions | | | 45,020 | | | 103,129 | | | — | | | — | | | 24,314 | | | 32,382 | |
Preferred Shares
Transactions in VMTP Shares were as follows:
| | | | Premium Income (NPI) | |
| | | Six Months | | | | | | | |
| | | Ended | | Year Ended | |
| | | 4/30/13 | | 10/31/12 | |
| | | | Shares | | | Amount | | | Shares | | | Amount | |
| VMTP Shares issued: Series 2015 | | | 4,070 | | $ | 407,000,000 | | | — | | $ | — | |
| VMTP Shares exchanged: Series 2014 | | | (4,024 | ) | | (402,400,000 | ) | | — | | | — | |
| Total | | | 46 | | $ | 4,600,000 | | | — | | | — | |
5. Investment Transactions
Purchases and sales (including maturities but excluding short-term investments, where applicable) during the six months ended April 30, 2013, were as follows:
| | | | Premium | | | Premium | | | Premium | |
| | | | Income | | | Income 2 | | | Income 4 | |
| | | | (NPI | ) | | (NPM | ) | | (NPT | ) |
| Purchases | | $ | 89,226,606 | | $ | 109,034,789 | | $ | 69,439,745 | |
| Sales and maturities | | | 69,651,657 | | | 95,651,648 | | | 60,245,577 | |
6. Income Tax Information
The following information is presented on an income tax basis. Differences between amounts for financial statement and federal income tax purposes are primarily due to timing differences in recognizing taxable market discount, timing differences in recognizing certain gains and losses on investment transactions and the treatment of investments in inverse floating rate securities reflected as financing transactions, if any. To the extent that differences arise that are permanent in nature, such amounts are reclassified within the capital accounts as detailed below. Temporary differences do not require reclassification. Temporary and permanent differences do not impact the net asset values of the Funds.
As of April 30, 2013, the cost and unrealized appreciation (depreciation) of investments, as determined on a federal income tax basis, were as follows:
| | | | | | | | | | | |
| | | | Premium | | | Premium | | | Premium | |
| | | | Income | | | Income 2 | | | Income 4 | |
| | | | (NPI | ) | | (NPM | ) | | (NPT | ) |
| Cost of investments | | $ | 1,255,055,026 | | $ | 1,439,866,355 | | $ | 794,322,828 | |
| Gross unrealized: | | | | | | | | | | |
| Appreciation | | $ | 133,708,579 | | $ | 162,860,453 | | $ | 92,083,625 | |
| Depreciation | | | (12,081,718 | ) | | (13,171,846 | ) | | (2,013,177 | ) |
| Net unrealized appreciation (depreciation) of investments | | $ | 121,626,861 | | $ | 149,688,607 | | $ | 90,070,448 | |
| | | Notes to |
| | | Financial Statements (Unaudited) (continued) |
Permanent differences, primarily due to federal taxes paid, non-deductible offering costs, taxable market discount and prior non-deductible reorganization expenses, resulted in reclassifications among the Funds’ components of Common share net assets as of October 31, 2012, the Funds’ last tax year end, as follows:
| | | | Premium | | | Premium | | | Premium | |
| | | | Income | | | Income 2 | | | Income 4 | |
| | | | (NPI | ) | | (NPM | ) | | (NPT | ) |
| Paid-in-surplus | | $ | (582,149 | ) | $ | 280,888 | | $ | (47,462 | ) |
| Undistributed (Over-distribution of) net investment income | | | 579,688 | | | (306,969 | ) | | 27,641 | |
| Accumulated net realized gain (loss) | | | 2,461 | | | 26,081 | | | 19,821 | |
The tax components of undistributed net tax-exempt income, net ordinary income and net long-term capital gains as of October 31, 2012, the Funds’ last tax year end, were as follows:
| | | | Premium | | | Premium | | | Premium | |
| | | | Income | | | Income 2 | | | Income 4 | |
| | | | (NPI | ) | | (NPM | ) | | (NPT | ) |
Undistributed net tax-exempt income 1 | | $ | 13,030,710 | | $ | 15,165,950 | | $ | 9,539,492 | |
Undistributed net ordinary income 2 | | | 34,938 | | | 65,316 | | | 19,852 | |
| Undistributed net long-term capital gains | | | — | | | — | | | — | |
| 1 | Undistributed net tax-exempt income (on a tax basis) has not been reduced for the dividend declared on October 1, 2012, paid on November 1, 2012. |
| 2 | Net ordinary income consists of taxable market discount income and net short-term capital gains, if any. |
The tax character of distributions paid during the Funds’ last tax year ended October 31, 2012, was designated for purposes of the dividends paid deduction as follows:
| | | | Premium | | | Premium | | | Premium | |
| | | | Income | | | Income 2 | | | Income 4 | |
| | | | (NPI | ) | | (NPM | ) | | (NPT | ) |
| Distributions from net tax-exempt income | | $ | 64,364,185 | | $ | 68,529,213 | | $ | 37,581,657 | |
Distributions from net ordinary income 2 | | | — | | | — | | | — | |
| Distributions from net long-term capital gains | | | — | | | — | | | — | |
| 2 | Net ordinary income consists of taxable market discount income and net short-term capital gains, if any. |
As of October 31, 2012, the Funds’ last tax year end, the Funds had unused capital loss carryforwards available for federal income tax purposes to be applied against future capital gains, if any. If not applied, the carryforwards will expire as follows:
| | | | Premium | | | Premium | | | Premium | |
| | | | Income | | | Income 2 | | | Income 4 | |
| | | | (NPI | ) | | (NPM | ) | | (NPT | ) |
| Expiration: | | | | | | | | | | |
| October 31, 2013 | | $ | — | | $ | — | | $ | 6,030,935 | |
| October 31, 2014 | | | 4,614,516 | | | — | | | 806,337 | |
| October 31, 2015 | | | — | | | 6,446,971 | | | — | |
| October 31, 2016 | | | 11,536,998 | | | 18,051,540 | | | 7,113,122 | |
| October 31, 2017 | | | 11,817,772 | | | 488,931 | | | — | |
| Total | | $ | 27,969,286 | | $ | 24,987,442 | | $ | 13,950,394 | |
During the Funds’ last tax year ended October 31, 2012, the following Funds utilized capital loss carryforwards as follows:
| | | | Premium | | | Premium | |
| | | | Income 2 | | | Income 4 | |
| | | | (NPM | ) | | (NPT | ) |
| Utilized capital loss carryforwards | | $ | 3,264,943 | | $ | 130,895 | |
Under the Regulated Investment Company Modernization Act of 2010, capital losses incurred by the Funds after December 31, 2010, will not be subject to expiration. During the Funds’ last tax year ended October 31, 2012, the following Fund generated post-enactment capital losses as follows:
| | | | Premium | |
| | | | Income | |
| | | | (NPI | ) |
| Post-enactment losses: | | | | |
| Short-term | | $ | — | |
| Long-term | | | 7,899,732 | |
7. Management Fees and Other Transactions with Affiliates
Each Fund’s management fee consists of two components – a fund-level fee, based only on the amount of assets within the Fund, and a complex-level fee, based on the aggregate amount of all eligible fund assets managed by the Adviser. This pricing structure enables Fund shareholders to benefit from growth in the assets within their respective Fund as well as from growth in the amount of complex-wide assets managed by the Adviser.
The annual fund-level fee for each Fund, payable monthly, is calculated according to the following schedule:
| Average Daily Managed Assets* | | | Fund-Level Fee Rate |
| For the first $125 million | | | .4500 | % |
| For the next $125 million | | | .4375 | |
| For the next $250 million | | | .4250 | |
| For the next $500 million | | | .4125 | |
| For the next $1 billion | | | .4000 | |
| For the next $3 billion | | | .3875 | |
| For managed assets over $5 billion | | | .3750 | |
The annual complex-level fee for each Fund, payable monthly, is calculated according to the following schedule:
| Complex-Level Managed Asset Breakpoint Level* | | Effective Rate at Breakpoint Level |
| $55 billion | | .2000 | % |
| $56 billion | | .1996 | |
| $57 billion | | .1989 | |
| $60 billion | | .1961 | |
| $63 billion | | .1931 | |
| $66 billion | | .1900 | |
| $71 billion | | .1851 | |
| $76 billion | | .1806 | |
| $80 billion | | .1773 | |
| $91 billion | | .1691 | |
| $125 billion | | .1599 | |
| $200 billion | | .1505 | |
| $250 billion | | .1469 | |
| $300 billion | | .1445 | |
| * | For the fund-level and complex-level fees, managed assets include closed-end fund assets managed by the Adviser that are attributable to financial leverage. For these purposes, financial leverage includes the funds’ use of preferred stock and borrowings and certain investments in the residual interest certificates (also called inverse floating rate securities) in tender option bond (TOB) trusts, including the portion of assets held by a TOB trust that has been effectively financed by the trust’s issuance of floating rate securities, subject to an agreement by the Adviser as to certain funds to limit the amount of such assets for determining managed assets in certain circumstances. The complex-level fee is calculated based upon the aggregate daily managed assets of all Nuveen Funds that constitute “eligible assets.” Eligible assets do not include assets attributable to investments in other Nuveen Funds or assets in excess of $2 billion added to the Nuveen Fund complex in connection with the Adviser’s assumption of the management of the former First American Funds effective January 1, 2011. As of April 30, 2013, the complex-level fee rate for each of these Funds was .1661%. |
The management fee compensates the Adviser for overall investment advisory and administrative services and general office facilities. The Adviser is responsible for each Fund’s overall strategy and asset allocation decisions. The Adviser has entered into sub-advisory agreements with Nuveen Asset Management, LLC (the “Sub-Adviser”), a wholly-owned subsidiary of the Adviser, under which the Sub-Adviser manages the investment portfolios of the Funds. The Sub-Adviser is compensated for its services to the Funds from the management fees paid to the Adviser.
The Funds pay no compensation directly to those of its directors who are affiliated with the Adviser or to its officers, all of whom receive remuneration for their services to the Funds from the Adviser or its affiliates. The Board of Directors has adopted a deferred compensation plan for independent directors that enables directors to elect to defer receipt of all or a portion of the annual compensation they are entitled to receive from certain Nuveen-advised funds. Under the plan, deferred amounts are treated as though equal dollar amounts had been invested in shares of select Nuveen-advised funds.
8. New Accounting Pronouncements
Financial Accounting Standards Board (“FASB”) Balance Sheet (Topic 210): Disclosures about Offsetting Assets and Liabilities
In January 2013, Accounting Standards Update (“ASU”) 2013-01, Clarifying the Scope of Disclosures about Offsetting Assets and Liabilities, replaced ASU 2011-11, Disclosures about Offsetting Assets and Liabilities. ASU 2013-01 is effective for fiscal years beginning on or after January 1, 2013. ASU 2011-11 was intended to enhance disclosure requirements on the offsetting of financial assets and liabilities. ASU 2013-01 limits the scope of the new balance sheet offsetting disclosures to derivatives, repurchase agreements and securities lending transactions to the extent that they are (1) offset in the financial statements or (2) subject to an enforceable master netting arrangement or similar agreement. Management is currently evaluating the application of ASU 2013-01 and its impact to the financial statements and footnote disclosures, if any.
Reinvest Automatically,
Easily and Conveniently
Nuveen makes reinvesting easy. A phone call is all it takes to set up your reinvestment account.
Nuveen Closed-End Funds Automatic Reinvestment Plan
Your Nuveen Closed-End Fund allows you to conveniently reinvest distributions in additional Fund shares.
By choosing to reinvest, you’ll be able to invest money regularly and automatically, and watch your investment grow through the power of compounding. Just like distributions in cash, there may be times when income or capital gains taxes may be payable on distributions that are reinvested.
It is important to note that an automatic reinvestment plan does not ensure a profit, nor does it protect you against loss in a declining market.
Easy and convenient
To make recordkeeping easy and convenient, each month you’ll receive a statement showing your total distributions, the date of investment, the shares acquired and the price per share, and the total number of shares you own.
How shares are purchased
The shares you acquire by reinvesting will either be purchased on the open market or newly issued by the Fund. If the shares are trading at or above net asset value at the time of valuation, the Fund will issue new shares at the greater of the net asset value or 95% of the then-current market price. If the shares are trading at less than net asset value, shares for your account will be purchased on the open market. If the Plan Agent begins purchasing Fund shares on the open market while shares are trading below net asset value, but the Fund’s shares subsequently trade at or above their net asset value before the Plan Agent is able to complete its purchases, the Plan Agent may cease open-market purchases and may invest the uninvested portion of the distribution in newly-issued Fund shares at a price equal to the greater of the shares’ net asset value or 95% of the shares’ market value on the last business day immediately prior to the purchase date. Distributions received to purchase shares in the open market will normally be invested shortly after the distribution payment date. No interest will be paid on distributions awaiting reinvestment. Because the market price of the shares may increase before purchases are completed, the average purchase price per share may
exceed the market price at the time of valuation, resulting in the acquisition of fewer shares than if the distribution had been paid in shares issued by the Fund. A pro rata portion of any applicable brokerage commissions on open market purchases will be paid by Plan participants. These commissions usually will be lower than those charged on individual transactions.
Flexible
You may change your distribution option or withdraw from the Plan at any time, should your needs or situation change.
You can reinvest whether your shares are registered in your name, or in the name of a brokerage firm, bank, or other nominee. Ask your investment advisor if his or her firm will participate on your behalf. Participants whose shares are registered in the name of one firm may not be able to transfer the shares to another firm and continue to participate in the Plan.
The Fund reserves the right to amend or terminate the Plan at any time. Although the Fund reserves the right to amend the Plan to include a service charge payable by the participants, there is no direct service charge to participants in the Plan at this time.
Call today to start reinvesting distributions
For more information on the Nuveen Automatic Reinvestment Plan or to enroll in or withdraw from the Plan, speak with your financial advisor or call us at (800) 257-8787.
Glossary of Terms
Used in this Report
| ■ | Auction Rate Bond: An auction rate bond is a security whose interest payments are adjusted periodically through an auction process, which process typically also serves as a means for buying and selling the bond. Auctions that fail to attract enough buyers for all the shares offered for sale are deemed to have “failed,” with current holders receiving a formula-based interest rate until the next scheduled auction. |
| | |
| ■ | Average Annual Total Return: This is a commonly used method to express an investment’s performance over a particular, usually multi-year time period. It expresses the return that would have been necessary each year to equal the investment’s actual cumulative performance (including change in NAV or market price and reinvested dividends and capital gains distributions, if any) over the time period being considered. |
| | |
| ■ | Duration: Duration is a measure of the expected period over which a bond’s principal and interest will be paid, and consequently is a measure of the sensitivity of a bond’s or bond Fund’s value to changes when market interest rates change. Generally, the longer a bond’s or Fund’s duration, the more the price of the bond or Fund will change as interest rates change. |
| | |
| ■ | Effective Leverage: Effective leverage is a Fund’s effective economic leverage, and includes both regulatory leverage (see Leverage) and the leverage effects of certain derivative investments in the Fund’s portfolio. Currently, the leverage effects of Tender Option Bond (TOB) inverse floater holdings are included in effective leverage values, in addition to any regulatory leverage. |
| | |
| ■ | Gross Domestic Product (GDP): The total market value of all final goods and services produced in a country/region in a given year, equal to total consumer, investment and government spending, plus the value of exports, minus the value of imports. |
| | |
| ■ | Inverse Floating Rate Securities: Inverse floating rate securities, also known as inverse-floaters or tender option bonds (TOBs), are created by depositing a municipal bond, typically with a fixed interest rate, into a special purpose trust created by a broker-dealer. This trust, in turn, (a) issues floating rate certificates typically paying short-term tax-exempt interest rates to third parties in amounts equal to some fraction of the deposited bond’s par amount or market value, and (b) issues an inverse floating rate certificate (sometimes referred to as an “inverse floater”) to an investor (such as a Fund) interested in gaining investment exposure to a long-term municipal bond. The income received by the holder of the inverse floater varies inversely with the short-term rate paid to the floating rate certificates’ holders, and in most circumstances the holder of the inverse floater bears substantially all of the underlying bond’s downside investment risk. The holder of the inverse floater typically also benefits disproportionately from any potential appreciation of the underlying bond’s value. Hence, an inverse floater essentially represents an investment in the underlying bond on a leveraged basis. |
| ■ | Leverage: Using borrowed money to invest in securities or other assets, seeking to increase the return of an investment or portfolio. |
| | |
| ■ | Lipper General & Insured Leveraged Municipal Debt Funds Classification Average: Calculated using the returns of all closed-end funds in this category. Lipper returns account for the effects of management fees and assume reinvestment of distributions, but do not reflect any applicable sales charges. |
| | |
| ■ | Net Asset Value (NAV): The net market value of all securities held in a portfolio. |
| | |
| ■ | Net Asset Value (NAV) Per Share: The market value of one share of a mutual fund or closed-end fund. For a Fund, the NAV is calculated daily by taking the Fund’s total assets (securities, cash, and accrued earnings), subtracting the Fund’s liabilities, and dividing by the number of shares outstanding. |
| | |
| ■ | Pre-Refunding: Pre-Refunding, also known as advanced refundings or refinancings, is a procedure used by state and local governments to refinance municipal bonds to lower interest expenses. The issuer sells new bonds with a lower yield and uses the proceeds to buy U.S. Treasury securities, the interest from which is used to make payments on the higher-yielding bonds. Because of this collateral, pre-refunding generally raises a bond’s credit rating and thus its value. |
| | |
| ■ | Regulatory Leverage: Regulatory Leverage consists of preferred shares issued by or borrowings of a Fund. Both of these are part of a Fund’s capital structure. Regulatory leverage is sometimes referred to as “‘40 Act Leverage” and is subject to asset coverage limits set in the Investment Company Act of 1940. |
| | |
| ■ | S&P Municipal Bond Index: An unleveraged, market value-weighted index designed to measure the performance of the tax-exempt, investment-grade U.S. municipal bond market. Index returns assume reinvestment of distributions, but do not reflect any applicable sales charges or management fees. |
| | |
| ■ | Total Investment Exposure: Total investment exposure is a Fund’s assets managed by the Adviser that are attributable to financial leverage. For these purposes, financial leverage includes a Fund’s use of preferred stock and borrowings and investments in the residual interest certificates (also called inverse floating rate securities) in tender option bond (TOB) trusts, including the portion of assets held by a TOB trust that has been effectively financed by the trust’s issuance of floating rate securities. |
| | |
| ■ | Zero Coupon Bond: A zero coupon bond does not pay a regular interest coupon to its holders during the life of the bond. Income to the holder of the bond comes from accretion of the difference between the original purchase price of the bond at issuance and the par value of the bond at maturity and is effectively paid at maturity. The market prices of zero coupon bonds generally are more volatile than the market prices of bonds that pay interest periodically. |
Notes
Notes
Notes
Additional Fund Information
Board of Directors
John P. Amboian
Robert P. Bremner
Jack B. Evans
William C. Hunter
David J. Kundert
William J. Schneider
Judith M. Stockdale
Carole E. Stone
Virginia L. Stringer
Terence J. Toth
Fund Manager
Nuveen Fund Advisors, LLC
333 West Wacker Drive
Chicago, IL 60606
Custodian
State Street Bank
& Trust Company
Boston, MA
Transfer Agent and
Shareholder Services
State Street Bank & Trust
Company
Nuveen Funds
P.O. Box 43071
Providence, RI 02940-3071
(800) 257-8787
Legal Counsel
Chapman and Cutler LLP
Chicago, IL
Independent Registered
Public Accounting Firm
Ernst & Young LLP
Chicago, IL
Quarterly Form N-Q Portfolio of Investments Information
Each Fund is required to file its complete schedule of portfolio holdings with the Securities and Exchange Commission (SEC) for the first and third quarters of each fiscal year on Form N-Q. You may obtain this information directly from the SEC. Visit the SEC on-line at http://www.sec.gov or in person at the SEC’s Public Reference Room in Washington, D.C. Call the SEC toll-free at (800) SEC -0330 for room hours and operation.
Nuveen Funds’ Proxy Voting Information
You may obtain (i) information regarding how each Fund voted proxies relating to portfolio securities held during the most recent twelve-month period ended June 30, without charge, upon request, by calling Nuveen Investments toll-free at (800) 257-8787 or on Nuveen’s website at www.nuveen.com and (ii) a description of the policies and procedures that each Fund used to determine how to vote proxies relating to portfolio securities without charge, upon request, by calling Nuveen Investments toll-free at (800) 257-8787. You may also obtain this information directly from the SEC. Visit the SEC online at http://www.sec.gov.
CEO Certification Disclosure
Each Fund’s Chief Executive Officer (CEO) has submitted to the New York Stock Exchange (NYSE) the annual CEO certification as required by Section 303A.12(a) of the NYSE Listed Company Manual.
Each Fund has filed with the SEC the certification of its Chief Executive Officer and Chief Financial Officer required by Section 302 of the Sarbanes-Oxley Act.
Common Share Information
Each Fund intends to repurchase shares of its own common stock in the future at such times and in such amounts as is deemed advisable. During the period covered by this report, the Funds repurchased shares of their common stock as shown in the accompanying table.
| | Common Shares |
| Fund | Repurchased |
| NPI | — |
| NPM | — |
| NPT | — |
Any future repurchases will be reported to shareholders in the next annual or semi-annual report.
Nuveen Investments:
Serving Investors for Generations
Since 1898, financial advisors and their clients have relied on Nuveen Investments to provide dependable investment solutions through continued adherence to proven, long-term investing principles. Today, we offer a range of high quality equity and fixed-income solutions designed to be integral components of a well-diversified core portfolio.
Focused on meeting investor needs.
Nuveen Investments provides high-quality investment services designed to help secure the long-term goals of institutional and individual investors as well as the consultants and financial advisors who serve them. Nuveen Investments markets a wide range of specialized investment solutions which provide investors access to capabilities of its high-quality boutique investment affiliates—Nuveen Asset Management, Symphony Asset Management, NWQ Investment Management Company, Santa Barbara Asset Management, Tradewinds Global Investors, Winslow Capital Management and Gresham Investment Management. In total, Nuveen Investments managed $224 billion as of March 31, 2013.
Find out how we can help you.
To learn more about how the products and services of Nuveen Investments may be able to help you meet your financial goals, talk to your financial advisor, or call us at (800) 257-8787. Please read the information provided carefully before you invest. Investors should consider the investment objective and policies, risk considerations, charges and expenses of any investment carefully. Where applicable, be sure to obtain a prospectus, which contains this and other relevant information. To obtain a prospectus, please contact your securities representative or Nuveen Investments, 333 W. Wacker Dr., Chicago, IL 60606. Please read the prospectus carefully before you invest or send money.
Learn more about Nuveen Funds at: www.nuveen.com/cef
Distributed by
Nuveen Securities, LLC
333 West Wacker Drive
Chicago, IL 60606
www.nuveen.com
ESA-E-0413D
ITEM 2. CODE OF ETHICS.
Not applicable to this filing.
ITEM 3. AUDIT COMMITTEE FINANCIAL EXPERT.
Not applicable to this filing.
ITEM 4. PRINCIPAL ACCOUNTANT FEES AND SERVICES.
Not applicable to this filing.
ITEM 5. AUDIT COMMITTEE OF LISTED REGISTRANTS.
Not applicable to this filing.
ITEM 6. SCHEDULE OF INVESTMENTS.
(a) See Portfolio of Investments in Item 1.
(b) Not applicable.
ITEM 7. DISCLOSURE OF PROXY VOTING POLICIES AND PROCEDURES FOR CLOSED-END MANAGEMENT INVESTMENT COMPANIES.
Not applicable to this filing.
ITEM 8. PORTFOLIO MANAGERS OF CLOSED-END MANAGEMENT INVESTMENT COMPANIES.
Not applicable to this filing.
ITEM 9. PURCHASES OF EQUITY SECURITIES BY CLOSED-END MANAGEMENT INVESTMENT COMPANY AND AFFILIATED PURCHASERS.
Not applicable.
ITEM 10. SUBMISSION OF MATTERS TO A VOTE OF SECURITY HOLDERS.
There have been no material changes to the procedures by which shareholders may recommend nominees to the registrant's Board implemented after the registrant last provided disclosure in response to this Item.
ITEM 11. CONTROLS AND PROCEDURES.
ITEM 12. EXHIBITS.
File the exhibits listed below as part of this Form.
Pursuant to the requirements of the Securities Exchange Act of 1934 and the Investment Company Act of 1940, the registrant has duly caused this report to be signed on its behalf by the undersigned, thereunto duly authorized.
Kevin J. McCarthy
Pursuant to the requirements of the Securities Exchange Act of 1934 and the Investment Company Act of 1940, this report has been signed below by the following persons on behalf of the registrant and in the capacities and on the dates indicated.
Gifford R. Zimmerman
Stephen D. Foy