UNITED STATES
SECURITIES AND EXCHANGE COMMISSION
Washington, D.C. 20549
FORM N-CSR
CERTIFIED SHAREHOLDER REPORT OF REGISTERED
MANAGEMENT INVESTMENT COMPANIES
Investment Company Act file number 811-07444
American Strategic Income Portfolio Inc. III
(Exact name of registrant as specified in charter)
800 Nicollet Mall, Minneapolis, MN | | 55402 |
(Address of principal executive offices) | | (Zip code) |
Charles D. Gariboldi, Jr., 800 Nicollet Mall, Minneapolis, MN 55402
(Name and address of agent for service)
Registrant’s telephone number, including area code: 800-677-3863
Date of fiscal year end: August 31
Date of reporting period: February 28, 2007
Form N-CSR is to be used by management investment companies to file reports with the Commission not later than 10 days after the transmission to stockholders of any report that is required to be transmitted to stockholders under Rule 30e-1 under the Investment Company Act of 1940 (17 CFR 270.30e-1). The Commission may use the information provided on Form N-CSR in its regulatory, disclosure review, inspection, and policymaking roles.
A registrant is required to disclose the information specified by Form N-CSR, and the Commission will make this information public. A registrant is not required to respond to the collection of information contained in Form N-CSR unless the Form displays a currently valid Office of Management and Budget (“OMB”) control number. Please direct comments concerning the accuracy of the information collection burden estimate and any suggestions for reducing the burden to Secretary, Securities and Exchange Commission, 450 Fifth Street, NW, Washington, DC 20549-0609. The OMB has reviewed this collection of information under the clearance requirements of 44 U.S.C. Section 3507.
Item 1. Report to Shareholders
AMERICAN STRATEGIC | |
INCOME PORTFOLIO INC. | |
| |
| |
AMERICAN STRATEGIC | |
INCOME PORTFOLIO INC. II | |
| |
| |
AMERICAN STRATEGIC | |
INCOME PORTFOLIO INC. III | |
| |
| |
AMERICAN SELECT | |
PORTFOLIO INC. | |
|
|
| February 28, 2007 |
| SEMIANNUAL REPORT |
| | |
FIRST AMERICAN | |
MORTGAGE FUNDS | |
| |
Our Image – George Washington | |
| |
His rich legacy as patriot and leader is widely recognized as embodying the sound judgment, reliability, and strategic vision that are central to our brand. Fashioned in a style reminiscent of an 18th century engraving, the illustration conveys the symbolic strength and vitality of Washington, which are attributes that we value at First American. | |
| |
Table of Contents | |
| |
1 | | Fund Overviews |
| | |
10 | | Financial Statements |
| | |
15 | | Notes to Financial Statements |
| | |
28 | | Schedule of Investments |
| | |
46 | | Notice to Shareholder |
| |
| |
NOT FDIC INSURED NO BANK GUARANTEE MAY LOSE VALUE | |
| | | |
Fund OVERVIEWS
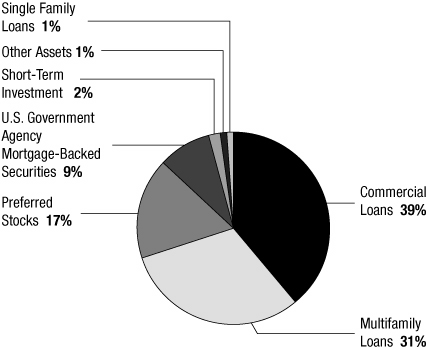
American Strategic Income Portfolio
Portfolio Allocation
As a percentage of total assets on February 28, 2007
Delinquent Loan Profile
The tables below show the percentages of single family loans and multifamily and commercial loans in the portfolio that are 30, 60, 90, or 120 or more days delinquent as of February 28, 2007, based on the value outstanding.
| Single family loans | | Multifamily and commercial loans | |
| Current | | | 96.3 | % | | Current | | | 100.0 | % | |
| 30 Days | | | 0.0 | % | | 30 Days | | | 0.0 | % | |
| 60 Days | | | 2.7 | % | | 60 Days | | | 0.0 | % | |
| 90 Days | | | 0.0 | % | | 90 Days | | | 0.0 | % | |
| 120+ Days | | | 1.0 | % | | 120+ Days | | | 0.0 | % | |
2007 Semiannual Report
First American Mortgage Funds
1
Fund OVERVIEWS continued
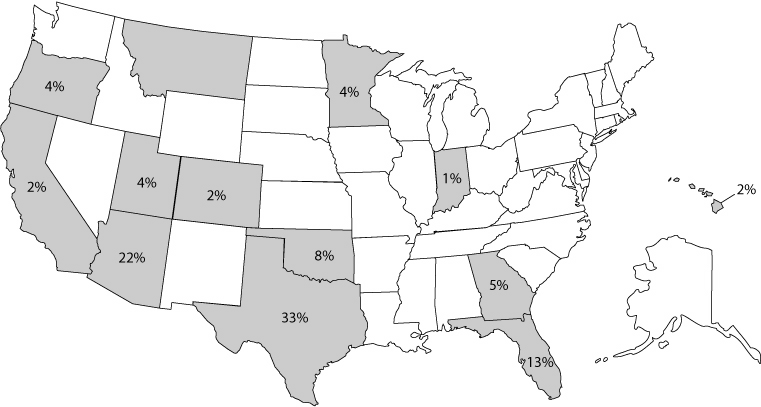
American Strategic Income Portfolio
Geographical Distribution
We attempt to buy mortgage loans in many parts of the country to help avoid the risks of concentrating in one area. These percentages reflect the value of whole loans and participation mortgages as of February 28, 2007. Shaded areas without values indicate states in which the fund has invested less than 0.50% of its assets.

2007 Semiannual Report
First American Mortgage Funds
2
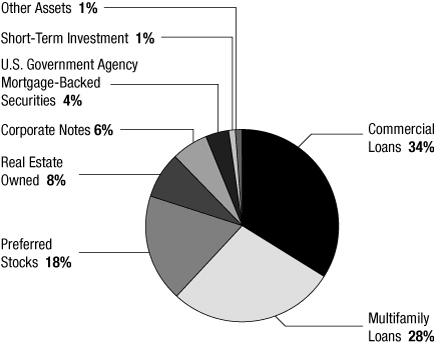
American Strategic Income Portfolio II
Portfolio Allocation
As a percentage of total assets on February 28, 2007
Delinquent Loan Profile
The tables below show the percentages of single family loans and multifamily and commercial loans in the portfolio that are 30, 60, 90, or 120 or more days delinquent as of February 28, 2007, based on the value outstanding.
| Single family loans | | Multifamily and commercial loans | |
| Current | | | 86.2 | % | | Current | | | 94.2 | % | |
| 30 Days | | | 13.8 | % | | 30 Days | | | 0.0 | % | |
| 60 Days | | | 0.0 | % | | 60 Days | | | 0.0 | % | |
| 90 Days | | | 0.0 | % | | 90 Days | | | 0.0 | % | |
| 120+ Days | | | 0.0 | % | | 120+ Days | | | 5.8 | % | |
2007 Semiannual Report
First American Mortgage Funds
3
Fund OVERVIEWS continued
American Strategic Income Portfolio II
Geographical Distribution
We attempt to buy mortgage loans in many parts of the country to help avoid the risks of concentrating in one area. These percentages reflect the value of whole loans and participation mortgages as of February 28, 2007. Shaded areas without values indicate states in which the fund has invested less than 0.50% of its assets.

2007 Semiannual Report
First American Mortgage Funds
4
American Strategic Income Portfolio III
Portfolio Allocation
As a percentage of total assets on February 28, 2007

Delinquent Loan Profile
The tables below show the percentages of single family loan and multifamily and commercial loans in the portfolio that are 30, 60, 90, or 120 or more days delinquent as of February 28, 2007, based on the value outstanding.
| Single family loan | | Multifamily and commercial loans | |
| Current | | | 100.0 | % | | Current | | | 92.0 | % | |
| 30 Days | | | 0.0 | % | | 30 Days | | | 0.0 | % | |
| 60 Days | | | 0.0 | % | | 60 Days | | | 0.0 | % | |
| 90 Days | | | 0.0 | % | | 90 Days | | | 0.0 | % | |
| 120+ Days | | | 0.0 | % | | 120+ Days | | | 8.0 | % | |
2007 Semiannual Report
First American Mortgage Funds
5
Fund OVERVIEWS continued
American Strategic Income Portfolio III
Geographical Distribution
We attempt to buy mortgage loans in many parts of the country to help avoid the risks of concentrating in one area. These percentages reflect the value of whole loans and participation mortgages as of February 28, 2007. Shaded areas without values indicate states in which the fund has invested less than 0.50% of its assets.
2007 Semiannual Report
First American Mortgage Funds
6
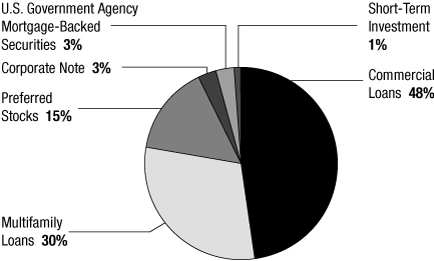
American Select Portfolio
Portfolio Allocation
As a percentage of total assets on February 28, 2007
Delinquent Loan Profile
The tables below show the percentages of multifamily and commercial loans in the portfolio that are 30, 60, 90, or 120 or more days delinquent as of February 28, 2007, based on the value outstanding.
| Multifamily and commercial loans | | | |
| Current | | | 95.1 | % | |
| 30 Days | | | 0.0 | % | |
| 60 Days | | | 0.0 | % | |
| 90 Days | | | 0.0 | % | |
| 120+ Days | | | 4.9 | % | |
2007 Semiannual Report
First American Mortgage Funds
7
Fund OVERVIEWS concluded
American Select Portfolio
Geographical Distribution
We attempt to buy mortgage loans in many parts of the country to help avoid the risks of concentrating in one area. These percentages reflect the value of whole loans and participation mortgages as of February 28, 2007. Shaded areas without values indicate states in which the fund has invested less than 0.50% of its assets.

2007 Semiannual Report
First American Mortgage Funds
8
(This page has been left blank intentionally.)
Financial STATEMENTS
Statements of Assets and Liabilities February 28, 2007 (unaudited)
| | | American
Strategic
Income
Portfolio | | American
Strategic
Income
Portfolio II | | American
Strategic
Income
Portfolio III | | American
Select
Portfolio | |
| Assets: | |
Investments in unaffiliated securities, at value (cost: $65,988,838, $224,988,988,
$299,071,677, $168,343,995) (note 2) | | $ | 65,786,185 | | | $ | 217,552,560 | | | $ | 293,412,718 | | | $ | 167,613,570 | | |
Investments in affiliated money market fund, at value (cost: $1,368,672, $2,039,798,
$14,372,737, $1,219,143) (note 3) | | | 1,368,672 | | | | 2,039,798 | | | | 14,372,737 | | | | 1,219,143 | | |
| Real estate owned (cost: $0, $24,426,928, $0, $0) (note 2) | | | — | | | | 18,684,000 | | | | — | | | | — | | |
| Cash | | | — | | | | 84,923 | | | | — | | | | — | | |
| Receivable for accrued interest | | | 325,175 | | | | 2,023,521 | | | | 1,178,019 | | | | 955,739 | | |
| Prepaid expenses and other assets | | | 33,706 | | | | 4,728 | | | | 55,801 | | | | 36,991 | | |
| Total assets | | | 67,513,738 | | | | 240,389,530 | | | | 309,019,275 | | | | 169,825,443 | | |
| Liabilities: | |
| Payable for reverse repurchase agreements (note 2) | | | 15,354,091 | | | | 43,432,468 | | | | 50,853,080 | | | | 30,529,757 | | |
| Bank overdraft | | | 18,387 | | | | — | | | | 12,207 | | | | 99,253 | | |
| Payable for investment advisory fees (note 3) | | | 30,364 | | | | 96,782 | | | | 113,031 | | | | 52,826 | | |
| Payable for administrative fees (note 3) | | | 9,907 | | | | 37,495 | | | | 49,156 | | | | 26,413 | | |
| Payable for interest expense | | | 53,471 | | | | 137,362 | | | | 128,423 | | | | 148,047 | | |
| Payable for professional fees | | | 23,221 | | | | 23,423 | | | | 23,880 | | | | 23,351 | | |
| Payable for other expenses | | | 28,109 | | | | 89,947 | | | | 92,408 | | | | 60,929 | | |
| Total liabilities | | | 15,517,550 | | | | 43,817,477 | | | | 51,272,185 | | | | 30,940,576 | | |
| Net assets applicable to outstanding capital stock | | $ | 51,996,188 | | | $ | 196,572,053 | | | $ | 257,747,090 | | | $ | 138,884,867 | | |
| Composition of net assets: | |
| Capital stock and additional paid-in capital | | $ | 54,221,146 | | | $ | 207,236,709 | | | $ | 263,968,796 | | | $ | 139,930,119 | | |
| Undistributed (distributions in excess of) net investment income | | | (5,583 | ) | | | 2,137,322 | | | | 457,022 | | | | 511,095 | | |
| Accumulated net realized gain (loss) on investments in securities (note 5) | | | (2,016,722 | ) | | | 377,378 | | | | (1,019,769 | ) | | | (825,922 | ) | |
| Unrealized depreciation of investments in securities | | | (202,653 | ) | | | (13,179,356 | ) | | | (5,658,959 | ) | | | (730,425 | ) | |
| Total–representing net assets applicable to capital stock | | $ | 51,996,188 | | | $ | 196,572,053 | | | $ | 257,747,090 | | | $ | 138,884,867 | | |
| Net asset value and market price of capital stock: | |
| Net assets outstanding | | $ | 51,996,188 | | | $ | 196,572,053 | | | $ | 257,747,090 | | | $ | 138,884,867 | | |
| Shares outstanding (authorized 1 billion shares for each fund of $0.01 par value) | | | 4,231,331 | | | | 15,985,741 | | | | 21,356,023 | | | | 10,662,195 | | |
| Net asset value per share | | $ | 12.29 | | | $ | 12.30 | | | $ | 12.07 | | | $ | 13.03 | | |
| Market price per share | | $ | 11.61 | | | $ | 11.60 | | | $ | 12.34 | | | $ | 12.84 | | |
See accompanying Notes to Financial Statements.
2007 Semiannual Report
First American Mortgage Funds
10
Financial STATEMENTS continued
Statements of Operations For the Six-Month Period Ended February 28, 2007 (unaudited)
| | | American
Strategic
Income
Portfolio | | American
Strategic
Income
Portfolio II | | American
Strategic
Income
Portfolio III | | American
Select
Portfolio | |
| Investment income: | |
| Interest from unaffiliated securities | | $ | 2,123,430 | | | $ | 8,524,310 | | | $ | 12,176,278 | | | $ | 5,966,406 | | |
| Dividends from unaffiliated securities | | | 355,469 | | | | 1,170,142 | | | | 1,555,066 | | | | 600,465 | | |
| Dividends from affiliated money market fund | | | 58,170 | | | | 136,382 | | | | 166,234 | | | | 75,828 | | |
| Net operating loss from real estate owned properties (note 2) | | | — | | | | (14,109 | ) | | | — | | | | — | | |
| Total investment income | | | 2,537,069 | | | | 9,816,725 | | | | 13,897,578 | | | | 6,642,699 | | |
| Expenses (note 3): | |
| Investment advisory fees | | | 145,427 | | | | 552,454 | | | | 827,851 | | | | 344,971 | | |
| Interest expense | | | 509,084 | | | | 1,202,253 | | | | 1,150,697 | | | | 1,173,642 | | |
| Administrative fees | | | 63,986 | | | | 240,987 | | | | 322,048 | | | | 172,486 | | |
| Custodian fees | | | 6,553 | | | | 27,102 | | | | 34,991 | | | | 19,646 | | |
| Mortgage servicing fees | | | 29,720 | | | | 66,108 | | | | 88,682 | | | | 60,348 | | |
| Professional fees | | | 25,777 | | | | 26,120 | | | | 26,273 | | | | 25,992 | | |
| Postage and printing fees | | | 5,502 | | | | 13,475 | | | | 17,396 | | | | 10,409 | | |
| Transfer agent fees | | | 7,944 | | | | 9,320 | | | | 9,658 | | | | 8,388 | | |
| Listing fees | | | 11,778 | | | | 12,397 | | | | 12,397 | | | | 12,397 | | |
| Directors' fees | | | 7,582 | | | | 8,137 | | | | 8,408 | | | | 7,928 | | |
| Other expenses | | | 30,440 | | | | 36,013 | | | | 41,674 | | | | 34,006 | | |
| Total expenses | | | 843,793 | | | | 2,194,366 | | | | 2,540,075 | | | | 1,870,213 | | |
| Less: Indirect payments from the custodian | | | (1,132 | ) | | | (6,796 | ) | | | (7,331 | ) | | | (3,586 | ) | |
| Total net expenses | | | 842,661 | | | | 2,187,570 | | | | 2,532,744 | | | | 1,866,627 | | |
| Net investment income | | | 1,694,408 | | | | 7,629,155 | | | | 11,364,834 | | | | 4,776,072 | | |
| Net realized and unrealized gains (losses) on investments in securities (note 4): | |
| Net realized gain (loss) on investments in securities | | | 19,464 | | | | 820,116 | | | | (356,836 | ) | | | 28,598 | | |
| Net change in unrealized appreciation or depreciation of investments in securities | | | 1,095,406 | | | | 4,149,443 | | | | 6,751,896 | | | | 1,209,459 | | |
| Net gain on investments | | | 1,114,870 | | | | 4,969,559 | | | | 6,395,060 | | | | 1,238,057 | | |
| Net increase in net assets resulting from operations | | $ | 2,809,278 | | | $ | 12,598,714 | | | $ | 17,759,894 | | | $ | 6,014,129 | | |
See accompanying Notes to Financial Statements.
2007 Semiannual Report
First American Mortgage Funds
11
Financial STATEMENTS continued
Statements of Changes in Net Assets
| | | American Strategic
Income Portfolio | | American Strategic
Income Portfolio II | |
| | | Six-Month
Period Ended
2/28/07
(unaudited) | | Year Ended
8/31/06 | | Six-Month
Period Ended
2/28/07
(unaudited) | | Year Ended
8/31/06 | |
| Operations: | |
| Net investment income | | $ | 1,694,408 | | | $ | 3,473,952 | | | $ | 7,629,155 | | | $ | 14,907,279 | | |
| Net realized gain (loss) on investments in securities | | | 19,464 | | | | 42,856 | | | | 820,116 | | | | 600,803 | | |
| Net change in unrealized appreciation or depreciation of investments in securities | | | 1,095,406 | | | | (1,597,776 | ) | | | 4,149,443 | | | | (4,372,789 | ) | |
| Net increase in net assets resulting from operations | | | 2,809,278 | | | | 1,919,032 | | | | 12,598,714 | | | | 11,135,293 | | |
| Distributions to shareholders (note 2): | |
| From net investment income | | | (1,905,157 | ) | | | (3,110,029 | ) | | | (6,565,665 | ) | | | (14,866,740 | ) | |
| From net realized gain on investments in securities | | | — | | | | — | | | | — | | | | — | | |
| Total distributions | | | (1,905,157 | ) | | | (3,110,029 | ) | | | (6,565,665 | ) | | | (14,866,740 | ) | |
| Total increase (decrease) in net assets | | | 904,121 | | | | (1,190,997 | ) | | | 6,033,049 | | | | (3,731,447 | ) | |
| Net assets at beginning of period | | | 51,092,067 | | | | 52,283,064 | | | | 190,539,004 | | | | 194,270,451 | | |
| Net assets at end of period | | $ | 51,996,188 | | | $ | 51,092,067 | | | $ | 196,572,053 | | | $ | 190,539,004 | | |
| Undistributed (distributions in excess of) net investment income | | $ | (5,583 | ) | | $ | 205,166 | | | $ | 2,137,322 | | | $ | 1,073,832 | | |
See accompanying Notes to Financial Statements.
2007 Semiannual Report
First American Mortgage Funds
12
| | | American Strategic
Income Portfolio III | | American
Select Portfolio | |
| | | Six-Month
Period Ended
2/28/07
(unaudited) | | Year Ended
8/31/06 | | Six-Month
Period Ended
2/28/07
(unaudited) | | Year Ended
8/31/06 | |
| Operations: | |
| Net investment income | | $ | 11,364,834 | | | $ | 21,472,124 | | | $ | 4,776,072 | | | $ | 9,975,934 | | |
| Net realized gain (loss) on investments in securities | | | (356,836 | ) | | | 1,726,513 | | | | 28,598 | | | | 1,238,090 | | |
| Net change in unrealized appreciation or depreciation of investments in securities | | | 6,751,896 | | | | (7,119,011 | ) | | | 1,209,459 | | | | (2,789,509 | ) | |
| Net increase in net assets resulting from operations | | | 17,759,894 | | | | 16,079,626 | | | | 6,014,129 | | | | 8,424,515 | | |
| Distributions to shareholders (note 2): | |
| From net investment income | | | (15,805,379 | ) | | | (16,871,262 | ) | | | (6,009,000 | ) | | | (11,621,793 | ) | |
| From net realized gain on investments in securities | | | (1,450,715 | ) | | | (10,037 | ) | | | (1,033,380 | ) | | | (1,531,837 | ) | |
| Total distributions | | | (17,256,094 | ) | | | (16,881,299 | ) | | | (7,042,380 | ) | | | (13,153,630 | ) | |
| Total increase (decrease) in net assets | | | 503,800 | | | | (801,673 | ) | | | (1,028,251 | ) | | | (4,729,115 | ) | |
| Net assets at beginning of period | | | 257,243,290 | | | | 258,044,963 | | | | 139,913,118 | | | | 144,642,233 | | |
| Net assets at end of period | | $ | 257,747,090 | | | $ | 257,243,290 | | | $ | 138,884,867 | | | $ | 139,913,118 | | |
| Undistributed (distributions in excess of) net investment income | | $ | 457,022 | | | $ | 4,897,567 | | | $ | 511,095 | | | $ | 1,744,023 | | |
See accompanying Notes to Financial Statements.
2007 Semiannual Report
First American Mortgage Funds
13
Financial STATEMENTS concluded
Statements of Cash Flows For the Six-Month Period Ended February 28, 2007 (unaudited)
| | | American
Strategic
Income
Portfolio | | American
Strategic
Income
Portfolio II | | American
Strategic
Income
Portfolio III | | American
Select
Portfolio | |
| Cash flows from operating activities: | |
| Net increase in net assets resulting from operations | | $ | 2,809,278 | | | $ | 12,598,714 | | | $ | 17,759,894 | | | $ | 6,014,129 | | |
Adjustments to reconcile net increase in net assets resulting from
operations to net cash provided by (used in) operating activities: | |
| Purchases of investments | | | (7,390,748 | ) | | | (104,543,942 | ) | | | (68,545,415 | ) | | | (37,197,400 | ) | |
| Proceeds from paydowns and sales of investments in securities | | | 8,982,271 | | | | 106,917,236 | | | | 82,774,508 | | | | 38,475,535 | | |
| Net purchases/sales of short-term securities | | | 254,611 | | | | 8,649,469 | | | | (4,994,970 | ) | | | 1,812,372 | | |
| Net amortization/accretion of bond discount and premium | | | 834 | | | | 5,408 | | | | 3,077 | | | | 2,821 | | |
| Net change in unrealized appreciation or depreciation of investments in securities | | | (1,095,406 | ) | | | (4,149,443 | ) | | | (6,751,896 | ) | | | (1,209,459 | ) | |
| Net realized gain/loss on investments | | | (19,464 | ) | | | (820,116 | ) | | | 356,836 | | | | (28,598 | ) | |
| Increase/decrease in accrued interest receivable | | | 13,775 | | | | 55,440 | | | | (98,189 | ) | | | 80,773 | | |
| Increase/decrease in prepaid expenses and other assets | | | (33,706 | ) | | | 160,707 | | | | (58,025 | ) | | | (39,205 | ) | |
| Increase/decrease in accrued fees and expenses | | | 11,072 | | | | (94,803 | ) | | | (29,326 | ) | | | 56,864 | | |
| Net cash provided by (used in) operating activities | | | 3,532,517 | | | | 18,778,670 | | | | 20,416,494 | | | | 7,967,832 | | |
| Cash flows from financing activities: | |
| Net proceeds for (payments from) reverse repurchase agreements | | | (1,624,412 | ) | | | (12,179,140 | ) | | | (3,308,245 | ) | | | (1,043,651 | ) | |
| Distributions paid to shareholders | | | (1,905,157 | ) | | | (6,565,665 | ) | | | (17,256,094 | ) | | | (7,042,380 | ) | |
| Net cash provided by (used in) financing activities | | | (3,529,569 | ) | | | (18,744,805 | ) | | | (20,564,339 | ) | | | (8,086,031 | ) | |
| Net increase/decrease in cash | | | 2,948 | | | | 33,865 | | | | (147,845 | ) | | | (118,199 | ) | |
| Cash (bank overdraft) at beginning of period | | | (21,335 | ) | | | 51,058 | | | | 135,638 | | | | 18,946 | | |
| Cash (bank overdraft) at end of period | | $ | (18,387 | ) | | $ | 84,923 | | | $ | (12,207 | ) | | $ | (99,253 | ) | |
Supplemental disclosure of cash flow information:
Cash paid for interest | | $ | 524,572 | | | $ | 1,336,689 | | | $ | 1,256,935 | | | $ | 1,163,277 | | |
See accompanying Notes to Financial Statements.
2007 Semiannual Report
First American Mortgage Funds
14
Notes to Financial STATEMENTS (unaudited as to February 28, 2007)
(1) Organization
American Strategic Income Portfolio Inc. ("ASP"), American Strategic Income Portfolio Inc. II ("BSP"), American Strategic Income Portfolio Inc. III ("CSP"), and American Select Portfolio Inc. ("SLA") (the "funds") are registered under the Investment Company Act of 1940 (as amended) as diversified, closed-end management investment companies. The funds emphasize investments in mortgage-related assets that directly or indirectly represent a participation in or are secured by and payable from mortgage loans. They may also invest in U.S. government securities, corporate debt securities, preferred stock issued by real estate investment trusts, and mortgage servicing rights. In addition, the funds may borrow using reverse repurchase agreements and revolvi ng credit facilities. Fund shares are listed on the New York Stock Exchange under the symbols ASP, BSP, CSP, and SLA, respectively.
(2) Summary of Significant Accounting Policies
Security Valuations
Security valuations for the funds' investments (other than whole loans, participation mortgages, and mortgage servicing rights) are furnished by an independent pricing service that has been approved by the funds' board of directors. Investments in equity securities that are traded on a national securities exchange are stated at the last quoted sales price if readily available for such securities on each business day. For securities traded on the Nasdaq national market system, the funds utilize the Nasdaq Official Closing Price which compares the last trade to the bid/ask price of a security. If the last trade falls within the bid/ask range, then that price will be the closing price. If the last trade is outside the bid/ask range, and falls above the ask, the ask price will be the closing price. If the last trade is below the bid, the bid will be the closing price. Other equity securities traded in the over-the-counter market and listed equity securities for which no sale was reported on that date are stated at the last quoted bid price. Debt obligations exceeding 60 days to maturity are valued by an independent pricing service. The pricing service may employ methodologies that utilize actual market transactions, broker-dealer supplied valuations, or other formula-driven valuation techniques. These techniques generally consider such factors as yields or prices of bonds of comparable quality, type of issue, coupon, maturity, ratings, and general market conditions. Securities for which prices are not available from an independent pricing service but where an active market exists are valued using market quotations obtained from one or more dealers that make markets in the securities or from a widely-used quotation system. When market quotations are not readily available, securities are valued at fair value as determined in good faith by procedures established and approved by the funds' board of directors. Some of the factors which may be considered in determining fair value are fundamental analytical data relating to the investment; the nature and duration of any restrictions on disposition; trading in similar securities of the same issuer or comparable companies; information from broker-dealers; and an evaluation of the forces that influence the market in which the security is purchased or sold. If events occur that materially affect the value of securities (including non-U.S. securities) between the close of trading in those securities and the close of regular trading on the New York Stock Exchange, the securities will be valued at fair value. Debt obligations with 60 days or less remaining until maturity may be valued at their amortized cost which approximates market value. Security valuations are performed once a week and at the end of each month.
The funds' investments in whole loans (single family, multifamily, and commercial), participation mortgages, and mortgage servicing rights are generally not traded in any organized market and therefore, market quotations are not readily available. These investments are valued at fair value according to procedures adopted by the funds' board of directors. Pursuant to these procedures, whole loan investments are initially valued at cost and their values are subsequently monitored and adjusted using a FAF Advisors, Inc. ("FAF Advisors") pricing model designed to incorporate, among other things, the present value of the projected stream of cash flows on such investments.
2007 Semiannual Report
First American Mortgage Funds
15
Notes to Financial STATEMENTS continued
The pricing model takes into account a number of relevant factors including the projected rate of prepayments, the delinquency profile, the historical payment record, the expected yield at purchase, changes in prevailing interest rates, and changes in the real or perceived liquidity of whole loans, participation mortgages or mortgage servicing rights, as the case may be. The results of the pricing model may be further subject to price ceilings due to the illiquid nature of the loans. Changes in prevailing interest rates, real or perceived liquidity, yield spreads, and creditworthiness are factored into the pricing model each week.
Certain mortgage loan information is received once a month. This information includes, but is not limited to, the projected rate of prepayments, projected rate and severity of defaults, the delinquency profile, and the historical payment record. Valuations of whole loans, participation mortgages, and mortgage servicing rights are determined no less frequently than weekly. Although FAF Advisors believes the pricing model to be reasonable and appropriate, the actual values that may be realized upon the sale of whole loans, participation mortgages, and mortgage servicing rights can only be determined in negotiations between the funds and third parties.
As of February 28, 2007, ASP, BSP, CSP, and SLA had fair valued securities with values of $48,431,524, $165,124,581, $230,351,169, and $137,581,468, respectively, or 93.1%, 84.0%, 89.4%, and 99.1% of net assets, respectively.
Security Transactions and Investment Income
For financial statement purposes, the funds record security transactions on the trade date of the security purchase or sale. Dividend income is recorded on the ex-dividend date. Interest income, including accretion of bond discounts and amortization of bond premiums, is recorded on the accrual basis. Security gains and losses are determined on the basis of identified cost, which is the same basis used for federal income tax purposes.
Whole Loans and Participation Mortgages
Whole loans and participation mortgages may bear a greater risk of loss arising from a default on the part of the borrower of the underlying loans than do traditional mortgage-backed securities. This is because whole loans and participation mortgages, unlike most mortgage-backed securities, generally are not backed by any government guarantee or private credit enhancement. Such risk may be greater during a period of declining or stagnant real estate values. The funds may invest in single family, multifamily, and commercial loans. Each fund currently limits its investment in commercial loans to 50% of its total assets.
At February 28, 2007, ASP had one loan representing 0.02% of net assets that was 120 or more days delinquent as to the timely monthly payment of principal and interest. This delinquency relates soley to a single family whole loan and represents 1.00% of total single family loans outstanding at February 28, 2007. At February 28, 2007, no multifamily or commercial loans in ASP were delinquent.
At February 28, 2007, BSP had five loans representing 4.45% of net assets that were 120 or more days delinquent as to the timely monthly payment of principal and interest. These delinquencies relate to multifamily whole loans and represent 12.77% of total multifamily loans outstanding at February 28, 2007. At February 28, 2007, no commercial loans in BSP were delinquent, and no single family loans in CSP were 120 or more days deliquent.
At February 28, 2007, CSP had four loans representing 6.75% of net assets that were 120 or more days delinquent as to the timely monthly payment of principal and interest. These delinquencies
2007 Semiannual Report
First American Mortgage Funds
16
relate to multifamily whole loans and represent 19.31% of total multifamily loans outstanding at February 28, 2007. At February 28, 2007, no single family or commercial loans in CSP were delinquent.
At February 28, 2007, SLA had two loans representing 4.69% of net assets that were 120 or more days delinquent as to the timely monthly payment of principal and interest. These delinquencies relate to multifamily whole loans and represent 12.78% of total multifamily loans outstanding at February 28, 2007. At February 28, 2007, no commercial loans in SLA were delinquent.
The funds may incur certain costs and delays in the event of a foreclosure. Also, there is no assurance that the subsequent sale of the property will produce an amount equal to the sum of the unpaid principal balance of the loan as of the date the borrower went into default, the accrued unpaid interest, and all of the foreclosure expenses. In this case, the funds may suffer a loss. In accordance with the valuation procedures adopted by the funds' board of directors, real estate acquired through foreclosure, if any, is valued at estimated market value, as determined by independent third party appraisals, less estimated selling costs. As material capital improvements are made to the property, new market value appraisals are obtained.
The funds may receive rental or other income as a result of holding real estate. In addition, the funds may incur expenses associated with maintaining or improving any real estate owned. As of February 28, 2007, BSP held real estate owned through foreclosure as follows:
| Property Description | | 2/28/07 Cost | | 2/28/07
Value | | Unrealized
Depreciation | |
| Hidden Woods Apartment Building | | $ | 13,751,064 | | | $ | 9,409,000 | | | $ | (4,342,064 | ) | |
| Sussex Club Apartment Building | | | 10,675,864 | | | | 9,275,000 | | | | (1,400,864 | ) | |
| Total | | $ | 24,426,928 | | | $ | 18,684,000 | | | $ | (5,742,928 | ) | |
The income and capital improvements for the six-month period ended February 28, 2007 were:
| Property Description | | Gross Rental
Income | | Operating
Expenses | | Net Operating
Income
(Loss) | | Capital
Improvements | |
| Hidden Woods Apartment Building | | $ | 965,140 | | | $ | 1,024,582 | | | $ | (59,442 | ) | | $ | 201,529 | | |
| Sussex Club Apartment Building | | | 654,262 | | | | 608,929 | | | | 45,333 | | | | 160,628 | | |
| Total | | $ | 1,619,402 | | | $ | 1,633,511 | | | $ | (14,109 | ) | | $ | 362,157 | | |
Real estate income is recorded on a net basis in the income section of the funds' Statements of Operations. Capital improvements are recorded as an addition to the cost basis of the property, which will increase any unrealized depreciation. Total unrealized depreciation on the properties is recorded in the funds' Statements of Assets and Liabilities under the "unrealized depreciation of investments in securities" caption.
As of and for the six-month period ended February 28, 2007, ASP, CSP, and SLA owned no real estate.
Mortgage Servicing Rights
The funds may acquire interests in the cash flow from servicing fees through contractual arrangements with mortgage services. Mortgage servicing rights, similar to interest-only securities, generate no further cash flow when a mortgage is prepaid or goes into default. Mortgage servicing rights are accounted for on a level-yield basis with recognized income based on the estimated amounts and timing of cash flows. Such estimates are adjusted periodically as the underlying market conditions change. As of and for the six-month period ended February 28, 2007, no fund held mortgage servicing rights.
2007 Semiannual Report
First American Mortgage Funds
17
Notes to Financial STATEMENTS continued
Reverse Repurchase Agreements
Reverse repurchase agreements involve the sale of portfolio-eligible securities by the funds, coupled with an agreement to repurchase the securities at a specified date and price. Reverse repurchase agreements may increase volatility of the funds' net asset values and involve the risk that interest costs on money borrowed may exceed the return on securities purchased with that borrowed money. Reverse repurchase agreements are considered to be borrowings by the funds, and are subject to the funds' overall restriction on borrowing under which each fund must maintain asset coverage of at least 300%. For the six-month period ended February 28, 2007, the weighted average borrowings outstanding for ASP, BSP, CSP, and SLA were $16,700,459, $37,454,765, $36,891,650, and $35,897,707, respectively, and the weighted average interest rates paid by the funds on such borrowings were 5.81%, 6.07%, 5.81%, and 6.15%, respectively.
Securities Purchased on a When-Issued Basis
Delivery and payment for securities that have been purchased by the funds on a when-issued or forward-commitment basis can take place a month or more after the transaction date. Such securities do not earn interest, are subject to market fluctuation and may increase or decrease in value prior to their delivery. Each fund segregates, with its custodian, assets with a market value equal to the amount of its purchase commitments. The purchase of securities on a when-issued or forward-commitment basis may increase the volatility of a fund's net asset value if the fund makes such purchases while remaining substantially fully invested. As of February 28, 2007, the funds had no outstanding when-issued or forward-commitment securities.
Federal Taxes
Each fund is treated as a seperate taxable entity. Each fund intends to continue to qualify as a regulated investment company as provided in Subchapter M of the Internal Revenue Code, as amended, and to distribute all taxable income, if any, to its shareholders. Accordingly, no provision for federal income taxes is required. Each fund also intends to distribute its taxable net investment income and realized gains, if any, to avoid the payment of any federal excise taxes.
Net investment income and net realized gains and losses may differ for financial statement and tax purposes. These differences are primarily due to deferred wash sales losses, paydown gains and losses, tax mark-to-market adjustments under Section 311(e) of the Taxpayer Relief Act of 1997, tax deductions for real estate owned and investments in REITS. The character of distributions made during the fiscal period from net investment income or net realized gains may differ from its ultimate characterization for federal income tax purposes. In addition, due to the timing of dividend distributions, the fiscal period in which amounts are distributed may differ from the fiscal period that income or realized gains or losses were recorded by the funds.
The tax character of distributions paid during the six-month period ended February 28, 2007 (estimated) and fiscal year ended August 31, 2006, were as follows:
| | | American Strategic
Income Portfolio | | American Strategic
Income Portfolio II | |
| | | Six-Month
Period Ended
2/28/07 | | Year Ended
8/31/06 | | Six-Month
Period Ended
2/28/07 | | Year Ended
8/31/06 | |
| Distributions paid from: | |
| Ordinary income | | $ | 1,905,157 | | | $ | 3,110,029 | | | $ | 6,565,665 | | | $ | 14,866,740 | | |
| Long-term capital gains | | | — | | | | — | | | | — | | | | — | | |
| Total | | $ | 1,905,157 | | | $ | 3,110,029 | | | $ | 6,565,665 | | | $ | 14,866,740 | | |
2007 Semiannual Report
First American Mortgage Funds
18
The tax character of distributions paid during the six-month period ended February 28, 2007 (estimated) and the fiscal year ended August 31, 2006, were as follows:
| | | American Strategic
Income Portfolio III | | American Select
Portfolio | |
| | | Six-Month
Period Ended
2/28/07 | | Year Ended
8/31/06 | | Six-Month
Period Ended
2/28/07 | | Year Ended
8/31/06 | |
| Distributions paid from: | |
| Ordinary income | | $ | 16,050,973 | | | $ | 16,871,262 | | | $ | 6,043,012 | | | $ | 11,621,793 | | |
| Long-term capital gains | | | 1,205,121 | | | | 10,037 | | | | 999,368 | | | | 1,531,837 | | |
| Total | | $ | 17,256,094 | | | $ | 16,881,299 | | | $ | 7,042,380 | | | $ | 13,153,630 | | |
At August 31, 2006, the components of accumulated deficit on a tax basis were as follows:
| | | American Strategic
Income Portfolio | | American Strategic
Income Portfolio II | | American Strategic
Income Portfolio III | | American Select
Portfolio | |
| Undistributed ordinary income | | $ | 202,763 | | | $ | 696,401 | | | $ | 4,897,515 | | | $ | 1,744,023 | | |
| Undistributed long-term capital gains | | | — | | | | — | | | | 1,048,544 | | | | 999,300 | | |
| Accumulated capital and post-October losses | | | (1,787,987 | ) | | | (7,187,580 | ) | | | — | | | | — | | |
| Unrealized depreciation | | | (1,543,855 | ) | | | (10,206,526 | ) | | | (12,671,565 | ) | | | (2,760,324 | ) | |
| Accumulated deficit | | $ | (3,129,079 | ) | | $ | (16,697,705 | ) | | $ | (6,725,506 | ) | | $ | (17,001 | ) | |
The difference between book basis and tax basis unrealized appreciation (depreciation) and accumulated realized gains (losses) at February 28, 2007, is attributable to a one-time tax election whereby the funds marked appreciated securities to market creating capital gains that were used to reduce capital loss carryovers and increase tax cost basis.
Distributions to Shareholders
Distributions from net investment income are declared and paid on a monthly basis. Any net realized capital gains on sales of securities for the funds are distributed to shareholders at least annually. These distributions are recorded as of the close of business on the ex-dividend date. Such distributions are payable in cash or, pursuant to the funds' dividend reinvestment plans, reinvested in additional shares of the funds' capital stock. Under each fund's plan, fund shares will be purchased in the open market unless the market price plus commissions exceeds the net asset value by 5% or more. If, at the close of business on the dividend payment date, the shares purchased in the open market are insufficient to satisfy the dividend reinvestment requirement, the funds will issue new shares at a discount of up to 5% from the current market price.
Repurchase Agreements and Other Short-Term Securities
For repurchase agreements entered into with certain broker-dealers, the funds, along with other affiliated registered investment companies, may transfer uninvested cash balances into a joint trading account, the daily aggregate of which is invested in repurchase agreements secured by U.S. government or agency obligations. Securities pledged as collateral for all individual and joint repurchase agreements are held by the funds' custodian bank until maturity of the repurchase agreement. All agreements require that the daily market value of the collateral be in excess of the repurchase amount, including accrued interest, to protect the funds in the event of a default. As of February 28, 2007, the funds had no outstanding repurchase agreements.
2007 Semiannual Report
First American Mortgage Funds
19
Notes to Financial STATEMENTS continued
Deferred Compensation Plan
Under a Deferred Compensation Plan (the "Plan"), non-interested directors of the First American Family of Funds may participate and elect to defer receipt of part or all of their annual compensation. Deferred amounts are treated as though equivalent dollar amounts had been invested in shares of open-end First American Funds, preselected by each Director. All amounts in the Plan are 100% vested and accounts under the Plan are obligations of the funds. Deferred amounts remain in the funds until distributed in accordance with the Plan.
Use of Estimates in Preparation of Financial Statements
The preparation of financial statements, in conformity with U.S. generally accepted accounting principles, requires management to make estimates and assumptions that affect the reported amounts of assets and liabilities and the disclosure of contingent assets and liabilities at the date of the financial statements and the results of operations during the reporting period. Actual results could differ from these estimates.
(3) Expenses
Investment Advisory Fees
Pursuant to investment advisory agreements with each fund (each an "Agreement"), FAF Advisors, a subsidiary of U.S. Bank National Association ("U.S. Bank"), manages the funds' assets and furnishes related office facilities, equipment, research, and personnel. For ASP, BSP, and CSP, the Agreement provides FAF Advisors with a monthly investment advisory fee in an amount equal to an annualized rate of 0.20% of the respective fund's average weekly net assets and 4.50% of the daily gross income accrued by such fund during the month (i.e., investment income, including accretion of bond discounts and amortization of premiums, other than gains from the sale of securities or gains from options and futures contracts less interest on money borrowed by the funds). The monthly investment advisory fee shall not exceed, in the aggregate, 1/12 of 0.725% of the respective fund's average weekly net assets during the month (approximately 0.725% on an annual basis). For SLA, the Agreement provides FAF Advisors with a monthly investment advisory fee in an amount equal to an annualized rate of 0.50% of the fund's average weekly net assets. For its fees, FAF Advisors provides investment advice and, in general, conducts the management and investment activities of the funds.
The funds may invest in money market funds that are series of First American Funds, Inc. ("FAF"), subject to certain limitations. In order to avoid the payment of duplicative investment advisory fees to FAF Advisors, which acts as the investment advisor to these funds and the related money market funds, FAF Advisors will reimburse to each fund an amount equal to the investment advisory fees received from the related money market funds that are attributable to the assets of that fund. For financial statement purposes, this reimbursement is recorded as investment income.
Administrative Fees
FAF Advisors serves as the funds' administrator pursuant to administration agreements between FAF Advisors and each fund. Under these agreements, FAF Advisors receives a monthly administrative fee from each fund in an amount equal to 0.25% of the fund's average weekly net assets. For its fee, FAF Advisors provides numerous services to the funds including, but not limited to, handling the general business affairs, financial and regulatory reporting, and various other services.
Custodian Fees
U.S. Bank serves as each fund's custodian pursuant to a custodian agreement with the funds. The custodian fee charged to each fund is equal to an annual rate of 0.02% of such fund's average weekly net assets. These fees are computed weekly and paid monthly.
2007 Semiannual Report
First American Mortgage Funds
20
Under the custodian agreement, interest earned on uninvested cash balances is used reduce the respective fund's custodian expenses. These credits, if any, are disclosed as "Indirect payments from the custodian" in the Statement of Operations. Conversely, the custodian charges a fee for any cash overdrafts incurred, which increases the respective the fund's custodian expenses. For the six-month period ended February 28, 2007, custodian fees for ASP, BSP, CSP, and SLA were increased by $302, $1,027, $1,896, and $2,262 as a result of overdrafts and reduced by $1,132, $6,796, $7,331, and $3,586 as a result of interest earned, respectively.
Mortgage Servicing Fees
The funds may enter into mortgage servicing agreements with mortgage servicers for whole loans and participation mortgages. For a fee, mortgage servicers maintain loan records, such as insurance and taxes and the proper allocation of payments between principal and interest.
Other Fees and Expenses
In addition to the investment advisory, administrative, custodian, and mortgage servicing fees, the funds are responsible for paying most other operating expenses, including: legal, auditing and accounting services, postage and printing of shareholder reports, transfer agent fees and expenses, listing fees, outside directors' fees and expenses, insurance, interest, expenses related to real estate owned, fees to outside parties retained to assist in conducting due diligence, taxes, and other miscellaneous expenses. For the six-month period ended February 28, 2007, legal fees and expenses of $4,562, $4,905, $5,058, and $4,777 for ASP, BSP, CSP, and SLA, respectively, were paid to a law firm of which an Assistant Secretary of the funds is a partner.
Expenses that are directly related to a fund are charged directly to that fund. Other operating expenses of the First American Family of Funds are allocated to the funds on several bases, including evenly across all funds, allocated based on relative net assets of all funds within the First American Family of Funds or a combination of both methods.
(4) Investment Security Transactions
Cost of purchases and proceeds from sales of securities and real estate, other than temporary investments in short-term securities, for the six-month period ended February 28, 2007, were as follows:
| | | Cost of Purchases | | Proceeds from Sales | |
| American Strategic Income Portfolio | | $ | 7,390,748 | | | $ | 8,982,271 | | |
| American Strategic Income Portfolio II | | | 104,543,942 | | | | 106,917,236 | | |
| American Strategic Income Portfolio III | | | 68,545,415 | | | | 82,774,508 | | |
| American Select Portfolio | | | 37,197,400 | | | | 38,475,535 | | |
Included in proceeds from sales for ASP, BSP, CSP, and SLA were $52,380, $905,984, $539,360, and $28,597, respectively, from prepayment penalties.
2007 Semiannual Report
First American Mortgage Funds
21
Notes to Financial STATEMENTS continued
(5) Capital Loss Carryover
For federal income tax purposes, the funds had capital loss carryovers at August 31, 2006, the funds' most recently completed fiscal year-end, which, if not offset by subsequent capital gains, will expire on the funds' fiscal year-ends as follows:
| | | Expiration | |
| | | 2007 | | 2008 | | 2009 | | 2010 | | 2011 | | 2012 | | 2013 | | 2014 | | Total | |
| American Strategic Income Portfolio | | $ | — | | | $ | 755,894 | | | $ | — | | | $ | 737,067 | | | $ | 267,385 | | | $ | — | | | $ | 27,641 | | | $ | — | | | $ | 1,787,987 | | |
| American Strategic Income Portfolio II | | | — | | | | — | | | | — | | | | — | | | | 58,161 | | | | — | | | | 753,718 | | | | 4,014,920 | | | | 4,826,799 | | |
| American Strategic Income Portfolio III | | | — | | | | — | | | | — | | | | — | | | | — | | | | — | | | | — | | | | — | | | | — | | |
| American Select Portfolio | | | — | | | | — | | | | — | | | | — | | | | — | | | | — | | | | — | | | | — | | | | — | | |
(6) Indemnifications
The funds enter into contracts that contain a variety of indemnifications. The funds' maximum exposure under these arrangements is unknown. However, the funds have not had prior claims or losses pursuant to these contracts and expect the risk of loss to be remote.
(7) New Accounting Pronouncements
On July 13, 2006, the Financial Accounting Standards Board ("FASB") released FASB Interpretation No. 48 "Accounting for Uncertainty in Income Taxes" ("FIN 48"). FIN 48 provides guidance for how uncertain tax positions should be recognized, measured, presented and disclosed in the financial statements. FIN 48 requires the evaluation of tax positions taken or expected to be taken in the course of preparing a fund's tax returns to determine whether the tax positions are "more-likely-than-not" of being sustained by the applicable tax authority. Tax positions not deemed to meet a more-likely-than-not threshold would be recorded as a tax expense in the current year. Adoption of FIN 48 is required for fiscal years beginning after December 15, 2006 and is to be applied to all open tax years as of the effective date. Recent Securities and Exchange Commission guidance allows implementing FIN 48 in fund net asset value calculations as late as the funds' last net asset value calculation in the first required financial statement reporting period. As a result, the funds will incorporate FIN 48 in their February 28, 2008 semiannual report.
In September 2006, the FASB issued Statement of Financial Accounting Standards No. 157, "Fair Value Measurements" ("FAS 157"). FAS 157 clarifies the definition of fair value and requires additional disclosure about the use of fair value measurements. FAS 157 is effective for financial statements issued for fiscal years beginning after November 15, 2007 and interim periods within those fiscal years. As of February 28, 2007, the funds do not believe the adoption of FAS 157 will impact the amounts reported in the financial statements; however, additional disclosures will be required about the inputs used to develop the measurements of fair value and the effect of certain of the measurements reported in the Statement of Operations for the fiscal period.
(8) Subsequent Events
On March 2, 2007, Hidden Woods Apartment Building, a real estate owned property in BSP was sold. The fund recognized a net realized loss of $4,300,422 on the sale.
On April 18, 2007, Sussex Club Apartment Building, a real estate owned property in BSP was sold. The fund recognized a net realized loss of $1,477,430 on the sale.
2007 Semiannual Report
First American Mortgage Funds
22
(9) Financial Highlights
Per-share data for a share of capital stock outstanding throughout each period and selected information for each period are as follows:
American Strategic Income Portfolio
| | | Six-Month
Period Ended
2/28/07 | | Year Ended | | Nine-Month
Fiscal
Period Ended | | Year Ended November 30, | |
| | | (unaudited) | | 8/31/06 | | 8/31/05 | | 2004 | | 2003 | | 2002 | |
| Per-Share Data | | | | | | | | | | | | | | | | | | | | | | | | | |
| Net asset value, beginning of period | | $ | 12.07 | | | $ | 12.36 | | | $ | 12.64 | | | $ | 12.67 | | | $ | 12.61 | | | $ | 12.63 | | |
| Operations: | |
| Net investment income | | | 0.40 | | | | 0.82 | | | | 0.55 | | | | 0.94 | | | | 0.89 | | | | 0.96 | | |
Net realized and unrealized gains
(losses) on investments | | | 0.27 | | | | (0.37 | ) | | | (0.19 | ) | | | (0.10 | ) | | | 0.04 | | | | 0.05 | | |
| Total from operations | | | 0.67 | | | | 0.45 | | | | 0.36 | | | | 0.84 | | | | 0.93 | | | | 1.01 | | |
| Distributions to shareholders: | |
| From net investment income | | | (0.45 | ) | | | (0.74 | ) | | | (0.62 | ) | | | (0.87 | ) | | | (0.87 | ) | | | (1.03 | ) | |
| From return of capital | | | — | | | | — | | | | (0.02 | ) | | | — | | | | — | | | | — | | |
| Total distributions | | | (0.45 | ) | | | (0.74 | ) | | | (0.64 | ) | | | (0.87 | ) | | | (0.87 | ) | | | (1.03 | ) | |
| Net asset value, end of period | | $ | 12.29 | | | $ | 12.07 | | | $ | 12.36 | | | $ | 12.64 | | | $ | 12.67 | | | $ | 12.61 | | |
| Market value, end of period | | $ | 11.61 | | | $ | 10.94 | | | $ | 11.35 | | | $ | 12.00 | | | $ | 12.80 | | | $ | 12.05 | | |
| Selected Information | | | | | | | | | | | | | | | | | | | | | | | | | |
| Total return, net asset value (a) | | | 5.65 | % (d) | | | 3.73 | % | | | 2.94 | % (d) | | | 6.85 | % | | | 7.65 | % | | | 8.32 | % | |
| Total return, market value (b) | | | 10.39 | % (d) | | | 3.18 | % | | | (0.14 | )% (d) | | | 0.48 | % | | | 13.92 | % | | | 2.32 | % | |
Net assets at end of period
(in millions) | | $ | 52 | | | $ | 51 | | | $ | 52 | | | $ | 54 | | | $ | 54 | | | $ | 53 | | |
Ratio of expenses to average weekly
net assets | | | 3.29 | % (e) | | | 2.10 | % | | | 1.59 | % (e) | | | 1.41 | % | | | 2.00 | % | | | 2.81 | % | |
Ratio of expenses to average weekly net
assets excluding interest expense | | | 1.30 | % (e) | | | 1.02 | % | | | 1.17 | % (e) | | | 1.13 | % | | | 1.39 | % | | | 1.63 | % | |
Ratio of net investment income
to average weekly net assets | | | 13.57 | % (e) | | | 6.76 | % | | | 5.85 | % (e) | | | 7.46 | % | | | 7.08 | % | | | 7.56 | % | |
| Portfolio turnover rate | | | 11 | % | | | 18 | % | | | 10 | % | | | 26 | % | | | 50 | % | | | 18 | % | |
Amount of borrowings outstanding
at end of period (in millions) | | $ | 15 | | | $ | 17 | | | $ | 8 | | | $ | 7 | | | $ | 16 | | | $ | 17 | | |
Per-share amount of borrowings
outstanding at end of period | | $ | 3.63 | | | $ | 4.01 | | | $ | 1.90 | | | $ | 1.64 | | | $ | 3.69 | | | $ | 3.92 | | |
Per-share amount of net assets, excluding
borrowings, at end of period | | $ | 15.92 | | | $ | 16.08 | | | $ | 14.48 | | | $ | 14.28 | | | $ | 16.36 | | | $ | 16.53 | | |
| Asset coverage ratio (c) | | | 439 | % | | | 401 | % | | | 751 | % | | | 872 | % | | | 443 | % | | | 421 | % | |
(a) Assumes reinvestment of distributions at net asset value.
(b) Assumes reinvestment of distributions at actual prices pursuant to the fund's dividend reinvestment plan.
(c) Represents net assets, excluding borrowings, at end of period divided by borrowings outstanding at end of period.
(d) Total return has not been annualized.
(e) Annualized.
2007 Semiannual Report
First American Mortgage Funds
23
Notes to Financial STATEMENTS continued
(9) Financial Highlights
Per-share data for a share of capital stock outstanding throughout each period and selected information for each period are as follows:
American Strategic Income Portfolio II
| | | Six-Month
Period Ended
2/28/07 | | Year Ended | | Three-Month
Fiscal
Period Ended | |
| | | (unaudited) | | 8/31/06 | | 8/31/05 | |
| Per-Share Data | | | | | | | | | | | | | |
| Net asset value, beginning of period | | $ | 11.92 | | | $ | 12.15 | | | $ | 12.41 | | |
| Operations: | |
| Net investment income | | | 0.48 | | | | 0.93 | | | | 0.23 | | |
Net realized and unrealized gains
(losses) on investments | | | 0.31 | | | | (0.23 | ) | | | (0.25 | ) | |
| Total from operations | | | 0.79 | | | | 0.70 | | | | (0.02 | ) | |
| Distributions to shareholders: | |
| From net investment income | | | (0.41 | ) | | | (0.93 | ) | | | (0.24 | ) | |
| Net asset value, end of period | | $ | 12.30 | | | $ | 11.92 | | | $ | 12.15 | | |
| Market value, end of period | | $ | 11.60 | | | $ | 10.76 | | | $ | 11.57 | | |
| Selected Information | | | | | | | | | | | | | |
| Total return, net asset value (a) | | | 6.74 | % (d) | | | 6.02 | % | | | 0.17 | % (d) | |
| Total return, market value (b) | | | 11.78 | % (d) | | | 1.34 | % | | | (1.59 | )% (d) | |
Net assets at end of period
(in millions) | | $ | 197 | | | $ | 191 | | | $ | 194 | | |
Ratio of expenses to average weekly
net assets | | | 2.27 | % (e) | | | 3.01 | % | | | 2.28 | % (e) | |
Ratio of expenses to average weekly net
assets excluding interest expense | | | 1.02 | % (e) | | | 2.05 | % | | | 1.06 | % (e) | |
Ratio of net investment income to
average weekly net assets | | | 7.91 | % (e) | | | 7.80 | % | | | 7.36 | % (e) | |
| Portfolio turnover rate | | | 46 | % | | | 49 | % | | | 8 | % | |
Amount of borrowings outstanding
at end of period (in millions) | | $ | 43 | | | $ | 56 | | | $ | 61 | | |
Per-share amount of borrowings
outstanding at end of period | | $ | 2.72 | | | $ | 3.48 | | | $ | 3.79 | | |
Per-share amount of net assets, excluding
borrowings, at end of period | | $ | 15.02 | | | $ | 15.40 | | | $ | 15.94 | | |
| Asset coverage ratio (c) | | | 553 | % | | | 443 | % | | | 421 | % | |
| | | Year Ended May 31, | |
| | | 2005 | | 2004 | | 2003 | | 2002 | |
| Per-Share Data | | | | | | | | | | | | | | | | | |
| Net asset value, beginning of period | | $ | 12.98 | | | $ | 13.12 | | | $ | 13.29 | | | $ | 13.06 | | |
| Operations: | |
| Net investment income | | | 1.06 | | | | 1.12 | | | | 1.12 | | | | 1.13 | | |
Net realized and unrealized gains
(losses) on investments | | | (0.59 | ) | | | (0.12 | ) | | | (0.15 | ) | | | 0.23 | | |
| Total from operations | | | 0.47 | | | | 1.00 | | | | 0.97 | | | | 1.36 | | |
| Distributions to shareholders: | |
| From net investment income | | | (1.04 | ) | | | (1.14 | ) | | | (1.14 | ) | | | (1.13 | ) | |
| Net asset value, end of period | | $ | 12.41 | | | $ | 12.98 | | | $ | 13.12 | | | $ | 13.29 | | |
| Market value, end of period | | $ | 12.00 | | | $ | 12.84 | | | $ | 13.70 | | | $ | 13.17 | | |
| Selected Information | | | | | | | | | | | | | | | | | |
| Total return, net asset value (a) | | | 3.85 | % | | | 7.95 | % | | | 7.59 | % | | | 10.66 | % | |
| Total return, market value (b) | | | 1.51 | % | | | 2.16 | % | | | 13.51 | % | | | 16.94 | % | |
Net assets at end of period
(in millions) | | $ | 198 | | | $ | 207 | | | $ | 209 | | | $ | 212 | | |
Ratio of expenses to average weekly
net assets | | | 1.78 | % | | | 1.77 | % | | | 2.99 | % | | | 2.30 | % | |
Ratio of expenses to average weekly net
assets excluding interest expense | | | 1.13 | % | | | 1.18 | % | | | 1.68 | % | | | 1.15 | % | |
Ratio of net investment income to
average weekly net assets | | | 8.40 | % | | | 8.61 | % | | | 8.52 | % | | | 8.55 | % | |
| Portfolio turnover rate | | | 44 | % | | | 34 | % | | | 24 | % | | | 46 | % | |
Amount of borrowings outstanding
at end of period (in millions) | | $ | 49 | | | $ | 63 | | | $ | 73 | | | $ | 83 | | |
Per-share amount of borrowings
outstanding at end of period | | $ | 3.09 | | | $ | 3.94 | | | $ | 4.55 | | | $ | 5.18 | | |
Per-share amount of net assets, excluding
borrowings, at end of period | | $ | 15.50 | | | $ | 16.92 | | | $ | 17.67 | | | $ | 18.47 | | |
| Asset coverage ratio (c) | | | 502 | % | | | 429 | % | | | 388 | % | | | 356 | % | |
(a) Assumes reinvestment of distributions at net asset value.
(b) Assumes reinvestment of distributions at actual prices pursuant to the fund's dividend reinvestment plan.
(c) Represents net assets, excluding borrowings, at end of period divided by borrowings outstanding at end of period.
(d) Total return has not been annualized.
(e) Annualized.
2007 Semiannual Report
First American Mortgage Funds
24
(9) Financial Highlights
Per-share data for a share of capital stock outstanding throughout each period and selected information for each period are as follows:
American Strategic Income Portfolio III
| | | Six-Month
Period Ended
2/28/07 | | Year Ended | | Three-Month
Fiscal
Period Ended | |
| | | (unaudited) | | 8/31/06 | | 8/31/05 | |
| Per-Share Data | | | | | | | | | | | | | |
| Net asset value, beginning of period | | $ | 12.04 | | | $ | 12.08 | | | $ | 12.14 | | |
| Operations: | |
| Net investment income | | | 0.53 | | | | 1.01 | | | | 0.23 | | |
Net realized and unrealized gains
(losses) on investments | | | 0.31 | | | | (0.26 | ) | | | (0.08 | ) | |
| Total from operations | | | 0.84 | | | | 0.75 | | | | 0.15 | | |
| Distributions to shareholders: | |
| From net investment income | | | (0.74 | ) | | | (0.79 | ) | | | (0.21 | ) | |
From net realized gain on
investments | | | (0.07 | ) | | | — | (f) | | | — | | |
| Total distributions | | | (0.81 | ) | | | (0.79 | ) | | | (0.21 | ) | |
| Net asset value, end of period | | $ | 12.07 | | | $ | 12.04 | | | $ | 12.08 | | |
| Market value, end of period | | $ | 12.34 | | | $ | 11.20 | | | $ | 11.10 | | |
| Selected Information | | | | | | | | | | | | | |
| Total return, net asset value (a) | | | 7.11 | % (d) | | | 6.45 | % | | | 1.67 | % (d) | |
| Total return, market value (b) | | | 17.80 | % (d) | | | 8.60 | % | | | (4.09 | )% (d) | |
Net assets at end of period
(in millions) | | $ | 258 | | | $ | 257 | | | $ | 258 | | |
Ratio of expenses to average weekly
net assets | | | 1.97 | % (e) | | | 2.20 | % | | | 2.21 | % (e) | |
Ratio of expenses to average weekly net
assets excluding interest expense | | | 1.07 | % (e) | | | 0.96 | % | | | 1.06 | % (e) | |
Ratio of net investment income to
average weekly net assets | | | 8.82 | % (e) | | | 8.39 | % | | | 7.49 | % (e) | |
| Portfolio turnover rate | | | 24 | % | | | 56 | % | | | 13 | % | |
Amount of borrowings outstanding
at end of period (in millions) | | $ | 51 | | | $ | 54 | | | $ | 62 | | |
Per-share amount of borrowings
outstanding at end of period | | $ | 2.38 | | | $ | 2.54 | | | $ | 2.93 | | |
Per-share amount of net assets, excluding
borrowings, at end of period | | $ | 14.45 | | | $ | 14.58 | | | $ | 14.82 | | |
| Asset coverage ratio (c) | | | 607 | % | | | 575 | % | | | 513 | % | |
| | | Year Ended May 31, | |
| | | 2005 | | 2004 | | 2003 | | 2002 | |
| Per-Share Data | | | | | | | | | | | | | | | | | |
| Net asset value, beginning of period | | $ | 12.40 | | | $ | 12.52 | | | $ | 12.55 | | | $ | 12.37 | | |
| Operations: | |
| Net investment income | | | 0.98 | | | | 1.04 | | | | 1.07 | | | | 1.08 | | |
Net realized and unrealized gains
(losses) on investments | | | (0.24 | ) | | | (0.04 | ) | | | (0.05 | ) | | | 0.15 | | |
| Total from operations | | | 0.74 | | | | 1.00 | | | | 1.02 | | | | 1.23 | | |
| Distributions to shareholders: | |
| From net investment income | | | (1.00 | ) | | | (1.12 | ) | | | (1.05 | ) | | | (1.05 | ) | |
From net realized gain on
investments | | | — | | | | — | | | | — | | | | — | | |
| Total distributions | | | (1.00 | ) | | | (1.12 | ) | | | (1.05 | ) | | | (1.05 | ) | |
| Net asset value, end of period | | $ | 12.14 | | | $ | 12.40 | | | $ | 12.52 | | | $ | 12.55 | | |
| Market value, end of period | | $ | 11.79 | | | $ | 12.00 | | | $ | 12.67 | | | $ | 12.43 | | |
| Selected Information | | | | | | | | | | | | | | | | | |
| Total return, net asset value (a) | | | 6.31 | % | | | 8.31 | % | | | 8.44 | % | | | 10.29 | % | |
| Total return, market value (b) | | | 6.64 | % | | | 3.49 | % | | | 11.01 | % | | | 14.04 | % | |
Net assets at end of period
(in millions) | | $ | 259 | | | $ | 265 | | | $ | 267 | | | $ | 268 | | |
Ratio of expenses to average weekly
net assets | | | 1.90 | % | | | 1.68 | % | | | 2.85 | % | | | 2.30 | % | |
Ratio of expenses to average weekly net
assets excluding interest expense | | | 1.12 | % | | | 1.13 | % | | | 1.71 | % | | | 1.15 | % | |
Ratio of net investment income to
average weekly net assets | | | 8.01 | % | | | 8.32 | % | | | 8.55 | % | | | 8.68 | % | |
| Portfolio turnover rate | | | 48 | % | | | 44 | % | | | 20 | % | | | 42 | % | |
Amount of borrowings outstanding
at end of period (in millions) | | $ | 59 | | | $ | 75 | | | $ | 63 | | | $ | 99 | | |
Per-share amount of borrowings
outstanding at end of period | | $ | 2.74 | | | $ | 3.53 | | | $ | 2.93 | | | $ | 4.66 | | |
Per-share amount of net assets, excluding
borrowings, at end of period | | $ | 14.88 | | | $ | 15.93 | | | $ | 15.45 | | | $ | 17.21 | | |
| Asset coverage ratio (c) | | | 543 | % | | | 451 | % | | | 527 | % | | | 369 | % | |
(a) Assumes reinvestment of distributions at net asset value.
(b) Assumes reinvestment of distributions at actual prices pursuant to the fund's dividend reinvestment plan.
(c) Represents net assets, excluding borrowings, at end of period divided by borrowings outstanding at end of period.
(d) Total return has not been annualized.
(e) Annualized.
(f) Amount rounds to $0.00 per share.
2007 Semiannual Report
First American Mortgage Funds
25
Notes to Financial STATEMENTS concluded
(9) Financial Highlights
Per-share data for a share of capital stock outstanding throughout each period and selected information for each period are as follows:
American Select Portfolio
| | | Six-Month
Period Ended
2/28/07 | | Year Ended | | Nine-Month
Fiscal
Period Ended | | Year Ended November 30, | |
| | | (unaudited) | | 8/31/06 | | 8/31/05 | | 2004 | | 2003 | | 2002 | |
| Per-Share Data | | | | | | | | | | | | | | | | | | | | | | | | | |
| Net asset value, beginning of period | | $ | 13.12 | | | $ | 13.57 | | | $ | 13.14 | | | $ | 13.41 | | | $ | 13.48 | | | $ | 13.38 | | |
| Operations: | |
| Net investment income | | | 0.45 | | | | 0.93 | | | | 0.96 | | | | 1.03 | | | | 1.05 | | | | 1.13 | | |
Net realized and unrealized gains
(losses) on investments | | | 0.12 | | | | (0.15 | ) | | | 0.12 | | | | (0.26 | ) | | | (0.04 | ) | | | 0.17 | | |
| Total from operations | | | 0.57 | | | | 0.78 | | | | 1.08 | | | | 0.77 | | | | 1.01 | | | | 1.30 | | |
| Distributions to shareholders: | |
| From net investment income | | | (0.56 | ) | | | (1.09 | ) | | | (0.65 | ) | | | (1.04 | ) | | | (1.08 | ) | | | (1.20 | ) | |
From net realized gain on
investments | | | (0.10 | ) | | | (0.14 | ) | | | — | | | | — | | | | — | | | | — | | |
| Total distributions | | | (0.66 | ) | | | (1.23 | ) | | | (0.65 | ) | | | (1.04 | ) | | | (1.08 | ) | | | (1.20 | ) | |
| Net asset value, end of period | | $ | 13.03 | | | $ | 13.12 | | | $ | 13.57 | | | $ | 13.14 | | | $ | 13.41 | | | $ | 13.48 | | |
| Market value, end of period | | $ | 12.84 | | | $ | 12.12 | | | $ | 12.45 | | | $ | 12.79 | | | $ | 13.64 | | | $ | 12.86 | | |
| Selected Information | | | | | | | | | | | | | | | | | | | | | | | | | |
| Total return, net asset value (a) | | | 4.46 | % (d) | | | 6.12 | % | | | 8.47 | % (d) | | | 5.97 | % | | | 7.72 | % | | | 10.13 | % | |
| Total return, market value (b) | | | 11.59 | % (d) | | | 7.86 | % | | | 2.61 | % (d) | | | 1.44 | % | | | 14.92 | % | | | 3.91 | % | |
Net assets at end of period
(in millions) | | $ | 139 | | | $ | 140 | | | $ | 145 | | | $ | 140 | | | $ | 143 | | | $ | 144 | | |
Ratio of expenses to average weekly
net assets | | | 2.71 | % (e) | | | 2.17 | % | | | 2.31 | % (e) | | | 1.87 | % | | | 2.05 | % | | | 2.82 | % | |
Ratio of expenses to average weekly net
assets excluding interest expense | | | 1.70 | % (e) | | | 0.89 | % | | | 1.02 | % (e) | | | 1.06 | % | | | 1.18 | % | | | 1.47 | % | |
Ratio of net investment income to average
weekly net assets | | | 6.92 | % (e) | | | 7.11 | % | | | 9.77 | % (e) | | | 7.79 | % | | | 7.79 | % | | | 8.41 | % | |
| Portfolio turnover rate | | | 22 | % | | | 32 | % | | | 35 | % | | | 13 | % | | | 38 | % | | | 31 | % | |
Amount of borrowings outstanding
at end of period (in millions) | | $ | 31 | | | $ | 32 | | | $ | 30 | | | $ | 41 | | | $ | 49 | | | $ | 29 | | |
Per-share amount of borrowings
outstanding at end of period | | $ | 2.86 | | | $ | 2.96 | | | $ | 2.82 | | | $ | 3.87 | | | $ | 4.57 | | | $ | 2.67 | | |
Per share amount of net assets, excluding
borrowings, at end of period | | $ | 15.89 | | | $ | 16.08 | | | $ | 16.39 | | | $ | 17.01 | | | $ | 17.98 | | | $ | 16.15 | | |
| Asset coverage ratio (c) | | | 555 | % | | | 543 | % | | | 581 | % | | | 439 | % | | | 394 | % | | | 604 | % | |
(a) Assumes reinvestment of distributions at net asset value.
(b) Assumes reinvestment of distributions at actual prices pursuant to the fund's dividend reinvestment plan.
(c) Represents net assets, excluding borrowings, at end of period divided by borrowings outstanding at end of period.
(d) Total return has not been annualized.
(e) Annualized.
2007 Semiannual Report
First American Mortgage Funds
26
(This page has been left blank intentionally.)
Schedule of INVESTMENTS (unaudited)
American Strategic Income Portfolio February 28, 2007
| Description of Security | | Date
Acquired | | Par Value | | Cost | | Value (a) | |
| (Percentages of each investment category relate to net assets) | |
| U.S. Government Agency Mortgage-Backed Securities — 11.9% | |
| Fixed Rate — 11.9% | |
| Federal Home Loan Mortgage Corporation, | |
| 5.50%, 1/1/18, #E93231 (b) | | | | $ | 752,552 | | | $ | 773,054 | | | $ | 755,935 | | |
| 9.00%, 7/1/30, #C40149 | | | | | 110,334 | | | | 113,072 | | | | 119,684 | | |
| Federal National Mortgage Association, | |
| 6.00%, 10/1/16, #610761 (b) | | | | | 421,859 | | | | 428,893 | | | | 428,921 | | |
| 5.00%, 7/1/18, #724954 (b) | | | | | 1,666,720 | | | | 1,664,665 | | | | 1,648,695 | | |
| 6.50%, 6/1/29, #252497 (b) | | | | | 193,231 | | | | 192,012 | | | | 198,772 | | |
| 7.50%, 3/1/30, #495694 | | | | | 181,967 | | | | 179,203 | | | | 187,316 | | |
| 7.50%, 5/1/30, #535289 (b) | | | | | 39,661 | | | | 38,415 | | | | 41,362 | | |
| 8.00%, 5/1/30, #538266 (b) | | | | | 11,813 | | | | 11,673 | | | | 12,464 | | |
| 6.00%, 5/1/31, #535909 (b) | | | | | 371,141 | | | | 373,105 | | | | 376,277 | | |
| 6.50%, 11/1/31, #613339 (b) | | | | | 182,127 | | | | 185,893 | | | | 187,137 | | |
| 5.50%, 7/1/33, #720735 (b) | | | | | 2,233,872 | | | | 2,208,850 | | | | 2,221,054 | | |
| Total U.S. Government Agency Mortgage-Backed Securities | | | 6,168,835 | | | | 6,177,617 | | |
| Whole Loans and Participation Mortgages (c) (d) — 93.1% | |
| Commercial Loans — 55.0% | |
| Advance Self Storage, Lincoln, NE, 6.13%, 1/1/11 | | 11/29/00 | | | 1,507,936 | | | | 1,507,936 | | | | 1,536,934 | | |
| Buca Restaurant, Maple Grove, MN, 8.63%, 1/1/11 | | 01/01/05 | | | 870,678 | | | | 870,678 | | | | 888,092 | | |
| Dependable Mini-Storage I, Plano, TX, 6.64%, 7/1/11 (b) (e) | | 06/27/06 | | | 2,800,000 | | | | 2,800,000 | | | | 2,909,418 | | |
| Dependable Mini-Storage II, Plano, TX, 11.88%, 7/1/07 (e) | | 06/27/06 | | | 300,000 | | | | 300,000 | | | | 312,000 | | |
| Dixie Highway, Pompano Beach, FL, 6.93%, 9/1/11 | | 08/31/04 | | | 820,365 | | | | 820,365 | | | | 861,384 | | |
| Hampden Medical Office, Englewood, CO, 7.38%, 10/1/12 (b) | | 09/09/02 | | | 1,675,221 | | | | 1,675,221 | | | | 1,541,411 | | |
| Integrity Plaza Shopping Center, Albuquerque, NM, 7.88%, 7/1/12 (b) | | 05/11/04 | | | 2,014,912 | | | | 2,014,912 | | | | 2,115,657 | | |
| Metro Center, Albuquerque, NM, 5.20%, 5/1/09 (b) | | 04/07/04 | | | 2,505,744 | | | | 2,505,744 | | | | 2,493,316 | | |
| Metro Center II, Albuquerque, NM, 7.88%, 5/1/09 | | 03/20/06 | | | 148,579 | | | | 148,579 | | | | 139,585 | | |
| Minikahda Mini Storage IV, Minneapolis, MN, 7.15%, 3/1/11 | | 02/28/06 | | | 1,613,038 | | | | 1,613,038 | | | | 1,661,429 | | |
| Murphy Industrial Building, Irvine, CA, 8.50%, 10/1/07 (b) (e) (f) | | 09/29/04 | | | 1,450,000 | | | | 1,450,000 | | | | 1,457,927 | | |
| Naples Boat Club, Naples, FL, 6.55%, 1/1/17 | | 12/28/06 | | | 1,796,679 | | | | 1,796,679 | | | | 1,817,402 | | |
| Orchard Commons, Englewood, CO, 8.75%, 4/1/11 | | 03/28/01 | | | 976,702 | | | | 976,702 | | | | 966,982 | | |
| Palace Court, Santa Fe, NM, 6.68%, 11/1/11 (b) (e) | | 10/02/06 | | | 1,900,000 | | | | 1,900,000 | | | | 1,976,000 | | |
| Par 3 Office Building, Bend, OR, 6.63%, 8/1/13 (b) (e) | | 08/03/06 | | | 1,900,000 | | | | 1,900,000 | | | | 1,995,000 | | |
| Perkins Restaurant, Maple Grove, MN, 6.38%, 1/1/11 (e) | | 12/23/05 | | | 1,398,987 | | | | 1,398,987 | | | | 1,432,061 | | |
| Rockwood Galleria, Gresham, OR, 7.25%, 2/1/11 | | 01/06/03 | | | 1,539,969 | | | | 1,539,969 | | | | 1,077,978 | | |
| Stephens Center, Missoula, MT, 6.38%, 9/1/10 (b) | | 08/21/03 | | | 1,880,732 | | | | 1,880,732 | | | | 1,932,851 | | |
| Voit Office Building, Orange, CA, 8.13%, 9/1/08 | | 08/17/01 | | | 1,470,339 | | | | 1,470,339 | | | | 1,499,745 | | |
| | | | 28,569,881 | | | | 28,615,172 | | |
| Multifamily Loans — 36.5% | |
| Applewood Manor, Duluth, MN, 8.63%, 1/1/08 | | 12/23/93 | | | 595,256 | | | | 592,279 | | | | 601,208 | | |
| Cascade Village, Cascade Township, MI, 5.25%, 12/1/09 (b) | | 11/23/04 | | | 1,575,853 | | | | 1,575,853 | | | | 1,558,713 | | |
| Forest Club Apartments, Dallas, TX, 11.88%, 5/1/08 (e) | | 04/19/06 | | | 1,720,000 | | | | 1,720,000 | | | | 1,657,784 | | |
| Franklin Woods Apartments, Franklin, NH, 6.00%, 3/1/10 | | 02/24/95 | | | 878,009 | | | | 891,922 | | | | 878,872 | | |
| Hunt Club Apartments, Waco, TX, 5.68%, 7/1/11 (b) | | 06/03/04 | | | 1,200,064 | | | | 1,200,064 | | | | 1,209,633 | | |
| Ironwood Apartments, Tucson, AZ, 8.82%, 4/1/08 (e) (f) | | 03/31/06 | | | 2,975,000 | | | | 2,975,000 | | | | 2,975,000 | | |
| Park Hollywood, Portland, OR, 7.38%, 6/1/12 | | 05/31/02 | | | 1,125,113 | | | | 1,125,113 | | | | 1,181,369 | | |
| Spring Creek Gardens, Plano, TX, 8.45%, 1/1/09 (e) (f) | | 12/22/05 | | | 2,050,000 | | | | 2,050,000 | | | | 2,050,000 | | |
| Steel Lake Apartments, Federal Way, WA, 7.97%, 6/1/08 (e) (f) | | 05/31/05 | | | 3,985,000 | | | | 3,985,000 | | | | 3,786,117 | | |
| Vanderbilt Condominiums, Austin, TX, 8.04%, 10/1/09 | | 09/29/99 | | | 1,106,528 | | | | 1,106,528 | | | | 1,139,724 | | |
| Villa Bonita, Chez Royalle, Fitzhugh Apartments I, Dallas, TX, 7.25%, 3/1/08 (b) (e) (f) | | 02/21/03 | | | 842,517 | | | | 842,517 | | | | 842,517 | | |
| Villa Bonita, Chez Royalle, Fitzhugh Apartments II, Dallas, TX, 9.88%, 3/1/08 (e) | | 02/21/03 | | | 155,288 | | | | 155,288 | | | | 144,916 | | |
| Woodland Garden Apartments, Arlington, WA, 7.38%, 9/1/08 | | 08/26/98 | | | 954,186 | | | | 954,186 | | | | 968,893 | | |
| | | | 19,173,750 | | | | 18,994,746 | | |
See accompanying Notes to Schedule of Investments.
2007 Semiannual Report
First American Mortgage Funds
28
American Strategic Income Portfolio (continued)
| Description of Security | | Date
Acquired | | Par Value/
Shares | | Cost | | Value (a) | |
| Single Family Loans — 1.6% | |
| Aegis II, 2 loans, midwestern United States, 9.66%, 1/28/14 (g) | | 12/28/95 | | $ | 16,887 | | | $ | 14,902 | | | $ | 15,485 | | |
| American Portfolio, 1 loan, California, 4.88%, 10/18/15 | | 07/18/95 | | | 23,060 | | | | 21,968 | | | | 22,872 | | |
| Anivan, 1 loan, Maryland, 5.19%, 4/14/12 | | 06/14/96 | | | 87,445 | | | | 87,995 | | | | 87,566 | | |
| Bank of New Mexico, 1 loan, New Mexico, 6.23%, 3/31/10 | | 03/01/04 | | | 37,937 | | | | 37,234 | | | | 38,538 | | |
| Bluebonnet Savings and Loan, 6 loans, Texas, 6.66%, 8/31/10 | | 05/22/92 | | | 155,991 | | | | 142,862 | | | | 154,859 | | |
| Bluebonnet Savings and Loan II, 1 loan, Texas, 11.50%, 8/31/10 | | 05/22/92 | | | 3,105 | | | | 3,056 | | | | 2,902 | | |
| CLSI Allison Wiliams, 2 loans, Texas, 9.38%, 8/1/17 | | 02/28/92 | | | 12,045 | | | | 10,771 | | | | 11,988 | | |
| Cross Roads Savings and Loan, 1 loan, Oklahoma, 6.25%, 1/1/21 | | 01/07/92 | | | 36,885 | | | | 34,883 | | | | 37,992 | | |
| Cross Roads Savings and Loan II, 2 loans, Oklahoma, 8.34%, 1/1/21 (g) | | 01/07/92 | | | 22,496 | | | | 20,898 | | | | 21,190 | | |
| Fairbanks, 1 loan, Utah, 5.50%, 9/23/15 | | 05/21/92 | | | 20,800 | | | | 17,648 | | | | 20,168 | | |
| First Boston Mortgage Pool, 5 loans, United States, 9.04%, 11/5/07 | | 06/23/92 | | | 31,807 | | | | 26,341 | | | | 32,462 | | |
| Knutson Mortgage Portfolio I, 2 loans, midwestern United States, 9.37%, 8/1/17 | | 02/26/92 | | | 148,807 | | | | 141,084 | | | | 153,271 | | |
| McClemore, Matrix Funding Corporation, 1 loan, North Carolina, 10.50%, 9/30/12 | | 09/09/92 | | | 45,799 | | | | 43,515 | | | | 47,173 | | |
| Nomura III, 4 loans, midwestern United States, 8.20%, 4/29/17 | | 09/29/95 | | | 111,264 | | | | 100,813 | | | | 110,824 | | |
| Rand Mortgage Corporation, 2 loans, Texas, 9.50%, 8/1/17 | | 07/01/02 | | | 62,443 | | | | 51,390 | | | | 64,316 | | |
| | | | 755,360 | | | | 821,606 | | |
| Total Whole Loans and Participation Mortgages | | | 48,498,991 | | | | 48,431,524 | | |
| Preferred Stocks– 21.5% | |
| Real Estate Investment Trusts — 21.5% | |
| AMB Property, Series L (b) | | | | | 14,500 | | | | 359,755 | | | | 360,760 | | |
| AMB Property, Series M (b) | | | | | 5,600 | | | | 139,850 | | | | 140,280 | | |
| BRE Properties, Series B (b) | | | | | 20,500 | | | | 539,150 | | | | 522,545 | | |
| BRE Properties, Series C (b) | | | | | 400 | | | | 10,216 | | | | 10,060 | | |
| BRE Properties, Series D (b) | | | | | 400 | | | | 10,180 | | | | 10,040 | | |
| Developers Diversified Realty, Series H | | | | | 4,750 | | | | 122,822 | | | | 121,505 | | |
| Developers Diversified Realty, Series I | | | | | 3,800 | | | | 100,450 | | | | 97,660 | | |
| Developers Diversified Realty, Series F | | | | | 13,000 | | | | 338,650 | | | | 325,390 | | |
| Duke Realty, Series J (b) | | | | | 2,100 | | | | 52,246 | | | | 52,815 | | |
| Duke Realty, Series K (b) | | | | | 6,200 | | | | 152,826 | | | | 155,930 | | |
| Duke Realty, Series L (b) | | | | | 12,000 | | | | 302,160 | | | | 303,600 | | |
| Duke Realty, Series M (b) | | | | | 2,000 | | | | 50,000 | | | | 51,700 | | |
| Equity Office Properties Trust, Series G | | | | | 20,500 | | | | 553,847 | | | | 512,500 | | |
| Equity Residential Properties, Series D (b) | | | | | 1,600 | | | | 42,553 | | | | 40,800 | | |
| Equity Residential Properties, Series N (b) | | | | | 20,100 | | | | 500,946 | | | | 504,510 | | |
| First Industrial Realty Trust, Series J (b) | | | | | 23,450 | | | | 594,458 | | | | 600,085 | | |
| First Industrial Realty Trust, Series K (b) | | | | | 26,600 | | | | 687,610 | | | | 682,822 | | |
| Health Care Properties, Series E (b) | | | | | 10,500 | | | | 274,759 | | | | 266,595 | | |
| Health Care Properties, Series F (b) | | | | | 15,150 | | | | 390,230 | | | | 386,173 | | |
| Hospitality Properties Trust, Series C (b) | | | | | 20,000 | | | | 500,000 | | | | 502,500 | | |
| HRPT Properties Trust, Series B (b) | | | | | 14,000 | | | | 364,477 | | | | 356,720 | | |
| Kimco Realty, Series F (b) | | | | | 19,400 | | | | 500,619 | | | | 490,432 | | |
| New Plan Excel Realty Trust, Series E (b) | | | | | 4,000 | | | | 102,624 | | | | 101,920 | | |
| Post Properties, Series B | | | | | 17,800 | | | | 468,112 | | | | 453,188 | | |
| Prologis Trust, Series F (b) | | | | | 6,700 | | | | 167,835 | | | | 170,314 | | |
| Prologis Trust, Series G (b) | | | | | 13,200 | | | | 330,984 | | | | 337,260 | | |
| Public Storage, Series A (b) | | | | | 6,000 | | | | 144,291 | | | | 148,020 | | |
| Public Storage, Series F (b) | | | | | 9,300 | | | | 231,105 | | | | 231,198 | | |
| Public Storage, Series L (b) | | | | | 16,400 | | | | 418,200 | | | | 416,396 | | |
| Public Storage, Series M | | | | | 4,000 | | | | 100,000 | | | | 99,320 | | |
| Public Storage, Series X (b) | | | | | 3,000 | | | | 74,330 | | | | 75,060 | | |
| Public Storage, Series Z (b) | | | | | 11,500 | | | | 282,309 | | | | 284,280 | | |
| Realty Income, Series D (b) | | | | | 20,500 | | | | 546,185 | | | | 523,980 | | |
| Realty Income, Series E (b) | | | | | 27,000 | | | | 679,050 | | | | 674,190 | | |
See accompanying Notes to Schedule of Investments.
2007 Semiannual Report
First American Mortgage Funds
29
Schedule of INVESTMENTS (unaudited) continued
American Strategic Income Portfolio (continued)
| Description of Security | | Shares | | Cost | | Value (a) | |
| Regency Centers, Series D (b) | | | 23,500 | | | $ | 620,605 | | | $ | 594,550 | | |
| Vornado Realty Trust, Series E (b) | | | 4,800 | | | | 121,338 | | | | 123,264 | | |
| Vornado Realty Trust, Series F (b) | | | 7,800 | | | | 199,340 | | | | 198,822 | | |
| Vornado Realty Trust, Series G (b) | | | 8,000 | | | | 200,400 | | | | 200,000 | | |
| Vornado Realty Trust, Series I (b) | | | 2,000 | | | | 46,500 | | | | 49,860 | | |
| Total Preferred Stocks | | | | | | | 11,321,012 | | | | 11,177,044 | | |
| Total Investments in Unaffiliated Securities | | | | | | | 65,988,838 | | | | 65,786,185 | | |
| Short-Term Investment (h) — 2.6% | |
| First American Prime Obligations Fund, Class Z | | | 1,368,672 | | | | 1,368,672 | | | | 1,368,672 | | |
| Total Investments in Securities (i) — 129.1% | | | | | | $ | 67,357,510 | | | $ | 67,154,857 | | |
| Other Assets and Liabilities, Net — (29.1)% | | | | | | | | | | | (15,158,669 | ) | |
| Total Net Assets — 100.0% | | | | | | | | | | $ | 51,996,188 | | |
Notes to Schedule of Investments:
(a) Securities are valued in accordance with procedures described in note 2 in Notes to Financial Statements.
(b) On February 28, 2007, securities valued at $35,470,541 were pledged as collateral for the following outstanding reverse repurchase agreements:
| | | Amount | | Acquisition
Date | | Rate* | | Due | | Accrued
Interest | | Name of Broker
and Description
of Collateral | |
| | | $ | 5,667,091 | | | 2/8/07 | | | 5.38 | % | | 3/8/07 | | $ | 18,414 | | | | (1 | ) | |
| | | | 5,000,000 | | | 2/1/07 | | | 6.20 | % | | 3/1/07 | | | 18,792 | | | | (2 | ) | |
| | | | 4,437,000 | | | 2/9/07 | | | 6.02 | % | | 3/9/07 | | | 15,680 | | | | (3 | ) | |
| | | | 250,000 | | | 2/23/07 | | | 6.02 | % | | 3/9/07 | | | 585 | | | | (3 | ) | |
| $ | 15,354,091 | | | | | | | | | | | | | | | $ | 53,471 | | | | | | |
* Interest rate as of February 28, 2007. Rate is based on the London InterBank Offered Rate (LIBOR) plus a spread and reset monthly.
Name of broker and description of collateral:
(1) Morgan Stanley:
Federal Home Loan Mortgage Corporation, 5.50%, 1/1/18, $752,552 par
Federal National Mortgage Association, 6.00%, 10/1/16, $421,859 par
Federal National Mortgage Association, 5.00%, 7/1/18, $1,666,720 par
Federal National Mortgage Association, 6.50%, 6/1/29, $193,231 par
Federal National Mortgage Association, 7.50%, 5/1/30, $39,661 par
Federal National Mortgage Association, 8.00%, 5/1/30, $11,813 par
Federal National Mortgage Association, 6.00%, 5/1/31, $371,141 par
Federal National Mortgage Association, 6.50%, 11/1/31, $182,127 par
Federal National Mortgage Association, 5.50%, 7/1/33, $2,233,872 par
(2) Morgan Stanley:
Cascade Village, 5.25%, 12/1/09, $1,575,853 par
Dependable Mini-Storage I, 6.64%, 7/1/11, $2,800,000 par
Hampden Medical Office, 7.38%, 10/1/12, $1,675,221 par
Hunt Club Apartments, 5.68%, 7/1/11, $1,200,064 par
Integrity Plaza Shopping Center, 7.88%, 7/1/12, $2,014,912 par
Metro Center, 5.20%, 5/1/09, $2,505,744 par
Murphy Industrial Building, 8.50%, 10/1/07, $1,450,000 par
Palace Court, 6.68%, 11/1/11, $1,900,000 par
Par 3 Office Building, 6.63%, 8/1/13, $1,900,000 par
Stephens Center, 6.38%, 9/1/10, $1,880,732 par
Villa Bonita, Chez Royalle, Fitzhugh Apartments I, 7.25%, 3/1/08, $842,517 par
(3) Dresdner Bank:
AMB Property, Series L, 14,500 shares
AMB Property, Series M, 5,600 shares
2007 Semiannual Report
First American Mortgage Funds
30
American Strategic Income Portfolio (concluded)
BRE Properties, Series B, 20,500 shares
BRE Properties, Series C, 400 shares
BRE Properties, Series D, 400 shares
Duke Realty, Series J, 2,100 shares
Duke Realty, Series K, 6,200 shares
Duke Realty, Series L, 12,000 shares
Duke Realty, Series M, 2,000 shares
Equity Residential Properties, Series D, 1,600 shares
Equity Residential Properties, Series N, 20,100 shares
First Industrial Realty Trust, Series J, 23,450 shares
First Industrial Realty Trust, Series K, 26,600 shares
Health Care Properties, Series E, 10,500 shares
Health Care Properties, Series F, 15,150 shares
Hospitality Property Trust, Series C, 20,000 shares
HRPT Properties Trust, Series B, 14,000 shares
Kimco Realty, Series F, 19,400 shares
New Plan Excel Realty Trust, Series E, 4,000 shares
Prologis Trust, Series F, 6,700 shares
Prologis Trust, Series G, 13,200 shares
Public Storage, Series A, 6,000 shares
P ublic Storage, Series F, 9,300 shares
Public Storage, Series L, 16,400 shares
Public Storage, Series X, 3,000 shares
Public Storage, Series Z, 11,500 shares
Realty Income, Series D, 20,500 shares
Realty Income, Series E, 27,000 shares
Regency Centers, Series D, 20,500 shares
Vornado Realty Trust, Series E, 4,800 shares
Vornado Realty Trust, Series F, 7,800 shares
Vornado Realty Trust, Series G, 8,000 shares
Vornado Realty Trust, Series I, 2,000 shares
The fund has entered into a lending commitment with Morgan Stanley. The agreement permits the fund to enter into reverse repurchase agreements up to $10,000,000 using whole loans as collateral. The fund pays a fee of 0.15% to Morgan Stanley on any unused portion of the $10,000,000 lending commitment.
The fund has entered into a lending commitment with Dresdner Bank. The agreement permits the fund to enter into reverse repurchase agreements up to $5,000,000 using preferred stock as collateral. The fund pays a fee of 0.25% to Dresdner Bank on any unused portion of the $5,000,000 lending commitment.
(c) Securities purchased as part of a private placement which have not been registered with the Securities and Exchange Commission under the Securities Act of 1933 and which are considered to be illiquid. These securities are fair valued in accordance with the board approved valuation procedures. On February 28, 2007, the total value of fair valued securities was $48,431,524 or 93.1% of net assets. See note 2 in Notes to Financial Statements.
(d) Interest rates on commercial and multifamily loans are the net coupon rates in effect (after reducing the coupon rate by any mortgage servicing fees paid to mortgage servicers) on February 28, 2007. Interest rates and maturity dates disclosed on single family loans represent the weighted average coupon and weighted average maturity for the underlying mortgage loans as of February 28, 2007.
(e) Interest only – Represents securities that entitle holders to receive only interest payments on the mortgage. Principal balance of the loan is due at maturity. The interest rate disclosed represents the net coupon rate in effect as of February 28, 2007.
(f) Variable Rate Security – The rate shown is the net coupon rate as of February 28, 2007.
(g) Loan or a portion of this loan not current on interest and/or principal payments.
(h) Investment in affiliated security. This money market fund is advised by FAF Advisors, Inc., which also serves as the advisor for the fund. See note 3 in Notes to Financial Statements.
(i) On February 28, 2007, the cost of investments in securities was $67,357,510. The aggregate gross unrealized appreciation and depreciation of investments in securities, based on this cost, were as follows:
| Gross unrealized appreciation | | $ | 944,089 | | |
| Gross unrealized depreciation | | | (1,146,742 | ) | |
| Net unrealized depreciation | | $ | (202,653 | ) | |
2007 Semiannual Report
First American Mortgage Funds
31
Schedule of INVESTMENTS (unaudited) continued
American Strategic Income Portfolio II February 28, 2007
| Description of Security | | Date
Acquired | | Par Value | | Cost | | Value (a) | |
| (Percentages of each investment category relate to net assets) | |
| U.S. Government Agency Mortgage-Backed Securities (b) — 4.3% | |
| Fixed Rate — 4.3% | |
| Federal Home Loan Mortgage Corporation, | |
| 5.50%, 1/1/18, #E93231 | | | | $ | 4,013,613 | | | $ | 4,122,954 | | | $ | 4,031,653 | | |
| 9.00%, 7/1/30, #C40149 | | | | | 183,890 | | | | 188,454 | | | | 199,473 | | |
| Federal National Mortgage Association, | |
| 6.00%, 10/1/16, #607030 | | | | | 272,166 | | | | 273,455 | | | | 276,722 | | |
| 5.50%, 6/1/17, #648508 | | | | | 384,820 | | | | 386,511 | | | | 386,677 | | |
| 5.00%, 9/1/17, #254486 | | | | | 588,815 | | | | 590,191 | | | | 582,562 | | |
| 5.00%, 11/1/17, #657356 | | | | | 1,181,493 | | | | 1,187,004 | | | | 1,168,946 | | |
| 6.50%, 6/1/29, #252497 | | | | | 1,288,205 | | | | 1,280,082 | | | | 1,325,149 | | |
| 7.50%, 4/1/30, #532867 | | | | | 48,612 | | | | 47,083 | | | | 50,697 | | |
| 7.50%, 5/1/30, #535289 | | | | | 142,779 | | | | 138,295 | | | | 148,903 | | |
| 8.00%, 5/1/30, #538266 | | | | | 42,527 | | | | 42,025 | | | | 44,871 | | |
| 8.00%, 6/1/30, #253347 | | | | | 188,991 | | | | 186,756 | | | | 199,407 | | |
| Total U.S. Government Agency Mortgage-Backed Securities | | | 8,442,810 | | | | 8,415,060 | | |
| Corporate Notes (c) (d) — 6.8% | |
| Adjustable Rate — 6.8% | |
| Stratus III, 6.56, 12/31/11 | | 12/12/06 | | | 8,000,000 | | | | 8,000,000 | | | | 8,220,800 | | |
| Stratus Properties, 9.82%, 12/31/11 | | 06/14/01 | | | 5,000,000 | | | | 5,000,000 | | | | 5,138,000 | | |
| Total Corporate Notes | | | 13,000,000 | | | | 13,358,800 | | |
| Whole Loans and Participation Mortgages (d) (e) — 77.2% | |
| Commercial Loans — 42.3% | |
| 5555 East Van Buren I, Phoenix, AZ, 5.68%, 7/1/11 (b) | | 06/23/04 | | | 6,457,058 | | | | 6,457,058 | | | | 6,504,815 | | |
| 5555 East Van Buren II, Phoenix, AZ, 7.13%, 7/1/11 | | 06/23/04 | | | 1,494,990 | | | | 1,494,990 | | | | 1,569,740 | | |
| Bigelow Office Building, Las Vegas, NV, 8.88%, 4/1/07 (b) | | 03/31/97 | | | 1,164,403 | | | | 1,164,403 | | | | 1,164,403 | | |
| Cypress Point Office Park I, Tampa, FL, 5.30%, 6/1/09 (b) | | 05/19/04 | | | 4,540,088 | | | | 4,540,088 | | | | 4,522,387 | | |
| Cypress Point Office Park II, Tampa, FL, 5.30% 7/1/09 (b) | | 05/19/04 | | | 4,410,958 | | | | 4,410,958 | | | | 4,393,760 | | |
| Hadley Avenue Business Center, Oakdale, MN 8.38%, 1/1/11 (b) | | 12/14/00 | | | 2,246,787 | | | | 2,246,787 | | | | 2,336,658 | | |
| Hillside Office Park, Elk River, MN, 7.63%, 8/1/08 | | 07/09/98 | | | 842,617 | | | | 842,617 | | | | 859,469 | | |
| LaCosta Centre, Austin, TX, 5.20%, 3/1/09 (b) | | 02/27/04 | | | 4,427,422 | | | | 4,427,422 | | | | 4,411,590 | | |
| Oak Knoll Village Shopping Center, Austin, TX, 6.73%, 10/1/13 (b) | | 09/17/03 | | | 1,563,075 | | | | 1,563,075 | | | | 1,641,229 | | |
| Oyster Point Office Park, Newport News, VA, 6.68%, 2/1/11 (b) (f) | | 01/04/06 | | | 12,200,000 | | | | 12,200,000 | | | | 12,674,836 | | |
| PennMont Office Plaza, Albuquerque, NM, 6.63%, 4/1/11 (b) (f) | | 04/30/01 | | | 1,450,000 | | | | 1,450,000 | | | | 1,505,854 | | |
| Perkins - Blaine, Blaine, MN, 6.63%, 1/1/17 | | 12/13/06 | | | 1,825,000 | | | | 1,825,000 | | | | 1,916,250 | | |
| Rapid Park Parking Lot, Minneapolis, MN, 7.35%, 1/1/11 (b) | | 08/07/97 | | | 3,840,698 | | | | 3,840,698 | | | | 3,955,919 | | |
| Raveneaux Country Club, Spring, TX, 9.00%, 1/1/07 (c) (f) | | 12/19/05 | | | 8,800,000 | | | | 8,800,000 | | | | 8,800,000 | | |
| Redwood Dental Building, Taylorsville, UT, 7.40%, 7/1/12 (b) | | 06/28/02 | | | 2,548,184 | | | | 2,548,184 | | | | 2,675,594 | | |
| Station Square, Pompano Beach, FL, 6.33%, 2/1/14 | | 01/19/07 | | | 12,000,000 | | | | 12,000,000 | | | | 12,415,596 | | |
| Sundance Plaza, Colorado Springs, CO, 7.13%, 11/1/08 | | 10/29/98 | | | 277,068 | | | | 277,068 | | | | 281,420 | | |
| Waste Connections Warehouse, Englewood, CO, 6.58%, 3/1/14 | | 02/15/07 | | | 1,300,000 | | | | 1,300,000 | | | | 1,342,732 | | |
| Woodmen Corporate Center, Colorado Springs, CO, 8.00%, 9/1/08 (b) (c) (f) | | 08/08/05 | | | 9,950,000 | | | | 9,950,000 | | | | 10,149,000 | | |
| | | | 81,338,348 | | | | 83,121,252 | | |
| Multifamily Loans — 34.8% | |
| Adelphi Springs Apartments, Adelphi, MD, 9.93%, 3/1/09 (f) (g) | | 06/27/03 | | | 5,084,592 | | | | 5,084,592 | | | | 3,559,214 | | |
| Chardonnay Apartments, Tulsa, OK, 6.40%, 7/1/13 (b) | | 06/05/03 | | | 3,986,264 | | | | 3,986,264 | | | | 2,932,164 | | |
| Highland Ridge & Highland Glen Apartments, Oklahoma City, OK, 14.90%, 10/1/08 (f) | | 09/30/04 | | | 3,850,000 | | | | 3,850,000 | | | | 3,500,832 | | |
| Misty Woods/Riverfall Square I, Arlington and Dallas, TX, 8.32%, 9/1/06 (b) (c) (f) | | 07/23/03 | | | 7,966,000 | | | | 7,966,000 | | | | 5,576,200 | | |
| Misty Woods/Riverfall Square II, Arlington and Dallas, TX, 9.88%, 9/1/06 (f) (g) | | 07/23/03 | | | 1,591,000 | | | | 1,591,000 | | | | 1,113,700 | | |
| Oakton Terrace Apartments, Adelphi, MD, 9.88%, 8/1/11 (f) (g) | | 06/27/03 | | | 670,141 | | | | 670,141 | | | | 469,099 | | |
See accompanying Notes to Schedule of Investments.
2007 Semiannual Report
First American Mortgage Funds
32
American Strategic Income Portfolio II (continued)
| Description of Security | | Date
Acquired | | Par Value/
Shares | | Cost | | Value (a) | |
| Park Hampshire Apartments, Adelphi, MD, 9.90%, 1/1/13 (f) (g) | | 06/27/03 | | $ | 3,111,280 | | | $ | 3,111,280 | | | $ | 2,177,896 | | |
| RP-Plaza Development, Oxnard, CA, 8.72%, 3/1/10 (c) (f) | | 02/23/05 | | | 5,000,000 | | | | 5,000,000 | | | | 5,131,295 | | |
| Sapphire Skies, Cle Elum, WA, 9.00%, 1/1/09 (c) (f) | | 12/23/05 | | | 9,250,000 | | | | 9,250,000 | | | | 9,250,000 | | |
| Scottsdale Terrace, Scottsdale, AZ, 8.75%, 11/1/08 (c) (f) | | 10/31/05 | | | 1,174,547 | | | | 1,174,547 | | | | 1,174,547 | | |
| Southridge Apartments, Austin, TX, 8.43%, 4/1/09 (b) | | 03/22/02 | | | 7,319,540 | | | | 7,319,540 | | | | 5,123,678 | | |
| Summit Chase Apartments I, Coral Springs, FL, 8.00%, 7/1/07 (c) (f) | | 07/07/05 | | | 12,670,000 | | | | 12,670,000 | | | | 12,670,000 | | |
| Summit Chase Apartments II, Coral Springs, FL, 10.00%, 7/1/07 (f) | | 07/07/05 | | | 2,974,000 | | | | 2,974,000 | | | | 2,146,025 | | |
| Timber Ridge Apartments, Houston, TX, 9.88%, 8/1/13 (f) | | 04/23/02 | | | 500,000 | | | | 500,000 | | | | 469,669 | | |
| Trinity Oaks Apartments I, Dallas, TX, 8.32%, 4/1/09 (b) (c) (f) | | 03/30/06 | | | 7,000,000 | | | | 7,000,000 | | | | 7,210,000 | | |
| Trinity Oaks Apartments II, Dallas, TX, 7.88%, 4/1/09 (f) (g) | | 03/30/06 | | | 1,690,000 | | | | 1,690,000 | | | | 1,417,976 | | |
| Vista Bonita Apartments, Denton, TX, 8.47%, 4/1/08 (b) (c) | | 03/04/05 | | | 2,759,179 | | | | 2,759,179 | | | | 2,814,363 | | |
| Winterland Apartments I, Grand Forks, ND, 9.23%, 7/1/12 | | 06/06/97 | | | 543,653 | | | | 543,653 | | | | 570,836 | | |
| Winterland Apartments II, Grand Forks, ND, 9.23%, 7/1/12 | | 06/06/97 | | | 1,042,001 | | | | 1,042,001 | | | | 1,094,101 | | |
| | | | 78,182,197 | | | | 68,401,595 | | |
| Single Family Loans — 0.1% | |
| Merchants Bank, 3 loans, Vermont, 10.48%, 12/1/20 (g) | | 12/18/92 | | | 62,796 | | | | 63,319 | | | | 64,641 | | |
| PHH U.S. Mortgage, 3 loans, United States, 8.65%, 1/1/12 | | 12/30/92 | | | 181,628 | | | | 176,213 | | | | 178,293 | | |
| | | | 239,532 | | | | 242,934 | | |
| Total Whole Loans and Participation Mortgages | | | 159,760,077 | | | | 151,765,781 | | |
| Preferred Stocks — 22.4% | |
| Real Estate Investment Trusts — 22.4% | |
| AMB Property, Series L (b) | | | | | 62,000 | | | | 1,583,757 | | | | 1,542,560 | | |
| AMB Property, Series M (b) | | | | | 14,360 | | | | 367,561 | | | | 359,718 | | |
| AMB Property, Series O (b) | | | | | 17,500 | | | | 437,500 | | | | 452,266 | | |
| BRE Properties, Series C (b) | | | | | 62,000 | | | | 1,560,500 | | | | 1,559,300 | | |
| BRE Properties, Series D (b) | | | | | 18,148 | | | | 457,465 | | | | 455,515 | | |
| Developers Diversified Realty, Series H | | | | | 63,700 | | | | 1,636,809 | | | | 1,629,446 | | |
| Developers Diversified Realty, Series I | | | | | 31,600 | | | | 823,427 | | | | 812,120 | | |
| Duke Realty, Series J (b) | | | | | 38,244 | | | | 974,588 | | | | 961,837 | | |
| Duke Realty, Series K (b) | | | | | 43,000 | | | | 1,081,863 | | | | 1,081,450 | | |
| Duke Realty, Series L (b) | | | | | 12,000 | | | | 302,160 | | | | 303,600 | | |
| Duke Realty, Series M (b) | | | | | 8,000 | | | | 200,000 | | | | 206,800 | | |
| Equity Residential Properties, Series N (b) | | | | | 85,000 | | | | 2,132,834 | | | | 2,133,500 | | |
| First Industrial Realty Trust, Series J (b) | | | | | 74,025 | | | | 1,876,534 | | | | 1,894,300 | | |
| Health Care Properties, Series E (b) | | | | | 10,000 | | | | 257,000 | | | | 253,900 | | |
| Health Care Properties, Series F (b) | | | | | 46,235 | | | | 1,166,230 | | | | 1,178,530 | | |
| Hospitality Properties Trust, Series C (b) | | | | | 160,000 | | | | 4,000,000 | | | | 4,020,000 | | |
| HRPT Properties, Series C (b) | | | | | 100,000 | | | | 2,500,000 | | | | 2,583,000 | | |
| Kimco Realty Corp, Series B (b) | | | | | 58,000 | | | | 1,406,500 | | | | 1,466,240 | | |
| New Plan Excel Realty Trust, Series E (b) | | | | | 10,375 | | | | 264,563 | | | | 264,355 | | |
| Prologis Trust, Series F (b) | | | | | 35,120 | | | | 892,477 | | | | 892,750 | | |
| Prologis Trust, Series G (b) | | | | | 43,190 | | | | 1,098,075 | | | | 1,103,505 | | |
| PS Business Parks, Series H | | | | | 35,000 | | | | 868,036 | | | | 886,200 | | |
| PS Business Parks, Series I | | | | | 20,000 | | | | 485,577 | | | | 503,200 | | |
| PS Business Parks, Series M | | | | | 43,180 | | | | 1,077,682 | | | | 1,109,726 | | |
| Public Storage, Series A (b) | | | | | 40,000 | | | | 977,346 | | | | 986,800 | | |
| Public Storage, Series E (b) | | | | | 15,000 | | | | 377,550 | | | | 379,200 | | |
| Public Storage, Series M (b) | | | | | 80,000 | | | | 2,000,000 | | | | 1,986,400 | | |
| Public Storage, Series X (b) | | | | | 20,000 | | | | 502,366 | | | | 500,400 | | |
| Public Storage, Series Z (b) | | | | | 20,000 | | | | 497,779 | | | | 494,400 | | |
| Realty Income, Series D (b) | | | | | 90,000 | | | | 2,281,500 | | | | 2,300,400 | | |
| Realty Income, Series E (b) | | | | | 49,500 | | | | 1,247,400 | | | | 1,236,015 | | |
| Regency Centers, Series D (b) | | | | | 36,888 | | | | 962,795 | | | | 933,266 | | |
See accompanying Notes to Schedule of Investments.
2007 Semiannual Report
First American Mortgage Funds
33
Schedule of INVESTMENTS (unaudited) continued
American Strategic Income Portfolio II (continued)
| Description of Security | | Shares | | Cost | | Value (a) | |
| Regency Centers, Series E (b) | | | 50,000 | | | $ | 1,245,000 | | | $ | 1,254,690 | | |
| Vornado Realty Trust, Series F (b) | | | 65,000 | | | | 1,611,277 | | | | 1,656,850 | | |
| Vornado Realty Trust, Series G (b) | | | 11,000 | | | | 257,950 | | | | 275,000 | | |
| Vornado Realty Trust, Series I (b) | | | 16,000 | | | | 374,000 | | | | 398,880 | | |
| Weingarten Realty Investors, Series F (b) | | | 160,000 | | | | 4,000,000 | | | | 3,956,800 | | |
| Total Preferred Stocks | | | | | | | 43,786,101 | | | | 44,012,919 | | |
| Total Investments in Unaffiliated Securities | | | | | | | 224,988,988 | | | | 217,552,560 | | |
| Real Estate Owned (h) — 9.5% | |
| Hidden Woods Apartment Building, College Park, GA | | | | | | | 13,751,064 | | | | 9,409,000 | | |
| Sussex Club Apartments Building, Athens, GA | | | | | | | 10,675,864 | | | | 9,275,000 | | |
| Total Real Estate Owned | | | | | | | 24,426,928 | | | | 18,684,000 | | |
| Short-Term Investment (i) — 1.0% | |
| First American Prime Obligations Fund, Class Z | | | 2,039,798 | | | | 2,039,798 | | | | 2,039,798 | | |
| Total Investments in Securities (j) — 121.2% | | | | | | $ | 251,455,714 | | | $ | 238,276,358 | | |
| Other Assets and Liabilities, Net — (21.2)% | | | | | | | | | | | (41,704,305 | ) | |
| Total Net Assets — 100.0% | | | | | | | | | | $ | 196,572,053 | | |
Notes to Schedule of Investments:
(a) Securities are valued in accordance with procedures described in note 2 in Notes to Financial Statements.
(b) On February 28, 2007, securities valued at $127,079,737 were pledged as collateral for the following outstanding reverse repurchase agreements:
| | | Amount | | Acquisition
Date | | Rate* | | Due | | Accrued
Interest | | Name of Broker
and Description
of Collateral | |
| | | $ | 7,502,468 | | | 2/8/07 | | | 5.38 | % | | 3/8/07 | | $ | 14,891 | | | | (1 | ) | |
| | | | 13,500,000 | | | 2/1/07 | | | 6.20 | % | | 3/1/07 | | | 48,548 | | | | (2 | ) | |
| | | | 3,000,000 | | | 2/21/07 | | | 6.20 | % | | 3/1/07 | | | 4,130 | | | | (2 | ) | |
| | | | 17,430,000 | | | 2/9/07 | | | 6.02 | % | | 3/9/07 | | | 65,111 | | | | (3 | ) | |
| | | | 2,000,000 | | | 2/23/07 | | | 6.02 | % | | 3/9/07 | | | 4,682 | | | | (3 | ) | |
| $ | 43,432,468 | | | | | | | | | | | | | | | $ | 137,362 | | | | | | |
* Interest rate as of February 28, 2007. Rates are based on the London InterBank Offered Rate (LIBOR) plus a spread and reset monthly.
Name of broker and description of collateral:
(1) Morgan Stanley:
Federal Home Loan Mortgage Corporation, 5.50%, 1/1/18, $4,013,613 par
Federal Home Loan Mortgage Corporation, 9.00%, 7/1/30, $183,890 par
Federal National Mortgage Association, 6.00%, 10/1/16, $272,166 par
Federal National Mortgage Association, 5.50%, 6/1/17, $384,820 par
Federal National Mortgage Association, 5.00%, 9/1/17, $588,815 par
Federal National Mortgage Association, 5.00%, 11/1/17, $1,181,493 par
Federal National Mortgage Association, 6.50%, 6/1/29, $1,288,205 par
Federal National Mortgage Association, 7.50%, 4/1/30, $48,612 par
Federal National Mortgage Association, 7.50%, 5/1/30, $142,779 par
Federal National Mortgage Association, 8.00%, 5/1/30, $42,527 par
Federal National Mortgage Association, 8.00%, 6/1/30, $188,991 par
(2) Morgan Stanley:
5555 East Van Buren I, 5.68%, 7/1/11, $6,457,058 par
Bigelow Office Building, 8.88%, 4/1/07, $1,164,403 par
Chardonnay Apartments, 6.40%, 7/1/13, $3,986,264 par
2007 Semiannual Report
First American Mortgage Funds
34
American Strategic Income Portfolio II (continued)
Cypress Point Office Park I, 5.30%, 6/1/09, $4,540,088 par
Cypress Point Office Park II, 5.30%, 7/1/09, $4,410,958 par
Hadley Avenue Business Center, 8.38%, 1/1/11, $2,246,787 par
LaCosta Centre, 5.20%, 3/1/09, $4,427,422 par
Misty Woods/Riverfall Square I, 8.32%, 9/1/06, $7,966,000 par
Oak Knoll Village Shopping Center, 6.73%, 10/1/13, $1,563,075 par
Oyster Point Office Park, 6.68%, 2/1/11, $12,200,000 par
PennMont Office Plaza, 6.63%, 4/1/11, $1,450,000 par
Rapid Park Parking Lot, 7.35%, 1/1/11, $3,840,698 par
Redwood Dental Building, 7.40%, 7/1/12, $2,548,184 par
Southridge Apartments, 8.43%, 4/1/09, $7,319,540 par
Trinity Oaks Apartments I, 8.32%, 4/1/09, $7,000,000 par
Vista Bonita Apartments, 8.47%, 4/1/08, $2,759,179 par
Woodmen Corporate Center, 8.00%, 9/1/08, $9,950,000 par
(3) Dresdner Bank:
AMB Property, Series L, 62,000 shares
AMB Property, Series M, 14,360 shares
AMB Property, Series O, 17,500 shares
BRE Properties, Series C, 62,000 shares
BRE Properties, Series D, 18,148 shares
Duke Realty, Series J, 38,244 shares
Duke Realty, Series K, 43,000 shares
Duke Realty, Series L, 12,000 shares
Duke Realty, Series M, 8,000 shares
Equity Residential Properties, Series N, 75,000 shares
First Industrial Realty Trust, Series J, 74,025 shares
Health Care Properties, Series E, 10,000 shares
Health Care Properties, Series F, 46,235 shares
Hospitality Properties Trust, Series C, 160,000 shares
HRPT Properties, Series C, 100,000 shares
Kimco Realty, Series B, 58,000 shares
New Plan Excel Realty Trust, Series E, 10,375 shares
Prologis Trust, Series F, 35,120 shares
Prologis Trust, Series G, 43,190 shares
Public Storage, Series A , 40,000 shares
Public Storage, Series E, 15,000 shares
Public Storage, Series M, 80,000 shares
Public Storage, Series X, 20,000 shares
Public Storage, Series Z, 20,000 shares
Realty Income, Series D, 90,000 shares
Realty Income, Series E, 49,500 shares
Regency Centers, Series D, 38,888 shares
Regency Centers, Series E, 50,000 shares
Vornado Realty Trust, Series F, 65,000 shares
Vornado Realty Trust, Series G, 11,000 shares
Vornado Realty Trust, Series I, 16,000 shares
Weingarten Realty Investors, Series F, 160,000 shares
The fund has entered into a lending commitment with Morgan Stanley. The agreement permits the fund to enter into reverse repurchase agreements up to $70,000,000 using whole loans as collateral. The fund pays a fee of 0.15% to Morgan Stanley on any unused portion of the $70,000,000 lending commitment.
The fund has entered into a lending commitment with Dresdner Bank. The agreement permits the fund to enter into reverse repurchase agreements up to $15,000,000 using preferred stock as collateral. The fund pays a fee of 0.25% to Dresdner Bank on any unused portion of the $15,000,000 lending commitment.
(c) Variable Rate Security – The rate shown is the net coupon rate in effect as of February 28, 2007.
(d) Securities purchased as part of a private placement which have not been registered with the Securities and Exchange Commission under the Securities Act of 1933 and which are considered to be illiquid. These securities are fair valued in accordance with the board approved valuation procedures. On February 28, 2007, the total value of fair valued securities was $165,124,581 or 84.0% of net assets. See note 2 in Notes to Financial Statements.
(e) Interest rates on commercial and multifamily loans are the net coupon rates (after reducing the coupon rate by any mortgage servicing fees paid to mortgage servicers) in effect on February 28, 2007. Interest rates and maturity dates disclosed on single family loans represent the weighted average coupon and weighted average maturity for the underlying mortgage loans as of February 28, 2007.
2007 Semiannual Report
First American Mortgage Funds
35
Schedule of INVESTMENTS (unaudited) continued
American Strategic Income Portfolio II (concluded)
(f) Interest only – Represents securities that entitle holders to receive only interest payments on the mortgages. Principal balance of the loan is due at maturity. The interest rate disclosed represents the net coupon rate in effect as of February 28, 2007.
(g) Loan or a portion of this loan not current on interest and/or principal payments.
(h) See note 2 in Notes to Financial Statements.
(i) Investment in affiliated security. This money market fund is advised by FAF Advisors, Inc., which also serves as advisor for the fund.
(j) On February 28, 2007, the cost of investments in securities was $251,455,714. The aggregate gross unrealized appreciation and depreciation of investments in securities, based on this cost, were as follows:
| Gross unrealized appreciation | | $ | 3,178,045 | | |
| Gross unrealized depreciation | | | (16,357,401 | ) | |
| Net unrealized depreciation | | $ | (13,179,356 | ) | |
2007 Semiannual Report
First American Mortgage Funds
36
American Strategic Income Portfolio III February 28, 2007
| Description of Security | | Date
Acquired | | Par Value | | Cost | | Value (a) | |
| (Percentages of each investment category relate to net assets) | |
| U.S. Government Agency Mortgage-Backed Securities (b) — 3.3% | |
| Fixed Rate — 3.3% | |
| Federal Home Loan Mortgage Corporation, | |
| 5.50%, 1/1/18, #E93231 | | | | $ | 4,013,613 | | | $ | 4,122,954 | | | $ | 4,031,653 | | |
| 9.00%, 7/1/30, #C40149 | | | | | 257,446 | | | | 263,835 | | | | 279,262 | | |
| Federal National Mortgage Association, | |
| 6.00%, 10/1/16, #607030 | | | | | 272,166 | | | | 273,457 | | | | 276,722 | | |
| 5.50%, 2/1/17, #623874 | | | | | 605,769 | | | | 604,502 | | | | 609,084 | | |
| 5.50%, 6/1/17, #648508 | | | | | 384,819 | | | | 386,511 | | | | 386,677 | | |
| 5.00%, 9/1/17, #254486 | | | | | 588,815 | | | | 590,191 | | | | 582,562 | | |
| 5.00%, 11/1/17, #657356 | | | | | 1,181,493 | | | | 1,187,004 | | | | 1,168,946 | | |
| 6.50%, 6/1/29, #252497 | | | | | 901,744 | | | | 896,057 | | | | 927,605 | | |
| 7.50%, 4/1/30, #532867 | | | | | 43,569 | | | | 42,198 | | | | 45,437 | | |
| 7.50%, 5/1/30, #535289 | | | | | 142,779 | | | | 138,295 | | | | 148,903 | | |
| 8.00%, 5/1/30, #538266 | | | | | 42,527 | | | | 42,025 | | | | 44,871 | | |
| 8.00%, 6/1/30, #253347 | | | | | 170,092 | | | | 168,080 | | | | 179,466 | | |
| Total U.S. Government Agency Mortgage-Backed Securities | | | 8,715,109 | | | | 8,681,188 | | |
| Corporate Note — 2.8% | |
| Adjustable Rate (c) (d) — 2.8% | |
| Stratus IV, 6.56%, 12/31/11 | | 12/12/06 | | | 7,000,000 | | | | 7,000,000 | | | | 7,193,200 | | |
| Private Mortgage-Backed Security (d) — 0.0% | |
| Fixed Rate — 0.0% | |
| First Gibraltar, Series 1992-MM, Class B, 8.79%, 10/25/21 | | 07/30/93 | | | 149,686 | | | | 82,538 | | | | — | | |
| Whole Loans and Participation Mortgages (d) (e) — 86.6% | |
| Commercial Loans — 49.6% | |
| 150 North Pantano I, Tucson, AZ, 8.72%, 2/1/08 (c) (f) | | 01/07/05 | | | 3,525,000 | | | | 3,525,000 | | | | 3,560,250 | | |
| 150 North Pantano II, Tucson, AZ, 14.88%, 2/1/08 (f) | | 01/07/05 | | | 440,000 | | | | 440,000 | | | | 429,630 | | |
| 2350 Lakeside, Richardson, TX, 7.93%, 4/1/09 (f) | | 03/07/06 | | | 6,700,000 | | | | 6,700,000 | | | | 6,242,431 | | |
| 8324 East Hartford Drive I, Scottsdale, AZ, 5.15%, 5/1/09 (b) (f) | | 04/08/04 | | | 3,800,000 | | | | 3,800,000 | | | | 3,776,356 | | |
| Academy Spectrum, Colorado Springs, CO, 7.73%, 5/1/09 (b) | | 12/18/02 | | | 5,067,654 | | | | 5,067,654 | | | | 5,219,683 | | |
| Alliant University, Fresno, CA, 7.15%, 8/1/11 (f) | | 07/12/06 | | | 2,800,000 | | | | 2,800,000 | | | | 2,940,000 | | |
| Biltmore Lakes Corporate Center, Phoenix, AZ, 6.00%, 9/1/09 (b) | | 08/02/04 | | | 3,301,878 | | | | 3,304,312 | | | | 3,339,952 | | |
| Carrier 360, Grand Prairie, TX, 5.40%, 7/1/09 (b) | | 06/28/04 | | | 3,327,233 | | | | 3,327,233 | | | | 3,325,169 | | |
| Carrier 360 II, Grand Prairie, TX, 5.88%, 7/1/09 | | 12/16/05 | | | 343,586 | | | | 343,586 | | | | 346,599 | | |
| Fairview Business Park, Salem, OR, 7.33%, 8/1/11 | | 07/14/06 | | | 7,600,000 | | | | 7,600,000 | | | | 7,980,000 | | |
| France Avenue Business Park II, Brooklyn Park, MN, 7.40%, 10/1/12 (b) | | 09/12/02 | | | 4,417,419 | | | | 4,417,419 | | | | 4,638,290 | | |
| Holiday Village Shopping Center, Park City, UT, 7.15%, 11/1/07 (b) | | 11/12/02 | | | 4,587,276 | | | | 4,587,276 | | | | 4,633,148 | | |
| Jackson Street Warehouse, Phoenix, AZ, 8.53%, 7/1/07 (b) | | 06/30/98 | | | 2,688,901 | | | | 2,688,901 | | | | 2,688,901 | | |
| Jilly's American Grill, Scottsdale, AZ, 7.70%, 9/1/08 (b) (c) (f) | | 08/19/05 | | | 1,810,000 | | | | 1,810,000 | | | | 1,810,000 | | |
| La Cholla Plaza I, Tucson, AZ, 8.50%, 8/1/09 (c) (f) | | 07/26/06 | | | 13,625,000 | | | | 13,625,000 | | | | 13,625,000 | | |
| La Cholla Plaza II, Tucson, AZ, 14.88%, 8/1/09 (f) | | 07/26/06 | | | 1,700,000 | | | | 1,700,000 | | | | 1,678,939 | | |
| North Austin Business Center, Austin, TX, 5.65%, 11/1/11 (b) | | 11/01/04 | | | 4,027,239 | | | | 4,027,239 | | | | 4,058,406 | | |
| Outlets at Casa Grande, Casa Grande, AZ, 6.93%, 3/1/11 (b) (f) | | 02/27/06 | | | 7,300,000 | | | | 7,300,000 | | | | 7,665,000 | | |
| Preston Trail Village I, Dallas, TX, 8.50%, 12/1/07 (b) (c) (f) | | 11/18/05 | | | 17,300,000 | | | | 17,300,000 | | | | 17,473,000 | | |
| Preston Trail Village II, Dallas, TX, 13.50%, 12/1/07 (f) | | 11/18/05 | | | 2,500,000 | | | | 2,500,000 | | | | 2,036,749 | | |
| RealtiCorp Fund III, Orlando/Crystal River, FL, 10.32%, 9/1/07 (c) (f) | | 02/28/06 | | | 4,222,755 | | | | 4,222,755 | | | | 4,222,755 | | |
| Shoppes at Jonathan's Landing, Jupiter, FL, 7.95%, 5/1/10 (b) | | 04/12/00 | | | 2,786,527 | | | | 2,786,527 | | | | 2,897,988 | | |
| Spa Atlantis, Pompano Beach, FL, 8.50%, 10/1/08 (c) (f) | | 09/30/05 | | | 19,281,600 | | | | 19,281,600 | | | | 19,474,416 | | |
| Tatum Ranch Center, Phoenix, AZ, 6.53%, 9/1/11 (b) | | 08/25/04 | | | 3,569,925 | | | | 3,569,925 | | | | 3,698,314 | | |
| | | | 126,724,427 | | | | 127,760,976 | | |
See accompanying Notes to Schedule of Investments.
2007 Semiannual Report
First American Mortgage Funds
37
Schedule of INVESTMENTS (unaudited) continued
American Strategic Income Portfolio III (continued)
| Description of Security | | Date
Acquired | | Par Value/
Shares | | Cost | | Value (a) | |
| Multifamily Loans — 34.9% | |
| Centennial Park I, Richardson, TX, 8.89%, 3/1/07 (c) (f) | | 02/28/06 | | $ | 12,135,000 | | | $ | 12,135,000 | | | $ | 12,135,000 | | |
| Centennial Park II, Richardson, TX, 14.90%, 3/1/07 (f) | | 02/28/06 | | | 2,530,000 | | | | 2,530,000 | | | | 2,104,137 | | |
| Centennial Park Additional Lots, Richardson, TX, 9.29%, 3/1/07 (c) (f) | | 05/01/06 | | | 2,700,000 | | | | 2,700,000 | | | | 2,700,000 | | |
| Chateau Club Apartments I, Athens, GA, 8.57%, 6/1/07 (c) (f) (g) | | 05/18/04 | | | 6,000,000 | | | | 6,000,000 | | | | 4,200,000 | | |
| Chateau Club Apartments II, Athens, GA, 11.88%, 6/1/07 (f) | | 05/18/04 | | | 500,000 | | | | 500,000 | | | | 350,000 | | |
| Country Villa Apartments, West Lafayette, IN, 6.90%, 9/1/13 (b) | | 08/29/03 | | | 2,512,188 | | | | 2,512,188 | | | | 2,636,250 | | |
| Courtyards at Mesquite I, Mesquite, TX, 6.60%, 11/1/09 (b) (f) | | 10/14/05 | | | 7,600,000 | | | | 7,600,000 | | | | 7,762,450 | | |
| Courtyards at Mesquite II, Mesquite, TX, 8.00%, 11/1/09 (f) (g) | | 10/14/05 | | | 2,850,000 | | | | 2,850,000 | | | | 2,674,769 | | |
| El Dorado Apartments I, Tucson, AZ, 7.60%, 9/1/07 (b) (c) | | 08/26/04 | | | 2,563,705 | | | | 2,563,705 | | | | 2,505,936 | | |
| El Dorado Apartments II, Tucson, AZ, 14.90%, 9/1/07 (f) | | 08/24/04 | | | 500,000 | | | | 500,000 | | | | 409,081 | | |
| Geneva Village Apartments I, West Jordan, UT, 7.00%, 1/1/14 (b) | | 12/24/03 | | | 1,355,918 | | | | 1,355,918 | | | | 1,423,714 | | |
| Geneva Village Apartments II, West Jordan, UT, 9.88%, 1/1/13 | | 12/24/03 | | | 56,777 | | | | 56,777 | | | | 57,676 | | |
| Good Haven Apartments I, Dallas, TX, 8.57%, 9/1/07 (b) (c) (f) | | 08/24/04 | | | 6,737,000 | | | | 6,737,000 | | | | 6,493,121 | | |
| Good Haven Apartments II, Dallas, TX, 14.88%, 9/1/07 (f) | | 08/24/04 | | | 842,000 | | | | 842,000 | | | | 622,842 | | |
| Lions Park Apartments I, Elk River, MN, 5.20%, 4/1/09 (b) | | 03/25/04 | | | 3,411,149 | | | | 3,411,149 | | | | 3,380,421 | | |
| Lions Park Apartments II, Elk River, MN, 11.88%, 4/1/09 | | 03/25/04 | | | 98,848 | | | | 98,848 | | | | 95,297 | | |
| Meadowview Village Apartments I, West Jordan, UT, 7.00%, 1/1/14 | | 12/24/03 | | | 984,134 | | | | 984,134 | | | | 1,033,341 | | |
| Meadowview Village Apartments II, West Jordan, UT, 9.88%, 1/1/13 | | 12/24/03 | | | 56,777 | | | | 56,777 | | | | 57,676 | | |
| Meridian Pointe Apartments, Kalispell, MT, 8.73%, 2/1/12 | | 03/07/97 | | | 1,073,472 | | | | 1,073,472 | | | | 1,127,146 | | |
| NCH Multifamily Pool, Oklahoma City, OK, 11.93%, 11/1/09 (f) | | 10/17/06 | | | 5,800,000 | | | | 5,800,000 | | | | 6,063,803 | | |
| Parkway Village Apartments I, West Jordan, UT, 7.00%, 1/1/14 | | 12/24/03 | | | 936,569 | | | | 936,569 | | | | 983,398 | | |
| Parkway Village Apartments II, West Jordan, UT, 9.88%, 1/1/13 | | 12/24/03 | | | 56,777 | | | | 56,777 | | | | 57,676 | | |
| Plantation Pines I, Tyler, TX, 6.59%, 2/1/10 | | 01/17/07 | | | 3,328,000 | | | | 3,328,000 | | | | 3,415,836 | | |
| Plantation Pines II, Tyler, TX, 10.57%, 2/1/10 | | 01/17/07 | | | 416,000 | | | | 416,000 | | | | 391,200 | | |
| Tulsa Apartment Portfolio I, Tulsa, OK, 9.93%, 3/1/07 (f) (g) | | 02/27/03 | | | 6,790,000 | | | | 6,790,000 | | | | 4,753,000 | | |
| Tulsa Apartment Portfolio II, Tulsa, OK, 9.93%, 3/1/07 (f) (g) | | 02/27/03 | | | 8,230,000 | | | | 8,230,000 | | | | 5,761,000 | | |
| Villas of Woodgate, Lansing, MI, 6.40%, 2/1/12 | | 02/01/07 | | | 3,650,000 | | | | 3,650,000 | | | | 3,774,246 | | |
| Westchase Apartments, Austell, GA, 7.50%, 8/1/07 (b) (c) (f) | | 08/12/03 | | | 5,000,000 | | | | 5,000,000 | | | | 5,000,000 | | |
| Whispering Oaks I, Little Rock, AR, 6.25%, 2/1/10 | | 01/10/07 | | | 6,800,000 | | | | 6,800,000 | | | | 6,932,940 | | |
| Whispering Oaks II, Little Rock, AR, 9.88%, 2/1/10 | | 01/10/07 | | | 1,360,000 | | | | 1,360,000 | | | | 1,154,792 | | |
| | | | 96,874,314 | | | | 90,056,748 | | |
| Single Family Loan — 2.1% | |
| 3500 Anini Road, 1 loan, Hawaii, 8.57%, 7/1/07 | | 06/08/05 | | | 5,525,000 | | | | 5,525,000 | | | | 5,340,245 | | |
| Total Whole Loans and Participation Mortgages | | | 229,123,741 | | | | 223,157,969 | | |
| Preferred Stocks — 21.1% | |
| Real Estate Investment Trusts — 21.1% | |
| AMB Property, Series L (b) | | | | | 97,000 | | | | 2,473,891 | | | | 2,413,360 | | |
| AMB Property, Series M (b) | | | | | 21,240 | | | | 543,889 | | | | 532,062 | | |
| AMB Property, Series O (b) | | | | | 12,500 | | | | 312,500 | | | | 323,047 | | |
| BRE Properties, Series C (b) | | | | | 93,600 | | | | 2,362,220 | | | | 2,354,040 | | |
| BRE Properties, Series D (b) | | | | | 32,918 | | | | 823,501 | | | | 826,242 | | |
| Developers Diversified Realty, Series G | | | | | 400 | | | | 10,380 | | | | 10,140 | | |
| Developers Diversified Realty, Series H | | | | | 63,000 | | | | 1,634,450 | | | | 1,611,540 | | |
| Developers Diversified Realty, Series I | | | | | 59,000 | | | | 1,538,322 | | | | 1,516,300 | | |
| Duke Realty, Series J (b) | | | | | 20,956 | | | | 535,385 | | | | 527,043 | | |
| Duke Realty, Series K (b) | | | | | 94,000 | | | | 2,361,279 | | | | 2,364,100 | | |
| Duke Realty, Series M (b) | | | | | 2,000 | | | | 50,000 | | | | 51,700 | | |
| Equity Residential Properties, Series N (b) | | | | | 125,000 | | | | 3,150,150 | | | | 3,137,500 | | |
| First Industrial Realty Trust, Series J (b) | | | | | 106,075 | | | | 2,689,001 | | | | 2,714,459 | | |
| Health Care Properties, Series E (b) | | | | | 14,990 | | | | 385,068 | | | | 380,596 | | |
| Health Care Properties, Series F (b) | | | | | 96,800 | | | | 2,444,530 | | | | 2,467,432 | | |
| HRPT Property Trust, Series C (b) | | | | | 100,000 | | | | 2,500,000 | | | | 2,583,000 | | |
See accompanying Notes to Schedule of Investments.
2007 Semiannual Report
First American Mortgage Funds
38
American Strategic Income Portfolio III (continued)
| Description of Security (continued) | | Shares | | Cost | | Value (a) | |
| Kimco Realty, Series F (b) | | | 113,000 | | | $ | 2,754,500 | | | $ | 2,856,640 | | |
| New Plan Excel Realty Trust, Series E (b) | | | 14,875 | | | | 379,313 | | | | 379,015 | | |
| Post Properties, Series B | | | 1,600 | | | | 39,940 | | | | 40,736 | | |
| Prologis Trust, Series F (b) | | | 54,580 | | | | 1,384,051 | | | | 1,387,424 | | |
| Prologis Trust, Series G (b) | | | 65,210 | | | | 1,654,640 | | | | 1,666,115 | | |
| PS Business Parks, Series H | | | 35,000 | | | | 864,224 | | | | 886,200 | | |
| PS Business Parks, Series I | | | 20,000 | | | | 488,475 | | | | 503,200 | | |
| PS Business Parks, Series L | | | 7,000 | | | | 179,550 | | | | 180,600 | | |
| PS Business Parks, Series M | | | 59,610 | | | | 1,487,689 | | | | 1,531,977 | | |
| Public Storage, Series A (b) | | | 38,000 | | | | 921,909 | | | | 937,460 | | |
| Public Storage, Series M (b) | | | 100,000 | | | | 2,500,000 | | | | 2,483,000 | | |
| Public Storage, Series X (b) | | | 30,000 | | | | 746,643 | | | | 741,600 | | |
| Public Storage, Series Z (b) | | | 59,000 | | | | 1,481,818 | | | | 1,476,180 | | |
| Realty Income, Series D (b) | | | 97,500 | | | | 2,474,125 | | | | 2,492,100 | | |
| Realty Income, Series E (b) | | | 49,550 | | | | 1,248,660 | | | | 1,237,264 | | |
| Regency Centers, Series C (b) | | | 68,424 | | | | 1,769,778 | | | | 1,731,127 | | |
| Regency Centers, Series D (b) | | | 50,000 | | | | 1,243,000 | | | | 1,254,690 | | |
| Vornado Realty Trust, Series E (b) | | | 7,400 | | | | 186,598 | | | | 190,032 | | |
| Vornado Realty Trust, Series F (b) | | | 65,000 | | | | 1,605,424 | | | | 1,656,850 | | |
| Vornado Realty Trust, Series G (b) | | | 41,850 | | | | 1,004,886 | | | | 1,046,250 | | |
| Vornado Realty Trust, Series I (b) | | | 18,000 | | | | 420,500 | | | | 448,740 | | |
| Weingarten Realty Investors, Series F (b) | | | 220,000 | | | | 5,500,000 | | | | 5,440,600 | | |
| Total Preferred Stocks | | | | | | | 54,150,289 | | | | 54,380,361 | | |
| Total Investments in Unaffiliated Securities | | | | | | | 299,071,677 | | | | 293,412,718 | | |
| Short-Term Investment (h) — 5.6% | |
| First American Prime Obligations Fund, Class Z | | | 14,372,737 | | | | 14,372,737 | | | | 14,372,737 | | |
| Total Investments in Securities (i) — 119.4% | | | | | | $ | 313,444,414 | | | $ | 307,785,455 | | |
| Other Assets and Liabilities, Net — (19.4)% | | | | | | | | | | | (50,038,365 | ) | |
| Total Net Assets — 100.0% | | | | | | | | | | $ | 257,747,090 | | |
Notes to Schedule of Investments:
(a) Securities are valued in accordance with procedures described in note 2 in Notes to Financial Statements.
(b) On February 28, 2007, securities valued at $150,850,164 were pledged as collateral for the following outstanding reverse repurchase agreements:
| | | Amount | | Acquisition
Date | | Rate* | | Due | | Accrued
Interest | | Name of Broker
and Description
of Collateral | |
| | | $ | 7,934,080 | | | 2/8/07 | | | 5.38 | % | | 3/8/07 | | $ | 24,450 | | | | (1 | ) | |
| | | | 5,000,000 | | | 2/1/07 | | | 6.20 | % | | 3/1/07 | | | 16,526 | | | | (2 | ) | |
| | | | 1,000,000 | | | 2/26/07 | | | 6.20 | % | | 3/1/07 | | | 516 | | | | (2 | ) | |
| | | | 13,000,000 | | | 2/28/07 | | | 6.20 | % | | 3/1/07 | | | 2,237 | | | | (2 | ) | |
| | | | 23,919,000 | | | 2/9/07 | | | 6.02 | % | | 3/9/07 | | | 84,694 | | | | (3 | ) | |
| $ | 50,853,080 | | | | | | | | | | | | | | | $ | 128,423 | | | | | | |
* Interest rate as of February 28, 2007. Rates are based on the London InterBank Offered Rate (LIBOR) plus a spread and reset monthly.
2007 Semiannual Report
First American Mortgage Funds
39
Schedule of INVESTMENTS (unaudited) continued
American Strategic Income Portfolio III (continued)
Name of broker and description of collateral:
(1) Morgan Stanley:
Federal Home Loan Mortgage Corporation, 5.50%, 1/1/18, $4,013,613 par
Federal Home Loan Mortgage Corporation, 9.00%, 7/1/30, $257,446 par
Federal National Mortgage Association, 6.00%, 10/1/16, $272,166 par
Federal National Mortgage Association, 5.50%, 2/1/17, $605,769 par
Federal National Mortgage Association, 5.50%, 6/1/17, $384,819 par
Federal National Mortgage Association, 5.00%, 9/1/17, $588,815 par
Federal National Mortgage Association, 5.00%, 11/1/17, $1,181,493 par
Federal National Mortgage Association, 6.50%, 6/1/29, $901,744 par
Federal National Mortgage Association, 7.50%, 4/1/30, $43,569 par
Federal National Mortgage Association, 7.50%, 5/1/30, $142,779 par
Federal National Mortgage Association, 8.00%, 5/1/30, $42,527 par
Federal National Mortgage Association, 8.00%, 6/1/30, $170,092 par
(2) Morgan Stanley:
8324 East Hartford Drive I, 5.15%, 5/1/09, $3,800,000 par
Academy Spectrum, 7.73%, 5/1/09, $5,067,654 par
Biltmore Lakes Corporate Center, 6.00%, 9/1/09, $3,301,878 par
Carrier 360, 5.40%, 7/1/09, $3,327,233 par
Country Villa Apartments, 6.90%, 9/1/13, $2,512,188 par
Courtyards at Mesquite I, 6.60%, 11/1/09, $7,600,000 par
El Dorado Apartments I, 7.60%, 9/1/07, $2,563,705 par
France Avenue Business Park II, 7.40%, 10/1/12, $4,417,419 par
Geneva Village Apartments I, 7.00%, 1/1/14, $1,355,918 par
Good Haven Apartments I, 8.57%, 9/1/07, $6,737,000 par
Holiday Village Shopping Center, 7.15%, 11/1/07, $4,587,276 par
Jackson Street Warehouse, 8.53%, 7/1/07, $2,688,901 par
Jilly's American Grill, 7.70%, 9/1/08, $1,810,000 par
Lions Park Apartments I, 5.20%, 4/1/09, $3,411,149 par
North Austin Business Center, 5.65%, 11/1/11, $4,027,239 par
Outle ts at Casa Grande, 6.93%, 3/1/11, $7,300,000 par
Preston Trail Village I, 8.50%, 12/1/07, $17,300,000 par
Shoppes at Jonathan's Landing, 7.95%, 5/1/10, $2,786,527 par
Tatum Ranch Center, 6.53%, 9/1/11, $3,569,925 par
Westchase Apartments, 7.50%, 8/1/07, $5,000,000 par
(3) Dresdner Bank:
AMB Property, Series L, 97,000 shares
AMB Property, Series M, 21,240 shares
AMB Property, Series O, 12,500 shares
BRE Property, Series C, 93,600 shares
BRE Property, Series D, 32,918 shares
Duke Realty, Series J, 20,956 shares
Duke Realty, Series K, 94,000 shares
Duke Realty, Series M, 2,000 shares
Equity Residential Properties, Series N, 125,000 shares
First Industrial Realty Trust, Series J, 106,075 shares
Health Care Properties, Series E, 14,990 shares
Health Care Properties, Series F, 82,800 shares
HRPT Property Trust, Series C, 100,000 shares
Kimco Realty, Series F, 113,000 shares
New Plan Excel Realty Trust, Series E, 14,875 shares
Prologis Trust, Series F, 54,580 shares
Prologis Trust, Series G, 65,210 shares
Public Storage, Series A, 38,000 shares
Public Storage, Series M, 100,000 shares
Public Storage, Series X, 30,000 shares
Public Storage, Series Z, 59,000 shares
Realty Income, Series D, 97,500 shares
Realty Income, Series E, 49,550 shares
Regency Centers, Series C, 68,424 shares
Regency Centers, Series D, 50,000 shares
Vornado Realty Trust, Series E, 7,400 shares
2007 Semiannual Report
First American Mortgage Funds
40
American Strategic Income Portfolio III (concluded)
Vornado Realty Trust, Series F, 65,000 shares
Vornado Realty Trust, Series G, 41,850 shares
Vornado Realty Trust, Series I, 18,000 shares
Weingarten Realty Investors, Series F, 220,000 shares
The fund has entered into a lending commitment with Morgan Stanley. The agreement permits the fund to enter into reverse repurchase agreements up to $90,000,000 using whole loans as collateral. The fund pays a fee of 0.15% to Morgan Stanley on any unused portion of the $90,000,000 lending commitment.
The fund has entered into a lending commitment with Dresdner Bank. The agreement permits the fund to enter into reverse repurchase agreements up to $20,000,000 using preferred stock as collateral. The fund pays a fee of 0.25% to Dresdner Bank on any unused portion of the $20,000,000 lending commitment.
(c) Variable Rate Security – The rate shown is the net coupon rate in effect as of February 28, 2007.
(d) Securities purchased as part of a private placement which have not been registered with the Securities and Exchange Commission under the Securities Act of 1933 and which are considered to be illiquid. These securities are fair valued in accordance with the board approved valuation procedures. On February 28, 2007, the total value of fair valued securities was $230,351,169 or 89.4% of net assets. See note 2 in Notes to Financial Statements.
(e) Interest rates on commercial and multifamily loans are the net coupon rates in effect (after reducing the coupon rate by any mortgage servicing fees paid to mortgage servicers) on February 28, 2007. Interest rates and maturity dates disclosed on single family loans represent the weighed average coupon and weighted average maturity for the underlying mortgage loans as of February 28, 2007.
(f) Interest only – Represents securities that entitle holders to receive only interest payments on the mortgage. Principal balance on the loan is due at maturity. The interest rate disclosed represents the net coupon in effect as of February 28, 2007.
(g) Loan not current on interest and/or principal payments.
(h) Investment in affiliated security. This money market fund is advised by FAF Advisors, Inc., which also serves as advisor for the fund. See note 3 in Notes to Financial Statements.
(i) On February 28, 2007, the cost of investments in securities was $313,444,414. The aggregate gross unrealized appreciation and depreciation of investments in securities, based on this cost, were as follows:
| Gross unrealized appreciation | | $ | 3,929,558 | | |
| Gross unrealized depreciation | | | (9,588,517 | ) | |
| Net unrealized depreciation | | $ | (5,658,959 | ) | |
2007 Semiannual Report
First American Mortgage Funds
41
Schedule of INVESTMENTS (unaudited) continued
American Select Portfolio February 28, 2007
| Description of Security | | Date
Acquired | | Par Value | | Cost | | Value (a) | |
| (Percentages of each investment category relate to net assets) | |
| U.S. Government Agency Mortgage-Backed Securities (b) — 3.6% | |
| Fixed Rate — 3.6% | |
| Federal Home Loan Mortgage Corporation, | |
| 5.50%, 1/1/18, #E93231 | | | | $ | 2,257,657 | | | $ | 2,319,162 | | | $ | 2,267,805 | | |
| 7.50%, 12/1/29, #C00896 | | | | | 323,056 | | | | 317,409 | | | | 337,491 | | |
| Federal National Mortgage Association, | |
| 5.00%, 11/1/17, #657356 | | | | | 1,181,493 | | | | 1,187,001 | | | | 1,168,946 | | |
| 6.50%, 6/1/29, #252497 | | | | | 1,159,385 | | | | 1,152,072 | | | | 1,192,634 | | |
| 7.50%, 5/1/30, #535289 | | | | | 79,322 | | | | 76,830 | | | | 82,724 | | |
| 8.00%, 5/1/30, #538266 | | | | | 23,626 | | | | 23,347 | | | | 24,928 | | |
| Total U.S. Government Agency Mortgage-Backed Securities | | | 5,075,821 | | | | 5,074,528 | | |
| Corporate Note — 3.7% | |
| Adjustable Rate (c) (d) — 3.7% | |
| Stratus II, 6.56%, 12/31/11 | | 12/28/00 | | | 5,000,000 | | | | 5,000,000 | | | | 5,138,000 | | |
| Whole Loans and Participation Mortgages (d) (e) — 95.4% | |
| Commercial Loans — 58.7% | |
| 12000 Aerospace, Clear Lake, TX, 5.43%, 1/1/10 (b) | | 12/22/04 | | | 5,128,747 | | | | 5,128,747 | | | | 5,124,389 | | |
| ABC Conoco, Aspen, CO, 6.65%, 11/1/11 | | 10/31/06 | | | 4,085,655 | | | | 4,085,655 | | | | 4,261,907 | | |
| Best Buy, Fullerton, CA, 8.63%, 1/1/11 | | 12/29/00 | | | 1,776,060 | | | | 1,776,060 | | | | 1,847,103 | | |
| Cingular Wireless Building, Richardson, TX, 7.03%, 7/1/11 | | 06/21/06 | | | 6,500,000 | | | | 6,500,000 | | | | 6,760,000 | | |
| Clear Lake Central I, Webster, TX, 6.70%, 8/1/11 | | 07/27/06 | | | 7,100,000 | | | | 7,100,000 | | | | 7,432,415 | | |
| Gallery Row, Tucson, AZ, 11.88%, 10/1/11 | | 09/07/06 | | | 500,000 | | | | 500,000 | | | | 518,262 | | |
| George Gee Hummer, Liberty Lake, WA, 7.25%, 7/1/10 (f) | | 06/30/05 | | | 2,125,000 | | | | 2,125,000 | | | | 2,231,250 | | |
| George Gee Pontiac, Liberty Lake, WA, 7.23%, 7/1/10 (f) | | 06/30/05 | | | 4,675,000 | | | | 4,675,000 | | | | 4,908,750 | | |
| George Gee Pontiac II, Liberty Lake, WA, 7.78%, 7/1/10 | | 09/14/06 | | | 750,000 | | | | 750,000 | | | | 787,500 | | |
| George Gee Porsche, Liberty Lake, WA, 7.78%, 7/1/10 | | 09/14/06 | | | 2,500,000 | | | | 2,500,000 | | | | 2,625,000 | | |
| Highland Park I, Scottsdale, AZ, 6.77%, 3/1/11 (f) | | 02/23/06 | | | 9,500,000 | | | | 9,500,000 | | | | 9,829,954 | | |
| Highland Park II, Scottsdale, AZ, 9.88%, 3/1/11 (f) | | 02/23/06 | | | 1,200,000 | | | | 1,200,000 | | | | 1,069,008 | | |
| Landmark Bank Center, Sarasota, FL, 5.85%, 7/1/09 (b) | | 10/01/04 | | | 4,668,088 | | | | 4,668,088 | | | | 4,706,675 | | |
| Northrop Grumman Campus I, Colorado Springs, CO, 8.50%, 12/1/08 (c) (f) | | 11/15/05 | | | 5,700,000 | | | | 5,700,000 | | | | 5,814,000 | | |
| Northrop Grumman Campus II, Colorado Springs, CO, 19.20%, 12/1/08 (f) | | 11/15/05 | | | 1,100,000 | | | | 1,100,000 | | | | 1,053,280 | | |
| Oxford Mall, Oxford, MS, 9.25%, 11/1/06 (c) (f) | | 09/24/04 | | | 4,600,000 | | | | 4,600,000 | | | | 4,600,000 | | |
| Peony Promenade, Plymouth, MN, 6.93%, 6/1/13 (b) | | 05/12/03 | | | 4,949,650 | | | | 4,949,650 | | | | 5,197,133 | | |
| Point Plaza, Turnwater, WA, 8.43%, 1/1/11 (b) | | 04/19/04 | | | 6,007,480 | | | | 6,007,480 | | | | 6,136,677 | | |
| Town Square #6, Olympia, WA, 7.40%, 9/1/12 (b) | | 08/02/02 | | | 3,830,662 | | | | 3,830,662 | | | | 4,022,196 | | |
| Victory Packaging, Phoenix, AZ, 8.53%, 1/1/12 (b) | | 12/20/01 | | | 2,442,056 | | | | 2,442,056 | | | | 2,564,159 | | |
| | | | 79,138,398 | | | | 81,489,658 | | |
| Multifamily Loans — 36.7% | |
| Blossom Corners Apartments I, Orlando, FL, 8.72%, 2/1/09 (c) (f) | | 01/19/06 | | | 3,750,000 | | | | 3,750,000 | | | | 3,825,000 | | |
| Blossom Corners Apartments II, Orlando, FL, 14.88%, 2/1/09 (f) | | 01/19/06 | | | 450,000 | | | | 450,000 | | | | 416,932 | | |
| Briarhill Apartments I, Eden Prairie, MN, 6.90%, 9/1/15 (b) | | 08/11/03 | | | 4,593,145 | | | | 4,593,145 | | | | 4,822,802 | | |
| Briarhill Apartments II, Eden Prairie, MN, 6.88%, 9/1/15 | | 08/11/03 | | | 627,060 | | | | 627,060 | | | | 658,160 | | |
Centre Court, White Oaks and Green Acres Apartments,
North Canton and Massilon, OH, 8.65%, 1/1/09 (b) | | 12/30/98 | | | 3,608,503 | | | | 3,608,503 | | | | 3,680,673 | | |
| El Conquistador Apartments, Tucson, AZ, 7.65%, 4/1/09 (b) | | 03/24/99 | | | 2,636,481 | | | | 2,636,481 | | | | 2,715,575 | | |
| Fountain Villas, Phoenix, AZ, 8.70%, 9/1/08 (c) (f) | | 08/08/05 | | | 1,825,000 | | | | 1,825,000 | | | | 1,825,000 | | |
| Glen Iris Land, Atlanta, GA, 8.82%, 3/1/07 (c) (f) | | 02/02/06 | | | 6,250,000 | | | | 6,250,000 | | | | 6,250,000 | | |
| Greenwood Residences, Milton, WA, 7.63%, 4/1/08 (b) | | 03/12/98 | | | 2,143,337 | | | | 2,143,337 | | | | 2,181,059 | | |
| Hunters Meadow, Colorado Springs, CO, 7.80%, 8/1/12 (b) | | 07/02/02 | | | 6,090,812 | | | | 6,090,812 | | | | 4,676,729 | | |
| Revere Apartments, Revere, MA, 7.28%, 5/1/09 (b) | | 04/22/99 | | | 1,176,884 | | | | 1,176,884 | | | | 1,212,191 | | |
| RP Urban Partners, Oxnard, CA, 8.72%, 3/1/10 (c) (f) | | 02/23/05 | | | 5,000,000 | | | | 5,000,000 | | | | 5,131,295 | | |
See accompanying Notes to Schedule of Investments.
2007 Semiannual Report
First American Mortgage Funds
42
American Select Portfolio (continued)
| Description of Security | | Date
Acquired | | Par Value/
Shares | | Cost | | Value (a) | |
| Sheridan Pond Apartments, Tulsa, OK, 6.43%, 7/1/13 (b) | | 06/05/03 | | $ | 6,915,927 | | | $ | 6,915,927 | | | $ | 7,048,394 | | |
| Woodstock Apartments I, Dallas, TX, 7.22%, 1/1/06 (c) (f) (g) | | 12/06/01 | | | 8,300,000 | | | | 8,300,000 | | | | 5,810,000 | | |
| Woodstock Apartments II, Dallas, TX, 11.00%, 1/1/06 (f) (g) | | 12/06/01 | | | 1,000,000 | | | | 1,000,000 | | | | 700,000 | | |
| | | | 54,367,149 | | | | 50,953,810 | | |
| Total Whole Loans and Participation Mortgages | | | 133,505,547 | | | | 132,443,468 | | |
| Preferred Stocks — 18.0% | |
| Real Estate Investment Trusts — 18.0% | |
| AMB Property, Series M (b) | | | | | 8,700 | | | | 222,285 | | | | 217,935 | | |
| AMB Property, Series O (b) | | | | | 55,000 | | | | 1,375,000 | | | | 1,421,409 | | |
| BRE Properties, Series C (b) | | | | | 68,000 | | | | 1,713,000 | | | | 1,710,200 | | |
| BRE Properties, Series D (b) | | | | | 3,434 | | | | 86,548 | | | | 86,193 | | |
| Developers Diversified Realty, Series H | | | | | 13,437 | | | | 338,536 | | | | 343,719 | | |
| Developers Diversified Realty, Series I | | | | | 52,912 | | | | 1,356,657 | | | | 1,359,838 | | |
| Duke Realty, Series L (b) | | | | | 71,000 | | | | 1,787,780 | | | | 1,796,300 | | |
| First Industry Realty Trust, Series J (b) | | | | | 45,050 | | | | 1,142,018 | | | | 1,152,830 | | |
| Health Care Properties, Series E (b) | | | | | 3,510 | | | | 90,207 | | | | 89,119 | | |
| Health Care Properties, Series F (b) | | | | | 42,800 | | | | 1,079,840 | | | | 1,090,972 | | |
| HRPT Properties Trust, Series C (b) | | | | | 50,000 | | | | 1,250,000 | | | | 1,291,500 | | |
| New Plan Excel Realty Trust, Series E (b) | | | | | 6,350 | | | | 161,925 | | | | 161,798 | | |
| PS Business Parks, Series H | | | | | 30,000 | | | | 744,037 | | | | 759,600 | | |
| PS Business Parks, Series I | | | | | 16,000 | | | | 388,272 | | | | 402,560 | | |
| PS Business Parks, Series M | | | | | 22,210 | | | | 554,629 | | | | 570,797 | | |
| Public Storage, Series E (b) | | | | | 65,000 | | | | 1,627,750 | | | | 1,643,200 | | |
| Public Storage, Series M (b) | | | | | 68,000 | | | | 1,700,000 | | | | 1,688,440 | | |
| Realty Income, Series D (b) | | | | | 60,000 | | | | 1,521,000 | | | | 1,533,600 | | |
| Realty Income, Series E (b) | | | | | 49,500 | | | | 1,247,400 | | | | 1,236,015 | | |
| Regency Centers, Series D (b) | | | | | 5,888 | | | | 151,779 | | | | 148,966 | | |
| Regency Centers, Series E (b) | | | | | 64,000 | | | | 1,592,900 | | | | 1,606,003 | | |
| Vornado Realty Trust, Series F (b) | | | | | 60,000 | | | | 1,491,564 | | | | 1,529,400 | | |
| Vornado Realty Trust, Series I (b) | | | | | 6,000 | | | | 139,500 | | | | 149,580 | | |
| Weingarten Realty Investors, Series F (b) | | | | | 120,000 | | | | 3,000,000 | | | | 2,967,600 | | |
| Total Preferred Stocks | | | 24,762,627 | | | | 24,957,574 | | |
| Total Investments in Unaffiliated Securities | | | 168,343,995 | | | | 167,613,570 | | |
| Short-Term Investment (h) — 0.9% | |
| First American Prime Obligations Fund, Class Z | | | | | 1,219,143 | | | | 1,219,143 | | | | 1,219,143 | | |
| Total Investments in Securities (i) — 121.6% | | | | | | | | $ | 169,563,138 | | | $ | 168,832,713 | | |
| Other Assets and Liabilities, Net — (21.6)% | | | | | | | | | | | | | (29,947,846 | ) | |
| Total Net Assets — 100.0% | | | | | | | | | | | | $ | 138,884,867 | | |
See accompanying Notes to Schedule of Investments.
2007 Semiannual Report
First American Mortgage Funds
43
Schedule of INVESTMENTS (unaudited) continued
American Select Portfolio (continued)
Notes to Schedule of Investments:
(a) Securities are valued in accordance with procedures described in note 2 in Notes to Financial Statements.
(b) On February 28, 2007, securities valued at $80,429,389 were pledged as collateral for the following outstanding reverse repurchase agreements:
| | | Amount | | Acquisition
Date | | Rate* | | Due | | Accrued
Interest | | Name of Broker
and Description
of Collateral | |
| | | $ | 4,892,757 | | | 2/8/07 | | | 5.38 | % | | 3/8/07 | | $ | 20,473 | | | | (1 | ) | |
| | | | 15,000,000 | | | 2/1/07 | | | 6.20 | % | | 3/1/07 | | | 77,769 | | | | (2 | ) | |
| | | | 1,486,000 | | | 2/9/07 | | | 6.02 | % | | 3/9/07 | | | 6,958 | | | | (3 | ) | |
| | | | 9,151,000 | | | 2/9/07 | | | 6.02 | % | | 3/9/07 | | | 42,847 | | | | (3 | ) | |
| $ | 30,529,757 | | | | | | | | | | | | | | | $ | 148,047 | | | | | | |
* Interest rate as of February 28, 2007. Rate is based on the London InterBank Offered Rate (LIBOR) plus a spread and reset monthly.
Name of broker and description of collateral:
(1) Morgan Stanley:
Federal Home Loan Mortgage Corporation, 5.50%, 1/1/18, $2,257,657 par
Federal Home Loan Mortgage Corporation, 7.50%, 12/1/29, $323,056 par
Federal National Mortgage Association, 5.00%, 11/1/17, $1,181,493 par
Federal National Mortgage Association, 6.50%, 6/1/29, $1,159,385 par
Federal National Mortgage Association, 7.50%, 5/1/30, $79,322 par
Federal National Mortgage Association, 8.00%, 5/1/30, $23,626 par
(2) Morgan Stanley:
12000 Aerospace, 5.43%, 1/1/10, $5,128,747 par
Briarhill Apartments I, 6.90%, 9/1/15, $4,593,145 par
Centre Court, White Oaks and Green Acres Apartments, 8.65%, 1/1/09, $3,608,503 par
El Conquistador Apartments, 7.65%, 4/1/09, $2,636,481 par
Greenwood Residences, 7.63%, 4/1/08, $2,143,337 par
Hunters Meadow, 7.80%, 8/1/12, $6,090,812 par
Landmark Bank Center, 5.85%, 7/1/09, $4,668,088 par
Peony Promenade, 6.93%, 6/1/13, $4,949,650 par
Point Plaza, 8.43%, 1/1/11, $6,007,480 par
Revere Apartments, 7.28%, 5/1/09, $1,176,884 par
Sheridan Pond Apartments, 6.43%, 7/1/13, $6,915,927 par
Town Square #6, 7.40%, 9/1/12, $3,830,662 par
Victory Packaging, 8.53%, 1/1/12, $2,442,056 par
(3) Dresdner Bank:
AMB Property, Series M, 8,700 shares
AMB Property, Series O, 55,000 shares
BRE Properties, Series C, 68,000 shares
BRE Properties, Series D, 3,434 shares
Duke Realty, Series L, 71,000 shares
First Industry Realty Trust, Series J, 45,050 shares
Health Care Properties, Series E, 3,510 shares
Health Care Properties, Series F, 42,800 shares
HRPT Properties Trust, Series C, 50,000 shares
New Plan Excel Realty Trust, Series E, 6,350 shares
Public Storage, Series E, 65,000 shares
Public Storage, Series M, 68,000 shares
Realty Income, Series D, 60,000 shares
Realty Income, Series E, 49,500 shares
Regency Centers, Series D, 5,888 shares
Regency Centers, Series E, 64,000 shares
Vornado Realty Trust, Series F, 60,000 shares
Vornado Realty Trust, Series I, 6,000 shares
Weingarten Realty Investors, Series F, 120,000 shares
2007 Semiannual Report
First American Mortgage Funds
44
American Select Portfolio (concluded)
The fund has entered into a lending commitment with Morgan Stanley. The agreement permits the fund to enter into reverse repurchase agreements up to $60,000,000 using whole loans as collateral. The fund pays a fee of 0.15% to Morgan Stanley on any unused portion of the $60,000,000 lending commitment.
The fund has entered into a lending commitment with Dresdner Bank. The agreement permits the fund to enter into reverse repurchase agreements up to $10,000,000 using preferred stock as collateral. The fund pays a fee of 0.25% to Dresdner Bank on any unused portion of the $10,000,000 lending commitment.
(c) Variable Rate Security – The rate shown is the net coupon rate in effect on February 28, 2007.
(d) Securities purchased as part of a private placement which have not been registered with the Securities and Exchange Commission under the Securities Act of 1933 and which are considered to be illiquid. These securities are fair valued in accordance with the board approved valuation procedures. On February 28, 2007, the total value of fair valued securities was $137,581,468 or 99.1% of net assets. See note 2 in Notes to Financial Statements.
(e) Interest rates on commercial and multifamily loans are the net coupon rates in effect (after reducing the coupon rate by any mortgage servicing fees paid to mortgage servicers) on February 28, 2007.
(f) Interest only – Represents securities that entitle holders to receive only interest payments on the mortgage. Principal balance on the loan is due at maturity. The interest rate disclosed represents the net coupon rate in effect as of February 28, 2007.
(g) Loan not current on interest and/or principal payments.
(h) Investment in affiliated security. This money market fund is advised by FAF Advisors, Inc., which also serves as advisor for the fund. See note 3 in Notes to Financial Statements.
(i) On February 28, 2007, the cost of investments in securities was $169,563,138. The aggregate gross unrealized appreciation and depreciation of investments in securities, based on this cost, were as follows:
| Gross unrealized appreciation | | $ | 3,825,084 | | |
| Gross unrealized depreciation | | | (4,555,509 | ) | |
| Net unrealized depreciation | | $ | (730,425 | ) | |
2007 Semiannual Report
First American Mortgage Funds
45
NOTICE TO SHAREHOLDERS (unaudited)
ANNUAL MEETING RESULTS
A joint annual meeting of the funds' shareholders was held on December 4, 2006. For American Strategic Income Portfolio II, American Strategic Income Portfolio III, and American Select Portfolio, the meeting was adjourned until December 21, 2006, with respect to the third agenda item noted below. Each matter voted upon at that meeting, as well as the number of votes cast for, against or withheld, the number of abstentions, and the number of broker non-votes (if any) with respect to such matters, are set forth below.
(1) The funds' shareholders elected the following nine directors:
| | | American Strategic
Income Portfolio | | American Strategic
Income Portfolio II | |
| | | Shares
Voted "For" | | Shares Witholding
Authority to Vote | | Shares
Voted "For" | | Share Witholding
Authority to Vote | |
| Benjamin R. Field III | | | 3,201,571 | | | | 166,602 | | | | 11,791,614 | | | | 166,628 | | |
| Roger A. Gibson | | | 3,204,071 | | | | 164,102 | | | | 11,791,319 | | | | 166,923 | | |
| Victoria J. Herget | | | 3,202,658 | | | | 165,515 | | | | 11,796,301 | | | | 161,941 | | |
| John P. Kayser | | | 3,204,379 | | | | 163,794 | | | | 11,787,329 | | | | 170,913 | | |
| Leonard W. Kedrowski | | | 2,096,241 | | | | 1,271,932 | | | | 7,596,243 | | | | 4,361,999 | | |
| Richard K. Riederer | | | 3,204,379 | | | | 163,794 | | | | 11,791,717 | | | | 166,525 | | |
| Joseph D. Strauss | | | 3,200,158 | | | | 168,015 | | | | 11,787,883 | | | | 170,359 | | |
| Virginia L. Stringer | | | 3,199,850 | | | | 168,323 | | | | 11,792,947 | | | | 165,295 | | |
| James M. Wade | | | 3,202,658 | | | | 165,515 | | | | 11,789,979 | | | | 168,263 | | |
| | | American Strategic
Income Portfolio III | | American Select
Portfolio | |
| | | Shares
Voted "For" | | Shares Witholding
Authority to Vote | | Shares
Voted "For" | | Share Witholding
Authority to Vote | |
| Benjamin R. Field III | | | 15,744,316 | | | | 594,296 | | | | 8,242,850 | | | | 135,420 | | |
| Roger A. Gibson | | | 15,737,559 | | | | 601,053 | | | | 8,234,945 | | | | 143,325 | | |
| Victoria J. Herget | | | 15,749,331 | | | | 589,281 | | | | 8,244,442 | | | | 133,828 | | |
| John P. Kayser | | | 15,742,389 | | | | 596,223 | | | | 8,238,960 | | | | 139,310 | | |
| Leonard W. Kedrowski | | | 11,765,055 | | | | 4,573,557 | | | | 5,879,475 | | | | 2,498,795 | | |
| Richard K. Riederer | | | 15,740,929 | | | | 597,683 | | | | 8,238,135 | | | | 140,135 | | |
| Joseph D. Strauss | | | 15,736,544 | | | | 602,068 | | | | 8,236,496 | | | | 141,774 | | |
| Virginia L. Stringer | | | 15,743,205 | | | | 595,407 | | | | 8,244,752 | | | | 133,518 | | |
| James M. Wade | | | 15,740,980 | | | | 597,632 | | | | 8,238,135 | | | | 140,135 | | |
(2) The funds' shareholders ratified the selection by the funds' board of directors of Ernst & Young LLP as the independent registered public accounting firm for the funds for the fiscal period ending August 31, 2007. The following votes were cast regarding this matter:
| Fund | | Shares
Voted "For" | | Shares
Voted "Against" | | Abstentions | | Broker
Non-Votes | |
| American Strategic Income Portfolio | | | 3,349,228 | | | | 11,765 | | | | 7,180 | | | | — | | |
| American Strategic Income Portfolio II | | | 11,804,945 | | | | 57,269 | | | | 96,028 | | | | — | | |
| American Strategic Income Portfolio III | | | 16,039,534 | | | | 106,052 | | | | 193,026 | | | | — | | |
| American Select Portfolio | | | 8,244,603 | | | | 57,165 | | | | 76,502 | | | | — | | |
(3) The funds' shareholders approved increasing the amount that a fund may invest in REIT preferred issues of any one issuer or its affiliate from 1% to 2% of a fund's total assets.
| Fund | | Shares
Voted "For" | | Shares
Voted "Against" | | Abstentions | | Broker
Non-Votes | |
| American Strategic Income Portfolio | | | 2,372,282 | | | | 43,825 | | | | 20,241 | | | | 931,825 | | |
| American Strategic Income Portfolio II | | | 8,169,055 | | | | 178,178 | | | | 195,355 | | | | 3,415,654 | | |
| American Strategic Income Portfolio III | | | 10,855,867 | | | | 316,941 | | | | 336,039 | | | | 4,829,765 | | |
| American Select Portfolio | | | 5,445,120 | | | | 107,327 | | | | 114,676 | | | | 2,711,147 | | |
2007 Semiannual Report
First American Mortgage Funds
46
PORTFOLIO MANAGER ADDITION
David A. Yale has been appointed a co-manager of the funds, effective April 2007. Mr. Yale joined FAF Advisors as a senior real estate portfolio manager in 2006. Prior to that, Mr. Yale had been in the Commercial Real Estate Department of U.S. Bank since 2005, and at ING Investment Management/ReliaStar Investment Research in the commercial loan area since 1989. Mr. Yale has been in the commercial lending industry since 1981.
John G. Wenker continues to act as the funds' lead portfolio manager. Mr. Wenker has managed the funds since January 1992 and has worked in the financial industry since 1983. Chris J. Neuharth continues to manage the mortgage-backed securities portion of the funds. Mr. Neuharth has acted in that capacity since 2000 and has been in the financial industry since 1981.
HOW TO OBTAIN A COPY OF THE FUNDS' PROXY VOTING POLICIES
A description of the policies and procedures that the funds use to determine how to vote proxies relating to portfolio securities, as well as information regarding how the funds voted proxies relating to portfolio securities during the most recent 12 month period ended June 30, is available (1) without charge upon request by calling 800.677.FUND; (2) at firstamericanfunds.com; and (3) on the U.S. Securities and Exchange Commission's website at www.sec.gov.
FORM N-Q HOLDINGS INFORMATION
The funds are required to file their complete schedule of portfolio holdings for the first and third quarters of each fiscal year with the Securities and Exchange Commission on Form N-Q. The funds' Forms N-Q are available (1) without charge upon request by calling 800.677.FUND and (2) on the U.S. Securities and Exchange Commission's website at www.sec.gov. In addition, you may review and copy the funds' Forms N-Q at the Commissions Public Reference Room in Washington D.C. You may obtain information on the operation of the Public Reference Room by calling 1-800-SEC-0330.
QUARTERLY PORTFOLIO HOLDINGS
The funds will make portfolio holdings information publicly available by posting the information at firstamericanfunds.com on a quarterly basis. The funds will attempt to post such information within 10 days of the quarter end.
2007 Semiannual Report
First American Mortgage Funds
47
(This page has been left blank intentionally.)
Board of DIRECTORS
VIRGINIA STRINGER
Chairperson of First American Mortgage Funds
Governance Consultant; former Owner and President of Strategic Management Resources, Inc.
BENJAMIN FIELD III
Director of First American Mortgage Funds
Retired; former Senior Financial Advisor, Senior Vice President, Chief Financial Officer,
and Treasurer of Bemis Company, Inc.
ROGER GIBSON
Director of First American Mortgage Funds
Director of Charterhouse Group, Inc.
VICTORIA HERGET
Director of First American Mortgage Funds
Investment Consultant; former Managing Director of Zurich Scudder Investments
JOHN KAYSER
Director of First American Mortgage Funds
Retired; former Principal, Chief Financial Officer, and Chief Administrative Officer of
William Blair & Company, LLC
LEONARD KEDROWSKI
Director of First American Mortgage Funds
Owner and President of Executive and Management Consulting, Inc.
RICHARD RIEDERER
Director of First American Mortgage Funds
Owner and Chief Executive Officer of RKR Consultants, Inc.
JOSEPH STRAUSS
Director of First American Mortgage Funds
Owner and President of Strauss Management Company
JAMES WADE
Director of First American Mortgage Funds
Owner and President of Jim Wade Homes
The Board of Directors of the First American Mortgage Funds is comprised entirely of independent directors.
AMERICAN STRATEGIC INCOME PORTFOLIO INC. |
AMERICAN STRATEGIC INCOME PORTFOLIO INC. II |
AMERICAN STRATEGIC INCOME PORTFOLIO INC. III |
AMERICAN SELECT PORTFOLIO INC. |
2007 Semiannual Report |
|
FAF Advisors, Inc., is a wholly owned subsidiary of U.S. Bank National Association, which is a wholly owned subsidiary of U.S. Bancorp. |
|
|

| This document is printed on paper containing 10% postconsumer waste. |
Item 2—Code of Ethics
Not applicable to the semi-annual report.
Item 3—Audit Committee Financial Expert
Not applicable to the semi-annual report.
Item 4—Principal Accountant Fees and Services
Not applicable to the semi-annual report.
Item 5—Audit Committee of Listed Registrants
Not applicable to the semi-annual report.
Item 6—Schedule of Investments
The schedule is included as part of the report to shareholders filed under Item 1 of this Form.
Item 7—Disclosure of Proxy Voting Policies and Procedures for Closed-End Management Investment Companies
Not applicable to the semi-annual report.
Item 8—Portfolio Managers of Closed-End Management Investment Companies
(a) Not applicable.
(b) David A. Yale has been appointed a co-manager of the registrant, effective April 2007. Mr. Yale joined FAF Advisors, Inc. (the “Advisor”) as a senior real estate portfolio manager in 2006. Prior to that, Mr. Yale had been in the Commercial Real Estate Department of U.S. Bank since 2005, and at ING Investment Management/ReliaStar Investment Research in the commercial loan area since 1989. Mr. Yale has been in the commercial lending industry since 1981. John G. Wenker continues to act as the registrant’s lead portfolio manager and Chris J. Neuharth continues to manage the mortgage-backed securities portion of the registrant’s portfolio.
The following table shows, as of the period ended April 30, 2007, the number of other accounts Mr. Yale managed within each of the following categories and the total assets in the accounts managed within each category. The table also shows the number of accounts and the total assets in the accounts, if any, with respect to which the advisory fee is based on the performance of the account.
Portfolio Manager | | Type of Account Managed | | Total
Number
of
Accounts | | Total Assets
of All
Accounts | | Accounts
Subject to
Performance-
Based Fee | | Total Assets
Subject��to
Performance-
Based Fee | |
David A. Yale | | Registered Investment Company | | 3 | | $ | 390.7 million | | 0 | | 0 | |
| | Other Pooled Investment Vehicles | | 0 | | 0 | | 0 | | 0 | |
| | Other Accounts | | 0 | | 0 | | 0 | | 0 | |
| | | | | | | | | | | | |
The registrant’s portfolio managers often manage multiple accounts. The Advisor has adopted policies and procedures regarding brokerage and trade allocation and allocation of investment opportunities that it believes are reasonably designed to address potential conflicts of interest associated with managing multiple accounts for multiple clients.
Portfolio manager compensation consists primarily of base pay, an annual cash incentive and long term incentive payments.
Base pay is determined based upon an analysis of the portfolio manager’s general performance, experience, and market levels of base pay for such position.
Portfolio managers are paid an annual incentive based upon investment performance, generally over the past one- and three-year periods unless the portfolio manager’s tenure is shorter. The maximum potential annual cash incentive is equal
to a multiple of base pay, determined based upon the particular portfolio manager’s performance and experience, and market levels of base pay for such position.
The portion of the maximum potential annual cash incentive that is paid out is based upon performance relative to the portfolio’s benchmark and performance relative to an appropriate Lipper industry peer group. Generally, the threshold for payment of an annual cash incentive is (i) benchmark performance and (ii) median performance versus the peer group, and the maximum annual cash incentive is attained at (i) a spread over the benchmark which the Advisor believes will, over time, deliver top quartile performance and (ii) top quartile performance versus the Lipper industry peer group.
Investment performance is measured on a pre-tax basis, gross of fees for registrant results and for the Lipper industry peer group.
Long term incentive payments are paid to portfolio managers on an annual basis based upon general performance and expected contributions to the success of the Advisor. Long-term incentive payments are comprised of two components: (i) performance equity units of the Advisor and (ii) U.S. Bancorp options and restricted stock.
There are generally no differences between the methods used to determine compensation with respect to the registrant and the other accounts managed by the registrant’s portfolio managers.
As of the period ended April 30, 2007, Mr. Yale did not beneficially own any equity securities of the registrant.
Item 9—Purchases of Equity Securities by Closed-End Management Investment Company and Affiliated Purchasers
Neither the registrant nor any “affiliated purchaser,” as defined in Rule 10b-18(a)(3) under the Exchange Act (17 CFR 240.10b-18(a)(3)), purchased any shares or other units of any class of the registrant’s equity securities that is registered pursuant to Section 12 of the Exchange Act (15 U.S.C. 781).
Item 10—Submission of Matters to a Vote of Security Holders
There have been no material changes to the procedures by which shareholders may recommend nominees to the registrant’s board of directors, where those changes were implemented after the registrant last provided disclosure in response to the requirements of Item 7(d)(2)(ii)(G) of Schedule 14A (17 CFR 240.14a-101), or this item.
Item 11—Controls and Procedures
(a) The registrant’s Principal Executive Officer and Principal Financial Officer have evaluated the registrant’s disclosure controls and procedures within 90 days of the date of this filing and have concluded that the registrant’s disclosure controls and procedures were effective, as of that date, in ensuring that information required to be disclosed by the registrant in this Form N-CSR was recorded, processed, summarized and reported timely.
(b) There were no changes in the registrant’s internal control over financial reporting that occurred during the second fiscal quarter of the period covered by this report that have materially affected, or are reasonably likely to materially affect, the registrant’s internal control over financial reporting.
Item 12—Exhibits
(a)(1) Not applicable.
(a)(2) Certifications of the Principal Executive Officer and Principal Financial Officer of the registrant as required by Rule 30a-2(a) under the Investment Company Act are filed as exhibits hereto.
(a)(3) Not applicable.
(b) Certifications of the Principal Executive Officer and Principal Financial Officer of the registrant as required by Rule 30a-2(b) under the Investment Company Act are filed as exhibits hereto.
Signatures
Pursuant to the requirements of the Securities Exchange Act of 1934 and the Investment Company Act of 1940, the registrant has duly caused this report to be signed on its behalf by the undersigned, thereunto duly authorized.
American Strategic Income Portfolio Inc. III |
| |
By: | |
| /s/ Thomas S. Schreier, Jr. | |
| Thomas S. Schreier, Jr. |
| President |
| |
Date: May 8, 2007 |
Pursuant to the requirements of the Securities Exchange Act of 1934 and the Investment Company Act of 1940, this report has been signed below by the following persons on behalf of the registrant and in the capacities and on the dates indicated.
By: | |
| /s/ Thomas S. Schreier, Jr. | |
| Thomas S. Schreier, Jr. |
| President |
| |
Date: May 8, 2007 |
| |
By: | |
| /s/ Charles D. Gariboldi, Jr. | |
| Charles D. Gariboldi, Jr. |
| Treasurer |
| |
Date: May 8, 2007 |