UNITED STATES
SECURITIES AND EXCHANGE COMMISSION
Washington, D.C. 20549
FORM N-CSR
CERTIFIED SHAREHOLDER REPORT OF REGISTERED
MANAGEMENT INVESTMENT COMPANIES
Investment Company Act file number 811-07444
American Strategic Income Portfolio Inc. III
(Exact name of registrant as specified in charter)
| | |
| 800 Nicollet Mall, Minneapolis, MN | | 55402 |
| (Address of principal executive offices) | | (Zip code) |
Jill M. Stevenson, 800 Nicollet Mall, Minneapolis, MN 55402
(Name and address of agent for service)
Registrant’s telephone number, including area code: 800-677-3863
Date of fiscal year end: August 31
Date of reporting period: February 28, 2014
Form N-CSR is to be used by management investment companies to file reports with the Commission not later than 10 days after the transmission to stockholders of any report that is required to be transmitted to stockholders under Rule 30e-1 under the Investment Company Act of 1940 (17 CFR 270.30e-1). The Commission may use the information provided on Form N-CSR in its regulatory, disclosure review, inspection, and policymaking roles.
A registrant is required to disclose the information specified by Form N-CSR, and the Commission will make this information public. A registrant is not required to respond to the collection of information contained in Form N-CSR unless the Form displays a currently valid Office of Management and Budget (“OMB”) control number. Please direct comments concerning the accuracy of the information collection burden estimate and any suggestions for reducing the burden to Secretary, Securities and Exchange Commission, 450 Fifth Street, NW, Washington, DC 20549-0609. The OMB has reviewed this collection of information under the clearance requirements of 44 U.S.C. Section 3507.

SEMIANNUAL REPORT
February 28, 2014

| | | | |
| ASP | | | | American Strategic
Income Portfolio Inc. |
| | |
| BSP | | | | American Strategic
Income Portfolio Inc. II |
| | |
| CSP | | | | American Strategic
Income Portfolio Inc. III |
| | |
| SLA | | | | American Select
Portfolio Inc. |
First American Mortgage Funds
OUR IMAGE–GEORGE WASHINGTON
His rich legacy as patriot and leader is widely recognized as embodying the sound judgment, reliability, and strategic vision that are central to our brand. Fashioned in a style reminiscent of an 18th century engraving, the illustration conveys the symbolic strength and vitality of Washington, which are attributes that we value at First American.

|
| NOT FDIC INSURED NO BANK GUARANTEE MAY LOSE VALUE |
EXPLANATION OF FINANCIAL STATEMENTS
As a shareholder in one or more of the funds, you receive shareholder reports semiannually. We strive to present this financial information in an easy-to-understand format; however, for many investors, the information contained in this shareholder report may seem very technical. So, we would like to take this opportunity to explain several sections of the shareholder report.
The Schedule of Investments details all of the securities held in the fund and their related dollar values on the last day of the reporting period. Securities are usually presented by type (bonds, common stock, etc.) and by industry classification (healthcare, education, etc.). This information is useful for analyzing how your fund’s assets are invested and seeing where your portfolio manager believes the best opportunities exist to meet your objectives. Holdings are subject to change without notice and do not constitute a recommendation of any individual security. The Notes to Financial Statements provide additional details on how the securities are valued.
The Statement of Assets and Liabilities lists the assets and liabilities of the fund on the last day of the reporting period and presents the fund’s net asset value (“NAV”) and market price per share. The NAV is calculated by dividing the fund’s net assets (assets minus liabilities) by the number of shares outstanding. The market price is the closing price on the exchange on which the fund’s shares trade. This price, which may be higher or lower than the fund’s NAV, is the price an investor pays or receives when shares of the fund are purchased or sold. The investments, as presented in the Schedule of Investments, comprise substantially all of the fund’s assets. Other assets include cash and receivables for items such as income earned by the fund but not yet received. Liabilities include payables for items such as fund expenses incurred but not yet paid.
The Statement of Operations details the dividends and interest income earned from investments as well as the expenses incurred by the fund during the reporting period. Fund expenses may be reduced through fee waivers or reimbursements. This statement reflects total expenses before any waivers or reimbursements, the amount of waivers and reimbursements (if any), and the net expenses. This statement also shows the net realized and unrealized gains and losses from investments owned during the period. The Notes to Financial Statements provide additional details on investment income and expenses of the fund.
The Statement of Changes in Net Assets describes how the fund’s net assets were affected by its operating results and distributions to shareholders during the reporting period. This statement is important to investors because it shows exactly what caused the fund’s net asset size to change during the period.
The Statement of Cash Flows is required when a fund has a substantial amount of illiquid investments, a substantial amount of the fund’s securities are internally fair valued, or the fund carries some amount of debt. When presented, this statement explains the change in cash during the reporting period. It reconciles net cash provided by and used for operating activities to the net increase or decrease in net assets from operations and classifies cash receipts and payments as resulting from operating, investing, and financing activities.
The Financial Highlights provide a per-share breakdown of the components that affected the fund’s NAV for the current and past reporting periods. It also shows total return, net investment income ratios, expense ratios, and portfolio turnover rates. The net investment income ratios summarize the income earned less expenses, divided by the average net assets. The expense ratios represent the percentage of average net assets that were used to cover operating expenses during the period. The portfolio turnover rate represents the percentage of the fund’s holdings that have changed over the course of the period, and gives an idea of how long the fund holds onto a particular security. A 100% turnover rate implies that an amount equal to the value of the entire portfolio is turned over in a year through the purchase or sale of securities.
The Notes to Financial Statements disclose the organizational background of the fund, its significant accounting policies, federal tax information, fees and compensation paid to affiliates, and significant risks and contingencies.
We hope this guide to your shareholder report will help you get the most out of this important resource.
| | | | | | |
| FIRST AMERICAN MORTGAGE FUNDS | | 2014 SEMIANNUAL REPORT | | | 1 | |
Fund Overviews
American Strategic Income Portfolio (ASP)
Portfolio Allocation
As a percentage of total investments on February 28, 2014
| | | | |
Commercial Loans | | | 28 | % |
Preferred Stocks | | | 28 | |
Corporate Bonds | | | 24 | |
U.S. Government Agency Mortgage-Backed Securities | | | 10 | |
Corporate Note | | | 5 | |
Real Estate Owned | | | 3 | |
Short-Term Investment | | | 2 | |
| | | 100 | % |
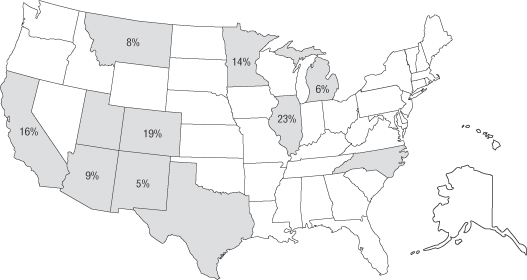
Geographical Distribution
We attempt to buy mortgage loans in many parts of the country to help avoid the risks of concentrating in one area. These percentages reflect the fair value of whole loans as of February 28, 2014. Shaded areas without fair values indicate states in which the fund has invested less than 0.50% of its investments.
Delinquent Loan Profile
The tables below show the percentages of single family loans and multifamily and commercial loans in the portfolio that are 30, 60, 90, or 120 or more days delinquent as of February 28, 2014, based on the fair value outstanding.
| | | | |
Single family loans | | | | |
Current | | | 100.0 | % |
30 Days | | | 0.0 | |
60 Days | | | 0.0 | |
90 Days | | | 0.0 | |
120+ Days | | | 0.0 | |
| | | 100.0 | % |
| | | | |
Multifamily and commercial loans | |
Current | | | 100.0 | % |
30 Days | | | 0.0 | |
60 Days | | | 0.0 | |
90 Days | | | 0.0 | |
120+ Days | | | 0.0 | |
| | | 100.0 | % |
| | | | |
| 2 | | FIRST AMERICAN MORTGAGE FUNDS | | 2014 SEMIANNUAL REPORT |
American Strategic Income Portfolio II (BSP)
Portfolio Allocation
As a percentage of total investments on February 28, 2014
| | | | |
Commercial Loans | | | 30 | % |
Preferred Stocks | | | 26 | |
Corporate Bonds | | | 21 | |
Multifamily Loans | | | 12 | |
Corporate Notes | | | 5 | |
U.S. Government Agency Mortgage-Backed Securities | | | 4 | |
Asset-Backed Security | | | 1 | |
Short-Term Investment | | | 1 | |
| | | 100 | % |
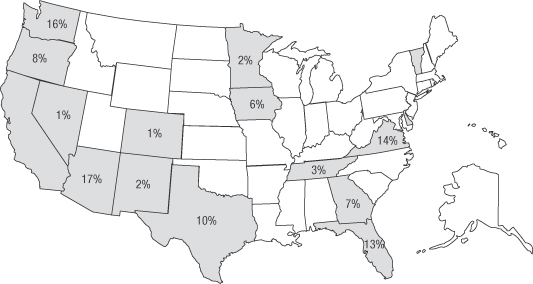
Geographical Distribution
We attempt to buy mortgage loans in many parts of the country to help avoid the risks of concentrating in one area. These percentages reflect the fair value of whole loans as of February 28, 2014. Shaded areas without fair values indicate states in which the fund has invested less than 0.50% of its investments.
Delinquent Loan Profile
The tables below show the percentages of single family loans and multifamily and commercial loans in the portfolio that are 30, 60, 90, or 120 or more days delinquent as of February 28, 2014, based on the fair value outstanding.
| | | | |
Single family loans | | | | |
Current | | | 85.6 | % |
30 Days | | | 14.4 | |
60 Days | | | 0.0 | |
90 Days | | | 0.0 | |
120+ Days | | | 0.0 | |
| | | 100.0 | % |
| | | | |
Multifamily and commercial loans | | | | |
Current | | | 94.4 | % |
30 Days | | | 0.0 | |
60 Days | | | 0.0 | |
90 Days | | | 0.0 | |
120+ Days | | | 5.6 | |
| | | 100.0 | % |
| | | | | | |
| FIRST AMERICAN MORTGAGE FUNDS | | 2014 SEMIANNUAL REPORT | | | 3 | |
Fund Overviews
American Strategic Income Portfolio III (CSP)
Portfolio Allocation
As a percentage of total investments on February 28, 2014
| | | | |
Commercial Loans | | | 29 | % |
Corporate Bonds | | | 29 | |
Preferred Stocks | | | 27 | |
Multifamily Loans | | | 10 | |
U.S. Government Agency Mortgage-Backed Securities | | | 4 | |
Short-Term Investment | | | 1 | |
| | | 100 | % |
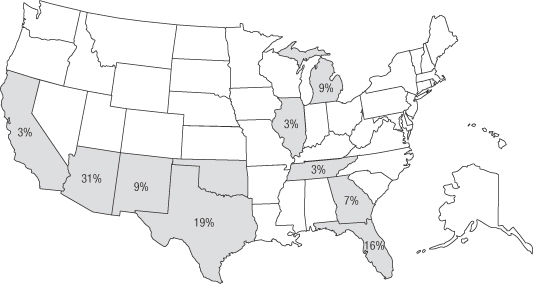
Geographical Distribution
We attempt to buy mortgage loans in many parts of the country to help avoid the risks of concentrating in one area. These percentages reflect the fair value of whole loans as of February 28, 2014. Shaded areas without fair values indicate states in which the fund has invested less than 0.50% of its investments.
Delinquent Loan Profile
The table below shows the percentages of multifamily and commercial loans in the portfolio that are 30, 60, 90, or 120 or more days delinquent as of February 28, 2014, based on the fair value outstanding.
| | | | |
Multifamily and commercial loans | |
Current | | | 75.5 | % |
30 Days | | | 0.0 | |
60 Days | | | 0.0 | |
90 Days | | | 0.0 | |
120+ Days | | | 24.5 | |
| | | 100.0 | % |
| | | | |
| 4 | | FIRST AMERICAN MORTGAGE FUNDS | | 2014 SEMIANNUAL REPORT |
American Select Portfolio (SLA)
Portfolio Allocation
As a percentage of total investments on February 28, 2014
| | | | |
Preferred Stocks | | | 27 | % |
Commercial Loans | | | 25 | |
Corporate Bonds | | | 24 | |
U.S. Government Agency Mortgage-Backed Securities | | | 9 | |
Multifamily Loans | | | 8 | |
Corporate Notes | | | 5 | |
Short-Term Investment | | | 1 | |
Asset-Backed Security | | | 1 | |
| | | 100 | % |
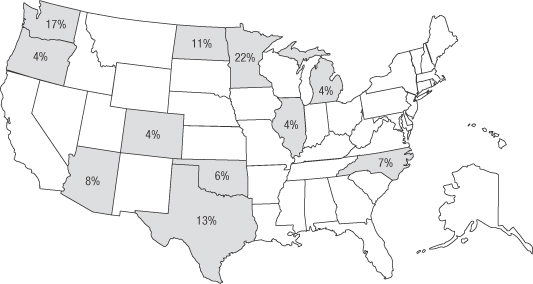
Geographical Distribution
We attempt to buy mortgage loans in many parts of the country to help avoid the risks of concentrating in one area. These percentages reflect the fair value of whole loans as of February 28, 2014. Shaded areas without fair values indicate states in which the fund has invested less than 0.50% of its investments.
Delinquent Loan Profile
The table below shows the percentages of multifamily and commercial loans in the portfolio that are 30, 60, 90, or 120 or more days delinquent as of February 28, 2014, based on the fair value outstanding.
| | | | |
Multifamily and commercial loans | |
Current | | | 91.6 | % |
30 Days | | | 0.0 | |
60 Days | | | 0.0 | |
90 Days | | | 0.0 | |
120+ Days | | | 8.4 | |
| | | 100.0 | % |
| | | | | | |
| FIRST AMERICAN MORTGAGE FUNDS | | 2014 SEMIANNUAL REPORT | | | 5 | |
| | |
| Schedule of Investments | | February 28, 2014 (unaudited) |
American Strategic Income Portfolio (ASP)
| | | | | | | | | | | | | | | | |
DESCRIPTION | | DATE
ACQUIRED | | | PAR | | | COST | | | VALUE ¶ | |
| | | | |
(Percentages of each investment category relate to total net assets) | | | | | | | | | | | | | | | | |
| | | | |
Whole Loans ¥ p — 40.4% | | | | | | | | | | | | | | | | |
Commercial Loans — 40.2% | | | | | | | | | | | | | | | | |
45755 Five Mile Road, Plymouth Township, MI, 4.13%, 1/1/19 r | | | 12/30/13 | | | $ | 1,123,048 | | | $ | 1,123,048 | | | $ | 1,123,048 | |
Apple Valley Retail Center, Apple Valley, MN, 4.78%, 10/1/23 | | | 9/26/13 | | | | 1,485,756 | | | | 1,485,756 | | | | 1,529,248 | |
Carl’s Jr., Idaho Springs, CO, 4.13%, 5/1/23 | | | 4/23/13 | | | | 1,464,770 | | | | 1,464,770 | | | | 1,454,829 | |
Chicago Social Security Building, Chicago, IL, 4.78%, 6/1/22 | | | 5/31/12 | | | | 2,080,028 | | | | 2,080,028 | | | | 2,184,029 | |
Copper Junction, Copper Mountain, CO, 6.38%, 7/1/17 | | | 6/14/07 | | | | 1,792,415 | | | | 1,792,415 | | | | 1,882,035 | |
Hampden Medical Office, Englewood, CO, 7.38%, 10/1/12 § | | | 9/9/02 | | | | 1,122,179 | | | | 1,122,179 | | | | 651,289 | |
La Costa Meadows Industrial Park I, San Marcos, CA, 6.78%, 7/1/17 | | | 6/28/07 | | | | 1,221,112 | | | | 1,221,112 | | | | 1,282,168 | |
La Costa Meadows Industrial Park II, San Marcos, CA, 7.53%, 7/1/17 | | | 6/28/07 | | | | 1,959,648 | | | | 1,959,648 | | | | 1,979,245 | |
Palace Court, Santa Fe, NM, 4.88%, 8/1/15 � | | | 10/2/06 | | | | 1,858,914 | | | | 1,858,914 | | | | 1,033,556 | |
Park Place, Northbrook, IL, 5.23%, 12/1/23 | | | 11/15/13 | | | | 2,492,760 | | | | 2,492,760 | | | | 2,617,398 | |
Perkins Restaurant, Maple Grove, MN, 6.38%, 1/1/18 | | | 12/23/05 | | | | 1,275,379 | | | | 1,275,379 | | | | 1,313,641 | |
Stephens Center, Missoula, MT, 6.88%, 9/1/15 | | | 4/20/06 | | | | 1,620,158 | | | | 1,620,158 | | | | 1,652,561 | |
| | | | | | | | | | | | | | | | |
| | | | | | | | | | | 19,496,167 | | | | 18,703,047 | |
| | | | | | | | | | | | | | | | |
Single Family Loans — 0.2% | | | | | | | | | | | | | | | | |
American Portfolio, 1 loan, California, 3.00%, 1/1/17 | | | 7/18/95 | | | | 8,026 | | | | 7,645 | | | | 7,989 | |
Bank of New Mexico, 1 loan, New Mexico, 3.63%, 2/1/18 | | | 5/31/96 | | | | 14,278 | | | | 14,278 | | | | 14,706 | |
Bluebonnet Savings & Loan, 1 loan, Texas, 2.88%, 11/1/15 | | | 5/22/92 | | | | 9,481 | | | | 9,481 | | | | 9,579 | |
McClemore, Matrix Funding Corporation, 1 loan, North Carolina, 10.50%, 8/1/19 | | | 9/9/92 | | | | 28,055 | | | | 26,653 | | | | 28,898 | |
Nomura III, 1 loan, California, 4.00%, 5/1/19 | | | 9/29/95 | | | | 30,477 | | | | 27,549 | | | | 30,924 | |
| | | | | | | | | | | | | | | | |
| | | | | | | | | | | 85,606 | | | | 92,096 | |
| | | | | | | | | | | | | | | | |
| | | | |
Total Whole Loans | | | | | | | | | | | 19,581,773 | | | | 18,795,143 | |
| | | | | | | | | | | | | | | | |
| | | | |
Corporate Note ¥ � — 7.6% | | | | | | | | | | | | | | | | |
Fixed Rate — 7.6% | | | | | | | | | | | | | | | | |
Stratus Properties V, 7.25%, 3/31/15 | | | 6/1/07 | | | | 3,500,000 | | | | 3,500,000 | | | | 3,535,000 | |
| | | | | | | | | | | | | | | | |
| | | | |
Corporate Bonds — 34.0% | | | | | | | | | | | | | | | | |
Real Estate Investment Trusts — 34.0% | | | | | | | | | | | | | | | | |
BioMed Realty, 4.25%, 7/15/22 | | | | | | | 470,000 | | | | 490,773 | | | | 468,014 | |
Brandywine Operating Partnership, 3.95%, 2/15/23 x | | | | | | | 1,500,000 | | | | 1,485,376 | | | | 1,465,674 | |
CommonWealth REIT, 5.88%, 9/15/20 x | | | | | | | 1,325,000 | | | | 1,422,871 | | | | 1,423,818 | |
Digital Realty, 3.63%, 10/1/22 x | | | | | | | 1,500,000 | | | | 1,498,179 | | | | 1,386,251 | |
Essex Portfolio, 3.63%, 8/15/22 x | | | | | | | 679,000 | | | | 647,844 | | | | 658,046 | |
Health Care REIT, 3.75%, 3/15/23 | | | | | | | 490,000 | | | | 494,374 | | | | 481,515 | |
Host Hotels & Resorts, 5.25%, 3/15/22 | | | | | | | 495,000 | | | | 511,750 | | | | 537,402 | |
Liberty Property, 3.38%, 6/15/23 x | | | | | | | 1,500,000 | | | | 1,496,777 | | | | 1,412,268 | |
Mid-America Apartments, 4.30%, 10/15/23 x | | | | | | | 1,170,000 | | | | 1,166,256 | | | | 1,182,587 | |
National Retail Properties, 3.80%, 10/15/22 | | | | | | | 1,225,000 | | | | 1,263,409 | | | | 1,214,298 | |
Post Apartment Homes, 3.38%, 12/1/22 | | | | | | | 395,000 | | | | 394,772 | | | | 373,846 | |
Realty Income, 4.65%, 8/1/23 | | | | | | | 265,000 | | | | 268,814 | | | | 278,512 | |
Senior Housing Properties, 5.63%, 8/1/42 x | | | | | | | 525,000 | | | | 512,400 | | | | 435,519 | |
Ventas Realty, 4.75%, 6/1/21 x | | | | | | | 1,350,000 | | | | 1,462,416 | | | | 1,452,932 | |
Ventas Realty, 5.45%, 3/15/43 | | | | | | | 1,605,650 | | | | 1,613,463 | | | | 1,434,809 | |
Weingarten Realty Investors, 3.38%, 10/15/22 x | | | | | | | 1,700,000 | | | | 1,701,385 | | | | 1,612,525 | |
| | | | | | | | | | | | | | | | |
| | | | |
Total Corporate Bonds | | | | | | | | | | | 16,430,859 | | | | 15,818,016 | |
| | | | | | | | | | | | | | | | |
| | | | |
U.S. Government Agency Mortgage-Backed Securities — 13.5% | | | | | | | | | | | | | | | | |
Fixed Rate — 13.5% | | | | | | | | | | | | | | | | |
Federal Home Loan Mortgage Corporation, | | | | | | | | | | | | | | | | |
5.50%, 1/1/18, #E93231 a | | | | | | | 95,465 | | | | 96,387 | | | | 102,390 | |
The accompanying notes are an integral part of the financial statements.
| | | | |
| 6 | | FIRST AMERICAN MORTGAGE FUNDS | | 2014 SEMIANNUAL REPORT |
American Strategic Income Portfolio (ASP)
| | | | | | | | | | | | | | |
DESCRIPTION | | | | PAR/
SHARES | | | COST | | | VALUE ¶ | |
| | | | |
9.00%, 7/1/30, #C40149 | | | | $ | 27,781 | | | $ | 28,264 | | | $ | 33,161 | |
5.00%, 5/1/39, #G05430 a | | | | | 364,671 | | | | 372,974 | | | | 397,571 | |
Federal National Mortgage Association, | | | | | | | | | | | | | | |
6.00%, 10/1/16, #610761 a | | | | | 26,991 | | | | 27,113 | | | | 27,967 | |
5.00%, 7/1/18, #724954 a | | | | | 426,365 | | | | 426,169 | | | | 457,096 | |
6.50%, 6/1/29, #252497 a | | | | | 35,346 | | | | 35,194 | | | | 39,954 | |
7.50%, 5/1/30, #535289 a | | | | | 11,578 | | | | 11,325 | | | | 13,250 | |
8.00%, 5/1/30, #538266 a | | | | | 6,646 | | | | 6,591 | | | | 6,967 | |
6.00%, 5/1/31, #535909 a | | | | | 51,548 | | | | 51,742 | | | | 58,117 | |
6.50%, 11/1/31, #613339 a | | | | | 40,262 | | | | 40,858 | | | | 45,874 | |
5.50%, 7/1/33, #720735 a | | | | | 424,139 | | | | 420,650 | | | | 470,053 | |
5.00%, 7/1/39, #935588 a | | | | | 230,303 | | | | 235,055 | | | | 252,151 | |
4.00%, 12/1/40, #AB1959 a | | | | | 853,812 | | | | 851,601 | | | | 896,121 | |
4.00%, 12/1/40, #MA0583 a | | | | | 390,020 | | | | 394,070 | | | | 409,272 | |
4.00%, 1/1/41, #MA0614 a | | | | | 635,515 | | | | 629,557 | | | | 666,899 | |
3.50%, 3/1/41, #AE0981 a | | | | | 1,139,662 | | | | 1,174,779 | | | | 1,156,782 | |
3.50%, 3/1/42, #AB4749 a | | | | | 1,201,555 | | | | 1,241,373 | | | | 1,219,566 | |
| | | | | | | | | | | | | | |
| | | | |
Total U.S. Government Agency Mortgage-Backed Securities | | | | | | | | | 6,043,702 | | | | 6,253,191 | |
| | | | | | | | | | | | | | |
| | | | |
Preferred Stocks — 39.5% | | | | | | | | | | | | | | |
Real Estate Investment Trusts — 39.5% | | | | | | | | | | | | | | |
Alexandria Real Estate Equities, Series E x | | | | | 60,403 | | | | 1,530,438 | | | | 1,410,410 | |
Boston Properties, Series B x | | | | | 63,450 | | | | 1,516,775 | | | | 1,329,849 | |
CommonWealth REIT, Series E x | | | | | 58,480 | | | | 1,508,824 | | | | 1,401,695 | |
Developers Diversified Realty, Series H x | | | | | 3,193 | | | | 65,457 | | | | 80,751 | |
Digital Realty, Series E x | | | | | 48,414 | | | | 1,231,102 | | | | 1,166,477 | |
Digital Realty, Series F x | | | | | 6,000 | | | | 152,580 | | | | 137,813 | |
Digital Realty, Series G | | | | | 4,905 | | | | 110,407 | | | | 98,389 | |
Duke Realty, Series J x | | | | | 2,100 | | | | 52,246 | | | | 50,881 | |
Duke Realty, Series L x | | | | | 8,750 | | | | 167,300 | | | | 212,004 | |
Equity Residential Properties, Series K x | | | | | 10,000 | | | | 557,500 | | | | 600,313 | |
Health Care REIT, Series J x | | | | | 57,700 | | | | 1,490,045 | | | | 1,398,013 | |
Hospitality Properties, Series D x | | | | | 29,652 | | | | 803,365 | | | | 741,003 | |
Kimco Realty, Series H | | | | | 6,400 | | | | 159,360 | | | | 164,864 | |
Kimco Realty, Series I | | | | | 9,141 | | | | 228,777 | | | | 208,815 | |
Kimco Realty, Series J x | | | | | 20,000 | | | | 503,000 | | | | 419,600 | |
Kimco Realty, Series K | | | | | 6,519 | | | | 167,212 | | | | 139,181 | |
National Retail Properties, Series D x | | | | | 59,996 | | | | 1,522,323 | | | | 1,428,505 | |
National Retail Properties, Series E | | | | | 1,500 | | | | 29,250 | | | | 30,915 | |
PS Business Parks, Series R x | | | | | 9,500 | | | | 234,175 | | | | 240,445 | |
PS Business Parks, Series S | | | | | 24,291 | | | | 606,546 | | | | 574,968 | |
PS Business Parks, Series T x | | | | | 24,875 | | | | 617,919 | | | | 558,195 | |
Public Storage, Series T | | | | | 3,859 | | | | 99,948 | | | | 87,638 | |
Public Storage, Series U x | | | | | 41,000 | | | | 954,300 | | | | 911,430 | |
Public Storage, Series V | | | | | 2,960 | | | | 75,036 | | | | 63,166 | |
Public Storage, Series W | | | | | 11,000 | | | | 277,750 | | | | 228,030 | |
Realty Income, Series E x | | | | | 38,666 | | | | 754,155 | | | | 966,650 | |
Realty Income, Series F | | | | | 12,000 | | | | 320,160 | | | | 299,400 | |
Regency Centers, Series F x | | | | | 47,900 | | | | 1,292,250 | | | | 1,151,947 | |
Regency Centers, Series G | | | | | 5,000 | | | | 126,900 | | | | 108,906 | |
Simon Property Group, Series J x | | | | | 11,000 | | | | 511,500 | | | | 691,282 | |
Vornado Realty, Series G x | | | | | 30,000 | | | | 483,000 | | | | 753,750 | |
Vornado Realty, Series J | | | | | 3,614 | | | | 89,989 | | | | 92,157 | |
Vornado Realty, Series K x | | | | | 12,007 | | | | 303,697 | | | | 263,314 | |
Vornado Realty, Series L | | | | | 4,000 | | | | 98,600 | | | | 83,375 | |
| | | | | | |
| FIRST AMERICAN MORTGAGE FUNDS | | 2014 SEMIANNUAL REPORT | | | 7 | |
| | |
| Schedule of Investments | | February 28, 2014 (unaudited) |
American Strategic Income Portfolio (ASP)
| | | | | | | | | | | | | | |
DESCRIPTION | | | |
SHARES | | | COST | | | VALUE ¶ | |
| | | | |
Weingarten Realty Investors, Series F x | | | | | 10,929 | | | $ | 260,657 | | | $ | 264,373 | |
| | | | | | | | | | | | | | |
| | | | |
Total Preferred Stocks | | | | | | | | | 18,902,543 | | | | 18,358,504 | |
| | | | | | | | | | | | | | |
| | | | |
Total Unaffiliated Investments | | | | | | | | | 64,458,877 | | | | 62,759,854 | |
| | | | | | | | | | | | | | |
| | | | |
Real Estate Owned ¥ l — 3.6% | | | | | | | | | | | | | | |
The Storage Place, Marana, AZ | | | | | | | | | 3,189,940 | | | | 1,700,000 | |
| | | | | | | | | | | | | | |
| | | | |
Short-Term Investment — 3.2% | | | | | | | | | | | | | | |
First American Prime Obligations Fund, Class Z, 0.02% W | | | | | 1,474,112 | | | | 1,474,112 | | | | 1,474,112 | |
| | | | | | | | | | | | | | |
| | | | |
Total Investments p — 141.8% | | | | | | | | $ | 69,122,929 | | | $ | 65,933,966 | |
| | | | | | | | | | | | | | |
Other Assets and Liabilities, Net — (41.8)% | | | | | | | | | | | | | (19,432,232 | ) |
| | | | | | | | | | | | | | |
Total Net Assets — 100.0% | | | | | | | | | | | | $ | 46,501,734 | |
| | | | | | | | | | | | | | |
| ¶ | Securities are valued in accordance with procedures described in note 2 in Notes to Financial Statements. |
| ¥ | Securities purchased as part of a private placement which have not been registered with the U.S. Securities and Exchange Commission under the Securities Act of 1933 and which are considered to be illiquid. These securities are fair valued in accordance with the board approved valuation procedures. On February 28, 2014, the total fair value of these securities was $24,030,143 or 51.7% of total net assets. See note 2 in Notes to Financial Statements. |
| p | Interest rates on commercial and multifamily loans are the net coupon rates in effect (after reducing the coupon rate by any mortgage servicing fees paid to mortgage servicers) on February 28, 2014. Interest rates and maturity dates disclosed on single family loans represent the weighted average coupon and weighted average maturity for the underlying mortgage loans as of February 28, 2014. |
| r | Variable Rate Security – The rate shown is the net coupon rate in effect as of February 28, 2014. |
| § | Loan has matured or will mature in the next couple of months and the fund is anticipating payoff or refinancing. Unless disclosed otherwise, the loan continues to make monthly payments. |
| � | Interest Only – Represents securities that entitle holders to receive only interest payments on the mortgage. Principal balance on the loan is due at maturity. The interest rate disclosed represents the net coupon rate in effect as of February 28, 2014. |
| x | Securities pledged as collateral for outstanding borrowings under a loan agreement with Bank of America, N.A. On February 28, 2014, securities valued at $27,208,320 were pledged as collateral for the following outstanding borrowings: |
| | | | | | | | | | |
| Amount | | | Rate* | | | Accrued
Interest | |
| $ | 13,800,000 | | | | 1.01 | % | | $ | 385 | |
| | | | | | | | | | |
| | * | Interest rate as of February 28, 2014. Rate is based on one-month London Interbank Offered Rate (“LIBOR”) plus 0.85%. |
Description of collateral:
Corporate Bonds
Brandywine Operating Partnership, 3.95%, 2/15/23, $1,500,000 par
CommonWealth REIT, 5.88%, 9/15/20, $1,325,000 par
Digital Realty, 3.63%, 10/1/22, $1,500,000 par
Essex Portfolio, 3.63%, 8/15/22, $679,000 par
Liberty Property, 3.38%, 6/15/23, $1,500,000 par
Mid-America Apartments, 4.30%, 10/15/23, $1,170,000 par
Senior Housing Properties, 5.63%, 8/1/42, $525,000 par
Ventas Realty, 4.75%, 6/1/21, $1,350,000 par
Weingarten Realty Investors, 3.38%, 10/15/22, $1,700,000 par
Preferred Stocks
Alexandria Real Estate Equities, Series E, 60,403 shares
Boston Properties, Series B, 63,450 shares
CommonWealth REIT, Series E, 58,480 shares
Developers Diversified Realty, Series H, 3,193 shares
Digital Realty, Series E, 48,414 shares
Digital Realty, Series F, 6,000 shares
Duke Realty, Series J, 2,100 shares
Duke Realty, Series L, 8,750 shares
The accompanying notes are an integral part of the financial statements.
| | | | |
| 8 | | FIRST AMERICAN MORTGAGE FUNDS | | 2014 SEMIANNUAL REPORT |
American Strategic Income Portfolio (ASP)
Equity Residential Properties, Series K, 10,000 shares
Health Care REIT, Series J, 57,700 shares
Hospitality Properties, Series D, 29,652 shares
Kimco Realty, Series J, 20,000 shares
National Retail Properties, Series D, 59,996 shares
PS Business Parks, Series R, 9,500 shares
PS Business Parks, Series T, 24,875 shares
Public Storage, Series U, 41,000 shares
Realty Income, Series E, 38,666 shares
Regency Centers, Series F, 47,900 shares
Simon Property Group, Series J, 11,000 shares
Vornado Realty, Series G, 30,000 shares
Vornado Realty, Series K, 12,007 shares
Weingarten Realty Investors, Series F, 10,929 shares
| a | Securities pledged as collateral for outstanding reverse repurchase agreements. On February 28, 2014, securities valued at $6,220,030 were pledged as collateral for the following outstanding reverse repurchase agreements: |
| | | | | | | | | | | | | | | | | | | | | | |
| Amount | | | Acquisition
Date | | | Rate* | | | Due | | | Accrued
Interest | | | Name of Broker
and Description
of Collateral | |
| $ | 5,946,000 | | | | 2/6/14 | | | | 0.36 | % | | | 3/7/14 | | | $ | 1,368 | | | | (1 | ) |
| | | | | | | | | | | | | | | | | | | | | | |
| | * | Interest rate as of February 28, 2014. Rate is based on one-month LIBOR plus a spread and reset monthly. |
Name of broker and description of collateral:
Federal Home Loan Mortgage Corporation, 5.50%, 1/1/18, $95,465 par
Federal Home Loan Mortgage Corporation, 5.00%, 5/1/39, $364,671 par
Federal National Mortgage Association, 6.00%, 10/1/16, $26,991 par
Federal National Mortgage Association, 5.00%, 7/1/18, $426,365 par
Federal National Mortgage Association, 6.50%, 6/1/29, $35,346 par
Federal National Mortgage Association, 7.50%, 5/1/30, $11,578 par
Federal National Mortgage Association, 8.00%, 5/1/30, $6,646 par
Federal National Mortgage Association, 6.00%, 5/1/31, $51,548 par
Federal National Mortgage Association, 6.50%, 11/1/31, $40,262 par
Federal National Mortgage Association, 5.50%, 7/1/33, $424,139 par
Federal National Mortgage Association, 5.00%, 7/1/39, $230,303 par
Federal National Mortgage Association, 4.00%, 12/1/40, $853,812 par
Federal National Mortgage Association, 4.00%, 12/1/40, $390,020 par
Federal National Mortgage Association, 4.00%, 1/1/41, $635,515 par
Federal National Mortgage Association, 3.50%, 3/1/41, $1,139,662 par
Federal National Mortgage Association, 3.50%, 3/1/42, $1,201,555 par
| | The fund has entered into a lending commitment with Goldman Sachs. The monthly agreement permits the fund to enter into reverse repurchase agreements using U.S. Government Agency Mortgage-Backed Securities as collateral. |
| l | Real Estate Owned. See note 2 in the Notes to Financial Statements. |
| W | Investment in affiliated security. This money market fund is advised by U.S. Bancorp Asset Management, Inc., which also serves as advisor for the fund. The rate shown is the annualized seven-day effective yield as of February 28, 2014. See note 2 in Notes to Financial Statements. |
| p | On February 28, 2014, the cost of investments for federal income tax purposes was approximately $69,122,929. The approximate aggregate gross unrealized appreciation and depreciation of investments, based on this cost, were as follows: |
| | | | |
Gross unrealized appreciation | | $ | 1,651,843 | |
Gross unrealized depreciation | | | (4,840,806 | ) |
| | | | |
Net unrealized depreciation | | $ | (3,188,963 | ) |
| | | | |
REIT–Real Estate Investment Trust
| | | | | | |
| FIRST AMERICAN MORTGAGE FUNDS | | 2014 SEMIANNUAL REPORT | | | 9 | |
| | |
| Schedule of Investments | | February 28, 2014 (unaudited) |
American Strategic Income Portfolio II (BSP)
| | | | | | | | | | | | | | | | |
DESCRIPTION | | DATE
ACQUIRED | | | PAR | | | COST | | | VALUE ¶ | |
| | | | |
(Percentages of each investment category relate to total net assets) | | | | | | | | | | | | | | | | |
| | | | |
Whole Loans ¥ p — 60.0% | | | | | | | | | | | | | | | | |
Commercial Loans — 43.0% | | | | | | | | | | | | | | | | |
5555 East Van Buren I, Phoenix, AZ, 4.93%, 10/1/14 � | | | 6/23/04 | | | $ | 6,035,296 | | | $ | 6,035,296 | | | $ | 4,008,559 | |
5555 East Van Buren II, Phoenix, AZ, 4.88%, 10/1/14 � | | | 8/18/06 | | | | 1,255,552 | | | | 1,255,552 | | | | 699,501 | |
American Mini-Storage, Memphis, TN, 6.80%, 12/1/11 § | | | 11/5/07 | | | | 2,962,479 | | | | 2,962,479 | | | | 2,962,479 | |
Bigelow Office Building, Las Vegas, NV, 6.38%, 4/1/17 | | | 3/31/97 | | | | 999,399 | | | | 999,399 | | | | 1,049,369 | |
Hickman Road, Clive, IA, 4.93%, 4/1/16 | | | 12/3/07 | | | | 5,294,897 | | | | 5,294,897 | | | | 5,400,795 | |
Office City Plaza, Houston, TX, 3.90%, 3/1/17 � | | | 2/10/12 | | | | 3,900,000 | | | | 3,900,000 | | | | 3,900,000 | |
Oyster Point Office Park, Newport News, VA, 4.18%, 5/1/16 � | | | 1/4/06 | | | | 11,831,854 | | | | 11,831,854 | | | | 11,717,345 | |
Oyster Point Office Park II, Newport News, VA, 4.88%, 5/1/16 | | | 4/29/13 | | | | 974,689 | | | | 974,689 | | | | 694,310 | |
PennMont Office Plaza, Albuquerque, NM, 5.88%, 4/1/14 � | | | 3/30/06 | | | | 1,406,043 | | | | 1,406,043 | | | | 1,406,043 | |
Perkins - Blaine, Blaine, MN, 6.63%, 1/1/17 | | | 12/13/06 | | | | 1,665,386 | | | | 1,665,386 | | | | 1,748,655 | |
Robberson Auto Dealerships, Bend and Prineville, OR, 6.40%, 4/1/17 | | | 3/30/07 | | | | 6,436,555 | | | | 6,436,555 | | | | 6,565,286 | |
Signal Butte, Mesa, AZ, 4.93%, 7/1/17 � | | | 6/20/07 | | | | 15,000,000 | | | | 15,002,903 | | | | 10,303,365 | |
Station Square, Pompano Beach, FL, 6.33%, 5/1/14 | | | 1/19/07 | | | | 11,741,992 | | | | 11,741,992 | | | | 11,741,992 | |
Waste Connections Warehouse, Englewood, CO, 6.58%, 3/1/14 | | | 2/15/07 | | | | 1,192,637 | | | | 1,192,637 | | | | 1,192,637 | |
| | | | | | | | | | | | | | | | |
| | | | | | | | | | | 70,699,682 | | | | 63,390,336 | |
| | | | | | | | | | | | | | | | |
Multifamily Loans � — 16.9% | | | | | | | | | | | | | | | | |
Meadows Point, College Station, TX, 7.93%, 5/1/16 � � | | | 1/24/08 | | | | 5,400,000 | | | | 5,400,000 | | | | 5,186,921 | |
Sapphire Skies I, Cle Elum, WA, 1.93%, 7/1/15 � | | | 12/23/05 | | | | 8,651,139 | | | | 8,692,729 | | | | 7,101,124 | |
Sapphire Skies II, Cle Elum, WA, 7.90%, 7/1/15 � � S | | | 3/20/09 | | | | 3,200,000 | | | | 3,200,000 | | | | 32,000 | |
Sapphire Skies III, Cle Elum, WA, 4.93%, 7/1/15 � ¿ | | | 7/13/10 | | | | 8,000,000 | | | | 8,000,000 | | | | 80,000 | |
Sapphire Skies IV, Cle Elum, WA, 3.88%, 7/1/15 � | | | 7/26/12 | | | | 8,000,000 | | | | 8,005,980 | | | | 6,566,648 | |
Sussex Club Apartments I, Athens, GA, 6.33%, 5/1/10 � § ¿ | | | 4/17/07 | | | | 8,800,000 | | | | 8,800,000 | | | | 4,892,800 | |
Sussex Club Apartments II, Athens, GA, 6.88%, 5/1/10 � � § S | | | 4/17/07 | | | | 2,298,600 | | | | 2,298,600 | | | | 1,165,250 | |
| | | | | | | | | | | | | | | | |
| | | | | | | | | | | 44,397,309 | | | | 25,024,743 | |
| | | | | | | | | | | | | | | | |
Single Family Loans — 0.1% | | | | | | | | | | | | | | | | |
Merchants Bank, 2 loans, Vermont, 11.27%, 11/24/16 | | | 12/18/92 | | | | 27,343 | | | | 27,568 | | | | 28,163 | |
PHH U.S. Mortgage, 2 loans, California & Delaware, 6.75%, 5/30/20 | | | 12/30/92 | | | | 96,078 | | | | 96,078 | | | | 98,961 | |
| | | | | | | | | | | | | | | | |
| | | | | | | | | | | 123,646 | | | | 127,124 | |
| | | | | | | | | | | | | | | | |
| | | | |
Total Whole Loans | | | | | | | | | | | 115,220,637 | | | | 88,542,203 | |
| | | | | | | | | | | | | | | | |
| | | | |
Corporate Notes ¥ � — 7.6% | | | | | | | | | | | | | | | | |
Fixed Rate — 7.6% | | | | | | | | | | | | | | | | |
Stratus Properties II, 7.25%, 12/31/15 | | | 6/14/01 | | | | 3,000,000 | | | | 3,000,000 | | | | 3,030,000 | |
Stratus Properties III, 7.25%, 12/31/16 | | | 12/12/06 | | | | 8,000,000 | | | | 8,000,000 | | | | 8,160,000 | |
| | | | | | | | | | | | | | | | |
| | | | |
Total Corporate Notes | | | | | | | | | | | 11,000,000 | | | | 11,190,000 | |
| | | | | | | | | | | | | | | | |
| | | | |
Corporate Bonds — 30.5% | | | | | | | | | | | | | | | | |
Real Estate Investment Trusts — 30.5% | | | | | | | | | | | | | | | | |
Alexandria Real Estate Equities, 4.60%, 4/1/22 x | | | | | | | 1,750,000 | | | | 1,864,199 | | | | 1,812,806 | |
BioMed Realty, 4.25%, 7/15/22 x | | | | | | | 1,395,000 | | | | 1,462,550 | | | | 1,389,105 | |
Brandywine Operating Partnership, 3.95%, 2/15/23 x | | | | | | | 2,000,000 | | | | 1,988,206 | | | | 1,954,232 | |
DCT Industrial Operating Partnership LP, 4.50%, 10/15/23 x ¢ | | | | | | | 1,000,000 | | | | 1,007,471 | | | | 997,778 | |
Developers Diversified Realty, 4.63%, 7/15/22 x | | | | | | | 1,980,000 | | | | 2,138,564 | | | | 2,077,574 | |
Developers Diversified Realty, 3.38%, 5/15/23 | | | | | | | 1,000,000 | | | | 938,853 | | | | 944,146 | |
Digital Realty, 5.25%, 3/15/21 x | | | | | | | 2,000,000 | | | | 2,209,567 | | | | 2,112,910 | |
Digital Realty, 3.63%, 10/1/22 x | | | | | | | 800,000 | | | | 793,941 | | | | 739,334 | |
Duke Realty, 4.38%, 6/15/22 x | | | | | | | 1,410,000 | | | | 1,496,299 | | | | 1,440,142 | |
Duke Realty, 3.88%, 10/15/22 x | | | | | | | 2,500,000 | | | | 2,558,169 | | | | 2,448,772 | |
Essex Portfolio LP, 3.25%, 5/1/23 x | | | | | | | 1,000,000 | | | | 936,167 | | | | 939,999 | |
The accompanying notes are an integral part of the financial statements.
| | | | |
| 10 | | FIRST AMERICAN MORTGAGE FUNDS | | 2014 SEMIANNUAL REPORT |
American Strategic Income Portfolio II (BSP)
| | | | | | | | | | | | | | |
DESCRIPTION | | | | PAR/
SHARES | | | COST | | | VALUE ¶ | |
| | | | |
Health Care REIT, 3.75%, 3/15/23 x | | | | $ | 2,000,000 | | | $ | 1,993,365 | | | $ | 1,965,368 | |
Highwoods Realty, 3.63%, 1/15/23 x | | | | | 3,300,000 | | | | 3,249,635 | | | | 3,134,815 | |
Kilroy Realty, 3.80%, 1/15/23 x | | | | | 3,050,000 | | | | 3,071,742 | | | | 2,973,594 | |
Mid-America Apartments, 4.30%, 10/15/23 | | | | | 650,000 | | | | 647,920 | | | | 656,993 | |
National Retail Properties, 3.80%, 10/15/22 x | | | | | 1,450,000 | | | | 1,472,896 | | | | 1,437,333 | |
Post Apartment Homes, 3.38%, 12/1/22 x | | | | | 695,000 | | | | 694,599 | | | | 657,780 | |
ProLogis, 6.88%, 3/15/20 x | | | | | 2,000,000 | | | | 2,362,273 | | | | 2,394,314 | |
Senior Housing Properties, 6.75%, 12/15/21 x | | | | | 1,500,000 | | | | 1,688,355 | | | | 1,701,374 | |
Senior Housing Properties, 5.63%, 8/1/42 x | | | | | 2,275,000 | | | | 2,205,600 | | | | 1,887,249 | |
Ventas Realty, 5.45%, 3/15/43 x | | | | | 4,248,100 | | | | 4,269,946 | | | | 3,796,102 | |
Vornado Realty, 5.00%, 1/15/22 x | | | | | 3,500,000 | | | | 3,843,651 | | | | 3,743,645 | |
Washington REIT, 3.95%, 10/15/22 x | | | | | 3,850,000 | | | | 3,955,949 | | | | 3,772,715 | |
| | | | | | | | | | | | | | |
| | | | |
Total Corporate Bonds | | | | | | | | | 46,849,917 | | | | 44,978,080 | |
| | | | | | | | | | | | | | |
| | | | |
U.S. Government Agency Mortgage-Backed Securities a — 5.1% | | | | | | | | | | | | | | |
Fixed Rate — 5.1% | | | | | | | | | | | | | | |
Federal Home Loan Mortgage Corporation, | | | | | | | | | | | | | | |
5.50%, 1/1/18, #E93231 | | | | | 509,147 | | | | 514,060 | | | | 546,081 | |
9.00%, 7/1/30, #C40149 | | | | | 46,302 | | | | 47,004 | | | | 55,269 | |
5.00%, 5/1/39, #G05430 | | | | | 776,094 | | | | 793,765 | | | | 846,113 | |
3.50%, 6/1/42, #C09000 | | | | | 1,770,911 | | | | 1,857,072 | | | | 1,793,308 | |
Federal National Mortgage Association, | |
6.00%, 10/1/16, #607030 | | | | | 25,066 | | | | 25,098 | | | | 25,946 | |
5.50%, 6/1/17, #648508 | | | | | 35,320 | | | | 35,369 | | | | 37,756 | |
5.00%, 9/1/17, #254486 | | | | | 57,347 | | | | 57,392 | | | | 61,423 | |
5.00%, 11/1/17, #657356 | | | | | 77,836 | | | | 77,961 | | | | 83,455 | |
6.50%, 6/1/29, #252497 | | | | | 235,642 | | | | 234,623 | | | | 266,356 | |
7.50%, 5/1/30, #535289 | | | | | 41,681 | | | | 40,768 | | | | 47,700 | |
8.00%, 5/1/30, #538266 | | | | | 23,924 | | | | 23,726 | | | | 25,081 | |
8.00%, 6/1/30, #253347 | | | | | 60,033 | | | | 59,537 | | | | 72,449 | |
5.00%, 11/1/33, #725027 | | | | | 2,031,791 | | | | 2,069,534 | | | | 2,238,452 | |
5.00%, 7/1/39, #935588 | | | | | 1,381,820 | | | | 1,407,028 | | | | 1,512,905 | |
| | | | | | | | | | | | | | |
| | | | |
Total U.S. Government Agency Mortgage-Backed Securities | | | | | | | | | 7,242,937 | | | | 7,612,294 | |
| | | | | | | | | | | | | | |
| | | | |
Asset-Backed Security ¢ — 0.6% | | | | | | | | | | | | | | |
Other — 0.6% | | | | | | | | | | | | | | |
321 Henderson Receivables I LLC, Series 2007-3A, Class A, 6.15%, 10/15/48 | | | | | 804,771 | | | | 889,968 | | | | 904,970 | |
| | | | | | | | | | | | | | |
| | | | |
Preferred Stocks — 37.8% | | | | | | | | | | | | | | |
Real Estate Investment Trusts — 37.8% | | | | | | | | | | | | | | |
Alexandria Real Estate Equities, Series E x | | | | | 181,042 | | | | 4,712,859 | | | | 4,227,331 | |
Boston Properties, Series B x | | | | | 180,098 | | | | 4,171,880 | | | | 3,774,674 | |
CommonWealth REIT, Series E x | | | | | 161,500 | | | | 4,172,200 | | | | 3,870,961 | |
Developers Diversified Realty, Series H x | | | | | 1,747 | | | | 35,813 | | | | 44,182 | |
Digital Realty, Series F x | | | | | 155,754 | | | | 4,029,076 | | | | 3,577,482 | |
Digital Realty, Series G x | | | | | 30,624 | | | | 730,783 | | | | 614,287 | |
Duke Realty, Series J x | | | | | 38,000 | | | | 893,000 | | | | 920,702 | |
Duke Realty, Series L x | | | | | 74,260 | | | | 1,529,361 | | | | 1,799,246 | |
Equity Residential Properties, Series K x | | | | | 30,000 | | | | 1,680,000 | | | | 1,800,939 | |
Health Care REIT, Series J x | | | | | 176,000 | | | | 4,399,968 | | | | 4,264,304 | |
Hospitality Properties, Series D x | | | | | 61,211 | | | | 1,639,301 | | | | 1,529,663 | |
Kimco Realty, Series H | | | | | 9,600 | | | | 239,040 | | | | 247,296 | |
Kimco Realty, Series I x | | | | | 43,766 | | | | 1,060,704 | | | | 999,782 | |
Kimco Realty, Series J x | | | | | 113,000 | | | | 2,743,850 | | | | 2,370,740 | |
Kimco Realty, Series K x | | | | | 26,148 | | | | 670,696 | | | | 558,260 | |
| | | | | | |
| FIRST AMERICAN MORTGAGE FUNDS | | 2014 SEMIANNUAL REPORT | | | 11 | |
| | |
| Schedule of Investments | | February 28, 2014 (unaudited) |
American Strategic Income Portfolio II (BSP)
| | | | | | | | | | | | | | |
DESCRIPTION | | | |
SHARES | | | COST | | | VALUE ¶ | |
| | | | |
National Retail Properties, Series D x | | | | | 177,437 | | | $ | 4,443,124 | | | $ | 4,224,775 | |
National Retail Properties, Series E | | | | | 6,400 | | | | 124,800 | | | | 131,904 | |
PS Business Parks, Series S x | | | | | 48,000 | | | | 1,286,400 | | | | 1,136,160 | |
PS Business Parks, Series T x | | | | | 123,501 | | | | 3,074,190 | | | | 2,771,362 | |
PS Business Parks, Series U | | | | | 3,000 | | | | 62,700 | | | | 63,810 | |
PS Business Parks, Series V | | | | | 18,600 | | | | 406,590 | | | | 394,506 | |
Public Storage, Series R x | | | | | 10,000 | | | | 272,500 | | | | 251,800 | |
Public Storage, Series T x | | | | | 21,719 | | | | 568,822 | | | | 493,238 | |
Public Storage, Series U x | | | | | 113,255 | | | | 2,678,467 | | | | 2,517,659 | |
Public Storage, Series V x | | | | | 18,752 | | | | 475,363 | | | | 400,168 | |
Public Storage, Series W | | | | | 6,985 | | | | 176,371 | | | | 144,799 | |
Public Storage, Series X | | | | | 16,000 | | | | 359,400 | | | | 331,680 | |
Realty Income, Series E x | | | | | 40,009 | | | | 872,024 | | | | 1,000,225 | |
Realty Income, Series F x | | | | | 39,000 | | | | 1,052,550 | | | | 973,050 | |
Regency Centers, Series F x | | | | | 152,936 | | | | 3,977,775 | | | | 3,677,958 | |
Regency Centers, Series G x | | | | | 27,908 | | | | 690,049 | | | | 607,872 | |
Vornado Realty, Series J | | | | | 5,490 | | | | 136,701 | | | | 139,995 | |
Vornado Realty, Series K x | | | | | 186,384 | | | | 4,601,320 | | | | 4,087,401 | |
Vornado Realty, Series L | | | | | 3,000 | | | | 60,000 | | | | 62,531 | |
Weingarten Realty Investors, Series F x | | | | | 70,352 | | | | 1,735,319 | | | | 1,701,815 | |
| | | | | | | | | | | | | | |
| | | | |
Total Preferred Stocks | | | | | | | | | 59,762,996 | | | | 55,712,557 | |
| | | | | | | | | | | | | | |
| | | | |
Total Unaffiliated Investments | | | | | | | | | 240,966,455 | | | | 208,940,104 | |
| | | | | | | | | | | | | | |
| | | | |
Short-Term Investment — 1.4% | | | | | | | | | | | | | | |
First American Prime Obligations Fund, Class Z, 0.02% W | | | | | 2,044,325 | | | | 2,044,325 | | | | 2,044,325 | |
| | | | | | | | | | | | | | |
| | | | |
Total Investments p — 143.0% | | | | | | | | $ | 243,010,780 | | | $ | 210,984,429 | |
| | | | | | | | | | | | | | |
Other Assets and Liabilities, Net — (43.0)% | | | | | | | | | | | | | (63,477,208 | ) |
| | | | | | | | | | | | | | |
Total Net Assets — 100.0% | | | | | | | | | | | | $ | 147,507,221 | |
| | | | | | | | | | | | | | |
| ¶ | Securities are valued in accordance with procedures described in note 2 in Notes to Financial Statements. |
| ¥ | Securities purchased as part of a private placement which have not been registered with the U.S. Securities and Exchange Commission under the Securities Act of 1933 and which are considered to be illiquid. These securities are fair valued in accordance with the board approved valuation procedures. On February 28, 2014, the total fair value of these securities was $99,732,203 or 67.6% of total net assets. See note 2 in Notes to Financial Statements. |
| p | Interest rates on commercial and multifamily loans are the net coupon rates in effect (after reducing the coupon rate by any mortgage servicing fees paid to mortgage servicers) on February 28, 2014. Interest rates and maturity dates disclosed on single family loans represent the weighted average coupon and weighted average maturity for the underlying mortgage loans as of February 28, 2014. For participating loans, the rates are based on the annual cash flow payments expected at the time of purchase. |
| � | Interest Only – Represents securities that entitle holders to receive only interest payments on the mortgage. Principal balance on the loan is due at maturity. The interest rate disclosed represents the net coupon rate in effect as of February 28, 2014. |
| § | Loan has matured or will mature in the next couple of months and the fund is anticipating payoff or refinancing. Unless disclosed otherwise, the loan continues to make monthly payments. |
| � | Participating Loan – A participating loan is one which contains provisions for the fund to participate in the income stream provided by the property, including net cash flows and capital proceeds. Monthly cash flow proceeds are only required to the extent excess cash flow is generated by the property as determined by the loan documents. |
| S | The participating loan is not currently making monthly cash flow payments or is making cash flow payments of less than original coupon rate disclosed. |
| ¿ | Loan is currently in default with regards to scheduled interest and/or principal payments. |
The accompanying notes are an integral part of the financial statements.
| | | | |
| 12 | | FIRST AMERICAN MORTGAGE FUNDS | | 2014 SEMIANNUAL REPORT |
American Strategic Income Portfolio II (BSP)
| x | Securities pledged as collateral for outstanding borrowings under a loan agreement with Bank of America, N.A. On February 28, 2014, securities valued at $97,572,977 were pledged as collateral for the following outstanding borrowings: |
| | | | | | | | | | |
| Amount | | | Rate* | | | Accrued
Interest | |
| $ | 57,000,000 | | | | 1.01 | % | | | 1,591 | |
| | | | | | | | | | |
| | * | Interest rate as of February 28, 2014. Rate is based on one-month London Interbank Offered Rate (“LIBOR”) plus 0.85%. |
Description of collateral:
Corporate Bonds
Alexandria Real Estate Equities, 4.60%, 4/1/22, $1,750,000 par
BioMed Realty, 4.25%, 7/15/22, $1,395,000 par
Brandywine Operating Partnership, 3.95%, 2/15/23, $2,000,000 par
DCT Industrial Operating Partnership LP, 4.50%, 10/15/23, $1,000,000 par
Developers Diversified Realty, 4.63%, 7/15/22, $1,980,000 par
Digital Realty, 5.25%, 3/15/21, $2,000,000 par
Digital Realty, 3.63%, 10/1/22, $800,000 par
Duke Realty, 4.38%, 6/15/22, $1,410,000 par
Duke Realty, 3.88%, 10/15/22, $2,500,000 par
Essex Portfolio LP, 3.25%, 5/1/23, $1,000,000 par
Health Care REIT, 3.75%, 3/15/23, $2,000,000 par
Highwoods Realty, 3.63%, 1/15/23, $3,300,000 par
Kilroy Realty, 3.80%, 1/15/23, $3,050,000 par
National Retail Properties, 3.80%, 10/15/22, $1,450,000 par
Post Apartment Homes, 3.38%, 12/1/22, $695,000 par
ProLogis, 6.88%, 3/15/20, $2,000,000 par
Senior Housing Properties, 6.75%, 12/15/21, $1,500,000 par
Senior Housing Properties, 5.63%, 8/1/42, $2,275,000 par
Ventas Realty, 5.45%, 3/15/43, $4,248,100 par
Vornado Realty, 5.00%, 1/15/22, $3,500,000 par
Washington REIT, 3.95%, 10/15/22, $3,850,000 par
Preferred Stocks
Alexandria Real Estate Equities, Series E, 181,042 shares
Boston Properties, Series B, 180,098 shares
CommonWealth REIT, Series E, 161,500 shares
Developers Diversified Realty, Series H, 1,747 shares
Digital Realty, Series F, 155,754 shares
Digital Realty, Series G, 30,624 shares
Duke Realty, Series J, 38,000 shares
Duke Realty, Series L, 74,260 shares
Equity Residential Properties, Series K, 30,000 shares
Health Care REIT, Series J, 176,000 shares
Hospitality Properties, Series D, 61,211 shares
Kimco Realty, Series I, 43,766 shares
Kimco Realty, Series J, 113,000 shares
Kimco Realty, Series K, 26,148 shares
National Retail Properties, Series D, 177,437 shares
PS Business Parks, Series S, 48,000 shares
PS Business Parks, Series T, 123,501 shares
Public Storage, Series R, 10,000 shares
Public Storage, Series T, 21,719 shares
Public Storage, Series U, 113,255 shares
Public Storage, Series V, 18,752 shares
Realty Income, Series E, 40,009 shares
Realty Income, Series F, 39,000 shares
Regency Centers, Series F, 152,936 shares
Regency Centers, Series G, 27,908 shares
Vornado Realty, Series K, 186,384 shares
Weingarten Realty Investors, Series F, 70,352 shares
| | | | | | |
| FIRST AMERICAN MORTGAGE FUNDS | | 2014 SEMIANNUAL REPORT | | | 13 | |
| | |
| Schedule of Investments | | February 28, 2014 (unaudited) |
American Strategic Income Portfolio II (BSP)
| a | Securities pledged as collateral for outstanding reverse repurchase agreements. On February 28, 2014, securities valued at $7,612,294 were pledged as collateral for the following outstanding reverse repurchase agreements: |
| | | | | | | | | | | | | | | | | | | | | | |
| Amount | | | Acquisition
Date | | | Rate* | | | Due | | | Accrued
Interest | | | Name of Broker
and Description
of Collateral | |
| $ | 7,321,000 | | | | 2/6/14 | | | | 0.36 | % | | | 3/7/14 | | | $ | 1,684 | | | | (1 | ) |
| | | | | | | | | | | | | | | | | | | | | | |
| | * | Interest rate as of February 28, 2014. Rate is based on one-month LIBOR plus a spread and reset monthly. |
Name of broker and description of collateral:
Federal Home Loan Mortgage Corporation, 5.50%, 1/1/18, $509,147 par
Federal Home Loan Mortgage Corporation, 9.00%, 7/1/30, $46,302 par
Federal Home Loan Mortgage Corporation, 5.00%, 5/1/39, $776,094 par
Federal Home Loan Mortgage Corporation, 3.50%, 6/1/42, $1,770,911 par
Federal National Mortgage Association, 6.00%, 10/1/16, $25,066 par
Federal National Mortgage Association, 5.50%, 6/1/17, $35,320 par
Federal National Mortgage Association, 5.00%, 9/1/17, $57,347 par
Federal National Mortgage Association, 5.00%, 11/1/17, $77,836 par
Federal National Mortgage Association, 6.50%, 6/1/29, $235,642 par
Federal National Mortgage Association, 7.50%, 5/1/30, $41,681 par
Federal National Mortgage Association, 8.00%, 5/1/30, $23,924 par
Federal National Mortgage Association, 8.00%, 6/1/30, $60,033 par
Federal National Mortgage Association, 5.00%, 11/1/33, $2,031,791 par
Federal National Mortgage Association, 5.00%, 7/1/39, $1,381,820 par
The fund has entered into a lending commitment with Goldman Sachs. The monthly agreement permits the fund to enter into reverse repurchase agreements using U.S. Government Agency Mortgage-Backed Securities as collateral.
| ¢ | Securities purchased within terms of a private placement memorandum, exempt from registration under Rule 144A of the Securities Act of 1933, as amended, which may be sold only to dealers in that program or other “qualified institutional buyers”. On February 28, 2014, the total fair value of these investments was $1,902,748 or 1.3% of total net assets. |
| W | Investment in affiliated security. This money market fund is advised by U.S. Bancorp Asset Management, Inc., which also serves as advisor for the fund. The rate shown is the annualized seven-day effective yield as of February 28, 2014. See note 2 in Notes to Financial Statements. |
| p | On February 28, 2014, the cost of investments for federal income tax purposes was approximately $243,010,780. The approximate aggregate gross unrealized appreciation and depreciation of investments, based on this cost, were as follows: |
| | | | |
Gross unrealized appreciation...... | | $ | 1,650,118 | |
Gross unrealized depreciation | | | (33,676,469 | ) |
| | | | |
Net unrealized depreciation...... | | $ | (32,026,351 | ) |
| | | | |
REIT–Real Estate Investment Trust
The accompanying notes are an integral part of the financial statements.
| | | | |
| 14 | | FIRST AMERICAN MORTGAGE FUNDS | | 2014 SEMIANNUAL REPORT |
| | |
| Schedule of Investments | | February 28, 2014 (unaudited) |
American Strategic Income Portfolio III (CSP)
| | | | | | | | | | | | | | | | |
DESCRIPTION | | DATE
ACQUIRED | | | PAR | | | COST | | | VALUE ¶ | |
| | | | |
(Percentages of each investment category relate to total net assets) | | | | | | | | | | | | | | | | |
| | | | |
Whole Loans ¥ p — 54.4% | | | | | | | | | | | | | | | | |
Commercial Loans — 40.1% | | | | | | | | | | | | | | | | |
150 North Pantano I, Tucson, AZ, 5.90%, 8/1/14 � ¿ | | | 1/4/05 | | | $ | 3,525,000 | | | $ | 3,526,138 | | | $ | 1,959,900 | |
150 North Pantano II, Tucson, AZ, 14.88%, 8/1/14 � ¿ | | | 1/4/05 | | | | 440,000 | | | | 440,259 | | | | 134,914 | |
2165 Shermer Road, Northbrook, IL, 4.13%, 9/1/28 | | | 8/13/13 | | | | 2,366,855 | | | | 2,366,855 | | | | 2,330,081 | |
5600 University Boulevard, Albuquerque, NM, 5.10%, 2/1/24 | | | 1/31/14 | | | | 3,000,000 | | | | 3,000,000 | | | | 3,149,580 | |
8324 East Hartford Drive I, Scottsdale, AZ, 5.90%, 5/1/20 � | | | 4/8/04 | | | | 3,220,015 | | | | 3,369,044 | | | | 3,220,015 | |
Allegiance Health, Jackson, MI, 5.88%, 1/1/21 | | | 12/28/10 | | | | 8,179,372 | | | | 8,179,372 | | | | 8,588,340 | |
Biltmore Lakes Corporate Center, Phoenix, AZ, 4.88%, 9/1/14 � | | | 8/2/04 | | | | 1,699,365 | | | | 1,699,365 | | | | 944,847 | |
Cresthaven Medical, Memphis, TN, 3.88%, 6/1/18 | | | 5/6/13 | | | | 2,343,750 | | | | 2,343,750 | | | | 2,292,408 | |
Jilly’s American Grill, Scottsdale, AZ, 6.38%, 3/1/17 � | | | 8/19/05 | | | | 1,810,000 | | | | 1,810,000 | | | | 1,810,000 | |
La Cholla Plaza I, Tucson, AZ, 3.43%, 8/1/14 � ¿ r | | | 7/26/06 | | | | 11,135,604 | | | | 11,136,400 | | | | 6,191,396 | |
La Cholla Plaza II, Tucson, AZ, 14.88%, 8/1/14 � ¿ | | | 7/26/06 | | | | 1,389,396 | | | | 1,389,396 | | | | 460,691 | |
NCH Commercial Pool II, Rocky Point, Mexico, 11.93%, 8/1/14 � ¿ | | | 12/4/07 | | | | 14,000,000 | | | | 14,237,806 | | | | 6,934,999 | |
Noah’s Ark Self Storage, San Antonio, TX, 6.48%, 9/1/11 � § | | | 8/24/07 | | | | 2,350,000 | | | | 2,350,000 | | | | 2,350,000 | |
North Austin Business Center, Austin, TX, 5.65%, 11/1/18 | | | 10/29/04 | | | | 3,318,948 | | | | 3,318,948 | | | | 3,484,896 | |
Paradise Boulevard, Albuquerque, NM, 6.50%, 4/1/17 | | | 3/26/07 | | | | 4,510,939 | | | | 4,510,939 | | | | 4,646,267 | |
RealtiCorp Fund III, Orlando/Crystal River, FL, 5.93%, 7/1/14 � | | | 2/28/06 | | | | 3,972,755 | | | | 3,972,755 | | | | 3,972,755 | |
Spa Atlantis, Pompano Beach, FL, 7.93%, 8/1/14 � | | | 9/30/05 | | | | 11,000,000 | | | | 11,000,000 | | | | 11,000,000 | |
Tatum Ranch Center, Phoenix, AZ, 6.15%, 10/1/15 � | | | 8/25/04 | | | | 3,204,207 | | | | 3,204,207 | | | | 3,204,207 | |
| | | | | | | | | | | | | | | | |
| | | | | | | | | | | 81,855,234 | | | | 66,675,296 | |
| | | | | | | | | | | | | | | | |
Multifamily Loans — 14.3% | | | | | | | | | | | | | | | | |
Chateau Club Apartments I, Athens, GA, 6.68%, 12/1/12 � ¿ § | | | 12/20/07 | | | | 6,000,000 | | | | 6,000,000 | | | | 4,214,874 | |
Chateau Club Apartments II, Athens, GA, 6.88%, 12/1/12 � § � S | | | 12/20/07 | | | | 2,991,624 | | | | 2,991,624 | | | | 2,054,172 | |
El Dorado Apartments I, Tucson, AZ, 5.65%, 9/1/17 � | | | 8/26/04 | | | | 2,420,444 | | | | 2,422,852 | | | | 2,420,444 | |
El Dorado Apartments II, Tucson, AZ, 7.13%, 9/1/17 | | | 8/26/04 | | | | 358,094 | | | | 358,094 | | | | 292,369 | |
Good Haven Apartments, Dallas, TX, 4.88%, 8/1/17 � | | | 8/24/04 | | | | 2,350,000 | | | | 2,350,000 | | | | 2,350,000 | |
Montevista Apartments, Fort Worth, TX, 7.43%, 3/1/17 � � | | | 8/30/07 | | | | 7,308,000 | | | | 7,308,000 | | | | 6,791,252 | |
NCH Multifamily Pool, Oklahoma City, OK, 11.93%, 8/1/14 � ¿ | | | 10/17/06 | | | | 4,933,450 | | | | 4,943,515 | | | | 283,831 | |
Plantation Pines I, Tyler, TX, 6.59%, 2/1/10 � ¿ § | | | 1/17/07 | | | | 3,328,000 | | | | 3,328,000 | | | | 1,850,368 | |
Plantation Pines II, Tyler, TX, 10.57%, 2/1/10 � ¿ § | | | 1/17/07 | | | | 416,000 | | | | 416,000 | | | | 103,122 | |
RiverPark Land Lot III, Oxnard, CA, 4.90%, 10/1/12 � § | | | 10/9/07 | | | | 3,650,000 | | | | 3,650,000 | | | | 3,472,351 | |
| | | | | | | | | | | | | | | | |
| | | | | | | | | | | 33,768,085 | | | | 23,832,783 | |
| | | | | | | | | | | | | | | | |
| | | | |
Total Whole Loans | | | | | | | | | | | 115,623,319 | | | | 90,508,079 | |
| | | | | | | | | | | | | | | | |
| | | | |
Private Mortgage-Backed Security ¥ Ä — 0.0% | | | | | | | | | | | | | | | | |
Fixed Rate — 0.0% | | | | | | | | | | | | | | | | |
First Gibraltar, Series 1992-MM, Class B, 6.06%, 10/25/21 | | | 7/30/93 | | | | 25,226 | | | | 19,316 | | | | — | |
| | | | | | | | | | | | | | | | |
| | | | |
Corporate Bonds — 40.0% | | | | | | | | | | | | | | | | |
Consumer Cyclical x — 0.6% | | | | | | | | | | | | | | | | |
American Water Capital, 4.30%, 12/1/42 | | | | | | | 1,000,000 | | | | 1,017,250 | | | | 949,848 | |
| | | | | | | | | | | | | | | | |
| | | | |
Real Estate Investment Trusts — 39.4% | | | | | | | | | | | | | | | | |
American Campus Communities Operating Partnership, 3.75%, 4/15/23 | | | | | | | 3,100,000 | | | | 2,982,043 | | | | 2,970,203 | |
BioMed Realty, 4.25%, 7/15/22 x | | | | | | | 1,755,000 | | | | 1,839,982 | | | | 1,747,583 | |
Brandywine Operating Partnership, 3.95%, 2/15/23 x | | | | | | | 2,000,000 | | | | 1,988,206 | | | | 1,954,232 | |
BRE Properties, 3.38%, 1/15/23 x | | | | | | | 2,425,000 | | | | 2,391,250 | | | | 2,297,105 | |
Corporate Office Properties, 3.60%, 5/15/23 | | | | | | | 2,000,000 | | | | 1,917,067 | | | | 1,857,000 | |
Developers Diversified Realty, 4.63%, 7/15/22 x | | | | | | | 3,200,000 | | | | 3,484,706 | | | | 3,357,696 | |
Digital Realty, 5.88%, 2/1/20 x | | | | | | | 2,536,000 | | | | 2,752,559 | | | | 2,817,354 | |
Digital Realty, 5.25%, 3/15/21 x | | | | | | | 3,000,000 | | | | 3,331,005 | | | | 3,169,365 | |
Duke Realty, 6.75%, 3/15/20 | | | | | | | 2,000,000 | | | | 2,384,665 | | | | 2,353,828 | |
The accompanying notes are an integral part of the financial statements.
| | | | | | |
| FIRST AMERICAN MORTGAGE FUNDS | | 2014 SEMIANNUAL REPORT | | | 15 | |
| | |
| Schedule of Investments | | February 28, 2014 (unaudited) |
American Strategic Income Portfolio III (CSP)
| | | | | | | | | | | | | | |
DESCRIPTION | | | | PAR/
SHARES | | | COST | | |
VALUE ¶ | |
| | | | |
Duke Realty, 4.38%, 6/15/22 | | | | $ | 1,150,000 | | | $ | 1,220,386 | | | $ | 1,174,584 | |
Equity One, 3.75%, 11/15/22 x | | | | | 6,055,000 | | | | 6,013,082 | | | | 5,815,216 | |
Essex Portfolio, 3.63%, 8/15/22 x | | | | | 4,600,000 | | | | 4,605,339 | | | | 4,458,044 | |
Health Care REIT, 3.75%, 3/15/23 | | | | | 1,175,000 | | | | 1,185,489 | | | | 1,154,654 | |
Hospitality Properties, 5.00%, 8/15/22 x | | | | | 4,390,000 | | | | 4,502,797 | | | | 4,576,812 | |
Hospitality Properties, 4.50%, 6/15/23 x | | | | | 2,000,000 | | | | 1,999,981 | | | | 1,990,866 | |
Host Hotels & Resorts, 3.75%, 10/15/23 x | | | | | 3,000,000 | | | | 2,945,351 | | | | 2,914,842 | |
Kilroy Realty, 3.80%, 1/15/23 x | | | | | 2,000,000 | | | | 1,989,501 | | | | 1,949,898 | |
Mack-Cali Realty, 7.75%, 8/15/19 x | | | | | 1,025,000 | | | | 1,213,493 | | | | 1,234,050 | |
Mid-America Apartments, 4.30%, 10/15/23 | | | | | 1,650,000 | | | | 1,644,720 | | | | 1,667,751 | |
National Retail Properties, 3.30%, 4/15/23 x | | | | | 5,150,000 | | | | 4,832,268 | | | | 4,880,603 | |
Post Apartment Homes, 3.38%, 12/1/22 | | | | | 595,000 | | | | 594,656 | | | | 563,135 | |
Senior Housing Properties, 5.63%, 8/1/42 x | | | | | 2,250,000 | | | | 2,191,000 | | | | 1,866,510 | |
Ventas Realty, 5.45%, 3/15/43 | | | | | 4,970,225 | | | | 4,998,520 | | | | 4,441,393 | |
Vornado Realty, 5.00%, 1/15/22 x | | | | | 1,735,000 | | | | 1,807,257 | | | | 1,855,779 | |
Washington REIT, 3.95%, 10/15/22 x | | | | | 2,510,000 | | | | 2,598,070 | | | | 2,459,614 | |
| | | | | | | | | | | | | | |
| | | | | | | | | 67,413,393 | | | | 65,528,117 | |
| | | | | | | | | | | | | | |
| | | | |
Total Corporate Bonds | | | | | | | | | 68,430,643 | | | | 66,477,965 | |
| | | | | | | | | | | | | | |
| | | | |
U.S. Government Agency Mortgage-Backed Securities a — 5.8% | | | | | | | | | | | | | | |
Fixed Rate — 5.8% | | | | | | | | | | | | | | |
Federal Home Loan Mortgage Corporation, | | | | | | | | | | | | | | |
5.50%, 1/1/18, #E93231 | | | | | 509,147 | | | | 514,060 | | | | 546,081 | |
9.00%, 7/1/30, #C40149 | | | | | 64,823 | | | | 65,949 | | | | 77,376 | |
5.00%, 5/1/39, #G05430 | | | | | 1,065,960 | | | | 1,090,232 | | | | 1,162,131 | |
3.50%, 6/1/42, #C09000 | | | | | 416,902 | | | | 440,726 | | | | 422,174 | |
Federal National Mortgage Association, | | | | | | | | | | | | | | |
6.00%, 10/1/16, #607030 | | | | | 25,066 | | | | 25,098 | | | | 25,946 | |
5.50%, 2/1/17, #623874 | | | | | 40,649 | | | | 40,624 | | | | 43,422 | |
5.50%, 6/1/17, #648508 | | | | | 35,320 | | | | 35,369 | | | | 37,756 | |
5.00%, 9/1/17, #254486 | | | | | 57,347 | | | | 57,392 | | | | 61,423 | |
5.00%, 11/1/17, #657356 | | | | | 77,836 | | | | 77,961 | | | | 83,455 | |
6.50%, 6/1/29, #252497 | | | | | 164,949 | | | | 164,236 | | | | 186,450 | |
7.50%, 5/1/30, #535289 | | | | | 41,681 | | | | 40,768 | | | | 47,700 | |
8.00%, 5/1/30, #538266 | | | | | 23,924 | | | | 23,726 | | | | 25,081 | |
8.00%, 6/1/30, #253347 | | | | | 54,030 | | | | 53,583 | | | | 65,204 | |
5.00%, 12/1/35, #995317 | | | | | 1,773,429 | | | | 1,820,014 | | | | 1,944,593 | |
5.00%, 7/1/39, #935512 | | | | | 944,133 | | | | 960,462 | | | | 1,034,129 | |
5.00%, 7/1/39, #AA9716 | | | | | 3,633,177 | | | | 3,720,546 | | | | 3,975,360 | |
| | | | | | | | | | | | | | |
| | | | |
Total U.S. Government Agency Mortgage-Backed Securities | | | | | | | | | 9,130,746 | | | | 9,738,281 | |
| | | | | | | | | | | | | | |
| | | | |
Preferred Stocks — 36.8% | | | | | | | | | | | | | | |
Real Estate Investment Trusts — 36.8% | | | | | | | | | | | | | | |
Alexandria Real Estate Equities, Series E x | | | | | 206,080 | | | | 5,206,973 | | | | 4,811,968 | |
Boston Properties, Series B | | | | | 233,480 | | | | 5,673,701 | | | | 4,893,507 | |
CommonWealth REIT, Series E x | | | | | 71,548 | | | | 1,791,008 | | | | 1,714,920 | |
Digital Realty, Series E x | | | | | 20,171 | | | | 514,524 | | | | 485,996 | |
Digital Realty, Series F x | | | | | 164,026 | | | | 4,108,851 | | | | 3,767,480 | |
Digital Realty, Series G | | | | | 26,367 | | | | 599,121 | | | | 528,896 | |
Duke Realty, Series J x | | | | | 56,556 | | | | 1,203,278 | | | | 1,370,295 | |
Duke Realty, Series L x | | | | | 13,000 | | | | 325,650 | | | | 314,977 | |
Health Care REIT, Series J x | | | | | 196,600 | | | | 5,186,949 | | | | 4,763,421 | |
Hospitality Properties, Series D x | | | | | 163,212 | | | | 4,127,357 | | | | 4,078,668 | |
Kimco Realty, Series I | | | | | 58,480 | | | | 1,381,498 | | | | 1,335,905 | |
The accompanying notes are an integral part of the financial statements.
| | | | |
| 16 | | FIRST AMERICAN MORTGAGE FUNDS | | 2014 SEMIANNUAL REPORT |
American Strategic Income Portfolio III (CSP)
| | | | | | | | | | | | | | |
DESCRIPTION | | | |
SHARES | | | COST | | |
VALUE ¶ | |
| | | | |
Kimco Realty, Series J x | | | | | 126,891 | | | $ | 3,184,070 | | | $ | 2,662,173 | |
Kimco Realty, Series K | | | | | 42,333 | | | | 1,070,441 | | | | 903,810 | |
National Retail Properties, Series D x | | | | | 195,623 | | �� | | 4,883,237 | | | | 4,657,784 | |
PS Business Parks, Series R | | | | | 37,373 | | | | 1,004,213 | | | | 945,911 | |
PS Business Parks, Series S x | | | | | 27,800 | | | | 724,910 | | | | 658,026 | |
PS Business Parks, Series T x | | | | | 123,291 | | | | 3,075,856 | | | | 2,766,650 | |
PS Business Parks, Series U | | | | | 21,300 | | | | 532,500 | | | | 453,051 | |
Public Storage, Series P | | | | | 11,300 | | | | 299,450 | | | | 290,410 | |
Public Storage, Series Q | | | | | 24,892 | | | | 615,870 | | | | 640,969 | |
Public Storage, Series R | | | | | 4,000 | | | | 100,600 | | | | 100,720 | |
Public Storage, Series S x | | | | | 62,000 | | | | 1,521,190 | | | | 1,455,066 | |
Public Storage, Series T x | | | | | 63,578 | | | | 1,670,070 | | | | 1,443,856 | |
Public Storage, Series U | | | | | 20,894 | | | | 441,908 | | | | 464,474 | |
Public Storage, Series X | | | | | 20,200 | | | | 507,660 | | | | 418,746 | |
Realty Income, Series E x | | | | | 36,520 | | | | 824,632 | | | | 913,000 | |
Realty Income, Series F x | | | | | 153,162 | | | | 4,062,388 | | | | 3,821,392 | |
Regency Centers, Series F x | | | | | 191,817 | | | | 4,987,634 | | | | 4,613,007 | |
Vornado Realty, Series J | | | | | 6,496 | | | | 161,750 | | | | 165,648 | |
Vornado Realty, Series K x | | | | | 126,480 | | | | 3,244,075 | | | | 2,773,706 | |
Vornado Realty, Series L | | | | | 75,000 | | | | 1,792,750 | | | | 1,563,285 | |
Weingarten Realty Investors, Series F x | | | | | 56,143 | | | | 1,279,575 | | | | 1,358,099 | |
| | | | | | | | | | | | | | |
| | | | |
Total Preferred Stocks | | | | | | | | | 66,103,689 | | | | 61,135,816 | |
| | | | | | | | | | | | | | |
| | | | |
Total Unaffiliated Investments | | | | | | | | | 259,307,713 | | | | 227,860,141 | |
| | | | | | | | | | | | | | |
| | | | |
Short-Term Investment — 1.5% | | | | | | | | | | | | | | |
First American Prime Obligations Fund, Class Z, 0.02% W | | | | | 2,545,312 | | | | 2,545,312 | | | | 2,545,312 | |
| | | | | | | | | | | | | | |
| | | | |
Total Investments p — 138.5% | | | | | | | | $ | 261,853,025 | | | $ | 230,405,453 | |
| | | | | | | | | | | | | | |
Other Assets and Liabilities, Net — (38.5)% | | | | | | | | | | | | | (64,087,448 | ) |
| | | | | | | | | | | | | | |
Total Net Assets — 100.0% | | | | | | | | | | | | $ | 166,318,005 | |
| | | | | | | | | | | | | | |
| ¶ | Securities are valued in accordance with procedures described in note 2 in Notes to Financial Statements. |
| ¥ | Securities purchased as part of a private placement which have not been registered with the U.S. Securities and Exchange Commission under the Securities Act of 1933 and which are considered to be illiquid. These securities are fair valued in accordance with the board approved valuation procedures. On February 28, 2014, the total fair value of these securities was $90,508,079 or 54.4% of total net assets. See note 2 in Notes to Financial Statements. |
| p | Interest rates on commercial and multifamily loans are the net coupon rates in effect (after reducing the coupon rate by any mortgage servicing fees paid to mortgage servicers) on February 28, 2014. For participating loans, the rates are based on the annual cash flow payments expected at the time of purchase. |
| � | Interest Only – Represents securities that entitle holders to receive only interest payments on the mortgage. Principal balance on the loan is due at maturity. The interest rate disclosed represents the net coupon rate in effect as of February 28, 2014. |
| ¿ | Loan is currently in default with regards to scheduled interest and/or principal payments. |
| r | Variable Rate Security – The rate shown is the net coupon rate in effect as of February 28, 2014. |
| § | Loan has matured or will mature in the next couple of months and the fund is anticipating payoff or refinancing. Unless disclosed otherwise, the loan continues to make monthly payments. |
| � | Participating Loan – A participating loan is one which contains provisions for the fund to participate in the income stream provided by the property, including net cash flows and capital proceeds. Monthly cash flow proceeds are only required to the extent excess cash flow is generated by the property as determined by the loan documents. |
| S | The participating loan is not currently making monthly cash flow payments or is making cash flow payments of less than original coupon rate disclosed. |
| Ä | Non-Income Producing Security – that is not considered to be in default of its original terms. |
| | | | | | |
| FIRST AMERICAN MORTGAGE FUNDS | | 2014 SEMIANNUAL REPORT | | | 17 | |
| | |
| Schedule of Investments | | February 28, 2014 (unaudited) |
American Strategic Income Portfolio III (CSP)
| x | Securities pledged as collateral for outstanding borrowings under a loan agreement with Bank of America, N.A. On February 28, 2014, securities valued at $98,725,901 were pledged as collateral for the following outstanding borrowings: |
| | | | | | | | | | |
| Amount | | | Rate* | | | Accrued
Interest | |
| $ | 55,500,000 | | | | 1.00 | % | | $ | 1,549 | |
| | | | | | | | | | |
| | * | Interest rate as of February 28, 2014. Rate is based on one-month London Interbank Offered Rate (“LIBOR”) plus 0.85%. |
Description of collateral:
Corporate Bonds
American Water Capital, 4.30%, 12/1/42, $1,000,000 par
BioMed Realty, 4.25%, 7/15/22, $1,755,000 par
Brandywine Operating Partnership, 3.95%, 2/15/23, $2,000,000 par
BRE Properties, 3.38%, 1/15/23, $2,425,000 par
Developers Diversified Realty, 4.63%, 7/15/22, $3,200,000 par
Digital Realty, 5.88%, 2/1/20, $2,536,000 par
Digital Realty, 5.25%, 3/15/21, $3,000,000 par
Equity One, 3.75%, 11/15/22, $6,055,000 par
Essex Portfolio, 3.63%, 8/15/22, $4,600,000 par
Hospitality Properties, 5.00%, 8/15/22, $4,390,000 par
Hospitality Properties, 4.50%, 6/15/23, $2,000,000 par
Host Hotels & Resorts, 3.75%, 10/15/23, $3,000,000 par
Kilroy Realty, 3.80%, 1/15/23, $2,000,000 par
Mack-Cali Realty, 7.75%, 8/15/19, $1,025,000 par
National Retail Properties, 3.30%, 4/15/23, $5,150,000 par
Senior Housing Properties, 5.63%, 8/1/42, $2,250,000 par
Vornado Realty, 5.00%, 1/15/22, $1,735,000 par
Washington REIT, 3.95%, 10/15/22, $2,510,000 par
Preferred Stocks
Alexandria Real Estate Equities, Series E, 206,080 shares
CommonWealth REIT, Series E, 71,548 shares
Digital Realty, Series E, 20,171 shares
Digital Realty, Series F, 164,026 shares
Duke Realty, Series J, 56,556 shares
Duke Realty, Series L, 13,000 shares
Health Care REIT, Series J, 196,600 shares
Hospitality Properties, Series D, 163,212 shares
Kimco Realty, Series J, 126,891 shares
National Retail Properties, Series D, 195,623 shares
PS Business Parks, Series S, 27,800 shares
PS Business Parks, Series T, 123,291 shares
Public Storage, Series S, 62,000 shares
Public Storage, Series T, 63,578 shares
Realty Income, Series E, 36,520 shares
Realty Income, Series F, 153,162 shares
Regency Centers, Series F, 191,817 shares
Vornado Realty, Series K, 126,480 shares
Weingarten Realty Investors, Series F, 56,143 shares
| a | Securities pledged as collateral for outstanding reverse repurchase agreements. On February 28, 2014, securities valued at $9,738,281 were pledged as collateral for the following outstanding reverse repurchase agreements: |
| | | | | | | | | | | | | | | | | | | | | | |
| Amount | | | Acquisition
Date | | | Rate* | | | Due | | | Accrued
Interest | | | Name of Broker
and Description
of Collateral | |
| $ | 9,452,000 | | | | 2/6/14 | | | | 0.36 | % | | | 3/7/14 | | | $ | 2,173 | | | | (1 | ) |
| | | | | | | | | | | | | | | | | | | | | | |
| | * | Interest rate as of February 28, 2014. Rate is based on one-month LIBOR plus a spread and reset monthly. |
Name of broker and description of collateral:
Federal Home Loan Mortgage Corporation, 5.50%, 1/1/18, $509,147 par
Federal Home Loan Mortgage Corporation, 9.00%, 7/1/30, $64,823 par
Federal Home Loan Mortgage Corporation, 5.00%, 5/1/39, $1,065,960 par
The accompanying notes are an integral part of the financial statements.
| | | | |
| 18 | | FIRST AMERICAN MORTGAGE FUNDS | | 2014 SEMIANNUAL REPORT |
American Strategic Income Portfolio III (CSP)
Federal Home Loan Mortgage Corporation, 3.50%, 6/1/42, $416,902 par
Federal National Mortgage Association, 6.00%, 10/1/16, $25,066 par
Federal National Mortgage Association, 5.50%, 2/1/17, $40,649 par
Federal National Mortgage Association, 5.50%, 6/1/17, $35,320 par
Federal National Mortgage Association, 5.00%, 9/1/17, $57,347 par
Federal National Mortgage Association, 5.00%, 11/1/17, $77,836 par
Federal National Mortgage Association, 6.50%, 6/1/29, $164,949 par
Federal National Mortgage Association, 7.50%, 5/1/30, $41,681 par
Federal National Mortgage Association, 8.00%, 5/1/30, $23,924 par
Federal National Mortgage Association, 8.00%, 6/1/30, $54,030 par
Federal National Mortgage Association, 5.00%, 12/1/35, $1,773,429 par
Federal National Mortgage Association, 5.00%, 7/1/39, $944,133 par
Federal National Mortgage Association, 5.00%, 7/1/39, $3,633,177 par
| | The fund has entered into a lending commitment with Goldman Sachs. The monthly agreement permits the fund to enter into reverse repurchase agreements using U.S. Government Agency Mortgage-Backed Securities as collateral. |
| W | Investment in affiliated security. This money market fund is advised by U.S. Bancorp Asset Management, Inc., which also serves as advisor for the fund. The rate shown is the annualized seven-day effective yield as of February 28, 2014. See note 2 in Notes to Financial Statements. |
| p | On February 28, 2014, the cost of investments for federal income tax purposes was approximately $261,853,025. The approximate aggregate gross unrealized appreciation and depreciation of investments, based on this cost, were as follows: |
| | | | |
Gross unrealized appreciation | | $ | 2,150,758 | |
Gross unrealized depreciation | | | (33,598,330 | ) |
| | | | |
Net unrealized depreciation | | $ | (31,447,572 | ) |
| | | | |
REIT–Real Estate Investment Trust
| | | | | | |
| FIRST AMERICAN MORTGAGE FUNDS | | 2014 SEMIANNUAL REPORT | | | 19 | |
| | |
| Schedule of Investments | | February 28, 2014 (unaudited) |
American Select Portfolio (SLA)
| | | | | | | | | | | | | | | | |
DESCRIPTION | | DATE
ACQUIRED | | | PAR | | | COST | | |
VALUE ¶ | |
| | | | |
(Percentages of each investment category relate to total net assets) | | | | | | | | | | | | | | | | |
| | | | |
Whole Loans ¥ p — 46.5% | | | | | | | | | | | | | | | | |
Commercial Loans — 35.6% | | | | | | | | | | | | | | | | |
31601 Industrial Drive, Livonia, MI, 4.13%, 1/1/24 r | | | 12/30/13 | | | $ | 2,220,285 | | | $ | 2,220,285 | | | $ | 2,220,285 | |
Clear Lake Central I, Webster, TX, 4.93%, 9/1/14 � | | | 7/27/06 | | | | 6,895,716 | | | | 6,895,716 | | | | 6,895,716 | |
Gateway Business Center, St. Cloud, MN, 4.82%, 10/1/23 | | | 9/13/13 | | | | 3,229,108 | | | | 3,229,108 | | | | 3,321,952 | |
George Gee Hummer, Liberty Lake, WA, 6.38%, 7/1/18 | | | 6/30/05 | | | | 2,106,753 | | | | 2,106,753 | | | | 1,999,315 | |
George Gee Pontiac I, Liberty Lake, WA, 6.40%, 7/1/18 | | | 6/30/05 | | | | 4,634,856 | | | | 4,634,856 | | | | 4,402,580 | |
George Gee Pontiac II, Liberty Lake, WA, 6.38%, 7/1/18 | | | 9/14/06 | | | | 743,560 | | | | 743,560 | | | | 705,545 | |
George Gee Porsche, Liberty Lake, WA, 6.38%, 7/1/18 | | | 9/14/06 | | | | 2,478,533 | | | | 2,478,533 | | | | 2,351,815 | |
Hacienda Colorado Restaurant, Englewood, CO, 4.38%, 7/1/23 | | | 6/5/13 | | | | 2,099,133 | | | | 2,099,133 | | | | 2,098,713 | |
Jamestown Medical Office Building, Jamestown, ND, 4.43%, 5/1/23 | | | 4/5/13 | | | | 6,102,252 | | | | 6,102,252 | | | | 6,148,769 | |
Mandala Agency Building, Bend, OR, 6.38%, 6/1/17 | | | 5/23/07 | | | | 2,137,672 | | | | 2,137,672 | | | | 2,159,049 | |
Rivertree Court, Vernon Hills, IL, 5.19%, 12/1/23 | | | 11/8/13 | | | | 2,090,762 | | | | 2,090,762 | | | | 2,195,300 | |
RL Stowe Portfolio, Belmont, NC & Chattanooga, TN, 2.93%, 1/1/14 § | | | 10/12/07 | | | | 6,966,539 | | | | 6,966,539 | | | | 3,873,396 | |
Superior Ford Dealership, Plymouth, MN, 6.43%, 7/1/17 | | | 6/28/07 | | | | 4,602,388 | | | | 4,602,388 | | | | 4,832,507 | |
| | | | | | | | | | | | | | | | |
| | | | 46,307,557 | | | | 43,204,942 | |
| | | | | | | | | | | | | | | | |
Multifamily Loans — 10.9% | | | | | | | | | | | | | | | | |
Briarhill Apartments I, Eden Prairie, MN, 6.90%, 9/1/15 | | | 8/11/03 | | | | 3,823,366 | | | | 3,823,366 | | | | 3,899,834 | |
Briarhill Apartments II, Eden Prairie, MN, 6.88%, 9/1/15 | | | 8/11/03 | | | | 16,239 | | | | 16,239 | | | | 16,405 | |
Keystone Crossings, Springdale, AR, 8.15%, 7/5/16 � � | | | 6/27/07 | | | | 4,875,000 | | | | 4,875,000 | | | | 4,564,053 | |
NCH Multifamily Pool II, Rocky Point, Mexico, 11.93%, 8/1/14 � ¿ | | | 10/1/07 | | | | 5,400,000 | | | | 5,647,813 | | | | 4,750,000 | |
| | | | | | | | | | | | | | | | |
| | | | 14,362,418 | | | | 13,230,292 | |
| | | | | | | | | | | | | | | | |
| | | | |
Total Whole Loans | | | | | | | | | | | 60,669,975 | | | | 56,435,234 | |
| | | | | | | | | | | | | | | | |
| | | | |
Corporate Notes ¥ � — 7.1% | | | | | | | | | | | | | | | | |
Fixed Rate — 7.1% | | | | | | | | | | | | | | | | |
Stratus Properties I, 7.25%, 3/31/15 | | | 12/28/00 | | | | 5,000,000 | | | | 5,000,000 | | | | 5,050,000 | |
Stratus Properties VII, 7.25%, 12/31/15 | | | 6/1/07 | | | | 3,500,000 | | | | 3,500,000 | | | | 3,535,000 | |
| | | | | | | | | | | | | | | | |
| | | | |
Total Corporate Notes | | | | | | | | | | | 8,500,000 | | | | 8,585,000 | |
| | | | | | | | | | | | | | | | |
| | | | |
Corporate Bonds — 34.8% | | | | | | | | | | | | | | | | |
Real Estate Investment Trusts — 34.8% | | | | | | | | | | | | | | | | |
Brandywine Operating Partnership, 3.95%, 2/15/23 x | | | | | | | 2,780,000 | | | | 2,746,699 | | | | 2,716,382 | |
CommonWealth REIT, 5.88%, 9/15/20 x | | | | | | | 1,375,000 | | | | 1,476,564 | | | | 1,477,547 | |
Developers Diversified Realty, 4.63%, 7/15/22 x | | | | | | | 2,200,000 | | | | 2,364,191 | | | | 2,308,416 | |
Digital Realty, 5.88%, 2/1/20 x | | | | | | | 1,000,000 | | | | 1,085,394 | | | | 1,110,944 | |
Duke Realty, 6.75%, 3/15/20 x | | | | | | | 1,600,000 | | | | 1,907,732 | | | | 1,883,062 | |
Equity One, 3.75%, 11/15/22 x | | | | | | | 2,203,000 | | | | 2,181,947 | | | | 2,115,759 | |
HCP, 3.15%, 8/1/22 | | | | | | | 2,000,000 | | | | 1,982,555 | | | | 1,908,540 | |
Health Care REIT, 5.25%, 1/15/22 x | | | | | | | 1,750,000 | | | | 1,954,444 | | | | 1,925,948 | |
Health Care REIT, 3.75%, 3/15/23 | | | | | | | 885,000 | | | | 892,900 | | | | 869,675 | |
Healthcare Realty, 5.75%, 1/15/21 x | | | | | | | 2,690,000 | | | | 2,982,101 | | | | 2,976,663 | |
Highwoods Realty, 3.63%, 1/15/23 | | | | | | | 750,000 | | | | 734,566 | | | | 712,458 | |
Host Hotels & Resorts, 5.25%, 3/15/22 | | | | | | | 1,000,000 | | | | 1,027,474 | | | | 1,085,660 | |
Host Hotels & Resorts, 3.75%, 10/15/23 | | | | | | | 197,000 | | | | 181,685 | | | | 191,408 | |
Kilroy Realty, 3.80%, 1/15/23 x | | | | | | | 3,000,000 | | | | 2,862,683 | | | | 2,924,847 | |
Liberty Property, 3.38%, 6/15/23 x | | | | | | | 2,500,000 | | | | 2,485,237 | | | | 2,353,780 | |
Mid-America Apartments, 4.30%, 10/15/23 | | | | | | | 1,100,000 | | | | 1,096,480 | | | | 1,111,834 | |
National Retail Properties, 3.80%, 10/15/22 x | | | | | | | 1,425,000 | | | | 1,477,928 | | | | 1,412,551 | |
Post Apartment Homes, 3.38%, 12/1/22 x | | | | | | | 1,515,000 | | | | 1,514,125 | | | | 1,433,866 | |
Realty Income, 4.65%, 8/1/23 | | | | | | | 1,430,000 | | | | 1,447,058 | | | | 1,502,913 | |
Senior Housing Properties, 6.75%, 12/15/21 | | | | | | | 340,000 | | | | 388,371 | | | | 385,645 | |
The accompanying notes are an integral part of the financial statements.
| | | | |
| 20 | | FIRST AMERICAN MORTGAGE FUNDS | | 2014 SEMIANNUAL REPORT |
American Select Portfolio (SLA)
| | | | | | | | | | | | | | |
DESCRIPTION | | | | PAR/
SHARES | | | COST | | | VALUE ¶ | |
| | | | |
Senior Housing Properties, 5.63%, 8/1/42 | | | | $ | 1,146,125 | | | $ | 1,126,745 | | | $ | 950,779 | |
Ventas Realty, 3.25%, 8/15/22 | | | | | 1,015,000 | | | | 997,190 | | | | 973,937 | |
Ventas Realty, 5.45%, 3/15/43 | | | | | 3,966,375 | | | | 3,985,676 | | | | 3,544,353 | |
Washington REIT, 3.95%, 10/15/22 x | | | | | 1,100,000 | | | | 1,136,079 | | | | 1,077,919 | |
Weingarten Realty Investors, 3.38%, 10/15/22 x | | | | | 3,450,000 | | | | 3,424,464 | | | | 3,272,477 | |
| | | | | | | | | | | | | | |
| | | | |
Total Corporate Bonds | | | | | | | | | 43,460,288 | | | | 42,227,363 | |
| | | | | | | | | | | | | | |
| | | | |
U.S. Government Agency Mortgage-Backed Securities a — 12.8% | | | | | | | | | | | | | | |
Fixed Rate — 12.8% | | | | | | | | | | | | | | |
Federal Home Loan Mortgage Corporation, | | | | | | | | | | | | | | |
5.50%, 1/1/18, #E93231 | | | | | 286,395 | | | | 289,158 | | | | 307,171 | |
7.50%, 12/1/29, #C00896 | | | | | 81,547 | | | | 80,560 | | | | 96,375 | |
5.00%, 5/1/39, #G05430 | | | | | 532,980 | | | | 545,116 | | | | 581,066 | |
Federal National Mortgage Association, | | | | | | | | | | | | | | |
5.00%, 11/1/17, #657356 | | | | | 77,836 | | | | 77,961 | | | | 83,455 | |
6.50%, 6/1/29, #252497 | | | | | 212,078 | | | | 211,161 | | | | 239,721 | |
7.50%, 5/1/30, #535289 | | | | | 23,156 | | | | 22,649 | | | | 26,500 | |
8.00%, 5/1/30, #538266 | | | | | 13,291 | | | | 13,181 | | | | 13,934 | |
5.00%, 11/1/33, #725027 | | | | | 749,388 | | | | 763,309 | | | | 825,611 | |
5.00%, 7/1/39, #935588 | | | | | 803,109 | | | | 817,760 | | | | 879,295 | |
4.50%, 3/1/40, #932669 | | | | | 1,033,376 | | | | 1,042,410 | | | | 1,110,003 | |
4.00%, 12/1/40, #MA0583 | | | | | 1,170,060 | | | | 1,181,349 | | | | 1,227,816 | |
3.50%, 2/1/41, #AE0828 | | | | | 1,769,084 | | | | 1,830,646 | | | | 1,795,670 | |
3.50%, 3/1/41, #AE0981 | | | | | 2,420,023 | | | | 2,509,013 | | | | 2,456,376 | |
3.50%, 2/1/42, #AB4514 | | | | | 1,886,188 | | | | 1,924,842 | | | | 1,914,472 | |
3.50%, 4/1/42, #MA1027 | | | | | 1,841,861 | | | | 1,905,951 | | | | 1,869,486 | |
3.50%, 8/1/42, #AL2417 | | | | | 2,024,361 | | | | 2,165,511 | | | | 2,054,797 | |
| | | | | | | | | | | | | | |
| | | | |
Total U.S. Government Agency Mortgage-Backed Securities | | | | | | | | | 15,380,577 | | | | 15,481,748 | |
| | | | | | | | | | | | | | |
| | | | |
Asset-Backed Security ¢ — 0.8% | | | | | | | | | | | | | | |
Other — 0.8% | | | | | | | | | | | | | | |
321 Henderson Receivables I LLC, Series 2007-3A, Class A, 6.15%, 10/15/48 | | | | | 804,771 | | | | 889,968 | | | | 904,971 | |
| | | | | | | | | | | | | | |
| | | | |
Preferred Stocks — 38.0% | | | | | | | | | | | | | | |
Real Estate Investment Trusts — 38.0% | | | | | | | | | | | | | | |
Alexandria Real Estate Equities, Series E x | | | | | 143,250 | | | | 3,612,290 | | | | 3,344,887 | |
Boston Properties, Series B x | | | | | 177,874 | | | | 4,220,719 | | | | 3,728,061 | |
CommonWealth REIT, Series E x | | | | | 137,698 | | | | 3,565,063 | | | | 3,300,456 | |
Developers Diversified Realty, Series H x | | | | | 6,305 | | | | 129,253 | | | | 159,453 | |
Digital Realty, Series E x | | | | | 141,400 | | | | 3,535,140 | | | | 3,406,863 | |
Digital Realty, Series G | | | | | 8,500 | | | | 171,530 | | | | 170,502 | |
Duke Realty, Series J | | | | | 630 | | | | 15,120 | | | | 15,264 | |
Duke Realty, Series K x | | | | | 35,000 | | | | 836,500 | | | | 842,188 | |
Duke Realty, Series L x | | | | | 17,270 | | | | 330,202 | | | | 418,435 | |
Equity Residential Properties, Series K x | | | | | 18,000 | | | | 991,800 | | | | 1,080,563 | |
Health Care REIT, Series J x | | | | | 123,170 | | | | 3,174,409 | | | | 2,984,286 | |
Hospitality Properties, Series D | | | | | 44,420 | | | | 1,204,560 | | | | 1,110,056 | |
Kimco Realty, Series I | | | | | 56,355 | | | | 1,345,579 | | | | 1,287,362 | |
Kimco Realty, Series J x | | | | | 88,000 | | | | 2,203,750 | | | | 1,846,240 | |
Kimco Realty, Series K | | | | | 30,000 | | | | 753,100 | | | | 640,500 | |
National Retail Properties, Series D x | | | | | 146,840 | | | | 3,680,710 | | | | 3,496,260 | |
National Retail Properties, Series E | | | | | 10,100 | | | | 196,950 | | | | 208,161 | |
PS Business Parks, Series S x | | | | | 48,000 | | | | 1,276,800 | | | | 1,136,160 | |
PS Business Parks, Series T x | | | | | 75,875 | | | | 1,866,356 | | | | 1,702,635 | |
| | | | | | |
| FIRST AMERICAN MORTGAGE FUNDS | | 2014 SEMIANNUAL REPORT | | | 21 | |
| | |
| Schedule of Investments | | February 28, 2014 (unaudited) |
American Select Portfolio (SLA)
| | | | | | | | | | | | | | |
DESCRIPTION | | | |
SHARES | | | COST | | | VALUE ¶ | |
| | | | |
PS Business Parks, Series U | | | | | 2,000 | | | $ | 41,800 | | | $ | 42,540 | |
PS Business Parks, Series V | | | | | 38,700 | | | | 899,826 | | | | 820,827 | |
Public Storage, Series P | | | | | 11,400 | | | | 300,960 | | | | 292,980 | |
Public Storage, Series Q x | | | | | 17,675 | | | | 443,666 | | | | 455,131 | |
Public Storage, Series R x | | | | | 36,500 | | | | 931,975 | | | | 919,070 | |
Public Storage, Series T | | | | | 7,715 | | | | 199,819 | | | | 175,208 | |
Public Storage, Series U | | | | | 18,930 | | | | 471,977 | | | | 420,814 | |
Public Storage, Series V | | | | | 23,288 | | | | 590,351 | | | | 496,966 | |
Public Storage, Series W | | | | | 7,015 | | | | 177,129 | | | | 145,421 | |
Public Storage, Series X | | | | | 34,800 | | | | 810,840 | | | | 721,404 | |
Realty Income, Series E x | | | | | 91,670 | | | | 2,214,334 | | | | 2,291,750 | |
Realty Income, Series F | | | | | 50,250 | | | | 1,303,543 | | | | 1,253,738 | |
Regency Centers, Series F x | | | | | 142,126 | | | | 3,772,790 | | | | 3,417,988 | |
Regency Centers, Series G | | | | | 14,400 | | | | 365,472 | | | | 313,651 | |
Vornado Realty, Series G x | | | | | 40,000 | | | | 998,000 | | | | 1,005,000 | |
Vornado Realty, Series I x | | | | | 24,000 | | | | 596,400 | | | | 595,896 | |
Vornado Realty, Series J | | | | | 4,400 | | | | 109,560 | | | | 112,200 | |
Vornado Realty, Series K x | | | | | 61,415 | | | | 1,568,468 | | | | 1,346,831 | |
Vornado Realty, Series L | | | | | 16,000 | | | | 394,400 | | | | 333,501 | |
| | | | | | | | | | | | | | |
| | | | |
Total Preferred Stocks | | | | | | | | | 49,301,141 | | | | 46,039,248 | |
| | | | | | | | | | | | | | |
| | | | |
Total Unaffiliated Investments | | | | | | | | | 178,201,949 | | | | 169,673,564 | |
| | | | | | | | | | | | | | |
| | | | |
Short-Term Investment — 2.0% | | | | | | | | | | | | | | |
First American Prime Obligations Fund, Class Z, 0.02% W | | | | | 2,476,349 | | | | 2,476,349 | | | | 2,476,349 | |
| | | | | | | | | | | | | | |
| | | | |
Total Investments p — 142.0% | | | | | | | | $ | 180,678,298 | | | $ | 172,149,913 | |
| | | | | | | | | | | | | | |
Other Assets and Liabilities, Net — (42.0)% | | | | | | | | | | | | | (50,878,239 | ) |
| | | | | | | | | | | | | | |
Total Net Assets — 100.0% | | | | | | | | | | | | $ | 121,271,674 | |
| | | | | | | | | | | | | | |
| ¶ | Securities are valued in accordance with procedures described in note 2 in Notes to Financial Statements. |
| ¥ | Securities purchased as part of a private placement which have not been registered with the U.S. Securities and Exchange Commission under the Securities Act of 1933 and which are considered to be illiquid. These securities are fair valued in accordance with the board approved valuation procedures. On February 28, 2014, the total fair value of these securities was $65,020,234 or 53.6% of total net assets. See note 2 in Notes to Financial Statements. |
| p | Interest rates on commercial and multifamily loans are the net coupon rates in effect (after reducing the coupon rate by any mortgage servicing fees paid to mortgage servicers) on February 28, 2014. For participating loans, the rates are based on the annual cash flow payments expected at the time of purchase. |
| r | Variable Rate Security – The rate shown is the net coupon rate in effect as of February 28, 2014. |
| � | Interest Only – Represents securities that entitle holders to receive only interest payments on the mortgage. Principal balance on the loan is due at maturity. The interest rate disclosed represents the net coupon rate in effect as of February 28, 2014. |
| § | Loan has matured or will mature in the next couple of months and the fund is anticipating payoff or refinancing. Unless disclosed otherwise, the loan continues to make monthly payments. |
| � | Participating Loan – A participating loan is one which contains provisions for the fund to participate in the income stream provided by the property, including net cash flows and capital proceeds. Monthly cash flow proceeds are only required to the extent excess cash flow is generated by the property as determined by the loan documents. |
| ¿ | Loan is currently in default with regards to scheduled interest and/or principal payments. |
| x | Securities pledged as collateral for outstanding borrowings under a loan agreement with Bank of America, N.A. On February 28, 2014, securities valued at $66,468,314 were pledged as collateral for the following outstanding borrowings: |
| | | | | | | | | | |
| Amount | | | Rate* | | | Accrued
Interest | |
| $ | 36,700,000 | | | | 1.00 | % | | $ | 1,024 | |
| | | | | | | | | | |
| | * | Interest rate as of February 28, 2014. Rate is based on one-month London Interbank Offered Rate (“LIBOR”) plus 0.85%. |
The accompanying notes are an integral part of the financial statements.
| | | | |
| 22 | | FIRST AMERICAN MORTGAGE FUNDS | | 2014 SEMIANNUAL REPORT |
American Select Portfolio (SLA)
Description of collateral:
Corporate Bonds
Brandywine Operating Partnership, 3.95%, 2/15/23, $2,780,000 par
CommonWealth REIT, 5.88%, 9/15/20, $1,375,000 par
Developers Diversified Realty, 4.63%, 7/15/22, $2,200,000 par
Digital Realty, 5.88%, 2/1/20, $1,000,000 par
Duke Realty, 6.75%, 3/15/20, $1,600,000 par
Equity One, 3.75%, 11/15/22, $2,203,000 par
Health Care REIT, 5.25%, 1/15/22, $1,750,000 par
Healthcare Realty, 5.75%, 1/15/21, $2,690,000 par
Kilroy Realty, 3.80%, 1/15/23, $3,000,000 par
Liberty Property, 3.38%, 6/15/23, $2,500,000 par
National Retail Properties, 3.80%, 10/15/22, $1,425,000 par
Post Apartment Homes, 3.38%, 12/1/22, $1,515,000 par
Washington REIT, 3.95%, 10/15/22, $1,100,000 par
Weingarten Realty Investors, 3.38%, 10/15/22, $3,450,000 par
Preferred Stocks
Alexandria Real Estate Equities, Series E, 143,250 shares
Boston Properties, Series B, 177,874 shares
CommonWealth REIT, Series E, 137,698 shares
Developers Diversified Realty, Series H, 6,305 shares
Digital Realty, Series E, 141,400 shares
Duke Realty, Series K, 35,000 shares
Duke Realty, Series L, 17,270 shares
Equity Residential Properties, Series K, 18,000 shares
Health Care REIT, Series J, 123,170 shares
Kimco Realty, Series J, 88,000 shares
National Retail Properties, Series D, 146,840 shares
PS Business Parks, Series S, 48,000 shares
PS Business Parks, Series T, 75,875 shares
Public Storage, Series Q, 17,675 shares
Public Storage, Series R, 36,500 shares
Realty Income, Series E, 91,670 shares
Regency Centers, Series F, 142,126 shares
Vornado Realty, Series G, 40,000 shares
Vornado Realty, Series I, 24,000 shares
Vornado Realty, Series K, 61,415 shares
| a | Securities pledged as collateral for outstanding reverse repurchase agreements. On February 28, 2014, securities valued at $15,481,748 were pledged as collateral for the following outstanding reverse repurchase agreements: |
| | | | | | | | | | | | | | | | | | | | | | |
| Amount | | | Acquisition
Date | | | Rate* | | | Due | | | Accrued
Interest | | | Name of Broker
and Description
of Collateral | |
| $ | 14,812,000 | | | | 2/6/14 | | | | 0.36 | % | | | 3/7/14 | | | $ | 3,407 | | | | (1 | ) |
| | | | | | | | | | | | | | | | | | | | | | |
| | * | Interest rate as of February 28, 2014. Rate is based on one-month LIBOR plus a spread and reset monthly. |
Name of broker and description of collateral:
Federal Home Loan Mortgage Corporation, 5.50%, 1/1/18, $286,395 par
Federal Home Loan Mortgage Corporation, 7.50%, 12/1/29, $81,547 par
Federal Home Loan Mortgage Corporation, 5.00%, 5/1/39, $532,980 par
Federal National Mortgage Association, 5.00%, 11/1/17, $77,836 par
Federal National Mortgage Association, 6.50%, 6/1/29, $212,078 par
Federal National Mortgage Association, 7.50%, 5/1/30, $23,156 par
Federal National Mortgage Association, 8.00%, 5/1/30, $13,291 par
Federal National Mortgage Association, 5.00%, 11/1/33, $749,388 par
Federal National Mortgage Association, 5.00%, 7/1/39, $803,109 par
Federal National Mortgage Association, 4.50%, 3/1/40, $1,033,376 par
Federal National Mortgage Association, 4.00%, 12/1/40, $1,170,060 par
Federal National Mortgage Association, 3.50%, 2/1/41, $1,769,084 par
Federal National Mortgage Association, 3.50%, 3/1/41, $2,420,023 par
Federal National Mortgage Association, 3.50%, 2/1/42, $1,886,188 par
Federal National Mortgage Association, 3.50%, 4/1/42, $1,841,861 par
Federal National Mortgage Association, 3.50%, 8/1/42, $2,024,361 par
| | | | | | |
| FIRST AMERICAN MORTGAGE FUNDS | | 2014 SEMIANNUAL REPORT | | | 23 | |
| | |
| Schedule of Investments | | February 28, 2014 (unaudited) |
American Select Portfolio (SLA)
| | The fund has entered into a lending commitment with Goldman Sachs. The monthly agreement permits the fund to enter into reverse repurchase agreements using U.S. Government Agency Mortgage-Backed Securities as collateral. |
| ¢ | Securities purchased within terms of a private placement memorandum, exempt from registration under Rule 144A of the Securities Act of 1933, as amended, which may be sold only to dealers in that program or other “qualified institutional buyers”. On February 28, 2014, the total fair value of these investments was $904,971 or 0.7% of total net assets. |
| W | Investment in affiliated security. This money market fund is advised by U.S. Bancorp Asset Management, Inc., which also serves as advisor for the fund. The rate shown is the annualized seven-day effective yield as of February 28, 2014. See note 2 in Notes to Financial Statements. |
| p | On February 28, 2014, the cost of investments for federal income tax purposes was approximately $180,678,298. The approximate aggregate gross unrealized appreciation and depreciation of investments, based on this cost, were as follows: |
| | | | |
Gross unrealized appreciation | | $ | 1,569,680 | |
Gross unrealized depreciation | | | (10,098,065 | ) |
| | | | |
Net unrealized depreciation | | $ | (8,528,385 | ) |
| | | | |
REIT–Real Estate Investment Trust
The accompanying notes are an integral part of the financial statements.
| | | | |
| 24 | | FIRST AMERICAN MORTGAGE FUNDS | | 2014 SEMIANNUAL REPORT |
| | |
| Statements of Assets and Liabilities | | February 28, 2014 (unaudited) |
| | | | | | | | | | | | | | | | |
| | | ASP | | | BSP | | | CSP | | | SLA | |
Assets: | | | | | | | | | | | | | | | | |
Unaffiliated investments, at fair value (Cost: $64,458,877,
$240,966,455, $259,307,713, $178,201,949) (note 2) | | $ | 62,759,854 | | | $ | 208,940,104 | | | $ | 227,860,141 | | | $ | 169,673,564 | |
Affiliated money market fund, at fair value (Cost: $1,474,112,
$2,044,325, $2,545,312, $2,476,349) (note 3) | | | 1,474,112 | | | | 2,044,325 | | | | 2,545,312 | | | | 2,476,349 | |
Real estate owned, at fair value (Cost: $3,189,940, $—, $—, $—) (note 2) | | | 1,700,000 | | | | — | | | | — | | | | — | |
Cash | | | — | | | | 2,558 | | | | — | | | | — | |
Receivable for investments sold in affiliates | | | — | | | | — | | | | 10,385 | | | | — | |
Receivable for accrued dividends and interest | | | 368,334 | | | | 1,029,418 | | | | 1,086,570 | | | | 820,088 | |
Receivable for accrued dividends in affiliated money market fund | | | 11 | | | | 16 | | | | 19 | | | | 19 | |
Prepaid expenses and other assets | | | 84,177 | | | | 35,532 | | | | 39,433 | | | | 37,714 | |
| | | | | | | | | | | | | | | | |
Total assets | | | 66,386,488 | | | | 212,051,953 | | | | 231,541,860 | | | | 173,007,734 | |
| | | | | | | | | | | | | | | | |
| | | | |
Liabilities: | | | | | | | | | | | | | | | | |
Payable for investments purchased | | | — | | | | 40,742 | | | | — | | | | — | |
Payable under loan agreement (note 2) | | | 13,800,000 | | | | 57,000,000 | | | | 55,500,000 | | | | 36,700,000 | |
Payable for reverse repurchase agreements (note 2) | | | 5,946,000 | | | | 7,321,000 | | | | 9,452,000 | | | | 14,812,000 | |
Bank overdraft | | | 25,944 | | | | — | | | | 45,553 | | | | 38,996 | |
Payable for investment advisory fees | | | 9,584 | | | | 45,557 | | | | 56,584 | | | | 45,013 | |
Payable for administrative fees | | | 8,954 | | | | 27,503 | | | | 31,137 | | | | 22,506 | |
Payable for audit fees | | | 33,259 | | | | 33,259 | | | | 33,259 | | | | 33,259 | |
Payable for legal fees | | | 19,094 | | | | 19,586 | | | | 17,534 | | | | 14,323 | |
Payable for transfer agent fees | | | 7,761 | | | | 2,985 | | | | 2,670 | | | | 1,996 | |
Payable for interest expense | | | 1,753 | | | | 3,275 | | | | 3,722 | | | | 4,431 | |
Payable for other expenses | | | 32,405 | | | | 50,825 | | | | 81,396 | | | | 63,536 | |
| | | | | | | | | | | | | | | | |
Total liabilities | | | 19,884,754 | | | | 64,544,732 | | | | 65,223,855 | | | | 51,736,060 | |
| | | | | | | | | | | | | | | | |
Net assets applicable to outstanding capital stock | | $ | 46,501,734 | | | $ | 147,507,221 | | | $ | 166,318,005 | | | $ | 121,271,674 | |
| | | | | | | | | | | | | | | | |
| | | | |
Composition of net assets: | | | | | | | | | | | | | | | | |
Capital stock and additional paid-in capital | | $ | 48,545,283 | | | $ | 187,280,145 | | | $ | 236,397,456 | | | $ | 129,111,072 | |
Undistributed (distributions in excess of) net investment income | | | 207,221 | | | | (57,515 | ) | | | (404,115 | ) | | | 671,797 | |
Accumulated net realized gain (loss) on investments | | | 938,193 | | | | (7,689,058 | ) | | | (38,227,764 | ) | | | 17,190 | |
Net unrealized depreciation of investments | | | (1,699,023 | ) | | | (32,026,351 | ) | | | (31,447,572 | ) | | | (8,528,385 | ) |
Net unrealized appreciation (depreciation) of real estate owned | | | (1,489,940 | ) | | | — | | | | — | | | | — | |
| | | | | | | | | | | | | | | | |
| | | | |
Total–representing net assets applicable to capital stock | | $ | 46,501,734 | | | $ | 147,507,221 | | | $ | 166,318,005 | | | $ | 121,271,674 | |
| | | | | | | | | | | | | | | | |
| | | | |
Net asset value and market price of capital stock: | | | | | | | | | | | | | | | | |
Net assets applicable to capital stock | | $ | 46,501,734 | | | $ | 147,507,221 | | | $ | 166,318,005 | | | $ | 121,271,674 | |
Shares outstanding (authorized 1 billion shares of each fund of $0.01 par value) | | | 4,231,331 | | | | 15,985,741 | | | | 21,356,023 | | | | 10,662,195 | |
Net asset value per share | | $ | 10.99 | | | $ | 9.23 | | | $ | 7.79 | | | $ | 11.37 | |
Market price per share | | $ | 10.13 | | | $ | 8.27 | | | $ | 7.15 | | | $ | 9.91 | |
The accompanying notes are an integral part of the financial statements.
| | | | | | |
| FIRST AMERICAN MORTGAGE FUNDS | | 2014 SEMIANNUAL REPORT | | | 25 | |
| | |
| Statements of Operations | | For the six-month period ended February 28, 2014 (unaudited) |
| | | | | | | | | | | | | | | | |
| | | ASP | | | BSP | | | CSP | | | SLA | |
Investment Income: | | | | | | | | | | | | | | | | |
Interest from unaffiliated investments | | $ | 1,160,146 | | | $ | 3,656,413 | | | $ | 4,157,329 | | | $ | 2,869,662 | |
Dividends from unaffiliated investments | | | 677,172 | | | | 2,045,266 | | | | 2,247,692 | | | | 1,704,479 | |
Participating income from investments no longer held (note 2) | | | — | | | | — | | | | 493,815 | | | | 233,317 | |
Dividends from affiliated money market fund | | | 45 | | | | 104 | | | | 108 | | | | 87 | |
Net operating income from real estate owned (note 2) | | | 28,389 | | | | — | | | | — | | | | — | |
| | | | | | | | | | | | | | | | |
Total investment income | | | 1,865,752 | | | | 5,701,783 | | | | 6,898,944 | | | | 4,807,545 | |
| | | | | | | | | | | | | | | | |
| | | | |
Expenses (note 3): | | | | | | | | | | | | | | | | |
Investment advisory fees | | | 125,432 | | | | 385,818 | | | | 454,936 | | | | 296,166 | |
Interest expense | | | 84,408 | | | | 305,226 | | | | 320,148 | | | | 221,740 | |
Administration fees | | | 58,647 | | | | 178,365 | | | | 199,127 | | | | 148,083 | |
Custodian fees | | | 4,692 | | | | 14,273 | | | | 15,933 | | | | 11,847 | |
Mortgage servicing fees | | | 9,209 | | | | 21,143 | | | | 57,965 | | | | 40,869 | |
Legal fees | | | 17,549 | | | | 17,549 | | | | 17,510 | | | | 17,510 | |
Audit fees | | | 28,935 | | | | 28,935 | | | | 28,935 | | | | 28,935 | |
Postage and printing fees | | | 4,750 | | | | 11,594 | | | | 13,097 | | | | 9,227 | |
Transfer agent fees | | | 8,429 | | | | 9,185 | | | | 9,182 | | | | 8,517 | |
Listing fees | | | 11,785 | | | | 12,484 | | | | 12,702 | | | | 11,785 | |
Directors’ fees | | | 34,548 | | | | 34,548 | | | | 34,548 | | | | 34,548 | |
Insurance fees | | | 17,228 | | | | 17,253 | | | | 17,257 | | | | 17,246 | |
Pricing fees | | | 10,829 | | | | 10,829 | | | | 10,829 | | | | 10,829 | |
Other expenses | | | 15,908 | | | | 13,612 | | | | 15,354 | | | | 13,489 | |
| | | | | | | | | | | | | | | | |
Total expenses | | | 432,349 | | | | 1,060,814 | | | | 1,207,523 | | | | 870,791 | |
| | | | | | | | | | | | | | | | |
Less: Fee reimbursements (note 3) | | | (672 | ) | | | (945 | ) | | | (980 | ) | | | (1,072 | ) |
Less: Indirect payments from custodian (note 3) | | | (3 | ) | | | (3 | ) | | | (8 | ) | | | (15 | ) |
| | | | | | | | | | | | | | | | |
Total net expenses | | | 431,674 | | | | 1,059,866 | | | | 1,206,535 | | | | 869,704 | |
| | | | | | | | | | | | | | | | |
| | | | |
Net investment income | | | 1,434,078 | | | | 4,641,917 | | | | 5,692,409 | | | | 3,937,841 | |
| | | | | | | | | | | | | | | | |
| | | | |
Net realized and unrealized gains (losses) on investments (notes 2 and 4): | | | | | | | | | | | | | | | | |
Net realized gain (loss) on investments | | | (242,043 | ) | | | (3,543,595 | ) | | | (160,821 | ) | | | 22,136 | |
Net change in unrealized appreciation or depreciation of investments | | | 1,523,828 | | | | 6,535,714 | | | | 4,476,449 | | | | 5,601,049 | |
| | | | | | | | | | | | | | | | |
| | | | |
Net gain on investments | | | 1,281,785 | | | | 2,992,119 | | | | 4,315,628 | | | | 5,623,185 | |
| | | | | | | | | | | | | | | | |
| | | | |
Net increase in net assets resulting from operations | | $ | 2,715,863 | | | $ | 7,634,036 | | | $ | 10,008,037 | | | $ | 9,561,026 | |
| | | | | | | | | | | | | | | | |
The accompanying notes are an integral part of the financial statements.
| | | | |
| 26 | | FIRST AMERICAN MORTGAGE FUNDS | | 2014 SEMIANNUAL REPORT |
(This page intentionally left blank.)
| | | | | | |
| FIRST AMERICAN MORTGAGE FUNDS | | 2014 SEMIANNUAL REPORT | | | 27 | |
Statements of Changes in Net Assets
| | | | | | | | | | | | | | | | |
| | | ASP | | | BSP | |
| | | Six-Month
Period Ended
2/28/14
(unaudited) | | | Year Ended
8/31/13 | | | Six-Month
Period Ended
2/28/14
(unaudited) | | | Year Ended
8/31/13 | |
Operations: | | | | | | | | | | | | | | | | |
Net investment income | | $ | 1,434,078 | | | $ | 3,105,870 | | | $ | 4,641,917 | | | $ | 9,754,680 | |
Net realized gain (loss) on investments | | | (242,043 | ) | | | 6,158,132 | | | | (3,543,595 | ) | | | 8,982,423 | |
Net realized loss on real estate owned | | | — | | | | — | | | | — | | | | — | |
Net change in unrealized appreciation or depreciation of investments | | | 1,523,828 | | | | (9,840,940 | ) | | | 6,535,714 | | | | (28,043,535 | ) |
Net change in unrealized appreciation or depreciation of real estate owned | | | — | | | | (1,489,940 | ) | | | — | | | | — | |
| | | | | | | | | | | | | | | | |
| | | | |
Net increase (decrease) in net assets resulting from operations | | | 2,715,863 | | | | (2,066,878 | ) | | | 7,634,036 | | | | (9,306,432 | ) |
| | | | | | | | | | | | | | | | |
| | | | |
Distributions to shareholders (note 2): | | | | | | | | | | | | | | | | |
From net investment income | | | (1,216,508 | ) | | | (3,215,812 | ) | | | (4,795,722 | ) | | | (9,351,660 | ) |
From net realized gain on investments | | | (3,404,529 | ) | | | (1,422,150 | ) | | | — | | | | — | |
| | | | | | | | | | | | | | | | |
Total distributions | | | (4,621,037 | ) | | | (4,637,962 | ) | | | (4,795,722 | ) | | | (9,351,660 | ) |
| | | | | | | | | | | | | | | | |
| | | | |
Total increase (decrease) in net assets | | | (1,905,174 | ) | | | (6,704,840 | ) | | | 2,838,314 | | | | (18,658,092 | ) |
| | | | |
Net assets at beginning of period | | | 48,406,908 | | | | 55,111,748 | | | | 144,668,907 | | | | 163,326,999 | |
| | | | | | | | | | | | | | | | |
| | | | |
Net assets at end of period | | $ | 46,501,734 | | | $ | 48,406,908 | | | $ | 147,507,221 | | | $ | 144,668,907 | |
| | | | | | | | | | | | | | | | |
| | | | |
Undistributed (distributions in excess of) net investment income | | $ | 207,221 | | | $ | (10,349 | ) | | $ | (57,515 | ) | | $ | 96,290 | |
| | | | | | | | | | | | | | | | |
The accompanying notes are an integral part of the financial statements.
| | | | |
| 28 | | FIRST AMERICAN MORTGAGE FUNDS | | 2014 SEMIANNUAL REPORT |
| | | | | | | | | | | | | | |
| CSP | | | SLA | |
Six-Month
Period Ended
2/28/14
(unaudited) | | | Year Ended
8/31/13 | | | Six-Month
Period Ended
2/28/14
(unaudited) | | | Year Ended
8/31/13 | |
| | | |
| $ | 5,692,409 | | | $ | 12,621,686 | | | $ | 3,937,841 | | | $ | 8,488,038 | |
| | (160,821 | ) | | | (2,212,161 | ) | | | 22,136 | | | | 6,468,764 | |
| | — | | | | (503,425 | ) | | | — | | | | — | |
| | 4,476,449 | | | | (13,471,780 | ) | | | 5,601,049 | | | | (15,465,772 | ) |
| | — | | | | 171,672 | | | | — | | | | — | |
| | | | | | | | | | | | | | |
| | | |
| | 10,008,037 | | | | (3,394,008 | ) | | | 9,561,026 | | | | (508,970 | ) |
| | | | | | | | | | | | | | |
| | | |
| | (5,552,567 | ) | | | (9,823,773 | ) | | | (3,065,381 | ) | | | (7,943,336 | ) |
| | — | | | | — | | | | (4,613,532 | ) | | | — | |
| | | | | | | | | | | | | | |
| | (5,552,567 | ) | | | (9,823,773 | ) | | | (7,678,913 | ) | | | (7,943,336 | ) |
| | | | | | | | | | | | | | |
| | | |
| | 4,455,470 | | | | (13,217,781 | ) | | | 1,882,113 | | | | (8,452,306 | ) |
| | | |
| | 161,862,535 | | | | 175,080,316 | | | | 119,389,561 | | | | 127,841,867 | |
| | | | | | | | | | | | | | |
| | | |
| $ | 166,318,005 | | | $ | 161,862,535 | | | $ | 121,271,674 | | | $ | 119,389,561 | |
| | | | | | | | | | | | | | |
| | | |
| $ | (404,115 | ) | | $ | (543,957 | ) | | $ | 671,797 | | | $ | (200,663 | ) |
| | | | | | | | | | | | | | |
| | | | | | |
| FIRST AMERICAN MORTGAGE FUNDS | | 2014 SEMIANNUAL REPORT | | | 29 | |
| | |
| Statements of Cash Flows | | For the six-month period ended February 28, 2014 (unaudited) |
| | | | | | | | | | | | | | | | |
| | | ASP | | | BSP | | | CSP | | | SLA | |
Cash flows from operating activities: | | | | | | | | | | | | | | | | |
Net increase in net assets resulting from operations | | $ | 2,715,863 | | | $ | 7,634,036 | | | $ | 10,008,037 | | | $ | 9,561,026 | |
Adjustments to reconcile net increase in net assets resulting from
operations to net cash provided by operating activities: | | | | | | | | | | | | | | | | |
Purchases of investments | | | (7,845,458 | ) | | | (7,076,790 | ) | | | (8,375,265 | ) | | | (18,082,397 | ) |
Proceeds from paydowns and sales of investments and real estate owned | | | 11,266,920 | | | | 7,497,754 | | | | 14,998,628 | | | | 23,704,608 | |
Net purchases/sales of short-term investments | | | 90,949 | | | | 512,324 | | | | (338,571 | ) | | | 102,130 | |
Net amortization/accretion of bond discount and premium | | | 38,571 | | | | 101,774 | | | | 108,602 | | | | 93,021 | |
Net change in unrealized appreciation or depreciation of investments | | | (1,523,828 | ) | | | (6,535,714 | ) | | | (4,476,449 | ) | | | (5,601,049 | ) |
Net realized gain (loss) on investments | | | 242,043 | | | | 3,543,595 | | | | 160,821 | | | | (22,136 | ) |
Decrease in receivable for accrued interest and dividends | | | 71,048 | | | | 75,620 | | | | 90,340 | | | | 63,477 | |
Increase (decrease) in prepaid expenses and other assets | | | (25,263 | ) | | | 3,909 | | | | 7,093 | | | | 4,611 | |
Increase (decrease) in accrued fees and expenses | | | 7,181 | | | | (14,180 | ) | | | (3,354 | ) | | | 9,936 | |
| | | | | | | | | | | | | | | | |
Net cash provided by operating activities | | | 5,038,026 | | | | 5,742,328 | | | | 12,179,882 | | | | 9,833,227 | |
| | | | | | | | | | | | | | | | |
| | | | |
Cash flows from financing activities: | | | | | | | | | | | | | | | | |
Net proceeds (payments) from borrowings under loan agreement | | | 100,000 | | | | — | | | | (5,300,000 | ) | | | (1,500,000 | ) |
Net payments for reverse repurchase agreements | | | (385,000 | ) | | | (853,000 | ) | | | (1,331,000 | ) | | | (924,000 | ) |
Distributions paid to shareholders | | | (4,621,037 | ) | | | (4,795,722 | ) | | | (5,552,567 | ) | | | (7,678,913 | ) |
| | | | | | | | | | | | | | | | |
Net cash used in financing activities | | | (4,906,037 | ) | | | (5,648,722 | ) | | | (12,183,567 | ) | | | (10,102,913 | ) |
| | | | | | | | | | | | | | | | |
| | | | |
Net increase (decrease) in cash | | | 131,989 | | | | 93,606 | | | | (3,685 | ) | | | (269,686 | ) |
Cash (bank overdraft) at beginning of period | | | (157,933 | ) | | | (91,048 | ) | | | (41,868 | ) | | | 230,690 | |
| | | | | | | | | | | | | | | | |
Cash (bank overdraft) at end of period | | $ | (25,944 | ) | | $ | 2,558 | | | $ | (45,553 | ) | | $ | (38,996 | ) |
| | | | | | | | | | | | | | | | |
| | | | |
Supplemental disclosure of cash flow information: | | | | | | | | | | | | | | | | |
Cash paid for interest | | $ | 84,898 | | | $ | 307,106 | | | $ | 322,399 | | | $ | 223,123 | |
| | | | | | | | | | | | | | | | |
The accompanying notes are an integral part of the financial statements.
| | | | |
| 30 | | FIRST AMERICAN MORTGAGE FUNDS | | 2014 SEMIANNUAL REPORT |
Financial Highlights
Per-share data for a share of capital stock outstanding throughout each period and selected information for each period are as follows:
ASP
| | | | | | | | | | | | | | | | | | | | | | | | |
| | | Six-Month
Period Ended
2/28/14
(unaudited) | | | Year Ended August 31, | |
| | | | 2013 | | | 2012 | | | 2011 | | | 2010 | | | 2009 | |
Per-Share Data | | | | | | | | | | | | | | | | | | | | | | | | |
Net asset value, beginning of period | | $ | 11.44 | | | $ | 13.02 | | | $ | 12.46 | | | $ | 13.30 | | | $ | 12.44 | | | $ | 11.72 | |
| | | | | | | | | | | | | | | | | | | | | | | | |
Operations: | | | | | | | | | | | | | | | | | | | | | | | | |
Net investment income | | | 0.34 | | | | 0.73 | | | | 0.84 | | | | 0.79 | | | | 0.85 | | | | 0.81 | |
Net realized and unrealized gain (losses) on investments | | | 0.30 | | | | (1.21 | ) | | | 0.62 | | | | (0.39 | ) | | | 1.20 | | | | 0.70 | |
| | | | | | | | | | | | | | | | | | | | | | | | |
Total from operations | | | 0.64 | | | | (0.48 | ) | | | 1.46 | | | | 0.40 | | | | 2.05 | | | | 1.51 | |
| | | | | | | | | | | | | | | | | | | | | | | | |
Distributions to shareholders: | | | | | | | | | | | | | | | | | | | | | | | | |
From net investment income | | | (0.29 | ) | | | (0.76 | ) | | | (0.90 | ) | | | (0.86 | ) | | | (0.84 | ) | | | (0.77 | ) |
From net realized gain on investments | | | (0.80 | ) | | | (0.34 | ) | | | — | | | | — | | | | — | | | | — | |
From return of capital | | | — | | | | — | | | | — | | | | (0.38 | ) | | | (0.35 | ) | | | (0.02 | ) |
| | | | | | | | | | | | | | | | | | | | | | | | |
Total distributions | | | (1.09 | ) | | | (1.10 | ) | | | (0.90 | ) | | | (1.24 | ) | | | (1.19 | ) | | | (0.79 | ) |
| | | | | | | | | | | | | | | | | | | | | | | | |
Net asset value, end of period | | $ | 10.99 | | | $ | 11.44 | | | $ | 13.02 | | | $ | 12.46 | | | $ | 13.30 | | | $ | 12.44 | |
| | | | | | | | | | | | | | | | | | | | | | | | |
Market value, end of period | | $ | 10.13 | | | $ | 9.56 | | | $ | 12.09 | | | $ | 11.01 | | | $ | 13.00 | | | $ | 10.75 | |
| | | | | | | | | | | | | | | | | | | | | | | | |
Selected Information | | | | | | | | | | | | | | | | | | | | | | | | |
Total return, net asset value 1 | | | 6.14 | % 4 | | | (4.19 | )% | | | 12.27 | % | | | 3.17 | % | | | 17.33 | % | | | 13.89 | % |
Total return, market value 2 | | | 18.75 | % 4 | | | (12.99 | )% | | | 19.02 | % | | | (5.90 | )% | | | 33.60 | % | | | 20.61 | % |
Net assets at end of period (in millions) | | $ | 47 | | | $ | 48 | | | $ | 55 | | | $ | 53 | | | $ | 56 | | | $ | 53 | |
Ratio of expenses to average weekly net assets before fee reimbursements | | | 1.84 | % 5 | | | 1.80 | % | | | 1.93 | % | | | 2.43 | % | | | 2.43 | % | | | 2.81 | % |
Ratio of expenses to average weekly net assets after fee reimbursements | | | 1.84 | % 5 | | | 1.80 | % | | | 1.93 | % | | | 2.43 | % | | | 2.43 | % | | | 2.81 | % |
Ratio of expenses to average weekly net assets excluding
interest expense and fee reimbursements | | | 1.48 | % 5 | | | 1.44 | % | | | 1.59 | % | | | 1.41 | % | | | 1.29 | % | | | 1.41 | % |
Ratio of net investment income to average weekly net assets
before fee reimbursements | | | 6.11 | % 5 | | | 5.85 | % | | | 6.69 | % | | | 6.18 | % | | | 6.65 | % | | | 7.19 | % |
Ratio of net investment income to average weekly net assets
after fee reimbursements | | | 6.11 | % 5 | | | 5.85 | % | | | 6.69 | % | | | 6.18 | % | | | 6.65 | % | | | 7.19 | % |
Portfolio turnover rate | | | 12 | % | | | 50 | % | | | 18 | % | | | 13 | % | | | 6 | % | | | 22 | % |
Amount of borrowings outstanding at end of period (in millions) | | $ | 20 | | | $ | 20 | | | $ | 22 | | | $ | 19 | | | $ | 16 | | | $ | 17 | |
Per-share amount of borrowings outstanding at end of period | | $ | 4.67 | | | $ | 4.73 | | | $ | 5.11 | | | $ | 4.41 | | | $ | 3.85 | | | $ | 4.13 | |
Per-share amount of net assets, excluding borrowings, at end of period | | $ | 15.66 | | | $ | 16.17 | | | $ | 18.13 | | | $ | 16.87 | | | $ | 17.15 | | | $ | 16.57 | |
Asset coverage ratio 3 | | | 335 | % | | | 342 | % | | | 355 | % | | | 383 | % | | | 445 | % | | | 401 | % |
| 1 | Assumes reinvestment of distributions at net asset value. |
| 2 | Assumes reinvestment of distributions at actual prices pursuant to the fund’s dividend reinvestment plan. |
| 3 | Represents net assets, excluding borrowings, at end of period divided by borrowings outstanding at end of period. |
| 4 | Total return has not been annualized. |
The accompanying notes are an integral part of the financial statements.
| | | | | | |
| FIRST AMERICAN MORTGAGE FUNDS | | 2014 SEMIANNUAL REPORT | | | 31 | |
Financial Highlights
Per-share data for a share of capital stock outstanding throughout each period and selected information for each period are as follows:
BSP
| | | | | | | | | | | | | | | | | | | | | | | | |
| | | Six-Month
Period Ended
2/28/14
(unaudited) | | | Year Ended August 31, | |
| | | | 2013 | | | 2012 | | | 2011 | | | 2010 | | | 2009 | |
Per-Share Data | | | | | | | | | | | | | | | | | | | | | | | | |
Net asset value, beginning of period | | $ | 9.05 | | | $ | 10.22 | | | $ | 9.98 | | | $ | 10.82 | | | $ | 11.36 | | | $ | 11.51 | |
| | | | | | | | | | | | | | | | | | | | | | | | |
Operations: | | | | | | | | | | | | | | | | | | | | | | | | |
Net investment income | | | 0.29 | | | | 0.61 | | | | 0.61 | | | | 0.59 | | | | 0.64 | | | | 0.78 | |
Net realized and unrealized gain (losses) on investments | | | 0.19 | | | | (1.19 | ) | | | 0.25 | | | | (0.30 | ) | | | (0.02 | ) | | | (0.20 | ) |
| | | | | | | | | | | | | | | | | | | | | | | | |
Total from operations | | | 0.48 | | | | (0.58 | ) | | | 0.86 | | | | 0.29 | | | | 0.62 | | | | 0.58 | |
| | | | | | | | | | | | | | | | | | | | | | | | |
Distributions to shareholders: | | | | | | | | | | | | | | | | | | | | | | | | |
From net investment income | | | (0.30 | ) | | | (0.59 | ) | | | (0.62 | ) | | | (0.58 | ) | | | (0.66 | ) | | | (0.73 | ) |
From return of capital | | | — | | | | — | | | | — | | | | (0.55 | ) | | | (0.50 | ) | | | — | |
| | | | | | | | | | | | | | | | | | | | | | | | |
Total distributions | | | (0.30 | ) | | | (0.59 | ) | | | (0.62 | ) | | | (1.13 | ) | | | (1.16 | ) | | | (0.73 | ) |
| | | | | | | | | | | | | | | | | | | | | | | | |
Net asset value, end of period | | $ | 9.23 | | | $ | 9.05 | | | $ | 10.22 | | | $ | 9.98 | | | $ | 10.82 | | | $ | 11.36 | |
| | | | | | | | | | | | | | | | | | | | | | | | |
Market value, end of period | | $ | 8.27 | | | $ | 8.17 | | | $ | 8.81 | | | $ | 8.75 | | | $ | 10.14 | | | $ | 9.71 | |
| | | | | | | | | | | | | | | | | | | | | | | | |
Selected Information | | | | | | | | | | | | | | | | | | | | | | | | |
Total return, net asset value 1 | | | 5.45 | % 4 | | | (6.15 | )% | | | 9.08 | % | | | 2.72 | % | | | 5.64 | % | | | 5.57 | % |
Total return, market value 2 | | | 5.07 | % 4 | | | (0.86 | )% | | | 8.50 | % | | | (2.42 | )% | | | 16.91 | % | | | 8.04 | % |
Net assets at end of period (in millions) | | $ | 148 | | | $ | 145 | | | $ | 163 | | | $ | 160 | | | $ | 173 | | | $ | 182 | |
Ratio of expenses to average weekly net assets before fee reimbursements | | | 1.49 | % 5 | | | 1.63 | % | | | 2.00 | % | | | 2.68 | % | | | 2.56 | % | | | 2.86 | % |
Ratio of expenses to average weekly net assets after fee reimbursements | | | 1.49 | % 5 | | | 1.63 | % | | | 2.00 | % | | | 2.68 | % | | | 2.56 | % | | | 2.86 | % |
Ratio of expenses to average weekly net assets excluding
interest expense and fee reimbursements | | | 1.06 | % 5 | | | 1.06 | % | | | 1.13 | % | | | 1.02 | % | | | 0.96 | % | | | 1.06 | % |
Ratio of net investment income to average weekly net assets
before fee reimbursements | | | 6.50 | % 5 | | | 6.08 | % | | | 6.18 | % | | | 5.60 | % | | | 5.74 | % | | | 7.23 | % |
Ratio of net investment income to average weekly net assets
after fee reimbursements | | | 6.50 | % 5 | | | 6.08 | % | | | 6.18 | % | | | 5.60 | % | | | 5.74 | % | | | 7.23 | % |
Portfolio turnover rate | | | 3 | % | | | 34 | % | | | 31 | % | | | 11 | % | | | 9 | % | | | 19 | % |
Amount of borrowings outstanding at end of period (in millions) | | $ | 64 | | | $ | 65 | | | $ | 67 | | | $ | 71 | | | $ | 77 | | | $ | 71 | |
Per-share amount of borrowings outstanding at end of period | | $ | 4.02 | | | $ | 4.08 | | | $ | 4.18 | | | $ | 4.44 | | | $ | 4.82 | | | $ | 4.44 | |
Per-share amount of net assets, excluding borrowings, at end of period | | $ | 13.25 | | | $ | 13.13 | | | $ | 14.40 | | | $ | 14.42 | | | $ | 15.64 | | | $ | 15.80 | |
Asset coverage ratio 3 | | | 329 | % | | | 322 | % | | | 344 | % | | | 325 | % | | | 324 | % | | | 356 | % |
| 1 | Assumes reinvestment of distributions at net asset value. |
| 2 | Assumes reinvestment of distributions at actual prices pursuant to the fund’s dividend reinvestment plan. |
| 3 | Represents net assets, excluding borrowings, at end of period divided by borrowings outstanding at end of period. |
| 4 | Total return has not been annualized. |
The accompanying notes are an integral part of the financial statements.
| | | | |
| 32 | | FIRST AMERICAN MORTGAGE FUNDS | | 2014 SEMIANNUAL REPORT |
Per-share data for a share of capital stock outstanding throughout each period and selected information for each period are as follows:
CSP
| | | | | | | | | | | | | | | | | | | | | | | | |
| | | Six-Month
Period Ended
2/28/14
(unaudited) | | | Year Ended August 31, | |
| | | | 2013 | | | 2012 | | | 2011 | | | 2010 | | | 2009 | |
Per-Share Data | | | | | | | | | | | | | | | | | | | | | | | | |
Net asset value, beginning of period | | $ | 7.58 | | | $ | 8.20 | | | $ | 8.43 | | | $ | 9.19 | | | $ | 10.67 | | | $ | 11.24 | |
| | | | | | | | | | | | | | | | | | | | | | | | |
Operations: | | | | | | | | | | | | | | | | | | | | | | | | |
Net investment income | | | 0.27 | | | | 0.59 | | | | 0.48 | | | | 0.46 | | | | 0.43 | | | | 0.73 | |
Net realized and unrealized gain (losses) on investments and real estate owned | | | 0.20 | | | | (0.75 | ) | | | (0.21 | ) | | | (0.15 | ) | | | (0.86 | ) | | | (0.53 | ) |
| | | | | | | | | | | | | | | | | | | | | | | | |
Total from operations | | | 0.47 | | | | (0.16 | ) | | | 0.27 | | | | 0.31 | | | | (0.43 | ) | | | 0.20 | |
| | | | | | | | | | | | | | | | | | | | | | | | |
Distributions to shareholders: | | | | | | | | | | | | | | | | | | | | | | | | |
From net investment income | | | (0.26 | ) | | | (0.46 | ) | | | (0.38 | ) | | | (0.45 | ) | | | (0.51 | ) | | | (0.70 | ) |
From return of capital | | | — | | | | — | | | | (0.12 | ) | | | (0.62 | ) | | | (0.54 | ) | | | (0.07 | ) |
| | | | | | | | | | | | | | | | | | | | | | | | |
Total distributions | | | (0.26 | ) | | | (0.46 | ) | | | (0.50 | ) | | | (1.07 | ) | | | (1.05 | ) | | | (0.77 | ) |
| | | | | | | | | | | | | | | | | | | | | | | | |
Net asset value, end of period | | $ | 7.79 | | | $ | 7.58 | | | $ | 8.20 | | | $ | 8.43 | | | $ | 9.19 | | | $ | 10.67 | |
| | | | | | | | | | | | | | | | | | | | | | | | |
Market value, end of period | | $ | 7.15 | | | $ | 6.84 | | | $ | 7.35 | | | $ | 7.57 | | | $ | 8.67 | | | $ | 8.83 | |
| | | | | | | | | | | | | | | | | | | | | | | | |
Selected Information | | | | | | | | | | | | | | | | | | | | | | | | |
Total return, net asset value 1 | | | 6.40 | % 4 | | | (2.17 | )% | | | 3.38 | % | | | 3.61 | % | | | (4.26 | )% | | | 1.98 | % |
Total return, market value 2 | | | 8.65 | % 4 | | | (0.87 | )% | | | 4.30 | % | | | 0.26 | % | | | 10.25 | % | | | (0.88 | )% |
Net assets at end of period (in millions) | | $ | 166 | | | $ | 162 | | | $ | 175 | | | $ | 180 | | | $ | 196 | | | $ | 228 | |
Ratio of expenses to average weekly net assets before fee reimbursements | | | 1.51 | % 5 | | | 1.73 | % | | | 2.11 | % | | | 2.72 | % | | | 2.52 | % | | | 2.75 | % |
Ratio of expenses to average weekly net assets after fee reimbursements | | | 1.51 | % 5 | | | 1.73 | % | | | 2.11 | % | | | 2.72 | % | | | 2.52 | % | | | 2.75 | % |
Ratio of expenses to average weekly net assets excluding
interest expense and fee reimbursements | | | 1.11 | % 5 | | | 1.11 | % | | | 1.11 | % | | | 0.97 | % | | | 0.90 | % | | | 1.03 | % |
Ratio of net investment income to average weekly net assets
before fee reimbursements | | | 7.14 | % 5 | | | 7.30 | % | | | 5.89 | % | | | 5.23 | % | | | 4.38 | % | | | 6.92 | % |
Ratio of net investment income to average weekly net assets
after fee reimbursements | | | 7.14 | % 5 | | | 7.30 | % | | | 5.89 | % | | | 5.23 | % | | | 4.38 | % | | | 6.92 | % |
Portfolio turnover rate | | | 4 | % | | | 44 | % | | | 52 | % | | | 13 | % | | | 10 | % | | | 16 | % |
Amount of borrowings outstanding at end of period (in millions) | | $ | 65 | | | $ | 72 | | | $ | 73 | | | $ | 79 | | | $ | 88 | | | $ | 81 | |
Per-share amount of borrowings outstanding at end of period | | $ | 3.04 | | | $ | 3.35 | | | $ | 3.42 | | | $ | 3.71 | | | $ | 4.12 | | | $ | 3.78 | |
Per-share amount of net assets, excluding borrowings, at end of period | | $ | 10.83 | | | $ | 10.93 | | | $ | 11.62 | | | $ | 12.14 | | | $ | 13.31 | | | $ | 14.45 | |
Asset coverage ratio 3 | | | 356 | % | | | 326 | % | | | 340 | % | | | 327 | % | | | 323 | % | | | 383 | % |
| 1 | Assumes reinvestment of distributions at net asset value. |
| 2 | Assumes reinvestment of distributions at actual prices pursuant to the fund’s dividend reinvestment plan. |
| 3 | Represents net assets, excluding borrowings, at end of period divided by borrowings outstanding at end of period. |
| 4 | Total return has not been annualized. |
| | | | | | |
| FIRST AMERICAN MORTGAGE FUNDS | | 2014 SEMIANNUAL REPORT | | | 33 | |
Financial Highlights
Per-share data for a share of capital stock outstanding throughout each period and selected information for each period are as follows:
SLA
| | | | | | | | | | | | | | | | | | | | | | | | |
| | | Six-Month
Period Ended
2/28/14
(unaudited) | | | Year Ended August 31, | |
| | | | 2013 | | | 2012 | | | 2011 | | | 2010 | | | 2009 | |
Per-Share Data | | | | | | | | | | | | | | | | | | | | | | | | |
Net asset value, beginning of period | | $ | 11.20 | | | $ | 11.99 | | | $ | 11.53 | | | $ | 12.09 | | | $ | 12.33 | | | $ | 12.42 | |
| | | | | | | | | | | | | | | | | | | | | | | | |
Operations: | | | | | | | | | | | | | | | | | | | | | | | | |
Net investment income | | | 0.37 | | | | 0.79 | | | | 0.80 | | | | 0.79 | | | | 0.78 | | | | 0.87 | |
Net realized and unrealized gain (losses) on investments | | | 0.52 | | | | (0.83 | ) | | | 0.50 | | | | (0.12 | ) | | | 0.25 | | | | (0.09 | ) |
| | | | | | | | | | | | | | | | | | | | | | | | |
Total from operations | | | 0.89 | | | | (0.04 | ) | | | 1.30 | | | | 0.67 | | | | 1.03 | | | | 0.78 | |
| | | | | | | | | | | | | | | | | | | | | | | | |
Distributions to shareholders: | | | | | | | | | | | | | | | | | | | | | | | | |
From net investment income | | | (0.29 | ) | | | (0.75 | ) | | | (0.84 | ) | | | (0.83 | ) | | | (0.83 | ) | | | (0.87 | ) |
From net realized gain on investment | | | (0.43 | ) | | | — | | | | — | | | | — | | | | — | | | | (0.00 | ) 4 |
From return of capital | | | — | | | | — | | | | — | | | | (0.40 | ) | | | (0.44 | ) | | | (0.00 | ) 4 |
| | | | | | | | | | | | | | | | | | | | | | | | |
Total distributions | | | (0.72 | ) | | | (0.75 | ) | | | (0.84 | ) | | | (1.23 | ) | | | (1.27 | ) | | | (0.87 | ) |
| | | | | | | | | | | | | | | | | | | | | | | | |
Net asset value, end of period | | $ | 11.37 | | | $ | 11.20 | | | $ | 11.99 | | | $ | 11.53 | | | $ | 12.09 | | | $ | 12.33 | |
| | | | | | | | | | | | | | | | | | | | | | | | |
Market value, end of period | | $ | 9.91 | | | $ | 9.48 | | | $ | 10.91 | | | $ | 10.34 | | | $ | 12.18 | | | $ | 10.64 | |
| | | | | | | | | | | | | | | | | | | | | | | | |
Selected Information | | | | | | | | | | | | | | | | | | | | | | | | |
Total return, net asset value 1 | | | 7.99 | % 5 | | | (0.61 | )% | | | 11.82 | % | | | 5.82 | % | | | 8.73 | % | | | 6.93 | % |
Total return, market value 2 | | | 12.52 | % 5 | | | (6.81 | )% | | | 14.58 | % | | | (4.78 | )% | | | 27.56 | % | | | 9.94 | % |
Net assets at end of period (in millions) | | $ | 121 | | | $ | 119 | | | $ | 128 | | | $ | 123 | | | $ | 129 | | | $ | 131 | |
Ratio of expenses to average weekly net assets before fee reimbursements | | | 1.47 | % 6 | | | 1.43 | % | | | 1.95 | % | | | 2.73 | % | | | 2.75 | % | | | 2.93 | % |
Ratio of expenses to average weekly net assets after fee reimbursements | | | 1.47 | % 6 | | | 1.43 | % | | | 1.95 | % | | | 2.73 | % | | | 2.75 | % | | | 2.93 | % |
Ratio of expenses to average weekly net assets excluding
interest expense and fee reimbursements | | | 1.10 | % 6 | | | 1.07 | % | | | 1.15 | % | | | 1.08 | % | | | 1.02 | % | | | 1.05 | % |
Ratio of net investment income to average weekly net assets
before fee reimbursements | | | 6.64 | % 6 | | | 6.63 | % | | | 6.86 | % | | | 6.68 | % | | | 6.33 | % | | | 7.43 | % |
Ratio of net investment income to average weekly net assets
after fee reimbursements | | | 6.64 | % 6 | | | 6.63 | % | | | 6.86 | % | | | 6.68 | % | | | 6.33 | % | | | 7.43 | % |
Portfolio turnover rate | | | 9 | % | | | 48 | % | | | 44 | % | | | 10 | % | | | 12 | % | | | 13 | % |
Amount of borrowings outstanding at end of period (in millions) | | $ | 52 | | | $ | 54 | | | $ | 52 | | | $ | 53 | | | $ | 53 | | | $ | 53 | |
Per-share amount of borrowings outstanding at end of period | | $ | 4.84 | | | $ | 5.06 | | | $ | 4.90 | | | $ | 5.02 | | | $ | 4.99 | | | $ | 5.01 | |
Per-share amount of net assets, excluding borrowings, at end of period | | $ | 16.21 | | | $ | 16.26 | | | $ | 16.89 | | | $ | 16.55 | | | $ | 17.08 | | | $ | 17.34 | |
Asset coverage ratio 3 | | | 335 | % | | | 321 | % | | | 345 | % | | | 330 | % | | | 342 | % | | | 346 | % |
| 1 | Assumes reinvestment of distributions at net asset value. |
| 2 | Assumes reinvestment of distributions at actual prices pursuant to the fund’s dividend reinvestment plan. |
| 3 | Represents net assets, excluding borrowings, at end of period divided by borrowings outstanding at end of period. |
| 4 | Amount rounds to less than $0.01 per share. |
| 5 | Total return has not been annualized. |
The accompanying notes are an integral part of the financial statements.
| | | | |
| 34 | | FIRST AMERICAN MORTGAGE FUNDS | | 2014 SEMIANNUAL REPORT |
| | |
| Notes to Financial Statements | | (unaudited as to February 28, 2014) |
American Strategic Income Portfolio Inc., American Strategic Income Portfolio Inc. II, American Strategic Income Portfolio Inc. III, and American Select Portfolio Inc. (the “funds”) are registered under the Investment Company Act of 1940, as amended (“Investment Company Act”), as diversified, closed-end management investment companies. The funds emphasize investments in mortgage-related assets that directly or indirectly represent a participation in or are secured by and payable from mortgage loans. They may also invest in U.S. Government securities, corporate debt securities, and preferred stock issued by real estate investment trusts. In addition, the funds may borrow using reverse repurchase agreements and credit facilities. Fund shares are listed on the New York Stock Exchange (“NYSE”) under the symbols ASP, BSP, CSP, and SLA, respectively.
| (2) | Summary of
Significant
Accounting
Policies |
Security Valuations
Security valuations for the funds’ investments (other than whole loans) are generally furnished by an independent
pricing service that has been approved by the funds’ board of directors. Investments in equity securities that are traded on a national securities exchange (or reported on the Nasdaq national market system) are stated at the last quoted sales price if readily available for such securities on each business day. For securities traded on the Nasdaq national market system, the funds utilize the Nasdaq Official Closing Price, which compares the last trade to the bid/ask price of a security. If the last trade falls within the bid/ask range, then that price will be the closing price. If the last trade is outside the bid/ask range, and falls above the ask, the ask price will be the closing price. If the last trade is below the bid, then the bid will be the closing price. Other equity securities traded in the over-the-counter market and listed equity securities for which no sale was reported on that date are stated at the last quoted bid price. Investments in open-end funds are valued at their net asset values on the valuation date.
Debt obligations exceeding 60 days to maturity are valued by an independent pricing service. Securities for which prices are not available from an independent pricing service, but where an active market exists, are valued using market quotations obtained from one or more dealers that make markets in the securities or from a widely-used quotation system. Debt obligations with 60 days or less remaining until maturity may be valued at their amortized cost which approximates market value.
The following investment vehicles, when held by a fund, are priced as follows: exchange listed futures and options on futures are priced at their last sale price on the exchange on which they are principally traded, as determined by the funds’ investment advisor, U.S. Bancorp Asset Management, Inc. (“USBAM”) on the day the valuation is made. If there were no sales on that day, futures and options on futures will be valued at the last reported bid price. Options on securities and indices traded on Nasdaq or listed on a stock exchange are valued at the last sale price on Nasdaq or on any exchange on the day the valuation is made. If there were no sales on that day, the options will be valued at the last sale price on the previous valuation date. Last sale prices are obtained from an independent pricing service. Swaps and over-the-counter options on securities and indices are valued at the quotations received from an independent pricing service, if available.
The funds’ investments in whole loans (single family, multifamily, and commercial) are generally not traded in any organized market therefore, market quotations are not readily available. These investments are valued at fair value according to procedures adopted by the funds’ board of directors.
When market quotations are not readily available, securities are internally valued at fair value as determined in good faith by procedures established and approved by the funds’ board of directors. Some of the factors that may be considered in determining fair value are fundamental analytical data relating to the investment; the nature and duration of any restrictions on disposition; trading in similar securities of the same issuer or comparable companies; information from broker-dealers; and an evaluation of the forces that influence the market in which the securities are purchased or sold. If events occur that materially affect the value of securities between the close of trading in those securities and the close of regular trading on the NYSE, the securities will be valued at fair value. The use of fair value pricing by a fund may cause the net asset value of its shares to differ significantly from the net asset value that would be calculated without fair value pricing.
| | | | | | |
| FIRST AMERICAN MORTGAGE FUNDS | | 2014 SEMIANNUAL REPORT | | | 35 | |
Notes to Financial Statements
In accordance with the valuation procedures adopted by the funds’ board of directors, real estate acquired through foreclosure, if any, is initially valued similar to defaulted multifamily and commercial whole loans. The value is subsequently revised to an estimated market value, as determined by independent third party appraisals, less estimated selling costs.
As of February 28, 2014, the funds held internally fair valued securities as follows:
| | | | | | | | |
Fund | | Fair Value | | | Percentage
of Total Net Assets | |
ASP | | $ | 24,030,143 | | | | 51.7 | % |
BSP | | | 99,732,203 | | | | 67.6 | |
CSP | | | 90,508,079 | | | | 54.4 | |
SLA | | | 65,020,234 | | | | 53.6 | |
The Financial Accounting Standards Board (“FASB”) Accounting Standards Codification (“ASC”) is the exclusive reference of authoritative U.S. generally accepted accounting principles (“GAAP”) recognized by the FASB to be applied by nongovernmental entities. The funds’ financial statements are prepared in accordance with GAAP, which may require the use of management estimates and assumptions. Actual results could differ from those estimates.
GAAP requires disclosures regarding the inputs and valuation techniques used to measure fair value and any changes in valuation inputs or techniques. The fair value of a financial instrument is the amount that would be received to sell an asset or paid to transfer a liability in an orderly transaction between market participants at the measurement date (i.e. the exit price). GAAP establishes a three-tier fair value hierarchy for observable and unobservable inputs used in measuring fair value. Observable inputs reflect the assumptions market participants would use in pricing an asset or liability and are based on market data obtained from sources independent of the reporting entity. Unobservable inputs reflect the reporting entity’s own assumptions about the assumptions market participants would use in pricing the asset or liability. Unobservable inputs are based on the best information available in the circumstances. Fair value inputs are summarized in the three broad levels listed below:
Level 1 - Quoted prices in active markets for identical securities.
Level 2 - Other significant observable inputs (including quoted prices for similar securities, with similar interest rates, prepayment speeds, credit risk, etc.).
Level 3 - Significant unobservable inputs (including a fund’s own assumptions in determining the fair value of investments). Generally, the types of securities included in Level 3 of a fund are securities that are not traded in any organized market, or for which there are significant unobservable fair value inputs available such as the funds’ investments in whole loans.
The fair value levels are not necessarily an indication of the risk associated with investing in these investments.
| | | | |
| 36 | | FIRST AMERICAN MORTGAGE FUNDS | | 2014 SEMIANNUAL REPORT |
As of February 28,2014, each fund’s investments were classified as follows:
| | | | | | | | | | | | | | | | |
Fund | | Level 1 | | | Level 2 | | | Level 3 | | | Total
Fair Value | |
ASP | | | | | | | | | | | | | | | | |
Whole Loans | | $ | — | | | $ | — | | | $ | 18,795,143 | | | $ | 18,795,143 | |
Corporate Note | | | — | | | | — | | | | 3,535,000 | | | | 3,535,000 | |
Corporate Bonds | | | 1,870,328 | | | | 13,947,688 | | | | — | | | | 15,818,016 | |
U.S. Government Agency Mortgage-Backed Securities | | | — | | | | 6,253,191 | | | | — | | | | 6,253,191 | |
Preferred Stocks | | | 18,358,504 | | | | — | | | | — | | | | 18,358,504 | |
Real Estate Owned | | | — | | | | — | | | | 1,700,000 | | | | 1,700,000 | |
Short-Term Investment | | | 1,474,112 | | | | — | | | | — | | | | 1,474,112 | |
| | | | | | | | | | | | | | | | |
Total Investments | | $ | 21,702,944 | | | $ | 20,200,879 | | | $ | 24,030,143 | | | $ | 65,933,966 | |
| | | | | | | | | | | | | | | | |
BSP | | | | | | | | | | | | | | | | |
Whole Loans | | $ | — | | | $ | — | | | $ | 88,542,203 | | | $ | 88,542,203 | |
Corporate Notes | | | — | | | | — | | | | 11,190,000 | | | | 11,190,000 | |
Corporate Bonds | | | 5,683,351 | | | | 39,294,729 | | | | — | | | | 44,978,080 | |
U.S. Government Agency Mortgage-Backed Securities | | | — | | | | 7,612,294 | | | | — | | | | 7,612,294 | |
Asset-Backed Security | | | — | | | | 904,970 | | | | — | | | | 904,970 | |
Preferred Stocks | | | 55,712,557 | | | | — | | | | — | | | | 55,712,557 | |
Short-Term Investment | | | 2,044,325 | | | | — | | | | — | | | | 2,044,325 | |
| | | | | | | | | | | | | | | | |
Total Investments | | $ | 63,440,233 | | | $ | 47,811,993 | | | $ | 99,732,203 | | | $ | 210,984,429 | |
| | | | | | | | | | | | | | | | |
CSP | | | | | | | | | | | | | | | | |
Whole Loans | | $ | — | | | $ | — | | | $ | 90,508,079 | | | $ | 90,508,079 | |
Private Mortgage-Backed Security† | | | — | | | | — | | | | — | | | | — | |
Corporate Bonds | | | 6,307,903 | | | | 60,170,062 | | | | — | | | | 66,477,965 | |
U.S. Government Agency Mortgage-Backed Securities | | | — | | | | 9,738,281 | | | | — | | | | 9,738,281 | |
Preferred Stocks | | | 61,135,816 | | | | — | | | | — | | | | 61,135,816 | |
Short-Term Investment | | | 2,545,312 | | | | — | | | | — | | | | 2,545,312 | |
| | | | | | | | | | | | | | | | |
Total Investments | | $ | 69,989,031 | | | $ | 69,908,343 | | | $ | 90,508,079 | | | $ | 230,405,453 | |
| | | | | | | | | | | | | | | | |
SLA | | | | | | | | | | | | | | | | |
Whole Loans | | $ | — | | | $ | — | | | $ | 56,435,234 | | | $ | 56,435,234 | |
Corporate Notes | | | — | | | | — | | | | 8,585,000 | | | | 8,585,000 | |
Corporate Bonds | | | 4,495,132 | | | | 37,732,231 | | | | — | | | | 42,227,363 | |
U.S. Government Agency Mortgage-Backed Securities | | | — | | | | 15,481,748 | | | | — | | | | 15,481,748 | |
Asset-Backed Security | | | — | | | | 904,971 | | | | — | | | | 904,971 | |
Preferred Stocks | | | 46,039,248 | | | | — | | | | — | | | | 46,039,248 | |
Short-Term Investment | | | 2,476,349 | | | | — | | | | — | | | | 2,476,349 | |
| | | | | | | | | | | | | | | | |
Total Investments | | $ | 53,010,729 | | | $ | 54,118,950 | | | $ | 65,020,234 | | | $ | 172,149,913 | |
| | | | | | | | | | | | | | | | |
† This category includes one security classified in Level 3 which is valued at zero.
| | | | | | |
| FIRST AMERICAN MORTGAGE FUNDS | | 2014 SEMIANNUAL REPORT | | | 37 | |
Notes to Financial Statements
The following is a reconciliation of Level 3 investments for which significant unobservable inputs were used to determine fair value:
| | | | | | | | | | | | | | | | | | | | |
Fund | | Whole Loans | | | Corporate
Notes | | | Private
Mortgage-
Backed
Security† | | | Real Estate
Owned | | | Total
Fair Value | |
ASP | | | | | | | | | | | | | | | | | | | | |
Balance as of August 31, 2013 | | $ | 13,719,843 | | | $ | 3,535,000 | | | $ | — | | | $ | 1,700,000 | | | $ | 18,954,843 | |
Accrued discounts/premiums | | | — | | | | — | | | | — | | | | — | | | | — | |
Realized gain (loss) | | | 379 | | | | — | | | | — | | | | — | | | | 379 | |
Net change in unrealized appreciation or depreciation | | | 227,665 | | | | — | | | | — | | | | — | | | | 227,665 | |
Purchases | | | 5,140,000 | | | | — | | | | — | | | | — | | | | 5,140,000 | |
Sales | | | (292,744 | ) | | | — | | | | — | | | | — | | | | (292,744 | ) |
| | | | | | | | | | | | | | | | | | | | |
Balance as of February 28, 2014 | | $ | 18,795,143 | | | $ | 3,535,000 | | | $ | — | | | $ | 1,700,000 | | | $ | 24,030,143 | |
| | | | | | | | | | | | | | | | | | | | |
Net change in unrealized appreciation or depreciation during the period of Level 3 investments held as of February 28, 2014 | | $ | 227,665 | | | $ | — | | | $ | — | | | $ | — | | | $ | 227,665 | |
| | | | | | | | | | | | | | | | | | | | |
BSP | | | | | | | | | | | | | | | | | | | | |
Balance as of August 31, 2013 | | $ | 92,806,490 | | | $ | 11,300,000 | | | $ | — | | | $ | — | | | $ | 104,106,490 | |
Accrued discounts/premiums | | | — | | | | — | | | | — | | | | — | | | | — | |
Realized gain (loss) | | | (3,606,595 | ) | | | — | | | | — | | | | — | | | | (3,606,595 | ) |
Net change in unrealized appreciation or depreciation | | | 3,987,862 | | | | (110,000 | ) | | | — | | | | — | | | | 3,877,862 | |
Purchases | | | — | | | | — | | | | — | | | | — | | | | — | |
Sales | | | (4,645,554 | ) | | | — | | | | — | | | | — | | | | (4,645,554 | ) |
| | | | | | | | | | | | | | | | | | | | |
Balance as of February 28, 2014 | | $ | 88,542,203 | | | $ | 11,190,000 | | | $ | — | | | $ | — | | | $ | 99,732,203 | |
| | | | | | | | | | | | | | | | | | | | |
Net change in unrealized appreciation or depreciation during the period of Level 3 investments held as of February 28, 2014 | | $ | 514,987 | | | $ | (110,000 | ) | | $ | — | | | $ | — | | | $ | 404,987 | |
| | | | | | | | | | | | | | | | | | | | |
CSP | | | | | | | | | | | | | | | | | | | | |
Balance as of August 31, 2013 | | $ | 94,435,747 | | | $ | — | | | $ | — | | | $ | — | | | $ | 94,435,747 | |
Accrued discounts/premiums | | | — | | | | — | | | | 383 | | | | — | | | | 383 | |
Realized gain (loss) | | | (45,035 | ) | | | — | | | | — | | | | — | | | | (45,035 | ) |
Net change in unrealized appreciation or depreciation | | | 701,226 | | | | — | | | | (383 | ) | | | — | | | | 700,843 | |
Purchases | | | 3,024,094 | | | | — | | | | — | | | | — | | | | 3,024,094 | |
Sales | | | (7,607,953 | ) | | | — | | | | — | | | | — | | | | (7,607,953 | ) |
| | | | | | | | | | | | | | | | | | | | |
Balance as of February 28, 2014 | | $ | 90,508,079 | | | $ | — | | | $ | — | | | $ | — | | | $ | 90,508,079 | |
| | | | | | | | | | | | | | | | | | | | |
Net change in unrealized appreciation or depreciation during the period of Level 3 investments held as of February 28, 2014 | | $ | (63,325 | ) | | $ | — | | | $ | (383 | ) | | $ | — | | | $ | (63,708 | ) |
| | | | | | | | | | | | | | | | | | | | |
SLA | | | | | | | | | | | | | | | | | | | | |
Balance as of August 31, 2013 | | $ | 49,236,724 | | | $ | 8,620,000 | | | $ | — | | | $ | — | | | $ | 57,856,724 | |
Accrued discounts/premiums | | | — | | | | — | | | | — | | | | — | | | | — | |
Realized gain (loss) | | | — | | | | — | | | | — | | | | — | | | | — | |
Net change in unrealized appreciation or depreciation | | | 2,689,488 | | | | (35,000 | ) | | | — | | | | — | | | | 2,654,488 | |
Purchases | | | 7,625,205 | | | | — | | | | — | | | | — | | | | 7,625,205 | |
Sales | | | (3,116,183 | ) | | | — | | | | — | | | | — | | | | (3,116,183 | ) |
| | | | | | | | | | | | | | | | | | | | |
Balance as of February 28, 2014 | | $ | 56,435,234 | | | $ | 8,585,000 | | | $ | — | | | $ | — | | | $ | 65,020,234 | |
| | | | | | | | | | | | | | | | | | | | |
Net change in unrealized appreciation or depreciation during the period of Level 3 investments held as of February 28, 2014 | | $ | 2,689,488 | | | $ | (35,000 | ) | | $ | — | | | $ | — | | | $ | 2,654,488 | |
| | | | | | | | | | | | | | | | | | | | |
† This category includes one security classified in Level 3 which is valued at zero for CSP.
| | | | |
| 38 | | FIRST AMERICAN MORTGAGE FUNDS | | 2014 SEMIANNUAL REPORT |
During the six-month period ended February 28, 2014, the funds recognized no transfers between valuation levels 1 and 2.
Valuation Methodologies for Fair Value Measurements Categorized within Levels 2 and 3
U.S. Government Agency Mortgage-Backed Securities, Asset-Backed Securities, and Corporate Bonds
U.S. government agency mortgage-backed securities, asset-backed securities, and corporate bonds are valued by an independent pricing service. The pricing service may employ methodologies that utilize actual market transactions, broker-dealer supplied valuations, or other formula-driven valuation techniques. These techniques generally consider such factors as yields or prices of bonds of comparable quality, type of issue, coupon, maturity, ratings, and general market conditions.
Commercial and Multifamily Whole Loans
Commercial and multifamily whole loans are analyzed using a pricing methodology designed to incorporate, among other things, the present value of the projected stream of cash flows on such investments (the “discounted cash flow” methodology). For commercial and multifamily whole loans, this pricing methodology takes into account a number of relevant factors, including changes in prevailing interest rates, yield spreads, the borrower’s creditworthiness (i.e. the debt service coverage ratio), lien position, delinquency status, and the projected rate of prepayments. For first lien loans, if the resulting price from the discounted cash flow methodology is lower than the current average loss recovery on commercial mortgage-backed securities (the “price floor”), the loan will be fair valued at the price floor (the “price floor” methodology). In addition, for all loans, if the resulting price from the discounted cash flow methodology is above the loan’s par value plus any prepayment penalty (the “price ceiling”), the loan will be fair valued at the price ceiling (the “anticipated recovery rate” methodology). Newly purchased loans are fair valued at cost and subsequently analyzed using the discounted cash flow methodology. Loans with a pending short payoff will be fair valued at the anticipated recovery rate. If the USBAM valuation committee concludes that the fundamentals of a loan or its underlying collateral do not support the use of the discounted cash flow, price ceiling or price floor methodologies, a fair value determination may be made that incorporates other relevant factors (e.g., appraisal of loan collateral). Valuations of commercial and multifamily whole loans are determined no less frequently than weekly. Although USBAM believes the pricing methodologies to be reasonable and appropriate, the actual values that may be realized upon the sale of whole loans can only be determined in negotiations between the funds’ and third parties.
The significant unobservable inputs used in the determination of fair value using the discounted cash flow methodology for commercial and multifamily whole loans include yield spreads and debt service coverage ratios. Significant increases (decreases) in yield spreads would result in lower (higher) fair values. A significant decrease (increase) in the debt service coverage ratio of a loan’s borrower could result in lower (higher) fair values.
Single Family Whole Loans
Single family whole loans are analyzed using the discounted cash flow methodology. For single family whole loans, the pricing methodology takes into account a number of relevant factors, including changes in prevailing interest rates, yield spreads, delinquency status, loan to value, lien position, and prepayment speeds. If the resulting price from the discounted cash flow methodology is above 103% of the loan’s par value (the “price ceiling”), the loan will be fair valued at the price ceiling (the “price ceiling” methodology). Valuations of single family whole loans are determined no less frequently than weekly. Although USBAM believes the pricing methodologies to be reasonable and appropriate, the actual values that may be realized upon the sale of whole loans can only be determined in negotiations between the fund and third parties.
The significant unobservable input used in the determination of fair value using the discounted cash flow methodology for single family whole loans is the yield spread. Significant increases (decreases) in yield spreads would result in lower (higher) fair values.
| | | | | | |
| FIRST AMERICAN MORTGAGE FUNDS | | 2014 SEMIANNUAL REPORT | | | 39 | |
Notes to Financial Statements
Corporate Notes
Corporate notes are analyzed using the discounted cash flow methodology. For corporate notes, the pricing methodology takes into account changes in prevailing interest rates and yield spreads. If the resulting price from the discounted cash flow methodology is above the note’s par value plus any prepayment penalty (the “price ceiling”), the note will be fair valued at the price ceiling (the “price ceiling” methodology). Currently all corporate notes are fair valued at the price ceiling. Valuations of corporate notes are determined no less frequently than weekly. Although USBAM believes the pricing methodologies to be reasonable and appropriate, the actual values that may be realized upon the sale of corporate notes can only be determined in negotiations between the fund and third parties.
The significant unobservable input used in the determination of fair value using the discounted cash flow methodology for corporate notes is the yield spread. Significant increases (decreases) in yield spreads would result in lower (higher) fair values.
Real Estate Owned
Real Estate Owned properties are valued, whenever possible, using an appraisal or broker’s opinion of value. If an appraisal or broker’s opinion is not available, a property is valued at the current average loss recovery on commercial mortgage-backed securities (the “average recovery rate” methodology).
| | | | |
| 40 | | FIRST AMERICAN MORTGAGE FUNDS | | 2014 SEMIANNUAL REPORT |
For commercial, multifamily and single family whole loans and corporate notes, if USBAM’s valuation committee concludes that the fundamentals of a loan or its underlying collateral do not support the use of the discounted cash flow, price ceiling or price floor methodologies, a fair value determination may be made as described below:
Quantitative Information about Level 3 Fair Value Measurements
| | | | | | | | | | |
Fund | | Fair Value as of
February 28, 2014 | | | Valuation Technique(s) | | Unobservable Input | | Range (Weighted
Average) |
ASP | | | | | | | | | | |
Commercial Whole Loans | | $ | 3,635,366 | | | Discounted Cash Flow | | Yield Spread | | 2.16% – 2.20% (2.19%) |
| | | | | | | | Debt Service Coverage Ratio | | 0.69 – 1.61 (1.37) |
Commercial Whole Loans and Corporate Notes | | | 17,569,125 | | | Price Ceiling | | N/A | | N/A |
Commercial Whole Loans | | | 1,033,556 | | | Price Floor | | Loss Severity | | 44.4% |
Single Family Whole Loans | | | 48,492 | | | Discounted Cash Flow | | Yield Spread | | 1.32% – 3.00% (2.67%) |
Single Family Whole Loans | | | 43,604 | | | Price Ceiling | | N/A | | N/A |
Real Estate Owned | | | 1,700,000 | | | Appraisal | | N/A | | N/A |
| | | | |
BSP | | | | | | | | | | |
Commercial & Multifamily Whole Loans | | $ | 33,775,251 | | | Discounted Cash Flow | | Yield Spread Debt Service Coverage Ratio | | 2.12% – 2.20% (2.16%)
0.64 – 1.16 (0.95) |
Commercial Whole Loans and Corporate Notes | | | 47,157,256 | | | Price Ceiling | | N/A | | N/A |
Multifamily Whole Loans | | | 4,892,800 | | | Price Floor | | Loss Severity | | 44.4% |
Single Family Whole Loans | | | 127,124 | | | Price Ceiling | | N/A | | N/A |
Multifamily Whole Loans | | | 13,779,772 | | | Appraisal | | N/A | | N/A |
| | | | |
CSP* | | | | | | | | | | |
Commercial & Multifamily Whole Loans | | $ | 22,107,294 | | | Discounted Cash Flow | | Yield Spread Debt Service Coverage Ratio | | 2.12% – 2.20% (2.14%)
0.00 – 1.87 (1.29) |
Commercial & Multifamily Whole Loans | | | 47,046,924 | | | Price Ceiling | | N/A | | N/A |
Commercial & Multifamily Whole Loans | | | 10,946,511 | | | Price Floor | | Loss Severity | | 44.4% |
Commercial & Multifamily Whole Loans | | | 10,407,350 | | | Appraisal | | N/A | | N/A |
| | | | |
SLA | | | | | | | | | | |
Commercial & Multifamily Whole Loans | | $ | 25,609,147 | | | Discounted Cash Flow | | Yield Spread Debt Service Coverage Ratio | | 2.12% – 2.30% (2.21%)
1.00 – 2.44 (1.40) |
Commercial & Multifamily Whole Loans, Corporate Notes | | | 30,787,691 | | | Price Ceiling | | N/A | | N/A |
Commercial & Multifamily Whole Loans | | | 3,873,396 | | | Price Floor | | Loss Severity | | 44.4% |
Multifamily Whole Loans | | | 4,750,000 | | | Appraisal | | N/A | | N/A |
* The fund’s investments classified as Level 3 include a private mortgage-backed security that is fair valued at zero.
Valuation Process for Fair Value Measurements Categorized within Level 3
The funds’ board of directors (the “board”) has adopted policies and procedures for the valuation of the funds’ investments (the “valuation procedures”). The valuation procedures establish a valuation committee consisting of representatives from USBAM’s investment management, legal, treasury and compliance departments (the “valuation committee”). The board has authorized the valuation committee to make fair value determinations in accordance with the valuation procedures. The audit committee of the board meets on a regular basis to, among other things, review fair value determinations made by the valuation committee, monitor the appropriateness of any previously determined fair value methodology, and approve in advance any proposed changes to such methodology, and presents such changes for ratification by the board.
| | | | | | |
| FIRST AMERICAN MORTGAGE FUNDS | | 2014 SEMIANNUAL REPORT | | | 41 | |
Notes to Financial Statements
Security Transactions and Investment Income
For financial statement purposes, the funds record security transactions on the trade date of the security purchase or sale. Dividend income is recorded on the ex-dividend date. Interest income, including accretion of bond discounts and amortization of bond premiums, is recorded on an accrual basis. Security gains and losses are determined on the basis of identified cost, which is the same basis used for federal income tax purposes. The resulting gain/loss is calculated as the difference between the sales price and the underlying cost of the security on the transaction date.
Distributions to Shareholders
Distributions from net investment income are declared and paid on a monthly basis. Any net realized gains on sales of securities for the funds are distributed to shareholders at least annually. These distributions are recorded as of the close of business on the ex-dividend date.
The funds will provide a notice, as required by Section 19(a) of the Investment Company Act, for any distribution that does not consist solely of net investment income. Any such notice will provide information regarding the estimated amounts of the distribution derived from net investment income, net realized capital gains, and return of capital. Such notices will be for informational purposes only and the amounts indicated in such notices likely will differ from the ultimate federal income tax characterization of distributions reported to shareholders on Form 1099-DIV after year end.
Distributions are payable in cash or, pursuant to the funds’ dividend reinvestment plans, reinvested in additional shares of the funds’ capital stock. Under each fund’s plan, fund shares will be purchased in the open market unless the market price plus commissions exceeds the net asset value by 5% or more. If, at the close of business on the dividend payment date, the shares purchased in the open market are insufficient to satisfy the dividend reinvestment requirement, the funds will issue new shares at a discount of up to 5% from the current market price.
The funds receive substantial distributions from holdings in real estate investment trusts (“REITs”). Distributions from REITs may be characterized as ordinary income, net capital gain, or a return of capital to the REIT shareholder. The proper characterization of REIT distributions is generally not known until after the end of each calendar year. As such, the funds must use estimates in reporting the character of its income and distributions for financial statement purposes. The actual character of distributions to a fund’s shareholders will be reflected on the Form 1099 received by shareholders after the end of the calendar year. Due to the nature of REIT investments, a portion of the distributions received by a fund shareholder may represent a return of capital.
Federal Taxes
Each fund is treated as a separate taxable entity. Each fund intends to continue to qualify as a regulated investment company as provided in Subchapter M of the Internal Revenue Code, as amended, and to distribute all taxable income, if any, to its shareholders. Accordingly, no provision for federal income taxes is required. Each fund also intends to distribute its taxable net investment income and realized gains, if any, to avoid the payment of any federal excise taxes. As of February 28, 2014, the funds did not have any tax positions that did not meet the “more-likely-than-not” threshold of being sustained by the applicable taxing authority. Generally, tax authorities can examine all the tax returns filed for the last three years.
Net investment income and net realized gains and losses may differ for financial statement and tax purposes because of temporary or permanent book/tax differences. These differences are primarily due to deferred wash sale losses, paydown gains and losses, tax mark-to-market adjustments under Section 311(e) of the Taxpayer Relief Act of 1997, tax deductions for real estate owned, and investments in REITs. To the extent these differences are permanent, reclassifications are made to the appropriate capital accounts in the fiscal period that the differences arise.
The character of distributions made during the fiscal period from net investment income or net realized gains may differ from its ultimate characterization for federal income tax purposes. In addition, due to the timing of dividend
| | | | |
| 42 | | FIRST AMERICAN MORTGAGE FUNDS | | 2014 SEMIANNUAL REPORT |
distributions, the fiscal period in which amounts are distributed may differ from the fiscal period that the income or realized gains or losses were recorded by the funds.
The character of distributions paid during the six-month period ended February 28, 2014, (estimated) and the fiscal year ended August 31, 2013, were as follows:
| | | | | | | | | | | | | | | | |
| | | ASP | | | BSP | |
| | | 02/28/14 | | | 8/31/13 | | | 02/28/14 | | | 8/31/13 | |
Distributions paid from: | | | | | | | | | | | | | | | | |
Ordinary income | | $ | 1,216,508 | | | $ | 3,215,812 | | | $ | 4,795,722 | | | $ | 9,351,660 | |
Long-term capital gains | | | 3,404,529 | | | | 1,422,150 | | | | — | | | | — | |
| | | | | | | | | | | | | | | | |
Total | | $ | 4,621,037 | | | $ | 4,637,962 | | | $ | 4,795,722 | | | $ | 9,351,660 | |
| | | | | | | | | | | | | | | | |
| | |
| | | CSP | | | SLA | |
| | | 02/28/14 | | | 8/31/13 | | | 02/28/14 | | | 8/31/13 | |
Distributions paid from: | | | | | | | | | | | | | | | | |
Ordinary income | | $ | 5,552,567 | | | $ | 9,823,773 | | | $ | 3,065,381 | | | $ | 7,943,336 | |
Long-term capital gains | | | — | | | | — | | | | 4,613,532 | | | | — | |
| | | | | | | | | | | | | | | | |
Total | | $ | 5,552,567 | | | $ | 9,823,773 | | | $ | 7,678,913 | | | $ | 7,943,336 | |
| | | | | | | | | | | | | | | | |
As of August 31, 2013, the components of accumulated earnings (deficits) on a tax basis were as follows:
| | | | | | | | | | | | | | | | |
| | | ASP | | | BSP | | | CSP | | | SLA | |
Undistributed ordinary income | | $ | 26,332 | | | $ | 222,994 | | | $ | 1,202,801 | | | $ | 364,651 | |
Undistributed long-term capital gains | | | 3,378,267 | | | | — | | | | — | | | | 4,613,334 | |
Accumulated capital and post-October losses | | | — | | | | (4,092,712 | ) | | | (38,059,098 | ) | | | — | |
Unrealized appreciation (depreciation) | | | (4,719,376 | ) | | | (38,636,437 | ) | | | (35,949,989 | ) | | | (14,140,420 | ) |
Other accumulated gain (loss) | | | 1,176,402 | | | | (105,083 | ) | | | (1,728,635 | ) | | | (559,076 | ) |
| | | | | | | | | | | | | | | | |
Accumulated earnings (deficits) | | $ | (138,375 | ) | | $ | (42,611,238 | ) | | $ | (74,534,921 | ) | | $ | (9,721,511 | ) |
| | | | | | | | | | | | | | | | |
The difference between book and tax basis unrealized appreciation (depreciation) at August 31, 2013, is attributable to adjustments for REITs, tax deferral of losses on wash sales, and a one-time tax election whereby the funds marked appreciated securities to market creating capital gains that were used to reduce capital loss carryovers and increase tax cost basis.
Under the Regulated Investment Company Modernization Act of 2010, the funds are permitted to carry forward capital losses incurred in taxable years beginning after December 22, 2010 for an unlimited period. Any losses incurred during those taxable years will be required to be utilized prior to the losses incurred in pre-enactment taxable years. Additionally, post-enactment capital losses that are carried forward will retain their character as either short-term or long-term capital losses rather than being considered all short-term as under previous law.
For federal income tax purposes, the following funds had capital loss carryovers as of August 31, 2013, the funds’ most recently completed fiscal year-end, which, if not offset by subsequent capital gains, will expire on the funds’ fiscal year-ends as follows:
| | | | | | | | | | | | | | | | | | | | | | | | | | | | |
| | | Expiration | |
Fund | | 2015 | | | 2016 | | | 2017 | | | 2018 | | | 2019 | | | Indefinite | | | Total | |
ASP | | $ | — | | | $ | — | | | $ | — | | | $ | — | | | $ | — | | | $ | — | | | $ | — | |
BSP | | | — | | | | — | | | | 1,884,191 | | | | 2,208,521 | | | | — | | | | — | | | | 4,092,712 | |
CSP | | | 551,492 | | | | 381,985 | | | | 5,238,593 | | | | 2,790,093 | | | | 8,176,579 | | | | 16,279,297 | | | | 33,418,039 | |
SLA | | | — | | | | — | | | | — | | | | — | | | | — | | | | — | | | | — | |
During the fiscal year, BSP and SLA utilized capital loss carryovers in the amounts of $4,301,698 and $1,578,427, respectively.
| | | | | | |
| FIRST AMERICAN MORTGAGE FUNDS | | 2014 SEMIANNUAL REPORT | | | 43 | |
Notes to Financial Statements
The funds incurred a loss for tax purposes for the period from November 1, 2012 to August 31, 2013. As permitted by tax regulations, the funds intend to elect to defer and treat the losses as arising in the fiscal year ending August 31, 2014. The deferred losses were as follow:
| | | | |
Fund | | Amount | |
ASP | | $ | — | |
BSP | | | — | |
CSP | | | 4,641,059 | |
SLA | | | — | |
Whole Loans
Whole loans may bear a greater risk of loss arising from a default on the part of the borrower of the underlying loans than do traditional mortgage-backed securities. This is because whole loans, unlike most mortgage-backed securities, generally are not backed by any government guarantee or private credit enhancement. Such risk may be greater during a period of declining or stagnant real estate values. The funds may invest in single family, multifamily, and commercial loans. Each fund currently limits its investment in commercial loans to 50% of its total assets. A participating loan is a whole loan which contains provisions for the lender to participate in the income stream provided by the property, including net cash flow and capital proceeds. CSP and SLA received income during the period from participating loans on which the mortgage obligation had previously been fully repaid. An outstanding participating loan agreement may provide excess cash flows and certain appreciation rights after the mortgage obligation has been fully paid and before the sale of the property to a third party.
At February 28, 2014, no single family or commercial loans in ASP were 120 or more days delinquent.
At February 28, 2014, BSP had two multifamily loans representing 3.37% of total net assets and 19.87% of total multifamily loans outstanding that were 120 or more days delinquent as to the timely monthly payment of principal and interest. At February 28, 2014, no single family or commercial loans were 120 or more days delinquent.
At February 28, 2014, CSP had four multifamily loans representing 3.88% of total net assets and 27.07% of total multifamily loans outstanding and five commercial loans representing 9.43% of total net assets and 23.66% of total commercial loans outstanding that were 120 or more days delinquent as to the timely monthly payment of principal and interest.
At February 28, 2014, SLA had one multifamily loan representing 3.92% of total net assets and 35.90% of total multifamily loans outstanding that were 120 or more days delinquent as to the timely monthly payment of principal and interest. At February 28, 2014, no commercial loans were 120 or more days delinquent.
The funds may incur certain costs and delays in the event of a foreclosure. Also, there is no assurance that the subsequent sale of the property will produce an amount equal to the sum of the unpaid principal balance of the loan as of the date the borrower went into default, the accrued unpaid interest, and all of the foreclosure expenses. In this case, the funds may suffer a loss.
Real estate may be acquired through foreclosure or deed in lieu of foreclosure on whole loans or similar obligations. The funds may receive rental or other income as a result of holding real estate. This income would generally fail to meet the test for “qualifying income” set forth in Section 851 of the Internal Revenue Code and could result in adverse tax consequences to the funds. In addition, the funds may incur expenses associated with maintaining or improving any real estate owned. Real estate income is recorded on a net basis in the income section of the funds’ Statement of Operations. Capital improvements are recorded as an addition to the cost basis of the property, which will increase any loss at sale. As of February 28, 2014, ASP held real estate owned through foreclosure as follows:
| | | | | | | | | | | | |
Fund | | 2/28/14
Cost | | | 2/28/14
Value | | | Unrealized
Depreciation | |
ASP | | | | | | | | | | | | |
The Storage Place | | $ | 3,189,940 | | | $ | 1,700,000 | | | $ | (1,489,940 | ) |
| | | | |
| 44 | | FIRST AMERICAN MORTGAGE FUNDS | | 2014 SEMIANNUAL REPORT |
The net operating income and capital improvements for the six-month period ended February 28, 2014 were:
| | | | | | | | | | | | | | | | |
Fund | | Gross Rental
Income | | | Operating
Expenses | | | Net Operating
Income (Loss) | | | Improvements | |
ASP | | | | | | | | | | | | | | | | |
The Storage Place | | $ | 129,261 | | | $ | 100,872 | | | $ | 28,389 | | | $ | — | |
As of and for the six-month period ended February 28, 2014, BSP, CSP, and SLA owned no real estate.
Mortgage Servicing Rights
The funds may acquire interests in the cash flow from servicing fees through contractual arrangements with mortgage servicers. Mortgage servicing rights, similar to interest-only securities, generate no further cash flow when a mortgage is prepaid or goes into default. Mortgage servicing rights are accounted for on a level-yield basis with recognized income based on the estimated amounts and timing of cash flows. Such estimates are adjusted periodically as the underlying market conditions change. As of and for the six-month period ending February 28, 2014, the funds held no mortgage servicing rights.
Securities Purchased on a When-Issued Basis
Delivery and payment for securities that have been purchased by the funds on a when-issued or forward-commitment basis can take place a month or more after the transaction date. Such securities do not earn interest, are subject to market fluctuation, and may increase or decrease in value prior to their delivery. Each fund segregates, with its custodian, assets with a market value equal to or greater than the amount of its purchase commitments. The purchase of securities on a when-issued or forward-commitment basis may increase the volatility of a fund’s net asset value if the fund makes such purchases while remaining substantially fully invested. As of February 28, 2014, the funds had no outstanding when-issued or forward-commitment securities.
Borrowings & Reverse Repurchase Agreements
Effective July 18, 2011, the funds entered into loan agreements with Bank of America, N.A. (“BofA”). Under the loan agreements, as amended, BofA has agreed to make credit facilities available to ASP, BSP, CSP, and SLA up to $15,000,000, $61,000,000, $65,000,000, and $40,000,000, respectively. Each credit facility continue on a revolving basis unless terminated in writing by BofA upon 180 days notice. Loans made under the loan agreements are secured by the respective fund’s holdings in REIT preferred stock and corporate bonds and bear interest at one-month LIBOR plus 0.85%. In addition, for any month in which less than 80% of a fund’s facility limit is outstanding, the respective fund pays a commitment fee equal to 0.40% per annum on the average daily undrawn portion of the respective fund’s facility limit.
The funds may also borrow money by entering into reverse repurchase agreements, which involve the sale of portfolio-eligible securities by the funds, coupled with an agreement to repurchase the securities at a specified date and price. Borrowings may increase volatility of the funds’ net asset values and involve the risk that interest costs on money borrowed may exceed the return on securities purchased with that borrowed money. Each fund is subject to a restriction on borrowing under which each fund must maintain asset coverage of at least 300%. The interest expense incurred on borrowings is recognized as “Interest Expense” in the Statements of Operations. For the six-month period ended February 28, 2014, the weighted average borrowings outstanding for ASP, BSP, CSP, and SLA were $20,502,000, $64,539,000, $68,726,833, and $52,868,333, respectively, and the weighted average interest rates paid by the funds on such borrowings were 0.82%, 0.95%, 0.93%, and 0.84%, respectively.
| | | | | | |
| FIRST AMERICAN MORTGAGE FUNDS | | 2014 SEMIANNUAL REPORT | | | 45 | |
Notes to Financial Statements
The table below shows the offsetting assets and liabilities relating to the reverse repurchase agreements shown on the Statement of Assets and Liabilities:
| | | | | | | | | | | | | | | | | | | | | | | | |
| | | Gross
Amounts of
Recognized
Liabilities | | | Gross
Amounts
Offset in the
Statement of
Assets and
Liabilities | | | Net Amounts
Presented in
the Statement
of Assets and
Liabilities | | | Gross Amounts Not Offset in
the Statement of Assets and
Liabilities | |
| | | | | Financial
Instruments | | | Collateral
Pledged
(Received) | | | Net Amount (1) | |
ASP | | | | | | | | | | | | | | | | | | | | | | | | |
Reverse Repurchase Agreements | | $ | 5,946,000 | | | $ | — | | | $ | 5,946,000 | | | $ | — | | | $ | 5,946,000 | | | $ | — | |
| | | | | | | | | | | | | | | | | | | | | | | | |
BSP | | | | | | | | | | | | | | | | | | | | | | | | |
Reverse Repurchase Agreements | | $ | 7,321,000 | | | $ | — | | | $ | 7,321,000 | | | $ | — | | | $ | 7,321,000 | | | $ | — | |
| | | | | | | | | | | | | | | | | | | | | | | | |
CSP | | | | | | | | | | | | | | | | | | | | | | | | |
Reverse Repurchase Agreements | | $ | 9,452,000 | | | $ | — | | | $ | 9,452,000 | | | $ | — | | | $ | 9,452,000 | | | $ | — | |
| | | | | | | | | | | | | | | | | | | | | | | | |
SLA | | | | | | | | | | | | | | | | | | | | | | | | |
Reverse Repurchase Agreements | | $ | 14,812,000 | | | $ | — | | | $ | 14,812,000 | | | $ | — | | | $ | 14,812,000 | | | $ | — | |
| | | | | | | | | | | | | | | | | | | | | | | | |
(1) Net amount represents the net amount due (to) from counterparty in the event of a default based on the contractual set-off rights under the agreement. Net amount excludes any over-collateralized amounts. Net amount excludes exchange traded derivatives.
Repurchase Agreements
For repurchase agreements entered into with certain broker-dealers, the funds, along with other affiliated registered investment companies, may transfer uninvested cash balances into a joint trading account, the daily aggregate of which is invested in repurchase agreements secured by U.S. Government or agency obligations. Securities pledged as collateral for all individual and joint repurchase agreements are held by the funds’ custodian or sub-custodian until maturity of the repurchase agreement. All agreements require that the daily market value of the eligible securities be in excess of the repurchase amount, including accrued interest, to protect the funds in the event of a default. As of February 28, 2014, the funds had no outstanding repurchase agreements.
Use of Estimates in the Preparation of Financial Statements
The preparation of financial statements, in conformity with GAAP, requires management to make estimates and assumptions that affect the reported amounts of assets and liabilities and the disclosure of contingent assets and liabilities at the date of the financial statements and the results of operations during the reporting period. Actual results could differ from these estimates.
Events Subsequent to Period End
On January 23, 2014, ASP and SLA announced that each fund’s directors had approved proposals to reorganize the funds into a newly-organized closed-end fund managed by NFA and sub-advised by NAM, both current sub-advisors of the funds. It was anticipated that the proposals would have been submitted to shareholders of each fund for a vote at a special meeting of shareholders anticipated to be held during the second quarter of 2014.
On March 27, 2014, ASP and SLA announced that the previously announced reorganization will not occur as originally planned. It is expected that the directors will consider a revised reorganization proposal from USBAM, NFA, and NAM at a meeting to be held in late April 2014 and that further information will be announced at that time.
On April 14, 2014, TIAA-CREF announced an agreement to acquire Nuveen Investments, Inc. The acquisition is expected to be completed by December 31, 2014, subject to customary closing conditions, including approval by
| | | | |
| 46 | | FIRST AMERICAN MORTGAGE FUNDS | | 2014 SEMIANNUAL REPORT |
the shareholders of the funds. The current sub-advisors of the funds, NFA and NAM, are, respectively, direct and indirect wholly-owned subsidiaries of Nuveen Investments, Inc.
Investment Advisory Fees
Pursuant to investment advisory agreements with each fund, USBAM, a subsidiary of U.S. Bank National Association (“U.S. Bank”), manages the funds’ assets and furnishes related office facilities, equipment, research, and personnel. For ASP, BSP, and CSP, the agreement provides USBAM with a monthly investment advisory fee in an amount equal to an annualized rate of 0.20% of the respective fund’s average weekly net assets and 4.50% of the daily gross income accrued by such fund during the month (i.e., investment income, including accretion of bond discounts and amortization of premiums, other than gains from the sale of securities or gains from options and futures contracts less interest on money borrowed by the funds). The monthly investment advisory fee may not exceed, in the aggregate, 1/12 of 0.725% of the respective fund’s average weekly net assets during the month (approximately 0.725% on an annual basis). For SLA, the agreement provides USBAM with a monthly investment advisory fee in an amount equal to an annualized rate of 0.50% of the fund’s average weekly net assets. For its fees, USBAM provides investment advice and, in general, conducts the management and investment activities of the funds.
The funds may invest in money market funds that are series of First American Funds, Inc., subject to certain limitations. In order to avoid the payment of duplicative investment advisory fees to USBAM, which acts as the investment advisor to the investing funds and the related money market funds, USBAM will reimburse to each investing fund an amount equal to that portion of USBAM’s investment advisory fee received from the related money market funds that is attributable to the assets of the investing fund. This reimbursement, if any, is included in “Fee reimbursements” in the Statements of Operations.
Nuveen Asset Management, LLC (“NAM”) and Nuveen Fund Advisors, Inc. (“NFA”) each serve as investment sub-advisor to each fund pursuant to separate investment sub-advisory agreements with USBAM. NAM makes investment decisions for the funds, places purchase and sale orders for each fund’s portfolio transactions, and employs the funds’ portfolio managers and the securities analysts that provide research services relating to the funds. NFA provides certain other investment sub-advisory services to the funds, including assisting in the supervision of each fund’s investment program, risk monitoring, managing the forms and level of leverage employed by a fund, assisting in dividend and distribution level determinations, providing tax advice on issues arising in connection with management of a fund’s portfolio, and assisting with pricing of a fund’s portfolio securities.
With respect to each fund, USBAM pays monthly fees to NAM and NFA for the services provided under their respective sub-advisory agreements with USBAM. For ASP, BSP, and CSP, USBAM pays NAM a monthly fee in an amount equal to an annualized rate of 0.10% of the respective fund’s average weekly net assets and 3.00% of the daily gross income accrued by such fund during the month (i.e., investment income, including amortization of discount income, other than gains from the sale of securities or gains received from options and futures contracts less interest on money borrowed by the fund). The monthly investment sub-advisory fee may not exceed, in the aggregate, 1/12 of 0.45% of the respective fund’s average weekly net assets during the month (approximately 0.45% on an annual basis). For SLA, USBAM pays NAM a monthly fee in an amount equal to an annualized rate of 0.30% of the fund’s average weekly net assets.
For ASP, BSP, and CSP, USBAM pays NFA a monthly fee in an amount equal to 1.50% of the daily gross income accrued by the respective fund during the month (i.e., investment income, including amortization of discount income, other than gains from the sale of securities or gains received from options and futures contracts less interest on money borrowed by the fund). The monthly investment sub-advisory fee may not exceed, in the aggregate, 1/12 of 0.175% of the respective fund’s average weekly net assets during the month (approximately 0.175% on an annual basis). For SLA, USBAM pays NFA a monthly fee in an amount equal to an annualized rate of 0.10% of the funds average weekly net assets.
| | | | | | |
| FIRST AMERICAN MORTGAGE FUNDS | | 2014 SEMIANNUAL REPORT | | | 47 | |
Notes to Financial Statements
Administration Fees
USBAM serves as the funds’ administrator pursuant to administration agreements between USBAM and each fund. Under these agreements, USBAM receives a monthly administration fee from each fund in an amount equal to 0.25% of the fund’s average weekly net assets. For its fee, USBAM provides numerous services to the funds including, but not limited to, handling the general business affairs, financial and regulatory reporting, and various other services.
Pursuant to a sub-administration agreement between USBAM and NFA, USBAM also pays NFA an annual fee, calculated weekly and paid monthly, equal to 0.10% of the average weekly net assets of each fund for certain administrative and other services that NFA provides to the funds.
Custodian Fees
U.S. Bank serves as each fund’s custodian pursuant to a custodian agreement with the funds. The custodian fee charged to each fund is equal to an annual rate of 0.02% of such fund’s average weekly net assets. These fees are computed weekly and paid monthly.
Under the custodian agreement, interest earned on uninvested cash balances is used to reduce a portion of each fund’s custodian expenses. These credits, if any, are disclosed as “Indirect payments from custodian” in the Statements of Operations. Conversely, the custodian charges a fee for any cash overdrafts incurred, which will increase the fund’s custodian expenses. For the six-month period ended February 28, 2014, custodian fees for ASP, BSP, CSP, and SLA were increased by $1, $4, $3, and $0 as a result of overdrafts and reduced by $3, $3, $8, and $15, as a result of interest earned, respectively.
Mortgage Servicing Fees
The funds may enter into mortgage servicing agreements with mortgage servicers for whole loans and participation mortgages. For a fee, mortgage servicers maintain loan records, such as insurance and taxes and the proper allocation of payments between principal and interest.
Other Fees and Expenses
In addition to the investment advisory, administrative, custodian, and mortgage servicing fees, the funds are responsible for paying most other operating expenses, including: legal, auditing and accounting services, postage and printing of shareholder reports, transfer agent fees and expenses, listing fees, outside directors’ fees and expenses, insurance, pricing, interest, expenses related to real estate owned, fees to outside parties retained to assist in conducting due diligence, taxes, and other miscellaneous expenses.
Expenses that are directly related to a fund are charged directly to that fund. Other operating expenses of the First American Family of Funds are allocated to the funds on several bases, including evenly across all funds, allocated based on relative net assets of all funds within the First American Family of Funds, or a combination of both methods.
| (4) | Investment
Security
Transactions |
Cost of purchases and proceeds from sales of securities and real estate, other than temporary investments in short-term securities, for the six-month period ended February 28, 2014, were as follows:
| | | | | | | | |
Fund | | Cost of
Purchases | | | Proceeds
from Sales | |
ASP | | $ | 7,806,887 | | | $ | 11,266,920 | |
BSP | | | 7,015,758 | | | | 7,497,754 | |
CSP | | | 8,266,663 | | | | 15,009,013 | |
SLA | | | 15,483,139 | | | | 17,670,610 | |
The funds enter into contracts that contain a variety of indemnifications. The funds’ maximum exposure under these arrangements is unknown. However, the funds have not had prior claims or losses pursuant to these contracts and expect the risk of loss to be remote.
| | | | |
| 48 | | FIRST AMERICAN MORTGAGE FUNDS | | 2014 SEMIANNUAL REPORT |
| | |
| Notice to Shareholders | | (unaudited) |
HOW TO OBTAIN A COPY OF THE FUNDS’ PROXY VOTING POLICIES AND PROXY VOTING RECORD
A description of the policies and procedures that the funds use to determine how to vote proxies relating to portfolio securities, as well as information regarding how each fund voted proxies relating to portfolio securities, is available without charge upon request by calling 800.677.3863 and on the U.S. Securities and Exchange Commission’s (“SEC”) website at www.sec.gov.
FORM N-Q HOLDINGS INFORMATION
The funds are required to file their complete schedule of portfolio holdings for the first and third quarters of each fiscal year with the SEC on Form N-Q. The funds’ Forms N-Q are available without charge (1) upon request by calling 800.677.3863 and (2) on the SEC’s website at www.sec.gov. In addition, you may review and copy the funds’ Forms N-Q at the SEC’s Public Reference Room in Washington D.C. You may obtain information on the operation of the Public Reference Room by calling 800.SEC.0330.
QUARTERLY PORTFOLIO HOLDINGS
The funds will make portfolio holdings information publicly available by posting the information at FirstAmericanFunds.com on a quarterly basis. The funds will attempt to post such information within 10 business days of the calendar quarter end.
| | | | | | |
| FIRST AMERICAN MORTGAGE FUNDS | | 2014 SEMIANNUAL REPORT | | | 49 | |
First American Funds’ Privacy Policy
We want you to understand what information we collect and how it’s used.
“Nonpublic personal information” is nonpublic information that we obtain while providing financial products or services to you.
How we collect your information
We obtain nonpublic information about you during the account opening process from the applications and other forms you are asked to complete and from the transactions you make with us. We may also receive nonpublic information about you from companies affiliated with us or from other companies that provide services to you. We do not use nonpublic information received from our affiliates for marketing purposes.
Why we collect your information
We gather nonpublic personal information about you and your accounts so that we can:
| • | | Know who you are and prevent unauthorized access to your information. |
| • | | Comply with the laws and regulations that govern us. |
The types of information we collect
We may collect the following nonpublic personal information about you:
| • | | Information about your identity, such as your name, address, and social security number. |
| • | | Information about your transactions with us. |
| • | | Information you provide on applications, such as your beneficiaries and banking information, if provided to us. |
Confidentiality and security
To protect nonpublic personal information about you, we restrict access to such information to only those employees and authorized agents who need to use the information. We maintain physical, electronic, and procedural safeguards to maintain the confidentiality and security of nonpublic information about you. In addition, we require our service providers to restrict access to nonpublic personal information about you to those employees who need that information in order to provide products or services to you. We also require them to maintain physical, electronic, and procedural safeguards that comply with applicable federal standards and regulations to guard your information.
What information we disclose
We may share some or all of the nonpublic personal information that we collect about you with our affiliated providers of financial services, including our family of funds and their advisor, and with companies that perform marketing services on our behalf.
We’re permitted by law to disclose nonpublic personal information about you to other third parties in certain circumstances. For example, we may disclose nonpublic personal information about you to affiliated and nonaffiliated third parties to assist us in servicing your account (e.g., mailing of fund-related materials) and to government entities (e.g., IRS for tax purposes).
We’ll continue to adhere to the privacy policies and practices described here even after your account is closed or becomes inactive.
Additional rights and protections
You may have other privacy protections under applicable state laws. To the extent that these state laws apply, we will comply with them when we share information about you. This privacy policy does not apply to your relationship with other financial service providers, such as broker-dealers. We may amend this privacy notice at any time, and we will inform you of changes as required by law.
Our pledge applies to products and services offered by
| | |
• First American Funds, Inc. | | • American Municipal Income Portfolio Inc. |
• American Strategic Income Portfolio Inc. | | • Minnesota Municipal Income Portfolio Inc. |
• American Strategic Income Portfolio Inc. II | | • First American Minnesota Municipal Income Fund II, Inc. |
• American Strategic Income Portfolio Inc. III | | • American Income Fund Inc. |
• American Select Portfolio Inc. | | |
|
| NOT FDIC INSURED NO BANK GUARANTEE MAY LOSE VALUE |
| | | | |
| 50 | | FIRST AMERICAN MORTGAGE FUNDS | | 2014 SEMIANNUAL REPORT |
BOARD OF DIRECTORS
Leonard Kedrowski
Chairperson of First American Mortgage Funds
Owner and President of Executive and Management Consulting, Inc.
Roger Gibson
Director of First American Mortgage Funds
Director of Charterhouse Group, Inc.
John Kayser
Director of First American Mortgage Funds
Retired; former Principal of William Blair & Company, LLC
Richard Riederer
Director of First American Mortgage Funds
Owner and Chief Executive Officer of RKR Consultants, Inc.
James Wade
Director of First American Mortgage Funds
Owner and President of Jim Wade Homes
First American Mortgage Funds’ Board of Directors is comprised entirely of independent directors.

P.O. Box 1330
Minneapolis, MN 55440-1330
American Strategic Income Portfolio Inc.
American Strategic Income Portfolio Inc. II
American Strategic Income Portfolio Inc. III
American Select Portfolio Inc.
2014 Semiannual Report
U.S. Bancorp Asset Management, Inc. is a wholly owned subsidiary of U.S. Bank National Association, which is a wholly owned subsidiary of U.S. Bancorp.

| This document is printed on paper containing 10% postconsumer waste. |
4/2014 0047-14 WHOLELOAN-SAR
Item 2—Code of Ethics
Not applicable to the semi-annual report.
Item 3—Audit Committee Financial Expert
Not applicable to the semi-annual report.
Item 4—Principal Accountant Fees and Services
Not applicable to the semi-annual report.
Item 5—Audit Committee of Listed Registrants
Not applicable to the semi-annual report.
Item 6—Schedule of Investments
The schedule is included as part of the report to shareholders filed under Item 1 of this Form.
Item 7—Disclosure of Proxy Voting Policies and Procedures for Closed-End Management Investment Companies
Not applicable to the semi-annual report.
Item 8—Portfolio Managers of Closed-End Management Investment Companies
Not applicable to the semi-annual report.
Item 9—Purchases of Equity Securities by Closed-End Management Investment Company and Affiliated Purchasers
Neither the registrant nor any “affiliated purchaser,” as defined in Rule 10b-18(a)(3) under the Exchange Act, purchased any shares or other units of any class of the registrant’s equity securities that is registered pursuant to Section 12 of the Exchange Act.
Item 10—Submission of Matters to a Vote of Security Holders
There have been no material changes to the procedures by which shareholders may recommend nominees to the registrant’s Board of Directors, where those changes were implemented after the registrant last provided disclosure in response to the requirements of Item 407(c)(2)(iv) of Regulation S-K (as required by Item 22(b)(15) of Schedule 14A), or this item.
Item 11—Controls and Procedures
| (a) | The registrant’s principal executive officer and principal financial officer have evaluated the effectiveness of the registrant’s disclosure controls and procedures within 90 days of the date of this filing and have concluded that the registrant’s disclosure controls and procedures were effective, as of that date, in ensuring that information required to be disclosed by the registrant in this Form N-CSR was recorded, processed, summarized and reported timely. |
| (b) | There were no changes in the registrant’s internal control over financial reporting that occurred during the second fiscal quarter of the period covered by this report that have materially affected, or are reasonably likely to materially affect, the registrant’s internal control over financial reporting. |
Item 12—Exhibits
| | |
| (a)(1) | | Not applicable. |
| |
| (a)(2) | | Certifications of the principal executive officer and principal financial officer of the registrant as required by Rule 30a-2(a) under the Investment Company Act of 1940 are filed as exhibits hereto. |
| |
| (a)(3) | | Not applicable. |
| |
| (b) | | Certifications of the principal executive officer and principal financial officer of the registrant as required by Rule 30a-2(b) under the Investment Company Act of 1940 are filed as exhibits hereto. |
Signatures
Pursuant to the requirements of the Securities Exchange Act of 1934 and the Investment Company Act of 1940, the registrant has duly caused this report to be signed on its behalf by the undersigned, thereunto duly authorized.
| | |
| American Strategic Income Portfolio Inc. III |
| |
| By: | | /s/ Joseph M. Ulrey III |
| | Joseph M. Ulrey III |
| | President |
|
| Date: April 21, 2014 |
Pursuant to the requirements of the Securities Exchange Act of 1934 and the Investment Company Act of 1940, this report has been signed below by the following persons on behalf of the registrant and in the capacities and on the dates indicated.
| | |
| By: | | /s/ Joseph M. Ulrey III |
| | Joseph M. Ulrey III |
| | President |
|
| Date: April 21, 2014 |
| |
| By: | | /s/ Jill M. Stevenson |
| | Jill M. Stevenson |
| | Treasurer |
|
| Date: April 21, 2014 |