UNITED STATES
SECURITIES AND EXCHANGE COMMISSION
Washington, D.C. 20549
FORM N-CSR
CERTIFIED SHAREHOLDER REPORT OF REGISTERED
MANAGEMENT INVESTMENT COMPANIES
Investment Company Act file number 811-7436
THE DFA INVESTMENT TRUST COMPANY
(Exact name of registrant as specified in charter)
6300 Bee Cave Road, Building One, Austin, TX 78746
(Address of principal executive offices) (Zip code)
Catherine L. Newell, Esquire, Vice President and Secretary
The DFA Investment Trust Company,
6300 Bee Cave Road, Building One, Austin, TX 78746
(Name and address of agent for service)
Registrant’s telephone number, including area code: 512-306-7400
Date of fiscal year end: October 31
Date of reporting period: October 31, 2009
| ITEM 1. | REPORTS TO STOCKHOLDERS. |

Dimensional Fund Advisors
6300 Bee Cave Road, Building One
Austin, TX 78746
December 2009
Dear Fellow Shareholder,
After sinking to ten-year lows, stock prices around the world rebounded sharply in March 2009 and posted steady gains in the seven months between March and September. March and April were among the best-return months in the life of Dimensional’s equity Funds.
The unexpected turns in the financial markets this year offered some valuable lessons. We were reminded that stock prices are unpredictable. We saw once again the benefits of staying disciplined in the market as it inevitably moves up and down. And I believe these markets showed very clearly why diversification is so important to long-term investment success.
Although diversification can’t prevent losses, it can help investors avoid the extreme outcomes that can result from concentrating investments in individual stocks or market segments. We believe that successful investing is about both increasing wealth and being able to sleep well at night. Investors who understand how markets work and have a realistic understanding of their own tolerance for risk are most likely to have a good overall experience.
More than $10 billion in net long-term assets flowed into Dimensional’s Funds during the first 10 months of 2009, a reflection of the trust our shareholders around the world have placed in us. We are grateful for that trust and want you to know that we take our responsibility as the steward of your investments in Dimensional’s Funds very seriously. We hope to have the opportunity to continue serving your needs for many years to come.
Sincerely, |
 |
David G. Booth |
Chairman and Chief Executive Officer |
[THIS PAGE INTENTIONALLY LEFT BLANK]
Table of Contents
| Page | ||
Letter to Shareholders | ||
| 1 | ||
DFA Investment Dimensions Group Inc. | ||
| 3 | ||
| 16 | ||
| 33 | ||
| 39 | ||
Schedules of Investments/Summary Schedules of Portfolio Holdings | ||
| 42 | ||
| 43 | ||
| 46 | ||
| 47 | ||
| 50 | ||
| 53 | ||
| 56 | ||
| 59 | ||
| 62 | ||
| 65 | ||
| 68 | ||
| 71 | ||
| 73 | ||
| 77 | ||
| 82 | ||
| 89 | ||
| 90 | ||
| 90 | ||
| 91 | ||
| 91 | ||
| 92 | ||
| 96 | ||
| 97 | ||
| 102 | ||
| 107 | ||
| 107 | ||
| 108 | ||
| 113 | ||
| 116 | ||
| 120 | ||
| 124 | ||
| 126 | ||
| 129 | ||
| 131 | ||
| 137 | ||
| 138 | ||
| 144 | ||
| 148 | ||
| 157 | ||
| 166 | ||
| 184 | ||
| 204 | ||
| 235 | ||
| 236 |
i
Table of Contents
Continued
| Page | ||
Dimensional Investment Group Inc. — DFA International Value Portfolio | ||
| 250 | ||
| 251 | ||
| 253 | ||
| 254 | ||
| 255 | ||
| 256 | ||
| 257 | ||
| 258 | ||
| 260 | ||
| 266 | ||
| 267 |
ii
Table of Contents
Continued
| Page | ||
The DFA Investment Trust Company | ||
| 268 | ||
| 272 | ||
| 279 | ||
| 281 | ||
Schedules of Investments/Summary Schedules of Portfolio Holdings | ||
| 283 | ||
| 286 | ||
| 289 | ||
| 293 | ||
| 296 | ||
| 299 | ||
| 302 | ||
| 306 | ||
| 309 | ||
| 313 | ||
| 317 | ||
| 320 | ||
| 323 | ||
| 328 | ||
| 333 | ||
| 343 | ||
| 344 | ||
| 350 | ||
| 358 | ||
| 359 |
This report is submitted for the information of the Fund’s shareholders. It is not authorized for distribution to prospective investors unless preceded or accompanied by an effective prospectus.
iii
[THIS PAGE INTENTIONALLY LEFT BLANK]
DFA INVESTMENT DIMENSIONS GROUP INC.
DIMENSIONAL INVESTMENT GROUP INC.
THE DFA INVESTMENT TRUST COMPANY
DEFINITIONS OF ABBREVIATIONS AND FOOTNOTES
Schedules of Investments/Summary Schedules of Portfolio Holdings
| Investment Abbreviations | ||
ADR | American Depositary Receipt | |
AMBAC | American Municipal Bond Assurance Corporation | |
ETM | Escrowed to Maturity | |
FGIC | Federal Guaranty Insurance Corporation | |
FSA | Financial Security Assurance | |
FHLMC | Federal Home Loan Mortgage Corporation | |
FNMA | Federal National Mortgage Association | |
GO | General Obligation | |
MBIA | Municipal Bond Insurance Association | |
NATL-RE | Credit rating enhanced by guaranty or insurance from National Public Finance Guarantee Corp. | |
P.L.C. | Public Limited Company | |
PSF-GTD | Public School Fund Guarantee | |
RB | Revenue Bond | |
REIT | Real Estate Investment Trust | |
SA | Special Assessment | |
SCSDE | South Carolina State Department of Education | |
SPDR | Standard & Poor’s Depository Receipts | |
TAN | Tax Anticipation Note | |
Investment Footnotes | ||
† | See Note B to Financial Statements. | |
†† | Securities have generally been fair valued. See Note B to Financial Statements. | |
** | Calculated as a percentage of total net assets. Percentages shown parenthetically next to the category headings have been calculated as a percentage of total investments. “Other Securities” are those securities that are not among the top 50 holdings of the Fund or do not represent more than 1.0% of the net assets of the Fund. Some of the individual securities within this category may include Total or Partial Securities on Loan and/or Non-Income Producing Securities. | |
* | Non-Income Producing Securities. | |
# | Total or Partial Securities on Loan. | |
^ | Denominated in local currency or the Euro, unless otherwise noted. | |
@ | Security purchased with cash proceeds from Securities on Loan. | |
(r) | The adjustable rate shown is effective as of October 31, 2009. | |
(y) | The rate shown is the effective yield. | |
(t) | Face Amount denominated in Australian Dollars. | |
(g) | Face Amount denominated in British Pounds. | |
(e) | Face Amount denominated in Euro. | |
(j) | Face Amount denominated in Japanese Yen. | |
(z) | Face Amount denominated in New Zealand Dollars. | |
(n) | Face Amount denominated in Norwegian Krone. | |
(u) | Face Amount denominated in United States Dollars. | |
§ | Affiliated Fund. | |
v | Security segregated as collateral for the Open Futures Contracts. | |
1
DEFINITIONS OF ABBREVIATIONS AND FOOTNOTES
CONTINUED
Financial Highlights
| (A) | Computed using average shares outstanding. |
| (B) | Annualized |
| (C) | Non-Annualized |
| (D) | Represents the combined ratios for the respective portfolio and its respective pro-rata share of its Master Fund Series. |
| (E) | Because of commencement of operations and related preliminary transaction costs, these ratios are not necessarily indicative of future ratios. |
| N/A | Does not apply to this fund. |
All Statements and Schedules
| — | Amounts designated as — are either zero or rounded to zero. |
| SEC | Securities and Exchange Commission |
| REITs | Real Estate Investment Trusts |
| (a) | Commencement of Operations. |
2
DFA INVESTMENT DIMENSIONS GROUP INC.
PERFORMANCE CHARTS
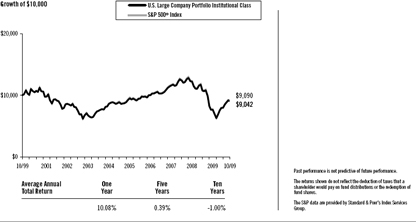
U.S. Large Company Portfolio Institutional Class vs.
S&P 500® Index
October 31, 1999-October 31, 2009
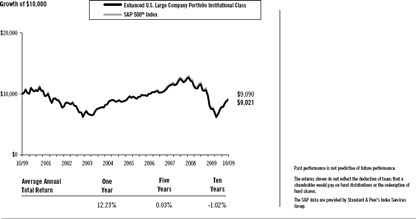
Enhanced U.S. Large Company Portfolio Institutional Class vs.
S&P 500® Index
October 31, 1999-October 31, 2009
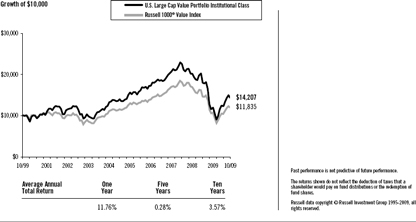
U.S. Large Cap Value Portfolio Institutional Class vs.
Russell 1000® Value Index
October 31, 1999-October 31, 2009
3
DFA INVESTMENT DIMENSIONS GROUP INC.
PERFORMANCE CHARTS
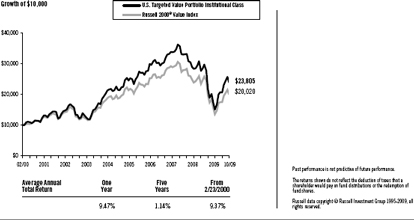
U.S. Targeted Value Portfolio Institutional Class vs.
Russell 2000® Value Index
February 23, 2000-October 31, 2009
 |
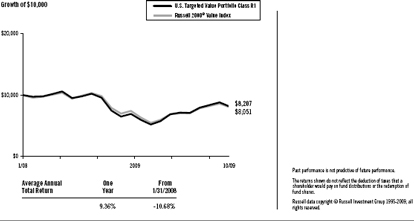
U.S. Targeted Value Portfolio Class R1 vs.
Russell 2000® Value Index
January 31, 2008-October 31, 2009
 |
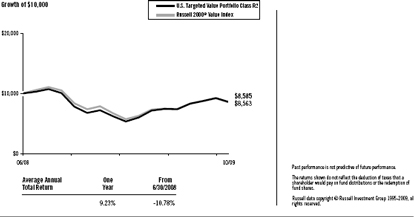
U.S. Targeted Value Portfolio Class R2 vs.
Russell 2000® Value Index
June 30, 2008-October 31, 2009
 |
4
DFA INVESTMENT DIMENSIONS GROUP INC.
PERFORMANCE CHARTS
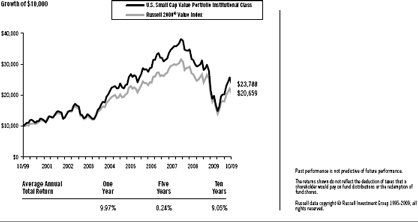
U.S. Small Cap Value Portfolio Institutional Class vs.
Russell 2000® Value Index
October 31, 1999-October 31, 2009
 |
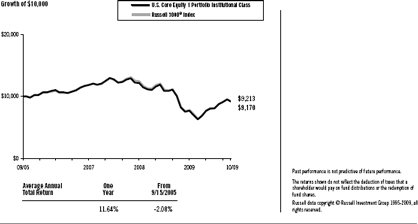
U.S. Core Equity 1 Portfolio Institutional Class vs.
Russell 3000® Index
September 15, 2005-October 31, 2009
 |
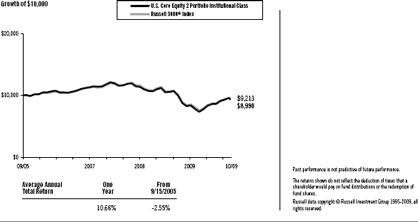
U.S. Core Equity 2 Portfolio Institutional Class vs.
Russell 3000® Index
September 15, 2005-October 31, 2009
 |
5
DFA INVESTMENT DIMENSIONS GROUP INC.
PERFORMANCE CHARTS
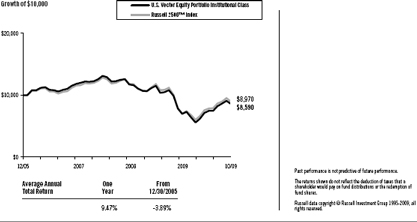
U.S. Vector Equity Portfolio Institutional Class vs.
Russell 2500™ Index
December 30, 2005-October 31, 2009
 |
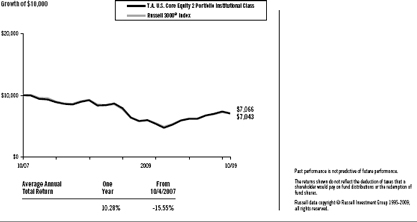
T.A. U.S. Core Equity 2 Portfolio Institutional Class vs.
Russell 3000® Index
October 4, 2007-October 31, 2009
 |
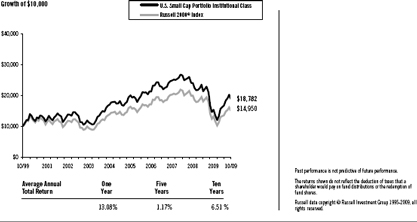
U.S. Small Cap Portfolio Institutional Class vs.
Russell 2000® Index
October 31, 1999-October 31, 2009
 |
6
DFA INVESTMENT DIMENSIONS GROUP INC.
PERFORMANCE CHARTS
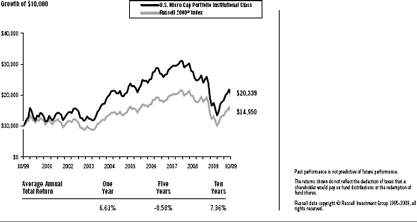
U.S. Micro Cap Portfolio Institutional Class vs.
Russell 2000® Index
October 31, 1999-October 31, 2009
 |
DFA Real Estate Securities Portfolio Institutional Class vs.
Dow Jones U.S. Select REIT IndexSM, S&P 500® Index
October 31, 1999-October 31, 2009
 |
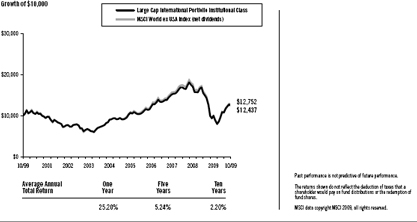
Large Cap International Portfolio Institutional Class vs.
MSCI World ex USA Index (net dividends)
October 31, 1999-October 31, 2009
 |
7
DFA INVESTMENT DIMENSIONS GROUP INC.
PERFORMANCE CHARTS
International Core Equity Portfolio Institutional Class vs.
MSCI World ex USA Index (net dividends)
September 15, 2005-October 31, 2009

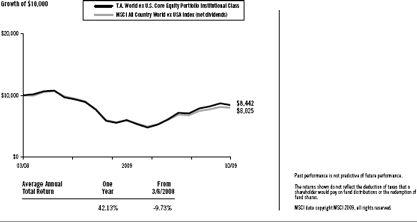
T.A. World ex U.S. Core Equity Portfolio Institutional Class vs.
MSCI All Country World ex USA Index (net dividends)
March 6, 2008-October 31, 2009
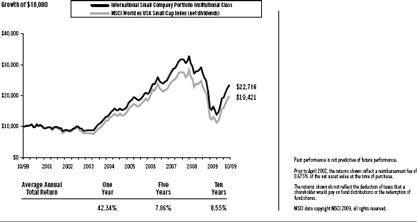
International Small Company Portfolio Institutional Class vs.
MSCI World ex USA Small Cap Index (net dividends)
October 31, 1999-October 31, 2009
8
DFA INVESTMENT DIMENSIONS GROUP INC.
PERFORMANCE CHARTS
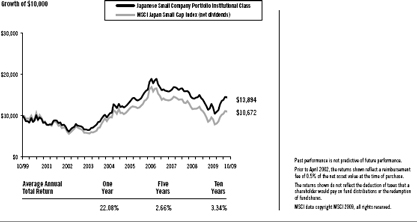
Japanese Small Company Portfolio Institutional Class vs.
MSCI Japan Small Cap Index (net dividends)
October 31, 1999-October 31, 2009
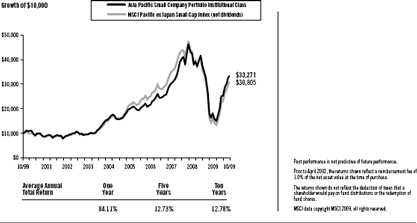
Asia Pacific Small Company Portfolio Institutional Class vs.
MSCI Pacific ex Japan Small Cap Index (net dividends)
October 31, 1999-October 31, 2009
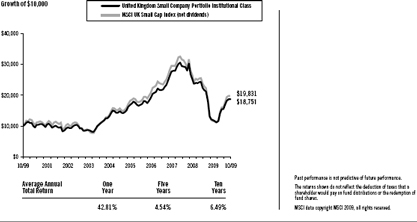
United Kingdom Small Company Portfolio Institutional Class vs.
MSCI UK Small Cap Index (net dividends)
October 31, 1999-October 31, 2009
9
DFA INVESTMENT DIMENSIONS GROUP INC.
PERFORMANCE CHARTS
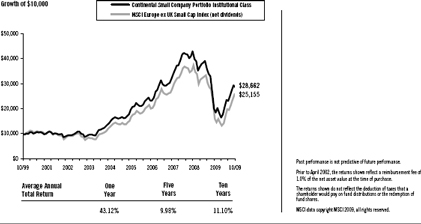
Continental Small Company Portfolio Institutional Class vs.
MSCI Europe ex UK Small Cap Index (net dividends),
October 31, 1999-October 31, 2009
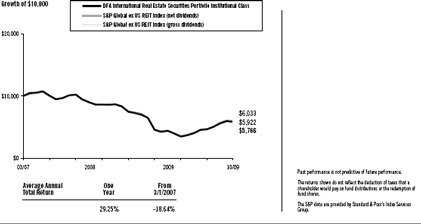
DFA International Real Estate Securities Portfolio Institutional Class vs.
S&P Global ex US REIT Index (net dividends), S&P Global ex US REIT Index (gross dividends)
March 1, 2007-October 31, 2009
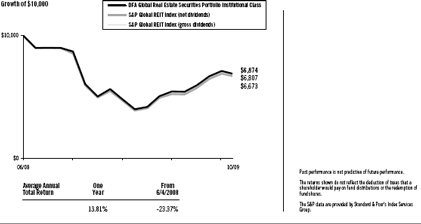
DFA Global Real Estate Securities Portfolio Institutional Class vs.
S&P Global REIT Index (net dividends), S&P Global REIT Index (gross dividends)
June 4, 2008-October 31, 2009
10
DFA INVESTMENT DIMENSIONS GROUP INC.
PERFORMANCE CHARTS
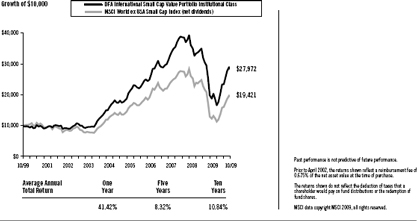
DFA International Small Cap Value Portfolio Institutional Class vs.
MSCI World ex USA Small Cap Index (net dividends)
October 31, 1999-October 31, 2009
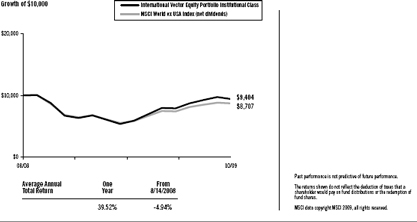
International Vector Equity Portfolio Institutional Class vs.
MSCI World ex USA Index (net dividends)
August 14, 2008-October 31, 2009
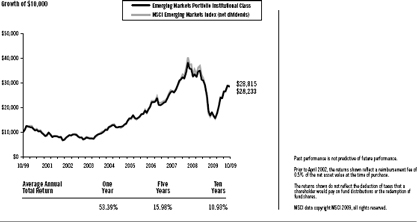
Emerging Markets Portfolio Institutional Class vs.
MSCI Emerging Markets Index (net dividends)
October 31, 1999-October 31, 2009
11
DFA INVESTMENT DIMENSIONS GROUP INC.
PERFORMANCE CHARTS
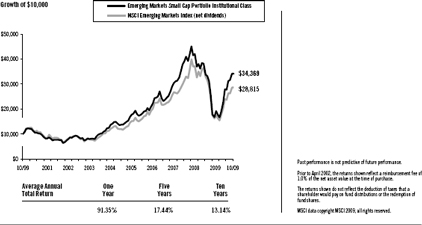
Emerging Markets Small Cap Portfolio Institutional Class vs.
MSCI Emerging Markets Index (net dividends)
October 31, 1999-October 31, 2009
 |
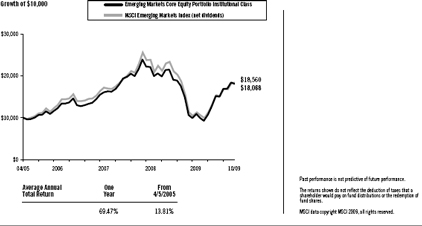
Emerging Markets Core Equity Portfolio Institutional Class vs.
MSCI Emerging Markets Index (net dividends)
April 5, 2005-October 31, 2009
 |
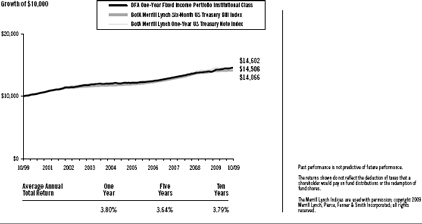
DFA One-Year Fixed Income Portfolio Institutional Class vs.
BofA Merrill Lynch Six-Month US Treasury Bill Index, BofA Merrill Lynch One-Year US Treasury Note Index
October 31, 1999-October 31, 2009
 |
12
DFA INVESTMENT DIMENSIONS GROUP INC.
PERFORMANCE CHARTS
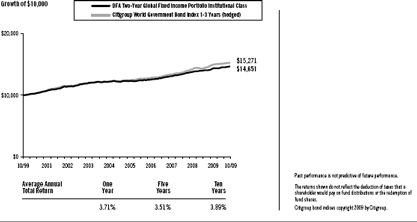
DFA Two-Year Global Fixed Income Portfolio Institutional Class vs.
Citigroup World Government Bond Index 1-3 Years (hedged)
October 31, 1999-October 31, 2009
 |
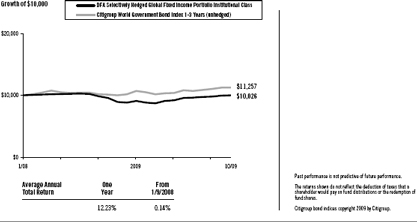
DFA Selectively Hedged Global Fixed Income Portfolio Institutional Class vs.
Citigroup World Government Bond Index 1-3 Years (unhedged)
January 9, 2008-October 31, 2009
 |
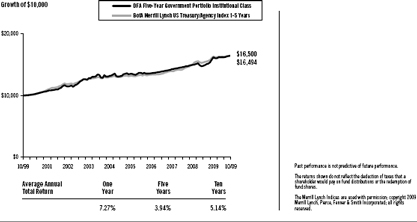
DFA Five-Year Government Portfolio Institutional Class vs.
BofA Merrill Lynch US Treasury/Agency Index 1-5 Years
October 31, 1999-October 31, 2009
 |
13
DFA INVESTMENT DIMENSIONS GROUP INC.
PERFORMANCE CHARTS
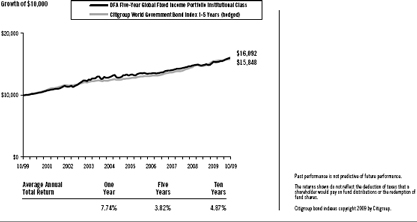
DFA Five-Year Global Fixed Income Portfolio Institutional Class vs.
Citigroup World Government Bond Index 1-5 Years (hedged)
October 31, 1999-October 31, 2009
 |
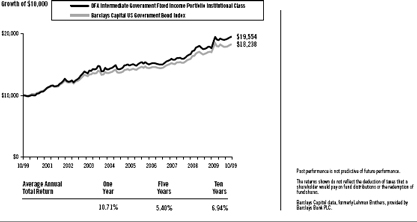
DFA Intermediate Government Fixed Income Portfolio Institutional Class vs.
Barclays Capital US Government Bond Index
October 31, 1999-October 31, 2009
 |
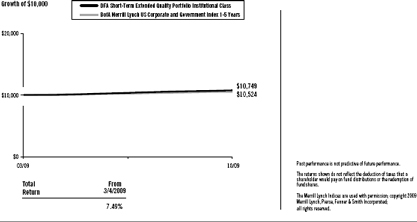
DFA Short-Term Extended Quality Portfolio Institutional Class vs.
BofA Merrill Lynch US Corporate and Government Index 1-5 Years
March 4, 2009-October 31, 2009
 |
14
DFA INVESTMENT DIMENSIONS GROUP INC.
PERFORMANCE CHARTS
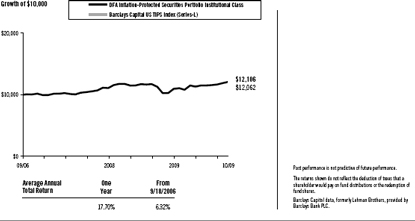
DFA Inflation-Protected Securities Portfolio Institutional Class vs.
Barclays Capital US TIPS Index (Series-L)
September 18, 2006-October 31, 2009
 |
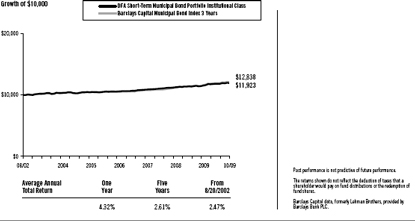
DFA Short-Term Municipal Bond Portfolio Institutional Class vs.
Barclays Capital Municipal Bond Index 3 Years
August 20, 2002-October 31, 2009
 |
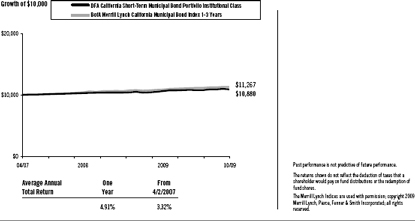
DFA California Short-Term Municipal Bond Portfolio Institutional Class vs.
BofA Merrill Lynch California Municipal Bond Index 1-3 Years
April 2, 2007-October 31, 2009
 |
15
DFA INVESTMENT DIMENSIONS GROUP INC.
MANAGEMENT’S DISCUSSION AND ANALYSIS
| U.S. Equity Market Review | 12 Months Ended October 31, 2009 |
The year ending October 31, 2009, was among the most volatile periods in U.S. market history. Broad market returns were positive with stocks represented by the mid cap index outperforming those within both small cap and large cap indexes and stocks represented by the growth index outperforming those represented by the value index. Investors moving out of stocks, beginning in late 2008 and extending into early 2009, contributed to high volatility and negative returns over that period. Markets turned sharply higher in March, and the size and value premiums both turned positive over the eight months ending October 2009. Although the large cap index outperformed the small cap index, and the growth index outperformed the value index, returns within the broader market (Russell 3000® Index) demonstrate that there was a positive small size premium and a positive value premium. This counterintuitive result occurred because the stock markets were characterized by extreme volatility, and the indexes, which are reconstituted annually, were not able to rebalance during the course of the year to maintain their intended asset class exposure. Among the most important factors explaining differences in the behavior of diversified equity portfolios are the company size and company value/growth characteristics of the portfolio’s holdings. Size is measured by market capitalization, and value classification is a function of stock price relative to one or more fundamental characteristics. Compared to other stocks, value stocks often have lower market value relative to their earnings, dividends, and book value.
For the 12 months ended October 31, 2009, the total return of the Russell Microcap® Index was 5.06%, the Russell 2000® Index was 6.46%, the CRSP 6-10 Index was 20.94%, and the MSCI US Small Cap 1750 Index was 14.11%. Large cap growth stocks outperformed large cap value stocks, as measured by the Russell 1000® Growth Index and Russell 1000® Value Index. Small cap growth stocks outperformed small cap value stocks, by a lesser amount than in large caps, as measured by the Russell 2000® Growth Index and Russell 2000® Value Index.
Total Return for 12 Months Ended October 31, 2009
Russell 2000® Index (small cap companies) | 6.46 | % | |
Russell Midcap® Index (mid cap companies) | 18.74 | % | |
Russell 1000® Index (large cap companies) | 11.19 | % | |
Russell 3000® Value Index | 4.55 | % | |
Russell 3000® Growth Index | 17.04 | % |
Further dividing the large, mid, and small cap market segments by value and growth characteristics shows more detail in the performance differences over the period.
Total Return for 12 Months Ended October 31, 2009
Russell 1000® Value Index (large cap value companies) | 4.78 | % | |
Russell 1000® Growth Index (large cap growth companies) | 17.50 | % | |
Russell Midcap® Value Index (mid cap value companies) | 14.52 | % | |
Russell Midcap® Growth Index (mid cap growth companies) | 22.48 | % | |
Russell 2500TM Value Index (small/mid cap value companies) | 8.56 | % | |
Russell 2500TM Growth Index (small/mid cap growth companies) | 18.20 | % | |
Russell 2000® Value Index (small cap value companies) | 1.95 | % | |
Russell 2000® Growth Index (small cap growth companies) | 11.34 | % |
Source: Russell data copyright © Russell Investment Group 1995-2009, all rights reserved.
Differences in returns for the various Dimensional U.S. equity funds over the 12 months ended October 31, 2009 were attributable primarily to differences in value/growth and size characteristics as well as the exclusion of
16
REIT securities from most Dimensional portfolios, except for the DFA Real Estate Securities Portfolio and portfolios investing in the U.S. Large Company Series. Moreover, the portfolio construction approach used by Dimensional Fund Advisors (the “Advisor”) generally resulted in portfolios with greater emphasis on value or small company characteristics relative to widely used index benchmarks.
Master-Feeder Structure
Certain portfolios described below, called “Feeder Funds,” do not buy individual securities directly; instead, these portfolios invest in corresponding funds called “Master Funds.” Master Funds, in turn, purchase stocks and/or other securities.
Domestic Equity Portfolios’ Performance Overview
U.S. Large Company Portfolio
The U.S. Large Company Portfolio seeks to approximate the returns of the S&P 500® Index by purchasing shares of a Master Fund that invests in S&P 500® Index stocks in approximately the same proportions as they are represented in the Index. The Portfolio was mostly invested in equities throughout the year: the average non-equitized cash level for the period was less than 1% of the Master Fund’s assets.
For the 12 months ended October 31, 2009, the total return was 10.08% for the Portfolio and 9.80% for the S&P 500® Index. Relative to the Index, outperformance was mostly due to the flexible trading approach employed by the Master Fund to gain exposure to the performance of the Index during periods of index reconstitution.
Enhanced U.S. Large Company Portfolio
The Enhanced U.S. Large Company Portfolio seeks to outperform the total return performance of the S&P 500® Index by using an “enhanced cash” strategy. This strategy combines investment in high-grade, short-term fixed income instruments with an overlay of S&P 500® Index futures contracts or swaps. For the 12 months ended October 31, 2009, approximately 97% of the overlay instruments consisted of S&P 500® Index futures contracts. Swaps and ETFs completed the equity exposure for the last month of the fiscal year. The behavior of S&P 500® Index futures contracts and ETFs linked to the S&P 500® Index is determined principally by the performance of the S&P 500® Index.
For the 12 months ended October 31, 2009, the total return was 12.23% for the Portfolio and 9.80% for the S&P 500® Index. Relative to the Index, the Portfolio’s outperformance was primarily due to the fixed income component of the Portfolio exceeding the return embedded in the Portfolio’s S&P 500 futures contracts. The Portfolio’s concentration in government agency and corporate fixed income securities with maturities between one and two years had the most significant contribution to the outperformance.
U.S. Large Cap Value Portfolio
The U.S. Large Cap Value Portfolio seeks to capture the returns of U.S. large company value stocks by purchasing shares of a Master Fund that invests in such stocks. The investment strategy employs a disciplined, quantitative approach, emphasizing broad diversification and consistent exposure to large cap value stocks, but does not attempt to track closely a specific equity index. As of October 31, 2009, the Master Fund held 213 stocks and was mostly invested in equities throughout the year: the average non-equitized cash level for the period was less than 1% of the Master Fund’s assets.
As a result of the Master Fund’s diversified investment approach, performance was determined principally by broad structural trends in the U.S. equity market, rather than the behavior of a limited number of stocks. For the 12 months ended October 31, 2009, total returns were 11.76% for the Portfolio and 4.78% for the Russell 1000® Value Index. The Portfolio benefited from a positive size premium and value premium over the last eight months of the period. Relative to the Index, the Master Fund’s greater exposure to stocks with more pronounced value characteristics and composition differences along the value/growth dimension added approximately 4.2% to the relative performance. Differences in sector weights between the Portfolio and Index also contributed to the outperformance.
17
The Master Fund’s larger allocation than the Index to consumer discretionary stocks, due to its strategy of maintaining consistent large cap value exposure, added approximately 3% to relative performance. The Portfolio also benefited from composition differences among the Master Fund’s basket of financial stocks, which added approximately 3.6% to relative performance.
U.S. Targeted Value Portfolio
The U.S. Targeted Value Portfolio seeks to capture the returns of U.S. small and mid capitalization value stocks. The investment strategy employed by the U.S. Targeted Value Portfolio is a disciplined, quantitative approach, emphasizing broad diversification and consistent exposure to small and mid cap value stocks, but does not attempt to track closely a specific equity index. As of October 31, 2009, the Portfolio held 1,580 stocks, and was mostly invested in equities throughout the year: the average non-equitized cash level for the period was less than 1% of the Portfolio’s assets.
As a result of the Portfolio’s diversified investment approach, performance was determined principally by broad structural trends in the U.S. equity market, rather than the behavior of a limited number of stocks. For the 12 months ended October 31, 2009, total returns were 9.47% for the Institutional Class shares of the Portfolio, 9.36% for the Class R1 shares of the Portfolio and 9.23% for the Class R2 shares of the Portfolio, as compared to 1.95% for the Russell 2000® Value Index. The Portfolio benefited from a positive size premium and value premium over the last eight months of the period. Relative to the Index, the Portfolio’s deeper value tilt contributed to outperformance. The Portfolio’s greater exposure to value stocks (42% of the Portfolio compared to 33% of the Index) added approximately 3.7% to the relative performance. Differences in sector weights between the Portfolio and Index also contributed to performance differences. The Portfolio’s greater exposure to information technology stocks and consumer discretionary stocks, due to its strategy of maintaining consistent small and value exposure, added approximately 1.5% and 1.1% respectively to relative performance.
U.S. Small Cap Value Portfolio
The U.S. Small Cap Value Portfolio seeks to capture the returns of U.S. small company value stocks. The investment strategy employs a disciplined, quantitative approach, emphasizing broad diversification and consistent exposure to small company and value stocks, but does not attempt to track closely a specific equity index. As of October 31, 2009, the Portfolio held 1,634 stocks and was mostly invested in equities throughout the year: the average non-equitized cash level for the period was less than 1% of the Portfolio’s assets.
As a result of the Portfolio’s diversified investment approach, performance was determined principally by broad structural trends in the U.S. equity market, rather than the behavior of a limited number of stocks. For the 12 months ended October 31, 2009, total returns were 9.97% for the Portfolio and 1.95% for the Russell 2000® Value Index. The Portfolio benefited from a positive size premium and value premium over the last eight months of the period. Relative to the Index, the Portfolio’s greater exposure to stocks with more pronounced value characteristics added approximately 4.0% to the relative performance. Higher exposure to, and differences in portfolio composition with respect to, the smallest stocks added approximately 3.8% to the Portfolio’s relative performance.
U.S. Core Equity 1 Portfolio
The U.S. Core Equity 1 Portfolio seeks to capture the returns of the total U.S. market universe, with increased exposure to smaller company stocks and those stocks with value characteristics as measured by book-to-market ratio. The investment strategy employs a disciplined, quantitative approach, emphasizing wide diversification and comprehensive exposure to U.S. stocks, but does not attempt to track closely a specific equity index. As of October 31, 2009, the Portfolio held 3,476 stocks and was mostly invested in equities throughout the year: the average non-equitized cash level for the period was less than 1% of the Portfolio’s assets.
As a result of the Portfolio’s diversified investment approach, performance was determined principally by broad structural trends in the U.S. equity market, rather than the behavior of a limited number of stocks. For the 12 months ended October 31, 2009, total returns were 11.64% for the Portfolio and 10.83% for the Russell 3000® Index. Relative to the Index, the Portfolio benefited from its greater small cap and value allocations and a positive size premium and value premium over the last eight months of the period. The Portfolio’s exposure to value stocks (on
18
average 9% more than the Index) added approximately 1.0% to the relative return. The Portfolio’s greater exposure to small cap stocks also contributed to the outperformance. The Portfolio’s increased exposure to the financials sector, which comes as a result of the Portfolio’s construction methodology which emphasizes value companies, detracted approximately 0.5% from relative return.
U.S. Core Equity 2 Portfolio
The U.S. Core Equity 2 Portfolio seeks to capture the returns of the total U.S. market universe with greater exposure to smaller company stocks and those stocks with value characteristics as measured by book-to-market ratio than the U.S. Core Equity 1 Portfolio. The investment strategy employs a disciplined, quantitative approach, emphasizing wide diversification and comprehensive exposure to U.S. stocks, but does not attempt to track closely a specific equity index. As of October 31, 2009, the Portfolio held 3,575 stocks and was mostly invested in equities throughout the year: the average non-equitized cash level for the period was less than 1% of the Portfolio’s assets.
As a result of the Portfolio’s diversified investment approach, performance was determined principally by broad structural trends in the U.S. equity market, rather than the behavior of a limited number of stocks. For the 12 months ended October 31, 2009, total returns were 10.66% for the Portfolio and 10.83% for the Russell 3000® Index. The Portfolio’s increased exposure to the financials sector, which comes as a result of the Portfolio’s construction methodology which emphasizes value companies, detracted approximately 1.5% from the relative return. Relative to the Index, the Portfolio benefited from its greater small cap and value allocations and a positive size premium and value premium over the last eight months of the period. The Portfolio’s exposure to value stocks (on average 17% more than the Index) added approximately 1.3% to the relative return. The Portfolio’s greater exposure to small cap stocks also had a positive impact.
U.S. Vector Equity Portfolio
The U.S. Vector Equity Portfolio seeks to capture the returns of a broadly diversified basket of U.S. stocks with stronger exposure to smaller company stocks and those stocks with value characteristics as measured by book-to-market ratio than the U.S. Core Equity 2 Portfolio. The investment strategy employs a disciplined, quantitative approach, emphasizing broad diversification, but does not attempt to track closely a specific equity index. As of October 31, 2009, the Portfolio held 3,310 stocks and essentially was mostly invested in equities throughout the year: the average non-equitized cash level for the period was less than 1% of the Portfolio’s assets.
As a result of the Portfolio’s diversified investment approach, performance was determined principally by broad structural trends in the U.S. equity market, rather than the behavior of a limited number of stocks. For the 12 months ended October 31, 2009, total returns were 9.47% for the Portfolio and 13.26% for the Russell 2500TM Index. The Portfolio’s increased exposure to the financials sector, which comes as a result of the Portfolio’s construction methodology which emphasizes value companies, detracted approximately 2.5% from the relative return. Relative to the Index, the Portfolio benefited from its greater small cap and value allocations and a positive size premium and value premium over the last eight months of the period. The Portfolio’s exposure to value stocks (more than twice the weight of the Index on average) added approximately 2.2% to the relative return. The Portfolio’s greater exposure to small cap stocks also had a positive impact.
T.A. U.S. Core Equity 2 Portfolio
The T.A. U.S. Core Equity 2 Portfolio seeks to capture the returns of the total U.S. market universe, with increased exposure to smaller company stocks and those stocks with value characteristics as measured by book-to-market ratio, while minimizing federal income tax implications of investment decisions. The investment strategy employs a disciplined, quantitative approach, emphasizing wide diversification and comprehensive exposure to U.S. stocks, but does not attempt to track closely a specific equity index. As of October 31, 2009, the Portfolio held 3,177 stocks and was mostly invested in equities throughout the year: the average non-equitized cash level for the period was less than 1% of the Portfolio’s assets.
As a result of the Portfolio’s diversified investment approach, performance was determined principally by broad structural trends in the U.S. equity market, rather than the behavior of a limited number of stocks. For the 12 months
19
ended October 31, 2009, total returns were 10.28% for the Portfolio and 10.83% for the Russell 3000® Index. The Portfolio’s tilt toward value companies caused an increased exposure to the financials sector, which was the worst performing sector of the period. This increase in exposure and specific composition detracted approximately 1.0% from the Portfolio’s performance relative to the Index. The Portfolio benefited from a positive size premium and value premium over the last eight months of the period. Relative to the Index, the Portfolio benefited from its greater small cap and value allocations and a positive size premium and value premium over the last eight months of the period. The Portfolio’s exposure to value stocks (on average 18% more than the Index) added approximately 1.0% to the relative return. The Portfolio’s greater exposure to small cap stocks also had a positive impact.
U.S. Small Cap Portfolio
The U.S. Small Cap Portfolio seeks to capture the returns of U.S. small company stocks. The investment strategy employs a disciplined, quantitative approach, emphasizing broad diversification and consistent exposure to small company stocks, but does not attempt to track closely a specific equity index. As of October 31, 2009, the Portfolio held 2,780 stocks and was mostly invested in equities throughout the year: the average non-equitized cash level for the period was less than 1% of the Portfolio’s assets.
As a result of the Portfolio’s diversified investment approach, performance was determined principally by broad structural trends in the U.S. equity market, rather than the behavior of a limited number of stocks. For the 12 months ended October 31, 2009, total returns were 13.08% for the Portfolio and 6.46% for the Russell 2000® Index. The Portfolio benefited from a positive size premium over the last eight months of the period. Relative to the Index, the Portfolio’s outperformance was primarily due to a larger allocation to small cap and micro cap stocks. The Portfolio also benefited from its larger allocation to the consumer discretionary and information technology sectors, due to the Portfolio’s strategy of maintaining consistent size exposure, which added approximately 1.7% and 0.7% respectively to the relative performance.
U.S. Micro Cap Portfolio
The U.S. Micro Cap Portfolio seeks to capture the returns of very small U.S. company stocks. The investment strategy employs a disciplined, quantitative approach, emphasizing broad diversification and consistent exposure to very small company stocks, but does not attempt to track closely a specific equity index. As of October 31, 2009, the Portfolio held 2,452 stocks and was mostly invested in equities throughout the year: the average non-equitized cash level for the period was less than 1% of the Portfolio’s assets.
As a result of the Portfolio’s diversified investment approach, performance was determined principally by broad structural trends in the U.S. equity market, rather than the behavior of a limited number of stocks. For the 12 months ended October 31, 2009, total returns were 6.61% for the Portfolio and 6.46% for the Russell 2000® Index. The Portfolio benefited from a positive size premium over the last eight months of the period. Relative to the Index, the Portfolio’s outperformance was primarily due to a larger allocation to micro cap stocks. On average, more than 50% of the Portfolio was allocated to the tiniest micro cap stocks, compared to 25% for the Index, adding approximately 1.1% to the relative performance.
DFA Real Estate Securities Portfolio
The DFA Real Estate Securities Portfolio is designed to capture the returns of a broadly diversified portfolio of real estate securities (e.g., REITs), but does not attempt to track closely a specific index. As of October 31, 2009, the Portfolio held 105 REITs and was mostly invested in equities throughout the year: the average non-equitized cash level for the period was less than 1% of the Portfolio’s assets.
As a result of the Portfolio’s diversified investment approach, performance was determined principally by broad structural trends in the real estate securities market, rather than the behavior of a limited number of stocks. For the 12 months ended October 31, 2009, total returns were 0.98% for the Portfolio, 9.80% for the S&P 500® Index and -0.26% for the Dow Jones U.S. Select REIT IndexSM. Over the period, the Portfolio’s greater diversification than the Dow Jones U.S. Select REIT IndexSM, including allocations to smaller REITs and net-lease REITs entirely excluded from the Index, contributed to the outperformance. Small REITs generally outperformed the broader
20
Index. Composition differences between the Portfolio and the Index across sectors also had a positive impact on the Portfolio’s relative performance.
As of March 31, 2009, the Dow Jones Wilshire REIT IndexSM has been discontinued, and the Dow Jones U.S. Select REIT IndexSM has been selected to take its place as an appropriate benchmark for the Portfolio. According to the index provider, Dow Jones Indexes, the Dow Jones U.S. Select REIT IndexSM uses the same methodology, composition and historical data back to 1987 as the Portfolio’s previous benchmark.
| International Equity Market Review | 12 Months Ended October 31, 2009 |
The one-year period ending October 31, 2009, was characterized by unprecedented volatility in non-US developed markets. Non-US developed markets lost 18.87% from November 2008 through February 2009, as measured by the MSCI World ex USA Index (net dividends). From March through October 2009 these same markets gained 57.56%. In April 2009, the Index had its largest-ever monthly gain (12.90%) since October 1990.
From November 2008 through February 2009, developed markets returns were negative across all asset classes. The US dollar rallied against most currencies, reversing a general trend of depreciation dating back to 2006. From March through October 2009 the market reversed course, with small cap and value stocks strongly outperforming large cap and growth stocks. The US dollar depreciated against most major currencies. The rally drove strong positive returns for the 12-month period, with small cap stocks significantly outperforming large cap stocks and value stocks outperforming growth stocks, as measured by the MSCI indexes.
12 Months Ended October 31, 2009
Ten Largest Foreign Developed Markets by Market Cap (BB) | Local Currency Return | U.S. Dollar Return | ||
Japan ($2,432) | 6.03% | 15.20% | ||
United Kingdom ($2,328) | 23.19% | 25.68% | ||
France ($1,106) | 10.09% | 28.10% | ||
Canada ($1,060) | 17.46% | 32.58% | ||
Australia ($912) | 21.91% | 66.97% | ||
Germany ($843) | 6.37% | 23.77% | ||
Switzerland ($821) | 5.78% | 20.63% | ||
Spain ($488) | 33.27% | 55.06% | ||
Italy ($388) | 7.57% | 25.17% | ||
Netherlands ($277) | 20.17% | 39.83% |
Country market capitalizations (in parentheses) are in USD billions. Source: Returns are of MSCI indices net of foreign withholding taxes on dividends. Country market capitalizations are based on country carve-outs of the MSCI All-Country World Investable Market Index. MSCI data copyright MSCI 2009, all rights reserved.
Small company stocks were the best-performing asset class in international markets, while growth stocks had the worst relative results.
12 Months Ended October 31, 2009
| U.S. Dollar Return | ||
MSCI World ex USA Small Cap Index | 50.01% | |
MSCI World ex USA Value Index | 31.71% | |
MSCI World ex USA Index | 27.83% | |
MSCI World ex USA Growth Index | 24.03% |
Source: MSCI indices are net of foreign withholding taxes on dividends, copyright MSCI 2009, all rights reserved.
21
Gains in emerging markets were better, on average, than in developed markets, although results varied widely among the individual emerging markets countries. For the 12 month period, returns in U.S. dollars were 64.13% for the MSCI Emerging Markets Index (net dividends) and 27.83% for the MSCI World ex USA Index (net dividends).
12 Months Ended October 31, 2009
Country | U.S. Dollar Return | |
Argentina | 53.21% | |
Brazil | 91.55% | |
Chile | 61.68% | |
China | 82.16% | |
Czech Republic | 26.83% | |
Hungary | 63.54% | |
India | 77.12% | |
Indonesia | 127.39% | |
Israel | 31.43% | |
Malaysia | 56.99% | |
Mexico | 39.79% | |
Philippines | 50.71% | |
Poland | 23.09% | |
South Africa | 61.69% | |
South Korea | 56.17% | |
Taiwan | 48.86% | |
Thailand | 78.58% | |
Turkey | 68.21% |
Source: Returns are of MSCI indices net of foreign withholding taxes on dividends, copyright MSCI 2009, all rights reserved.
Global REIT Market Review
The publicly-traded REIT market experienced significant volatility during the 1-year period ended October 31, 2009. REITs were particularly impacted by the credit crises that started with Lehman Brothers’ bankruptcy, as financing became increasingly expensive or unavailable, and serious concerns over both the residential and commercial real estate markets rippled through REIT valuations. The S&P Global REIT Index (net dividends) lost 34.55% from October 31, 2008 through February 28, 2009, which was on the heels of its largest ever monthly decline (–30.56%) in October 2008. The Index then returned 71.68% from February 28 through October 31, 2009, after large amounts of government-supplied liquidity helped ease the credit crisis and restored confidence in the markets. During this 8-month period, the Index saw its largest ever monthly return (+20.9%) in April 2009.
12 Months Ended October 31, 2009
| U.S. Dollar Return | ||
S&P Global ex U.S. REIT Index (net dividends) | 30.51% | |
S&P Global REIT Index (net dividends) | 12.36% |
Master-Feeder Structure
Certain portfolios described below, called “Feeder Funds,” do not buy individual securities directly; instead, these portfolios invest in corresponding funds called “Master Funds.” The Master Funds, in turn, purchase stocks and/or other securities.
22
International Equity Portfolios’ Performance Overview
Large Cap International Portfolio
The Large Cap International Portfolio seeks to capture the returns of a broadly diversified basket of international large company stocks. The investment strategy employs a disciplined quantitative approach, emphasizing broad diversification, but does not attempt to track closely a specific equity index. As of October 31, 2009, the Portfolio held 1,212 stocks in 22 developed country markets and was mostly invested in equities throughout the year: the average non-equitized cash level for the period was less than 1% of the Portfolio’s assets.
As a result of the Portfolio’s diversified investment approach, performance was determined principally by broad structural trends in the international equity markets rather than by the behavior of a limited number of stocks. For the 12 months ended October 31, 2009, total returns were 25.20% for the Portfolio and 27.83% for the MSCI World ex USA Index (net dividends). No single stock, industry sector, or geographical region explained a significant amount of the performance difference. Over the period, there was a wider than usual performance difference between the best and worst performing stocks within countries, industry sectors, and asset classes. Consequently, slight differences in weights or in holdings between the Portfolio and the Index had a significant impact on relative performance.
International Core Equity Portfolio
The International Core Equity Portfolio seeks to capture the returns of a broadly diversified basket of international stocks, with increased exposure to smaller company stocks and those with value characteristics as measured by book-to-market ratio. The investment strategy employs a disciplined quantitative approach, emphasizing broad diversification, but does not attempt to track closely a specific equity index. As of October 31, 2009, the Portfolio held 4,785 stocks in 22 developed country markets and was mostly invested in equities throughout the year: the average non-equitized cash level for the period was less than 1% of the Portfolio’s assets.
As a result of the Portfolio’s diversified investment approach, performance was determined principally by broad structural trends in the international equity markets, rather than by the behavior of a limited number of stocks. For the 12 months ended October 31, 2009, total returns were 34.81% for the Portfolio and 27.83% for the MSCI World ex USA Index (net dividends). Relative to the Index, the Portfolio’s outperformance was primarily due to strong tilts towards small cap and value stocks. On average, the deepest value names constituted 44% of the Portfolio as compared to 26% for the Index. Small cap stocks, which accounted for 18% of the Portfolio on average and were excluded from the Index, also added to relative performance. The Portfolio’s larger relative allocation to materials and industrials, the best performing industries over the period, and smaller relative allocation to utilities and healthcare, the worst performing industries over the period, also contributed to the relative outperformance.
T.A. World ex U.S. Core Equity Portfolio
The T.A. World ex U.S. Core Equity Portfolio seeks to capture the returns of a broadly diversified basket of international stocks in developed and emerging markets, with stronger exposure to smaller company stocks and those with value characteristics as measured by book-to-market ratio. The Portfolio intends to consider the effects of the realization of capital gains and taxable dividend income. When selling a security, the Portfolio typically will select the highest cost shares in order to limit the realization of capital gains and, when possible, will refrain from disposing of a security until the long-term holding period for capital gains tax purposes has been satisfied. The purchase of a stock may be delayed to avoid dividend income, and a stock may be sold to realize a capital loss, subject to applicable investment criteria. The investment strategy employs a disciplined quantitative approach, emphasizing broad diversification, but does not attempt to track closely a specific equity index. As of October 31, 2009, the Portfolio held 4,239 stocks in 22 developed country markets and 18 emerging markets countries. The Portfolio was mostly invested in equities throughout the year as the average non-equitized cash level for the period was less than 1% of the Portfolio’s assets.
As a result of the Portfolio’s diversified investment approach, performance was determined principally by broad structural trends in the international equity markets, rather than by the behavior of a limited number of stocks. For the 12 months ended October 31, 2009, total returns were 42.13% for the Portfolio and 34.10% for the MSCI All
23
Country World ex USA Index (net dividends). Relative to the Index, the Portfolio’s outperformance was primarily due to strong tilts towards small cap and value stocks. On average, the deepest value names constituted 43% of the Portfolio as compared to 26% for the Index. Small cap stocks, which accounted for 37% of the Portfolio as compared to 8% for the Index, also added to relative performance. The Portfolio’s larger relative allocation to materials, financials, and industrials, the best performing industries over the period, and smaller relative allocation to utilities and healthcare, the worst performing industries over the period, also contributed to the relative outperformance.
International Small Company Portfolio
The International Small Company Portfolio seeks to capture the returns of international small company stocks by purchasing shares of five Master Funds that invest individually in Canada, the United Kingdom, Continental Europe (excluding the U.K.), Japan, and Asia Pacific. The investment strategy employs a disciplined, quantitative approach, emphasizing broad diversification and consistent exposure to small company stocks, but does not attempt to track closely a specific equity index. As of October 31, 2009, the Master Funds held 4,201 stocks in 22 developed country markets and were mostly invested in equities throughout the year: the combined average non-equitized cash level for the period was less than 1% of the Master Funds’ assets.
As a result of the Master Funds’ diversified investment approach, performance was determined principally by broad structural trends in international equity markets, rather than the behavior of a limited number of stocks. Over the period, international small company stocks outperformed international large company stocks. For the 12 months ended October 31, 2009, total returns were 42.34% for the Portfolio and 50.01% for the MSCI World ex USA Small Cap Index (net dividends). The Master Funds hold a large number of stocks, and no single stock explained a significant amount of the performance difference. Relative to the Index, the Portfolio underperformed primarily due to composition differences in the Continental Europe region, particularly in value stocks. The Portfolio and Index held a number of securities in common, but in different weights, due to the different methods for defining size and the Portfolio’s exclusion rules. Other differences in performance resulted from the process of continually rebalancing the Master Funds toward their targets. Over the period, there was a wider than usual performance difference between the best and worst performing stocks within countries, industry sectors, and asset classes. Consequently, slight differences in weights or in holdings between the Master Fund and the Index had a significant impact on relative performance.
Japanese Small Company Portfolio
The Japanese Small Company Portfolio seeks to capture the returns of Japanese small company stocks by purchasing shares of a Master Fund that invests in such stocks. The investment strategy employs a disciplined, quantitative approach, emphasizing broad diversification and consistent exposure to small company stocks, but does not attempt to track closely a specific equity index. As of October 31, 2009, the Master Fund held 1,313 stocks and was mostly invested in equities throughout the year: the average non-equitized cash level for period was less than 1% of the Master Fund’s assets.
As a result of the Master Fund’s diversified investment approach, performance was determined principally by broad structural trends in the Japanese equity market, rather than the behavior of a limited number of stocks. Over the period, Japanese small company stocks outperformed Japanese large company stocks. For the 12 months ended October 31, 2009, total returns were 22.08% for the Portfolio and 24.60% for the MSCI Japan Small Cap Index (net dividends). The Master Fund holds a large number of stocks, and no single stock explained a significant amount of the performance difference. Relative to the Index, the Portfolio underperformed primarily due to composition differences, a result of the Master Fund’s process of continually rebalancing toward its target. Over the period, there was a wider than usual performance difference between the best and worst performing stocks within countries, industry sectors, and asset classes. Consequently, slight differences in weights or in holdings between the Master Fund and the Index had a significant impact on relative performance.
Asia Pacific Small Company Portfolio
The Asia Pacific Small Company Portfolio seeks to capture the returns of small company stocks in developed Asia Pacific markets, excluding Japan, by purchasing shares of a Master Fund that invests in such stocks. The
24
investments strategy employs a disciplined, quantitative approach, emphasizing broad diversification and consistent exposure to small company stocks, but does not attempt to track closely a specific equity index. As of October 31, 2009, the Master Fund held 963 stocks, and assets were allocated mainly among four countries: Australia, Hong Kong, New Zealand, and Singapore (approximately 59%, 21%, 7%, and 13% respectively). Country allocations are determined by utilizing the approximate weights of individual securities within a universe of Asia Pacific small company stocks constructed by the Advisor. The allocations do not represent a forecast of future performance and are subject to change by the Advisor. The average non-equitized cash level for period was less than 1% of the Master Fund’s assets.
As a result of the Master Fund’s diversified investment approach, performance was determined principally by broad structural trends in Asia Pacific equity markets rather than the behavior of a limited number of stocks. Over the period, Asia Pacific small company stocks outperformed Asia Pacific large company stocks. For the 12 months ended October 31, 2009, total returns were 84.11% for the Portfolio and 90.41% for the MSCI Pacific ex Japan Small Cap Index (net dividends). The Master Fund holds a large number of stocks, and no single stock explained a significant amount of the performance difference. Relative to the Index, the Portfolio underperformed primarily due to composition differences, a result of the Master Fund’s process of continually rebalancing toward its target. Over the period, there was a wider than usual performance difference between the best and worst performing stocks within countries, industry sectors, and asset classes. Consequently, slight differences in weights or in holdings between the Master Fund and the Index had a significant impact on relative performance.
United Kingdom Small Company Portfolio
The United Kingdom Small Company Portfolio seeks to capture the returns of U.K. small company stocks by purchasing shares of a Master Fund that invests in such stocks. The investment strategy employs a disciplined, quantitative approach, emphasizing broad diversification and consistent exposure to small company stocks, but does not attempt to track closely a specific equity index. As of October 31, 2009, the Master Fund held 386 stocks and was mostly invested in equities throughout the year: the average non-equitized cash level for the period was less than 1% of the Master Fund’s assets.
As a result of the Master Fund’s diversified investment approach, performance was determined principally by broad structural trends in the U.K. equity market, rather than the behavior of a limited number of stocks. Over the period, U.K. small company stocks outperformed U.K. large company stocks. For the 12 months ended October 31, 2009, total returns were 42.81% for the Portfolio and 51.09% for the MSCI UK Small Cap Index (net dividends). The Master Fund holds a large number of stocks, and no single stock explained a significant amount of the performance difference. Relative to the Index, the Portfolio underperformed primarily due to composition differences, a result of the Master Fund’s process of continually rebalancing toward its target. Over the period, there was a wider than usual performance difference between the best and worst performing stocks within countries, industry sectors, and asset classes. Consequently, slight differences in weights or in holdings between the Master Fund and the Index had a significant impact on relative performance.
Continental Small Company Portfolio
The Continental Small Company Portfolio seeks to capture the returns of small company stocks in developed markets of Europe, excluding the U.K., by purchasing shares of a Master Fund that invests in such stocks. The investment strategy employs a disciplined, quantitative approach, emphasizing broad diversification and consistent exposure to small company stocks, but does not attempt to track closely a specific equity index. As of October 31, 2009, the Master Fund held 1,234 stocks in 15 developed continental European countries. Country allocations reflect the approximate weights of individual securities within a universe of continental European small company stocks constructed by the Advisor. Country allocations do not represent a forecast of future performance and are subject to change by the Advisor. The average non-equitized cash level for period was less than 1% of the Master Fund’s assets.
As a result of the Master Fund’s diversified investment approach, performance was determined principally by broad structural trends in the continental European equity markets, excluding the U.K., rather than the behavior of
25
a limited number of stocks. Over the period, continental European small company stocks outperformed continental European large company stocks. For the 12 months ended October 31, 2009, total returns were 43.12% for the Portfolio and 57.29% for the MSCI Europe ex UK Small Cap Index (net dividends). The Master Fund holds a large number of stocks, and no single stock explained a significant amount of the performance difference. Relative to the Index, the Portfolio underperformed primarily due to composition differences, a result of the Portolio’s process of continually rebalancing toward its target. Over the period, there was a wider than usual performance difference between the best and worst performing stocks within countries, industry sectors, and asset classes. Consequently, slight differences in weights or in holdings between the Master Fund and the Index had a significant impact on relative performance.
DFA International Real Estate Securities Portfolio
The DFA International Real Estate Securities Portfolio is designed to capture the returns of a broadly diversified portfolio of real estate securities in international markets, but does not attempt to track closely a specific index. As of October 31, 2009, the Portfolio held 172 stocks in 16 developed and emerging countries and was mostly invested in equities throughout the year: the average non-equitized cash level for the period was less than 1% of the Portfolio’s assets.
As a result of the Portfolio’s diversified approach, performance was determined principally by structural trends in international real estate securities markets, rather than the behavior of a limited number of stocks. For the 12 months ended October 31, 2009, total returns were 29.25% for the Portfolio, 31.95% for the S&P Global ex US REIT Index (gross dividends), and 30.51% for the S&P Global ex US REIT Index (net dividends). The Portfolio’s underperformance relative to the Indexes was primarily the result of withholding taxes, expenses, and a difference in the timing of the pricing of securities and foreign exchange rates between the Portfolio and the Indexes. The Portfolio prices foreign exchange rates at the closing of the U.S. markets while the Index uses rates at 4 P.M. London time. Relative to the Index (net dividends), the Portfolio benefited from a smaller allocation to large cap REITs which generally underperformed over the period.
DFA Global Real Estate Securities Portfolio
The DFA Global Real Estate Securities Portfolio, a fund of funds, is designed to capture the returns of a broadly diversified portfolio of real estate securities in U.S. and international markets, but does not attempt to track closely a specific index. As of October 31, 2009, the Portfolio invested in the DFA International Real Estate Securities Portfolio and the DFA Real Estate Securities Portfolio. As of October 31, 2009, the Portfolio had exposure to 277 stocks, through its underlying funds, in 17 developed and emerging markets countries and was mostly invested in equities throughout the year: the average non-equitized cash level for the period was less than 1% of the Portfolio’s assets.
As a result of the diversified approach of the Portfolio’s underlying funds, performance was principally determined by structural trends in global real estate securities markets, rather than the behavior of a limited number of stocks. For the 12 months ended October 31, 2009, total returns were 13.81% for the Portfolio, 14.11% for the S&P Global REIT Index (gross dividends), and 12.36% for the S&P Global REIT Index (net dividends). Relative to the Index (net dividends), the Portfolio’s outperformance was primarily due to a greater allocation to small cap REITs, which outperformed over the period, and a smaller allocation to large cap REITs, which generally underperformed over the period.
DFA International Small Cap Value Portfolio
The DFA International Small Cap Value Portfolio seeks to capture the returns of international small company value stocks. The investment strategy employs a disciplined, quantitative approach, emphasizing broad diversification and consistent exposure to small company value stocks, but does not attempt to track closely a specific equity index. As of October 31, 2009, the Portfolio held 2,127 stocks in 22 developed countries and was mostly invested in equities throughout the year: the average non-equitized cash level for the period was less than 1% of the Portfolio’s assets.
26
As a result of the Portfolio’s diversified investment approach, performance was determined principally by broad structural trends in international equity markets, rather than the behavior of a limited number of stocks. Over the period, international small stocks outperformed international large stocks and international value stocks outperformed international growth stocks. For the 12 months ended October 31, 2009, total returns were 41.42% for the Portfolio and 50.01% for the MSCI World ex USA Small Cap Index (net dividends). The Portfolio holds a large number of stocks, and no single stock explained a significant amount of the performance difference. The Portfolio’s greater allocation than the Index to value stocks had a positive impact on relative performance. However, composition differences in the Portfolio’s stock portfolio relative to the Index had a greater negative impact. The Portfolio and Index held a number of securities in common, but in different weights, due to the different methods for defining size and value and the Portfolio’s exclusion rules. Other differences in performance resulted from the process of continually rebalancing the Portfolio toward its target. Over the period, there was a wider than usual performance difference between the best and worst performing stocks within countries, industry sectors, and asset classes. Consequently, slight differences in weights or in holdings between the Portfolio and the Index had a significant impact on relative performance.
International Vector Equity Portfolio
The International Vector Equity Portfolio seeks to capture the returns of a broadly diversified basket of international stocks, with stronger exposure to smaller company stocks and those with value characteristics, as measured by book-to-market ratio, than the International Core Equity Portfolio. The investment strategy employs a disciplined quantitative approach, emphasizing broad diversification, but does not attempt to track closely a specific equity index. As of October 31, 2009, the Portfolio held 2,989 stocks in 22 developed country markets and was mostly invested in equities throughout the year: the average non-equitized cash level for the period was less than 1% of the Portfolio’s assets.
As a result of the Portfolio’s diversified investment approach, performance was determined principally by broad structural trends in the international equity markets, rather than by the behavior of a limited number of stocks. For the 12 months ended October 31, 2009, total returns were 39.52% for the Portfolio and 27.83% for the MSCI World ex USA Index (net dividends). Relative to the Index, the Portfolio’s outperformance was primarily due to strong tilts towards small cap and value stocks. On average, the deepest value names constituted 53% of the Portfolio as compared to 26% for the Index. Small cap stocks, which accounted for 26% of the Portfolio on average and were excluded from the Index, also added to relative performance. The Portfolio’s larger relative allocation to materials and industrials, the best performing industries over the period, and smaller relative allocation to utilities and healthcare, the worst performing industries over the period, also contributed to the relative outperformance.
Emerging Markets Portfolio
The Emerging Markets Portfolio seeks to capture the returns of large company stocks in selected emerging markets by purchasing shares of a Master Fund investing in such firms. The investment strategy employs a disciplined quantitative approach, emphasizing broad diversification and consistent exposure to large company emerging markets stocks, but does not attempt to track closely a specific equity index. As of October 31, 2009, the Master Fund held 654 stocks in 18 emerging countries and was mostly invested in equities throughout the year: the average non-equitized cash level for the period was less than 1% of the Portfolio’s assets. The Master Fund’s target country weights are capped at a ceiling set by the manager in order to limit single-country risk exposure.
As a result of the Master Fund’s diversified approach, performance was generally determined by structural trends in emerging country stock markets, rather than the behavior of a limited number of stocks. For the 12 months ended October 31, 2009, total returns were 53.39% for the Portfolio and 64.13% for the MSCI Emerging Markets Index (net dividends). The Portfolio’s relative underperformance was primarily due to differences in country weights and in the composition of the Master Fund’s holdings relative to the Index. Over the period, there was a wider than usual performance difference between the best and worst performing stocks within countries, industry sectors, and asset classes. Consequently, slight differences in weights or in holdings between the Master Fund and the Index had a significant impact on relative performance.
27
Emerging Markets Small Cap Portfolio
The Emerging Markets Small Cap Portfolio seeks to capture the returns of small company stocks in selected emerging markets by purchasing shares of a Master Fund investing in such firms. The investment strategy employs a disciplined quantitative approach, emphasizing broad diversification and consistent exposure to emerging markets small company stocks, but does not attempt to track closely a specific equity index. As of October 31, 2009, the Master Fund held 2,152 stocks across 16 emerging countries and was mostly invested in equities throughout the year: the average non-equitized cash level for the period was less than 1% of the Master Fund’s assets. The Master Fund’s target country weights are capped at a ceiling set by the manager in order to limit single-country risk exposure.
As a result of the Master Fund’s diversified approach, performance was generally determined by structural trends in emerging country stock markets, rather than the behavior of a limited number of stocks. For the 12 months ended October 31, 2009, total returns were 91.35% for the Portfolio and 64.13% for the MSCI Emerging Markets Index (net dividends). The Portfolio outperformed primarily because small cap stocks dramatically outperformed large cap stocks during the period. Over the period, there was a wider than usual performance difference between the best and worst performing stocks within countries, industry sectors, and asset classes. Consequently, slight differences in weights or in holdings between the Master Fund and the Index had a significant impact on relative performance.
Emerging Markets Core Equity Portfolio
The Emerging Markets Core Equity Portfolio seeks to capture the returns of the broad universe of emerging markets stocks with increased exposure to smaller company stocks and those stocks with value characteristics as measured by book-to-market ratio. The investment strategy employs a disciplined quantitative approach, emphasizing broad diversification and consistent exposure to emerging market countries, but does not attempt to track closely a specific equity index. As of October 31, 2009, the Portfolio held 2,665 stocks across 18 emerging countries and was mostly invested in equities throughout the year: the average non-equitized cash level for the period was less than 1% of the Portfolio’s assets. The Portfolio’s target country weights were capped at a ceiling set by the manager in order to limit single-country risk exposure.
As a result of the Portfolio’s diversified approach, performance was generally determined by structural trends in emerging country stock markets, rather than the behavior of a limited number of stocks. For the 12 months ended October 31, 2009, total returns were 69.47% for the Portfolio and 64.13% for the MSCI Emerging Markets Index (net dividends). The Portfolio’s outperformance was primarily due to a stronger tilt than the Index toward value and small cap stocks, which outperformed their growth and large cap counterparts. Composition differences in the Portfolio’s holdings relative to the Index also had a positive impact on the relative performance. Over the period, there was a wider than usual performance difference between the best and worst performing stocks within countries, industry sectors, and asset classes. Consequently, slight differences in weights or in holdings between the Portfolio and the Index had a significant impact on relative performance.
| Fixed Income Market Review | 12 Months Ended October 31, 2009 |
U.S. and international credit markets experienced high levels of volatility in the fiscal year ended October 31, 2009. Investor appetite for credit risk returned as the year progressed, and credit spreads narrowed significantly. Over the course of the year the U.S. Federal Reserve lowered the target rate for federal funds from 1.00% on October 31, 2008 to between 0% and 0.25% by October 31, 2009, and continued to add liquidity into the financial system through various loan programs and capital injections into financial institutions. Central banks around the world took similar actions to loosen credit markets. The three-month London Interbank Offered Rate (LIBOR), a widely-used benchmark of short-term interest rates, fell 275 basis points during the 12 months ended October 31, 2009, while the yield on ten-year U.S. Treasury notes declined 57 basis points. The yield curve remained upwardly sloped throughout the year.
28
| 10/31/09 | 10/31/08 | Change | ||||||||
Three-Month LIBOR (yield) | 0.28% | 3.03% | –90.76% | |||||||
Ten-Year U.S. Treasury Notes (yield) | 3.38% | 3.95% | –14.43% |
Source: Bloomberg. “Change” values are calculated prior to rounding.
There is generally an inverse relationship between interest rates and bond prices, such that bond prices fall when interest rates rise. For the fiscal year under review, changes in interest rates and bond prices were more pronounced in some parts of the yield curve than others. For the 12 months ended October 31, 2009, total returns were 0.32% for three-month U.S. Treasury bills, 6.77% for five-year U.S. Treasury notes, and 5.57% for thirty-year U.S. Treasury bonds.
Some of the Advisor’s fixed income strategies are based on a shifting-maturity strategy that identifies the maturity range with the highest risk-adjusted expected return. When the yield curve is flat or inverted, short-term securities are believed to offer the most attractive opportunity on a risk-adjusted basis. When the yield curve is upwardly sloped, maturities are lengthened to achieve higher returns associated with longer maturities. During the period under review, weighted average maturities of most Portfolios lengthened, reflecting upwardly sloped yield curves in the U.S.
Fixed Income Portfolio Performance Overview
DFA One-Year Fixed Income Portfolio
The DFA One-Year Fixed Income Portfolio seeks to maximize risk-adjusted total returns from a universe of high-quality fixed income securities with an average maturity of one year or less. The investment strategy shifts maturities based on changes in the yield curve. Using current prices, the strategy creates a matrix of expected returns from different buy and sell strategies, and identifies the maturity range for the highest risk-adjusted expected returns according to the variable maturity model. Maturities are shifted if expected premiums can be documented. The average maturity of the Portfolio increased to 340 days on October 31, 2009, from 265 days on October 31, 2008.
For the 12 months ended October 31, 2009 the total return was 3.80% for the Portfolio, 1.05% for the BofA Merrill Lynch Six-Month U.S. Treasury Bill Index, and 1.86% for the BofA Merrill Lynch One-Year U.S. Treasury Note Index. During the period, interest rates declined but maintained a positive expected return premium. Relative to the Indexes, the Portfolio benefited from exposure to securities with higher credit risk premium. The Portfolio had exposure to corporate and agency debt, which significantly outperformed Treasury debt during the period of tightening credit spreads. Additionally, the Portfolio benefited from the period of falling interest rates, as it maintained a higher average maturity than the BofA Merrill Lynch Six-Month U.S. Treasury Bill Index and had allocations to 1-2 year maturity securities, which significantly outperformed less-than-1-year maturity securities. The benchmarks had no exposure to securities with maturities of over one year.
DFA Two-Year Global Fixed Income Portfolio
The DFA Two-Year Global Fixed Income Portfolio seeks to maximize risk-adjusted returns from a universe of U.S. and foreign government securities, high-quality corporate securities, and currency-hedged global fixed income instruments maturing in two years or less. Eligible countries include but are not limited to Australia, Canada, Denmark, France, Germany, Japan, the Netherlands, Norway, Sweden, Switzerland, the United Kingdom, and the United States. The investment strategy shifts maturities based on changes in the yield curve. Using current prices, the strategy creates a matrix of expected returns from different buy and sell strategies and identifies the maturity range for the highest risk-adjusted expected returns according to the variable maturity model. Maturities are shifted if expected premiums can be documented. The average maturity of the Portfolio increased to 1.46 years on October 31, 2009, from 0.74 years on October 31, 2008.
29
For the 12 months ended October 31, 2009 the total return was 3.71% for the Portfolio and 3.42% for the Citigroup World Government Bond Index 1-3 Years (hedged). Relative to the Index, outperformance of the Portfolio was primarily due to structural and maturity differences between the Portfolio and Index. A higher exposure to government agency securities, which outperformed sovereign government debt, had a positive impact on the relative performance. The Portfolio had an average duration of 1.42 years on October 31, 2009 compared to 1.89 years for the Index, which limited relative returns in a falling interest rate environment.
DFA Selectively Hedged Global Fixed Income Portfolio
The DFA Selectively Hedged Global Fixed Income Portfolio seeks to maximize risk-adjusted returns from a universe of U.S. and foreign government securities, high-quality corporate securities, and global fixed income instruments maturing in two years or less. It hedges foreign currency exposure on a selective basis to capture the higher interest rates that may be offered in foreign yield curves. Eligible countries include but are not limited to Australia, Canada, Denmark, the EMU countries, Japan, Sweden, Switzerland, the United Kingdom, and the United States. The investment strategy shifts maturities based on changes in the yield curve. Using current prices, the strategy creates a matrix of expected returns from different buy and sell strategies and identifies the maturity range for the highest risk-adjusted expected returns according to the variable maturity model. Maturities are shifted if expected premiums can be documented. The average maturity of the Portfolio increased to 1.31 years on October 31, 2009, from 0.47 years on October 31, 2008.
For the 12 months ended October 31, 2009, total returns were 12.23% for the Portfolio and 12.18% for the Citigroup World Government Bond Index 1-3 Years (unhedged). Relative to the Index, outperformance of the Portfolio was primarily due to differences in currency exposures. In particular, the Portfolio was aided by its unhedged Australian Dollar, New Zealand Dollar and Norwegian Krone holdings.
DFA Five-Year Government Portfolio
The DFA Five-Year Government Portfolio seeks to maximize risk-adjusted total returns from a universe of U.S. government securities maturing in five years or less. The investment strategy shifts maturities based on changes in the yield curve. Using current prices, the strategy creates a matrix of expected returns from different buy and sell strategies, and identifies the maturity range for the highest risk-adjusted expected returns according to the variable maturity model. Maturities are shifted if expected premiums can be documented. The average maturity of the Portfolio decreased to 3.06 years on October 31, 2009 from 3.46 years on October 31, 2008.
For the 12 months ended October 31, 2009, total returns were 7.27% for the Portfolio and 4.56% for the BofA Merrill Lynch US Treasury/Agency Index 1-5 Years. Relative to the Index, outperformance by the Portfolio was primarily due to structural differences. The Portfolio had much higher exposure to agency debt, which significantly outperformed Treasury debt during the period of significantly tightening credit spreads. Interest rates declined during the period, but the yield curve continued to be upwardly-sloped and exhibited positive expected term premium. The Portfolio also benefited from a longer duration than the Index during the period when interest rates declined.
DFA Five-Year Global Fixed Income Portfolio
The DFA Five-Year Global Fixed Income Portfolio seeks to maximize risk-adjusted returns from a universe of U.S. and foreign government securities, high-quality corporate securities, and currency-hedged global fixed income instruments maturing in five years or less. Eligible countries include but are not limited to Australia, Canada, Denmark, France, Germany, Japan, the Netherlands, Norway, Sweden, Switzerland, the United Kingdom, and the United States. The investment strategy shifts maturities based on changes in the yield curve. Using current prices, the strategy creates a matrix of expected returns from different buy and sell strategies and identifies the maturity range for the highest risk-adjusted expected returns according to the variable maturity model. Maturities are shifted if expected premiums can be documented. The average maturity of the Portfolio increased from 2.46 years on October 31, 2008 to 3.52 years on October 31, 2009.
30
For the 12 months ended October 31, 2009 the total return was 7.74% for the Portfolio and 4.26% for the Citigroup World Government Bond Index 1-5 Years (hedged). Relative to the Index, outperformance by the Portfolio was primarily due to structural and maturity differences. A higher exposure to government agency and corporate securities, during a period when credit spreads narrowed relative to sovereign governments, contributed to the outperformance.
DFA Intermediate Government Fixed Income Portfolio
The DFA Intermediate Government Fixed Income Portfolio seeks to provide a market rate of return and current income from investing generally in U.S. Treasury and government agency issues with maturities of between five and fifteen years. The investment strategy maintains a relatively constant average maturity. The average maturity of the Portfolio decreased to 5.83 years on October 31, 2009 from 6.37 years on October 31, 2008.
For the 12 months ended October 31, 2009, total returns were 10.71% for the Portfolio and 7.05% for the Barclays Capital U.S. Government Bond Index. The Portfolio’s outperformance was primarily due to a much higher allocation to agency debt, which significantly outperformed Treasury debt during the period of tightening credit spreads. The Portfolio also benefited from the period of falling interest rates, as it had a higher allocation to securities with maturities greater than ten years.
DFA Short-Term Extended Quality Portfolio
The DFA Short-Term Extended Quality Fixed Income Portfolio seeks to maximize total returns from a universe of U.S. and foreign corporate debt securities with an investment grade credit rating. The Portfolio emphasizes investment grade obligations rated in the lower half of the investment grade spectrum. However, the Portfolio will not emphasize investment grade obligations rated in the lower half of the investment grade spectrum when the Advisor believes the credit risk premium does not warrant the investment. The Portfolio primarily invests in securities that mature within five years from the date of settlement, and seeks to maintain an average portfolio duration of approximately three years or less. The Portfolio hedges foreign currency risks. The average maturity of the Portfolio was 3.12 years on October 31, 2009.
From the Portfolio’s inception on March 4, 2009, through October 31, 2009, total returns were 7.49% for the Portfolio and 5.24% for the BofA Merrill Lynch US Corporate and Government Index 1-5 Years. Relative to the Index, the Portfolio’s outperformance was primarily due to its significant overweight in corporate securities during the period when corporate securities outperformed government securities. The Portfolio’s average duration remained close to 2.8 years over the period as upwardly sloped yield curves exhibited positive expected return premiums.
DFA Inflation-Protected Securities Portfolio
The DFA Inflation-Protected Securities Portfolio seeks to provide inflation protection and current income from investing generally in inflation-protected securities issued by the US government and its agencies and instrumentalities with maturities of between five and twenty years. The investment strategy maintains a relatively constant average maturity. The average maturity of the Portfolio increased to 8.73 years on October 31, 2009, from 8.60 years on October 31, 2008.
For the 12 months ended October 31, 2009, total returns were 17.70% for the Portfolio and 17.15% for the Barclays Capital U.S. TIPS Index. The Portfolio’s outperformance was primarily due to structural differences with the Index. A much lower allocation to short-term securities, which underperformed intermediate and long-term securities during the period of falling interest rates, contributed to the outperformance.
DFA Short-Term Municipal Bond Portfolio
The DFA Short-Term Municipal Bond Portfolio seeks to provide a market rate of return from a universe of high-quality municipal securities providing current income exempt from federal personal income tax. The weighted average maturity of the Portfolio generally will not exceed three years. The average maturity of the Portfolio increased to 2.78 years on October 31, 2009 from 1.53 years on October 31, 2008.
31
For the 12 months ended October 31, 2009, total returns were 4.32% for the Portfolio and 7.34% for the Barclays Capital Municipal Bond Index 3 Years. Municipal interest rates decreased significantly during the period, and the Portfolio’s relative underperformance was primarily due to its shorter duration.
DFA California Short-Term Municipal Bond Portfolio
The DFA California Short-Term Municipal Bond Portfolio seeks to provide a market rate of return from a universe of municipal securities providing current income exempt from federal personal income taxes and California state personal income taxes. The weighted average maturity of the Portfolio generally will not exceed three years. The average maturity increased to 2.78 years on October 31, 2009, from 2.12 years on October 31, 2008.
For the 12 months ended October 31, 2009, total returns were 4.91% for the Portfolio and 5.37% for the BofA Merrill Lynch California Municipal Bond Index 1-3 Years. California municipal interest rates decreased significantly during the period, and the Portfolio’s 25% average allocation to securities with maturities of less than one year contributed to the relative underperformance.
Sources: Citigroup bond indexes copyright 2009 by Citigroup. Barclays Capital data, formerly Lehman Brothers, provided by Barclays Bank PLC. The Merrill Lynch Indices are used with permission; copyright 2009 Merrill Lynch, Pierce, Fenner & Smith Incorporated; all rights reserved.
32
DFA INVESTMENT DIMENSIONS GROUP INC.
DISCLOSURE OF FUND EXPENSES
(Unaudited)
The following Expense Tables are shown so that you can understand the impact of fees on your investment. All mutual funds have operating expenses. As a shareholder of the fund, you incur ongoing costs, which include costs for portfolio management, administrative services, and shareholder reports, among others. Operating expenses, legal and audit services, which are deducted from a fund’s gross income, directly reduce the investment return of the fund. A fund’s expenses are expressed as a percentage of its average net assets. This figure is known as the expense ratio. The following examples are intended to help you understand the ongoing costs, in dollars, of investing in the fund and to compare these costs with those of other mutual funds. The examples are based on an investment of $1,000 made at the beginning of the period shown and held for the entire period.
The Expense Tables below illustrate your fund’s costs in two ways.
Actual Fund Return
This section helps you to estimate the actual expenses after fee waivers that you paid over the period. The “Ending Account Value” shown is derived from the fund’s actual return and “Expenses Paid During Period” reflect the dollar amount that would have been paid by an investor who started with $1,000 in the fund. You may use the information here, together with the amount you invested, to estimate the expenses that you paid over the period.
To do so, simply divide your account value by $1,000 (for example, a $7,500 account value divided by $1,000 = 7.5), then multiply the result by the number given for your fund under the heading “Expenses Paid During Period.”
Hypothetical Example for Comparison Purposes
This section is intended to help you compare your fund’s costs with those of other mutual funds. The hypothetical “Ending Account Value” and “Expenses Paid During Period” are derived from the fund’s actual expense ratio and an assumed 5% annual return before expenses. In this case, because the return used is not the fund’s actual return, the results do not apply to your investment. The example is useful in making comparisons because the SEC requires all mutual funds to calculate expenses based on a 5% annual return. You can assess your fund’s costs by comparing this hypothetical example with the hypothetical examples that appear in shareholder reports of other funds.
Please note that the expenses shown in the tables are meant to highlight and help you compare ongoing costs only and do not reflect any transactional costs, if applicable. The “Annualized Expense Ratio” represents the actual expenses for the six-month period indicated.
Six Months Ended October 31, 2009
EXPENSE TABLES
| Beginning Account Value 05/01/09 | Ending Account Value 10/31/09 | Annualized Expense Ratio* | Expenses Paid During Period* | |||||||||
U.S. Large Company Portfolio** | ||||||||||||
Actual Fund Return | ||||||||||||
Institutional Class Shares | $ | 1,000.00 | $ | 1,200.60 | 0.15 | % | $ | 0.83 | ||||
Hypothetical 5% Annual Return | ||||||||||||
Institutional Class Shares | $ | 1,000.00 | $ | 1,024.45 | 0.15 | % | $ | 0.77 | ||||
33
DISCLOSURE OF FUND EXPENSES
CONTINUED
| Beginning Account Value 05/01/09 | Ending Account Value 10/31/09 | Annualized Expense Ratio* | Expenses Paid During Period* | |||||
Enhanced U.S. Large Company Portfolio | ||||||||
Actual Fund Return | ||||||||
Institutional Class Shares | $1,000.00 | $1,216.90 | 0.30% | $1.68 | ||||
Hypothetical 5% Annual Return | ||||||||
Institutional Class Shares | $1,000.00 | $1,023.69 | 0.30% | $1.53 | ||||
U.S. Large Cap Value Portfolio** | ||||||||
Actual Fund Return | ||||||||
Institutional Class Shares | $1,000.00 | $1,241.40 | 0.30% | $1.69 | ||||
Hypothetical 5% Annual Return | ||||||||
Institutional Class Shares | $1,000.00 | $1,023.69 | 0.30% | $1.53 | ||||
U.S. Targeted Value Portfolio | ||||||||
Actual Fund Return | ||||||||
Class R1 Shares | $1,000.00 | $1,189.10 | 0.52% | $2.87 | ||||
Class R2 Shares | $1,000.00 | $1,189.90 | 0.68% | $3.75 | ||||
Institutional Class Shares | $1,000.00 | $1,190.70 | 0.42% | $2.32 | ||||
Hypothetical 5% Annual Return | ||||||||
Class R1 Shares | $1,000.00 | $1,022.58 | 0.52% | $2.65 | ||||
Class R2 Shares | $1,000.00 | $1,021.78 | 0.68% | $3.47 | ||||
Institutional Class Shares | $1,000.00 | $1,023.09 | 0.42% | $2.14 | ||||
U.S. Small Cap Value Portfolio | ||||||||
Actual Fund Return | ||||||||
Institutional Class Shares | $1,000.00 | $1,214.80 | 0.54% | $3.01 | ||||
Hypothetical 5% Annual Return | ||||||||
Institutional Class Shares | $1,000.00 | $1,022.48 | 0.54% | $2.75 | ||||
U.S. Core Equity 1 Portfolio | ||||||||
Actual Fund Return | ||||||||
Institutional Class Shares | $1,000.00 | $1,194.80 | 0.23% | $1.27 | ||||
Hypothetical 5% Annual Return | ||||||||
Institutional Class Shares | $1,000.00 | $1,024.05 | 0.23% | $1.17 | ||||
U.S. Core Equity 2 Portfolio | ||||||||
Actual Fund Return | ||||||||
Institutional Class Shares | $1,000.00 | $1,192.60 | 0.25% | $1.38 | ||||
Hypothetical 5% Annual Return | ||||||||
Institutional Class Shares | $1,000.00 | $1,023.95 | 0.25% | $1.28 | ||||
U.S. Vector Equity Portfolio | ||||||||
Actual Fund Return | ||||||||
Institutional Class Shares | $1,000.00 | $1,196.70 | 0.36% | $1.99 | ||||
Hypothetical 5% Annual Return | ||||||||
Institutional Class Shares | $1,000.00 | $1,023.39 | 0.36% | $1.84 | ||||
34
DISCLOSURE OF FUND EXPENSES
CONTINUED
| Beginning Account Value 05/01/09 | Ending Account Value 10/31/09 | Annualized Expense Ratio* | Expenses Paid During Period* | |||||
T.A. U.S. Core Equity 2 Portfolio | ||||||||
Actual Fund Return | ||||||||
Institutional Class Shares | $1,000.00 | $1,188.30 | 0.29% | $1.60 | ||||
Hypothetical 5% Annual Return | ||||||||
Institutional Class Shares | $1,000.00 | $1,023.74 | 0.29% | $1.48 | ||||
U.S. Small Cap Portfolio | ||||||||
Actual Fund Return | ||||||||
Institutional Class Shares | $1,000.00 | $1,200.50 | 0.40% | $2.22 | ||||
Hypothetical 5% Annual Return | ||||||||
Institutional Class Shares | $1,000.00 | $1,023.19 | 0.40% | $2.04 | ||||
U.S. Micro Cap Portfolio | ||||||||
Actual Fund Return | ||||||||
Institutional Class Shares | $1,000.00 | $1,175.90 | 0.55% | $3.02 | ||||
Hypothetical 5% Annual Return | ||||||||
Institutional Class Shares | $1,000.00 | $1,022.43 | 0.55% | $2.80 | ||||
DFA Real Estate Securities Portfolio | ||||||||
Actual Fund Return | ||||||||
Institutional Class Shares | $1,000.00 | $1,270.00 | 0.37% | $2.12 | ||||
Hypothetical 5% Annual Return | ||||||||
Institutional Class Shares | $1,000.00 | $1,023.34 | 0.37% | $1.89 | ||||
Large Cap International Portfolio | ||||||||
Actual Fund Return | ||||||||
Institutional Class Shares | $1,000.00 | $1,299.90 | 0.32% | $1.86 | ||||
Hypothetical 5% Annual Return | ||||||||
Institutional Class Shares | $1,000.00 | $1,023.59 | 0.32% | $1.63 | ||||
International Core Equity Portfolio | ||||||||
Actual Fund Return | ||||||||
Institutional Class Shares | $1,000.00 | $1,347.00 | 0.42% | $2.48 | ||||
Hypothetical 5% Annual Return | ||||||||
Institutional Class Shares | $1,000.00 | $1,023.09 | 0.42% | $2.14 | ||||
T.A. World ex U.S. Core Equity Portfolio | ||||||||
Actual Fund Return | ||||||||
Institutional Class Shares | $1,000.00 | $1,363.10 | 0.51% | $3.04 | ||||
Hypothetical 5% Annual Return | ||||||||
Institutional Class Shares | $1,000.00 | $1,022.63 | 0.51% | $2.60 | ||||
International Small Company Portfolio*** | ||||||||
Actual Fund Return | ||||||||
Institutional Class Shares | $1,000.00 | $1,372.40 | 0.57% | $3.41 | ||||
Hypothetical 5% Annual Return | ||||||||
Institutional Class Shares | $1,000.00 | $1,022.33 | 0.57% | $2.91 | ||||
35
DISCLOSURE OF FUND EXPENSES
CONTINUED
| Beginning Account Value 05/01/09 | Ending Account Value 10/31/09 | Annualized Expense Ratio* | Expenses Paid During Period* | |||||
Japanese Small Company Portfolio** | ||||||||
Actual Fund Return | ||||||||
Institutional Class Shares | $1,000.00 | $1,226.20 | 0.57% | $3.20 | ||||
Hypothetical 5% Annual Return | ||||||||
Institutional Class Shares | $1,000.00 | $1,022.33 | 0.57% | $2.91 | ||||
Asia Pacific Small Company Portfolio** | ||||||||
Actual Fund Return | ||||||||
Institutional Class Shares | $1,000.00 | $1,670.90 | 0.64% | $4.31 | ||||
Hypothetical 5% Annual Return | ||||||||
Institutional Class Shares | $1,000.00 | $1,021.98 | 0.64% | $3.26 | ||||
United Kingdom Small Company Portfolio** | ||||||||
Actual Fund Return | ||||||||
Institutional Class Shares | $1,000.00 | $1,334.70 | 0.62% | $3.65 | ||||
Hypothetical 5% Annual Return | ||||||||
Institutional Class Shares | $1,000.00 | $1,022.08 | 0.62% | $3.16 | ||||
Continental Small Company Portfolio** | ||||||||
Actual Fund Return | ||||||||
Institutional Class Shares | $1,000.00 | $1,394.00 | 0.62% | $3.74 | ||||
Hypothetical 5% Annual Return | ||||||||
Institutional Class Shares | $1,000.00 | $1,022.08 | 0.62% | $3.16 | ||||
DFA International Real Estate Securities Portfolio | ||||||||
Actual Fund Return | ||||||||
Institutional Class Shares | $1,000.00 | $1,459.60 | 0.43% | $2.67 | ||||
Hypothetical 5% Annual Return | ||||||||
Institutional Class Shares | $1,000.00 | $1,023.04 | 0.43% | $2.19 | ||||
DFA Global Real Estate Securities Portfolio*** | ||||||||
Actual Fund Return | ||||||||
Institutional Class Shares | $1,000.00 | $1,360.90 | 0.47% | $2.80 | ||||
Hypothetical 5% Annual Return | ||||||||
Institutional Class Shares | $1,000.00 | $1,022.84 | 0.47% | $2.40 | ||||
DFA International Small Cap Value Portfolio | ||||||||
Actual Fund Return | ||||||||
Institutional Class Shares | $1,000.00 | $1,360.20 | 0.71% | $4.22 | ||||
Hypothetical 5% Annual Return | ||||||||
Institutional Class Shares | $1,000.00 | $1,021.63 | 0.71% | $3.62 | ||||
International Vector Equity Portfolio | ||||||||
Actual Fund Return | ||||||||
Institutional Class Shares | $1,000.00 | $1,359.20 | 0.60% | $3.57 | ||||
Hypothetical 5% Annual Return | ||||||||
Institutional Class Shares | $1,000.00 | $1,022.18 | 0.60% | $3.06 | ||||
36
DISCLOSURE OF FUND EXPENSES
CONTINUED
| Beginning Account Value 05/01/09 | Ending Account Value 10/31/09 | Annualized Expense Ratio* | Expenses Paid During Period* | |||||
Emerging Markets Portfolio** | ||||||||
Actual Fund Return | ||||||||
Institutional Class Shares | $1,000.00 | $1,380.80 | 0.62% | $3.72 | ||||
Hypothetical 5% Annual Return | ||||||||
Institutional Class Shares | $1,000.00 | $1,022.08 | 0.62% | $3.16 | ||||
Emerging Markets Small Cap Portfolio** | ||||||||
Actual Fund Return | ||||||||
Institutional Class Shares | $1,000.00 | $1,509.00 | 0.80% | $5.06 | ||||
Hypothetical 5% Annual Return | ||||||||
Institutional Class Shares | $1,000.00 | $1,021.17 | 0.80% | $4.08 | ||||
Emerging Markets Core Equity Portfolio | ||||||||
Actual Fund Return | ||||||||
Institutional Class Shares | $1,000.00 | $1,422.40 | 0.67% | $4.09 | ||||
Hypothetical 5% Annual Return | ||||||||
Institutional Class Shares | $1,000.00 | $1,021.83 | 0.67% | $3.41 | ||||
DFA One-Year Fixed Income Portfolio**** | ||||||||
Actual Fund Return | ||||||||
Institutional Class Shares | $1,000.00 | $1,013.20 | 0.22% | $1.12 | ||||
Hypothetical 5% Annual Return | ||||||||
Institutional Class Shares | $1,000.00 | $1,024.10 | 0.22% | $1.12 | ||||
DFA Two-Year Global Fixed Income Portfolio**** | ||||||||
Actual Fund Return | ||||||||
Institutional Class Shares | $1,000.00 | $1,013.30 | 0.22% | $1.12 | ||||
Hypothetical 5% Annual Return | ||||||||
Institutional Class Shares | $1,000.00 | $1,024.10 | 0.22% | $1.12 | ||||
DFA Selectively Hedged Global Fixed Income Portfolio | ||||||||
Actual Fund Return | ||||||||
Institutional Class Shares | $1,000.00 | $1,091.70 | 0.26% | $1.37 | ||||
Hypothetical 5% Annual Return | ||||||||
Institutional Class Shares | $1,000.00 | $1,023.89 | 0.26% | $1.33 | ||||
DFA Five-Year Government Portfolio | ||||||||
Actual Fund Return | ||||||||
Institutional Class Shares | $1,000.00 | $1,018.90 | 0.27% | $1.37 | ||||
Hypothetical 5% Annual Return | ||||||||
Institutional Class Shares | $1,000.00 | $1,023.84 | 0.27% | $1.38 | ||||
DFA Five-Year Global Fixed Income Portfolio | ||||||||
Actual Fund Return | ||||||||
Institutional Class Shares | $1,000.00 | $1,037.70 | 0.32% | $1.64 | ||||
Hypothetical 5% Annual Return | ||||||||
Institutional Class Shares | $1,000.00 | $1,023.59 | 0.32% | $1.63 | ||||
37
DISCLOSURE OF FUND EXPENSES
CONTINUED
| Beginning Account Value 05/01/09 | Ending Account Value 10/31/09 | Annualized Expense Ratio* | Expenses Paid During Period* | |||||||
DFA Intermediate Government Fixed Income Portfolio | ||||||||||
Actual Fund Return | ||||||||||
Institutional Class Shares | $ | 1,000.00 | $ | 1,026.90 | 0.16% | $0.82 | ||||
Hypothetical 5% Annual Return | ||||||||||
Institutional Class Shares | $ | 1,000.00 | $ | 1,024.40 | 0.16% | $0.82 | ||||
DFA Short-Term Extended Quality Portfolio | ||||||||||
Actual Fund Return | ||||||||||
Institutional Class Shares | $ | 1,000.00 | $ | 1,060.60 | 0.22% | $1.14 | ||||
Hypothetical 5% Annual Return | ||||||||||
Institutional Class Shares | $ | 1,000.00 | $ | 1,024.10 | 0.22% | $1.12 | ||||
DFA Inflation-Protected Securities Portfolio | ||||||||||
Actual Fund Return | ||||||||||
Institutional Class Shares | $ | 1,000.00 | $ | 1,066.20 | 0.17% | $0.89 | ||||
Hypothetical 5% Annual Return | ||||||||||
Institutional Class Shares | $ | 1,000.00 | $ | 1,024.35 | 0.17% | $0.87 | ||||
DFA Short-Term Municipal Bond Portfolio | ||||||||||
Actual Fund Return | ||||||||||
Institutional Class Shares | $ | 1,000.00 | $ | 1,010.10 | 0.26% | $1.32 | ||||
Hypothetical 5% Annual Return | ||||||||||
Institutional Class Shares | $ | 1,000.00 | $ | 1,023.89 | 0.26% | $1.33 | ||||
DFA California Short-Term Municipal Bond Portfolio | ||||||||||
Actual Fund Return | ||||||||||
Institutional Class Shares | $ | 1,000.00 | $ | 1,009.70 | 0.27% | $1.37 | ||||
Hypothetical 5% Annual Return | ||||||||||
Institutional Class Shares | $ | 1,000.00 | $ | 1,023.84 | 0.27% | $1.38 | ||||
| * | Expenses are equal to the fund’s annualized expense ratio for the six-month period, multiplied by the average account value over the period, multiplied by the number of days in the most recent six-month period (184), then divided by the number of days in the year (365) to reflect the six-month period. |
| ** | The Portfolio is a Feeder Fund. The expenses shown reflect the direct expenses of the Feeder Fund and the indirect payment of the Feeder Fund’s portion of the expenses of its Master Fund (Affiliated Investment Company). |
| *** | The Portfolio is a Fund of Funds. The expenses shown reflect the direct expenses of the Fund of Funds and the indirect payment of the Fund of Funds’ portion of the expenses of its Master Funds (Affiliated Investment Companies). |
| **** | Effective October 23, 2009, the Portfolio invests directly in securities rather than through the Master Fund. The expenses shown reflect the direct expenses of the Portfolio and the indirect payments of the Portfolio’s portion of the expenses, for the period May 1, 2009 through October 22, 2009 of the Master Fund (Affiliated Investment Company). |
38
DFA INVESTMENT DIMENSIONS GROUP INC.
DISCLOSURE OF PORTFOLIO HOLDINGS
(Unaudited)
The SEC requires that all Funds file a complete Schedule of Investments with the SEC for their first and third fiscal quarters on Form N-Q. For DFA Investment Dimensions Group Inc., this would be for the fiscal quarters ending January 31 and July 31. The Form N-Q filing must be made within 60 days of the end of the quarter. DFA Investment Dimensions Group Inc. filed its most recent Form N-Q with the SEC on September 29, 2009. It is available upon request, without charge, by calling collect: (512) 306-7400 or by mailing a request to Dimensional Fund Advisors LP, 6300 Bee Cave Road, Building One, Austin, Texas 78746, or by visiting the SEC’s website at http://www.sec.gov, or they may be reviewed and copied at the SEC’s Public Reference Room in Washington, D.C. (call 1-800-732-0330 for information on the operation of the Public Reference Room).
SEC regulations permit a fund to include in its reports to shareholders a “Summary Schedule of Portfolio Holdings” in lieu of a full Schedule of Investments. The Summary Schedule of Portfolio Holdings reports the fund’s 50 largest holdings in unaffiliated issuers and any investments that exceed one percent of the fund’s net assets at the end of the reporting period. The amendments also require that the Summary Schedule of Portfolio Holdings identify each category of investments that are held.
The fund is required to file a complete Schedule of Investments with the SEC on Form N-CSR within ten days after mailing the annual and semi-annual reports to shareholders. It will be available upon request, without charge, by calling collect: (512) 306-7400 or by mailing a request to Dimensional Fund Advisors LP, 6300 Bee Cave Road, Building One, Austin, Texas 78746, or by visiting the SEC’s website at http://www.sec.gov, or they may be reviewed and copied at the SEC’s Public Reference Room in Washington, D.C. (call 1-800-732-0330 for information on the operation of the Public Reference Room).
PORTFOLIO HOLDINGS
The SEC requires that all Funds present their categories of portfolio holdings in a table, chart or graph format in their annual and semi-annual shareholder reports, whether or not a Schedule of Investments is utilized. The following table, which presents portfolio holdings as a percent of total investments before short-term investments and collateral for loaned securities, is provided in compliance with such requirement. The categories shown below represent broad industry sectors. Each industry sector consists of one or more specific industry classifications.
The categories of industry classification for the Affiliated Investment Companies are represented in the Disclosure of Portfolio Holdings, which are included elsewhere within the report. Refer to the Schedule of Investments/Summary Schedule of Portfolio Holdings for each of the underlying Master Funds’ holdings which reflect the investments by category or country.
FEEDER FUNDS
| Affiliated Investment Companies | ||
U.S. Large Company Portfolio | 100.0% | |
U.S. Large Cap Value Portfolio | 100.0% | |
International Small Company Portfolio | 100.0% | |
Japanese Small Company Portfolio | 100.0% | |
Asia Pacific Small Company Portfolio | 100.0% | |
United Kingdom Small Company Portfolio | 100.0% | |
Continental Small Company Portfolio | 100.0% | |
DFA Global Real Estate Securities Portfolio | 100.0% | |
Emerging Markets Portfolio | 100.0% | |
Emerging Markets Small Cap Portfolio | 100.0% |
39
DISCLOSURE OF PORTFOLIO HOLDINGS
CONTINUED
DOMESTIC AND INTERNATIONAL EQUITY PORTFOLIOS
| U.S. Targeted Value Portfolio | ||
Consumer Discretionary | 18.1% | |
Consumer Staples | 3.5% | |
Energy | 8.5% | |
Financials | 22.6% | |
Health Care | 7.3% | |
Industrials | 14.8% | |
Information Technology | 18.2% | |
Materials | 6.2% | |
Telecommunication Services | 0.3% | |
Utilities | 0.5% | |
| 100.0% | ||
| U.S. Small Cap Value Portfolio | ||
Consumer Discretionary | 18.3% | |
Consumer Staples | 3.0% | |
Energy | 8.7% | |
Financials | 22.6% | |
Health Care | 6.1% | |
Industrials | 18.2% | |
Information Technology | 16.5% | |
Materials | 6.3% | |
Other | — | |
Telecommunication Services | 0.3% | |
Utilities | — | |
| 100.0% | ||
| U.S. Core Equity 1 Portfolio | ||
Consumer Discretionary | 12.7% | |
Consumer Staples | 9.0% | |
Energy | 10.1% | |
Financials | 15.7% | |
Health Care | 11.6% | |
Industrials | 12.1% | |
Information Technology | 17.3% | |
Materials | 4.9% | |
Other | — | |
Telecommunication Services | 2.7% | |
Utilities | 3.9% | |
| 100.0% | ||
| U.S. Core Equity 2 Portfolio | ||
Consumer Discretionary | 14.5% | |
Consumer Staples | 7.2% | |
Energy | 10.4% | |
Financials | 19.4% | |
Health Care | 10.1% | |
Industrials | 12.9% | |
Information Technology | 14.6% | |
Materials | 5.2% | |
Other | — | |
Telecommunication Services | 3.1% | |
Utilities | 2.6% | |
| 100.0% | ||
| U.S. Vector Equity Portfolio | ||
Consumer Discretionary | 16.3% | |
Consumer Staples | 5.2% | |
Energy | 10.0% | |
Financials | 23.3% | |
Health Care | 8.9% | |
Industrials | 13.0% | |
Information Technology | 14.3% | |
Materials | 5.6% | |
Other | — | |
Telecommunication Services | 1.9% | |
Utilities | 1.5% | |
| 100.0% | ||
| T.A. U.S. Core Equity 2 Portfolio | ||
Consumer Discretionary | 14.8% | |
Consumer Staples | 6.8% | |
Energy | 10.3% | |
Financials | 18.5% | |
Health Care | 10.3% | |
Industrials | 13.5% | |
Information Technology | 14.8% | |
Materials | 4.8% | |
Telecommunication Services | 3.4% | |
Utilities | 2.8% | |
| 100.0% | ||
| U.S. Small Cap Portfolio | ||
Consumer Discretionary | 18.1% | |
Consumer Staples | 4.2% | |
Energy | 5.6% | |
Financials | 12.8% | |
Health Care | 13.0% | |
Industrials | 17.3% | |
Information Technology | 20.6% | |
Materials | 5.0% | |
Other | — | |
Telecommunication Services | 1.1% | |
Utilities | 2.3% | |
| 100.0% | ||
| U.S. Micro Cap Portfolio | ||
Consumer Discretionary | 17.6% | |
Consumer Staples | 4.8% | |
Energy | 3.5% | |
Financials | 14.5% | |
Health Care | 14.5% | |
Industrials | 16.7% | |
Information Technology | 21.3% | |
Materials | 4.2% | |
Other | — | |
Telecommunication Services | 1.2% | |
Utilities | 1.7% | |
| 100.0% | ||
| DFA Real Estate Securities Portfolio | ||
Real Estate Investment Trusts | 100.0% | |
| 100.0% | ||
| Large Cap International Portfolio | ||
Consumer Discretionary | 9.3% | |
Consumer Staples | 9.5% | |
Energy | 9.9% | |
Financials | 25.7% | |
Health Care | 7.5% | |
Industrials | 10.9% | |
Information Technology | 4.9% | |
Materials | 10.8% | |
Other | — | |
Real Estate Investment Trusts | — | |
Telecommunication Services | 6.0% | |
Utilities | 5.5% | |
| 100.0% | ||
| International Core Equity Portfolio | ||
Consumer Discretionary | 13.3% | |
Consumer Staples | 6.8% | |
Energy | 8.4% | |
Financials | 26.8% | |
Health Care | 4.1% | |
Industrials | 16.2% | |
Information Technology | 5.4% | |
Materials | 13.0% | |
Other | 0.1% | |
Real Estate Investment Trusts | — | |
Telecommunication Services | 3.1% | |
Utilities | 2.8% | |
| 100.0% | ||
| T.A. World ex U.S. Core Equity Portfolio | ||
Consumer Discretionary | 12.7% | |
Consumer Staples | 6.3% | |
Energy | 7.4% | |
Financials | 27.0% | |
Health Care | 4.0% | |
Industrials | 16.1% | |
Information Technology | 6.5% | |
Materials | 14.3% | |
Other | 0.1% | |
Real Estate Investment Trusts | — | |
Telecommunication Services | 2.8% | |
Utilities | 2.8% | |
| 100.0% | ||
| 40 |
DISCLOSURE OF PORTFOLIO HOLDINGS
CONTINUED
| DFA International Real Estate Securities Portfolio | ||
Financials | 5.3% | |
Other | — | |
Real Estate Investment Trusts | 94.7% | |
| 100.0% | ||
| DFA International Small Cap Value Portfolio | ||
Consumer Discretionary | 18.4% | |
Consumer Staples | 6.9% | |
Energy | 4.4% | |
Financials | 21.4% | |
Health Care | 1.8% | |
Industrials | 23.3% | |
Information Technology | 5.7% | |
Materials | 17.2% | |
Other | 0.1% | |
Real Estate Investment Trusts | 0.1% | |
Telecommunication Services | 0.3% | |
Utilities | 0.4% | |
| 100.0% | ||
| International Vector Equity Portfolio | ||
Consumer Discretionary | 15.2% | |
Consumer Staples | 5.9% | |
Energy | 6.8% | |
Financials | 26.2% | |
Health Care | 3.5% | |
Industrials | 18.0% | |
Information Technology | 6.1% | |
Materials | 15.1% | |
Other | 0.1% | |
Real Estate Investment Trusts | — | |
Telecommunication Services | 1.7% | |
Utilities | 1.4% | |
| 100.0% | ||
| Emerging Markets Core Equity Portfolio | ||
Consumer Discretionary | 10.2% | |
Consumer Staples | 6.6% | |
Energy | 9.1% | |
Financials | 23.5% | |
Health Care | 3.7% | |
Industrials | 11.3% | |
Information Technology | 9.9% | |
Materials | 16.2% | |
Other | 0.1% | |
Real Estate Investment Trusts | — | |
Telecommunication Services | 5.9% | |
Utilities | 3.5% | |
| 100.0% | ||
FIXED INCOME PORTFOLIOS
| Enhanced U.S. Large Company Portfolio | ||
Corporate | 20.2% | |
Government | 21.0% | |
Foreign Corporate | 19.7% | |
Foreign Government | 34.3% | |
Supranational | 4.8% | |
| 100.0% | ||
| DFA One-Year Fixed Income Portfolio | ||
Corporate | 43.2% | |
Government | 39.5% | |
Foreign Corporate | 7.2% | |
Foreign Government | 9.8% | |
Supranational | 0.3% | |
| 100.0% | ||
| DFA Two-Year Global Fixed Income Portfolio | ||
Corporate | 13.2% | |
Government | 36.7% | |
Foreign Corporate | 13.4% | |
Foreign Government | 35.1% | |
Supranational | 1.6% | |
| 100.0% | ||
| DFA Selectively Hedged Global Fixed Income Portfolio | ||
Corporate | 13.2% | |
Government | 25.9% | |
Foreign Corporate | 20.5% | |
Foreign Government | 30.5% | |
Supranational | 9.9% | |
| 100.0% | ||
| DFA Five-Year Government Portfolio | ||
Government | 100.0% | |
| 100.0% | ||
| DFA Five-Year Global Fixed Income Portfolio | ||
Corporate | 16.4% | |
Government | 29.9% | |
Foreign Corporate | 18.7% | |
Foreign Government | 22.3% | |
Supranational | 12.7% | |
| 100.0% | ||
| DFA Intermediate Government Fixed Income Portfolio | ||
Government | 100.0% | |
| 100.0% | ||
| DFA Short-Term Extended Quality Portfolio | ||
Corporate | 59.8% | |
Government | 6.7% | |
Foreign Corporate | 13.8% | |
Foreign Government | 18.3% | |
Supranational | 1.4% | |
| 100.0% | ||
| DFA Inflation-Protected Securities Portfolio | ||
Government | 100.0% | |
| 100.0% | ||
| DFA Short-Term Municipal Bond Portfolio | ||
Muni Insured | 30.3% | |
Muni G.O. Local | 30.0% | |
Muni G.O. State | 27.6% | |
Muni Revenue | 12.1% | |
| 100.0% | ||
| DFA California Short-Term Municipal Bond Portfolio | ||
Muni Insured | 57.6% | |
Muni G.O. Local | 14.4% | |
Muni G.O. State | 15.7% | |
Muni Revenue | 12.3% | |
| 100.0% | ||
41
DFA INVESTMENT DIMENSIONS GROUP INC.
SCHEDULE OF INVESTMENTS
October 31, 2009
U.S. LARGE COMPANY PORTFOLIO
Value† | |||
AFFILIATED INVESTMENT COMPANY — (100.0%) | |||
Investment in The U.S. Large Company Series of The DFA Investment Trust Company | $ | 2,719,708,191 | |
TOTAL INVESTMENTS IN AFFILIATED INVESTMENT COMPANY | $ | 2,719,708,191 | |
Summary of inputs used to value the Portfolio’s net assets as of October 31, 2009 is as follows (See Security Valuation Note):
| Valuation Inputs | ||||||||||
| Investment in Securities (Market Value) | ||||||||||
| Level 1 | Level 2 | Level 3 | Total | |||||||
Affiliated Investment Company | $ | 2,719,708,191 | — | — | $ | 2,719,708,191 | ||||
See accompanying Notes to Financial Statements.
42
ENHANCED U.S. LARGE COMPANY PORTFOLIO
SCHEDULE OF INVESTMENTS
October 31, 2009
Face | Value† | ||||
(000) | |||||
BONDS — (70.1%) | |||||
AUSTRALIA — (4.8%) | |||||
Australia & New Zealand Banking Group, Ltd. | |||||
(u) 4.875%, 11/08/10 | 3,258 | $ | 3,351,439 | ||
(u) 5.500%, 05/24/11 | 1,000 | 1,052,732 | |||
Commonwealth Bank of Australia | |||||
(u) 4.750%, 01/27/11 | 434 | 447,160 | |||
(g) 6.000%, 03/18/11 | 1,000 | 1,729,714 | |||
National Australia Bank, Ltd. | |||||
(u) 5.125%, 03/08/10 | 1,500 | 1,520,665 | |||
TOTAL AUSTRALIA | 8,101,710 | ||||
AUSTRIA — (3.4%) | |||||
ASFINAG | |||||
(u) 4.750%, 11/17/10 | 3,500 | 3,639,191 | |||
Oesterreichische Kontrollbank AG | |||||
(u) 2.875%, 03/15/11 | 1,000 | 1,030,422 | |||
Republic of Austria | |||||
(u) 4.375%, 08/30/10 | 1,000 | 1,030,087 | |||
TOTAL AUSTRIA | 5,699,700 | ||||
CANADA — (8.1%) | |||||
Canada Housing Trust | |||||
4.600%, 09/15/11 | 2,000 | 1,956,934 | |||
Canadian Government Bond | |||||
1.250%, 06/01/11 | 2,500 | 2,318,747 | |||
Ontario, Province of Canada | |||||
(u) 3.125%, 09/08/10 | 3,400 | 3,475,361 | |||
Royal Bank of Canada | |||||
(u) 5.650%, 07/20/11 | 1,500 | 1,611,332 | |||
(e) 5.750%, 07/25/11 | 2,000 | 3,130,774 | |||
Toronto-Dominion Bank | |||||
(g) 6.875%, 06/24/11 | 650 | 1,147,065 | |||
TOTAL CANADA | 13,640,213 | ||||
FRANCE — (3.1%) | |||||
Agence Francaise de Developpement | |||||
(u) 4.125%, 06/24/11 | 1,500 | 1,565,511 | |||
Caisse D’amortissement de la Dette Sociale | |||||
(u) 4.250%, 11/08/10 | 3,500 | 3,615,916 | |||
TOTAL FRANCE | 5,181,427 | ||||
Face | Value† | ||||
(000) | |||||
GERMANY — (7.4%) | |||||
Kreditanstalt fuer Wiederaufbau | |||||
(u) 4.625%, 01/20/11 | 3,000 | $ | 3,132,237 | ||
(g) 4.375%, 03/07/11 | 600 | 1,024,404 | |||
Landeskreditbank Baden-Wuerttemberg Foerderbank | |||||
(u) 3.250%, 10/29/10 | 4,000 | 4,089,112 | |||
Landwirtschaftliche Rentenbank | |||||
(u) 4.250%, 01/21/11 | 4,000 | 4,156,204 | |||
TOTAL GERMANY | 12,401,957 | ||||
JAPAN — (0.6%) | |||||
Japan Finance Corp. | |||||
(u) 2.000%, 06/24/11 | 1,000 | 1,015,621 | |||
NETHERLANDS — (10.0%) | |||||
Bank Nederlandse Gemeenten | |||||
(u) 3.375%, 12/15/10 | 3,000 | 3,076,824 | |||
(u) 3.375%, 01/18/11 | 800 | 822,731 | |||
Deutsche Bahn Finance | |||||
(u) 5.125%, 01/05/11 | 4,500 | 4,678,285 | |||
Nederlandse Waterschapsbank | |||||
(u) 2.875%, 06/16/11 | 4,000 | 4,100,980 | |||
Rabobank Nederland | |||||
(u) 5.000%, 02/15/11 | 2,200 | 2,306,971 | |||
(g) 5.000%, 04/11/11 | 1,000 | 1,708,046 | |||
TOTAL NETHERLANDS | 16,693,837 | ||||
NORWAY — (2.5%) | |||||
Kommunalbanken | |||||
(u) 3.250%, 06/15/11 | 4,000 | 4,129,264 | |||
SPAIN — (2.7%) | |||||
Instituto de Credito Oficial | |||||
(u) 4.625%, 10/26/10 | 3,400 | 3,519,112 | |||
(u) 1.875%, 04/15/11 | 1,000 | 1,013,200 | |||
TOTAL SPAIN | 4,532,312 | ||||
SUPRANATIONAL ORGANIZATION OBLIGATIONS — (4.6%) | |||||
Council of Europe Development Bank | |||||
(u) 6.125%, 01/25/11 | 2,000 | 2,121,490 | |||
Inter-American Development Bank | |||||
(u) 5.000%, 04/05/11 | 1,500 | 1,586,520 | |||
43
ENHANCED U.S. LARGE COMPANY PORTFOLIO
CONTINUED
Face | Value† | ||||
(000) | |||||
SUPRANATIONAL ORGANIZATION OBLIGATIONS — (Continued) | |||||
Nordic Investment Bank | |||||
(u) 4.875%, 03/15/11 | 3,840 | $ | 4,060,401 | ||
TOTAL SUPRANATIONAL ORGANIZATION OBLIGATIONS | 7,768,411 | ||||
SWEDEN — (3.3%) | |||||
Kommuninvest I Sverige | |||||
(u) 5.375%, 06/15/11 | 1,000 | 1,061,023 | |||
Svensk Exportkredit AB | |||||
(u) 4.000%, 06/15/10 | 4,332 | 4,424,800 | |||
TOTAL SWEDEN | 5,485,823 | ||||
UNITED KINGDOM — (5.7%) | |||||
BP Capital Markets P.L.C. Floating Rate Note | |||||
(r)(u)1.293%, 03/17/11 | 2,000 | 2,027,078 | |||
Network Rail Infrastructure Finance P.L.C. | |||||
(u) 3.000%, 01/24/11 | 3,115 | 3,191,031 | |||
United Kingdom Gilt | |||||
9.000%, 07/12/11 | 2,300 | 4,272,379 | |||
TOTAL UNITED KINGDOM | 9,490,488 | ||||
UNITED STATES — (13.9%) | |||||
CME Group, Inc. Floating Rate Note | |||||
(r) 1.121%, 08/06/10 | $4,000 | 4,019,660 | |||
General Electric Capital Corp. Floating Rate Note | |||||
(r) 0.933%, 02/01/11 | 4,000 | 3,982,756 | |||
John Deere Capital Corp. Floating Rate Note | |||||
(r) 0.837%, 02/26/10 | 4,000 | 4,005,840 | |||
JPMorgan Chase & Co. Floating Rate Note | |||||
(r) 0.781%, 11/19/09 | 2,000 | 2,000,504 | |||
(r) 1.050%, 06/13/11 | 1,800 | 1,812,994 | |||
Procter & Gamble International Funding Floating Rate Note | |||||
(r) 0.478%, 05/07/10 | 400 | 399,620 | |||
Toyota Motor Credit Corp. Floating Rate Note | |||||
(r) 0.345%, 06/16/10 | 1,000 | 1,000,631 | |||
(r) 0.384%, 10/04/11 | 2,000 | 1,996,186 | |||
Face | Value† | |||||
(000) | ||||||
UNITED STATES — (Continued) | ||||||
Wells Fargo Bank & Co. | ||||||
4.625%, 08/09/10 | $ | 4,000 | $ | 4,121,152 | ||
TOTAL UNITED STATES | 23,339,343 | |||||
TOTAL BONDS | 117,480,106 | |||||
AGENCY OBLIGATIONS — (18.0%) | ||||||
Federal Farm Credit Bank | ||||||
1.125%, 10/03/11 | 2,000 | 1,998,506 | ||||
Federal Home Loan Bank | ||||||
1.625%, 03/16/11 | 1,000 | 1,013,162 | ||||
1.375%, 05/16/11 | 1,500 | 1,514,568 | ||||
3.750%, 09/09/11 | 2,000 | 2,105,046 | ||||
v 3.625%, 09/16/11 | 4,200 | 4,414,070 | ||||
Federal Home Loan Bank Discount Note | ||||||
(y) 0.077%, 12/11/09 | 15,000 | 14,999,028 | ||||
Federal Home Loan Mortgage Corporation | ||||||
6.000%, 06/15/11 | 1,000 | 1,083,118 | ||||
Federal National Mortgage Association | ||||||
3.375%, 05/19/11 | 3,000 | 3,122,145 | ||||
TOTAL AGENCY OBLIGATIONS | 30,249,643 | |||||
COMMERCIAL PAPER — (8.4%) | ||||||
Bank of America Corp. | ||||||
0.100%, 11/02/09 | 2,500 | 2,499,986 | ||||
Caisse Cent Desjardins Du Quebec | ||||||
0.310%, 11/19/09 | 2,000 | 1,999,728 | ||||
Ireland | ||||||
0.400%, 11/20/09 | 2,000 | 1,999,711 | ||||
PACCAR Financial Corp. | ||||||
0.200%, 12/17/09 | 2,000 | 1,999,408 | ||||
Procter & Gamble International Funding | ||||||
0.220%, 11/02/09 | 2,000 | 1,999,971 | ||||
Queensland Treasury Corp. | ||||||
0.190%, 12/15/09 | 2,000 | 1,999,438 | ||||
Total Capital | ||||||
0.170%, 12/30/09 | 1,500 | 1,499,570 | ||||
TOTAL COMMERCIAL PAPER | 13,997,812 | |||||
Shares | ||||||
EXCHANGE-TRADED FUND — (2.7%) | ||||||
UNITED STATES — (2.7%) | ||||||
SPDR Trust Series I | 44,100 | 4,566,996 | ||||
44
ENHANCED U.S. LARGE COMPANY PORTFOLIO
CONTINUED
Shares | Value† | ||||
TEMPORARY CASH INVESTMENTS — (0.8%) | |||||
BlackRock Liquidity Funds Tempcash Portfolio - Institutional Shares | 1,327,514 | $ | 1,327,514 | ||
Value† | |||
TOTAL INVESTMENTS — (100.0%) | $ | 167,622,071 | |
Summary of inputs used to value the Portfolio’s net assets as of October 31, 2009 is as follows (See Security Valuation Note):
| Valuation Inputs | |||||||||||
| Investment in Securities (Market Value) | |||||||||||
| Level 1 | Level 2 | Level 3 | Total | ||||||||
Bonds | $ | — | $ | 117,480,106 | — | $ | 117,480,106 | ||||
Agency Obligations | — | 30,249,643 | — | 30,249,643 | |||||||
Commercial Paper | — | 13,997,812 | — | 13,997,812 | |||||||
Exchange-Traded Fund | 4,566,996 | — | — | 4,566,996 | |||||||
Temporary Cash Investments | 1,327,514 | — | — | 1,327,514 | |||||||
Other Financial Instruments** | 1,705,113 | 38,625 | — | 1,743,738 | |||||||
TOTAL | $ | 7,599,623 | $ | 161,766,186 | — | $ | 169,365,809 | ||||
| ** | Other financial instruments are derivative instruments not reflected in the Schedule of Investments, such as futures and forwards which are valued at the unrealized appreciation/depreciation on the investment. |
See accompanying Notes to Financial Statements.
45
DFA INVESTMENT DIMENSIONS GROUP INC.
SCHEDULE OF INVESTMENTS
October 31, 2009
U.S. LARGE CAP VALUE PORTFOLIO
Value† | |||
AFFILIATED INVESTMENT COMPANY — (100.0%) | |||
Investment in The U.S. Large Cap Value Series of The DFA Investment Trust Company | $ | 5,864,670,633 | |
TOTAL INVESTMENTS IN AFFILIATED INVESTMENT COMPANY | $ | 5,864,670,633 | |
Summary of inputs used to value the Portfolio’s net assets as of October 31, 2009 is as follows (See Security Valuation Note):
| Valuation Inputs | ||||||||||
| Investment in Securities (Market Value) | ||||||||||
| Level 1 | Level 2 | Level 3 | Total | |||||||
Affiliated Investment Company | $ | 5,864,670,633 | — | — | $ | 5,864,670,633 | ||||
See accompanying Notes to Financial Statements.
46
SUMMARY SCHEDULE OF PORTFOLIO HOLDINGS
October 31, 2009
Shares | Value† | Percentage | |||||
COMMON STOCKS — (83.3%) | |||||||
Consumer Discretionary — (15.1%) | |||||||
#*AutoNation, Inc. | 285,685 | $ | 4,925,209 | 0.3% | |||
Cinemark Holdings, Inc. | 382,492 | 4,433,082 | 0.3% | ||||
#*Collective Brands, Inc. | 278,432 | 5,164,914 | 0.4% | ||||
#Jarden Corp. | 239,973 | 6,572,860 | 0.5% | ||||
#*Mohawk Industries, Inc. | 102,954 | 4,409,520 | 0.3% | ||||
#*Penske Automotive Group, Inc. | 322,318 | 5,047,500 | 0.3% | ||||
Phillips-Van Heusen Corp. | 104,053 | 4,177,728 | 0.3% | ||||
#*Royal Caribbean Cruises, Ltd. | 278,627 | 5,636,624 | 0.4% | ||||
#*Toll Brothers, Inc. | 269,219 | 4,662,873 | 0.3% | ||||
#Whirlpool Corp. | 110,030 | 7,877,048 | 0.5% | ||||
#Wyndham Worldwide Corp. | 271,939 | 4,636,560 | 0.3% | ||||
Other Securities | 211,275,934 | 14.2% | |||||
Total Consumer Discretionary | 268,819,852 | 18.1% | |||||
Consumer Staples — (2.9%) | |||||||
*Constellation Brands, Inc. Class A | 282,958 | 4,476,396 | 0.3% | ||||
Del Monte Foods Co. | 386,240 | 4,171,392 | 0.3% | ||||
#PepsiAmericas, Inc. | 160,714 | 4,699,277 | 0.3% | ||||
Other Securities | 38,325,835 | 2.6% | |||||
Total Consumer Staples | 51,672,900 | 3.5% | |||||
Energy — (7.1%) | |||||||
#Cimarex Energy Co. | 126,477 | 4,952,839 | 0.3% | ||||
#Pioneer Natural Resources Co. | 149,975 | 6,165,472 | 0.4% | ||||
*Plains Exploration & Production Co. | 155,941 | 4,132,436 | 0.3% | ||||
*Whiting Petroleum Corp. | 72,600 | 4,094,640 | 0.3% | ||||
Other Securities | 106,147,722 | 7.2% | |||||
Total Energy | 125,493,109 | 8.5% | |||||
Financials — (18.9%) | |||||||
American Financial Group, Inc. | 221,530 | 5,449,638 | 0.3% | ||||
#*AmeriCredit Corp. | 308,822 | 5,450,708 | 0.4% | ||||
First American Corp. | 179,565 | 5,456,980 | 0.4% | ||||
*First Horizon National Corp. | 346,956 | 4,104,489 | 0.3% | ||||
Genworth Financial, Inc. | 545,763 | 5,796,003 | 0.4% | ||||
Hanover Insurance Group, Inc. | 99,669 | 4,192,078 | 0.3% | ||||
HCC Insurance Holdings, Inc. | 177,467 | 4,683,354 | 0.3% | ||||
Huntington Bancshares, Inc. | 1,168,996 | 4,453,875 | 0.3% | ||||
#Old Republic International Corp. | 431,692 | 4,610,471 | 0.3% | ||||
Reinsurance Group of America, Inc. | 119,151 | 5,492,861 | 0.4% | ||||
Transatlantic Holdings, Inc. | 115,613 | 5,838,456 | 0.4% | ||||
White Mountains Insurance Group, Ltd. | 15,966 | 4,952,174 | 0.3% | ||||
Other Securities | 274,940,649 | 18.5% | |||||
Total Financials | 335,421,736 | 22.6% | |||||
Health Care — (6.1%) | |||||||
#*Community Health Systems, Inc. | 178,748 | 5,591,237 | 0.4% | ||||
#*Inverness Medical Innovations, Inc. | 131,000 | 4,979,310 | 0.3% | ||||
*King Pharmaceuticals, Inc. | 479,100 | 4,853,283 | 0.3% | ||||
Other Securities | 92,153,883 | 6.2% | |||||
Total Health Care | 107,577,713 | 7.2% | |||||
Industrials — (12.3%) | |||||||
Applied Industrial Technologies, Inc. | 202,120 | 4,088,888 | 0.3% | ||||
Masco Corp. | 483,152 | 5,677,036 | 0.4% | ||||
#Ryder System, Inc. | 101,652 | 4,121,989 | 0.3% | ||||
47
U.S. TARGETED VALUE PORTFOLIO
CONTINUED
Shares | Value† | Percentage | |||||
Industrials — (Continued) | |||||||
Other Securities | $ | 205,535,777 | 13.8% | ||||
Total Industrials | 219,423,690 | 14.8% | |||||
Information Technology — (15.2%) | |||||||
*3Com Corp. | 1,419,866 | 7,298,111 | 0.5% | ||||
*Arrow Electronics, Inc. | 227,021 | 5,752,712 | 0.4% | ||||
*Avnet, Inc. | 196,527 | 4,869,939 | 0.3% | ||||
*Benchmark Electronics, Inc. | 298,403 | 5,013,170 | 0.3% | ||||
#*Cypress Semiconductor Corp. | 579,563 | 4,885,716 | 0.3% | ||||
*Euronet Worldwide, Inc. | 170,179 | 4,024,733 | 0.3% | ||||
Fidelity National Information Services, Inc. | 259,600 | 5,648,896 | 0.4% | ||||
*IAC/InterActiveCorp. | 221,621 | 4,197,502 | 0.3% | ||||
*Ingram Micro, Inc. | 317,283 | 5,600,045 | 0.4% | ||||
Jabil Circuit, Inc. | 387,509 | 5,184,870 | 0.3% | ||||
#*Rovi Corp. | 191,465 | 5,274,861 | 0.4% | ||||
*Tech Data Corp. | 220,978 | 8,492,185 | 0.6% | ||||
Other Securities | 203,236,729 | 13.7% | |||||
Total Information Technology | 269,479,469 | 18.2% | |||||
Materials — (5.1%) | |||||||
Cabot Corp. | 204,579 | 4,486,417 | 0.3% | ||||
#MeadWestavco Corp. | 313,877 | 7,165,812 | 0.5% | ||||
Other Securities | 79,535,488 | 5.3% | |||||
Total Materials | 91,187,717 | 6.1% | |||||
Telecommunication Services — (0.2%) | |||||||
Other Securities | 4,169,050 | 0.3% | |||||
Utilities — (0.4%) | |||||||
Other Securities | 7,562,210 | 0.5% | |||||
TOTAL COMMON STOCKS | 1,480,807,446 | 99.8% | |||||
RIGHTS/WARRANTS — (0.0%) | |||||||
Other Securities | 969 | 0.0% | |||||
TEMPORARY CASH INVESTMENTS — (0.9%) | |||||||
BlackRock Liquidity Funds Tempcash Portfolio - Institutional Shares | 15,296,895 | 15,296,895 | 1.0% | ||||
Shares/ Face Amount | |||||||
| (000) | |||||||
SECURITIES LENDING COLLATERAL — (15.8%) | |||||||
§@DFA Short Term Investment Fund LP | 278,907,219 | 278,907,219 | 18.8% | ||||
@Repurchase Agreement, Deutsche Bank Securities 0.08%, 11/02/09 (Collateralized by $2,598,967 FHLMC 5.793%(r), 01/01/37, valued at $1,459,993) to be repurchased at $1,417,478 | $1,417 | 1,417,469 | 0.1% | ||||
TOTAL SECURITIES LENDING COLLATERAL | 280,324,688 | 18.9% | |||||
TOTAL INVESTMENTS — (100.0%) | $ | 1,776,429,998 | 119.7% | ||||
48
U.S. TARGETED VALUE PORTFOLIO
CONTINUED
Summary of inputs used to value the Portfolio’s net assets as of October 31, 2009 is as follows (See Security Valuation Note):
| Valuation Inputs | |||||||||||
| Investment in Securities (Market Value) | |||||||||||
| Level 1 | Level 2 | Level 3 | Total | ||||||||
Common Stocks | |||||||||||
Consumer Discretionary | $ | 268,812,122 | $ | 7,730 | — | $ | 268,819,852 | ||||
Consumer Staples | 51,672,900 | — | — | 51,672,900 | |||||||
Energy | 125,493,109 | — | — | 125,493,109 | |||||||
Financials | 335,421,736 | — | — | 335,421,736 | |||||||
Health Care | 107,577,713 | — | — | 107,577,713 | |||||||
Industrials | 219,423,690 | — | — | 219,423,690 | |||||||
Information Technology | 269,476,519 | 2,950 | — | 269,479,469 | |||||||
Materials | 91,187,717 | — | — | 91,187,717 | |||||||
Telecommunication Services | 4,169,050 | — | — | 4,169,050 | |||||||
Utilities | 7,562,210 | — | — | 7,562,210 | |||||||
Rights/Warrants | 969 | — | — | 969 | |||||||
Temporary Cash Investments | 15,296,895 | — | — | 15,296,895 | |||||||
Securities Lending Collateral | — | 280,324,688 | — | 280,324,688 | |||||||
TOTAL | $ | 1,496,094,630 | $ | 280,335,368 | — | $ | 1,776,429,998 | ||||
See accompanying Notes to Financial Statements.
49
U.S. SMALL CAP VALUE PORTFOLIO
SUMMARY SCHEDULE OF PORTFOLIO HOLDINGS
October 31, 2009
Shares | Value† | Percentage | |||||
COMMON STOCKS — (86.3%) | |||||||
Consumer Discretionary — (15.8%) | |||||||
#American Greetings Corp. Class A | 1,904,200 | $ | 38,731,428 | 0.7% | |||
Bob Evans Farms, Inc. | 984,921 | 25,873,875 | 0.4% | ||||
Foot Locker, Inc. | 2,143,946 | 22,468,554 | 0.4% | ||||
Jarden Corp. | 1,909,448 | 52,299,781 | 0.9% | ||||
Jones Apparel Group, Inc. | 1,788,255 | 31,991,882 | 0.6% | ||||
#*Penske Automotive Group, Inc. | 2,028,957 | 31,773,467 | 0.6% | ||||
#Scholastic Corp. | 1,711,917 | 42,575,376 | 0.7% | ||||
Other Securities | 793,297,778 | 14.0% | |||||
Total Consumer Discretionary | 1,039,012,141 | 18.3% | |||||
Consumer Staples — (2.6%) | |||||||
#*Hain Celestial Group, Inc. | 1,303,172 | 22,857,637 | 0.4% | ||||
#Universal Corp. | 653,753 | 27,189,587 | 0.5% | ||||
Other Securities | 119,553,794 | 2.1% | |||||
Total Consumer Staples | 169,601,018 | 3.0% | |||||
Energy — (7.5%) | |||||||
*Bristow Group, Inc. | 929,038 | 27,081,458 | 0.5% | ||||
#*Helix Energy Solutions Group, Inc. | 1,727,104 | 23,713,138 | 0.4% | ||||
#Overseas Shipholding Group, Inc. | 736,187 | 28,895,340 | 0.5% | ||||
#*SEACOR Holdings, Inc. | 312,838 | 25,424,344 | 0.5% | ||||
Other Securities | 385,596,115 | 6.8% | |||||
Total Energy | 490,710,395 | 8.7% | |||||
Financials — (19.5%) | |||||||
#*AmeriCredit Corp. | 2,109,220 | 37,227,733 | 0.7% | ||||
*Argo Group International Holdings, Ltd. | 919,019 | 31,209,885 | 0.5% | ||||
Delphi Financial Group, Inc. Class A | 1,232,969 | 26,755,427 | 0.5% | ||||
Infinity Property & Casualty Corp. | 579,946 | 22,426,512 | 0.4% | ||||
*Navigators Group, Inc. | 458,215 | 24,317,470 | 0.4% | ||||
#NewAlliance Bancshares, Inc. | 3,348,207 | 37,098,134 | 0.6% | ||||
#*PHH Corp. | 1,619,647 | 26,173,496 | 0.5% | ||||
#Prosperity Bancshares, Inc. | 777,550 | 27,828,514 | 0.5% | ||||
Provident Financial Services, Inc. | 2,524,606 | 27,139,514 | 0.5% | ||||
Selective Insurance Group, Inc. | 1,931,259 | 29,586,888 | 0.5% | ||||
Unitrin, Inc. | 1,168,143 | 22,895,603 | 0.4% | ||||
Washington Federal, Inc. | 1,442,759 | 24,743,317 | 0.4% | ||||
#Wintrust Financial Corp. | 865,512 | 24,416,094 | 0.4% | ||||
Other Securities | 916,613,580 | 16.2% | |||||
Total Financials | 1,278,432,167 | 22.5% | |||||
Health Care — (5.2%) | |||||||
*Kindred Healthcare, Inc. | 1,556,280 | 22,877,316 | 0.4% | ||||
#*LifePoint Hospitals, Inc. | 1,732,785 | 49,089,799 | 0.9% | ||||
Other Securities | 271,704,113 | 4.8% | |||||
Total Health Care | 343,671,228 | 6.1% | |||||
Industrials — (15.8%) | |||||||
#Alexander & Baldwin, Inc. | 1,094,786 | 31,562,680 | 0.6% | ||||
#Applied Industrial Technologies, Inc. | 1,273,350 | 25,759,871 | 0.4% | ||||
#Briggs & Stratton Corp. | 1,918,846 | 35,882,420 | 0.6% | ||||
*EnerSys, Inc. | 1,239,788 | 27,399,315 | 0.5% | ||||
*Esterline Technologies Corp. | 1,043,023 | 43,921,699 | 0.8% | ||||
#GATX Corp. | 1,374,465 | 37,357,959 | 0.7% | ||||
*MPS Group, Inc. | 2,729,886 | 36,908,059 | 0.6% | ||||
*Oshkosh Truck Corp. Class B | 1,447,301 | 45,242,629 | 0.8% | ||||
50
U.S. SMALL CAP VALUE PORTFOLIO
CONTINUED
Shares | Value† | Percentage | |||||
Industrials — (Continued) | |||||||
Seaboard Corp. | 18,999 | $ | 25,667,649 | 0.4% | |||
SkyWest, Inc. | 1,621,728 | 22,655,540 | 0.4% | ||||
#Trinity Industries, Inc. | 1,569,201 | 26,488,113 | 0.5% | ||||
Watts Water Technologies, Inc. | 882,816 | 24,939,552 | 0.4% | ||||
Other Securities | 650,146,702 | 11.5% | |||||
Total Industrials | 1,033,932,188 | 18.2% | |||||
Information Technology — (14.2%) | |||||||
*Benchmark Electronics, Inc. | 2,841,081 | 47,730,161 | 0.8% | ||||
#*Coherent, Inc. | 952,417 | 23,934,239 | 0.4% | ||||
*Integrated Device Technology, Inc. | 3,811,553 | 22,411,932 | 0.4% | ||||
*MKS Instruments, Inc. | 1,978,214 | 30,939,267 | 0.6% | ||||
#*Skyworks Solutions, Inc. | 3,593,575 | 37,480,987 | 0.7% | ||||
#*SYNNEX Corp. | 978,845 | 25,185,682 | 0.4% | ||||
*Tech Data Corp. | 1,314,127 | 50,501,901 | 0.9% | ||||
Other Securities | 696,324,463 | 12.3% | |||||
Total Information Technology | 934,508,632 | 16.5% | |||||
Materials — (5.4%) | |||||||
#*Coeur d’Alene Mines Corp. | 1,229,731 | 24,692,998 | 0.5% | ||||
#*OM Group, Inc. | 836,126 | 22,592,125 | 0.4% | ||||
#Westlake Chemical Corp. | 1,707,624 | 41,478,187 | 0.7% | ||||
Other Securities | 266,133,234 | 4.7% | |||||
Total Materials | 354,896,544 | 6.3% | |||||
Other — (0.0%) | |||||||
Other Securities | 14,709 | 0.0% | |||||
Telecommunication Services — (0.3%) | |||||||
Other Securities | 19,487,174 | 0.3% | |||||
Utilities — (0.0%) | |||||||
Other Securities | 1,886,349 | 0.0% | |||||
TOTAL COMMON STOCKS | 5,666,152,545 | 99.9% | |||||
RIGHTS/WARRANTS — (0.0%) | |||||||
Other Securities | 8,086 | 0.0% | |||||
Shares/ Face Amount | |||||||
| (000) | |||||||
SECURITIES LENDING COLLATERAL — (13.7%) | |||||||
§@DFA Short Term Investment Fund LP | 891,912,224 | 891,912,224 | 15.7% | ||||
@Repurchase Agreement, Deutsche Bank Securities 0.08%, 11/02/09 (Collateralized by $12,306,408 FHLMC 5.945%(r), 07/01/37, valued at $9,454,190) to be repurchased at $9,178,886 | $9,179 | 9,178,825 | 0.2% | ||||
TOTAL SECURITIES LENDING COLLATERAL | 901,091,049 | 15.9% | |||||
TOTAL INVESTMENTS — (100.0%) | $ | 6,567,251,680 | 115.8% | ||||
51
U.S. SMALL CAP VALUE PORTFOLIO
CONTINUED
Summary of inputs used to value the Portfolio’s net assets as of October 31, 2009 is as follows (See Security Valuation Note):
| Valuation Inputs | |||||||||||
| Investment in Securities (Market Value) | |||||||||||
| Level 1 | Level 2 | Level 3 | Total | ||||||||
Common Stocks | |||||||||||
Consumer Discretionary | $ | 1,038,674,739 | $ | 337,402 | — | $ | 1,039,012,141 | ||||
Consumer Staples | 169,601,018 | — | — | 169,601,018 | |||||||
Energy | 490,710,395 | — | — | 490,710,395 | |||||||
Financials | 1,278,432,167 | — | — | 1,278,432,167 | |||||||
Health Care | 343,010,581 | 660,647 | — | 343,671,228 | |||||||
Industrials | 1,033,932,188 | — | — | 1,033,932,188 | |||||||
Information Technology | 934,303,993 | 204,639 | — | 934,508,632 | |||||||
Materials | 354,896,544 | — | — | 354,896,544 | |||||||
Other | — | 14,709 | — | 14,709 | |||||||
Telecommunication Services | 19,487,174 | — | — | 19,487,174 | |||||||
Utilities | 1,886,349 | — | — | 1,886,349 | |||||||
Rights/Warrants | 8,086 | — | — | 8,086 | |||||||
Securities Lending Collateral | — | 901,091,049 | — | 901,091,049 | |||||||
TOTAL | $ | 5,664,943,234 | $ | 902,308,446 | — | $ | 6,567,251,680 | ||||
See accompanying Notes to Financial Statements.
52
SUMMARY SCHEDULE OF PORTFOLIO HOLDINGS
October 31, 2009
Shares | Value† | Percentage | |||||
COMMON STOCKS — (87.6%) | |||||||
Consumer Discretionary — (11.1%) | |||||||
*Amazon.com, Inc. | 49,380 | $ | 5,866,838 | 0.3% | |||
Comcast Corp. Class A | 347,609 | 5,040,331 | 0.3% | ||||
Disney (Walt) Co. | 289,025 | 7,910,614 | 0.4% | ||||
#Home Depot, Inc. | 200,625 | 5,033,681 | 0.2% | ||||
McDonald’s Corp. | 124,831 | 7,316,345 | 0.4% | ||||
Time Warner, Inc. | 188,821 | 5,687,289 | 0.3% | ||||
Other Securities | 215,017,573 | 10.8% | |||||
Total Consumer Discretionary | 251,872,671 | 12.7% | |||||
Consumer Staples — (7.9%) | |||||||
Coca-Cola Co. | 250,108 | 13,333,257 | 0.7% | ||||
CVS Caremark Corp. | 263,150 | 9,289,195 | 0.5% | ||||
Kraft Foods, Inc. | 255,784 | 7,039,176 | 0.3% | ||||
#PepsiCo, Inc. | 171,759 | 10,400,007 | 0.5% | ||||
Philip Morris International, Inc. | 212,774 | 10,076,977 | 0.5% | ||||
Procter & Gamble Co. | 341,128 | 19,785,424 | 1.0% | ||||
Wal-Mart Stores, Inc. | 347,708 | 17,274,133 | 0.9% | ||||
Other Securities | 90,417,306 | 4.5% | |||||
Total Consumer Staples | 177,615,475 | 8.9% | |||||
Energy — (8.9%) | |||||||
Anadarko Petroleum Corp. | 76,361 | 4,652,676 | 0.2% | ||||
Apache Corp. | 58,756 | 5,530,115 | 0.3% | ||||
Chevron Corp. | 276,544 | 21,166,678 | 1.1% | ||||
ConocoPhillips | 239,732 | 12,029,752 | 0.6% | ||||
Exxon Mobil Corp. | 442,772 | 31,733,469 | 1.6% | ||||
Occidental Petroleum Corp. | 64,024 | 4,858,141 | 0.3% | ||||
Schlumberger, Ltd. | 129,860 | 8,077,292 | 0.4% | ||||
Other Securities | 112,273,218 | 5.6% | |||||
Total Energy | 200,321,341 | 10.1% | |||||
Financials — (13.8%) | |||||||
Bank of America Corp. | 1,196,477 | 17,444,635 | 0.9% | ||||
Bank of New York Mellon Corp. | 186,378 | 4,968,837 | 0.3% | ||||
Goldman Sachs Group, Inc. | 77,173 | 13,132,529 | 0.7% | ||||
JPMorgan Chase & Co. | 629,826 | 26,307,832 | 1.3% | ||||
Morgan Stanley | 209,929 | 6,742,919 | 0.3% | ||||
Travelers Cos., Inc. (The) | 98,865 | 4,922,488 | 0.2% | ||||
U.S. Bancorp | 210,315 | 4,883,514 | 0.2% | ||||
Wells Fargo & Co. | 683,030 | 18,796,986 | 0.9% | ||||
Other Securities | 214,138,947 | 10.8% | |||||
Total Financials | 311,338,687 | 15.6% | |||||
Health Care — (10.1%) | |||||||
Abbott Laboratories | 178,855 | 9,044,697 | 0.5% | ||||
*Amgen, Inc. | 127,585 | 6,855,142 | 0.3% | ||||
Bristol-Myers Squibb Co. | 231,655 | 5,050,079 | 0.2% | ||||
Johnson & Johnson | 304,296 | 17,968,679 | 0.9% | ||||
#Merck & Co., Inc. | 237,954 | 7,359,917 | 0.4% | ||||
Pfizer, Inc. | 1,180,571 | 20,105,124 | 1.0% | ||||
Schering-Plough Corp. | 182,136 | 5,136,235 | 0.3% | ||||
UnitedHealth Group, Inc. | 183,755 | 4,768,442 | 0.2% | ||||
Other Securities | 152,555,741 | 7.7% | |||||
Total Health Care | 228,844,056 | 11.5% | |||||
53
U.S. CORE EQUITY 1 PORTFOLIO
CONTINUED
Shares | Value† | Percentage | |||||
Industrials — (10.6%) | |||||||
3M Co. | 79,085 | $ | 5,818,283 | 0.3% | |||
General Electric Co. | 1,278,657 | 18,233,649 | 0.9% | ||||
United Technologies Corp. | 103,303 | 6,347,969 | 0.3% | ||||
Other Securities | 209,232,706 | 10.5% | |||||
Total Industrials | 239,632,607 | 12.0% | |||||
Information Technology — (15.2%) | |||||||
*Apple, Inc. | 99,324 | 18,722,574 | 0.9% | ||||
*Cisco Sytems, Inc. | 713,334 | 16,299,682 | 0.8% | ||||
*Google, Inc. | 26,997 | 14,473,632 | 0.7% | ||||
Hewlett-Packard Co. | 277,599 | 13,174,849 | 0.7% | ||||
Intel Corp. | 614,522 | 11,743,515 | 0.6% | ||||
International Business Machines Corp. | 135,495 | 16,342,052 | 0.8% | ||||
Microsoft Corp. | 975,390 | 27,047,565 | 1.4% | ||||
Oracle Corp. | 551,185 | 11,630,004 | 0.6% | ||||
QUALCOMM, Inc. | 185,100 | 7,664,991 | 0.4% | ||||
Other Securities | 205,577,304 | 10.3% | |||||
Total Information Technology | 342,676,168 | 17.2% | |||||
Materials — (4.3%) | |||||||
Other Securities | 97,072,917 | 4.9% | |||||
Other — (0.0%) | |||||||
Other Securities | — | 0.0% | |||||
Telecommunication Services — (2.4%) | |||||||
AT&T, Inc. | 926,606 | 23,785,976 | 1.2% | ||||
Verizon Communications, Inc. | 446,911 | 13,224,096 | 0.7% | ||||
Other Securities | 16,360,101 | 0.8% | |||||
Total Telecommunication Services | 53,370,173 | 2.7% | |||||
Utilities — (3.3%) | |||||||
Other Securities | 75,909,223 | 3.8% | |||||
TOTAL COMMON STOCKS | 1,978,653,318 | 99.4% | |||||
RIGHTS/WARRANTS — (0.0%) | |||||||
Other Securities | 601 | 0.0% | |||||
TEMPORARY CASH INVESTMENTS — (0.3%) | |||||||
BlackRock Liquidity Funds Tempcash Portfolio - Institutional Shares | 7,604,090 | 7,604,090 | 0.4% | ||||
Shares/ Face Amount | |||||||
| (000) | |||||||
SECURITIES LENDING COLLATERAL — (12.1%) | |||||||
§@DFA Short Term Investment Fund LP | 270,634,566 | 270,634,566 | 13.6% | ||||
@Repurchase Agreement, Deutsche Bank Securities 0.08%, 11/02/09 (Collateralized by $2,521,878 FHLMC 5.793%(r), 01/01/37, valued at $1,416,688) to be repurchased at $1,375,434 | $1,375 | 1,375,425 | 0.1% | ||||
TOTAL SECURITIES LENDING COLLATERAL | 272,009,991 | 13.7% | |||||
TOTAL INVESTMENTS — (100.0%) | $ | 2,258,268,000 | 113.5% | ||||
54
U.S. CORE EQUITY 1 PORTFOLIO
CONTINUED
Summary of inputs used to value the Portfolio’s net assets as of October 31, 2009 is as follows (See Security Valuation Note):
| Valuation Inputs | |||||||||||
| Investment in Securities (Market Value) | |||||||||||
Level 1 | Level 2 | Level 3 | Total | ||||||||
Common Stocks | |||||||||||
Consumer Discretionary | $ | 251,868,671 | $ | 4,000 | — | $ | 251,872,671 | ||||
Consumer Staples | 177,615,475 | — | — | 177,615,475 | |||||||
Energy | 200,321,341 | — | — | 200,321,341 | |||||||
Financials | 311,338,687 | — | — | 311,338,687 | |||||||
Health Care | 228,820,192 | 23,864 | — | 228,844,056 | |||||||
Industrials | 239,632,607 | — | — | 239,632,607 | |||||||
Information Technology | 342,675,389 | 779 | — | 342,676,168 | |||||||
Materials | 97,072,917 | — | — | 97,072,917 | |||||||
Other | — | — | — | — | |||||||
Telecommunication Services | 53,370,173 | — | — | 53,370,173 | |||||||
Utilities | 75,909,223 | — | — | 75,909,223 | |||||||
Rights/Warrants | 334 | 267 | — | 601 | |||||||
Temporary Cash Investments | 7,604,090 | — | — | 7,604,090 | |||||||
Securities Lending Collateral | — | 272,009,991 | — | 272,009,991 | |||||||
TOTAL | $ | 1,986,229,099 | $ | 272,038,901 | — | $ | 2,258,268,000 | ||||
See accompanying Notes to Financial Statements.
55
SUMMARY SCHEDULE OF PORTFOLIO HOLDINGS
October 31, 2009
Shares | Value† | Percentage | |||||
COMMON STOCKS — (87.6%) | |||||||
Consumer Discretionary — (12.7%) | |||||||
Comcast Corp. Class A | 803,975 | $ | 11,657,638 | 0.3% | |||
Disney (Walt) Co. | 762,512 | 20,869,953 | 0.5% | ||||
*Liberty Media Corp. Entertainment Class A | 324,533 | 10,002,107 | 0.3% | ||||
Lowe’s Cos., Inc. | 577,087 | 11,293,593 | 0.3% | ||||
News Corp. Class A | 776,144 | 8,941,179 | 0.2% | ||||
Time Warner, Inc. | 505,637 | 15,229,786 | 0.4% | ||||
Other Securities | 471,143,837 | 12.4% | |||||
Total Consumer Discretionary | 549,138,093 | 14.4% | |||||
Consumer Staples — (6.3%) | |||||||
Coca-Cola Co. | 172,459 | 9,193,789 | 0.3% | ||||
CVS Caremark Corp. | 598,385 | 21,122,991 | 0.6% | ||||
Kraft Foods, Inc. | 594,231 | 16,353,237 | 0.4% | ||||
Procter & Gamble Co. | 480,488 | 27,868,304 | 0.7% | ||||
Wal-Mart Stores, Inc. | 405,500 | 20,145,240 | 0.5% | ||||
Other Securities | 179,330,811 | 4.7% | |||||
Total Consumer Staples | 274,014,372 | 7.2% | |||||
Energy — (9.1%) | |||||||
Anadarko Petroleum Corp. | 191,338 | 11,658,224 | 0.3% | ||||
Apache Corp. | 140,063 | 13,182,730 | 0.3% | ||||
Chevron Corp. | 638,061 | 48,837,189 | 1.3% | ||||
ConocoPhillips | 584,396 | 29,324,991 | 0.8% | ||||
Devon Energy Corp. | 160,926 | 10,413,521 | 0.3% | ||||
Exxon Mobil Corp. | 404,458 | 28,987,505 | 0.8% | ||||
Marathon Oil Corp. | 294,470 | 9,414,206 | 0.2% | ||||
Occidental Petroleum Corp. | 157,660 | 11,963,241 | 0.3% | ||||
XTO Energy, Inc. | 240,650 | 10,001,414 | 0.3% | ||||
Other Securities | 220,292,233 | 5.8% | |||||
Total Energy | 394,075,254 | 10.4% | |||||
Financials — (17.0%) | |||||||
Bank of America Corp. | 3,267,707 | 47,643,168 | 1.3% | ||||
Bank of New York Mellon Corp. | 476,180 | 12,694,959 | 0.3% | ||||
Goldman Sachs Group, Inc. | 174,144 | 29,634,084 | 0.8% | ||||
JPMorgan Chase & Co. | 1,554,737 | 64,941,364 | 1.7% | ||||
MetLife, Inc. | 327,880 | 11,157,756 | 0.3% | ||||
Morgan Stanley | 535,661 | 17,205,431 | 0.5% | ||||
PNC Financial Services Group, Inc. | 182,154 | 8,914,617 | 0.2% | ||||
Prudential Financial, Inc. | 185,892 | 8,407,895 | 0.2% | ||||
Travelers Cos., Inc. (The) | 240,418 | 11,970,412 | 0.3% | ||||
Wells Fargo & Co. | 1,945,537 | 53,541,178 | 1.4% | ||||
Other Securities | 469,783,862 | 12.3% | |||||
Total Financials | 735,894,726 | 19.3% | |||||
Health Care — (8.8%) | |||||||
Johnson & Johnson | 294,829 | 17,409,652 | 0.5% | ||||
Pfizer, Inc. | 2,232,446 | 38,018,555 | 1.0% | ||||
UnitedHealth Group, Inc. | 468,620 | 12,160,689 | 0.3% | ||||
*WellPoint, Inc. | 211,328 | 9,881,697 | 0.3% | ||||
Other Securities | 304,873,393 | 8.0% | |||||
Total Health Care | 382,343,986 | 10.1% | |||||
Industrials — (11.3%) | |||||||
Burlington Northern Santa Fe Corp. | 139,866 | 10,534,707 | 0.3% | ||||
FedEx Corp. | 127,079 | 9,237,373 | 0.2% | ||||
56
U.S. CORE EQUITY 2 PORTFOLIO
CONTINUED
Shares | Value† | Percentage | ||||||
Industrials — (Continued) | ||||||||
General Electric Co. | 3,116,591 | $ | 44,442,588 | 1.2% | ||||
Union Pacific Corp. | 206,650 | 11,394,681 | 0.3% | |||||
Other Securities | 413,720,137 | 10.9% | ||||||
Total Industrials | 489,329,486 | 12.9% | ||||||
Information Technology — (12.8%) | ||||||||
*Apple, Inc. | 70,536 | 13,296,036 | 0.4% | |||||
*Cisco Sytems, Inc. | 558,086 | 12,752,265 | 0.3% | |||||
*Google, Inc. | 21,180 | 11,355,022 | 0.3% | |||||
Hewlett-Packard Co. | 421,467 | 20,002,824 | 0.5% | |||||
Intel Corp. | 620,264 | 11,853,245 | 0.3% | |||||
International Business Machines Corp. | 91,559 | 11,042,931 | 0.3% | |||||
Microsoft Corp. | 709,934 | 19,686,470 | 0.5% | |||||
Oracle Corp. | 435,610 | 9,191,371 | 0.2% | |||||
Other Securities | 443,187,202 | 11.7% | ||||||
Total Information Technology | 552,367,366 | 14.5% | ||||||
Materials — (4.6%) | ||||||||
Dow Chemical Co. | 460,717 | 10,817,635 | 0.3% | |||||
International Paper Co. | 388,835 | 8,674,909 | 0.2% | |||||
Other Securities | 178,059,818 | 4.7% | ||||||
Total Materials | 197,552,362 | 5.2% | ||||||
Other — (0.0%) | ||||||||
Other Securities | 63 | 0.0% | ||||||
Telecommunication Services — (2.8%) | ||||||||
AT&T, Inc. | 2,076,121 | 53,294,026 | 1.4% | |||||
Verizon Communications, Inc. | 1,065,744 | 31,535,365 | 0.8% | |||||
Other Securities | 34,309,434 | 0.9% | ||||||
Total Telecommunication Services | 119,138,825 | 3.1% | ||||||
Utilities — (2.2%) | ||||||||
Other Securities | 96,927,672 | 2.5% | ||||||
TOTAL COMMON STOCKS | 3,790,782,205 | 99.6% | ||||||
RIGHTS/WARRANTS — (0.0%) | ||||||||
Other Securities | 2,115 | 0.0% | ||||||
TEMPORARY CASH INVESTMENTS — (0.5%) | ||||||||
BlackRock Liquidity Funds Tempcash Portfolio - Institutional Shares | 21,699,929 | 21,699,929 | 0.6% | |||||
Shares/ Face Amount | ||||||||
| (000) | ||||||||
SECURITIES LENDING COLLATERAL — (11.9%) | ||||||||
§@DFA Short Term Investment Fund LP | 511,775,326 | 511,775,326 | 13.4% | |||||
@Repurchase Agreement, Deutsche Bank Securities 0.08%, | ||||||||
11/02/09 (Collateralized by $4,768,923 FHLMC 5.793%(r), 01/01/37, valued at $2,678,986) to be repurchased at $2,600,974 | $ | 2,601 | 2,600,957 | 0.1% | ||||
TOTAL SECURITIES LENDING COLLATERAL | 514,376,283 | 13.5% | ||||||
57
U.S. CORE EQUITY 2 PORTFOLIO
CONTINUED
Value† | Percentage | ||||
TOTAL INVESTMENTS — (100.0%) | $ | 4,326,860,532 | 113.7% | ||
Summary of inputs used to value the Portfolio’s net assets as of October 31, 2009 is as follows (See Security Valuation Note):
| Valuation Inputs | |||||||||||
| Investment in Securities (Market Value) | |||||||||||
Level 1 | Level 2 | Level 3 | Total | ||||||||
Common Stocks | |||||||||||
Consumer Discretionary | $ | 549,128,925 | $ | 9,168 | — | $ | 549,138,093 | ||||
Consumer Staples | 274,014,372 | — | — | 274,014,372 | |||||||
Energy | 394,075,254 | — | — | 394,075,254 | |||||||
Financials | 735,894,726 | — | — | 735,894,726 | |||||||
Health Care | 382,279,666 | 64,320 | — | 382,343,986 | |||||||
Industrials | 489,329,486 | — | — | 489,329,486 | |||||||
Information Technology | 552,365,768 | 1,598 | — | 552,367,366 | |||||||
Materials | 197,552,362 | — | — | 197,552,362 | |||||||
Other | — | 63 | — | 63 | |||||||
Telecommunication Services | 119,138,825 | — | — | 119,138,825 | |||||||
Utilities | 96,927,672 | — | — | 96,927,672 | |||||||
Rights/Warrants | 951 | 1,164 | — | 2,115 | |||||||
Temporary Cash Investments | 21,699,929 | — | — | 21,699,929 | |||||||
Securities Lending Collateral | — | 514,376,283 | — | 514,376,283 | |||||||
TOTAL | $ | 3,812,407,936 | $ | 514,452,596 | — | $ | 4,326,860,532 | ||||
See accompanying Notes to Financial Statements.
58
SUMMARY SCHEDULE OF PORTFOLIO HOLDINGS
October 31, 2009
Shares | Value† | Percentage | |||||
COMMON STOCKS — (84.1%) | |||||||
Consumer Discretionary — (13.7%) | |||||||
#*AutoNation, Inc. | 161,659 | $ | 2,787,001 | 0.2% | |||
Carnival Corp. | 88,808 | 2,586,089 | 0.2% | ||||
Comcast Corp. Class A | 298,194 | 4,323,813 | 0.4% | ||||
Disney (Walt) Co. | 112,792 | 3,087,117 | 0.3% | ||||
Jarden Corp. | 98,783 | 2,705,666 | 0.2% | ||||
*Liberty Media Corp. Interactive Class A | 257,857 | 2,924,098 | 0.3% | ||||
#*Sears Holdings Corp. | 54,760 | 3,716,014 | 0.3% | ||||
Time Warner, Inc. | 198,927 | 5,991,681 | 0.5% | ||||
Other Securities | 162,744,900 | 13.8% | |||||
Total Consumer Discretionary | 190,866,379 | 16.2% | |||||
Consumer Staples — (4.4%) | |||||||
CVS Caremark Corp. | 88,513 | 3,124,509 | 0.3% | ||||
J.M. Smucker Co. | 49,794 | 2,625,638 | 0.2% | ||||
Kraft Foods, Inc. | 120,422 | 3,314,013 | 0.3% | ||||
Procter & Gamble Co. | 76,240 | 4,421,920 | 0.4% | ||||
Other Securities | 47,503,444 | 4.0% | |||||
Total Consumer Staples | 60,989,524 | 5.2% | |||||
Energy — (8.4%) | |||||||
Anadarko Petroleum Corp. | 62,067 | 3,781,742 | 0.3% | ||||
Chevron Corp. | 79,607 | 6,093,120 | 0.5% | ||||
ConocoPhillips | 197,546 | 9,912,858 | 0.8% | ||||
Exxon Mobil Corp. | 66,600 | 4,773,222 | 0.4% | ||||
Marathon Oil Corp. | 94,908 | 3,034,209 | 0.3% | ||||
XTO Energy, Inc. | 69,919 | 2,905,834 | 0.3% | ||||
Other Securities | 86,347,519 | 7.3% | |||||
Total Energy | 116,848,504 | 9.9% | |||||
Financials — (19.6%) | |||||||
American Financial Group, Inc. | 129,237 | 3,179,230 | 0.3% | ||||
Ameriprise Financial, Inc. | 89,186 | 3,092,079 | 0.3% | ||||
Bank of America Corp. | 531,294 | 7,746,267 | 0.7% | ||||
#*CNA Financial Corp. | 123,408 | 2,686,592 | 0.2% | ||||
Discover Financial Services | 235,869 | 3,335,188 | 0.3% | ||||
First American Corp. | 86,160 | 2,618,402 | 0.2% | ||||
Goldman Sachs Group, Inc. | 21,070 | 3,585,482 | 0.3% | ||||
JPMorgan Chase & Co. | 539,281 | 22,525,767 | 1.9% | ||||
#M&T Bank Corp. | 55,943 | 3,516,018 | 0.3% | ||||
MetLife, Inc. | 84,340 | 2,870,090 | 0.2% | ||||
Morgan Stanley | 84,025 | 2,698,883 | 0.2% | ||||
Reinsurance Group of America, Inc. | 59,129 | 2,725,847 | 0.2% | ||||
Travelers Cos., Inc. (The) | 73,100 | 3,639,649 | 0.3% | ||||
Unum Group | 203,475 | 4,059,326 | 0.3% | ||||
Wells Fargo & Co. | 161,404 | 4,441,838 | 0.4% | ||||
Other Securities | 200,054,535 | 17.0% | |||||
Total Financials | 272,775,193 | 23.1% | |||||
Health Care — (7.5%) | |||||||
#*Community Health Systems, Inc. | 104,600 | 3,271,888 | 0.3% | ||||
Pfizer, Inc. | 326,770 | 5,564,893 | 0.5% | ||||
*WellPoint, Inc. | 62,400 | 2,917,824 | 0.2% | ||||
Other Securities | 93,197,030 | 7.9% | |||||
Total Health Care | 104,951,635 | 8.9% | |||||
59
U.S. VECTOR EQUITY PORTFOLIO
CONTINUED
Shares | Value† | Percentage | ||||||
Industrials — (10.9%) | ||||||||
General Electric Co. | 267,064 | $ | 3,808,333 | 0.3% | ||||
Ryder System, Inc. | 66,622 | 2,701,522 | 0.2% | |||||
Southwest Airlines Co. | 307,716 | 2,584,814 | 0.2% | |||||
Other Securities | 143,551,380 | 12.2% | ||||||
Total Industrials | 152,646,049 | 12.9% | ||||||
Information Technology — (12.1%) | ||||||||
Fidelity National Information Services, Inc. | 121,153 | 2,636,289 | 0.2% | |||||
*IAC/InterActiveCorp | 143,788 | 2,723,345 | 0.2% | |||||
*Ingram Micro, Inc. | 166,139 | 2,932,353 | 0.3% | |||||
Jabil Circuit, Inc. | 223,919 | 2,996,036 | 0.3% | |||||
*Rovi Corp. | 110,469 | 3,043,421 | 0.3% | |||||
*Tellabs, Inc. | 426,210 | 2,565,784 | 0.2% | |||||
#Xerox Corp. | 518,918 | 3,902,263 | 0.3% | |||||
Other Securities | 147,333,309 | 12.5% | ||||||
Total Information Technology | 168,132,800 | 14.3% | ||||||
Materials — (4.7%) | ||||||||
International Paper Co. | 281,200 | 6,273,572 | 0.5% | |||||
MeadWestavco Corp. | 151,161 | 3,451,006 | 0.3% | |||||
Other Securities | 55,796,528 | 4.8% | ||||||
Total Materials | 65,521,106 | 5.6% | ||||||
Other ��� (0.0%) | ||||||||
Other Securities | 6 | 0.0% | ||||||
Telecommunication Services — (1.6%) | ||||||||
AT&T, Inc. | 332,498 | 8,535,224 | 0.7% | |||||
Verizon Communications, Inc. | 159,887 | 4,731,056 | 0.4% | |||||
Other Securities | 9,379,784 | 0.8% | ||||||
Total Telecommunication Services | 22,646,064 | 1.9% | ||||||
Utilities — (1.2%) | ||||||||
Other Securities | 17,444,083 | 1.5% | ||||||
TOTAL COMMON STOCKS | 1,172,821,343 | 99.5% | ||||||
RIGHTS/WARRANTS — (0.0%) | ||||||||
Other Securities | 1,158 | 0.0% | ||||||
TEMPORARY CASH INVESTMENTS — (0.7%) | ||||||||
BlackRock Liquidity Funds Tempcash Portfolio - Institutional Shares | 10,352,638 | 10,352,638 | 0.9% | |||||
Shares/ Face Amount | ||||||||
| (000) | ||||||||
SECURITIES LENDING COLLATERAL — (15.2%) | ||||||||
§@DFA Short Term Investment Fund LP | 210,532,503 | 210,532,503 | 17.9% | |||||
@Repurchase Agreement, Deutsche Bank Securities 0.08%, | ||||||||
11/02/09 (Collateralized by $1,961,824 FHLMC 5.793%(r), 01/01/37, valued at $1,102,073) to be repurchased at $1,069,980 | $ | 1,070 | 1,069,973 | 0.1% | ||||
TOTAL SECURITIES LENDING COLLATERAL | 211,602,476 | 18.0% | ||||||
TOTAL INVESTMENTS — (100.0%) | $ | 1,394,777,615 | 118.4% | |||||
60
U.S. VECTOR EQUITY PORTFOLIO
CONTINUED
Summary of inputs used to value the Portfolio’s net assets as of October 31, 2009 is as follows (See Security Valuation Note):
| Valuation Inputs | |||||||||||
| Investment in Securities (Market Value) | |||||||||||
Level 1 | Level 2 | Level 3 | Total | ||||||||
Common Stocks | |||||||||||
Consumer Discretionary | $ | 190,856,379 | $ | 10,000 | — | $ | 190,866,379 | ||||
Consumer Staples | 60,989,524 | — | — | 60,989,524 | |||||||
Energy | 116,848,504 | — | — | 116,848,504 | |||||||
Financials | 272,775,193 | — | — | 272,775,193 | |||||||
Health Care | 104,930,024 | 21,611 | — | 104,951,635 | |||||||
Industrials | 152,646,049 | — | — | 152,646,049 | |||||||
Information Technology | 168,131,625 | 1,175 | — | 168,132,800 | |||||||
Materials | 65,521,106 | — | — | 65,521,106 | |||||||
Other | — | 6 | — | 6 | |||||||
Telecommunication Services | 22,646,064 | — | — | 22,646,064 | |||||||
Utilities | 17,444,083 | — | — | 17,444,083 | |||||||
Rights/Warrants | 238 | 920 | — | 1,158 | |||||||
Temporary Cash Investments | 10,352,638 | — | — | 10,352,638 | |||||||
Securities Lending Collateral | — | 211,602,476 | — | 211,602,476 | |||||||
TOTAL | $ | 1,183,141,427 | $ | 211,636,188 | — | $ | 1,394,777,615 | ||||
See accompanying Notes to Financial Statements.
61
T.A. U.S. CORE EQUITY 2 PORTFOLIO
SUMMARY SCHEDULE OF PORTFOLIO HOLDINGS
October 31, 2009
Shares | Value† | Percentage | |||||
COMMON STOCKS — (87.0%) | |||||||
Consumer Discretionary — (12.9%) | |||||||
Comcast Corp. Class A | 346,719 | $ | 5,027,426 | 0.4% | |||
Disney (Walt) Co. | 340,594 | 9,322,058 | 0.6% | ||||
*Liberty Media Corp. Entertainment Class A | 118,270 | 3,645,081 | 0.3% | ||||
Lowe’s Cos., Inc. | 167,907 | 3,285,940 | 0.2% | ||||
News Corp. Class A | 318,443 | 3,668,463 | 0.3% | ||||
Time Warner Cable, Inc. | 88,298 | 3,482,473 | 0.2% | ||||
Time Warner, Inc. | 177,057 | 5,332,957 | 0.4% | ||||
Other Securities | 178,121,726 | 12.3% | |||||
Total Consumer Discretionary | 211,886,124 | 14.7% | |||||
Consumer Staples — (5.9%) | |||||||
Archer-Daniels-Midland Co. | 114,684 | 3,454,282 | 0.2% | ||||
Coca-Cola Co. | 69,082 | 3,682,761 | 0.3% | ||||
CVS Caremark Corp. | 246,749 | 8,710,240 | 0.6% | ||||
Kraft Foods, Inc. | 258,941 | 7,126,056 | 0.5% | ||||
Procter & Gamble Co. | 126,580 | 7,341,640 | 0.5% | ||||
Other Securities | 67,570,477 | 4.7% | |||||
Total Consumer Staples | 97,885,456 | 6.8% | |||||
Energy — (8.9%) | |||||||
Anadarko Petroleum Corp. | 71,637 | 4,364,842 | 0.3% | ||||
Apache Corp. | 56,903 | 5,355,710 | 0.4% | ||||
Chevron Corp. | 236,822 | 18,126,356 | 1.3% | ||||
ConocoPhillips | 207,460 | 10,410,343 | 0.7% | ||||
Devon Energy Corp. | 70,570 | 4,566,585 | 0.3% | ||||
Exxon Mobil Corp. | 232,529 | 16,665,353 | 1.1% | ||||
Marathon Oil Corp. | 136,394 | 4,360,516 | 0.3% | ||||
Other Securities | 83,187,956 | 5.8% | |||||
Total Energy | 147,037,661 | 10.2% | |||||
Financials — (16.1%) | |||||||
Bank of America Corp. | 763,692 | 11,134,629 | 0.8% | ||||
Bank of New York Mellon Corp. | 183,418 | 4,889,924 | 0.3% | ||||
#BlackRock, Inc. | 18,115 | 3,921,716 | 0.3% | ||||
CME Group, Inc. | 12,950 | 3,918,799 | 0.3% | ||||
Goldman Sachs Group, Inc. | 79,332 | 13,499,926 | 0.9% | ||||
JPMorgan Chase & Co. | 633,250 | 26,450,852 | 1.8% | ||||
MetLife, Inc. | 126,449 | 4,303,059 | 0.3% | ||||
Morgan Stanley | 205,947 | 6,615,018 | 0.5% | ||||
Travelers Cos., Inc. (The) | 100,570 | 5,007,380 | 0.4% | ||||
Wells Fargo & Co. | 439,736 | 12,101,535 | 0.8% | ||||
Other Securities | 173,514,260 | 12.0% | |||||
Total Financials | 265,357,098 | 18.4% | |||||
Health Care — (9.0%) | |||||||
Johnson & Johnson | 92,545 | 5,464,782 | 0.4% | ||||
Pfizer, Inc. | 810,516 | 13,803,087 | 0.9% | ||||
*Thermo Fisher Scientific, Inc. | 74,214 | 3,339,630 | 0.2% | ||||
UnitedHealth Group, Inc. | 200,614 | 5,205,933 | 0.4% | ||||
*WellPoint, Inc. | 83,721 | 3,914,794 | 0.3% | ||||
Other Securities | 116,692,475 | 8.1% | |||||
Total Health Care | 148,420,701 | 10.3% | |||||
Industrials — (11.8%) | |||||||
Burlington Northern Santa Fe Corp. | 54,536 | 4,107,652 | 0.3% | ||||
FedEx Corp. | 55,500 | 4,034,295 | 0.3% | ||||
62
T.A. U.S. CORE EQUITY 2 PORTFOLIO
CONTINUED
Shares | Value† | Percentage | ||||||
Industrials — (Continued) | ||||||||
General Electric Co. | 1,163,033 | $ | 16,584,851 | 1.1% | ||||
Union Pacific Corp. | 87,049 | 4,799,882 | 0.3% | |||||
Other Securities | 164,472,087 | 11.4% | ||||||
Total Industrials | 193,998,767 | 13.4% | ||||||
Information Technology — (12.9%) | ||||||||
*Apple, Inc. | 27,332 | 5,152,082 | 0.4% | |||||
*Cisco Sytems, Inc. | 153,862 | 3,515,747 | 0.2% | |||||
*Google, Inc. | 7,940 | 4,256,793 | 0.3% | |||||
Hewlett-Packard Co. | 150,483 | 7,141,923 | 0.5% | |||||
Intel Corp. | 314,896 | 6,017,663 | 0.4% | |||||
International Business Machines Corp. | 43,923 | 5,297,553 | 0.4% | |||||
Microsoft Corp. | 263,082 | 7,295,264 | 0.5% | |||||
Oracle Corp. | 166,850 | 3,520,535 | 0.2% | |||||
Other Securities | 170,774,371 | 11.8% | ||||||
Total Information Technology | 212,971,931 | 14.7% | ||||||
Materials — (4.2%) | ||||||||
Dow Chemical Co. | 170,500 | 4,003,340 | 0.3% | |||||
International Paper Co. | 173,200 | 3,864,092 | 0.3% | |||||
Other Securities | 61,355,121 | 4.2% | ||||||
Total Materials | 69,222,553 | 4.8% | ||||||
Telecommunication Services — (2.9%) | ||||||||
AT&T, Inc. | 887,556 | 22,783,563 | 1.6% | |||||
Verizon Communications, Inc. | 417,968 | 12,367,673 | 0.8% | |||||
Other Securities | 12,939,327 | 0.9% | ||||||
Total Telecommunication Services | 48,090,563 | 3.3% | ||||||
Utilities — (2.4%) | ||||||||
Other Securities | 39,536,347 | 2.7% | ||||||
TOTAL COMMON STOCKS | 1,434,407,201 | 99.3% | ||||||
RIGHTS/WARRANTS — (0.0%) | ||||||||
Other Securities | — | 0.0% | ||||||
TEMPORARY CASH INVESTMENTS — (0.8%) | ||||||||
BlackRock Liquidity Funds Tempcash Portfolio - Institutional Shares | 13,452,630 | 13,452,630 | 0.9% | |||||
Shares/ Face Amount | ||||||||
| (000) | ||||||||
SECURITIES LENDING COLLATERAL — (12.2%) | ||||||||
§@DFA Short Term Investment Fund LP | 199,507,736 | 199,507,736 | 13.8% | |||||
@Repurchase Agreement, Deutsche Bank Securities 0.08%, | ||||||||
11/02/09 (Collateralized by $1,164,996 FNMA 7.000%, 10/01/38, valued at $1,044,362) to be repurchased at $1,013,950 | $ | 1,014 | 1,013,943 | 0.1% | ||||
TOTAL SECURITIES LENDING COLLATERAL | 200,521,679 | 13.9% | ||||||
TOTAL INVESTMENTS — (100.0%) | $ | 1,648,381,510 | 114.1% | |||||
63
T.A. U.S. CORE EQUITY 2 PORTFOLIO
CONTINUED
Summary of inputs used to value the Portfolio’s net assets as of October 31, 2009 is as follows (See Security Valuation Note):
| Valuation Inputs | |||||||||||
| Investment in Securities (Market Value) | |||||||||||
Level 1 | Level 2 | Level 3 | Total | ||||||||
Common Stocks | |||||||||||
Consumer Discretionary | $ | 211,883,636 | $ | 2,488 | — | $ | 211,886,124 | ||||
Consumer Staples | 97,885,456 | — | — | 97,885,456 | |||||||
Energy | 147,037,661 | — | — | 147,037,661 | |||||||
Financials | 265,357,098 | — | — | 265,357,098 | |||||||
Health Care | 148,398,711 | 21,990 | — | 148,420,701 | |||||||
Industrials | 193,998,767 | — | — | 193,998,767 | |||||||
Information Technology | 212,971,931 | — | — | 212,971,931 | |||||||
Materials | 69,222,553 | — | — | 69,222,553 | |||||||
Telecommunication Services | 48,090,563 | — | — | 48,090,563 | |||||||
Utilities | 39,536,347 | — | — | 39,536,347 | |||||||
Rights/Warrants | — | — | — | — | |||||||
Temporary Cash Investments | 13,452,630 | — | — | 13,452,630 | |||||||
Securities Lending Collateral | — | 200,521,679 | — | 200,521,679 | |||||||
TOTAL | $ | 1,447,835,353 | $ | 200,546,157 | — | $ | 1,648,381,510 | ||||
See accompanying Notes to Financial Statements.
64
SUMMARY SCHEDULE OF PORTFOLIO HOLDINGS
October 31, 2009
Shares | Value† | Percentage | |||||
COMMON STOCKS — (84.2%) | |||||||
Consumer Discretionary — (15.2%) | |||||||
#Buckle, Inc. | 124,650 | $ | 3,740,746 | 0.1% | |||
#Cooper Tire & Rubber Co. | 483,812 | 7,382,971 | 0.3% | ||||
#*Gymboree Corp. | 83,700 | 3,563,109 | 0.1% | ||||
*Harman International Industries, Inc. | 103,046 | 3,875,560 | 0.2% | ||||
*Liberty Media Corp. Capital Class A | 306,878 | 6,349,306 | 0.3% | ||||
Stage Stores, Inc. | 454,540 | 5,363,572 | 0.2% | ||||
Tupperware Corp. | 100,500 | 4,524,510 | 0.2% | ||||
*Warnaco Group, Inc. | 133,817 | 5,423,603 | 0.2% | ||||
Wolverine World Wide, Inc. | 146,900 | 3,757,702 | 0.2% | ||||
Other Securities | 409,239,690 | 16.2% | |||||
Total Consumer Discretionary | 453,220,769 | 18.0% | |||||
Consumer Staples — (3.6%) | |||||||
#Casey’s General Stores, Inc. | 137,677 | 4,340,956 | 0.2% | ||||
*Central Garden & Pet Co. Class A | 502,714 | 4,755,674 | 0.2% | ||||
Lancaster Colony Corp. | 86,132 | 4,184,293 | 0.2% | ||||
Nu Skin Enterprises, Inc. Class A | 180,500 | 4,108,180 | 0.1% | ||||
Other Securities | 88,819,373 | 3.5% | |||||
Total Consumer Staples | 106,208,476 | 4.2% | |||||
Energy — (4.7%) | |||||||
CARBO Ceramics, Inc. | 66,655 | 3,891,985 | 0.2% | ||||
Other Securities | 137,267,123 | 5.4% | |||||
Total Energy | 141,159,108 | 5.6% | |||||
Financials — (10.8%) | |||||||
#Prosperity Bancshares, Inc. | 112,211 | 4,016,032 | 0.2% | ||||
#*SVB Financial Group | 86,286 | 3,559,298 | 0.1% | ||||
#Westamerica Bancorporation | 79,557 | 3,802,825 | 0.2% | ||||
Other Securities | 310,538,970 | 12.3% | |||||
Total Financials | 321,917,125 | 12.8% | |||||
Health Care — (11.0%) | |||||||
#*Allscripts-Misys Healthcare Solutions, Inc. | 193,106 | 3,765,567 | 0.2% | ||||
*Catalyst Health Solutions, Inc. | 114,340 | 3,586,846 | 0.1% | ||||
*Dionex Corp. | 53,415 | 3,625,810 | 0.1% | ||||
#*NuVasive, Inc. | 97,252 | 3,529,275 | 0.1% | ||||
#*PSS World Medical, Inc. | 178,200 | 3,603,204 | 0.1% | ||||
#Quality Systems, Inc. | 72,918 | 4,449,456 | 0.2% | ||||
*Varian, Inc. | 76,999 | 3,942,349 | 0.2% | ||||
Other Securities | 299,868,947 | 11.9% | |||||
Total Health Care | 326,371,454 | 12.9% | |||||
Industrials — (14.6%) | |||||||
*EMCOR Group, Inc. | 176,300 | 4,164,206 | 0.2% | ||||
#Heartland Express, Inc. | 264,941 | 3,603,198 | 0.1% | ||||
Knight Transportation, Inc. | 227,179 | 3,643,951 | 0.1% | ||||
*MPS Group, Inc. | 266,800 | 3,607,136 | 0.1% | ||||
Nordson Corp. | 92,150 | 4,862,756 | 0.2% | ||||
*Oshkosh Truck Corp. Class B | 113,829 | 3,558,295 | 0.1% | ||||
#Regal-Beloit Corp. | 82,104 | 3,849,036 | 0.2% | ||||
*Tetra Tech, Inc. | 153,296 | 3,944,306 | 0.2% | ||||
*United Stationers, Inc. | 76,209 | 3,592,492 | 0.1% | ||||
#Werner Enterprises, Inc. | 203,184 | 3,809,700 | 0.2% | ||||
Other Securities | 396,316,990 | 15.7% | |||||
Total Industrials | 434,952,066 | 17.2% | |||||
65
U.S. SMALL CAP PORTFOLIO
CONTINUED
Shares | Value† | Percentage | |||||
Information Technology — (17.3%) | |||||||
#Adtran, Inc. | 210,232 | $ | 4,843,745 | 0.2% | |||
#*Atheros Communications, Inc. | 149,696 | 3,685,516 | 0.1% | ||||
#*Concur Technologies, Inc. | 107,483 | 3,830,694 | 0.1% | ||||
*Euronet Worldwide, Inc. | 178,724 | 4,226,823 | 0.2% | ||||
*Exar Corp. | 521,305 | 3,597,004 | 0.1% | ||||
#*Informatica Corp. | 245,857 | 5,219,544 | 0.2% | ||||
*Quest Software, Inc. | 296,730 | 4,976,162 | 0.2% | ||||
*RF Micro Devices, Inc. | 1,149,123 | 4,573,510 | 0.2% | ||||
#*Silicon Laboratories, Inc. | 92,924 | 3,893,516 | 0.1% | ||||
*Skyworks Solutions, Inc. | 384,710 | 4,012,525 | 0.2% | ||||
*Starent Networks Corp. | 141,611 | 4,777,955 | 0.2% | ||||
Syntel, Inc. | 108,782 | 3,897,659 | 0.2% | ||||
*TIBCO Software, Inc. | 474,473 | 4,151,639 | 0.2% | ||||
Other Securities | 461,308,866 | 18.3% | |||||
Total Information Technology | 516,995,158 | 20.5% | |||||
Materials — (4.2%) | |||||||
#NewMarket Corp. | 43,500 | 4,067,250 | 0.1% | ||||
Schweitzer-Maudoit International, Inc. | 80,768 | 4,171,667 | 0.2% | ||||
Other Securities | 115,900,513 | 4.6% | |||||
Total Materials | 124,139,430 | 4.9% | |||||
Other — (0.0%) | |||||||
Other Securities | 1,790 | 0.0% | |||||
Telecommunication Services — (0.9%) | |||||||
Other Securities | 26,637,821 | 1.1% | |||||
Utilities — (1.9%) | |||||||
#Cleco Corp. | 157,387 | 3,895,328 | 0.1% | ||||
Other Securities | 52,686,048 | 2.1% | |||||
Total Utilities | 56,581,376 | 2.2% | |||||
TOTAL COMMON STOCKS | 2,508,184,573 | 99.4% | |||||
RIGHTS/WARRANTS — (0.0%) | |||||||
Other Securities | 1,961 | 0.0% | |||||
Face Amount | |||||||
| (000) | |||||||
TEMPORARY CASH INVESTMENTS — (0.2%) | |||||||
Repurchase Agreement, PNC Capital Markets, Inc. 0.19%, 11/02/09 (Collateralized by $6,820,000 FNMA 5.00%, 08/25/18, valued at $5,330,182) to be repurchased at $5,249,083 | $5,249 | 5,249,000 | 0.2% | ||||
Shares/ Face Amount | |||||||
| (000) | |||||||
SECURITIES LENDING COLLATERAL — (15.6%) | |||||||
§@DFA Short Term Investment Fund LP | 463,746,494 | 463,746,494 | 18.4% | ||||
@Repurchase Agreement, Deutsche Bank Securities 0.08%, | |||||||
11/02/09 (Collateralized by $4,321,370 FHLMC 5.793%(r), 01/01/37, valued at $2,427,569) to be repurchased at $2,356,879 | $2,357 | 2,356,863 | 0.1% | ||||
TOTAL SECURITIES LENDING COLLATERAL | 466,103,357 | 18.5% | |||||
66
U.S. SMALL CAP PORTFOLIO
CONTINUED
Value† | Percentage | ||||
TOTAL INVESTMENTS — (100.0%) | $ | 2,979,538,891 | 118.1% | ||
Summary of inputs used to value the Portfolio’s net assets as of October 31, 2009 is as follows (See Security Valuation Note):
| Valuation Inputs | |||||||||||
| Investment in Securities (Market Value) | |||||||||||
Level 1 | Level 2 | Level 3 | Total | ||||||||
Common Stocks | |||||||||||
Consumer Discretionary | $ | 453,196,769 | $ | 24,000 | — | $ | 453,220,769 | ||||
Consumer Staples | 106,208,476 | — | — | 106,208,476 | |||||||
Energy | 141,159,108 | — | — | 141,159,108 | |||||||
Financials | 321,917,125 | — | — | 321,917,125 | |||||||
Health Care | 326,239,973 | 131,481 | — | 326,371,454 | |||||||
Industrials | 434,952,066 | — | — | 434,952,066 | |||||||
Information Technology | 516,973,323 | 21,835 | — | 516,995,158 | |||||||
Materials | 124,139,430 | — | — | 124,139,430 | |||||||
Other | — | 1,790 | — | 1,790 | |||||||
Telecommunication Services | 26,637,821 | — | — | 26,637,821 | |||||||
Utilities | 56,581,376 | — | — | 56,581,376 | |||||||
Rights/Warrants | 1,961 | — | — | 1,961 | |||||||
Temporary Cash Investments | — | 5,249,000 | — | 5,249,000 | |||||||
Securities Lending Collateral | — | 466,103,357 | — | 466,103,357 | |||||||
TOTAL | $ | 2,508,007,428 | $ | 471,531,463 | — | $ | 2,979,538,891 | ||||
See accompanying Notes to Financial Statements.
67
SUMMARY SCHEDULE OF PORTFOLIO HOLDINGS
October 31, 2009
Shares | Value† | Percentage | |||||
COMMON STOCKS — (85.7%) | |||||||
Consumer Discretionary — (15.0%) | |||||||
#*Brunswick Corp. | 643,908 | $ | 6,104,248 | 0.2% | |||
#*Buffalo Wild Wings, Inc. | 156,089 | 6,401,210 | 0.2% | ||||
*Jo-Ann Stores, Inc. | 231,900 | 6,173,178 | 0.2% | ||||
#*Jos. A. Bank Clothiers, Inc. | 176,578 | 7,236,166 | 0.3% | ||||
Monro Muffler Brake, Inc. | 187,706 | 5,817,009 | 0.2% | ||||
#*Penske Automotive Group, Inc. | 835,188 | 13,079,044 | 0.5% | ||||
*Steven Madden, Ltd. | 180,802 | 7,322,481 | 0.3% | ||||
#*True Religion Apparel, Inc. | 215,705 | 5,558,718 | 0.2% | ||||
UniFirst Corp. | 132,382 | 5,573,282 | 0.2% | ||||
*Valassis Communications, Inc. | 395,647 | 7,212,645 | 0.2% | ||||
Other Securities | 420,820,301 | 14.9% | |||||
Total Consumer Discretionary | 491,298,282 | 17.4% | |||||
Consumer Staples — (4.1%) | |||||||
#Cal-Maine Foods, Inc. | 207,719 | 5,639,571 | 0.2% | ||||
J & J Snack Foods Corp. | 181,697 | 7,117,071 | 0.3% | ||||
#Lance, Inc. | 242,775 | 5,855,733 | 0.2% | ||||
PriceSmart, Inc. | 296,600 | 5,724,380 | 0.2% | ||||
Other Securities | 110,564,745 | 3.9% | |||||
Total Consumer Staples | 134,901,500 | 4.8% | |||||
Energy — (3.0%) | |||||||
*NATCO Group, Inc. Class A | 168,512 | 7,343,753 | 0.3% | ||||
*Rosetta Resources, Inc. | 481,444 | 6,513,937 | 0.2% | ||||
Other Securities | 84,623,767 | 3.0% | |||||
Total Energy | 98,481,457 | 3.5% | |||||
Financials — (12.4%) | |||||||
FBL Financial Group, Inc. Class A | 293,211 | 5,908,202 | 0.2% | ||||
Infinity Property & Casualty Corp. | 144,873 | 5,602,239 | 0.2% | ||||
*PICO Holdings, Inc. | 170,271 | 5,778,998 | 0.2% | ||||
#*Portfolio Recovery Associates, Inc. | 134,197 | 6,191,850 | 0.2% | ||||
Other Securities | 383,238,435 | 13.6% | |||||
Total Financials | 406,719,724 | 14.4% | |||||
Health Care — (12.5%) | |||||||
*Amsurg Corp. | 297,081 | 6,259,497 | 0.3% | ||||
*CONMED Corp. | 266,279 | 5,642,452 | 0.2% | ||||
#Invacare Corp. | 251,311 | 5,636,906 | 0.2% | ||||
*Par Pharmaceutical Cos., Inc. | 271,575 | 5,694,928 | 0.2% | ||||
Other Securities | 383,894,332 | 13.6% | |||||
Total Health Care | 407,128,115 | 14.5% | |||||
Industrials — (14.3%) | |||||||
#American Science & Engineering, Inc. | 88,885 | 5,877,076 | 0.2% | ||||
#Badger Meter, Inc. | 157,501 | 5,870,062 | 0.2% | ||||
Healthcare Services Group, Inc. | 353,878 | 6,989,090 | 0.3% | ||||
#Raven Industries, Inc. | 253,116 | 6,251,965 | 0.2% | ||||
*Sykes Enterprises, Inc. | 354,492 | 8,415,640 | 0.3% | ||||
Other Securities | 433,609,242 | 15.4% | |||||
Total Industrials | 467,013,075 | 16.6% | |||||
Information Technology — (18.3%) | |||||||
#*Cabot Microelectronics Corp. | 234,301 | 7,492,946 | 0.3% | ||||
*Forrester Research, Inc. | 224,649 | 5,690,359 | 0.2% | ||||
*Littlefuse, Inc. | 204,498 | 5,635,965 | 0.2% | ||||
68
U.S. MICRO CAP PORTFOLIO
CONTINUED
Shares | Value† | Percentage | ||||||
Information Technology — (Continued) | ||||||||
#*Manhattan Associates, Inc. | 243,170 | $ | 5,580,752 | 0.2% | ||||
Maximus, Inc. | 144,349 | 6,677,585 | 0.2% | |||||
#*Monolithic Power Systems, Inc. | 283,490 | 5,666,965 | 0.2% | |||||
#Pegasystems, Inc. | 274,711 | 7,875,964 | 0.3% | |||||
#Power Integrations, Inc. | 254,493 | 7,940,182 | 0.3% | |||||
#*ScanSource, Inc. | 237,698 | 6,035,152 | 0.2% | |||||
#*STEC, Inc. | 446,325 | 9,515,649 | 0.3% | |||||
#*TNS, Inc. | 214,400 | 6,058,944 | 0.2% | |||||
*Triquint Semiconductor, Inc. | 1,347,578 | 7,263,445 | 0.3% | |||||
#*Tyler Technologies, Inc. | 367,652 | 6,992,741 | 0.3% | |||||
#*Ultimate Software Group, Inc. | 243,491 | 6,211,455 | 0.2% | |||||
United Online, Inc. | 732,564 | 5,860,512 | 0.2% | |||||
Other Securities | 496,102,824 | 17.6% | ||||||
Total Information Technology | 596,601,440 | 21.2% | ||||||
Materials — (3.6%) | ||||||||
#AMCOL International Corp. | 271,602 | 7,072,516 | 0.2% | |||||
Arch Chemicals, Inc. | 221,263 | 6,126,772 | 0.2% | |||||
Schweitzer-Maudoit International, Inc. | 146,820 | 7,583,253 | 0.3% | |||||
Other Securities | 97,697,901 | 3.5% | ||||||
Total Materials | 118,480,442 | 4.2% | ||||||
Other — (0.0%) | ||||||||
Other Securities | 10,290 | 0.0% | ||||||
Telecommunication Services — (1.1%) | ||||||||
Other Securities | 34,241,370 | 1.2% | ||||||
Utilities — (1.4%) | ||||||||
American States Water Co. | 165,279 | 5,478,999 | 0.2% | |||||
Empire District Electric Co. | 300,150 | 5,420,709 | 0.2% | |||||
#MGE Energy, Inc. | 197,335 | 6,910,672 | 0.2% | |||||
Other Securities | 28,565,305 | 1.0% | ||||||
Total Utilities | 46,375,685 | 1.6% | ||||||
TOTAL COMMON STOCKS | 2,801,251,380 | 99.4% | ||||||
RIGHTS/WARRANTS — (0.0%) | ||||||||
Other Securities | 2,209 | 0.0% | ||||||
TEMPORARY CASH INVESTMENTS — (0.3%) | ||||||||
BlackRock Liquidity Funds Tempcash Portfolio - Institutional Shares | 9,293,471 | 9,293,471 | 0.3% | |||||
Shares/ Face Amount | ||||||||
| (000) | ||||||||
SECURITIES LENDING COLLATERAL — (14.0%) | ||||||||
§@DFA Short Term Investment Fund LP | 456,745,018 | 456,745,018 | 16.2% | |||||
@Repurchase Agreement, Deutsche Bank Securities 0.08%, | ||||||||
11/02/09 (Collateralized by $4,256,128 FHLMC 5.793%(r), 01/01/37, valued at $2,390,919) to be repurchased at $2,321,295 | $ | 2,321 | 2,321,280 | 0.1% | ||||
TOTAL SECURITIES LENDING COLLATERAL | 459,066,298 | 16.3% | ||||||
TOTAL INVESTMENTS — (100.0%) | $ | 3,269,613,358 | 116.0% | |||||
69
U.S. MICRO CAP PORTFOLIO
CONTINUED
Summary of inputs used to value the Portfolio’s net assets as of October 31, 2009 is as follows (See Security Valuation Note):
| Valuation Inputs | |||||||||||
| Investment in Securities (Market Value) | |||||||||||
Level 1 | Level 2 | Level 3 | Total | ||||||||
Common Stocks | |||||||||||
Consumer Discretionary | $ | 491,089,532 | $ | 208,750 | — | $ | 491,298,282 | ||||
Consumer Staples | 134,901,500 | — | — | 134,901,500 | |||||||
Energy | 98,481,457 | — | — | 98,481,457 | |||||||
Financials | 406,719,724 | — | — | 406,719,724 | |||||||
Health Care | 406,927,042 | 201,073 | — | 407,128,115 | |||||||
Industrials | 467,013,075 | — | — | 467,013,075 | |||||||
Information Technology | 596,601,440 | — | — | 596,601,440 | |||||||
Materials | 118,480,442 | — | — | 118,480,442 | |||||||
Other | — | 10,290 | — | 10,290 | |||||||
Telecommunication Services | 34,241,370 | — | — | 34,241,370 | |||||||
Utilities | 46,375,685 | — | — | 46,375,685 | |||||||
Rights/Warrants | 2,209 | — | — | 2,209 | |||||||
Temporary Cash Investments | 9,293,471 | — | — | 9,293,471 | |||||||
Securities Lending Collateral | — | 459,066,298 | — | 459,066,298 | |||||||
TOTAL | $ | 2,810,126,947 | $ | 459,486,411 | — | $ | 3,269,613,358 | ||||
See accompanying Notes to Financial Statements.
70
DFA REAL ESTATE SECURITIES PORTFOLIO
SUMMARY SCHEDULE OF PORTFOLIO HOLDINGS
October 31, 2009
Shares | Value† | Percentage | |||||
COMMON STOCKS — (73.6%) | |||||||
Real Estate Investment Trusts — (73.6%) | |||||||
#Alexander’s, Inc. | 55,500 | $ | 14,703,060 | 0.7% | |||
#Alexandria Real Estate Equities, Inc. | 419,576 | 22,728,432 | 1.1% | ||||
#AMB Property Corp. | 1,436,481 | 31,573,852 | 1.6% | ||||
American Campus Communites, Inc. | 508,012 | 13,726,484 | 0.7% | ||||
#Apartment Investment & Management Co. Class A | 1,251,241 | 15,452,826 | 0.8% | ||||
#AvalonBay Communities, Inc. | 828,309 | 56,971,093 | 2.8% | ||||
BioMed Realty Trust, Inc. | 955,828 | 12,970,586 | 0.6% | ||||
#Boston Properties, Inc. | 1,347,700 | 81,899,729 | 4.1% | ||||
#BRE Properties, Inc. Class A | 548,615 | 14,938,786 | 0.7% | ||||
#Camden Property Trust | 635,103 | 23,022,484 | 1.1% | ||||
#Corporate Office Properties Trust | 570,400 | 18,931,576 | 0.9% | ||||
#Developers Diversified Realty Corp. | 1,727,951 | 14,843,099 | 0.7% | ||||
#Digital Realty Trust, Inc. | 798,117 | 36,019,020 | 1.8% | ||||
#Douglas Emmett, Inc. | 1,309,963 | 15,457,563 | 0.8% | ||||
#Duke Realty Corp. | 2,172,470 | 24,418,563 | 1.2% | ||||
#Equity Lifestyle Properties, Inc. | 298,926 | 13,885,113 | 0.7% | ||||
#Equity One, Inc. | 849,219 | 12,670,347 | 0.6% | ||||
#Equity Residential | 2,734,906 | 78,984,085 | 3.9% | ||||
#Essex Property Trust, Inc. | 283,571 | 21,318,868 | 1.1% | ||||
#Federal Realty Investment Trust | 631,358 | 37,269,063 | 1.8% | ||||
#HCP, Inc. | 2,837,822 | 83,971,153 | 4.2% | ||||
#Health Care REIT, Inc. | 1,174,673 | 52,120,241 | 2.6% | ||||
#Healthcare Realty Trust, Inc. | 635,960 | 13,247,047 | 0.7% | ||||
#Highwood Properties, Inc. | 695,760 | 19,147,315 | 0.9% | ||||
#Home Properties, Inc. | 352,370 | 13,805,857 | 0.7% | ||||
#Hospitality Properties Trust | 1,194,605 | 23,067,823 | 1.1% | ||||
#Host Marriott Corp. | 5,857,767 | 59,222,024 | 2.9% | ||||
#HRPT Properties Trust | 2,385,161 | 16,767,682 | 0.8% | ||||
#Kimco Realty Corp. | 3,650,770 | 46,145,733 | 2.3% | ||||
#Liberty Property Trust | 1,082,967 | 31,806,741 | 1.6% | ||||
#Macerich Co. (The) | 864,550 | 25,763,590 | 1.3% | ||||
Mack-Cali Realty Corp. | 779,841 | 24,136,079 | 1.2% | ||||
#Mid-America Apartment Communities, Inc. | 302,710 | 13,264,752 | 0.7% | ||||
#National Retail Properties, Inc. | 857,504 | 16,618,428 | 0.8% | ||||
Nationwide Health Properties, Inc. | 1,090,924 | 35,182,299 | 1.7% | ||||
#Omega Healthcare Investors, Inc. | 882,824 | 13,383,612 | 0.7% | ||||
#ProLogis | 4,295,149 | 48,664,038 | 2.4% | ||||
#Public Storage | 1,703,066 | 125,345,658 | 6.2% | ||||
#Realty Income Corp. | 1,118,748 | 25,932,579 | 1.3% | ||||
#Regency Centers Corp. | 788,282 | 26,446,861 | 1.3% | ||||
#Senior Housing Properties Trust | 1,265,132 | 24,391,745 | 1.2% | ||||
#Simon Property Group, Inc. | 2,747,056 | 186,497,632 | 9.2% | ||||
#SL Green Realty Corp. | 761,883 | 29,530,585 | 1.5% | ||||
#Tanger Factory Outlet Centers, Inc. | 368,951 | 14,045,965 | 0.7% | ||||
#Taubman Centers, Inc. | 565,761 | 17,261,368 | 0.9% | ||||
#UDR, Inc. | 1,491,932 | 21,453,982 | 1.1% | ||||
#Ventas, Inc. | 1,545,828 | 62,034,078 | 3.1% | ||||
#Vornado Realty Trust | 1,740,706 | 103,676,449 | 5.1% | ||||
#Washington REIT | 570,272 | 15,226,262 | 0.8% | ||||
#Weingarten Realty Investors | 1,161,941 | 21,495,908 | 1.1% | ||||
Other Securities | 232,842,748 | 11.5% | |||||
TOTAL COMMON STOCKS | 2,004,280,863 | 99.3% | |||||
RIGHTS/WARRANTS — (0.0%) | |||||||
Other Securities | — | 0.0% | |||||
71
DFA REAL ESTATE SECURITIES PORTFOLIO
CONTINUED
Face Amount | Value† | Percentage | ||||||
| (000) | ||||||||
TEMPORARY CASH INVESTMENTS — (0.7%) | ||||||||
Repurchase Agreement, PNC Capital Markets, Inc. 0.19%, 11/02/09 (Collateralized by $18,765,000 FNMA 6.50%, 06/25/39, valued at $20,195,831) to be repurchased at $19,896,315 | $19,896 | $ | 19,896,000 | 1.0% | ||||
Shares/ Face Amount | ||||||||
| (000) | ||||||||
SECURITIES LENDING COLLATERAL — (25.7%) | ||||||||
§@DFA Short Term Investment Fund LP | 696,103,948 | 696,103,948 | 34.5% | |||||
@Repurchase Agreement, Deutsche Bank Securities 0.08%, | ||||||||
11/02/09 (Collateralized by $4,743,207 FHLMC 5.945%, 07/01/37, valued at $3,643,889) to be repurchased at $3,537,780 | $ | 3,538 | 3,537,756 | 0.1% | ||||
TOTAL SECURITIES LENDING COLLATERAL | 699,641,704 | 34.6% | ||||||
TOTAL INVESTMENTS — (100.0%) | $ | 2,723,818,567 | 134.9% | |||||
Summary of inputs used to value the Portfolio’s net assets as of October 31, 2009 is as follows (See Security Valuation Note):
| Valuation Inputs | |||||||||||
| Investment in Securities (Market Value) | |||||||||||
Level 1 | Level 2 | Level 3 | Total | ||||||||
Common Stocks | $ | 2,004,205,423 | $ | 75,440 | — | $ | 2,004,280,863 | ||||
Rights/Warrants | — | — | — | — | |||||||
Temporary Cash Investments | — | 19,896,000 | — | 19,896,000 | |||||||
Securities Lending Collateral | — | 699,641,704 | — | 699,641,704 | |||||||
TOTAL | $ | 2,004,205,423 | $ | 719,613,144 | — | $ | 2,723,818,567 | ||||
See accompanying Notes to Financial Statements.
72
LARGE CAP INTERNATIONAL PORTFOLIO
SUMMARY SCHEDULE OF PORTFOLIO HOLDINGS
October 31, 2009
Shares | Value†† | Percentage | |||||
COMMON STOCKS — (84.9%) | |||||||
AUSTRALIA — (6.4%) | |||||||
Australia & New Zealand Banking Group, Ltd. | 313,082 | $ | 6,385,657 | 0.5% | |||
BHP Billiton, Ltd. | 297,885 | 9,769,625 | 0.7% | ||||
Commonwealth Bank of Australia | 205,240 | 9,484,434 | 0.7% | ||||
National Australia Bank, Ltd. | 269,835 | 7,129,483 | 0.5% | ||||
Westpac Banking Corp. | 303,665 | 7,097,436 | 0.5% | ||||
Other Securities | 62,682,123 | 4.6% | |||||
TOTAL AUSTRALIA | 102,548,758 | 7.5% | |||||
AUSTRIA — (0.3%) | |||||||
Other Securities | 4,353,395 | 0.3% | |||||
BELGIUM — (0.6%) | |||||||
Other Securities | 9,594,243 | 0.7% | |||||
CANADA — (7.3%) | |||||||
Bank of Nova Scotia | 131,127 | 5,483,570 | 0.4% | ||||
EnCana Corp | 98,862 | 5,481,928 | 0.4% | ||||
#Royal Bank of Canada | 194,768 | 9,863,949 | 0.7% | ||||
Suncor Energy, Inc. | 211,107 | 7,007,960 | 0.5% | ||||
#Toronto Dominion Bank | 115,015 | 6,556,190 | �� | 0.5% | |||
Other Securities | 81,866,578 | 6.0% | |||||
TOTAL CANADA | 116,260,175 | 8.5% | |||||
DENMARK — (0.8%) | |||||||
Other Securities | 12,304,930 | 0.9% | |||||
FINLAND — (0.8%) | |||||||
Other Securities | 12,017,978 | 0.9% | |||||
FRANCE — (7.9%) | |||||||
BNP Paribas SA | 125,043 | 9,420,006 | 0.7% | ||||
France Telecom SA | 214,253 | 5,308,922 | 0.4% | ||||
#*GDF Suez | 152,694 | 6,383,743 | 0.5% | ||||
Sanofi - Aventis SA | 101,521 | 7,441,704 | 0.5% | ||||
#Total SA | 177,977 | 10,650,191 | 0.8% | ||||
Other Securities | 86,909,130 | 6.4% | |||||
TOTAL FRANCE | 126,113,696 | 9.3% | |||||
GERMANY — (5.8%) | |||||||
BASF AG | 108,701 | 5,850,644 | 0.4% | ||||
E.ON AG | 177,264 | 6,772,790 | 0.5% | ||||
#Siemens AG Sponsored ADR | 61,550 | 5,540,731 | 0.4% | ||||
Other Securities | 74,896,903 | 5.5% | |||||
TOTAL GERMANY | 93,061,068 | 6.8% | |||||
GREECE — (0.4%) | |||||||
Other Securities | 7,184,018 | 0.5% | |||||
HONG KONG — (1.8%) | |||||||
Other Securities | 28,121,806 | 2.1% | |||||
IRELAND — (0.2%) | |||||||
Other Securities | 3,035,031 | 0.2% | |||||
ITALY — (2.7%) | |||||||
Eni SpA | 241,210 | 5,973,993 | 0.4% | ||||
*UniCredito SpA | 1,875,900 | 6,284,651 | 0.5% | ||||
73
LARGE CAP INTERNATIONAL PORTFOLIO
CONTINUED
Shares | Value†† | Percentage | |||||
ITALY — (Continued) | |||||||
Other Securities | $ | 31,732,183 | 2.3% | ||||
TOTAL ITALY | 43,990,827 | 3.2% | |||||
JAPAN — (17.3%) | |||||||
Mitsubishi UFJ Financial Group, Inc. ADR | 1,013,378 | 5,381,037 | 0.4% | ||||
Toyota Motor Corp. | 249,300 | 9,841,604 | 0.7% | ||||
Other Securities | 260,980,547 | 19.2% | |||||
TOTAL JAPAN | 276,203,188 | 20.3% | |||||
NETHERLANDS — (2.2%) | |||||||
#Royal Dutch Shell P.L.C. Series A | 280,159 | 8,306,337 | 0.6% | ||||
Other Securities | 26,344,081 | 1.9% | |||||
TOTAL NETHERLANDS | 34,650,418 | 2.5% | |||||
NEW ZEALAND — (0.1%) | |||||||
Other Securities | 1,507,930 | 0.1% | |||||
NORWAY — (0.7%) | |||||||
Other Securities | 11,130,516 | 0.8% | |||||
PORTUGAL — (0.2%) | |||||||
Other Securities | 3,989,070 | 0.3% | |||||
SINGAPORE — (0.9%) | |||||||
Other Securities | 14,774,570 | 1.1% | |||||
SPAIN — (3.8%) | |||||||
#Banco Bilbao Vizcaya SA Sponsored ADR | 367,402 | 6,539,756 | 0.5% | ||||
Banco Santander SA | 406,785 | 6,546,088 | 0.5% | ||||
Banco Santander SA Sponsored ADR | 632,567 | 10,159,026 | 0.7% | ||||
Telefonica SA | 257,024 | 7,177,778 | 0.5% | ||||
#Telefonica SA Sponsored ADR | 119,800 | 10,054,814 | 0.7% | ||||
Other Securities | 21,096,802 | 1.6% | |||||
TOTAL SPAIN | 61,574,264 | 4.5% | |||||
SWEDEN — (2.0%) | |||||||
Other Securities | 31,496,226 | 2.3% | |||||
SWITZERLAND — (6.2%) | |||||||
Credit Suisse Group AG | 113,322 | 6,057,874 | 0.4% | ||||
Nestle SA | 475,908 | 22,130,471 | 1.6% | ||||
Novartis AG | 171,916 | 8,952,381 | 0.7% | ||||
Novartis AG ADR | 120,800 | 6,275,560 | 0.5% | ||||
Roche Holding AG Genusschein | 86,959 | 13,927,609 | 1.0% | ||||
*UBS AG | 372,238 | 6,206,973 | 0.5% | ||||
Other Securities | 35,996,303 | 2.6% | |||||
TOTAL SWITZERLAND | 99,547,171 | 7.3% | |||||
UNITED KINGDOM — (16.5%) | |||||||
*Anglo American P.L.C. | 178,356 | 6,453,474 | 0.5% | ||||
AstraZeneca P.L.C. | 134,585 | 6,041,736 | 0.4% | ||||
BG Group P.L.C. | 396,021 | 6,816,838 | 0.5% | ||||
BP P.L.C. | 1,435,437 | 13,450,442 | 1.0% | ||||
#*BP P.L.C. Sponsored ADR | 160,400 | 9,081,848 | 0.7% | ||||
British American Tobacco P.L.C. | 244,717 | 7,798,164 | 0.6% | ||||
GlaxoSmithKline P.L.C. | 503,498 | 10,328,121 | 0.7% | ||||
HSBC Holdings P.L.C. | 1,247,046 | 13,922,088 | 1.0% | ||||
HSBC Holdings P.L.C. Sponsored ADR | 200,759 | 11,120,041 | 0.8% | ||||
Rio Tinto P.L.C. | 153,950 | 6,806,118 | 0.5% | ||||
Royal Dutch Shell P.L.C. ADR | 93,987 | 5,466,284 | 0.4% | ||||
74
LARGE CAP INTERNATIONAL PORTFOLIO
CONTINUED
Shares | Value†† | Percentage | ||||||
UNITED KINGDOM — (Continued) | ||||||||
Royal Dutch Shell P.L.C. Series B | 235,872 | $ | 6,790,173 | 0.5% | ||||
Standard Chartered P.L.C. | 265,170 | 6,505,166 | 0.5% | |||||
Tesco P.L.C. | 1,025,017 | 6,853,642 | 0.5% | |||||
Vodafone Group P.L.C. | 4,315,608 | 9,510,887 | 0.7% | |||||
Vodafone Group P.L.C. Sponsored ADR | 303,700 | 6,739,103 | 0.5% | |||||
Other Securities | 130,529,930 | 9.6% | ||||||
TOTAL UNITED KINGDOM | 264,214,055 | 19.4% | ||||||
TOTAL COMMON STOCKS | 1,357,673,333 | 99.5% | ||||||
PREFERRED STOCKS — (0.0%) | ||||||||
ITALY — (0.0%) | ||||||||
Other Securities | 26,635 | 0.0% | ||||||
RIGHTS/WARRANTS — (0.0%) | ||||||||
BELGIUM — (0.0%) | ||||||||
Other Securities | 7 | 0.0% | ||||||
HONG KONG — (0.0%) | ||||||||
Other Securities | 6,412 | 0.0% | ||||||
ITALY — (0.0%) | ||||||||
Other Securities | — | 0.0% | ||||||
JAPAN — (0.0%) | ||||||||
Other Securities | — | 0.0% | ||||||
TOTAL RIGHTS/WARRANTS | 6,419 | 0.0% | ||||||
Face Amount | ||||||||
| (000) | Value† | |||||||
TEMPORARY CASH INVESTMENTS — (0.0%) | ||||||||
Repurchase Agreement, PNC Capital Markets, Inc. 0.19%, 11/02/09 (Collateralized by $730,000 FNMA 6.50%, 06/25/39, valued at $785,663) to be repurchased at $772,012 | $ | 772 | 772,000 | 0.1% | ||||
Shares/ Face Amount | ||||||||
| (000) | ||||||||
SECURITIES LENDING COLLATERAL — (15.1%) | ||||||||
§@DFA Short Term Investment Fund LP | 237,395,211 | 237,395,211 | 17.4% | |||||
@Repurchase Agreement, Deutsche Bank Securities 0.07%, 11/02/09 (Collateralized by various corporate obligations, ranging in par value from $4,247,617 to $16,429,280, rates ranging from 5.000% to 7.000%, maturities ranging from 03/01/37 to 10/01/39, valued at $4,251,826) to be repurchased at $4,168,481 | $ | 4,168 | 4,168,457 | 0.3% | ||||
TOTAL SECURITIES LENDING COLLATERAL | 241,563,668 | 17.7% | ||||||
TOTAL INVESTMENTS — (100.0%) | $ | 1,600,042,055 | 117.3% | |||||
75
LARGE CAP INTERNATIONAL PORTFOLIO
CONTINUED
Summary of inputs used to value the Portfolio’s net assets as of October 31, 2009 is as follows (See Security Valuation Note):
| Valuation Inputs | |||||||||||
| Investment in Securities (Market Value) | |||||||||||
| Level 1 | Level 2 | Level 3 | Total | ||||||||
Common Stocks | |||||||||||
Australia | $ | 6,198,344 | $ | 96,350,414 | — | $ | 102,548,758 | ||||
Austria | 78,240 | 4,275,155 | — | 4,353,395 | |||||||
Belgium | 359,340 | 9,234,903 | — | 9,594,243 | |||||||
Canada | 116,260,175 | — | — | 116,260,175 | |||||||
Denmark | 1,521,494 | 10,783,436 | — | 12,304,930 | |||||||
Finland | 2,495,194 | 9,522,784 | — | 12,017,978 | |||||||
France | 11,817,363 | 114,296,333 | — | 126,113,696 | |||||||
Germany | 23,137,574 | 69,923,494 | — | 93,061,068 | |||||||
Greece | 891,949 | 6,292,069 | — | 7,184,018 | |||||||
Hong Kong | — | 28,121,806 | — | 28,121,806 | |||||||
Ireland | 1,529,520 | 1,505,511 | — | 3,035,031 | |||||||
Italy | 5,133,789 | 38,857,038 | — | 43,990,827 | |||||||
Japan | 23,900,740 | 252,302,448 | — | 276,203,188 | |||||||
Netherlands | 1,086,918 | 33,563,500 | — | 34,650,418 | |||||||
New Zealand | — | 1,507,930 | — | 1,507,930 | |||||||
Norway | 949,419 | 10,181,097 | — | 11,130,516 | |||||||
Portugal | — | 3,989,070 | — | 3,989,070 | |||||||
Singapore | — | 14,774,570 | — | 14,774,570 | |||||||
Spain | 28,615,596 | 32,958,668 | — | 61,574,264 | |||||||
Sweden | 414,585 | 31,081,641 | — | 31,496,226 | |||||||
Switzerland | 14,774,954 | 84,772,217 | — | 99,547,171 | |||||||
United Kingdom | 66,124,743 | 198,089,312 | — | 264,214,055 | |||||||
Preferred Stocks | |||||||||||
Italy | — | 26,635 | — | 26,635 | |||||||
Rights/Warrants | |||||||||||
Belgium | 7 | — | — | 7 | |||||||
Hong Kong | — | 6,412 | — | 6,412 | |||||||
Italy | — | — | — | — | |||||||
Japan | — | — | — | — | |||||||
Temporary Cash Investments | — | 772,000 | — | 772,000 | |||||||
Securities Lending Collateral | — | 241,563,668 | — | 241,563,668 | |||||||
TOTAL | $ | 305,289,944 | $ | 1,294,752,111 | — | $ | 1,600,042,055 | ||||
See accompanying Notes to Financial Statements.
76
INTERNATIONAL CORE EQUITY PORTFOLIO
SUMMARY SCHEDULE OF PORTFOLIO HOLDINGS
October 31, 2009
Shares | Value†† | Percentage | |||||
COMMON STOCKS — (84.3%) | |||||||
AUSTRALIA — (5.9%) | |||||||
Australia & New Zealand Banking Group, Ltd. | 642,628 | $ | 13,107,115 | 0.4% | |||
Commonwealth Bank of Australia | 249,307 | 11,520,833 | 0.3% | ||||
National Australia Bank, Ltd. | 468,016 | 12,365,750 | 0.3% | ||||
Other Securities | 222,067,785 | 6.0% | |||||
TOTAL AUSTRALIA | 259,061,483 | 7.0% | |||||
AUSTRIA — (0.5%) | |||||||
Other Securities | 23,127,388 | 0.6% | |||||
BELGIUM — (0.9%) | |||||||
Other Securities | 40,361,634 | 1.1% | |||||
CANADA — (7.5%) | |||||||
#Bank of Montreal | 202,373 | 9,362,592 | 0.2% | ||||
EnCana Corp. | 208,817 | 11,578,966 | 0.3% | ||||
#Manulife Financial Corp. | 443,273 | 8,316,105 | 0.2% | ||||
#Royal Bank of Canada | 162,793 | 8,244,588 | 0.2% | ||||
Suncor Energy, Inc. | 402,417 | 13,358,748 | 0.4% | ||||
Talisman Energy, Inc. | 499,600 | 8,523,281 | 0.2% | ||||
*Teck Resources, Ltd. Class B | 337,587 | 9,799,554 | 0.3% | ||||
#Toronto Dominion Bank | 234,460 | 13,364,903 | 0.4% | ||||
Other Securities | 242,654,600 | 6.6% | |||||
TOTAL CANADA | 325,203,337 | 8.8% | |||||
DENMARK — (0.8%) | |||||||
Other Securities | 33,362,644 | 0.9% | |||||
FINLAND — (1.3%) | |||||||
Other Securities | 57,389,630 | 1.6% | |||||
FRANCE — (7.1%) | |||||||
#AXA SA Sponsored ADR | 450,270 | 11,166,696 | 0.3% | ||||
BNP Paribas SA | 264,297 | 19,910,585 | 0.5% | ||||
#Compagnie de Saint-Gobain SA | 199,892 | 9,740,682 | 0.3% | ||||
#*GDF Suez SA | 332,503 | 13,901,095 | 0.4% | ||||
Sanofi - Aventis SA ADR | 423,195 | 15,624,359 | 0.4% | ||||
#Schneider Electric SA | 86,442 | 8,988,999 | 0.2% | ||||
Societe Generale Paris SA | 172,286 | 11,443,202 | 0.3% | ||||
Total SA Sponsored ADR | 155,727 | 9,354,521 | 0.3% | ||||
Other Securities | 211,624,580 | 5.7% | |||||
TOTAL FRANCE | 311,754,719 | 8.4% | |||||
GERMANY — (5.0%) | |||||||
Allianz SE Sponsored ADR | 984,886 | 11,178,456 | 0.3% | ||||
#E.ON AG Sponsored ADR | 218,470 | 8,389,248 | 0.2% | ||||
Munchener Rueckversicherungs-Gesellschaft AG | 59,826 | 9,465,241 | 0.2% | ||||
Siemens AG Sponsored ADR | 125,474 | 11,295,169 | 0.3% | ||||
Other Securities | 179,767,598 | 4.9% | |||||
TOTAL GERMANY | 220,095,712 | 5.9% | |||||
GREECE — (1.0%) | |||||||
Other Securities | 44,809,050 | 1.2% | |||||
HONG KONG — (1.8%) | |||||||
Other Securities | 77,593,825 | 2.1% | |||||
77
INTERNATIONAL CORE EQUITY PORTFOLIO
CONTINUED
Shares | Value†† | Percentage | |||||
IRELAND — (0.6%) | |||||||
Other Securities | $ | 23,913,871 | 0.6% | ||||
ITALY — (2.6%) | |||||||
#*Intesa Sanpaolo SpA | 2,143,093 | 9,019,162 | 0.2% | ||||
*UniCredito SpA | 4,050,516 | 13,570,061 | 0.4% | ||||
Other Securities | 88,829,673 | 2.4% | |||||
TOTAL ITALY | 111,418,896 | 3.0% | |||||
JAPAN — (17.1%) | |||||||
#Honda Motor Co., Ltd. Sponsored ADR | 409,732 | 12,689,400 | 0.3% | ||||
#Mitsubishi UFJ Financial Group, Inc. ADR | 1,712,038 | 9,090,922 | 0.3% | ||||
Sony Corp. Sponsored ADR | 290,300 | 8,531,917 | 0.2% | ||||
#Toyota Motor Corp. Sponsored ADR | 260,669 | 20,564,177 | 0.6% | ||||
Other Securities | 695,631,016 | 18.8% | |||||
TOTAL JAPAN | 746,507,432 | 20.2% | |||||
NETHERLANDS — (2.4%) | |||||||
#*ING Groep NV Sponsored ADR | 843,215 | 10,877,473 | 0.3% | ||||
Other Securities | 91,719,715 | 2.5% | |||||
TOTAL NETHERLANDS | 102,597,188 | 2.8% | |||||
NEW ZEALAND — (0.2%) | |||||||
Other Securities | 9,828,546 | 0.3% | |||||
NORWAY — (0.9%) | |||||||
Other Securities | 40,646,423 | 1.1% | |||||
PORTUGAL — (0.5%) | |||||||
Other Securities | 20,329,702 | 0.5% | |||||
SINGAPORE — (1.2%) | |||||||
Other Securities | 51,319,251 | 1.4% | |||||
SPAIN — (2.9%) | |||||||
#Banco Bilbao Vizcaya SA Sponsored ADR | 858,383 | 15,279,217 | 0.4% | ||||
Banco Santander SA Sponsored ADR | 2,128,205 | 34,178,972 | 0.9% | ||||
Other Securities | 75,624,685 | 2.1% | |||||
TOTAL SPAIN | 125,082,874 | 3.4% | |||||
SWEDEN — (2.0%) | |||||||
#Nordea Bank AB | 910,765 | 9,775,622 | 0.3% | ||||
Other Securities | 77,992,798 | 2.1% | |||||
TOTAL SWEDEN | 87,768,420 | 2.4% | |||||
SWITZERLAND — (5.7%) | |||||||
Credit Suisse Group AG Sponsored ADR | 405,680 | 21,622,744 | 0.6% | ||||
#*Holcim, Ltd. | 196,366 | 12,497,670 | 0.3% | ||||
Nestle SA | 546,164 | 25,397,485 | 0.7% | ||||
#Novartis AG ADR | 446,694 | 23,205,753 | 0.6% | ||||
Roche Holding AG Genusschein | 82,873 | 13,273,183 | 0.4% | ||||
Zurich Financial Services AG | 61,540 | 14,092,204 | 0.4% | ||||
Other Securities | 138,371,293 | 3.7% | |||||
TOTAL SWITZERLAND | 248,460,332 | 6.7% | |||||
UNITED KINGDOM — (16.4%) | |||||||
*Anglo American P.L.C. | 536,326 | 19,405,941 | 0.5% | ||||
Aviva P.L.C. | 1,407,246 | 8,799,750 | 0.2% | ||||
#*Barclays P.L.C. Sponsored ADR | 892,663 | 18,656,657 | 0.5% | ||||
#*BP P.L.C. Sponsored ADR | 717,376 | 40,617,829 | 1.1% | ||||
#HSBC Holdings P.L.C. Sponsored ADR | 1,132,387 | 62,722,916 | 1.7% | ||||
78
INTERNATIONAL CORE EQUITY PORTFOLIO
CONTINUED
Shares | Value†† | Percentage | ||||||
UNITED KINGDOM — (Continued) | ||||||||
#Pearson P.L.C. Sponsored ADR | 607,283 | $ | 8,265,122 | 0.2% | ||||
Royal Dutch Shell P.L.C. ADR | 935,795 | 54,425,837 | 1.5% | |||||
SABmiller P.L.C. | 376,453 | 9,867,463 | 0.3% | |||||
Standard Chartered P.L.C. | 749,103 | 18,377,039 | 0.5% | |||||
Vodafone Group P.L.C. Sponsored ADR | 1,571,531 | 34,872,273 | 1.0% | |||||
*Xstrata P.L.C. | 782,713 | 11,273,856 | 0.3% | |||||
Other Securities | 429,857,805 | 11.6% | ||||||
TOTAL UNITED KINGDOM | 717,142,488 | 19.4% | ||||||
UNITED STATES — (0.0%) | ||||||||
Other Securities | 158,075 | 0.0% | ||||||
TOTAL COMMON STOCKS | 3,677,932,920 | 99.4% | ||||||
PREFERRED STOCKS — (0.0%) | ||||||||
AUSTRALIA — (0.0%) | ||||||||
Other Securities | 92,550 | 0.0% | ||||||
RIGHTS/WARRANTS — (0.0%) | ||||||||
AUSTRALIA — (0.0%) | ||||||||
Other Securities | 4,504 | 0.0% | ||||||
BELGIUM — (0.0%) | ||||||||
Other Securities | 80 | 0.0% | ||||||
DENMARK — (0.0%) | ||||||||
Other Securities | 8,768 | 0.0% | ||||||
FRANCE — (0.0%) | ||||||||
Other Securities | 8 | 0.0% | ||||||
GERMANY — (0.0%) | ||||||||
Other Securities | 24,017 | 0.0% | ||||||
HONG KONG — (0.0%) | ||||||||
Other Securities | 56,110 | 0.0% | ||||||
ITALY — (0.0%) | ||||||||
Other Securities | — | 0.0% | ||||||
JAPAN — (0.0%) | ||||||||
Other Securities | — | 0.0% | ||||||
SPAIN — (0.0%) | ||||||||
Other Securities | 82,382 | 0.0% | ||||||
UNITED KINGDOM — (0.0%) | ||||||||
Other Securities | 57,481 | 0.0% | ||||||
TOTAL RIGHTS/WARRANTS | 233,350 | 0.0% | ||||||
Face | ||||||||
| (000) | Value† | |||||||
TEMPORARY CASH INVESTMENTS — (0.3%) | ||||||||
Repurchase Agreement, PNC Capital Markets, Inc. 0.19%, 11/02/09 (Collateralized by $19,120,000 FNMA 5.058%(r), 01/01/36, valued at $12,807,097) to be repurchased at $12,615,200 | $ | 12,615 | 12,615,000 | 0.3% | ||||
79
INTERNATIONAL CORE EQUITY PORTFOLIO
CONTINUED
Shares/ Face Amount | Value† | Percentage | ||||||
| (000) | ||||||||
SECURITIES LENDING COLLATERAL — (15.4%) | ||||||||
§@DFA Short Term Investment Fund LP | 670,812,556 | $ | 670,812,556 | 18.1% | ||||
@Repurchase Agreement, Deutsche Bank Securities 0.07%, 11/02/09 (Collateralized by various corporate obligations, ranging in par value from $4,247,617 to $16,429,280, rates ranging from 5.000% to 7.000%, maturities ranging from 03/01/37 to 10/01/39, valued at $1,919,841) to be repurchased at $1,882,208 | $ | 1,882 | 1,882,197 | 0.1% | ||||
TOTAL SECURITIES LENDING COLLATERAL | 672,694,753 | 18.2% | ||||||
TOTAL INVESTMENTS — (100.0%) | $ | 4,363,568,573 | 117.9% | |||||
80
INTERNATIONAL CORE EQUITY PORTFOLIO
CONTINUED
Summary of inputs used to value the Portfolio’s net assets as of October 31, 2009 is as follows (See Security Valuation Note):
| Valuation Inputs | |||||||||||
| Investment in Securities (Market Value) | |||||||||||
| Level 1 | Level 2 | Level 3 | Total | ||||||||
Common Stocks | |||||||||||
Australia | $ | 14,324,535 | $ | 244,736,948 | — | $ | 259,061,483 | ||||
Austria | 136,920 | 22,990,468 | — | 23,127,388 | |||||||
Belgium | 4,443,476 | 35,918,158 | — | 40,361,634 | |||||||
Canada | 325,194,945 | 8,392 | — | 325,203,337 | |||||||
Denmark | 1,655,474 | 31,707,170 | — | 33,362,644 | |||||||
Finland | 4,054,711 | 53,334,919 | — | 57,389,630 | |||||||
France | 58,844,669 | 252,910,050 | — | 311,754,719 | |||||||
Germany | 51,479,020 | 168,616,692 | — | 220,095,712 | |||||||
Greece | 9,703,353 | 35,105,697 | — | 44,809,050 | |||||||
Hong Kong | 367,693 | 77,226,132 | — | 77,593,825 | |||||||
Ireland | 8,090,545 | 15,823,326 | — | 23,913,871 | |||||||
Italy | 11,908,539 | 99,510,357 | — | 111,418,896 | |||||||
Japan | 77,579,498 | 668,927,934 | — | 746,507,432 | |||||||
Netherlands | 23,506,438 | 79,090,750 | — | 102,597,188 | |||||||
New Zealand | 449,228 | 9,379,318 | — | 9,828,546 | |||||||
Norway | 1,899,632 | 38,746,791 | — | 40,646,423 | |||||||
Portugal | 320,178 | 20,009,524 | — | 20,329,702 | |||||||
Singapore | 250,797 | 51,068,454 | — | 51,319,251 | |||||||
Spain | 61,473,102 | 63,609,772 | — | 125,082,874 | |||||||
Sweden | 7,169,735 | 80,598,685 | — | 87,768,420 | |||||||
Switzerland | 62,098,431 | 186,361,901 | — | 248,460,332 | |||||||
United Kingdom | 283,516,061 | 433,626,427 | — | 717,142,488 | |||||||
United States | 158,075 | — | — | 158,075 | |||||||
Preferred Stocks | |||||||||||
Australia | — | 92,550 | — | 92,550 | |||||||
Rights/Warrants | |||||||||||
Australia | — | 4,504 | — | 4,504 | |||||||
Belgium | 80 | — | — | 80 | |||||||
Denmark | 8,768 | — | — | 8,768 | |||||||
France | 8 | — | — | 8 | |||||||
Germany | — | 24,017 | — | 24,017 | |||||||
Hong Kong | — | 56,110 | — | 56,110 | |||||||
Italy | — | — | — | — | |||||||
Japan | — | — | — | — | |||||||
Spain | — | 82,382 | — | 82,382 | |||||||
United Kingdom | 57,481 | — | — | 57,481 | |||||||
Temporary Cash Investments | — | 12,615,000 | — | 12,615,000 | |||||||
Securities Lending Collateral | — | 672,694,753 | — | 672,694,753 | |||||||
TOTAL | $ | 1,008,691,392 | $ | 3,354,877,181 | — | $ | 4,363,568,573 | ||||
See accompanying Notes to Financial Statements.
81
T.A. WORLD EX U.S. CORE EQUITY PORTFOLIO
SUMMARY SCHEDULE OF PORTFOLIO HOLDINGS
October 31, 2009
Shares | Value†† | Percentage | |||||
COMMON STOCKS — (90.9%) | |||||||
AUSTRALIA — (5.2%) | |||||||
Australia & New Zealand Banking Group, Ltd. | 96,142 | $ | 1,960,923 | 0.3% | |||
Commonwealth Bank of Australia | 50,642 | 2,340,239 | 0.3% | ||||
National Australia Bank, Ltd. | 65,156 | 1,721,528 | 0.3% | ||||
Other Securities | 31,119,926 | 4.7% | |||||
TOTAL AUSTRALIA | 37,142,616 | 5.6% | |||||
AUSTRIA — (0.5%) | |||||||
Other Securities | 3,352,618 | 0.5% | |||||
BELGIUM — (0.8%) | |||||||
Other Securities | 5,498,868 | 0.8% | |||||
BRAZIL — (1.8%) | |||||||
Cia Vale do Rio Doce | 52,700 | 1,343,323 | 0.2% | ||||
Other Securities | 11,352,922 | 1.7% | |||||
TOTAL BRAZIL | 12,696,245 | 1.9% | |||||
CANADA — (6.4%) | |||||||
Royal Bank of Canada | 39,027 | 1,976,507 | 0.3% | ||||
Suncor Energy, Inc. | 70,464 | 2,339,140 | 0.4% | ||||
*Teck Resources, Ltd. Class B | 51,800 | 1,503,662 | 0.2% | ||||
Toronto Dominion Bank | 37,400 | 2,131,909 | 0.3% | ||||
Other Securities | 38,015,826 | 5.7% | |||||
TOTAL CANADA | 45,967,044 | 6.9% | |||||
CHILE — (0.3%) | |||||||
Other Securities | 2,173,675 | 0.3% | |||||
CHINA — (4.3%) | |||||||
Bank of China, Ltd. | 2,353,000 | 1,353,034 | 0.2% | ||||
China Construction Bank Corp. | 1,628,000 | 1,403,550 | 0.2% | ||||
*Industrial & Commercial Bank of China, Ltd. | 1,714,000 | 1,363,684 | 0.2% | ||||
Other Securities | 26,921,629 | 4.0% | |||||
TOTAL CHINA | 31,041,897 | 4.6% | |||||
CZECH REPUBLIC — (0.1%) | |||||||
Other Securities | 607,478 | 0.1% | |||||
DENMARK — (0.6%) | |||||||
Other Securities | 4,631,600 | 0.7% | |||||
FINLAND — (1.1%) | |||||||
Other Securities | 7,702,907 | 1.2% | |||||
FRANCE — (5.9%) | |||||||
AXA SA Sponsored ADR | 62,400 | 1,547,520 | 0.2% | ||||
BNP Paribas SA | 43,518 | 3,278,391 | 0.5% | ||||
#Lafarge SA | 15,620 | 1,267,872 | 0.2% | ||||
Sanofi - Aventis SA | 17,594 | 1,289,677 | 0.2% | ||||
Schneider Electric SA | 14,962 | 1,555,880 | 0.2% | ||||
Societe Generale Paris SA | 27,595 | 1,832,854 | 0.3% | ||||
Other Securities | 31,931,445 | 4.8% | |||||
TOTAL FRANCE | 42,703,639 | 6.4% | |||||
GERMANY — (4.1%) | |||||||
Allianz SE | 11,378 | 1,303,354 | 0.2% | ||||
#Deutsche Bank AG | 20,100 | 1,439,763 | 0.2% | ||||
82
T.A. WORLDEX U.S. CORE EQUITY PORTFOLIO
CONTINUED
Shares | Value†† | Percentage | |||||
GERMANY — (Continued) | |||||||
E.ON AG | 52,403 | $ | 2,002,180 | 0.3% | |||
Munchener Rueckversicherungs-Gesellschaft AG | 8,352 | 1,321,394 | 0.2% | ||||
Other Securities | 23,413,988 | 3.5% | |||||
TOTAL GERMANY | 29,480,679 | 4.4% | |||||
GREECE — (0.9%) | |||||||
Other Securities | 6,504,671 | 1.0% | |||||
HONG KONG — (1.7%) | |||||||
Other Securities | 11,943,648 | 1.8% | |||||
HUNGARY — (0.2%) | |||||||
Other Securities | 1,268,151 | 0.2% | |||||
INDIA — (2.0%) | |||||||
Other Securities | 14,392,828 | 2.2% | |||||
INDONESIA — (0.4%) | |||||||
Other Securities | 2,832,953 | 0.4% | |||||
IRELAND — (0.4%) | |||||||
Other Securities | 2,897,143 | 0.4% | |||||
ISRAEL — (0.5%) | |||||||
Other Securities | 3,660,827 | 0.6% | |||||
ITALY — (2.2%) | |||||||
*UniCredito SpA | 486,410 | 1,629,574 | 0.2% | ||||
Other Securities | 14,033,052 | 2.1% | |||||
TOTAL ITALY | 15,662,626 | 2.3% | |||||
JAPAN — (14.2%) | |||||||
Toyota Motor Corp. Sponsored ADR | 26,776 | 2,112,359 | 0.3% | ||||
Other Securities | 100,458,222 | 15.0% | |||||
TOTAL JAPAN | 102,570,581 | 15.3% | |||||
MALAYSIA — (0.7%) | |||||||
Other Securities | 4,824,190 | 0.7% | |||||
MEXICO — (0.8%) | |||||||
Other Securities | 6,009,411 | 0.9% | |||||
NETHERLANDS — (2.0%) | |||||||
#*ING Groep NV Sponsored ADR | 141,618 | 1,826,872 | 0.3% | ||||
Philips Electronics NV ADR | 58,800 | 1,475,292 | 0.2% | ||||
Other Securities | 11,423,625 | 1.7% | |||||
TOTAL NETHERLANDS | 14,725,789 | 2.2% | |||||
NEW ZEALAND — (0.2%) | |||||||
Other Securities | 1,536,665 | 0.2% | |||||
NORWAY — (0.8%) | |||||||
Other Securities | 5,893,963 | 0.9% | |||||
PHILIPPINES — (0.1%) | |||||||
Other Securities | 789,804 | 0.1% | |||||
POLAND — (0.3%) | |||||||
Other Securities | 2,027,176 | 0.3% | |||||
83
T.A. WORLDEX U.S. CORE EQUITY PORTFOLIO
CONTINUED
Shares | Value†† | Percentage | |||||
PORTUGAL — (0.4%) | |||||||
Other Securities | $ | 2,941,399 | 0.4% | ||||
RUSSIA — (0.0%) | |||||||
Other Securities | 40,151 | 0.0% | |||||
SINGAPORE — (0.9%) | |||||||
Other Securities | 6,821,647 | 1.0% | |||||
SOUTH AFRICA — (1.5%) | |||||||
Other Securities | 10,630,181 | 1.6% | |||||
SOUTH KOREA — (2.8%) | |||||||
Other Securities | 20,380,746 | 3.1% | |||||
SPAIN — (2.5%) | |||||||
Banco Bilbao Vizcaya SA Sponsored ADR | 146,546 | 2,608,519 | 0.4% | ||||
Banco Santander SA | 198,448 | 3,193,476 | 0.4% | ||||
Banco Santander SA Sponsored ADR | 157,920 | 2,536,195 | 0.4% | ||||
Other Securities | 9,886,784 | 1.5% | |||||
TOTAL SPAIN | 18,224,974 | 2.7% | |||||
SWEDEN — (1.7%) | |||||||
#Nordea Bank AB | 145,566 | 1,562,421 | 0.2% | ||||
Other Securities | 10,615,068 | 1.6% | |||||
TOTAL SWEDEN | 12,177,489 | 1.8% | |||||
SWITZERLAND — (4.7%) | |||||||
Credit Suisse Group AG | 43,068 | 2,302,294 | 0.4% | ||||
Credit Suisse Group AG Sponsored ADR | 28,818 | 1,535,999 | 0.2% | ||||
#*Holcim, Ltd. | 31,260 | 1,989,536 | 0.3% | ||||
Nestle SA | 33,903 | 1,576,543 | 0.2% | ||||
Novartis AG ADR | 69,100 | 3,589,745 | 0.5% | ||||
Roche Holding AG Genusschein | 9,111 | 1,459,245 | 0.2% | ||||
*UBS AG ADR | 128,000 | 2,123,520 | 0.3% | ||||
Zurich Financial Services AG | 10,105 | 2,313,970 | 0.4% | ||||
Other Securities | 17,317,610 | 2.6% | |||||
TOTAL SWITZERLAND | 34,208,462 | 5.1% | |||||
TAIWAN — (2.4%) | |||||||
Other Securities | 17,643,449 | 2.6% | |||||
THAILAND — (0.3%) | |||||||
Other Securities | 2,296,967 | 0.4% | |||||
TURKEY — (0.4%) | |||||||
Other Securities | 2,590,955 | 0.4% | |||||
UNITED KINGDOM — (14.8%) | |||||||
*Anglo American P.L.C. | 76,082 | 2,752,883 | 0.4% | ||||
Aviva P.L.C. | 240,528 | 1,504,063 | 0.2% | ||||
*Barclays P.L.C. | 374,834 | 1,964,536 | 0.3% | ||||
*BP P.L.C. Sponsored ADR | 96,420 | 5,459,300 | 0.8% | ||||
HSBC Holdings P.L.C. | 167,327 | 1,868,048 | 0.3% | ||||
HSBC Holdings P.L.C. Sponsored ADR | 103,820 | 5,750,590 | 0.9% | ||||
Kingfisher P.L.C. | 390,107 | 1,425,888 | 0.2% | ||||
Royal Dutch Shell P.L.C. ADR | 108,043 | 6,283,781 | 0.9% | ||||
SABmiller P.L.C. | 61,179 | 1,603,604 | 0.2% | ||||
Standard Chartered P.L.C. | 138,929 | 3,408,215 | 0.5% | ||||
Vodafone Group P.L.C. Sponsored ADR | 196,999 | 4,371,408 | 0.7% | ||||
*Xstrata P.L.C. | 143,852 | 2,071,981 | 0.3% | ||||
84
T.A. WORLDEX U.S. CORE EQUITY PORTFOLIO
CONTINUED
Shares | Value†† | Percentage | ||||||
UNITED KINGDOM — (Continued) | ||||||||
Other Securities | $ | 68,498,903 | 10.3% | |||||
TOTAL UNITED KINGDOM | 106,963,200 | 16.0% | ||||||
UNITED STATES — (0.0%) | ||||||||
Other Securities | 59,244 | 0.0% | ||||||
TOTAL COMMON STOCKS | 655,518,556 | 98.0% | ||||||
PREFERRED STOCKS — (1.3%) | ||||||||
BRAZIL — (1.3%) | ||||||||
Cia Vale do Rio Doce | 66,950 | 1,546,545 | 0.2% | |||||
Other Securities | 7,337,728 | 1.1% | ||||||
TOTAL BRAZIL | 8,884,273 | 1.3% | ||||||
TOTAL PREFERRED STOCKS | 8,884,273 | 1.3% | ||||||
RIGHTS/WARRANTS — (0.0%) | ||||||||
BELGIUM — (0.0%) | ||||||||
Other Securities | — | 0.0% | ||||||
BRAZIL — (0.0%) | ||||||||
Other Securities | 4,501 | 0.0% | ||||||
DENMARK — (0.0%) | ||||||||
Other Securities | 4,510 | 0.0% | ||||||
GERMANY — (0.0%) | ||||||||
Other Securities | 3,707 | 0.0% | ||||||
HONG KONG — (0.0%) | ||||||||
Other Securities | 8,989 | 0.0% | ||||||
ITALY — (0.0%) | ||||||||
Other Securities | — | 0.0% | ||||||
SPAIN — (0.0%) | ||||||||
Other Securities | 19,316 | 0.0% | ||||||
TAIWAN — (0.0%) | ||||||||
Other Securities | 2,503 | 0.0% | ||||||
UNITED KINGDOM — (0.0%) | ||||||||
Other Securities | 10,252 | 0.0% | ||||||
TOTAL RIGHTS/WARRANTS | 53,778 | 0.0% | ||||||
Face Amount | Value† | |||||||
| (000) | ||||||||
TEMPORARY CASH INVESTMENTS — (0.6%) | ||||||||
Repurchase Agreement, PNC Capital Markets, Inc. 0.19%, 11/02/09 (Collateralized by $7,150,000 FHLMC 6.040%(r), 11/01/36, valued at $4,590,056) to be repurchased at $4,521,072 | $ | 4,521 | 4,521,000 | 0.7% | ||||
Shares/ Face Amount | ||||||||
| (000) | ||||||||
SECURITIES LENDING COLLATERAL — (7.2%) | ||||||||
§@DFA Short Term Investment Fund LP | 47,095,489 | 47,095,489 | 7.1% | |||||
85
T.A. WORLDEX U.S. CORE EQUITY PORTFOLIO
CONTINUED
Shares/ Amount | Value† | Percentage | ||||||
| (000) | ||||||||
@Repurchase Agreement, Deutsche Bank Securities 0.07%11/02/09 (Collateralized by various corporate obligations, ranging in par value from $4,247,617 to $16,429,280, rates ranging from 5.000% to 7.000%, maturities ranging from 03/01/37 to 10/01/39, valued at $4,991,891) to be repurchased at $4,894,040 | $ | 4,894 | 4,894,011 | 0.7% | ||||
TOTAL SECURITIES LENDING COLLATERAL | 51,989,500 | 7.8% | ||||||
TOTAL INVESTMENTS — (100.0%) | $ | 720,967,107 | 107.8% | |||||
86
T.A. WORLDEX U.S. CORE EQUITY PORTFOLIO
CONTINUED
Summary of inputs used to value the Portfolio’s net assets as of October 31, 2009 is as follows (See Security Valuation Note):
| Valuation Inputs | |||||||||||
| Investment in Securities (Market Value) | |||||||||||
| Level 1 | Level 2 | Level 3 | Total | ||||||||
Common Stocks | |||||||||||
Australia | $ | 1,225,736 | $ | 35,916,880 | — | $ | 37,142,616 | ||||
Austria | — | 3,352,618 | — | 3,352,618 | |||||||
Belgium | 911,842 | 4,587,026 | — | 5,498,868 | |||||||
Brazil | 12,696,245 | — | — | 12,696,245 | |||||||
Canada | 45,967,044 | — | — | 45,967,044 | |||||||
Chile | 2,173,675 | — | — | 2,173,675 | |||||||
China | 3,407,086 | 27,634,811 | — | 31,041,897 | |||||||
Czech Republic | — | 607,478 | — | 607,478 | |||||||
Denmark | 211,980 | 4,419,620 | — | 4,631,600 | |||||||
Finland | 361,058 | 7,341,849 | — | 7,702,907 | |||||||
France | 4,886,686 | 37,816,953 | — | 42,703,639 | |||||||
Germany | 5,824,473 | 23,656,206 | — | 29,480,679 | |||||||
Greece | 1,441,545 | 5,063,126 | — | 6,504,671 | |||||||
Hong Kong | 15,483 | 11,928,165 | — | 11,943,648 | |||||||
Hungary | 102,720 | 1,165,431 | — | 1,268,151 | |||||||
India | 874,488 | 13,518,340 | — | 14,392,828 | |||||||
Indonesia | 70,126 | 2,762,827 | — | 2,832,953 | |||||||
Ireland | 565,371 | 2,331,772 | — | 2,897,143 | |||||||
Israel | 1,160,535 | 2,500,292 | — | 3,660,827 | |||||||
Italy | 1,103,915 | 14,558,711 | — | 15,662,626 | |||||||
Japan | 9,057,114 | 93,513,467 | — | 102,570,581 | |||||||
Malaysia | — | 4,824,190 | — | 4,824,190 | |||||||
Mexico | 6,009,411 | — | — | 6,009,411 | |||||||
Netherlands | 5,536,180 | 9,189,609 | — | 14,725,789 | |||||||
New Zealand | 32,256 | 1,504,409 | — | 1,536,665 | |||||||
Norway | 154,418 | 5,739,545 | — | 5,893,963 | |||||||
Philippines | 53,300 | 736,504 | — | 789,804 | |||||||
Poland | — | 2,027,176 | — | 2,027,176 | |||||||
Portugal | 4,386 | 2,937,013 | — | 2,941,399 | |||||||
Russia | — | 40,151 | — | 40,151 | |||||||
Singapore | — | 6,821,647 | — | 6,821,647 | |||||||
South Africa | 1,169,370 | 9,460,811 | — | 10,630,181 | |||||||
South Korea | 2,200,192 | 18,180,554 | — | 20,380,746 | |||||||
Spain | 6,894,180 | 11,330,794 | — | 18,224,974 | |||||||
Sweden | 268,124 | 11,909,365 | — | 12,177,489 | |||||||
Switzerland | 8,892,771 | 25,315,691 | — | 34,208,462 | |||||||
Taiwan | 228,385 | 17,415,064 | — | 17,643,449 | |||||||
Thailand | 2,296,967 | — | — | 2,296,967 | |||||||
Turkey | 52,576 | 2,538,379 | — | 2,590,955 | |||||||
United Kingdom | 28,580,518 | 78,382,682 | — | 106,963,200 | |||||||
United States | 59,244 | — | — | 59,244 | |||||||
Preferred Stocks | |||||||||||
Brazil | 8,884,273 | — | — | 8,884,273 | |||||||
Rights/Warrants | |||||||||||
Belgium | — | — | — | — | |||||||
87
T.A. WORLDEX U.S. CORE EQUITY PORTFOLIO
CONTINUED
| Valuation Inputs | |||||||||||
| Investment in Securities (Market Value) | |||||||||||
| Level 1 | Level 2 | Level 3 | Total | ||||||||
Brazil | $ | 4,501 | — | — | $ | 4,501 | |||||
Denmark | 4,510 | — | — | 4,510 | |||||||
Germany | — | $ | 3,707 | — | 3,707 | ||||||
Hong Kong | 2,895 | 6,094 | — | 8,989 | |||||||
Italy | — | — | — | — | |||||||
Spain | — | 19,316 | — | 19,316 | |||||||
Taiwan | — | 2,503 | — | 2,503 | |||||||
United Kingdom | 10,252 | — | — | 10,252 | |||||||
Temporary Cash Investments | — | 4,521,000 | — | 4,521,000 | |||||||
Securities Lending Collateral | — | 51,989,500 | — | 51,989,500 | |||||||
TOTAL | $ | 163,395,831 | $ | 557,571,276 | — | $ | 720,967,107 | ||||
See accompanying Notes to Financial Statements.
88
DFA INVESTMENT DIMENSIONS GROUP INC.
SCHEDULES OF INVESTMENTS
October 31, 2009
INTERNATIONAL SMALL COMPANY PORTFOLIO
Value† | |||
AFFILIATED INVESTMENT COMPANIES — (100.0%) | |||
Investment in The Continental Small Company Series of | $ | 1,519,912,526 | |
Investment in The Japanese Small Company Series of | 1,068,920,039 | ||
Investment in The United Kingdom Small Company Series of | 742,599,754 | ||
Investment in The Asia Pacific Small Company Series of | 579,094,079 | ||
Investment in The Canadian Small Company Series of | 365,189,000 | ||
TOTAL INVESTMENTS IN AFFILIATED INVESTMENT COMPANIES | $ | 4,275,715,398 | |
Summary of inputs used to value the Portfolio’s net assets as of October 31, 2009 is as follows (See Security Valuation Note):
| Valuation Inputs | ||||||||||
| Investment in Securities (Market Value) | ||||||||||
| Level 1 | Level 2 | Level 3 | Total | |||||||
Affiliated Investment Companies | $ | 4,275,715,398 | — | — | $ | 4,275,715,398 | ||||
See accompanying Notes to Financial Statements.
89
DFA INVESTMENT DIMENSIONS GROUP INC.
SCHEDULESOF INVESTMENTS
CONTINUED
JAPANESE SMALL COMPANY PORTFOLIO
Value† | |||
AFFILIATED INVESTMENT COMPANY — (100.0%) | |||
Investment in The Japanese Small Company Series of | $ | 114,114,441 | |
TOTAL INVESTMENTS IN AFFILIATED INVESTMENT COMPANY | $ | 114,114,441 | |
Summary of inputs used to value the Portfolio’s net assets as of October 31, 2009 is as follows (See Security Valuation Note):
| Valuation Inputs | ||||||||||
| Investment in Securities (Market Value) | ||||||||||
| Level 1 | Level 2 | Level 3 | Total | |||||||
Affiliated Investment Company | $ | 114,114,441 | — | — | $ | 114,114,441 | ||||
ASIA PACIFIC SMALL COMPANY PORTFOLIO
Value† | |||
AFFILIATED INVESTMENT COMPANY — (100.0%) | |||
Investment in The Asia Pacific Small Company Series of | $ | 101,906,415 | |
TOTAL INVESTMENTS IN AFFILIATED INVESTMENT COMPANY | $ | 101,906,415 | |
Summary of inputs used to value the Portfolio’s net assets as of October 31, 2009 is as follows (See Security Valuation Note):
| Valuation Inputs | ||||||||||
| Investment in Securities (Market Value) | ||||||||||
| Level 1 | Level 2 | Level 3 | Total | |||||||
Affiliated Investment Company | $ | 101,906,415 | — | — | $ | 101,906,415 | ||||
90
DFA INVESTMENT DIMENSIONS GROUP INC.
SCHEDULES OF INVESTMENTS
October 31, 2009
UNITED KINGDOM SMALL COMPANY PORTFOLIO
Value† | |||
AFFILIATED INVESTMENT COMPANY — (100.0%) | |||
Investment in The United Kingdom Small Company Series of | $ | 27,871,894 | |
TOTAL INVESTMENTS IN AFFILIATED INVESTMENT COMPANY | $ | 27,871,894 | |
Summary of inputs used to value the Portfolio’s net assets as of October 31, 2009 is as follows (See Security Valuation Note):
| Valuation Inputs | ||||||||||
| Investment in Securities (Market Value) | ||||||||||
| Level 1 | Level 2 | Level 3 | Total | |||||||
Affiliated Investment Company | $ | 27,871,894 | — | — | $ | 27,871,894 | ||||
CONTINENTAL SMALL COMPANY PORTFOLIO
Value† | |||
AFFILIATED INVESTMENT COMPANY — (100.0%) | |||
Investment in The Continental Small Company Series of | $ | 110,985,135 | |
TOTAL INVESTMENTS IN AFFILIATED INVESTMENT COMPANY | $ | 110,985,135 | |
Summary of inputs used to value the Portfolio’s net assets as of October 31, 2009 is as follows (See Security Valuation Note):
| Valuation Inputs | ||||||||||
| Investment in Securities (Market Value) | ||||||||||
| Level 1 | Level 2 | Level 3 | Total | |||||||
Affiliated Investment Company | $ | 110,985,135 | — | — | $ | 110,985,135 | ||||
See accompanying Notes to Financial Statements.
91
DFA INTERNATIONAL REAL ESTATE SECURITIES PORTFOLIO
SUMMARY SCHEDULE OF PORTFOLIO HOLDINGS
October 31, 2009
Shares | Value†† | Percentage | |||||
COMMON STOCKS — (85.0%) | |||||||
AUSTRALIA — (22.2%) | |||||||
CFS Retail Property Trust | 9,299,087 | $ | 15,978,498 | 2.1% | |||
Commonwealth Property Office Fund | 8,329,358 | 6,533,372 | 0.9% | ||||
Dexus Property Group | 21,038,811 | 14,864,254 | 2.0% | ||||
#Goodman Group | 16,279,701 | 8,729,311 | 1.2% | ||||
GPT Group | 38,018,670 | 19,402,061 | 2.6% | ||||
ING Office Fund | 9,301,027 | 4,907,378 | 0.6% | ||||
Macquarie Country Wide Trust | 6,416,906 | 3,550,288 | 0.5% | ||||
Macquarie Office Trust | 17,635,306 | 4,937,341 | 0.7% | ||||
Stockland Trust Group | 10,526,908 | 34,969,564 | 4.7% | ||||
Westfield Group | 5,691,219 | 61,658,889 | 8.3% | ||||
Other Securities | 17,694,934 | 2.4% | |||||
TOTAL AUSTRALIA | 193,225,890 | 26.0% | |||||
BELGIUM — (1.7%) | |||||||
Befimmo SCA | 54,310 | 5,169,734 | 0.7% | ||||
#Cofinimmo SA | 37,088 | 5,344,597 | 0.7% | ||||
Other Securities | 4,474,108 | 0.6% | |||||
TOTAL BELGIUM | 14,988,439 | 2.0% | |||||
CANADA — (4.1%) | |||||||
#Boardwalk REIT | 110,766 | 3,786,548 | 0.5% | ||||
#Riocan REIT | 530,784 | 8,996,422 | 1.2% | ||||
Other Securities | 22,539,091 | 3.1% | |||||
TOTAL CANADA | 35,322,061 | 4.8% | |||||
CHINA — (0.1%) | |||||||
Other Securities | 880,600 | 0.1% | |||||
FRANCE — (14.0%) | |||||||
#Fonciere des Regions SA | 76,369 | 8,417,507 | 1.1% | ||||
*Gecina SA | 45,779 | 4,870,047 | 0.7% | ||||
Icade SA | 87,009 | 9,160,308 | 1.2% | ||||
#Klepierre SA | 406,887 | 16,865,600 | 2.3% | ||||
#Mercialys SA | 101,662 | 4,097,176 | 0.6% | ||||
#Societe Immobiliere de Location pour l’Industrie et le Commerce SA | 60,852 | 7,730,059 | 1.0% | ||||
#Unibail-Rodamco SE | 295,081 | 65,344,360 | 8.8% | ||||
Other Securities | 5,071,061 | 0.7% | |||||
TOTAL FRANCE | 121,556,118 | 16.4% | |||||
GERMANY — (0.1%) | |||||||
Other Securities | 918,116 | 0.1% | |||||
GREECE — (0.0%) | |||||||
Other Securities | 421,005 | 0.1% | |||||
HONG KONG — (3.2%) | |||||||
#Champion REIT | 10,915,658 | 4,594,160 | 0.6% | ||||
Link REIT (The) | 9,083,626 | 20,618,431 | 2.8% | ||||
Other Securities | 2,418,572 | 0.3% | |||||
TOTAL HONG KONG | 27,631,163 | 3.7% | |||||
ITALY — (0.1%) | |||||||
Other Securities | 792,853 | 0.1% | |||||
JAPAN — (13.0%) | |||||||
Frontier Real Estate Investment Corp. | 595 | 4,484,008 | 0.6% | ||||
92
DFA INTERNATIONAL REAL ESTATE SECURITIES PORTFOLIO
CONTINUED
Shares | Value†† | Percentage | |||||
JAPAN — (Continued) | |||||||
Japan Logistics Fund, Inc. | 565 | $ | 4,293,002 | 0.6% | |||
Japan Prime Realty Investment Corp. | 2,682 | 5,840,893 | 0.8% | ||||
Japan Real Estate Investment Corp. | 1,633 | 13,029,902 | 1.7% | ||||
Japan Retail Fund Investment | 1,570 | 7,381,067 | 1.0% | ||||
#MORI TRUST Sogo REIT, Inc. | 494 | 3,798,479 | 0.5% | ||||
Nippon Building Fund, Inc. | 1,884 | 15,443,177 | 2.1% | ||||
#Nomura Real Estate Office Fund, Inc. | 1,246 | 7,698,702 | 1.0% | ||||
Orix Jreit, Inc. | 1,134 | 5,194,029 | 0.7% | ||||
#TOKYU REIT, Inc. | 697 | 3,503,253 | 0.5% | ||||
United Urban Investment Corp. | 857 | 4,999,093 | 0.7% | ||||
Other Securities | 37,013,139 | 5.0% | |||||
TOTAL JAPAN | 112,678,744 | 15.2% | |||||
NETHERLANDS — (4.0%) | |||||||
#Corio NV | 194,995 | 13,222,285 | 1.8% | ||||
Eurocommercial Properties NV | 98,088 | 4,249,401 | 0.6% | ||||
#VastNed Retail NV | 61,128 | 4,076,447 | 0.5% | ||||
#Wereldhave NV | 87,503 | 8,542,822 | 1.1% | ||||
Other Securities | 4,257,365 | 0.6% | |||||
TOTAL NETHERLANDS | 34,348,320 | 4.6% | |||||
NEW ZEALAND — (0.8%) | |||||||
Other Securities | 7,017,019 | 1.0% | |||||
SINGAPORE — (5.0%) | |||||||
Ascendas REIT | 5,236,000 | 6,805,677 | 0.9% | ||||
CapitaCommercial Trust | 9,676,000 | 7,274,904 | 1.0% | ||||
CapitaMall Trust | 8,698,300 | 9,770,603 | 1.3% | ||||
Suntec REIT | 6,516,000 | 5,542,650 | 0.8% | ||||
Other Securities | 14,063,235 | 1.9% | |||||
TOTAL SINGAPORE | 43,457,069 | 5.9% | |||||
SOUTH AFRICA — (1.2%) | |||||||
Other Securities | 10,626,976 | 1.4% | |||||
TAIWAN — (0.4%) | |||||||
Other Securities | 3,802,919 | 0.5% | |||||
UNITED KINGDOM — (15.1%) | |||||||
British Land Co. P.L.C. | 3,002,251 | 23,249,638 | 3.1% | ||||
Derwent London P.L.C. | 487,068 | 9,921,298 | 1.3% | ||||
#Great Portland Estates P.L.C. | 1,223,426 | 4,944,721 | 0.7% | ||||
Hammerson P.L.C. | 2,396,955 | 15,898,980 | 2.2% | ||||
Land Securities Group P.L.C. | 3,104,143 | 33,587,116 | 4.5% | ||||
Liberty International P.L.C. | 1,794,983 | 13,250,009 | 1.8% | ||||
Segro P.L.C. | 2,987,900 | 17,218,157 | 2.3% | ||||
Shaftesbury P.L.C. | 977,674 | 6,022,655 | 0.8% | ||||
Other Securities | 6,802,638 | 0.9% | |||||
TOTAL UNITED KINGDOM | 130,895,212 | 17.6% | |||||
TOTAL COMMON STOCKS | 738,562,504 | 99.5% | |||||
RIGHTS/WARRANTS — (0.0%) | |||||||
SINGAPORE — (0.0%) | |||||||
Other Securities | 38,850 | 0.0% | |||||
93
DFA INTERNATIONAL REAL ESTATE SECURITIES PORTFOLIO
CONTINUED
Face Amount | Value† | Percentage | ||||||
| (000) | ||||||||
TEMPORARY CASH INVESTMENTS — (0.5%) | ||||||||
Repurchase Agreement, PNC Capital Markets, Inc. 0.19%, 11/02/09 (Collateralized by $3,915,000 FNMA 6.50%, 06/25/39, valued at $4,213,519) to be repurchased at $4,146,066 | $ | 4,146 | 4,146,000 | 0.6% | ||||
Shares/ Face Amount | ||||||||
| (000) | ||||||||
SECURITIES LENDING COLLATERAL — (14.5%) | ||||||||
§@DFA Short Term Investment Fund LP | 125,600,221 | 125,600,221 | 16.9% | |||||
@Repurchase Agreement, Deutsche Bank Securities 0.07%, 11/02/09 (Collateralized by various corporate obligations, ranging in par value from $4,247,617 to $16,429,280, rates ranging from 5.000% to 7.000%, maturities ranging from 03/01/37 to 10/01/39, valued at $108,366) to be repurchased at $106,242 | $ | 106 | 106,241 | 0.0% | ||||
TOTAL SECURITIES LENDING COLLATERAL | 125,706,462 | 16.9% | ||||||
TOTAL INVESTMENTS — (100.0%) | $ | 868,453,816 | 117.0% | |||||
94
DFA INTERNATIONAL REAL ESTATE SECURITIES PORTFOLIO
CONTINUED
Summary of inputs used to value the Portfolio’s net assets as of October 31, 2009 is as follows (See Security Valuation Note):
| Valuation Inputs | |||||||||||
| Investment in Securities (Market Value) | |||||||||||
| Level 1 | Level 2 | Level 3 | Total | ||||||||
Common Stocks | |||||||||||
Australia | — | $ | 193,225,890 | — | $ | 193,225,890 | |||||
Belgium | — | 14,988,439 | — | 14,988,439 | |||||||
Canada | $ | 35,322,061 | — | — | 35,322,061 | ||||||
China | — | 880,600 | — | 880,600 | |||||||
France | — | 121,556,118 | — | 121,556,118 | |||||||
Germany | — | 918,116 | — | 918,116 | |||||||
Greece | — | 421,005 | — | 421,005 | |||||||
Hong Kong | — | 27,631,163 | — | 27,631,163 | |||||||
Italy | — | 792,853 | — | 792,853 | |||||||
Japan | — | 112,678,744 | — | 112,678,744 | |||||||
Netherlands | — | 34,348,320 | — | 34,348,320 | |||||||
New Zealand | — | 7,017,019 | — | 7,017,019 | |||||||
Singapore | 33,178 | 43,423,891 | — | 43,457,069 | |||||||
South Africa | 1,963,337 | 8,663,639 | — | 10,626,976 | |||||||
Taiwan | 748,199 | 3,054,720 | — | 3,802,919 | |||||||
United Kingdom | — | 130,895,212 | — | 130,895,212 | |||||||
Rights/Warrants | |||||||||||
Singapore | — | 38,850 | — | 38,850 | |||||||
Temporary Cash Investments | — | 4,146,000 | — | 4,146,000 | |||||||
Securities Lending Collateral | — | 125,706,462 | — | 125,706,462 | |||||||
TOTAL | $ | 38,066,775 | $ | 830,387,041 | — | $ | 868,453,816 | ||||
See accompanying Notes to Financial Statements.
95
DFA INVESTMENT DIMENSIONS GROUP INC.
SCHEDULE OF INVESTMENTS
October 31, 2009
DFA GLOBAL REAL ESTATE SECURITIES PORTFOLIO
Shares | Value† | ||||
AFFILIATED INVESTMENT COMPANIES — (99.7%) | |||||
Investment in DFA Real Estate Securities Portfolio of | 14,759,754 | $ | 225,676,641 | ||
Investment in DFA International Real Estate Securities Portfolio | 39,193,696 | 205,374,965 | |||
TOTAL INVESTMENTS IN AFFILIATED INVESTMENT COMPANIES
| 431,051,606 | ||||
TEMPORARY CASH INVESTMENTS — (0.3%) | |||||
BlackRock Liquidity Funds Tempcash | 1,475,873 | 1,475,873 | |||
TOTAL INVESTMENTS - (100.0%) (Cost $400,302,412) | $ | 432,527,479 | |||
Summary of inputs used to value the Portfolio’s net assets as of October 31, 2009 is as follows (See Security Valuation Note):
| Valuation Inputs | ||||||||||
| Investment in Securities (Market Value) | ||||||||||
Level 1 | Level 2 | Level 3 | Total | |||||||
Affiliated Investment Companies | $ | 431,051,606 | — | — | $ | 431,051,606 | ||||
Temporary Cash Investments | 1,475,873 | — | — | 1,475,873 | ||||||
TOTAL | $ | 432,527,479 | — | — | $ | 432,527,479 | ||||
See accompanying Notes to Financial Statements.
96
DFA INTERNATIONAL SMALL CAP VALUE PORTFOLIO
SUMMARY SCHEDULE OF PORTFOLIO HOLDINGS
October 31, 2009
Shares | Value†† | Percentage of Net Assets** | |||||
COMMON STOCKS — (91.0%) | |||||||
AUSTRALIA — (6.9%) | |||||||
#Downer EDI, Ltd. | 3,069,424 | $ | 23,365,680 | 0.4% | |||
*Pacific Brands, Ltd. | 29,002,108 | 33,770,277 | 0.5% | ||||
Other Securities | 462,236,503 | 6.7% | |||||
TOTAL AUSTRALIA | 519,372,460 | 7.6% | |||||
AUSTRIA — (1.0%) | |||||||
*Wienerberger AG | 1,587,273 | 28,673,473 | 0.4% | ||||
Other Securities | 49,351,717 | 0.7% | |||||
TOTAL AUSTRIA | 78,025,190 | 1.1% | |||||
BELGIUM — (1.4%) | |||||||
Other Securities | 106,691,942 | 1.6% | |||||
CANADA — (7.6%) | |||||||
*Celestica, Inc. | 4,081,842 | 33,649,120 | 0.5% | ||||
#Laurentian Bank of Canada | 689,000 | 25,170,898 | 0.4% | ||||
*Lundin Mining Corp. | 6,297,886 | 25,318,427 | 0.4% | ||||
Sherritt International Corp. | 5,573,711 | 35,748,398 | 0.5% | ||||
#*Viterra, Inc. | 3,936,739 | 37,473,695 | 0.5% | ||||
Other Securities | 413,560,283 | 6.0% | |||||
TOTAL CANADA | 570,920,821 | 8.3% | |||||
DENMARK — (0.5%) | |||||||
Other Securities | 37,680,909 | 0.6% | |||||
FINLAND — (2.9%) | |||||||
#Huhtamaki Oyj | 1,826,851 | 24,693,015 | 0.4% | ||||
#Kemira Oyj | 1,754,896 | 27,826,374 | 0.4% | ||||
#Outokumpu Oyj Series A | 2,864,481 | 47,366,190 | 0.7% | ||||
#Pohjola Bank P.L.C. | 3,363,010 | 37,370,684 | 0.5% | ||||
#Rautaruukki Oyj Series K | 1,108,900 | 22,603,880 | 0.3% | ||||
Other Securities | 58,739,847 | 0.9% | |||||
TOTAL FINLAND | 218,599,990 | 3.2% | |||||
FRANCE — (6.1%) | |||||||
Arkema SA | 1,028,400 | 39,258,912 | 0.6% | ||||
*Atos Origin SA | 752,174 | 35,214,237 | 0.5% | ||||
#Havas SA | 8,111,619 | 30,830,117 | 0.4% | ||||
#Nexans SA | 593,945 | 41,941,024 | 0.6% | ||||
*Valeo SA | 1,402,110 | 38,061,454 | 0.6% | ||||
Other Securities | 268,325,024 | 3.9% | |||||
TOTAL FRANCE | 453,630,768 | 6.6% | |||||
GERMANY — (5.8%) | |||||||
#Aurubis AG | 1,148,031 | 45,536,498 | 0.7% | ||||
#Bilfinger Berger AG | 956,696 | 61,253,282 | 0.9% | ||||
#Lanxess AG | 1,049,103 | 32,980,226 | 0.5% | ||||
#Rheinmetall AG | 482,624 | 26,206,443 | 0.4% | ||||
Other Securities | 269,817,799 | 3.9% | |||||
TOTAL GERMANY | 435,794,248 | 6.4% | |||||
GREECE — (0.8%) | |||||||
Other Securities | 58,439,452 | 0.9% | |||||
HONG KONG — (2.2%) | |||||||
Other Securities | 163,275,519 | 2.4% | |||||
97
DFA INTERNATIONAL SMALL CAP VALUE PORTFOLIO
CONTINUED
Shares | Value†† | Percentage of Net Assets** | |||||
IRELAND — (0.9%) | |||||||
Other Securities | $ | 64,395,941 | 0.9% | ||||
ITALY — (4.5%) | |||||||
Banca Popolare di Milano Scarl | 10,151,010 | 75,527,076 | 1.1% | ||||
#Fondiaria - SAI SpA | 1,781,588 | 32,470,921 | 0.5% | ||||
*Pirelli & Co. SpA | 67,386,003 | 37,862,403 | 0.6% | ||||
Other Securities | 188,514,113 | 2.7% | |||||
TOTAL ITALY | 334,374,513 | 4.9% | |||||
JAPAN — (19.9%) | |||||||
Other Securities | 1,490,165,879 | 21.7% | |||||
MALAYSIA — (0.0%) | |||||||
Other Securities | — | 0.0% | |||||
NETHERLANDS — (1.9%) | |||||||
Nutreco Holding NV | 746,767 | 37,693,977 | 0.5% | ||||
#*USG People NV | 1,386,176 | 24,117,169 | 0.4% | ||||
Other Securities | 79,748,369 | 1.2% | |||||
TOTAL NETHERLANDS | 141,559,515 | 2.1% | |||||
NEW ZEALAND — (0.3%) | |||||||
Other Securities | 23,944,763 | 0.3% | |||||
NORWAY — (1.0%) | |||||||
Other Securities | 78,702,123 | 1.1% | |||||
PORTUGAL — (0.2%) | |||||||
Other Securities | 13,469,857 | 0.2% | |||||
SINGAPORE — (1.6%) | |||||||
Other Securities | 118,964,304 | 1.7% | |||||
SPAIN — (1.3%) | |||||||
Ebro Puleva SA | 1,461,723 | 27,835,690 | 0.4% | ||||
Other Securities | 71,335,758 | 1.0% | |||||
TOTAL SPAIN | 99,171,448 | 1.4% | |||||
SWEDEN — (3.3%) | |||||||
#Boliden AB | 4,986,751 | 60,046,993 | 0.9% | ||||
#*Trelleborg AB Series B | 6,681,684 | 40,590,079 | 0.6% | ||||
Other Securities | 142,855,875 | 2.1% | |||||
TOTAL SWEDEN | 243,492,947 | 3.6% | |||||
SWITZERLAND — (4.6%) | |||||||
��*Clariant AG | 4,668,293 | 44,630,582 | 0.6% | ||||
Helvetia Holding AG | 86,089 | 27,449,020 | 0.4% | ||||
#PSP Swiss Property AG | 588,827 | 33,042,294 | 0.5% | ||||
Other Securities | 237,538,217 | 3.5% | |||||
TOTAL SWITZERLAND | 342,660,113 | 5.0% | |||||
UNITED KINGDOM — (16.3%) | |||||||
Amlin P.L.C. | 9,708,370 | 56,193,562 | 0.8% | ||||
Bellway P.L.C. | 3,481,205 | 41,637,233 | 0.6% | ||||
*Bovis Homes Group P.L.C. | 4,184,856 | 28,182,882 | 0.4% | ||||
Brit Insurance Holdings P.L.C. | 11,179,422 | 38,072,361 | 0.6% | ||||
Catlin Group, Ltd. | 8,508,243 | 45,940,078 | 0.7% | ||||
Close Brothers Group P.L.C. | 2,135,186 | 24,553,339 | 0.4% | ||||
*Cookson Group P.L.C. | 3,902,119 | 23,284,656 | 0.3% | ||||
DS Smith P.L.C. | 12,895,987 | 24,629,261 | 0.4% | ||||
98
DFA INTERNATIONAL SMALL CAP VALUE PORTFOLIO
CONTINUED
Shares | Value†† | Percentage of Net Assets** | |||||
UNITED KINGDOM — (Continued) | |||||||
Greene King P.L.C. | 5,260,781 | $ | 33,988,997 | 0.5% | |||
Hiscox, Ltd. | 10,648,017 | 55,841,012 | 0.8% | ||||
Meggitt P.L.C. | 12,962,458 | 51,899,258 | 0.8% | ||||
Millennium & Copthorne Hotels P.L.C. | 5,019,556 | 27,745,529 | 0.4% | ||||
Mondi P.L.C. | 7,958,099 | 43,926,465 | 0.6% | ||||
*Persimmon P.L.C. | 6,879,478 | 45,355,560 | 0.7% | ||||
*Premier Foods P.L.C. | 40,873,986 | 23,964,979 | 0.3% | ||||
Tomkins P.L.C. | 13,525,823 | 37,106,806 | 0.5% | ||||
Travis Perkins P.L.C. | 3,875,156 | 47,804,947 | 0.7% | ||||
Other Securities | 572,280,454 | 8.3% | |||||
TOTAL UNITED KINGDOM | 1,222,407,379 | 17.8% | |||||
TOTAL COMMON STOCKS | 6,815,740,081 | 99.4% | |||||
PREFERRED STOCKS — (0.0%) | |||||||
AUSTRALIA — (0.0%) | |||||||
Other Securities | 2,217,142 | 0.0% | |||||
FINLAND — (0.0%) | |||||||
Other Securities | 18,739 | 0.0% | |||||
TOTAL PREFERRED STOCKS | 2,235,881 | 0.0% | |||||
RIGHTS/WARRANTS — (0.2%) | |||||||
AUSTRALIA — (0.0%) | |||||||
Other Securities | 103,581 | 0.0% | |||||
BELGIUM — (0.0%) | |||||||
Other Securities | 14 | 0.0% | |||||
CANADA — (0.0%) | |||||||
Other Securities | 24,280 | 0.0% | |||||
FRANCE — (0.0%) | |||||||
Other Securities | 27,132 | 0.0% | |||||
GERMANY — (0.0%) | |||||||
Other Securities | 308,692 | 0.0% | |||||
HONG KONG — (0.0%) | |||||||
Other Securities | 1,197,219 | 0.0% | |||||
ITALY — (0.0%) | |||||||
Other Securities | 37,152 | 0.0% | |||||
JAPAN — (0.0%) | |||||||
Other Securities | — | 0.0% | |||||
MALAYSIA — (0.0%) | |||||||
Other Securities | 3,012 | 0.0% | |||||
NORWAY — (0.0%) | |||||||
Other Securities | 13,925 | 0.0% | |||||
SPAIN — (0.1%) | |||||||
Other Securities | 2,182,764 | 0.1% | |||||
UNITED KINGDOM — (0.1%) | |||||||
Other Securities | 6,923,620 | 0.1% | |||||
TOTAL RIGHTS/WARRANTS | 10,821,391 | 0.2% | |||||
99
DFA INTERNATIONAL SMALL CAP VALUE PORTFOLIO
CONTINUED
Shares/ Face Amount | Value† | Percentage of Net Assets** | |||||
| (000) | |||||||
SECURITIES LENDING COLLATERAL — (8.8%) | |||||||
§@DFA Short Term Investment Fund LP | 660,084,739 | $ | 660,084,739 | 9.6% | |||
@Repurchase Agreement, Deutsche Bank Securities 0.07%, | |||||||
11/02/09 (Collateralized by various corporate obligations, ranging in par value from $4,247,617 to $16,429,280, rates ranging from 5.000% to 7.000%, maturities ranging from 03/01/37 to 10/01/39, valued at $355,813) to be repurchased at $348,838 | $349 | 348,836 | 0.0% | ||||
TOTAL SECURITIES LENDING COLLATERAL | 660,433,575 | 9.6% | |||||
TOTAL INVESTMENTS — (100.0%) | $ | 7,489,230,928 | 109.2% | ||||
Summary of inputs used to value the Portfolio’s net assets as of October 31, 2009 is as follows (See Security Valuation Note):
| Valuation Inputs | |||||||||||
| Investment in Securities (Market Value) | |||||||||||
| Level 1 | Level 2 | Level 3 | Total | ||||||||
Common Stocks | |||||||||||
Australia | $ | 288,015 | $ | 519,084,445 | — | $ | 519,372,460 | ||||
Austria | 22,426 | 78,002,764 | — | 78,025,190 | |||||||
Belgium | — | 106,691,942 | — | 106,691,942 | |||||||
Canada | 570,920,821 | — | — | 570,920,821 | |||||||
Denmark | 98,745 | 37,582,164 | — | 37,680,909 | |||||||
Finland | — | 218,599,990 | — | 218,599,990 | |||||||
France | 1,488,725 | 452,142,043 | — | 453,630,768 | |||||||
Germany | — | 435,794,248 | — | 435,794,248 | |||||||
Greece | 96,399 | 58,343,053 | — | 58,439,452 | |||||||
Hong Kong | 258,326 | 163,017,193 | — | 163,275,519 | |||||||
Ireland | 154,426 | 64,241,515 | — | 64,395,941 | |||||||
Italy | — | 334,374,513 | — | 334,374,513 | |||||||
Japan | 541,687 | 1,489,624,192 | — | 1,490,165,879 | |||||||
Malaysia | — | — | — | — | |||||||
Netherlands | — | 141,559,515 | — | 141,559,515 | |||||||
New Zealand | — | 23,944,763 | — | 23,944,763 | |||||||
Norway | — | 78,702,123 | — | 78,702,123 | |||||||
Portugal | — | 13,469,857 | — | 13,469,857 | |||||||
Singapore | 930,728 | 118,033,576 | — | 118,964,304 | |||||||
Spain | — | 99,171,448 | — | 99,171,448 | |||||||
Sweden | — | 243,492,947 | — | 243,492,947 | |||||||
Switzerland | 690,857 | 341,969,256 | — | 342,660,113 | |||||||
United Kingdom | 385,964 | 1,222,021,415 | — | 1,222,407,379 | |||||||
Preferred Stocks | |||||||||||
Australia | — | 2,217,142 | — | 2,217,142 | |||||||
100
DFA INTERNATIONAL SMALL CAP VALUE PORTFOLIO
CONTINUED
| Valuation Inputs | |||||||||||
| Investment in Securities (Market Value) | |||||||||||
| Level 1 | Level 2 | Level 3 | Total | ||||||||
Finland | — | $ | 18,739 | — | $ | 18,739 | |||||
Rights/Warrants | |||||||||||
Australia | — | 103,581 | — | 103,581 | |||||||
Belgium | $ | 14 | — | — | 14 | ||||||
Canada | 24,280 | — | — | 24,280 | |||||||
France | 27,132 | — | — | 27,132 | |||||||
Germany | — | 308,692 | — | 308,692 | |||||||
Hong Kong | 51,124 | 1,146,095 | — | 1,197,219 | |||||||
Italy | 37,152 | — | — | 37,152 | |||||||
Japan | — | — | — | — | |||||||
Malaysia | — | 3,012 | — | 3,012 | |||||||
Norway | — | 13,925 | — | 13,925 | |||||||
Spain | — | 2,182,764 | — | 2,182,764 | |||||||
United Kingdom | 1,771,371 | 5,152,249 | — | 6,923,620 | |||||||
Securities Lending Collateral | — | 660,433,575 | — | 660,433,575 | |||||||
TOTAL | $ | 577,788,192 | $ | 6,911,442,736 | — | $ | 7,489,230,928 | ||||
See accompanying Notes to Financial Statements.
101
INTERNATIONAL VECTOR EQUITY PORTFOLIO
SUMMARY SCHEDULE OF PORTFOLIO HOLDINGS
October 31, 2009
Shares | Value†† | Percentage of Net Assets** | |||||
COMMON STOCKS — (86.2%) | |||||||
AUSTRALIA — (6.1%) | |||||||
Australia & New Zealand Banking Group, Ltd. | 29,839 | $ | 608,600 | 0.3% | |||
#Macquarie Group, Ltd. | 13,345 | 584,454 | 0.2% | ||||
Other Securities | 17,131,267 | 6.5% | |||||
TOTAL AUSTRALIA | 18,324,321 | 7.0% | |||||
AUSTRIA — (0.7%) | |||||||
Voestalpine AG | 16,154 | 552,370 | 0.2% | ||||
Other Securities | 1,529,125 | 0.6% | |||||
TOTAL AUSTRIA | 2,081,495 | 0.8% | |||||
BELGIUM — (1.0%) | |||||||
Solvay SA | 5,891 | 578,480 | 0.2% | ||||
Other Securities | 2,468,869 | 1.0% | |||||
TOTAL BELGIUM | 3,047,349 | 1.2% | |||||
CANADA — (8.1%) | |||||||
#Bank of Montreal | 20,300 | 939,160 | 0.4% | ||||
Sun Life Financial, Inc. | 19,778 | 547,069 | 0.2% | ||||
Suncor Energy, Inc. | 29,572 | 981,664 | 0.4% | ||||
Talisman Energy, Inc. | 45,748 | 780,470 | 0.3% | ||||
*Teck Resources, Ltd. Class B | 33,100 | 960,835 | 0.4% | ||||
#Toronto Dominion Bank | 11,000 | 627,032 | 0.2% | ||||
Other Securities | 19,751,980 | 7.5% | |||||
TOTAL CANADA | 24,588,210 | 9.4% | |||||
DENMARK — (1.0%) | |||||||
Other Securities | 2,897,663 | 1.1% | |||||
FINLAND — (1.7%) | |||||||
UPM-Kymmene Oyj | 45,985 | 551,884 | 0.2% | ||||
Other Securities | 4,542,667 | 1.7% | |||||
TOTAL FINLAND | 5,094,551 | 1.9% | |||||
FRANCE — (6.2%) | |||||||
BNP Paribas SA | 13,962 | 1,051,815 | 0.4% | ||||
Compagnie Generale des Establissements Michelin SA Series B | 8,950 | 662,989 | 0.3% | ||||
#Lafarge SA | 8,284 | 672,410 | 0.3% | ||||
*Natixis SA | 99,455 | 558,692 | 0.2% | ||||
Societe Generale Paris SA | 9,034 | 600,036 | 0.2% | ||||
Other Securities | 15,242,693 | 5.8% | |||||
TOTAL FRANCE | 18,788,635 | 7.2% | |||||
GERMANY — (4.5%) | |||||||
#Deutsche Bank AG | 20,528 | 1,470,421 | 0.5% | ||||
E.ON AG | 18,237 | 696,788 | 0.3% | ||||
Other Securities | 11,465,158 | 4.4% | |||||
TOTAL GERMANY | 13,632,367 | 5.2% | |||||
GREECE — (1.5%) | |||||||
*Alpha Bank A.E. | 33,606 | 647,924 | 0.3% | ||||
*Piraeus Bank S.A. | 34,245 | 590,409 | 0.2% | ||||
Other Securities | 3,220,866 | 1.2% | |||||
TOTAL GREECE | 4,459,199 | 1.7% | |||||
102
INTERNATIONAL VECTOR EQUITY PORTFOLIO
CONTINUED
Shares | Value†† | Percentage of Net Assets** | |||||
HONG KONG — (1.9%) | |||||||
Other Securities | $ | 5,818,759 | 2.2% | ||||
IRELAND — (0.8%) | |||||||
Other Securities | 2,323,811 | 0.9% | |||||
ITALY — (2.6%) | |||||||
Other Securities | 7,735,814 | 2.9% | |||||
JAPAN — (18.9%) | |||||||
Toyota Motor Corp. Sponsored ADR | 7,600 | 599,564 | 0.2% | ||||
Other Securities | 56,552,820 | 21.6% | |||||
TOTAL JAPAN | 57,152,384 | 21.8% | |||||
NETHERLANDS — (2.5%) | |||||||
Koninklijke DSM NV | 11,964 | 524,191 | 0.2% | ||||
Philips Electronics NV | 22,955 | 576,648 | 0.2% | ||||
Other Securities | 6,514,761 | 2.5% | |||||
TOTAL NETHERLANDS | 7,615,600 | 2.9% | |||||
NEW ZEALAND — (0.3%) | |||||||
Other Securities | 919,440 | 0.4% | |||||
NORWAY — (1.2%) | |||||||
Other Securities | 3,760,388 | 1.4% | |||||
PORTUGAL — (0.5%) | |||||||
Other Securities | 1,619,843 | 0.6% | |||||
SINGAPORE — (1.2%) | |||||||
Other Securities | 3,732,209 | 1.4% | |||||
SPAIN — (2.4%) | |||||||
Banco Bilbao Vizcaya SA Sponsored ADR | 40,108 | 713,922 | 0.3% | ||||
Banco Santander SA | 71,865 | 1,156,470 | 0.4% | ||||
Banco Santander SA Sponsored ADR | 49,420 | 793,685 | 0.3% | ||||
Other Securities | 4,688,871 | 1.8% | |||||
TOTAL SPAIN | 7,352,948 | 2.8% | |||||
SWEDEN — (2.0%) | |||||||
Other Securities | 6,102,081 | 2.3% | |||||
SWITZERLAND — (5.4%) | |||||||
Credit Suisse Group AG | 13,655 | 729,958 | 0.3% | ||||
#*Holcim, Ltd. | 21,970 | 1,398,276 | 0.5% | ||||
Novartis AG ADR | 11,400 | 592,230 | 0.2% | ||||
#Swatch Group AG | 2,763 | 645,152 | 0.3% | ||||
Swiss Reinsurance Co., Ltd. AG | 23,898 | 973,141 | 0.4% | ||||
*UBS AG | 52,017 | 867,370 | 0.3% | ||||
*UBS AG ADR | 34,236 | 567,975 | 0.2% | ||||
Zurich Financial Services AG | 6,240 | 1,428,914 | 0.5% | ||||
Other Securities | 9,144,399 | 3.5% | |||||
TOTAL SWITZERLAND | 16,347,415 | 6.2% | |||||
UNITED KINGDOM — (15.7%) | |||||||
*Anglo American P.L.C. | 48,414 | 1,751,769 | 0.7% | ||||
Aviva P.L.C. | 128,562 | 803,920 | 0.3% | ||||
*Barclays P.L.C. | 105,354 | 552,169 | 0.2% | ||||
*BP P.L.C. Sponsored ADR | 18,084 | 1,023,916 | 0.4% | ||||
HSBC Holdings P.L.C. Sponsored ADR | 35,757 | 1,980,580 | 0.8% | ||||
International Power P.L.C. | 146,938 | 610,041 | 0.2% | ||||
Kingfisher P.L.C. | 225,944 | 825,853 | 0.3% | ||||
103
INTERNATIONAL VECTOR EQUITY PORTFOLIO
CONTINUED
Shares | Value†† | Percentage of Net Assets** | |||||
UNITED KINGDOM — (Continued) | |||||||
Legal & General Group P.L.C. | 575,477 | $ | 738,420 | 0.3% | |||
Old Mutual P.L.C. | 499,092 | 866,235 | 0.3% | ||||
Prudential P.L.C. | 68,348 | 620,833 | 0.2% | ||||
Royal Dutch Shell P.L.C. ADR | 32,048 | 1,863,912 | 0.7% | ||||
RSA Insurance Group P.L.C. | 322,917 | 639,902 | 0.2% | ||||
Standard Chartered P.L.C. | 26,514 | 650,443 | 0.3% | ||||
Standard Life P.L.C. | 213,961 | 762,724 | 0.3% | ||||
Vodafone Group P.L.C. Sponsored ADR | 56,540 | 1,254,623 | 0.5% | ||||
*Xstrata P.L.C. | 53,951 | 777,087 | 0.3% | ||||
Other Securities | 31,609,787 | 12.0% | |||||
TOTAL UNITED KINGDOM | 47,332,214 | 18.0% | |||||
TOTAL COMMON STOCKS | 260,726,696 | 99.3% | |||||
RIGHTS/WARRANTS — (0.0%) | |||||||
BELGIUM — (0.0%) | |||||||
Other Securities | — | 0.0% | |||||
DENMARK — (0.0%) | |||||||
Other Securities | 568 | 0.0% | |||||
GERMANY — (0.0%) | |||||||
Other Securities | 3,559 | 0.0% | |||||
HONG KONG — (0.0%) | |||||||
Other Securities | 5,586 | 0.0% | |||||
ITALY — (0.0%) | |||||||
Other Securities | — | 0.0% | |||||
NORWAY — (0.0%) | |||||||
Other Securities | 2,334 | 0.0% | |||||
SPAIN — (0.0%) | |||||||
Other Securities | 6,021 | 0.0% | |||||
UNITED KINGDOM — (0.0%) | |||||||
Other Securities | 33,339 | 0.0% | |||||
TOTAL RIGHTS/WARRANTS | 51,407 | 0.0% | |||||
Face Amount | |||||||
| (000) | Value† | ||||||
TEMPORARY CASH INVESTMENTS — (0.4%) | |||||||
Repurchase Agreement, PNC Capital Markets, Inc. 0.19%, | |||||||
11/02/09 (Collateralized by $1,830,000 FHLMC 6.040%(r), 11/01/36, valued at $1,174,798) to be repurchased at $1,155,018 | $1,155 | 1,155,000 | 0.5% | ||||
Shares/ Face Amount | |||||||
| (000) | |||||||
SECURITIES LENDING COLLATERAL — (13.4%) | |||||||
§@DFA Short Term Investment Fund LP | 38,492,317 | 38,492,317 | 14.7% | ||||
104
INTERNATIONAL VECTOR EQUITY PORTFOLIO
CONTINUED
Shares/ Face Amount | Value† | Percentage of Net Assets** | ||||||
| (000) | ||||||||
@Repurchase Agreement, Deutsche Bank Securities 0.07% 11/02/09 | ||||||||
(Collateralized by various corporate obligations, ranging in par value from $4,247,617 to $16,429,280, rates ranging from 5.000% to 7.000%, maturities ranging from 03/01/37 to 10/01/39, valued at $2,012,891) to be repurchased at $1,973,435 | $ | 1,973 | 1,973,423 | 0.7% | ||||
TOTAL SECURITIES LENDING COLLATERAL | 40,465,740 | 15.4% | ||||||
TOTAL INVESTMENTS — (100.0%) | $ | 302,398,843 | 115.2% | |||||
Summary of inputs used to value the Portfolio’s net assets as of October 31, 2009 is as follows (See Security Valuation Note):
| Valuation Inputs | |||||||||||
| Investment in Securities (Market Value) | |||||||||||
Level 1 | Level 2 | Level 3 | Total | ||||||||
Common Stocks | |||||||||||
Australia | $ | 411,657 | $ | 17,912,664 | — | $ | 18,324,321 | ||||
Austria | — | 2,081,495 | — | 2,081,495 | |||||||
Belgium | 230,520 | 2,816,829 | — | 3,047,349 | |||||||
Canada | 24,588,210 | — | — | 24,588,210 | |||||||
Denmark | 17,522 | 2,880,141 | — | 2,897,663 | |||||||
Finland | — | 5,094,551 | — | 5,094,551 | |||||||
France | 1,046,254 | 17,742,381 | — | 18,788,635 | |||||||
Germany | 2,742,895 | 10,889,472 | — | 13,632,367 | |||||||
Greece | 381,443 | 4,077,756 | — | 4,459,199 | |||||||
Hong Kong | 9,693 | 5,809,066 | — | 5,818,759 | |||||||
Ireland | 495,321 | 1,828,490 | — | 2,323,811 | |||||||
Italy | 473,358 | 7,262,456 | — | 7,735,814 | |||||||
Japan | 2,796,176 | 54,356,208 | — | 57,152,384 | |||||||
Netherlands | 1,819,243 | 5,796,357 | — | 7,615,600 | |||||||
New Zealand | 11,648 | 907,792 | — | 919,440 | |||||||
Norway | — | 3,760,388 | — | 3,760,388 | |||||||
Portugal | — | 1,619,843 | — | 1,619,843 | |||||||
Singapore | — | 3,732,209 | — | 3,732,209 | |||||||
Spain | 1,724,397 | 5,628,551 | — | 7,352,948 | |||||||
Sweden | 62,400 | 6,039,681 | — | 6,102,081 | |||||||
Switzerland | 1,752,841 | 14,594,574 | — | 16,347,415 | |||||||
United Kingdom | 7,015,128 | 40,317,086 | — | 47,332,214 | |||||||
Rights/Warrants | |||||||||||
Belgium | — | — | — | — | |||||||
Denmark | 568 | — | — | 568 | |||||||
Germany | — | 3,559 | — | 3,559 | |||||||
Hong Kong | — | 5,586 | — | 5,586 | |||||||
Italy | — | — | — | — | |||||||
105
INTERNATIONAL VECTOR EQUITY PORTFOLIO
CONTINUED
| Valuation Inputs | |||||||||||
| Investment in Securities (Market Value) | |||||||||||
| Level 1 | Level 2 | Level 3 | Total | ||||||||
Norway | — | $ | 2,334 | — | $ | 2,334 | |||||
Spain | — | 6,021 | — | 6,021 | |||||||
United Kingdom | $ | 6,884 | 26,455 | — | 33,339 | ||||||
Temporary Cash Investments | — | 1,155,000 | — | 1,155,000 | |||||||
Securities Lending Collateral | — | 40,465,740 | — | 40,465,740 | |||||||
TOTAL | $ | 45,586,158 | $ | 256,812,685 | — | $ | 302,398,843 | ||||
See accompanying Notes to Financial Statements.
106
DFA INVESTMENT DIMENSIONS GROUP INC.
SCHEDULES OF INVESTMENTS
October 31, 2009
EMERGING MARKETS PORTFOLIO
Value† | |||
AFFILIATED INVESTMENT COMPANY — (100.0%) | |||
Investment in The Emerging Markets Series of | $ | 1,967,084,229 | |
TOTAL INVESTMENTS IN AFFILIATED INVESTMENT COMPANY | $ | 1,967,084,229 | |
Summary of inputs used to value the Portfolio’s net assets as of October 31, 2009 is as follows (See Security Valuation Note):
| Valuation Inputs | ||||||||||
| Investment in Securities (Market Value) | ||||||||||
Level 1 | Level 2 | Level 3 | Total | |||||||
Affiliated Investment Company | $ | 1,967,084,229 | — | — | $ | 1,967,084,229 | ||||
EMERGING MARKETS SMALL CAP PORTFOLIO
Value† | |||
AFFILIATED INVESTMENT COMPANY — (100.0%) | |||
Investment in The Emerging Markets Small Cap Series of | $ | 1,134,439,234 | |
TOTAL INVESTMENTS IN AFFILIATED INVESTMENT COMPANY | $ | 1,134,439,234 | |
Summary of inputs used to value the Portfolio’s net assets as of October 31, 2009 is as follows (See Security Valuation Note):
| Valuation Inputs | ||||||||||
| Investment in Securities (Market Value) | ||||||||||
Level 1 | Level 2 | Level 3 | Total | |||||||
Affiliated Investment Company | $ | 1,134,439,234 | — | — | $ | 1,134,439,234 | ||||
See accompanying Notes to Financial Statements.
107
EMERGING MARKETS CORE EQUITY PORTFOLIO
SUMMARY SCHEDULE OF PORTFOLIO HOLDINGS
October 31, 2009
Shares | Value†† | Percentage of Net Assets** | |||||
COMMON STOCKS — (84.5%) | |||||||
BRAZIL — (7.4%) | |||||||
BM&F Bovespa SA | 1,104,321 | $ | 7,115,147 | 0.3% | |||
Cia Vale do Rio Doce | 708,190 | 18,051,763 | 0.7% | ||||
#Itau Unibanco Holding SA ADR | 1,648,537 | 31,552,998 | 1.3% | ||||
Petroleo Brasileiro SA ADR (71654V101) | 637,166 | 25,563,100 | 1.0% | ||||
#Petroleo Brasileiro SA ADR (71654V408) | 462,510 | 21,377,212 | 0.9% | ||||
Other Securities | 98,747,396 | 4.0% | |||||
TOTAL BRAZIL | 202,407,616 | 8.2% | |||||
CHILE — (1.8%) | |||||||
Other Securities | 49,299,787 | 2.0% | |||||
CHINA — (11.0%) | |||||||
Bank of China, Ltd. | 17,448,000 | 10,033,035 | 0.4% | ||||
China Construction Bank Corp. | 16,648,000 | 14,352,768 | 0.6% | ||||
#China Life Insurance Co., Ltd. ADR | 159,456 | 10,940,276 | 0.5% | ||||
#China Mobile, Ltd. Sponsored ADR | 318,041 | 14,862,056 | 0.6% | ||||
#China Petroleum and Chemical Corp. (Sinopec) ADR | 88,100 | 7,432,116 | 0.3% | ||||
#CNOOC, Ltd. ADR | 116,476 | 17,347,935 | 0.7% | ||||
#*Industrial & Commercial Bank of China, Ltd. | 21,941,000 | 17,456,588 | 0.7% | ||||
#PetroChina Co., Ltd. ADR | 129,733 | 15,573,149 | 0.6% | ||||
Other Securities | 193,263,616 | 7.9% | |||||
TOTAL CHINA | 301,261,539 | 12.3% | |||||
CZECH REPUBLIC — (0.6%) | |||||||
Other Securities | 16,134,619 | 0.7% | |||||
HUNGARY — (1.1%) | |||||||
*MOL Hungarian Oil & Gas NYRT | 83,994 | 7,017,209 | 0.3% | ||||
#*OTP Bank NYRT | 488,536 | 13,737,383 | 0.6% | ||||
Other Securities | 8,659,120 | 0.3% | |||||
TOTAL HUNGARY | 29,413,712 | 1.2% | |||||
INDIA — (10.5%) | |||||||
ICICI Bank, Ltd. Sponsored ADR | 396,338 | 12,464,830 | 0.5% | ||||
Infosys Technologies, Ltd. | 225,217 | 10,455,397 | 0.4% | ||||
*Reliance Industries, Ltd. | 690,546 | 27,939,425 | 1.1% | ||||
Other Securities | 237,253,820 | 9.7% | |||||
TOTAL INDIA | 288,113,472 | 11.7% | |||||
INDONESIA — (2.3%) | |||||||
PT Astra International Tbk | 2,085,000 | 6,708,063 | 0.3% | ||||
Other Securities | 57,010,581 | 2.3% | |||||
TOTAL INDONESIA | 63,718,644 | 2.6% | |||||
ISRAEL — (3.6%) | |||||||
*Bank Hapoalim B.M. | 1,946,691 | 7,106,879 | 0.3% | ||||
*Bank Leumi Le-Israel B.M. | 1,734,653 | 6,774,661 | 0.3% | ||||
Teva Pharmaceutical Industries, Ltd. Sponsored ADR | 838,566 | 42,330,812 | 1.7% | ||||
Other Securities | 42,860,323 | 1.7% | |||||
TOTAL ISRAEL | 99,072,675 | 4.0% | |||||
MALAYSIA — (3.8%) | |||||||
Other Securities | 105,292,715 | 4.3% | |||||
MEXICO — (5.0%) | |||||||
America Movil S.A.B. de C.V. Series L ADR | 359,075 | 15,845,980 | 0.6% | ||||
108
EMERGING MARKETS CORE EQUITY PORTFOLIO
CONTINUED
Shares | Value†† | Percentage of Net Assets** | |||||
MEXICO — (Continued) | |||||||
*Cemex S.A.B. de C.V. Sponsored ADR | 1,165,980 | $ | 12,102,873 | 0.5% | |||
Fomento Economico Mexicano S.A.B. de C.V. Sponsored ADR | 230,240 | 9,971,694 | 0.4% | ||||
*Grupo Financiero Banorte S.A.B. de C.V. | 2,596,307 | 8,297,957 | 0.3% | ||||
*Grupo Mexico S.A.B. de C.V. Series B | 5,000,219 | 9,997,598 | 0.4% | ||||
Grupo Televisa S.A. de C.V. Sponsored ADR | 356,510 | 6,902,034 | 0.3% | ||||
Other Securities | 74,768,418 | 3.1% | |||||
TOTAL MEXICO | 137,886,554 | 5.6% | |||||
PHILIPPINES — (0.6%) | |||||||
Other Securities | 15,883,678 | 0.6% | |||||
POLAND — (1.8%) | |||||||
KGHM Polska Miedz SA | 192,817 | 6,490,348 | 0.2% | ||||
Other Securities | 43,827,902 | 1.8% | |||||
TOTAL POLAND | 50,318,250 | 2.0% | |||||
RUSSIA — (0.9%) | |||||||
*Gazprom OAO Sponsored ADR | 410,963 | 9,855,738 | 0.4% | ||||
Other Securities | 13,898,180 | 0.6% | |||||
TOTAL RUSSIA | 23,753,918 | 1.0% | |||||
SINGAPORE — (0.0%) | |||||||
Other Securities | 114,229 | 0.0% | |||||
SOUTH AFRICA — (9.2%) | |||||||
#Gold Fields, Ltd. Sponsored ADR | 755,800 | 9,636,450 | 0.4% | ||||
Impala Platinum Holdings, Ltd. | 418,209 | 9,088,505 | 0.4% | ||||
MTN Group, Ltd. | 1,041,866 | 15,512,590 | 0.6% | ||||
Naspers, Ltd. Series N | 378,717 | 13,663,814 | 0.5% | ||||
Sanlam, Ltd. | 3,530,404 | 9,688,256 | 0.4% | ||||
Sasol, Ltd. Sponsored ADR | 466,600 | 17,446,174 | 0.7% | ||||
Standard Bank Group, Ltd. | 1,207,837 | 15,143,321 | 0.6% | ||||
Other Securities | 163,739,983 | 6.7% | |||||
TOTAL SOUTH AFRICA | 253,919,093 | 10.3% | |||||
SOUTH KOREA — (10.5%) | |||||||
Hyundai Motor Co., Ltd. | 92,301 | 8,372,115 | 0.4% | ||||
*KB Financial Group, Inc. ADR | 206,311 | 9,787,394 | 0.4% | ||||
#POSCO ADR | 127,995 | 13,070,849 | 0.5% | ||||
Samsung Electronics Co., Ltd. | 46,112 | 27,747,117 | 1.1% | ||||
Shinhan Financial Group Co., Ltd. ADR | 97,355 | 7,364,906 | 0.3% | ||||
Other Securities | 222,288,787 | 9.1% | |||||
TOTAL SOUTH KOREA | 288,631,168 | 11.8% | |||||
TAIWAN — (10.3%) | |||||||
Hon Hai Precision Industry Co., Ltd. | 3,065,530 | 12,007,153 | 0.5% | ||||
Taiwan Semiconductor Manufacturing Co., Ltd. | 6,259,652 | 11,354,999 | 0.5% | ||||
Other Securities | 260,512,700 | 10.6% | |||||
TOTAL TAIWAN | 283,874,852 | 11.6% | |||||
THAILAND — (1.8%) | |||||||
Other Securities | 50,759,389 | 2.1% | |||||
TURKEY — (2.3%) | |||||||
Turkiye Garanti Bankasi A.S. | 1,790,492 | 6,502,250 | 0.3% | ||||
Other Securities | 56,452,562 | 2.3% | |||||
TOTAL TURKEY | 62,954,812 | 2.6% | |||||
TOTAL COMMON STOCKS | 2,322,810,722 | 94.6% | |||||
109
EMERGING MARKETS CORE EQUITY PORTFOLIO
CONTINUED
Shares | Value†† | Percentage of Net Assets** | |||||
PREFERRED STOCKS — (4.6%) | |||||||
BRAZIL — (4.6%) | |||||||
#Banco Bradesco SA Sponsored ADR | 696,802 | $ | 13,726,999 | 0.6% | |||
Cia Vale do Rio Doce | 738,786 | 17,065,957 | 0.7% | ||||
#Gerdau SA Sponsored ADR | 678,100 | 10,239,310 | 0.4% | ||||
Metalurgica Gerdau SA | 394,900 | 7,251,939 | 0.3% | ||||
Usinas Siderurgicas de Minas Gerais SA Series A | 330,300 | 8,625,000 | 0.3% | ||||
Other Securities | 68,244,882 | 2.8% | |||||
TOTAL BRAZIL | 125,154,087 | 5.1% | |||||
INDIA — (0.0%) | |||||||
Other Securities | 6,467 | 0.0% | |||||
TOTAL PREFERRED STOCKS | 125,160,554 | 5.1% | |||||
RIGHTS/WARRANTS — (0.0%) | |||||||
BRAZIL — (0.0%) | |||||||
Other Securities | 36,466 | 0.0% | |||||
CHILE — (0.0%) | |||||||
Other Securities | 638 | 0.0% | |||||
CHINA — (0.0%) | |||||||
Other Securities | 12,816 | 0.0% | |||||
MALAYSIA — (0.0%) | |||||||
Other Securities | 22,681 | 0.0% | |||||
PHILIPPINES — (0.0%) | |||||||
Other Securities | 33,455 | 0.0% | |||||
SOUTH AFRICA — (0.0%) | |||||||
Other Securities | 10,914 | 0.0% | |||||
SOUTH KOREA — (0.0%) | |||||||
Other Securities | 27 | 0.0% | |||||
TAIWAN — (0.0%) | |||||||
Other Securities | 39,026 | 0.0% | |||||
THAILAND — (0.0%) | |||||||
Other Securities | 96,005 | 0.0% | |||||
TOTAL RIGHTS/WARRANTS | 252,028 | 0.0% | |||||
Face Amount | |||||||
| (000) | Value† | ||||||
TEMPORARY CASH INVESTMENTS — (0.3%) | |||||||
Repurchase Agreement, PNC Capital Markets, Inc. 0.19%, | |||||||
11/02/09 (Collateralized by $14,795,000 FHLMC 6.040%(r), 11/01/36, valued at $9,497,885) to be repurchased at $9,355,148 | $9,355 | 9,355,000 | 0.4% | ||||
110
EMERGING MARKETS CORE EQUITY PORTFOLIO
CONTINUED
Shares/ Face Amount | Value† | Percentage of Net Assets** | ||||||
| (000) | ||||||||
SECURITIES LENDING COLLATERAL — (10.6%) | ||||||||
§@DFA Short Term Investment Fund LP | 288,996,329 | $ | 288,996,329 | 11.8% | ||||
@Repurchase Agreement, Deutsche Bank Securities 0.07%, | ||||||||
11/02/09 (Collateralized by various corporate obligations, ranging in par value from $4,247,617 to $16,429,280, rates ranging from 5.000% to 7.000%, maturities ranging from 03/01/37 to 10/01/39, valued at $2,814,708) to be repurchased at $2,759,534 | $ | 2,760 | 2,759,518 | 0.1% | ||||
TOTAL SECURITIES LENDING COLLATERAL | 291,755,847 | 11.9% | ||||||
TOTAL INVESTMENTS — (100.0%) | $ | 2,749,334,151 | 112.0% | |||||
Summary of inputs used to value the Portfolio’s net assets as of October 31, 2009 is as follows (See Security Valuation Note):
| Valuation Inputs | |||||||||||
| Investment in Securities (Market Value) | |||||||||||
Level 1 | Level 2 | Level 3 | Total | ||||||||
Common Stocks | |||||||||||
Brazil | $ | 202,407,616 | — | — | $ | 202,407,616 | |||||
Chile | 49,299,787 | — | — | 49,299,787 | |||||||
China | 93,691,579 | $ | 207,569,960 | — | 301,261,539 | ||||||
Czech Republic | — | 16,134,619 | — | 16,134,619 | |||||||
Hungary | 840,571 | 28,573,141 | — | 29,413,712 | |||||||
India | 16,678,159 | 271,435,313 | — | 288,113,472 | |||||||
Indonesia | 5,180,275 | 58,538,369 | — | 63,718,644 | |||||||
Israel | 46,850,946 | 52,221,729 | — | 99,072,675 | |||||||
Malaysia | 103,683 | 105,189,032 | — | 105,292,715 | |||||||
Mexico | 137,844,921 | 41,633 | — | 137,886,554 | |||||||
Philippines | 2,041,390 | 13,842,288 | — | 15,883,678 | |||||||
Poland | — | 50,318,250 | — | 50,318,250 | |||||||
Russia | 1,112,475 | 22,641,443 | — | 23,753,918 | |||||||
Singapore | — | 114,229 | — | 114,229 | |||||||
South Africa | 36,360,155 | 217,558,938 | — | 253,919,093 | |||||||
South Korea | 37,224,895 | 251,406,273 | — | 288,631,168 | |||||||
Taiwan | 7,621,543 | 276,253,309 | — | 283,874,852 | |||||||
Thailand | 50,753,618 | 5,771 | — | 50,759,389 | |||||||
Turkey | 550,208 | 62,404,604 | — | 62,954,812 | |||||||
Preferred Stocks | |||||||||||
Brazil | 125,154,087 | — | — | 125,154,087 | |||||||
India | — | 6,467 | — | 6,467 | |||||||
Rights/Warrants | |||||||||||
Brazil | 36,466 | — | — | 36,466 | |||||||
Chile | 638 | — | — | 638 | |||||||
China | 12,816 | — | — | 12,816 | |||||||
Malaysia | 22,681 | — | — | 22,681 | |||||||
Philippines | — | 33,455 | — | 33,455 | |||||||
111
EMERGING MARKETS CORE EQUITY PORTFOLIO
CONTINUED
| Valuation Inputs | |||||||||||
| Investment in Securities (Market Value) | |||||||||||
| Level 1 | Level 2 | Level 3 | Total | ||||||||
South Africa | $ | 10,914 | — | — | $ | 10,914 | |||||
South Korea | — | $ | 27 | — | 27 | ||||||
Taiwan | — | 39,026 | — | 39,026 | |||||||
Thailand | 96,005 | — | — | 96,005 | |||||||
Temporary Cash Investments | — | 9,355,000 | — | 9,355,000 | |||||||
Securities Lending Collateral | — | 291,755,847 | — | 291,755,847 | |||||||
TOTAL | $ | 813,895,428 | $ | 1,935,438,723 | — | $ | 2,749,334,151 | ||||
See accompanying Notes to Financial Statements.
112
DFA ONE-YEAR FIXED INCOME PORTFOLIO
SCHEDULE OF INVESTMENTS
OCTOBER 31, 2009
Face Amount | Value† | |||||||
| (000) | ||||||||
AGENCY OBLIGATIONS — (28.4%) | ||||||||
Federal Farm Credit Bank | ||||||||
# | 5.375%, 07/18/11 | $ | 57,000 | $ | 61,302,189 | |||
3.875%, 08/25/11 | 40,000 | 42,065,120 | ||||||
# | 1.125%, 10/03/11 | 30,000 | 29,977,590 | |||||
Federal Home Loan Bank | ||||||||
# | 1.375%, 05/16/11 | 77,000 | 77,747,824 | |||||
# | 2.625%, 05/20/11 | 40,000 | 41,157,240 | |||||
# | 3.375%, 06/24/11 | 85,000 | 88,343,050 | |||||
# | 3.625%, 07/01/11 | 112,000 | 117,147,968 | |||||
# | 1.625%, 07/27/11 | 133,200 | 134,744,454 | |||||
# | 5.375%, 08/19/11 | 55,000 | 59,265,525 | |||||
3.750%, 09/09/11 | 90,000 | 94,727,070 | ||||||
# | 3.625%, 09/16/11 | 121,000 | 127,167,249 | |||||
Federal Home Loan Mortgage Corporation | ||||||||
# | 5.625%, 03/15/11 | 65,000 | 69,381,455 | |||||
1.625%, 04/26/11 | 80,000 | 81,012,880 | ||||||
# | 6.000%, 06/15/11 | 79,000 | 85,566,322 | |||||
5.250%, 07/18/11 | 65,000 | 69,901,975 | ||||||
Federal National Mortgage Association | ||||||||
# | 4.500%, 02/15/11 | 63,000 | 66,203,172 | |||||
1.750%, 03/23/11 | 40,000 | 40,576,760 | ||||||
1.375%, 04/28/11 | 82,000 | 82,689,046 | ||||||
# | 6.000%, 05/15/11 | 65,000 | 70,099,185 | |||||
3.375%, 05/19/11 | 20,000 | 20,814,300 | ||||||
TOTAL AGENCY OBLIGATIONS | 1,459,890,374 | |||||||
BONDS — (31.3%) | ||||||||
Bank of America | ||||||||
1.700%, 12/23/10 | 40,000 | 40,446,440 | ||||||
Bank of New York Mellon Corp. | ||||||||
4.950%, 01/14/11 | 5,000 | 5,199,450 | ||||||
Bank of New York Mellon Corp. Floating Rate Note | ||||||||
(r) | 0.872%, 02/05/10 | 59,000 | 59,062,894 | |||||
BP Capital Markets P.L.C. | ||||||||
1.550%, 08/11/11 | 24,000 | 24,355,608 | ||||||
BP Capital Markets P.L.C. Floating Rate Note | ||||||||
(r) | 1.293%, 03/17/11 | 29,364 | 29,761,559 | |||||
Citigroup, Inc. | ||||||||
1.500%, 07/12/11 | 39,000 | 39,361,920 | ||||||
1.250%, 09/22/11 | 20,000 | 20,082,220 | ||||||
Face Amount | Value† | |||||||
| (000) | ||||||||
CME Group, Inc. Floating Rate Note | ||||||||
(r) | 1.121%, 08/06/10 | $ | 100,000 | $ | 100,491,500 | |||
Deutsche Bank AG Floating Rate Note | ||||||||
(r) | 0.892%, 06/18/10 | 100,000 | 99,599,300 | |||||
General Electric Capital Corp. | ||||||||
5.000%, 12/01/10 | 10,000 | 10,389,700 | ||||||
1.625%, 01/07/11 | 60,000 | 60,648,780 | ||||||
General Electric Capital Corp. Floating Rate Note | ||||||||
(r) | 0.330%, 03/12/10 | 15,000 | 15,000,825 | |||||
(r) | 0.524%, 05/10/10 | 10,200 | 10,203,468 | |||||
Goldman Sachs Group, Inc. | ||||||||
1.700%, 03/15/11 | 50,000 | 50,722,350 | ||||||
1.625%, 07/15/11 | 66,000 | 66,804,672 | ||||||
Japan Finance Corp. | ||||||||
2.000%, 06/24/11 | 78,200 | 79,421,562 | ||||||
JPMorgan Chase & Co. Floating Rate Note | ||||||||
(r) | 0.781%, 11/19/09 | 66,510 | 66,526,761 | |||||
(r) | 0.454%, 01/17/11 | 10,000 | 9,953,260 | |||||
(r) | 0.550%, 05/16/11 | 15,000 | 14,884,380 | |||||
(r) | 1.050%, 06/13/11 | 10,490 | 10,565,727 | |||||
Kreditanstalt fuer Wiederaufbau | ||||||||
4.625%, 01/20/11 | 58,000 | 60,556,582 | ||||||
1.875%, 03/15/11 | 35,000 | 35,542,290 | ||||||
3.250%, 10/14/11 | 20,000 | 20,824,500 | ||||||
Landeskreditbank Baden-Wuerttemberg Foerderbank | ||||||||
4.250%, 09/15/10 | 24,400 | 25,165,867 | ||||||
Manitoba, Province of Canada | ||||||||
4.450%, 04/12/10 | 5,450 | 5,546,312 | ||||||
Morgan Stanley | ||||||||
2.900%, 12/01/10 | 90,000 | 92,098,170 | ||||||
# | 2.000%, 09/22/11 | 25,000 | 25,489,250 | |||||
Nordea Bank Finland P.L.C. Floating Rate Note | ||||||||
(r) | 0.584%, 10/14/11 | 50,000 | 50,000,000 | |||||
Nordic Investment Bank | ||||||||
4.875%, 03/15/11 | 12,291 | 12,996,454 | ||||||
Oesterreichische Kontrollbank AG | ||||||||
4.250%, 10/06/10 | 10,000 | 10,344,380 | ||||||
Oesterreichische Kontrollbank AG | ||||||||
2.875%, 03/15/11 | 82,000 | 84,494,604 | ||||||
113
DFA ONE-YEAR FIXED INCOME PORTFOLIO
CONTINUED
Face Amount | Value† | |||||||
| (000) | ||||||||
Regions Bank | ||||||||
2.750%, 12/10/10 | $ | 18,000 | $ | 18,394,128 | ||||
Royal Bank of Canada | ||||||||
5.650%, 07/20/11 | 23,000 | 24,707,083 | ||||||
Svensk Exportkredit AB | ||||||||
4.000%, 06/15/10 | 77,000 | 78,649,494 | ||||||
4.500%, 09/27/10 | 13,000 | 13,463,437 | ||||||
Toyota Motor Credit Corp. Floating Rate Note | ||||||||
(r) | 0.384%, 10/04/11 | 48,000 | 47,908,464 | |||||
Wachovia Corp. Floating Rate Note | ||||||||
(r) | 0.857%, 11/24/09 | 93,000 | 93,027,528 | |||||
Wells Fargo & Co. Floating Rate Note | ||||||||
(r) | 0.384%, 01/12/11 | 25,000 | 24,916,150 | |||||
Westpac Banking Corp. Floating Rate Note | ||||||||
(r) | 0.304%, 10/06/10 | 75,000 | 74,931,525 | |||||
TOTAL BONDS | 1,612,538,594 | |||||||
U.S. TREASURY OBLIGATIONS — (1.9%) | ||||||||
U.S. Treasury Note | ||||||||
# | 1.000%, 09/30/11 | 96,000 | 96,269,952 | |||||
COMMERCIAL PAPER — (20.7%) | ||||||||
ANZ National (International), Ltd. | ||||||||
1.605%, 11/06/09 | 57,000 | 56,998,336 | ||||||
0.230%, 11/09/09 | 30,000 | 29,998,683 | ||||||
Australia & New Zealand Banking Group, Ltd. | ||||||||
0.240%, 11/10/09 | 12,000 | 11,999,413 | ||||||
0.000%, 01/15/10 | 21,200 | 21,189,434 | ||||||
Bank of Nova Scotia | ||||||||
0.260%, 11/02/09 | 75,000 | 74,999,250 | ||||||
BNP Paribas Finance, Inc. | ||||||||
0.240%, 12/04/09 | 20,000 | 19,996,306 | ||||||
Caisse Cent Desjardins Du Quebec | ||||||||
0.300%, 11/19/09 | 25,000 | 24,997,640 | ||||||
0.310%, 11/19/09 | 25,000 | 24,997,640 | ||||||
0.220%, 12/11/09 | 10,000 | 9,997,783 | ||||||
0.230%, 12/29/09 | 50,000 | 49,982,500 | ||||||
CBA Delaware Finance, Inc. | ||||||||
0.280%, 11/06/09 | 50,000 | 49,998,835 | ||||||
0.230%, 12/02/09 | 55,000 | 54,993,648 | ||||||
Face Amount | Value† | |||||||
| (000) | ||||||||
DnB NOR Bank ASA | ||||||||
0.230%, 12/07/09 | $ | 15,000 | $ | 14,996,991 | ||||
0.220%, 12/30/09 | 24,000 | 23,991,420 | ||||||
Eksportfinans ASA | ||||||||
0.200%, 11/24/09 | 11,000 | 10,998,633 | ||||||
Fortis Funding LLC | ||||||||
0.230%, 12/22/09 | 70,000 | 69,976,193 | ||||||
0.260%, 01/15/10 | 20,000 | 19,988,750 | ||||||
National Australia Funding Delaware, Inc. | ||||||||
0.265%, 11/02/09 | 55,000 | 54,999,219 | ||||||
0.240%, 11/17/09 | 50,000 | 49,995,250 | ||||||
Nestle Capital Corp. | ||||||||
0.180%, 11/24/09 | 25,000 | 24,997,918 | ||||||
Nestle Finance International, Ltd. | ||||||||
0.210%, 12/04/09 | 87,435 | 87,423,948 | ||||||
NRW.BANK | ||||||||
0.230%, 11/27/09 | 28,000 | 27,995,948 | ||||||
0.000%, 12/28/09 | 59,000 | 58,979,793 | ||||||
0.285%, 01/06/10 | 15,000 | 14,993,739 | ||||||
Procter & Gamble International Funding | ||||||||
0.220%, 11/02/09 | 27,000 | 26,999,730 | ||||||
Procter & Gamble International Funding SCA | ||||||||
0.180%, 12/03/09 | 7,650 | 7,649,075 | ||||||
0.190%, 12/11/09 | 5,350 | 5,349,101 | ||||||
Rabobank USA Financial Corp. | ||||||||
0.230%, 12/01/09 | 15,000 | 14,998,347 | ||||||
0.230%, 12/10/09 | 25,000 | 24,995,958 | ||||||
Scotiabanc, Inc. | ||||||||
0.210%, 12/08/09 | 17,000 | 16,996,501 | ||||||
Svenska Handelsbanken AB | ||||||||
0.225%, 01/27/10 | 20,000 | 19,987,688 | ||||||
Svenska Handelsbanken, Inc. | ||||||||
0.210%, 01/04/10 | 35,000 | 34,986,010 | ||||||
Total Capital Canada, Ltd. | ||||||||
0.230%, 11/10/09 | 22,300 | 22,298,910 | ||||||
TOTAL COMMERCIAL PAPER | 1,063,748,590 | |||||||
114
DFA ONE-YEAR FIXED INCOME PORTFOLIO
CONTINUED
Face Amount | Value† | |||||
| (000) | ||||||
TEMPORARY CASH INVESTMENTS — (0.3%) | ||||||
Repurchase Agreement, PNC Capital Markets, Inc. 0.19%, 11/02/09 (Collateralized by $23,955,000 FNMA 5.00%, 08/25/18, valued at $18,722,068) to be repurchased at $18,442,292 | $ | 18,442 | $ | 18,442,000 | ||
Shares | Value† | ||||
SECURITIES LENDING COLLATERAL — (17.4%) | |||||
§@ DFA Short Term Investment Fund LP | 894,976,200 | $ | 894,976,200 | ||
TOTAL INVESTMENTS — (100.0%) | $ | 5,145,865,710 | |||
Summary of inputs used to value the Portfolio’s net assets as of October 31, 2009 is as follows (See Security Valuation Note):
| Valuation Inputs | ||||||||||
| Investment in Securities (Market Value) | ||||||||||
Level 1 | Level 2 | Level 3 | Total | |||||||
Agency Obligations | — | $ | 1,459,890,374 | — | $ | 1,459,890,374 | ||||
Bonds | — | 1,612,538,594 | — | 1,612,538,594 | ||||||
U.S. Treasury Obligations | — | 96,269,952 | — | 96,269,952 | ||||||
Commercial Paper | — | 1,063,748,590 | — | 1,063,748,590 | ||||||
Temporary Cash Investments | — | 18,442,000 | — | 18,442,000 | ||||||
Securities Lending Collateral | — | 894,976,200 | — | 894,976,200 | ||||||
TOTAL | — | $ | 5,145,865,710 | — | $ | 5,145,865,710 | ||||
See accompanying Notes to Financial Statements.
115
DFA TWO-YEAR GLOBAL FIXED INCOME PORTFOLIO
SCHEDULE OF INVESTMENTS
OCTOBER 31, 2009
Face Amount^ | Value† | ||||||
| (000) | |||||||
BONDS — (42.7%) | |||||||
AUSTRALIA — (0.5%) | |||||||
Australia & New Zealand Banking Group, Ltd. | |||||||
(u) | 4.875%, 11/08/10 | 4,085 | $ | 4,202,158 | |||
(g) | 4.500%, 12/15/10 | 3,410 | 5,755,032 | ||||
Commonwealth Bank of Australia | |||||||
(e) | 3.625%, 04/05/11 | 5,800 | 8,725,206 | ||||
Westpac Banking Corp. | |||||||
(g) | 4.875%, 04/13/11 | 5,639 | 9,635,502 | ||||
TOTAL AUSTRALIA | 28,317,898 | ||||||
AUSTRIA — (0.2%) | |||||||
Erste Group Bank AG | |||||||
2.250%, 05/13/11 | 8,400 | 12,450,001 | |||||
CANADA — (7.5%) | |||||||
Bank of Nova Scotia | |||||||
4.400%, 05/09/11 | 21,500 | 20,768,795 | |||||
Canada Housing Trust | |||||||
4.600%, 09/15/11 | 55,000 | 53,815,674 | |||||
Canada Mortgage & Housing Corp. | |||||||
(u) | 4.800%, 10/01/10 | 26,280 | 27,304,683 | ||||
Canadian Government Bond | |||||||
1.250%, 06/01/11 | 108,500 | 100,633,612 | |||||
Ontario, Province of Canada | |||||||
(u) | 3.125%, 09/08/10 | 89,000 | 90,972,685 | ||||
Royal Bank of Canada | |||||||
(g) | 4.625%, 12/07/10 | 6,313 | 10,668,101 | ||||
4.920%, 07/06/11 | 8,000 | 7,819,971 | |||||
(u) | 5.650%, 07/20/11 | 3,500 | 3,759,774 | ||||
(e) | 5.750%, 07/25/11 | 48,000 | 75,138,567 | ||||
TOTAL CANADA | 390,881,862 | ||||||
FRANCE — (4.1%) | |||||||
Agence Francaise de Developpement | |||||||
(u) | 1.750%, 01/18/11 | 26,500 | 26,730,206 | ||||
(u) | 4.125%, 06/24/11 | 45,500 | 47,487,167 | ||||
Caisse d’Amortissement de la Dette Sociale | |||||||
(u) | 4.000%, 07/15/11 | 31,720 | 33,208,302 | ||||
French Treasury Note | |||||||
3.500%, 07/12/11 | 70,000 | 106,813,586 | |||||
TOTAL FRANCE | 214,239,261 | ||||||
Face Amount^ | Value† | ||||||
| (000) | |||||||
GERMANY — (7.5%) | |||||||
Bundesschatzanweisungen | |||||||
1.500%, 06/10/11 | 70,000 | $ | 103,623,199 | ||||
Deutsche Bank AG Floating Rate Note | |||||||
(r)(u) | 0.940%, 02/16/10 | 40,000 | 40,063,880 | ||||
Kreditanstalt fuer Wiederaufbau | |||||||
(u) | 4.625%, 01/20/11 | 53,200 | 55,545,003 | ||||
(u) | 1.875%, 03/15/11 | 19,755 | 20,061,084 | ||||
(u) | 3.250%, 10/14/11 | 5,000 | 5,206,125 | ||||
Landeskreditbank Baden-Wuerttemberg Foerderbank | |||||||
(u) | 4.250%, 09/15/10 | 25,000 | 25,784,700 | ||||
(u) | 3.250%, 10/29/10 | 34,000 | 34,757,452 | ||||
(u) | 2.500%, 02/14/11 | 29,000 | 29,537,370 | ||||
(u) | 4.125%, 07/15/11 | 18,000 | 18,847,728 | ||||
Landwirtschaftliche Rentenbank | |||||||
(u) | 4.250%, 01/21/11 | 25,000 | 25,976,275 | ||||
#(u) | 4.875%, 02/14/11 | 9,100 | 9,582,236 | ||||
(u) | 3.125%, 06/15/11 | 18,400 | 19,021,313 | ||||
TOTAL GERMANY | 388,006,365 | ||||||
JAPAN — (0.6%) | |||||||
Japan Finance Corp. | |||||||
(u) | 2.000%, 06/24/11 | 29,600 | 30,062,382 | ||||
NETHERLANDS — (7.1%) | |||||||
Bank Nederlandse Gemeenten | |||||||
(u) | 3.375%, 12/15/10 | 8,648 | 8,869,458 | ||||
(u) | 3.375%, 01/18/11 | 15,000 | 15,426,210 | ||||
(g) | 4.500%, 08/16/11 | 18,000 | 30,886,335 | ||||
(u) | 5.125%, 10/20/11 | 28,600 | 30,493,835 | ||||
Deutsche Bahn Finance | |||||||
(u) | 5.125%, 01/05/11 | 48,385 | 50,301,965 | ||||
Nederlandse Waterschapsbank | |||||||
(u) | 2.875%, 06/16/11 | 107,000 | 109,701,215 | ||||
Netherlands Government Bond | |||||||
5.000%, 07/15/11 | 70,000 | 109,449,751 | |||||
Rabobank Nederland | |||||||
(u) | 5.000%, 02/15/11 | 6,884 | 7,218,721 | ||||
(g) | 5.000%, 04/11/11 | 4,870 | 8,318,183 | ||||
TOTAL NETHERLANDS | 370,665,673 | ||||||
116
DFA TWO-YEAR GLOBAL FIXED INCOME PORTFOLIO
CONTINUED
Face Amount^ | Value† | ||||||
| (000) | |||||||
NORWAY — (2.0%) | |||||||
Kommunalbanken | |||||||
(u) | 3.250%, 06/15/11 | 101,832 | $ | 105,122,803 | |||
SPAIN — (0.6%) | |||||||
Instituto de Credito Oficial | |||||||
(u) | 4.625%, 10/26/10 | 26,300 | 27,221,368 | ||||
(u) | 3.000%, 03/15/11 | 5,000 | 5,127,410 | ||||
TOTAL SPAIN | 32,348,778 | ||||||
SUPRANATIONAL ORGANIZATION OBLIGATIONS — (1.2%) | |||||||
Council of Europe Development Bank | |||||||
(u) | 6.125%, 01/25/11 | 21,208 | 22,496,280 | ||||
(u) | 3.375%, 09/15/11 | 6,000 | 6,238,812 | ||||
European Investment Bank | |||||||
(g) | 5.375%, 03/07/11 | 5,860 | 10,144,846 | ||||
(u) | 3.250%, 10/14/11 | 22,000 | 22,941,644 | ||||
TOTAL SUPRANATIONAL ORGANIZATION OBLIGATIONS | 61,821,582 | ||||||
SWEDEN — (1.1%) | |||||||
Kommuninvest I Sverige | |||||||
(u) | 5.375%, 06/15/11 | 23,000 | 24,403,529 | ||||
Svensk Exportkredit AB | |||||||
(u) | 4.000%, 06/15/10 | 5,767 | 5,890,541 | ||||
Sweden Government International Bond | |||||||
(u) | 4.500%, 02/07/11 | 25,000 | 26,204,825 | ||||
TOTAL SWEDEN | 56,498,895 | ||||||
UNITED KINGDOM — (3.8%) | |||||||
BP Capital Markets P.L.C. | |||||||
(u) | 4.750%, 11/10/10 | 5,814 | 6,027,839 | ||||
(u) | 3.625%, 05/27/11 | 3,160 | 3,282,169 | ||||
#(u) | 1.550%, 08/11/11 | 21,000 | 21,311,157 | ||||
Lloyds TSB Bank P.L.C. | |||||||
(u) | 2.300%, 04/01/11 | 40,000 | 40,651,840 | ||||
Network Rail Infrastructure Finance P.L.C. | |||||||
(u) | 3.000%, 01/24/11 | 21,200 | 21,717,450 | ||||
United Kingdom Gilt | |||||||
9.000%, 07/12/11 | 56,000 | 104,023,136 | |||||
TOTAL UNITED KINGDOM | 197,013,591 | ||||||
Face Amount | Value† | |||||||
| (000) | ||||||||
UNITED STATES — (6.5%) | ||||||||
Bank of America | ||||||||
# | 1.700%, 12/23/10 | $ | 80,000 | $ | 80,892,880 | |||
Bank of America Corp. | ||||||||
4.500%, 08/01/10 | 5,092 | 5,215,461 | ||||||
Citigroup, Inc. | ||||||||
1.500%, 07/12/11 | 65,000 | 65,603,200 | ||||||
1.375%, 08/10/11 | 20,000 | 20,134,220 | ||||||
1.250%, 09/22/11 | 15,000 | 15,061,665 | ||||||
General Electric Capital Corp. | ||||||||
1.625%, 01/07/11 | 40,000 | 40,432,520 | ||||||
Goldman Sachs Group, Inc. | ||||||||
1.625%, 07/15/11 | 24,000 | 24,292,608 | ||||||
Morgan Stanley | ||||||||
2.000%, 09/22/11 | 86,200 | 87,886,934 | ||||||
TOTAL UNITED STATES | 339,519,488 | |||||||
TOTAL BONDS | 2,226,948,579 | |||||||
AGENCY OBLIGATIONS — (25.3%) | ||||||||
Federal Farm Credit Bank | ||||||||
# | 5.375%, 07/18/11 | 10,800 | 11,615,152 | |||||
# | 3.875%, 08/25/11 | 20,000 | 21,032,560 | |||||
# | 1.125%, 10/03/11 | 70,500 | 70,447,336 | |||||
# | 3.500%, 10/03/11 | 20,000 | 20,938,620 | |||||
Federal Home Loan Bank | ||||||||
# | 4.375%, 10/22/10 | 60,000 | 62,213,460 | |||||
# | 1.625%, 01/21/11 | 100,000 | 101,318,200 | |||||
# | 1.375%, 05/16/11 | 88,200 | 89,056,598 | |||||
# | 2.625%, 05/20/11 | 80,000 | 82,314,480 | |||||
# | 3.375%, 06/24/11 | 65,000 | 67,556,450 | |||||
# | 3.625%, 07/01/11 | 110,600 | 115,683,618 | |||||
# | 1.625%, 07/27/11 | 95,000 | 96,101,525 | |||||
# | 3.750%, 09/09/11 | 126,800 | 133,459,916 | |||||
# | 3.625%, 09/16/11 | 70,000 | 73,567,830 | |||||
Federal Home Loan Mortgage Corporation | ||||||||
# | 4.750%, 01/18/11 | 20,000 | 20,996,680 | |||||
# | 1.625%, 04/26/11 | 60,000 | 60,759,660 | |||||
# | 6.000%, 06/15/11 | 79,000 | 85,566,322 | |||||
# | 5.250%, 07/18/11 | 13,500 | 14,518,102 | |||||
117
DFA TWO-YEAR GLOBAL FIXED INCOME PORTFOLIO
CONTINUED
Face Amount | Value† | |||||||
| (000) | ||||||||
Federal National Mortgage Association | ||||||||
# | 4.500%, 02/15/11 | $ | 13,500 | $ | 14,186,394 | |||
# | 1.375%, 04/28/11 | 20,000 | 20,168,060 | |||||
# | 6.000%, 05/15/11 | 69,000 | 74,412,981 | |||||
# | 3.375%, 05/19/11 | 80,000 | 83,257,200 | |||||
TOTAL AGENCY OBLIGATIONS | 1,319,171,144 | |||||||
U.S. TREASURY OBLIGATIONS — (1.3%) | ||||||||
U.S. Treasury Note | ||||||||
# | 1.000%, 09/30/11 | 65,000 | 65,182,780 | |||||
CERTIFICATES OF DEPOSIT INTEREST BEARING — (1.5%) | ||||||||
Nordea Bank Finland | ||||||||
1.650%, 01/28/10 | 40,000 | 40,136,552 | ||||||
Toronto Dominion Bank | ||||||||
1.650%, 01/28/10 | 40,000 | 40,155,852 | ||||||
TOTAL CERTIFICATES OF DEPOSIT INTEREST BEARING | 80,292,404 | |||||||
COMMERCIAL PAPER — (1.5%) | ||||||||
Westpac Banking Corp. | ||||||||
1.370%, 01/15/10 | 80,000 | 79,962,352 | ||||||
TEMPORARY CASH INVESTMENTS — (0.9%) | ||||||||
Repurchase Agreement, PNC Capital Markets, Inc. 0.19%, 11/02/09 (Collateralized by $42,415,000 FNMA 6.50%, 06/25/39, valued at $44,641,788) to be repurchased at $43,978,696 | $ | 43,978 | 43,978,000 | |||||
Shares | Value† | ||||||
SECURITIES LENDING COLLATERAL — (26.8%) | |||||||
§@ | DFA Short Term Investment Fund LP | 1,395,043,125 | $ | 1,395,043,125 | |||
TOTAL INVESTMENTS — (100.0%) | $ | 5,210,578,384 | |||||
118
DFA TWO-YEAR GLOBAL FIXED INCOME PORTFOLIO
CONTINUED
Summary of inputs used to value the Portfolio’s net assets as of October 31, 2009 is as follows (See Security Valuation Note):
| Valuation Inputs | ||||||||||
| Investment in Securities (Market Value) | ||||||||||
| Level 1 | Level 2 | Level 3 | Total | |||||||
Bonds | ||||||||||
Australia | — | $ | 28,317,898 | — | $ | 28,317,898 | ||||
Austria | — | 12,450,001 | — | 12,450,001 | ||||||
Canada | — | 390,881,862 | — | 390,881,862 | ||||||
France | — | 214,239,261 | — | 214,239,261 | ||||||
Germany | — | 388,006,365 | — | 388,006,365 | ||||||
Japan | — | 30,062,382 | — | 30,062,382 | ||||||
Netherlands | — | 370,665,673 | — | 370,665,673 | ||||||
Norway | — | 105,122,803 | — | 105,122,803 | ||||||
Spain | — | 32,348,778 | — | 32,348,778 | ||||||
Supranational Organization Obligations | — | 61,821,582 | — | 61,821,582 | ||||||
Sweden | — | 56,498,895 | — | 56,498,895 | ||||||
United Kingdom | — | 197,013,591 | — | 197,013,591 | ||||||
United States | — | 339,519,488 | — | 339,519,488 | ||||||
Agency Obligations | ||||||||||
United States | — | 1,319,171,144 | — | 1,319,171,144 | ||||||
U.S. Treasury Obligations | ||||||||||
United States | — | 65,182,780 | — | 65,182,780 | ||||||
Certificates of Deposit Interest Bearing | ||||||||||
United States | — | 80,292,404 | — | 80,292,404 | ||||||
Commercial Paper | ||||||||||
United States | — | 79,962,352 | — | 79,962,352 | ||||||
Temporary Cash Investments | — | 43,978,000 | — | 43,978,000 | ||||||
Securities Lending Collateral | — | 1,395,043,125 | — | 1,395,043,125 | ||||||
Other Financial Instruments** | — | 6,880,002 | — | 6,880,002 | ||||||
TOTAL | — | $ | 5,217,458,386 | — | $ | 5,217,458,386 | ||||
| ** | Other financial instruments are derivative instruments not reflected in the Schedule of Investments, such as futures and forwards which are valued at the unrealized appreciation/depreciation on the investment. |
See accompanying Notes to Financial Statements.
119
DFA SELECTIVELY HEDGED GLOBAL FIXED INCOME PORTFOLIO
SCHEDULE OF INVESTMENTS
October 31, 2009
Face | Value† | ||||||
| (000) | |||||||
BONDS — (72.1%) | |||||||
AUSTRALIA — (4.0%) | |||||||
Australia & New Zealand Banking Group, Ltd. | |||||||
6.500%, 02/02/10 | 1,279 | $ | 1,157,274 | ||||
5.750%, 02/22/10 | 2,576 | 2,325,465 | |||||
(u) | 5.500%, 05/24/11 | 1,311 | 1,380,132 | ||||
Commonwealth Bank of Australia | |||||||
7.250%, 09/17/10 | 5,000 | 4,583,367 | |||||
Westpac Banking Corp. Floating Rate Note | |||||||
(e)(r) | 0.812%, 12/22/09 | 1,750 | 2,574,316 | ||||
TOTAL AUSTRALIA | 12,020,554 | ||||||
AUSTRIA — (2.4%) | |||||||
ASFINAG | |||||||
(u) | 4.750%, 11/17/10 | 3,500 | 3,639,192 | ||||
Oesterreichische Kontrollbank AG | |||||||
(u) | 2.875%, 03/15/11 | 3,500 | 3,606,477 | ||||
TOTAL AUSTRIA | 7,245,669 | ||||||
CANADA — (8.9%) | |||||||
Bank of Nova Scotia | |||||||
(g) | 4.625%, 01/25/11 | 1,700 | 2,872,242 | ||||
4.400%, 05/09/11 | 3,500 | 3,380,967 | |||||
Canada Housing Trust | |||||||
4.600%, 09/15/11 | 7,000 | 6,849,268 | |||||
Canadian Government Bond | |||||||
1.250%, 06/01/11 | 6,900 | 6,399,741 | |||||
Ontario, Province of Canada | |||||||
(u) | 3.125%, 09/08/10 | 5,000 | 5,110,825 | ||||
(z) | 6.375%, 10/12/10 | 1,800 | 1,320,846 | ||||
Royal Bank of Canada | |||||||
(u) | 5.650%, 07/20/11 | 1,000 | 1,074,221 | ||||
TOTAL CANADA | 27,008,110 | ||||||
DENMARK — (0.2%) | |||||||
Denmark, Kingdom of | |||||||
6.000%, 11/15/09 | 2,600 | 514,904 | |||||
FINLAND — (0.2%) | |||||||
Municipality Finance P.L.C. | |||||||
(t) | 6.705%, 08/25/10 | 800 | 726,865 | ||||
Face | Value† | ||||||
| (000) | |||||||
FRANCE — (5.8%) | |||||||
Agence Francaise de Developpement | |||||||
(u) | 1.750%, 01/18/11 | 3,500 | $ | 3,530,405 | |||
BNP Paribas Finance, Inc. Floating Rate Note | |||||||
(r) | 1.243%, 04/14/10 | 3,850 | 5,676,074 | ||||
Caisse d’Amortissement de la Dette Sociale | |||||||
(u) | 4.000%, 07/15/11 | 8,000 | 8,375,360 | ||||
TOTAL FRANCE | 17,581,839 | ||||||
GERMANY — (6.6%) | |||||||
Kreditanstalt fuer Wiederaufbau | |||||||
(z) | 8.000%, 01/14/11 | 4,302 | 3,226,988 | ||||
(n) | 5.250%, 05/16/11 | 27,000 | 4,910,573 | ||||
Landeskreditbank Baden-Wuerttemberg Foerderbank | |||||||
(n) | 3.500%, 04/15/10 | 2,930 | 511,651 | ||||
(u) | 3.250%, 10/29/10 | 4,500 | 4,600,251 | ||||
(u) | 4.125%, 07/15/11 | 3,000 | 3,141,288 | ||||
Landwirtschaftliche Rentenbank | |||||||
(u) | 4.250%, 01/21/11 | 2,000 | 2,078,102 | ||||
(t) | 6.500%, 05/04/11 | 1,000 | 916,349 | ||||
Norddeutsche Landesbank Girozentrale AG | |||||||
(z) | 6.500%, 11/11/09 | 1,053 | 755,826 | ||||
TOTAL GERMANY | 20,141,028 | ||||||
IRELAND — (1.9%) | |||||||
General Electric Capital Corp. Floating Rate Note | |||||||
(g)(r) | 1.276%, 02/01/10 | 3,600 | 5,895,720 | ||||
JAPAN — (1.4%) | |||||||
Japan Finance Corp. | |||||||
(u) | 2.000%, 06/24/11 | 4,200 | 4,265,608 | ||||
NETHERLANDS — (6.5%) | |||||||
Bank Nederlandse Gemeenten | |||||||
(t) | 5.000%, 07/16/10 | 3,800 | 3,424,833 | ||||
(u) | 5.125%, 10/20/11 | 1,400 | 1,492,705 | ||||
Deutsche Bahn Finance | |||||||
(u) | 5.125%, 01/05/11 | 5,000 | 5,198,095 | ||||
Nederlandse Waterschapsbank | |||||||
(u) | 2.875%, 06/16/11 | 4,000 | 4,100,980 | ||||
120
DFA SELECTIVELY HEDGED GLOBAL FIXED INCOME PORTFOLIO
CONTINUED
Face | Value† | ||||||
| (000) | |||||||
NETHERLANDS — (Continued) | |||||||
Nederlandse Waterschapsbank NV | |||||||
(z) | 8.250%, 01/21/10 | 2,299 | $ | 1,664,488 | |||
(t) | 7.375%, 02/18/11 | 2,000 | 1,851,512 | ||||
Toyota Motor Finance | |||||||
(t) | 6.630%, 05/25/10 | 2,100 | 1,892,028 | ||||
TOTAL NETHERLANDS | 19,624,641 | ||||||
NORWAY — (2.5%) | |||||||
Kommunalbanken | |||||||
5.250%, 11/10/10 | 4,000 | 719,226 | |||||
(t) | 4.000%, 11/15/10 | 1,300 | 1,156,675 | ||||
3.500%, 03/01/11 | 9,290 | 1,645,451 | |||||
(u) | 3.250%, 06/15/11 | 4,000 | 4,129,264 | ||||
TOTAL NORWAY | 7,650,616 | ||||||
SPAIN — (2.1%) | |||||||
Instituto de Credito Oficial | |||||||
(u) | 4.625%, 10/26/10 | 4,500 | 4,657,649 | ||||
(u) | 1.875%, 04/15/11 | 1,700 | 1,722,440 | ||||
TOTAL SPAIN | 6,380,089 | ||||||
SUPRANATIONAL ORGANIZATION OBLIGATIONS — (9.7%) | |||||||
Council of Europe Development Bank | |||||||
(u) | 6.125%, 01/25/11 | 1,800 | 1,909,341 | ||||
(u) | 3.375%, 09/15/11 | 4,000 | 4,159,208 | ||||
Eurofima | |||||||
(z) | 6.500%, 10/21/10 | 5,500 | 4,038,086 | ||||
European Investment Bank | |||||||
(z) | 7.250%, 02/08/10 | 1,000 | 724,450 | ||||
(n) | 6.000%, 08/06/10 | 7,500 | 1,344,066 | ||||
(z) | 6.250%, 09/30/10 | 3,252 | 2,381,961 | ||||
(z) | 7.750%, 10/26/10 | 3,674 | 2,737,684 | ||||
Inter-American Development Bank | |||||||
(z) | 7.410%, 01/29/10 | 1,300 | 941,446 | ||||
(z) | 6.125%, 07/19/11 | 3,800 | 2,800,426 | ||||
International Bank for Reconstruction & Development | |||||||
(t) | 0.500%, 03/12/10 | 2,059 | 1,828,995 | ||||
(t) | 5.520%, 04/18/11 | 1,796 | 1,616,615 | ||||
(t) | 5.520%, 04/18/11 | 1,000 | 900,120 | ||||
(t) | 5.760%, 04/26/11 | 1,200 | 1,086,085 | ||||
Face | Value† | |||||||
| (000) | ||||||||
SUPRANATIONAL ORGANIZATION OBLIGATIONS — (Continued) | ||||||||
Nordic Investment Bank | ||||||||
(n) | 4.625%, 07/30/10 | 16,000 | $ | 2,830,652 | ||||
TOTAL SUPRANATIONAL ORGANIZATION OBLIGATIONS | 29,299,135 | |||||||
SWEDEN — (2.5%) | ||||||||
City of Stockholm | ||||||||
3.375%, 03/08/10 | 10,000 | 1,415,398 | ||||||
Kommuninvest I Sverige | ||||||||
(u) | 5.375%, 06/15/11 | 4,000 | 4,244,092 | |||||
Svensk Exportkredit AB | ||||||||
(u) | 4.875%, 09/29/11 | 1,000 | 1,065,380 | |||||
Swedish Export Credit | ||||||||
(t) | 5.800%, 09/13/10 | 1,000 | 902,397 | |||||
TOTAL SWEDEN | 7,627,267 | |||||||
UNITED KINGDOM — (4.6%) | ||||||||
BP Capital Markets P.L.C. | ||||||||
(t) | 8.000%, 03/11/11 | 4,728 | 4,393,785 | |||||
Lloyds TSB Bank P.L.C. | ||||||||
(u) | 2.300%, 04/01/11 | 5,500 | 5,589,628 | |||||
Network Rail Infrastructure Finance P.L.C. | ||||||||
(u) | 3.000%, 01/24/11 | 3,800 | 3,892,750 | |||||
TOTAL UNITED KINGDOM | 13,876,163 | |||||||
UNITED STATES — (12.8%) | ||||||||
Bank of America Corp. | ||||||||
4.500%, 08/01/10 | $ | 1,472 | 1,507,690 | |||||
Citigroup, Inc. | ||||||||
1.500%, 07/12/11 | 7,300 | 7,367,744 | ||||||
General Electric Capital Corp. | ||||||||
(z) | 6.625%, 02/04/10 | 1,000 | 721,750 | |||||
(z) | 9.000%, 01/04/11 | 1,100 | 820,338 | |||||
Goldman Sachs Group, Inc. | ||||||||
1.700%, 03/15/11 | 5,300 | 5,376,569 | ||||||
1.625%, 07/15/11 | 2,000 | 2,024,384 | ||||||
Morgan Stanley | ||||||||
2.900%, 12/01/10 | 2,000 | 2,046,626 | ||||||
2.000%, 09/22/11 | 5,000 | 5,097,850 | ||||||
Nestle Holdings, Inc. | ||||||||
(n) | 4.750%, 02/12/10 | 6,000 | 1,054,174 | |||||
(z) | 8.250%, 03/31/10 | 2,000 | 1,459,381 | |||||
(n) | 5.000%, 01/31/11 | 29,500 | 5,291,700 | |||||
121
DFA SELECTIVELY HEDGED GLOBAL FIXED INCOME PORTFOLIO
CONTINUED
Face | Value† | |||||||
| (000) | ||||||||
UNITED STATES — (Continued) | ||||||||
Regions Bank | ||||||||
2.750%, 12/10/10 | $ | 1,000 | $ | 1,021,896 | ||||
Toyota Motor Credit Corp. | ||||||||
(n) | 4.625%, 01/22/10 | 4,200 | 735,842 | |||||
(z) | 7.660%, 04/26/10 | 2,800 | 2,037,166 | |||||
(z) | 8.500%, 12/21/10 | 1,300 | 972,643 | |||||
(z) | 7.375%, 01/18/11 | 1,800 | 1,333,569 | |||||
TOTAL UNITED STATES | 38,869,322 | |||||||
TOTAL BONDS | 218,727,530 | |||||||
AGENCY OBLIGATIONS — (24.8%) | ||||||||
Federal Farm Credit Bank | ||||||||
2.625%, 04/21/11 | 1,300 | 1,335,632 | ||||||
5.375%, 07/18/11 | 4,500 | 4,839,646 | ||||||
3.875%, 08/25/11 | 7,000 | 7,361,396 | ||||||
1.125%, 10/03/11 | 3,000 | 2,997,759 | ||||||
Federal Home Loan Bank | ||||||||
1.625%, 01/21/11 | 5,000 | 5,065,910 | ||||||
1.375%, 05/16/11 | 4,000 | 4,038,848 | ||||||
3.375%, 06/24/11 | 1,000 | 1,039,330 | ||||||
1.625%, 07/27/11 | 8,500 | 8,598,558 | ||||||
3.750%, 09/09/11 | 11,600 | 12,209,267 | ||||||
3.625%, 09/16/11 | 9,800 | 10,299,496 | ||||||
Federal Home Loan Mortgage Corporation | ||||||||
4.750%, 01/18/11 | 1,700 | 1,784,718 | ||||||
1.625%, 04/26/11 | 2,500 | 2,531,652 | ||||||
6.000%, 06/15/11 | 4,500 | 4,874,031 | ||||||
5.250%, 07/18/11 | 4,500 | 4,839,368 | ||||||
Federal National Mortgage Association | ||||||||
6.000%, 05/15/11 | 2,000 | 2,156,898 | ||||||
3.375%, 05/19/11 | 1,000 | 1,040,715 | ||||||
TOTAL AGENCY OBLIGATIONS | 75,013,224 | |||||||
U.S. TREASURY OBLIGATIONS — (0.7%) | ||||||||
U.S. Treasury Note | ||||||||
1.000%, 09/30/11 | 2,200 | 2,206,186 | ||||||
Face | Value† | |||||||
| (000) | ||||||||
TEMPORARY CASH INVESTMENTS — (2.4%) | ||||||||
Repurchase Agreement, PNC Capital Markets, Inc. 0.19%, 11/02/09 (Collateralized by $6,940,000 FNMA 6.50%, 06/25/39, valued at $7,469,175) to be repurchased at $7,357,116. | $ | 7,357 | $ | 7,357,000 | ||||
TOTAL INVESTMENTS — (100.0%) | $ | 303,303,940 | ||||||
122
DFA SELECTIVELY HEDGED GLOBAL FIXED INCOME PORTFOLIO
CONTINUED
Summary of inputs used to value the Portfolio’s net assets as of October 31, 2009 is as follows (See Security Valuation Note):
| Valuation Inputs | ||||||||||
| Investment in Securities (Market Value) | ||||||||||
| Level 1 | Level 2 | Level 3 | Total | |||||||
Bonds | ||||||||||
Australia | — | $ | 12,020,554 | — | $ | 12,020,554 | ||||
Austria | — | 7,245,669 | — | 7,245,669 | ||||||
Canada | — | 27,008,110 | — | 27,008,110 | ||||||
Denmark | — | 514,904 | — | 514,904 | ||||||
Finland | — | 726,865 | — | 726,865 | ||||||
France | — | 17,581,839 | — | 17,581,839 | ||||||
Germany | — | 20,141,028 | — | 20,141,028 | ||||||
Ireland | — | 5,895,720 | — | 5,895,720 | ||||||
Japan | — | 4,265,608 | — | 4,265,608 | ||||||
Netherlands | — | 19,624,641 | — | 19,624,641 | ||||||
Norway | — | 7,650,616 | — | 7,650,616 | ||||||
Spain | — | 6,380,089 | — | 6,380,089 | ||||||
Supranational Organization Obligations | — | 29,299,135 | — | 29,299,135 | ||||||
Sweden | — | 7,627,267 | — | 7,627,267 | ||||||
United Kingdom | — | 13,876,163 | — | 13,876,163 | ||||||
United States | — | 38,869,322 | — | 38,869,322 | ||||||
Agency Obligations | ||||||||||
United States | — | 75,013,224 | — | 75,013,224 | ||||||
U.S. Treasury Obligations | ||||||||||
United States | — | 2,206,186 | — | 2,206,186 | ||||||
Temporary Cash Investments | — | 7,357,000 | — | 7,357,000 | ||||||
Other Financial Instruments** | — | 255,714 | — | 255,714 | ||||||
TOTAL | — | $ | 303,559,654 | — | $ | 303,559,654 | ||||
| ** | Other financial instruments are derivative instruments not reflected in the Schedule of Investments, such as futures and forwards which are valued at the unrealized appreciation/depreciation on the investment. |
See accompanying Notes to Financial Statements.
123
DFA FIVE-YEAR GOVERNMENT PORTFOLIO
SCHEDULE OF INVESTMENTS
October 31, 2009
Face | Value† | |||||
| (000) | ||||||
AGENCY OBLIGATIONS — (77.8%) | ||||||
Federal Farm Credit Bank | ||||||
2.625%, 04/17/14 | $ | 31,500 | $ | 31,653,878 | ||
3.000%, 09/22/14 | 9,000 | 9,193,536 | ||||
Federal Home Loan Bank | ||||||
1.625%, 01/21/11 | 10,000 | 10,131,820 | ||||
4.625%, 02/18/11 | 21,500 | 22,606,669 | ||||
1.375%, 05/16/11 | 4,000 | 4,038,848 | ||||
2.625%, 05/20/11 | 50,200 | 51,652,336 | ||||
3.375%, 06/24/11 | 6,300 | 6,547,779 | ||||
5.375%, 08/19/11 | 50,000 | 53,877,750 | ||||
3.750%, 09/09/11 | 40,000 | 42,100,920 | ||||
3.625%, 09/16/11 | 50,000 | 52,548,450 | ||||
4.875%, 11/18/11 | 50,000 | 53,892,450 | ||||
5.750%, 05/15/12 | 150,000 | 166,461,600 | ||||
4.625%, 10/10/12 | 100,000 | 108,867,700 | ||||
5.250%, 06/18/14 | 65,000 | 73,109,985 | ||||
5.500%, 08/13/14 | 67,500 | 76,731,435 | ||||
Tennessee Valley Authority | ||||||
5.625%, 01/18/11 | 10,930 | 11,597,954 | ||||
TOTAL AGENCY OBLIGATIONS | 775,013,110 | |||||
U.S. TREASURY OBLIGATIONS — (21.4%) | ||||||
U.S. Treasury Notes | ||||||
2.750%, 10/31/13 | 50,000 | 51,621,100 | ||||
2.000%, 11/30/13 | 112,000 | 112,323,792 | ||||
1.750%, 01/31/14 | 50,000 | 49,457,050 | ||||
TOTAL U.S. TREASURY OBLIGATIONS | 213,401,942 | |||||
TEMPORARY CASH INVESTMENTS — (0.8%) | ||||||
Repurchase Agreement, PNC Capital Markets, Inc. 0.19%, 11/02/09 (Collateralized by $7,650,000 FNMA 6.50%, 06/25/39, valued at $8,233,313) to be repurchased at $8,107,128 | 8,107 | 8,107,000 | ||||
TOTAL INVESTMENTS — (100.0%) | $ | 996,522,052 | ||||
124
DFA FIVE-YEAR GOVERNMENT PORTFOLIO
CONTINUED
Summary of inputs used to value the Portfolio’s net assets as of October 31, 2009 is as follows (See Security Valuation Note):
| Valuation Inputs | ||||||||||
| Investment in Securities (Market Value) | ||||||||||
| Level 1 | Level 2 | Level 3 | Total | |||||||
Agency Obligations | — | $ | 775,013,110 | — | $ | 775,013,110 | ||||
U.S. Treasury Obligations | — | 213,401,942 | — | 213,401,942 | ||||||
Temporary Cash Investments | — | 8,107,000 | — | 8,107,000 | ||||||
TOTAL | — | $ | 996,522,052 | — | $ | 996,522,052 | ||||
See accompanying Notes to Financial Statements.
125
DFA FIVE-YEAR GLOBAL FIXED INCOME PORTFOLIO
SCHEDULE OF INVESTMENTS
October 31, 2009
Face Amount^ | Value† | ||||||
| (000) | |||||||
BONDS — (53.6%) | |||||||
AUSTRALIA — (2.0%) | |||||||
National Australia Bank, Ltd. | |||||||
(u) | 5.350%, 06/12/13 | 10,364 | $ | 11,102,518 | |||
SunCorp-Metway, Ltd. | |||||||
(g) | 4.000%, 01/16/14 | 43,555 | 73,461,203 | ||||
TOTAL AUSTRALIA | 84,563,721 | ||||||
AUSTRIA — (2.3%) | |||||||
Oesterreichischen Kontrollbank AG | |||||||
(u) | 3.625%, 06/17/13 | 2,867 | 2,993,435 | ||||
PfandBriefstelle der Oesterreichischen Landes-Hypothekenbanken | |||||||
(j) | 1.600%, 02/15/11 | 8,246,000 | 91,282,299 | ||||
TOTAL AUSTRIA | 94,275,734 | ||||||
BELGIUM — (2.2%) | |||||||
Belgium Government International Bond | |||||||
(u) | 4.250%, 09/03/13 | 78,000 | 83,219,292 | ||||
(u) | 2.875%, 09/15/14 | 8,000 | 8,019,208 | ||||
TOTAL BELGIUM | 91,238,500 | ||||||
CANADA — (2.2%) | |||||||
Ontario, Province of | |||||||
(u) | 4.375%, 02/15/13 | 55,000 | 58,246,485 | ||||
(u) | 4.100%, 06/16/14 | 31,000 | 32,775,866 | ||||
TOTAL CANADA | 91,022,351 | ||||||
FRANCE — (2.5%) | |||||||
Caisse d’Amortissement de la Dette Sociale | |||||||
(u) | 3.500%, 07/01/14 | 88,833 | 91,991,013 | ||||
Total Capital SA | |||||||
(g) | 4.625%, 03/07/12 | 2,014 | 3,473,486 | ||||
(u) | 5.000%, 05/22/12 | 9,900 | 10,651,687 | ||||
TOTAL FRANCE | 106,116,186 | ||||||
GERMANY — (5.1%) | |||||||
Bayerische Landesbank | |||||||
(j) | 1.000%, 09/20/10 | 2,950,000 | 32,786,965 | ||||
Kreditanstalt fuer Wiederaufbau | |||||||
(g) | 4.875%, 01/15/13 | 5,000 | 8,793,992 | ||||
(u) | 4.000%, 10/15/13 | 10,200 | 10,834,756 | ||||
(g) | 3.250%, 02/24/14 | 10,000 | 16,539,567 | ||||
Face | Value† | ||||||
| (000) | |||||||
GERMANY — (Continued) | |||||||
(u) | 3.500%, 03/10/14 | 51,800 | $ | 54,032,321 | |||
Landeskreditbank Baden-Wuerttemberg Foerderbank | |||||||
(u) | 4.875%, 01/13/12 | 9,000 | 9,613,782 | ||||
Landwirtschaftliche Rentenbank | |||||||
(u) | 4.125%, 07/15/13 | 9,000 | 9,592,236 | ||||
(u) | 4.875%, 01/10/14 | 64,200 | 69,836,632 | ||||
TOTAL GERMANY | 212,030,251 | ||||||
NETHERLANDS — (3.4%) | |||||||
Bank Nederlandse Gemeenten | |||||||
(g) | 5.750%, 03/07/12 | 6,500 | 11,483,930 | ||||
(g) | 4.750%, 04/22/13 | 13,577 | 23,531,631 | ||||
(u) | 5.000%, 05/16/14 | 19,200 | 20,787,475 | ||||
Rabobank Nederland | |||||||
(j) | 0.800%, 02/03/11 | 7,292,000 | 80,990,089 | ||||
#(u) | 4.200%, 05/13/14 | 3,000 | 3,128,124 | ||||
TOTAL NETHERLANDS | 139,921,249 | ||||||
NORWAY — (2.0%) | |||||||
Eksportfinans | |||||||
(j) | 1.800%, 06/21/10 | 5,998,000 | 66,979,099 | ||||
Kommunalbanken | |||||||
(g) | 4.875%, 12/10/12 | 8,965 | 15,627,199 | ||||
TOTAL NORWAY | 82,606,298 | ||||||
SPAIN — (1.0%) | |||||||
Instituto de Credito Oficial | |||||||
(g) | 4.500%, 03/07/13 | 15,640 | 26,876,221 | ||||
(u) | 3.250%, 05/14/13 | 15,600 | 16,005,085 | ||||
TOTAL SPAIN | 42,881,306 | ||||||
SUPRANATIONAL ORGANIZATION OBLIGATIONS — (9.7%) | |||||||
African Development Bank | |||||||
(u) | 3.000%, 05/27/14 | 90,100 | 91,644,494 | ||||
Asian Development Bank | |||||||
(u) | 2.750%, 05/21/14 | 20,500 | 20,746,184 | ||||
Council of Europe Development Bank | |||||||
(g) | 4.625%, 03/07/12 | 12,800 | 22,231,679 | ||||
(u) | 4.500%, 06/30/14 | 14,400 | 15,455,261 | ||||
(u) | 4.500%, 06/30/14 | 50,000 | 53,664,100 | ||||
126
DFA FIVE-YEAR GLOBAL FIXED INCOME PORTFOLIO
CONTINUED
Face | Value† | |||||||
| (000) | ||||||||
SUPRANATIONAL ORGANIZATION OBLIGATIONS — (Continued) | ||||||||
Eurofima | ||||||||
(u) | 4.250%, 09/05/13 | 40,100 | $ | 42,676,746 | ||||
(u) | 4.250%, 02/04/14 | 42,860 | 45,478,446 | |||||
European Investment Bank | ||||||||
(u) | 3.000%, 04/08/14 | 10,500 | 10,732,386 | |||||
(g) | 6.250%, 04/15/14 | 12,500 | 23,153,225 | |||||
#(u) | 3.125%, 06/04/14 | 50,000 | 51,259,500 | |||||
Inter-American Development Bank | ||||||||
(u) | 3.000%, 04/22/14 | 13,463 | 13,728,867 | |||||
Nordic Investment Bank | ||||||||
(u) | 2.625%, 10/06/14 | 10,000 | 9,999,000 | |||||
TOTAL SUPRANATIONAL ORGANIZATION OBLIGATIONS | 400,769,888 | |||||||
SWEDEN — (0.9%) | ||||||||
Svensk Exportkredit AB | ||||||||
(u) | 3.250%, 09/16/14 | 35,810 | 36,213,364 | |||||
UNITED KINGDOM — (7.7%) | ||||||||
Barclays Bank P.L.C. | ||||||||
(u) | 5.200%, 07/10/14 | 35,800 | 38,174,363 | |||||
BP Capital Markets P.L.C. | ||||||||
(u) | 5.250%, 11/07/13 | 77,000 | 84,981,204 | |||||
Lloyds TSB Bank P.L.C. | ||||||||
2.750%, 03/16/12 | 27,400 | 45,572,136 | ||||||
Network Rail Infrastructure Finance P.L.C. | ||||||||
4.875%, 03/07/12 | 18,888 | 32,841,426 | ||||||
(u) | 3.500%, 06/17/13 | 24,000 | 24,980,472 | |||||
United Kingdom Gilt | ||||||||
5.250%, 06/07/12 | 47,000 | 83,802,250 | ||||||
5.000%, 09/07/14 | 4,000 | 7,235,571 | ||||||
TOTAL UNITED KINGDOM | 317,587,422 | |||||||
UNITED STATES — (12.6%) | ||||||||
3M Co. | ||||||||
4.375%, 08/15/13 | $ | 19,600 | 21,183,190 | |||||
Bank of America Corp. | ||||||||
4.900%, 05/01/13 | 54,265 | 56,502,292 | ||||||
Bank of New York Mellon Corp. | ||||||||
4.500%, 04/01/13 | 10,000 | 10,605,800 | ||||||
4.300%, 05/15/14 | 65,000 | 68,504,020 | ||||||
General Electric Capital Corp. | ||||||||
(j) | 1.450%, 11/10/11 | 5,140,000 | 56,652,833 | |||||
Face | Value† | |||||||
| (000) | ||||||||
UNITED STATES — (Continued) | ||||||||
4.800%, 05/01/13 | $ | 34,800 | $ | 36,576,296 | ||||
JPMorgan Chase & Co. | ||||||||
4.750%, 05/01/13 | 15,000 | 15,898,575 | ||||||
Mellon Funding Corp. | ||||||||
5.200%, 05/15/14 | 11,760 | 12,787,448 | ||||||
Merck & Co., Inc. | ||||||||
4.375%, 02/15/13 | 30,506 | 31,875,811 | ||||||
Microsoft Corp. | ||||||||
2.950%, 06/01/14 | 22,300 | 22,624,666 | ||||||
Toyota Motor Credit Corp. | ||||||||
(j) | 1.300%, 03/16/12 | 5,550,000 | 62,103,091 | |||||
Wal-Mart Stores, Inc. | ||||||||
4.250%, 04/15/13 | 18,500 | 19,731,212 | ||||||
7.250%, 06/01/13 | 47,800 | 55,812,523 | ||||||
3.200%, 05/15/14 | 5,000 | 5,123,635 | ||||||
Wells Fargo Bank & Co. | ||||||||
5.250%, 10/23/12 | 42,700 | 45,679,649 | ||||||
TOTAL UNITED STATES | 521,661,041 | |||||||
TOTAL BONDS | 2,220,887,311 | |||||||
AGENCY OBLIGATIONS — (22.9%) | ||||||||
Federal Farm Credit Bank | ||||||||
# | 4.250%, 07/08/13 | 50,000 | 53,960,200 | |||||
# | 2.625%, 04/17/14 | 50,000 | 50,244,250 | |||||
# | 3.000%, 09/22/14 | 45,000 | 45,967,680 | |||||
Federal Home Loan Bank | ||||||||
# | 5.750%, 05/15/12 | 50,000 | 55,487,200 | |||||
# | 3.625%, 05/29/13 | 37,500 | 39,713,625 | |||||
# | 5.500%, 08/13/14 | 112,000 | 127,317,344 | |||||
Federal Home Loan Mortgage Corporation | ||||||||
# | 4.750%, 03/05/12 | 100,000 | 108,275,400 | |||||
# | 3.000%, 07/28/14 | 112,000 | 114,528,736 | |||||
Federal National Mortgage Association | ||||||||
# | 5.000%, 02/16/12 | 50,000 | 54,198,250 | |||||
# | 6.125%, 03/15/12 | 50,000 | 55,667,450 | |||||
# | 4.875%, 05/18/12 | 100,000 | 108,707,500 | |||||
# | 3.000%, 09/16/14 | 118,000 | 120,358,466 | |||||
# | 4.625%, 10/15/14 | 15,000 | 16,403,190 | |||||
TOTAL AGENCY OBLIGATIONS | 950,829,291 | |||||||
127
DFA FIVE-YEAR GLOBAL FIXED INCOME PORTFOLIO
CONTINUED
Face | Value† | ||||
| (000) | |||||
TEMPORARY CASH INVESTMENTS — (0.7%) | |||||
Repurchase Agreement, PNC Capital Markets, Inc. 0.19%, 11/02/09 (Collateralized by $34,615,000 FHLMC 4.50%, 05/01/23, valued at $29,372,432) to be repurchased at $28,937,458 | $ | 28,937 | 28,937,000 | ||
Shares | Value† | ||||||
SECURITIES LENDING COLLATERAL — (22.8%) | |||||||
§@ | DFA Short Term Investment Fund LP | 943,857,350 | $ | 943,857,350 | |||
TOTAL INVESTMENTS — (100.0%) | $ | 4,144,510,952 | |||||
Summary of inputs used to value the Portfolio’s net assets as of October 31, 2009 is as follows (See Security Valuation Note):
| Valuation Inputs | ||||||||||||
| Investment in Securities (Market Value) | ||||||||||||
| Level 1 | Level 2 | Level 3 | Total | |||||||||
Bonds | ||||||||||||
Australia | — | $ | 84,563,721 | — | $ | 84,563,721 | ||||||
Austria | — | 94,275,734 | — | 94,275,734 | ||||||||
Belgium | — | 91,238,500 | — | 91,238,500 | ||||||||
Canada | — | 91,022,351 | — | 91,022,351 | ||||||||
France | — | 106,116,186 | — | 106,116,186 | ||||||||
Germany | — | 212,030,251 | — | 212,030,251 | ||||||||
Netherlands | — | 139,921,249 | — | 139,921,249 | ||||||||
Norway | — | 82,606,298 | — | 82,606,298 | ||||||||
Spain | — | 42,881,306 | — | 42,881,306 | ||||||||
Supranational Organization Obligations | — | 400,769,888 | — | 400,769,888 | ||||||||
Sweden | — | 36,213,364 | — | 36,213,364 | ||||||||
United Kingdom | — | 317,587,422 | — | 317,587,422 | ||||||||
United States | — | 521,661,041 | — | 521,661,041 | ||||||||
Agency Obligations | ||||||||||||
United States | — | 950,829,291 | — | 950,829,291 | ||||||||
Temporary Cash Investments | — | 28,937,000 | — | 28,937,000 | ||||||||
Securities Lending Collateral | — | 943,857,350 | — | 943,857,350 | ||||||||
Other Financial Instruments** | — | (5,596,063 | ) | — | (5,596,063 | ) | ||||||
TOTAL | — | $ | 4,138,914,889 | — | $ | 4,138,914,889 | ||||||
| ** | Other financial instruments are derivative instruments not reflected in the Schedule of Investments, such as futures and forwards which are valued at the unrealized appreciation/depreciation on the investment. |
See accompanying Notes to Financial Statements.
128
DFA INTERMEDIATE GOVERNMENT FIXED INCOME PORTFOLIO
SCHEDULE OF INVESTMENTS
October 31, 2009
Face | Value† | |||||
| (000) | ||||||
AGENCY OBLIGATIONS — (66.0%) | ||||||
Federal Farm Credit Bank | ||||||
4.800%, 05/24/11 | $ | 3,300 | $ | 3,503,999 | ||
6.300%, 06/06/11 | 2,800 | 3,041,920 | ||||
4.250%, 07/11/11 | 13,600 | 14,362,062 | ||||
4.350%, 11/02/11 | 8,000 | 8,507,328 | ||||
4.200%, 11/07/11 | 6,650 | 7,053,675 | ||||
4.300%, 11/23/11 | 5,500 | 5,849,228 | ||||
6.260%, 12/02/11 | 2,000 | 2,208,306 | ||||
4.950%, 12/22/11 | 9,000 | 9,707,220 | ||||
5.230%, 02/14/12 | 12,000 | 13,055,964 | ||||
4.500%, 03/14/12 | 8,500 | 9,120,934 | ||||
4.625%, 03/16/12 | 7,000 | 7,532,343 | ||||
5.000%, 06/01/12 | 4,295 | 4,677,075 | ||||
4.480%, 08/24/12 | 12,000 | 12,949,968 | ||||
6.280%, 11/26/12 | 3,000 | 3,407,448 | ||||
4.400%, 01/03/13 | 11,000 | 11,890,395 | ||||
4.150%, 05/15/13 | 10,000 | 10,754,950 | ||||
5.580%, 07/03/13 | 23,000 | 25,898,046 | ||||
3.880%, 07/08/13 | 7,000 | 7,460,362 | ||||
4.920%, 08/26/13 | 4,125 | 4,552,985 | ||||
4.710%, 10/18/13 | 7,000 | 7,676,088 | ||||
4.900%, 01/16/14 | 5,700 | 6,241,768 | ||||
5.300%, 02/18/14 | 12,000 | 13,439,520 | ||||
5.250%, 06/05/14 | 14,400 | 16,096,694 | ||||
4.375%, 06/30/14 | 3,915 | 4,225,961 | ||||
3.000%, 09/22/14 | 7,000 | 7,150,528 | ||||
8.160%, 09/30/14 | 3,615 | 4,516,635 | ||||
4.700%, 12/10/14 | 4,000 | 4,359,968 | ||||
4.550%, 02/03/15 | 4,500 | 4,868,874 | ||||
4.375%, 02/17/15 | 14,300 | 15,346,760 | ||||
6.030%, 03/21/16 | 4,700 | 5,428,495 | ||||
5.050%, 03/08/17 | 10,000 | 10,782,700 | ||||
5.625%, 08/18/17 | 4,000 | 4,506,620 | ||||
5.100%, 09/03/19 | 9,000 | 9,630,018 | ||||
5.320%, 09/03/19 | 21,300 | 22,845,720 | ||||
5.150%, 11/15/19 | 11,200 | 12,005,347 | ||||
4.670%, 05/07/20 | 5,600 | 5,782,963 | ||||
5.350%, 08/07/20 | 6,700 | 7,306,169 | ||||
5.250%, 03/02/21 | 6,100 | 6,433,786 | ||||
5.220%, 02/22/22 | 5,000 | 5,224,285 | ||||
5.210%, 12/19/22 | 21,200 | 22,736,449 | ||||
Federal Home Loan Bank | ||||||
7.200%, 06/14/11 | 3,000 | 3,308,493 | ||||
5.750%, 08/15/11 | 12,000 | 13,009,992 | ||||
5.000%, 10/13/11 | 25,000 | 26,959,850 | ||||
5.625%, 11/15/11 | 5,000 | 5,465,830 | ||||
5.625%, 02/15/12 | 6,100 | 6,711,464 | ||||
Face | Value† | |||||
| (000) | ||||||
5.750%, 05/15/12 | $ | 8,300 | $ | 9,210,875 | ||
4.625%, 08/15/12 | 15,175 | 16,465,877 | ||||
4.500%, 11/15/12 | 18,000 | 19,517,292 | ||||
5.126%, 02/28/13 | 5,615 | 6,217,810 | ||||
3.875%, 06/14/13 | 12,600 | 13,451,445 | ||||
5.375%, 06/14/13 | 52,400 | 58,556,738 | ||||
4.500%, 09/16/13 | 11,000 | 11,993,883 | ||||
6.395%, 06/03/14 | 5,200 | 6,104,748 | ||||
5.250%, 06/18/14 | 50,300 | 56,575,881 | ||||
6.700%, 06/25/14 | 12,500 | 14,853,625 | ||||
5.500%, 08/13/14 | 35,500 | 40,355,051 | ||||
4.500%, 11/14/14 | 4,000 | 4,364,456 | ||||
4.875%, 03/11/16 | 13,600 | 14,799,996 | ||||
5.375%, 05/18/16 | 6,000 | 6,766,230 | ||||
5.375%, 09/09/16 | 6,000 | 6,609,708 | ||||
4.875%, 05/17/17 | 10,500 | 11,437,009 | ||||
5.000%, 11/17/17 | 31,000 | 33,890,285 | ||||
4.625%, 09/11/20 | 11,200 | 11,527,006 | ||||
5.000%, 03/12/21 | 5,200 | 5,503,623 | ||||
5.000%, 12/10/21 | 39,500 | 43,175,198 | ||||
5.750%, 06/10/22 | 19,500 | 22,003,040 | ||||
4.750%, 03/10/23 | 22,200 | 22,767,232 | ||||
Tennessee Valley Authority | ||||||
6.790%, 05/23/12 | 37,600 | 42,481,946 | ||||
6.000%, 03/15/13 | 28,100 | 31,679,547 | ||||
4.750%, 08/01/13 | 12,500 | 13,586,850 | ||||
4.375%, 06/15/15 | 6,500 | 6,979,635 | ||||
6.250%, 12/15/17 | 10,000 | 11,626,650 | ||||
4.500%, 04/01/18 | 10,000 | 10,388,480 | ||||
TOTAL AGENCY OBLIGATIONS | 970,485,301 | |||||
U.S. TREASURY OBLIGATIONS — (33.0%) | ||||||
U.S. Treasury Bonds | ||||||
11.250%, 02/15/15 | 19,000 | 27,319,929 | ||||
10.625%, 08/15/15 | 11,000 | 15,752,341 | ||||
9.875%, 11/15/15 | 11,600 | 16,272,619 | ||||
9.250%, 02/15/16 | 9,000 | 12,386,952 | ||||
7.250%, 05/15/16 | 6,000 | 7,565,628 | ||||
7.500%, 11/15/16 | 17,800 | 22,882,737 | ||||
9.000%, 11/15/18 | 12,200 | 17,584,202 | ||||
8.125%, 08/15/19 | 3,800 | 5,278,436 | ||||
8.750%, 08/15/20 | 12,700 | 18,522,163 | ||||
8.125%, 05/15/21 | 27,100 | 38,299,915 | ||||
7.250%, 08/15/22 | 21,000 | 28,169,526 | ||||
6.250%, 08/15/23 | 21,000 | 26,043,276 | ||||
129
DFA INTERMEDIATE GOVERNMENT FIXED INCOME PORTFOLIO
CONTINUED
Face | Value† | |||||
| (000) | ||||||
U.S. Treasury Notes | ||||||
4.875%, 02/15/12 | $ | 51,800 | $ | 56,239,415 | ||
4.375%, 08/15/12 | 54,700 | 59,349,500 | ||||
4.000%, 11/15/12 | 9,700 | 10,451,750 | ||||
3.875%, 02/15/13 | 27,600 | 29,620,403 | ||||
3.625%, 05/15/13 | 7,700 | 8,210,726 | ||||
4.250%, 08/15/13 | 30,100 | 32,801,957 | ||||
4.000%, 02/15/14 | 10,500 | 11,358,868 | ||||
4.250%, 08/15/14 | 15,500 | 16,939,810 | ||||
4.250%, 11/15/14 | 7,500 | 8,189,062 | ||||
4.875%, 08/15/16 | 8,200 | 9,207,706 | ||||
3.000%, 09/30/16 | 7,000 | 7,018,592 | ||||
TOTAL U.S. TREASURY OBLIGATIONS | 485,465,513 | |||||
Face | Value† | |||||
| (000) | ||||||
TEMPORARY CASH INVESTMENTS — (1.0%) | ||||||
Repurchase Agreement, PNC Capital Markets, Inc. 0.19%, 11/02/09 (Collateralized by $13,455,000 FNMA 6.50%, 06/25/39, valued at $14,161,388) to be repurchased at $13,952,221 | $ | 13,952 | $ | 13,952,000 | ||
TOTAL INVESTMENTS — (100.0%) | $ | 1,469,902,814 | ||||
Summary of inputs used to value the Portfolio’s net assets as of October 31, 2009 is as follows (See Security Valuation Note):
| Valuation Inputs | ||||||||||
| Investment in Securities (Market Value) | ||||||||||
| Level 1 | Level 2 | Level 3 | Total | |||||||
Agency Obligations | — | $ | 970,485,301 | — | $ | 970,485,301 | ||||
U.S. Treasury Obligations | — | 485,465,513 | — | 485,465,513 | ||||||
Temporary Cash Investments | — | 13,952,000 | — | 13,952,000 | ||||||
TOTAL | — | $ | 1,469,902,814 | — | $ | 1,469,902,814 | ||||
See accompanying Notes to Financial Statements.
130
DFA SHORT-TERM EXTENDED QUALITY PORTFOLIO
SCHEDULE OF INVESTMENTS
October 31, 2009
Face | Value† | |||||
| (000) | ||||||
AGENCY OBLIGATIONS — (6.7%) | ||||||
Federal Farm Credit Bank | ||||||
2.625%, 04/17/14 | $ | 5,000 | $ | 5,024,425 | ||
Federal Home Loan Bank | ||||||
1.625%, 03/16/11 | 6,600 | 6,686,869 | ||||
Federal Home Loan Mortgage Corporation | ||||||
3.250%, 02/25/11 | 6,500 | 6,709,196 | ||||
Federal National Mortgage Association | ||||||
1.750%, 03/23/11 | 6,600 | 6,695,165 | ||||
TOTAL AGENCY OBLIGATIONS | 25,115,655 | |||||
BONDS — (91.8%) | ||||||
Abbott Laboratories | ||||||
5.600%, 05/15/11 | 600 | 640,937 | ||||
Aetna, Inc. | ||||||
5.750%, 06/15/11 | 1,600 | 1,684,789 | ||||
African Development Bank | ||||||
1.875%, 01/23/12 | 1,000 | 1,010,670 | ||||
3.000%, 05/27/14 | 4,000 | 4,068,568 | ||||
Agence Francaise de Developpement | ||||||
2.250%, 05/22/12 | 2,000 | 2,019,670 | ||||
Alcoa, Inc. | ||||||
6.000%, 01/15/12 | 1,000 | 1,055,160 | ||||
5.375%, 01/15/13 | 470 | 488,245 | ||||
Allied Waste North America, Inc. | ||||||
6.375%, 04/15/11 | 1,100 | 1,161,310 | ||||
Allstate Corp. | ||||||
7.500%, 06/15/13 | 1,100 | 1,242,909 | ||||
Allstate Corp.(The) | ||||||
6.200%, 05/16/14 | 500 | 552,204 | ||||
Altria Group, Inc. | ||||||
7.750%, 02/06/14 | 1,600 | 1,825,781 | ||||
American Express Credit Corp. | ||||||
5.875%, 05/02/13 | 1,000 | 1,073,205 | ||||
7.300%, 08/20/13 | 1,800 | 2,021,533 | ||||
Anadarko Petroleum Corp. | ||||||
5.000%, 10/01/12 | 600 | 624,235 | ||||
7.625%, 03/15/14 | 500 | 572,099 | ||||
Analog Devices, Inc. | ||||||
5.000%, 07/01/14 | 1,500 | 1,576,764 | ||||
Anheuser-Busch Cos., Inc. | ||||||
6.000%, 04/15/11 | 300 | 315,638 | ||||
Apache Corp. | ||||||
6.000%, 09/15/13 | 1,100 | 1,224,926 | ||||
Face | Value† | |||||
| (000) | ||||||
Appalachian Power Co. | ||||||
5.650%, 08/15/12 | $ | 600 | $ | 645,243 | ||
Archer-Daniels-Midland Co. | ||||||
7.125%, 03/01/13 | 800 | 905,614 | ||||
Arizona Public Service Co. | ||||||
6.500%, 03/01/12 | 600 | 649,463 | ||||
AT&T, Inc. | ||||||
6.700%, 11/15/13 | 1,700 | 1,930,945 | ||||
Atmos Energy Corp. | ||||||
7.375%, 05/15/11 | 800 | 860,066 | ||||
Australia & New Zealand Banking Group, Ltd. | ||||||
5.125%, 11/14/11 | 2,400 | 2,544,415 | ||||
Austria Government International Bond | ||||||
5.500%, 02/22/12 | 3,020 | 3,253,050 | ||||
AutoZone, Inc. | ||||||
5.875%, 10/15/12 | 760 | 814,688 | ||||
Avon Products, Inc. | ||||||
5.125%, 01/15/11 | 1,100 | 1,137,497 | ||||
Baker Hughes, Inc. | ||||||
6.500%, 11/15/13 | 1,870 | 2,125,083 | ||||
Bank of America Corp. | ||||||
5.375%, 09/11/12 | 3,100 | 3,297,123 | ||||
Bank of New York Mellon Corp. | ||||||
4.950%, 11/01/12 | 2,500 | 2,708,400 | ||||
4.300%, 05/15/14 | 2,000 | 2,107,816 | ||||
Barclays Bank P.L.C. | ||||||
5.450%, 09/12/12 | 2,700 | 2,922,278 | ||||
Baxter International, Inc. | ||||||
4.000%, 03/01/14 | 1,600 | 1,668,357 | ||||
BB&T Corp. | ||||||
3.850%, 07/27/12 | 500 | 516,863 | ||||
5.700%, 04/30/14 | 1,000 | 1,082,044 | ||||
Bear Stearns Cos. LLC | ||||||
5.500%, 08/15/11 | 1,600 | 1,677,987 | ||||
Belgium Government International Bond | ||||||
4.250%, 09/03/13 | 1,000 | 1,066,914 | ||||
BHP Billiton Finance, Ltd. | ||||||
5.125%, 03/29/12 | 600 | 646,150 | ||||
5.500%, 04/01/14 | 1,000 | 1,098,500 | ||||
Black & Decker Corp. | ||||||
7.125%, 06/01/11 | 1,430 | 1,534,719 | ||||
Black Hills Corp. | ||||||
6.500%, 05/15/13 | 1,500 | 1,582,430 | ||||
131
DFA SHORT-TERM EXTENDED QUALITY PORTFOLIO
CONTINUED
Face | Value† | |||||
| (000) | ||||||
Block Financial LLC | ||||||
5.125%, 10/30/14 | $ | 1,000 | $ | 1,013,823 | ||
Boeing Capital Corp. | ||||||
7.375%, 09/27/10 | 600 | 635,887 | ||||
Boeing Co. | ||||||
5.000%, 03/15/14 | 1,000 | 1,087,604 | ||||
BP Capital Markets P.L.C. | ||||||
3.125%, 03/10/12 | 3,500 | 3,618,797 | ||||
3.750%, 06/17/13 | 2,500 | 2,608,375 | ||||
5.250%, 11/07/13 | 1,000 | 1,103,652 | ||||
Bristol-Myers Squibb Co. | ||||||
5.250%, 08/15/13 | 600 | 653,552 | ||||
Brown-Forman Corp. | ||||||
5.000%, 02/01/14 | 1,510 | 1,611,372 | ||||
Burlington Northern Santa Fe Corp. | ||||||
5.900%, 07/01/12 | 1,100 | 1,201,078 | ||||
Caisse d’Amortissement de la Dette Sociale | ||||||
4.125%, 12/09/11 | 1,400 | 1,479,729 | ||||
3.500%, 07/01/14 | 3,800 | 3,935,090 | ||||
Campbell Soup Co. | ||||||
4.875%, 10/01/13 | 2,050 | 2,227,618 | ||||
Canadian National Railway Co. | ||||||
4.400%, 03/15/13 | 600 | 634,774 | ||||
Capital One Financial Corp. | ||||||
7.375%, 05/23/14 | 1,500 | 1,702,476 | ||||
Caterpillar Financial Services Corp. | ||||||
6.200%, 09/30/13 | 1,576 | 1,756,194 | ||||
CenterPoint Energy Resources Corp. | ||||||
7.875%, 04/01/13 | 600 | 676,644 | ||||
CIGNA Corp. | ||||||
6.375%, 10/15/11 | 1,000 | 1,064,962 | ||||
Cisco Systems, Inc. | ||||||
5.250%, 02/22/11 | 1,100 | 1,159,805 | ||||
Citigroup, Inc. | ||||||
6.000%, 02/21/12 | 1,100 | 1,169,891 | ||||
6.500%, 08/19/13 | 2,000 | 2,143,896 | ||||
CNA Financial Corp. | ||||||
6.000%, 08/15/11 | 1,000 | 1,022,197 | ||||
Coca-Cola Co. | ||||||
3.625%, 03/15/14 | 1,500 | 1,563,638 | ||||
Coca-Cola Enterprises, Inc. | ||||||
7.375%, 03/03/14 | 1,600 | 1,879,354 | ||||
Comcast Cable Communications Holdings, Inc. | ||||||
8.375%, 03/15/13 | 600 | 697,429 | ||||
Face | Value† | |||||
| (000) | ||||||
Comcast Corp. | ||||||
5.300%, 01/15/14 | $ | 1,000 | $ | 1,066,464 | ||
Commonwealth Bank of Australia | ||||||
4.750%, 01/27/11 | 1,800 | 1,854,580 | ||||
2.500%, 12/10/12 | 1,400 | 1,429,613 | ||||
ConAgra Foods, Inc. | ||||||
6.750%, 09/15/11 | 800 | 872,277 | ||||
ConocoPhillips | ||||||
4.750%, 02/01/14 | 1,600 | 1,717,934 | ||||
Consolidated Edison Co. of New York, Inc. | ||||||
3.850%, 06/15/13 | 600 | 617,557 | ||||
Credit Suisse | ||||||
5.000%, 05/15/13 | 1,100 | 1,174,172 | ||||
Credit Suisse USA, Inc. | ||||||
5.125%, 01/15/14 | 500 | 534,456 | ||||
CSX Corp. | ||||||
6.750%, 03/15/11 | 600 | 638,354 | ||||
5.500%, 08/01/13 | 500 | 536,301 | ||||
CVS Caremark Corp. | ||||||
5.750%, 08/15/11 | 600 | 645,410 | ||||
4.875%, 09/15/14 | 1,000 | 1,064,188 | ||||
Dell, Inc. | ||||||
4.700%, 04/15/13 | 600 | 638,446 | ||||
5.625%, 04/15/14 | 500 | 552,281 | ||||
Detroit Edison Co. | ||||||
6.400%, 10/01/13 | 600 | 666,750 | ||||
Deutsche Bank AG | ||||||
4.875%, 05/20/13 | 1,100 | 1,174,936 | ||||
3.875%, 08/18/14 | 500 | 509,377 | ||||
Deutsche Telekom International Finance | ||||||
5.250%, 07/22/13 | 1,500 | 1,604,754 | ||||
Devon Energy Corp. | ||||||
5.625%, 01/15/14 | 1,100 | 1,194,474 | ||||
Diageo Capital P.L.C. | ||||||
5.200%, 01/30/13 | 600 | 643,370 | ||||
7.375%, 01/15/14 | 1,500 | 1,747,209 | ||||
Dominion Resources, Inc. | ||||||
5.000%, 03/15/13 | 600 | 633,395 | ||||
Dover Corp. | ||||||
6.500%, 02/15/11 | 1,100 | 1,173,220 | ||||
Dow Chemical Co. | ||||||
6.000%, 10/01/12 | 1,500 | 1,602,982 | ||||
DTE Energy Co. | ||||||
7.625%, 05/15/14 | 1,000 | 1,103,565 | ||||
Duke Energy Corp. | ||||||
3.950%, 09/15/14 | 570 | 580,364 | ||||
132
DFA SHORT-TERM EXTENDED QUALITY PORTFOLIO
CONTINUED
Face | Value† | |||||
| (000) | ||||||
Duke Energy Ohio, Inc. | ||||||
5.700%, 09/15/12 | $ | 450 | $ | 492,682 | ||
E.I. Du Pont de Nemours & Co. | ||||||
4.750%, 11/15/12 | 1,000 | 1,071,249 | ||||
5.875%, 01/15/14 | 600 | 667,774 | ||||
Eaton Corp. | ||||||
5.950%, 03/20/14 | 600 | 659,415 | ||||
Eksportfinans | ||||||
5.000%, 02/14/12 | 1,900 | 2,037,203 | ||||
Eli Lilly & Co. | ||||||
3.550%, 03/06/12 | 600 | 628,208 | ||||
4.200%, 03/06/14 | 1,000 | 1,061,272 | ||||
Emerson Electric Co. | ||||||
5.625%, 11/15/13 | 480 | 531,532 | ||||
Enbridge Energy Partners LP | ||||||
4.750%, 06/01/13 | 800 | 816,064 | ||||
EnCana Holdings Finance Corp. | ||||||
5.800%, 05/01/14 | 1,500 | 1,635,798 | ||||
Enterprise Products Operating LLC | ||||||
7.625%, 02/15/12 | 1,500 | 1,658,698 | ||||
9.750%, 01/31/14 | 600 | 723,859 | ||||
Export Development Canada | ||||||
2.375%, 03/19/12 | 1,000 | 1,024,320 | ||||
Express Scripts, Inc. | ||||||
5.250%, 06/15/12 | 1,500 | 1,597,902 | ||||
FirstEnergy Corp. | ||||||
6.450%, 11/15/11 | 49 | 52,959 | ||||
Fortune Brands, Inc. | ||||||
4.875%, 12/01/13 | 600 | 604,052 | ||||
FPL Group Capital, Inc. | ||||||
5.625%, 09/01/11 | 800 | 859,908 | ||||
General Dynamics Corp. | ||||||
5.250%, 02/01/14 | 1,100 | 1,202,883 | ||||
General Electric Capital Corp. | ||||||
5.875%, 02/15/12 | 600 | 646,933 | ||||
4.800%, 05/01/13 | 1,000 | 1,051,043 | ||||
General Mills, Inc. | ||||||
6.000%, 02/15/12 | 600 | 652,931 | ||||
GlaxoSmithKline Capital, Inc. | ||||||
4.850%, 05/15/13 | 2,100 | 2,264,690 | ||||
Goldman Sachs Group, Inc. | ||||||
4.750%, 07/15/13 | 1,600 | 1,680,534 | ||||
6.000%, 05/01/14 | 1,200 | 1,319,238 | ||||
Halliburton Co. | ||||||
5.500%, 10/15/10 | 600 | 626,059 | ||||
Hess Corp. | ||||||
7.000%, 02/15/14 | 1,100 | 1,238,230 | ||||
Face | Value† | |||||
| (000) | ||||||
Hewlett-Packard Co. | ||||||
6.125%, 03/01/14 | $ | 2,100 | $ | 2,362,410 | ||
Home Depot, Inc. | ||||||
5.200%, 03/01/11 | 1,100 | 1,149,118 | ||||
Honeywell International, Inc. | ||||||
3.875%, 02/15/14 | 2,100 | 2,191,266 | ||||
Husky Energy, Inc. | ||||||
5.900%, 06/15/14 | 1,500 | 1,629,513 | ||||
Hydro-Quebec | ||||||
6.300%, 05/11/11 | 800 | 864,398 | ||||
ICI Wilmington, Inc. | ||||||
5.625%, 12/01/13 | 1,000 | 1,030,538 | ||||
Instituto de Credito Oficial | ||||||
5.375%, 07/02/12 | 8,500 | 9,266,981 | ||||
International Business Machines Corp. | ||||||
6.500%, 10/15/13 | 1,500 | 1,716,016 | ||||
John Deere Capital Corp. | ||||||
7.000%, 03/15/12 | 1,600 | 1,789,021 | ||||
Johnson Controls, Inc. | ||||||
4.875%, 09/15/13 | 1,000 | 1,022,991 | ||||
JPMorgan Chase & Co. | ||||||
5.375%, 10/01/12 | 800 | 873,936 | ||||
4.650%, 06/01/14 | 500 | 527,435 | ||||
Kansas City Power & Light Co. | ||||||
6.500%, 11/15/11 | 800 | 862,947 | ||||
Kellogg Co. | ||||||
6.600%, 04/01/11 | 600 | 645,326 | ||||
Kerr-McGee Corp. | ||||||
6.875%, 09/15/11 | 400 | 432,974 | ||||
Kinder Morgan Energy Partners LP | ||||||
7.125%, 03/15/12 | 500 | 545,425 | ||||
5.850%, 09/15/12 | 600 | 646,635 | ||||
Kohl’s Corp. | ||||||
7.375%, 10/15/11 | 600 | 659,155 | ||||
Kommunalbanken AS | ||||||
5.125%, 05/30/12 | 1,500 | 1,613,691 | ||||
Kommuninvest I Sverige | ||||||
5.375%, 07/03/12 | 5,600 | 6,107,080 | ||||
Koninklijke Philips Electronics NV | ||||||
7.250%, 08/15/13 | 1,500 | 1,711,214 | ||||
Kraft Foods, Inc. | ||||||
6.250%, 06/01/12 | 2,100 | 2,280,453 | ||||
Kreditanstalt fuer Wiederaufbau | ||||||
3.250%, 10/14/11 | 1,900 | 1,970,710 | ||||
4.750%, 05/15/14 | 1,000 | 1,085,473 | ||||
Kroger Co. | ||||||
6.800%, 04/01/11 | 600 | 639,222 | ||||
133
DFA SHORT-TERM EXTENDED QUALITY PORTFOLIO
CONTINUED
Face | Value† | |||||
| (000) | ||||||
Lafarge SA | ||||||
6.150%, 07/15/11 | $ | 800 | $ | 837,002 | ||
Landeskreditbank Baden-Wuerttemberg Foerderbank | ||||||
4.875%, 01/13/12 | 1,000 | 1,068,198 | ||||
2.000%, 10/01/12 | 6,800 | 6,792,649 | ||||
Landwirtschaftliche Rentenbank | ||||||
1.875%, 09/24/12 | 4,000 | 4,012,872 | ||||
4.125%, 07/15/13 | 1,800 | 1,918,447 | ||||
Lowe’s Cos., Inc. | ||||||
8.250%, 06/01/10 | 600 | 626,616 | ||||
Marathon Oil Corp. | ||||||
6.125%, 03/15/12 | 500 | 540,570 | ||||
6.500%, 02/15/14 | 1,100 | 1,223,583 | ||||
Marriott International, Inc. | ||||||
4.625%, 06/15/12 | 1,100 | 1,109,438 | ||||
Marsh & McLennan Cos., Inc. | ||||||
6.250%, 03/15/12 | 600 | 620,038 | ||||
McDonald’s Corp. | ||||||
4.300%, 03/01/13 | 600 | 637,049 | ||||
McKesson Corp. | ||||||
6.500%, 02/15/14 | 1,600 | 1,759,778 | ||||
Medtronic, Inc. | ||||||
4.500%, 03/15/14 | 1,100 | 1,176,748 | ||||
MetLife, Inc. | ||||||
5.375%, 12/15/12 | 600 | 645,661 | ||||
Molson Coors Capital Finance | ||||||
4.850%, 09/22/10 | 1,275 | 1,318,370 | ||||
Monsanto Co. | ||||||
7.375%, 08/15/12 | 700 | 803,729 | ||||
Morgan Stanley | ||||||
5.250%, 11/02/12 | 2,000 | 2,132,846 | ||||
5.300%, 03/01/13 | 1,100 | 1,163,552 | ||||
National Rural Utilities Cooperative Finance Corp. | ||||||
7.250%, 03/01/12 | 1,600 | 1,777,846 | ||||
Network Rail Infrastructure Finance P.L.C. | ||||||
2.000%, 01/17/12 | 2,600 | 2,630,053 | ||||
Newell Rubbermaid, Inc. | ||||||
4.000%, 05/01/10 | 170 | 171,679 | ||||
Nisource Finance Corp. | ||||||
6.150%, 03/01/13 | 1,000 | 1,055,831 | ||||
Nordstrom, Inc. | ||||||
6.750%, 06/01/14 | 1,000 | 1,114,334 | ||||
Norfolk Southern Corp. | ||||||
8.625%, 05/15/10 | 600 | 625,347 | ||||
Face | Value† | |||||
| (000) | ||||||
Northern States Power Co. | ||||||
8.000%, 08/28/12 | $ | 800 | $ | 928,318 | ||
Northern Trust Corp. | ||||||
5.500%, 08/15/13 | 2,000 | 2,198,796 | ||||
Northrop Grumman Corp. | ||||||
3.700%, 08/01/14 | 1,500 | 1,523,952 | ||||
Northrop Grumman Systems Corp. | ||||||
7.125%, 02/15/11 | 800 | 855,221 | ||||
Occidental Petroleum Corp. | ||||||
7.000%, 11/01/13 | 1,600 | 1,855,416 | ||||
Oesterreichischen Kontrollbank AG | ||||||
3.125%, 10/14/11 | 1,900 | 1,953,947 | ||||
4.750%, 11/08/11 | 1,800 | 1,916,167 | ||||
4.750%, 10/16/12 | 3,800 | 4,108,096 | ||||
ONEOK Partners LP | ||||||
5.900%, 04/01/12 | 600 | 631,399 | ||||
Ontario Electricity Financial Corp. | ||||||
7.450%, 03/31/13 | 1,000 | 1,138,169 | ||||
Ontario, Province of | ||||||
4.100%, 06/16/14 | 7,900 | 8,352,559 | ||||
Oracle Corp. | ||||||
4.950%, 04/15/13 | 1,100 | 1,191,159 | ||||
3.750%, 07/08/14 | 1,000 | 1,039,569 | ||||
PACCAR, Inc. | ||||||
6.875%, 02/15/14 | 1,500 | 1,712,982 | ||||
Pacific Gas & Electric Co. | ||||||
4.800%, 03/01/14 | 600 | 638,737 | ||||
Packaging Corp. of America | ||||||
5.750%, 08/01/13 | 800 | 829,146 | ||||
Panhandle Eastern Pipeline Co. | ||||||
6.050%, 08/15/13 | 600 | 639,702 | ||||
Pepco Holdings, Inc. | ||||||
6.450%, 08/15/12 | 1,100 | 1,181,869 | ||||
PepsiAmericas, Inc. | ||||||
4.375%, 02/15/14 | 1,100 | 1,154,022 | ||||
PepsiCo, Inc. | ||||||
3.750%, 03/01/14 | 1,500 | 1,562,596 | ||||
Philip Morris International, Inc. | ||||||
4.875%, 05/16/13 | 1,100 | 1,170,235 | ||||
Pitney Bowes, Inc. | ||||||
4.625%, 10/01/12 | 800 | 858,202 | ||||
Plains All American Pipeline LP | ||||||
4.250%, 09/01/12 | 1,500 | 1,541,307 | ||||
PNC Funding Corp. | ||||||
5.125%, 12/14/10 | 600 | 619,838 | ||||
5.400%, 06/10/14 | 500 | 541,213 | ||||
134
DFA SHORT-TERM EXTENDED QUALITY PORTFOLIO
CONTINUED
Face | Value† | |||||
| (000) | ||||||
Potash Corp. of Saskatchewan, Inc. | ||||||
7.750%, 05/31/11 | $ | 600 | $ | 657,143 | ||
PPL Energy Supply LLC | ||||||
6.300%, 07/15/13 | 600 | 648,255 | ||||
Praxair, Inc. | ||||||
6.375%, 04/01/12 | 1,200 | 1,326,646 | ||||
Principal Financial Group, Inc. | ||||||
7.875%, 05/15/14 | 760 | 852,313 | ||||
Progress Energy, Inc. | ||||||
7.100%, 03/01/11 | 600 | 636,931 | ||||
Prudential Financial, Inc. | ||||||
5.100%, 09/20/14 | 1,500 | 1,545,344 | ||||
PSEG Power LLC | ||||||
5.000%, 04/01/14 | 1,000 | 1,048,707 | ||||
Rabobank Nederland | ||||||
4.200%, 05/13/14 | 6,000 | 6,256,248 | ||||
Reynolds American, Inc. | ||||||
6.500%, 07/15/10 | 600 | 616,129 | ||||
7.250%, 06/01/13 | 1,000 | 1,090,254 | ||||
Royal Bank of Canada | ||||||
5.650%, 07/20/11 | 2,200 | 2,363,286 | ||||
Ryder System, Inc. | ||||||
5.000%, 06/15/12 | 900 | 924,113 | ||||
6.000%, 03/01/13 | 600 | 632,474 | ||||
Safeway, Inc. | ||||||
4.950%, 08/16/10 | 600 | 618,641 | ||||
5.800%, 08/15/12 | 500 | 546,807 | ||||
5.625%, 08/15/14 | 1,000 | 1,088,434 | ||||
Sara Lee Corp. | ||||||
6.250%, 09/15/11 | 1,100 | 1,187,447 | ||||
Smith International, Inc. | ||||||
8.625%, 03/15/14 | 1,000 | 1,147,199 | ||||
Southern California Edison Co. | ||||||
5.750%, 03/15/14 | 800 | 891,441 | ||||
Southern Co. | ||||||
5.300%, 01/15/12 | 1,600 | 1,716,120 | ||||
Southwest Airlines Co. | ||||||
5.250%, 10/01/14 | 2,000 | 2,015,372 | ||||
Spectra Energy Capital LLC | ||||||
5.668%, 08/15/14 | 1,500 | 1,596,045 | ||||
St. Jude Medical, Inc. | ||||||
3.750%, 07/15/14 | 2,000 | 2,037,064 | ||||
State Street Corp. | ||||||
4.300%, 05/30/14 | 1,500 | 1,576,804 | ||||
SunTrust Banks, Inc. | ||||||
5.250%, 11/05/12 | 1,100 | 1,150,902 | ||||
Svensk Exportkredit AB | ||||||
4.875%, 09/29/11 | 1,000 | 1,065,380 | ||||
Face | Value† | |||||
| (000) | ||||||
Tampa Electric Co. | ||||||
6.375%, 08/15/12 | $ | 600 | $ | 649,262 | ||
Target Corp. | ||||||
6.350%, 01/15/11 | 600 | 635,190 | ||||
5.875%, 03/01/12 | 1,000 | 1,089,372 | ||||
Time Warner Cable, Inc. | ||||||
5.400%, 07/02/12 | 800 | 854,436 | ||||
6.200%, 07/01/13 | 800 | 876,430 | ||||
Total Capital SA | ||||||
5.000%, 05/22/12 | 2,900 | 3,120,191 | ||||
Toyota Motor Credit Corp. | ||||||
4.250%, 06/27/11 | 2,500 | 2,591,455 | ||||
TransCanada Pipelines, Ltd. | ||||||
4.000%, 06/15/13 | 800 | 815,925 | ||||
Transocean, Inc. | ||||||
5.250%, 03/15/13 | 595 | 632,821 | ||||
Unilever Capital Corp. | ||||||
3.650%, 02/15/14 | 1,650 | 1,712,306 | ||||
Union Pacific Corp. | ||||||
6.650%, 01/15/11 | 1,100 | 1,160,965 | ||||
United Technologies Corp. | ||||||
6.100%, 05/15/12 | 1,600 | 1,765,568 | ||||
UnitedHealth Group, Inc. | ||||||
5.250%, 03/15/11 | 1,100 | 1,148,226 | ||||
Valero Energy Corp. | ||||||
6.875%, 04/15/12 | 1,600 | 1,743,286 | ||||
Veolia Environnement | ||||||
5.250%, 06/03/13 | 800 | 851,553 | ||||
Verizon Communications, Inc. | ||||||
4.350%, 02/15/13 | 600 | 632,038 | ||||
5.250%, 04/15/13 | 1,500 | 1,628,220 | ||||
Wal-Mart Stores, Inc. | ||||||
5.000%, 04/05/12 | 3,300 | 3,564,591 | ||||
7.250%, 06/01/13 | 1,000 | 1,167,626 | ||||
3.200%, 05/15/14 | 3,000 | 3,074,181 | ||||
Walt Disney Co. | ||||||
4.700%, 12/01/12 | 500 | 539,968 | ||||
4.500%, 12/15/13 | 1,100 | 1,179,237 | ||||
Waste Management, Inc. | ||||||
6.375%, 11/15/12 | 655 | 717,535 | ||||
5.000%, 03/15/14 | 258 | 268,855 | ||||
Weatherford International, Ltd. | ||||||
4.950%, 10/15/13 | 1,045 | 1,097,081 | ||||
Wellpoint Health Networks, Inc. | ||||||
6.375%, 01/15/12 | 600 | 645,484 | ||||
Wells Fargo Bank & Co. | ||||||
5.250%, 10/23/12 | 2,600 | 2,781,431 | ||||
Western Union Co. | ||||||
6.500%, 02/26/14 | 600 | 678,592 | ||||
135
DFA SHORT-TERM EXTENDED QUALITY PORTFOLIO
CONTINUED
Face | Value† | |||||
| (000) | ||||||
WR Berkley Corp. | ||||||
5.875%, 02/15/13 | $ | 1,000 | $ | 994,514 | ||
XTO Energy, Inc. | ||||||
5.900%, 08/01/12 | 1,500 | 1,618,857 | ||||
5.750%, 12/15/13 | 600 | 652,721 | ||||
Yum! Brands, Inc. | ||||||
8.875%, 04/15/11 | 820 | 893,512 | ||||
TOTAL BONDS | 345,909,699 | |||||
Face | Value† | |||||
| (000) | ||||||
TEMPORARY CASH INVESTMENTS — (1.5%) | ||||||
Repurchase Agreement, PNC Capital Markets, Inc. 0.19%, 11/02/09 (Collateralized by $10,215,000 FNMA 4.381%(r), 10/01/35, valued at $5,723,998) to be repurchased at $5,637,089 | $ | 5,637 | $ | 5,637,000 | ||
TOTAL INVESTMENTS — (100.0%) | $ | 376,662,354 | ||||
Summary of inputs used to value the Portfolio’s net assets as of October 31, 2009 is as follows (See Security Valuation Note):
| Valuation Inputs | ||||||||||
| Investment in Securities (Market Value) | ||||||||||
| Level 1 | Level 2 | Level 3 | Total | |||||||
Agency Obligations | — | $ | 25,115,655 | — | $ | 25,115,655 | ||||
Bonds | — | 345,909,699 | — | 345,909,699 | ||||||
Temporary Cash Investments | — | 5,637,000 | — | 5,637,000 | ||||||
TOTAL | — | $ | 376,662,354 | — | $ | 376,662,354 | ||||
See accompanying Notes to Financial Statements.
136
DFA INFLATION-PROTECTED SECURITIES PORTFOLIO
SCHEDULE OF INVESTMENTS
October 31, 2009
Face | Value† | |||||
| (000) | ||||||
U.S. TREASURY OBLIGATIONS — (99.3%) | ||||||
U.S. Treasury Inflation Notes | ||||||
1.875%, 07/15/13 | $ | 10,700 | $ | 13,161,612 | ||
2.000%, 01/15/14 | 44,800 | 54,927,184 | ||||
2.000%, 07/15/14 | 49,700 | 60,015,702 | ||||
1.625%, 01/15/15 | 53,100 | 62,052,025 | ||||
1.875%, 07/15/15 | 55,300 | 64,320,694 | ||||
2.000%, 01/15/16 | 50,550 | 57,813,690 | ||||
2.500%, 07/15/16 | 48,500 | 56,316,925 | ||||
2.375%, 01/15/17 | 49,900 | 57,582,741 | ||||
2.625%, 07/15/17 | 42,100 | 48,236,964 | ||||
1.625%, 01/15/18 | 38,700 | 40,836,576 | ||||
1.375%, 07/15/18 | 32,300 | 32,468,489 | ||||
2.125%, 01/15/19 | 31,900 | 34,130,585 | ||||
1.875%, 07/15/19 | 20,400 | 21,539,670 | ||||
2.375%, 01/15/25 | 27,500 | 33,463,688 | ||||
2.000%, 01/15/26 | 22,400 | 24,572,204 | ||||
2.375%, 01/15/27 | 18,300 | 20,709,036 | ||||
1.750%, 01/15/28 | 22,200 | 22,014,229 | ||||
3.625%, 04/15/28 | 11,200 | 18,529,037 | ||||
2.500%, 01/15/29 | 11,300 | 12,222,364 | ||||
3.875%, 04/15/29 | 16,400 | 27,746,673 | ||||
TOTAL U.S. TREASURY OBLIGATIONS | 762,660,088 | |||||
TEMPORARY CASH INVESTMENTS — (0.7%) | ||||||
Repurchase Agreement, PNC Capital Markets, Inc. 0.19%, 11/02/09 (Collateralized by $5,005,000 FNMA 6.50%, 06/25/39, valued at $5,267,763) to be repurchased at $5,189,082 | 5,189 | 5,189,000 | ||||
TOTAL INVESTMENTS — (100.0%) | $ | 767,849,088 | ||||
Summary of inputs used to value the Portfolio’s net assets as of October 31, 2009 is as follows (See Security Valuation Note):
| Valuation Inputs | ||||||||||
| Investment in Securities (Market Value) | ||||||||||
| Level 1 | Level 2 | Level 3 | Total | |||||||
U.S. Treasury Obligations | — | $ | 762,660,088 | — | $ | 762,660,088 | ||||
Temporary Cash Investments | — | 5,189,000 | — | 5,189,000 | ||||||
TOTAL | — | $ | 767,849,088 | — | $ | 767,849,088 | ||||
See accompanying Notes to Financial Statements.
137
DFA SHORT-TERM MUNICIPAL BOND PORTFOLIO
SCHEDULE OF INVESTMENTS
October 31, 2009
Face | Value† | |||||
| (000) | ||||||
MUNICIPAL BONDS — (97.3%) | ||||||
ARIZONA — (3.8%) | ||||||
Arizona State Transportation Board (RB) | ||||||
5.000%, 07/01/13 | $ | 8,000 | $ | 8,974,720 | ||
City of Phoenix (GO) Series A | ||||||
5.000%, 07/01/14 | 7,975 | 8,999,788 | ||||
Maricopa County Unified School District (GO) | ||||||
7.400%, 07/01/10 | 3,485 | 3,646,878 | ||||
Maricopa County Unified School District (GO) (FSA) | ||||||
5.000%, 07/01/13 | 6,800 | 7,595,056 | ||||
Salt River Project Agricultural Improvement & Power District (RB) Series A | ||||||
5.000%, 01/01/14 | 7,000 | 7,801,150 | ||||
Scottsdale Municipal Property Corp. (RB) | ||||||
5.000%, 07/01/13 | 3,070 | 3,409,327 | ||||
Town of Gilbert (GO) | ||||||
5.000%, 07/01/14 | 3,600 | 4,069,440 | ||||
TOTAL ARIZONA | 44,496,359 | |||||
CALIFORNIA — (2.6%) | ||||||
California State (GO) | ||||||
5.250%, 11/01/09 | 7,695 | 7,695,000 | ||||
California State Department of Water Resources Power Supply (RB) (ETM) Series A | ||||||
5.125%, 05/01/12 | 1,900 | 2,110,938 | ||||
California State Economic Recovery (GO) Series A | ||||||
5.000%, 01/01/11 | 9,100 | 9,509,409 | ||||
California State Economic Recovery (GO) Series A (MBIA) | ||||||
5.000%, 07/01/12 | 8,400 | 9,092,244 | ||||
Los Angeles Unified School District (GO) Series E (AMBAC) | ||||||
5.750%, 07/01/12 | 2,000 | 2,222,880 | ||||
TOTAL CALIFORNIA | 30,630,471 | |||||
COLORADO — (0.8%) | ||||||
Arapahoe County School District (GO) (FSA) | ||||||
5.000%, 12/15/10 | 9,000 | 9,448,200 | ||||
Face | Value† | |||||
| (000) | ||||||
CONNECTICUT — (2.8%) | ||||||
Connecticut State (GO) | ||||||
5.000%, 03/15/12 | $ | 5,000 | $ | 5,461,100 | ||
Connecticut State (GO) Series A | ||||||
5.000%, 03/01/13 | 3,855 | 4,296,282 | ||||
5.000%, 04/15/13 | 4,000 | 4,471,480 | ||||
Connecticut State (GO) Series B | ||||||
5.000%, 12/01/13 | 5,000 | 5,674,350 | ||||
Connecticut State (GO) Series C | ||||||
5.000%, 12/15/09 | 4,000 | 4,021,360 | ||||
Connecticut State (GO) Series E | ||||||
5.500%, 11/15/12 | 3,300 | 3,724,215 | ||||
Connecticut State Health & Educational Facility Authority (GO) Series B (MBIA) | ||||||
5.000%, 12/01/12 | 4,000 | 4,460,080 | ||||
TOTAL CONNECTICUT | 32,108,867 | |||||
DELAWARE — (2.2%) | ||||||
Delaware State (GO) | ||||||
5.000%, 08/01/12 | 11,370 | 12,580,450 | ||||
Delaware State (GO) Series B | ||||||
5.000%, 02/01/11 | 7,470 | 7,873,007 | ||||
5.000%, 02/01/12 | 5,000 | 5,451,500 | ||||
TOTAL DELAWARE | 25,904,957 | |||||
FLORIDA — (4.7%) | ||||||
Broward County (GO) | ||||||
5.000%, 01/01/14 | 5,000 | 5,642,450 | ||||
City of Gainesville (RB) Series C | ||||||
5.000%, 10/01/10 | 2,265 | 2,358,092 | ||||
Florida State Board of Education (GO) Series 2006C | ||||||
5.000%, 06/01/12 | 2,935 | 3,190,374 | ||||
Florida State Board of Education (GO) Series B | ||||||
5.250%, 06/01/13 | 3,700 | 4,133,196 | ||||
Florida State Board of Education (GO) Series D | ||||||
5.000%, 06/01/13 | 13,085 | 14,504,330 | ||||
Florida State Board of Education (GO) Series H | ||||||
5.250%, 06/01/12 | 4,650 | 5,083,845 | ||||
138
DFA SHORT-TERM MUNICIPAL BOND PORTFOLIO
CONTINUED
Face | Value† | |||||
| (000) | ||||||
FLORIDA — (Continued) | ||||||
Florida State Department of Environmental Protection Preservation (RB) Series A (MBIA) | ||||||
5.000%, 07/01/11 | $ | 5,330 | $ | 5,629,813 | ||
5.000%, 07/01/11 | 5,130 | 5,418,563 | ||||
Florida State Department of Environmental Protection Preservation (RB) Series B (MBIA) | ||||||
5.000%, 07/01/11 | 5,800 | 6,145,912 | ||||
Johns River Power Park System (RB) Series 21 | ||||||
5.000%, 10/01/11 | 2,325 | 2,494,376 | ||||
TOTAL FLORIDA | 54,600,951 | |||||
GEORGIA — (6.2%) | ||||||
De Kalb County School District (GO) | ||||||
5.000%, 02/01/12 | 21,330 | 23,201,494 | ||||
Georgia State (GO) Series C | ||||||
5.500%, 07/01/12 | 8,400 | 9,379,608 | ||||
Georgia State (GO) Series D | ||||||
5.800%, 11/01/09 | 2,010 | 2,010,000 | ||||
5.000%, 08/01/12 | 7,100 | 7,855,866 | ||||
Georgia State (GO) Series G | ||||||
5.000%, 10/01/12 | 8,000 | 8,897,840 | ||||
Henry County School District (GO) Series A | ||||||
5.000%, 04/01/13 | 14,000 | 15,636,880 | ||||
Private Colleges & Universities Authority (RB) Series A | ||||||
4.750%, 09/01/12 | 4,450 | 4,883,519 | ||||
TOTAL GEORGIA | 71,865,207 | |||||
HAWAII — (2.0%) | ||||||
City & County of Honolulu (GO) (ETM) Series A (MBIA) | ||||||
5.000%, 03/01/10 | 1,255 | 1,274,139 | ||||
City & County of Honolulu (GO) Series A (MBIA) | ||||||
5.000%, 03/01/10 | 745 | 756,339 | ||||
City & County of Honolulu (GO) Series C (MBIA) | ||||||
5.000%, 07/01/12 | 5,000 | 5,484,500 | ||||
Face | Value† | |||||
| (000) | ||||||
HAWAII — (Continued) | ||||||
Hawaii State (GO) Series CY (FSA) | ||||||
5.750%, 02/01/13 | $ | 4,750 | $ | 5,392,770 | ||
Hawaii State (GO) Series DE | ||||||
5.000%, 10/01/12 | 3,340 | 3,699,618 | ||||
Hawaii State (GO) Series DG (AMBAC) | ||||||
5.000%, 07/01/13 | 6,000 | 6,719,700 | ||||
TOTAL HAWAII | 23,327,066 | |||||
ILLINOIS — (1.9%) | ||||||
Chicago Park District (GO) Series A (FGIC) | ||||||
5.250%, 01/01/13 | 4,935 | 5,523,153 | ||||
City of Chicago (GO) Series A (FSA) | ||||||
5.000%, 01/01/13 | 8,150 | 8,957,584 | ||||
Cook County (GO) Series D (AMBAC) | ||||||
5.250%, 11/15/12 | 2,000 | 2,210,720 | ||||
Illinois State (GO) First Series (MBIA) | ||||||
5.125%, 10/01/11 | 5,300 | 5,677,678 | ||||
TOTAL ILLINOIS | 22,369,135 | |||||
KANSAS — (0.5%) | ||||||
Johnson County Unified School District (GO) Series A (MBIA) | ||||||
5.000%, 10/01/11 | 5,770 | 6,220,002 | ||||
KENTUCKY — (1.3%) | ||||||
Kentucky Asset Liability Commission (RB) First Series (MBIA) | ||||||
5.000%, 09/01/11 | 14,300 | 15,221,492 | ||||
MARYLAND — (3.6%) | ||||||
Baltimore County (GO) | ||||||
5.000%, 02/01/12 | 1,700 | 1,851,929 | ||||
5.000%, 02/01/14 | 4,750 | 5,370,018 | ||||
Maryland State (GO) | ||||||
5.250%, 02/15/12 | 5,000 | 5,489,800 | ||||
5.500%, 08/01/13 | 6,000 | 6,888,840 | ||||
Maryland State (GO) Series B | ||||||
5.000%, 02/15/13 | 14,000 | 15,653,260 | ||||
139
DFA SHORT-TERM MUNICIPAL BOND PORTFOLIO
CONTINUED
Face | Value† | |||||
| (000) | ||||||
MARYLAND — (Continued) | ||||||
Montgomery County (GO) Series A | ||||||
5.000%, 08/01/12 | $ | 5,990 | $ | 6,629,432 | ||
TOTAL MARYLAND | 41,883,279 | |||||
MASSACHUSETTS — (2.6%) | ||||||
City of Boston (GO) Series A | ||||||
5.000%, 04/01/14 | 4,650 | 5,267,288 | ||||
Commonwealth of Massachusetts (GO) Series D | ||||||
5.500%, 11/01/13 | 7,550 | 8,646,411 | ||||
Commonwealth of Massachusetts (GO) Series D (NATL-RE) | ||||||
5.500%, 11/01/12 | 910 | 1,022,358 | ||||
Commonwealth of Massachusetts (RB) Series A | ||||||
5.500%, 12/15/13 | 9,450 | 10,846,426 | ||||
University of Massachusetts Building Authority (RB) Series 1 | ||||||
5.250%, 11/01/13 | 3,490 | 3,996,678 | ||||
TOTAL MASSACHUSETTS | 29,779,161 | |||||
MICHIGAN — (3.4%) | ||||||
Kent County (GO) Series A | ||||||
5.000%, 11/01/09 | 7,235 | 7,235,000 | ||||
Michigan Municipal Bond Authority (RB) | ||||||
5.000%, 10/01/13 | 3,240 | 3,643,898 | ||||
5.500%, 10/01/13 | 15,085 | 17,249,547 | ||||
Michigan State (GO) | ||||||
5.500%, 12/01/13 | 10,000 | 11,167,600 | ||||
TOTAL MICHIGAN | 39,296,045 | |||||
MINNESOTA — (3.1%) | ||||||
City of Minneapolis (GO) | ||||||
5.000%, 12/01/10 | 6,840 | 7,173,382 | ||||
City of Minneapolis (GO) Series A | ||||||
3.000%, 12/01/12 | 5,200 | 5,496,296 | ||||
Minnesota Public Facilities Authority (RB) Series B | ||||||
5.000%, 03/01/14 | 5,800 | 6,573,952 | ||||
Minnesota State (GO) | ||||||
5.000%, 06/01/11 | 7,050 | 7,523,972 | ||||
5.250%, 11/01/12 | 8,000 | 8,969,360 | ||||
TOTAL MINNESOTA | 35,736,962 | |||||
Face | Value† | |||||
| (000) | ||||||
MISSISSIPPI — (0.3%) | ||||||
Mississippi State (GO) Series A | ||||||
5.375%, 12/01/12 | $ | 3,350 | $ | 3,761,246 | ||
MISSOURI — (0.3%) | ||||||
Missouri State (GO) Series A | ||||||
5.000%, 10/01/13 | 2,600 | 2,948,374 | ||||
NEVADA — (3.9%) | ||||||
Clark County (GO) (AMBAC) | ||||||
5.000%, 11/01/11 | 5,010 | 5,379,437 | ||||
Clark County School District (GO) Series A (AMBAC) | ||||||
4.500%, 06/15/11 | 11,000 | 11,580,140 | ||||
Nevada State (GO) | ||||||
5.000%, 06/01/13 | 12,990 | 14,318,487 | ||||
5.000%, 12/01/13 | 1,400 | 1,559,488 | ||||
Nevada State (GO) Series A | ||||||
5.000%, 02/01/10 | 10,045 | 10,158,709 | ||||
5.000%, 02/01/12 | 2,000 | 2,157,380 | ||||
TOTAL NEVADA | 45,153,641 | |||||
NEW JERSEY — (2.8%) | ||||||
Monmouth County (GO) | ||||||
4.250%, 09/15/12 | 5,115 | 5,574,020 | ||||
New Jersey State (GO) | ||||||
5.000%, 04/01/13 | 3,900 | 4,340,817 | ||||
New Jersey State (GO) (ETM) | ||||||
5.250%, 08/01/12 | 8,400 | 9,338,784 | ||||
New Jersey Transportation Trust Fund Authority (RB) Series B (FGIC) | ||||||
5.250%, 12/15/09 | 6,130 | 6,163,776 | ||||
New Jersey Transportation Trust Fund Authority (RB) Series B (FSA) | ||||||
5.500%, 12/15/11 | 6,035 | 6,547,190 | ||||
TOTAL NEW JERSEY | 31,964,587 | |||||
NEW MEXICO — (2.0%) | ||||||
New Mexico State (GO) | ||||||
5.000%, 03/01/12 | 10,260 | 11,188,325 | ||||
New Mexico State Severance Tax (RB) (MBIA) | ||||||
5.000%, 07/01/10 | 11,385 | 11,734,292 | ||||
TOTAL NEW MEXICO | 22,922,617 | |||||
140
DFA SHORT-TERM MUNICIPAL BOND PORTFOLIO
CONTINUED
Face | Value† | |||||
| (000) | ||||||
NEW YORK — (4.2%) | ||||||
Nassau County Interim Finance Authority (RB) Series A (AMBAC) | ||||||
5.000%, 11/15/09 | $ | 3,415 | $ | 3,419,952 | ||
New York City (GO) Series C | ||||||
5.000%, 08/01/10 | 5,000 | 5,164,800 | ||||
New York City (GO) Series G | ||||||
5.000%, 08/01/10 | 5,040 | 5,206,118 | ||||
New York City (GO) Series H | ||||||
5.000%, 08/01/12 | 3,000 | 3,265,710 | ||||
New York City (GO) Series J-1 | ||||||
5.000%, 08/01/10 | 11,180 | 11,548,493 | ||||
New York State (GO) Series A | ||||||
3.500%, 03/15/12 | 1,755 | 1,852,578 | ||||
New York State Dormitory Authority (RB) | ||||||
5.000%, 07/01/13 | 4,590 | 5,150,990 | ||||
New York State Dormitory Authority (RB) Series C | ||||||
5.000%, 03/15/14 | 7,500 | 8,349,225 | ||||
New York State Tollway Authority (RB) (MBIA) | ||||||
5.000%, 01/01/10 | 5,000 | 5,035,750 | ||||
TOTAL NEW YORK | 48,993,616 | |||||
NORTH CAROLINA — (4.5%) | ||||||
Guilford County (GO) Series C | ||||||
5.000%, 10/01/12 | 8,040 | 8,942,329 | ||||
Mecklenburg County | ||||||
5.000%, 02/01/14 | 5,680 | 6,441,290 | ||||
North Carolina State (GO) Series A | ||||||
5.000%, 03/01/11 | 13,000 | 13,757,250 | ||||
5.000%, 06/01/11 | 10,000 | 10,675,600 | ||||
5.500%, 03/01/14 | 3,000 | 3,462,510 | ||||
Wake County (GO) | ||||||
4.500%, 03/01/13 | 7,800 | 8,596,146 | ||||
TOTAL NORTH CAROLINA | 51,875,125 | |||||
OHIO — (4.5%) | ||||||
Cincinnati City School District (GO) (FSA) | ||||||
5.000%, 12/01/13 | 11,730 | 13,351,907 | ||||
City of Columbus (GO) Series 2 | ||||||
5.000%, 07/01/13 | 3,000 | 3,370,080 | ||||
5.000%, 07/01/14 | 4,605 | 5,229,622 | ||||
Face | Value† | |||||
| (000) | ||||||
OHIO — (Continued) | ||||||
City of Columbus (GO) Series A | ||||||
5.000%, 06/15/12 | $ | 3,875 | $ | 4,265,406 | ||
Ohio State (GO) | ||||||
5.500%, 11/01/12 | 8,615 | 9,651,729 | ||||
5.000%, 05/01/14 | 5,000 | 5,607,000 | ||||
Ohio State (GO) Series E | ||||||
5.000%, 09/15/11 | 10,470 | 11,239,336 | ||||
TOTAL OHIO | 52,715,080 | |||||
OKLAHOMA — (0.6%) | ||||||
Oklahoma Turnpike Authority (RB) Series A | ||||||
5.000%, 01/01/10 | 7,160 | 7,213,772 | ||||
PENNSYLVANIA — (2.6%) | ||||||
Commonwealth of Pennsylvania (GO) First Series | ||||||
5.000%, 08/01/11 | 13,000 | 13,935,220 | ||||
Commonwealth of Pennsylvania (GO) First Series (MBIA) | ||||||
5.000%, 01/01/10 | 3,500 | 3,525,935 | ||||
5.250%, 02/01/13 | 5,755 | 6,444,967 | ||||
Commonwealth of Pennsylvania (GO) First Series A | ||||||
5.000%, 11/01/10 | 3,000 | 3,136,140 | ||||
Commonwealth of Pennsylvania, (GO) Third Series | ||||||
5.000%, 09/01/12 | 2,800 | 3,096,268 | ||||
TOTAL PENNSYLVANIA | 30,138,530 | |||||
RHODE ISLAND — (0.9%) | ||||||
Rhode Island State & Providence Plantations (GO) Series B | ||||||
5.000%, 08/01/12 | 5,200 | 5,713,500 | ||||
5.000%, 08/01/13 | 4,700 | 5,254,412 | ||||
TOTAL RHODE ISLAND | 10,967,912 | |||||
SOUTH CAROLINA — (0.4%) | ||||||
Beaufort County School District (GO) Series B (SCSDE) | ||||||
5.000%, 03/01/14 | 2,795 | 3,155,527 | ||||
Richland County School District No. 2 (GO) Series B (FGIC) | ||||||
5.000%, 02/01/10 | 1,500 | 1,517,010 | ||||
TOTAL SOUTH CAROLINA | 4,672,537 | |||||
141
DFA SHORT-TERM MUNICIPAL BOND PORTFOLIO
CONTINUED
Face | Value† | |||||
| (000) | ||||||
TENNESSEE — (2.7%) | ||||||
Hamilton County (GO) | ||||||
5.000%, 03/01/11 | $ | 5,700 | $ | 6,021,081 | ||
5.000%, 03/01/12 | 5,095 | 5,554,722 | ||||
Knox County (GO) | ||||||
5.500%, 04/01/14 | 6,300 | 7,254,639 | ||||
Shelby County (GO) | ||||||
5.000%, 04/01/14 | 8,345 | 9,403,730 | ||||
Tennessee State (GO) Series A | ||||||
5.000%, 05/01/14 | 3,000 | 3,402,720 | ||||
TOTAL TENNESSEE | 31,636,892 | |||||
TEXAS — (13.2%) | ||||||
Arlington Independent School District (GO) | ||||||
5.000%, 02/15/14 | 5,885 | 6,636,632 | ||||
Austin Independent School District (GO) (PSF-GTD) | ||||||
5.000%, 08/01/14 | 6,895 | 7,839,477 | ||||
City of Dallas (GO) | ||||||
4.750%, 02/15/10 | 11,675 | 11,820,587 | ||||
5.000%, 02/15/14 | 8,770 | 9,843,974 | ||||
5.000%, 02/15/14 | 4,585 | 5,146,479 | ||||
City of Dallas (RB) (AMBAC) | ||||||
5.000%, 10/01/12 | 13,985 | 15,456,921 | ||||
5.000%, 10/01/13 | 7,605 | 8,553,039 | ||||
City of San Antonio (RB) (NATL-RE FGIC) | ||||||
5.000%, 05/15/12 | 7,000 | 7,651,840 | ||||
City of San Antonio (RB) Series A | ||||||
5.500%, 02/01/11 | 2,000 | 2,117,160 | ||||
Dallas Area Rapid Transit (RB) (FGIC) | ||||||
5.000%, 12/01/12 | 10,475 | 11,706,755 | ||||
Fort Worth Independent School District (GO) | ||||||
5.000%, 02/15/13 | 8,025 | 8,923,399 | ||||
Katy Independent School District (GO) Series A | ||||||
5.000%, 02/15/12 | 7,465 | 8,145,360 | ||||
North Texas Municipal Water District (RB) | ||||||
5.000%, 09/01/14 | 605 | 685,386 | ||||
San Marcos Consolidated Independent School District (GO) (PSF-GTD) | ||||||
5.250%, 08/01/14 | 3,195 | 3,685,880 | ||||
5.500%, 08/01/14 | 4,200 | 4,892,748 | ||||
Face | Value† | |||||
| (000) | ||||||
TEXAS — (Continued) | ||||||
Texas A&M University (RB) Series B | ||||||
5.000%, 05/15/12 | $ | 3,975 | $ | 4,351,432 | ||
Texas Public Finance Authority (GO) Series A | ||||||
5.000%, 10/01/12 | 1,500 | 1,662,420 | ||||
Texas State (GO) | ||||||
5.000%, 10/01/12 | 3,000 | 3,324,840 | ||||
Texas State Transportation Commission (RB) | ||||||
4.000%, 04/01/13 | 1,500 | 1,621,005 | ||||
5.000%, 04/01/14 | 5,870 | 6,617,368 | ||||
Travis County (GO) | ||||||
5.000%, 03/01/12 | 3,375 | 3,672,202 | ||||
University of Texas (RB) Series A | ||||||
5.000%, 08/15/12 | 3,500 | 3,864,595 | ||||
5.000%, 07/01/14 | 5,250 | 5,987,258 | ||||
University of Texas (RB) Series B | ||||||
5.250%, 08/15/12 | 2,730 | 3,033,003 | ||||
5.250%, 08/15/13 | 3,850 | 4,367,979 | ||||
University of Texas (RB) Series D | ||||||
5.000%, 08/15/12 | 1,815 | 2,004,069 | ||||
TOTAL TEXAS | 153,611,808 | |||||
UTAH — (2.0%) | ||||||
Salt Lake County (GO) | ||||||
5.000%, 06/15/12 | 10,060 | 11,081,794 | ||||
Utah State (GO) Series A | ||||||
5.000%, 07/01/12 | 6,440 | 7,099,714 | ||||
Utah State (GO) Series B | ||||||
4.000%, 07/01/13 | 4,700 | 5,121,919 | ||||
TOTAL UTAH | 23,303,427 | |||||
VIRGINIA — (4.8%) | ||||||
Fairfax County (GO) Series A | ||||||
5.000%, 04/01/13 | 9,975 | 11,180,180 | ||||
5.000%, 04/01/14 | 9,375 | 10,649,250 | ||||
Loudoun County (GO) Series B | ||||||
4.000%, 11/01/12 | 1,000 | 1,087,890 | ||||
5.000%, 12/01/13 | 5,285 | 6,024,741 | ||||
Virginia Commonwealth Transportation Board (RB) | ||||||
5.000%, 10/01/11 | 1,940 | 2,092,057 | ||||
5.000%, 09/27/12 | 4,040 | 4,477,007 | ||||
142
DFA SHORT-TERM MUNICIPAL BOND PORTFOLIO
CONTINUED
Face Amount | Value† | |||||
| (000) | ||||||
VIRGINIA — (Continued) | ||||||
Virginia State Public School Authority (RB) Series B | ||||||
5.000%, 08/01/11 | $ | 9,595 | $ | 10,285,264 | ||
5.000%, 08/01/13 | 5,505 | 6,188,446 | ||||
West Virginia State (GO) (NATL-RE FGIC) | ||||||
5.000%, 06/01/12 | 3,300 | 3,614,358 | ||||
TOTAL VIRGINIA | 55,599,193 | |||||
WASHINGTON — (3.6%) | ||||||
City of Seattle (GO) | ||||||
5.000%, 05/01/14 | 8,300 | 9,345,551 | ||||
City of Seattle (RB) (FSA) | ||||||
5.000%, 08/01/12 | 1,500 | 1,643,445 | ||||
Grant County Public Utility District No. 2 Priest Rapids (RB) Series H (FSA) | ||||||
5.000%, 01/01/10 | 2,000 | 2,014,760 | ||||
Snohomish County Public Utility (RB) Series B | ||||||
5.250%, 12/01/10 | 11,000 | 11,559,460 | ||||
Washington State (GO) Series C | ||||||
5.000%, 02/01/14 | 6,895 | 7,711,092 | ||||
Washington State (GO) (FSA) | ||||||
5.000%, 07/01/14 | 5,145 | 5,798,827 | ||||
Washington State (GO) Series D | ||||||
5.000%, 01/01/14 | 3,330 | 3,722,374 | ||||
TOTAL WASHINGTON | 41,795,509 | |||||
Face Amount | Value† | |||||
| (000) | ||||||
WISCONSIN — (2.5%) | ||||||
Wisconsin State (GO) Series 1 (MBIA) | ||||||
5.500%, 05/01/11 | $ | 16,000 | $ | 17,107,840 | ||
Wisconsin State (GO) Series A | ||||||
5.000%, 05/01/12 | 6,760 | 7,386,990 | ||||
Wisconsin State (RB) Series B (AMBAC) | ||||||
5.000%, 07/01/12 | 3,775 | 4,136,645 | ||||
TOTAL WISCONSIN | 28,631,475 | |||||
TOTAL MUNICIPAL BONDS | 1,130,793,495 | |||||
Shares | ||||||
TEMPORARY CASH INVESTMENTS — (2.7%) | ||||||
BlackRock Liquidity Funds MuniFund - Institutional Shares | 31,145,864 | 31,145,864 | ||||
TOTAL INVESTMENTS — (100.0%) | $ | 1,161,939,359 | ||||
Summary of inputs used to value the Portfolio’s net assets as of October 31, 2009 is as follows (See Security Valuation Note):
| Valuation Inputs | |||||||||||
| Investment in Securities (Market Value) | |||||||||||
| Level 1 | Level 2 | Level 3 | Total | ||||||||
Municipal Bonds | — | $ | 1,130,793,495 | — | $ | 1,130,793,495 | |||||
Temporary Cash Investments | $ | 31,145,864 | — | — | 31,145,864 | ||||||
TOTAL | $ | 31,145,864 | $ | 1,130,793,495 | — | $ | 1,161,939,359 | ||||
See accompanying Notes to Financial Statements.
143
DFA CALIFORNIA SHORT-TERM MUNICIPAL BOND PORTFOLIO
SCHEDULE OF INVESTMENTS
October 31, 2009
Face | Value† | |||||
| (000) | ||||||
MUNICIPAL BONDS — (98.0%) | ||||||
CALIFORNIA — (98.0%) | ||||||
Anaheim Union High School District (GO) (FSA) | ||||||
5.000%, 08/01/14 | $ | 800 | $ | 884,728 | ||
Anaheim Union High School District (GO) Series A (FSA) | ||||||
5.000%, 08/01/12 | 1,275 | 1,412,572 | ||||
Bay Area Toll Authority (RB) (FGIC) | ||||||
5.125%, 04/01/11 | 1,535 | 1,632,258 | ||||
Bay Area Toll Authority (RB) Series F | ||||||
5.000%, 04/01/13 | 775 | 853,910 | ||||
Berryessa Union School District (GO) Series B (FSA) | ||||||
5.375%, 08/01/11 | 1,205 | 1,317,571 | ||||
California Educational Facilities Authority (RB) Series A | ||||||
5.000%, 04/01/13 | 2,250 | 2,526,637 | ||||
California Educational Facilities Authority (RB) Series P | ||||||
5.250%, 12/01/13 | 925 | 1,059,634 | ||||
California Educational Facilities Authority (RB) Series T-4 | ||||||
5.000%, 03/15/14 | 3,390 | 3,818,937 | ||||
California Infrastructure & Economic Development Bank (RB) (FSA) | ||||||
5.250%, 07/01/13 | 2,000 | 2,276,700 | ||||
California Infrastructure & Economic Development Bank (RB) Series A (AMBAC) | ||||||
5.000%, 10/01/10 | 3,180 | 3,296,165 | ||||
California State (GO) | ||||||
5.000%, 02/01/10 | 1,500 | 1,512,390 | ||||
5.000%, 03/01/10 | 3,000 | 3,033,330 | ||||
5.250%, 09/01/10 | 550 | 566,098 | ||||
5.000%, 10/01/10 | 2,000 | 2,059,580 | ||||
4.000%, 02/01/11 | 1,000 | 1,029,620 | ||||
5.250%, 03/01/11 | 800 | 838,328 | ||||
5.000%, 04/01/11 | 3,000 | 3,142,290 | ||||
5.000%, 06/01/11 | 500 | 526,490 | ||||
5.000%, 10/01/11 | 2,215 | 2,355,520 | ||||
5.000%, 04/01/12 | 1,500 | 1,604,160 | ||||
5.000%, 02/01/14 | 770 | 831,508 | ||||
5.000%, 03/01/14 | 800 | 865,088 | ||||
5.000%, 03/01/14 | 2,850 | 3,081,876 | ||||
Face | Value† | |||||
| (000) | ||||||
CALIFORNIA — (Continued) | ||||||
5.000%, 04/01/14 | $ | 1,000 | $ | 1,082,410 | ||
5.000%, 04/01/14 | 555 | 600,738 | ||||
5.000%, 05/01/14 | 700 | 758,723 | ||||
5.000%, 08/01/14 | 1,480 | 1,609,855 | ||||
California State (GO) Series A | ||||||
5.250%, 07/01/14 | 425 | 473,900 | ||||
California State Department of Transportation (RB) Series A (MBIA) | ||||||
5.000%, 02/01/11 | 1,125 | 1,178,944 | ||||
California State Department of Water Resources (RB) | ||||||
5.500%, 12/01/13 | 1,075 | 1,235,153 | ||||
California State Department of Water Resources (RB) Series A | ||||||
5.500%, 05/01/10 | 500 | 512,210 | ||||
5.250%, 05/01/12 | 2,000 | 2,177,100 | ||||
California State Department of Water Resources (RB) Series A (FSA) | ||||||
5.250%, 05/01/11 | 1,450 | 1,534,114 | ||||
California State Department of Water Resources Power Supply (RB) (ETM) Series A | ||||||
5.125%, 05/01/12 | 1,850 | 2,055,387 | ||||
California State Department of Water Resources Power Supply (RB) Series A (MBIA) | ||||||
5.000%, 05/01/11 | 1,000 | 1,054,330 | ||||
California State Economic Recovery (GO) Series A | ||||||
5.000%, 01/01/10 | 985 | 991,599 | ||||
5.000%, 01/01/11 | 3,500 | 3,657,465 | ||||
3.500%, 07/01/11 | 1,075 | 1,110,787 | ||||
5.000%, 07/01/11 | 1,000 | 1,057,770 | ||||
California State Economic Recovery (GO) Series A (MBIA) | ||||||
5.000%, 07/01/11 | 800 | 846,216 | ||||
5.000%, 07/01/12 | 2,475 | 2,678,965 | ||||
5.250%, 07/01/13 | 3,810 | 4,216,184 | ||||
California State University (RB) Series A | ||||||
3.000%, 11/01/12 | 500 | 520,220 | ||||
4.000%, 11/01/12 | 545 | 583,722 | ||||
4.000%, 11/01/12 | 1,000 | 1,071,050 | ||||
144
DFA CALIFORNIA SHORT-TERM MUNICIPAL BOND PORTFOLIO
CONTINUED
Face | Value† | |||||
| (000) | ||||||
CALIFORNIA — (Continued) | ||||||
Chabot-Las Positas Community College District (GO) (AMBAC) | ||||||
5.000%, 08/01/11 | $ | 1,010 | $ | 1,080,478 | ||
Charter Oak Unified School District (GO) Series B (FSA) | ||||||
5.000%, 07/01/13 | 2,805 | 3,168,135 | ||||
Chino Basin Regional Financing Authority (RB) | ||||||
5.900%, 08/01/11 | 810 | 875,262 | ||||
City & County of San Francisco (GO) Series A (AMBAC) | ||||||
5.000%, 06/15/12 | 1,600 | 1,744,720 | ||||
City & County of San Francisco (GO) Series R-1 (FGIC) | ||||||
5.000%, 06/15/12 | 3,855 | 4,219,298 | ||||
City of Folsom (GO) | ||||||
4.000%, 08/01/14 | 1,285 | 1,387,967 | ||||
City of Los Angeles (GO) (MBIA) | ||||||
4.000%, 09/01/10 | 1,000 | 1,028,690 | ||||
City of Los Angeles (GO) Series A | ||||||
2.500%, 09/01/13 | 2,500 | 2,559,700 | ||||
City of Los Angeles (GO) Series A (MBIA) | ||||||
5.000%, 09/01/12 | 1,165 | 1,280,405 | ||||
City of Los Angeles (RB) Series A | ||||||
4.000%, 06/01/12 | 815 | 854,446 | ||||
5.000%, 06/01/13 | 1,300 | 1,412,788 | ||||
5.000%, 06/01/14 | 2,000 | 2,255,440 | ||||
City of Los Angeles (RB) Series C (NATL-RE) | ||||||
5.375%, 06/01/13 | 600 | 676,158 | ||||
East Bay Regional Park District (GO) | ||||||
4.000%, 09/01/13 | 1,375 | 1,496,949 | ||||
El Camino Community College District (GO) Series A (MBIA) | ||||||
5.000%, 08/01/13 | 2,915 | 3,300,742 | ||||
5.000%, 08/01/13 | 3,060 | 3,464,930 | ||||
El Camino Community College District (GO) Series A (NATL-RE) | ||||||
5.000%, 08/01/13 | 600 | 679,398 | ||||
El Monte Union High School District (GO) Series A (FSA) | ||||||
5.000%, 06/01/13 | 2,185 | 2,457,513 | ||||
Escondido Union School District (GO) Series A | ||||||
5.000%, 08/01/12 | 3,045 | 3,369,171 | ||||
Face | Value† | |||||
| (000) | ||||||
CALIFORNIA — (Continued) | ||||||
Foothill-De Anza Community College District (GO) Series B | ||||||
5.250%, 08/01/13 | $ | 2,000 | $ | 2,278,900 | ||
5.250%, 08/01/13 | 3,675 | 4,187,479 | ||||
Fremont Union High School District (GO) (MBIA) | ||||||
4.000%, 09/01/11 | 750 | 789,045 | ||||
Fresno (RB) Series A-1 (AMBAC) | ||||||
6.250%, 09/01/10 | 300 | 312,318 | ||||
Hacienda La Puente Unified School District (GO) Series B | ||||||
5.000%, 08/01/13 | 4,340 | 4,914,312 | ||||
Industry Public Facilities Authority (TAN) (MBIA) | ||||||
4.500%, 05/01/10 | 700 | 712,859 | ||||
Long Beach Bond Finance Authority (TAN) (AMBAC) | ||||||
5.375%, 08/01/12 | 1,585 | 1,762,916 | ||||
Long Beach Unified School District (GO) | ||||||
4.000%, 08/01/12 | 500 | 538,205 | ||||
Long Beach Unified School District (GO) Series A | ||||||
5.000%, 08/01/13 | 2,000 | 2,245,960 | ||||
Los Angeles Community College District (GO) Series A (FSA) | ||||||
5.250%, 08/01/14 | 4,000 | 4,573,480 | ||||
Los Angeles Community College District (GO) Series F-1 | ||||||
3.250%, 08/01/14 | 850 | 887,621 | ||||
Los Angeles Convention & Exhibit Center Authority (RB) Series A | ||||||
6.125%, 08/15/11 | 1,500 | 1,596,480 | ||||
Los Angeles County Capital Asset Leasing Corp. (RB) Series A (AMBAC) | ||||||
4.000%, 12/01/09 | 520 | 521,342 | ||||
Los Angeles County Metropolitan Transportation Authority (RB) (ETM) Series A (FSA) | ||||||
5.000%, 07/01/11 | 2,500 | 2,708,150 | ||||
Los Angeles County Metropolitan Transportation Authority (RB) Series A | ||||||
4.000%, 07/01/11 | 750 | 784,875 | ||||
145
DFA CALIFORNIA SHORT-TERM MUNICIPAL BOND PORTFOLIO
CONTINUED
Face | Value† | |||||
| (000) | ||||||
CALIFORNIA — (Continued) | ||||||
Los Angeles County Metropolitan Transportation Authority (RB) Series C (AMBAC) | ||||||
6.000%, 07/01/11 | $ | 580 | $ | 626,464 | ||
Los Angeles County Public Works Financing Authority (RB) Series A (MBIA) | ||||||
5.000%, 12/01/09 | 1,300 | 1,303,081 | ||||
Los Angeles County Sanitation Districts Financing Authority (RB) Series A (FSA) | ||||||
5.000%, 10/01/12 | 5,000 | 5,517,200 | ||||
Los Angeles Department of Water & Power (RB) Series A-1 (MBIA) | ||||||
5.000%, 07/01/11 | 460 | 490,102 | ||||
Los Angeles Municipal Improvement Corp (RB) Series A (NATL-RE) | ||||||
5.250%, 06/01/12 | 1,050 | 1,137,696 | ||||
Los Angeles Unified School District (GO) | ||||||
5.500%, 07/01/11 | 800 | 858,912 | ||||
Los Angeles Unified School District (GO) (AMBAC) | ||||||
5.000%, 07/01/11 | 175 | 186,452 | ||||
Los Angeles Unified School District (GO) (MBIA) | ||||||
5.500%, 07/01/12 | 800 | 883,952 | ||||
Los Angeles Unified School District (GO) Series A (FGIC) | ||||||
6.000%, 07/01/11 | 1,000 | 1,081,840 | ||||
Los Angeles Unified School District (GO) Series A (MBIA) | ||||||
5.250%, 07/01/12 | 3,600 | 3,954,420 | ||||
Los Angeles Unified School District (GO) Series B | ||||||
4.000%, 07/01/13 | 500 | 535,095 | ||||
Los Angeles Wastewater System (RB) Series A | ||||||
4.000%, 06/01/12 | 1,000 | 1,069,200 | ||||
Metropolitan Water District of Southern California (GO) Series B | ||||||
4.000%, 03/01/11 | 500 | 520,500 | ||||
Face | Value† | |||||
| (000) | ||||||
CALIFORNIA — (Continued) | ||||||
Metropolitan Water District of Southern California (RB) Series B | ||||||
3.750%, 07/01/11 | $ | 3,000 | $ | 3,142,440 | ||
Mountain View-Whisman School District (GO) Series D (MBIA) | ||||||
5.000%, 06/01/12 | 1,480 | 1,644,532 | ||||
Norwalk Redevelopment Agency (TAN) Series A (MBIA) | ||||||
4.000%, 10/01/10 | 670 | 686,891 | ||||
Orange County (RB) Series A (MBIA) | ||||||
5.000%, 06/01/12 | 730 | 794,101 | ||||
Oxnard School District (GO) (FSA) | ||||||
5.000%, 08/01/12 | 610 | 670,061 | ||||
Pasadena Unified School District (GO) (FSA) | ||||||
5.000%, 11/01/12 | 2,000 | 2,206,520 | ||||
Piedmont Unified School District (GO) | ||||||
2.000%, 08/01/13 | 725 | 731,532 | ||||
2.000%, 08/01/14 | 340 | 339,079 | ||||
Sacramento Regional County Sanitation District (RB) (NATL-RE) | ||||||
5.000%, 08/01/14 | 750 | 832,612 | ||||
San Diego County Water Authority (NATL-RE FGIC) Series A | ||||||
5.250%, 05/01/13 | 795 | 880,304 | ||||
San Diego Public Facilities Financing Authority (RB) Series A | ||||||
2.750%, 05/15/11 | 1,150 | 1,172,367 | ||||
2.750%, 05/15/12 | 1,655 | 1,693,297 | ||||
San Diego Public Facilities Financing Authority (RB) Series B | ||||||
5.000%, 05/15/14 | 1,000 | 1,099,250 | ||||
San Diego Unified School District (GO) Series F (FSA) | ||||||
5.000%, 07/01/14 | 1,555 | 1,774,861 | ||||
San Francisco Bay Area Transit Financing Authority (RB) | ||||||
6.750%, 07/01/11 | 795 | 869,428 | ||||
San Francisco City & County Public Utilities Commission (RB) Series A (FSA) | ||||||
5.000%, 11/01/12 | 4,810 | 5,291,818 | ||||
146
DFA CALIFORNIA SHORT-TERM MUNICIPAL BOND PORTFOLIO
CONTINUED
Face Amount | Value† | |||||
| (000) | ||||||
CALIFORNIA — (Continued) | ||||||
San Jose Unified School District (GO) (FGIC) | ||||||
5.000%, 08/01/11 | $ | 1,300 | $ | 1,386,034 | ||
5.000%, 08/01/12 | 5,000 | 5,464,000 | ||||
San Leandro Unified School District (GO) Series A (FSA) | ||||||
6.000%, 08/01/10 | 615 | 640,522 | ||||
San Mateo County Community College District (GO) Series A | ||||||
4.500%, 09/01/13 | 2,000 | 2,214,320 | ||||
Santa Clara County Financing Authority (RB) (AMBAC) | ||||||
7.750%, 11/15/09 | 1,200 | 1,202,700 | ||||
Santa Clara Unified School District (GO) | ||||||
4.000%, 07/01/13 | 915 | 965,956 | ||||
Sonoma County (RB) Series A (FGIC) | ||||||
4.000%, 09/01/12 | 1,950 | 2,098,922 | ||||
Southern California Public Power Authority (RB) Series A (AMBAC) | ||||||
5.000%, 07/01/13 | 1,545 | 1,742,065 | ||||
Southern Kern Unified School District (GO) | ||||||
4.000%, 12/01/09 | 2,800 | 2,806,160 | ||||
Southwestern Community College District (GO) Series B | ||||||
5.250%, 08/01/12 | 750 | 822,915 | ||||
Face Amount | Value† | |||||
| (000) | ||||||
CALIFORNIA — (Continued) | ||||||
Torrance Unified School District (GO) | ||||||
4.000%, 08/01/13 | $ | 830 | $ | 887,984 | ||
University of California (RB) Series A (AMBAC) | ||||||
5.000%, 05/15/11 | 1,140 | 1,210,520 | ||||
University of California (RB) Series E (MBIA) | ||||||
5.000%, 05/15/13 | 1,560 | 1,730,009 | ||||
University of California (RB) Series J (MBIA) | ||||||
5.000%, 05/15/12 | 450 | 490,018 | ||||
University of California (RB) Series K (MBIA) | ||||||
5.000%, 05/15/12 | 500 | 544,465 | ||||
TOTAL MUNICIPAL BONDS | 203,858,961 | |||||
Shares | ||||||
TEMPORARY CASH INVESTMENTS — (2.0%) | ||||||
BlackRock Liquidity Funds California Money Fund - Institutional Shares | 4,098,274 | 4,098,274 | ||||
TOTAL INVESTMENTS — (100.0%) | $ | 207,957,235 | ||||
Summary of inputs used to value the Portfolio’s net assets as of October 31, 2009 is as follows (See Security Valuation Note):
| Valuation Inputs | |||||||||||
| Investment in Securities (Market Value) | |||||||||||
Level 1 | Level 2 | Level 3 | Total | ||||||||
Municipal Bonds | — | $ | 203,858,961 | — | $ | 203,858,961 | |||||
Temporary Cash Investments | $ | 4,098,274 | — | — | 4,098,274 | ||||||
TOTAL | $ | 4,098,274 | $ | 203,858,961 | — | $ | 207,957,235 | ||||
See accompanying Notes to Financial Statements.
147
DFA INVESTMENT DIMENSIONS GROUP INC.
STATEMENTS OF ASSETS AND LIABILITIES
OCTOBER 31, 2009
(Amounts in thousands, except share and per share amounts)
| U.S. Large Company Portfolio | Enhanced U.S. Large Company Portfolio | U.S. Large Cap Value Portfolio | U.S. Targeted Value Portfolio | |||||||||||||
ASSETS: | ||||||||||||||||
Investments in Affiliated Investment Companies at Value | $ | 2,719,708 | — | $ | 5,864,671 | — | ||||||||||
Investments at Value (including $0, $0, $0 and $254,637 of securities on loan, respectively) | — | $ | 166,294 | — | $ | 1,480,808 | ||||||||||
Temporary Cash Investments at Value & Cost | — | 1,328 | — | 15,297 | ||||||||||||
Collateral Received from Securities on Loan at Value & Cost | — | — | — | 280,325 | ||||||||||||
Foreign Currencies at Value | — | 2 | — | — | ||||||||||||
Receivables: | ||||||||||||||||
Investment Securities/Affiliated Investment Companies Sold | 367 | 1,803 | 1,788 | 39 | ||||||||||||
Dividends and Interest | — | 2,134 | — | 414 | ||||||||||||
Securities Lending Income | — | — | — | 113 | ||||||||||||
Fund Shares Sold | 1,641 | 22 | 3,418 | 2,403 | ||||||||||||
Unrealized Gain on Forward Currency Contracts | — | 84 | — | — | ||||||||||||
Prepaid Expenses and Other Assets | 21 | 19 | 75 | 37 | ||||||||||||
Total Assets | 2,721,737 | 171,686 | 5,869,952 | 1,779,436 | ||||||||||||
LIABILITIES: | ||||||||||||||||
Payables: | ||||||||||||||||
Upon Return of Securities Loaned | — | — | — | 280,325 | ||||||||||||
Investment Securities/Affiliated Investment Companies Purchased | 70 | 1,816 | 6 | 14,119 | ||||||||||||
Fund Shares Redeemed | 1,938 | 113 | 5,200 | 640 | ||||||||||||
Due to Advisor | 162 | 28 | 772 | 460 | ||||||||||||
Forward Currency Contracts | — | 1 | — | — | ||||||||||||
Futures Margin Variation | — | 4,433 | — | — | ||||||||||||
Unrealized Loss on Forward Currency Contracts | — | 45 | — | — | ||||||||||||
Accrued Expenses and Other Liabilities | 149 | 19 | 322 | 132 | ||||||||||||
Total Liabilities | 2,319 | 6,455 | 6,300 | 295,676 | ||||||||||||
NET ASSETS | $ | 2,719,418 | $ | 165,231 | $ | 5,863,652 | $ | 1,483,760 | ||||||||
NET ASSET VALUE, OFFERING AND REDEMPTION PRICE PER SHARE: | ||||||||||||||||
Class R1 Shares — based on net assets of $0; $0; $0 and $31,393 and shares outstanding of 0; 0; 0 and 3,932,911, respectively | N/A | N/A | N/A | $ | 7.98 | |||||||||||
NUMBER OF SHARES AUTHORIZED | 100,000,000 | * | 100,000,000 | * | 100,000,000 | * | 100,000,000 | |||||||||
Class R2 Shares — based on net assets of $0; $0; $0 and $2,930 and shares outstanding of 0; 0; 0 and 348,148, respectively | N/A | N/A | N/A | $ | 8.42 | |||||||||||
NUMBER OF SHARES AUTHORIZED | 100,000,000 | * | 100,000,000 | * | 100,000,000 | * | 100,000,000 | |||||||||
Institutional Class Shares — based on net assets of $2,719,418; $165,231; $5,863,652 and $1,449,437 and shares outstanding of 88,883,846; 25,491,421; 370,896,893 and 123,882,701, respectively | $ | 30.60 | $ | 6.48 | $ | 15.81 | $ | 11.70 | ||||||||
NUMBER OF SHARES AUTHORIZED | 500,000,000 | 300,000,000 | 2,000,000,000 | 700,000,000 | ||||||||||||
Investments in Affiliated Investment Companies at Cost | $ | 2,707,794 | $ | — | $ | 4,959,195 | $ | — | ||||||||
Investments at Cost | $ | — | $ | 164,421 | $ | — | $ | 1,579,217 | ||||||||
Foreign Currencies at Cost | $ | — | $ | 2 | $ | — | $ | — | ||||||||
NET ASSETS CONSIST OF: | ||||||||||||||||
Paid-In Capital | $ | 3,083,525 | $ | 270,995 | $ | 7,386,030 | $ | 1,664,507 | ||||||||
Undistributed Net Investment Income (Distributions in Excess of Net Investment Income) | 7,113 | 285 | 13,540 | 1,308 | ||||||||||||
Accumulated Net Realized Gain (Loss) | (383,134 | ) | (109,666 | ) | (2,441,394 | ) | (83,646 | ) | ||||||||
Net Unrealized Foreign Exchange Gain (Loss) | — | 39 | — | — | ||||||||||||
Net Unrealized Appreciation (Depreciation) | 11,914 | 3,578 | 905,476 | (98,409 | ) | |||||||||||
NET ASSETS | $ | 2,719,418 | $ | 165,231 | $ | 5,863,652 | $ | 1,483,760 | ||||||||
| * | Share class has not yet commenced operations. See Organization note in Notes to Financial Statements. |
See accompanying Notes to Financial Statements.
148
DFA INVESTMENT DIMENSIONS GROUP INC.
STATEMENTS OF ASSETS AND LIABILITIES
OCTOBER 31, 2009
(Amounts in thousands, except share and per share amounts)
| U.S. Small Cap Value Portfolio | U.S. Core Equity 1 Portfolio | U.S. Core Equity 2 Portfolio | U.S. Vector Equity Portfolio | |||||||||||||
ASSETS: | ||||||||||||||||
Investments at Value (including $805,217, $252,234, $475,044 and $194,392 of securities on loan, respectively) | $ | 5,666,160 | $ | 1,978,654 | $ | 3,790,784 | $ | 1,172,822 | ||||||||
Temporary Cash Investments at Value & Cost | — | 7,604 | 21,700 | 10,353 | ||||||||||||
Collateral Received from Securities on Loan at Value & Cost | 901,091 | 272,010 | 514,376 | 211,602 | ||||||||||||
Receivables: | ||||||||||||||||
Investment Securities Sold | 11,613 | 187 | 482 | 157 | ||||||||||||
Dividends and Interest | 1,762 | 1,891 | 3,381 | 761 | ||||||||||||
Securities Lending Income | 503 | 128 | 296 | 151 | ||||||||||||
Fund Shares Sold | 2,578 | 2,570 | 3,354 | 1,717 | ||||||||||||
Prepaid Expenses and Other Assets | 36 | 59 | 117 | 38 | ||||||||||||
Total Assets | 6,583,743 | 2,263,103 | 4,334,490 | 1,397,601 | ||||||||||||
LIABILITIES: | ||||||||||||||||
Payables: | ||||||||||||||||
Upon Return of Securities Loaned | 901,091 | 272,010 | 514,376 | 211,602 | ||||||||||||
Investment Securities Purchased | 231 | — | 13,346 | 6,909 | ||||||||||||
Fund Shares Redeemed | 3,650 | 1,086 | 1,516 | 573 | ||||||||||||
Due to Advisor | 2,572 | 293 | 663 | 311 | ||||||||||||
Loan Payable | 6,072 | — | — | — | ||||||||||||
Accrued Expenses and Other Liabilities | 468 | 131 | 264 | 92 | ||||||||||||
Total Liabilities | 914,084 | 273,520 | 530,165 | 219,487 | ||||||||||||
NET ASSETS | $ | 5,669,659 | $ | 1,989,583 | $ | 3,804,325 | $ | 1,178,114 | ||||||||
NET ASSET VALUE, OFFERING AND REDEMPTION PRICE PER SHARE: | ||||||||||||||||
Institutional Class Shares — based on net assets of $5,669,659; $1,989,583; $3,804,325 and $1,178,114 and shares outstanding of 320,480,765; 232,927,015; 453,514,041 and 146,773,590, respectively | $ | 17.69 | $ | 8.54 | $ | 8.39 | $ | 8.03 | ||||||||
NUMBER OF SHARES AUTHORIZED | 1,700,000,000 | 1,500,000,000 | 2,300,000,000 | 1,000,000,000 | ||||||||||||
Investments at Cost | $ | 6,445,519 | $ | 2,207,480 | $ | 4,451,889 | $ | 1,404,900 | ||||||||
NET ASSETS CONSIST OF: | ||||||||||||||||
Paid-In Capital | $ | 7,033,726 | $ | 2,300,603 | $ | 4,561,822 | $ | 1,503,595 | ||||||||
Undistributed Net Investment Income (Distributions in Excess of Net Investment Income) | 2,918 | 373 | 698 | 1,895 | ||||||||||||
Accumulated Net Realized Gain (Loss) | (587,626 | ) | (82,567 | ) | (97,090 | ) | (95,298 | ) | ||||||||
Net Unrealized Appreciation (Depreciation) | (779,359 | ) | (228,826 | ) | (661,105 | ) | (232,078 | ) | ||||||||
NET ASSETS | $ | 5,669,659 | $ | 1,989,583 | $ | 3,804,325 | $ | 1,178,114 | ||||||||
See accompanying Notes to Financial Statements.
149
DFA INVESTMENT DIMENSIONS GROUP INC.
STATEMENTS OF ASSETS AND LIABILITIES
OCTOBER 31, 2009
(Amounts in thousands, except share and per share amounts)
| T.A. U.S. Core Equity 2 Portfolio | U.S. Small Cap Portfolio | U.S. Micro Cap Portfolio | DFA Real Estate Securities Portfolio | |||||||||||||
ASSETS: | ||||||||||||||||
Investments at Value (including $185,052, $424,249, $414,662 and $657,820 of securities on loan, respectively) | $ | 1,434,407 | $ | 2,508,187 | $ | 2,801,254 | $ | 2,004,281 | ||||||||
Temporary Cash Investments at Value & Cost | 13,453 | 5,249 | 9,293 | 19,896 | ||||||||||||
Collateral Received from Securities on Loan at Value & Cost | 200,522 | 466,103 | 459,066 | 699,642 | ||||||||||||
Cash | — | 817 | — | — | ||||||||||||
Receivables: | ||||||||||||||||
Investment Securities Sold | 245 | 7,518 | 8,032 | — | ||||||||||||
Dividends and Interest | 1,314 | 799 | 1,044 | 2,002 | ||||||||||||
Securities Lending Income | 131 | 439 | 448 | 138 | ||||||||||||
Fund Shares Sold | 3,590 | 2,376 | 5,459 | 1,407 | ||||||||||||
Prepaid Expenses and Other Assets | 75 | 28 | 18 | 33 | ||||||||||||
Total Assets | 1,653,737 | 2,991,516 | 3,284,614 | 2,727,399 | ||||||||||||
LIABILITIES: | ||||||||||||||||
Payables: | ||||||||||||||||
Upon Return of Securities Loaned | 200,522 | 466,103 | 459,066 | 699,642 | ||||||||||||
Investment Securities Purchased | 7,318 | 50 | 4,270 | 7,269 | ||||||||||||
Fund Shares Redeemed | 623 | 2,360 | 1,397 | 1,227 | ||||||||||||
Due to Advisor | 276 | 795 | 1,265 | 515 | ||||||||||||
Accrued Expenses and Other Liabilities | 112 | 207 | 251 | 187 | ||||||||||||
Total Liabilities | 208,851 | 469,515 | 466,249 | 708,840 | ||||||||||||
NET ASSETS | $ | 1,444,886 | $ | 2,522,001 | $ | 2,818,365 | $ | 2,018,559 | ||||||||
NET ASSET VALUE, OFFERING AND REDEMPTION PRICE PER SHARE: | ||||||||||||||||
Institutional Class Shares — based on net assets of $1,444,886; $2,522,001; $2,818,365 and $2,018,559 and shares outstanding of 211,424,756; 169,387,953; 294,459,077 and 132,015,997, respectively | $ | 6.83 | $ | 14.89 | $ | 9.57 | $ | 15.29 | ||||||||
NUMBER OF SHARES AUTHORIZED | 1,000,000,000 | 1,000,000,000 | 1,500,000,000 | 700,000,000 | ||||||||||||
Investments at Cost | $ | 1,403,575 | $ | 2,546,150 | $ | 3,004,867 | $ | 2,384,790 | ||||||||
NET ASSETS CONSIST OF: | ||||||||||||||||
Paid-In Capital | $ | 1,460,862 | $ | 2,976,209 | $ | 3,539,037 | $ | 2,582,474 | ||||||||
Undistributed Net Investment Income (Distributions in Excess of Net Investment Income) | 3,080 | 3,780 | 3,100 | 8,197 | ||||||||||||
Accumulated Net Realized Gain (Loss) | (49,888 | ) | (420,025 | ) | (520,159 | ) | (191,603 | ) | ||||||||
Net Unrealized Appreciation (Depreciation) | 30,832 | (37,963 | ) | (203,613 | ) | (380,509 | ) | |||||||||
NET ASSETS | $ | 1,444,886 | $ | 2,522,001 | $ | 2,818,365 | $ | 2,018,559 | ||||||||
See accompanying Notes to Financial Statements.
150
DFA INVESTMENT DIMENSIONS GROUP INC.
STATEMENTS OF ASSETS AND LIABILITIES
OCTOBER 31, 2009
(Amounts in thousands, except share and per share amounts)
| Large Cap International Portfolio | International Core Equity Portfolio | T.A. World ex U.S. Core Equity Portfolio | International Small Company Portfolio | |||||||||||||
ASSETS: | ||||||||||||||||
Investments in Affiliated Investment Companies at Value | — | — | — | $ | 4,275,715 | |||||||||||
Investments at Value (including $228,732, $638,659, $48,751 and $0 of securities on loan, respectively) | $ | 1,357,706 | $ | 3,678,259 | $ | 664,457 | — | |||||||||
Temporary Cash Investments at Value & Cost | 772 | 12,615 | 4,521 | — | ||||||||||||
Collateral Received from Securities on Loan at Value & Cost | 241,564 | 672,695 | 51,990 | — | ||||||||||||
Foreign Currencies at Value | 4,670 | 4,897 | 637 | — | ||||||||||||
Cash | 15 | 15 | 16 | — | ||||||||||||
Receivables: | ||||||||||||||||
Investment Securities/Affiliated Investment Companies Sold | — | 94 | — | — | ||||||||||||
Dividends, Interest and Tax Reclaims | 3,097 | 7,308 | 1,242 | — | ||||||||||||
Securities Lending Income | 94 | 369 | 28 | — | ||||||||||||
Fund Shares Sold | 644 | 2,762 | 1,167 | 1,809 | ||||||||||||
Prepaid Expenses and Other Assets | 20 | 97 | 13 | 25 | ||||||||||||
Total Assets | 1,608,582 | 4,379,111 | 724,071 | 4,277,549 | ||||||||||||
LIABILITIES: | ||||||||||||||||
Payables: | ||||||||||||||||
Upon Return of Securities Loaned | 241,564 | 672,695 | 51,990 | — | ||||||||||||
Investment Securities/Affiliated Investment Companies Purchased | 816 | 3,402 | 2,511 | — | ||||||||||||
Fund Shares Redeemed | 1,415 | 1,553 | 434 | 4,028 | ||||||||||||
Due to Advisor | 294 | 1,117 | 230 | 1,459 | ||||||||||||
Loan Payable | — | — | — | 1,970 | ||||||||||||
Unrealized Loss on Foreign Currency Contracts | — | — | 13 | — | ||||||||||||
Deferred Thailand Capital Gains Tax | — | — | 101 | — | ||||||||||||
Accrued Expenses and Other Liabilities | 142 | 502 | 64 | 228 | ||||||||||||
Total Liabilities | 244,231 | 679,269 | 55,343 | 7,685 | ||||||||||||
NET ASSETS | $ | 1,364,351 | $ | 3,699,842 | $ | 668,728 | $ | 4,269,864 | ||||||||
NET ASSET VALUE, OFFERING AND REDEMPTION PRICE PER SHARE: | ||||||||||||||||
Institutional Class Shares — based on net assets of $1,364,351; $3,699,842; $668,728 and $4,269,864 and shares outstanding of 75,697,978; 378,082,644; 82,247,205 and 305,149,395, respectively | $ | 18.02 | $ | 9.79 | $ | 8.13 | $ | 13.99 | ||||||||
NUMBER OF SHARES AUTHORIZED | 500,000,000 | 2,000,000,000 | 500,000,000 | 1,500,000,000 | ||||||||||||
Investments in Affiliated Investment Companies at Cost | $ | — | $ | — | $ | — | $ | 4,294,421 | ||||||||
Investments at Cost | $ | 1,267,278 | $ | 4,029,287 | $ | 555,458 | $ | — | ||||||||
Foreign Currencies at Cost | $ | 4,632 | $ | 4,955 | $ | 636 | $ | — | ||||||||
NET ASSETS CONSIST OF: | ||||||||||||||||
Paid-In Capital | $ | 1,438,873 | $ | 4,147,095 | $ | 569,997 | $ | 4,510,524 | ||||||||
Undistributed Net Investment Income (Distributions in Excess of Net Investment Income) | 5,593 | 2,148 | 1,772 | 13,949 | ||||||||||||
Accumulated Net Realized Gain (Loss) | (170,622 | ) | (98,357 | ) | (11,965 | ) | (236,142 | ) | ||||||||
Deferred Thailand Capital Gains Tax | — | — | (101 | ) | — | |||||||||||
Net Unrealized Foreign Exchange Gain (Loss) | 41 | 42 | 25 | 239 | ||||||||||||
Net Unrealized Appreciation (Depreciation) | 90,466 | (351,086 | ) | 109,000 | (18,706 | ) | ||||||||||
NET ASSETS | $ | 1,364,351 | $ | 3,699,842 | $ | 668,728 | $ | 4,269,864 | ||||||||
See accompanying Notes to Financial Statements.
151
DFA INVESTMENT DIMENSIONS GROUP INC.
STATEMENTS OF ASSETS AND LIABILITIES
OCTOBER 31, 2009
(Amounts in thousands, except share and per share amounts)
| Japanese Small Company Portfolio | Asia Pacific Small Company Portfolio | United Kingdom Small Company Portfolio | Continental Small Company Portfolio | |||||||||||||
ASSETS: | ||||||||||||||||
Investments in Affiliated Investment Companies at Value | $ | 114,115 | $ | 101,906 | $ | 27,872 | $ | 110,985 | ||||||||
Receivables: | ||||||||||||||||
Fund Shares Sold | 39 | 60 | — | 2 | ||||||||||||
Prepaid Expenses and Other Assets | 6 | 541 | 8 | 8 | ||||||||||||
| �� | ||||||||||||||||
Total Assets | 114,160 | 102,507 | 27,880 | 110,995 | ||||||||||||
LIABILITIES: | ||||||||||||||||
Payables: | ||||||||||||||||
Affiliated Investment Companies Purchased | 5 | — | — | 2 | ||||||||||||
Fund Shares Redeemed | 35 | 590 | — | — | ||||||||||||
Due to Advisor | 39 | 45 | 10 | 47 | ||||||||||||
Accrued Expenses and Other Liabilities | 23 | 19 | 7 | 20 | ||||||||||||
Total Liabilities | 102 | 654 | 17 | 69 | ||||||||||||
NET ASSETS | $ | 114,058 | $ | 101,853 | $ | 27,863 | $ | 110,926 | ||||||||
NET ASSET VALUE, OFFERING AND REDEMPTION PRICE PER SHARE: | ||||||||||||||||
Institutional Class Shares — based on net assets of $114,058; $101,853; $27,863 and $110,926 and shares outstanding of 7,965,887; 4,946,123; 1,405,185 and 7,384,856, respectively | $ | 14.32 | $ | 20.59 | $ | 19.83 | $ | 15.02 | ||||||||
NUMBER OF SHARES AUTHORIZED | 100,000,000 | 100,000,000 | 100,000,000 | 100,000,000 | ||||||||||||
Investments in Affiliated Investment Companies at Cost | $ | 200,814 | $ | 94,124 | $ | 30,454 | $ | 112,793 | ||||||||
NET ASSETS CONSIST OF: | ||||||||||||||||
Paid-In Capital | $ | 281,358 | $ | 133,100 | $ | 33,451 | $ | 136,984 | ||||||||
Undistributed Net Investment Income (Distributions in Excess of Net Investment Income) | 665 | 246 | 171 | (12 | ) | |||||||||||
Accumulated Net Realized Gain (Loss) | (81,282 | ) | (39,285 | ) | (3,182 | ) | (24,284 | ) | ||||||||
Net Unrealized Foreign Exchange Gain (Loss) | 16 | 10 | 5 | 46 | ||||||||||||
Net Unrealized Appreciation (Depreciation) | (86,699 | ) | 7,782 | (2,582 | ) | (1,808 | ) | |||||||||
NET ASSETS | $ | 114,058 | $ | 101,853 | $ | 27,863 | $ | 110,926 | ||||||||
See accompanying Notes to Financial Statements.
152
DFA INVESTMENT DIMENSIONS GROUP INC.
STATEMENTS OF ASSETS AND LIABILITIES
OCTOBER 31, 2009
(Amounts in thousands, except share and per share amounts)
| DFA International Real Estate Securities Portfolio | DFA Global Real Estate Securities Portfolio | DFA International Small Cap Value Portfolio | International Vector Equity Portfolio | |||||||||||||
ASSETS: | ||||||||||||||||
Investments in Affiliated Investment Companies at Value | — | $ | 431,052 | — | — | |||||||||||
Investments at Value (including $115,028, $0, $608,093 and $37,782 of securities on loan, respectively) | $ | 738,601 | — | $ | 6,828,797 | $ | 260,778 | |||||||||
Temporary Cash Investments at Value & Cost | 4,146 | 1,476 | — | 1,155 | ||||||||||||
Collateral Received from Securities on Loan at Value & Cost | 125,706 | — | 660,434 | 40,466 | ||||||||||||
Foreign Currencies at Value | 2,412 | — | 15,132 | 393 | ||||||||||||
Cash | 15 | — | — | 16 | ||||||||||||
Receivables: | ||||||||||||||||
Investment Securities/Affiliated Investment Companies Sold | — | — | 30,421 | — | ||||||||||||
Dividends, Interest and Tax Reclaims | 2,843 | — | 14,992 | 505 | ||||||||||||
Securities Lending Income | 84 | — | 796 | 29 | ||||||||||||
Fund Shares Sold | 1,443 | 1,216 | 3,242 | 433 | ||||||||||||
Unrealized Gain on Foreign Currency Contracts | — | — | 11 | — | ||||||||||||
Prepaid Expenses and Other Assets | 23 | 11 | 44 | 11 | ||||||||||||
Total Assets | 875,273 | 433,755 | 7,553,869 | 303,786 | ||||||||||||
LIABILITIES: | ||||||||||||||||
Payables: | ||||||||||||||||
Upon Return of Securities Loaned | 125,706 | — | 660,434 | 40,466 | ||||||||||||
Investment Securities/Affiliated Investment Companies Purchased | 6,642 | 851 | 5,189 | 608 | ||||||||||||
Fund Shares Redeemed | 278 | 364 | 17,039 | 28 | ||||||||||||
Due to Advisor | 220 | 12 | 3,900 | 114 | ||||||||||||
Loan Payable | — | — | 6,784 | — | ||||||||||||
Unrealized Loss on Foreign Currency Contracts | 12 | — | — | — | ||||||||||||
Accrued Expenses and Other Liabilities | 86 | 26 | 566 | 26 | ||||||||||||
Total Liabilities | 132,944 | 1,253 | 693,912 | 41,242 | ||||||||||||
NET ASSETS | $ | 742,329 | $ | 432,502 | $ | 6,859,957 | $ | 262,544 | ||||||||
NET ASSET VALUE, OFFERING AND REDEMPTION PRICE PER SHARE: | ||||||||||||||||
Institutional Cass Shares — based on net assets of $742,329; $432,502; $6,859,957 and $262,544 and shares outstanding of 141,680,837; 64,034,248; 459,928,367 and 28,473,641, respectively | $ | 5.24 | $ | 6.75 | $ | 14.92 | $ | 9.22 | ||||||||
NUMBER OF SHARES AUTHORIZED | 700,000,000 | 500,000,000 | 2,300,000,000 | 500,000,000 | ||||||||||||
Investments in Affiliated Investment Companies at Cost | $ | — | $ | 398,827 | $ | — | $ | — | ||||||||
Investments at Cost | $ | 957,745 | $ | — | $ | 7,473,482 | $ | 206,191 | ||||||||
Foreign Currencies at Cost | $ | 2,416 | $ | — | $ | 15,313 | $ | 397 | ||||||||
NET ASSETS CONSIST OF: | ||||||||||||||||
Paid-In Capital | $ | 987,291 | $ | 402,565 | $ | 7,526,604 | $ | 211,061 | ||||||||
Undistributed Net Investment Income (Distributions in Excess of Net Investment Income) | 24,078 | 4,918 | 11,837 | 715 | ||||||||||||
Accumulated Net Realized Gain (Loss) | (49,991 | ) | (7,206 | ) | (33,616 | ) | (3,819 | ) | ||||||||
Net Unrealized Foreign Exchange Gain (Loss) | 99 | — | (2 | ) | 4 | |||||||||||
Net Unrealized Appreciation (Depreciation) | (219,148 | ) | 32,225 | (644,866 | ) | 54,583 | ||||||||||
NET ASSETS | $ | 742,329 | $ | 432,502 | $ | 6,859,957 | $ | 262,544 | ||||||||
See accompanying Notes to Financial Statements.
153
DFA INVESTMENT DIMENSIONS GROUP INC.
STATEMENTS OF ASSETS AND LIABILITIES
OCTOBER 31, 2009
(Amounts in thousands, except share and per share amounts)
| Emerging Markets Portfolio | Emerging Markets Small Cap Portfolio | Emerging Markets Core Equity Portfolio | DFA One-Year Fixed Income Portfolio | |||||||||||||
ASSETS: | ||||||||||||||||
Investments in Affiliated Investment Companies at Value | $ | 1,967,084 | $ | 1,134,439 | — | — | ||||||||||
Investments at Value (including $0, $0, $268,990 and $878,404 of securities on loan, respectively) | — | — | $ | 2,448,223 | $ | 4,232,448 | ||||||||||
Temporary Cash Investments at Value & Cost | — | — | 9,355 | 18,442 | ||||||||||||
Collateral Received from Securities on Loan at Value & Cost | — | — | 291,756 | 894,976 | ||||||||||||
Foreign Currencies at Value | — | — | 2,773 | — | ||||||||||||
Cash | — | — | 20 | 1 | ||||||||||||
Receivables: | ||||||||||||||||
Investment Securities/Affiliated Investment Companies Sold | — | 570 | 131 | 30,611 | ||||||||||||
Dividends, Interest and Tax Reclaims | — | — | 2,785 | 20,258 | ||||||||||||
Securities Lending Income | — | — | 287 | 92 | ||||||||||||
Fund Shares Sold | 1,632 | 2,107 | 3,735 | 4,025 | ||||||||||||
Prepaid Expenses and Other Assets | 83 | 20 | 51 | 68 | ||||||||||||
Total Assets | 1,968,799 | 1,137,136 | 2,759,116 | 5,200,921 | ||||||||||||
LIABILITIES: | ||||||||||||||||
Payables: | ||||||||||||||||
Upon Return of Securities Loaned | — | — | 291,756 | 894,976 | ||||||||||||
Investment Securities/Affiliated Investment Companies Purchased | 5 | — | 7,266 | 31,674 | ||||||||||||
Fund Shares Redeemed | 1,693 | 2,677 | 1,685 | 3,676 | ||||||||||||
Due to Advisor | 687 | 440 | 1,172 | 529 | ||||||||||||
Deferred Thailand Capital Gains Tax | — | — | 1,833 | — | ||||||||||||
Accrued Expenses and Other Liabilities | 126 | 61 | 369 | 451 | ||||||||||||
Total Liabilities | 2,511 | 3,178 | 304,081 | 931,306 | ||||||||||||
NET ASSETS | $ | 1,966,288 | $ | 1,133,958 | $ | 2,455,035 | $ | 4,269,615 | ||||||||
NET ASSET VALUE, OFFERING AND REDEMPTION PRICE PER SHARE: | ||||||||||||||||
Institutional Class Shares — based on net assets of $1,966,288; $1,133,958; $2,455,035 and $4,269,615 and shares outstanding of 77,941,731; 64,989,784; 148,925,100 and 413,344,376, respectively | $ | 25.23 | $ | 17.45 | $ | 16.49 | $ | 10.33 | ||||||||
NUMBER OF SHARES AUTHORIZED | 500,000,000 | 500,000,000 | 1,000,000,000 | 2,000,000,000 | ||||||||||||
Investments in Affiliated Investment Companies at Cost | $ | 1,011,671 | $ | 854,969 | $ | — | $ | — | ||||||||
Investments at Cost | $ | — | $ | — | $ | 1,999,175 | $ | 4,213,549 | ||||||||
Foreign Currencies at Cost | $ | — | $ | — | $ | 2,802 | $ | — | ||||||||
NET ASSETS CONSIST OF: | ||||||||||||||||
Paid-In Capital | $ | 977,560 | $ | 890,751 | $ | 2,091,817 | $ | 4,248,039 | ||||||||
Undistributed Net Investment Income (Distributions in Excess of Net Investment Income) | 3,281 | 2,323 | 6,664 | 3,329 | ||||||||||||
Accumulated Net Realized Gain (Loss) | 32,042 | (38,091 | ) | (90,709 | ) | (652 | ) | |||||||||
Deferred Thailand Capital Gains Tax | (2,072 | ) | (570 | ) | (1,832 | ) | — | |||||||||
Net Unrealized Foreign Exchange Gain (Loss) | 64 | 75 | 76 | — | ||||||||||||
Net Unrealized Appreciation (Depreciation) | 955,413 | 279,470 | 449,019 | 18,899 | ||||||||||||
NET ASSETS | $ | 1,966,288 | $ | 1,133,958 | $ | 2,455,035 | $ | 4,269,615 | ||||||||
See accompanying Notes to Financial Statements.
154
DFA INVESTMENT DIMENSIONS GROUP INC.
STATEMENTS OF ASSETS AND LIABILITIES
OCTOBER 31, 2009
(Amounts in thousands, except share and per share amounts)
| DFA Two-Year Global Fixed Income Portfolio | DFA Selectively Hedged Global Fixed Income Portfolio | DFA Five-Year Government Portfolio | DFA Five-Year Global Fixed Income Portfolio | |||||||||||
ASSETS: | ||||||||||||||
Investments at Value (including $1,393,220, $0, $0 and $942,168 of securities on loan, respectively) | $ | 3,771,558 | $ | 295,947 | $ | 988,415 | $ | 3,171,717 | ||||||
Temporary Cash Investments at Value & Cost | 43,978 | 7,357 | 8,107 | 28,937 | ||||||||||
Collateral Received from Securities on Loan at Value & Cost | 1,395,043 | — | — | 943,857 | ||||||||||
Foreign Currencies at Value | 4 | 318 | — | 31 | ||||||||||
Cash | 16 | 15 | — | 15 | ||||||||||
Receivables: | ||||||||||||||
Interest | 38,547 | 4,094 | 11,429 | 43,757 | ||||||||||
Securities Lending Income | 120 | — | — | 94 | ||||||||||
Fund Shares Sold | 3,971 | 264 | 1,179 | 2,772 | ||||||||||
Unrealized Gain on Forward Currency Contracts | 7,608 | 221 | — | 1,098 | ||||||||||
Prepaid Expenses and Other Assets | 53 | 21 | 21 | 36 | ||||||||||
Total Assets | 5,260,898 | 308,237 | 1,009,151 | 4,192,314 | ||||||||||
LIABILITIES: | ||||||||||||||
Payables: | ||||||||||||||
Upon Return of Securities Loaned | 1,395,043 | — | — | 943,857 | ||||||||||
Investment Securities Purchased | 16,145 | 4,730 | — | 15,361 | ||||||||||
Fund Shares Redeemed | 2,053 | 10 | 665 | 1,907 | ||||||||||
Due to Advisor | 473 | 37 | 166 | 661 | ||||||||||
Forward Currency Contracts | — | — | — | 2,755 | ||||||||||
Unrealized Loss on Forward Currency Contracts | 728 | — | — | 6,734 | ||||||||||
Accrued Expenses and Other Liabilities | 427 | 20 | 83 | 252 | ||||||||||
Total Liabilities | 1,414,869 | 4,797 | 914 | 971,527 | ||||||||||
NET ASSETS | $ | 3,846,029 | $ | 303,440 | $ | 1,008,237 | $ | 3,220,787 | ||||||
NET ASSET VALUE, OFFERING AND REDEMPTION PRICE PER SHARE: | ||||||||||||||
Institutional Class Shares — based on net assets of $3,846,029; $303,440; $1,008,237 and $3,220,787 and shares outstanding of 374,426,564; 30,329,215; 92,315,819 and 285,848,266, respectively | $ | 10.27 | $ | 10.00 | $ | 10.92 | $ | 11.27 | ||||||
NUMBER OF SHARES AUTHORIZED | 2,000,000,000 | 300,000,000 | 500,000,000 | 1,500,000,000 | ||||||||||
Investments at Cost | $ | 3,733,561 | $ | 291,974 | $ | 960,118 | $ | 2,989,151 | ||||||
Foreign Currencies at Cost | $ | 4 | $ | 328 | $ | — | $ | 25 | ||||||
NET ASSETS CONSIST OF: | ||||||||||||||
Paid-In Capital | $ | 3,761,961 | $ | 299,175 | $ | 968,280 | $ | 2,997,967 | ||||||
Undistributed Net Investment Income (Distributions in Excess of Net Investment Income) | 35,357 | (262 | ) | 4,029 | 51,072 | |||||||||
Accumulated Net Realized Gain (Loss) | 3,896 | 230 | 7,631 | (5,372 | ) | |||||||||
Net Unrealized Foreign Exchange Gain (Loss) | 6,818 | 334 | — | (5,452 | ) | |||||||||
Net Unrealized Appreciation (Depreciation) | 37,997 | 3,963 | 28,297 | 182,572 | ||||||||||
NET ASSETS | $ | 3,846,029 | $ | 303,440 | $ | 1,008,237 | $ | 3,220,787 | ||||||
See accompanying Notes to Financial Statements.
155
DFA INVESTMENT DIMENSIONS GROUP INC.
STATEMENTS OF ASSETS AND LIABILITIES
OCTOBER 31, 2009
(Amounts in thousands, except share and per share amounts)
| DFA Intermediate Government Fixed Income Portfolio | DFA Short-Term Extended Quality Portfolio | DFA Inflation- Protected Securities Portfolio | DFA Short-Term Municipal Bond Portfolio | DFA California Short-Term Municipal Bond Portfolio | |||||||||||||
ASSETS: | |||||||||||||||||
Investments at Value | $ | 1,455,951 | $ | 371,025 | $ | 762,660 | $ | 1,130,793 | $ | 203,859 | |||||||
Temporary Cash Investments at Value & Cost | 13,952 | 5,637 | 5,189 | 31,146 | 4,098 | ||||||||||||
Cash | — | 1,249 | 1 | — | — | ||||||||||||
Receivables: | |||||||||||||||||
Interest | 20,658 | 4,739 | 4,182 | 14,817 | 2,717 | ||||||||||||
Fund Shares Sold | 1,383 | 760 | 2,441 | 773 | 216 | ||||||||||||
Prepaid Expenses and Other Assets | 21 | 5 | 29 | 29 | 8 | ||||||||||||
Deferred Offering Costs | — | 13 | — | — | — | ||||||||||||
Total Assets | 1,491,965 | 383,428 | 774,502 | 1,177,558 | 210,898 | ||||||||||||
LIABILITIES: | |||||||||||||||||
Payables: | |||||||||||||||||
Investment Securities Purchased | 7,073 | 4,583 | — | 8,637 | — | ||||||||||||
Fund Shares Redeemed | 506 | 303 | 268 | 389 | 74 | ||||||||||||
Due to Advisor | 122 | 31 | 62 | 194 | 35 | ||||||||||||
Accrued Expenses and Other Liabilities | 109 | 36 | 62 | 79 | 15 | ||||||||||||
Total Liabilities | 7,810 | 4,953 | 392 | 9,299 | 124 | ||||||||||||
NET ASSETS | $ | 1,484,155 | $ | 378,475 | $ | 774,110 | $ | 1,168,259 | $ | 210,774 | |||||||
NET ASSET VALUE, OFFERING AND REDEMPTION PRICE PER SHARE: | |||||||||||||||||
Institutional Class Shares — based on net assets of $1,484,155; $378,475; $774,110; $1,168,259 and $210,774 and shares outstanding of 120,610,863; 35,845,121; 70,674,107; 114,050,473 and 20,544,763, respectively | $ | 12.31 | $ | 10.56 | $ | 10.95 | $ | 10.24 | $ | 10.26 | |||||||
NUMBER OF SHARES AUTHORIZED | 700,000,000 | 500,000,000 | 500,000,000 | 500,000,000 | 300,000,000 | ||||||||||||
Investments at Cost | $ | 1,352,911 | $ | 359,936 | $ | 732,410 | $ | 1,112,922 | $ | 200,300 | |||||||
NET ASSETS CONSIST OF: | |||||||||||||||||
Paid-In Capital | $ | 1,365,244 | $ | 366,048 | $ | 738,273 | $ | 1,148,598 | $ | 206,861 | |||||||
Undistributed Net Investment Income (Distributions in Excess of Net Investment Income) | 9,734 | 1,051 | 6,361 | 1,807 | 354 | ||||||||||||
Accumulated Net Realized Gain (Loss) | 6,137 | 287 | (774 | ) | (17 | ) | — | ||||||||||
Net Unrealized Appreciation (Depreciation) | 103,040 | 11,089 | 30,250 | 17,871 | 3,559 | ||||||||||||
NET ASSETS | $ | 1,484,155 | $ | 378,475 | $ | 774,110 | $ | 1,168,259 | $ | 210,774 | |||||||
See accompanying Notes to Financial Statements.
156
DFA INVESTMENT DIMENSIONS GROUP INC.
STATEMENTS OF OPERATIONS
FOR THE YEAR ENDED OCTOBER 31, 2009
(Amounts in thousands)
| U.S. Large Company Portfolio* | Enhanced U.S. Large Company Portfolio | U.S. Large Cap Value Portfolio* | U.S. Targeted Value Portfolio | |||||||||||||
Investment Income | ||||||||||||||||
Dividends | $ | 59,319 | $ | 70 | $ | 117,909 | $ | 15,053 | ||||||||
Interest | 102 | 1,745 | 134 | 174 | ||||||||||||
Income from Securities Lending | 2,885 | — | 10,208 | 2,833 | ||||||||||||
Expenses Allocated from Affiliated Investment Company | (1,420 | ) | — | (6,547 | ) | — | ||||||||||
Total Investment Income | 60,886 | 1,815 | 121,704 | 18,060 | ||||||||||||
Expenses | ||||||||||||||||
Investment Advisory Services Fees | — | 52 | — | 1,129 | ||||||||||||
Administrative Services Fees | 2,248 | 237 | 7,521 | 2,823 | ||||||||||||
Accounting & Transfer Agent Fees | 58 | 32 | 108 | 161 | ||||||||||||
S&P 500® Fees | — | 3 | — | — | ||||||||||||
Shareholder Servicing Fees — | ||||||||||||||||
Class R1 Shares | — | — | — | 26 | ||||||||||||
Class R2 Shares | — | — | — | 5 | ||||||||||||
Custodian Fees | — | 5 | — | 49 | ||||||||||||
Filing Fees | 90 | 32 | 148 | 149 | ||||||||||||
Shareholders’ Reports | 114 | 18 | 250 | 94 | ||||||||||||
Directors’/Trustees’ Fees & Expenses | 47 | — | 97 | 31 | ||||||||||||
Professional Fees | 32 | 7 | 76 | 61 | ||||||||||||
Other | 29 | 20 | 64 | 132 | ||||||||||||
Total Expenses | 2,618 | 406 | 8,264 | 4,660 | ||||||||||||
Fees Waived, Expenses Reimbursed, and/or Previously Waived Fees Recovered by Advisor (Note C) | (485 | ) | — | — | — | |||||||||||
Net Expenses | 2,133 | 406 | 8,264 | 4,660 | ||||||||||||
Net Investment Income (Loss) | 58,753 | 1,409 | 113,440 | 13,400 | ||||||||||||
Realized and Unrealized Gain (Loss) | ||||||||||||||||
Net Realized Gain (Loss) on: | ||||||||||||||||
Investment Securities Sold | (177,354 | ) | (24,217 | ) | (2,244,299 | ) | (80,571 | ) | ||||||||
Futures | 7,676 | 25,750 | — | (823 | ) | |||||||||||
Foreign Currency Transactions | — | (1,379 | ) | — | — | |||||||||||
Change in Unrealized Appreciation (Depreciation) of: | ||||||||||||||||
Investment Securities | 354,409 | 2,720 | 2,728,048 | 244,441 | ||||||||||||
Futures | (4,182 | ) | 1,705 | — | (3 | ) | ||||||||||
Translation of Foreign Currency Denominated Amounts | — | 39 | — | — | ||||||||||||
Net Realized and Unrealized Gain (Loss) | 180,549 | 4,618 | 483,749 | 163,044 | ||||||||||||
Net Increase (Decrease) in Net Assets Resulting from Operations | $ | 239,302 | $ | 6,027 | $ | 597,189 | $ | 176,444 | ||||||||
| * | Investment Income and Realized and Unrealized Gain (Loss) were allocated from each Portfolio’s Master Fund (Affiliated Investment Companies). |
See accompanying Notes to Financial Statements.
157
DFA INVESTMENT DIMENSIONS GROUP INC.
STATEMENTS OF OPERATIONS
FOR THE YEAR ENDED OCTOBER 31, 2009
(Amounts in thousands)
| U.S. Small Cap Value Portfolio | U.S. Core Equity 1 Portfolio | U.S. Core Equity 2 Portfolio | U.S. Vector Equity Portfolio | |||||||||||||
Investment Income | ||||||||||||||||
Dividends | $ | 35,309 | $ | 32,271 | $ | 56,277 | $ | 15,402 | ||||||||
Interest | 31 | 125 | 229 | 70 | ||||||||||||
Income from Securities Lending | 4,728 | 2,723 | 5,784 | 2,521 | ||||||||||||
Total Investment Income | 40,068 | 35,119 | 62,290 | 17,993 | ||||||||||||
Expenses | ||||||||||||||||
Investment Advisory Services Fees | 6,898 | 2,668 | 5,833 | 2,766 | ||||||||||||
Administrative Services Fees | 14,851 | — | — | — | ||||||||||||
Accounting & Transfer Agent Fees | 472 | 212 | 377 | 133 | ||||||||||||
Custodian Fees | 85 | 48 | 72 | 41 | ||||||||||||
Filing Fees | 72 | 120 | 194 | 97 | ||||||||||||
Shareholders’ Reports | 352 | 45 | 102 | 50 | ||||||||||||
Directors’/Trustees’ Fees & Expenses | — | 40 | 69 | 21 | ||||||||||||
Professional Fees | 226 | 67 | 122 | 38 | ||||||||||||
Other | 553 | 190 | 341 | 114 | ||||||||||||
Total Expenses | 23,509 | 3,390 | 7,110 | 3,260 | ||||||||||||
Net Investment Income (Loss) | 16,559 | 31,729 | 55,180 | 14,733 | ||||||||||||
Realized and Unrealized Gain (Loss) | ||||||||||||||||
Net Realized Gain (Loss) on: | ||||||||||||||||
Investment Securities Sold | (373,304 | ) | (60,672 | ) | (38,804 | ) | (80,019 | ) | ||||||||
Futures | 570 | 683 | 3,212 | 407 | ||||||||||||
Change in Unrealized Appreciation (Depreciation) of: | ||||||||||||||||
Investment Securities | 602,920 | 253,827 | 375,912 | 173,818 | ||||||||||||
Futures | — | (2 | ) | (1 | ) | — | ||||||||||
Net Realized and Unrealized Gain (Loss) | 230,186 | 193,836 | 340,319 | 94,206 | ||||||||||||
Net Increase (Decrease) in Net Assets Resulting from Operations | $ | 246,745 | $ | 225,565 | $ | 395,499 | $ | 108,939 | ||||||||
See accompanying Notes to Financial Statements.
158
DFA INVESTMENT DIMENSIONS GROUP INC.
STATEMENTS OF OPERATIONS
FOR THE YEAR ENDED OCTOBER 31, 2009
(Amounts in thousands)
| T.A. U.S. Core Equity 2 Portfolio | U.S. Small Cap Portfolio | U.S. Micro Cap Portfolio | DFA Real Estate Securities Portfolio | |||||||||||||
Investment Income | ||||||||||||||||
Dividends | $ | 20,994 | $ | 15,145 | $ | 19,025 | $ | 71,430 | ||||||||
Interest | 174 | 16 | 15 | 51 | ||||||||||||
Income from Securities Lending | 1,782 | 3,676 | 4,341 | 3,792 | ||||||||||||
Total Investment Income | 22,950 | 18,837 | 23,381 | 75,273 | ||||||||||||
Expenses | ||||||||||||||||
Investment Advisory Services Fees | 2,406 | 447 | 1,753 | 4,606 | ||||||||||||
Administrative Services Fees | — | 6,693 | 10,155 | — | ||||||||||||
Accounting & Transfer Agent Fees | 152 | 212 | 251 | 211 | ||||||||||||
Custodian Fees | 50 | 58 | 47 | 20 | ||||||||||||
Filing Fees | 201 | 132 | 68 | 97 | ||||||||||||
Shareholders’ Reports | 29 | 146 | 198 | 147 | ||||||||||||
Directors’/Trustees’ Fees & Expenses | 35 | — | — | 24 | ||||||||||||
Professional Fees | 45 | 91 | 113 | 69 | ||||||||||||
Other | 129 | 240 | 287 | 369 | ||||||||||||
Total Expenses | 3,047 | 8,019 | 12,872 | 5,543 | ||||||||||||
Net Investment Income (Loss) | 19,903 | 10,818 | 10,509 | 69,730 | ||||||||||||
Realized and Unrealized Gain (Loss) | ||||||||||||||||
Capital Gain Distributions Received from Investment Securities | — | — | — | 16,169 | ||||||||||||
Net Realized Gain (Loss) on: | ||||||||||||||||
Investment Securities Sold | (41,654 | ) | (68,079 | ) | (190,350 | ) | (106,626 | ) | ||||||||
Futures | (854 | ) | — | — | (1,065 | ) | ||||||||||
Change in Unrealized Appreciation (Depreciation) of: | ||||||||||||||||
Investment Securities | 211,836 | 284,014 | 168,490 | 92,786 | ||||||||||||
Futures | (1 | ) | — | — | (10 | ) | ||||||||||
Net Realized and Unrealized Gain (Loss) | 169,327 | 215,935 | (21,860 | ) | 1,254 | |||||||||||
Net Increase (Decrease) in Net Assets Resulting from Operations | $ | 189,230 | $ | 226,753 | $ | (11,351 | ) | $ | 70,984 | |||||||
See accompanying Notes to Financial Statements.
159
DFA INVESTMENT DIMENSIONS GROUP INC.
STATEMENTS OF OPERATIONS
FOR THE YEAR ENDED OCTOBER 31, 2009
(Amounts in thousands)
| Large Cap International Portfolio | International Core Equity Portfolio | T.A. World ex U.S. Core Equity Portfolio | International Small Company Portfolio* | |||||||||||||
Investment Income | ||||||||||||||||
Net Investment Income Received from Affiliated Investment Companies: | ||||||||||||||||
Dividends (Net of Foreign Taxes Withheld of $0, $0, $0 and $6,806, respectively) | — | — | — | $ | 89,418 | |||||||||||
Interest | — | — | — | 106 | ||||||||||||
Income from Securities Lending | — | — | — | 13,207 | ||||||||||||
Expenses Allocated from Affiliated Investment Company | — | — | — | (5,258 | ) | |||||||||||
Total Net Investment Income Received from Affiliated Investment Companies | — | — | — | 97,473 | ||||||||||||
Fund Investment Income | ||||||||||||||||
Dividends (Net of Foreign Taxes Withheld of $3,405, $7,233, $1,206, and $0, respectively) | $ | 37,283 | $ | 81,517 | $ | 13,481 | — | |||||||||
Interest | 26 | 112 | 27 | 21 | ||||||||||||
Income from Securities Lending | 2,539 | 7,668 | 488 | — | ||||||||||||
Total Fund Investment Income | 39,848 | 89,297 | 13,996 | 21 | ||||||||||||
Fund Expenses | ||||||||||||||||
Investment Advisory Services Fees | 2,880 | 9,575 | 1,911 | — | ||||||||||||
Administrative Services Fees | — | — | — | 13,452 | ||||||||||||
Accounting & Transfer Agent Fees | 169 | 359 | 83 | 77 | ||||||||||||
Custodian Fees | 202 | 589 | 248 | — | ||||||||||||
Filing Fees | 88 | 187 | 63 | 107 | ||||||||||||
Shareholders’ Reports | 106 | 118 | 14 | 189 | ||||||||||||
Directors’/Trustees’ Fees & Expenses | 17 | 68 | 16 | 59 | ||||||||||||
Professional Fees | 53 | 118 | 35 | 36 | ||||||||||||
Organizational & Offering Costs | — | — | 17 | — | ||||||||||||
Other | 161 | 342 | 64 | 34 | ||||||||||||
Total Expenses | 3,676 | 11,356 | 2,451 | 13,954 | ||||||||||||
Fees Waived, Expenses Reimbursed, and/or Previously Waived Fees Recovered by Advisor (Note C) | — | — | 135 | — | ||||||||||||
Net Expenses | 3,676 | 11,356 | 2,586 | 13,954 | ||||||||||||
Net Investment Income (Loss) | 36,172 | 77,941 | 11,410 | 83,540 | ||||||||||||
Realized and Unrealized Gain (Loss) | ||||||||||||||||
Net Realized Gain (Loss) on: | ||||||||||||||||
Investment Securities Sold | (150,602 | ) | (83,575 | ) | (8,990 | ) | (110,040 | ) | ||||||||
Futures | 919 | (2,556 | ) | (660 | ) | 592 | ||||||||||
Foreign Currency Transactions | 951 | 1,319 | 97 | 1,180 | ||||||||||||
Change in Unrealized Appreciation (Depreciation) of: | ||||||||||||||||
Investment Securities and Foreign Currency | 374,243 | 928,934 | 196,743 | 1,280,471 | ||||||||||||
Futures | — | (15 | ) | (1 | ) | 1 | ||||||||||
Translation of Foreign Currency Denominated Amounts | (64 | ) | (108 | ) | (31 | ) | (297 | ) | ||||||||
Change in Deferred Thailand Capital Gains Tax | — | — | (101 | ) | — | |||||||||||
Net Realized and Unrealized Gain (Loss) | 225,447 | 843,999 | 187,057 | 1,171,907 | ||||||||||||
Net Increase (Decrease) in Net Assets Resulting from Operations | $ | 261,619 | $ | 921,940 | $ | 198,467 | $ | 1,255,447 | ||||||||
| * | Investment Income and Realized and Unrealized Gain (Loss) were allocated from each Portfolio’s Master Fund (Affiliated Investment Companies). |
See accompanying Notes to Financial Statements.
160
DFA INVESTMENT DIMENSIONS GROUP INC.
STATEMENTS OF OPERATIONS
FOR THE YEAR ENDED OCTOBER 31, 2009
(Amounts in thousands)
| Japanese Small Company Portfolio* | Asia Pacific Small Company Portfolio* | United Kingdom Small Company Portfolio* | Continental Small Company Portfolio* | |||||||||||||
Investment Income | ||||||||||||||||
Dividends (Net of Foreign Taxes Withheld of $142, $58, $0 and $358, respectively) | $ | 1,899 | $ | 2,693 | $ | 989 | $ | 2,349 | ||||||||
Interest | 2 | 2 | 1 | 5 | ||||||||||||
Income from Securities Lending | 640 | 299 | 17 | 380 | ||||||||||||
Expenses Allocated from Affiliated Investment Companies | (169 | ) | (132 | ) | (34 | ) | (142 | ) | ||||||||
Total Net Investment Income Received from Affiliated Investment Companies | 2,372 | 2,862 | 973 | 2,592 | ||||||||||||
Expenses | ||||||||||||||||
Administrative Services Fees | 446 | 286 | 95 | 362 | ||||||||||||
Accounting & Transfer Agent Fees | 15 | 15 | 13 | 15 | ||||||||||||
Filing Fees | 18 | 20 | 15 | 22 | ||||||||||||
Shareholders’ Reports | 6 | 6 | 3 | 7 | ||||||||||||
Directors’/Trustees’ Fees & Expenses | 2 | 1 | — | 1 | ||||||||||||
Professional Fees | 2 | 3 | 2 | 2 | ||||||||||||
Other | 4 | 2 | 4 | 4 | ||||||||||||
Total Expenses | 493 | 333 | 132 | 413 | ||||||||||||
Fees Waived, Expenses Reimbursed, and/or Previously Waived Fees Recovered by Advisor (Note C) | — | 4 | (20 | ) | 11 | |||||||||||
Net Expenses | 493 | 337 | 112 | 424 | ||||||||||||
Net Investment Income (Loss) | 1,879 | 2,525 | 861 | 2,168 | ||||||||||||
Realized and Unrealized Gain (Loss) | ||||||||||||||||
Net Realized Gain (Loss) on: | ||||||||||||||||
Investment Securities Sold | (14,110 | ) | (8,877 | ) | (2,247 | ) | (7,421 | ) | ||||||||
Futures | 43 | (89 | ) | 26 | (137 | ) | ||||||||||
Foreign Currency Transactions | 250 | 23 | (10 | ) | (49 | ) | ||||||||||
Change in Unrealized Appreciation (Depreciation) of: | ||||||||||||||||
Investment Securities | 37,328 | 52,469 | 9,569 | 37,449 | ||||||||||||
Futures | — | — | — | (1 | ) | |||||||||||
Translation of Foreign Currency Denominated Amounts | (61 | ) | 29 | (6 | ) | 24 | ||||||||||
Net Realized and Unrealized Gain (Loss) | 23,450 | 43,555 | 7,332 | 29,865 | ||||||||||||
Net Increase (Decrease) in Net Assets Resulting from Operations | $ | 25,329 | $ | 46,080 | $ | 8,193 | $ | 32,033 | ||||||||
| * | Investment Income and Realized and Unrealized Gain (Loss) were allocated from each Portfolio’s respective Master Fund (Affiliated Investment Companies). |
See accompanying Notes to Financial Statements.
161
DFA INVESTMENT DIMENSIONS GROUP INC.
STATEMENTS OF OPERATIONS
FOR THE YEAR ENDED OCTOBER 31, 2009
(Amounts in thousands)
| DFA International Real Estate Securities Portfolio | DFA Global Real Estate Securities Portfolio* | DFA International Small Cap Value Portfolio | International Vector Equity Portfolio | |||||||||||||
Investment Income | ||||||||||||||||
Income Distributions Received from Affiliated Investment Companies | — | $ | 7,670 | — | — | |||||||||||
Dividends (Net of Foreign Taxes Withheld of $3,542, $0, $10,608 and $431, respectively) | $ | 32,209 | — | $ | 142,769 | $ | 4,841 | |||||||||
Interest | 5 | 10 | 231 | 12 | ||||||||||||
Income from Securities Lending | 2,060 | — | 14,358 | 412 | ||||||||||||
Total Investment Income | 34,274 | 7,680 | 157,358 | 5,265 | ||||||||||||
Expenses | ||||||||||||||||
Investment Advisory Services Fees | 1,753 | — | 35,181 | 811 | ||||||||||||
Administrative Services Fees | — | 769 | — | — | ||||||||||||
Accounting & Transfer Agent Fees | 87 | 16 | 693 | 47 | ||||||||||||
Custodian Fees | 108 | — | 1,096 | 107 | ||||||||||||
Filing Fees | 66 | 31 | 121 | 16 | ||||||||||||
Shareholders’ Reports | 63 | 15 | 275 | 16 | ||||||||||||
Directors’/Trustees’ Fees & Expenses | 12 | 7 | 99 | 6 | ||||||||||||
Professional Fees | 20 | 7 | 254 | 7 | ||||||||||||
Organizational & Offering Costs | — | 33 | — | 35 | ||||||||||||
Other | 64 | 4 | 730 | 22 | ||||||||||||
Total Expenses | 2,173 | 882 | 38,449 | 1,067 | ||||||||||||
Fees Waived, Expenses Reimbursed, and/or Previously Waived Fees Recovered by Advisor (Note C) | — | (706 | ) | — | 17 | |||||||||||
Net Expenses | 2,173 | 176 | 38,449 | 1,084 | ||||||||||||
Net Investment Income (Loss) | 32,101 | 7,504 | 118,909 | 4,181 | ||||||||||||
Realized and Unrealized Gain (Loss) | ||||||||||||||||
Net Realized Gain (Loss) on: | ||||||||||||||||
Investment Securities Sold | (36,531 | ) | (6,921 | ) | (20,925 | ) | (3,551 | ) | ||||||||
Futures | 234 | — | (9,031 | ) | (232 | ) | ||||||||||
Foreign Currency Transactions | 185 | — | (2,189 | ) | (23 | ) | ||||||||||
Change in Unrealized Appreciation (Depreciation) of: | ||||||||||||||||
Investment Securities and Foreign Currency | 170,229 | 66,893 | 1,907,503 | 71,485 | ||||||||||||
Futures | — | — | (28 | ) | (1 | ) | ||||||||||
Translation of Foreign Currency Denominated Amounts | 209 | — | (469 | ) | (11 | ) | ||||||||||
Net Realized and Unrealized Gain (Loss) | 134,326 | 59,972 | 1,874,861 | 67,667 | ||||||||||||
Net Increase (Decrease) in Net Assets Resulting from Operations | $ | 166,427 | $ | 67,476 | $ | 1,993,770 | $ | 71,848 | ||||||||
| * | Investment Income and Realized and Unrealized Gain (Loss) were allocated from each Portfolio’s Master Fund (Affiliated Investment Companies). |
See accompanying Notes to Financial Statements.
162
DFA INVESTMENT DIMENSIONS GROUP INC.
STATEMENTS OF OPERATIONS
FOR THE YEAR ENDED OCTOBER 31, 2009
(Amounts in thousands)
| Emerging Markets Portfolio* | Emerging Markets Small Cap Portfolio* | Emerging Markets Core Equity Portfolio | DFA One-Year Fixed Income Portfolio* | |||||||||||||
Investment Income | ||||||||||||||||
Dividends (Net of Foreign Taxes Withheld of $4,615, $1,814, $4,585 and $0, respectively) | $ | 40,471 | $ | 19,964 | $ | 43,855 | — | |||||||||
Interest | 67 | 21 | 48 | $ | 50,479 | |||||||||||
Income from Securities Lending | 3,108 | 2,129 | 4,061 | — | ||||||||||||
Expenses Allocated from Affiliated Investment Companies | (3,138 | ) | (2,578 | ) | — | (1,302 | ) | |||||||||
Total Investment Income | 40,508 | 19,536 | 47,964 | 49,177 | ||||||||||||
Expenses | ||||||||||||||||
Investment Advisory Services Fees | — | — | 9,732 | 46 | ||||||||||||
Administrative Services Fees | 6,299 | 3,484 | — | 3,448 | ||||||||||||
Accounting & Transfer Agent Fees | 44 | 28 | 241 | 86 | ||||||||||||
Custodian Fees | — | — | 1,315 | 1 | ||||||||||||
Filing Fees | 63 | 58 | 152 | 183 | ||||||||||||
Shareholders’ Reports | 117 | 48 | 114 | 152 | ||||||||||||
Directors’/Trustees’ Fees & Expenses | 21 | 12 | 41 | 94 | ||||||||||||
Professional Fees | 17 | 8 | 103 | 72 | ||||||||||||
Other | 25 | 13 | 226 | 78 | ||||||||||||
Total Expenses | 6,586 | 3,651 | 11,924 | 4,160 | ||||||||||||
Net Investment Income (Loss) | 33,922 | 15,885 | 36,040 | 45,017 | ||||||||||||
Realized and Unrealized Gain (Loss) | ||||||||||||||||
Net Realized Gain (Loss) on: | ||||||||||||||||
Investment Securities Sold | 37,268 | (15,114 | ) | (25,567 | ) | 6,804 | ||||||||||
Futures | (2,712 | ) | (630 | ) | (873 | ) | — | |||||||||
Foreign Currency Transactions | (28 | ) | (178 | ) | (297 | ) | — | |||||||||
In-Kind Redemptions | 17,805 | ** | — | — | — | |||||||||||
Change in Unrealized Appreciation (Depreciation) of: | ||||||||||||||||
Investment Securities and Foreign Currency | 592,684 | 522,143 | 981,322 | 30,261 | ||||||||||||
Futures | (30 | ) | (9 | ) | (4 | ) | — | |||||||||
Translation of Foreign Currency Denominated Amounts | 196 | 168 | 33 | — | ||||||||||||
Change in Deferred Thailand Capital Gains Tax | (1,264 | ) | (785 | ) | (1,800 | ) | — | |||||||||
Net Realized and Unrealized Gain (Loss) | 643,919 | 505,595 | 952,814 | 37,065 | ||||||||||||
Net Increase (Decrease) in Net Assets Resulting from Operations | $ | 677,841 | $ | 521,480 | $ | 988,854 | $ | 82,082 | ||||||||
| * | For the period November 1, 2008 to June 4, 2009 Investment Income and Realized and Unrealized Gain (Loss) were allocated from each Portfolio’s respective Master Fund (Affiliated Investment Companies). |
| ** | See Note M in the Notes to Financial Statements. |
See accompanying Notes to Financial Statements.
163
DFA INVESTMENT DIMENSIONS GROUP INC.
STATEMENTS OF OPERATIONS
FOR THE YEAR ENDED OCTOBER 31, 2009
(Amounts in thousands)
| DFA Two-Year Global Fixed Income Portfolio* | DFA Selectively Hedged Global Fixed Income Portfolio | DFA Five-Year Government Portfolio | DFA Five-Year Global Fixed Income Portfolio | ||||||||||||
Investment Income | |||||||||||||||
Interest | $ | 66,491 | $ | 6,472 | $ | 27,157 | $ | 84,414 | |||||||
Income from Securities Lending | 39 | — | — | 160 | |||||||||||
Expenses Allocated from Affiliated Investment Company | (2,534 | ) | — | — | — | ||||||||||
Total Investment Income | 63,996 | 6,472 | 27,157 | 84,574 | |||||||||||
Expenses | |||||||||||||||
Investment Advisory Services Fees | 41 | 318 | 2,022 | 7,617 | |||||||||||
Administrative Services Fees | 3,169 | — | — | — | |||||||||||
Accounting & Transfer Agent Fees | 80 | 51 | 147 | 406 | |||||||||||
Custodian Fees | 13 | 18 | 11 | 184 | |||||||||||
Filing Fees | 122 | 61 | 66 | 144 | |||||||||||
Shareholders’ Reports | 156 | 6 | 56 | 158 | |||||||||||
Directors’/Trustees’ Fees & Expenses | 86 | 6 | 24 | 73 | |||||||||||
Professional Fees | 68 | 12 | 47 | 143 | |||||||||||
Organizational & Offering Costs | — | 7 | — | — | |||||||||||
Other | 78 | 27 | 144 | 400 | |||||||||||
Total Expenses | 3,813 | 506 | 2,517 | 9,125 | |||||||||||
Net Investment Income (Loss) | 60,183 | 5,966 | 24,640 | 75,449 | |||||||||||
Realized and Unrealized Gain (Loss) | |||||||||||||||
Net Realized Gain (Loss) on: | |||||||||||||||
Investment Securities Sold | 25,365 | 384 | 27,247 | 19,184 | |||||||||||
Foreign Currency Transactions | 25,954 | (15,821 | ) | — | 49,631 | ||||||||||
Change in Unrealized Appreciation (Depreciation) of: | |||||||||||||||
Investment Securities and Foreign Currency | (6,521 | ) | 32,803 | 22,977 | 87,483 | ||||||||||
Translation of Foreign Currency Denominated Amounts | 6,818 | 806 | — | (3,992 | ) | ||||||||||
Net Realized and Unrealized Gain (Loss) | 51,616 | 18,172 | 50,224 | 152,306 | |||||||||||
Net Increase (Decrease) in Net Assets Resulting from Operations | $ | 111,799 | $ | 24,138 | $ | 74,864 | $ | 227,755 | |||||||
| * | For the period November 1, 2008 to October 16, 2009 Investment Income and Realized and Unrealized Gain (Loss) were allocated from each Portfolio’s respective Master Fund (Affiliated Investment Companies). |
See accompanying Notes to Financial Statements.
164
DFA INVESTMENT DIMENSIONS GROUP INC.
STATEMENTS OF OPERATIONS
FOR THE YEAR ENDED OCTOBER 31, 2009
(Amounts in thousands)
| DFA Intermediate Government Fixed Income Portfolio | DFA Short-Term Extended Quality Portfolio(a) | DFA Inflation- Protected Securities Portfolio | DFA Short-Term Municipal Bond Portfolio | DFA California Short-Term Municipal Bond Portfolio | |||||||||||||
Investment Income | |||||||||||||||||
Interest | $ | 57,708 | $ | 5,679 | $ | 7,287 | $ | 23,118 | $ | 4,669 | |||||||
Total Investment Income | 57,708 | 5,679 | 7,287 | 23,118 | 4,669 | ||||||||||||
Expenses | |||||||||||||||||
Investment Advisory Services Fees | 1,333 | 300 | 536 | 2,064 | 385 | ||||||||||||
Accounting & Transfer Agent Fees | 186 | 34 | 86 | 148 | 44 | ||||||||||||
Custodian Fees | 15 | 7 | 7 | 11 | 3 | ||||||||||||
Filing Fees | 114 | 21 | 79 | 70 | 17 | ||||||||||||
Shareholders’ Reports | 63 | 3 | 28 | 36 | 5 | ||||||||||||
Directors’/Trustees’ Fees & Expenses | 34 | 7 | 15 | 27 | 5 | ||||||||||||
Professional Fees | 61 | 6 | 23 | 46 | 10 | ||||||||||||
Organizational & Offering Costs | — | 27 | — | — | — | ||||||||||||
Other | 167 | 15 | 68 | 137 | 28 | ||||||||||||
Total Expenses | 1,973 | 420 | 842 | 2,539 | 497 | ||||||||||||
Fees Waived, Expenses Reimbursed, and/or Previously Waived Fees Recovered by Advisor (Note C) | — | (87 | ) | — | — | — | |||||||||||
Net Expenses | 1,973 | 333 | 842 | 2,539 | 497 | ||||||||||||
Net Investment Income (Loss) | 55,735 | 5,346 | 6,445 | 20,579 | 4,172 | ||||||||||||
Realized and Unrealized Gain (Loss) | |||||||||||||||||
Net Realized Gain (Loss) on Investment Securities Sold | 6,168 | 287 | (774 | ) | — | 23 | |||||||||||
Change in Unrealized Appreciation (Depreciation) of Investment Securities | 71,964 | 11,089 | 77,881 | 22,482 | 4,608 | ||||||||||||
Net Realized and Unrealized Gain (Loss) | 78,132 | 11,376 | 77,107 | 22,482 | 4,631 | ||||||||||||
Net Increase (Decrease) in Net Assets Resulting from Operations | $ | 133,867 | $ | 16,722 | $ | 83,552 | $ | 43,061 | $ | 8,803 | |||||||
| (a) | The Portfolio commenced operations on March 4, 2009. |
See accompanying Notes to Financial Statements.
165
DFA INVESTMENT DIMENSIONS GROUP INC.
STATEMENTS OF CHANGES IN NET ASSETS
(Amounts in thousands)
| U.S. Large Company Portfolio | Enhanced U.S. Large Company Portfolio | |||||||||||||||||||||||||||
| Year Ended Oct. 31, 2009 | Period Dec. 1, 2007 to Oct. 31, 2008 | Year Ended Nov. 30, 2007 | Year Ended Oct. 31, 2009 | Period Dec. 1, 2007 to Oct. 31, 2008 | Year Ended Nov. 30, 2007 | |||||||||||||||||||||||
Increase (Decrease) in Net Assets | ||||||||||||||||||||||||||||
Operations: | ||||||||||||||||||||||||||||
Net Investment Income (Loss) | $ | 58,753 | $ | 61,569 | $ | 59,476 | $ | 1,409 | $ | 12,018 | $ | 9,767 | ||||||||||||||||
Capital Gain Distributions Received from Affiliated Investment Company | — | — | — | — | 8,681 | 26,075 | ||||||||||||||||||||||
Net Realized Gain (Loss) on: | ||||||||||||||||||||||||||||
Investment Securities Sold/Affiliated Investment Company Shares Sold | (177,354 | ) | (104,970 | ) | 3,775 | (24,217 | ) | (11,592 | ) | 3,051 | ||||||||||||||||||
Futures | 7,676 | (17,555 | ) | 714 | 25,750 | — | — | |||||||||||||||||||||
Foreign Currency Transactions | — | — | — | (1,379 | ) | — | — | |||||||||||||||||||||
Change in Unrealized Appreciation (Depreciation) of: | ||||||||||||||||||||||||||||
Investment Securities/Affiliated Investment Company Shares | 354,409 | (1,194,131 | ) | 164,399 | 2,720 | (116,750 | ) | (13,649 | ) | |||||||||||||||||||
Futures | (4,182 | ) | 521 | (288 | ) | 1,705 | — | — | ||||||||||||||||||||
Translation of Foreign Currency Denominated Amounts | — | — | — | 39 | — | — | ||||||||||||||||||||||
Net Increase (Decrease) in Net Assets Resulting from Operations | 239,302 | (1,254,566 | ) | 228,076 | 6,027 | (107,643 | ) | 25,244 | ||||||||||||||||||||
Distributions From: | ||||||||||||||||||||||||||||
Net Investment Income: | ||||||||||||||||||||||||||||
Institutional Class Shares | (62,498 | ) | (67,060 | ) | (55,847 | ) | (17,802 | ) | (10,906 | ) | (11,397 | ) | ||||||||||||||||
Net Short-Term Gains: | ||||||||||||||||||||||||||||
Institutional Class Shares | — | — | — | (1,762 | ) | (4,842 | ) | (11,623 | ) | |||||||||||||||||||
Net Long-Term Gains: | ||||||||||||||||||||||||||||
Institutional Class Shares | — | — | — | — | (17,601 | ) | (1,991 | ) | ||||||||||||||||||||
Total Distributions | (62,498 | ) | (67,060 | ) | (55,847 | ) | (19,564 | ) | (33,349 | ) | (25,011 | ) | ||||||||||||||||
Capital Share Transactions (1): | ||||||||||||||||||||||||||||
Shares Issued | 812,573 | 1,128,680 | 906,212 | 58,709 | * | 75,527 | 93,808 | |||||||||||||||||||||
Shares Issued in Lieu of Cash Distributions | 49,324 | 59,339 | 51,856 | 18,404 | 32,429 | 24,050 | ||||||||||||||||||||||
Shares Redeemed | (863,321 | ) | (738,188 | ) | (583,275 | ) | (98,676 | ) | (103,683 | ) | (128,257 | ) | ||||||||||||||||
Net Increase (Decrease) from Capital Share Transactions | (1,424 | ) | 449,831 | 374,793 | (21,563 | ) | 4,273 | (10,399 | ) | |||||||||||||||||||
Total Increase (Decrease) in Net Assets | 175,380 | (871,795 | ) | 547,022 | (35,100 | ) | (136,719 | ) | (10,166 | ) | ||||||||||||||||||
Net Assets | ||||||||||||||||||||||||||||
Beginning of Period | 2,544,038 | 3,415,833 | 2,868,811 | 200,331 | 337,050 | 347,216 | ||||||||||||||||||||||
End of Period | $ | 2,719,418 | $ | 2,544,038 | $ | 3,415,833 | $ | 165,231 | $ | 200,331 | $ | 337,050 | ||||||||||||||||
(1) Shares Issued and Redeemed: | ||||||||||||||||||||||||||||
Shares Issued | 31,260 | 29,917 | 21,005 | 9,053 | 9,136 | 8,538 | ||||||||||||||||||||||
Shares Issued in Lieu of Cash Distributions | 1,881 | 1,514 | 1,222 | 3,392 | 3,364 | 2,263 | ||||||||||||||||||||||
Shares Redeemed | (33,310 | ) | (20,702 | ) | (13,462 | ) | (17,904 | ) | (12,436 | ) | (11,632 | ) | ||||||||||||||||
Net Increase (Decrease) from Shares Issued and Redeemed | (169 | ) | 10,729 | 8,765 | (5,459 | ) | 64 | (831 | ) | |||||||||||||||||||
Undistributed Net Investment Income (Distributions in Excess of Net Investment Income) | $ | 7,113 | $ | 10,863 | $ | 16,354 | $ | 285 | $ | 15,378 | $ | 4 | ||||||||||||||||
| * | Includes $7,414 in capital contributions related to the liquidation of The Enhanced U.S. Large Company Series. See Organization note within the Notes to Financial Statements. |
See accompanying Notes to Financial Statements.
166
DFA INVESTMENT DIMENSIONS GROUP INC.
STATEMENTS OF CHANGES IN NET ASSETS
(Amounts in thousands)
| U.S. Large Cap Value Portfolio | U.S. Targeted Value Portfolio | |||||||||||||||||||||||||||
| Year Ended Oct. 31, 2009 | Period Dec. 1, 2007 to Oct. 31, 2008 | Year Ended Nov. 30, 2007 | Year Ended Oct. 31, 2009 | Period Dec. 1, 2007 to Oct. 31, 2008 | Year Ended Nov. 30, 2007 | |||||||||||||||||||||||
Increase (Decrease) in Net Assets | ||||||||||||||||||||||||||||
Operations: | ||||||||||||||||||||||||||||
Net Investment Income (Loss) | $ | 113,440 | $ | 119,241 | $ | 95,990 | $ | 13,400 | $ | 10,389 | $ | 3,886 | ||||||||||||||||
Capital Gain Distributions Received from Affiliated Investment Company | — | — | �� | — | — | — | 26,668 | |||||||||||||||||||||
Net Realized Gain (Loss) on: | ||||||||||||||||||||||||||||
Investment Securities Sold | (2,244,299 | ) | — | † | 346,023 | † | (80,571 | ) | (2,137 | ) | (2,825 | ) | ||||||||||||||||
Futures | — | — | — | (823 | ) | — | — | |||||||||||||||||||||
Change in Unrealized Appreciation (Depreciation) of: | ||||||||||||||||||||||||||||
Investment Securities | 2,728,048 | (3,044,875 | )† | (554,415 | )† | 244,441 | (319,766 | ) | (75,837 | ) | ||||||||||||||||||
Futures | — | — | — | (3 | ) | 3 | — | |||||||||||||||||||||
Net Increase (Decrease) in Net Assets Resulting from Operations | 597,189 | (2,925,634 | ) | (112,402 | ) | 176,444 | (311,511 | ) | (48,108 | ) | ||||||||||||||||||
Distributions From: | ||||||||||||||||||||||||||||
Net Investment Income: | ||||||||||||||||||||||||||||
Class R1 Shares | — | — | — | (424 | ) | (351 | ) | — | ||||||||||||||||||||
Class R2 Shares | — | — | — | (27 | ) | (10 | ) | — | ||||||||||||||||||||
Institutional Class Shares | (123,996 | ) | (113,742 | ) | (88,197 | ) | (13,728 | ) | (7,766 | ) | (3,642 | ) | ||||||||||||||||
Net Short-Term Gains: | ||||||||||||||||||||||||||||
Institutional Class Shares | (6,242 | ) | (304 | ) | (10,685 | ) | — | — | (5,313 | ) | ||||||||||||||||||
Net Long-Term Gains: | ||||||||||||||||||||||||||||
Institutional Class Shares | — | (315,650 | ) | (127,166 | ) | — | (14,019 | ) | (11,902 | ) | ||||||||||||||||||
Total Distributions | (130,238 | ) | (429,696 | ) | (226,048 | ) | (14,179 | ) | (22,146 | ) | (20,857 | ) | ||||||||||||||||
Capital Share Transactions (1): | ||||||||||||||||||||||||||||
Shares Issued | 1,807,041 | 2,629,415 | 2,547,717 | 850,582 | 975,465 | 500,717 | * | |||||||||||||||||||||
Shares Issued in Lieu of Cash Distributions | 117,409 | 398,086 | 203,411 | 13,641 | 21,294 | 18,152 | ||||||||||||||||||||||
Shares Redeemed | (1,858,197 | ) | (1,877,275 | ) | (1,287,212 | ) | (425,490 | ) | (335,145 | ) | (110,437 | ) | ||||||||||||||||
Net Increase (Decrease) from Capital Share Transactions | 66,253 | 1,150,226 | 1,463,916 | 438,733 | 661,614 | 408,432 | ||||||||||||||||||||||
Total Increase (Decrease) in Net Assets | 533,204 | (2,205,104 | ) | 1,125,466 | 600,998 | 327,957 | 339,467 | |||||||||||||||||||||
Net Assets | ||||||||||||||||||||||||||||
Beginning of Period | 5,330,448 | 7,535,552 | 6,410,086 | 882,762 | 554,805 | 215,338 | ||||||||||||||||||||||
End of Period | $ | 5,863,652 | $ | 5,330,448 | $ | 7,535,552 | $ | 1,483,760 | $ | 882,762 | $ | 554,805 | ||||||||||||||||
(1) Shares Issued and Redeemed: | ||||||||||||||||||||||||||||
Shares Issued | 140,615 | 131,947 | 97,946 | 88,462 | 71,448 | 28,579 | ||||||||||||||||||||||
Shares Issued in Lieu of Cash Distributions | 10,018 | 17,729 | 8,025 | 1,442 | 1,447 | 1,060 | ||||||||||||||||||||||
Shares Redeemed | (145,245 | ) | (92,441 | ) | (50,063 | ) | (44,353 | ) | (25,199 | ) | (6,247 | ) | ||||||||||||||||
Net Increase (Decrease) from Shares Issued and Redeemed | 5,388 | 57,235 | 55,908 | 45,551 | 47,696 | 23,392 | ||||||||||||||||||||||
Undistributed Net Investment Income (Distributions in Excess of Net Investment Income) | $ | 13,540 | $ | 25,004 | $ | 23,690 | $ | 1,308 | $ | 2,098 | $ | 794 | ||||||||||||||||
| * | Includes $6,246 in capital contributions related to the liquidation of The U.S. Targeted Value Series. See Organization note within the Notes to Financial Statements. |
| † | See Note A in the Notes to Financial Statements. |
See accompanying Notes to Financial Statements.
167
DFA INVESTMENT DIMENSIONS GROUP INC.
STATEMENTS OF CHANGES IN NET ASSETS
(Amounts in thousands)
| U.S. Small Cap Value Portfolio | U.S. Core Equity 1 Portfolio | |||||||||||||||||||||||||||
| Year Ended Oct. 31, 2009 | Period Dec. 1, 2007 to Oct. 31, 2008 | Year Ended Nov. 30, 2007 | Year Ended Oct. 31, 2009 | Period Dec. 1, 2007 to Oct. 31, 2008 | Year Ended Nov. 30, 2007 | |||||||||||||||||||||||
Increase (Decrease) in Net Assets | ||||||||||||||||||||||||||||
Operations: | ||||||||||||||||||||||||||||
Net Investment Income (Loss) | $ | 16,559 | $ | 60,650 | $ | 92,097 | $ | 31,729 | $ | 22,840 | $ | 14,928 | ||||||||||||||||
Capital Gain Distributions Received from Affiliated Investment Company | — | 1,046,424 | 875,446 | — | — | — | ||||||||||||||||||||||
Net Realized Gain (Loss) on: | ||||||||||||||||||||||||||||
Investment Securities Sold/Affiliated Investment Company Shares Sold | (373,304 | ) | (209,110 | ) | (37,370 | ) | (60,672 | ) | (19,218 | ) | (3,304 | ) | ||||||||||||||||
Futures | 570 | — | — | 683 | — | — | ||||||||||||||||||||||
Change in Unrealized Appreciation (Depreciation) of: | ||||||||||||||||||||||||||||
Investment Securities/Affiliated Investment Company Shares | 602,920 | (3,538,529 | ) | (1,754,043 | ) | 253,827 | (553,125 | ) | 15,592 | |||||||||||||||||||
Futures | — | — | — | (2 | ) | 2 | — | |||||||||||||||||||||
Net Increase (Decrease) in Net Assets Resulting from Operations | 246,745 | (2,640,565 | ) | (823,870 | ) | 225,565 | (549,501 | ) | 27,216 | |||||||||||||||||||
Distributions From: | ||||||||||||||||||||||||||||
Net Investment Income: | ||||||||||||||||||||||||||||
Institutional Class Shares | (69,882 | ) | (74,354 | ) | (85,546 | ) | (31,598 | ) | (22,927 | ) | (14,899 | ) | ||||||||||||||||
Net Short-Term Gains: | ||||||||||||||||||||||||||||
Institutional Class Shares | — | — | (72,477 | ) | — | — | (578 | ) | ||||||||||||||||||||
Net Long-Term Gains: | ||||||||||||||||||||||||||||
Institutional Class Shares | — | (746,639 | ) | (592,599 | ) | — | — | (1,040 | ) | |||||||||||||||||||
Total Distributions | (69,882 | ) | (820,993 | ) | (750,622 | ) | (31,598 | ) | (22,927 | ) | (16,517 | ) | ||||||||||||||||
Capital Share Transactions (1): | ||||||||||||||||||||||||||||
Shares Issued | 1,293,768 | * | 1,857,448 | 2,756,160 | 1,158,480 | 1,087,323 | 609,131 | |||||||||||||||||||||
Shares Issued in Lieu of Cash Distributions | 67,125 | 798,952 | 722,554 | 30,660 | 21,544 | 16,079 | ||||||||||||||||||||||
Shares Redeemed | (1,372,042 | ) | (2,493,743 | ) | (1,839,654 | ) | (714,086 | ) | (425,908 | ) | (78,148 | ) | ||||||||||||||||
Net Increase (Decrease) from Capital Share Transactions | (11,149 | ) | 162,657 | 1,639,060 | 475,054 | 682,959 | 547,062 | |||||||||||||||||||||
Total Increase (Decrease) in Net Assets | 165,714 | (3,298,901 | ) | 64,568 | 669,021 | 110,531 | 557,761 | |||||||||||||||||||||
Net Assets | ||||||||||||||||||||||||||||
Beginning of Period | 5,503,945 | 8,802,846 | 8,738,278 | 1,320,562 | 1,210,031 | 652,270 | ||||||||||||||||||||||
End of Period | $ | 5,669,659 | $ | 5,503,945 | $ | 8,802,846 | $ | 1,989,583 | $ | 1,320,562 | $ | 1,210,031 | ||||||||||||||||
(1) Shares Issued and Redeemed: | ||||||||||||||||||||||||||||
Shares Issued | 72,979 | 84,519 | 93,005 | 160,998 | 107,874 | 50,720 | ||||||||||||||||||||||
Shares Issued in Lieu of Cash Distributions | 4,580 | 34,137 | 24,691 | 4,155 | 2,264 | 1,371 | ||||||||||||||||||||||
Shares Redeemed | (94,264 | ) | (113,726 | ) | (62,068 | ) | (101,230 | ) | (43,396 | ) | (6,544 | ) | ||||||||||||||||
Net Increase (Decrease) from Shares Issued and Redeemed | (16,705 | ) | 4,930 | 55,628 | 63,923 | 66,742 | 45,547 | |||||||||||||||||||||
Undistributed Net Investment Income (Distributions in Excess of Net Investment Income) | $ | 2,918 | $ | 31,701 | $ | 8,847 | $ | 373 | $ | 257 | $ | 344 | ||||||||||||||||
| * | Includes $28,400 in capital contributions related to the liquidation of The U.S. Small Cap Value Series. See Organization note within the Notes to Financial Statements. |
See accompanying Notes to Financial Statements.
168
DFA INVESTMENT DIMENSIONS GROUP INC.
STATEMENTS OF CHANGES IN NET ASSETS
(Amounts in thousands)
| U.S. Core Equity 2 Portfolio | U.S. Vector Equity Portfolio | |||||||||||||||||||||||||||
| Year Ended Oct. 31, 2009 | Period Dec. 1, 2007 to Oct. 31, 2008 | Year Ended Nov. 30, 2007 | Year Ended Oct. 31, 2009 | Period Dec. 1, 2007 to Oct. 31, 2008 | Year Ended Nov. 30, 2007 | |||||||||||||||||||||||
Increase (Decrease) in Net Assets | ||||||||||||||||||||||||||||
Operations: | ||||||||||||||||||||||||||||
Net Investment Income (Loss) | $ | 55,180 | $ | 47,930 | $ | 34,532 | $ | 14,733 | $ | 15,482 | $ | 9,503 | ||||||||||||||||
Net Realized Gain (Loss) on: | ||||||||||||||||||||||||||||
Investment Securities Sold | (38,804 | ) | (45,734 | ) | (15,734 | ) | (80,019 | ) | (13,893 | ) | (1,810 | ) | ||||||||||||||||
Futures | 3,212 | — | — | 407 | — | — | ||||||||||||||||||||||
Change in Unrealized Appreciation (Depreciation) of: | ||||||||||||||||||||||||||||
Investment Securities | 375,912 | (1,104,305 | ) | (32,306 | ) | 173,818 | (400,041 | ) | (41,111 | ) | ||||||||||||||||||
Futures | (1 | ) | 1 | — | — | — | — | |||||||||||||||||||||
Net Increase (Decrease) in Net Assets Resulting from Operations | 395,499 | (1,102,108 | ) | (13,508 | ) | 108,939 | (398,452 | ) | (33,418 | ) | ||||||||||||||||||
Distributions From: | ||||||||||||||||||||||||||||
Net Investment Income: | ||||||||||||||||||||||||||||
Institutional Class Shares | (55,009 | ) | (48,004 | ) | (34,490 | ) | (16,454 | ) | (14,964 | ) | (7,650 | ) | ||||||||||||||||
Net Short-Term Gains: | ||||||||||||||||||||||||||||
Institutional Class Shares | — | — | (1,625 | ) | — | — | (6,329 | ) | ||||||||||||||||||||
Net Long-Term Gains: | ||||||||||||||||||||||||||||
Institutional Class Shares | — | — | (1,516 | ) | — | — | — | |||||||||||||||||||||
Total Distributions | (55,009 | ) | (48,004 | ) | (37,631 | ) | (16,454 | ) | (14,964 | ) | (13,979 | ) | ||||||||||||||||
Capital Share Transactions (1): | ||||||||||||||||||||||||||||
Shares Issued | 1,847,067 | 1,647,226 | 2,019,061 | 508,175 | 599,481 | 689,895 | ||||||||||||||||||||||
Shares Issued in Lieu of Cash Distributions | 54,122 | 47,199 | 37,027 | 16,189 | 14,671 | 13,800 | ||||||||||||||||||||||
Shares Redeemed | (938,382 | ) | (982,705 | ) | (281,839 | ) | (289,358 | ) | (309,855 | ) | (99,868 | ) | ||||||||||||||||
Net Increase (Decrease) from Capital Share Transactions | 962,807 | 711,720 | 1,774,249 | 235,006 | 304,297 | 603,827 | ||||||||||||||||||||||
Total Increase (Decrease) in Net Assets | 1,303,297 | (438,392 | ) | 1,723,110 | 327,491 | (109,119 | ) | 556,430 | ||||||||||||||||||||
Net Assets | ||||||||||||||||||||||||||||
Beginning of Period | 2,501,028 | 2,939,420 | 1,216,310 | 850,623 | 959,742 | 403,312 | ||||||||||||||||||||||
End of Period | $ | 3,804,325 | $ | 2,501,028 | $ | 2,939,420 | $ | 1,178,114 | $ | 850,623 | $ | 959,742 | ||||||||||||||||
(1) Shares Issued and Redeemed: | ||||||||||||||||||||||||||||
Shares Issued | 258,455 | 166,628 | 165,360 | 74,700 | 59,904 | 57,308 | ||||||||||||||||||||||
Shares Issued in Lieu of Cash Distributions | 7,485 | 5,013 | 3,137 | 2,427 | 1,411 | 1,170 | ||||||||||||||||||||||
Shares Redeemed | (135,979 | ) | (97,859 | ) | (23,138 | ) | (44,108 | ) | (31,898 | ) | (8,342 | ) | ||||||||||||||||
Net Increase (Decrease) from Shares Issued and Redeemed | 129,961 | 73,782 | 145,359 | 33,019 | 29,417 | 50,136 | ||||||||||||||||||||||
Undistributed Net Investment Income (Distributions in Excess of Net Investment Income) | $ | 698 | $ | 399 | $ | 473 | $ | 1,895 | $ | 3,637 | $ | 3,119 | ||||||||||||||||
See accompanying Notes to Financial Statements.
169
DFA INVESTMENT DIMENSIONS GROUP INC.
STATEMENTS OF CHANGES IN NET ASSETS
(Amounts in thousands)
| T.A. U.S. Core Equity 2 Portfolio | U.S. Small Cap Portfolio | |||||||||||||||||||||||||||
| Year Ended Oct. 31, 2009 | Period Dec. 1, 2007 to Oct. 31, 2008 | Period Oct. 4, 2007(a) to Nov. 30 2007 | Year Ended Oct. 31, 2009 | Period Dec. 1, 2007 to Oct. 31, 2008 | Year Ended Nov. 30, 2007 | |||||||||||||||||||||||
Increase (Decrease) in Net Assets | ||||||||||||||||||||||||||||
Operations: | ||||||||||||||||||||||||||||
Net Investment Income (Loss) | $ | 19,903 | $ | 6,271 | $ | 167 | $ | 10,818 | $ | 21,360 | $ | 33,291 | ||||||||||||||||
Capital Gain Distributions Received from Affiliated Investment Company | — | — | — | — | 243,531 | 216,208 | ||||||||||||||||||||||
Net Realized Gain (Loss) on: | ||||||||||||||||||||||||||||
Investment Securities Sold/Affiliated Investment Company Shares Sold | (41,654 | ) | (7,078 | ) | (310 | ) | (68,079 | ) | (116,947 | ) | 2,061 | |||||||||||||||||
Futures | (854 | ) | — | — | — | — | — | |||||||||||||||||||||
Change in Unrealized Appreciation (Depreciation) of: | ||||||||||||||||||||||||||||
Investment Securities/Affiliated Investment Company Shares | 211,836 | (179,572 | ) | (1,432 | ) | 284,014 | (1,073,797 | ) | (321,609 | ) | ||||||||||||||||||
Futures | (1 | ) | 1 | — | — | — | — | |||||||||||||||||||||
Net Increase (Decrease) in Net Assets Resulting from Operations | 189,230 | (180,378 | ) | (1,575 | ) | 226,753 | (925,853 | ) | (70,049 | ) | ||||||||||||||||||
Distributions From: | ||||||||||||||||||||||||||||
Net Investment Income: | ||||||||||||||||||||||||||||
Institutional Class Shares | (18,642 | ) | (4,648 | ) | — | (26,412 | ) | (26,222 | ) | (32,047 | ) | |||||||||||||||||
Net Short-Term Gains: | ||||||||||||||||||||||||||||
Institutional Class Shares | — | — | — | — | (8,922 | ) | (34,803 | ) | ||||||||||||||||||||
Net Long-Term Gains: | ||||||||||||||||||||||||||||
Institutional Class Shares | — | — | — | — | (173,725 | ) | (134,723 | ) | ||||||||||||||||||||
Total Distributions | (18,642 | ) | (4,648 | ) | — | (26,412 | ) | (208,869 | ) | (201,573 | ) | |||||||||||||||||
Capital Share Transactions (1): | ||||||||||||||||||||||||||||
Shares Issued | 1,195,628 | 995,838 | 120,639 | 877,915 | * | 937,947 | 727,472 | |||||||||||||||||||||
Shares Issued in Lieu of Cash Distributions | 18,449 | 4,587 | — | 24,690 | 204,052 | 197,467 | ||||||||||||||||||||||
Shares Redeemed | (524,944 | ) | (336,741 | ) | (12,557 | ) | (647,794 | ) | (1,225,521 | ) | (665,423 | ) | ||||||||||||||||
Net Increase (Decrease) from Capital Share Transactions | 689,133 | 663,684 | 108,082 | 254,811 | (83,522 | ) | 259,516 | |||||||||||||||||||||
Total Increase (Decrease) in Net Assets | 859,721 | 478,658 | 106,507 | 455,152 | (1,218,244 | ) | (12,106 | ) | ||||||||||||||||||||
Net Assets | ||||||||||||||||||||||||||||
Beginning of Period | 585,165 | 106,507 | — | 2,066,849 | 3,285,093 | 3,297,199 | ||||||||||||||||||||||
End of Period | $ | 1,444,886 | $ | 585,165 | $ | 106,507 | $ | 2,522,001 | $ | 2,066,849 | $ | 3,285,093 | ||||||||||||||||
(1) Shares Issued and Redeemed: | ||||||||||||||||||||||||||||
Shares Issued | 209,711 | 125,252 | 12,664 | 67,035 | 54,875 | 33,265 | ||||||||||||||||||||||
Shares Issued in Lieu of Cash Distributions | 3,194 | 543 | — | 2,058 | 10,771 | 9,289 | ||||||||||||||||||||||
Shares Redeemed | (94,288 | ) | (44,316 | ) | (1,335 | ) | (54,475 | ) | (70,022 | ) | (30,180 | ) | ||||||||||||||||
Net Increase (Decrease) from Shares Issued and Redeemed | 118,617 | 81,479 | 11,329 | 14,618 | (4,376 | ) | 12,374 | |||||||||||||||||||||
Undistributed Net Investment Income (Distributions in Excess of Net Investment Income) | $ | 3,080 | $ | 1,827 | $ | 173 | $ | 3,780 | $ | 7,754 | $ | 3,498 | ||||||||||||||||
See page 1 & 2 for the Definitions of Abbreviations and Footnotes.
| * | Includes $8,355 in capital contributions related to the liquidation of The U.S. Small Cap Series. See Organization note within the Notes to Financial Statements. |
See accompanying Notes to Financial Statements.
170
DFA INVESTMENT DIMENSIONS GROUP INC.
STATEMENTS OF CHANGES IN NET ASSETS
(Amounts in thousands)
| U.S. Micro Cap Portfolio | DFA Real Estate Securities Portfolio | |||||||||||||||||||||||||||
| Year Ended Oct. 31, 2009 | Period Dec. 1, 2007 to Oct. 31, 2008 | Year Ended Nov. 30, 2007 | Year Ended Oct. 31, 2009 | Period Dec. 1, 2007 to Oct. 31, 2008 | Year Ended Nov. 30, 2007 | |||||||||||||||||||||||
Increase (Decrease) in Net Assets | ||||||||||||||||||||||||||||
Operations: | ||||||||||||||||||||||||||||
Net Investment Income (Loss) | $ | 10,509 | $ | 33,434 | $ | 45,400 | $ | 69,730 | $ | 68,746 | $ | 57,485 | ||||||||||||||||
Capital Gain Distributions Received from: | ||||||||||||||||||||||||||||
Affiliated Investment Company | — | 379,091 | 436,439 | — | — | — | ||||||||||||||||||||||
Investment Securities | — | — | — | 16,169 | 42,861 | 41,558 | ||||||||||||||||||||||
Net Realized Gain (Loss) on: | ||||||||||||||||||||||||||||
Investment Securities Sold/Affiliated Investment Company Shares Sold | (190,350 | ) | (130,372 | ) | (3,367 | ) | (106,626 | ) | (142,397 | ) | 181,105 | |||||||||||||||||
Futures | — | — | — | (1,065 | ) | (1,472 | ) | — | ||||||||||||||||||||
Change in Unrealized Appreciation (Depreciation) of: | ||||||||||||||||||||||||||||
Investment Securities/Affiliated Investment Company Shares | 168,490 | (1,674,701 | ) | (655,320 | ) | 92,786 | (893,193 | ) | (762,357 | ) | ||||||||||||||||||
Futures | — | — | — | (10 | ) | 10 | — | |||||||||||||||||||||
Net Increase (Decrease) in Net Assets Resulting from Operations | (11,351 | ) | (1,392,548 | ) | (176,848 | ) | 70,984 | (925,445 | ) | (482,209 | ) | |||||||||||||||||
Distributions From: | ||||||||||||||||||||||||||||
Net Investment Income: | ||||||||||||||||||||||||||||
Institutional Class Shares | (57,816 | ) | (42,596 | ) | (40,532 | ) | (95,934 | ) | (31,389 | ) | (62,692 | ) | ||||||||||||||||
Net Short-Term Gains: | ||||||||||||||||||||||||||||
Institutional Class Shares | — | (40,254 | ) | (62,657 | ) | — | (3,305 | ) | (2,939 | ) | ||||||||||||||||||
Net Long-Term Gains: | ||||||||||||||||||||||||||||
Institutional Class Shares | — | (350,779 | ) | (324,224 | ) | — | (200,903 | ) | (70,533 | ) | ||||||||||||||||||
Total Distributions | (57,816 | ) | (433,629 | ) | (427,413 | ) | (95,934 | ) | (235,597 | ) | (136,164 | ) | ||||||||||||||||
Capital Share Transactions (1): | ||||||||||||||||||||||||||||
Shares Issued | 588,720 | * | 799,061 | 1,088,866 | 760,871 | 946,371 | 1,093,839 | |||||||||||||||||||||
Shares Issued in Lieu of Cash Distributions | 56,003 | 425,522 | 415,408 | 93,552 | 232,037 | 133,705 | ||||||||||||||||||||||
Shares Redeemed | (681,416 | ) | (1,174,552 | ) | (1,023,645 | ) | (557,875 | ) | (941,862 | ) | (774,740 | ) | ||||||||||||||||
Net Increase (Decrease) from Capital Share Transactions | (36,693 | ) | 50,031 | 480,629 | 296,548 | 236,546 | 452,804 | |||||||||||||||||||||
Total Increase (Decrease) in Net Assets | (105,860 | ) | (1,776,146 | ) | (123,632 | ) | 271,598 | (924,496 | ) | (165,569 | ) | |||||||||||||||||
Net Assets | ||||||||||||||||||||||||||||
Beginning of Period | 2,924,225 | 4,700,371 | 4,824,003 | 1,746,961 | 2,671,457 | 2,837,026 | ||||||||||||||||||||||
End of Period | $ | 2,818,365 | $ | 2,924,225 | $ | 4,700,371 | $ | 2,018,559 | $ | 1,746,961 | $ | 2,671,457 | ||||||||||||||||
(1) Shares Issued and Redeemed: | ||||||||||||||||||||||||||||
Shares Issued | 53,716 | 65,963 | 68,282 | 61,585 | 41,914 | 34,996 | ||||||||||||||||||||||
Shares Issued in Lieu of Cash Distributions | 6,981 | 32,229 | 26,806 | 7,388 | 9,889 | 4,257 | ||||||||||||||||||||||
Shares Redeemed | (84,421 | ) | (97,545 | ) | (64,141 | ) | (45,050 | ) | (41,934 | ) | (24,958 | ) | ||||||||||||||||
Net Increase (Decrease) from Shares Issued and Redeemed | (23,724 | ) | 647 | 30,947 | 23,923 | 9,869 | 14,295 | |||||||||||||||||||||
Undistributed Net Investment Income (Distributions in Excess of Net Investment Income) | $ | 3,100 | $ | 36,069 | $ | 6,812 | $ | 8,197 | $ | 34,213 | $ | 161 | ||||||||||||||||
| * | Includes $11,529 in capital contributions related to the liquidation of The U.S. Micro Cap Series. See Organization note within the Notes to Financial Statements. |
See accompanying Notes to Financial Statements.
171
DFA INVESTMENT DIMENSIONS GROUP INC.
STATEMENTS OF CHANGES IN NET ASSETS
(Amounts in thousands)
| Large Cap International Portfolio | International Core Equity Portfolio | |||||||||||||||||||||||||||
| Year Ended Oct. 31, 2009 | Period Dec. 1, 2007 to Oct. 31, 2008 | Year Ended Nov. 30, 2007 | Year Ended Oct. 31, 2009 | Period Dec. 1, 2007 to Oct. 31, 2008 | Year Ended Nov. 30, 2007 | |||||||||||||||||||||||
Increase (Decrease) in Net Assets | ||||||||||||||||||||||||||||
Operations: | ||||||||||||||||||||||||||||
Net Investment Income (Loss) | $ | 36,172 | $ | 56,577 | $ | 51,732 | $ | 77,941 | $ | 76,838 | $ | 39,035 | ||||||||||||||||
Net Realized Gain (Loss) on: | ||||||||||||||||||||||||||||
Investment Securities Sold | (150,602 | ) | (19,013 | ) | 37,442 | (83,575 | ) | (11,335 | ) | 24,982 | ||||||||||||||||||
Futures | 919 | — | — | (2,556 | ) | — | — | |||||||||||||||||||||
Foreign Currency Transactions | 951 | (1,346 | ) | 174 | 1,319 | (911 | ) | 105 | ||||||||||||||||||||
In-Kind Redemptions | — | 14,987 | * | — | — | 7,590 | * | — | ||||||||||||||||||||
Change in Unrealized Appreciation (Depreciation) of: | ||||||||||||||||||||||||||||
Investment Securities and Foreign Currency | 374,243 | (1,012,012 | ) | 231,080 | 928,934 | (1,484,029 | ) | 105,889 | ||||||||||||||||||||
Futures | — | — | — | (15 | ) | 15 | — | |||||||||||||||||||||
Translation of Foreign Currency Denominated Amounts | (64 | ) | 65 | (44 | ) | (108 | ) | 73 | 59 | |||||||||||||||||||
Net Increase (Decrease) in Net Assets Resulting from Operations | 261,619 | (960,742 | ) | 320,384 | 921,940 | (1,411,759 | ) | 170,070 | ||||||||||||||||||||
Distributions From: | ||||||||||||||||||||||||||||
Net Investment Income: | ||||||||||||||||||||||||||||
Institutional Class Shares | (32,286 | ) | (53,392 | ) | (51,063 | ) | (77,469 | ) | (76,637 | ) | (38,518 | ) | ||||||||||||||||
Net Short-Term Gains: | ||||||||||||||||||||||||||||
Institutional Class Shares | — | — | — | — | (7,592 | ) | (2,252 | ) | ||||||||||||||||||||
Net Long-Term Gains: | ||||||||||||||||||||||||||||
Institutional Class Shares | — | (28,968 | ) | — | — | (17,164 | ) | (205 | ) | |||||||||||||||||||
Total Distributions | (32,286 | ) | (82,360 | ) | (51,063 | ) | (77,469 | ) | (101,393 | ) | (40,975 | ) | ||||||||||||||||
Capital Share Transactions (1): | ||||||||||||||||||||||||||||
Shares Issued | 380,682 | 534,434 | 529,554 | 1,709,907 | 1,729,052 | 1,460,555 | ||||||||||||||||||||||
Shares Issued in Lieu of Cash Distributions | 31,081 | 78,686 | 47,880 | 75,441 | 97,113 | 39,306 | ||||||||||||||||||||||
Shares Redeemed | (483,605 | ) | (587,338 | )* | (295,814 | ) | (911,026 | ) | (674,151 | )* | (137,846 | ) | ||||||||||||||||
Net Increase (Decrease) from Capital Share Transactions | (71,842 | ) | 25,782 | 281,620 | 874,322 | 1,152,014 | 1,362,015 | |||||||||||||||||||||
Total Increase (Decrease) in Net Assets | 157,491 | (1,017,320 | ) | 550,941 | 1,718,793 | (361,138 | ) | 1,491,110 | ||||||||||||||||||||
Net Assets | ||||||||||||||||||||||||||||
Beginning of Period | 1,206,860 | 2,224,180 | 1,673,239 | 1,981,049 | 2,342,187 | 851,077 | ||||||||||||||||||||||
End of Period | $ | 1,364,351 | $ | 1,206,860 | $ | 2,224,180 | $ | 3,699,842 | $ | 1,981,049 | $ | 2,342,187 | ||||||||||||||||
(1) Shares Issued and Redeemed: | ||||||||||||||||||||||||||||
Shares Issued | 26,226 | 24,768 | 20,502 | 227,407 | 156,232 | 103,681 | ||||||||||||||||||||||
Shares Issued in Lieu of Cash Distributions | 2,085 | 3,394 | 1,862 | 9,039 | 8,456 | 2,819 | ||||||||||||||||||||||
Shares Redeemed | (34,086 | ) | (28,525 | ) | (11,428 | ) | (123,941 | ) | (62,282 | ) | (9,741 | ) | ||||||||||||||||
Net Increase (Decrease) from Shares Issued and Redeemed | (5,775 | ) | (363 | ) | 10,936 | 112,505 | 102,406 | 96,759 | ||||||||||||||||||||
Undistributed Net Investment Income (Distributions in Excess of Net Investment Income) | $ | 5,593 | $ | 449 | $ | (1,254 | ) | $ | 2,148 | $ | (485 | ) | $ | 1,609 | ||||||||||||||
| * | See Note M in the Notes to Financial Statements. |
See accompanying Notes to Financial Statements.
172
DFA INVESTMENT DIMENSIONS GROUP INC.
STATEMENTS OF CHANGES IN NET ASSETS
(Amounts in thousands)
| T.A. World ex U.S. Core Equity Portfolio | International Small Company Portfolio | |||||||||||||||||||||||
| Year Ended Oct. 31, 2009 | Period Mar. 6, 2008(a) to Oct. 31, 2008 | Year Ended Oct. 31, 2009 | Period Dec. 1, 2007 to Oct. 31, 2008 | Year Ended Nov. 30, 2007 | ||||||||||||||||||||
Increase (Decrease) in Net Assets | ||||||||||||||||||||||||
Operations: | ||||||||||||||||||||||||
Net Investment Income (Loss) | $ | 11,410 | $ | 2,171 | $ | 83,540 | $ | 131,960 | $ | 108,657 | ||||||||||||||
Net Realized Gain (Loss) on: | ||||||||||||||||||||||||
Investment Securities Sold | (8,990 | ) | (2,290 | ) | (110,040 | ) | (120,455 | ) | 331,045 | |||||||||||||||
Futures | (660 | ) | — | 592 | (569 | ) | — | |||||||||||||||||
Foreign Currency Transactions | 97 | 6 | 1,180 | (3,640 | ) | 1,035 | ||||||||||||||||||
Change in Unrealized Appreciation (Depreciation) of: | ||||||||||||||||||||||||
Investment Securities and Foreign Currency | 196,743 | (87,743 | ) | 1,280,471 | (2,759,513 | ) | 162,772 | |||||||||||||||||
Futures | (1 | ) | 1 | 1 | (1 | ) | — | |||||||||||||||||
Translation of Foreign Currency Denominated Amounts | (31 | ) | 56 | (297 | ) | 188 | 160 | |||||||||||||||||
Change in Deferred Thailand Capital Gains Tax | (101 | ) | — | — | — | — | ||||||||||||||||||
Net Increase (Decrease) in Net Assets Resulting from Operations | 198,467 | (87,799 | ) | 1,255,447 | (2,752,030 | ) | 603,669 | |||||||||||||||||
Distributions From: | ||||||||||||||||||||||||
Net Investment Income: | ||||||||||||||||||||||||
Institutional Class Shares | (10,761 | ) | (1,192 | ) | (81,118 | ) | (132,809 | ) | (114,210 | ) | ||||||||||||||
Net Short-Term Gains: | ||||||||||||||||||||||||
Institutional Class Shares | — | — | — | (36,135 | ) | (28,033 | ) | |||||||||||||||||
Net Long-Term Gains: | ||||||||||||||||||||||||
Institutional Class Shares | — | — | — | (278,291 | ) | (129,328 | ) | |||||||||||||||||
Total Distributions | (10,761 | ) | (1,192 | ) | (81,118 | ) | (447,235 | ) | (271,571 | ) | ||||||||||||||
Capital Share Transactions (1): | ||||||||||||||||||||||||
Shares Issued | 495,969 | 408,243 | 890,444 | 1,327,412 | 1,085,538 | |||||||||||||||||||
Shares Issued in Lieu of Cash Distributions | 10,580 | 1,155 | 77,147 | 430,141 | 258,985 | |||||||||||||||||||
Shares Redeemed | (253,845 | ) | (92,089 | ) | (956,429 | ) | (1,071,124 | ) | (625,483 | ) | ||||||||||||||
Net Increase (Decrease) from Capital Share Transactions | 252,704 | 317,309 | 11,162 | 686,429 | 719,040 | |||||||||||||||||||
Total Increase (Decrease) in Net Assets | 440,410 | 228,318 | 1,185,491 | (2,512,836 | ) | 1,051,138 | ||||||||||||||||||
Net Assets | ||||||||||||||||||||||||
Beginning of Period | 228,318 | — | 3,084,373 | 5,597,209 | 4,546,071 | |||||||||||||||||||
End of Period | $ | 668,728 | $ | 228,318 | $ | 4,269,864 | $ | 3,084,373 | $ | 5,597,209 | ||||||||||||||
(1) Shares Issued and Redeemed: | ||||||||||||||||||||||||
Shares Issued | 85,214 | 51,464 | 81,822 | 83,183 | 52,082 | |||||||||||||||||||
Shares Issued in Lieu of Cash Distributions | 1,589 | 124 | 6,961 | 24,110 | 13,230 | |||||||||||||||||||
Shares Redeemed | (43,612 | ) | (12,532 | ) | (89,990 | ) | (70,097 | ) | (30,074 | ) | ||||||||||||||
Net Increase (Decrease) from Shares Issued and Redeemed | 43,191 | 39,056 | (1,207 | ) | 37,196 | 35,238 | ||||||||||||||||||
Undistributed Net Investment Income (Distributions in Excess of Net Investment Income) | $ | 1,772 | $ | 1,014 | $ | 13,949 | $ | 8,898 | $ | 6,151 | ||||||||||||||
See page 1 & 2 for the Definitions of Abbreviations and Footnotes.
See accompanying Notes to Financial Statements.
173
DFA INVESTMENT DIMENSIONS GROUP INC.
STATEMENTS OF CHANGES IN NET ASSETS
(Amounts in thousands)
| Japanese Small Company Portfolio | Asia Pacific Small Company Portfolio | |||||||||||||||||||||||||
| Year Ended Oct. 31, 2009 | Period Dec. 1, 2007 to Oct. 31, 2008 | Year Ended Nov. 30, 2007 | Year Ended Oct. 31, 2009 | Period Dec. 1, 2007 to Oct. 31, 2008 | Year Ended Nov. 30, 2007 | |||||||||||||||||||||
Increase (Decrease) in Net Assets | ||||||||||||||||||||||||||
Operations: | ||||||||||||||||||||||||||
Net Investment Income (Loss) | $ | 1,879 | $ | 3,548 | $ | 3,072 | $ | 2,525 | $ | 4,300 | $ | 3,553 | ||||||||||||||
Net Realized Gain (Loss) on: | ||||||||||||||||||||||||||
Investment Securities Sold | (14,110 | ) | (22,824 | ) | (7,840 | ) | (8,877 | ) | (21,574 | ) | 4,912 | |||||||||||||||
Futures | 43 | (10 | ) | — | (89 | ) | (34 | ) | — | |||||||||||||||||
Foreign Currency Transactions | 250 | (46 | ) | (35 | ) | 23 | (193 | ) | 93 | |||||||||||||||||
Change in Unrealized Appreciation (Depreciation) of: | ||||||||||||||||||||||||||
Investment Securities and Foreign Currency | 37,328 | (35,124 | ) | 365 | 52,469 | (69,553 | ) | 32,175 | ||||||||||||||||||
Translation of Foreign Currency Denominated Amounts | (61 | ) | 60 | 19 | 29 | (15 | ) | (2 | ) | |||||||||||||||||
Net Increase (Decrease) in Net Assets Resulting from Operations | 25,329 | (54,396 | ) | (4,419 | ) | 46,080 | (87,069 | ) | 40,731 | |||||||||||||||||
Distributions From: | ||||||||||||||||||||||||||
Net Investment Income: | ||||||||||||||||||||||||||
Institutional Class Shares | (2,426 | ) | (3,574 | ) | (2,759 | ) | (2,724 | ) | (4,433 | ) | (3,089 | ) | ||||||||||||||
Total Distributions | (2,426 | ) | (3,574 | ) | (2,759 | ) | (2,724 | ) | (4,433 | ) | (3,089 | ) | ||||||||||||||
Capital Share Transactions (1): | ||||||||||||||||||||||||||
Shares Issued | 18,298 | 32,726 | 102,980 | 18,265 | 51,749 | 58,296 | ||||||||||||||||||||
Shares Issued in Lieu of Cash Distributions | 2,219 | 3,367 | 2,746 | 2,398 | 4,090 | 3,008 | ||||||||||||||||||||
Shares Redeemed | (62,735 | ) | (43,830 | ) | (68,425 | ) | (26,210 | ) | (46,600 | ) | (24,176 | ) | ||||||||||||||
Net Increase (Decrease) from Capital Share Transactions | (42,218 | ) | (7,737 | ) | 37,301 | (5,547 | ) | 9,239 | 37,128 | |||||||||||||||||
Total Increase (Decrease) in Net Assets | (19,315 | ) | (65,707 | ) | 30,123 | 37,809 | (82,263 | ) | 74,770 | |||||||||||||||||
Net Assets | ||||||||||||||||||||||||||
Beginning of Period | 133,373 | 199,080 | 168,957 | 64,044 | 146,307 | 71,537 | ||||||||||||||||||||
End of Period | $ | 114,058 | $ | 133,373 | $ | 199,080 | $ | 101,853 | $ | 64,044 | $ | 146,307 | ||||||||||||||
(1) Shares Issued and Redeemed: | ||||||||||||||||||||||||||
Shares Issued | 1,589 | 2,312 | 5,861 | 1,318 | 2,384 | 2,409 | ||||||||||||||||||||
Shares Issued in Lieu of Cash Distributions | 174 | 220 | 157 | 196 | 168 | 131 | ||||||||||||||||||||
Shares Redeemed | (4,937 | ) | (3,276 | ) | (3,939 | ) | (2,055 | ) | (2,157 | ) | (979 | ) | ||||||||||||||
Net Increase (Decrease) from Shares Issued and Redeemed | (3,174 | ) | (744 | ) | 2,079 | (541 | ) | 395 | 1,561 | |||||||||||||||||
Undistributed Net Investment Income (Distributions in Excess of Net Investment Income) | $ | 665 | $ | 964 | $ | 894 | $ | 246 | $ | 412 | $ | 621 | ||||||||||||||
See accompanying Notes to Financial Statements.
174
DFA INVESTMENT DIMENSIONS GROUP INC.
STATEMENTS OF CHANGES IN NET ASSETS
(Amounts in thousands)
| United Kingdom Small Company Portfolio | Continental Small Company Portfolio | |||||||||||||||||||||||||
| Year Ended Oct. 31, 2009 | Period Dec. 1, 2007 to Oct. 31, 2008 | Year Ended Nov. 30, 2007 | Year Ended Oct. 31, 2009 | Period Dec. 1, 2007 to Oct. 31, 2008 | Year Ended Nov. 30, 2007 | |||||||||||||||||||||
Increase (Decrease) in Net Assets | ||||||||||||||||||||||||||
Operations: | ||||||||||||||||||||||||||
Net Investment Income (Loss) | $ | 861 | $ | 1,182 | $ | 899 | $ | 2,168 | $ | 4,234 | $ | 2,554 | ||||||||||||||
Net Realized Gain (Loss) on: | ||||||||||||||||||||||||||
Investment Securities Sold | (2,247 | ) | (771 | ) | 1,545 | (7,421 | ) | (16,519 | ) | 7,620 | ||||||||||||||||
Futures | 26 | — | — | (137 | ) | (16 | ) | — | ||||||||||||||||||
Foreign Currency Transactions | (10 | ) | (77 | ) | 13 | (49 | ) | (16 | ) | 39 | ||||||||||||||||
Change in Unrealized Appreciation (Depreciation) of: | ||||||||||||||||||||||||||
Investment Securities and Foreign Currency | 9,569 | (24,744 | ) | (2,123 | ) | 37,449 | (81,292 | ) | 4,064 | |||||||||||||||||
Futures | — | — | — | (1 | ) | 1 | — | |||||||||||||||||||
Translation of Foreign Currency Denominated Amounts | (6 | ) | 11 | — | 24 | (30 | ) | 10 | ||||||||||||||||||
Net Increase (Decrease) in Net Assets Resulting from Operations | 8,193 | (24,399 | ) | 334 | 32,033 | (93,638 | ) | 14,287 | ||||||||||||||||||
Distributions From: | ||||||||||||||||||||||||||
Net Investment Income: | ||||||||||||||||||||||||||
Institutional Class Shares | (658 | ) | (1,104 | ) | (1,097 | ) | (2,087 | ) | (3,979 | ) | (2,638 | ) | ||||||||||||||
Return of Capital | — | (19 | ) | — | — | (97 | ) | — | ||||||||||||||||||
Net Short-Term Gains: | ||||||||||||||||||||||||||
Institutional Class Shares | — | (123 | ) | (217 | ) | — | (347 | ) | (549 | ) | ||||||||||||||||
Net Long-Term Gains: | ||||||||||||||||||||||||||
Institutional Class Shares | — | (1,311 | ) | (1,092 | ) | — | (6,764 | ) | (1,842 | ) | ||||||||||||||||
Total Distributions | (658 | ) | (2,557 | ) | (2,406 | ) | (2,087 | ) | (11,187 | ) | (5,029 | ) | ||||||||||||||
Capital Share Transactions (1): | ||||||||||||||||||||||||||
Shares Issued | 4,137 | 25,474 | 11,009 | 14,850 | 72,836 | 94,168 | ||||||||||||||||||||
Shares Issued in Lieu of Cash Distributions | 556 | 2,517 | 2,404 | 1,874 | 10,871 | 4,921 | ||||||||||||||||||||
Shares Redeemed | (10,248 | ) | (12,291 | ) | (6,010 | ) | (29,732 | ) | (55,803 | ) | (27,699 | ) | ||||||||||||||
Net Increase (Decrease) from Capital Share Transactions | (5,555 | ) | 15,700 | 7,403 | (13,008 | ) | 27,904 | 71,390 | ||||||||||||||||||
Total Increase (Decrease) in Net Assets | 1,980 | (11,256 | ) | 5,331 | 16,938 | (76,921 | ) | 80,648 | ||||||||||||||||||
Net Assets | ||||||||||||||||||||||||||
Beginning of Period | 25,883 | 37,139 | 31,808 | 93,988 | 170,909 | 90,261 | ||||||||||||||||||||
End of Period | $ | 27,863 | $ | 25,883 | $ | 37,139 | $ | 110,926 | $ | 93,988 | $ | 170,909 | ||||||||||||||
(1) Shares Issued and Redeemed: | ||||||||||||||||||||||||||
Shares Issued | 288 | 1,087 | 327 | 1,344 | 3,830 | 4,007 | ||||||||||||||||||||
Shares Issued in Lieu of Cash Distributions | 36 | 96 | 74 | 148 | 539 | 227 | ||||||||||||||||||||
Shares Redeemed | (733 | ) | (556 | ) | (179 | ) | (2,868 | ) | (3,056 | ) | (1,195 | ) | ||||||||||||||
Net Increase (Decrease) from Shares Issued and Redeemed | (409 | ) | 627 | 222 | (1,376 | ) | 1,313 | 3,039 | ||||||||||||||||||
Undistributed Net Investment Income (Distributions in Excess of Net Investment Income) | $ | 171 | $ | (41 | ) | $ | (171 | ) | $ | (12 | ) | $ | (43 | ) | $ | (198 | ) | |||||||||
See accompanying Notes to Financial Statements.
175
DFA INVESTMENT DIMENSIONS GROUP INC.
STATEMENTS OF CHANGES IN NET ASSETS
(Amounts in thousands)
| DFA International Real Estate Securities Portfolio | DFA Global Real Estate Securities Portfolio | |||||||||||||||||||||
| Year Ended Oct. 31, 2009 | Period Dec. 1, 2007 to Oct. 31, 2008 | Year Ended Nov. 30, 2007 | Year Ended Oct. 31, 2009 | Period June 4, 2008(a) to Oct. 31, 2008 | ||||||||||||||||||
Increase (Decrease) in Net Assets | ||||||||||||||||||||||
Operations: | ||||||||||||||||||||||
Net Investment Income (Loss) | $ | 32,101 | $ | 22,511 | $ | 4,578 | $ | 7,504 | $ | (10 | ) | |||||||||||
Net Realized Gain (Loss) on: | ||||||||||||||||||||||
Investment Securities Sold | (36,531 | ) | (13,579 | ) | (3 | ) | (6,921 | ) | (280 | ) | ||||||||||||
Futures | 234 | — | — | — | — | |||||||||||||||||
Foreign Currency Transactions | 185 | (521 | ) | 9 | — | — | ||||||||||||||||
Change in Unrealized Appreciation (Depreciation) of: | ||||||||||||||||||||||
Investment Securities and Foreign Currency | 170,229 | (363,676 | ) | (25,701 | ) | 66,893 | (34,668 | ) | ||||||||||||||
Translation of Foreign Currency Denominated Amounts | 209 | (124 | ) | 14 | — | — | ||||||||||||||||
Net Increase (Decrease) in Net Assets Resulting from Operations | 166,427 | (355,389 | ) | (21,103 | ) | 67,476 | (34,958 | ) | ||||||||||||||
Distributions From: | ||||||||||||||||||||||
Net Investment Income: | ||||||||||||||||||||||
Institutional Class Shares | (11,227 | ) | (19,783 | ) | (2,361 | ) | (2,346 | ) | — | |||||||||||||
Net Short-Term Gains: | ||||||||||||||||||||||
Institutional Class Shares | — | — | — | (24 | ) | — | ||||||||||||||||
Total Distributions | (11,227 | ) | (19,783 | ) | (2,361 | ) | (2,370 | ) | — | |||||||||||||
Capital Share Transactions (1): | ||||||||||||||||||||||
Shares Issued | 331,853 | 580,235 | 375,453 | 345,457 | 144,246 | |||||||||||||||||
Shares Issued in Lieu of Cash Distributions | 11,113 | 19,359 | 2,263 | 2,351 | — | |||||||||||||||||
Shares Redeemed | (150,317 | ) | (166,782 | ) | (17,412 | ) | (71,084 | ) | (18,616 | ) | ||||||||||||
Net Increase (Decrease) from Capital Share Transactions | 192,649 | 432,812 | 360,304 | 276,724 | 125,630 | |||||||||||||||||
Total Increase (Decrease) in Net Assets | 347,849 | 57,640 | 336,840 | 341,830 | 90,672 | |||||||||||||||||
Net Assets | ||||||||||||||||||||||
Beginning of Period | 394,480 | 336,840 | — | 90,672 | — | |||||||||||||||||
End of Period | $ | 742,329 | $ | 394,480 | $ | 336,840 | $ | 432,502 | $ | 90,672 | ||||||||||||
(1) Shares Issued and Redeemed: | ||||||||||||||||||||||
Shares Issued | 82,981 | 81,466 | 37,594 | 62,358 | 17,468 | |||||||||||||||||
Shares Issued in Lieu of Cash Distributions | 3,104 | 2,444 | 239 | 445 | — | |||||||||||||||||
Shares Redeemed | (38,756 | ) | (25,570 | ) | (1,821 | ) | (13,777 | ) | (2,460 | ) | ||||||||||||
Net Increase (Decrease) from Shares Issued and Redeemed | 47,329 | 58,340 | 36,012 | 49,026 | 15,008 | |||||||||||||||||
Undistributed Net Investment Income (Distributions in Excess of Net Investment Income) | $ | 24,078 | $ | 4,089 | $ | 1,877 | $ | 4,918 | $ | 6 | ||||||||||||
See page 1 & 2 for the Definitions of Abbreviations and Footnotes.
See accompanying Notes to Financial Statements.
176
DFA INVESTMENT DIMENSIONS GROUP INC.
STATEMENTS OF CHANGES IN NET ASSETS
(Amounts in thousands)
| DFA International Small Cap Value Portfolio | International Vector Equity Portfolio | |||||||||||||||||||||
| Year Ended Oct. 31, 2009 | Period Dec. 1, 2007 to Oct. 31, 2008 | Year Ended Nov. 30, 2007 | Year Ended Oct. 31, 2009 | Period Aug. 14, 2008(a) to Oct. 31, 2008 | ||||||||||||||||||
Increase (Decrease) in Net Assets | ||||||||||||||||||||||
Operations: | ||||||||||||||||||||||
Net Investment Income (Loss) | $ | 118,909 | $ | 222,701 | $ | 162,639 | $ | 4,181 | $ | 246 | ||||||||||||
Net Realized Gain (Loss) on: | ||||||||||||||||||||||
Investment Securities Sold | (20,925 | ) | 28,945 | 682,920 | (3,551 | ) | (27 | ) | ||||||||||||||
Futures | (9,031 | ) | (1,804 | ) | — | (232 | ) | — | ||||||||||||||
Foreign Currency Transactions | (2,189 | ) | (3,478 | ) | 3,452 | (23 | ) | (19 | ) | |||||||||||||
Change in Unrealized Appreciation (Depreciation) of: | ||||||||||||||||||||||
Investment Securities and Foreign Currency | 1,907,503 | (4,209,886 | ) | (197,398 | ) | 71,485 | (16,902 | ) | ||||||||||||||
Futures | (28 | ) | 28 | — | (1 | ) | 1 | |||||||||||||||
Translation of Foreign Currency Denominated Amounts | (469 | ) | 112 | 46 | (11 | ) | 15 | |||||||||||||||
Net Increase (Decrease) in Net Assets Resulting from Operations | 1,993,770 | (3,963,382 | ) | 651,659 | 71,848 | (16,686 | ) | |||||||||||||||
Distributions From: | ||||||||||||||||||||||
Net Investment Income: | ||||||||||||||||||||||
Institutional Class Shares | (105,935 | ) | (245,481 | ) | (179,161 | ) | (3,671 | ) | — | |||||||||||||
Net Short-Term Gains: | ||||||||||||||||||||||
Institutional Class Shares | — | (65,513 | ) | (22,039 | ) | — | — | |||||||||||||||
Net Long-Term Gains: | ||||||||||||||||||||||
Institutional Class Shares | (25,433 | ) | (533,622 | ) | (365,355 | ) | — | — | ||||||||||||||
Total Distributions | (131,368 | ) | (844,616 | ) | (566,555 | ) | (3,671 | ) | — | |||||||||||||
Capital Share Transactions (1): | ||||||||||||||||||||||
Shares Issued | 1,516,998 | 2,492,365 | 2,243,987 | 203,871 | 88,814 | |||||||||||||||||
Shares Issued in Lieu of Cash Distributions | 123,396 | 812,456 | 539,597 | 3,533 | — | |||||||||||||||||
Shares Redeemed | (1,442,587 | ) | (1,877,934 | ) | (1,420,896 | ) | (79,811 | ) | (5,354 | ) | ||||||||||||
Net Increase (Decrease) from Capital Share Transactions | 197,807 | 1,426,887 | 1,362,688 | 127,593 | 83,460 | |||||||||||||||||
Total Increase (Decrease) in Net Assets | 2,060,209 | (3,381,111 | ) | 1,447,792 | 195,770 | 66,774 | ||||||||||||||||
Net Assets | ||||||||||||||||||||||
Beginning of Period | 4,799,748 | 8,180,859 | 6,733,067 | 66,774 | — | |||||||||||||||||
End of Period | $ | 6,859,957 | $ | 4,799,748 | $ | 8,180,859 | $ | 262,544 | $ | 66,774 | ||||||||||||
(1) Shares Issued and Redeemed: | ||||||||||||||||||||||
Shares Issued | 132,410 | 143,771 | 98,177 | 30,203 | 10,648 | |||||||||||||||||
Shares Issued in Lieu of Cash Distributions | 10,640 | 43,511 | 25,571 | 455 | — | |||||||||||||||||
Shares Redeemed | (126,703 | ) | (114,727 | ) | (62,812 | ) | (12,091 | ) | (741 | ) | ||||||||||||
Net Increase (Decrease) from Shares Issued and Redeemed | 16,347 | 72,555 | 60,936 | 18,567 | 9,907 | |||||||||||||||||
Undistributed Net Investment Income (Distributions in Excess of Net Investment Income) | $ | 11,837 | $ | 681 | $ | 33,083 | $ | 715 | $ | 232 | ||||||||||||
See page 1 & 2 for the Definitions of Abbreviations and Footnotes.
See accompanying Notes to Financial Statements.
177
DFA INVESTMENT DIMENSIONS GROUP INC.
STATEMENTS OF CHANGES IN NET ASSETS
(Amounts in thousands)
| Emerging Markets Portfolio | Emerging Markets Small Cap Portfolio | |||||||||||||||||||||||||
| Year Ended Oct. 31, 2009 | Period Dec. 1, 2007 to Oct. 31, 2008 | Year Ended Nov. 30, 2007 | Year Ended Oct. 31, 2009 | Period Dec. 1, 2007 to Oct. 31, 2008 | Year Ended Nov. 30, 2007 | |||||||||||||||||||||
Increase (Decrease) in Net Assets | ||||||||||||||||||||||||||
Operations: | ||||||||||||||||||||||||||
Net Investment Income (Loss) | $ | 33,922 | $ | 65,186 | $ | 61,164 | $ | 15,885 | $ | 27,317 | $ | 17,268 | ||||||||||||||
Net Realized Gain (Loss) on: | ||||||||||||||||||||||||||
Investment Securities Sold | 37,268 | 25,666 | 138,572 | (15,114 | ) | (21,877 | ) | 98,170 | ||||||||||||||||||
Futures | (2,712 | ) | (348 | ) | — | (630 | ) | (404 | ) | — | ||||||||||||||||
Foreign Currency Transactions | (28 | ) | (820 | ) | (116 | ) | (178 | ) | (1,270 | ) | (319 | ) | ||||||||||||||
In-Kind Redemptions | 17,805 | * | — | — | — | — | — | |||||||||||||||||||
Change in Unrealized Appreciation (Depreciation) of: | ||||||||||||||||||||||||||
Investment Securities and Foreign Currency | 592,684 | (1,562,393 | ) | 809,069 | 522,143 | (754,950 | ) | 268,054 | ||||||||||||||||||
Futures | (30 | ) | 30 | — | (9 | ) | 9 | — | ||||||||||||||||||
Translation of Foreign Currency Denominated Amounts | 196 | (130 | ) | (26 | ) | 168 | (175 | ) | 74 | |||||||||||||||||
Change in Deferred Thailand Capital Gains Tax | (1,264 | ) | 2,600 | (825 | ) | (785 | ) | 1,394 | (451 | ) | ||||||||||||||||
Net Increase (Decrease) in Net Assets Resulting from Operations | 677,841 | (1,470,209 | ) | 1,007,838 | 521,480 | (749,956 | ) | 382,796 | ||||||||||||||||||
Distributions From: | ||||||||||||||||||||||||||
Net Investment Income: | ||||||||||||||||||||||||||
Institutional Class Shares | (33,127 | ) | (63,916 | ) | (50,360 | ) | (16,832 | ) | (24,950 | ) | (13,632 | ) | ||||||||||||||
Net Short-Term Gains: | ||||||||||||||||||||||||||
Institutional Class Shares | — | (855 | ) | — | — | (7,087 | ) | (5,938 | ) | |||||||||||||||||
Net Long-Term Gains: | ||||||||||||||||||||||||||
Institutional Class Shares | (20,948 | ) | (126,608 | ) | (14,375 | ) | — | (83,694 | ) | (46,706 | ) | |||||||||||||||
Total Distributions | (54,075 | ) | (191,379 | ) | (64,735 | ) | (16,832 | ) | (115,731 | ) | (66,276 | ) | ||||||||||||||
Capital Share Transactions (1): | ||||||||||||||||||||||||||
Shares Issued | 448,802 | 564,637 | 654,824 | 278,046 | 293,300 | 507,036 | ||||||||||||||||||||
Shares Issued in Lieu of Cash Distributions | 48,701 | 160,500 | 52,208 | 15,192 | 95,251 | 60,107 | ||||||||||||||||||||
Shares Redeemed | (663,241 | )* | (943,731 | ) | (606,683 | ) | (211,257 | ) | (433,687 | ) | (264,459 | ) | ||||||||||||||
Net Increase (Decrease) from Capital Share Transactions | (165,738 | ) | (218,594 | ) | 100,349 | 81,981 | (45,136 | ) | 302,684 | |||||||||||||||||
Total Increase (Decrease) in Net Assets | 458,028 | (1,880,182 | ) | 1,043,452 | 586,629 | (910,823 | ) | 619,204 | ||||||||||||||||||
Net Assets | ||||||||||||||||||||||||||
Beginning of Period | 1,508,260 | 3,388,442 | 2,344,990 | 547,329 | 1,458,152 | 838,948 | ||||||||||||||||||||
End of Period | $ | 1,966,288 | $ | 1,508,260 | $ | 3,388,442 | $ | 1,133,958 | $ | 547,329 | $ | 1,458,152 | ||||||||||||||
(1) Shares Issued and Redeemed: | ||||||||||||||||||||||||||
Shares Issued | 23,617 | 20,801 | 21,863 | 23,468 | 17,412 | 23,711 | ||||||||||||||||||||
Shares Issued in Lieu of Cash Distributions | 2,705 | 5,181 | 1,846 | 1,244 | 4,649 | 3,382 | ||||||||||||||||||||
Shares Redeemed | (36,851 | ) | (33,697 | ) | (19,853 | ) | (18,390 | ) | (24,805 | ) | (12,406 | ) | ||||||||||||||
Net Increase (Decrease) from Shares Issued and Redeemed | (10,529 | ) | (7,715 | ) | 3,856 | 6,322 | (2,744 | ) | 14,687 | |||||||||||||||||
Undistributed Net Investment Income (Distributions in Excess of Net Investment Income) | $ | 3,281 | $ | 5,826 | $ | 10,896 | $ | 2,323 | $ | 3,451 | $ | 2,393 | ||||||||||||||
| * | See Note M in the Notes to Financial Statements. |
See accompanying Notes to Financial Statements.
178
DFA INVESTMENT DIMENSIONS GROUP INC.
STATEMENTS OF CHANGES IN NET ASSETS
(Amounts in thousands)
| Emerging Markets Core Equity Portfolio | DFA One-Year Fixed Income Portfolio | |||||||||||||||||||||||||
| Year Ended Oct. 31, 2009 | Period Dec. 1, 2007 to Oct. 31, 2008 | Year Ended Nov. 30, 2007 | Year Ended Oct. 31, 2009 | Period Dec. 1, 2007 to Oct. 31, 2008 | Year Ended Nov. 30, 2007 | |||||||||||||||||||||
Increase (Decrease) in Net Assets | ||||||||||||||||||||||||||
Operations: | ||||||||||||||||||||||||||
Net Investment Income (Loss) | $ | 36,040 | $ | 42,186 $ | 24,655 | $ | 45,017 | $ | 102,695 | $ | 149,623 | |||||||||||||||
Net Realized Gain (Loss) on: | ||||||||||||||||||||||||||
Investment Securities Sold | (25,567 | ) | (64,050 | ) | 7,602 | 6,804 | — | — | ||||||||||||||||||
Futures | (873 | ) | — | — | — | — | — | |||||||||||||||||||
Foreign Currency Transactions | (297 | ) | (1,282 | ) | (348 | ) | — | — | — | |||||||||||||||||
In-Kind Redemptions | — | 1,902 | * | — | — | — | — | |||||||||||||||||||
Change in Unrealized Appreciation (Depreciation) of: | ||||||||||||||||||||||||||
Investment Securities and Foreign Currency | 981,322 | (1,113,650 | ) | 426,503 | 30,261 | (14,362 | )† | 2,923 | † | |||||||||||||||||
Futures | (4 | ) | 4 | — | — | — | — | |||||||||||||||||||
Translation of Foreign Currency Denominated Amounts | 33 | 30 | (1 | ) | — | — | — | |||||||||||||||||||
Change in Deferred Thailand Capital Gains Tax | (1,800 | ) | 1,150 | (772 | ) | — | — | — | ||||||||||||||||||
Net Increase (Decrease) in Net Assets Resulting from Operations | 988,854 | (1,133,710 | ) | 457,639 | 82,082 | 88,333 | 152,546 | |||||||||||||||||||
Distributions From: | ||||||||||||||||||||||||||
Net Investment Income: | ||||||||||||||||||||||||||
Institutional Class Shares | (29,028 | ) | (40,942 | ) | (23,343 | ) | (72,237 | ) | (102,391 | ) | (149,471 | ) | ||||||||||||||
Return of Capital | — | (204 | ) | — | — | — | — | |||||||||||||||||||
Net Short-Term Gains: | ||||||||||||||||||||||||||
Institutional Class Shares | — | (1,827 | ) | (1,657 | ) | — | — | — | ||||||||||||||||||
Net Long-Term Gains: | ||||||||||||||||||||||||||
Institutional Class Shares | — | (5,265 | ) | (1,602 | ) | — | — | — | ||||||||||||||||||
Total Distributions | (29,028 | ) | (48,238 | ) | (26,602 | ) | (72,237 | ) | (102,391 | ) | (149,471 | ) | ||||||||||||||
Capital Share Transactions (1): | ||||||||||||||||||||||||||
Shares Issued | 935,028 | 940,532 | 857,837 | 2,452,200 | ** | 1,593,555 | 2,045,675 | |||||||||||||||||||
Shares Issued in Lieu of Cash Distributions | 27,561 | 47,045 | 25,903 | 70,060 | 100,257 | 146,025 | ||||||||||||||||||||
Shares Redeemed | (622,906 | ) | (479,569 | )* | (307,447 | ) | (1,456,910 | ) | (1,714,911 | ) | (1,383,749 | ) | ||||||||||||||
Net Increase (Decrease) from Capital Share Transactions | 339,683 | 508,008 | 576,293 | 1,065,350 | (21,099 | ) | 807,951 | |||||||||||||||||||
Total Increase (Decrease) in Net Assets | 1,299,509 | (673,940 | ) | 1,007,330 | 1,075,195 | (35,157 | ) | 811,026 | ||||||||||||||||||
Net Assets | ||||||||||||||||||||||||||
Beginning of Period | 1,155,526 | 1,829,466 | 822,136 | 3,194,420 | 3,229,577 | 2,418,551 | ||||||||||||||||||||
End of Period | $ | 2,455,035 | $ | 1,155,526 | $ | 1,829,466 | $ | 4,269,615 | $ | 3,194,420 | $ | 3,229,577 | ||||||||||||||
(1) Shares Issued and Redeemed: | ||||||||||||||||||||||||||
Shares Issued | 84,048 | 59,236 | 46,855 | 234,250 | 156,545 | 200,504 | ||||||||||||||||||||
Shares Issued in Lieu of Cash Distributions | 2,073 | 3,094 | 1,454 | 6,837 | 9,865 | 14,346 | ||||||||||||||||||||
Shares Redeemed | (54,153 | ) | (31,680 | ) | (16,331 | ) | (141,838 | ) | (168,625 | ) | (135,669 | ) | ||||||||||||||
Net Increase (Decrease) from Shares Issued and Redeemed | 31,968 | 30,650 | 31,978 | 99,249 | (2,215 | ) | 79,181 | |||||||||||||||||||
Undistributed Net Investment Income (Distributions in Excess of Net Investment Income) | $ | 6,664 | $ | (45 | ) $ | (11 | ) | $ | 3,329 | $ | 9,703 | $ | 545 | |||||||||||||
| * | See Note M in the Notes to Financial Statements. |
| ** | Includes $42,141 in capital contributions related to the liquidation of The DFA One-Year Fixed Income Series. See Organization note within the Notes to Financial Statements. |
| † | See Note A in the Notes to Financial Statements. |
See accompanying Notes to Financial Statements.
179
DFA INVESTMENT DIMENSIONS GROUP INC.
STATEMENTS OF CHANGES IN NET ASSETS
(Amounts in thousands)
| DFA Two-Year Global Fixed Income Portfolio | DFA Selectively Hedged Global Fixed Income Portfolio | |||||||||||||||||||||
| Year Ended Oct. 31, 2009 | Period Dec. 1, 2007 to Oct. 31, 2008 | Year Ended Nov. 30, 2007 | Year Ended Oct. 31, 2009 | Period Jan. 9, 2008(a) to Oct. 31, 2008 | ||||||||||||||||||
Increase (Decrease) in Net Assets | ||||||||||||||||||||||
Operations: | ||||||||||||||||||||||
Net Investment Income (Loss) | $ | 60,183 | $ | 120,570 | $ | 71,628 | $ | 5,966 | $ | 5,310 | ||||||||||||
Net Realized Gain (Loss) on: | ||||||||||||||||||||||
Investment Securities Sold | 25,365 | — | — | 384 | 84 | |||||||||||||||||
Foreign Currency Transactions | 25,954 | — | — | (15,821 | ) | (7,531 | ) | |||||||||||||||
Change in Unrealized Appreciation (Depreciation) of: | ||||||||||||||||||||||
Investment Securities and Foreign Currency | (6,521 | ) | (29,349 | )† | 64,546 | † | 32,803 | (28,840 | ) | |||||||||||||
Translation of Foreign Currency Denominated Amounts | 6,818 | — | — | 806 | (472 | ) | ||||||||||||||||
Net Increase (Decrease) in Net Assets Resulting from Operations | 111,799 | 91,221 | 136,174 | 24,138 | (31,449 | ) | ||||||||||||||||
Distributions From: | ||||||||||||||||||||||
Net Investment Income: | ||||||||||||||||||||||
Institutional Class Shares | (137,717 | ) | (99,225 | ) | (78,938 | ) | — | — | ||||||||||||||
Return of Capital | — | — | — | — | (68 | ) | ||||||||||||||||
Net Short-Term Gains: | ||||||||||||||||||||||
Institutional Class Shares | — | (300 | ) | — | — | — | ||||||||||||||||
Net Long-Term Gains: | ||||||||||||||||||||||
Institutional Class Shares | — | (299 | ) | — | — | — | ||||||||||||||||
Total Distributions | (137,717 | ) | (99,824 | ) | (78,938 | ) | — | (68 | ) | |||||||||||||
Capital Share Transactions (1): | ||||||||||||||||||||||
Shares Issued | 1,712,693 | * | 860,433 | 1,087,521 | 137,279 | 300,770 | ||||||||||||||||
Shares Issued in Lieu of Cash Distributions | 135,759 | 98,963 | 78,258 | — | 68 | |||||||||||||||||
Shares Redeemed | (1,101,490 | ) | (923,706 | ) | (548,739 | ) | (56,142 | ) | (71,156 | ) | ||||||||||||
Net Increase (Decrease) from Capital Share Transactions | 746,962 | 35,690 | 617,040 | 81,137 | 229,682 | |||||||||||||||||
Total Increase (Decrease) in Net Assets | 721,044 | 27,087 | 674,276 | 105,275 | 198,165 | |||||||||||||||||
Net Assets | ||||||||||||||||||||||
Beginning of Period | 3,124,985 | 3,097,898 | 2,423,622 | 198,165 | — | |||||||||||||||||
End of Period | $ | 3,846,029 | $ | 3,124,985 | $ | 3,097,898 | $ | 303,440 | $ | 198,165 | ||||||||||||
(1) Shares Issued and Redeemed: | ||||||||||||||||||||||
Shares Issued | 166,814 | 83,111 | 105,633 | 14,290 | 29,751 | |||||||||||||||||
Shares Issued in Lieu of Cash Distributions | 13,402 | 9,614 | 7,641 | — | 7 | |||||||||||||||||
Shares Redeemed | (107,449 | ) | (89,218 | ) | (53,359 | ) | (6,214 | ) | (7,505 | ) | ||||||||||||
Net Increase (Decrease) from Shares Issued and Redeemed | 72,767 | 3,507 | 59,915 | 8,076 | 22,253 | |||||||||||||||||
Undistributed Net Investment Income (Distributions in Excess of Net Investment Income) | $ | 35,357 | $ | 78,106 | $ | 206 | $ | (262 | ) | $ | 4 | |||||||||||
See page 1 & 2 for the Definitions of Abbreviations and Footnotes.
| * | Includes $3,286 in capital contributions related to the liquidation of The DFA Two-Year Global Fixed Income Series. See Organization note within the Notes to Financial Statements. |
| † | See Note A in the Notes to Financial Statements. |
See accompanying Notes to Financial Statements.
180
DFA INVESTMENT DIMENSIONS GROUP INC.
STATEMENTS OF CHANGES IN NET ASSETS
(Amounts in thousands)
| DFA Five-Year Government Portfolio | DFA Five-Year Global Fixed Income Portfolio | |||||||||||||||||||||||||
| Year Ended Oct. 31, 2009 | Period Dec. 1, 2007 to Oct. 31, 2008 | Year Ended Nov. 30, 2007 | Year Ended Oct. 31, 2009 | Period Dec. 1, 2007 to Oct. 31, 2008 | Year Ended Nov. 30, 2007 | |||||||||||||||||||||
Increase (Decrease) in Net Assets | ||||||||||||||||||||||||||
Operations: | ||||||||||||||||||||||||||
Net Investment Income (Loss) | $ | 24,640 | $ | 30,580 | $ | 51,637 | $ | 75,449 | $ | 83,061 | $ | 87,390 | ||||||||||||||
Net Realized Gain (Loss) on: | ||||||||||||||||||||||||||
Investment Securities Sold | 27,247 | 2,704 | — | 19,184 | (7,737 | ) | (13,531 | ) | ||||||||||||||||||
Foreign Currency Transactions | — | — | — | 49,631 | (17,965 | ) | (29,264 | ) | ||||||||||||||||||
Change in Unrealized Appreciation (Depreciation) of: | ||||||||||||||||||||||||||
Investment Securities and Foreign Currency | 22,977 | 4,964 | 645 | 87,483 | 8,004 | 31,164 | ||||||||||||||||||||
Translation of Foreign Currency Denominated Amounts | — | — | — | (3,992 | ) | (14,921 | ) | 67,297 | ||||||||||||||||||
Net Increase (Decrease) in Net Assets Resulting from Operations | 74,864 | 38,248 | 52,282 | 227,755 | 50,442 | 143,056 | ||||||||||||||||||||
Distributions From: | ||||||||||||||||||||||||||
Net Investment Income: | ||||||||||||||||||||||||||
Institutional Class Shares | (25,750 | ) | (38,626 | ) | (49,378 | ) | (61,945 | ) | (96,473 | ) | (60,967 | ) | ||||||||||||||
Return of Capital | — | — | — | — | (5,349 | ) | — | |||||||||||||||||||
Total Distributions | (25,750 | ) | (38,626 | ) | (49,378 | ) | (61,945 | ) | (101,822 | ) | (60,967 | ) | ||||||||||||||
Capital Share Transactions (1): | ||||||||||||||||||||||||||
Shares Issued | 312,955 | 358,924 | 467,057 | 1,025,996 | 1,006,419 | 1,355,752 | ||||||||||||||||||||
Shares Issued in Lieu of Cash Distributions | 24,243 | 37,437 | 48,237 | 57,682 | 96,878 | 58,427 | ||||||||||||||||||||
Shares Redeemed | (493,112 | ) | (497,555 | ) | (233,710 | ) | (1,347,958 | ) | (1,217,579 | ) | (399,133 | ) | ||||||||||||||
Net Increase (Decrease) from Capital Share Transactions | (155,914 | ) | (101,194 | ) | 281,584 | (264,280 | ) | (114,282 | ) | 1,015,046 | ||||||||||||||||
Total Increase (Decrease) in Net Assets | (106,800 | ) | (101,572 | ) | 284,488 | (98,470 | ) | (165,662 | ) | 1,097,135 | ||||||||||||||||
Net Assets | ||||||||||||||||||||||||||
Beginning of Period | 1,115,037 | 1,216,609 | 932,121 | 3,319,257 | 3,484,919 | 2,387,784 | ||||||||||||||||||||
End of Period | $ | 1,008,237 | $ | 1,115,037 | $ | 1,216,609 | $ | 3,220,787 | $ | 3,319,257 | $ | 3,484,919 | ||||||||||||||
(1) Shares Issued and Redeemed: | ||||||||||||||||||||||||||
Shares Issued | 28,916 | 34,739 | 44,986 | 92,928 | 93,497 | 126,584 | ||||||||||||||||||||
Shares Issued in Lieu of Cash Distributions | 2,254 | 3,640 | 4,674 | 5,258 | 9,019 | 5,452 | ||||||||||||||||||||
Shares Redeemed | (45,608 | ) | (48,135 | ) | (22,517 | ) | (122,986 | ) | (113,277 | ) | (37,300 | ) | ||||||||||||||
Net Increase (Decrease) from Shares Issued and Redeemed | (14,438 | ) | (9,756 | ) | 27,143 | (24,800 | ) | (10,761 | ) | 94,736 | ||||||||||||||||
Undistributed Net Investment Income (Distributions in Excess of Net Investment Income) | $ | 4,029 | $ | 5,139 | $ | 13,185 | $ | 51,072 | $ | 1,377 | $ | 35,427 | ||||||||||||||
See accompanying Notes to Financial Statements.
181
DFA INVESTMENT DIMENSIONS GROUP INC.
STATEMENTS OF CHANGES IN NET ASSETS
(Amounts in thousands)
| DFA Intermediate Government Fixed Income Portfolio | DFA Short-Term Extended Quality Portfolio | DFA Inflation-Protected Securities Portfolio | ||||||||||||||||||||||||||||||
| Year Ended Oct. 31, 2009 | Period Dec. 1, 2007 to Oct. 31, 2008 | Year Ended Nov. 30, 2007 | Period March 4, 2009(a) to Oct. 31, 2009 | Year Ended Oct. 31, 2009 | Period Dec. 1, 2007 to Oct. 31, 2008 | Year Ended Nov. 30, 2007 | ||||||||||||||||||||||||||
Increase (Decrease) in Net Assets | ||||||||||||||||||||||||||||||||
Operations: | ||||||||||||||||||||||||||||||||
Net Investment Income (Loss) | $ | 55,735 | $ | 55,814 | $ | 51,217 | $ | 5,346 | $ | 6,445 | $ | 22,209 | $ | 4,228 | ||||||||||||||||||
Net Realized Gain (Loss) on Investment Securities Sold | 6,168 | 6,370 | 99 | 287 | (774 | ) | 416 | — | ||||||||||||||||||||||||
Change in Unrealized Appreciation (Depreciation) of Investment Securities | 71,964 | (24,474 | ) | 43,651 | 11,089 | 77,881 | (60,021 | ) | 11,920 | |||||||||||||||||||||||
Net Increase (Decrease) in Net Assets Resulting from Operations | 133,867 | 37,710 | 94,967 | 16,722 | 83,552 | (37,396 | ) | 16,148 | ||||||||||||||||||||||||
Distributions From: | ||||||||||||||||||||||||||||||||
Net Investment Income: | ||||||||||||||||||||||||||||||||
Institutional Class Shares | (56,385 | ) | (59,933 | ) | (46,222 | ) | (4,322 | ) | (3,971 | ) | (19,588 | ) | (2,996 | ) | ||||||||||||||||||
Net Short-Term Gains: | ||||||||||||||||||||||||||||||||
Institutional Class Shares | — | — | — | — | (80 | ) | — | — | ||||||||||||||||||||||||
Net Long-Term Gains: | ||||||||||||||||||||||||||||||||
Institutional Class Shares | (6,325 | ) | (112 | ) | (310 | ) | — | (401 | ) | — | — | |||||||||||||||||||||
Total Distributions | (62,710 | ) | (60,045 | ) | (46,532 | ) | (4,322 | ) | (4,452 | ) | (19,588 | ) | (2,996 | ) | ||||||||||||||||||
Capital Share Transactions (1): | ||||||||||||||||||||||||||||||||
Shares Issued | 524,999 | 443,281 | 484,902 | 377,923 | 478,535 | 273,593 | 197,991 | |||||||||||||||||||||||||
Shares Issued in Lieu of Cash Distributions | 58,792 | 56,181 | 42,284 | 4,280 | 4,435 | 19,520 | 2,996 | |||||||||||||||||||||||||
Shares Redeemed | (419,307 | ) | (543,466 | ) | (132,160 | ) | (16,128 | ) | (159,707 | ) | (104,785 | ) | (8,035 | ) | ||||||||||||||||||
Net Increase (Decrease) from Capital Share Transactions | 164,484 | (44,004 | ) | 395,026 | 366,075 | 323,263 | 188,328 | 192,952 | ||||||||||||||||||||||||
Total Increase (Decrease) in Net Assets | 235,641 | (66,339 | ) | 443,461 | 378,475 | 402,363 | 131,344 | 206,104 | ||||||||||||||||||||||||
Net Assets | ||||||||||||||||||||||||||||||||
Beginning of Period | 1,248,514 | 1,314,853 | 871,392 | — | 371,747 | 240,403 | 34,299 | |||||||||||||||||||||||||
End of Period | $ | 1,484,155 | $ | 1,248,514 | $ | 1,314,853 | $ | 378,475 | $ | 774,110 | $ | 371,747 | $ | 240,403 | ||||||||||||||||||
(1) Shares Issued and Redeemed: | ||||||||||||||||||||||||||||||||
Shares Issued | 42,884 | 37,222 | 42,833 | 36,989 | 46,497 | 25,237 | 19,382 | |||||||||||||||||||||||||
Shares Issued in Lieu of Cash Distributions | 4,837 | 4,761 | 3,751 | 414 | 459 | 1,803 | 298 | |||||||||||||||||||||||||
Shares Redeemed | (34,207 | ) | (45,743 | ) | (11,629 | ) | (1,558 | ) | (15,790 | ) | (9,793 | ) | (786 | ) | ||||||||||||||||||
Net Increase (Decrease) from Shares Issued and Redeemed | 13,514 | (3,760 | ) | 34,955 | 35,845 | 31,166 | 17,247 | 18,894 | ||||||||||||||||||||||||
Undistributed Net Investment Income (Distributions in Excess of Net Investment Income) | $ | 9,734 | $ | 10,384 | $ | 14,503 | $ | 1,051 | $ | 6,361 | $ | 3,952 | $ | 1,299 | ||||||||||||||||||
See page 1 & 2 for the Definitions of Abbreviations and Footnotes.
See accompanying Notes to Financial Statements.
182
DFA INVESTMENT DIMENSIONS GROUP INC.
STATEMENTS OF CHANGES IN NET ASSETS
(Amounts in thousands)
| DFA Short-Term Municipal Bond Portfolio | DFA California Short-Term Municipal Bond Portfolio | |||||||||||||||||||||||||
| Year Ended Oct. 31, 2009 | Period Dec. 1, 2007 to Oct. 31, 2008 | Year Ended Nov. 30, 2007 | Year Ended Oct. 31, 2009 | Period Dec. 1, 2007 to Oct. 31, 2008 | Period April 2, 2007(a) to Nov. 30, 2007 | |||||||||||||||||||||
Increase (Decrease) in Net Assets | ||||||||||||||||||||||||||
Operations: | ||||||||||||||||||||||||||
Net Investment Income (Loss) | $ | 20,579 | $ | 18,477 | $ | 25,609 | $ | 4,172 | $ | 3,606 | $ | 1,493 | ||||||||||||||
Net Realized Gain (Loss) on Investment Securities Sold | — | — | — | 23 | (19 | ) | (4 | ) | ||||||||||||||||||
Change in Unrealized Appreciation (Depreciation) of Investment Securities | 22,482 | (3,435 | ) | 2,926 | 4,608 | (1,259 | ) | 210 | ||||||||||||||||||
Net Increase (Decrease) in Net Assets Resulting from Operations | 43,061 | 15,042 | 28,535 | 8,803 | 2,328 | 1,699 | ||||||||||||||||||||
Distributions From: | ||||||||||||||||||||||||||
Net Investment Income: | ||||||||||||||||||||||||||
Institutional Class Shares | (20,942 | ) | (18,834 | ) | (24,969 | ) | (4,257 | ) | (3,577 | ) | (1,116 | ) | ||||||||||||||
Total Distributions | (20,942 | ) | (18,834 | ) | (24,969 | ) | (4,257 | ) | (3,577 | ) | (1,116 | ) | ||||||||||||||
Capital Share Transactions (1): | ||||||||||||||||||||||||||
Shares Issued | 617,393 | 411,057 | 452,239 | 124,576 | 152,527 | 143,647 | ||||||||||||||||||||
Shares Issued in Lieu of Cash Distributions | 20,381 | 18,360 | 24,353 | 4,153 | 3,453 | 1,060 | ||||||||||||||||||||
Shares Redeemed | (483,552 | ) | (382,133 | ) | (229,674 | ) | (103,416 | ) | (102,799 | ) | (16,307 | ) | ||||||||||||||
Net Increase (Decrease) from Capital Share Transactions | 154,222 | 47,284 | 246,918 | 25,313 | 53,181 | 128,400 | ||||||||||||||||||||
Total Increase (Decrease) in Net Assets | 176,341 | 43,492 | 250,484 | 29,859 | 51,932 | 128,983 | ||||||||||||||||||||
Net Assets | ||||||||||||||||||||||||||
Beginning of Period | 991,918 | 948,426 | 697,942 | 180,915 | 128,983 | — | ||||||||||||||||||||
End of Period | $ | 1,168,259 | $ | 991,918 | $ | 948,426 | $ | 210,774 | $ | 180,915 | $ | 128,983 | ||||||||||||||
(1) Shares Issued and Redeemed: | ||||||||||||||||||||||||||
Shares Issued | 60,500 | 40,917 | 45,158 | 12,194 | 15,158 | 14,330 | ||||||||||||||||||||
Shares Issued in Lieu of Cash Distributions | 2,002 | 1,829 | 2,434 | 407 | 344 | 106 | ||||||||||||||||||||
Shares Redeemed | (47,480 | ) | (38,066 | ) | (22,928 | ) | (10,148 | ) | (10,222 | ) | (1,624 | ) | ||||||||||||||
Net Increase (Decrease) from Shares Issued and Redeemed | 15,022 | 4,680 | 24,664 | 2,453 | 5,280 | 12,812 | ||||||||||||||||||||
Undistributed Net Investment Income (Distributions in Excess of Net Investment Income) | $ | 1,807 | $ | 2,170 | $ | 2,527 | $ | 354 | $ | 439 | $ | 399 | ||||||||||||||
See page 1 & 2 for the Definitions of Abbreviations and Footnotes.
See accompanying Notes to Financial Statements.
183
DFA INVESTMENT DIMENSIONS GROUP INC.
FINANCIAL HIGHLIGHTS
(for a share outstanding throughout each period)
| U.S. Large Company Portfolio | ||||||||||||||||||||||||||
Year Ended Oct. 31, 2009 | Period Dec. 1, 2007 to Oct. 31, 2008 | Year Ended Nov. 30, | Year Ended Nov. 30, | Year Ended Nov. 30, | Year Ended Nov. 30, | |||||||||||||||||||||
Net Asset Value, Beginning of Period | $ | 28.57 | $ | 43.61 | $ | 41.24 | $ | 36.79 | $ | 34.59 | $ | 31.16 | ||||||||||||||
Income From Investment Operations | ||||||||||||||||||||||||||
Net Investment Income (Loss) | 0.67 | (A) | 0.72 | (A) | 0.80 | (A) | 0.71 | (A) | 0.60 | 0.61 | ||||||||||||||||
Net Gains (Losses) on Securities (Realized and Unrealized) | 2.08 | (14.96 | ) | 2.33 | 4.41 | 2.28 | 3.31 | |||||||||||||||||||
Total From Investment Operations | 2.75 | (14.24 | ) | 3.13 | 5.12 | 2.88 | 3.92 | |||||||||||||||||||
Less Distributions | ||||||||||||||||||||||||||
Net Investment Income | (0.72 | ) | (0.80 | ) | (0.76 | ) | (0.67 | ) | (0.68 | ) | (0.49 | ) | ||||||||||||||
Net Realized Gains | — | — | — | — | — | — | ||||||||||||||||||||
Total Distributions | (0.72 | ) | (0.80 | ) | (0.76 | ) | (0.67 | ) | (0.68 | ) | (0.49 | ) | ||||||||||||||
Net Asset Value, End of Period | $ | 30.60 | $ | 28.57 | $ | 43.61 | $ | 41.24 | $ | 36.79 | $ | 34.59 | ||||||||||||||
Total Return | 10.08 | % | (33.14 | )%(C) | 7.66 | % | 14.12 | % | 8.41 | % | 12.68 | % | ||||||||||||||
Net Assets, End of Period (thousands) | $ | 2,719,418 | $ | 2,544,038 | $ | 3,415,833 | $ | 2,868,811 | $ | 2,088,128 | $ | 1,440,869 | ||||||||||||||
Ratio of Expenses to Average Net Assets | 0.15 | %(D) | 0.15 | %(B)(D) | 0.15 | %(D) | 0.15 | %(D) | 0.15 | %(D) | 0.15 | %(D) | ||||||||||||||
Ratio of Expenses to Average Net Assets (Excluding Waivers and Assumption of Expenses and/or Recovery of Previously Waived Fees) | 0.17 | %(D) | 0.15 | %(B)(D) | 0.15 | %(D) | 0.19 | %(D) | 0.30 | %(D) | 0.30 | %(D) | ||||||||||||||
Ratio of Net Investment Income to Average Net Assets | 2.48 | % | 2.05 | %(B) | 1.85 | % | 1.85 | % | 1.78 | % | 1.92 | % | ||||||||||||||
Portfolio Turnover Rate | N/A | N/A | N/A | N/A | N/A | N/A | ||||||||||||||||||||
| Enhanced U.S. Large Company Portfolio | ||||||||||||||||||||||||
| Year Ended Oct. 31, 2009 | Period Dec. 1, 2007 to Oct. 31, 2008 | Year Ended Nov. 30, 2007 | Year Ended Nov. 30, 2006 | Year Ended Nov. 30, 2005 | Year Ended Nov. 30, 2004 | |||||||||||||||||||
Net Asset Value, Beginning of Period | $ | 6.47 | $ | 10.91 | $ | 10.95 | $ | 9.82 | $ | 9.35 | $ | 8.42 | ||||||||||||
Income From Investment Operations | ||||||||||||||||||||||||
Net Investment Income (Loss) | 0.05 | (A) | 0.39 | (A) | 0.30 | (A) | 0.12 | (A) | 0.29 | 0.09 | ||||||||||||||
Net Gains (Losses) on Securities (Realized and Unrealized) | 0.61 | (3.74 | ) | 0.45 | 1.19 | 0.37 | 0.94 | |||||||||||||||||
Total From Investment Operations | 0.66 | (3.35 | ) | 0.75 | 1.31 | 0.66 | 1.03 | |||||||||||||||||
Less Distributions | ||||||||||||||||||||||||
Net Investment Income | (0.59 | ) | (0.36 | ) | (0.36 | ) | (0.18 | ) | (0.19 | ) | (0.10 | ) | ||||||||||||
Net Realized Gains | (0.06 | ) | (0.73 | ) | (0.43 | ) | — | — | — | |||||||||||||||
Total Distributions | (0.65 | ) | (1.09 | ) | (0.79 | ) | (0.18 | ) | (0.19 | ) | (0.10 | ) | ||||||||||||
Net Asset Value, End of Period | $ | 6.48 | $ | 6.47 | $ | 10.91 | $ | 10.95 | $ | 9.82 | $ | 9.35 | ||||||||||||
Total Return | 12.23 | % | (33.89 | )%(C) | 7.13 | % | 13.52 | % | 7.08 | % | 12.28 | % | ||||||||||||
Net Assets, End of Period (thousands) | $ | 165,231 | $ | 200,331 | $ | 337,050 | $ | 347,216 | $ | 313,543 | $ | 221,744 | ||||||||||||
Ratio of Expenses to Average Net Assets | 0.29 | %** | 0.25 | %(B)(D) | 0.25 | %(D) | 0.26 | %(D) | 0.34 | %(D) | 0.37 | %(D) | ||||||||||||
Ratio of Expenses to Average Net Assets (Excluding Waivers and Assumption of Expenses and/or Recovery of Previously Waived Fees) | 0.29 | %** | 0.25 | %(B)(D) | 0.25 | %(D) | 0.26 | %(D) | 0.34 | %(D) | 0.37 | %(D) | ||||||||||||
Ratio of Net Investment Income to Average Net Assets | 0.86 | % | 4.74 | %(B) | 2.67 | % | 1.19 | % | 3.11 | % | 0.95 | % | ||||||||||||
Portfolio Turnover Rate | 46 | %* | N/A | N/A | N/A | N/A | N/A | |||||||||||||||||
| * | For the period February 28, 2009 through October 31, 2009. Effective February 28, 2009, the Enhanced U.S. Large Company Portfolio invests directly in securities rather than through the Series. |
| ** | Represents the combined ratios for the respective portfolio and for the period November 1, 2008 through February 27, 2009, its respective pro-rata share of its Master Fund Series. |
See page 1 & 2 for the Definitions of Abbreviations and Footnotes.
See accompanying Notes to Financial Statements.
184
DFA INVESTMENT DIMENSIONS GROUP INC.
FINANCIAL HIGHLIGHTS
(for a share outstanding throughout each period)
| U.S. Large Cap Value Portfolio | ||||||||||||||||||||||||
Year Ended 2009 | Period Dec. 1 2007 to Oct. 31, 2008 | Year Ended Nov. 30, | Year Ended | Year Ended Nov. 30, | Year Ended Nov. 30, | |||||||||||||||||||
Net Asset Value, Beginning of Period | $ | 14.58 | $ | 24.44 | $ | 25.40 | $ | 21.93 | $ | 19.37 | $ | 16.14 | ||||||||||||
Income From Investment Operations | ||||||||||||||||||||||||
Net Investment Income (Loss) | 0.31 | (A) | 0.36 | (A) | 0.33 | (A) | 0.38 | (A) | 0.30 | 0.16 | ||||||||||||||
Net Gains (Losses) on Securities (Realized and Unrealized) | 1.28 | (8.83 | ) | (0.43 | ) | 3.50 | 2.49 | 3.28 | ||||||||||||||||
Total From Investment Operations | 1.59 | (8.47 | ) | (0.10 | ) | 3.88 | 2.79 | 3.44 | ||||||||||||||||
Less Distributions | ||||||||||||||||||||||||
Net Investment Income | (0.34 | ) | (0.35 | ) | (0.32 | ) | (0.35 | ) | (0.23 | ) | (0.21 | ) | ||||||||||||
Net Realized Gains | (0.02 | ) | (1.04 | ) | (0.54 | ) | (0.06 | ) | — | — | ||||||||||||||
Total Distributions | (0.36 | ) | (1.39 | ) | (0.86 | ) | (0.41 | ) | (0.23 | ) | (0.21 | ) | ||||||||||||
Net Asset Value, End of Period | $ | 15.81 | $ | 14.58 | $ | 24.44 | $ | 25.40 | $ | 21.93 | $ | 19.37 | ||||||||||||
Total Return | 11.76 | % | (36.63 | )%(C) | (0.49 | )% | 17.97 | % | 14.49 | % | 21.48 | % | ||||||||||||
Net Assets, End of Period (thousands) | $ | 5,863,652 | $ | 5,330,448 | $ | 7,535,552 | $ | 6,410,086 | $ | 4,046,083 | $ | 2,630,361 | ||||||||||||
Ratio of Expenses to Average Net Assets (D) | 0.30 | % | 0.28 | %(B) | 0.27 | % | 0.28 | % | 0.30 | % | 0.32 | % | ||||||||||||
Ratio of Net Investment Income to Average Net Assets | 2.26 | % | 1.86 | %(B) | 1.28 | % | 1.64 | % | 1.48 | % | 0.89 | % | ||||||||||||
See page 1 & 2 for the Definitions of Abbreviations and Footnotes.
See accompanying Notes to Financial Statements.
185
DFA INVESTMENT DIMENSIONS GROUP INC.
FINANCIAL HIGHLIGHTS
(for a share outstanding throughout each period)
| U.S. Targeted Value Portfolio- Institutional Class Shares | U.S. Targeted Value Portfolio- Class R1 Shares | U.S. Targeted Value Portfolio- Class R2 Shares | ||||||||||||||||||||||||||||||||||||||||||||||||
Year Ended Oct. 31, 2009 | Period Dec. 1, 2007 to Oct. 31, 2008 | Year Ended Nov. 30, 2007 | Year Ended Nov. 30, 2006 | Year Ended Nov. 30, 2005 | Year Ended Nov. 30, 2004 | Year Ended Oct. 31, 2009 | Period Jan. 31, 2008(a) to Oct. 31, 2008 | Year Ended Oct. 31, 2009 | Period June 30, 2008(a) to Oct. 31, 2008 | |||||||||||||||||||||||||||||||||||||||||
Net Asset Value, Beginning of Period | $ | 10.84 | $ | 15.89 | $ | 18.69 | $ | 17.33 | $ | 17.09 | $ | 15.14 | $ | 7.43 | $ | 10.00 | $ | 7.83 | $ | 10.00 | ||||||||||||||||||||||||||||||
Income From Investment Operations | ||||||||||||||||||||||||||||||||||||||||||||||||||
Net Investment Income (Loss) | 0.12 | (A) | 0.18 | (A) | 0.20 | (A) | 0.21 | (A) | 0.32 | 0.86 | 0.08 | (A) | 0.09 | (A) | 0.07 | (A) | 0.04 | (A) | ||||||||||||||||||||||||||||||||
Net Gains (Losses) on Securities (Realized and Unrealized) | 0.88 | (4.68 | ) | (1.32 | ) | 2.84 | 1.59 | 2.88 | 0.59 | (2.56 | ) | 0.63 | (2.17 | ) | ||||||||||||||||||||||||||||||||||||
Total From Investment Operations | 1.00 | (4.50 | ) | (1.12 | ) | 3.05 | 1.91 | 3.74 | 0.67 | (2.47 | ) | 0.70 | (2.13 | ) | ||||||||||||||||||||||||||||||||||||
Less Distributions | ||||||||||||||||||||||||||||||||||||||||||||||||||
Net Investment Income | (0.14 | ) | (0.15 | ) | (0.20 | ) | (0.25 | ) | (0.23 | ) | (0.90 | ) | (0.12 | ) | (0.10 | ) | (0.11 | ) | (0.04 | ) | ||||||||||||||||||||||||||||||
Net Realized Gains | — | (0.40 | ) | (1.48 | ) | (1.44 | ) | (1.44 | ) | (0.89 | ) | — | — | — | — | |||||||||||||||||||||||||||||||||||
Total Distributions | (0.14 | ) | (0.55 | ) | (1.68 | ) | (1.69 | ) | (1.67 | ) | (1.79 | ) | (0.12 | ) | (0.10 | ) | (0.11 | ) | (0.04 | ) | ||||||||||||||||||||||||||||||
Net Asset Value, End of Period | $ | 11.70 | $ | 10.84 | $ | 15.89 | $ | 18.69 | $ | 17.33 | $ | 17.09 | $ | 7.98 | $ | 7.43 | $ | 8.42 | $ | 7.83 | ||||||||||||||||||||||||||||||
Total Return | 9.47 | % | (29.27 | )%(C) | (6.59 | )% | 19.48 | % | 12.17 | % | 27.36 | % | 9.36 | % | (24.96 | )%(C) | 9.23 | % | (21.40 | )%(C) | ||||||||||||||||||||||||||||||
Net Assets, End of Period (thousands) | $ | 1,449,437 | $ | 855,448 | $ | 554,805 | $ | 215,338 | $ | 172,595 | $ | 159,325 | $ | 31,393 | $ | 25,599 | $ | 2,930 | $ | 1,715 | ||||||||||||||||||||||||||||||
Ratio of Expenses to Average Net Assets | 0.41 | % | 0.40 | %(B) | 0.41 | %(D)** | 0.46 | %(D) | 0.47 | %(D) | 0.50 | %(D) | 0.52 | % | 0.50 | %(B)(E) | 0.67 | % | 0.66 | %(B)(E) | ||||||||||||||||||||||||||||||
Ratio of Expenses to Average Net Assets (Excluding Waivers and Assumption of Expenses and/or Recovery of Previously Waived Fees) | 0.41 | % | 0.40 | %(B) | 0.41 | %(D)** | 0.46 | %(D) | 0.47 | %(D) | 0.48 | %(D) | 0.52 | % | 0.50 | %(B)(E) | 0.67 | % | 0.66 | %(B)(E) | ||||||||||||||||||||||||||||||
Ratio of Net Investment Income to Average Net Assets | 1.19 | % | 1.39 | %(B) | 1.12 | % | 1.19 | % | 1.91 | % | 0.27 | % | 1.12 | % | 1.24 | %(B)(E) | 0.91 | % | 1.35 | %(B)(E) | ||||||||||||||||||||||||||||||
Portfolio Turnover Rate | 17 | % | 20 | %(C) | 9 | %(C)* | N/A | N/A | N/A | 17 | % | 20 | %(C) | 17 | % | 20 | %(C) | |||||||||||||||||||||||||||||||||
| * For | the period March 30, 2007 through November 30, 2007. Effective March 30, 2007, the U.S. Targeted Value Portfolio invests directly in securities rather than through the Series. |
| ** | Represents the combined ratios for the respective portfolio and for the period December 1, 2006 through March 29, 2007, its respective pro-rata share of its Master Fund Series. |
See page 1 & 2 for the Definitions of Abbreviations and Footnotes.
See accompanying Notes to Financial Statements.
186
DFA INVESTMENT DIMENSIONS GROUP INC.
FINANCIAL HIGHLIGHTS
(for a share outstanding throughout each period)
| U.S. Small Cap Value Portfolio | ||||||||||||||||||||||||||
Year Ended Oct. 31, 2009 | Period Dec. 1, 2007 to Oct. 31, 2008 | Year Ended Nov. 30, | Year Ended Nov. 30, | Year Ended Nov. 30, | Year Ended Nov. 30, | |||||||||||||||||||||
Net Asset Value, Beginning of Period | $ | 16.32 | $ | 26.49 | $ | 31.59 | $ | 28.74 | $ | 27.71 | $ | 23.26 | ||||||||||||||
Income From Investment Operations | ||||||||||||||||||||||||||
Net Investment Income (Loss) | 0.04 | (A) | 0.18 | (A) | 0.30 | (A) | 0.28 | (A) | 0.29 | 0.30 | ||||||||||||||||
Net Gains (Losses) on Securities (Realized and Unrealized) | 1.54 | (7.86 | ) | (2.72 | ) | 5.06 | 2.66 | 5.73 | ||||||||||||||||||
Total From Investment Operations | 1.58 | (7.68 | ) | (2.42 | ) | 5.34 | 2.95 | 6.03 | ||||||||||||||||||
Less Distributions | ||||||||||||||||||||||||||
Net Investment Income | (0.21 | ) | (0.22 | ) | (0.28 | ) | (0.23 | ) | (0.26 | ) | (0.38 | ) | ||||||||||||||
Net Realized Gains | — | (2.27 | ) | (2.40 | ) | (2.26 | ) | (1.66 | ) | (1.20 | ) | |||||||||||||||
Total Distributions | (0.21 | ) | (2.49 | ) | (2.68 | ) | (2.49 | ) | (1.92 | ) | (1.58 | ) | ||||||||||||||
Net Asset Value, End of Period | $ | 17.69 | $ | 16.32 | $ | 26.49 | $ | 31.59 | $ | 28.74 | $ | 27.71 | ||||||||||||||
Total Return | 9.97 | % | (31.80 | )%(C) | (8.41 | )% | 20.29 | % | 11.32 | % | 27.46 | % | ||||||||||||||
Net Assets, End of Period (thousands) | $ | 5,669,659 | $ | 5,503,945 | $ | 8,802,846 | $ | 8,738,278 | $ | 6,924,234 | $ | 5,795,166 | ||||||||||||||
Ratio of Expenses to Average Net Assets | 0.54 | %** | 0.52 | %(B)(D) | 0.52 | %(D) | 0.53 | %(D) | 0.55 | %(D) | 0.56 | %(D) | ||||||||||||||
Ratio of Net Investment Income to Average Net Assets | 0.27 | % | 0.86 | %(B) | 0.98 | % | 0.94 | % | 1.04 | % | 0.04 | % | ||||||||||||||
Portfolio Turnover Rate | 21 | %* | N/A | N/A | N/A | N/A | N/A | |||||||||||||||||||
| * For | the period February 28, 2009 through October 31, 2009. Effective February 28, 2009, the U.S. Small Cap Value Portfolio invests directly in securities rather than through the Series. |
| ** | Represents the combined ratios for the respective portfolio and for the period November 1, 2008 through February 27, 2009, its respective pro-rata share of its Master Fund Series. |
See page 1 & 2 for the Definitions of Abbreviations and Footnotes.
See accompanying Notes to Financial Statements.
187
DFA INVESTMENT DIMENSIONS GROUP INC.
FINANCIAL HIGHLIGHTS
(for a share outstanding throughout each period)
| U.S. Core Equity 1 Portfolio | U.S. Core Equity 2 Portfolio | |||||||||||||||||||||||||||||||||||||||||||
| Year Ended Oct. 31, 2009 | Period Dec. 1, 2007 to Oct. 31, 2008 | Year Ended Nov. 30, 2007 | Year Ended Nov. 30, 2006 | Period Sept. 15, 2005(a) to Nov. 30, 2005 | Year Ended Oct. 31, 2009 | Period Dec. 1, 2007 to Oct. 31, 2008 | Year Ended Nov. 30, 2007 | Year Ended Nov. 30, 2006 | Period Sept. 15, 2005(a) to Nov. 30, 2005 | |||||||||||||||||||||||||||||||||||
Net Asset Value, Beginning of Period | $ | 7.81 | $ | 11.83 | $ | 11.50 | $ | 10.22 | $ | 10.00 | $ | 7.73 | $ | 11.77 | $ | 11.65 | $ | 10.24 | $ | 10.00 | ||||||||||||||||||||||||
Income From Investment Operations | ||||||||||||||||||||||||||||||||||||||||||||
Net Investment Income (Loss) | 0.15 | (A) | 0.17 | (A) | 0.19 | (A) | 0.17 | (A) | 0.03 | 0.14 | (A) | 0.17 | (A) | 0.19 | (A) | 0.17 | (A) | 0.03 | ||||||||||||||||||||||||||
Net Gains (Losses) on Securities (Realized and Unrealized) | 0.73 | (4.03 | ) | 0.35 | 1.28 | 0.19 | 0.66 | (4.04 | ) | 0.13 | 1.40 | 0.21 | ||||||||||||||||||||||||||||||||
Total From Investment Operations | 0.88 | (3.86 | ) | 0.54 | 1.45 | 0.22 | 0.80 | (3.87 | ) | 0.32 | 1.57 | 0.24 | ||||||||||||||||||||||||||||||||
Less Distributions | ||||||||||||||||||||||||||||||||||||||||||||
Net Investment Income | (0.15 | ) | (0.16 | ) | (0.18 | ) | (0.17 | ) | — | (0.14 | ) | (0.17 | ) | (0.17 | ) | (0.16 | ) | — | ||||||||||||||||||||||||||
Net Realized Gains | — | — | (0.03 | ) | — | — | — | — | (0.03 | ) | — | — | ||||||||||||||||||||||||||||||||
Total Distributions | (0.15 | ) | (0.16 | ) | (0.21 | ) | (0.17 | ) | — | (0.14 | ) | (0.17 | ) | (0.20 | ) | (0.16 | ) | — | ||||||||||||||||||||||||||
Net Asset Value, End of Period | $ | 8.54 | $ | 7.81 | $ | 11.83 | $ | 11.50 | $ | 10.22 | $ | 8.39 | $ | 7.73 | $ | 11.77 | $ | 11.65 | $ | 10.24 | ||||||||||||||||||||||||
Total Return | 11.64 | % | (32.85 | )%(C) | 4.68 | % | 14.35 | % | 2.20 | %(C) | 10.66 | % | (33.16 | )%(C) | 2.78 | % | 15.50 | % | 2.40 | %(C) | ||||||||||||||||||||||||
Net Assets, End of Period (thousands) | $ | 1,989,583 | $ | 1,320,562 | $ | 1,210,031 | $ | 652,270 | $ | 123,591 | $ | 3,804,325 | $ | 2,501,028 | $ | 2,939,420 | $ | 1,216,310 | $ | 182,078 | ||||||||||||||||||||||||
Ratio of Expenses to Average Net Assets | 0.22 | % | 0.20 | %(B) | 0.20 | % | 0.23 | % | 0.23 | %(B)(E) | 0.24 | % | 0.23 | %(B) | 0.23 | % | 0.26 | % | 0.26 | %(B)(E) | ||||||||||||||||||||||||
Ratio of Expenses to Average Net Assets (Excluding Waivers and Assumption of Expenses and/or Recovery of Previously Waived Fees) | 0.22 | % | 0.20 | %(B) | 0.20 | % | 0.23 | % | 0.37 | %(B)(E) | 0.24 | % | 0.23 | %(B) | 0.23 | % | 0.26 | % | 0.38 | %(B)(E) | ||||||||||||||||||||||||
Ratio of Net Investment Income to Average Net Assets | 2.02 | % | 1.78 | %(B) | 1.53 | % | 1.52 | % | 1.85 | %(B)(E) | 1.89 | % | 1.77 | %(B) | 1.55 | % | 1.55 | % | 1.92 | %(B)(E) | ||||||||||||||||||||||||
Portfolio Turnover Rate | 7 | % | 5 | %(C) | 10 | % | 6 | % | 0 | %(C) | 4 | % | 8 | %(C) | 7 | % | 5 | % | 0 | %(C) | ||||||||||||||||||||||||
See page 1 & 2 for the Definitions of Abbreviations and Footnotes.
See accompanying Notes to Financial Statements.
188
DFA INVESTMENT DIMENSIONS GROUP INC.
FINANCIAL HIGHLIGHTS
(for a share outstanding throughout each period)
| U.S. Vector Equity Portfolio | T.A. U.S. Core Equity 2 Portfolio | |||||||||||||||||||||||||||||||
| Year Ended Oct. 31, 2009 | Period Dec. 1, 2007 to Oct. 31, 2008 | Year Ended Nov. 30, 2007 | Period Dec. 30, 2005(a) to Nov. 30, 2006 | Year Ended Oct. 31, 2009 | Period Dec. 1, 2007 to Oct. 31, 2008 | Period Oct. 4, 2007(a) to Nov. 30, 2007 | ||||||||||||||||||||||||||
Net Asset Value, Beginning of Period | $ | 7.48 | $ | 11.38 | $ | 11.79 | $ | 10.00 | $ | 6.31 | $ | 9.40 | $ | 10.00 | ||||||||||||||||||
Income From Investment Operations | ||||||||||||||||||||||||||||||||
Net Investment Income (Loss) | 0.11 | (A) | 0.15 | (A) | 0.16 | (A) | 0.13 | (A) | 0.11 | (A) | 0.13 | (A) | 0.02 | (A) | ||||||||||||||||||
Net Gains (Losses) on Securities (Realized and Unrealized) | 0.57 | (3.89 | ) | (0.25 | ) | 1.73 | 0.52 | (3.12 | ) | (0.62 | ) | |||||||||||||||||||||
Total From Investment Operations | 0.68 | (3.74 | ) | (0.09 | ) | 1.86 | 0.63 | (2.99 | ) | (0.60 | ) | |||||||||||||||||||||
Less Distributions | ||||||||||||||||||||||||||||||||
Net Investment Income | (0.13 | ) | (0.16 | ) | (0.14 | ) | (0.07 | ) | (0.11 | ) | (0.10 | ) | — | |||||||||||||||||||
Net Realized Gains | — | — | (0.18 | ) | — | — | — | — | ||||||||||||||||||||||||
Total Distributions | (0.13 | ) | (0.16 | ) | (0.32 | ) | (0.07 | ) | (0.11 | ) | (0.10 | ) | — | |||||||||||||||||||
Net Asset Value, End of Period | $ | 8.03 | $ | 7.48 | $ | 11.38 | $ | 11.79 | $ | 6.83 | $ | 6.31 | $ | 9.40 | ||||||||||||||||||
Total Return | 9.47 | % | (33.29 | )%(C) | (0.87 | )% | 18.65 | %(C) | 10.28 | % | (32.16 | )%(C) | (6.00 | )%(C) | ||||||||||||||||||
Net Assets, End of Period (thousands) | $ | 1,178,114 | $ | 850,623 | $ | 959,742 | $ | 403,312 | $ | 1,444,886 | $ | 585,165 | $ | 106,507 | ||||||||||||||||||
Ratio of Expenses to Average Net Assets | 0.35 | % | 0.34 | %(B) | 0.34 | % | 0.36 | %(B)(E) | 0.28 | % | 0.29 | %(B) | 0.30 | %(B)(E) | ||||||||||||||||||
Ratio of Expenses to Average Net Assets (Excluding Waivers and Assumption of Expenses and/or Recovery of Previously Waived Fees) | 0.35 | % | 0.34 | %(B) | 0.33 | % | 0.39 | %(B)(E) | 0.28 | % | 0.29 | %(B) | 0.60 | %(B)(E) | ||||||||||||||||||
Ratio of Net Investment Income to Average Net Assets | 1.60 | % | 1.66 | %(B) | 1.29 | % | 1.24 | %(B)(E) | 1.82 | % | 1.75 | %(B) | 2.09 | %(B)(E) | ||||||||||||||||||
Portfolio Turnover Rate | 11 | % | 11 | %(C) | 14 | % | 24 | %(C) | 5 | % | 9 | %(C) | 0 | %(C) | ||||||||||||||||||
See page 1 & 2 for the Definitions of Abbreviations and Footnotes.
See accompanying Notes to Financial Statements.
189
DFA INVESTMENT DIMENSIONS GROUP INC.
FINANCIAL HIGHLIGHTS
(for a share outstanding throughout each period)
| U.S. Small Cap Portfolio | ||||||||||||||||||||||||||
Year Ended Oct. 31, 2009 | Period Dec. 1, 2007 to Oct. 31, 2008 | Year Ended Nov. 30, 2007 | Year Ended Nov. 30, 2006 | Year Ended Nov. 30, 2005 | Year Ended Nov. 30, 2004 | |||||||||||||||||||||
Net Asset Value, Beginning of Period | $ | 13.35 | $ | 20.64 | $ | 22.46 | $ | 20.75 | $ | 19.13 | $ | 16.52 | ||||||||||||||
Income From Investment Operations | ||||||||||||||||||||||||||
Net Investment Income (Loss) | 0.06 | (A) | 0.14 | (A) | 0.21 | (A) | 0.17 | (A) | 0.15 | 0.05 | ||||||||||||||||
Net Gains (Losses) on Securities (Realized and Unrealized) | 1.65 | (6.08 | ) | (0.66 | ) | 2.84 | 1.75 | 2.67 | ||||||||||||||||||
Total From Investment Operations | 1.71 | (5.94 | ) | (0.45 | ) | 3.01 | 1.90 | 2.72 | ||||||||||||||||||
Less Distributions | ||||||||||||||||||||||||||
Net Investment Income | (0.17 | ) | (0.17 | ) | (0.21 | ) | (0.13 | ) | (0.13 | ) | (0.10 | ) | ||||||||||||||
Net Realized Gains | — | (1.18 | ) | (1.16 | ) | (1.17 | ) | (0.15 | ) | — | ||||||||||||||||
Tax Return of Capital | — | — | — | — | — | (0.01 | ) | |||||||||||||||||||
Total Distributions | (0.17 | ) | (1.35 | ) | (1.37 | ) | (1.30 | ) | (0.28 | ) | (0.11 | ) | ||||||||||||||
Net Asset Value, End of Period | $ | 14.89 | $ | 13.35 | $ | 20.64 | $ | 22.46 | $ | 20.75 | $ | 19.13 | ||||||||||||||
Total Return | 13.08 | % | (30.67 | )%(C) | (2.17 | )% | 15.49 | % | 10.04 | % | 16.59 | % | ||||||||||||||
Net Assets, End of Period (thousands) | $ | 2,522,001 | $ | 2,066,849 | $ | 3,285,093 | $ | 3,297,199 | $ | 2,641,670 | $ | 2,137,970 | ||||||||||||||
Ratio of Expenses to Average Net Assets | 0.40 | %** | 0.38 | %(B)(D) | 0.38 | %(D) | 0.38 | %(D) | 0.40 | %(D) | 0.41 | %(D) | ||||||||||||||
Ratio of Net Investment Income to Average Net Assets | 0.50 | % | 0.86 | %(B) | 0.95 | % | 0.82 | % | 0.78 | % | 0.22 | % | ||||||||||||||
Portfolio Turnover Rate | 17 | %* | N/A | N/A | N/A | N/A | N/A | |||||||||||||||||||
| U.S. Micro Cap Portfolio | ||||||||||||||||||||||||||
Year Ended Oct. 31, 2009 | Period Dec. 1, 2007 to Oct. 31, 2008 | Year Ended Nov. 30, 2007 | Year Ended Nov. 30, 2006 | Year Ended Nov. 30, 2005 | Year Ended Nov. 30, 2004 | |||||||||||||||||||||
Net Asset Value, Beginning of Period | $ | 9.19 | $ | 14.80 | $ | 16.83 | $ | 15.91 | $ | 15.06 | $ | 13.34 | ||||||||||||||
Income From Investment Operations | ||||||||||||||||||||||||||
Net Investment Income (Loss) | 0.03 | (A) | 0.10 | (A) | 0.14 | (A) | 0.10 | (A) | 0.07 | 0.19 | ||||||||||||||||
Net Gains (Losses) on Securities (Realized and Unrealized) | 0.54 | (4.32 | ) | (0.69 | ) | 2.04 | 1.43 | 1.93 | ||||||||||||||||||
Total From Investment Operations | 0.57 | (4.22 | ) | (0.55 | ) | 2.14 | 1.50 | 2.12 | ||||||||||||||||||
Less Distributions | ||||||||||||||||||||||||||
Net Investment Income | (0.19 | ) | (0.13 | ) | (0.13 | ) | (0.08 | ) | (0.06 | ) | (0.22 | ) | ||||||||||||||
Net Realized Gains | — | (1.26 | ) | (1.35 | ) | (1.14 | ) | (0.59 | ) | (0.18 | ) | |||||||||||||||
Tax Return of Capital | — | — | — | — | — | — | ||||||||||||||||||||
Total Distributions | (0.19 | ) | (1.39 | ) | (1.48 | ) | (1.22 | ) | (0.65 | ) | (0.40 | ) | ||||||||||||||
Net Asset Value, End of Period | $ | 9.57 | $ | 9.19 | $ | 14.80 | $ | 16.83 | $ | 15.91 | $ | 15.06 | ||||||||||||||
Total Return | 6.61 | % | (31.33 | )%(C) | (3.63 | )% | 14.52 | % | 10.33 | % | 16.34 | % | ||||||||||||||
Net Assets, End of Period (thousands) | $ | 2,818,365 | $ | 2,924,225 | $ | 4,700,371 | $ | 4,824,003 | $ | 3,949,511 | $ | 3,214,520 | ||||||||||||||
Ratio of Expenses to Average Net Assets | 0.54 | %** | 0.53 | %(B)(D) | 0.52 | %(D) | 0.53 | %(D) | 0.55 | %(D) | 0.56 | %(D) | ||||||||||||||
Ratio of Net Investment Income to Average Net Assets | 0.38 | % | 0.91 | %(B) | 0.89 | % | 0.64 | % | 0.48 | % | 0.06 | % | ||||||||||||||
Portfolio Turnover Rate | 12 | %* | N/A | N/A | N/A | N/A | N/A | |||||||||||||||||||
| * | For the period February 28, 2009 through October 31, 2009. Effective February 28, 2009, the Portfolios invest directly in securities rather than through the Series. |
| ** | Represents the combined ratios for the respective portfolio and for the period November 1, 2008 through February 27, 2009, its respective pro-rata share of its Master Fund Series. |
See page 1 & 2 for the Definitions of Abbreviations and Footnotes.
See accompanying Notes to Financial Statements.
190
DFA INVESTMENT DIMENSIONS GROUP INC.
FINANCIAL HIGHLIGHTS
(for a share outstanding throughout each period)
| DFA Real Estate Securities Portfolio | ||||||||||||||||||||||||||
Year Ended Oct. 31, 2009 | Period Dec. 1, 2007 to Oct. 31, 2008 | Year Ended Nov. 30, 2007 | Year Ended Nov. 30, 2006 | Year Ended Nov. 30, 2005 | Year Ended Nov. 30, 2004 | |||||||||||||||||||||
Net Asset Value, Beginning of Period | $ | 16.16 | $ | 27.20 | $ | 33.80 | $ | 25.75 | $ | 23.02 | $ | 18.80 | ||||||||||||||
Income From Investment Operations | ||||||||||||||||||||||||||
Net Investment Income (Loss) | 0.58 | (A) | 0.64 | (A) | 0.62 | (A) | 0.64 | (A) | 0.82 | 0.62 | ||||||||||||||||
Net Gains (Losses) on Securities (Realized and Unrealized) | (0.62 | ) | (9.28 | ) | (5.64 | ) | 8.84 | 3.33 | 4.47 | |||||||||||||||||
Total From Investment Operations | (0.04 | ) | (8.64 | ) | (5.02 | ) | 9.48 | 4.15 | 5.09 | |||||||||||||||||
Less Distributions | ||||||||||||||||||||||||||
Net Investment Income | (0.83 | ) | (0.30 | ) | (0.70 | ) | (1.02 | ) | (0.86 | ) | (0.71 | ) | ||||||||||||||
Net Realized Gains | — | (2.10 | ) | (0.88 | ) | (0.41 | ) | (0.56 | ) | (0.16 | ) | |||||||||||||||
Total Distributions | (0.83 | ) | (2.40 | ) | (1.58 | ) | (1.43 | ) | (1.42 | ) | (0.87 | ) | ||||||||||||||
Net Asset Value, End of Period | $ | 15.29 | $ | 16.16 | $ | 27.20 | $ | 33.80 | $ | 25.75 | $ | 23.02 | ||||||||||||||
Total Return | 0.98 | % | (34.46 | )%(C) | (15.45 | )% | 38.23 | % | 18.81 | % | 29.44 | % | ||||||||||||||
Net Assets, End of Period (thousands) | $ | 2,018,559 | $ | 1,746,961 | $ | 2,671,457 | $ | 2,837,026 | $ | 1,836,650 | $ | 1,308,898 | ||||||||||||||
Ratio of Expenses to Average Net Assets | 0.36 | % | 0.33 | %(B) | 0.33 | % | 0.33 | % | 0.37 | % | 0.39 | % | ||||||||||||||
Ratio of Net Investment Income to Average Net Assets | 4.54 | % | 3.01 | %(B) | 1.99 | % | 2.25 | % | 3.11 | % | 3.61 | % | ||||||||||||||
Portfolio Turnover Rate | 2 | % | 13 | %(C) | 17 | % | 10 | % | 3 | % | 6 | % | ||||||||||||||
| Large Cap International Portfolio | ||||||||||||||||||||||||||
Year Ended Oct. 31, 2009 | Period Dec. 1, 2007 to Oct. 31, 2008 | Year Ended Nov. 30, 2007 | Year Ended Nov. 30, 2006 | Year Ended Nov. 30, 2005 | Year Ended Nov. 30, 2004 | |||||||||||||||||||||
Net Asset Value, Beginning of Period | $ | 14.81 | $ | 27.18 | $ | 23.60 | $ | 19.00 | $ | 17.31 | $ | 14.65 | ||||||||||||||
Income From Investment Operations | ||||||||||||||||||||||||||
Net Investment Income (Loss) | 0.48 | (A) | 0.68 | (A) | 0.68 | (A) | 0.55 | (A) | 0.44 | 0.31 | ||||||||||||||||
Net Gains (Losses) on Securities (Realized and Unrealized) | 3.16 | (12.06 | ) | 3.57 | 4.68 | 1.72 | 2.86 | |||||||||||||||||||
Total From Investment Operations | 3.64 | (11.38 | ) | 4.25 | 5.23 | 2.16 | 3.17 | |||||||||||||||||||
Less Distributions | ||||||||||||||||||||||||||
Net Investment Income | (0.43 | ) | (0.64 | ) | (0.67 | ) | (0.63 | ) | (0.47 | ) | (0.51 | ) | ||||||||||||||
Net Realized Gains | — | (0.35 | ) | — | — | — | — | |||||||||||||||||||
Total Distributions | (0.43 | ) | (0.99 | ) | (0.67 | ) | (0.63 | ) | (0.47 | ) | (0.51 | ) | ||||||||||||||
Net Asset Value, End of Period | $ | 18.02 | $ | 14.81 | $ | 27.18 | $ | 23.60 | $ | 19.00 | $ | 17.31 | ||||||||||||||
Total Return | 25.20 | % | (43.14 | )%(C) | 18.18 | % | 28.00 | % | 12.73 | % | 22.09 | % | ||||||||||||||
Net Assets, End of Period (thousands) | $ | 1,364,351 | $ | 1,206,860 | $ | 2,224,180 | $ | 1,673,239 | $ | 1,125,455 | $ | 844,883 | ||||||||||||||
Ratio of Expenses to Average Net Assets | 0.32 | % | 0.29 | %(B) | 0.29 | % | 0.29 | % | 0.37 | % | 0.41 | % | ||||||||||||||
Ratio of Net Investment Income to Average Net Assets | 3.14 | % | 3.18 | %(B) | 2.62 | % | 2.56 | % | 2.41 | % | 2.07 | % | ||||||||||||||
Portfolio Turnover Rate | 12 | % | 12 | %(C) | 5 | % | 4 | % | 4 | % | 1 | % | ||||||||||||||
See page 1 & 2 for the Definitions of Abbreviations and Footnotes.
See accompanying Notes to Financial Statements.
191
DFA INVESTMENT DIMENSIONS GROUP INC.
FINANCIAL HIGHLIGHTS
(for a share outstanding throughout each period)
| International Core Equity Portfolio | T.A World ex U.S. Core Equity Portfolio | |||||||||||||||||||||||||||||||
Year Ended Oct. 31, 2009 | Period Dec. 1, 2007 to Oct. 31, 2008 | Year Ended Nov. 30, | Year Ended Nov. 30, 2006 | Period to Nov. 30, | Year Ended Oct. 31, 2009 | Period to Oct. 31, | ||||||||||||||||||||||||||
Net Asset Value, Beginning of Period | $ | 7.46 | $ | 14.35 | $ | 12.82 | $ | 10.07 | $ | 10.00 | $ | 5.85 | $ | 10.00 | ||||||||||||||||||
Income From Investment Operations | ||||||||||||||||||||||||||||||||
Net Investment Income (Loss) | 0.23 | (A) | 0.37 | (A) | 0.35 | (A) | 0.28 | (A) | 0.04 | (A) | 0.16 | (A) | 0.15 | (A) | ||||||||||||||||||
Net Gains (Losses) on Securities (Realized and Unrealized) | 2.32 | (6.76 | ) | 1.54 | 2.71 | 0.03 | 2.27 | (4.15 | ) | |||||||||||||||||||||||
Total From Investment Operations | 2.55 | (6.39 | ) | 1.89 | 2.99 | 0.07 | 2.43 | (4.00 | ) | |||||||||||||||||||||||
Less Distributions | ||||||||||||||||||||||||||||||||
Net Investment Income | (0.22 | ) | (0.35 | ) | (0.32 | ) | (0.24 | ) | — | (0.15 | ) | (0.15 | ) | |||||||||||||||||||
Net Realized Gains | — | (0.15 | ) | (0.04 | ) | — | — | — | — | |||||||||||||||||||||||
Total Distributions | (0.22 | ) | (0.50 | ) | (0.36 | ) | (0.24 | ) | — | (0.15 | ) | (0.15 | ) | |||||||||||||||||||
Net Asset Value, End of Period | $ | 9.79 | $ | 7.46 | $ | 14.35 | $ | 12.82 | $ | 10.07 | $ | 8.13 | $ | 5.85 | ||||||||||||||||||
Total Return | 34.81 | % | (45.76 | )%(C) | 14.83 | % | 30.06 | % | 0.70 | %(C) | 42.13 | % | (40.61 | )%(C) | ||||||||||||||||||
Net Assets, End of Period (thousands) | $ | 3,699,842 | $ | 1,981,049 | $ | 2,342,187 | $ | 851,077 | $ | 121,249 | $ | 668,728 | $ | 228,318 | ||||||||||||||||||
Ratio of Expenses to Average Net Assets | 0.41 | % | 0.41 | %(B) | 0.41 | % | 0.48 | % | 0.49 | %(B)(E) | 0.54 | % | 0.60 | %(B)(E) | ||||||||||||||||||
Ratio of Expenses to Average Net Assets (Excluding Waivers and Assumption of Expenses and/or Recovery of Previously Waived Fees) | 0.41 | % | 0.41 | %(B) | 0.41 | % | 0.46 | % | 0.90 | %(B)(E) | 0.51 | % | 0.85 | %(B)(E) | ||||||||||||||||||
Ratio of Net Investment Income to Average Net Assets | 2.84 | % | 3.39 | %(B) | 2.49 | % | 2.35 | % | 1.89 | %(B)(E) | 2.38 | % | 3.27 | %(B)(E) | ||||||||||||||||||
Portfolio Turnover Rate | 5 | % | 4 | %(C) | 4 | % | 2 | % | 0 | %(C) | 5 | % | 2 | %(C) | ||||||||||||||||||
See page 1 & 2 for the Definitions of Abbreviations and Footnotes.
See accompanying Notes to Financial Statements.
192
DFA INVESTMENT DIMENSIONS GROUP INC.
FINANCIAL HIGHLIGHTS
(for a share outstanding throughout each period)
| International Small Company Portfolio | Japanese Small Company Portfolio | |||||||||||||||||||||||||||||||||||||||||||||||||
Year Ended Oct. 31, 2009 | Period Dec. 1, 2007 to Oct. 31, 2008 | Year Ended Nov. 30, 2007 | Year Ended Nov. 30, | Year Ended Nov. 30, 2005 | Year Ended Nov. 30, | Year Ended Oct. 31, 2009 | Period Dec. 1, 2007 to Oct. 31, 2008 | Year Ended Nov. 30, 2007 | Year Ended Nov. 30, 2006 | Year Ended Nov. 30, 2005 | Year Ended Nov. 30, 2004 | |||||||||||||||||||||||||||||||||||||||
Net Asset Value, Beginning of Period | $ | 10.07 | $ | 20.80 | $ | 19.43 | $ | 16.19 | $ | 14.12 | $ | 11.00 | $ | 11.97 | $ | 16.75 | $ | 17.23 | $ | 17.97 | $ | 13.99 | $ | 10.80 | ||||||||||||||||||||||||||
Income From Investment Operations | ||||||||||||||||||||||||||||||||||||||||||||||||||
Net Investment Income (Loss) | 0.28 | (A) | 0.44 | (A) | 0.43 | (A) | 0.36 | (A) | 0.31 | (A) | 0.22 | 0.22 | (A) | 0.29 | (A) | 0.27 | (A) | 0.22 | (A) | 0.16 | (A) | 0.22 | ||||||||||||||||||||||||||||
Net Gains (Losses) on Securities (Realized and Unrealized) | 3.91 | (9.55 | ) | 2.07 | 4.02 | 2.38 | 3.24 | 2.39 | (4.78 | ) | (0.52 | ) | (0.73 | ) | 4.00 | 3.16 | ||||||||||||||||||||||||||||||||||
Total From Investment Operations | 4.19 | (9.11 | ) | 2.50 | 4.38 | 2.69 | 3.46 | 2.61 | (4.49 | ) | (0.25 | ) | (0.51 | ) | 4.16 | 3.38 | ||||||||||||||||||||||||||||||||||
Less Distributions | ||||||||||||||||||||||||||||||||||||||||||||||||||
Net Investment Income | (0.27 | ) | (0.45 | ) | (0.46 | ) | (0.36 | ) | (0.29 | ) | (0.34 | ) | (0.26 | ) | (0.29 | ) | (0.23 | ) | (0.23 | ) | (0.18 | ) | (0.19 | ) | ||||||||||||||||||||||||||
Net Realized Gains | — | (1.17 | ) | (0.67 | ) | (0.78 | ) | (0.33 | ) | — | — | — | — | — | — | — | ||||||||||||||||||||||||||||||||||
Total Distributions | (0.27 | ) | (1.62 | ) | (1.13 | ) | (1.14 | ) | (0.62 | ) | (0.34 | ) | (0.26 | ) | (0.29 | ) | (0.23 | ) | (0.23 | ) | (0.18 | ) | (0.19 | ) | ||||||||||||||||||||||||||
Net Asset Value, End of Period | $ | 13.99 | $ | 10.07 | $ | 20.80 | $ | 19.43 | $ | 16.19 | $ | 14.12 | $ | 14.32 | $ | 11.97 | $ | 16.75 | $ | 17.23 | $ | 17.97 | $ | 13.99 | ||||||||||||||||||||||||||
Total Return | 42.34 | % | (47.13 | )%(C) | 13.29 | % | 28.51 | % | 19.74 | % | 32.10 | % | 22.08 | % | (27.16 | )%(C) | (1.51 | )% | (2.94 | )% | 30.13 | % | 31.79 | % | ||||||||||||||||||||||||||
Net Assets, End of Period (thousands) | $ | 4,269,864 | $ | 3,084,373 | $ | 5,597,209 | $ | 4,546,071 | $ | 2,725,231 | $ | 1,658,184 | $ | 114,058 | $ | 133,373 | $ | 199,080 | $ | 168,957 | $ | 169,995 | $ | 65,879 | ||||||||||||||||||||||||||
Ratio of Expenses to Average Net Assets (D) | 0.57 | % | 0.55 | %(B) | 0.55 | % | 0.56 | % | 0.64 | % | 0.69 | % | 0.59 | % | 0.58 | %(B) | 0.56 | % | 0.61 | % | 0.68 | % | 0.73 | % | ||||||||||||||||||||||||||
Ratio of Expenses to Average Net Assets (Excluding Waivers and Assumption of Expenses and/or Recovery of Previously Waived Fees) (D) | 0.57 | % | 0.55 | %(B) | 0.55 | % | 0.56 | % | 0.64 | % | 0.69 | % | 0.59 | % | 0.58 | %(B) | 0.56 | % | 0.58 | % | 0.68 | % | 0.79 | % | ||||||||||||||||||||||||||
Ratio of Net Investment Income to Average Net Assets | 2.48 | % | 2.90 | %(B) | 2.03 | % | 2.04 | % | 2.05 | % | 1.82 | % | 1.68 | % | 2.18 | %(B) | 1.51 | % | 1.19 | % | 1.03 | % | 1.01 | % | ||||||||||||||||||||||||||
See page 1 & 2 for the Definitions of Abbreviations and Footnotes.
See accompanying Notes to Financial Statements.
193
DFA INVESTMENT DIMENSIONS GROUP INC.
FINANCIAL HIGHLIGHTS
(for a share outstanding throughout each period)
| Asia Pacific Small Company Portfolio | United Kingdom Small Company Portfolio | |||||||||||||||||||||||||||||||||||||||||||||||||
| Year Ended Oct. 31, 2009 | Period 2007 to | Year Ended Nov. 30, 2007 | Year Ended Nov. 30, 2006 | Year Ended Nov. 30, 2005 | Year Ended Nov. 30, 2004 | Year Ended Oct. 31, 2009 | Period Dec. 1, 2007 to Oct. 31, 2008 | Year Ended Nov. 30, 2007 | Year Ended Nov. 30, 2006 | Year Ended Nov. 30, 2005 | Year Ended Nov. 30, 2004 | |||||||||||||||||||||||||||||||||||||||
Net Asset Value, Beginning of Period | $ | 11.67 | $ | 28.73 | $ | 20.26 | $ | 15.28 | $ | 14.54 | $ | 12.10 | $ | 14.27 | $ | 31.29 | $ | 32.97 | $ | 24.65 | $ | 23.47 | $ | 19.26 | ||||||||||||||||||||||||||
Income From Investment Operations | ||||||||||||||||||||||||||||||||||||||||||||||||||
Net Investment Income (Loss) | 0.50 | (A) | 0.83 | (A) | 0.79 | (A) | 0.64 | (A) | 0.70 | 0.50 | 0.55 | (A) | 0.77 | (A) | 0.78 | (A) | 0.61 | (A) | 0.64 | (A) | 0.48 | |||||||||||||||||||||||||||||
Net Gains (Losses) on Securities (Realized and Unrealized) | 8.95 | (17.04 | ) | 8.43 | 4.92 | 0.54 | 2.58 | 5.44 | (15.84 | ) | (0.08 | ) | 9.61 | 2.15 | 4.87 | |||||||||||||||||||||||||||||||||||
Total From Investment Operations | 9.45 | (16.21 | ) | 9.22 | 5.56 | 1.24 | 3.08 | 5.99 | (15.07 | ) | 0.70 | 10.22 | 2.79 | 5.35 | ||||||||||||||||||||||||||||||||||||
Less Distributions | ||||||||||||||||||||||||||||||||||||||||||||||||||
Net Investment Income | (0.53 | ) | (0.85 | ) | (0.75 | ) | (0.58 | ) | (0.50 | ) | (0.64 | ) | (0.43 | ) | (0.72 | ) | (1.03 | ) | (0.68 | ) | (0.59 | ) | (1.14 | ) | ||||||||||||||||||||||||||
Net Realized Gains | — | — | — | — | — | — | — | (1.22 | ) | (1.35 | ) | (1.22 | ) | (1.02 | ) | — | ||||||||||||||||||||||||||||||||||
Return of Capital | — | — | — | — | — | — | — | (0.01 | ) | — | — | — | — | |||||||||||||||||||||||||||||||||||||
Total Distributions | (0.53 | ) | (0.85 | ) | (0.75 | ) | (0.58 | ) | (0.50 | ) | (0.64 | ) | (0.43 | ) | (1.95 | ) | (2.38 | ) | (1.90 | ) | (1.61 | ) | (1.14 | ) | ||||||||||||||||||||||||||
Net Asset Value, End of Period | $ | 20.59 | $ | 11.67 | $ | 28.73 | $ | 20.26 | $ | 15.28 | $ | 14.54 | $ | 19.83 | $ | 14.27 | $ | 31.29 | $ | 32.97 | $ | 24.65 | $ | 23.47 | ||||||||||||||||||||||||||
Total Return | 84.11 | % | (57.94 | )%(C) | 46.55 | % | 37.52 | % | 8.81 | % | 26.73 | % | 42.81 | % | (50.97 | )%(C) | 1.94 | % | 44.15 | % | 12.35 | % | 29.05 | % | ||||||||||||||||||||||||||
Net Assets, End of Period (thousands) | $ | 101,853 | $ | 64,044 | $ | 146,307 | $ | 71,537 | $ | 38,927 | $ | 26,735 | $ | 27,863 | $ | 25,883 | $ | 37,139 | $ | 31,808 | $ | 20,578 | $ | 15,816 | ||||||||||||||||||||||||||
Ratio of Expenses to Average Net Assets(D) | 0.65 | % | 0.62 | %(B) | 0.62 | % | 0.64 | % | 0.74 | % | 0.80 | % | 0.61 | % | 0.59 | %(B) | 0.59 | % | 0.60 | % | 0.70 | % | 0.74 | % | ||||||||||||||||||||||||||
Ratio of Expenses to Average Net Assets (Excluding Waivers and Assumption of Expenses and/or Recovery of Previously Waived Expenses)(D) | 0.65 | % | 0.61 | %(B) | 0.59 | % | 0.64 | % | 0.86 | % | 0.96 | % | 0.70 | % | 0.65 | %(B) | 0.62 | % | 0.67 | % | 0.89 | % | 1.04 | % | ||||||||||||||||||||||||||
Ratio of Net Investment Income to Average Net Assets | 3.53 | % | 3.85 | %(B) | 3.13 | % | 3.68 | % | 3.89 | % | 3.29 | % | 3.62 | % | 3.41 | %(B) | 2.28 | % | 2.20 | % | 2.70 | % | 2.21 | % | ||||||||||||||||||||||||||
See page 1 & 2 for the Definitions of Abbreviations and Footnotes.
See accompanying Notes to Financial Statements.
194
DFA INVESTMENT DIMENSIONS GROUP INC.
FINANCIAL HIGHLIGHTS
(for a share outstanding throughout each period)
| Continental Small Company Portfolio | DFA International Real Estate Securities Portfolio | |||||||||||||||||||||||||||||||||||
Year Ended Oct. 31, 2009 | Period Dec. 1, 2007 to Oct. 31, 2008 | Year Ended Nov. 30, 2007 | Year Ended Nov. 30, 2006 | Year Ended Nov. 30, 2005 | Year Ended Nov. 30, 2004 | Year Ended Oct. 31, 2009 | Period Dec. 1, 2007 to Oct. 31, 2008 | Period March 1, 2007(a) to Nov. 30, 2007 | ||||||||||||||||||||||||||||
Net Asset Value, Beginning of Period | $ | 10.73 | $ | 22.95 | $ | 20.47 | $ | 15.78 | $ | 14.12 | $ | 12.60 | $ | 4.18 | $ | 9.35 | $ | 10.00 | ||||||||||||||||||
Income From Investment Operations | ||||||||||||||||||||||||||||||||||||
Net Investment Income (Loss) | 0.28 | (A) | 0.52 | (A) | 0.40 | (A) | 0.31 | (A) | 0.21 | 0.17 | 0.26 | (A) | 0.34 | (A) | 0.23 | (A) | ||||||||||||||||||||
Net Gains (Losses) on Securities (Realized and Unrealized) | 4.29 | (11.32 | ) | 3.00 | 6.28 | 2.28 | 3.64 | 0.91 | (5.08 | ) | (0.76) | |||||||||||||||||||||||||
Total From Investment Operations | 4.57 | (10.80 | ) | 3.40 | 6.59 | 2.49 | 3.81 | 1.17 | (4.74 | ) | (0.53) | |||||||||||||||||||||||||
Less Distributions | ||||||||||||||||||||||||||||||||||||
Net Investment Income | (0.28 | ) | (0.45 | ) | (0.38 | ) | (0.34 | ) | (0.30 | ) | (0.50 | ) | (0.11 | ) | (0.43 | ) | (0.12) | |||||||||||||||||||
Net Realized Gains | — | (0.96 | ) | (0.54 | ) | (1.56 | ) | (0.53 | ) | (1.79 | ) | — | — | — | ||||||||||||||||||||||
Return of Capital | — | (0.01 | ) | — | — | — | — | — | — | — | ||||||||||||||||||||||||||
Total Distributions | (0.28 | ) | (1.42 | ) | (0.92 | ) | (1.90 | ) | (0.83 | ) | (2.29 | ) | (0.11 | ) | (0.43 | ) | (0.12 | ) | ||||||||||||||||||
Net Asset Value, End of Period | $ | 15.02 | $ | 10.73 | $ | 22.95 | $ | 20.47 | $ | 15.78 | $ | 14.12 | $ | 5.24 | $ | 4.18 | $ | 9.35 | ||||||||||||||||||
Total Return | 43.12 | % | (49.89 | )%(C) | 16.99 | % | 46.33 | % | 18.42 | % | 35.91 | % | 29.25 | % | (52.85 | )%(C) | (5.38) | %(C) | ||||||||||||||||||
Net Assets, End of Period (thousands) | $ | 110,926 | $ | 93,988 | $ | 170,909 | $ | 90,261 | $ | 52,061 | $ | 33,839 | $ | 742,329 | $ | 394,480 | $ | 336,840 | ||||||||||||||||||
Ratio of Expenses to Average Net Assets | 0.62 | %(D) | 0.59 | %(B)(D) | 0.61 | %(D) | 0.62 | %(D) | 0.71 | %(D) | 0.73 | %(D) | 0.43 | % | 0.44 | %(B) | 0.48 | %(B)(E) | ||||||||||||||||||
Ratio of Expenses to Average Net Assets (Excluding Waivers and Assumption of Expenses and/or Recovery of Previously Waived Fees) | 0.61 | %(D) | 0.59 | %(B)(D) | 0.57 | %(D) | 0.61 | %(D) | 0.78 | %(D) | 0.87 | %(D) | 0.43 | % | 0.44 | %(B) | 0.48 | %(B)(E) | ||||||||||||||||||
Ratio of Net Investment Income (Loss) to Average Net Assets | 2.39 | % | 3.04 | %(B) | 1.70 | % | 1.78 | % | 1.77 | % | 1.56 | % | 6.40 | % | 5.20 | %(B) | 3.50 | %(B)(E) | ||||||||||||||||||
Portfolio Turnover Rate | N/A | N/A | N/A | N/A | N/A | N/A | 5 | % | 1 | %(C) | 2 | %(C) | ||||||||||||||||||||||||
See page 1 & 2 for the Definitions of Abbreviations and Footnotes.
See accompanying Notes to Financial Statements.
195
DFA INVESTMENT DIMENSIONS GROUP INC.
FINANCIAL HIGHLIGHTS
(for a share outstanding throughout each period)
| DFA Global Real Estate Securities Portfolio | DFA International Small Cap Value Portfolio | |||||||||||||||||||||||||||||||
Year Ended Oct. 31, | Period June 4, 2008(a) to Oct. 31, 2008 | Year Ended Oct. 31, 2009 | Period Dec. 1, 2007 to Oct. 31, 2008 | Year Ended Nov. 30, 2007 | Year Ended Nov. 30, 2006 | Year Ended Nov. 30, 2005 | Year Ended Nov. 30, 2004 | |||||||||||||||||||||||||
Net Asset Value, Beginning of Period | $ | 6.04 | $ | 10.00 | $ | 10.82 | $ | 22.05 | $ | 21.71 | $ | 17.57 | $ | 15.16 | $ | 11.52 | ||||||||||||||||
Income From Investment Operations | ||||||||||||||||||||||||||||||||
Net Investment Income (Loss) | 0.19 | (A) | — | (A) | 0.26 | (A) | 0.52 | (A) | 0.46 | (A) | 0.36 | (A) | 0.40 | (A) | 0.23 | |||||||||||||||||
Net Gains (Losses) on Securities (Realized and Unrealized) | 0.62 | (3.96 | ) | 4.14 | (9.60 | ) | 1.66 | 4.95 | 2.77 | 3.85 | ||||||||||||||||||||||
Total From Investment Operations | 0.81 | (3.96 | ) | 4.40 | (9.08 | ) | 2.12 | 5.31 | 3.17 | 4.08 | ||||||||||||||||||||||
Less Distributions | ||||||||||||||||||||||||||||||||
Net Investment Income | (0.10 | ) | — | (0.24 | ) | (0.58 | ) | (0.53 | ) | (0.38 | ) | (0.36 | ) | (0.35 | ) | |||||||||||||||||
Net Realized Gains | — | — | (0.06 | ) | (1.57 | ) | (1.25 | ) | (0.79 | ) | (0.40 | ) | (0.09 | ) | ||||||||||||||||||
Total Distributions | (0.10 | ) | — | (0.30 | ) | (2.15 | ) | (1.78 | ) | (1.17 | ) | (0.76 | ) | (0.44 | ) | |||||||||||||||||
Net Asset Value, End of Period | $ | 6.75 | $ | 6.04 | $ | 14.92 | $ | 10.82 | $ | 22.05 | $ | 21.71 | $ | 17.57 | $ | 15.16 | ||||||||||||||||
Total Return | 13.81 | % | (39.60 | )%(C) | 41.42 | % | (45.17 | )%(C) | 10.25 | % | 31.73 | % | 21.75 | % | 36.34 | % | ||||||||||||||||
Net Assets, End of Period (thousands) | $ | 432,502 | $ | 90,672 | $ | 6,859,957 | $ | 4,799,748 | $ | 8,180,859 | $ | 6,733,067 | $ | 4,128,428 | $ | 2,215,523 | ||||||||||||||||
Ratio of Expenses to Average Net Assets | 0.47 | %(D) | 0.54 | %(B)(D)(E) | 0.71 | % | 0.69 | %(B) | 0.69 | % | 0.70 | % | 0.75 | % | 0.78 | % | ||||||||||||||||
Ratio of Expenses to Average Net Assets (Excluding Waivers and Assumption of Expenses and/or Recovery of Previously Waived Fees) | 0.79 | %(D) | 0.86 | %(B)(D)(E) | 0.71 | % | 0.69 | %(B) | 0.69 | % | 0.70 | % | 0.75 | % | 0.78 | % | ||||||||||||||||
Ratio of Net Investment Income to Average Net Assets | 3.40 | % | (0.04 | )%(B)(E) | 2.19 | % | 3.22 | %(B) | 2.03 | % | 1.85 | % | 2.44 | % | 1.63 | % | ||||||||||||||||
Portfolio Turnover Rate | N/A | N/A | 22 | % | 16 | %(C) | 18 | % | 14 | % | 13 | % | 10 | % | ||||||||||||||||||
See page 1 & 2 for the Definitions of Abbreviations and Footnotes.
See accompanying Notes to Financial Statements.
196
DFA INVESTMENT DIMENSIONS GROUP INC.
FINANCIAL HIGHLIGHTS
(for a share outstanding throughout each period)
| International Vector Equity Portfolio | Emerging Markets Portfolio | |||||||||||||||||||||||||||||||
Year Ended Oct. 31, 2009 | Period August 14, 2008(a) to Oct. 31, 2008 | Year Ended Oct. 31, 2009 | Period Dec. 1, 2007 to Oct. 31, 2008 | Year Ended Nov. 30, 2007 | Year Ended Nov. 30, 2006 | Year Ended Nov. 30, 2005 | Year Ended Nov. 30, 2004 | |||||||||||||||||||||||||
Net Asset Value, Beginning of Period | $ | 6.74 | $ | 10.00 | $ | 17.05 | $ | 35.23 | $ | 25.40 | $ | 19.89 | $ | 15.61 | $ | 11.87 | ||||||||||||||||
Income From Investment Operations | ||||||||||||||||||||||||||||||||
Net Investment Income (Loss) | 0.17 | (A) | 0.06 | (A) | 0.42 | (A) | 0.70 | (A) | 0.64 | (A) | 0.48 | (A) | 0.58 | (A) | 0.27 | |||||||||||||||||
Net Gains (Losses) on Securities (Realized and Unrealized) | 2.46 | (3.32 | ) | 8.42 | (16.85 | ) | 9.88 | 5.61 | 4.13 | 3.80 | ||||||||||||||||||||||
Total From Investment Operations | 2.63 | (3.26 | ) | 8.84 | (16.15 | ) | 10.52 | 6.09 | 4.71 | 4.07 | ||||||||||||||||||||||
Less Distributions | ||||||||||||||||||||||||||||||||
Net Investment Income | (0.15 | ) | — | (0.41 | ) | (0.69 | ) | (0.53 | ) | (0.58 | ) | (0.43 | ) | (0.33 | ) | |||||||||||||||||
Net Realized Gains | — | — | (0.25 | ) | (1.34 | ) | (0.16 | ) | — | — | — | |||||||||||||||||||||
Total Distributions | (0.15 | ) | — | (0.66 | ) | (2.03 | ) | (0.69 | ) | (0.58 | ) | (0.43 | ) | (0.33 | ) | |||||||||||||||||
Net Asset Value, End of Period | $ | 9.22 | $ | 6.74 | $ | 25.23 | $ | 17.05 | $ | 35.23 | $ | 25.40 | $ | 19.89 | $ | 15.61 | ||||||||||||||||
Total Return | 39.52 | % | (32.60 | )%(C) | 53.39 | % | (48.37 | )%(C) | 42.08 | % | 31.31 | % | 30.65 | % | 34.95 | % | ||||||||||||||||
Net Assets, End of Period (thousands) | $ | 262,544 | $ | 66,774 | $ | 1,966,288 | $ | 1,508,260 | $ | 3,388,442 | $ | 2,344,990 | $ | 1,805,186 | $ | 1,131,778 | ||||||||||||||||
Ratio of Expenses to Average Net Assets | 0.60 | % | 0.60 | %(B)(E) | 0.62 | %(D) | 0.60 | %(B)(D) | 0.60 | %(D) | 0.61 | %(D) | 0.69 | %(D) | 0.74 | %(D) | ||||||||||||||||
Ratio of Expenses to Average Net Assets (Excluding Waivers and Assumption of Expenses and/or Recovery of Previously Waived Fees) | 0.59 | % | 1.15 | %(B)(E) | 0.62 | %(D) | 0.60 | %(B)(D) | 0.60 | %(D) | 0.61 | %(D) | 0.69 | %(D) | 0.74 | %(D) | ||||||||||||||||
Ratio of Net Investment Income to Average Net Assets. | 2.31 | % | 3.01 | %(B)(E) | 2.15 | % | 2.59 | %(B) | 2.12 | % | 2.13 | % | 3.28 | % | 2.20 | % | ||||||||||||||||
Portfolio Turnover Rate | 8 | % | 0 | %(C) | N/A | N/A | N/A | N/A | N/A | N/A | ||||||||||||||||||||||
See page 1 & 2 for the Definitions of Abbreviations and Footnotes.
See accompanying Notes to Financial Statements.
197
DFA INVESTMENT DIMENSIONS GROUP INC.
FINANCIAL HIGHLIGHTS
(for a share outstanding throughout each period)
| Emerging Markets Small Cap Portfolio | ||||||||||||||||||||||||
Year Ended Oct. 31, 2009 | Period Dec. 1, 2007 to Oct. 31, 2008 | Year Ended Nov. 30, 2007 | Year Ended Nov. 30, 2006 | Year Ended Nov. 30, 2005 | Year Ended Nov. 30, 2004 | |||||||||||||||||||
Net Asset Value, Beginning of Period | $ | 9.33 | $ | 23.74 | $ | 17.96 | $ | 13.37 | $ | 11.44 | $ | 8.74 | ||||||||||||
Income From Investment Operations | ||||||||||||||||||||||||
Net Investment Income (Loss) | 0.26 | (A) | 0.44 | (A) | 0.31 | (A) | 0.30 | (A) | 0.27 | (A) | 0.11 | |||||||||||||
Net Gains (Losses) on Securities (Realized and Unrealized) | 8.14 | (12.95 | ) | 6.86 | 4.86 | 2.37 | 2.85 | |||||||||||||||||
Total From Investment Operations | 8.40 | (12.51 | ) | 7.17 | 5.16 | 2.64 | 2.96 | |||||||||||||||||
Less Distributions | ||||||||||||||||||||||||
Net Investment Income | (0.28 | ) | (0.41 | ) | (0.26 | ) | (0.26 | ) | (0.22 | ) | (0.19 | ) | ||||||||||||
Net Realized Gains | — | (1.49 | ) | (1.13 | ) | (0.31 | ) | (0.49 | ) | (0.07 | ) | |||||||||||||
| �� | ||||||||||||||||||||||||
Total Distributions | (0.28 | ) | (1.90 | ) | (1.39 | ) | (0.57 | ) | (0.71 | ) | (0.26 | ) | ||||||||||||
Net Asset Value, End of Period | $ | 17.45 | $ | 9.33 | $ | 23.74 | $ | 17.96 | $ | 13.37 | $ | 11.44 | ||||||||||||
Total Return | 91.35 | % | (57.00 | )%(C) | 42.58 | % | 39.95 | % | 24.27 | % | 34.55 | % | ||||||||||||
Net Assets, End of Period (thousands) | $ | 1,133,958 | $ | 547,329 | $ | 1,458,152 | $ | 838,948 | $ | 482,378 | $ | 190,028 | ||||||||||||
Ratio of Expenses to Average Net Assets | 0.80 | %(D) | 0.77 | %(B)(D) | 0.78 | %(D) | 0.81 | %(D) | 0.97 | %(D) | 1.04 | %(D) | ||||||||||||
Ratio of Expenses to Average Net Assets (Excluding Waivers and Assumption of Expenses and/or Recovery of Previously Waived Fees) | 0.80 | %(D) | 0.77 | %(B)(D) | 0.78 | %(D) | 0.81 | %(D) | 0.97 | %(D) | 1.04 | %(D) | ||||||||||||
Ratio of Net Investment Income to Average Net Assets | 2.05 | % | 2.61 | %(B) | 1.48 | % | 1.92 | % | 2.21 | % | 1.41 | % | ||||||||||||
Portfolio Turnover Rate | N/A | N/A | N/A | N/A | N/A | N/A | ||||||||||||||||||
| Emerging Markets Core Equity Portfolio | ||||||||||||||||||||||||
Year Ended Oct. 31, 2009 | Period Dec. 1, 2007 to Oct. 31, 2008 | Year Ended Nov. 30, 2007 | Year Ended Nov. 30, 2006 | Period April 5, 2005(a) to Nov. 30, 2005 | ||||||||||||||||||||
Net Asset Value, Beginning of Period | $ | 9.88 | $ | 21.20 | $ | 15.13 | $ | 11.54 | $ | 10.00 | ||||||||||||||
Income From Investment Operations | ||||||||||||||||||||||||
Net Investment Income (Loss) | 0.25 | (A) | 0.43 | (A) | 0.35 | (A) | 0.27 | (A) | 0.10 | |||||||||||||||
Net Gains (Losses) on Securities (Realized and Unrealized) | 6.56 | (11.27 | ) | 6.10 | 3.54 | 1.51 | ||||||||||||||||||
Total From Investment Operations | 6.81 | (10.84 | ) | 6.45 | 3.81 | 1.61 | ||||||||||||||||||
Less Distributions | ||||||||||||||||||||||||
Net Investment Income | (0.20 | ) | (0.40 | ) | (0.32 | ) | (0.22 | ) | (0.07 | ) | ||||||||||||||
Net Realized Gains | — | (0.08 | ) | (0.06 | ) | — | — | |||||||||||||||||
Total Distributions | (0.20 | ) | (0.48 | ) | (0.38 | ) | (0.22 | ) | (0.07 | ) | ||||||||||||||
Net Asset Value, End of Period | $ | 16.49 | $ | 9.88 | $ | 21.20 | $ | 15.13 | $ | 11.54 | ||||||||||||||
Total Return | 69.47 | % | (51.93 | )%(C) | 43.20 | % | 33.39 | % | 16.12 | %(C) | ||||||||||||||
Net Assets, End of Period (thousands) | $ | 2,455,035 | $ | 1,155,526 | $ | 1,829,466 | $ | 822,136 | $ | 218,563 | ||||||||||||||
Ratio of Expenses to Average Net Assets | 0.67 | % | 0.65 | %(B) | 0.65 | % | 0.74 | % | 1.00 | %(B)(E) | ||||||||||||||
Ratio of Expenses to Average Net Assets (Excluding Waivers and Assumption of Expenses and/or Recovery of Previously Waived Fees) | 0.67 | % | 0.65 | %(B) | 0.65 | % | 0.72 | % | 1.09 | %(B)(E) | ||||||||||||||
Ratio of Net Investment Income to Average Net Assets | 2.03 | % | 2.62 | %(B) | 1.87 | % | 2.02 | % | 1.79 | %(B)(E) | ||||||||||||||
Portfolio Turnover Rate | 6 | % | 3 | %(C) | 2 | % | 6 | % | 2 | %(C) | ||||||||||||||
See page 1 & 2 for the Definitions of Abbreviations and Footnotes.
See accompanying Notes to Financial Statements.
198
DFA INVESTMENT DIMENSIONS GROUP INC.
FINANCIAL HIGHLIGHTS
(for a share outstanding throughout each period)
| DFA One-Year Fixed Income Portfolio | ||||||||||||||||||||||||
Year Ended Oct. 31, 2009 | Period Dec. 1, 2007 to Oct. 31 2008 | Year Ended Nov. 30, 2007 | Year Ended Nov. 30, 2006 | Year Ended Nov. 30, 2005 | Year Ended Nov. 30, 2004 | |||||||||||||||||||
Net Asset Value, Beginning of Period | $ | 10.17 | $ | 10.21 | $ | 10.20 | $ | 10.14 | $ | 10.20 | $ | 10.30 | ||||||||||||
Income From Investment Operations | ||||||||||||||||||||||||
Net Investment Income (Loss) | 0.13 | (A) | 0.31 | (A) | 0.51 | (A) | 0.40 | (A) | 0.28 | 0.25 | ||||||||||||||
Net Gains (Losses) on Securities (Realized and Unrealized) | 0.25 | (0.04 | ) | 0.01 | 0.06 | (0.05 | ) | (0.10 | ) | |||||||||||||||
Total From Investment Operations | 0.38 | 0.27 | 0.52 | 0.46 | 0.23 | 0.15 | ||||||||||||||||||
Less Distributions | ||||||||||||||||||||||||
Net Investment Income | (0.22 | ) | (0.31 | ) | (0.51 | ) | (0.40 | ) | (0.29 | ) | (0.25 | ) | ||||||||||||
Net Realized Gains | — | — | — | — | — | — | ||||||||||||||||||
Total Distributions | (0.22 | ) | (0.31 | ) | (0.51 | ) | (0.40 | ) | (0.29 | ) | (0.25 | ) | ||||||||||||
Net Asset Value, End of Period | $ | 10.33 | $ | 10.17 | $ | 10.21 | $ | 10.20 | $ | 10.14 | $ | 10.20 | ||||||||||||
Total Return | 3.80 | % | 2.68 | %(C) | 5.20 | % | 4.58 | % | 2.24 | % | 1.08 | % | ||||||||||||
Net Assets, End of Period (thousands) | $ | 4,269,615 | $ | 3,194,420 | $ | 3,229,577 | $ | 2,418,551 | $ | 1,953,884 | $ | 1,738,574 | ||||||||||||
Ratio of Expenses to Average Net Assets | 0.20 | %** | 0.18 | %(B)(D) | 0.18 | %(D) | 0.18 | %(D) | 0.19 | %(D) | 0.20 | %(D) | ||||||||||||
Ratio of Net Investment Income to Average Net Assets | 1.26 | % | 3.30 | %(B) | 4.96 | % | 3.89 | % | 2.78 | % | 1.40 | % | ||||||||||||
Portfolio Turnover Rate | 2 | %* | N/A | N/A | N/A | N/A | N/A | |||||||||||||||||
| DFA Two-Year Global Fixed Income Portfolio | ||||||||||||||||||||||||
Year Ended Oct. 31, 2009 | Period Dec. 1, 2007 to Oct. 31, 2008 | Year Ended Nov. 30, 2007 | Year Ended Nov. 30, 2006 | Year Ended Nov. 30, 2005 | Year Ended Nov. 30, 2004 | |||||||||||||||||||
Net Asset Value, Beginning of Period | $ | 10.36 | $ | 10.39 | $ | 10.17 | $ | 9.88 | $ | 9.92 | $ | 10.08 | ||||||||||||
Income From Investment Operations | ||||||||||||||||||||||||
Net Investment Income (Loss) | 0.19 | (A) | 0.39 | (A) | 0.27 | (A) | 0.07 | (A) | 0.31 | 0.25 | ||||||||||||||
Net Gains (Losses) on Securities (Realized and Unrealized) | 0.18 | (0.09 | ) | 0.24 | 0.36 | (0.14 | ) | (0.14 | ) | |||||||||||||||
Total From Investment Operations | 0.37 | 0.30 | 0.51 | 0.43 | 0.17 | 0.11 | ||||||||||||||||||
Less Distributions | ||||||||||||||||||||||||
Net Investment Income | (0.46 | ) | (0.33 | ) | (0.29 | ) | (0.14 | ) | (0.21 | ) | (0.27 | ) | ||||||||||||
Net Realized Gains | — | — | — | — | — | — | ||||||||||||||||||
Total Distributions | (0.46 | ) | (0.33 | ) | (0.29 | ) | (0.14 | ) | (0.21 | ) | (0.27 | ) | ||||||||||||
Net Asset Value, End of Period | $ | 10.27 | $ | 10.36 | $ | 10.39 | $ | 10.17 | $ | 9.88 | $ | 9.92 | ||||||||||||
Total Return | 3.71 | % | 2.93 | %(C) | 5.06 | % | 4.41 | % | 1.77 | % | 1.08 | % | ||||||||||||
Net Assets, End of Period (thousands) | $ | 3,846,029 | $ | 3,124,985 | $ | 3,097,898 | $ | 2,423,622 | $ | 1,992,869 | $ | 1,674,972 | ||||||||||||
Ratio of Expenses to Average Net Assets | 0.20 | %** | 0.18 | %(B)(D) | 0.18 | %(D) | 0.19 | %(D) | 0.21 | %(D) | 0.23 | %(D) | ||||||||||||
Ratio of Net Investment Income to Average Net Assets | 1.89 | % | 4.12 | %(B) | 2.59 | % | 0.72 | % | 3.25 | % | 1.35 | % | ||||||||||||
Portfolio Turnover Rate | 1 | %* | N/A | N/A | N/A | N/A | N/A | |||||||||||||||||
| * | For the period October 23, 2009 through October 31, 2009. Effective October 23, 2009, the Portfolios directly invest in securities rather than through the Series. |
| ** | Represents the combined ratios for the respective portfolios and for the period November 1, 2008 through October 22, 2009, its respective pro-rata shares of its Master Fund Series. |
See page 1 & 2 for the Definitions of Abbreviations and Footnotes.
See accompanying Notes to Financial Statements.
199
DFA INVESTMENT DIMENSIONS GROUP INC.
FINANCIAL HIGHLIGHTS
(for a share outstanding throughout each period)
| DFA Selectively Hedged Global Fixed Income Portfolio | DFA Five-Year Government Portfolio | |||||||||||||||||||||||||||||||
Year Ended Oct. 31, 2009 | Period Jan. 9, 2008(a) to Oct. 31, 2008 | Year Ended Oct. 31, 2009 | Period Dec. 1, 2007 to Oct. 31, 2008 | Year Ended Nov. 30, 2007 | Year Ended Nov. 30, 2006 | Year Ended Nov. 30, 2005 | Year Ended Nov. 30, 2004 | |||||||||||||||||||||||||
Net Asset Value, Beginning of Period | $ | 8.91 | $ | 10.00 | $ | 10.44 | $ | 10.44 | $ | 10.43 | $ | 10.41 | $ | 10.64 | $ | 11.11 | ||||||||||||||||
Income From Investment Operations | ||||||||||||||||||||||||||||||||
Net Investment Income (Loss) | 0.26 | (A) | 0.33 | (A) | 0.26 | (A) | 0.26 | (A) | 0.50 | (A) | 0.46 | (A) | 0.35 | 0.33 | ||||||||||||||||||
Net Gains (Losses) on Securities (Realized and Unrealized) | 0.83 | (1.39 | ) | 0.49 | 0.07 | 0.01 | (0.02 | ) | (0.24 | ) | (0.01 | ) | ||||||||||||||||||||
Total From Investment Operations | 1.09 | (1.06 | ) | 0.75 | 0.33 | 0.51 | 0.44 | 0.11 | 0.32 | |||||||||||||||||||||||
Less Distributions | ||||||||||||||||||||||||||||||||
Net Investment Income | — | — | (0.27 | ) | (0.33 | ) | (0.50 | ) | (0.42 | ) | (0.34 | ) | (0.41 | ) | ||||||||||||||||||
Net Realized Gains | — | — | — | — | — | — | — | (0.38 | ) | |||||||||||||||||||||||
Return of Capital | — | (0.03 | ) | — | — | — | — | — | — | |||||||||||||||||||||||
Total Distributions | — | (0.03 | ) | (0.27 | ) | (0.33 | ) | (0.50 | ) | (0.42 | ) | (0.34 | ) | (0.79 | ) | |||||||||||||||||
Net Asset Value, End of Period | $ | 10.00 | $ | 8.91 | $ | 10.92 | $ | 10.44 | $ | 10.44 | $ | 10.43 | $ | 10.41 | $ | 10.64 | ||||||||||||||||
Total Return | 12.23 | % | (10.67 | )%(C) | 7.27 | % | 3.25 | %(C) | 4.98 | % | 4.36 | % | 1.02 | % | 3.02 | % | ||||||||||||||||
Net Assets, End of Period (thousands) | $ | 303,440 | $ | 198,165 | $ | 1,008,237 | $ | 1,115,037 | $ | 1,216,609 | $ | 932,121 | $ | 748,847 | $ | 542,634 | ||||||||||||||||
Ratio of Expenses to Average Net Assets | 0.24 | % | 0.24 | %(B)(E) | 0.25 | % | 0.23 | %(B) | 0.23 | % | 0.23 | % | 0.25 | % | 0.27 | % | ||||||||||||||||
Ratio of Net Investment Income to Average Net Assets | 2.81 | % | 4.32 | %(B)(E) | 2.44 | % | 2.77 | %(B) | 4.81 | % | 4.45 | % | 3.47 | % | 3.21 | % | ||||||||||||||||
Portfolio Turnover Rate | 28 | % | 21 | %(C) | 72 | % | 79 | %(C) | 0 | % | 86 | % | 36 | % | 45 | % | ||||||||||||||||
See page 1 & 2 for the Definitions of Abbreviations and Footnotes.
See accompanying Notes to Financial Statements.
200
DFA INVESTMENT DIMENSIONS GROUP INC.
FINANCIAL HIGHLIGHTS
(for a share outstanding throughout each period)
| DFA Five-Year Global Fixed Income Portfolio | ||||||||||||||||||||||||
Year Ended Oct. 31, 2009 | Period Dec. 1, 2007 to Oct. 31, 2008 | Year Ended Nov. 30, 2007 | Year Ended Nov. 30, 2006 | Year Ended Nov. 30, 2005 | Year Ended Nov. 30, 2004 | |||||||||||||||||||
Net Asset Value, Beginning of Period | $ | 10.68 | $ | 10.84 | $ | 10.53 | $ | 10.48 | $ | 10.50 | $ | 10.92 | ||||||||||||
Income From Investment Operations | ||||||||||||||||||||||||
Net Investment Income (Loss) | 0.27 | (A) | 0.25 | (A) | 0.32 | (A) | 0.28 | (A) | 0.34 | (A) | 0.26 | |||||||||||||
Net Gains (Losses) on Securities (Realized and Unrealized) | 0.55 | (0.10 | ) | 0.20 | 0.12 | (0.11 | ) | 0.06 | ||||||||||||||||
Total From Investment Operations | 0.82 | 0.15 | 0.52 | 0.40 | 0.23 | 0.32 | ||||||||||||||||||
Less Distributions | ||||||||||||||||||||||||
Net Investment Income | (0.23 | ) | (0.30 | ) | (0.21 | ) | (0.33 | ) | (0.25 | ) | (0.32 | ) | ||||||||||||
Net Realized Gains | — | — | — | — | — | (0.42 | ) | |||||||||||||||||
Return of Capital | — | (0.01 | ) | — | (0.02 | ) | — | — | ||||||||||||||||
Total Distributions | (0.23 | ) | (0.31 | ) | (0.21 | ) | (0.35 | ) | (0.25 | ) | (0.74 | ) | ||||||||||||
Net Asset Value, End of Period | $ | 11.27 | $ | 10.68 | $ | 10.84 | $ | 10.53 | $ | 10.48 | $ | 10.50 | ||||||||||||
Total Return | 7.74 | % | 1.40 | %(C) | 5.00 | % | 3.89 | % | 2.15 | % | 3.04 | % | ||||||||||||
Net Assets, End of Period (thousands) | $ | 3,220,787 | $ | 3,319,257 | $ | 3,484,919 | $ | 2,387,784 | $ | 1,699,793 | $ | 1,205,578 | ||||||||||||
Ratio of Expenses to Average Net Assets | 0.30 | % | 0.28 | %(B) | 0.28 | % | 0.29 | % | 0.33 | % | 0.34 | % | ||||||||||||
Ratio of Net Investment Income to Average Net Assets | 2.48 | % | 2.53 | %(B) | 3.01 | % | 2.72 | % | 3.22 | % | 3.12 | % | ||||||||||||
Portfolio Turnover Rate | 70 | % | 55 | %(C) | 108 | % | 92 | % | 69 | % | 90 | % | ||||||||||||
| DFA Intermediate Government Fixed Income Portfolio | ||||||||||||||||||||||||
Year Ended Oct. 31, 2009 | Period Dec. 1, 2007 to Oct. 31, 2008 | Year Ended Nov. 30, 2007 | Year Ended Nov. 30, 2006 | Year Ended Nov. 30, 2005 | Year Ended Nov. 30, 2004 | |||||||||||||||||||
Net Asset Value, Beginning of Period | $ | 11.66 | $ | 11.86 | $ | 11.48 | $ | 11.45 | $ | 11.79 | $ | 12.14 | ||||||||||||
Income From Investment Operations | ||||||||||||||||||||||||
Net Investment Income (Loss) | 0.51 | (A) | 0.49 | (A) | 0.54 | (A) | 0.53 | (A) | 0.52 | 0.55 | ||||||||||||||
Net Gains (Losses) on Securities (Realized and Unrealized) | 0.72 | (0.17 | ) | 0.35 | 0.05 | (0.29 | ) | (0.05 | ) | |||||||||||||||
Total From Investment Operations | 1.23 | 0.32 | 0.89 | 0.58 | 0.23 | 0.50 | ||||||||||||||||||
Less Distributions | ||||||||||||||||||||||||
Net Investment Income | (0.52 | ) | (0.52 | ) | (0.51 | ) | (0.49 | ) | (0.53 | ) | (0.56 | ) | ||||||||||||
Net Realized Gains | (0.06 | ) | — | — | (0.06 | ) | (0.04 | ) | (0.29 | ) | ||||||||||||||
Return of Capital | — | — | — | — | — | — | ||||||||||||||||||
Total Distributions | (0.58 | ) | (0.52 | ) | (0.51 | ) | (0.55 | ) | (0.57 | ) | (0.85 | ) | ||||||||||||
Net Asset Value, End of Period | $ | 12.31 | $ | 11.66 | $ | 11.86 | $ | 11.48 | $ | 11.45 | $ | 11.79 | ||||||||||||
Total Return | 10.71 | % | 2.73 | %(C) | 8.06 | % | 5.31 | % | 1.87 | % | 4.21 | % | ||||||||||||
Net Assets, End of Period (thousands) | $ | 1,484,155 | $ | 1,248,514 | $ | 1,314,853 | $ | 871,392 | $ | 463,538 | $ | 373,108 | ||||||||||||
Ratio of Expenses to Average Net Assets | 0.15 | % | 0.13 | %(B) | 0.13 | % | 0.14 | % | 0.15 | % | 0.17 | % | ||||||||||||
Ratio of Net Investment Income to Average Net Assets | 4.18 | % | 4.44 | %(B) | 4.72 | % | 4.72 | % | 4.61 | % | 4.72 | % | ||||||||||||
Portfolio Turnover Rate | 8 | % | 14 | %(C) | 0 | % | 3 | % | 16 | % | 6 | % | ||||||||||||
See page 1 & 2 for the Definitions of Abbreviations and Footnotes.
See accompanying Notes to Financial Statements.
201
DFA INVESTMENT DIMENSIONS GROUP INC.
FINANCIAL HIGHLIGHTS
(for a share outstanding throughout each period)
| DFA Short-Term Extended Quality Portfolio | DFA Inflation-Protected Securities Portfolio | |||||||||||||||||||
Period March 4, 2009(a) to Oct. 31, 2009 | Year Ended Oct. 31, 2009 | Period Dec. 1, 2007 to Oct. 31, 2008 | Year Ended Nov. 30, 2007 | Period Sept. 18, 2006(a) to Nov. 30, 2006 | ||||||||||||||||
Net Asset Value, Beginning of Period | $ | 10.00 | $ | 9.41 | $ | 10.80 | $ | 10.19 | $ | 10.00 | ||||||||||
Income From Investment Operations | ||||||||||||||||||||
Net Investment Income (Loss) | 0.24 | (A) | 0.12 | (A) | 0.70 | (A) | 0.45 | (A) | 0.02 | (A) | ||||||||||
Net Gains (Losses) on Securities (Realized and Unrealized) | 0.50 | 1.53 | (1.48 | ) | 0.50 | 0.17 | ||||||||||||||
Total From Investment Operations | 0.74 | 1.65 | (0.78 | ) | 0.95 | 0.19 | ||||||||||||||
Less Distributions | ||||||||||||||||||||
Net Investment Income | (0.18 | ) | (0.10 | ) | (0.61 | ) | (0.34 | ) | — | |||||||||||
Net Realized Gains | — | (0.01 | ) | — | — | — | ||||||||||||||
Total Distributions | (0.18 | ) | (0.11 | ) | (0.61 | ) | (0.34 | ) | — | |||||||||||
Net Asset Value, End of Period | $ | 10.56 | $ | 10.95 | $ | 9.41 | $ | 10.80 | $ | 10.19 | ||||||||||
Total Return | 7.49 | %(C) | 17.70 | % | (7.90 | )%(C) | 9.59 | % | 1.90 | %(C) | ||||||||||
Net Assets, End of Period (thousands) | $ | 378,475 | $ | 774,110 | $ | 371,747 | $ | 240,403 | $ | 34,299 | ||||||||||
Ratio of Expenses to Average Net Assets | 0.22 | %(B)(E) | 0.16 | % | 0.15 | %(B) | 0.20 | % | 0.20 | %(B)(E) | ||||||||||
Ratio of Expenses to Average Net Assets (Excluding Waivers and Assumption of Expenses and/or Recovery of Previously Waived Fees) | 0.28 | %(B)(E) | 0.16 | % | 0.14 | %(B) | 0.21 | % | 0.60 | %(B)(E) | ||||||||||
Ratio of Net Investment Income to Average Net Assets | 3.54 | %(B)(E) | 1.20 | % | 7.01 | %(B) | 4.58 | % | 0.94 | %(B)(E) | ||||||||||
Portfolio Turnover Rate | 2 | %(C) | 6 | % | 3 | %(C) | 0 | % | 0 | %(C) | ||||||||||
See page 1 & 2 for the Definitions of Abbreviations and Footnotes.
See accompanying Notes to Financial Statements.
202
DFA INVESTMENT DIMENSIONS GROUP INC.
FINANCIAL HIGHLIGHTS
(for a share outstanding throughout each period)
| DFA Short-Term Municipal Bond Portfolio | DFA California Short-Term Municipal Bond Portfolio | |||||||||||||||||||||||||||||||||||||
Year Ended Oct. 31, 2009 | Period Dec. 1, 2007 to Oct. 31, 2008 | Year Ended Nov. 30, 2007 | Year Ended Nov. 30, 2006 | Year Ended Nov. 30, 2005 | Year Ended Nov. 30, 2004 | Year Ended Oct. 31, 2009 | Period Dec. 1, 2007 to Oct. 31, 2008 | Period April 2, 2007(a) to Nov. 30, 2007 | ||||||||||||||||||||||||||||||
Net Asset Value, Beginning of Period | $ | 10.02 | $ | 10.05 | $ | 10.02 | $ | 9.99 | $ | 10.09 | $ | 10.13 | $ | 10.00 | $ | 10.07 | $ | 10.00 | ||||||||||||||||||||
Income From Investment Operations | ||||||||||||||||||||||||||||||||||||||
Net Investment Income (Loss) | 0.20 | (A) | 0.19 | (A) | 0.31 | (A) | 0.28 | (A) | 0.22 | 0.17 | 0.22 | (A) | 0.21 | (A) | 0.20 | (A) | ||||||||||||||||||||||
Net Gains (Losses) on Securities (Realized and Unrealized) | 0.23 | (0.03 | ) | 0.02 | 0.02 | (0.11 | ) | (0.04 | ) | 0.27 | (0.06 | ) | 0.02 | |||||||||||||||||||||||||
Total From Investment Operations | 0.43 | 0.16 | 0.33 | 0.30 | 0.11 | 0.13 | 0.49 | 0.15 | 0.22 | |||||||||||||||||||||||||||||
Less Distributions | ||||||||||||||||||||||||||||||||||||||
Net Investment Income | (0.21 | ) | (0.19 | ) | (0.30 | ) | (0.27 | ) | (0.21 | ) | (0.17 | ) | (0.23 | ) | (0.22 | ) | (0.15 | ) | ||||||||||||||||||||
Total Distributions | (0.21 | ) | (0.19 | ) | (0.30 | ) | (0.27 | ) | (0.21 | ) | (0.17 | ) | (0.23 | ) | (0.22 | ) | (0.15 | ) | ||||||||||||||||||||
Net Asset Value, End of Period
| $ | 10.24 | $ | 10.02 | $ | 10.05 | $ | 10.02 | $ | 9.99 | $ | 10.09 | $ | 10.26 | $ | 10.00 | $ | 10.07 | ||||||||||||||||||||
Total Return | 4.32 | % | 1.63 | %(C) | 3.38 | % | 3.01 | % | 1.11 | % | 1.27 | % | 4.91 | % | 1.45 | %(C) | 2.23 | %(C) | ||||||||||||||||||||
Net Assets, End of Period (thousands) | $ | 1,168,259 | $ | 991,918 | $ | 948,426 | $ | 697,942 | $ | 511,543 | $ | 381,709 | $ | 210,774 | $ | 180,915 | $ | 128,983 | ||||||||||||||||||||
Ratio of Expenses to Average Net Assets | 0.25 | % | 0.23 | %(B) | 0.23 | % | 0.26 | % | 0.30 | % | 0.30 | % | 0.26 | % | 0.27 | %(B) | 0.30 | %(B)(E) | ||||||||||||||||||||
Ratio of Expenses to Average Net Assets (Excluding Waivers and Assumption of Expenses and/or Recovery of Previously Waived Fees) | 0.25 | % | 0.23 | %(B) | 0.23 | % | 0.24 | % | 0.29 | % | 0.33 | % | 0.26 | % | 0.26 | %(B) | 0.33 | %(B)(E) | ||||||||||||||||||||
Ratio of Net Investment Income to Average Net Assets | 1.99 | % | 2.04 | %(B) | 3.07 | % | 2.77 | % | 2.22 | % | 1.73 | % | 2.17 | % | 2.27 | %(B) | 3.22 | %(B)(E) | ||||||||||||||||||||
Portfolio Turnover Rate | 0 | % | 1 | %(C) | 0 | % | 0 | % | 2 | % | 6 | % | 4 | % | 17 | %(C) | 7 | %(C) | ||||||||||||||||||||
See page 1 & 2 for the Definitions of Abbreviations and Footnotes.
See accompanying Notes to Financial Statements.
203
DFA INVESTMENT DIMENSIONS GROUP INC.
NOTES TO FINANCIAL STATEMENTS
A. Organization:
DFA Investment Dimensions Group Inc. (the “Fund”) is an open-end management investment company registered under the Investment Company Act of 1940, whose shares are generally offered to institutional investors, retirement plans and clients of registered investment advisors. The Fund consists of fifty-seven operational portfolios, of which thirty-seven (the “Portfolios”) are included in this report and the remaining twenty are presented in separate reports.
Of the Portfolios, ten invest in one or more series of The DFA Investment Trust Company, and the DFA Global Real Estate Securities Portfolio invests in two portfolios of the DFA Investment Dimensions Group Inc.
Feeder Funds | Master Funds | Percentage Ownership at 10/31/09 | ||
U.S. Large Company Portfolio | The U.S. Large Company Series | 78% | ||
U.S. Large Cap Value Portfolio | The U.S. Large Cap Value Series | 78% | ||
Japanese Small Company Portfolio | The Japanese Small Company Series | 10% | ||
Asia Pacific Small Company Portfolio | The Asia Pacific Small Company Series | 15% | ||
United Kingdom Small Company Portfolio | The United Kingdom Small Company Series | 4% | ||
Continental Small Company Portfolio | The Continental Small Company Series | 7% | ||
Emerging Markets Portfolio | The Emerging Markets Series | 93% | ||
Emerging Markets Small Cap Portfolio | The Emerging Markets Small Cap Series | 97% | ||
Fund of Funds | ||||
International Small Company Portfolio | The Japanese Small Company Series | 90% | ||
The Asia Pacific Small Company Series | 85% | |||
The United Kingdom Small Company Series | 96% | |||
The Continental Small Company Series | 93% | |||
The Canadian Small Company Series | 100% | |||
DFA Global Real Estate Securities Portfolio | DFA Real Estate Securities Portfolio | 11% | ||
| DFA International Real Estate Securities Portfolio | 28% | |||
Each feeder fund and fund of funds (collectively, “Feeder Funds) invests primarily in a corresponding master fund(s) (”Master Fund“) as indicated. The DFA Global Real Estate Securities Portfolio also invests in short-term temporary cash investments.
The financial statements of the Master Funds are included elsewhere in this report and should be read in conjunction with the financial statements of the Feeder Funds.
Prior to March 30, 2007, the U.S.Targeted Value Portfolio invested substantially all of its assets in shares of The U.S. Targeted Value Series. At the close of business on March 29, 2007, the U.S. Targeted Value Portfolio received its pro-rata share of cash and securities from The U.S. Targeted Value Series in a complete liquidation of its interest in the Series. Effective March 30, 2007, the U.S. Targeted Value Portfolio invests directly in securities rather than through the Series and maintains the same investment objective.
Prior to October 23, 2009, the DFA One-Year Fixed Income Portfolio and DFA Two-Year Global Fixed Income Portfolio invested substantially all of their assets in respective shares of The DFA One-Year Fixed Income Series and The DFA Two-Year Global Fixed Income Series. At the close of business on October 23, 2009, the Portfolios received their pro-rata share of cash and securities from the respective Series in a complete liquidation of their
204
interest in the Series. Effective October 23, 2009, the Portfolios invest directly in securities rather than through the Series and maintain the same investment objectives.
Effective February 28, 2009, the Enhanced U.S. Large Company Portfolio, U.S. Small Cap Value Portfolio, U.S. Small Cap Portfolio and U.S. Micro Cap Portfolio invest directly in securities rather than through a Master Fund. See Federal Income Taxes note for more information regarding these transactions.
Effective December 31, 2008, The U.S. Large Cap Value Series, a master fund in a RIC/RIC master-feeder structure, elected with the consent of its respective Holder(s) to change its U.S. federal income tax classification from that of an association taxable as a corporation to a partnership pursuant to Treasury Regulation §301.7701-3. The change in capital structure and retroactive reclassification of the statement of changes in net assets and financial highlights for the respective funds is a result of the treatment of a partnership for book purposes. The Series/Portfolio will maintain its books and records and present its financial statements in accordance with generally accepted accounting principles for investment partnerships.
On January 31, 2008, Class R1 Shares and on June 30, 2008, Class R2 Shares of U.S. Targeted Value Portfolio commenced operations. The Class R1 Shares and Class R2 Shares of each Portfolio of the Fund (the U.S. Small Cap Value Portfolio, T.A. U.S. Core Equity 2 Portfolio, U.S. Micro Cap Portfolio, T.A. World ex U.S. Core Equity Portfolio, Japanese Small Company Portfolio, Asia Pacific Small Company Portfolio, United Kingdom Small Company Portfolio, Continental Small Company Portfolio, DFA Global Real Estate Securities Portfolio, DFA International Small Cap Value Portfolio, International Vector Equity Portfolio, Emerging Markets Small Cap Portfolio, DFA Selectively Hedged Global Fixed Income Portfolio, DFA Short-Term Extended Quality Portfolio, DFA Short-Term Municipal Bond Portfolio and DFA California Short-Term Municipal Bond Portfolio) contained in this report, had not commenced operations as of October 31, 2009. Class R1 and Class R2 Shares of each Portfolio have 100,000,000 authorized shares.
At a regular meeting of the Board of Directors/Trustees (the “Board”) on September 16, 2008, the Board voted to change the fiscal and tax year ends of the Portfolios from November 30 to October 31.
B. Significant Accounting Policies:
The following significant accounting policies are in conformity with accounting principles generally accepted in the United States of America. Such policies are consistently followed by the Fund in preparation of its financial statements. The preparation of financial statements in accordance with accounting principles generally accepted in the United States of America requires management to make estimates and assumptions that affect the reported amounts of assets and liabilities and disclosure of contingent assets and liabilities at the date of the financial statements and the reported amounts of increases and decreases in net assets from operations during the reporting period. Actual results could differ from those estimates and those differences could be material.
1. Security Valuation: Securities held by U.S. Targeted Value Portfolio, U.S. Small Cap Value Portfolio, U.S. Core Equity 1 Portfolio, U.S. Core Equity 2 Portfolio, U.S. Vector Equity Portfolio, T.A. U.S. Core Equity 2 Portfolio, U.S. Small Cap Portfolio, U.S. Micro Cap Portfolio and DFA Real Estate Securities Portfolio (the “Domestic Equity Portfolios”) and Large Cap International Portfolio, International Core Equity Portfolio, T.A. World ex U.S. Core Equity Portfolio, DFA International Real Estate Securities Portfolio, DFA International Small Cap Value Portfolio, International Vector Equity Portfolio and Emerging Markets Core Equity Portfolio (the “International Equity Portfolios”), including over-the-counter securities, are valued at the last quoted sale price of the day. Securities held by the Domestic Equity Portfolios and the International Equity Portfolios that are listed on Nasdaq are valued at the Nasdaq Official Closing Price (“NOCP”). If there is no last reported sale price or NOCP for the day, the Domestic Equity Portfolios and International Equity Portfolios value the securities at the mean of the most recent quoted bid and asked prices. Price information on listed securities is taken from the exchange where the security is primarily traded. Generally, securities issued by open-end investment companies are valued using their respective net asset values or public offering prices, as appropriate, for purchase orders placed at the close of the New York Stock Exchange (NYSE).
Securities for which no market quotations are readily available (including restricted securities), or for which market quotations have become unreliable, are valued in good faith at fair value in accordance with procedures
205
adopted by the Board of Directors/Trustees. Fair value pricing may also be used if events that have a significant effect on the value of an investment (as determined in the discretion of the Investment Committee of the Advisor) occur before the net asset value is calculated. When fair value pricing is used, the prices of securities used by the Domestic Equity Portfolios and International Equity Portfolios may differ from the quoted or published prices for the same securities on their primary markets or exchanges.
The International Equity Portfolios will also apply a fair value price in the circumstances described below. Generally, trading in foreign securities markets is completed each day at various times prior to the close of the NYSE. For example, trading in the Japanese securities markets is completed each day at the close of the Tokyo Stock Exchange (normally, 11:00 p.m. PT), which is fourteen hours prior to the close of the NYSE (normally, 1:00 p.m. PT) and the time that the net asset values of the International Equity Portfolios are computed. Due to the time differences between the closings of the relevant foreign securities exchanges and the time the International Equity Portfolios price their shares at the close of the NYSE, the International Equity Portfolios will fair value their foreign investments when it is determined that the market quotations for the foreign investments are either unreliable or not readily available. The fair value prices will attempt to reflect the impact of the U.S. financial markets’ perceptions and trading activities on the International Equity Portfolios’ foreign investments since the last closing prices of the foreign investments were calculated on their primary foreign securities markets or exchanges. For these purposes, the Board of Directors/Trustees of the Fund have determined that movements in relevant indices or other appropriate market indicators, after the close of the Tokyo Stock Exchange or the London Stock Exchange, demonstrate that market quotations may be unreliable. Fair valuation of portfolio securities may occur on a daily basis. The fair value pricing by the International Equity Portfolios utilizes data furnished by an independent pricing service (and that data draws upon, among other information, the market values of foreign investments). When an International Equity Portfolio uses fair value pricing, the values assigned to the International Equity Portfolio’s foreign investments may not be the quoted or published prices of the investments on their primary markets or exchanges.
Securities held by Enhanced U.S. Large Company Portfolio, DFA One-Year Fixed Income Portfolio, DFA Two-Year Global Fixed Income Portfolio, DFA Selectively Hedged Global Fixed Income Portfolio, DFA Five-Year Government Portfolio, DFA Five-Year Global Fixed Income Portfolio, DFA Intermediate Government Fixed Income Portfolio, DFA Short-Term Extended Quality Portfolio, DFA Inflation-Protected Securities Portfolio, DFA Short-Term Extended Quality Portfolio, DFA Short-Term Municipal Bond Portfolio and DFA California Short-Term Municipal Bond Portfolio (the “Fixed Income Portfolios”), are valued on the basis of prices provided by one or more pricing services or other reasonably reliable sources including broker/dealers that typically handle the purchase and sale of such securities. Securities which are traded over-the-counter and on a stock exchange generally will be valued according to the broadest and most representative market, and it is expected that for bonds and other fixed income securities, this ordinarily will be the over-the-counter market. Securities for which quotations are not readily available (including restricted securities), or for which market quotations have become unreliable, are valued in good faith at fair value in accordance with procedures adopted by the Board of Directors/Trustees.
Master Fund shares held by the International Small Company Portfolio and the DFA Global Real Estate Securities Portfolio are valued at their respective daily net asset value. The Feeder Funds’ investments reflect proportionate interest in the net assets of their corresponding Master Fund.
The Portfolios utilize a fair value hierarchy which prioritizes the inputs to valuation techniques used to measure fair value into three broad levels described below:
— Level 1 – quoted prices in active markets for identical securities
— Level 2 – other significant observable inputs (including quoted prices for similar securities, interest rates, prepayment speeds, credit risk, etc.)
— Level 3 – significant unobservable inputs (including the Portfolios’ own assumptions in determining the fair value of investments)
206
A summary of inputs used to value the Portfolios’ net assets by each major security type, industry and/or country is disclosed at the end of the Summary Schedule of Portfolio Holdings/Schedule of Investments. The inputs or methodology used for valuing securities are not necessarily an indication of the risk associated with investing in those securities.
2. Foreign Currency Translation: Securities and other assets and liabilities of the Enhanced U.S. Large Company Portfolio, the International Equity Portfolios, the DFA Two-Year Global Fixed Income Portfolio, the DFA Selectively Hedged Global Fixed Income Portfolio, and the DFA Five-Year Global Fixed Income Portfolio whose values are initially expressed in foreign currencies are translated to U.S. dollars using the mean between the most recently quoted bid and asked prices for the U.S. dollar as quoted by generally recognized reliable sources. Dividend and interest income and certain expenses are translated to U.S. dollars at the rate of exchange on their respective accrual dates. Receivables and payables denominated in foreign currencies are marked to market daily based on daily exchange rates and exchange gains or losses are realized upon ultimate receipt or disbursement. Enhanced U.S. Large Company Portfolio, DFA Two-Year Global Fixed Income Portfolio, DFA Selectively Hedged Global Fixed Income Portfolio and DFA Five-Year Global Fixed Income Portfolio also enter into forward foreign currency contracts solely for the purpose of hedging against fluctuations in currency exchange rates. These contracts are marked to market daily based on daily forward exchange rates. The DFA Selectively Hedged Global Fixed Income Portfolio may hedge the currency exposure of its foreign securities or leave some or all of the currency exposure unhedged.
The International Equity Portfolios do not isolate the effect of fluctuation in foreign exchange rates from the effect of fluctuations in the market prices of securities whether realized or unrealized. However, the Enhanced U.S. Large Company Portfolio, DFA Two-Year Global Fixed Income Portfolio, DFA Selectively Hedged Global Fixed Income Portfolio, and the DFA Five-Year Global Fixed Income Portfolio do isolate the effect of fluctuations in foreign currency rates when determining the realized gain or loss upon the sale or maturity of foreign currency denominated debt obligations pursuant to U.S. Federal income tax regulations; such amounts are categorized as foreign exchange gain or loss for both financial reporting and income tax reporting purposes.
Realized gains or losses on foreign currency transactions represent net foreign exchange gains or losses from the disposition of foreign currencies, currency gains or losses realized between the trade and settlement dates on securities transactions, and the difference between amounts of interest, dividends and foreign withholding taxes recorded on the books of the International Equity Portfolios, the Enhanced U.S. Large Company Portfolio, the DFA Two-Year Global Fixed Income Portfolio, the DFA Selectively Hedged Global Fixed Income Portfolio, and the DFA Five-Year Global Fixed Income Portfolio and the U.S. dollar equivalent amounts actually received or paid.
3. Deferred Compensation Plan: Each eligible Director of the Fund may elect participation in the Deferred Compensation Plan (the “Plan”). Under the Plan, effective January 1, 2002, such Directors may defer payment of all or a portion of their total fees earned as a Director. These deferred amounts may be treated as though such amounts had been invested in shares of the following funds: U.S. Large Cap Value Portfolio; U.S. Core Equity 1 Portfolio; U.S. Core Equity 2 Portfolio; U.S. Vector Equity Portfolio; U.S. Micro Cap Portfolio; DFA International Value Portfolio; International Core Equity Portfolio; Emerging Markets Portfolio; Emerging Markets Core Equity Portfolio; and/or DFA Two-Year Global Fixed Income Portfolio. Contributions made under the Plan and the change in unrealized appreciation (depreciation) and income are included in Directors’/Trustees’ Fees & Expenses or Other Expenses.
Each Director has the option to receive their distribution of proceeds in one of the following methods upon one year’s notice: lump sum; annual installments over a period of agreed upon years; or semi-annual installments over a period of agreed upon years. As of October 31, 2009, none of the Directors have requested distribution of proceeds.
4. Other: Security transactions are accounted for as of the trade date. Costs used in determining realized gains and losses on the sale of investment securities/affiliated investment companies are on the basis of identified cost. Dividend income and distributions to shareholders are recorded on the ex-dividend date. Distributions received on securities that represent a return of capital or capital gain are recorded as a reduction of cost of investments or as a realized gain, respectively. The Portfolios estimate the character of distributions received that may be considered return of capital distributions. Interest income is recorded on an accrual basis. Discount and premium on debt securities purchased are amortized over the lives of the respective securities utilizing the effective interest method.
207
Expenses directly attributable to a Portfolio are directly charged. Common expenses of the Fund or Portfolios are allocated using methods approved by the Board of Directors/Trustees, generally based on average net assets.
Class R1 Shares, Class R2 Shares and Institutional Class Shares have equal rights to assets and earnings of the Portfolio. Income, gains and losses, and common expenses of the Portfolio are allocated to each class of shares based on its relative net assets. Each class will bear its own class-specific expenses, if any.
The U.S. Large Company Portfolio, U.S. Large Cap Value Portfolio, International Small Company Portfolio, Japanese Small Company Portfolio, Asia Pacific Small Company Portfolio, United Kingdom Small Company Portfolio, Continental Small Company Portfolio, Emerging Markets Portfolio, and Emerging Markets Small Cap Portfolio each recognize their pro-rata share of net investment income and realized and unrealized gains/losses on a daily basis, from their respective Master Funds, which are treated as partnerships for federal income tax purposes.
Prior to June 4, 2009 and October 16, 2009, the DFA One-Year Fixed Income Portfolio and DFA Two-Year Global Fixed Income Portfolio, respectively, recognized their pro-rata share of net investment income and realized and unrealized gains/losses on a daily basis from their respective investments in the DFA One-Year Fixed Income Series and DFA Two-Year Global Fixed Income Series which were treated as partnerships in accordance with both U.S. federal income tax regulations and accounting principles generally accepted in the United States of America. Effective June 4, 2009 and October 16, 2009, The DFA One-Year Fixed Income Series’ and The DFA Two-Year Global Fixed Income Series’, respectively, partnership status ceased and each became a corporate master fund in a RIC/RIC master-feeder structure. The Portfolios became the feeders of these Funds. On October 23, 2009, both the DFA One-Year Fixed Income Portfolio and DFA Two-Year Global Fixed Income Portfolio liquidated their investment in The DFA One-Year Fixed Income Series and The DFA Two-Year Global Fixed Income Series, respectively. Effective October 24, 2009, the DFA One-Year Fixed Income Portfolio and DFA Two-Year Global Fixed Income Portfolio invest directly in securities rather than through the Series and maintain the same investment objective. See Federal Income Taxes note for more information regarding these transactions.
The Portfolios may be subject to taxes imposed by countries in which they invest, with respect to their investments in issuers existing or operating in such countries. Such taxes are generally based on income earned or repatriated and capital gains realized on the sale of such investments. The Portfolios accrue such taxes when the related income or capital gains are earned or throughout the holding period. Some countries require governmental approval for the repatriation of investment income, capital or the proceeds of sales earned by foreign investors. In addition, if there is a deterioration in a country’s balance of payments or for other reasons, a country may impose temporary restrictions on foreign capital remittances abroad.
The Emerging Markets Core Equity Portfolio’s investments in Thailand and the investments in Thailand held by the Master Funds of Emerging Markets Portfolio and Emerging Markets Small Cap Portfolio are subject to a 15% governmental capital gains tax. Such taxes are due upon sale of individual securities. The Emerging Markets Core Equity Portfolio and the Master Funds of Emerging Markets Portfolio and Emerging Markets Small Cap Portfolio accrues for taxes on the capital gains throughout the holding period based on the unrealized gain of the underlying securities. These funds are also subject to a 15% governmental capital gains tax on short-term capital gains for investments in India. Such taxes are due upon sale of individual securities. The taxes for the capital gains are accrued when the capital gains are earned.
C. Investment Advisor and Administrator:
Dimensional Fund Advisors LP (“Dimensional” or the “Advisor”) provides investment advisory services to all Portfolios except the Feeder Funds. The Advisor provides administrative services to the Feeder Funds, including supervision of services provided by others, providing information to shareholders and the Board of Directors/Trustees, and other administrative services.
For the year ended , October 31, 2009, the Portfolios’ investment advisory services fees were accrued daily and paid monthly to the Advisor based on the following effective annual rates of average daily net assets:
Enhanced U.S. Large Company Portfolio* | 0.05 | % |
208
U.S. Targeted Value Portfolio | 0.10 | % | |
U.S. Small Cap Value Portfolio* | 0.20 | % | |
U.S. Core Equity 1 Portfolio | 0.17 | % | |
U.S. Core Equity 2 Portfolio | 0.20 | % | |
U.S. Vector Equity Portfolio | 0.30 | % | |
T.A. U.S. Core Equity 2 Portfolio | 0.22 | % | |
U.S. Small Cap Portfolio* | 0.03 | % | |
U.S. Micro Cap Portfolio* | 0.10 | % | |
DFA Real Estate Securities Portfolio | 0.30 | % | |
Large Cap International Portfolio | 0.25 | % | |
International Core Equity Portfolio | 0.35 | % | |
T.A. World ex U.S. Core Equity Portfolio | 0.40 | % | |
DFA International Real Estate Securities Portfolio | 0.35 | % | |
DFA Global Real Estate Securities Portfolio | 0.35 | % | |
DFA International Small Cap Value Portfolio | 0.65 | % | |
International Vector Equity Portfolio | 0.45 | % | |
Emerging Markets Core Equity Portfolio | 0.55 | % | |
DFA One-Year Fixed Income Portfolio** | 0.05 | % | |
DFA Two-Year Global Fixed Income Portfolio** | 0.05 | % | |
DFA Selectively Hedged Global Fixed Income Portfolio | 0.15 | % | |
DFA Five-Year Government Portfolio | 0.20 | % | |
DFA Five-Year Global Fixed Income Portfolio | 0.25 | % | |
DFA Intermediate Government Fixed Income Portfolio | 0.10 | % | |
DFA Short-Term Extended Quality Portfolio | 0.20 | % | |
DFA Inflation-Protected Securities Portfolio | 0.10 | % | |
DFA Short-Term Municipal Bond Portfolio | 0.20 | % |
For the year ended October 31, 2009, the Feeder Funds’ and the Enhanced U.S. Large Company Portfolio, U.S. Targeted Value Portfolio, U.S. Small Cap Value Portfolio, U.S. Small Cap Portfolio, U.S. Micro Cap Portfolio, DFA One-Year Fixed Income Portfolio and DFA Two-Year Global Fixed Income Portfolio administrative services fees were accrued daily and paid monthly to the Advisor based on the following effective annual rates of average daily net assets:
U.S. Large Company Portfolio | 0.095 | % | |
Enhanced U.S. Large Company Portfolio* | 0.15 | % | |
U.S. Large Cap Value Portfolio | 0.15 | % | |
U.S. Targeted Value Portfolio | 0.25 | % | |
U.S. Small Cap Value Portfolio* | 0.30 | % | |
U.S. Small Cap Portfolio* | 0.32 | % | |
U.S. Micro Cap Portfolio* | 0.40 | % | |
International Small Company Portfolio | 0.40 | % | |
Japanese Small Company Portfolio | 0.40 | % | |
Asia Pacific Small Company Portfolio | 0.40 | % | |
United Kingdom Small Company Portfolio | 0.40 | % | |
Continental Small Company Portfolio | 0.40 | % | |
Emerging Markets Portfolio | 0.40 | % | |
Emerging Markets Small Cap Portfolio | 0.45 | % | |
DFA One-Year Fixed Income Portfolio** | 0.10 | % | |
DFA Two-Year Global Fixed Income Portfolio** | 0.10 | % |
209
* Effective February 28, 2009, the Portfolio no longer invests substantially all of its assets in its respective Series. Instead, the Portfolio’s assets are managed directly in accordance with the Portfolio’s investment objective and strategies, pursuant to an investment management agreement between the Fund, on behalf of the Portfolio, and Dimensional, which previously was the manager of the Series’ assets. The investment advisory fee paid by the Portfolio is identical to the advisory fee that was charged to the Series.
** Effective October 23, 2009, the Portfolio no longer invests substantially all of its assets in its respective Series. Instead, the Portfolio’s assets are managed directly in accordance with the Portfolio’s investment objective and strategies, pursuant to an investment management agreement between the Fund, on behalf of the Portfolio, and Dimensional, which previously was the manager of the Series’ assets. The investment advisory fee paid by the Portfolio is identical to the advisory fee that was charged to the Series.
Pursuant to a Fee Waiver and Expense Assumption Agreement, the Advisor has contractually agreed to waive certain fees, including administration/advisory fees, and in certain instances, assume certain expenses of the Portfolios, as described in the notes below. The Fee Waiver and Expense Assumption Agreement for the Portfolios below will remain in effect through March 1, 2010, and shall continue in effect from year to year thereafter unless terminated by the Fund or the Advisor. For the year ended October 31, 2009, the Portfolios had expense limits based on a percentage of average net assets on an annualized basis, and the Advisor recovered previously waived fees and/or expenses assumed as listed below (amounts in thousands). Previously waived fees subject to future recovery by the Advisor are also reflected below (amounts in thousands). The Portfolios are not obligated to reimburse the Advisor for fees previously waived or expenses previously assumed by the Advisor more than thirty-six months before the date of recovery.
Institutional Class Shares | Expense Limits | Recovery of Previously Waived Fees/ Expenses Assumed | Previously Waived Fees/ Expenses Assumed Subject to Future Recovery | |||
U.S. Large Company Portfolio (1) | 0.15% | — | $617 | |||
U.S. Targeted Value Portfolio (1) | 0.50% | — | — | |||
U.S. Core Equity 1 Portfolio (2) | 0.23% | — | — | |||
U.S. Core Equity 2 Portfolio (2) | 0.26% | — | — | |||
U.S. Vector Equity Portfolio (2) | 0.36% | — | — | |||
T.A. U.S. Core Equity 2 Portfolio (2) | 0.30% | — | — | |||
International Core Equity Portfolio (2) | 0.49% | — | — | |||
T.A. World ex U.S. Core Equity Portfolio (3) | 0.60% | $135 | — | |||
International Small Company Portfolio (4) | 0.45% | — | — | |||
Japanese Small Company Portfolio (4) | 0.47% | — | — | |||
Asia Pacific Small Company Portfolio (4) | 0.47% | 4 | 25 | |||
United Kingdom Small Company Portfolio (4) | 0.47% | — | 52 | |||
Continental Small Company Portfolio (4) | 0.47% | 11 | — | |||
DFA International Real Estate Securities Portfolio (5) | 0.65% | — | — | |||
DFA Global Real Estate Securities Portfolio (6) | 0.55% | — | 794 | |||
International Vector Equity Portfolio (5) | 0.60% | 17 | 28 | |||
Emerging Markets Core Equity Portfolio (5) | 0.85% | — | — | |||
DFA Selectively Hedged Global Fixed Income Portfolio (5) | 0.25% | — | — | |||
DFA Short-Term Extended Quality Portfolio (2) | 0.22% | — | 87 | |||
DFA Inflation-Protected Securities Portfolio (5) | 0.20% | — | — | |||
DFA Short-Term Municipal Bond Portfolio (7) | 0.30% | — | — | |||
DFA California Short-Term Municipal Bond Portfolio (5) | 0.30% | — | — | |||
Class R1 Shares | ||||||
U.S. Targeted Value Portfolio (8) | 0.62% | — | — | |||
210
Institutional Class Shares | Expense Limits | Recovery of Previously Waived Fees/ Expenses Assumed | Previously Waived Fees/ Expenses Assumed Subject to Future Recovery | |||
Class R2 Shares | ||||||
U.S. Targeted Value Portfolio (9) | 0.77% | — | — | |||
(1) The Advisor has contractually agreed to waive its administration fee and to assume each Portfolio’s direct and indirect expenses (including, for U.S. Large Company Portfolio, the expenses the Portfolio bears as a shareholder of its Master Fund) to the extent necessary to limit the expenses of each Portfolio to the rates listed above as a percentage of average net assets on an annualized basis. At any time that the annualized expenses of a Portfolio are less than the rate listed above for such Portfolio, the Advisor retains the right to recover any fees previously waived and/or expenses previously assumed to the extent that such recovery will not cause the Portfolio’s annualized expenses to exceed the applicable percentage of average net assets on an annualized basis, as listed above.
(2) The Advisor has contractually agreed to waive all or a portion of its advisory fee and assume each Portfolio’s ordinary operating expenses (excluding the expenses a Portfolio incurs indirectly through investment in other investment companies) (“Portfolio Expenses”) to the extent necessary to limit the Portfolio Expenses of each Portfolio to the rates listed above as a percentage of average net assets on an annualized basis. At any time that the annualized Portfolio Expenses of a Portfolio are less than the rates listed above for such Portfolio, the Advisor retains the right to recover any fees previously waived and/or expenses previously assumed to the extent that such recovery will not cause the Portfolio’s annualized Portfolio Expenses to exceed the applicable percentage of average net assets on an annualized basis, as listed above.
(3) The Advisor has contractually agreed to waive all or a portion of the Portfolio’s advisory fee to the extent necessary to limit the total advisory fees paid by the Portfolio to the Advisor directly or indirectly (the proportionate share of the advisory fees paid by the Portfolio through its investment in other funds managed by the Advisor) to 0.40% of the Portfolio’s average net assets on an annualized basis. The Advisor has also contractually agreed to waive all or a portion of its advisory fee and to assume the expenses of the Portfolio (including the expenses that the Portfolio bears as a shareholder of other funds managed by the Advisor but excluding the expenses that the Portfolio incurs indirectly through its investment in unaffiliated investment companies) (“Portfolio Expenses”) to the extent necessary to limit the Portfolio Expenses of the Portfolio to the rate listed above as a percentage of average net assets on an annualized basis. At any time that the annualized expenses of the Portfolio are less than the rate listed above for the Portfolio, the Advisor retains the right to recover any fees previously waived and/or expenses previously assumed to the extent that such recovery will not cause the Portfolio’s annualized expenses to exceed the applicable percentage of average net assets on an annualized basis, as listed above.
(4) The Advisor has contractually agreed to waive its administration fee and to assume each Portfolio’s other direct expenses (for International Small Company, not including expenses incurred through its investment in other investment companies) to the extent necessary to limit the direct expenses of each Portfolio to the rates listed above as a percentage of average net assets on an annualized basis. The Fee Waiver and Expense Assumption Agreement does not include the indirect expenses each Portfolio bears as a shareholder of its Master Funds. At any time that the direct expenses of a Portfolio are less than the rates listed above as a percentage of average net assets on an annualized basis, the Advisor retains the right to recover any fees previously waived and/or expenses previously assumed to the extent that such recovery will not cause the Portfolio’s direct expenses to exceed the applicable percentage of average net assets on an annualized basis, as listed above.
(5) The Advisor has contractually agreed to waive all or a portion of its advisory fee and to assume each Portfolio’s ordinary operating expenses (excluding the expenses a Portfolio incurs indirectly through investment in other investment companies) (“Portfolio Expenses”) to the extent necessary to limit the Portfolio Expenses of each Portfolio to the rates listed above as a percentage of average net assets on an annualized basis. At any time that the annualized Portfolio Expenses of a Portfolio are less than the rate listed above as a percentage of average net assets on an annualized basis, the Advisor retains the right to recover any fees previously waived and/or expenses
211
previously assumed to the extent that such recovery will not cause the Portfolio’s annualized Portfolio Expenses to exceed the applicable percentage of average net assets on an annualized basis, as listed above.
(6) The Advisor has contractually agreed to waive all or a portion of its administration fee and to assume the expenses of the Portfolio (including the expenses that the Portfolio bears as a shareholder of other investment companies managed by the Advisor but excluding the expenses that the Portfolio incurs indirectly through its investment in unaffiliated investment companies) (“Portfolio Expenses”) to the extent necessary to limit the Portfolio Expenses of the Portfolio to the rate listed above as a percentage of average net assets on an annualized basis. At any time that the annualized Portfolio Expenses of the Portfolio are less than the rate listed above as a percentage of average net assets on an annualized basis, the Advisor retains the right to recover any fees previously waived and/or expenses previously assumed to the extent that such recovery will not cause the Portfolio’s annualized Portfolio Expenses to exceed the applicable percentage of average net assets on an annualized basis, as listed above. The Advisor has voluntarily agreed to waive all or a portion of its administration fee to the extent necessary to limit the total administration fees paid by the Portfolio to the Advisor directly and indirectly (the proportionate share of the administration fees paid by the Portfolio through its investment in other funds managed by the Advisor) to 0.35% of the Portfolio’s average net assets on an annualized basis.
(7) The Advisor has contractually agreed to waive all or a portion of its advisory fee to the extent necessary to reduce the Portfolio’s ordinary operating expenses (not including expenses incurred through its investment in other investment companies) (“Portfolio Expenses”) up to the amount of its total advisory fee when its Portfolio Expenses exceed the rate listed above as a percentage of average net assets on an annualized basis. At any time that the annualized Portfolio Expenses of the Portfolio are less than the rate listed above as a percentage of average net assets on an annualized basis, the Advisor retains the right to recover any fees previously waived to the extent that such recovery will not cause the Portfolio’s annualized Portfolio Expenses to exceed the applicable percentage of average net assets on an annualized basis, as listed above.
(8) The Advisor has contractually agreed to waive its administration fee and to assume the Portfolio’s direct and indirect expenses (excluding the expenses the Portfolio incurs indirectly through investment in other investment companies) (“Portfolio Expenses”) to the extent necessary to limit the Portfolio Expenses of the Class R1 Shares to the rate listed above as a percentage of average net assets on an annualized basis. At any time that the Class R1 Shares’ annualized expenses are less than the rate listed above as a percentage of average net assets on an annualized basis, the Advisor retains the right to recover any fees previously waived and/or expenses previously assumed to the extent that such recovery will not cause the Portfolio’s annualized expenses to exceed the applicable percentage of average net assets on an annualized basis, as listed above.
(9) The Advisor has contractually agreed to waive its administration fee and to assume the Portfolio’s direct and indirect expenses (excluding the expenses the Portfolio incurs indirectly through investment in other investment companies) (“Portfolio Expenses”) to the extent necessary to limit the Portfolio Expenses of the Class R2 Shares to the rate listed above as a percentage of average net assets on an annualized basis. At any time that the Class R2 Shares’ annualized expenses are less than the rate listed above as a percentage of average net assets on an annualized basis, the Advisor retains the right to recover any fees previously waived and/or expenses previously assumed to the extent that such recovery will not cause the Portfolio’s annualized expenses to exceed the applicable percentage of average net assets on an annualized basis, as listed above.
Fees Paid to Officers and Directors/Trustees:
Certain Officers and Directors/Trustees of the Advisor are also Officers and Directors/Trustees of the Fund; however, such Officers and Directors/Trustees (with the exception of the Chief Compliance Officer (“CCO”)) receive no compensation from the Fund. For the year ended October 31, 2009, the total related amounts paid by the Fund to the CCO were $197 (in thousands). The total related amounts paid by each of the Portfolios are included in Other Expenses on the Statement of Operations.
212
D. Deferred Compensation:
At October 31, 2009, the total liability for deferred compensation to Directors/Trustees is included in Accrued Expenses and Other Liabilities on the Statement of Assets and Liabilities as follows (amounts in thousands):
U.S. Large Company Portfolio | $ 67 | |
Enhanced U.S. Large Company Portfolio | 5 | |
U.S. Large Cap Value Portfolio | 143 | |
U.S. Targeted Value Portfolio | 32 | |
U.S. Small Cap Value Portfolio | 141 | |
U.S. Core Equity 1 Portfolio | 45 | |
U.S. Core Equity 2 Portfolio | 83 | |
U.S. Vector Equity Portfolio | 26 | |
T.A. U.S. Core Equity 2 Portfolio | 31 | |
U.S. Small Cap Portfolio | 60 | |
U.S. Micro Cap Portfolio | 72 | |
DFA Real Estate Securities Portfolio | 44 | |
Large Cap International Portfolio | 33 | |
International Core Equity Portfolio | 78 | |
T.A. World ex U.S. Core Equity Portfolio | 14 | |
International Small Company Portfolio | 96 | |
Japanese Small Company Portfolio | 3 | |
Asia Pacific Small Company Portfolio | 2 | |
United Kingdom Small Company Portfolio | 1 | |
Continental Small Company Portfolio | 3 | |
DFA International Real Estate Securities Portfolio | 14 | |
DFA Global Real Estate Securities Portfolio | 6 | |
DFA International Small Cap Value Portfolio | 154 | |
International Vector Equity Portfolio | 5 | |
Emerging Markets Portfolio | 45 | |
Emerging Markets Small Cap Portfolio | 22 | |
Emerging Markets Core Equity Portfolio | 51 | |
DFA One-Year Fixed Income Portfolio | 196 | |
DFA Two-Year Global Fixed Income Portfolio | 182 | |
DFA Selectively Hedged Global Fixed Income Portfolio | 6 | |
DFA Five-Year Government Portfolio | 29 | |
DFA Five-Year Global Fixed Income Portfolio | 87 | |
DFA Intermediate Government Fixed Income Portfolio | 38 | |
DFA Short-Term Extended Quality Portfolio | 6 | |
DFA Inflation-Protected Securities Portfolio | 15 | |
DFA Short-Term Municipal Bond Portfolio | 29 | |
DFA California Short-Term Municipal Bond Portfolio | 5 |
213
E. Purchases and Sales of Securities:
For the year ended October 31, 2009, the Portfolios made the following purchases and sales of investment securities, other than short-term securities (amounts in thousands):
| U.S. Government Securities | Other Investment Securities | |||||||
| Purchases | Sales | Purchases | Sales | |||||
Enhanced U.S. Large Company Portfolio* | $ 17,221 | $ 27,607 | $ 83,078 | $ 27,487 | ||||
U.S. Targeted Value Portfolio | — | — | 651,247 | 191,035 | ||||
U.S. Small Cap Value Portfolio* | — | — | 1,103,537 | 1,218,825 | ||||
U.S. Core Equity 1 Portfolio | — | — | 586,197 | 112,979 | ||||
U.S. Core Equity 2 Portfolio | — | — | 1,096,280 | 112,471 | ||||
U.S. Vector Equity Portfolio | — | — | 336,346 | 98,773 | ||||
T.A. U.S. Core Equity 2 Portfolio | — | — | 752,211 | 56,631 | ||||
U.S. Small Cap Portfolio* | — | — | 499,660 | 383,415 | ||||
U.S. Micro Cap Portfolio* | — | — | 330,753 | 408,096 | ||||
DFA Real Estate Securities Portfolio | — | — | 348,104 | 34,556 | ||||
Large Cap International Portfolio | — | — | 139,779 | 187,901 | ||||
International Core Equity Portfolio | — | — | 1,054,265 | 123,079 | ||||
T.A. World ex U.S. Core Equity Portfolio | — | — | 280,810 | 24,082 | ||||
DFA International Real Estate Securities Portfolio | — | — | 260,673 | 23,908 | ||||
DFA International Small Cap Value Portfolio | — | — | 1,540,691 | 1,178,091 | ||||
International Vector Equity Portfolio | — | — | 143,899 | 13,463 | ||||
Emerging Markets Core Equity Portfolio | — | — | 468,871 | 108,517 | ||||
DFA One-Year Fixed Income Portfolio** | 47,152 | 21,008 | 30,615 | 30,326 | ||||
DFA Two-Year Global Fixed Income Portfolio** | 24,906 | 22,829 | 60,081 | 20,035 | ||||
DFA Selectively Hedged Global Fixed Income Portfolio | 62,928 | 17,676 | 265,145 | 35,804 | ||||
DFA Five-Year Government Portfolio | 720,934 | 842,124 | — | — | ||||
DFA Five-Year Global Fixed Income Portfolio | 586,954 | 972,316 | 1,525,274 | 1,181,228 | ||||
DFA Intermediate Government Fixed Income Portfolio | 264,518 | 102,492 | — | — | ||||
DFA Short-Term Extended Quality Portfolio | 19,968 | — | 345,149 | 4,257 | ||||
DFA Inflation-Protected Securities Portfolio | 353,068 | 31,714 | — | — | ||||
DFA Short-Term Municipal Bond Portfolio | — | — | 658,802 | — | ||||
DFA California Short-Term Municipal Bond Portfolio | — | — | 116,165 | 7,876 | ||||
| * | For the period February 28, 2009 through October 31, 2009, during which the Portfolio invested directly in securities. |
| ** | For the period October 23, 2009 through October 31, 2009, during which the Portfolio invested directly in securities. |
F. Federal Income Taxes:
Each Portfolio has qualified and intends to continue to qualify as a regulated investment company under Subchapter M of the Internal Revenue Code for federal income tax purposes and to distribute substantially all of its taxable income and net capital gains to its shareholders. Accordingly, no provision has been made for federal income taxes.
Distributions from net investment income and net realized capital gains are determined in accordance with U.S. federal income tax regulations, which may differ from those amounts determined under accounting principles generally accepted in the United States of America. These book/tax differences are either temporary or permanent in nature. To the extent these differences are permanent, they are charged or credited to paid-in capital, undistributed net investment income or accumulated net realized gains, as appropriate, in the period that the differences arise. Accordingly, the following permanent differences as of October 31, 2009, primarily attributable to net realized gains on securities
214
considered to be “passive foreign investment companies”, non-deductible offering costs, foreign bond bifurcation, the utilization of accumulated earnings and profits distributed to shareholders on redemptions of shares as part of the dividends paid deduction for income tax purposes and distribution redesignations, were reclassified to the following accounts. These reclassifications had no effect on net assets or net asset value per share (amounts in thousands):
| Increase (Decrease) Paid-In Capital | Increase (Decrease) Undistributed Net Investment Income | Increase (Decrease) Accumulated Net Realized Gains (Losses) | ||||
U.S. Large Company Portfolio | $ (1,323) | $ (5) | $ 1,328 | |||
Enhanced U.S. Large Company Portfolio | (58,767) | 1,300 | 57,467 | |||
U.S. Large Cap Value Portfolio | (61) | (908) | 969 | |||
U.S. Targeted Value Portfolio | (43) | (11) | 54 | |||
U.S. Small Cap Value Portfolio | (200,882) | 24,540 | 176,342 | |||
U.S. Core Equity 1 Portfolio | — | (15) | 15 | |||
U.S. Core Equity 2 Portfolio | (178) | 128 | 50 | |||
U.S. Vector Equity Portfolio | — | (21) | 21 | |||
T.A. U.S. Core Equity 2 Portfolio | — | (8) | 8 | |||
U.S. Small Cap Portfolio | (47,334) | 11,620 | 35,714 | |||
U.S. Micro Cap Portfolio | (147,324) | 14,338 | 132,986 | |||
DFA Real Estate Securities Portfolio | (199) | 188 | 11 | |||
Large Cap International Portfolio | — | 1,258 | (1,258) | |||
International Core Equity Portfolio | — | 2,161 | (2,161) | |||
T.A. World ex U.S. Core Equity Portfolio | 13 | 109 | (122) | |||
International Small Company Portfolio | (8,890) | 2,627 | 6,263 | |||
Japanese Small Company Portfolio | (3,671) | 248 | 3,423 | |||
Asia Pacific Small Company Portfolio | (271) | 33 | 238 | |||
United Kingdom Small Company Portfolio | (88) | 9 | 79 | |||
Continental Small Company Portfolio | (272) | (50) | 322 | |||
DFA International Real Estate Securities Portfolio | 1,139 | (885) | (254) | |||
DFA Global Real Estate Securities Portfolio | 227 | (246) | 19 | |||
DFA International Small Cap Value Portfolio | 2,536 | (1,818) | (718) | |||
International Vector Equity Portfolio | 13 | (27) | 14 | |||
Emerging Markets Portfolio | 24,336 | (3,340) | (20,996) | |||
Emerging Markets Small Cap Portfolio | — | (181) | 181 | |||
Emerging Markets Core Equity Portfolio | — | (303) | 303 | |||
DFA One-Year Fixed Income Portfolio | (43,319) | 20,846 | 22,473 | |||
DFA Two-Year Global Fixed Income Portfolio | (10,273) | 34,785 | (24,512) | |||
DFA Selectively Hedged Global Fixed Income Portfolio | (9,435) | (6,232) | 15,667 | |||
DFA Five-Year Global Fixed Income Portfolio | — | 36,191 | (36,191) | |||
DFA Short-Term Extended Quality Portfolio | (27) | 27 | — | |||
DFA Inflation-Protected Securities Portfolio | — | (65) | 65 |
The tax character of dividends and distributions declared and paid during the year ended November 30, 2007, the period December 1, 2007 to October 31, 2008 and the year ended October 31, 2009 were as follows (amounts in thousands):
215
| Net Investment Income and Short-Term Capital Gains | Long-Term Capital Gains | Total | ||||
U.S. Large Company Portfolio | ||||||
2007 | $ 55,847 | — | $ 55,847 | |||
2008 | 67,060 | — | 67,060 | |||
2009 | 62,498 | — | 62,498 | |||
Enhanced U.S. Large Company Portfolio | ||||||
2007 | 23,020 | $ 1,991 | 25,011 | |||
2008 | 15,756 | 17,593 | 33,349 | |||
2009 | 19,564 | — | 19,564 | |||
U.S. Large Cap Value Portfolio | ||||||
2007 | 105,066 | 146,660 | 251,726 | |||
2008 | 118,438 | 315,456 | 433,894 | |||
2009 | 130,238 | — | 130,238 | |||
U.S. Targeted Value Portfolio | ||||||
2007 | 9,597 | 12,911 | 22,508 | |||
2008 | 9,084 | 14,001 | 23,085 | |||
2009 | 14,179 | — | 14,179 | |||
U.S. Small Cap Value Portfolio | ||||||
2007 | 168,338 | 643,084 | 811,422 | |||
2008 | 73,038 | 747,955 | 820,993 | |||
2009 | 69,882 | — | 69,882 | |||
U.S. Core Equity 1 Portfolio | ||||||
2007 | 15,517 | 1,000 | 16,517 | |||
2008 | 22,927 | — | 22,927 | |||
2009 | 31,598 | — | 31,598 | |||
U.S. Core Equity 2 Portfolio | ||||||
2007 | 36,180 | 1,451 | 37,631 | |||
2008 | 48,004 | — | 48,004 | |||
2009 | 55,009 | — | 55,009 | |||
U.S. Vector Equity Portfolio | ||||||
2007 | 13,979 | — | 13,979 | |||
2008 | 14,964 | — | 14,964 | |||
2009 | 16,454 | — | 16,454 | |||
T.A. U.S. Core Equity 2 Portfolio | ||||||
2007 | — | — | — | |||
2008 | 4,648 | — | 4,648 | |||
2009 | 18,642 | — | 18,642 | |||
216
| Net Investment Income and Short-Term Capital Gains | Long-Term Capital Gains | Total | ||||
U.S. Small Cap Portfolio | ||||||
2007 | $ 70,394 | $144,164 | $214,558 | |||
2008 | 35,218 | 173,651 | 208,869 | |||
2009 | 26,412 | — | 26,412 | |||
U.S. Micro Cap Portfolio | ||||||
2007 | 109,408 | 344,357 | 453,765 | |||
2008 | 82,937 | 350,692 | 433,629 | |||
2009 | 57,816 | — | 57,816 | |||
DFA Real Estate Securities Portfolio | ||||||
2007 | 65,631 | 77,963 | 143,594 | |||
2008 | 34,694 | 200,903 | 235,597 | |||
2009 | 95,934 | — | 95,934 | |||
Large Cap International Portfolio | ||||||
2007 | 52,781 | 909 | 53,690 | |||
2008 | 54,328 | 28,913 | 83,241 | |||
2009 | 32,286 | — | 32,286 | |||
International Core Equity Portfolio | ||||||
2007 | 40,770 | 205 | 40,975 | |||
2008 | 85,639 | 17,053 | 102,692 | |||
2009 | 77,469 | — | 77,469 | |||
T.A. World ex U.S. Core Equity Portfolio | ||||||
2008 | 1,192 | — | 1,192 | |||
2009 | 10,761 | — | 10,761 | |||
International Small Company Portfolio | ||||||
2007 | 147,606 | 139,397 | 287,003 | |||
2008 | 167,345 | 279,890 | 447,235 | |||
2009 | 81,118 | — | 81,118 | |||
Japanese Small Company Portfolio | ||||||
2007 | 2,759 | — | 2,759 | |||
2008 | 3,574 | — | 3,574 | |||
2009 | 2,426 | — | 2,426 | |||
Asia Pacific Small Company Portfolio | ||||||
2007 | 3,089 | — | 3,089 | |||
2008 | 4,433 | — | 4,433 | |||
2009 | 2,724 | — | 2,724 | |||
217
| Net Investment Income and Short-Term Capital Gains | Long-Term Capital Gains | Return of Capital | Total | |||||
United Kingdom Small Company Portfolio | ||||||||
2007 | $ 1,360 | $ 1,153 | — | $ 2,513 | ||||
2008 | 1,227 | 1,311 | $ 19 | 2,557 | ||||
2009 | 658 | — | — | 658 | ||||
Continental Small Company Portfolio | ||||||||
2007 | 3,386 | 2,271 | — | 5,657 | ||||
2008 | 4,326 | 6,764 | 97 | 11,187 | ||||
2009 | 2,087 | — | — | 2,087 | ||||
DFA International Real Estate Securities Portfolio | ||||||||
2007 | 2,768 | — | — | 2,768 | ||||
2008 | 19,791 | — | — | 19,791 | ||||
2009 | 11,227 | — | — | 11,227 | ||||
DFA Global Real Estate Securities Portfolio | ||||||||
2008 | — | — | — | — | ||||
2009 | 2,370 | — | — | 2,370 | ||||
DFA International Small Cap Value Portfolio | ||||||||
2007 | 218,066 | 401,394 | — | 619,460 | ||||
2008 | 318,023 | 534,468 | — | 852,491 | ||||
2009 | 108,717 | 25,188 | — | 133,905 | ||||
International Vector Equity Portfolio | ||||||||
2008 | — | — | — | — | ||||
2009 | 3,671 | — | — | 3,671 | ||||
Emerging Markets Portfolio | ||||||||
2007 | 54,872 | 23,352 | — | 78,224 | ||||
2008 | 70,205 | 128,306 | — | 198,511 | ||||
2009 | 36,673 | 23,932 | — | 60,605 | ||||
Emerging Markets Small Cap Portfolio | ||||||||
2007 | 21,595 | 53,499 | — | 75,094 | ||||
2008 | 32,090 | 83,686 | — | 115,776 | ||||
2009 | 16,832 | — | — | 16,832 | ||||
Emerging Markets Core Equity Portfolio | ||||||||
2007 | 26,413 | 1,966 | — | 28,379 | ||||
2008 | 42,769 | 5,265 | 204 | 48,238 | ||||
2009 | 29,028 | — | — | 29,028 | ||||
DFA One-Year Fixed Income Portfolio | ||||||||
2007 | 149,471 | — | — | 149,471 | ||||
2008 | 102,391 | — | — | 102,391 | ||||
2009 | 72,237 | — | — | 72,237 | ||||
218
| Net Investment Income and Short-Term Capital Gains | Long-Term Capital Gains | Return of Capital | Total | |||||
DFA Two-Year Global Fixed Income Portfolio | ||||||||
2007 | $ 78,938 | — | — | $ 78,938 | ||||
2008 | 99,528 | $ 296 | — | 99,824 | ||||
2009 | 137,717 | — | — | 137,717 | ||||
DFA Selectively Hedged Global Fixed Income Portfolio | ||||||||
2008 | — | — | $ 68 | 68 | ||||
2009 | — | — | — | — | ||||
DFA Five-Year Government Portfolio | ||||||||
2007 | 49,378 | — | — | 49,378 | ||||
2008 | 38,626 | — | — | 38,626 | ||||
2009 | 25,750 | — | — | 25,750 | ||||
DFA Five-Year Global Fixed Income Portfolio | ||||||||
2007 | 60,967 | — | — | 60,967 | ||||
2008 | 96,473 | — | 5,349 | 101,822 | ||||
2009 | 61,945 | — | — | 61,945 | ||||
DFA Intermediate Government Fixed Income Portfolio | ||||||||
2007 | 46,222 | 310 | — | 46,532 | ||||
2008 | 59,933 | 112 | — | 60,045 | ||||
2009 | 56,385 | 6,325 | — | 62,710 | ||||
DFA Short-Term Extended Quality Portfolio | ||||||||
2009 | 4,322 | — | — | 4,322 | ||||
DFA Inflation-Protected Securities Portfolio | ||||||||
2007 | 2,996 | — | — | 2,996 | ||||
2008 | 19,588 | — | — | 19,588 | ||||
2009 | 4,088 | 364 | — | 4,452 | ||||
DFA Short-Term Municipal Bond Portfolio | ||||||||
2007 | 24,969 | — | — | 24,969 | ||||
2008 | 18,834 | — | — | 18,834 | ||||
2009 | 20,942 | — | — | 20,942 | ||||
DFA California Short-Term Municipal Bond Portfolio | ||||||||
2007 | 1,116 | — | — | 1,116 | ||||
2008 | 3,577 | — | — | 3,577 | ||||
2009 | 4,256 | — | — | 4,256 | ||||
At October 31, 2009, the following net investment income and short-term capital gains and long-term capital gains distributions designated for federal income tax purposes are due to the utilization of accumulated earnings and profits distributed to shareholders upon redemption of shares (amounts in thousands):
219
| Net Investment Income and Short-Term Capital Gains | Long-Term Capital Gains | Total | ||||
T.A. World ex U.S. Core Equity Portfolio | $ 30 | — | $ 30 | |||
DFA International Real Estate Securities Portfolio | 1,139 | — | 1,139 | |||
DFA Global Real Estate Securities Portfolio | 319 | — | 319 | |||
DFA International Small Cap Value Portfolio | 2,537 | — | 2,537 | |||
International Vector Equity Portfolio | 29 | — | 29 | |||
Emerging Markets Portfolio | 3,546 | $2,984 | 6,530 |
At October 31, 2009, the components of distributable earnings (accumulated losses) were as follows (amounts in thousands):
| Undistributed Net Investment Income and Short-Term Capital Gains | Undistributed Long-Term Capital Gains | Capital Loss Carryforward | Total Net Distributable Earnings (Accumulated Losses) | |||||||
U.S. Large Company Portfolio | $ 7,182 | — | $(213,037 | ) | $(205,855 | ) | ||||
Enhanced U.S. Large Company Portfolio | 328 | — | (107,961 | ) | (107,633 | ) | ||||
U.S. Large Cap Value Portfolio | 13,684 | — | (2,441,394 | ) | (2,427,710 | ) | ||||
U.S. Targeted Value Portfolio | 1,248 | — | (82,714 | ) | (81,466 | ) | ||||
U.S. Small Cap Value Portfolio | 2,747 | — | (574,282 | ) | (571,535 | ) | ||||
U.S. Core Equity 1 Portfolio | 419 | — | (82,131 | ) | (81,712 | ) | ||||
U.S. Core Equity 2 Portfolio | 777 | — | (94,753 | ) | (93,976 | ) | ||||
U.S. Vector Equity Portfolio | 1,903 | — | (94,679 | ) | (92,776 | ) | ||||
T.A. U.S. Core Equity 2 Portfolio | 3,092 | — | (49,818 | ) | (46,726 | ) | ||||
U.S. Small Cap Portfolio | 3,710 | — | (380,659 | ) | (376,949 | ) | ||||
U.S. Micro Cap Portfolio | 2,984 | — | (515,046 | ) | (512,062 | ) | ||||
DFA Real Estate Securities Portfolio | 8,242 | — | (138,089 | ) | (129,847 | ) | ||||
Large Cap International Portfolio | 7,702 | — | (154,396 | ) | (146,694 | ) | ||||
International Core Equity Portfolio | 3,803 | — | (98,253 | ) | (94,450 | ) | ||||
T.A. World ex U.S. Core Equity Portfolio | 1,785 | — | (9,680 | ) | (7,895 | ) | ||||
International Small Company Portfolio | 22,490 | — | (227,832 | ) | (205,342 | ) | ||||
Japanese Small Company Portfolio | 787 | — | (78,684 | ) | (77,897 | ) | ||||
Asia Pacific Small Company Portfolio | 932 | — | (38,642 | ) | (37,710 | ) | ||||
United Kingdom Small Company Portfolio | 192 | — | (3,008 | ) | (2,816 | ) | ||||
Continental Small Company Portfolio | 402 | — | (24,183 | ) | (23,781 | ) | ||||
DFA International Real Estate Securities Portfolio | 71,386 | — | (48,084 | ) | 23,302 | |||||
DFA Global Real Estate Securities Portfolio | 4,924 | — | — | 4,924 | ||||||
DFA International Small Cap Value Portfolio | 32,551 | — | (32,601 | ) | (50 | ) | ||||
International Vector Equity Portfolio | 720 | — | (3,383 | ) | (2,663 | ) | ||||
Emerging Markets Portfolio | 5,734 | $29,774 | — | 35,508 | ||||||
Emerging Markets Small Cap Portfolio | 2,699 | — | (37,102 | ) | (34,403 | ) | ||||
Emerging Markets Core Equity Portfolio | 6,737 | — | (89,395 | ) | (82,658 | ) | ||||
DFA One-Year Fixed Income Portfolio | 3,526 | — | (651 | ) | 2,875 | |||||
DFA Two-Year Global Fixed Income Portfolio | 42,421 | 3,896 | — | 46,317 | ||||||
DFA Selectively Hedged Global Fixed Income Portfolio | — | 230 | — | 230 | ||||||
DFA Five-Year Government Portfolio | 11,738 | — | — | 11,738 |
220
| Undistributed Net Investment Income and Short-Term Capital Gains | Undistributed Long-Term Capital Gains | Capital Loss Carryforward | Total Net Distributable Earnings (Accumulated Losses) | ||||||||||
DFA Five-Year Global Fixed Income Portfolio | $ | 45,563 | — | $ | (5,372 | ) | $ | 40,191 | |||||
DFA Intermediate Government Fixed Income Portfolio | 10,456 | $ | 5,453 | — | 15,909 | ||||||||
DFA Short-Term Extended Quality Portfolio | 1,345 | — | — | 1,345 | |||||||||
DFA Inflation-Protected Securities Portfolio | 6,370 | — | (774 | ) | 5,596 | ||||||||
DFA Short-Term Municipal Bond Portfolio | 1,836 | — | (17 | ) | 1,819 | ||||||||
DFA California Short-Term Municipal Bond Portfolio | 359 | — | — | 359 | |||||||||
For federal income tax purposes, the Fund measures its capital loss carryforwards annually at October 31, its fiscal year end. Capital loss carryforwards may be carried forward and applied against future capital gains. As of October 31, 2009, the following Portfolios had capital loss carryforwards available to offset future realized capital gains through the indicated expiration dates (amounts in thousands):
| 2010 | 2011 | 2012 | 2013 | 2014 | 2015 | 2016 | 2017 | Total | |||||||||||||||||||
U.S. Large Company Portfolio | — | $ | 27,798 | — | $ | 5,485 | $ | 8,867 | — | $ | 86,015 | $ | 84,872 | $ | 213,037 | ||||||||||||
Enhanced U.S. Large Company Portfolio | — | — | — | — | — | — | 107,961 | — | 107,961 | ||||||||||||||||||
U.S. Large Cap Value Portfolio | — | — | — | — | — | — | — | 2,441,394 | 2,441,394 | ||||||||||||||||||
U.S. Targeted Value Portfolio | — | — | — | — | — | — | 998 | 81,716 | 82,714 | ||||||||||||||||||
U.S. Small Cap Value Portfolio | — | — | — | — | — | — | 371,018 | 203,264 | 574,282 | ||||||||||||||||||
U.S. Core Equity 1 Portfolio | — | — | — | — | — | $ | 3,266 | 18,644 | 60,221 | 82,131 | |||||||||||||||||
U.S. Core Equity 2 Portfolio | — | — | — | — | — | 15,562 | 42,181 | 37,010 | 94,753 | ||||||||||||||||||
U.S. Vector Equity Portfolio | — | — | — | — | — | 1,759 | 12,704 | 80,216 | 94,679 | ||||||||||||||||||
T.A. U.S. Core Equity 2 Portfolio | — | — | — | — | — | 310 | 6,972 | 42,536 | 49,818 | ||||||||||||||||||
U.S. Small Cap Portfolio | — | — | — | — | — | — | 380,119 | 540 | 380,659 | ||||||||||||||||||
U.S. Micro Cap Portfolio | — | — | — | — | — | — | 453,532 | 61,514 | 515,046 | ||||||||||||||||||
DFA Real Estate Securities Portfolio | — | — | — | — | — | — | 81,911 | 56,178 | 138,089 | ||||||||||||||||||
Large Cap International Portfolio | — | — | — | — | — | — | 19,004 | 135,392 | 154,396 | ||||||||||||||||||
International Core Equity Portfolio | — | — | — | — | — | — | 10,739 | 87,514 | 98,253 | ||||||||||||||||||
T.A. World ex U.S. Core Equity Portfolio | — | — | — | — | — | — | 2,250 | 7,430 | 9,680 | ||||||||||||||||||
International Small Company Portfolio | — | — | — | — | — | — | 133,454 | 94,378 | 227,832 | ||||||||||||||||||
Japanese Small Company Portfolio | $ | 4,453 | 19,912 | $ | 3,801 | 3,055 | 2,451 | 8,003 | 23,057 | 13,952 | 78,684 | ||||||||||||||||
Asia Pacific Small Company Portfolio | — | 5,837 | 1,150 | 907 | 864 | — | 21,680 | 8,204 | 38,642 | ||||||||||||||||||
United Kingdom Small Company Portfolio | — | — | — | — | — | — | 1,020 | 1,988 | 3,008 | ||||||||||||||||||
Continental Small Company Portfolio | — | — | — | — | — | — | 16,959 | 7,224 | 24,183 | ||||||||||||||||||
DFA International Real Estate Securities Portfolio | — | — | — | — | — | 46 | 13,446 | 34,592 | 48,084 | ||||||||||||||||||
DFA International Small Cap Value Portfolio | — | — | — | — | — | — | — | 32,601 | 32,601 | ||||||||||||||||||
International Vector Equity Portfolio | — | — | — | — | — | — | 27 | 3,356 | 3,383 | ||||||||||||||||||
Emerging Markets Small Cap Portfolio | — | — | — | — | — | — | 21,881 | 15,221 | 37,102 | ||||||||||||||||||
Emerging Markets Core Equity Portfolio | — | — | — | — | — | — | 62,950 | 26,445 | 89,395 | ||||||||||||||||||
DFA One-Year Fixed Income Portfolio | — | — | — | — | — | — | 651 | — | 651 | ||||||||||||||||||
DFA Five-Year Global Fixed Income Portfolio | — | — | — | — | 309 | — | 5,063 | — | 5,372 | ||||||||||||||||||
DFA Inflation Protected Securities Portfolio | — | — | — | — | — | — | — | 774 | 774 | ||||||||||||||||||
DFA Short-Term Municipal Bond Portfolio | — | — | 17 | — | — | — | — | — | 17 | ||||||||||||||||||
During the year ended October 31, 2009, the following Portfolios utilized capital loss carryforwards to offset realized capital gains for federal income tax purposes (amounts in thousands):
Enhanced U.S. Large Company Portfolio | $ | 8,177 | |
DFA One-Year Fixed Income Portfolio | 29,277 | ||
DFA Two-Year Global Fixed Income Portfolio | 22,911 | ||
DFA Five-Year Government Portfolio | 19,566 | ||
DFA Five-Year Global Fixed Income Portfolio | 32,624 | ||
DFA California Short-Term Municipal Bond Portfolio | 23 |
221
For the year ended October 31, 2009, the Japanese Small Company Portfolio had capital loss carryforward expirations of $3,508 (in thousands).
Some of the Portfolios’ investments and investments held by the Master Funds are in securities considered to be “passive foreign investment companies” for which any unrealized appreciation (depreciation) (mark to market) and/or realized gains are required to be included in distributable net investment income for federal income tax purposes. At October 31, 2009, the following Portfolios had cumulative unrealized appreciation (depreciation) (mark to market) to be included in distributable net investment income for federal tax purposes. For the Year Ended October 31, 2009, realized gains on the sale of passive foreign investment companies have been reclassified from accumulated net realized gains to accumulated net investment income for federal tax purposes. Amounts listed below are in thousands.
| Mark to Market | Realized Gains | |||||
Large Cap International Portfolio | $ | 1,808 | — | |||
International Core Equity Portfolio | 638 | $ | 838 | |||
T.A. World ex U.S. Core Equity Portfolio | — | 25 | ||||
International Small Company Portfolio | 8,444 | 574 | ||||
Japanese Small Company Portfolio | 117 | — | ||||
Asia Pacific Small Company Portfolio | 684 | — | ||||
United Kingdom Small Company Portfolio | 20 | 9 | ||||
Continental Small Company Portfolio | 403 | — | ||||
DFA International Real Estate Securities Portfolio | 47,294 | 56 | ||||
DFA International Small Cap Value Portfolio | 20,585 | 2,797 | ||||
Emerging Markets Small Cap Portfolio | 354 | — | ||||
Emerging Markets Core Equity Portfolio | 4 | — | ||||
At October 31, 2009, the total cost and aggregate gross unrealized appreciation and (depreciation) of securities for federal income tax purposes were different from amounts reported for financial reporting purposes (amounts in thousands):
| Federal Tax Cost | Unrealized Appreciation | Unrealized (Depreciation) | Net Unrealized Appreciation (Depreciation) | |||||||||||
U.S. Large Company Portfolio | $ | 2,877,782 | $ | 352,056 | $ | (510,130 | ) | $ | (158,074 | ) | ||||
Enhanced U.S. Large Company Portfolio | 165,749 | 1,894 | (21 | ) | 1,873 | |||||||||
U.S. Large Cap Value Portfolio | 4,959,196 | 1,012,620 | (107,145 | ) | 905,475 | |||||||||
U.S. Targeted Value Portfolio | 1,875,678 | 182,315 | (281,563 | ) | (99,248 | ) | ||||||||
U.S. Small Cap Value Portfolio | 7,359,688 | 856,341 | (1,648,779 | ) | (792,438 | ) | ||||||||
U.S. Core Equity 1 Portfolio | 2,487,529 | 139,350 | (368,611 | ) | (229,261 | ) | ||||||||
U.S. Core Equity 2 Portfolio | 4,990,297 | 260,228 | (923,665 | ) | (663,437 | ) | ||||||||
U.S. Vector Equity Portfolio | 1,627,456 | 92,281 | (324,960 | ) | (232,679 | ) | ||||||||
T.A. U.S. Core Equity 2 Portfolio | 1,617,600 | 164,083 | (133,301 | ) | 30,782 | |||||||||
U.S. Small Cap Portfolio | 3,056,739 | 463,996 | (541,196 | ) | (77,200 | ) | ||||||||
U.S. Micro Cap Portfolio | 3,478,151 | 656,832 | (865,370 | ) | (208,538 | ) | ||||||||
DFA Real Estate Securities Portfolio | 3,157,842 | 143,598 | (577,621 | ) | (434,023 | ) | ||||||||
Large Cap International Portfolio | 1,527,916 | 270,759 | (198,633 | ) | 72,126 | |||||||||
International Core Equity Portfolio | 4,716,225 | 295,954 | (648,610 | ) | (352,656 | ) | ||||||||
T.A. World ex U.S. Core Equity Portfolio | 614,254 | 134,993 | (28,279 | ) | 106,714 | |||||||||
International Small Company Portfolio | 4,311,177 | 727,413 | (762,875 | ) | (35,462 | ) | ||||||||
Japanese Small Company Portfolio | 203,529 | 52,585 | (141,999 | ) | (89,414 | ) | ||||||||
Asia Pacific Small Company Portfolio | $ | 95,452 | $ | 61,222 | $ | (54,768 | ) | $ | 6,454 | |||||
222
| Federal Tax Cost | Unrealized Appreciation | Unrealized (Depreciation) | Net Unrealized Appreciation (Depreciation) | |||||||
United Kingdom Small Company Portfolio | 30,650 | 20,946 | (23,724 | ) | (2,778 | ) | ||||
Continental Small Company Portfolio | 113,305 | 64,204 | (66,524 | ) | (2,320 | ) | ||||
DFA International Real Estate Securities Portfolio | 1,136,799 | 11,976 | (280,322 | ) | (268,346 | ) | ||||
DFA Global Real Estate Securities Portfolio | 407,508 | 32,225 | (7,205 | ) | 25,020 | |||||
DFA International Small Cap Value Portfolio | 8,155,491 | 1,022,184 | (1,688,444 | ) | (666,260 | ) | ||||
International Vector Equity Portfolio | 248,248 | 60,999 | (6,848 | ) | 54,151 | |||||
Emerging Markets Portfolio | 1,011,811 | 1,037,753 | (82,480 | ) | 955,273 | |||||
Emerging Markets Small Cap Portfolio | 856,324 | 358,008 | (79,893 | ) | 278,115 | |||||
Emerging Markets Core Equity Portfolio | 2,301,604 | 614,169 | (166,439 | ) | 447,730 | |||||
DFA One-Year Fixed Income Portfolio | 5,126,966 | 19,644 | (744 | ) | 18,900 | |||||
DFA Two-Year Global Fixed Income Portfolio | 5,172,582 | 38,592 | (595 | ) | 37,997 | |||||
DFA Selectively Hedged Global Fixed Income Portfolio | 299,331 | 4,281 | (308 | ) | 3,973 | |||||
DFA Five-Year Government Portfolio | 968,275 | 31,245 | (2,998 | ) | 28,247 | |||||
DFA Five-Year Global Fixed Income Portfolio | 3,961,945 | 170,703 | 11,863 | 182,566 | ||||||
DFA Intermediate Government Fixed Income Portfolio | 1,366,863 | 103,431 | (391 | ) | 103,040 | |||||
DFA Short-Term Extended Quality Portfolio | 365,573 | 11,120 | (31 | ) | 11,089 | |||||
DFA Inflation-Protected Securities Portfolio | 737,599 | 30,004 | 246 | 30,250 | ||||||
DFA Short-Term Municipal Bond Portfolio | 1,144,069 | 19,233 | (1,363 | ) | 17,870 | |||||
DFA California Short-Term Municipal Bond Portfolio | 204,398 | 4,000 | (441 | ) | 3,559 |
Accounting for Uncertainty in Income Taxes sets forth a minimum threshold for financial statement recognition of the benefit of a tax position taken or expected to be taken in a tax return. Management has analyzed each Portfolio’s tax positions and has concluded that no provision for income tax is required in any Portfolios’ financial statements. No Portfolio is aware of any tax positions for which it is reasonably possible that the total amounts of unrecognized tax benefits will significantly change in the next twelve months. Each of the Portfolios’ federal tax returns for the prior three fiscal years remains subject to examination by the Internal Revenue Service.
On October 22, 2008, The U.S. Micro Cap Series and The U.S. Small Cap Value Series and on October 25, 2008 The U.S. Small Cap Series, each a master fund in a RIC/RIC master-feeder structure, each with a RIC feeder (“the Portfolios”), having 100% investment in their respective master fund, have each made a “Check-the-box” election for federal income tax purposes pursuant to Treasury Regulation § 301.7701-3, to change their federal entity classifications from a corporation taxable as a regulated investment company to a disregarded entity. As a result of this election for tax purposes, each master fund is deemed to have liquidated and distributed all of its assets and liabilities to its owners, the respective portfolios (the RIC feeders), with the respective portfolios deemed the surviving entities. The final tax year end of the Master Funds was October 21, 2008 for The U.S. Micro Cap Series and The U.S. Small Cap Value Series and October 24, 2008 for The U.S. Small Cap Series. For Federal income tax purposes, pursuant to Code §337(a), each of the master funds recognizes no gain or loss and, pursuant to Code §332(a), each of the Portfolios recognizes no gain or loss on the deemed liquidation. However, pursuant to IRC §332 (c), each of the aforementioned Portfolios has recognized the master fund’s deemed dividend, which was distributed as part of the deemed liquidating distribution, as taxable income. Pursuant to IRC Code §334(b)(1) and §1223, each of the Portfolios will maintain each respective master fund’s holding period and tax basis in the assets deemed transferred to the respective Portfolio.
223
Effective December 31, 2008, The U.S. Large Cap Value Series, a master fund in a RIC/RIC master-feeder structure with four RIC feeders and other direct client investor(s), made a “Check-the-box” election for federal income tax purposes pursuant to Treasury Regulation §301.7701-3, to change its federal entity classification from a corporation taxable as a regulated investment company to a partnership. As a result of this election, the master fund is deemed to have distributed all of its assets and liabilities, in a taxable transaction, to its shareholders in liquidation of the master fund. Immediately thereafter, the shareholders contributed all of the distributed assets and liabilities to a newly formed partnership. The final tax year end of The U.S. Large Cap Value Series was December 30, 2008. For Federal income tax purposes, pursuant to IRC Code §336(a), the master fund recognized a loss as if the master’s investment securities were sold to its shareholders and, pursuant to IRC Code §331, each of the Portfolios recognized a gain as if it liquidated its investment in the master. For tax purposes, pursuant to IRC Code §334(a), each of the Portfolios took a fair market value basis in the securities deemed received by them and a new holding period for those securities commenced on the deemed liquidation date.
The master fund had book/tax differences upon its deemed liquidation. The following summary of permanent differences occurred as of the respective effective “Check the Box” election date.
Increase (Decrease) Paid-In Capital | Unrealized Appreciation (Depreciation) Investment Securities | Increase (Decrease) Undistributed Net Investment Income | Increase (Decrease) Accumulated Net Realized Gains (Losses) | |||
$(3,038,312,278) | $2,303,664,484 | $(698,899) | $735,346,693 |
As a result of the transaction, The U.S. Large Cap Value Series recognized a ($2,303,664,484) capital loss for tax year ended December 30, 2008. Additionally, the fund has written off $3,039,011,176 of expired capital loss carryover as a permanent book/tax reporting difference decreasing paid in capital.
Each Portfolio impacted by the ”Check the Box“ election also has a permanent book/tax difference resulting from the transaction. Listed below is the permanent difference impacting each respective Portfolio. For financial statement purposes, this adjustment did not result in any changes to each respective fund’s net assets or net asset value per share.
| Increase (Decrease) Undistributed Net Investment Income | Increase (Decrease) Accumulated Net Realized Gains (Losses) | ||||||
DFA U.S. Large Cap Value Portfolio | $ | (606,345 | ) | $ | 606,345 | ||
DFA U.S. Large Cap Value Portfolio II | (10,872 | ) | 10,872 | ||||
DFA U.S. Large Cap Value Portfolio III | (139,353 | ) | 139,353 | ||||
LWAS/DFA U.S. High Book To Market Portfolio | (7,793 | ) | 7,793 | ||||
For financial reporting purposes, this transaction had no impact on the net assets of the respective funds.
On November 1, 2008, The Enhanced U.S. Large Company Series, a master fund in a RIC/RIC master-feeder structure and The Enhanced U.S. Large Company Portfolio (“the Portfolio”), having 100% investment in its respective master fund, made a “Check-the-box” election for federal income tax purposes pursuant to Treasury Regulation §301.7701-3, to change the Series’ federal entity classification from a corporation taxable as a regulated investment company to a disregarded entity. As a result of this election for tax purposes, the master fund is deemed to have liquidated and distributed all of its assets and liabilities to its owner, the Portfolio, with the Portfolio deemed the surviving entity. The final tax year end of the Master Fund was October 31, 2008. For Federal income tax purposes, pursuant to Code §337(a), the Master Fund did not recognize any gain or loss and, pursuant to Code §332(a), the Portfolio did not recognize any gain or loss on the deemed liquidation. However, pursuant to IRC §332(c), the Portfolio has recognized the Master Fund’s deemed dividend, which was distributed as part of the deemed liquidating distribution, as taxable income. Pursuant to IRC Code §334(b)(1) and §1223, the Portfolio will maintain its respective master fund’s holding period and tax basis in the assets deemed transferred to the respective Portfolio.
224
On November 1, 2008, The DFA One-Year Fixed Income Series and The DFA Two-Year Global Fixed Income Series, each a master fund in a RIC/RIC master-feeder structure with RIC feeders, underlying fund of fund investors (Two-Year Global Fixed Income Series) and other direct client investor(s), have each made a “Check-the-box” election for federal income tax purposes pursuant to Treasury Regulation §301.7701-3, to change their federal entity classifications from a corporation taxable as a regulated investment company to a partnership. As a result of this election, for tax purposes, the Master Funds are deemed to have distributed all of their assets and liabilities to their shareholders in liquidation of the Master Fund. Since each Master Fund has a shareholder owning 80% or more of the fund’s shares and also has shareholders owning less than 80%, each fund’s respective transaction creates a non-taxable transaction, pursuant to Internal Revenue Code §332 for those owning more than 80%, and a taxable transaction, pursuant to Internal Revenue Code §331, for those shareholders owning less than 80%. Immediately after the deemed liquidation, the shareholders contributed all of the distributed assets and liabilities to newly formed partnerships. The final tax year end of the Master Funds was October 31, 2008.
For federal income tax purposes, pursuant to IRC §332(a), the DFA One-Year Fixed Income Portfolio and the DFA Two-Year Global Fixed Income Portfolio, having a more than 80% investment in its respective master fund, will not recognize any gain or loss on the deemed liquidation. However, pursuant to IRC §332(c), a portion of the deemed distribution, which otherwise would have been tax-free as discussed above, since it is utilized by the Master Fund to satisfy its dividends paid deduction for the tax year, must be recognized and treated as a dividend by the 80% or greater shareholder. Pursuant to IRC §334(b)(1) and §1223, the 80% or greater shareholder’s basis and holding period in the securities received in liquidation is the same as it was in the possession of the Master Fund. However, any security distributed in satisfaction of the Master Fund’s final dividend would have a basis equal to its fair market value and would be deemed acquired on the liquidation date.
For financial reporting purposes, this transaction had no impact on the net assets of the respective funds.
G. Capital Share Transactions:
The capital share transactions by class were as follows (amounts in thousands):
| Year Ended Oct. 31, 2009 | Period Dec. 1, 2007 to Oct. 31, 2008 | Year Ended Nov. 30, 2007 | ||||||||||||||||
| Amount |
Shares | Amount | Shares | Amount | Shares | |||||||||||||
U.S. Targeted Value Portfolio | ||||||||||||||||||
Class R1 Shares* | ||||||||||||||||||
Shares Issued | $ | 7,979 | 1,266 | $ | 41,494 | 4,172 | N/A | N/A | ||||||||||
Shares Issued in Lieu of Cash Distributions | 423 | 64 | 351 | 36 | N/A | N/A | ||||||||||||
Shares Redeemed | (5,207 | ) | (844 | ) | (7,142 | ) | (761 | ) | N/A | N/A | ||||||||
Net Increase (Decrease) — Class R1 Shares | $ | 3,195 | 486 | $ | 34,703 | 3,447 | N/A | N/A | ||||||||||
Class R2 Shares** | ||||||||||||||||||
Shares Issued | $ | 1,638 | 210 | $ | 3,032 | 306 | N/A | N/A | ||||||||||
Shares Issued in Lieu of Cash Distributions | 27 | 4 | 10 | 1 | N/A | N/A | ||||||||||||
Shares Redeemed | (626 | ) | (85 | ) | (799 | ) | (88 | ) | N/A | N/A | ||||||||
Net Increase (Decrease) — Class R2 Shares | $ | 1,039 | 129 | $ | 2,243 | �� | 219 | N/A | N/A | |||||||||
225
| Year Ended Oct. 31, 2009 | Period Dec. 1, 2007 to Oct. 31, 2008 | Year Ended Nov. 30, 2007 | |||||||||||||||||||
Amount | Shares | Amount | Shares | Amount | Shares | ||||||||||||||||
U.S. Targeted Value Portfolio | |||||||||||||||||||||
Institutional Class Shares | |||||||||||||||||||||
Shares Issued | $ | 840,965 | 86,986 | $ | 930,939 | 66,970 | $ | 500,717 | 28,579 | ||||||||||||
Shares Issued in Lieu of Cash Distributions | 13,191 | 1,374 | 20,933 | 1,410 | 18,152 | 1,060 | |||||||||||||||
Shares Redeemed | (419,657 | ) | (43,424 | ) | (327,204 | ) | (24,350 | ) | (110,437 | ) | (6,247 | ) | |||||||||
Net Increase | |||||||||||||||||||||
(Decrease) — Institutional Class Shares | $ | 434,499 | 44,936 | $ | 624,668 | 44,030 | $ | 408,432 | 23,392 | ||||||||||||
| * | Class R1 Shares commenced operations on January 31, 2008. |
| ** | Class R2 Shares commenced operations on June 30, 2008. |
H. Financial Instruments:
In accordance with the Portfolios’ investment objectives and policies, the Portfolios may invest, either directly or indirectly through their investment in a corresponding Master Fund, in certain financial instruments that have off-balance sheet risk in excess of the amounts recognized in the financial statements and concentrations of credit and market risk. These instruments and their significant corresponding risks are described below:
1. Repurchase Agreements: The Portfolios may purchase certain U.S. Government securities subject to the counterparty’s agreement to repurchase them at an agreed upon date and price. The counterparty will be required on a daily basis to maintain the value of the collateral subject to the agreement at not less than the repurchase price (including accrued interest). The agreements are conditioned upon the collateral being deposited under the Federal Reserve book-entry system with the Fund’s custodian or a third party sub-custodian. In the event of default or bankruptcy by the other party to the agreement, retention of the collateral may be subject to legal proceedings. All open repurchase agreements were entered into on October 30, 2009.
2. Treasury Inflation-Protected Securities (TIPS): The DFA Inflation-Protected Securities Portfolio may purchase TIPS which are securities issued by the U.S. Treasury. Because the interest and/or principal payments on an inflation-protected security are adjusted periodically for changes in inflation, the income distributed by the Portfolio may be irregular. In addition, the current market value of inflation-protected securities is not guaranteed and will fluctuate.
3. Foreign Market Risks: Investments in foreign markets may involve certain considerations and risks not typically associated with investments in U.S. companies, including the possibility of future political and economic developments and the level of foreign governmental supervision and regulation of foreign securities markets. These markets are generally smaller, less liquid and more volatile than the major securities markets in the United States of America. Consequently, acquisition and disposition of international securities held by the Portfolios may be inhibited.
Derivative Financial Instruments:
Disclosures on derivative instruments and hedging activities are intended to improve financial reporting for derivative instruments by enabling investors to understand how and why a Portfolio uses derivatives, how derivatives are accounted for and how derivative instruments affect a Portfolio’s results of operations and financial position. Summarized below are the specific types of derivative instruments used by the Portfolios.
4. Forward Currency Contracts: The Enhanced U.S. Large Company Portfolio, DFA Two-Year Global Fixed Income Portfolio, DFA Selectively Hedged Global Fixed Income Portfolio, DFA Five-Year Global Fixed Income Portfolio
226
and DFA Short-Term Extended Quality Portfolio may enter into forward foreign currency contracts only to hedge against adverse changes in the relationship of the U.S. dollar to foreign currencies (foreign exchange rate risk). The decision to hedge a Portfolio’s currency exposure with respect to a foreign market will be based primarily on the Portfolio’s existing exposure to a given foreign currency. Each contract is valued daily and the change in value is recorded by the Portfolios as an unrealized gain or loss, which is presented in the Statements of Operations as the change in unrealized appreciation or depreciation of translation of foreign currency denominated amounts. When the contract is closed or offset with the same counterparty, the Portfolio records a realized gain or loss equal to the change in the value of the contract when it was opened and the value at the time it was closed or offset. This is presented in the Statements of Operations as a net realized gain or loss on foreign currency transactions. At October 31, 2009, the Portfolios had entered into the following contracts and the net unrealized foreign exchange gain/(loss) is reflected in the accompanying financial statements (amounts in thousands):
Enhanced U.S. Large Company Portfolio*
Settlement Date | Currency Amount | Currency Sold | Contract Amount | Value at | Unrealized Foreign Exchange Gain (Loss) | ||||||
11/18/09 | 4,648 | Canadian Dollar | $ 4,364 | $ 4,296 | $ 68 | ||||||
11/18/09 | 2,162 | Euro | 3,198 | 3,182 | 16 | ||||||
11/18/09 | 6,200 | Pound Sterling | 10,129 | 10,174 | (45 | ) | |||||
| $17,691 | $17,652 | $ 39 | |||||||||
| DFA Two-Year Global Fixed Income Portfolio* | |||||||||||
Settlement Date | Currency Amount | Currency Sold | Contract Amount | Value at | Unrealized Foreign Exchange Gain (Loss) | ||||||
11/06/09 | 142,065 | Euro | $212,339 | $209,067 | $3,272 | ||||||
11/18/09 | 198,938 | Canadian Dollar | 187,075 | 183,855 | 3,220 | ||||||
11/18/09 | 144,042 | Euro | 213,086 | 211,970 | 1,116 | ||||||
11/18/09 | 112,239 | Pound Sterling | 183,461 | 184,189 | (728 | ) | |||||
| $795,961 | $789,081 | $6,880 | |||||||||
| DFA Selectively Hedged Global Fixed Income Portfolio* | ||||||||||
Settlement Date | Currency Amount | Currency Sold | Contract Amount | Value at | Unrealized Foreign Exchange Gain (Loss) | |||||
11/18/09 | 18,062 | Canadian Dollar | $16,948 | $16,692 | $256 | |||||
| DFA Five-Year Global Fixed Income Portfolio* | |||||||||||
Settlement Date | Currency Amount | Currency Sold | Contract Amount | Value at | Unrealized Foreign Exchange Gain (Loss) | ||||||
11/09/09 | 17,858,616 | Japanese Yen | $196,481 | $198,406 | $(1,925 | ) | |||||
11/13/09 | 17,553,714 | Japanese Yen | 191,063 | 195,023 | (3,960 | ) | |||||
11/13/09 | 119,009 | Pound Sterling | 194,496 | 195,305 | (809 | ) | |||||
11/13/09 | 4,438 | Pound Sterling | 7,323 | 7,284 | 39 | ||||||
11/23/09 | 123,425 | Pound Sterling | 203,599 | 202,540 | 1,059 | ||||||
| $792,962 | $798,558 | $(5,596 | ) | ||||||||
227
*During the year ended October 31, 2009, the Portfolios had limited activity in these transactions.
Risks may arise upon entering into these contracts from the potential inability of counterparties to meet the terms of their contracts and from unanticipated movements in the value of foreign currency relative to the U.S. dollar.
5. Futures Contracts: Certain Portfolios may enter into futures contracts to gain market exposure on uninvested cash pending investment in securities or to maintain liquidity to pay redemptions. Additionally, the Enhanced U.S. Large Company Portfolio uses stock index futures to hedge against changes in equity securities’ prices in the normal course of pursuing its investment objectives. Upon entering into a futures contract, the Portfolio deposits cash or pledges U.S. Government securities to a broker, equal to the minimum “initial margin” requirements of the exchange on which the contract is traded. Subsequent payments are received from or paid to the broker each day, based on the daily fluctuation in the market value of the contract. These receipts or payments are known as “variation margin” and are recorded daily by the Portfolio as unrealized gains or losses until the contracts are closed. When the contracts are closed, the Portfolio records a realized gain or loss, which is presented in the Statement of Operations as a net realized gain or loss on futures, equal to the difference between the value of the contract at the time it was opened and the value at the time it was closed.
Risks may arise upon entering into futures contracts from potential imperfect price correlations between the futures contracts and the underlying securities, from the possibility of an illiquid secondary market for these instruments and from the possibility that the Portfolio could lose more than the initial margin requirements. The Portfolios entering into stock index futures are subject to equity price risk from those futures contracts. Counterparty credit risk related to exchange-traded futures is minimal because the exchange’s clearinghouse, as counterparty to all exchange-traded futures, guarantees the futures against default.
At October 31, 2009, the following Portfolio had outstanding futures contracts (dollar amounts in thousands):
| Description | Expiration Date | Number of Contracts | Contract Value | Unrealized Gain (Loss) | ||||||
Enhanced U.S. Large Company Portfolio | S&P 500 Index® | 12/18/2009 | 620* | $160,115 | $1,705 |
Enhanced Securities have been segregated as collateral for open futures contracts.
*Outstanding contracts on futures at year end October 31, 2009 are indicative of the volume of activity during the year.
Additional disclosure on derivative instruments is required showing a summary by primary risk exposure of the derivatives instruments’ (i) location in the balance sheet and fair value at period end and (ii) the location in the Statements of Operations and the realized and change in unrealized gain or loss over the reporting period. The following is a summary of the Portfolios’ derivative instrument holdings for the year ended October 31, 2009.
The following is a summary of the location of derivatives on the Portfolios��� Statements of Assets and Liabilities as of October 31, 2009:
Location on the Statements of Assets and Liabilities | ||||||||
Derivative Type | Asset Derivatives | Liability Derivatives | ||||||
| Foreign exchange contracts | Unrealized Gain on Forward Currency Contracts | Unrealized Loss on Forward Currency Contracts | ||||||
Equity contracts | Payables: Futures Margin Variation | |||||||
228
The following is a summary of the Portfolios’ derivative instrument holdings categorized by primary risk exposure as of October 31, 2009 (amounts in thousands):
| Asset Derivatives Value | ||||||
| Total Value at October 31, 2009 | Foreign Exchange Contracts | Equity Contracts | ||||
Enhanced U.S. Large Company Portfolio | $1,789 | $ 84 | $1,705* | |||
DFA Two-Year Global Fixed Income Portfolio | 7,608 | 7,608 | — | |||
DFA Selectively Hedged Global Fixed Income Portfolio | 256 | 256 | — | |||
DFA Five-Year Global Fixed Income Portfolio | 1,098 | 1,098 | — | |||
| Liability Derivatives Value | ||||||
| Total Value at October 31, 2009 | Foreign Exchange Contracts | Equity Contracts | ||||
Enhanced U.S. Large Company Portfolio | $ 45 | $ 45 | — | |||
DFA Two-Year Global Fixed Income Portfolio | 728 | 728 | — | |||
DFA Five-Year Global Fixed Income Portfolio | 6,694 | 6,694 | — | |||
| * | Includes cumulative appreciation (depreciation) of futures contracts. Only current day’s margin variation is reported within the Statement of Assets and Liabilities. |
The following is a summary of the location on the Portfolios’ Statements of Operations of realized and change in unrealized gains and losses from the Portfolio’s derivative instrument holdings through the year ended October 31, 2009 (amounts in thousands):
Derivative Type | Location of Gain (Loss) on Derivatives Recognized in Income | |||
Foreign exchange contracts | Net Realized Gain (Loss) on: Foreign Currency Transactions Change in Unrealized Appreciation (Depreciation) of: Translation of Foreign Currency Denominated Amounts | |||
Equity contracts | Net Realized Gain (Loss) on: Futures Change in Unrealized Appreciation (Depreciation) of: Futures | |||
The following is a summary of the realized and change in unrealized gains and losses from the Portfolios’ derivative instrument holdings categorized by primary risk exposure through the year ended October 31, 2009 (amounts in thousands):
| Realized Gain (Loss) on Derivatives Recognized in Income | |||||||||
| Total | Foreign Exchange Contracts | Equity Contracts | |||||||
Enhanced U.S. Large Company Portfolio | $25,521 | $(229 | ) | $25,750 | |||||
U.S. Targeted Value Portfolio* | (823 | ) | — | (823 | ) | ||||
U.S. Small Cap Value Portfolio* | 570 | — | 570 | ||||||
U.S. Core Equity 1 Portfolio* | 683 | — | 683 | ||||||
U.S. Core Equity 2 Portfolio* | 3,212 | — | 3,212 | ||||||
U.S. Vector Equity Portfolio* | 407 | — | 407 | ||||||
T.A. U.S. Core Equity 2 Portfolio* | (854 | ) | — | (854 | ) | ||||
DFA Real Estate Securities Portfolio* | (1,065 | ) | — | (1,065 | ) | ||||
Large Cap International Portfolio* | 919 | — | 919 | ||||||
229
| Realized Gain (Loss) on Derivatives Recognized in Income | |||||||||
| Total | Foreign Exchange Contracts | Equity Contracts | |||||||
International Core Equity Portfolio* | $ (2,556 | ) | — | $(2,556 | ) | ||||
T.A. World ex U.S. Core Equity Portfolio* | (660 | ) | — | (660 | ) | ||||
DFA International Real Estate Securities Portfolio* | 234 | — | 234 | ||||||
DFA International Small Cap Value Portfolio* | (9,031 | ) | — | (9,031 | ) | ||||
International Vector Equity Portfolio* | (232 | ) | — | (232 | ) | ||||
Emerging Markets Core Equity Portfolio* | (873 | ) | — | (873 | ) | ||||
DFA Two-Year Global Fixed Income Portfolio | (3,286 | ) | $ (3,286 | ) | — | ||||
DFA Selectively Hedged Global Fixed Income Portfolio | (37 | ) | (37 | ) | — | ||||
DFA Five-Year Global Fixed Income Portfolio | (63,248 | ) | (63,248 | ) | — | ||||
| Change in Unrealized Appreciation (Depreciation) on Derivatives Recognized in Income | |||||||||
| Total | Foreign Exchange Contracts | Equity Contracts | |||||||
Enhanced U.S. Large Company Portfolio | $ 1,744 | $ 39 | $1,705 | ||||||
U.S. Targeted Value Portfolio* | (3 | ) | — | (3 | ) | ||||
U.S. Core Equity 1 Portfolio* | (2 | ) | — | (2 | ) | ||||
U.S. Core Equity 2 Portfolio* | (1 | ) | — | (1 | ) | ||||
T.A. U.S. Core Equity 2 Portfolio* | (1 | ) | — | (1 | ) | ||||
DFA Real Estate Securities Portfolio* | (10 | ) | — | (10 | ) | ||||
International Core Equity Portfolio* | (15 | ) | — | (15 | ) | ||||
T.A. World ex U.S. Core Equity Portfolio* | (1 | ) | — | (1 | ) | ||||
DFA International Small Cap Value Portfolio* | (28 | ) | — | (28 | ) | ||||
International Vector Equity Portfolio* | (1 | ) | — | (1 | ) | ||||
Emerging Markets Core Equity Portfolio* | (4 | ) | — | (4 | ) | ||||
DFA Two-Year Global Fixed Income Portfolio | 6,880 | 6,880 | — | ||||||
DFA Selectively Hedged Global Fixed Income Portfolio | 262 | 262 | — | ||||||
DFA Five-Year Global Fixed Income Portfolio | (4,167 | ) | (4,167 | ) | — | ||||
| * | As of October 31, 2009, there were no futures contracts outstanding. During the year ended October 31, 2009, the Portfolios had limited activity in these transactions. |
I. Line of Credit:
The Fund, together with other Dimensional-advised portfolios, has entered into an amended and restated $250 million unsecured discretionary line of credit effective July 8, 2009 with an affiliate of its domestic custodian bank. Each portfolio is permitted to borrow, subject to its investment limitations, up to a maximum of $250 million, as long as total borrowings under the line of credit do not exceed $250 million in the aggregate. Borrowings under the line of credit are charged interest at the then current Federal Funds Rate plus 1%. Each portfolio is individually, and not jointly, liable for its particular advances under the line of credit. There is no commitment fee on the unused portion of the line of credit. The agreement for the discretionary line of credit may be terminated by either party at any time. The line of credit is scheduled to expire on June 22, 2010.
230
For the year ended October 31, 2009, borrowings by the Portfolios under this line of credit were as follows (amounts in thousands, except percentages and days):
| Weighted Average Interest Rate | Weighted Average Loan Balance | Number of Days Outstanding | Interest Expense Incurred | Maximum Amount Borrowed During the Period | ||||||
U.S. Targeted Value Portfolio | 1.95% | $1,732 | 1 | — | $ 1,732 | |||||
U.S. Small Cap Value Portfolio | 1.99% | 9,824 | 18 | $10 | 24,299 | |||||
U.S. Core Equity 1 Portfolio | 1.99% | 2,842 | 20 | 3 | 12,148 | |||||
U.S. Vector Equity Portfolio | 2.25% | 4,672 | 20 | 6 | 14,819 | |||||
T.A. U.S. Core Equity 2 Portfolio | 2.05% | 3,160 | 17 | 3 | 12,832 | |||||
U.S. Small Cap Portfolio | 2.06% | 7,934 | 20 | 9 | 27,804 | |||||
U.S. Micro Cap Portfolio | 1.87% | 4,049 | 21 | 4 | 22,530 | |||||
DFA Real Estate Securities Portfolio | 1.90% | 3,088 | 20 | 3 | 6,865 | |||||
DFA Global Real Estate Securities Portfolio | 1.99% | 110 | 14 | — | 263 |
At October 31, 2009, U.S. Small Cap Value Portfolio had a loan outstanding in the amount of $6,072 (in thousands).
The Fund, together with other Dimensional-advised portfolios, has also entered into an additional $500 million unsecured line of credit effective January 15, 2009 with its international custodian bank. Each portfolio is permitted to borrow, subject to its investment limitations, up to a maximum of $500 million, as long as total borrowings under the line of credit do not exceed $500 million in the aggregate. Each portfolio is individually, and not jointly, liable for its particular advances under the line of credit. Borrowings under the line of credit are charged interest at rates agreed to by the parties at the time of borrowing. There is no commitment fee on the unused portion of the line of credit. The agreement for the line of credit expires on January 15, 2010.
For the year ended October 31, 2009, borrowings by the Portfolios under this line of credit were as follows (amounts in thousands, except percentages and days):
| Weighted Average Interest Rate | Weighted Average Loan Balance | Number of Days Outstanding | Interest Expense Incurred | Maximum Amount Borrowed During the Period | ||||||
Large Cap International Portfolio | 0.95% | $3,702 | 39 | $ 4 | $14,855 | |||||
International Core Equity Portfolio | 0.96% | 7,333 | 27 | 5 | 19,021 | |||||
T.A. World ex U.S. Core Equity Portfolio | 0.89% | 3,108 | 30 | 2 | 8,114 | |||||
International Small Company Portfolio | 0.92% | 3,301 | 45 | 4 | 9,459 | |||||
DFA International Real Estate Securities Portfolio | 0.94% | 855 | 17 | — | 2,591 | |||||
DFA International Small Cap Value Portfolio | 0.93% | 6,909 | 53 | 9 | 22,578 | |||||
International Vector Equity Portfolio | 0.95% | 971 | 30 | 1 | 2,875 | |||||
Emerging Markets Core Equity Portfolio | 0.94% | 3,107 | 56 | 5 | 12,568 |
At October 31, 2009, International Small Company Portfolio and DFA International Small Cap Value Portfolio had loans outstanding in the amounts of $1,970 and $6,784 (in thousands), respectively.
J. Securities Lending:
As of October 31, 2009, some of the Portfolios had securities on loan to brokers/dealers, for which each Portfolio held cash collateral. Each Portfolio invests the cash collateral, as described below, and records a liability for the return of the collateral, during the period the securities are on loan. Loans of securities are expected at all times to be secured by collateral equal to at least (i) 100% of the current market value of the loaned securities with respect to securities of the U.S. government or its agencies, (ii) 102% of the current market value of the loaned securities with respect to U.S. securities, and (iii) 105% of the current market value of the loaned securities with respect to foreign securities. However, daily market fluctuations could cause the Portfolios’ collateral to be lower or higher than
231
the expected thresholds. If this were to occur, the collateral would be adjusted the next business day to ensure adequate collateralization. In the event of default or bankruptcy by the other party to the agreement, realization and/or retention of the collateral may be subject to legal proceedings. If the borrower fails to return loaned securities, and cash collateral being maintained by the borrower is insufficient to cover the value of loaned securities and provided such collateral insufficiency is not the result of investment losses, the lending agent has agreed to pay the amount of the shortfall to the Portfolio or, at the option of the lending agent, to replace the securities.
Subject to each Portfolios’ investment policy, the cash collateral received by the Portfolio from securities on loan is invested in securities of the U.S. government or its agencies, repurchase agreements collateralized by securities of the U.S. government or its agencies or shares of the DFA Short Term Investment Fund LP. Agencies include both agency debentures and agency mortgage backed securities. In addition, each Portfolio will be able to terminate the loan at any time and will receive reasonable interest on the loan, as well as amounts equal to any dividends, interest or other distributions on the loaned securities. However, dividend income received from loaned securities may not be eligible to be taxed at qualified dividend income rates.
K. Shareholder Servicing Fees:
The Class R1 Shares pay a shareholder servicing fee in the amount of 0.10% and Class R2 Shares pay a shareholder servicing fee in the amount of 0.25% of their annual average net assets to compensate service agents that provide shareholder servicing, record keeping, account maintenance and other services to investors in the U.S. Targeted Value Portfolio Class R1 and Class R2 Shares.
L. Indemnitees; Contractual Obligations:
Under the Fund’s organizational documents, its officers and directors are indemnified against certain liabilities arising out of the performance of their duties to the Fund.
In the normal course of business, the Fund enters into contracts that contain a variety of representations and warranties which provide general indemnification. The Fund’s maximum exposure under these arrangements is unknown as this would involve future claims that may be made against the Fund and/or its affiliates that have not yet occurred. However, based on experience, the Fund expects the risk of loss to be remote.
M. In-Kind Redemptions:
In accordance with guidelines described in the Portfolios’ prospectus, the fund may distribute portfolio securities rather than cash as payment for a redemption of fund shares (in-kind redemption). For financial reporting purposes, the fund recognizes a gain on in-kind redemptions to the extent the value of the distributed securities on the date of redemption exceeds the cost of those securities. Gains and losses realized on in-kind redemptions are not recognized for tax purposes and are reclassified from undistributed realized gain (loss) to paid-in capital.
During the year ended October 31, 2009, the Emerging Markets Portfolio realized net gains of in-kind redemptions in the amount of $17,805 (amount in thousands).
During the period ended October 31, 2008, the following Portfolios realized net gains of in-kind redemptions (amounts in thousands):
Large Cap International Portfolio | $ | 14,987 | |
International Core Equity Portfolio | 7,590 | ||
Emerging Markets Core Equity Portfolio | 1,902 |
N. Other:
At October 31, 2009, the following number of shareholders held the following approximate percentages of outstanding shares of the Portfolios. One or more of the shareholders may be omnibus accounts, which typically hold shares for the benefit of several other underlying investors.
232
| Number of Shareholders | Approximate Percentage of Outstanding Shares | |||
U.S. Large Company Portfolio — Institutional Class Shares | 2 | 59% | ||
Enhanced U.S. Large Company Portfolio — Institutional Class Shares | 3 | 81% | ||
U.S. Large Cap Value Portfolio — Institutional Class Shares | 3 | 75% | ||
U.S. Targeted Value Portfolio — Class R1 Shares | 1 | 97% | ||
U.S. Targeted Value Portfolio — Class R2 Shares | 1 | 89% | ||
U.S. Targeted Value Portfolio — Institutional Class Shares | 2 | 59% | ||
U.S. Small Cap Value Portfolio — Institutional Class Shares | 2 | 52% | ||
U.S. Core Equity 1 Portfolio — Institutional Class Shares | 3 | 62% | ||
U.S. Core Equity 2 Portfolio — Institutional Class Shares | 3 | 67% | ||
U.S. Vector Equity Portfolio — Institutional Class Shares | 4 | 89% | ||
T.A. U.S. Core Equity 2 Portfolio — Institutional Class Shares | 3 | 93% | ||
U.S. Small Cap Portfolio — Institutional Class Shares | 3 | 53% | ||
U.S. Micro Cap Portfolio — Institutional Class Shares | 2 | 55% | ||
DFA Real Estate Securities Portfolio — Institutional Class Shares | 3 | 72% | ||
Large Cap International Portfolio — Institutional Class Shares | 2 | 76% | ||
International Core Equity Portfolio — Institutional Class Shares | 3 | 69% | ||
T.A. World ex U.S. Core Equity Portfolio — Institutional Class Shares | 3 | 92% | ||
International Small Company Portfolio — Institutional Class Shares | 2 | 51% | ||
Japanese Small Company Portfolio — Institutional Class Shares | 3 | 68% | ||
Asia Pacific Small Company Portfolio — Institutional Class Shares | 2 | 68% | ||
United Kingdom Small Company Portfolio — Institutional Class Shares | 2 | 86% | ||
Continental Small Company Portfolio — Institutional Class Shares | 2 | 63% | ||
DFA International Real Estate Securities Portfolio — Institutional Class Shares . | 3 | 82% | ||
DFA Global Real Estate Securities Portfolio — Institutional Class Shares | 2 | 87% | ||
DFA International Small Cap Value Portfolio — Institutional Class Shares | 2 | 49% | ||
International Vector Equity Portfolio — Institutional Class Shares | 3 | 92% | ||
Emerging Markets Portfolio — Institutional Class Shares | 2 | 56% | ||
Emerging Markets Small Cap Portfolio — Institutional Class Shares | 1 | 34% | ||
Emerging Markets Core Equity Portfolio — Institutional Class Shares | 3 | 79% | ||
DFA One-Year Fixed Income Portfolio — Institutional Class Shares | 2 | 60% | ||
DFA Two-Year Global Fixed Income Portfolio — Institutional Class Shares | 3 | 81% | ||
DFA Selectively Hedged Global Fixed Income Portfolio — Institutional Class Shares | 4 | 96% | ||
DFA Five-Year Government Portfolio — Institutional Class Shares | 3 | 77% | ||
DFA Five-Year Global Fixed Income Portfolio — Institutional Class Shares | 3 | 74% | ||
DFA Intermediate Government Fixed Income Portfolio — Institutional Class Shares | 2 | 75% | ||
DFA Short-Term Extended Quality Portfolio — Institutional Class Shares | 4 | 86% | ||
DFA Inflation-Protected Securities Portfolio — Institutional Class Shares | 3 | 81% | ||
DFA Short-Term Municipal Bond Portfolio — Institutional Class Shares | 3 | 82% | ||
DFA California Short-Term Municipal Bond Portfolio — Institutional Class Shares | 3 | 96% |
233
O. Subsequent Event Evaluations:
Management has evaluated the impact of all subsequent events on the Fund through December 23, 2009, the date the financial statements were available for issuance, and has determined that the following subsequent event requires recognition or disclosure in the financial statements.
On December 18, 2009, the Board of Directors of DFA Investment Dimensions Group Inc., on behalf of the U.S. Large Company Portfolio (the “Large Company Portfolio”), approved an Agreement and Plan of Reorganization (the “Plan of Reorganization”), under which the Large Company Portfolio will be reorganized with and into the U.S. Large Company Institutional Index Portfolio (the “Large Company Institutional Portfolio”), a portfolio of Dimensional Investment Group Inc. Under the Plan of Reorganization, the Large Company Portfolio will transfer substantially all of its assets to the Large Company Institutional Portfolio in exchange solely for shares of the Large Company Institutional Portfolio (the “Reorganization”), which will be distributed to shareholders of the Large Company Portfolio according to their interests held in the Large Company Portfolio immediately prior to the Reorganization. As soon as practicable thereafter, the Large Company Portfolio will be liquidated and dissolved.
234
REPORT OF INDEPENDENT REGISTERED PUBLIC ACCOUNTING FIRM
To the Shareholders of the Portfolios, as defined, and
Board of Directors of DFA Investment Dimensions Group Inc.:
In our opinion, the accompanying statements of assets and liabilities, including the schedules of investments/ summary schedules of portfolio holdings, and the related statements of operations and of changes in net assets and the financial highlights present fairly, in all material respects, the financial position of U.S. Large Company Portfolio, Enhanced U.S. Large Company Portfolio, U.S. Large Cap Value Portfolio, U.S. Targeted Value Portfolio, U.S. Small Cap Value Portfolio, U.S. Core Equity 1 Portfolio, U.S. Core Equity 2 Portfolio, U.S. Vector Equity Portfolio, T.A. U.S. Core Equity 2 Portfolio, U.S. Small Cap Portfolio, U.S. Micro Cap Portfolio, DFA Real Estate Securities Portfolio, Large Cap International Portfolio, International Core Equity Portfolio, T.A. World ex U.S. Core Equity Portfolio, International Small Company Portfolio, Japanese Small Company Portfolio, Asia Pacific Small Company Portfolio, United Kingdom Small Company Portfolio, Continental Small Company Portfolio, DFA International Real Estate Securities Portfolio, DFA Global Real Estate Securities Portfolio, DFA International Small Cap Value Portfolio, International Vector Equity Portfolio, Emerging Markets Portfolio, Emerging Markets Small Cap Portfolio, Emerging Markets Core Equity Portfolio, DFA One-Year Fixed Income Portfolio, DFA Two-Year Global Fixed Income Portfolio, DFA Selectively Hedged Global Fixed Income Portfolio, DFA Five-Year Government Portfolio, DFA Five-Year Global Fixed Income Portfolio, DFA Intermediate Government Fixed Income Portfolio, DFA Short-Term Extended Quality Portfolio, DFA Inflation-Protected Securities Portfolio, DFA Short-Term Municipal Bond Portfolio and DFA California Short-Term Municipal Bond Portfolio (constituting portfolios within DFA Investment Dimensions Group Inc., hereafter referred to as the “Portfolios”) at October 31, 2009, the results of each of their operations, the changes in each of their net assets and the financial highlights for each of the periods indicated, in conformity with accounting principles generally accepted in the United States of America. These financial statements and financial highlights (hereafter referred to as “financial statements”) are the responsibility of the Portfolios’ management; our responsibility is to express an opinion on these financial statements based on our audits. We conducted our audits of these financial statements in accordance with the standards of the Public Company Accounting Oversight Board (United States). Those standards require that we plan and perform the audit to obtain reasonable assurance about whether the financial statements are free of material misstatement. An audit includes examining, on a test basis, evidence supporting the amounts and disclosures in the financial statements, assessing the accounting principles used and significant estimates made by management, and evaluating the overall financial statement presentation. We believe that our audits, which included confirmation of securities at October 31, 2009 by correspondence with the custodians, brokers, and the transfer agents of the investee funds, provide a reasonable basis for our opinion.
PricewaterhouseCoopers LLP
Philadelphia, Pennsylvania
December 23, 2009
235
RESULTS OF THE SHAREHOLDER MEETING
On June 2, 2009 and July 8, 2009, DFA Investment Dimensions Group Inc. (“DFAIDG”) held a Special Joint Meeting of Shareholders for the purpose of voting on several proposals affecting DFAIDG and the Portfolios, including, among other items, the election of Directors, the amendment of certain fundamental investment limitations, and the elimination of certain fundamental investment limitations. The shareholders of the Portfolios approved each of the applicable proposals for DFAIDG and the Portfolios presented at the Meeting. Listed below are the voting results from the Meeting. Please note that not all Proposals presented at the Meeting were voted on by each Portfolio. Additionally, the Proposal numbers reflected below correlate to the Proposal numbers presented for vote at the Meeting.
DFAIDG
| Shares Voted | Percent of Outstanding Shares Voted | |||||||||||||||||||||||
| For | % | Against | % | Abstain/WithHold | % | NonVote | % | For | Against | Abstain / WithHold | ||||||||||||||
Proposal 1: Election of Directors for DFAIDG* | ||||||||||||||||||||||||
1a | David G. Booth | 5,100,343,281 | 93.94% | — | 0.00% | 328,971,623 | 6.06% | 81.55% | 0.00% | 5.26% | ||||||||||||||
| 1b | George M. Constantinides | 5,105,280,301 | 94.03% | — | 0.00% | 324,034,602 | 5.97% | 81.63% | 0.00% | 5.18% | ||||||||||||||
| 1c | John P. Gould | 5,100,584,112 | 93.95% | — | 0.00% | 328,730,791 | 6.05% | 81.55% | 0.00% | 5.26% | ||||||||||||||
| 1d | Roger G. Ibbotson | 5,105,426,112 | 94.03% | — | 0.00% | 323,888,792 | 5.97% | 81.63% | 0.00% | 5.18% | ||||||||||||||
| 1e | Robert C. Merton | 5,107,268,900 | 94.07% | — | 0.00% | 322,046,003 | 5.93% | 81.66% | 0.00% | 5.15% | ||||||||||||||
| 1f | Myron S. Scholes | 5,104,997,961 | 94.03% | — | 0.00% | 324,316,942 | 5.97% | 81.62% | 0.00% | 5.19% | ||||||||||||||
| 1g | Eduardo A. Repetto | 5,094,783,848 | 93.84% | — | 0.00% | 334,531,055 | 6.16% | 81.46% | 0.00% | 5.35% | ||||||||||||||
| 1h | Abbie J. Smith | 5,100,861,923 | 93.95% | — | 0.00% | 328,452,981 | 6.05% | 81.55% | 0.00% | 5.25% | ||||||||||||||
| Shares Voted | Percent of Outstanding Shares Voted | |||||||||||||||||
| For | % | Against | % | Abstain/WithHold | % | For | Against | Abstain / WithHold | ||||||||||
Proposal 2: To approve Articles of Amendment and Restatement for DFAIDG* | 3,385,698,613 | 93.83% | 43,557,844 | 1.21% | 179,189,489 | 4.97% | 54.13% | 0.70% | 4.97% | |||||||||
| * | Results are for all Portfolios within DFAIDG |
U.S. Large Company Portfolio
| Shares Voted | Percent of Outstanding Shares Voted | |||||||||||||||||||
| For | % | Against | % | Abstain/WithHold | % | For | Against | Abstain / WithHold | ||||||||||||
Proposals: | ||||||||||||||||||||
5 | To approve amendments to certain fundamental investment restrictions | |||||||||||||||||||
5a | Borrowing Money | 40,430,126 | 80.58% | 1,516,358 | 3.02% | 8,224,375 | 16.39% | 47.41% | 1.78% | 9.64% | ||||||||||
5b | Making Loans | 40,467,481 | 80.66% | 1,486,422 | 2.96% | 8,216,956 | 16.38% | 47.46% | 1.74% | 9.64% | ||||||||||
5c | Investments in Real Estate | 41,229,199 | 82.18% | 716,953 | 1.43% | 8,224,707 | 16.39% | 48.35% | 0.84% | 9.65% | ||||||||||
5d | Investments in Commodities | 40,474,610 | 80.67% | 1,471,256 | 2.93% | 8,224,993 | 16.39% | 47.46% | 1.73% | 9.65% | ||||||||||
5e | Diversification of Investments | 40,673,446 | 81.07% | 1,282,998 | 2.56% | 8,214,415 | 16.37% | 47.70% | 1.50% | 9.63% | ||||||||||
6 | To approve the elimination of certain fundamental investment restrictions | |||||||||||||||||||
6a | Pledging, Mortgaging, or Hypothecating Assets | 40,286,840 | 80.30% | 1,636,196 | 3.26% | 8,247,823 | 16.44% | 47.24% | 1.92% | 9.67% | ||||||||||
6b | Purchasing Securities on Margin | 40,249,338 | 80.22% | 1,678,831 | 3.35% | 8,242,690 | 16.43% | 47.20% | 1.97% | 9.67% | ||||||||||
6c | Investing in Restricted or Illiquid Securities | 40,254,755 | 80.24% | 1,673,457 | 3.34% | 8,242,647 | 16.43% | 47.21% | 1.96% | 9.67% | ||||||||||
6d | Investing for the Purpose of Exercising Control | 40,412,651 | 80.55% | 1,506,361 | 3.00% | 8,251,847 | 16.45% | 47.39% | 1.77% | 9.68% | ||||||||||
6e | Investing in Other Investment Companies | 40,411,300 | 80.55% | 1,514,178 | 3.02% | 8,245,381 | 16.43% | 47.39% | 1.78% | 9.67% | ||||||||||
6f | Management Ownership of Securities of an Issuer | 40,509,353 | 80.74% | 1,400,147 | 2.79% | 8,261,359 | 16.47% | 47.51% | 1.64% | 9.69% | ||||||||||
6g | Investing in Oil, Gas, or other Mineral Exploration, Leases or Development Programs | 40,571,084 | 80.87% | 1,360,203 | 2.71% | 8,239,572 | 16.42% | 47.58% | 1.60% | 9.66% | ||||||||||
6h | Investing in Securities of Unseasoned Issuers | 40,332,047 | 80.39% | 1,592,824 | 3.17% | 8,245,988 | 16.44% | 47.30% | 1.87% | 9.67% | ||||||||||
6i | Investing in Warrants | 40,461,757 | 80.65% | 1,435,624 | 2.86% | 8,273,478 | 16.49% | 47.45% | 1.68% | 9.70% | ||||||||||
6j | Writing or Acquiring Options | 40,450,447 | 80.63% | 1,454,481 | 2.90% | 8,265,931 | 16.48% | 47.44% | 1.71% | 9.69% | ||||||||||
8 | Approval of Investment Advisory Agreement between Dimensional Fund Advisors LP and the Company | 41,387,142 | 82.49% | 542,566 | 1.08% | 8,241,151 | 16.43% | 48.53% | 0.64% | 9.66% | ||||||||||
236
Enhanced U.S. Large Company Portfolio
| Shares Voted | Percent of Outstanding Shares Voted | |||||||||||||||||||||||
| For | % | Against | % | Abstain/WithHold | % | NonVote | % | For | Against | Abstain / WithHold | ||||||||||||||
Proposals: | ||||||||||||||||||||||||
5 | To approve amendments to certain fundamental investment restrictions | |||||||||||||||||||||||
5a | Borrowing Money | 15,387,271 | 56.14% | 40,860 | 0.15% | 394,026 | 1.44% | 11,586,812 | 42.27% | 56.13% | 0.15% | 1.44% | ||||||||||||
5b | Making Loans | 15,381,417 | 56.12% | 50,690 | 0.18% | 390,050 | 1.42% | 11,586,812 | 42.27% | 56.11% | 0.18% | 1.42% | ||||||||||||
5c | Investments in Real Estate | 15,387,025 | 56.14% | 44,866 | 0.16% | 390,266 | 1.42% | 11,586,812 | 42.27% | 56.13% | 0.16% | 1.42% | ||||||||||||
5d | Investments in Commodities | 15,365,625 | 56.06% | 66,266 | 0.24% | 390,266 | 1.42% | 11,586,812 | 42.27% | 56.05% | 0.24% | 1.42% | ||||||||||||
5e | Diversification of Investments | 15,392,316 | 56.16% | 39,575 | 0.14% | 390,266 | 1.42% | 11,586,812 | 42.27% | 56.15% | 0.14% | 1.42% | ||||||||||||
6 | To approve the elimination of certain fundamental investment restrictions | |||||||||||||||||||||||
6a | Pledging, Mortgaging, or Hypothecating Assets | 15,381,129 | 56.12% | 45,153 | 0.16% | 395,875 | 1.44% | 11,586,812 | 42.27% | 56.11% | 0.16% | 1.44% | ||||||||||||
6b | Purchasing Securities on Margin | 15,384,140 | 56.13% | 42,142 | 0.15% | 395,875 | 1.44% | 11,586,812 | 42.27% | 56.12% | 0.15% | 1.44% | ||||||||||||
6d | Investing for the Purpose of Exercising Control | 15,381,129 | 56.12% | 45,153 | 0.16% | 395,875 | 1.44% | 11,586,812 | 42.27% | 56.11% | 0.16% | 1.44% | ||||||||||||
6e | Investing in Other Investment Companies | 15,372,610 | 56.09% | 42,874 | 0.16% | 406,673 | 1.48% | 11,586,812 | 42.27% | 56.08% | 0.16% | 1.48% | ||||||||||||
6f | Management Ownership of Securities of an Issuer | 15,373,342 | 56.09% | 42,142 | 0.15% | 406,673 | 1.48% | 11,586,812 | 42.27% | 56.08% | 0.15% | 1.48% | ||||||||||||
6h | Investing in Securities of Unseasoned Issuers | 15,370,330 | 56.08% | 50,977 | 0.19% | 400,850 | 1.46% | 11,586,812 | 42.27% | 56.07% | 0.19% | 1.46% | ||||||||||||
6i | Investing in Warrants | 15,375,621 | 56.10% | 45,686 | 0.17% | 400,850 | 1.46% | 11,586,812 | 42.27% | 56.09% | 0.17% | 1.46% | ||||||||||||
U.S. Large Cap Value Portfolio
| Shares Voted | Percent of Outstanding Shares Voted | |||||||||||||||||||
| For | % | Against | % | Abstain/WithHold | % | For | Against | Abstain / WithHold | ||||||||||||
Proposals: | ||||||||||||||||||||
5 | To approve amendments to certain fundamental investment restrictions | |||||||||||||||||||
5a | Borrowing Money | 172,893,840 | 88.81% | 7,186,773 | 3.69% | 14,599,592 | 7.50% | 46.64% | 1.94% | 3.94% | ||||||||||
5b | Making Loans | 172,791,986 | 88.76% | 7,254,169 | 3.73% | 14,634,050 | 7.52% | 46.61% | 1.96% | 3.95% | ||||||||||
5c | Investments in Real Estate | 175,160,321 | 89.97% | 4,984,199 | 2.56% | 14,535,685 | 7.47% | 47.25% | 1.34% | 3.92% | ||||||||||
5d | Investments in Commodities | 173,112,100 | 88.92% | 7,020,863 | 3.61% | 14,547,242 | 7.47% | 46.70% | 1.89% | 3.92% | ||||||||||
5e | Diversification of Investments | 174,205,973 | 89.48% | 6,003,329 | 3.08% | 14,470,903 | 7.43% | 46.99% | 1.62% | 3.90% | ||||||||||
6 | To approve the elimination of certain fundamental investment restrictions | |||||||||||||||||||
6a | Pledging, Mortgaging, or Hypothecating Assets | 171,633,445 | 88.16% | 8,205,849 | 4.22% | 14,840,911 | 7.62% | 46.30% | 2.21% | 4.00% | ||||||||||
6b | Purchasing Securities on Margin | 171,417,311 | 88.05% | 8,446,023 | 4.34% | 14,816,871 | 7.61% | 46.24% | 2.28% | 4.00% | ||||||||||
6c | Investing in Restricted or Illiquid Securities | 171,472,444 | 88.08% | 8,394,752 | 4.31% | 14,813,009 | 7.61% | 46.25% | 2.26% | 4.00% | ||||||||||
6d | Investing for the Purpose of Exercising Control | 172,419,927 | 88.57% | 7,483,007 | 3.84% | 14,777,271 | 7.59% | 46.51% | 2.02% | 3.99% | ||||||||||
6e | Investing in Other Investment Companies | 172,365,026 | 88.54% | 7,593,625 | 3.90% | 14,721,554 | 7.56% | 46.50% | 2.05% | 3.97% | ||||||||||
6f | Management Ownership of Securities of an Issuer | 172,683,982 | 88.70% | 7,182,843 | 3.69% | 14,813,380 | 7.61% | 46.58% | 1.94% | 4.00% | ||||||||||
6g | Investing in Oil, Gas, or other Mineral Exploration, Leases or Development Programs | 173,364,846 | 89.05% | 6,724,869 | 3.45% | 14,590,490 | 7.49% | 46.77% | 1.81% | 3.94% | ||||||||||
6h | Investing in Securities of Unseasoned Issuers | 171,698,443 | 88.20% | 8,063,113 | 4.14% | 14,918,649 | 7.66% | 46.32% | 2.18% | 4.02% | ||||||||||
6i | Investing in Warrants | 172,471,724 | 88.59% | 7,221,658 | 3.71% | 14,986,823 | 7.70% | 46.52% | 1.95% | 4.04% | ||||||||||
6j | Writing or Acquiring Options | 172,546,830 | 88.63% | 7,283,118 | 3.74% | 14,850,257 | 7.63% | 46.54% | 1.96% | 4.01% | ||||||||||
8 | Approval of Investment Advisory Agreement between Dimensional Fund Advisors LP and the Company | 175,966,526 | 90.39% | 3,924,543 | 2.02% | 14,789,136 | 7.60% | 47.47% | 1.06% | 3.99% | ||||||||||
U.S. Targeted Value Portfolio
| Shares Voted | Percent of Outstanding Shares Voted | |||||||||||||||||||
| For | % | Against | % | Abstain/WithHold | % | For | Against | Abstain / WithHold | ||||||||||||
Proposals: | ||||||||||||||||||||
5 | To approve amendments to certain fundamental investment restrictions | |||||||||||||||||||
5a | Borrowing Money | 53,117,513 | 85.60% | 2,133,467 | 3.44% | 6,803,169 | 10.96% | 47.78% | 1.92% | 6.12% | ||||||||||
5b | Making Loans | 53,052,457 | 85.49% | 2,177,756 | 3.51% | 6,823,936 | 11.00% | 47.72% | 1.96% | 6.14% | ||||||||||
5c | Investments in Real Estate | 53,653,525 | 86.46% | 1,628,785 | 2.62% | 6,771,840 | 10.91% | 48.26% | 1.47% | 6.09% | ||||||||||
5d | Investments in Commodities | 52,832,185 | 85.14% | 2,453,403 | 3.95% | 6,768,562 | 10.91% | 47.52% | 2.21% | 6.09% | ||||||||||
5e | Diversification of Investments | 53,540,956 | 86.28% | 1,762,547 | 2.84% | 6,750,646 | 10.88% | 48.16% | 1.59% | 6.07% | ||||||||||
237
| Shares Voted | Percent of Outstanding Shares Voted | |||||||||||||||||||
| For | % | Against | % | Abstain/WithHold | % | For | Against | Abstain / WithHold | ||||||||||||
Proposals: | ||||||||||||||||||||
6 | To approve the elimination of certain fundamental investment restrictions | |||||||||||||||||||
6b | Purchasing Securities on Margin | 52,457,864 | 84.54% | 2,842,428 | 4.58% | 6,753,858 | 10.88% | 47.18% | 2.56% | 6.07% | ||||||||||
6e | Investing in Other Investment Companies | 53,069,209 | 85.52% | 2,199,274 | 3.54% | 6,785,666 | 10.94% | 47.73% | 1.98% | 6.10% | ||||||||||
U.S. Small Cap Value Portfolio
| Shares Voted | Percent of Outstanding Shares Voted | |||||||||||||||||||
| For | % | Against | % | Abstain/WithHold | % | For | Against | Abstain / WithHold | ||||||||||||
Proposals: | ||||||||||||||||||||
5 | To approve amendments to certain fundamental investment restrictions | |||||||||||||||||||
5a | Borrowing Money | 173,119,722 | 92.72% | 7,695,223 | 4.12% | 5,896,085 | 3.16% | 52.84% | 2.35% | 1.80% | ||||||||||
5b | Making Loans | 172,804,656 | 92.55% | 7,706,222 | 4.13% | 6,200,153 | 3.32% | 52.74% | 2.35% | 1.89% | ||||||||||
5c | Investments in Real Estate | 174,223,319 | 93.31% | 6,289,826 | 3.37% | 6,197,885 | 3.32% | 53.18% | 1.92% | 1.89% | ||||||||||
5d | Investments in Commodities | 173,534,303 | 92.94% | 7,026,376 | 3.76% | 6,150,351 | 3.29% | 52.97% | 2.14% | 1.88% | ||||||||||
5e | Diversification of Investments | 174,656,837 | 93.54% | 5,903,682 | 3.16% | 6,150,511 | 3.29% | 53.31% | 1.80% | 1.88% | ||||||||||
6 | To approve the elimination of certain fundamental investment restrictions | |||||||||||||||||||
6a | Pledging, Mortgaging, or Hypothecating Assets | 171,661,614 | 91.94% | 8,760,032 | 4.69% | 6,289,384 | 3.37% | 52.39% | 2.67% | 1.92% | ||||||||||
6b | Purchasing Securities on Margin | 171,441,491 | 91.82% | 9,025,749 | 4.83% | 6,243,791 | 3.34% | 52.33% | 2.75% | 1.91% | ||||||||||
6c | Investing in Restricted or Illiquid Securities | 172,683,093 | 92.49% | 7,799,254 | 4.18% | 6,228,683 | 3.34% | 52.71% | 2.38% | 1.90% | ||||||||||
6d | Investing for the Purpose of Exercising Control | 172,786,379 | 92.54% | 7,641,558 | 4.09% | 6,283,093 | 3.37% | 52.74% | 2.33% | 1.92% | ||||||||||
6e | Investing in Other Investment Companies | 172,761,077 | 92.53% | 7,687,308 | 4.12% | 6,262,646 | 3.35% | 52.73% | 2.35% | 1.91% | ||||||||||
6f | Management Ownership of Securities of an Issuer | 172,799,765 | 92.55% | 7,635,419 | 4.09% | 6,275,846 | 3.36% | 52.74% | 2.33% | 1.92% | ||||||||||
6g | Investing in Oil, Gas, or other Mineral Exploration, Leases or Development Programs | 173,667,640 | 93.01% | 6,844,588 | 3.67% | 6,198,802 | 3.32% | 53.01% | 2.09% | 1.89% | ||||||||||
6h | Investing in Securities of Unseasoned Issuers | 173,452,804 | 92.90% | 7,025,400 | 3.76% | 6,232,826 | 3.34% | 52.94% | 2.14% | 1.90% | ||||||||||
6i | Investing in Warrants | 174,070,813 | 93.23% | 6,367,229 | 3.41% | 6,272,988 | 3.36% | 53.13% | 1.94% | 1.91% | ||||||||||
6j | Writing or Acquiring Options | 172,730,578 | 92.51% | 7,736,815 | 4.14% | 6,243,638 | 3.34% | 52.72% | 2.36% | 1.91% | ||||||||||
U.S. Core Equity 1 Portfolio
| Shares Voted | Percent of Outstanding Shares Voted | |||||||||||||||||||||||||
| For | % | Against | % | Abstain/WithHold | % | NonVote | % | For | Against | Abstain / WithHold | Non-Vote | |||||||||||||||
Proposals: | ||||||||||||||||||||||||||
5 | To approve amendments to certain fundamental investment restrictions | |||||||||||||||||||||||||
5a | Borrowing Money | 104,483,941 | 52.11% | 1,098,003 | 0.55% | 1,009,578 | 0.50% | 93,932,769 | 46.84% | 51.39% | 0.54% | 0.50% | NA | |||||||||||||
5b | Making Loans | 104,358,224 | 52.04% | 1,139,060 | 0.57% | 1,094,238 | 0.55% | 93,932,769 | 46.84% | 51.33% | 0.56% | 0.54% | NA | |||||||||||||
5c | Investments in Real Estate | 104,566,166 | 52.15% | 982,878 | 0.49% | 1,042,478 | 0.52% | 93,932,769 | 46.84% | 51.43% | 0.48% | 0.51% | NA | |||||||||||||
5d | Investments in Commodities | 104,404,880 | 52.07% | 1,088,620 | 0.54% | 1,098,022 | 0.55% | 93,932,769 | 46.84% | 51.35% | 0.54% | 0.54% | NA | |||||||||||||
5e | Diversification of Investments | 104,679,991 | 52.20% | 932,378 | 0.46% | 979,153 | 0.49% | 93,932,769 | 46.84% | 51.49% | 0.46% | 0.48% | NA | |||||||||||||
U.S. Core Equity 2 Portfolio
| Shares Voted | Percent of Outstanding Shares Voted | |||||||||||||||||||||||||
| For | % | Against | % | Abstain/WithHold | % | NonVote | % | For | Against | Abstain / WithHold | Non-Vote | |||||||||||||||
Proposals: | ||||||||||||||||||||||||||
5 | To approve amendments to certain fundamental investment restrictions | |||||||||||||||||||||||||
5a | Borrowing Money | 213,171,499 | 62.76% | 1,782,444 | 0.52% | 2,933,581 | 0.86% | 121,790,485 | 35.85% | 55.36% | 0.46% | 0.76% | NA | |||||||||||||
5b | Making Loans | 212,884,025 | 62.67% | 1,771,008 | 0.52% | 3,232,491 | 0.95% | 121,790,485 | 35.85% | 55.28% | 0.46% | 0.84% | NA | |||||||||||||
5c | Investments in Real Estate | 213,332,926 | 62.80% | 1,646,861 | 0.48% | 2,907,737 | 0.86% | 121,790,485 | 35.85% | 55.40% | 0.43% | 0.76% | NA | |||||||||||||
5d | Investments in Commodities | 213,163,570 | 62.75% | 1,876,742 | 0.55% | 2,847,212 | 0.84% | 121,790,485 | 35.85% | 55.35% | 0.49% | 0.74% | NA | |||||||||||||
5e | Diversification of Investments | 213,641,376 | 62.90% | 1,393,944 | 0.41% | 2,852,204 | 0.84% | 121,790,485 | 35.85% | 55.48% | 0.36% | 0.74% | NA | |||||||||||||
238
U.S. Vector Equity Portfolio
| Shares Voted | Percent of Outstanding Shares Voted | |||||||||||||||||||
| For | % | Against | % | Abstain/WithHold | % | For | Against | Abstain / WithHold | ||||||||||||
Proposals: | ||||||||||||||||||||
5 | To approve amendments to certain fundamental investment restrictions | |||||||||||||||||||
5a | Borrowing Money | 64,539,853 | 94.75% | 1,390,999 | 2.04% | 2,184,255 | 3.21% | 51.32% | 1.11% | 1.74% | ||||||||||
5b | Making Loans | 64,564,833 | 94.79% | 1,389,158 | 2.04% | 2,161,116 | 3.17% | 51.34% | 1.10% | 1.72% | ||||||||||
5c | Investments in Real Estate | 64,620,224 | 94.87% | 1,344,830 | 1.97% | 2,150,053 | 3.16% | 51.39% | 1.07% | 1.71% | ||||||||||
5d | Investments in Commodities | 64,507,548 | 94.70% | 1,443,149 | 2.12% | 2,164,410 | 3.18% | 51.30% | 1.15% | 1.72% | ||||||||||
5e | Diversification of Investments | 64,723,933 | 95.02% | 1,275,843 | 1.87% | 2,115,331 | 3.11% | 51.47% | 1.01% | 1.68% | ||||||||||
T.A. U.S. Core Equity 2 Portfolio
| Shares Voted | Percent of Outstanding Shares Voted | |||||||||||||||||||
| For | % | Against | % | Abstain/WithHold | % | For | Against | Abstain / WithHold | ||||||||||||
Proposals: | ||||||||||||||||||||
5 | To approve amendments to certain fundamental investment restrictions | |||||||||||||||||||
5a | Borrowing Money | 92,018,708 | 91.72% | 2,273,749 | 2.27% | 6,033,779 | 6.01% | 50.98% | 1.26% | 3.34% | ||||||||||
5b | Making Loans | 92,000,616 | 91.70% | 2,303,383 | 2.30% | 6,022,237 | 6.00% | 50.97% | 1.28% | 3.34% | ||||||||||
5c | Investments in Real Estate | 92,151,224 | 91.85% | 2,192,495 | 2.19% | 5,982,517 | �� | 5.96% | 51.06% | 1.21% | 3.31% | |||||||||
5d | Investments in Commodities | 92,398,250 | 92.10% | 1,909,189 | 1.90% | 6,018,797 | 6.00% | 51.19% | 1.06% | 3.33% | ||||||||||
5e | Diversification of Investments | 92,414,737 | 92.11% | 1,994,656 | 1.99% | 5,916,843 | 5.90% | 51.20% | 1.11% | 3.28% | ||||||||||
U.S. Small Cap Portfolio
| Shares Voted | Percent of Outstanding Shares Voted | |||||||||||||||||||||||||
| For | % | Against | % | Abstain/WithHold | % | NonVote | % | For | Against | Abstain / WithHold | Non-Vote | |||||||||||||||
Proposals: | ||||||||||||||||||||||||||
5 | To approve amendments to certain fundamental investment restrictions | |||||||||||||||||||||||||
5a | Borrowing Money | 82,575,641 | 57.01% | 6,234,882 | 4.30% | 663,803 | 0.46% | 55,371,235 | 38.23% | 52.22% | 3.94% | 0.42% | NA | |||||||||||||
5b | Making Loans | 82,405,615 | 56.89% | 6,269,283 | 4.33% | 799,428 | 0.55% | 55,371,235 | 38.23% | 52.11% | 3.96% | 0.51% | NA | |||||||||||||
5c | Investments in Real Estate | 83,174,614 | 57.42% | 5,640,775 | 3.89% | 658,937 | 0.45% | 55,371,235 | 38.23% | 52.60% | 3.57% | 0.42% | NA | |||||||||||||
5d | Investments in Commodities | 82,541,203 | 56.99% | 6,276,843 | 4.33% | 656,280 | 0.45% | 55,371,235 | 38.23% | 52.20% | 3.97% | 0.41% | NA | |||||||||||||
5e | Diversification of Investments | 82,695,020 | 57.09% | 6,131,184 | 4.23% | 648,122 | 0.45% | 55,371,235 | 38.23% | 52.29% | 3.88% | 0.41% | NA | |||||||||||||
6 | To approve the elimination of certain fundamental investment restrictions | |||||||||||||||||||||||||
6a | Pledging, Mortgaging, or Hypothecating Assets | 82,406,144 | 56.89% | 6,379,410 | 4.40% | 688,772 | 0.48% | 55,371,235 | 38.23% | 52.11% | 4.03% | 0.44% | NA | |||||||||||||
6b | Purchasing Securities on Margin | 82,364,690 | 56.86% | 6,425,765 | 4.44% | 683,871 | 0.47% | 55,371,235 | 38.23% | 52.08% | 4.06% | 0.43% | NA | |||||||||||||
6c | Investing in Restricted or Illiquid Securities | 82,382,951 | 56.88% | 6,408,942 | 4.42% | 682,433 | 0.47% | 55,371,235 | 38.23% | 52.10% | 4.05% | 0.43% | NA | |||||||||||||
6d | Investing for the Purpose of Exercising Control | 82,193,695 | 56.75% | 6,595,405 | 4.55% | 685,226 | 0.47% | 55,371,235 | 38.23% | 51.98% | 4.17% | 0.43% | NA | |||||||||||||
6e | Investing in Other Investment Companies | 82,354,250 | 56.86% | 6,444,117 | 4.45% | 675,959 | 0.47% | 55,371,235 | 38.23% | 52.08% | 4.07% | 0.43% | NA | |||||||||||||
6f | Management Ownership of Securities of an Issuer | 82,495,363 | 56.95% | 6,289,478 | 4.34% | 689,485 | 0.48% | 55,371,235 | 38.23% | 52.17% | 3.98% | 0.44% | NA | |||||||||||||
6g | Investing in Oil, Gas, or other Mineral Exploration, Leases or Development Programs | 82,572,008 | 57.01% | 6,254,150 | 4.32% | 648,168 | 0.45% | 55,371,235 | 38.23% | 52.21% | 3.95% | 0.41% | NA | |||||||||||||
6h | Investing in Securities of Unseasoned Issuers | 82,229,235 | 56.77% | 6,552,410 | 4.52% | 692,681 | 0.48% | 55,371,235 | 38.23% | 52.00% | 4.14% | 0.44% | NA | |||||||||||||
6i | Investing in Warrants | 82,525,143 | 56.97% | 6,265,011 | 4.33% | 684,172 | 0.47% | 55,371,235 | 38.23% | 52.18% | 3.96% | 0.43% | NA | |||||||||||||
6j | Writing or Acquiring Options | 82,296,649 | 56.82% | 6,498,926 | 4.49% | 678,751 | 0.47% | 55,371,235 | 38.23% | 52.04% | 4.11% | 0.43% | NA | |||||||||||||
U.S. Micro Cap Portfolio
| Shares Voted | Percent of Outstanding Shares Voted | |||||||||||||||||||||||||
| For | % | Against | % | Abstain/WithHold | % | For | Against | Abstain / WithHold | ||||||||||||||||||
Proposals: | ||||||||||||||||||||||||||
5 | To approve amendments to certain fundamental investment restrictions | |||||||||||||||||||||||||
5a | Borrowing Money | 164,980,200 | 96.27 | % | 3,066,686 | 1.79 | % | 3,319,399 | 1.94 | % | 54.77 | % | 1.02 | % | 1.10 | % | ||||||||||
5b | Making Loans | 164,907,178 | 96.23 | % | 3,097,794 | 1.81 | % | 3,361,313 | 1.96 | % | 54.74 | % | 1.03 | % | 1.12 | % | ||||||||||
5c | Investments in Real Estate | 165,176,839 | 96.39 | % | 2,886,113 | 1.68 | % | 3,303,333 | 1.93 | % | 54.83 | % | 0.96 | % | 1.10 | % | ||||||||||
5d | Investments in Commodities | 163,886,571 | 95.64 | % | 4,195,928 | 2.45 | % | 3,283,786 | 1.92 | % | 54.40 | % | 1.39 | % | 1.09 | % | ||||||||||
5e | Diversification of Investments | 165,476,898 | 96.56 | % | 2,620,926 | 1.53 | % | 3,268,461 | 1.91 | % | 54.93 | % | 0.87 | % | 1.09 | % | ||||||||||
6 | To approve the elimination of certain fundamental investment restrictions | |||||||||||||||||||||||||
6a | Pledging, Mortgaging, or Hypothecating Assets | 163,544,790 | 95.44 | % | 4,428,988 | 2.58 | % | 3,392,506 | 1.98 | % | 54.29 | % | 1.47 | % | 1.13 | % | ||||||||||
239
| Shares Voted | Percent of Outstanding Shares Voted | |||||||||||||||||||
| For | % | Against | % | Abstain/WithHold | % | For | Against | Abstain / WithHold | ||||||||||||
Proposals: | ||||||||||||||||||||
| 6b | Purchasing Securities on Margin | 163,473,742 | 95.39% | 4,520,335 | 2.64% | 3,372,208 | 1.97% | 54.27% | 1.50% | 1.12% | ||||||||||
| 6c | Investing in Restricted or Illiquid Securities | 163,626,099 | 95.48% | 4,371,813 | 2.55% | 3,368,374 | 1.97% | 54.32% | 1.45% | 1.12% | ||||||||||
| 6e | Investing in Other Investment Companies | 164,860,510 | 96.20% | 3,170,962 | 1.85% | 3,334,813 | 1.95% | 54.73% | 1.05% | 1.11% | ||||||||||
| 6f | Management Ownership of Securities of an Issuer | 165,048,646 | 96.31% | 2,969,253 | 1.73% | 3,348,387 | 1.95% | 54.79% | 0.99% | 1.11% | ||||||||||
| 6g | Investing in Oil, Gas, or other Mineral Exploration, Leases or Development Programs | 164,132,773 | 95.78% | 3,920,347 | 2.29% | 3,313,165 | 1.93% | 54.49% | 1.30% | 1.10% | ||||||||||
| 6i | Investing in Warrants | 165,149,647 | 96.37% | 2,844,275 | 1.66% | 3,372,363 | 1.97% | 54.82% | 0.94% | 1.12% | ||||||||||
| 6j | Writing or Acquiring Options | 165,066,228 | 96.32% | 2,958,519 | 1.73% | 3,341,538 | 1.95% | 54.80% | 0.98% | 1.11% | ||||||||||
| DFA Real Estate Securities Portfolio | ||||||||||||||||||||
| Shares Voted | Percent of Outstanding Shares Voted | |||||||||||||||||||
| For | % | Against | % | Abstain/WithHold | % | For | Against | Abstain / WithHold | ||||||||||||
Proposals: | ||||||||||||||||||||
| 5 | To approve amendments to certain fundamental investment restrictions | |||||||||||||||||||
| 5a | Borrowing Money | 61,754,553 | 93.39% | 1,889,527 | 2.86% | 2,480,208 | 3.75% | 52.56% | 1.61% | 2.11% | ||||||||||
| 5b | Making Loans | 61,717,979 | 93.34% | 1,938,943 | 2.93% | 2,467,366 | 3.73% | 52.53% | 1.65% | 2.10% | ||||||||||
| 5c | Investments in Real Estate | 62,160,227 | 94.01% | 1,481,985 | 2.24% | 2,482,076 | 3.75% | 52.91% | 1.26% | 2.11% | ||||||||||
| 5d | Investments in Commodities | 61,395,815 | 92.85% | 2,252,630 | 3.41% | 2,475,843 | 3.74% | 52.26% | 1.92% | 2.11% | ||||||||||
| 5e | Diversification of Investments | 62,144,270 | 93.98% | 1,529,527 | 2.31% | 2,450,491 | 3.71% | 52.90% | 1.30% | 2.09% | ||||||||||
| 6 | To approve the elimination of certain fundamental investment restrictions | |||||||||||||||||||
| 6a | Pledging, Mortgaging, or Hypothecating Assets | 61,103,483 | 92.41% | 2,522,483 | 3.81% | 2,498,322 | 3.78% | 52.01% | 2.15% | 2.13% | ||||||||||
| 6b | Purchasing Securities on Margin | 61,040,406 | 92.31% | 2,607,638 | 3.94% | 2,476,244 | 3.74% | 51.96% | 2.22% | 2.11% | ||||||||||
| 6c | Investing in Restricted or Illiquid Securities | 61,152,163 | 92.48% | 2,491,475 | 3.77% | 2,480,650 | 3.75% | 52.05% | 2.12% | 2.11% | ||||||||||
| 6d | Investing for the Purpose of Exercising Control | 61,741,715 | 93.37% | 1,893,125 | 2.86% | 2,489,448 | 3.76% | 52.55% | 1.61% | 2.12% | ||||||||||
| 6e | Investing in Other Investment Companies | 61,680,175 | 93.28% | 1,962,785 | 2.97% | 2,481,328 | 3.75% | 52.50% | 1.67% | 2.11% | ||||||||||
| 6f | Management Ownership of Securities of an Issuer | 61,837,326 | 93.52% | 1,792,836 | 2.71% | 2,494,126 | 3.77% | 52.64% | 1.53% | 2.12% | ||||||||||
| 6g | Investing in Oil, Gas, or other Mineral Exploration, Leases or Development Programs | 61,567,170 | 93.11% | 2,111,244 | 3.19% | 2,445,874 | 3.70% | 52.41% | 1.80% | 2.08% | ||||||||||
| 6i | Investing in Warrants | 61,810,828 | 93.48% | 1,814,347 | 2.74% | 2,499,113 | 3.78% | 52.61% | 1.54% | 2.13% | ||||||||||
| 6j | Writing or Acquiring Options | 61,781,880 | 93.43% | 1,850,982 | 2.80% | 2,491,426 | 3.77% | 52.59% | 1.58% | 2.12% | ||||||||||
| Large Cap International Portfolio | ||||||||||||||||||||
| Shares Voted | Percent of Outstanding Shares Voted | |||||||||||||||||||
| For | % | Against | % | Abstain/WithHold | % | For | Against | Abstain / WithHold | ||||||||||||
Proposals: | ||||||||||||||||||||
5 | To approve amendments to certain fundamental investment restrictions | |||||||||||||||||||
| 5a | Borrowing Money | 37,997,717 | 94.68% | 873,247 | 2.18% | 1,263,266 | 3.15% | 50.99% | 1.17% | 1.70% | ||||||||||
| 5b | Making Loans | 37,952,326 | 94.56% | 930,997 | 2.32% | 1,250,907 | 3.12% | 50.93% | 1.25% | 1.68% | ||||||||||
| 5c | Investments in Real Estate | 37,421,132 | 93.24% | 1,513,828 | 3.77% | 1,199,271 | 2.99% | 50.22% | 2.03% | 1.61% | ||||||||||
| 5d | Investments in Commodities | 37,427,437 | 93.26% | 1,517,390 | 3.78% | 1,189,404 | 2.96% | 50.22% | 2.04% | 1.60% | ||||||||||
| 5e | Diversification of Investments | 38,181,915 | 95.14% | 774,663 | 1.93% | 1,177,653 | 2.93% | 51.24% | 1.04% | 1.58% | ||||||||||
| 6 | To approve the elimination of certain fundamental investment restrictions | |||||||||||||||||||
| 6a | Pledging, Mortgaging, or Hypothecating Assets | 37,089,479 | 92.41% | 1,807,123 | 4.50% | 1,237,628 | 3.08% | 49.77% | 2.42% | 1.66% | ||||||||||
| 6b | Purchasing Securities on Margin | 37,110,845 | 92.47% | 1,790,428 | 4.46% | 1,232,957 | 3.07% | 49.80% | 2.40% | 1.65% | ||||||||||
| 6c | Investing in Restricted or Illiquid Securities | 37,035,863 | 92.28% | 1,861,009 | 4.64% | 1,237,358 | 3.08% | 49.70% | 2.50% | 1.66% | ||||||||||
| 6d | Investing for the Purpose of Exercising Control | 37,986,250 | 94.65% | 913,502 | 2.28% | 1,234,478 | 3.08% | 50.97% | 1.23% | 1.66% | ||||||||||
| 6e | Investing in Other Investment Companies | 37,922,294 | 94.49% | 982,986 | 2.45% | 1,228,950 | 3.06% | 50.89% | 1.32% | 1.65% | ||||||||||
| 6f | Management Ownership of Securities of an Issuer | 37,951,172 | 94.56% | 964,995 | 2.40% | 1,218,063 | 3.03% | 50.93% | 1.29% | 1.63% | ||||||||||
| 6g | Investing in Oil, Gas, or other Mineral Exploration, Leases or Development Programs | 37,396,426 | 93.18% | 1,493,613 | 3.72% | 1,244,191 | 3.10% | 50.18% | 2.00% | 1.67% | ||||||||||
240
| Shares Voted | Percent of Outstanding Shares Voted | |||||||||||||||||||
| For | % | Against | % | Abstain/WithHold | % | For | Against | Abstain / WithHold | ||||||||||||
Proposals: | ||||||||||||||||||||
| 6h | Investing in Securities of Unseasoned Issuers | 37,762,857 | 94.09% | 1,085,971 | 2.71% | 1,285,402 | 3.20% | 50.67% | 1.46% | 1.72% | ||||||||||
| 6i | Investing in Warrants | 37,928,700 | 94.50% | 918,894 | 2.29% | 1,286,636 | 3.21% | 50.90% | 1.23% | 1.73% | ||||||||||
| 6j | Writing or Acquiring Options | 37,941,166 | 94.54% | 903,732 | 2.25% | 1,289,332 | 3.21% | 50.91% | 1.21% | 1.73% | ||||||||||
| 7a | Proposed Sub-Advisory Agreement among Dimensional Fund Advisors LP, DFA Australia Limited, and the Company | 38,233,655 | 95.26% | 584,902 | 1.46% | 1,315,673 | 3.28% | 51.31% | 0.78% | 1.77% | ||||||||||
| 7b | Proposed Sub-Advisory Agreement among Dimensional Fund Advisors LP, Dimensional Fund Advisors Ltd., and the Company | 38,232,780 | 95.26% | 584,735 | 1.46% | 1,316,715 | 3.28% | 51.30% | 0.78% | 1.77% | ||||||||||
International Core Equity Portfolio
| Shares Voted | Percent of Outstanding Shares Voted | |||||||||||||||||||||||
| For | % | Against | % | Abstain/WithHold | % | NonVote | % | For | Against | Abstain / WithHold | ||||||||||||||
Proposals: | ||||||||||||||||||||||||
| 5 | To approve amendments to certain fundamental investment restrictions | |||||||||||||||||||||||
| 5a | Borrowing Money | 177,373,455 | 56.74% | 4,154,996 | 1.33% | 4,660,259 | 1.49% | 126,424,297 | 40.44% | 53.06% | 1.24% | 1.39% | ||||||||||||
| 5b | Making Loans | 176,924,084 | 56.60% | 4,414,472 | 1.41% | 4,850,153 | 1.55% | 126,424,297 | 40.44% | 52.92% | 1.32% | 1.45% | ||||||||||||
| 5c | Investments in Real Estate | 177,497,921 | 56.78% | 4,005,870 | 1.28% | 4,684,919 | 1.50% | 126,424,297 | 40.44% | 53.10% | 1.20% | 1.40% | ||||||||||||
| 5d | Investments in Commodities | 177,390,060 | 56.74% | 4,174,411 | 1.34% | 4,624,239 | 1.48% | 126,424,297 | 40.44% | 53.06% | 1.25% | 1.38% | ||||||||||||
| 5e | Diversification of Investments | 177,693,681 | 56.84% | 3,871,733 | 1.24% | 4,623,296 | 1.48% | 126,424,297 | 40.44% | 53.16% | 1.16% | 1.38% | ||||||||||||
T.A. World ex U.S. Core Equity Portfolio
| Shares Voted | Percent of Outstanding Shares Voted | |||||||||||||||||||
| For | % | Against | % | Abstain/WithHold | % | For | Against | Abstain / WithHold | ||||||||||||
Proposals: | ||||||||||||||||||||
5 | To approve amendments to certain fundamental investment restrictions | |||||||||||||||||||
| 5a | Borrowing Money | 39,055,490 | 91.06% | 1,840,767 | 4.29% | 1,994,796 | 4.65% | 53.00% | 2.50% | 2.71% | ||||||||||
| 5b | Making Loans | 39,042,172 | 91.03% | 1,854,086 | 4.32% | 1,994,795 | 4.65% | 52.98% | 2.52% | 2.71% | ||||||||||
| 5c | Investments in Real Estate | 39,039,635 | 91.02% | 1,848,576 | 4.31% | 2,002,842 | 4.67% | 52.98% | 2.51% | 2.72% | ||||||||||
| 5d | Investments in Commodities | 39,107,803 | 91.18% | 1,808,202 | 4.22% | 1,975,048 | 4.60% | 53.07% | 2.45% | 2.68% | ||||||||||
| 5e | Diversification of Investments | 39,122,349 | 91.21% | 1,812,695 | 4.23% | 1,956,009 | 4.56% | 53.09% | 2.46% | 2.65% | ||||||||||
International Small Company Portfolio
| Shares Voted | Percent of Outstanding Shares Voted | |||||||||||||||||||
| For | % | Against | % | Abstain/WithHold | % | For | Against | Abstain / WithHold | ||||||||||||
Proposals: | ||||||||||||||||||||
| 5 | To approve amendments to certain fundamental investment restrictions | |||||||||||||||||||
| 5a | Borrowing Money | 146,761,050 | 82.53% | 5,759,650 | 3.24% | 25,304,179 | 14.23% | 49.23% | 1.93% | 8.49% | ||||||||||
| 5b | Making Loans | 146,487,502 | 82.38% | 5,764,592 | 3.24% | 25,572,786 | 14.38% | 49.13% | 1.93% | 8.58% | ||||||||||
| 5c | Investments in Real Estate | 136,816,309 | 76.94% | 15,717,711 | 8.84% | 25,290,860 | 14.22% | 45.89% | 5.27% | 8.48% | ||||||||||
| 5d | Investments in Commodities | 146,666,615 | 82.48% | 5,882,289 | 3.31% | 25,275,976 | 14.21% | 49.19% | 1.97% | 8.48% | ||||||||||
| 5e | Diversification of Investments | 147,253,567 | 82.81% | 5,304,294 | 2.98% | 25,267,019 | 14.21% | 49.39% | 1.78% | 8.48% | ||||||||||
| 6 | To approve the elimination of certain fundamental investment restrictions | |||||||||||||||||||
| 6a | Pledging, Mortgaging, or Hypothecating Assets | 146,450,914 | 82.36% | 6,115,754 | 3.44% | 25,258,212 | 14.20% | 49.12% | 2.05% | 8.47% | ||||||||||
| 6b | Purchasing Securities on Margin | 146,093,000 | 82.16% | 6,478,434 | 3.64% | 25,253,445 | 14.20% | 49.00% | 2.17% | 8.47% | ||||||||||
| 6d | Investing for the Purpose of Exercising Control | 146,487,649 | 82.38% | 6,046,180 | 3.40% | 25,291,052 | 14.22% | 49.13% | 2.03% | 8.48% | ||||||||||
| 6e | Investing in Other Investment Companies | 150,205,417 | 84.47% | 2,351,498 | 1.32% | 25,267,965 | 14.21% | 50.38% | 0.79% | 8.48% | ||||||||||
| 6f | Management Ownership of Securities of an Issuer | 147,009,760 | 82.67% | 5,540,873 | 3.12% | 25,274,247 | 14.21% | 49.31% | 1.86% | 8.48% | ||||||||||
| 6g | Investing in Oil, Gas, or other Mineral Exploration, Leases or Development Programs | 132,479,321 | 74.50% | 20,087,264 | 11.30% | 25,258,295 | 14.20% | 44.44% | 6.74% | 8.47% | ||||||||||
| 6h | Investing in Securities of Unseasoned Issuers | 137,270,123 | 77.19% | 15,257,960 | 8.58% | 25,296,797 | 14.23% | 46.04% | 5.12% | 8.49% | ||||||||||
| 6i | Investing in Warrants | 148,246,012 | 83.37% | 4,311,609 | 2.42% | 25,267,259 | 14.21% | 49.72% | 1.45% | 8.48% | ||||||||||
| 6j | Writing or Acquiring Options | 133,979,497 | 75.34% | 18,558,642 | 10.44% | 25,286,741 | 14.22% | 44.94% | 6.22% | 8.48% | ||||||||||
241
Japanese Small Company Portfolio
| Shares Voted | Percent of Outstanding Shares Voted | |||||||||||||||||||||||
| For | % | Against | % | Abstain/WithHold | % | NonVote | % | For | Against | Abstain / WithHold | ||||||||||||||
Proposals: | ||||||||||||||||||||||||
| 5 | To approve amendments to certain fundamental investment restrictions | |||||||||||||||||||||||
| 5a | Borrowing Money | 6,133,943 | 80.60% | 10,327 | 0.14% | 2,027 | 0.03% | 1,464,448 | 19.24% | 74.07% | 0.12% | 0.02% | ||||||||||||
| 5b | Making Loans | 6,133,943 | 80.60% | 10,327 | 0.14% | 2,027 | 0.03% | 1,464,448 | 19.24% | 74.07% | 0.12% | 0.02% | ||||||||||||
| 5c | Investments in Real Estate | 6,133,943 | 80.60% | 10,327 | 0.14% | 2,027 | 0.03% | 1,464,448 | 19.24% | 74.07% | 0.12% | 0.02% | ||||||||||||
| 5d | Investments in Commodities | 6,135,575 | 80.62% | 8,694 | 0.11% | 2,028 | 0.03% | 1,464,448 | 19.24% | 74.09% | 0.10% | 0.02% | ||||||||||||
| 5e | Diversification of Investments | 6,135,575 | 80.62% | 8,694 | 0.11% | 2,028 | 0.03% | 1,464,448 | 19.24% | 74.09% | 0.10% | 0.02% | ||||||||||||
| 6 | To approve the elimination of certain fundamental investment restrictions | |||||||||||||||||||||||
| 6a | Pledging, Mortgaging, or Hypothecating Assets | 6,133,943 | 80.60% | 10,327 | 0.14% | 2,027 | 0.03% | 1,464,448 | 19.24% | 74.07% | 0.12% | 0.02% | ||||||||||||
| 6b | Purchasing Securities on Margin | 6,134,672 | 80.61% | 9,597 | 0.13% | 2,028 | 0.03% | 1,464,448 | 19.24% | 74.08% | 0.12% | 0.02% | ||||||||||||
| 6c | Investing in Restricted or Illiquid Securities | 6,133,943 | 80.60% | 10,327 | 0.14% | 2,027 | 0.03% | 1,464,448 | 19.24% | 74.07% | 0.12% | 0.02% | ||||||||||||
| 6d | Investing for the Purpose of Exercising Control | 6,004,971 | 78.90% | 139,298 | 1.83% | 2,027 | 0.03% | 1,464,448 | 19.24% | 72.51% | 1.68% | 0.02% | ||||||||||||
| 6e | Investing in Other Investment Companies | 6,136,305 | 80.63% | 7,965 | 0.10% | 2,027 | 0.03% | 1,464,448 | 19.24% | 74.10% | 0.10% | 0.02% | ||||||||||||
| 6f | Management Ownership of Securities of an Issuer | 6,134,672 | 80.61% | 9,597 | 0.13% | 2,028 | 0.03% | 1,464,448 | 19.24% | 74.08% | 0.12% | 0.02% | ||||||||||||
| 6g | Investing in Oil, Gas, or other Mineral Exploration, Leases or Development Programs | 6,133,943 | 80.60% | 10,327 | 0.14% | 2,027 | 0.03% | 1,464,448 | 19.24% | 74.07% | 0.12% | 0.02% | ||||||||||||
| 6h | Investing in Securities of Unseasoned Issuers | 6,005,700 | 78.91% | 138,569 | 1.82% | 2,028 | 0.03% | 1,464,448 | 19.24% | 72.52% | 1.67% | 0.02% | ||||||||||||
| 6i | Investing in Warrants | 6,133,943 | 80.60% | 10,327 | 0.14% | 2,027 | 0.03% | 1,464,448 | 19.24% | 74.07% | 0.12% | 0.02% | ||||||||||||
| 6j | Writing or Acquiring Options | 6,004,971 | 78.90% | 139,298 | 1.83% | 2,028 | 0.03% | 1,464,448 | 19.24% | 72.51% | 1.68% | 0.02% | ||||||||||||
| 8 | Approval of Investment Advisory Agreement between Dimensional Fund Advisors LP and the Company | 6,136,900 | 80.63% | 7,370 | 0.10% | 2,027 | 0.03% | 1,464,448 | 19.24% | 74.10% | 0.09% | 0.02% | ||||||||||||
| Asia Pacific Small Company Portfolio | ||||||||||||||||||||||||
| Shares Voted | Percent of Outstanding Shares Voted | |||||||||||||||||||||||
| For | % | Against | % | Abstain/WithHold | % | NonVote | % | For | Against | Abstain / WithHold | ||||||||||||||
Proposals: | ||||||||||||||||||||||||
| 5 | To approve amendments to certain fundamental investment restrictions | |||||||||||||||||||||||
| 5a | Borrowing Money | 3,125,999 | 65.79% | 87,920 | 1.85% | 13,068 | 0.28% | 1,524,711 | 32.09% | 62.92% | 1.77% | 0.26% | ||||||||||||
| 5b | Making Loans | 3,125,999 | 65.79% | 87,920 | 1.85% | 13,068 | 0.28% | 1,524,711 | 32.09% | 62.92% | 1.77% | 0.26% | ||||||||||||
| 5c | Investments in Real Estate | 3,125,999 | 65.79% | 87,920 | 1.85% | 13,068 | 0.28% | 1,524,711 | 32.09% | 62.92% | 1.77% | 0.26% | ||||||||||||
| 5d | Investments in Commodities | 3,127,867 | 65.83% | 86,052 | 1.81% | 13,068 | 0.28% | 1,524,711 | 32.09% | 62.96% | 1.73% | 0.26% | ||||||||||||
| 5e | Diversification of Investments | 3,127,867 | 65.83% | 86,052 | 1.81% | 13,068 | 0.28% | 1,524,711 | 32.09% | 62.96% | 1.73% | 0.26% | ||||||||||||
| 6 | To approve the elimination of certain fundamental investment restrictions | |||||||||||||||||||||||
| 6a | Pledging, Mortgaging, or Hypothecating Assets | 3,124,333 | 65.75% | 88,471 | 1.86% | 14,183 | 0.30% | 1,524,711 | 32.09% | 62.89% | 1.78% | 0.29% | ||||||||||||
| 6b | Purchasing Securities on Margin | 3,125,189 | 65.77% | 87,615 | 1.84% | 14,183 | 0.30% | 1,524,711 | 32.09% | 62.91% | 1.76% | 0.29% | ||||||||||||
| 6c | Investing in Restricted or Illiquid Securities | 3,123,874 | 65.74% | 88,930 | 1.87% | 14,183 | 0.30% | 1,524,711 | 32.09% | 62.88% | 1.79% | 0.29% | ||||||||||||
| 6d | Investing for the Purpose of Exercising Control | 3,020,946 | 63.58% | 191,858 | 4.04% | 14,183 | 0.30% | 1,524,711 | 32.09% | 60.81% | 3.86% | 0.29% | ||||||||||||
| 6e | Investing in Other Investment Companies | 3,123,780 | 65.74% | 89,023 | 1.87% | 14,184 | 0.30% | 1,524,711 | 32.09% | 62.88% | 1.79% | 0.29% | ||||||||||||
| 6f | Management Ownership of Securities of an Issuer | 3,124,333 | 65.75% | 88,471 | 1.86% | 14,183 | 0.30% | 1,524,711 | 32.09% | 62.89% | 1.78% | 0.29% | ||||||||||||
| 6g | Investing in Oil, Gas, or other Mineral Exploration, Leases or Development Programs | 3,125,742 | 65.78% | 87,062 | 1.83% | 14,183 | 0.30% | 1,524,711 | 32.09% | 62.92% | 1.75% | 0.29% | ||||||||||||
| 6h | Investing in Securities of Unseasoned Issuers | 3,019,079 | 63.54% | 193,725 | 4.08% | 14,183 | 0.30% | 1,524,711 | 32.09% | 60.77% | 3.90% | 0.29% | ||||||||||||
| 6i | Investing in Warrants | 3,123,818 | 65.74% | 89,023 | 1.87% | 14,146 | 0.30% | 1,524,711 | 32.09% | 62.88% | 1.79% | 0.28% | ||||||||||||
| 6j | Writing or Acquiring Options | 3,018,526 | 63.53% | 194,278 | 4.09% | 14,183 | 0.30% | 1,524,711 | 32.09% | 60.76% | 3.91% | 0.29% | ||||||||||||
242
| Shares Voted | Percent of Outstanding Shares Voted | |||||||||||||||||||||||
| For | % | Against | % | Abstain/WithHold | % | NonVote | % | For | Against | Abstain / WithHold | ||||||||||||||
Proposals: | ||||||||||||||||||||||||
8 | Approval of Investment Advisory Agreement between Dimensional Fund Advisors LP and the Company | 3,128,063 | 65.83% | 85,856 | 1.81% | 13,068 | 0.28% | 1,524,711 | 32.09% | 62.96% | 1.73% | 0.26% | ||||||||||||
| United Kingdom Small Company Portfolio | ||||||||||||||||||||||||
| Shares Voted | Percent of Outstanding Shares Voted | |||||||||||||||||||||||
| For | % | Against | % | Abstain/WithHold | % | NonVote | % | For | Against | Abstain / WithHold | ||||||||||||||
Proposals: | ||||||||||||||||||||||||
5 | To approve amendments to certain fundamental investment restrictions | |||||||||||||||||||||||
| 5a | Borrowing Money | 1,281,767 | 83.93% | 1,704 | 0.11% | 1,940 | 0.13% | 241,804 | 15.83% | 81.64% | 0.11% | 0.12% | ||||||||||||
| 5b | Making Loans | 1,281,767 | 83.93% | 1,704 | 0.11% | 1,940 | 0.13% | 241,804 | 15.83% | 81.64% | 0.11% | 0.12% | ||||||||||||
| 5c | Investments in Real Estate | 1,281,767 | 83.93% | 1,704 | 0.11% | 1,940 | 0.13% | 241,804 | 15.83% | 81.64% | 0.11% | 0.12% | ||||||||||||
| 5d | Investments in Commodities | 1,281,767 | 83.93% | 1,704 | 0.11% | 1,940 | 0.13% | 241,804 | 15.83% | 81.64% | 0.11% | 0.12% | ||||||||||||
| 5e | Diversification of Investments | 1,281,767 | 83.93% | 1,704 | 0.11% | 1,940 | 0.13% | 241,804 | 15.83% | 81.64% | 0.11% | 0.12% | ||||||||||||
6 | To approve the elimination of certain fundamental investment restrictions | |||||||||||||||||||||||
| 6a | Pledging, Mortgaging, or Hypothecating Assets | 1,281,767 | 83.93% | 1,704 | 0.11% | 1,940 | 0.13% | 241,804 | 15.83% | 81.64% | 0.11% | 0.12% | ||||||||||||
| 6b | Purchasing Securities on Margin | 1,281,533 | 83.91% | 1,937 | 0.13% | 1,941 | 0.13% | 241,804 | 15.83% | 81.63% | 0.12% | 0.12% | ||||||||||||
| 6c | Investing in Restricted or Illiquid Securities | 1,281,767 | 83.93% | 1,704 | 0.11% | 1,940 | 0.13% | 241,804 | 15.83% | 81.64% | 0.11% | 0.12% | ||||||||||||
| 6d | Investing for the Purpose of Exercising Control | 1,226,898 | 80.34% | 56,572 | 3.70% | 1,941 | 0.13% | 241,804 | 15.83% | 78.15% | 3.60% | 0.12% | ||||||||||||
| 6e | Investing in Other Investment Companies | 1,281,767 | 83.93% | 1,704 | 0.11% | 1,940 | 0.13% | 241,804 | 15.83% | 81.64% | 0.11% | 0.12% | ||||||||||||
| 6f | Management Ownership of Securities of an Issuer | 1,281,767 | 83.93% | 1,704 | 0.11% | 1,940 | 0.13% | 241,804 | 15.83% | 81.64% | 0.11% | 0.12% | ||||||||||||
| 6g | Investing in Oil, Gas, or other Mineral Exploration, Leases or Development Programs | 1,281,767 | 83.93% | 1,704 | 0.11% | 1,940 | 0.13% | 241,804 | 15.83% | 81.64% | 0.11% | 0.12% | ||||||||||||
| 6h | Investing in Securities of Unseasoned Issuers | 1,226,898 | 80.34% | 56,572 | 3.70% | 1,941 | 0.13% | 241,804 | 15.83% | 78.15% | 3.60% | 0.12% | ||||||||||||
| 6i | Investing in Warrants | 1,281,533 | 83.91% | 1,937 | 0.13% | 1,941 | 0.13% | 241,804 | 15.83% | 81.63% | 0.12% | 0.12% | ||||||||||||
| 6j | Writing or Acquiring Options | 1,226,665 | 80.32% | 56,805 | 3.72% | 1,941 | 0.13% | 241,804 | 15.83% | 78.13% | 3.62% | 0.12% | ||||||||||||
8 | Approval of Investment Advisory Agreement between Dimensional Fund Advisors LP and the Company | 1,281,840 | 83.93% | 1,630 | 0.11% | 1,941 | 0.13% | 241,804 | 15.83% | 81.65% | 0.10% | 0.12% | ||||||||||||
| Continental Small Company Portfolio | ||||||||||||||||||||||||
| Shares Voted | Percent of Outstanding Shares Voted | |||||||||||||||||||||||
| For | % | Against | % | Abstain/WithHold | % | NonVote | % | For | Against | Abstain / WithHold | ||||||||||||||
Proposals: | ||||||||||||||||||||||||
| 5 | To approve amendments to certain fundamental investment restrictions | |||||||||||||||||||||||
| 5a | Borrowing Money | 5,570,603 | 77.24% | 24,245 | 0.34% | 22,517 | 0.31% | 1,595,160 | 22.12% | 74.40% | 0.32% | 0.30% | ||||||||||||
| 5b | Making Loans | 5,428,383 | 75.26% | 166,465 | 2.31% | 22,517 | 0.31% | 1,595,160 | 22.12% | 72.50% | 2.22% | 0.30% | ||||||||||||
| 5c | Investments in Real Estate | 5,570,603 | 77.24% | 24,245 | 0.34% | 22,517 | 0.31% | 1,595,160 | 22.12% | 74.40% | 0.32% | 0.30% | ||||||||||||
| 5d | Investments in Commodities | 5,572,946 | 77.27% | 24,245 | 0.34% | 20,174 | 0.28% | 1,595,160 | 22.12% | 74.43% | 0.32% | 0.27% | ||||||||||||
| 5e | Diversification of Investments | 5,570,603 | 77.24% | 24,245 | 0.34% | 22,517 | 0.31% | 1,595,160 | 22.12% | 74.40% | 0.32% | 0.30% | ||||||||||||
| 6 | To approve the elimination of certain fundamental investment restrictions | |||||||||||||||||||||||
| 6a | Pledging, Mortgaging, or Hypothecating Assets | 5,569,884 | 77.23% | 24,964 | 0.35% | 22,517 | 0.31% | 1,595,160 | 22.12% | 74.39% | 0.33% | 0.30% | ||||||||||||
| 6b | Purchasing Securities on Margin | 5,569,884 | 77.23% | 24,964 | 0.35% | 22,517 | 0.31% | 1,595,160 | 22.12% | 74.39% | 0.33% | 0.30% | ||||||||||||
| 6c | Investing in Restricted or Illiquid Securities | 5,413,476 | 75.06% | 181,373 | 2.51% | 22,516 | 0.31% | 1,595,160 | 22.12% | 72.30% | 2.42% | 0.30% | ||||||||||||
| 6d | Investing for the Purpose of Exercising Control | 5,476,922 | 75.94% | 117,926 | 1.64% | 22,517 | 0.31% | 1,595,160 | 22.12% | 73.15% | 1.58% | 0.30% | ||||||||||||
| 6e | Investing in Other Investment Companies | 5,414,106 | 75.07% | 180,742 | 2.51% | 22,517 | 0.31% | 1,595,160 | 22.12% | 72.31% | 2.41% | 0.30% | ||||||||||||
| 6f | Management Ownership of Securities of an Issuer | 5,427,664 | 75.25% | 167,184 | 2.32% | 22,517 | 0.31% | 1,595,160 | 22.12% | 72.49% | 2.23% | 0.30% | ||||||||||||
| 6g | Investing in Oil, Gas, or other Mineral Exploration, Leases or Development Programs | 5,569,884 | 77.23% | 24,964 | 0.35% | 22,517 | 0.31% | 1,595,160 | 22.12% | 74.39% | 0.33% | 0.30% | ||||||||||||
243
| Shares Voted | Percent of Outstanding Shares Voted | |||||||||||||||||||||||
| For | % | Against | % | Abstain/WithHold | % | NonVote | % | For | Against | Abstain / WithHold | ||||||||||||||
Proposals: | ||||||||||||||||||||||||
| 6h | Investing in Securities of Unseasoned Issuers | 5,463,995 | 75.76% | 130,853 | 1.81% | 22,517 | 0.31% | 1,595,160 | 22.12% | 72.98% | 1.75% | 0.30% | ||||||||||||
| 6i | Investing in Warrants | 5,569,884 | 77.23% | 24,964 | 0.35% | 22,517 | 0.31% | 1,595,160 | 22.12% | 74.39% | 0.33% | 0.30% | ||||||||||||
| 6j | Writing or Acquiring Options | 5,476,922 | 75.94% | 117,926 | 1.64% | 22,517 | 0.31% | 1,595,160 | 22.12% | 73.15% | 1.58% | 0.30% | ||||||||||||
| 8 | Approval of Investment Advisory Agreement between Dimensional Fund Advisors LP and the Company | 5,428,490 | 75.26% | 166,358 | 2.31% | 22,517 | 0.31% | 1,595,160 | 22.12% | 72.50% | 2.22% | 0.30% | ||||||||||||
| DFA International Real Estate Securities Portfolio | ||||||||||||||||||||||||
| Shares Voted | Percent of Outstanding Shares Voted | |||||||||||||||||||||||
| For | % | Against | % | Abstain/WithHold | % | NonVote | % | For | Against | Abstain / WithHold | ||||||||||||||
Proposals: | ||||||||||||||||||||||||
| 5 | To approve amendments to certain fundamental investment restrictions | |||||||||||||||||||||||
| 5a | Borrowing Money | 60,208,121 | 57.02% | 847,657 | 0.80% | 924,740 | 0.88% | 43,608,759 | 41.30% | 51.93% | 0.73% | 0.80% | ||||||||||||
| 5b | Making Loans | 60,111,915 | 56.93% | 856,731 | 0.81% | 1,011,872 | 0.96% | 43,608,759 | 41.30% | 51.85% | 0.74% | 0.87% | ||||||||||||
| 5c | Investments in Real Estate | 60,225,576 | 57.04% | 837,514 | 0.79% | 917,428 | 0.87% | 43,608,759 | 41.30% | 51.95% | 0.72% | 0.79% | ||||||||||||
| 5d | Investments in Commodities | 60,227,589 | 57.04% | 836,068 | 0.79% | 916,861 | 0.87% | 43,608,759 | 41.30% | 51.95% | 0.72% | 0.79% | ||||||||||||
| 5e | Diversification of Investments | 60,072,714 | 56.89% | 991,378 | 0.94% | 916,426 | 0.87% | 43,608,759 | 41.30% | 51.81% | 0.86% | 0.79% | ||||||||||||
DFA Global Real Estate Securities Portfolio
| Shares Voted | Percent of Outstanding Shares Voted | |||||||||||||||||||
| For | % | Against | % | Abstain/WithHold | % | For | Against | Abstain / WithHold | ||||||||||||
Proposals: | ||||||||||||||||||||
5 | To approve amendments to certain fundamental investment restrictions | |||||||||||||||||||
| 5a | Borrowing Money | 16,862,648 | 76.95% | 525,109 | 2.40% | 4,524,924 | 20.65% | 47.50% | 1.48% | 12.75% | ||||||||||
| 5b | Making Loans | 16,870,688 | 76.99% | 525,109 | 2.40% | 4,516,884 | 20.61% | 47.53% | 1.48% | 12.72% | ||||||||||
| 5c | Investments in Real Estate | 16,877,330 | 77.02% | 512,787 | 2.34% | 4,522,564 | 20.64% | 47.54% | 1.44% | 12.74% | ||||||||||
| 5d | Investments in Commodities | 16,862,467 | 76.95% | 556,044 | 2.54% | 4,494,170 | 20.51% | 47.50% | 1.57% | 12.66% | ||||||||||
| 5e | Diversification of Investments | 16,885,025 | 77.06% | 510,772 | 2.33% | 4,516,884 | 20.61% | 47.57% | 1.44% | 12.72% | ||||||||||
| DFA International Small Cap Value Portfolio | ||||||||||||||||||||
| Shares Voted | Percent of Outstanding Shares Voted | |||||||||||||||||||
| For | % | Against | % | Abstain/WithHold | % | For | Against | Abstain / WithHold | ||||||||||||
Proposals: | ||||||||||||||||||||
5 | To approve amendments to certain fundamental investment restrictions | |||||||||||||||||||
| 5a | Borrowing Money | 241,024,647 | 90.81% | 16,685,673 | 6.29% | 7,720,246 | 2.91% | 54.48% | 3.77% | 1.74% | ||||||||||
| 5b | Making Loans | 246,529,473 | 92.88% | 10,966,978 | 4.13% | 7,934,116 | 2.99% | 55.72% | 2.48% | 1.79% | ||||||||||
| 5c | Investments in Real Estate | 243,318,088 | 91.67% | 14,402,198 | 5.43% | 7,710,280 | 2.90% | 55.00% | 3.26% | 1.74% | ||||||||||
| 5d | Investments in Commodities | 246,941,521 | 93.03% | 10,784,598 | 4.06% | 7,704,447 | 2.90% | 55.81% | 2.44% | 1.74% | ||||||||||
| 5e | Diversification of Investments | 247,689,322 | 93.32% | 10,372,791 | 3.91% | 7,368,453 | 2.78% | 55.98% | 2.34% | 1.67% | ||||||||||
6 | To approve the elimination of certain fundamental investment restrictions | |||||||||||||||||||
| 6a | Pledging, Mortgaging, or Hypothecating Assets | 240,479,220 | 90.60% | 17,424,322 | 6.56% | 7,527,025 | 2.84% | 54.35% | 3.94% | 1.70% | ||||||||||
| 6b | Purchasing Securities on Margin | 231,448,174 | 87.20% | 26,471,659 | 9.97% | 7,510,734 | 2.83% | 52.31% | 5.98% | 1.70% | ||||||||||
| 6c | Investing in Restricted or Illiquid Securities | 246,099,078 | 92.72% | 11,923,494 | 4.49% | 7,407,995 | 2.79% | 55.62% | 2.70% | 1.67% | ||||||||||
| 6d | Investing for the Purpose of Exercising Control | 247,063,679 | 93.08% | 10,955,999 | 4.13% | 7,410,888 | 2.79% | 55.84% | 2.48% | 1.68% | ||||||||||
| 6e | Investing in Other Investment Companies | 246,884,157 | 93.01% | 11,150,453 | 4.20% | 7,395,957 | 2.79% | 55.80% | 2.52% | 1.67% | ||||||||||
| 6f | Management Ownership of Securities of an Issuer | 246,927,220 | 93.03% | 10,962,683 | 4.13% | 7,540,664 | 2.84% | 55.81% | 2.48% | 1.70% | ||||||||||
| 6g | Investing in Oil, Gas, or other Mineral Exploration, Leases or Development Programs | 247,330,663 | 93.18% | 10,697,732 | 4.03% | 7,402,171 | 2.79% | 55.90% | 2.42% | 1.67% | ||||||||||
| 6h | Investing in Securities of Unseasoned Issuers | 247,045,502 | 93.07% | 10,940,101 | 4.12% | 7,444,963 | 2.80% | 55.84% | 2.47% | 1.68% | ||||||||||
| 6i | Investing in Warrants | 247,420,726 | 93.21% | 10,575,200 | 3.98% | 7,434,640 | 2.80% | 55.92% | 2.39% | 1.68% | ||||||||||
| 6j | Writing or Acquiring Options | 236,706,345 | 89.18% | 21,199,007 | 7.99% | 7,525,215 | 2.84% | 53.50% | 4.79% | 1.70% | ||||||||||
244
| Shares Voted | Percent of Outstanding Shares Voted | |||||||||||||||||||
| For | % | Against | % | Abstain/WithHold | % | For | Against | Abstain / WithHold | ||||||||||||
Proposals: | ||||||||||||||||||||
| 7a | Proposed Sub-Advisory Agreement among Dimensional Fund Advisors LP, DFA Australia Limited, and the Company | 256,232,261 | 96.53% | 1,564,025 | 0.59% | 7,634,280 | 2.88% | 57.91% | 0.35% | 1.73% | ||||||||||
| 7b | Proposed Sub-Advisory Agreement among Dimensional Fund Advisors LP, Dimensional Fund Advisors Ltd., and the Company | 256,223,264 | 96.53% | 1,572,911 | 0.59% | 7,634,391 | 2.88% | 57.91% | 0.36% | 1.73% | ||||||||||
International Vector Equity Portfolio
| Shares Voted | Percent of Outstanding Shares Voted | |||||||||||||||||||||||
| For | % | Against | % | Abstain/WithHold | % | NonVote | % | For | Against | Abstain / WithHold | ||||||||||||||
Proposals: | ||||||||||||||||||||||||
| 5 | To approve amendments to certain fundamental investment restrictions | |||||||||||||||||||||||
| 5a | Borrowing Money | 12,634,182 | 53.44% | 339,533 | 1.44% | 95,624 | 0.40% | 10,572,971 | 44.72% | 53.01% | 1.42% | 0.40% | ||||||||||||
| 5b | Making Loans | 12,635,088 | 53.44% | 338,627 | 1.43% | 95,624 | 0.40% | 10,572,971 | 44.72% | 53.01% | 1.42% | 0.40% | ||||||||||||
| 5c | Investments in Real Estate | 12,639,741 | 53.46% | 333,973 | 1.41% | 95,624 | 0.40% | 10,572,971 | 44.72% | 53.03% | 1.40% | 0.40% | ||||||||||||
| 5d | Investments in Commodities | 12,636,624 | 53.45% | 337,090 | 1.43% | 95,624 | 0.40% | 10,572,971 | 44.72% | 53.02% | 1.41% | 0.40% | ||||||||||||
| 5e | Diversification of Investments | 12,649,164 | 53.50% | 315,724 | 1.34% | 104,451 | 0.44% | 10,572,971 | 44.72% | 53.07% | 1.32% | 0.44% | ||||||||||||
Emerging Markets Portfolio
| Shares Voted | Percent of Outstanding Shares Voted | |||||||||||||||||||
| For | % | Against | % | Abstain/WithHold | % | For | Against | Abstain / WithHold | ||||||||||||
Proposals: | ||||||||||||||||||||
5 | To approve amendments to certain fundamental investment restrictions | |||||||||||||||||||
| 5a | Borrowing Money | 37,169,348 | 93.78% | 1,245,444 | 3.14% | 1,221,412 | 3.08% | 47.22% | 1.58% | 1.55% | ||||||||||
| 5b | Making Loans | 37,216,081 | 93.89% | 1,177,804 | 2.97% | 1,242,319 | 3.13% | 47.28% | 1.50% | 1.58% | ||||||||||
| 5c | Investments in Real Estate | 37,416,071 | 94.40% | 1,013,151 | 2.56% | 1,206,982 | 3.05% | 47.53% | 1.29% | 1.53% | ||||||||||
| 5d | Investments in Commodities | 37,201,487 | 93.86% | 1,224,791 | 3.09% | 1,209,926 | 3.05% | 47.26% | 1.56% | 1.54% | ||||||||||
| 5e | Diversification of Investments | 37,578,860 | 94.81% | 850,957 | 2.15% | 1,206,387 | 3.04% | 47.74% | 1.08% | 1.53% | ||||||||||
6 | To approve the elimination of certain fundamental investment restrictions | |||||||||||||||||||
| 6a | Pledging, Mortgaging, or Hypothecating Assets | 36,955,077 | 93.24% | 1,405,465 | 3.55% | 1,275,662 | 3.22% | 46.95% | 1.79% | 1.62% | ||||||||||
| 6b | Purchasing Securities on Margin | 36,960,851 | 93.25% | 1,412,821 | 3.56% | 1,262,532 | 3.19% | 46.95% | 1.79% | 1.60% | ||||||||||
| 6c | Investing in Restricted or Illiquid Securities | 36,949,469 | 93.22% | 1,413,050 | 3.57% | 1,273,685 | 3.21% | 46.94% | 1.80% | 1.62% | ||||||||||
| 6d | Investing for the Purpose of Exercising Control | 37,109,742 | 93.63% | 1,268,403 | 3.20% | 1,258,059 | 3.17% | 47.14% | 1.61% | 1.60% | ||||||||||
| 6e | Investing in Other Investment Companies | 37,246,632 | 93.97% | 1,130,044 | 2.85% | 1,259,528 | 3.18% | 47.32% | 1.44% | 1.60% | ||||||||||
| 6f | Management Ownership of Securities of an Issuer | 37,303,599 | 94.11% | 1,062,837 | 2.68% | 1,269,768 | 3.20% | 47.39% | 1.35% | 1.61% | ||||||||||
| 6g | Investing in Oil, Gas, or other Mineral Exploration, Leases or Development Programs | 34,987,306 | 88.27% | 3,417,693 | 8.62% | 1,231,206 | 3.11% | 44.45% | 4.34% | 1.56% | ||||||||||
| 6h | Investing in Securities of Unseasoned Issuers | 37,137,132 | 93.69% | 1,223,800 | 3.09% | 1,275,272 | 3.22% | 47.18% | 1.55% | 1.62% | ||||||||||
| 6i | Investing in Warrants | 37,332,785 | 94.19% | 1,044,802 | 2.64% | 1,258,617 | 3.18% | 47.43% | 1.33% | 1.60% | ||||||||||
| 6j | Writing or Acquiring Options | 37,208,618 | 93.88% | 1,176,807 | 2.97% | 1,250,779 | 3.16% | 47.27% | 1.49% | 1.59% | ||||||||||
| 8 | Approval of Investment Advisory Agreement between Dimensional Fund Advisors LP and the Company | 37,650,756 | 94.99% | 719,321 | 1.81% | 1,266,127 | 3.19% | 47.83% | 0.91% | 1.61% | ||||||||||
| Emerging Markets Small Cap Portfolio | ||||||||||||||||||||
| Shares Voted | Percent of Outstanding Shares Voted | |||||||||||||||||||
| For | % | Against | % | Abstain/WithHold | % | For | Against | Abstain / WithHold | ||||||||||||
Proposals: | ||||||||||||||||||||
5 | To approve amendments to certain fundamental investment restrictions | |||||||||||||||||||
| 5a | Borrowing Money | 34,906,600 | 96.69% | 636,885 | 1.76% | 558,129 | 1.55% | 57.34% | 1.05% | 0.92% | ||||||||||
| 5b | Making Loans | 34,860,289 | 96.56% | 648,269 | 1.80% | 593,056 | 1.64% | 57.27% | 1.06% | 0.97% | ||||||||||
| 5c | Investments in Real Estate | 34,900,964 | 96.67% | 641,082 | 1.78% | 559,568 | 1.55% | 57.34% | 1.05% | 0.92% | ||||||||||
| 5d | Investments in Commodities | 34,808,353 | 96.42% | 738,763 | 2.05% | 554,498 | 1.54% | 57.18% | 1.21% | 0.91% | ||||||||||
245
| Shares Voted | Percent of Outstanding Shares Voted | |||||||||||||||||||
| For | % | Against | % | Abstain/WithHold | % | For | Against | Abstain / WithHold | ||||||||||||
Proposals: | ||||||||||||||||||||
| 5e | Diversification of Investments | 35,011,893 | 96.98% | 536,458 | 1.49% | 553,263 | 1.53% | 57.52% | 0.88% | 0.91% | ||||||||||
6 | To approve the elimination of certain fundamental investment restrictions | |||||||||||||||||||
| 6a | Pledging, Mortgaging, or Hypothecating Assets | 34,721,947 | 96.18% | 819,310 | 2.27% | 560,357 | 1.55% | 57.04% | 1.35% | 0.92% | ||||||||||
| 6b | Purchasing Securities on Margin | 34,707,419 | 96.14% | 839,880 | 2.33% | 554,315 | 1.54% | 57.02% | 1.38% | 0.91% | ||||||||||
| 6d | Investing for the Purpose of Exercising Control | 34,904,556 | 96.68% | 640,251 | 1.77% | 556,807 | 1.54% | 57.34% | 1.05% | 0.91% | ||||||||||
| 6e | Investing in Other Investment Companies | 34,889,974 | 96.64% | 657,584 | 1.82% | 554,056 | 1.53% | 57.32% | 1.08% | 0.91% | ||||||||||
| 6f | Management Ownership of Securities of an Issuer | 34,978,653 | 96.89% | 564,851 | 1.56% | 558,110 | 1.55% | 57.46% | 0.93% | 0.92% | ||||||||||
| 6g | Investing in Oil, Gas, or other Mineral Exploration, Leases or Development Programs | 34,877,263 | 96.61% | 665,189 | 1.84% | 559,162 | 1.55% | 57.30% | 1.09% | 0.92% | ||||||||||
| 6h | Investing in Securities of Unseasoned Issuers | 34,951,721 | 96.81% | 593,562 | 1.64% | 556,331 | 1.54% | 57.42% | 0.98% | 0.91% | ||||||||||
| 6i | Investing in Warrants | 34,929,577 | 96.75% | 610,801 | 1.69% | 561,236 | 1.55% | 57.38% | 1.00% | 0.92% | ||||||||||
| 6j | Writing or Acquiring Options | 34,985,838 | 96.91% | 555,585 | 1.54% | 560,191 | 1.55% | 57.47% | 0.91% | 0.92% | ||||||||||
8 | Approval of Investment Advisory Agreement between Dimensional Fund Advisors LP and the Company | 35,075,885 | 97.16% | 462,218 | 1.28% | 563,511 | 1.56% | 57.62% | 0.76% | 0.93% | ||||||||||
| Emerging Markets Core Equity Portfolio | ||||||||||||||||||||
| Shares Voted | Percent of Outstanding Shares Voted | |||||||||||||||||||
| For | % | Against | % | Abstain/WithHold | % | For | Against | Abstain / WithHold | ||||||||||||
Proposals: | ||||||||||||||||||||
5 | To approve amendments to certain fundamental investment restrictions | |||||||||||||||||||
| 5a | Borrowing Money | 76,691,134 | 94.65% | 1,233,644 | 1.52% | 3,102,222 | 3.83% | 54.29% | 0.87% | 2.20% | ||||||||||
| 5b | Making Loans | 76,467,186 | 94.37% | 1,229,941 | 1.52% | 3,329,873 | 4.11% | 54.13% | 0.87% | 2.36% | ||||||||||
| 5c | Investments in Real Estate | 76,841,272 | 94.83% | 1,091,087 | 1.35% | 3,094,641 | 3.82% | 54.40% | 0.77% | 2.19% | ||||||||||
| 5d | Investments in Commodities | 76,729,334 | 94.70% | 1,195,718 | 1.48% | 3,101,948 | 3.83% | 54.32% | 0.85% | 2.20% | ||||||||||
| 5e | Diversification of Investments | 76,941,496 | 94.96% | 989,883 | 1.22% | 3,095,621 | 3.82% | 54.47% | 0.70% | 2.19% | ||||||||||
7a | Proposed Sub-Advisory Agreement among Dimensional Fund Advisors LP, DFA Australia Limited, and the Company | 76,964,499 | 94.99% | 897,886 | 1.11% | 3,164,615 | 3.91% | 54.48% | 0.64% | 2.24% | ||||||||||
7b | Proposed Sub-Advisory Agreement among Dimensional Fund Advisors LP, Dimensional Fund Advisors Ltd., and the Company | 76,970,688 | 94.99% | 888,008 | 1.10% | 3,168,304 | 3.91% | 54.49% | 0.63% | 2.24% | ||||||||||
| DFA One-Year Fixed Income Portfolio | ||||||||||||||||||||
| Shares Voted | Percent of Outstanding Shares Voted | |||||||||||||||||||
| For | % | Against | % | Abstain/WithHold | % | For | Against | Abstain / WithHold | ||||||||||||
Proposals: | ||||||||||||||||||||
5 | To approve amendments to certain fundamental investment restrictions | |||||||||||||||||||
| 5a | Borrowing Money | 153,377,768 | 91.51% | 6,144,346 | 3.67% | 8,089,183 | 4.83% | 48.46% | 1.94% | 2.56% | ||||||||||
| 5b | Making Loans | 152,748,450 | 91.13% | 6,592,602 | 3.93% | 8,270,245 | 4.93% | 48.26% | 2.08% | 2.61% | ||||||||||
| 5c | Investments in Real Estate | 154,207,507 | 92.00% | 5,311,570 | 3.17% | 8,092,220 | 4.83% | 48.72% | 1.68% | 2.56% | ||||||||||
| 5d | Investments in Commodities | 152,064,206 | 90.72% | 7,572,711 | 4.52% | 7,974,380 | 4.76% | 48.04% | 2.39% | 2.52% | ||||||||||
| 5e | Diversification of Investments | 154,698,156 | 92.30% | 5,086,651 | 3.03% | 7,826,490 | 4.67% | 48.87% | 1.61% | 2.47% | ||||||||||
6 | To approve the elimination of certain fundamental investment restrictions | |||||||||||||||||||
| 6a | Pledging, Mortgaging, or Hypothecating Assets | 150,707,343 | 89.91% | 8,650,102 | 5.16% | 8,253,852 | 4.92% | 47.61% | 2.73% | 2.61% | ||||||||||
| 6b | Purchasing Securities on Margin | 150,472,257 | 89.77% | 8,973,993 | 5.35% | 8,165,047 | 4.87% | 47.54% | 2.84% | 2.58% | ||||||||||
| 6c | Investing in Restricted or Illiquid Securities | 150,768,260 | 89.95% | 8,621,479 | 5.14% | 8,221,558 | 4.91% | 47.63% | 2.72% | 2.60% | ||||||||||
| 6d | Investing for the Purpose of Exercising Control | 152,161,542 | 90.78% | 7,368,734 | 4.40% | 8,081,021 | 4.82% | 48.07% | 2.33% | 2.55% | ||||||||||
| 6e | Investing in Other Investment Companies | 151,990,281 | 90.68% | 7,538,347 | 4.50% | 8,082,669 | 4.82% | 48.02% | 2.38% | 2.55% | ||||||||||
| 6f | Management Ownership of Securities of an Issuer | 151,924,487 | 90.64% | 7,181,676 | 4.28% | 8,505,134 | 5.07% | 48.00% | 2.27% | 2.69% | ||||||||||
246
| Shares Voted | Percent of Outstanding Shares Voted | |||||||||||||||||||
| For | % | Against | % | Abstain/WithHold | % | For | Against | Abstain / WithHold | ||||||||||||
Proposals: | ||||||||||||||||||||
| 6g | Investing in Oil, Gas, or other Mineral Exploration, Leases or Development Programs | 153,645,763 | 91.67% | 6,091,872 | 3.63% | 7,873,662 | 4.70% | 48.54% | 1.92% | 2.49% | ||||||||||
| 6h | Investing in Securities of Unseasoned Issuers | 150,891,239 | 90.02% | 8,513,610 | 5.08% | 8,206,448 | 4.90% | 47.67% | 2.69% | 2.59% | ||||||||||
| 6i | Investing in Warrants | 151,466,137 | 90.37% | 7,900,018 | 4.71% | 8,245,142 | 4.92% | 47.85% | 2.50% | 2.60% | ||||||||||
| 6j | Writing or Acquiring Options | 151,858,071 | 90.60% | 7,499,862 | 4.47% | 8,253,364 | 4.92% | 47.98% | 2.37% | 2.61% | ||||||||||
8 | Approval of Investment Advisory Agreement between Dimensional Fund Advisors LP and the Company | 154,827,452 | 92.37% | 4,814,053 | 2.87% | 7,969,792 | 4.75% | 48.91% | 1.52% | 2.52% | ||||||||||
| DFA Two-Year Global Fixed Income Portfolio | ||||||||||||||||||||
| Shares Voted | Percent of Outstanding Shares Voted | |||||||||||||||||||
| For | % | Against | % | Abstain/WithHold | % | For | Against | Abstain / WithHold | ||||||||||||
Proposals: | ||||||||||||||||||||
5 | To approve amendments to certain fundamental investment restrictions | |||||||||||||||||||
| 5a | Borrowing Money | 139,368,344 | 91.55% | 5,265,257 | 3.46% | 7,599,709 | 4.99% | 48.10% | 1.82% | 2.62% | ||||||||||
| 5b | Making Loans | 138,424,532 | 90.93% | 6,081,866 | 4.00% | 7,726,912 | 5.08% | 47.77% | 2.10% | 2.67% | ||||||||||
| 5c | Investments in Real Estate | 139,514,480 | 91.65% | 5,058,809 | 3.32% | 7,660,021 | 5.03% | 48.15% | 1.75% | 2.64% | ||||||||||
| 5d | Investments in Commodities | 139,272,598 | 91.49% | 5,366,927 | 3.53% | 7,593,785 | 4.99% | 48.07% | 1.85% | 2.62% | ||||||||||
| 5e | Diversification of Investments | 139,699,396 | 91.77% | 5,027,412 | 3.30% | 7,506,502 | 4.93% | 48.21% | 1.74% | 2.59% | ||||||||||
6 | To approve the elimination of certain fundamental investment restrictions | |||||||||||||||||||
| 6a | Pledging, Mortgaging, or Hypothecating Assets | 137,994,426 | 90.65% | 6,376,548 | 4.19% | 7,862,336 | 5.16% | 47.63% | 2.20% | 2.71% | ||||||||||
| 6b | Purchasing Securities on Margin | 137,625,225 | 90.40% | 6,934,367 | 4.56% | 7,673,718 | 5.04% | 47.50% | 2.39% | 2.65% | ||||||||||
| 6d | Investing for the Purpose of Exercising Control | 138,357,280 | 90.89% | 6,162,929 | 4.05% | 7,713,101 | 5.07% | 47.75% | 2.13% | 2.66% | ||||||||||
| 6e | Investing in Other Investment Companies | 138,122,567 | 90.73% | 6,431,516 | 4.22% | 7,679,227 | 5.04% | 47.67% | 2.22% | 2.65% | ||||||||||
| 6f | Management Ownership of Securities of an Issuer | 138,594,487 | 91.04% | 5,812,947 | 3.82% | 7,825,876 | 5.14% | 47.83% | 2.01% | 2.70% | ||||||||||
| 6g | Investing in Oil, Gas, or other Mineral Exploration, Leases or Development Programs | 139,120,718 | 91.39% | 5,428,157 | 3.57% | 7,684,435 | 5.05% | 48.01% | 1.87% | 2.65% | ||||||||||
| 6h | Investing in Securities of Unseasoned Issuers | 138,057,537 | 90.69% | 6,530,145 | 4.29% | 7,645,628 | 5.02% | 47.65% | 2.25% | 2.64% | ||||||||||
| 6i | Investing in Warrants | 138,431,219 | 90.93% | 5,957,354 | 3.91% | 7,844,737 | 5.15% | 47.78% | 2.06% | 2.71% | ||||||||||
| 6j | Writing or Acquiring Options | 138,371,663 | 90.89% | 6,052,179 | 3.98% | 7,809,468 | 5.13% | 47.76% | 2.09% | 2.70% | ||||||||||
8 | Approval of Investment Advisory Agreement between Dimensional Fund Advisors LP and the Company | 140,431,098 | 92.25% | 3,991,763 | 2.62% | 7,810,449 | 5.13% | 48.47% | 1.38% | 2.70% | ||||||||||
DFA Selectively Hedged Global Fixed Income Portfolio
| Shares Voted | Percent of Outstanding Shares Voted | |||||||||||||||||||||||
| For | % | Against | % | Abstain/WithHold | % | NonVote | % | For | Against | Abstain / WithHold | ||||||||||||||
Proposals: | ||||||||||||||||||||||||
| 5 | To approve amendments to certain fundamental investment restrictions | |||||||||||||||||||||||
| 5a | Borrowing Money | 14,004,711 | 71.19% | 69,771 | 0.35% | 142,380 | 0.72% | 5,454,109 | 27.73% | 69.44% | 0.35% | 0.71% | ||||||||||||
| 5b | Making Loans | 14,004,711 | 71.19% | 69,771 | 0.35% | 142,380 | 0.72% | 5,454,109 | 27.73% | 69.44% | 0.35% | 0.71% | ||||||||||||
| 5c | Investments in Real Estate | 14,005,443 | 71.20% | 69,039 | 0.35% | 142,380 | 0.72% | 5,454,109 | 27.73% | 69.44% | 0.34% | 0.71% | ||||||||||||
| 5d | Investments in Commodities | 14,001,626 | 71.18% | 72,856 | 0.37% | 142,380 | 0.72% | 5,454,109 | 27.73% | 69.42% | 0.36% | 0.71% | ||||||||||||
| 5e | Diversification of Investments | 14,004,711 | 71.19% | 69,771 | 0.35% | 142,380 | 0.72% | 5,454,109 | 27.73% | 69.44% | 0.35% | 0.71% | ||||||||||||
DFA Five-Year Government Portfolio
| Shares Voted | Percent of Outstanding Shares Voted | |||||||||||||||||||
| For | % | Against | % | Abstain/WithHold | % | For | Against | Abstain / WithHold | ||||||||||||
Proposals: | ||||||||||||||||||||
| 5 | To approve amendments to certain fundamental investment restrictions | |||||||||||||||||||
| 5a | Borrowing Money | 46,558,553 | 92.40% | 1,353,231 | 2.69% | 2,475,682 | 4.91% | 50.03% | 1.45% | 2.66% | ||||||||||
| 5b | Making Loans | 46,562,156 | 92.41% | 1,273,283 | 2.53% | 2,552,027 | 5.06% | 50.04% | 1.37% | 2.74% | ||||||||||
| 5c | Investments in Real Estate | 46,677,621 | 92.64% | 1,175,541 | 2.33% | 2,534,304 | 5.03% | 50.16% | 1.26% | 2.72% | ||||||||||
| 5d | Investments in Commodities | 46,451,042 | 92.19% | 1,439,885 | 2.86% | 2,496,539 | 4.95% | 49.92% | 1.55% | 2.68% | ||||||||||
247
| Shares Voted | Percent of Outstanding Shares Voted | |||||||||||||||||||
| For | % | Against | % | Abstain/WithHold | % | For | Against | Abstain / WithHold | ||||||||||||
Proposals: | ||||||||||||||||||||
| 5e | Diversification of Investments | 46,842,089 | 92.96% | 994,424 | 1.97% | 2,550,953 | 5.06% | 50.34% | 1.07% | 2.74% | ||||||||||
6 | To approve the elimination of certain fundamental investment restrictions | |||||||||||||||||||
| 6a | Pledging, Mortgaging, or Hypothecating Assets | 46,327,059 | 91.94% | 1,424,209 | 2.83% | 2,636,198 | 5.23% | 49.78% | 1.53% | 2.83% | ||||||||||
| 6b | Purchasing Securities on Margin | 46,149,375 | 91.59% | 1,677,783 | 3.33% | 2,560,308 | 5.08% | 49.59% | 1.80% | 2.75% | ||||||||||
| 6c | Investing in Restricted or Illiquid Securities | 46,275,781 | 91.84% | 1,556,039 | 3.09% | 2,555,646 | 5.07% | 49.73% | 1.67% | 2.75% | ||||||||||
| 6d | Investing for the Purpose of Exercising Control | 46,556,994 | 92.40% | 1,189,269 | 2.36% | 2,641,203 | 5.24% | 50.03% | 1.28% | 2.84% | ||||||||||
| 6e | Investing in Other Investment Companies | 46,370,043 | 92.03% | 1,480,358 | 2.94% | 2,537,065 | 5.04% | 49.83% | 1.59% | 2.73% | ||||||||||
| 6f | Management Ownership of Securities of an Issuer | 46,582,785 | 92.45% | 1,119,663 | 2.22% | 2,685,018 | 5.33% | 50.06% | 1.20% | 2.89% | ||||||||||
| 6g | Investing in Oil, Gas, or other Mineral Exploration, Leases or Development Programs | 46,631,031 | 92.54% | 1,203,255 | 2.39% | 2,553,180 | 5.07% | 50.11% | 1.29% | 2.74% | ||||||||||
| 6h | Investing in Securities of Unseasoned Issuers | 46,336,492 | 91.96% | 1,383,463 | 2.75% | 2,667,511 | 5.29% | 49.79% | 1.49% | 2.87% | ||||||||||
| 6i | Investing in Warrants | 46,483,170 | 92.25% | 1,247,053 | 2.47% | 2,657,243 | 5.27% | 49.95% | 1.34% | 2.86% | ||||||||||
| 6j | Writing or Acquiring Options | 46,458,268 | 92.20% | 1,324,131 | 2.63% | 2,605,067 | 5.17% | 49.92% | 1.42% | 2.80% | ||||||||||
| DFA Five-Year Global Fixed Income Portfolio | ||||||||||||||||||||
| Shares Voted | Percent of Outstanding Shares Voted | |||||||||||||||||||
| For | % | Against | % | Abstain/WithHold | % | For | Against | Abstain / WithHold | ||||||||||||
Proposals: | ||||||||||||||||||||
5 | To approve amendments to certain fundamental investment restrictions | |||||||||||||||||||
| 5a | Borrowing Money | 134,955,377 | 91.87% | 4,431,120 | 3.02% | 7,511,430 | 5.11% | 50.02% | 1.64% | 2.78% | ||||||||||
| 5b | Making Loans | 135,102,367 | 91.97% | 4,353,195 | 2.96% | 7,442,365 | 5.07% | 50.08% | 1.61% | 2.76% | ||||||||||
| 5c | Investments in Real Estate | 134,638,282 | 91.65% | 4,797,569 | 3.27% | 7,462,076 | 5.08% | 49.91% | 1.78% | 2.77% | ||||||||||
| 5d | Investments in Commodities | 133,701,933 | 91.02% | 5,712,099 | 3.89% | 7,483,895 | 5.09% | 49.56% | 2.12% | 2.77% | ||||||||||
| 5e | Diversification of Investments | 135,608,777 | 92.31% | 3,898,510 | 2.65% | 7,390,640 | 5.03% | 50.27% | 1.45% | 2.74% | ||||||||||
6 | To approve the elimination of certain fundamental investment restrictions | |||||||||||||||||||
| 6a | Pledging, Mortgaging, or Hypothecating Assets | 131,739,647 | 89.68% | 7,131,409 | 4.85% | 8,026,871 | 5.46% | 48.83% | 2.64% | 2.98% | ||||||||||
| 6b | Purchasing Securities on Margin | 131,816,552 | 89.73% | 7,196,541 | 4.90% | 7,884,834 | 5.37% | 48.86% | 2.67% | 2.92% | ||||||||||
| 6c | Investing in Restricted or Illiquid Securities | 131,862,431 | 89.76% | 7,113,623 | 4.84% | 7,921,873 | 5.39% | 48.88% | 2.64% | 2.94% | ||||||||||
| 6d | Investing for the Purpose of Exercising Control | 133,826,154 | 91.10% | 5,166,047 | 3.52% | 7,905,726 | 5.38% | 49.61% | 1.91% | 2.93% | ||||||||||
| 6e | Investing in Other Investment Companies | 133,405,684 | 90.82% | 5,645,906 | 3.84% | 7,846,337 | 5.34% | 49.45% | 2.09% | 2.91% | ||||||||||
| 6f | Management Ownership of Securities of an Issuer | 133,890,906 | 91.15% | 5,135,516 | 3.50% | 7,871,505 | 5.36% | 49.63% | 1.90% | 2.92% | ||||||||||
| 6g | Investing in Oil, Gas, or other Mineral Exploration, Leases or Development Programs | 132,957,234 | 90.51% | 6,236,723 | 4.25% | 7,703,970 | 5.24% | 49.28% | 2.31% | 2.86% | ||||||||||
| 6h | Investing in Securities of Unseasoned Issuers | 133,013,383 | 90.55% | 5,913,651 | 4.03% | 7,970,893 | 5.43% | 49.30% | 2.19% | 2.95% | ||||||||||
| 6i | Investing in Warrants | 133,424,158 | 90.83% | 5,484,620 | 3.73% | 7,989,149 | 5.44% | 49.46% | 2.03% | 2.96% | ||||||||||
| 6j | Writing or Acquiring Options | 133,569,451 | 90.93% | 5,394,696 | 3.67% | 7,933,780 | 5.40% | 49.51% | 2.00% | 2.94% | ||||||||||
| DFA Intermediate Government Fixed Income Portfolio | ||||||||||||||||||||
| Shares Voted | Percent of Outstanding Shares Voted | |||||||||||||||||||
| For | % | Against | % | Abstain/WithHold | % | For | Against | Abstain / WithHold | ||||||||||||
Proposals: | ||||||||||||||||||||
5 | To approve amendments to certain fundamental investment restrictions | |||||||||||||||||||
| 5a | Borrowing Money | 54,112,609 | 94.93% | 1,332,170 | 2.34% | 1,560,712 | 2.74% | 52.04% | 1.28% | 1.50% | ||||||||||
| 5b | Making Loans | 54,115,618 | 94.93% | 1,332,103 | 2.34% | 1,557,770 | 2.73% | 52.04% | 1.28% | 1.50% | ||||||||||
| 5c | Investments in Real Estate | 54,203,775 | 95.09% | 1,268,740 | 2.23% | 1,532,976 | 2.69% | 52.12% | 1.22% | 1.47% | ||||||||||
| 5d | Investments in Commodities | 54,116,557 | 94.93% | 1,216,191 | 2.13% | 1,672,743 | 2.93% | 52.04% | 1.17% | 1.61% | ||||||||||
| 5e | Diversification of Investments | 54,424,099 | 95.47% | 1,063,379 | 1.87% | 1,518,013 | 2.66% | 52.34% | 1.02% | 1.46% | ||||||||||
6 | To approve the elimination of certain fundamental investment restrictions | |||||||||||||||||||
| 6a | Pledging, Mortgaging, or Hypothecating Assets | 53,888,561 | 94.53% | 1,358,039 | 2.38% | 1,758,891 | 3.09% | 51.82% | 1.31% | 1.69% | ||||||||||
| 6b | Purchasing Securities on Margin | 53,837,539 | 94.44% | 1,460,949 | 2.56% | 1,707,003 | 2.99% | 51.77% | 1.40% | 1.64% | ||||||||||
248
| Shares Voted | Percent of Outstanding Shares Voted | |||||||||||||||||||
| For | % | Against | % | Abstain/WithHold | % | For | Against | Abstain / WithHold | ||||||||||||
Proposals: | ||||||||||||||||||||
| 6c | Investing in Restricted or Illiquid Securities | 53,834,633 | 94.44% | 1,461,291 | 2.56% | 1,709,567 | 3.00% | 51.77% | 1.41% | 1.64% | ||||||||||
| 6d | Investing for the Purpose of Exercising Control | 54,012,976 | 94.75% | 1,269,332 | 2.23% | 1,723,183 | 3.02% | 51.94% | 1.22% | 1.66% | ||||||||||
| 6e | Investing in Other Investment Companies | 53,976,867 | 94.69% | 1,318,326 | 2.31% | 1,710,298 | 3.00% | 51.91% | 1.27% | 1.64% | ||||||||||
| 6f | Management Ownership of Securities of an Issuer | 53,649,613 | 94.11% | 1,257,167 | 2.21% | 2,098,711 | 3.68% | 51.59% | 1.21% | 2.02% | ||||||||||
| 6g | Investing in Oil, Gas, or other Mineral Exploration, Leases or Development Programs | 54,233,916 | 95.14% | 1,071,047 | 1.88% | 1,700,528 | 2.98% | 52.15% | 1.03% | 1.64% | ||||||||||
| 6h | Investing in Securities of Unseasoned Issuers | 53,872,308 | 94.50% | 1,409,329 | 2.47% | 1,723,854 | 3.02% | 51.81% | 1.36% | 1.66% | ||||||||||
| 6i | Investing in Warrants | 53,958,445 | 94.65% | 1,256,814 | 2.20% | 1,790,232 | 3.14% | 51.89% | 1.21% | 1.72% | ||||||||||
| 6j | Writing or Acquiring Options | 53,954,255 | 94.65% | 1,331,376 | 2.34% | 1,719,860 | 3.02% | 51.88% | 1.28% | 1.65% | ||||||||||
| DFA Inflation-Protected Securities Portfolio | ||||||||||||||||||||
| Shares Voted | Percent of Outstanding Shares Voted | |||||||||||||||||||
| For | % | Against | % | Abstain/WithHold | % | For | Against | Abstain / WithHold | ||||||||||||
Proposals: | ||||||||||||||||||||
5 | To approve amendments to certain fundamental investment restrictions | |||||||||||||||||||
| 5a | Borrowing Money | 22,200,756 | 88.45% | 549,282 | 2.19% | 2,349,633 | 9.36% | 47.34% | 1.17% | 5.01% | ||||||||||
| 5b | Making Loans | 22,158,222 | 88.28% | 616,217 | 2.46% | 2,325,232 | 9.26% | 47.25% | 1.31% | 4.96% | ||||||||||
| 5c | Investments in Real Estate | 22,208,512 | 88.48% | 555,632 | 2.21% | 2,335,527 | 9.31% | 47.35% | 1.18% | 4.98% | ||||||||||
| 5d | Investments in Commodities | 22,054,691 | 87.87% | 717,727 | 2.86% | 2,327,253 | 9.27% | 47.03% | 1.53% | 4.96% | ||||||||||
| 5e | Diversification of Investments | 22,330,643 | 88.97% | 436,065 | 1.74% | 2,332,963 | 9.29% | 47.61% | 0.93% | 4.97% | ||||||||||
| DFA Short-Term Municipal Bond Portfolio | ||||||||||||||||||||
| Shares Voted | Percent of Outstanding Shares Voted | |||||||||||||||||||
| For | % | Against | % | Abstain/WithHold | % | For | Against | Abstain / WithHold | ||||||||||||
Proposals: | ||||||||||||||||||||
| 5 | To approve amendments to certain fundamental investment restrictions | |||||||||||||||||||
| 5a | Borrowing Money | 47,846,807 | 90.90% | 1,786,880 | 3.39% | 3,004,747 | 5.71% | 49.85% | 1.86% | 3.13% | ||||||||||
| 5b | Making Loans | 47,551,098 | 90.34% | 2,148,747 | 4.08% | 2,938,589 | 5.58% | 49.54% | 2.24% | 3.06% | ||||||||||
| 5c | Investments in Real Estate | 47,659,646 | 90.54% | 2,033,544 | 3.86% | 2,945,243 | 5.60% | 49.66% | 2.12% | 3.07% | ||||||||||
| 5d | Investments in Commodities | 47,877,083 | 90.95% | 1,865,943 | 3.54% | 2,895,408 | 5.50% | 49.88% | 1.94% | 3.02% | ||||||||||
| 5e | Diversification of Investments | 48,432,918 | 92.01% | 1,307,493 | 2.48% | 2,898,023 | 5.51% | 50.46% | 1.36% | 3.02% | ||||||||||
6 | To approve the elimination of certain fundamental investment restrictions | |||||||||||||||||||
| 6b | Purchasing Securities on Margin | 47,283,554 | 89.83% | 2,333,055 | 4.43% | 3,021,825 | 5.74% | 49.26% | 2.43% | 3.15% | ||||||||||
| 6c | Investing in Restricted or Illiquid Securities | 47,328,591 | 89.91% | 2,240,528 | 4.26% | 3,069,315 | 5.83% | 49.31% | 2.33% | 3.20% | ||||||||||
| 6e | Investing in Other Investment Companies | 47,695,950 | 90.61% | 1,985,833 | 3.77% | 2,956,651 | 5.62% | 49.69% | 2.07% | 3.08% | ||||||||||
| DFA California Short-Term Municipal Bond Portfolio | ||||||||||||||||||||
| Shares Voted | Percent of Outstanding Shares Voted | |||||||||||||||||||
| For | % | Against | % | Abstain/WithHold | % | For | Against | Abstain / WithHold | ||||||||||||
Proposals: | ||||||||||||||||||||
5 | To approve amendments to certain fundamental investment restrictions | |||||||||||||||||||
| 5a | Borrowing Money | 9,590,777 | 93.26% | 364,898 | 3.55% | 328,092 | 3.19% | 50.94% | 1.94% | 1.74% | ||||||||||
| 5b | Making Loans | 9,608,945 | 93.44% | 350,863 | 3.41% | 323,958 | 3.15% | 51.03% | 1.86% | 1.72% | ||||||||||
| 5c | Investments in Real Estate | 9,582,414 | 93.18% | 377,674 | 3.67% | 323,679 | 3.15% | 50.89% | 2.01% | 1.72% | ||||||||||
| 5d | Investments in Commodities | 9,756,933 | 94.88% | 233,103 | 2.27% | 293,730 | 2.86% | 51.82% | 1.24% | 1.56% | ||||||||||
249
DIMENSIONAL INVESTMENT GROUP INC.
PERFORMANCE CHARTS
DFA International Value Portfolio Institutional Class vs.
MSCI World ex USA Index (net dividends)
October 31, 1999-October 31, 2009
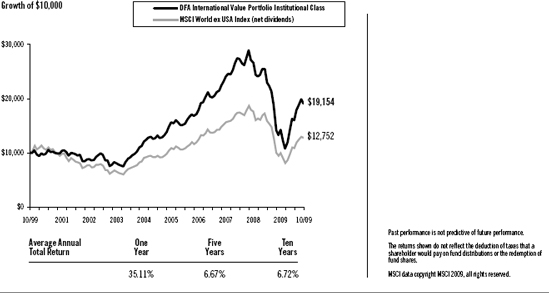
DFA International Value Portfolio Class R2 vs.
MSCI World ex USA Index (net dividends)
April 30, 2008-October 31, 2009
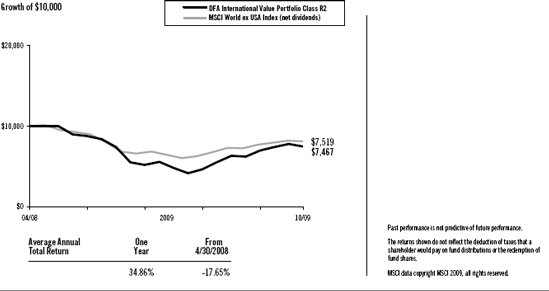
250
DIMENSIONAL INVESTMENT GROUP INC.
MANAGEMENT’S DISCUSSION AND ANALYSIS
| International Equity Market Review | 12 Months Ended October 31, 2009 |
The one-year period ending October 31, 2009, was characterized by unprecedented volatility in non-US developed markets. Non-US developed markets lost 18.87% from November 2008 through February 2009, as measured by the MSCI World ex USA Index (net dividends). From March through October 2009 these same markets gained 57.56%. In April 2009, the Index had its largest-ever monthly gain (12.90%) since October 1990.
From November 2008 through February 2009, developed markets returns were negative across all asset classes. The US dollar rallied against most currencies, reversing a general trend of depreciation dating back to 2006. From March through October 2009 the market reversed course, with small cap and value stocks strongly outperforming large cap and growth stocks. The US dollar depreciated against most major currencies. The rally drove strong positive returns for the 12-month period, with small cap stocks significantly outperforming large cap stocks and value stocks outperforming growth stocks, as measured by the MSCI indexes.
12 Months Ended October 31, 2009
Ten Largest Foreign Developed Markets by Market Cap (BB) | Local Currency Return | U.S. Dollar Return | ||
Japan ($2,432) | 6.03% | 15.20% | ||
United Kingdom ($2,328) | 23.19% | 25.68% | ||
France ($1,106) | 10.09% | 28.10% | ||
Canada ($1,060) | 17.46% | 32.58% | ||
Australia ($912) | 21.91% | 66.97% | ||
Germany ($843) | 6.37% | 23.77% | ||
Switzerland ($821) | 5.78% | 20.63% | ||
Spain ($488) | 33.27% | 55.06% | ||
Italy ($388) | 7.57% | 25.17% | ||
Netherlands ($277) | 20.17% | 39.83% |
Country market capitalizations (in parentheses) are in USD billions. Source: Returns are of MSCI indices net of foreign withholding taxes on dividends. Country market capitalizations are based on country carve-outs of the MSCI All-Country World Investable Market Index. MSCI data copyright MSCI 2009, all rights reserved.
Small company stocks were the best-performing asset class in international markets, while growth stocks had the worst relative results.
12 Months Ended October 31, 2009
| U.S. Dollar Return | ||
MSCI World ex USA Small Cap Index | 50.01% | |
MSCI World ex USA Value Index | 31.71% | |
MSCI World ex USA Index | 27.83% | |
MSCI World ex USA Growth Index | 24.03% |
Source: MSCI indices are net of foreign withholding taxes on dividends, copyright MSCI 2009, all rights reserved.
Gains in emerging markets were better, on average, than in developed markets, although results varied widely among the individual emerging markets countries. For the 12 month period, returns in U.S. dollars were 64.13% for the MSCI Emerging Markets Index (net dividends) and 27.83% for the MSCI World ex USA Index (net dividends).
251
12 Months Ended October 31, 2009
Country | U.S. Dollar Return | |
Argentina | 53.21% | |
Brazil | 91.55% | |
Chile | 61.68% | |
China | 82.16% | |
Czech Republic | 26.83% | |
Hungary | 63.54% | |
India | 77.12% | |
Indonesia | 127.39% | |
Israel | 31.43% | |
Malaysia | 56.99% | |
Mexico | 39.79% | |
Philippines | 50.71% | |
Poland | 23.09% | |
South Africa | 61.69% | |
South Korea | 56.17% | |
Taiwan | 48.86% | |
Thailand | 78.58% | |
Turkey | 68.21% |
Source: Returns are of MSCI indices net of foreign withholding taxes on dividends, copyright MSCI 2009, all rights reserved.
Master-Feeder Structure
The Portfolio described below, called a “Feeder Fund”, does not buy individual securities directly; instead, the Portfolio invests in a corresponding fund called a “Master Fund“. The Master Fund, in turn, purchases stocks and/or other securities.
International Equity Portfolio Performance Overview
DFA International Value Portfolio
The DFA International Value Portfolio seeks to capture the returns of international large company value stocks by purchasing shares of a Master Fund that invests in such stocks. The investment strategy employs a disciplined, quantitative approach, emphasizing broad diversification and consistent exposure to large cap value stocks, but does not attempt to track closely a specific equity index. As of October 31, 2009, the Master Fund held 465 stocks in 22 developed countries and was mostly invested in equities throughout the year: the average non-equitized cash level for the period was less than 1% of the Master Fund’s assets.
As a result of the Master Fund’s diversified investment approach, performance was determined principally by broad structural trends in global equity markets rather than the behavior of a limited number of stocks. For the 12 months ended October 31, 2009, value stocks outperformed growth stocks in international developed markets. Total returns were 35.11% for the Institutional Class Shares of the Portfolio, 34.86% for the Class R2 Shares of the Portfolio and 27.83% for the MSCI World ex USA Index (net dividends). The Master Fund’s greater allocation than the Index to value stocks (66% on average vs. 26% in the Index) added approximately 6.7% to the relative performance.
252
DIMENSIONAL INVESTMENT GROUP INC.
DFA INTERNATIONAL VALUE PORTFOLIO
DISCLOSURE OF FUND EXPENSES
(Unaudited)
The following Expense Table is shown so that you can understand the impact of fees on your investment. All mutual funds have operating expenses. As a shareholder of the fund, you incur ongoing costs, which include costs for portfolio management, administrative services, and shareholder reports, among others. Operating expenses, legal and audit services, which are deducted from a fund’s gross income, directly reduce the investment return of the fund. A fund’s expenses are expressed as a percentage of its average net assets. This figure is known as the expense ratio. The following examples are intended to help you understand the ongoing costs, in dollars, of investing in the fund and to compare these costs with those of other mutual funds. The examples are based on an investment of $1,000 made at the beginning of the period shown and held for the entire period.
The Expense Table below illustrates your fund’s costs in two ways.
Actual Fund Return
This section helps you to estimate the actual expenses after fee waivers that you paid over the period. The “Ending Account Value” shown is derived from the fund’s actual return and “Expenses Paid During Period” reflect the dollar amount that would have been paid by an investor who started with $1,000 in the fund. You may use the information here, together with the amount you invested, to estimate the expenses that you paid over the period.
To do so, simply divide your account value by $1,000 (for example, a $7,500 account value divided by $1,000 = 7.5), then multiply the result by the number given for your fund under the heading “Expenses Paid During Period.”
Hypothetical Example for Comparison Purposes
This section is intended to help you compare your fund’s costs with those of other mutual funds. The hypothetical “Ending Account Value” and “Expenses Paid During Period” are derived from the fund’s actual expense ratio and an assumed 5% annual return before expenses. In this case, because the return used is not the fund’s actual return, the results do not apply to your investment. The example is useful in making comparisons because the SEC requires all mutual funds to calculate expenses based on a 5% annual return. You can assess your fund’s costs by comparing this hypothetical example with the hypothetical examples that appear in shareholder reports of other funds.
Please note that the expenses shown in the table are meant to highlight and help you compare ongoing costs only and do not reflect any transactional costs, if applicable. The “Annualized Expense Ratio” represents the actual expenses for the six-month period indicated.
| Six Months Ended October 31, 2009 | ||||||||
EXPENSE TABLE | ||||||||
| Beginning Account Value 05/01/09 | Ending Account Value 10/31/09 | Annualized Expense Ratio* | Expenses Paid During Period* | |||||
Actual Fund Return | ||||||||
Class R2 Shares | $1,000.00 | $1,348.00 | 0.74% | $4.38 | ||||
Institutional Class Shares | $1,000.00 | $1,349.40 | 0.46% | $2.72 | ||||
Hypothetical 5% Annual Return | ||||||||
Class R2 Shares | $1,000.00 | $1,021.48 | 0.74% | $3.77 | ||||
Institutional Class Shares | $1,000.00 | $1,022.89 | 0.46% | $2.35 | ||||
| * | Expenses are equal to the fund’s annualized expense ratio for the six-month period, multiplied by the average account value over the period, multiplied by the number of days in the most recent six-month period (184), then divided by the number of days in the year (365) to reflect the six-month period. The Portfolio is a Feeder Fund. The expenses shown reflect the direct expenses of the Feeder Fund and the indirect payment of the Feeder Fund’s portion of the expenses of its Master Fund (Affiliated Investment Company). |
253
DIMENSIONAL INVESTMENT GROUP INC.
DFA INTERNATIONAL VALUE PORTFOLIO
DISCLOSURE OF PORTFOLIO HOLDINGS
(Unaudited)
The SEC requires that all Funds file a complete Schedule of Investments with the SEC for their first and third fiscal quarters on Form N-Q. For Dimensional Investment Group Inc., this would be for the fiscal quarters ending January 31 and July 31. The Form N-Q filing must be made within 60 days of the end of the quarter. Dimensional Investment Group Inc. filed its most recent Form N-Q with the SEC on September 29, 2009. It is available upon request, without charge, by calling collect: (512) 306-7400 or by mailing a request to Dimensional Fund Advisors LP, 6300 Bee Cave Road, Building One, Austin, Texas 78746, or by visiting the SEC’s website at http://www.sec.gov, or they may be reviewed and copied at the SEC’s Public Reference Room in Washington, D.C. (call 1-800-732-0330 for information on the operation of the Public Reference Room).
PORTFOLIO HOLDINGS
The SEC requires that all Funds present their categories of portfolio holdings in a table, chart or graph format in their annual and semi-annual shareholder reports, whether or not a Schedule of Investments is utilized. The following table, which presents portfolio holdings as a percent of total investments before short-term investments and collateral for loaned securities, is provided in compliance with such requirement.
The categories of industry classification for the Affiliated Investment Company is represented in the Disclosure of Portfolio Holdings, which is included elsewhere within the report. Refer to the Summary Schedule of Portfolio Holdings for the underlying Master Fund’s holdings which reflects the investments by country.
Affiliated Investment Company | 100.0% |
254
DIMENSIONAL INVESTMENT GROUP INC.
DFA INTERNATIONAL VALUE PORTFOLIO
STATEMENT OF ASSETS AND LIABILITIES
OCTOBER 31, 2009
(Amounts in thousands, except share and per share amounts)
ASSETS: | ||||
Investments in The DFA International Value Series of The DFA Investment Trust Company (Affiliated Investment Company) at Value† | $ | 4,442,243 | ||
Receivables: | ||||
Investment Securities Sold | 3,206 | |||
Fund Shares Sold | 6,504 | |||
Prepaid Expenses and Other Assets | 60 | |||
Total Assets | 4,452,013 | |||
LIABILITIES: | ||||
Payables: | ||||
Affiliated Investment Company Shares Sold | 85 | |||
Fund Shares Redeemed | 9,624 | |||
Due to Advisor | 777 | |||
Accrued Expenses and Other Liabilities | 238 | |||
Total Liabilities | 10,724 | |||
NET ASSETS | $ | 4,441,289 | ||
NET ASSET VALUE, OFFERING AND REDEMPTION PRICE PER SHARE: | ||||
Class R2 Shares — based on net assets of $3,443 and shares outstanding of 528,722 | $ | 6.51 | ||
NUMBER OF SHARES AUTHORIZED | 100,000,000 | |||
Institutional Class Shares — based on net assets of $4,437,846 and shares outstanding of 269,611,153 | $ | 16.46 | ||
NUMBER OF SHARES AUTHORIZED | 1,500,000,000 | |||
Investment in Affiliated Investment Company at Cost | $ | 3,454,200 | ||
NET ASSETS CONSIST OF: | ||||
Paid-In Capital | $ | 4,788,452 | ||
Undistributed Net Investment Income (Distributions in Excess of Net Investment Income) | 12,961 | |||
Accumulated Net Realized Gain (Loss) | (1,348,339 | ) | ||
Net Unrealized Foreign Exchange Gain (Loss) | 172 | |||
Net Unrealized Appreciation (Depreciation) | 988,043 | |||
NET ASSETS | $ | 4,441,289 | ||
See accompanying Notes to Financial Statements.
255
DIMENSIONAL INVESTMENT GROUP INC.
DFA INTERNATIONAL VALUE PORTFOLIO
STATEMENT OF OPERATIONS
FOR THE YEAR ENDED OCTOBER 31, 2009
(Amounts in thousands)
Investment Income | ||||
Dividends (Net of Foreign Taxes Withheld of $10,174) | $ | 113,412 | ||
Interest | 140 | |||
Income from Securities Lending | 9,229 | |||
Expenses Allocated from Affiliated Investment Company | (8,633 | ) | ||
Total Investment Income | 114,148 | |||
Expenses | ||||
Administrative Services Fees | 7,097 | |||
Accounting & Transfer Agent Fees | 82 | |||
Shareholder Servicing Fees — Class R2 Shares | 8 | |||
Filing Fees | 117 | |||
Shareholders’ Reports | 169 | |||
Directors’/Trustees’ Fees & Expenses | 58 | |||
Professional Fees | 57 | |||
Other | 49 | |||
Total Expenses | 7,637 | |||
Net Investment Income (Loss) | 106,511 | |||
Realized and Unrealized Gain (Loss) | ||||
Net Realized Gain (Loss) on: | ||||
Investment Securities Sold | 45,432 | |||
Futures | (824 | ) | ||
Foreign Currency Transactions | 2,711 | |||
Change in Unrealized Appreciation (Depreciation) of: | ||||
Investment Securities | 988,043 | |||
Translation of Foreign Currency Denominated Amounts | 172 | |||
Net Realized and Unrealized Gain (Loss) | 1,035,534 | |||
Net Increase (Decrease) in Net Assets Resulting from Operations | $ | 1,142,045 | ||
Investment Income and Realized and Unrealized Gain (Loss) were allocated from the Portfolio’s Master Fund (Affiliated Investment Company).
See accompanying Notes to Financial Statements.
256
DIMENSIONAL INVESTMENT GROUP INC.
DFA INTERNATIONAL VALUE PORTFOLIO
STATEMENTS OF CHANGES IN NET ASSETS
(Amounts in thousands)
| Year Ended Oct. 31, 2009 | Period Dec. 1, 2007 to Oct. 31, 2008 | Year Ended Nov. 30, 2007 | ||||||||||
Increase (Decrease) in Net Assets | ||||||||||||
Operations: | ||||||||||||
Net Investment Income (Loss) | $ | 106,511 | $ | 193,222 | $ | 160,985 | ||||||
Net Realized Gain (Loss) on: | ||||||||||||
Investment Securities Sold | 45,432 | 414,722 | † | 120,165 | † | |||||||
Futures | (824 | ) | — | — | ||||||||
Foreign Currency Transactions | 2,711 | — | — | |||||||||
Change in Unrealized Appreciation (Depreciation) of: | ||||||||||||
Investment Securities | 988,043 | (3,685,039 | )† | 517,981 | † | |||||||
Translation of Foreign Currency Denominated Amounts | 172 | — | — | |||||||||
Net Increase (Decrease) in Net Assets Resulting from Operations | 1,142,045 | (3,077,095 | ) | 799,131 | ||||||||
Distributions From: | ||||||||||||
Net Investment Income: | ||||||||||||
Class R2 Shares | (208 | ) | (218 | ) | — | |||||||
Institutional Class Shares | (105,492 | ) | (203,735 | ) | (140,110 | ) | ||||||
Net Short-Term Gains: | ||||||||||||
Institutional Class Shares | — | (14,929 | ) | (9,341 | ) | |||||||
Net Long-Term Gains: | ||||||||||||
Institutional Class Shares | — | (106,397 | ) | (65,358 | ) | |||||||
Total Distributions | (105,700 | ) | (325,279 | ) | (214,809 | ) | ||||||
Capital Share Transactions: | ||||||||||||
Shares Issued | 1,077,621 | 1,701,392 | 2,157,333 | |||||||||
Shares Issued in Lieu of Cash Distributions | 98,218 | 301,997 | 192,509 | |||||||||
Shares Redeemed | (1,124,340 | ) | (1,509,639 | ) | (1,128,154 | ) | ||||||
Net Increase (Decrease) from Capital Share Transactions | 51,499 | 493,750 | 1,221,688 | |||||||||
Total Increase (Decrease) in Net Assets | 1,087,844 | (2,908,624 | ) | 1,806,010 | ||||||||
Net Assets | ||||||||||||
Beginning of Period | 3,353,445 | 6,262,069 | 4,456,059 | |||||||||
End of Period | $ | 4,441,289 | $ | 3,353,445 | $ | 6,262,069 | ||||||
Undistributed Net Investment Income (Distributions in Excess of Net Investment Income) | $ | 12,961 | $ | 9,456 | $ | 20,513 | ||||||
| † | See Note A in the Notes to Financial Statements. |
See accompanying Notes to Financial Statements.
257
DIMENSIONAL INVESTMENT GROUP INC.
DFA INTERNATIONAL VALUE PORTFOLIO
FINANCIAL HIGHLIGHTS
(for a share outstanding throughout each period)
Class R2 Shares
| Year Ended Oct. 31, 2009 | Period April 30, Oct. 31, 2008 | |||||||
Net Asset Value, Beginning of Period | $ | 5.16 | $ | 10.00 | ||||
Income from Investment Operations | ||||||||
Net Investment Income (Loss) | 0.16 | (A) | 0.25 | (A) | ||||
Net Gains (Losses) on Securities (Realized and Unrealized) | 1.56 | (4.46 | ) | |||||
Total from Investment Operations | 1.72 | (4.21 | ) | |||||
Less Distributions | ||||||||
Net Investment Income | (0.37 | ) | (0.63 | ) | ||||
Net Realized Gains | — | — | ||||||
Total Distributions | (0.37 | ) | (0.63 | ) | ||||
Net Asset Value, End of Period | $ | 6.51 | $ | 5.16 | ||||
Total Return | 34.86 | % | (44.63)%( | C) | ||||
Net Assets, End of Period (thousands) | $ | 3,443 | $ | 3,372 | ||||
Ratio of Expenses to Average Net Assets (D) | 0.74 | % | 0.73%(B | )(E) | ||||
Ratio of Net Investment Income to Average Net Assets | 2.96 | % | 7.47%(B | )(E) | ||||
See page 1 & 2 for the Definitions of Abbreviations and Footnotes.
See accompanying Notes to Financial Statements.
258
DIMENSIONAL INVESTMENT GROUP INC.
DFA INTERNATIONAL VALUE PORTFOLIO
FINANCIAL HIGHLIGHTS
(for a share outstanding throughout each period)
Institutional Class Shares
Year Ended Oct. 31, 2009 | Period Dec. 1, 2007 to Oct. 31, 2008 | Year Ended Nov. 30, | Year Ended Nov. 30, 2006 | Year Ended Nov. 30, 2005 | Year Ended Nov. 30, 2004 | |||||||||||||||||||
Net Asset Value, Beginning of Period | $ | 12.54 | $ | 25.51 | $ | 22.71 | $ | 17.67 | $ | 15.73 | $ | 12.20 | ||||||||||||
Income from Investment | ||||||||||||||||||||||||
Operations | ||||||||||||||||||||||||
Net Investment Income (Loss) | 0.40 | (A) | 0.74 | (A) | 0.72 | (A) | 0.66 | (A) | 0.48 | 0.26 | ||||||||||||||
Net Gains (Losses) on Securities (Realized and Unrealized) | 3.92 | (12.44 | ) | 3.09 | 5.37 | 1.89 | 3.58 | |||||||||||||||||
Total from Investment Operations | 4.32 | (11.70 | ) | 3.81 | 6.03 | 2.37 | 3.84 | |||||||||||||||||
Less Distributions | ||||||||||||||||||||||||
Net Investment Income | (0.40 | ) | (0.78 | ) | (0.63 | ) | (0.65 | ) | (0.42 | ) | (0.31 | ) | ||||||||||||
Net Realized Gains | — | (0.49 | ) | (0.38 | ) | (0.34 | ) | (0.01 | ) | — | ||||||||||||||
Total Distributions | (0.40 | ) | (1.27 | ) | (1.01 | ) | (0.99 | ) | (0.43 | ) | (0.31 | ) | ||||||||||||
Net Asset Value, End of Period | $ | 16.46 | $ | 12.54 | $ | 25.51 | $ | 22.71 | $ | 17.67 | $ | 15.73 | ||||||||||||
Total Return | 35.11 | % | (47.96 | )%(C) | 17.09 | % | 35.39 | % | 15.40 | % | 31.86 | % | ||||||||||||
Net Assets, End of Period (thousands) | $ | 4,437,846 | $ | 3,350,073 | $ | 6,262,069 | $ | 4,456,059 | $ | 2,518,457 | $ | 1,431,989 | ||||||||||||
Ratio of Expenses to Average Net Assets (D) | 0.46 | % | 0.44 | %(B) | 0.44 | % | 0.44 | % | 0.48 | % | 0.51 | % | ||||||||||||
Ratio of Net Investment Income to Average Net Assets | 3.00 | % | 3.86 | %(B) | 2.89 | % | 3.25 | % | 2.86 | % | 1.87 | % | ||||||||||||
See page 1 & 2 for the Definitions of Abbreviations and Footnotes.
See accompanying Notes to Financial Statements.
259
DIMENSIONAL INVESTMENT GROUP INC.
DFA INTERNATIONAL VALUE PORTFOLIO
NOTES TO FINANCIAL STATEMENTS
A. Organization:
Dimensional Investment Group Inc. (the “Fund”) is an open-end management investment company registered under the Investment Company Act of 1940, whose shares are generally offered to institutional investors, retirement plans and clients of registered investment advisors. The Fund consists of fifteen portfolios, of which the DFA International Value Portfolio (the “Portfolio”) is presented in this section of the report.
The Portfolio primarily invests its assets in The DFA International Value Series (the “Series”), a corresponding series of The DFA Investment Trust Company. At October 31, 2009, the Portfolio owned 72% of the Series. The financial statements of the Series are included elsewhere in this report and should be read in conjunction with the financial statements of the Portfolio.
Class R2 shares commenced operations on April 30, 2008. As of October 31, 2009, Class R1 shares has 100,000,000 authorized shares and has not commenced operations.
On November 1, 2008, The DFAInternational Value Series, a master fund in a RIC/RIC master-feeder structure, elected with the consent of its respective Holder(s) to change its U.S. federal income tax classification from that of an association taxable as a corporation to a partnership pursuant to Treasury Regulation § 301.7701-3. The change in capital structure and retroactive reclassification of the statement of changes in net assets and financial highlights for the respective funds is a result of the treatment of a partnership for book purposes. The Series/Portfolio will maintain its books and records and present its financial statements in accordance with generally accepted accounting principles for investment partnerships.
At a regular meeting of the Board of Directors/Trustees (the “Board”) on September 16, 2008, the Board voted to change the fiscal and tax year ends of the Portfolio from November 30 to October 31.
B. Significant Accounting Policies:
The following significant accounting policies are in conformity with accounting principles generally accepted in the United States of America. Such policies are consistently followed by the Fund in preparation of its financial statements. The preparation of financial statements in accordance with accounting principles generally accepted in the United States of America requires management to make estimates and assumptions that affect the reported amounts of assets and liabilities and disclosure of contingent assets and liabilities at the date of the financial statements and the reported amounts of increases and decreases in net assets from operations during the reporting period. Actual results could differ from those estimates and those differences could be material.
1. Security Valuation: The Portfolio’s investment reflects its proportionate interest in the net assets of the Series.
The Portfolio utilizes a fair value heirarchy which prioritizes the inputs to valuation techniques used to measure fair value into three broad levels described below:
— Level 1 – quoted prices in active markets for identical securities
— Level 2 – other significant observable inputs (including quoted prices for similar securities, interest rates, prepayment speeds, credit risk, etc.)
— Level 3 – significant unobservable inputs (including the Portfolio’s own assumptions in determining the fair value of investments)
260
The inputs or methodology used for valuing securities are not necessarily an indication of the risk associated with investing in those securities. A summary of the inputs used to value the Portfolio’s net assets as of October 31, 2009 is listed below (in thousands):
| Valuation Inputs | ||||||||||
| Investments in Securities (Market Value) | ||||||||||
| Level 1 | Level 2 | Level 3 | Total | |||||||
DFA International Value Portfolio | $ | 4,442,243 | — | — | $ | 4,442,243 | ||||
2. Deferred Compensation Plan: Each eligible Director of the Fund may elect participation in the Deferred Compensation Plan (the “Plan”). Under the Plan, effective January 1, 2002, such Directors may defer payment of all or a portion of their total fees earned as a Director. These deferred amounts may be treated as though such amounts had been invested in shares of the following funds: U.S. Large Cap Value Portfolio; U.S. Core Equity 1 Portfolio; U.S. Core Equity 2 Portfolio; U.S. Vector Equity Portfolio; U.S. Micro Cap Portfolio; DFA International Value Portfolio; International Core Equity Portfolio; Emerging Markets Portfolio; Emerging Markets Core Equity Portfolio; and/or DFA Two-Year Global Fixed Income Portfolio. Contributions made under the Plan and the change in unrealized appreciation (depreciation) and income, are included in Directors’/Trustees’ Fees & Expenses. At October 31, 2009, the total liability for deferred compensation to Directors is included in Accrued Expenses and Other Liabilities on the Statement of Assets and Liabilities in the amount of $101 (in thousands).
Each Director has the option to receive their distribution of proceeds in one of the following methods upon one year’s notice: lump sum; annual installments over a period of agreed upon years; or semi-annual installments over a period of agreed upon years. As of October 31, 2009, none of the Directors have requested distribution of proceeds.
3. Other: The Portfolio recognizes its pro-rata share, on a daily basis, of net investment income and realized and unrealized gains and losses of investment securities from the Series, which is treated as a partnership for federal income tax purposes. Dividend income and distributions to shareholders are recorded on the ex-dividend date. Distributions received on securities that represent a return of capital or capital gain are recorded as a reduction of cost of investments or as a realized gain, respectively. The Portfolio estimates the character of distributions received that may be considered return of capital distributions. Expenses directly attributable to the Portfolio are directly charged. Common expenses of the Fund are allocated using methods approved by the Board of Directors/Trustees, generally based on average net assets.
Class R2 Shares and Institutional Class Shares have equal rights to assets and earnings of the Portfolio. Income, gains and losses, and common expenses of the Portfolio are allocated to each class of shares based on its relative net assets. Each class will bear its own class-specific expenses, if any.
C. Investment Advisor:
Dimensional Fund Advisors LP (“Dimensional” or the “Advisor”) provides administrative services to the Portfolio, including supervision of services provided by others, providing information to the shareholders and to the Board of Directors/Trustees, and other administrative services. The Advisor provides investment advisory services to the Series. For the year ended October 31, 2009, the Portfolio’s administrative services fees were accrued daily and paid monthly to the Advisor based on an effective annual rate of 0.20% of average daily net assets.
Pursuant to the Expense Assumption Agreement for the Class R2 shares of the DFA International Value Portfolio, the Advisor has contractually agreed to assume the Portfolio’s direct expenses (excluding management fees and custodian fees) to the extent necessary to limit the expenses of the Class R2 shares of the Portfolio to 0.79% of its average net assets on an annualized basis. At any time that the annualized expenses of the Class R2 shares of the Portfolio are less than 0.79% of its average net assets on an annualized basis, the Advisor retains the right to recover any fees previously waived and/or expenses previously assumed to the extent that such recovery will not cause the annualized expenses to exceed 0.79% of its average net assets on an annualized basis. The Portfolio is
261
not obligated to reimburse the advisor for fees previously waived or expenses previously assumed by the Advisor more than thirty-six months before the date of such reimbursement.
The Expense Assumption Agreement will remain in effect until March 1, 2010 and shall continue to remain in effect for year to year thereafter unless terminated by the Fund or the Advisor. At October 31, 2009, there were no fees subject to future recovery by the Advisor.
Fees Paid to Officers and Directors/Trustees:
Certain Officers and Directors/Trustees of the Advisor are also Officers and Directors/Trustees of the Fund; however, such Officers and Directors/Trustees (with the exception of the Chief Compliance Officer (“CCO”)) receive no compensation from the Fund. For the year ended October 31, 2009, the total related amounts paid by the Fund to the CCO were $27 (in thousands). The total related amounts paid by the Portfolio are included in Other Expenses on the Statement of Operations.
D. Federal Income Taxes:
The Portfolio has qualified and intends to continue to qualify as a regulated investment company under Subchapter M of the Internal Revenue Code for federal income tax purposes and to distribute substantially all of its taxable income and net capital gains to its shareholders. Accordingly, no provision has been made for federal income taxes.
Distributions from net investment income and from net realized capital gains are determined in accordance with U.S. federal income tax regulations, which may differ from those amounts determined under accounting principles generally accepted in the United States of America. These book/tax differences are either temporary or permanent in nature. To the extent these differences are permanent, they are charged or credited to paid-in capital, undistributed net investment income, accumulated net realized gains or unrealized appreciation, as appropriate, in the period that the differences arise. Accordingly, the following permanent differences as of October 31, 2009, primarily attributable to a reclassification of distributions, were reclassified to the following accounts. These reclassifications had no effect on net assets or net asset value per share (amounts in thousands):
| Increase (Decrease) Undistributed Net Investment Income | Increase (Decrease) Accumulated Net Realized Gains (Losses) | |
| $2,694 | $(2,694) |
The tax character of dividends and distributions declared and paid during the year ended November 30, 2007, the period December 1, 2007 to October 31, 2008 and the year ended October 31, 2009 were as follows (amounts in thousands):
| Net Investment Income and Short-Term Capital Gains | Long-Term Capital Gains | Total | ||||
2007 | $156,076 | $ 69,683 | $225,759 | |||
2008 | 218,970 | 106,309 | 325,279 | |||
2009 | 105,700 | — | 105,700 |
262
At October 31, 2009, the components of distributable earnings (accumulated losses) were as follows (amounts in thousands):
| Undistributed Net Investment Income and Short-Term Capital Gains | Undistributed Long-Term Capital Gains | Capital Loss Carryforward | Total Net Distributable Earnings (Accumulated Losses) | |||||||
| $13,063 | — | $ | (1,348,208 | ) | $ | (1,335,145 | ) | |||
For federal income tax purposes, the Fund measures its capital loss carryforwards annually at October 31, its fiscal year end. Capital loss carryforwards may be carried forward and applied against future capital gains. As of October 31, 2009, the Portfolio had capital loss carryforwards in the amount of $1,348,208 to offset future realized capital gains expiring in 2016.
For the year ended October 31, 2009, the Portfolio had utilized capital loss carryforwards to offset realized capital gains for federal income tax purposes of $44,756 (amount in thousands).
At October 31, 2009, the total cost and aggregate gross unrealized appreciation and (depreciation) of securities for federal income tax purposes were different from amounts reported for financial reporting purposes (amounts in thousands):
| Federal Tax Cost | Unrealized Appreciation | Unrealized (Depreciation) | Net Unrealized Appreciation (Depreciation) | |||||
| $ | 3,454,309 | $ | 1,035,783 | $(47,849) | $987,934 | |||
Accounting for Uncertainty in Income Taxes sets forth a minimum threshold for financial statement recognition of the benefit of a tax position taken or expected to be taken in a tax return. Management has analyzed the Portfolio’s tax positions and has concluded that no provision for income tax is required in the Portfolio’s financial statements. The Portfolio is not aware of any tax positions for which it is reasonably possible that the total amounts of unrecognized tax benefits will significantly change in the next twelve months. The Portfolio’s federal tax returns for the prior three fiscal years remains subject to examination by the Internal Revenue Service.
On November 1, 2008, The DFA International Value Series, a master fund in a RIC/RIC master-feeder structure with five RIC feeders and other direct client investor(s), made a “Check-the-box” election for federal income tax purposes pursuant to Treasury Regulation §301.7701-3, to change its federal entity classification from a corporation taxable as a regulated investment company to a partnership. As a result of this election, the master fund is deemed to have distributed all of its assets and liabilities, in a taxable transaction, to its shareholders in liquidation of the master fund. Immediately thereafter, the shareholders contributed all of the distributed assets and liabilities to a newly formed partnership. The final tax year end of The DFA International Value Series was October 31, 2008. For Federal income tax purposes, pursuant to Internal Revenue Code §336(a), the master fund recognizes gain or loss as if the master’s investment securities were sold to its shareholders and, pursuant to IRC Code §331, each of the Portfolios recognizes gain or loss as if it liquidated its investment in the master. As a result of the transaction, The DFA International Value Series recognized a ($2,309,440,866) and ($718,733) capital and currency loss respectively for tax year ended October 31, 2008. For tax purposes, pursuant to IRC Code §334(a), each of the Portfolios will take a fair market value basis in the securities deemed received by them and a new holding period for those securities commences on the deemed liquidation date.
263
E. Capital Share Transactions:
The capital share transactions by class were as follows (amounts in thousands):
| Year Ended Oct. 31, 2009 | Period Dec. 1, 2007 to Oct. 31, 2008 | Year Ended Nov. 30, 2007 | |||||||||||||||||||
| Amount | Shares | Amount | Shares | Amount | Shares | ||||||||||||||||
Class R2 Shares* | |||||||||||||||||||||
Shares Issued | $ | 1,393 | 263 | $ | 5,585 | 703 | N/A | N/A | |||||||||||||
Shares Issued in Lieu of Cash Distributions | 207 | 38 | 218 | 25 | N/A | N/A | |||||||||||||||
Shares Redeemed | (2,329 | ) | (425 | ) | (624 | ) | (75 | ) | N/A | N/A | |||||||||||
Net Increase (Decrease) — Class R2 Shares | $ | (729 | ) | (124 | ) | $ | 5,179 | 653 | N/A | N/A | |||||||||||
Institutional Class Shares | |||||||||||||||||||||
Shares Issued | $ | 1,076,228 | 84,945 | $ | 1,695,807 | 84,544 | $ | 2,157,333 | 86,715 | ||||||||||||
Shares Issued in Lieu of Cash Distributions | 98,011 | 7,185 | 301,779 | 13,697 | 192,509 | 7,988 | |||||||||||||||
Shares Redeemed | (1,122,011 | ) | (89,725 | ) | (1,509,015 | ) | (76,488 | ) | (1,128,154 | ) | (45,424 | ) | |||||||||
Net Increase (Decrease) — Institutional Class Shares | $ | 52,228 | 2,405 | $ | 488,571 | 21,753 | $ | 1,221,688 | 49,279 | ||||||||||||
| * | Class R2 Shares commenced operations on April 30, 2008. |
F. Line of Credit:
The Fund, together with other Dimensional-advised portfolios, has entered into an amended and restated $250 million unsecured discretionary line of credit effective July 8, 2009 with an affiliate of its domestic custodian bank. Each portfolio is permitted to borrow, subject to its investment limitations, up to a maximum of $250 million, as long as total borrowings under the line of credit do not exceed $250 million in the aggregate. Borrowings under the line of credit are charged interest at the current overnight Federal Funds Rate plus 1%. Each portfolio is individually, and not jointly, liable for its particular advances under the line of credit. There is no commitment fee on the unused portion of the line of credit. The agreement for the discretionary line of credit may be terminated by either party at any time. The line of credit is scheduled to expire on June 22, 2010. There were no borrowings by the Portfolio under this line of credit during the year ended October 31, 2009.
The Fund, together with other Dimensional-advised portfolios, has also entered into an additional $500 million unsecured line of credit effective January 15, 2009 with its international custodian bank. Each portfolio is permitted to borrow, subject to its investment limitations, up to a maximum of $500 million, as long as total borrowings under the line of credit do not exceed $500 million in the aggregate. Each portfolio is individually, and not jointly, liable for its particular advances under the line of credit. Borrowings under the line of credit are charged interest at rates agreed to by the parties at the time of borrowing. There is no commitment fee on the unused portion of the line of credit. The agreement of the line of credit expires on January 15, 2010. There were no borrowings by the Portfolio under this line of credit during the year ended October 31, 2009.
G. Shareholder Servicing Fees:
The Class R2 Shares pay a shareholder servicing fee in the amount of 0.25% of their annual average net assets to compensate service agents that provide shareholder servicing, record keeping, account maintenance and other services to investors in the DFA International Value Portfolio Class R2 Shares.
264
H. Indemnitees; Contractual Obligations:
Under the Fund’s organizational documents, its officers and directors are indemnified against certain liabilities arising out of the performance of their duties to the Fund.
In the normal course of business, the Fund enters into contracts that contain a variety of representations and warranties which provide general indemnification. The Fund’s maximum exposure under these arrangements is unknown as this would involve future claims that may be made against the Fund and/or its affiliates that have not yet occurred. However, based on experience, the Fund expects the risk of loss to be remote.
I. Other:
At October 31, 2009, two shareholders held approximately 89% of the outstanding shares of Class R2 shares of the Portfolio and two shareholders held approximately 46% of the outstanding shares of the Institutional Class shares of the Portfolio. One or more of the shareholders is an omnibus account, which typically holds shares for the benefit of several other underlying investors.
J. Subsequent Event Evaluations:
Management has evaluated the impact of all subsequent events on the Portfolio through December 23, 2009, the date the financial statements were available for issuance, and has determined that there are no subsequent events requiring recognition or disclosure in the financial statements.
265
REPORT OF INDEPENDENT REGISTERED PUBLIC ACCOUNTING FIRM
To the Shareholders of DFA International Value Portfolio and
Board of Directors of Dimensional Investment Group Inc.:
In our opinion, the accompanying statement of assets and liabilities, and the related statements of operations and of changes in net assets and the financial highlights present fairly, in all material respects, the financial position of DFA International Value Portfolio (one of the portfolios constituting Dimensional Investment Group Inc., hereafter referred to as the “Portfolio”) at October 31, 2009, the results of its operations for the year then ended, the changes in its net assets and the financial highlights for each of the periods indicated, in conformity with accounting principles generally accepted in the United States of America. These financial statements and financial highlights (hereafter referred to as “financial statements”) are the responsibility of the Portfolio’s management; our responsibility is to express an opinion on these financial statements based on our audits. We conducted our audits of these financial statements in accordance with the standards of the Public Company Accounting Oversight Board (United States). Those standards require that we plan and perform the audit to obtain reasonable assurance about whether the financial statements are free of material misstatement. An audit includes examining, on a test basis, evidence supporting the amounts and disclosures in the financial statements, assessing the accounting principles used and significant estimates made by management, and evaluating the overall financial statement presentation. We believe that our audits, which included confirmation of securities at October 31, 2009 by correspondence with the transfer agent of the investee fund, provide a reasonable basis for our opinion.
PricewaterhouseCoopers LLP
Philadelphia, Pennsylvania
December 23, 2009
266
RESULTS OF THE SHAREHOLDER MEETING
On June 2, 2009, June 5, 2009, and July 8, 2009, Dimensional Investment Group Inc. (“DIG”) held a Special Joint Meeting of Shareholders for the purpose of voting on several proposals affecting DIG and the Portfolio, including, among other items, the election of Directors, the amendment of certain fundamental investment limitations, and the elimination of certain fundamental investment limitations. The shareholders of the Portfolio approved each of the applicable proposals for DIG and the Portfolio presented at the Meeting. Listed below are the voting results from the Meeting. Please note that not all Proposals presented at the Meeting were voted on by the Portfolio. Additionally, the Proposal numbers reflected below correlate to the Proposal numbers presented for vote at the Meeting.
DIG
| Shares Voted | Percent of Outstanding Shares Voted | |||||||||||||||||||
| For | % | Against | % | Abstain/WithHold | % | For | Against | Abstain / WithHold | ||||||||||||
Proposal 1: Election of Directors for DIG* | ||||||||||||||||||||
| 1a | David G. Booth | 754,612,895 | 96.26% | — | 0.00% | 29,301,677 | 3.74% | 85.87% | 0.00% | 3.33% | ||||||||||
| 1b | George M. Constantinides | 753,991,785 | 96.18% | — | 0.00% | 29,922,787 | 3.82% | 85.80% | 0.00% | 3.41% | ||||||||||
| 1c | John P. Gould | 753,344,569 | 96.10% | — | 0.00% | 30,570,003 | 3.90% | 85.73% | 0.00% | 3.48% | ||||||||||
| 1d | Roger G. Ibbotson | 754,232,365 | 96.21% | — | 0.00% | 29,682,207 | 3.79% | 85.83% | 0.00% | 3.38% | ||||||||||
| 1e | Robert C. Merton | 754,598,874 | 96.26% | — | 0.00% | 29,315,698 | 3.74% | 85.87% | 0.00% | 3.34% | ||||||||||
| 1f | Myron S. Scholes | 754,057,040 | 96.19% | — | 0.00% | 29,857,532 | 3.81% | 85.81% | 0.00% | 3.40% | ||||||||||
| 1g | Eduardo A. Repetto | 753,295,592 | 96.09% | — | 0.00% | 30,618,979 | 3.91% | 85.72% | 0.00% | 3.48% | ||||||||||
| 1h | Abbie J. Smith | 754,123,603 | 96.20% | — | 0.00% | 29,790,969 | 3.80% | 85.82% | 0.00% | 3.39% | ||||||||||
| Shares Voted | Percent of Outstanding Shares Voted | |||||||||||||||||||||
| For | % | Against | % | Abstain/WithHold | % | NonVote | % | For | Against | Abstain / WithHold | ||||||||||||
Proposal 2: To approve Articles of Amendment and Restatement for DIG* | 479,705,048 | 93.81% | 7,503,436 | 1.47% | 24,156,664 | 4.72% | NA | NA | 54.59% | 0.85% | 2.75% | |||||||||||
| * | Results are for all Portfolios within DIG |
DFA International Value Portfolio
| Shares Voted | Percent of Outstanding Shares Voted | |||||||||||||||||||||||||
| For | % | Against | % | Abstain/WithHold | % | NonVote | % | For | Against | Abstain / WithHold | Non-Vote | |||||||||||||||
Proposals: | ||||||||||||||||||||||||||
5 | To approve amendments to certain fundamental investment restrictions | |||||||||||||||||||||||||
| 5a | Borrowing Money | 127,614,315 | 85.58% | 14,496,066 | 9.72% | 7,013,040 | 4.70% | NA | NA | 48.32% | 5.49% | 2.66% | NA | |||||||||||||
| 5b | Making Loans | 127,641,188 | 85.59% | 14,331,582 | 9.61% | 7,150,651 | 4.80% | NA | NA | 48.33% | 5.43% | 2.71% | NA | |||||||||||||
| 5c | Investments in Real Estate | 129,571,288 | 86.89% | 12,561,171 | 8.42% | 6,990,962 | 4.69% | NA | NA | 49.06% | 4.76% | 2.65% | NA | |||||||||||||
| 5d | Investments in Commodities | 127,850,565 | 85.73% | 14,282,207 | 9.58% | 6,990,649 | 4.69% | NA | NA | 48.41% | 5.41% | 2.65% | NA | |||||||||||||
| 5e | Diversification of Investments | 128,058,001 | 85.87% | 13,639,129 | 9.15% | 7,426,291 | 4.98% | NA | NA | 48.49% | 5.16% | 2.81% | NA | |||||||||||||
6 | To approve the elimination of certain fundamental investment restrictions | |||||||||||||||||||||||||
| 6a | Pledging, Mortgaging, or Hypothecating Assets | 126,781,111 | 85.02% | 15,180,463 | 10.18% | 7,161,847 | 4.80% | NA | NA | 48.00% | 5.75% | 2.71% | NA | |||||||||||||
| 6b | Purchasing Securities on Margin | 126,743,961 | 84.99% | 15,230,781 | 10.21% | 7,148,679 | 4.79% | NA | NA | 47.99% | 5.77% | 2.71% | NA | |||||||||||||
| 6c | Investing in Restricted or Illiquid Securities | 126,892,075 | 85.09% | 15,147,599 | 10.16% | 7,083,747 | 4.75% | NA | NA | 48.05% | 5.74% | 2.68% | NA | |||||||||||||
| 6d | Investing for the Purpose of Exercising Control | 127,557,569 | 85.54% | 14,485,326 | 9.71% | 7,080,526 | 4.75% | NA | NA | 48.30% | 5.48% | 2.68% | NA | |||||||||||||
| 6e | Investing in Other Investment Companies | 127,306,100 | 85.37% | 14,765,431 | 9.90% | 7,051,890 | 4.73% | NA | NA | 48.20% | 5.59% | 2.67% | NA | |||||||||||||
| 6f | Management Ownership of Securities of an Issuer | 127,523,344 | 85.52% | 13,985,818 | 9.38% | 7,614,259 | 5.11% | NA | NA | 48.29% | 5.30% | 2.88% | NA | |||||||||||||
| 6g | Investing in Oil, Gas, or other Mineral Exploration, Leases or Development Programs | 128,355,439 | 86.07% | 13,751,004 | 9.22% | 7,016,978 | 4.71% | NA | NA | 48.60% | 5.21% | 2.66% | NA | |||||||||||||
| 6h | Investing in Securities of Unseasoned Issuers | 127,429,787 | 85.45% | 14,603,028 | 9.79% | 7,090,605 | 4.75% | NA | NA | 48.25% | 5.53% | 2.68% | NA | |||||||||||||
| 6i | Investing in Warrants | 127,537,439 | 85.52% | 13,993,622 | 9.38% | 7,592,359 | 5.09% | NA | NA | 48.29% | 5.30% | 2.87% | NA | |||||||||||||
| 6j | Writing or Acquiring Options | 127,281,114 | 85.35% | 14,227,906 | 9.54% | 7,614,401 | 5.11% | NA | NA | 48.19% | 5.39% | 2.88% | NA | |||||||||||||
8 | Approval of Investment Advisory Agreement between Dimensional Fund Advisors LP and the Company | 129,446,599 | 86.81% | 8,913,716 | 5.98% | 10,763,106 | 7.22% | NA | NA | 49.01% | 3.38% | 4.08% | NA | |||||||||||||
267
THE DFA INVESTMENT TRUST COMPANY
PERFORMANCE CHARTS
The U.S. Large Company Series vs.
S&P 500® Index
October 31, 1999-October 31, 2009
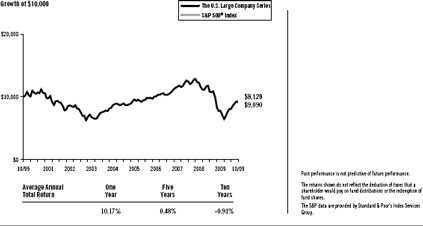
The U.S. Large Cap Value Series vs.
Russell 1000® Value Index
October 31, 1999-October 31, 2009

The DFA International Value Series vs.
MSCI World ex USA Index (net dividends)
October 31, 1999-October 31, 2009
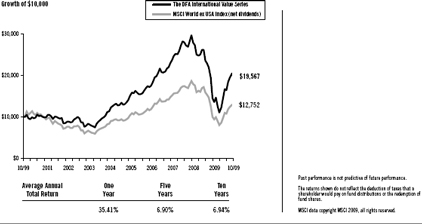
268
THE DFA INVESTMENT TRUST COMPANY
PERFORMANCE CHARTS
The Japanese Small Company Series vs.
MSCI Japan Small Cap Index (net dividends)
October 31, 1999-October 31, 2009
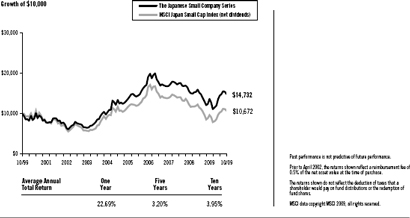
The Asia Pacific Small Company Series vs.
MSCI Pacific ex Japan Small Cap Index (net dividends)
October 31, 1999-October 31, 2009
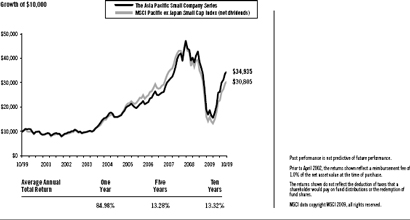
The United Kingdom Small Company Series vs.
MSCI UK Small Cap Index (net dividends)
October 31, 1999-October 31, 2009
269
THE DFA INVESTMENT TRUST COMPANY
PERFORMANCE CHARTS
The Continental Small Company Series vs.
MSCI Europe ex UK Small Cap Index (net dividends)
October 31, 1999-October 31, 2009
The Canadian Small Company Series vs.
MSCI Canada Small Cap Index (net dividends)
April 2, 2007-October 31, 2009
270
THE DFA INVESTMENT TRUST COMPANY
PERFORMANCE CHARTS
The Emerging Markets Series vs.
MSCI Emerging Markets Index (net dividends)
October 31, 1999-October 31, 2009
The Emerging Markets Small Cap Series vs.
MSCI Emerging Markets Index (net dividends)
October 31, 1999-October 31, 2009
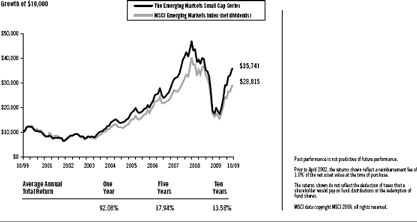
271
THE DFA INVESTMENT TRUST COMPANY
MANAGEMENT’S DISCUSSION AND ANALYSIS
| U.S. Equity Market Review | 12 Months Ended October 31, 2009 |
The year ending October 31, 2009, was among the most volatile periods in U.S. market history. Broad market returns were positive with stocks represented by the mid cap index outperforming those within both small cap and large cap indexes and stocks represented by the growth index outperforming those represented by the value index. Investors moving out of stocks, beginning in late 2008 and extending into early 2009, contributed to high volatility and negative returns over that period. Markets turned higher sharply in March, and the size and value premiums both turned positive over the eight months ending October 2009. Although the large cap index outperformed the small cap index, and the growth index outperformed the value index, returns within the broader market (Russell 3000® Index) demonstrate that there was a positive small size premium and a positive value premium. This counterintuitive result occurred because the stock markets were characterized by extreme volatility, and the indexes, which are reconstituted annually, were not able to rebalance during the course of the year to maintain their intended asset class exposure. Among the most important factors explaining differences in the behavior of diversified equity portfolios are the company size and company value/growth characteristics of the portfolio’s holdings. Size is measured by market capitalization, and value classification is a function of stock price relative to one or more fundamental characteristics. Compared to other stocks, value stocks often have lower market value relative to their earnings, dividends, and book value.
For the 12 months ended October 31, 2009, the total return of the Russell Microcap® Index was 5.06%, the Russell 2000® Index was 6.46%, the CRSP 6-10 Index was 20.94%, and the MSCI US Small Cap 1750 Index was 14.11%. Large cap growth stocks outperformed large cap value stocks, as measured by the Russell 1000® Growth Index and Russell 1000® Value Index. Small cap growth stocks outperformed small cap value stocks, by a lesser amount than in large caps, as measured by the Russell 2000® Growth Index and Russell 2000® Value Index.
Total Return for 12 Months Ended October 31, 2009
Russell 2000® Index (small cap companies) | 6.46% | |
Russell Midcap® Index (mid cap companies) | 18.74% | |
Russell 1000® Index (large cap companies) | 11.19% | |
Russell 3000® Value Index | 4.55% | |
Russell 3000® Growth Index | 17.04% |
Further dividing the large, mid, and small cap market segments by value and growth characteristics shows more detail in the performance differences over the period.
Total Return for 12 Months Ended October 31, 2009
Russell 1000® Value Index (large cap value companies) | 4.78% | |
Russell 1000® Growth Index (large cap growth companies) | 17.50% | |
Russell Midcap® Value Index (mid cap value companies) | 14.52% | |
Russell Midcap® Growth Index (mid cap growth companies) | 22.48% | |
Russell 2500TM Value Index (small/mid cap value companies) | 8.56% | |
Russell 2500TM Growth Index (small/mid cap growth companies) | 18.20% | |
Russell 2000® Value Index (small cap value companies) | 1.95% | |
Russell 2000® Growth Index (small cap growth companies) | 11.34% |
Source: Russell data copyright © Russell Investment Group 1995-2009, all rights reserved.
Differences in returns for the various Dimensional U.S. equity funds over the 12 months ended October 31, 2009 were attributable primarily to differences in value/growth and size characteristics as well as the exclusion of
272
REIT securities from most Dimensional portfolios, except for the DFA Real Estate Securities Portfolio and portfolios investing in the U.S. Large Company Series. Moreover, the portfolio construction approach used by Dimensional Fund Advisors (the “Advisor”) generally resulted in portfolios with greater emphasis on value or small company characteristics relative to widely used index benchmarks.
Domestic Equity Series’ Performance Overview
The U.S. Large Company Series
The U.S. Large Company Series seeks to approximate the returns of the S&P 500® Index by purchasing shares in S&P 500® Index stocks in approximately the same proportions as they are represented in the Index. The Series was mostly invested in equities throughout the year: the average non-equitized cash level for the period was less than 1% of the Series’ assets.
For the 12 months ended October 31, 2009, the total return was 10.17% for the Series and 9.80% for the S&P 500® Index Relative to the Index, outperformance was mostly due to the flexible trading approach employed by the Series to gain exposure to the performance of the Index during periods of index reconstitution.
The U.S. Large Cap Value Series
The U.S. Large Cap Value Series seeks to capture the returns of U.S. large company value stocks. The investment strategy employs a disciplined, quantitative approach, emphasizing broad diversification and consistent exposure to large cap value stocks, but does not attempt to track closely a specific equity index. As of October 31, 2009, the Series held 213 stocks and was mostly invested in equities throughout the year: the average non-equitized cash level for the period was less than 1% of the Series’ assets.
As a result of the Series’ diversified investment approach, performance was determined principally by broad structural trends in the U.S. equity market, rather than the behavior of a limited number of stocks. For the 12 months ended October 31, 2009, total returns were 11.90% for the Series and 4.78% for the Russell 1000® Value Index. The Series benefited from a positive size premium and value premium over the last eight months of the period. Relative to the Index, the Series’ greater exposure to stocks with more pronounced value characteristics and composition differences along the value/growth dimension added approximately 4.2% to the relative performance. Differences in sector weights between the Series and Index also contributed to the outperformance. The Series’ larger allocation than the Index to consumer discretionary stocks, due to its strategy of maintaining consistent large cap value exposure, added approximately 3% to relative performance. The Series also benefited from composition differences among the Series’ basket of financial stocks, which added approximately 3.6% to relative performance.
| International Equity Market Review | 12 Months Ended October 31, 2009 |
The one-year period ending October 31, 2009, was characterized by unprecedented volatility in non-US developed markets. Non-US developed markets lost 18.87% from November 2008 through February 2009, as measured by the MSCI World ex USA Index (net dividends). From March through October 2009 these same markets gained 57.56%. In April 2009, the Index had its largest-ever monthly gain (12.90%) since October 1990.
From November 2008 through February 2009, developed markets returns were negative across all asset classes. The US dollar rallied against most currencies, reversing a general trend of depreciation dating back to 2006. From March through October 2009 the market reversed course, with small cap and value stocks strongly outperforming large cap and growth stocks. The US dollar depreciated against most major currencies. The rally drove strong positive returns for the 12-month period, with small cap stocks significantly outperforming large cap stocks and value stocks outperforming growth stocks, as measured by the MSCI indexes.
273
12 Months Ended October 31, 2009
Ten Largest Foreign Developed Markets by Market Cap (BB) | Local Currency Return | U.S. Dollar Return | ||
Japan ($2,432) | 6.03% | 15.20% | ||
United Kingdom ($2,328) | 23.19% | 25.68% | ||
France ($1,106) | 10.09% | 28.10% | ||
Canada ($1,060) | 17.46% | 32.58% | ||
Australia ($912) | 21.91% | 66.97% | ||
Germany ($843) | 6.37% | 23.77% | ||
Switzerland ($821) | 5.78% | 20.63% | ||
Spain ($488) | 33.27% | 55.06% | ||
Italy ($388) | 7.57% | 25.17% | ||
Netherlands ($277) | 20.17% | 39.83% |
Country market capitalizations (in parentheses) are in USD billions. Source: Returns are of MSCI indices net of foreign withholding taxes on dividends. Country market capitalizations are based on country carve-outs of the MSCI All-Country World Investable Market Index. MSCI data copyright MSCI 2009, all rights reserved.
Small company stocks were the best-performing asset class in international markets, while growth stocks had the worst relative results.
12 Months Ended October 31, 2009
| U.S. Dollar Return | ||
MSCI World ex USA Small Cap Index | 50.01% | |
MSCI World ex USA Value Index | 31.71% | |
MSCI World ex USA Index | 27.83% | |
MSCI World ex USA Growth Index | 24.03% |
Source: MSCI indices are net of foreign withholding taxes on dividends, copyright MSCI 2009, all rights reserved.
Gains in emerging markets were better, on average, than in developed markets, although results varied widely among the individual emerging markets countries. For the 12 month period, returns in U.S. dollars were 64.13% for the MSCI Emerging Markets Index (net dividends) and 27.83% for the MSCI World ex USA Index (net dividends).
12 Months Ended October 31, 2009
Country | U.S. Dollar Return | |
Argentina | 53.21% | |
Brazil | 91.55% | |
Chile | 61.68% | |
China | 82.16% | |
Czech Republic | 26.83% | |
Hungary | 63.54% | |
India | 77.12% | |
Indonesia | 127.39% | |
Israel | 31.43% | |
Malaysia | 56.99% | |
Mexico | 39.79% |
274
12 Months Ended October 31, 2009
Country | U.S. Dollar Return | |
Philippines | 50.71% | |
Poland | 23.09% | |
South Africa | 61.69% | |
South Korea | 56.17% | |
Taiwan | 48.86% | |
Thailand | 78.58% | |
Turkey | 68.21% |
Source: Returns are of MSCI indices net of foreign withholding taxes on dividends, copyright MSCI 2008, all rights reserved.
International Equity Series’ Performance Overview
The DFA International Value Series
The DFA International Value Series seeks to capture the returns of international large company value stocks by purchasing shares in such stocks. The investment strategy employs a disciplined, quantitative approach, emphasizing broad diversification and consistent exposure to large cap value stocks, but does not attempt to track closely a specific equity index. As of October 31, 2009, the Series held 465 stocks in 22 developed countries and was mostly invested in equities throughout the year: the average non-equitized cash level for the period was less than 1% of the Series’ assets.
As a result of the Series’ diversified investment approach, performance principally was determined by broad structural trends in global equity markets, rather than the behavior of a limited number of stocks. For the 12 months ended October 31, 2009, value stocks outperformed growth stocks in international developed markets. Total returns were 35.41% for the Series and 27.83% for the MSCI World ex USA Index (net dividends). The Series’ greater allocation than the Index to value stocks (66% on average vs. 26% in the Index) added approximately 6.7% to the relative performance.
The Japanese Small Company Series
The Japanese Small Company Series seeks to capture the returns of Japanese small company stocks. The investment strategy employs a disciplined, quantitative approach, emphasizing broad diversification and consistent exposure to small company stocks, but does not attempt to track closely a specific equity index. As of October 31, 2009, the Series held 1,313 stocks and was mostly invested in equities throughout the year: the average non-equitized cash level for period was less than 1% of the Series’ assets.
As a result of the Series’ diversified investment approach, performance was determined principally by broad structural trends in the Japanese equity market, rather than the behavior of a limited number of stocks. Over the period, Japanese small company stocks outperformed Japanese large company stocks. For the 12 months ended October 31, 2009, total returns were 22.69% for the Series and 24.60% for the MSCI Japan Small Cap Index (net dividends). The Series holds a large number of stocks, and no single stock explained a significant amount of the performance difference. Relative to the Index, the Series underperformed primarily due to composition differences, a result of the Series’ process of continually rebalancing toward its target. Over the period, there was a wider than usual performance difference between the best and worst performing stocks within countries, industry sectors and asset classes. Consequently, slight differences in weights or in holdings between the Series and the Index had a significant impact on relative performance.
275
The Asia Pacific Small Company Series
The Asia Pacific Small Company Series seeks to capture the returns of small company stocks in developed Asia Pacific markets, excluding Japan, by purchasing shares of a Master Fund that invests in such stocks. The investments strategy employs a disciplined, quantitative approach, emphasizing broad diversification and consistent exposure to small company stocks, but does not attempt to track closely a specific equity index. As of October 31, 2009, the Series held 963 stocks, and assets were allocated mainly among four countries: Australia, Hong Kong, New Zealand, and Singapore (approximately 59%, 21%, 7%, and 13% respectively). Country allocations are determined by utilizing the approximate weights of individual securities within a universe of Asia Pacific small company stocks constructed by the Advisor. The allocations do not represent a forecast of future performance and are subject to change by the Advisor. The average non-equitized cash level for period was less than 1% of the Series’ assets.
As a result of the Series’ diversified investment approach, performance was determined principally by broad structural trends in Asia Pacific equity markets rather than the behavior of a limited number of stocks. Over the period, Asia Pacific small company stocks outperformed Asia Pacific large company stocks. For the 12 months ended October 31, 2009, total returns were 84.98% for the Series and 90.41% for the MSCI Pacific ex Japan Small Cap Index (net dividends). The Series holds a large number of stocks, and no single stock explained a significant amount of the performance difference. Relative to the Index, the Series underperformed primarily due to composition differences, a result of the Series’ process of continually rebalancing toward its target. Over the period, there was a wider than usual performance difference between the best and worst performing stocks within countries, industry sectors and asset classes. Consequently, slight differences in weights or in holdings between the Series and the Index had a significant impact on relative performance.
The United Kingdom Small Company Series
The United Kingdom Small Company Series seeks to capture the returns of U.K. small company stocks. The investment strategy employs a disciplined, quantitative approach, emphasizing broad diversification and consistent exposure to small company stocks, but does not attempt to track closely a specific equity index. As of October 31, 2009, the Series held 386 stocks and was mostly invested in equities throughout the year: the average non-equitized cash level for the period was less than 1% of the Series’ assets.
As a result of the Series’ diversified investment approach, performance was determined principally by broad structural trends in the U.K. equity market, rather than the behavior of a limited number of stocks. Over the period, U.K. small company stocks outperformed U.K. large company stocks. For the 12 months ended October 31, 2009, total returns were 43.51% for the Series and 51.09% for the MSCI UK Small Cap Index (net dividends). The Series holds a large number of stocks, and no single stock explained a significant amount of the performance difference. Relative to the Index, the Series underperformed primarily due to composition differences, a result of the Series’ process of continually rebalancing toward its target. Over the period, there was a wider than usual performance difference between the best and worst performing stocks within countries, industry sectors and asset classes. Consequently, slight differences in weights or in holdings between the Series and the Index had a significant impact on relative performance.
The Continental Small Company Series
The Continental Small Company Series seeks to capture the returns of small company stocks in developed markets of Europe, excluding the U.K., by purchasing shares in such stocks. The investment strategy employs a disciplined, quantitative approach, emphasizing broad diversification and consistent exposure to small company stocks, but does not attempt to track closely a specific equity index. As of October 31, 2009, the Series held 1,234 stocks in 15 developed continental European countries. Country allocations reflect the approximate weights of individual securities within a universe of continental European small company stocks constructed by the Advisor. Country allocations do not represent a forecast of future performance and are subject to change by the Advisor. The average non-equitized cash level for period was less than 1% of the Series’ assets.
276
As a result of the Series’ diversified investment approach, performance was determined principally by broad structural trends in the continental European equity markets, excluding the U.K., rather than the behavior of a limited number of stocks. Over the period, continental European small company stocks outperformed continental European large company stocks. For the 12 months ended October 31, 2009, total returns were 43.78% for the Series and 57.29% for the MSCI Europe ex UK Small Cap Index (net dividends). The Series holds a large number of stocks, and no single stock explained a significant amount of the performance difference. Relative to the Index, the Series underperformed primarily due to composition differences, a result of the Series’ process of continually rebalancing toward its target. Over the period, there was a wider than usual performance difference between the best and worst performing stocks within countries, industry sectors and asset classes. Consequently, slight differences in weights or in holdings between the Series and the Index had a significant impact on relative performance.
The Canadian Small Company Series
The Canadian Small Company Series seeks to capture the returns of Canadian small company stocks. The investment strategy employs a disciplined, quantitative approach, emphasizing broad diversification and consistent exposure to small company stocks, but does not attempt to track closely a specific equity index. As of October 31, 2009, the Series held 306 stocks and was mostly invested in equities throughout the year: the average non-equitized cash level for the period was less than 1% of the Series’ assets.
As a result of the Series’ diversified investment approach, performance was determined principally by broad structural trends in the Canadian equity market, rather than the behavior of a limited number of stocks. Over the period, Canadian small company stocks outperformed Canadian large company stocks. For the 12 months ended October 31, 2009, total returns were 61.67% for the Series and 63.84% for the MSCI Canada Small Cap Index (net dividends). The Series holds a large number of stocks, and no single stock explained a significant amount of the performance difference. Relative to the Index, the Portfolio underperformed primarily due to composition differences, a result of the Series’ process of continually rebalancing toward its target. Over the period, there was a wider than usual performance difference between the best and worst performing stocks within countries, industry sectors and asset classes. Consequently, slight differences in weights or in holdings between the Series and the Index had a significant impact on relative performance.
The Emerging Markets Series
The Emerging Markets Series seeks to capture the returns of large company stocks in selected emerging markets. The investment strategy employs a disciplined quantitative approach, emphasizing broad diversification and consistent exposure to large company emerging markets stocks, but does not attempt to track closely a specific equity index. As of October 31, 2009, the Series held 654 stocks in 18 emerging countries and was mostly invested in equities throughout the year: the average non-equitized cash level for the period was less than 1% of the Series’ assets. The Series’ target country weights are capped at a ceiling set by the manager in order to limit single-country risk exposure.
As a result of the Series’ diversified approach, performance was generally determined by structural trends in emerging country stock markets, rather than the behavior of a limited number of stocks. For the 12 months ended October 31, 2009, total returns were 53.99% for the Series and 64.13% for the MSCI Emerging Markets Index (net dividends). The Series’ relative underperformance was primarily due to differences in country weights and in the composition of the Series’ holdings relative to the Index. Over the period, there was a wider than usual performance difference between the best and worst performing stocks within countries, industry sectors and asset classes. Consequently, slight differences in weights or in holdings between the Series and the Index had a significant impact on relative performance.
The Emerging Markets Small Cap Series
The Emerging Markets Small Cap Series seeks to capture the returns of small company stocks in selected emerging markets. The investment strategy employs a disciplined quantitative approach, emphasizing broad diversification and consistent exposure to emerging markets small company stocks, but does not attempt to track closely a specific equity index. As of October 31, 2009, the Series held 2,152 stocks in 16 emerging countries and
277
was mostly invested in equities throughout the year: the average non-equitized cash level for the period was less than 1% of the Series’ assets. The Series’ target country weights are capped at a ceiling set by the manager in order to limit single-country risk exposure.
As a result of the Series’ diversified approach, performance was principally determined by structural trends in emerging country stock markets, rather than the behavior of a limited number of stocks. For the 12 months ended October 31, 2009, total returns were 92.08% for the Series and 64.13% for the MSCI Emerging Markets Index (net dividends). The Series’ outperformance was primarily because small cap stocks dramatically outperformed large cap stocks during the period. Also, over the period, there was a wider than usual performance difference between the best and worst performing stocks within countries, industry sectors, and asset classes. Consequently, slight differences in weights or in holdings between the Series and the Index had a significant impact on relative performance.
278
THE DFA INVESTMENT TRUST COMPANY
DISCLOSURE OF FUND EXPENSES
(Unaudited)
The following Expense Tables are shown so that you can understand the impact of fees on your investment. All mutual funds have operating expenses. As a shareholder of the fund, you incur ongoing costs, which include costs for portfolio management, administrative services, and shareholder reports, among others. Operating expenses, legal and audit services, which are deducted from a fund’s gross income, directly reduce the investment return of the fund. A fund’s expenses are expressed as a percentage of its average net assets. This figure is known as the expense ratio. The following examples are intended to help you understand the ongoing costs, in dollars, of investing in the fund and to compare these costs with those of other mutual funds. The examples are based on an investment of $1,000 made at the beginning of the period shown and held for the entire period.
The Expense Tables below illustrate your fund’s costs in two ways.
Actual Fund Return
This section helps you to estimate the actual expenses after fee waivers that you paid over the period. The “Ending Account Value” shown is derived from the fund’s actual return and “Expenses Paid During Period” reflect the dollar amount that would have been paid by an investor who started with $1,000 in the fund. You may use the information here, together with the amount you invested, to estimate the expenses that you paid over the period.
To do so, simply divide your account value by $1,000 (for example, a $7,500 account value divided by $1,000 = 7.5), then multiply the result by the number given for your fund under the heading “Expenses Paid During Period.”
Hypothetical Example for Comparison Purposes
This section is intended to help you compare your fund’s costs with those of other mutual funds. The hypothetical “Ending Account Value” and “Expenses Paid During Period” are derived from the fund’s actual expense ratio and an assumed 5% annual return before expenses. In this case, because the return used is not the fund’s actual return, the results do not apply to your investment. The example is useful in making comparisons because the SEC requires all mutual funds to calculate expenses based on a 5% annual return. You can assess your fund’s costs by comparing this hypothetical example with the hypothetical examples that appear in shareholder reports of other funds.
Please note that the expenses shown in the tables are meant to highlight and help you compare ongoing costs only and do not reflect any transactional costs, if applicable. The “Annualized Expense Ratio” represents the actual expenses for the six-month period indicated.
Six Months Ended October 31, 2009
EXPENSE TABLES
| Beginning Account Value 05/01/09 | Ending Account Value 10/31/09 | Annualized Expense Ratio* | Expenses Paid During Period* | |||||
The U.S. Large Company Series | ||||||||
Actual Fund Return | $1,000.00 | $1,200.50 | 0.06% | $0.33 | ||||
Hypothetical 5% Annual Return | $1,000.00 | $1,024.90 | 0.06% | $0.31 | ||||
The U.S. Large Cap Value Series | ||||||||
Actual Fund Return | $1,000.00 | $1,242.20 | 0.14% | $0.79 | ||||
Hypothetical 5% Annual Return | $1,000.00 | $1,024.50 | 0.14% | $0.71 | ||||
279
DISCLOSURE OF FUND EXPENSES
CONTINUED
| Beginning Account Value 05/01/09 | Ending Account Value 10/31/09 | Annualized Expense Ratio* | Expenses Paid During Period* | |||||
The DFA International Value Series | ||||||||
Actual Fund Return | $1,000.00 | $1,350.50 | 0.25% | $1.48 | ||||
Hypothetical 5% Annual Return | $1,000.00 | $1,023.95 | 0.25% | $1.28 | ||||
The Japanese Small Company Series | ||||||||
Actual Fund Return | $1,000.00 | $1,228.70 | 0.16% | $0.90 | ||||
Hypothetical 5% Annual Return | $1,000.00 | $1,024.40 | 0.16% | $0.82 | ||||
The Asia Pacific Small Company Series | ||||||||
Actual Fund Return | $1,000.00 | $1,674.70 | 0.17% | $1.15 | ||||
Hypothetical 5% Annual Return | $1,000.00 | $1,024.35 | 0.17% | $0.87 | ||||
The United Kingdom Small Company Series | ||||||||
Actual Fund Return | $1,000.00 | $1,337.60 | 0.14% | $0.82 | ||||
Hypothetical 5% Annual Return | $1,000.00 | $1,024.50 | 0.14% | $0.71 | ||||
The Continental Small Company Series | ||||||||
Actual Fund Return | $1,000.00 | $1,396.50 | 0.16% | $0.97 | ||||
Hypothetical 5% Annual Return | $1,000.00 | $1,024.40 | 0.16% | $0.82 | ||||
The Canadian Small Company Series | ||||||||
Actual Fund Return | $1,000.00 | $1,464.20 | 0.16% | $0.99 | ||||
Hypothetical 5% Annual Return | $1,000.00 | $1,024.40 | 0.16% | $0.82 | ||||
The Emerging Markets Series | ||||||||
Actual Fund Return | $1,000.00 | $1,383.70 | 0.21% | $1.26 | ||||
Hypothetical 5% Annual Return | $1,000.00 | $1,024.15 | 0.21% | $1.07 | ||||
The Emerging Markets Small Cap Series | ||||||||
Actual Fund Return | $1,000.00 | $1,509.50 | 0.34% | $2.15 | ||||
Hypothetical 5% Annual Return | $1,000.00 | $1,023.49 | 0.34% | $1.73 | ||||
| * | Expenses are equal to the fund’s annualized expense ratio for the six-month period, multiplied by the average account value over the period, multiplied by the number of days in the most recent six-month period (184), then divided by the number of days in the year (365) to reflect the six-month period. |
280
DISCLOSURE OF PORTFOLIO HOLDINGS
(Unaudited)
The SEC requires that all Funds file a complete Schedule of Investments with the SEC for their first and third fiscal quarters on Form N-Q. For The DFA Investment Trust Company, this would be for the fiscal quarters ending January 31 and July 31. The Form N-Q filing must be made within 60 days of the end of the quarter. The DFA Investment Trust Company filed its most recent Form N-Q with the SEC on September 29, 2009. It is available upon request, without charge, by calling collect: (512) 306-7400 or by mailing a request to Dimensional Fund Advisors LP, 6300 Bee Cave Road, Building One, Austin, Texas 78746, or by visiting the SEC’s website at http://www.sec.gov, or they may be reviewed and copied at the SEC’s Public Reference Room in Washington, D.C. (call 1-800-732-0330 for information on the operation of the Public Reference Room).
SEC regulations permit a fund to include in its reports to shareholders a “Summary Schedule of Portfolio Holdings” in lieu of a full Schedule of Investments. The Summary Schedule of Portfolio Holdings reports the fund’s 50 largest holdings in unaffiliated issuers and any investments that exceed one percent of the fund’s net assets at the end of the reporting period. The amendments also require that the Summary Schedule of Portfolio Holdings identify each category of investments that are held.
The fund is required to file a complete Schedule of Investments with the SEC on Form N-CSR within ten days after mailing the annual and semi-annual reports to shareholders. It will be available upon request, without charge, by calling collect: (512) 306-7400 or by mailing a request to Dimensional Fund Advisors LP, 6300 Bee Cave Road, Building One, Austin, Texas 78746, or by visiting the SEC’s website at http://www.sec.gov, or they may be reviewed and copied at the SEC’s Public Reference Room in Washington, D.C. (call 1-800-732-0330 for information on the operation of the Public Reference Room).
PORTFOLIO HOLDINGS
The SEC requires that all Funds present their categories of portfolio holdings in a table, chart or graph format in their annual and semi-annual shareholder reports, whether or not a Schedule of Investments is utilized. The following table, which presents portfolio holdings as a percent of total investments before short-term investments and collateral for loaned securities, is provided in compliance with such requirement. The categories shown below represent broad industry sectors. Each industry sector consists of one or more specific industry classifications.
DOMESTIC AND INTERNATIONAL EQUITY PORTFOLIOS
| The U.S. Large Company Series | ||
Consumer Discretionary | 9.2% | |
Consumer Staples | 11.9% | |
Energy | 12.4% | |
Financials | 13.6% | |
Health Care | 12.6% | |
Industrials | 10.0% | |
Information Technology | 19.0% | |
Materials | 3.4% | |
Real Estate Investment Trusts | 1.1% | |
Telecommunication Services | 3.1% | |
Utilities | 3.7% | |
| 100.0% | ||
| The U.S. Large Cap Value Series | ||
Consumer Discretionary | 16.7% | |
Consumer Staples | 6.4% | |
Energy | 13.9% | |
Financials | 31.3% | |
Health Care | 5.5% | |
Industrials | 14.7% | |
Information Technology | 3.6% | |
Materials | 3.8% | |
Telecommunication Services | 3.6% | |
Utilities | 0.5% | |
| 100.0% | ||
| The DFA International Value Series | ||
Consumer Discretionary | 13.2% | |
Consumer Staples | 4.9% | |
Energy | 6.0% | |
Financials | 42.8% | |
Health Care | 0.4% | |
Industrials | 10.3% | |
Information Technology | 3.1% | |
Materials | 11.2% | |
Other | — | |
Telecommunication Services | 6.9% | |
Utilities | 1.2% | |
| 100.0% | ||
281
DISCLOSURE OF PORTFOLIO HOLDINGS
CONTINUED
| The Japanese Small Company Series | ||
Consumer Discretionary | 21.1% | |
Consumer Staples | 10.4% | |
Energy | 1.4% | |
Financials | 10.4% | |
Health Care | 4.0% | |
Industrials | 27.4% | |
Information Technology | 11.5% | |
Materials | 12.9% | |
Other | — | |
Telecommunication Services | 0.1% | |
Utilities | 0.8% | |
| 100.0% | ||
| The Asia Pacific Small Company Series | ||
Consumer Discretionary | 23.1% | |
Consumer Staples | 4.1% | |
Energy | 6.8% | |
Financials | 13.0% | |
Health Care | 6.6% | |
Industrials | 23.4% | |
Information Technology | 5.0% | |
Materials | 12.3% | |
Other | 0.1% | |
Real Estate Investment Trusts | 0.2% | |
Telecommunication Services | 1.8% | |
Utilities | 3.6% | |
| 100.0% | ||
| The United Kingdom Small Company Series | ||
Consumer Discretionary | 21.0% | |
Consumer Staples | 4.3% | |
Energy | 5.3% | |
Financials | 14.2% | |
Health Care | 3.6% | |
Industrials | 33.0% | |
Information Technology | 13.0% | |
Materials | 4.4% | |
Other | — | |
Telecommunication Services | 0.7% | |
Utilities | 0.5% | |
| 100.0% | ||
| The Continental Small Company Series | ||
Consumer Discretionary | 14.2% | |
Consumer Staples | 7.0% | |
Energy | 5.4% | |
Financials | 17.3% | |
Health Care | 8.3% | |
Industrials | 25.8% | |
Information Technology | 8.6% | |
Materials | 9.6% | |
Other | — | |
Telecommunication Services | 1.0% | |
Utilities | 2.8% | |
| 100.0% | ||
| The Canadian Small Company Series | ||
Consumer Discretionary | 13.6% | |
Consumer Staples | 2.8% | |
Energy | 20.6% | |
Financials | 7.8% | |
Health Care | 4.9% | |
Industrials | 7.9% | |
Information Technology | 6.4% | |
Materials | 35.2% | |
Telecommunication Services | 0.4% | |
Utilities | 0.4% | |
| 100.0% | ||
| The Emerging Markets Series | ||
Consumer Discretionary | 6.3% | |
Consumer Staples | 8.5% | |
Energy | 12.9% | |
Financials | 20.7% | |
Health Care | 3.4% | |
Industrials | 6.5% | |
Information Technology | 13.7% | |
Materials | 13.5% | |
Other | — | |
Telecommunication Services | 10.7% | |
Utilities | 3.8% | |
| 100.0% | ||
| The Emerging Markets Small Cap Series | ||
Consumer Discretionary | 19.3% | |
Consumer Staples | 10.9% | |
Energy | 1.3% | |
Financials | 15.0% | |
Health Care | 4.8% | |
Industrials | 17.6% | |
Information Technology | 9.3% | |
Materials | 15.9% | |
Other | 0.2% | |
Real Estate Investment Trusts | — | |
Telecommunication Services | 1.3% | |
Utilities | 4.4% | |
| 100.0% | ||
282
SUMMARY SCHEDULE OF PORTFOLIO HOLDINGS
October 31, 2009
Shares | Value† | Percentage | |||||
COMMON STOCKS — (92.1%) | |||||||
Consumer Discretionary — (8.5%) | |||||||
*Amazon.com, Inc. | 126,572 | $ | 15,038,019 | 0.4% | |||
Comcast Corp. Class A | 1,092,473 | 15,840,859 | 0.4% | ||||
Disney (Walt) Co. | 707,515 | 19,364,686 | 0.6% | ||||
#Home Depot, Inc. | 648,891 | 16,280,675 | 0.5% | ||||
McDonald’s Corp. | 415,454 | 24,349,759 | 0.7% | ||||
Other Securities | 227,637,040 | 6.5% | |||||
Total Consumer Discretionary | 318,511,038 | 9.1% | |||||
Consumer Staples — (11.0%) | |||||||
Coca-Cola Co. | 882,204 | 47,030,295 | 1.3% | ||||
Colgate-Palmolive Co. | 189,741 | 14,919,335 | 0.4% | ||||
CVS Caremark Corp. | 549,409 | 19,394,138 | 0.6% | ||||
Kraft Foods, Inc. | 561,489 | 15,452,177 | 0.4% | ||||
PepsiCo, Inc. | 593,045 | 35,908,875 | 1.0% | ||||
Philip Morris International, Inc. | 736,409 | 34,876,330 | 1.0% | ||||
Procter & Gamble Co. | 1,111,163 | 64,447,454 | 1.8% | ||||
Wal-Mart Stores, Inc. | 822,201 | 40,846,946 | 1.2% | ||||
Other Securities | 141,728,671 | 4.1% | |||||
Total Consumer Staples | 414,604,221 | 11.8% | |||||
Energy — (11.4%) | |||||||
Chevron Corp. | 763,458 | 58,435,075 | 1.7% | ||||
ConocoPhillips | 564,511 | 28,327,162 | 0.8% | ||||
Exxon Mobil Corp. | 1,829,468 | 131,117,972 | 3.7% | ||||
Occidental Petroleum Corp. | 308,646 | 23,420,058 | 0.7% | ||||
Schlumberger, Ltd. | 455,987 | 28,362,391 | 0.8% | ||||
Other Securities | 159,417,519 | 4.5% | |||||
Total Energy | 429,080,177 | 12.2% | |||||
Financials — (12.5%) | |||||||
American Express Co. | 452,705 | 15,772,242 | 0.4% | ||||
Bank of America Corp. | 3,293,490 | 48,019,084 | 1.4% | ||||
Citigroup, Inc. | 4,964,744 | 20,305,803 | 0.6% | ||||
Goldman Sachs Group, Inc. | 194,617 | 33,117,975 | 0.9% | ||||
JPMorgan Chase & Co. | 1,497,052 | 62,531,862 | 1.8% | ||||
Morgan Stanley | 517,407 | 16,619,113 | 0.5% | ||||
#U.S. Bancorp | 727,850 | 16,900,677 | 0.5% | ||||
Wells Fargo & Co. | 1,778,388 | 48,941,238 | 1.4% | ||||
Other Securities | 209,712,141 | 6.0% | |||||
Total Financials | 471,920,135 | 13.5% | |||||
Health Care — (11.7%) | |||||||
Abbott Laboratories | 588,498 | 29,760,344 | 0.8% | ||||
*Amgen, Inc. | 386,571 | 20,770,460 | 0.6% | ||||
Bristol-Myers Squibb Co. | 754,098 | 16,439,336 | 0.5% | ||||
*Gilead Sciences, Inc. | 344,234 | 14,647,157 | 0.4% | ||||
Johnson & Johnson | 1,049,083 | 61,948,351 | 1.8% | ||||
Medtronic, Inc. | 421,338 | 15,041,767 | 0.4% | ||||
#Merck & Co., Inc. | 802,803 | 24,830,697 | 0.7% | ||||
Pfizer, Inc. | 3,069,869 | 52,279,869 | 1.5% | ||||
Schering-Plough Corp. | 622,008 | 17,540,626 | 0.5% | ||||
Other Securities | 186,020,772 | 5.3% | |||||
Total Health Care | 439,279,379 | 12.5% | |||||
Industrials — (9.2%) | |||||||
3M Co. | 265,836 | 19,557,555 | 0.6% | ||||
283
THE U.S. LARGE COMPANY SERIES
CONTINUED
Shares | Value† | Percentage | ||||
Industrials — (Continued) | ||||||
General Electric Co. | 4,045,427 | $ 57,687,789 | 1.6% | |||
United Parcel Service, Inc. | 378,570 | 20,321,638 | 0.6% | |||
United Technologies Corp. | 358,323 | 22,018,948 | 0.6% | |||
Other Securities | 228,629,561 | 6.5% | ||||
Total Industrials | 348,215,491 | 9.9% | ||||
Information Technology — (17.5%) | ||||||
*Apple, Inc. | 341,019 | 64,282,082 | 1.8% | |||
*Cisco Sytems, Inc. | 2,195,717 | 50,172,133 | 1.4% | |||
*Google, Inc. | 91,589 | 49,102,695 | 1.4% | |||
Hewlett-Packard Co. | 902,618 | 42,838,250 | 1.2% | |||
Intel Corp. | 2,131,047 | 40,724,308 | 1.2% | |||
International Business Machines Corp. | 499,027 | 60,187,646 | 1.7% | |||
Microsoft Corp. | 2,951,141 | 81,835,140 | 2.4% | |||
Oracle Corp. | 1,486,799 | 31,371,459 | 0.9% | |||
QUALCOMM, Inc. | 632,808 | 26,204,579 | 0.8% | |||
Other Securities | 214,771,869 | 6.1% | ||||
Total Information Technology | 661,490,161 | 18.9% | ||||
Materials — (3.1%) | ||||||
Other Securities | 117,813,227 | 3.4% | ||||
Real Estate Investment Trusts — (1.0%) | ||||||
Other Securities | 37,279,130 | 1.1% | ||||
Telecommunication Services — (2.8%) | ||||||
AT&T, Inc. | 2,246,012 | 57,655,128 | 1.7% | |||
Verizon Communications, Inc. | 1,081,364 | 31,997,561 | 0.9% | |||
Other Securities | 17,544,350 | 0.5% | ||||
Total Telecommunication Services | 107,197,039 | 3.1% | ||||
Utilities — (3.4%) | ||||||
Other Securities | 127,970,719 | 3.6% | ||||
TOTAL COMMON STOCKS | 3,473,360,717 | 99.1% | ||||
Face | ||||||
| (000) | ||||||
TEMPORARY CASH INVESTMENTS — (0.7%) | ||||||
Repurchase Agreement, PNC Capital Markets, Inc. 0.19%, 11/02/09 (Collateralized by $25,855,000, FNMA 6.50%, 06/25/39 valued at $27,826,444) to be repurchased at $27,414,434 | $27,414 | 27,414,000 | 0.8% | |||
284
THE U.S. LARGE COMPANY SERIES
CONTINUED
Shares/ Face Amount | Value† | Percentage | ||||
| (000) | ||||||
SECURITIES LENDING COLLATERAL — (7.2%) | ||||||
§@DFA Short Term Investment Fund LP | 269,088,352 | $ 269,088,352 | 7.7% | |||
@Repurchase Agreement, Deutsche Bank Securities 0.08%, 11/02/09 (Collateralized by $2,507,470 FHLMC 5.793%(r), 01/01/37, valued at $1,408,594) to be repurchased at $1,367,576 | $1,368 | 1,367,567 | 0.0% | |||
TOTAL SECURITIES LENDING COLLATERAL | 270,455,919 | 7.7% | ||||
TOTAL INVESTMENTS — (100.0%) | $3,771,230,636 | 107.6% | ||||
Summary of inputs used to value the Series’ net assets as of October 31, 2009 is as follows (See Security Valuation Note):
| Valuation Inputs | |||||||||||
Investment in Securities (Market Value) | |||||||||||
| Level 1 | Level 2 | Level 3 | Total | ||||||||
Common Stocks | |||||||||||
Consumer Discretionary | $ | 318,511,038 | — | — | $ | 318,511,038 | |||||
Consumer Staples | 414,604,221 | — | — | 414,604,221 | |||||||
Energy | 429,080,177 | — | — | 429,080,177 | |||||||
Financials | 471,920,135 | — | — | 471,920,135 | |||||||
Health Care | 439,279,379 | — | — | 439,279,379 | |||||||
Industrials | 348,215,491 | — | — | 348,215,491 | |||||||
Information Technology | 661,490,161 | — | — | 661,490,161 | |||||||
Materials | 117,813,227 | — | — | 117,813,227 | |||||||
Real Estate Investment Trusts | 37,279,130 | — | — | 37,279,130 | |||||||
Telecommunication Services | 107,197,039 | — | — | 107,197,039 | |||||||
Utilities | 127,970,719 | — | — | 127,970,719 | |||||||
Temporary Cash Investments | — | $ | 27,414,000 | — | 27,414,000 | ||||||
Securities Lending Collateral | — | 270,455,919 | — | 270,455,919 | |||||||
Other Financial Instruments** | 140,905 | — | — | 140,905 | |||||||
TOTAL | $ | 3,473,501,622 | $ | 297,869,919 | — | $ | 3,771,371,541 | ||||
| ** | Other financial instruments are derivative instruments not reflected in the Schedule of Investments, such as futures and forwards which are valued at the unrealized appreciation/depreciation on the investment. |
See accompanying Notes to Financial Statements.
285
THE U.S. LARGE CAP VALUE SERIES
SUMMARY SCHEDULE OF PORTFOLIO HOLDINGS
October 31, 2009
Shares | Value† | Percentage | |||||
COMMON STOCKS — (93.1%) | |||||||
Consumer Discretionary — (15.5%) | |||||||
Carnival Corp. | 2,624,598 | $ | 76,428,294 | 1.0% | |||
CBS Corp. Class B | 3,870,469 | 45,555,420 | 0.6% | ||||
Comcast Corp. Class A | 11,512,642 | 166,933,309 | 2.2% | ||||
Comcast Corp. Special Class A | 3,396,043 | 47,612,523 | 0.6% | ||||
#Disney (Walt) Co. | 4,577,802 | 125,294,441 | 1.7% | ||||
*Liberty Media Corp. Entertainment Class A | 2,954,309 | 91,051,803 | 1.2% | ||||
*Liberty Media Corp. Interactive Class A | 3,585,265 | 40,656,905 | 0.6% | ||||
News Corp. Class A | 5,810,104 | 66,932,398 | 0.9% | ||||
Time Warner Cable, Inc. | 1,980,956 | 78,128,905 | 1.0% | ||||
Time Warner, Inc. | 6,114,193 | 184,159,493 | 2.5% | ||||
Other Securities | 325,704,783 | 4.3% | |||||
Total Consumer Discretionary | 1,248,458,274 | 16.6% | |||||
Consumer Staples — (5.9%) | |||||||
Archer-Daniels-Midland Co. | 1,723,060 | 51,898,567 | 0.7% | ||||
CVS Caremark Corp. | 4,840,631 | 170,874,274 | 2.3% | ||||
Kraft Foods, Inc. | 2,137,904 | 58,835,118 | 0.8% | ||||
Other Securities | 193,282,891 | 2.5% | |||||
Total Consumer Staples | 474,890,850 | 6.3% | |||||
Energy — (13.0%) | |||||||
Anadarko Petroleum Corp. | 2,760,568 | 168,201,408 | 2.2% | ||||
#Chesapeake Energy Corp. | 2,647,458 | 64,862,721 | 0.9% | ||||
ConocoPhillips | 5,213,766 | 261,626,778 | 3.5% | ||||
Marathon Oil Corp. | 3,280,335 | 104,872,310 | 1.4% | ||||
*National-Oilwell, Inc. | 1,160,300 | 47,560,697 | 0.6% | ||||
XTO Energy, Inc. | 2,156,495 | 89,623,932 | 1.2% | ||||
Other Securities | 306,390,542 | 4.1% | |||||
Total Energy | 1,043,138,388 | 13.9% | |||||
Financials — (29.1%) | |||||||
Allstate Corp. | 2,596,315 | 76,773,035 | 1.0% | ||||
Bank of America Corp. | 16,675,426 | 243,127,711 | 3.2% | ||||
Bank of New York Mellon Corp. | 1,972,678 | 52,591,595 | 0.7% | ||||
#Capital One Financial Corp. | 1,815,684 | 66,454,034 | 0.9% | ||||
Chubb Corp. | 1,669,873 | 81,022,238 | 1.1% | ||||
Citigroup, Inc. | 19,573,191 | 80,054,351 | 1.1% | ||||
CME Group, Inc. | 203,881 | 61,696,429 | 0.8% | ||||
JPMorgan Chase & Co. | 7,983,370 | 333,465,365 | 4.4% | ||||
#Loews Corp. | 2,592,160 | 85,800,496 | 1.1% | ||||
MetLife, Inc. | 4,663,914 | 158,712,993 | 2.1% | ||||
#Morgan Stanley | 3,619,297 | 116,251,820 | 1.5% | ||||
PNC Financial Services Group, Inc. | 1,190,568 | 58,266,398 | 0.8% | ||||
Prudential Financial, Inc. | 1,918,000 | 86,751,140 | 1.2% | ||||
Travelers Cos., Inc. (The) | 3,328,076 | 165,704,904 | 2.2% | ||||
Unum Group | 1,898,589 | 37,876,851 | 0.5% | ||||
Other Securities | 634,916,189 | 8.5% | |||||
Total Financials | 2,339,465,549 | 31.1% | |||||
Health Care — (5.1%) | |||||||
*Thermo Fisher Scientific, Inc. | 1,056,245 | 47,531,025 | 0.7% | ||||
UnitedHealth Group, Inc. | 2,406,388 | 62,445,769 | 0.8% | ||||
*WellPoint, Inc. | 2,580,122 | 120,646,505 | 1.6% | ||||
Other Securities | 181,920,544 | 2.4% | |||||
Total Health Care | 412,543,843 | 5.5% | |||||
286
THE U.S. LARGE CAP VALUE SERIES
CONTINUED
Shares | Value† | Percentage | ||||
Industrials — (13.7%) | ||||||
Burlington Northern Santa Fe Corp. | 1,930,415 | $ 145,398,858 | 1.9% | |||
#CSX Corp. | 2,287,204 | 96,474,265 | 1.3% | |||
#FedEx Corp. | 599,693 | 43,591,684 | 0.6% | |||
General Electric Co. | 18,139,800 | 258,673,548 | 3.4% | |||
Norfolk Southern Corp. | 2,186,220 | 101,921,576 | 1.4% | |||
#Northrop Grumman Corp. | 1,926,678 | 96,584,368 | 1.3% | |||
Union Pacific Corp. | 2,835,808 | 156,366,453 | 2.1% | |||
Other Securities | 203,214,199 | 2.7% | ||||
Total Industrials | 1,102,224,951 | 14.7% | ||||
Information Technology — (3.3%) | ||||||
*Computer Sciences Corp. | 946,932 | 48,018,922 | 0.7% | |||
Other Securities | 219,566,373 | 2.9% | ||||
Total Information Technology | 267,585,295 | 3.6% | ||||
Materials — (3.6%) | ||||||
#Alcoa, Inc. | 4,317,440 | 53,622,605 | 0.7% | |||
#Dow Chemical Co. | 3,993,594 | 93,769,587 | 1.3% | |||
#International Paper Co. | 1,909,245 | 42,595,256 | 0.6% | |||
#Weyerhaeuser Co. | 1,105,551 | 40,175,723 | 0.5% | |||
Other Securities | 54,072,078 | 0.7% | ||||
Total Materials | 284,235,249 | 3.8% | ||||
Telecommunication Services — (3.4%) | ||||||
#AT&T, Inc. | 8,438,300 | 216,611,161 | 2.9% | |||
Other Securities | 52,619,682 | 0.7% | ||||
Total Telecommunication Services | 269,230,843 | 3.6% | ||||
Utilities — (0.5%) | ||||||
Other Securities | 39,398,283 | 0.5% | ||||
TOTAL COMMON STOCKS | 7,481,171,525 | 99.6% | ||||
Face Amount | ||||||
| (000) | ||||||
TEMPORARY CASH INVESTMENTS — (0.5%) | ||||||
Repurchase Agreement, PNC Capital Markets, Inc. 0.19%, 11/02/09 (Collateralized by $39,850,000 FNMA 6.50%, 6/25/39, valued at $42,888,563) to be repurchased at $42,250,669 | $42,250 | 42,250,000 | 0.6% | |||
Shares/ Face Amount | ||||||
| (000) | ||||||
SECURITIES LENDING COLLATERAL — (6.4%) | ||||||
§@DFA Short Term Investment Fund LP | 512,733,772 | 512,733,772 | 6.8% | |||
@Repurchase Agreement, Deutsche Bank Securities 0.08%, 11/02/09 (Collateralized by $3,853,074 FHLMC 5.793%(r), 01/01/37 & 5.945%(r), 07/01/37, valued at $2,684,003) to be repurchased at $2,605,845 | $2,606 | 2,605,828 | 0.1% | |||
TOTAL SECURITIES LENDING COLLATERAL | 515,339,600 | 6.9% | ||||
TOTAL INVESTMENTS — (100.0%) | $8,038,761,125 | 107.1% | ||||
287
THE U.S. LARGE CAP VALUE SERIES
CONTINUED
Summary of inputs used to value the Series’ net assets as of October 31, 2009 is as follows (See Security Valuation Note):
| Valuation Inputs | |||||||||||
Investment in Securities (Market Value) | |||||||||||
| Level 1 | Level 2 | Level 3 | Total | ||||||||
Common Stocks | |||||||||||
Consumer Discretionary | $ | 1,248,458,274 | — | — | $ | 1,248,458,274 | |||||
Consumer Staples | 474,890,850 | — | — | 474,890,850 | |||||||
Energy | 1,043,138,388 | — | — | 1,043,138,388 | |||||||
Financials | 2,339,465,549 | — | — | 2,339,465,549 | |||||||
Health Care | 412,543,843 | — | — | 412,543,843 | |||||||
Industrials | 1,102,224,951 | — | — | 1,102,224,951 | |||||||
Information Technology | 267,585,295 | — | — | 267,585,295 | |||||||
Materials | 284,235,249 | — | — | 284,235,249 | |||||||
Telecommunication Services | 269,230,843 | — | — | 269,230,843 | |||||||
Utilities | 39,398,283 | — | — | 39,398,283 | |||||||
Temporary Cash Investments | — | $ | 42,250,000 | — | 42,250,000 | ||||||
Securities Lending Collateral | — | 515,339,600 | — | 515,339,600 | |||||||
TOTAL | $ | 7,481,171,525 | $ | 557,589,600 | — | $ | 8,038,761,125 | ||||
See accompanying Notes to Financial Statements.
288
THE DFA INTERNATIONAL VALUE SERIES
SUMMARY SCHEDULE OF PORTFOLIO HOLDINGS
October 31, 2009
Shares | Value†† | Percentage | |||||
COMMON STOCKS — (85.2%) | |||||||
AUSTRALIA — (4.5%) | |||||||
Australia & New Zealand Banking Group, Ltd. | 3,343,351 | $ | 68,191,374 | 1.1% | |||
National Australia Bank, Ltd. | 2,465,437 | 65,140,887 | 1.0% | ||||
Wesfarmers, Ltd. | 1,898,047 | 47,362,464 | 0.8% | ||||
Other Securities | 141,329,082 | 2.3% | |||||
TOTAL AUSTRALIA | 322,023,807 | 5.2% | |||||
AUSTRIA — (0.5%) | |||||||
Other Securities | 34,182,743 | 0.6% | |||||
BELGIUM — (0.5%) | |||||||
Other Securities | 38,019,953 | 0.6% | |||||
CANADA — (7.6%) | |||||||
EnCana Corp. | 671,498 | 37,234,767 | 0.6% | ||||
#Manulife Financial Corp. | 2,074,478 | 38,918,630 | 0.6% | ||||
*Teck Resources, Ltd. Class B | 1,418,230 | 41,168,712 | 0.7% | ||||
#Thomson Reuters Corp. | 1,832,184 | 58,281,755 | 0.9% | ||||
#Toronto Dominion Bank | 944,998 | 53,867,637 | 0.9% | ||||
Other Securities | 318,836,929 | 5.2% | |||||
TOTAL CANADA | 548,308,430 | 8.9% | |||||
DENMARK — (1.1%) | |||||||
Other Securities | 77,023,723 | 1.2% | |||||
FINLAND — (0.6%) | |||||||
Other Securities | 40,451,320 | 0.7% | |||||
FRANCE — (8.3%) | |||||||
#AXA SA | 2,818,397 | 70,093,978 | 1.1% | ||||
BNP Paribas SA | 913,891 | 68,847,185 | 1.1% | ||||
#Compagnie de Saint-Gobain SA | 846,142 | 41,232,265 | 0.7% | ||||
#Lafarge SA | 467,217 | 37,923,901 | 0.6% | ||||
#Societe Generale Paris SA | 913,312 | 60,662,002 | 1.0% | ||||
Vivendi SA | 2,686,677 | 74,534,678 | 1.2% | ||||
Other Securities | 244,803,391 | 4.0% | |||||
TOTAL FRANCE | 598,097,400 | 9.7% | |||||
GERMANY — (7.4%) | |||||||
Allianz SE | 442,712 | 50,712,808 | 0.8% | ||||
#Bayerische Motoren Werke AG | 915,762 | 44,797,554 | 0.7% | ||||
#Daimler AG | 1,684,003 | 81,364,327 | 1.3% | ||||
#Deutsche Bank AG | 774,190 | 56,245,973 | 0.9% | ||||
#Deutsche Telekom AG | 2,621,866 | 35,693,819 | 0.6% | ||||
Deutsche Telekom AG Sponsored ADR | 2,809,150 | 38,035,891 | 0.6% | ||||
Munchener Rueckversicherungs-Gesellschaft AG | 388,934 | 61,534,351 | 1.0% | ||||
Other Securities | 167,080,419 | 2.7% | |||||
TOTAL GERMANY | 535,465,142 | 8.6% | |||||
GREECE — (0.3%) | |||||||
Other Securities | 19,019,902 | 0.3% | |||||
HONG KONG — (2.7%) | |||||||
Cheung Kong Holdings, Ltd. | 3,224,000 | 41,120,708 | 0.7% | ||||
Hutchison Whampoa, Ltd. | 5,568,000 | 39,081,157 | 0.6% | ||||
Other Securities | 117,731,620 | 1.9% | |||||
TOTAL HONG KONG | 197,933,485 | 3.2% | |||||
289
THE DFA INTERNATIONAL VALUE SERIES
CONTINUED
Shares | Value†† | Percentage | |||||
IRELAND — (0.0%) | |||||||
Other Securities | $ | 57,893 | 0.0% | ||||
ITALY — (2.9%) | |||||||
#*Intesa Sanpaolo SpA | 11,201,860 | 47,142,793 | 0.8% | ||||
*UniCredito SpA | 19,413,366 | 65,038,767 | 1.0% | ||||
Other Securities | 98,411,874 | 1.6% | |||||
TOTAL ITALY | 210,593,434 | 3.4% | |||||
JAPAN — (11.7%) | |||||||
FUJIFILM Holdings Corp. | 1,257,700 | 35,755,504 | 0.6% | ||||
*Nissan Motor Co., Ltd. | 4,991,500 | 36,119,215 | 0.6% | ||||
Sony Corp. Sponsored ADR | 1,725,386 | 50,709,095 | 0.8% | ||||
Other Securities | 726,760,636 | 11.7% | |||||
TOTAL JAPAN | 849,344,450 | 13.7% | |||||
MALAYSIA — (0.0%) | |||||||
Other Securities | — | 0.0% | |||||
NETHERLANDS — (3.7%) | |||||||
#ArcelorMittal NV | 2,446,831 | 82,806,981 | 1.3% | ||||
*ING Groep NV | 3,093,625 | 40,259,293 | 0.7% | ||||
Philips Electronics NV | 3,072,622 | 77,186,781 | 1.2% | ||||
Other Securities | 69,089,143 | 1.1% | |||||
TOTAL NETHERLANDS | 269,342,198 | 4.3% | |||||
NEW ZEALAND — (0.1%) | |||||||
Other Securities | 8,185,686 | 0.1% | |||||
NORWAY — (1.0%) | |||||||
Other Securities | 75,691,447 | 1.2% | |||||
PORTUGAL — (0.2%) | |||||||
Other Securities | 13,072,321 | 0.2% | |||||
SINGAPORE — (1.6%) | |||||||
DBS Group Holdings, Ltd. | 4,164,750 | 38,138,997 | 0.6% | ||||
Other Securities | 78,569,480 | 1.3% | |||||
TOTAL SINGAPORE | 116,708,477 | 1.9% | |||||
SPAIN — (4.7%) | |||||||
Banco Santander SA | 5,654,108 | 90,987,342 | 1.5% | ||||
Banco Santander SA Sponsored ADR | 5,549,048 | 89,117,711 | 1.4% | ||||
#Repsol YPF SA Sponsored ADR | 1,332,613 | 35,447,506 | 0.6% | ||||
Other Securities | 120,997,642 | 1.9% | |||||
TOTAL SPAIN | 336,550,201 | 5.4% | |||||
SWEDEN — (2.9%) | |||||||
#Nordea Bank AB | 6,583,962 | 70,668,421 | 1.2% | ||||
Other Securities | 138,442,067 | 2.2% | |||||
TOTAL SWEDEN | 209,110,488 | 3.4% | |||||
SWITZERLAND — (6.3%) | |||||||
Credit Suisse Group AG | 1,755,349 | 93,836,004 | 1.5% | ||||
#Credit Suisse Group AG Sponsored ADR | 840,377 | 44,792,094 | 0.7% | ||||
#*Holcim, Ltd. | 650,248 | 41,384,888 | 0.7% | ||||
*UBS AG | 3,481,616 | 58,055,052 | 1.0% | ||||
Zurich Financial Services AG | 322,012 | 73,738,360 | 1.2% | ||||
Other Securities | 144,088,911 | 2.3% | |||||
TOTAL SWITZERLAND | 455,895,309 | 7.4% | |||||
290
THE DFA INTERNATIONAL VALUE SERIES
CONTINUED
Shares | Value†† | Percentage of Net Assets** | |||||
UNITED KINGDOM — (16.6%) | |||||||
*Anglo American P.L.C. | 1,329,421 | $ | 48,102,581 | 0.8% | |||
Aviva P.L.C. | 7,396,866 | 46,253,871 | 0.7% | ||||
#*Barclays P.L.C. Sponsored ADR | 2,451,654 | 51,239,569 | 0.8% | ||||
#HSBC Holdings P.L.C. Sponsored ADR | 3,278,400 | 181,590,576 | 2.9% | ||||
Kingfisher P.L.C. | 9,743,172 | 35,612,473 | 0.6% | ||||
#Royal Dutch Shell P.L.C. ADR | 2,252,783 | 131,021,859 | 2.1% | ||||
Vodafone Group P.L.C. | 34,976,333 | 77,082,062 | 1.2% | ||||
#Vodafone Group P.L.C. Sponsored ADR | 7,395,974 | 164,116,663 | 2.7% | ||||
*Xstrata P.L.C. | 3,245,577 | 46,747,872 | 0.8% | ||||
Other Securities | 419,126,814 | 6.8% | |||||
TOTAL UNITED KINGDOM | 1,200,894,340 | 19.4% | |||||
TOTAL COMMON STOCKS | 6,155,972,149 | 99.4% | |||||
RIGHTS/WARRANTS — (0.0%) | |||||||
GERMANY — (0.0%) | |||||||
Other Securities | 41,059 | 0.0% | |||||
ITALY — (0.0%) | |||||||
Other Securities | 76,976 | 0.0% | |||||
TOTAL RIGHTS/WARRANTS | 118,035 | 0.0% | |||||
Face Amount | |||||||
| (000) | Value† | ||||||
TEMPORARY CASH INVESTMENTS — (0.2%) | |||||||
Repurchase Agreement, PNC Capital Markets, Inc. 0.19%, 11/02/09 (Collateralized by $13,010,000 FNMA 6.50%, 06/25/39, valued at $14,002,013) to be repurchased at $13,790,218 | $13,790 | 13,790,000 | 0.2% | ||||
Shares/ Face Amount | |||||||
| (000) | |||||||
SECURITIES LENDING COLLATERAL — (14.6%) | |||||||
§@DFA Short Term Investment Fund LP | 1,055,086,714 | 1,055,086,714 | 17.1% | ||||
@Repurchase Agreement, Deutsche Bank Securities 0.07%, 11/02/09 (Collateralized by various corporate obligations, ranging in par value from $4,247,617 to $16,429,280, rates ranging from 5.000% to 7.000%, maturities ranging from 03/01/37 to 10/01/39, valued at $1,212,860) to be repurchased at $1,189,085 | $1,189 | 1,189,078 | 0.0% | ||||
TOTAL SECURITIES LENDING COLLATERAL | 1,056,275,792 | 17.1% | |||||
TOTAL INVESTMENTS — (100.0%) | $ | 7,226,155,976 | 116.7% | ||||
291
THE DFA INTERNATIONAL VALUE SERIES
CONTINUED
Summary of inputs used to value the Series’ net assets as of October 31, 2009 is as follows (See Security Valuation Note):
| Valuation Inputs | |||||||||||
| Investment in Securities (Market Value) | |||||||||||
| Level 1 | Level 2 | Level 3 | Total | ||||||||
Common Stocks | |||||||||||
Australia | $ | 2,073,789 | $ | 319,950,018 | — | $ | 322,023,807 | ||||
Austria | — | 34,182,743 | — | 34,182,743 | |||||||
Belgium | 3,586,620 | 34,433,333 | — | 38,019,953 | |||||||
Canada | 548,308,430 | — | — | 548,308,430 | |||||||
Denmark | — | 77,023,723 | — | 77,023,723 | |||||||
Finland | 1,516,659 | 38,934,661 | — | 40,451,320 | |||||||
France | 3,494,320 | 594,603,080 | — | 598,097,400 | |||||||
Germany | 98,912,195 | 436,552,947 | — | 535,465,142 | |||||||
Greece | 4,501,802 | 14,518,100 | — | 19,019,902 | |||||||
Hong Kong | — | 197,933,485 | — | 197,933,485 | |||||||
Ireland | 57,893 | — | — | 57,893 | |||||||
Italy | 29,729,570 | 180,863,864 | — | 210,593,434 | |||||||
Japan | 56,497,996 | 792,846,454 | — | 849,344,450 | |||||||
Malaysia | — | — | — | — | |||||||
Netherlands | 10,297,313 | 259,044,885 | — | 269,342,198 | |||||||
New Zealand | — | 8,185,686 | — | 8,185,686 | |||||||
Norway | 401,330 | 75,290,117 | — | 75,691,447 | |||||||
Portugal | — | 13,072,321 | — | 13,072,321 | |||||||
Singapore | — | 116,708,477 | — | 116,708,477 | |||||||
Spain | 131,434,682 | 205,115,519 | — | 336,550,201 | |||||||
Sweden | 7,351,053 | 201,759,435 | — | 209,110,488 | |||||||
Switzerland | 46,226,255 | 409,669,054 | — | 455,895,309 | |||||||
United Kingdom | 564,527,406 | 636,366,934 | — | 1,200,894,340 | |||||||
Rights/Warrants | |||||||||||
Germany | — | 41,059 | — | 41,059 | |||||||
Italy | 76,976 | — | — | 76,976 | |||||||
Temporary Cash Investments | — | 13,790,000 | — | 13,790,000 | |||||||
Securities Lending Collateral | — | 1,056,275,792 | — | 1,056,275,792 | |||||||
TOTAL | $ | 1,508,994,289 | $ | 5,717,161,687 | — | $ | 7,226,155,976 | ||||
See accompanying Notes to Financial Statements.
292
THE JAPANESE SMALL COMPANY SERIES
SUMMARY SCHEDULE OF PORTFOLIO HOLDINGS
October 31, 2009
Shares | Value†† | Percentage of Net Assets** | |||||
COMMON STOCKS — (87.1%) | |||||||
Consumer Discretionary — (18.4%) | |||||||
#K’s Holdings Corp. | 130,772 | $ | 4,237,998 | 0.4% | |||
Nissan Shatai Co., Ltd. | 407,023 | 3,430,896 | 0.3% | ||||
PanaHome Corp. | 440,200 | 2,756,561 | 0.2% | ||||
#Saizeriya Co., Ltd. | 168,800 | 3,256,721 | 0.3% | ||||
Shochiku Co., Ltd. | 416,400 | 3,658,864 | 0.3% | ||||
#Tomy Co., Ltd. | 313,193 | 2,764,145 | 0.2% | ||||
Other Securities | 227,372,576 | 19.2% | |||||
Total Consumer Discretionary | 247,477,761 | 20.9% | |||||
Consumer Staples — (9.1%) | |||||||
Fancl Corp. | 170,300 | 3,039,176 | 0.3% | ||||
Itoham Foods, Inc. | 693,800 | 2,742,506 | 0.2% | ||||
Life Corp. | 183,900 | 3,224,609 | 0.3% | ||||
*Megmilk Snow Brand Co., Ltd. | 180,000 | 3,549,408 | 0.3% | ||||
Morinaga Milk Industry Co., Ltd. | 852,000 | 3,975,218 | 0.3% | ||||
Nippon Flour Mills Co., Ltd. | 604,000 | 3,069,254 | 0.3% | ||||
#Nisshin Oillio Group, Ltd. (The) | 548,000 | 2,887,732 | 0.2% | ||||
Other Securities | 99,240,254 | 8.4% | |||||
Total Consumer Staples | 121,728,157 | 10.3% | |||||
Energy — (1.2%) | |||||||
Other Securities | 16,608,436 | 1.4% | |||||
Financials — (9.1%) | |||||||
Aichi Bank, Ltd. (The) | 34,100 | 2,859,215 | 0.2% | ||||
#Bank of Iwate, Ltd. (The) | 57,400 | 3,400,866 | 0.3% | ||||
Century Tokyo Leasing Corp. | 308,990 | 3,451,730 | 0.3% | ||||
#Fukui Bank, Ltd. (The) | 841,000 | 2,791,181 | 0.2% | ||||
Okasan Securities Group, Inc. | 594,000 | 2,807,164 | 0.2% | ||||
#*Senshu Ikeda Holdings, Inc. | 1,258,000 | 4,304,438 | 0.4% | ||||
Tokai Tokyo Financial Holdings, Inc. | 898,000 | 2,910,323 | 0.3% | ||||
Yamagata Bank, Ltd. | 584,500 | 2,803,136 | 0.2% | ||||
Other Securities | 96,639,604 | 8.2% | |||||
Total Financials | 121,967,657 | 10.3% | |||||
Health Care — (3.5%) | |||||||
Hogy Medical Co., Ltd. | 50,300 | 2,703,731 | 0.2% | ||||
Kaken Pharmaceutical Co., Ltd. | 348,000 | 3,148,930 | 0.3% | ||||
Kyorin Co., Ltd. | 177,000 | 2,830,803 | 0.3% | ||||
Nippon Shinyaku Co., Ltd. | 237,000 | 3,278,069 | 0.3% | ||||
Nipro Corp. | 180,100 | 3,888,012 | 0.3% | ||||
Other Securities | 31,071,410 | 2.6% | |||||
Total Health Care | 46,920,955 | 4.0% | |||||
Industrials — (23.9%) | |||||||
#Daiseki Co., Ltd. | 147,263 | 2,893,882 | 0.3% | ||||
*Ebara Corp. | 825,000 | 3,624,591 | 0.3% | ||||
#*Iseki & Co., Ltd. | 759,000 | 2,841,757 | 0.2% | ||||
Kyowa Exeo Corp. | 306,000 | 2,802,620 | 0.2% | ||||
#Meidensha Corp. | 764,050 | 3,828,337 | 0.3% | ||||
Miura Co., Ltd. | 132,100 | 3,689,039 | 0.3% | ||||
Nippon Konpo Unyu Soko Co., Ltd. | 247,000 | 2,682,995 | 0.2% | ||||
Takara Standard Co., Ltd. | 515,000 | 2,970,448 | 0.3% | ||||
#Toshiba Plant Kensetsu Co., Ltd. | 219,450 | 2,872,309 | 0.2% | ||||
Other Securities | 292,927,396 | 24.8% | |||||
Total Industrials | 321,133,374 | 27.1% | |||||
293
THE JAPANESE SMALL COMPANY SERIES
CONTINUED
Shares | Value†† | Percentage of Net Assets** | |||||
Information Technology — (10.0%) | |||||||
#*Dainippon Screen Manufacturing Co., Ltd. | 652,000 | $ | 2,771,193 | 0.2% | |||
eAccess, Ltd. | 4,312 | 3,024,281 | 0.3% | ||||
Hosiden Corp. | 243,000 | 2,942,705 | 0.3% | ||||
IT Holdings Corp. | 262,001 | 3,228,913 | 0.3% | ||||
Ryosan Co., Ltd. | 122,000 | 2,913,094 | 0.2% | ||||
Other Securities | 119,972,304 | 10.1% | |||||
Total Information Technology | 134,852,490 | 11.4% | |||||
Materials — (11.2%) | |||||||
Adeka Corp. | 341,200 | 3,127,162 | 0.2% | ||||
#FP Corp. | 63,900 | 3,165,602 | 0.3% | ||||
Hokuetsu Kishu Paper Co., Ltd. | 601,199 | 3,109,276 | 0.2% | ||||
Kureha Corp. | 627,500 | 3,384,770 | 0.3% | ||||
Nifco, Inc. | 162,700 | 3,329,607 | 0.3% | ||||
Nihon Parkerizing Co., Ltd. | 230,000 | 2,726,796 | 0.2% | ||||
#Nippon Paint Co., Ltd. | 727,200 | 4,364,964 | 0.4% | ||||
#NOF Corp. | 701,000 | 3,179,395 | 0.3% | ||||
Toagosei Co., Ltd. | 897,000 | 3,137,826 | 0.3% | ||||
Other Securities | 121,727,189 | 10.3% | |||||
Total Materials | 151,252,587 | 12.8% | |||||
Telecommunication Services — (0.0%) | |||||||
Other Securities | 596,409 | 0.1% | |||||
Utilities — (0.7%) | |||||||
#Saibu Gas Co., Ltd. | 1,291,000 | 3,693,034 | 0.3% | ||||
Other Securities | 5,914,064 | 0.5% | |||||
Total Utilities | 9,607,098 | 0.8% | |||||
TOTAL COMMON STOCKS | 1,172,144,924 | 99.1% | |||||
RIGHTS/WARRANTS — (0.0%) | |||||||
Other Securities | — | 0.0% | |||||
Face Amount | |||||||
| (000) | Value† | ||||||
TEMPORARY CASH INVESTMENTS — (0.0%) | |||||||
Repurchase Agreement, PNC Capital Markets, Inc. 0.19%, 11/02/09 (Collateralized by $115,000 FNMA 6.50%, 06/25/39, valued at $123,769) to be repurchased at $118,002 | $118 | 118,000 | 0.0% | ||||
Shares/ Face Amount | |||||||
(000) | |||||||
SECURITIES LENDING COLLATERAL — (12.9%) | |||||||
§@DFA Short Term Investment Fund LP | 172,297,110 | 172,297,110 | 14.6% | ||||
@Repurchase Agreement, Deutsche Bank Securities 0.07%, 11/02/09 (Collateralized by various corporate obligations, ranging in par value from $4,247,617 to $16,429,280, rates ranging from 5.000% to 7.000%, maturities ranging from 03/01/37 to 10/01/39, valued at $752,982) to be repurchased at $738,222 | $738 | 738,218 | 0.0% | ||||
TOTAL SECURITIES LENDING COLLATERAL | 173,035,328 | 14.6% | |||||
294
THE JAPANESE SMALL COMPANY SERIES
CONTINUED
Value† | Percentage of Net Assets** | ||||
TOTAL INVESTMENTS — (100.0%) | $ | 1,345,298,252 | 113.7% | ||
Summary of inputs used to value the Series’ net assets as of October 31, 2009 is as follows (See Security Valuation Note):
| Valuation Inputs | |||||||||||
| Investment in Securities (Market Value) | |||||||||||
| Level 1 | Level 2 | Level 3 | Total | ||||||||
Common Stocks | |||||||||||
Consumer Discretionary | — | $ | 247,477,761 | — | $ | 247,477,761 | |||||
Consumer Staples | $ | 3,549,408 | 118,178,749 | — | 121,728,157 | ||||||
Energy | — | 16,608,436 | — | 16,608,436 | |||||||
Financials | 4,304,438 | 117,663,219 | — | 121,967,657 | |||||||
Health Care | — | 46,920,955 | — | 46,920,955 | |||||||
Industrials | 176,637 | 320,956,737 | — | 321,133,374 | |||||||
Information Technology | — | 134,852,490 | — | 134,852,490 | |||||||
Materials | — | 151,252,587 | — | 151,252,587 | |||||||
Telecommunication Services | — | 596,409 | — | 596,409 | |||||||
Utilities | — | 9,607,098 | — | 9,607,098 | |||||||
Temporary Cash Investments | — | 118,000 | — | 118,000 | |||||||
Securities Lending Collateral | — | 173,035,328 | — | 173,035,328 | |||||||
TOTAL | $ | 8,030,483 | $ | 1,337,267,769 | — | $ | 1,345,298,252 | ||||
See accompanying Notes to Financial Statements.
295
THE ASIA PACIFIC SMALL COMPANY SERIES
SUMMARY SCHEDULE OF PORTFOLIO HOLDINGS
October 31, 2009
Shares | Value†† | Percentage of Net Assets** | |||||
COMMON STOCKS — (82.9%) | |||||||
AUSTRALIA — (48.9%) | |||||||
#Adelaide Brighton, Ltd. | 1,480,311 | $ | 3,724,318 | 0.5% | |||
#*Andean Resources, Ltd. | 1,464,837 | 2,876,891 | 0.4% | ||||
#APA Group, Ltd. | 1,044,302 | 2,954,348 | 0.4% | ||||
*Austar United Communications, Ltd. | 3,107,163 | 3,602,715 | 0.5% | ||||
Australian Infrastructure Fund | 2,805,723 | 4,426,075 | 0.7% | ||||
#Australian Pharmaceutical Industries, Ltd. (6002840) | 5,079,394 | 3,377,108 | 0.5% | ||||
*Australian Pharmaceutical Industries, Ltd. (60028RR) | 4,331,586 | 2,904,802 | 0.4% | ||||
Australian Worldwide Exploration, Ltd. | 1,482,305 | 3,397,856 | 0.5% | ||||
#AWB, Ltd. | 3,807,619 | 4,157,632 | 0.6% | ||||
#Bradken, Ltd. | 582,247 | 3,202,182 | 0.5% | ||||
#Campbell Brothers, Ltd. | 240,269 | 6,196,971 | 0.9% | ||||
*Centamin Egypt, Ltd. | 2,112,300 | 4,331,276 | 0.6% | ||||
#Centennial Coal Co., Ltd. | 1,196,500 | 3,341,606 | 0.5% | ||||
Challenger Financial Services Group, Ltd. | 1,750,037 | 5,754,880 | 0.8% | ||||
#ConnectEast Group, Ltd. | 8,607,304 | 3,049,683 | 0.5% | ||||
#Crane Group, Ltd. | 345,440 | 2,783,584 | 0.4% | ||||
#David Jones, Ltd. | 1,296,067 | 6,140,136 | 0.9% | ||||
#Downer EDI, Ltd. | 908,261 | 6,914,045 | 1.0% | ||||
#DUET Group, Ltd. | 2,903,270 | 4,392,324 | 0.6% | ||||
#Flight Centre, Ltd. | 192,954 | 2,910,033 | 0.4% | ||||
#*Graincorp, Ltd. Series A | 461,398 | 2,868,614 | 0.4% | ||||
#Healthscope, Ltd. | 857,741 | 3,640,247 | 0.5% | ||||
Invocare, Ltd. | 637,257 | 3,346,428 | 0.5% | ||||
#IOOF Holdings, Ltd. | 950,183 | 4,451,477 | 0.7% | ||||
#JB Hi-Fi, Ltd. | 281,420 | 5,175,392 | 0.8% | ||||
#*Karoon Gas Australia, Ltd. | 628,673 | 4,257,692 | 0.6% | ||||
Monadelphous Group, Ltd. | 302,955 | 3,598,672 | 0.5% | ||||
#*Mount Gibson Iron, Ltd. | 3,114,599 | 3,290,085 | 0.5% | ||||
Navitas, Ltd. | 1,205,167 | 4,012,073 | 0.6% | ||||
*Pacific Brands, Ltd. | 4,412,120 | 5,137,506 | 0.8% | ||||
#*PanAust, Ltd. | 8,757,197 | 3,578,848 | 0.5% | ||||
#Perpetual Trustees Australia, Ltd. | 95,745 | 3,190,548 | 0.5% | ||||
#Reece Australia, Ltd. | 238,457 | 5,244,014 | 0.8% | ||||
#*Riversdale Mining, Ltd. | 692,356 | 3,279,236 | 0.5% | ||||
#Seek, Ltd. | 666,916 | 3,584,917 | 0.5% | ||||
Sigma Pharmaceuticals, Ltd. | 4,862,235 | 4,070,078 | 0.6% | ||||
#Spark Infrastructure Group, Ltd. | 2,596,492 | 2,815,225 | 0.4% | ||||
Super Cheap Auto Group, Ltd. | 718,503 | 3,377,562 | 0.5% | ||||
*Tap Oil, Ltd. | 3,987,713 | 3,732,072 | 0.6% | ||||
#Ten Network Holdings, Ltd. | 2,056,782 | 2,807,921 | 0.4% | ||||
Tower Australia Group, Ltd. | 1,159,243 | 3,055,999 | 0.5% | ||||
Transfield Services, Ltd. | 753,413 | 2,840,717 | 0.4% | ||||
#West Australian Newspapers Holdings, Ltd. | 709,322 | 4,717,984 | 0.7% | ||||
#Wotif.com Holdings, Ltd. | 538,244 | 2,893,564 | 0.4% | ||||
Other Securities | 229,192,872 | 33.7% | |||||
TOTAL AUSTRALIA | 398,598,208 | 58.5% | |||||
HONG KONG — (17.2%) | |||||||
Daphne International Holdings, Ltd. | 4,086,000 | 3,088,086 | 0.5% | ||||
Lee & Man Paper Manufacturing, Ltd. | 1,504,400 | 2,974,469 | 0.4% | ||||
Pacific Basin Shipping, Ltd. | 3,924,000 | 2,888,627 | 0.4% | ||||
Other Securities | 131,448,120 | 19.3% | |||||
TOTAL HONG KONG | 140,399,302 | 20.6% | |||||
MALAYSIA — (0.0%) | |||||||
Other Securities | 3,780 | 0.0% | |||||
296
THE ASIA PACIFIC SMALL COMPANY SERIES
CONTINUED
Shares | Value†† | Percentage of Net Assets** | |||||
NEW ZEALAND — (5.7%) | |||||||
#Fisher & Paykel Healthcare Corp., Ltd. | 2,418,756 | $ | 5,359,380 | 0.8% | |||
Sky City Entertainment Group, Ltd. | 2,535,089 | 6,262,217 | 0.9% | ||||
Other Securities | 35,214,606 | 5.2% | |||||
TOTAL NEW ZEALAND | 46,836,203 | 6.9% | |||||
SINGAPORE — (11.1%) | |||||||
Venture Corp., Ltd. | 504,000 | 3,215,158 | 0.5% | ||||
Other Securities | 87,252,814 | 12.8% | |||||
TOTAL SINGAPORE | 90,467,972 | 13.3% | |||||
TOTAL COMMON STOCKS | 676,305,465 | 99.3% | |||||
PREFERRED STOCKS — (0.1%) | |||||||
AUSTRALIA — (0.1%) | |||||||
Other Securities | 518,901 | 0.1% | |||||
RIGHTS/WARRANTS — (0.0%) | |||||||
AUSTRALIA — (0.0%) | |||||||
Other Securities | 38,010 | 0.0% | |||||
HONG KONG — (0.0%) | |||||||
Other Securities | 311,564 | 0.0% | |||||
SINGAPORE — (0.0%) | |||||||
Other Securities | 16,019 | 0.0% | |||||
TOTAL RIGHTS/WARRANTS | 365,593 | 0.0% | |||||
Face Amount | |||||||
| (000) | Value† | ||||||
TEMPORARY CASH INVESTMENTS — (0.1%) | |||||||
Repurchase Agreement, PNC Capital Markets, Inc. 0.19%, 11/02/09 (Collateralized by $465,000 FNMA 6.50%, 06/25/39, valued at $500,456) to be repurchased at $490,008 | $490 | 490,000 | 0.1% | ||||
Shares/ Face Amount | |||||||
(000) | |||||||
SECURITIES LENDING COLLATERAL — (16.9%) | |||||||
§@DFA Short Term Investment Fund LP | 133,343,064 | 133,343,064 | 19.6% | ||||
@Repurchase Agreement, Deutsche Bank Securities 0.07%, 11/02/09 (Collateralized by various corporate obligations, ranging in par value from $4,247,617 to $16,429,280, rates ranging from 5.000% to 7.000%, maturities ranging from 03/01/37 to 10/01/39, valued at $4,861,165) to be repurchased at $4,765,876 | $4,766 | 4,765,848 | 0.7% | ||||
TOTAL SECURITIES LENDING COLLATERAL | 138,108,912 | 20.3% | |||||
TOTAL INVESTMENTS — (100.0%) | $ | 815,788,871 | 119.8% | ||||
297
THE ASIA PACIFIC SMALL COMPANY SERIES
CONTINUED
Summary of inputs used to value the Series’ net assets as of October 31, 2009 is as follows (See Security Valuation Note):
| Valuation Inputs | |||||||||||
| Investment in Securities (Market Value) | |||||||||||
| Level 1 | Level 2 | Level 3 | Total | ||||||||
Common Stocks | |||||||||||
Australia | $ | 4,134,169 | $ | 394,464,039 | — | $ | 398,598,208 | ||||
Hong Kong | 364,876 | 140,034,426 | — | 140,399,302 | |||||||
Malaysia | — | 3,780 | — | 3,780 | |||||||
New Zealand | — | 46,836,203 | — | 46,836,203 | |||||||
Singapore | 2,266,376 | 88,201,596 | — | 90,467,972 | |||||||
Preferred Stocks | |||||||||||
Australia | — | 518,901 | — | 518,901 | |||||||
Rights/Warrants | |||||||||||
Australia | 1,380 | 36,630 | — | 38,010 | |||||||
Hong Kong | 29,621 | 281,943 | — | 311,564 | |||||||
Singapore | 16,019 | — | — | 16,019 | |||||||
Temporary Cash Investments | — | 490,000 | — | 490,000 | |||||||
Securities Lending Collateral | — | 138,108,912 | — | 138,108,912 | |||||||
TOTAL | $ | 6,812,441 | $ | 808,976,430 | — | $ | 815,788,871 | ||||
See accompanying Notes to Financial Statements.
298
THE UNITED KINGDOM SMALL COMPANY SERIES
SUMMARY SCHEDULE OF PORTFOLIO HOLDINGS
October 31, 2009
Shares | Value†† | Percentage of Net Assets** | |||||
COMMON STOCKS — (96.4%) | |||||||
Consumer Discretionary — (20.2%) | |||||||
Aegis Group P.L.C. | 3,279,567 | $ | 5,895,612 | 0.8% | |||
Bellway P.L.C. | 420,170 | 5,025,477 | 0.7% | ||||
*DSG International P.L.C. | 10,089,373 | 5,051,941 | 0.7% | ||||
Halfords Group P.L.C. | 837,680 | 5,371,161 | 0.7% | ||||
Informa P.L.C. | 1,440,320 | 6,909,243 | 0.9% | ||||
United Business Media P.L.C. | 864,643 | 6,542,539 | 0.8% | ||||
WH Smith P.LC. | 588,205 | 4,851,076 | 0.6% | ||||
Other Securities | 120,525,991 | 15.6% | |||||
Total Consumer Discretionary | 160,173,040 | 20.8% | |||||
Consumer Staples — (4.2%) | |||||||
PZ Cussons P.L.C. | 1,348,567 | 5,515,893 | 0.7% | ||||
Other Securities | 27,693,553 | 3.6% | |||||
Total Consumer Staples | 33,209,446 | 4.3% | |||||
Energy — (5.2%) | |||||||
*Dana Petroleum P.L.C. | 333,328 | 6,973,969 | 0.9% | ||||
*Premier Oil P.L.C. | 335,099 | 6,460,840 | 0.8% | ||||
*Soco International P.L.C. | 258,739 | 5,459,305 | 0.7% | ||||
Other Securities | 21,961,724 | 2.9% | |||||
Total Energy | 40,855,838 | 5.3% | |||||
Financials — (13.8%) | |||||||
Aberdeen Asset Management P.L.C. | 2,558,118 | 5,538,248 | 0.7% | ||||
Amlin P.L.C. | 1,027,564 | 5,947,701 | 0.8% | ||||
Catlin Group, Ltd. | 977,375 | 5,277,316 | 0.7% | ||||
Close Brothers Group P.L.C. | 481,680 | 5,539,027 | 0.7% | ||||
#Henderson Group P.L.C. | 2,936,019 | 6,189,595 | 0.8% | ||||
Hiscox, Ltd. | 1,535,730 | 8,053,774 | 1.1% | ||||
IG Group Holdings P.L.C. | 1,241,907 | 6,140,967 | 0.8% | ||||
Jardine Lloyd Thompson Group P.L.C. | 663,478 | 4,936,106 | 0.6% | ||||
#Provident Financial P.L.C. | 485,695 | 7,409,228 | 1.0% | ||||
Other Securities | 54,027,848 | 7.0% | |||||
Total Financials | 109,059,810 | 14.2% | |||||
Health Care — (3.4%) | |||||||
SSL International P.L.C. | 753,239 | 7,822,386 | 1.0% | ||||
Other Securities | 19,383,617 | 2.5% | |||||
Total Health Care | 27,206,003 | 3.5% | |||||
Industrials — (31.8%) | |||||||
Aggreko P.L.C. | 611,546 | 7,601,086 | 1.0% | ||||
Babcock International Group P.L.C. | 853,247 | 8,470,820 | 1.1% | ||||
Carillion P.L.C. | 1,523,518 | 7,339,374 | 1.0% | ||||
Charter International P.L.C. | 614,873 | 6,992,444 | 0.9% | ||||
Chemring Group P.L.C. | 128,869 | 5,527,463 | 0.7% | ||||
De la Rue P.L.C. | 387,017 | 5,796,504 | 0.7% | ||||
Hays P.L.C. | 5,101,389 | 8,172,104 | 1.1% | ||||
#Homeserve P.L.C. | 227,284 | 6,015,087 | 0.8% | ||||
IMI P.L.C. | 1,191,221 | 8,401,977 | 1.1% | ||||
Intertek Group P.L.C. | 539,854 | 11,091,513 | 1.4% | ||||
Meggitt P.L.C. | 1,630,199 | 6,527,012 | 0.8% | ||||
Michael Page International P.L.C. | 1,235,568 | 6,511,423 | 0.8% | ||||
Qinetiq P.L.C. | 2,172,472 | 5,838,845 | 0.8% | ||||
Regus P.L.C. | 3,220,926 | 5,379,876 | 0.7% | ||||
Spirax-Sarco Engineering P.L.C. | 301,608 | 5,381,748 | 0.7% | ||||
299
THE UNITED KINGDOM SMALL COMPANY SERIES
CONTINUED
Shares | Value†† | Percentage of Net Assets** | |||||
Industrials — (Continued) | |||||||
Tomkins P.L.C. | 3,282,427 | $ | 9,005,026 | 1.2% | |||
Travis Perkins P.L.C. | 482,448 | 5,951,606 | 0.8% | ||||
Ultra Electronics Holdings P.L.C. | 267,145 | 5,766,343 | 0.7% | ||||
VT Group P.L.C. | 677,021 | 6,026,593 | 0.8% | ||||
Weir Group P.L.C. (The) | 479,090 | 5,490,425 | 0.7% | ||||
Other Securities | 115,352,022 | 15.0% | |||||
Total Industrials | 252,639,291 | 32.8% | |||||
Information Technology — (12.5%) | |||||||
ARM Holdings P.L.C. | 4,777,637 | 11,606,124 | 1.5% | ||||
Dimension Data Holdings P.L.C. | 5,615,130 | 6,524,511 | 0.8% | ||||
Halma P.L.C. | 1,486,473 | 5,547,008 | 0.7% | ||||
Logica P.L.C. | 3,037,910 | 5,759,339 | 0.8% | ||||
*Misys P.L.C. | 1,982,492 | 6,711,250 | 0.9% | ||||
Rotork P.L.C. | 350,626 | 6,524,289 | 0.8% | ||||
Spectris P.L.C. | 490,382 | 5,442,149 | 0.7% | ||||
Other Securities | 51,368,435 | 6.7% | |||||
Total Information Technology | 99,483,105 | 12.9% | |||||
Materials — (4.2%) | |||||||
Croda International P.L.C. | 484,717 | 5,935,810 | 0.7% | ||||
Mondi P.L.C. | 943,611 | 5,208,467 | 0.7% | ||||
Other Securities | 22,152,270 | 2.9% | |||||
Total Materials | 33,296,547 | 4.3% | |||||
Other — (0.0%) | |||||||
Other Securities | 295,816 | 0.0% | |||||
Telecommunication Services — (0.7%) | |||||||
Other Securities | 5,415,067 | 0.7% | |||||
Utilities — (0.4%) | |||||||
Other Securities | 3,451,570 | 0.5% | |||||
TOTAL COMMON STOCKS | 765,085,533 | 99.3% | |||||
RIGHTS/WARRANTS — (0.1%) | |||||||
Other Securities | 1,093,389 | 0.1% | |||||
TOTAL RIGHTS/WARRANTS | 1,093,389 | 0.1% | |||||
Face Amount | |||||||
| (000) | Value† | ||||||
TEMPORARY CASH INVESTMENTS — (0.3%) | |||||||
Repurchase Agreement, PNC Capital Markets, Inc. 0.19%, 11/02/09 (Collateralized by $2,070,000 FNMA 6.50%, 06/25/39,valued at $2,227,838) to be repurchased at $2,191,035 | $2,191 | 2,191,000 | 0.3% | ||||
Shares/ Face Amount | |||||||
| (000) | |||||||
SECURITIES LENDING COLLATERAL — (3.2%) | |||||||
§@DFA Short Term Investment Fund LP | 24,472,278 | 24,472,278 | 3.2% | ||||
300
THE UNITED KINGDOM SMALL COMPANY SERIES
CONTINUED
Shares/ Face Amount | Value† | Percentage of Net Assets** | |||||
| (000) | |||||||
@Repurchase Agreement, Deutsche Bank Securities 0.07%, 11/02/09 (Collateralized by various corporate obligations, ranging in par value from $4,247,617 to $16,429,280, rates ranging from 5.000% to 7.000%, maturities ranging from 03/01/37 to 10/01/39, valued at $527,028) to be repurchased at $516,697 | $517 | 516,694 | 0.1% | ||||
TOTAL SECURITIES LENDING COLLATERAL | 24,988,972 | 3.3% | |||||
TOTAL INVESTMENTS — (100.0%) | $ | 793,358,894 | 103.0% | ||||
Summary of inputs used to value the Series’ net assets as of October 31, 2009 is as follows (See Security Valuation Note):
| Valuation Inputs | |||||||||||
Investment in Securities (Market Value) | |||||||||||
| Level 1 | Level 2 | Level 3 | Total | ||||||||
Common Stocks | |||||||||||
Consumer Discretionary | — | $ | 160,173,040 | — | $ | 160,173,040 | |||||
Consumer Staples | — | 33,209,446 | — | 33,209,446 | |||||||
Energy | — | 40,855,838 | — | 40,855,838 | |||||||
Financials | $ | 626 | 109,059,184 | — | 109,059,810 | ||||||
Health Care | — | 27,206,003 | — | 27,206,003 | |||||||
Industrials | 35,451 | 252,603,840 | — | 252,639,291 | |||||||
Information Technology | — | 99,483,105 | — | 99,483,105 | |||||||
Materials | — | 33,296,547 | — | 33,296,547 | |||||||
Other | — | 295,816 | — | 295,816 | |||||||
Telecommunication Services | — | 5,415,067 | — | 5,415,067 | |||||||
Utilities | — | 3,451,570 | — | 3,451,570 | |||||||
Rights/Warrants | 415,536 | 677,853 | — | 1,093,389 | |||||||
Temporary Cash Investments | — | 2,191,000 | — | 2,191,000 | |||||||
Securities Lending Collateral | — | 24,988,972 | — | 24,988,972 | |||||||
TOTAL | $ | 451,613 | $ | 792,907,281 | — | $ | 793,358,894 | ||||
See accompanying Notes to Financial Statements.
301
THE CONTINENTAL SMALL COMPANY SERIES
SUMMARY SCHEDULE OF PORTFOLIO HOLDINGS
October 31, 2009
Shares | Value†† | Percentage of Net Assets** | |||||
COMMON STOCKS — (88.5%) | |||||||
AUSTRIA — (2.9%) | |||||||
Andritz AG | 116,739 | $ | 6,428,780 | 0.4% | |||
Other Securities | 46,101,446 | 2.8% | |||||
TOTAL AUSTRIA | 52,530,226 | 3.2% | |||||
BELGIUM — (3.8%) | |||||||
Ackermans & van Haaren NV | 81,854 | 5,925,427 | 0.4% | ||||
Bekaert SA | 56,746 | 7,297,993 | 0.5% | ||||
Other Securities | 56,164,707 | 3.4% | |||||
TOTAL BELGIUM | 69,388,127 | 4.3% | |||||
DENMARK — (2.3%) | |||||||
Other Securities | 42,483,853 | 2.6% | |||||
FINLAND — (7.0%) | |||||||
Elisa Oyj | 276,614 | 5,356,961 | 0.3% | ||||
KCI Konecranes Oyj | 234,271 | 6,252,168 | 0.4% | ||||
#*Metso Corp. Oyj | 206,460 | 5,765,320 | 0.4% | ||||
*M-Real Oyj Series B | 3,798,185 | 5,517,413 | 0.3% | ||||
#Nokian Renkaat Oyj | 325,926 | 6,954,619 | 0.4% | ||||
Tieto Oyj | 277,638 | 5,544,956 | 0.3% | ||||
Other Securities | 92,587,386 | 5.7% | |||||
TOTAL FINLAND | 127,978,823 | 7.8% | |||||
FRANCE — (12.3%) | |||||||
Arkema SA | 199,362 | 7,610,594 | 0.5% | ||||
*Atos Origin SA | 143,571 | 6,721,508 | 0.4% | ||||
#Bourbon SA | 162,224 | 6,746,721 | 0.4% | ||||
Establissements Maurel et Prom SA | 305,061 | 6,132,788 | 0.4% | ||||
*Gemalto NV | 149,247 | 6,272,472 | 0.4% | ||||
#Neopost SA | 61,086 | 5,345,872 | 0.3% | ||||
Nexans SA | 92,377 | 6,523,139 | 0.4% | ||||
Societe BIC SA | 84,787 | 5,884,544 | 0.3% | ||||
#*Valeo SA | 232,962 | 6,323,949 | 0.4% | ||||
Other Securities | 167,942,426 | 10.3% | |||||
TOTAL FRANCE | 225,504,013 | 13.8% | |||||
GERMANY — (13.4%) | |||||||
*Aareal Bank AG | 561,290 | 12,138,286 | 0.7% | ||||
Aixtron AG | 259,027 | 7,740,951 | 0.5% | ||||
Aurubis AG | 146,836 | 5,824,231 | 0.4% | ||||
Bilfinger Berger AG | 162,980 | 10,434,934 | 0.6% | ||||
DVB Bank SE | 173,470 | 6,413,252 | 0.4% | ||||
Lanxess AG | 218,704 | 6,875,309 | 0.4% | ||||
MTU Aero Engines Holding AG | 163,223 | 7,393,072 | 0.4% | ||||
Rheinmetall AG | 107,359 | 5,829,585 | 0.4% | ||||
Rhoen-Klinikum AG | 379,608 | 9,172,173 | 0.6% | ||||
#*SGL Carbon SE | 217,830 | 8,239,684 | 0.5% | ||||
Software AG | 70,053 | 6,245,235 | 0.4% | ||||
Wincor Nixdorf AG | 112,151 | 6,558,995 | 0.4% | ||||
Other Securities | 151,967,940 | 9.3% | |||||
TOTAL GERMANY | 244,833,647 | 15.0% | |||||
GREECE — (3.5%) | |||||||
Bank of Greece S.A. | 73,229 | 5,536,868 | 0.4% | ||||
Other Securities | 58,866,685 | 3.6% | |||||
TOTAL GREECE | 64,403,553 | 4.0% | |||||
302
THE CONTINENTAL SMALL COMPANY SERIES
CONTINUED
Shares | Value†† | Percentage of Net Assets** | |||||
IRELAND — (2.6%) | |||||||
DCC P.L.C | 308,989 | $ | 8,138,971 | 0.5% | |||
*Dragon Oil P.L.C. | 1,347,570 | 9,171,834 | 0.6% | ||||
Paddy Power P.L.C. | 180,573 | 5,778,573 | 0.3% | ||||
Other Securities | 25,358,738 | 1.6% | |||||
TOTAL IRELAND | 48,448,116 | 3.0% | |||||
ITALY — (7.9%) | |||||||
Banca Popolare di Milano Scarl | 1,012,836 | 7,535,855 | 0.4% | ||||
Other Securities | 138,031,663 | 8.5% | |||||
TOTAL ITALY | 145,567,518 | 8.9% | |||||
NETHERLANDS — (5.4%) | |||||||
Imtech NV | 248,834 | 6,325,202 | 0.4% | ||||
Nutreco Holding NV | 139,331 | 7,032,903 | 0.4% | ||||
Other Securities | 85,739,447 | 5.3% | |||||
TOTAL NETHERLANDS | 99,097,552 | 6.1% | |||||
NORWAY — (3.8%) | |||||||
Tandberg ASA Series A | 208,204 | 5,570,172 | 0.3% | ||||
*TGS Nopec Geophysical Co. ASA | 404,241 | 6,130,506 | 0.4% | ||||
Other Securities | 58,632,730 | 3.6% | |||||
TOTAL NORWAY | 70,333,408 | 4.3% | |||||
PORTUGAL — (1.4%) | |||||||
Other Securities | 26,035,355 | 1.6% | |||||
SPAIN — (4.9%) | |||||||
Ebro Puleva SA | 312,280 | 5,946,769 | 0.3% | ||||
Other Securities | 84,329,623 | 5.2% | |||||
TOTAL SPAIN | 90,276,392 | 5.5% | |||||
SWEDEN — (5.7%) | |||||||
Boliden AB | 497,124 | 5,986,022 | 0.4% | ||||
#Elekta AB Series B | 302,500 | 5,701,787 | 0.3% | ||||
Other Securities | 92,630,985 | 5.7% | |||||
TOTAL SWEDEN | 104,318,794 | 6.4% | |||||
SWITZERLAND — (11.6%) | |||||||
*Aryzta AG | 265,691 | 10,429,578 | 0.6% | ||||
*Bank Sarasin & Cie AG Series B | 172,644 | 6,874,386 | 0.4% | ||||
*Clariant AG | 756,817 | 7,235,446 | 0.5% | ||||
#PSP Swiss Property AG | 141,111 | 7,918,508 | 0.5% | ||||
Romande Energie Holding SA | 2,714 | 5,386,990 | 0.3% | ||||
Sika AG | 4,203 | 5,698,044 | 0.4% | ||||
Swiss Prime Site AG | 163,073 | 8,976,492 | 0.6% | ||||
#Valiant Holding AG | 33,293 | 6,559,434 | 0.4% | ||||
Other Securities | 153,867,567 | 9.4% | |||||
TOTAL SWITZERLAND | 212,946,445 | 13.1% | |||||
TOTAL COMMON STOCKS | 1,624,145,822 | 99.6% | |||||
PREFERRED STOCKS — (0.1%) | |||||||
SWITZERLAND — (0.1%) | |||||||
Other Securities | 1,565,574 | 0.1% | |||||
RIGHTS/WARRANTS — (0.0%) | |||||||
BELGIUM — (0.0%) | |||||||
Other Securities | 1,373 | 0.0% | |||||
303
THE CONTINENTAL SMALL COMPANY SERIES
CONTINUED
Shares | Value†† | Percentage of Net Assets** | ||||||
DENMARK — (0.0%) | ||||||||
Other Securities | $ | 82,324 | 0.0% | |||||
FINLAND — (0.0%) | ||||||||
Other Securities | 232,888 | 0.0% | ||||||
FRANCE — (0.0%) | ||||||||
Other Securities | 1,083 | 0.0% | ||||||
GERMANY — (0.0%) | ||||||||
Other Securities | 37,491 | 0.0% | ||||||
ITALY — (0.0%) | ||||||||
Other Securities | 8,898 | 0.0% | ||||||
NORWAY — (0.0%) | ||||||||
Other Securities | 6,649 | 0.0% | ||||||
SPAIN — (0.0%) | ||||||||
Other Securities | 426,564 | 0.0% | ||||||
TOTAL RIGHTS/WARRANTS | 797,270 | 0.0% | ||||||
Face Amount | Value† | |||||||
| (000) | ||||||||
TEMPORARY CASH INVESTMENTS — (0.2%) | ||||||||
Repurchase Agreement, PNC Capital Markets, Inc. 0.19%, 11/02/09 (Collateralized by $2,725,000 FNMA 6.50%, 06/25/39, valued at $2,932,781) to be repurchased at $2,888,046 | $ | 2,888 | 2,888,000 | 0.2% | ||||
| Shares/ Face Amount | ||||||||
| (000) | ||||||||
SECURITIES LENDING COLLATERAL — (11.2%) | ||||||||
§@DFA Short Term Investment Fund LP | 200,182,842 | 200,182,842 | 12.3% | |||||
@Repurchase Agreement, Deutsche Bank Securities 0.07%, 11/02/09 (Collateralized by various corporate obligations, ranging in par value from $4,247,617 to $16,429,280, rates ranging from 5.000% to 7.000%, maturities ranging from 03/01/37 to 10/01/39, valued at $4,949,334) to be repurchased at $4,852,316 | $ | 4,852 | 4,852,288 | 0.3% | ||||
TOTAL SECURITIES LENDING COLLATERAL | 205,035,130 | 12.6% | ||||||
TOTAL INVESTMENTS — (100.0%) | $ | 1,834,431,796 | 112.5% | |||||
304
THE CONTINENTAL SMALL COMPANY SERIES
CONTINUED
Summary of inputs used to value the Series’ net assets as of October 31, 2009 is as follows (See Security Valuation Note):
| Valuation Inputs | |||||||||||
| Investment in Securities (Market Value) | |||||||||||
| Level 1 | Level 2 | Level 3 | Total | ||||||||
Common Stocks | |||||||||||
Austria | $ | 127,622 | $ | 52,402,604 | — | $ | 52,530,226 | ||||
Belgium | 618,245 | 68,769,882 | — | 69,388,127 | |||||||
Denmark | 71,185 | 42,412,668 | — | 42,483,853 | |||||||
Finland | — | 127,978,823 | — | 127,978,823 | |||||||
France | 304,773 | 225,199,240 | — | 225,504,013 | |||||||
Germany | 620,371 | 244,213,276 | — | 244,833,647 | |||||||
Greece | 62,295 | 64,341,258 | — | 64,403,553 | |||||||
Ireland | 184,669 | 48,263,447 | — | 48,448,116 | |||||||
Italy | — | 145,567,518 | — | 145,567,518 | |||||||
Netherlands | 903,918 | 98,193,634 | — | 99,097,552 | |||||||
Norway | 28,118 | 70,305,290 | — | 70,333,408 | |||||||
Portugal | 325,570 | 25,709,785 | — | 26,035,355 | |||||||
Spain | — | 90,276,392 | — | 90,276,392 | |||||||
Sweden | — | 104,318,794 | — | 104,318,794 | |||||||
Switzerland | 2,599,415 | 210,347,030 | — | 212,946,445 | |||||||
Preferred Stocks | |||||||||||
Switzerland | 1,565,574 | — | — | 1,565,574 | |||||||
Rights/Warrants | |||||||||||
Belgium | 1,373 | — | — | 1,373 | |||||||
Denmark | 82,324 | — | — | 82,324 | |||||||
Finland | — | 232,888 | — | 232,888 | |||||||
France | 1,066 | 17 | — | 1,083 | |||||||
Germany | �� | — | 37,491 | — | 37,491 | ||||||
Italy | 8,898 | — | — | 8,898 | |||||||
Norway | — | 6,649 | — | 6,649 | |||||||
Spain | — | 426,564 | — | 426,564 | |||||||
Temporary Cash Investments | — | 2,888,000 | — | 2,888,000 | |||||||
Securities Lending Collateral | — | 205,035,130 | — | 205,035,130 | |||||||
TOTAL | $ | 7,505,416 | $ | 1,826,926,380 | — | $ | 1,834,431,796 | ||||
See accompanying Notes to Financial Statements.
305
THE CANADIAN SMALL COMPANY SERIES
SUMMARY SCHEDULE OF PORTFOLIO HOLDINGS
October 31, 2009
Shares | Value†† | Percentage of Net Assets** | |||||
COMMON STOCKS — (84.0%) | |||||||
Consumer Discretionary — (11.4%) | |||||||
Astral Media, Inc. Class A | 186,347 | $ | 5,517,821 | 1.5% | |||
Corus Entertainment, Inc. Class B | 278,300 | 4,575,534 | 1.2% | ||||
Dorel Industries, Inc. Class B | 107,500 | 2,884,086 | 0.8% | ||||
*Gildan Activewear, Inc. | 246,010 | 4,333,395 | 1.2% | ||||
Groupe Aeroplan, Inc. | 283,650 | 2,427,428 | 0.7% | ||||
Linamar Corp. | 179,780 | 2,508,829 | 0.7% | ||||
Quebecor, Inc. Class B | 159,493 | 3,258,990 | 0.9% | ||||
Reitmans Canada, Ltd. | 193,400 | 2,920,527 | 0.8% | ||||
*RONA, Inc. | 426,885 | 5,842,768 | 1.6% | ||||
Other Securities | 15,002,844 | 4.1% | |||||
Total Consumer Discretionary | 49,272,222 | 13.5% | |||||
Consumer Staples — (2.3%) | |||||||
*Cott Corp. | 512,400 | 4,053,550 | 1.1% | ||||
#Maple Leaf Foods, Inc. | 254,000 | 2,631,431 | 0.7% | ||||
Other Securities | 3,374,521 | 1.0% | |||||
Total Consumer Staples | 10,059,502 | 2.8% | |||||
Energy — (17.3%) | |||||||
#*Bankers Petroleum, Ltd. | 685,432 | 3,002,586 | 0.8% | ||||
*Nuvista Energy, Ltd. | 274,221 | 2,911,880 | 0.8% | ||||
#*PetroBakken Energy, Ltd. | 185,863 | 5,362,638 | 1.5% | ||||
#Progress Energy Resources Corp. | 333,082 | 4,260,297 | 1.2% | ||||
ShawCor, Ltd. | 209,500 | 5,452,169 | 1.5% | ||||
Trican Well Service, Ltd. | 391,971 | 4,586,066 | 1.2% | ||||
Trinidad Drilling, Ltd. | 389,000 | 2,541,685 | 0.7% | ||||
#*Uranium One, Inc. | 1,819,900 | 5,163,433 | 1.4% | ||||
Other Securities | 41,607,072 | 11.4% | |||||
Total Energy | 74,887,826 | 20.5% | |||||
Financials — (6.5%) | |||||||
AGF Management, Ltd. Class B | 348,279 | 5,188,538 | 1.4% | ||||
Canadian Western Bank | 226,200 | 4,469,439 | 1.2% | ||||
Home Capital Group, Inc. | 113,700 | 3,835,359 | 1.1% | ||||
Laurentian Bank of Canada | 92,400 | 3,375,604 | 0.9% | ||||
Other Securities | 11,355,113 | 3.1% | |||||
Total Financials | 28,224,053 | 7.7% | |||||
Health Care — (4.2%) | |||||||
#Biovail Corp. | 304,150 | 4,103,868 | 1.1% | ||||
*MDS, Inc. | 464,108 | 3,671,517 | 1.0% | ||||
*SXC Health Solutions Corp. | 84,161 | 3,864,849 | 1.1% | ||||
Other Securities | 6,324,915 | 1.7% | |||||
Total Health Care | 17,965,149 | 4.9% | |||||
Industrials — (6.7%) | |||||||
#Russel Metals, Inc. | 229,900 | 3,359,104 | 0.9% | ||||
*Stantec, Inc. | 156,600 | 3,784,566 | 1.0% | ||||
#Toromont Industries, Ltd. | 214,900 | 4,917,447 | 1.4% | ||||
Transcontinental, Inc. Class A | 256,564 | 3,080,048 | 0.8% | ||||
Other Securities | 13,687,961 | 3.8% | |||||
Total Industrials | 28,829,126 | 7.9% | |||||
Information Technology — (5.4%) | |||||||
*Celestica, Inc. | 797,607 | 6,575,162 | 1.8% | ||||
#*MacDonald Dettweiler & Associates, Ltd. | 129,900 | 4,429,842 | 1.2% | ||||
306
THE CANADIAN SMALL COMPANY SERIES
CONTINUED
Shares | Value†† | Percentage of Net Assets** | ||||||
Information Technology — (Continued) | ||||||||
Other Securities | $ | 12,304,418 | 3.4% | |||||
Total Information Technology | 23,309,422 | 6.4% | ||||||
Materials — (29.5%) | ||||||||
*Alamos Gold, Inc. | 347,100 | 2,771,539 | 0.8% | |||||
*Aurizon Mines, Ltd. | 561,000 | 2,410,841 | 0.7% | |||||
#*Equinox Minerals, Ltd. | 1,678,290 | 5,645,742 | 1.5% | |||||
#*Euro Goldfields, Ltd. | 521,060 | 2,937,448 | 0.8% | |||||
#*Golden Star Resources, Ltd. | 855,400 | 2,664,108 | 0.7% | |||||
*HudBay Minerals, Inc. | 477,851 | 6,187,045 | 1.7% | |||||
*Lundin Mining Corp. | 1,147,100 | 4,611,511 | 1.3% | |||||
Methanex Corp. | 359,200 | 6,194,420 | 1.7% | |||||
#*New Gold, Inc. | 725,960 | 2,629,974 | 0.7% | |||||
*Northgate Minerals Corp. | 937,300 | 2,399,446 | 0.6% | |||||
#*Osisko Mining Corp. | 522,931 | 3,527,930 | 1.0% | |||||
*Pan Amer Silver Corp. | 213,700 | 4,520,672 | 1.2% | |||||
#*Quadra Mining, Ltd. | 253,150 | 3,528,027 | 1.0% | |||||
Sherritt International Corp. | 641,601 | 4,115,069 | 1.1% | |||||
*Silver Standard Resources, Inc. | 229,462 | 4,300,623 | 1.2% | |||||
#Silvercorp Metals, Inc. | 482,000 | 2,490,070 | 0.7% | |||||
#*Thompson Creek Metals Co., Inc. | 474,700 | 4,795,038 | 1.3% | |||||
#West Fraser Timber Co., Ltd. | 123,716 | 2,984,139 | 0.8% | |||||
Other Securities | 59,011,979 | 16.2% | ||||||
Total Materials | 127,725,621 | 35.0% | ||||||
Telecommunication Services — (0.3%) | ||||||||
Other Securities | 1,271,891 | 0.3% | ||||||
Utilities — (0.4%) | ||||||||
Other Securities | 1,602,945 | 0.4% | ||||||
TOTAL COMMON STOCKS | 363,147,757 | 99.4% | ||||||
Face Amount | Value† | |||||||
| (000) | ||||||||
TEMPORARY CASH INVESTMENTS — (0.2%) | ||||||||
Repurchase Agreement, PNC Capital Markets, Inc. 0.19%, 11/02/09 (Collateralized by $1,075,000 FHLMC 4.50%, 05/01/23, valued at $912,187) to be repurchased at $896,014 | $ | 896 | 896,000 | 0.3% | ||||
Shares/ Face Amount | ||||||||
| (000) | ||||||||
SECURITIES LENDING COLLATERAL — (15.8%) | ||||||||
§@DFA Short Term Investment Fund LP | 62,142,299 | 62,142,299 | 17.0% | |||||
@Repurchase Agreement, Deutsche Bank Securities 0.05%, 11/02/09 (Collateralized by $5,049,431 U.S. Treasury Note 0.875%, 01/31/11, valued at $5,028,666) to be repurchased at $4,979,736 | $ | 4,980 | 4,979,715 | 1.4% | ||||
307
THE CANADIAN SMALL COMPANY SERIES
CONTINUED
Shares/ | Value† | Percentage of Net Assets** | |||||||
| (000) | |||||||||
@Repurchase Agreement, Deutsche Bank Securities 0.07%, 11/02/09 (Collateralized by various corporate obligations, ranging in par value from $4,247,617 to $16,429,280, rates ranging from 5.000% to 7.000%, maturities ranging from 03/01/37 to 10/01/39, valued at $1,434,975) to be repurchased at $1,406,846 | $ | 1,407 | 1,406,838 | 0.4 | % | ||||
TOTAL SECURITIES LENDING COLLATERAL | 68,528,852 | 18.8 | % | ||||||
TOTAL INVESTMENTS — (100.0%) | $ | 432,572,609 | 118.5 | % | |||||
Summary of inputs used to value the Series’ net assets as of October 31, 2009 is as follows (See Security Valuation Note):
| Valuation Inputs | |||||||||||
| Investment in Securities (Market Value) | |||||||||||
| Level 1 | Level 2 | Level 3 | Total | ||||||||
Common Stocks | |||||||||||
Consumer Discretionary | $ | 49,272,222 | — | — | $ | 49,272,222 | |||||
Consumer Staples | 10,059,502 | — | — | 10,059,502 | |||||||
Energy | 74,887,826 | — | — | 74,887,826 | |||||||
Financials | 28,224,053 | — | — | 28,224,053 | |||||||
Health Care | 17,965,149 | — | — | 17,965,149 | |||||||
Industrials | 28,829,126 | — | — | 28,829,126 | |||||||
Information Technology | 23,308,884 | $ | 538 | — | 23,309,422 | ||||||
Materials | 127,724,533 | 1,088 | — | 127,725,621 | |||||||
Telecommunication Services | 1,271,891 | — | — | 1,271,891 | |||||||
Utilities | 1,602,945 | — | — | 1,602,945 | |||||||
Temporary Cash Investments | — | 896,000 | — | 896,000 | |||||||
Securities Lending Collateral | — | 68,528,852 | — | 68,528,852 | |||||||
TOTAL | $ | 363,146,131 | $ | 69,426,478 | — | $ | 432,572,609 | ||||
See accompanying Notes to Financial Statements.
308
SUMMARY SCHEDULE OF PORTFOLIO HOLDINGS
October 31, 2009
Shares | Value†† | Percentage of Net Assets** | |||||
COMMON STOCKS — (82.9%) | |||||||
ARGENTINA — (0.1%) | |||||||
Other Securities | $ | 1,818,247 | 0.1% | ||||
BRAZIL — (5.8%) | |||||||
Companhia Siderurgica Nacional SA | 367,276 | 12,132,034 | 0.6% | ||||
Petroleo Brasilerio SA ADR (71654V101) | 1,256,219 | 50,399,506 | 2.4% | ||||
Petroleo Brasilerio SA ADR (71654V408) | 914,546 | 42,270,316 | 2.0% | ||||
Other Securities | 30,983,709 | 1.4% | |||||
TOTAL BRAZIL | 135,785,565 | 6.4% | |||||
CHILE — (1.7%) | |||||||
Empresa Nacional de Electricidad SA Sponsored ADR | 207,763 | 9,534,244 | 0.4% | ||||
Other Securities | 29,219,969 | 1.4% | |||||
TOTAL CHILE | 38,754,213 | 1.8% | |||||
CHINA — (9.4%) | |||||||
Bank of China, Ltd. | 56,691,000 | 32,598,740 | 1.6% | ||||
#China Life Insurance Co., Ltd. ADR | 250,705 | 17,200,870 | 0.8% | ||||
China Mobile, Ltd. Sponsored ADR | 696,697 | 32,556,651 | 1.5% | ||||
#CNOOC, Ltd. ADR | 67,956 | 10,121,367 | 0.5% | ||||
*Industrial & Commercial Bank of China, Ltd. | 34,093,000 | 27,124,901 | 1.3% | ||||
#PetroChina Co., Ltd. ADR | 115,210 | 13,829,808 | 0.7% | ||||
Tencent Holdings, Ltd. | 700,600 | 12,199,255 | 0.6% | ||||
Other Securities | 74,618,243 | 3.5% | |||||
TOTAL CHINA | 220,249,835 | 10.5% | |||||
CZECH REPUBLIC — (1.0%) | |||||||
CEZ A.S. | 301,862 | 14,864,947 | 0.7% | ||||
Other Securities | 8,518,048 | 0.4% | |||||
TOTAL CZECH REPUBLIC | 23,382,995 | 1.1% | |||||
HUNGARY — (1.5%) | |||||||
#*OTP Bank NYRT | 618,710 | 17,397,809 | 0.8% | ||||
Other Securities | 17,906,431 | 0.9% | |||||
TOTAL HUNGARY | 35,304,240 | 1.7% | |||||
INDIA — (11.2%) | |||||||
HDFC Bank, Ltd. | 386,733 | 13,175,290 | 0.6% | ||||
Hindustan Unilever, Ltd. | 1,633,609 | 9,748,048 | 0.5% | ||||
Infosys Technologies, Ltd. | 657,429 | 30,520,259 | 1.4% | ||||
Infosys Technologies, Ltd. Sponsored ADR | 233,496 | 10,740,816 | 0.5% | ||||
ITC, Ltd. | 2,007,345 | 10,823,298 | 0.5% | ||||
Larsen & Toubro, Ltd. | 371,281 | 12,248,925 | 0.6% | ||||
*Reliance Industries, Ltd. | 1,030,847 | 41,707,940 | 2.0% | ||||
Tata Consultancy Services, Ltd. | 756,974 | 10,030,279 | 0.5% | ||||
Other Securities | 122,736,201 | 5.8% | |||||
TOTAL INDIA | 261,731,056 | 12.4% | |||||
INDONESIA — (2.2%) | |||||||
PT Astra International Tbk | 4,017,561 | 12,925,685 | 0.6% | ||||
PT Telekomunikasi Indonesia Tbk | 14,011,140 | 12,065,191 | 0.6% | ||||
Other Securities | 25,780,160 | 1.2% | |||||
TOTAL INDONESIA | 50,771,036 | 2.4% | |||||
ISRAEL — (3.6%) | |||||||
Israel Chemicals, Ltd. | 780,753 | 9,119,540 | 0.5% | ||||
Teva Pharmaceutical Industries, Ltd. Sponsored ADR | 888,925 | 44,872,934 | 2.1% | ||||
309
THE EMERGING MARKETS SERIES
CONTINUED
Shares | Value†† | Percentage of Net Assets** | |||||
ISRAEL — (Continued) | |||||||
Other Securities | $ | 29,303,182 | 1.4% | ||||
TOTAL ISRAEL | 83,295,656 | 4.0% | |||||
MALAYSIA — (4.4%) | |||||||
CIMB Group Holdings Berhad | 3,095,227 | 11,229,284 | 0.5% | ||||
Other Securities | 92,150,262 | 4.4% | |||||
TOTAL MALAYSIA | 103,379,546 | 4.9% | |||||
MEXICO — (6.8%) | |||||||
#America Movil S.A.B. de C.V. Series L | 17,737,259 | 39,145,222 | 1.8% | ||||
#Fomento Economico Mexicano S.A.B. de C.V. Series B & D | 2,109,900 | 9,132,314 | 0.4% | ||||
#*Grupo Mexico S.A.B. de C.V. Series B | 9,098,785 | 18,192,402 | 0.9% | ||||
#Wal-Mart de Mexico S.A.B. de C.V. Series V | 4,372,680 | 15,250,358 | 0.7% | ||||
Other Securities | 77,158,719 | 3.7% | |||||
TOTAL MEXICO | 158,879,015 | 7.5% | |||||
PHILIPPINES — (0.6%) | |||||||
Other Securities | 13,288,391 | 0.6% | |||||
POLAND — (1.3%) | |||||||
Other Securities | 30,821,592 | 1.5% | |||||
RUSSIA — (0.6%) | |||||||
Other Securities | 13,599,374 | 0.7% | |||||
SINGAPORE — (0.0%) | |||||||
Other Securities | 513,710 | 0.0% | |||||
SOUTH AFRICA — (8.2%) | |||||||
*Anglo American Platinum Corp., Ltd. | 114,526 | 9,954,766 | 0.5% | ||||
Impala Platinum Holdings, Ltd. | 478,692 | 10,402,919 | 0.5% | ||||
MTN Group, Ltd. | 1,659,950 | 24,715,390 | 1.2% | ||||
Naspers, Ltd. Series N | 324,237 | 11,698,218 | 0.5% | ||||
#Sasol, Ltd. Sponsored ADR | 1,270,370 | 47,499,134 | 2.2% | ||||
#Standard Bank Group, Ltd. | 843,110 | 10,570,537 | 0.5% | ||||
Other Securities | 77,167,798 | 3.7% | |||||
TOTAL SOUTH AFRICA | 192,008,762 | 9.1% | |||||
SOUTH KOREA — (11.5%) | |||||||
POSCO | 46,060 | 19,088,540 | 0.9% | ||||
#Samsung Electronics Co., Ltd. | 97,139 | 58,451,752 | 2.8% | ||||
*Samsung Electronics Co., Ltd. GDR | 49,372 | 14,972,842 | 0.7% | ||||
Other Securities | 174,979,885 | 8.3% | |||||
TOTAL SOUTH KOREA | 267,493,019 | 12.7% | |||||
TAIWAN — (9.6%) | |||||||
Formosa Plastics Corp. | 5,051,649 | 9,689,505 | 0.5% | ||||
Hon Hai Precision Industry Co., Ltd. | 4,590,177 | 17,978,933 | 0.9% | ||||
Media Tek, Inc. | 735,527 | 10,294,431 | 0.5% | ||||
Nan Ya Plastic Corp. | 7,084,565 | 11,269,977 | 0.5% | ||||
Taiwan Semiconductor Manufacturing Co., Ltd. | 22,386,808 | 40,609,637 | 1.9% | ||||
Other Securities | 133,066,226 | 6.3% | |||||
TOTAL TAIWAN | 222,908,709 | 10.6% | |||||
THAILAND — (1.4%) | |||||||
Other Securities | 32,436,355 | 1.5% | |||||
TURKEY — (2.0%) | |||||||
Turkiye Garanti Bankasi A.S. | 2,842,585 | 10,322,968 | 0.5% | ||||
310
THE EMERGING MARKETS SERIES
CONTINUED
Shares | Value†† | Percentage | |||||
TURKEY — (Continued) | |||||||
Other Securities | $ | 36,814,452 | 1.7% | ||||
TOTAL TURKEY | 47,137,420 | 2.2% | |||||
TOTAL COMMON STOCKS | 1,933,558,736 | 91.7% | |||||
PREFERRED STOCKS — (7.1%) | |||||||
BRAZIL — (7.1%) | |||||||
Banco Bradesco SA | 1,309,200 | 25,610,259 | 1.2% | ||||
#Companhia de Bebidas das Americas Preferred ADR | 151,600 | 13,656,128 | 0.7% | ||||
Gerdau SA | 756,268 | 11,398,113 | 0.5% | ||||
Itau Unibanco Holding SA | 1,765,755 | 33,589,042 | 1.6% | ||||
Vale SA Series A | 1,412,691 | 31,796,775 | 1.5% | ||||
Other Securities | 49,632,382 | 2.4% | |||||
TOTAL BRAZIL | 165,682,699 | 7.9% | |||||
TOTAL PREFERRED STOCKS | 165,682,699 | 7.9% | |||||
RIGHTS/WARRANTS — (0.0%) | |||||||
SOUTH AFRICA — (0.0%) | |||||||
Other Securities | 40,450 | 0.0% | |||||
TAIWAN — (0.0%) | |||||||
Other Securities | 8,490 | 0.0% | |||||
TOTAL RIGHTS/WARRANTS | 48,940 | 0.0% | |||||
Face Amount | |||||||
| (000) | Value† | ||||||
TEMPORARY CASH INVESTMENTS — (0.0%) | |||||||
Repurchase Agreement, PNC Capital Markets, Inc. 0.19%, 11/02/09 (Collateralized by $310,000 FNMA 6.50%, 06/25/39, valued at $326,275) to be repurchased at $317,005 | $317 | 317,000 | 0.0% | ||||
Shares/ Face Amount | |||||||
| (000) | |||||||
SECURITIES LENDING COLLATERAL — (10.0%) | |||||||
§@DFA Short Term Investment Fund LP | 226,669,881 | 226,669,881 | 10.7% | ||||
@Repurchase Agreement, Deutsche Bank Securities 0.07%, 11/02/09 (Collateralized by various corporate obligations, ranging in par value from $4,247,617 to $16,429,280, rates ranging from 5.000% to 7.000%, maturities ranging from 03/01/37 to 10/01/39, valued at $6,420,547) to be repurchased at $6,294,691 | $6,295 | 6,294,654 | 0.3% | ||||
TOTAL SECURITIES LENDING COLLATERAL | 232,964,535 | 11.0% | |||||
TOTAL INVESTMENTS — (100.0%) | $ | 2,332,571,910 | 110.6% | ||||
311
THE EMERGING MARKETS SERIES
CONTINUED
Summary of inputs used to value the Series’ net assets as of October 31, 2009 is as follows (See Security Valuation Note):
| Valuation Inputs | |||||||||||
| Investment in Securities (Market Value) | |||||||||||
| Level 1 | Level 2 | Level 3 | Total | ||||||||
Common Stocks | |||||||||||
Argentina | �� | $ | 1,818,247 | — | — | $ | 1,818,247 | ||||
Brazil | 135,785,565 | — | — | 135,785,565 | |||||||
Chile | 38,754,213 | — | — | 38,754,213 | |||||||
China | 81,011,010 | $ | 139,238,825 | — | 220,249,835 | ||||||
Czech Republic | — | 23,382,995 | — | 23,382,995 | |||||||
Hungary | — | 35,304,240 | — | 35,304,240 | |||||||
India | 16,626,590 | 245,104,466 | — | 261,731,056 | |||||||
Indonesia | — | 50,771,036 | — | 50,771,036 | |||||||
Israel | 44,872,934 | 38,422,722 | — | 83,295,656 | |||||||
Malaysia | — | 103,379,546 | — | 103,379,546 | |||||||
Mexico | 158,715,803 | 163,212 | — | 158,879,015 | |||||||
Philippines | — | 13,288,391 | — | 13,288,391 | |||||||
Poland | — | 30,821,592 | — | 30,821,592 | |||||||
Russia | 206,569 | 13,392,805 | — | 13,599,374 | |||||||
Singapore | — | 513,710 | — | 513,710 | |||||||
South Africa | 64,231,071 | 127,777,691 | — | 192,008,762 | |||||||
South Korea | 2,797,395 | 264,695,624 | — | 267,493,019 | |||||||
Taiwan | 3,072,894 | 219,835,815 | — | 222,908,709 | |||||||
Thailand | 32,436,355 | — | — | 32,436,355 | |||||||
Turkey | — | 47,137,420 | — | 47,137,420 | |||||||
Preferred Stocks | |||||||||||
Brazil | 165,682,699 | — | — | 165,682,699 | |||||||
Rights/Warrants | |||||||||||
South Africa | 40,450 | — | — | 40,450 | |||||||
Taiwan | — | 8,490 | — | 8,490 | |||||||
Temporary Cash Investments | — | 317,000 | — | 317,000 | |||||||
Securities Lending Collateral | — | 232,964,535 | — | 232,964,535 | |||||||
TOTAL | $ | 746,051,795 | $ | 1,586,520,115 | — | $ | 2,332,571,910 | ||||
See accompanying Notes to Financial Statements.
312
THE EMERGING MARKETS SMALL CAP SERIES
SUMMARY SCHEDULE OF PORTFOLIO HOLDINGS
October 31, 2009
Shares | Value†† | Percentage | |||||
COMMON STOCKS — (87.8%) | |||||||
ARGENTINA — (0.0%) | |||||||
Other Securities | $ | — | 0.0% | ||||
BRAZIL — (7.3%) | |||||||
B2W Cia Global Do Varejo | 123,200 | 3,570,954 | 0.3% | ||||
*BRF - Brasil Foods SA ADR | 112,544 | 5,443,753 | 0.5% | ||||
Cyrela Brazil Realty SA | 326,200 | 4,138,607 | 0.4% | ||||
*Duratex SA | 624,462 | 4,324,725 | 0.4% | ||||
*Global Village Telecom Holding SA | 178,300 | 5,116,408 | 0.4% | ||||
Lojas Renner SA | 273,700 | 4,847,548 | 0.4% | ||||
*Magnesita Refratarios SA | 441,455 | 3,232,726 | 0.3% | ||||
Other Securities | 60,956,792 | 5.2% | |||||
TOTAL BRAZIL | 91,631,513 | 7.9% | |||||
CHILE — (2.1%) | |||||||
Other Securities | 26,049,604 | 2.2% | |||||
CHINA — (11.8%) | |||||||
#*Brilliance China Automotive Holdings, Ltd. | 18,522,000 | 3,404,681 | 0.3% | ||||
#*Byd Co., Ltd. | 482,000 | 4,418,950 | 0.4% | ||||
China Travel International Investment Hong Kong, Ltd. | 21,347,000 | 4,357,667 | 0.4% | ||||
China Yurun Food Group, Ltd. | 2,622,000 | 5,375,559 | 0.5% | ||||
Hopson Development Holdings, Ltd. | 3,914,000 | 6,810,095 | 0.6% | ||||
#*Hunan Non-Ferrous Metal Corp., Ltd. | 14,290,000 | 4,362,982 | 0.4% | ||||
#*Semiconductor Manufacturing International Corp. | 167,851,000 | 8,306,535 | 0.7% | ||||
Shenzhen International Holdings, Ltd. | 71,794,300 | 5,020,114 | 0.4% | ||||
Shenzhen Investment, Ltd. | 14,500,000 | 5,729,496 | 0.5% | ||||
#Skyworth Digital Holdings, Ltd. | 14,661,400 | 8,252,870 | 0.7% | ||||
TPV Technology, Ltd. | 14,518,000 | 9,396,713 | 0.8% | ||||
Xinao Gas Holdings, Ltd. | 2,178,000 | 4,667,339 | 0.4% | ||||
Other Securities | 78,871,412 | 6.7% | |||||
TOTAL CHINA | 148,974,413 | 12.8% | |||||
HUNGARY — (0.3%) | |||||||
Other Securities | 3,747,270 | 0.3% | |||||
INDIA — (11.2%) | |||||||
Other Securities | 141,238,191 | 12.1% | |||||
INDONESIA — (2.9%) | |||||||
Other Securities | 36,214,944 | 3.1% | |||||
ISRAEL — (2.9%) | |||||||
*Clal Insurance Enterprise Holdings, Ltd. | 257,136 | 5,443,527 | 0.5% | ||||
*Harel Insurance Investments & Finances, Ltd. | 96,806 | 4,582,314 | 0.4% | ||||
Other Securities | 27,039,061 | 2.3% | |||||
TOTAL ISRAEL | 37,064,902 | 3.2% | |||||
MALAYSIA — (5.3%) | |||||||
Other Securities | 66,950,408 | 5.7% | |||||
MEXICO — (5.3%) | |||||||
*Corporacion GEO S.A.B. de C.V. Series B | 1,330,000 | 3,500,331 | 0.3% | ||||
#*Desarrolladora Homex S.A.B. de C.V. | 576,300 | 3,428,448 | 0.3% | ||||
Embotelladora Arca S.A.B. de C.V. | 1,909,100 | 4,800,312 | 0.4% | ||||
*Empresas ICA S.A.B. de C.V. | 1,463,608 | 3,210,155 | 0.3% | ||||
#*Empresas ICA S.A.B. de C.V. Sponsored ADR | 681,589 | 5,943,456 | 0.5% | ||||
Grupo Continental S.A.B. de C.V. | 3,323,559 | 7,777,940 | 0.6% | ||||
*Industrias CH S.A.B. de C.V. Series B | 1,854,348 | 5,645,729 | 0.5% | ||||
313
THE EMERGING MARKETS SMALL CAP SERIES
CONTINUED
Shares | Value†† | Percentage | |||||
MEXICO — (Continued) | |||||||
#TV Azteca S.A.B. de C.V. Series A | 6,581,300 | $ | 3,394,388 | 0.3% | |||
Other Securities | 29,031,756 | 2.5% | |||||
TOTAL MEXICO | 66,732,515 | 5.7% | |||||
PHILIPPINES — (1.4%) | |||||||
Other Securities | 17,814,064 | 1.5% | |||||
POLAND — (2.5%) | |||||||
Other Securities | 30,873,987 | 2.6% | |||||
SOUTH AFRICA — (9.2%) | |||||||
Aveng, Ltd. | 981,591 | 5,205,828 | 0.4% | ||||
Barloworld, Ltd. | 579,959 | 3,615,988 | 0.3% | ||||
Dimension Data Holdings P.L.C. | 3,458,471 | 4,021,101 | 0.3% | ||||
Foschini, Ltd. | 521,461 | 4,117,902 | 0.4% | ||||
#Grindrod, Ltd. | 1,607,864 | 3,688,055 | 0.3% | ||||
Imperial Holdings, Ltd. | 467,965 | 4,816,593 | 0.4% | ||||
JD Group, Ltd. | 1,161,251 | 6,410,898 | 0.6% | ||||
Mr. Price Group, Ltd. | 928,134 | 4,276,741 | 0.4% | ||||
Reunert, Ltd. | 594,843 | 4,189,937 | 0.4% | ||||
Spar Group, Ltd. (The) | 559,850 | 4,893,172 | 0.4% | ||||
Tongaat-Hulett, Ltd. | 625,434 | 8,045,394 | 0.7% | ||||
Woolworths Holdings, Ltd. | 2,268,438 | 5,072,025 | 0.4% | ||||
Other Securities | 58,194,480 | 5.0% | |||||
TOTAL SOUTH AFRICA | 116,548,114 | 10.0% | |||||
SOUTH KOREA — (10.1%) | |||||||
Daegu Bank Co., Ltd. | 261,800 | 3,473,548 | 0.3% | ||||
#*NCsoft Corp. | 29,254 | 3,128,582 | 0.3% | ||||
Other Securities | 120,778,808 | 10.3% | |||||
TOTAL SOUTH KOREA | 127,380,938 | 10.9% | |||||
TAIWAN — (10.6%) | |||||||
Other Securities | 134,178,175 | 11.5% | |||||
THAILAND — (2.3%) | |||||||
Other Securities | 29,202,227 | 2.5% | |||||
TURKEY — (2.6%) | |||||||
Other Securities | 32,724,404 | 2.8% | |||||
TOTAL COMMON STOCKS | 1,107,325,669 | 94.8% | |||||
PREFERRED STOCKS — (4.6%) | |||||||
BRAZIL — (4.6%) | |||||||
*Braskem SA Preferred A Sponsored ADR | 301,000 | 3,949,120 | 0.3% | ||||
Eletropaulo Metropolita SA Preferred A | 184,200 | 3,485,119 | 0.3% | ||||
Klabin SA | 1,412,700 | 3,368,154 | 0.3% | ||||
Lojas Americanas SA | 488,403 | 3,185,599 | 0.3% | ||||
*Net Servicos de Comunicacao SA | 400,902 | 4,940,726 | 0.4% | ||||
*Suzano Papel e Celullose SA | 390,634 | 3,394,986 | 0.3% | ||||
Ultrapar Participacoes SA | 208,040 | 9,111,198 | 0.8% | ||||
Other Securities | 26,457,903 | 2.3% | |||||
TOTAL BRAZIL | 57,892,805 | 5.0% | |||||
INDIA — (0.0%) | |||||||
Other Securities | 41,324 | 0.0% | |||||
MALAYSIA — (0.0%) | |||||||
Other Securities | 20,742 | 0.0% | |||||
TOTAL PREFERRED STOCKS | 57,954,871 | 5.0% | |||||
314
THE EMERGING MARKETS SMALL CAP SERIES
CONTINUED
Shares | Value†† | Percentage | |||||
RIGHTS/WARRANTS — (0.0%) | |||||||
BRAZIL — (0.0%) | |||||||
Other Securities | $ | 33,992 | 0.0% | ||||
CHILE — (0.0%) | |||||||
Other Securities | 24,024 | 0.0% | |||||
CHINA — (0.0%) | |||||||
Other Securities | 4,329 | 0.0% | |||||
MALAYSIA — (0.0%) | |||||||
Other Securities | 232 | 0.0% | |||||
PHILIPPINES — (0.0%) | |||||||
Other Securities | 50,992 | 0.0% | |||||
SOUTH AFRICA — (0.0%) | |||||||
Other Securities | 262,200 | 0.0% | |||||
SOUTH KOREA — (0.0%) | |||||||
Other Securities | 67 | 0.0% | |||||
TAIWAN — (0.0%) | |||||||
Other Securities | 10,085 | 0.0% | |||||
THAILAND — (0.0%) | |||||||
Other Securities | 171,980 | 0.0% | |||||
TOTAL RIGHTS/WARRANTS | 557,901 | 0.0% | |||||
| Face | |||||||
Amount | |||||||
| (000) | Value† | ||||||
TEMPORARY CASH INVESTMENTS — (0.1%) | |||||||
Repurchase Agreement, PNC Capital Markets, Inc. 0.19%, 11/02/09 (Collateralized by $2,270,000 FHLMC 6.040%(r), 11/01/36, valued at $1,457,263) to be repurchased at $1,433,023 | $1,433 | 1,433,000 | 0.1% | ||||
Shares/ Amount | |||||||
| (000) | |||||||
SECURITIES LENDING COLLATERAL — (7.5%) | |||||||
§@DFA Short Term Investment Fund LP | 93,074,091 | 93,074,091 | 8.0% | ||||
@Repurchase Agreement, Deutsche Bank Securities 0.07%, 11/02/09 (Collateralized by various corporate obligations, ranging in par value from $4,247,617 to $16,429,280, rates ranging from 5.000% to 7.000%, maturities ranging from 03/01/37 to 10/01/39, valued at $1,345,493) to be repurchased at $1,319,119 | $1,319 | 1,319,111 | 0.1% | ||||
TOTAL SECURITIES LENDING COLLATERAL | 94,393,202 | 8.1% | |||||
TOTAL INVESTMENTS — (100.0%) | $ | 1,261,664,643 | 108.0% | ||||
315
THE EMERGING MARKETS SMALL CAP SERIES
CONTINUED
Summary of inputs used to value the Series’ net assets as of October 31, 2009 is as follows (See Security Valuation Note):
| Valuation Inputs | |||||||||||
| Investment in Securities (Market Value) | |||||||||||
| Level 1 | Level 2 | Level 3 | Total | ||||||||
Common Stocks | |||||||||||
Argentina | — | — | — | — | |||||||
Brazil | $ | 91,631,513 | — | — | $ | 91,631,513 | |||||
Chile | 26,049,604 | — | — | 26,049,604 | |||||||
China | — | $ | 148,974,413 | — | 148,974,413 | ||||||
Hungary | — | 3,747,270 | — | 3,747,270 | |||||||
India | 62,079 | 141,176,112 | — | 141,238,191 | |||||||
Indonesia | 521,444 | 35,693,500 | — | 36,214,944 | |||||||
Israel | 264,352 | 36,800,550 | — | 37,064,902 | |||||||
Malaysia | 117,274 | 66,833,134 | — | 66,950,408 | |||||||
Mexico | 66,238,177 | 494,338 | — | 66,732,515 | |||||||
Philippines | 409,393 | 17,404,671 | — | 17,814,064 | |||||||
Poland | — | 30,873,987 | — | 30,873,987 | |||||||
South Africa | 49,374 | 116,498,740 | — | 116,548,114 | |||||||
South Korea | 398,960 | 126,981,978 | — | 127,380,938 | |||||||
Taiwan | 2,836 | 134,175,339 | — | 134,178,175 | |||||||
Thailand | 29,110,102 | 92,125 | — | 29,202,227 | |||||||
Turkey | — | 32,724,404 | — | 32,724,404 | |||||||
Preferred Stocks | |||||||||||
Brazil | 57,858,189 | 34,616 | — | 57,892,805 | |||||||
India | — | 41,324 | — | 41,324 | |||||||
Malaysia | 20,742 | — | — | 20,742 | |||||||
Rights/Warrants | |||||||||||
Brazil | 33,992 | — | — | 33,992 | |||||||
Chile | 24,024 | — | — | 24,024 | |||||||
China | 4,329 | — | — | 4,329 | |||||||
Malaysia | 40 | 192 | — | 232 | |||||||
Philippines | — | 50,992 | — | 50,992 | |||||||
South Africa | 262,200 | — | — | 262,200 | |||||||
South Korea | — | 67 | — | 67 | |||||||
Taiwan | — | 10,085 | — | 10,085 | |||||||
Thailand | 171,980 | — | — | 171,980 | |||||||
Temporary Cash Investments | — | 1,433,000 | — | 1,433,000 | |||||||
Securities Lending Collateral | — | 94,393,202 | — | 94,393,202 | |||||||
TOTAL | $ | 273,230,604 | $ | 988,434,039 | — | $ | 1,261,664,643 | ||||
See accompanying Notes to Financial Statements.
316
THE DFA INVESTMENT TRUST COMPANY
STATEMENTS OF ASSETS AND LIABILITIES
OCTOBER 31, 2009
(Amounts in thousands)
| The U.S. | The U.S. | The DFA | The Japanese | |||||||||
| Large | Large Cap | International | Small | |||||||||
| Company | Value | Value | Company | |||||||||
| Series | Series | Series | Series | |||||||||
ASSETS: | ||||||||||||
Investments at Value (including $252,538, $470,665, $1,004,314 and $160,740 of securities on loan, respectively) | $ | 3,473,361 | $ | 7,481,171 | $ | 6,156,090 | $ | 1,172,145 | ||||
Temporary Cash Investments at Value & Cost | 27,414 | 42,250 | 13,790 | 118 | ||||||||
Collateral Received from Securities on Loan at Value & Cost | 270,456 | 515,340 | 1,056,276 | 173,035 | ||||||||
Foreign Currencies at Value | — | — | 19,131 | 114 | ||||||||
Cash | 2,839 | 1 | 16 | 16 | ||||||||
Receivables: | ||||||||||||
Investment Securities Sold | — | 1,660 | 10,656 | 4,019 | ||||||||
Dividends, Interest and Tax Reclaims | 4,362 | 7,943 | 10,784 | 6,521 | ||||||||
Securities Lending Income | 62 | 700 | 444 | 279 | ||||||||
Fund Shares Sold | 71 | 365 | 724 | 5 | ||||||||
Unrealized Gain on Foreign Currency Contracts | — | — | 19 | — | ||||||||
Prepaid Expenses and Other Assets | 1 | — | — | — | ||||||||
Total Assets | 3,778,566 | 8,049,430 | 7,267,930 | 1,356,252 | ||||||||
LIABILITIES: | ||||||||||||
Payables: | ||||||||||||
Upon Return of Securities Loaned | 270,456 | 515,340 | 1,056,276 | 173,035 | ||||||||
Investment Securities Purchased | 1,042 | 22,419 | 14,723 | — | ||||||||
Fund Shares Redeemed | 458 | 2,242 | 3,518 | — | ||||||||
Due to Advisor | 75 | 659 | 1,084 | 99 | ||||||||
Futures Margin Variation | 851 | — | — | — | ||||||||
Accrued Expenses and Other Liabilities | 233 | 370 | 365 | 82 | ||||||||
Total Liabilities | 273,115 | 541,030 | 1,075,966 | 173,216 | ||||||||
NET ASSETS | $ | 3,505,451 | $ | 7,508,400 | $ | 6,191,964 | $ | 1,183,036 | ||||
Investments at Cost | $ | 3,246,163 | $ | 6,319,801 | $ | 4,760,222 | $ | 1,387,190 | ||||
Foreign Currencies at Cost | $ | — | $ | — | $ | 19,163 | $ | 113 | ||||
See accompanying Notes to Financial Statements.
317
THE DFA INVESTMENT TRUST COMPANY
STATEMENTS OF ASSETS AND LIABILITIES
OCTOBER 31, 2009
(Amounts in thousands)
| The | The United | The | The | ||||||||||
| Asia Pacific | Kingdom | Continental | Canadian | ||||||||||
| Small | Small | Small | Small | ||||||||||
| Company | Company | Company | Company | ||||||||||
| Series | Series | Series | Series | ||||||||||
ASSETS: | |||||||||||||
Investments at Value (including $123,079, $23,377, $189,629 and $64,936 of securities on loan, respectively) | $ | 677,190 | $ | 766,179 | $ | 1,626,509 | $ | 363,148 | |||||
Temporary Cash Investments at Value & Cost | 490 | 2,191 | 2,888 | 896 | |||||||||
Collateral Received from Securities on Loan at Value & Cost | 138,109 | 24,989 | 205,035 | 68,529 | |||||||||
Foreign Currencies at Value | 3,065 | 3,035 | 60 | 2,668 | |||||||||
Cash | 15 | 15 | 16 | 15 | |||||||||
Receivables: | |||||||||||||
Investment Securities Sold | 4,364 | 1,326 | 1,220 | — | |||||||||
Dividends, Interest and Tax Reclaims | 898 | 1,791 | 1,590 | 116 | |||||||||
Securities Lending Income | 176 | 17 | 199 | 73 | |||||||||
Fund Shares Sold | — | — | 2 | — | |||||||||
Total Assets | 824,307 | 799,543 | 1,837,519 | 435,445 | |||||||||
LIABILITIES: | |||||||||||||
Payables: | |||||||||||||
Upon Return of Securities Loaned | 138,109 | 24,989 | 205,035 | 68,529 | |||||||||
Investment Securities Purchased | 4,568 | 3,978 | 1,339 | 1,682 | |||||||||
Fund Shares Redeemed | 530 | — | — | �� | — | ||||||||
Due to Advisor | 58 | 65 | 141 | 31 | |||||||||
Unrealized Loss on Foreign Currency Contracts | — | — | 6 | — | |||||||||
Accrued Expenses and Other Liabilities | 45 | 39 | 106 | 22 | |||||||||
Total Liabilities | 143,310 | 29,071 | 206,627 | 70,264 | |||||||||
NET ASSETS | $ | 680,997 | $ | 770,472 | $ | 1,630,892 | $ | 365,181 | |||||
Investments at Cost | $ | 609,505 | $ | 823,827 | $ | 1,459,189 | $ | 489,028 | |||||
Foreign Currencies at Cost | $ | 3,072 | $ | 3,020 | $ | (142 | ) | $ | 2,722 | ||||
See accompanying Notes to Financial Statements.
318
THE DFA INVESTMENT TRUST COMPANY
STATEMENTS OF ASSETS AND LIABILITIES
OCTOBER 31, 2009
(Amounts in thousands)
| The | The Emerging | |||||
| Emerging | Markets | |||||
| Markets | Small Cap | |||||
| Series | Series | |||||
ASSETS: | ||||||
Investments at Value (including $213,269 and $82,334 of securities on loan, respectively) | $ | 2,099,290 | $ | 1,165,839 | ||
Temporary Cash Investments at Value & Cost | 317 | 1,433 | ||||
Collateral Received from Securities on Loan at Value & Cost | 232,965 | 94,393 | ||||
Foreign Currencies at Value | 1,950 | 701 | ||||
Cash | 21 | 81 | ||||
Receivables: | ||||||
Investment Securities Sold | 6,815 | 1,164 | ||||
Dividends, Interest and Tax Reclaims | 3,192 | 1,017 | ||||
Securities Lending Income | 185 | 175 | ||||
Fund Shares Sold | 188 | 1,018 | ||||
Unrealized Gain on Foreign Currency Contracts | 6 | — | ||||
Total Assets | 2,344,929 | 1,265,821 | ||||
LIABILITIES: | ||||||
Payables: | ||||||
Upon Return of Securities Loaned | 232,965 | 94,393 | ||||
Investment Securities Purchased | — | 553 | ||||
Fund Shares Redeemed | 67 | 1,588 | ||||
Due to Advisor | 184 | 201 | ||||
Deferred Thailand Capital Gains Tax | 2,154 | 951 | ||||
Accrued Expenses and Other Liabilities | 243 | 162 | ||||
Total Liabilities | 235,613 | 97,848 | ||||
NET ASSETS | $ | 2,109,316 | $ | 1,167,973 | ||
Investments at Cost | $ | 1,064,309 | $ | 872,486 | ||
Foreign Currencies at Cost | $ | 1,958 | $ | 701 | ||
See accompanying Notes to Financial Statements.
319
THE DFA INVESTMENT TRUST COMPANY
STATEMENTS OF OPERATIONS
FOR THE YEAR ENDED OCTOBER 31, 2009
(AMOUNTS IN THOUSANDS)
| The U.S. | The U.S. | The DFA | The Japanese | |||||||||||||
| Large | Large | International | Small | |||||||||||||
| Company | Cap Value | Value | Company | |||||||||||||
| Series | Series | Series | Series | |||||||||||||
Investment Income | ||||||||||||||||
Dividends (Net of Foreign Taxes Withheld of $2, $20, $14,384 and $1,431, respectively) | $ | 76,385 | $ | 150,233 | $ | 160,091 | $ | 19,179 | ||||||||
Interest | 131 | 170 | 197 | 16 | ||||||||||||
Income from Securities Lending | 3,715 | 13,048 | 13,032 | 6,156 | ||||||||||||
Total Investment Income | 80,231 | 163,451 | 173,320 | 25,351 | ||||||||||||
Expenses | ||||||||||||||||
Investment Advisory Services Fees | 762 | 6,414 | 9,991 | 1,101 | ||||||||||||
Accounting & Transfer Agent Fees | 341 | 695 | 549 | 141 | ||||||||||||
S&P 500® Fees | 90 | — | — | — | ||||||||||||
Custodian Fees | 47 | 73 | 688 | 190 | ||||||||||||
Shareholders’ Reports | 32 | 66 | 49 | 12 | ||||||||||||
Directors’/Trustees’ Fees & Expenses | 59 | 120 | 78 | 25 | ||||||||||||
Audit Fees | 63 | 137 | 111 | 23 | ||||||||||||
Legal Fees | 75 | 164 | 110 | 25 | ||||||||||||
Other | 359 | 702 | 574 | 149 | ||||||||||||
Total Expenses | 1,828 | 8,371 | 12,150 | 1,666 | ||||||||||||
Net Investment Income (Loss) | 78,403 | 155,080 | 161,170 | 23,685 | ||||||||||||
Realized and Unrealized Gain (Loss) | ||||||||||||||||
Net Realized Gain (Loss) on: | ||||||||||||||||
Investment Securities Sold | (215,329 | ) | (122,113 | ) | 63,984 | (27,421 | ) | |||||||||
Futures | 20,268 | 7,204 | (1,125 | ) | 1,131 | |||||||||||
Foreign Currency Transactions | — | — | 3,828 | 2,027 | ||||||||||||
Change in Unrealized Appreciation (Depreciation) of: | ||||||||||||||||
Investment Securities and Foreign Currency | 427,495 | 1,161,370 | 1,395,836 | 227,157 | ||||||||||||
Futures | (2,236 | ) | (29 | ) | — | — | ||||||||||
Translation of Foreign Currency Denominated Amounts | — | — | 240 | (641 | ) | |||||||||||
Net Realized and Unrealized Gain (Loss) | 230,198 | 1,046,432 | 1,462,763 | 202,253 | ||||||||||||
Net Increase (Decrease) in Net Assets Resulting from Operations | $ | 308,601 | $ | 1,201,512 | $ | 1,623,933 | $ | 225,938 | ||||||||
See accompanying Notes to Financial Statements.
320
THE DFA INVESTMENT TRUST COMPANY
STATEMENTS OF OPERATIONS
FOR THE YEAR ENDED OCTOBER 31, 2009
(AMOUNTS IN THOUSANDS)
| The Asia Pacific Small Company Series | The United Kingdom Small Company Series | The Continental Small Company Series | The Canadian Small Company Series | |||||||||||||
Investment Income | ||||||||||||||||
Dividends (Net of Foreign Taxes Withheld of $392, $2, $5,010 and $528, respectively) | $ | 18,390 | $ | 23,954 | $ | 32,817 | $ | 3,021 | ||||||||
Interest | 17 | 13 | 66 | 5 | ||||||||||||
Income from Securities Lending | 2,043 | 395 | 5,130 | 821 | ||||||||||||
Total Investment Income | 20,450 | 24,362 | 38,013 | 3,847 | ||||||||||||
Expenses | ||||||||||||||||
Investment Advisory Services Fees | 488 | 585 | 1,230 | 251 | ||||||||||||
Accounting & Transfer Agent Fees | 76 | 86 | 154 | 51 | ||||||||||||
Custodian Fees | 245 | 50 | 310 | 65 | ||||||||||||
Shareholders’ Reports | 4 | 6 | 12 | 3 | ||||||||||||
Directors’/Trustees’ Fees & Expenses | 5 | 8 | 18 | 4 | ||||||||||||
Professional Fees | 19 | 22 | 48 | 10 | ||||||||||||
Other | 66 | 72 | 150 | 31 | ||||||||||||
Total Expenses | 903 | 829 | 1,922 | 415 | ||||||||||||
Net Investment Income (Loss) | 19,547 | 23,533 | 36,091 | 3,432 | ||||||||||||
Realized and Unrealized Gain (Loss) | ||||||||||||||||
Net Realized Gain (Loss) on: | ||||||||||||||||
Investment Securities Sold | (32,245 | ) | (34,448 | ) | (13,321 | ) | (38,817 | ) | ||||||||
Futures | (432 | ) | 534 | (476 | ) | (322 | ) | |||||||||
Foreign Currency Transactions | 146 | (50 | ) | (549 | ) | (182 | ) | |||||||||
Change in Unrealized Appreciation (Depreciation) of: | ||||||||||||||||
Investment Securities and Foreign Currency | 330,580 | 234,459 | 468,759 | 159,928 | ||||||||||||
Futures | (3 | ) | (1 | ) | (9 | ) | — | |||||||||
Translation of Foreign Currency Denominated Amounts | 209 | (199 | ) | 305 | 19 | |||||||||||
Net Realized and Unrealized Gain (Loss) | 298,255 | 200,295 | 454,709 | 120,626 | ||||||||||||
Net Increase (Decrease) in Net Assets Resulting from Operations | $ | 317,802 | $ | 223,828 | $ | 490,800 | $ | 124,058 | ||||||||
See accompanying Notes to Financial Statements.
321
THE DFA INVESTMENT TRUST COMPANY
STATEMENTS OF OPERATIONS
FOR THE YEAR ENDED OCTOBER 31, 2009
(AMOUNTS IN THOUSANDS)
| The Emerging Markets Series | The Emerging Markets Small Cap Series | |||||||
Investment Income | ||||||||
Dividends (Net of Foreign Taxes Withheld of $4,972 and $1,870, respectively) | $ | 43,658 | $ | 20,584 | ||||
Interest | 73 | 22 | ||||||
Income from Securities Lending | 3,350 | 2,196 | ||||||
Total Investment Income | 47,081 | 22,802 | ||||||
Expenses | ||||||||
Investment Advisory Services Fees | 1,697 | 1,597 | ||||||
Accounting & Transfer Agent Fees | 203 | 108 | ||||||
Custodian Fees | 1,105 | 747 | ||||||
Shareholders’ Reports | 17 | 7 | ||||||
Directors’/Trustees’ Fees & Expenses | 22 | 12 | ||||||
Professional Fees | 127 | 83 | ||||||
Other | 210 | 104 | ||||||
Total Expenses | 3,381 | 2,658 | ||||||
Net Investment Income (Loss) | 43,700 | 20,144 | ||||||
Realized and Unrealized Gain (Loss) | ||||||||
Net Realized Gain (Loss) on: | ||||||||
Investment Securities Sold | 40,421 | (13,070 | ) | |||||
Futures | (2,920 | ) | (181 | ) | ||||
Foreign Currency Transactions | (24 | ) | (182 | ) | ||||
In-Kind Redemptions | 17,805 | * | — | |||||
Change in Unrealized Appreciation (Depreciation) of: | ||||||||
Investment Securities and Foreign Currency | 642,058 | 535,144 | ||||||
Futures | (32 | ) | (10 | ) | ||||
Translation of Foreign Currency Denominated Amounts | 210 | 185 | ||||||
Change in Deferred Thailand Capital Gains Tax | (1,366 | ) | (786 | ) | ||||
Net Realized and Unrealized Gain (Loss) | 696,152 | 521,100 | ||||||
Net Increase (Decrease) in Net Assets Resulting from Operations | $ | 739,852 | $ | 541,244 | ||||
| * | See Note K in the Notes to Financial Statements. |
See accompanying Notes to Financial Statements.
322
THE DFA INVESTMENT TRUST COMPANY
STATEMENTS OF CHANGES IN NET ASSETS
(Amounts in thousands)
| The U.S. Large Company Series | The U.S. Large Cap Value Series | |||||||||||||||||||||||||||
| Year Ended Oct. 31, 2009 | Period Dec. 1, 2007 to Oct. 31, 2008 | Year Ended Nov. 30, 2007 | Year Ended Oct. 31, 2009 | Period Dec. 1, 2007 to Oct. 31, 2008 | Year Ended Nov. 30, 2007 | |||||||||||||||||||||||
Increase (Decrease) in Net Assets | ||||||||||||||||||||||||||||
Operations: | ||||||||||||||||||||||||||||
Net Investment Income (Loss) | $ | 78,403 | $ | 84,705 $ | 94,262 | $ | 155,080 | $ | 166,016 | $ | 146,991 | |||||||||||||||||
Net Realized Gain (Loss) on: | ||||||||||||||||||||||||||||
Investment Securities Sold | (215,329 | ) | (126,174 | ) | 10,206 | (122,113 | ) | (422,637 | ) | (118,412 | ) | |||||||||||||||||
Futures | 20,268 | (22,232 | ) | 3,585 | 7,204 | (1,861 | ) | — | ||||||||||||||||||||
In-Kind Redemptions | — | 24,362 | * | 529,199 | * | — | 52,271 | * | — | |||||||||||||||||||
Change in Unrealized Appreciation (Depreciation) of: | ||||||||||||||||||||||||||||
Investment Securities and Foreign Currency | 427,495 | (1,591,847 | ) | (217,829 | ) | 1,161,370 | (3,601,292 | ) | (150,559 | ) | ||||||||||||||||||
Futures | (2,236 | ) | 1,195 | (216 | ) | (29 | ) | 29 | — | |||||||||||||||||||
Net Increase (Decrease) in Net Assets Resulting from Operations | 308,601 | (1,629,991 | ) | 419,207 | 1,201,512 | (3,807,474 | ) | (121,980 | ) | |||||||||||||||||||
Transactions in Interest: | ||||||||||||||||||||||||||||
Contributions | 363,357 | 696,520 | 616,294 | 734,173 | 1,370,762 | † | 1,783,358 | † | ||||||||||||||||||||
Withdrawals | (440,159 | ) | (299,226 | )* | (1,482,132 | )* | (1,166,648 | ) | (983,247 | )*† | (368,362 | )† | ||||||||||||||||
Net Increase (Decrease) from Transactions in Interest | (76,802 | ) | 397,294 | (865,838 | ) | (432,475 | ) | 387,515 | 1,414,996 | |||||||||||||||||||
Total Increase (Decrease) in Net Assets | 231,799 | (1,232,697 | ) | (446,631 | ) | 769,037 | (3,419,959 | ) | 1,293,016 | |||||||||||||||||||
Net Assets | ||||||||||||||||||||||||||||
Beginning of Period | 3,273,652 | 4,506,349 | 4,952,980 | 6,739,363 | 10,159,322 | 8,866,306 | ||||||||||||||||||||||
End of Period | $ | 3,505,451 | $ | 3,273,652 | $ | 4,506,349 | $ | 7,508,400 | $ | 6,739,363 | $ | 10,159,322 | ||||||||||||||||
| * | See Note K in the Notes to Financial Statements. |
| † | See Note A in the Notes to Financial Statements. |
See accompanying Notes to Financial Statements.
323
THE DFA INVESTMENT TRUST COMPANY
STATEMENTS OF CHANGES IN NET ASSETS
(Amounts in thousands)
| The DFA International Value Series | The Japanese Small Company Series | |||||||||||||||||||||||||||
| Year Ended Oct. 31, 2009 | Period Dec. 1, 2007 to Oct. 31, 2008 | Year Ended Nov. 30, 2007 | Year Ended Oct. 31, 2009 | Period Dec. 1, 2007 to Oct. 31, 2008 | Year Ended Nov. 30, 2007 | |||||||||||||||||||||||
Increase (Decrease) in Net Assets | ||||||||||||||||||||||||||||
Operations: | ||||||||||||||||||||||||||||
Net Investment Income (Loss) | $ | 161,170 | $ | 304,387 | $ | 274,613 | $ | 23,685 | $ | 32,246 | $ | 29,640 | ||||||||||||||||
Net Realized Gain (Loss) on: | ||||||||||||||||||||||||||||
Investment Securities Sold | 63,984 | 137,811 | 654,522 | (27,421 | ) | (68,518 | ) | 51,317 | ||||||||||||||||||||
Futures | (1,125 | ) | (1,153 | ) | — | 1,131 | (16 | ) | — | |||||||||||||||||||
Foreign Currency Transactions | 3,828 | (4,593 | ) | 2,498 | 2,027 | (321 | ) | (227 | ) | |||||||||||||||||||
In-Kind Redemptions | — | 103,024 | * | — | — | 1,625 | * | — | ||||||||||||||||||||
Change in Unrealized Appreciation (Depreciation) of: | ||||||||||||||||||||||||||||
Investment Securities and Foreign Currency | 1,395,836 | (5,026,911 | ) | 403,307 | 227,157 | (374,750 | ) | (103,081 | ) | |||||||||||||||||||
Futures | — | 19 | — | — | — | — | ||||||||||||||||||||||
Translation of Foreign Currency Denominated Amounts | 240 | (76 | ) | (180 | ) | (641 | ) | 495 | 144 | |||||||||||||||||||
Net Increase (Decrease) in Net Assets Resulting from Operations | 1,623,933 | (4,487,492 | ) | 1,334,760 | 225,938 | (409,239 | ) | (22,207 | ) | |||||||||||||||||||
Transactions in Interest: | ||||||||||||||||||||||||||||
Contributions | 449,410 | 927,878 | † | 1,731,698 | † | 37,597 | 64,727 | 227,009 | ||||||||||||||||||||
Withdrawals | (581,716 | ) | (1,378,770 | )*† | (884,989 | )† | (143,463 | ) | (97,345 | )* | (85,703 | ) | ||||||||||||||||
Net Increase (Decrease) from Transactions in Interest | (132,306 | ) | (450,892 | ) | 846,709 | (105,866 | ) | (32,618 | ) | 141,306 | ||||||||||||||||||
Total Increase (Decrease) in Net Assets | 1,491,627 | (4,938,384 | ) | 2,181,469 | 120,072 | (441,857 | ) | 119,099 | ||||||||||||||||||||
Net Assets | ||||||||||||||||||||||||||||
Beginning of Period | 4,700,337 | 9,638,721 | 7,457,252 | 1,062,964 | 1,504,821 | 1,385,722 | ||||||||||||||||||||||
End of Period | $ | 6,191,964 | $ | 4,700,337 | $ | 9,638,721 | $ | 1,183,036 | $ | 1,062,964 | $ | 1,504,821 | ||||||||||||||||
| * | See Note K in the Notes to Financial Statements. |
| † | See Note A in the Notes to Financial Statements. |
See accompanying Notes to Financial Statements.
324
THE DFA INVESTMENT TRUST COMPANY
STATEMENTS OF CHANGES IN NET ASSETS
(Amounts in thousands)
| The Asia Pacific Small Company Series | The United Kingdom Small Company Series | |||||||||||||||||||||||||||
| Year Ended Oct. 31, 2009 | Period Dec. 1, 2007 to Oct. 31, 2008 | Year Ended Nov. 30, 2007 | Year Ended Oct. 31, 2009 | Period Dec. 1, 2007 to Oct. 31, 2008 | Year Ended Nov. 30, 2007 | |||||||||||||||||||||||
Increase (Decrease) in Net Assets | ||||||||||||||||||||||||||||
Operations: | ||||||||||||||||||||||||||||
Net Investment Income (Loss) | $ | 19,547 | $ | 37,740 | $ | 36,380 | $ | 23,533 | $ | 34,127 | $ | 33,556 | ||||||||||||||||
Net Realized Gain (Loss) on: | ||||||||||||||||||||||||||||
Investment Securities Sold | (32,245 | ) | (38,746 | ) | 111,215 | (34,448 | ) | 10,543 | 42,995 | |||||||||||||||||||
Futures | (432 | ) | (283 | ) | — | 534 | — | — | ||||||||||||||||||||
Foreign Currency Transactions | 146 | (1,429 | ) | 874 | (50 | ) | (1,788 | ) | 397 | |||||||||||||||||||
In-Kind Redemptions | — | 4,018 | * | — | — | 6,873 | * | — | ||||||||||||||||||||
Change in Unrealized Appreciation (Depreciation) of: | ||||||||||||||||||||||||||||
Investment Securities and Foreign Currency | 330,580 | (649,251 | ) | 232,165 | 234,459 | (643,213 | ) | (51,516 | ) | |||||||||||||||||||
Futures | (3 | ) | 3 | — | (1 | ) | 1 | — | ||||||||||||||||||||
Translation of Foreign Currency Denominated Amounts | 209 | (121 | ) | (25 | ) | (199 | ) | 222 | (10 | ) | ||||||||||||||||||
Net Increase (Decrease) in Net Assets Resulting from Operations | 317,802 | (648,069 | ) | 380,609 | 223,828 | (593,235 | ) | 25,422 | ||||||||||||||||||||
Transactions in Interest: | ||||||||||||||||||||||||||||
Contributions | 21,607 | 50,371 | 123,444 | 26,861 | 52,563 | 36,898 | ||||||||||||||||||||||
Withdrawals | (99,649 | ) | (166,219 | )* | (48,526 | ) | (35,607 | ) | (62,518 | )* | (21,566 | ) | ||||||||||||||||
Net Increase (Decrease) from Transactions in Interest | (78,042 | ) | (115,848 | ) | 74,918 | (8,746 | ) | (9,955 | ) | 15,332 | ||||||||||||||||||
Total Increase (Decrease) in Net Assets | 239,760 | (763,917 | ) | 455,527 | 215,082 | (603,190 | ) | 40,754 | ||||||||||||||||||||
Net Assets | ||||||||||||||||||||||||||||
Beginning of Period | 441,237 | 1,205,154 | 749,627 | 555,390 | 1,158,580 | 1,117,826 | ||||||||||||||||||||||
End of Period | $ | 680,997 | $ | 441,237 | $ | 1,205,154 | $ | 770,472 | $ | 555,390 | $ | 1,158,580 | ||||||||||||||||
| * | See Note K in the Notes to Financial Statements. |
See accompanying Notes to Financial Statements.
325
THE DFA INVESTMENT TRUST COMPANY
STATEMENTS OF CHANGES IN NET ASSETS
(Amounts in thousands)
| The Continental Small Company Series | The Canadian Small Company Series | |||||||||||||||||||||||||||
| Year Ended Oct. 31, 2009 | Period Dec. 1, 2007 to Oct. 31, 2008 | Year Ended Nov. 30, 2007 | Year Ended Oct. 31, 2009 | Period Dec. 1, 2007 to Oct. 31, 2008 | Period April 2, 2007(a) to Nov. 30, 2007 | |||||||||||||||||||||||
Increase (Decrease) in Net Assets | ||||||||||||||||||||||||||||
Operations: | ||||||||||||||||||||||||||||
Net Investment Income (Loss) | $ | 36,091 | $ | 63,045 | $ | 48,296 | $ | 3,432 | $ | 3,212 | $ | 383 | ||||||||||||||||
Net Realized Gain (Loss) on: | ||||||||||||||||||||||||||||
Investment Securities Sold | (13,321 | ) | (48,434 | ) | 151,648 | (38,817 | ) | (20,515 | ) | 1,663 | ||||||||||||||||||
Futures | (476 | ) | (358 | ) | — | (322 | ) | — | — | |||||||||||||||||||
Foreign Currency Transactions | (549 | ) | (76 | ) | 559 | (182 | ) | (433 | ) | (413 | ) | |||||||||||||||||
In-Kind Redemptions | — | 16,564 | * | — | — | (2,616 | )* | — | ||||||||||||||||||||
Change in Unrealized Appreciation (Depreciation) of: | ||||||||||||||||||||||||||||
Investment Securities and Foreign Currency | 468,759 | (1,158,591 | ) | 126,217 | 159,928 | (279,292 | ) | (6,570 | ) | |||||||||||||||||||
Futures | (9 | ) | 9 | — | — | — | — | |||||||||||||||||||||
Translation of Foreign Currency Denominated Amounts | 305 | (386 | ) | 83 | 19 | (6 | ) | (2 | ) | |||||||||||||||||||
Net Increase (Decrease) in Net Assets Resulting from Operations | 490,800 | (1,128,227 | ) | 326,803 | 124,058 | (299,650 | ) | (4,939 | ) | |||||||||||||||||||
Transactions in Interest: | ||||||||||||||||||||||||||||
Contributions | 118,904 | 131,960 | 103,548 | 37,000 | 341,843 | 222,468 | ||||||||||||||||||||||
Withdrawals | (90,397 | ) | (148,270 | )* | (49,423 | ) | (28,750 | ) | (22,849 | )* | (4,000 | ) | ||||||||||||||||
Net Increase (Decrease) from Transactions in Interest | 28,507 | (16,310 | ) | 54,125 | 8,250 | 318,994 | 218,468 | |||||||||||||||||||||
Total Increase (Decrease) in Net Assets | 519,307 | (1,144,537 | ) | 380,928 | 132,308 | 19,344 | 213,529 | |||||||||||||||||||||
Net Assets | ||||||||||||||||||||||||||||
Beginning of Period | 1,111,585 | 2,256,122 | 1,875,194 | 232,873 | 213,529 | — | ||||||||||||||||||||||
End of Period | $ | 1,630,892 | $ | 1,111,585 | $ | 2,256,122 | $ | 365,181 | $ | 232,873 | $ | 213,529 | ||||||||||||||||
See page 1 & 2 for the Definitions of Abbreviations and Footnotes.
| * | See Note K in the Notes to Financial Statements. |
See accompanying Notes to Financial Statements.
326
THE DFA INVESTMENT TRUST COMPANY
STATEMENTS OF CHANGES IN NET ASSETS
(Amounts in thousands)
| The Emerging Markets Series | The Emerging Markets Small Cap Series | |||||||||||||||||||||||||||
| Year Ended Oct. 31, 2009 | Period Dec. 1, 2007 to Oct. 31, 2008 | Year Ended Nov. 30, 2007 | Year Ended Oct. 31, 2009 | Period Dec. 1, 2007 to Oct. 31, 2008 | Year Ended Nov. 30, 2007 | |||||||||||||||||||||||
Increase (Decrease) in Net Assets | ||||||||||||||||||||||||||||
Operations: | ||||||||||||||||||||||||||||
Net Investment Income (Loss) | $ | 43,700 | $ | 82,436 | $ | 76,347 | $ | 20,144 | $ | 33,406 | $ | 23,921 | ||||||||||||||||
Net Realized Gain (Loss) on: | ||||||||||||||||||||||||||||
Investment Securities Sold | 40,421 | (59,927 | ) | 143,019 | (13,070 | ) | (9,181 | ) | 107,316 | |||||||||||||||||||
Futures | (2,920 | ) | (361 | ) | — | (181 | ) | (439 | ) | — | ||||||||||||||||||
Foreign Currency Transactions | (24 | ) | (1,036 | ) | (111 | ) | (182 | ) | (1,324 | ) | (336 | ) | ||||||||||||||||
In-Kind Redemptions | 17,805 | * | — | — | — | — | — | |||||||||||||||||||||
Change in Unrealized Appreciation (Depreciation) of: | ||||||||||||||||||||||||||||
Investment Securities and Foreign Currency | 642,058 | (1,612,126 | ) | 859,017 | 535,144 | (796,299 | ) | 279,364 | ||||||||||||||||||||
Futures | (32 | ) | 32 | — | (10 | ) | 10 | — | ||||||||||||||||||||
Translation of Foreign Currency Denominated Amounts | 210 | (139 | ) | (27 | ) | 185 | (182 | ) | 76 | |||||||||||||||||||
Change in Deferred Thailand Capital Gains Tax | (1,366 | ) | 2,797 | (884 | ) | (786 | ) | 1,377 | (450 | ) | ||||||||||||||||||
Net Increase (Decrease) in Net Assets Resulting from Operations | 739,852 | (1,588,324 | ) | 1,077,361 | 541,244 | (772,632 | ) | 409,891 | ||||||||||||||||||||
Transactions in Interest: | ||||||||||||||||||||||||||||
Contributions | 162,102 | 197,789 | 481,891 | 168,060 | 137,703 | 360,040 | ||||||||||||||||||||||
Withdrawals | (417,162 | )* | (692,731 | ) | (266,433 | ) | (107,710 | ) | (324,263 | ) | (147,889 | ) | ||||||||||||||||
Net Increase (Decrease) from Transactions in Interest | (255,060 | ) | (494,942 | ) | 215,458 | 60,350 | (186,560 | ) | 212,151 | |||||||||||||||||||
Total Increase (Decrease) in Net Assets | 484,792 | (2,083,266 | ) | 1,292,819 | 601,594 | (959,192 | ) | 622,042 | ||||||||||||||||||||
Net Assets | ||||||||||||||||||||||||||||
Beginning of Period | 1,624,524 | 3,707,790 | 2,414,971 | 566,379 | 1,525,571 | 903,529 | ||||||||||||||||||||||
End of Period | $ | 2,109,316 | $ | 1,624,524 | $ | 3,707,790 | $ | 1,167,973 | $ | 566,379 | $ | 1,525,571 | ||||||||||||||||
| * | See Note K in the Notes to Financial Statements. |
See accompanying Notes to Financial Statements.
327
THE DFA INVESTMENT TRUST COMPANY
FINANCIAL HIGHLIGHTS
| The U.S. Large Company Series | ||||||||||||||||||||||||
Year Ended Oct. 31, 2009 | Period Dec. 1, 2007 to Oct. 31, 2008 | Year Ended Nov. 30, 2007 | Year Ended Nov. 30, 2006 | Year Ended Nov. 30, 2005 | Year Ended Nov. 30, 2004 | |||||||||||||||||||
Total Return | 10.17 | % | (33.10 | )%(C) | 7.77 | % | 14.25 | % | 8.51 | % | 12.77 | % | ||||||||||||
Net Assets, End of Period (thousands) | $ | 3,505,451 | $ | 3,273,652 | $4,506,349 | $ | 4,952,980 | $ | 4,238,712 | $ | 3,493,919 | |||||||||||||
Ratio of Expenses to Average Net Assets | 0.06 | % | 0.04 | %(B) | 0.04 | % | 0.04 | % | 0.05 | % | 0.05 | % | ||||||||||||
Ratio of Net Investment Income to Average Net Assets | 2.57 | % | 2.16 | %(B) | 1.96 | % | 1.95 | % | 1.87 | % | 1.99 | % | ||||||||||||
Portfolio Turnover Rate | 10 | % | 6 | %(C) | 13 | %* | 4 | % | 6 | % | 2 | % | ||||||||||||
| The U.S. Large Cap Value Series† | ||||||||||||||||||||||||
Year Ended Oct. 31, 2009 | Period Dec. 1, 2007 to Oct. 31, 2008 | Year Ended Nov. 30, 2007 | Year Ended Nov. 30, 2006 | Year Ended Nov. 30, 2005 | Year Ended Nov. 30, 2004 | |||||||||||||||||||
Total Return | 11.90 | % | (36.53 | )%(C) | (0.32 | )% | 18.16 | % | 14.66 | % | 21.68 | % | ||||||||||||
Net Assets, End of Period (thousands) | $ | 7,508,400 | $ | 6,739,363 | $ | 10,159,322 | $ | 8,866,306 | $ | 5,831,587 | $ | 3,919,913 | ||||||||||||
Ratio of Expenses to Average Net Assets | 0.13 | % | 0.11 | %(B) | 0.11 | % | 0.12 | % | 0.14 | % | 0.15 | % | ||||||||||||
Ratio of Net Investment Income to Average Net Assets | 2.42 | % | 1.97 | %(B) | 1.44 | % | 1.68 | % | 1.56 | % | 1.41 | % | ||||||||||||
Portfolio Turnover Rate | 29 | % | 19 | %(C) | 9 | % | 13 | % | 9 | % | 7 | % | ||||||||||||
See page 1 & 2 for the Definitions of Abbreviations and Footnotes.
* Excluding security sales due to the In-Kind Redemptions the portfolio turnover rate would have been 5%. See Note K in the Notes to Financial Statements.
† See Note A in the Notes to Financial Statements.
See accompanying Notes to Financial Statements.
328
THE DFA INVESTMENT TRUST COMPANY
FINANCIAL HIGHLIGHTS
| The DFA International Value Series† | ||||||||||||||||||||||||
Year Ended Oct. 31, 2009 | Period Dec. 1, 2007 to Oct. 31, 2008 | Year Ended Nov. 30, 2007 | �� | Year Ended Nov. 30, 2006 | Year Ended Nov. 30, 2005 | Year Ended Nov. 30, 2004 | ||||||||||||||||||
Total Return | 35.41 | % | (47.87 | )%(C) | 17.32 | % | 35.73 | % | 15.61 | % | 32.15 | % | ||||||||||||
Net Assets, End of Period (thousands) | $ | 6,191,964 | $ | 4,700,337 | $ | 9,638,721 | $ | 7,457,252 | $ | 4,367,698 | $ | 2,804,043 | ||||||||||||
Ratio of Expenses to Average Net Assets | 0.24 | % | 0.23 | %(B) | 0.23 | % | 0.23 | % | 0.27 | % | 0.28 | % | ||||||||||||
Ratio of Net Investment Income to Average Net Assets | 3.22 | % | 4.15 | %(B) | 3.04 | % | 3.29 | % | 2.71 | % | 2.35 | % | ||||||||||||
Portfolio Turnover Rate | 18 | % | 16 | %(C) | 16 | % | 8 | % | 10 | % | 15 | % | ||||||||||||
| The Japanese Small Company Series | ||||||||||||||||||||||||
Year Ended Oct. 31, 2009 | Period Dec. 1, 2007 to Oct. 31, 2008 | Year Ended Nov. 30, 2007 | Year Ended Nov. 30, 2006 | Year Ended Nov. 30, 2005 | Year Ended Nov. 30, 2004 | |||||||||||||||||||
Total Return | 22.69 | % | (26.87 | )%(C) | (1.16 | )% | (2.28 | )% | 31.03 | % | 32.73 | % | ||||||||||||
Net Assets, End of Period (thousands) | $ | 1,183,036 | $ | 1,062,964 | $ | 1,504,821 | $ | 1,385,722 | $ | 1,151,429 | $605,132 | |||||||||||||
Ratio of Expenses to Average Net Assets | 0.15 | % | 0.13 | %(B) | 0.13 | % | 0.14 | % | 0.22 | % | 0.27 | % | ||||||||||||
Ratio of Net Investment Income to Average Net Assets | 2.15 | % | 2.64 | %(B) | 1.94 | % | 1.68 | % | 1.51 | % | 1.45 | % | ||||||||||||
Portfolio Turnover Rate | 7 | % | 10 | %(C) | 9 | % | 9 | % | 6 | % | 5 | % | ||||||||||||
See page 1 & 2 for the Definitions of Abbreviations and Footnotes.
† See Note A in the Notes to Financial Statements.
See accompanying Notes to Financial Statements.
329
THE DFA INVESTMENT TRUST COMPANY
FINANCIAL HIGHLIGHTS
| The Asia Pacific Small Company Series | ||||||||||||||||||||||||
Year Ended Oct. 31, 2009 | Period 2007 to Oct. 31, 2008 | Year Ended Nov. 30, 2007 | Year Ended Nov. 30, 2006 | Year Ended Nov. 30, 2005 | Year Ended Nov. 30, 2004 | |||||||||||||||||||
Total Return | 84.98 | % | (57.75 | )%(C) | 47.23 | % | 38.26 | % | 9.30 | % | 27.40 | % | ||||||||||||
Net Assets, End of Period (thousands) | $ | 680,997 | $ | 441,237 | $ | 1,205,154 | $749,627 | $ | 395,923 | $ | 282,999 | |||||||||||||
Ratio of Expenses to Average Net Assets | 0.18 | % | 0.15 | %(B) | 0.15 | % | 0.17 | % | 0.27 | % | 0.32 | % | ||||||||||||
Ratio of Net Investment Income to Average Net Assets | 4.00 | % | 4.33 | %(B) | 3.58 | % | 4.19 | % | 4.33 | % | 3.82 | % | ||||||||||||
Portfolio Turnover Rate | 23 | % | 20 | %(C) | 25 | % | 14 | % | 10 | % | 11 | % | ||||||||||||
| The United Kingdom Small Company Series | ||||||||||||||||||||||||
Year Ended Oct. 31, | Period Dec. 1, 2007 to Oct. 31, 2008 | Year Ended Nov. 30, 2007 | Year Ended Nov. 30, 2006 | Year Ended Nov. 30, 2005 | Year Ended Nov. 30, 2004 | |||||||||||||||||||
Total Return | 43.51 | % | (50.77 | )%(C) | 2.42 | % | 44.80 | % | 12.88 | % | 29.68 | % | ||||||||||||
Net Assets, End of Period (thousands) | $ | 770,472 | $ | 555,390 | $ | 1,158,580 | $ | 1,117,826 | $ | 643,038 | $ | 377,763 | ||||||||||||
Ratio of Expenses to Average Net Assets | 0.14 | % | 0.12 | %(B) | 0.12 | % | 0.13 | % | 0.22 | % | 0.27 | % | ||||||||||||
Ratio of Net Investment Income to Average Net Assets | 4.02 | % | 3.79 | %(B) | 2.72 | % | 2.70 | % | 3.19 | % | 2.70 | % | ||||||||||||
Portfolio Turnover Rate | 10 | % | 25 | %(C) | 12 | % | 8 | % | 12 | % | 7 | % | ||||||||||||
See page 1 & 2 for the Definitions of Abbreviations and Footnotes.
See accompanying Notes to Financial Statements.
330
THE DFA INVESTMENT TRUST COMPANY
FINANCIAL HIGHLIGHTS
| The Continental Small Company Series | |||||||||||||||||||||||
Year Ended Oct. 31, 2009 | Period Dec. 1, 2007 to Oct. 31, 2008 | Year Ended Nov. 30, 2007 | Year Ended Nov. 30, 2006 | Year Ended Nov. 30, 2005 | Year Ended Nov. 30, 2004 | ||||||||||||||||||
Total Return | 43.78 | % | (49.66 | )%(C) | 17.49 | % | 47.10 | % | 18.97 | % | 36.57 | % | |||||||||||
Net Assets, End of Period (thousands) | $ | 1,630,892 | $ | 1,111,585 | $ | 2,256,122 | $ | 1,875,194 | $ | 981,938 | $654,644 | ||||||||||||
Ratio of Expenses to Average Net Assets | 0.16 | % | 0.14 | %(B) | 0.14 | % | 0.15 | % | 0.24 | % | 0.26 | % | |||||||||||
Ratio of Net Investment Income to Average Net Assets | 2.93 | % | 3.49 | %(B) | 2.16 | % | 2.27 | % | 2.16 | % | 2.09 | % | |||||||||||
Portfolio Turnover Rate | 7 | % | 18 | %(C) | 12 | % | 7 | % | 18 | % | 9 | % | |||||||||||
| The Canadian Small Company Series | ||||||||||
| Year Ended Oct. 31, 2009 | Period Dec. 1, 2007 to Oct. 31, 2008 | Period April 2, 2007(a) to Nov. 30, 2007 | ||||||||
Total Return | 61.67 | % | (56.44 | )%(C) | 10.20 | %(C) | ||||
Net Assets, End of Period (thousands) | $ | 365,181 | $232,873 | $213,529 | ||||||
Ratio of Expenses to Average Net Assets | 0.17 | % | 0.18 | %(B) | 0.26 | %(B)(E) | ||||
Ratio of Net Investment Income to Average Net Assets | 1.37 | % | 0.97 | %(B) | 0.47 | %(B)(E) | ||||
Portfolio Turnover Rate | 23 | % | 21 | %(C) | 6 | %(C) | ||||
See page 1 & 2 for the Definitions of Abbreviations and Footnotes.
See accompanying Notes to Financial Statements.
331
THE DFA INVESTMENT TRUST COMPANY
FINANCIAL HIGHLIGHTS
| The Emerging Markets Series | ||||||||||||||||||||||||
Year Ended Oct. 31, 2009 | Period Dec. 1, 2007 to Oct. 31, 2008 | Year Ended Nov. 30, | Year Ended Nov. 30, | Year Ended Nov. 30, | Year Ended Nov. 30, | |||||||||||||||||||
Total Return | 53.99 | % | (48.15 | )%(C) | 42.62 | % | 31.87 | % | 31.23 | % | 35.47 | % | ||||||||||||
Net Assets, End of Period (thousands) | $ | 2,109,316 | $ | 1,624,524 | $ | 3,707,790 | $ | 2,414,971 | $ | 1,852,565 | $ | 1,160,262 | ||||||||||||
Ratio of Expenses to Average Net Assets | 0.20 | % | 0.18 | %(B) | 0.19 | % | 0.20 | % | 0.27 | % | 0.31 | % | ||||||||||||
Ratio of Net Investment Income to Average Net Assets | 2.57 | % | 3.00 | %(B) | 2.52 | % | 2.54 | % | 3.70 | % | 2.63 | % | ||||||||||||
Portfolio Turnover Rate | 14 | % | 19 | %(C) | 7 | % | 11 | % | 9 | % | 2 | % | ||||||||||||
| The Emerging Markets Small Cap Series | ||||||||||||||||||||||||
Year Ended Oct. 31, 2009 | Period Dec. 1, Oct. 31, | Year Ended Nov. 30, | Year Ended Nov. 30, | Year Ended Nov. 30, 2005 | Year Ended Nov. 30, 2004 | |||||||||||||||||||
Total Return | 92.08 | % | (56.84 | )%(C) | 43.32 | % | 40.55 | % | 24.85 | % | 35.22 | % | ||||||||||||
Net Assets, End of Period (thousands) | $ | 1,167,973 | $566,379 | $ | 1,525,571 | $903,529 | $545,271 | $237,865 | ||||||||||||||||
Ratio of Expenses to Average Net Assets | 0.33 | % | 0.30 | %(B) | 0.31 | % | 0.34 | % | 0.49 | % | 0.52 | % | ||||||||||||
Ratio of Net Investment Income to Average Net Assets | 2.52 | % | 3.07 | %(B) | 1.94 | % | 2.39 | % | 2.70 | % | 1.93 | % | ||||||||||||
Portfolio Turnover Rate | 13 | % | 19 | %(C) | 16 | % | 18 | % | 8 | % | 11 | % | ||||||||||||
See page 1 & 2 for the Definitions of Abbreviations and Footnotes.
See accompanying Notes to Financial Statements.
332
THE DFA INVESTMENT TRUST COMPANY
NOTES TO FINANCIAL STATEMENTS
A. Organization:
The DFA Investment Trust Company (the “Trust”) is an open-end management investment company registered under the Investment Company Act of 1940. The Trust consists of twelve investment portfolios, of which ten are included in this section of the report (collectively, the “Series”), and two are presented in separate reports.
Domestic Equity Portfolios | International Equity Portfolios | |
The U.S. Large Company Series | The DFA International Value Series | |
The U.S. Large Cap Value Series | The Japanese Small Company Series | |
The Asia Pacific Small Company Series | ||
The United Kingdom Small Company Series | ||
The Continental Small Company Series | ||
The Canadian Small Company Series | ||
The Emerging Markets Series | ||
The Emerging Markets Small Cap Series |
Effective December 31, 2008 and November 1, 2008, The U.S. Large Cap Value Series and The DFA International Value Series, respectively, each a master fund in a RIC/RIC master-feeder structure, elected with the consent of their respective Holder(s) to change their U.S. federal income tax classification from that of an association taxable as a corporation to a partnership pursuant to Treasury Regulation § 301.7701-3. The change in capital structure and retroactive reclassification of the statement of changes in net assets and financial highlights for the respective funds is a result of the treatment of a partnership for book purposes. Each Series/Portfolio will maintain its books and records and present its financial statements in accordance with generally accepted accounting principles for investment partnerships.
At a regular meeting of the Board of Directors/Trustees (the “Board”) on September 16, 2008, the Board voted to change the fiscal and tax year ends of the Series from November 30 to October 31.
B. Significant Accounting Policies:
The following significant accounting policies are in conformity with accounting principles generally accepted in the United States of America. Such policies are consistently followed by the Trust in preparation of its financial statements. The preparation of financial statements in accordance with accounting principles generally accepted in the United States of America requires management to make estimates and assumptions that affect the reported amounts of assets and liabilities and disclosure of contingent assets and liabilities at the date of the financial statements and the reported amounts of increases and decreases in net assets from operations during the reporting period. Actual results could differ from those estimates and those differences could be material.
1. Security Valuation: Securities held by the Domestic Equity Portfolios and the International Equity Portfolios, including over-the-counter securities, are valued at the last quoted sale price of the day. Securities held by the Domestic Equity Portfolios and the International Equity Portfolios that are listed on Nasdaq are valued at the Nasdaq Official Closing Price (“NOCP”). If there is no last reported sale price or NOCP for the day, the Domestic Equity Portfolios and International Equity Portfolios value the securities at the mean of the most recent quoted bid and asked prices. Price information on listed securities is taken from the exchange where the security is primarily traded. Generally, securities issued by open-end investment companies are valued using their respective net asset values or public offering prices, as appropriate, for purchase orders placed at the close of the New York Stock Exchange (NYSE).
333
Securities for which no market quotations are readily available (including restricted securities), or for which market quotations have become unreliable, are valued in good faith at fair value in accordance with procedures adopted by the Board of Directors/Trustees. Fair value pricing may also be used if events that have a significant effect on the value of an investment (as determined in the discretion of the Investment Committee of the Advisor) occur before the net asset value is calculated. When fair value pricing is used, the prices of securities used by the Domestic Equity Portfolios and International Equity Portfolios may differ from the quoted or published prices for the same securities on their primary markets or exchanges.
The International Equity Portfolios will also apply a fair value price in the circumstances described below. Generally, trading in foreign securities markets is completed each day at various times prior to the close of the NYSE. For example, trading in the Japanese securities markets is completed each day at the close of the Tokyo Stock Exchange (normally, 11:00 p.m. PT), which is fourteen hours prior to the close of the NYSE (normally, 1:00 p.m. PT) and the time that the net asset values of the International Equity Portfolios are computed. Due to the time differences between the closings of the relevant foreign securities exchanges and the time the International Equity Portfolios price their shares at the close of the NYSE, the International Equity Portfolios will fair value their foreign investments when it is determined that the market quotations for the foreign investments are either unreliable or not readily available. The fair value prices will attempt to reflect the impact of the U.S. financial markets’ perceptions and trading activities on the International Equity Portfolios’ foreign investments since the last closing prices of the foreign investments were calculated on their primary foreign securities markets or exchanges. For these purposes, the Board of Directors/Trustees of the Trust have determined that movements in relevant indices or other appropriate market indicators, after the close of the Tokyo Stock Exchange or the London Stock Exchange, demonstrate that market quotations may be unreliable. Fair valuation of portfolio securities may occur on a daily basis. The fair value pricing by the International Equity Portfolios utilizes data furnished by an independent pricing service (and that data draws upon, among other information, the market values of foreign investments). When an International Equity Portfolio uses fair value pricing, the values assigned to the International Equity Portfolio’s foreign investments may not be the quoted or published prices of the investments on their primary markets or exchanges.
Futures contracts held by the Series are valued using the settlement price established each day on the exchange on which they are traded.
The Series utilizes a fair value hierarchy which prioritizes the inputs to valuation techniques used to measure fair value into three broad levels described below:
• Level 1 – quoted prices in active markets for identical securities
• Level 2 – other significant observable inputs (including quoted prices for similar securities, interest rates, prepayment speeds, credit risk, etc.)
• Level 3 – significant unobservable inputs (including the Series’ own assumptions in determining the fair value of investments)
A summary of the inputs used to value the Series’ net assets by each major security type, industry and/or country is disclosed at the end of the Summary Schedule of Portfolio Holdings/Schedule of Investments. The inputs or methodology used for valuing securities are not necessarily an indication of the risk associated with investing in those securities.
2. Foreign Currency Translation: Securities and other assets and liabilities of the International Equity Portfolios, whose values are initially expressed in foreign currencies, are translated to U.S. dollars using the mean between the most recently quoted bid and asked prices for the U.S. dollar as quoted by generally recognized reliable sources. Dividend and interest income and certain expenses are translated to U.S. dollars at the rate of exchange on their respective accrual dates. Receivables and payables denominated in foreign currencies are marked to market daily based on daily exchange rates and exchange gains or losses are realized upon ultimate receipt or disbursement.
The International Equity Portfolios do not isolate the effect of fluctuations in foreign exchange rates from the effect of fluctuations in the market prices of securities held whether realized or unrealized.
334
Realized gains or losses on foreign currency transactions represent net foreign exchange gains or losses from the disposition of foreign currencies, currency gains or losses realized between the trade and settlement dates on securities transactions, and the difference between amounts of interest, dividends and foreign withholding taxes recorded on the books of the International Equity Portfolios and the U.S. dollar equivalent amounts actually received or paid.
3. Deferred Compensation Plan: Each eligible Trustee of the Trust may elect participation in the Deferred Compensation Plan (the “Plan”). Under the Plan, effective January 1, 2002, such Trustees may defer payment of all or a portion of their total fees earned as a Trustee. These deferred amounts may be treated as though such amounts had been invested in shares of the following funds: U.S. Large Cap Value Portfolio; U.S. Core Equity 1 Portfolio; U.S. Core Equity 2 Portfolio; U.S. Vector Equity Portfolio; U.S. Micro Cap Portfolio; DFA International Value Portfolio; International Core Equity Portfolio; Emerging Markets Portfolio; Emerging Markets Core Equity Portfolio; and/or DFA Two-Year Global Fixed Income Portfolio. Contributions made under the Plan and the change in unrealized appreciation (depreciation) and income, are included in Directors’/Trustees’ Fees & Expenses.
Each Trustee has the option to receive their distribution of proceeds in one of the following methods upon one year’s notice: lump sum; annual installments over a period of agreed upon years; or semi-annual installments over a period of agreed upon years. As of October 31, 2009, none of the Trustees have requested distribution of proceeds.
4. Other: Security transactions are accounted for as of the trade date. Costs used in determining realized gains and losses on the sale of investment securities are on the basis of identified cost. Dividend income and distributions to shareholders are recorded on the ex-dividend date. Distributions received on securities that represent a return of capital or capital gain are recorded as a reduction of cost of investments or as a realized gain, respectively. The Series estimate the character of distributions received that may be considered return of capital distributions. Interest income is recorded on an accrual basis. Discount and premium on securities purchased are amortized over the lives of the respective securities, utilizing the effective interest method. Expenses directly attributable to a Series are directly charged. Common expenses of the Trust or Series are allocated using methods approved by the Board of Directors/Trustees, generally based on average net assets.
The International Portfolios may be subject to taxes imposed by countries in which they invest, with respect to their investments in issuers existing or operating in such countries. Such taxes are generally based on income earned or repatriated and capital gains realized on the sale of such investments. The Series accrue such taxes when the related income or capital gains are earned or throughout the holding period. Some countries require governmental approval for the repatriation of investment income, capital or the proceeds of sales earned by foreign investors. In addition, if there is a deterioration in a country’s balance of payments or for other reasons, a country may impose temporary restrictions on foreign capital remittances abroad.
The Emerging Markets Series and The Emerging Markets Small Cap Series investments in Thailand are subject to a 15% governmental capital gains tax. Such taxes are due upon sale of individual securities. The Emerging Markets Series and The Emerging Markets Small Cap Series accrue for taxes on the capital gains throughout the holding period based on the unrealized gain of the underlying securities. These Series are also subject to a 15% governmental capital gains tax on short-term capital gains for investments in India. Such taxes are due upon sale of individual securities. The taxes for the capital gains are accrued when the capital gains are earned.
C. Investment Advisor:
Dimensional Fund Advisors LP (“Dimensional” or the “Advisor”) provides investment advisory services to the Trust. For year ended October 31, 2009, the Series’ investment advisory services fees were accrued daily and paid monthly to the Advisor based on the following effective annual rates of average daily net assets:
The U.S. Large Company Series | 0.025 | % | |
The U.S. Large Cap Value Series | 0.10 | % | |
The DFA International Value Series | 0.20 | % | |
The Japanese Small Company Series | 0.10 | % |
335
The Asia Pacific Small Company Series | 0.10 | % | |
The United Kingdom Small Company Series | 0.10 | % | |
The Continental Small Company Series | 0.10 | % | |
The Canadian Small Company Series | 0.10 | % | |
The Emerging Markets Series | 0.10 | % | |
The Emerging Markets Small Cap Series | 0.20 | % |
Fees Paid to Officers and Directors/Trustees:
Certain Officers and Directors/Trustees of the Advisor are also Officers and Directors/Trustees of the Trust; however, such Officers and Directors/Trustees (with the exception of the Chief Compliance Officer (“CCO”)) receive no compensation from the Trust. For the year ended October 31, 2009, the total related amounts paid by the Trust to the CCO were $98 (in thousands). The total related amounts paid by each of the Series are included in Other Expenses on the Statement of Operations.
D. Deferred Compensation:
At October 31, 2009, the total liability for deferred compensation to Directors/Trustees is included in Accrued Expenses and Other Liabilities on the Statement of Assets and Liabilities as follows (amounts in thousands):
The U.S. Large Company Series | $ | 87 | |
The U.S. Large Cap Value Series | 183 | ||
The DFA International Value Series | 143 | ||
The Japanese Small Company Series | 31 | ||
The Asia Pacific Small Company Series | 14 | ||
The United Kingdom Small Company Series | 17 | ||
The Continental Small Company Series | 35 | ||
The Canadian Small Company Series | 7 | ||
The Emerging Markets Series | 48 | ||
The Emerging Markets Small Cap Series | 23 |
E. Purchases and Sales of Securities:
For the year ended October 31, 2009, the Series made the following purchases and sales of investment securities, other than short-term securities and U.S. government securities (amounts in thousands):
| Purchases | Sales | |||||
The U.S. Large Company Series | $ | 324,298 | $ | 294,824 | ||
The U.S. Large Cap Value Series | 1,964,487 | 1,887,094 | ||||
The DFA International Value Series | 1,071,984 | 935,775 | ||||
The Japanese Small Company Series | 76,298 | 144,852 | ||||
The Asia Pacific Small Company Series | 111,607 | 164,466 | ||||
The United Kingdom Small Company Series | 101,735 | 57,562 | ||||
The Continental Small Company Series | 199,144 | 90,144 | ||||
The Canadian Small Company Series | 65,303 | 57,297 | ||||
The Emerging Markets Series | 230,547 | 367,789 | ||||
The Emerging Markets Small Cap Series | 206,567 | 105,446 | ||||
336
F. Federal Income Taxes:
No provision for federal income taxes is required since the Series are treated as partnerships for Federal income tax purposes. Any net investment income and realized and unrealized gains and losses have been deemed to have been “passed down” to their respective partners.
Some of the Series’ investments are in securities considered to be “passive foreign investment companies” for which any unrealized appreciation (depreciation) (mark to market) and/or realized gains are required to be included in distributable net investment income for federal income tax purposes. At October 31, 2009, the following Series had cumulative unrealized appreciation (depreciation) (mark to market) to be included in distributable net investment income for federal tax purposes. For the year ended October 31, 2009, realized gains on the sale of passive foreign investment companies have been reclassified from accumulated net realized gains to accumulated net investment income for federal tax purposes. Amounts listed below are in thousands.
| Mark to Market | Realized Gains | |||
The Japanese Small Company Series | $ 801 | — | ||
The Asia Pacific Small Company Series | 241 | $385 | ||
The United Kingdom Small Company Series | 2,879 | 256 | ||
The Continental Small Company Series | 6,098 | — | ||
The Emerging Markets Small Cap Series | 476 | — |
At October 31, 2009, the total cost and aggregate gross unrealized appreciation and (depreciation) of securities for federal income tax purposes were different from amounts reported for financial reporting purposes (amounts in thousands):
| Federal Tax Cost | Unrealized Appreciation | Unrealized (Depreciation) | Net Unrealized Appreciation (Depreciation) | ||||||||||
The U.S. Large Company Series | $ | 3,858,145 | $ | 789,949 | $(876,863 | ) | $ | (86,914 | ) | ||||
The U.S. Large Cap Value Series | 6,877,391 | 1,296,505 | (135,135 | ) | 1,161,370 | ||||||||
The DFA International Value Series | 5,830,471 | 1,458,762 | (63,077 | ) | 1,395,685 | ||||||||
The Japanese Small Company Series | 1,561,973 | 122,281 | (338,956 | ) | (216,675 | ) | |||||||
The Asia Pacific Small Company Series | 752,488 | 164,965 | (101,664 | ) | 63,301 | ||||||||
The United Kingdom Small Company Series | 856,216 | 134,083 | (196,940 | ) | (62,857 | ) | |||||||
The Continental Small Company Series | 1,674,575 | 418,155 | (258,298 | ) | 159,857 | ||||||||
The Canadian Small Company Series | 558,453 | 22,376 | (148,256 | ) | (125,880 | ) | |||||||
The Emerging Markets Series | 1,299,053 | 1,057,665 | (24,146 | ) | 1,033,519 | ||||||||
The Emerging Markets Small Cap Series | 969,640 | 402,071 | (110,046 | ) | 292,025 | ||||||||
Accounting for Uncertainty in Income Taxes sets forth a minimum threshold for financial statement recognition of the benefit of a tax position taken or expected to be taken in a tax return. Management has analyzed each Series’ tax positions and has concluded that no provision for income tax is required in any Series’ financial statements. No Series is aware of any tax positions for which it is reasonably possible that the total amounts of unrecognized tax benefits will significantly change in the next twelve months. Each of the Series’ federal tax returns for the prior three fiscal years remains subject to examination by the Internal Revenue Service.
On November 1, 2008, The DFA International Value Series, a master fund in a RIC/RIC master-feeder structure with five RIC feeders and other direct client investor(s), made a “Check-the-box” election for federal income tax purposes pursuant to Treasury Regulation §301.7701-3, to change its federal entity classification from a corporation taxable as a regulated investment company to a partnership. As a result of this election, the master fund is deemed to have distributed all of its assets and liabilities, in a taxable transaction, to its shareholders in liquidation of the master fund. Immediately thereafter, the shareholders contributed all of the distributed assets and liabilities to a newly formed partnership. The final tax year end of The DFA International Value Series was October 31, 2008. For
337
Federal income tax purposes, pursuant to Internal Revenue Code §336(a), the master fund recognizes gain or loss as if the master’s investment securities were sold to its shareholders and, pursuant to IRC Code §331, each of the Portfolios recognizes gain or loss as if it liquidated its investment in the master. As a result of the transaction, The DFA International Value Series recognized a ($2,309,440,866) and ($718,733) capital and currency loss respectively for tax year ended October 31, 2008. For tax purposes, pursuant to IRC Code §334(a), each of the Portfolios will take a fair market value basis in the securities deemed received by them and a new holding period for those securities commences on the deemed liquidation date.
Effective December 31, 2008, The U.S. Large Cap Value Series, a master fund in a RIC/RIC master-feeder structure with four RIC feeders and other direct client investor(s), made a “Check-the-box” election for federal income tax purposes pursuant to Treasury Regulation §301.7701-3, to change its federal entity classification from a corporation taxable as a regulated investment company to a partnership. As a result of this election, the master fund is deemed to have distributed all of its assets and liabilities, in a taxable transaction, to its shareholders in liquidation of the master fund. Immediately thereafter, the shareholders contributed all of the distributed assets and liabilities to a newly formed partnership. The final tax year end of The U.S. Large Cap Value Series was December 30, 2008. For Federal income tax purposes, pursuant to IRC Code §336(a), the master fund recognized a loss as if the master’s investment securities were sold to its shareholders and, pursuant to IRC Code §331, each of the Portfolios recognized a gain as if it liquidated its investment in the master. For tax purposes, pursuant to IRC Code §334(a), each of the Portfolios took a fair market value basis in the securities deemed received by them and a new holding period for those securities commenced on the deemed liquidation date.
The master fund had book/tax differences upon its deemed liquidation. The following summary of permanent differences occurred as of the respective effective “Check the Box” election date.
| Increase (Decrease) Paid-In Capital | Unrealized Appreciation (Depreciation) Investment Securities | Increase (Decrease) Undistributed Net Investment Income | Increase (Decrease) Accumulated Net Realized Gains (Losses) | ||||
| $(3,038,312,278 | ) | $2,303,664,484 | $(698,899) | $735,346,693 |
As a result of the transaction, The U.S. Large Cap Value Series recognized a ($2,303,664,484) capital loss for tax year ended December 30, 2008. Additionally, the fund has written off $3,039,011,176 of expired capital loss carryover as a permanent book/tax reporting difference decreasing paid in capital.
G. Financial Instruments:
In accordance with the Series’ investment objectives and policies, the Series may invest in certain financial instruments that have off-balance sheet risk in excess of the amounts recognized in the financial statements and concentrations of credit and market risk. These instruments and their significant corresponding risks are described below:
1. Repurchase Agreements: The Series may purchase certain U.S. Government securities subject to the counterparty’s agreement to repurchase them at an agreed upon date and price. The counterparty will be required on a daily basis to maintain the value of the collateral subject to the agreement at not less than the repurchase price (including accrued interest). The agreements are conditioned upon the collateral being deposited under the Federal Reserve book-entry system with the Trust’s custodian or a third party sub-custodian. In the event of default or bankruptcy by the other party to the agreement, retention of the collateral may be subject to legal proceedings. All open repurchase agreements were entered into on October 30, 2009.
2. Foreign Markets Risks: Investments in foreign markets may involve certain consideration and risks not typically associated with investments in the United States of America, including the possibility of future political and economic developments and the level of foreign government supervision and regulation of foreign securities markets. These markets are generally smaller, less liquid and more volatile than the major securities markets in the United States of America. Consequently, acquisition and disposition of securities by the Master Funds may be inhibited.
338
Derivative Financial Instruments:
Disclosures on derivative instruments and hedging activities are intended to improve financial reporting for derivative instruments by enabling investors to understand how and why a fund uses derivatives, how derivatives are accounted for and how derivative instruments affect a fund’s results of operations and financial position. Summarized below are the specific types of derivative instruments used by the Series.
3. Futures Contracts: The Series may enter into futures contracts to gain market exposure on uninvested cash pending investment in securities or to maintain liquidity to pay redemptions. Upon entering into a futures contract, the Series deposits cash or pledges U.S. Government securities to a broker, equal to the minimum “initial margin” requirements of the exchange on which the contract is traded. Subsequent payments are received from or paid to the broker each day, based on the daily fluctuation in the market value of the contract. These receipts or payments are known as “variation margin” and are recorded daily by the Series as unrealized gains or losses until the contracts are closed. When the contracts are closed, the Series record a realized gain or loss, which is presented in the Statements of Operations as a net realized gain or loss on futures, equal to the difference between the value of the contract at the time it was opened and the value at the time it was closed.
Risks may arise upon entering into futures contracts from potential imperfect price correlations between the futures contracts and the underlying securities, from the possibility of an illiquid secondary market for these instruments and from the possibility that the Series could lose more than the initial margin requirements. The Series entering into stock index futures are subject to equity price risk from those futures contracts. Counterparty credit risk related to exchange-traded futures is minimal because the exchange’s clearinghouse, as counterparty to all exchange-traded futures, guarantees the futures against default.
At October 31, 2009, the following Series had the following outstanding futures contracts (dollar amounts in thousands):
| Description | Expiration Date | Number of Contracts | Contract Value | Unrealized Gain (Loss) | Approximate Cash Collateral | ||||||||
The U.S. Large Company Series | S&P 500 ®Index | 12/18/2009 | 118* | $ | 30,474 | $141 | $2,655 | ||||||
*During the year ended October 31, 2009, the Series had limited activity in futures transactions.
Additional disclosure on derivative instruments is required showing a summary by primary risk exposure of the derivatives instruments’ (i) location in the balance sheet and fair value at period end and (ii) the location in the Statements of Operations and the realized and change in unrealized gain or loss over the reporting period. The following is a summary of the Series’ derivative instrument holdings for the year ended October 31, 2009.
The following is a summary of the Series’ location and value of derivative instrument holdings on the Series’ Statements of Assets and Liabilities categorized by primary risk exposure as of October 31, 2009 (amounts in thousands):
| Asset Derivatives Value | ||||
Location on the Statements Liabilities | Equity Contracts | |||
The U.S. Large Company Series | Payables: Futures Margin Variation | $141* |
| * | Includes cumulative appreciation (depreciation) of futures contracts. Only current day’s margin variation is reported within the Statement of Assets and Liabilities. |
The following is a summary of the location on the Series’ Statements of Operations of realized and change in unrealized gains and losses from the Series’ derivative instrument holdings through the year ended October 31, 2009 (amounts in thousands):
339
Derivative Type | Location of Gain (Loss) on Derivatives Recognized in Income | |
Equity contracts | Net Realized Gain (Loss) on: Futures Change in Unrealized Appreciation (Depreciation) of: Futures |
The following is a summary of the location of realized and change in unrealized gains and losses on the Series’ Statements of Operations for the Series’ derivative instrument holdings categorized by primary risk exposure through the year ended October 31, 2009 (amounts in thousands):
| Realized Gain (Loss) on Derivatives Recognized in Income | ||
| Equity Contracts | ||
The U.S. Large Company Series | $20,268 | |
The U.S. Large Cap Value Series* | 7,204 | |
The DFA International Value Series* | (1,125) | |
The Japanese Small Company Series* | 1,131 | |
The Asia Pacific Small Company Series* | (432) | |
The United Kingdom Small Company Series* | (534) | |
The Continental Small Company Series* | (476) | |
The Canadian Small Company Series* | (322) | |
The Emerging Markets Series* | (2,920) | |
The Emerging Markets Small Cap Series* | (181) | |
| Change in Unrealized Appreciation (Depreciation) on Derivatives Recognized in Income | ||
| Equity Contracts | ||
The U.S. Large Company Series | $(2,236) | |
The U.S. Large Cap Value Series* | (29) | |
The Asia Pacific Small Company Series* | (3) | |
The United Kingdom Small Company Series* | (1) | |
The Continental Small Company Series* | (9) | |
The Emerging Markets Series* | (32) | |
The Emerging Markets Small Cap Series* | (10) | |
| * | As of October 31, 2009, there were no futures contracts outstanding. During the year ended October 31, 2009, the Series had limited activity in these transactions. |
H. Line of Credit:
The Trust, together with other Dimensional-advised portfolios, has entered into an amended and restated $250 million unsecured discretionary line of credit effective July 8, 2009 with an affiliate of its domestic custodian bank. Each portfolio is permitted to borrow, subject to its investment limitations, up to a maximum of $250 million, as long as total borrowings under the line of credit do not exceed $250 million in the aggregate. Borrowings under the line of credit are charged interest at the then current Federal Funds Rate plus 1%. Each portfolio is individually, and not jointly, liable for its particular advances under the line of credit. There is no commitment fee on the unused portion of the line of credit. The agreement for the discretionary line of credit may be terminated by either party at any time. The line of credit is scheduled to expire on June 22, 2010.
340
For the year ended October 31, 2009, borrowings by the Series under this line of credit were as follows (amounts in thousands, except percentages and days):
| Weighted Average Interest Rate | Weighted Average Loan Balance | Number of Days Outstanding | Interest Expense Incurred | Maximum Amount Borrowed During the Period | ||||||
The U.S. Large Company Series | 2.48% | $ 8,245 | 10 | $6 | $14,732 | |||||
The U.S. Large Cap Value Series | 1.90% | 11,126 | 5 | 3 | 31,000 |
There were no outstanding borrowings by the Series under this line of credit as of October 31, 2009.
The Trust, together with other Dimensional-advised portfolios, has also entered into an additional $500 million unsecured line of credit effective January 15, 2009 with its international custodian bank. Each portfolio is permitted to borrow, subject to its investment limitations, up to a maximum of $500 million, as long as total borrowings under the line of credit do not exceed $500 million in the aggregate. Each portfolio is individually, and not jointly, liable for its particular advances under the line of credit. Borrowings under the line of credit are charged interest at rates agreed to by the parties at the time of borrowing. There is no commitment fee on the unused portion of the line of credit. The agreement for the line of credit expires on January 15, 2010.
For the year ended October 31, 2009, borrowings by the Series under this line of credit were as follows (amounts in thousands, except percentages and days):
| Weighted Average Interest Rate | Weighted Average Loan Balance | Number of Days Outstanding | Interest Expense Incurred | Maximum Amount Borrowed During the Period | ||||||
The DFA International Value Series | 0.95% | $8,517 | 11 | $ 2 | $18,062 | |||||
The Japanese Small Company Series | 0.94% | 1,248 | 13 | — | 10,042 | |||||
The Asia Pacific Small Company Series | 0.92% | 601 | 32 | — | 2,864 | |||||
The United Kingdom Small Company Series | 0.93% | 940 | 10 | — | 2,977 | |||||
The Continental Small Company Series | 0.95% | 695 | 13 | — | 1,624 | |||||
The Emerging Markets Series | 0.91% | 3,365 | 87 | 7 | 13,587 | |||||
The Emerging Markets Small Cap Series | 0.92% | 1,891 | 30 | 1 | 6,555 |
There were no outstanding borrowings by the Series under this line of credit as of October 31, 2009.
I. Securities Lending:
As of October 31, 2009, some of the Series had securities on loan to brokers/dealers, for which each Series held cash collateral. Each Series invests the cash collateral, as described below, and records a liability for the return of the collateral, during the period the securities are on loan. Loans of securities are expected at all times to be secured by collateral equal to at least (i) 100% of the current market value of the loaned securities with respect to securities of the U.S. government or its agencies, (ii) 102% of the current market value of the loaned securities with respect to U.S. securities, and (iii) 105% of the current market value of the loaned securities with respect to foreign securities. However, daily market fluctuations could cause the Series’ collateral to be lower or higher than the expected thresholds. If this were to occur, the collateral would be adjusted the next business day to ensure adequate collateralization. In the event of default or bankruptcy by the other party to the agreement, realization and/or retention of the collateral may be subject to legal proceedings. If the borrower fails to return loaned securities, and cash collateral being maintained by the borrower is insufficient to cover the value of loaned securities and provided such collateral insufficiency is not the result of investment losses, the lending agent has agreed to pay the amount of the shortfall to the Series or, at the option of the lending agent, to replace the securities.
Subject to each Series’ investment policy, the cash collateral received by the Series from securities on loan is invested in securities of the U.S. government or its agencies, repurchase agreements collateralized by securities of the U.S. government or its agencies or shares of the DFA Short Term Investment Fund LP. Agencies include both agency debentures and agency mortgage backed securities. In addition, each Series will be able to terminate the
341
loan at any time and will receive reasonable interest on the loan, as well as amounts equal to any dividends, interest or other distributions on the loaned securities. However, dividend income received from loaned securities may not be eligible to be taxed at qualified dividend income rates.
J. Indemnitees; Contractual Obligations:
Under the Trust’s organizational documents, its officers and directors are indemnified against certain liabilities arising out of the performance of their duties to the Trust.
In the normal course of business, the Trust enters into contracts that contain a variety of representations and warranties which provide general indemnification. The Trust’s maximum exposure under these arrangements is unknown as this would involve future claims that may be made against the Trust and/or its affiliates that have not yet occurred. However, based on experience, the Trust expects the risk of loss to be remote.
K. In-Kind Redemptions:
In accordance with guidelines described in the Series’ prospectus, the fund may distribute portfolio securities rather than cash as payment for a redemption of fund shares (in-kind redemption). For financial reporting purposes, the fund recognizes a gain on in-kind redemptions to the extent the value of the distributed securities on the date of redemption exceeds the cost of those securities. Gains and losses realized on in-kind redemptions are not recognized for tax purposes and are reclassified from undistributed realized gain (loss) to paid-in capital.
During the year ended October 31, 2009, The Emerging Markets Series realized net gains of $17,805 (in thousands) of in-kind redemptions.
During the period December 1, 2007 to October 31, 2008, the following Series realized net gains (losses) of in-kind redemptions (amounts in thousands):
The U.S. Large Company Series | $ | 24,362 | |
The U.S. Large Cap Value Series | 52,271 | ||
The DFA International Value Series | 103,024 | ||
The Japanese Small Company Series | 1,625 | ||
The Asia Pacific Small Company Series | 4,018 | ||
The United Kingdom Small Company Series | 6,873 | ||
The Continental Small Company Series | 16,564 | ||
The Canadian Small Company Series | (2,616) |
During the year ended November 30, 2007, The U.S. Large Company Series distributed securities in lieu of cash for shareholder redemptions. The value of the redemption was $1,099,445 (in thousands) which resulted in a realized gain of $529,199 (in thousands) to the Series.
L. Subsequent Event Evaluations:
Management has evaluated the impact of all subsequent events on the Series through December 23, 2009, the date the financial statements were available for issuance, and has determined that there are no subsequent events requiring recognition or disclosure in the financial statements.
342
REPORT OF INDEPENDENT REGISTERED PUBLIC ACCOUNTING FIRM
To the Shareholders of the Series, as defined, and
Board of Trustees of The DFA Investment Trust Company.:
In our opinion, the accompanying statements of assets and liabilities, including the summary schedules of portfolio holdings, and the related statements of operations and of changes in net assets and the financial highlights present fairly, in all material respects, the financial position of The U.S. Large Company Series, The U.S. Large Cap Value Series, The DFA International Value Series, The Japanese Small Company Series, The Asia Pacific Small Company Series, The United Kingdom Small Company Series, The Continental Small Company Series, The Canadian Small Company Series, The Emerging Markets Series and The Emerging Markets Small Cap Series (constituting portfolios within The DFA Investment Trust Company, hereafter referred to as the “Series”) at October 31, 2009, the results of each of their operations for the year then ended, the changes in each of their net assets and the financial highlights for each of the periods indicated, in conformity with accounting principles generally accepted in the United States of America. These financial statements and financial highlights (hereafter referred to as “financial statements”) are the responsibility of the Series’ management; our responsibility is to express an opinion on these financial statements based on our audits. We conducted our audits of these financial statements in accordance with the standards of the Public Company Accounting Oversight Board (United States). Those standards require that we plan and perform the audit to obtain reasonable assurance about whether the financial statements are free of material misstatement. An audit includes examining, on a test basis, evidence supporting the amounts and disclosures in the financial statements, assessing the accounting principles used and significant estimates made by management, and evaluating the overall financial statement presentation. We believe that our audits, which included confirmation of securities at October 31, 2009 by correspondence with the custodians, brokers, and the transfer agent of the investee fund, provide a reasonable basis for our opinion.
PricewaterhouseCoopers LLP
Philadelphia, Pennsylvania
December 23, 2009
343
RESULTS OF THE SHAREHOLDER MEETING
On June 2, 2009 and June 5, 2009, The DFA Investment Trust Company (“DFAITC”) held a Special Joint Meeting of Shareholders for the purpose of voting on several proposals affecting DFAITC and the Series, including, among other items, the election of Trustees, the amendment of certain fundamental investment limitations, and the elimination of certain fundamental investment limitations. The shareholders of the Series approved each of the applicable proposals for DFAITC and the Series presented at the Meeting. Listed below are the voting results from the Meeting. Please note that not all Proposals presented at the Meeting were voted on by each Series. Additionally, the Proposal numbers reflected below correlate to the Proposal numbers presented for vote at the Meeting.
DFAITC
| Shares Voted | Percent of Outstanding Shares Voted | |||||||||||||||||||
| For | % | Against | % | Abstain/WithHold | % | For | Against | Abstain / WithHold | ||||||||||||
Proposal 1: Election of Trustees for DFAITC*
| ||||||||||||||||||||
1a | David G. Booth | 2,166,359,402 | 96.50% | — | 0.00% | 78,661,259 | 3.50% | 95.78% | 0.00% | 3.48% | ||||||||||
1b | George M. Constantinides | 2,169,219,982 | 96.62% | — | 0.00% | 75,800,679 | 3.38% | 95.90% | 0.00% | 3.35% | ||||||||||
1c | John P. Gould | 2,168,577,186 | 96.59% | — | 0.00% | 76,443,476 | 3.41% | 95.88% | 0.00% | 3.38% | ||||||||||
1d | Roger G. Ibbotson | 2,169,778,365 | 96.65% | — | 0.00% | 75,242,297 | 3.35% | 95.93% | 0.00% | 3.33% | ||||||||||
1e | Robert C. Merton | 2,170,124,638 | 96.66% | — | 0.00% | 74,896,023 | 3.34% | 95.94% | 0.00% | 3.31% | ||||||||||
1f | Myron S. Scholes | 2,169,439,189 | 96.63% | — | 0.00% | 75,581,473 | 3.37% | 95.91% | 0.00% | 3.34% | ||||||||||
1g | Eduardo A. Repetto | 2,167,010,793 | 96.53% | — | 0.00% | 78,009,868 | 3.47% | 95.81% | 0.00% | 3.45% | ||||||||||
1h | Abbie J. Smith | 2,169,626,842 | 96.64% | — | 0.00% | 75,393,820 | 3.36% | 95.92% | 0.00% | 3.33% | ||||||||||
| Shares Voted | Percent of Outstanding Shares Voted | |||||||||||||||||||||
| For | % | Against | % | Abstain/WithHold | % | NonVote | % | For | Against | Abstain / WithHold | ||||||||||||
| Proposal 4: Approval of an Amended and Restated Agreement and Declaration of Trust for DFAITC* | 2,076,877,329 | 92.43% | 36,623,148 | 1.63% | 133,356,326 | 5.94% | NA | NA | 91.82% | 1.62% | 5.90% | |||||||||||
* Results are for all Series within DFAITC
The U.S. Large Company Series
| Shares Voted | Percent of Outstanding Shares Voted | |||||||||||||||||||
| For | % | Against | % | Abstain/WithHold | % | For | Against | Abstain / WithHold | ||||||||||||
Proposals:
| ||||||||||||||||||||
5 | To approve amendments to certain fundamental investment restrictions | |||||||||||||||||||
5a | Borrowing Money | 98,665,686 | 84.14% | 3,106,492 | 2.65% | 15,494,433 | 13.21% | 84.14% | 2.65% | 13.21% | ||||||||||
5b | Making Loans | 98,733,300 | 84.20% | 3,052,305 | 2.60% | 15,481,007 | 13.20% | 84.20% | 2.60% | 13.20% | ||||||||||
5c | Investments in Real Estate | 100,125,217 | 85.38% | 1,637,239 | 1.40% | 15,504,156 | 13.22% | 85.38% | 1.40% | 13.22% | ||||||||||
5d | Investments in Commodities | 98,776,384 | 84.23% | 2,997,328 | 2.56% | 15,492,899 | 13.21% | 84.23% | 2.56% | 13.21% | ||||||||||
5e | Diversification of Investments | 99,185,648 | 84.58% | 2,614,284 | 2.23% | 15,466,679 | 13.19% | 84.58% | 2.23% | 13.19% | ||||||||||
6 | To approve the elimination of certain fundamental investment restrictions | |||||||||||||||||||
6a | Pledging, Mortgaging, or Hypothecating Assets | 98,359,523 | 83.88% | 3,372,501 | 2.88% | 15,534,587 | 13.25% | 83.88% | 2.88% | 13.25% | ||||||||||
6b | Purchasing Securities on Margin | 98,444,356 | 83.95% | 3,290,886 | 2.81% | 15,531,369 | 13.24% | 83.95% | 2.81% | 13.24% | ||||||||||
6c | Investing in Restricted or Illiquid Securities | 98,296,531 | 83.82% | 3,028,611 | 2.58% | 15,941,469 | 13.59% | 83.82% | 2.58% | 13.59% | ||||||||||
6d | Investing for the Purpose of Exercising Control | 98,535,100 | 84.03% | 2,726,201 | 2.32% | 16,005,309 | 13.65% | 84.03% | 2.32% | 13.65% | ||||||||||
6e | Investing in Other Investment Companies | 98,532,657 | 84.02% | 2,740,349 | 2.34% | 15,993,605 | 13.64% | 84.02% | 2.34% | 13.64% | ||||||||||
6f | Management Ownership of Securities of an Issuer | 98,694,385 | 84.16% | 2,533,976 | 2.16% | 16,038,250 | 13.68% | 84.16% | 2.16% | 13.68% | ||||||||||
6g | Investing in Oil, Gas, or other Mineral Exploration, Leases or Development Programs | 98,853,168 | 84.30% | 2,461,685 | 2.10% | 15,951,758 | 13.60% | 84.30% | 2.10% | 13.60% | ||||||||||
6h | Investing in Securities of Unseasoned Issuers | 98,385,119 | 83.90% | 2,882,682 | 2.46% | 15,998,811 | 13.64% | 83.90% | 2.46% | 13.64% | ||||||||||
6i | Investing in Warrants | 98,619,865 | 84.10% | 2,598,182 | 2.22% | 16,048,564 | 13.69% | 84.10% | 2.22% | 13.69% | ||||||||||
6j | Writing or Acquiring Options | 98,646,590 | 84.12% | 2,632,309 | 2.24% | 15,987,712 | 13.63% | 84.12% | 2.24% | 13.63% | ||||||||||
344
The U.S. Large Cap Value Series
| Shares Voted | Percent of Outstanding Shares Voted | |||||||||||||||||||
| For | % | Against | % | Abstain/WithHold | % | For | Against | Abstain / WithHold | ||||||||||||
Proposals:
| ||||||||||||||||||||
5 | To approve amendments to certain fundamental investment restrictions | |||||||||||||||||||
5a | Borrowing Money | 450,089,477 | 90.34% | 13,835,372 | 2.78% | 34,296,468 | 6.88% | 90.12% | 2.77% | 6.87% | ||||||||||
5b | Making Loans | 446,508,610 | 89.62% | 17,323,887 | 3.48% | 34,388,819 | 6.90% | 89.41% | 3.47% | 6.89% | ||||||||||
5c | Investments in Real Estate | 449,117,076 | 90.14% | 14,867,126 | 2.98% | 34,237,115 | 6.87% | 89.93% | 2.98% | 6.86% | ||||||||||
5d | Investments in Commodities | 445,240,298 | 89.37% | 18,945,498 | 3.80% | 34,035,520 | 6.83% | 89.15% | 3.79% | 6.82% | ||||||||||
5e | Diversification of Investments | 450,429,968 | 90.41% | 13,968,473 | 2.80% | 33,822,876 | 6.79% | 90.19% | 2.80% | 6.77% | ||||||||||
6 | To approve the elimination of certain fundamental investment restrictions | |||||||||||||||||||
6a | Pledging, Mortgaging, or Hypothecating Assets | 442,477,364 | 88.81% | 21,095,580 | 4.23% | 34,648,372 | 6.95% | 88.60% | 4.22% | 6.94% | ||||||||||
6b | Purchasing Securities on Margin | 442,025,675 | 88.72% | 21,654,237 | 4.35% | 34,541,405 | 6.93% | 88.51% | 4.34% | 6.92% | ||||||||||
6c | Investing in Restricted or Illiquid Securities | 441,905,416 | 88.70% | 21,661,567 | 4.35% | 34,654,334 | 6.96% | 88.48% | 4.34% | 6.94% | ||||||||||
6d | Investing for the Purpose of Exercising Control | 446,950,234 | 89.71% | 16,844,128 | 3.38% | 34,426,955 | 6.91% | 89.49% | 3.37% | 6.89% | ||||||||||
6e | Investing in Other Investment Companies | 446,376,678 | 89.59% | 17,480,520 | 3.51% | 34,364,119 | 6.90% | 89.38% | 3.50% | 6.88% | ||||||||||
6f | Management Ownership of Securities of an Issuer | 446,904,545 | 89.70% | 16,712,196 | 3.35% | 34,604,577 | 6.95% | 89.49% | 3.35% | 6.93% | ||||||||||
6g | Investing in Oil, Gas, or other Mineral Exploration, Leases or Development Programs | 445,817,286 | 89.48% | 18,271,331 | 3.67% | 34,132,700 | 6.85% | 89.27% | 3.66% | 6.83% | ||||||||||
6h | Investing in Securities of Unseasoned Issuers | 445,230,922 | 89.36% | 18,304,705 | 3.67% | 34,685,690 | 6.96% | 89.15% | 3.67% | 6.95% | ||||||||||
6i | Investing in Warrants | 446,950,388 | 89.71% | 16,531,063 | 3.32% | 34,739,866 | 6.97% | 89.49% | 3.31% | 6.96% | ||||||||||
6j | Writing or Acquiring Options | 446,696,672 | 89.66% | 16,985,456 | 3.41% | 34,539,189 | 6.93% | 89.44% | 3.40% | 6.92% | ||||||||||
The DFA International Value Series
| ||||||||||||||||||||
| Shares Voted | Percent of Outstanding Shares Voted | |||||||||||||||||||
| For | % | Against | % | Abstain/WithHold | % | For | Against | Abstain / WithHold | ||||||||||||
Proposals:
| ||||||||||||||||||||
5 | To approve amendments to certain fundamental investment restrictions | |||||||||||||||||||
5a | Borrowing Money | 349,117,663 | 88.20% | 30,044,848 | 7.59% | 16,661,166 | 4.21% | 86.14% | 7.41% | 4.11% | ||||||||||
5b | Making Loans | 348,947,065 | 88.16% | 29,971,477 | 7.57% | 16,905,135 | 4.27% | 86.10% | 7.40% | 4.17% | ||||||||||
5c | Investments in Real Estate | 351,165,048 | 88.72% | 28,070,820 | 7.09% | 16,587,809 | 4.19% | 86.65% | 6.93% | 4.09% | ||||||||||
5d | Investments in Commodities | 347,839,401 | 87.88% | 31,372,412 | 7.93% | 16,611,864 | 4.20% | 85.82% | 7.74% | 4.10% | ||||||||||
5e | Diversification of Investments | 351,038,355 | 88.69% | 28,302,302 | 7.15% | 16,483,020 | 4.16% | 86.61% | 6.98% | 4.07% | ||||||||||
6 | To approve the elimination of certain fundamental investment restrictions | |||||||||||||||||||
6a | Pledging, Mortgaging, or Hypothecating Assets | 346,783,275 | 87.61% | 32,195,687 | 8.13% | 16,844,715 | 4.26% | 85.56% | 7.94% | 4.16% | ||||||||||
6b | Purchasing Securities on Margin | 346,279,680 | 87.48% | 32,728,442 | 8.27% | 16,815,555 | 4.25% | 85.44% | 8.08% | 4.15% | ||||||||||
6c | Investing in Restricted or Illiquid Securities | 346,650,940 | 87.58% | 32,506,501 | 8.21% | 16,666,236 | 4.21% | 85.53% | 8.02% | 4.11% | ||||||||||
6d | Investing for the Purpose of Exercising Control | 349,242,494 | 88.23% | 29,958,913 | 7.57% | 16,621,270 | 4.20% | 86.17% | 7.39% | 4.10% | ||||||||||
6e | Investing in Other Investment Companies | 349,373,590 | 88.26% | 29,787,506 | 7.53% | 16,662,582 | 4.21% | 86.20% | 7.35% | 4.11% | ||||||||||
6f | Management Ownership of Securities of an Issuer | 349,991,995 | 88.42% | 28,988,874 | 7.32% | 16,842,809 | 4.26% | 86.36% | 7.15% | 4.16% | ||||||||||
6g | Investing in Oil, Gas, or other Mineral Exploration, Leases or Development Programs | 348,999,679 | 88.17% | 30,314,009 | 7.66% | 16,509,990 | 4.17% | 86.11% | 7.48% | 4.07% | ||||||||||
6h | Investing in Securities of Unseasoned Issuers | 349,376,398 | 88.27% | 29,792,320 | 7.53% | 16,653,959 | 4.21% | 86.20% | 7.35% | 4.11% | ||||||||||
6i | Investing in Warrants | 349,983,930 | 88.42% | 29,092,914 | 7.35% | 16,745,833 | 4.23% | 86.35% | 7.18% | 4.13% | ||||||||||
6j | Writing or Acquiring Options | 349,310,900 | 88.25% | 29,764,139 | 7.52% | 16,747,638 | 4.23% | 86.19% | 7.34% | 4.13% | ||||||||||
7a | Proposed Sub-Advisory Agreement among Dimensional Fund Advisors LP, DFA Australia Limited, and the Company | 355,560,358 | 89.83% | 17,051,279 | 4.31% | 23,212,041 | 5.86% | 87.73% | 4.21% | 5.73% | ||||||||||
7b | Proposed Sub-Advisory Agreement among Dimensional Fund Advisors LP, Dimensional Fund Advisors Ltd., and the Company | 355,594,969 | 89.84% | 16,996,602 | 4.29% | 23,232,105 | 5.87% | 87.74% | 4.19% | 5.73% | ||||||||||
345
The Japanese Small Company Series
| Shares Voted | Percent of Outstanding Shares Voted | |||||||||||||||||||
| For | % | Against | % | Abstain/WithHold | % | For | Against | Abstain / WithHold | ||||||||||||
Proposals: | ||||||||||||||||||||
5 | To approve amendments to certain fundamental investment restrictions | |||||||||||||||||||
5a | Borrowing Money | 146,642,769 | 99.96% | 44,210 | 0.03% | 19,310 | 0.01% | 99.96% | 0.03% | 0.01% | ||||||||||
5b | Making Loans | 146,642,769 | 99.96% | 44,210 | 0.03% | 19,310 | 0.01% | 99.96% | 0.03% | 0.01% | ||||||||||
5c | Investments in Real Estate | 146,642,769 | 99.96% | 44,210 | 0.03% | 19,310 | 0.01% | 99.96% | 0.03% | 0.01% | ||||||||||
5d | Investments in Commodities | 146,646,464 | 99.96% | 40,512 | 0.03% | 19,313 | 0.01% | 99.96% | 0.03% | 0.01% | ||||||||||
5e | Diversification of Investments | 146,646,464 | 99.96% | 40,512 | 0.03% | 19,313 | 0.01% | 99.96% | 0.03% | 0.01% | ||||||||||
6 | To approve the elimination of certain fundamental investment restrictions | |||||||||||||||||||
6a | Pledging, Mortgaging, or Hypothecating Assets | 146,642,769 | 99.96% | 44,210 | 0.03% | 19,310 | 0.01% | 99.96% | 0.03% | 0.01% | ||||||||||
6b | Purchasing Securities on Margin | 146,644,420 | 99.96% | 42,557 | 0.03% | 19,313 | 0.01% | 99.96% | 0.03% | 0.01% | ||||||||||
6c | Investing in Restricted or Illiquid Securities | 146,642,296 | 99.96% | 44,683 | 0.03% | 19,310 | 0.01% | 99.96% | 0.03% | 0.01% | ||||||||||
6d | Investing for the Purpose of Exercising Control | 146,350,730 | 99.76% | 336,246 | 0.23% | 19,313 | 0.01% | 99.76% | 0.23% | 0.01% | ||||||||||
6e | Investing in Other Investment Companies | 146,644,420 | 99.96% | 42,557 | 0.03% | 19,313 | 0.01% | 99.96% | 0.03% | 0.01% | ||||||||||
6f | Management Ownership of Securities of an Issuer | 146,644,420 | 99.96% | 42,557 | 0.03% | 19,313 | 0.01% | 99.96% | 0.03% | 0.01% | ||||||||||
6g | Investing in Oil, Gas, or other Mineral Exploration, Leases or Development Programs | 146,660,306 | 99.97% | 26,673 | 0.02% | 19,310 | 0.01% | 99.97% | 0.02% | 0.01% | ||||||||||
6h | Investing in Securities of Unseasoned Issuers | 146,370,392 | 99.77% | 316,585 | 0.22% | 19,313 | 0.01% | 99.77% | 0.22% | 0.01% | ||||||||||
6i | Investing in Warrants | 146,660,780 | 99.97% | 26,199 | 0.02% | 19,310 | 0.01% | 99.97% | 0.02% | 0.01% | ||||||||||
6j | Writing or Acquiring Options | 146,368,741 | 99.77% | 318,236 | 0.22% | 19,313 | 0.01% | 99.77% | 0.22% | 0.01% | ||||||||||
The Asia Pacific Small Company Series
| ||||||||||||||||||||
| Shares Voted | Percent of Outstanding Shares Voted | |||||||||||||||||||
| For | % | Against | % | Abstain/WithHold | % | For | Against | Abstain / WithHold | ||||||||||||
| Proposals: | ||||||||||||||||||||
5 | To approve amendments to certain fundamental investment restrictions | |||||||||||||||||||
5a | Borrowing Money | 27,034,666 | 99.48% | 101,817 | 0.37% | 39,663 | 0.15% | 99.48% | 0.37% | 0.15% | ||||||||||
5b | Making Loans | 27,031,355 | 99.47% | 101,817 | 0.37% | 42,973 | 0.16% | 99.47% | 0.37% | 0.16% | ||||||||||
5c | Investments in Real Estate | 27,032,309 | 99.47% | 100,863 | 0.37% | 42,973 | 0.16% | 99.47% | 0.37% | 0.16% | ||||||||||
5d | Investments in Commodities | 27,031,355 | 99.47% | 101,817 | 0.37% | 42,973 | 0.16% | 99.47% | 0.37% | 0.16% | ||||||||||
5e | Diversification of Investments | 27,031,355 | 99.47% | 101,817 | 0.37% | 42,973 | 0.16% | 99.47% | 0.37% | 0.16% | ||||||||||
6 | To approve the elimination of certain fundamental investment restrictions | |||||||||||||||||||
6a | Pledging, Mortgaging, or Hypothecating Assets | 27,030,130 | 99.46% | 101,817 | 0.37% | 44,198 | 0.16% | 99.46% | 0.37% | 0.16% | ||||||||||
6b | Purchasing Securities on Margin | 27,029,461 | 99.46% | 102,444 | 0.38% | 44,240 | 0.16% | 99.46% | 0.38% | 0.16% | ||||||||||
6c | Investing in Restricted or Illiquid Securities | 27,030,088 | 99.46% | 101,817 | 0.37% | 44,240 | 0.16% | 99.46% | 0.37% | 0.16% | ||||||||||
6d | Investing for the Purpose of Exercising Control | 26,910,498 | 99.02% | 221,407 | 0.81% | 44,240 | 0.16% | 99.02% | 0.81% | 0.16% | ||||||||||
6e | Investing in Other Investment Companies | 27,029,461 | 99.46% | 102,444 | 0.38% | 44,240 | 0.16% | 99.46% | 0.38% | 0.16% | ||||||||||
6f | Management Ownership of Securities of an Issuer | 27,030,088 | 99.46% | 101,817 | 0.37% | 44,240 | 0.16% | 99.46% | 0.37% | 0.16% | ||||||||||
6g | Investing in Oil, Gas, or other Mineral Exploration, Leases or Development Programs | 27,030,130 | 99.46% | 101,817 | 0.37% | 44,198 | 0.16% | 99.46% | 0.37% | 0.16% | ||||||||||
6h | Investing in Securities of Unseasoned Issuers | 26,910,498 | 99.02% | 221,407 | 0.81% | 44,240 | 0.16% | 99.02% | 0.81% | 0.16% | ||||||||||
6i | Investing in Warrants | 27,029,461 | 99.46% | 102,444 | 0.38% | 44,240 | 0.16% | 99.46% | 0.38% | 0.16% | ||||||||||
6j | Writing or Acquiring Options | 26,909,871 | 99.02% | 222,034 | 0.82% | 44,240 | 0.16% | 99.02% | 0.82% | 0.16% | ||||||||||
The United Kingdom Small Company Series
| ||||||||||||||||||||
| Shares Voted | Percent of Outstanding Shares Voted | |||||||||||||||||||
| For | % | Against | % | Abstain/WithHold | % | For | Against | Abstain / WithHold | ||||||||||||
| Proposals: | ||||||||||||||||||||
5 | To approve amendments to certain fundamental investment restrictions | |||||||||||||||||||
5a | Borrowing Money | 27,789,656 | 99.98% | 2,228 | 0.01% | 3,028 | 0.01% | 99.98% | 0.01% | 0.01% | ||||||||||
5b | Making Loans | 27,789,656 | 99.98% | 2,228 | 0.01% | 3,028 | 0.01% | 99.98% | 0.01% | 0.01% | ||||||||||
5c | Investments in Real Estate | 27,789,656 | 99.98% | 2,228 | 0.01% | 3,028 | 0.01% | 99.98% | 0.01% | 0.01% | ||||||||||
346
| Shares Voted | Percent of Outstanding Shares Voted | |||||||||||||||||||
| For | % | Against | % | Abstain/WithHold | % | For | Against | Abstain / WithHold | ||||||||||||
Proposals: | ||||||||||||||||||||
5d | Investments in Commodities | 27,789,656 | 99.98% | 2,228 | 0.01% | 3,028 | 0.01% | 99.98% | 0.01% | 0.01% | ||||||||||
5e | Diversification of Investments | 27,789,656 | 99.98% | 2,228 | 0.01% | 3,028 | 0.01% | 99.98% | 0.01% | 0.01% | ||||||||||
6 | To approve the elimination of certain fundamental investment restrictions | |||||||||||||||||||
6a | Pledging, Mortgaging, or Hypothecating Assets | 27,789,656 | 99.98% | 2,228 | 0.01% | 3,028 | 0.01% | 99.98% | 0.01% | 0.01% | ||||||||||
6b | Purchasing Securities on Margin | 27,789,450 | 99.98% | 2,434 | 0.01% | 3,028 | 0.01% | 99.98% | 0.01% | 0.01% | ||||||||||
6c | Investing in Restricted or Illiquid Securities | 27,789,656 | 99.98% | 2,228 | 0.01% | 3,028 | 0.01% | 99.98% | 0.01% | 0.01% | ||||||||||
6d | Investing for the Purpose of Exercising Control | 27,741,238 | 99.81% | 50,646 | 0.18% | 3,028 | 0.01% | 99.81% | 0.18% | 0.01% | ||||||||||
6e | Investing in Other Investment Companies | 27,789,656 | 99.98% | 2,228 | 0.01% | 3,028 | 0.01% | 99.98% | 0.01% | 0.01% | ||||||||||
6f | Management Ownership of Securities of an Issuer | 27,789,656 | 99.98% | 2,228 | 0.01% | 3,028 | 0.01% | 99.98% | 0.01% | 0.01% | ||||||||||
6g | Investing in Oil, Gas, or other Mineral Exploration, Leases or Development Programs | 27,789,656 | 99.98% | 2,228 | 0.01% | 3,028 | 0.01% | 99.98% | 0.01% | 0.01% | ||||||||||
6h | Investing in Securities of Unseasoned Issuers | 27,741,238 | 99.81% | 50,646 | 0.18% | 3,028 | 0.01% | 99.81% | 0.18% | 0.01% | ||||||||||
6i | Investing in Warrants | 27,789,450 | 99.98% | 2,434 | 0.01% | 3,028 | 0.01% | 99.98% | 0.01% | 0.01% | ||||||||||
6j | Writing or Acquiring Options | 27,741,032 | 99.81% | 50,853 | 0.18% | 3,028 | 0.01% | 99.81% | 0.18% | 0.01% | ||||||||||
The Continental Small Company Series
| ||||||||||||||||||||
| Shares Voted | Percent of Outstanding Shares Voted | |||||||||||||||||||
| For | % | Against | % | Abstain/WithHold | % | For | Against | Abstain / WithHold | ||||||||||||
Proposals: | ||||||||||||||||||||
5 | To approve amendments to certain fundamental investment restrictions | |||||||||||||||||||
5a | Borrowing Money | 38,121,496 | 99.90% | 19,389 | 0.05% | 17,169 | 0.04% | 99.90% | 0.05% | 0.04% | ||||||||||
5b | Making Loans | 38,121,654 | 99.90% | 19,230 | 0.05% | 17,169 | 0.04% | 99.90% | 0.05% | 0.04% | ||||||||||
5c | Investments in Real Estate | 38,121,826 | 99.91% | 19,059 | 0.05% | 17,169 | 0.04% | 99.91% | 0.05% | 0.04% | ||||||||||
5d | Investments in Commodities | 38,121,654 | 99.90% | 19,230 | 0.05% | 17,169 | 0.04% | 99.90% | 0.05% | 0.04% | ||||||||||
5e | Diversification of Investments | 38,128,283 | 99.92% | 12,602 | 0.03% | 17,169 | 0.04% | 99.92% | 0.03% | 0.04% | ||||||||||
6 | To approve the elimination of certain fundamental investment restrictions | |||||||||||||||||||
6a | Pledging, Mortgaging, or Hypothecating Assets | 38,121,654 | 99.90% | 19,230 | 0.05% | 17,169 | 0.04% | 99.90% | 0.05% | 0.04% | ||||||||||
6b | Purchasing Securities on Margin | 38,121,496 | 99.90% | 19,389 | 0.05% | 17,169 | 0.04% | 99.90% | 0.05% | 0.04% | ||||||||||
6c | Investing in Restricted or Illiquid Securities | 38,121,348 | 99.90% | 19,536 | 0.05% | 17,169 | 0.04% | 99.90% | 0.05% | 0.04% | ||||||||||
6d | Investing for the Purpose of Exercising Control | 38,076,201 | 99.79% | 64,684 | 0.17% | 17,169 | 0.04% | 99.79% | 0.17% | 0.04% | ||||||||||
6e | Investing in Other Investment Companies | 38,121,187 | 99.90% | 19,697 | 0.05% | 17,169 | 0.04% | 99.90% | 0.05% | 0.04% | ||||||||||
6f | Management Ownership of Securities of an Issuer | 38,121,346 | 99.90% | 19,539 | 0.05% | 17,169 | 0.04% | 99.90% | 0.05% | 0.04% | ||||||||||
6g | Investing in Oil, Gas, or other Mineral Exploration, Leases or Development Programs | 38,121,826 | 99.91% | 19,059 | 0.05% | 17,169 | 0.04% | 99.91% | 0.05% | 0.04% | ||||||||||
6h | Investing in Securities of Unseasoned Issuers | 38,076,201 | 99.79% | 64,684 | 0.17% | 17,169 | 0.04% | 99.79% | 0.17% | 0.04% | ||||||||||
6i | Investing in Warrants | 38,120,643 | 99.90% | 20,241 | 0.05% | 17,169 | 0.04% | 99.90% | 0.05% | 0.04% | ||||||||||
6j | Writing or Acquiring Options | 38,076,042 | 99.79% | 64,842 | 0.17% | 17,169 | 0.04% | 99.79% | 0.17% | 0.04% | ||||||||||
The Canadian Small Company Series
| ||||||||||||||||||||
| Shares Voted | Percent of Outstanding Shares Voted | |||||||||||||||||||
| For | % | Against | % | Abstain/WithHold | % | For | Against | Abstain / WithHold | ||||||||||||
Proposals: | ||||||||||||||||||||
5 | To approve amendments to certain fundamental investment restrictions | |||||||||||||||||||
5a | Borrowing Money | 43,055,683 | 100.00% | — | 0.00% | — | 0.00% | 100.00% | 0.00% | 0.00% | ||||||||||
5b | Making Loans | 43,055,683 | 100.00% | — | 0.00% | — | 0.00% | 100.00% | 0.00% | 0.00% | ||||||||||
5c | Investments in Real Estate | 43,055,683 | 100.00% | — | 0.00% | — | 0.00% | 100.00% | 0.00% | 0.00% | ||||||||||
5d | Investments in Commodities | 43,055,683 | 100.00% | — | 0.00% | — | 0.00% | 100.00% | 0.00% | 0.00% | ||||||||||
5e | Diversification of Investments | 43,055,683 | 100.00% | — | 0.00% | — | 0.00% | 100.00% | 0.00% | 0.00% | ||||||||||
The Emerging Markets Series
347
| Shares Voted | Percent of Outstanding Shares Voted | |||||||||||||||||||
| For | % | Against | % | Abstain/WithHold | % | For | Against | Abstain / WithHold | ||||||||||||
Proposals: | ||||||||||||||||||||
5 | To approve amendments to certain fundamental investment restrictions | |||||||||||||||||||
5a | Borrowing Money | 52,121,556 | 93.84% | 1,664,956 | 3.00% | 1,757,089 | 3.16% | 87.03% | 2.78% | 2.93% | ||||||||||
5b | Making Loans | 52,099,490 | 93.80% | 1,648,888 | 2.97% | 1,795,223 | 3.23% | 86.99% | 2.75% | 3.00% | ||||||||||
5c | Investments in Real Estate | 52,397,882 | 94.34% | 1,398,009 | 2.52% | 1,747,709 | 3.15% | 87.49% | 2.33% | 2.92% | ||||||||||
5d | Investments in Commodities | 52,040,226 | 93.69% | 1,748,233 | 3.15% | 1,755,143 | 3.16% | 86.89% | 2.92% | 2.93% | ||||||||||
5e | Diversification of Investments | 52,611,281 | 94.72% | 1,181,063 | 2.13% | 1,751,257 | 3.15% | 87.85% | 1.97% | 2.92% | ||||||||||
6 | To approve the elimination of certain fundamental investment restrictions | |||||||||||||||||||
6a | Pledging, Mortgaging, or Hypothecating Assets | 51,861,192 | 93.37% | 1,894,995 | 3.41% | 1,787,414 | 3.22% | 86.60% | 3.16% | 2.98% | ||||||||||
6b | Purchasing Securities on Margin | 51,912,008 | 93.46% | 1,862,926 | 3.35% | 1,768,666 | 3.18% | 86.68% | 3.11% | 2.95% | ||||||||||
6c | Investing in Restricted or Illiquid Securities | 51,782,840 | 93.23% | 1,972,942 | 3.55% | 1,787,818 | 3.22% | 86.47% | 3.29% | 2.99% | ||||||||||
6d | Investing for the Purpose of Exercising Control | 52,148,416 | 93.89% | 1,633,661 | 2.94% | 1,761,524 | 3.17% | 87.08% | 2.73% | 2.94% | ||||||||||
6e | Investing in Other Investment Companies | 52,226,140 | 94.03% | 1,552,404 | 2.79% | 1,765,057 | 3.18% | 87.21% | 2.59% | 2.95% | ||||||||||
6f | Management Ownership of Securities of an Issuer | 52,340,283 | 94.23% | 1,414,052 | 2.55% | 1,789,266 | 3.22% | 87.40% | 2.36% | 2.99% | ||||||||||
6g | Investing in Oil, Gas, or other Mineral Exploration, Leases or Development Programs | 49,027,368 | 88.27% | 4,764,525 | 8.58% | 1,751,708 | 3.15% | 81.86% | 7.96% | 2.92% | ||||||||||
6h | Investing in Securities of Unseasoned Issuers | 52,200,460 | 93.98% | 1,550,569 | 2.79% | 1,792,572 | 3.23% | 87.16% | 2.59% | 2.99% | ||||||||||
6i | Investing in Warrants | 52,426,418 | 94.39% | 1,350,164 | 2.43% | 1,767,018 | 3.18% | 87.54% | 2.25% | 2.95% | ||||||||||
6j | Writing or Acquiring Options | 52,093,118 | 93.79% | 1,682,479 | 3.03% | 1,768,004 | 3.18% | 86.98% | 2.81% | 2.95% | ||||||||||
7a | Proposed Sub-Advisory Agreement among Dimensional Fund Advisors LP, DFA Australia Limited, and the Company | 52,843,359 | 95.14% | 879,647 | 1.58% | 1,820,595 | 3.28% | 88.24% | 1.47% | 3.04% | ||||||||||
7b | Proposed Sub-Advisory Agreement among Dimensional Fund Advisors LP, Dimensional Fund Advisors Ltd., and the Company | 52,852,461 | 95.15% | 862,958 | 1.55% | 1,828,182 | 3.29% | 88.25% | 1.44% | 3.05% | ||||||||||
The Emerging Markets Small Cap Series
| ||||||||||||||||||||
| Shares Voted | Percent of Outstanding Shares Voted | |||||||||||||||||||
| For | % | Against | % | Abstain/WithHold | % | For | Against | Abstain / WithHold | ||||||||||||
Proposals: | ||||||||||||||||||||
5 | To approve amendments to certain fundamental investment restrictions | |||||||||||||||||||
5a | Borrowing Money | 28,003,797 | 96.84% | 486,844 | 1.68% | 426,138 | 1.47% | 96.84% | 1.68% | 1.47% | ||||||||||
5b | Making Loans | 27,099,770 | 93.72% | 1,364,563 | 4.72% | 452,447 | 1.56% | 93.72% | 4.72% | 1.56% | ||||||||||
5c | Investments in Real Estate | 27,992,430 | 96.80% | 499,696 | 1.73% | 424,654 | 1.47% | 96.80% | 1.73% | 1.47% | ||||||||||
5d | Investments in Commodities | 27,913,853 | 96.53% | 577,490 | 2.00% | 425,436 | 1.47% | 96.53% | 2.00% | 1.47% | ||||||||||
5e | Diversification of Investments | 28,035,370 | 96.95% | 422,105 | 1.46% | 459,304 | 1.59% | 96.95% | 1.46% | 1.59% | ||||||||||
6 | To approve the elimination of certain fundamental investment restrictions | |||||||||||||||||||
6a | Pledging, Mortgaging, or Hypothecating Assets | 26,983,015 | 93.31% | 1,471,880 | 5.09% | 461,884 | 1.60% | 93.31% | 5.09% | 1.60% | ||||||||||
6b | Purchasing Securities on Margin | 27,848,848 | 96.31% | 604,830 | 2.09% | 463,101 | 1.60% | 96.31% | 2.09% | 1.60% | ||||||||||
6d | Investing for the Purpose of Exercising Control | 27,959,095 | 96.69% | 492,373 | 1.70% | 465,311 | 1.61% | 96.69% | 1.70% | 1.61% | ||||||||||
6e | Investing in Other Investment Companies | 27,939,843 | 96.62% | 515,813 | 1.78% | 461,123 | 1.59% | 96.62% | 1.78% | 1.59% | ||||||||||
6f | Management Ownership of Securities of an Issuer | 28,014,739 | 96.88% | 431,977 | 1.49% | 470,062 | 1.63% | 96.88% | 1.49% | 1.63% | ||||||||||
6g | Investing in Oil, Gas, or other Mineral Exploration, Leases or Development Programs | 27,936,946 | 96.61% | 518,946 | 1.79% | 460,887 | 1.59% | 96.61% | 1.79% | 1.59% | ||||||||||
6h | Investing in Securities of Unseasoned Issuers | 27,999,589 | 96.83% | 447,127 | 1.55% | 470,063 | 1.63% | 96.83% | 1.55% | 1.63% | ||||||||||
6i | Investing in Warrants | 28,022,853 | 96.91% | 428,573 | 1.48% | 465,354 | 1.61% | 96.91% | 1.48% | 1.61% | ||||||||||
6j | Writing or Acquiring Options | 28,028,907 | 96.93% | 425,938 | 1.47% | 461,934 | 1.60% | 96.93% | 1.47% | 1.60% | ||||||||||
7a | Proposed Sub-Advisory Agreement among Dimensional Fund Advisors LP, DFA Australia Limited, and the Company | 28,096,987 | 97.16% | 355,522 | 1.23% | 464,270 | 1.61% | 97.16% | 1.23% | 1.61% | ||||||||||
348
| Shares Voted | Percent of Outstanding Shares Voted | |||||||||||||||||||
| For | % | Against | % | Abstain/WithHold | % | For | Against | Abstain / WithHold | ||||||||||||
Proposals: | ||||||||||||||||||||
7b |
Proposed Sub-Advisory Agreement among Dimensional Fund Advisors LP, Dimensional Fund Advisors Ltd., and the Company | 28,096,987 | 97.16% | 355,522 | 1.23% | 464,270 | 1.61% | 97.16% | 1.23% | 1.61% | ||||||||||
349
Trustees/Directors
Each Board of Trustees/Directors of The DFA Investment Trust Company Inc. (“DFAITC”), DFA Investment Dimensions Group Inc. (“DFAIDG”), Dimensional Investment Group Inc. (“DIG”) and Dimensional Emerging Markets Value Fund (“DEM”) (each, the “Fund” and collectively, the “Funds”) is responsible for establishing the Funds’ policies and for overseeing the management of the Funds. The Trustees/Directors of the Funds, including all of the disinterested Directors, have adopted written procedures to monitor potential conflicts of interest that might develop between portfolios of the Funds (the “Feeder Portfolios”) that invest in certain series of DFAITC or DEM (the “Master Funds”).
Each Board has two standing committees, an Audit Committee and a Portfolio Performance and Service Review Committee (the “Performance Committee”). The Audit Committee is comprised of George M. Constantinides, Roger G. Ibbotson and Abbie J. Smith. Each member of the Audit Committee is a disinterested Director. The Audit Committee oversees the Fund’s accounting and financial reporting policies and practices, the Fund’s internal controls, the Fund’s financial statements and the independent audits thereof and performs other oversight functions as requested by the Board. The Audit Committee recommends the appointment of each Fund’s independent registered certified public accounting firm and also acts as a liaison between the Fund’s independent registered certified public accounting firm and the full Board. There were two Audit Committee meetings held during the fiscal year ended October 31, 2009.
Each Board’s Performance Committee is comprised of Messrs. Constantinides and Ibbotson, Ms. Smith, John P. Gould, Myron S. Scholes and Robert C. Merton. Each member of the Fund’s Performance Committee is a disinterested Director. The Performance Committee regularly reviews and monitors the investment performance of the Fund’s series and reviews the performance of the Fund’s service providers. There were six Performance Committee meetings held during the fiscal year ended October 31, 2009.
Certain biographical information for each disinterested Trustee/Director and each interested Trustee/Director of the Funds is set forth in the tables below, including a description of each Trustee/Director’s experience as a Trustee/ Director of the Funds and as a director or trustee of other funds, as well as other recent professional experience.
The statements of additional information (together, “SAI”) of the Funds include additional information about each Trustee/Director. You may obtain copies of the SAI and prospectus of each Fund advised by Dimensional Fund Advisors LP by calling collect (512) 306-7400 or by mailing a request to Dimensional Fund Advisors LP, 6300 Bee Cave Road, Building One, Austin, Texas 78746. Prospectuses are also available at www.dimensional.com.
Name, Position with the Fund, Address and Age
| Term of Office1 and Length of Service
| Portfolios within the DFA Fund Complex2
| Principal Occupation(s) During Past 5 Years and Other Directorships of Public Companies Held
| |||
Disinterested Trustees/Directors
| ||||||
George M. Constantinides Director of DFAIDG, DIG and DEM. Trustee of DFAITC. The University of Chicago Booth School of Business 5807 S. Woodlawn Avenue Chicago, IL 60637 Age: 62
|
DFAITC - since 1993 DFAIDG - since 1983 DIG - since 1993 DEM - since 1993 |
87 portfolios in 4 investment companies |
Leo Melamed Professor of Finance, The University of Chicago Booth School of Business. | |||
John P. Gould Director of DFAIDG, DIG and DEM. Trustee of DFAITC. The University of Chicago Booth School of Business 5807 S. Woodlawn Avenue Chicago, IL 60637 Age: 70
|
DFAITC - since 1993 DFAIDG - since 1986 DIG - since 1993 DEM - since 1993 |
87 portfolios in 4 investment companies |
Steven G. Rothmeier Distinguished Service Professor of Economics, The University of Chicago Booth School of Business (since 1965). Member of the Boards of Milwaukee Mutual Insurance Company (since 1997). Member and Chair, Competitive Markets Advisory Committee, Chicago Mercantile Exchange (futures trading exchange) (since 2004). Formerly, Director of UNext, Inc. (1999-2006). Formerly, Senior Vice-President, Lexecon Inc. (economics, law, strategy and finance consulting) (1994-2004). Trustee, Harbor Fund (registered investment company) (27 Portfolios) (since 1994).
| |||
350
Name, Position with the Fund, Address and Age
| Term of Office1 and Length of Service
|
Portfolios within the DFA Fund Complex2 Overseen
| Principal Occupation(s) During Past 5 Years and
| |||
Roger G. Ibbotson Director of DFAIDG, DIG and DEM. Trustee of DFAITC. Yale School of Management 135 Prospect Street New Haven, CT 06520-8200 Age: 66
|
DFAITC - since 1993 DFAIDG - since 1981 DIG - since 1993 DEM - since 1993 |
87 portfolios in 4 investment companies |
Professor in Practice of Finance, Yale School of Management (since 1984). Director, BIRR Portfolio Analysis, Inc. (software products) (since 1990). Chairman, CIO and Partner, Zebra Capital Management, LLC (hedge fund manager) (since 2001). Formerly, Chairman, Ibbotson Associates, Inc., Chicago, IL (software data publishing and consulting) (1977-2006). | |||
Robert C. Merton Director of DFAIDG, DIG and DEM. Trustee of DFAITC. Harvard Business School 353 Baker Library Soldiers Field Boston, MA 02163 Age: 65 |
DFAITC - since 2003 DFAIDG - since 2003 DIG - since 2003 DEM - since 2003 |
87 portfolios in 4 investment companies |
John and Natty McArthur University Professor, Graduate School of Business Administration, Harvard University (since 1998). Director, MF Risk, Inc. (risk management software) (since 2001). Director, Peninsula Banking Group (bank) (since 2003). Director, Community First Financial Group (bank holding company) (since 2003). Member Competitive Markets Advisory Council, Chicago Mercantile Exchange (futures trading exchange) (since 2004). Chairman and Director, Daedalus Software (medical software) (since 2008). Formerly, Advisory Board Member, Alpha Simplex Group (hedge fund) (2001-2007). Formerly, Chief Science Officer and Director, Trinsum Group, a successor to Integrated Finance Limited (2002-2008). Director, Vical Incorporated (biopharmaceutical product development) (since 2002).
| |||
Myron S. Scholes Director of DFAIDG, DIG and DEM. Trustee of DFAITC. Platinum Grove Asset Management, L.P. Reckson Executive Park 1100 King Street Building 4 Rye Brook, NY 10573 Age: 68
|
DFAITC - since 1993 DFAIDG - since 1981 DIG - since 1993 DEM - since 1993 |
87 portfolios in 4 investment companies |
Frank E. Buck Professor Emeritus of Finance, Stanford University (since 1981). Chairman, Platinum Grove Asset Management, L.P. (hedge fund) (formerly, Oak Hill Platinum Partners) (since 1999). Formerly, Managing Partner, Oak Hill Capital Management (private equity firm) (until 2004). Formerly, Director, Chicago Mercantile Exchange (2001-2008). Director, American Century Fund Complex (registered investment companies) (37 Portfolios) (since 1981). | |||
Abbie J. Smith Director of DFAIDG, DIG and DEM. Trustee of DFAITC. The University of Chicago Booth School of Business 5807 S. Woodlawn Avenue Chicago, IL 60637 Age: 56
|
DFAITC - since 2000 DFAIDG - since 2000 DIG - since 2000 DEM - since 2000 |
87 portfolios in 4 investment companies |
Boris and Irene Stern Professor of Accounting, The University of Chicago Booth School of Business (since 1980), and Co-Director Investment Research, Fundamental Investment Advisors (hedge fund) (since 2008). Director, HNI Corporation (formerly known as HON Industries Inc.) (office furniture) (since 2000). Director, Ryder System Inc. (transportation, logistics and supply-chain management) (since 2003). Director/ Trustee, UBS Funds (fund complex) (5 portfolios) (since 2008). |
351
Name, Position with the Fund, Address and Age
| Term of Office1 and Length of Service
|
Portfolios within the DFA Fund Complex2 Overseen
| Principal Occupation(s) During Past 5 Years and
| |||
Interested Trustees/Directors*
| ||||||
David G. Booth Chairman, Director, Chief Executive Officer and President of DFAIDG, DIG and DEM. Chairman, Trustee, Chief Executive Officer, Chief Investment Officer and President of DFAITC. 6300 Bee Cave Road, Building One Austin, Texas 78746 Age: 62
|
DFAITC - since 1993 DFAIDG - since 1981 DIG - since 1992 DEM - since 1993 |
87 portfolios in 4 investment companies |
Chairman, Director/Trustee, President, Chief Executive Officer and formerly Chief Investment Officer of the following companies: Dimensional Holdings Inc., Dimensional Fund Advisors LP, Dimensional Fund Advisors Canada ULC, DFAIDG, DIG, DEM and DFAITC. President and Chief Executive Officer of DFA Securities LLC. Director of Dimensional Fund Advisors Ltd, and formerly Chief Investment Officer. Director and formerly, President and Chief Investment Officer of DFA Australia Ltd. Formerly, Director of Dimensional Funds PLC and Dimensional Fund II PLC. Chairman, Director and Chief Executive Officer of Dimensional Fund Advisors Canada ULC (All Chief Investment Officer positions held starting 1/03 through 3/07 except Dimensional Holdings Inc., which was from 10/06 through 3/07.)
Limited Partner, Oak Hill Partners (since 2001) and VSC Investors, LLC (since 2007). Trustee, The University of Chicago Booth School of Business. Formerly, Director, SA Funds (registered investment company). Formerly Director, Assante Corporation (investment management) (until 2002).
| |||
Eduardo A. Repetto Director, Chief Investment Officer and Vice President of DFAIDG, DIG and DEM. Trustee, Chief Investment Officer and Vice President of DFAITC 6300 Bee Cave Road, Building One Austin, TX 78746 Age: 42
|
DFAITC - since 2009 DFAIDG - since 2009 DIG - since 2009 DEM - since 2009 |
87 portfolios in 4 investment companies |
Director/Trustee (beginning June 2009), Chief Investment Officer (beginning March 2007) and Vice President of DFAIDG, DIG, DEM and DFAITC. Chief Investment Officer (beginning March 2007) and Vice President of all the DFA Entities, DFA Australia Limited and Dimensional Fund Advisors Canada ULC. | |||
| 1 | Each Trustee/Director holds office for an indefinite term until his or her successor is elected and qualified. |
| 2 | Each Trustee/Director is a director or trustee of each of the four registered investment companies within the DFA Fund Complex, which includes the Funds. |
| * | Interested Trustees/Directors are described as such because they are deemed to be “interested persons,” as that term is defined under the Investment Company Act of 1940, as amended, due to their positions with Dimensional Fund Advisors LP. |
352
Officers
The name, age, information regarding positions with the Funds and the principal occupation for each officer of the Funds are set forth below. Each officer listed below holds the same office (except as otherwise noted) in the following entities: Dimensional Fund Advisors LP (prior to November 3, 2006, Dimensional Fund Advisors Inc.) (“Dimensional”), DFA Securities Inc., DFAIDG, DIG, DFAITC and DEM (collectively, the “DFA Entities”). The address of each officer is: Dimensional Fund Advisors LP, 6300 Bee Cave Road, Building One, Austin, Texas 78746, unless otherwise indicated.
Name, Position with the Fund and Age
|
Term of Office1 and Length of Service
| Principal Occupation(s) During Past 5 Years
| ||
Officers
| ||||
April A. Aandal Vice President and Chief Learning Officer Age: 46
|
Since 2008 |
Vice President of all the DFA Entities. Chief Learning Officer of Dimensional (since September 2008). Formerly, Regional Director of Dimensional (2004-2008); Vice President of Professional Development at Assante Asset Management (June 2002-January 2005).
| ||
Darryl D. Avery Vice President Age: 43
|
Since 2005 |
Vice President of all the DFA Entities. From June 2002 to January 2005, institutional client service representative of Dimensional. | ||
Arthur H. Barlow Vice President Age: 53
|
Since 1993 |
Vice President of all the DFA Entities. Formerly, Vice President of DFA Australia Limited and Dimensional Fund Advisors Ltd. | ||
Scott A. Bosworth Vice President Age: 40
|
Since 2007 |
Vice President of all the DFA Entities. Regional Director of Dimensional (since November 1997). | ||
Valerie A. Brown Vice President and Assistant Secretary Age: 42
|
Since 2001 |
Vice President and Assistant Secretary of all the DFA Entities, DFA Australia Limited, Dimensional Fund Advisors Ltd., and since June 2003, Dimensional Fund Advisors Canada ULC. | ||
David P. Butler Vice President Age: 45
|
Since 2007 |
Vice President of all the DFA Entities. Director of Global Financial Services of Dimensional (since 2008). Formerly, Regional Director of Dimensional Fund Advisors LP (January 1995 to January 2005).
| ||
Patrick Carter Vice President Age: 47
|
Since 2007 |
Vice President of all the DFA Entities. Regional Director of Dimensional (since March 2006). Formerly, Director of Merrill Lynch Retirement Group (December 1998 to March 2006).
| ||
Joseph H. Chi Vice President Age: 43
|
Since 2009 |
Vice President of all the DFA Entities. Portfolio Manager for Dimensional Fund Advisors LP (since October 2005). Prior to October 2005, Corporate Counsel at Hewitt Associates (July 2002-August 2005).
| ||
Stephen A. Clark Vice President Age: 37
|
Since 2004 |
Vice President of all the DFA Entities. Formerly, Portfolio Manager of Dimensional (April 2001-April 2004). | ||
Robert P. Cornell Vice President Age: 60
|
Since 2007 |
Vice President of all the DFA Entities. Regional Director of Financial Services Group of Dimensional (since August 1993). | ||
Christopher S. Crossan Vice President and Chief Compliance Officer Age: 43
|
Since 2004 |
Vice President and Chief Compliance Officer of all the DFA Entities. | ||
James L. Davis Vice President Age: 52
|
Since 1999 |
Vice President of all the DFA Entities. Formerly, Vice President of DFA Australia Limited and Dimensional Fund Advisors Ltd. | ||
Robert T. Deere Vice President Age: 52
|
Since 1994 |
Vice President of all the DFA Entities and DFA Australia Limited. | ||
Robert W. Dintzner Vice President Age: 39
|
Since 2001 |
Vice President of all the DFA Entities. | ||
353
Name, Position with the Fund and Age
|
Term of Office1 and Length of Service
| Principal Occupation(s) During Past 5 Years
| ||
Kenneth Elmgren Vice President Age: 55
|
Since 2007 |
Vice President of all the DFA Entities. Formerly, Managing Principal of Beverly Capital (May 2004 to September 2006). | ||
Richard A. Eustice Vice President and Assistant Secretary Age: 44
|
Since 1998 |
Vice President and Assistant Secretary of all the DFA Entities and DFA Australia Limited. Chief Operating Officer of Dimensional Fund Advisors Ltd. (since July 2008). Formerly, Vice President of Dimensional Fund Advisors Ltd. | ||
Eugene F. Fama, Jr. Vice President Age: 48
|
Since 1993 |
Vice President of all the DFA Entities. Formerly, Vice President of DFA Australia Limited and Dimensional Fund Advisors Ltd. | ||
Gretchen A. Flicker Vice President Age: 38
|
Since 2004 |
Vice President of all the DFA Entities. Prior to April 2004, institutional client service representative of Dimensional. | ||
Jed S. Fogdall Vice President Age: 35
|
Since 2008 |
Vice President of all the DFA Entities. Portfolio Manager for Dimensional (since September 2004). Prior to September 2004, Staff Engineer at the Boeing Company (1997-2004).
| ||
Glenn S. Freed Vice President Age: 47
|
Since 2001 |
Vice President of all the DFA Entities. | ||
Jeremy P. Freeman Vice President Age: 38
|
Since 2009 |
Vice President of all the DFA Entities. Senior Technology Manager for Dimensional Fund Advisors LP (since June 2006). Formerly, Principal at AIM Investments/Amvescap PLC (now Invesco) (June 1998-June 2006).
| ||
Mark R. Gochnour Vice President Age: 42
|
Since 2007 |
Vice President of all the DFA Entities. Regional Director of Dimensional. | ||
Henry F. Gray Vice President Age: 42
|
Since 2000 |
Vice President of all the DFA Entities. Prior to July 2000, Portfolio Manager of Dimensional. Formerly, Vice President of DFA Australia Limited. | ||
John T. Gray Vice President Age: 35
|
Since 2007 |
Vice President of all the DFA Entities. Formerly, Regional Director of Dimensional (January 2005 to February 2007). | ||
Darla Hastings Vice President Age: 54 |
Since 2007 |
Vice President of all the DFA Entities. Chief Marketing Officer of Dimensional. Formerly, Senior Vice President, Customer Experience for Benchmark Assisted Living (May 2005 to April 2006); Executive Vice President and Chief Marketing Officer of State Street Corporation (September 2001 to October 2005).
| ||
Joel H. Hefner Vice President Age: 41
|
Since 2007 |
Vice President of all the DFA Entities. Regional Director of Dimensional (since June 1998). | ||
Julie Henderson Vice President and Fund Controller Age: 35
|
Since 2005 |
Vice President and Fund Controller of all the DFA Entities. Formerly, Senior Manager at PricewaterhouseCoopers LLP (July 1996 to April 2005). | ||
Kevin Hight Vice President Age: 41
|
Since 2005 |
Vice President of all the DFA Entities. Formerly, Regional Director of Dimensional (since March 2003 to March 2005). | ||
Christine W. Ho Vice President Age: 41
|
Since 2004 |
Vice President of all the DFA Entities. Prior to April 2004, Assistant Controller of Dimensional. | ||
Jeff J. Jeon Vice President Age: 35
|
Since 2004 |
Vice President of all the DFA Entities. Counsel of Dimensional (since September 2001). | ||
Patrick M. Keating Vice President Age: 54
|
Since 2003 |
Vice President of all the DFA Entities and Chief Operating Officer of Dimensional. Director, Vice President and Chief Privacy Officer of Dimensional Fund Advisors Canada ULC. Director of DFA Australia Limited.
|
354
Name, Position with the Fund and Age
|
Term of Office1 and Length of Service
| Principal Occupation(s) During Past 5 Years
| ||
Joseph F. Kolerich Vice President Age: 37
|
Since 2004 |
Vice President of all the DFA Entities. Portfolio Manager for Dimensional (since April 2001). | ||
Michael F. Lane Vice President Age: 42
|
Since 2004 |
Vice President of all the DFA Entities. Formerly, Vice President of Advisor Services at TIAA-CREF (July 2001 to September 2004). | ||
Kristina M. LaRusso Vice President Age: 34
|
Since 2006 |
Vice President of all DFA Entities. Formerly, Operations Supervisor of Dimensional (March 2003 to December 2006). | ||
Inmoo Lee Vice President Age: 43 |
Since 2007 |
Vice President of all the DFA Entities. Associate Professor Department of Finance and Accounting, Business School, National University of Singapore (July 2004 to present); Associate Professor, College of Business Administration, Korea University (September 2001 to May 2006).
| ||
Juliet Lee Vice President Age: 38
|
Since 2005 |
Vice President of all the DFA Entities. Human Resources Manager of Dimensional (since January 2004). | ||
Aaron M. Marcus Vice President & Head of Global Human Resources Age: 39 |
Since 2008 |
Vice President and Head of Global Human Resources of Dimensional. Formerly, Global Head of Recruiting and Vice President of Goldman Sachs & Co. (June 2006 to January 2008); Global Co-Head of HR of the Equities & FICC Division, and Vice President of Goldman Sachs & Co. (May 2005 to May 2006); Head of Americas Campus Recruiting and Vice President of Goldman Sachs & Co. (April 2003 to May 2005).
| ||
David R. Martin Vice President, Chief Financial Officer and Treasurer Age: 52 |
Since 2007 |
Vice President, Chief Financial Officer and Treasurer of all the DFA Entities. Director, Vice President, Chief Financial Officer and Treasurer of Dimensional Fund Advisors Ltd. and DFA Australia Limited. Chief Financial Officer, Treasurer, and Vice President of Dimensional Fund Advisors Canada ULC. Director of Dimensional Funds PLC and Dimensional Funds II PLC. Formerly, Executive Vice President and Chief Financial Officer of Janus Capital Group Inc. (June 2005 to March 2007); Senior Vice President of Finance at Charles Schwab & Co., Inc. (March 1999 to May 2005).
| ||
Catherine L. Newell Vice President and Secretary Age: 45 |
Vice President since 1997 and Secretary since 2000 |
Vice President and Secretary of all the DFA Entities. Director, Vice President and Secretary of DFA Australia Limited and Dimensional Fund Advisors Ltd. (since February 2002, April 1997 and May 2002, respectively). Vice President and Secretary of Dimensional Fund Advisors Canada ULC (since June 2003). Director, Dimensional Funds PLC and Dimensional Funds II PLC (since 2002 and 2006, respectively). Formerly, Assistant Secretary of all DFA Entities, DFA Australia Limited and Dimensional Fund Advisors Ltd.
| ||
Christian Newton Vice President Age: 34
|
Since 2009 |
Vice President of all DFA Entities. Web Services Manager for Dimensional Fund Advisors LP (Since January 2008). Formerly Design Manager (2005-2008) and Web Developer (2002-2005) of Dimensional Fund Advisors LP.
| ||
Gerard K. O’Reilly Vice President Age: 32
|
Since 2007 |
Vice President of all the DFA Entities. Formerly, Research Associate of Dimensional Fund Advisors LP (2004 to 2006); Research Assistant in PhD program, Aeronautics Department California Institute of Technology (1998 to 2004).
| ||
Daniel C. Ong Vice President Age: 35
|
Since 2009 |
Vice President of all the DFA Entities. Portfolio Manager for Dimensional Fund Advisors LP (since July 2005). Prior to 2005, Graduate Student at the University of Chicago Booth School of Business (2003-2005).
| ||
Carmen Palafox Vice President Age: 35
|
Since 2006 |
Vice President of all the DFA Entities. Operations Manager of Dimensional Fund Advisors LP (since May 1996). | ||
Sonya Park Vice President Age: 37
|
Since 2005 |
Vice President of all the DFA Entities. From February 2002 to January 2005, institutional client service representative of Dimensional. |
355
Name, Position with the Fund and Age
|
Term of Office1 and Length of Service
| Principal Occupation(s) During Past 5 Years
| ||
David A. Plecha Vice President Age: 48
|
Since 1993 |
Vice President of all the DFA Entities, DFA Australia Limited and Dimensional Fund Advisors Ltd. | ||
Ted Randall Vice President Age: 36
|
Since 2008 |
Vice President of all the DFA Entities. Formerly, Research Associate of Dimensional (2006-2008). Systems Developer of Dimensional (2001-2006). | ||
L. Jacobo Rodriguez Vice President Age: 38
|
Since 2005 |
Vice President of all the DFA Entities. From August 2004 to July 2005, institutional client service representative of Dimensional. Formerly, Financial Services Analyst, Cato Institute (September 2001 to June 2004); Book Review Editor, Cato Journal, Cato Institute (May 1996 to June 2004).
| ||
David E. Schneider Vice President Age: 63
|
Since 2001 |
Vice President of all the DFA Entities. Currently, Director of Institutional Services. | ||
Bruce A. Simmons Vice President Age: 44 |
Since 2009 |
Vice President of all the DFA Entities. Investment Operations Manager for Dimensional Fund Advisors LP (since May 2007). Formerly, Vice President Client and Fund Reporting at Mellon Financial (September 2005-May 2007); Vice President Business Development at CUADPRO Marketing (July 2003-September 2005).
| ||
Ted R. Simpson Vice President Age: 41
|
Since 2007 |
Vice President of all the DFA Entities. Regional Director of Dimensional (since December 2002). | ||
Bryce D. Skaff Vice President Age: 34
|
Since 2007 |
Vice President of all the DFA Entities. Formerly, Regional Director of Dimensional (December 1999 to January 2007). | ||
Grady M. Smith Vice President Age: 53
|
Since 2004 |
Vice President of all the DFA Entities. Prior to April 2004, Portfolio Manager of Dimensional. | ||
Carl G. Snyder Vice President Age: 46
|
Since 2000 |
Vice President of all the DFA Entities. Formerly, Vice President of DFA Australia Limited. | ||
Lawrence R. Spieth Vice President Age: 61
|
Since 2004 |
Vice President of all the DFA Entities. Prior to April 2004, Regional Director of Dimensional. | ||
Bradley G. Steiman Vice President Age: 36
|
Since 2004 |
Vice President of all the DFA Entities and Director and Vice President of Dimensional Fund Advisors Canada ULC. | ||
Robert C. Trotter Vice President Age: 51
|
Since 2009 |
Vice President of all the DFA Entities. Senior Manager Technology for Dimensional Fund Advisors LP (since March 2007). Formerly, Director of Technology at AMVESCAP (2002-2007).
| ||
Karen E. Umland Vice President Age: 43
|
Since 1997 |
Vice President of all the DFA Entities, DFA Australia Limited, Dimensional Fund Advisors Ltd., and Dimensional Fund Advisors Canada ULC. | ||
Sunil Wahal Vice President Age: 42 |
Since 2009 |
Vice President of all the DFA Entities. Formerly, Research Associate for Dimensional Fund Advisors LP (July 2008-January 2009); Consultant to Dimensional Fund Advisors LP (September 2005-July 2008); Jack D. Furst Professor of Finance at Arizona State University, WP Carey School of Business (July 2005-July 2008); Associate Professor of Finance at Goizueta Business School, Emory University (1997-2005).
| ||
Brian J. Walsh Vice President Age: 39
|
Since 2009 |
Vice President of all the DFA Entities. Portfolio Manager for Dimensional Fund Advisors LP (since 2004). Formerly, Trader for Dimensional Fund Advisors LP (1997-2004). | ||
Carol W. Wardlaw Vice President Age: 51
|
Since 2004 |
Vice President of all the DFA Entities. Prior to April 2004, Regional Director of Dimensional. |
356
Name, Position with the Fund and Age
|
Term of Office1 and Length of Service
| Principal Occupation(s) During Past 5 Years
| ||
Weston J. Wellington Vice President Age: 58
|
Since 1997 |
Vice President of all the DFA Entities. Formerly, Vice President of DFA Australia Limited. | ||
Daniel M. Wheeler Vice President Age: 64
|
Since 2001 |
Vice President of all the DFA Entities. Prior to 2001 and currently, Director of Financial Advisors Services of Dimensional. Director of Dimensional Fund Advisors Ltd. (since October 2003) and President of Dimensional Fund Advisors Canada ULC (since June 2003).
| ||
Ryan Wiley Vice President Age: 33
|
Since 2007 |
Vice President of all the DFA Entities. Senior Trader of Dimensional. Formerly, Portfolio Manager (2006 to 2007); Trader (2001 to 2006). | ||
Paul E. Wise Vice President Age: 54
|
Since 2005 |
Vice President of all the DFA Entities. Chief Technology Officer for Dimensional (since 2004). Formerly, Principal of Turnbuckle Management Group (January 2002 to August 2004). |
| 1 | Each officer holds office for an indefinite term at the pleasure of the Boards of Trustees/Directors and until his or her successor is elected and qualified. |
357
VOTING PROXIES ON FUND PORTFOLIO SECURITIES
A description of the policies and procedures that the Fund and the Trust use in voting proxies relating to securities held in the portfolios is available without charge, upon request, by calling collect: (512) 306-7400. Information regarding how the Advisor votes these proxies is available from the EDGAR database on the SEC’s website at http://www.sec.gov and from the Advisor’s website at http://www.dimensional.com and reflects the twelve-month period beginning July 1st and ending June 30th.
358
(Unaudited)
For shareholders that do not have an October 31, 2009 tax year end, this notice is for informational purposes only. For shareholders with an October 31, 2009 tax year end, please consult your tax advisor as to the pertinence of this notice. For the fiscal year November 1, 2008 to October 31, 2009, each Portfolio is designating the following items with regard to distributions paid during the fiscal year. All designations are based on financial information available as of the date of this annual report and, accordingly are subject to change. For each item, it is the intention of the Portfolio to designate the maximum amount permitted under the Internal Revenue Code and the regulations thereunder.
DFA Investment | Net Investment Income Distributions | Short-Term Capital Gain Distributions | Long-Term Capital Gain Distributions | Return of Capital | Tax-Exempt Interest | Total Distributions | Qualifying For Corporate Dividends Received Deduction(1) | Qualifying Dividend Income(2) | U.S. Government Interest(3) | Foreign Tax Credit(4) | Foreign Source Income(5) | Qualifying Interest Income(6) | Qualifying Short-Term Capital Gain(7) | |||||||||||||
U.S. Large Company Portfolio | 100% | — | — | — | — | 100% | 100% | 100% | — | — | — | 100% | 100% | |||||||||||||
Enhanced U.S. Large Company Portfolio | 91% | 9% | — | — | — | 100% | — | — | 1% | — | — | 100% | 100% | |||||||||||||
U.S. Large Cap Value Portfolio | 95% | 5% | — | — | — | 100% | 100% | 100% | — | — | — | 100% | 100% | |||||||||||||
U.S. Targeted Value Portfolio | 100% | — | — | — | — | 100% | 100% | 100% | — | — | — | 100% | 100% | |||||||||||||
U.S. Small Cap Value Portfolio | 100% | — | — | — | — | 100% | 100% | 100% | — | — | — | 100% | 100% | |||||||||||||
U.S. Core Equity 1 Portfolio | 100% | — | — | — | — | 100% | 100% | 100% | — | — | — | 100% | 100% | |||||||||||||
U.S. Core Equity 2 Portfolio | 100% | — | — | — | — | 100% | 100% | 100% | — | — | — | 100% | 100% | |||||||||||||
U.S. Vector Equity Portfolio | 100% | — | — | — | — | 100% | 100% | 100% | — | — | — | 100% | 100% | |||||||||||||
T.A. U.S. Core Equity 2 Portfolio | 100% | — | — | — | — | 100% | 100% | 100% | — | — | — | 100% | 100% | |||||||||||||
U.S. Small Cap Portfolio | 100% | — | — | — | — | 100% | 100% | 100% | — | — | — | 100% | 100% | |||||||||||||
U.S. Micro Cap Portfolio | 100% | — | — | — | — | 100% | 100% | 100% | — | — | — | 100% | 100% | |||||||||||||
DFA Real Estate Securities Portfolio | 100% | — | — | — | — | 100% | 100% | 100% | — | — | — | 100% | 100% | |||||||||||||
Large Cap International Portfolio | 100% | — | — | — | — | 100% | 100% | 100% | — | 8% | 124% | 100% | 100% | |||||||||||||
International Core Equity Portfolio | 100% | — | — | — | — | 100% | 100% | 100% | 1% | 7% | 113% | 100% | 100% | |||||||||||||
T.A. World ex U.S. Core Equity Portfolio | 100% | — | — | — | — | 100% | 100% | 100% | — | 8% | 137% | 100% | 100% | |||||||||||||
International Small Company Portfolio | 100% | — | — | — | — | 100% | 100% | 100% | — | 7% | 119% | 100% | 100% | |||||||||||||
Japanese Small Company Portfolio | 100% | — | — | — | — | 100% | 100% | 100% | — | 6% | 85% | 100% | 100% | |||||||||||||
Asia Pacific Small Company Portfolio | 100% | — | — | — | — | 100% | 100% | 100% | — | 2% | 101% | 100% | 100% | |||||||||||||
United Kingdom Small Company Portfolio | 100% | — | — | — | — | 100% | 100% | 100% | — | — | — | 100% | 100% | |||||||||||||
Continental Small Company Portfolio | 100% | — | — | — | — | 100% | 100% | 100% | — | 12% | 124% | 100% | 100% | |||||||||||||
DFA International Real Estate Securities Portfolio | 100% | — | — | — | — | 100% | 100% | 100% | — | 15% | 290% | 100% | 100% | |||||||||||||
DFA Global Real Estate Securities Portfolio | 100% | — | — | — | — | 100% | 100% | 100% | — | — | — | 100% | 100% | |||||||||||||
DFA International Small Cap Value Portfolio | 81% | — | 19% | — | — | 100% | 100% | 100% | — | 8% | 142% | 100% | 100% | |||||||||||||
International Vector Equity Portfolio | 100% | — | — | — | — | 100% | 100% | 100% | — | 9% | 140% | 100% | 100% | |||||||||||||
Emerging Markets Portfolio | 59% | 1% | 40% | — | — | 100% | 100% | 100% | — | 8% | 123% | 100% | 100% | |||||||||||||
Emerging Markets Small Cap Portfolio | 100% | — | — | — | — | 100% | 100% | 100% | — | 10% | 130% | 100% | 100% | |||||||||||||
Emerging Markets Core Equity Portfolio | 100% | — | — | — | — | 100% | 100% | 100% | — | 9% | 167% | 100% | 100% | |||||||||||||
DFA One-Year Fixed Income Portfolio | 100% | — | — | — | — | 100% | — | — | 1% | — | — | 100% | 100% | |||||||||||||
DFA Two-Year Global Fixed Income Portfolio | 100% | — | — | — | — | 100% | — | — | 2% | — | — | 100% | 100% | |||||||||||||
DFA Selectively Hedged Global Fixed Income Portfolio | — | — | — | — | — | — | — | — | — | — | — | — | — | |||||||||||||
DFA Five-Year Government Portfolio | 100% | — | — | — | — | 100% | — | — | 100% | — | — | 100% | 100% | |||||||||||||
DFA Five-Year Global Fixed Income Portfolio | 100% | — | — | — | — | 100% | — | — | 23% | — | — | 100% | 100% | |||||||||||||
DFA Intermediate Government Fixed Income Portfolio | 89% | — | 11% | — | — | 100% | — | — | 100% | — | — | 100% | 100% | |||||||||||||
DFA Short-Term Extended Quality Portfolio | 100% | — | — | — | — | 100% | — | — | — | — | — | 100% | 100% | |||||||||||||
DFA Inflation-Protected Securities Portfolio | 90% | 1% | 9% | — | — | 100% | — | — | 34% | — | — | 100% | 100% | |||||||||||||
DFA Short-Term Municipal Bond Portfolio | — | — | — | — | 100% | 100% | — | — | — | — | — | 100% | 100% | |||||||||||||
DFA California Short-Term Municipal Bond Portfolio | — | — | — | — | 100% | 100% | — | — | — | — | — | 100% | 100% | |||||||||||||
Dimensional Investment Group Inc. | ||||||||||||||||||||||||||
DFA International Value Portfolio | 100% | — | — | — | — | 100% | 100% | 100% | — | 7% | 114% | 100% | 100% |
| (1) | Qualifying dividends represent dividends which qualify for the corporate dividends received deduction and is reflected as a percentage of ordinary Income distributions (the total of short-term capital gain and net investment income distributions). |
| (2) | The percentage in this column represents the amount of “Qualifying Dividend Income” as created by the Jobs and Growth Tax Relief Reconciliation Act of 2003 and is reflected as a percentage of ordinary income distributions (the total of short-term capital gain and net investment income distributions). Please note that these percentages are designated only, refer to your 1099 for actual qualified dividend income. |
| (3) | “U.S. Government Interest” represents the amount of interest that was derived from direct U.S. Government obligations and distributed during the fiscal year. This amount is reflected as a percentage of total ordinary income distributions (the total of short-term capital gain and net investment income distributions). Generally, interest from direct U.S. Government obligations is exempt from state income tax. However, for residents of California, Connecticut and New York, the statutory threshold requirements were satisfied for DFA Five-Year Government Portfolio, DFA Intermediate Government Fixed Income Portfolio, and DFA Inflation-Protected Securities Portfolio to permit exemption of these amounts from state income for these funds. |
| (4) | “Foreign Tax Credit” represents dividends which qualify for the foreign tax credit pass through and is reflected as a percentage of investment company taxable income (the total of short-term capital gain and net investment income distributions). |
| (5) | “Foreign Source Income” represents the portion of dividends derived from foreign sources, and is reflected as a percentage of ordinary income (i.e., the sum of short-term capital gain and net investment income) distributions made during the period. |
| (6) | The percentage in this column represents the amount of “Qualifying Interest Income” as created by The American Jobs Creation Act of 2004. The information is reflected as a percentage ordinary income distributions (the total of short-term capital gain and net investment income distributions). |
| (7) | The percentage in this column represents the amount of “Qualifying Short-Term Capital Gain” as created by The American Jobs Creation Act of 2004. The information is reflected as a percentage of ordinary income distributions (the total of short-term capital gain and net investment income distributions). |
359


Dimensional Fund Advisors
6300 Bee Cave Road, Building One
Austin, TX 78746
December 2009
Dear Fellow Shareholder,
After sinking to ten-year lows, stock prices around the world rebounded sharply in March 2009 and posted steady gains in the seven months between March and September. March and April were among the best-return months in the life of Dimensional’s equity Funds.
The unexpected turns in the financial markets this year offered some valuable lessons. We were reminded that stock prices are unpredictable. We saw once again the benefits of staying disciplined in the market as it inevitably moves up and down. And I believe these markets showed very clearly why diversification is so important to long-term investment success.
Although diversification can’t prevent losses, it can help investors avoid the extreme outcomes that can result from concentrating investments in individual stocks or market segments. We believe that successful investing is about both increasing wealth and being able to sleep well at night. Investors who understand how markets work and have a realistic understanding of their own tolerance for risk are most likely to have a good overall experience.
More than $10 billion in net long-term assets flowed into Dimensional’s Funds during the first 10 months of 2009, a reflection of the trust our shareholders around the world have placed in us. We are grateful for that trust and want you to know that we take our responsibility as the steward of your investments in Dimensional’s Funds very seriously. We hope to have the opportunity to continue serving your needs for many years to come.
Sincerely, |
|
David G. Booth |
Chairman and Chief Executive Officer |

[THIS PAGE INTENTIONALLY LEFT BLANK]
ANNUAL REPORT
Table of Contents
| Page | ||
Letter to Shareholders | ||
| 1 | ||
DFA Investment Dimensions Group Inc. | ||
| 2 | ||
| 4 | ||
| 8 | ||
| 10 | ||
Schedules of Investments/Summary Schedules of Portfolio Holdings | ||
| 11 | ||
| 11 | ||
| 12 | ||
| 15 | ||
| 18 | ||
| 22 | ||
| 24 | ||
| 26 | ||
| 28 | ||
| 31 | ||
| 41 | ||
| 42 | ||
The DFA Investment Trust Company | ||
| 44 | ||
| 45 | ||
| 46 | ||
| 47 | ||
Summary Schedules of Portfolio Holdings | ||
| 48 | ||
| 51 | ||
| 54 | ||
| 55 | ||
| 56 | ||
| 57 | ||
| 58 | ||
| 64 | ||
| 65 | ||
| 67 | ||
| 75 | ||
| 76 | ||
This report is submitted for the information of the Fund’s shareholders. It is not authorized for distribution to prospective investors unless preceded or accompanied by an effective prospectus.
i
[THIS PAGE INTENTIONALLY LEFT BLANK]
DFA INVESTMENT DIMENSIONS GROUP INC.
THE DFA INVESTMENT TRUST COMPANY
DEFINITIONS OF ABBREVIATIONS AND FOOTNOTES
Schedules of Investments/Summary Schedules of Portfolio Holdings
Investment Abbreviations | ||
ADR | American Depositary Receipt | |
FNMA | Federal National Mortgage Association | |
FHLMC | Federal Home Loan Mortgage Corporation | |
P.L.C. | Public Limited Company | |
Investment Footnotes | ||
† | See Note B to Financial Statements. | |
†† | Securities have generally been fair valued. See Note B to Financial Statements. | |
** | Calculated as a percentage of total net assets. Percentages shown parenthetically next to the category headings have been calculated as a percentage of total investments. “Other Securities” are those securities that are not among the top 50 holdings of the Fund or do not represent more than 1.0% of the net assets of the Fund. Some of the individual securities within this category may include Total or Partial Securities on Loan and/or Non-Income Producing Securities. | |
* | Non-Income Producing Securities. | |
# | Total or Partial Securities on Loan. | |
@ | Security purchased with cash proceeds from Securities on Loan. | |
(r) | The adjustable rate shown is effective as of October 31, 2009. | |
§ | Affiliated Fund. | |
| Financial Highlights | ||
(A) | Computed using average shares outstanding. | |
(B) | Annualized | |
(C) | Non-Annualized | |
(D) | Represents the combined ratios for the respective portfolio and its respective pro-rata share of its Master Fund Series. | |
| All Statements and Schedules | ||
— | Amounts designated as — are either zero or rounded to zero. | |
SEC | Securities and Exchange Commission | |
1
DFA INVESTMENT DIMENSIONS GROUP INC.
Tax-Managed U.S. Marketwide Value Portfolio vs.
Russell 3000® Value Index
October 31, 1999-October 31, 2009
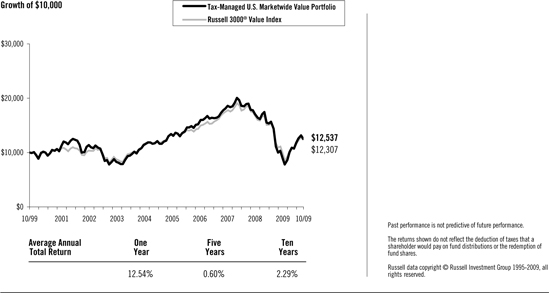
Tax-Managed U.S. Equity Portfolio vs.
Dow Jones US Total Stock Market (Full Cap) Index
September 25, 2001-October 31, 2009

2
DFA INVESTMENT DIMENSIONS GROUP INC.
PERFORMANCE CHARTS
Tax-Managed U.S. Targeted Value Portfolio vs.
Russell 2000® Value Index
October 31, 1999-October 31, 2009
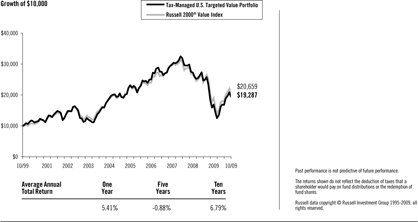
Tax-Managed U.S. Small Cap Portfolio vs.
Russell 2000® Index
October 31, 1999-October 31, 2009
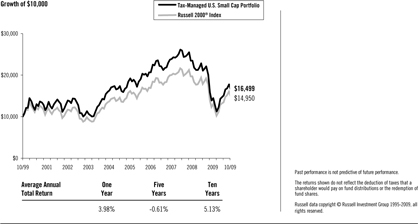
Tax-Managed DFA International Value Portfolio vs.
MSCI World ex USA Index (net dividends)
October 31, 1999-October 31, 2009
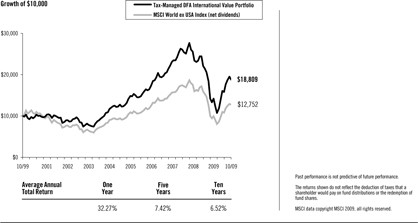
3
DFA INVESTMENT DIMENSIONS GROUP INC.
MANAGEMENT’S DISCUSSION AND ANALYSIS
U.S. Equity Market Review | 12 Months Ended October 31, 2009 |
The year ending October 31, 2009, was among the most volatile periods in U.S. market history. Broad market returns were positive with stocks represented by the mid cap index outperforming those within both small cap and large cap indexes and stocks represented by the growth index outperforming those represented by the value index. Investors moving out of stocks, beginning in late 2008 and extending into early 2009, contributed to high volatility and negative returns over that period. Markets turned sharply higher in March, and the size and value premiums both turned positive over the eight months ending October 2009. Although the large cap index outperformed the small cap index, and the growth index outperformed the value index, returns within the broader market (Russell 3000® Index) demonstrate that there was a positive small size premium and a positive value premium. This counterintuitive result occurred because the stock markets were characterized by extreme volatility, and the indexes, which are reconstituted annually, were not able to rebalance during the course of the year to maintain their intended asset class exposure. Among the most important factors explaining differences in the behavior of diversified equity portfolios are the company size and company value/growth characteristics of the portfolio’s holdings. Size is measured by market capitalization, and value classification is a function of stock price relative to one or more fundamental characteristics. Compared to other stocks, value stocks often have lower market value relative to their earnings, dividends, and book value.
For the 12 months ended October 31, 2009, the total return of the Russell Microcap® Index was 5.06%, the Russell 2000® Index was 6.46%, the CRSP 6-10 Index was 20.94%, and the MSCI US Small Cap 1750 Index was 14.11%. Large cap growth stocks outperformed large cap value stocks, as measured by the Russell 1000® Growth Index and Russell 1000® Value Index. Small cap growth stocks outperformed small cap value stocks, by a lesser amount than in large caps, as measured by the Russell 2000® Growth Index and Russell 2000® Value Index.
| Total Return for 12 Months Ended October 31, 2009 | ||
Russell 2000® Index (small cap companies) | 6.46% | |
Russell Midcap® Index (mid cap companies) | 18.74% | |
Russell 1000® Index (large cap companies) | 11.19% | |
Russell 3000® Value Index | 4.55% | |
Russell 3000® Growth Index | 17.04% | |
Further dividing the large, mid, and small cap market segments by value and growth characteristics shows more detail in the performance differences over the period.
| Total Return for 12 Months Ended October 31, 2009 | ||
Russell 1000® Value Index (large cap value companies) | 4.78% | |
Russell 1000® Growth Index (large cap growth companies) | 17.50% | |
Russell Midcap® Value Index (mid cap value companies) | 14.52% | |
Russell Midcap® Growth Index (mid cap growth companies) | 22.48% | |
Russell 2500TM Value Index (small/mid cap value companies) | 8.56% | |
Russell 2500TM Growth Index (small/mid cap growth companies) | 18.20% | |
Russell 2000® Value Index (small cap value companies) | 1.95% | |
Russell 2000® Growth Index (small cap growth companies) | 11.34% | |
Source: Russell data copyright © Russell Investment Group 1995-2009, all rights reserved.
Differences in returns for the various Dimensional U.S. equity funds over the 12 months ended October 31, 2009 were attributable primarily to differences in value/growth and size characteristics as well as the exclusion of
4
REIT securities from most Dimensional portfolios, except for the DFA Real Estate Securities Portfolio and portfolios investing in the U.S. Large Company Series. Moreover, the portfolio construction approach used by Dimensional Fund Advisors (the “Advisor”) generally resulted in portfolios with greater emphasis on value or small company characteristics relative to widely used index benchmarks.
Master-Feeder Structure
Certain portfolios described below, called “Feeder Funds”, do not buy individual securities directly; instead, these portfolios invest in corresponding funds called “Master Funds”. The Master Funds, in turn, purchase stocks and/or other securities.
Domestic Equity Portfolios’ Performance Overview
Tax-Managed U.S. Marketwide Value Portfolio
The Tax-Managed U.S. Marketwide Value Portfolio seeks to capture the returns of U.S. value stocks by purchasing shares of a Master Fund that invests in such stocks. The Portfolio also seeks to maximize the after-tax value of a shareholder’s investment. The investment strategy employs a disciplined, quantitative approach, emphasizing broad diversification and consistent exposure to U.S. value stocks, but does not attempt to track closely a specific equity index. As of October 31, 2009, the Portfolio held 1,410 stocks and was mostly invested in equities throughout the year: the average non-equitized cash level for the period was less than 1% of the Portfolio’s assets.
As a result of the Portfolio’s diversified investment approach, performance principally was determined by broad structural trends in the U.S. equity market, rather than the behavior of a limited number of stocks. For the 12 months ended October 31, 2009, total returns were 12.54% for the Portfolio and 4.55% for the Russell 3000® Value Index. The Portfolio benefited from a positive size premium and value premium over the last eight months of the period. Relative to the Index, the Portfolio’s greater exposure to stocks with more pronounced value characteristics added more than 8% to the outperformance. The Portfolio is more inclusive than the Index across the market cap spectrum, particularly in the micro cap range, resulting in a slight size tilt for the Portfolio which also contributed to outperformance.
Tax-Managed U.S. Equity Portfolio
The Tax-Managed U.S. Equity Portfolio seeks to capture the returns associated with the broad universe of U.S. stocks by purchasing shares of a Master Fund that invests in such stocks. The Portfolio also seeks to maximize the after-tax value of a shareholder’s investment. The investment strategy employs a disciplined, quantitative approach, emphasizing broad diversification and consistent exposure to the U.S. equity universe, but does not attempt to track closely a specific equity index. As of October 31, 2009, the Portfolio held 2,700 stocks and was mostly invested in equities throughout the year: the average non-equitized cash level for the period was less than 1% of the Portfolio’s assets.
As a result of the Portfolio’s diversified investment approach, performance was determined principally by broad structural trends in the U.S. equity market, rather than the behavior of a limited number of stocks. For the 12 months ended October 31, 2009, total returns were 8.30% for the Portfolio and 11.34% for the Dow Jones US Total Stock Market Index (Full Cap). Over the period, there was a wider than usual performance difference between the best and worst performing stocks within industry sectors and asset classes. Consequently, slight differences in weights or holdings and in the timing of cash flows and trading between the Portfolio and the Index had a significant impact on relative performance.
Tax-Managed U.S. Targeted Value Portfolio
The Tax-Managed U.S. Targeted Value Portfolio seeks to capture the returns of U.S. small and mid capitalization value stocks. The Portfolio also seeks to maximize the after-tax value of a shareholder’s investment. The
5
investment strategy employs a disciplined, quantitative approach, emphasizing broad diversification and consistent exposure to small and mid capitalization company value stocks, but does not attempt to track closely a specific equity index. As of October 31, 2009, the Portfolio held 1,496 stocks and was mostly invested in equities throughout the year: the average non-equitized cash level for the period was less than 1% of the Portfolio’s assets.
As a result of the Portfolio’s diversified investment approach, performance was determined principally by broad structural trends in the U.S. equity market, rather than the behavior of a limited number of stocks. For the 12 months ended October 31, 2009, total returns were 5.41% for the Portfolio and 1.95% for the Russell 2000® Value Index. The Portfolio benefited from a positive value premium over the last eight months of the period. The Portfolio’s greater exposure to value stocks was primarily responsible for the relative outperformance. This positive value effect was tempered by the slightly larger size characteristics of the Portfolio and the impact of avoiding REITs; both of which negatively impacted Portfolio returns when compared to the Index.
Tax-Managed U.S. Small Cap Portfolio
The Tax-Managed U.S. Small Cap Portfolio seeks to capture the returns of U.S. small company stocks. The Portfolio also seeks to maximize the after-tax value of a shareholder’s investment. The investment strategy employs a disciplined, quantitative approach, emphasizing broad diversification and consistent exposure to small company stocks, but does not attempt to track closely a specific equity index. As of October 31, 2009, the Portfolio held 2,314 stocks and was mostly invested in equities throughout the year: the average non-equitized cash level for the period was less than 1% of the Portfolio’s assets.
As a result of the Portfolio’s diversified investment approach, performance was determined principally by broad structural trends in the U.S. equity market, rather than the behavior of a limited number of stocks. For the 12 months ended October 31, 2009, total returns were 3.98% for the Portfolio and 6.46% for the Russell 2000® Index. Over the period, there was a wider than usual performance difference between the best and worst performing stocks within industry sectors and asset classes. Consequently, slight differences in weights or holdings and in the timing of cash flows and trading between the Portfolio and the Index had a significant impact on relative performance. The Portfolio benefited from a positive size premium over the last eight months of the period. However, composition differences between the Portfolio’s holdings and those in the Index more than offset the positive size premium.
| International Equity Market Review | 12 Months Ended October 31, 2009 |
The one-year period ending October 31, 2009, was characterized by unprecedented volatility in non-US developed markets. Non-US developed markets lost 18.87% from November 2008 through February 2009, as measured by the MSCI World ex USA Index (net dividends). From March through October 2009 these same markets gained 57.56%. In April 2009, the Index had its largest-ever monthly gain (12.90%) since October 1990.
From November 2008 through February 2009, developed markets returns were negative across all asset classes. The US dollar rallied against most currencies, reversing a general trend of depreciation dating back to 2006. From March through October 2009 the market reversed course, with small cap and value stocks strongly outperforming large cap and growth stocks. The US dollar depreciated against most major currencies. The rally drove strong positive returns for the 12-month period, with small cap stocks significantly outperforming large cap stocks and value stocks outperforming growth stocks, as measured by the MSCI indexes.
12 Months Ended October 31, 2009
Ten Largest Foreign Developed Markets by Market Cap (BB) | Local Currency Return | U.S. Dollar Return | ||
Japan ($2,432) | 6.03% | 15.20% | ||
United Kingdom ($2,328) | 23.19% | 25.68% | ||
France ($1,106) | 10.09% | 28.10% | ||
Canada ($1,060) | 17.46% | 32.58% | ||
Australia ($912) | 21.91% | 66.97% |
6
12 Months Ended October 31, 2009
Ten Largest Foreign Developed Markets by Market Cap (BB) | Local Currency Return | U.S. Dollar Return | ||
Germany ($843) | 6.37% | 23.77% | ||
Switzerland ($821) | 5.78% | 20.63% | ||
Spain ($488) | 33.27% | 55.06% | ||
Italy ($388) | 7.57% | 25.17% | ||
Netherlands ($277) | 20.17% | 39.83% |
Country market capitalizations (in parentheses) are in USD billions. Source: Returns are of MSCI indices net of foreign withholding taxes on dividends. Country market capitalizations are based on country carve-outs of the MSCI All-Country World Investable Market Index. MSCI data copyright MSCI 2009, all rights reserved.
Small company stocks were the best-performing asset class in international markets, while growth stocks had the worst relative results.
12 Months Ended October 31, 2009
| U.S. Dollar Return | ||
MSCI World ex USA Small Cap Index | 50.01% | |
MSCI World ex USA Value Index | 31.71% | |
MSCI World ex USA Index | 27.83% | |
MSCI World ex USA Growth Index | 24.03% |
Source: MSCI indices are net of foreign withholding taxes on dividends, copyright MSCI 2009, all rights reserved.
International Equity Portfolio Performance Overview
Tax-Managed DFA International Value Portfolio
The Tax-Managed DFA International Value Portfolio seeks to capture the returns of international large company value stocks. The Portfolio also seeks to maximize the after-tax value of a shareholder’s investment. The investment strategy employs a disciplined, quantitative approach, emphasizing broad diversification and consistent exposure to large cap value stocks, but does not attempt to track closely a specific equity index. As of October 31, 2009, the Portfolio held 424 stocks in 22 developed countries and was mostly invested in equities throughout the year: the average non-equitized cash level for the period was less than 1% of the Portfolio’s assets.
As a result of the Portfolio’s diversified investment approach, performance was determined principally by broad structural trends in global equity markets rather than the behavior of a limited number of stocks. For the 12 months ended October 31, 2009, value stocks outperformed growth stocks in international developed markets. Total returns were 32.27% for the Portfolio and 27.83% for the MSCI World ex USA Index (net dividends). The Portfolio’s greater allocation than the Index to value stocks (67% on average vs. 26% in the Index) added approximately 6.2% to the relative performance.
7
DFA INVESTMENT DIMENSIONS GROUP INC.
(Unaudited)
The following Expense Tables are shown so that you can understand the impact of fees on your investment. All mutual funds have operating expenses. As a shareholder of the fund, you incur ongoing costs, which include costs for portfolio management, administrative services, and shareholder reports, among others. Operating expenses, legal and audit services, which are deducted from a fund’s gross income, directly reduce the investment return of the fund. A fund’s expenses are expressed as a percentage of its average net assets. This figure is known as the expense ratio. The following examples are intended to help you understand the ongoing costs, in dollars, of investing in the fund and to compare these costs with those of other mutual funds. The examples are based on an investment of $1,000 made at the beginning of the period shown and held for the entire period.
The Expense Tables below illustrate your fund’s costs in two ways.
Actual Fund Return
This section helps you to estimate the actual expenses after fee waivers that you paid over the period. The “Ending Account Value” shown is derived from the fund’s actual return and “Expenses Paid During Period” reflect the dollar amount that would have been paid by an investor who started with $1,000 in the fund. You may use the information here, together with the amount you invested, to estimate the expenses that you paid over the period.
To do so, simply divide your account value by $1,000 (for example, a $7,500 account value divided by $1,000 = 7.5), then multiply the result by the number given for your fund under the heading “Expenses Paid During Period.”
Hypothetical Example for Comparison Purposes
This section is intended to help you compare your fund’s costs with those of other mutual funds. The hypothetical “Ending Account Value” and “Expenses Paid During Period” are derived from the fund’s actual expense ratio and an assumed 5% annual return before expenses. In this case, because the return used is not the fund’s actual return, the results do not apply to your investment. The example is useful in making comparisons because the SEC requires all mutual funds to calculate expenses based on a 5% annual return. You can assess your fund’s costs by comparing this hypothetical example with the hypothetical examples that appear in shareholder reports of other funds.
Please note that the expenses shown in the tables are meant to highlight and help you compare ongoing costs only and do not reflect any transactional costs, if applicable. The “Annualized Expense Ratio” represents the actual expenses for the six-month period indicated.
Six Months Ended October 31, 2009
EXPENSE TABLES
| Beginning Account Value 05/01/09 | Ending Account Value 10/31/09 | Annualized Expense Ratio* | Expenses Paid During Period* | |||||
Tax-Managed U.S. Marketwide Value Portfolio** | ||||||||
Actual Fund Return | $1,000.00 | $1,238.40 | 0.40% | $2.26 | ||||
Hypothetical 5% Annual Return | $1,000.00 | $1,023.19 | 0.40% | $2.04 |
8
| Beginning Account Value 05/01/09 | Ending Account Value 10/31/09 | Annualized Expense Ratio* | Expenses Paid During Period* | |||||
Tax-Managed U.S. Equity Portfolio** | ||||||||
Actual Fund Return | $1,000.00 | $1,184.90 | 0.22% | $1.21 | ||||
Hypothetical 5% Annual Return | $1,000.00 | $1,024.10 | 0.22% | $1.12 | ||||
Tax-Managed U.S. Targeted Value Portfolio | ||||||||
Actual Fund Return | $1,000.00 | $1,190.60 | 0.47% | $2.60 | ||||
Hypothetical 5% Annual Return | $1,000.00 | $1,022.84 | 0.47% | $2.40 | ||||
Tax-Managed U.S. Small Cap Portfolio | ||||||||
Actual Fund Return | $1,000.00 | $1,153.60 | 0.56% | $3.04 | ||||
Hypothetical 5% Annual Return | $1,000.00 | $1,022.38 | 0.56% | $2.85 | ||||
Tax-Managed DFA International Value Portfolio | ||||||||
Actual Fund Return | $1,000.00 | $1,345.10 | 0.56% | $3.31 | ||||
Hypothetical 5% Annual Return | $1,000.00 | $1,022.38 | 0.56% | $2.85 | ||||
| * | Expenses are equal to the fund’s annualized expense ratio for the six-month period, multiplied by the average account value over the period, multiplied by the number of days in the most recent six-month period (184), then divided by the number of days in the year (365) to reflect the six-month period. |
| ** | The Portfolio is a Feeder Fund. The expenses shown reflect the direct expenses of the Feeder Fund and the indirect payment of the Feeder Fund’s portion of the expenses of its Master Fund. |
9
DFA INVESTMENT DIMENSIONS GROUP INC.
DISCLOSURE OF PORTFOLIO HOLDINGS
(Unaudited)
The SEC requires that all funds file a complete Schedule of Investments with the SEC for their first and third fiscal quarters on Form N-Q. For DFA Investment Dimensions Group Inc., this would be for the fiscal quarters ending January 31 and July 31. The Form N-Q filing must be made within 60 days of the end of the quarter. DFA Investment Dimensions Group Inc. filed its most recent Form N-Q with the SEC on September 29, 2009. It is available upon request, without charge, by calling collect: (512) 306-7400 or by mailing a request to Dimensional Fund Advisors LP, 6300 Bee Cave Road, Building One, Austin, Texas 78746, or by visiting the SEC’s website at http://www.sec.gov, or they may be reviewed and copied at the SEC’s Public Reference Room in Washington, D.C. (call 1-800-732-0330 for information on the operation of the Public Reference Room).
SEC regulations permit a fund to include in its reports to shareholders a “Summary Schedule of Portfolio Holdings” in lieu of a full Schedule of Investments. The Summary Schedule of Portfolio Holdings reports the fund’s 50 largest holdings in unaffiliated issuers and any investments that exceed one percent of the fund’s net assets at the end of the reporting period. The amendments also require that the Summary Schedule of Portfolio Holdings identify each category of investments that are held.
The fund is required to file a complete Schedule of Investments with the SEC on Form N-CSR within ten days after mailing the annual and semi-annual reports to shareholders. It will be available upon request, without charge, by calling collect: (512) 306-7400 or by mailing a request to Dimensional Fund Advisors LP, 6300 Bee Cave Road, Building One, Austin, Texas 78746, or by visiting the SEC’s website at http://www.sec.gov, or they may be reviewed and copied at the SEC’s Public Reference Room in Washington, D.C. (call 1-800-732-0330 for information on the operation of the Public Reference Room).
PORTFOLIO HOLDINGS
The SEC requires that all funds present their categories of portfolio holdings in a table, chart or graph format in their annual and semi-annual shareholder reports, whether or not a Schedule of Investments is utilized. The following tables, which presents portfolio holdings as a percent of total investments before short-term investments and collateral for loaned securities, are provided in compliance with such requirement. The categories shown below represent broad industry sectors. Each industry sector consists of one or more specific industry classifications.
The categories of industry classification for the Affiliated Investment Companies are represented in the Disclosure of Portfolio Holdings, which are included elsewhere within the report. Refer to the Summary Schedule of Portfolio Holdings for each of the underlying Master Funds’ holdings which reflect the investments by category.
FEEDER FUNDS
| Affiliated Investment Companies | ||
Tax-Managed U.S. Marketwide Value Portfolio | 100.0% | |
Tax-Managed U.S. Equity Portfolio | 100.0% |
DOMESTIC AND INTERNATIONAL EQUITY PORTFOLIOS
Tax-Managed U.S. Targeted Value Portfolio
Consumer Discretionary | 18.0% | |
Consumer Staples | 3.4% | |
Energy | 8.4% | |
Financials | 25.0% | |
Health Care | 7.3% | |
Industrials | 15.1% | |
Information Technology | 15.5% | |
Materials | 6.4% | |
Other | — | |
Telecommunication Services | 0.3% | |
Utilities | 0.6% | |
| 100.0% |
Tax-Managed U.S. Small Cap Portfolio
Consumer Discretionary | 16.2% | |
Consumer Staples | 4.4% | |
Energy | 4.4% | |
Financials | 15.0% | |
Health Care | 13.9% | |
Industrials | 16.4% | |
Information Technology | 20.9% | |
Materials | 5.1% | |
Other | — | |
Telecommunication Services | 1.3% | |
Utilities | 2.4% | |
| 100.0% |
| Tax-Managed DFA International Value Portfolio | ||
Consumer Discretionary | 12.1% | |
Consumer Staples | 5.3% | |
Energy | 6.5% | |
Financials | 43.5% | |
Health Care | 0.4% | |
Industrials | 10.6% | |
Information Technology | 2.9% | |
Materials | 10.5% | |
Telecommunication Services | 6.5% | |
Utilities | 1.7% | |
| 100.0% | ||
10
DFA INVESTMENT DIMENSIONS GROUP INC.
SCHEDULES OF INVESTMENTS
October 31, 2009
TAX-MANAGED U.S. MARKETWIDE VALUE PORTFOLIO
Value† | |||
AFFILIATED INVESTMENT COMPANY — (100.0%) | |||
Investment in The Tax-Managed U.S. Marketwide Value Series of | $ | 1,618,516,785 | |
TOTAL INVESTMENTS IN AFFILIATED INVESTMENT COMPANY | $ | 1,618,516,785 | |
Summary of inputs used to value the Portfolio’s net assets as of October 31, 2009 is as follows (See Security Valuation Note):
| Valuation Inputs | ||||||||||
| Investment in Securities (Market Value) | ||||||||||
| Level 1 | Level 2 | Level 3 | Total | |||||||
Affiliated Investment Company | $ | 1,618,516,785 | $— | — | $ | 1,618,516,785 | ||||
TAX MANAGED U.S. EQUITY PORTFOLIO
Value† | |||
AFFILIATED INVESTMENT COMPANY — (100.0%) | |||
Investment in The Tax-Managed U.S. Equity Series of | $ | 1,141,591,293 | |
TOTAL INVESTMENTS IN AFFILIATED INVESTMENT COMPANY | $ | 1,141,591,293 | |
Summary of inputs used to value the Portfolio’s net assets as of October 31, 2009 is as follows (See Security Valuation Note):
| Valuation Inputs | ||||||||||
| Investment in Securities (Market Value) | ||||||||||
| Level 1 | Level 2 | Level 3 | Total | |||||||
Affiliated Investment Company | $ | 1,141,591,293 | $— | — | $ | 1,141,591,293 | ||||
See accompanying Notes to Financial Statements.
11
TAX-MANAGED U.S. TARGETED VALUE PORTFOLIO
SUMMARY SCHEDULE OF PORTFOLIO HOLDINGS
October 31, 2009
Shares | Value† | Percentage of Net Assets** | |||||
COMMON STOCKS — (86.1%) | |||||||
Consumer Discretionary — (15.5%) | |||||||
#*AutoNation, Inc. | 412,136 | $ | 7,105,225 | 0.4% | |||
Bob Evans Farms, Inc. | 219,781 | 5,773,647 | 0.3% | ||||
*Chico’s FAS, Inc. | 492,017 | 5,879,603 | 0.4% | ||||
#Dillard’s, Inc. | 440,846 | 6,004,323 | 0.4% | ||||
Jarden Corp. | 210,600 | 5,768,334 | 0.3% | ||||
*Liberty Media Corp. Capital Class A | 360,759 | 7,464,104 | 0.4% | ||||
#*Mohawk Industries, Inc. | 153,400 | 6,570,122 | 0.4% | ||||
#*Royal Caribbean Cruises, Ltd. | 333,477 | 6,746,240 | 0.4% | ||||
Scholastic Corp. | 230,922 | 5,743,030 | 0.3% | ||||
Whirlpool Corp. | 117,954 | 8,444,327 | 0.5% | ||||
Wyndham Worldwide Corp. | 363,900 | 6,204,495 | 0.4% | ||||
Other Securities | 232,731,379 | 13.7% | |||||
Total Consumer Discretionary | 304,434,829 | 17.9% | |||||
Consumer Staples — (2.9%) | |||||||
Del Monte Foods Co. | 713,356 | 7,704,245 | 0.5% | ||||
Other Securities | 49,608,711 | 2.9% | |||||
Total Consumer Staples | 57,312,956 | 3.4% | |||||
Energy — (7.2%) | |||||||
Cimarex Energy Co. | 269,028 | 10,535,136 | 0.6% | ||||
*Plains Exploration & Production Co. | 245,238 | 6,498,807 | 0.4% | ||||
Rowan Cos., Inc. | 238,371 | 5,542,126 | 0.3% | ||||
*SEACOR Holdings, Inc. | 69,842 | 5,676,059 | 0.3% | ||||
#*Whiting Petroleum Corp. | 181,168 | 10,217,875 | 0.6% | ||||
Other Securities | 103,026,499 | 6.1% | |||||
Total Energy | 141,496,502 | 8.3% | |||||
Financials — (21.5%) | |||||||
American Financial Group, Inc. | 275,910 | 6,787,386 | 0.4% | ||||
#*AmeriCredit Corp. | 350,332 | 6,183,360 | 0.4% | ||||
Comerica, Inc. | 277,200 | 7,692,300 | 0.5% | ||||
Community Bank System, Inc. | 294,258 | 5,476,141 | 0.3% | ||||
#Endurance Specialty Holdings, Ltd. | 174,222 | 6,270,250 | 0.4% | ||||
First American Corp. | 198,075 | 6,019,499 | 0.4% | ||||
*First Horizon National Corp. | 470,950 | 5,571,338 | 0.3% | ||||
Genworth Financial, Inc. | 525,160 | 5,577,199 | 0.3% | ||||
Harleysville Group, Inc. | 238,282 | 7,465,375 | 0.4% | ||||
NewAlliance Bancshares, Inc. | 533,508 | 5,911,269 | 0.3% | ||||
#Old Republic International Corp. | 573,555 | 6,125,567 | 0.4% | ||||
Reinsurance Group of America, Inc. | 159,148 | 7,336,723 | 0.4% | ||||
Transatlantic Holdings, Inc. | 179,018 | 9,040,409 | 0.5% | ||||
*Validus Holdings, Ltd. | 219,890 | 5,563,217 | 0.3% | ||||
White Mountains Insurance Group, Ltd. | 25,436 | 7,889,484 | 0.5% | ||||
Other Securities | 323,268,869 | 19.0% | |||||
Total Financials | 422,178,386 | 24.8% | |||||
Health Care — (6.3%) | |||||||
#*Community Health Systems, Inc. | 284,500 | 8,899,160 | 0.5% | ||||
*CONMED Corp. | 289,759 | 6,139,993 | 0.4% | ||||
#*King Pharmaceuticals, Inc. | 650,171 | 6,586,232 | 0.4% | ||||
Omnicare, Inc. | 341,925 | 7,409,515 | 0.4% | ||||
Other Securities | 93,876,799 | 5.5% | |||||
Total Health Care | 122,911,699 | 7.2% | |||||
12
TAX-MANAGED U.S. TARGETED VALUE PORTFOLIO
CONTINUED
Shares | Value† | Percentage | |||||
Industrials — (13.0%) | |||||||
Applied Industrial Technologies, Inc. | 272,225 | $ | 5,507,112 | 0.3% | |||
#*Hertz Global Holdings, Inc. | 704,289 | 6,556,931 | 0.4% | ||||
*MPS Group, Inc. | 544,200 | 7,357,584 | 0.4% | ||||
*Oshkosh Truck Corp. Class B | 193,927 | 6,062,158 | 0.4% | ||||
*Owens Corning, Inc. | 268,753 | 5,942,129 | 0.3% | ||||
Ryder System, Inc. | 255,543 | 10,362,269 | 0.6% | ||||
Other Securities | 213,415,304 | 12.6% | |||||
Total Industrials | 255,203,487 | 15.0% | |||||
Information Technology — (13.4%) | |||||||
*Arrow Electronics, Inc. | 272,551 | 6,906,442 | 0.4% | ||||
*IAC/InterActiveCorp. | 403,904 | 7,649,942 | 0.5% | ||||
*Ingram Micro, Inc. | 412,271 | 7,276,583 | 0.4% | ||||
*Rovi Corp. | 225,865 | 6,222,581 | 0.4% | ||||
*Sandisk Corp. | 371,916 | 7,616,840 | 0.4% | ||||
#*SYNNEX Corp. | 215,600 | 5,547,388 | 0.3% | ||||
Other Securities | 220,785,677 | 13.0% | |||||
Total Information Technology | 262,005,453 | 15.4% | |||||
Materials — (5.5%) | |||||||
MeadWestavco Corp. | 317,600 | 7,250,808 | 0.4% | ||||
Reliance Steel & Aluminum Co. | 206,415 | 7,530,019 | 0.5% | ||||
Other Securities | 93,885,284 | 5.5% | |||||
Total Materials | 108,666,111 | 6.4% | |||||
Other — (0.0%) | |||||||
Other Securities | 952 | 0.0% | |||||
Telecommunication Services — (0.3%) | |||||||
Other Securities | 6,100,561 | 0.4% | |||||
Utilities — (0.5%) | |||||||
Other Securities | 10,621,087 | 0.6% | |||||
TOTAL COMMON STOCKS | 1,690,932,023 | 99.4% | |||||
RIGHTS/WARRANTS — (0.0%) | |||||||
Other Securities | — | 0.0% | |||||
TEMPORARY CASH INVESTMENTS — (1.2%) | |||||||
BlackRock Liquidity Funds Tempcash Portfolio - Institutional | 23,515,202 | 23,515,202 | 1.4% | ||||
Shares/ | |||||||
| (000) | |||||||
SECURITIES LENDING COLLATERAL — (12.7%) | |||||||
§@DFA Short Term Investment Fund LP | 247,987,484 | 247,987,484 | 14.6% | ||||
@Repurchase Agreement, Deutsche Bank Securities 0.08%, | $1,260 | 1,260,328 | 0.1% | ||||
TOTAL SECURITIES LENDING COLLATERAL | 249,247,812 | 14.7% | |||||
TOTAL INVESTMENTS — (100.0%) | $ | 1,963,695,037 | 115.5% | ||||
13
TAX-MANAGED U.S. TARGETED VALUE PORTFOLIO
CONTINUED
Summary of inputs used to value the Portfolio’s net assets as of October 31, 2009 is as follows (See Security Valuation Note):
| Valuation Inputs | |||||||||||
| Investment in Securities (Market Value) | |||||||||||
| Level 1 | Level 2 | Level 3 | Total | ||||||||
Common Stocks | |||||||||||
Consumer Discretionary | $ | 304,329,304 | $ | 105,525 | — | $ | 304,434,829 | ||||
Consumer Staples | 57,312,956 | — | — | 57,312,956 | |||||||
Energy | 141,496,502 | — | — | 141,496,502 | |||||||
Financials | 422,178,386 | — | — | 422,178,386 | |||||||
Health Care | 122,911,699 | — | — | 122,911,699 | |||||||
Industrials | 255,203,487 | — | — | 255,203,487 | |||||||
Information Technology | 261,969,549 | 35,904 | — | 262,005,453 | |||||||
Materials | 108,666,111 | — | — | 108,666,111 | |||||||
Other | — | 952 | — | 952 | |||||||
Telecommunication Services | 6,100,561 | — | — | 6,100,561 | |||||||
Utilities | 10,621,087 | — | — | 10,621,087 | |||||||
Rights/Warrants | — | — | — | — | |||||||
Temporary Cash Investments | 23,515,202 | — | — | 23,515,202 | |||||||
Securities Lending Collateral | — | 249,247,812 | — | 249,247,812 | |||||||
TOTAL | $ | 1,714,304,844 | $ | 249,390,193 | — | $ | 1,963,695,037 | ||||
See accompanying Notes to Financial Statements.
14
TAX-MANAGED U.S. SMALL CAP PORTFOLIO
SUMMARY SCHEDULE OF PORTFOLIO HOLDINGS
October 31, 2009
Shares | Value† | Percentage | |||||
COMMON STOCKS — (84.4%) | |||||||
Consumer Discretionary — (13.7%) | |||||||
*99 Cents Only Stores | 211,533 | $ | 2,405,130 | 0.2% | |||
#*Chico’s FAS, Inc. | 130,600 | 1,560,670 | 0.2% | ||||
#*Collective Brands, Inc. | 91,420 | 1,695,841 | 0.2% | ||||
*Helen of Troy, Ltd. | 72,200 | 1,649,048 | 0.2% | ||||
Jarden Corp. | 86,799 | 2,377,425 | 0.2% | ||||
*Jo-Ann Stores, Inc. | 58,500 | 1,557,270 | 0.2% | ||||
Men’s Wearhouse, Inc. (The) | 68,601 | 1,589,485 | 0.2% | ||||
#*Penske Automotive Group, Inc. | 122,009 | 1,910,661 | 0.2% | ||||
Phillips-Van Heusen Corp. | 47,987 | 1,926,678 | 0.2% | ||||
Thor Industries, Inc. | 56,991 | 1,494,304 | 0.1% | ||||
Other Securities | 136,633,497 | 14.3% | |||||
Total Consumer Discretionary | 154,800,009 | 16.2% | |||||
Consumer Staples — (3.7%) | |||||||
J & J Snack Foods Corp. | 36,407 | 1,426,062 | 0.1% | ||||
*NBTY, Inc. | 77,011 | 2,803,971 | 0.3% | ||||
*TreeHouse Foods, Inc. | 53,953 | 2,017,842 | 0.2% | ||||
Other Securities | 35,973,989 | 3.8% | |||||
Total Consumer Staples | 42,221,864 | 4.4% | |||||
Energy — (3.7%) | |||||||
Other Securities | 41,592,888 | 4.3% | |||||
Financials — (12.7%) | |||||||
#*AmeriCredit Corp. | 170,800 | 3,014,620 | 0.3% | ||||
#Assured Guaranty, Ltd. | 114,200 | 1,893,436 | 0.2% | ||||
*Investors Bancorp, Inc. | 129,914 | 1,408,268 | 0.1% | ||||
Jones Lang LaSalle, Inc. | 30,623 | 1,434,688 | 0.2% | ||||
Trustmark Corp. | 81,319 | 1,540,995 | 0.2% | ||||
Unitrin, Inc. | 82,180 | 1,610,728 | 0.2% | ||||
Zenith National Insurance Corp. | 50,154 | 1,430,894 | 0.1% | ||||
Other Securities | 130,955,563 | 13.7% | |||||
Total Financials | 143,289,192 | 15.0% | |||||
Health Care — (11.7%) | |||||||
#*ev3, Inc. | 141,766 | 1,670,003 | 0.2% | ||||
#*HMS Holdings Corp. | 42,940 | 1,843,414 | 0.2% | ||||
*Salix Pharmaceuticals, Ltd. | 137,067 | 2,520,662 | 0.2% | ||||
Other Securities | 126,096,640 | 13.2% | |||||
Total Health Care | 132,130,719 | 13.8% | |||||
Industrials — (13.8%) | |||||||
#*Allegiant Travel Co. | 41,915 | 1,580,615 | 0.2% | ||||
#*American Superconductor Corp. | 46,459 | 1,557,306 | 0.2% | ||||
#*Beacon Roofing Supply, Inc. | 108,640 | 1,560,070 | 0.2% | ||||
*EnerSys, Inc. | 68,399 | 1,511,618 | 0.1% | ||||
*Esterline Technologies Corp. | 43,192 | 1,818,815 | 0.2% | ||||
*MPS Group, Inc. | 137,586 | 1,860,163 | 0.2% | ||||
*Oshkosh Truck Corp. Class B | 50,960 | 1,593,010 | 0.2% | ||||
*Sykes Enterprises, Inc. | 62,843 | 1,491,893 | 0.1% | ||||
Werner Enterprises, Inc. | 78,842 | 1,478,288 | 0.1% | ||||
Other Securities | 141,341,196 | 14.8% | |||||
Total Industrials | 155,792,974 | 16.3% | |||||
Information Technology — (17.7%) | |||||||
*3Com Corp. | 336,245 | 1,728,299 | 0.2% | ||||
15
TAX-MANAGED U.S. SMALL CAP PORTFOLIO
CONTINUED
Shares | Value† | Percentage of Net Assets** | |||||
Information Technology — (Continued) | |||||||
#*Arris Group, Inc. | 166,606 | $ | 1,709,378 | 0.2% | |||
*Avocent Corp. | 65,215 | 1,621,897 | 0.2% | ||||
*Benchmark Electronics, Inc. | 92,359 | 1,551,631 | 0.1% | ||||
*Blue Coat Systems, Inc. | 83,571 | 1,861,962 | 0.2% | ||||
#*CyberSource Corp. | 115,887 | 1,898,229 | 0.2% | ||||
*Euronet Worldwide, Inc. | 66,770 | 1,579,110 | 0.2% | ||||
*Integrated Device Technology, Inc. | 240,550 | 1,414,434 | 0.1% | ||||
*Multi-Fineline Electronix, Inc. | 53,609 | 1,460,845 | 0.1% | ||||
Pegasystems, Inc. | 85,128 | 2,440,620 | 0.2% | ||||
#*Skyworks Solutions, Inc. | 180,948 | 1,887,288 | 0.2% | ||||
#*STEC, Inc. | 126,449 | 2,695,893 | 0.3% | ||||
Other Securities | 177,754,628 | 18.6% | |||||
Total Information Technology | 199,604,214 | 20.8% | |||||
Materials — (4.3%) | |||||||
AK Steel Holding Corp. | 100,772 | 1,599,252 | 0.2% | ||||
Cabot Corp. | 75,100 | 1,646,943 | 0.2% | ||||
NewMarket Corp. | 27,175 | 2,540,862 | 0.3% | ||||
Schweitzer-Maudoit International, Inc. | 28,091 | 1,450,900 | 0.1% | ||||
Westlake Chemical Corp. | 74,700 | 1,814,463 | 0.2% | ||||
*WR Grace & Co. | 68,900 | 1,508,221 | 0.1% | ||||
Other Securities | 37,970,418 | 4.0% | |||||
Total Materials | 48,531,059 | 5.1% | |||||
Other — (0.0%) | |||||||
Other Securities | 1,463 | 0.0% | |||||
Telecommunication Services — (1.1%) | |||||||
Other Securities | 12,269,006 | 1.3% | |||||
Utilities — (2.0%) | |||||||
Other Securities | 23,201,834 | 2.4% | |||||
TOTAL COMMON STOCKS | 953,435,222 | 99.6% | |||||
RIGHTS/WARRANTS — (0.0%) | |||||||
Other Securities | 7 | 0.0% | |||||
TEMPORARY CASH INVESTMENTS — (0.6%) | |||||||
BlackRock Liquidity Funds Tempcash Portfolio - Institutional | 6,576,158 | 6,576,158 | 0.7% | ||||
Shares/ Face Amount | |||||||
| (000) | |||||||
SECURITIES LENDING COLLATERAL — (15.0%) | |||||||
§@DFA Short Term Investment Fund LP | 168,716,508 | 168,716,508 | 17.6% | ||||
@Repurchase Agreement, Deutsche Bank Securities 0.08%, | $857 | 857,455 | 0.1% | ||||
TOTAL SECURITIES LENDING COLLATERAL | 169,573,963 | 17.7% | |||||
TOTAL INVESTMENTS — (100.0%) | $ | 1,129,585,350 | 118.0% | ||||
16
TAX-MANAGED U.S. SMALL CAP PORTFOLIO
CONTINUED
Summary of inputs used to value the Portfolio’s net assets as of October 31, 2009 is as follows (See Security Valuation Note):
| Valuation Inputs | |||||||||||
| Investment in Securities (Market Value) | |||||||||||
| Level 1 | Level 2 | Level 3 | Total | ||||||||
Common Stocks | |||||||||||
Consumer Discretionary | $ | 154,744,281 | $ | 55,728 | — | $ | 154,800,009 | ||||
Consumer Staples | 42,221,864 | — | — | 42,221,864 | |||||||
Energy | 41,592,888 | — | — | 41,592,888 | |||||||
Financials | 143,289,192 | — | — | 143,289,192 | |||||||
Health Care | 132,074,084 | 56,635 | — | 132,130,719 | |||||||
Industrials | 155,792,974 | — | — | 155,792,974 | |||||||
Information Technology | 199,594,847 | 9,367 | — | 199,604,214 | |||||||
Materials | 48,531,059 | — | — | 48,531,059 | |||||||
Other | — | 1,463 | — | 1,463 | |||||||
Telecommunication Services | 12,269,006 | — | — | 12,269,006 | |||||||
Utilities | 23,201,834 | — | — | 23,201,834 | |||||||
Rights/Warrants | 7 | — | — | 7 | |||||||
Temporary Cash Investments | 6,576,158 | — | — | 6,576,158 | |||||||
Securities Lending Collateral | — | 169,573,963 | — | 169,573,963 | |||||||
TOTAL | $ | 959,888,194 | $ | 169,697,156 | — | $ | 1,129,585,350 | ||||
See accompanying Notes to Financial Statements.
17
TAX-MANAGED DFA INTERNATIONAL VALUE PORTFOLIO
SUMMARY SCHEDULE OF PORTFOLIO HOLDINGS
October 31, 2009
Shares | Value†† | Percentage | |||||
COMMON STOCKS — (88.0%) | |||||||
AUSTRALIA — (3.6%) | |||||||
Wesfarmers, Ltd. | 767,473 | $ | 19,150,955 | 1.2% | |||
Other Securities | 46,834,229 | 2.8% | |||||
TOTAL AUSTRALIA | 65,985,184 | 4.0% | |||||
AUSTRIA — (0.2%) | |||||||
Other Securities | 4,378,631 | 0.3% | |||||
BELGIUM — (0.6%) | |||||||
Other Securities | 11,463,198 | 0.7% | |||||
CANADA — (7.6%) | |||||||
Bank of Montreal | 316,796 | 14,656,262 | 0.9% | ||||
Goldcorp, Inc. | 296,096 | 10,885,540 | 0.7% | ||||
#Manulife Financial Corp. | 583,408 | 10,945,134 | 0.7% | ||||
Sun Life Financial, Inc. | 488,350 | 13,507,985 | 0.8% | ||||
Thomson Reuters Corp. | 286,601 | 9,116,775 | 0.6% | ||||
#Toronto Dominion Bank | 322,721 | 18,396,036 | 1.1% | ||||
Other Securities | 63,138,454 | 3.8% | |||||
TOTAL CANADA | 140,646,186 | 8.6% | |||||
DENMARK — (1.1%) | |||||||
Other Securities | 19,642,313 | 1.2% | |||||
FINLAND — (0.8%) | |||||||
Other Securities | 15,155,789 | 0.9% | |||||
FRANCE — (9.3%) | |||||||
AXA SA | 948,963 | 23,600,860 | 1.4% | ||||
AXA SA Sponsored ADR | 403,078 | 9,996,334 | 0.6% | ||||
BNP Paribas SA | 295,719 | 22,277,734 | 1.4% | ||||
Compagnie de Saint-Gobain SA | 267,410 | 13,030,815 | 0.8% | ||||
Credit Agricole SA | 469,537 | 8,994,054 | 0.5% | ||||
#Lafarge SA | 109,354 | 8,876,240 | 0.5% | ||||
Societe Generale Paris SA | 234,111 | 15,549,606 | 1.0% | ||||
Vivendi SA | 551,039 | 15,287,105 | 0.9% | ||||
Other Securities | 54,947,159 | 3.4% | |||||
TOTAL FRANCE | 172,559,907 | 10.5% | |||||
GERMANY — (8.3%) | |||||||
Allianz SE | 188,633 | 21,607,974 | 1.3% | ||||
#Bayerische Motoren Werke AG | 235,671 | 11,528,633 | 0.7% | ||||
#Daimler AG | 505,191 | 24,408,820 | 1.5% | ||||
Deutsche Telekom AG | 920,799 | 12,535,665 | 0.8% | ||||
Deutsche Telekom AG Sponsored ADR | 681,300 | 9,224,802 | 0.6% | ||||
E.ON AG | 439,688 | 16,799,319 | 1.0% | ||||
Munchener Rueckversicherungs-Gesellschaft AG | 109,310 | 17,294,245 | 1.1% | ||||
Other Securities | 39,731,111 | 2.4% | |||||
TOTAL GERMANY | 153,130,569 | 9.4% | |||||
GREECE — (0.0%) | |||||||
Other Securities | 915,777 | 0.1% | |||||
HONG KONG — (3.1%) | |||||||
Cheung Kong Holdings, Ltd. | 892,000 | 11,377,069 | 0.7% | ||||
Hutchison Whampoa, Ltd. | 1,568,000 | 11,005,613 | 0.7% | ||||
Sun Hung Kai Properties, Ltd. | 657,000 | 9,920,620 | 0.6% | ||||
18
TAX-MANAGED DFA INTERNATIONAL VALUE PORTFOLIO
CONTINUED
Shares | Value†† | Percentage | |||||
HONG KONG — (Continued) | |||||||
Other Securities | $ | 24,698,090 | 1.5% | ||||
TOTAL HONG KONG | 57,001,392 | 3.5% | |||||
IRELAND — (0.0%) | |||||||
Other Securities | 58,214 | 0.0% | |||||
ITALY — (2.0%) | |||||||
*IntesaSanpaolo SpA | 2,175,138 | 9,154,023 | 0.5% | ||||
*UniCreditoSpA | 2,737,011 | 9,169,550 | 0.6% | ||||
Other Securities | 18,207,935 | 1.1% | |||||
TOTAL ITALY | 36,531,508 | 2.2% | |||||
JAPAN — (12.1%) | |||||||
FUJIFILM Holdings Corp. | 363,000 | 10,319,828 | 0.6% | ||||
Sony Corp. Sponsored ADR | 526,299 | 15,467,928 | 0.9% | ||||
Other Securities | 197,623,499 | 12.1% | |||||
TOTAL JAPAN | 223,411,255 | 13.6% | |||||
NETHERLANDS — (3.5%) | |||||||
ArcelorMittal NV | 511,865 | 17,322,813 | 1.1% | ||||
*INGGroep NV | 693,503 | 9,024,992 | 0.5% | ||||
Philips Electronics NV | 814,648 | 20,464,625 | 1.2% | ||||
Other Securities | 17,431,538 | 1.1% | |||||
TOTAL NETHERLANDS | 64,243,968 | 3.9% | |||||
NEW ZEALAND — (0.1%) | |||||||
Other Securities | 1,172,580 | 0.1% | |||||
NORWAY — (0.8%) | |||||||
Other Securities | 15,666,160 | 1.0% | |||||
PORTUGAL — (0.2%) | |||||||
Other Securities | 3,305,294 | 0.2% | |||||
SINGAPORE — (1.6%) | |||||||
DBS Group Holdings, Ltd. | 1,086,900 | 9,953,365 | 0.6% | ||||
Other Securities | 19,364,195 | 1.2% | |||||
TOTAL SINGAPORE | 29,317,560 | 1.8% | |||||
SPAIN — (5.6%) | |||||||
Banco Santander SA | 3,095,407 | 49,812,076 | 3.1% | ||||
Banco Santander SA Sponsored ADR | 876,182 | 14,071,483 | 0.9% | ||||
Repsol YPF SA | 453,348 | 12,068,710 | 0.7% | ||||
Other Securities | 28,185,605 | 1.7% | |||||
TOTAL SPAIN | 104,137,874 | 6.4% | |||||
SWEDEN — (3.3%) | |||||||
#NordeaBank AB | 2,166,737 | 23,256,495 | 1.4% | ||||
Other Securities | 37,322,781 | 2.3% | |||||
TOTAL SWEDEN | 60,579,276 | 3.7% | |||||
SWITZERLAND — (7.5%) | |||||||
Compagnie Financiere Richemont SA Series A | 393,600 | 11,018,388 | 0.7% | ||||
Credit Suisse Group AG | 616,112 | 32,935,609 | 2.0% | ||||
Credit Suisse Group AG Sponsored ADR | 198,516 | 10,580,903 | 0.6% | ||||
#*Holcim, Ltd. | 205,405 | 13,072,955 | 0.8% | ||||
Swiss Reinsurance Co., Ltd. AG | 230,487 | 9,385,568 | 0.6% | ||||
#ZurichFinancial Services AG | 121,786 | 27,888,091 | 1.7% | ||||
19
TAX-MANAGED DFA INTERNATIONAL VALUE PORTFOLIO
CONTINUED
Shares | Value†† | Percentage of Net Assets** | |||||
SWITZERLAND — (Continued) | |||||||
Other Securities | $ | 33,438,928 | 2.0% | ||||
TOTAL SWITZERLAND | 138,320,442 | 8.4% | |||||
UNITED KINGDOM — (16.7%) | |||||||
Aviva P.L.C. | 1,783,838 | 11,154,645 | 0.7% | ||||
*BP P.L.C. Sponsored ADR | 169,600 | 9,602,752 | 0.6% | ||||
HSBC Holdings P.L.C. Sponsored ADR. | 946,732 | 52,439,485 | 3.2% | ||||
Royal Dutch Shell P.L.C. ADR. | 665,357 | 38,697,163 | 2.3% | ||||
Vodafone Group P.L.C. | 15,557,592 | 34,286,364 | 2.1% | ||||
Vodafone Group P.L.C. Sponsored ADR | 1,430,950 | 31,752,780 | 1.9% | ||||
William Morrison Supermarkets P.L.C | 2,028,411 | 9,296,624 | 0.6% | ||||
Other Securities | 120,864,715 | 7.4% | |||||
TOTAL UNITED KINGDOM | 308,094,528 | 18.8% | |||||
TOTAL COMMON STOCKS | 1,625,717,605 | 99.3% | |||||
RIGHTS/WARRANTS — (0.0%) | |||||||
GERMANY — (0.0%) | |||||||
Other Securities | 5,908 | 0.0% | |||||
ITALY — (0.0%) | |||||||
Other Securities | 22,479 | 0.0% | |||||
TOTAL RIGHTS/WARRANTS | 28,387 | 0.0% | |||||
Face Amount | Value† | ||||||
| (000) | |||||||
TEMPORARY CASH INVESTMENTS — (0.3%) | |||||||
Repurchase Agreement, PNC Capital Markets, Inc. 0.19%, | $6,328 | 6,328,000 | 0.4% | ||||
Shares/ Face Amount | |||||||
| (000) | |||||||
SECURITIES LENDING COLLATERAL — (11.7%) | |||||||
§@DFA Short Term Investment Fund LP | 214,860,995 | 214,860,995 | 13.1% | ||||
@Repurchase Agreement, Deutsche Bank Securities 0.07%, | $611 | 611,198 | 0.0% | ||||
TOTAL SECURITIES LENDING COLLATERAL | 215,472,193 | 13.1% | |||||
TOTAL INVESTMENTS — (100.0%) | $ | 1,847,546,185 | 112.8% | ||||
20
TAX-MANAGED DFA INTERNATIONAL VALUE PORTFOLIO
CONTINUED
Summary of inputs used to value the Portfolio’s net assets as of October 31, 2009 is as follows (See Security Valuation Note):
| Valuation Inputs | |||||||||||
| Investment in Securities (Market Value) | |||||||||||
| Level 1 | Level 2 | Level 3 | Total | ||||||||
Common Stocks | |||||||||||
Australia | $ | 196,462 | $ | 65,788,722 | — | $ | 65,985,184 | ||||
Austria | — | 4,378,631 | — | 4,378,631 | |||||||
Belgium | 718,680 | 10,744,518 | — | 11,463,198 | |||||||
Canada | 140,646,186 | — | — | 140,646,186 | |||||||
Denmark | — | 19,642,313 | — | 19,642,313 | |||||||
Finland | — | 15,155,789 | — | 15,155,789 | |||||||
France | 9,996,334 | 162,563,573 | — | 172,559,907 | |||||||
Germany | 22,316,120 | 130,814,449 | — | 153,130,569 | |||||||
Greece | — | 915,777 | — | 915,777 | |||||||
Hong Kong | — | 57,001,392 | — | 57,001,392 | |||||||
Ireland | 58,214 | — | — | 58,214 | |||||||
Italy | 3,271,918 | 33,259,590 | — | 36,531,508 | |||||||
Japan | 16,749,483 | 206,661,772 | — | 223,411,255 | |||||||
Netherlands | 1,443,510 | 62,800,458 | — | 64,243,968 | |||||||
New Zealand | — | 1,172,580 | — | 1,172,580 | |||||||
Norway | — | 15,666,160 | — | 15,666,160 | |||||||
Portugal | — | 3,305,294 | — | 3,305,294 | |||||||
Singapore | — | 29,317,560 | — | 29,317,560 | |||||||
Spain | 22,539,101 | 81,598,773 | — | 104,137,874 | |||||||
Sweden | — | 60,579,276 | — | 60,579,276 | |||||||
Switzerland | 11,164,446 | 127,155,996 | — | 138,320,442 | |||||||
United Kingdom | 142,365,211 | 165,729,317 | — | 308,094,528 | |||||||
Rights/Warrants | |||||||||||
Germany | — | 5,908 | — | 5,908 | |||||||
Italy | 22,479 | — | — | 22,479 | |||||||
Temporary Cash Investments | — | 6,328,000 | — | 6,328,000 | |||||||
Securities Lending Collateral | — | 215,472,193 | — | 215,472,193 | |||||||
TOTAL | $ | 371,488,144 | $ | 1,476,058,041 | — | $ | 1,847,546,185 | ||||
See accompanying Notes to Financial Statements.
21
DFA INVESTMENT DIMENSIONS GROUP INC.
STATEMENTS OF ASSETS AND LIABILITIES
OCTOBER 31, 2009
(Amounts in thousands, except share and per share amounts)
| Tax-Managed U.S. Marketwide Value Portfolio | Tax-Managed U.S. Equity Portfolio | Tax-Managed U.S. Targeted Value Portfolio | ||||||||||
ASSETS: | ||||||||||||
Investments in Affiliated Investment Companies at Value | $ | 1,618,517 | $ | 1,141,591 | — | |||||||
Investments at Value (including $0, $0 and $223,895 of securities on loan, respectively) | — | — | $ | 1,690,932 | ||||||||
Temporary Cash Investments at Value & Cost | — | — | 23,515 | |||||||||
Collateral Received from Securities on Loan at Value & Cost | — | — | 249,248 | |||||||||
Receivables: | ||||||||||||
Investment Securities Sold/Affiliated Investment Companies Sold | 570 | 169 | 867 | |||||||||
Dividends and Interest | — | — | 436 | |||||||||
Securities Lending Income | — | — | 148 | |||||||||
Fund Shares Sold | 555 | 488 | 977 | |||||||||
Prepaid Expenses and Other Assets | 31 | 44 | 41 | |||||||||
Total Assets | 1,619,673 | 1,142,292 | 1,966,164 | |||||||||
LIABILITIES: | ||||||||||||
Payables: | ||||||||||||
Upon Return of Securities Loaned | — | — | 249,248 | |||||||||
Investment Securities Purchased | — | — | 14,752 | |||||||||
Fund Shares Redeemed | 1,125 | 657 | 1,073 | |||||||||
Due to Advisor | 214 | 129 | 639 | |||||||||
Accrued Expenses and Other Liabilities | 78 | 57 | 109 | |||||||||
Total Liabilities | 1,417 | 843 | 265,821 | |||||||||
NET ASSETS | $ | 1,618,256 | $ | 1,141,449 | $ | 1,700,343 | ||||||
SHARES OUTSTANDING, $0.01 PAR VALUE (1) | 139,387,676 | 104,346,854 | 113,622,667 | |||||||||
NET ASSET VALUE, OFFERING AND REDEMPTION PRICE PER SHARE | $ | 11.61 | $ | 10.94 | $ | 14.96 | ||||||
Investments in Affiliated Investment Companies at Cost | $ | 1,671,505 | $ | 927,660 | $ | — | ||||||
Investments at Cost | $ | — | $ | — | $ | 1,748,855 | ||||||
NET ASSETS CONSIST OF: | ||||||||||||
Paid-In Capital | $ | 1,957,195 | $ | 1,419,144 | $ | 2,026,139 | ||||||
Undistributed Net Investment Income (Distributions in Excess of Net Investment Income) | 3,335 | 2,759 | 1,429 | |||||||||
Accumulated Net Realized Gain (Loss) | (289,286 | ) | (494,385 | ) | (269,302 | ) | ||||||
Net Unrealized Appreciation (Depreciation) | (52,988 | ) | 213,931 | (57,923 | ) | |||||||
NET ASSETS | $ | 1,618,256 | $ | 1,141,449 | $ | 1,700,343 | ||||||
(1) NUMBER OF SHARES AUTHORIZED | 700,000,000 | 500,000,000 | 700,000,000 | |||||||||
See accompanying Notes to Financial Statements.
22
DFA INVESTMENT DIMENSIONS GROUP INC.
STATEMENTS OF ASSETS AND LIABILITIES
OCTOBER 31, 2009
(Amounts in thousands, except share and per share amounts)
| Tax-Managed U.S. Small Cap Portfolio | Tax-Managed DFA International Value Portfolio | |||||||
ASSETS: | ||||||||
Investments at Value (including $154,947 and $205,941 of securities on loan, respectively) | $ | 953,435 | $ | 1,625,746 | ||||
Temporary Cash Investments at Value & Cost | 6,576 | 6,328 | ||||||
Collateral Received from Securities on Loan at Value & Cost | 169,574 | 215,472 | ||||||
Foreign Currencies at Value | — | 1,563 | ||||||
Cash | — | 16 | ||||||
Receivables: | ||||||||
Investment Securities Sold | 1,206 | 1,939 | ||||||
Dividends, Interest and Tax Reclaims | 325 | 5,741 | ||||||
Securities Lending Income | 186 | 130 | ||||||
Fund Shares Sold | 556 | 1,342 | ||||||
Prepaid Expenses and Other Assets | 18 | 33 | ||||||
Total Assets | 1,131,876 | 1,858,310 | ||||||
LIABILITIES: | ||||||||
Payables: | ||||||||
Upon Return of Securities Loaned | 169,574 | 215,472 | ||||||
Investment Securities Purchased | 3,267 | 2,534 | ||||||
Fund Shares Redeemed | 1,391 | 1,633 | ||||||
Due to Advisor | 428 | 713 | ||||||
Unrealized Loss on Foreign Currency Contracts | — | 1 | ||||||
Accrued Expenses and Other Liabilities | 71 | 123 | ||||||
Total Liabilities | 174,731 | 220,476 | ||||||
NET ASSETS | $ | 957,145 | $ | 1,637,834 | ||||
SHARES OUTSTANDING, $0.01 PAR VALUE (1) | 58,862,789 | 121,444,157 | ||||||
NET ASSET VALUE, OFFERING AND REDEMPTION PRICE PER SHARE | $ | 16.26 | $ | 13.49 | ||||
Investments at Cost | $ | 873,776 | $ | 1,477,309 | ||||
Foreign Currencies at Cost | $ | — | $ | 1,536 | ||||
NET ASSETS CONSIST OF: | ||||||||
Paid-In Capital | $ | 1,108,554 | $ | 1,654,503 | ||||
Undistributed Net Investment Income (Distributions in Excess of Net Investment Income) | 868 | 4,253 | ||||||
Accumulated Net Realized Gain (Loss) | (231,936 | ) | (169,460 | ) | ||||
Net Unrealized Foreign Exchange Gain (Loss) | — | 74 | ||||||
Net Unrealized Appreciation (Depreciation) | 79,659 | 148,464 | ||||||
NET ASSETS | $ | 957,145 | $ | 1,637,834 | ||||
(1) NUMBER OF SHARES AUTHORIZED | 500,000,000 | 700,000,000 | ||||||
See accompanying Notes to Financial Statements.
23
DFA INVESTMENT DIMENSIONS GROUP INC.
FOR THE YEAR ENDED OCTOBER 31, 2009
(Amounts in thousands)
| Tax-Managed U.S. Marketwide Value Portfolio* | Tax-Managed U.S. Equity Portfolio* | Tax-Managed U.S. Targeted Value Portfolio | ||||||||||
Investment Income | ||||||||||||
Dividends | $ | 30,213 | $ | 23,761 | $ | 18,863 | ||||||
Interest | 125 | 85 | 119 | |||||||||
Income from Securities Lending | 4,081 | 1,534 | 2,890 | |||||||||
Expenses Allocated from Affiliated Investment Companies | (3,216 | ) | (894 | ) | — | |||||||
Total Investment Income | 31,203 | 24,486 | 21,872 | |||||||||
Expenses | ||||||||||||
Investment Advisory Services Fees | — | — | 6,097 | |||||||||
Administrative Services Fees | 2,085 | 1,549 | — | |||||||||
Accounting & Transfer Agent Fees | 39 | 32 | 201 | |||||||||
Custodian Fees | — | — | 43 | |||||||||
Filing Fees | 126 | 100 | 133 | |||||||||
Shareholders’ Reports | 46 | 31 | 50 | |||||||||
Directors’/Trustees’ Fees & Expenses | 20 | 17 | 20 | |||||||||
Professional Fees | 18 | 15 | 67 | |||||||||
Other | 10 | 3 | 177 | |||||||||
Total Expenses | 2,344 | 1,747 | 6,788 | |||||||||
Fees Waived, Expenses Reimbursed, and/or Previously Waived Fees Recovered by Advisor (Note C) | — | (367 | ) | — | ||||||||
Net Expenses | 2,344 | 1,380 | 6,788 | |||||||||
Net Investment Income (Loss) | 28,859 | 23,106 | 15,084 | |||||||||
Realized and Unrealized Gain (Loss) | ||||||||||||
Net Realized Gain (Loss) on: | ||||||||||||
Investment Securities Sold | (170,564 | ) | (289,047 | ) | (225,418 | ) | ||||||
Futures | 1,628 | 2,732 | 1,204 | |||||||||
Change in Unrealized Appreciation (Depreciation) of: | ||||||||||||
Investment Securities | 293,293 | 328,913 | 287,952 | |||||||||
Futures | (11 | ) | — | (13 | ) | |||||||
Net Realized and Unrealized Gain (Loss) | 124,346 | 42,598 | 63,725 | |||||||||
Net Increase (Decrease) in Net Assets Resulting from Operations | $ | 153,205 | $ | 65,704 | $ | 78,809 | ||||||
| * | Investment Income and Realized and Unrealized Gain (Loss) were allocated from each Portfolio’s respective Master Fund (Affiliated Investment Company). |
See accompanying Notes to Financial Statements.
24
DFA INVESTMENT DIMENSIONS GROUP INC.
STATEMENTS OF OPERATIONS
FOR THE YEAR ENDED OCTOBER 31, 2009
(Amounts in thousands)
| Tax-Managed U.S. Small Cap Portfolio | Tax-Managed DFA International Value Portfolio | |||||||
Investment Income | ||||||||
Dividends (Net of Foreign Taxes Withheld of $0 and $4,453, respectively) | $ | 9,099 | $ | 45,193 | ||||
Interest | 69 | 40 | ||||||
Income from Securities Lending | 3,275 | 1,377 | ||||||
Total Investment Income | 12,443 | 46,610 | ||||||
Expenses | ||||||||
Investment Advisory Services Fees | 4,333 | 6,701 | ||||||
Accounting & Transfer Agent Fees | 128 | 191 | ||||||
Custodian Fees | 51 | 199 | ||||||
Filing Fees | 89 | 97 | ||||||
Shareholders’ Reports | 34 | 47 | ||||||
Directors’/Trustees’ Fees & Expenses | 12 | 18 | ||||||
Professional Fees | 41 | 56 | ||||||
Other | 113 | 175 | ||||||
Total Expenses | 4,801 | 7,484 | ||||||
Net Investment Income (Loss) | 7,642 | 39,126 | ||||||
Realized and Unrealized Gain (Loss) | ||||||||
Net Realized Gain (Loss) on: | ||||||||
Investment Securities Sold | (183,556 | ) | (153,420 | ) | ||||
Futures | (1,022 | ) | (264 | ) | ||||
Foreign Currency Transactions | — | 875 | ||||||
Change in Unrealized Appreciation (Depreciation) of: | ||||||||
Investment Securities and Foreign Currency | 193,172 | 509,093 | ||||||
Futures | (8 | ) | (2 | ) | ||||
Translation of Foreign Currency Denominated Amounts | — | 390 | ||||||
Net Realized and Unrealized Gain (Loss) | 8,586 | 356,672 | ||||||
Net Increase (Decrease) in Net Assets Resulting from Operations | $ | 16,228 | $ | 395,798 | ||||
See accompanying Notes to Financial Statements.
25
DFA INVESTMENT DIMENSIONS GROUP INC.
STATEMENTS OF CHANGES IN NET ASSETS
(Amounts in thousands)
| Tax-Managed U.S. Marketwide Value Portfolio | Tax-Managed U.S. Equity Portfolio | Tax-Managed U.S. Targeted Value Portfolio | ||||||||||||||||||||||||||||||||||||||
| Year Ended Oct. 31, 2009 | Period Dec. 1, 2007 to Oct. 31, 2008 | Year Ended Nov. 30, 2007 | Year Ended Oct. 31, 2009 | Period Dec. 1, 2007 to Oct. 31, 2008 | Year Ended Nov. 30, 2007 | Year Ended Oct. 31, 2009 | Period Dec. 1, 2007 to Oct. 31, 2008 | Year Ended Nov. 30, 2007 | ||||||||||||||||||||||||||||||||
Increase (Decrease) in Net Assets | ||||||||||||||||||||||||||||||||||||||||
Operations: | ||||||||||||||||||||||||||||||||||||||||
Net Investment Income (Loss) | $ | 28,859 | $ | 42,142 | $ | 41,019 | $ | 23,106 | $ | 27,966 | $ | 27,394 | $ | 15,084 | $ | 24,799 | $ | 32,533 | ||||||||||||||||||||||
Net Realized Gain (Loss) on: | ||||||||||||||||||||||||||||||||||||||||
Investment Securities Sold/Affiliated Investment Companies Sold | (170,564 | ) | (117,785 | ) | 139,228 | (289,047 | ) | (142,472 | ) | 10,874 | (225,418 | ) | (42,385 | ) | 167,039 | |||||||||||||||||||||||||
Futures | 1,628 | (1,959 | ) | — | 2,732 | — | — | 1,204 | (2,493 | ) | — | |||||||||||||||||||||||||||||
Change in Unrealized Appreciation (Depreciation) of: | ||||||||||||||||||||||||||||||||||||||||
Investment Securities/Affiliated Investment Companies | 293,293 | (943,227 | ) | (180,378 | ) | 328,913 | (530,593 | ) | 73,457 | 287,952 | (869,703 | ) | (423,757 | ) | ||||||||||||||||||||||||||
Futures | (11 | ) | 11 | — | — | — | — | (13 | ) | 13 | — | |||||||||||||||||||||||||||||
Net Increase (Decrease) in Net Assets Resulting from Operations | 153,205 | (1,020,818 | ) | (131 | ) | 65,704 | (645,099 | ) | 111,725 | 78,809 | (889,769 | ) | (224,185 | ) | ||||||||||||||||||||||||||
Distributions From: | ||||||||||||||||||||||||||||||||||||||||
Net Investment Income | (34,714 | ) | (44,833 | ) | (39,785 | ) | (25,432 | ) | (30,460 | ) | (25,931 | ) | (20,085 | ) | (21,993 | ) | (30,833 | ) | ||||||||||||||||||||||
Net Long-Term Gains | — | (36,063 | ) | — | — | — | — | — | (152,308 | ) | (284,595 | ) | ||||||||||||||||||||||||||||
Total Distributions | (34,714 | ) | (80,896 | ) | (39,785 | ) | (25,432 | ) | (30,460 | ) | (25,931 | ) | (20,085 | ) | (174,301 | ) | (315,428 | ) | ||||||||||||||||||||||
Capital Share Transactions (1): | ||||||||||||||||||||||||||||||||||||||||
Shares Issued | 755,723 | 910,672 | 613,164 | 513,816 | 612,783 | 385,068 | 870,260 | 1,332,158 | 691,351 | |||||||||||||||||||||||||||||||
Shares Issued in Lieu of Cash Distributions | 33,539 | 77,490 | 36,864 | 22,376 | 28,458 | 25,647 | 19,909 | 170,820 | 304,575 | |||||||||||||||||||||||||||||||
Shares Redeemed | (866,254 | ) | (1,057,534 | ) | (368,048 | ) | (703,345 | ) | (521,164 | ) | (160,308 | ) | (911,324 | ) | (1,681,828 | ) | (754,382 | ) | ||||||||||||||||||||||
Net Increase (Decrease) from Capital Share Transactions | (76,992 | ) | (69,372 | ) | 281,980 | (167,153 | ) | 120,077 | 250,407 | (21,155 | ) | (178,850 | ) | 241,544 | ||||||||||||||||||||||||||
Total Increase (Decrease) in Net Assets | 41,499 | (1,171,086 | ) | 242,064 | (126,881 | ) | (555,482 | ) | 336,201 | 37,569 | (1,242,920 | ) | (298,069 | ) | ||||||||||||||||||||||||||
Net Assets | ||||||||||||||||||||||||||||||||||||||||
Beginning of Period | 1,576,757 | 2,747,843 | 2,505,779 | 1,268,330 | 1,823,812 | 1,487,611 | 1,662,774 | 2,905,694 | 3,203,763 | |||||||||||||||||||||||||||||||
End of Period | $ | 1,618,256 | $ | 1,576,757 | $ | 2,747,843 | $ | 1,141,449 | $ | 1,268,330 | $ | 1,823,812 | $ | 1,700,343 | $ | 1,662,774 | $ | 2,905,694 | ||||||||||||||||||||||
(1) Shares Issued and Redeemed: | ||||||||||||||||||||||||||||||||||||||||
Shares Issued | 81,360 | 63,309 | 33,160 | 54,781 | 45,772 | 24,964 | 71,153 | 69,006 | 27,123 | |||||||||||||||||||||||||||||||
Shares Issued in Lieu of Cash Distributions | 3,525 | 4,802 | 2,019 | 2,355 | 2,012 | 1,685 | 1,600 | 8,130 | 12,193 | |||||||||||||||||||||||||||||||
Shares Redeemed | (94,446 | ) | (76,114 | ) | (20,036 | ) | (75,273 | ) | (42,430 | ) | (10,356 | ) | (74,530 | ) | (87,563 | ) | (30,452 | ) | ||||||||||||||||||||||
Net Increase (Decrease) from Shares Issued and Redeemed | (9,561 | ) | (8,003 | ) | 15,143 | (18,137 | ) | 5,354 | 16,293 | (1,777 | ) | (10,427 | ) | 8,864 | ||||||||||||||||||||||||||
Undistributed Net Investment Income (Distributions in Excess of Net Investment Income) | $ | 3,335 | $ | 9,190 | $ | 11,940 | $ | 2,759 | $ | 5,085 | $ | 7,579 | $ | 1,429 | $ | 6,430 | $ | 3,626 | ||||||||||||||||||||||
See accompanying Notes to Financial Statements.
26
DFA INVESTMENT DIMENSIONS GROUP INC.
STATEMENTS OF CHANGES IN NET ASSETS
(Amounts in thousands)
| Tax-Managed U.S. Small Cap Portfolio | Tax-Managed DFA International Value Portfolio | |||||||||||||||||||||||||
| Year Ended Oct. 31, 2009 | Period Dec. 1, 2007 to Oct. 31, 2008 | Year Ended Nov. 30, 2007 | Year Ended Oct. 31, 2009 | Period Dec. 1, 2007 to Oct. 31, 2008 | Year Ended Nov. 30, 2007 | |||||||||||||||||||||
Increase (Decrease) in Net Assets | ||||||||||||||||||||||||||
Operations: | ||||||||||||||||||||||||||
Net Investment Income (Loss) | $ | 7,642 | $ | 13,988 | $ | 11,947 | $ | 39,126 | $ | 80,461 | $ | 75,534 | ||||||||||||||
Net Realized Gain (Loss) on: | ||||||||||||||||||||||||||
Investment Securities Sold | (183,556 | ) | (44,705 | ) | 182,553 | (153,420 | ) | (12,092 | ) | 225,699 | ||||||||||||||||
Futures | (1,022 | ) | (1,909 | ) | — | (264 | ) | (2,244 | ) | — | ||||||||||||||||
Foreign Currency Transactions | — | — | — | 875 | (391 | ) | 440 | |||||||||||||||||||
Change in Unrealized Appreciation (Depreciation) of: | ||||||||||||||||||||||||||
Investment Securities and Foreign Currency | 193,172 | (533,613 | ) | (217,967 | ) | 509,093 | (1,307,758 | ) | 116,793 | |||||||||||||||||
Futures | (8 | ) | 8 | — | (2 | ) | 2 | — | ||||||||||||||||||
Translation of Foreign Currency Denominated Amounts | — | — | — | 390 | (455 | ) | 17 | |||||||||||||||||||
Net Increase (Decrease) in Net Assets Resulting from Operations | 16,228 | (566,231 | ) | (23,467 | ) | 395,798 | (1,242,477 | ) | 418,483 | |||||||||||||||||
Distributions From: | ||||||||||||||||||||||||||
Net Investment Income | (10,036 | ) | (13,009 | ) | (11,189 | ) | (45,214 | ) | (87,425 | ) | (61,441 | ) | ||||||||||||||
Net Short-Term Gains | — | — | — | — | — | (119 | ) | |||||||||||||||||||
Net Long-Term Gains | — | (140,329 | ) | — | — | (217,882 | ) | (108,595 | ) | |||||||||||||||||
Total Distributions | (10,036 | ) | (153,338 | ) | (11,189 | ) | (45,214 | ) | (305,307 | ) | (170,155 | ) | ||||||||||||||
Capital Share Transactions (1): | ||||||||||||||||||||||||||
Shares Issued | 439,219 | 600,180 | 344,218 | 664,208 | 840,715 | 480,977 | ||||||||||||||||||||
Shares Issued in Lieu of Cash Distributions | 9,806 | 151,576 | 11,049 | 43,924 | 294,717 | 162,246 | ||||||||||||||||||||
Shares Redeemed | (575,467 | ) | (734,037 | ) | (194,404 | ) | (814,111 | ) | (1,053,689 | ) | (402,964 | ) | ||||||||||||||
Net Increase (Decrease) from Capital Share Transactions | (126,442 | ) | 17,719 | 160,863 | (105,979 | ) | 81,743 | 240,259 | ||||||||||||||||||
Total Increase (Decrease) in Net Assets | (120,250 | ) | (701,850 | ) | 126,207 | 244,605 | (1,466,041 | ) | 488,587 | |||||||||||||||||
Net Assets | ||||||||||||||||||||||||||
Beginning of Period | 1,077,395 | 1,779,245 | 1,653,038 | 1,393,229 | 2,859,270 | 2,370,683 | ||||||||||||||||||||
End of Period | $ | 957,145 | $ | 1,077,395 | $ | 1,779,245 | $ | 1,637,834 | $ | 1,393,229 | $ | 2,859,270 | ||||||||||||||
(1) Shares Issued and Redeemed: | ||||||||||||||||||||||||||
Shares Issued | 32,424 | 28,781 | 12,633 | 66,593 | 54,627 | 22,796 | ||||||||||||||||||||
Shares Issued in Lieu of Cash Distributions | 703 | 6,564 | 412 | 3,975 | 16,014 | 8,062 | ||||||||||||||||||||
Shares Redeemed | (42,310 | ) | (36,092 | ) | (7,188 | ) | (81,205 | ) | (69,078 | ) | (19,134 | ) | ||||||||||||||
Net Increase (Decrease) from Shares Issued and Redeemed | (9,183 | ) | (747 | ) | 5,857 | (10,637 | ) | 1,563 | 11,724 | |||||||||||||||||
Undistributed Net Investment Income | $ | 868 | $ | 3,269 | $ | 2,350 | $ | 4,253 | $ | 9,469 | $ | 18,976 | ||||||||||||||
See accompanying Notes to Financial Statements.
27
DFA INVESTMENT DIMENSIONS GROUP INC.
(for a share outstanding throughout each period)
| Tax-Managed U.S. Marketwide Value Portfolio | Tax-Managed U.S. Equity Portfolio | |||||||||||||||||||||||||||||||||||
Year Ended Oct. 31, 2009 | Period Dec. 1, 2007 to Oct. 31, 2008 | Year Ended Nov. 30, | Year Ended Nov. 30, | Year Ended Nov. 30, | Year Ended Nov. 30, | Year Ended Oct. 31, | Period Dec. 1, 2007 to Oct. 31, | Year Ended Nov. 30, | Year Ended Nov. 30, | Year Ended Nov. 30, 2005 | Year Ended Nov. 30, 2004 | |||||||||||||||||||||||||
Net Asset Value, Beginning of Period | $ | 10.59 | $ | 17.51 | $ | 17.67 | $ | 15.26 | $ | 13.27 | $ | 11.12 | $ | 10.36 | $ | 15.57 $ | 14.75 | $ | 13.26 | $ | 12.23 | $ | 11.05 | |||||||||||||
Income from Investment Operations | ||||||||||||||||||||||||||||||||||||
Net Investment Income (Loss) | 0.21(A) | 0.27(A) | 0.27(A) | 0.24(A) | 0.18 | 0.11 | 0.22(A) | 0.23(A) | 0.25(A) | 0.21(A) | 0.16 | 0.14 | ||||||||||||||||||||||||
Net Gains (Losses) on Securities (Realized and Unrealized) | 1.06 | (6.66) | (0.16) | 2.39 | 1.96 | 2.13 | 0.60 | (5.19) | 0.81 | 1.47 | 1.05 | 1.18 | ||||||||||||||||||||||||
Total from Investment Operations | 1.27 | (6.39) | 0.11 | 2.63 | 2.14 | 2.24 | 0.82 | (4.96) | 1.06 | 1.68 | 1.21 | 1.32 | ||||||||||||||||||||||||
Less Distributions | ||||||||||||||||||||||||||||||||||||
Net Investment Income | (0.25) | (0.29) | (0.27) | (0.22) | (0.15) | (0.09) | (0.24) | (0.25) | (0.24) | (0.19) | (0.18) | (0.14) | ||||||||||||||||||||||||
Net Realized Gains | — | (0.24) | — | — | — | — | — | — | — | — | — | — | ||||||||||||||||||||||||
Total Distributions | (0.25) | (0.53) | (0.27) | (0.22) | (0.15) | (0.09) | (0.24) | (0.25) | (0.24) | (0.19) | (0.18) | (0.14) | ||||||||||||||||||||||||
Net Asset Value, End of Period | $ | 11.61 | $ | 10.59 | $ | 17.51 | $ | 17.67 | $ | 15.26 | $ | 13.27 | $ | 10.94 | $ | 10.36 | $ | 15.57 | $ | 14.75 | $ | 13.26 | $ | 12.23 | ||||||||||||
Total Return | 12.54% | (37.53)%(C) | 0.54% | 17.45% | 16.27% | 20.24% | 8.30% | (32.30)%(C) | 7.23% | 12.84% | 9.97% | 12.03% | ||||||||||||||||||||||||
Net Assets, End of Period (thousands) | $ | 1,618,256 | $ | 1,576,757 | $ | 2,747,843 | $ | 2,505,779 | $ | 1,754,320 | $ | 1,197,227 | $ | 1,141,449 | $ | 1,268,330 | $ | 1,823,812 | $ | 1,487,611 | $ | 999,215 | $ | 618,888 | ||||||||||||
Ratio of Expenses to Average Net Assets (D) | 0.40% | 0.38%(B) | 0.37% | 0.38% | 0.40% | 0.42% | 0.22% | 0.22%(B) | 0.22% | 0.23% | 0.25% | 0.25% | ||||||||||||||||||||||||
Ratio of Expenses to Average Net Assets (Excluding Waivers and Assumption of Expenses and/or Recovery of Previously Waived Fees) (D) | 0.40% | 0.38%(B) | 0.37% | 0.38% | 0.40% | 0.42% | 0.26% | 0.23%(B) | 0.23% | 0.24% | 0.26% | 0.29% | ||||||||||||||||||||||||
Ratio of Net Investment Income to Average Net Assets | 2.07% | 1.93%(B) | 1.45% | 1.47% | 1.35% | 0.97% | 2.24% | 1.76%(B) | 1.59% | 1.55% | 1.35% | 1.37% | ||||||||||||||||||||||||
See page 1 for the Definitions of Abbreviations and Footnotes.
See accompanying Notes to Financial Statements.
28
DFA INVESTMENT DIMENSIONS GROUP INC.
FINANCIAL HIGHLIGHTS
(for a share outstanding throughout each period)
| Tax-Managed U.S. Targeted Value Portfolio | Tax-Managed U.S. Small Cap Portfolio | |||||||||||||||||||||||||||||||||||
Year Ended Oct. 31, 2009 | Period Dec. 1, 2007 to Oct. 31, | Year Ended Nov. 30, | Year Ended Nov. 30, | Year Ended Nov. 30, | Year Ended Nov. 30, | Year Ended Oct. 31, 2009 | Period Dec. 1, 2007 to Oct. 31, | Year Ended Nov. 30, | Year Ended Nov. 30, | Year Ended Nov. 30, | Year Ended Nov. 30, 2004 | |||||||||||||||||||||||||
Net Asset Value, Beginning of Period | $ | 14.41 | $ | 23.09 | $ | 27.39 | $ | 25.60 | $ | 23.32 | $ | 19.22 | $ | 15.83 | $ | 25.86 $ | 26.27 | $ | 22.95 | $ | 20.53 | $ | 17.84 | |||||||||||||
Income from Investment Operations | ||||||||||||||||||||||||||||||||||||
Net Investment Income (Loss) | 0.14(A) | 0.20(A) | 0.25(A) | 0.22(A) | 0.09 | 0.09 | 0.13(A) | 0.19(A) | 0.18(A) | 0.10(A) | 0.04 | 0.01 | ||||||||||||||||||||||||
Net Gains (Losses) on Securities (Realized and Unrealized) | 0.60 | (7.29) | (1.87) | 3.90 | 2.68 | 4.09 | 0.47 | (7.87) | (0.42) | 3.30 | 2.42 | 2.69 | ||||||||||||||||||||||||
Total from Investment Operations | 0.74 | (7.09) | (1.62) | 4.12 | 2.77 | 4.18 | 0.60 | (7.68) | (0.24) | 3.40 | 2.46 | 2.70 | ||||||||||||||||||||||||
Less Distributions | ||||||||||||||||||||||||||||||||||||
Net Investment Income | (0.19) | (0.18) | (0.24) | (0.19) | (0.10) | (0.08) | (0.17) | (0.18) | (0.17) | (0.08) | (0.04) | (0.01) | ||||||||||||||||||||||||
Net Realized Gains | — | (1.41) | (2.44) | (2.14) | (0.39) | — | — | (2.17) | — | — | — | — | ||||||||||||||||||||||||
Total Distributions | (0.19) | (1.59) | (2.68) | (2.33) | (0.49) | (0.08) | (0.17) | (2.35) | (0.17) | (0.08) | (0.04) | (0.01) | ||||||||||||||||||||||||
Net Asset Value, End of Period | $ | 14.96 | $ | 14.41 | $ | 23.09 | $ | 27.39 | $ | 25.60 | $ | 23.32 | $ | 16.26 | $ | 15.83 $ | 25.86 | $ | 26.27 | $ | 22.95 | $ | 20.53 | |||||||||||||
Total Return | 5.41% | (32.85)%(C) | (6.58)% | 17.70% | 12.09% | 21.84% | 3.98% | (32.53)%(C) | (0.94)% | 14.88% | 11.98% | 15.17% | ||||||||||||||||||||||||
Net Assets, End of Period (thousands) | $ | 1,700,343 | $ | 1,662,774 | $ | 2,905,694 | $ | 3,203,763 | $ | 2,634,891 | $ | 2,078,718 | $ | 957,145 | $ | 1,077,395 | $ | 1,779,245 | $ | 1,653,038 | $ | 1,242,288 | $ | 958,233 | ||||||||||||
Ratio of Expenses to Average Net Assets | 0.47% | 0.45%(B) | 0.47% | 0.53% | 0.55% | 0.56% | 0.55% | 0.53%(B) | 0.53% | 0.53% | 0.55% | 0.56% | ||||||||||||||||||||||||
Ratio of Net Investment Income to Average Net Assets | 1.04% | 1.07%(B) | 0.98% | 0.85% | 0.39% | 0.45% | 0.88% | 0.98%(B) | 0.65% | 0.41% | 0.21% | 0.08% | ||||||||||||||||||||||||
Portfolio Turnover Rate | 34% | 40%(C) | 28% | 35% | 21% | 21% | 28% | 39%(C) | 31% | 22% | 15% | 7% | ||||||||||||||||||||||||
See page 1 for the Definitions of Abbreviations and Footnotes.
See accompanying Notes to Financial Statements.
29
DFA INVESTMENT DIMENSIONS GROUP INC.
FINANCIAL HIGHLIGHTS
(for a share outstanding throughout each period)
| Tax-Managed DFA International Value Portfolio | ||||||||||||||||||||||||
| Year Ended Oct. 31, 2009 | Period Dec. 1, 2007 to Oct. 31, 2008 | Year Ended Nov. 30, 2007 | Year Ended Nov. 30, 2006 | Year Ended Nov. 30, 2005 | Year Ended Nov. 30, 2004 | |||||||||||||||||||
Net Asset Value, Beginning of Period | $ | 10.55 | $ | 21.91 | $ | 19.96 | $ | 15.51 | $ | 13.63 | $ | 10.84 | ||||||||||||
Income from Investment Operations | ||||||||||||||||||||||||
Net Investment Income (Loss) | 0.32 | (A) | 0.59 | (A) | 0.59 | (A) | 0.54 | (A) | 0.33 | (A) | 0.22 | |||||||||||||
Net Gains (Losses) on Securities (Realized and Unrealized) | 3.00 | (9.60 | ) | 2.76 | 4.71 | 1.90 | 2.93 | |||||||||||||||||
Total from Investment Operations | 3.32 | (9.01 | ) | 3.35 | 5.25 | 2.23 | 3.15 | |||||||||||||||||
Less Distributions | ||||||||||||||||||||||||
Net Investment Income | (0.38 | ) | (0.64 | ) | (0.48 | ) | (0.59 | ) | (0.35 | ) | (0.36 | ) | ||||||||||||
Net Realized Gains | — | (1.71 | ) | (0.92 | ) | (0.21 | ) | — | — | |||||||||||||||
Total Distributions | (0.38 | ) | (2.35 | ) | (1.40 | ) | (0.80 | ) | (0.35 | ) | (0.36 | ) | ||||||||||||
Net Asset Value, End of Period | $ | 13.49 | $ | 10.55 | $ | 21.91 | $ | 19.96 | $ | 15.51 | $ | 13.63 | ||||||||||||
Total Return | 32.27 | % | (45.58) | %(C) | 17.51 | % | 35.01 | % | 16.63 | % | 29.69 | % | ||||||||||||
Net Assets, End of Period (thousands) | $ | 1,637,834 | $ | 1,393,229 | $ | 2,859,270 | $ | 2,370,683 | $ | 1,571,217 | $ | 1,082,275 | ||||||||||||
Ratio of Expenses to Average Net Assets | 0.56 | % | 0.54 | %(B) | 0.54 | % | 0.54 | % | 0.60 | % | 0.65 | % | ||||||||||||
Ratio of Net Investment Income to Average Net Assets | 2.92 | % | 3.76 | %(B) | 2.77 | % | 3.04 | % | 2.23 | % | 1.91 | % | ||||||||||||
Portfolio Turnover Rate | 24 | % | 24 | %(C) | 20 | % | 13 | % | 11 | % | 7 | % | ||||||||||||
See page 1 for the Definitions of Abbreviations and Footnotes.
See accompanying Notes to Financial Statements.
30
DFA INVESTMENT DIMENSIONS GROUP INC.
A. Organization:
DFA Investment Dimensions Group Inc. (the “Fund”) is an open-end management investment company registered under the Investment Company Act of 1940, whose shares are generally offered to institutional investors, retirement plans and clients of registered investment advisors. The Fund consists of fifty-seven operational portfolios, five of which (the “Portfolios”) are included in this section of the report.
The Tax-Managed U.S. Marketwide Value Portfolio and Tax-Managed U.S. Equity Portfolio (the “Feeder Funds”) primarily invest their assets in The Tax-Managed U.S. Marketwide Value Series and The Tax-Managed U.S. Equity Series (the “Series”), respectively. At October 31, 2009, the Tax-Managed U.S. Marketwide Value Portfolio and Tax-Managed U.S. Equity Portfolio owned 71% and 100% of their respective Series.
The financial statements of the Series are included elsewhere in this report and should be read in conjunction with the financial statements of the Feeder Funds.
Tax-Managed U.S. Targeted Value Portfolio, Tax-Managed U.S. Small Cap Portfolio, and Tax-Managed DFA International Value Portfolio are organized as stand-alone registered investment companies.
At a regular meeting of the Board of Directors/Trustees (the “Board”) on September 16, 2008, the Board voted to change the fiscal and tax year ends of the Portfolios from November 30 to October 31.
B. Significant Accounting Policies:
The following significant accounting policies are in conformity with accounting principles generally accepted in the United States of America. Such policies are consistently followed by the Fund in preparation of its financial statements. The preparation of financial statements in accordance with accounting principles generally accepted in the United States of America requires management to make estimates and assumptions that affect the reported amounts of assets and liabilities and disclosure of contingent assets and liabilities at the date of the financial statements and the reported amounts of increases and decreases in net assets from operations during the reporting period. Actual results could differ from those estimates and those differences could be material.
1. Security Valuation: Securities held by Tax-Managed U.S. Targeted Value Portfolio and Tax-Managed U.S Small Cap Portfolio (the “Domestic Equity Portfolios”) and Tax-Managed DFA International Value Portfolio (the “International Equity Portfolio”), including over-the-counter securities, are valued at the last quoted sale price of the day. Securities held by the Domestic Equity Portfolios and the International Equity Portfolio that are listed on Nasdaq are valued at the Nasdaq Official Closing Price (“NOCP”). If there is no last reported sale price or NOCP for the day, the Domestic Equity Portfolios and International Equity Portfolio value the securities at the mean of the most recent quoted bid and asked prices. Price information on listed securities is taken from the exchange where the security is primarily traded. Generally, securities issued by open-end investment companies are valued using their respective net asset values or public offering prices, as appropriate, for purchase orders placed at the close of the New York Stock Exchange (NYSE).
Securities for which no market quotations are readily available (including restricted securities), or for which market quotations have become unreliable, are valued in good faith at fair value in accordance with procedures adopted by the Board of Directors/Trustees. Fair value pricing may also be used if events that have a significant effect on the value of an investment (as determined in the discretion of the Investment Committee of the Advisor) occur before the net asset value is calculated. When fair value pricing is used, the prices of securities used by the Domestic Equity Portfolios and International Equity Portfolio may differ from the quoted or published prices for the same securities on their primary markets or exchanges.
31
The International Equity Portfolio will also apply a fair value price in the circumstances described below. Generally, trading in foreign securities markets is completed each day at various times prior to the close of the NYSE. For example, trading in the Japanese securities markets is completed each day at the close of the Tokyo Stock Exchange (normally, 11:00 p.m. PT), which is fourteen hours prior to the close of the NYSE (normally, 1:00 p.m. PT) and the time that the net asset value of the International Equity Portfolio is computed. Due to the time differences between the closings of the relevant foreign securities exchanges and the time the International Equity Portfolio prices its shares at the close of the NYSE, the International Equity Portfolio will fair value its foreign investments when it is determined that the market quotations for the foreign investments are either unreliable or not readily available. The fair value prices will attempt to reflect the impact of the U.S. financial markets’ perceptions and trading activities on the International Equity Portfolio’s foreign investments since the last closing prices of the foreign investments were calculated on their primary foreign securities markets or exchanges. For these purposes, the Board of Directors/Trustees of the Fund have determined that movements in relevant indices or other appropriate market indicators, after the close of the Tokyo Stock Exchange or the London Stock Exchange, demonstrate that market quotations may be unreliable. Fair valuation of portfolio securities may occur on a daily basis. The fair value pricing by the International Equity Portfolio utilizes data furnished by an independent pricing service (and that data draws upon, among other information, the market values of foreign investments). When an International Equity Portfolio uses fair value pricing, the values assigned to the International Equity Portfolio’s foreign investments may not be the quoted or published prices of the investments on their primary markets or exchanges.
Futures contracts held by the Portfolios are valued using the settlement price established each day on the exchange on which they are traded.
For the Tax-Managed U.S. Marketwide Value Portfolio and the Tax-Managed U.S. Equity Portfolio, their investments reflect each of their proportionate interest in the net assets of their respective Series.
The Portfolios utilize a fair value hierarchy which prioritizes the inputs to valuation techniques used to measure fair value into three broad levels described below:
• Level 1 – quoted prices in active markets for identical securities
• Level 2 – other significant observable inputs (including quoted prices for similar securities, interest rates, prepayment speeds, credit risk, etc.)
• Level 3 – significant unobservable inputs (including the Portfolios’ own assumptions in determining the fair value of investments)
A summary of the inputs used to value the Portfolios’ net assets by each major security type, industry and/or country is disclosed at the end of the Summary Schedule of Portfolio Holdings/Schedule of Investments. The inputs or methodology used for valuing securities are not necessarily an indication of the risk associated with investing in those securities.
2. Foreign Currency Translation: Securities and other assets and liabilities of the Tax-Managed DFA International Value Portfolio whose values are initially expressed in foreign currencies, are translated to U.S. dollars using the mean between the most recently quoted bid and asked prices for the U.S. dollar as quoted by generally recognized reliable sources. Dividend and interest income and certain expenses are translated to U.S. dollars at the rate of exchange on their respective accrual dates. Receivables and payables denominated in foreign currencies are marked to market daily based on daily exchange rates and exchange gains or losses are realized upon ultimate receipt or disbursement.
The Tax-Managed DFA International Value Portfolio does not isolate the effect of fluctuations in foreign exchange rates from the effect of fluctuations in the market prices of securities whether realized or unrealized.
Realized gains or losses on foreign currency transactions represent net foreign exchange gains or losses from the disposition of foreign currencies, currency gains or losses realized between the trade and settlement dates on securities transactions, and the difference between the amount of interest, dividends and foreign withholding taxes recorded on the books of the Tax-Managed DFA International Value Portfolio and the U.S. dollar equivalent amounts actually received or paid.
32
3. Deferred Compensation Plan: Each eligible Director of the Fund may elect participation in the Deferred Compensation Plan (the “Plan”). Under the Plan, effective January 1, 2002, such Directors may defer payment of all or a portion of their total fees earned as a Director. These deferred amounts may be treated as though such amounts had been invested in shares of the following funds: U.S. Large Cap Value Portfolio; U.S. Core Equity 1 Portfolio; U.S. Core Equity 2 Portfolio; U.S. Vector Equity Portfolio; U.S. Micro Cap Portfolio; DFA International Value Portfolio; International Core Equity Portfolio; Emerging Markets Portfolio; Emerging Markets Core Equity Portfolio; and/or DFA Two-Year Global Fixed Income Portfolio. Contributions made under the Plan and the change in unrealized appreciation (depreciation) and income, are included in Directors’/Trustees’ Fees & Expenses.
Each Director has the option to receive their distribution of proceeds in one of the following methods upon one year’s notice: lump sum; annual installments over a period of agreed upon years; or semi-annual installments over a period of agreed upon years. As of October 31, 2009, none of the Directors have requested distribution of proceeds.
4. Other: Security transactions are accounted for as of the trade date. Costs used in determining realized gains and losses on the sale of investment securities are on the basis of identified cost. Dividend income and distributions to shareholders are recorded on the ex-dividend date. Distributions received on securities that represent a return of capital or capital gain are recorded as a reduction of cost of investments or as a realized gain, respectively. The Portfolios estimate the character of distributions received that may be considered return of capital distributions. Interest income is recorded on the accrual basis. Expenses directly attributable to a Portfolio are directly charged. Common expenses of the Fund or Portfolios are allocated using methods approved by the Board of Directors/Trustees, generally based on average net assets.
The Feeder Funds each recognize their pro-rata share of net investment income and realized and unrealized gains/losses of investment securities, on a daily basis, from their respective Series, which are treated as partnerships for federal income tax purposes.
The Tax-Managed DFA International Value Portfolio may be subject to taxes imposed by countries in which it invests, with respect to its investments in issuers existing or operating in such countries. Such taxes are generally based on income earned or repatriated and capital gains realized on the sale of such investments. The Portfolio accrues such taxes when the related income or capital gains are earned or throughout the holding period. Some countries require governmental approval for the repatriation of investment income, capital or the proceeds of sales earned by foreign investors. In addition, if there is a deterioration in a country’s balance of payments or for other reasons, a country may impose temporary restrictions on foreign capital abroad.
C. Investment Advisor:
Dimensional Fund Advisors LP (“Dimensional” or “the Advisor”) provides investment advisory services to each of the Portfolios except the Feeder Funds. The Advisor provides administrative services to the Feeder Funds, including supervision of services provided by others, providing information to shareholders and the Board of Directors/Trustees, and other administrative services. For the year ended October 31, 2009, the Portfolios’ investment advisory services fees were accrued daily and paid monthly to the Advisor based on the following effective annual rates of average daily net assets:
Tax-Managed U.S. Targeted Value Portfolio | 0.42 | % | |
Tax-Managed U.S. Small Cap Portfolio | 0.50 | % | |
Tax-Managed DFA International Value Portfolio | 0.50 | % |
For the year ended October 31, 2009, the Feeder Funds’ administrative services fees were accrued daily and paid monthly to the Advisor based on an effective annual rate of 0.15% of average daily net assets.
Pursuant to a Fee Waiver and Expense Assumption Agreement for the Tax-Managed U.S. Equity Portfolio, the Advisor has contractually agreed to waive its administration fee and assume the expenses of the Portfolio (up to the amount of fees paid to the Advisor based on the Portfolio’s assets invested in its Series) to the extent necessary to reduce the Portfolio’s expenses when its total operating expenses exceed 0.22% of the average net assets on an annualized basis. At any time that the annualized expenses of the Tax-Managed U.S. Equity Portfolio are less than 0.22% of the Portfolio’s average net assets on an annualized basis, the Advisor retains the right to recover any fees
33
previously waived and/or any expenses previously assumed to the extent that such recovery will not cause the Portfolio’s annualized expenses to exceed 0.22% of its average net assets. The Tax-Managed U.S. Equity Portfolio is not obligated to reimburse the Advisor for fees waived or expenses assumed by the Advisor more than thirty-six months prior to the date of such recovery. The Fee Waiver and Expense Assumption Agreement will remain in effect until March 1, 2010, and shall continue to remain in effect from year to year thereafter unless terminated by the Fund or the Advisor. At October 31, 2009, Tax-Managed U.S. Equity Portfolio had approximately $726 (in thousands) of previously waived fees subject to future recovery by the Advisor over various periods not exceeding October 31, 2012.
Fees Paid to Officers and Directors/Trustees:
Certain Officers and Directors/Trustees of the Advisor are also Officers and Directors/Trustees of the Fund; however, such Officers and Directors/Trustees (with the exception of the Chief Compliance Officer (“CCO”)) receive no compensation from the Fund. For the year ended October 31, 2009, the total related amounts paid to the CCO by the Fund were $197 (in thousands). The total related amounts paid by each of the Portfolios are included in Other Expenses on the Statement of Operations.
D. Deferred Compensation:
At October 31, 2009, the total liability for deferred compensation to Directors/Trustees is included in Accrued Expenses and Other Liabilities on the Statement of Assets and Liabilities as follows (amounts in thousands):
Tax-Managed U.S. Marketwide Value Portfolio | $ | 40 | |
Tax-Managed U.S. Equity Portfolio | 29 | ||
Tax-Managed U.S. Targeted Value Portfolio | 41 | ||
Tax-Managed U.S. Small Cap Portfolio | 25 | ||
Tax-Managed DFA International Value Portfolio | 38 |
E. Purchases and Sales of Securities:
For the year ended October 31, 2009, the Portfolios made the following purchases and sales of investment securities, other than short-term securities and U.S. government securities (amounts in thousands):
| Purchases | Sales | |||||
Tax-Managed U.S. Targeted Value Portfolio | $ | 492,602 | $ | 490,384 | ||
Tax-Managed U.S. Small Cap Portfolio | 242,129 | 349,961 | ||||
Tax-Managed DFA International Value Portfolio | 327,860 | 419,841 | ||||
There were no purchases or sales of long-term U.S. government securities.
F. Federal Income Taxes:
Each Portfolio has qualified and intends to continue to qualify as a regulated investment company under Subchapter M of the Internal Revenue Code for federal income tax purposes and to distribute substantially all of its taxable income and net capital gains to shareholders. Accordingly, no provision has been made for federal income taxes.
Distributions from net investment income and net realized capital gains are determined in accordance with U.S. federal income tax regulations, which may differ from those amounts determined under accounting principles generally accepted in the United States of America. These book/tax differences are either temporary or permanent in nature. To the extent these differences are permanent, they are charged or credited to paid-in capital, undistributed net investment income or accumulated net realized gains, as appropriate, in the period that the differences arise. Accordingly, the following permanent differences as of October 31, 2009, primarily attributable to net realized foreign currency gains/losses and net realized gains on securities considered to be “passive foreign investment companies” and the utilization of accumulated earnings and profits distributed to shareholders on redemptions of shares as part of the dividends paid deduction for income tax purposes, were reclassified to the following accounts. These reclassifications
34
had no effect on net assets or net asset value per share (amounts in thousands):
| Increase (Decrease) Paid-In Capital | Increase (Decrease) Undistributed Net Investment Income | Increase (Decrease) Accumulated Net Realized Gains (Losses) | ||||||||
Tax-Managed U.S. Small Cap Portfolio | — | $ | (7 | ) | $ | 7 | ||||
Tax-Managed DFA International Value Portfolio | — | 872 | (872 | ) | ||||||
The tax character of dividends and distributions declared and paid during the year ended November 30, 2007, the period December 1, 2007 to October 31, 2008 and the year ended October 31, 2009 were as follows (amounts in thousands):
| Net Investment Income and Short-Term Capital Gains | Long-Term Capital Gain | Total | |||||||
Tax-Managed U.S. Marketwide Value Portfolio | |||||||||
2007 | $ | 39,785 | — | $ | 39,785 | ||||
2008 | 44,892 | $ | 36,004 | 80,896 | |||||
2009 | 34,714 | — | 34,714 | ||||||
Tax-Managed U.S. Equity Portfolio | |||||||||
2007 | 25,931 | — | 25,931 | ||||||
2008 | 30,460 | — | 30,460 | ||||||
2009 | 25,432 | — | 25,432 | ||||||
Tax-Managed U.S. Targeted Value Portfolio | |||||||||
2007 | 33,610 | 298,723 | $ | 332,333 | |||||
2008 | 21,996 | 152,305 | 174,301 | ||||||
2009 | 20,085 | — | 20,085 | ||||||
Tax-Managed U.S. Small Cap Portfolio | |||||||||
2007 | 11,633 | 5,395 | 17,028 | ||||||
2008 | 13,069 | 140,269 | 153,338 | ||||||
2009 | 10,036 | — | 10,036 | ||||||
Tax-Managed DFA International Value Portfolio | |||||||||
2007 | 62,952 | 112,266 | 175,218 | ||||||
2008 | 89,577 | 217,870 | 307,447 | ||||||
2009 | 45,214 | — | 45,214 | ||||||
At October 31, 2009, the components of distributable earnings (accumulated losses) were as follows (amounts in thousands):
| Undistributed Net Investment Income and Short-Term Capital Gains | Capital Loss Carryforward | Total Net Distributable Earnings (Accumulated Losses) | ||||||||
Tax-Managed U.S. Marketwide Value Portfolio | $3,360 | $ | (289,226 | ) | $ | (285,866 | ) | |||
Tax-Managed U.S. Equity Portfolio | 2,788 | (493,914 | ) | (491,126 | ) | |||||
Tax-Managed U.S. Targeted Value Portfolio | 1,374 | (268,973 | ) | (267,599 | ) | |||||
Tax-Managed U.S. Small Cap Portfolio | 696 | (231,307 | ) | (230,611 | ) | |||||
Tax-Managed DFA International Value Portfolio | 4,292 | (164,699 | ) | (160,407 | ) | |||||
35
For federal income tax purposes, the Fund measures its capital loss carryforwards annually at October 31, its fiscal year end. Capital loss carryforwards may be carried forward and applied against future capital gains. As of October 31, 2009, the following Portfolios had capital loss carryforwards available to offset future realized capital gains through the indicated expiration dates (amounts in thousands):
| Expires on October 31, | |||||||||||||||||||||
| 2010 | 2011 | 2013 | 2014 | 2016 | 2017 | Total | |||||||||||||||
Tax-Managed U.S. Marketwide Value Portfolio | — | — | — | — | $ | 120,399 | $ | 168,827 | $ | 289,226 | |||||||||||
Tax-Managed U.S. Equity Portfolio | $ | 12,034 | $ | 12,492 | $ | 13,463 | $ | 27,199 | 142,157 | 286,569 | 493,914 | ||||||||||
Tax-Managed U.S. Targeted Value Portfolio | — | — | — | — | 43,968 | 225,005 | 268,973 | ||||||||||||||
Tax-Managed U.S. Small Cap Portfolio | — | — | — | — | 46,001 | 185,306 | 231,307 | ||||||||||||||
Tax-Managed DFA International Value Portfolio | — | — | — | — | 12,590 | 152,109 | 164,699 | ||||||||||||||
At October 31, 2009, the total cost and aggregate gross unrealized appreciation and (depreciation) of securities for federal income tax purposes were different from amounts reported for financial reporting purposes (amounts in thousands):
| Federal Tax Cost | Unrealized Appreciation | Unrealized (Depreciation) | Net Unrealized Appreciation (Depreciation) | |||||||||||
Tax-Managed U.S. Marketwide Value Portfolio | $ | 1,671,550 | $ | 278,099 | $ | (331,132 | ) | $ | (53,033 | ) | ||||
Tax-Managed U.S. Equity Portfolio | 928,131 | 250,556 | (37,096 | ) | 213,460 | |||||||||
Tax-Managed U.S. Targeted Value Portfolio | 2,021,851 | 298,644 | (356,800 | ) | (58,156 | ) | ||||||||
Tax-Managed U.S. Small Cap Portfolio | 1,050,359 | 219,421 | (140,195 | ) | 79,226 | |||||||||
Tax-Managed DFA International Value Portfolio | 1,703,869 | 288,855 | (145,178 | ) | 143,677 | |||||||||
Accounting for Uncertainty in Income Taxes sets forth a minimum threshold for financial statement recognition of the benefit of a tax position taken or expected to be taken on a tax return. Management has analyzed each Portfolio’s tax position and has concluded that no provision for income tax is required in the Portfolios’ financial statements. The Portfolios are not aware of any tax positions for which it is reasonably possible that the total amounts of unrecognized tax benefits will significantly change in the next twelve months. Each of the Portfolio’s federal tax returns for the prior three years remain subject to examination by the Internal Revenue Service.
G. Financial Instruments:
In accordance with the Portfolios’ investment objectives and policies, the Portfolios may invest in certain financial instruments that have off-balance sheet risk in excess of the amounts recognized in the financial statements and concentrations of credit and market risk. These instruments and their significant corresponding risks are described below:
1. Repurchase Agreements: The Portfolios may purchase certain U.S. Government securities subject to the counterparty’s agreement to repurchase them at an agreed upon date and price. The counterparty will be required on a daily basis to maintain the value of the collateral subject to the agreement at not less than the repurchase price (including accrued interest). The agreements are conditioned upon the collateral being deposited under the Federal Reserve book-entry system with the Fund’s custodian or a third party sub-custodian. In the event of default or bankruptcy by the other party to the agreement, retention of the collateral may be subject to legal proceedings. All open repurchase agreements were entered into on October 30, 2009.
36
2. Foreign Market Risks: Investments in foreign markets may involve certain considerations and risks not typically associated with investments in the United States of America, including the possibility of future political and economic developments and the level of foreign governmental supervision and regulation of foreign securities markets. These markets are generally smaller, less liquid and more volatile than the major securities markets in the United States of America. Consequently, acquisition and disposition of securities by the Portfolios may be inhibited.
Derivative Financial Instruments:
Disclosures on derivative instruments and hedging activities are intended to improve financial reporting for derivative instruments by enabling investors to understand how and why a fund uses derivatives, how derivatives are accounted for and how derivative instruments affect a fund’s results of operations and financial position. Summarized below are the specific types of derivative instruments used by the Portfolios.
3. Futures Contracts: The Portfolios may enter into futures contracts to gain market exposure on uninvested cash pending investment in securities or to maintain liquidity to pay redemptions. Upon entering into a futures contract, the Portfolio deposits cash or pledges U.S. Government securities to a broker, equal to the minimum “initial margin” requirements of the exchange on which the contract is traded. Subsequent payments are received from or paid to the broker each day, based on the daily fluctuation in the market value of the contract. These receipts or payments are known as “variation margin” and are recorded daily by the Portfolio as unrealized gains or losses until the contracts are closed. When the contracts are closed, the Portfolio records a realized gain or loss, which is presented in the Statement of Operations as a net realized gain or loss on futures, equal to the difference between the value of the contract at the time it was opened and the value at the time it was closed.
Risks may arise upon entering into futures contracts from potential imperfect price correlations between the futures contracts and the underlying securities, from the possibility of an illiquid secondary market for these instruments and from the possibility that the Portfolio could lose more than the initial margin requirements. The Portfolios entering into stock index futures are subject to equity price risk from those futures contracts. Counterparty credit risk related to exchange-traded futures is minimal because the exchange’s clearinghouse, as counterparty to all exchange-traded futures, guarantees the futures against default.
Additional disclosure on derivative instruments is required showing a summary by primary risk exposure of the derivatives instruments’ (i) location in the balance sheet and fair value at period end and (ii) the location in the Statements of Operations and the realized and change in unrealized gain or loss over the reporting period. The following is a summary of the Portfolios’ derivative instrument holdings for the year ended October 31, 2009.
At October 31, 2009, the Portfolios had no outstanding futures contracts.
The following is a summary of the Portfolios’ location of realized and change in unrealized gains and losses on the Portfolios’ Statements of Operations for the Portfolios’ derivative instrument holdings through the year ended October 31, 2009:
Derivative Type | Location of Gain (Loss) on Derivatives Recognized in Income | |
Equity contracts | Net Realized Gain (Loss) on: Futures | |
Change in Unrealized Appreciation |
The following is a summary of the realized and change in unrealized gains and losses from the Portfolios’ derivative instrument holdings categorized by primary risk exposure through the year ended October 31, 2009 (amounts in thousands):
| Realized Gain (Loss) on Derivatives Recognized in Income | ||
| Equity Contracts | ||
Tax-Managed U.S. Targeted Value Portfolio* | $1,204 | |
37
Realized Gain (Loss) | ||
Equity Contracts | ||
Tax-Managed U.S. Small Cap Portfolio* | (1,022) | |
Tax-Managed DFA International Value Portfolio* | (264) | |
| Change in Unrealized Appreciation (Depreciation) on Derivatives Recognized in Income | ||
| Equity Contracts | ||
Tax-Managed U.S. Targeted Value Portfolio* | $(13) | |
Tax-Managed U.S. Small Cap Portfolio* | (8) | |
Tax-Managed DFA International Value Portfolio* | (2) | |
| * | As of October 31, 2009, there were no futures contracts outstanding. During the year ended October 31, 2009, the Portfolios had limited activity in these transactions. |
H. Line of Credit:
The Fund, together with other Dimensional-advised portfolios, has entered into an amended and restated $250 million unsecured line of credit effective July 8, 2009 with an affiliate of its domestic custodian bank. Each portfolio is permitted to borrow, subject to its investment limitations, up to a maximum of $250 million, as long as total borrowings under the line of credit do not exceed $250 million in the aggregate. Borrowings under the line are charged interest at the then current Federal Funds Rate plus 1%. Each portfolio is individually, and not jointly, liable for its particular advances under the line of credit. There is no commitment fee on the unused portion of the line of credit. The agreement for the discretionary line of credit may be terminated by either party at any time. The line of credit is scheduled to expire on June 22, 2010.
For the year ended October 31, 2009, borrowings by the Portfolios under this line of credit were as follows (amounts in thousands, except percentages and days):
| Weighted Average Interest Rate | Weighted Average Loan Balance | Number of Days Outstanding | Interest Expense Incurred | Maximum Amount Borrowed During the Period | ||||||||||
Tax-Managed U.S. Targeted Value Portfolio | 1.91 | % | $ | 2,921 | 21 | $ | 3 | $ | 8,485 | |||||
Tax-Managed U.S. Small Cap Portfolio | 2.10 | % | 1,837 | 32 | 3 | 9,441 | ||||||||
There were no outstanding borrowings by the Portfolios under this line of credit as of October 31, 2009.
The Fund, together with other Dimensional-advised portfolios, has also entered into an additional $500 million unsecured line of credit effective January 15, 2009 with its international custodian bank. Each portfolio is permitted to borrow, subject to its investment limitations, up to a maximum of $500 million, as long as total borrowings under the line of credit do not exceed $500 million in the aggregate. Each portfolio is individually, and not jointly, liable for its particular advances under the line of credit. Borrowings under the line of credit are charged interest at rates agreed to by the parties at the time of borrowing. There is no commitment fee on the unused portion of the line of credit. The agreement for the line of credit expires on January 15, 2010.
38
For the year ended October 31, 2009, borrowings by the Portfolios under this line of credit were as follows (amounts in thousands, except percentages and days):
| Weighted Average Interest Rate | Weighted Average Loan Balance | Number of Days Outstanding | Interest Expense Incurred | Maximum Amount Borrowed During the Period | ||||||
Tax-Managed DFA International Value Portfolio | 1.05% | $3,232 | 42 | $4 | $21,408 |
There were no outstanding borrowings by the Portfolios under this line of credit as of October 31, 2009.
I. Securities Lending:
As of October 31, 2009, some of the Portfolios had securities on loan to brokers/dealers, for which each Portfolio held cash collateral. Each Portfolio invests the cash collateral, as described below, and records a liability for the return of the collateral, during the period the securities are on loan. Loans of securities are expected at all times to be secured by collateral equal to at least (i) 100% of the current market value of the loaned securities with respect to securities of the U.S. government or its agencies, (ii) 102% of the current market value of the loaned securities with respect to U.S. securities, and (iii) 105% of the current market value of the loaned securities with respect to foreign securities. However, daily market fluctuations could cause the Portfolios’ collateral to be lower or higher than the expected thresholds. If this were to occur, the collateral would be adjusted the next business day to ensure adequate collateralization. In the event of default or bankruptcy by the other party to the agreement, realization and/or retention of the collateral may be subject to legal proceedings. If the borrower fails to return loaned securities, and cash collateral being maintained by the borrower is insufficient to cover the value of loaned securities and provided such collateral insufficiency is not the result of investment losses, the lending agent has agreed to pay the amount of the shortfall to the Portfolio or, at the option of the lending agent, to replace the securities.
Subject to each Portfolios’ investment policy, the cash collateral received by the Portfolio from securities on loan is invested in securities of the U.S. government or its agencies, repurchase agreements collateralized by securities of the U.S. government or its agencies and shares of the DFA Short Term Investment Fund LP. Agencies include both agency debentures and agency mortgage backed securities. In addition, each Portfolio will be able to terminate the loan at any time and will receive reasonable interest on the loan, as well as amounts equal to any dividends, interest or other distributions on the loaned securities. However, dividend income received from loaned securities may not be eligible to be taxed at qualified dividend income rates.
J. Indemnitees; Contractual Obligations:
Under the Fund’s organizational documents, its officers and directors are indemnified against certain liabilities arising out of the performance of their duties to the Fund.
In the normal course of business, the Fund enters into contracts that contain a variety of representations and warranties which provide general indemnification. The Fund’s maximum exposure under these arrangements is unknown as this would involve future claims that may be made against the Fund and/or its affiliates that have not yet occurred. However, based on experience, the Fund expects the risk of loss to be remote.
K. Other:
At October 31, 2009, the following number of shareholders held the following approximate percentages of outstanding shares of the Portfolios. One or more of the shareholders may be omnibus accounts, which typically hold shares for the benefit of several other underlying investors.
| Number of Shareholders | Approximate Percentage of Outstanding Shares | |||
Tax-Managed U.S. Marketwide Value Portfolio | 3 | 87% | ||
Tax-Managed U.S. Equity Portfolio | 2 | 75% | ||
Tax-Managed U.S. Targeted Value Portfolio | 3 | 95% |
39
| Number of Shareholders | Approximate Percentage of Outstanding Shares | |||
Tax-Managed U.S. Small Cap Portfolio | 2 | 85% | ||
Tax-Managed DFA International Value Portfolio | 3 | 92% |
L. Subsequent Event Evaluations:
Management has evaluated the impact of all subsequent events on the Portfolios through December 23, 2009, the date the financial statements were available for issuance, and has determined that there are no subsequent events requiring recognition or disclosure in the financial statements.
40
REPORT OF INDEPENDENT REGISTERED PUBLIC ACCOUNTING FIRM
To the Shareholders of the Portfolios, as defined, and
Board of Directors of DFA Investment Dimensions Group Inc.:
In our opinion, the accompanying statements of assets and liabilities, including the schedules of investments/ summary schedules of portfolio holdings, and the related statements of operations and of changes in net assets and the financial highlights present fairly, in all material respects, the financial position of Tax-Managed U.S. Marketwide Value Portfolio, Tax-Managed U.S. Equity Portfolio, Tax-Managed U.S. Targeted Value Portfolio, Tax-Managed U.S. Small Cap Portfolio and Tax-Managed DFA International Value Portfolio (constituting portfolios within DFA Investment Dimensions Group Inc., hereafter referred to as the “Portfolios”) at October 31, 2009, the results of each of their operations for the year then ended, the changes in each of their net assets and the financial highlights for each of the periods indicated, in conformity with accounting principles generally accepted in the United States of America. These financial statements and financial highlights (hereafter referred to as “financial statements”) are the responsibility of the Portfolios’ management; our responsibility is to express an opinion on these financial statements based on our audits. We conducted our audits of these financial statements in accordance with the standards of the Public Company Accounting Oversight Board (United States). Those standards require that we plan and perform the audit to obtain reasonable assurance about whether the financial statements are free of material misstatement. An audit includes examining, on a test basis, evidence supporting the amounts and disclosures in the financial statements, assessing the accounting principles used and significant estimates made by management, and evaluating the overall financial statement presentation. We believe that our audits, which included confirmation of securities at October 31, 2009 by correspondence with the custodians, brokers and transfer agents of the investee funds, provide a reasonable basis for our opinion.
PricewaterhouseCoopers LLP
Philadelphia, Pennsylvania
December 23, 2009
41
RESULTS OF THE SHAREHOLDER MEETING
On June 2, 2009 and July 8, 2009, DFA Investment Dimensions Group Inc. (“DFAIDG”) held a Special Joint Meeting of Shareholders for the purpose of voting on several proposals affecting DFAIDG and the Portfolios, including, among other items, the election of Directors, the amendment of certain fundamental investment limitations and the elimination of certain fundamental investment limitations. The shareholders of the Portfolios approved each of the applicable proposals for DFAIDG and the Portfolios presented at the Meeting. Listed below are the voting results from the Meeting. Please note that not all Proposals presented at the Meeting were voted on by each Portfolio. Additionally, the Proposal numbers reflected below correlate to the Proposal numbers presented for vote at the Meeting.
DFAIDG
| Shares Voted | Percent of Outstanding Shares Voted | |||||||||||||||||||||||
| For | % | Against | % | Abstain/WithHold | % | NonVote | % | For | Against | Abstain / WithHold | ||||||||||||||
Proposal 1: Election of | ||||||||||||||||||||||||
1a | David G. Booth | 5,100,343,281 | 93.94% | — | 0.00% | 328,971,623 | 6.06% | 81.55% | 0.00% | 5.26% | ||||||||||||||
1b | George M. Constantinides | 5,105,280,301 | 94.03% | — | 0.00% | 324,034,602 | 5.97% | 81.63% | 0.00% | 5.18% | ||||||||||||||
1c | John P. Gould | 5,100,584,112 | 93.95% | — | 0.00% | 328,730,791 | 6.05% | 81.55% | 0.00% | 5.26% | ||||||||||||||
1d | Roger G. Ibbotson | 5,105,426,112 | 94.03% | — | 0.00% | 323,888,792 | 5.97% | 81.63% | 0.00% | 5.18% | ||||||||||||||
1e | Robert C. Merton | 5,107,268,900 | 94.07% | — | 0.00% | 322,046,003 | 5.93% | 81.66% | 0.00% | 5.15% | ||||||||||||||
1f | Myron S. Scholes | 5,104,997,961 | 94.03% | — | 0.00% | 324,316,942 | 5.97% | 81.62% | 0.00% | 5.19% | ||||||||||||||
1g | Eduardo A. Repetto | 5,094,783,848 | 93.84% | — | 0.00% | 334,531,055 | 6.16% | 81.46% | 0.00% | 5.35% | ||||||||||||||
1h | Abbie J. Smith | 5,100,861,923 | 93.95% | — | 0.00% | 328,452,981 | 6.05% | 81.55% | 0.00% | 5.25% | ||||||||||||||
| Shares Voted | Percent of Outstanding Shares Voted | |||||||||||||||||
| For | % | Against | % | Abstain/WithHold | % | For | Against | Abstain / WithHold | ||||||||||
| Proposal 2: To approve Articles of Amendment and Restatement for DFAIDG* | 3,385,698,613 | 93.83% | 43,557,844 | 1.21% | 179,189,489 | 4.97% | 54.13% | 0.70% | 4.97% | |||||||||
| * | Results are for all Portfolios within DFAIDG |
Tax-Managed U.S. Marketwide Value Portfolio
| Shares Voted | Percent of Outstanding Shares Voted | |||||||||||||||||||
| For | % | Against | % | Abstain/WithHold | % | For | Against | Abstain / WithHold | ||||||||||||
Proposals: | ||||||||||||||||||||
5 | To approve amendments to certain fundamental investment restrictions | |||||||||||||||||||
5a | Borrowing Money | 67,665,836 | 90.13% | 2,083,374 | 2.77% | 5,328,079 | 7.10% | 49.02% | 1.51% | 3.86% | ||||||||||
5b | Making Loans | 67,511,141 | 89.92% | 2,161,749 | 2.88% | 5,404,399 | 7.20% | 48.90% | 1.57% | 3.91% | ||||||||||
5c | Investments in Real Estate | 67,877,067 | 90.41% | 1,902,615 | 2.53% | 5,297,607 | 7.06% | 49.17% | 1.38% | 3.84% | ||||||||||
5d | Investments in Commodities | 67,840,345 | 90.36% | 1,953,695 | 2.60% | 5,283,249 | 7.04% | 49.14% | 1.42% | 3.83% | ||||||||||
5e | Diversification of Investments | 68,197,746 | 90.84% | 1,592,944 | 2.12% | 5,286,599 | 7.04% | 49.40% | 1.15% | 3.83% | ||||||||||
6 | To approve the elimination of certain fundamental investment restrictions | |||||||||||||||||||
6b | Purchasing Securities on Margin | 66,921,000 | 89.14% | 2,876,810 | 3.83% | 5,279,479 | 7.03% | 48.48% | 2.08% | 3.82% | ||||||||||
8 | Approval of Investment Advisory Agreement between Dimensional Fund Advisors LP and the Company | 68,207,091 | 90.85% | 1,514,424 | 2.02% | 5,355,774 | 7.13% | 49.41% | 1.10% | 3.88% | ||||||||||
Tax-Managed U.S. Equity Portfolio
| Shares Voted | Percent of Outstanding Shares Voted | |||||||||||||||||||
| For | % | Against | % | Abstain/WithHold | % | For | Against | Abstain / WithHold | ||||||||||||
Proposals: | ||||||||||||||||||||
5 | To approve amendments to certain fundamental investment restrictions | |||||||||||||||||||
5a | Borrowing Money | 49,632,813 | 79.86% | 1,463,393 | 2.35% | 11,052,774 | 17.78% | 47.35% | 1.40% | 10.54% | ||||||||||
5b | Making Loans | 49,550,679 | 79.73% | 1,537,896 | 2.47% | 11,060,405 | 17.80% | 47.27% | 1.47% | 10.55% | ||||||||||
5c | Investments in Real Estate | 49,507,592 | 79.66% | 1,554,239 | 2.50% | 11,087,149 | 17.84% | 47.23% | 1.48% | 10.58% | ||||||||||
5d | Investments in Commodities | 49,377,412 | 79.45% | 1,717,065 | 2.76% | 11,054,503 | 17.79% | 47.10% | 1.64% | 10.55% | ||||||||||
5e | Diversification of Investments | 49,832,551 | 80.18% | 1,276,191 | 2.05% | 11,040,238 | 17.76% | 47.54% | 1.22% | 10.53% | ||||||||||
6 | To approve the elimination of certain fundamental investment restrictions | |||||||||||||||||||
6b | Purchasing Securities on Margin | 48,770,089 | 78.47% | 2,295,365 | 3.69% | 11,083,526 | 17.83% | 46.52% | 2.19% | 10.57% | ||||||||||
42
| Shares Voted | Percent of Outstanding Shares Voted | |||||||||||||||||||
| For | % | Against | % | Abstain/WithHold | % | For | Against | Abstain / WithHold | ||||||||||||
Proposals: | ||||||||||||||||||||
8 | Approval of Investment Advisory Agreement between Dimensional Fund Advisors LP and the Company | 49,894,854 | 80.28% | 1,185,722 | 1.91% | 11,068,404 | 17.81% | 47.60% | 1.13% | 10.56% | ||||||||||
Tax-Managed U.S. Targeted Value Portfolio
| Shares Voted | Percent of Outstanding Shares Voted | |||||||||||||||||||
| For | % | Against | % | Abstain/WithHold | % | For | Against | Abstain / WithHold | ||||||||||||
Proposals: | ||||||||||||||||||||
5 | To approve amendments to certain fundamental investment restrictions | |||||||||||||||||||
5a | Borrowing Money | 53,033,322 | 91.41% | 1,769,259 | 3.05% | 3,212,158 | 5.54% | 48.90% | 1.63% | 2.96% | ||||||||||
5b | Making Loans | 52,880,589 | 91.15% | 1,862,557 | 3.21% | 3,271,593 | 5.64% | 48.75% | 1.72% | 3.02% | ||||||||||
5c | Investments in Real Estate | 53,015,194 | 91.38% | 1,782,424 | 3.07% | 3,217,121 | 5.55% | 48.88% | 1.64% | 2.97% | ||||||||||
5d | Investments in Commodities | 53,035,758 | 91.42% | 1,775,632 | 3.06% | 3,203,349 | 5.52% | 48.90% | 1.64% | 2.95% | ||||||||||
5e | Diversification of Investments | 53,307,193 | 91.89% | 1,518,234 | 2.62% | 3,189,312 | 5.50% | 49.15% | 1.40% | 2.94% | ||||||||||
6 | To approve the elimination of certain fundamental investment restrictions | |||||||||||||||||||
6b | Purchasing Securities on Margin | 52,280,552 | 90.12% | 2,486,824 | 4.29% | 3,247,363 | 5.60% | 48.20% | 2.29% | 2.99% | ||||||||||
Tax-Managed U.S. Small Cap Portfolio
| Shares Voted | Percent of Outstanding Shares Voted | |||||||||||||||||||
| For | % | Against | % | Abstain/WithHold | % | For | Against | Abstain / WithHold | ||||||||||||
Proposals: | ||||||||||||||||||||
5 | To approve amendments to certain fundamental investment restrictions | |||||||||||||||||||
5a | Borrowing Money | 30,304,893 | 92.39% | 813,712 | 2.48% | 1,682,751 | 5.13% | 51.57% | 1.38% | 2.86% | ||||||||||
5b | Making Loans | 30,233,254 | 92.17% | 833,842 | 2.54% | 1,734,260 | 5.29% | 51.45% | 1.42% | 2.95% | ||||||||||
5c | Investments in Real Estate | 30,255,535 | 92.24% | 854,183 | 2.60% | 1,691,638 | 5.16% | 51.49% | 1.45% | 2.88% | ||||||||||
5d | Investments in Commodities | 30,294,660 | 92.36% | 823,275 | 2.51% | 1,683,421 | 5.13% | 51.55% | 1.40% | 2.86% | ||||||||||
5e | Diversification of Investments | 30,517,701 | 93.04% | 607,975 | 1.85% | 1,675,680 | 5.11% | 51.93% | 1.03% | 2.85% | ||||||||||
6 | To approve the elimination of certain fundamental investment restrictions | |||||||||||||||||||
6b | Purchasing Securities on Margin | 30,010,233 | 91.49% | 1,099,221 | 3.35% | 1,691,902 | 5.16% | 51.07% | 1.87% | 2.88% | ||||||||||
Tax-Managed DFA International Value Portfolio
| Shares Voted | Percent of Outstanding Shares Voted | |||||||||||||||||||
| For | % | Against | % | Abstain/WithHold | % | For | Against | Abstain / WithHold | ||||||||||||
Proposals: | ||||||||||||||||||||
5 | To approve amendments to certain fundamental investment restrictions | |||||||||||||||||||
5a | Borrowing Money | 62,082,362 | 92.59% | 1,830,089 | 2.73% | 3,141,976 | 4.69% | 51.15% | 1.51% | 2.59% | ||||||||||
5b | Making Loans | 61,996,063 | 92.46% | 1,845,069 | 2.75% | 3,213,295 | 4.79% | 51.08% | 1.52% | 2.65% | ||||||||||
5c | Investments in Real Estate | 62,256,952 | 92.85% | 1,664,712 | 2.48% | 3,132,763 | 4.67% | 51.29% | 1.37% | 2.58% | ||||||||||
5d | Investments in Commodities | 62,132,668 | 92.66% | 1,797,560 | 2.68% | 3,124,199 | 4.66% | 51.19% | 1.48% | 2.57% | ||||||||||
5e | Diversification of Investments | 62,510,574 | 93.22% | 1,446,468 | 2.16% | 3,097,385 | 4.62% | 51.50% | 1.19% | 2.55% | ||||||||||
6 | To approve the elimination of certain fundamental investment restrictions | |||||||||||||||||||
6b | Purchasing Securities on Margin | 61,505,495 | 91.72% | 2,409,538 | 3.59% | 3,139,394 | 4.68% | 50.67% | 1.99% | 2.59% | ||||||||||
7a | Proposed Sub-Advisory Agreement among Dimensional Fund Advisors LP, DFA Australia Limited, and the Company | 62,665,591 | 93.45% | 1,161,686 | 1.73% | 3,227,150 | 4.81% | 51.63% | 0.96% | 2.66% | ||||||||||
7b | Proposed Sub-Advisory Agreement among Dimensional Fund Advisors LP, Dimensional Fund Advisors Ltd., and the Company | 62,691,724 | 93.49% | 1,131,893 | 1.69% | 3,230,810 | 4.82% | 51.65% | 0.93% | 2.66% | ||||||||||
43
THE DFA INVESTMENT TRUST COMPANY
The Tax-Managed U.S. Marketwide Value Series vs.
Russell 3000® Value Index
October 31, 1999-October 31, 2009
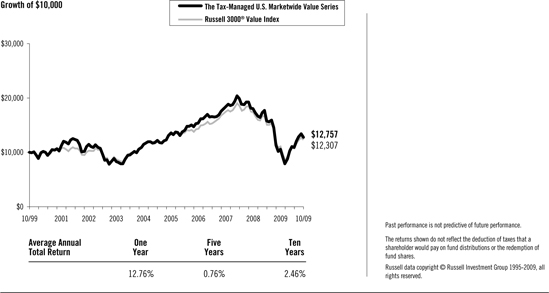
The Tax-Managed U.S. Equity Series vs.
Dow Jones US Total Stock Market Index (Full Cap)
September 25, 2001-October 31, 2009
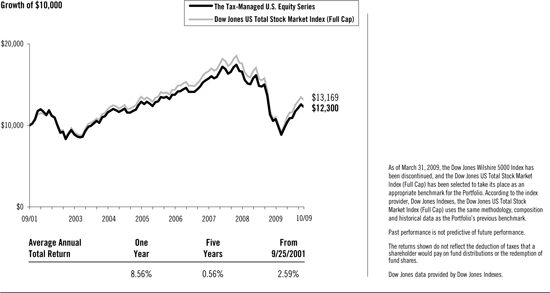
44
THE DFA INVESTMENT TRUST COMPANY
MANAGEMENT’S DISCUSSION AND ANALYSIS
Tax-Managed Series
The Tax-Managed U.S. Marketwide Value Series
The Tax-Managed U.S. Marketwide Value Series seeks to capture the returns of U.S. value stocks. The Series also seeks to maximize the after-tax value of a shareholder’s investment. The investment strategy employs a disciplined, quantitative approach, emphasizing broad diversification and consistent exposure to U.S. value stocks, but does not attempt to track closely a specific equity index. As of October 31, 2009, the Series held 1,410 stocks and was mostly invested in equities throughout the year: the average non-equitized cash level for the period was less than 1% of the Series’ assets.
As a result of the Series’ diversified investment approach, performance principally was determined by broad structural trends in the U.S. equity market, rather than the behavior of a limited number of stocks. For the 12 months ended October 31, 2009, total returns were 12.76% for the Series and 4.55% for the Russell 3000® Value Index. The Series benefited from a positive size premium and value premium over the last eight months of the period. Relative to the Index, the Series’ greater exposure to stocks with more pronounced value characteristics added nearly 6% to the outperformance.
The Tax-Managed U.S. Equity Series
The Tax-Managed U.S. Equity Series seeks to capture the returns associated with the broad universe of U.S. stocks. The Series also seeks to maximize the after-tax value of a shareholder’s investment. The investment strategy employs a disciplined, quantitative approach, emphasizing broad diversification and consistent exposure to the U.S. equity universe, but does not attempt to track closely a specific equity index. As of October 31, 2009, the Series held 2,700 stocks and was mostly invested in equities throughout the year: the average non-equitized cash level for the period was less than 1% of the Series’ assets.
As a result of the Series’ diversified investment approach, performance was determined principally by broad structural trends in the U.S. equity market, rather than the behavior of a limited number of stocks. For the 12 months ended October 31, 2009, total returns were 8.56% for the Series and 11.34% for the Dow Jones US Total Stock Market Index (Full Cap). Over the period, there was a wider than usual performance difference between the best and worst performing stocks within industry sectors and asset classes. Consequently, slight differences in weights or holdings and in the timing of cash flows and trading between the Series and the Index had a significant impact on relative performance.
45
THE DFA INVESTMENT TRUST COMPANY
(Unaudited)
The following Expense Tables are shown so that you can understand the impact of fees on your investment. All mutual funds have operating expenses. As a shareholder of the fund, you incur ongoing costs, which include costs for portfolio management, administrative services, and shareholder reports, among others. Operating expenses, legal and audit services, which are deducted from a fund’s gross income, directly reduce the investment return of the fund. A fund’s expenses are expressed as a percentage of its average net assets. This figure is known as the expense ratio. The following examples are intended to help you understand the ongoing costs, in dollars, of investing in the fund and to compare these costs with those of other mutual funds. The examples are based on an investment of $1,000 made at the beginning of the period shown and held for the entire period.
The Expense Tables below illustrate your fund’s costs in two ways.
Actual Fund Return
This section helps you to estimate the actual expenses after fee waivers that you paid over the period. The “Ending Account Value” shown is derived from the fund’s actual return and “Expenses Paid During Period” reflect the dollar amount that would have been paid by an investor who started with $1,000 in the fund. You may use the information here, together with the amount you invested, to estimate the expenses that you paid over the period.
To do so, simply divide your account value by $1,000 (for example, a $7,500 account value divided by $1,000 = 7.5), then multiply the result by the number given for your fund under the heading “Expenses Paid During Period.”
Hypothetical Example for Comparison Purposes
This section is intended to help you compare your fund’s costs with those of other mutual funds. The hypothetical “Ending Account Value” and “Expenses Paid During Period” are derived from the fund’s actual expense ratio and an assumed 5% annual return before expenses. In this case, because the return used is not the fund’s actual return, the results do not apply to your investment. The example is useful in making comparisons because the SEC requires all mutual funds to calculate expenses based on a 5% annual return. You can assess your fund’s costs by comparing this hypothetical example with the hypothetical examples that appear in shareholder reports of other funds.
Please note that the expenses shown in the tables are meant to highlight and help you compare ongoing costs only and do not reflect any transactional costs, if applicable. The “Annualized Expense Ratio” represents the actual expenses for the six-month period indicated.
EXPENSE TABLES | Six Months Ended October 31, 2009 |
| Beginning Account Value 05/01/09 | Ending Account Value 10/31/09 | Annualized Expense Ratio* | Expenses Paid During Period* | ||||||||
The Tax-Managed U.S. Marketwide Value Series | |||||||||||
Actual Fund Return | $ | 1,000.00 | $ | 1,240.10 | 0.24% | $ | 1.36 | ||||
Hypothetical 5% Annual Return | $ | 1,000.00 | $ | 1,024.00 | 0.24% | $ | 1.22 | ||||
The Tax-Managed U.S. Equity Series | |||||||||||
Actual Fund Return | $ | 1,000.00 | $ | 1,186.10 | 0.09% | $ | 0.50 | ||||
Hypothetical 5% Annual Return | $ | 1,000.00 | $ | 1,024.75 | 0.09% | $ | 0.46 | ||||
| * | Expenses are equal to the fund’s annualized expense ratio for the six-month period, multiplied by the average account value over the period, multiplied by the number of days in the most recent six-month period (184), then divided by the number of days in the year (365) to reflect the six-month period. |
46
THE DFA INVESTMENT TRUST COMPANY
DISCLOSURE OF PORTFOLIO HOLDINGS
(Unaudited)
The SEC requires that all funds file a complete Schedule of Investments with the SEC for their first and third fiscal quarters on Form N-Q. For The DFA Investment Trust Company, this would be for the fiscal quarters ending January 31 and July 31. The Form N-Q filing must be made within 60 days of the end of the quarter. The DFA Investment Trust Company filed its most recent Form N-Q with the SEC on September 29, 2009. It is available upon request, without charge, by calling collect: (512) 306-7400 or by mailing a request to Dimensional Fund Advisors LP, 6300 Bee Cave Road, Building One, Austin, Texas 78746, or by visiting the SEC’s website at http://www.sec.gov, or they may be reviewed and copied at the SEC’s Public Reference Room in Washington, D.C. (call 1-800-732-0330 for information on the operation of the Public Reference Room).
SEC regulations permit a fund to include in its reports to shareholders a “Summary Schedule of Portfolio Holdings” in lieu of a full Schedule of Investments. The Summary Schedule of Portfolio Holdings reports the fund’s 50 largest holdings in unaffiliated issuers and any investments that exceed one percent of the fund’s net assets at the end of the reporting period. The amendments also require that the Summary Schedule of Portfolio Holdings identify each category of investments that are held.
The fund is required to file a complete Schedule of Investments with the SEC on Form N-CSR within ten days after mailing the annual and semi-annual reports to shareholders. It will be available upon request, without charge, by calling collect: (512) 306-7400 or by mailing a request to Dimensional Fund Advisors LP, 6300 Bee Cave Road, Building One, Austin, Texas 78746, or by visiting the SEC’s website at http://www.sec.gov, or they may be reviewed and copied at the SEC’s Public Reference Room in Washington, D.C. (call 1-800-732-0330 for information on the operation of the Public Reference Room).
PORTFOLIO HOLDINGS
The SEC requires that all funds present their categories of portfolio holdings in a table, chart or graph format in their annual and semi-annual shareholder reports, whether or not a Schedule of Investments is utilized. The following table, which presents portfolio holdings as a percent of total investments before short-term investments and collateral for loaned securities, is provided in compliance with such requirement. The categories shown below represent broad industry sectors. Each industry sector consists of one or more specific industry classifications.
DOMESTIC EQUITY PORTFOLIOS
| The Tax-Managed U.S. Marketwide Value Series | ||
Consumer Discretionary | 18.5% | |
Consumer Staples | 5.3% | |
Energy | 14.0% | |
Financials | 30.2% | |
Health Care | 4.5% | |
Industrials | 12.2% | |
Information Technology | 6.8% | |
Materials | 3.3% | |
Other | — | |
Telecommunication Services | 4.3% | |
Utilities | 0.9% | |
| 100.0% | ||
The Tax-Managed U.S. Equity Series
| ||
Consumer Discretionary | 10.9% | |
Consumer Staples | 11.2% | |
Energy | 11.4% | |
Financials | 13.0% | |
Health Care | 12.8% | |
Industrials | 11.0% | |
Information Technology | 19.4% | |
Materials | 4.0% | |
Other | — | |
Telecommunication Services | 2.8% | |
Utilities | 3.5% | |
| 100.0% | ||
47
THE TAX-MANAGED U.S. MARKETWIDE VALUE SERIES
SUMMARY SCHEDULE OF PORTFOLIO HOLDINGS
October 31, 2009
Shares | Value† | Percentage | |||||
COMMON STOCKS — (91.3%) | |||||||
Consumer Discretionary — (16.9%) | |||||||
Carnival Corp. | 688,708 | $ | 20,055,177 | 0.9% | |||
Comcast Corp. Class A | 3,570,978 | 51,779,181 | 2.3% | ||||
Comcast Corp. Special Class A | 1,432,185 | 20,079,234 | 0.9% | ||||
#Disney (Walt) Co. | 1,135,556 | 31,080,168 | 1.3% | ||||
*Liberty Media Corp. Entertainment Class A | 578,364 | 17,825,178 | 0.8% | ||||
News Corp. Class A | 1,864,745 | 21,481,862 | 0.9% | ||||
#News Corp. Class B | 855,872 | 11,639,859 | 0.5% | ||||
Time Warner Cable, Inc. | 693,942 | 27,369,072 | 1.2% | ||||
Time Warner, Inc. | 1,534,860 | 46,229,983 | 2.0% | ||||
Other Securities | 173,853,500 | 7.6% | |||||
Total Consumer Discretionary | 421,393,214 | 18.4% | |||||
Consumer Staples — (4.8%) | |||||||
Archer-Daniels-Midland Co. | 487,589 | 14,686,181 | 0.6% | ||||
CVS Caremark Corp. | 866,755 | 30,596,452 | 1.3% | ||||
#Kraft Foods, Inc. | 1,077,208 | 29,644,764 | 1.3% | ||||
Other Securities | 45,163,659 | 2.0% | |||||
Total Consumer Staples | 120,091,056 | 5.2% | |||||
Energy — (12.8%) | |||||||
Anadarko Petroleum Corp. | 845,068 | 51,489,993 | 2.2% | ||||
Apache Corp. | 185,830 | 17,490,320 | 0.8% | ||||
#Chesapeake Energy Corp. | 618,000 | 15,141,000 | 0.7% | ||||
ConocoPhillips | 1,496,850 | 75,111,933 | 3.3% | ||||
Marathon Oil Corp. | 856,737 | 27,389,882 | 1.2% | ||||
Valero Energy Corp. | 714,360 | 12,929,916 | 0.6% | ||||
XTO Energy, Inc. | 397,536 | 16,521,596 | 0.7% | ||||
Other Securities | 103,389,457 | 4.5% | |||||
Total Energy | 319,464,097 | 14.0% | |||||
Financials — (27.6%) | |||||||
Allstate Corp. | 501,660 | 14,834,086 | 0.6% | ||||
Bank of America Corp. | 4,536,955 | 66,148,804 | 2.9% | ||||
Capital One Financial Corp. | 401,285 | 14,687,031 | 0.6% | ||||
Chubb Corp. | 390,477 | 18,945,944 | 0.8% | ||||
Citigroup, Inc. | 3,545,800 | 14,502,322 | 0.6% | ||||
CME Group, Inc. | 67,810 | 20,519,984 | 0.9% | ||||
JPMorgan Chase & Co. | 2,495,918 | 104,254,495 | 4.6% | ||||
Lincoln National Corp. | 464,693 | 11,073,634 | 0.5% | ||||
Loews Corp. | 747,772 | 24,751,253 | 1.1% | ||||
MetLife, Inc. | 847,339 | 28,834,946 | 1.3% | ||||
Morgan Stanley | 628,799 | 20,197,024 | 0.9% | ||||
PNC Financial Services Group, Inc. | 263,050 | 12,873,667 | 0.6% | ||||
Prudential Financial, Inc. | 430,708 | 19,480,923 | 0.8% | ||||
Travelers Cos., Inc. (The) | 769,714 | 38,324,060 | 1.7% | ||||
Wells Fargo & Co. | 529,123 | 14,561,465 | 0.6% | ||||
Other Securities | 265,392,627 | 11.6% | |||||
Total Financials | 689,382,265 | 30.1% | |||||
Health Care — (4.1%) | |||||||
*Thermo Fisher Scientific, Inc. | 321,928 | 14,486,760 | 0.6% | ||||
*WellPoint, Inc. | 440,420 | 20,594,039 | 0.9% | ||||
Other Securities | 67,176,867 | 3.0% | |||||
Total Health Care | 102,257,666 | 4.5% | |||||
48
THE TAX-MANAGED U.S. MARKETWIDE VALUE SERIES
CONTINUED
Shares | Value† | Percentage | |||||
Industrials — (11.1%) | |||||||
Burlington Northern Santa Fe Corp. | 248,329 | $ | 18,704,140 | 0.8% | |||
CSX Corp. | 562,627 | 23,731,607 | 1.0% | ||||
FedEx Corp. | 184,382 | 13,402,728 | 0.6% | ||||
General Electric Co. | 2,283,412 | 32,561,455 | 1.4% | ||||
Norfolk Southern Corp. | 333,288 | 15,537,887 | 0.7% | ||||
Tyco International, Ltd. | 456,370 | 15,311,214 | 0.7% | ||||
#Union Pacific Corp. | 489,811 | 27,008,179 | 1.2% | ||||
Other Securities | 131,483,405 | 5.7% | |||||
Total Industrials | 277,740,615 | 12.1% | |||||
Information Technology — (6.2%) | |||||||
*Computer Sciences Corp. | 225,553 | 11,437,793 | 0.5% | ||||
#Motorola, Inc. | 2,108,701 | 18,071,568 | 0.8% | ||||
Tyco Electronics, Ltd. | 549,298 | 11,672,583 | 0.5% | ||||
Other Securities | 112,756,385 | 4.9% | |||||
Total Information Technology | 153,938,329 | 6.7% | |||||
Materials — (3.0%) | |||||||
Dow Chemical Co. | 578,018 | 13,571,863 | 0.6% | ||||
Weyerhaeuser Co. | 311,975 | 11,337,172 | 0.5% | ||||
Other Securities | 49,738,377 | 2.2% | |||||
Total Materials | 74,647,412 | 3.3% | |||||
Other — (0.0%) | |||||||
Other Securities | 54 | 0.0% | |||||
Telecommunication Services — (3.9%) | |||||||
AT&T, Inc. | 2,510,122 | 64,434,832 | 2.8% | ||||
Verizon Communications, Inc. | 566,352 | 16,758,356 | 0.7% | ||||
Other Securities | 17,187,908 | 0.8% | |||||
Total Telecommunication Services | 98,381,096 | 4.3% | |||||
Utilities — (0.9%) | |||||||
Other Securities | 21,258,951 | 0.9% | |||||
TOTAL COMMON STOCKS | 2,278,554,755 | 99.5% | |||||
RIGHTS/WARRANTS — (0.0%) | |||||||
Other Securities | — | 0.0% | |||||
TEMPORARY CASH INVESTMENTS — (0.5%) | |||||||
BlackRock Liquidity Funds Tempcash Portfolio - Institutional | 13,814,176 | 13,814,176 | 0.6% | ||||
Shares/ Face Amount | |||||||
| (000) | |||||||
SECURITIES LENDING COLLATERAL — (8.2%) | |||||||
§@DFA Short Term Investment Fund LP | 202,493,142 | 202,493,142 | 8.8% | ||||
@RepurchaseAgreement, Deutsche Bank Securities 0.08%, | $1,029 | 1,029,115 | 0.1% | ||||
TOTAL SECURITIES LENDING COLLATERAL | 203,522,257 | 8.9% | |||||
TOTAL INVESTMENTS — (100.0%) | $ | 2,495,891,188 | 109.0% | ||||
49
THE TAX-MANAGED U.S. MARKETWIDE VALUE SERIES
CONTINUED
Summary of inputs used to value the Series’ net assets as of October 31, 2009 is as follows (See Security Valuation Note):
| Valuation Inputs | |||||||||||
| Investment in Securities (Market Value) | |||||||||||
| Level 1 | Level 2 | Level 3 | Total | ||||||||
Common Stocks | |||||||||||
Consumer Discretionary | $ | 421,361,264 | $ | 31,950 | — | $ | 421,393,214 | ||||
Consumer Staples | 120,091,056 | — | — | 120,091,056 | |||||||
Energy | 319,464,097 | — | — | 319,464,097 | |||||||
Financials | 689,382,265 | — | — | 689,382,265 | |||||||
Health Care | 102,257,666 | — | — | 102,257,666 | |||||||
Industrials | 277,740,615 | — | — | 277,740,615 | |||||||
Information Technology | 153,931,809 | 6,520 | — | 153,938,329 | |||||||
Materials | 74,647,412 | — | — | 74,647,412 | |||||||
Other | — | 54 | — | 54 | |||||||
Telecommunication Services | 98,381,096 | — | — | 98,381,096 | |||||||
Utilities | 21,258,951 | — | — | 21,258,951 | |||||||
Rights/Warrants | — | — | — | — | |||||||
Temporary Cash Investments | 13,814,176 | — | — | 13,814,176 | |||||||
Securities Lending Collateral | — | 203,522,257 | — | 203,522,257 | |||||||
TOTAL | $ | 2,292,330,407 | $ | 203,560,781 | — | $ | 2,495,891,188 | ||||
See accompanying Notes to Financial Statements.
50
THE TAX-MANAGED U.S. EQUITY SERIES
SUMMARY SCHEDULE OF PORTFOLIO HOLDINGS
October 31, 2009
Shares | Value† | Percentage | |||||
COMMON STOCKS — (90.4%) | |||||||
Consumer Discretionary — (9.8%) | |||||||
*Amazon.com, Inc. | 41,900 | $ | 4,978,139 | 0.4% | |||
#Disney (Walt) Co. | 187,757 | 5,138,909 | 0.4% | ||||
#Home Depot, Inc. | 169,830 | 4,261,035 | 0.4% | ||||
McDonald’s Corp. | 112,100 | 6,570,181 | 0.6% | ||||
Target Corp. | 79,844 | 3,866,845 | 0.3% | ||||
Other Securities | 98,835,870 | 8.7% | |||||
Total Consumer Discretionary | 123,650,979 | 10.8% | |||||
Consumer Staples — (10.1%) | |||||||
Altria Group, Inc. | 207,400 | 3,756,014 | 0.3% | ||||
Coca-Cola Co. | 237,262 | 12,648,437 | 1.1% | ||||
Colgate-Palmolive Co. | 59,400 | 4,670,622 | 0.4% | ||||
CVS Caremark Corp. | 150,047 | 5,296,659 | 0.5% | ||||
Kraft Foods, Inc. | 160,324 | 4,412,116 | 0.4% | ||||
#PepsiCo, Inc. | 166,379 | 10,074,248 | 0.9% | ||||
Philip Morris International, Inc. | 193,500 | 9,164,160 | 0.8% | ||||
Procter & Gamble Co. | 303,583 | 17,607,814 | 1.5% | ||||
Walgreen Co. | 97,025 | 3,670,456 | 0.3% | ||||
Wal-Mart Stores, Inc. | 315,296 | 15,663,905 | 1.4% | ||||
Other Securities | 40,552,476 | 3.6% | |||||
Total Consumer Staples | 127,516,907 | 11.2% | |||||
Energy — (10.3%) | |||||||
Chevron Corp. | 205,614 | 15,737,696 | 1.4% | ||||
ConocoPhillips | 118,739 | 5,958,323 | 0.5% | ||||
Exxon Mobil Corp. | 530,943 | 38,052,685 | 3.3% | ||||
Occidental Petroleum Corp. | 84,088 | 6,380,597 | 0.6% | ||||
Schlumberger, Ltd. | 119,648 | 7,442,106 | 0.6% | ||||
Other Securities | 55,564,072 | 4.9% | |||||
Total Energy | 129,135,479 | 11.3% | |||||
Financials — (11.8%) | |||||||
Bank of America Corp. | 803,514 | 11,715,234 | 1.0% | ||||
Goldman Sachs Group, Inc. | 50,600 | 8,610,602 | 0.8% | ||||
JPMorgan Chase & Co. | 409,432 | 17,101,975 | 1.5% | ||||
Morgan Stanley | 125,943 | 4,045,289 | 0.4% | ||||
Wells Fargo & Co. | 461,728 | 12,706,755 | 1.1% | ||||
Other Securities | 93,666,597 | 8.2% | |||||
Total Financials | 147,846,452 | 13.0% | |||||
Health Care — (11.6%) | |||||||
Abbott Laboratories | 159,127 | 8,047,052 | 0.7% | ||||
*Amgen, Inc. | 106,871 | 5,742,179 | 0.5% | ||||
Bristol-Myers Squibb Co. | 204,650 | 4,461,370 | 0.4% | ||||
#*Gilead Sciences, Inc. | 101,750 | 4,329,462 | 0.4% | ||||
Johnson & Johnson | 292,484 | 17,271,180 | 1.5% | ||||
Medtronic, Inc. | 110,304 | 3,937,853 | 0.3% | ||||
#Merck & Co., Inc. | 217,914 | 6,740,080 | 0.6% | ||||
Pfizer, Inc. | 798,203 | 13,593,397 | 1.2% | ||||
Schering-Plough Corp. | 208,323 | 5,874,709 | 0.5% | ||||
Other Securities | 75,561,169 | 6.6% | |||||
Total Health Care | 145,558,451 | 12.7% | |||||
Industrials — (9.9%) | |||||||
3M Co. | 60,323 | 4,437,963 | 0.4% | ||||
General Electric Co. | 1,043,623 | 14,882,064 | 1.3% | ||||
51
THE TAX-MANAGED U.S. EQUITY SERIES
CONTINUED
Shares | Value† | Percentage | |||||
Industrials — (Continued) | |||||||
United Parcel Service, Inc. | 69,650 | $ | 3,738,812 | 0.4% | |||
United Technologies Corp. | 96,270 | 5,915,792 | 0.5% | ||||
Other Securities | 96,104,447 | 8.4% | |||||
Total Industrials | 125,079,078 | 11.0% | |||||
Information Technology — (17.6%) | |||||||
*Apple, Inc. | 88,060 | 16,599,310 | 1.5% | ||||
*Cisco Systems, Inc. | 596,400 | 13,627,740 | 1.2% | ||||
*Google, Inc. | 22,737 | 12,189,760 | 1.1% | ||||
Hewlett-Packard Co. | 242,700 | 11,518,542 | 1.0% | ||||
Intel Corp. | 557,770 | 10,658,985 | 0.9% | ||||
International Business Machines Corp. | 142,483 | 17,184,875 | 1.5% | ||||
Microsoft Corp. | 844,660 | 23,422,422 | 2.0% | ||||
Oracle Corp. | 507,951 | 10,717,766 | 0.9% | ||||
QUALCOMM, Inc. | 165,920 | 6,870,747 | 0.6% | ||||
Visa, Inc. | 56,500 | 4,280,440 | 0.4% | ||||
Other Securities | 93,531,886 | 8.2% | |||||
Total Information Technology | 220,602,473 | 19.3% | |||||
Materials — (3.6%) | |||||||
Other Securities | 44,970,840 | 3.9% | |||||
Other — (0.0%) | |||||||
Other Securities | 6 | 0.0% | |||||
Telecommunication Services — (2.5%) | |||||||
AT&T, Inc. | 568,312 | 14,588,569 | 1.3% | ||||
Verizon Communications, Inc. | 300,825 | 8,901,412 | 0.8% | ||||
Other Securities | 7,926,753 | 0.7% | |||||
Total Telecommunication Services | 31,416,734 | 2.8% | |||||
Utilities — (3.2%) | |||||||
Other Securities | 39,976,320 | 3.5% | |||||
TOTAL COMMON STOCKS | 1,135,753,719 | 99.5% | |||||
TEMPORARY CASH INVESTMENTS — (0.4%) | |||||||
BlackRock Liquidity Funds Tempcash Portfolio - Institutional | 4,739,449 |
| 4,739,449 | 0.4% | |||
Shares/ Face Amount | |||||||
| (000) | |||||||
SECURITIES LENDING COLLATERAL — (9.2%) | |||||||
§@DFA Short Term Investment Fund LP | 114,652,240 | 114,652,240 | 10.0% | ||||
@Repurchase Agreement, Deutsche Bank Securities 0.08%, | $583 | 582,688 | 0.1% | ||||
TOTAL SECURITIES LENDING COLLATERAL | 115,234,928 | 10.1% | |||||
TOTAL INVESTMENTS — (100.0%) | $ | 1,255,728,096 | 110.0% | ||||
52
THE TAX-MANAGED U.S. EQUITY SERIES
CONTINUED
Summary of inputs used to value the Series’ net assets as of October 31, 2009 is as follows (See Security Valuation Note):
| Valuation Inputs | |||||||||||
| Investment in Securities (Market Value) | |||||||||||
| Level 1 | Level 2 | Level 3 | Total | ||||||||
Common Stocks | |||||||||||
Consumer Discretionary | $ | 123,650,979 | — | — | $ | 123,650,979 | |||||
Consumer Staples | 127,516,907 | — | — | 127,516,907 | |||||||
Energy | 129,135,479 | — | — | 129,135,479 | |||||||
Financials | 147,846,452 | — | — | 147,846,452 | |||||||
Health Care | 145,549,937 | $ | 8,514 | — | 145,558,451 | ||||||
Industrials | 125,079,078 | — | — | 125,079,078 | |||||||
Information Technology | 220,601,981 | 492 | — | 220,602,473 | |||||||
Materials | 44,970,840 | — | — | 44,970,840 | |||||||
Other | — | 6 | — | 6 | |||||||
Telecommunication Services | 31,416,734 | — | — | 31,416,734 | |||||||
Utilities | 39,976,320 | — | — | 39,976,320 | |||||||
Temporary Cash Investments | 4,739,449 | — | — | 4,739,449 | |||||||
Securities Lending Collateral | — | 115,234,928 | — | 115,234,928 | |||||||
TOTAL | $ | 1,140,484,156 | $ | 115,243,940 | — | $ | 1,255,728,096 | ||||
See accompanying Notes to Financial Statements.
53
THE DFA INVESTMENT TRUST COMPANY
STATEMENTS OF ASSETS AND LIABILITIES
OCTOBER 31, 2009
(Amounts in thousands)
| The Tax-Managed U.S. Marketwide Value Series | The Tax-Managed U.S. Equity Series | |||||
ASSETS: | ||||||
Investments at Value (including $185,881 and $107,680 of securities on loan, respectively) | $ | 2,278,555 | $ | 1,135,754 | ||
Temporary Cash Investments at Value & Cost | 13,814 | 4,739 | ||||
Collateral Received from Securities on Loan at Value & Cost | 203,522 | 115,235 | ||||
Receivables: | ||||||
Investment Securities Sold | 2,290 | 49 | ||||
Dividends and Interest | 2,664 | 1,281 | ||||
Securities Lending Income | 210 | 47 | ||||
Fund Shares Sold | 53 | — | ||||
Total Assets | 2,501,108 | 1,257,105 | ||||
LIABILITIES: | ||||||
Payables: | ||||||
Upon Return of Securities Loaned | 203,522 | 115,235 | ||||
Investment Securities Purchased | 6,575 | — | ||||
Fund Shares Redeemed | 570 | 169 | ||||
Due to Advisor | 403 | 49 | ||||
Accrued Expenses and Other Liabilities | 111 | 59 | ||||
Total Liabilities | 211,181 | 115,512 | ||||
NET ASSETS | $ | 2,289,927 | $ | 1,141,593 | ||
Investments at Cost | $ | 2,335,557 | $ | 921,823 | ||
See accompanying Notes to Financial Statements.
54
THE DFA INVESTMENT TRUST COMPANY
FOR THE YEAR ENDED OCTOBER 31, 2009
(Amounts in thousands)
| The Tax-Managed U.S. Marketwide Value Series | The Tax-Managed U.S. Equity Series | |||||||
Investment Income | ||||||||
Dividends | $ | 41,661 | $ | 23,761 | ||||
Interest | 169 | 86 | ||||||
Income from Securities Lending | 5,646 | 1,534 | ||||||
Total Investment Income | 47,476 | 25,381 | ||||||
Expenses | ||||||||
Investment Advisory Services Fees | 3,861 | 516 | ||||||
Accounting & Transfer Agent Fees | 223 | 129 | ||||||
Custodian Fees | 41 | 47 | ||||||
Shareholders’ Reports | 11 | 7 | ||||||
Directors’/Trustees’ Fees & Expenses | 28 | 17 | ||||||
Professional Fees | 85 | 48 | ||||||
Other | 218 | 130 | ||||||
Total Expenses | 4,467 | 894 | ||||||
Net Investment Income (Loss) | 43,009 | 24,487 | ||||||
Realized and Unrealized Gain (Loss) | ||||||||
Net Realized Gain (Loss) on: | ||||||||
Investment Securities Sold | (224,739 | ) | (289,047 | ) | ||||
Futures | 2,063 | 2,732 | ||||||
Change in Unrealized Appreciation (Depreciation) of: | ||||||||
Investment Securities | 417,983 | 328,914 | ||||||
Futures | (16 | ) | — | |||||
Net Realized and Unrealized Gain (Loss) | 195,291 | 42,599 | ||||||
Net Increase (Decrease) in Net Assets Resulting from Operations | $ | 238,300 | $ | 67,086 | ||||
See accompanying Notes to Financial Statements.
55
THE DFA INVESTMENT TRUST COMPANY
STATEMENTS OF CHANGES IN NET ASSETS
(Amounts in thousands)
| The Tax-Managed U.S. Marketwide Value Series | The Tax-Managed U.S. Equity Series | |||||||||||||||||||||||||
| Year Ended Oct. 31, 2009 | Period Dec. 1, 2007 to Oct. 31, 2008 | Year Ended Nov. 30, 2007 | Year Ended Oct. 31, 2009 | Period Dec. 1, 2007 to Oct. 31, 2008 | Year Ended Nov. 30, 2007 | |||||||||||||||||||||
Increase (Decrease) in Net Assets | ||||||||||||||||||||||||||
Operations: | ||||||||||||||||||||||||||
Net Investment Income (Loss) | $ | 43,009 | $ | 63,704 | $ | 63,884 | $ | 24,487 | $ | 30,373 | $ | 30,009 | ||||||||||||||
Net Realized Gain (Loss) on: | ||||||||||||||||||||||||||
Investment Securities Sold | (224,739 | ) | (152,733 | ) | 197,904 | (289,047 | ) | (142,472 | ) | 10,874 | ||||||||||||||||
Futures | 2,063 | (2,752 | ) | — | 2,732 | — | — | |||||||||||||||||||
Change in Unrealized Appreciation (Depreciation) of: | ||||||||||||||||||||||||||
Investment Securities | 417,983 | (1,321,745 | ) | (257,139 | ) | 328,914 | (530,594 | ) | 73,456 | |||||||||||||||||
Futures | (16 | ) | 16 | — | — | — | — | |||||||||||||||||||
Net Increase (Decrease) in Net Assets Resulting from Operations | 238,300 | (1,413,510 | ) | 4,649 | 67,086 | (642,693 | ) | 114,339 | ||||||||||||||||||
Transactions in Interest: | ||||||||||||||||||||||||||
Contributions | 347,943 | 457,034 | 478,784 | 111,879 | 296,257 | 253,998 | ||||||||||||||||||||
Withdrawals | (487,040 | ) | (711,380 | ) | (146,412 | ) | (305,880 | ) | (209,089 | ) | (32,090 | ) | ||||||||||||||
Net Increase (Decrease) from Transactions in Interest | (139,097 | ) | (254,346 | ) | 332,372 | (194,001 | ) | 87,168 | 221,908 | |||||||||||||||||
Total Increase (Decrease) in Net Assets | 99,203 | (1,667,856 | ) | 337,021 | (126,915 | ) | (555,525 | ) | 336,247 | |||||||||||||||||
Net Assets | ||||||||||||||||||||||||||
Beginning of Period | 2,190,724 | 3,858,580 | 3,521,559 | 1,268,508 | 1,824,033 | 1,487,786 | ||||||||||||||||||||
End of Period | $ | 2,289,927 | $ | 2,190,724 | $ | 3,858,580 | $ | 1,141,593 | $ | 1,268,508 | $ | 1,824,033 | ||||||||||||||
See accompanying Notes to Financial Statements.
56
THE DFA INVESTMENT TRUST COMPANY
| The Tax-Managed U.S. Marketwide Value Series | The Tax-Managed U.S. Equity Series | |||||||||||||||||||||||||||||||||||||||
Year Ended Oct. 31, 2009 | Period Dec. 1, 2007 to Oct. 31, 2008 | Year Ended Nov. 30, | Year Ended Nov. 30, | Year Ended Nov. 30, | Year Ended Nov. 30, | Year Ended Oct. 31, 2009 | Period Dec. 1, 2007 to | Year Ended Nov. 30, | Year Ended Nov. 30, | Year Ended Nov. 30, 2005 | Year Ended Nov. 30, 2004 | |||||||||||||||||||||||||||||
Total Return | 12.76 | % | (37.44 | )%(C) | 0.67 | % | 17.70 | % | 16.44 | % | 20.49 | % | 8.56 | % | (32.28 | )%(C) | 7.38 | % | 13.06 | % | 10.15 | % | 12.20 | % | ||||||||||||||||
Net Assets, End of Period (thousands) | $2,289,927 | $2,190,724 | $3,858,580 | $3,521,559 | $2,476,387 | $1,702,613 | $1,141,593 | $1,268,508 | $1,824,033 | $1,487,786 | $999,348 | $618,950 | ||||||||||||||||||||||||||||
Ratio of Expenses to Average Net Assets | 0.23 | % | 0.22 | %(B) | 0.22 | % | 0.22 | % | 0.24 | % | 0.25 | % | 0.09 | % | 0.07 | %(B) | 0.07 | % | 0.07 | % | 0.09 | % | 0.10 | % | ||||||||||||||||
Ratio of Net Investment Income to Average Net Assets | 2.23 | % | 2.09 | %(B) | 1.61 | % | 1.63 | % | 1.52 | % | 1.14 | % | 2.37 | % | 1.91 | %(B) | 1.74 | % | 1.71 | % | 1.51 | % | 1.52 | % | ||||||||||||||||
Portfolio Turnover Rate | 28 | % | 40 | %(C) | 21 | % | 21 | % | 12 | % | 5 | % | 27 | % | 13 | %(C) | 6 | % | 21 | % | 10 | % | 5 | % | ||||||||||||||||
See page 1 for the Definitions of Abbreviations and Footnotes.
See accompanying Notes to Financial Statements.
57
THE DFA INVESTMENT TRUST COMPANY
A. Organization:
The DFA Investment Trust Company (the “Trust”) is an open-end management investment company registered under the Investment Company Act of 1940. The Trust consists of twelve investment portfolios, of which The Tax-Managed U.S. Marketwide Value Series and The Tax-Managed U.S. Equity Series (the “Series”) are presented in this section of the report.
At a regular meeting of the Board of Directors/Trustees (the “Board”) on September 16, 2008, the Board voted to change the fiscal and tax year ends of the Series from November 30 to October 31.
B. Significant Accounting Policies:
The following significant accounting policies are in conformity with accounting principles generally accepted in the United States of America. Such policies are consistently followed by the Trust in preparation of its financial statements. The preparation of financial statements in accordance with accounting principles generally accepted in the United States of America requires management to make estimates and assumptions that affect the reported amounts of assets and liabilities and disclosure of contingent assets and liabilities at the date of the financial statements and the reported amounts of increases and decreases in net assets from operations during the reporting period. Actual results could differ from those estimates and those differences could be material.
1. Security Valuation: Securities held by the Series (including over-the-counter securities) are valued at the last quoted sale price of the day. Securities held by the Series that are listed on Nasdaq are valued at the Nasdaq Official Closing Price (“NOCP”). If there is no last reported sale price or NOCP for the day, the Series values the securities at the mean of the most recent quoted bid and asked prices. Price information on listed securities is taken from the exchange where the security is primarily traded. Generally, securities issued by open-end investment companies are valued using their respective net asset values or public offering prices, as appropriate, for purchase orders placed at the close of the New York Stock Exchange (NYSE).
Securities for which no market quotations are readily available (including restricted securities), or for which market quotations have become unreliable, are valued in good faith at fair value in accordance with procedures adopted by the Board of Directors/Trustees. Fair value pricing may also be used if events that have a significant effect on the value of an investment (as determined in the discretion of the Investment Committee of the Advisor) occur before the net asset value is calculated. When fair value pricing is used, the prices of securities used by the Series may differ from the quoted or published prices for the same securities on their primary markets or exchanges.
Futures contracts held by the Series are valued using the settlement price established each day on the exchange on which they are traded.
The Series utilize a fair value hierarchy which prioritizes the inputs to valuation techniques used to measure fair value into three broad levels described below:
• Level 1 – quoted prices in active markets for identical securities
• Level 2 – other significant observable inputs (including quoted prices for similar securities, interest rates, prepayment speeds, credit risk, etc.)
• Level 3 – significant unobservable inputs (including the Series’ own assumptions in determining the fair value of investments)
A summary of the inputs used to value the Series’ net assets by each major security type, industry and/or country is disclosed at the end of the Summary Schedule of Portfolio Holdings. The inputs or methodology used for valuing securities are not necessarily an indication of the risk associated with investing in those securities.
58
2. Deferred Compensation Plan: Each eligible Trustee of the Trust may elect participation in the Deferred Compensation Plan (the “Plan”). Under the Plan, effective January 1, 2002, such Trustees may defer payment of all or a portion of their total fees earned as a Trustee. These deferred amounts may be treated as though such amounts had been invested in shares of the following funds: U.S. Large Cap Value Portfolio; U.S. Core Equity 1 Portfolio; U.S. Core Equity 2 Portfolio; U.S. Vector Equity Portfolio; U.S. Micro Cap Portfolio; DFA International Value Portfolio; International Core Equity Portfolio; Emerging Markets Portfolio; Emerging Markets Core Equity Portfolio; and/or DFA Two-Year Global Fixed Income Portfolio. Contributions made under the Plan and the change in unrealized appreciation (depreciation) and income, are included in Directors’/Trustees’ Fees & Expenses.
Each Trustee has the option to receive their distribution of proceeds in one of the following methods upon one year’s notice: lump sum; annual installments over a period of agreed upon years; or semi-annual installments over a period of agreed upon years. As of October 31, 2009, none of the Trustees have requested distribution of proceeds.
3. Other: Security transactions are accounted for as of the trade date. Costs used in determining realized gains and losses on the sale of investment securities are on the basis of identified cost. Dividend income and distributions to shareholders are recorded on the ex-dividend date. Distributions received on securities that represent a return of capital or capital gain are recorded as a reduction of cost of investments or as a realized gain, respectively. The Series estimate the character of distributions received that may be considered return of capital distributions. Interest income is recorded on the accrual basis. Discount and premium on debt securities purchased are amortized over the lives of the respective securities utilizing the effective interest method. Expenses directly attributable to a Series are directly charged. Common expenses of the Trust are allocated using methods approved by the Board of Directors/Trustees, generally based on average net assets.
C. Investment Advisor:
Dimensional Fund Advisors LP (“Dimensional” or the “Advisor”) provides investment advisory services to the Series. For the year ended October 31, 2009, the Series’ investment advisory services fees were accrued daily and paid monthly to the Advisor based on the following effective annual rates of average daily net assets:
The Tax-Managed U.S. Marketwide Value Series | 0.20 | % | |
The Tax-Managed U.S. Equity Series | 0.05 | % |
Fees Paid to Officers and Directors/Trustees:
Certain Officers and Directors/Trustees of the Advisor are also Officers and Directors/Trustees of the Trust; however, such Officers and Directors/Trustees (with the exception of the Chief Compliance Officer (“CCO”)) receive no compensation from the Trust. For the year ended October 31, 2009, the total related amounts paid to the CCO by the Trust were $98 (in thousands). The total related amounts paid by each of the Series are included in Other Expenses on the Statement of Operations.
D. Deferred Compensation:
At October 31, 2009, the total liability for deferred compensation to Directors/Trustees is included in Accrued Expenses and Other Liabilities on the Statement of Assets and Liabilities as follows (amounts in thousands):
The Tax-Managed U.S. Marketwide Value Series | $ | 55 | |
The Tax-Managed U.S. Equity Series | 29 |
E. Purchases and Sales of Securities:
For the year ended October 31, 2009, the Series made the following purchases and sales of investment securities, other than short-term securities and U.S. government securities (amounts in thousands):
| Purchases | Sales | |||||
The Tax-Managed U.S. Marketwide Value Series | $ | 549,371 | $ | 583,865 | ||
59
| Purchases | Sales | |||
The Tax-Managed U.S. Equity Series | 275,853 | 416,816 |
There were no purchases or sales of long-term U.S. government securities.
F. Federal Income Taxes:
The Tax-Managed U.S. Marketwide Value Series and The Tax-Managed U.S. Equity Series are treated as partnerships for federal income tax purposes and therefore, no provision for federal income taxes is required. Any net investment income and realized and unrealized gains and losses have been deemed to have been “passed down” to their respective partners.
At October 31, 2009, the total cost and aggregate gross unrealized appreciation and (depreciation) of securities for federal income tax purposes were different from amounts reported for financial reporting purposes (amounts in thousands):
| Federal Tax Cost | Unrealized Appreciation | Unrealized (Depreciation) | Net Unrealized Appreciation (Depreciation) | ||||||
The Tax-Managed U.S. Marketwide Value Series | $ | 2,553,643 | $383,784 | $(441,536) | $(57,752) | ||||
The Tax-Managed U.S. Equity Series | 1,042,271 | 250,545 | (37,088) | 213,457 | |||||
Accounting for Uncertainty in Income Taxes sets forth a minimum threshold for financial statement recognition of the benefit of a tax position taken or expected to be taken in a tax return. Management has analyzed each Series’ tax position and has concluded that no provision for income tax is required in any Series’ financial statements. No Series is aware of any tax position for which it is reasonably possible that the total amounts of unrecognized tax benefits will significantly change in the next twelve months. Each of the Series’ federal tax returns for the prior three fiscal years remain subject to examination by the Internal Revenue Service.
G. Financial Instruments:
In accordance with the Series’ investment objectives and policies, the Series may invest in certain financial instruments that have off-balance sheet risk in excess of the amounts recognized in the financial statements and concentrations of credit and market risk. These instruments and their significant corresponding risks are described below:
1. Repurchase Agreements: The Series may purchase certain U.S. Government securities subject to the counterparty’s agreement to repurchase them at an agreed upon date and price. The counterparty will be required on a daily basis to maintain the value of the collateral subject to the agreement at not less than the repurchase price (including accrued interest). The agreements are conditioned upon the collateral being deposited under the Federal Reserve book-entry system with the Trust’s custodian or a third party sub-custodian. In the event of default or bankruptcy by the other party to the agreement, retention of the collateral may be subject to legal proceedings. All open repurchase agreements were entered into on October 30, 2009.
Derivative Financial Instruments:
Disclosures on derivative instruments and hedging activities are intended to improve financial reporting for derivative instruments by enabling investors to understand how and why a fund uses derivatives, how derivatives are accounted for and how derivative instruments affect a fund’s results of operations and financial position. Summarized below are the specific types of derivative instruments used by the Series.
2. Futures Contracts: The Series may enter into futures contracts to gain market exposure on uninvested cash pending investment in securities or to maintain liquidity to pay redemptions. Upon entering into a futures contract, the Series deposits cash or pledges U.S. Government securities to a broker, equal to the minimum “initial margin” requirements of the exchange on which the contract is traded. Subsequent payments are received from or
60
paid to the broker each day, based on the daily fluctuation in the market value of the contract. These receipts or payments are known as “variation margin” and are recorded daily by the Series as unrealized gains or losses until the contracts are closed. When the contracts are closed, the Series records a realized gain or loss, which is presented in the Statement of Operations as a net realized gain or loss on futures, equal to the difference between the value of the contract at the time it was opened and the value at the time it was closed.
Risks may arise upon entering into futures contracts from potential imperfect price correlations between the futures contracts and the underlying securities, from the possibility of an illiquid secondary market for these instruments and from the possibility that the Series could lose more than the initial margin requirements. The Series entering into stock index futures are subject to equity price risk from those futures contracts. Counterparty credit risk related to exchange-traded futures is minimal because the exchange’s clearinghouse, as counterparty to all exchange-traded futures, guarantees the futures against default.
Additional disclosure on derivative instruments is required showing a summary by primary risk exposure of the derivatives instruments’ (i) location in the balance sheet and fair value at period end and (ii) the location in the Statements of Operations and the realized and change in unrealized gain or loss over the reporting period. The following is a summary of the Series’ derivative instrument holdings for the year ended October 31, 2009.
At October 31, 2009, the Series had no outstanding futures contracts.
The following is a summary of the Series’ location of realized and change in unrealized gains and losses on the Series’ Statements of Operations for the Series’ derivative instrument holdings through the year ended October 31, 2009:
Derivative Type | Location of Gain (Loss) on Derivatives Recognized in Income | |
Equity contracts | Net Realized Gain (Loss) on: Futures (Depreciation) of: Futures |
The following is a summary of the realized and change in unrealized gains and losses from the Series’ derivative instrument holdings categorized by primary risk exposure through the year ended October 31, 2009 (amounts in thousands):
| Realized Gain (Loss) on Derivatives Recognized in Income | ||
| Equity Contracts | ||
The Tax-Managed U.S. Marketwide Value Series* | $2,063 | |
The Tax-Managed U.S. Equity Series* | 2,732 |
| Change in Unrealized Appreciation (Depreciation) on Derivatives Recognized in Income | ||
| Equity Contracts | ||
The Tax-Managed U.S. Marketwide Value Series* | $(16) |
| * | As of October 31, 2009, there were no futures contracts outstanding. During the year ended October 31, 2009, the Series had limited activity in these transactions. |
H. Line of Credit:
The Trust, together with other Dimensional-advised portfolios, has entered into an amended and restated $250 million unsecured discretionary line of credit effective July 8, 2009 with an affiliate of its domestic custodian bank. Each portfolio is permitted to borrow, subject to its investment limitations, up to a maximum of $250 million, as long as total borrowings under the line of credit do not exceed $250 million in the aggregate. Borrowings under the line
61
of credit are charged interest at the then current Federal Funds Rate plus 1%. Each portfolio is individually, and not jointly, liable for its particular advances under the line of credit. There is no commitment fee on the unused portion of the line of credit. The agreement for the discretionary line of credit may be terminated by either party at any time. The line of credit is scheduled to expire on June 22, 2010.
For the year ended October 31, 2009, borrowings by the Series under this line of credit were as follows (amounts in thousands, except percentages and days):
| Weighted Average Interest Rate | Weighted Average Loan Balance | Number of Days Outstanding | Interest Expense Incurred | Maximum Amount Borrowed During the Period | ||||||
The Tax-Managed U.S. Marketwide Value Series | 1.96% | $8,120 | 19 | $8 | $18,993 | |||||
The Tax-Managed U.S. Equity Series | 1.99% | 3,481 | 30 | 6 | 10,160 |
There were no outstanding borrowings by the Series under this line of credit as of October 31, 2009.
The Trust, together with other Dimensional-advised portfolios, has also entered into an additional $500 million unsecured line of credit effective January 15, 2009 with its international custodian bank. Each portfolio is permitted to borrow, subject to its investment limitations, up to a maximum of $500 million, as long as total borrowings under the line of credit do not exceed $500 million in the aggregate. Each portfolio is individually, and not jointly, liable for its particular advances under the line of credit. Borrowings under the line of credit are charged interest at rates agreed to by the parties at the time of borrowing. There is no commitment fee on the unused portion of the line of credit. The agreement for the line of credit expires on January 15, 2010. There were no borrowings by the Series under this line of credit during the year ended October 31, 2009.
I. Securities Lending:
As of October 31, 2009, the Series had securities on loan to brokers/dealers, for which each Series held cash collateral. Each Series invests the cash collateral, as described below, and records a liability for the return of the collateral, during the period the securities are on loan. Loans of securities are expected at all times to be secured by collateral equal to at least (i) 100% of the current market value of the loaned securities with respect to securities of the U.S. government or its agencies, (ii) 102% of the current market value of the loaned securities with respect to U.S. securities, and (iii) 105% of the current market value of the loaned securities with respect to foreign securities. However, daily market fluctuations could cause the Series’ collateral to be lower or higher than the expected thresholds. If this were to occur, the collateral would be adjusted the next business day to ensure adequate collateralization. In the event of default or bankruptcy by the other party to the agreement, realization and/or retention of the collateral may be subject to legal proceedings. If the borrower fails to return loaned securities, and cash collateral being maintained by the borrower is insufficient to cover the value of loaned securities and provided such collateral insufficiency is not the result of investment losses, the lending agent has agreed to pay the amount of the shortfall to the Series or, at the option of the lending agent, to replace the securities.
Subject to the Series’ investment policy, the cash collateral received by the Series from securities on loan is invested in securities of the U.S. government or its agencies, repurchase agreements collateralized by securities of the U.S. government or its agencies and shares of the DFA Short Term Investment Fund LP. Agencies include both agency debentures and agency mortgage backed securities. In addition, the Series will be able to terminate the loan at any time and will receive reasonable interest on the loan, as well as amounts equal to any dividends, interest or other distributions on the loaned securities. However, dividend income received from loaned securities may not be eligible to be taxed at qualified dividend income rates.
J. Indemnitees; Contractual Obligations:
Under the Trust’s organizational documents, its officers and trustees are indemnified against certain liabilities arising out of the performance of their duties to the Trust.
In the normal course of business, the Trust enters into contracts that contain a variety of representations and warranties which provide general indemnification. The Trust’s maximum exposure under these arrangements is
62
unknown as this would involve future claims that may be made against the Trust and/or its affiliates that have not yet occurred. However, based on experience, the Trust expects the risk of loss to be remote.
K. Subsequent Event Evaluations:
Management has evaluated the impact of all subsequent events on the Series through December 23, 2009, the date the financial statements were available for issuance, and has determined that there are no subsequent events requiring recognition or disclosure in the financial statements.
63
REPORT OF INDEPENDENT REGISTERED PUBLIC ACCOUNTING FIRM
To the Shareholders of the Series, as defined, and
Board of Trustees of The DFA Investment Trust Company:
In our opinion, the accompanying statements of assets and liabilities, including the summary schedules of portfolio holdings, and the related statements of operations and of changes in net assets and the financial highlights present fairly, in all material respects, the financial position of The Tax-Managed U.S. Marketwide Value Series and The Tax-Managed U.S. Equity Series (constituting portfolios within The DFA Investment Trust Company, hereafter referred to as the “Series”) at October 31, 2009, the results of each of their operations for the year then ended, the changes in each of their net assets and the financial highlights for each of the periods indicated, in conformity with accounting principles generally accepted in the United States of America. These financial statements and financial highlights (hereafter referred to as “financial statements”) are the responsibility of the Series’ management; our responsibility is to express an opinion on these financial statements based on our audits. We conducted our audits of these financial statements in accordance with the standards of the Public Company Accounting Oversight Board (United States). Those standards require that we plan and perform the audit to obtain reasonable assurance about whether the financial statements are free of material misstatement. An audit includes examining, on a test basis, evidence supporting the amounts and disclosures in the financial statements, assessing the accounting principles used and significant estimates made by management, and evaluating the overall financial statement presentation. We believe that our audits, which included confirmation of securities at October 31, 2009 by correspondence with the custodian, brokers, and the transfer agent of the investee fund, provide a reasonable basis for our opinion.
PricewaterhouseCoopers LLP
Philadelphia, Pennsylvania
December 23, 2009
64
RESULTS OF THE SHAREHOLDER MEETING
On June 2, 2009 and June 5, 2009, The DFA Investment Trust Company (“DFAITC”) held a Special Joint Meeting of Shareholders for the purpose of voting on several proposals affecting DFAITC and the Series, including, among other items, the election of Trustees, the amendment of certain fundamental investment limitations, and the elimination of certain fundamental investment limitations. The shareholders of the Series approved each of the applicable proposals for DFAITC and the Series presented at the Meeting. Listed below are the voting results from the Meeting. Please note that not all Proposals presented at the Meeting were voted on by each Series. Additionally, the Proposal numbers reflected below correlate to the Proposal numbers presented for vote at the Meeting.
DFAITC
| Shares Voted | Percent of Outstanding Shares Voted | |||||||||||||||||||
| For | % | Against | % | Abstain/WithHold | % | For | Against | Abstain / WithHold | ||||||||||||
Proposal 1: Election of Trustees for DFAITC* | ||||||||||||||||||||
| 1a | David G. Booth | 2,166,359,402 | 96.50% | — | 0.00% | 78,661,259 | 3.50% | 95.78% | 0.00% | 3.48% | ||||||||||
| 1b | George M. Constantinides | 2,169,219,982 | 96.62% | — | 0.00% | 75,800,679 | 3.38% | 95.90% | 0.00% | 3.35% | ||||||||||
| 1c | John P. Gould | 2,168,577,186 | 96.59% | — | 0.00% | 76,443,476 | 3.41% | 95.88% | 0.00% | 3.38% | ||||||||||
| 1d | Roger G. Ibbotson | 2,169,778,365 | 96.65% | — | 0.00% | 75,242,297 | 3.35% | 95.93% | 0.00% | 3.33% | ||||||||||
| 1e | Robert C. Merton | 2,170,124,638 | 96.66% | — | 0.00% | 74,896,023 | 3.34% | 95.94% | 0.00% | 3.31% | ||||||||||
| 1f | Myron S. Scholes | 2,169,439,189 | 96.63% | — | 0.00% | 75,581,473 | 3.37% | 95.91% | 0.00% | 3.34% | ||||||||||
| 1g | Eduardo A. Repetto | 2,167,010,793 | 96.53% | — | 0.00% | 78,009,868 | 3.47% | 95.81% | 0.00% | 3.45% | ||||||||||
| 1h | Abbie J. Smith | 2,169,626,842 | 96.64% | — | 0.00% | 75,393,820 | 3.36% | 95.92% | 0.00% | 3.33% | ||||||||||
| Shares Voted | Percent of Outstanding Shares Voted | |||||||||||||||||||||
| For | % | Against | % | Abstain/WithHold | % | NonVote | % | For | Against | Abstain / WithHold | ||||||||||||
Proposal 4: Approval of an Amended and Restated Agreement and Declaration of Trust for DFAITC* | 2,076,877,329 | 92.43% | 36,623,148 | 1.63% | 133,356,326 | 5.94% | NA | NA | 91.82% | 1.62% | 5.90% | |||||||||||
| * | Results are for all Series within DFAITC |
The Tax-Managed U.S. Marketwide Value Series
| Shares Voted | Percent of Outstanding Shares Voted | |||||||||||||||||||
| For | % | Against | % | Abstain/WithHold | % | For | Against | Abstain / WithHold | ||||||||||||
Proposals: | ||||||||||||||||||||
| 5 | To approve amendments to certain fundamental investment restrictions | |||||||||||||||||||
| 5a | Borrowing Money | 146,890,401 | 90.32% | 4,215,416 | 2.59% | 11,527,664 | 7.09% | 90.32% | 2.59% | 7.09% | ||||||||||
| 5b | Making Loans | 146,648,973 | 90.17% | 4,349,979 | 2.67% | 11,634,529 | 7.15% | 90.17% | 2.67% | 7.15% | ||||||||||
| 5c | Investments in Real Estate | 146,728,379 | 90.22% | 4,371,378 | 2.69% | 11,533,725 | 7.09% | 90.22% | 2.69% | 7.09% | ||||||||||
| 5d | Investments in Commodities | 146,688,336 | 90.20% | 4,544,246 | 2.79% | 11,400,899 | 7.01% | 90.20% | 2.79% | 7.01% | ||||||||||
| 5e | Diversification of Investments | 148,013,098 | 91.01% | 3,279,120 | 2.02% | 11,341,263 | 6.97% | 91.01% | 2.02% | 6.97% | ||||||||||
| 6 | To approve the elimination of certain fundamental investment restrictions | |||||||||||||||||||
| 6b | Purchasing Securities on Margin | 145,363,087 | 89.38% | 5,839,478 | 3.59% | 11,430,917 | 7.03% | 89.38% | 3.59% | 7.03% | ||||||||||
| 6e | Investing in Other Investment Companies | 147,177,599 | 90.50% | 4,082,139 | 2.51% | 11,373,744 | 6.99% | 90.50% | 2.51% | 6.99% | ||||||||||
| 6g | Investing in Oil, Gas, or other Mineral Exploration, Leases or Development Programs | 147,268,382 | 90.55% | 3,924,367 | 2.41% | 11,440,733 | 7.03% | 90.55% | 2.41% | 7.03% | ||||||||||
The Tax-Managed U.S. Equity Series
| Shares Voted | Percent of Outstanding Shares Voted | |||||||||||||||||||
| For | % | Against | % | Abstain/WithHold | % | For | Against | Abstain / WithHold | ||||||||||||
Proposals: | ||||||||||||||||||||
| 5 | To approve amendments to certain fundamental investment restrictions | |||||||||||||||||||
| 5a | Borrowing Money | 74,831,147 | 79.43% | 2,371,613 | 2.52% | 17,007,387 | 18.05% | 79.43% | 2.52% | 18.05% | ||||||||||
| 5b | Making Loans | 74,796,494 | 79.39% | 2,442,446 | 2.59% | 16,971,206 | 18.01% | 79.39% | 2.59% | 18.01% | ||||||||||
| 5c | Investments in Real Estate | 74,895,472 | 79.50% | 2,344,955 | 2.49% | 16,969,720 | 18.01% | 79.50% | 2.49% | 18.01% | ||||||||||
| 5d | Investments in Commodities | 74,909,074 | 79.51% | 2,441,748 | 2.59% | 16,859,323 | 17.90% | 79.51% | 2.59% | 17.90% | ||||||||||
| 5e | Diversification of Investments | 75,340,745 | 79.97% | 2,068,850 | 2.20% | 16,800,551 | 17.83% | 79.97% | 2.20% | 17.83% | ||||||||||
| 6 | To approve the elimination of certain fundamental investment restrictions | |||||||||||||||||||
| 6b | Purchasing Securities on Margin | 73,900,334 | 78.44% | 3,463,456 | 3.68% | 16,846,357 | 17.88% | 78.44% | 3.68% | 17.88% | ||||||||||
| 6e | Investing in Other Investment Companies | 75,259,269 | 79.88% | 2,177,629 | 2.31% | �� | 16,773,248 | 17.80% | 79.88% | 2.31% | 17.80% | |||||||||
65
| Shares Voted | Percent of Outstanding Shares Voted | |||||||||||||||||||
| For | % | Against | % | Abstain/WithHold | % | For | Against | Abstain / WithHold | ||||||||||||
Proposals: | ||||||||||||||||||||
6g | Investing in Oil, Gas, or other Mineral Exploration, Leases or Development Programs | 75,361,156 | 79.99% | 2,060,102 | 2.19% | 16,788,889 | 17.82% | 79.99% | 2.19% | 17.82% | ||||||||||
66
Trustees/Directors
Each Board of Trustees/Directors of The DFA Investment Trust Company Inc. (“DFAITC”), DFA Investment Dimensions Group Inc. (“DFAIDG”), Dimensional Investment Group Inc. (“DIG”) and Dimensional Emerging Markets Value Fund (“DEM”) (each, the “Fund” and collectively, the “Funds”) is responsible for establishing the Funds’ policies and for overseeing the management of the Funds. The Trustees/Directors of the Funds, including all of the disinterested Directors, have adopted written procedures to monitor potential conflicts of interest that might develop between portfolios of the Funds (the “Feeder Portfolios”) that invest in certain series of DFAITC or DEM (the “Master Funds”).
Each Board has two standing committees, an Audit Committee and a Portfolio Performance and Service Review Committee (the “Performance Committee”). The Audit Committee is comprised of George M. Constantinides, Roger G. Ibbotson and Abbie J. Smith. Each member of the Audit Committee is a disinterested Director. The Audit Committee oversees the Fund’s accounting and financial reporting policies and practices, the Fund’s internal controls, the Fund’s financial statements and the independent audits thereof and performs other oversight functions as requested by the Board. The Audit Committee recommends the appointment of each Fund’s independent registered certified public accounting firm and also acts as a liaison between the Fund’s independent registered certified public accounting firm and the full Board. There were two Audit Committee meetings held during the fiscal year ended October 31, 2009.
Each Board’s Performance Committee is comprised of Messrs. Constantinides and Ibbotson, Ms. Smith, John P. Gould, Myron S. Scholes and Robert C. Merton. Each member of the Fund’s Performance Committee is a disinterested Director. The Performance Committee regularly reviews and monitors the investment performance of the Fund’s series and reviews the performance of the Fund’s service providers. There were six Performance Committee meetings held during the fiscal year ended October 31, 2009.
Certain biographical information for each disinterested Trustee/Director and each interested Trustee/Director of the Funds is set forth in the tables below, including a description of each Trustee/Director’s experience as a Trustee/ Director of the Funds and as a director or trustee of other funds, as well as other recent professional experience.
The statements of additional information (together, “SAI”) of the Funds include additional information about each Trustee/Director. You may obtain copies of the SAI and prospectus of each Fund advised by Dimensional Fund Advisors LP by calling collect (512) 306-7400 or by mailing a request to Dimensional Fund Advisors LP, 6300 Bee Cave Road, Building One, Austin, Texas 78746. Prospectuses are also available at www.dimensional.com.
Name, Position with the Fund, Address and Age
| Term of Office1 and Length of Service
| Portfolios within the DFA Fund Complex2
| Principal Occupation(s) During Past 5 Years and Other Directorships of Public Companies Held
| |||
| Disinterested Trustees/Directors | ||||||
George M. Constantinides Director of DFAIDG, DIG Trustee of DFAITC. The University of Chicago 5807 S. Woodlawn
| DFAITC - since 1993 DFAIDG - since 1983 DIG - since 1993 DEM - since 1993 | 87 portfolios in 4 investment companies | Leo Melamed Professor of Finance, The University of Chicago Booth School of Business. | |||
John P. Gould Director of DFAIDG, DIG and DEM. Trustee of DFAITC. 5807 S. Woodlawn Chicago, IL 60637 | DFAITC - since 1993 DFAIDG - since 1986 DIG - since 1993 DEM - since 1993 | 87 portfolios in 4 investment companies | Steven G. Rothmeier Distinguished Service Professor of Economics, The University of Chicago Booth School of Business (since 1965). Member of the Boards of Milwaukee Mutual Insurance Company (since 1997). Member and Chair, Competitive Markets Advisory Committee, Chicago Mercantile Exchange (futures trading exchange) (since 2004). Formerly, Director of UNext, Inc. (1999-2006). Formerly, Senior Vice-President, Lexecon Inc. (economics, law, strategy and finance consulting) (1994-2004). Trustee, Harbor Fund (registered investment company) (27 Portfolios) (since 1994).
| |||
67
Name, Position with the Fund, Address and Age
| Term of Office1 and Length of Service
| Portfolios within the DFA Fund Complex2 Overseen
| Principal Occupation(s) During Past 5 Years and Other Directorships of Public Companies Held
| |||
Roger G. Ibbotson Director of DFAIDG, DIG and DEM. Trustee of DFAITC. Yale School of Management 135 Prospect Street New Haven, CT 06520-8200 Age: 66
| DFAITC - since 1993 DFAIDG - since 1981 DIG - since 1993 DEM - since 1993 | 87 portfolios in 4 investment companies | Professor in Practice of Finance, Yale School of Management (since 1984). Director, BIRR Portfolio Analysis, Inc. (software products) (since 1990). Chairman, CIO and Partner, Zebra Capital Management, LLC (hedge fund manager) (since 2001). Formerly, Chairman, Ibbotson Associates, Inc., Chicago, IL (software data publishing and consulting) (1977-2006). | |||
Robert C. Merton Trustee of DFAITC. Harvard Business School 353 Baker Library Soldiers Field Boston, MA 02163 Age: 65 | DFAITC - since 2003 DFAIDG - since 2003 DIG - since 2003 DEM - since 2003 | 87 portfolios in 4 investment companies | John and Natty McArthur University Professor, Graduate School of Business Administration, Harvard University (since 1998). Director, MF Risk, Inc. (risk management software) (since 2001). Director, Peninsula Banking Group (bank) (since 2003). Director, Community First Financial Group (bank holding company) (since 2003). Member Competitive Markets Advisory Council, Chicago Mercantile Exchange (futures trading exchange) (since 2004). Chairman and Director, Daedalus Software (medical software) (since 2008). Formerly, Advisory Board Member, Alpha Simplex Group (hedge fund) (2001-2007). Formerly, Chief Science Officer and Director, Trinsum Group, a successor to Integrated Finance Limited (2002-2008). Director, Vical Incorporated (biopharmaceutical product development) (since 2002).
| |||
Myron S. Scholes Director of DFAIDG, DIG and DEM. Trustee of DFAITC. Platinum Grove Asset Management, L.P. Reckson Executive Park 1100 King Street Building 4 Rye Brook, NY 10573
| DFAITC - since 1993 DFAIDG - since 1981 DIG - since 1993 DEM - since 1993 | 87 portfolios in 4 investment companies | Frank E. Buck Professor Emeritus of Finance, Stanford University (since 1981). Chairman, Platinum Grove Asset Management, L.P. (hedge fund) (formerly, Oak Hill Platinum Partners) (since 1999). Formerly, Managing Partner, Oak Hill Capital Management (private equity firm) (until 2004). Formerly, Director, Chicago Mercantile Exchange (2001-2008). Director, American Century Fund Complex (registered investment companies) (37 Portfolios) (since 1981). | |||
Abbie J. Smith Director of DFAIDG, DIG and DEM. Trustee of DFAITC. The University of Chicago Booth School of Business 5807 S. Woodlawn Avenue Chicago, IL 60637
| DFAITC - since 2000 DFAIDG - since 2000 DIG - since 2000 DEM - since 2000 | 87 portfolios in 4 investment companies | Boris and Irene Stern Professor of Accounting, The University of Chicago Booth School of Business (since 1980), and Co-Director Investment Research, Fundamental Investment Advisors (hedge fund) (since 2008). Director, HNI Corporation (formerly known as HON Industries Inc.) (office furniture) (since 2000). Director, Ryder System Inc. (transportation, logistics and supply-chain management) (since 2003). Director/ Trustee, UBS Funds (fund complex) (5 portfolios) (since 2008). |
68
Name, Position with the Fund, Address and Age
| Term of Office1 and Length of Service
| Portfolios within the
| Principal Occupation(s) During Past 5 Years and Other Directorships of Public Companies Held
| |||
| Interested Trustees/Directors* | ||||||
David G. Booth Chairman, Director, Chief Executive Officer and President of DFAIDG, DIG and DEM. Chairman, Trustee, Chief Executive Officer, Chief Investment Officer and President of DFAITC. 6300 Bee Cave Road, Building One Austin, Texas 78746 Age: 62 | DFAITC - since 1993 DFAIDG - since 1981 DIG - since 1992 DEM - since 1993 | 87 portfolios in 4 investment companies | Chairman, Director/Trustee, President, Chief Executive Officer and formerly Chief Investment Officer of the following companies: Dimensional Holdings Inc., Dimensional Fund Advisors LP, Dimensional Fund Advisors Canada ULC, DFAIDG, DIG, DEM and DFAITC. President and Chief Executive Officer of DFA Securities LLC. Director of Dimensional Fund Advisors Ltd, and formerly Chief Investment Officer. Director and formerly, President and Chief Investment Officer of DFA Australia Ltd. Formerly, Director of Dimensional Funds PLC and Dimensional Fund II PLC. Chairman, Director and Chief Executive Officer of Dimensional Fund Advisors Canada ULC (All Chief Investment Officer positions held starting 1/03 through 3/07 except Dimensional Holdings Inc., which was from 10/06 through 3/07.)
Limited Partner, Oak Hill Partners (since 2001) and VSC Investors, LLC (since 2007). Trustee, The University of Chicago Booth School of Business. Formerly, Director, SA Funds (registered investment company). Formerly Director, Assante Corporation (investment management) (until 2002).
| |||
Eduardo A. Repetto Director, Chief Investment Officer and Vice President of DFAIDG, DIG and DEM. Trustee, Chief Investment Officer and Vice President of DFAITC 6300 Bee Cave Road, Building One Austin, TX 78746 Age: 42
| DFAITC - since 2009 DFAIDG - since 2009 DIG - since 2009 DEM - since 2009 | 87 portfolios in 4 investment companies | Director/Trustee (beginning June 2009), Chief Investment Officer (beginning March 2007) and Vice President of DFAIDG, DIG, DEM and DFAITC. Chief Investment Officer (beginning March 2007) and Vice President of all the DFA Entities, DFA Australia Limited and Dimensional Fund Advisors Canada ULC. | |||
| 1 | Each Trustee/Director holds office for an indefinite term until his or her successor is elected and qualified. |
| 2 | Each Trustee/Director is a director or trustee of each of the four registered investment companies within the DFA Fund Complex, which includes the Funds. |
| * | Interested Trustees/Directors are described as such because they are deemed to be “interested persons,” as that term is defined under the Investment Company Act of 1940, as amended, due to their positions with Dimensional Fund Advisors LP. |
69
Officers
The name, age, information regarding positions with the Funds and the principal occupation for each officer of the Funds are set forth below. Each officer listed below holds the same office (except as otherwise noted) in the following entities: Dimensional Fund Advisors LP (prior to November 3, 2006, Dimensional Fund Advisors Inc.) (“Dimensional”), DFA Securities Inc., DFAIDG, DIG, DFAITC and DEM (collectively, the “DFA Entities”). The address of each officer is: Dimensional Fund Advisors LP, 6300 Bee Cave Road, Building One, Austin, Texas 78746, unless otherwise indicated.
Name, Position with the Fund and Age
|
Term of Office1 and Length of Service
| Principal Occupation(s) During Past 5 Years
| ||
Officers | ||||
April A. Aandal
| Since 2008 | Vice President of all the DFA Entities. Chief Learning Officer of Dimensional (since September 2008). Formerly, Regional Director of Dimensional (2004-2008); Vice President of Professional Development at Assante Asset Management (June 2002-January 2005).
| ||
Darryl D. Avery
| Since 2005 | Vice President of all the DFA Entities. From June 2002 to January 2005, institutional client service representative of Dimensional. | ||
Arthur H. Barlow
| Since 1993 | Vice President of all the DFA Entities. Formerly, Vice President of DFA Australia Limited and Dimensional Fund Advisors Ltd. | ||
Scott A. Bosworth
| Since 2007 | Vice President of all the DFA Entities. Regional Director of Dimensional (since November 1997). | ||
Valerie A. Brown
| Since 2001 | Vice President and Assistant Secretary of all the DFA Entities, DFA Australia Limited, Dimensional Fund Advisors Ltd., and since June 2003, Dimensional Fund Advisors Canada ULC.
| ||
David P. Butler
| Since 2007 | Vice President of all the DFA Entities. Director of Global Financial Services of Dimensional (since 2008). Formerly, Regional Director of Dimensional Fund Advisors LP (January 1995 to January 2005).
| ||
Patrick Carter
| Since 2007 | Vice President of all the DFA Entities. Regional Director of Dimensional (since March 2006). Formerly, Director of Merrill Lynch Retirement Group (December 1998 to March 2006).
| ||
Joseph H. Chi
| Since 2009 | Vice President of all the DFA Entities. Portfolio Manager for Dimensional Fund Advisors LP (since October 2005). Prior to October 2005, Corporate Counsel at Hewitt Associates (July 2002-August 2005).
| ||
Stephen A. Clark
| Since 2004 | Vice President of all the DFA Entities. Formerly, Portfolio Manager of Dimensional (April 2001-April 2004). | ||
Robert P. Cornell
| Since 2007 | Vice President of all the DFA Entities. Regional Director of Financial Services Group of Dimensional (since August 1993). | ||
Christopher S. Crossan
| Since 2004 | Vice President and Chief Compliance Officer of all the DFA Entities. | ||
James L. Davis
| Since 1999 | Vice President of all the DFA Entities. Formerly, Vice President of DFA Australia Limited and Dimensional Fund Advisors Ltd. | ||
Robert T. Deere
| Since 1994 | Vice President of all the DFA Entities and DFA Australia Limited. | ||
Robert W. Dintzner
| Since 2001 | Vice President of all the DFA Entities. | ||
70
Name, Position with the Fund and Age
|
Term of Office1 and Length of Service
| Principal Occupation(s) During Past 5 Years
| ||
Kenneth Elmgren
| Since 2007 | Vice President of all the DFA Entities. Formerly, Managing Principal of Beverly Capital (May 2004 to September 2006). | ||
| Richard A. Eustice Vice President and Assistant Secretary Age: 44 | Since 1998 | Vice President and Assistant Secretary of all the DFA Entities and DFA Australia Limited. Chief Operating Officer of Dimensional Fund Advisors Ltd. (since July 2008). Formerly, Vice President of Dimensional Fund Advisors Ltd.
| ||
Eugene F. Fama, Jr.
| Since 1993 | Vice President of all the DFA Entities. Formerly, Vice President of DFA Australia Limited and Dimensional Fund Advisors Ltd. | ||
Gretchen A. Flicker
| Since 2004 | Vice President of all the DFA Entities. Prior to April 2004, institutional client service representative of Dimensional. | ||
Jed S. Fogdall
| Since 2008 | Vice President of all the DFA Entities. Portfolio Manager for Dimensional (since September 2004). Prior to September 2004, Staff Engineer at the Boeing Company (1997-2004).
| ||
Glenn S. Freed
| Since 2001 | Vice President of all the DFA Entities. | ||
| Jeremy P. Freeman Vice President Age: 38 | Since 2009 | Vice President of all the DFA Entities. Senior Technology Manager for Dimensional Fund Advisors LP (since June 2006). Formerly, Principal at AIM Investments/Amvescap PLC (now Invesco) (June 1998-June 2006).
| ||
Mark R. Gochnour
| Since 2007 | Vice President of all the DFA Entities. Regional Director of Dimensional. | ||
Henry F. Gray
| Since 2000 | Vice President of all the DFA Entities. Prior to July 2000, Portfolio Manager of Dimensional. Formerly, Vice President of DFA Australia Limited.
| ||
John T. Gray
| Since 2007 | Vice President of all the DFA Entities. Formerly, Regional Director of Dimensional (January 2005 to February 2007). | ||
Darla Hastings
| Since 2007 | Vice President of all the DFA Entities. Chief Marketing Officer of Dimensional. Formerly, Senior Vice President, Customer Experience for Benchmark Assisted Living (May 2005 to April 2006); Executive Vice President and Chief Marketing Officer of State Street Corporation (September 2001 to October 2005).
| ||
Joel H. Hefner
| Since 2007 | Vice President of all the DFA Entities. Regional Director of Dimensional (since June 1998). | ||
Julie Henderson
| Since 2005 | Vice President and Fund Controller of all the DFA Entities. Formerly, Senior Manager at PricewaterhouseCoopers LLP (July 1996 to April 2005).
| ||
Kevin Hight
| Since 2005 | Vice President of all the DFA Entities. Formerly, Regional Director of Dimensional (since March 2003 to March 2005). | ||
Christine W. Ho
| Since 2004 | Vice President of all the DFA Entities. Prior to April 2004, Assistant Controller of Dimensional. | ||
Jeff J. Jeon
| Since 2004 | Vice President of all the DFA Entities. Counsel of Dimensional (since September 2001). | ||
Patrick M. Keating
| Since 2003 | Vice President of all the DFA Entities and Chief Operating Officer of Dimensional. Director, Vice President and Chief Privacy Officer of Dimensional Fund Advisors Canada ULC. Director of DFA Australia Limited.
|
71
Name, Position with the Fund and Age
|
Term of Office1 and Length of Service
| Principal Occupation(s) During Past 5 Years
| ||
Joseph F. Kolerich
| Since 2004 | Vice President of all the DFA Entities. Portfolio Manager for Dimensional (since April 2001). | ||
Michael F. Lane
| Since 2004 | Vice President of all the DFA Entities. Formerly, Vice President of Advisor Services at TIAA-CREF (July 2001 to September 2004). | ||
Kristina M. LaRusso
| Since 2006 | Vice President of all DFA Entities. Formerly, Operations Supervisor of Dimensional (March 2003 to December 2006). | ||
Inmoo Lee
| Since 2007 | Vice President of all the DFA Entities. Associate Professor Department of Finance and Accounting, Business School, National University of Singapore (July 2004 to present); Associate Professor, College of Business Administration, Korea University (September 2001 to May 2006).
| ||
Juliet Lee
| Since 2005 | Vice President of all the DFA Entities. Human Resources Manager of Dimensional (since January 2004). | ||
Aaron M. Marcus
| Since 2008 | Vice President and Head of Global Human Resources of Dimensional. Formerly, Global Head of Recruiting and Vice President of Goldman Sachs & Co. (June 2006 to January 2008); Global Co-Head of HR of the Equities & FICC Division, and Vice President of Goldman Sachs & Co. (May 2005 to May 2006); Head of Americas Campus Recruiting and Vice President of Goldman Sachs & Co. (April 2003 to May 2005).
| ||
David R. Martin
| Since 2007 | Vice President, Chief Financial Officer and Treasurer of all the DFA Entities. Director, Vice President, Chief Financial Officer and Treasurer of Dimensional Fund Advisors Ltd. and DFA Australia Limited. Chief Financial Officer, Treasurer, and Vice President of Dimensional Fund Advisors Canada ULC. Director of Dimensional Funds PLC and Dimensional Funds II PLC. Formerly, Executive Vice President and Chief Financial Officer of Janus Capital Group Inc. (June 2005 to March 2007); Senior Vice President of Finance at Charles Schwab & Co., Inc. (March 1999 to May 2005).
| ||
Catherine L. Newell Age: 45
| Vice President since 1997 and Secretary since 2000 | Vice President and Secretary of all the DFA Entities. Director, Vice President and Secretary of DFA Australia Limited and Dimensional Fund Advisors Ltd. (since February 2002, April 1997 and May 2002, respectively). Vice President and Secretary of Dimensional Fund Advisors Canada ULC (since June 2003). Director, Dimensional Funds PLC and Dimensional Funds II PLC (since 2002 and 2006, respectively). Formerly, Assistant Secretary of all DFA Entities, DFA Australia Limited and Dimensional Fund Advisors Ltd.
| ||
| Christian Newton Vice President Age: 34 | Since 2009 | Vice President of all DFA Entities. Web Services Manager for Dimensional Fund Advisors LP (Since January 2008). Formerly Design Manager (2005-2008) and Web Developer (2002-2005) of Dimensional Fund Advisors LP.
| ||
| Gerard K. O’Reilly Vice President Age: 32 | Since 2007 | Vice President of all the DFA Entities. Formerly, Research Associate of Dimensional Fund Advisors LP (2004 to 2006); Research Assistant in PhD program, Aeronautics Department California Institute of Technology (1998 to 2004).
| ||
| Daniel C. Ong Vice President Age: 35 | Since 2009 | Vice President of all the DFA Entities. Portfolio Manager for Dimensional Fund Advisors LP (since July 2005). Prior to 2005, Graduate Student at the University of Chicago Booth School of Business (2003-2005).
| ||
Carmen Palafox
| Since 2006 | Vice President of all the DFA Entities. Operations Manager of Dimensional Fund Advisors LP (since May 1996). | ||
Sonya Park
| Since 2005 | Vice President of all the DFA Entities. From February 2002 to January 2005, institutional client service representative of Dimensional.
|
72
Name, Position with the Fund and Age
|
Term of Office1 and Length of Service
| Principal Occupation(s) During Past 5 Years
| ||
David A. Plecha
| Since 1993 | Vice President of all the DFA Entities, DFA Australia Limited and Dimensional Fund Advisors Ltd | ||
Ted Randall
| Since 2008 | Vice President of all the DFA Entities. Formerly, Research Associate of Dimensional (2006-2008). Systems Developer of Dimensional (2001-2006). | ||
| L. Jacobo Rodriguez Vice President Age: 38 | Since 2005 | Vice President of all the DFA Entities. From August 2004 to July 2005, institutional client service representative of Dimensional. Formerly, Financial Services Analyst, Cato Institute (September 2001 to June 2004); Book Review Editor, Cato Journal, Cato Institute (May 1996 to June 2004).
| ||
David E. Schneider
| Since 2001 | Vice President of all the DFA Entities. Currently, Director of Institutional Services. | ||
Bruce A. Simmons
| Since 2009 | Vice President of all the DFA Entities. Investment Operations Manager for Dimensional Fund Advisors LP (since May 2007). Formerly, Vice President Client and Fund Reporting at Mellon Financial (September 2005-May 2007); Vice President Business Development at CUADPRO Marketing (July 2003-September 2005).
| ||
Ted R. Simpson
| Since 2007 | Vice President of all the DFA Entities. Regional Director of Dimensional (since December 2002). | ||
Bryce D. Skaff
| Since 2007 | Vice President of all the DFA Entities. Formerly, Regional Director of Dimensional (December 1999 to January 2007). | ||
Grady M. Smith
| Since 2004 | Vice President of all the DFA Entities. Prior to April 2004, Portfolio Manager of Dimensional. | ||
Carl G. Snyder
| Since 2000 | Vice President of all the DFA Entities. Formerly, Vice President of DFA Australia Limited. | ||
Lawrence R. Spieth
| Since 2004 | Vice President of all the DFA Entities. Prior to April 2004, Regional Director of Dimensional. | ||
Bradley G. Steiman
| Since 2004 | Vice President of all the DFA Entities and Director and Vice President of Dimensional Fund Advisors Canada ULC. | ||
Robert C. Trotter
| Since 2009 | Vice President of all the DFA Entities. Senior Manager Technology for Dimensional Fund Advisors LP (since March 2007). Formerly, Director of Technology at AMVESCAP (2002-2007).
| ||
Karen E. Umland
| Since 1997 | Vice President of all the DFA Entities, DFA Australia Limited, Dimensional Fund Advisors Ltd., and Dimensional Fund Advisors Canada ULC. | ||
Sunil Wahal
| Since 2009 | Vice President of all the DFA Entities. Formerly, Research Associate for Dimensional Fund Advisors LP (July 2008-January 2009); Consultant to Dimensional Fund Advisors LP (September 2005-July 2008); Jack D. Furst Professor of Finance at Arizona State University, WP Carey School of Business (July 2005-July 2008); Associate Professor of Finance at Goizueta Business School, Emory University (1997-2005).
| ||
Brian J. Walsh
| Since 2009 | Vice President of all the DFA Entities. Portfolio Manager for Dimensional Fund Advisors LP (since 2004). Formerly, Trader for Dimensional Fund Advisors LP (1997-2004).
| ||
Carol W. Wardlaw
| Since 2004 | Vice President of all the DFA Entities. Prior to April 2004, Regional Director of Dimensional. |
73
Name, Position with the Fund and Age
|
Term of Office1 and Length of Service
| Principal Occupation(s) During Past 5 Years
| ||
Weston J. Wellington
| Since 1997 | Vice President of all the DFA Entities. Formerly, Vice President of DFA Australia Limited. | ||
Daniel M. Wheeler
| Since 2001 | Vice President of all the DFA Entities. Prior to 2001 and currently, Director of Financial Advisors Services of Dimensional. Director of Dimensional Fund Advisors Ltd. (since October 2003) and President of Dimensional Fund Advisors Canada ULC (since June 2003).
| ||
Ryan Wiley
| Since 2007 | Vice President of all the DFA Entities. Senior Trader of Dimensional. Formerly, Portfolio Manager (2006 to 2007); Trader (2001 to 2006). | ||
Paul E. Wise
| Since 2005 | Vice President of all the DFA Entities. Chief Technology Officer for Dimensional (since 2004). Formerly, Principal of Turnbuckle Management Group (January 2002 to August 2004).
|
| 1 | Each officer holds office for an indefinite term at the pleasure of the Boards of Trustees/Directors and until his or her successor is elected and qualified. |
74
VOTING PROXIES ON FUND PORTFOLIO SECURITIES
A description of the policies and procedures that the Fund and the Trust use in voting proxies relating to securities held in the portfolios is available without charge, upon request, by calling collect: (512) 306-7400. Information regarding how the Advisor votes these proxies is available from the EDGAR database on the SEC’s website at http://www.sec.gov and from the Advisor’s website at http://www.dimensional.com and reflects the twelve-month period beginning July 1st and ending June 30th.
75
(Unaudited)
For shareholders that do not have an October 31, 2009 tax year end, this notice is for informational purposes only. For shareholders with an October 31, 2009 tax year end, please consult your tax advisor as to the pertinence of this notice. For the fiscal year November 1, 2008 to October 31, 2009, each Portfolio is designating the following items with regard to distributions paid during the fiscal year. All designations are based on financial information available as of the date of this annual report and, accordingly are subject to change. For each item, it is the intention of the Portfolios to designate the maximum amount permitted under the Internal Revenue Code and the regulations thereunder.
DFA Investment | Net Investment Income Distributions | Short-Term Capital Gain Distributions | Long-Term Capital Gain Distributions | Total Distributions | Qualifying For Corporate Dividends Received Deduction(1) | Qualifying Dividend Income(2) | Foreign Tax Credit(3) | Foreign Source Income(4) | Qualifying Interest Income(5) | Qualifying Short-Term Capital Gain(6) | ||||||||||
Tax-Managed U.S. Marketwide Value Portfolio | 100% | — | — | 100% | 100% | 100% | — | — | 100% | 100% | ||||||||||
Tax-Managed U.S. Equity Portfolio | 100% | — | — | 100% | 100% | 100% | — | — | 100% | 100% | ||||||||||
Tax-Managed U.S. Targeted Value Portfolio | 100% | — | — | 100% | 100% | 100% | — | — | 100% | 100% | ||||||||||
Tax-Managed U.S. Small Cap Portfolio | 100% | — | — | 100% | 100% | 100% | — | — | 100% | 100% | ||||||||||
Tax-Managed DFA International Value Portfolio | 100% | — | — | 100% | 100% | 100% | 7% | 107% | 100% | 100% |
| (1) | Qualifying dividends represent dividends which qualify for the corporate dividends received deduction and is reflected as a percentage of ordinary income distributions (the total of short-term capital gain and net investment income distributions). |
| (2) | The percentage in this column represents the amount of “Qualifying Dividend Income” as created by the Jobs and Growth Tax Relief Reconciliation Act of 2003 and is reflected as a percentage of ordinary income distributions (the total of short-term capital gain and net investment income distributions). Please note that these percentages are designated only, refer to your 1099 for actual qualified dividend income. |
| (3) | “Foreign Tax Credit” represents dividends which qualify for the foreign tax credit pass through and is reflected as a percentage of investment company taxable income (the total of short-term capital gain and net investment income distributions). |
| (4) | “Foreign Source Income” represents the portion of dividends derived from foreign sources, an is reflected as a percentage of ordinary income (i.e., the sum of short-term capital gain and net investment income) distributions made during the period. |
| (5) | The percentage in this column represents the amount of “Qualifying Interest Income” as created by The American Jobs Creation Act of 2004. The information is reflected as a percentage of ordinary income distributions (the total of short-term capital gain and net investment income distributions). |
| (6) | The percentage in this column represents the amount of “Qualifying Short-Term Capital Gain” as created by The American Jobs Creation Act of 2004. The information is reflected as a percentage of ordinary income distributions (the total of short-term capital gain and net investment income distributions). |
76

| ITEM 2. | CODE OF ETHICS. |
The Registrant has adopted, as of the end of the period covered by this Form N-CSR (the “Report”), a code of ethics that applies to the Registrant’s principal executive officer and principal financial officer (the “Code of Business Ethics”). The Registrant has not made any substantive amendments to the Code of Business Ethics during the period covered by this Report. The Registrant also has not granted any waiver from any provisions of the Code of Business Ethics during the period covered by this Report. A copy of the Code of Business Ethics is filed as an exhibit to this Report.
| ITEM 3. | AUDIT COMMITTEE FINANCIAL EXPERT. |
The Registrant’s Board of Trustees has determined that Abbie J. Smith possesses the technical attributes to qualify as an “audit committee financial expert” serving on the Registrant’s Audit Committee and has designated Ms. Smith as the “audit committee financial expert.” Ms. Smith
earned a Ph.D. in Accounting, and has taught Accounting at the graduate level since 1980. Ms. Smith’s education and career have provided her with an understanding of generally accepted accounting principles and financial statements; the ability to assess the general application of such principles in connection with the accounting for estimates, accruals and reserves; and experience preparing, analyzing and evaluating financial statements that present a breadth and level of complexity of issues that can reasonably be expected to be raised by the Registrant’s financial statements. In addition, Ms. Smith has served on the boards of directors and audit committees of entities other than the Registrant. Ms. Smith is independent under the standards set forth in Item 3 of Form N-CSR.
| ITEM 4. | PRINCIPAL ACCOUNTANT FEES AND SERVICES. |
(a) | Audit Fees | |
Fiscal Year Ended October 31, 2009: $388,560 | ||
Fiscal Year Ended October 31, 2008: $366,368 |
(b) | Audit-Related Fees | |||||
Fees for Registrant – Fiscal Year Ended October 31, 2009: $24,608 | ||||||
Fiscal Year Ended October 31, 2008: $25,517 | ||||||
For fiscal years ended October 31, 2008 and October 31, 2009, Audited-Related Fees included fees for services related to limited procedures performed in connection with the production of the Registrant’s semi-annual financial statements.
Audit-Related Fees required to be approved pursuant to paragraph (c)(7)(ii) of Rule 2-01 of Regulation S-X
| Fiscal Year Ended October 31, 2009: $158,695 | ||||||||
| Fiscal Year Ended October 31, 2008: $165,000 | ||||||||
For the fiscal years ended October 31, 2009 and October 31, 2008, Audit-Related Fees required to be approved pursuant to paragraph (c)(7)(ii) of Rule 2-01 of Regulation S-X included fees for services rendered in connection with the issuance of a Type II SAS 70 over controls at the Registrant’s investment adviser.
(c) | Tax Fees | |||||
Fees for Registrant – Fiscal Year Ended October 31, 2009: $89,278 | ||||||
Fiscal Year Ended October 31, 2008: $97,206 | ||||||
Tax Fees included, for the fiscal years ended October 31, 2008 and October 31, 2009, fees for tax services in connection with the Registrant’s excise tax calculations, review of the Registrant’s applicable tax returns and capital gains tax services in India.
There were no Tax Fees required to be approved pursuant to paragraph (c)(7)(ii) of Rule 2-01 of Regulation S-X during the fiscal years indicated above.
| (d) | All Other Fees |
Fees for Registrant – Fiscal Year Ended October 31, 2009: $0
Fiscal Year Ended October 31, 2008: $0
There were no “All Other Fees” required to be approved pursuant to paragraph (c)(7)(ii) of Rule 2-01 of Regulation S-X during the fiscal years indicated above.
| (e)(1) Audit Committee’s Pre-Approval Policies and Procedures |
Pre-Approval Policies and Procedures
as adopted by the
Audit Committees
of
DFA Investment Dimensions Group Inc.
Dimensional Emerging Markets Value Fund
Dimensional Investment Group Inc.
The DFA Investment Trust Company
(together, the “Funds”)
The Sarbanes-Oxley Act of 2002 (the “Act”) and the rules (the “Rules”) adopted by the U.S. Securities and Exchange Commission (the “SEC”) require that the Funds’ Audit Committees (together, the “Committee”) pre-approve all audit services and non-audit services provided to the Funds by their independent registered public accounting firm (the “Auditor”). The Act and the Rules also require that the Committee pre-approve all non-audit services provided by the Auditor to Dimensional Fund Advisors LP (“Dimensional”), the Funds’ investment advisor, and to affiliates of Dimensional that provide ongoing services to the Funds (with Dimensional, together the “Service Affiliates”) if the services directly impact the Funds’ operations and financial reporting.
The following policies and procedures govern the ways in which the Committee will pre-approve audit and various types of non-audit services that the Auditor provides to the Funds and to Service Affiliates. These policies and procedures do not apply in the case of audit services that the Auditor provides to Service Affiliates, nor do they apply to services that an audit firm other than the Auditor provides to such entities.
These policies and procedures comply with the requirements for pre-approval, but also provide a mechanism by which management of the Funds may request and secure pre-approval of audit and non-audit services in an orderly manner with minimal disruption to normal business operations. Pre-approval of non-audit services may be achieved through a combination of the procedures described in Sections C and D below.
| A. | General |
| 1. | The Committee must pre-approve all audit services and non-audit services that the Auditor provides to the Funds. |
| 2. | The Committee must pre-approve any engagement of the Auditor to provide non-audit services to any Service Affiliate during the period of the Auditor’s engagement to provide audit services to the Funds, if the non-audit services to the Service Affiliate directly impact the Funds’ operations and financial reporting. |
| B. | Pre-Approval of Audit Services to the Funds |
| 1. | The Committee shall approve the engagement of an independent registered public accounting firm to certify the Funds’ financial statements for each fiscal year (the “Engagement”). The approval of the Engagement shall not be delegated to a Designated Member (as that term is defined in Section D below). In approving the Engagement, the Committee shall obtain, review and consider sufficient information concerning the proposed Auditor to enable the Committee to make a reasonable evaluation of the Auditor’s qualifications and independence. The Committee also shall consider the Auditor’s proposed fees for the Engagement, in light of the scope and nature of the audit services that the Funds will receive. |
| 2. | The Committee shall report to the Boards of Directors/Trustees of the Funds (together, the “Board”) regarding its approval of the Engagement and of the proposed fees for the Engagement, and the basis for such approval. |
| 3. | Unless otherwise in accordance with applicable law, the Engagement, in any event, shall require that the Auditor be selected by the vote, cast in person, of a majority of the members of the Board who are not “interested persons” of the Funds (as that term is defined in Section 2(a)(19) of the Investment Company Act of 1940) (the “Independent Directors”). |
| C. | Pre-Approval of Non-Audit Services to the Funds and to Service Affiliates—by Types of Services |
| 1. | The Committee may pre-approve types of non-audit services to the Funds and their Service Affiliates pursuant to this Section C. |
| 2. | Annually, at such time as the Committee considers the Engagement of the Auditor, management of the Funds, in consultation with the Auditor, shall provide to the Committee, for its consideration and action, the following: (a) a list of those types of non-audit services, if any, that the Funds may request from the Auditor during the fiscal year; and (b) a list of those types of non-audit services directly impacting the Funds’ operations and financial reporting that Service Affiliates may request from the Auditor during the fiscal year. |
| 3. | The lists submitted to the Committee shall describe the types of non-audit services in reasonable detail and shall include an estimated budget (or budgeted range) of fees, where possible, and such other information as the Committee may request. |
| 4. | The Committee’s pre-approval of the types of non-audit services submitted pursuant to this Section C shall constitute authorization for management of the Funds to utilize the Auditor for the types of non-audit services so pre-approved, if needed or desired during the fiscal year. |
| 5. | A list of the types of non-audit services pre-approved by the Committee pursuant to this Section C will be distributed to management of the Service Affiliates and the appropriate partners of the Auditor. Periodically, the Auditor will discuss with the Committee those non-audit services that have been or are being provided pursuant to this Section C. |
| D. | Pre-Approval of Non-Audit Services to the Funds and to Service Affiliates—Project-by-Project Basis |
| 1. | The Committee also may pre-approve non-audit services on a project-by-project basis pursuant to this Section D. |
| 2. | Management of the Funds, in consultation with the Auditor, may submit either to the Committee or to the Designated Member, as provided in this Section D, for their consideration and action, a pre-approval request identifying one or more non-audit service projects. The request so submitted shall describe the project(s) in reasonable detail and shall include an estimated budget (or budgeted range) of fees and such other information as the Committee or the Designated Member, as appropriate, shall request. |
| 3. | The Committee, from time to time, shall designate one or more of its members who are Independent Directors (each a “Designated Member”) to consider, on the Committee’s behalf, any non-audit services, whether to the Funds or to any Service Affiliate, that have not been pre-approved by the Committee. The Designated Member also shall review, on the Committee’s behalf, any proposed material change in the nature or extent of any non-audit services previously approved. The Funds’ management, in consultation with the Auditor, shall explain why such non-audit services or material change in non-audit services are necessary and appropriate and the anticipated costs thereof. |
| 4. | The Designated Member will review the requested non-audit services or proposed material change in such services and will either: |
| (a) | pre-approve, pre-approve subject to conditions, or disapprove any such requested services, or any proposed material change in services, whether to the Funds or to a Service Affiliate; or |
| (b) | refer such matter to the Committee for its consideration and action. |
In considering any requested non-audit services or proposed material change in such services, the Designated Member’s authority shall be limited to approving
non-audit services or proposed material changes that do not exceed $10,000 in value.
| 5. | The Designated Member’s pre-approval (or pre-approval subject to conditions) of the requested non-audit services or proposed material change in services pursuant to this Section D shall constitute authorization for the management of the Funds or the Service Affiliate, as the case may be, to utilize the Auditor for the non-audit services so pre-approved. Any action by the Designated Member in approving a requested non-audit service shall be presented for ratification by the Committee not later than at its next scheduled meeting. If the Designated Member does not approve the Auditor providing the requested non-audit service, the matter may be presented to the full Committee for its consideration and action. |
| E. | Amendment; Annual Review |
| 1. | The Committee may amend these procedures from time to time. |
| 2. | These procedures shall be reviewed annually by the Committee. |
| F. | Recordkeeping |
| 1. | The Funds shall maintain a written record of all decisions made by the Committee or by a Designated Member pursuant to these procedures, together with appropriate supporting materials. |
| 2. | In connection with the approval of any non-audit service pursuant to the de minimis exception provided in the Rules, a record shall be made indicating that each of the conditions for this exception, as set forth in the Rules, has been satisfied. |
| 3. | A copy of these Procedures (and of any amendments to these Procedures) shall be maintained and preserved permanently in an easily accessible place. The written records referred to in paragraphs 1 and 2 of this Section F shall be maintained and preserved for six years from the end of the fiscal year in which the actions recorded were taken, for at least the first two years in an easily accessible location. |
| (e)(2) | The fees disclosed in Items 4(b), 4(c) or 4(d) were approved by the Registrant’s Audit Committee but not pursuant to paragraph (c)(7)(i)(C) of Rule 2-01 of Regulation S-X. |
| (f) | The percentage of hours expended on the principal accountant’s engagement to audit the Registrant’s financial statements for the fiscal year ended October 31, 2009 that were attributed to work performed by persons other than the principal accountant’s full time, permanent employees was not greater than 50%. |
| (g) | Aggregate Non-Audit Fees |
| Fiscal Year Ended October 31, 2009: $627,111 | ||||||
| Fiscal Year Ended October 31, 2008: $738,472 | ||||||
| (h) | The Registrant’s Audit Committee has considered whether the provision of non-audit services that were rendered to the Registrant’s investment adviser, and any entity controlling, controlled by, or under common control with the investment adviser that provides ongoing services to the Registrant, that were not pre-approved pursuant to paragraph (c)(7)(ii) of Rule 2-01 of Regulation S-X is compatible with maintaining the principal accountant’s independence. |
| ITEM 5. | AUDIT COMMITTEE OF LISTED REGISTRANTS. |
This item is not applicable to the Registrant because it is not a listed issuer.
| ITEM 6. | INVESTMENTS. |
(a) Please see the schedules of investments contained in the reports to stockholders included under Item 1 of this Report except as discussed below. Provided below is a complete schedule of investments for each series of the Registrant that provided a summary schedule of portfolio holdings in its report to stockholders included under Item 1 in lieu of a complete schedule of investments. The schedules of investments for the following series are provided below:
Name of Entity for which Schedule of Investments is Provided |
| The U.S. Large Company Series |
| The U.S. Large Cap Value Series |
| The DFA International Value Series |
| The Japanese Small Company Series |
| The Asia Pacific Small Company Series |
| The United Kingdom Small Company Series |
| The Continental Small Company Series |
| The Canadian Small Company Series |
| The Emerging Markets Series |
| The Emerging Markets Small Cap Series |
| The Tax-Managed U.S. Marketwide Value Series |
The Tax-Managed U.S. Equity Series |
THE DFA INVESTMENT TRUST COMPANY
DEFINITIONS OF ABBREVIATIONS AND FOOTNOTES
Schedules of Investments
Investment Abbreviations
| ADR | American Depositary Receipt | |
| FHLMC | Federal Home Loan Mortgage Corporation | |
| FNMA | Federal National Mortgage Association | |
| P.L.C. | Public Limited Company | |
| REIT | Real Estate Investment Trust |
Investment Footnotes
| † | See Note B to Financial Statements. |
| †† | Securities have generally been fair valued. See Note B to Financial Statements. |
| * | Non-Income Producing Securities. |
| # | Total or Partial Securities on Loan. |
| @ | Security purchased with cash proceeds from Securities on Loan. |
| • | Security is being fair valued as of October 31, 2009. |
| (r) | The adjustable rate shown is effective as of October 31, 2009. |
| § | Affiliated Fund. |
| — | Amounts designated as — are either zero or rounded to zero. |
1
THE U.S. LARGE COMPANY SERIES
SCHEDULE OF INVESTMENTS
October 31, 2009
| Shares | Value† | ||||
COMMON STOCKS — (92.1%) | |||||
Consumer Discretionary — (8.5%) | |||||
#Abercrombie & Fitch Co. | 33,482 | $ | 1,098,879 | ||
*Amazon.com, Inc. | 126,572 | 15,038,019 | |||
#*Apollo Group, Inc. Class A | 48,560 | 2,772,776 | |||
#*AutoNation, Inc. | 35,918 | 619,226 | |||
*Autozone, Inc. | 11,603 | 1,570,002 | |||
*Bed Bath & Beyond, Inc. | 99,697 | 3,510,331 | |||
#Best Buy Co., Inc. | 129,969 | 4,962,216 | |||
*Big Lots, Inc. | 31,453 | 787,898 | |||
Black & Decker Corp. | 22,904 | 1,081,527 | |||
Carnival Corp. | 166,799 | 4,857,187 | |||
CBS Corp. Class B | 257,996 | 3,036,613 | |||
#Coach, Inc. | 121,087 | 3,992,238 | |||
Comcast Corp. Class A | 1,092,473 | 15,840,859 | |||
#D.R. Horton, Inc. | 105,020 | 1,151,019 | |||
#Darden Restaurants, Inc. | 53,081 | 1,608,885 | |||
DeVry, Inc. | 23,569 | 1,303,130 | |||
#*DIRECTV Group, Inc. (The) | 171,135 | 4,500,850 | |||
Disney (Walt) Co. | 707,515 | 19,364,686 | |||
#Eastman Kodak Co. | 102,099 | 382,871 | |||
*Expedia, Inc. | 80,162 | 1,817,273 | |||
Family Dollar Stores, Inc. | 53,190 | 1,505,277 | |||
*Ford Motor Co. | 1,226,281 | 8,583,967 | |||
Fortune Brands, Inc. | 57,196 | 2,227,784 | |||
#*GameStop Corp. Class A | 62,688 | 1,522,692 | |||
Gannett Co., Inc. | 89,365 | 877,564 | |||
Gap, Inc. | 183,301 | 3,911,643 | |||
#Genuine Parts Co. | 60,730 | 2,124,943 | |||
*Goodyear Tire & Rubber Co. | 92,084 | 1,186,042 | |||
H&R Block, Inc. | 127,644 | 2,340,991 | |||
Harley-Davidson, Inc. | 89,296 | 2,225,256 | |||
*Harman International Industries, Inc. | 26,392 | 992,603 | |||
Hasbro, Inc. | 47,929 | 1,307,024 | |||
#Home Depot, Inc. | 648,891 | 16,280,675 | |||
International Game Technology | 112,795 | 2,012,263 | |||
#*Interpublic Group of Cos., Inc. | 185,053 | 1,114,019 | |||
#J.C. Penney Co., Inc. | 89,790 | 2,974,743 | |||
Johnson Controls, Inc. | 255,253 | 6,105,652 | |||
#KB Home | 28,163 | 399,351 | |||
*Kohl’s Corp. | 116,329 | 6,656,345 | |||
#Leggett & Platt, Inc. | 59,438 | 1,148,937 | |||
#Lennar Corp. Class A | 58,705 | 739,683 | |||
#Limited Brands, Inc. | 101,642 | 1,788,899 | |||
Lowe’s Cos., Inc. | 562,477 | 11,007,675 | |||
Macy’s, Inc. | 160,084 | 2,812,676 | |||
#Marriott International, Inc. Class A | 95,692 | 2,398,042 | |||
#Mattel, Inc. | 137,032 | 2,594,016 | |||
McDonald’s Corp. | 415,454 | 24,349,759 | |||
McGraw-Hill Cos., Inc. | 119,838 | 3,448,938 | |||
Meredith Corp. | 13,862 | 375,106 | |||
#*New York Times Co. Class A (The) | 44,003 | 350,704 | |||
#Newell Rubbermaid, Inc. | 105,714 | 1,533,910 | |||
News Corp. Class A | 855,886 | 9,859,807 | |||
#NIKE, Inc. Class B | 147,987 | 9,201,832 | |||
#Nordstrom, Inc. | 62,711 | 1,992,956 | |||
*Office Depot, Inc. | 104,586 | 632,745 | |||
Omnicom Group, Inc. | 118,302 | 4,055,393 | |||
#*O’Reilly Automotive, Inc. | 52,054 | 1,940,573 | |||
#Polo Ralph Lauren Corp. | 22,011 | 1,638,059 | |||
2
THE U.S. LARGE COMPANY SERIES
CONTINUED
| Shares | Value† | ||||
Consumer Discretionary — (Continued) | |||||
#*Pulte Homes, Inc. | 120,324 | $ | 1,084,119 | ||
*RadioShack Corp. | 47,651 | 804,825 | |||
Scripps Networks Interactive, Inc. | 33,964 | 1,282,481 | |||
#*Sears Holdings Corp. | 18,996 | 1,289,069 | |||
#Sherwin-Williams Co. | 37,184 | 2,120,975 | |||
Snap-On, Inc. | 21,970 | 802,564 | |||
Stanley Works (The) | 30,208 | 1,366,308 | |||
#Staples, Inc. | 274,981 | 5,967,088 | |||
*Starbucks Corp. | 280,599 | 5,325,769 | |||
#Starwood Hotels & Resorts Worldwide, Inc. | 71,123 | 2,066,834 | |||
Target Corp. | 286,217 | 13,861,489 | |||
#Tiffany & Co. | 47,246 | 1,856,295 | |||
Time Warner Cable, Inc. | 134,137 | 5,290,363 | |||
Time Warner, Inc. | 451,338 | 13,594,301 | |||
TJX Cos., Inc. (The) | 161,352 | 6,026,497 | |||
V.F. Corp. | 33,941 | 2,411,169 | |||
*Viacom, Inc. Class B | 231,022 | 6,373,897 | |||
Washington Post Co. | 2,361 | 1,019,952 | |||
#Whirlpool Corp. | 28,181 | 2,017,478 | |||
Wyndham Worldwide Corp. | 67,995 | 1,159,315 | |||
#*Wynn Resorts, Ltd. | 26,245 | 1,423,004 | |||
Yum! Brands, Inc. | 177,609 | 5,852,217 | |||
Total Consumer Discretionary | 318,511,038 | ||||
Consumer Staples — (11.0%) | |||||
Altria Group, Inc. | 788,525 | 14,280,188 | |||
Archer-Daniels-Midland Co. | 244,411 | 7,361,659 | |||
Avon Products, Inc. | 162,531 | 5,209,119 | |||
#Brown-Forman Corp. Class B | 42,292 | 2,064,273 | |||
Campbell Soup Co. | 73,347 | 2,328,767 | |||
Clorox Co. | 53,046 | 3,141,915 | |||
Coca-Cola Co. | 882,204 | 47,030,295 | |||
Coca-Cola Enterprises, Inc. | 120,739 | 2,302,493 | |||
Colgate-Palmolive Co. | 189,741 | 14,919,335 | |||
ConAgra, Inc. | 168,296 | 3,534,216 | |||
*Constellation Brands, Inc. Class A | 75,643 | 1,196,672 | |||
Costco Wholesale Corp. | 165,550 | 9,411,518 | |||
CVS Caremark Corp. | 549,409 | 19,394,138 | |||
*Dean Foods Co. | 68,630 | 1,251,125 | |||
*Dr Pepper Snapple Group, Inc. | 96,703 | 2,636,124 | |||
Estee Lauder Cos., Inc. | 44,927 | 1,909,398 | |||
General Mills, Inc. | 123,879 | 8,166,104 | |||
H.J. Heinz Co. | 119,985 | 4,828,196 | |||
Hershey Co. (The) | 63,128 | 2,385,607 | |||
Hormel Foods Corp. | 26,567 | 968,633 | |||
J.M. Smucker Co. | 45,279 | 2,387,562 | |||
Kellogg Co. | 97,646 | 5,032,675 | |||
Kimberly-Clark Corp. | 157,789 | 9,650,375 | |||
Kraft Foods, Inc. | 561,489 | 15,452,177 | |||
Kroger Co. (The) | 247,994 | 5,736,101 | |||
Lorillard, Inc. | 62,871 | 4,886,334 | |||
#McCormick & Co., Inc. | 49,749 | 1,741,712 | |||
Molson Coors Brewing Co. | 59,692 | 2,923,117 | |||
Pepsi Bottling Group, Inc. | 54,836 | 2,053,060 | |||
PepsiCo, Inc. | 593,045 | 35,908,875 | |||
Philip Morris International, Inc. | 736,409 | 34,876,330 | |||
Procter & Gamble Co. | 1,111,163 | 64,447,454 | |||
Reynolds American, Inc. | 64,330 | 3,118,718 | |||
Safeway, Inc. | 158,553 | 3,540,488 | |||
Sara Lee Corp. | 264,823 | 2,989,852 | |||
SUPERVALU, Inc. | 80,700 | 1,280,709 | |||
3
THE U.S. LARGE COMPANY SERIES
CONTINUED
| Shares | Value† | ||||
Consumer Staples — (Continued) | |||||
Sysco Corp. | 224,988 | $ | 5,950,933 | ||
#Tyson Foods, Inc. Class A | 116,228 | 1,455,175 | |||
Walgreen Co. | 377,779 | 14,291,380 | |||
Wal-Mart Stores, Inc. | 822,201 | 40,846,946 | |||
*Whole Foods Market, Inc. | 53,477 | 1,714,473 | |||
Total Consumer Staples | 414,604,221 | ||||
Energy — (11.4%) | |||||
Anadarko Petroleum Corp. | 186,733 | 11,377,642 | |||
Apache Corp. | 127,812 | 12,029,665 | |||
#Baker Hughes, Inc. | 117,964 | 4,962,745 | |||
BJ Services Co. | 111,205 | 2,135,136 | |||
Cabot Oil & Gas Corp. | 39,455 | 1,517,834 | |||
*Cameron International Corp. | 83,693 | 3,094,130 | |||
#Chesapeake Energy Corp. | 244,264 | 5,984,468 | |||
Chevron Corp. | 763,458 | 58,435,075 | |||
ConocoPhillips | 564,511 | 28,327,162 | |||
CONSOL Energy, Inc. | 68,789 | 2,944,857 | |||
#*Denbury Resources, Inc. | 94,956 | 1,386,358 | |||
Devon Energy Corp. | 168,945 | 10,932,431 | |||
#Diamond Offshore Drilling, Inc. | 26,458 | 2,520,125 | |||
El Paso Corp. | 266,931 | 2,618,593 | |||
ENSCO International, Inc. | 54,225 | 2,482,963 | |||
EOG Resources, Inc. | 95,905 | 7,831,602 | |||
Exxon Mobil Corp. | 1,829,468 | 131,117,972 | |||
*FMC Technologies, Inc. | 46,615 | 2,451,949 | |||
Halliburton Co. | 343,265 | 10,026,771 | |||
Hess Corp. | 110,806 | 6,065,520 | |||
Marathon Oil Corp. | 269,417 | 8,613,261 | |||
Massey Energy Co. | 32,536 | 946,472 | |||
Murphy Oil Corp. | 72,640 | 4,441,210 | |||
#*Nabors Industries, Ltd. | 108,128 | 2,252,306 | |||
*National-Oilwell, Inc. | 159,200 | 6,525,608 | |||
Noble Energy, Inc. | 66,008 | 4,332,105 | |||
Occidental Petroleum Corp. | 308,646 | 23,420,058 | |||
Peabody Energy Corp. | 101,888 | 4,033,746 | |||
#Pioneer Natural Resources Co. | 43,802 | 1,800,700 | |||
Range Resources Corp. | 59,864 | 2,996,193 | |||
Rowan Cos., Inc. | 43,300 | 1,006,725 | |||
Schlumberger, Ltd. | 455,987 | 28,362,391 | |||
#Smith International, Inc. | 83,954 | 2,328,044 | |||
*Southwestern Energy Co. | 131,140 | 5,715,081 | |||
Spectra Energy Corp. | 245,884 | 4,701,302 | |||
Sunoco, Inc. | 44,501 | 1,370,631 | |||
#Tesoro Petroleum Corp. | 53,123 | 751,159 | |||
Valero Energy Corp. | 214,231 | 3,877,581 | |||
Williams Cos., Inc. (The) | 221,923 | 4,183,249 | |||
XTO Energy, Inc. | 220,870 | 9,179,357 | |||
Total Energy | 429,080,177 | ||||
Financials — (12.5%) | |||||
Aflac, Inc. | 177,977 | 7,384,266 | |||
Allstate Corp. | 204,191 | 6,037,928 | |||
American Express Co. | 452,705 | 15,772,242 | |||
#*American International Group, Inc. | 51,230 | 1,722,353 | |||
Ameriprise Financial, Inc. | 97,073 | 3,365,521 | |||
AON Corp. | 104,489 | 4,023,871 | |||
Assurant, Inc. | 44,892 | 1,343,618 | |||
Bank of America Corp. | 3,293,490 | 48,019,084 | |||
Bank of New York Mellon Corp. | 457,892 | 12,207,401 | |||
BB&T Corp. | 259,467 | 6,203,856 | |||
4
THE U.S. LARGE COMPANY SERIES
CONTINUED
| Shares | Value† | ||||
Financials — (Continued) | |||||
Capital One Financial Corp. | 173,196 | $ | 6,338,974 | ||
#*CB Richard Ellis Group, Inc. | 91,429 | 946,290 | |||
Charles Schwab Corp. (The) | 362,369 | 6,283,478 | |||
Chubb Corp. | 133,200 | 6,462,864 | |||
Cincinnati Financial Corp. | 61,911 | 1,570,063 | |||
Citigroup, Inc. | 4,964,744 | 20,305,803 | |||
CME Group, Inc. | 25,287 | 7,652,099 | |||
Comerica, Inc. | 57,526 | 1,596,347 | |||
Discover Financial Services | 203,931 | 2,883,584 | |||
#*E*TRADE Financial Corp. | 548,126 | 800,264 | |||
#Federated Investors, Inc. | 33,679 | 884,074 | |||
Fifth Third Bancorp | 302,760 | 2,706,674 | |||
*First Horizon National Corp. | 83,228 | 984,587 | |||
Franklin Resources, Inc. | 56,992 | 5,963,073 | |||
Genworth Financial, Inc. | 183,187 | 1,945,446 | |||
Goldman Sachs Group, Inc. | 194,617 | 33,117,975 | |||
Hartford Financial Services Group, Inc. | 146,282 | 3,586,835 | |||
Hudson City Bancorp, Inc. | 179,555 | 2,359,353 | |||
Huntington Bancshares, Inc. | 271,933 | 1,036,065 | |||
#*IntercontinentalExchange, Inc. | 27,853 | 2,790,592 | |||
Invesco, Ltd. | 158,383 | 3,349,800 | |||
#Janus Capital Group, Inc. | 69,329 | 909,596 | |||
JPMorgan Chase & Co. | 1,497,052 | 62,531,862 | |||
#KeyCorp | 334,444 | 1,802,653 | |||
#Legg Mason, Inc. | 61,819 | 1,799,551 | |||
*Leucadia National Corp. | 72,360 | 1,625,929 | |||
Lincoln National Corp. | 115,001 | 2,740,474 | |||
Loews Corp. | 138,469 | 4,583,324 | |||
#M&T Bank Corp. | 31,432 | 1,975,501 | |||
#Marsh & McLennan Cos., Inc. | 199,409 | 4,678,135 | |||
Marshall & Ilsley Corp. | 191,909 | 1,020,956 | |||
*MBIA, Inc. | 60,176 | 244,315 | |||
MetLife, Inc. | 311,639 | 10,605,075 | |||
#Moody’s Corp. | 74,662 | 1,767,996 | |||
Morgan Stanley | 517,407 | 16,619,113 | |||
*NASDAQ OMX Group, Inc. (The) | 54,025 | 975,692 | |||
Northern Trust Corp. | 91,897 | 4,617,824 | |||
NYSE Euronext, Inc. | 98,976 | 2,558,530 | |||
#People’s United Financial, Inc. | 132,618 | 2,125,867 | |||
#Plum Creek Timber Co., Inc. | 61,979 | 1,939,323 | |||
PNC Financial Services Group, Inc. | 175,646 | 8,596,115 | |||
#Principal Financial Group, Inc. | 121,412 | 3,040,156 | |||
*Progressive Corp. | 258,329 | 4,133,264 | |||
Prudential Financial, Inc. | 176,254 | 7,971,968 | |||
Regions Financial Corp. | 452,320 | 2,189,229 | |||
*SLM Corp. | 178,009 | 1,726,687 | |||
State Street Corp. | 188,242 | 7,902,399 | |||
#SunTrust Banks, Inc. | 189,893 | 3,628,855 | |||
T. Rowe Price Group, Inc. | 97,500 | 4,751,175 | |||
#Torchmark Corp. | 31,495 | 1,278,697 | |||
Travelers Cos., Inc. (The) | 216,059 | 10,757,578 | |||
#U.S. Bancorp | 727,850 | 16,900,677 | |||
Unum Group | 126,162 | 2,516,932 | |||
Wells Fargo & Co. | 1,778,388 | 48,941,238 | |||
XL Capital, Ltd. | 130,258 | 2,137,534 | |||
Zions Bancorporation | 48,131 | 681,535 | |||
Total Financials | 471,920,135 | ||||
Health Care — (11.7%) | |||||
Abbott Laboratories | 588,498 | 29,760,344 | |||
Aetna, Inc. | 166,166 | 4,325,301 | |||
5
THE U.S. LARGE COMPANY SERIES
CONTINUED
| Shares | Value† | ||||
Health Care — (Continued) | |||||
Allergan, Inc. | 117,063 | $ | 6,584,794 | ||
AmerisourceBergen Corp. | 113,159 | 2,506,472 | |||
*Amgen, Inc. | 386,571 | 20,770,460 | |||
Bard (C.R.), Inc. | 37,160 | 2,789,601 | |||
Baxter International, Inc. | 229,440 | 12,403,526 | |||
Becton Dickinson & Co. | 91,131 | 6,229,715 | |||
*Biogen Idec, Inc. | 109,961 | 4,632,657 | |||
*Boston Scientific Corp. | 573,874 | 4,659,857 | |||
Bristol-Myers Squibb Co. | 754,098 | 16,439,336 | |||
Cardinal Health, Inc. | 136,924 | 3,880,426 | |||
*CareFusion Corp. | 68,526 | 1,532,927 | |||
*Celgene Corp. | 174,588 | 8,912,717 | |||
*Cephalon, Inc. | 28,416 | 1,550,945 | |||
Cigna Corp. | 103,813 | 2,890,154 | |||
*Coventry Health Care, Inc. | 56,940 | 1,129,120 | |||
*DaVita, Inc. | 39,590 | 2,099,458 | |||
#DENTSPLY International, Inc. | 56,566 | 1,864,415 | |||
Eli Lilly & Co. | 384,920 | 13,091,129 | |||
*Express Scripts, Inc. | 104,464 | 8,348,763 | |||
*Forest Laboratories, Inc. | 114,842 | 3,177,678 | |||
*Genzyme Corp. | 102,900 | 5,206,740 | |||
*Gilead Sciences, Inc. | 344,234 | 14,647,157 | |||
*Hospira, Inc. | 61,322 | 2,737,414 | |||
*Humana, Inc. | 64,585 | 2,427,104 | |||
IMS Health, Inc. | 69,431 | 1,137,974 | |||
#*Intuitive Surgical, Inc. | 14,441 | 3,557,540 | |||
Johnson & Johnson | 1,049,083 | 61,948,351 | |||
*King Pharmaceuticals, Inc. | 94,460 | 956,880 | |||
*Laboratory Corp. of America Holdings | 41,227 | 2,840,128 | |||
*Life Technologies Corp. | 67,129 | 3,166,475 | |||
McKesson Corp. | 101,314 | 5,950,171 | |||
*Medco Health Solutions, Inc. | 180,344 | 10,120,905 | |||
Medtronic, Inc. | 421,338 | 15,041,767 | |||
#Merck & Co., Inc. | 802,803 | 24,830,697 | |||
*Millipore Corp. | 21,145 | 1,416,926 | |||
#*Mylan, Inc. | 116,233 | 1,887,624 | |||
#*Patterson Cos., Inc. | 35,388 | 903,456 | |||
PerkinElmer, Inc. | 44,426 | 826,768 | |||
Pfizer, Inc. | 3,069,869 | 52,279,869 | |||
Quest Diagnostics, Inc. | 59,396 | 3,322,018 | |||
Schering-Plough Corp. | 622,008 | 17,540,626 | |||
*St. Jude Medical, Inc. | 132,469 | 4,514,544 | |||
Stryker Corp. | 107,450 | 4,942,700 | |||
*Tenet Healthcare Corp. | 164,825 | 843,904 | |||
*Thermo Fisher Scientific, Inc. | 155,375 | 6,991,875 | |||
UnitedHealth Group, Inc. | 442,510 | 11,483,134 | |||
#*Varian Medical Systems, Inc. | 47,787 | 1,958,311 | |||
*Waters Corp. | 36,361 | 2,088,212 | |||
*Watson Pharmaceuticals, Inc. | 40,248 | 1,385,336 | |||
*WellPoint, Inc. | 180,844 | 8,456,265 | |||
*Zimmer Holdings, Inc. | 81,581 | 4,288,713 | |||
Total Health Care | 439,279,379 | ||||
Industrials — (9.2%) | |||||
3M Co. | 265,836 | 19,557,555 | |||
Avery Dennison Corp. | 42,919 | 1,530,062 | |||
B.F. Goodrich Co. | 47,197 | 2,565,157 | |||
#Boeing Co. | 276,538 | 13,218,516 | |||
Burlington Northern Santa Fe Corp. | 99,669 | 7,507,069 | |||
#C.H. Robinson Worldwide, Inc. | 64,098 | 3,532,441 | |||
#Caterpillar, Inc. | 236,514 | 13,022,461 | |||
6
THE U.S. LARGE COMPANY SERIES
CONTINUED
| Shares | Value† | ||||
Industrials — (Continued) | |||||
Cintas Corp. | 50,021 | $ | 1,385,082 | ||
CSX Corp. | 149,236 | 6,294,774 | |||
#Cummins, Inc. | 76,823 | 3,307,998 | |||
#Danaher Corp. | 98,591 | 6,726,864 | |||
Deere & Co. | 161,007 | 7,333,869 | |||
#Dover Corp. | 70,857 | 2,669,892 | |||
#Dun & Bradstreet Corp. (The) | 20,085 | 1,537,708 | |||
Eaton Corp. | 63,040 | 3,810,768 | |||
Emerson Electric Co. | 286,115 | 10,800,841 | |||
Equifax, Inc. | 48,108 | 1,317,197 | |||
#Expeditors International of Washington, Inc. | 80,754 | 2,601,894 | |||
#Fastenal Co. | 50,323 | 1,736,144 | |||
FedEx Corp. | 118,899 | 8,642,768 | |||
*First Solar, Inc. | 18,365 | 2,239,244 | |||
Flowserve Corp. | 21,290 | 2,090,891 | |||
Fluor Corp. | 68,471 | 3,041,482 | |||
General Dynamics Corp. | 146,596 | 9,191,569 | |||
General Electric Co. | 4,045,427 | 57,687,789 | |||
Honeywell International, Inc. | 286,292 | 10,275,020 | |||
Illinois Tool Works, Inc. | 146,604 | 6,732,056 | |||
#*Iron Mountain, Inc. | 68,608 | 1,676,093 | |||
ITT Industries, Inc. | 69,436 | 3,520,405 | |||
#*Jacobs Engineering Group, Inc. | 47,170 | 1,994,819 | |||
L-3 Communications Holdings, Inc. | 44,378 | 3,208,086 | |||
Lockheed Martin Corp. | 122,905 | 8,454,635 | |||
Masco Corp. | 136,740 | 1,606,695 | |||
#*Monster Worldwide, Inc. | 47,928 | 695,915 | |||
Norfolk Southern Corp. | 139,952 | 6,524,562 | |||
Northrop Grumman Corp. | 121,097 | 6,070,593 | |||
#Paccar, Inc. | 138,308 | 5,174,102 | |||
Pall Corp. | 44,893 | 1,424,904 | |||
Parker Hannifin Corp. | 61,106 | 3,236,174 | |||
Pitney Bowes, Inc. | 78,820 | 1,931,090 | |||
Precision Castparts Corp. | 53,378 | 5,091,194 | |||
#*Quanta Services, Inc. | 79,648 | 1,688,538 | |||
R. R. Donnelley & Sons Co. | 78,153 | 1,569,312 | |||
#Raytheon Co. | 148,232 | 6,711,945 | |||
Republic Services, Inc. | 122,699 | 3,179,131 | |||
#Robert Half International, Inc. | 57,812 | 1,341,238 | |||
#Rockwell Automation, Inc. | 54,040 | 2,212,938 | |||
#Rockwell Collins, Inc. | 60,012 | 3,023,405 | |||
Ryder System, Inc. | 21,300 | 863,715 | |||
Southwest Airlines Co. | 282,254 | 2,370,934 | |||
#*Stericycle, Inc. | 32,377 | 1,695,583 | |||
#Textron, Inc. | 102,873 | 1,829,082 | |||
Union Pacific Corp. | 191,978 | 10,585,667 | |||
United Parcel Service, Inc. | 378,570 | 20,321,638 | |||
United Technologies Corp. | 358,323 | 22,018,948 | |||
#W.W. Grainger, Inc. | 23,822 | 2,232,836 | |||
#Waste Management, Inc. | 187,557 | 5,604,203 | |||
Total Industrials | 348,215,491 | ||||
Information Technology — (17.5%) | |||||
#*Adobe Systems, Inc. | 199,856 | 6,583,257 | |||
#*Advanced Micro Devices, Inc. | 213,484 | 982,026 | |||
*Affiliated Computer Services, Inc. Class A | 37,170 | 1,936,185 | |||
*Agilent Technologies, Inc. | 131,377 | 3,250,267 | |||
#*Akamai Technologies, Inc. | 65,629 | 1,443,838 | |||
Altera Corp. | 111,990 | 2,216,282 | |||
#Amphenol Corp. | 65,255 | 2,618,031 | |||
Analog Devices, Inc. | 110,986 | 2,844,571 | |||
7
THE U.S. LARGE COMPANY SERIES
CONTINUED
| Shares | Value† | ||||
Information Technology — (Continued) | |||||
*Apple, Inc. | 341,019 | $ | 64,282,082 | ||
Applied Materials, Inc. | 507,718 | 6,194,160 | |||
*Autodesk, Inc. | 87,454 | 2,180,228 | |||
Automatic Data Processing, Inc. | 191,159 | 7,608,128 | |||
*BMC Software, Inc. | 70,040 | 2,602,686 | |||
*Broadcom Corp. | 164,237 | 4,370,347 | |||
CA, Inc. | 151,544 | 3,170,300 | |||
#*Ciena Corp. | 34,849 | 408,779 | |||
*Cisco Sytems, Inc. | 2,195,717 | 50,172,133 | |||
*Citrix Systems, Inc. | 69,681 | 2,561,474 | |||
*Cognizant Technology Solutions Corp. | 111,619 | 4,314,074 | |||
*Computer Sciences Corp. | 57,749 | 2,928,452 | |||
*Compuware Corp. | 90,425 | 638,401 | |||
*Convergys Corp. | 46,766 | 507,411 | |||
#Corning, Inc. | 591,800 | 8,646,198 | |||
*Dell, Inc. | 655,130 | 9,492,834 | |||
*eBay, Inc. | 427,370 | 9,517,530 | |||
*Electronic Arts, Inc. | 123,158 | 2,246,402 | |||
*EMC Corp. | �� | 769,753 | 12,677,832 | ||
Fidelity National Information Services, Inc. | 118,567 | 2,580,018 | |||
*Fiserv, Inc. | 58,769 | 2,695,734 | |||
*FLIR Systems, Inc. | 57,665 | 1,603,664 | |||
*Google, Inc. | 91,589 | 49,102,695 | |||
Harris Corp. | 49,895 | 2,081,619 | |||
Hewlett-Packard Co. | 902,618 | 42,838,250 | |||
Intel Corp. | 2,131,047 | 40,724,308 | |||
International Business Machines Corp. | 499,027 | 60,187,646 | |||
*Intuit, Inc. | 122,984 | 3,575,145 | |||
Jabil Circuit, Inc. | 70,197 | 939,236 | |||
*JDS Uniphase Corp. | 82,608 | 461,779 | |||
#*Juniper Networks, Inc. | 199,558 | 5,090,725 | |||
#KLA-Tencor Corp. | 64,969 | 2,112,142 | |||
#*Lexmark International, Inc. | 29,727 | 758,038 | |||
#Linear Technology Corp. | 84,622 | 2,190,017 | |||
*LSI Corp. | 248,171 | 1,270,636 | |||
MasterCard, Inc. Class A | 36,526 | 7,999,925 | |||
*McAfee, Inc. | 59,842 | 2,506,183 | |||
*MEMC Electronic Materials, Inc. | 85,101 | 1,056,954 | |||
#Microchip Technology, Inc. | 69,645 | 1,668,694 | |||
*Micron Technology, Inc. | 322,377 | 2,188,940 | |||
Microsoft Corp. | 2,951,141 | 81,835,140 | |||
#Molex, Inc. | 51,741 | 966,004 | |||
Motorola, Inc. | 873,799 | 7,488,457 | |||
#National Semiconductor Corp. | 89,101 | 1,152,967 | |||
*NetApp, Inc. | 128,047 | 3,463,671 | |||
*Novell, Inc. | 132,018 | 539,954 | |||
*Novellus Systems, Inc. | 37,149 | 764,526 | |||
*Nvidia Corp. | 208,536 | 2,494,091 | |||
Oracle Corp. | 1,486,799 | 31,371,459 | |||
#Paychex, Inc. | 122,300 | 3,474,543 | |||
*QLogic Corp. | 44,958 | 788,563 | |||
QUALCOMM, Inc. | 632,808 | 26,204,579 | |||
*Red Hat, Inc. | 71,570 | 1,847,222 | |||
#*Salesforce.com, Inc. | 41,539 | 2,357,338 | |||
*Sandisk Corp. | 86,436 | 1,770,209 | |||
*Sun Microsystems, Inc. | 286,790 | 2,345,942 | |||
*Symantec Corp. | 310,065 | 5,450,943 | |||
*Tellabs, Inc. | 150,815 | 907,906 | |||
*Teradata Corp. | 65,400 | 1,823,352 | |||
#*Teradyne, Inc. | 66,456 | 556,237 | |||
Texas Instruments, Inc. | 480,199 | 11,260,667 | |||
8
THE U.S. LARGE COMPANY SERIES
CONTINUED
| Shares | Value† | ||||
Information Technology — (Continued) | |||||
Total System Services, Inc. | 75,049 | $ | 1,198,533 | ||
#*VeriSign, Inc. | 73,421 | 1,674,733 | |||
*Western Digital Corp. | 85,533 | 2,880,751 | |||
Western Union Co. | 267,065 | 4,852,571 | |||
Xerox Corp. | 330,841 | 2,487,924 | |||
#Xilinx, Inc. | 105,073 | 2,285,338 | |||
*Yahoo!, Inc. | 454,106 | 7,220,285 | |||
Total Information Technology | 661,490,161 | ||||
Materials — (3.1%) | |||||
Air Products & Chemicals, Inc. | 79,974 | 6,168,395 | |||
Airgas, Inc. | 31,087 | 1,379,019 | |||
AK Steel Holding Corp. | 41,643 | 660,874 | |||
#Alcoa, Inc. | 370,924 | 4,606,876 | |||
Allegheny Technologies, Inc. | 37,334 | 1,152,127 | |||
#Ball Corp. | 35,828 | 1,767,395 | |||
Bemis Co., Inc. | 41,111 | 1,061,897 | |||
CF Industries Holdings, Inc. | 18,088 | 1,505,826 | |||
Dow Chemical Co. | 435,353 | 10,222,088 | |||
du Pont (E.I.) de Nemours & Co. | 343,985 | 10,945,603 | |||
Eastman Chemical Co. | 27,662 | 1,452,532 | |||
#Ecolab, Inc. | 90,154 | 3,963,170 | |||
FMC Corp. | 27,596 | 1,410,156 | |||
Freeport-McMoRan Copper & Gold, Inc. Class B | 156,762 | 11,500,060 | |||
#International Flavors & Fragrances, Inc. | 30,070 | 1,145,366 | |||
International Paper Co. | 164,743 | 3,675,416 | |||
MeadWestavco Corp. | 65,139 | 1,487,123 | |||
Monsanto Co. | 207,818 | 13,961,213 | |||
Newmont Mining Corp. | 186,532 | 8,106,681 | |||
Nucor Corp. | 119,789 | 4,773,592 | |||
*Owens-Illinois, Inc. | 64,099 | 2,043,476 | |||
*Pactiv Corp. | 50,236 | 1,159,949 | |||
PPG Industries, Inc. | 62,777 | 3,542,506 | |||
Praxair, Inc. | 116,791 | 9,277,877 | |||
Sealed Air Corp. | 60,443 | 1,162,319 | |||
#Sigma-Aldrich Corp. | 46,372 | 2,408,098 | |||
#*Titanium Metals Corp. | 32,306 | 277,832 | |||
#United States Steel Corp. | 54,560 | 1,881,774 | |||
#Vulcan Materials Co. | 47,580 | 2,190,107 | |||
#Weyerhaeuser Co. | 80,459 | 2,923,880 | |||
Total Materials | 117,813,227 | ||||
Real Estate Investment Trusts — (1.0%) | |||||
#Apartment Investment & Management Co. Class A | 44,555 | 550,254 | |||
#AvalonBay Communities, Inc. | 30,429 | 2,092,907 | |||
Boston Properties, Inc. | 52,756 | 3,205,982 | |||
#Equity Residential | 104,297 | 3,012,097 | |||
#HCP, Inc. | 111,576 | 3,301,534 | |||
#Health Care REIT, Inc. | 45,638 | 2,024,958 | |||
Host Marriott Corp. | 229,891 | 2,324,198 | |||
#Kimco Realty Corp. | 143,275 | 1,810,996 | |||
#ProLogis | 168,564 | 1,909,830 | |||
#Public Storage | 51,624 | 3,799,526 | |||
Simon Property Group, Inc. | 107,758 | 7,315,691 | |||
#Ventas, Inc. | 59,591 | 2,391,387 | |||
Vornado Realty Trust | 59,432 | 3,539,770 | |||
Total Real Estate Investment Trusts | 37,279,130 | ||||
Telecommunication Services — (2.8%) | |||||
*American Tower Corp. | 150,228 | 5,531,395 | |||
9
THE U.S. LARGE COMPANY SERIES
CONTINUED
| Shares | Value† | |||||
Telecommunication Services — (Continued) | ||||||
AT&T, Inc. | 2,246,012 | $ | 57,655,128 | |||
CenturyTel, Inc. | 113,161 | 3,673,206 | ||||
Frontier Communications Corp. | 118,909 | 852,578 | ||||
#*MetroPCS Communications, Inc. | 99,201 | 618,022 | ||||
#Qwest Communications International, Inc. | 564,344 | 2,025,995 | ||||
*Sprint Nextel Corp. | 1,094,778 | 3,240,543 | ||||
Verizon Communications, Inc. | 1,081,364 | 31,997,561 | ||||
Windstream Corp. | 166,246 | 1,602,611 | ||||
Total Telecommunication Services | 107,197,039 | |||||
Utilities — (3.4%) | ||||||
*AES Corp. | 253,916 | 3,318,682 | ||||
Allegheny Energy, Inc. | 64,518 | 1,472,301 | ||||
#Ameren Corp. | 88,840 | 2,162,366 | ||||
American Electric Power Co., Inc. | 181,504 | 5,485,051 | ||||
CenterPoint Energy, Inc. | 147,094 | 1,853,384 | ||||
#CMS Energy Corp. | 87,144 | 1,159,015 | ||||
#Consolidated Edison, Inc. | 104,681 | 4,258,423 | ||||
Constellation Energy Group, Inc. | 76,375 | 2,361,515 | ||||
#Dominion Resources, Inc. | 226,600 | 7,724,794 | ||||
#DTE Energy Co. | 62,611 | 2,315,355 | ||||
Duke Energy Corp. | 493,637 | 7,809,337 | ||||
#*Dynegy, Inc. | 192,997 | 385,994 | ||||
Edison International, Inc. | 124,029 | 3,946,603 | ||||
Entergy Corp. | 74,534 | 5,718,248 | ||||
EQT Corp. | 49,832 | 2,085,968 | ||||
Exelon Corp. | 250,898 | 11,782,170 | ||||
FirstEnergy Corp. | 116,044 | 5,022,384 | ||||
FPL Group, Inc. | 156,635 | 7,690,778 | ||||
#Integrys Energy Group, Inc. | 29,092 | 1,006,583 | ||||
#Nicor, Inc. | 17,215 | 638,332 | ||||
NiSource, Inc. | 104,816 | 1,354,223 | ||||
Northeast Utilities, Inc. | 66,726 | 1,538,034 | ||||
Pepco Holdings, Inc. | 84,062 | 1,255,046 | ||||
PG&E Corp. | 141,113 | 5,770,111 | ||||
Pinnacle West Capital Corp. | 38,525 | 1,206,603 | ||||
PPL Corp. | 143,356 | 4,220,401 | ||||
Progress Energy, Inc. | 106,323 | 3,990,302 | ||||
*Public Service Enterprise Group, Inc. | 192,617 | 5,739,987 | ||||
Questar Corp. | 66,325 | 2,642,388 | ||||
SCANA Corp. | 41,976 | 1,420,468 | ||||
Sempra Energy | 93,395 | 4,805,173 | ||||
Southern Co. | 303,041 | 9,451,849 | ||||
#TECO Energy, Inc. | 81,368 | 1,166,817 | ||||
#Wisconsin Energy Corp. | 44,506 | 1,943,577 | ||||
#Xcel Energy, Inc. | 173,485 | 3,268,457 | ||||
Total Utilities | 127,970,719 | |||||
TOTAL COMMON STOCKS | 3,473,360,717 | |||||
| Face Amount | ||||||
| (000) | ||||||
TEMPORARY CASH INVESTMENTS — (0.7%) | ||||||
Repurchase Agreement, PNC Capital Markets, Inc. 0.19%, 11/02/09 (Collateralized by $25,855,000, FNMA 6.50%, 06/25/39 valued at $27,826,444) to be repurchased at $27,414,434 | $ | 27,414 | 27,414,000 | |||
10
THE U.S. LARGE COMPANY SERIES
CONTINUED
| Shares/ Face Amount | Value† | |||||
| (000) | ||||||
SECURITIES LENDING COLLATERAL — (7.2%) | ||||||
§@DFA Short Term Investment Fund LP | 269,088,352 | $ | 269,088,352 | |||
@Repurchase Agreement, Deutsche Bank Securities 0.08%, 11/02/09 (Collateralized by $2,507,470 FHLMC 5.793%(r), 01/01/37, valued at $1,408,594) to be repurchased at $1,367,576 | $ | 1,368 | 1,367,567 | |||
TOTAL SECURITIES LENDING COLLATERAL | 270,455,919 | |||||
TOTAL INVESTMENTS — (100.0%) | $ | 3,771,230,636 | ||||
See accompanying Notes to Financial Statements.
11
THE U.S. LARGE CAP VALUE SERIES
SCHEDULE OF INVESTMENTS
October 31, 2009
| Shares | Value† | ||||
COMMON STOCKS — (93.1%) | |||||
Consumer Discretionary — (15.5%) | |||||
#*AutoNation, Inc. | 307,114 | $ | 5,294,645 | ||
Carnival Corp. | 2,624,598 | 76,428,294 | |||
CBS Corp. | 4,758 | 56,144 | |||
CBS Corp. Class B | 3,870,469 | 45,555,420 | |||
#*Clear Channel Outdoor Holdings, Inc. | 94,100 | 641,762 | |||
Comcast Corp. Class A | 11,512,642 | 166,933,309 | |||
Comcast Corp. Special Class A | 3,396,043 | 47,612,523 | |||
#*Discovery Communications, Inc. (25470F104) | 584,895 | 16,084,612 | |||
*Discovery Communications, Inc. (25470F302) | 563,115 | 13,526,022 | |||
#Disney (Walt) Co. | 4,577,802 | 125,294,441 | |||
#*Expedia, Inc. | 1,028,174 | 23,308,705 | |||
Fortune Brands, Inc. | 669,010 | 26,057,940 | |||
#J.C. Penney Co., Inc. | 815,260 | 27,009,564 | |||
#Lennar Corp. Class A | 180,100 | 2,269,260 | |||
#*Liberty Global, Inc. Class A | 529,579 | 10,872,257 | |||
#*Liberty Global, Inc. Series C | 383,654 | 7,895,599 | |||
*Liberty Media Corp. Entertainment Class A | 2,954,309 | 91,051,803 | |||
*Liberty Media Corp. Interactive Class A | 3,585,265 | 40,656,905 | |||
#Macy’s, Inc. | 1,848,030 | 32,469,887 | |||
*MGM Mirage | 149,600 | 1,386,792 | |||
#*Mohawk Industries, Inc. | 392,417 | 16,807,220 | |||
News Corp. Class A | 5,810,104 | 66,932,398 | |||
#News Corp. Class B | 2,307,061 | 31,376,030 | |||
#*Royal Caribbean Cruises, Ltd. | 663,875 | 13,430,191 | |||
#*Sears Holdings Corp. | 539,227 | 36,591,944 | |||
*Ticketmaster Entertainment, Inc. | 73,729 | 711,485 | |||
Time Warner Cable, Inc. | 1,980,956 | 78,128,905 | |||
Time Warner, Inc. | 6,114,193 | 184,159,493 | |||
#*Toll Brothers, Inc. | 904,000 | 15,657,280 | |||
Washington Post Co. | 24,866 | 10,742,112 | |||
Wendy’s/Arby’s Group, Inc. | 834,900 | 3,297,855 | |||
#Whirlpool Corp. | 322,215 | 23,067,372 | |||
#Wyndham Worldwide Corp. | 419,361 | 7,150,105 | |||
Total Consumer Discretionary | 1,248,458,274 | ||||
Consumer Staples — (5.9%) | |||||
Archer-Daniels-Midland Co. | 1,723,060 | 51,898,567 | |||
#Bunge, Ltd. | 245,372 | 14,000,926 | |||
*Constellation Brands, Inc. Class A | 855,902 | 13,540,370 | |||
Corn Products International, Inc. | 428,526 | 12,075,863 | |||
CVS Caremark Corp. | 4,840,631 | 170,874,274 | |||
Del Monte Foods Co. | 150,209 | 1,622,257 | |||
J.M. Smucker Co. | 526,102 | 27,741,358 | |||
Kraft Foods, Inc. | 2,137,904 | 58,835,118 | |||
Molson Coors Brewing Co. | 757,690 | 37,104,079 | |||
PepsiAmericas, Inc. | 521,775 | 15,256,701 | |||
*Ralcorp Holdings, Inc. | 79,900 | 4,290,630 | |||
Safeway, Inc. | 1,005,594 | 22,454,914 | |||
SUPERVALU, Inc. | 1,327,679 | 21,070,266 | |||
#Tyson Foods, Inc. Class A | 1,926,959 | 24,125,527 | |||
Total Consumer Staples | 474,890,850 | ||||
Energy — (13.0%) | |||||
Anadarko Petroleum Corp. | 2,760,568 | 168,201,408 | |||
BJ Services Co. | 567,800 | 10,901,760 | |||
Cabot Oil & Gas Corp. | 214,857 | 8,265,549 | |||
#Chesapeake Energy Corp. | 2,647,458 | 64,862,721 | |||
#Cimarex Energy Co. | 368,647 | 14,436,217 | |||
12
THE U.S. LARGE CAP VALUE SERIES
CONTINUED
| Shares | Value† | ||||
Energy — (Continued) | |||||
ConocoPhillips | 5,213,766 | $ | 261,626,778 | ||
ENSCO International, Inc. | 614,773 | 28,150,456 | |||
#Helmerich & Payne, Inc. | 470,183 | 17,876,358 | |||
Hess Corp. | 624,400 | 34,179,656 | |||
Marathon Oil Corp. | 3,280,335 | 104,872,310 | |||
#*Nabors Industries, Ltd. | 649,438 | 13,527,794 | |||
*National-Oilwell, Inc. | 1,160,300 | 47,560,697 | |||
Noble Energy, Inc. | 464,500 | 30,485,135 | |||
#Patterson-UTI Energy, Inc. | 419,900 | 6,542,042 | |||
#Pioneer Natural Resources Co. | 650,933 | 26,759,856 | |||
*Plains Exploration & Production Co. | 345,600 | 9,158,400 | |||
*Pride International, Inc. | 644,204 | 19,042,670 | |||
Rowan Cos., Inc. | 456,566 | 10,615,160 | |||
#Smith International, Inc. | 631,653 | 17,515,738 | |||
Sunoco, Inc. | 155,000 | 4,774,000 | |||
#Tesoro Petroleum Corp. | 321,700 | 4,548,838 | |||
#Tidewater, Inc. | 273,715 | 11,405,704 | |||
Valero Energy Corp. | 1,735,295 | 31,408,840 | |||
#*Whiting Petroleum Corp. | 120,503 | 6,796,369 | |||
XTO Energy, Inc. | 2,156,495 | 89,623,932 | |||
Total Energy | 1,043,138,388 | ||||
Financials — (29.1%) | |||||
*Allegheny Corp. | 36,844 | 9,211,000 | |||
Allied World Assurance Co. Holdings, Ltd. | 45,300 | 2,027,628 | |||
Allstate Corp. | 2,596,315 | 76,773,035 | |||
American Financial Group, Inc. | 689,393 | 16,959,068 | |||
#American National Insurance Co. | 92,588 | 7,730,172 | |||
#*AmeriCredit Corp. | 88,688 | 1,565,343 | |||
Ameriprise Financial, Inc. | 283,766 | 9,838,167 | |||
*Arch Capital Group, Ltd. | 57,368 | 3,864,882 | |||
Aspen Insurance Holdings, Ltd. | 176,521 | 4,554,242 | |||
Assurant, Inc. | 294,109 | 8,802,682 | |||
Axis Capital Holdings, Ltd. | 305,766 | 8,833,580 | |||
Bank of America Corp. | 16,675,426 | 243,127,711 | |||
Bank of New York Mellon Corp. | 1,972,678 | 52,591,595 | |||
#BB&T Corp. | 273,886 | 6,548,614 | |||
#Capital One Financial Corp. | 1,815,684 | 66,454,034 | |||
Chubb Corp. | 1,669,873 | 81,022,238 | |||
Cincinnati Financial Corp. | 990,152 | 25,110,255 | |||
Citigroup, Inc. | 19,573,191 | 80,054,351 | |||
#City National Corp. | 60,935 | 2,295,421 | |||
CME Group, Inc. | 203,881 | 61,696,429 | |||
#*CNA Financial Corp. | 1,676,585 | 36,499,255 | |||
#Comerica, Inc. | 630,208 | 17,488,272 | |||
Discover Financial Services | 1,976,830 | 27,952,376 | |||
Endurance Specialty Holdings, Ltd. | 7,900 | 284,321 | |||
#Everest Re Group, Ltd. | 181,300 | 15,861,937 | |||
Fidelity National Financial, Inc. | 945,859 | 12,835,307 | |||
Fifth Third Bancorp | 2,042,900 | 18,263,526 | |||
First American Corp. | 567,231 | 17,238,150 | |||
*First Horizon National Corp. | 631,085 | 7,465,736 | |||
First Niagara Financial Group, Inc. | 100,726 | 1,293,322 | |||
Genworth Financial, Inc. | 1,169,100 | 12,415,842 | |||
Hanover Insurance Group, Inc. | 304,654 | 12,813,747 | |||
Hartford Financial Services Group, Inc. | 1,483,798 | 36,382,727 | |||
#HCC Insurance Holdings, Inc. | 468,789 | 12,371,342 | |||
Huntington Bancshares, Inc. | 726,500 | 2,767,965 | |||
Invesco, Ltd. | 752,003 | 15,904,863 | |||
JPMorgan Chase & Co. | 7,983,370 | 333,465,365 | |||
KeyCorp | 1,129,300 | 6,086,927 | |||
13
THE U.S. LARGE CAP VALUE SERIES
CONTINUED
| Shares | Value† | ||||
Financials — (Continued) | |||||
#Legg Mason, Inc. | 433,647 | $ | 12,623,464 | ||
Lincoln National Corp. | 1,331,373 | 31,726,619 | |||
#Loews Corp. | 2,592,160 | 85,800,496 | |||
#M&T Bank Corp. | 474,420 | 29,817,297 | |||
#*Markel Corp. | 7,885 | 2,544,490 | |||
Marshall & Ilsley Corp. | 221,900 | 1,180,508 | |||
#Mercury General Corp. | 171,128 | 6,239,327 | |||
MetLife, Inc. | 4,663,914 | 158,712,993 | |||
#Morgan Stanley | 3,619,297 | 116,251,820 | |||
*NASDAQ OMX Group, Inc. (The) | 200,000 | 3,612,000 | |||
#New York Community Bancorp, Inc. | 2,039,500 | 22,026,600 | |||
NYSE Euronext, Inc. | 1,013,866 | 26,208,436 | |||
#Old Republic International Corp. | 1,432,884 | 15,303,201 | |||
PartnerRe, Ltd. | 90,832 | 6,946,831 | |||
People’s United Financial, Inc. | 252,479 | 4,047,238 | |||
PNC Financial Services Group, Inc. | 1,190,568 | 58,266,398 | |||
Prudential Financial, Inc. | 1,918,000 | 86,751,140 | |||
#Raymond James Financial, Inc. | 35,371 | 835,109 | |||
Regions Financial Corp. | 1,100,600 | 5,326,904 | |||
Reinsurance Group of America, Inc. | 509,512 | 23,488,503 | |||
RenaissanceRe Holdings, Ltd. | 106,328 | 5,582,220 | |||
#SunTrust Banks, Inc. | 1,508,760 | 28,832,404 | |||
Transatlantic Holdings, Inc. | 295,249 | 14,910,074 | |||
Travelers Cos., Inc. (The) | 3,328,076 | 165,704,904 | |||
Unum Group | 1,898,589 | 37,876,851 | |||
#W. R. Berkley Corp. | 667,640 | 16,504,061 | |||
#Wesco Financial Corp. | 19,877 | 6,519,656 | |||
White Mountains Insurance Group, Ltd. | 30,224 | 9,374,578 | |||
Total Financials | 2,339,465,549 | ||||
Health Care — (5.1%) | |||||
Aetna, Inc. | 1,077,768 | 28,054,301 | |||
*Boston Scientific Corp. | 4,237,207 | 34,406,121 | |||
Cardinal Health, Inc. | 380,120 | 10,772,601 | |||
*CareFusion Corp. | 164,010 | 3,668,904 | |||
#*Community Health Systems, Inc. | 370,974 | 11,604,067 | |||
*Coventry Health Care, Inc. | 343,613 | 6,813,846 | |||
#*Hologic, Inc. | 697,338 | 10,306,656 | |||
*Humana, Inc. | 283,046 | 10,636,869 | |||
*Inverness Medical Innovations, Inc. | 223,740 | 8,504,357 | |||
*King Pharmaceuticals, Inc. | 1,215,010 | 12,308,051 | |||
#Omnicare, Inc. | 582,523 | 12,623,273 | |||
#PerkinElmer, Inc. | 424,381 | 7,897,730 | |||
Teleflex, Inc. | 52,080 | 2,590,980 | |||
*Thermo Fisher Scientific, Inc. | 1,056,245 | 47,531,025 | |||
UnitedHealth Group, Inc. | 2,406,388 | 62,445,769 | |||
*Watson Pharmaceuticals, Inc. | 631,400 | 21,732,788 | |||
*WellPoint, Inc. | 2,580,122 | 120,646,505 | |||
Total Health Care | 412,543,843 | ||||
Industrials — (13.7%) | |||||
#*AGCO Corp. | 126,940 | 3,568,283 | |||
Burlington Northern Santa Fe Corp. | 1,930,415 | 145,398,858 | |||
#CSX Corp. | 2,287,204 | 96,474,265 | |||
#Eaton Corp. | 395,650 | 23,917,042 | |||
#FedEx Corp. | 599,693 | 43,591,684 | |||
General Electric Co. | 18,139,800 | 258,673,548 | |||
#*Hertz Global Holdings, Inc. | 820,911 | 7,642,681 | |||
#Ingersoll-Rand P.L.C. | 635,764 | 20,083,785 | |||
#*Kansas City Southern | 206,873 | 5,012,533 | |||
#Masco Corp. | 1,592,858 | 18,716,082 | |||
14
THE U.S. LARGE CAP VALUE SERIES
CONTINUED
| Shares | Value† | ||||
Industrials — (Continued) | |||||
Norfolk Southern Corp. | 2,186,220 | $ | 101,921,576 | ||
#Northrop Grumman Corp. | 1,926,678 | 96,584,368 | |||
#Pentair, Inc. | 341,927 | 9,950,076 | |||
R. R. Donnelley & Sons Co. | 920,372 | 18,481,070 | |||
Republic Services, Inc. | 548,028 | 14,199,405 | |||
#Ryder System, Inc. | 319,005 | 12,935,653 | |||
Southwest Airlines Co. | 4,297,932 | 36,102,629 | |||
SPX Corp. | 50,000 | 2,639,000 | |||
Timken Co. | 217,642 | 4,794,653 | |||
Tyco International, Ltd. | 336,967 | 11,305,243 | |||
Union Pacific Corp. | 2,835,808 | 156,366,453 | |||
*URS Corp. | 356,821 | 13,866,064 | |||
Total Industrials | 1,102,224,951 | ||||
Information Technology — (3.3%) | |||||
*Activision Blizzard, Inc. | 1,656,656 | 17,941,584 | |||
*Arrow Electronics, Inc. | 505,000 | 12,796,700 | |||
*Avnet, Inc. | 860,267 | 21,317,416 | |||
AVX Corp. | 179,574 | 2,032,778 | |||
*Computer Sciences Corp. | 946,932 | 48,018,922 | |||
Fidelity National Information Services, Inc. | 935,123 | 20,348,276 | |||
*IAC/InterActiveCorp. | 815,025 | 15,436,574 | |||
*Ingram Micro, Inc. | 969,555 | 17,112,646 | |||
#*Micron Technology, Inc. | 3,863,757 | 26,234,910 | |||
*Sandisk Corp. | 606,339 | 12,417,823 | |||
*Tellabs, Inc. | 1,931,218 | 11,625,932 | |||
Tyco Electronics, Ltd. | 1,547,828 | 32,891,345 | |||
#Xerox Corp. | 3,910,956 | 29,410,389 | |||
Total Information Technology | 267,585,295 | ||||
Materials — (3.6%) | |||||
#Alcoa, Inc. | 4,317,440 | 53,622,605 | |||
Ashland, Inc. | 160,300 | 5,536,762 | |||
Commercial Metals Co. | 104,500 | 1,550,780 | |||
#Dow Chemical Co. | 3,993,594 | 93,769,587 | |||
#International Paper Co. | 1,909,245 | 42,595,256 | |||
MeadWestavco Corp. | 1,023,001 | 23,355,113 | |||
Reliance Steel & Aluminum Co. | 300,700 | 10,969,536 | |||
Steel Dynamics, Inc. | 52,700 | 705,653 | |||
#United States Steel Corp. | 346,600 | 11,954,234 | |||
#Weyerhaeuser Co. | 1,105,551 | 40,175,723 | |||
Total Materials | 284,235,249 | ||||
Telecommunication Services — (3.4%) | |||||
#AT&T, Inc. | 8,438,300 | 216,611,161 | |||
#*Sprint Nextel Corp. | 9,790,408 | 28,979,608 | |||
Telephone & Data Systems, Inc. | 309,373 | 9,163,628 | |||
Telephone & Data Systems, Inc. Special Shares | 174,000 | 4,802,400 | |||
*United States Cellular Corp. | 264,225 | 9,673,277 | |||
Verizon Communications, Inc. | 26 | 769 | |||
Total Telecommunication Services | 269,230,843 | ||||
Utilities — (0.5%) | |||||
*AES Corp. | 528,748 | 6,910,736 | |||
*Calpine Corp. | 989,786 | 11,125,195 | |||
#*Mirant Corp. | 321,125 | 4,489,328 | |||
*NRG Energy, Inc. | 103,100 | 2,370,269 | |||
*Public Service Enterprise Group, Inc. | 62,200 | 1,853,560 | |||
Questar Corp. | 207,166 | 8,253,493 | |||
15
THE U.S. LARGE CAP VALUE SERIES
CONTINUED
| Shares | Value† | |||||
Utilities — (Continued) | ||||||
*RRI Energy, Inc. | 834,099 | $ | 4,395,702 | |||
Total Utilities | 39,398,283 | |||||
TOTAL COMMON STOCKS | 7,481,171,525 | |||||
| Face Amount | ||||||
| (000) | ||||||
TEMPORARY CASH INVESTMENTS — (0.5%) | ||||||
Repurchase Agreement, PNC Capital Markets, Inc. 0.19%, 11/02/09 (Collateralized by $39,850,000 FNMA 6.50%, 6/25/39, valued at $42,888,563) to be repurchased at $42,250,669 | $ | 42,250 | 42,250,000 | |||
| Shares/ Face Amount | ||||||
| (000) | ||||||
SECURITIES LENDING COLLATERAL — (6.4%) | ||||||
§@DFA Short Term Investment Fund LP | 512,733,772 | 512,733,772 | ||||
@Repurchase Agreement, Deutsche Bank Securities 0.08%, 11/02/09 (Collateralized by $3,853,074 FHLMC 5.793%(r), 01/01/37 & 5.945%(r), 07/01/37, valued at $2,684,003) to be repurchased at $2,605,845 | $ | 2,606 | 2,605,828 | |||
TOTAL SECURITIES LENDING COLLATERAL | 515,339,600 | |||||
TOTAL INVESTMENTS — (100.0%) | $ | 8,038,761,125 | ||||
See accompanying Notes to Financial Statements.
16
THE DFA INTERNATIONAL VALUE SERIES
SCHEDULE OF INVESTMENTS
October 31, 2009
| Shares | Value†† | ||||
COMMON STOCKS — (85.2%) | |||||
AUSTRALIA — (4.5%) | |||||
#*Alumina, Ltd. Sponsored ADR | 87,059 | $ | 503,201 | ||
Amcor, Ltd. | 2,026,464 | 10,435,306 | |||
Amcor, Ltd. Sponsored ADR | 77,103 | 1,570,588 | |||
Australia & New Zealand Banking Group, Ltd. | 3,343,351 | 68,191,374 | |||
#Bendigo Bank, Ltd. | 238,547 | 1,933,236 | |||
BlueScope Steel, Ltd. | 2,708,973 | 7,179,189 | |||
#Boral, Ltd. | 1,212,600 | 6,185,111 | |||
#*Caltex Australia, Ltd. | 265,507 | 2,407,251 | |||
#Crown, Ltd. | 726,400 | 5,287,521 | |||
CSR, Ltd. (6238645) | 2,438,600 | 4,147,596 | |||
CSR, Ltd. (B58VXV1) | 426,755 | 739,474 | |||
#Downer EDI, Ltd. | 480,526 | 3,657,956 | |||
#Fairfax Media, Ltd. | 2,908,662 | 4,122,034 | |||
Goodman Fielder, Ltd. | 2,376,765 | 3,409,367 | |||
Harvey Norman Holdings, Ltd. | 113,157 | 400,883 | |||
*Incitec Pivot, Ltd. | 2,357,913 | 5,500,234 | |||
Insurance Australia Group, Ltd. | 2,620,594 | 8,815,390 | |||
Lend Lease Corp., Ltd. | 629,285 | 5,216,216 | |||
#Macquarie Group, Ltd. | 410,696 | 17,986,733 | |||
National Australia Bank, Ltd. | 2,465,437 | 65,140,887 | |||
OneSteel, Ltd. | 1,673,037 | 4,542,208 | |||
Origin Energy, Ltd. | 167,471 | 2,401,339 | |||
*OZ Minerals, Ltd. | 3,889,713 | 4,067,350 | |||
Qantas Airways, Ltd. | 2,226,972 | 5,537,350 | |||
#Sims Metal Management, Ltd. | 90,490 | 1,595,361 | |||
Suncorp-Metway, Ltd. | 2,617,468 | 20,473,493 | |||
TABCORP Holdings, Ltd. | 1,277,891 | 8,151,750 | |||
Tatts Group, Ltd. | 1,434,845 | 3,177,050 | |||
#Toll Holdings, Ltd. | 69,091 | 523,719 | |||
#Washington H. Soul Pattinson & Co., Ltd. | 113,801 | 1,362,176 | |||
Wesfarmers, Ltd. | 1,898,047 | 47,362,464 | |||
TOTAL AUSTRALIA | 322,023,807 | ||||
AUSTRIA — (0.5%) | |||||
#Erste Group Bank AG | 303,609 | 12,205,974 | |||
OMV AG | 383,710 | 15,812,244 | |||
Voestalpine AG | 180,281 | 6,164,525 | |||
TOTAL AUSTRIA | 34,182,743 | ||||
BELGIUM — (0.5%) | |||||
Delhaize Group SA | 201,237 | 13,670,396 | |||
#Delhaize Group SA Sponsored ADR | 52,900 | 3,586,620 | |||
#*KBC Groep NV | 78,843 | 3,375,020 | |||
Solvay SA | 55,827 | 5,482,055 | |||
#UCB SA | 278,888 | 11,905,862 | |||
TOTAL BELGIUM | 38,019,953 | ||||
CANADA — (7.6%) | |||||
Astral Media, Inc. Class A | 40,138 | 1,188,505 | |||
#Bank of Montreal | 764,416 | 35,364,969 | |||
Barrick Gold Corp. | 375,441 | 13,518,027 | |||
BCE, Inc. | 651,325 | 15,584,127 | |||
Canadian Pacific Railway, Ltd. | 427,751 | 18,540,291 | |||
#Canadian Tire Corp. Class A | 166,647 | 8,422,831 | |||
*CGI Group, Inc. | 400,789 | 4,896,660 | |||
#Empire Co., Ltd. Class A | 65,500 | 2,602,324 | |||
EnCana Corp. | 671,498 | 37,234,767 | |||
Ensign Energy Services, Inc. | 128,319 | 1,840,498 | |||
17
THE DFA INTERNATIONAL VALUE SERIES
CONTINUED
| Shares | Value†† | ||||
CANADA — (Continued) | |||||
Fairfax Financial Holdings, Inc. | 46,500 | $ | 16,633,940 | ||
#George Weston, Ltd. | 109,600 | 5,587,113 | |||
Gerdau Ameristeel Corp. | 403,761 | 2,746,343 | |||
Goldcorp, Inc. | 442,407 | 16,264,452 | |||
Industrial Alliance Insurance & Financial Services, Inc. | 140,300 | 3,601,991 | |||
Inmet Mining Corp. | 87,300 | 4,626,202 | |||
Intact Financial Corp. | 128,700 | 3,913,156 | |||
Loblaw Cos., Ltd. | 184,013 | 5,077,980 | |||
Magna International, Inc. Class A | 243,268 | 9,602,122 | |||
Manitoba Telecom Services, Inc. | 40,500 | 1,175,643 | |||
#Manulife Financial Corp. | 2,074,478 | 38,918,630 | |||
Metro, Inc. Class A | 137,300 | 4,282,496 | |||
National Bank of Canada | 135,767 | 7,075,367 | |||
Onex Corp. | 110,200 | 2,486,005 | |||
*Sino-Forest Corp. | 278,730 | 3,923,162 | |||
#Sun Life Financial, Inc. | 1,262,400 | 34,918,564 | |||
Suncor Energy, Inc. | 1,020,281 | 33,869,501 | |||
Talisman Energy, Inc. | 1,787,820 | 30,500,584 | |||
*Teck Resources, Ltd. Class B | 1,418,230 | 41,168,712 | |||
#Thomson Reuters Corp. | 1,832,184 | 58,281,755 | |||
#Toronto Dominion Bank | 944,998 | 53,867,637 | |||
TransCanada Corp. | 292,621 | 8,967,527 | |||
#*Viterra, Inc. | 460,598 | 4,384,418 | |||
Yamana Gold, Inc. | 1,625,161 | 17,242,131 | |||
TOTAL CANADA | 548,308,430 | ||||
DENMARK — (1.1%) | |||||
A.P. Moller - Maersk A.S. | 3,478 | 23,747,910 | |||
Carlsberg A.S. Series B | 277,074 | 19,425,578 | |||
#Danisco A.S. | 107,780 | 6,721,474 | |||
*Danske Bank A.S. | 965,053 | 22,163,991 | |||
*Jyske Bank A.S. | 93,150 | 3,476,738 | |||
#*Sydbank A.S. | 60,841 | 1,488,032 | |||
TOTAL DENMARK | 77,023,723 | ||||
FINLAND — (0.6%) | |||||
Kesko Oyj | 152,447 | 5,073,299 | |||
Sampo Oyj | 503,782 | 12,058,152 | |||
Stora Enso Oyj Series R | 1,183,538 | 8,958,178 | |||
Stora Enso Oyj Sponsored ADR | 91,500 | 689,910 | |||
#UPM-Kymmene Oyj | 1,070,295 | 12,845,032 | |||
UPM-Kymmene Oyj Sponsored ADR | 69,300 | 826,749 | |||
TOTAL FINLAND | 40,451,320 | ||||
FRANCE — (8.3%) | |||||
#*Air France-KLM SA | 320,673 | 4,916,514 | |||
#AXA SA | 2,818,397 | 70,093,978 | |||
#AXA SA Sponsored ADR | 140,900 | 3,494,320 | |||
BNP Paribas SA | 913,891 | 68,847,185 | |||
Capgemini SA | 259,094 | 12,002,899 | |||
#Casino Guichard Perrachon SA | 93,798 | 7,453,321 | |||
Ciments Francais SA | 26,702 | 2,909,965 | |||
CNP Assurances SA | 72,302 | 6,986,719 | |||
#Compagnie de Saint-Gobain SA | 846,142 | 41,232,265 | |||
Compagnie Generale des Establissements Michelin SA Series B | 218,195 | 16,163,226 | |||
Credit Agricole SA | 1,845,722 | 35,355,091 | |||
#European Aeronautic Defence & Space Co. EADS NV | 968,650 | 18,138,440 | |||
France Telecom SA | 690,822 | 17,117,707 | |||
*GDF Suez SA | 100,344 | 4,195,124 | |||
#Lafarge SA | 467,217 | 37,923,901 | |||
18
THE DFA INTERNATIONAL VALUE SERIES
CONTINUED
| Shares | Value†† | ||||
FRANCE — (Continued) | |||||
Lagardere SCA | 238,722 | $ | 10,785,307 | ||
#*Peugeot SA | 325,797 | 10,612,551 | |||
PPR SA | 161,317 | 17,580,856 | |||
#*Renault SA | 500,084 | 22,379,134 | |||
Safran SA | 312,438 | 5,040,487 | |||
#Schneider Electric SA | 311,215 | 32,362,873 | |||
SCOR SE | 193,766 | 4,931,514 | |||
#Societe Generale Paris SA | 913,312 | 60,662,002 | |||
#STMicroelectronics NV | 1,542,301 | 12,377,343 | |||
Vivendi SA | 2,686,677 | 74,534,678 | |||
TOTAL FRANCE | 598,097,400 | ||||
GERMANY — (7.4%) | |||||
Allianz SE | 442,712 | 50,712,808 | |||
Allianz SE Sponsored ADR | 2,834,240 | 32,168,624 | |||
#Bayerische Motoren Werke AG | 915,762 | 44,797,554 | |||
#*Commerzbank AG | 1,089,462 | 11,355,014 | |||
#Daimler AG (5529027) | 1,684,003 | 81,364,327 | |||
#Daimler AG (D1668R123) | 404,583 | 19,513,038 | |||
#Deutsche Bank AG (5750355) | 774,190 | 56,245,973 | |||
#Deutsche Bank AG (D18190898) | 128,363 | 9,194,642 | |||
#Deutsche Lufthansa AG | 464,311 | 7,169,646 | |||
#*Deutsche Postbank AG | 14,003 | 434,041 | |||
#Deutsche Telekom AG | 2,621,866 | 35,693,819 | |||
Deutsche Telekom AG Sponsored ADR | 2,809,150 | 38,035,891 | |||
E.ON AG | 545,840 | 20,855,107 | |||
#Fraport AG | 41,329 | 1,945,832 | |||
Generali Deutschland Holding AG | 33,484 | 3,149,955 | |||
#*Hannover Rueckversicherung AG | 110,141 | 4,994,555 | |||
Heidelberger Zement AG | 58,318 | 3,475,436 | |||
Hochtief AG | 8,774 | 656,241 | |||
#Linde AG | 133,956 | 13,925,660 | |||
Munchener Rueckversicherungs-Gesellschaft AG | 388,934 | 61,534,351 | |||
Porsche Automobil Holding SE | 190,907 | 14,602,883 | |||
*Salzgitter AG | 79,216 | 7,128,508 | |||
SCA Hygiene Products SE | 3,195 | 1,522,487 | |||
#ThyssenKrupp AG | 409,120 | 13,148,388 | |||
#*TUI AG | 265,715 | 1,840,362 | |||
TOTAL GERMANY | 535,465,142 | ||||
GREECE — (0.3%) | |||||
*Agricultural Bank of Greece S.A. | 285,278 | 808,603 | |||
*Alpha Bank A.E. | 214,210 | 4,129,970 | |||
*EFG Eurobank Ergasias S.A. | 61,225 | 969,817 | |||
Hellenic Petroleum S.A. | 355,700 | 4,311,585 | |||
Marfin Investment Group S.A. | 323,492 | 1,288,925 | |||
#National Bank of Greece S.A. ADR | 619,230 | 4,501,802 | |||
*Piraeus Bank S.A. | 174,541 | 3,009,200 | |||
TOTAL GREECE | 19,019,902 | ||||
HONG KONG — (2.7%) | |||||
*Cathay Pacific Airways, Ltd. | 2,498,000 | 4,047,441 | |||
Cheung Kong Holdings, Ltd. | 3,224,000 | 41,120,708 | |||
*Dah Sing Financial Holdings, Ltd. | 176,400 | 995,902 | |||
Great Eagle Holdings, Ltd. | 471,721 | 1,232,322 | |||
Hang Lung Group, Ltd. | 1,737,000 | 8,795,011 | |||
Henderson Land Development Co., Ltd. | 1,995,000 | 14,116,669 | |||
Hong Kong & Shanghai Hotels, Ltd. | 1,164,505 | 1,666,562 | |||
Hopewell Holdings, Ltd. | 1,129,000 | 3,587,647 | |||
Hutchison Whampoa, Ltd. | 5,568,000 | 39,081,157 | |||
19
THE DFA INTERNATIONAL VALUE SERIES
CONTINUED
| Shares | Value†† | ||||
HONG KONG — (Continued) | |||||
Hysan Development Co., Ltd. | 1,029,302 | $ | 3,020,220 | ||
New World Development Co., Ltd. | 4,135,660 | 8,891,315 | |||
Pacific Basin Shipping, Ltd. | 301,000 | 221,579 | |||
#Sino Land Co., Ltd. | 2,559,315 | 4,900,059 | |||
Sinotrans Shipping, Ltd. | 1,275,000 | 572,602 | |||
Sun Hung Kai Properties, Ltd. | 2,274,000 | 34,337,122 | |||
Wharf Holdings, Ltd. | 3,509,740 | 19,030,072 | |||
Wheelock & Co., Ltd. | 3,482,000 | 11,231,223 | |||
Wheelock Properties, Ltd. | 1,565,000 | 1,085,874 | |||
TOTAL HONG KONG | 197,933,485 | ||||
IRELAND — (0.0%) | |||||
CRH P.L.C. Sponsored ADR | 2,341 | 57,893 | |||
ITALY — (2.9%) | |||||
Banca Monte Dei Paschi di Siena SpA | 5,698,737 | 10,828,144 | |||
Banca Popolare di Milano Scarl | 982,340 | 7,308,954 | |||
*Banco Popolare Scarl | 426,228 | 3,702,705 | |||
#*Fiat SpA | 443,245 | 6,598,916 | |||
Fondiaria - SAI SpA | 167,605 | 3,054,740 | |||
#*Intesa Sanpaolo SpA | 11,201,860 | 47,142,793 | |||
#Italcementi SpA | 273,413 | 3,935,555 | |||
Telecom Italia SpA | 5,476,933 | 8,700,840 | |||
#Telecom Italia SpA Sponsored ADR | 1,874,500 | 29,729,570 | |||
*UniCredito SpA | 19,413,366 | 65,038,767 | |||
Unione di Banche Italiane ScpA | 1,533,872 | 21,909,611 | |||
#*Unipol Gruppo Finanziario SpA | 1,822,774 | 2,642,839 | |||
TOTAL ITALY | 210,593,434 | ||||
JAPAN — (11.7%) | |||||
#77 Bank, Ltd. (The) | 737,372 | 4,243,571 | |||
#*AEON Co., Ltd. | 1,607,900 | 14,341,543 | |||
Aisin Seiki Co., Ltd. | 282,500 | 7,182,732 | |||
Ajinomoto Co., Inc. | 1,130,000 | 10,605,762 | |||
Amada Co., Ltd. | 631,000 | 3,860,332 | |||
Aoyama Trading Co., Ltd. | 105,500 | 1,690,680 | |||
*Aozora Bank, Ltd. | 943,000 | 1,114,962 | |||
Asahi Glass Co., Ltd. | 1,414,000 | 11,912,693 | |||
#Asatsu-DK, Inc. | 32,500 | 640,929 | |||
Awa Bank, Ltd. (The) | 65,600 | 341,777 | |||
Bank of Iwate, Ltd. (The) | 19,600 | 1,161,271 | |||
Bank of Kyoto, Ltd. (The) | 353,400 | 3,206,866 | |||
Bridgestone Corp. | 807,000 | 13,308,004 | |||
Canon Marketing Japan, Inc. | 124,900 | 2,023,563 | |||
#Chiba Bank, Ltd. (The) | 823,000 | 5,075,357 | |||
Chudenko Corp. | 41,100 | 608,129 | |||
Chugoku Bank, Ltd. (The) | 240,800 | 3,251,522 | |||
Citizen Holdings Co., Ltd. | 377,500 | 2,124,119 | |||
#Coca-Cola West Co., Ltd. | 90,707 | 1,684,922 | |||
Comsys Holdings Corp. | 149,000 | 1,472,604 | |||
Cosmo Oil Co., Ltd. | 1,085,364 | 2,851,115 | |||
Credit Saison Co., Ltd. | 168,300 | 1,881,426 | |||
Dai Nippon Printing Co., Ltd. | 1,348,000 | 16,889,628 | |||
Daicel Chemical Industries, Ltd. | 515,000 | 3,109,942 | |||
#Daido Steel Co., Ltd. | 398,000 | 1,354,628 | |||
Daishi Bank, Ltd. (The) | 573,932 | 2,090,712 | |||
Daiwa House Industry Co., Ltd. | 916,000 | 9,786,139 | |||
#Dentsu, Inc. | 52,700 | 1,129,049 | |||
DIC Corp. | 596,000 | 975,467 | |||
*Elpida Memory, Inc. | 39,200 | 512,150 | |||
*Fuji Electric Holdings Co., Ltd. | 181,780 | 337,791 | |||
20
THE DFA INTERNATIONAL VALUE SERIES
CONTINUED
| Shares | Value†† | ||||
JAPAN — (Continued) | |||||
*Fuji Heavy Industries, Ltd. | 1,286,000 | $ | 5,025,424 | ||
*Fuji Television Network, Inc. | 555 | 815,489 | |||
FUJIFILM Holdings Corp. | 1,257,700 | 35,755,504 | |||
Fujikura, Ltd. | 609,000 | 2,936,354 | |||
Fukuoka Financial Group, Inc. | 1,446,000 | 5,287,134 | |||
Glory, Ltd. | 75,400 | 1,659,103 | |||
Gunma Bank, Ltd. (The) | 585,397 | 3,049,802 | |||
#H2O Retailing Corp. | 198,000 | 1,203,406 | |||
Hachijuni Bank, Ltd. (The) | 993,231 | 5,876,067 | |||
#Hakuhodo Dy Holdings, Inc. | 29,940 | 1,503,793 | |||
Higo Bank, Ltd. (The) | 376,000 | 2,225,776 | |||
*Hino Motors, Ltd. | 217,000 | 802,194 | |||
Hitachi Chemical Co., Ltd. | 6,300 | 125,072 | |||
Hitachi High-Technologies Corp. | 35,600 | 589,672 | |||
#Hitachi Transport System, Ltd. | 111,000 | 1,455,965 | |||
*Hitachi, Ltd. | 6,574,000 | 21,226,498 | |||
*Hitachi, Ltd. Sponsored ADR | 144,840 | 4,653,709 | |||
Hokkoku Bank, Ltd. (The) | 435,409 | 1,708,616 | |||
#House Foods Corp. | 117,000 | 1,863,018 | |||
Hyakugo Bank, Ltd. (The) | 475,028 | 2,271,711 | |||
Hyakujishi Bank, Ltd. (The) | 329,000 | 1,355,835 | |||
#Idemitsu Kosan Co., Ltd. | 46,924 | 3,441,084 | |||
#Isetan Mitsukoshi Holdings, Ltd. | 705,700 | 6,763,322 | |||
*Isuzu Motors, Ltd. | 1,099,000 | 2,323,674 | |||
Itochu Corp. | 343,000 | 2,168,029 | |||
#*J Front Retailing Co., Ltd. | 905,000 | 4,289,809 | |||
Joyo Bank, Ltd. (The) | 842,000 | 3,704,175 | |||
JS Group Corp. | 561,100 | 9,157,444 | |||
JTEKT Corp. | 208,300 | 2,200,452 | |||
Juroku Bank, Ltd. | 400,000 | 1,431,060 | |||
Kagoshima Bank, Ltd. (The) | 358,143 | 2,644,699 | |||
Kajima Corp. | 1,104,000 | 2,584,767 | |||
Kamigumi Co., Ltd. | 488,000 | 3,665,658 | |||
#Kandenko Co., Ltd. | 129,000 | 795,619 | |||
Kaneka Corp. | 580,542 | 3,779,424 | |||
Kansai Paint Co., Ltd. | 64,000 | 541,552 | |||
#*Kawasaki Kisen Kaisha, Ltd. | 753,087 | 2,744,038 | |||
Keiyo Bank, Ltd. (The) | 317,000 | 1,523,545 | |||
Kinden Corp. | 285,000 | 2,314,625 | |||
*Kobe Steel, Ltd. | 3,785,000 | 6,878,464 | |||
Kuraray Co., Ltd. | 30,500 | 314,864 | |||
Kyocera Corp. | 327,900 | 27,505,650 | |||
#Kyocera Corp. Sponsored ADR | 13,600 | 1,135,192 | |||
#Marui Group Co., Ltd. | 542,642 | 3,117,172 | |||
#Mazda Motor Corp. | 2,017,000 | 4,552,092 | |||
Medipal Holdings Corp. | 168,100 | 2,347,503 | |||
*Meiji Holdings Co., Ltd. | 51,095 | 2,081,051 | |||
Mitsubishi Chemical Holdings Corp. | 2,412,500 | 8,958,586 | |||
*Mitsubishi Gas Chemical Co., Inc. | 566,000 | 2,610,761 | |||
Mitsubishi Heavy Industries, Ltd. | 7,188,000 | 25,417,348 | |||
Mitsubishi Logistics Corp. | 199,000 | 2,165,109 | |||
*Mitsubishi Materials Corp. | 1,745,000 | 4,601,377 | |||
#Mitsubishi Rayon Co., Ltd. | 307,000 | 1,060,452 | |||
Mitsubishi Tanabe Pharma Corp. | 385,000 | 4,915,204 | |||
#Mitsui Chemicals, Inc. | 1,351,800 | 4,642,520 | |||
*Mitsui Mining & Smelting Co., Ltd. | 385,000 | 992,054 | |||
Musashino Bank, Ltd. | 37,500 | 1,071,868 | |||
Nagase & Co., Ltd. | 235,889 | 2,869,101 | |||
Namco Bandai Holdings, Inc. | 162,600 | 1,662,560 | |||
Nanto Bank, Ltd. (The) | 263,000 | 1,427,559 | |||
#*NEC Corp. | 4,453,101 | 12,657,266 | |||
21
THE DFA INTERNATIONAL VALUE SERIES
CONTINUED
| Shares | Value†† | ||||
JAPAN — (Continued) | |||||
#NGK Spark Plug Co., Ltd. | 145,000 | $ | 1,643,333 | ||
Nippon Express Co., Ltd. | 1,602,238 | 6,560,618 | |||
Nippon Kayaku Co., Ltd. | 7,000 | 62,623 | |||
#Nippon Meat Packers, Inc. | 360,536 | 4,227,230 | |||
Nippon Mining Holdings, Inc. | 1,899,050 | 8,472,073 | |||
Nippon Oil Corp. | 3,113,050 | 15,340,349 | |||
Nippon Paper Group, Inc. | 188,900 | 5,012,951 | |||
Nippon Sheet Glass Co., Ltd. | 1,141,739 | 3,364,278 | |||
Nippon Shokubai Co., Ltd. | 231,000 | 1,941,496 | |||
Nippon Television Network Corp. | 10,680 | 1,391,886 | |||
*Nippon Yusen K.K. | 1,279,000 | 4,721,208 | |||
Nishi-Nippon Bank, Ltd. | 1,193,569 | 2,952,678 | |||
*Nissan Motor Co., Ltd. | 4,991,500 | 36,119,215 | |||
#Nissay Dowa General Insurance Co., Ltd. | 383,000 | 1,699,964 | |||
Nisshin Steel Co., Ltd. | 1,226,000 | 2,046,021 | |||
#Nisshinbo Holdings, Inc. | 305,000 | 2,997,718 | |||
NOK Corp. | 112,600 | 1,494,005 | |||
NSK, Ltd. | 477,000 | 2,771,257 | |||
NTN Corp. | 70,000 | 264,315 | |||
#Obayashi Corp. | 1,393,682 | 5,262,857 | |||
Ogaki Kyoritsu Bank, Ltd. (The) | 334,000 | 1,144,275 | |||
#Oji Paper Co., Ltd. | 1,756,000 | 7,641,694 | |||
#Onward Holdings Co., Ltd. | 278,000 | 1,725,747 | |||
#Panasonic Electric Works Co., Ltd. | 575,000 | 7,258,163 | |||
Ricoh Co., Ltd. | 1,423,000 | 19,338,909 | |||
Rohm Co., Ltd. | 178,000 | 11,804,415 | |||
San-in Godo Bank, Ltd. (The) | 309,900 | 2,694,654 | |||
#Sapporo Hokuyo Holdings, Inc. | 428,000 | 1,444,752 | |||
#SBI Holdings, Inc. | 17,223 | 3,164,679 | |||
#Seiko Epson Corp. | 249,600 | 3,858,497 | |||
Seino Holdings Co., Ltd. | 295,000 | 2,182,953 | |||
Sekisui Chemical Co., Ltd. | 849,000 | 5,135,210 | |||
Sekisui House, Ltd. | 1,147,000 | 9,918,951 | |||
#Sharp Corp. | 706,000 | 7,532,589 | |||
Shiga Bank, Ltd. | 326,185 | 2,023,578 | |||
Shimachu Co., Ltd. | 70,700 | 1,671,411 | |||
#Shimizu Corp. | 831,000 | 3,186,498 | |||
#*Shinsei Bank, Ltd. | 1,290,000 | 1,682,910 | |||
#Shizuoka Bank, Ltd. | 38,000 | 377,567 | |||
#Showa Denko K.K. | 1,456,000 | 2,802,507 | |||
Sohgo Security Services Co., Ltd. | 101,300 | 1,172,377 | |||
Sojitz Corp. | 2,136,700 | 3,944,714 | |||
Sony Corp. | 652,500 | 19,267,546 | |||
Sony Corp. Sponsored ADR | 1,725,386 | 50,709,095 | |||
Sumco Corp. | 59,600 | 1,137,368 | |||
Sumitomo Bakelite Co., Ltd. | 347,000 | 1,636,368 | |||
Sumitomo Chemical Co., Ltd. | 1,982,000 | 7,896,805 | |||
Sumitomo Corp. | 2,756,900 | 26,763,189 | |||
Sumitomo Electric Industries, Ltd. | 1,567,000 | 19,015,183 | |||
Sumitomo Forestry Co., Ltd. | 158,000 | 1,210,489 | |||
*Sumitomo Heavy Industries, Ltd. | 384,000 | 1,742,238 | |||
Sumitomo Rubber Industries, Ltd. | 230,300 | 2,122,983 | |||
#Sumitomo Trust & Banking Co., Ltd. | 2,806,000 | 14,619,243 | |||
Suzuken Co., Ltd. | 94,400 | 3,340,722 | |||
#*Taiheiyo Cement Corp. | 1,638,800 | 1,902,677 | |||
Taisei Corp. | 1,831,703 | 3,594,713 | |||
#Takashimaya Co., Ltd. | 459,634 | 3,099,092 | |||
TDK Corp. | 208,700 | 11,999,382 | |||
#Teijin, Ltd. | 1,866,862 | 5,486,727 | |||
Toda Corp. | 385,000 | 1,283,405 | |||
Tokuyama Corp. | 382,000 | 2,400,336 | |||
22
THE DFA INTERNATIONAL VALUE SERIES
CONTINUED
| Shares | Value†† | ||||
JAPAN — (Continued) | |||||
Tokyo Broadcasting System, Inc. | 60,700 | $ | 905,383 | ||
Tokyo Steel Manufacturing Co., Ltd. | 191,400 | 2,506,851 | |||
Toppan Printing Co., Ltd. | 1,218,000 | 10,885,786 | |||
#Tosoh Corp. | 884,000 | 2,376,873 | |||
#Toyo Seikan Kaisha, Ltd. | 342,249 | 5,749,746 | |||
Toyobo Co., Ltd. | 743,000 | 1,152,667 | |||
Toyota Auto Body Co., Ltd. | 105,100 | 1,952,084 | |||
*Toyota Tsusho Corp. | 435,400 | 6,225,376 | |||
TV Asahi Corp. | 755 | 1,147,958 | |||
UNY Co., Ltd. | 323,750 | 2,404,752 | |||
Yamaguchi Financial Group, Inc. | 362,148 | 3,460,012 | |||
Yamaha Corp. | 285,400 | 2,948,457 | |||
#Yamaha Motor Co., Ltd. | 397,300 | 4,731,153 | |||
*Yokogawa Electric Corp. | 74,600 | 604,619 | |||
Yokohama Rubber Co., Ltd. | 410,000 | 1,795,791 | |||
TOTAL JAPAN | 849,344,450 | ||||
MALAYSIA — (0.0%) | |||||
*Rekapacific Berhad | 691,000 | — | |||
NETHERLANDS — (3.7%) | |||||
*Aegon NV | 3,202,429 | 22,761,054 | |||
#ArcelorMittal NV | 2,446,831 | 82,806,981 | |||
*ING Groep NV | 3,093,625 | 40,259,293 | |||
#*ING Groep NV Sponsored ADR | 538,200 | 6,942,780 | |||
Koninklijke Ahold NV | 1,318,845 | 16,612,403 | |||
Koninklijke DSM NV | 443,200 | 19,418,373 | |||
Philips Electronics NV | 3,072,622 | 77,186,781 | |||
Philips Electronics NV ADR | 133,700 | 3,354,533 | |||
TOTAL NETHERLANDS | 269,342,198 | ||||
NEW ZEALAND — (0.1%) | |||||
Contact Energy, Ltd. | 929,259 | 4,138,385 | |||
Fletcher Building, Ltd. | 685,164 | 4,047,301 | |||
TOTAL NEW ZEALAND | 8,185,686 | ||||
NORWAY — (1.0%) | |||||
#*DnB NOR ASA Series A | 2,507,294 | 28,722,407 | |||
#*Marine Harvest ASA | 5,002,000 | 3,629,062 | |||
#*Norsk Hydro ASA | 2,002,345 | 13,123,305 | |||
*Norsk Hydro ASA Sponsored ADR | 59,900 | 401,330 | |||
#Orkla ASA | 2,700,350 | 24,964,057 | |||
#*Storebrand ASA | 713,900 | 4,851,286 | |||
TOTAL NORWAY | 75,691,447 | ||||
PORTUGAL — (0.2%) | |||||
Banco BPI SA | 275,646 | 929,774 | |||
#Banco Comercial Portugues SA | 3,941,284 | 5,618,638 | |||
Banco Espirito Santo SA | 747,704 | 5,518,458 | |||
Cimpor Cimentos de Portugal SA | 129,009 | 1,005,451 | |||
TOTAL PORTUGAL | 13,072,321 | ||||
SINGAPORE — (1.6%) | |||||
#Capitaland, Ltd. | 5,173,000 | 15,001,103 | |||
City Developments, Ltd. | 884,000 | 6,193,525 | |||
DBS Group Holdings, Ltd. | 4,164,750 | 38,138,997 | |||
Fraser & Neave, Ltd. | 2,351,450 | 6,402,182 | |||
Jardine Cycle & Carriage, Ltd. | 28,324 | 465,142 | |||
Neptune Orient Lines, Ltd. | 1,457,000 | 1,621,584 | |||
#Overseas-Chinese Banking Corp., Ltd. | 3,238,777 | 17,453,380 | |||
23
THE DFA INTERNATIONAL VALUE SERIES
CONTINUED
| Shares | Value†† | ||||
SINGAPORE — (Continued) | |||||
#Singapore Airlines, Ltd. | 1,568,600 | $ | 15,042,479 | ||
#*Singapore Airport Terminal Services, Ltd. | 1,145,078 | 2,001,087 | |||
Singapore Land, Ltd. | 532,000 | 2,082,638 | |||
United Industrial Corp., Ltd. | 1,391,000 | 1,795,865 | |||
United Overseas Bank, Ltd. | 528,000 | 6,329,063 | |||
UOL Group, Ltd. | 1,376,600 | 3,284,172 | |||
Venture Corp., Ltd. | 48,000 | 306,205 | |||
Wheelock Properties, Ltd. | 476,000 | 591,055 | |||
TOTAL SINGAPORE | 116,708,477 | ||||
SPAIN — (4.7%) | |||||
Acciona SA | 73,176 | 8,914,017 | |||
Acerinox SA | 155,237 | 3,087,220 | |||
#Banco Bilbao Vizcaya SA Sponsored ADR | 385,925 | 6,869,465 | |||
#Banco de Sabadell SA | 2,431,718 | 16,416,332 | |||
#Banco Espanol de Credito SA | 218,246 | 2,762,397 | |||
#Banco Popular Espanol SA | 2,035,899 | 18,134,989 | |||
Banco Santander SA | 5,654,108 | 90,987,342 | |||
Banco Santander SA Sponsored ADR | 5,549,048 | 89,117,711 | |||
Criteria Caixacorp SA | 1,702,347 | 8,298,618 | |||
#Fomento de Construcciones y Contratas SA | 38,756 | 1,576,531 | |||
Gas Natural SDG SA | 549,680 | 11,043,487 | |||
Iberdrola Renovables SA | 1,953,105 | 8,681,835 | |||
#Mapfre SA | 359,181 | 1,539,222 | |||
Repsol YPF SA | 1,204,043 | 32,053,183 | |||
#Repsol YPF SA Sponsored ADR | 1,332,613 | 35,447,506 | |||
*Sacyr Vallehermoso SA | 107,104 | 1,620,346 | |||
TOTAL SPAIN | 336,550,201 | ||||
SWEDEN — (2.9%) | |||||
#Boliden AB | 91,703 | 1,104,224 | |||
Holmen AB Series A | 6,300 | 176,579 | |||
Holmen AB Series B | 146,100 | 3,942,996 | |||
#Nordea Bank AB | 6,583,962 | 70,668,421 | |||
#*Skandinaviska Enskilda Banken AB Series A | 2,552,148 | 15,458,949 | |||
*Skandinaviska Enskilda Banken AB Series C | 9,800 | 66,633 | |||
#SSAB AB Series A | 507,586 | 7,737,518 | |||
#SSAB AB Series B | 233,785 | 3,268,952 | |||
Svenska Cellulosa AB | 57,000 | 781,203 | |||
Svenska Cellulosa AB Series B | 1,586,671 | 21,802,524 | |||
#Svenska Handelsbanken AB Series A | 740,000 | 19,123,005 | |||
#*Swedbank AB Series A | 363,437 | 3,130,853 | |||
Tele2 AB Series B | 857,471 | 12,498,320 | |||
#Telefonaktiebolaget LM Erricson AB Sponsored ADR | 706,832 | 7,351,053 | |||
TeliaSonera AB | 3,615,084 | 23,960,555 | |||
#Volvo AB Series A | 898,101 | 8,294,065 | |||
Volvo AB Series B | 1,028,966 | 9,744,638 | |||
TOTAL SWEDEN | 209,110,488 | ||||
SWITZERLAND — (6.3%) | |||||
#Adecco SA | 366,804 | 16,390,414 | |||
Baloise-Holding AG | 200,163 | 17,138,340 | |||
Banque Cantonale Vaudoise | 7,063 | 2,660,418 | |||
Compagnie Financiere Richemont SA Series A | 1,205,682 | 33,751,706 | |||
Credit Suisse Group AG | 1,755,349 | 93,836,004 | |||
#Credit Suisse Group AG Sponsored ADR | 840,377 | 44,792,094 | |||
GAM Holdings, Ltd. | 38,097 | 464,786 | |||
Givaudan SA | 15,362 | 11,403,803 | |||
#*Holcim, Ltd. | 650,248 | 41,384,888 | |||
*Julius Baer Group, Ltd. | 38,097 | 1,434,161 | |||
24
THE DFA INTERNATIONAL VALUE SERIES
CONTINUED
| Shares | Value†† | ||||
SWITZERLAND — (Continued) | |||||
#PSP Swiss Property AG | 95,780 | $ | 5,374,738 | ||
St. Galler Kantonalbank AG | 5,534 | 2,519,876 | |||
#Swatch Group AG | 34,658 | 8,092,532 | |||
Swiss Life Holding AG | 123,557 | 14,800,026 | |||
Swiss Reinsurance Co., Ltd. AG | 738,155 | 30,058,111 | |||
*UBS AG | 3,481,616 | 58,055,052 | |||
Zurich Financial Services AG | 322,012 | 73,738,360 | |||
TOTAL SWITZERLAND | 455,895,309 | ||||
UNITED KINGDOM — (16.6%) | |||||
*Anglo American P.L.C. | 1,329,421 | 48,102,581 | |||
Associated British Foods P.L.C. | 1,637,844 | 22,178,287 | |||
Aviva P.L.C. | 7,396,866 | 46,253,871 | |||
#*Barclays P.L.C. Sponsored ADR | 2,451,654 | 51,239,569 | |||
#*British Airways P.L.C. | 2,372,765 | 7,046,439 | |||
Carnival P.L.C. | 658,867 | 20,425,788 | |||
#Carnival P.L.C. ADR | 218,000 | 6,753,640 | |||
*easyJet P.L.C. | 687,918 | 4,049,542 | |||
Friends Provident Group P.L.C. | 5,399,716 | 7,199,159 | |||
#HSBC Holdings P.L.C. Sponsored ADR | 3,278,400 | 181,590,576 | |||
International Power P.L.C. | 6,384,014 | 26,504,435 | |||
Investec P.L.C. | 1,003,281 | 7,161,546 | |||
*Kazakhmys P.L.C. | 729,615 | 12,984,716 | |||
Kingfisher P.L.C. | 9,743,172 | 35,612,473 | |||
#Ladbrokes P.L.C. | 861,132 | 1,715,434 | |||
Legal & General Group P.L.C. | 15,758,133 | 20,219,946 | |||
Mondi P.L.C. | 877,217 | 4,841,991 | |||
Old Mutual P.L.C. | 9,616,350 | 16,690,338 | |||
Pearson P.L.C. | 820,157 | 11,148,222 | |||
#Pearson P.L.C. Sponsored ADR | 1,845,066 | 25,111,348 | |||
Rexam P.L.C. | 3,544,129 | 16,048,596 | |||
*Rolls-Royce Group P.L.C. (3283648) | 1,317,228 | 9,714,334 | |||
*Rolls-Royce Group P.L.C. (B3XLQZ7) | 79,033,680 | 129,714 | |||
*Royal Bank of Scotland Group P.L.C. | 15,142,602 | 10,347,950 | |||
#Royal Dutch Shell P.L.C. ADR | 2,252,783 | 131,021,859 | |||
RSA Insurance Group P.L.C. | 13,252,463 | 26,261,469 | |||
SABmiller P.L.C. | 1,174,082 | 30,774,654 | |||
Sainsbury (J.) P.L.C. | 5,000,726 | 26,987,115 | |||
Schroders P.L.C. | 123,678 | 2,223,821 | |||
Schroders P.L.C. Non-Voting | 63,155 | 932,375 | |||
Standard Chartered P.L.C. | 927,972 | 22,765,064 | |||
Thomas Cook Group P.L.C. | 1,861,207 | 6,232,613 | |||
Tomkins P.L.C. Sponsored ADR | 330,800 | 3,599,104 | |||
Vodafone Group P.L.C. | 34,976,333 | 77,082,062 | |||
#Vodafone Group P.L.C. Sponsored ADR | 7,395,974 | 164,116,663 | |||
Whitbread P.L.C. | 653,031 | 13,585,022 | |||
William Morrison Supermarkets P.L.C. | 6,906,878 | 31,655,641 | |||
*Wolseley P.L.C. | 566,229 | 11,453,707 | |||
WPP P.L.C. | 1,259,793 | 11,290,157 | |||
#WPP P.L.C. Sponsored ADR | 24,445 | 1,094,647 | |||
*Xstrata P.L.C. | 3,245,577 | 46,747,872 | |||
TOTAL UNITED KINGDOM | 1,200,894,340 | ||||
TOTAL COMMON STOCKS | 6,155,972,149 | ||||
RIGHTS/WARRANTS — (0.0%) | |||||
GERMANY — (0.0%) | |||||
*TUI AG Rights 11/11/09 | 265,715 | 41,059 | |||
ITALY — (0.0%) | |||||
*Unione di Banche Italiane ScpA Warrants 06/30/11 | 817,282 | 76,976 | |||
TOTAL RIGHTS/WARRANTS | 118,035 | ||||
25
THE DFA INTERNATIONAL VALUE SERIES
CONTINUED
| Face Amount | Value† | |||||
| (000) | ||||||
TEMPORARY CASH INVESTMENTS — (0.2%) | ||||||
Repurchase Agreement, PNC Capital Markets, Inc. 0.19%, 11/02/09 (Collateralized by $13,010,000 FNMA 6.50%, 06/25/39, valued at $14,002,013) to be repurchased at $13,790,218 | $ | 13,790 | $ | 13,790,000 | ||
| Shares/ Face Amount | ||||||
| (000) | ||||||
SECURITIES LENDING COLLATERAL — (14.6%) | ||||||
§@DFA Short Term Investment Fund LP | 1,055,086,714 | 1,055,086,714 | ||||
@Repurchase Agreement, Deutsche Bank Securities 0.07%, 11/02/09 (Collateralized by various corporate obligations, ranging in par value from $4,247,617 to $16,429,280, rates ranging from 5.000% to 7.000%, maturities ranging from 03/01/37 to 10/01/39, valued at $1,212,860) to be repurchased at $1,189,085 | $ | 1,189 | 1,189,078 | |||
TOTAL SECURITIES LENDING COLLATERAL | 1,056,275,792 | |||||
TOTAL INVESTMENTS — (100.0%) | $ | 7,226,155,976 | ||||
See accompanying Notes to Financial Statements.
26
THE JAPANESE SMALL COMPANY SERIES
SCHEDULE OF INVESTMENTS
October 31, 2009
| Shares | Value†† | ||||
COMMON STOCKS — (87.1%) | |||||
Consumer Discretionary — (18.4%) | |||||
*ABILIT Corp. | 450,500 | $ | 582,733 | ||
Accordia Golf Co., Ltd. | 1,227 | 1,139,298 | |||
Aeon Fantasy Co., Ltd. | 60,432 | 798,816 | |||
Aichi Machine Industry Co., Ltd. | 285,000 | 842,144 | |||
*Aigan Co., Ltd. | 61,600 | 368,311 | |||
Aisan Industry Co., Ltd. | 133,600 | 988,718 | |||
#*Akebono Brake Industry Co., Ltd. | 296,500 | 2,307,863 | |||
*Alpen Co., Ltd. | 13,700 | 252,541 | |||
Alpha Corp. | 31,700 | 188,412 | |||
*Alpine Electronics, Inc. | 217,800 | 2,140,689 | |||
#Amiyaki Tei Co., Ltd. | 239 | 503,548 | |||
Amuse, Inc. | 29,999 | 336,174 | |||
*Anrakutei Co., Ltd. | 50,000 | 236,362 | |||
AOI Advertising Promotion, Inc. | 39,000 | 194,938 | |||
AOKI Holdings, Inc. | 139,400 | 1,361,263 | |||
Aoyama Trading Co., Ltd. | 95,000 | 1,522,413 | |||
*Arnest One Corp. | 61,700 | 710,137 | |||
*Asahi Co., Ltd. | 4,400 | 81,512 | |||
#*Asahi Tec Corp. | 2,201,000 | 651,633 | |||
#Asatsu-DK, Inc. | 53,600 | 1,057,040 | |||
#*ASKUL Corp. | 24,200 | 475,183 | |||
Asti Corp. | 50,000 | 109,904 | |||
#*Atom Corp. | 139,300 | 464,311 | |||
Atsugi Co., Ltd. | 701,000 | 882,277 | |||
Autobacs Seven Co., Ltd. | 40,800 | 1,376,034 | |||
#Avex Group Holdings, Inc. | 151,400 | 1,368,926 | |||
Bals Corp. | 7 | 5,474 | |||
Best Denki Co., Ltd. | 271,000 | 1,193,253 | |||
#Bic Camera, Inc. | 501 | 188,209 | |||
Bookoff Corp. | 7,900 | 108,522 | |||
#*Calsonic Kansei Corp. | 506,000 | 1,368,310 | |||
*Can Do Co., Ltd. | 9 | 9,940 | |||
*Carchs Holdings Co., Ltd. | 710,600 | 274,349 | |||
Catena Corp. | 92,000 | 218,138 | |||
*Chimney Co., Ltd. | 600 | 10,199 | |||
Chiyoda Co., Ltd. | 136,600 | 1,627,557 | |||
Chofu Seisakusho Co., Ltd. | 105,600 | 2,087,462 | |||
Chori Co., Ltd. | 658,000 | 761,790 | |||
Chuo Spring Co., Ltd. | 205,000 | 587,920 | |||
#*Clarion Co., Ltd. | 689,000 | 654,391 | |||
Cleanup Corp. | 119,300 | 831,851 | |||
Colowide Co., Ltd. | 200,450 | 1,334,472 | |||
#*Columbia Music Entertainment, Inc. | 157,000 | 57,912 | |||
Corona Corp. | 84,800 | 1,135,722 | |||
Cross Plus, Inc. | 22,000 | 228,952 | |||
#Culture Convenience Club Co., Ltd. | 120,600 | 742,341 | |||
#Daido Metal Co., Ltd. | 144,000 | 387,234 | |||
Daidoh, Ltd. | 125,600 | 883,242 | |||
#*Daiei, Inc. (The) | 223,900 | 829,392 | |||
Daikoku Denki Co., Ltd. | 49,400 | 979,267 | |||
Daimaruenawin Co., Ltd. | 400 | 2,514 | |||
Dainichi Co., Ltd. | 57,700 | 377,825 | |||
Daisyo Corp. | 63,200 | 854,344 | |||
*Daito Woolen Spinning & Weaving Co., Ltd. | 13,000 | 11,248 | |||
#Daiwabo Holdings Co., Ltd. | 466,000 | 1,816,795 | |||
DCM Japan Holdings Co., Ltd. | 241,300 | 1,560,591 | |||
Descente, Ltd. | 260,000 | 1,257,295 | |||
#Doshisha Co., Ltd. | 63,600 | 1,193,191 | |||
27
THE JAPANESE SMALL COMPANY SERIES
CONTINUED
| Shares | Value†† | ||||
Consumer Discretionary — (Continued) | |||||
Doutor Nichires Holdings Co., Ltd. | 172,286 | $ | 2,493,483 | ||
Dynic Corp. | 127,000 | 212,170 | |||
Eagle Industry Co., Ltd. | 136,000 | 675,978 | |||
#*Econach Co., Ltd. | 177,000 | 83,582 | |||
#Edion Corp. | 266,500 | 2,152,446 | |||
Exedy Corp. | 120,500 | 2,477,717 | |||
F&A Aqua Holdings, Inc. | 60,638 | 671,237 | |||
FCC Co., Ltd. | 44,700 | 768,600 | |||
Fine Sinter Co., Ltd. | 49,000 | 90,183 | |||
#Foster Electric Co., Ltd. | 81,900 | 2,096,701 | |||
#France Bed Holdings Co., Ltd. | 759,000 | 1,177,629 | |||
#Fuji Co., Ltd. | 100,200 | 1,992,367 | |||
Fuji Corp., Ltd. | 113,900 | 461,573 | |||
#*Fuji Kiko Co., Ltd. | 151,000 | 182,949 | |||
#Fuji Kyuko Co., Ltd. | 356,000 | 1,767,450 | |||
Fuji Oozx, Inc. | 6,000 | 15,910 | |||
Fujibo Holdings, Inc. | 46,000 | 76,202 | |||
Fujikura Rubber, Ltd. | 74,000 | 308,177 | |||
#Fujita Kanko, Inc. | 402,100 | 1,597,248 | |||
#Fujitsu General, Ltd. | 334,000 | 1,102,633 | |||
Funai Electric Co., Ltd. | 21,800 | 1,017,116 | |||
#Furukawa Battery Co., Ltd. | 71,000 | 625,439 | |||
G-7 Holdings, Inc. | 29,200 | 161,310 | |||
*Gajoen Kanko Co. | 37,000 | — | |||
#Gakken Holdings Co., Ltd. | 327,000 | 934,136 | |||
Genki Sushi Co., Ltd. | 19,200 | 255,024 | |||
GEO Co., Ltd. | 1,255 | 1,303,278 | |||
#GLOBERIDE, Inc. | 433,000 | 541,004 | |||
#*Goldwin, Inc. | 175,000 | 337,525 | |||
Gourmet Kineya Co., Ltd. | 67,000 | 446,923 | |||
*Gro-Bels Co., Ltd. | 177,000 | 37,262 | |||
*GSI Creos Corp. | 194,000 | 221,905 | |||
#Gulliver International Co., Ltd. | 8,380 | 621,453 | |||
Gunze, Ltd. | 624,000 | 2,458,023 | |||
#H2O Retailing Corp. | 119,000 | 723,259 | |||
Hakuyosha Co., Ltd. | 88,000 | 270,158 | |||
Happinet Corp. | 36,100 | 500,988 | |||
Haruyama Trading Co., Ltd. | 49,900 | 217,132 | |||
#*Haseko Corp. | 1,933,000 | 1,483,692 | |||
Heiwa Corp. | 68,900 | 674,506 | |||
#Hiday Hidaka Corp. | 6,900 | 85,421 | |||
Hikari Tsushin, Inc. | 49,100 | 921,145 | |||
#Himaraya Co., Ltd. | 38,300 | 133,425 | |||
#HIS Co., Ltd. | 108,500 | 2,331,925 | |||
#Hitachi Koki Co., Ltd. | 81,800 | 905,463 | |||
Horipro, Inc. | 47,000 | 410,436 | |||
*I Metal Technology Co., Ltd. | 150,000 | 234,118 | |||
#*Ichibanya Co., Ltd. | 3,400 | 86,097 | |||
Ichikawa Co., Ltd. | 63,000 | 136,670 | |||
#*Ichikoh Industries, Ltd. | 289,000 | 514,399 | |||
*Ikyu Corp. | 192 | 90,954 | |||
Imasen Electric Industrial Co., Ltd. | 54,400 | 695,065 | |||
Imperial Hotel, Ltd. | 10,250 | 206,096 | |||
*Impress Holdings, Inc. | 112,400 | 278,798 | |||
*Intage, Inc. | 1,300 | 23,326 | |||
Ishizuka Glass Co., Ltd. | 109,000 | 234,130 | |||
*Izuhakone Railway Co., Ltd. | 300 | 17,997 | |||
*Izutsuya Co., Ltd. | 350,000 | 164,112 | |||
#*Janome Sewing Machine Co., Ltd. | 37,000 | 25,102 | |||
Japan Vilene Co., Ltd. | 166,000 | 883,669 | |||
#Japan Wool Textile Co., Ltd. (The) | 308,000 | 2,056,646 | |||
28
THE JAPANESE SMALL COMPANY SERIES
CONTINUED
| Shares | Value†† | ||||
Consumer Discretionary — (Continued) | |||||
Jeans Mate Corp. | 38,208 | $ | 222,254 | ||
*Jidosha Buhin Kogyo Co., Ltd. | 82,000 | 129,623 | |||
Joban Kosan Co., Ltd. | 221,000 | 362,915 | |||
#Joshin Denki Co., Ltd. | 196,000 | 1,370,265 | |||
Juntendo Co., Ltd. | 35,000 | 46,526 | |||
#*JVC Kenwood Holdings, Inc. | 2,477,300 | 1,180,994 | |||
Kabuki-Za Co., Ltd. | 39,000 | 1,587,083 | |||
Kadokawa Holdings, Inc. | 91,900 | 2,180,660 | |||
Kanto Auto Works, Ltd. | 178,600 | 1,697,589 | |||
#*Kappa Create Co., Ltd. | 3,750 | 84,696 | |||
Kasai Kogyo Co., Ltd. | 119,000 | 314,386 | |||
#Kawai Musical Instruments Manufacturing Co., Ltd. | 256,000 | 318,277 | |||
#*Kawashima Selkon Textiles Co., Ltd. | 335,000 | 267,804 | |||
*Kayaba Industry Co., Ltd. | 726,000 | 2,098,187 | |||
Keihin Corp. | 57,300 | 870,352 | |||
#Keiyo Co., Ltd. | 195,000 | 946,874 | |||
Kentucky Fried Chicken Japan, Ltd. | 78,000 | 1,455,688 | |||
#*Kinki Nippon Tourist Co., Ltd. | 46,000 | 41,967 | |||
Kinugawa Rubber Industrial Co., Ltd. | 198,000 | 383,033 | |||
#Kisoji Co., Ltd. | 87,000 | 1,901,052 | |||
Koekisha Co., Ltd. | 13,600 | 242,000 | |||
Kohnan Shoji Co., Ltd. | 91,600 | 1,112,302 | |||
#Kojima Co., Ltd. | 126,600 | 638,568 | |||
Komatsu Seiren Co., Ltd. | 145,000 | 568,627 | |||
Komeri Co., Ltd. | 59,600 | 1,647,271 | |||
Konaka Co., Ltd. | 104,960 | 304,651 | |||
Kourakuen Corp. | 1,100 | 14,243 | |||
#K’s Holdings Corp. | 130,772 | 4,237,998 | |||
Ku Holdings Co., Ltd. | 68,200 | 252,799 | |||
Kura Corp. | 283 | 984,686 | |||
Kurabo Industries, Ltd. | 856,000 | 1,477,290 | |||
#Kuraudia Co., Ltd. | 4,800 | 70,227 | |||
Kuroganeya Co., Ltd. | 14,000 | 50,104 | |||
#Kyoritsu Maintenance Co., Ltd. | 49,660 | 816,470 | |||
Kyoto Kimono Yuzen Co., Ltd. | 55,700 | 551,950 | |||
Kyowa Leather Cloth Co., Ltd. | 73,500 | 295,913 | |||
#*Laox Co., Ltd. | 706,000 | 775,489 | |||
#*Look, Inc. | 588,000 | 617,766 | |||
*Magara Construction Co., Ltd. | 135,000 | 1,500 | |||
*Mamiya-Op Co., Ltd. | 285,000 | 281,493 | |||
Marche Corp. | 23,000 | 190,788 | |||
Mars Engineering Corp. | 45,500 | 1,418,579 | |||
Maruei Department Store Co., Ltd. | 142,000 | 198,741 | |||
#*Maruzen Co., Ltd. (6569583) | 85,000 | 91,000 | |||
Maruzen Co., Ltd. (6573498) | 46,000 | 224,500 | |||
#*Matsuya Co., Ltd. | 162,500 | 1,551,616 | |||
Matsuya Foods Co., Ltd. | 59,400 | 851,659 | |||
*Meiwa Industry Co., Ltd. | 38,000 | 54,247 | |||
Mikuni Corp. | 114,000 | 156,516 | |||
#*Misawa Homes Co., Ltd., | 77,000 | 279,987 | |||
#Misawa Resort Co., Ltd. | 190,000 | 310,720 | |||
*Mitsuba Corp. | 152,690 | 670,390 | |||
Mitsui Home Co., Ltd. | 167,000 | 921,751 | |||
#Mizuno Corp. | 450,000 | 2,074,423 | |||
Mos Food Services, Inc. | 110,000 | 1,814,924 | |||
MR Max Corp. | 123,800 | 589,856 | |||
Musashi Seimitsu Industry Co., Ltd. | 33,400 | 693,049 | |||
#*Naigai Co., Ltd. | 2,723,000 | 1,340,373 | |||
#Nexyz Corp. | 3,700 | 130,233 | |||
*Nice Holdings, Inc. | 335,000 | 712,023 | |||
*Nichimo Corp. | 667,000 | 7,410 | |||
29
THE JAPANESE SMALL COMPANY SERIES
CONTINUED
| Shares | Value†† | ||||
Consumer Discretionary — (Continued) | |||||
Nidec Copal Corp. | 108,700 | $ | 1,629,716 | ||
Nidec Tosok Corp. | 61,000 | 520,798 | |||
Nihon Tokushu Toryo Co., Ltd. | 56,000 | 208,205 | |||
Nikko Travel Co., Ltd. | 12,200 | 27,055 | |||
Nippon Felt Co., Ltd. | 67,200 | 302,469 | |||
*Nippon Piston Ring Co., Ltd. | 293,000 | 313,512 | |||
Nippon Seiki Co., Ltd. | 148,400 | 1,558,419 | |||
#Nishimatsuya Chain Co., Ltd. | 222,800 | 2,231,426 | |||
Nissan Shatai Co., Ltd. | 407,023 | 3,430,896 | |||
Nissen Holdings Co., Ltd. | 207,400 | 679,305 | |||
Nissin Kogyo Co., Ltd. | 64,300 | 956,856 | |||
Nittan Valve Co., Ltd. | 82,800 | 264,662 | |||
*Nitto Kako Co., Ltd. | 98,000 | 75,392 | |||
Noritsu Koki Co., Ltd. | 96,200 | 810,391 | |||
#*Omikenshi Co., Ltd. | 176,000 | 155,394 | |||
Onward Holdings Co., Ltd. | 62,000 | 384,879 | |||
Pacific Golf Group International Holdings KK | 594 | 407,445 | |||
Pacific Industrial Co., Ltd. | 183,000 | 827,758 | |||
*Pal Co., Ltd. | 2,000 | 42,428 | |||
PanaHome Corp. | 440,200 | 2,756,561 | |||
Parco Co., Ltd. | 270,800 | 2,370,672 | |||
#Paris Miki Holdings, Inc. | 164,400 | 1,352,069 | |||
*PIA Corp. | 28,800 | 390,795 | |||
Piolax, Inc. | 44,500 | 755,375 | |||
#*Pioneer Electronic Corp. | 4,100 | 10,158 | |||
Plenus Co., Ltd. | 15,400 | 210,022 | |||
Press Kogyo Co., Ltd. | 375,000 | 820,759 | |||
#Resorttrust, Inc. | 164,008 | 1,866,646 | |||
*Rhythm Watch Co., Ltd. | 443,000 | 595,389 | |||
Right On Co., Ltd. | 70,525 | 598,982 | |||
Riken Corp. | 359,000 | 1,301,874 | |||
#Ringer Hut Co., Ltd. | 74,800 | 947,411 | |||
Riso Kyoiku Co., Ltd. | 785 | 47,083 | |||
Roland Corp. | 88,300 | 942,606 | |||
Round One Corp. | 15,000 | 109,873 | |||
#Royal Co., Ltd. | 138,200 | 1,526,546 | |||
Ryohin Keikaku Co., Ltd. | 25,100 | 1,129,748 | |||
*Sagami Chain Co., Ltd. | 77,000 | 685,903 | |||
#*Sagami Co., Ltd. | 239,000 | 473,566 | |||
Sagami Rubber Industries Co., Ltd. | 15,000 | 39,611 | |||
#Saint Marc Holdings Co., Ltd. | 37,300 | 1,120,835 | |||
#Saizeriya Co., Ltd. | 168,800 | 3,256,721 | |||
*Sakai Ovex Co., Ltd. | 205,000 | 199,910 | |||
*Sanden Corp. | 487,000 | 1,405,320 | |||
Sanoh Industrial Co., Ltd. | 114,900 | 727,922 | |||
#Sanrio Co., Ltd. | 235,800 | 1,933,963 | |||
Sanyo Housing Nagoya Co., Ltd. | 354 | 324,047 | |||
#Sanyo Shokai, Ltd. | 462,000 | 1,492,328 | |||
Scroll Corp. | 77,300 | 327,123 | |||
#Seiko Holdings Corp. | 391,407 | 811,599 | |||
Seiren Co., Ltd. | 215,100 | 1,413,966 | |||
Senshukai Co., Ltd. | 159,600 | 1,076,037 | |||
#*Seven Seas Holdings Co., Ltd. | 827,000 | 383,860 | |||
#Shikibo, Ltd. | 497,000 | 1,187,296 | |||
Shimachu Co., Ltd. | 53,000 | 1,252,967 | |||
Shinyei Kaisha | 96,000 | 132,397 | |||
*Shiroki Co., Ltd. | 302,000 | 482,420 | |||
#Shobunsha Publications, Inc. | 353,700 | 2,401,120 | |||
Shochiku Co., Ltd. | 416,400 | 3,658,864 | |||
Showa Corp. | 247,300 | 1,442,323 | |||
#*Silver Seiko, Ltd. | 742,000 | 48,989 | |||
30
THE JAPANESE SMALL COMPANY SERIES
CONTINUED
| Shares | Value†† | ||||
Consumer Discretionary — (Continued) | |||||
SKY Perfect JSAT Holdings, Inc. | 1,241 | $ | 567,458 | ||
SNT Corp. | 93,800 | 243,644 | |||
#*Sofmap Co., Ltd. | 43,100 | 80,591 | |||
Soft99 Corp. | 71,500 | 404,305 | |||
Sotoh Co., Ltd. | 49,700 | 483,483 | |||
SPK Corp. | 16,800 | 213,239 | |||
*Studio Alice Co., Ltd. | 6,100 | 62,127 | |||
Suminoe Textile Co., Ltd. | 260,000 | 367,003 | |||
#Sumitomo Forestry Co., Ltd. | 197,266 | 1,511,319 | |||
#*Suzutan Co., Ltd. | 26,200 | 75,214 | |||
*SxL Corp. | 493,000 | 280,101 | |||
Tac Co., Ltd. | 1,300 | 5,237 | |||
Tachikawa Corp. | 50,800 | 250,098 | |||
Tachi-S Co., Ltd. | 119,440 | 954,892 | |||
Taiho Kogyo Co., Ltd. | 95,200 | 708,110 | |||
Takamatsu Construction Group Co., Ltd. | 97,000 | 1,367,139 | |||
#Taka-Q Co., Ltd. | 73,000 | 125,532 | |||
*Takata Corp. | 9,000 | 167,924 | |||
#*Take & Give Needs Co., Ltd. | 1,380 | 178,066 | |||
*Tamron Co., Ltd. | 7,900 | 86,069 | |||
#*Tasaki Shinju Co., Ltd. | 714,000 | 816,117 | |||
Taya Co., Ltd. | 5,000 | 36,823 | |||
*TBK Co., Ltd. | 72,000 | 120,845 | |||
*TDF Corp. | 27,000 | 30,556 | |||
Teikoku Piston Ring Co., Ltd. | 108,100 | 440,545 | |||
Teikoku Sen-I Co., Ltd. | 78,000 | 453,756 | |||
Telepark Corp. | 315 | 602,551 | |||
#*Ten Allied Co., Ltd. | 50,000 | 174,912 | |||
Tigers Polymer Corp. | 59,000 | 253,809 | |||
#Toabo Corp. | 346,000 | 269,902 | |||
Toei Co., Ltd. | 339,000 | 1,908,896 | |||
#*Tohoku Misawa Homes Co., Ltd. | 37,500 | 87,139 | |||
*Tokai Kanko Co., Ltd. | 505,999 | 161,231 | |||
Tokai Rika Co., Ltd. | 85,400 | 1,763,647 | |||
Tokai Rubber Industries, Ltd. | 106,300 | 1,253,996 | |||
#*Tokai Senko K.K. | 284,000 | 378,758 | |||
*Token Corp. | 7,710 | 243,148 | |||
Tokyo Dome Corp. | 638,200 | 2,003,691 | |||
Tokyo Individualized Educational Institute , Inc. | 3,200 | 5,988 | |||
Tokyo Kaikan Co., Ltd. | 12,000 | 48,087 | |||
Tokyo Soir Co., Ltd. | 49,000 | 123,427 | |||
Tokyo Style Co., Ltd. | 316,700 | 2,663,662 | |||
Tokyotokeiba Co., Ltd. | 876,000 | 1,376,463 | |||
Tokyu Recreation Co., Ltd. | 77,000 | 475,223 | |||
#Tomy Co., Ltd. | 313,193 | 2,764,145 | |||
#*Tonichi Carlife Group, Inc. | 318,000 | 331,098 | |||
Topre Corp. | 180,100 | 1,609,688 | |||
*Toridoll.Corp. | 23 | 49,050 | |||
*Totenko Co., Ltd. | 57,000 | 103,950 | |||
#*Touei Housing Corp. | 118,740 | 1,360,916 | |||
*Tow Co., Ltd. | 4,800 | 28,196 | |||
Toyo Radiator Co., Ltd. | 253,000 | 677,378 | |||
*Toyo Tire & Rubber Co., Ltd. | 711,000 | 1,339,650 | |||
Toyobo Co., Ltd. | 1,507,000 | 2,337,913 | |||
TS Tech Co., Ltd. | 58,700 | 1,126,220 | |||
#*Tsukamoto Co., Ltd. | 67,000 | 58,762 | |||
Tsutsumi Jewelry Co., Ltd. | 53,300 | 1,254,610 | |||
TV Tokyo Corp. | 3,200 | 80,361 | |||
United Arrows, Ltd. | 2,300 | 23,380 | |||
#*Unitika, Ltd. | 1,629,000 | 1,284,522 | |||
#U-Shin, Ltd. | 94,500 | 499,265 | |||
31
THE JAPANESE SMALL COMPANY SERIES
CONTINUED
| Shares | Value†† | ||||
Consumer Discretionary — (Continued) | |||||
Watabe Wedding Corp. | 29,500 | $ | 380,978 | ||
#Watami Food Service Co., Ltd. | 119,600 | 2,355,367 | |||
*Wondertable, Ltd. | 97,000 | 96,365 | |||
Xebio Co., Ltd. | 52,800 | 1,194,615 | |||
Yamato International, Inc. | 43,000 | 189,400 | |||
Yellow Hat, Ltd. | 73,700 | 702,534 | |||
Yokohama Reito Co., Ltd. | 175,000 | 1,172,032 | |||
#Yomiuri Land Co., Ltd. | 246,000 | 813,275 | |||
Yonex Co., Ltd. | 40,000 | 295,829 | |||
#Yorozu Corp. | 73,500 | 880,060 | |||
#Yoshinoya Holdings Co., Ltd. | 2,168 | 2,538,257 | |||
#Zenrin Co., Ltd. | 127,400 | 1,865,455 | |||
#Zensho Co., Ltd. | 362,900 | 2,526,504 | |||
Total Consumer Discretionary | 247,477,761 | ||||
Consumer Staples — (9.1%) | |||||
#Aderans Holdings Co., Ltd. | 142,450 | 1,764,083 | |||
*Aeon Hokkaido Corp. | 424,900 | 1,359,990 | |||
Ahjikan Co., Ltd. | 10,500 | 87,472 | |||
Arcs Co., Ltd. | 2,000 | 29,381 | |||
#Ariake Japan Co., Ltd. | 111,700 | 1,742,013 | |||
Cawachi, Ltd. | 81,200 | 1,684,685 | |||
CFS Corp. | 122,000 | 696,919 | |||
#Chubu Shiryo Co., Ltd. | 89,000 | 828,033 | |||
Chuo Gyorui Co., Ltd. | 93,000 | 186,163 | |||
Circle K Sunkus Co., Ltd. | 2,800 | 38,436 | |||
Coca-Cola Central Japan Co., Ltd. | 118,800 | 1,591,809 | |||
Cocakara Fine Holdings, Inc. | 36,060 | 823,804 | |||
CVS Bay Area, Inc. | 55,000 | 70,277 | |||
DyDo Drinco, Inc. | 54,800 | 1,673,288 | |||
Echo Trading Co., Ltd. | 11,000 | 124,683 | |||
Ensuiko Sugar Refining Co., Ltd. | 103,000 | 179,470 | |||
Fancl Corp. | 170,300 | 3,039,176 | |||
#*First Baking Co., Ltd. | 183,000 | 217,220 | |||
Fuji Oil Co., Ltd. | 155,000 | 2,339,901 | |||
Fujicco Co., Ltd. | 117,600 | 1,292,223 | |||
#*Fujiya Co., Ltd. | 549,000 | 1,034,092 | |||
Hagoromo Foods Corp. | 40,000 | 458,754 | |||
Harashin Narus Holdings Co., Ltd. | 61,500 | 677,938 | |||
#*Hayashikane Sangyo Co., Ltd. | 336,000 | 459,050 | |||
Heiwado Co., Ltd. | 174,800 | 2,288,622 | |||
#Hohsui Corp. | 120,000 | 161,662 | |||
Hokkaido Coca-Cola Bottling Co., Ltd. | 87,000 | 474,868 | |||
Hokuto Corp. | 105,700 | 2,362,600 | |||
Inageya Co., Ltd. | 175,000 | 1,820,393 | |||
ITO EN, LTD. | 2,400 | 40,366 | |||
Itochu-Shokuhin Co., Ltd. | 28,600 | 973,775 | |||
Itoham Foods, Inc. | 693,800 | 2,742,506 | |||
Izumiya Co., Ltd. | 292,000 | 1,505,873 | |||
J-Oil Mills, Inc. | 513,000 | 1,751,895 | |||
#Kameda Seika Co., Ltd. | 70,000 | 1,303,176 | |||
Kasumi Co., Ltd. | 211,000 | 1,048,200 | |||
Kato Sangyo Co., Ltd. | 115,600 | 1,995,111 | |||
Key Coffee, Inc. | 76,600 | 1,350,352 | |||
Kirindo Co., Ltd. | 32,800 | 173,498 | |||
Kose Corp. | 6,100 | 133,451 | |||
#Kyodo Shiryo Co., Ltd. | 353,000 | 484,013 | |||
Kyokuyo Co., Ltd. | 370,000 | 747,242 | |||
Life Corp. | 183,900 | 3,224,609 | |||
Lion Corp. | 3,000 | 14,959 | |||
Mandom Corp. | 82,200 | 2,143,545 | |||
32
THE JAPANESE SMALL COMPANY SERIES
CONTINUED
| Shares | Value†† | ||||
Consumer Staples — (Continued) | |||||
Marudai Food Co., Ltd. | 443,000 | $ | 1,461,227 | ||
Maruetsu, Inc. (The) | 417,000 | 1,924,974 | |||
#Maruha Nichiro Holdings, Inc. | 1,651,069 | 2,422,025 | |||
*Maruya Co., Ltd. | 14,000 | 15,613 | |||
Matsumotokiyoshi Holdings Co., Ltd. | 14,600 | 335,163 | |||
*Maxvalu Tohok Co., Ltd. | 18,200 | 123,106 | |||
#Maxvalu Tokai Co., Ltd. | 59,400 | 694,826 | |||
*Megmilk Snow Brand Co., Ltd. | 180,000 | 3,549,408 | |||
#Meito Sangyo Co., Ltd. | 62,300 | 874,310 | |||
Mercian Corp. | 413,000 | 970,299 | |||
Mikuni Coca-Cola Bottling Co., Ltd. | 183,600 | 1,547,845 | |||
Milbon Co., Ltd. | 42,840 | 1,043,646 | |||
Ministop Co., Ltd. | 80,600 | 1,126,556 | |||
Mitsui Sugar Co., Ltd. | 465,850 | 1,652,403 | |||
Miyoshi Oil & Fat Co., Ltd. | 261,000 | 415,253 | |||
#Morinaga & Co., Ltd. | 909,000 | 1,934,253 | |||
Morinaga Milk Industry Co., Ltd. | 852,000 | 3,975,218 | |||
Morishita Jinton Co., Ltd. | 47,800 | 136,841 | |||
Morozoff, Ltd. | 108,000 | 369,684 | |||
#Nagatanien Co., Ltd. | 118,000 | 1,145,598 | |||
#Nakamuraya Co., Ltd. | 203,000 | 1,075,519 | |||
#Nichimo Co., Ltd. | 112,000 | 187,252 | |||
Nichirei Corp. | 17,000 | 63,144 | |||
Nihon Chouzai Co., Ltd. | 22,380 | 507,166 | |||
Niitaka Co., Ltd. | 7,260 | 81,073 | |||
Nippon Beet Sugar Manufacturing Co., Ltd. | 513,000 | 1,314,448 | |||
Nippon Flour Mills Co., Ltd. | 604,000 | 3,069,254 | |||
*Nippon Formula Feed Manufacturing Co., Ltd. | 267,000 | 324,029 | |||
#Nippon Suisan Kaisha, Ltd. | 514,500 | 1,474,528 | |||
#Nisshin Oillio Group, Ltd. (The) | 548,000 | 2,887,732 | |||
Nissin Sugar Manufacturing Co., Ltd. | 149,000 | 320,996 | |||
Nitto Flour Milling Co., Ltd. | 64,000 | 230,150 | |||
#Oenon Holdings, Inc. | 247,000 | 522,605 | |||
Oie Sangyo Co., Ltd. | 20,900 | 182,030 | |||
Okuwa Co., Ltd. | 125,000 | 1,394,172 | |||
Olympic Corp. | 65,000 | 463,086 | |||
Oriental Yeast Co., Ltd. | 101,000 | 596,560 | |||
Pietro Co., Ltd. | 10,300 | 93,190 | |||
#Pigeon Corp. | 67,800 | 2,628,743 | |||
Poplar Co., Ltd. | 25,760 | 178,902 | |||
Prima Meat Packers, Ltd. | 705,000 | 815,667 | |||
Riken Vitamin Co., Ltd. | 79,300 | 2,104,680 | |||
Rock Field Co., Ltd. | 47,800 | 635,087 | |||
Ryoshoku, Ltd. | 111,300 | 2,666,186 | |||
S Foods, Inc. | 80,500 | 733,769 | |||
#Sakata Seed Corp. | 171,000 | 2,673,715 | |||
*San-A Co., Ltd. | 600 | 21,722 | |||
Shoei Foods Corp. | 44,000 | 216,910 | |||
Showa Sangyo Co., Ltd. | 557,000 | 1,861,814 | |||
#Sogo Medical Co., Ltd. | 23,000 | 606,513 | |||
Sonton Food Industry Co., Ltd. | 43,000 | 339,107 | |||
Starzen Corp. | 279,000 | 727,434 | |||
Sugi Holdings Co., Ltd. | 3,400 | 73,845 | |||
Takara Holdings, Inc. | 28,000 | 171,337 | |||
Three F Co., Ltd. | 17,700 | 118,643 | |||
Tobu Store Co., Ltd. | 215,000 | 711,001 | |||
Toho Co., Ltd. | 158,000 | 586,919 | |||
Tohto Suisan Co., Ltd. | 120,000 | 220,932 | |||
Torigoe Co., Ltd. | 84,500 | 752,723 | |||
#Toyo Sugar Refining Co., Ltd. | 157,000 | 225,346 | |||
Tsukiji Uoichiba Co., Ltd. | 57,000 | 89,635 | |||
33
THE JAPANESE SMALL COMPANY SERIES
CONTINUED
| Shares | Value†† | ||||
Consumer Staples — (Continued) | |||||
Tsuruha Holdings, Inc. | 45,200 | $ | 1,761,725 | ||
Unicafe, Inc. | 14,260 | 157,406 | |||
Unicharm Petcare Corp. | 73,900 | 2,611,546 | |||
Unimat Offisco Corp. | 85,100 | 867,946 | |||
UNY Co., Ltd. | 78,800 | 585,311 | |||
Valor Co., Ltd. | 173,600 | 1,489,494 | |||
Warabeya Nichiyo Co., Ltd. | 51,360 | 628,183 | |||
Yaizu Suisankagaku Industry Co., Ltd. | 41,000 | 510,136 | |||
#Yaoko Co., Ltd. | 42,200 | 1,475,485 | |||
Yomeishu Seizo Co., Ltd. | 100,000 | 961,903 | |||
Yonekyu Corp. | 98,000 | 995,199 | |||
Yuasa Funashoku Co., Ltd. | 112,000 | 268,442 | |||
#Yukiguni Maitake Co., Ltd. | 104,256 | 515,893 | |||
Yutaka Foods Corp. | 6,000 | 94,100 | |||
Total Consumer Staples | 121,728,157 | ||||
Energy — (1.2%) | |||||
#AOC Holdings, Inc. | 139,600 | 934,194 | |||
#BP Castrol K.K. | 69,800 | 267,302 | |||
#*Fuji Kosan Co., Ltd. | 264,000 | 212,646 | |||
Itochu Enex Co., Ltd. | 321,400 | 1,650,134 | |||
Japan Oil Transportation Co., Ltd. | 79,000 | 170,654 | |||
Kanto Natural Gas Development Co., Ltd. | 169,000 | 1,023,169 | |||
#Kyoei Tanker Co., Ltd. | 115,000 | 265,189 | |||
Mitsuuroko Co., Ltd. | 178,700 | 1,270,211 | |||
#Modec, Inc. | 89,200 | 1,772,480 | |||
#Nippon Gas Co., Ltd. | 148,900 | 2,580,203 | |||
Nippon Seiro Co., Ltd. | 64,000 | 106,842 | |||
Sala Corp. | 129,500 | 827,245 | |||
#San-Ai Oil Co., Ltd. | 259,000 | 1,332,632 | |||
Shinko Plantech Co., Ltd. | 154,800 | 1,581,785 | |||
Sinanen Co., Ltd. | 259,000 | 1,378,447 | |||
Toa Oil Co., Ltd. | 360,000 | 461,704 | |||
Toyo Kanetsu K.K. | 466,000 | 773,599 | |||
Total Energy | 16,608,436 | ||||
Financials — (9.1%) | |||||
Aichi Bank, Ltd. (The) | 34,100 | 2,859,215 | |||
Airport Facilities Co., Ltd. | 139,670 | 824,671 | |||
Akita Bank, Ltd. (The) | 666,400 | 2,601,266 | |||
#Aomori Bank, Ltd. (The) | 611,000 | 1,724,912 | |||
#*Arealink Co., Ltd. | 3,000 | 163,205 | |||
Awa Bank, Ltd. (The) | 113,000 | 588,732 | |||
#Bank of Iwate, Ltd. (The) | 57,400 | 3,400,866 | |||
Bank of Nagoya, Ltd. (The) | 255,297 | 1,008,404 | |||
Bank of Okinawa, Ltd. (The) | 74,500 | 2,568,916 | |||
Bank of Saga, Ltd. (The) | 584,000 | 1,987,588 | |||
Bank of the Ryukyus, Ltd. | 121,780 | 1,309,899 | |||
#*Cedyna Financial Corp. | 502,350 | 992,128 | |||
Century Tokyo Leasing Corp. | 308,990 | 3,451,730 | |||
*Chiba Kogyo Bank, Ltd. (The) | 169,600 | 1,486,525 | |||
Chukyo Bank, Ltd. (The) | 727,000 | 1,994,034 | |||
Daiko Clearing Services Corp. | 49,700 | 263,502 | |||
#*Daikyo, Inc. | 536,000 | 1,328,490 | |||
#*Daisan Bank, Ltd. (The) | 621,000 | 1,496,248 | |||
Daishi Bank, Ltd. (The) | 170,000 | 619,274 | |||
Daito Bank, Ltd. (The) | 498,000 | 371,480 | |||
Ehime Bank, Ltd. (The) | 593,000 | 1,613,200 | |||
Eighteenth Bank, Ltd. (The) | 614,000 | 1,694,315 | |||
*Fuji Fire & Marine Insurance Co., Ltd. (The) | 526,000 | 602,215 | |||
#Fukui Bank, Ltd. (The) | 841,000 | 2,791,181 | |||
34
THE JAPANESE SMALL COMPANY SERIES
CONTINUED
| Shares | Value†† | ||||
Financials — (Continued) | |||||
*Fukushima Bank, Ltd. | 836,000 | $ | 485,909 | ||
Fuyo General Lease Co., Ltd. | 92,500 | 2,043,865 | |||
Goldcrest Co., Ltd. | 55,870 | 1,695,929 | |||
Heiwa Real Estate Co., Ltd. | 171,000 | 560,299 | |||
Higashi-Nippon Bank, Ltd. | 626,000 | 1,350,903 | |||
Higo Bank, Ltd. (The) | 95,000 | 562,364 | |||
Hokkoku Bank, Ltd. (The) | 634,000 | 2,487,919 | |||
Hokuetsu Bank, Ltd. (The) | 875,000 | 1,469,677 | |||
Hyakugo Bank, Ltd. (The) | 235,000 | 1,123,833 | |||
Hyakujishi Bank, Ltd. (The) | 195,000 | 803,610 | |||
IBJ Leasing Co., Ltd. | 96,200 | 1,646,509 | |||
Ichiyoshi Securities Co., Ltd. | 160,600 | 1,196,683 | |||
*Iida Home Max | 2,600 | 46,701 | |||
Juroku Bank, Ltd. | 293,000 | 1,048,252 | |||
#*Kabu.Com Securities Co., Ltd. | 1,023 | 1,094,448 | |||
*Kachikaihatsu Co., Ltd. | 186,000 | 50,976 | |||
Kagawa Bank, Ltd. (The) | 269,350 | 971,585 | |||
*Kanto Tsukuba Bank, Ltd. (The) | 188,800 | 629,763 | |||
Keiyo Bank, Ltd. (The) | 14,000 | 67,286 | |||
#*Kenedix, Inc. | 722 | 274,385 | |||
Kirayaka Bank, Ltd. | 98,000 | 83,199 | |||
Kita-Nippon Bank, Ltd. (The) | 29,706 | 895,635 | |||
Kiyo Holdings, Inc. | 2,135,900 | 2,559,406 | |||
#Kobayashi Yoko Co., Ltd. | 268,200 | 912,155 | |||
#Kosei Securities Co., Ltd. | 295,000 | 321,340 | |||
Leopalace21 Corp. | 98,700 | 534,073 | |||
Marusan Securities Co., Ltd. | 256,000 | 1,520,881 | |||
Michinoku Bank, Ltd. (The) | 524,000 | 1,186,007 | |||
*Minato Bank, Ltd. (The) | 1,190,000 | 1,496,942 | |||
*Mito Securities Co., Ltd. | 271,000 | 603,011 | |||
Miyazaki Bank, Ltd. (The) | 494,000 | 2,256,087 | |||
#*Mizuho Investors Securities Co., Ltd. | 1,017,000 | 1,037,688 | |||
#Monex Group, Inc. | 2,606 | 1,030,830 | |||
Musashino Bank, Ltd. | 62,900 | 1,797,880 | |||
Nagano Bank, Ltd. (The) | 314,000 | 658,044 | |||
*New Real Property K.K. | 43,900 | — | |||
#*NIS Group Co., Ltd. | 1,193,425 | 493,074 | |||
#Nisshin Fudosan Co., Ltd. | 103,700 | 556,007 | |||
Ogaki Kyoritsu Bank, Ltd. (The) | 306,000 | 1,048,348 | |||
Oita Bank, Ltd. (The) | 491,900 | 1,997,881 | |||
Okasan Securities Group, Inc. | 594,000 | 2,807,164 | |||
Ricoh Leasing Co., Ltd. | 89,000 | 1,820,043 | |||
#RISA Partners, Inc. | 479 | 377,184 | |||
San-in Godo Bank, Ltd. (The) | 79,000 | 686,924 | |||
#Sankei Building Co., Ltd. | 182,100 | 1,405,883 | |||
Sapporo Hokuyo Holdings, Inc. | 426,200 | 1,438,676 | |||
#*Senshu Ikeda Holdings, Inc. | 1,258,000 | 4,304,438 | |||
Shikoku Bank, Ltd. | 742,000 | 2,503,893 | |||
#Shimizu Bank, Ltd. | 32,100 | 1,383,797 | |||
Sumitomo Real Estate Sales Co., Ltd. | 33,200 | 1,164,240 | |||
*Sun Frontier Fudousan Co., Ltd. | 208 | 51,706 | |||
Takagi Securities Co., Ltd. | 208,000 | 375,340 | |||
#TOC Co., Ltd. | 422,050 | 1,979,424 | |||
Tochigi Bank, Ltd. | 386,000 | 1,769,077 | |||
Toho Bank, Ltd. | 759,200 | 2,528,493 | |||
Toho Real Estate Co., Ltd. | 158,200 | 975,469 | |||
Tohoku Bank, Ltd. | 390,000 | 595,324 | |||
Tokai Tokyo Financial Holdings, Inc. | 898,000 | 2,910,323 | |||
#Tokushima Bank, Ltd. | 267,200 | 979,953 | |||
Tokyo Rakutenchi Co., Ltd. | 222,000 | 907,768 | |||
Tokyo Tatemono Co., Ltd. | 359,000 | 1,711,799 | |||
35
THE JAPANESE SMALL COMPANY SERIES
CONTINUED
| Shares | Value†† | ||||
Financials — (Continued) | |||||
#Tokyo Theatres Co., Inc. | 299,000 | $ | 497,976 | ||
Tokyo Tomin Bank, Ltd. | 110,100 | 1,605,126 | |||
#Tokyu Livable, Inc. | 102,300 | 925,517 | |||
Tomato Bank, Ltd. | 397,000 | 831,977 | |||
#Tottori Bank, Ltd. | 328,000 | 932,930 | |||
#*Towa Bank, Ltd. | 876,000 | 574,008 | |||
*Toyo Securities Co., Ltd. | 307,000 | 604,606 | |||
Yachiyo Bank, Ltd. | 1,400 | 41,376 | |||
Yamagata Bank, Ltd. | 584,500 | 2,803,136 | |||
Yamanashi Chuo Bank, Ltd. | 244,000 | 1,116,474 | |||
Yuraku Real Estate Co., Ltd. | 281,000 | 1,016,233 | |||
Total Financials | 121,967,657 | ||||
Health Care — (3.5%) | |||||
Aloka Co., Ltd. | 89,000 | 711,092 | |||
As One Corp. | 69,568 | 1,283,821 | |||
ASKA Pharmaceutical Co., Ltd. | 101,000 | 884,210 | |||
Create Medic Co., Ltd. | 28,000 | 279,562 | |||
Eiken Chemical Co., Ltd. | 78,900 | 922,550 | |||
Falco Biosystems, Ltd. | 34,300 | 384,124 | |||
#Fuso Pharmaceutical Industries, Ltd. | 322,000 | 1,000,475 | |||
Hitachi Medical Corp. | 84,000 | 809,893 | |||
Hogy Medical Co., Ltd. | 50,300 | 2,703,731 | |||
#Iwaki & Co., Ltd. | 55,000 | 163,590 | |||
*J Bridge Corp. | 1,375,900 | 286,298 | |||
Japan Medical Dynamic Marketing, Inc. | 44,900 | 128,396 | |||
#Jeol, Ltd. | 268,000 | 1,076,692 | |||
JMS Co., Ltd. | 126,000 | 551,475 | |||
Kaken Pharmaceutical Co., Ltd. | 348,000 | 3,148,930 | |||
Kawamoto Corp. | 4,000 | 24,549 | |||
Kawanishi Holdings, Ltd. | 7,400 | 56,296 | |||
Kawasumi Laboratories, Inc. | 45,000 | 314,545 | |||
Kissei Pharmaceutical Co., Ltd. | 3,000 | 66,757 | |||
Kyorin Co., Ltd. | 177,000 | 2,830,803 | |||
Mochida Pharmaceutical Co., Ltd. | 31,000 | 319,972 | |||
Nichii Gakkan Co. | 242,400 | 2,404,219 | |||
Nihon Kohden Corp. | 151,200 | 2,530,818 | |||
Nikkiso Co., Ltd. | 237,000 | 1,790,350 | |||
#Nippon Chemiphar Co., Ltd. | 131,000 | 418,670 | |||
Nippon Shinyaku Co., Ltd. | 237,000 | 3,278,069 | |||
Nipro Corp. | 180,100 | 3,888,012 | |||
Nissui Pharmaceutical Co., Ltd. | 66,100 | 519,276 | |||
Paramount Bed Co., Ltd. | 92,900 | 2,069,447 | |||
Rion Co., Ltd. | 5,000 | 26,641 | |||
Rohto Pharmaceutical Co., Ltd. | 17,000 | 217,387 | |||
Sawai Pharmaceutical Co., Ltd. | 4,500 | 255,905 | |||
Seikagaku Corp. | 190,200 | 2,401,854 | |||
Ship Health Care Holdings, Inc. | 940 | 573,755 | |||
#*So-Net M3, Inc. | 32 | 109,771 | |||
#SSP Co., Ltd. | 298,000 | 1,622,101 | |||
Toho Holdings Co., Ltd. | 3,100 | 45,599 | |||
Torii Pharmaceutical Co., Ltd. | 72,800 | 1,406,427 | |||
#Towa Pharmaceutical Co., Ltd. | 54,500 | 2,650,243 | |||
*Vital Ksk Holdings, Inc. | 142,400 | 850,636 | |||
#Wakamoto Pharmaceutical Co., Ltd. | 100,000 | 359,618 | |||
#Zeria Pharmaceutical Co., Ltd. | 141,000 | 1,554,396 | |||
Total Health Care | 46,920,955 | ||||
Industrials — (23.9%) | |||||
*A&A Material Corp. | 235,000 | 178,859 | |||
#Advan Co., Ltd. | 99,400 | 626,732 | |||
36
THE JAPANESE SMALL COMPANY SERIES
CONTINUED
| Shares | Value†† | ||||
Industrials — (Continued) | |||||
*Advanex, Inc. | 119,000 | $ | 93,722 | ||
Aeon Delight Co., Ltd. | 96,400 | 1,478,002 | |||
Aica Kogyo Co., Ltd. | 236,500 | 2,262,546 | |||
Aichi Corp. | 174,200 | 750,635 | |||
Aida Engineering, Ltd. | 265,700 | 793,867 | |||
Airtech Japan, Ltd. | 26,700 | 180,452 | |||
Alps Logistics Co., Ltd. | 52,500 | 502,359 | |||
Altech Co., Ltd. | 23,000 | 47,138 | |||
Altech Corp. | 37,150 | 235,365 | |||
Amano Corp. | 269,000 | 2,315,421 | |||
Ando Corp. | 257,000 | 339,347 | |||
Anest Iwata Corp. | 149,000 | 478,028 | |||
*AOMI Construction Co., Ltd. | 211,000 | 2,344 | |||
Asahi Diamond Industrial Co., Ltd. | 245,000 | 1,726,691 | |||
Asahi Holdings, Inc. | 120,450 | 2,040,394 | |||
Asahi Kogyosha Co., Ltd. | 99,000 | 415,004 | |||
*Asanuma Corp. | 1,337,000 | 1,013,734 | |||
Asia Air Survey Co., Ltd. | 32,000 | 86,450 | |||
Asunaro Aoki Construction Co., Ltd. | 166,500 | 1,041,414 | |||
Ataka Construction & Engineering Co., Ltd. | 60,000 | 143,096 | |||
Bando Chemical Industries, Ltd. | 340,000 | 958,991 | |||
Bidec Servo Corp. | 78,000 | 374,195 | |||
Biken Techno Corp. | 14,100 | 67,007 | |||
Bunka Shutter Co., Ltd. | 239,000 | 824,728 | |||
Central Glass Co., Ltd. | 601,000 | 2,420,747 | |||
Central Security Patrols Co., Ltd. | 44,700 | 434,722 | |||
Chudenko Corp. | 153,600 | 2,272,715 | |||
Chugai Ro Co., Ltd. | 327,000 | 917,915 | |||
#CKD Corp. | 229,700 | 1,708,412 | |||
Commuture Corp. | 148,202 | 896,305 | |||
Cosel Co., Ltd. | 130,700 | 1,468,294 | |||
CTI Engineering Co., Ltd. | 44,000 | 241,703 | |||
Dai-Dan Co., Ltd. | 156,000 | 800,168 | |||
Daido Kogyo Co., Ltd. | 145,000 | 243,028 | |||
Daifuku Co., Ltd. | 192,500 | 1,192,031 | |||
Daihen Corp. | 459,000 | 1,599,348 | |||
#*Daiho Corp. | 1,019,000 | 749,193 | |||
#*Daiichi Chuo Kisen Kaisha | 259,000 | 618,661 | |||
#Daiichi Jitsugyo Co., Ltd. | 194,000 | 558,161 | |||
Daimei Telecom Engineering Corp. | 140,000 | 1,178,937 | |||
#Daiseki Co., Ltd. | 147,263 | 2,893,882 | |||
*Daisue Construction Co., Ltd. | 271,500 | 109,804 | |||
Daiwa Industries, Ltd. | 169,000 | 881,615 | |||
Daiwa Odakyu Construction Co., Ltd. | 63,500 | 169,906 | |||
#Danto Holdings Corp. | 484,000 | 576,170 | |||
Denyo Co., Ltd. | 90,600 | 665,999 | |||
*Dijet Industrial Co., Ltd. | 81,000 | 125,155 | |||
DMW Corp. | 4,800 | 78,804 | |||
*Dream Incubator, Inc. | 168 | 114,836 | |||
*Duskin Co., Ltd. | 84,800 | 1,528,523 | |||
*Ebara Corp. | 825,000 | 3,624,591 | |||
#*Enshu, Ltd. | 215,000 | 180,515 | |||
Freesia Macross Corp. | 1,355,000 | 265,774 | |||
*Fuji Electric Holdings Co., Ltd. | 1,214,000 | 2,255,906 | |||
*Fujisash Co., Ltd. | 49,300 | 22,787 | |||
Fujitec Co., Ltd. | 304,000 | 1,591,069 | |||
*Fukuda Corp. | 683,000 | 1,283,321 | |||
Fukusima Industries Corp. | 29,700 | 270,137 | |||
#Fukuyama Transporting Co., Ltd. | 425,400 | 2,211,852 | |||
Funai Consulting, Co., Ltd. | 99,300 | 587,706 | |||
Furukawa Co., Ltd. | 1,390,000 | 1,840,275 | |||
37
THE JAPANESE SMALL COMPANY SERIES
CONTINUED
| Shares | Value†† | ||||
Industrials — (Continued) | |||||
Furusato Industries, Ltd. | 50,600 | $ | 305,160 | ||
Futaba Corp. | 159,500 | 2,469,449 | |||
Gecoss Corp. | 113,600 | 500,960 | |||
*Hamai Co., Ltd. | 97,000 | 85,184 | |||
Hanwa Co., Ltd. | 726,000 | 2,535,267 | |||
Hazama Corp. | 285,800 | 304,508 | |||
Hibiya Engineering, Ltd. | 130,000 | 1,114,080 | |||
Hitachi Cable, Ltd. | 390,000 | 1,038,685 | |||
Hitachi Metals Techno, Ltd. | 57,500 | 233,893 | |||
#Hitachi Tool Engineering, Ltd. | 94,000 | 835,783 | |||
Hitachi Transport System, Ltd. | 27,400 | 359,400 | |||
#*Hitachi Zosen Corp. | 1,506,500 | 1,962,177 | |||
Hokuetsu Industries Co., Ltd. | 96,000 | 153,557 | |||
Hokuriku Electrical Construction Co., Ltd. | 56,000 | 175,939 | |||
Hosokawa Micron Corp. | 144,000 | 570,584 | |||
*Howa Machinery, Ltd. | 379,000 | 216,036 | |||
Ichiken Co., Ltd. | 105,000 | 144,170 | |||
Ichinen Holdings Co., Ltd. | 71,100 | 276,426 | |||
#Idec Corp. | 131,900 | 1,003,112 | |||
IHI Transport Machinery Co., Ltd. | 73,000 | 315,813 | |||
Iino Kaiun Kaisha, Ltd. | 337,400 | 1,499,268 | |||
Inaba Denki Sangyo Co., Ltd. | 86,000 | 2,039,682 | |||
Inaba Seisakusho Co., Ltd. | 60,800 | 618,497 | |||
Inabata & Co., Ltd. | 219,900 | 833,242 | |||
Inui Steamship Co., Ltd. | 80,800 | 628,683 | |||
#*Iseki & Co., Ltd. | 759,000 | 2,841,757 | |||
#Ishii Iron Works Co., Ltd. | 110,000 | 200,509 | |||
#*Ishikawa Seisakusho, Ltd. | 154,000 | 90,833 | |||
*Ishikawajima Construction Materials Co., Ltd. | 215,000 | 170,333 | |||
Itoki Corp. | 174,200 | 420,625 | |||
#Iwatani International Corp. | 847,000 | 2,535,233 | |||
#Jalux, Inc. | 43,300 | 615,788 | |||
#Jamco Corp. | 82,000 | 447,412 | |||
Japan Airport Terminal Co., Ltd. | 57,800 | 807,435 | |||
#*Japan Bridge Corp. | 44,350 | 83,829 | |||
Japan Foundation Engineering Co., Ltd. | 95,600 | 215,839 | |||
Japan Kenzai Co., Ltd. | 93,440 | 402,748 | |||
Japan Pulp & Paper Co., Ltd. | 498,000 | 1,898,695 | |||
Japan Steel Tower Co., Ltd. | 44,000 | 154,780 | |||
Japan Transcity Corp. | 231,000 | 680,236 | |||
JFE Shoji Holdings, Inc. | 243,000 | 879,212 | |||
K.R.S. Corp. | 38,200 | 438,412 | |||
*Kamagai Gumi Co., Ltd. | 583,800 | 413,132 | |||
Kamei Corp. | 118,000 | 613,655 | |||
Kanaden Corp. | 118,000 | 628,149 | |||
Kanagawa Chuo Kotsu Co., Ltd. | 192,000 | 1,102,849 | |||
Kanamoto Co., Ltd. | 114,000 | 486,692 | |||
*Kanematsu Corp. | 1,442,625 | 1,186,067 | |||
#*Kanematsu-NNK Corp. | 125,000 | 162,909 | |||
#Katakura Industries Co., Ltd. | 115,900 | 1,248,648 | |||
#Kato Works Co., Ltd. | 197,000 | 382,678 | |||
#*Kawada Technologies, Inc. | 106,000 | 1,810,018 | |||
Kawagishi Bridge Works Co., Ltd. | 38,000 | 103,937 | |||
Kawasaki Kinkai Kisen Kaisha, Ltd. | 100,000 | 273,109 | |||
*Keihin Co., Ltd. (The) | 199,000 | 266,828 | |||
Kimura Chemical Plants Co., Ltd. | 59,400 | 583,127 | |||
Kinki Sharyo Co., Ltd. | 203,000 | 1,702,327 | |||
Kintetsu World Express, Inc. | 101,800 | 2,366,170 | |||
#Kitagawa Iron Works Co., Ltd. | 335,000 | 371,562 | |||
#Kitano Construction Corp. | 252,000 | 615,013 | |||
Kitazawa Sangyo Co., Ltd. | 57,000 | 137,492 | |||
38
THE JAPANESE SMALL COMPANY SERIES
CONTINUED
| Shares | Value†† | ||||
Industrials — (Continued) | |||||
Kitz Corp. | 409,000 | $ | 2,115,368 | ||
Kodensha Co., Ltd. (The) | 25,000 | 56,909 | |||
#Koike Sanso Kogyo Co., Ltd. | 152,000 | 430,635 | |||
Koito Industries, Ltd. | 102,000 | 308,791 | |||
Kokuyo Co., Ltd. | 107,825 | 941,222 | |||
Komai Tekko, Inc. | 109,000 | 230,296 | |||
Komatsu Wall Industry Co., Ltd. | 32,900 | 399,603 | |||
Komori Corp. | 109,000 | 1,289,288 | |||
Kondotec, Inc. | 40,500 | 269,060 | |||
*Kosaido Co., Ltd. | 386,900 | 861,232 | |||
Kuroda Electric Co., Ltd. | 109,900 | 1,588,760 | |||
Kyodo Printing Co., Ltd. | 303,000 | 870,187 | |||
Kyoei Sangyo Co., Ltd. | 97,000 | 205,382 | |||
Kyokuto Boeki Kaisha, Ltd. | 82,000 | 113,260 | |||
Kyokuto Kaihatsu Kogyo Co., Ltd. | 146,400 | 579,191 | |||
Kyosan Electric Manufacturing Co., Ltd. | 213,000 | 984,775 | |||
Kyowa Exeo Corp. | 306,000 | 2,802,620 | |||
Kyudenko Corp. | 237,000 | 1,422,227 | |||
*LCA Holdings Corp. | 14,600 | 1,112 | |||
#*Lonseal Corp. | 127,000 | 139,470 | |||
Maeda Corp. | 624,000 | 1,716,026 | |||
Maeda Road Construction Co., Ltd. | 291,000 | 2,371,962 | |||
*Maezawa Industries, Inc. | 59,300 | 102,801 | |||
Maezawa Kaisei Industries Co., Ltd. | 53,300 | 579,562 | |||
Maezawa Kyuso Industries Co., Ltd. | 50,400 | 735,441 | |||
*Makino Milling Machine Co., Ltd. | 322,000 | 1,258,495 | |||
Marubeni Construction Material Lease Co., Ltd. | 78,000 | 106,996 | |||
Maruka Machinery Co., Ltd. | 28,100 | 234,600 | |||
Maruwn Corp. | 66,000 | 171,072 | |||
#Maruyama Manufacturing Co., Inc. | 150,000 | 301,480 | |||
Maruzen Showa Unyu Co., Ltd. | 327,000 | 1,109,408 | |||
#Matsuda Sangyo Co., Ltd. | 80,282 | 1,362,442 | |||
Matsui Construction Co., Ltd. | 98,600 | 364,328 | |||
Max Co., Ltd. | 184,000 | 1,890,820 | |||
#Meidensha Corp. | 764,050 | 3,828,337 | |||
*Meiji Machine Co., Ltd. | 213,000 | 93,475 | |||
#Meiji Shipping Co., Ltd. | 106,100 | 518,120 | |||
Meisei Industrial Co., Ltd. | 29,000 | 64,917 | |||
#Meitec Corp. | 132,000 | 2,225,357 | |||
Meito Transportation Co., Ltd. | 22,000 | 191,021 | |||
#*Meiwa Trading Co., Ltd. | 140,000 | 249,771 | |||
Mesco, Inc. | 30,000 | 176,637 | |||
Misumi Group, Inc. | 29,700 | 506,867 | |||
Mitani Corp. | 52,600 | 334,496 | |||
*Mitsubishi Cable Industries, Ltd. | 717,000 | 647,583 | |||
Mitsubishi Kakoki Kaisha, Ltd. | 248,000 | 654,902 | |||
Mitsubishi Pencil Co., Ltd. | 118,300 | 1,420,406 | |||
#Mitsuboshi Belting, Ltd. | 274,000 | 1,035,662 | |||
Mitsui Matsushima Co., Ltd. | 338,000 | 579,749 | |||
#Mitsui-Soko Co., Ltd. | 475,000 | 1,647,633 | |||
Mitsumura Printing Co., Ltd. | 93,000 | 327,354 | |||
Miura Co., Ltd. | 132,100 | 3,689,039 | |||
Miura Printing Corp. | 19,000 | 44,922 | |||
#*Miyaji Engineering Group, Inc. | 1,872,175 | 1,615,607 | |||
#*Miyakoshi Corp. | 48,400 | 292,844 | |||
*Mori Denki Mfg. Co., Ltd. | 625,000 | 81,832 | |||
Mori Seiki Co., Ltd. | 110,400 | 1,193,749 | |||
Morita Holdings Corp. | 159,000 | 819,508 | |||
#Moshi Moshi Hotline, Inc. | 117,900 | 2,142,207 | |||
Mystar Engineering Corp. | 15,600 | 49,885 | |||
Nabtesco Corp. | 174,000 | 2,003,262 | |||
39
THE JAPANESE SMALL COMPANY SERIES
CONTINUED
| Shares | Value†† | ||||
Industrials — (Continued) | |||||
Nac Co., Ltd. | 28,900 | $ | 273,390 | ||
Nachi-Fujikoshi Corp. | 588,000 | 1,302,687 | |||
Naikai Zosen Corp. | 75,000 | 244,943 | |||
Nakano Corp. | 103,000 | 189,737 | |||
Narasaki Sangyo Co., Ltd. | 68,000 | 68,699 | |||
NEC Capital Solutions, Ltd. | 70,700 | 960,657 | |||
NEC Networks & System Integration Corp. | 127,000 | 1,543,109 | |||
New Tachikawa Aircraft Co., Ltd. | 9,900 | 547,566 | |||
*Nichias Corp. | 424,000 | 1,531,860 | |||
Nichiban Co., Ltd. | 122,000 | 421,024 | |||
*Nichiha Corp. | 112,480 | 676,560 | |||
Nichireki Co., Ltd. | 96,000 | 405,645 | |||
*Nihon Spindle Manufacturing Co., Ltd. | 115,000 | 171,018 | |||
Nikko Co., Ltd. | 127,000 | 350,993 | |||
Nippo Corp. | 276,000 | 2,129,147 | |||
Nippon Carbon Co., Ltd. | 396,000 | 1,350,777 | |||
#Nippon Conveyor Co., Ltd. | 168,000 | 145,005 | |||
Nippon Densetsu Kogyo Co., Ltd. | 204,000 | 1,714,178 | |||
Nippon Denwa Shisetu Co., Ltd. | 203,000 | 616,336 | |||
Nippon Filcon Co., Ltd. | 73,100 | 397,503 | |||
Nippon Hume Corp. | 91,000 | 259,703 | |||
Nippon Jogesuido Sekkei Co., Ltd. | 289 | 332,036 | |||
#Nippon Kanzai Co., Ltd. | 51,300 | 984,299 | |||
Nippon Koei Co., Ltd. | 272,000 | 869,767 | |||
Nippon Konpo Unyu Soko Co., Ltd. | 247,000 | 2,682,995 | |||
#Nippon Seisen Co., Ltd. | 107,000 | 304,935 | |||
#Nippon Sharyo, Ltd. | 78,000 | 494,232 | |||
*Nippon Shindo Co., Ltd. | 50,000 | 52,301 | |||
Nippon Signal Co., Ltd. | 210,200 | 1,900,987 | |||
Nippon Steel Trading Co., Ltd. | 369,000 | 627,150 | |||
#Nippon Thompson Co., Ltd. | 255,000 | 1,337,420 | |||
*Nippon Tungsten Co., Ltd. | 81,000 | 116,157 | |||
Nippon Yusoki Co., Ltd. | 138,000 | 314,124 | |||
Nishimatsu Construction Co., Ltd. | 954,000 | 1,450,671 | |||
Nishishiba Electric Co., Ltd. | 101,000 | 185,833 | |||
Nissei Corp. | 104,600 | 720,153 | |||
*Nissei Plastic Industrial Co., Ltd. | 392,200 | 1,230,562 | |||
Nissin Corp. | 342,000 | 781,207 | |||
Nissin Electric Co., Ltd. | 19,000 | 105,733 | |||
Nitchitsu Co., Ltd. | 60,000 | 145,741 | |||
Nitta Corp. | 101,400 | 1,479,502 | |||
Nitto Boseki Co., Ltd. | 847,000 | 1,530,011 | |||
Nitto Electric Works, Ltd. | 150,700 | 1,502,254 | |||
Nitto Kohki Co., Ltd. | 73,500 | 1,524,184 | |||
Nitto Seiko Co., Ltd. | 140,000 | 345,576 | |||
*Nittoc Construction Co., Ltd. | 316,000 | 155,264 | |||
*Noda Corp. | 169,300 | 283,046 | |||
Nomura Co., Ltd. | 205,000 | 590,482 | |||
Noritake Co., Ltd. | 543,000 | 1,586,086 | |||
#Noritz Corp. | 100,900 | 1,280,653 | |||
*Oak Capital Corp. | 662,354 | 131,552 | |||
Obayashi Road Corp. | 106,000 | 185,390 | |||
Oiles Corp. | 119,142 | 1,954,734 | |||
Okamoto Machine Tool Works, Ltd. | 164,000 | 162,868 | |||
#Okamura Corp. | 342,900 | 1,685,440 | |||
#Okano Valve Manufacturing Co. | 58,000 | 568,461 | |||
*Oki Electric Cable Co., Ltd. | 117,000 | 172,906 | |||
#*OKK Corp. | 255,000 | 208,215 | |||
OKUMA Corp. | 152,000 | 737,015 | |||
#Okumura Corp. | 750,400 | 2,614,142 | |||
O-M, Ltd. | 105,000 | 338,869 | |||
40
THE JAPANESE SMALL COMPANY SERIES
CONTINUED
| Shares | Value†† | ||||
Industrials — (Continued) | |||||
Onoken Co., Ltd. | 70,000 | $ | 584,518 | ||
Organo Corp. | 195,000 | 1,387,244 | |||
*Oriental Shiraishi Corp. | 442,800 | 4,919 | |||
*Original Engineering Consultants Co., Ltd. | 66,500 | 86,699 | |||
OSG Corp. | 116,800 | 1,148,746 | |||
Oyo Corp. | 107,500 | 953,761 | |||
#*P.S. Mitsubishi Construction Co., Ltd. | 76,800 | 284,086 | |||
#Park24 Co., Ltd. | 131,900 | 1,471,242 | |||
*Penta-Ocean Construction Co., Ltd. | 841,000 | 951,673 | |||
Pilot Corp. | 759 | 886,327 | |||
Pronexus, Inc. | 133,400 | 887,801 | |||
Raito Kogyo Co., Ltd. | 193,700 | 385,717 | |||
Rheon Automatic Machinery Co., Ltd. | 64,000 | 195,059 | |||
*Ryobi, Ltd. | 558,200 | 1,444,762 | |||
*Sailor Pen Co., Ltd. | 127,000 | 80,852 | |||
Sakai Heavy Industries, Ltd. | 126,000 | 185,785 | |||
*Sakurada Co., Ltd. | 225,000 | 61,844 | |||
#*Sanix, Inc. | 157,400 | 279,720 | |||
Sanki Engineering Co., Ltd. | 261,000 | 1,916,981 | |||
#Sanko Metal Industrial Co., Ltd. | 118,000 | 313,558 | |||
*Sankyo-Tateyama Holdings, Inc. | 1,102,000 | 1,085,064 | |||
Sankyu, Inc. | 445,000 | 1,951,308 | |||
Sanritsu Corp. | 17,800 | 113,009 | |||
Sanwa Holdings Corp. | 326,000 | 893,853 | |||
Sanyo Denki Co., Ltd. | 214,000 | 993,020 | |||
Sanyo Engineering & Construction, Inc. | 48,000 | 169,558 | |||
Sanyo Industries, Ltd. | 102,000 | 164,076 | |||
#Sasebo Heavy Industries Co., Ltd. | 546,000 | 1,208,581 | |||
Sato Corp. | 108,600 | 1,322,037 | |||
Sato Shoji Corp. | 65,300 | 350,025 | |||
*Sawafuji Electric Co., Ltd. | 48,000 | 81,115 | |||
Secom Joshinetsu Co., Ltd. | 33,900 | 692,107 | |||
Secom Techno Service Co., Ltd. | 40,500 | 1,119,569 | |||
Seibu Electric Industry Co., Ltd. | 67,000 | 292,309 | |||
Seika Corp. | 267,000 | 616,582 | |||
#*Seikitokyu Kogyo Co., Ltd. | 335,000 | 173,590 | |||
Seino Holdings Co., Ltd. | 157,000 | 1,161,775 | |||
Sekisui Jushi Co., Ltd. | 162,000 | 1,305,216 | |||
Senko Co., Ltd. | 371,000 | 1,390,823 | |||
Senshu Electric Co., Ltd. | 37,300 | 418,312 | |||
#Shibusawa Warehouse Co., Ltd. | 259,000 | 803,145 | |||
Shibuya Kogyo Co., Ltd. | 82,300 | 746,097 | |||
#Shima Seiki Manufacturing Co., Ltd. | 59,600 | 1,215,954 | |||
Shin Nippon Air Technologies Co., Ltd. | 84,980 | 598,458 | |||
#Shin-Keisei Electric Railway Co., Ltd. | 174,000 | 688,742 | |||
#Shin-Kobe Electric Machinery Co., Ltd. | 109,000 | 1,336,687 | |||
Shinmaywa Industries, Ltd. | 403,000 | 1,452,387 | |||
Shinnihon Corp. | 215,900 | 388,568 | |||
Shinsho Corp. | 284,000 | 470,414 | |||
*Shinwa Kaiun Kaisha, Ltd. | 409,000 | 1,115,577 | |||
Sho-Bond Corp. | 98,100 | 1,715,842 | |||
#Shoko Co., Ltd. | 316,000 | 393,523 | |||
#Showa Aircraft Industry Co., Ltd. | 112,000 | 742,344 | |||
Showa KDE Co., Ltd. | 124,000 | 136,829 | |||
#Sinfonia Technology Co., Ltd. | 496,000 | 1,185,052 | |||
Sintokogio, Ltd. | 191,800 | 1,359,375 | |||
Soda Nikka Co., Ltd. | 67,000 | 239,049 | |||
Sohgo Security Services Co., Ltd. | 142,100 | 1,644,568 | |||
#Space Co., Ltd. | 73,420 | 533,484 | |||
Subaru Enterprise Co., Ltd. | 59,000 | 179,655 | |||
Sugimoto & Co., Ltd. | 34,100 | 332,989 | |||
41
THE JAPANESE SMALL COMPANY SERIES
CONTINUED
| Shares | Value†† | ||||
Industrials — (Continued) | |||||
Sumitomo Densetsu Co., Ltd. | 104,600 | $ | 546,299 | ||
*Sumitomo Mitsui Construction Co., Ltd. | 122,000 | 106,045 | |||
#Sumitomo Precision Products Co., Ltd. | 176,000 | 529,841 | |||
Sumitomo Warehouse Co., Ltd. | 292,000 | 1,286,527 | |||
#Sun Wave Corp. | 785,000 | 2,215,942 | |||
*Suzuki Metal Industry Co., Ltd. | 71,000 | 141,107 | |||
*SWCC Showa Holdings Co., Ltd. | 831,000 | 785,304 | |||
Tadano, Ltd. | 157,579 | 746,197 | |||
Taihei Dengyo Kaisha, Ltd. | 152,000 | 1,840,158 | |||
*Taihei Kogyo Co., Ltd. | 257,000 | 829,147 | |||
#*Taiheiyo Kaiun Co., Ltd. | 167,000 | 149,178 | |||
Taiheiyo Kouhatsu, Inc. | 95,000 | 74,581 | |||
Taikisha, Ltd. | 125,600 | 1,585,035 | |||
Takada Kiko Co., Ltd. | 350,000 | 665,195 | |||
Takano Co., Ltd. | 52,000 | 319,989 | |||
#Takara Printing Co., Ltd. | 38,055 | 324,386 | |||
Takara Standard Co., Ltd. | 515,000 | 2,970,448 | |||
#Takasago Thermal Engineering Co., Ltd. | 292,000 | 2,318,285 | |||
#*Takashima & Co., Ltd. | 137,000 | 197,746 | |||
Takigami Steel Construction Co., Ltd. | 50,000 | 122,004 | |||
Takisawa Machine Tool Co., Ltd. | 191,000 | 139,867 | |||
*Takuma Co., Ltd. | 297,000 | 773,936 | |||
*Tanseisha Co., Ltd. | 74,000 | 189,888 | |||
Tatsuta Electric Wire & Cable Co., Ltd. | 215,000 | 498,671 | |||
*TCM Corp. | 238,000 | 557,145 | |||
TECHNO ASSOCIE Co., Ltd. | 58,400 | 418,487 | |||
Techno Ryowa, Ltd. | 71,390 | 377,221 | |||
#Teikoku Electric Manufacturing Co., Ltd. | 32,100 | 670,702 | |||
*Tekken Corp. | 521,000 | 454,808 | |||
Teraoka Seisakusho Co., Ltd. | 53,600 | 248,903 | |||
Toa Corp. | 744,000 | 782,319 | |||
Toa Doro Kogyo Co., Ltd. | 155,000 | 222,829 | |||
#*Tobishima Corp. | 1,548,500 | 406,182 | |||
#Tocalo Co., Ltd. | 51,600 | 837,925 | |||
Toda Corp. | 623,000 | 2,076,783 | |||
Todentu Corp. | 121,000 | 216,168 | |||
Toenec Corp. | 246,000 | 1,488,122 | |||
Tokai Lease Co., Ltd. | 86,000 | 136,177 | |||
#Toko Electric Corp. | 88,000 | 492,568 | |||
Tokyo Biso Kogyo Corp. | 19,000 | 139,310 | |||
Tokyo Energy & Systems, Inc. | 126,000 | 1,006,859 | |||
Tokyo Keiki, Inc. | 265,000 | 320,450 | |||
#Tokyo Kikai Seisakusho, Ltd. | 304,000 | 483,112 | |||
Tokyo Sangyo Co., Ltd. | 78,000 | 225,808 | |||
Tokyu Community Corp. | 48,200 | 1,036,181 | |||
Toli Corp. | 207,000 | 376,314 | |||
Tomoe Corp. | 115,500 | 282,721 | |||
Tonami Holdings Co., Ltd. | 331,000 | 900,731 | |||
#*Tori Holdings Co., Ltd. | 230,100 | 115,131 | |||
#Torishima Pump Manufacturing Co., Ltd. | 100,000 | 1,735,168 | |||
#Toshiba Machine Co., Ltd. | 249,000 | 796,701 | |||
#Toshiba Plant Kensetsu Co., Ltd. | 219,450 | 2,872,309 | |||
Tosho Printing Co., Ltd. | 243,000 | 512,538 | |||
Totetsu Kogyo Co., Ltd. | 122,000 | 716,297 | |||
*Totoku Electric Co., Ltd. | 101,000 | 105,686 | |||
#Toyo Electric Co., Ltd. | 156,000 | 1,363,770 | |||
Toyo Engineering Corp. | 628,400 | 2,092,719 | |||
*Toyo Machinery & Metal Co., Ltd. | 61,000 | 92,603 | |||
Toyo Shutter Co., Ltd. | 11,800 | 78,350 | |||
#Toyo Tanso Co, Ltd. | 19,400 | 958,925 | |||
#Toyo Wharf & Warehouse Co., Ltd. | 274,000 | 506,202 | |||
42
THE JAPANESE SMALL COMPANY SERIES
CONTINUED
| Shares | Value†† | ||||
Industrials — (Continued) | |||||
Trinity Industrial Corp. | 56,000 | $ | 272,954 | ||
Trusco Nakayama Corp. | 101,500 | 1,581,456 | |||
Tsubakimoto Chain Co. | 579,700 | 2,505,300 | |||
Tsubakimoto Kogyo Co., Ltd. | 97,000 | 208,369 | |||
#Tsugami Corp. | 265,000 | 498,120 | |||
Tsukishima Kikai Co., Ltd. | 140,000 | 878,749 | |||
Tsurumi Manufacturing Co., Ltd. | 94,000 | 664,490 | |||
Tsuzuki Denki Co., Ltd. | 75,000 | 301,157 | |||
TTK Co., Ltd. | 62,000 | 228,368 | |||
Uchida Yoko Co., Ltd. | 171,000 | 513,745 | |||
Ueki Corp. | 455,000 | 638,205 | |||
#Union Tool Co. | 67,100 | 1,956,843 | |||
Utoc Corp. | 96,400 | 267,379 | |||
*Venture Link Co., Ltd. | 405,500 | 66,338 | |||
#*Wakachiku Construction Co., Ltd. | 2,549,000 | 1,305,914 | |||
Weathernews, Inc. | 26,700 | 349,977 | |||
Yahagi Construction Co., Ltd. | 151,000 | 994,698 | |||
Yamabiko Corp. | 28,782 | 350,204 | |||
Yamato Corp. | 82,000 | 278,297 | |||
Yamaura Corp. | 40,500 | 88,792 | |||
Yamazen Co., Ltd. | 306,600 | 994,476 | |||
Yasuda Warehouse Co., Ltd. (The) | 98,200 | 668,435 | |||
Yokogawa Bridge Holdings Corp. | 139,400 | 1,178,417 | |||
Yondenko Corp. | 133,800 | 752,591 | |||
Yuasa Trading Co., Ltd. | 779,000 | 730,313 | |||
Yuken Kogyo Co., Ltd. | 156,000 | 223,594 | |||
Yurtec Corp. | 231,000 | 1,457,637 | |||
Yusen Air & Sea Service Co., Ltd. | 9,700 | 129,922 | |||
Yushin Precision Equipment Co., Ltd. | 53,534 | 860,138 | |||
Total Industrials | 321,133,374 | ||||
Information Technology — (10.0%) | |||||
#Ai Holdings Corp. | 182,600 | 642,298 | |||
Aichi Tokei Denki Co., Ltd. | 113,000 | 337,288 | |||
Aiphone Co., Ltd. | 70,900 | 1,259,539 | |||
#*Allied Telesis Holdings K.K. | 470,700 | 246,569 | |||
Alpha Systems, Inc. | 36,500 | 697,263 | |||
*Alps Electric Co., Ltd. | 351,500 | 2,193,937 | |||
*Anritsu Corp. | 435,000 | 1,528,960 | |||
AOI Electronics Co., Ltd. | 37,400 | 629,235 | |||
*Apic Yamada Corp. | 36,000 | 73,163 | |||
#CAC Corp. | 69,100 | 478,985 | |||
Canon Electronics, Inc. | 68,200 | 1,355,796 | |||
Canon Finetech, Inc. | 107,970 | 1,403,326 | |||
Capcom Co., Ltd. | 137,800 | 2,316,110 | |||
Chino Corp. | 158,000 | 412,851 | |||
#*CMK Corp. | 70,100 | 497,050 | |||
Computer Engineering & Consulting, Ltd. | 61,500 | 398,921 | |||
Core Corp. | 45,700 | 320,142 | |||
Cresco, Ltd. | 23,200 | 107,645 | |||
#*CSK Holdings Corp. | 144,200 | 542,798 | |||
#Cybozu, Inc. | 615 | 272,890 | |||
*Daiko Denshi Tsushin, Ltd. | 23,000 | 42,575 | |||
#*Dainippon Screen Manufacturing Co., Ltd. | 652,000 | 2,771,193 | |||
Denki Kogyo Co., Ltd. | 237,000 | 1,135,043 | |||
DKK TOA Corp. | 31,000 | 64,525 | |||
DTS Corp. | 84,900 | 729,692 | |||
#Dwango Co., Ltd. | 230 | 479,074 | |||
eAccess, Ltd. | 4,312 | 3,024,281 | |||
Eizo Nanao Corp. | 75,600 | 1,795,087 | |||
*Elna Co., Ltd. | 97,000 | 93,750 | |||
43
THE JAPANESE SMALL COMPANY SERIES
CONTINUED
| Shares | Value†† | ||||
Information Technology — (Continued) | |||||
ESPEC Corp. | 79,800 | $ | 500,170 | ||
#*FDK Corp. | 469,000 | 738,047 | |||
#Fuji Soft, Inc. | 122,700 | 2,122,495 | |||
*Fujitsu Component, Ltd. | 176 | 45,246 | |||
Fujitsu Frontech, Ltd. | 78,600 | 657,428 | |||
Fuso Dentsu Co., Ltd. | 16,000 | 53,691 | |||
Future Architect, Inc. | 1,445 | 582,772 | |||
#GMO Internet, Inc. | 10,100 | 46,152 | |||
Hakuto Co., Ltd. | 80,300 | 720,196 | |||
Hitachi Business Solution Co., Ltd. | 43,200 | 322,295 | |||
#Hitachi Kokusai Electric, Inc. | 292,500 | 2,260,145 | |||
#Hochiki Corp. | 97,000 | 538,851 | |||
#Hokuriku Electric Industry Co., Ltd. | 308,000 | 547,749 | |||
#Horiba, Ltd. | 83,500 | 2,019,160 | |||
Hosiden Corp. | 243,000 | 2,942,705 | |||
Icom, Inc. | 49,700 | 1,200,180 | |||
#*Ikegami Tsushinki Co., Ltd. | 174,000 | 150,032 | |||
Ines Corp. | 172,500 | 1,299,767 | |||
I-Net Corp. | 47,800 | 262,849 | |||
Information Services International-Dentsu, Ltd. | 84,500 | 535,057 | |||
Internet Initiative Japan, Inc. | 24 | 54,136 | |||
#Ishii Hyoki Co., Ltd. | 23,700 | 298,685 | |||
IT Holdings Corp. | 262,001 | 3,228,913 | |||
ITC Networks Corp. | 21 | 48,896 | |||
*Iwatsu Electric Co., Ltd. | 303,000 | 273,480 | |||
Japan Aviation Electronics Industry, Ltd. | 300,600 | 1,835,527 | |||
Japan Business Computer Co., Ltd. | 74,900 | 514,519 | |||
#Japan Cash Machine Co., Ltd. | 98,115 | 785,336 | |||
Japan Digital Laboratory Co., Ltd. | 110,800 | 1,372,198 | |||
Japan Radio Co., Ltd. | 435,000 | 855,210 | |||
Jastec Co., Ltd. | 61,400 | 394,096 | |||
JBIS Holdings, Inc. | 79,600 | 279,482 | |||
JIEC Co., Ltd. | 199 | 160,228 | |||
Kaga Electronics Co., Ltd. | 97,300 | 976,655 | |||
#Kakaku.com, Inc. | 507 | 1,853,942 | |||
Kanematsu Electronics, Ltd. | 83,100 | 748,478 | |||
Kawatetsu Systems, Inc. | 174 | 153,937 | |||
Koa Corp. | 148,700 | 1,201,234 | |||
#*Kubotek Corp. | 401 | 128,005 | |||
Kyoden Co., Ltd. | 160,000 | 220,347 | |||
Kyowa Electronic Instruments Co., Ltd. | 52,000 | 154,997 | |||
Macnica, Inc. | 56,400 | 895,298 | |||
#Marubun Corp. | 96,100 | 507,098 | |||
Maruwa Co., Ltd. | 36,500 | 843,954 | |||
#Maspro Denkoh Corp. | 61,000 | 580,022 | |||
#Megachips Corp. | 87,300 | 1,445,650 | |||
*Meisei Electric Co., Ltd. | 359,000 | 346,134 | |||
Melco Holdings, Inc. | 9,000 | 180,363 | |||
Mimasu Semiconductor Industry Co., Ltd. | 95,081 | 1,234,455 | |||
Miroku Jyoho Service Co., Ltd. | 107,000 | 238,976 | |||
*Mitsui High-Tec, Inc. | 138,700 | 1,400,746 | |||
Mitsui Knowledge Industry Co., Ltd. | 3,688 | 619,675 | |||
*Mutoh Holdings Co., Ltd. | 160,000 | 250,158 | |||
*Nagano Japan Radio Co., Ltd. | 85,000 | 128,744 | |||
*Nagano Keiki Co., Ltd. | 600 | 3,870 | |||
Nakayo Telecommunications, Inc. | 543,000 | 1,062,953 | |||
*NEC Electronics Corp. | 63,300 | 469,443 | |||
NEC Fielding, Ltd. | 109,600 | 1,613,700 | |||
NEC Mobiling, Ltd. | 49,600 | 1,351,481 | |||
#Net One Systems Co., Ltd. | 1,889 | 2,476,401 | |||
*Netmarks, Inc. | 523 | 120,646 | |||
44
THE JAPANESE SMALL COMPANY SERIES
CONTINUED
| Shares | Value†† | ||||
Information Technology — (Continued) | |||||
Nichicon Corp. | 265,000 | $ | 2,649,101 | ||
#Nidec Sankyo Corp. | 200,000 | 1,519,702 | |||
Nihon Dempa Kogyo Co., Ltd. | 69,000 | 1,285,788 | |||
#*Nihon Inter Electronics Corp. | 104,700 | 359,673 | |||
Nihon Unisys, Ltd. | 169,700 | 1,446,209 | |||
*Nippon Avionics Co., Ltd. | 83,000 | 163,243 | |||
#Nippon Ceramic Co., Ltd. | 86,700 | 1,172,052 | |||
#*Nippon Chemi-Con Corp. | 466,000 | 1,724,293 | |||
Nippon Systemware Co., Ltd. | 30,000 | 100,909 | |||
Nohmi Bosai, Ltd. | 134,000 | 984,819 | |||
#NS Solutions Corp. | 55,700 | 1,019,076 | |||
#NSD Co., Ltd. | 173,800 | 1,772,174 | |||
#Obic Business Consultants Co., Ltd. | 5,800 | 278,961 | |||
Okaya Electric Industries Co., Ltd. | 73,000 | 185,759 | |||
*Oki Electric Industry Co., Ltd. | 2,062,000 | 1,860,276 | |||
Ono Sokki Co., Ltd. | 103,000 | 463,620 | |||
Origin Electric Co., Ltd. | 105,000 | 269,501 | |||
Osaki Electric Co., Ltd. | 128,000 | 1,238,360 | |||
Panasonic Electric Works Information Systems Co., Ltd. | 1,600 | 44,947 | |||
PCA Corp. | 17,500 | 157,250 | |||
#*Pixela Corp. | 19,200 | 65,949 | |||
*Rikei Corp. | 174,500 | 175,070 | |||
Riken Keiki Co., Ltd. | 77,800 | 554,738 | |||
#Roland DG Corp. | 57,500 | 754,129 | |||
Ryoden Trading Co., Ltd. | 152,000 | 871,288 | |||
Ryosan Co., Ltd. | 122,000 | 2,913,094 | |||
Ryoyo Electro Corp. | 108,000 | 883,516 | |||
Sanken Electric Co., Ltd. | 300,000 | 1,091,890 | |||
Sanko Co., Ltd. | 22,000 | 72,437 | |||
Sanshin Electronics Co., Ltd. | 108,100 | 851,584 | |||
Satori Electric Co., Ltd. | 56,380 | 360,986 | |||
*Saxa Holdings, Inc. | 194,000 | 407,702 | |||
*Sekonic Corp. | 36,000 | 45,760 | |||
#*Shibaura Mechatronics Corp. | 171,000 | 630,662 | |||
*Shindengen Electric Manufacturing Co., Ltd. | 296,000 | 700,421 | |||
Shinkawa, Ltd. | 68,400 | 1,098,542 | |||
Shinko Shoji Co., Ltd. | 75,900 | 589,072 | |||
#Shizuki Electric Co., Inc. | 103,000 | 443,139 | |||
#Siix Corp. | 83,700 | 918,629 | |||
*Simplex Technology, Inc. | 115 | 54,512 | |||
#SMK Corp. | 265,000 | 1,679,866 | |||
So-Net Entertainment Corp. | 26 | 56,735 | |||
Sorun Corp. | 92,600 | 468,161 | |||
*SPC Electronics Corp. | 48,200 | 59,911 | |||
#SRA Holdings, Inc. | 49,700 | 436,678 | |||
Star Micronics Co., Ltd. | 133,000 | 1,093,625 | |||
#Sumida Corp. | 66,249 | 438,013 | |||
Sumisho Computer Systems Corp. | 125,700 | 1,990,521 | |||
#SUNX, Ltd. | 117,400 | 406,174 | |||
#SystemPro Co., Ltd. | 676 | 322,325 | |||
Tachibana Eletech Co., Ltd. | 62,400 | 448,779 | |||
Taiyo Yuden Co., Ltd. | 200,000 | 2,250,265 | |||
#*Tamura Corp. | 253,000 | 817,893 | |||
*Tecmo Koei Holdings Co., Ltd. | 182,030 | 1,521,189 | |||
#Teikoku Tsushin Kogyo Co., Ltd. | 172,000 | 397,491 | |||
TKC Corp. | 97,900 | 1,975,342 | |||
*Toko, Inc. | 331,000 | 487,528 | |||
Tokyo Denpa Co., Ltd. | 24,900 | 168,219 | |||
Tokyo Electron Device, Ltd. | 352 | 454,281 | |||
#*Tokyo Seimitsu Co., Ltd. | 110,000 | 1,381,464 | |||
Tomen Electronics Corp. | 50,600 | 567,606 | |||
45
THE JAPANESE SMALL COMPANY SERIES
CONTINUED
| Shares | Value†† | ||||
Information Technology — (Continued) | |||||
#Topcon Corp. | 154,800 | $ | 850,267 | ||
Tose Co., Ltd. | 23,100 | 155,865 | |||
*Toshiba TEC Corp. | 335,000 | 1,358,266 | |||
Toukei Computer Co., Ltd. | 27,710 | 369,551 | |||
Toyo Corp. | 110,600 | 997,821 | |||
#*Trans Cosmos, Inc. | 138,600 | 1,221,515 | |||
Tsuzuki Densan Co., Ltd. | 22,500 | 62,461 | |||
#Ulvac, Inc. | 86,700 | 2,038,640 | |||
#*Uniden Corp. | 121,000 | 281,555 | |||
*Union Holdings Co., Ltd. | 891,600 | 117,004 | |||
*Wacom Co., Ltd. | 519 | 1,155,123 | |||
XNET Corp. | 21 | 31,212 | |||
#*Yamaichi Electronics Co., Ltd. | 260,900 | 529,188 | |||
Yaskawa Information Systems Corp. | 40,000 | 135,743 | |||
Ye Data, Inc. | 43,000 | 66,512 | |||
Yokowo Co., Ltd. | 69,500 | 408,197 | |||
#Zuken, Inc. | 95,200 | 769,630 | |||
Total Information Technology | 134,852,490 | ||||
Materials — (11.2%) | |||||
Achilles Corp. | 670,000 | 961,683 | |||
Adeka Corp. | 341,200 | 3,127,162 | |||
Agro-Kanesho Co., Ltd. | 7,000 | 58,963 | |||
Aichi Steel Corp. | 367,000 | 1,756,650 | |||
Arakawa Chemical Industries, Ltd. | 67,700 | 837,040 | |||
Araya Industrial Co., Ltd. | 204,000 | 307,109 | |||
Aronkasei Co., Ltd. | 124,000 | 537,665 | |||
Asahi Organic Chemicals Industry Co., Ltd. | 334,000 | 840,928 | |||
Chuetsu Pulp & Paper Co., Ltd. | 395,000 | 780,979 | |||
#*Chugai Mining Co., Ltd. | 852,400 | 386,443 | |||
Chugoku Marine Paints, Ltd. | 233,000 | 1,634,219 | |||
#*Chugokukogyo Co., Ltd. | 105,000 | 111,431 | |||
Chuo Denki Kogyo Co., Ltd. | 90,000 | 745,227 | |||
#Co-Op Chemical Co., Ltd. | 159,000 | 286,110 | |||
*Dai Nippon Toryo, Ltd. | 488,000 | 561,088 | |||
#Daiichi Kigenso Kagaku-Kyogyo Co., Ltd. | 14,300 | 464,599 | |||
Daiichi Kogyo Seiyaku Co., Ltd. | 121,000 | 368,612 | |||
#Daiken Corp. | 439,000 | 983,783 | |||
Dainichiseika Colour & Chemicals Manufacturing Co., Ltd. | 312,000 | 1,049,626 | |||
Daio Paper Corp. | 119,500 | 1,002,104 | |||
Daiso Co., Ltd. | 356,000 | 1,006,286 | |||
DC Co., Ltd. | 113,900 | 352,194 | |||
DIC Corp. | 250,000 | 409,173 | |||
Dowa Holdings Co., Ltd. | 283,000 | 1,652,237 | |||
Dynapac Co., Ltd. | 25,000 | 81,143 | |||
#FP Corp. | 63,900 | 3,165,602 | |||
Fujikura Kasei Co., Ltd. | 94,500 | 488,220 | |||
Fumakilla, Ltd. | 85,000 | 416,018 | |||
Geostar Corp. | 88,000 | 94,977 | |||
Godo Steel, Ltd. | 542,000 | 1,051,669 | |||
#Gun-Ei Chemical Industry Co., Ltd. | 278,000 | 668,193 | |||
Harima Chemicals, Inc. | 78,000 | 483,855 | |||
#Hodogaya Chemical Co., Ltd. | 281,000 | 687,493 | |||
Hokkan Holdings, Ltd. | 210,000 | 535,269 | |||
Hokko Chemical Industry Co., Ltd. | 90,000 | 303,007 | |||
Hokuetsu Kishu Paper Co., Ltd. | 601,199 | 3,109,276 | |||
#Hokushin Co., Ltd. | 64,000 | 112,914 | |||
Honshu Chemical Industry Co., Ltd. | 35,000 | 152,206 | |||
Ihara Chemical Industry Co., Ltd. | 155,000 | 526,722 | |||
#ISE Chemicals Corp. | 86,000 | 557,015 | |||
*Ishihara Sangyo Kaisha, Ltd. | 1,292,500 | 1,051,973 | |||
46
THE JAPANESE SMALL COMPANY SERIES
CONTINUED
| Shares | Value†† | ||||
Materials — (Continued) | |||||
Japan Carlit Co., Ltd. | 59,800 | $ | 297,476 | ||
JSP Corp. | 106,700 | 1,020,133 | |||
#Kanto Denka Kogyo Co., Ltd. | 194,000 | 1,579,983 | |||
Katakura Chikkarin Co., Ltd. | 43,000 | 133,327 | |||
Kawakin Holdings Co., Ltd. | 11,000 | 35,489 | |||
Kawasaki Kasei Chemicals, Ltd. | 121,000 | 152,516 | |||
Koatsu Gas Kogyo Co., Ltd. | 166,000 | 956,588 | |||
#Kohsoku Corp. | 62,800 | 479,844 | |||
Konishi Co., Ltd. | 67,500 | 644,747 | |||
#Kumiai Chemical Industry Co., Ltd. | 227,000 | 795,500 | |||
Kureha Corp. | 627,500 | 3,384,770 | |||
*Kurosaki Harima Corp. | 286,000 | 440,117 | |||
Kyoei Steel, Ltd. | 8,900 | 198,860 | |||
Lintec Corp. | 87,400 | 1,547,548 | |||
MEC Co., Ltd. | 61,200 | 450,472 | |||
Mitsubishi Paper Mills, Ltd. | 1,094,000 | 1,408,328 | |||
*Mitsubishi Steel Manufacturing Co., Ltd. | 523,000 | 1,024,153 | |||
*Mitsui Mining & Smelting Co., Ltd. | 389,000 | 1,002,361 | |||
Mory Industries, Inc. | 154,000 | 332,026 | |||
Nakabayashi Co., Ltd. | 181,000 | 373,092 | |||
Nakayama Steel Works, Ltd. | 443,000 | 674,451 | |||
#Neturen Co., Ltd. | 153,800 | 1,088,011 | |||
Nichia Steel Works, Ltd. | 175,900 | 541,116 | |||
Nifco, Inc. | 162,700 | 3,329,607 | |||
Nihon Kagaku Sangyo Co., Ltd. | 79,000 | 544,410 | |||
*Nihon Matai Co., Ltd. | 111,000 | 117,135 | |||
#Nihon Nohyaku Co., Ltd. | 219,000 | 1,392,424 | |||
Nihon Parkerizing Co., Ltd. | 230,000 | 2,726,796 | |||
Nihon Seiko Co., Ltd. | 18,000 | 38,713 | |||
*Nippon Carbide Industries Co., Inc. | 201,000 | 235,914 | |||
Nippon Chemical Industrial Co., Ltd. | 281,000 | 661,408 | |||
*Nippon Chutetsukan K.K. | 97,000 | 154,885 | |||
Nippon Chuzo K.K. | 136,000 | 166,589 | |||
Nippon Coke & Engineering Co., Ltd. | 772,500 | 933,333 | |||
#Nippon Concrete Industries Co., Ltd. | 157,000 | 260,143 | |||
#Nippon Denko Co., Ltd. | 372,000 | 2,646,303 | |||
Nippon Fine Chemical Co., Ltd. | 90,600 | 833,044 | |||
#Nippon Kasei Chemical Co., Ltd. | 355,000 | 763,766 | |||
Nippon Kayaku Co., Ltd. | 248,000 | 2,218,653 | |||
#*Nippon Kinzoku Co., Ltd. | 222,000 | 397,397 | |||
#Nippon Koshuha Steel Co., Ltd. | 438,000 | 451,970 | |||
*Nippon Light Metal Co., Ltd. | 1,115,000 | 981,569 | |||
#Nippon Metal Industry Co., Ltd. | 592,000 | 1,059,251 | |||
#Nippon Paint Co., Ltd. | 727,200 | 4,364,964 | |||
Nippon Paper Group, Inc. | 16,119 | 427,759 | |||
Nippon Pigment Co., Ltd. | 43,000 | 76,813 | |||
*Nippon Pillar Packing Co., Ltd. | 83,000 | 376,105 | |||
Nippon Soda Co., Ltd. | 525,000 | 2,113,538 | |||
Nippon Synthetic Chemical Industry Co., Ltd. (The) | 310,000 | 2,276,763 | |||
Nippon Valqua Industries, Ltd. | 313,000 | 615,364 | |||
Nippon Yakin Kogyo Co., Ltd. | 395,500 | 1,919,131 | |||
Nittetsu Mining Co., Ltd. | 281,000 | 1,505,230 | |||
#Nitto FC Co., Ltd. | 72,000 | 401,256 | |||
#NOF Corp. | 701,000 | 3,179,395 | |||
Okabe Co., Ltd. | 186,900 | 662,344 | |||
Okamoto Industries, Inc. | 401,000 | 1,523,119 | |||
*Okura Industrial Co., Ltd. | 211,000 | 633,887 | |||
Osaka Organic Chemical Industry, Ltd. | 66,000 | 284,921 | |||
Osaka Steel Co., Ltd. | 81,400 | 1,503,735 | |||
#Osaka Titanium Technologies Co., Ltd. | 31,000 | 821,810 | |||
Pacific Metals Co., Ltd. | 210,000 | 1,577,975 | |||
47
THE JAPANESE SMALL COMPANY SERIES
CONTINUED
| Shares | Value†† | ||||
Materials — (Continued) | |||||
#Pack Corp. (The) | 66,200 | $ | 995,258 | ||
Riken Technos Corp. | 197,000 | 460,493 | |||
#*S Science Co., Ltd. | 3,252,000 | 105,962 | |||
S.T. Chemical Co., Ltd. | 84,400 | 946,147 | |||
Sakai Chemical Industry Co., Ltd. | 355,000 | 1,437,335 | |||
Sakata INX Corp. | 214,000 | 820,642 | |||
Sanyo Chemical Industries, Ltd. | 340,000 | 1,903,004 | |||
Sanyo Special Steel Co., Ltd. | 542,300 | 1,994,051 | |||
Sekisui Plastics Co., Ltd. | 245,000 | 962,019 | |||
Shikoku Chemicals Corp. | 202,000 | 1,300,291 | |||
Shinagawa Refractories Co., Ltd. | 224,000 | 435,299 | |||
Shin-Etsu Polymer Co., Ltd. | 245,200 | 1,582,416 | |||
Shinko Wire Co., Ltd. | 185,000 | 292,896 | |||
Showa Tansan Co., Ltd. | 13,000 | 57,402 | |||
Somar Corp. | 43,000 | 104,601 | |||
#Stella Chemifa Corp. | 42,100 | 2,316,828 | |||
Sumitomo Bakelite Co., Ltd. | 192,000 | 905,426 | |||
*Sumitomo Light Metal Industries, Ltd. | 1,248,000 | 1,116,154 | |||
#Sumitomo Osaka Cement Co., Ltd. | 225,000 | 394,142 | |||
Sumitomo Pipe & Tube Co., Ltd. | 108,100 | 613,196 | |||
Sumitomo Seika Chemicals Co., Ltd. | 238,000 | 911,612 | |||
#T. Hasegawa Co., Ltd. | 129,300 | 1,992,997 | |||
Taisei Lamick Co., Ltd. | 18,500 | 446,430 | |||
Takasago International Corp. | 339,000 | 1,770,727 | |||
Takiron Co., Ltd. | 243,000 | 669,146 | |||
Tayca Corp. | 151,000 | 421,898 | |||
Tenma Corp. | 98,900 | 1,158,072 | |||
#*Titan Kogyo K.K. | 59,000 | 136,963 | |||
Toagosei Co., Ltd. | 897,000 | 3,137,826 | |||
#Toda Kogyo Corp. | 158,000 | 1,517,709 | |||
#Toho Titanium Co., Ltd. | 65,400 | 817,178 | |||
#Toho Zinc Co., Ltd. | 425,000 | 2,116,108 | |||
Tokai Carbon Co., Ltd. | 387,000 | 1,867,980 | |||
Tokushu Tokai Holdings Co., Ltd. | 505,580 | 1,272,255 | |||
Tokyo Ohka Kogyo Co., Ltd. | 111,900 | 2,155,927 | |||
#Tokyo Rope Manufacturing Co., Ltd. | 557,000 | 1,572,477 | |||
#*Tomoegawa Paper Co., Ltd. | 125,000 | 307,323 | |||
Tomoku Co., Ltd. | 294,000 | 668,838 | |||
Topy Industries, Ltd. | 748,000 | 1,451,842 | |||
Toyo Ink Manufacturing Co., Ltd. | 541,000 | 1,881,610 | |||
Toyo Kohan Co., Ltd. | 273,000 | 1,323,157 | |||
TYK Corp. | 142,000 | 330,006 | |||
Ube Material Industries, Ltd. | 275,000 | 722,082 | |||
Wood One Co., Ltd. | 169,000 | 433,866 | |||
Yamamura Glass Co., Ltd. | 360,000 | 1,145,462 | |||
Yodogawa Steel Works, Ltd. | 624,500 | 2,584,582 | |||
Yuki Gosei Kogyo Co., Ltd. | 64,000 | 182,812 | |||
#Yushiro Chemical Industry Co., Ltd. | 51,600 | 780,454 | |||
Zeon Corp. | 503,000 | 2,286,496 | |||
Total Materials | 151,252,587 | ||||
Telecommunication Services — (0.0%) | |||||
#*Invoice, Inc. | 39,279 | 596,409 | |||
Utilities — (0.7%) | |||||
Hokkaido Gas Co., Ltd. | 210,000 | 585,987 | |||
Hokuriku Gas Co., Ltd. | 99,000 | 286,289 | |||
Okinawa Electric Power Co., Ltd. | 32,671 | 1,759,591 | |||
#Saibu Gas Co., Ltd. | 1,291,000 | 3,693,034 | |||
Shizuoka Gas Co., Ltd. | 258,000 | 1,990,313 | |||
48
THE JAPANESE SMALL COMPANY SERIES
CONTINUED
| Shares | Value†† | |||||
Utilities — (Continued) | ||||||
#Tokai Corp. | 236,000 | $ | 1,291,884 | |||
Total Utilities | 9,607,098 | |||||
TOTAL COMMON STOCKS | 1,172,144,924 | |||||
RIGHTS/WARRANTS — (0.0%) | ||||||
*Showa Rubber Co., Ltd. Warrants 01/01/10 | 16,520 | — | ||||
| Face Amount | Value† | |||||
| (000) | ||||||
TEMPORARY CASH INVESTMENTS — (0.0%) | ||||||
Repurchase Agreement, PNC Capital Markets, Inc. 0.19%, 11/02/09 (Collateralized by $115,000 FNMA 6.50%, 06/25/39, valued at $123,769) to be repurchased at $118,002 | $ | 118 | 118,000 | |||
| Shares/ Face Amount | ||||||
| (000) | ||||||
SECURITIES LENDING COLLATERAL — (12.9%) | ||||||
§@DFA Short Term Investment Fund LP | 172,297,110 | 172,297,110 | ||||
@Repurchase Agreement, Deutsche Bank Securities 0.07%, 11/02/09 (Collateralized by various corporate obligations, ranging in par value from $4,247,617 to $16,429,280, rates ranging from 5.000% to 7.000%, maturities ranging from 03/01/37 to 10/01/39, valued at $752,982) to be repurchased at $738,222 | $ | 738 | 738,218 | |||
TOTAL SECURITIES LENDING COLLATERAL | 173,035,328 | |||||
TOTAL INVESTMENTS — (100.0%) | $ | 1,345,298,252 | ||||
See accompanying Notes to Financial Statements.
49
THE ASIA PACIFIC SMALL COMPANY SERIES
SCHEDULE OF INVESTMENTS
October 31, 2009
| Shares | Value†† | ||||
COMMON STOCKS — (82.9%) | |||||
AUSTRALIA — (48.9%) | |||||
#*A.B.C. Learning Centres, Ltd. | 535,970 | $ | — | ||
*Adacel Technologies, Ltd. | 113,249 | 57,159 | |||
*Adamus Resources, Ltd. | 895,668 | 336,150 | |||
ADCorp Australia, Ltd. | 212,402 | 57,599 | |||
#Adelaide Brighton, Ltd. | 1,480,311 | 3,724,318 | |||
*Aditya Birla Minerals, Ltd. | 841,658 | 943,247 | |||
Adtrans Group, Ltd. | 37,239 | 105,911 | |||
#*AED Oil, Ltd. | 282,000 | 139,482 | |||
Aevum, Ltd. | 442,938 | 592,077 | |||
*Agenix, Ltd. | 707,478 | 10,826 | |||
*Ainsworth Game Technology, Ltd. | 380,243 | 56,675 | |||
#AJ Lucas Group, Ltd. | 333,607 | 1,286,330 | |||
*Alchemia, Ltd. | 613,381 | 388,289 | |||
#Alesco Corp., Ltd. | 457,971 | 2,053,018 | |||
*Alkane Resources, Ltd. | 938,520 | 314,681 | |||
#*Alliance Resources, Ltd. | 334,977 | 185,729 | |||
*Allied Medical, Ltd. | 11,746 | — | |||
Altium, Ltd. | 158,490 | 35,198 | |||
*Amadeus Energy, Ltd. | 819,137 | 200,151 | |||
Amalgamated Holdings, Ltd. | 374,540 | 2,011,308 | |||
Amcom Telecommunications, Ltd. | 1,135,725 | 224,057 | |||
Ammtec, Ltd. | 13,918 | 32,632 | |||
#*Andean Resources, Ltd. | 1,464,837 | 2,876,891 | |||
Ansell, Ltd. | 265,435 | 2,452,554 | |||
AP Eagers, Ltd. | 37,790 | 349,786 | |||
#APA Group, Ltd. | 1,044,302 | 2,954,348 | |||
*Apex Minerals NL | 2,317,078 | 86,150 | |||
#APN News & Media, Ltd. | 1,324,541 | 2,644,357 | |||
*Aquila Resources, Ltd. | 380,685 | 2,547,769 | |||
*Arafura Resources, Ltd. | 162,638 | 118,950 | |||
ARB Corporation, Ltd. | 304,681 | 1,435,620 | |||
Ariadne Australia, Ltd. | 267,324 | 66,173 | |||
*Arturus Capital, Ltd. | 98,412 | 24,804 | |||
ASG Group, Ltd. | 186,445 | 166,115 | |||
Astron, Ltd. | 87,221 | 161,109 | |||
#*Atlas Iron, Ltd. | 662,409 | 1,039,060 | |||
*Aurora Oil and Gas, Ltd. | 540,105 | 147,556 | |||
#Ausdrill, Ltd. | 694,863 | 1,048,365 | |||
Austal, Ltd. | 631,677 | 1,369,446 | |||
*Austar United Communications, Ltd. | 3,107,163 | 3,602,715 | |||
#Austbrokers Holdings, Ltd. | 58,240 | 252,782 | |||
Austereo Group, Ltd. | 1,051,320 | 1,397,996 | |||
Austin Engineering, Ltd. | 60,135 | 134,176 | |||
*Austpac Resources NL | 1,627,877 | 51,285 | |||
*Australian Agricultural Co., Ltd. | 887,546 | 1,150,250 | |||
Australian Infrastructure Fund | 2,805,723 | 4,426,075 | |||
#Australian Pharmaceutical Industries, Ltd. (6002840) | 5,079,394 | 3,377,108 | |||
*Australian Pharmaceutical Industries, Ltd. (60028RR) | 4,331,586 | 2,904,802 | |||
Australian Worldwide Exploration, Ltd. | 1,482,305 | 3,397,856 | |||
*Autodom, Ltd. | 173,083 | 12,950 | |||
Automotive Holdings Group, Ltd. | 11,861 | 23,096 | |||
*Autron Corporation, Ltd. | 989,247 | 13,802 | |||
*Avexa, Ltd. | 461,667 | 72,153 | |||
#AVJennings, Ltd. | 5,350,378 | 2,545,418 | |||
#*Avoca Resources, Ltd. | 656,313 | 893,526 | |||
#AWB, Ltd. | 3,807,619 | 4,157,632 | |||
*Ballarat South Gold, Ltd. | 1,996 | 16,213 | |||
Bank of Queensland, Ltd. | 70,274 | 769,290 | |||
50
THE ASIA PACIFIC SMALL COMPANY SERIES
CONTINUED
| Shares | Value†† | ||||
AUSTRALIA — (Continued) | |||||
*Bannerman Resources, Ltd. | 207,242 | $ | 198,817 | ||
Beach Petroleum, Ltd. | 3,630,729 | 2,546,745 | |||
*Berkeley Resources, Ltd. | 39,273 | 33,027 | |||
Beyond International, Ltd. | 61,256 | 33,911 | |||
#*Biota Holdings, Ltd. | 940,673 | 2,379,816 | |||
*Bisalloy Steel Group, Ltd. | 469,001 | 90,773 | |||
Blackmores, Ltd. | 75,215 | 1,392,428 | |||
#*Boart Longyear Group | 7,154,699 | 1,724,096 | |||
#*Boulder Steel, Ltd. | 1,667,795 | 222,628 | |||
*Bow Energy, Ltd. | 60,825 | 68,812 | |||
#Bradken, Ltd. | 582,247 | 3,202,182 | |||
*Breakaway Resporces, Ltd. | 580,505 | 50,090 | |||
Breville Group, Ltd. | 598,466 | 1,201,151 | |||
Brickworks, Ltd. | 130,635 | 1,522,130 | |||
*Brockman Resources, Ltd. | 653,924 | 1,164,764 | |||
BSA, Ltd. | 587,227 | 130,522 | |||
*BT Investment Management, Ltd. | 21,295 | 59,650 | |||
#Cabcharge Australia, Ltd. | 408,669 | 2,145,584 | |||
#Calliden Group, Ltd. | 633,393 | 186,684 | |||
#Campbell Brothers, Ltd. (6161729) | 240,269 | 6,196,971 | |||
*Campbell Brothers, Ltd. (B4TK967) | 40,045 | 1,044,958 | |||
*Cape Range Wireless, Ltd. | 7,260 | — | |||
*Capral, Ltd. | 219,283 | 6,436 | |||
#*Cardno, Ltd. | 247,493 | 1,066,231 | |||
#*Carnarvon Petroleum, Ltd. | 2,906,082 | 1,373,793 | |||
*Carnegie Wave Energy, Ltd. | 1,008,948 | 194,098 | |||
*Carpentaria Exploration, Ltd. | 87,077 | 13,322 | |||
Cash Converters International, Ltd. | 1,086,054 | 543,176 | |||
#*Catalpa Resources, Ltd. | 577,084 | 80,054 | |||
*CBH Resources, Ltd. | 408,220 | — | |||
*CDS Technologies, Ltd. | 13,276 | 11,353 | |||
Cedar Woods Properties, Ltd. | 100,585 | 224,528 | |||
#Cellestis, Ltd. | 387,333 | 1,229,116 | |||
*Cellnet Group, Ltd. | 921,474 | 236,397 | |||
*Centamin Egypt, Ltd. | 2,112,300 | 4,331,276 | |||
#Centennial Coal Co., Ltd. | 1,196,500 | 3,341,606 | |||
*Centrex Metals, Ltd. | 46,889 | 25,833 | |||
#*Ceramic Fuel Cells, Ltd. | 2,190,662 | 424,707 | |||
Challenger Financial Services Group, Ltd. | 1,750,037 | 5,754,880 | |||
*Chandler Macleod Group, Ltd. | 88,156 | 13,559 | |||
*Chemeq, Ltd. | 166,742 | 12,458 | |||
*ChemGenex Pharmaceuticals, Ltd. (6273635) | 621,179 | 439,139 | |||
*ChemGenex Pharmaceuticals, Ltd. (B298LK5) | 115,291 | 2,594 | |||
*Circadian Technologies, Ltd. | 64,591 | 42,661 | |||
*Citadel Resource Group, Ltd. | 1,735,175 | 666,296 | |||
#*Citigold Corp., Ltd. | 3,765,806 | 468,446 | |||
#*Clarius Group, Ltd. | 1,105,857 | 1,049,319 | |||
*Clinuvel Pharmaceuticals, Ltd. | 1,184,356 | 323,311 | |||
Clough, Ltd. | 1,650,373 | 1,228,325 | |||
Clover Corp., Ltd. | 269,348 | 51,799 | |||
#*CO2 Group, Ltd. | 844,559 | 293,412 | |||
*Cockatoo Coal, Ltd. | 83,491 | 28,218 | |||
Codan, Ltd. | 142,942 | 118,490 | |||
*Coffey International, Ltd. | 555,688 | 1,088,412 | |||
Collection House, Ltd. | 1,759,373 | 1,082,048 | |||
*Comet Ridge, Ltd. | 65,567 | 23,045 | |||
#ConnectEast Group, Ltd. | 8,607,304 | 3,049,683 | |||
#*Conquest Mining, Ltd. | 1,061,185 | 549,957 | |||
Consolidated Media Holdings, Ltd. | 965,454 | 2,618,474 | |||
Corporate Express Australia, Ltd. | 422,355 | 1,621,057 | |||
#Count Financial, Ltd. | 991,201 | 1,212,267 | |||
51
THE ASIA PACIFIC SMALL COMPANY SERIES
CONTINUED
| Shares | Value†† | ||||
AUSTRALIA — (Continued) | |||||
Coventry Group, Ltd. | 140,775 | $ | 212,659 | ||
#Crane Group, Ltd. | 345,440 | 2,783,584 | |||
*Crescent Gold, Ltd. | 1,124,856 | 221,975 | |||
CSG, Ltd. | 135,235 | 176,593 | |||
*CuDeco, Ltd. | 96,711 | 489,898 | |||
#*Cue Energy Resources, Ltd. | 452,354 | 102,128 | |||
#*Customers, Ltd. | 477,130 | 1,336,895 | |||
Danks Holdings, Ltd. | 10,425 | 122,034 | |||
Data#3, Ltd. | 5,572 | 39,183 | |||
#David Jones, Ltd. | 1,296,067 | 6,140,136 | |||
Devine, Ltd. | 993,850 | 413,745 | |||
Dominion Mining, Ltd. | 394,791 | 1,242,211 | |||
#Downer EDI, Ltd. | 908,261 | 6,914,045 | |||
*Dragon Mining, Ltd. | 1,665,100 | 121,924 | |||
#DUET Group, Ltd. | 2,903,270 | 4,392,324 | |||
#DWS Advanced Business Solutions, Ltd. | 102,144 | 158,921 | |||
*Dyesol, Ltd. | 52,231 | 40,594 | |||
#*Eastern Star Gas, Ltd. | 2,840,990 | 2,148,807 | |||
#*Elders, Ltd. | 13,223,946 | 2,168,817 | |||
*Ellect Holdings, Ltd. | 482 | 1,562 | |||
*Ellex Medical Lasers, Ltd. | 210,483 | 43,398 | |||
Emeco Holdings, Ltd. | 1,240,388 | 959,137 | |||
#Energy Developments, Ltd. | 627,582 | 1,346,076 | |||
#*Energy World Corp., Ltd. | 4,084,764 | 1,750,350 | |||
Envestra, Ltd. | 4,390,935 | 2,069,475 | |||
Envirozel, Ltd. | 381,802 | 54,521 | |||
Euroz, Ltd. | 8,038 | 11,502 | |||
#*Extract Resources, Ltd. | 140,902 | 1,044,876 | |||
*Falcon Minerals, Ltd. | 4,587 | 820 | |||
Fantastic Holdings, Ltd. | 355,613 | 1,272,100 | |||
*Fig Tree Developments, Ltd. | 20,365 | 183 | |||
*First Australian Resources, Ltd. | 414,263 | 15,011 | |||
#Fleetwood Corp., Ltd. | 238,527 | 1,613,405 | |||
FlexiGroup, Ltd. | 436,156 | 588,070 | |||
#Flight Centre, Ltd. | 192,954 | 2,910,033 | |||
#*Flinders Mines, Ltd. | 5,948,301 | 757,041 | |||
*Forest Enterprises Australia, Ltd. | 2,849,173 | 194,454 | |||
Forge Group, Ltd. | 170,828 | 224,009 | |||
*Forte Energy NL | 850,000 | 125,244 | |||
Gazal Corp., Ltd. | 104,542 | 128,921 | |||
*Geodynamics, Ltd. | 1,015,653 | 822,326 | |||
*Gindalbie Metals, Ltd. | 1,817,381 | 1,408,883 | |||
*Giralia Resources NL | 625,030 | 574,826 | |||
*Glengarry Resources, Ltd. | 768,955 | 36,560 | |||
Goodman Fielder, Ltd. | 864,773 | 1,240,480 | |||
Gowing Bros., Ltd. | 82,167 | 201,212 | |||
#*Graincorp, Ltd. Series A | 461,398 | 2,868,614 | |||
#*Grange Resources, Ltd. | 903,958 | 201,261 | |||
*GRD, Ltd. | 1,354,280 | 653,194 | |||
#*Great Southern, Ltd. | 9,302,784 | 1,004,864 | |||
#GUD Holdings, Ltd. | 338,555 | 2,611,536 | |||
Gunns, Ltd. | 2,872,620 | 2,588,470 | |||
#GWA International, Ltd. | 957,332 | 2,435,122 | |||
Hastie Group, Ltd. | 784,777 | 1,323,797 | |||
*Havilah Resources NL | 271,898 | 144,789 | |||
#Healthscope, Ltd. | 857,741 | 3,640,247 | |||
*HFA Holdings, Ltd. | 186,406 | 38,953 | |||
HGL, Ltd. | 108,137 | 105,759 | |||
*Highlands Pacific, Ltd. | 2,651,500 | 692,154 | |||
#Hills Industries, Ltd. | 926,493 | 1,701,501 | |||
*Horizon Oil, Ltd. | 3,227,717 | 878,995 | |||
52
THE ASIA PACIFIC SMALL COMPANY SERIES
CONTINUED
| Shares | Value†† | ||||
AUSTRALIA — (Continued) | |||||
*Hutchison Telecommunications (Australia), Ltd. | 7,914,113 | $ | 811,262 | ||
*Icon Energy, Ltd. | 111,982 | 43,396 | |||
*ICSGlobal, Ltd. | 248,727 | 23,193 | |||
IDT Australia, Ltd. | 82,205 | 110,407 | |||
iiNet, Ltd. | 416,802 | 691,611 | |||
*Iluka Resources, Ltd. | 506,650 | 1,569,617 | |||
Imdex, Ltd. | 812,684 | 615,550 | |||
*IMF Australia, Ltd. | 231,410 | 335,322 | |||
*IMX Resources, Ltd. | 594,082 | 161,745 | |||
Independence Group NL | 552,303 | 2,093,310 | |||
*Indophil Resources NL | 1,738,038 | 1,422,340 | |||
#Industrea, Ltd. | 3,394,391 | 1,324,506 | |||
#Infigen Energy, Ltd. | 1,556,089 | 1,982,319 | |||
#Infomedia, Ltd. | 1,458,074 | 523,355 | |||
*Innamincka Petroleum, Ltd. | 780,031 | 128,460 | |||
Integrated Research, Ltd. | 261,513 | 105,581 | |||
#*Intrepid Mines, Ltd. | 666,867 | 197,292 | |||
Invocare, Ltd. | 637,257 | 3,346,428 | |||
#IOOF Holdings, Ltd. | 950,183 | 4,451,477 | |||
#Iress Market Technology, Ltd. | 348,498 | 2,403,394 | |||
#iSOFT Group, Ltd. | 2,688,547 | 1,922,611 | |||
*Ivanhoe Australia, Ltd. | 34,933 | 112,095 | |||
*Ixla, Ltd. | 89,921 | 1,862 | |||
#*Jabiru Metals, Ltd. | 1,854,281 | 689,876 | |||
#JB Hi-Fi, Ltd. | 281,420 | 5,175,392 | |||
K&S Corp., Ltd. | 160,535 | 413,646 | |||
#*Kagara, Ltd. | 1,628,074 | 1,434,927 | |||
#*Karoon Gas Australia, Ltd. | 628,673 | 4,257,692 | |||
*Kings Minerals NL | 1,634,196 | 226,333 | |||
#Kingsgate Consolidated, Ltd. | 395,739 | 2,669,366 | |||
*Kingsrose Mining, Ltd. | 134,627 | 78,309 | |||
*Lednium, Ltd. | 195,019 | 14,044 | |||
Lemarne Corp., Ltd. | 25,882 | 104,391 | |||
#*Lend Lease Primelife, Ltd. | 2,140,495 | 576,058 | |||
#*Linc Energy, Ltd. | 866,033 | 1,201,414 | |||
*Liquefied Natural Gas, Ltd. | 54,592 | 63,521 | |||
*Lodestar Minerals, Ltd. | 26,307 | 1,539 | |||
Lycopodium, Ltd. | 45,700 | 117,868 | |||
#*Lynas Corp., Ltd. (6121176) | 5,059,481 | 2,130,679 | |||
*Lynas Corp., Ltd. (B4T1K12) | 356,375 | 155,583 | |||
*M2 Telecommunications Group, Ltd. | 60,939 | 86,465 | |||
#MAC Services Group, Ltd. | 185,743 | 344,150 | |||
#Macarthur Coal, Ltd. | 283,794 | 2,125,783 | |||
MacMahon Holdings, Ltd. | 3,283,150 | 1,638,707 | |||
#Macquarie Media Group, Ltd. (B1FQWB4) | 786,064 | 1,285,493 | |||
*Macquarie Media Group, Ltd. (B50HWQ5) | 786,064 | 1,309,010 | |||
*Macquarie Telecom Group, Ltd. | 35,019 | 115,892 | |||
*Magma Metals, Ltd. | 154,165 | 92,544 | |||
#*Mantra Resources, Ltd. | 31,175 | 122,748 | |||
#*Marion Energy, Ltd. | 434,665 | 49,721 | |||
*Maryborough Sugar Factory, Ltd. | 2,560 | 5,284 | |||
MaxiTRANS Industries, Ltd. | 889,356 | 354,023 | |||
*McGuigan Simeon Wines, Ltd. | 2,456,151 | 747,128 | |||
#McMillan Shakespeare, Ltd. | 194,418 | 722,531 | |||
*McPherson’s, Ltd. | 303,441 | 789,789 | |||
*Medusa Mining, Ltd. | 119,453 | 350,258 | |||
Melbourne IT, Ltd. | 379,204 | 593,008 | |||
#*MEO Australia, Ltd. | 380,000 | 187,899 | |||
#Mermaid Marine Australia, Ltd. | 737,634 | 1,770,166 | |||
*Metgasco, Ltd. | 44,450 | 20,138 | |||
*Mikoh Corp., Ltd. | 856,548 | 80,457 | |||
53
THE ASIA PACIFIC SMALL COMPANY SERIES
CONTINUED
| Shares | Value†† | ||||
AUSTRALIA — (Continued) | |||||
*Millennium Minerals, Ltd. | 656,280 | $ | 30,751 | ||
#*Minara Resources, Ltd. | 697,128 | 538,406 | |||
#Mincor Resources NL | 946,204 | 1,792,123 | |||
#Mineral Resources, Ltd. | 381,930 | 2,425,764 | |||
*Mirabela Nickel, Ltd. | 60,633 | 145,757 | |||
Mitchell Communications Group, Ltd. | 1,225,532 | 960,162 | |||
#*Molopo Australia, Ltd. | 893,604 | 1,071,894 | |||
Monadelphous Group, Ltd. | 302,955 | 3,598,672 | |||
Mortgage Choice, Ltd. | 675,512 | 841,205 | |||
*Mosaic Oil NL | 2,209,067 | 236,033 | |||
#*Mount Gibson Iron, Ltd. | 3,114,599 | 3,290,085 | |||
*Murchison Metals, Ltd. | 338,689 | 425,690 | |||
Namoi Cotton Cooperative, Ltd. | 196,490 | 80,068 | |||
National Can Industries, Ltd. | 97,017 | 104,795 | |||
Navitas, Ltd. | 1,205,167 | 4,012,073 | |||
#*Nexbis, Ltd. | 362,894 | 61,676 | |||
#*Nexus Energy, Ltd. | 2,957,188 | 839,826 | |||
NIB Holdings, Ltd. | 101,807 | 120,569 | |||
#*Nido Petroleum, Ltd. | 4,759,793 | 543,828 | |||
#Nomad Building Solutions, Ltd. | 29,955 | 20,978 | |||
*Norton Gold Fields, Ltd. | 276,468 | 72,289 | |||
#*Novogen, Ltd. | 391,594 | 211,275 | |||
*NuSep, Ltd. | 872 | 133 | |||
#Oakton, Ltd. | 378,695 | 1,180,025 | |||
*Orbital Corp., Ltd. | 1,013,772 | 61,692 | |||
OrotonGroup, Ltd. | 79,968 | 431,420 | |||
*Otto Energy, Ltd. | 1,486,012 | 89,587 | |||
*Pacific Brands, Ltd. | 4,412,120 | 5,137,506 | |||
Pan Pacific Petroleum NL | 1,059,542 | 397,196 | |||
#*PanAust, Ltd. | 8,757,197 | 3,578,848 | |||
Panoramic Resources, Ltd. | 901,883 | 1,851,823 | |||
*Paperlinx, Ltd. | 2,771,649 | 1,347,337 | |||
*Payce Consolidated, Ltd. | 29,670 | 19,229 | |||
#Peet, Ltd. | 996,525 | 1,982,589 | |||
#*Perilya, Ltd. | 354,317 | 148,141 | |||
#Perpetual Trustees Australia, Ltd. | 95,745 | 3,190,548 | |||
*Perseus Mining, Ltd. | 299,013 | 393,750 | |||
#*Pharmaxis, Ltd. | 815,846 | 1,838,484 | |||
Photon Group, Ltd. | 36,148 | 57,717 | |||
*Planet Gas, Ltd. | 55,177 | 9,326 | |||
*Plantcorp NL | 4,329 | — | |||
#*Platinum Australia, Ltd. | 983,731 | 783,021 | |||
*PMP, Ltd. | 1,829,096 | 970,666 | |||
*Port Bouvard, Ltd. | 270,578 | 60,890 | |||
*Poseidon Nickel, Ltd. | 470,468 | 118,375 | |||
*Prana Biotechnology, Ltd. | 195,424 | 33,287 | |||
#Premier Investments, Ltd. | 187,265 | 1,370,509 | |||
Prime Media Group, Ltd. | 1,001,480 | 722,873 | |||
*Prime Retirement & Aged Care Property Trust | 535,374 | 76,793 | |||
#Programmed Maintenance Service, Ltd. | 450,034 | 1,741,916 | |||
#*Ramelius Resources, Ltd. | 147,307 | 56,733 | |||
Ramsay Health Care, Ltd. | 255,779 | 2,419,442 | |||
*Raptis Group, Ltd. | 12,000 | 4,321 | |||
#RCR Tomlinson, Ltd. | 1,119,113 | 1,135,966 | |||
#REA Group, Ltd. | 46,463 | 341,876 | |||
Reckon, Ltd. | 141,500 | 225,458 | |||
*Red Fork Energy, Ltd. | 22,020 | 19,483 | |||
#Redflex Holdings, Ltd. | 384,390 | 796,959 | |||
#Reece Australia, Ltd. | 238,457 | 5,244,014 | |||
Reject Shop, Ltd. (The) | 112,300 | 1,310,920 | |||
#*Resolute Mining, Ltd. | 1,442,710 | 919,160 | |||
54
THE ASIA PACIFIC SMALL COMPANY SERIES
CONTINUED
| Shares | Value†† | ||||
AUSTRALIA — (Continued) | |||||
*Resource Generation, Ltd. | 67,290 | $ | 31,990 | ||
Retail Food Group, Ltd. | 321 | 748 | |||
Reverse Corp., Ltd. | 236,664 | 119,617 | |||
*RHG, Ltd. | 279,073 | 176,837 | |||
Ridley Corp., Ltd. | 1,283,068 | 1,222,691 | |||
*RiverCity Motorway Group, Ltd. | 902,760 | 125,613 | |||
#*Riversdale Mining, Ltd. | 692,356 | 3,279,236 | |||
*Roc Oil Co., Ltd. | 937,716 | 508,443 | |||
Rock Building Society, Ltd. | 28,109 | 64,610 | |||
Ross Human Directions, Ltd. | 143,511 | 46,661 | |||
#Ruralco Holdings, Ltd. | 88,146 | 190,477 | |||
#SAI Global, Ltd. | 797,840 | 2,469,614 | |||
#*Salinas Energy, Ltd. | 637,362 | 84,316 | |||
Salmat, Ltd. | 707,196 | 2,606,393 | |||
*Samson Oil & Gas, Ltd. | 1,851,708 | 19,742 | |||
Schaffer Corp., Ltd. | 33,766 | 194,932 | |||
*SDI, Ltd. | 178,683 | 56,320 | |||
Sedgman, Ltd. | 158,566 | 214,359 | |||
#Seek, Ltd. | 666,916 | 3,584,917 | |||
Select Harvests, Ltd. | 196,698 | 705,557 | |||
Servcorp, Ltd. | 300,722 | 1,052,189 | |||
#Service Stream, Ltd. | 1,462,044 | 520,174 | |||
#Seven Network, Ltd. | 330,352 | 1,904,716 | |||
*Shield Mining, Ltd. | 58,492 | 6,713 | |||
Sigma Pharmaceuticals, Ltd. | 4,862,235 | 4,070,078 | |||
#*Silex System, Ltd. | 470,343 | 2,673,974 | |||
#*Silver Lake Resources, Ltd. | 103,729 | 78,186 | |||
*Sino Gold Mining, Ltd. | 321,734 | 1,888,702 | |||
*Sino Strategic International, Ltd. | 130,864 | 77,050 | |||
*Sirtex Medical, Ltd. | 216,786 | 1,164,191 | |||
#Skilled Group, Ltd. | 391,640 | 786,763 | |||
SMS Management & Technology, Ltd. | 292,441 | 1,368,631 | |||
SP Telemedia, Ltd. | 528,127 | 632,565 | |||
#Spark Infrastructure Group, Ltd. | 2,596,492 | 2,815,225 | |||
*Specialty Fashion Group, Ltd. | 807,082 | 839,785 | |||
*Sphere Investments, Ltd. | 7,555 | — | |||
Spotless Group, Ltd. | 1,144,847 | 2,574,680 | |||
#*St. Barbara, Ltd. | 3,232,274 | 874,682 | |||
*Starpharma Holdings, Ltd. | 497,958 | 253,944 | |||
Straits Resources, Ltd. | 878,069 | 1,239,586 | |||
#*Structural Systems, Ltd. | 172,988 | 166,879 | |||
#*Stuart Petroleum, Ltd. | 201,731 | 95,367 | |||
STW Communications Group, Ltd. | 14,827 | 11,058 | |||
#*Sundance Resources, Ltd. | 5,993,157 | 815,692 | |||
Sunland Group, Ltd. | 852,875 | 553,541 | |||
Super Cheap Auto Group, Ltd. | 718,503 | 3,377,562 | |||
*Swick Mining Services, Ltd. | 49,595 | 24,826 | |||
Symex Holdings, Ltd. | 355,611 | 169,285 | |||
*Talent2 International, Ltd. | 474,826 | 663,582 | |||
*Tap Oil, Ltd. | 3,987,713 | 3,732,072 | |||
#Tassal Group, Ltd. | 598,270 | 945,778 | |||
Technology One, Ltd. | 1,318,149 | 956,384 | |||
#Ten Network Holdings, Ltd. | 2,056,782 | 2,807,921 | |||
#*Terramin Australia, Ltd. | 129,679 | 116,730 | |||
#TFS Corp., Ltd. | 996,484 | 810,275 | |||
Thakral Holdings Group, Ltd. | 2,559,697 | 994,866 | |||
*TNG, Ltd. | 621,584 | 50,765 | |||
Tower Australia Group, Ltd. | 1,159,243 | 3,055,999 | |||
*Tox Free Solutions, Ltd. | 308,907 | 680,334 | |||
Transfield Services, Ltd. | 753,413 | 2,840,717 | |||
#Transfield Services, Ltd. Infrastructure Fund | 766,966 | 674,346 | |||
55
THE ASIA PACIFIC SMALL COMPANY SERIES
CONTINUED
| Shares | Value†† | ||||
AUSTRALIA — (Continued) | |||||
#*Transpacific Industries Group, Ltd. | 363,760 | $ | 486,339 | ||
#Troy Resources NL | 298,451 | 617,097 | |||
Trust Co., Ltd. | 82,756 | 455,133 | |||
#*Unilife Medical Solutions, Ltd. | 608,036 | 587,629 | |||
United Group, Ltd. | 225,753 | 2,715,175 | |||
*United Minerals Corp. NL | 161,411 | 179,337 | |||
#UXC, Ltd. | 968,954 | 730,008 | |||
*Victoria Petroleum NL | 74,027 | 23,030 | |||
*View Resources, Ltd. | 1,283,369 | 150,179 | |||
#Village Roadshow, Ltd. | 596,487 | 931,882 | |||
#*Virgin Blue Holdings, Ltd. | 5,081,560 | 2,261,041 | |||
*Viterra, Inc. | 38,330 | 361,243 | |||
*Voyager Resources, Ltd. | 19,640 | 513 | |||
Watpac, Ltd. | 628,444 | 825,175 | |||
#*Wattyl, Ltd. | 433,037 | 397,273 | |||
#WDS, Ltd. | 375,342 | 602,453 | |||
#Webjet, Ltd. | 373,212 | 628,779 | |||
Webster, Ltd. | 158,276 | 72,241 | |||
#West Australian Newspapers Holdings, Ltd. | 709,322 | 4,717,984 | |||
#*Western Areas NL | 529,359 | 2,243,835 | |||
#*White Energy Co., Ltd. | 141,468 | 324,152 | |||
Whitehaven Coal, Ltd. | 341,119 | 1,182,621 | |||
WHK Group, Ltd. | 1,202,433 | 1,120,217 | |||
#Wide Bay Australia, Ltd. | 70,360 | 566,654 | |||
Willmott Forests, Ltd. (6315601) | 21,095 | 7,618 | |||
*Willmott Forests, Ltd. (B4T0C02) | 17,224 | 6,279 | |||
#*Windimurra Vanadium, Ltd. | 537,429 | 82,240 | |||
#Wotif.com Holdings, Ltd. | 538,244 | 2,893,564 | |||
TOTAL AUSTRALIA | 398,598,208 | ||||
HONG KONG — (17.2%) | |||||
AAC Acoustic Technologies Holdings, Inc. | 1,210,000 | 1,517,846 | |||
*ABC Communications (Holdings), Ltd. | 172,000 | 65,025 | |||
Aeon Credit Service (Asia) Co., Ltd. | 740,000 | 608,146 | |||
Aeon Stores Hong Kong Co., Ltd. | 234,000 | 425,099 | |||
Alco Holdings, Ltd. | 1,468,000 | 475,042 | |||
Allan International Holdings, Ltd. | 592,000 | 122,416 | |||
Allied Group, Ltd. | 683,200 | 1,612,760 | |||
*Allied Properties, Ltd. | 10,530,000 | 1,696,133 | |||
Amax Holdings, Ltd. | 1,650,000 | 44,432 | |||
*Apac Resources, Ltd. | 4,140,000 | 284,845 | |||
*APT Satellite Holdings, Ltd. | 850,000 | 212,769 | |||
Arts Optical International Holdings, Ltd. | 730,000 | 272,007 | |||
Asia Commercial Holdings, Ltd. | 131,040 | 12,382 | |||
*Asia Energy Logistics Group, Ltd. | 210,400 | 4,325 | |||
Asia Financial Holdings, Ltd. | 2,546,908 | 867,826 | |||
Asia Satellite Telecommunications Holdings, Ltd. | 962,000 | 1,423,977 | |||
*Asia Standard Hotel Group, Ltd. | 13,095,018 | 737,102 | |||
*Asia Standard International Group, Ltd. | 14,569,281 | 2,138,374 | |||
*Asia TeleMedia, Ltd. | 2,832,000 | 36,541 | |||
*Associated International Hotels, Ltd. | 954,000 | 2,061,749 | |||
Automated Systems Holdings, Ltd. | 340,000 | 65,602 | |||
#*AVIC International Holding HK, Ltd. | 5,332,000 | 204,484 | |||
*Bal Holdings, Ltd. | 45 | 2 | |||
*Beijing Enterprises Water Group, Ltd. | 3,762,000 | 908,296 | |||
Bossini International Holdings, Ltd. | 3,871,500 | 202,267 | |||
Brightoil Petroleum Holdings, Ltd. | 1,424,000 | 1,140,220 | |||
*Burwill Holdings, Ltd. | 7,148,960 | 384,250 | |||
#C C Land Holdings, Ltd. | 2,870,000 | 1,557,682 | |||
Cafe de Coral Holdings, Ltd. | 154,000 | 332,951 | |||
*Capital Estate, Ltd. | 28,570,000 | 141,537 | |||
56
THE ASIA PACIFIC SMALL COMPANY SERIES
CONTINUED
| Shares | Value†† | ||||
HONG KONG — (Continued) | |||||
*Capital Publications, Ltd. | 20,847,170 | $ | 775,448 | ||
Capital Strategic Investment, Ltd. | 18,239,625 | 484,735 | |||
*CASH Financial Services Group, Ltd. | 119,565 | 9,469 | |||
*Celestial Asia Securities Holdings, Ltd. | 343,810 | 68,811 | |||
Century City International Holdings, Ltd. | 4,332,600 | 255,411 | |||
Chevalier International Holdings, Ltd. | 733,482 | 525,717 | |||
Chevalier Pacific Holdings, Ltd. | 355,250 | 63,682 | |||
*China Best Group Holding, Ltd. | 3,721,400 | 119,233 | |||
*China Digicontent Co., Ltd. | 2,710,000 | 3,497 | |||
*China Electronics Corp. Holdings Co., Ltd. | 890,250 | 101,684 | |||
China Hong Kong Photo Products Holdings, Ltd. | 1,909,000 | 124,485 | |||
*China Infrastructure Investment, Ltd. | 6,280,000 | 164,576 | |||
*China Investments Holdings, Ltd. | 210,000 | 5,789 | |||
China Metal International Holdings, Ltd. | 2,582,000 | 577,153 | |||
China Motion Telecom International, Ltd. | 5,080,000 | 116,987 | |||
China Motor Bus Co., Inc. | 74,000 | 569,528 | |||
*China Properties Investment Holdings, Ltd. | 880,000 | 13,691 | |||
*China Seven Star Shopping, Ltd. | 12,410,000 | 376,200 | |||
*China Solar Energy Holdings, Ltd. | 2,160,000 | 32,956 | |||
*China Strategic Holdings, Ltd. | 1,670,000 | 79,727 | |||
*China Timber Resources Group, Ltd. | 3,400,000 | 63,648 | |||
China Ting Group Holdings, Ltd. | 228,000 | 34,425 | |||
#*China WindPower Group, Ltd. | 7,060,000 | 797,572 | |||
China Zirconium, Ltd. | 116,400 | 136,336 | |||
*ChinaVision Media Group, Ltd. | 130,000 | 7,126 | |||
*Chinese People Holdings Co., Ltd. | 8,960,000 | 373,395 | |||
Chinney Investments, Ltd. | 1,144,000 | 150,375 | |||
#Chong Hing Bank, Ltd. | 1,019,000 | 1,976,531 | |||
Chow Sang Sang Holdings, Ltd. | 1,227,680 | 1,216,407 | |||
Chu Kong Shipping Development, Ltd. | 1,584,000 | 234,940 | |||
Chuang’s Consortium International, Ltd. | 3,588,786 | 364,039 | |||
*Chun Wo Development Holdings, Ltd. | 2,002,926 | 127,207 | |||
#Citic 1616 Holdings, Ltd. | 1,060,000 | 347,507 | |||
*City e-Solutions, Ltd. | 186,000 | 16,742 | |||
City Telecom, Ltd. | 1,506,751 | 500,866 | |||
*Clear Media, Ltd. | 45,000 | 19,947 | |||
*Climax International Co., Ltd. | 40,700 | 131 | |||
*CNNC International, Ltd. | 330,000 | 368,725 | |||
*CNT Group, Ltd. | 9,397,264 | 222,458 | |||
*COL Capital, Ltd. | 2,749,840 | 413,790 | |||
*Compass Pacific Holdings, Ltd. | 1,248,000 | 43,553 | |||
Computer & Technologies Holdings, Ltd. | 432,000 | 69,250 | |||
Continental Holdings, Ltd. | 98,825 | 23,404 | |||
Convenience Retail Asia, Ltd. | 64,000 | 17,306 | |||
*Cosmos Machinery Enterprises, Ltd. | 1,616,400 | 122,504 | |||
#Cross-Harbour Holdings, Ltd. | 591,520 | 590,487 | |||
*Dah Sing Banking Group, Ltd. | 706,000 | 980,631 | |||
*Dah Sing Financial Holdings, Ltd. | 245,600 | 1,386,585 | |||
*Daisho Microline Holdings, Ltd. | 1,236,000 | 97,570 | |||
*Dan Form Holdings Co., Ltd. | 3,153,260 | 255,793 | |||
Daphne International Holdings, Ltd. | 4,086,000 | 3,088,086 | |||
Dawnrays Pharmaceutical (Holdings), Ltd. | 1,832,000 | 242,472 | |||
Dickson Concepts International, Ltd. | 825,000 | 381,847 | |||
*Dragon Hill Wuling Automobile Holdings, Ltd. | 112,500 | 14,624 | |||
*Dynamic Global Holdings, Ltd. | 3,522,000 | 64,943 | |||
Dynamic Holdings, Ltd. | 374,000 | 75,906 | |||
Eagle Nice (International) Holdings, Ltd. | 238,000 | 81,240 | |||
EcoGreen Fine Chemical Group, Ltd. | 1,112,000 | 265,014 | |||
*Eforce Holdings, Ltd. | 3,480,000 | 44,165 | |||
#*EganaGoldpfeil Holdings, Ltd. | 4,121,757 | — | |||
*E-Kong Group, Ltd. | 620,000 | 31,641 | |||
57
THE ASIA PACIFIC SMALL COMPANY SERIES
CONTINUED
| Shares | Value†† | ||||
HONG KONG — (Continued) | |||||
*Emperor Capital Group, Ltd. | 749,672 | $ | 40,036 | ||
Emperor Entertainment Hotel, Ltd. | 2,410,000 | 277,986 | |||
*Emperor International Holdings, Ltd. | 3,808,360 | 689,777 | |||
*ENM Holdings, Ltd. | 27,244,000 | 1,161,462 | |||
*eSun Holdings, Ltd. | 302,000 | 43,631 | |||
*Extrawell Pharmaceutical Holdings, Ltd. | 2,490,000 | 632,926 | |||
*Ezcom Holdings, Ltd. | 72,576 | 450 | |||
Fairwood Holdings, Ltd. | 316,600 | 264,196 | |||
#Far East Consortium International, Ltd. | 4,117,766 | 1,312,252 | |||
*Far East Technology International, Ltd. | 179,520 | 23,212 | |||
*First Natural Foods Holdings, Ltd. | 2,365,000 | — | |||
Fong’s Industries Co., Ltd. | 102,000 | 27,165 | |||
Four Seas Food Investment Holdings, Ltd. | 202,184 | 23,676 | |||
Four Seas Mercantile Holdings, Ltd. | 592,000 | 146,268 | |||
*Frasers Property China, Ltd. | 16,477,000 | 277,103 | |||
*Freeman Corp., Ltd. | 315,000 | 24,345 | |||
#Fubon Bank Hong Kong, Ltd. | 1,336,000 | 597,730 | |||
*Fujian Holdings, Ltd. | 117,800 | 9,455 | |||
Fujikon Industrial Holdings, Ltd. | 912,000 | 180,012 | |||
#*Galaxy Entertainment Group, Ltd. | 2,630,121 | 1,114,834 | |||
#Get Nice Holdings, Ltd. | 11,788,000 | 654,644 | |||
#Giordano International, Ltd. | 6,824,000 | 1,691,607 | |||
*Global Tech (Holdings), Ltd. | 5,612,000 | 38,858 | |||
Glorious Sun Enterprises, Ltd. | 2,700,000 | 844,024 | |||
Gold Peak Industries (Holdings), Ltd. | 3,080,250 | 484,827 | |||
Golden Resources Development International, Ltd. | 2,848,500 | 151,060 | |||
*Goldin Properties Holdings, Ltd. | 1,876,000 | 734,654 | |||
Golik Holdings, Ltd. | 930,500 | 38,620 | |||
*GR Vietnam Holdings, Ltd. | 620,000 | 10,573 | |||
Grande Holdings, Ltd. | 882,000 | 62,993 | |||
Great Eagle Holdings, Ltd. | 481,499 | 1,257,866 | |||
*Group Sense International, Ltd. | 2,448,000 | 81,537 | |||
Guangnan Holdings, Ltd. | 1,779,600 | 250,270 | |||
*Hang Fung Gold Technology, Ltd. | 1,972,482 | — | |||
*Hannstar Board International Holdings, Ltd. | 430,000 | 105,668 | |||
*Hans Energy Co., Ltd. | 7,556,000 | 393,889 | |||
Harbour Centre Development, Ltd. | 889,500 | 720,549 | |||
*Heng Tai Consumables Group, Ltd. | 4,759,500 | 345,661 | |||
*Hi Sun Technology (China), Ltd. | 2,865,000 | 1,110,568 | |||
High Fashion International, Ltd. | 268,000 | 63,846 | |||
#*HKR International, Ltd. | 2,412,736 | 1,008,524 | |||
*Hong Fok Land, Ltd. | 1,210,000 | 1,561 | |||
Hong Kong & Shanghai Hotels, Ltd. | 292,176 | 418,143 | |||
Hong Kong Catering Management, Ltd. | 542,796 | 149,346 | |||
Hong Kong Ferry (Holdings) Co., Ltd. | 809,300 | 656,103 | |||
Hongkong Chinese, Ltd. | 4,482,000 | 401,431 | |||
*Hop Fung Group Holdings, Ltd. | 888,000 | 121,372 | |||
*Hop Hing Group Holdings, Ltd. | 792,318 | 30,730 | |||
Hsin Chong Construction Group, Ltd. | 1,569,658 | 147,795 | |||
#Huafeng Group Holdings, Ltd. | 12,853,325 | 568,901 | |||
Hung Hing Printing Group, Ltd. | 242,000 | 73,470 | |||
*Huscoke Resources Holdings, Ltd. | 670,000 | 49,940 | |||
Hutchison Harbour Ring, Ltd. | 10,412,000 | 761,968 | |||
*Hutchison Telecommunications International, Ltd. | 4,239,000 | 849,032 | |||
*HyComm Wireless, Ltd. | 47,090 | 6,285 | |||
*I.T., Ltd. | 2,734,000 | 275,051 | |||
*IDT International, Ltd. | 6,240,183 | 166,467 | |||
Integrated Distribution Services Group, Ltd. | 759,000 | 1,062,317 | |||
*Interchina Holdings Co., Ltd. | 14,985,000 | 163,739 | |||
*IPE Group, Ltd. | 1,140,000 | 71,053 | |||
ITC Corp., Ltd. | 893,645 | 50,183 | |||
58
THE ASIA PACIFIC SMALL COMPANY SERIES
CONTINUED
| Shares | Value†† | ||||
HONG KONG — (Continued) | |||||
*ITC Properties Group, Ltd. | 3,858,747 | $ | 564,612 | ||
*Jiuzhou Development Co., Ltd. | 2,632,000 | 259,692 | |||
*JLF Investment Co., Ltd. | 1,036,250 | 74,671 | |||
#*Johnson Electric Holdings, Ltd. | 4,319,500 | 1,880,661 | |||
*Joyce Boutique Holdings, Ltd. | 1,530,000 | 32,862 | |||
*Junefield Department Store Group, Ltd. | 384,000 | 13,066 | |||
K Wah International Holdings, Ltd. | 2,788,405 | 948,947 | |||
Kantone Holdings, Ltd. | 10,351,685 | 246,369 | |||
*Karl Thomson Holdings, Ltd. | 1,188,000 | 160,996 | |||
Karrie International Holdings, Ltd. | 1,431,600 | 108,607 | |||
Keck Seng Investments (Hong Kong), Ltd. | 904,600 | 440,563 | |||
Kee Shing Holdings, Ltd. | 886,000 | 77,737 | |||
Kin Yat Holdings, Ltd. | 586,000 | 121,104 | |||
King Fook Holdings, Ltd. | 998,000 | 107,289 | |||
*King Pacific International Holdings, Ltd. | 1,404,200 | 22,104 | |||
Kingmaker Footwear Holdings, Ltd. | 1,476,955 | 174,507 | |||
*Kong Sun Holdings, Ltd. | 2,198,000 | 10,957 | |||
Kowloon Development Co., Ltd. | 1,620,000 | 1,726,555 | |||
*KPI Co., Ltd. | 396,000 | 17,332 | |||
KTP Holdings, Ltd. | 560,400 | 80,692 | |||
Kwoon Chung Bus Holdings, Ltd. | 556,000 | 80,487 | |||
*Lai Sun Development Co., Ltd. | 78,052,800 | 1,396,639 | |||
Lam Soon Hong Kong, Ltd. | 302,310 | 183,173 | |||
Le Saunda Holdings, Ltd. | 1,424,000 | 261,691 | |||
*Leading Spirit High-Tech Holdings Co., Ltd. | 2,310,000 | 2,981 | |||
Lee & Man Holdings, Ltd. | 1,780,000 | 612,645 | |||
Lee & Man Paper Manufacturing, Ltd. | 1,504,400 | 2,974,469 | |||
Lerado Group Holding Co., Ltd. | 1,602,000 | 158,452 | |||
*LeRoi Holdings, Ltd. | 4,648,000 | 138,880 | |||
*Lijun International Pharmaceutical Holding, Ltd. | 355,000 | 49,936 | |||
Lippo, Ltd. | 1,195,700 | 389,512 | |||
Liu Chong Hing Investment, Ltd. | 755,200 | 678,659 | |||
*Longrun Tea Group Co., Ltd. | 480,000 | 52,469 | |||
*Loudong General Nice Resources China Holdings, Ltd. | 35,708 | 5,053 | |||
Luen Thai Holdings, Ltd. | 1,345,000 | 129,576 | |||
Luk Fook Holdings (International), Ltd. | 1,192,000 | 690,723 | |||
#Luks Industrial Group, Ltd. | 302,913 | 164,878 | |||
*Lung Cheong International Holdings, Ltd. | 2,426,000 | 109,035 | |||
Lung Kee (Bermuda) Holdings, Ltd. | 1,597,875 | 814,278 | |||
*Magnificent Estates, Ltd. | 12,744,000 | 224,853 | |||
Mainland Headwear Holdings, Ltd. | 765,600 | 88,843 | |||
Man Yue International Holdings, Ltd. | 1,084,000 | 326,702 | |||
Matrix Holdings, Ltd. | 1,067,414 | 204,888 | |||
*Mei Ah Entertainment Group, Ltd. | 1,732,000 | 115,920 | |||
Melbourne Enterprises, Ltd. | 45,500 | 415,215 | |||
#*Melco International Development, Ltd. | 2,228,000 | 1,215,129 | |||
*Midas International Holdings, Ltd. | 3,272,000 | 100,417 | |||
Midland Holdings, Ltd. | 3,068,000 | 2,626,996 | |||
*Ming An Holdings Co., Ltd. | 3,990,000 | 1,261,322 | |||
#*Minmetals Holdings, Ltd. | 2,670,000 | 848,626 | |||
Miramar Hotel & Investment Co., Ltd. | 772,000 | 846,288 | |||
Nanyang Holdings, Ltd. | 137,500 | 189,541 | |||
National Electronics Holdings, Ltd. | 2,156,000 | 130,314 | |||
Natural Beauty Bio-Technology, Ltd. | 4,790,000 | 813,988 | |||
*Neo-Neon Holdings, Ltd. | 366,000 | 237,131 | |||
New Century Group Hong Kong, Ltd. | 13,351,464 | 222,805 | |||
New Island Printing Holdings, Ltd. | 176,000 | 16,617 | |||
*New Times Energy Corp, Ltd. | 7,108,000 | 281,388 | |||
*New World Mobile Holdings, Ltd. | 22,140 | 8,780 | |||
Neway Group Holdings, Ltd. | 16,400,000 | 456,233 | |||
*Next Media, Ltd. | 4,370,000 | 555,949 | |||
59
THE ASIA PACIFIC SMALL COMPANY SERIES
CONTINUED
| Shares | Value†† | ||||
HONG KONG — (Continued) | |||||
*Norstar Founders Group, Ltd. | 3,256,000 | $ | 306,686 | ||
*Orient Power Holdings, Ltd. | 804,000 | 19,503 | |||
Oriental Watch Holdings, Ltd. | 671,000 | 126,764 | |||
Pacific Andes International Holdings, Ltd. | 3,206,797 | 535,297 | |||
Pacific Basin Shipping, Ltd. | 3,924,000 | 2,888,627 | |||
*Pacific Century Premium Developments, Ltd. | 4,569,000 | 1,232,029 | |||
*Pacific Textile Holdings, Ltd. | 109,000 | 54,010 | |||
Paliburg Holdings, Ltd. | 2,198,830 | 649,354 | |||
*Paradise Entertainment, Ltd. | 396,900 | 11,881 | |||
Paul Y Engineering Group, Ltd. | 75,692 | 5,835 | |||
PCCW, Ltd. | 2,179,000 | 535,178 | |||
#*Peace Mark Holdings, Ltd. | 2,738,022 | — | |||
Pegasus International Holdings, Ltd. | 226,000 | 39,599 | |||
Pico Far East Holdings, Ltd. | 3,670,000 | 671,636 | |||
*Playmates Toys, Ltd. | 220,000 | 6,160 | |||
*PME Group, Ltd. | 950,000 | 35,972 | |||
Pokfulam Development Co., Ltd. | 234,000 | 140,704 | |||
*Pokphand (C.P.) Co., Ltd. | 5,970,000 | 335,109 | |||
*Polyard Petroleum International Group, Ltd. | 1,170,000 | 13,524 | |||
*Polytec Asset Holdings, Ltd. | 1,290,000 | 220,220 | |||
#Ports Design, Ltd. | 1,014,500 | 2,727,513 | |||
*Premium Land, Ltd. | 4,950,000 | 134,738 | |||
*Proview International Holdings, Ltd. | 10,969,322 | 364,202 | |||
#Public Financial Holdings, Ltd. | 1,848,000 | 954,004 | |||
*Pyxis Group, Ltd. | 1,936,000 | 42,359 | |||
*QPL International Holdings, Ltd. | 2,009,000 | 73,126 | |||
Quality Healthcare Asia, Ltd. | 478,995 | 253,045 | |||
Raymond Industrial, Ltd. | 1,509,400 | 132,459 | |||
#Regal Hotels International Holdings, Ltd. | 2,253,800 | 842,537 | |||
*Rexlot Holdings, Ltd. | 3,650,000 | 321,095 | |||
Rivera Holdings, Ltd. | 5,710,000 | 231,153 | |||
#Road King Infrastructure, Ltd. | 1,108,000 | 893,818 | |||
Roadshow Holdings, Ltd. | 1,456,000 | 126,300 | |||
S.A.S. Dragon Holdings, Ltd. | 1,456,000 | 205,408 | |||
Sa Sa International Holdings, Ltd. | 2,064,000 | 1,026,346 | |||
Safety Godown Co., Ltd. | 408,000 | 219,165 | |||
Samson Paper Holdings, Ltd. | 666,000 | 65,489 | |||
*San Miguel Brewery Hong Kong, Ltd. | 612,800 | 90,558 | |||
*Sanyuan Group, Ltd. | 415,000 | 8,032 | |||
Sea Holdings, Ltd. | 1,138,000 | 503,882 | |||
*SEEC Media Group, Ltd. | 2,550,000 | 62,517 | |||
Shell Electric Manufacturing Co., Ltd. | 1,254,172 | 1,007,163 | |||
#Shenyin Wanguo, Ltd. | 1,212,500 | 550,004 | |||
*Shougang Concord Century Holdings, Ltd. | 3,916,000 | 416,788 | |||
*Shougang Concord Grand Group, Ltd. | 2,451,000 | 135,047 | |||
*Shougang Concord Technology Holdings, Ltd. | 2,639,809 | 188,289 | |||
#Shui On Construction & Materials, Ltd. | 534,000 | 824,884 | |||
*Shun Ho Resources Holdings, Ltd. | 483,000 | 50,958 | |||
*Shun Ho Technology Holdings, Ltd. | 1,037,452 | 97,359 | |||
#Shun Tak Holdings, Ltd. | 2,188,000 | 1,471,831 | |||
Silver Grant International Industries, Ltd. | 5,033,000 | 1,139,841 | |||
*Sincere Co., Ltd. | 505,500 | 19,639 | |||
Sing Tao News Corp., Ltd. | 1,842,000 | 125,116 | |||
Singamas Container Holdings, Ltd. | 1,718,000 | 326,046 | |||
*Sinocan Holdings, Ltd. | 350,000 | 1,761 | |||
*Skyfame Realty Holdings, Ltd. | 2,737,750 | 188,597 | |||
Smartone Telecommunications Holdings, Ltd. | 1,272,500 | 974,304 | |||
*SMI Publishing Group, Ltd. | 250,511 | 485 | |||
*Solartech International Holdings, Ltd. | 618,000 | 11,475 | |||
#Solomon Systech International, Ltd. | 2,554,000 | 238,453 | |||
South China (China), Ltd. | 5,620,000 | 403,989 | |||
60
THE ASIA PACIFIC SMALL COMPANY SERIES
CONTINUED
| Shares | Value†† | ||||
HONG KONG — (Continued) | |||||
South China Financial Holdings, Ltd. | 4,872,000 | $ | 57,502 | ||
Southeast Asia Properties & Finance, Ltd. | 289,892 | 69,388 | |||
*Star Cruises, Ltd. | 56,000 | 12,926 | |||
*Starlight International Holdings, Ltd. | 1,903,792 | 68,610 | |||
Stella International Holdings, Ltd. | 184,500 | 351,882 | |||
*Styland Holdings, Ltd. | 101,991 | 325 | |||
*Success Universe Group, Ltd. | 5,560,000 | 237,438 | |||
Sun Hing Vision Group Holdings, Ltd. | 358,000 | 122,767 | |||
Sun Hung Kai & Co., Ltd. | 237,000 | 185,510 | |||
Sunway International Holdings, Ltd. | 866,000 | 22,136 | |||
*Superb Summit International Timber Co., Ltd. | 2,401,600 | 74,370 | |||
SW Kingsway Capitol Holdings, Ltd. | 4,650,000 | 110,688 | |||
Synergis Holdings, Ltd. | 350,033 | 35,998 | |||
#*Tack Fat Group International, Ltd. | 4,448,000 | 229,568 | |||
Tai Cheung Holdings, Ltd. | 1,799,000 | 998,873 | |||
Tai Fook Securities Group, Ltd. | 1,141,899 | 503,390 | |||
Tai Sang Land Development, Ltd. | 576,984 | 214,277 | |||
Tak Sing Alliance Holdings, Ltd. | 2,703,865 | 421,437 | |||
Tan Chong International, Ltd. | 1,212,000 | 233,511 | |||
*TCC International Holdings, Ltd. | 1,829,789 | 738,680 | |||
*Technology Venture Holdings, Ltd. | 58,600 | 21,954 | |||
#Techtronic Industries Co., Ltd. | 3,354,000 | 2,690,038 | |||
*Termbray Industries International (Holdings), Ltd. | 2,304,900 | 356,138 | |||
Tern Properties Co., Ltd. | 61,200 | 26,082 | |||
Texhong Textile Group, Ltd. | 1,930,000 | 240,004 | |||
Texwinca Holdings, Ltd. | 1,976,000 | 1,674,030 | |||
*Tian Teck Land, Ltd. | 1,076,000 | 948,420 | |||
*Titan Petrochemicals Group, Ltd. | 520,000 | 14,378 | |||
*Tomorrow International Holdings, Ltd. | 1,296,420 | 86,709 | |||
Tongda Group Holdings, Ltd. | 6,010,000 | 168,186 | |||
*Top Form International, Ltd. | 2,760,000 | 204,646 | |||
*Topsearch International (Holdings), Ltd. | 3,860,000 | 124,281 | |||
Transport International Holdings, Ltd. | 188,800 | 533,741 | |||
Tristate Holdings, Ltd. | 188,000 | 35,770 | |||
Truly International Holdings, Ltd. | 1,020,000 | 1,050,842 | |||
Tungtex (Holdings) Co., Ltd. | 910,000 | 160,094 | |||
Tysan Holdings, Ltd. | 1,040,773 | 159,242 | |||
#*United Laboratories, Ltd. (The) | 408,000 | 185,201 | |||
*United Power Investment, Ltd. | 5,696,000 | 190,645 | |||
*U-Right International Holdings, Ltd. | 4,746,000 | 8,573 | |||
USI Holdings, Ltd. | 1,452,999 | 484,196 | |||
#*Value Partners Group, Ltd. | 610,000 | 268,983 | |||
*Van Shung Chong Holdings, Ltd. | 2,205,335 | 140,454 | |||
*Vantage International Holdings, Ltd. | 204,000 | 18,031 | |||
#Varitronix International, Ltd. | 877,293 | 269,035 | |||
Vedan International (Holdings), Ltd. | 3,144,000 | 305,673 | |||
Veeko International Holdings, Ltd. | 1,532,981 | 27,402 | |||
*Victory City International Holdings, Ltd. | 2,759,185 | 386,258 | |||
*Vital Biotech Holdings, Ltd. | 470,000 | 10,753 | |||
#Vitasoy International Holdings, Ltd. | 3,457,000 | 2,093,358 | |||
*Vongroup, Ltd. | 10,865,000 | 253,123 | |||
VST Holdings, Ltd. | 144,000 | 28,704 | |||
#Vtech Holdings, Ltd. | 120,000 | 1,000,107 | |||
Wah Ha Realty Co., Ltd. | 278,600 | 85,559 | |||
*Wah Nam International Holdings, Ltd. | 760,000 | 121,821 | |||
*Wai Kee Holdings, Ltd. | 8,218,738 | 1,859,076 | |||
Wang On Group, Ltd. | 35,148 | 998 | |||
*Warderly International Holdings, Ltd. | 520,000 | 32,206 | |||
Wheelock Properties, Ltd. | 155,000 | 107,547 | |||
*Winfoong International, Ltd. | 1,210,000 | 31,975 | |||
Wing On Co. International, Ltd. | 785,000 | 1,039,609 | |||
61
THE ASIA PACIFIC SMALL COMPANY SERIES
CONTINUED
| Shares | Value†† | ||||
HONG KONG — (Continued) | |||||
Winteam Pharmaceutical Group, Ltd. | 1,170,000 | $ | 115,846 | ||
Wong’s International (Holdings), Ltd. | 737,641 | 109,239 | |||
*Wong’s Kong King International (Holdings), Ltd. | 120,000 | 11,553 | |||
#Xinyi Glass Holding Co., Ltd. | 1,902,000 | 1,501,628 | |||
*Xpress Group, Ltd. | 3,464,000 | 37,621 | |||
Y. T. Realty Group, Ltd. | 965,000 | 177,138 | |||
Yangtzekiang Garment, Ltd. | 607,500 | 120,640 | |||
Yau Lee Holdings, Ltd. | 534,000 | 76,561 | |||
YGM Trading, Ltd. | 284,000 | 182,337 | |||
*Yueshou Environmental Holdings, Ltd. | 510,800 | 10,454 | |||
*Yugang International, Ltd. | 100,824,000 | 1,283,515 | |||
*Yunnan Enterprises Holdings, Ltd. | 240,000 | 15,290 | |||
TOTAL HONG KONG | 140,399,302 | ||||
MALAYSIA — (0.0%) | |||||
*Autoways Holdings Berhad | 10,000 | 3,780 | |||
*Rekapacific Berhad | 473,000 | — | |||
TOTAL MALAYSIA | 3,780 | ||||
NEW ZEALAND — (5.7%) | |||||
Abano Healthcare Group, Ltd. | 31,300 | 141,380 | |||
*AFFCO Holdings, Ltd. | 1,806,887 | 479,443 | |||
Air New Zealand, Ltd. | 1,332,900 | 1,235,867 | |||
*Auckland International Airport, Ltd. | 1,214,407 | 1,746,973 | |||
Cavalier Corp., Ltd. | 283,674 | 505,648 | |||
*CDL Investments (New Zealand), Ltd. | 395,965 | 79,218 | |||
Colonial Motor Co., Ltd. | 126,795 | 245,160 | |||
Ebos Group, Ltd. | 161,966 | 683,469 | |||
Fisher & Paykel Appliances Holdings, Ltd. | 2,969,564 | 1,386,684 | |||
#Fisher & Paykel Healthcare Corp., Ltd. | 2,418,756 | 5,359,380 | |||
#Freightways, Ltd. | 739,163 | 1,584,448 | |||
#Hallenstein Glassons Holdings, Ltd. | 242,461 | 545,889 | |||
Hellaby Holdings, Ltd. | 242,239 | 285,808 | |||
Horizon Energy Distribution, Ltd. | 40,420 | 92,552 | |||
Infratil, Ltd. | 2,070,579 | 2,407,238 | |||
Mainfreight, Ltd. | 423,727 | 1,612,058 | |||
Methven, Ltd. | 10,000 | 11,949 | |||
Michael Hill International, Ltd. | 1,534,152 | 722,271 | |||
Millennium & Copthorne Hotels (New Zealand), Ltd. | 1,387,344 | 438,466 | |||
New Zealand Exchange, Ltd. | 71,379 | 405,110 | |||
#*New Zealand Oil & Gas, Ltd. | 1,729,680 | 2,114,232 | |||
New Zealand Refining Co., Ltd. | 515,110 | 1,962,654 | |||
Northland Port Corp. (New Zealand), Ltd. | 219,997 | 281,056 | |||
#Nuplex Industries, Ltd. | 904,126 | 1,587,934 | |||
*Pike River Coal, Ltd. | 186,615 | 148,473 | |||
Port of Tauranga, Ltd. | 538,944 | 2,713,073 | |||
*ProvencoCadmus, Ltd. | 524,201 | 13,020 | |||
#Pumpkin Patch, Ltd. | 606,913 | 859,691 | |||
#*Pyne Gould Guinness, Ltd. | 741,889 | 323,274 | |||
#*Rakon, Ltd. | 52,061 | 43,537 | |||
Restaurant Brand (New Zealand), Ltd. | 369,175 | 391,625 | |||
*Richina Pacific, Ltd. | 309,644 | 79,987 | |||
*Rubicon, Ltd. | 974,601 | 664,580 | |||
#Ryman Healthcare, Ltd. | 1,877,940 | 2,538,281 | |||
Sanford, Ltd. | 407,276 | 1,420,338 | |||
*Scott Technology, Ltd. | 60,843 | 44,883 | |||
*Seafresh Fisheries, Ltd. | 80,520 | 1,618 | |||
Skellerup Holdings, Ltd. | 252,287 | 98,470 | |||
Sky City Entertainment Group, Ltd. | 2,535,089 | 6,262,217 | |||
Sky Network Television, Ltd. | 309,049 | 1,057,049 | |||
South Port (New Zealand), Ltd. | 30,744 | 59,294 | |||
62
THE ASIA PACIFIC SMALL COMPANY SERIES
CONTINUED
| Shares | Value†† | ||||
NEW ZEALAND — (Continued) | |||||
#Steel & Tube Holdings, Ltd. | 404,138 | $ | 907,788 | ||
Taylors Group, Ltd. | 29,646 | 46,791 | |||
*Tenon, Ltd. | 19,132 | 12,605 | |||
Tourism Holdings, Ltd. | 274,867 | 140,956 | |||
#Tower, Ltd. | 840,553 | 1,026,790 | |||
Trustpower, Ltd. | 3,300 | 17,899 | |||
Vector, Ltd. | 316,231 | 438,200 | |||
Warehouse Group, Ltd. | 497,796 | 1,610,877 | |||
TOTAL NEW ZEALAND | 46,836,203 | ||||
SINGAPORE — (11.1%) | |||||
*Addvalue Technologies, Ltd. | 1,043,000 | 25,562 | |||
Advanced Holdings, Ltd. | 691,000 | 157,925 | |||
Allgreen Properties, Ltd. | 2,604,000 | 2,102,074 | |||
*Apollo Enterprises, Ltd. | 302,000 | 301,236 | |||
Aqua-Terra Supply Co., Ltd. | 641,000 | 125,944 | |||
Armstrong Industrial Corp., Ltd. | 1,340,000 | 235,928 | |||
*ASA Group Holdings, Ltd. | 336,000 | 14,384 | |||
*Asia Environment Holdings, Ltd. | 528,793 | 107,719 | |||
*Asia Food & Properties, Ltd. | 699,000 | 279,767 | |||
*Asia-Pacific Strategic Investments, Ltd. | 1,410 | 163 | |||
ASL Marine Holdings, Ltd. | 497,000 | 347,682 | |||
A-Sonic Aerospace, Ltd. | 626,996 | 31,000 | |||
Aussino Group, Ltd. | 967,000 | 61,941 | |||
*Ban Joo & Co., Ltd. | 1,175,000 | 62,373 | |||
Best World International, Ltd. | 307,500 | 83,553 | |||
Beyonics Technology, Ltd. | 7,152,300 | 979,228 | |||
Bonvests Holdings, Ltd. | 990,000 | 629,191 | |||
Broadway Industrial Group, Ltd. | 461,000 | 191,799 | |||
Brothers (Holdings), Ltd. | 504,628 | 54,048 | |||
#Bukit Sembawang Estates, Ltd. | 374,003 | 1,273,161 | |||
CEI Contract Manufacturing, Ltd. | 432,000 | 33,596 | |||
Cerebos Pacific, Ltd. | 528,000 | 1,266,903 | |||
#CH Offshore, Ltd. | 1,393,400 | 677,001 | |||
*Changjiang Fertilizer Holdings, Ltd. | 515 | 94 | |||
Chemical Industries (Far East), Ltd. | 105,910 | 35,138 | |||
#China Aviation Oil Singapore Corp., Ltd. | 152,000 | 117,575 | |||
*China Dairy Group, Ltd. | 1,502,000 | 213,297 | |||
#*China Energy, Ltd. | 3,110,000 | 529,668 | |||
China Merchants Holdings Pacific, Ltd. | 809,000 | 362,870 | |||
Chip Eng Seng Corp., Ltd. | 1,612,800 | 402,276 | |||
Chosen Holdings, Ltd. | 1,284,000 | 118,738 | |||
Chuan Hup Holdings, Ltd. | 4,052,000 | 914,792 | |||
*Chuan Soon Huat Industrial Group, Ltd. | 614,000 | 4,381 | |||
*Compact Metal Industries, Ltd. | 643,000 | 4,588 | |||
#Cosco Corp. (Singapore), Ltd. | 2,004,000 | 1,585,679 | |||
#*Creative Technology Co., Ltd. | 257,350 | 1,085,926 | |||
#CSC Holdings, Ltd. | 1,829,000 | 220,072 | |||
CSE Global, Ltd. | 1,854,000 | 1,046,195 | |||
CWT, Ltd. | 1,027,700 | 475,996 | |||
#*Delong Holdings, Ltd. | 1,287,000 | 777,981 | |||
*Digiland International, Ltd. | 11,763,000 | 41,964 | |||
*Eagle Brand Holdings, Ltd. | 14,387,000 | 410,603 | |||
*Eastern Asia Technology, Ltd. | 1,034,000 | 80,772 | |||
*Ellipsiz, Ltd. | 123,000 | 10,412 | |||
Engro Corp., Ltd. | 354,000 | 224,501 | |||
*Enviro-Hub Holdings, Ltd. | 1,445,666 | 161,832 | |||
Eu Yan Sang International, Ltd. | 213,000 | 71,956 | |||
*Eucon Holdings, Ltd. | 3,096,000 | 81,759 | |||
*Ezion Holdings, Ltd. | 215,000 | 115,294 | |||
#*Ezra Holdings, Ltd. | 1,355,000 | 1,814,860 | |||
63
THE ASIA PACIFIC SMALL COMPANY SERIES
CONTINUED
| Shares | Value†† | ||||
SINGAPORE — (Continued) | |||||
#F.J. Benjamin Holdings, Ltd. | 1,095,000 | $ | 266,726 | ||
Federal International (2000), Ltd. | 985,500 | 152,494 | |||
*Firstlink Investments Corp., Ltd. | 1,513,000 | 58,494 | |||
*Fischer Tech, Ltd. | 244,000 | 17,409 | |||
Food Empire Holdings, Ltd. | 1,094,400 | 259,196 | |||
*Fragrance Group, Ltd. | 41,000 | 16,665 | |||
*Freight Links Express Holdings, Ltd. | 3,893,000 | 136,318 | |||
*Fu Yu Corp., Ltd. | 3,955,750 | 276,211 | |||
*Gallant Venture, Ltd. | 1,310,000 | 289,013 | |||
GK Goh Holdings, Ltd. | 1,463,000 | 657,116 | |||
Global Yellow Pages, Ltd. | 299,000 | 34,097 | |||
#Goodpack, Ltd. | 1,091,000 | 985,895 | |||
GP Batteries International, Ltd. | 395,000 | 308,865 | |||
GP Industries, Ltd. | 3,054,209 | 707,036 | |||
*Grand Banks Yachts, Ltd. | 250,000 | 82,498 | |||
Guocoland, Ltd. | 495,500 | 666,765 | |||
Hersing Corp., Ltd. | 1,285,000 | 219,147 | |||
*Hiap Seng Engineering, Ltd. | 88,000 | 40,954 | |||
Hi-P International, Ltd. | 1,152,000 | 565,693 | |||
Ho Bee Investment, Ltd. | 945,000 | 935,251 | |||
*Hong Fok Corp., Ltd. | 3,222,700 | 1,436,252 | |||
Hong Leong Asia, Ltd. | 604,000 | 883,266 | |||
Hotel Grand Central, Ltd. | 1,060,514 | 496,519 | |||
#Hotel Properties, Ltd. | 1,501,800 | 2,217,423 | |||
Hour Glass, Ltd. | 622,744 | 307,665 | |||
HTL International Holdings, Ltd. | 1,063,843 | 323,438 | |||
*Huan Hsin Holdings, Ltd. | 1,138,400 | 211,134 | |||
HupSteel, Ltd. | 1,572,875 | 328,035 | |||
Hwa Hong Corp., Ltd. | 2,436,000 | 697,165 | |||
#Hyflux, Ltd. | 1,230,000 | 2,673,091 | |||
IDT Holdings, Ltd. | 693,000 | 213,167 | |||
IFS Capital, Ltd. | 382,800 | 145,212 | |||
*Indofood Agri Resources, Ltd. | 651,000 | 777,203 | |||
*Informatics Education, Ltd. | 1,339,000 | 47,092 | |||
#InnoTek, Ltd. | 613,000 | 196,379 | |||
*Intraco, Ltd. | 608,500 | 145,444 | |||
IPC Corp., Ltd. | 1,512,000 | 143,862 | |||
Isetan (Singapore), Ltd. | 122,500 | 288,091 | |||
*Jadason Enterprises, Ltd. | 728,000 | 49,086 | |||
*Jasper Investments, Ltd. | 90,680 | 9,802 | |||
#Jaya Holdings, Ltd. | 1,530,000 | 490,515 | |||
*JK Yaming International Holdings, Ltd. | 907,000 | 250,767 | |||
#*Jurong Technologies Industrial Corp., Ltd. | 2,227,680 | 39,736 | |||
K1 Ventures, Ltd. | 3,349,500 | 401,987 | |||
#Keppel Telecommunications and Transportation, Ltd. | 1,537,600 | 1,497,059 | |||
Khong Guan Flour Milling, Ltd. | 38,000 | 29,631 | |||
Kian Ann Engineering, Ltd. | 1,302,000 | 164,785 | |||
Kian Ho Bearings, Ltd. | 781,500 | 89,216 | |||
Kim Eng Holdings, Ltd. | 1,308,620 | 1,850,998 | |||
Koh Brothers Group, Ltd. | 1,312,000 | 235,895 | |||
KS Energy Services, Ltd. | 498,000 | 395,376 | |||
Lafe Corp., Ltd. | 1,234,800 | 78,460 | |||
*LanTroVision (S), Ltd. | 5,028,750 | 107,168 | |||
LC Development, Ltd. | 2,041,254 | 274,466 | |||
Lee Kim Tah Holdings, Ltd. | 1,600,000 | 559,381 | |||
Lion Asiapac, Ltd. | 473,000 | 107,916 | |||
Low Keng Huat Singapore, Ltd. | 1,834,000 | 451,111 | |||
Lum Chang Holdings, Ltd. | 1,042,030 | 233,806 | |||
*Manhattan Resources, Ltd. | 668,000 | 263,054 | |||
*Manufacturing Integration Technology, Ltd. | 588,000 | 58,735 | |||
*Mediaring.Com, Ltd. | 3,161,500 | 478,758 | |||
64
THE ASIA PACIFIC SMALL COMPANY SERIES
CONTINUED
| Shares | Value†† | ||||
SINGAPORE — (Continued) | |||||
Memtech International, Ltd. | 1,322,000 | $ | 88,774 | ||
Metro Holdings, Ltd. | 1,675,160 | 902,586 | |||
#Midas Holdings, Ltd. | 1,530,000 | 885,546 | |||
*Mirach Energy, Ltd. | 460,000 | 44,260 | |||
Miyoshi Precision, Ltd. | 353,500 | 38,409 | |||
MobileOne, Ltd. | 1,794,000 | 2,219,317 | |||
*Multi-Chem, Ltd. | 1,263,000 | 162,206 | |||
Nera Telecommunications, Ltd. | 1,272,000 | 284,152 | |||
New Toyo International Holdings, Ltd. | 1,043,000 | 167,440 | |||
NSL, Ltd. | 414,000 | 376,872 | |||
#*Oceanus Group, Ltd. | 547,000 | 137,693 | |||
*Orchard Parade Holdings, Ltd. | 956,022 | 648,708 | |||
*Osim International, Ltd. | 964,000 | 296,841 | |||
Ossia International, Ltd. | 750,554 | 72,315 | |||
*Overseas Union Enterprise, Ltd. | 86,000 | 576,683 | |||
Pan Pacific Hotels Group, Ltd. | 1,687,500 | 1,598,559 | |||
Pan-United Corp., Ltd. | 2,026,000 | 787,711 | |||
#Parkway Holdings, Ltd. | 1,326,133 | 2,364,521 | |||
PCI, Ltd. | 734,000 | 188,955 | |||
*Penguin International, Ltd. | 400,000 | 43,666 | |||
Pertama Holdings, Ltd. | 459,750 | 126,291 | |||
#Petra Foods, Ltd. | 881,000 | 542,480 | |||
Popular Holdings, Ltd. | 2,550,500 | 326,162 | |||
*PSC Corp., Ltd. | 1,973,419 | 336,954 | |||
QAF, Ltd. | 881,000 | 286,874 | |||
Qian Hu Corp., Ltd. | 674,600 | 73,844 | |||
#Raffles Education Corp., Ltd. | 3,843,781 | 1,349,514 | |||
*Raffles Medical Group, Ltd. | 104,000 | 98,101 | |||
Rotary Engineering, Ltd. | 1,108,600 | 816,498 | |||
San Teh, Ltd. | 1,006,087 | 220,080 | |||
SBS Transit, Ltd. | 962,500 | 1,217,684 | |||
#*SC Global Developments, Ltd. | 42,000 | 41,735 | |||
*Seroja Investments, Ltd. | 17,768 | 7,353 | |||
Sim Lian Group, Ltd. | 1,380,000 | 452,927 | |||
*Sing Holdings, Ltd. | 36,666 | 7,573 | |||
Sing Investments & Finance, Ltd. | 198,450 | 181,109 | |||
Singapore Land, Ltd. | 148,000 | 579,380 | |||
Singapore Post, Ltd. | 3,567,900 | 2,394,721 | |||
Singapore Reinsurance Corp., Ltd. | 1,514,530 | 314,614 | |||
Singapore Shipping Corp., Ltd. | 1,710,000 | 333,162 | |||
Singapura Finance, Ltd. | 174,062 | 174,178 | |||
Sinwa, Ltd. | 259,000 | 83,232 | |||
SMB United, Ltd. | 1,224,000 | 228,329 | |||
SMRT Corp., Ltd. | 1,421,000 | 1,694,510 | |||
*SP Corp., Ltd. | 454,000 | 21,055 | |||
#SSH Corp., Ltd. | 1,307,000 | 202,148 | |||
Stamford Land Corp., Ltd. | 2,803,000 | 801,128 | |||
Straco Corp., Ltd. | 130,000 | 11,362 | |||
#Straits Asia Resources, Ltd. | 1,380,000 | 1,764,048 | |||
*Sunningdale Tech, Ltd. | 5,579,000 | 509,062 | |||
*Sunright, Ltd. | 378,000 | 45,175 | |||
Superbowl Holdings, Ltd. | 980,000 | 126,953 | |||
Superior Multi-Packaging, Ltd. | 490,500 | 36,747 | |||
#*Swiber Holdings, Ltd. | 801,000 | 512,509 | |||
#Tat Hong Holdings, Ltd. | 1,054,800 | 772,450 | |||
*Thakral Corp., Ltd. | 6,028,000 | 252,303 | |||
Tiong Woon Corp. Holding, Ltd. | 924,000 | 484,861 | |||
Transcu Group, Ltd. | 265,000 | 21,438 | |||
Trek 2000 International, Ltd. | 1,004,000 | 117,587 | |||
*TT International, Ltd. | 480 | 13 | |||
UMS Holdings, Ltd. | 941,000 | 122,692 | |||
65
THE ASIA PACIFIC SMALL COMPANY SERIES
CONTINUED
| Shares | Value†† | |||||
SINGAPORE — (Continued) | ||||||
#United Engineers, Ltd. | 577,666 | $ | 683,240 | |||
*United Envirotech, Ltd. | 352,000 | 92,420 | ||||
United Industrial Corp., Ltd. | 404,000 | 521,588 | ||||
United Overseas Insurance, Ltd. | 188,250 | 400,286 | ||||
*United Pulp & Paper Co., Ltd. | 708,000 | 71,930 | ||||
UOB-Kay Hian Holdings, Ltd. | 1,478,400 | 1,522,391 | ||||
UOL Group, Ltd. | 774,000 | 1,846,542 | ||||
Venture Corp., Ltd. | 504,000 | 3,215,158 | ||||
Vicom, Ltd. | 120,000 | 180,756 | ||||
WBL Corp., Ltd. | 600,000 | 1,969,284 | ||||
Wheelock Properties, Ltd. | 1,207,000 | 1,498,747 | ||||
Wing Tai Holdings, Ltd. | 1,619,000 | 1,895,269 | ||||
Xpress Holdings, Ltd. | 3,079,000 | 174,291 | ||||
YHI International, Ltd. | 1,174,000 | 178,252 | ||||
*Yoma Strategic Holdings, Ltd. | 132,000 | 8,910 | ||||
Yongnam Holdings, Ltd. | 1,970,000 | 359,472 | ||||
TOTAL SINGAPORE | 90,467,972 | |||||
TOTAL COMMON STOCKS | 676,305,465 | |||||
PREFERRED STOCKS — (0.1%) | ||||||
AUSTRALIA — (0.1%) | ||||||
#Village Roadshow, Ltd. Series A | 334,417 | 518,901 | ||||
RIGHTS/WARRANTS — (0.0%) | ||||||
AUSTRALIA — (0.0%) | ||||||
*Apex Minerals NL Warrants 11/09/12 | 189,579 | — | ||||
*Capral, Ltd. Rights 11/06/09 | 365,710 | 2,634 | ||||
*Havilah Resources NL Warrants 04/30/10 | 2,017 | 54 | ||||
*Samson Oil & Gas, Ltd. Warrants 12/31/12 | 306,678 | 1,380 | ||||
*UXC, Ltd. Options 03/31/10 | 94,269 | 33,942 | ||||
TOTAL AUSTRALIA | 38,010 | |||||
HONG KONG — (0.0%) | ||||||
*Asia Standard Hotel Group, Ltd. Rights 08/27/10 | 5,122,000 | 271,624 | ||||
*Goldin Properties Holdings, Ltd. Warrants 08/28/10 | 191,400 | — | ||||
*Hop Hing Group Holdings, Ltd. Warrants 05/31/13 | 158,464 | 2,791 | ||||
*ITC Corp., Ltd. Warrants 11/04/09 | 1,154,917 | 1,490 | ||||
*ITC Properties Group, Ltd. Warrants 06/02/10 | 4,368,736 | 5,637 | ||||
*Lippo, Ltd. Warrants 07/04/11 | 82,470 | 3,192 | ||||
*South China (China), Ltd. Rights 09/06/10 | 1,124,000 | 26,830 | ||||
TOTAL HONG KONG | 311,564 | |||||
SINGAPORE — (0.0%) | ||||||
*Qian Hu Corp., Ltd. Rights 09/19/10 | 204,100 | 16,019 | ||||
TOTAL RIGHTS/WARRANTS | 365,593 | |||||
| Face Amount | Value† | |||||
| (000) | ||||||
TEMPORARY CASH INVESTMENTS — (0.1%) | ||||||
Repurchase Agreement, PNC Capital Markets, Inc. 0.19%, 11/02/09 (Collateralized by $465,000 FNMA 6.50%, 06/25/39, valued at $500,456) to be repurchased at $490,008 | $ | 490 | 490,000 | |||
66
THE ASIA PACIFIC SMALL COMPANY SERIES
CONTINUED
| Shares/ Face Amount | Value† | |||||
| (000) | ||||||
SECURITIES LENDING COLLATERAL — (16.9%) | ||||||
§@DFA Short Term Investment Fund LP | 133,343,064 | $ | 133,343,064 | |||
@Repurchase Agreement, Deutsche Bank Securities 0.07%, 11/02/09 (Collateralized by various corporate obligations, ranging in par value from $4,247,617 to $16,429,280, rates ranging from 5.000% to 7.000%, maturities ranging from 03/01/37 to 10/01/39, valued at $4,861,165) to be repurchased at $4,765,876 | $ | 4,766 | 4,765,848 | |||
TOTAL SECURITIES LENDING COLLATERAL | 138,108,912 | |||||
TOTAL INVESTMENTS — (100.0%) | $ | 815,788,871 | ||||
See accompanying Notes to Financial Statements.
67
THE UNITED KINGDOM SMALL COMPANY SERIES
SCHEDULE OF INVESTMENTS
October 31, 2009
| Shares | Value†† | ||||
COMMON STOCKS — (96.4%) | |||||
Consumer Discretionary — (20.2%) | |||||
4imprint Group P.L.C. | 96,735 | $ | 229,699 | ||
Aegis Group P.L.C. | 3,279,567 | 5,895,612 | |||
Aga Rangemaster Group P.L.C. | 288,143 | 545,169 | |||
*Arena Leisure P.L.C. | 1,372,024 | 636,108 | |||
#*Barratt Developments P.L.C. | 235,159 | 533,476 | |||
Bellway P.L.C. | 420,170 | 5,025,477 | |||
*Berkeley Group Holdings P.L.C. (The) | 320,225 | 4,469,576 | |||
Bloomsbury Publishing P.L.C. | 271,841 | 557,353 | |||
#*Bovis Homes Group P.L.C. | 474,842 | 3,197,820 | |||
Burberry Group P.L.C. | 277,987 | 2,451,469 | |||
Caffyns P.L.C. | 6,000 | 43,384 | |||
Carpetright P.L.C. | 167,232 | 2,407,344 | |||
*Carphone Warehouse Group P.L.C. | 1,000,721 | 3,018,103 | |||
Centaur Media P.L.C. | 617,725 | 543,484 | |||
Chime Communications P.L.C. | 211,086 | 674,905 | |||
*Chrysalis Group P.L.C. | 107,232 | 182,936 | |||
Churchill China P.L.C. | 30,000 | 136,781 | |||
*Cineworld Group P.L.C. | 3,286 | 8,493 | |||
Clinton Cards P.L.C. | 740,506 | 502,574 | |||
*Cosalt P.L.C. | 648,218 | 103,144 | |||
Daily Mail & General Trust P.L.C. Series A | 636,483 | 4,140,995 | |||
Debenhams P.L.C. | 2,383,809 | 3,039,099 | |||
Dignity P.L.C. | 255,526 | 2,442,716 | |||
*Domino’s Pizza UK & IRL P.L.C. | 28,654 | 143,358 | |||
*DSG International P.L.C. | 10,089,373 | 5,051,941 | |||
Dunelm Group P.L.C. | 38,882 | 207,179 | |||
*eaga P.L.C. | 140,286 | 334,611 | |||
*Enterprise Inns P.L.C. | 627,886 | 1,215,708 | |||
Euromoney Institutional Investor P.L.C. | 326,227 | 2,032,203 | |||
#Findel P.L.C. | 1,283,962 | 820,397 | |||
*Forminster P.L.C. | 43,333 | 2,667 | |||
*French Connection Group P.L.C. | 373,475 | 251,730 | |||
Fuller Smith & Turner P.L.C. | 129,026 | 1,053,166 | |||
Future P.L.C. | 1,324,863 | 433,303 | |||
*Galiform P.L.C. | 521,046 | 639,660 | |||
Game Group P.L.C. | 1,441,697 | 3,498,464 | |||
#*Games Workshop Group P.L.C. | 101,889 | 476,092 | |||
*GKN P.L.C. | 1,074,476 | 1,882,190 | |||
Greene King P.L.C. | 716,652 | 4,630,165 | |||
Halfords Group P.L.C. | 837,680 | 5,371,161 | |||
Haynes Publishing Group P.L.C. | 14,703 | 53,071 | |||
Headlam Group P.L.C. | 330,383 | 1,677,730 | |||
Henry Boot P.L.C. | 426,786 | 788,437 | |||
#HMV Group P.L.C. | 1,627,244 | 2,956,524 | |||
Holidaybreak P.L.C. | 206,890 | 946,838 | |||
Hornby P.L.C. | 154,220 | 378,809 | |||
Huntsworth P.L.C. | 795,153 | 872,247 | |||
*Inchcape P.L.C. | 6,045,584 | 2,899,598 | |||
Informa P.L.C. | 1,440,320 | 6,909,243 | |||
ITV P.L.C. | 2,312,304 | 1,617,208 | |||
#J.D. Wetherspoon P.L.C. | 483,984 | 3,647,901 | |||
JD Sports Fashion P.L.C. | 122,850 | 948,344 | |||
*JJB Sports P.L.C. | 750,992 | 368,928 | |||
John Menzies P.L.C. | 244,534 | 1,303,407 | |||
*Johnston Press P.L.C. | 109,928 | 50,717 | |||
Kesa Electricals P.L.C. | 2,031,662 | 4,414,098 | |||
#Ladbrokes P.L.C. | 1,188,699 | 2,367,970 | |||
Laura Ashley Holdings P.L.C. | 2,806,720 | 767,950 | |||
68
THE UNITED KINGDOM SMALL COMPANY SERIES
CONTINUED
| Shares | Value†† | ||||
Consumer Discretionary — (Continued) | |||||
*Lookers P.L.C. | 1,251,177 | $ | 1,211,432 | ||
Luminar Group Holdings P.L.C. | 347,909 | 424,763 | |||
#*Manganese Bronze Holdings P.L.C. | 68,818 | 169,254 | |||
Marston’s P.L.C. | 1,367,965 | 1,941,650 | |||
Millennium & Copthorne Hotels P.L.C. | 609,888 | 3,371,148 | |||
*Mitchells & Butlers P.L.C. | 284,973 | 1,095,003 | |||
Mothercare P.L.C. | 324,479 | 3,062,616 | |||
N Brown Group P.L.C. | 877,699 | 3,752,296 | |||
Pace P.L.C. | 772,437 | 2,797,208 | |||
#*PartyGaming P.L.C. | 238,967 | 894,189 | |||
*Pendragon P.L.C. | 2,285,154 | 1,103,196 | |||
*Persimmon P.L.C. | 506,151 | 3,336,992 | |||
#Pinewood Shepperton P.L.C. | 182,105 | 395,405 | |||
*Punch Taverns P.L.C. | 591,433 | 804,232 | |||
*Rank Group P.L.C. | 915,711 | 1,329,133 | |||
*Redrow P.L.C. | 626,857 | 1,441,081 | |||
Restaurant Group P.L.C. | 732,507 | 2,243,156 | |||
Rightmove P.L.C. | 261,219 | 2,253,502 | |||
Smiths News P.L.C. | 674,129 | 1,345,153 | |||
*Sportech P.L.C. | 329,794 | 343,524 | |||
Sports Direct International P.L.C. | 456,794 | 729,306 | |||
St. Ives Group P.L.C. | 436,379 | 481,410 | |||
*Stylo P.L.C. | 64,096 | 4,997 | |||
*Tandem Group P.L.C. Non-Voting Shares | 327,365 | — | |||
*Taylor Wimpey P.L.C. | 759,589 | 460,504 | |||
Ted Baker P.L.C. | 161,086 | 1,084,038 | |||
*Topps Tiles P.L.C. | 761,166 | 1,025,985 | |||
Trinity Mirror P.L.C. | 91,191 | 239,416 | |||
United Business Media P.L.C. | 864,643 | 6,542,539 | |||
UTV Media P.L.C. | 217,432 | 373,365 | |||
Vitec Group P.L.C. (The) | 160,303 | 998,492 | |||
*Wagon P.L.C. | 237,979 | 7,538 | |||
WH Smith P.LC. | 588,205 | 4,851,076 | |||
Whitbread P.L.C. | 136,622 | 2,842,151 | |||
William Hill P.L.C. | 1,297,070 | 3,561,537 | |||
Wilmington Group P.L.C. | 346,234 | 822,087 | |||
#*Yell Group P.L.C. | 1,233,372 | 1,034,934 | |||
Total Consumer Discretionary | 160,173,040 | ||||
Consumer Staples — (4.2%) | |||||
A.G. Barr P.L.C. | 128,572 | 1,751,139 | |||
Anglo-Eastern Plantations P.L.C. | 108,333 | 639,956 | |||
Britvic P.L.C. | 621,890 | 3,556,289 | |||
Cranswick P.L.C. | 174,592 | 2,005,806 | |||
#Dairy Crest Group P.L.C. | 520,119 | 3,409,515 | |||
Devro P.L.C. | 605,749 | 1,195,295 | |||
*European Home Retail P.L.C. | 109,256 | — | |||
Greggs P.L.C. | 395,967 | 2,795,402 | |||
McBride P.L.C. | 781,394 | 2,851,597 | |||
Northern Foods P.L.C. | 1,927,475 | 1,994,460 | |||
*Premier Foods P.L.C. | 4,876,073 | 2,858,909 | |||
PZ Cussons P.L.C. | 1,348,567 | 5,515,893 | |||
R.E.A. Holdings P.L.C. | 49,233 | 335,824 | |||
Robert Wiseman Dairies P.L.C. | 224,570 | 1,644,610 | |||
Tate & Lyle P.L.C. | 174,059 | 1,281,391 | |||
Thorntons P.L.C. | 313,060 | 639,136 | |||
*Uniq P.L.C. | 463,373 | 293,530 | |||
Young & Co.’s Brewery P.L.C. | 40,000 | 269,589 | |||
Young & Co.’s Brewery P.L.C. Series A | 20,936 | 171,105 | |||
Total Consumer Staples | 33,209,446 | ||||
69
THE UNITED KINGDOM SMALL COMPANY SERIES
CONTINUED
| Shares | Value†† | ||||
Energy — (5.2%) | |||||
Anglo Pacific Group P.L.C. | 426,647 | $ | 1,446,731 | ||
*Dana Petroleum P.L.C. | 333,328 | 6,973,969 | |||
*Fortune Oil P.L.C. | 5,889,851 | 845,200 | |||
*Hardy Oil & Gas P.L.C. | 49,802 | 229,034 | |||
*Heritage Oil P.L.C. | 242,868 | 1,842,209 | |||
Hunting P.L.C. | 448,514 | 3,852,592 | |||
James Fisher & Sons P.L.C. | 189,802 | 1,349,693 | |||
JKX Oil & Gas P.L.C. | 481,113 | 2,163,660 | |||
John Wood Group P.L.C. | 858,822 | 4,498,894 | |||
*Lamprell P.L.C. | 100,437 | 333,460 | |||
Melrose Resources P.L.C. | 346,959 | 1,939,615 | |||
*Premier Oil P.L.C. | 335,099 | 6,460,840 | |||
*Salamander Energy P.L.C. | 287,546 | 1,158,000 | |||
*Soco International P.L.C. | 258,739 | 5,459,305 | |||
*UK Coal P.L.C. | 889,073 | 1,249,499 | |||
Wellstream Holdings P.L.C. | 125,733 | 1,053,137 | |||
Total Energy | 40,855,838 | ||||
Financials — (13.8%) | |||||
Aberdeen Asset Management P.L.C. | 2,558,118 | 5,538,248 | |||
Amlin P.L.C. | 1,027,564 | 5,947,701 | |||
Arbuthnot Banking Group P.L.C. | 67,329 | 421,124 | |||
Ashmore Group P.L.C. | 419,900 | 1,876,252 | |||
*BCB Holdings, Ltd. | 5,979 | 11,558 | |||
Beazley P.L.C. | 1,047,415 | 1,837,931 | |||
BlueBay Asset Management P.L.C. | 154,645 | 941,505 | |||
Brewin Dolphin Holdings P.L.C. | 870,024 | 2,284,222 | |||
Brit Insurance Holdings P.L.C. | 1,289,236 | 4,390,590 | |||
Capital & Regional P.L.C. | 814,788 | 452,668 | |||
Catlin Group, Ltd. | 977,375 | 5,277,316 | |||
Charles Stanley Group P.L.C. | 123,753 | 516,834 | |||
Charles Taylor Consulting P.L.C. | 139,215 | 512,669 | |||
Chesnara P.L.C. | 200,658 | 599,326 | |||
Close Brothers Group P.L.C. | 481,680 | 5,539,027 | |||
Collins Stewart P.L.C. | 98,837 | 129,284 | |||
Daejan Holdings P.L.C. | 36,248 | 1,591,602 | |||
Development Securities P.L.C. | 322,788 | 1,641,474 | |||
#*DTZ Holdings P.L.C. | 224,770 | 309,038 | |||
Evolution Group P.L.C. | 1,150,083 | 3,108,231 | |||
F&C Asset Management P.L.C. | 554,000 | 671,682 | |||
Friends Provident Group P.L.C. | 23,320 | 31,091 | |||
*Full Circle Future, Ltd. | 135,600 | — | |||
Hansard Global P.L.C. | 4,765 | 13,448 | |||
Hardy Underwriting Group P.L.C. | 153,854 | 735,855 | |||
Hargreaves Lansdown P.L.C. | 446,110 | 1,993,579 | |||
Helical Bar P.L.C. | 385,573 | 2,090,997 | |||
#Henderson Group P.L.C. | 2,936,019 | 6,189,595 | |||
Hiscox, Ltd. | 1,535,730 | 8,053,774 | |||
IG Group Holdings P.L.C. | 1,241,907 | 6,140,967 | |||
*Industrial & Commercial Holdings P.L.C. | 5,000 | 123 | |||
Intermediate Capital Group P.L.C. | 572,472 | 2,383,828 | |||
International Personal Finance P.L.C. | 930,623 | 3,126,755 | |||
*IP Group P.L.C. | 250,011 | 229,454 | |||
Jardine Lloyd Thompson Group P.L.C. | 663,478 | 4,936,106 | |||
Liontrust Asset Management P.L.C. | 129,935 | 273,326 | |||
#*LSL Property Services P.L.C. | 134,125 | 655,462 | |||
*MWB Group Holdings P.L.C. | 379,622 | 300,254 | |||
Novae Group P.L.C. | 234,907 | 1,192,968 | |||
Park Group P.L.C. | 166,600 | 57,125 | |||
#Provident Financial P.L.C. | 485,695 | 7,409,228 | |||
*Quintain Estates & Development P.L.C. | 318,342 | 1,009,484 | |||
70
THE UNITED KINGDOM SMALL COMPANY SERIES
CONTINUED
| Shares | Value†† | ||||
Financials — (Continued) | |||||
Rathbone Brothers P.L.C. | 159,131 | $ | 2,414,766 | ||
Rensburg Sheppards P.L.C. | 168,448 | 1,895,158 | |||
*Rutland Trust P.L.C. | 85,288 | 93,786 | |||
S&U P.L.C. | 21,140 | 154,606 | |||
Savills P.L.C. | 501,321 | 2,630,584 | |||
*Shellproof, Ltd. | 1,156 | 626 | |||
Shore Capital Group P.L.C. | 1,193,004 | 790,932 | |||
St. James’s Place P.L.C. | 718,698 | 3,069,744 | |||
*St. Modwen Properties P.L.C. | 614,076 | 2,256,538 | |||
Tullett Prebon P.L.C. | 757,461 | 4,495,501 | |||
Unite Group P.L.C. | 192,038 | 835,868 | |||
Total Financials | 109,059,810 | ||||
Health Care — (3.4%) | |||||
#*Alizyme P.L.C. | 660,805 | 43,382 | |||
*Antisoma P.L.C. | 2,024,536 | 1,244,051 | |||
*Ark Therapeutics Group P.L.C. | 638,344 | 460,016 | |||
*Assura Group, Ltd. P.L.C. | 48,153 | 23,515 | |||
*Axis-Shield P.L.C. | 223,504 | 1,546,312 | |||
Biocompatibles International P.L.C. | 147,081 | 595,848 | |||
Bioquell P.L.C. | 90,893 | 208,442 | |||
*BTG P.L.C. | 730,460 | 2,280,666 | |||
Care UK P.L.C. | 199,792 | 1,154,424 | |||
Consort Medical P.L.C. | 116,271 | 770,887 | |||
Corin Group P.L.C. | 151,637 | 181,291 | |||
Dechra Pharmaceuticals P.L.C. | 201,204 | 1,514,262 | |||
Genetix Group P.L.C. | 151,246 | 157,436 | |||
Genus P.L.C. | 157,057 | 1,720,380 | |||
Goldshield Group P.L.C. | 119,590 | 941,786 | |||
Hikma Pharmaceuticals P.L.C. | 430,418 | 3,326,687 | |||
Nestor Healthcare Group P.L.C. | 443,850 | 349,168 | |||
*Oxford Biomedica P.L.C. | 2,123,042 | 488,054 | |||
*Prostrakan Group P.L.C. | 38,359 | 68,314 | |||
*Renovo Group P.L.C. | 95,255 | 39,008 | |||
*SkyePharma P.L.C. | 55,765 | 75,241 | |||
*Southern Cross Healthcare, Ltd. P.L.C. | 195,059 | 392,188 | |||
SSL International P.L.C. | 753,239 | 7,822,386 | |||
Synergy Health P.L.C. | 28,214 | 280,425 | |||
*Vectura Group P.L.C. | 1,085,207 | 1,519,534 | |||
*William Ransom & Son P.L.C. | 30,000 | 2,300 | |||
Total Health Care | 27,206,003 | ||||
Industrials — (31.8%) | |||||
*AEA Technology P.L.C. | 539,970 | 247,866 | |||
Aggreko P.L.C. | 611,546 | 7,601,086 | |||
Air Partner P.L.C. | 37,086 | 344,813 | |||
Alumasc Group P.L.C. | 131,547 | 232,173 | |||
Arriva P.L.C. | 655,941 | 4,727,085 | |||
Ashtead Group P.L.C. | 1,976,882 | 2,600,495 | |||
Atkins WS P.L.C. | 425,663 | 3,936,911 | |||
*Autologic Holdings P.L.C. | 96,590 | 44,575 | |||
*Avis Europe P.L.C. | 197,823 | 99,842 | |||
Babcock International Group P.L.C. | 853,247 | 8,470,820 | |||
Balfour Beatty P.L.C. | 98,175 | 426,801 | |||
BBA Aviation P.L.C. | 1,204,134 | 3,038,629 | |||
Bodycote P.L.C. | 722,295 | 1,929,905 | |||
Braemar Shipping Services P.L.C. | 81,108 | 578,476 | |||
#Brammer P.L.C. | 185,266 | 389,640 | |||
*British Airways P.L.C. | 92,560 | 274,877 | |||
BSS Group P.L.C. | 489,152 | 2,132,909 | |||
Camellia P.L.C. | 2,437 | 301,464 | |||
71
THE UNITED KINGDOM SMALL COMPANY SERIES
CONTINUED
| Shares | Value†† | ||||
Industrials — (Continued) | |||||
Carillion P.L.C. | 1,523,518 | $ | 7,339,374 | ||
Carr’s Milling Industries P.L.C. | 35,330 | 260,563 | |||
Castings P.L.C. | 162,757 | 499,285 | |||
Charter International P.L.C. | 614,873 | 6,992,444 | |||
Chemring Group P.L.C. | 128,869 | 5,527,463 | |||
Chloride Group P.L.C. | 1,025,093 | 2,706,429 | |||
Clarkson P.L.C. | 68,229 | 923,134 | |||
Communisis P.L.C. | 561,133 | 151,859 | |||
Connaught P.L.C. | 319,006 | 2,115,251 | |||
*Cookson Group P.L.C. | 515,765 | 3,077,664 | |||
Costain Group P.L.C. | 1,269,584 | 572,067 | |||
*Danka Business Systems P.L.C. | 1,029,605 | 34,304 | |||
Davis Service Group P.L.C. | 670,430 | 4,593,693 | |||
De la Rue P.L.C. | 387,017 | 5,796,504 | |||
Dewhurst P.L.C. | 9,000 | 35,451 | |||
*easyJet P.L.C. | 548,462 | 3,228,611 | |||
Eleco P.L.C. | 80,000 | 48,796 | |||
Fenner P.L.C. | 671,987 | 1,762,557 | |||
Firstgroup P.L.C. | 681,105 | 4,188,837 | |||
Forth Ports P.L.C. | 175,092 | 3,170,037 | |||
*Fortress Holdings P.L.C. | 120,728 | — | |||
Galliford Try P.L.C. | 143,430 | 798,795 | |||
Go-Ahead Group P.L.C. | 169,568 | 3,949,503 | |||
Hampson Industries P.L.C. | 430,496 | 511,804 | |||
Hays P.L.C. | 5,101,389 | 8,172,104 | |||
Helphire P.L.C. | 1,050,597 | 988,065 | |||
Hogg Robinson Group P.L.C. | 103,893 | 62,904 | |||
#Homeserve P.L.C. | 227,284 | 6,015,087 | |||
Hyder Consulting P.L.C. | 168,297 | 682,539 | |||
IMI P.L.C. | 1,191,221 | 8,401,977 | |||
*Impellam Group P.L.C. | 35,258 | 38,961 | |||
Interserve P.L.C. | 498,625 | 1,903,082 | |||
Intertek Group P.L.C. | 539,854 | 11,091,513 | |||
Invensys P.L.C. | 472,034 | 2,181,893 | |||
ITE Group P.L.C. | 1,190,261 | 2,366,151 | |||
J. Smart & Co. (Contractors) P.L.C. | 22,500 | 155,150 | |||
Keller Group P.L.C. | 271,131 | 3,172,382 | |||
Kier Group P.L.C. | 141,688 | 2,236,677 | |||
Latchways P.L.C. | 41,288 | 439,960 | |||
Lavendon Group P.L.C. | 175,529 | 402,949 | |||
Lincat Group P.L.C. | 14,452 | 100,826 | |||
*Low & Bonar P.L.C. | 763,541 | 410,735 | |||
Management Consulting Group P.L.C. | 1,026,246 | 446,274 | |||
*Mears Group P.L.C. | 31,734 | 146,542 | |||
Meggitt P.L.C. | 1,630,199 | 6,527,012 | |||
Melrose P.L.C. | 1,121,380 | 3,131,043 | |||
Michael Page International P.L.C. | 1,235,568 | 6,511,423 | |||
Mitie Group P.L.C. | 1,208,230 | 4,726,741 | |||
*MJ Gleeson Group P.L.C. | 195,875 | 364,620 | |||
Morgan Crucible Co. P.L.C. | 1,144,879 | 2,940,790 | |||
Morgan Sindall P.L.C. | 161,485 | 1,493,495 | |||
Mouchel Group P.L.C. | 469,006 | 1,463,496 | |||
MS International P.L.C. | 50,000 | 171,889 | |||
#National Express Group P.L.C. | 487,807 | 2,594,794 | |||
Northgate P.L.C. | 313,860 | 1,127,334 | |||
PayPoint P.L.C. | 87,805 | 645,787 | |||
PV Crystalox Solar P.L.C. | 597,857 | 639,642 | |||
Qinetiq P.L.C. | 2,172,472 | 5,838,845 | |||
Regus P.L.C. | 3,220,926 | 5,379,876 | |||
*Rentokil Initial P.L.C. | 1,708,492 | 2,903,403 | |||
Ricardo P.L.C. | 222,000 | 880,802 | |||
72
THE UNITED KINGDOM SMALL COMPANY SERIES
CONTINUED
| Shares | Value†† | ||||
Industrials — (Continued) | |||||
*Richmond Oil & Gas P.L.C. | 220,000 | $ | — | ||
Robert Walters P.L.C. | 392,488 | 1,149,195 | |||
ROK P.L.C. | 723,316 | 551,027 | |||
RPS Group P.L.C. | 788,615 | 2,704,036 | |||
Scott Wilson Group P.L.C. | 83,704 | 176,206 | |||
Senior P.L.C. | 1,671,692 | 1,674,429 | |||
Severfield-Rowen P.L.C. | 351,952 | 951,663 | |||
Shanks Group P.L.C. | 1,642,693 | 2,314,321 | |||
SIG P.L.C. | 1,366,866 | 2,659,983 | |||
Speedy Hire P.L.C. | 178,122 | 105,787 | |||
*Spice P.L.C. | 4,494 | 5,864 | |||
Spirax-Sarco Engineering P.L.C. | 301,608 | 5,381,748 | |||
Stagecoach Group P.L.C. | 803,167 | 1,902,230 | |||
Sthree P.L.C. | 299,337 | 1,233,040 | |||
#T. Clarke P.L.C. | 148,717 | 321,063 | |||
Tarsus Group P.L.C. | 212,372 | 402,573 | |||
Tomkins P.L.C. | 3,282,427 | 9,005,026 | |||
Travis Perkins P.L.C. | 482,448 | 5,951,606 | |||
Tribal Group P.L.C. | 132,810 | 145,661 | |||
Trifast P.L.C. | 359,985 | 147,437 | |||
UK Mail Group P.L.C. | 198,762 | 1,101,315 | |||
Ultra Electronics Holdings P.L.C. | 267,145 | 5,766,343 | |||
Umeco P.L.C. | 196,406 | 884,624 | |||
#*Volex Group P.L.C. | 241,088 | 322,298 | |||
Vp P.L.C. | 167,463 | 456,068 | |||
VT Group P.L.C. | 677,021 | 6,026,593 | |||
Weir Group P.L.C. (The) | 479,090 | 5,490,425 | |||
Wincanton P.L.C. | 479,763 | 1,736,629 | |||
WSP Group P.L.C. | 262,651 | 1,287,303 | |||
XP Power, Ltd. | 73,546 | 365,243 | |||
Total Industrials | 252,639,291 | ||||
Information Technology — (12.5%) | |||||
Acal P.L.C. | 104,729 | 215,116 | |||
Alphameric P.L.C. | 127,141 | 62,437 | |||
*Alterian P.L.C. | 179,139 | 514,174 | |||
Anite P.L.C. | 1,166,924 | 650,909 | |||
ARM Holdings P.L.C. | 4,777,637 | 11,606,124 | |||
Aveva Group P.L.C. | 275,408 | 4,011,311 | |||
Computacenter P.L.C. | 423,790 | 1,963,471 | |||
*CSR P.L.C. | 380,954 | 2,780,599 | |||
#Dialight P.L.C. | 111,362 | 344,820 | |||
Dicom Group P.L.C. | 317,667 | 937,760 | |||
Dimension Data Holdings P.L.C. | 5,615,130 | 6,524,511 | |||
Diploma P.L.C. | 459,990 | 1,243,611 | |||
Domino Printing Sciences P.L.C. | 455,803 | 2,221,533 | |||
E2V Technologies P.L.C. | 247,588 | 284,423 | |||
Electrocomponents P.L.C. | 1,576,293 | 3,781,033 | |||
Fidessa Group P.L.C. | 130,344 | 2,555,467 | |||
*Gresham Computing P.L.C. | 204,631 | 88,745 | |||
Halma P.L.C. | 1,486,473 | 5,547,008 | |||
*Imagination Technologies Group P.L.C. | 882,944 | 3,036,006 | |||
Innovation Group P.L.C. | 2,537,718 | 468,227 | |||
*Intec Telecom Systems P.L.C. | 1,201,847 | 2,152,591 | |||
Kewill P.L.C. | 368,863 | 577,747 | |||
Laird P.L.C. | 719,642 | 1,720,360 | |||
Logica P.L.C. | 3,037,910 | 5,759,339 | |||
Micro Focus International P.L.C. | 452,097 | 2,499,600 | |||
*Misys P.L.C. | 1,982,492 | 6,711,250 | |||
*Morse P.L.C. | 367,208 | 233,523 | |||
Oxford Instruments P.L.C. | 193,856 | 774,164 | |||
73
THE UNITED KINGDOM SMALL COMPANY SERIES
CONTINUED
| Shares | Value†† | ||||
Information Technology — (Continued) | |||||
Phoenix IT Group, Ltd. P.L.C. | 197,369 | $ | 722,966 | ||
Premier Farnell P.L.C. | 1,379,926 | 3,254,202 | |||
Psion P.L.C. | 499,513 | 959,501 | |||
*Raymarine P.L.C. | 249,080 | 44,800 | |||
Renishaw P.L.C. | 184,262 | 1,646,022 | |||
RM P.L.C. | 363,499 | 870,461 | |||
*RMS Communications P.L.C. | 15,000 | — | |||
Rotork P.L.C. | 350,626 | 6,524,289 | |||
*Scipher P.L.C. | 34,563 | 638 | |||
*SDL P.L.C. | 333,680 | 2,209,413 | |||
Spectris P.L.C. | 490,382 | 5,442,149 | |||
Spirent Communications P.L.C. | 2,766,948 | 4,160,245 | |||
*Telecity Group P.L.C. | 25,779 | 141,487 | |||
TT electronics P.L.C. | 595,193 | 709,634 | |||
Vislink P.L.C. | 588,460 | 233,855 | |||
*Wolfson Microelectronics P.L.C. | 493,841 | 986,517 | |||
Xaar P.L.C. | 220,887 | 336,951 | |||
Xchanging P.L.C. | 541,322 | 1,974,116 | |||
Total Information Technology | 99,483,105 | ||||
Materials — (4.2%) | |||||
British Polythene Industries P.L.C. | 102,332 | 396,632 | |||
Carclo P.L.C. | 214,230 | 341,285 | |||
Croda International P.L.C. | 484,717 | 5,935,810 | |||
Delta P.L.C. | 591,338 | 1,619,359 | |||
DS Smith P.L.C. | 1,591,931 | 3,040,332 | |||
Elementis P.L.C. | 1,858,096 | 1,933,572 | |||
*Ferrexpo P.L.C. | 53,508 | 130,263 | |||
Filtrona P.L.C. | 704,266 | 1,928,873 | |||
*Gem Diamonds, Ltd. | 3,895 | 14,681 | |||
Hill & Smith Holdings P.L.C. | 275,101 | 1,444,135 | |||
#Hochschild Mining P.L.C. | 223,726 | 1,005,217 | |||
*Inveresk P.L.C. | 125,000 | 3,283 | |||
Marshalls P.L.C. | 658,597 | 1,027,348 | |||
Mondi P.L.C. | 943,611 | 5,208,467 | |||
*Petropavlovsk P.L.C. | 105,983 | 1,819,991 | |||
Porvair P.L.C. | 158,128 | 188,652 | |||
RPC Group P.L.C. | 404,286 | 1,707,979 | |||
Victrex P.L.C. | 321,880 | 4,006,413 | |||
Yule Catto & Co. P.L.C. | 505,169 | 1,401,099 | |||
Zotefoams P.L.C. | 96,852 | 143,156 | |||
Total Materials | 33,296,547 | ||||
Other — (0.0%) | |||||
*JJB Sports P.L.C. Excess Application Shares | 600,793 | 295,816 | |||
Telecommunication Services — (0.7%) | |||||
*COLT Telecom Group SA | 1,213,428 | 2,463,297 | |||
Kcom Group P.L.C. | 2,504,455 | 1,664,477 | |||
Telecom Plus P.L.C. | 257,500 | 1,287,293 | |||
Total Telecommunication Services | 5,415,067 | ||||
Utilities — (0.4%) | |||||
Dee Valley Group P.L.C. | 12,109 | 167,797 | |||
Drax Group P.L.C. | 81,042 | 616,586 | |||
Northumbrian Water Group P.L.C. | 607,244 | 2,292,806 | |||
Pennon Group P.L.C. | 50,392 | 374,381 | |||
Total Utilities | 3,451,570 | ||||
TOTAL COMMON STOCKS | 765,085,533 | ||||
74
THE UNITED KINGDOM SMALL COMPANY SERIES
CONTINUED
| Shares | Value†† | |||||
RIGHTS/WARRANTS — (0.1%) | ||||||
*Barratt Developments P.L.C. Rights 11/03/09 | 305,706 | $ | 677,853 | |||
*Brammer P.L.C. Rights 11/13/09 | 185,266 | 176,360 | ||||
*Laird P.L.C. Rights 11/13/09 | 359,821 | 239,176 | ||||
*SFI Holdings, Ltd. Litigation Certificate | 26,713 | — | ||||
*Ultraframe Litigation Notes | 319,285 | — | ||||
TOTAL RIGHTS/WARRANTS | 1,093,389 | |||||
| Face Amount | Value† | |||||
| (000) | ||||||
TEMPORARY CASH INVESTMENTS — (0.3%) | ||||||
Repurchase Agreement, PNC Capital Markets, Inc. 0.19%, 11/02/09 (Collateralized by $2,070,000 FNMA 6.50%, 06/25/39, valued at $2,227,838) to be repurchased at $2,191,035 | $ | 2,191 | 2,191,000 | |||
| Shares/ Face Amount | ||||||
| (000) | ||||||
SECURITIES LENDING COLLATERAL — (3.2%) | ||||||
§@DFA Short Term Investment Fund LP | 24,472,278 | 24,472,278 | ||||
@Repurchase Agreement, Deutsche Bank Securities 0.07%, 11/02/09 (Collateralized by various corporate obligations, ranging in par value from $4,247,617 to $16,429,280, rates ranging from 5.000% to 7.000%, maturities ranging from 03/01/37 to 10/01/39, valued at $527,028) to be repurchased at $516,697 | $ | 517 | 516,694 | |||
TOTAL SECURITIES LENDING COLLATERAL | 24,988,972 | |||||
TOTAL INVESTMENTS — (100.0%) | $ | 793,358,894 | ||||
See accompanying Notes to Financial Statements.
75
THE CONTINENTAL SMALL COMPANY SERIES
SCHEDULE OF INVESTMENTS
October 31, 2009
| Shares | Value†† | ||||
COMMON STOCKS — (88.5%) | |||||
AUSTRIA — (2.9%) | |||||
Agrana Beteiligungs AG | 16,245 | $ | 1,535,657 | ||
Andritz AG | 116,739 | 6,428,780 | |||
#*A-TEC Industries AG | 21,828 | 332,896 | |||
Austria Email AG | 715 | 4,556 | |||
*Austriamicrosystems AG | 123 | 2,632 | |||
BKS Bank AG | 3,120 | 81,270 | |||
*BWIN Interactive Entertainment AG | 79,165 | 3,826,318 | |||
BWT AG | 27,601 | 705,831 | |||
#*CA Immobilien Anlagen AG | 130,641 | 1,933,494 | |||
*Christ Water Techology AG | 24,819 | 120,737 | |||
Constantia Packaging AG | 18,095 | 988,393 | |||
*Conwert Immobilien Invest AG | 48,984 | 598,275 | |||
*EAG-Beteiligungs AG | 1,650 | 25,518 | |||
EVN AG | 36,696 | 693,613 | |||
Flughafen Wien AG | 39,948 | 2,005,054 | |||
*Frauenthal Holding AG | 12,084 | 135,157 | |||
*Intercell AG | 104,732 | 4,046,151 | |||
Josef Manner & Co. AG | 870 | 57,615 | |||
*Kapsch TrafficCom AG | 1,065 | 37,445 | |||
Lenzing AG | 4,701 | 1,611,558 | |||
#Mayr-Melnhof Karton AG | 31,265 | 2,945,598 | |||
Oberbank AG | 37,974 | 2,368,883 | |||
#Oesterreichischen Post AG | 98,332 | 2,869,880 | |||
#Palfinger AG | 45,976 | 1,091,428 | |||
*RHI AG | 93,231 | 2,586,931 | |||
Rosenbauer International AG | 11,816 | 456,894 | |||
*S&T System Integration & Technology Distribution AG | 6,404 | 131,761 | |||
#Schoeller-Bleckmann Oilfield Equipment AG | 32,197 | 1,500,791 | |||
*Sparkassen Immobilien AG | 58,185 | 458,968 | |||
Strabag SE | 95,319 | 2,930,618 | |||
UBM Realitaetenentwicklung AG | 1,440 | 65,451 | |||
#Uniqa Versicherungen AG | 183,096 | 3,608,383 | |||
Voestalpine AG | 65,130 | 2,227,054 | |||
*Warimpex Finanz und Beteiligungs AG | 5,570 | 18,801 | |||
*Wienerberger AG | 142,991 | 2,583,077 | |||
*Wolford AG | 11,165 | 197,872 | |||
*Zumtobel AG | 76,175 | 1,316,886 | |||
TOTAL AUSTRIA | 52,530,226 | ||||
BELGIUM — (3.8%) | |||||
Ackermans & van Haaren NV | 81,854 | 5,925,427 | |||
*Agfa-Gevaert NV | 368,855 | 2,221,886 | |||
Banque Nationale de Belgique SA | 952 | 4,812,253 | |||
*Barco NV | 53,143 | 2,138,057 | |||
Bekaert SA | 56,746 | 7,297,993 | |||
Co.Br.Ha Societe Commerciale de Brasserie SA | 115 | 233,212 | |||
Compagnie d’Entreprises CFE | 40,394 | 2,299,506 | |||
*Compagnie du Bois Sauvage SA | 87 | 13 | |||
Compagnie Immobiliere de Belgique SA | 10,535 | 320,155 | |||
#Compagnie Maritime Belge SA | 61,365 | 1,842,684 | |||
#*Deceuninck NV | 247,412 | 504,861 | |||
*Devgen NV | 3,090 | 45,991 | |||
D’Ieteren SA | 12,852 | 4,658,971 | |||
Duvel Moorgat SA | 8,799 | 604,544 | |||
Econocom Group SA | 65,485 | 941,868 | |||
Elia System Operator SA/NV | 112,393 | 4,538,575 | |||
Euronav SA | 86,793 | 1,692,198 | |||
EVS Broadcast Equipment SA | 13,059 | 960,281 | |||
76
THE CONTINENTAL SMALL COMPANY SERIES
CONTINUED
| Shares | Value†† | ||||
BELGIUM — (Continued) | |||||
#Exmar NV | 76,531 | $ | 966,728 | ||
Floridienne SA | 2,033 | 284,178 | |||
*Galapagos NV | 4,970 | 59,349 | |||
Hamon & Compagnie International SA | 2,193 | 92,258 | |||
Henex SA | 7,487 | 429,108 | |||
Image Recognition Integrated Systems (I.R.I.S.) SA | 6,284 | 381,548 | |||
#*International Brachtherapy SA | 35,773 | 214,956 | |||
Ion Beam Applications SA | 67,020 | 915,386 | |||
Jensen-Group NV | 12,030 | 116,889 | |||
Kinepolis Group NV | 5,063 | 206,377 | |||
Lotus Bakeries SA | 1,361 | 646,649 | |||
#Melexis NV | 88,696 | 930,919 | |||
*Nyrstar NV | 140,979 | 1,643,320 | |||
Omega Pharma SA | 82,044 | 4,035,271 | |||
#*Option NV | 19,215 | 36,372 | |||
*Picanol NV | 16,620 | 60,016 | |||
#*RealDolmen NV | 6,066 | 126,724 | |||
Recticel SA | 52,387 | 392,387 | |||
*Resilux NV | 4,095 | 288,924 | |||
Rosier SA | 655 | 263,246 | |||
*Roularta Media Group NV | 3,344 | 75,206 | |||
SAPEC SA (4775951) | 3,531 | 324,846 | |||
*SAPEC SA (5389544) | 75 | 1,214 | |||
Sioen Industries NV | 52,140 | 329,715 | |||
Sipef NV | 24,100 | 1,274,149 | |||
*Spector Photo Group SA | 11,235 | 14,041 | |||
*Systemat-Datarelay SA | 26,232 | 176,665 | |||
*Telenet Group Holding NV | 148,890 | 3,968,405 | |||
Ter Beke NV | 2,281 | 171,820 | |||
Tessenderlo Chemie NV | 90,268 | 3,307,293 | |||
*ThromboGenics NV | 13,144 | 304,578 | |||
Umicore SA | 143,678 | 4,363,987 | |||
Unibra SA | 1,600 | 383,806 | |||
Van De Velde NV | 27,632 | 1,136,520 | |||
*VPK Packaging Group SA | 12,084 | 426,802 | |||
TOTAL BELGIUM | 69,388,127 | ||||
DENMARK — (2.3%) | |||||
*Aarhus Lokalbank A.S. | 8,030 | 110,307 | |||
*Aktieselskabet Roskilde Bank A.S. | 32,685 | 2,262 | |||
*Aktieselskabet Skjern Bank A.S. | 3,276 | 118,008 | |||
Alk-Abello A.S. | 14,179 | 1,203,864 | |||
*Alm. Brand A.S. | 27,560 | 671,259 | |||
*Amagerbanken A.S. | 32,395 | 356,581 | |||
Ambu A.S. | 22,100 | 452,958 | |||
Arkil Holdings A.S. Series B | 780 | 118,224 | |||
#Auriga Industries A.S. Series B | 46,057 | 777,614 | |||
*Bang & Olufsen Holdings A.S. | 91,461 | 1,405,669 | |||
*Bavarian Nordic A.S. | 17,176 | 682,588 | |||
#*BoConcept Holding A.S. | 5,650 | 133,414 | |||
*Brodrene Hartmann A.S. Series B | 11,730 | 169,233 | |||
*Brondbyernes IF Fodbold A.S. Series B | 15,450 | 91,623 | |||
D/S Norden A.S. | 45,306 | 1,697,747 | |||
*Dalhoff, Larson & Horneman A.S. Series B | 32,000 | 153,702 | |||
*Dantherm Holding A.S. | 13,100 | 61,092 | |||
*DFDS A.S. | 11,236 | 771,552 | |||
*DiBa Bank A.S. | 2,300 | 46,644 | |||
*Djursland Bank A.S. | 8,970 | 279,300 | |||
East Asiatic Co., Ltd. A.S. | 52,687 | 1,903,458 | |||
F.E. Bording A.S. | 600 | 71,185 | |||
*Fionia Holding A.S. | 17,880 | — | |||
77
THE CONTINENTAL SMALL COMPANY SERIES
CONTINUED
| Shares | Value†† | ||||
DENMARK — (Continued) | |||||
Fluegger A.S. Series B | 4,198 | $ | 332,091 | ||
#*GN Store Nord A.S. | 517,039 | 2,902,924 | |||
*GPV Industi A.S. | 2,200 | 13,051 | |||
#*Greentech Energy Systems A.S. | 70,326 | 349,528 | |||
*Gronlandsbanken A.S. | 768 | 60,528 | |||
#*H&H International A.S. Series B | 1,920 | 98,230 | |||
Harboes Bryggeri A.S. | 10,250 | 242,552 | |||
Hojgaard Holding A.S. Series B | 2,750 | 108,144 | |||
IC Companys A.S. | 33,305 | 922,208 | |||
*Incentive A.S. | 3,575 | 13,078 | |||
Jeudan A.S. | 2,516 | 222,037 | |||
*Jyske Bank A.S. | 65,983 | 2,462,755 | |||
*Lan & Spar Bank A.S. | 5,150 | 286,894 | |||
*Lastas A.S. Series B | 11,200 | 85,074 | |||
*Lollands Bank A.S. | 750 | 29,053 | |||
*Maconomy Corp. A.S. | 7,833 | 10,834 | |||
#*Mols-Linien A.S. | 27,490 | 311,147 | |||
#*NeuroSearch A.S. | 42,054 | 693,738 | |||
#*NKT Holding A.S. | 58,121 | 3,297,826 | |||
*Nordjyske Bank A.S. | 17,600 | 401,634 | |||
*Norresundby Bank A.S. | 7,350 | 260,343 | |||
*Ostjydsk Bank A.S. | 2,554 | 237,821 | |||
#*Parken Sport & Entertainment A.S. | 8,234 | 804,336 | |||
Per Aarsleff A.S. Series B | 5,975 | 640,197 | |||
#*Ringkjoebing Landbobank A.S. | 14,890 | 1,814,477 | |||
Roblon A.S. Series B | 540 | 64,018 | |||
#Rockwool International A.S. | 6,487 | 548,676 | |||
*Royal Unibrew A.S. | 12,465 | 362,628 | |||
*Salling Bank A.S. | 910 | 87,577 | |||
*Sanistal A.S. Series B | 4,051 | 66,091 | |||
Satair A.S. | 8,525 | 292,591 | |||
Schouw & Co. A.S. | 70,768 | 1,384,233 | |||
SimCorp A.S. | 16,263 | 3,131,107 | |||
#*Sjaelso Gruppen A.S. | 29,228 | 85,604 | |||
*SKAKO Industries A.S. | 5,130 | 50,400 | |||
Solar Holdings A.S. Series B | 3,694 | 214,572 | |||
Sondagsavisen A.S. | 36,665 | 198,872 | |||
*Spar Nord Bank A.S. | 115,369 | 1,384,617 | |||
*Sparbank A.S. | 10,930 | 274,195 | |||
*Sparekassen Faaborg A.S. | 1,972 | 335,459 | |||
*Sydbank A.S. | 140,905 | 3,446,214 | |||
Thrane & Thrane A.S. | 9,883 | 269,581 | |||
Tivoli A.S. | 969 | 615,822 | |||
*TK Development A.S. | 91,681 | 432,535 | |||
#*TopoTarget A.S. | 79,781 | 40,539 | |||
Torm A.S. | 69,423 | 742,672 | |||
*Vestfyns Bank A.S. | 680 | 77,738 | |||
*Vestjysk Bank A.S. | 24,162 | 499,328 | |||
TOTAL DENMARK | 42,483,853 | ||||
FINLAND — (7.0%) | |||||
Ahlstrom Oyj | 4,420 | 60,631 | |||
#*Aldata Solutions Oyj | 194,535 | 137,258 | |||
Alma Media Oyj | 277,852 | 2,771,641 | |||
*Amanda Capital Oyj | 67,120 | 177,662 | |||
Amer Sports Oyj Series A | 307,264 | 2,691,136 | |||
Aspo Oyj | 68,141 | 601,442 | |||
Atria P.L.C. | 2,584 | 48,221 | |||
Bank of Aland P.L.C. | 17,663 | 621,730 | |||
BasWare Oyj | 34,550 | 677,981 | |||
*Biotie Therapies Corp. Oyj | 265,590 | 203,331 | |||
78
THE CONTINENTAL SMALL COMPANY SERIES
CONTINUED
| Shares | Value†† | ||||
FINLAND — (Continued) | |||||
Cargotec Oyj Series B | 109,737 | $ | 2,350,380 | ||
Componenta Oyj | 34,400 | 207,222 | |||
#Comptel P.L.C. | 324,863 | 348,328 | |||
#Cramo Oyj | 104,189 | 1,687,587 | |||
Digia P.L.C. | 55,020 | 249,055 | |||
Efore Oyj | 114,965 | 143,476 | |||
Elisa Oyj | 276,614 | 5,356,961 | |||
Etteplan Oyj | 62,600 | 279,565 | |||
*Finnair Oyj | 186,376 | 1,059,743 | |||
*Finnlines Oyj | 124,906 | 1,285,816 | |||
Fiskars Oyj Abp Series A | 181,663 | 2,570,588 | |||
F-Secure Oyj | 445,873 | 1,624,416 | |||
*GeoSentric Oyj | 244,900 | 18,036 | |||
#Glaston Oyj Abp | 131,940 | 229,067 | |||
HKScan Oyj Series A | 72,398 | 938,861 | |||
Huhtamaki Oyj | 338,637 | 4,577,258 | |||
#Ilkka-Yhtyma Oyj | 60,256 | 538,025 | |||
KCI Konecranes Oyj | 234,271 | 6,252,168 | |||
Kemira Oyj | 248,868 | 3,946,156 | |||
Kesko Oyj | 138,078 | 4,595,112 | |||
Laennen Tehtaat Oyj | 18,920 | 414,543 | |||
Lassila & Tikanoja Oyj | 117,954 | 2,637,726 | |||
Lemminkainen Oyj | 13,072 | 500,195 | |||
#*Metso Corp. Oyj | 206,460 | 5,765,320 | |||
*M-Real Oyj Series B | 3,798,185 | 5,517,413 | |||
Neomarkka Oyj | 16,652 | 137,093 | |||
#Nokian Renkaat Oyj | 325,926 | 6,954,619 | |||
Nordic Aluminium Oyj | 10,440 | 224,230 | |||
Okmetic Oyj | 54,904 | 201,377 | |||
Olvi Oyj Series A | 31,354 | 1,121,465 | |||
Oriola-KD Oyj Series A | 26,000 | 138,068 | |||
Oriola-KD Oyj Series B | 124,131 | 654,572 | |||
Orion Oyj Series A | 96,540 | 1,844,063 | |||
Orion Oyj Series B | 253,721 | 4,821,430 | |||
Outokumpu Oyj Series A | 188,979 | 3,124,899 | |||
Outotec Oyj | 36,018 | 1,139,206 | |||
#PKC Group Oyj | 48,390 | 390,878 | |||
Pohjola Bank P.L.C. | 372,375 | 4,137,933 | |||
*Ponsse Oyj | 22,814 | 174,531 | |||
Poyry Oyj | 179,728 | 2,659,181 | |||
Raisio P.L.C. | 462,617 | 1,727,837 | |||
*Ramirent Oyj | 299,709 | 2,981,112 | |||
Rapala VMC Oyj | 113,258 | 808,334 | |||
Rautaruukki Oyj Series K | 135,670 | 2,765,505 | |||
Raute Oyj Series A | 10,390 | 112,594 | |||
#Ruukki Group Oyj | 303,857 | 973,952 | |||
#Sanoma Oyj | 162,312 | 2,996,276 | |||
Scanfil Oyj | 123,479 | 470,335 | |||
*Sponda Oyj | 159,511 | 571,542 | |||
Stockmann Oyj Abp Series A | 43,914 | 1,198,639 | |||
#Stockmann Oyj Abp Series B | 99,920 | 2,559,681 | |||
Talentum Oyj | 129,629 | 358,903 | |||
Tecnomen Lifetree Oyj | 2,061 | 2,785 | |||
Teleste Oyj | 53,559 | 313,989 | |||
Tieto Oyj | 277,638 | 5,544,956 | |||
#Trainers’ House P.L.C. | 107,200 | 82,058 | |||
Tulikivi Oyj | 79,440 | 122,739 | |||
Turkistuottajat Oyj | 8,490 | 107,478 | |||
#Uponor Oyj Series A | 206,241 | 3,733,202 | |||
Vacon Oyj | 42,777 | 1,519,638 | |||
#Vaisala Oyj Series A | 39,132 | 1,391,390 | |||
79
THE CONTINENTAL SMALL COMPANY SERIES
CONTINUED
| Shares | Value†† | ||||
FINLAND — (Continued) | |||||
Viking Line Abp | 10,400 | $ | 504,518 | ||
Wartsila Corp. Oyj Series B | 119,988 | 4,343,652 | |||
#Yit Oyj | 206,080 | 3,980,113 | |||
TOTAL FINLAND | 127,978,823 | ||||
FRANCE — (12.3%) | |||||
#Akka Technologies SA | 6,655 | 113,375 | |||
Ales Groupe SA | 32,239 | 569,362 | |||
*ALTEN SA | 60,626 | 1,520,936 | |||
#*Altran Technologies SA | 343,804 | 1,654,821 | |||
April Group SA | 70,844 | 2,656,760 | |||
Arkema SA | 199,362 | 7,610,594 | |||
Assystem SA | 52,519 | 707,363 | |||
#*Atari SA | 4,202 | 49,703 | |||
*Atos Origin SA | 143,571 | 6,721,508 | |||
Aubay SA | 10,285 | 60,542 | |||
Audika SA | 21,857 | 696,681 | |||
*Baccarat SA | 1,090 | 235,898 | |||
Banque Tarneaud SA | 1,430 | 236,148 | |||
Beneteau SA | 176,815 | 2,766,425 | |||
Bigben Interactive | 8,718 | 114,495 | |||
bioMerieux SA | 16,058 | 1,782,336 | |||
Boiron SA | 27,525 | 1,133,974 | |||
Boizel Chanoine Champagne SA | 6,006 | 362,229 | |||
#Bonduelle SCA | 12,784 | 1,465,603 | |||
*Bongrain SA | 14,661 | 1,105,846 | |||
#Bourbon SA | 162,224 | 6,746,721 | |||
*Bull SA | 289,386 | 1,209,623 | |||
Burelle SA | 3,894 | 497,245 | |||
*Cafom SA | 5,092 | 74,022 | |||
Canal Plus SA | 258,807 | 2,064,545 | |||
Carbone Lorraine SA | 56,403 | 1,932,548 | |||
CBo Territoria | 28,320 | 166,535 | |||
#*Cegedim SA | 11,061 | 1,058,232 | |||
#*Club Mediterranee SA | 60,303 | 1,223,299 | |||
*Compagnie Generale de Geophysique-Veritas SA | 219,970 | 4,356,572 | |||
Compagnie Industrielle et Financiere D’Entreprises SA | 1,200 | 80,319 | |||
*Compagnie International Andre Trigano SA | 983 | 83,181 | |||
#*CS Communication & Systemes SA | 7,938 | 95,830 | |||
Damartex SA | 21,236 | 464,861 | |||
#Delachaux SA | 27,616 | 1,908,510 | |||
#Derichebourg SA | 530,469 | 2,604,416 | |||
*Dynaction SA | 14,655 | 171,341 | |||
#EDF Energies Nouvelles SA | 24,912 | 1,329,799 | |||
Electricite de Strasbourg SA | 22,706 | 3,723,105 | |||
Esso S.A.F. | 8,945 | 1,224,598 | |||
Establissements Maurel et Prom SA | 305,061 | 6,132,788 | |||
Euler Hermes SA | 36,906 | 2,929,848 | |||
*Euro Disney SCA (4320878) | 89 | 16 | |||
#*Euro Disney SCA (B29QD14) | 48,370 | 383,568 | |||
Exel Industries SA | 10,841 | 444,191 | |||
*Explosifs et de Produits Chimiques | 524 | 243,754 | |||
#*Faurecia SA | 76,758 | 1,482,878 | |||
#Fimalac SA | 29,963 | 1,561,545 | |||
#Fleury Michon SA | 4,694 | 264,944 | |||
*Gascogne SA | 6,907 | 325,065 | |||
Gaumont SA | 14,184 | 858,814 | |||
*GECI International | 60,409 | 276,954 | |||
*Gemalto NV | 149,247 | 6,272,472 | |||
Gevelot SA | 3,584 | 131,129 | |||
GFI Informatique SA | 122,870 | 604,348 | |||
80
THE CONTINENTAL SMALL COMPANY SERIES
CONTINUED
| Shares | Value†† | ||||
FRANCE — (Continued) | |||||
#Gifi SA | 7,360 | $ | 488,947 | ||
Ginger Groupe Ingenierie Europe SA | 10,523 | 213,662 | |||
GL Events SA | 7,882 | 183,924 | |||
GPE Groupe Pizzorno | 5,200 | 132,917 | |||
Groupe Crit SA | 24,255 | 592,646 | |||
*Groupe Eurotunnel SA | 186,644 | 1,845,067 | |||
#*Groupe Flo SA | 29,358 | 175,451 | |||
*Groupe Go Sport SA | 2,740 | 88,711 | |||
*Groupe Gorge | 18,510 | 223,248 | |||
Groupe Guillin SA | 1,200 | 87,915 | |||
#Groupe Open SA | 27,590 | 254,797 | |||
#Groupe Steria SCA | 66,183 | 1,977,199 | |||
Guerbet SA | 5,824 | 958,888 | |||
Guyenne et Gascogne SA | 25,246 | 2,523,710 | |||
#Haulotte Group SA | 55,825 | 608,180 | |||
Havas SA | 1,165,955 | 4,431,486 | |||
#Idsud SA | 2,227 | 96,591 | |||
#Imerys SA | 39,232 | 2,150,400 | |||
Ingenico SA | 103,297 | 2,549,658 | |||
Ipsen SA | 18,673 | 951,420 | |||
Ipsos SA | 83,610 | 2,559,934 | |||
*JC Decaux SA | 51,262 | 1,036,428 | |||
#*Kaufman & Broad SA | 2,387 | 58,037 | |||
Korian SA | 5,455 | 156,851 | |||
Laurent-Perrier SA | 11,820 | 943,915 | |||
*Lectra SA | 83,499 | 306,952 | |||
Lisi SA | 16,055 | 730,551 | |||
#*LVL Medical Groupe SA | 24,346 | 540,741 | |||
M6 Metropole Television SA | 148,116 | 3,567,675 | |||
Maisons France Confort SA | 1,726 | 59,879 | |||
#*Manitou BF SA | 46,880 | 680,953 | |||
Manutan International SA | 13,517 | 737,793 | |||
*MGI Coutier SA | 2,753 | 68,875 | |||
Mr. Bricolage SA | 23,846 | 428,955 | |||
#Naturex SA | 8,691 | 369,790 | |||
#Neopost SA | 61,086 | 5,345,872 | |||
Nexans SA | 92,377 | 6,523,139 | |||
Nexity SA | 18,755 | 697,694 | |||
Norbert Dentressangle SA | 12,330 | 850,795 | |||
*Oeneo SA | 102,487 | 168,636 | |||
Orpea SA | 96,748 | 4,358,917 | |||
*Osiatis | 1,400 | 6,319 | |||
#PagesJaunes SA | 183,448 | 2,247,779 | |||
Paris Orleans et Cie SA | 2,708 | 85,657 | |||
Pierre & Vacances SA | 15,567 | 1,282,922 | |||
Plastic Omnium SA | 29,952 | 853,845 | |||
Plastivaloire SA | 4,552 | 93,780 | |||
PSB Industries SA | 8,438 | 223,727 | |||
Radiall SA | 4,766 | 336,488 | |||
#Rallye SA | 77,113 | 2,618,134 | |||
*Recylex SA | 35,449 | 455,267 | |||
#Remy Cointreau SA | 76,509 | 3,693,977 | |||
*Rexel SA | 234,965 | 3,135,519 | |||
#*Rhodia SA | 224,856 | 3,313,268 | |||
Robertet SA | 3,167 | 381,664 | |||
*Rougier SA | 6,115 | 244,536 | |||
#Rubis SA | 32,177 | 2,954,101 | |||
#*S.T. Dupont SA | 39,440 | 12,162 | |||
*Sa des Ciments Vicat SA | 158 | 13,109 | |||
Sabeton SA | 13,500 | 217,662 | |||
Saft Groupe SA | 42,327 | 2,197,660 | |||
81
THE CONTINENTAL SMALL COMPANY SERIES
CONTINUED
| Shares | Value†† | ||||
FRANCE — (Continued) | |||||
SAMSE SA | 8,545 | $ | 692,324 | ||
SCOR SE | 108,387 | 2,758,544 | |||
SEB SA | 88,673 | 4,935,375 | |||
Sechilienne SA | 56,504 | 2,284,088 | |||
Securidev SA | 2,500 | 66,914 | |||
*SeLoger.com SA | 7,108 | 248,935 | |||
Signaux Girod SA | 894 | 66,248 | |||
Societe BIC SA | 84,787 | 5,884,544 | |||
Societe des Bains de Mer et du Cercle des Etrangers a Monaco SA | 46,150 | 3,319,024 | |||
Societe Pour l’Informatique Industrielle SA | 40,908 | 283,191 | |||
#Societe Television Francaise 1 SA | 171,170 | 2,687,492 | |||
#*Soitec SA | 107,280 | 1,463,695 | |||
*Solving Efeso International SA | 1,567 | 5,331 | |||
Somfy SA | 21,738 | 5,117,758 | |||
Sopra Group SA | 22,982 | 1,646,212 | |||
Sperian Protection SA | 18,519 | 1,320,880 | |||
#Stallergenes SA | 31,063 | 2,622,824 | |||
Stef-TFE SA | 28,838 | 1,739,358 | |||
Sucriere de Pithiviers Le Vieil | 1,745 | 1,614,733 | |||
Synergie SA | 32,941 | 837,162 | |||
Teleperformance SA | 158,000 | 5,072,800 | |||
Tessi SA | 5,050 | 364,769 | |||
#*Theolia SA | 86,282 | 489,743 | |||
#*THOMSON | 1,013,751 | 1,403,723 | |||
#Tonnellerie Francois Freres SA | 3,839 | 179,306 | |||
Toupargel Groupe SA | 75 | 1,909 | |||
*UbiSoft Entertainment SA | 196,028 | 3,089,361 | |||
#Union Financiere de France Banque SA | 15,895 | 616,114 | |||
#*Valeo SA | 232,962 | 6,323,949 | |||
Viel et Compagnie SA | 158,130 | 756,829 | |||
#Vilmorin & Cie SA | 18,821 | 2,061,717 | |||
#Virbac SA | 16,251 | 1,529,186 | |||
VM Materiaux SA | 6,914 | 416,820 | |||
Vranken Pommery Monopole SA | 9,533 | 434,652 | |||
#Zodiac Aerospace SA | 105,911 | 3,572,436 | |||
Zueblin Immobiliere France SA | 1,285 | 9,077 | |||
TOTAL FRANCE | 225,504,013 | ||||
GERMANY — (13.4%) | |||||
A.S. Creation Tapeton AG | 6,853 | 226,664 | |||
*AAP Implantate AG | 47,250 | 80,766 | |||
*Aareal Bank AG | 561,290 | 12,138,286 | |||
*Abwicklungsellschaft Roesch AG | 7,300 | 397 | |||
ADCapital AG | 33,040 | 324,718 | |||
*Adlink Internet Media AG | 69,691 | 391,522 | |||
Agrob Immobilien AG | 5,800 | 78,538 | |||
Aixtron AG | 259,027 | 7,740,951 | |||
*Aligna AG | 324,899 | 384,348 | |||
Amadeus Fire AG | 16,192 | 320,923 | |||
Andreae-Noris Zahn AG | 26,412 | 933,284 | |||
Augusta Technologie AG | 26,396 | 361,488 | |||
Aurubis AG | 146,836 | 5,824,231 | |||
*Axel Springer AG | 1,437 | 150,072 | |||
Baader Bank AG | 135,150 | 632,436 | |||
Bauer AG | 4,607 | 182,608 | |||
Bechtle AG | 39,024 | 923,794 | |||
Bertrandt AG | 22,607 | 589,152 | |||
*Beta Systems Software AG | 8,550 | 33,066 | |||
Bilfinger Berger AG | 162,980 | 10,434,934 | |||
*Biolitec AG | 26,843 | 155,288 | |||
Biotest AG | 21,301 | 1,331,950 | |||
82
THE CONTINENTAL SMALL COMPANY SERIES
CONTINUED
| Shares | Value†† | ||||
GERMANY — (Continued) | |||||
*BKN International AG | 35,508 | $ | 5,691 | ||
*BMP AG | 45,099 | 55,650 | |||
*Borussia Dortmund GmbH & Co. KGaA | 208,512 | 284,919 | |||
*Business Media China AG | 3,172 | 1,819 | |||
Carl Zeiss Meditec AG | 36,394 | 539,164 | |||
*CENTROTEC Sustainable AG | 41,054 | 517,757 | |||
#*Centrotherm Photovoltaics AG | 5,094 | 232,543 | |||
#Cewe Color Holding AG | 13,917 | 474,357 | |||
Comdirect Bank AG | 131,903 | 1,153,697 | |||
#*Constantin Medien AG | 318,746 | 810,026 | |||
*CropEnergies AG | 6,700 | 33,007 | |||
CTS Eventim AG | 50,168 | 2,549,922 | |||
#Curanum AG | 83,165 | 386,346 | |||
D. Logistics AG | 113,203 | 205,034 | |||
DAB Bank AG | 130,043 | 770,599 | |||
Data Modul AG | 10,414 | 123,928 | |||
Demag Cranes AG | 14,647 | 501,379 | |||
Deutsche Euroshop AG | 87,386 | 2,980,056 | |||
#*Deutsche Wohnen AG | 68,918 | 763,874 | |||
*Deutz AG | 249,610 | 1,170,503 | |||
*Dierig Holding AG | 10,500 | 109,557 | |||
#Douglas Holding AG | 100,341 | 4,461,443 | |||
Dr. Hoenle AG | 14,858 | 111,694 | |||
*Drillisch AG | 92,184 | 579,293 | |||
Duerr AG | 36,259 | 792,745 | |||
DVB Bank SE | 173,470 | 6,413,252 | |||
Elexis AG | 32,938 | 463,545 | |||
*Elmos Semiconductor AG | 34,592 | 215,524 | |||
#ElreingKlinger AG | 18,000 | 355,301 | |||
Erlus AG | 2,970 | 116,045 | |||
Euwax AG | 17,978 | 1,374,639 | |||
#*Evotec AG | 1,204,328 | 3,541,975 | |||
#Fielmann AG | 56,670 | 4,183,786 | |||
*Freenet AG | 225,238 | 2,964,290 | |||
Fuchs Petrolub AG | 27,656 | 2,090,284 | |||
GBW AG | 28,417 | 503,929 | |||
GEA Group AG | 158,840 | 3,002,088 | |||
Gerresheimer AG | 27,781 | 807,507 | |||
Gerry Weber International AG | 42,943 | 1,362,884 | |||
#Gesco AG | 9,182 | 501,203 | |||
GFK SE | 68,806 | 2,159,596 | |||
GFT Technologies AG | 66,050 | 233,137 | |||
Gildemeister AG | 43,990 | 600,787 | |||
*Grammer AG | 5,985 | 58,249 | |||
Grenkeleasing AG | 31,484 | 1,232,683 | |||
Hamborner AG | 62,450 | 720,208 | |||
Hamburger Hafen und Logistik AG | 31,666 | 1,233,729 | |||
*Hansa Group AG | 146,815 | 208,545 | |||
Hawesko Holding AG | 19,463 | 542,562 | |||
#*Heidelberger Druckmaschinen AG | 19,905 | 146,251 | |||
Hochtief AG | 30,167 | 2,256,304 | |||
*Homag Group AG | 761 | 9,457 | |||
*IKB Deutsche Industriebank AG | 21,843 | 29,186 | |||
Indus Holding AG | 40,147 | 688,428 | |||
Innovation in Traffic Systems AG | 23,949 | 299,894 | |||
Interseroh SE | 21,842 | 1,550,742 | |||
#*Intershop Communications AG | 58,426 | 125,421 | |||
Isra Vision Systems AG | 10,917 | 169,285 | |||
*IVG Immobilien AG | 410,355 | 3,667,986 | |||
*Jenoptik AG | 153,250 | 822,977 | |||
*Kampa AG | 35,505 | 16,917 | |||
83
THE CONTINENTAL SMALL COMPANY SERIES
CONTINUED
| Shares | Value†† | ||||
GERMANY — (Continued) | |||||
#*Kizoo AG | 33,967 | $ | 265,419 | ||
Kontron AG | 176,510 | 2,100,390 | |||
Krones AG | 71,467 | 3,560,518 | |||
KSB AG | 4,336 | 2,446,234 | |||
#*Kuka AG | 83,226 | 1,192,773 | |||
KWS Saat AG | 17,268 | 2,872,198 | |||
Lanxess AG | 218,704 | 6,875,309 | |||
Leifheit AG | 12,500 | 212,050 | |||
Leoni AG | 112,502 | 2,284,862 | |||
Loewe AG | 25,187 | 327,933 | |||
*Manz Automation AG | 553 | 38,033 | |||
*Marbert AG | 1,360 | 3,181 | |||
*MasterFlex AG | 10,531 | 58,112 | |||
*Maxdata Computer AG | 94,120 | 16,760 | |||
Mediclin AG | 119,554 | 518,723 | |||
#*Medigene AG | 87,499 | 527,264 | |||
#Medion AG | 81,672 | 856,419 | |||
Mensch und Maschine Software AG | 27,532 | 138,122 | |||
MLP AG | 213,537 | 2,347,025 | |||
*Mologen AG | 22,062 | 226,644 | |||
*Morphosys AG | 57,456 | 1,497,045 | |||
MTU Aero Engines Holding AG | 163,223 | 7,393,072 | |||
#Muehlbauer Holding AG & Co. | 14,905 | 394,530 | |||
MVV Energie AG | 114,055 | 5,160,275 | |||
#*Nemetschek AG | 23,340 | 515,023 | |||
*Nexus AG | 33,813 | 169,734 | |||
#*Nordex AG | 104,915 | 1,718,475 | |||
*November AG | 4,881 | 7,173 | |||
OHB Technology AG | 35,659 | 457,360 | |||
Oldenburgische Landesbank AG | 4,234 | 275,791 | |||
P&I Personal & Informatik AG | 17,889 | 471,928 | |||
*Patrizia Immobilien AG | 2,483 | 13,883 | |||
Pfeiffer Vacuum Technology AG | 30,723 | 2,289,201 | |||
#*Pfleiderer AG | 166,950 | 1,683,495 | |||
*PNE Wind AG | 162,926 | 426,861 | |||
Praktiker Bau-und Heimwerkermaerkte Holding AG | 6,406 | 77,901 | |||
Progress-Werk Oberkirch AG | 6,250 | 160,188 | |||
#*PSI AG fuer Produkte und Systeme der Informationstechnologie | 28,359 | 321,991 | |||
Puma AG Rudolf Dassler Sport | 2,479 | 758,736 | |||
*PVA TePla AG | 51,882 | 297,584 | |||
*QIAGEN NV | 257,056 | 5,338,220 | |||
#*QSC AG | 287,340 | 683,992 | |||
R. Stahl AG | 14,410 | 324,224 | |||
#Rational AG | 14,646 | 2,091,981 | |||
REALTECH AG | 13,541 | 143,459 | |||
Renk AG | 18,838 | 1,361,059 | |||
*Repower Systems AG | 5,428 | 828,403 | |||
Rheinmetall AG | 107,359 | 5,829,585 | |||
Rhoen-Klinikum AG | 379,608 | 9,172,173 | |||
Ruecker AG | 20,949 | 136,705 | |||
*S.A.G. Solarstrom AG | 2,145 | 9,227 | |||
Sartorius AG | 31,248 | 781,773 | |||
*Sektkellerei Schloss Wachenheim AG | 14,520 | 130,942 | |||
*SER Systems AG | 9,400 | 207 | |||
#*SGL Carbon SE | 217,830 | 8,239,684 | |||
*Sinner AG | 2,660 | 58,972 | |||
Sixt AG | 37,202 | 1,018,504 | |||
*Sky Deutschland AG | 388,970 | 1,604,050 | |||
*SM Wirtschaftsberatungs AG | 18,841 | 148,689 | |||
Software AG | 70,053 | 6,245,235 | |||
*Solar Millennium AG | 34,471 | 1,083,128 | |||
84
THE CONTINENTAL SMALL COMPANY SERIES
CONTINUED
| Shares | Value†† | ||||
GERMANY — (Continued) | |||||
#Solarworld AG | 110,335 | $ | 2,394,382 | ||
#*Solon SE | 18,438 | 212,203 | |||
Stada Arzneimittel AG | 173,213 | 4,662,443 | |||
STINAG Stuttgarter Invest AG | 35,003 | 983,902 | |||
*Stoehr & Co. AG | 11,000 | 43,088 | |||
Stratec Biomedical Systems AG | 26,506 | 846,706 | |||
Sued-Chemie AG | 28,301 | 3,705,669 | |||
Suedzucker AG | 61,211 | 1,265,258 | |||
*Suess Microtec AG | 59,969 | 275,807 | |||
Symrise AG | 164,574 | 2,974,310 | |||
Syzygy AG | 30,656 | 169,091 | |||
Takkt AG | 126,507 | 1,395,917 | |||
*TDS Informationstechnologie AG | 89,063 | 518,986 | |||
Telegate AG | 20,500 | 269,731 | |||
Tognum AG | 84,268 | 1,287,876 | |||
#*Tomorrow Focus AG | 113,715 | 545,917 | |||
#*TUI AG | 242,621 | 1,680,411 | |||
*UMS United Medical Systems International AG | 22,300 | 179,201 | |||
Umweltbank AG | 17,805 | 393,077 | |||
*United Internet AG | 167,408 | 2,169,885 | |||
VBH Holding AG | 9,415 | 54,972 | |||
#*Versatel AG | 12,209 | 94,758 | |||
Vossloh AG | 35,932 | 3,540,655 | |||
*VTG AG | 690 | 9,529 | |||
*Wanderer-Werke AG | 7,903 | 24,690 | |||
Wincor Nixdorf AG | 112,151 | 6,558,995 | |||
Wirecard AG | 255,878 | 3,276,007 | |||
Wuerttembergische Lebensversicherung AG | 27,308 | 702,385 | |||
Wuerttembergische Metallwarenfabrik AG | 29,451 | 851,056 | |||
Zhongde Waste Technology AG | 2,018 | 35,298 | |||
TOTAL GERMANY | 244,833,647 | ||||
GREECE — (3.5%) | |||||
*Aegean Airlines S.A. | 5,746 | 35,176 | |||
*Aegek S.A. | 120,000 | 294,405 | |||
*Agricultural Bank of Greece S.A. | 418,043 | 1,184,918 | |||
Alapis Holdings Industrial & Commercial S.A. | 2,093,884 | 1,768,249 | |||
*Alfa Alfa Energy S.A. | 3,810 | 7,794 | |||
*Altec S.A. Information & Communication Systems | 80,278 | 23,312 | |||
Alumil Aluminum Industry S.A. | 52,886 | 89,636 | |||
*Alysida S.A. | 2,376 | 6,962 | |||
*Anek Lines S.A. | 605,331 | 724,757 | |||
*Aspis Bank S.A. | 228,007 | 361,602 | |||
*Astir Palace Hotels S.A. | 93,886 | 531,054 | |||
Athens Medical Center S.A. | 150,874 | 350,178 | |||
*Atlantic Supermarkets S.A. | 35,080 | 56,546 | |||
*Attica Bank S.A. | 181,970 | 546,551 | |||
*Atti-Kat S.A. | 56,554 | 44,311 | |||
Autohellas S.A. | 83,520 | 240,356 | |||
*Babis Vovos International Construction S.A. | 59,807 | 444,419 | |||
*Balafas S.A. | 15,200 | 4,250 | |||
*Balkan Real Estate S.A. | 41,970 | 70,628 | |||
Bank of Greece S.A. | 73,229 | 5,536,868 | |||
*Benrubi S.A. | 20,823 | 97,461 | |||
Centric Multimedia S.A. | 51,942 | 82,427 | |||
*Daios Plastics S.A. | 16,350 | 167,628 | |||
*Diagnostic & Therapeutic Center of Athens Hygeia S.A. | 177,709 | 560,833 | |||
*Dynamic Life S.A. | 16,440 | — | |||
Elastron S.A. | 247,021 | 244,258 | |||
*Elbisco Holding S.A. | 28,098 | 21,502 | |||
Elektrak S.A. | 36,580 | 157,766 | |||
85
THE CONTINENTAL SMALL COMPANY SERIES
CONTINUED
| Shares | Value†† | ||||
GREECE — (Continued) | |||||
Elektroniki Athinon S.A. | 34,490 | $ | 143,402 | ||
*Elephant S.A. | 26,310 | — | |||
Ellaktor S.A. | 508,053 | 4,352,197 | |||
*Emporiki Bank of Greece S.A. | 5,563 | 40,318 | |||
*Etma Rayon S.A. | 11,242 | 23,327 | |||
*Euro Reliance General Insurance Co. S.A. | 55,110 | 64,222 | |||
*Euromedica S.A. | 67,698 | 529,240 | |||
EYDAP Athens Water Supply & Sewage Co. S.A. | 63,535 | 540,432 | |||
F.G. Europe S.A. | 4,536 | 9,386 | |||
*Forthnet S.A. | 226,337 | 504,966 | |||
Fourlis Holdings S.A. | 128,489 | 2,134,588 | |||
Frigoglass S.A. | 85,507 | 1,149,541 | |||
GEK Terna S.A. | 267,249 | 2,558,641 | |||
*Geniki Bank S.A. | 300,115 | 423,398 | |||
*Halkor S.A. | 226,556 | 563,239 | |||
*Hellenic Cables S.A. | 65,236 | 162,780 | |||
Hellenic Duty Free Shops S.A. | 98,334 | 903,904 | |||
Hellenic Exchanges S.A. | 133,376 | 1,897,046 | |||
Hellenic Petroleum S.A. | 188,457 | 2,284,364 | |||
*Hellenic Sugar Industry S.A. | 78,005 | 164,500 | |||
Heracles General Cement Co. S.A. | 77,436 | 698,348 | |||
Iaso S.A. | 206,042 | 1,259,843 | |||
Inform P. Lykos S.A. | 35,570 | 85,729 | |||
*Informatics S.A. | 3,778 | 1,724 | |||
*Intracom Holdings S.A. | 181,308 | 425,924 | |||
*Intracom Technical & Steel Constructions S.A. | 345,350 | 458,263 | |||
*Ionian Hotel Enterprises S.A. | 16,914 | 393,285 | |||
*Ipirotiki Software & Publications S.A. | 22,110 | 63,124 | |||
Karelia Tobacco Co., Inc. S.A. | 5,810 | 517,753 | |||
*Kathimerini Publishing S.A. | 47,170 | 339,733 | |||
*Lambrakis Press S.A. | 115,149 | 463,038 | |||
*Lan-Net S.A. | 12,688 | 22,407 | |||
*Lavipharm S.A. | 96,324 | 200,029 | |||
Loulis Mills S.A. | 41,702 | 110,470 | |||
Marfin Investment Group S.A. | 1,010,504 | 4,026,262 | |||
*Maritime Company of Lesvos S.A. | 299,836 | 211,802 | |||
Metka S.A. | 97,586 | 1,520,831 | |||
Michaniki S.A. | 165,545 | 399,379 | |||
Motor Oil (Hellas) Corinth Refineries S.A. | 129,895 | 2,288,476 | |||
Mytilineos Holdings S.A. | 308,027 | 2,648,167 | |||
*Neorion Holdings S.A. | 24,145 | 40,576 | |||
*Pegasus Publishing S.A. | 95,510 | 364,598 | |||
*Piraeus Bank S.A. | 34,771 | 599,476 | |||
Piraeus Port Authority S.A. | 17,752 | 430,249 | |||
*Promota Hellas S.A. | 8,860 | 2,999 | |||
*Proton Bank S.A. | 72,791 | 205,021 | |||
*Real Estate Development & Services S.A. | 94,497 | 223,321 | |||
S&B Industrial Minerals S.A. | 54,669 | 421,671 | |||
*Sanyo Hellas S.A. | 23,637 | 12,392 | |||
Sarantis S.A. | 74,884 | 547,561 | |||
*Selected Textile S.A. | 87,690 | 56,070 | |||
*Sfakianakis S.A. | 91,320 | 210,675 | |||
*Shelman Hellenic-Swiss Wood S.A. | 155,548 | 155,248 | |||
*Spyroy Agricultural Products S.A. | 61,348 | 62,295 | |||
Teletypos S.A. Mega Channel S.A. | 77,669 | 520,048 | |||
*Terna Energy S.A. | 77,105 | 733,879 | |||
*Themeliodomi S.A. | 37,422 | 20,377 | |||
Thessaloniki Port Authority S.A. | 6,936 | 142,311 | |||
*Thrace Plastics Co. S.A. | 109,280 | 130,759 | |||
Titan Cement Co. S.A. | 111,366 | 3,848,992 | |||
*TT Hellenic Postbank S.A. | 645,380 | 4,583,559 | |||
86
THE CONTINENTAL SMALL COMPANY SERIES
CONTINUED
| Shares | Value†† | ||||
GREECE — (Continued) | |||||
*Varvaressos S.A.-European Spinning Mills | 36,350 | $ | 10,826 | ||
Viohalco S.A. | 406,612 | 2,842,725 | |||
TOTAL GREECE | 64,403,553 | ||||
IRELAND — (2.6%) | |||||
*Abbey P.L.C. | 84,370 | 604,501 | |||
*Aer Lingus Group P.L.C. | 380,166 | 318,862 | |||
*Allied Irish Banks P.L.C. | 807,981 | 2,230,838 | |||
*Aminex P.L.C. | 496,086 | 73,583 | |||
*BlackRock International Land P.L.C. | 897,420 | 92,298 | |||
C&C Group P.L.C. (B010DT8) | 399,607 | 1,475,081 | |||
C&C Group P.L.C. (B011Y09) | 318,475 | 1,175,075 | |||
DCC P.L.C. | 308,989 | 8,138,971 | |||
Donegal Creameries P.L.C. | 26,085 | 86,685 | |||
*Dragon Oil P.L.C. | 1,347,570 | 9,171,834 | |||
FBD Holdings P.L.C. | 125,728 | 1,249,944 | |||
Fyffes P.L.C. | 1,020,533 | 561,484 | |||
Glanbia P.L.C. (0066950) | 700,613 | 2,798,643 | |||
Glanbia P.L.C. (4058629) | 2,463 | 9,853 | |||
Grafton Group P.L.C. | 107,557 | 536,745 | |||
Greencore Group P.L.C. | 615,927 | 1,392,852 | |||
IFG Group P.L.C. | 205,432 | 392,715 | |||
*Independent News & Media P.L.C. | 1,021,294 | 299,991 | |||
Irish Continental Group P.L.C. | 91,000 | 1,723,793 | |||
Irish Life & Permanent P.L.C. | 91,543 | 661,981 | |||
*Kenmare Resources P.L.C. | 2,265,253 | 902,781 | |||
*Kingspan Group P.L.C. | 351,640 | 2,966,163 | |||
*Lantor P.L.C. | 34,575 | — | |||
*McInerney Holdings P.L.C. | 697,135 | 184,669 | |||
Paddy Power P.L.C. | 180,573 | 5,778,573 | |||
*Providence Resources P.L.C. | 6,258,198 | 414,696 | |||
Smurfit Kappa Group P.L.C. | 273,766 | 2,130,413 | |||
Total Produce P.L.C. | 871,395 | 443,005 | |||
United Drug P.L.C. | 799,527 | 2,632,087 | |||
*Waterford Wedgwood P.L.C. | 7,869,750 | — | |||
TOTAL IRELAND | 48,448,116 | ||||
ITALY — (7.9%) | |||||
*A.S. Roma SpA | 293,436 | 335,565 | |||
ACEA SpA | 177,488 | 2,076,284 | |||
Acegas-APS SpA | 110,973 | 680,972 | |||
Actelios SpA | 21,699 | 122,673 | |||
*Aedes SpA | 267,165 | 87,007 | |||
Aeroporto de Firenze SpA | 17,399 | 371,063 | |||
*Alerion Cleanpower SpA | 62,549 | 48,726 | |||
*Amplifon SpA | 127,871 | 496,819 | |||
Ansaldo STS SpA | 50,735 | 970,958 | |||
Ascopiave SpA | 1,411 | 3,418 | |||
Astaldi SpA | 216,415 | 2,018,428 | |||
*Autogrill SpA | 231,260 | 2,600,650 | |||
Azimut Holding SpA | 424,469 | 5,121,362 | |||
Banca Finnat Euramerica SpA | 685,945 | 631,454 | |||
Banca Generali SpA | 21,809 | 251,234 | |||
Banca Ifis SpA | 52,946 | 610,212 | |||
*Banca Intermobiliare SpA | 34,484 | 183,177 | |||
Banca Piccolo Credito Valtellinese Scarl SpA | 478,970 | 4,401,672 | |||
Banca Popolare di Milano Scarl | 1,012,836 | 7,535,855 | |||
*Banca Profilo SpA | 253,156 | 230,761 | |||
Banco di Desio e della Brianza SpA | 232,296 | 1,536,418 | |||
#Beghelli SpA | 427,981 | 436,009 | |||
Benetton Group SpA | 209,290 | 2,023,657 | |||
87
THE CONTINENTAL SMALL COMPANY SERIES
CONTINUED
| Shares | Value†† | ||||
ITALY — (Continued) | |||||
Beni Stabili SpA | 1,309,500 | $ | 1,180,162 | ||
#*Biesse SpA | 54,004 | 485,077 | |||
#Bonifica Terreni Ferraresi e Imprese Agricole SpA | 10,867 | 591,114 | |||
Brembo SpA | 141,075 | 1,065,704 | |||
#Bulgari SpA | 395,239 | 3,234,165 | |||
Buzzi Unicem SpA | 175,555 | 2,945,298 | |||
*C.I.R. SpA - Compagnie Industriali Riunite | 1,432,967 | 3,224,309 | |||
Caltagirone SpA | 248,460 | 909,410 | |||
*Cam Finanziaria SpA | 36,527 | 24,693 | |||
*Carraro SpA | 113,633 | 456,959 | |||
Cembre SpA | 40,330 | 277,710 | |||
Cementir SpA | 254,820 | 1,159,519 | |||
*Class Editore SpA | 165,655 | 177,460 | |||
Credito Artigiano SpA | 361,183 | 979,816 | |||
Credito Bergamasco SpA | 133,144 | 5,053,190 | |||
*Credito Emiliano SpA | 228,115 | 1,487,856 | |||
CSP International Fashion Group SpA | 13,481 | 14,533 | |||
*Dada SpA | 5,381 | 57,322 | |||
#Danieli & Co. SpA | 54,740 | 1,374,445 | |||
Davide Campari - Milano SpA | 457,009 | 4,360,961 | |||
De Longhi SpA | 305,654 | 1,308,371 | |||
DiaSorin SpA | 30,626 | 1,121,041 | |||
#*Digital Multimedia Technologies SpA | 24,275 | 517,187 | |||
#*EEMS Italia SpA | 4,797 | 5,562 | |||
Emak SpA | 57,399 | 276,740 | |||
*ERG Renew SpA | 95,849 | 108,362 | |||
#ERG SpA | 189,613 | 2,798,731 | |||
*ErgyCapital SpA | 4,794 | 3,555 | |||
Esprinet SpA | 58,242 | 583,583 | |||
*Eurotech SpA | 49,871 | 218,588 | |||
#*Fastweb SpA | 35,779 | 1,018,372 | |||
#Fiera Milano SpA | 37,863 | 274,313 | |||
Fondiaria - SAI SpA | 127,995 | 2,332,815 | |||
Gas Plus SpA | 54 | 552 | |||
Gefran SpA | 31,849 | 104,227 | |||
#*Gemina SpA | 1,186,766 | 999,999 | |||
#Geox SpA | 149,354 | 1,143,403 | |||
Gewiss SpA | 232,707 | 1,034,754 | |||
Granitifiandre SpA | 79,737 | 409,752 | |||
*Gruppo Ceramiche Ricchetti SpA | 127,131 | 116,863 | |||
*Gruppo Coin SpA | 77,286 | 460,187 | |||
#*Gruppo Editoriale L’Espresso SpA | 639,121 | 1,819,543 | |||
Hera SpA | 1,460,251 | 3,228,764 | |||
*I Grandi Viaggi SpA | 98,547 | 142,191 | |||
*Immsi SpA | 696,806 | 934,338 | |||
Impregilo SpA | 1,180,326 | 4,030,887 | |||
*Indesit Co. SpA | 177,464 | 2,011,450 | |||
Industria Macchine Automatique SpA | 58,626 | 1,116,995 | |||
Industria Romagnola Conduttori Elettrici SpA | 43,452 | 107,422 | |||
Intek SpA | 661,259 | 308,457 | |||
#*Interpump Group SpA | 241,525 | 1,473,976 | |||
#Iride SpA | 1,343,807 | 2,479,210 | |||
*Isagro SpA | 10,591 | 59,237 | |||
Italcementi SpA | 149,237 | 2,148,144 | |||
*Italmobiliare SpA | 23,493 | 1,128,493 | |||
Landi Renzo SpA | 57,780 | 238,475 | |||
Lottomatica SpA | 89,443 | 1,905,758 | |||
Maire Tecnimont SpA | 115,375 | 478,013 | |||
#*Mariella Burani SpA | 32,721 | 121,468 | |||
Marr SpA | 127,201 | 1,117,425 | |||
#Mediolanum SpA | 170,520 | 1,082,180 | |||
88
THE CONTINENTAL SMALL COMPANY SERIES
CONTINUED
| Shares | Value†† | ||||
ITALY — (Continued) | |||||
Milano Assicurazioni SpA | 635,144 | $ | 2,089,839 | ||
#*Mondadori (Arnoldo) Editore SpA | 361,989 | 1,660,946 | |||
*Monrif SpA | 315,834 | 195,335 | |||
*Montefibre SpA | 172,887 | 38,193 | |||
Nice SpA | 14,229 | 64,793 | |||
*Pagnossin SpA | 9,000 | — | |||
PanariaGroup Industrie Ceramiche SpA | 42,000 | 124,243 | |||
*Permasteelisa SpA | 65,300 | 1,238,886 | |||
Piaggio & C. SpA | 353,619 | 898,717 | |||
*Pininfarina SpA | 82,321 | 374,234 | |||
*Pirelli & Co. SpA | 6,723,096 | 3,777,529 | |||
*Premafin Finanziaria SpA | 961,257 | 1,573,480 | |||
Prysmian SpA | 244,229 | 4,294,274 | |||
*RDM Realty SpA | 5,771 | 21,073 | |||
Recordati SpA | 390,377 | 3,028,625 | |||
*Richard-Ginori 1735 SpA | 140,800 | 20,954 | |||
#Sabaf SpA | 22,649 | 516,279 | |||
#SAES Getters SpA | 30,068 | 309,082 | |||
#*Safilo Group SpA | 503,765 | 384,578 | |||
Saras SpA | 557,668 | 1,810,750 | |||
*Seat Pagine Gialle SpA | 27,669 | 7,843 | |||
*Snai SpA | 85,704 | 399,025 | |||
Societa Iniziative Autostradali e Servizi SpA | 83,188 | 736,386 | |||
#*Societe Cattolica di Assicurazoni Scrl SpA | 166,479 | 5,337,373 | |||
*Sogefi SpA | 173,096 | 383,952 | |||
Sol SpA | 166,511 | 990,483 | |||
*Sorin SpA | 1,079,611 | 1,965,509 | |||
#*Stefanel SpA | 216,413 | 117,268 | |||
*Telecom Italia Media SpA | 109,544 | 19,164 | |||
*Tiscali SpA | 3,437,478 | 956,080 | |||
Tod’s SpA | 45,421 | 3,131,252 | |||
Trevi Finanziaria SpA | 121,804 | 2,073,303 | |||
*Unipol Gruppo Finanziario SpA | 1,521,628 | 2,206,208 | |||
Vianini Industria SpA | 59,070 | 131,955 | |||
Vianini Lavori SpA | 175,180 | 1,283,048 | |||
*Vincenzo Zucchi SpA | 76,176 | 50,243 | |||
Vittoria Assicurazioni SpA | 121,346 | 686,892 | |||
Zignago Vetro SpA | 11,414 | 66,264 | |||
TOTAL ITALY | 145,567,518 | ||||
NETHERLANDS — (5.4%) | |||||
#Aalberts Industries NV | 355,012 | 4,447,924 | |||
#Accell Group NV | 35,188 | 1,714,594 | |||
*AFC Ajax NV | 18,134 | 170,757 | |||
Amsterdam Commodities NV | 60,689 | 408,611 | |||
Arcadis NV | 180,820 | 3,614,633 | |||
#*ASM International NV | 196,173 | 3,974,752 | |||
*Atag Group NV | 4,630 | 1,976 | |||
Batenburg Beheer NV | 10,306 | 295,792 | |||
#Beter Bed Holding NV | 67,391 | 1,468,079 | |||
*BinckBank NV | 31,274 | 618,690 | |||
Brunel International NV | 49,814 | 1,406,110 | |||
Crown Van Gelder NV | 18,307 | 222,839 | |||
*Crucell NV | 230,971 | 4,588,537 | |||
*Crucell NV ADR | 45,768 | 903,918 | |||
DOCdata NV | 22,463 | 264,550 | |||
*Draka Holding NV | 47,528 | 885,918 | |||
Exact Holding NV | 58,947 | 1,625,189 | |||
*Fornix Biosciences NV | 29,890 | 316,402 | |||
Fugro NV | 78,737 | 4,385,536 | |||
Grontmij NV | 75,397 | 2,075,420 | |||
89
THE CONTINENTAL SMALL COMPANY SERIES
CONTINUED
| Shares | Value†† | ||||
NETHERLANDS — (Continued) | |||||
Imtech NV | 248,834 | $ | 6,325,202 | ||
#*InnoConcepts NV | 82,239 | 264,987 | |||
KAS Bank NV | 47,628 | 979,198 | |||
Kendrion NV | 39,829 | 532,950 | |||
Koninklijke Bam Groep NV | 415,704 | 4,889,299 | |||
Koninklijke Boskalis Westminster NV | 133,054 | 4,669,923 | |||
#Koninklijke Ten Cate NV | 98,297 | 2,301,208 | |||
Koninklijke Vopak NV | 65,067 | 4,389,893 | |||
#Macintosh Retail Group NV | 43,877 | 901,336 | |||
Mediq NV | 208,313 | 3,296,291 | |||
Nederlandsche Apparatenfabriek NV | 28,810 | 747,999 | |||
Nutreco Holding NV | 139,331 | 7,032,903 | |||
Oce NV | 336,989 | 2,130,943 | |||
*Ordina NV | 150,761 | 932,806 | |||
*Punch Graphix NV | 49,509 | 111,589 | |||
*Qurius NV | 351,539 | 149,460 | |||
*Randstad Holdings NV | 25,148 | 954,175 | |||
*Roto Smeets Group NV | 12,436 | 239,866 | |||
Royal Reesink NV | 2,050 | 206,757 | |||
SBM Offshore NV | 134,711 | 2,579,785 | |||
Sligro Food Group NV | 95,164 | 2,932,082 | |||
#Smit Internationale NV | 44,064 | 3,463,648 | |||
*SNS Reaal Groep NV | 203,922 | 1,441,366 | |||
*Stern Groep NV | 1,258 | 30,524 | |||
*Super De Boer NV | 255,159 | 1,786,557 | |||
#Telegraaf Media Groep NV | 163,704 | 3,069,877 | |||
*Textielgroep Twenthe NV | 1,000 | 3,679 | |||
TKH Group NV | 98,188 | 1,627,166 | |||
#*TomTom NV | 175,974 | 1,677,353 | |||
*Unit 4 Agresso NV | 74,403 | 1,768,040 | |||
*USG People NV | 203,344 | 3,537,849 | |||
#*Van der Moolen Holding NV | 117,201 | 6,853 | |||
Wavin NV | 351,774 | 725,761 | |||
TOTAL NETHERLANDS | 99,097,552 | ||||
NORWAY — (3.8%) | |||||
Acergy SA | 192,943 | 2,410,016 | |||
*Acta Holding ASA | 230,000 | 153,781 | |||
Aker Kvaerner ASA | 140,625 | 1,690,463 | |||
#*Aktiv Kapital ASA | 78,617 | 562,247 | |||
Arendals Fosse Kompani ASA | 100 | 28,118 | |||
Atea ASA | 222,782 | 1,462,262 | |||
#*Austevoll Seafood ASA | 42,508 | 251,503 | |||
#*Blom ASA | 80,567 | 173,485 | |||
Bonheur ASA | 50,200 | 1,550,275 | |||
#*BW Offshore, Ltd. | 138,779 | 186,092 | |||
*Camillo Eitze & Co. ASA | 58,200 | 136,853 | |||
*Cermaq ASA | 201,540 | 1,752,489 | |||
*Copeinca ASA | 32,494 | 228,390 | |||
*Deep Sea Supply P.L.C. | 34,000 | 48,959 | |||
*Det Norske Oljeselskap ASA (B0ZY5P6) | 15,400 | 128,797 | |||
#*Det Norske Oljeselskap ASA (B15GGN4) | 3,050,200 | 2,390,338 | |||
#*Dockwise, Ltd. | 94,000 | 138,277 | |||
#*DOF ASA | 117,912 | 671,554 | |||
*EDB Business Partner ASA | 164,034 | 702,572 | |||
#*Eitzen Chemical ASA | 21,068 | 8,128 | |||
#Ekornes ASA | 111,690 | 2,057,822 | |||
Farstad Shipping ASA | 59,440 | 1,378,773 | |||
Ganger Rolf ASA | 52,803 | 1,478,816 | |||
*Golar LNG, Ltd. | 9,000 | 112,519 | |||
#*Golden Ocean Group, Ltd. | 284,000 | 389,420 | |||
90
THE CONTINENTAL SMALL COMPANY SERIES
CONTINUED
| Shares | Value†† | ||||
NORWAY — (Continued) | |||||
#*Havila Shipping ASA | 22,400 | $ | 177,874 | ||
*IOT Holdings ASA | 75,603 | 1,840 | |||
Kongsberg Gruppen ASA | 126,836 | 1,744,269 | |||
*Kverneland Group ASA | 258,080 | 173,028 | |||
Leroy Seafood Group ASA | 15,160 | 276,889 | |||
#*Marine Harvest ASA | 4,227,581 | 3,067,203 | |||
Nordic Semiconductor ASA | 4,000 | 30,005 | |||
#*Norse Energy Corp. ASA | 1,143,079 | 742,283 | |||
#*Norske Skogindustrier ASA Series A | 320,620 | 532,344 | |||
#*Norwegian Air Shuttle ASA | 49,007 | 1,391,207 | |||
*Norwegian Energy Co. ASA | 201,900 | 544,346 | |||
Odfjell ASA Series A | 92,300 | 821,972 | |||
ODIM ASA | 56,787 | 314,311 | |||
*Olav Thon Eiendomsselskap ASA | 12,960 | 1,523,673 | |||
#Opera Software ASA | 75,000 | 321,327 | |||
*PCI Biotech AS | 3,357 | 5,863 | |||
*Petroleum-Geo Services ASA | 351,000 | 3,305,240 | |||
*Petrolia Drilling ASA | 7,286,093 | 580,723 | |||
#*Photocure ASA | 33,562 | 284,329 | |||
*Pronova BioPharma ASA | 248,317 | 770,287 | |||
Prosafe ASA | 372,606 | 1,939,870 | |||
*Prosafe Production Public, Ltd. | 261,500 | 585,714 | |||
#*Q-Free ASA | 51,500 | 206,232 | |||
Rieber and Son ASA Series A | 106,654 | 770,720 | |||
Scana Industrier ASA | 299,618 | 473,911 | |||
*Schibsted ASA | 96,737 | 1,589,876 | |||
*Sevan Marine ASA | 325,562 | 523,163 | |||
*Siem Offshore, Inc. | 2,000 | 3,078 | |||
Solstad Offshore ASA | 57,000 | 1,070,217 | |||
#*Songa Offshore SE | 139,750 | 697,647 | |||
SpareBanken 1 SMN | 178,812 | 1,571,100 | |||
*Storebrand ASA | 633,500 | 4,304,930 | |||
*Subsea 7, Inc. | 100,800 | 1,413,196 | |||
Tandberg ASA Series A | 208,204 | 5,570,172 | |||
*TGS Nopec Geophysical Co. ASA | 404,241 | 6,130,506 | |||
Tomra Systems ASA | 587,328 | 2,956,184 | |||
*TTS Marine ASA | 41,000 | 48,250 | |||
Veidekke ASA | 310,230 | 2,375,411 | |||
Wilh. Wilhelmsen ASA | 60,550 | 1,402,269 | |||
TOTAL NORWAY | 70,333,408 | ||||
PORTUGAL — (1.4%) | |||||
#*Altri SGPS SA | 94,568 | 543,067 | |||
Banco BPI SA | 559,833 | 1,888,356 | |||
Banif SGPS SA | 193,177 | 372,270 | |||
*Corticeira Amorim SA | 223,729 | 309,366 | |||
*Finibanco Holdings SGPS SA | 291,186 | 697,452 | |||
Ibersol SGPS SA | 20,401 | 291,330 | |||
#*Impresa Sociedade Gestora de Participacoes SA | 369,303 | 739,787 | |||
#*Investimentos Participacoes e Gestao SA | 319,480 | 305,750 | |||
Jeronimo Martins SGPS SA | 506,890 | 4,515,539 | |||
Mota-Engil SGPS SA | 341,524 | 2,028,717 | |||
*Novabase SGPS SA | 65,729 | 473,278 | |||
*ParaRede SGPS SA | 94,525 | 123,776 | |||
Portucel-Empresa Produtora de Pasta de Papel SA | 827,234 | 2,337,127 | |||
Redes Energeticas Nacionais SA | 178,117 | 781,052 | |||
Sag Gest - Solucoes Automovel Globais SGPS SA | 251,556 | 517,684 | |||
Sociedade de Investimento e Gestao SGPS SA | 256,388 | 2,836,249 | |||
#*Sonae Industria SGPS SA | 264,159 | 952,375 | |||
#Sonae SGPS SA | 1,138,893 | 1,498,768 | |||
91
THE CONTINENTAL SMALL COMPANY SERIES
CONTINUED
| Shares | Value†† | ||||
PORTUGAL — (Continued) | |||||
*Sonaecom SGPS SA | 453,482 | $ | 1,297,672 | ||
*Sumol + Compal SA | 67,967 | 139,302 | |||
#*Teixeira Duarte Engenharia e Construcoes SA | 734,737 | 1,155,446 | |||
Toyota Caetano Portugal SA | 53,308 | 325,570 | |||
#Zon Multimedia Servicos de Telecomunicacoes e Multimedia SGPS SA | 299,904 | 1,905,422 | |||
TOTAL PORTUGAL | 26,035,355 | ||||
SPAIN — (4.9%) | |||||
#Abengoa SA | 134,166 | 3,536,051 | |||
Adolfo Dominguez SA | 20,351 | 325,777 | |||
#Almirall SA | 94,542 | 1,249,201 | |||
#Amper SA | 88,114 | 780,942 | |||
#Antena 3 de Television SA | 240,050 | 2,042,476 | |||
#*Avanzit SA | 555,254 | 616,880 | |||
*Azkoyen SA | 70,532 | 323,276 | |||
#Banco Guipuzcoano SA | 339,914 | 2,557,274 | |||
Banco Pastor SA | 255,727 | 1,909,833 | |||
Banco Popular Espanol SA | 24 | 218 | |||
*Baron de Ley SA | 13,910 | 674,879 | |||
#Bolsas y Mercados Espanoles SA | 123,169 | 4,106,091 | |||
Campofrio Food Group SA | 95,179 | 963,396 | |||
#Cementos Portland Valderrivas SA | 30,644 | 1,415,899 | |||
Compania Vinicola del Norte de Espana SA | 16,119 | 338,085 | |||
Construcciones y Auxiliar de Ferrocarriles SA | 7,283 | 3,588,937 | |||
#*Corporacion Dermoestetica SA | 30,628 | 143,214 | |||
Duro Felguera SA | 172,631 | 1,715,941 | |||
Ebro Puleva SA | 312,280 | 5,946,769 | |||
#Elecnor SA | 198,254 | 3,522,631 | |||
*Ercros SA | 226,106 | 464,089 | |||
*Estacionamientos Urbanos SA | 4,200 | — | |||
#Faes Farma SA | 455,399 | 2,535,864 | |||
*Fluidra SA | 31,021 | 148,704 | |||
#*General de Alquiler de Maquinaria SA | 32,241 | 284,684 | |||
#Gestevision Telecinco SA | 191,290 | 1,977,087 | |||
Grupo Catalana Occidente SA | 160,495 | 3,888,704 | |||
*Grupo Empresarial Ence SA | 358,144 | 1,439,749 | |||
#*Grupo Tavex SA | 244,131 | 231,136 | |||
#*Iberia Lineas Aereas de Espana SA | 1,381,661 | 3,810,409 | |||
Iberpapel Gestion SA | 25,850 | 425,452 | |||
*Inbesos SA | 12,494 | 43,951 | |||
Indra Sistemas SA | 28,883 | 679,238 | |||
Inmobiliaria del Sur SA | 2,902 | 80,217 | |||
#*La Seda de Barcelona SA | 1,923,682 | 959,079 | |||
#Laboratorios Farmaceuticos Rovi SA | 18,975 | 214,429 | |||
#Mecalux SA | 38,470 | 578,712 | |||
Miquel y Costas & Miquel SA | 26,111 | 562,504 | |||
*Natra SA | 109,456 | 462,941 | |||
*Natraceutical SA | 645,689 | 420,560 | |||
#*NH Hoteles SA | 421,083 | 2,203,390 | |||
*Nicolas Correa SA | 26,994 | 85,220 | |||
#Obrascon Huarte Lain SA | 130,017 | 3,454,582 | |||
Papeles y Cartones de Europa SA | 209,482 | 1,188,465 | |||
Pescanova SA | 24,512 | 852,223 | |||
Prim SA | 39,424 | 413,305 | |||
#*Promotora de Informaciones SA | 303,496 | 1,447,400 | |||
#Prosegur Cia de Seguridad SA | 87,574 | 3,684,623 | |||
*Realia Business SA | 112,559 | 302,312 | |||
Service Point Solutions SA | 461,144 | 770,137 | |||
#*Sociedad Nacional Inds. Aplicaciones Celulosa Espanola SA | 220,774 | 431,762 | |||
Sol Melia SA | 206,682 | 1,831,629 | |||
#*Solaria Energia y Medio Ambiente SA | 59,008 | 219,390 | |||
#*SOS Corporacion Alimentaria SA | 294,272 | 888,348 | |||
92
THE CONTINENTAL SMALL COMPANY SERIES
CONTINUED
| Shares | Value†† | ||||
SPAIN — (Continued) | |||||
Tecnicas Reunidas SA | 39,312 | $ | 2,073,604 | ||
#*Tecnocom Telecomunicaciones y Energia SA | 146,125 | 620,052 | |||
Tubacex SA | 427,191 | 1,764,905 | |||
Tubos Reunidos SA | 416,951 | 1,276,044 | |||
Unipapel SA | 47,385 | 716,100 | |||
#*Vertice Trescientos Sesenta Grados SA | 57,183 | 30,426 | |||
Vidrala SA | 64,706 | 1,759,675 | |||
Viscofan SA | 183,430 | 4,794,518 | |||
#*Vocento SA | 193,449 | 1,211,703 | |||
#*Zeltia SA | 556,824 | 3,291,300 | |||
TOTAL SPAIN | 90,276,392 | ||||
SWEDEN — (5.7%) | |||||
#Aarhuskarlshamn AB | 52,836 | 1,060,036 | |||
Acando AB | 160,086 | 331,259 | |||
*Active Biotech AB | 104,812 | 849,404 | |||
Addtech AB Series B | 59,000 | 848,759 | |||
AF AB Series B | 47,200 | 1,176,959 | |||
Aros Quality Group AB | 41,400 | 282,812 | |||
Atrium Ljungberg AB Series B | 15,200 | 136,549 | |||
*Avanza Bank Holding AB | 5,406 | 116,638 | |||
Axfood AB | 89,350 | 2,665,974 | |||
#Axis Communications AB | 174,894 | 1,890,138 | |||
#B&B Tools AB | 77,850 | 910,396 | |||
BE Group AB | 38,662 | 221,565 | |||
Beiger Electronics AB | 14,700 | 265,034 | |||
Beijer Alma AB | 57,200 | 712,646 | |||
*Bergs Timber AB Series B | 17,000 | 85,871 | |||
*Bilia AB Series A | 113,425 | 922,410 | |||
*Billerud AB | 326,600 | 1,809,416 | |||
BioGaia AB Series B | 38,000 | 416,579 | |||
Biotage AB | 141,240 | 126,581 | |||
*Biovitrum AB | 23,757 | 197,288 | |||
Boliden AB | 497,124 | 5,986,022 | |||
Bong Ljungdahl AB | 24,800 | 78,301 | |||
*Boras Waefveri AB Series B | 11,500 | 8,335 | |||
*Bure Equity AB | 12,042 | 61,497 | |||
Cantena AB | 56,762 | 708,612 | |||
Cardo AB | 61,300 | 1,652,944 | |||
Castellum AB | 408,700 | 3,804,158 | |||
#Clas Ohlson AB Series B | 62,396 | 1,174,723 | |||
*Cloetta AB | 55,296 | 242,613 | |||
Concordia Maritime AB Series B | 70,300 | 173,275 | |||
Consilium AB Series B | 16,994 | 67,429 | |||
#*D. Carnegie & Co. AB | 181,000 | 454,270 | |||
*DORO AB | 1,200 | 1,483 | |||
*Duni AB | 8,394 | 59,013 | |||
*East Capital Explorer AB | 4,981 | 45,440 | |||
#Elekta AB Series B | 302,500 | 5,701,787 | |||
*Enea Data AB Series B | 56,200 | 375,296 | |||
*Eniro AB | 206,986 | 952,821 | |||
#Fabege AB | 391,400 | 2,272,517 | |||
Fagerhult AB | 16,800 | 307,219 | |||
G & L Beijer AB Series B | 27,400 | 690,072 | |||
#*Gunnebo AB | 106,800 | 509,277 | |||
Hakon Invest AB | 68,557 | 1,143,433 | |||
#*Haldex AB | 72,500 | 626,365 | |||
Heba Fastighets AB Series B | 43,500 | 343,732 | |||
#Hexagon AB | 146,005 | 1,909,079 | |||
*Hexpol AB | 8,172 | 68,202 | |||
*HIQ International AB | 123,289 | 435,460 | |||
93
THE CONTINENTAL SMALL COMPANY SERIES
CONTINUED
| Shares | Value†† | ||||
SWEDEN — (Continued) | |||||
HL Display AB Series B | 57,600 | $ | 259,779 | ||
Hoganas AB Series B | 85,800 | 1,552,241 | |||
Holmen AB Series B | 43,508 | 1,174,208 | |||
Industrial & Financial Systems AB Series B | 50,260 | 454,702 | |||
#Intrum Justitia AB | 180,322 | 2,222,000 | |||
*JM AB | 267,473 | 3,972,895 | |||
KappAhl Holding AB | 93,099 | 733,089 | |||
Klovern AB | 294,976 | 932,311 | |||
#Kungsleden AB | 412,300 | 2,870,958 | |||
Lagercrantz Group AB Series B | 64,300 | 237,940 | |||
Lammhults Design Group AB | 19,547 | 130,836 | |||
*LBI International AB | 127,651 | 260,758 | |||
Lennart Wallenstam Byggnads AB Series B | 120,400 | 1,969,959 | |||
#Lindab International AB | 54,077 | 574,851 | |||
*Loomis AB | 69,887 | 752,439 | |||
#*Lundin Petroleum AB | 255,814 | 2,166,852 | |||
*Meda AB Series A | 272,190 | 2,463,244 | |||
*Medivir AB Series B | 44,650 | 434,450 | |||
Mekonomen AB | 11,461 | 221,376 | |||
*Midelfart Sonesson AB Series B | 4,160 | 4,324 | |||
#Modern Times Group AB Series B | 106,141 | 4,603,164 | |||
*Munters AB | 181,900 | 1,254,552 | |||
NCC AB Series B | 216,320 | 3,268,004 | |||
*Net Insight AB Series B | 924,000 | 662,163 | |||
New Wave Group AB Series B | 79,101 | 275,722 | |||
NIBE Industrier AB | 192,620 | 2,146,694 | |||
*Nobia AB | 421,100 | 2,613,823 | |||
Nolato AB Series B | 66,440 | 539,547 | |||
OEM International AB Series B | 44,400 | 261,735 | |||
ORC Software AB | 36,300 | 695,796 | |||
Oriflame Cosmetics SA SDR | 8,264 | 457,671 | |||
*Pa Resources AB | 357,209 | 1,383,536 | |||
*Partnertech AB | 28,800 | 105,971 | |||
Peab AB Series B | 425,900 | 2,668,549 | |||
Poolia AB Series B | 33,150 | 157,353 | |||
*Pricer AB Series B | 1,711,500 | 145,500 | |||
ProAct IT Group AB | 29,000 | 285,222 | |||
#*Proffice AB | 215,400 | 717,231 | |||
Profilgruppen AB | 13,582 | 92,255 | |||
*Q-Med AB | 154,800 | 937,723 | |||
Rederi AB Transatlantic Series B | 93,000 | 305,464 | |||
*Rezidor Hotel Group AB | 51,396 | 164,324 | |||
#*rnb Retail & Brands AB | 208,325 | 203,500 | |||
#*SAS AB | 1,938,372 | 1,176,279 | |||
*Scribona AB Series B | 226,140 | 273,085 | |||
*Seco Tools AB | 16,463 | 217,000 | |||
*Semcon AB | 39,900 | 162,415 | |||
Sigma AB Series B | 25,800 | 15,418 | |||
*Sintercast AB | 11,800 | 88,749 | |||
Skanditek Industrifoervaltnings AB | 1,000 | 2,768 | |||
Skistar AB | 92,100 | 1,732,801 | |||
Studsvik AB | 21,900 | 228,059 | |||
SWECO AB Series B | 183,300 | 1,441,990 | |||
*Trelleborg AB Series B | 878,565 | 5,337,131 | |||
Uniflex AB Series B | 3,630 | 43,618 | |||
VBG AB Series B | 1,084 | 12,428 | |||
Vitrolife AB | 41,500 | 174,557 | |||
Wihlborgs Fastigheter AB | 63,858 | 1,198,096 | |||
TOTAL SWEDEN | 104,318,794 | ||||
94
THE CONTINENTAL SMALL COMPANY SERIES
CONTINUED
| Shares | Value†† | ||||
SWITZERLAND — (11.6%) | |||||
Acino Holding AG | 8,398 | $ | 1,378,179 | ||
*Advanced Digital Broadcast Holdings SA | 368 | 18,706 | |||
Affichage Holding SA | 5,703 | 664,630 | |||
*AFG Arbonia-Forster Holding AG | 4,661 | 99,478 | |||
Allreal Holding AG | 26,513 | 3,203,717 | |||
*Also Holding AG | 16,195 | 650,206 | |||
*Aryzta AG | 265,691 | 10,429,578 | |||
*Ascom Holding AG | 160,822 | 1,706,948 | |||
*Athis Holding AG | 2,754 | 568,116 | |||
Bachem Holdings AG | 24,136 | 1,659,246 | |||
Baloise-Holding AG | 2,510 | 214,911 | |||
Bank Coop AG | 30,796 | 2,152,843 | |||
*Bank Sarasin & Cie AG Series B | 172,644 | 6,874,386 | |||
Banque Cantonale de Geneve SA | 4,021 | 937,845 | |||
Banque Cantonale du Jura SA | 4,500 | 267,050 | |||
Banque Cantonale Vaudoise | 8,999 | 3,389,651 | |||
Banque Privee Edmond de Rothschild SA | 157 | 4,165,873 | |||
Barry Callebaut AG | 3,696 | 2,064,701 | |||
Basellandschaftliche Kantonalbank | 583 | 566,721 | |||
*Basilea Pharmaceutica AG | 2,629 | 217,440 | |||
Basler Kantonalbank AG | 3,114 | 358,699 | |||
Belimo Holdings AG | 1,830 | 1,869,457 | |||
Bell Holding AG | 47 | 72,361 | |||
Bellevue Group AG | 26,524 | 1,078,525 | |||
Berner Kantonalbank AG | 23,122 | 5,216,367 | |||
*Bobst Group AG | 35,619 | 1,318,058 | |||
Bossard Holding AG | 8,222 | 471,665 | |||
Bucher Industries AG | 31,723 | 3,332,904 | |||
Burckhardt Compression Holding AG | 904 | 131,736 | |||
Calida Holding AG | 396 | 119,682 | |||
Carlo Gavazzi Holding AG | 1,065 | 149,831 | |||
Centralschweizerische Kraftwerke AG | 96 | 33,501 | |||
*Cham Paper Holding AG | 490 | 84,025 | |||
Charles Voegele Holding AG | 28,617 | 1,128,581 | |||
*Clariant AG | 756,817 | 7,235,446 | |||
#Compagnie Financiere Tradition SA | 5,511 | 683,449 | |||
Conzzeta AG | 1,375 | 2,368,668 | |||
*Cytos Biotechnology AG | 2,412 | 31,680 | |||
Daetwyler Holding AG | 26,077 | 1,283,891 | |||
Datacolor AG | 458 | 137,609 | |||
Edipresse SA | 1,527 | 386,554 | |||
#EFG International AG | 45,259 | 753,744 | |||
Elektrizitaets-Gesellschaft Laufenberg AG | 3,062 | 2,967,286 | |||
*ELMA Electronic AG | 472 | 197,852 | |||
Emmi AG | 13,244 | 1,559,798 | |||
EMS-Chemie Holding AG | 26,147 | 2,905,137 | |||
Energiedienst Holding AG | 71,249 | 3,890,894 | |||
Feintol International Holding AG | 1,601 | 348,008 | |||
Flughafen Zuerich AG | 13,056 | 3,800,739 | |||
Forbo Holding AG | 5,817 | 1,643,697 | |||
Fuchs Petrolub AG | 19,235 | 1,443,703 | |||
#Galenica Holding AG | 15,281 | 5,265,334 | |||
GAM Holdings, Ltd. | 18,237 | 222,493 | |||
George Fisher AG | 10,991 | 2,890,104 | |||
Gurit Holding AG | 1,288 | 710,655 | |||
Helvetia Holding AG | 12,462 | 3,973,442 | |||
Hexagon AB | 81,720 | 1,075,368 | |||
#Implenia AG | 48,118 | 1,336,187 | |||
*Interroll-Holding SA | 2,404 | 689,533 | |||
Intershop Holding AG | 3,345 | 955,140 | |||
Kaba Holding AG | 10,381 | 2,402,753 | |||
95
THE CONTINENTAL SMALL COMPANY SERIES
CONTINUED
| Shares | Value†† | ||||
SWITZERLAND — (Continued) | |||||
*Kardex AG | 17,464 | $ | 579,425 | ||
Komax Holding AG | 8,744 | 655,181 | |||
Kudelski SA | 103,843 | 2,118,821 | |||
Kuoni Reisen Holding AG | 12,443 | 4,217,808 | |||
Lem Holdings SA | 3,546 | 1,018,748 | |||
#*lifeWatch AG | 55,532 | 1,081,566 | |||
#*Logitech International SA | 92,687 | 1,582,169 | |||
Luzerner Kantonalbank AG | 17,409 | 4,462,195 | |||
Medisize Holding AG | 12,876 | 658,457 | |||
Metall Zug AG | 202 | 475,817 | |||
*Meyer Burger Technology AG | 1,343 | 292,176 | |||
*Micronas Semiconductor Holding AG | 37,365 | 132,688 | |||
Mobilezone Holding AG | 112,258 | 862,279 | |||
Mobimo Holding AG | 1,856 | 299,195 | |||
Nobel Biocare Holding AG | 163,678 | 4,643,682 | |||
*Orascom Development Holding AG | 442 | 34,482 | |||
Orell Fuessli Holding AG | 4,930 | 706,075 | |||
#Panalpina Welttransport Holding AG | 5,945 | 416,334 | |||
*Parco Industriale e Immobiliare SA | 600 | 2,047 | |||
Partners Group Holdings AG | 15,823 | 1,940,684 | |||
Petroplus Holdings AG | 141,857 | 3,090,524 | |||
Phoenix Mecano AG | 2,953 | 1,113,857 | |||
#PSP Swiss Property AG | 141,111 | 7,918,508 | |||
*Rieters Holdings AG | 15,236 | 3,411,538 | |||
Romande Energie Holding SA | 2,714 | 5,386,990 | |||
*Schaffner Holding AG | 1,830 | 292,950 | |||
Schulthess Group AG | 14,148 | 818,772 | |||
Schweiter Technology AG | 3,994 | 1,963,068 | |||
*Schweizerische National-Versicherungs-Gesellschaft AG | 38,367 | 1,177,082 | |||
Siegfried Holding AG | 8,312 | 841,556 | |||
Sika AG | 4,203 | 5,698,044 | |||
Societa Elettrica Sopracenerina SA | 2,340 | 524,571 | |||
St. Galler Kantonalbank AG | 8,951 | 4,075,788 | |||
#Straumann Holding AG | 8,595 | 2,074,619 | |||
Sulzer AG | 45,310 | 3,527,868 | |||
Swiss Prime Site AG | 163,073 | 8,976,492 | |||
Swisslog Holding AG | 775,803 | 663,652 | |||
*Swissmetal Holding AG | 13,504 | 144,390 | |||
Swissquote Group Holding SA | 40,025 | 2,062,506 | |||
Tamedia AG | 14,878 | 1,101,073 | |||
Tecan Group AG | 38,976 | 2,388,131 | |||
#*Temenos Group AG | 148,205 | 3,382,567 | |||
*Tornos SA | 38,028 | 271,331 | |||
Valartis Group AG | 560 | 17,174 | |||
#Valiant Holding AG | 33,293 | 6,559,434 | |||
Valora Holding AG | 10,995 | 2,621,486 | |||
Vaudoise Assurances Holdings SA | 3,140 | 566,949 | |||
Verwaltungs und Privat-Bank AG | 790 | 84,453 | |||
Villars Holding SA | 150 | 80,344 | |||
Von Roll Holding AG | 19,689 | 134,902 | |||
Vontobel Holdings AG | 94,743 | 3,032,255 | |||
VZ Holding AG | 266 | 20,484 | |||
Walliser Kantonalbank AG | 1,416 | 770,078 | |||
WMH Walter Meier Holding AG | 4,738 | 373,576 | |||
Ypsomed Holdings AG | 2,419 | 153,311 | |||
Zehnder Holding AG | 764 | 840,584 | |||
*Zueblin Immobilien Holding AG | 76,620 | 339,447 | |||
Zuger Kantonalbank AG | 613 | 2,511,481 | |||
TOTAL SWITZERLAND | 212,946,445 | ||||
TOTAL COMMON STOCKS | 1,624,145,822 | ||||
96
THE CONTINENTAL SMALL COMPANY SERIES
CONTINUED
| Shares | Value†† | |||||
PREFERRED STOCKS — (0.1%) | ||||||
SWITZERLAND — (0.1%) | ||||||
Fuchs Petrolub AG | 19,235 | $ | 1,565,574 | |||
RIGHTS/WARRANTS — (0.0%) | ||||||
BELGIUM — (0.0%) | ||||||
#*Deceuninck NV STRIP VVPR | 247,412 | 1,092 | ||||
*RealDolmen NV STRIP VVPR | 6,067 | 268 | ||||
*Zenitel NV STRIP VVPR | 8,654 | 13 | ||||
TOTAL BELGIUM | 1,373 | |||||
DENMARK — (0.0%) | ||||||
#*NeuroSearch A.S. Rights 11/09/09 | 126,162 | 82,324 | ||||
FINLAND — (0.0%) | ||||||
#*Amer Sports Oyj Rights 10/19/09 | 75,000 | 232,888 | ||||
FRANCE — (0.0%) | ||||||
*Atari SA Warrants 12/31/09 | 77,833 | 1,031 | ||||
*Cybergun SA Warrants Series B 07/15/10 | 1,136 | 17 | ||||
*Groupe Focal SA Warrants 02/21/10 | 466 | — | ||||
*Mr Bricolage SA Rights 11/04/09 | 23,846 | 35 | ||||
TOTAL FRANCE | 1,083 | |||||
GERMANY — (0.0%) | ||||||
*TUI AG Rights 11/11/09 | 242,621 | 37,491 | ||||
ITALY — (0.0%) | ||||||
*Intek SpA Warrants 12/30/11 | 167,960 | 8,898 | ||||
*Tiscali SpA Warrants 12/15/14 | 5,347 | — | ||||
TOTAL ITALY | 8,898 | |||||
NORWAY — (0.0%) | ||||||
*Dockwise, Ltd. Rights 11/20/09 | 50,760 | 6,649 | ||||
SPAIN — (0.0%) | ||||||
*Pescanova SA Rights 10/22/09 | 12,256 | 426,564 | ||||
TOTAL RIGHTS/WARRANTS | 797,270 | |||||
| Face Amount | Value† | |||||
| (000) | ||||||
TEMPORARY CASH INVESTMENTS — (0.2%) | ||||||
Repurchase Agreement, PNC Capital Markets, Inc. 0.19%, 11/02/09 (Collateralized by $2,725,000 FNMA 6.50%, 06/25/39, valued at $2,932,781) to be repurchased at $2,888,046 | $ | 2,888 | 2,888,000 | |||
| Shares/ Face Amount | ||||||
| (000) | ||||||
SECURITIES LENDING COLLATERAL — (11.2%) | ||||||
§@DFA Short Term Investment Fund LP | 200,182,842 | 200,182,842 | ||||
@Repurchase Agreement, Deutsche Bank Securities 0.07%, 11/02/09 (Collateralized by various corporate obligations, ranging in par value from $4,247,617 to $16,429,280, rates ranging from 5.000% to 7.000%, maturities ranging from 03/01/37 to 10/01/39, valued at $4,949,334) to be repurchased at $4,852,316 | $ | 4,852 | 4,852,288 | |||
TOTAL SECURITIES LENDING COLLATERAL | 205,035,130 | |||||
TOTAL INVESTMENTS — (100.0%) | $ | 1,834,431,796 | ||||
See accompanying Notes to Financial Statements.
97
THE CANADIAN SMALL COMPANY SERIES
SCHEDULE OF INVESTMENTS
October 31, 2009
| Shares | Value†† | ||||
COMMON STOCKS — (84.0%) | |||||
Consumer Discretionary — (11.4%) | |||||
*AlarmForce Industries, Inc. | 700 | $ | 3,571 | ||
Astral Media, Inc. Class A | 186,347 | 5,517,821 | |||
#*Ballard Power Systems, Inc. | 376,152 | 816,928 | |||
#*Coastal Contacts, Inc. | 146,900 | 166,986 | |||
Cogeco Cable, Inc. | 59,756 | 1,710,864 | |||
Corus Entertainment, Inc. Class B | 278,300 | 4,575,534 | |||
Dorel Industries, Inc. Class B | 107,500 | 2,884,086 | |||
easyhome, Ltd. | 3,600 | 28,379 | |||
Forzani Group, Ltd. Class A | 130,900 | 1,512,176 | |||
*Gildan Activewear, Inc. | 246,010 | 4,333,395 | |||
*Glacier Media, Inc. | 137,300 | 234,744 | |||
Glentel, Inc. | 15,500 | 200,545 | |||
*Great Canadian Gaming Corp. | 301,200 | 2,093,271 | |||
Groupe Aeroplan, Inc. | 283,650 | 2,427,428 | |||
*Imax Corp. | 22,897 | 236,366 | |||
#Le Chateau, Inc. | 79,200 | 878,333 | |||
Leon’s Furniture, Ltd. | 118,877 | 1,054,682 | |||
Linamar Corp. | 179,780 | 2,508,829 | |||
*Martinrea International, Inc. | 217,878 | 1,445,741 | |||
*MDC Partners, Inc. Class A | 71,000 | 573,486 | |||
Quebecor, Inc. Class B | 159,493 | 3,258,990 | |||
Reitmans Canada, Ltd. | 193,400 | 2,920,527 | |||
*RONA, Inc. | 426,885 | 5,842,768 | |||
#Torstar Corp. Class B | 179,800 | 1,281,140 | |||
TVA Group, Inc. Class B | 7,000 | 82,159 | |||
Uni-Select, Inc. | 54,900 | 1,364,319 | |||
#*Westport Innovations, Inc. | 133,401 | 1,319,154 | |||
Total Consumer Discretionary | 49,272,222 | ||||
Consumer Staples — (2.3%) | |||||
*Atrium Innovations, Inc. | 102,400 | 1,334,356 | |||
Canada Bread Co., Ltd. | 13,261 | 560,686 | |||
Corby Distilleries, Ltd. | 51,708 | 738,310 | |||
*Cott Corp. | 512,400 | 4,053,550 | |||
Jean Coutu Group (PJC), Inc. Class A (The) | 11,600 | 94,554 | |||
#Maple Leaf Foods, Inc. | 254,000 | 2,631,431 | |||
*SunOpta, Inc. | 176,001 | 645,741 | |||
*Sun-Rype Products, Ltd. | 100 | 874 | |||
Total Consumer Staples | 10,059,502 | ||||
Energy — (17.3%) | |||||
*Advantage Oil & Gas, Ltd. | 140,589 | 878,316 | |||
Akita Drilling, Ltd. | 42,000 | 373,014 | |||
*Anderson Energy, Ltd. | 282,833 | 258,772 | |||
#*Antrim Energy, Inc. | 487,500 | 581,188 | |||
#*Bankers Petroleum, Ltd. | 685,432 | 3,002,586 | |||
#*Berens Energy, Ltd. | 208,200 | 221,274 | |||
*Birchcliff Energy, Ltd. | 336,400 | 2,275,725 | |||
*Breaker Energy, Ltd. | 140,400 | 698,075 | |||
Calfrac Well Services, Ltd. | 107,264 | 1,699,094 | |||
*Calvalley Petroleum, Inc. | 302,339 | 578,385 | |||
*CE Franklin, Ltd. | 20,400 | 122,545 | |||
*Celtic Exploration, Ltd. | 122,600 | 2,209,417 | |||
#*Comaplex Minerals Corp. | 78,800 | 455,155 | |||
*Compton Petroleum Corp. | 352,300 | 358,144 | |||
*Connacher Oil & Gas, Ltd. | 782,500 | 715,933 | |||
*Corridor Resources, Inc. | 348,780 | 1,015,348 | |||
*Crew Energy, Inc. | 250,936 | 2,298,208 | |||
98
THE CANADIAN SMALL COMPANY SERIES
CONTINUED
| Shares | Value†† | ||||
Energy — (Continued) | |||||
#*Daylight Resources Trust | 176,978 | $ | 1,416,410 | ||
*Delphi Energy Corp. | 263,700 | 375,304 | |||
#*Denison Mines Corp. | 708,441 | 1,080,290 | |||
Ensign Energy Services, Inc. | 83,300 | 1,194,784 | |||
*Fairborne Energy, Ltd. | 262,300 | 1,078,726 | |||
*Flint Energy Services, Ltd. | 139,000 | 1,509,403 | |||
*Galleon Energy, Inc. Class A | 261,437 | 1,314,373 | |||
#*Iteration Energy, Ltd. | 608,800 | 641,405 | |||
#*Ivanhoe Energy, Inc. | 831,620 | 1,936,770 | |||
*Mega Uranium, Ltd. | 635,600 | 428,805 | |||
#*MGM Energy Corp. | 14,000 | 1,682 | |||
#*Midnight Oil Exploration, Ltd. | 44,300 | 45,035 | |||
#Mullen Group, Ltd. | 79,171 | 1,145,073 | |||
*Nuvista Energy, Ltd. | 274,221 | 2,911,880 | |||
*Paramount Resources, Ltd. Class A | 126,300 | 1,573,425 | |||
#Pason Systems, Inc. | 222,900 | 2,338,076 | |||
#*PetroBakken Energy, Ltd. | 185,863 | 5,362,638 | |||
#*Petrominerales, Ltd. | 73,723 | 1,021,991 | |||
#Progress Energy Resources Corp. | 333,082 | 4,260,297 | |||
Pulse Seismic, Inc. | 156,524 | 166,353 | |||
#*Questerre Energy Corp. | 649,400 | 1,434,375 | |||
Savanna Energy Services Corp. | 249,213 | 1,655,969 | |||
ShawCor, Ltd. | 209,500 | 5,452,169 | |||
#*Storm Exploration, Inc. | 135,100 | 1,683,053 | |||
*Transglobe Energy Corp. | 186,200 | 707,252 | |||
Trican Well Service, Ltd. | 391,971 | 4,586,066 | |||
Trinidad Drilling, Ltd. | 389,000 | 2,541,685 | |||
#*UEX Corp. | 608,088 | 618,176 | |||
#*Uranium One, Inc. | 1,819,900 | 5,163,433 | |||
*UTS Energy Corp. | 549,843 | 1,036,625 | |||
#*Verenex Energy, Inc. | 111,600 | 706,492 | |||
*Vero Energy, Inc. | 127,000 | 460,090 | |||
*West Energy, Ltd. | 245,800 | 581,533 | |||
*Xtreme Coil Drilling Corp. | 86,700 | 392,616 | |||
ZCL Composite, Inc. | 90,700 | 324,393 | |||
Total Energy | 74,887,826 | ||||
Financials — (6.5%) | |||||
AGF Management, Ltd. Class B | 348,279 | 5,188,538 | |||
*Canaccord Capital, Inc. | 204,300 | 2,144,862 | |||
Canadian Western Bank | 226,200 | 4,469,439 | |||
Clairvest Group, Inc. | 1,900 | 21,730 | |||
DundeeWealth, Inc. | 114,120 | 1,322,550 | |||
EGI Financial Holdings, Inc. | 14,650 | 142,161 | |||
Equitable Group, Inc. | 47,000 | 894,783 | |||
*FirstService Corp. | 80,500 | 1,434,351 | |||
Gluskin Shef & Associates, Inc. | 40,000 | 700,522 | |||
*GMP Capital, Inc. | 8,007 | 108,186 | |||
Home Capital Group, Inc. | 113,700 | 3,835,359 | |||
Industrial Alliance Insurance & Financial Services, Inc. | 72,394 | 1,858,607 | |||
Kingsway Financial Services, Inc. | 212,900 | 808,668 | |||
Laurentian Bank of Canada | 92,400 | 3,375,604 | |||
*Pacific and Western Credit Corp. | 9,000 | 32,230 | |||
*Parkbridge Lifestyles Communities, Inc. | 81,700 | 305,795 | |||
Quest Capital Corp. | 725,001 | 716,927 | |||
Rentcash, Inc. | 33,670 | 322,060 | |||
Sceptre Invesment Counsel, Ltd. | 36,300 | 201,285 | |||
#Western Financial Group, Inc. | 163,700 | 340,396 | |||
Total Financials | 28,224,053 | ||||
99
THE CANADIAN SMALL COMPANY SERIES
CONTINUED
| Shares | Value†† | ||||
Health Care — (4.2%) | |||||
*AEterna Zentaris, Inc. | 124,800 | $ | 129,177 | ||
*Angiotech Pharmaceuticals, Inc. | 61,300 | 79,879 | |||
#Biovail Corp. | 304,150 | 4,103,868 | |||
*Burcon NutraScience Corp. | 9,700 | 64,096 | |||
*Cangene Corp. | 175,700 | 945,034 | |||
#*Cardiome Pharma Corp. | 298,200 | 1,143,690 | |||
*Helix BioPharma Corp. | 5,500 | 11,843 | |||
#*Labopharm, Inc. | 282,600 | 438,767 | |||
*Logibec Group Informatique, Ltd. | 2,600 | 43,251 | |||
*MDS, Inc. | 464,108 | 3,671,517 | |||
*Noveko International, Inc. | 5,400 | 12,476 | |||
*Nuvo Research, Inc. | 223,500 | 66,097 | |||
#*Oncolytics Biotech, Inc. | 84,200 | 271,575 | |||
*Paladin Labs, Inc. | 45,700 | 779,229 | |||
*ProMetic Life Sciences, Inc. | 861,300 | 151,238 | |||
*QLT, Inc. | 212,100 | 715,461 | |||
#*Resverlogix Corp. | 86,200 | 192,786 | |||
*SXC Health Solutions Corp. | 84,161 | 3,864,849 | |||
#*Theratechnologies, Inc. | 288,200 | 745,770 | |||
*Transition Therapeutics, Inc. | 74,633 | 534,546 | |||
Total Health Care | 17,965,149 | ||||
Industrials — (6.7%) | |||||
Aecon Group, Inc. | 204,400 | 2,117,577 | |||
AG Growth International, Inc. | 2,100 | 61,833 | |||
#*Alexco Resource Corp. | 95,500 | 234,767 | |||
*ATS Automation Tooling System, Inc. | 304,017 | 1,756,024 | |||
CAE, Inc. | 155,195 | 1,209,088 | |||
*Churchill Corp. (The) | 66,413 | 971,598 | |||
#*Clarke, Inc. | 99,356 | 299,340 | |||
*Electrovaya, Inc. | 2,000 | 1,479 | |||
Exco Technologies, Ltd. | 9,700 | 15,688 | |||
*Garda World Security Corp. Class A | 16,300 | 141,752 | |||
*Heroux-Devtek, Inc. | 85,400 | 396,200 | |||
*Hydrogenics Corp. | 361,330 | 173,644 | |||
IESI-BFC, Ltd. | 145,431 | 1,868,205 | |||
#*Intermap Technologies, Ltd. | 113,894 | 263,144 | |||
Marsulex, Inc. | 48,300 | 453,071 | |||
Richelieu Hardware, Ltd. | 51,300 | 960,053 | |||
#Russel Metals, Inc. | 229,900 | 3,359,104 | |||
*Stantec, Inc. | 156,600 | 3,784,566 | |||
Student Transportation of America, Ltd. | 32,114 | 130,587 | |||
#Superior Plus Corp. | 164,325 | 1,869,452 | |||
#Toromont Industries, Ltd. | 214,900 | 4,917,447 | |||
Transat A.T., Inc. Class A | 2,400 | 31,784 | |||
Transcontinental, Inc. Class A | 256,564 | 3,080,048 | |||
TransForce, Inc. | 34,212 | 233,023 | |||
#*Vector Aerospace Corp. | 83,205 | 469,833 | |||
*WaterFurnace Renewable Energy, Inc. | 1,300 | 29,819 | |||
Total Industrials | 28,829,126 | ||||
Information Technology — (5.4%) | |||||
*Aastra Technologies, Ltd. | 2,300 | 66,425 | |||
*Absolute Software Corp. | 159,900 | 755,131 | |||
*AXIA NetMedia Corp. | 182,767 | 234,782 | |||
Calian Technologies, Ltd. | 9,800 | 158,495 | |||
*Celestica, Inc. | 797,607 | 6,575,162 | |||
*COM DEV International, Ltd. | 235,300 | 667,595 | |||
Computer Modelling Group, Ltd. | 42,400 | 609,717 | |||
Constellation Software, Inc. | 20,100 | 664,087 | |||
Dalsa Corp. | 59,800 | 387,411 | |||
100
THE CANADIAN SMALL COMPANY SERIES
CONTINUED
| Shares | Value†† | ||||
Information Technology — (Continued) | |||||
*Descartes Systems Group, Ltd. (The) | 142,300 | $ | 737,769 | ||
Enghouse Systems, Ltd. | 27,550 | 173,134 | |||
Evertz Technologies, Ltd. | 116,100 | 1,565,454 | |||
*Exfo Electro-Optical Engineering, Inc. | 21,451 | 78,306 | |||
Gennum Corp. | 111,700 | 437,695 | |||
*Hemisphere GPS, Inc. | 197,900 | 173,749 | |||
*KAB Distribution, Inc. | 298,515 | 538 | |||
#*MacDonald Dettweiler & Associates, Ltd. | 129,900 | 4,429,842 | |||
*March Networks Corp. | 29 | 103 | |||
#Matrikon, Inc. | 72,400 | 184,003 | |||
*Miranda Technologies, Inc. | 84,301 | 441,742 | |||
MKS, Inc. | 11,060 | 93,525 | |||
Mosaid Technologies, Inc. | 35,600 | 541,213 | |||
*Open Text Corp. | 46,790 | 1,746,977 | |||
*Points International, Ltd. | 355,081 | 108,291 | |||
*Sandvine Corp. | 128,500 | 149,633 | |||
*Sierra Wireless, Inc. | 127,100 | 1,142,907 | |||
*Vecima Network, Inc. | 39,308 | 198,711 | |||
#*Webtech Wireless, Inc. | 279,500 | 258,306 | |||
Wi-LAN, Inc. | 320,200 | 645,105 | |||
*Zarlink Semiconductor, Inc. | 117,500 | 83,614 | |||
Total Information Technology | 23,309,422 | ||||
Materials — (29.5%) | |||||
*Alamos Gold, Inc. | 347,100 | 2,771,539 | |||
*Almaden Minerals, Ltd. | 108,300 | 73,064 | |||
*Altius Minerals Corp. | 112,600 | 704,498 | |||
*Anatolia Minerals Development, Ltd. | 10,400 | 20,568 | |||
#*Anvil Mining, Ltd. | 214,740 | 597,354 | |||
#*Aquiline Resources, Inc. | 224,900 | 1,220,057 | |||
*Athabasca Potash, Inc. | 3,750 | 20,447 | |||
*Atna Resource, Ltd. | 126,947 | 87,991 | |||
*Augusta Resource Corp. | 268,174 | 674,122 | |||
*Aura Minerals, Inc. | 31,000 | 90,245 | |||
*Aurizon Mines, Ltd. | 561,000 | 2,410,841 | |||
*Avalon Rare Metals, Inc. | 13,900 | 32,243 | |||
Canam Group, Inc. Class A | 158,700 | 1,013,462 | |||
*Canfor Corp. | 330,690 | 1,848,967 | |||
*Capstone Mining Corp. | 308,865 | 833,497 | |||
*Cardero Resource Corp. | 185,860 | 212,991 | |||
Cascades, Inc. | 235,076 | 1,520,754 | |||
*Catalyst Paper Corp. | 1,675,887 | 410,434 | |||
CCL Industries, Inc. Class B | 95,640 | 1,985,190 | |||
#*Centerra Gold, Inc. | 71,791 | 550,682 | |||
*Chariot Resouces, Ltd. | 34,500 | 9,565 | |||
*Claude Resources, Inc. | 1,133,600 | 806,684 | |||
*Consolidated Thompson Iron Mines, Ltd. | 343,016 | 1,585,028 | |||
#*Crystallex International Corp. | 1,355,025 | 300,546 | |||
#*Detour Gold Corp. | 63,241 | 780,248 | |||
*Dundee Precious Metals, Inc. | 223,854 | 746,835 | |||
*Eastern Platinum, Ltd. | 2,320,390 | 1,543,996 | |||
#*Eastmain Resources, Inc. | 231,714 | 278,387 | |||
#*ECU Silver Mining, Inc. | 108,050 | 71,897 | |||
#*Endeavour Silver Corp. | 147,700 | 395,850 | |||
#*Entree Gold, Inc. | 261,600 | 635,838 | |||
#*Equinox Minerals, Ltd. | 1,678,290 | 5,645,742 | |||
*Etruscan Resources, Inc. | 333,375 | 152,507 | |||
#*Euro Goldfields, Ltd. | 521,060 | 2,937,448 | |||
#*Far West Mining, Ltd. | 153,396 | 440,887 | |||
*Farallon Mining, Ltd. | 987,400 | 428,888 | |||
#*First Majestic Silver Corp. | 18,500 | 53,685 | |||
101
THE CANADIAN SMALL COMPANY SERIES
CONTINUED
| Shares | Value†† | ||||
Materials — (Continued) | |||||
*First Nickel, Inc. | 300 | $ | 30 | ||
*First Uranium Corp. | 51,430 | 128,331 | |||
*FNX Mining Co., Inc. | 182,850 | 1,701,677 | |||
#*Forsys Metals Corp. | 199,402 | 689,214 | |||
*Fronteer Development Group, Inc. | 325,800 | 1,240,512 | |||
*Gammon Gold, Inc. | 219,740 | 1,785,051 | |||
*Globestar Mining Corp. | 296,306 | 243,715 | |||
#*Golden Star Resources, Ltd. | 855,400 | 2,664,108 | |||
*Grande Cache Coal Corp. | 245,800 | 847,312 | |||
#*Great Basin Gold, Ltd. | 860,590 | 1,264,579 | |||
#*Greystar Resources, Ltd. | 34,500 | 146,666 | |||
#*Guyana Goldfields, Inc. | 187,452 | 968,400 | |||
*Hanfeng Evergreen, Inc. | 142,791 | 785,182 | |||
#Harry Winston Diamond Corp. | 219,100 | 1,796,051 | |||
*HudBay Minerals, Inc. | 477,851 | 6,187,045 | |||
#*Imperial Metals Corp. | 69,090 | 359,481 | |||
*Inter-Citic Minerals, Inc. | 26,125 | 19,074 | |||
*International Forest Products, Ltd. Series A | 166,200 | 460,792 | |||
International Royalty Corp. | 280,680 | 1,063,526 | |||
*Intertape Polymer Group, Inc. | 117,000 | 203,281 | |||
#*Jaguar Mining, Inc. | 74,850 | 626,027 | |||
#*Jinshan Gold Mines, Inc. | 490,000 | 797,006 | |||
*Katanga Mining, Ltd. | 7,000 | 4,723 | |||
*Keegan Resources, Inc. | 13,000 | 61,032 | |||
*Kimber Resources, Inc. | 21,200 | 12,735 | |||
*Kirkland Lake Gold, Inc. | 187,280 | 1,453,863 | |||
*La Mancha Resources, Inc. | 64,250 | 100,943 | |||
#*Lake Shore Gold Corp. | 474,700 | 1,500,369 | |||
#*Laramide Resources, Ltd. | 241,000 | 285,088 | |||
*Linear Gold Corp. | 3,600 | 6,721 | |||
*Lundin Mining Corp. | 1,147,100 | 4,611,511 | |||
*MAG Silver Corp. | 7,300 | 38,387 | |||
Major Drilling Group International, Inc. | 101,500 | 2,024,278 | |||
#*MDN, Inc. | 242,980 | 130,242 | |||
*Mercator Minerals, Ltd. | 31,605 | 71,269 | |||
Methanex Corp. | 359,200 | 6,194,420 | |||
#*Migao Corp. | 160,400 | 999,118 | |||
*Minco Base Metals Corp. | 2,780 | — | |||
*Minera Andes, Inc. | 107,500 | 63,583 | |||
*Neo Material Technologies, Inc. | 384,000 | 1,224,343 | |||
#*New Gold, Inc. | 725,960 | 2,629,974 | |||
Norbord, Inc. | 30,920 | 425,488 | |||
*Norsemont Mining, Inc. | 16,500 | 32,023 | |||
#*North American Palladium, Ltd. | 199,710 | 479,872 | |||
*Northern Dynasty Minerals, Ltd. | 13,400 | 87,926 | |||
*Northgate Minerals Corp. | 937,300 | 2,399,446 | |||
#*NovaGold Resources, Inc. | 282,049 | 1,206,864 | |||
*Orvana Minerals Corp. | 118,300 | 92,930 | |||
#*Osisko Mining Corp. | 522,931 | 3,527,930 | |||
*Pan Amer Silver Corp. | 213,700 | 4,520,672 | |||
*Peregrine Diamonds, Ltd. | 15,300 | 33,229 | |||
*Petaquilla Minerals, Ltd. | 257,380 | 64,223 | |||
#*Platinum Group Metals, Ltd. | 189,187 | 293,733 | |||
*Polaris Miner Corp. | 16,700 | 27,626 | |||
#*PolyMet Mining Corp. | 423,377 | 1,111,215 | |||
*Potash One, Inc. | 37,400 | 86,410 | |||
#*Quadra Mining, Ltd. | 253,150 | 3,528,027 | |||
#*Queenston Mining, Inc. | 169,669 | 870,258 | |||
*Richmont Mines, Inc. | 24,000 | 64,988 | |||
#*Rubicon Minerals Corp. | 462,115 | 1,862,041 | |||
Samuel Manu-Tech, Inc. | 20,400 | 82,388 | |||
102
THE CANADIAN SMALL COMPANY SERIES
CONTINUED
| Shares | Value†† | |||||
Materials — (Continued) | ||||||
*Seabridge Gold, Inc. | 38,186 | $ | 767,567 | |||
*SEMAFO, Inc. | 689,365 | 2,089,661 | ||||
Sherritt International Corp. | 641,601 | 4,115,069 | ||||
#*Shore Gold, Inc. | 837,013 | 696,189 | ||||
*Silver Standard Resources, Inc. | 229,462 | 4,300,623 | ||||
#Silvercorp Metals, Inc. | 482,000 | 2,490,070 | ||||
*St. Andrew Goldfields, Ltd. | 11,500 | 5,314 | ||||
*Starfield Resources, Inc. | 953,115 | 92,488 | ||||
Stella-Jones, Inc. | 29,600 | 590,878 | ||||
*Tahera Diamond Corp. | 235,400 | 1,088 | ||||
#*Tanzanian Royalty Exploration Corp. | 316,139 | 914,482 | ||||
*Taseko Mines, Ltd. | 649,000 | 1,757,377 | ||||
#*Thompson Creek Metals Co., Inc. | 474,700 | 4,795,038 | ||||
#*Timminco, Ltd. | 194,700 | 331,083 | ||||
*Virginia Mines, Inc. | 29,800 | 139,629 | ||||
Wesdome Gold Mines, Ltd. | 99,000 | 185,731 | ||||
#West Fraser Timber Co., Ltd. | 123,716 | 2,984,139 | ||||
*West Timmins Mining, Inc. | 269,700 | 623,123 | ||||
*Western Coal Corp. | 124,100 | 321,131 | ||||
Winpak, Ltd. | 63,110 | 445,016 | ||||
Total Materials | 127,725,621 | |||||
Telecommunication Services — (0.3%) | ||||||
#Manitoba Telecom Services, Inc. | 40,000 | 1,161,129 | ||||
*Wireless Matrix Corp. | 127,500 | 110,762 | ||||
Total Telecommunication Services | 1,271,891 | |||||
Utilities — (0.4%) | ||||||
*Boralex, Inc. Class A | 81,274 | 668,489 | ||||
Emera, Inc. | 19,090 | 388,663 | ||||
*MAXIM Power Corp. | 89,500 | 288,670 | ||||
Pacific Northern Gas, Ltd. | 4,000 | 68,832 | ||||
#*Plutonic Power Corp. | 66,800 | 188,291 | ||||
Total Utilities | 1,602,945 | |||||
TOTAL COMMON STOCKS | 363,147,757 | |||||
| Face Amount | Value† | |||||
| (000) | ||||||
TEMPORARY CASH INVESTMENTS — (0.2%) | ||||||
Repurchase Agreement, PNC Capital Markets, Inc. 0.19%, 11/02/09 (Collateralized by $1,075,000 FHLMC 4.50%, 05/01/23, valued at $912,187) to be repurchased at $896,014 | $ | 896 | 896,000 | |||
| Shares/ Face Amount | ||||||
| (000) | ||||||
SECURITIES LENDING COLLATERAL — (15.8%) | ||||||
§@DFA Short Term Investment Fund LP | 62,142,299 | 62,142,299 | ||||
@Repurchase Agreement, Deutsche Bank Securities 0.05%, 11/02/09 (Collateralized by $5,049,431 U.S. Treasury Note 0.875%, 01/31/11, valued at $5,028,666) to be repurchased at $4,979,736 | $ | 4,980 | 4,979,715 | |||
103
THE CANADIAN SMALL COMPANY SERIES
CONTINUED
| Shares/ Face Amount | Value† | |||||
| (000) | ||||||
@Repurchase Agreement, Deutsche Bank Securities 0.07%, 11/02/09 (Collateralized by various corporate obligations, ranging in par value from $4,247,617 to $16,429,280, rates ranging from 5.000% to 7.000%, maturities ranging from 03/01/37 to 10/01/39, valued at $1,434,975) to be repurchased at $1,406,846 | $ | 1,407 | $ | 1,406,838 | ||
TOTAL SECURITIES LENDING COLLATERAL | 68,528,852 | |||||
TOTAL INVESTMENTS — (100.0%) | $ | 432,572,609 | ||||
See accompanying Notes to Financial Statements.
104
THE EMERGING MARKETS SERIES
SCHEDULE OF INVESTMENTS
October 31, 2009
| Shares | Value��† | ||||
COMMON STOCKS — (82.9%) | |||||
ARGENTINA — (0.1%) | |||||
*Petrobras Energia Participaciones SA ADR | 106,144 | $ | 1,818,247 | ||
BRAZIL — (5.8%) | |||||
#*BRF - Brasil Foods SA ADR | 173,299 | 8,382,473 | |||
Companhia de Bebidas das Americas | 66,744 | 5,076,651 | |||
Companhia Siderurgica Nacional SA | 367,276 | 12,132,034 | |||
CPFL Energia SA | 1,935 | 33,887 | |||
*Empresa Brasileira de Aeronautica SA ADR | 130,800 | 2,648,700 | |||
Itau Unibanco Holding SA ADR | 271,347 | 5,193,580 | |||
Petroleo Brasilerio SA ADR (71654V101) | 1,256,219 | 50,399,506 | |||
Petroleo Brasilerio SA ADR (71654V408) | 914,546 | 42,270,316 | |||
Souza Cruz SA | 95,874 | 3,402,613 | |||
Tele Norte Leste Participacoes SA | 59,254 | 1,335,368 | |||
Tractebel Energia SA | 140,100 | 1,709,894 | |||
Vivo Participacoes SA | 16,288 | 401,282 | |||
Vivo Participacoes SA ADR | 2,500 | 60,625 | |||
Weg Industrias SA | 278,866 | 2,738,636 | |||
TOTAL BRAZIL | 135,785,565 | ||||
CHILE — (1.7%) | |||||
#Banco de Chile Series F ADR | 47,993 | 2,231,654 | |||
Banco Santander Chile SA ADR | 68,948 | 3,629,423 | |||
Colbun SA | 1,731,270 | 407,588 | |||
Compania Cervecerias Unidas SA ADR | 53,246 | 1,885,973 | |||
#Embotelladora Andina SA Series A ADR | 26,368 | 395,520 | |||
#Embotelladora Andina SA Series B ADR | 41,533 | 757,977 | |||
Empresa Nacional de Electricidad SA Sponsored ADR | 207,763 | 9,534,244 | |||
Empresas Copec SA | 20,500 | 275,911 | |||
Enersis SA Sponsored ADR | 487,951 | 8,626,974 | |||
#Lan Airlines SA Sponsored ADR | 264,595 | 3,548,219 | |||
Masisa SA | 165,507 | 24,551 | |||
Sociedad Quimica y Minera de Chile SA Sponsored ADR | 169,117 | 6,215,050 | |||
#Vina Concha Y Toro SA Sponsored ADR | 28,665 | 1,221,129 | |||
TOTAL CHILE | 38,754,213 | ||||
CHINA — (9.4%) | |||||
*Air China, Ltd. | 262,000 | 141,822 | |||
Alibaba.com, Ltd. | 59,500 | 137,388 | |||
#*Aluminum Corp. of China, Ltd. ADR | 26,300 | 715,360 | |||
#Angang Steel Co., Ltd. | 142,000 | 262,465 | |||
Anhui Conch Cement Co., Ltd. | 72,000 | 465,864 | |||
Bank of China, Ltd. | 56,691,000 | 32,598,740 | |||
Bank of Communications Co., Ltd. | 1,206,000 | 1,443,515 | |||
*Beijing Capital International Airport Co., Ltd. | 3,368,000 | 2,264,943 | |||
Beijing Enterprises Holdings, Ltd. | 50,000 | 298,021 | |||
Belle International Holdings, Ltd. | 1,948,000 | 1,969,215 | |||
#*Byd Co., Ltd. | 395,886 | 3,629,462 | |||
China Citic Bank | 932,000 | 695,295 | |||
China Coal Energy Co. | 356,000 | 492,608 | |||
China Communications Construction Co., Ltd. | 502,000 | 540,323 | |||
China Construction Bank Corp. | 9,048,000 | 7,800,567 | |||
#China COSCO Holdings Co., Ltd. | 415,500 | 511,585 | |||
China High Speed Transmission Equipment Group Co., Ltd. | 523,000 | 1,048,871 | |||
#China Life Insurance Co., Ltd. ADR | 250,705 | 17,200,870 | |||
China Merchants Bank Co., Ltd. | 1,078,350 | 2,758,788 | |||
China Merchants Holdings (International) Co., Ltd. | 133,652 | 427,103 | |||
China Mobile, Ltd. Sponsored ADR | 696,697 | 32,556,651 | |||
China National Building Material Co., Ltd. | 72,000 | 154,950 | |||
105
THE EMERGING MARKETS SERIES
CONTINUED
| Shares | Value†† | ||||
CHINA — (Continued) | |||||
China Oilfield Services, Ltd. | 168,000 | $ | 181,527 | ||
China Overseas Land & Investment, Ltd. | 1,550,000 | 3,341,659 | |||
China Petroleum and Chemical Corp. (Sinopec) ADR | 41,800 | 3,526,248 | |||
*China Power International Development, Ltd. | 839,000 | 232,111 | |||
*China Railway Construction Corp., Ltd. | 116,500 | 154,128 | |||
*China Railway Group, Ltd. | 441,000 | 346,625 | |||
China Resources Enterprise, Ltd. | 2,219,000 | 7,445,893 | |||
China Resources Land, Ltd. | 748,000 | 1,803,752 | |||
China Resources Power Holdings Co., Ltd. | 920,000 | 1,910,581 | |||
China Shenhua Energy Co., Ltd. | 786,000 | 3,521,138 | |||
#*China Shipping Container Lines Co., Ltd. | 292,000 | 104,500 | |||
China Shipping Development Co., Ltd. | 98,000 | 138,537 | |||
*China Southern Airlines Co., Ltd. ADR | 4,600 | 66,010 | |||
*China Taiping Insurance Holdings Co., Ltd. | 17,000 | 60,024 | |||
#China Telecom Corp., Ltd. ADR | 20,200 | 888,396 | |||
China Travel International Investment Hong Kong, Ltd. | 1,992,000 | 406,637 | |||
China Unicom Hong Kong, Ltd. ADR | 88,800 | 1,123,320 | |||
CITIC Pacific, Ltd. | 1,898,000 | 4,879,271 | |||
*CITIC Resources Holdings, Ltd. | 2,180,000 | 609,934 | |||
CNOOC, Ltd. | 45,000 | 66,721 | |||
#CNOOC, Ltd. ADR | 67,956 | 10,121,367 | |||
#Country Garden Holdings Co. | 2,232,000 | 855,794 | |||
Dalian Port (PDA) Co., Ltd. | 596,000 | 216,320 | |||
Datang International Power Generation Co., Ltd. | 380,000 | 177,571 | |||
Dongfeng Motor Corp. | 204,000 | 242,800 | |||
#*FU JI Food & Catering Services | 289,000 | 283,399 | |||
*GOME Electrical Appliances Holdings, Ltd. | 181,000 | 53,020 | |||
#Guangshen Railway Co., Ltd. Sponsored ADR | 1,400 | 28,070 | |||
Guangzhou R&F Properties Co., Ltd. | 67,200 | 125,921 | |||
Harbin Power Equipment Co., Ltd. | 494,000 | 458,896 | |||
Hengan International Group Co., Ltd. | 36,000 | 231,739 | |||
#HKC (Holdings), Ltd. | 3,062,634 | 240,291 | |||
Hopson Development Holdings, Ltd. | 420,000 | 730,772 | |||
#*Huadian Power International Corp. | 694,000 | 192,726 | |||
#Huaneng Power International, Inc. ADR | 8,800 | 224,488 | |||
*Industrial & Commercial Bank of China, Ltd. | 34,093,000 | 27,124,901 | |||
Jiangsu Express Co., Ltd. | 764,000 | 677,471 | |||
Jiangxi Copper Co., Ltd. | 135,000 | 305,876 | |||
#Lenovo Group, Ltd. | 114,000 | 64,280 | |||
#Li Ning Co., Ltd. | 435,500 | 1,184,311 | |||
#*Maanshan Iron & Steel Co., Ltd. | 124,000 | 74,646 | |||
#PetroChina Co., Ltd. ADR | 115,210 | 13,829,808 | |||
#*PICC Property & Casualty Co., Ltd. | 168,000 | 123,954 | |||
Ping An Insurance (Group) Co. of China, Ltd. | 248,500 | 2,176,260 | |||
#*Semiconductor Manufacturing International Corp. ADR | 255,943 | 619,382 | |||
#Shanghai Electric Group Co., Ltd. | 2,392,000 | 1,123,350 | |||
Shenzhen Expressway Co., Ltd. | 744,000 | 355,210 | |||
Shenzhen International Holdings, Ltd. | 6,415,000 | 448,560 | |||
Shimao Property Holdings, Ltd. | 157,500 | 292,966 | |||
Sino-Ocean Land Holdings, Ltd. | 291,000 | 282,630 | |||
*Sinopec Shanghai Petrochemical Co., Ltd. Sponsored ADR | 1,188 | 46,760 | |||
Sinotrans, Ltd. | 951,000 | 249,261 | |||
Tencent Holdings, Ltd. | 700,600 | 12,199,255 | |||
#Tingyi (Cayman Islands) Holding Corp. | 1,072,000 | 2,391,885 | |||
TPV Technology, Ltd. | 802,000 | 519,091 | |||
Weichai Power Co., Ltd. | 8,000 | 51,766 | |||
Zijin Mining Group Co., Ltd. | 428,000 | 414,277 | |||
#ZTE Corp. | 465,688 | 2,589,343 | |||
TOTAL CHINA | 220,249,835 | ||||
106
THE EMERGING MARKETS SERIES
CONTINUED
| Shares | Value†† | ||||
CZECH REPUBLIC — (1.0%) | |||||
CEZ A.S. | 301,862 | $ | 14,864,947 | ||
Komercni Banka A.S. | 14,663 | 2,875,426 | |||
Telefonica 02 Czech Republic A.S. | 239,489 | 5,642,622 | |||
TOTAL CZECH REPUBLIC | 23,382,995 | ||||
HUNGARY — (1.5%) | |||||
ELMU NYRT | 185 | 28,698 | |||
Magyar Telekom Telecommunications P.L.C. | 665,618 | 2,869,587 | |||
#*MOL Hungarian Oil & Gas NYRT | 100,838 | 8,424,427 | |||
#*OTP Bank NYRT | 618,710 | 17,397,809 | |||
#Richter Gedeon NYRT | 28,511 | 5,937,751 | |||
Tisza Chemical Group NYRT | 40,321 | 645,968 | |||
TOTAL HUNGARY | 35,304,240 | ||||
INDIA — (11.2%) | |||||
*ACC, Ltd. | 43,053 | 677,843 | |||
Adani Enterprises, Ltd. | 51,000 | 769,346 | |||
Aditya Birla Nuvo, Ltd. | 5,819 | 96,679 | |||
Ambuja Cements, Ltd. | 1,162,146 | 2,176,996 | |||
Asea Brown Boveri India, Ltd. | 97,291 | 1,573,395 | |||
Asian Paints, Ltd. | 60,748 | 2,099,916 | |||
Aventis Pharma, Ltd. | 3,628 | 120,838 | |||
Axis Bank, Ltd. | 349,044 | 6,648,124 | |||
Bajaj Auto, Ltd. | 83,940 | 2,476,506 | |||
Bajaj Finserv, Ltd. | 59,835 | 387,988 | |||
Bajaj Holdings & Investment, Ltd. | 37,300 | 382,989 | |||
Bharat Electronics, Ltd. | 7,300 | 221,456 | |||
Bharti Airtel, Ltd. | 852,924 | 5,259,701 | |||
Bosch, Ltd. | 20,203 | 1,807,356 | |||
Cipla, Ltd. | 639,901 | 3,883,604 | |||
Colgate-Palmolive (India), Ltd. | 68,534 | 1,015,777 | |||
Crompton Greaves, Ltd. | 184,828 | 1,484,210 | |||
Cummins India, Ltd. | 37,898 | 299,507 | |||
Dabur India, Ltd. | 308,253 | 987,668 | |||
Divi’s Laboratories, Ltd. | 63,020 | 706,277 | |||
Dr. Reddy’s Laboratories, Ltd. | 128,934 | 2,754,964 | |||
#Dr. Reddy’s Laboratories, Ltd. ADR | 83,498 | 1,814,412 | |||
EIH, Ltd. | 129,641 | 335,943 | |||
Exide Industries, Ltd. | 202,666 | 419,505 | |||
GAIL India, Ltd. | 57,000 | 418,868 | |||
GAIL India, Ltd. Sponsored GDR | 28,791 | 1,280,929 | |||
GlaxoSmithKline Pharmaceuticals, Ltd. | 42,501 | 1,421,145 | |||
Glenmark Pharmaceuticals, Ltd. | 99,187 | 468,235 | |||
Godrej Consumer Products, Ltd. | 109,632 | 627,737 | |||
Grasim Industries, Ltd. | 6,300 | 289,938 | |||
HCL Technologies, Ltd. | 311,688 | 1,996,102 | |||
HDFC Bank, Ltd. | 386,733 | 13,175,290 | |||
Hero Honda Motors, Ltd. Series B | 158,834 | 5,246,290 | |||
Hindustan Unilever, Ltd. | 1,633,609 | 9,748,048 | |||
ICICI Bank, Ltd. Sponsored ADR | 88,726 | 2,790,433 | |||
Infosys Technologies, Ltd. | 657,429 | 30,520,259 | |||
Infosys Technologies, Ltd. Sponsored ADR | 233,496 | 10,740,816 | |||
Infrastructure Development Finance Co., Ltd. | 1,931 | 5,959 | |||
ITC, Ltd. | 2,007,345 | 10,823,298 | |||
Jindal Steel & Power, Ltd. | 627,060 | 8,432,190 | |||
JSW Steel, Ltd. | 106,526 | 1,688,039 | |||
Jubilant Organosys, Ltd. | 66,060 | 326,175 | |||
Larsen & Toubro, Ltd. | 371,281 | 12,248,925 | |||
Lupin, Ltd. | 44,351 | 1,149,244 | |||
Mahanagar Telephone Nigam, Ltd. | 130,940 | 190,092 | |||
Mahindra & Mahindra, Ltd. | 254,183 | 4,918,411 | |||
107
THE EMERGING MARKETS SERIES
CONTINUED
| Shares | Value†† | ||||
INDIA — (Continued) | |||||
Mangalore Refinery & Petrochemicals, Ltd. | 846,013 | $ | 1,324,041 | ||
Maruti Suzuki India, Ltd. | 129,741 | 3,833,424 | |||
Nirma, Ltd. | 66,235 | 245,854 | |||
*Oracle Financial Services Software, Ltd. | 14,000 | 625,545 | |||
Pantaloon Retail India, Ltd. | 9,760 | 64,289 | |||
*Pantaloon Retail India, Ltd. Class B | 976 | 4,776 | |||
Petronet LNG, Ltd. | 97,953 | 133,402 | |||
Piramal Healthcare, Ltd. | 76,008 | 613,837 | |||
Proctor & Gamble Hygiene & Health Care, Ltd. | 11,227 | 343,654 | |||
*Ranbaxy Laboratories, Ltd. | 213,395 | 1,757,722 | |||
Reliance Capital, Ltd. | 101,317 | 1,584,442 | |||
Reliance Communications, Ltd. | 1,071,955 | 3,953,396 | |||
Reliance Energy, Ltd. | 191,590 | 4,247,845 | |||
*Reliance Industries, Ltd. | 1,030,847 | 41,707,940 | |||
*Reliance Natural Resources, Ltd. | 1,099,793 | 1,474,126 | |||
Satyam Computer Services, Ltd. | 772,898 | 1,671,873 | |||
Sesa Goa, Ltd. | 534,990 | 3,380,627 | |||
Shree Cement, Ltd. | 2,872 | 93,631 | |||
Shriram Transport Finance Co., Ltd. | 2,300 | 19,078 | |||
Siemens India, Ltd. | 153,743 | 1,661,564 | |||
Sterling Biotech, Ltd. | 68,760 | 131,356 | |||
Sterlite Industries (India), Ltd. Series A | 431,495 | 6,977,657 | |||
Sun Pharmaceuticals Industries, Ltd. | 138,878 | 4,050,120 | |||
Sun TV Network, Ltd. | 25,000 | 165,404 | |||
Tata Chemicals, Ltd. | 62,804 | 347,497 | |||
Tata Consultancy Services, Ltd. | 756,974 | 10,030,279 | |||
Tata Power Co., Ltd. | 144,515 | 4,075,894 | |||
Tata Steel, Ltd. | 88,890 | 878,630 | |||
Tata Tea, Ltd. | 8,903 | 161,651 | |||
*Tech Mahindra, Ltd. | 6,379 | 124,774 | |||
Titan Industries, Ltd. | 7,547 | 199,158 | |||
United Phosphorus, Ltd. | 69,388 | 210,431 | |||
United Spirits, Ltd. | 21,912 | 493,446 | |||
Videsh Sanchar Nigam, Ltd. | 75,115 | 614,909 | |||
Wipro, Ltd. | 440,456 | 5,629,808 | |||
Zee Entertainment Enterprises, Ltd. | 402,083 | 1,950,192 | |||
Zydus Wellness, Ltd. | 11,485 | 41,361 | |||
TOTAL INDIA | 261,731,056 | ||||
INDONESIA — (2.2%) | |||||
PT Aneka Tambang Tbk | 2,782,000 | 646,516 | |||
PT Astra Agro Lestari Tbk | 195,500 | 434,005 | |||
PT Astra International Tbk | 4,017,561 | 12,925,685 | |||
*PT Bakrie & Brothers Tbk | 21,200,000 | 215,254 | |||
PT Bank Central Asia Tbk | 9,187,000 | 4,326,175 | |||
PT Bank Danamon Indonesia Tbk | 2,719,740 | 1,268,775 | |||
PT Bank Mandiri Persero Tbk | 2,325,000 | 1,115,662 | |||
*PT Bank Pan Indonesia Tbk | 8,711,500 | 699,402 | |||
PT Bank Rakyat Indonesia Tbk | 1,910,000 | 1,389,902 | |||
PT Bumi Resources Tbk | 15,481,000 | 3,726,858 | |||
PT Gudang Garam Tbk | 56,500 | 83,113 | |||
*PT Holcim Indonesia Tbk | 2,854,500 | 474,620 | |||
*PT Indo Tambangraya Megah Tbk | 179,000 | 417,398 | |||
PT Indocement Tunggal Prakarsa Tbk | 815,500 | 928,583 | |||
PT Indofood Sukses Makmur Tbk | 87,500 | 27,653 | |||
PT Indosat Tbk | 2,332,000 | 1,238,711 | |||
*PT International Nickel Indonesia Tbk | 1,038,000 | 430,157 | |||
PT Kalbe Farma Tbk | 3,591,000 | 450,366 | |||
*PT Lippo Karawaci Tbk | 11,865,250 | 802,615 | |||
*PT Panasia Indosyntec Tbk | 75,100 | 1,848 | |||
*PT Perusahaan Gas Negara Tbk | 100,000 | 37,208 | |||
108
THE EMERGING MARKETS SERIES
CONTINUED
| Shares | Value†† | ||||
INDONESIA — (Continued) | |||||
PT Semen Gresik Tbk | 2,976,500 | $ | 2,103,504 | ||
PT Sinar Mas Agro Resources & Technology Tbk | 1,152,500 | 373,570 | |||
*PT Tambang Batubara Bukit Asam Tbk | 234,500 | 365,322 | |||
PT Telekomunikasi Indonesia Tbk | 14,011,140 | 12,065,191 | |||
PT Unilever Indonesia Tbk | 3,087,000 | 3,228,631 | |||
PT United Tractors Tbk | 648,500 | 994,312 | |||
TOTAL INDONESIA | 50,771,036 | ||||
ISRAEL — (3.6%) | |||||
*Bank Hapoalim B.M. | 1,922,358 | 7,018,046 | |||
*Bank Leumi Le-Israel B.M. | 2,275,389 | 8,886,498 | |||
Bezeq Israeli Telecommunication Corp., Ltd. | 2,044,881 | 4,563,602 | |||
*Clal Industries, Ltd. | 23,420 | 119,479 | |||
*Clal Insurance Enterprise Holdings, Ltd. | 1,996 | 42,255 | |||
Discount Investment Corp. | 32,858 | 772,085 | |||
Elbit Systems, Ltd. | 40,946 | 2,480,757 | |||
IDB Holding Corp., Ltd. | — | 9 | |||
Israel Chemicals, Ltd. | 780,753 | 9,119,540 | |||
Koor Industries, Ltd. | 1 | 15 | |||
Makhteshim-Agan Industries, Ltd. | 245,728 | 1,148,509 | |||
*Migdal Insurance & Financial Holdings, Ltd. | 261,456 | 409,788 | |||
*Mizrahi Tefahot Bank, Ltd. | 141,699 | 1,151,620 | |||
Osem Investment, Ltd. | 33,175 | 430,358 | |||
Partner Communications Co., Ltd. | 115,542 | 2,190,776 | |||
Strauss Group, Ltd. | 6,896 | 89,385 | |||
Teva Pharmaceutical Industries, Ltd. Sponsored ADR | 888,925 | 44,872,934 | |||
TOTAL ISRAEL | 83,295,656 | ||||
MALAYSIA — (4.4%) | |||||
Affin Holdings Berhad | 312,600 | 185,744 | |||
Alliance Financial Group Berhad | 301,700 | 215,568 | |||
AMMB Holdings Berhad | 874,959 | 1,202,999 | |||
*Axiata Group Berhad | 4,359,375 | 3,712,616 | |||
Batu Kawan Berhad | 15,000 | 43,499 | |||
Berjaya Corp. Berhad | 734,800 | 251,736 | |||
Berjaya Sports Toto Berhad | 803,464 | 1,012,749 | |||
Boustead Holdings Berhad | 159,460 | 158,802 | |||
British American Tobacco Malaysia Berhad | 239,100 | 3,140,052 | |||
CIMB Group Holdings Berhad | 3,095,227 | 11,229,284 | |||
Digi.Com Berhad | 495,162 | 3,161,925 | |||
EON Capital Berhad | 175,500 | 286,640 | |||
Fraser & Neave Holdings Berhad | 61,000 | 189,010 | |||
Gamuda Berhad | 805,700 | 735,639 | |||
Genting Berhad | 3,086,500 | 6,488,243 | |||
Genting Malaysia Berhad | 4,928,500 | 3,936,659 | |||
Genting Plantations Berhad | 276,600 | 494,513 | |||
Hong Leong Bank Berhad | 820,150 | 1,793,395 | |||
Hong Leong Financial Group Berhad | 548,429 | 992,196 | |||
IJM Corp. Berhad | 336,560 | 469,447 | |||
IOI Corp. Berhad | 5,328,755 | 8,262,279 | |||
KLCC Property Holdings Berhad | 778,600 | 743,780 | |||
Kuala Lumpur Kepong Berhad | 814,200 | 3,555,718 | |||
Lafarge Malayan Cement Berhad | 259,580 | 458,076 | |||
Malayan Banking Berhad | 780,353 | 1,511,306 | |||
*Malaysian Airlines System Berhad | 599,367 | 542,627 | |||
Malaysian Bulk Carriers Berhad | 63,000 | 57,288 | |||
Malaysian Pacific Industries Berhad | 22,100 | 36,258 | |||
MISC Berhad | 2,124,832 | 5,523,974 | |||
MMC Corp. Berhad | 1,503,800 | 1,089,840 | |||
Nestle (Malaysia) Berhad | 217,200 | 2,112,520 | |||
Oriental Holdings Berhad | 241,300 | 391,152 | |||
109
THE EMERGING MARKETS SERIES
CONTINUED
| Shares | Value†† | ||||
MALAYSIA — (Continued) | |||||
Parkson Holdings Berhad | 182,650 | $ | 270,993 | ||
Petronas Dagangan Berhad | 445,100 | 1,157,880 | |||
Petronas Gas Berhad | 886,800 | 2,534,794 | |||
Plus Expressways Berhad | 2,589,600 | 2,496,163 | |||
PPB Group Berhad | 889,100 | 3,926,339 | |||
Public Bank Berhad (B012W42) | 44,291 | 138,418 | |||
Public Bank Berhad (B012W53) | 1,550,201 | 4,829,053 | |||
RHB Capital Berhad | 525,900 | 825,042 | |||
Sarawak Energy Berhad | 430,200 | 325,623 | |||
Shell Refining Co. Federation of Malaysia Berhad | 227,000 | 710,978 | |||
Sime Darby Berhad | 3,457,620 | 8,940,046 | |||
SP Setia Berhad | 971,150 | 1,092,051 | |||
Star Publications (Malaysia) Berhad | 411,600 | 409,557 | |||
Telekom Malaysia Berhad | 1,816,400 | 1,596,307 | |||
Tenaga Nasional Berhad | 2,121,000 | 5,198,622 | |||
*UEM Land Holdings Berhad | 700,625 | 339,368 | |||
UMW Holdings Berhad | 729,066 | 1,342,730 | |||
YTL Corp. Berhad | 1,449,385 | 3,082,191 | |||
YTL Power International Berhad | 283,040 | 177,857 | |||
TOTAL MALAYSIA | 103,379,546 | ||||
MEXICO — (6.8%) | |||||
#America Movil S.A.B. de C.V. Series L | 17,737,259 | 39,145,222 | |||
#*Carso Global Telecom S.A.B. de C.V. Telecom Series A1 | 1,166,771 | 4,538,511 | |||
*Cementos de Mexico S.A.B de C.V. Series B | 267,800 | 278,271 | |||
*Cemex S.A.B. de C.V. Sponsored ADR | 12,500 | 129,750 | |||
#Coca-Cola Femsa S.A.B. de C.V. Series L | 517,300 | 2,790,276 | |||
*Corporacion Interamericana de Entramiento S.A.B. de C.V. Series B | 28,827 | 14,333 | |||
*Corporacion Mexicana de Restaurantes S.A.B. de C.V. Series B | 1,107 | 246 | |||
Corporativo Fragua S.A.B. de C.V. Series B | 21 | 155 | |||
*Dine S.A.B. de C.V. | 116,965 | 51,822 | |||
El Puerto de Liverpool S.A.B. de C.V. Series C1 | 289,300 | 1,205,074 | |||
Embotelladora Arca S.A.B. de C.V. | 385,803 | 970,077 | |||
*Empresas ICA S.A.B. de C.V. | 50 | 110 | |||
#Fomento Economico Mexicano S.A.B. de C.V. Series B & D | 2,109,900 | 9,132,314 | |||
#*Gruma S.A.B. de C.V. ADR | 82,911 | 591,985 | |||
#Grupo Carso S.A.B. de C.V. Series A-1 | 990,932 | 2,926,922 | |||
#Grupo Elektra S.A. de C.V. | 117,475 | 4,608,694 | |||
*Grupo Financiero Banorte S.A.B. de C.V. | 2,827,109 | 9,035,615 | |||
#Grupo Financiero Inbursa S.A.B. de C.V. Series O | 1,426,864 | 4,020,020 | |||
Grupo Gigante S.A.B. de C.V. Series B | 62,282 | 64,175 | |||
#Grupo Industrial Bimbo S.A.B. de C.V. Series A | 626,600 | 3,649,383 | |||
Grupo Industrial Maseca S.A.B. de C.V. Series B | 229,000 | 155,919 | |||
*Grupo Kuo S.A.B. de C.V. Series B | 68 | 44 | |||
#*Grupo Mexico S.A.B. de C.V. Series B | 9,098,785 | 18,192,402 | |||
#*Grupo Modelo S.A.B. de C.V. Series C | 924,700 | 4,197,086 | |||
*Grupo Nutrisa S.A. de C.V. | 129 | 274 | |||
*Grupo Qumma S.A. de C.V. Series B | 1,591 | 22 | |||
Grupo Televisa S.A. de C.V. | 1,704,800 | 6,604,224 | |||
Grupo Televisa S.A. de C.V. Sponsored ADR | 109,820 | 2,126,115 | |||
#*Impulsora Del Desarrollo Y El Empleo en America Latina S.A. de C.V. | 2,945,976 | 2,855,893 | |||
#Industrias Penoles S.A.B. de C.V. | 194,550 | 3,552,623 | |||
#Kimberly Clark de Mexico S.A.B. de C.V. Series A | 690,100 | 2,733,483 | |||
#*Organizacion Soriana S.A.B. de C.V. Series B | 2,134,000 | 4,720,942 | |||
*Promotora y Operadora de Infraestructura S.A. de C.V. | 2,085 | 3,790 | |||
*Savia S.A. de C.V. | 120,000 | 7,271 | |||
Telefonos de Mexico S.A. de C.V. Series A | 200,000 | 166,619 | |||
#Telefonos de Mexico S.A.B. de C.V. | 9,705,800 | 8,093,220 | |||
Telmex Internacional S.A.B. de C.V. (B39SQ41) | 200,000 | 131,781 | |||
#Telmex Internacional S.A.B. de C.V. (B39SR26) | 9,705,800 | 6,527,502 | |||
Telmex Internacional S.A.B. de C.V. ADR | 30,200 | 406,492 | |||
110
THE EMERGING MARKETS SERIES
CONTINUED
| Shares | Value†† | ||||
MEXICO — (Continued) | |||||
#Wal-Mart de Mexico S.A.B. de C.V. Series V | 4,372,680 | $ | 15,250,358 | ||
TOTAL MEXICO | 158,879,015 | ||||
PHILIPPINES — (0.6%) | |||||
Aboitiz Equity Ventures, Inc. | 2,671,000 | 461,066 | |||
*Aboitiz Power Corp. | 530,000 | 82,355 | |||
Ayala Corp. Series A | 313,453 | 1,896,672 | |||
Ayala Land, Inc. | 9,214,518 | 1,992,395 | |||
Banco de Oro Unibank, Inc. | 1,292,908 | 938,466 | |||
Bank of the Philippine Islands | 2,320,456 | 2,257,761 | |||
*Energy Development Corp. | 1,212,500 | 104,718 | |||
*Filipina Water Bottling Corp. | 2,006,957 | — | |||
*Jollibee Food Corp. | 65,000 | 69,146 | |||
Metro Bank & Trust Co. | 257,100 | 217,483 | |||
Philippine Long Distance Telephone Co. | 95,200 | 5,116,460 | |||
Robinson’s Land Corp. Series B | 183,100 | 46,494 | |||
SM Prime Holdings, Inc. | 508,168 | 105,375 | |||
TOTAL PHILIPPINES | 13,288,391 | ||||
POLAND — (1.3%) | |||||
Asseco Poland SA | 29,080 | 584,279 | |||
*Bank Handlowy w Warszawie SA | 17,748 | 389,219 | |||
*Bank Pekao SA | 163,030 | 8,750,507 | |||
*Bank Przemyslowo Handlowy BPH SA | 2,029 | 48,398 | |||
*Bank Zackodni WBK SA | 37,228 | 1,987,437 | |||
Browary Zywiec SA | 13,634 | 2,291,069 | |||
*Getin Holdings SA | 100,000 | 284,600 | |||
KGHM Polska Miedz SA | 61,000 | 2,053,300 | |||
*Kredyt Bank SA | 88,259 | 370,012 | |||
*Mondi Packaging Paper Swiecie SA | 26,883 | 656,504 | |||
*PBG SA | 5,605 | 436,581 | |||
*Polski Koncern Naftowy Orlen SA | 267,237 | 2,781,598 | |||
Polskie Gornictwo Naftowe I Gazownictwo SA | 718,661 | 875,101 | |||
Powszechna Kasa Oszczednosci Bank Polski SA | 220,087 | 2,607,810 | |||
Telekomunikacja Polska SA | 1,112,400 | 6,528,358 | |||
TVN SA | 35,681 | 176,819 | |||
TOTAL POLAND | 30,821,592 | ||||
RUSSIA — (0.6%) | |||||
*Gazprom OAO Sponsored ADR | 176,802 | 4,240,075 | |||
*Gazpromneft JSC Sponsored ADR | 3,783 | 98,021 | |||
*Lukoil OAO Sponsored ADR | 66,901 | 3,881,038 | |||
*Magnitogorsk Iron & Steel Works Sponsored GDR | 7,844 | 74,105 | |||
*MMC Norilsk Nickel JSC ADR | 62,016 | 814,674 | |||
*Novolipetsk Steel OJSC GDR | 8,565 | 223,086 | |||
*Novorossiysk Sea Trade Port GDR | 137 | 1,562 | |||
*Polymetal GDR | 3,453 | 30,451 | |||
*Rosneft Oil Co. GDR | 214,884 | 1,633,941 | |||
*RusHydro Sponsored ADR | 58,025 | 206,569 | |||
*Severstal GDR | 40,100 | 289,256 | |||
*Surgutneftegaz Sponsored ADR | 88,866 | 784,306 | |||
*Tatneft Sponsored ADR | 18,577 | 481,087 | |||
*TMK OAO GDR | 10,067 | 181,859 | |||
*Uralkali Sponsored GDR | 14,556 | 327,635 | |||
*VTB Bank OJSC GDR | 83,338 | 331,709 | |||
TOTAL RUSSIA | 13,599,374 | ||||
SINGAPORE — (0.0%) | |||||
*Genting Singapore P.L.C. | 672,420 | 513,710 | |||
111
THE EMERGING MARKETS SERIES
CONTINUED
| Shares | Value†† | ||||
SOUTH AFRICA — (8.2%) | |||||
ABSA Group, Ltd. | 362,514 | $ | 5,832,653 | ||
Adcock Ingram Holdings, Ltd. | 5,100 | 34,703 | |||
African Bank Investments, Ltd. | 318,206 | 1,228,688 | |||
African Rainbow Minerals, Ltd. | 277,277 | 5,368,620 | |||
*Anglo American Platinum Corp., Ltd. | 114,526 | 9,954,766 | |||
#AngloGold Ashanti, Ltd. Sponsored ADR | 197,922 | 7,429,992 | |||
ArcelorMittal South Africa, Ltd. | 330,893 | 4,452,959 | |||
*Aspen Pharmacare Holdings, Ltd. | 37,154 | 313,129 | |||
Aveng, Ltd. | 49,466 | 262,341 | |||
Barloworld, Ltd. | 4,883 | 30,445 | |||
Bidvest Group, Ltd. | 182,111 | 2,851,668 | |||
Data Tec, Ltd. | 10,700 | 39,054 | |||
Discovery Holdings, Ltd. | 391,199 | 1,531,869 | |||
Exxaro Resources, Ltd. | 83,898 | 937,185 | |||
FirstRand, Ltd. | 1,540,707 | 3,444,914 | |||
Freeworld Coatings, Ltd. | 117,583 | 131,598 | |||
Gold Fields, Ltd. Sponsored ADR | 425,086 | 5,419,846 | |||
Harmony Gold Mining Co., Ltd. | 387,997 | 3,879,325 | |||
Harmony Gold Mining Co., Ltd. Sponsored ADR | 389,769 | 3,882,099 | |||
Impala Platinum Holdings, Ltd. | 478,692 | 10,402,919 | |||
Investec, Ltd. | 118,615 | 877,719 | |||
Kumba Iron Ore, Ltd. | 15,092 | 451,320 | |||
Liberty Holdings, Ltd. | 209,134 | 1,808,161 | |||
Massmart Holdings, Ltd. | 124,452 | 1,437,809 | |||
Mondi, Ltd. | 11,693 | 65,843 | |||
MTN Group, Ltd. | 1,659,950 | 24,715,390 | |||
Murray & Roberts Holdings, Ltd. | 107,838 | 749,834 | |||
Naspers, Ltd. Series N | 324,237 | 11,698,218 | |||
Nedbank Group, Ltd. | 54,403 | 840,133 | |||
Network Healthcare Holdings, Ltd. | 374,194 | 553,217 | |||
Pick’n Pay Stores, Ltd. | 288,558 | 1,515,842 | |||
Pretoria Portland Cement Co., Ltd. | 753,899 | 3,205,776 | |||
PSG Group, Ltd. | 189,027 | 530,740 | |||
Sanlam, Ltd. | 961,639 | 2,638,963 | |||
#Sasol, Ltd. Sponsored ADR | 1,270,370 | 47,499,134 | |||
Shoprite Holdings, Ltd. | 596,920 | 4,864,260 | |||
#Standard Bank Group, Ltd. | 843,110 | 10,570,537 | |||
Steinhoff International Holdings, Ltd. | 694,492 | 1,678,287 | |||
*Super Group, Ltd. | 513,680 | 40,380 | |||
Telkom South Africa, Ltd. | 521,362 | 2,921,082 | |||
Tiger Brands, Ltd. | 76,245 | 1,511,714 | |||
Truworths International, Ltd. | 138,004 | 790,579 | |||
*Vodacom Group Pty, Ltd. | 521,362 | 3,615,051 | |||
TOTAL SOUTH AFRICA | 192,008,762 | ||||
SOUTH KOREA — (11.5%) | |||||
Amorepacific Corp. | 3,527 | 2,434,041 | |||
Cheil Industrial, Inc. | 20,690 | 771,898 | |||
#Daewoo Engineering & Construction Co., Ltd. | 207,178 | 2,110,624 | |||
#Daewoo International Corp. | 47,246 | 1,290,461 | |||
Daewoo Securities Co., Ltd. | 103,195 | 1,567,960 | |||
#Daewoo Shipbuilding & Marine Engineering Co., Ltd. | 142,290 | 1,871,598 | |||
#Doosan Heavy Industries & Construction Co., Ltd. | 14,950 | 802,291 | |||
#Doosan Infracore Co., Ltd. | 82,000 | 1,166,820 | |||
#Glovis Co., Ltd. | 6,360 | 554,620 | |||
*GS Engineering & Construction Corp. | 27,320 | 2,395,751 | |||
GS Holdings Corp. | 42,945 | 1,063,760 | |||
Hana Financial Group, Inc. | 112,261 | 3,329,396 | |||
Hankook Tire Manufacturing Co., Ltd. | 84,420 | 1,613,639 | |||
#Hite Brewery Co., Ltd. | 6,098 | 829,741 | |||
#*Hynix Semiconductor, Inc. | 163,310 | 2,424,588 | |||
112
THE EMERGING MARKETS SERIES
CONTINUED
| Shares | Value†† | ||||
SOUTH KOREA — (Continued) | |||||
Hyundai Department Store Co., Ltd. | 3,893 | $ | 372,113 | ||
#Hyundai Development Co. | 33,870 | 1,002,429 | |||
#Hyundai Heavy Industries Co., Ltd. | 49,890 | 6,833,593 | |||
#Hyundai Merchant Marine Co., Ltd. | 24,600 | 504,302 | |||
Hyundai Mobis | 53,070 | 7,076,531 | |||
#Hyundai Motor Co., Ltd. | 95,919 | 8,700,283 | |||
Hyundai Securities Co., Ltd. | 18,410 | 209,021 | |||
Hyundai Steel Co. | 58,560 | 3,720,090 | |||
*Industrial Bank of Korea, Ltd. | 78,210 | 947,488 | |||
Kangwon Land, Inc. | 150,410 | 2,009,728 | |||
*KB Financial Group, Inc. | 139,085 | 6,689,974 | |||
#KCC Corp. | 7,410 | 2,136,122 | |||
#*Kia Motors Corp. | 225,130 | 3,343,977 | |||
*Korea Electric Power Corp. | 295,290 | 8,367,346 | |||
Korea Exchange Bank | 200,200 | 2,275,087 | |||
Korea Gas Corp. | 35,793 | 1,510,254 | |||
Korea Investment Holdings Co., Ltd. | 6,730 | 179,486 | |||
KT Corp. | 195,930 | 6,386,780 | |||
KT&G Corp. | 103,590 | 6,032,838 | |||
LG Chemical, Ltd. | 32,392 | 5,582,128 | |||
#LG Corp. | 129,413 | 7,331,661 | |||
*LG Display Co., Ltd. ADR | 128,466 | 1,528,745 | |||
#LG Electronics, Inc. | 88,910 | 8,265,115 | |||
#*LG Hausys, Ltd. | 4,382 | 438,083 | |||
#LG Household & Healthcare Co., Ltd. | 5,120 | 1,063,382 | |||
*LG Telecom, Ltd. | 44,600 | 334,154 | |||
#Lotte Confectionary Co., Ltd. | 315 | 316,777 | |||
*LS Industrial Systems Co., Ltd. | 1,000 | 74,910 | |||
Macquarie Korea Infrastructure Fund | 75,002 | 315,776 | |||
*Mirae Asset Securities Co., Ltd. | 7,275 | 380,272 | |||
#*NCsoft Corp. | 4,529 | 484,356 | |||
*OCI Co., Ltd. | 780 | 137,033 | |||
POSCO | 46,060 | 19,088,540 | |||
S1 Corp. | 3,130 | 125,286 | |||
Samsung Card Co., Ltd. | 23,720 | 939,781 | |||
Samsung Corp. | 100,930 | 4,107,927 | |||
#Samsung Electro-Mechanics Co., Ltd. | 37,767 | 3,140,135 | |||
#Samsung Electronics Co., Ltd. | 97,139 | 58,451,752 | |||
*Samsung Electronics Co., Ltd. GDR | 49,372 | 14,972,842 | |||
#*Samsung Engineering Co., Ltd. | 6,628 | 586,001 | |||
Samsung Fire & Marine Insurance, Ltd. | 35,022 | 6,376,598 | |||
#Samsung Heavy Industries Co., Ltd. | 126,000 | 2,383,568 | |||
Samsung SDI Co., Ltd. | 20,352 | 2,323,439 | |||
Samsung Securities Co., Ltd. | 33,780 | 1,655,772 | |||
*Samsung Techwin Co., Ltd. | 7,702 | 589,756 | |||
*Shinhan Financial Group Co., Ltd. | 218,686 | 8,297,155 | |||
Shinhan Financial Group Co., Ltd. ADR | 16,770 | 1,268,650 | |||
Shinsegae Co., Ltd. | 12,596 | 5,438,180 | |||
#SK Co., Ltd. | 21,194 | 1,681,277 | |||
SK Energy Co., Ltd. | 51,889 | 4,765,922 | |||
SK Telecom Co., Ltd. | 56,085 | 8,541,662 | |||
S-Oil Corp. | 47,310 | 2,288,654 | |||
*STX Pan Ocean Co., Ltd. | 30,480 | 277,740 | |||
Woongjin Coway Co., Ltd. | 13,260 | 443,263 | |||
Woori Investment & Securities Co., Ltd. | 67,386 | 847,114 | |||
Yuhan Corp. | 776 | 124,983 | |||
TOTAL SOUTH KOREA | 267,493,019 | ||||
TAIWAN — (9.6%) | |||||
Acer, Inc. | 2,802,239 | 6,605,262 | |||
Advanced Semiconductor Engineering, Inc. | 2,990,899 | 2,357,252 | |||
113
THE EMERGING MARKETS SERIES
CONTINUED
| Shares | Value†† | ||||
TAIWAN — (Continued) | |||||
Advantech Co., Ltd. | 73,609 | $ | 131,013 | ||
Asia Cement Corp. | 2,452,114 | 2,574,670 | |||
Asustek Computer, Inc. | 2,968,206 | 5,451,570 | |||
AU Optronics Corp. | 1,332,874 | 1,181,930 | |||
#AU Optronics Corp. Sponsored ADR | 348,006 | 3,072,894 | |||
Catcher Co., Ltd. | 191,430 | 463,409 | |||
*Cathay Financial Holdings Co., Ltd. | 2,746,761 | 4,710,330 | |||
Chang Hwa Commercial Bank | 1,962,000 | 853,660 | |||
Cheng Shin Rubber Industry Co., Ltd. | 1,078,790 | 2,216,776 | |||
Cheng Uei Precision Industry Co., Ltd. | 233,232 | 443,098 | |||
*Chi Mei Optoelectronic Corp. | 1,814,000 | 904,977 | |||
Chicony Electronics Co., Ltd. | 199,368 | 435,993 | |||
*China Development Financial Holding Corp. | 3,970,000 | 1,034,191 | |||
China Steel Corp. | 8,747,669 | 7,766,540 | |||
Chinatrust Financial Holdings Co., Ltd. | 2,380,770 | 1,430,065 | |||
*Chungwa Picture Tubes Co., Ltd. | 2,846,000 | 291,962 | |||
*Clevo Co. | 471,643 | 588,614 | |||
Compal Electronics, Inc. | 3,708,375 | 4,636,228 | |||
Delta Electronics Industrial Co., Ltd. | 1,812,367 | 5,032,454 | |||
*E.Sun Financial Holding Co., Ltd. | 1,125,790 | 438,224 | |||
Epistar Corp. | 224,000 | 652,289 | |||
Eternal Chemical Co., Ltd. | 254,520 | 235,853 | |||
*Evergreen International Storage & Transport Corp. | 357,000 | 288,928 | |||
*Evergreen Marine Corp., Ltd. | 481,869 | 243,377 | |||
Everlight Electronics Co., Ltd. | 146,000 | 399,114 | |||
Far East Textile, Ltd. | 4,292,007 | 5,061,208 | |||
*Far EasTone Telecommunications Co., Ltd. | 446,000 | 501,795 | |||
Feng Hsin Iron & Steel Co., Ltd. | 170,000 | 257,027 | |||
First Financial Holding Co., Ltd. | 5,210,574 | 3,010,102 | |||
Formosa Chemicals & Fiber Co., Ltd. | 4,748,445 | 8,848,806 | |||
Formosa International Hotels Corp. | 35,200 | 439,195 | |||
Formosa Plastics Corp. | 5,051,649 | 9,689,505 | |||
Formosa Taffeta Co., Ltd. | 605,000 | 410,142 | |||
Foxconn Technology Co., Ltd. | 684,791 | 2,281,263 | |||
*Fubon Financial Holding Co., Ltd. | 5,940,052 | 6,591,267 | |||
Giant Manufacture Co., Ltd. | 201,600 | 522,777 | |||
*HannStar Display Corp. | 1,337,000 | 252,089 | |||
Hon Hai Precision Industry Co., Ltd. | 4,590,177 | 17,978,933 | |||
Hotai Motor Co., Ltd. | 387,000 | 899,036 | |||
HTC Corp. | 527,200 | 5,235,375 | |||
Hua Nan Financial Holding Co., Ltd. | 5,725,898 | 3,326,863 | |||
Innolux Display Corp. | 1,748,940 | 2,303,546 | |||
Inventec Corp. | 1,732,722 | 958,531 | |||
Kinsus Interconnect Technology Corp. | 78,000 | 195,531 | |||
Largan Precision Co., Ltd. | 43,860 | 502,322 | |||
Lee Chang Yung Chemical Industry Corp. | 312,825 | 346,941 | |||
Lite-On Technology Corp. | 506,520 | 667,118 | |||
Macronix International Co., Ltd. | 1,794,825 | 909,789 | |||
Media Tek, Inc. | 735,527 | 10,294,431 | |||
Mega Financial Holding Co., Ltd. | 4,537,000 | 2,526,558 | |||
Mitac International Corp. | 209,288 | 97,884 | |||
Nan Ya Plastic Corp. | 7,084,565 | 11,269,977 | |||
Nan Ya Printed Circuit Board Corp. | 200,940 | 625,293 | |||
*Polaris Securities Co., Ltd. | 673,000 | 345,336 | |||
Pou Chen Corp. | 2,007,342 | 1,376,278 | |||
President Chain Store Corp. | 881,831 | 1,995,217 | |||
Shihlin Electric & Engineering Corp. | 235,000 | 282,551 | |||
*Shin Kong Financial Holding Co., Ltd. | 1,800,619 | 732,597 | |||
Siliconware Precision Industries Co., Ltd. | 2,347,324 | 3,086,123 | |||
*SinoPac Holdings Co., Ltd. | 2,807,000 | 1,036,665 | |||
Synnex Technology International Corp. | 927,700 | 1,755,182 | |||
114
THE EMERGING MARKETS SERIES
CONTINUED
| Shares | Value†† | ||||
TAIWAN — (Continued) | |||||
*Taishin Financial Holdings Co., Ltd. | 1,609,000 | $ | 629,681 | ||
*Taiwan Business Bank | 921,000 | 224,884 | |||
Taiwan Cement Corp. | 2,415,895 | 2,478,577 | |||
Taiwan Cooperative Bank | 2,997,634 | 1,768,718 | |||
Taiwan Fertilizer Co., Ltd. | 133,000 | 412,896 | |||
Taiwan Glass Industrial Corp. | 1,309,200 | 1,006,462 | |||
Taiwan Secom Co., Ltd. | 150,000 | 229,289 | |||
Taiwan Semiconductor Manufacturing Co., Ltd. | 22,386,808 | 40,609,637 | |||
*Tatung Co., Ltd. | 1,058,000 | 233,017 | |||
Ton Yi Industrial Corp. | 220,000 | 76,652 | |||
Transcend Information, Inc. | 131,181 | 410,279 | |||
TSRC Corp. | 368,000 | 428,664 | |||
Tung Ho Steel Enterprise Corp. | 216,000 | 205,317 | |||
U-Ming Marine Transport Corp. | 648,860 | 1,176,881 | |||
*Unimicron Technology Corp. | 200,000 | 228,196 | |||
Uni-President Enterprises Corp. | 3,496,347 | 3,901,188 | |||
*United Microelectronics Corp. | 5,956,000 | 2,863,129 | |||
*Walsin Lihwa Corp. | 2,278,539 | 738,384 | |||
*Wan Hai Lines Co., Ltd. | 543,209 | 249,909 | |||
Wistron Corp. | 1,251,699 | 2,095,430 | |||
WPG Holdings Co., Ltd. | 201,000 | 274,992 | |||
Yang Ming Marine Transport Corp. | 341,131 | 120,503 | |||
*Young Fast Optoelectronics Co., Ltd. | 4,000 | 45,768 | |||
Yuanta Financial Holding Co., Ltd. | 1,945,885 | 1,284,145 | |||
Yulon Motor Co., Ltd. | 145,000 | 162,185 | |||
TOTAL TAIWAN | 222,908,709 | ||||
THAILAND — (1.4%) | |||||
Advance Info Service PCL (Foreign) | 1,541,800 | 3,978,467 | |||
Bangkok Bank PCL (Foreign) NVDR | 286,400 | 959,665 | |||
Bangkok Dusit Medical Services PCL (Foreign) | 586,600 | 424,704 | |||
Bank of Ayudhya PCL (Foreign) | 2,590,200 | 1,394,872 | |||
Banpu PCL (Foreign) | 115,100 | 1,508,266 | |||
BEC World PCL (Foreign) | 1,097,600 | 735,564 | |||
Bumrungrad Hospital PCL (Foreign) | 297,000 | 248,796 | |||
C.P. ALL PCL (Foreign) | 2,436,200 | 1,384,826 | |||
Charoen Pokphand Foods PCL (Foreign) | 4,181,300 | 1,207,167 | |||
Delta Electronics (Thailand) PCL (Foreign) | 622,510 | 322,197 | |||
Electricity Generating PCL (Foreign) NVDR | 60,000 | 134,630 | |||
Glow Energy PCL (Foreign) | 119,000 | 113,927 | |||
IRPC PCL (Foreign) | 4,240,300 | 487,143 | |||
Kasikornbank PCL (Foreign) | 1,612,200 | 3,955,135 | |||
Krung Thai Bank PCL (Foreign) | 7,726,870 | 2,034,299 | |||
Land & Houses PCL (Foreign) NVDR | 790,000 | 133,538 | |||
PTT Aromatics & Refining PCL (Foreign) | 1,287,137 | 820,225 | |||
PTT Chemical PCL (Foreign) | 1,037,460 | 1,939,903 | |||
PTT Exploration & Production PCL (Foreign) | 592,000 | 2,568,138 | |||
PTT PCL (Foreign) | 218,400 | 1,568,168 | |||
Ratchaburi Electricity Generating Holding PCL (Foreign) | 864,300 | 956,742 | |||
Siam Cement PCL (Foreign) (The) | 117,100 | 732,203 | |||
Siam Cement PCL (Foreign) NVDR (The) | 41,600 | 253,894 | |||
Siam City Bank PCL (Foreign) | 833,100 | 590,710 | |||
Siam City Cement PCL (Foreign) | 156,413 | 1,034,174 | |||
Siam Commercial Bank PCL (Foreign) | 1,001,366 | 2,314,301 | |||
Siam Makro PCL (Foreign) | 112,500 | 268,418 | |||
Thai Oil PCL (Foreign) | 196,000 | 241,885 | |||
*TMB Bank PCL (Foreign) | 3,780,000 | 124,398 | |||
TOTAL THAILAND | 32,436,355 | ||||
TURKEY — (2.0%) | |||||
Akbank T.A.S. | 1,190,899 | 6,432,963 | |||
115
THE EMERGING MARKETS SERIES
CONTINUED
| Shares | Value†† | ||||
TURKEY — (Continued) | |||||
Aksigorta A.S. | 97,752 | $ | 295,221 | ||
Anadolu Efes Biracilik ve Malt Sanayi A.S. | 385,869 | 4,408,477 | |||
*Asya Katilim Bankasi A.S. | 151,578 | 313,514 | |||
Aygaz A.S. | — | 1 | |||
BIM BirlesikMagazalar A.S. | 17,544 | 636,076 | |||
*Dogan Sirketler Grubu Holding A.S. | 1,908,886 | 1,255,854 | |||
*Dogan Yayin Holding A.S. | 3 | 2 | |||
Enka Insaat ve Sanayi A.S. | 385,612 | 1,556,083 | |||
*Eregli Demir ve Celik Fabrikalari Turk A.S. | 874,563 | 2,374,127 | |||
Ford Otomotiv Sanayi A.S. | 114,792 | 721,907 | |||
*Koc Holding A.S. Series B | 1,063,963 | 2,710,397 | |||
*TAV Havalimanlari Holding A.S. | 48,000 | 131,261 | |||
Tofas Turk Otomobil Fabrikasi A.S. | 1 | 2 | |||
Tupras-Turkiye Petrol Rafinerileri A.S. | 216,078 | 3,711,354 | |||
*Turk Ekonomi Bankasi A.S. | — | — | |||
*Turk Hava Yollari A.S. | 131,400 | 366,838 | |||
*Turk Sise ve Cam Fabrikalari A.S. | 531,423 | 557,699 | |||
Turkcell Iletisim Hizmetleri A.S. | 240,093 | 1,588,542 | |||
Turkiye Garanti Bankasi A.S. | 2,842,585 | 10,322,968 | |||
Turkiye Halk Bankasi A.S. | 139,950 | 837,551 | |||
Turkiye Is Bankasi A.S. | 1,429,127 | 5,412,568 | |||
*Turkiye Vakiflar Bankasi T.A.O. | 385,861 | 935,743 | |||
*Yapi ve Kredi Bankasi A.S. | 1,249,137 | 2,568,272 | |||
TOTAL TURKEY | 47,137,420 | ||||
TOTAL COMMON STOCKS | 1,933,558,736 | ||||
PREFERRED STOCKS — (7.1%) | |||||
BRAZIL — (7.1%) | |||||
*Aracruz Celulose SA Series B | 102,635 | 191,683 | |||
Banco Bradesco SA | 1,309,200 | 25,610,259 | |||
Brasil Telecom Participacoes SA | 222,326 | 2,246,482 | |||
Brasil Telecom Participacoes SA ADR | 9,465 | 476,373 | |||
Brasil Telecom SA | 234,762 | 2,000,328 | |||
*Braskem SA Preferred A Sponsored ADR | 39,323 | 515,918 | |||
#Cia Vale do Rio Doce | 302,400 | 6,985,440 | |||
#Companhia Brasileira de Distribuicao Grupo Pao de Acucar Sponsored ADR | 81,000 | 4,899,690 | |||
Companhia de Bebidas das Americas | 83 | 7,536 | |||
#Companhia de Bebidas das Americas Preferred ADR | 151,600 | 13,656,128 | |||
Companhia Energetica de Minas Gerais SA | 409,748 | 6,431,380 | |||
#Companhia Energetica de Minas Gerais SA Sponsored ADR | 25,925 | 409,356 | |||
Empresa Nasional de Comercio Redito e Participacoes SA | 480 | 4,223 | |||
Gerdau SA | 756,268 | 11,398,113 | |||
Itau Unibanco Holding SA | 1,765,755 | 33,589,042 | |||
Net Servicos de Comunicacao SA Preferred ADR | 197,391 | 2,425,935 | |||
Tele Norte Leste Participacoes SA | 180,034 | 3,423,671 | |||
#Tele Norte Leste Participacoes SA ADR | 127,600 | 2,432,056 | |||
Telecomunicacoes de Sao Paulo SA | 96,700 | 2,397,189 | |||
Telemar Norte Leste SA | 37,912 | 1,193,143 | |||
Ultrapar Participacoes SA Sponsored ADR | 113,254 | 4,992,236 | |||
Usinas Siderurgicas de Minas Gerais SA Series A | 193,962 | 5,064,857 | |||
Vale SA Series A | 1,412,691 | 31,796,775 | |||
Vale SA Series B | 81,160 | — | |||
Vivo Participacoes SA | 134,958 | 3,285,081 | |||
*Votorantim Celulose e Papel SA Sponsored ADR | 18,181 | 249,805 | |||
TOTAL BRAZIL | 165,682,699 | ||||
TOTAL PREFERRED STOCKS | 165,682,699 | ||||
116
THE EMERGING MARKETS SERIES
CONTINUED
| Shares | Value†† | |||||
RIGHTS/WARRANTS — (0.0%) | ||||||
SOUTH AFRICA — (0.0%) | ||||||
*Super Group, Ltd. Rights 11/20/09 | 2,106,088 | 40,450 | ||||
TAIWAN — (0.0%) | ||||||
*Shin Kong Financial Holding Co., Ltd. Rights 12/07/09 | 92,039 | 8,490 | ||||
TOTAL RIGHTS/WARRANTS | 48,940 | |||||
| Face Amount | Value† | |||||
| (000) | ||||||
TEMPORARY CASH INVESTMENTS — (0.0%) | ||||||
Repurchase Agreement, PNC Capital Markets, Inc. 0.19%, 11/02/09 (Collateralized by $310,000 FNMA 6.50%, 06/25/39, valued at $326,275) to be repurchased at $317,005 | $ | 317 | 317,000 | |||
| Shares/ Face Amount | ||||||
| (000) | ||||||
SECURITIES LENDING COLLATERAL — (10.0%) | ||||||
§@DFA Short Term Investment Fund LP | 226,669,881 | 226,669,881 | ||||
@Repurchase Agreement, Deutsche Bank Securities 0.07%, 11/02/09 (Collateralized by various corporate obligations, ranging in par value from $4,247,617 to $16,429,280, rates ranging from 5.000% to 7.000%, maturities ranging from 03/01/37 to 10/01/39, valued at $6,420,547) to be repurchased at $6,294,691 | $ | 6,295 | 6,294,654 | |||
TOTAL SECURITIES LENDING COLLATERAL | 232,964,535 | |||||
TOTAL INVESTMENTS — (100.0%) | $ | 2,332,571,910 | ||||
See accompanying Notes to Financial Statements.
117
THE EMERGING MARKETS SMALL CAP SERIES
SCHEDULE OF INVESTMENTS
October 31, 2009
| Shares | Value†† | ||||
COMMON STOCKS — (87.8%) | |||||
ARGENTINA — (0.0%) | |||||
Ferrum SA de Ceramica y Metalurgica Series B | 1 | $ | — | ||
BRAZIL — (7.3%) | |||||
Acos Villares SA | 719,000 | 355,092 | |||
*Acucar Guarani SA | 18,000 | 46,901 | |||
AES Tiete SA (2440693) | 53,900 | 574,921 | |||
AES Tiete SA (2441038) | 97,828 | 1,102,342 | |||
All America Latina Logistica SA | 253,700 | 1,862,137 | |||
American Banknote SA | 66,200 | 660,271 | |||
*Anhanguera Educacional Participacoes SA | 126,200 | 1,744,420 | |||
B2W Cia Global Do Varejo | 123,200 | 3,570,954 | |||
Banco ABC Brasil SA | 23,000 | 129,780 | |||
Banco Alfa de Investimento SA | 700 | 3,250 | |||
*Banco Cruzeiro do Sul SA | 19,400 | 112,550 | |||
Banco Daycoval SA | 10,300 | 53,500 | |||
Banco Industrial e Comercial SA | 60,300 | 378,929 | |||
Banco Panamericano SA | 63,700 | 238,658 | |||
Banco Pine SA | 62,500 | 366,499 | |||
Banco Sofisa SA | 92,600 | 291,215 | |||
Bematech SA | 68,200 | 321,333 | |||
*Bombril SA | 17,600 | 67,439 | |||
*BR Malls Participacoes SA | 120,800 | 1,295,363 | |||
*BRF - Brasil Foods SA | 20,654 | 497,931 | |||
*BRF - Brasil Foods SA ADR | 112,544 | 5,443,753 | |||
Brookfield Incorporacoes SA | 98,100 | 371,996 | |||
Camargo Correa Desenvolvimento Imobiliario SA | 13,100 | 41,272 | |||
Cia de Gas de Sao Paulo | 24,800 | 464,578 | |||
Cia de Saneamento de Minas Gerais-Copasa | 75,300 | 1,325,102 | |||
Cia de Saneamento do Parana | 176,900 | 231,970 | |||
Cia Energetica de Sao Paulo | 156,900 | 1,825,869 | |||
Cia Hering SA | 27,900 | 327,844 | |||
#Companhia de Saneamento Basico do Estado de Sao Paulo ADR | 33,100 | 1,275,012 | |||
*Cosan SA Industria e Comercio | 169,700 | 1,796,608 | |||
Cremer SA | 12,000 | 95,368 | |||
Cyrela Brazil Realty SA | 326,200 | 4,138,607 | |||
*Diagnosticos Da America SA | 126,800 | 3,127,532 | |||
*Duratex SA | 624,462 | 4,324,725 | |||
*Eletropaulo Metropolitana Eletricidade de Sao Paulo SA | 124,900 | 2,356,055 | |||
*Energias do Brazil SA | 52,102 | 835,832 | |||
*Equatorial Energia SA | 19,300 | 183,074 | |||
Eternit SA | 148,770 | 650,278 | |||
Even Construtora e Incorporadora SA | 12,500 | 43,852 | |||
*Ferbasa-Ferro Ligas da Bahia SA | 92,500 | 612,781 | |||
*Fertilizantes Fosfatados SA | 123,100 | 1,187,954 | |||
Gafisa SA | 150,800 | 2,234,264 | |||
*Global Village Telecom Holding SA | 178,300 | 5,116,408 | |||
Globex Utilidades SA | 58,737 | 268,411 | |||
Grendene SA | 164,100 | 734,985 | |||
Guararapes Confeccoes SA | 3,800 | 91,031 | |||
*IdeiasNet SA | 234,800 | 699,762 | |||
Iguatemi Empresa de Shopping Centers SA | 44,200 | 653,616 | |||
Industrias Romi SA | 77,500 | 547,726 | |||
JBS SA | 96,900 | 534,666 | |||
JHSF Participacoes SA | 39,700 | 79,779 | |||
*Klabin Segall SA | 38,000 | 102,464 | |||
Light SA | 199,200 | 2,744,428 | |||
Localiza Rent a Car SA | 219,700 | 2,301,013 | |||
Lojas Americanas SA | 8,000 | 42,461 | |||
Lojas Renner SA | 273,700 | 4,847,548 | |||
118
THE EMERGING MARKETS SMALL CAP SERIES
CONTINUED
| Shares | Value†† | ||||
BRAZIL — (Continued) | |||||
*LPS Brasila Consultoria de Imoveis SA | 15,200 | $ | 159,282 | ||
*Lupatech SA | 34,700 | 526,725 | |||
M Dias Branco SA | 44,100 | 950,794 | |||
*M&G Poliester SA | 640,780 | 50,925 | |||
*Magnesita Refratarios SA (B23VRX5) | 441,455 | 3,232,726 | |||
*Magnesita Refratarios SA (B46JS37) | 97,149 | 722,441 | |||
Mangels Industrial SA | 14,600 | 92,825 | |||
*Marisa SA | 11,600 | 57,223 | |||
*Medial Saude SA | 48,250 | 394,414 | |||
*Mmx Mineracao e Metalicos SA | 120,800 | 790,658 | |||
MPX Energia SA | 46,000 | 621,219 | |||
Multiplan Empreendimentos Imobiliarios SA | 2,500 | 37,849 | |||
Natura Cosmeticos SA | 120,300 | 2,162,067 | |||
Obrascon Huarte Lain Brasil SA | 6,200 | 98,547 | |||
OdontoPrev SA | 47,400 | 1,349,404 | |||
Parana Banco SA | 24,700 | 131,801 | |||
*Paranapanema SA | 85,998 | 329,034 | |||
PDG Realty SA Empreendimentos e Participacoes | 353,800 | 2,952,350 | |||
*Plascar Participacoes Industriais SA | 99,700 | 118,286 | |||
Porto Seguro SA | 261,800 | 2,762,751 | |||
*Positivo Informatica SA | 33,300 | 379,011 | |||
Rodobens Negocios Imobiliarios SA | 2,500 | 26,098 | |||
Rossi Residencial SA | 148,600 | 981,050 | |||
Sao Carlos Empreendimentos e Participacoes SA | 51,500 | 482,374 | |||
*Sao Martinho SA | 64,100 | 629,502 | |||
Sao Paulo Alpargatas SA | 5,100 | 221,185 | |||
*SLC Agricola SA | 12,100 | 87,920 | |||
Sul America SA | 29,700 | 697,990 | |||
*Tam SA | 135,800 | 1,918,745 | |||
*Terna Participacoes SA | 3,800 | 79,167 | |||
Totvs SA | 49,764 | 2,711,652 | |||
Universo Online SA | 72,700 | 427,137 | |||
*Votorantim Celulose e Papel SA | 8,487 | 116,252 | |||
TOTAL BRAZIL | 91,631,513 | ||||
CHILE — (2.1%) | |||||
*AFP Cuprum SA | 1,398 | 49,764 | |||
Aguas Andinas SA Series A | 703,732 | 291,592 | |||
*Almendral SA | 1,445,104 | 139,489 | |||
Banmedica SA | 1,312,094 | 1,386,354 | |||
Cementos Bio-Bio SA | 452,622 | 954,773 | |||
Cintac SA | 324,650 | 141,245 | |||
Compania de Consumidores de Gas Santiago SA | 76,171 | 341,439 | |||
Compania General de Electricidad SA | 45,665 | 287,691 | |||
*Compania SudAmericana de Vapores SA | 1,981,730 | 1,626,777 | |||
CorpBanca SA | 327,140,907 | 2,218,113 | |||
#CorpBanca SA ADR | 31,658 | 1,051,046 | |||
Cristalerias de Chile SA | 159,630 | 1,809,912 | |||
Embotelladora Andina SA Series B | 404,281 | 1,240,369 | |||
Embotelladora Andina SA Series B ADR | 900 | 16,425 | |||
*Empresa Electrica del Norte Grande SA | 293,151 | 475,314 | |||
*Empresa Electrica Pilmaiquen SA | 10,752 | 47,184 | |||
*Empresas Iansa SA | 4,176,187 | 302,822 | |||
*Empresas La Polar SA | 467,179 | 2,373,686 | |||
Farmacias Ahumada SA | 242,158 | 519,936 | |||
*Forus SA | 24,439 | 28,538 | |||
*Grupo Security SA | 92,721 | 25,566 | |||
Industrias Forestales SA | 20,000 | 4,709 | |||
*Inversiones Aguas Metropolitanas SA | 1,490,266 | 1,760,981 | |||
Madeco SA | 31,606,701 | 2,053,736 | |||
Masisa SA | 8,936,076 | 1,325,559 | |||
119
THE EMERGING MARKETS SMALL CAP SERIES
CONTINUED
| Shares | Value†† | ||||
CHILE — (Continued) | |||||
*Multiexport Foods SA | 1,414,508 | $ | 266,411 | ||
Parque Arauco SA | 1,055,338 | 1,093,401 | |||
*Ripley Corp. SA | 1,192,149 | 904,210 | |||
*Socovesa SA | 806,419 | 296,049 | |||
Soquimic Comercial SA | 562,478 | 238,361 | |||
Vina Concha Y Toro SA | 1,152,066 | 2,471,208 | |||
Vina Concha Y Toro SA Sponsored ADR | 200 | 8,520 | |||
Vina San Pedro Tarapaca SA | 40,113,498 | 298,424 | |||
TOTAL CHILE | 26,049,604 | ||||
CHINA — (11.8%) | |||||
Agile Property Holdings, Ltd. | 1,094,000 | 1,397,482 | |||
Ajisen China Holdings, Ltd. | 480,000 | 404,519 | |||
Anhui Expressway Co., Ltd. | 834,000 | 521,701 | |||
Anta Sports Products, Ltd. | 174,000 | 209,142 | |||
*AviChina Industry and Technology Co., Ltd. | 104,000 | 33,532 | |||
Baoye Group Co., Ltd. | 2,298,000 | 1,768,251 | |||
*Beijing Capital International Airport Co., Ltd. | 200,000 | 134,498 | |||
#Beijing Capital Land, Ltd. | 5,436,000 | 2,279,486 | |||
#Beijing North Star Co., Ltd. | 536,000 | 197,890 | |||
Bosideng International Holdings, Ltd. | 814,000 | 144,348 | |||
#*Brilliance China Automotive Holdings, Ltd. | 18,522,000 | 3,404,681 | |||
#*Byd Co., Ltd. | 482,000 | 4,418,950 | |||
*Central China Real Estate, Ltd. | 32,000 | 8,686 | |||
Chaoda Modern Agriculture (Holdings), Ltd. | 184,000 | 142,167 | |||
*China Aerospace International Holdings, Ltd. | 13,201,500 | 2,343,310 | |||
China Agri-Industries Holdings, Ltd. | 712,000 | 682,025 | |||
China BlueChemical, Ltd. | 432,000 | 229,295 | |||
*China Chengtong Development Group, Ltd. | 74,000 | 5,874 | |||
*China Communications Services Corp., Ltd. | 608,000 | 316,060 | |||
#*China Eastern Airlines Corp., Ltd. | 1,222,000 | 338,440 | |||
#China Everbright International, Ltd. | 5,281,800 | 2,411,605 | |||
China Everbright, Ltd. | 166,000 | 392,165 | |||
#China Gas Holdings, Ltd. | 5,115,500 | 2,043,620 | |||
China Green (Holdings), Ltd. | 129,000 | 113,168 | |||
China High Speed Transmission Equipment Group Co., Ltd. | 347,000 | 695,905 | |||
China Huiyuan Juice Group, Ltd. | 34,000 | 22,030 | |||
*China Mengniu Dairy Co., Ltd. | 77,000 | 215,255 | |||
#*China Mining Resources Group, Ltd. | 28,069,900 | 1,020,366 | |||
#*China National Materials Co., Ltd. | 320,000 | 253,591 | |||
*China Oil & Gas Group, Ltd. | 40,000 | 4,057 | |||
China Pharmaceutical Group, Ltd. | 182,000 | 102,171 | |||
*China Power International Development, Ltd. | 5,805,200 | 1,606,020 | |||
*China Power New Energy Development Co., Ltd. | 1,080,000 | 69,663 | |||
China Resources Gas Group, Ltd. | 22,000 | 21,290 | |||
#China Shineway Pharmaceutical Group, Ltd. | 460,200 | 647,581 | |||
China Starch Holdings, Ltd. | 75,000 | 7,267 | |||
#China State Construction International Holdings, Ltd. | 3,580,800 | 1,438,995 | |||
China Travel International Investment Hong Kong, Ltd. | 21,347,000 | 4,357,667 | |||
China Yurun Food Group, Ltd. | 2,622,000 | 5,375,559 | |||
Chongqing Iron and Steel Co., Ltd. | 3,824,000 | 1,402,536 | |||
*CITIC 21CN Co., Ltd. | 4,363,200 | 131,428 | |||
*CITIC Resources Holdings, Ltd. | 8,560,600 | 2,395,140 | |||
CNPC Hong Kong, Ltd. | 120,000 | 125,463 | |||
#COSCO International Holdings, Ltd. | 5,483,000 | 2,312,644 | |||
COSCO Pacific, Ltd. | 566,000 | 783,284 | |||
Coslight Technology International Group, Ltd. | 6,000 | 11,968 | |||
Dachan Food Asia, Ltd. | 101,000 | 18,222 | |||
Denway Motors, Ltd. | 2,024,000 | 968,826 | |||
Digital China Holdings, Ltd. | 443,800 | 454,589 | |||
#Dongfang Electric Co., Ltd. | 63,000 | 312,960 | |||
120
THE EMERGING MARKETS SMALL CAP SERIES
CONTINUED
| Shares | Value†† | ||||
CHINA — (Continued) | |||||
Dynasty Fine Wines Group, Ltd. | 38,000 | $ | 9,835 | ||
*Enerchina Holdings, Ltd. | 10,646,167 | 164,946 | |||
First Tractor Co., Ltd. | 303,176 | 123,971 | |||
Fosun International, Ltd. | 359,500 | 243,958 | |||
*Founder Holdings, Ltd. | 3,356,900 | 159,191 | |||
Franshion Properties China, Ltd. | 378,000 | 105,215 | |||
#*FU JI Food & Catering Services | 1,857,800 | 1,821,796 | |||
*Fushan International Energy Group, Ltd. | 802,000 | 615,634 | |||
*GCL Poly Energy Holdings, Ltd. | 455,000 | 114,239 | |||
*Genesis Energy Holdings, Ltd. | 80,000 | 2,279 | |||
Global Bio-Chem Technology Group Co., Ltd. | 308,000 | 75,360 | |||
Golden Eagle Retail Group, Ltd. | 236,000 | 405,901 | |||
Great Wall Motor Co., Ltd. | 698,500 | 784,522 | |||
Great Wall Technology Co., Ltd. | 1,708,000 | 537,054 | |||
Greentown China Holdings, Ltd. | 12,000 | 17,351 | |||
Guangdong Investment, Ltd. | 5,402,000 | 2,850,611 | |||
Guangzhou Investment Co., Ltd. | 92,000 | 24,538 | |||
Guangzhou Pharmaceutical Co., Ltd. | 46,000 | 22,075 | |||
#Guangzhou Shipyard International Co., Ltd. | 280,000 | 516,192 | |||
#GZI Transport, Ltd. | 2,027,300 | 861,734 | |||
*Haier Electronics Group Co., Ltd. | 2,000 | 735 | |||
Hengdeli Holdings, Ltd. | 1,422,000 | 463,013 | |||
*Hidili Industry International Development, Ltd. | 309,000 | 316,988 | |||
#HKC (Holdings), Ltd. | 19,536,227 | 1,532,792 | |||
*Honghua Group, Ltd. | 163,000 | 33,730 | |||
Hopson Development Holdings, Ltd. | 3,914,000 | 6,810,095 | |||
*Hua Han Bio-Pharmaceutical Holdings, Ltd. | 148,000 | 26,255 | |||
Huabao International Holdings, Ltd. | 468,000 | 444,599 | |||
#*Hunan Non-Ferrous Metal Corp., Ltd. | 14,290,000 | 4,362,982 | |||
*Inspur International, Ltd. | 30,000 | 4,255 | |||
Ju Teng International Holdings, Ltd. | 92,000 | 72,851 | |||
*Kai Yuan Holdings, Ltd. | 900,000 | 36,768 | |||
Kingboard Chemical Holdings, Ltd. | 58,500 | 235,457 | |||
Kingboard Laminates Holdings, Ltd. | 55,500 | 38,603 | |||
Kingdee International Software Group Co., Ltd. | 1,620,000 | 349,718 | |||
#Kingsoft Corp., Ltd. | 179,000 | 166,595 | |||
#*Kingway Brewery Holdings, Ltd. | 7,535,800 | 1,255,505 | |||
KWG Property Holding, Ltd. | 969,500 | 694,250 | |||
*Lai Fung Holdings, Ltd. | 67,000 | 2,227 | |||
#Li Ning Co., Ltd. | 279,000 | 758,720 | |||
Lianhua Supermarket Holdings Co., Ltd. | 326,000 | 699,973 | |||
#*Lingbao Gold Co., Ltd. | 2,356,000 | 859,648 | |||
*Little Sheep Group, Ltd. | 6,000 | 3,438 | |||
#Lonking Holdings, Ltd. | 3,324,000 | 1,914,606 | |||
*Mingyuan Medicare Development Co., Ltd. | 30,000 | 3,741 | |||
*Minmetals Resources, Ltd. | 7,190,000 | 1,904,033 | |||
*Nanjing Panda Electronics Co., Ltd. | 284,000 | 75,009 | |||
*Neo-China Land Group (Holdings), Ltd. | 1,594,025 | 1,046,887 | |||
#*New World China Land, Ltd. | 122,000 | 48,627 | |||
New World Department Store China, Ltd. | 170,000 | 151,282 | |||
*Oriental Ginza Holdings, Ltd. | 94,000 | 34,112 | |||
Poly Hong Kong Investment, Ltd. | 394,000 | 450,823 | |||
Qunxing Paper Holdings Co., Ltd. | 158,000 | 63,564 | |||
#*Semiconductor Manufacturing International Corp. | 167,851,000 | 8,306,535 | |||
Shandong Molong Petroleum Machinery Co., Ltd. | 164,000 | 22,837 | |||
Shanghai Industrial Holdings, Ltd. | 114,000 | 535,543 | |||
Shanghai Prime Machinery Co., Ltd. | 6,050,000 | 1,084,359 | |||
Shenji Kunming Machine Tool Co., Ltd. | 95,000 | 80,380 | |||
Shenzhen Expressway Co., Ltd. | 2,290,000 | 1,093,321 | |||
Shenzhen International Holdings, Ltd. | 71,794,300 | 5,020,114 | |||
Shenzhen Investment, Ltd. | 14,500,000 | 5,729,496 | |||
121
THE EMERGING MARKETS SMALL CAP SERIES
CONTINUED
| Shares | Value†† | ||||
CHINA — (Continued) | |||||
Shimao Property Holdings, Ltd. | 508,500 | $ | 945,862 | ||
Shougang Concord International Enterprises Co., Ltd. | 11,314,100 | 1,948,111 | |||
Shui On Land, Ltd. | 406,000 | 246,092 | |||
Sichuan Expressway Co., Ltd. | 1,552,000 | 670,715 | |||
SinoCom Software Group, Ltd. | 2,024,200 | 225,220 | |||
Sinofert Holdings, Ltd. | 10,000 | 4,936 | |||
#Sinolink Worldwide Holdings, Ltd. | 16,073,300 | 3,083,348 | |||
Sino-Ocean Land Holdings, Ltd. | 110,794 | 107,607 | |||
Sinopec Kantons Holdings, Ltd. | 8,000 | 2,858 | |||
*Sinopec Yizheng Chemical Fibre Co., Ltd. | 418,000 | 103,948 | |||
*Sinotruk Hong Kong, Ltd. | 227,000 | 269,915 | |||
#Skyworth Digital Holdings, Ltd. | 14,661,400 | 8,252,870 | |||
*Soho China, Ltd. | 292,500 | 157,180 | |||
*Solargiga Energy Holdings, Ltd. | 9,000 | 2,083 | |||
#*SRE Group, Ltd. | 13,466,053 | 1,534,204 | |||
*Stone Group Holdings, Ltd. | 13,122,000 | 804,231 | |||
*TCL Communication Technology Holdings, Ltd. | 2,698,799 | 425,206 | |||
*TCL Multimedia Technology Holdings, Ltd. | 3,583,510 | 2,806,647 | |||
Tian An China Investments Co., Ltd. | 17,000 | 10,394 | |||
*Tiangong International Co., Ltd. | 42,000 | 14,692 | |||
#Tianjin Capital Environmental Protection Group Co., Ltd. | 1,542,000 | 433,141 | |||
#Tianjin Development Holdings, Ltd. | 1,515,800 | 936,080 | |||
#Towngas China Co., Ltd. | 2,893,000 | 1,156,339 | |||
TPV Technology, Ltd. | 14,518,000 | 9,396,713 | |||
Travelsky Technology, Ltd. | 17,000 | 14,508 | |||
*Uni-President China Holdings, Ltd. | 214,000 | 131,753 | |||
Vinda International Holdings, Ltd. | 140,000 | 89,920 | |||
*Wasion Group Holdings, Ltd. | 114,000 | 94,802 | |||
Weichai Power Co., Ltd. | 51,600 | 333,894 | |||
Weiqiao Textile Co., Ltd. | 3,389,000 | 2,364,590 | |||
*Welling Holdings, Ltd. | 540,000 | 24,805 | |||
Wuyi International Pharmaceutical Co., Ltd. | 22,500 | 2,188 | |||
#Xiamen International Port Co., Ltd. | 7,668,000 | 1,424,220 | |||
Xinao Gas Holdings, Ltd. | 2,178,000 | 4,667,339 | |||
#Xinjiang Xinxin Mining Industry Co., Ltd. | 241,000 | 127,964 | |||
#*Xiwang Sugar Holdings Co., Ltd. | 2,898,178 | 678,023 | |||
*Zhaojin Mining Industry Co., Ltd. | 185,000 | 323,893 | |||
*Zhejiang Glass Co., Ltd. | 445,000 | 117,036 | |||
Zhong An Real Estate, Ltd. | 69,000 | 26,175 | |||
*Zhuzhou CSR Times Electric Co., Ltd. | 71,000 | 128,671 | |||
TOTAL CHINA | 148,974,413 | ||||
HUNGARY — (0.3%) | |||||
*Danubius Hotel & Spa NYRT | 47,091 | 867,781 | |||
Egis Gyogyszergyar NYRT | 2,076 | 218,854 | |||
*FHB Mortgage Bank NYRT | 59,489 | 390,648 | |||
*Fotex Holding SE Co., Ltd. | 119,895 | 266,859 | |||
*Pannonplast NYRT | 194,795 | 804,111 | |||
*RABA Automotive Holding NYRT | 300,981 | 1,111,474 | |||
Zwack Unicum NYRT | 1,100 | 87,543 | |||
TOTAL HUNGARY | 3,747,270 | ||||
INDIA — (11.2%) | |||||
*3M India, Ltd. | 4,899 | 173,325 | |||
Aban Offshore, Ltd. | 7,350 | 196,609 | |||
*Abhishek Industries, Ltd. | 172,482 | 52,798 | |||
Aditya Birla Nuvo, Ltd. | 25,024 | 415,758 | |||
Ador Welding, Ltd. | 8,088 | 23,712 | |||
Agro Tech Foods, Ltd. | 39,674 | 204,858 | |||
*AIA Engineering, Ltd. | 17,307 | 114,545 | |||
Ajmera Realty & Infra India, Ltd. | 33,510 | 162,500 | |||
122
THE EMERGING MARKETS SMALL CAP SERIES
CONTINUED
| Shares | Value†† | ||||
INDIA — (Continued) | |||||
Alembic, Ltd. | 329,290 | $ | 311,291 | ||
Allahabad Bank, Ltd. | 59,190 | 148,791 | |||
Alok Industries, Ltd. | 969,073 | 391,928 | |||
Alstom Projects India, Ltd. | 14,515 | 161,091 | |||
Andhra Bank | 81,607 | 193,067 | |||
Ansal Properties & Infrastructure, Ltd. | 196,315 | 265,833 | |||
Apollo Hospitals Enterprise, Ltd. | 124,821 | 1,404,957 | |||
Apollo Tyres, Ltd. | 880,050 | 886,792 | |||
*Aptech, Ltd. | 69,254 | 263,949 | |||
*Arvind Mills, Ltd. | 279,573 | 199,981 | |||
*Asahi India Glass, Ltd. | 307,030 | 431,114 | |||
*Ashapura Minechem, Ltd. | 62,965 | 48,582 | |||
Ashok Leyland, Ltd. | 473,432 | 450,606 | |||
*Asian Hotels, Ltd. | 26,208 | 233,630 | |||
Aurobindo Pharma, Ltd. | 108,294 | 1,708,848 | |||
Automotive Axles, Ltd. | 19,185 | 113,192 | |||
Avaya GlobalConnect, Ltd. | 5,050 | 16,826 | |||
Aventis Pharma, Ltd. | 23,466 | 781,584 | |||
Bajaj Auto Finance, Ltd. | 54,772 | 293,342 | |||
Bajaj Hindusthan, Ltd. | 81,444 | 336,078 | |||
Bajaj Holdings & Investment, Ltd. | 22,180 | 227,740 | |||
Balaji Telefilms, Ltd. | 131,073 | 159,183 | |||
Ballarpur Industries, Ltd. | 1,021,629 | 475,813 | |||
Balmer Lawrie & Co., Ltd. | 23,290 | 234,403 | |||
Balrampur Chini Mills, Ltd. | 876,659 | 2,745,971 | |||
Bank of Maharashtra, Ltd. | 660,031 | 599,420 | |||
Bank of Rajasthan, Ltd. | 258,218 | 428,381 | |||
Bannari Amman Sugars, Ltd. | 15,919 | 401,471 | |||
Bata India, Ltd. | 86,199 | 307,161 | |||
BEML, Ltd. | 8,967 | 175,762 | |||
Bengal & Assam Co., Ltd. | 3,943 | 11,754 | |||
Berger Paints India, Ltd. | 577,884 | 683,822 | |||
Bharat Electronics, Ltd. | 11,630 | 352,813 | |||
Bharat Forge, Ltd. | 110,747 | 579,679 | |||
Bharati Shipyard, Ltd. | 44,652 | 147,756 | |||
Bhushan Steel & Strips, Ltd. | 82,431 | 2,003,326 | |||
Biocon, Ltd. | 56,399 | 293,136 | |||
Birla Corp., Ltd. | 124,628 | 784,902 | |||
Blue Dart Express, Ltd. | 16,011 | 181,441 | |||
Blue Star, Ltd. | 130,203 | 906,569 | |||
Bombay Burmah Trading Co. | 10,000 | 61,979 | |||
Bombay Dyeing & Manufacturing Co., Ltd. | 56,142 | 452,460 | |||
Bombay Rayon Fashions, Ltd. | 37,443 | 147,403 | |||
Britannia Industries, Ltd. | 30,375 | 1,058,672 | |||
Cadila Healthcare, Ltd. | 72,934 | 868,388 | |||
Carborundum Universal, Ltd. | 152,175 | 443,524 | |||
Century Enka, Ltd. | 7,619 | 29,932 | |||
CESC, Ltd. | 164,998 | 1,290,596 | |||
Chambal Fertilizers & Chemicals, Ltd. | 637,986 | 634,641 | |||
*Chemplast Sanmar, Ltd. | 79,745 | 15,053 | |||
*Chennai Petroleum Corp., Ltd. | 231,113 | 1,032,096 | |||
*Cholamandalam DBS Finance, Ltd. | 38,368 | 44,156 | |||
City Union Bank, Ltd. | 504,250 | 286,310 | |||
Clariant Chemicals (India), Ltd. | 25,417 | 199,807 | |||
CMC, Ltd. | 29,521 | 773,030 | |||
Coromandel International, Ltd. | 236,478 | 1,061,324 | |||
Corporation Bank | 47,850 | 428,867 | |||
Cranes Software International, Ltd. | 182,944 | 148,767 | |||
Crisil, Ltd. | 10,145 | 896,363 | |||
Crompton Greaves, Ltd. | 51,564 | 414,070 | |||
Cummins India, Ltd. | 53,126 | 419,854 | |||
123
THE EMERGING MARKETS SMALL CAP SERIES
CONTINUED
| Shares | Value†† | ||||
INDIA — (Continued) | |||||
Dalmia Cement (Bharat), Ltd. | 60,289 | $ | 182,924 | ||
DCM Shriram Consolidated, Ltd. | 258,455 | 278,190 | |||
Deepak Fertilizers & Petrochemicals Corp., Ltd. | 172,498 | 317,943 | |||
*Dishman Pharmaceuticals & Chemicals, Ltd. | 160,467 | 791,558 | |||
Divi’s Laboratories, Ltd. | 23,752 | 266,193 | |||
E.I.D. - Parry (India), Ltd. | 178,726 | 1,158,832 | |||
Edelweiss Capital, Ltd. | 10,155 | 99,530 | |||
Eicher Motors, Ltd. | 44,035 | 462,877 | |||
EIH, Ltd. | 136,145 | 352,797 | |||
Elder Pharmaceuticals, Ltd. | 45,749 | 258,117 | |||
Electrosteel Casings, Ltd. | 384,060 | 328,965 | |||
Elgi Equipments, Ltd. | 112,237 | 170,148 | |||
Esab India, Ltd. | 31,753 | 306,216 | |||
*Escorts, Ltd. | 105,268 | 233,906 | |||
Essel Propack, Ltd. | 229,455 | 203,271 | |||
*Eveready Industries (India), Ltd. | 149,446 | 183,016 | |||
Everest Kanto Cylinder, Ltd. | 35,000 | 102,001 | |||
Exide Industries, Ltd. | 1,026,382 | 2,124,544 | |||
FAG Bearings (India), Ltd. | 26,817 | 273,228 | |||
FDC, Ltd. | 423,054 | 508,498 | |||
Federal Bank, Ltd. | 279,298 | 1,405,168 | |||
Financial Technologies (India), Ltd. | 29,448 | 729,663 | |||
Finolex Cables, Ltd. | 253,437 | 273,123 | |||
Finolex Industries, Ltd. | 229,394 | 230,970 | |||
*Fortis Healthcare, Ltd. | 42,000 | 89,934 | |||
*Gammon India, Ltd. | 141,799 | 683,252 | |||
Geodesic, Ltd. | 144,811 | 340,790 | |||
*GHCL, Ltd. | 159,986 | 129,412 | |||
Gillette India, Ltd. | 8,591 | 219,305 | |||
GlaxoSmithKline Consumer Healthcare, Ltd. | 56,286 | 1,440,876 | |||
Glenmark Pharmaceuticals, Ltd. | 89,614 | 423,043 | |||
Godfrey Phillips India, Ltd. | 2,778 | 102,472 | |||
Godrej Consumer Products, Ltd. | 295,660 | 1,692,906 | |||
Godrej Industries, Ltd. | 146,574 | 549,436 | |||
*Goetze (India), Ltd. | 60,504 | 149,307 | |||
Graphite India, Ltd. | 221,802 | 293,908 | |||
Great Eastern Shipping Co., Ltd. | 78,007 | 393,378 | |||
Great Offshore, Ltd. | 42,090 | 457,400 | |||
Greaves Cotton, Ltd. | 123,608 | 530,014 | |||
*GTL Infrastructure, Ltd. | 516,486 | 328,671 | |||
GTL, Ltd. | 172,195 | 1,214,466 | |||
Gujarat Alkalies & Chemicals, Ltd. | 135,835 | 327,740 | |||
Gujarat Ambuja Exports, Ltd. | 180,510 | 80,125 | |||
Gujarat Fluorochemicals, Ltd. | 164,960 | 480,415 | |||
Gujarat Gas Co., Ltd. | 171,320 | 739,096 | |||
Gujarat Narmada Valley Fertilizers Co., Ltd. | 246,752 | 482,056 | |||
Gujarat State Fertilizers & Chemicals, Ltd. | 129,079 | 483,983 | |||
*Gujarat State Petronet, Ltd. | 118,083 | 201,358 | |||
*GVK Power & Infrastructure, Ltd. | 738,454 | 687,072 | |||
H.E.G., Ltd. | 76,619 | 414,116 | |||
HCL Infosystems, Ltd. | 280,963 | 909,040 | |||
*HeidelbergCement India, Ltd. | 274,729 | 207,095 | |||
Hexaware Technologies, Ltd. | 166,745 | 268,979 | |||
*Hikal, Ltd. | 17,498 | 126,222 | |||
*Himachal Futuristic Communications, Ltd. | 705,174 | 153,670 | |||
Hinduja Global Solutions, Ltd. | 36,075 | 396,829 | |||
Hinduja Ventures, Ltd. | 36,075 | 230,180 | |||
Hindustan Construction Co., Ltd. | 512,201 | 1,348,506 | |||
*Hindustan Oil Exploration Co., Ltd. | 68,772 | 417,449 | |||
*Honeywell Automation India, Ltd. | 6,781 | 274,286 | |||
Hotel Leelaventure, Ltd. | 580,370 | 416,320 | |||
124
THE EMERGING MARKETS SMALL CAP SERIES
CONTINUED
| Shares | Value†† | ||||
INDIA — (Continued) | |||||
*Housing Development & Infrastructure, Ltd. | 76,514 | $ | 507,037 | ||
HSIL, Ltd. | 69,904 | 77,717 | |||
ICI India, Ltd. | 50,985 | 620,805 | |||
ICSA (India), Ltd. | 8,443 | 31,881 | |||
IDBI Bank, Ltd. | 60,365 | 144,689 | |||
India Cements, Ltd. | 148,839 | 345,518 | |||
India Infoline, Ltd. | 94,224 | 254,038 | |||
Indiabulls Financial Services, Ltd. | 226,804 | 795,059 | |||
*Indiabulls Real Estate, Ltd. | 187,970 | 982,105 | |||
*Indian Bank | 21,517 | 70,638 | |||
Indian Hotels Co., Ltd. | 640,595 | 995,161 | |||
Indian Overseas Bank | 196,756 | 419,088 | |||
*Indo Rama Synthetics (India), Ltd. | 136,867 | 89,594 | |||
Indoco Remedies, Ltd. | 12,300 | 65,156 | |||
IndusInd Bank, Ltd. | 447,357 | 1,096,325 | |||
INEIS ABS India, Ltd. | 23,441 | 81,052 | |||
*Infomedia 18, Ltd. | 23,790 | 36,533 | |||
*Infotech Enterprises, Ltd. | 87,418 | 439,089 | |||
ING Vysya Bank, Ltd. | 19,494 | 116,454 | |||
Ipca Laboratories, Ltd. | 50,588 | 969,126 | |||
IRB Infrastructure Developers, Ltd. | 215,222 | 1,048,232 | |||
IVRCL Infrastructures & Projects, Ltd. | 246,781 | 1,797,386 | |||
J.B. Chemicals & Pharmaceuticals, Ltd. | 136,681 | 136,812 | |||
Jain Irrigation Systems, Ltd. | 111,368 | 1,804,171 | |||
Jaiprakash Hydro Power, Ltd. | 236,636 | 313,466 | |||
Jammu & Kashmir Bank, Ltd. | 74,481 | 884,887 | |||
JBF Industries, Ltd. | 99,101 | 181,756 | |||
*Jet Airways (India), Ltd. | 15,491 | 123,051 | |||
*Jindal Drilling & Industries, Ltd. | 6,563 | 72,937 | |||
Jindal Poly Films, Ltd. | 29,404 | 182,437 | |||
Jindal Saw, Ltd. | 73,518 | 1,073,856 | |||
*JSL, Ltd. | 232,194 | 483,601 | |||
Jubilant Organosys, Ltd. | 91,504 | 451,806 | |||
Jyoti Structures, Ltd. | 116,466 | 326,367 | |||
K.S.B. Pumps, Ltd. | 15,895 | 125,805 | |||
Karnataka Bank, Ltd. | 198,190 | 544,130 | |||
Karur Vysya Bank, Ltd. | 103,349 | 851,220 | |||
KEC International, Ltd. | 50,258 | 580,272 | |||
Kesoram Industries, Ltd. | 83,108 | 593,456 | |||
Kirloskar Oil Engines, Ltd. | 374,592 | 995,611 | |||
Koutons Retail India, Ltd. | 6,600 | 48,118 | |||
KPIT Cummins Infosystems, Ltd. | 107,009 | 178,610 | |||
KS Oils, Ltd. | 254,017 | 341,503 | |||
Lakshmi Machine Works, Ltd. | 5,560 | 158,196 | |||
*Lanco Infratech, Ltd. | 14,251 | 146,009 | |||
LIC Housing Finance, Ltd. | 148,431 | 2,320,561 | |||
Lupin, Ltd. | 40,135 | 1,039,997 | |||
*Madras Cements, Ltd. | 51,240 | 115,947 | |||
Mahanagar Telephone Nigam, Ltd. | 290,051 | 421,081 | |||
Maharashtra Scooters, Ltd. | 4,550 | 17,008 | |||
Maharashtra Seamless, Ltd. | 99,628 | 688,268 | |||
Mahindra Lifespace Developers, Ltd. | 56,900 | 385,037 | |||
Mangalam Cement, Ltd. | 18,450 | 46,859 | |||
Marico, Ltd. | 901,020 | 1,854,571 | |||
Mastek, Ltd. | 59,764 | 369,646 | |||
*MAX India, Ltd. | 261,485 | 978,792 | |||
McLeod Russel India, Ltd. | 4,391 | 18,973 | |||
*Megasoft, Ltd. | 21,301 | 9,993 | |||
Mercator Lines, Ltd. | 350,017 | 352,992 | |||
Merck, Ltd. | 20,256 | 223,546 | |||
Micro Inks, Ltd. | 11,233 | 94,140 | |||
125
THE EMERGING MARKETS SMALL CAP SERIES
CONTINUED
| Shares | Value†† | ||||
INDIA — (Continued) | |||||
Monnet Ispat, Ltd. | 67,091 | $ | 526,763 | ||
Monsanto India, Ltd. | 11,378 | 363,094 | |||
Moser Baer (India), Ltd. | 372,370 | 590,702 | |||
Motherson Sumi Systems, Ltd. | 666,405 | 1,573,234 | |||
MphasiS, Ltd. | 214,746 | 3,056,632 | |||
MPS, Ltd. | 479 | 579 | |||
MRF, Ltd. | 7,798 | 869,325 | |||
Mukta Arts, Ltd. | 672 | 669 | |||
Nagarjuna Construction Co., Ltd. | 309,858 | 957,991 | |||
*Nagarjuna Fertilizers & Chemicals, Ltd. | 836,022 | 480,177 | |||
Nahar Capital & Financial Services, Ltd. | 31,896 | 32,759 | |||
Nahar Poly Films, Ltd. | 45,938 | 20,826 | |||
Nahar Spinning Mills, Ltd. | 67,990 | 82,026 | |||
Navneet Publications (India), Ltd. | 169,970 | 138,775 | |||
NIIT Technologies, Ltd. | 114,330 | 326,799 | |||
NIIT, Ltd. | 340,635 | 427,612 | |||
Nirma, Ltd. | 28,800 | 106,901 | |||
NOCIL, Ltd. | 201,948 | 96,679 | |||
Nucleus Software Exports, Ltd. | 42,062 | 93,612 | |||
OCL India, Ltd. | 56,194 | 129,438 | |||
*Octav Investments, Ltd. | 4,020 | 1,533 | |||
Omax Autos, Ltd. | 17,939 | 18,429 | |||
*OnMobile Global, Ltd. | 15,514 | 118,730 | |||
Opto Circuits India, Ltd. | 347,144 | 1,451,657 | |||
Orchid Chemicals & Pharmaceuticals, Ltd. | 113,459 | 366,330 | |||
Orient Paper & Industries, Ltd. | 296,620 | 269,434 | |||
Oriental Bank of Commerce | 38,349 | 193,903 | |||
*Panacea Biotec, Ltd. | 119,514 | 374,698 | |||
Pantaloon Retail India, Ltd. | 2,575 | 16,961 | |||
*Pantaloon Retail India, Ltd. Class B | 257 | 1,258 | |||
*Parsvnath Developers, Ltd. | 20,034 | 44,175 | |||
Patel Engineering, Ltd. | 97,383 | 926,742 | |||
Patni Computer Systems, Ltd. | 38,820 | 363,416 | |||
Petronet LNG, Ltd. | 641,661 | 873,880 | |||
Pidilite Industries, Ltd. | 481,710 | 1,668,707 | |||
Piramal Healthcare, Ltd. | 66,807 | 539,530 | |||
Polaris Software Lab, Ltd. | 157,531 | 518,667 | |||
Praj Industries, Ltd. | 268,545 | 472,278 | |||
*Prakash Industries, Ltd. | 35,972 | 101,769 | |||
*Pricol, Ltd. | 86,536 | 23,939 | |||
Prism Cements, Ltd. | 596,393 | 502,102 | |||
PSL, Ltd. | 63,467 | 186,472 | |||
PTC India, Ltd. | 323,705 | 691,070 | |||
Punj Lloyd, Ltd. | 191,267 | 812,046 | |||
*PVP Ventures, Ltd. | 43,697 | 36,926 | |||
Radico Khaitan, Ltd. | 156,080 | 373,712 | |||
Rain Commodities, Ltd. | 76,883 | 241,552 | |||
Rallis India, Ltd. | 19,769 | 373,845 | |||
*Rama Newsprint & Papers, Ltd. | 69,017 | 23,358 | |||
*Raymond, Ltd. | 98,113 | 376,088 | |||
Redington India, Ltd. | 5,023 | 29,795 | |||
REI Agro, Ltd. | 613,300 | 579,003 | |||
Rei Six Ten Retail, Ltd. | 229,985 | 713,356 | |||
Reliance Industrial Infrastructure, Ltd. | 24,104 | 434,117 | |||
*Reliance Media World, Ltd. | 66,472 | 14,295 | |||
*Reliance MediaWorks, Ltd. | 66,472 | 352,023 | |||
Rico Auto Industries, Ltd. | 136,391 | 65,163 | |||
Rolta India, Ltd. | 266,216 | 967,020 | |||
Ruchi Soya Industries, Ltd. | 371,710 | 620,762 | |||
*SEAMEC, Ltd. | 58,658 | 250,545 | |||
Shree Cement, Ltd. | 9,242 | 301,302 | |||
126
THE EMERGING MARKETS SMALL CAP SERIES
CONTINUED
| Shares | Value†† | ||||
INDIA — (Continued) | |||||
*Shree Precoated Steels, Ltd. | 78,190 | $ | 32,381 | ||
*Shree Renuka Sugars, Ltd. | 73,786 | 288,874 | |||
Shriram Transport Finance Co., Ltd. | 301,310 | 2,499,367 | |||
*Sicagen India, Ltd. | 41,648 | 10,487 | |||
*Sical Logistics, Ltd. | 4,846 | 6,229 | |||
SKF India, Ltd. | 95,810 | 545,987 | |||
Solectron Centum Electronics, Ltd. | 9,432 | 11,341 | |||
Solectron EMS India, Ltd. | 9,432 | 8,343 | |||
*Sona Koyo Steering Systems, Ltd. | 233,120 | 76,744 | |||
Sonata Software, Ltd. | 155,438 | 109,985 | |||
South India Bank, Ltd. | 163,780 | 455,109 | |||
SREI Infrastructure Finance, Ltd. | 165,360 | 248,069 | |||
SRF, Ltd. | 101,277 | 394,243 | |||
Sterling Biotech, Ltd. | 469,728 | 897,348 | |||
Sterlite Technologies, Ltd. | 95,694 | 561,480 | |||
*Strides Arcolab, Ltd. | 64,472 | 213,270 | |||
*Sun Pharma Advanced Research Co., Ltd. | 147,386 | 250,851 | |||
Sun TV Network, Ltd. | 29,505 | 195,209 | |||
Sundaram-Clayton, Ltd. | 7,780 | 17,197 | |||
Sundram Fastners, Ltd. | 465,052 | 460,333 | |||
Supreme Industries, Ltd. | 22,265 | 145,115 | |||
Supreme Petrochem, Ltd. | 144,830 | 77,098 | |||
Swaraj Engines, Ltd. | 3,100 | 19,756 | |||
Syndicate Bank | 375,000 | 683,920 | |||
Taj GVK Hotels and Resorts, Ltd. | 83,666 | 208,836 | |||
Tata Chemicals, Ltd. | 40,145 | 222,124 | |||
Tata Elxsi, Ltd. | 51,574 | 168,723 | |||
Tata Investment Corp., Ltd. | 50,540 | 466,532 | |||
*Tata Metaliks, Ltd. | 10,815 | 21,926 | |||
Tata Tea, Ltd. | 29,537 | 536,302 | |||
*Tata Teleservices Maharashtra, Ltd. | 893,799 | 499,081 | |||
*Tech Mahindra, Ltd. | 20,882 | 408,454 | |||
*Teledata Marine Solutions | 152,395 | 111,137 | |||
*Teledata Technology Solutions, Ltd. | 152,395 | 17,944 | |||
Texmaco, Ltd. | 215,690 | 577,337 | |||
Thermax, Ltd. | 35,410 | 392,871 | |||
Thomas Cook (India), Ltd. | 134,500 | 152,860 | |||
Titan Industries, Ltd. | 14,800 | 390,558 | |||
Torrent Pharmaceuticals, Ltd. | 194,766 | 1,346,405 | |||
Torrent Power, Ltd. | 20,643 | 122,691 | |||
Trent, Ltd. | 18,895 | 267,447 | |||
Triveni Engineering & Industries, Ltd. | 29,067 | 62,531 | |||
Tube Investments of India, Ltd. | 338,984 | 425,040 | |||
Tulip Telecom, Ltd. | 12,538 | 243,990 | |||
TVS Motor Co., Ltd. | 92,814 | 105,557 | |||
UCO Bank | 483,746 | 512,724 | |||
Unichem Laboratories, Ltd. | 52,347 | 281,702 | |||
United Phosphorus, Ltd. | 323,860 | 982,160 | |||
Usha Martin, Ltd. | 433,015 | 574,271 | |||
*Uttam Galva Steels, Ltd. | 127,929 | 313,167 | |||
Vardhman Textiles, Ltd. | 76,291 | 244,576 | |||
Varun Shipping Co., Ltd. | 261,746 | 294,602 | |||
Vesuvius India, Ltd. | 1,802 | 6,140 | |||
Videocon Industries, Ltd. | 76,102 | 355,197 | |||
Vijaya Bank, Ltd. | 191,841 | 176,660 | |||
WABCO-TVS (India), Ltd. | 3,890 | 35,795 | |||
*Welspun Global Brands, Ltd. | 9,265 | 4,143 | |||
*Welspun India, Ltd. | 92,659 | 162,406 | |||
*Welspun Investments, Ltd. | 4,632 | 2,071 | |||
Welspun-Gujarat Stahl Rohren, Ltd. | 292,491 | 1,569,958 | |||
*Wockhardt, Ltd. | 52,983 | 190,073 | |||
127
THE EMERGING MARKETS SMALL CAP SERIES
CONTINUED
| Shares | Value†† | ||||
INDIA — (Continued) | |||||
Wyeth, Ltd. | 40,457 | $ | 593,012 | ||
*Yes Bank, Ltd. | 160,036 | 791,437 | |||
Zee Entertainment Enterprises, Ltd. | 92,576 | 449,014 | |||
Zensar Technologies, Ltd. | 41,117 | 204,382 | |||
Zuari Industries, Ltd. | 55,762 | 473,386 | |||
Zydus Wellness, Ltd. | 17,414 | 62,714 | |||
TOTAL INDIA | 141,238,191 | ||||
INDONESIA — (2.9%) | |||||
PT Aneka Tambang Tbk | 6,700,500 | 1,557,146 | |||
PT Asahimas Flat Glass Tbk | 983,000 | 184,301 | |||
*PT Bakrie & Brothers Tbk | 78,238,500 | 794,393 | |||
*PT Bakrieland Development Tbk | 32,742,250 | 919,422 | |||
*PT Bank Bukopin Tbk | 1,422,000 | 56,348 | |||
*PT Bank Pan Indonesia Tbk | 26,324,875 | 2,113,491 | |||
PT Berlian Laju Tanker Tbk | 12,848,933 | 938,900 | |||
PT Bhakti Investama Tbk | 23,571,100 | 468,973 | |||
*PT Bisi International Tbk | 3,425,000 | 599,029 | |||
PT Budi Acid Jaya Tbk | 5,947,000 | 147,733 | |||
*PT Central Proteinaprima Tbk | 19,754,500 | 135,987 | |||
*PT Charoen Pokphand Indonesia Tbk | 7,595,500 | 1,584,155 | |||
*PT Ciputra Development Tbk | 3,913,000 | 252,944 | |||
*PT Ciputra Surya Tbk | 1,642,000 | 96,174 | |||
PT Citra Marga Nusaphala Persada Tbk | 6,995,000 | 615,730 | |||
PT Clipan Finance Indonesia Tbk | 1,482,000 | 29,907 | |||
*PT Davomas Adabi Tbk | 41,920,000 | 320,436 | |||
*PT Delta Dunia Petronda Tbk | 12,220,000 | 2,313,817 | |||
*PT Dynaplast Tbk | 1,038,000 | 86,953 | |||
*PT Energi Mega Persada Tbk | 21,237,000 | 614,120 | |||
*PT Ever Shine Textile Tbk | 4,029,640 | 26,583 | |||
*PT Global Mediacom Tbk | 15,651,000 | 354,348 | |||
*PT Hanson International Tbk | 5,038,000 | 26,377 | |||
*PT Hero Supermarket Tbk | 33,000 | 13,822 | |||
*PT Hexindo Adiperkasa Tbk | 573,500 | 168,783 | |||
*PT Holcim Indonesia Tbk | 9,852,500 | 1,638,183 | |||
*PT Indah Kiat Pulp and Paper Corp. Tbk | 3,884,000 | 718,703 | |||
*PT Indo Tambangraya Megah Tbk | 136,500 | 318,295 | |||
PT Indofood Sukses Makmur Tbk | 7,668,000 | 2,423,386 | |||
*PT Indo-Rama Synthetics Tbk | 485,000 | 24,885 | |||
*PT Intiland Development Tbk | 2,097,400 | 160,858 | |||
PT Jasa Marga Tbk | 3,773,500 | 696,039 | |||
PT Jaya Real Property Tbk | 1,967,500 | 145,245 | |||
PT Kalbe Farma Tbk | 14,904,238 | 1,869,217 | |||
*PT Kawasan Industry Jababeka Tbk | 107,567,500 | 1,303,480 | |||
*PT Keramika Indonesia Assosiasi Tbk | 100,000 | 2,304 | |||
*PT Lippo Karawaci Tbk | 35,036,250 | 2,369,997 | |||
*PT Matahari Putra Prima Tbk | �� | 2,543,000 | 234,559 | ||
PT Mayorah Indah Tbk | 2,473,500 | 758,733 | |||
PT Medco Energi International Tbk | 3,599,500 | 1,006,004 | |||
*PT Mitra Adiperkasa Tbk | 3,015,000 | 162,242 | |||
*PT Mitra Rajasa Tbk | 4,391,000 | 170,639 | |||
*PT Modern Photo Tbk | 40,000 | 948 | |||
*PT Pakuwon Jati Tbk | 409,500 | 21,225 | |||
*PT Panasia Indosyntec Tbk | 79,000 | 1,944 | |||
*PT Panin Insurance Tbk | 6,609,000 | 152,808 | |||
*PT Panin Life Tbk | 23,792,000 | 306,693 | |||
*PT Perusahaan Perkebunan London Sumatra Indonesia Tbk | 778,000 | 620,326 | |||
*PT Pioneerindo Gourmet International Tbk | 29,000 | 850 | |||
*PT Polaris Investama Tbk | 2,730,500 | 296,823 | |||
*PT Polychem Indonesia Tbk | 4,228,000 | 50,075 | |||
*PT Prasidha Aneka Niaga Tbk | 84,000 | 880 | |||
128
THE EMERGING MARKETS SMALL CAP SERIES
CONTINUED
| Shares | Value†† | ||||
INDONESIA — (Continued) | |||||
PT Ramayana Lestari Sentosa Tbk | 14,295,000 | $ | 829,490 | ||
*PT Sampoerna Agro Tbk | 864,500 | 204,249 | |||
PT Samudera Indonesia Tbk | 223,000 | 94,514 | |||
PT Selamat Semp Tbk | 1,920,000 | 138,722 | |||
PT Sinar Mas Agro Resources & Technology Tbk | 1,071,460 | 347,302 | |||
*PT Sumalindo Lestari Jaya Tbk | 250 | 11 | |||
PT Summarecon Agung Tbk | 16,534,532 | 985,250 | |||
*PT Sunson Textile Manufacturer Tbk | 2,325,500 | 60,877 | |||
*PT Surabaya Agung Industri Pulp & Kertas Tbk | 64,500 | 878 | |||
*PT Surya Dumai Industri Tbk | 3,298,500 | — | |||
*PT Suryainti Permata Tbk | 7,252,000 | 79,087 | |||
*PT Suryamas Dutamakmur Tbk | 125,000 | 1,257 | |||
*PT Texmaco Jaya Tbk | 93,000 | 28,728 | |||
PT Timah Tbk | 8,795,000 | 1,756,399 | |||
PT Trias Sentosa Tbk | 38,725,600 | 849,135 | |||
PT Trimegah Sec Tbk | 9,961,000 | 187,747 | |||
*PT Truba Alam Manunggal Engineering Tbk | 10,474,000 | 136,637 | |||
PT Tunas Ridean Tbk | 3,838,000 | 604,115 | |||
PT Ultrajaya Milk Industry & Trading Co. Tbk | 390,000 | 24,094 | |||
PT Unggul Indah Cahaya Tbk | 48,239 | 11,239 | |||
TOTAL INDONESIA | 36,214,944 | ||||
ISRAEL — (2.9%) | |||||
*Africa-Israel Investments, Ltd. | 21,693 | 274,395 | |||
Alony Hetz Properties & Investments, Ltd. | 229,187 | 814,050 | |||
*Alvarion, Ltd. | 102,477 | 411,933 | |||
*Analyst IMS Investment Management Services, Ltd. | 700 | 5,207 | |||
*AudioCodes, Ltd. | 111,296 | 308,127 | |||
*AudioCodes, Ltd. ADR | 82,926 | 218,925 | |||
*Azorim Investment Development & Construction Co., Ltd. | 58,001 | 372,253 | |||
*Baran Group, Ltd. | 9,500 | 47,591 | |||
*Beit Shemesh Engines Holdings, Ltd. | — | — | |||
*Blue Square-Israel, Ltd. | 100,987 | 1,022,880 | |||
*Clal Industries, Ltd. | 39,800 | 203,043 | |||
*Clal Insurance Enterprise Holdings, Ltd. | 257,136 | 5,443,527 | |||
*Compugen, Ltd. | 11,938 | 31,626 | |||
Dan Vehicle & Transportation | 45,809 | 282,141 | |||
Delek Automotive Systems, Ltd. | 37,228 | 422,835 | |||
*Delta-Galil Industries, Ltd. | 31,301 | 139,093 | |||
*Direct Insurance - I.D.I. Insurance Co., Ltd. | 59,860 | 114,213 | |||
*Elbit Medical Imaging, Ltd. | 37,507 | 928,388 | |||
Electra (Israel), Ltd. | 5,396 | 496,740 | |||
*Electra Real Estate, Ltd. | 23,202 | 227,261 | |||
*Feuchtwanger Investments, Ltd. | 4,200 | 13 | |||
*First International Bank of Israel, Ltd. (6123804) | 456,181 | 1,285,711 | |||
*First International Bank of Israel, Ltd. (6123815) | 26,108 | 378,244 | |||
FMS Enterprises Migun, Ltd. | 10,169 | 357,175 | |||
Formula Systems, Ltd. | 18,238 | 195,475 | |||
*Formula Vision Technologies, Ltd. | 1 | — | |||
*Frutarom Industries, Ltd. | 155,741 | 1,260,311 | |||
*Granite Hacarmel Investments, Ltd. | 19,200 | 40,900 | |||
*Hadera Paper, Ltd. | 8,541 | 544,248 | |||
*Hamlet (Israel-Canada), Ltd. | 6,342 | 40,450 | |||
*Harel Insurance Investments & Finances, Ltd. | 96,806 | 4,582,314 | |||
*Hot Telecommunications Systems | 68,469 | 703,779 | |||
IBI Investment House, Ltd. | 6,530 | 62,964 | |||
Industrial Building Corp., Ltd. | 276,524 | 484,803 | |||
*Israel Discount Bank, Ltd. | 885,303 | 1,689,977 | |||
Israel Land Development Co., Ltd. (The) | 34,759 | 160,383 | |||
Ituran Location & Control, Ltd. | 31,200 | 383,251 | |||
*Jerusalem Oil Exploration, Ltd. | 18,145 | 282,524 | |||
129
THE EMERGING MARKETS SMALL CAP SERIES
CONTINUED
| Shares | Value†† | ||||
ISRAEL — (Continued) | |||||
*Knafaim Arkia Holdings, Ltd. | 27,233 | $ | 117,808 | ||
*Leader Holding & Investments, Ltd. | 74,777 | 30,339 | |||
*Magic Software Enterprises, Ltd. | 43,946 | 82,829 | |||
*Menorah Mivtachim Holdings, Ltd. | 29,926 | 343,103 | |||
Mer Industries, Ltd. | 19,959 | 127,213 | |||
*Metalink, Ltd. | 38,682 | 13,849 | |||
*Metis Capital, Ltd. | 1,079 | 4,819 | |||
Middle East Tube Co., Ltd. | 13,500 | 20,568 | |||
*Migdal Insurance & Financial Holdings, Ltd. | 242,339 | 379,825 | |||
*Mivtach Shamir Holdings, Ltd. | 16,251 | 487,274 | |||
*Mizrahi Tefahot Bank, Ltd. | 173,961 | 1,413,821 | |||
*Naphtha Israel Petroleum Corp. | 24,647 | 88,469 | |||
*Neto M.E. Holdings, Ltd. | 6,938 | 262,221 | |||
O.R.T. Technologies, Ltd. | 6,000 | 46,270 | |||
*OCIF Investments and Development, Ltd. | 5,002 | 32,713 | |||
*Oil Refineries, Ltd. | 1,901,697 | 1,044,464 | |||
*Orckit Communications, Ltd. | 125,396 | 458,182 | |||
Ormat Industries, Ltd. | 35,000 | 305,110 | |||
Osem Investment, Ltd. | 1 | 8 | |||
Paz Oil Co., Ltd. | 1,200 | 186,910 | |||
*Retalix, Ltd. | 11,628 | 127,525 | |||
*Scailex Corp., Ltd. | 60,694 | 1,091,416 | |||
Shikun & Binui, Ltd. | 815,326 | 1,428,089 | |||
Spectronix, Ltd. | 4,387 | 29,898 | |||
Strauss Group, Ltd. | 34,182 | 443,062 | |||
*Suny Electronic, Ltd. | 24,470 | 222,068 | |||
Super-Sol, Ltd. Series B | 449,336 | 2,126,450 | |||
*Tower Semiconductor, Ltd. | 827,655 | 809,711 | |||
*TTI Team Telecom International, Ltd. ADR | 12,465 | 15,083 | |||
*Union Bank of Israel, Ltd. | 210,322 | 960,694 | |||
*Urdan Industries, Ltd. | 303,535 | 148,356 | |||
*VeriFone Holdings, Inc. | — | 5 | |||
TOTAL ISRAEL | 37,064,902 | ||||
MALAYSIA — (5.3%) | |||||
*A&M Realty Berhad | 130,000 | 26,761 | |||
Acoustech Berhad | 156,200 | 34,839 | |||
Aeon Co. Berhad | 974,200 | 1,457,235 | |||
Affin Holdings Berhad | 286,400 | 170,176 | |||
*Airasia Berhad | 306,700 | 120,593 | |||
Al-’Aqar KPJ REIT Berhad | 75,371 | 21,652 | |||
*AMBD Berhad | 716,033 | 101,551 | |||
Amway (Malaysia) Holdings Berhad | 396,700 | 848,205 | |||
*Ancom Berhad | 400,500 | 72,657 | |||
*Ann Joo Resources Berhad | 981,750 | 745,137 | |||
*Anson Perdana Berhad | 10,000 | 132 | |||
APM Automotive Holdings Berhad | 215,100 | 147,306 | |||
*Asas Dunia Berhad | 137,000 | 24,273 | |||
*Asia Pacific Land Berhad | 1,888,600 | 157,032 | |||
Bandar Raya Developments Berhad | 1,190,200 | 616,009 | |||
*Berjaya Assets Berhad | 684,000 | 91,185 | |||
Berjaya Corp. Berhad | 4,195,800 | 1,437,444 | |||
*Berjaya Land Berhad | 933,500 | 1,136,971 | |||
Bernas Padiberas Nasional Berhad | 1,175,200 | 700,922 | |||
Bimb Holdings Berhad | 926,600 | 302,762 | |||
*Bintulu Port Holdings Berhad | 23,400 | 41,945 | |||
Bolton Properties Berhad | 674,600 | 129,938 | |||
*Boustead Heavy Industries Corp. Berhad | 43,500 | 61,398 | |||
Boustead Holdings Berhad | 706,520 | 703,605 | |||
Cahya Mata Sarawak Berhad | 823,600 | 403,608 | |||
Carlsberg Brewery Malaysia Berhad | 655,600 | 862,379 | |||
130
THE EMERGING MARKETS SMALL CAP SERIES
CONTINUED
| Shares | Value†† | ||||
MALAYSIA — (Continued) | |||||
CB Industrial Product Holding Berhad | 111,800 | $ | 100,895 | ||
Chemical Co. of Malaysia Berhad | 472,600 | 359,276 | |||
Chin Teck Plantations Berhad | 33,000 | 69,361 | |||
Cycle & Carriage Bintang Berhad | 15,000 | 15,320 | |||
*Datuk Keramik Holdings Berhad | 24,000 | — | |||
*Dialog Group Berhad | 3,564,000 | 1,344,522 | |||
Dijaya Corp. Berhad | 144,200 | 58,743 | |||
DNP Holdings Berhad | 544,400 | 234,076 | |||
DRB-Hicom Berhad | 2,020,500 | 640,038 | |||
*Dreamgate Corp. Berhad | 100,000 | 4,906 | |||
Dutch Lady Milk Industries Berhad | 125,700 | 425,031 | |||
*Eastern & Oriental Berhad | 866,200 | 269,671 | |||
Eastern Pacific Industrial Corp. Berhad | 218,100 | 96,201 | |||
ECM Libra Avenue Berhad | 1,592,777 | 298,867 | |||
*Encorp Berhad | 196,700 | 58,936 | |||
Eng Kah Corp. Berhad | 32,000 | 22,519 | |||
Esso Malaysia Berhad | 420,600 | 322,686 | |||
Faber Group Berhad | 538,000 | 162,457 | |||
Far East Holdings Berhad | 61,500 | 114,176 | |||
*Fountain View Development Berhad | 808,200 | 52,104 | |||
Fraser & Neave Holdings Berhad | 322,700 | 999,892 | |||
General Corp. Berhad | 225,100 | 69,211 | |||
George Kent (Malaysia) Berhad | 34,200 | 8,568 | |||
*GHL Systems Berhad | 2 | — | |||
Globetronics Technology Berhad | 517,560 | 127,151 | |||
Glomac Berhad | 370,200 | 134,766 | |||
*Gold Is Berhad | 419,400 | 148,244 | |||
*Golden Plus Holdings Berhad | 216,000 | 66,462 | |||
Grand United Holdings Berhad | 787,000 | 191,802 | |||
Guiness Anchor Berhad | 897,100 | 1,837,720 | |||
GuocoLand (Malaysia) Berhad | 1,359,800 | 456,582 | |||
*Hai-O Enterprise Berhad | 8,400 | 18,416 | |||
Hap Seng Consolidated Berhad | 1,171,900 | 835,751 | |||
Hap Seng Plantations Holdings Berhad | 3,000 | 1,973 | |||
HLG Capital Berhad | 90,000 | 28,367 | |||
Hock Seng Lee Berhad | 1,010,300 | 320,035 | |||
Hong Leong Industries Berhad | 605,900 | 744,743 | |||
*Hovid Berhad | 1,803,300 | 135,723 | |||
Hume Industries (Malaysia) Berhad | 412,267 | 410,064 | |||
Hunza Properties Berhad | 500,400 | 210,935 | |||
Hwang-DBS (Malaysia) Berhad | 293,200 | 134,453 | |||
*IGB Corp. Berhad | 319,700 | 181,583 | |||
*IJM Land Berhad | 1,807,400 | 1,234,185 | |||
IJM Plantations Berhad | 1,188,700 | 909,075 | |||
*Insas Berhad | 1,642,200 | 259,608 | |||
Integrated Logistics Berhad | 544,300 | 148,536 | |||
*Jaks Resources Berhad | 800,700 | 175,128 | |||
Jaya Tiasa Holdings Berhad | 436,390 | 313,578 | |||
JT International Berhad | 550,600 | 748,493 | |||
*K & N Kenanga Holdings Berhad | 762,300 | 135,171 | |||
*Karambunai Corp. Berhad | 3,120,500 | 62,678 | |||
Keck Seng (Malaysia) Berhad | 552,100 | 646,335 | |||
*Kencana Petroleum Berhad | 790,200 | 500,569 | |||
KFC Holdings (Malaysia) Berhad | 562,000 | 1,254,092 | |||
Kian Joo Can Factory Berhad | 1,091,080 | 378,890 | |||
Kim Loong Resources Berhad | 221,760 | 121,610 | |||
KLCC Property Holdings Berhad | 256,700 | 245,220 | |||
KNM Group Berhad | 6,269,700 | 1,422,907 | |||
Kossan Rubber Industries Berhad | 144,900 | 214,381 | |||
KPJ Healthcare Berhad | 327,700 | 425,281 | |||
KrisAssets Holdings Berhad | 88,863 | 77,954 | |||
131
THE EMERGING MARKETS SMALL CAP SERIES
CONTINUED
| Shares | Value†† | ||||
MALAYSIA — (Continued) | |||||
KSL Holdings Berhad | 649,266 | $ | 244,209 | ||
Kub Malaysia Berhad | 1,353,500 | 192,608 | |||
Kuchai Development Berhad | 38,100 | 8,558 | |||
Kulim Malaysia Berhad | 536,050 | 1,152,744 | |||
*Kumpulan Europlus Berhad | 900,100 | 75,359 | |||
*Kumpulan Hartanah Selangor Berhad | 708,600 | 98,987 | |||
*Kurnia Asia Berhad | 2,485,800 | 574,287 | |||
Kwantas Corp. Berhad | 343,600 | 199,890 | |||
*Landmarks Berhad | 923,400 | 359,520 | |||
*LBS Bina Group Berhad | 161,800 | 21,073 | |||
Leader Universal Holdings Berhad | 1,018,700 | 233,861 | |||
Leong Hup Holdings Berhad | 397,700 | 123,099 | |||
Lingkaran Trans Kota Holdings Berhad | 915,600 | 752,800 | |||
*Lion Corp Berhad | 616,300 | 69,357 | |||
Lion Diversified Holdings Berhad | 427,000 | 59,679 | |||
Lion Industries Corp. Berhad | 424,800 | 173,706 | |||
LPI Capital Berhad | 4,000 | 14,713 | |||
*MAA Holdings Berhad | 346,666 | 73,230 | |||
Mah Sing Group Berhad | 305,800 | 160,864 | |||
*Malaysia Aica Berhad | 48,200 | 7,841 | |||
Malaysia Building Society Berhad | 7,000 | 1,836 | |||
Malaysian Bulk Carriers Berhad | 115,900 | 105,392 | |||
Malaysian Mosaics Berhad | 71,460 | 23,262 | |||
Malaysian Pacific Industries Berhad | 339,500 | 556,991 | |||
*Malaysian Resources Corp. Berhad | 2,297,766 | 907,892 | |||
*Mancon Berhad | 12,000 | 3,059 | |||
Manulife Holdings Berhad | 100,800 | 71,800 | |||
Marco Holdings Berhad | 2,815,400 | 96,893 | |||
MBM Resources Berhad | 322,366 | 229,141 | |||
*Measat Global Berhad | 217,500 | 105,694 | |||
Media Prima Berhad | 1,448,833 | 718,586 | |||
Mega First Corp. Berhad | 361,600 | 122,425 | |||
*MEMS Technology Berhad | 1,917,000 | 36,286 | |||
Metro Kajang Holdings Berhad | 138,900 | 59,140 | |||
*Minho (M) Berhad | 181,100 | 19,564 | |||
MNRB Holdings Berhad | 497,100 | 451,417 | |||
MTD ACPI Engineering Berhad | 541,000 | 104,153 | |||
Muhibbah Engineering Berhad | 750,150 | 253,348 | |||
*Mulpha International Berhad | 2,268,650 | 310,917 | |||
Multi-Purpose Holdings Berhad | 502,700 | 272,301 | |||
Naim Holdings Berhad | 622,300 | 560,672 | |||
*Narra Industries Berhad | 16,000 | 2,110 | |||
NCB Holdings Berhad | 1,147,200 | 1,025,281 | |||
New Straits Times Press Berhad | 720,000 | 416,682 | |||
*Nikko Electronics Berhad | 36,600 | 107 | |||
Notion VTEC Berhad | 1,293,600 | 197,617 | |||
NTPM Holdings Berhad | 991,080 | 147,673 | |||
NV Multi Corp. Berhad | 430,900 | 80,593 | |||
*NWP Holdings Berhad | 112,000 | 6,236 | |||
Nylex (Malaysia) Berhad | 550,800 | 129,882 | |||
OKS Property Holdings Berhad | 206,835 | 33,850 | |||
Oriental Holdings Berhad | 23,500 | 38,094 | |||
OSK Holdings Berhad | 1,375,271 | 599,431 | |||
P.I.E. Industrial Berhad | 140,100 | 175,024 | |||
*Pan Malaysia Cement Works Berhad | 646,600 | 26,394 | |||
*Pan Malaysian Industries Berhad | 1,129,000 | 18,027 | |||
Panasonic Manufacturing Malaysia Berhad | 157,184 | 572,659 | |||
*Panglobal Berhad | 14,000 | 7,754 | |||
Paramount Corp. Berhad | 24,000 | 17,672 | |||
PBA Holdings Berhad | 274,100 | 74,877 | |||
Pelikan International Corp. Berhad | 599,560 | 236,281 | |||
132
THE EMERGING MARKETS SMALL CAP SERIES
CONTINUED
| Shares | Value†† | ||||
MALAYSIA — (Continued) | |||||
PJ Development Holdings Berhad | 1,070,900 | $ | 210,394 | ||
POS Malaysia Berhad | 112,600 | 76,058 | |||
*Prime Utilities Berhad | 3,000 | 79 | |||
Protasco Berhad | 575,600 | 157,887 | |||
Proton Holdings Berhad | 654,700 | 721,019 | |||
Puncak Niaga Holdings Berhad | 749,520 | 698,647 | |||
QL Resources Berhad | 673,050 | 739,652 | |||
QSR Brand Berhad | 37,333 | 36,458 | |||
*Ramunia Holdings Berhad | 695,447 | 79,263 | |||
RCE Capital Berhad | 1,023,900 | 187,804 | |||
*Rekapacific Berhad | 55,000 | — | |||
Salcon Berhad | 702,400 | 104,468 | |||
SapuraCrest Petroleum Berhad | 1,112,300 | 671,079 | |||
Sarawak Energy Berhad | 60,100 | 45,490 | |||
Sarawak Oil Palms Berhad | 179,660 | 144,123 | |||
Scientex, Inc. Berhad | 344,862 | 138,498 | |||
Selangor Dredging Berhad | 1,118,200 | 179,661 | |||
Shangri-La Hotels (Malaysia) Berhad | 171,200 | 92,308 | |||
SHL Consolidated Berhad | 277,400 | 108,928 | |||
*South East Asia Lumber, Inc. Berhad | 618,000 | 60,348 | |||
Southern Acids (Malaysia) Berhad | 41,000 | 15,739 | |||
Southern Steel Berhad | 502,800 | 282,351 | |||
*SPK Sentosa Corp. Berhad | 239,000 | 32,274 | |||
*SRI Hartemas Berhad | 65,000 | — | |||
Star Publications (Malaysia) Berhad | 584,600 | 581,698 | |||
Subur Tiasa Holdings Berhad | 386,085 | 218,679 | |||
*Sunrise Berhad | 836,008 | 521,170 | |||
Sunway City Berhad | 724,900 | 651,048 | |||
Sunway Holdings Berhad | 1,046,000 | 418,738 | |||
Supermax Corp. Berhad | 708,700 | 747,352 | |||
Suria Capital Holdings Berhad | 672,800 | 273,448 | |||
Symphony House Berhad | 136,586 | 10,293 | |||
Ta Ann Holdings Berhad | 409,380 | 551,836 | |||
TA Enterprise Berhad | 4,878,900 | 1,090,130 | |||
*TA Global Berhad | 2,927,340 | 425,354 | |||
*TA Global Berhad Ordinary Shares | 2,927,340 | 425,354 | |||
Tahp Group Berhad | 4,000 | 3,619 | |||
*Talam Corp. Berhad | 783,450 | 20,338 | |||
*Tamco Corp. Holdings Berhad | 38,025 | 613 | |||
Tan Chong Motor Holdings Berhad | 1,344,900 | 885,142 | |||
TDM Berhad | 355,500 | 159,230 | |||
*Tebrau Teguh Berhad | 1,016,400 | 209,158 | |||
Thong Guan Industries Berhad | 215,100 | 50,302 | |||
*Time Dotcom Berhad | 1,328,100 | 157,035 | |||
*Titan Chemicals Corp. Berhad | 691,200 | 232,698 | |||
Top Glove Corp. Berhad | 555,880 | 1,324,311 | |||
Tradewinds (Malaysia) Berhad | 384,000 | 308,784 | |||
TRC Synergy Berhad | 64,800 | 26,465 | |||
UAC Berhad | 44,715 | 41,116 | |||
Uchi Technologies Berhad | 529,000 | 212,734 | |||
Unico-Desa Plantations Berhad | 1,853,775 | 433,197 | |||
Unisem (M) Berhad | 921,800 | 398,122 | |||
United Malacca Rubber Estates Berhad | 267,400 | 624,714 | |||
United Malayan Land Berhad | 13,000 | 5,075 | |||
United Plantations Berhad | 535,700 | 2,080,791 | |||
VS Industry Berhad | 427,326 | 152,836 | |||
Wah Seong Corp. Berhad | 1,157,250 | 815,604 | |||
WCT Berhad | 1,873,300 | 1,426,862 | |||
WTK Holdings Berhad | 1,165,000 | 392,724 | |||
Yeo Hiap Seng (Malaysia) Berhad | 56,760 | 23,251 | |||
YTL Cement Berhad | 54,800 | 66,137 | |||
133
THE EMERGING MARKETS SMALL CAP SERIES
CONTINUED
| Shares | Value†† | ||||
MALAYSIA — (Continued) | |||||
YTL e-Solutions Berhad | 3,485,600 | $ | 676,633 | ||
*YTL Land & Development Berhad | 47,800 | 14,428 | |||
*Yu Neh Huat Berhad | 815,145 | 401,087 | |||
Zelan Berhad | 1,146,600 | 294,744 | |||
TOTAL MALAYSIA | 66,950,408 | ||||
MEXICO — (5.3%) | |||||
#Alfa S.A.B. de C.V. Series A | 528,650 | 2,737,389 | |||
*Alsea de Mexico S.A.B. de C.V. | 482,100 | 324,595 | |||
#*Axtel S.A.B. de C.V. | 1,080,500 | 800,325 | |||
#Banco Compartamos S.A. de C.V. | 583,800 | 2,392,458 | |||
*Bolsa Mexicana de Valores S.A. de C.V. | 411,100 | 457,686 | |||
*Carso Infraestructura y Construccion S.A.B. de CV. | 709,000 | 397,357 | |||
#Cia Minera Autlan S.A.B. de C.V. | 186,900 | 402,712 | |||
#*Consorcio ARA S.A.B. de C.V. | 660,100 | 413,945 | |||
*Consorcio Hogar S.A.B. de C.V. Series B | 767,929 | 84,913 | |||
*Corporacion GEO S.A.B. de C.V. Series B | 1,330,000 | 3,500,331 | |||
#*Corporacion Interamericana de Entramiento S.A.B. de C.V. Series B | 960,372 | 477,504 | |||
*Corporacion Mexicana de Restaurantes S.A.B. de C.V. Series B | 1,623 | 360 | |||
Corporacion Moctezuma S.A.B. de C.V. | 858,200 | 1,819,907 | |||
Corporativo Fragua S.A.B. de C.V. Series B | 31 | 229 | |||
Corporativo GBM S.A.B de C.V. | 29,028 | 11,212 | |||
#*Desarrolladora Homex S.A.B. de C.V. | 576,300 | 3,428,448 | |||
*Dine S.A.B. de C.V. | 196,367 | 87,002 | |||
Embotelladora Arca S.A.B. de C.V. | 1,909,100 | 4,800,312 | |||
*Empaques Ponderosa S.A. de C.V. Series B | 206,000 | 14,041 | |||
*Empresas ICA S.A.B. de C.V. | 1,463,608 | 3,210,155 | |||
#*Empresas ICA S.A.B. de C.V. Sponsored ADR | 681,589 | 5,943,456 | |||
*Financiera Independencia S.A.B de C.V. | 65,800 | 48,289 | |||
#*Genomma Lab Internacional S.A. de C.V. | 262,500 | 428,231 | |||
*Gruma S.A.B. de C.V. ADR | 58,800 | 419,832 | |||
#*Gruma S.A.B. de C.V. Series B | 1,253,434 | 2,266,932 | |||
#Grupo Aeroportuario del Centro Norte, S.A.B. de C.V. | 393,000 | 565,521 | |||
#*Grupo Aeroportuario del Pacifico S.A.B de C.V. | 547,700 | 1,400,801 | |||
#Grupo Aeroportuario del Sureste S.A.B. de C.V. | 150,700 | 613,472 | |||
#Grupo Aeroportuario del Sureste S.A.B. de C.V. ADR | 62,500 | 2,543,125 | |||
*Grupo Cementos de Chihuahua S.A.B. de C.V. | 829,200 | 2,474,961 | |||
Grupo Continental S.A.B. de C.V. | 3,323,559 | 7,777,940 | |||
#*Grupo FAMSA S.A.B. de C.V. | 207,500 | 355,321 | |||
Grupo Herdez S.A.B. de C.V. | 107,000 | 130,876 | |||
Grupo Industrial Maseca S.A.B. de C.V. Series B | 578,600 | 393,950 | |||
*Grupo Industrial Saltillo S.A.B. de C.V. | 243,300 | 47,909 | |||
#*Grupo Iusacell S.A.B. de C.V. | 58,150 | 198,182 | |||
*Grupo Kuo S.A.B. de C.V. Series B | 222,767 | 142,733 | |||
*Grupo Nutrisa S.A. de C.V. | 188 | 399 | |||
*Grupo Posadas S.A. de C.V. Series L | 199,000 | 198,943 | |||
*Grupo Qumma S.A. de C.V. Series B | 105,334 | 1,436 | |||
#*Grupo Simec, S.A. de C.V. | 128,100 | 313,756 | |||
Industrias Bachoco S.A.B. de C.V. Series B | 152,000 | 291,251 | |||
*Industrias CH S.A.B. de C.V. Series B | 1,854,348 | 5,645,729 | |||
Mexichem S.A.B.de C.V. | 1,522,183 | 2,420,967 | |||
*Promotora y Operadora de Infraestructura S.A. de C.V. | 176,410 | 320,654 | |||
*Sanluis Corporacion S.A. de C.V. Series A | 3,300 | 237 | |||
*Sanluis Corporacion S.A. de C.V. Series C & Series B | 4,642 | 809 | |||
#*SARE Holding S.A. de C.V. | 271,300 | 98,421 | |||
*Savia S.A. de C.V. | 610,700 | 37,002 | |||
#TV Azteca S.A.B. de C.V. Series A | 6,581,300 | 3,394,388 | |||
*Urbi Desarrollos Urbanos S.A.B. de C.V. | 1,041,700 | 1,996,814 | |||
*Vitro S.A.B. de C.V. | 736,702 | 343,139 | |||
*Vitro S.A.B. de C.V. Sponsored ADR | 415,043 | 556,158 | |||
TOTAL MEXICO | 66,732,515 | ||||
134
THE EMERGING MARKETS SMALL CAP SERIES
CONTINUED
| Shares | Value†† | ||||
PHILIPPINES — (1.4%) | |||||
A. Soriano Corp. | 3,430,211 | $ | 157,059 | ||
Aboitiz Equity Ventures, Inc. | 6,767,000 | 1,168,117 | |||
Alaska Milk Corp. | 1,404,000 | 177,607 | |||
Bacnotan Consolidated Industries, Inc. | 135,549 | 26,226 | |||
*Belle Corp. | 20,937,000 | 611,682 | |||
*Benpres Holdings Corp. | 7,752,000 | 567,540 | |||
Cebu Holdings, Inc. | 2,284,000 | 90,407 | |||
China Banking Corp. | 5,098 | 38,558 | |||
*Digital Telecommunications Phils., Inc. | 15,500,000 | 451,772 | |||
DMCI Holdings, Inc. | 1,102,000 | 222,087 | |||
Filinvest Development Corp. | 11,428,000 | 511,304 | |||
Filinvest Land, Inc. | 137,257,577 | 2,583,927 | |||
*First Philippines Holdings Corp. | 2,269,900 | 2,222,007 | |||
Ginebra San Miguel, Inc. | 1,003,200 | 469,935 | |||
House of Investments, Inc. | 692,000 | 30,567 | |||
International Container Terminal Services, Inc. | 2,700,000 | 1,143,231 | |||
*Ionics, Inc. | 769,825 | 28,543 | |||
*Jollibee Food Corp. | 508,500 | 540,937 | |||
*Lepanto Consolidated Mining Co. Series B | 2,970,000 | 14,990 | |||
*Mabuhay Holdings Corp. | 516,000 | 4,877 | |||
Macroasia Corp. | 447,500 | 26,458 | |||
*Manila Jockey Club, Inc. | 163,277 | 11,659 | |||
*Manila Mining Corp. | 149,300,000 | 80,157 | |||
*Manila Water Co, Inc. | 1,593,600 | 537,891 | |||
Megaworld Corp. | 20,404,000 | 641,500 | |||
*Metro Pacific Corp. Series A | 1,827,193 | 79,819 | |||
*Paxys, Inc. | 1,757,280 | 105,107 | |||
*Philex Mining Corp. | 2,554,900 | 607,462 | |||
*Philippine Bank of Communications | 14,726 | 12,371 | |||
*Philippine National Bank | 728,975 | 353,290 | |||
*Philippine National Construction Corp. | 173,000 | 17,803 | |||
Philippine Savings Bank | 356,863 | 374,738 | |||
Philippine Stock Exchange, Inc. | 23,180 | 158,204 | |||
*Philippine Townships, Inc. | 318,733 | 31,796 | |||
Republic Glass Holding Corp. | 507,500 | 18,119 | |||
RFM Corp. | 9,174,268 | 101,199 | |||
Rizal Commercial Banking Corp. | 150,900 | 51,685 | |||
Robinson’s Land Corp. Series B | 3,434,870 | 872,203 | |||
Security Bank Corp. | 320,842 | 373,883 | |||
Semirara Mining Corp. | 266,900 | 222,079 | |||
Shang Properties, Inc. | 1,759,970 | 63,859 | |||
SM Development Corp. | 7,811,320 | 668,738 | |||
Union Bank of the Philippines | 186,900 | 134,300 | |||
*Universal Rightfield Property Holdings, Inc. | 1,062,000 | 624 | |||
Universal Robina Corp. | 3,594,015 | 937,323 | |||
*Victorias Milling Co., Inc. | 139,680 | 2,552 | |||
*Vista Land & Lifescapes, Inc. | 6,555,700 | 267,872 | |||
*Yehey! Corp. | 29,670 | — | |||
TOTAL PHILIPPINES | 17,814,064 | ||||
POLAND — (2.5%) | |||||
*Agora SA | 156,140 | 1,024,589 | |||
*Alchemia SA | 113,938 | 265,404 | |||
Apator SA | 24,153 | 124,587 | |||
Asseco Poland SA | 15,235 | 306,104 | |||
*Bank Millennium SA | 624,909 | 1,025,631 | |||
*Bank Przemyslowo Handlowy BPH SA | 18,428 | 439,565 | |||
*Barlinek SA | 148,077 | 188,352 | |||
*Bioton SA | 7,909,195 | 622,116 | |||
Budimex SA | 37,430 | 1,027,334 | |||
*Cersanit-Krasnystaw SA | 170,318 | 833,552 | |||
135
THE EMERGING MARKETS SMALL CAP SERIES
CONTINUED
| Shares | Value†† | ||||
POLAND — (Continued) | |||||
*Ciech SA | 44,017 | $ | 588,686 | ||
Debica SA | 29,862 | 639,468 | |||
Decora SA | 9,066 | 73,442 | |||
Dom Development SA | 5,960 | 90,689 | |||
*Echo Investment SA | 1,181,980 | 1,695,130 | |||
Elektrobudowa SA | 10,608 | 640,059 | |||
*Elstar Oils SA | 15,000 | 46,312 | |||
Emperia Holding SA | 600 | 13,531 | |||
Eurocash SA | 160,686 | 784,401 | |||
Fabryki Mebli Forte SA | 55,216 | 259,722 | |||
*Famur SA | 175,740 | 118,344 | |||
*Farmacol SA | 61,368 | 876,290 | |||
*Ferrum SA | 309 | 995 | |||
*Grupa Kety SA | 39,137 | 1,420,373 | |||
*Grupa Lotos SA | 130,928 | 1,190,071 | |||
*HTL-Strefa SA | 16,700 | 77,903 | |||
*Impexmetal SA | 599,390 | 513,194 | |||
*Inter Cars SA | 1,305 | 32,092 | |||
*Koelner SA | 15,481 | 66,819 | |||
*Kredyt Bank SA | 39,842 | 167,031 | |||
*LC Corp. SA | 457,007 | 256,794 | |||
Lentex SA | 24,214 | 215,510 | |||
*LPP SA | 1,283 | 634,790 | |||
*MNI SA | 253,024 | 363,584 | |||
*Mondi Packaging Paper Swiecie SA | 31,048 | 758,216 | |||
Mostostal Siedlce SA | 677,652 | 871,356 | |||
*Mostostal Warszawa SA | 37,200 | 850,564 | |||
*Mostostal Zabrze Holding SA | 160,331 | 252,210 | |||
*Multimedia Polska SA | 107,733 | 258,930 | |||
*Netia Holdings SA | 1,021,505 | 1,486,872 | |||
NG2 SA | 64,565 | 901,263 | |||
*Noble Bank SA | 94,588 | 161,905 | |||
*Orbis SA | 137,403 | 2,172,319 | |||
Pekaes SA | 24,538 | 80,347 | |||
*Pfleiderer Grajewo SA | 1,555 | 8,225 | |||
*Pol-Aqua SA | 2,583 | 18,606 | |||
*Polnord SA | 26,765 | 317,835 | |||
*Polska Grupa Farmaceutyczna SA | 33,497 | 529,315 | |||
*Przedsiebiorstwo Eksportu Inzyn Importu Kopex SA | 30,753 | 273,626 | |||
Raciborska Fabryka Kotlow SA | 245,241 | 792,324 | |||
Sniezka SA | 5,612 | 68,525 | |||
*Stalexport SA | 666,131 | 358,081 | |||
*Synthos SA | 2,064,706 | 847,284 | |||
*Vistula Group SA | 232,490 | 175,066 | |||
Zaklad Przetworstwa Hutniczego Stalprodukt SA | 9,334 | 1,704,377 | |||
*Zaklady Azotowe Pulawy SA | 15,049 | 392,480 | |||
*Zaklady Azotowe w Tarnowie-Moscicach SA | 7,050 | 41,521 | |||
Zaklady Tluszcowe Kruszwica SA | 37,250 | 794,892 | |||
*Zelmer SA | 12,580 | 135,384 | |||
TOTAL POLAND | 30,873,987 | ||||
SOUTH AFRICA — (9.2%) | |||||
Adcock Ingram Holdings, Ltd. | 323,348 | 2,200,221 | |||
Adcorp Holdings, Ltd. | 106,979 | 366,062 | |||
Advtech, Ltd. | 487,995 | 318,162 | |||
Aeci, Ltd. | 243,529 | 1,925,187 | |||
Afgri, Ltd. | 426,711 | 324,855 | |||
African Oxygen, Ltd. | 192,579 | 566,042 | |||
*AG Industries, Ltd. | 1,547,458 | 29,774 | |||
Allied Electronics Corp., Ltd. | 163,698 | 611,693 | |||
Allied Technologies, Ltd. | 90,099 | 885,709 | |||
136
THE EMERGING MARKETS SMALL CAP SERIES
CONTINUED
| Shares | Value†† | ||||
SOUTH AFRICA — (Continued) | |||||
Argent Industrial, Ltd. | 37,236 | $ | 42,999 | ||
*Argility, Ltd. | 65,013 | — | |||
AST Group, Ltd. | 370,226 | 42,600 | |||
Astral Foods, Ltd. | 91,188 | 1,167,810 | |||
Aveng, Ltd. | 981,591 | 5,205,828 | |||
AVI, Ltd. | 327,587 | 875,901 | |||
Avusa, Ltd. | 404,845 | 1,138,425 | |||
Barloworld, Ltd. | 579,959 | 3,615,988 | |||
*Basil Read Holdings, Ltd. | 33,641 | 72,538 | |||
*Bell Equipment, Ltd. | 158,539 | 221,681 | |||
*Blue Label Telecoms, Ltd. | 139,855 | 97,927 | |||
*Business Connexion Group | 246,827 | 149,552 | |||
Capitec Bank Holdings, Ltd. | 83,248 | 681,244 | |||
Cashbuild, Ltd. | 36,547 | 326,029 | |||
Ceramic Industries, Ltd. | 31,493 | 437,199 | |||
*Cipla Medpro South Africa, Ltd. | 371,002 | 228,174 | |||
City Lodge Hotels, Ltd. | 80,828 | 827,616 | |||
Clicks Group, Ltd. | 918,874 | 2,905,876 | |||
*Corpgro, Ltd. | 241,136 | — | |||
*Cullinan Holdings, Ltd. | 434,430 | 20,025 | |||
Data Tec, Ltd. | 326,074 | 1,190,151 | |||
Datacentrix Holdings, Ltd. | 20,000 | 10,951 | |||
Delta EMD, Ltd. | 83,032 | 100,406 | |||
Dimension Data Holdings P.L.C. | 3,458,471 | 4,021,101 | |||
Distell Group, Ltd. | 297,735 | 2,434,164 | |||
*Distribution & Warehousing Network, Ltd. | 258,997 | 235,016 | |||
*Dorbyl, Ltd. | 222,291 | 148,454 | |||
#Durban Roodeport Deep, Ltd. | 667,660 | 401,267 | |||
*ElementOne, Ltd. | 325,845 | 477,442 | |||
*Eqstra Holdings, Ltd. | 30,000 | 28,923 | |||
Famous Brands, Ltd. | 14,984 | 45,507 | |||
Foschini, Ltd. | 521,461 | 4,117,902 | |||
Freeworld Coatings, Ltd. | 35,052 | 39,230 | |||
*Gold One International, Ltd. | 164,683 | 45,603 | |||
Gold Reef Resorts, Ltd. | 287,815 | 720,902 | |||
#Grindrod, Ltd. | 1,607,864 | 3,688,055 | |||
Group Five, Ltd. | 292,935 | 1,502,166 | |||
*Highveld Steel & Vanadilum Corp., Ltd. | 216,434 | 1,794,420 | |||
Hudaco Industries, Ltd. | 68,822 | 506,891 | |||
Hulamin, Ltd. | 96,862 | 172,169 | |||
Iliad Africa, Ltd. | 314,538 | 349,494 | |||
Illovo Sugar, Ltd. | 338,964 | 1,536,475 | |||
Imperial Holdings, Ltd. | 467,965 | 4,816,593 | |||
*JCI, Ltd. | 1,622,051 | — | |||
JD Group, Ltd. | 1,161,251 | 6,410,898 | |||
JSE, Ltd. | 229,619 | 1,781,423 | |||
*Kap International Holdings, Ltd. | 1,834,945 | 512,210 | |||
Lewis Group, Ltd. | 283,002 | 1,976,226 | |||
*M Cubed Holdings, Ltd. | 385,000 | 9,859 | |||
Medi-Clinic Corp., Ltd. | 570,080 | 1,752,095 | |||
*Merafe Resources, Ltd. | 4,526,666 | 809,122 | |||
*Metorex, Ltd. | 1,453,388 | 582,773 | |||
Metropolitan Holdings, Ltd. | 1,697,716 | 2,914,897 | |||
Mondi, Ltd. | 8,725 | 49,130 | |||
Mr. Price Group, Ltd. | 928,134 | 4,276,741 | |||
Murray & Roberts Holdings, Ltd. | 4,350 | 30,247 | |||
Mustek, Ltd. | 784,364 | 261,589 | |||
*Mvelaphanda Group, Ltd. | 50,330 | 45,599 | |||
Nampak, Ltd. | 1,326,125 | 2,894,631 | |||
Network Healthcare Holdings, Ltd. | 1,208,664 | 1,786,916 | |||
#Northam Platinum, Ltd. | 394,263 | 1,842,477 | |||
137
THE EMERGING MARKETS SMALL CAP SERIES
CONTINUED
| Shares | Value†† | ||||
SOUTH AFRICA — (Continued) | |||||
Nu-World Holdings, Ltd. | 28,894 | $ | 60,915 | ||
Oceana Group, Ltd. | 235,042 | 896,259 | |||
Omnia Holdings, Ltd. | 80,602 | 597,530 | |||
Palabora Mining Co., Ltd. | 7,851 | 103,127 | |||
Peregrine Holdings, Ltd. | 481,947 | 568,850 | |||
PSG Group, Ltd. | 145,126 | 407,477 | |||
Rainbow Chicken, Ltd. | 63,665 | 129,026 | |||
*Randgold & Exploration Co., Ltd. | 60,670 | — | |||
Raubex Group, Ltd. | 192,298 | 609,585 | |||
Redefine Income Fund, Ltd. | 29,488 | 27,104 | |||
Reunert, Ltd. | 594,843 | 4,189,937 | |||
Santam, Ltd. | 73,236 | 943,156 | |||
Sappi, Ltd. | 459,138 | 1,696,631 | |||
*SecureData Holdings, Ltd. | 339,582 | 29,349 | |||
#*Sentula Mining, Ltd. | 825,428 | 383,235 | |||
*Simmer & Jack Mines, Ltd. | 1,186,177 | 304,065 | |||
Spar Group, Ltd. (The) | 559,850 | 4,893,172 | |||
Spur Corp., Ltd. | 58,316 | 78,222 | |||
*Stefanutti Stocks Holdings, Ltd. | 32,116 | 41,011 | |||
*Sun International, Ltd. | 181,940 | 2,129,146 | |||
#*Super Group, Ltd. | 3,329,723 | 261,745 | |||
Tongaat-Hulett, Ltd. | 625,434 | 8,045,394 | |||
*Trans Hex Group, Ltd. | 153,546 | 77,487 | |||
Trencor, Ltd. | 97,601 | 314,898 | |||
UCS Group, Ltd. | 144,872 | 32,078 | |||
Value Group, Ltd. | 363,719 | 168,928 | |||
*Wesizwe Platinum, Ltd. | 401,595 | 98,807 | |||
Wilson Bayly Holme-Ovcon, Ltd. | 190,920 | 2,750,150 | |||
Woolworths Holdings, Ltd. | 2,268,438 | 5,072,025 | |||
*Zeder Investments, Ltd. | 147,835 | 33,573 | |||
TOTAL SOUTH AFRICA | 116,548,114 | ||||
SOUTH KOREA — (10.1%) | |||||
#Aekyung Petrochemical Co., Ltd. | 7,150 | 101,763 | |||
*Artone Paper Manufacturing Co., Ltd. | 8,916 | 36,636 | |||
#Asia Cement Manufacturing Co., Ltd. | 3,603 | 173,424 | |||
*Asia Paper Manufacturing Co., Ltd. | 8,880 | 73,593 | |||
*Asiana Airlines, Inc. | 176,710 | 535,749 | |||
Baek Kwang Mineral Products Co., Ltd. | 1,860 | 27,672 | |||
Bing Grae Co., Ltd. | 12,140 | 455,208 | |||
Bohae Brewery Co., Ltd. | 20 | 258 | |||
Boo Kook Securities Co., Ltd. | 7,410 | 147,020 | |||
Boryung Pharmaceutical Co., Ltd. | 3,586 | 125,534 | |||
#Bu Kwang Pharmaceutical Co., Ltd. | 26,171 | 372,205 | |||
Busan Bank | 260,060 | 2,948,829 | |||
BYC Co., Ltd. | 710 | 74,328 | |||
Byuck San Corp. | 5,300 | 37,678 | |||
*Byuck San Engineering and Construction Co., Ltd. | 38,300 | 87,159 | |||
#*Capro Corp. | 50,930 | 355,295 | |||
#*Celrun Co., Ltd. | 22,630 | 39,626 | |||
#Cheil Worldwide, Inc. | 8,623 | 2,213,909 | |||
*Cho Kwang Leather Co., Ltd. | 10,640 | 65,959 | |||
*Choil Aluminum Manufacturing Co., Ltd. | 7,700 | 39,074 | |||
*Chong Kun Dang Pharmaceutical Corp. | 22,392 | 410,174 | |||
*Choongwae Holdings Co., Ltd. | 5,482 | 52,861 | |||
#Choongwae Pharmaceutical Corp. | 10,203 | 174,625 | |||
Chosun Refractories Co., Ltd. | 2,210 | 116,779 | |||
#Chungho Comnet Co., Ltd. | 2,320 | 20,478 | |||
#CJ CGV Co., Ltd. | 28,890 | 473,223 | |||
#CJ Cheiljedang Corp. | 10,245 | 1,732,507 | |||
CJ Corp. | 26,223 | 1,048,646 | |||
138
THE EMERGING MARKETS SMALL CAP SERIES
CONTINUED
| Shares | Value†† | ||||
SOUTH KOREA — (Continued) | |||||
*Cosmochemical Co., Ltd. | 14,640 | $ | 91,394 | ||
Crown Confectionery Co., Ltd. | 1,360 | 74,965 | |||
Dae Dong Industrial Co., Ltd. | 6,090 | 116,779 | |||
*Dae Ho Corp. | 543 | 60 | |||
#*Dae Sang Corp. | 34,350 | 239,998 | |||
#Dae Won Kang Up Co., Ltd. | 80,800 | 109,868 | |||
Daeduck Electronics Co., Ltd. | 36,917 | 158,105 | |||
Daeduck Industries Co., Ltd. | 21,536 | 182,134 | |||
Daegu Bank Co., Ltd. | 261,800 | 3,473,548 | |||
Daegu Department Store Co., Ltd. | 13,040 | 133,633 | |||
#Daehan City Gas Co., Ltd. | 11,541 | 276,111 | |||
#*Daehan Fire & Marine Insurance Co., Ltd. | 48,040 | 321,480 | |||
Daehan Flour Mills Co., Ltd. | 2,110 | 238,711 | |||
Daehan Synthetic Fiber Co., Ltd. | 1,750 | 97,808 | |||
Daekyo Co., Ltd. | 98,400 | 396,238 | |||
#*Daekyung Machinery & Engineering Co., Ltd. | 54,200 | 142,751 | |||
Daelim Industrial Co., Ltd. | 42,135 | 2,673,961 | |||
Daelim Trading Co., Ltd. | 17,730 | 64,178 | |||
Daesang Holdings Co., Ltd. | 7,072 | 20,577 | |||
#Daesung Industrial Co., Ltd. | 6,130 | 387,489 | |||
#*Daewoo Motor Sales Corp. | 42,810 | 355,304 | |||
Daewoong Co., Ltd. | 6,546 | 121,623 | |||
Daewoong Pharmaceutical Co., Ltd. | 11,178 | 519,352 | |||
Dahaam E-Tec Co., Ltd. | 2,200 | 52,570 | |||
Daishin Securities Co., Ltd. | 91,200 | 1,142,881 | |||
*Daiyang Metal Co., Ltd. | 22,400 | 30,938 | |||
#Daou Technology, Inc. | 56,480 | 349,966 | |||
Digital Power Communications Co., Ltd. | 50,540 | 60,654 | |||
Dong Ah Tire Industrial Co., Ltd. | 22,245 | 154,439 | |||
Dong IL Rubber Belt Co., Ltd. | 13,290 | 69,079 | |||
Dong-A Pharmaceutical Co., Ltd. | 18,194 | 1,769,227 | |||
Dongbang Agro Co., Ltd. | 19,470 | 103,744 | |||
Dongbang Transport Logistics Co., Ltd. | 26,000 | 57,879 | |||
Dongbu Corp. | 25,950 | 164,508 | |||
*Dongbu HiTek Co., Ltd. | 32,873 | 170,028 | |||
Dongbu Insurance Co., Ltd. | 33,140 | 1,005,586 | |||
#*Dongbu Securities Co., Ltd. | 35,541 | 177,434 | |||
Dongbu Steel Co., Ltd. | 50,266 | 318,804 | |||
Dong-Il Corp. | 3,124 | 121,411 | |||
Dongil Paper Manufacturing Co., Ltd. | 6,080 | 4,710 | |||
#Dongkuk Steel Mill Co., Ltd. | 49,930 | 1,060,341 | |||
#Dongwha Pharm Co., Ltd. | 47,350 | 279,521 | |||
Dongwon F&B Co., Ltd. | 3,360 | 122,346 | |||
Dongwon Industries Co., Ltd. | 3,115 | 289,804 | |||
#*Dongwon Systems Corp. | 138,447 | 160,913 | |||
#Dongyang Mechatronics Corp. | 44,411 | 140,929 | |||
#*Doosan Construction & Engineering Co., Ltd. | 83,770 | 512,894 | |||
DPI Co., Ltd. | 8,565 | 42,538 | |||
#E1 Corp. | 7,720 | 443,703 | |||
*Eagon Industrial Co., Ltd. | 3,120 | 32,852 | |||
F&F Co., Ltd. | 21,060 | 60,887 | |||
*First Fire & Marine Insurance Co., Ltd. | 23,310 | 132,961 | |||
#*Firstech Co., Ltd. | 29,829 | 39,456 | |||
*Foosung Co., Ltd. | 46,809 | 145,005 | |||
Fursys, Inc. | 15,560 | 346,385 | |||
Gaon Cable Co., Ltd. | 4,470 | 117,921 | |||
#GIIR, Inc. | 14,410 | 132,099 | |||
#Global & Yuasa Battery Co., Ltd. | 16,060 | 271,846 | |||
#Green Cross Corp. | 6,272 | 842,309 | |||
Green Cross Holdings Corp. | 1,825 | 128,735 | |||
#*Green Non-Life Insurance Co., Ltd. | 4,877 | 18,684 | |||
139
THE EMERGING MARKETS SMALL CAP SERIES
CONTINUED
| Shares | Value†† | ||||
SOUTH KOREA — (Continued) | |||||
#GS Global Corp. | 8,372 | $ | 169,996 | ||
*Gwangju Shinsegae Co., Ltd. | 1,820 | 192,621 | |||
Halla Climate Control Corp. | 106,070 | 1,031,217 | |||
#Halla Engineering & Construction Corp. | 13,160 | 299,108 | |||
#*Han All Pharmaceutical Co., Ltd. | 34,948 | 137,196 | |||
#Han Kuk Carbon Co., Ltd. | 28,623 | 146,788 | |||
#Han Yang Securities Co., Ltd. | 12,760 | 110,971 | |||
Handok Pharmaceuticals Co., Ltd. | 12,760 | 163,852 | |||
#Handsome Corp. | 34,799 | 419,844 | |||
#Hanil Cement Manufacturing Co., Ltd. | 11,411 | 716,851 | |||
Hanil Construction Co., Ltd. | 8,938 | 35,829 | |||
Hanil E-Wha Co., Ltd. | 38,970 | 120,866 | |||
#Hanjin Heavy Industries & Construction Co., Ltd. | 41,830 | 747,421 | |||
#Hanjin Shipping Co., Ltd. | 23,790 | 323,328 | |||
#Hanjin Transportation Co., Ltd. | 13,211 | 368,037 | |||
Hankook Cosmetics Co., Ltd. | 25,320 | 57,189 | |||
Hankook Shell Oil Co., Ltd. | 1,620 | 168,060 | |||
*Hankook Synthetics, Inc. | 550 | 44 | |||
Hankuk Electric Glass Co., Ltd. | 3,760 | 90,869 | |||
Hankuk Glass Industries, Inc. | 12,660 | 226,522 | |||
#Hankuk Paper Manufacturing Co., Ltd. | 5,840 | 207,494 | |||
#Hanmi Pharm Co., Ltd. | 14,831 | 1,434,232 | |||
*Hansae Co., Ltd. | 16,560 | 88,909 | |||
Hansae Yes24 Holdings Co., Ltd. | 5,520 | 13,964 | |||
Hansol Chemical Co., Ltd. | 12,170 | 110,945 | |||
Hansol CSN Co., Ltd. | 65,160 | 71,315 | |||
#Hansol LCD, Inc. | 5,777 | 96,891 | |||
#*Hansol Paper Co., Ltd. | 53,310 | 468,367 | |||
#Hanssem Co., Ltd. | 30,600 | 256,924 | |||
Hanwha Chemical Corp. | 155,677 | 1,447,440 | |||
#*Hanwha Non-Life Insurance Co., Ltd. | 24,410 | 202,472 | |||
Hanwha Securities Co., Ltd. | 65,931 | 437,305 | |||
Hanwha Timeworld Co., Ltd. | 5,120 | 59,977 | |||
#*HeungKuk Fire & Marine Insurance Co., Ltd. | 79,817 | 392,304 | |||
#*Hite Holdings Co., Ltd. | 12,830 | 331,143 | |||
*HMC Investment Securities Co., Ltd. | 37,920 | 582,874 | |||
#Hotel Shilla Co., Ltd. | 64,708 | 950,518 | |||
*HS R&A Co., Ltd. | 1,460 | 11,274 | |||
#Huchems Fine Chemical Corp. | 31,846 | 797,763 | |||
#Husteel Co., Ltd. | 7,220 | 91,641 | |||
Hwa Sung Industrial Co., Ltd. | 12,520 | 53,891 | |||
Hwacheon Machinery Works Co., Ltd. | 370 | 4,199 | |||
#Hwashin Co., Ltd. | 22,220 | 62,904 | |||
Hyosung T & C Co., Ltd. | 7,106 | 390,555 | |||
#*Hyundai Cement Co., Ltd. | 10,020 | 136,211 | |||
#*Hyundai Corp. | 21,801 | 313,697 | |||
Hyundai Department Store Co., Ltd. | 15,781 | 1,508,430 | |||
Hyundai DSF Co., Ltd. | 7,510 | 50,791 | |||
#Hyundai Elevator Co., Ltd. | 7,294 | 347,811 | |||
*Hyundai Engineering Plastics Co., Ltd. | 28,840 | 116,062 | |||
#Hyundai H & S Co., Ltd. | 6,210 | 440,861 | |||
#Hyundai Hysco | 91,740 | 1,160,527 | |||
Hyundai Marine & Fire Insurance Co., Ltd. | 132,660 | 2,450,222 | |||
Hyundai Mobis | 6,742 | 899,000 | |||
Hyundai Pharmaceutical Ind. Co., Ltd. | 14,100 | 28,510 | |||
#*IHQ, Inc. | 22,450 | 18,990 | |||
#Il Dong Pharmaceutical Co., Ltd. | 7,553 | 201,833 | |||
Il Sung Construction Co., Ltd. | 2,700 | 16,378 | |||
*Il Yang Pharmaceutical Co., Ltd. | 19,910 | 504,125 | |||
*Iljin Display Co., Ltd. | 10,908 | 51,599 | |||
#*Iljin Electric Co., Ltd. | 26,649 | 214,376 | |||
140
THE EMERGING MARKETS SMALL CAP SERIES
CONTINUED
| Shares | Value†† | ||||
SOUTH KOREA — (Continued) | |||||
#*Iljin Holdings Co., Ltd. | 27,632 | $ | 71,213 | ||
Ilshin Spinning Co., Ltd. | 1,730 | 85,110 | |||
Ilsung Pharmaceutical Co., Ltd. | 2,040 | 105,351 | |||
InziControls Co., Ltd. | 1,260 | 3,417 | |||
IS Dongseo Co., Ltd. | 7,558 | 48,721 | |||
#ISU Chemical Co., Ltd. | 7,920 | 93,532 | |||
#Jahwa Electronics Co., Ltd. | 16,460 | 105,351 | |||
Jeil Pharmaceutical Co. | 18,840 | 150,801 | |||
Jeonbuk Bank, Ltd. | 63,490 | 382,474 | |||
Jinheung Mutual Savings Bank Co., Ltd. | 24,579 | 88,191 | |||
#K.C. Tech Co., Ltd. | 26,276 | 105,629 | |||
*KCO Energy, Inc. | 120,778 | 73,014 | |||
#*Keangnam Enterprises, Ltd. | 21,653 | 199,171 | |||
*Kedcom Co., Ltd. | 42,070 | 4,732 | |||
KG Chemical Corp. | 8,410 | 73,646 | |||
#KISCO Corp. | 10,860 | 425,433 | |||
#KISWIRE, Ltd. | 16,702 | 541,499 | |||
Kolon Engineering & Construction Co., Ltd. | 21,890 | 116,434 | |||
#Kolon Industries, Inc. | 23,890 | 684,130 | |||
Korea Cast Iron Pipe Co., Ltd. | 26,090 | 85,268 | |||
*Korea Circuit Co., Ltd. | 19,330 | 43,137 | |||
#Korea Cottrell Co., Ltd. | 14,960 | 108,356 | |||
#*Korea Development Co., Ltd. | 14,820 | 67,016 | |||
Korea Development Leasing Corp. | 4,545 | 122,115 | |||
Korea Electric Terminal Co., Ltd. | 14,990 | 256,392 | |||
Korea Export Packing Industries Co., Ltd. | 3,990 | 42,289 | |||
#*Korea Express Co., Ltd. | 9,211 | 505,746 | |||
*Korea Flange Co., Ltd. | 6,900 | 59,920 | |||
*Korea Green Paper Manufacturing Co., Ltd. | 1,002 | 1,303 | |||
Korea Investment Holdings Co., Ltd. | 58,270 | 1,554,035 | |||
#Korea Iron & Steel Co., Ltd. | 3,289 | 219,870 | |||
#Korea Komho Petrochemical Co., Ltd. | 26,400 | 511,572 | |||
#Korea Line Corp. | 13,950 | 566,864 | |||
*Korea Mutual Savings Bank | 6,040 | 71,826 | |||
*Korea Petrochemical Industry Co., Ltd. | 10,960 | 356,091 | |||
#Korea Reinsurance Co., Ltd. | 185,883 | 1,679,491 | |||
#*Korea Technology Industry Co., Ltd. | 97,090 | 167,788 | |||
#Korea Zinc Co., Ltd. | 16,015 | 2,475,218 | |||
#Korean Air Terminal Service Co., Ltd. | 3,350 | 88,802 | |||
*Korean French Banking Corp. | 126,839 | 84,513 | |||
*KP Chemical Corp. | 121,051 | 698,892 | |||
KPX Chemical Co., Ltd. | 3,420 | 136,500 | |||
KPX Fine Chemical Co., Ltd. | 3,369 | 142,296 | |||
KPX Holdings Corp. | 3,008 | 162,524 | |||
#*KTB Securities Co., Ltd. | 80,240 | 287,892 | |||
Kukdo Chemical Co., Ltd. | 8,450 | 188,767 | |||
Kukdong Oil & Chemicals Co., Ltd. | 3,623 | 47,523 | |||
Kumbi Corp. | 670 | 18,692 | |||
#Kumho Electronics Co., Ltd. | 7,292 | 308,010 | |||
#Kumho Industrial Co., Ltd. | 46,110 | 387,282 | |||
Kumho Investment Bank | 129,490 | 115,618 | |||
#*Kumho Tire Co., Inc. | 90,000 | 374,439 | |||
Kumkang Industrial Co., Ltd. | 5,810 | 60,026 | |||
Kunsul Chemical Industrial Co., Ltd. | 7,190 | 83,597 | |||
Kwang Dong Pharmaceutical Co., Ltd. | 74,760 | 179,128 | |||
Kyeryong Construction Industrial Co., Ltd. | 10,770 | 200,633 | |||
#Kyobo Securities Co., Ltd. | 44,300 | 363,993 | |||
Kyung Dong Navien Co., Ltd. | 1,740 | 56,654 | |||
#*Kyungbang Co., Ltd. | 1,100 | 126,982 | |||
Kyungdong City Gas Co., Ltd. | 2,270 | 93,272 | |||
*Kyung-in Synthetic Corp. | 25,170 | 54,687 | |||
141
THE EMERGING MARKETS SMALL CAP SERIES
CONTINUED
| Shares | Value†† | ||||
SOUTH KOREA — (Continued) | |||||
Kyungnam Energy Co., Ltd. | 28,770 | $ | 68,675 | ||
LG Dacom Corp. | 66,170 | 1,044,980 | |||
#LG Fashion Corp. | 36,645 | 828,451 | |||
#LG International Corp. | 65,552 | 1,603,935 | |||
*LG Life Sciences, Ltd. | 26,935 | 1,559,379 | |||
#LIG Insurance Co., Ltd. | 79,960 | 1,638,101 | |||
#Lotte Chilsung Beverage Co., Ltd. | 1,401 | 958,523 | |||
#Lotte Confectionary Co., Ltd. | 1,056 | 1,061,958 | |||
#Lotte Midopa Co., Ltd. | 61,160 | 599,016 | |||
#Lotte Sam Kang Co., Ltd. | 1,770 | 313,631 | |||
#*LS Industrial Systems Co., Ltd. | 31,342 | 2,347,826 | |||
Macquarie Korea Infrastructure Fund | 327,111 | 1,377,214 | |||
Manho Rope & Wire Co., Ltd. | 3,950 | 58,479 | |||
*Meritz Fire Marine Insurance Co., Ltd. | 180,948 | 1,251,592 | |||
#Meritz Securities Co., Ltd. | 278,555 | 278,067 | |||
Miwon Commercial Co., Ltd. | 831 | 44,183 | |||
*Miwon Specialty Chemical Co., Ltd. | 448 | 24,460 | |||
#Moorim Paper Co., Ltd. | 21,778 | 182,878 | |||
Motonic Corp. | 20,900 | 155,677 | |||
#Namhae Chemical Corp. | 63,074 | 780,156 | |||
#*Namkwang Engineering & Construction Co., Ltd. | 32,027 | 236,846 | |||
Namyang Dairy Products Co., Ltd. | 745 | 339,305 | |||
*Nasan Co., Ltd. | 23,824 | 25,197 | |||
National Plastic Co., Ltd. | 32,500 | 52,668 | |||
#*NCsoft Corp. | 29,254 | 3,128,582 | |||
Nexen Corp. | 3,320 | 107,056 | |||
*Nexen Tire Corp. | 47,670 | 259,461 | |||
NH Investment & Securities Co., Ltd. | 59,219 | 483,800 | |||
Nong Shim Co., Ltd. | 5,583 | 1,131,767 | |||
Nong Shim Holdings Co., Ltd. | 5,210 | 306,398 | |||
Noroo Paint Co., Ltd. | 14,277 | 38,892 | |||
*ON*Media Corp. | 106,370 | 299,815 | |||
#ORION Corp. | 7,780 | 1,570,900 | |||
Ottogi Corp. | 3,910 | 479,929 | |||
#Pacific Corp. | 6,730 | 823,257 | |||
Pacific Pharmaceutical Co., Ltd. | 2,030 | 52,499 | |||
*PaperCorea, Inc. | 13,740 | 90,808 | |||
Pohang Coated Steel Co., Ltd. | 6,320 | 137,810 | |||
*Poong Lim Industrial Co., Ltd. | 31,880 | 68,026 | |||
*Poongsan Corp. | 34,931 | 724,946 | |||
#*Poongsan Holdings Corp. | 6,567 | 115,667 | |||
*Prime Entertainment Co., Ltd. | 2,676 | 2,167 | |||
#Pulmuone Co., Ltd. | 2,916 | 130,498 | |||
Pum Yang Construction Co., Ltd. | 8,260 | 52,781 | |||
Pusan City Gas Co., Ltd. | 14,730 | 277,672 | |||
*Pyung Hwa Holdings Co., Ltd. | 2 | 2 | |||
Pyung Hwa Industrial Co., Ltd. | 6 | 11 | |||
S&T Corp. | 93 | 2,218 | |||
#*S&T Daewoo Co., Ltd. | 12,330 | 266,229 | |||
S&T Dynamics Co., Ltd. | 37,642 | 463,582 | |||
#S&T Holdings Co, Ltd. | 31,368 | 369,656 | |||
#S1 Corp. | 28,093 | 1,124,491 | |||
#*Saehan Industries, Inc. | 651,800 | 707,898 | |||
*Saehan Media Corp. | 3,460 | 8,440 | |||
*Sajo Industries Co., Ltd. | 5,990 | 135,855 | |||
*Sajodaerim Corp. | 4,770 | 76,378 | |||
#Sam Jin Pharmaceutical Co., Ltd. | 25,657 | 320,737 | |||
#Sam Kwang Glass Industrial Co., Ltd. | 4,820 | 155,998 | |||
Sam Whan Camus Co., Ltd. | 5,270 | 36,086 | |||
Sam Yung Trading Co., Ltd. | 13,450 | 57,723 | |||
#Sambu Construction Co., Ltd. | 10,903 | 218,599 | |||
142
THE EMERGING MARKETS SMALL CAP SERIES
CONTINUED
| Shares | Value†† | ||||
SOUTH KOREA — (Continued) | |||||
#Samchully Co., Ltd. | 5,480 | $ | 579,603 | ||
*Samho International Co., Ltd. | 12,681 | 41,609 | |||
*Samhwa Asset Co. | 317 | 4,438 | |||
Samhwa Crown and Closure Co., Ltd. | 412 | 7,558 | |||
Samhwa Paints Industrial Co., Ltd. | 26,400 | 89,529 | |||
*Samick Musical Instruments Co., Ltd. | 146,160 | 118,204 | |||
Samsung Climate Control Co., Ltd. | 6,810 | 39,160 | |||
Samsung Fine Chemicals Co., Ltd. | 37,500 | 1,485,979 | |||
*Samwha Capacitor Co., Ltd. | 6,510 | 56,543 | |||
Samwhan Corp. | 13,660 | 136,054 | |||
#Samyang Corp. | 8,990 | 290,587 | |||
Samyang Foods Co., Ltd. | 7,360 | 113,128 | |||
Samyang Genex Co., Ltd. | 4,026 | 196,236 | |||
Samyang Tongsang Co., Ltd. | 1,760 | 41,506 | |||
#Samyoung Electronics Co., Ltd. | 17,870 | 166,662 | |||
#Seah Besteel Corp. | 21,720 | 263,379 | |||
SeAH Holdings Corp. | 4,622 | 228,307 | |||
#SeAH Steel Corp. | 6,214 | 176,844 | |||
Sebang Co., Ltd. | 15,655 | 178,724 | |||
#Sejong Industrial Co., Ltd. | 21,610 | 107,732 | |||
Seoul City Gas Co., Ltd. | 3,590 | 189,932 | |||
#*Seoul Securities Co., Ltd. | 706,624 | 597,842 | |||
*Serim Paper Manufacturing Co., Ltd. | 32,013 | 108,234 | |||
#Sewon Cellontech Co., Ltd. | 50,071 | 351,697 | |||
#*SH Chemical Co., Ltd. | 148,722 | 62,016 | |||
Shin Won Corp. | 60,100 | 81,289 | |||
Shin Young Securities Co., Ltd. | 10,600 | 314,234 | |||
Shinhan Engineering & Construction Co., Ltd. | 3,676 | 46,247 | |||
Shinpoong Pharmaceutical Co., Ltd. | 4,680 | 84,273 | |||
Shinsegae Engineering & Construction Co., Ltd. | 2,990 | 33,362 | |||
Shinsung Engineering Co., Ltd. | 924 | 1,869 | |||
Shinsung FA Co., Ltd. | 914 | 1,858 | |||
#Shinsung Holdings Co., Ltd. | 42,570 | 143,595 | |||
#Sindo Ricoh Co., Ltd. | 11,169 | 562,002 | |||
SJM Co., Ltd. | 22,510 | 102,340 | |||
#SK Chemicals Co., Ltd. | 22,820 | 1,244,025 | |||
SK Energy Co., Ltd. | 8 | 735 | |||
#SK Gas Co., Ltd. | 9,960 | 429,048 | |||
SKC Co., Ltd. | 36,520 | 558,567 | |||
SL Corp. | 19,820 | 88,261 | |||
*Solomon Mutual Savings Bank | 11,267 | 40,557 | |||
*Songwon Industrial Co., Ltd. | 12,420 | 108,223 | |||
#*Ssangyong Cement Industry Co., Ltd. | 79,381 | 564,676 | |||
#*STX Corp. | 31,266 | 430,620 | |||
#*STX Engine Co., Ltd. | 42,322 | 617,989 | |||
#*STX Offshore & Shipbuilding Co., Ltd. | 104,630 | 1,116,751 | |||
Suheung Capsule Co., Ltd. | 16,030 | 102,261 | |||
#*Sung Shin Cement Co., Ltd. | 16,490 | 99,715 | |||
*Sungchang Enterprise Holdings, Ltd. | 6,150 | 101,272 | |||
#*Sungwon Corp. | 49,310 | 162,213 | |||
*Sunjin Co., Ltd. | 2,840 | 73,828 | |||
#Sunkyong Securities Co., Ltd. | 382,400 | 817,865 | |||
Tae Kwang Industrial Co., Ltd. | 880 | 554,112 | |||
#Tae Kyung Industrial Co., Ltd. | 29,140 | 126,253 | |||
#Taeyoung Engineering & Construction | 90,740 | 375,134 | |||
#Tai Han Electric Wire Co., Ltd. | 46,650 | 745,490 | |||
Tai Lim Packaging Industries Co., Ltd. | 62,000 | 41,285 | |||
#TCC Steel | 16,345 | 69,359 | |||
*Tec & Co. | 25,071 | 80,583 | |||
Telcoware Co., Ltd. | 9,000 | 52,276 | |||
#*Tong Yang Major Corp. | 70,586 | 229,991 | |||
143
THE EMERGING MARKETS SMALL CAP SERIES
CONTINUED
| Shares | Value†† | ||||
SOUTH KOREA — (Continued) | |||||
#Tong Yang Securities, Inc. | 146,666 | $ | 1,343,759 | ||
*Trigem Computer, Inc. | 13 | — | |||
*TRYBRANDS, Inc. | 3,207 | 9,048 | |||
#TS Corp. | 5,500 | 220,346 | |||
#Uangel Corp. | 12,280 | 59,747 | |||
#Unid Co., Ltd. | 6,000 | 155,291 | |||
Union Steel Manufacturing Co., Ltd. | 13,912 | 253,624 | |||
Whanin Pharmaceutical Co., Ltd. | 13,650 | 155,597 | |||
#Woongjin Thinkbig Co., Ltd. | 34,669 | 652,270 | |||
#*Woongjin.Com Co., Ltd. | 62,107 | 557,959 | |||
#Woori Financial Co., Ltd. | 20,620 | 162,570 | |||
WooSung Feed Co., Ltd. | 17,000 | 22,373 | |||
YESCO Co., Ltd. | 5,950 | 130,169 | |||
Yoosung Enterprise Co., Ltd. | 33,540 | 67,658 | |||
#Youlchon Chemical Co., Ltd. | 32,710 | 257,175 | |||
*Young Poong Mining & Construction Corp. | 1,580 | 74 | |||
Young Poong Paper Manufacturing Co., Ltd. | 580 | 8,052 | |||
#Youngone Corp. (6150493) | 15,176 | 311,559 | |||
*Youngone Corp. (B622C10) | 60,704 | 398,960 | |||
Youngpoong Corp. | 2,040 | 993,570 | |||
Yuhan Corp. | 13,486 | 2,172,055 | |||
Yuhwa Securities Co., Ltd. | 12,910 | 163,039 | |||
#*Yungjin Pharm Co., Ltd. | 95,136 | 115,539 | |||
*ZeroOne Interactive Co., Ltd. | 16,000 | 2,545 | |||
TOTAL SOUTH KOREA | 127,380,938 | ||||
TAIWAN — (10.6%) | |||||
*A.G.V. Products Corp. | 741,782 | 277,045 | |||
Aaeon Technology, Inc. | 174,392 | 233,501 | |||
Ability Enterprise Co., Ltd. | 752,076 | 1,384,992 | |||
*Abocom Systems, Inc. | 470 | 157 | |||
Acbel Polytech, Inc. | 777,600 | 531,448 | |||
Accton Technology Corp. | 36,000 | 13,412 | |||
*Adlink Technology, Inc. | 62,000 | 43,574 | |||
Advantech Co., Ltd. | 199,000 | 354,187 | |||
*ALI Corp. | 149,000 | 293,429 | |||
Altek Corp. | 524,042 | 887,815 | |||
Ambassador Hotel (The) | 597,000 | 605,263 | |||
Ampoc Far East Co., Ltd. | 158,444 | 59,985 | |||
Amtran Technology Co., Ltd. | 1,108,190 | 1,053,231 | |||
Apex Biotechnology Corp. | 205,381 | 355,451 | |||
*Apex Science & Engineering Corp. | 124,000 | 57,458 | |||
*Arima Communication Corp. | 36,000 | 13,093 | |||
*Arima Optoelectronics Corp. | 92,594 | 32,904 | |||
*Asia Chemical Corp. | 559,000 | 170,233 | |||
*Asia Optical Co, Inc. | 133,000 | 214,644 | |||
Asia Polymer Corp. | 495,936 | 358,267 | |||
Asia Vital Components Co., Ltd. | 391,575 | 406,352 | |||
Aten International Co., Ltd. | 197,479 | 267,908 | |||
Aurora Corp. | 541,499 | 564,360 | |||
Aurora Systems Corp. | 244,244 | 127,440 | |||
*AV Tech Corp. | 24,000 | 69,472 | |||
*Avermedia Technologies, Inc. | 362,447 | 431,071 | |||
Basso Industry Corp., Ltd. | 7,000 | 6,604 | |||
*Behavior Tech Computer Corp. | 775 | 90 | |||
Bes Engineering Corp. | 2,691,750 | 746,240 | |||
*Biostar Microtech International Corp. | 231,975 | 169,557 | |||
*Bright Led Electronics Corp. | 80,000 | 86,549 | |||
C Sun Manufacturing, Ltd. | 255,221 | 112,275 | |||
*Cameo Communications, Inc. | 23,000 | 12,407 | |||
*Capital Securities Corp. | 1,088,000 | 504,463 | |||
144
THE EMERGING MARKETS SMALL CAP SERIES
CONTINUED
| Shares | Value†† | ||||
TAIWAN — (Continued) | |||||
*Carnival Industrial Corp. | 656,000 | $ | 131,904 | ||
*Cathay Real Estate Development Co., Ltd. | 571,000 | 226,092 | |||
*Central Reinsurance Co., Ltd. | 826,402 | 322,262 | |||
Chain Qui Development Co., Ltd. | 226,083 | 163,119 | |||
Champion Building Materials Co., Ltd. | 560,993 | 225,077 | |||
Charoen Pokphand Enterprises Co., Ltd. | 351,000 | 167,735 | |||
*Cheng Loong Corp. | 1,760,330 | 574,339 | |||
Cheng Uei Precision Industry Co., Ltd. | 349,000 | 663,035 | |||
Chenming Mold Industrial Corp. | 276,437 | 76,656 | |||
*Chia Hsin Cement Corp. | 1,068,304 | 540,395 | |||
*Chia Hsin Food & Synthetic Fiber Co., Ltd. | 97,211 | — | |||
Chicony Electronics Co., Ltd. | 541,711 | 1,184,654 | |||
Chilisin Electronics Corp. | 207,535 | 101,720 | |||
China Chemical & Pharmaceutical Co. | 408,000 | 282,227 | |||
China Ecotek Corp. | 170,000 | 214,758 | |||
China Electric Manufacturing Co., Ltd. | 694,900 | 483,180 | |||
*China General Plastics Corp. | 665,000 | 236,112 | |||
*China Glaze Co., Ltd. | 329,423 | 185,057 | |||
China Hi-Ment Corp. | 396,348 | 488,850 | |||
*China Life Insurance Co., Ltd. | 1,647,177 | 1,196,252 | |||
China Man-Made Fiber Co., Ltd. | 2,399,879 | 438,921 | |||
*China Metal Products Co., Ltd. | 426,182 | 496,318 | |||
*China Motor Co., Ltd. | 363,000 | 248,997 | |||
*China Petrochemical Development Corp. | 1,295,000 | 463,397 | |||
*China Rebar Co., Ltd. | 55,174 | — | |||
China Steel Chemical Corp. | 412,554 | 1,050,601 | |||
China Steel Structure Co., Ltd. | 232,000 | 163,473 | |||
China Synthetic Rubber Corp. | 712,954 | 739,157 | |||
*China United Trust & Investment Corp. | 164,804 | — | |||
*China Wire & Cable Co., Ltd. | 521,000 | 145,903 | |||
Chinese Maritime Transport, Ltd. | 446,850 | 1,174,206 | |||
Ching Feng Home Fashions Industries Co., Ltd. | 199,403 | 42,851 | |||
Chin-Poon Industrial Co., Ltd. | 559,208 | 413,487 | |||
*Chong Hong Construction Co. | 134,000 | 243,854 | |||
*Chou Chin Industrial Co., Ltd. | 825 | — | |||
Chroma Ate, Inc. | 581,380 | 1,114,752 | |||
Chun Yu Works & Co., Ltd. | 469,000 | 125,004 | |||
Chun Yuan Steel Industrial Co., Ltd. | 1,046,537 | 346,594 | |||
Chung Hsin Electric & Machinery Co., Ltd. | 753,000 | 451,502 | |||
*Chung Hung Steel Corp. | 39,000 | 14,751 | |||
Chung Hwa Pulp Corp. | 843,594 | 347,155 | |||
*Clevo Co. | 344,000 | 429,315 | |||
*CMC Magnetics Corp. | 2,990,000 | 656,617 | |||
Collins Co., Ltd. | 462,700 | 120,836 | |||
Compal Communications, Inc. | 535,000 | 789,556 | |||
*Compeq Manufacturing Co., Ltd. | 2,207,000 | 569,493 | |||
Continental Engineering Corp. | 1,297,067 | 486,538 | |||
*Cosmo Electronics Corp. | 207,900 | 198,533 | |||
*Cosmos Bank Taiwan | 575,090 | 63,354 | |||
CTCI Corp. | 950,013 | 826,156 | |||
CX Technology Co., Ltd. | 62,368 | 19,413 | |||
*Cyberlink Corp. | 69,000 | 266,133 | |||
Cybertan Technology, Inc. | 440,779 | 571,872 | |||
Cyntec Co., Ltd. | 327,304 | 740,798 | |||
Da-Cin Construction Co., Ltd. | 482,711 | 302,860 | |||
*De Licacy Industries Co., Ltd. | 70,000 | 12,818 | |||
*Delpha Construction Co., Ltd. | 357,265 | 123,901 | |||
*Der Pao Construction Co., Ltd. | 476,000 | 12,001 | |||
Diamond Flower Electric Instrument Co., Ltd. | 203,524 | 235,699 | |||
D-Link Corp. | 898,665 | 837,373 | |||
*Dynamic Electronics Co., Ltd. | 111,000 | 110,692 | |||
145
THE EMERGING MARKETS SMALL CAP SERIES
CONTINUED
| Shares | Value†† | ||||
TAIWAN — (Continued) | |||||
*Eastern Media International Corp. | 2,366,337 | $ | 495,955 | ||
Eclat Textile Co., Ltd. | 240,920 | 141,166 | |||
*Edom Technology Co., Ltd. | 238,776 | 101,254 | |||
Elan Microelectronics Corp. | 614,715 | 832,326 | |||
*E-Lead Electronic Co., Ltd. | 82,942 | 55,854 | |||
Elite Material Co., Ltd. | 342,129 | 234,544 | |||
Elite Semiconductor Memory Technology, Inc. | 118,200 | 163,859 | |||
Elitegroup Computer Systems Co., Ltd. | 412,182 | 156,455 | |||
*Enlight Corp. | 149,899 | 9,280 | |||
*EnTie Commercial Bank | 293,603 | 81,945 | |||
Eternal Chemical Co., Ltd. | 510,290 | 472,864 | |||
*Everest Textile Co., Ltd. | 830,562 | 159,675 | |||
*Evergreen International Storage & Transport Corp. | 1,691,000 | 1,368,566 | |||
Everlight Chemical Industrial Corp. | 655,000 | 469,908 | |||
*Evertop Wire Cable Corp. | 45,461 | 8,062 | |||
Excel Cell Electronics Co., Ltd. | 143,000 | 51,837 | |||
*Far Eastern International Bank | 314,724 | 106,516 | |||
*Faraday Technology Corp. | 205,000 | 318,601 | |||
*Federal Corp. | 742,244 | 555,684 | |||
Feng Hsin Iron & Steel Co., Ltd. | 381,100 | 576,193 | |||
Feng Tay Enterprise Co., Ltd. | 791,561 | 653,733 | |||
*FIC Global, Inc. | 27,289 | 2,836 | |||
*First Copper Technology Co., Ltd. | 703,000 | 239,685 | |||
First Hotel | 424,955 | 310,425 | |||
*First Insurance Co., Ltd. (The) | 531,179 | 190,170 | |||
First Steamship Co., Ltd. | 335,200 | 423,670 | |||
Flytech Technology Co., Ltd. | 123,750 | 286,951 | |||
*Forhouse Corp. | 40,000 | 36,765 | |||
Formosa Epitaxy, Inc. | 226,758 | 313,082 | |||
Formosan Rubber Group, Inc. | 841,000 | 627,670 | |||
Fortune Electric Co., Ltd. | 478,170 | 423,441 | |||
*Fu I Industrial Co., Ltd. | 97,900 | 25,297 | |||
*Fwuson Industry Co., Ltd. | 466,590 | 168,989 | |||
G Shank Enterprise Co., Ltd. | 335,014 | 229,637 | |||
*G.T.M. Corp. | 338,000 | 209,659 | |||
Gem Terminal Industries Co., Ltd. | 302,386 | 212,522 | |||
*GeoVision, Inc. | 19,000 | 71,996 | |||
Getac Technology Corp. | 679,360 | 604,434 | |||
Giant Manufacture Co., Ltd. | 633,994 | 1,644,033 | |||
*Giantplus Technology Co., Ltd. | 29,000 | 16,123 | |||
Giga-Byte Technology Co., Ltd. | 1,390,800 | 1,179,669 | |||
*Global Unichip Corp. | 51,000 | 219,756 | |||
Globe Union Industrial Corp. | 426,944 | 385,367 | |||
*Gold Circuit Electronics, Ltd. | 839,056 | 297,577 | |||
Goldsun Development & Construction Co., Ltd. | 2,125,148 | 961,404 | |||
Good Will Instrument Co., Ltd. | 141,120 | 80,443 | |||
*Grand Pacific Petrochemical Corp. | 1,130,000 | 569,309 | |||
Grape King, Inc. | 183,000 | 177,204 | |||
Great China Metal Industry Co., Ltd. | 462,000 | 276,078 | |||
Great Taipei Gas Co., Ltd. | 830,000 | 405,937 | |||
Great Wall Enterprise Co., Ltd. | 791,692 | 819,730 | |||
Greatek Co., Ltd. | 853,621 | 808,930 | |||
Hanpin Co., Ltd. | 151,000 | 62,528 | |||
Hey Song Corp. | 765,000 | 400,987 | |||
Highwealth Construction Corp. | 1,037,871 | 1,289,013 | |||
Hitron Technologies, Inc. | 177,659 | 89,105 | |||
*Ho Tung Holding Corp. | 1,003,818 | 455,055 | |||
*Hocheng Corp. | 542,700 | 167,982 | |||
*Hold-Key Electric Wire & Cable Co., Ltd. | 337,079 | 221,213 | |||
*Holtek Semiconductor, Inc. | 103,000 | 115,287 | |||
Hong Tai Electric Industrial Co., Ltd. | 567,000 | 225,790 | |||
146
THE EMERGING MARKETS SMALL CAP SERIES
CONTINUED
| Shares | Value†† | ||||
TAIWAN — (Continued) | |||||
*Hong Yi Fiber Industry Co., Ltd. | 158,320 | $ | 36,794 | ||
*Honmyue Enterprise Co., Ltd. | 139,080 | 26,689 | |||
Hsin Kuang Steel Co., Ltd. | 399,442 | 314,367 | |||
Hsing Ta Cement Co., Ltd. | 620,000 | 189,312 | |||
*Hua Eng Wire & Cable Co., Ltd. | 988,565 | 314,039 | |||
*Huaku Development Co., Ltd. | 180,000 | 426,848 | |||
*Huang Hsiang Construction Corp. | 194,800 | 361,920 | |||
Hung Ching Development & Construction Co., Ltd. | 449,000 | 222,078 | |||
Hung Poo Construction Corp. | 490,658 | 707,985 | |||
*Hwa Fong Rubber Co., Ltd. | 471,670 | 189,290 | |||
*Ichia Technologies, Inc. | 26,000 | 13,597 | |||
I-Chiun Precision Industry Co., Ltd. | 258,313 | 334,867 | |||
*ICP Electronics, Inc. | 45,000 | 45,503 | |||
*Inernational Semiconductor Technology, Ltd. | 45,000 | 14,391 | |||
Infortrend Technology, Inc. | 439,164 | 659,533 | |||
ITE Technology, Inc. | 186,408 | 347,780 | |||
*Jess-Link Products Co., Ltd. | 71,000 | 149,456 | |||
*Jui Li Enterprise Co., Ltd. | 346,080 | 91,749 | |||
K Laser Technology, Inc. | 295,693 | 158,238 | |||
Kang Na Hsiung Co., Ltd. | 305,020 | 207,387 | |||
*Kao Hsing Chang Iron & Steel Corp. | 784,000 | 138,923 | |||
Kaulin Manufacturing Co., Ltd. | 274,330 | 123,371 | |||
Kee Tai Properties Co., Ltd. | 830,997 | 415,561 | |||
Kenda Rubber Industrial Co., Ltd. | 831,751 | 982,427 | |||
*King Slide Works Co., Ltd. | 4,000 | 20,725 | |||
King Yuan Electronics Co., Ltd. | 2,116,979 | 817,088 | |||
Kingdom Construction Co., Ltd. | 889,000 | 665,561 | |||
*King’s Town Bank | 1,795,701 | 427,572 | |||
*King’s Town Construction Co., Ltd. | 545,359 | 451,091 | |||
*Kinpo Electronics, Inc. | 2,658,157 | 696,738 | |||
Kinsus Interconnect Technology Corp. | 205,000 | 513,896 | |||
Knowledge-Yield-Excellence Systems Corp. | 415,904 | 384,532 | |||
Kung Long Batteries Industrial Co., Ltd. | 64,000 | 79,361 | |||
*Kuoyang Construction Co., Ltd. | 687,000 | 329,327 | |||
*Kwong Fong Industries Corp. | 996,000 | 240,485 | |||
*Lan Fa Textile Co., Ltd. | 618,423 | 167,509 | |||
*Lead Data Co., Ltd. | 494,858 | 93,367 | |||
Leader Electronics, Inc. | 58,081 | 39,812 | |||
*Leadtek Research, Inc. | 6,961 | 1,431 | |||
*Lealea Enterprise Co., Ltd. | 1,198,050 | 247,157 | |||
Lee Chang Yung Chemical Industry Corp. | 1,296,619 | 1,438,027 | |||
Lee Chi Enterprises Co., Ltd. | 326,000 | 110,114 | |||
*Leofoo Development Co., Ltd. | 507,000 | 266,573 | |||
Les Enphants Co., Ltd. | 318,800 | 317,118 | |||
*Li Peng Enterprise Co., Ltd. | 967,824 | 393,832 | |||
Lien Hwa Industrial Corp. | 1,183,783 | 542,046 | |||
Lingsen Precision Industries, Ltd. | 506,506 | 175,371 | |||
*Lite-On Semiconductor Corp. | 152,000 | 99,724 | |||
*Long Bon International Co., Ltd. | 797,945 | 279,634 | |||
*Long Chen Paper Co., Ltd. | 866,062 | 276,169 | |||
*Lucky Cement Corp. | 620,000 | 153,200 | |||
*Lumax International Corp., Ltd. | 41,100 | 72,212 | |||
Makalot Industrial Co., Ltd. | 237,202 | 418,879 | |||
*Mayer Steel Pipe Corp. | 282,160 | 160,650 | |||
Maywufa Co., Ltd. | 67,632 | 34,619 | |||
Meiloon Co., Ltd. | 399,053 | 146,676 | |||
*Mercuries & Associates, Ltd. | 987,477 | 415,136 | |||
Merida Industry Co., Ltd. | 432,170 | 696,159 | |||
Merry Electronics Co., Ltd. | 31,363 | 52,347 | |||
Microelectronics Technology, Inc. | 672,315 | 283,804 | |||
Micro-Star International Co., Ltd. | 1,802,075 | 1,077,540 | |||
147
THE EMERGING MARKETS SMALL CAP SERIES
CONTINUED
| Shares | Value†† | ||||
TAIWAN — (Continued) | |||||
Min Aik Technology Co., Ltd. | 224,317 | $ | 249,303 | ||
Mirle Automation Corp. | 250,568 | 202,671 | |||
Mitac International Corp. | 1,126,000 | 526,629 | |||
*Mobiletron Electronics Co., Ltd. | 135,000 | 100,232 | |||
*Mospec Seminconductor Corp. | 117,000 | 53,815 | |||
*Mustek Systems, Inc. | 129,119 | 23,926 | |||
Nak Sealing Technologies Corp. | 121,954 | 107,182 | |||
*Namchow Chemical Industrial Co., Ltd. | 473,000 | 296,283 | |||
*Nankang Rubber Tire Co., Ltd. | 1,011,622 | 1,007,217 | |||
Nantex Industry Co., Ltd. | 455,135 | 288,152 | |||
National Petroleum Co., Ltd. | 455,824 | 471,675 | |||
*New Asia Construction & Development Co., Ltd. | 133,618 | 28,618 | |||
*Ocean Plastics Co., Ltd. | 342,200 | 231,991 | |||
*Optimax Technology Corp. | 674 | 37 | |||
Opto Tech Corp. | 789,886 | 576,175 | |||
Oriental Union Chemical Corp. | 1,095,788 | 753,268 | |||
*Pacific Construction Co., Ltd. | 1,054,000 | 131,460 | |||
Pan Jit International, Inc. | 463,318 | 312,952 | |||
Pan-International Industrial Corp. | 452,088 | 658,763 | |||
PC Home Online | 49,000 | 101,313 | |||
Phihong Technology Co., Ltd. | 585,001 | 500,029 | |||
*Phoenix Precision Technology Corp. | 499,000 | 336,398 | |||
*Picvue Electronics, Ltd. | 72,760 | — | |||
Pihsiang Machinery Mfg. Co., Ltd. | 262,534 | 538,971 | |||
*Potrans Electrical Corp. | 228,000 | 30,565 | |||
*President Securities Corp. | 739,000 | 432,469 | |||
*Prince Housing & Development Corp. | 1,616,398 | 701,188 | |||
*Procomp Informatics, Ltd. | 21,675 | — | |||
*Prodisc Technology, Inc. | 1,707,199 | 36,073 | |||
Promise Technology, Inc. | 232,309 | 164,330 | |||
*Protop Technology Co., Ltd. | 192,000 | 1,240 | |||
*Quintain Steel Co., Ltd. | 459,750 | 107,566 | |||
*Radium Life Tech Corp. | 837,999 | 619,215 | |||
Ralec Electronic Corp. | 92,405 | 115,268 | |||
*Rectron, Ltd. | 178 | 26 | |||
*Rexon Industrial Corp., Ltd. | 469,000 | 143,368 | |||
*Ritek Corp. | 4,755,000 | 1,132,990 | |||
Ruentex Development Co., Ltd. | 886,000 | 993,587 | |||
*Ruentex Industries, Ltd. | 1,279,000 | 2,087,604 | |||
*Sainfoin Technology Corp. | 131,260 | — | |||
*Sampo Corp. | 1,721,124 | 270,618 | |||
San Fang Chemical Industry Co., Ltd. | 316,522 | 372,174 | |||
*Sanyang Industrial Co., Ltd. | 1,402,046 | 562,068 | |||
Sanyo Electric Co., Ltd. | 503,000 | 503,916 | |||
SDI Corp. | 274,000 | 320,411 | |||
Senao International Co., Ltd. | 375,541 | 505,764 | |||
Sheng Yu Steel Co., Ltd. | 552,980 | 379,027 | |||
*Shih Wei Navigation Co., Ltd. | 171,000 | 234,104 | |||
Shihlin Electric & Engineering Corp. | 895,000 | 1,076,097 | |||
*Shihlin Paper Corp. | 418,000 | 821,773 | |||
Shin Shin Co., Ltd. | 49,000 | 36,074 | |||
*Shin Zu Shing Co., Ltd. | 3,000 | 13,711 | |||
*Shinkong Co., Ltd. | 542,131 | 276,278 | |||
Shinkong Synthetic Fibers Co., Ltd. | 2,321,961 | 573,162 | |||
*Shuttle, Inc. | 290,152 | 205,259 | |||
Sigurd Microelectronics Corp. | 424,974 | 212,650 | |||
*Silicon Integrated Systems Corp. | 1,939,000 | 918,138 | |||
Silitech Technology Corp. | 247,651 | 770,913 | |||
Sincere Navigation Corp. | 24,786 | 27,553 | |||
*Sinkang Industries Co., Ltd. | 259,805 | 112,946 | |||
*Sinkong Spinning Co., Ltd. | 469,542 | 438,634 | |||
148
THE EMERGING MARKETS SMALL CAP SERIES
CONTINUED
| Shares | Value†† | ||||
TAIWAN — (Continued) | |||||
Sinon Corp. | 556,510 | $ | 220,392 | ||
*Sintek Photronics Corp. | 1,044,508 | 541,409 | |||
Sinyi Realty, Inc. | 317,474 | 528,277 | |||
Sitronix Technology Corp. | 57,000 | 95,063 | |||
Siward Crystal Technology Co., Ltd. | 201,013 | 81,307 | |||
Solomon Technology Corp. | 281,138 | 116,216 | |||
*Sonix Technology Co., Ltd. | 94,000 | 175,192 | |||
South East Soda Manufacturing Co., Ltd. | 279,250 | 243,958 | |||
*Southeast Cement Co., Ltd. | 899,700 | 305,827 | |||
SPI Electronic Co., Ltd. | 281,556 | 296,782 | |||
Springsoft, Inc. | 123,000 | 107,741 | |||
Standard Chemical & Pharmaceutical Co., Ltd. | 212,685 | 177,941 | |||
Standard Foods Taiwan, Ltd. | 533,655 | 583,409 | |||
Stark Technology, Inc. | 226,860 | 128,926 | |||
Sunonwealth Electric Machine Industry Co., Ltd. | 339,486 | 203,445 | |||
*Sunplus Technology Co., Ltd. | 80,000 | 66,326 | |||
Sunrex Technology Corp. | 612,736 | 629,701 | |||
*Syscom Computer Engineering Co. | 30,000 | 9,226 | |||
Sysware Systex Corp. | 261,388 | 324,937 | |||
T JOIN Transportation Co., Ltd. | 802,000 | 498,656 | |||
*Ta Chen Stainless Pipe Co., Ltd. | 30,197 | 20,689 | |||
*Ta Chong Bank, Ltd. | 3,172,212 | 623,254 | |||
*Ta Ya Electric Wire & Cable Co., Ltd. | 884,858 | 203,624 | |||
Ta Yih Industrial Co., Ltd. | 194,000 | 176,153 | |||
Tah Hsin Industrial Corp. | 447,000 | 310,669 | |||
Ta-I Technology Co., Ltd. | 241,946 | 171,547 | |||
Taichung Commercial Bank | 2,300,841 | 569,823 | |||
Tainan Enterprises Co., Ltd. | 263,370 | 185,629 | |||
*Tainan Spinning Co., Ltd. | 2,480,000 | 915,333 | |||
*Taisun Enterprise Co., Ltd. | 542,000 | 208,155 | |||
*Taita Chemical Co., Ltd. | 452,170 | 185,948 | |||
Taiwan Acceptance Corp. | 229,480 | 215,370 | |||
*Taiwan Cogeneration Corp. | 355,000 | 172,341 | |||
*Taiwan Fire & Marine Insurance Co., Ltd. | 529,602 | 414,663 | |||
*Taiwan Flourescent Lamp Co., Ltd. | 176,000 | 16,126 | |||
Taiwan Hon Chuan Enterprise Co., Ltd. | 337,311 | 543,905 | |||
Taiwan Kai Yih Industrial Co., Ltd. | 242,396 | 143,248 | |||
*Taiwan Kolin Co., Ltd. | 1,356,000 | — | |||
*Taiwan Life Insurance Co., Ltd. | 964,816 | 862,849 | |||
Taiwan Line Tek Electronic Co., Ltd. | 77,214 | 116,889 | |||
Taiwan Mask Corp. | 528,720 | 181,281 | |||
Taiwan Navigation Co., Ltd. | 598,777 | 807,921 | |||
Taiwan Paiho Co., Ltd. | 438,253 | 271,037 | |||
*Taiwan Pulp & Paper Corp. | 618,000 | 180,710 | |||
Taiwan Sakura Corp. | 423,437 | 176,435 | |||
Taiwan Secom Co., Ltd. | 710,332 | 1,085,807 | |||
Taiwan Sogo Shinkong Security Co., Ltd. | 538,278 | 346,549 | |||
*Taiwan Styrene Monomer Corp. | 987,303 | 411,124 | |||
*Taiwan Tea Corp. | 825,739 | 469,504 | |||
*Taiyen Biotech Co., Ltd. | 438,000 | 255,595 | |||
Teco Electric & Machinery Co., Ltd. | 354,000 | 140,927 | |||
*Tecom, Ltd. | 447,114 | 168,016 | |||
Ten Ren Tea Co., Ltd. | 123,980 | 132,472 | |||
*Test Research, Inc. | 78,000 | 58,644 | |||
Test-Rite International Co., Ltd. | 794,438 | 359,107 | |||
Thinking Electronic Industrial Co., Ltd. | 184,204 | 278,638 | |||
*Thye Ming Industrial Co., Ltd. | 267,015 | 361,191 | |||
Ton Yi Industrial Corp. | 2,487,280 | 866,617 | |||
*Topco Scientific Co., Ltd. | 19,000 | 18,329 | |||
Tsann Kuen Enterprise Co., Ltd. | 324,642 | 267,515 | |||
TSRC Corp. | 397,000 | 462,445 | |||
149
THE EMERGING MARKETS SMALL CAP SERIES
CONTINUED
| Shares | Value†† | ||||
TAIWAN — (Continued) | |||||
TTET Union Corp. | 264,000 | $ | 299,703 | ||
*Twinhead International Corp. | 500 | 79 | |||
TYC Brother Industrial Co., Ltd. | 506,910 | 307,480 | |||
*Tycoons Group Enterprise Co., Ltd. | 719,000 | 108,358 | |||
*Tyntek Corp. | 449,337 | 393,429 | |||
*Tze Shin International Co., Ltd. | 329,558 | 124,391 | |||
*Uniform Industrial Corp. | 88,823 | 69,982 | |||
*Union Bank of Taiwan | 3,105,488 | 550,169 | |||
*Union Insurance Co., Ltd. | 79,732 | 66,560 | |||
Unitech Electronics Co., Ltd. | 250,804 | 128,000 | |||
*Unitech Printed Circuit Board Corp. | 660,303 | 216,795 | |||
United Integration Service Co., Ltd. | 446,439 | 230,378 | |||
*Unity Opto Technology Co., Ltd. | 130,000 | 201,359 | |||
*Universal Cement Corp. | 944,191 | 447,613 | |||
Universal Scientific Industrial Co., Ltd. | 1,735,843 | 856,400 | |||
Universal, Inc. | 126,690 | 115,639 | |||
UPC Technology Corp. | 1,364,071 | 657,446 | |||
*USI Corp. | 1,203,000 | 566,261 | |||
Ve Wong Corp. | 326,550 | 246,566 | |||
*Veutron Corp. | 145,000 | 9,357 | |||
*Visual Photonics Epitacy Co., Ltd. | 182,813 | 363,469 | |||
*Wah Lee Industrial Corp. | 99,000 | 113,459 | |||
*Walsin Technology Corp., Ltd. | 1,100,544 | 425,947 | |||
Wan Hwa Enterprise Co., Ltd. | 484,100 | 206,603 | |||
*Waterland Financial Holdings | 3,648,021 | 1,109,797 | |||
*Wei Chih Steel Industrial Co., Ltd. | 433,000 | 100,024 | |||
*Wei Chuan Food Corp. | 737,000 | 959,302 | |||
*Weikeng Industrial Co., Ltd. | 36,000 | 20,034 | |||
*Weltrend Semiconductor, Inc. | 374,833 | 281,257 | |||
*Winbond Electronics Corp. | 1,088,000 | 200,941 | |||
*Wintek Corp. | 663,000 | 441,510 | |||
Wistron NeWeb Corp. | 313,202 | 414,187 | |||
WPG Holdings Co., Ltd. | 244,904 | 335,058 | |||
*WT Microelectronics Co., Ltd. | 28,000 | 18,975 | |||
Yageo Corp. | 4,968,000 | 1,369,228 | |||
Yeung Cyang Industrial Co., Ltd. | 509,170 | 387,729 | |||
Yieh Phui Enterprise Co., Ltd. | 2,488,569 | 807,319 | |||
Yosun Industrial Corp. | 543,269 | 488,238 | |||
*Yuen Foong Yu Paper Manufacturing Co., Ltd. | 2,909,507 | 1,041,678 | |||
*Yulon Nissan Motor Co., Ltd. | 157,000 | 305,157 | |||
Yung Chi Paint & Varnish Manufacturing Co., Ltd. | 258,869 | 326,499 | |||
Yung Shin Pharmaceutical Industrial Co., Ltd. | 406,300 | 434,545 | |||
Yung Tay Engineering Co., Ltd. | 729,000 | 541,407 | |||
*Zenitron Corp. | 36,000 | 21,848 | |||
*Zig Sheng Industrial Co., Ltd. | 809,759 | 311,254 | |||
Zinwell Corp. | 452,586 | 778,484 | |||
Zippy Technology Corp. | 217,948 | 101,978 | |||
Zyxel Communication Corp. | 974,430 | 670,859 | |||
TOTAL TAIWAN | 134,178,175 | ||||
THAILAND — (2.3%) | |||||
*ACL Bank PCL (Foreign) | 121,000 | 39,458 | |||
Aeon Thana Sinsap (Thailand) PCL (Foreign) | 142,500 | 135,359 | |||
Amata Corp. PCL (Foreign) | 1,818,700 | 424,409 | |||
*Apex Development PCL (Foreign) | 3,536 | 2,279 | |||
Asian Property Development PCL (Foreign) NVDR | 2,158,000 | 361,550 | |||
Bangchak Petroleum PCL (Foreign) | 709,300 | 292,845 | |||
Bangkok Aviation Fuel Services PCL (Foreign) | 854,917 | 195,665 | |||
Bangkok Chain Hospital PCL (Foreign) | 2,918,125 | 422,550 | |||
Bangkok Dusit Medical Services PCL (Foreign) | 732,500 | 530,337 | |||
Bangkok Expressway PCL (Foreign) | 1,170,400 | 644,289 | |||
150
THE EMERGING MARKETS SMALL CAP SERIES
CONTINUED
| Shares | Value†† | ||||
THAILAND — (Continued) | |||||
Bangkok First Investment & Trust PCL (Foreign) | 681,700 | $ | 82,395 | ||
Bangkok Insurance PCL (Foreign) | 84,734 | 600,807 | |||
*Bangkok Land PCL (Foreign) NVDR | 21,859,870 | 385,859 | |||
*Bangkok Rubber PCL (Foreign) | 14,600 | 1,083 | |||
Big C Supercenter PCL (Foreign) | 80,900 | 101,654 | |||
Bumrungrad Hospital PCL (Foreign) | 439,300 | 368,000 | |||
Cal-Comp Electronics (Thailand) PCL (Foreign) | 3,894,500 | 405,471 | |||
*Central Paper Industry PCL (Foreign) | 20 | 1,257 | |||
Central Plaza Hotel PCL (Foreign) | 916,100 | 115,112 | |||
Ch. Karnchang PCL (Foreign) | 708,100 | 127,108 | |||
*Charoong Thai Wire & Cable PCL (Foreign) | 452,700 | 56,071 | |||
*Country Group Securities PCL (Foreign) | 4,205,461 | 132,109 | |||
Delta Electronics (Thailand) PCL (Foreign) | 649,000 | 335,907 | |||
Dynasty Ceramic PCL (Foreign) | 882,400 | 679,785 | |||
Eastern Water Resources Development & Management PCL (Foreign) | 2,199,400 | 248,728 | |||
Erawan Group PCL (Foreign) | 4,046,270 | 292,954 | |||
*G J Steel PCL (Foreign) | 15,187,500 | 104,506 | |||
GMM Grammy PCL (Foreign) | 928,000 | 410,902 | |||
Hana Microelectronics PCL (Foreign) | 1,281,796 | 713,281 | |||
Hermraj Land & Development PCL (Foreign) | 5,290,100 | 126,614 | |||
Home Product Center PCL (Foreign) | 6,381,093 | 797,995 | |||
ICC International PCL (Foreign) | 204,600 | 252,498 | |||
Indorama Polymers PCL (Foreign) | 833,100 | 299,093 | |||
*Italian-Thai Development PCL (Foreign) NVDR | 1,244,530 | 118,403 | |||
*ITV PCL (Foreign) | 2,785,600 | 87,506 | |||
Jasmine International PCL (Foreign) | 2,110,700 | 29,679 | |||
Khon Kaen Sugar Industry PCL (Foreign) | 934,800 | 349,589 | |||
Kiatnakin Bank PCL (Foreign) NVDR | 764,800 | 577,747 | |||
Kim Eng Securities Thailand PCL (Foreign) | 367,600 | 144,071 | |||
*Krungthai Card PCL (Foreign) | 576,700 | 222,571 | |||
Laguna Resorts & Hotels PCL (Foreign) | 80,500 | 92,120 | |||
Lanna Resources PCL (Foreign) | 548,800 | 244,641 | |||
*Loxley PCL (Foreign) | 3,228,020 | 241,438 | |||
Major Cineplex Group PCL (Foreign) | 1,494,300 | 326,354 | |||
MBK Development PCL (Foreign) | 330,900 | 663,285 | |||
*MCOT PCL (Foreign) | 1,092,200 | 741,748 | |||
Minor International PCL (Foreign) | 3 | 1 | |||
*Muang Thai Insurance PCL (Foreign) | 19,588 | 30,180 | |||
Muramoto Electronic (Thailand) PCL (Foreign) | 14,000 | 67,225 | |||
*Nation Multimedia Group PCL (Foreign) | 106,259 | 15,895 | |||
Padaeng Industry PCL (Foreign) NVDR (6362351) | 509,500 | 275,900 | |||
Padaeng Industry PCL (Foreign) NVDR (6666990) | 73,800 | 39,964 | |||
Patum Rice Mill & Granary PCL (Foreign) | 5,500 | 7,734 | |||
Polyplex PCL (Foreign) | 1,057,800 | 181,970 | |||
Precious Shipping PCL (Foreign) | 480,900 | 266,168 | |||
*Preuksa Real Estate PCL (Foreign) | 1,330,300 | 620,873 | |||
Property Perfect PCL (Foreign) | 1,745,800 | 208,921 | |||
Quality Houses PCL (Foreign) | 11,876,300 | 888,280 | |||
*Regional Container Lines PCL (Foreign) | 1,112,300 | 362,725 | |||
Robinson Department Store PCL (Foreign) | 1,875,025 | 524,502 | |||
Rojana Industrial Park PCL (Foreign) | 1,122,800 | 345,994 | |||
Saha Pathana Inter-Holding PCL (Foreign) | 350,000 | 182,722 | |||
Saha-Union PCL (Foreign) | 636,600 | 342,821 | |||
*Sahaviriya Steel Industries PCL (Foreign) | 23,578,500 | 881,769 | |||
Samart Corporation PCL (Foreign) | 1,676,200 | 303,396 | |||
Samart I-Mobile PCL (Foreign) | 9,503,000 | 497,539 | |||
Sansiri PCL (Foreign) | 2,621,166 | 316,814 | |||
SC Asset Corp. PCL (Foreign) | 580,100 | 197,850 | |||
SE-Education PCL (Foreign) | 138,900 | 31,998 | |||
Serm Suk PCL (Foreign) | 10,000 | 4,547 | |||
*Shinawatra Satellite PCL (Foreign) | 615,700 | 140,916 | |||
151
THE EMERGING MARKETS SMALL CAP SERIES
CONTINUED
| Shares | Value†† | ||||
THAILAND — (Continued) | |||||
*Siam Future Development PCL (Foreign) | 440,000 | $ | 41,071 | ||
Siam Makro PCL (Foreign) | 355,600 | 848,440 | |||
*Sino-Thai Engineering & Construction PCL (Foreign) | 694,700 | 138,213 | |||
Sri Trang Agro Industry PCL (Foreign) | 370,998 | 183,140 | |||
Supalai PCL (Foreign) | 2,640,533 | 442,393 | |||
*Tata Steel (Thailand) PCL (Foreign) | 8,945,300 | 567,361 | |||
Thai Carbon Black PCL (Foreign) | 87,900 | 47,599 | |||
Thai Plastic & Chemicals PCL (Foreign) | 1,357,900 | 739,380 | |||
Thai Reinsurance PCL (Foreign) | 1,484,700 | 220,317 | |||
Thai Stanley Electric (Thailand) PCL (Foreign) | 127,600 | 400,838 | |||
Thai Union Frozen Products PCL (Foreign) | 533,900 | 443,253 | |||
Thai Vegetable Oil PCL (Foreign) | 1,087,875 | 517,493 | |||
Thai Wacoal PCL (Foreign) | 78,000 | 91,010 | |||
Thanachart Capital PCL (Foreign) | 2,034,100 | 1,198,856 | |||
Thoresen Thai Agencies PCL (Foreign) | 327,500 | 262,098 | |||
Ticon Industrial Connection PCL (Foreign) | 1,026,600 | 299,457 | |||
*Tipco Asphalt PCL (Foreign) | 352,190 | 305,565 | |||
TIPCO Foods (Thailand) PCL (Foreign) | 642,282 | 93,004 | |||
Tisco Financial Group PCL (Foreign) | 655,900 | 423,858 | |||
*TPI Polene PCL (Foreign) | 933,860 | 268,214 | |||
*True Corp. PCL (Foreign) | 4,526,000 | 468,510 | |||
*Tycoons Worldwide Group PCL (Foreign) | 804,700 | 142,041 | |||
Univanich Palm Oil PCL (Foreign) | 30,000 | 69,559 | |||
Univentures PCL (Foreign) | 1,801,100 | 120,702 | |||
Vanachai Group PCL (Foreign) | 2,463,066 | 160,643 | |||
Vinythai PCL (Foreign) | 2,273,034 | 445,426 | |||
TOTAL THAILAND | 29,202,227 | ||||
TURKEY — (2.6%) | |||||
*Acibadem Saglik Hizmetleri ve Ticares A.S. | — | 2 | |||
Adana Cimento Sanayi Ticaret A.S. | 532,137 | 214,520 | |||
*Adana Cimento T.A.S. | 45,000 | 183,023 | |||
Afyon Cimento Sanayii Ticaret A.S. | 66 | 66,086 | |||
*Ak-Al Tekstil A.S. | — | — | |||
Akcansa Cimento Sanayi ve Ticaret A.S. | 324,378 | 1,284,615 | |||
Akenerji Elektrik Uretim A.S. | 80,193 | 719,650 | |||
*Aksa Akrilik Kimya Sanayii A.S. | 142,045 | 152,966 | |||
Aksigorta A.S. | 294,017 | 887,960 | |||
*Aksu Iplik Dokuma ve Boya Apre Fabrikalari A.S. | — | — | |||
*Aktas Elektrik Ticaret A.S. | 370 | 36,920 | |||
Alarko Holding A.S. | 129,551 | 326,344 | |||
*Albaraka Turk Katilim Bankasi AS | 413,352 | 641,314 | |||
*Alcatel Telekomunikasyon Endustri ve Ticaret A.S. | 1 | 1 | |||
*Alternatifbank A.S. | 1 | 1 | |||
*Altinyildiz mensucat ve Konfeksiyon Fabrikalari A.S. | 1 | 2 | |||
Anadolu Anonim Turk Sigorta Sirketi A.S. | 522,746 | 431,479 | |||
*Anadolu Cam Sanayii A.S. | 574,121 | 664,191 | |||
Anadolu Hayat Sigorta A.S. | 84,165 | 221,800 | |||
*Anadolu Isuzu Otomotiv Sanayi ve Ticaret A.S. | 1 | 4 | |||
*Arcelik A.S. | 140,494 | 458,805 | |||
*Aselsan Elektronik Sanayi Ve Ticaret A.S. | 55,044 | 222,621 | |||
Ayen Enerji A.S. | 133,075 | 231,729 | |||
Aygaz A.S. | 216,147 | 765,640 | |||
Bagfas Bandirma Gubre Fabrikalari A.S. | 7,343 | 391,617 | |||
*Banvit Bandirma Vitaminli Yem Sanayii Ticaret A.S. | 158,502 | 341,119 | |||
*Bati Anabolu Cimento A.S. | 121,578 | 482,727 | |||
*Bati Soeke Cimento Sanayi A.S. | 1 | — | |||
Bolu Cimento Sanayii A.S. | 214,724 | 250,472 | |||
*Borusan Mannesmann Boru Sanayi A.S. | 29,797 | 225,800 | |||
*Boyner Buyuk Magazacilik A.S. | 189,233 | 135,084 | |||
Bursa Cimento Fabrikasi A.S. | 173,040 | 578,900 | |||
152
THE EMERGING MARKETS SMALL CAP SERIES
CONTINUED
| Shares | Value†† | ||||
TURKEY — (Continued) | |||||
Celebi Hava Servisi A.S. | 36,194 | $ | 253,211 | ||
Cemtas Celik Makina Sanayi ve Ticaret A.S. | — | — | |||
Cimsa Cimento Sanayi ve Ticaret A.S. | 228,659 | 987,967 | |||
*Dentas Ambalaj ve Kagit Sanayi A.S. | 1 | — | |||
*Deva Holding A.S. | 194,391 | 448,727 | |||
*Dogan Gazetecilik A.S. | 98,158 | 191,413 | |||
*Dogan Yayin Holding A.S. | 410,154 | 285,279 | |||
*Dogus Otomotiv Servis ve Ticaret A.S. | 563,686 | 1,741,359 | |||
*Ege Plstik Ticaret ve Sanayi A.S. | 1 | — | |||
*EGE Seramik Sanayi ve Ticaret A.S. | — | — | |||
EIS Eczacibasi Ilac ve Sinai ve Finansal Yatirimlar Sanayi ve Ticaret A.S. | 1,730,297 | 1,788,239 | |||
*Fortis Bank A.S. | 1 | 1 | |||
*Galatasaray Sportif Sinai ve Ticari Yatirimlar A.S. | 302 | 27,918 | |||
*Global Yatirim Holding A.S. | 388,675 | 207,699 | |||
*Goldas Kuyumculuk Sanayi A.S. | 49,862 | 31,034 | |||
Goltas Goller Bolgesi Cimento Sanayi ve Ticaret A.S. | 7,128 | 179,301 | |||
Goodyear Lastikleri T.A.S. | 21,850 | 166,802 | |||
*GSD Holding A.S. | 427,556 | 264,576 | |||
*Gubre Fabrikalari Ticaret A.S. | 30,478 | 149,054 | |||
*Gunes Sigorta A.S. | 143,245 | 185,039 | |||
*Hektas Ticaret T.A.S. | 16,327 | 9,291 | |||
*Hurriyet Gazetecilik ve Matbaacilik A.S. | 516,032 | 550,169 | |||
*Ihlas Ev Aletleri Imalat Sanayi ve Ticaret A.S. | 305,120 | 218,039 | |||
*Ihlas Holding A.S. | 410,855 | 138,624 | |||
*Izmir Demir Celik Sanayii A.S. | 137,998 | 209,714 | |||
*Kardemir Karabuk Demir Sanayi ve Ticaret A.S. | 837,370 | 455,346 | |||
Karton Sanayi ve Ticaret A.S. | 980 | 48,859 | |||
Konya Cimento Sanayii A.S. | 4,921 | 179,492 | |||
*Kordsa Global Endustriyel Iplik ve Kord Bezi Sanayi ve Ticaret A.S. | 156,178 | 246,535 | |||
*Koza Anadolu Metal Madencilik Isletmeleri A.S. | 158,000 | 410,252 | |||
Mardin Cimento Sanayii ve Ticaret A.S. | 166,618 | 800,027 | |||
*Marmari Marti Otel Isletmeleri A.S. | — | — | |||
Marshall Boya ve Vernik Sanayii A.S. | 1 | 7 | |||
*Medya Holdings A.S. | 15,849 | — | |||
*Menderes Tekstil Sanayi ve Ticaret A.S. | — | — | |||
*Mudurnu Tavukculuk A.S. | 1,740 | 521 | |||
*Nergis Holding A.S. | 1,784 | 4,391 | |||
*Net Holding A.S. | 550,177 | 217,584 | |||
*Net Turizm Ticaret ve Sanayi A.S. | 9,397 | 7,431 | |||
Nortel Networks Netas Telekomuenikasyon A.S. | 13,916 | 409,313 | |||
Otobus Karoseri Sanayi A.S. | 39,067 | 367,548 | |||
*Park Elektrik Madencilik Sanayi Ve Ticaret A.S. | 58,000 | 112,729 | |||
*Petkim Petrokimya Holding A.S. | 172,124 | 829,779 | |||
Pinar Sut Mamulleri Sanayii A.S. | 155,270 | 664,178 | |||
*Raks Elektronik Sanayi ve Ticaret A.S. | 2,730 | 1,435 | |||
*Sarkuysan Elektrolitik Bakir Sanayi ve Ticaret A.S. | 86,251 | 152,228 | |||
*Sekerbank T.A.S. | 241,845 | 401,892 | |||
Selcuk Ecza Deposu Ticaret ve Sanayi A.S. | 353,435 | 538,746 | |||
*Sonmez Filament Sentetik Iplik ve Elyaf Sanayi A.S. | — | — | |||
*Tat Konserve Sanayii A.S. | 144,018 | 296,100 | |||
*TAV Havalimanlari Holding A.S. | 152,500 | 417,027 | |||
*Tekfen Holding A.S. | 311,586 | 892,185 | |||
*Tekstil Bankasi A.S. | 181,377 | 125,317 | |||
*Tire Kutsan Oluklu Mukavva Kutu Ve Kagit Sanayii A.S. | 141,425 | 223,483 | |||
Tofas Turk Otomobil Fabrikasi A.S. | 306,405 | 769,799 | |||
*Trakya Cam Sanayii A.S. | 351,036 | 412,760 | |||
Turcas Petrol A.S. | 144,981 | 443,230 | |||
*Turk Demir Dokum Fabrikalari A.S. | 1 | 3 | |||
*Turk Ekonomi Bankasi A.S. | 528,459 | 777,761 | |||
*Turk Hava Yollari A.S. | 528,355 | 1,475,045 | |||
*Turk Sise ve Cam Fabrikalari A.S. | 631,330 | 662,546 | |||
153
THE EMERGING MARKETS SMALL CAP SERIES
CONTINUED
| Shares | Value†† | ||||
TURKEY — (Continued) | |||||
*Turk Traktor ve Ziraat Makineleri A.S. | 18,530 | $ | 96,545 | ||
*Turkiye Sinai Kalkinma Bankasi A.S. | 543,470 | 532,362 | |||
Ulker Biskuvi Sanayi A.S. | 125,020 | 292,441 | |||
*Uzel Makina Sanayii A.S. | 172,635 | 89,576 | |||
*Vakif Finansal Kiralama A.S. | 1 | 2 | |||
*Vestel Beyaz Esya Sanayi ve Ticaret A.S. | 64,926 | 139,994 | |||
*Vestel Elektronik Sanayi ve Ticaret A.S. | 190,016 | 296,217 | |||
Yapi Kredi Sigorta A.S. | 102,412 | 630,298 | |||
*Zorlu Enerji Elektrik Uretim A.S. | 185,560 | 354,572 | |||
TOTAL TURKEY | 32,724,404 | ||||
TOTAL COMMON STOCKS | 1,107,325,669 | ||||
PREFERRED STOCKS — (4.6%) | |||||
BRAZIL — (4.6%) | |||||
Banco Alfa de Investimento SA | 3,200 | 12,825 | |||
Banco Mercantil do Brasil SA | 6,500 | 47,045 | |||
Bardella SA Industrias Mecanicas | 1,100 | 87,795 | |||
*Braskem SA Preferred A Sponsored ADR | 301,000 | 3,949,120 | |||
Centrais Electricas de Santa Catarina SA | 57,900 | 1,154,647 | |||
#Companhia Brasileira de Distribuicao Grupo Pao de Acucar Sponsored ADR | 38,000 | 2,298,620 | |||
Companhia de Tecidos Norte de Minas | 144,942 | 478,862 | |||
Companhia Energetica do Ceara Coelce Series A | 63,400 | 991,525 | |||
Companhia Paranaense de Energia-Copel Series B | 171,200 | 2,982,589 | |||
#Companhia Paranaense de Energia-Copel Sponsored ADR | 15,800 | 278,080 | |||
Confab Industrial SA | 483,613 | 1,422,068 | |||
Contax Participacoes SA | 17,700 | 793,767 | |||
Eletropaulo Metropolita SA Preferred A | 184,200 | 3,485,119 | |||
*Empressa Metropolitanade Aguas e Energia SA | 24,000 | 164,850 | |||
*Energisa SA | 138,800 | 160,736 | |||
Forjas Taurus SA | 181,082 | 713,391 | |||
Fras-Le SA | 20,200 | 46,211 | |||
*Gol Linhas Aereas Inteligentes SA | 91,900 | 939,033 | |||
*Industria de Bebidas Antarctica Polar SA | 23,000 | 34,273 | |||
*Inepar Industria e Construcoes SA | 11,690 | 271,479 | |||
Klabin SA | 1,412,700 | 3,368,154 | |||
Lojas Americanas SA | 488,403 | 3,185,599 | |||
Mahle-Metal Leve SA Industria e Comercio | 28,666 | 349,050 | |||
Marcopolo SA | 335,800 | 1,155,170 | |||
*Net Servicos de Comunicacao SA | 400,902 | 4,940,726 | |||
Net Servicos de Comunicacao SA Preferred ADR | 176,445 | 2,168,509 | |||
*Paranapanema SA | 269,523 | 1,070,993 | |||
Randon e Participacoes SA | 213,000 | 1,609,349 | |||
Rasip Agro-Pastoril SA | 51,000 | 13,317 | |||
Sao Paulo Alpargatas SA | 24,300 | 1,103,404 | |||
Saraiva SA Livreiros Editores | 54,100 | 902,895 | |||
*Sharp SA Equipamentos Eletronicos | 30,200,000 | 343 | |||
*Suzano Papel e Celullose SA | 390,634 | 3,394,986 | |||
Ultrapar Participacoes SA | 208,040 | 9,111,198 | |||
Uniao de Industrias Petroquimicas SA Series B | 1,321,579 | 795,228 | |||
Vivo Participacoes SA | 75,886 | 1,847,181 | |||
#*Votorantim Celulose e Papel SA Sponsored ADR | 141,687 | 1,946,779 | |||
Whirlpool SA | 301,516 | 617,889 | |||
TOTAL BRAZIL | 57,892,805 | ||||
INDIA — (0.0%) | |||||
*Ispat Industries, Ltd. | 620,622 | 41,324 | |||
MALAYSIA — (0.0%) | |||||
*Malayan United Industries Berhad A1 | 176,957 | 11,408 | |||
154
THE EMERGING MARKETS SMALL CAP SERIES
CONTINUED
| Shares | Value†† | |||||
MALAYSIA — (Continued) | ||||||
*Malayan United Industries Berhad A2 | 176,957 | $ | 9,334 | |||
TOTAL MALAYSIA | 20,742 | |||||
TOTAL PREFERRED STOCKS | 57,954,871 | |||||
RIGHTS/WARRANTS — (0.0%) | ||||||
BRAZIL — (0.0%) | ||||||
*Eternit SA Rights 11/24/09 | 37,192 | 33,992 | ||||
CHILE — (0.0%) | ||||||
*Empresas La Polar SA Rights 11/27/09 | 60,740 | 24,024 | ||||
CHINA — (0.0%) | ||||||
*New World China Land, Ltd. Rights 11/11/09 | 61,000 | 4,329 | ||||
MALAYSIA — (0.0%) | ||||||
*OSK Holdings Berhad Warrants 09/30/12 | 1,696 | 40 | ||||
*Ramunia Holdings Berhad Warrants 12/20/09 | 1,840 | 192 | ||||
TOTAL MALAYSIA | 232 | |||||
PHILIPPINES — (0.0%) | ||||||
*Security Bank Corp. Rights 11/11/09 | 86,714 | 50,992 | ||||
SOUTH AFRICA — (0.0%) | ||||||
*Super Group, Ltd. Rights 11/20/09 | 13,651,864 | 262,200 | ||||
SOUTH KOREA — (0.0%) | ||||||
*Pumyang Construction Co., Ltd. Rights 12/02/09 | 3,500 | 67 | ||||
TAIWAN — (0.0%) | ||||||
*Tyntek Corp. Rights 12/10/09 | 29,285 | 10,085 | ||||
THAILAND — (0.0%) | ||||||
*Bangkok Land PCL (Foreign) (B1NBVQ9) Warrants 01/07/10 | 217,333 | 65 | ||||
*Bangkok Land PCL (Foreign) (B2R9Y45) Warrants 01/07/10 | 8,472,752 | 40,558 | ||||
*Nation Multimedia Group PCL (Foreign) Rights 10/09/09 | 11,806 | — | ||||
*Rojana Industrial Park PCL (Foreign) Warrants 11/30/14 | 374,266 | 68,863 | ||||
*Sansiri PCL (Foreign) Warrants | 1,310,583 | — | ||||
*Thai Vegetable Oil PCL (Foreign) Warrants 05/18/12 | 217,575 | 46,216 | ||||
*Ticon Industrial Connection PCL (Foreign) Warrants 05/20/11 | 171,100 | 16,278 | ||||
TOTAL THAILAND | 171,980 | |||||
TOTAL RIGHTS/WARRANTS | 557,901 | |||||
| Face Amount | Value† | |||||
| (000) | ||||||
TEMPORARY CASH INVESTMENTS — (0.1%) | ||||||
Repurchase Agreement, PNC Capital Markets, Inc. 0.19%, 11/02/09 (Collateralized by $2,270,000 FHLMC 6.040%(r), 11/01/36, valued at $1,457,263) to be repurchased at $1,433,023 | $ | 1,433 | 1,433,000 | |||
155
THE EMERGING MARKETS SMALL CAP SERIES
CONTINUED
| Shares/ Face Amount | Value† | |||||
| (000) | ||||||
SECURITIES LENDING COLLATERAL — (7.5%) | ||||||
§@DFA Short Term Investment Fund LP | 93,074,091 | $ | 93,074,091 | |||
@Repurchase Agreement, Deutsche Bank Securities 0.07%, 11/02/09 (Collateralized by various corporate obligations, ranging in par value from $4,247,617 to $16,429,280, rates ranging from 5.000% to 7.000%, maturities ranging from 03/01/37 to 10/01/39, valued at $1,345,493) to be repurchased at $1,319,119 | $ | 1,319 | 1,319,111 | |||
TOTAL SECURITIES LENDING COLLATERAL | 94,393,202 | |||||
TOTAL INVESTMENTS — (100.0%) | $ | 1,261,664,643 | ||||
See accompanying Notes to Financial Statements.
156
THE TAX-MANAGED U.S. MARKETWIDE VALUE SERIES
SCHEDULE OF INVESTMENTS
October 31, 2009
| Shares | Value† | ||||
COMMON STOCKS — (91.3%) | |||||
Consumer Discretionary — (16.9%) | |||||
*4Kids Entertainment, Inc. | 200 | $ | 360 | ||
#*99 Cents Only Stores | 12,430 | 141,329 | |||
*AC Moore Arts & Crafts, Inc. | 25,417 | 121,493 | |||
Acme United Corp. | 1,030 | 8,652 | |||
*Aldila, Inc. | 6,471 | 19,154 | |||
*Alloy, Inc. | 16,956 | 111,570 | |||
American Greetings Corp. Class A | 73,700 | 1,499,058 | |||
*America’s Car-Mart, Inc. | 2,770 | 57,422 | |||
Ameristar Casinos, Inc. | 200 | 2,944 | |||
*AnnTaylor Stores Corp. | 14,100 | 182,877 | |||
#*Arctic Cat, Inc. | 19,566 | 116,222 | |||
*Asbury Automotive Group, Inc. | 49,069 | 477,932 | |||
*Ascent Media Corp. | 162 | 2,823 | |||
*Atrinsic, Inc. | 948 | 939 | |||
*Audiovox Corp. Class A | 23,289 | 150,447 | |||
#*AutoNation, Inc. | 305,400 | 5,265,096 | |||
*Ballantyne Strong, Inc. | 8,032 | 27,309 | |||
#Barnes & Noble, Inc. | 38,682 | 642,508 | |||
*Beasley Broadcast Group, Inc. | 9,802 | 33,425 | |||
#*Beazer Homes USA, Inc. | 9,300 | 40,827 | |||
bebe stores, inc. | 1,900 | 11,894 | |||
*Benihana, Inc. | 3,200 | 19,648 | |||
*Bluegreen Corp. | 14,675 | 42,117 | |||
Blyth, Inc. | 4,825 | 170,950 | |||
Bob Evans Farms, Inc. | 52,387 | 1,376,206 | |||
#*Bon-Ton Stores, Inc. (The) | 14,849 | 137,353 | |||
Books-A-Million, Inc. | 21,400 | 185,324 | |||
*Boyd Gaming Corp. | 20,700 | 152,352 | |||
#*Brookfield Homes Corp. | 39,865 | 224,440 | |||
Brown Shoe Co., Inc. | 74,175 | 769,195 | |||
*Brunswick Corp. | 112,200 | 1,063,656 | |||
*Build-A-Bear-Workshop, Inc. | 25,190 | 130,484 | |||
#*Cabela’s, Inc. | 109,175 | 1,372,330 | |||
*Cache, Inc. | 9,000 | 43,290 | |||
#*California Coastal Communities, Inc. | 3,309 | 2,780 | |||
#Callaway Golf Co. | 91,170 | 623,603 | |||
*Canterbury Park Holding Corp. | 2,755 | 19,313 | |||
*Caribou Coffee Co., Inc. | 3,840 | 31,450 | |||
*Carmike Cinemas, Inc. | 9,095 | 89,404 | |||
Carnival Corp. | 688,708 | 20,055,177 | |||
*Carriage Services, Inc. | 19,056 | 72,413 | |||
*Cavco Industries, Inc. | 9,633 | 292,843 | |||
CBS Corp. | 16,200 | 191,160 | |||
CBS Corp. Class B | 483,866 | 5,695,103 | |||
#*Charming Shoppes, Inc. | 26,798 | 121,395 | |||
#*Chico’s FAS, Inc. | 190,700 | 2,278,865 | |||
Christopher & Banks Corp. | 56,231 | 342,447 | |||
*Churchill Downs, Inc. | 3,137 | 98,439 | |||
Cinemark Holdings, Inc. | 82,874 | 960,510 | |||
*Coldwater Creek, Inc. | 1,100 | 6,325 | |||
#*Collective Brands, Inc. | 59,190 | 1,097,975 | |||
Comcast Corp. Class A | 3,570,978 | 51,779,181 | |||
Comcast Corp. Special Class A | 1,432,185 | 20,079,234 | |||
*Concord Camera Corp. | — | 1 | |||
#*Conn’s, Inc. | 21,820 | 137,684 | |||
#Cooper Tire & Rubber Co. | 147,627 | 2,252,788 | |||
#*Core-Mark Holding Co., Inc. | 24,894 | 681,349 | |||
*Craftmade International, Inc. | 2,799 | 7,389 | |||
157
THE TAX-MANAGED U.S. MARKETWIDE VALUE SERIES
CONTINUED
| Shares | Value† | ||||
Consumer Discretionary — (Continued) | |||||
CSS Industries, Inc. | 16,792 | $ | 340,878 | ||
*Culp, Inc. | 21,913 | 126,438 | |||
*Cybex International, Inc. | 29,933 | 41,008 | |||
#D.R. Horton, Inc. | 121,320 | 1,329,667 | |||
*dELiA*s, Inc. | 22,143 | 46,943 | |||
*Delta Apparel, Inc. | 6,832 | 60,395 | |||
*Destination Maternity Corp. | 11,725 | 235,086 | |||
#Dillard’s, Inc. | 120,300 | 1,638,486 | |||
*DineEquity, Inc. | 49,683 | 1,051,292 | |||
#*Discovery Communications, Inc. (25470F104) | 40,480 | 1,113,200 | |||
#*Discovery Communications, Inc. (25470F203) | 3,937 | 108,012 | |||
*Discovery Communications, Inc. (25470F302) | 163,880 | 3,936,398 | |||
#Disney (Walt) Co. | 1,135,556 | 31,080,168 | |||
*Dixie Group, Inc. | 11,800 | 34,220 | |||
*Dorman Products, Inc. | 12,347 | 180,513 | |||
Dover Motorsports, Inc. | 15,200 | 21,128 | |||
#*Drew Industries, Inc. | 57,500 | 1,100,550 | |||
#*DSW, Inc. | 2,000 | 38,400 | |||
*Duckwall-ALCO Stores, Inc. | 700 | 12,110 | |||
Educational Development Corp. | 2,100 | 11,025 | |||
#Ethan Allen Interiors, Inc. | 20,300 | 252,938 | |||
*Exide Technologies | 12,623 | 77,253 | |||
#*Federal Mogul Corp. | 6,900 | 76,935 | |||
Finish Line, Inc. Class A | 99,209 | 1,005,979 | |||
*Fisher Communications, Inc. | 15,023 | 292,798 | |||
*Flanigan’s Enterprises, Inc. | 865 | 4,931 | |||
Flexsteel Industries, Inc. | 1,719 | 13,872 | |||
Foot Locker, Inc. | 177,119 | 1,856,207 | |||
Fortune Brands, Inc. | 149,626 | 5,827,933 | |||
FortuNet, Inc. | 900 | 1,224 | |||
*Franklin Electronic Publishers, Inc. | 4,850 | 11,931 | |||
Fred’s, Inc. | 41,937 | 496,534 | |||
Frisch’s Restaurants, Inc. | 600 | 14,070 | |||
*Full House Resorts, Inc. | 700 | 1,680 | |||
*Furniture Brands International, Inc. | 71,463 | 303,718 | |||
*GameTech International, Inc. | 5,360 | 7,129 | |||
*Gaming Partners International Corp. | 500 | 2,255 | |||
*Gander Mountain Co. | 42,828 | 213,712 | |||
Gannett Co., Inc. | 31,300 | 307,366 | |||
#*Gaylord Entertainment Co. | 28,382 | 426,581 | |||
*Genesco, Inc. | 51,445 | 1,341,171 | |||
*G-III Apparel Group, Ltd. | 19,700 | 315,397 | |||
*Great Wolf Resorts, Inc. | 34,400 | 114,896 | |||
*Group 1 Automotive, Inc. | 63,000 | 1,601,460 | |||
Harte-Hanks, Inc. | 6,300 | 73,962 | |||
*Hastings Entertainment, Inc. | 1,572 | 6,744 | |||
*Haverty Furniture Cos., Inc. | 38,589 | 467,313 | |||
*Heelys, Inc. | 24,120 | 53,546 | |||
*Helen of Troy, Ltd. | 64,389 | 1,470,645 | |||
*Hollywood Media Corp. | 28,505 | 42,758 | |||
Hooker Furniture Corp. | 4,341 | 55,608 | |||
#*Hot Topic, Inc. | 1,540 | 11,858 | |||
*HSN, Inc. | 60,525 | 904,244 | |||
*Iconix Brand Group, Inc. | 95,450 | 1,112,947 | |||
*Isle of Capri Casinos, Inc. | 15,000 | 116,250 | |||
*J. Alexander’s Corp. | 9,296 | 39,415 | |||
#J.C. Penney Co., Inc. | 214,499 | 7,106,352 | |||
*JAKKS Pacific, Inc. | 15,024 | 213,792 | |||
Jarden Corp. | 108,050 | 2,959,490 | |||
*Jo-Ann Stores, Inc. | 45,950 | 1,223,189 | |||
Johnson Controls, Inc. | 3,600 | 86,112 | |||
158
THE TAX-MANAGED U.S. MARKETWIDE VALUE SERIES
CONTINUED
| Shares | Value† | ||||
Consumer Discretionary — (Continued) | |||||
*Johnson Outdoors, Inc. | 12,128 | $ | 106,120 | ||
Jones Apparel Group, Inc. | 35,815 | 640,730 | |||
*Kenneth Cole Productions, Inc. Class A | 10,174 | 96,755 | |||
*Kid Brands, Inc. | 24,676 | 122,640 | |||
KSW, Inc. | 446 | 1,534 | |||
#*K-Swiss, Inc. Class A | 11,908 | 97,169 | |||
Lacrosse Footwear, Inc. | 495 | 5,811 | |||
*Lakeland Industries, Inc. | 11,757 | 86,532 | |||
*Lakes Entertainment, Inc. | 23,964 | 58,951 | |||
*Landry’s Restaurants, Inc. | 23,900 | 260,510 | |||
•*Lazare Kaplan International, Inc. | 12,780 | 31,950 | |||
Lennar Corp. Class A | 160,100 | 2,017,260 | |||
#*Liberty Global, Inc. Class A | 68,111 | 1,398,319 | |||
#*Liberty Global, Inc. Series C | 64,637 | 1,330,229 | |||
*Liberty Media Corp. Capital Class A | 217,289 | 4,495,709 | |||
*Liberty Media Corp. Capital Class B | 6,066 | 125,809 | |||
*Liberty Media Corp. Entertainment Class A | 578,364 | 17,825,178 | |||
*Liberty Media Corp. Entertainment Class B | 17,188 | 547,610 | |||
*Liberty Media Corp. Interactive Class A | 882,463 | 10,007,130 | |||
*Liberty Media Corp. Interactive Class B | 35,506 | 401,573 | |||
#*Life Time Fitness, Inc. | 10,700 | 230,585 | |||
*Lifetime Brands, Inc. | 13,658 | 82,904 | |||
*Lithia Motors, Inc. | 37,982 | 316,770 | |||
*Live Nation, Inc. | 130,962 | 872,207 | |||
#*Liz Claiborne, Inc. | 22,114 | 126,934 | |||
*Lodgian, Inc. | 21,628 | 38,065 | |||
*Luby’s, Inc. | 46,323 | 165,373 | |||
*M/I Homes, Inc. | 37,930 | 423,678 | |||
*Mac-Gray Corp. | 13,247 | 107,698 | |||
Macy’s, Inc. | 391,800 | 6,883,926 | |||
Marcus Corp. | 9,332 | 109,184 | |||
*MarineMax, Inc. | 16,594 | 113,005 | |||
*McCormick & Schmick’s Seafood Restaurants, Inc. | 15,712 | 94,586 | |||
*Media General, Inc. | 20,200 | 167,458 | |||
Men’s Wearhouse, Inc. (The) | 82,560 | 1,912,915 | |||
Meredith Corp. | 58,650 | 1,587,069 | |||
*Meritage Homes Corp. | 56,983 | 1,039,370 | |||
*Modine Manufacturing Co. | 42,200 | 434,660 | |||
#*Mohawk Industries, Inc. | 98,740 | 4,229,034 | |||
*Morton’s Restaurant Group, Inc. | 16,226 | 60,685 | |||
*Movado Group, Inc. | 30,500 | 319,640 | |||
*MTR Gaming Group, Inc. | 35,575 | 77,198 | |||
*Multimedia Games, Inc. | 34,039 | 167,131 | |||
*Nautilus, Inc. | 24,965 | 44,687 | |||
*New Frontier Media, Inc. | 22,735 | 44,106 | |||
*New York & Co., Inc. | 34,900 | 153,560 | |||
News Corp. Class A | 1,864,745 | 21,481,862 | |||
#News Corp. Class B | 855,872 | 11,639,859 | |||
*O’Charleys, Inc. | 28,308 | 198,439 | |||
*Office Depot, Inc. | 233,937 | 1,415,319 | |||
*OfficeMax, Inc. | 5,000 | 57,150 | |||
*Orbitz Worldwide, Inc. | 41,101 | 214,958 | |||
#*Orient-Express Hotels, Ltd. | 2,500 | 21,500 | |||
#*Orleans Homebuilders, Inc. | 21,771 | 47,461 | |||
#*Outdoor Channel Holdings, Inc. | 42,955 | 297,249 | |||
Oxford Industries, Inc. | 34,709 | 671,619 | |||
*Palm Harbor Homes, Inc. | 2,600 | 5,746 | |||
#*Penske Automotive Group, Inc. | 87,002 | 1,362,451 | |||
Pep Boys - Manny, Moe & Jack (The) | 81,600 | 715,632 | |||
*Perry Ellis International, Inc. | 28,161 | 384,961 | |||
Phillips-Van Heusen Corp. | 84,340 | 3,386,251 | |||
159
THE TAX-MANAGED U.S. MARKETWIDE VALUE SERIES
CONTINUED
| Shares | Value† | ||||
Consumer Discretionary — (Continued) | |||||
*Pinnacle Entertainment, Inc. | 94,530 | $ | 798,778 | ||
*Pomeroy IT Solutions, Inc. | 10,282 | 66,730 | |||
#*Pulte Homes, Inc. | 95,570 | 861,086 | |||
*Quiksilver, Inc. | 124,972 | 248,694 | |||
*RC2 Corp. | 6,724 | 87,815 | |||
*Red Lion Hotels Corp. | 28,076 | 133,923 | |||
*Red Robin Gourmet Burgers, Inc. | 41,775 | 698,060 | |||
#Regis Corp. | 55,200 | 896,448 | |||
#*Rent-A-Center, Inc. | 40,770 | 748,537 | |||
*Retail Ventures, Inc. | 80,824 | 518,082 | |||
*Rex Stores Corp. | 4,050 | 50,018 | |||
RG Barry Corp. | 700 | 5,992 | |||
*Rick’s Cabaret International, Inc. | 5,300 | 38,743 | |||
#*Rocky Brands, Inc. | 9,337 | 77,590 | |||
#*Royal Caribbean Cruises, Ltd. | 322,500 | 6,524,175 | |||
*Rubio’s Restaurants, Inc. | 12,912 | 94,128 | |||
*Ruby Tuesday, Inc. | 11,600 | 77,256 | |||
*Saga Communications, Inc. | 6,520 | 83,130 | |||
*Saks, Inc. | 400 | 2,244 | |||
*Salem Communications Corp. | 731 | 2,244 | |||
Scholastic Corp. | 38,300 | 952,521 | |||
#*Sears Holdings Corp. | 137,330 | 9,319,214 | |||
Service Corp. International | 260,071 | 1,786,688 | |||
*Shiloh Industries, Inc. | 25,710 | 115,695 | |||
*Shoe Carnival, Inc. | 31,193 | 468,207 | |||
*Sinclair Broadcast Group, Inc. Class A | 99,274 | 391,140 | |||
*Skechers U.S.A., Inc. Class A | 49,610 | 1,082,490 | |||
Skyline Corp. | 5,123 | 89,601 | |||
Spartan Motors, Inc. | 10,400 | 51,896 | |||
Speedway Motorsports, Inc. | 71,417 | 966,986 | |||
*Sport Chalet, Inc. Class A | 875 | 1,461 | |||
*Sport Chalet, Inc. Class B | 400 | 1,360 | |||
Sport Supply Group, Inc. | 22,269 | 229,816 | |||
Stage Stores, Inc. | 60,550 | 714,490 | |||
*Standard Motor Products, Inc. | 23,500 | 196,460 | |||
*Standard Pacific Corp. | 19,894 | 59,682 | |||
*Stanley Furniture, Inc. | 12,564 | 98,753 | |||
#*Steak n Shake Co. (The) | 68,906 | 802,755 | |||
*Steinway Musical Instruments, Inc. | 6,246 | 73,203 | |||
Stewart Enterprises, Inc. | 27,202 | 124,585 | |||
*Stoneridge, Inc. | 17,667 | 129,852 | |||
*Strattec Security Corp. | 5,656 | 79,184 | |||
Superior Industries International, Inc. | 38,400 | 509,952 | |||
*Syms Corp. | 5,500 | 38,665 | |||
#*Systemax, Inc. | 7,773 | 104,780 | |||
*Tandy Brands Accessories, Inc. | 10,432 | 41,206 | |||
*Tandy Leather Factory, Inc. | 500 | 1,645 | |||
*Timberland Co. Class A | 3,300 | 53,394 | |||
Time Warner Cable, Inc. | 693,942 | 27,369,072 | |||
Time Warner, Inc. | 1,534,860 | 46,229,983 | |||
#*Toll Brothers, Inc. | 238,999 | 4,139,463 | |||
*Trans World Entertainment Corp. | 5,781 | 7,978 | |||
*TRW Automotive Holdings Corp. | 153,112 | 2,396,203 | |||
*Tuesday Morning Corp. | 100 | 323 | |||
*Tween Brands, Inc. | 1,700 | 14,416 | |||
*Unifi, Inc. | 163,482 | 454,480 | |||
UniFirst Corp. | 14,720 | 619,712 | |||
#*Vail Resorts, Inc. | 8,370 | 288,263 | |||
*Valassis Communications, Inc. | 12,367 | 225,450 | |||
Washington Post Co. | 4,880 | 2,108,160 | |||
#*West Marine, Inc. | 22,463 | 171,168 | |||
160
THE TAX-MANAGED U.S. MARKETWIDE VALUE SERIES
CONTINUED
| Shares | Value† | ||||
Consumer Discretionary — (Continued) | |||||
#Whirlpool Corp. | 88,001 | $ | 6,299,992 | ||
Williams-Sonoma, Inc. | 11,805 | 221,698 | |||
*WPT Enterprises, Inc. | 1,185 | 1,315 | |||
Wyndham Worldwide Corp. | 240,716 | 4,104,208 | |||
*Zale Corp. | 72,940 | 345,006 | |||
Total Consumer Discretionary | 421,393,214 | ||||
Consumer Staples — (4.8%) | |||||
Andersons, Inc. (The) | 9,100 | 282,373 | |||
Archer-Daniels-Midland Co. | 487,589 | 14,686,181 | |||
B&G Foods, Inc. | 62,773 | 490,257 | |||
Bunge, Ltd. | 71,000 | 4,051,260 | |||
*Cagle’s, Inc. Class A | 600 | 2,400 | |||
CCA Industries, Inc. | 7,023 | 31,884 | |||
*Central European Distribution Corp. | 2,400 | 74,664 | |||
*Central Garden & Pet Co. | 37,832 | 375,293 | |||
*Central Garden & Pet Co. Class A | 15,054 | 142,411 | |||
*Chiquita Brands International, Inc. | 70,190 | 1,136,376 | |||
*Constellation Brands, Inc. Class A | 91,650 | 1,449,903 | |||
#*Constellation Brands, Inc. Class B | 12,715 | 204,076 | |||
Corn Products International, Inc. | 63,717 | 1,795,545 | |||
*Craft Brewers Alliance, Inc. | 2,446 | 8,096 | |||
CVS Caremark Corp. | 866,755 | 30,596,452 | |||
Del Monte Foods Co. | 342,870 | 3,702,996 | |||
*Dr Pepper Snapple Group, Inc. | 77,894 | 2,123,390 | |||
*Elizabeth Arden, Inc. | 2,400 | 25,560 | |||
Farmer Brothers Co. | 23,593 | 445,908 | |||
#*Great Atlantic & Pacific Tea Co. | 10,300 | 102,073 | |||
Griffin Land & Nurseries, Inc. Class A | 1,500 | 44,535 | |||
#*Hain Celestial Group, Inc. | 63,205 | 1,108,616 | |||
*HQ Sustainable Maritime Industries, Inc. | 10,070 | 76,230 | |||
Imperial Sugar Co. | 14,662 | 183,128 | |||
Ingles Markets, Inc. | 5,338 | 82,098 | |||
Inter Parfums, Inc. | 3,525 | 43,287 | |||
J.M. Smucker Co. | 31,800 | 1,676,814 | |||
#Kraft Foods, Inc. | 1,077,208 | 29,644,764 | |||
Mannatech, Inc. | 14,038 | 47,729 | |||
*MGP Ingredients, Inc. | 7,362 | 31,951 | |||
Molson Coors Brewing Co. | 190,750 | 9,341,028 | |||
Molson Coors Brewing Co. Class A | 1,908 | 92,624 | |||
*NBTY, Inc. | 70,000 | 2,548,700 | |||
*Nutraceutical International Corp. | 20,022 | 217,839 | |||
*Omega Protein Corp. | 34,625 | 144,040 | |||
*Pantry, Inc. | 14,500 | 204,595 | |||
*Parlux Fragrances, Inc. | 556 | 1,073 | |||
*PC Group, Inc. | 3,618 | 1,809 | |||
*Physicians Formula Holdings, Inc. | 947 | 2,074 | |||
*Prestige Brands Holdings, Inc. | 116,810 | 789,636 | |||
#*Ralcorp Holdings, Inc. | 15,700 | 843,090 | |||
Safeway, Inc. | 81,400 | 1,817,662 | |||
*Sanfilippo (John B.) & Son, Inc. | 9,100 | 124,852 | |||
*Seneca Foods Corp. Class B | 300 | 8,505 | |||
#*Smart Balance, Inc. | 28,450 | 150,216 | |||
#*Smithfield Foods, Inc. | 154,673 | 2,063,338 | |||
#SUPERVALU, Inc. | 18,300 | 290,421 | |||
*Susser Holdings Corp. | 9,700 | 115,333 | |||
Tasty Baking Co. | 10,988 | 70,433 | |||
#Tyson Foods, Inc. Class A | 405,030 | 5,070,976 | |||
Universal Corp. | 11,590 | 482,028 | |||
#*Winn-Dixie Stores, Inc. | 92,300 | 1,023,607 | |||
161
THE TAX-MANAGED U.S. MARKETWIDE VALUE SERIES
CONTINUED
| Shares | Value† | ||||
Consumer Staples — (Continued) | |||||
*Zapata Corp. | 3,064 | $ | 20,927 | ||
Total Consumer Staples | 120,091,056 | ||||
Energy — (12.8%) | |||||
*Adams Resources & Energy, Inc. | 6,758 | 153,407 | |||
*Allis-Chalmers Energy, Inc. | 58,826 | 204,714 | |||
#Alon USA Energy, Inc. | 36,500 | 306,600 | |||
Anadarko Petroleum Corp. | 845,068 | 51,489,993 | |||
Apache Corp. | 185,830 | 17,490,320 | |||
*Atlas Energy, Inc. | 6,800 | 178,024 | |||
*Barnwell Industries, Inc. | 5,190 | 23,615 | |||
*Basic Energy Services, Inc. | 58,596 | 410,172 | |||
Berry Petroleum Corp. Class A | 7,074 | 179,397 | |||
*Bill Barrett Corp. | 6,540 | 202,609 | |||
BJ Services Co. | 158,482 | 3,042,854 | |||
#*Brigham Exploration Co. | 37,193 | 353,334 | |||
*Bristow Group, Inc. | 40,500 | 1,180,575 | |||
*Bronco Drilling Co., Inc. | 26,439 | 167,094 | |||
Cabot Oil & Gas Corp. | 15,905 | 611,865 | |||
*Cal Dive International, Inc. | 53,900 | 413,952 | |||
#*Carrizo Oil & Gas, Inc. | 4,500 | 104,310 | |||
#Chesapeake Energy Corp. | 618,000 | 15,141,000 | |||
Chevron Corp. | 9,400 | 719,476 | |||
Cimarex Energy Co. | 105,300 | 4,123,548 | |||
*Complete Production Services, Inc. | 57,027 | 543,467 | |||
ConocoPhillips | 1,496,850 | 75,111,933 | |||
*CREDO Petroleum Corp. | 700 | 6,818 | |||
*CVR Energy, Inc. | 8,500 | 89,420 | |||
Delek US Holdings, Inc. | 68,089 | 459,601 | |||
Devon Energy Corp. | 120,755 | 7,814,056 | |||
*Double Eagle Petroleum Co. | 3,969 | 18,773 | |||
*Encore Acquisition Co. | 44,278 | 1,641,385 | |||
#ENSCO International, Inc. | 59,067 | 2,704,678 | |||
#*Exterran Holdings, Inc. | 62,389 | 1,274,607 | |||
#General Maritime Corp. | 6,600 | 45,474 | |||
*Geokinetics, Inc. | 12,504 | 201,064 | |||
*GeoMet, Inc. | 64,409 | 121,089 | |||
*GeoResources, Inc. | 300 | 3,327 | |||
*Global Industries, Ltd. | 15,300 | 111,537 | |||
#*GulfMark Offshore, Inc. | 37,045 | 1,025,035 | |||
*Harvest Natural Resources, Inc. | 27,900 | 153,171 | |||
#*Helix Energy Solutions Group, Inc. | 17,000 | 233,410 | |||
Helmerich & Payne, Inc. | 64,234 | 2,442,177 | |||
*Hercules Offshore, Inc. | 94,700 | 485,811 | |||
Hess Corp. | 73,197 | 4,006,804 | |||
*HKN, Inc. | 17,831 | 58,842 | |||
#Holly Corp. | 8,300 | 240,783 | |||
*Hornbeck Offshore Services, Inc. | 9,800 | 238,238 | |||
#*International Coal Group, Inc. | 2,500 | 10,225 | |||
*Key Energy Services, Inc. | 16,700 | 122,077 | |||
Lufkin Industries, Inc. | 600 | 34,230 | |||
Marathon Oil Corp. | 856,737 | 27,389,882 | |||
*Mitcham Industries, Inc. | 5,676 | 41,151 | |||
#*Nabors Industries, Ltd. | 83,107 | 1,731,119 | |||
*National-Oilwell, Inc. | 239,591 | 9,820,835 | |||
*Natural Gas Services Group, Inc. | 15,260 | 257,436 | |||
*Newfield Exploration Co. | 148,740 | 6,101,315 | |||
*Newpark Resources, Inc. | 89,420 | 269,154 | |||
Noble Energy, Inc. | 138,742 | 9,105,637 | |||
*Oil States International, Inc. | 39,000 | 1,343,160 | |||
*OMNI Energy Services Corp. | 1,000 | 1,420 | |||
162
THE TAX-MANAGED U.S. MARKETWIDE VALUE SERIES
CONTINUED
| Shares | Value† | ||||
Energy — (Continued) | |||||
Overseas Shipholding Group, Inc. | 31,009 | $ | 1,217,103 | ||
*OYO Geospace Corp. | 2,501 | 65,651 | |||
*Parker Drilling Co. | 87,100 | 452,920 | |||
#*Patriot Coal Corp. | 13,500 | 152,550 | |||
Patterson-UTI Energy, Inc. | 111,625 | 1,739,118 | |||
*Petroleum Development Corp. | 4,070 | 67,969 | |||
*PHI, Inc. Non-Voting | 23,117 | 397,150 | |||
*PHI, Inc. Voting | 200 | 3,620 | |||
*Pioneer Drilling Co. | 62,027 | 414,961 | |||
Pioneer Natural Resources Co. | 164,693 | 6,770,529 | |||
*Plains Exploration & Production Co. | 162,430 | 4,304,395 | |||
#*Pride International, Inc. | 64,020 | 1,892,431 | |||
*Rosetta Resources, Inc. | 79,112 | 1,070,385 | |||
Rowan Cos., Inc. | 44,876 | 1,043,367 | |||
#*SEACOR Holdings, Inc. | 36,653 | 2,978,789 | |||
#*Seahawk Drilling, Inc. | 4,268 | 115,236 | |||
#Smith International, Inc. | 56,185 | 1,558,010 | |||
Southern Union Co. | — | — | |||
*Stone Energy Corp. | 44,236 | 678,138 | |||
Sunoco, Inc. | 70,498 | 2,171,338 | |||
*Swift Energy Corp. | 32,130 | 680,513 | |||
*T-3 Energy Services, Inc. | 1,100 | 22,022 | |||
#Tesoro Petroleum Corp. | 122,780 | 1,736,109 | |||
*Tetra Technologies, Inc. | 13,000 | 122,980 | |||
*TGC Industries, Inc. | 787 | 3,423 | |||
Tidewater, Inc. | 22,100 | 920,907 | |||
*Toreador Resources Corp. | 9,565 | 81,589 | |||
*Trico Marine Services, Inc. | 32,915 | 200,782 | |||
*Union Drilling, Inc. | 31,871 | 243,494 | |||
#*Unit Corp. | 57,000 | 2,227,560 | |||
#*USEC, Inc. | 163,200 | 629,952 | |||
Valero Energy Corp. | 714,360 | 12,929,916 | |||
#*Western Refining, Inc. | 55,400 | 310,794 | |||
*Whiting Petroleum Corp. | 69,755 | 3,934,182 | |||
#*Willbros Group, Inc. | 3,700 | 48,618 | |||
XTO Energy, Inc. | 397,536 | 16,521,596 | |||
Total Energy | 319,464,097 | ||||
Financials — (27.6%) | |||||
1st Source Corp. | 47,839 | 708,974 | |||
21st Century Holding Co. | 19,667 | 90,272 | |||
Abington Bancorp, Inc. | 68,562 | 470,335 | |||
Access National Corp. | 600 | 3,636 | |||
*Affirmative Insurance Holdings, Inc. | 12,124 | 48,496 | |||
*Allegheny Corp. | 14,836 | 3,709,000 | |||
Alliance Bancorp, Inc. of Pennsylvania | 700 | 6,024 | |||
Allstate Corp. | 501,660 | 14,834,086 | |||
*Altisource Portfolio Solutions SA | 700 | 10,675 | |||
#American Capital, Ltd. | 84,768 | 227,178 | |||
*American Equity Investment Life Holding Co. | 88,700 | 582,759 | |||
American Financial Group, Inc. | 199,200 | 4,900,320 | |||
*American Independence Corp. | 866 | 3,810 | |||
American National Insurance Co. | 48,061 | 4,012,613 | |||
*American Safety Insurance Holdings, Ltd. | 11,675 | 173,024 | |||
#*AmeriCredit Corp. | 224,750 | 3,966,838 | |||
Ameriprise Financial, Inc. | 148,012 | 5,131,576 | |||
Ameris Bancorp | 35,719 | 210,385 | |||
*AMERISAFE, Inc. | 18,913 | 350,647 | |||
*AmeriServe Financial, Inc. | 33,075 | 57,881 | |||
*Arch Capital Group, Ltd. | 2,438 | 164,248 | |||
*Argo Group International Holdings, Ltd. | 34,700 | 1,178,412 | |||
163
THE TAX-MANAGED U.S. MARKETWIDE VALUE SERIES
CONTINUED
| Shares | Value† | ||||
Financials — (Continued) | |||||
Aspen Insurance Holdings, Ltd. | 89,116 | $ | 2,299,193 | ||
#*Asset Acceptance Capital Corp. | 6,790 | 49,363 | |||
Associated Banc-Corp. | 105,623 | 1,353,031 | |||
#Assured Guaranty, Ltd. | 152,510 | 2,528,616 | |||
ASTA Funding, Inc. | 4,938 | 32,245 | |||
Atlantic Coast Federal Corp. | 4,355 | 6,315 | |||
*Atlantic Southern Financial Group, Inc. | 390 | 679 | |||
*Avatar Holdings, Inc. | 21,050 | 343,115 | |||
Axis Capital Holdings, Ltd. | 14,900 | 430,461 | |||
#*B of I Holding, Inc. | 13,154 | 109,704 | |||
Baldwin & Lyons, Inc. | 300 | 6,861 | |||
Baldwin & Lyons, Inc. Class B | 8,413 | 191,901 | |||
Bancorp Rhode Island, Inc. | 1,300 | 33,176 | |||
*Bancorp, Inc. | 21,975 | 112,073 | |||
#BancTrust Financial Group, Inc. | 34,553 | 110,915 | |||
Bank Mutual Corp. | 51,800 | 363,636 | |||
Bank of America Corp. | 4,536,955 | 66,148,804 | |||
*Bank of Florida Corp. | 23,074 | 33,688 | |||
*Bank of Granite Corp. | 24,999 | 12,999 | |||
Bank of New York Mellon Corp. | 15,200 | 405,232 | |||
*BankAtlantic Bancorp, Inc. | 45,976 | 67,585 | |||
BankFinancial Corp. | 43,669 | 412,235 | |||
#Banner Corp. | 13,022 | 39,978 | |||
Bar Harbor Bankshares | 2,200 | 62,480 | |||
BB&T Corp. | 238,480 | 5,702,057 | |||
*Beach First National Bancshares, Inc. | 7,596 | 9,039 | |||
Berkshire Hills Bancorp, Inc. | 22,974 | 472,116 | |||
#BlackRock, Inc. | 11,600 | 2,511,284 | |||
Boston Private Financial Holdings, Inc. | 94,618 | 562,977 | |||
Brookline Bancorp, Inc. | 60,704 | 594,292 | |||
Cadence Financial Corp. | 27,481 | 45,344 | |||
Capital City Bank Group, Inc. | 14,196 | 166,661 | |||
Capital One Financial Corp. | 401,285 | 14,687,031 | |||
Capital Southwest Corp. | 7,359 | 546,479 | |||
CapitalSource, Inc. | 9,700 | 34,532 | |||
#*Capitol Bancorp, Ltd. | 30,014 | 67,532 | |||
Cardinal Financial Corp. | 26,257 | 213,995 | |||
#Carver Bancorp, Inc. | 600 | 4,170 | |||
Cascade Financial Corp. | 10,277 | 20,348 | |||
Cathay General Bancorp | 50,900 | 449,447 | |||
Center Bancorp, Inc. | 1,346 | 10,472 | |||
*Center Financial Corp. | 40,776 | 171,667 | |||
CenterState Banks of Florida, Inc. | 400 | 3,012 | |||
*Central Jersey Bancorp | 8,049 | 39,038 | |||
#*Central Pacific Financial Corp. | 9,380 | 13,226 | |||
Centrue Financial Corp. | 1,000 | 1,980 | |||
Century Bancorp, Inc. Class A | 1,206 | 29,342 | |||
CFS Bancorp, Inc. | 14,148 | 66,496 | |||
Chemical Financial Corp. | 33,175 | 728,191 | |||
*Chicopee Bancorp, Inc. | 1,000 | 12,580 | |||
Chubb Corp. | 390,477 | 18,945,944 | |||
Cincinnati Financial Corp. | 230,743 | 5,851,642 | |||
#*CIT Group, Inc. | 25,600 | 18,432 | |||
Citigroup, Inc. | 3,545,800 | 14,502,322 | |||
Citizens Community Bancorp, Inc. | 10,355 | 41,731 | |||
Citizens South Banking Corp. | 1,842 | 11,126 | |||
City National Corp. | 37,300 | 1,405,091 | |||
CME Group, Inc. | 67,810 | 20,519,984 | |||
#*CNA Financial Corp. | 313,566 | 6,826,332 | |||
*CNA Surety Corp. | 59,978 | 867,282 | |||
CoBiz Financial, Inc. | 37,574 | 179,228 | |||
164
THE TAX-MANAGED U.S. MARKETWIDE VALUE SERIES
CONTINUED
| Shares | Value† | ||||
Financials — (Continued) | |||||
Codorus Valley Bancorp, Inc. | 115 | $ | 679 | ||
Colony Bankcorp, Inc. | 300 | 1,635 | |||
Columbia Banking System, Inc. | 49,127 | 722,167 | |||
#Comerica, Inc. | 195,322 | 5,420,186 | |||
Commonwealth Bankshares, Inc. | 1,300 | 5,720 | |||
Community Bank System, Inc. | 1,686 | 31,376 | |||
*Community West Bancshares | 400 | 1,098 | |||
Compass Diversified Holdings | 22,392 | 229,070 | |||
#*CompuCredit Holdings Corp. | 89,574 | 293,803 | |||
#*Conseco, Inc. | 60 | 313 | |||
*Cowen Group, Inc. | 4,400 | 33,220 | |||
*Crescent Financial Corp. | 19,040 | 77,493 | |||
#CVB Financial Corp. | 2,102 | 16,837 | |||
Danvers Bancorp, Inc. | 3,600 | 49,428 | |||
*Dearborn Bancorp, Inc. | 4,983 | 2,442 | |||
Delphi Financial Group, Inc. Class A | 68,878 | 1,494,653 | |||
Discover Financial Services | 719,953 | 10,180,135 | |||
Donegal Group, Inc. Class A | 39,155 | 571,663 | |||
Donegal Group, Inc. Class B | 300 | 5,253 | |||
#*Doral Financial Corp. | 11,332 | 32,183 | |||
East West Bancorp, Inc. | 100,365 | 906,296 | |||
Eastern Insurance Holdings, Inc. | 23,777 | 167,866 | |||
Eastern Virginia Bankshares, Inc. | 300 | 2,187 | |||
EMC Insurance Group, Inc. | 20,727 | 426,562 | |||
*Encore Bancshares, Inc. | 5,200 | 40,040 | |||
*Encore Capital Group, Inc. | 38,372 | 574,429 | |||
Endurance Specialty Holdings, Ltd. | 76,288 | 2,745,605 | |||
*Enstar Group, Ltd. | 900 | 54,900 | |||
Enterprise Bancorp, Inc. | 600 | 6,402 | |||
Enterprise Financial Services Corp. | 18,728 | 159,750 | |||
ESB Financial Corp. | 1,000 | 11,660 | |||
ESSA Bancorp, Inc. | 21,670 | 259,390 | |||
Evans Bancorp, Inc. | 400 | 5,008 | |||
Everest Re Group, Ltd. | 22,900 | 2,003,521 | |||
F.N.B. Corp. | 135,507 | 959,390 | |||
Farmers Capital Bank Corp. | 1,900 | 21,128 | |||
FBL Financial Group, Inc. Class A | 40,435 | 814,765 | |||
Federal Agricultural Mortgage Corp. | 4,457 | 35,790 | |||
Federal Agricultural Mortgage Corp. Class A | 177 | 1,066 | |||
Fidelity Bancorp, Inc. | 400 | 2,370 | |||
Fidelity National Financial, Inc. | 246,259 | 3,341,735 | |||
*Fidelity Southern Corp. | 6,391 | 24,860 | |||
Fifth Third Bancorp | 911,741 | 8,150,965 | |||
Financial Institutions, Inc. | 6,350 | 67,056 | |||
*First Acceptance Corp. | 39,006 | 85,813 | |||
First American Corp. | 155,240 | 4,717,744 | |||
#First Bancorp (318672102) | 106,576 | 201,429 | |||
First Bancorp (318910106) | 12,302 | 166,815 | |||
*First Bancshares, Inc. (318687100) | 400 | 3,520 | |||
*First Bancshares, Inc. (318916103) | 300 | 2,190 | |||
First Busey Corp. | 63,046 | 243,988 | |||
First Business Financial Services, Inc. | 300 | 2,787 | |||
First Citizens BancShares, Inc. | 18,375 | 2,737,875 | |||
First Defiance Financial Corp. | 10,257 | 147,906 | |||
First Federal Bancshares of Arkansas, Inc. | 1,300 | 4,888 | |||
*First Federal of Northern Michigan Bancorp, Inc. | 1,100 | 2,090 | |||
First Financial Holdings, Inc. | 2,652 | 35,775 | |||
First Financial Northwest, Inc. | 26,672 | 157,898 | |||
First Financial Service Corp. | 900 | 8,244 | |||
*First Horizon National Corp. | 273,010 | 3,229,708 | |||
First M&F Corp. | 100 | 203 | |||
165
THE TAX-MANAGED U.S. MARKETWIDE VALUE SERIES
CONTINUED
| Shares | Value† | ||||
Financials — (Continued) | |||||
First Merchants Corp. | 28,481 | $ | 174,304 | ||
First Mercury Financial Corp. | 16,714 | 212,268 | |||
First Midwest Bancorp, Inc. | 58,300 | 606,320 | |||
First Niagara Financial Group, Inc. | 191,382 | 2,457,345 | |||
First PacTrust Bancorp, Inc. | 900 | 4,482 | |||
First Place Financial Corp. | 24,003 | 72,969 | |||
First Security Group, Inc. | 17,516 | 47,293 | |||
First South Bancorp, Inc. | 1,699 | 17,992 | |||
#*First State Bancorporation | 4,530 | 4,439 | |||
First United Corp. | 600 | 6,600 | |||
*FirstCity Financial Corp. | 5,952 | 40,176 | |||
Flagstone Reinsurance Holdings, Ltd. | 22,733 | 248,926 | |||
Flushing Financial Corp. | 47,920 | 538,142 | |||
#FNB United Corp. | 20,931 | 34,536 | |||
*Forest City Enterprises, Inc. Class A | 8,900 | 77,608 | |||
*FPIC Insurance Group, Inc. | 10,398 | 351,764 | |||
Fulton Financial Corp. | 169,790 | 1,402,465 | |||
German American Bancorp, Inc. | 13,358 | 200,904 | |||
GFI Group, Inc. | 16,600 | 85,490 | |||
Goldman Sachs Group, Inc. | 16,500 | 2,807,805 | |||
#Great Southern Bancorp, Inc. | 10,762 | 246,665 | |||
#*Greene Bancshares, Inc. | 25,523 | 105,665 | |||
*Greenlight Capital Re, Ltd. | 5,300 | 98,898 | |||
GS Financial Corp. | 400 | 6,000 | |||
*Guaranty Bancorp | 111,190 | 145,659 | |||
*Guaranty Federal Bancshares, Inc. | 1,684 | 10,188 | |||
*Hallmark Financial Services, Inc. | 27,334 | 209,652 | |||
Hampden Bancorp, Inc. | 5,786 | 62,778 | |||
#Hampton Roads Bankshares, Inc. | 12,469 | 25,561 | |||
*Hanmi Financial Corp. | 4,001 | 6,122 | |||
Hanover Insurance Group, Inc. | 94,280 | 3,965,417 | |||
Harleysville National Corp. | 66,871 | 385,177 | |||
*Harrington West Financial Group, Inc. | 400 | 272 | |||
*Harris & Harris Group, Inc. | 60,335 | 258,837 | |||
#Hartford Financial Services Group, Inc. | 358,609 | 8,793,093 | |||
HCC Insurance Holdings, Inc. | 163,623 | 4,318,011 | |||
Heartland Financial USA, Inc. | 13,016 | 167,125 | |||
*Heritage Commerce Corp. | 26,836 | 70,847 | |||
*Heritage Financial Corp. | 8,911 | 111,477 | |||
HF Financial Corp. | 400 | 4,360 | |||
*Hilltop Holdings, Inc. | 38,627 | 457,344 | |||
Hingham Institution for Savings | 500 | 14,813 | |||
*HMN Financial, Inc. | 3,996 | 22,857 | |||
Home Federal Bancorp, Inc. | 29,247 | 337,803 | |||
HopFed Bancorp, Inc. | 4,019 | 40,753 | |||
Horace Mann Educators Corp. | 54,928 | 682,755 | |||
Horizon Bancorp | 300 | 4,950 | |||
Huntington Bancshares, Inc. | 257,100 | 979,551 | |||
IBERIABANK Corp. | 1,140 | 49,373 | |||
Independence Holding Co. | 22,770 | 126,374 | |||
Independent Bank Corp. (453836108) | 27,357 | 581,883 | |||
Independent Bank Corp. (453838104) | 38,685 | 45,648 | |||
Infinity Property & Casualty Corp. | 32,000 | 1,237,440 | |||
Integra Bank Corp. | 20,387 | 17,533 | |||
#*Intervest Bancshares Corp. | 4,036 | 13,359 | |||
Invesco, Ltd. | 204,200 | 4,318,830 | |||
*Investment Technology Group, Inc. | 4,490 | 96,849 | |||
*Investors Bancorp, Inc. | 8,766 | 95,023 | |||
Investors Title Co. | 1,100 | 34,100 | |||
Jones Lang LaSalle, Inc. | 25,800 | 1,208,730 | |||
JPMorgan Chase & Co. | 2,495,918 | 104,254,495 | |||
166
THE TAX-MANAGED U.S. MARKETWIDE VALUE SERIES
CONTINUED
| Shares | Value† | ||||
Financials — (Continued) | |||||
Kentucky First Federal Bancorp | 3,100 | $ | 32,581 | ||
#KeyCorp | 380,192 | 2,049,235 | |||
*LaBranche & Co., Inc. | 2,500 | 6,900 | |||
Lakeland Bancorp, Inc. | 14,567 | 88,567 | |||
Lakeland Financial Corp. | 1,997 | 41,078 | |||
Landmark Bancorp, Inc. | 1,543 | 24,788 | |||
Legacy Bancorp, Inc. | 22,079 | 211,075 | |||
Legg Mason, Inc. | 119,817 | 3,487,873 | |||
*Leucadia National Corp. | 95,372 | 2,143,009 | |||
Lincoln National Corp. | 464,693 | 11,073,634 | |||
LNB Bancorp, Inc. | 12,489 | 69,064 | |||
Loews Corp. | 747,772 | 24,751,253 | |||
#*Louisiana Bancorp, Inc. | 5,606 | 80,054 | |||
LSB Corp. | 800 | 8,384 | |||
#M&T Bank Corp. | 80,954 | 5,087,959 | |||
#*Macatawa Bank Corp. | 33,467 | 64,257 | |||
*Magyar Bancorp, Inc. | 500 | 1,675 | |||
MainSource Financial Group, Inc. | 50,993 | 297,289 | |||
*Marlin Business Services Corp. | 3,393 | 22,767 | |||
Marshall & Ilsley Corp. | 114,660 | 609,991 | |||
#*Maui Land & Pineapple Co., Inc. | 4,100 | 25,174 | |||
Max Capital Group, Ltd. | 47,537 | 981,639 | |||
MB Financial, Inc. | 42,349 | 757,200 | |||
*MBIA, Inc. | 337,600 | 1,370,656 | |||
MBT Financial Corp. | 23,713 | 48,137 | |||
Meadowbrook Insurance Group, Inc. | 112,475 | 756,957 | |||
Medallion Financial Corp. | 24,860 | 195,151 | |||
#*Mercantile Bancorp, Inc. | 282 | 635 | |||
Mercantile Bank Corp. | 3,316 | 11,838 | |||
Mercer Insurance Group, Inc. | 15,286 | 284,014 | |||
*Meridian Interstate Bancorp, Inc. | 1,700 | 14,620 | |||
Meta Financial Group, Inc. | 1,601 | 34,918 | |||
MetLife, Inc. | 847,339 | 28,834,946 | |||
*Metro Bancorp, Inc. | 1,121 | 13,261 | |||
MetroCorp Bancshares, Inc. | 2,600 | 9,360 | |||
*MF Global, Ltd. | 8,600 | 61,232 | |||
*MGIC Investment Corp. | 8,500 | 36,635 | |||
MicroFinancial, Inc. | 5,300 | 17,967 | |||
Morgan Stanley | 628,799 | 20,197,024 | |||
MutualFirst Financial, Inc. | 2,300 | 14,375 | |||
*Nara Bancorp, Inc. | 42,957 | 316,164 | |||
*National Financial Partners Corp. | 4,200 | 34,230 | |||
National Penn Bancshares, Inc. | 44,875 | 252,198 | |||
*National Western Life Insurance Co. Class A | 900 | 158,544 | |||
*Navigators Group, Inc. | 4,074 | 216,207 | |||
*Nelnet, Inc. Class A | 36,200 | 507,886 | |||
*New Century Bancorp, Inc. | 600 | 3,390 | |||
New Hampshire Thrift Bancshares, Inc. | 2,300 | 21,275 | |||
New Westfield Financial, Inc. | 41,439 | 333,584 | |||
#New York Community Bancorp, Inc. | 33,564 | 362,491 | |||
NewAlliance Bancshares, Inc. | 169,860 | 1,882,049 | |||
*NewBridge Bancorp | 6,101 | 14,642 | |||
*Newport Bancorp, Inc. | 700 | 8,680 | |||
*NewStar Financial, Inc. | 43,749 | 109,810 | |||
*North Valley Bancorp | 4,538 | 12,570 | |||
Northeast Community Bancorp, Inc. | 18,190 | 121,873 | |||
Northfield Bancorp, Inc. | 2,770 | 34,431 | |||
Northrim Bancorp, Inc. | 6,315 | 94,978 | |||
NYMAGIC, Inc. | 13,520 | 193,201 | |||
NYSE Euronext, Inc. | 181,031 | 4,679,651 | |||
OceanFirst Financial Corp. | 2,500 | 23,750 | |||
167
THE TAX-MANAGED U.S. MARKETWIDE VALUE SERIES
CONTINUED
| Shares | Value† | ||||
Financials — (Continued) | |||||
*Ocwen Financial Corp. | 2,100 | $ | 22,953 | ||
Old National Bancorp | 2,000 | 20,740 | |||
Old Republic International Corp. | 333,632 | 3,563,190 | |||
#Old Second Bancorp, Inc. | 25,516 | 136,511 | |||
OneBeacon Insurance Group, Ltd. | 24,760 | 295,139 | |||
Osage Bancshares, Inc. | 600 | 4,617 | |||
#Pacific Capital Bancorp | 80,780 | 104,206 | |||
Pacific Continental Corp. | 4,430 | 48,287 | |||
*Pacific Mercantile Bancorp | 16,884 | 50,145 | |||
*Pacific Premier Bancorp, Inc. | 200 | 744 | |||
#PacWest Bancorp | 1,071 | 18,186 | |||
Pamrapo Bancorp, Inc. | 2,200 | 14,850 | |||
Parkvale Financial Corp. | 500 | 4,505 | |||
PartnerRe, Ltd. | 5,900 | 451,232 | |||
#Patriot National Bancorp | 2,700 | 5,170 | |||
#*Penson Worldwide, Inc. | 33,200 | 323,700 | |||
Peoples Bancorp of North Carolina | 300 | 1,830 | |||
Peoples Bancorp, Inc. | 19,892 | 213,640 | |||
#*PHH Corp, | 91,687 | 1,481,662 | |||
*PICO Holdings, Inc. | 6,383 | 216,639 | |||
*Pinnacle Financial Partners, Inc. | 27,599 | 350,507 | |||
*PMA Capital Corp. | 38,357 | 183,346 | |||
PNC Financial Services Group, Inc. | 263,050 | 12,873,667 | |||
Porter Bancorp, Inc. | 1,575 | 25,074 | |||
*Preferred Bank | 9,898 | 25,042 | |||
Premier Financial Bancorp, Inc. | 1,301 | 8,177 | |||
Presidential Life Corp. | 23,158 | 216,064 | |||
Princeton National Bancorp, Inc. | 1,100 | 16,544 | |||
*ProAssurance Corp. | 40,933 | 2,058,111 | |||
Prosperity Bancshares, Inc. | 75,055 | 2,686,218 | |||
Protective Life Corp. | 75,553 | 1,454,395 | |||
Provident Financial Holdings, Inc. | 8,307 | 58,149 | |||
Provident Financial Services, Inc. | 97,245 | 1,045,384 | |||
Provident New York Bancorp | 79,163 | 675,260 | |||
Prudential Financial, Inc. | 430,708 | 19,480,923 | |||
Pulaski Financial Corp. | 5,450 | 40,003 | |||
#Radian Group, Inc. | 217,050 | 1,256,720 | |||
Regions Financial Corp. | 344,216 | 1,666,005 | |||
Reinsurance Group of America, Inc. | 169,166 | 7,798,553 | |||
Renasant Corp. | 57,659 | 844,128 | |||
*Republic First Bancorp, Inc. | 7,211 | 31,728 | |||
Resource America, Inc. | 22,388 | 86,418 | |||
*Riverview Bancorp, Inc. | 17,187 | 55,170 | |||
Rome Bancorp, Inc. | 12,761 | 106,873 | |||
*Royal Bancshares of Pennsylvania, Inc. Class A | 900 | 954 | |||
Safety Insurance Group, Inc. | 25,435 | 851,309 | |||
Sanders Morris Harris Group, Inc. | 56,186 | 326,441 | |||
Sandy Spring Bancorp, Inc. | 43,518 | 503,068 | |||
*Seabright Insurance Holdings | 54,746 | 612,060 | |||
Seacoast Banking Corp. of Florida | 28,781 | 42,884 | |||
Selective Insurance Group, Inc. | 82,800 | 1,268,496 | |||
SI Financial Group, Inc. | 6,062 | 26,370 | |||
#Simmons First National Corp. Class A | 12,255 | 358,581 | |||
Somerset Hills Bancorp | 4,111 | 32,518 | |||
South Financial Group, Inc. | 2,082 | 1,666 | |||
*Southcoast Financial Corp. | 700 | 2,978 | |||
*Southern Community Financial Corp. | 29,890 | 69,644 | |||
*Southern First Bancshares, Inc. | 900 | 7,065 | |||
Southwest Bancorp, Inc. | 32,685 | 321,620 | |||
*Specialty Underwriters’ Alliance, Inc. | 2,510 | 17,118 | |||
State Auto Financial Corp. | 68,262 | 1,109,940 | |||
168
THE TAX-MANAGED U.S. MARKETWIDE VALUE SERIES
CONTINUED
| Shares | Value† | ||||
Financials — (Continued) | |||||
StellarOne Corp. | 19,587 | $ | 207,818 | ||
Sterling Bancshares, Inc. | 55,670 | 310,082 | |||
#*Sterling Financial Corp. | 10,529 | 8,423 | |||
#*Stewart Information Services Corp. | 18,452 | 164,961 | |||
*Stratus Properties, Inc. | 3,069 | 29,156 | |||
Student Loan Corp. | 1,100 | 46,255 | |||
*Sun Bancorp, Inc. | 33,558 | 136,245 | |||
#SunTrust Banks, Inc. | 411,103 | 7,856,178 | |||
#*Superior Bancorp | 5,062 | 10,731 | |||
Susquehanna Bancshares, Inc. | 124,870 | 688,034 | |||
#*SVB Financial Group | 3,400 | 140,250 | |||
SWS Group, Inc. | 24,945 | 333,764 | |||
#*Taylor Capital Group, Inc. | 13,335 | 76,010 | |||
Teche Holding Co. | 600 | 18,630 | |||
#*Texas Capital Bancshares, Inc. | 25,614 | 373,196 | |||
TF Financial Corp. | 600 | 11,160 | |||
*Thomas Weisel Partners Group, Inc. | 33,535 | 151,914 | |||
*TIB Financial Corp. | 7,112 | 7,539 | |||
*Tidelands Bancshares, Inc. | 400 | 1,400 | |||
*TierOne Corp. | 10,513 | 20,921 | |||
Timberland Bancorp, Inc. | 3,000 | 13,710 | |||
Tower Group, Inc. | 2,807 | 68,996 | |||
#TowneBank | 4,300 | 49,622 | |||
Transatlantic Holdings, Inc. | 91,903 | 4,641,102 | |||
Travelers Cos., Inc. (The) | 769,714 | 38,324,060 | |||
*Tree.com, Inc. | 4,680 | 36,551 | |||
Trustmark Corp. | 50,524 | 957,430 | |||
Umpqua Holdings Corp. | 89,305 | 885,013 | |||
Unico American Corp. | 1,900 | 18,962 | |||
Union Bankshares Corp. | 15,866 | 195,469 | |||
*United America Indemnity, Ltd. | 19,928 | 139,695 | |||
United Bankshares, Inc. | 2,100 | 37,485 | |||
*United Community Banks, Inc. | 67,631 | 274,582 | |||
United Financial Bancorp, Inc. | 27,089 | 348,094 | |||
United Fire & Casualty Co. | 41,412 | 723,882 | |||
*United PanAm Financial Corp. | 14,353 | 43,059 | |||
*United Security Bancshares | 339 | 848 | |||
Unitrin, Inc. | 90,527 | 1,774,329 | |||
*Unity Bancorp, Inc. | 2,925 | 11,963 | |||
Unum Group | 530,100 | 10,575,495 | |||
#*Validus Holdings, Ltd. | 51,844 | 1,311,653 | |||
#*Virginia Commerce Bancorp, Inc. | 36,036 | 144,865 | |||
W. R. Berkley Corp. | 80,768 | 1,996,585 | |||
Washington Banking Co. | 5,191 | 48,899 | |||
Washington Federal, Inc. | 118,236 | 2,027,747 | |||
Washington Trust Bancorp, Inc. | 3,300 | 49,566 | |||
*Waterstone Financial, Inc. | 1,300 | 4,433 | |||
Webster Financial Corp. | 25,570 | 289,197 | |||
Wells Fargo & Co. | 529,123 | 14,561,465 | |||
WesBanco, Inc. | 32,017 | 453,041 | |||
Wesco Financial Corp. | 12,881 | 4,224,968 | |||
West Bancorporation | 19,399 | 85,356 | |||
West Coast Bancorp | 3,775 | 8,720 | |||
#*Western Alliance Bancorp | 28,882 | 125,637 | |||
White Mountains Insurance Group, Ltd. | 18,685 | 5,795,526 | |||
*White River Capital, Inc. | 300 | 3,630 | |||
#Whitney Holding Corp. | 70,532 | 566,372 | |||
Wilmington Trust Corp. | 6,400 | 77,120 | |||
Wilshire Bancorp, Inc. | 17,744 | 124,918 | |||
#Wintrust Financial Corp. | 42,047 | 1,186,146 | |||
#*World Acceptance Corp. | 3,300 | 82,797 | |||
169
THE TAX-MANAGED U.S. MARKETWIDE VALUE SERIES
CONTINUED
| Shares | Value† | ||||
Financials — (Continued) | |||||
WSB Holdings, Inc. | 100 | $ | 219 | ||
Yadkin Valley Financial Corp. | 18,686 | 68,764 | |||
Zenith National Insurance Corp. | 1,900 | 54,207 | |||
#Zions Bancorporation | 37,412 | 529,754 | |||
*ZipRealty, Inc. | 11,417 | 42,814 | |||
Total Financials | 689,382,265 | ||||
Health Care — (4.1%) | |||||
*A.D.A.M., Inc. | 7,504 | 24,613 | |||
*Adolor Corp. | 14,642 | 21,231 | |||
Aetna, Inc. | 153,637 | 3,999,171 | |||
#*Affymetrix, Inc. | 10,978 | 57,415 | |||
*Albany Molecular Research, Inc. | 33,600 | 273,504 | |||
*Allied Healthcare International, Inc. | 57,415 | 152,724 | |||
*Allied Healthcare Products, Inc. | 1,000 | 5,470 | |||
*Allion Healthcare, Inc. | 40,273 | 259,358 | |||
*American Dental Partners, Inc. | 23,799 | 282,970 | |||
*AMICAS, Inc. | 91,876 | 289,409 | |||
*AMN Healthcare Services, Inc. | 26,800 | 222,976 | |||
*Amsurg Corp. | 9,300 | 195,951 | |||
Analogic Corp. | 2,988 | 111,572 | |||
*AngioDynamics, Inc. | 37,093 | 560,104 | |||
*Anika Therapeutics, Inc. | 19,285 | 141,166 | |||
*ARCA Biopharma, Inc. | 1,740 | 4,611 | |||
*Arena Pharmaceuticals, Inc. | 8,200 | 28,946 | |||
*Arrhythmia Research Technology, Inc. | 1,200 | 4,932 | |||
*Assisted Living Concepts, Inc. | 12,487 | 258,731 | |||
*BioClinica, Inc. | 8,850 | 39,471 | |||
*BioScrip, Inc. | 60,081 | 453,011 | |||
#*BMP Sunstone Corp. | 6,967 | 25,360 | |||
*Boston Scientific Corp. | 1,019,920 | 8,281,750 | |||
#*Brookdale Senior Living, Inc. | 112,800 | 1,899,552 | |||
*Cambrex Corp. | 4,200 | 25,200 | |||
*Cantel Medical Corp. | 20,806 | 334,144 | |||
*Capital Senior Living Corp. | 45,075 | 238,447 | |||
*Cardiac Science Corp. | 32,003 | 112,011 | |||
Cardinal Health, Inc. | 208,009 | 5,894,975 | |||
*CareFusion Corp. | 43,350 | 969,740 | |||
#*Celera Corp. | 39,414 | 243,973 | |||
#*Community Health Systems, Inc. | 151,474 | 4,738,107 | |||
*CONMED Corp. | 43,239 | 916,234 | |||
#Cooper Cos., Inc. | 52,556 | 1,472,094 | |||
*Coventry Health Care, Inc. | 24,800 | 491,784 | |||
*Cross Country Healthcare, Inc. | 31,940 | 263,824 | |||
*Cutera, Inc. | 22,676 | 204,311 | |||
Daxor Corp. | 900 | 12,195 | |||
*Digirad Corp. | 17,648 | 43,238 | |||
#*Dynacq Healthcare, Inc. | 909 | 2,927 | |||
#*Emeritus Corp. | 26,084 | 486,727 | |||
*ev3, Inc. | 114,429 | 1,347,974 | |||
*Five Star Quality Care, Inc. | 9,500 | 32,775 | |||
*Gentiva Health Services, Inc. | 13,810 | 331,440 | |||
#*Greatbatch, Inc. | 17,658 | 347,333 | |||
*Health Net, Inc. | 5,900 | 87,969 | |||
*HealthSpring, Inc. | 86,917 | 1,245,521 | |||
*HealthTronics, Inc. | 58,694 | 134,409 | |||
*Healthways, Inc. | 15,427 | 248,066 | |||
Hill-Rom Holdings, Inc. | 85,074 | 1,666,600 | |||
*Hi-Tech Pharmacal Co., Inc. | 9,080 | 165,619 | |||
#*Hologic, Inc. | 288,724 | 4,267,341 | |||
*Home Diagnostics, Inc. | 15,923 | 99,519 | |||
170
THE TAX-MANAGED U.S. MARKETWIDE VALUE SERIES
CONTINUED
| Shares | Value† | ||||
Health Care — (Continued) | |||||
#*Humana, Inc. | 66,100 | $ | 2,484,038 | ||
*I-Flow Corp. | 5,812 | 73,347 | |||
*IntegraMed America, Inc. | 3,874 | 32,929 | |||
Invacare Corp. | 10,870 | 243,814 | |||
*InVentiv Health, Inc. | 15,200 | 258,096 | |||
*Inverness Medical Innovations, Inc. | 45,100 | 1,714,251 | |||
Kewaunee Scientific Corp. | 1,631 | 21,138 | |||
*Kindred Healthcare, Inc. | 43,118 | 633,835 | |||
*King Pharmaceuticals, Inc. | 426,520 | 4,320,648 | |||
*Lannet Co., Inc. | 574 | 3,857 | |||
*LCA-Vision, Inc. | 29,200 | 131,400 | |||
*LeMaitre Vascular, Inc. | 5,200 | 22,204 | |||
#*LifePoint Hospitals, Inc. | 82,208 | 2,328,953 | |||
*Martek Biosciences Corp. | 10,600 | 190,376 | |||
*Maxygen, Inc. | 5,200 | 29,016 | |||
*MedCath Corp. | 32,364 | 265,708 | |||
*Medical Action Industries, Inc. | 1,524 | 16,673 | |||
*MediciNova, Inc. | 623 | 3,866 | |||
Medicis Pharmaceutical Corp. Class A | 600 | 12,702 | |||
*MEDTOX Scientific, Inc. | 4,767 | 47,575 | |||
*Misonix, Inc. | 4,083 | 10,371 | |||
#*Molina Healthcare, Inc. | 12,070 | 225,950 | |||
*Nanosphere, Inc. | 2,402 | 16,045 | |||
*National Dentex Corp. | 400 | 3,200 | |||
*Natus Medical, Inc. | 1,300 | 18,057 | |||
*Nighthawk Radiology Holdings, Inc. | 11,000 | 65,890 | |||
#*NovaMed, Inc. | 27,004 | 108,826 | |||
*NxStage Medical, Inc. | 22,100 | 123,318 | |||
Omnicare, Inc. | 197,388 | 4,277,398 | |||
*Osteotech, Inc. | 24,810 | 107,179 | |||
*Palomar Medical Technologies, Inc. | 4,400 | 44,704 | |||
*Par Pharmaceutical Cos., Inc. | 27,889 | 584,832 | |||
*PDI, Inc. | 15,476 | 77,690 | |||
PerkinElmer, Inc. | 6,600 | 122,826 | |||
*Prospect Medical Holdings, Inc. | 14,274 | 57,096 | |||
#*Psychiatric Solutions, Inc. | 2,600 | 53,664 | |||
*Regeneration Technologies, Inc. | 31,152 | 122,116 | |||
*RehabCare Group, Inc. | 25,081 | 470,269 | |||
#*Res-Care, Inc. | 40,983 | 493,025 | |||
#*Sirona Dental Systems, Inc. | 21,400 | 575,874 | |||
*Skilled Healthcare Group, Inc. | 29,820 | 239,753 | |||
*SonoSite, Inc. | 2,287 | 56,695 | |||
*Spectranetics Corp. | 25,700 | 146,490 | |||
*SRI/Surgical Express, Inc. | 1,600 | 3,776 | |||
*Sun Healthcare Group, Inc. | 15,900 | 144,372 | |||
*SunLink Health Systems, Inc. | 1,750 | 4,112 | |||
#*Sunrise Senior Living, Inc. | 2,900 | 12,064 | |||
*Symmetry Medical, Inc. | 5,028 | 40,224 | |||
Teleflex, Inc. | 1,500 | 74,625 | |||
*Theragenics Corp. | 21,383 | 28,867 | |||
*Thermo Fisher Scientific, Inc. | 321,928 | 14,486,760 | |||
*Tomotherapy, Inc. | 2,900 | 9,628 | |||
*Triple-S Management Corp. | 9,640 | 160,988 | |||
*Universal American Corp. | 85,628 | 856,280 | |||
*Viropharma, Inc. | 58,354 | 439,989 | |||
*Vital Images, Inc. | 20,279 | 231,383 | |||
*WellCare Health Plans, Inc. | 9,700 | 253,461 | |||
*WellPoint, Inc. | 440,420 | 20,594,039 | |||
Young Innovations, Inc. | 2,660 | 62,909 | |||
Total Health Care | 102,257,666 | ||||
171
THE TAX-MANAGED U.S. MARKETWIDE VALUE SERIES
CONTINUED
| Shares | Value† | ||||
Industrials — (11.1%) | |||||
#*AAR Corp. | 5,400 | $ | 105,894 | ||
*ACCO Brands Corp. | 9,019 | 54,655 | |||
Aceto Corp. | 9,213 | 51,040 | |||
Aircastle, Ltd. | 47,000 | 372,240 | |||
#*AirTran Holdings, Inc. | 12,900 | 54,567 | |||
Alamo Group, Inc. | 25,037 | 343,007 | |||
*Alaska Air Group, Inc. | 59,445 | 1,528,925 | |||
Albany International Corp. | 28,323 | 471,861 | |||
Alexander & Baldwin, Inc. | 66,441 | 1,915,494 | |||
*Allied Defense Group, Inc. | 16,161 | 101,814 | |||
*Allied Motion Technologies, Inc. | 262 | 590 | |||
*Altra Holdings, Inc. | 3,245 | 28,459 | |||
*Amerco, Inc. | 30,877 | 1,305,171 | |||
American Railcar Industries, Inc. | 14,200 | 142,000 | |||
*American Reprographics Co. | 5,977 | 35,862 | |||
Ameron International Corp. | 7,300 | 430,554 | |||
*AMREP Corp. | 866 | 10,539 | |||
Apogee Enterprises, Inc. | 3,300 | 43,692 | |||
Applied Industrial Technologies, Inc. | 53,325 | 1,078,765 | |||
Arkansas Best Corp. | 25,200 | 650,664 | |||
#*Armstrong World Industries, Inc. | 94,043 | 3,503,102 | |||
*AT Cross Co. | 18,431 | 69,116 | |||
*ATC Technology Corp. | 23,952 | 500,597 | |||
*Atlas Air Worldwide Holdings, Inc. | 1,600 | 42,064 | |||
Baldor Electric Co. | 3,280 | 84,788 | |||
Barnes Group, Inc. | 42,700 | 676,795 | |||
Barrett Business Services, Inc. | 14,200 | 164,720 | |||
*BE Aerospace, Inc. | 16,300 | 288,999 | |||
#*BlueLinx Holdings, Inc. | 51,324 | 150,379 | |||
*Bowne & Co., Inc. | 20,451 | 133,545 | |||
Brady Co. Class A | 2,936 | 79,507 | |||
Briggs & Stratton Corp. | 50,961 | 952,971 | |||
*BTU International, Inc. | 1,900 | 9,652 | |||
*Builders FirstSource, Inc. | 49,478 | 192,469 | |||
Burlington Northern Santa Fe Corp. | 248,329 | 18,704,140 | |||
#*C&D Technologies, Inc. | 29,838 | 54,604 | |||
*CAI International, Inc. | 5,100 | 38,250 | |||
Cascade Corp. | 5,900 | 146,556 | |||
*Casella Waste Systems, Inc. | 5,416 | 15,111 | |||
CDI Corp. | 57,209 | 696,806 | |||
*CECO Environmental Corp. | 9,578 | 35,726 | |||
*Celadon Group, Inc. | 39,349 | 384,046 | |||
#*Cenveo, Inc. | 100 | 708 | |||
*Ceradyne, Inc. | 3,400 | 54,808 | |||
*Champion Industries, Inc. | 4,486 | 8,165 | |||
*Chart Industries, Inc. | 3,000 | 59,310 | |||
Chicago Rivet & Machine Co. | 300 | 3,645 | |||
CIRCOR International, Inc. | 12,350 | 336,538 | |||
*Columbus McKinnon Corp. | 58,123 | 961,936 | |||
Comfort Systems USA, Inc. | 2,600 | 28,340 | |||
CompX International, Inc. | 700 | 4,921 | |||
*Consolidated Graphics, Inc. | 33,700 | 676,022 | |||
*Cornell Cos., Inc. | 2,500 | 57,100 | |||
Courier Corp. | 2,371 | 35,162 | |||
*Covenant Transportation Group, Inc. | 6,518 | 32,851 | |||
*CPI Aerostructures, Inc. | 5,826 | 39,850 | |||
CSX Corp. | 562,627 | 23,731,607 | |||
Ducommun, Inc. | 16,159 | 275,026 | |||
*Dycom Industries, Inc. | 35,250 | 348,270 | |||
#*Eagle Bulk Shipping, Inc. | 1,600 | 7,584 | |||
Eastern Co. | 10,193 | 162,782 | |||
172
THE TAX-MANAGED U.S. MARKETWIDE VALUE SERIES
CONTINUED
| Shares | Value† | ||||
Industrials — (Continued) | |||||
Eaton Corp. | 109,451 | $ | 6,616,313 | ||
Ecology & Environment, Inc. Class A | 900 | 13,050 | |||
#Encore Wire Corp. | 2,148 | 44,571 | |||
*EnerSys, Inc. | 60,439 | 1,335,702 | |||
Ennis, Inc. | 43,200 | 654,480 | |||
#*EnPro Industries, Inc. | 18,755 | 423,488 | |||
Espey Manufacturing & Electronics Corp. | 2,464 | 47,802 | |||
*Esterline Technologies Corp. | 24,194 | 1,018,809 | |||
*ExpressJet Holdings, Inc. | 1,060 | 3,180 | |||
Federal Signal Corp. | 21,047 | 129,229 | |||
FedEx Corp. | 184,382 | 13,402,728 | |||
*First Advantage Corp. | 14,062 | 247,491 | |||
*Flow International Corp. | 3,900 | 9,399 | |||
*Franklin Covey Co. | 11,816 | 61,680 | |||
Frozen Food Express Industries, Inc. | 8,986 | 26,059 | |||
G & K Services, Inc. Class A | 29,714 | 658,165 | |||
*Gardner Denver Machinery, Inc. | 3,295 | 118,323 | |||
GATX Corp. | 65,445 | 1,778,795 | |||
#*Genco Shipping & Trading, Ltd. | 1,100 | 21,879 | |||
*Gencor Industries, Inc. | 8,666 | 64,995 | |||
General Electric Co. | 2,283,412 | 32,561,455 | |||
*Gibraltar Industries, Inc. | 53,888 | 583,068 | |||
*GP Strategies Corp. | 16,800 | 118,272 | |||
Great Lakes Dredge & Dock Corp. | 65,383 | 400,798 | |||
*Greenbrier Cos., Inc. | 13,077 | 116,124 | |||
*Griffon Corp. | 45,266 | 396,983 | |||
*H&E Equipment Services, Inc. | 66,829 | 708,387 | |||
Hardinge, Inc. | 25,790 | 135,398 | |||
Heidrick & Struggles International, Inc. | 2,100 | 57,456 | |||
*Herley Industries, Inc. | 5,800 | 65,598 | |||
#*Hertz Global Holdings, Inc. | 389,227 | 3,623,703 | |||
HNI Corp. | 200 | 5,264 | |||
#*Hoku Scientific, Inc. | 400 | 880 | |||
Horizon Lines, Inc. | 3,300 | 17,325 | |||
*Hudson Highland Group, Inc. | 35,619 | 115,406 | |||
#*Hurco Cos., Inc. | 6,200 | 98,580 | |||
*ICT Group, Inc. | 8,739 | 138,513 | |||
Ingersoll-Rand P.L.C. | 309,696 | 9,783,297 | |||
*Insituform Technologies, Inc. Class A | 700 | 14,840 | |||
Insteel Industries, Inc. | 4,889 | 54,366 | |||
#*Interline Brands, Inc. | 74,162 | 1,082,765 | |||
International Shipholding Corp. | 8,797 | 291,621 | |||
*Intersections, Inc. | 34,678 | 197,665 | |||
#*JetBlue Airways Corp. | 152,100 | 754,416 | |||
*Kadant, Inc. | 4,057 | 52,295 | |||
#*Kansas City Southern | 10,954 | 265,415 | |||
KBR, Inc. | 748 | 15,312 | |||
*Kelly Services, Inc. Class A | 44,445 | 492,451 | |||
Kennametal, Inc. | 10,600 | 249,736 | |||
*Key Technology, Inc. | 2,124 | 23,045 | |||
*Kforce, Inc. | 18,078 | 212,055 | |||
Kimball International, Inc. Class B | 24,527 | 183,953 | |||
*Korn/Ferry International | 8,500 | 135,660 | |||
L.S. Starrett Co. Class A | 4,097 | 41,994 | |||
L-3 Communications Holdings, Inc. | 23,933 | 1,730,117 | |||
*Ladish Co., Inc. | 45,562 | 590,484 | |||
Lawson Products, Inc. | 1,959 | 30,462 | |||
*Layne Christensen Co. | 2,100 | 54,390 | |||
*LECG Corp. | 28,048 | 96,766 | |||
*LGL Group, Inc. | 400 | 1,144 | |||
*LMI Aerospace, Inc. | 11,300 | 121,701 | |||
173
THE TAX-MANAGED U.S. MARKETWIDE VALUE SERIES
CONTINUED
| Shares | Value† | ||||
Industrials — (Continued) | |||||
LSI Industries, Inc. | 24,254 | $ | 169,535 | ||
*Lydall, Inc. | 10,301 | 51,505 | |||
*M&F Worldwide Corp. | 29,869 | 635,612 | |||
#Manitowoc Co., Inc. (The) | 4,200 | 38,388 | |||
#Manpower, Inc. | 40,067 | 1,899,576 | |||
*Marten Transport, Ltd. | 31,777 | 557,369 | |||
Masco Corp. | 155,344 | 1,825,292 | |||
McGrath Rentcorp | 2,900 | 57,275 | |||
*Metalico, Inc. | 22,900 | 92,516 | |||
*MFRI, Inc. | 7,300 | 49,056 | |||
*Miller Industries, Inc. | 18,210 | 183,010 | |||
#*Mobile Mini, Inc. | 54,461 | 789,684 | |||
*Moog, Inc. | 7,683 | 191,845 | |||
*MPS Group, Inc. | 112,578 | 1,522,055 | |||
Mueller Industries, Inc. | 18,063 | 427,371 | |||
Mueller Water Products, Inc. | 150,535 | 674,397 | |||
NACCO Industries, Inc. Class A | 10,965 | 653,514 | |||
National Technical Systems, Inc. | 15,400 | 87,472 | |||
Norfolk Southern Corp. | 333,288 | 15,537,887 | |||
Northrop Grumman Corp. | 211,819 | 10,618,486 | |||
#*Northwest Pipe Co. | 12,085 | 363,758 | |||
#*Ocean Power Technologies, Inc. | 1,500 | 9,090 | |||
*On Assignment, Inc. | 57,765 | 348,901 | |||
*Oshkosh Truck Corp. Class B | 61,610 | 1,925,929 | |||
#*Owens Corning, Inc. | 152,823 | 3,378,917 | |||
*P.A.M. Transportation Services, Inc. | 20,690 | 160,554 | |||
*Park-Ohio Holdings Corp. | 5,647 | 35,124 | |||
Pentair, Inc. | 3,773 | 109,794 | |||
*PGT, Inc. | 7,271 | 17,959 | |||
*Pike Electric Corp. | 3,700 | 46,435 | |||
*Pinnacle Airlines Corp. | 8,182 | 49,337 | |||
#*Polypore International, Inc. | 500 | 5,480 | |||
Portec Rail Products, Inc. | 7,087 | 61,728 | |||
*PowerSecure International, Inc. | 26,900 | 223,808 | |||
Providence & Worcester Railroad Co. | 1,000 | 11,125 | |||
Quanex Building Products Corp. | 2,800 | 41,636 | |||
R. R. Donnelley & Sons Co. | 182,554 | 3,665,684 | |||
*RCM Technologies, Inc. | 16,740 | 38,000 | |||
*Republic Airways Holdings, Inc. | 48,800 | 390,888 | |||
Republic Services, Inc. | 252,623 | 6,545,462 | |||
*Rush Enterprises, Inc. Class A | 31,175 | 340,431 | |||
*Rush Enterprises, Inc. Class B | 18,522 | 169,476 | |||
Ryder System, Inc. | 89,844 | 3,643,174 | |||
*Saia, Inc. | 10,800 | 158,328 | |||
*Sauer-Danfoss, Inc. | 6,000 | 43,200 | |||
Schawk, Inc. | 51,516 | 505,887 | |||
#*School Specialty, Inc. | 27,776 | 618,016 | |||
Seaboard Corp. | 2,041 | 2,757,391 | |||
*SIFCO Industries, Inc. | 6,623 | 88,417 | |||
SkyWest, Inc. | 93,838 | 1,310,917 | |||
*SL Industries, Inc. | 300 | 2,460 | |||
Southwest Airlines Co. | 1,077,730 | 9,052,932 | |||
*Sparton Corp. | 3,557 | 14,762 | |||
*Spherion Corp. | 46,700 | 231,165 | |||
#SPX Corp. | 13,500 | 712,530 | |||
Standex International Corp. | 29,500 | 518,610 | |||
Steelcase, Inc. Class A | 85,520 | 493,450 | |||
*Sunair Electronics, Inc. | 1,500 | 4,005 | |||
Superior Uniform Group, Inc. | 8,978 | 79,006 | |||
*Supreme Industries, Inc. | 1,140 | 2,690 | |||
*Sypris Solutions, Inc. | 8,651 | 26,818 | |||
174
THE TAX-MANAGED U.S. MARKETWIDE VALUE SERIES
CONTINUED
| Shares | Value† | ||||
Industrials — (Continued) | |||||
TAL International Group, Inc. | 27,396 | $ | 324,917 | ||
*Tech/Ops Sevcon, Inc. | 774 | 2,167 | |||
Technology Research Corp. | 11,621 | 41,836 | |||
*Tecumseh Products Co. Class A | 11,200 | 117,040 | |||
*Tecumseh Products Co. Class B | 1,400 | 14,518 | |||
#Textainer Group Holdings, Ltd. | 200 | 3,012 | |||
Timken Co. | 131,078 | 2,887,648 | |||
Titan International, Inc. | 8,801 | 73,928 | |||
#*Titan Machinery, Inc. | 2,900 | 31,117 | |||
Todd Shipyards Corp. | 9,546 | 159,227 | |||
*TRC Cos., Inc. | 31,413 | 99,579 | |||
Tredegar Industries, Inc. | 40,177 | 547,613 | |||
*Trimas Corp. | 6,336 | 28,512 | |||
Trinity Industries, Inc. | 85,250 | 1,439,020 | |||
Triumph Group, Inc. | 7,736 | 362,122 | |||
*Tufco Technologies, Inc. | 1,000 | 2,510 | |||
*Tutor Perini Corp. | 40,023 | 706,406 | |||
Twin Disc, Inc. | 8,794 | 82,576 | |||
Tyco International, Ltd. | 456,370 | 15,311,214 | |||
*U.S. Home Systems, Inc. | 4,314 | 10,181 | |||
#Union Pacific Corp. | 489,811 | 27,008,179 | |||
*United Capital Corp. | 300 | 5,448 | |||
#*United Rentals, Inc. | 70,481 | 668,865 | |||
*United Stationers, Inc. | 100 | 4,714 | |||
Universal Forest Products, Inc. | 31,800 | 1,134,624 | |||
*URS Corp. | 84,698 | 3,291,364 | |||
*USA Truck, Inc. | 15,305 | 171,875 | |||
#*USG Corp. | 5,400 | 70,956 | |||
*Valpey Fisher Corp. | 1,464 | 1,786 | |||
*Versar, Inc. | 6,026 | 23,140 | |||
Viad Corp. | 27,199 | 475,982 | |||
Virco Manufacturing Corp. | 12,601 | 35,031 | |||
*Volt Information Sciences, Inc. | 44,159 | 358,129 | |||
*Waste Services, Inc. | 32,675 | 214,348 | |||
Watts Water Technologies, Inc. | 53,615 | 1,514,624 | |||
*WCA Waste Corp. | 29,254 | 117,309 | |||
Werner Enterprises, Inc. | 64,932 | 1,217,475 | |||
*WESCO International, Inc. | 2,010 | 51,376 | |||
*Willdan Group, Inc. | 1,000 | 2,540 | |||
*Willis Lease Finance Corp. | 7,300 | 92,929 | |||
Total Industrials | 277,740,615 | ||||
Information Technology — (6.2%) | |||||
*3Com Corp. | 78,700 | 404,518 | |||
*Acorn Energy, Inc. | 1,230 | 8,598 | |||
*Actel Corp. | 22,878 | 272,706 | |||
*ActivIdentity Corp. | 60,201 | 136,656 | |||
*Activision Blizzard, Inc. | 697,227 | 7,550,968 | |||
*Adaptec, Inc. | 166,097 | 529,849 | |||
*Adept Technology, Inc. | 700 | 1,680 | |||
*Advanced Analogic Technologies, Inc. | 15,762 | 49,650 | |||
Agilysys, Inc. | 21,014 | 98,976 | |||
*Amtech Systems, Inc. | 10,600 | 57,240 | |||
*Anadigics, Inc. | 400 | 1,284 | |||
*Applied Micro Circuits Corp. | 65,224 | 510,052 | |||
#*Arris Group, Inc. | 198,932 | 2,041,042 | |||
*Arrow Electronics, Inc. | 182,170 | 4,616,188 | |||
Astro-Med, Inc. | 2,626 | 16,281 | |||
#*ATMI, Inc. | 3,100 | 46,965 | |||
*Avid Technology, Inc. | 54,450 | 687,704 | |||
*Avnet, Inc. | 112,932 | 2,798,455 | |||
175
THE TAX-MANAGED U.S. MARKETWIDE VALUE SERIES
CONTINUED
| Shares | Value† | ||||
Information Technology — (Continued) | |||||
*Avocent Corp. | 70,720 | $ | 1,758,806 | ||
AVX Corp. | 293,831 | 3,326,167 | |||
*Aware, Inc. | 22,140 | 51,808 | |||
*AXT, Inc. | 17,200 | 39,732 | |||
Bel Fuse, Inc. Class A | 4,174 | 74,130 | |||
Bel Fuse, Inc. Class B | 20,997 | 380,046 | |||
*Benchmark Electronics, Inc. | 93,903 | 1,577,570 | |||
Black Box Corp. | 26,600 | 705,166 | |||
*Brightpoint, Inc. | 17,400 | 128,238 | |||
#*Brooks Automation, Inc. | 91,316 | 628,254 | |||
*BSQUARE Corp. | 3,500 | 8,120 | |||
*Cadence Design Systems, Inc. | 65,000 | 397,150 | |||
*California Micro Devices Corp. | 34,898 | 104,345 | |||
*Cascade Microtech, Inc. | 23,771 | 128,363 | |||
*Checkpoint Systems, Inc. | 40,000 | 542,800 | |||
*Ciber, Inc. | 31,700 | 102,074 | |||
Cognex Corp. | 3,890 | 62,590 | |||
Cohu, Inc. | 41,402 | 471,155 | |||
*Comarco, Inc. | 5,608 | 17,665 | |||
Communications Systems, Inc. | 12,053 | 132,342 | |||
*Computer Sciences Corp. | 225,553 | 11,437,793 | |||
*Concurrent Computer Corp. | 13,740 | 52,762 | |||
*Convergys Corp. | 197,364 | 2,141,399 | |||
*CPI International, Inc. | 19,208 | 190,159 | |||
*Cray, Inc. | 18,873 | 140,793 | |||
*CSP, Inc. | 2,414 | 8,884 | |||
CTS Corp. | 34,200 | 306,432 | |||
*CyberOptics Corp. | 9,134 | 55,078 | |||
*Cypress Semiconductor Corp. | 224,209 | 1,890,082 | |||
*Datalink Corp. | 5,600 | 22,288 | |||
*Dataram Corp. | 11,134 | 29,950 | |||
*DDi Corp. | 30,020 | 121,581 | |||
#*DealerTrack Holdings, Inc. | 3,829 | 63,102 | |||
*Digi International, Inc. | 35,811 | 284,697 | |||
*DSP Group, Inc. | 59,734 | 345,263 | |||
*Dynamics Research Corp. | 16,586 | 212,467 | |||
*Edgewater Technology, Inc. | 15,903 | 45,324 | |||
Electro Rent Corp. | 46,027 | 492,949 | |||
*Electro Scientific Industries, Inc. | 34,300 | 375,242 | |||
*Electronics for Imaging, Inc. | 72,920 | 850,247 | |||
*EMS Technologies, Inc. | 1,490 | 25,971 | |||
*Emulex Corp. | 8,000 | 80,800 | |||
*Endwave Corp. | 16,615 | 38,713 | |||
#*Epicor Software Corp. | 107,892 | 832,926 | |||
*ePlus, Inc. | 6,354 | 95,564 | |||
*Euronet Worldwide, Inc. | 33,370 | 789,201 | |||
*Exar Corp. | 39,600 | 273,240 | |||
Fair Isaac Corp. | 4,800 | 97,584 | |||
*Fairchild Semiconductor Corp. Class A | 144,238 | 1,078,900 | |||
Fidelity National Information Services, Inc. | 166,320 | 3,619,123 | |||
*Frequency Electronics, Inc. | 16,953 | 74,593 | |||
*Gerber Scientific, Inc. | 50,097 | 231,448 | |||
*Globecomm Systems, Inc. | 41,466 | 280,310 | |||
*GSI Technology, Inc. | 27,494 | 99,253 | |||
*GTSI Corp. | 8,203 | 61,112 | |||
*Hackett Group, Inc. | 50,220 | 156,686 | |||
*Harris Stratex Networks, Inc. Class A | 38,192 | 240,610 | |||
*Henry Bros. Electronics, Inc. | 8,085 | 38,323 | |||
*Hutchinson Technology, Inc. | 44,671 | 259,985 | |||
*Hypercom Corp. | 66,500 | 189,525 | |||
*I.D. Systems, Inc. | 13,298 | 48,538 | |||
176
THE TAX-MANAGED U.S. MARKETWIDE VALUE SERIES
CONTINUED
| Shares | Value† | ||||
Information Technology — (Continued) | |||||
*IAC/InterActive Corp. | 178,991 | $ | 3,390,090 | ||
*Ikanos Communications, Inc. | 2,371 | 4,102 | |||
*Imation Corp. | 49,331 | 435,099 | |||
*Immersion Corp. | 11,256 | 41,310 | |||
*infoGROUP, Inc. | 28,026 | 183,851 | |||
*InfoSpace, Inc. | 65,156 | 558,387 | |||
*Ingram Micro, Inc. | 277,679 | 4,901,034 | |||
*Insight Enterprises, Inc. | 23,900 | 251,428 | |||
*Integrated Device Technology, Inc. | 18,820 | 110,662 | |||
*Integrated Silicon Solution, Inc. | 27,577 | 96,520 | |||
*Internap Network Services Corp. | 35,546 | 113,747 | |||
*International Rectifier Corp. | 80,500 | 1,471,540 | |||
*Internet Brands, Inc. | 28,066 | 208,811 | |||
*Internet Capital Group, Inc. | 58,172 | 422,910 | |||
*Interphase Corp. | 4,460 | 10,615 | |||
*Intevac, Inc. | 34,801 | 354,970 | |||
*IntriCon Corp. | 2,835 | 9,568 | |||
*INX, Inc. | 500 | 3,360 | |||
iPass, Inc. | 26,936 | 35,017 | |||
*IXYS Corp. | 16,391 | 109,820 | |||
Jabil Circuit, Inc. | 139,658 | 1,868,624 | |||
*JDS Uniphase Corp. | 137,990 | 771,364 | |||
Keithley Instruments, Inc. | 9,443 | 30,784 | |||
*KEY Tronic Corp. | 15,546 | 35,134 | |||
*Keynote Systems, Inc. | 18,330 | 187,333 | |||
*Kopin Corp. | 20,076 | 89,137 | |||
*KVH Industries, Inc. | 9,179 | 96,380 | |||
#*L-1 Identity Solutions, Inc. | 127,178 | 751,622 | |||
*Lattice Semiconductor Corp. | 131,578 | 251,314 | |||
*Littlefuse, Inc. | 2,763 | 76,148 | |||
*LoJack Corp. | 5,158 | 21,767 | |||
*LookSmart, Ltd. | 34,780 | 45,562 | |||
*Loral Space & Communications, Inc. | 35,669 | 942,375 | |||
*Mace Security International, Inc. | 1,291 | 1,084 | |||
Marchex, Inc. Class B | 34,253 | 155,166 | |||
*Measurement Specialties, Inc. | 4,190 | 32,305 | |||
*Mentor Graphics Corp. | 16,127 | 117,727 | |||
*Mercury Computer Systems, Inc. | 18,900 | 202,230 | |||
*Merrimac Industries, Inc. | 2,600 | 20,540 | |||
Methode Electronics, Inc. | 79,571 | 576,890 | |||
*Micron Technology, Inc. | 990,716 | 6,726,962 | |||
*Microtune, Inc. | 12,031 | 20,573 | |||
*MKS Instruments, Inc. | 82,222 | 1,285,952 | |||
*ModusLink Global Solutions, Inc. | 68,955 | 566,810 | |||
*MoSys, Inc. | 11,829 | 27,916 | |||
#Motorola, Inc. | 2,108,701 | 18,071,568 | |||
*Nanometrics, Inc. | 46,005 | 377,241 | |||
*Newport Corp. | 56,016 | 416,759 | |||
*Nu Horizons Electronics Corp. | 13,732 | 53,417 | |||
*Occam Networks, Inc. | 27,224 | 81,128 | |||
*OmniVision Technologies, Inc. | 38,897 | 476,877 | |||
*Oplink Communications, Inc. | 33,986 | 504,012 | |||
*Opnext, Inc. | 37,258 | 91,655 | |||
*Optelecom-NKF, Inc. | 4,329 | 17,013 | |||
*Optical Cable Corp. | 9,195 | 27,769 | |||
*ORBCOMM, Inc. | 11,500 | 27,255 | |||
*PAR Technology Corp. | 23,205 | 126,467 | |||
*PC Connection, Inc. | 50,013 | 294,076 | |||
*PC Mall, Inc. | 10,070 | 71,396 | |||
*PC-Tel, Inc. | 50,569 | 296,334 | |||
*PDF Solutions, Inc. | 793 | 2,807 | |||
177
THE TAX-MANAGED U.S. MARKETWIDE VALUE SERIES
CONTINUED
| Shares | Value† | ||||
Information Technology — (Continued) | |||||
*Perceptron, Inc. | 4,904 | $ | 16,526 | ||
*Perficient, Inc. | 14,478 | 117,851 | |||
*Performance Technologies, Inc. | 25,851 | 72,641 | |||
*Pericom Semiconductor Corp. | 12,868 | 121,088 | |||
*Pervasive Software, Inc. | 35,664 | 174,754 | |||
*Phoenix Technologies, Ltd. | 200 | 468 | |||
Plantronics, Inc. | 19,000 | 458,090 | |||
*Presstek, Inc. | 7,000 | 11,900 | |||
•*Price Communications Liquidation Trust | 47,738 | 6,520 | |||
Qualstar Corp. | 12,400 | 23,684 | |||
*RadiSys Corp. | 37,693 | 320,767 | |||
*RealNetworks, Inc. | 167,359 | 597,472 | |||
Richardson Electronics, Ltd. | 20,479 | 115,706 | |||
#*Rofin-Sinar Technologies, Inc. | 11,100 | 238,095 | |||
*Rovi Corp. | 129,011 | 3,554,253 | |||
*Rudolph Technologies, Inc. | 69,020 | 437,587 | |||
#*Sandisk Corp. | 197,936 | 4,053,729 | |||
*SCM Microsystems, Inc. | 18,612 | 46,902 | |||
*SeaChange International, Inc. | 27,986 | 189,465 | |||
*Semitool, Inc. | 10,407 | 73,473 | |||
Servidyne, Inc. | 7,283 | 15,258 | |||
#*Sigma Designs, Inc. | 2,475 | 29,725 | |||
*Silicon Image, Inc. | 29,804 | 62,886 | |||
*Silicon Storage Technology, Inc. | 147,812 | 300,058 | |||
#*Skyworks Solutions, Inc. | 35,404 | 369,264 | |||
*Smart Modular Technologies (WWH), Inc. | 20,400 | 82,824 | |||
*Smith Micro Software, Inc. | 8,495 | 77,135 | |||
*SonicWALL, Inc. | 159,432 | 1,265,890 | |||
*Spectrum Control, Inc. | 20,295 | 171,493 | |||
*Standard Microsystems Corp. | 33,319 | 641,724 | |||
*StarTek, Inc. | 31,481 | 182,590 | |||
*Support.com, Inc. | 37,208 | 89,299 | |||
#*Sycamore Networks, Inc. | 493,647 | 1,406,894 | |||
*Symmetricom, Inc. | 91,342 | 437,528 | |||
*Symyx Technologies, Inc. | 40,492 | 237,688 | |||
#*SYNNEX Corp. | 60,100 | 1,546,373 | |||
#*Tech Data Corp. | 85,452 | 3,283,920 | |||
Technitrol, Inc. | 5,403 | 42,089 | |||
*TechTarget, Inc. | 7,400 | 46,620 | |||
*TechTeam Global, Inc. | 19,326 | 151,323 | |||
*Tellabs, Inc. | 24,344 | 146,551 | |||
*Telular Corp. | 24,670 | 73,270 | |||
#*Teradyne, Inc. | 126,050 | 1,055,038 | |||
Tessco Technologies, Inc. | 10,246 | 173,670 | |||
TheStreet.com, Inc. | 34,407 | 85,673 | |||
*Tier Technologies, Inc. Class B | 5,660 | 46,299 | |||
*Tollgrade Communications, Inc. | 19,226 | 114,395 | |||
*Track Data Corp. | 1,932 | 7,747 | |||
*Trident Microsystems, Inc. | 2,123 | 3,991 | |||
*Triquint Semiconductor, Inc. | 147,914 | 797,256 | |||
*TSR, Inc. | 1,300 | 2,782 | |||
*TTM Technologies, Inc. | 62,699 | 637,649 | |||
Tyco Electronics, Ltd. | 549,298 | 11,672,583 | |||
*Ultra Clean Holdings, Inc. | 2,816 | 15,516 | |||
United Online, Inc. | 51,420 | 411,360 | |||
*UTStarcom, Inc. | 192,273 | 348,014 | |||
*Vicon Industries, Inc. | 5,787 | 39,062 | |||
*Video Display Corp. | 600 | 2,931 | |||
*Virage Logic Corp. | 29,928 | 176,575 | |||
*Virtusa Corp. | 39,100 | 351,118 | |||
*Vishay Intertechnology, Inc. | 213,119 | 1,327,731 | |||
178
THE TAX-MANAGED U.S. MARKETWIDE VALUE SERIES
CONTINUED
| Shares | Value† | ||||
Information Technology — (Continued) | |||||
*Web.com Group, Inc. | 54,075 | $ | 380,688 | ||
*WPCS International, Inc. | 9,861 | 29,780 | |||
#Xerox Corp. | 974,182 | 7,325,849 | |||
*Zoran Corp. | 82,007 | 727,402 | |||
*Zygo Corp. | 31,737 | 219,303 | |||
Total Information Technology | 153,938,329 | ||||
Materials — (3.0%) | |||||
A. Schulman, Inc. | 25,252 | 438,627 | |||
A.M. Castle & Co. | 43,846 | 494,144 | |||
Alcoa, Inc. | 504,639 | 6,267,616 | |||
*American Pacific Corp. | 5,747 | 40,689 | |||
Ashland, Inc. | 112,560 | 3,887,822 | |||
*Brush Engineered Materials, Inc. | 38,767 | 715,251 | |||
*Buckeye Technologies, Inc. | 22,600 | 202,496 | |||
*BWAY Holding Co. | 43,508 | 773,137 | |||
Cabot Corp. | 110,278 | 2,418,397 | |||
Carpenter Technology Corp. | 3,300 | 69,399 | |||
#*Coeur d’Alene Mines Corp. | 1,400 | 28,112 | |||
Commercial Metals Co. | 19,325 | 286,783 | |||
*Continental Materials Corp. | 100 | 1,100 | |||
*Core Molding Technologies, Inc. | 2,488 | 6,991 | |||
Cytec Industries, Inc. | 64,700 | 2,146,099 | |||
Dow Chemical Co. | 578,018 | 13,571,863 | |||
Eastman Chemical Co. | 2,800 | 147,028 | |||
*Ferro Corp. | 49,500 | 303,435 | |||
*Flotek Industries, Inc. | 15,089 | 24,293 | |||
Friedman Industries, Inc. | 17,753 | 102,435 | |||
*Graphic Packaging Holding Co. | 1,716 | 3,930 | |||
*Haynes International, Inc. | 800 | 22,656 | |||
*Headwaters, Inc. | 53,696 | 221,228 | |||
#*Hecla Mining Co. | 9,000 | 36,990 | |||
*Horsehead Holding Corp. | 16,770 | 159,818 | |||
*ICO, Inc. | 20,858 | 80,095 | |||
*Innospec, Inc. | 2,811 | 33,226 | |||
International Paper Co. | 460,475 | 10,273,197 | |||
Kaiser Aluminum Corp. | 27,181 | 1,085,881 | |||
*KapStone Paper & Packaging Corp. | 1,140 | 7,912 | |||
KMG Chemicals, Inc. | 2,795 | 34,379 | |||
*Kronos Worldwide, Inc. | 3,319 | 44,375 | |||
#*Louisiana-Pacific Corp. | 153,257 | 804,599 | |||
MeadWestavco Corp. | 188,451 | 4,302,336 | |||
Minerals Technologies, Inc. | 2,900 | 142,854 | |||
*Mod-Pac Corp. | 1,091 | 3,153 | |||
Myers Industries, Inc. | 65,520 | 574,610 | |||
Neenah Paper, Inc. | 23,100 | 239,085 | |||
NL Industries, Inc. | 59,918 | 371,492 | |||
#*Northern Technologies International Corp. | 3,000 | 23,250 | |||
Olympic Steel, Inc. | 2,500 | 63,250 | |||
#*OM Group, Inc. | 42,299 | 1,142,919 | |||
P.H. Glatfelter Co. | 50,000 | 528,500 | |||
*Penford Corp. | 38,934 | 229,711 | |||
*PolyOne Corp. | 117,993 | 658,401 | |||
Quaker Chemical Corp. | 2,300 | 47,380 | |||
*Ready Mix, Inc. | 3,839 | 11,901 | |||
Reliance Steel & Aluminum Co. | 50,700 | 1,849,536 | |||
*Rock of Ages Corp. | 1,200 | 4,272 | |||
#*Rockwood Holdings, Inc. | 14,772 | 293,667 | |||
*RTI International Metals, Inc. | 35,400 | 733,134 | |||
#Schnitzer Steel Industries, Inc. Class A | 5,700 | 246,468 | |||
Schweitzer-Maudoit International, Inc. | 17,415 | 899,485 | |||
179
THE TAX-MANAGED U.S. MARKETWIDE VALUE SERIES
CONTINUED
| Shares | Value† | ||||
Materials — (Continued) | |||||
*Solutia, Inc. | 2,500 | $ | 27,500 | ||
*Spartech Corp. | 18,620 | 178,193 | |||
#*Stillwater Mining Co. | 22,462 | 139,264 | |||
*Synalloy Corp. | 4,995 | 45,155 | |||
Temple-Inland, Inc. | 44,500 | 687,525 | |||
Texas Industries, Inc. | 46,594 | 1,551,114 | |||
#*Titanium Metals Corp. | 7,100 | 61,060 | |||
*U.S. Concrete, Inc. | 68,202 | 109,805 | |||
*Universal Stainless & Alloy Products, Inc. | 6,709 | 101,239 | |||
Westlake Chemical Corp. | 105,000 | 2,550,450 | |||
Weyerhaeuser Co. | 311,975 | 11,337,172 | |||
Worthington Industries, Inc. | 64,670 | 714,604 | |||
#*Zoltek Cos., Inc. | 5,042 | 44,924 | |||
Total Materials | 74,647,412 | ||||
Other — (0.0%) | |||||
•#*ePresence, Inc. Escrow Shares | 6,400 | — | |||
•*MAIR Holdings, Inc. Escrow Shares | 1,415 | — | |||
•#*Pelican Financial, Inc. Escrow Shares | 300 | — | |||
•*Petrocorp, Inc. Escrow Shares | 900 | 54 | |||
Total Other | 54 | ||||
Telecommunication Services — (3.9%) | |||||
*Arbinet Corp. | 3,200 | 7,008 | |||
AT&T, Inc. | 2,510,122 | 64,434,832 | |||
CenturyTel, Inc. | 16,863 | 547,373 | |||
D&E Communications, Inc. | 23,654 | 264,925 | |||
*General Communications, Inc. Class A | 44,592 | 274,241 | |||
#*Sprint Nextel Corp. | 3,528,077 | 10,443,108 | |||
*SureWest Communications | 15,836 | 139,674 | |||
Telephone & Data Systems, Inc. | 80,200 | 2,375,524 | |||
Telephone & Data Systems, Inc. Special Shares | 67,452 | 1,861,675 | |||
*United States Cellular Corp. | 33,568 | 1,228,924 | |||
Verizon Communications, Inc. | 566,352 | 16,758,356 | |||
*Xeta Corp. | 18,366 | 45,456 | |||
Total Telecommunication Services | 98,381,096 | ||||
Utilities — (0.9%) | |||||
*AES Corp. | 425,099 | 5,556,044 | |||
*Calpine Corp. | 201,943 | 2,269,839 | |||
Maine & Maritimes Corp. | 1,600 | 58,000 | |||
*Mirant Corp. | 172,860 | 2,416,583 | |||
*Public Service Enterprise Group, Inc. | 175,933 | 5,242,803 | |||
Questar Corp. | 83,700 | 3,334,608 | |||
#*RRI Energy, Inc. | 444,750 | 2,343,832 | |||
Unitil Corp. | 1,800 | 37,242 | |||
Total Utilities | 21,258,951 | ||||
TOTAL COMMON STOCKS | 2,278,554,755 | ||||
RIGHTS/WARRANTS — (0.0%) | |||||
•*Enterprise Bancorp, Inc. Rights 11/19/09 | 600 | — | |||
•*Lantronix, Inc. Warrants | 33 | — | |||
TOTAL RIGHTS/WARRANTS | — | ||||
TEMPORARY CASH INVESTMENTS — (0.5%) | |||||
BlackRock Liquidity Funds Tempcash Portfolio - Institutional Shares | 13,814,176 | 13,814,176 | |||
180
THE TAX-MANAGED U.S. MARKETWIDE VALUE SERIES
CONTINUED
| Shares/ Face Amount | Value† | |||||
| (000) | ||||||
SECURITIES LENDING COLLATERAL — (8.2%) | ||||||
§@DFA Short Term Investment Fund LP | 202,493,142 | $ | 202,493,142 | |||
@Repurchase Agreement, Deutsche Bank Securities 0.08%, 11/02/09 (Collateralized by $1,886,910 FHLMC 5.793%(r), 01/01/37, valued at $1,059,989) to be repurchased at $1,029,122 | $ | 1,029 | 1,029,115 | |||
TOTAL SECURITIES LENDING COLLATERAL | 203,522,257 | |||||
TOTAL INVESTMENTS — (100.0%) | $ | 2,495,891,188 | ||||
See accompanying Notes to Financial Statements.
181
THE TAX-MANAGED U.S. EQUITY SERIES
SCHEDULE OF INVESTMENTS
October 31, 2009
| Shares | Value† | ||||
COMMON STOCKS — (90.4%) | |||||
Consumer Discretionary — (9.8%) | |||||
*1-800-FLOWERS.COM, Inc. | 1,200 | $ | 4,608 | ||
#*99 Cents Only Stores | 11,100 | 126,207 | |||
#Aaron’s, Inc. | 5,200 | 130,260 | |||
#Abercrombie & Fitch Co. | 8,350 | 274,047 | |||
*AC Moore Arts & Crafts, Inc. | 1,068 | 5,105 | |||
Acme United Corp. | 400 | 3,360 | |||
Advance Auto Parts, Inc. | 10,000 | 372,600 | |||
#*Aeropostale, Inc. | 6,550 | 245,821 | |||
*AFC Enterprises, Inc. | 2,300 | 18,469 | |||
*Aldila, Inc. | 700 | 2,072 | |||
*Alloy, Inc. | 2,475 | 16,285 | |||
*Amazon.com, Inc. | 41,900 | 4,978,139 | |||
Ambassadors Group, Inc. | 1,423 | 18,086 | |||
*American Apparel, Inc. | 7,200 | 22,104 | |||
#*American Axle & Manufacturing Holdings, Inc. | 5,400 | 32,346 | |||
American Eagle Outfitters, Inc. | 21,800 | 381,282 | |||
American Greetings Corp. Class A | 3,222 | 65,535 | |||
#*American Public Education, Inc. | 2,200 | 70,180 | |||
*America’s Car-Mart, Inc. | 1,600 | 33,168 | |||
*Amerigon, Inc. | 2,000 | 12,860 | |||
Ameristar Casinos, Inc. | 5,810 | 85,523 | |||
*AnnTaylor Stores Corp. | 4,625 | 59,986 | |||
#*Apollo Group, Inc. Class A | 15,810 | 902,751 | |||
#Arbitron, Inc. | 1,200 | 26,016 | |||
#*Arctic Cat, Inc. | 2,500 | 14,850 | |||
*Asbury Automotive Group, Inc. | 3,400 | 33,116 | |||
*Audiovox Corp. Class A | 1,600 | 10,336 | |||
*AutoNation, Inc. | 22,038 | 379,935 | |||
*Autozone, Inc. | 5,700 | 771,267 | |||
*Ballantyne Strong, Inc. | 2,600 | 8,840 | |||
*Bally Technologies, Inc. | 6,300 | 248,157 | |||
#Barnes & Noble, Inc. | 6,300 | 104,643 | |||
bebe stores, inc. | 10,275 | 64,321 | |||
*Bed Bath & Beyond, Inc. | 26,084 | 918,418 | |||
*Benihana, Inc. | 800 | 4,912 | |||
*Benihana, Inc. Class A | 700 | 3,388 | |||
#Best Buy Co., Inc. | 40,060 | 1,529,491 | |||
Big 5 Sporting Goods Corp. | 1,546 | 22,803 | |||
*Big Lots, Inc. | 8,052 | 201,703 | |||
#*BJ’s Restaurants, Inc. | 2,798 | 44,656 | |||
Black & Decker Corp. | 4,150 | 195,963 | |||
#*Blue Nile, Inc. | 2,096 | 125,865 | |||
*Bluegreen Corp. | 2,100 | 6,027 | |||
Blyth, Inc. | 875 | 31,001 | |||
Bob Evans Farms, Inc. | 3,500 | 91,945 | |||
#*Bon-Ton Stores, Inc. (The) | 1,900 | 17,575 | |||
Books-A-Million, Inc. | 1,295 | 11,215 | |||
*Borders Group, Inc. | 6,400 | 12,416 | |||
#BorgWarner, Inc. | 12,800 | 388,096 | |||
*Boyd Gaming Corp. | 10,020 | 73,747 | |||
Brinker International, Inc. | 10,260 | 129,686 | |||
*Brink’s Home Security Holdings, Inc. | 5,000 | 154,900 | |||
#*Brookfield Homes Corp. | 2,400 | 13,512 | |||
Brown Shoe Co., Inc. | 5,187 | 53,789 | |||
*Brunswick Corp. | 8,960 | 84,941 | |||
Buckle, Inc. | 4,670 | 140,147 | |||
#*Buffalo Wild Wings, Inc. | 1,800 | 73,818 | |||
*Build-A-Bear-Workshop, Inc. | 2,400 | 12,432 | |||
182
THE TAX-MANAGED U.S. EQUITY SERIES
CONTINUED
| Shares | Value† | ||||
Consumer Discretionary — (Continued) | |||||
Burger King Holdings, Inc. | 10,400 | $ | 178,464 | ||
#*Cabela’s, Inc. | 7,700 | 96,789 | |||
Cablevision Systems Corp. | 24,829 | 570,074 | |||
#*California Pizza Kitchen, Inc. | 2,415 | 31,371 | |||
Callaway Golf Co. | 8,600 | 58,824 | |||
*Canterbury Park Holding Corp. | 500 | 3,505 | |||
#*Capella Education Co. | 2,300 | 158,470 | |||
#*Career Education Corp. | 9,659 | 201,294 | |||
*Caribou Coffee Co., Inc. | 1,700 | 13,923 | |||
#*CarMax, Inc. | 21,994 | 432,622 | |||
*Carmike Cinemas, Inc. | 265 | 2,605 | |||
Carnival Corp. | 61,832 | 1,800,548 | |||
*Carriage Services, Inc. | 3,100 | 11,780 | |||
*Carrols Restaurant Group, Inc. | 3,650 | 23,688 | |||
*Carter’s, Inc. | 7,100 | 167,560 | |||
Cato Corp. Class A | 3,450 | 68,000 | |||
*Cavco Industries, Inc. | 1,157 | 35,173 | |||
CBS Corp. | 5,700 | 67,260 | |||
CBS Corp. Class B | 59,297 | 697,926 | |||
*CEC Entertainment, Inc. | 2,357 | 68,848 | |||
#*Charming Shoppes, Inc. | 13,800 | 62,514 | |||
#*Cheesecake Factory, Inc. | 4,650 | 84,537 | |||
Cherokee, Inc. | 542 | 10,260 | |||
*Chico’s FAS, Inc. | 19,200 | 229,440 | |||
#*Children’s Place Retail Stores, Inc. (The) | 2,340 | 73,593 | |||
*Chipotle Mexican Grill, Inc. | 1,425 | 116,123 | |||
*Chipotle Mexican Grill, Inc. Class B | 1,960 | 156,624 | |||
#Choice Hotels International, Inc. | 6,500 | 193,830 | |||
Christopher & Banks Corp. | 4,050 | 24,664 | |||
*Churchill Downs, Inc. | 1,444 | 45,313 | |||
Cinemark Holdings, Inc. | 13,300 | 154,147 | |||
#*Citi Trends, Inc. | 1,200 | 31,596 | |||
CKE Restaurants, Inc. | 5,037 | 44,074 | |||
Coach, Inc. | 31,868 | 1,050,688 | |||
*Coinstar, Inc. | 3,800 | 120,612 | |||
*Coldwater Creek, Inc. | 6,649 | 38,232 | |||
#*Collective Brands, Inc. | 8,400 | 155,820 | |||
Columbia Sportswear Co. | 3,992 | 151,896 | |||
Comcast Corp. Class A | 199,041 | 2,886,094 | |||
Comcast Corp. Special Class A | 79,563 | 1,115,473 | |||
#*Conn’s, Inc. | 2,500 | 15,775 | |||
#Cooper Tire & Rubber Co. | 7,169 | 109,399 | |||
*Core-Mark Holding Co., Inc. | 2,100 | 57,477 | |||
#*Corinthian Colleges, Inc. | 8,800 | 139,568 | |||
CPI Corp. | 131 | 1,488 | |||
Cracker Barrel Old Country Store, Inc. | 2,500 | 82,875 | |||
*CROCS, Inc. | 9,700 | 58,976 | |||
#*Crown Media Holdings, Inc. | 4,987 | 7,680 | |||
CSS Industries, Inc. | 1,250 | 25,375 | |||
*Culp, Inc. | 1,566 | 9,036 | |||
#D.R. Horton, Inc. | 28,400 | 311,264 | |||
Darden Restaurants, Inc. | 14,790 | 448,285 | |||
#*Deckers Outdoor Corp. | 1,400 | 125,538 | |||
*dELiA*s, Inc. | 1,100 | 2,332 | |||
*Destination Maternity Corp. | 1,300 | 26,065 | |||
DeVry, Inc. | 7,600 | 420,204 | |||
#*Dick’s Sporting Goods, Inc. | 7,814 | 177,300 | |||
#Dillard’s, Inc. | 8,336 | 113,536 | |||
*DineEquity, Inc. | 1,200 | 25,392 | |||
#*DIRECTV Group, Inc. (The) | 96,900 | 2,548,470 | |||
#*Discovery Communications, Inc. (25470F104) | 8,101 | 222,778 | |||
183
THE TAX-MANAGED U.S. EQUITY SERIES
CONTINUED
| Shares | Value† | ||||
Consumer Discretionary — (Continued) | |||||
*Discovery Communications, Inc. (25470F302) | 18,452 | $ | 443,217 | ||
*DISH Network Corp. | 17,600 | 306,240 | |||
#Disney (Walt) Co. | 187,757 | 5,138,909 | |||
*Dolan Media Co. | 2,800 | 33,432 | |||
#*Dollar Tree, Inc. | 10,000 | 451,300 | |||
*Domino’s Pizza, Inc. | 7,790 | 57,179 | |||
*Dorman Products, Inc. | 1,189 | 17,383 | |||
Dover Downs Gaming & Entertainment, Inc. | 2,000 | 9,500 | |||
*DreamWorks Animation SKG, Inc. | 7,680 | 245,760 | |||
#*Dress Barn, Inc. (The) | 6,300 | 113,715 | |||
*Drew Industries, Inc. | 2,900 | 55,506 | |||
#*DSW, Inc. | 2,194 | 42,125 | |||
#Eastman Kodak Co. | 22,500 | 84,375 | |||
*Einstein Noah Restaurant Group, Inc. | 1,810 | 23,566 | |||
*Entercom Communications Corp. | 4,800 | 33,984 | |||
Ethan Allen Interiors, Inc. | 3,275 | 40,806 | |||
*Exide Technologies | 9,000 | 55,080 | |||
#*Expedia, Inc. | 1,914 | 43,390 | |||
Family Dollar Stores, Inc. | 13,612 | 385,220 | |||
*Famous Dave’s of America, Inc. | 1,098 | 6,742 | |||
*Federal Mogul Corp. | 3,500 | 39,025 | |||
*FGX International Holdings, Ltd. | 2,663 | 35,125 | |||
Finish Line, Inc. Class A | 6,378 | 64,673 | |||
*Fisher Communications, Inc. | 1,200 | 23,388 | |||
Foot Locker, Inc. | 16,541 | 173,350 | |||
*Ford Motor Co. | 309,040 | 2,163,280 | |||
Fortune Brands, Inc. | 14,280 | 556,206 | |||
FortuNet, Inc. | 1,200 | 1,632 | |||
*Fossil, Inc. | 6,950 | 185,774 | |||
#Fred’s, Inc. | 5,517 | 65,321 | |||
*Fuel Systems Solutions, Inc. | 2,050 | 67,117 | |||
*Furniture Brands International, Inc. | 4,400 | 18,700 | |||
#*GameStop Corp. Class A | 17,340 | 421,189 | |||
*Gaming Partners International Corp. | 800 | 3,608 | |||
*Gander Mountain Co. | 2,459 | 12,270 | |||
Gannett Co., Inc. | 22,900 | 224,878 | |||
Gap, Inc. | 76,630 | 1,635,284 | |||
#*Garmin, Ltd. | 19,297 | 583,927 | |||
#*Gaylord Entertainment Co. | 2,537 | 38,131 | |||
#*Genesco, Inc. | 2,400 | 62,568 | |||
Gentex Corp. | 13,434 | 215,078 | |||
#Genuine Parts Co. | 17,330 | 606,377 | |||
*G-III Apparel Group, Ltd. | 1,400 | 22,414 | |||
*Global Traffic Network, Inc. | 2,700 | 11,718 | |||
*Goodyear Tire & Rubber Co. | 23,460 | 302,165 | |||
*Great Wolf Resorts, Inc. | 4,588 | 15,324 | |||
*Group 1 Automotive, Inc. | 2,780 | 70,668 | |||
Guess?, Inc. | 9,000 | 328,950 | |||
*Gymboree Corp. | 3,300 | 140,481 | |||
H&R Block, Inc. | 31,220 | 572,575 | |||
#*Hanesbrands, Inc. | 6,975 | 150,800 | |||
#Harley-Davidson, Inc. | 21,200 | 528,304 | |||
*Harman International Industries, Inc. | 6,000 | 225,660 | |||
Harte-Hanks, Inc. | 9,156 | 107,491 | |||
Hasbro, Inc. | 15,000 | 409,050 | |||
*Haverty Furniture Cos., Inc. | 1,700 | 20,587 | |||
*Hawk Corp. | 1,220 | 16,982 | |||
*Helen of Troy, Ltd. | 4,400 | 100,496 | |||
#*hhgregg, Inc. | 3,700 | 61,013 | |||
#*Hibbett Sporting Goods, Inc. | 2,888 | 54,121 | |||
Hillenbrand, Inc. | 6,205 | 123,976 | |||
184
THE TAX-MANAGED U.S. EQUITY SERIES
CONTINUED
| Shares | Value† | ||||
Consumer Discretionary — (Continued) | |||||
#Home Depot, Inc. | 169,830 | $ | 4,261,035 | ||
Hooker Furniture Corp. | 1,600 | 20,496 | |||
#*Hot Topic, Inc. | 6,106 | 47,016 | |||
#*Hovnanian Enterprises, Inc. | 6,300 | 24,633 | |||
*HSN, Inc. | 5,404 | 80,736 | |||
*Iconix Brand Group, Inc. | 8,398 | 97,921 | |||
Interactive Data Corp. | 9,600 | 252,480 | |||
International Game Technology | 28,800 | 513,792 | |||
International Speedway Corp. | 2,675 | 68,239 | |||
#*Interpublic Group of Cos., Inc. | 47,316 | 284,842 | |||
*Interval Leisure Group, Inc. | 4,310 | 48,100 | |||
*iRobot Corp. | 2,385 | 31,887 | |||
*Isle of Capri Casinos, Inc. | 4,000 | 31,000 | |||
*ITT Educational Services, Inc. | 3,990 | 360,496 | |||
*J. Alexander’s Corp. | 800 | 3,392 | |||
#*J. Crew Group, Inc. | 5,783 | 235,831 | |||
#J.C. Penney Co., Inc. | 20,870 | 691,423 | |||
*Jack in the Box, Inc. | 6,300 | 118,188 | |||
*JAKKS Pacific, Inc. | 2,600 | 36,998 | |||
Jarden Corp. | 7,825 | 214,327 | |||
*Jo-Ann Stores, Inc. | 2,773 | 73,817 | |||
Johnson Controls, Inc. | 58,751 | 1,405,324 | |||
*Johnson Outdoors, Inc. | 1,287 | 11,261 | |||
Jones Apparel Group, Inc. | 9,866 | 176,503 | |||
*Jos. A. Bank Clothiers, Inc. | 2,200 | 90,156 | |||
*K12, Inc. | 1,700 | 27,268 | |||
KB Home | 9,900 | 140,382 | |||
*Kenneth Cole Productions, Inc. Class A | 1,100 | 10,461 | |||
*Kirkland’s, Inc. | 1,700 | 21,386 | |||
*Knology, Inc. | 3,300 | 33,165 | |||
*Kohl’s Corp. | 31,960 | 1,828,751 | |||
*Kona Grill, Inc. | 1,120 | 3,349 | |||
*Krispy Kreme Doughnuts, Inc. | 6,700 | 22,713 | |||
#*K-Swiss, Inc. Class A | 2,837 | 23,150 | |||
*Lakeland Industries, Inc. | 1,000 | 7,360 | |||
#*Lamar Advertising Co. | 7,015 | 170,464 | |||
#*Las Vegas Sands Corp. | 65,800 | 992,922 | |||
*La-Z-Boy, Inc. | 6,000 | 42,600 | |||
*Learning Tree International, Inc. | 1,754 | 19,084 | |||
#Leggett & Platt, Inc. | 14,897 | 287,959 | |||
Lennar Corp. Class A | 15,800 | 199,080 | |||
#*Liberty Global, Inc. Class A | 14,837 | 304,604 | |||
*Liberty Global, Inc. Class B | 95 | 1,952 | |||
#*Liberty Global, Inc. Series C | 14,812 | 304,831 | |||
*Liberty Media Corp. Capital Class A | 10,116 | 209,300 | |||
*Liberty Media Corp. Entertainment Class A | 50,852 | 1,567,259 | |||
*Liberty Media Corp. Entertainment Class B | 2,274 | 72,450 | |||
*Liberty Media Corp. Interactive Class A | 49,900 | 565,866 | |||
*Liberty Media Corp. Interactive Class B | 400 | 4,524 | |||
#*Life Time Fitness, Inc. | 3,100 | 66,805 | |||
*Lifetime Brands, Inc. | 300 | 1,821 | |||
#Limited Brands, Inc. | 28,260 | 497,376 | |||
*Lincoln Educational Services Corp. | 3,676 | 72,858 | |||
*Live Nation, Inc. | 5,192 | 34,579 | |||
#*Liz Claiborne, Inc. | 11,000 | 63,140 | |||
#*LKQ Corp. | 12,089 | 208,777 | |||
*LodgeNet Interactive Corp. | 1,700 | 8,245 | |||
*Lodgian, Inc. | 400 | 704 | |||
Lowe’s Cos., Inc. | 147,590 | 2,888,336 | |||
*Luby’s, Inc. | 1,849 | 6,601 | |||
#*Lumber Liquidators, Inc. | 1,700 | 36,125 | |||
185
THE TAX-MANAGED U.S. EQUITY SERIES
CONTINUED
| Shares | Value† | ||||
Consumer Discretionary — (Continued) | |||||
*M/I Homes, Inc. | 2,200 | $ | 24,574 | ||
*Mac-Gray Corp. | 1,591 | 12,935 | |||
Macy’s, Inc. | 41,000 | 720,370 | |||
*Maidenform Brands, Inc. | 2,442 | 34,383 | |||
Marcus Corp. | 2,400 | 28,080 | |||
*Marine Products Corp. | 3,012 | 14,608 | |||
#Marriott International, Inc. Class A | 33,658 | 843,469 | |||
#*Martha Stewart Living Omnimedia, Inc. | 3,500 | 18,130 | |||
*Marvel Entertainment, Inc. | 9,400 | 469,718 | |||
#Mattel, Inc. | 34,665 | 656,208 | |||
Matthews International Corp. Class A | 3,400 | 124,882 | |||
*McCormick & Schmick’s Seafood Restaurants, Inc. | 2,212 | 13,316 | |||
McDonald’s Corp. | 112,100 | 6,570,181 | |||
McGraw-Hill Cos., Inc. | 24,400 | 702,232 | |||
MDC Holdings, Inc. | 5,260 | 171,581 | |||
*Media General, Inc. | 800 | 6,632 | |||
*Mediacom Communications Corp. | 5,481 | 26,199 | |||
Men’s Wearhouse, Inc. (The) | 5,635 | 130,563 | |||
Meredith Corp. | 3,900 | 105,534 | |||
*Meritage Homes Corp. | 3,900 | 71,136 | |||
#*MGM Mirage | 38,025 | 352,492 | |||
*Midas, Inc. | 1,456 | 11,735 | |||
*Modine Manufacturing Co. | 2,700 | 27,810 | |||
#*Mohawk Industries, Inc. | 7,200 | 308,376 | |||
#*Monarch Casino & Resort, Inc. | 2,372 | 16,462 | |||
Monro Muffler Brake, Inc. | 1,688 | 52,311 | |||
*Morgans Hotel Group Co. | 2,500 | 8,300 | |||
*Morningstar, Inc. | 4,800 | 244,896 | |||
*Morton’s Restaurant Group, Inc. | 1,090 | 4,077 | |||
*Movado Group, Inc. | 2,362 | 24,754 | |||
*Multimedia Games, Inc. | 2,364 | 11,607 | |||
*Nathan’s Famous, Inc. | 1,109 | 16,080 | |||
National CineMedia, Inc. | 4,700 | 75,200 | |||
National Presto Industries, Inc. | 1,100 | 95,623 | |||
#*Netflix, Inc. | 6,500 | 347,425 | |||
*New Frontier Media, Inc. | 2,800 | 5,432 | |||
*New York & Co., Inc. | 5,059 | 22,260 | |||
#*New York Times Co. Class A (The) | 9,400 | 74,918 | |||
#Newell Rubbermaid, Inc. | 26,784 | 388,636 | |||
News Corp. Class A | 161,651 | 1,862,220 | |||
#News Corp. Class B | 78,692 | 1,070,211 | |||
#NIKE, Inc. Class B | 39,400 | 2,449,892 | |||
#Nordstrom, Inc. | 21,000 | 667,380 | |||
Nutri/System, Inc. | 3,600 | 77,472 | |||
#*NVR, Inc. | 500 | 331,135 | |||
*O’Charleys, Inc. | 1,700 | 11,917 | |||
*Office Depot, Inc. | 24,100 | 145,805 | |||
*OfficeMax, Inc. | 7,500 | 85,725 | |||
Omnicom Group, Inc. | 29,000 | 994,120 | |||
#*O’Reilly Automotive, Inc. | 16,458 | 613,554 | |||
#*Orleans Homebuilders, Inc. | 1,545 | 3,368 | |||
*Outdoor Channel Holdings, Inc. | 3,807 | 26,344 | |||
#*Overstock.com, Inc. | 2,430 | 34,020 | |||
*P.F. Chang’s China Bistro, Inc. | 2,500 | 72,975 | |||
*Pacific Sunwear of California, Inc. | 6,200 | 37,448 | |||
*Palm Harbor Homes, Inc. | 1,500 | 3,315 | |||
*Panera Bread Co. | 3,000 | 179,940 | |||
*Papa John’s International, Inc. | 2,800 | 63,000 | |||
#*Peet’s Coffee & Tea, Inc. | 1,500 | 51,000 | |||
*Penn National Gaming, Inc. | 8,100 | 203,553 | |||
#*Penske Automotive Group, Inc. | 8,674 | 135,835 | |||
186
THE TAX-MANAGED U.S. EQUITY SERIES
CONTINUED
| Shares | Value† | ||||
Consumer Discretionary — (Continued) | |||||
*Perry Ellis International, Inc. | 969 | $ | 13,246 | ||
PetMed Express, Inc. | 3,100 | 48,639 | |||
PetSmart, Inc. | 13,200 | 310,596 | |||
Phillips-Van Heusen Corp. | 6,591 | 264,629 | |||
*Pinnacle Entertainment, Inc. | 5,100 | 43,095 | |||
*Playboy Enterprises, Inc. Class B | 3,000 | 9,210 | |||
Polaris Industries, Inc. | 3,025 | 127,262 | |||
Polo Ralph Lauren Corp. | 5,700 | 424,194 | |||
*Pomeroy IT Solutions, Inc. | 300 | 1,947 | |||
Pool Corp. | 3,300 | 64,614 | |||
#*Pre-Paid Legal Services, Inc. | 1,200 | 47,448 | |||
#*Priceline.com, Inc. | 4,100 | 646,939 | |||
Primedia, Inc. | 3,300 | 8,283 | |||
#*Princeton Review, Inc. | 4,059 | 18,590 | |||
#*Pulte Homes, Inc. | 36,437 | 328,297 | |||
*RadioShack Corp. | 10,383 | 175,369 | |||
*RC2 Corp. | 1,400 | 18,284 | |||
*RCN Corp. | 4,500 | 37,530 | |||
*Red Lion Hotels Corp. | 2,934 | 13,995 | |||
#*Red Robin Gourmet Burgers, Inc. | 1,300 | 21,723 | |||
Regal Entertainment Group | 14,260 | 179,819 | |||
#Regis Corp. | 4,900 | 79,576 | |||
*Rent-A-Center, Inc. | 9,080 | 166,709 | |||
*Rentrak Corp. | 1,137 | 17,476 | |||
*Retail Ventures, Inc. | 4,157 | 26,646 | |||
RG Barry Corp. | 1,300 | 11,128 | |||
Ross Stores, Inc. | 12,300 | 541,323 | |||
#*Royal Caribbean Cruises, Ltd. | 20,300 | 410,669 | |||
*Rubio’s Restaurants, Inc. | 1,297 | 9,455 | |||
*Ruby Tuesday, Inc. | 5,500 | 36,630 | |||
*Ruth’s Hospitality Group, Inc. | 1,700 | 5,287 | |||
Ryland Group, Inc. | 3,100 | 57,505 | |||
*Saga Communications, Inc. | 507 | 6,464 | |||
*Saks, Inc. | 8,910 | 49,985 | |||
*Sally Beauty Holdings, Inc. | 17,450 | 117,788 | |||
Scholastic Corp. | 2,600 | 64,662 | |||
*Scientific Games Corp. | 6,970 | 98,068 | |||
Scripps Networks Interactive, Inc. | 12,399 | 468,186 | |||
*Sealy Corp. | 7,900 | 22,910 | |||
#*Sears Holdings Corp. | 11,285 | 765,800 | |||
Service Corp. International | 28,770 | 197,650 | |||
Sherwin-Williams Co. | 12,100 | 690,184 | |||
*Shiloh Industries, Inc. | 3,192 | 14,364 | |||
*Shoe Carnival, Inc. | 1,463 | 21,960 | |||
*Shuffle Master, Inc. | 6,626 | 51,749 | |||
*Shutterfly, Inc. | 4,000 | 56,400 | |||
*Signet Jewelers, Ltd. ADR | 7,900 | 199,159 | |||
*Skechers U.S.A., Inc. Class A | 3,800 | 82,916 | |||
Skyline Corp. | 800 | 13,992 | |||
*Smith & Wesson Holding Corp. | 4,800 | 20,496 | |||
Snap-On, Inc. | 6,470 | 236,349 | |||
*Sonic Automotive, Inc. | 1,901 | 16,995 | |||
*Sonic Corp. | 5,738 | 53,650 | |||
Sotheby’s Class A | 5,800 | 91,988 | |||
Spartan Motors, Inc. | 3,375 | 16,841 | |||
Speedway Motorsports, Inc. | 5,200 | 70,408 | |||
Sport Supply Group, Inc. | 2,340 | 24,149 | |||
Stage Stores, Inc. | 3,250 | 38,350 | |||
#*Stamps.com, Inc. | 1,943 | 19,508 | |||
#*Standard Motor Products, Inc. | 1,900 | 15,884 | |||
*Stanley Furniture, Inc. | 1,979 | 15,555 | |||
187
THE TAX-MANAGED U.S. EQUITY SERIES
CONTINUED
| Shares | Value† | ||||
Consumer Discretionary — (Continued) | |||||
#Stanley Works (The) | 8,557 | $ | 387,033 | ||
#Staples, Inc. | 71,950 | 1,561,315 | |||
*Starbucks Corp. | 73,430 | 1,393,701 | |||
#Starwood Hotels & Resorts Worldwide, Inc. | 18,100 | 525,986 | |||
*Steak n Shake Co. (The) | 4,300 | 50,095 | |||
*Stein Mart, Inc. | 4,300 | 40,850 | |||
*Steinway Musical Instruments, Inc. | 900 | 10,548 | |||
*Steven Madden, Ltd. | 2,250 | 91,125 | |||
Stewart Enterprises, Inc. | 8,882 | 40,680 | |||
Strayer Education, Inc. | 1,500 | 304,455 | |||
Sturm Ruger & Co., Inc. | 1,500 | 15,930 | |||
Superior Industries International, Inc. | 1,700 | 22,576 | |||
#*Systemax, Inc. | 6,196 | 83,522 | |||
*Talbots, Inc. | 5,170 | 46,892 | |||
*Tandy Brands Accessories, Inc. | 700 | 2,765 | |||
*Tandy Leather Factory, Inc. | 663 | 2,181 | |||
Target Corp. | 79,844 | 3,866,845 | |||
*Tempur-Pedic International, Inc. | 7,700 | 149,149 | |||
*Tenneco, Inc. | 5,600 | 76,272 | |||
*Texas Roadhouse, Inc. | 8,700 | 82,389 | |||
Thor Industries, Inc. | 6,800 | 178,296 | |||
*Ticketmaster Entertainment, Inc. | 64 | 618 | |||
#Tiffany & Co. | 14,000 | 550,060 | |||
*Timberland Co. Class A | 5,500 | 88,990 | |||
Time Warner Cable, Inc. | 32,604 | 1,285,902 | |||
Time Warner, Inc. | 116,086 | 3,496,510 | |||
TJX Cos., Inc. (The) | 46,321 | 1,730,089 | |||
#*Toll Brothers, Inc. | 17,260 | 298,943 | |||
*Town Sports International Holdings, Inc. | 3,500 | 10,395 | |||
*Tractor Supply Co. | 3,501 | 156,495 | |||
*True Religion Apparel, Inc. | 2,500 | 64,425 | |||
*TRW Automotive Holdings Corp. | 10,900 | 170,585 | |||
*Tuesday Morning Corp. | 3,100 | 10,013 | |||
Tupperware Corp. | 6,100 | 274,622 | |||
*Ulta Salon Cosmetics & Fragrance, Inc. | 4,600 | 69,644 | |||
#*Under Armour, Inc. Class A | 3,200 | 85,920 | |||
UniFirst Corp. | 1,740 | 73,254 | |||
*Universal Electronics, Inc. | 1,700 | 35,020 | |||
*Universal Technical Institute, Inc. | 1,500 | 26,985 | |||
#*Urban Outfitters, Inc. | 16,400 | 514,632 | |||
V.F. Corp. | 11,250 | 799,200 | |||
#*Vail Resorts, Inc. | 5,400 | 185,976 | |||
*Valassis Communications, Inc. | 3,990 | 72,738 | |||
Value Line, Inc. | 400 | 12,304 | |||
*VCG Holding Corp. | 1,800 | 3,384 | |||
#*Viacom, Inc. Class A | 5,500 | 160,490 | |||
*Viacom, Inc. Class B | 66,300 | 1,829,217 | |||
#*Volcom, Inc. | 1,526 | 25,347 | |||
WABCO Holdings, Inc. | 5,443 | 129,108 | |||
#*Warnaco Group, Inc. | 5,680 | 230,210 | |||
*Warner Music Group Corp. | 14,000 | 80,640 | |||
Weight Watchers International, Inc. | 7,000 | 185,570 | |||
Wendy’s/Arby’s Group, Inc. | 48,718 | 192,436 | |||
#*West Marine, Inc. | 2,681 | 20,429 | |||
*Wet Seal, Inc. (The) | 11,405 | 36,382 | |||
Whirlpool Corp. | 7,500 | 536,925 | |||
Wiley (John) & Sons, Inc. Class A | 5,300 | 186,666 | |||
*Williams Controls, Inc. | 600 | 5,016 | |||
Williams-Sonoma, Inc. | 10,760 | 202,073 | |||
*Winmark Corp. | 300 | 6,339 | |||
*Winnebago Industries, Inc. | 2,700 | 31,050 | |||
188
THE TAX-MANAGED U.S. EQUITY SERIES
CONTINUED
| Shares | Value† | ||||
Consumer Discretionary — (Continued) | |||||
*WMS Industries, Inc. | 5,290 | $ | 211,494 | ||
Wolverine World Wide, Inc. | 5,450 | 139,411 | |||
World Wrestling Entertainment, Inc. | 3,100 | 41,168 | |||
Wyndham Worldwide Corp. | 18,900 | 322,245 | |||
#*Wynn Resorts, Ltd. | 11,960 | 648,471 | |||
Yum! Brands, Inc. | 47,717 | 1,572,275 | |||
#*Zumiez, Inc. | 3,400 | 45,798 | |||
Total Consumer Discretionary | 123,650,979 | ||||
Consumer Staples — (10.1%) | |||||
Alberto-Culver Co. | 10,350 | 277,587 | |||
Alico, Inc. | 1,200 | 34,896 | |||
#*Alliance One International, Inc. | 11,189 | 49,343 | |||
Altria Group, Inc. | 207,400 | 3,756,014 | |||
*American Italian Pasta Co. | 1,122 | 30,485 | |||
Andersons, Inc. (The) | 400 | 12,412 | |||
Archer-Daniels-Midland Co. | 66,090 | 1,990,631 | |||
Avon Products, Inc. | 42,400 | 1,358,920 | |||
B&G Foods, Inc. | 4,970 | 38,816 | |||
*Bare Escentuals, Inc. | 8,022 | 101,318 | |||
#*BJ’s Wholesale Club, Inc. | 5,300 | 185,659 | |||
*Boston Beer Co., Inc. Class A | 1,231 | 46,778 | |||
Brown-Forman Corp. Class A | 8,170 | 418,222 | |||
#Brown-Forman Corp. Class B | 10,486 | 511,822 | |||
Bunge, Ltd. | 13,270 | 757,186 | |||
*Calavo Growers, Inc. | 1,800 | 32,130 | |||
Cal-Maine Foods, Inc. | 2,100 | 57,015 | |||
Campbell Soup Co. | 38,403 | 1,219,295 | |||
Casey’s General Stores, Inc. | 6,195 | 195,328 | |||
*Central European Distribution Corp. | 4,275 | 132,995 | |||
*Central Garden & Pet Co. | 2,800 | 27,776 | |||
*Central Garden & Pet Co. Class A | 7,529 | 71,224 | |||
*Chattem, Inc. | 2,100 | 133,077 | |||
*Chiquita Brands International, Inc. | 4,900 | 79,331 | |||
Church & Dwight Co., Inc. | 7,550 | 429,444 | |||
Clorox Co. | 13,971 | 827,502 | |||
Coca-Cola Co. | 237,262 | 12,648,437 | |||
Coca-Cola Enterprises, Inc. | 50,344 | 960,060 | |||
Colgate-Palmolive Co. | 59,400 | 4,670,622 | |||
ConAgra, Inc. | 47,279 | 992,859 | |||
*Constellation Brands, Inc. Class A | 21,012 | 332,410 | |||
Corn Products International, Inc. | 8,033 | 226,370 | |||
Costco Wholesale Corp. | 35,550 | 2,021,018 | |||
CVS Caremark Corp. | 150,047 | 5,296,659 | |||
*Darling International, Inc. | 8,700 | 60,465 | |||
*Dean Foods Co. | 16,650 | 303,530 | |||
Del Monte Foods Co. | 26,120 | 282,096 | |||
Diamond Foods, Inc. | 2,435 | 73,415 | |||
*Dr Pepper Snapple Group, Inc. | 29,420 | 801,989 | |||
*Elizabeth Arden, Inc. | 3,500 | 37,275 | |||
*Energizer Holdings, Inc. | 6,400 | 389,568 | |||
Estee Lauder Cos., Inc. | 11,600 | 493,000 | |||
Farmer Brothers Co. | 2,399 | 45,341 | |||
#Flowers Foods, Inc. | 9,918 | 231,684 | |||
*Fresh Del Monte Produce, Inc. | 5,939 | 128,936 | |||
General Mills, Inc. | 33,000 | 2,175,360 | |||
#*Great Atlantic & Pacific Tea Co. | 4,751 | 47,082 | |||
*Green Mountain Coffee, Inc. | 4,786 | 318,508 | |||
H.J. Heinz Co. | 31,300 | 1,259,512 | |||
#*Hain Celestial Group, Inc. | 4,715 | 82,701 | |||
#*Hansen Natural Corp. | 7,324 | 264,763 | |||
189
THE TAX-MANAGED U.S. EQUITY SERIES
CONTINUED
| Shares | Value† | ||||
Consumer Staples — (Continued) | |||||
Herbalife, Ltd. | 5,900 | $ | 198,535 | ||
Hershey Co. (The) | 19,069 | 720,618 | |||
Hormel Foods Corp. | 17,730 | 646,436 | |||
*HQ Sustainable Maritime Industries, Inc. | 1,600 | 12,112 | |||
Imperial Sugar Co. | 1,726 | 21,558 | |||
Ingles Markets, Inc. | 1,610 | 24,762 | |||
Inter Parfums, Inc. | 3,152 | 38,707 | |||
J & J Snack Foods Corp. | 2,491 | 97,572 | |||
J.M. Smucker Co. | 12,176 | 642,040 | |||
Kellogg Co. | 36,700 | 1,891,518 | |||
Kimberly-Clark Corp. | 38,810 | 2,373,620 | |||
Kraft Foods, Inc. | 160,324 | 4,412,116 | |||
Kroger Co. (The) | 66,700 | 1,542,771 | |||
Lancaster Colony Corp. | 2,988 | 145,157 | |||
Lance, Inc. | 4,200 | 101,304 | |||
*Lifeway Foods, Inc. | 1,134 | 13,653 | |||
Lorillard, Inc. | 18,408 | 1,430,670 | |||
Mannatech, Inc. | 2,370 | 8,058 | |||
#McCormick & Co., Inc. | 12,914 | 452,119 | |||
McCormick & Co., Inc. Voting | 607 | 21,245 | |||
*Medifast, Inc. | 3,000 | 66,060 | |||
Molson Coors Brewing Co. | 17,550 | 859,424 | |||
Nash-Finch Co. | 1,300 | 37,674 | |||
*National Beverage Corp. | 5,976 | 65,437 | |||
*Natural Alternatives International, Inc. | 1,000 | 7,540 | |||
*NBTY, Inc. | 11,100 | 404,151 | |||
Nu Skin Enterprises, Inc. Class A | 6,010 | 136,788 | |||
*Nutraceutical International Corp. | 1,559 | 16,962 | |||
Oil-Dri Corp. of America | 641 | 9,801 | |||
*Omega Protein Corp. | 2,100 | 8,736 | |||
*Overhill Farms, Inc. | 2,000 | 10,920 | |||
*Pantry, Inc. | 3,100 | 43,741 | |||
PepsiAmericas, Inc. | 14,400 | 421,056 | |||
#PepsiCo, Inc. | 166,379 | 10,074,248 | |||
Philip Morris International, Inc. | 193,500 | 9,164,160 | |||
*Prestige Brands Holdings, Inc. | 4,300 | 29,068 | |||
PriceSmart, Inc. | 3,522 | 67,975 | |||
Procter & Gamble Co. | 303,583 | 17,607,814 | |||
*Ralcorp Holdings, Inc. | 5,695 | 305,822 | |||
Reliv’ International, Inc. | 1,707 | 5,343 | |||
*Revlon, Inc. | 4,600 | 38,778 | |||
Reynolds American, Inc. | 30,397 | 1,473,647 | |||
Rocky Mountain Chocolate Factory, Inc. | 950 | 8,094 | |||
Ruddick Corp. | 5,200 | 138,944 | |||
Safeway, Inc. | 42,600 | 951,258 | |||
#Sanderson Farms, Inc. | 2,350 | 85,986 | |||
*Sanfilippo (John B.) & Son, Inc. | 1,596 | 21,897 | |||
Sara Lee Corp. | 61,153 | 690,417 | |||
#*Smart Balance, Inc. | 7,834 | 41,364 | |||
#*Smithfield Foods, Inc. | 15,600 | 208,104 | |||
Spartan Stores, Inc. | 2,074 | 29,368 | |||
#SUPERVALU, Inc. | 22,014 | 349,362 | |||
*Susser Holdings Corp. | 2,446 | 29,083 | |||
Sysco Corp. | 51,100 | 1,351,595 | |||
Tasty Baking Co. | 400 | 2,564 | |||
Tootsie Roll Industries, Inc. | 4,606 | 114,275 | |||
#*TreeHouse Foods, Inc. | 4,830 | 180,642 | |||
#Tyson Foods, Inc. Class A | 26,840 | 336,037 | |||
#*United Natural Foods, Inc. | 4,776 | 115,149 | |||
United-Guardian, Inc. | 600 | 6,000 | |||
Universal Corp. | 3,100 | 128,929 | |||
190
THE TAX-MANAGED U.S. EQUITY SERIES
CONTINUED
| Shares | Value† | ||||
Consumer Staples — (Continued) | |||||
*USANA Health Sciences, Inc. | 1,310 | $ | 37,754 | ||
#Vector Group, Ltd. | 7,794 | 113,091 | |||
Walgreen Co. | 97,025 | 3,670,456 | |||
Wal-Mart Stores, Inc. | 315,296 | 15,663,905 | |||
WD-40 Co. | 1,600 | 50,384 | |||
Weis Markets, Inc. | 3,501 | 123,935 | |||
*Whole Foods Market, Inc. | 12,983 | 416,235 | |||
*Winn-Dixie Stores, Inc. | 7,529 | 83,497 | |||
Total Consumer Staples | 127,516,907 | ||||
Energy — (10.3%) | |||||
*Adams Resources & Energy, Inc. | 600 | 13,620 | |||
#Alon USA Energy, Inc. | 6,300 | 52,920 | |||
*Alpha Natural Resources, Inc. | 8,828 | 299,887 | |||
Anadarko Petroleum Corp. | 50,650 | 3,086,104 | |||
Apache Corp. | 34,425 | 3,240,081 | |||
*Approach Resources, Inc. | 1,300 | 10,088 | |||
#Arch Coal, Inc. | 14,200 | 307,572 | |||
*Arena Resources, Inc. | 4,136 | 154,107 | |||
*Atlas Energy, Inc. | 4,638 | 121,423 | |||
*ATP Oil & Gas Corp. | 1,979 | 34,256 | |||
#*Atwood Oceanics, Inc. | 6,200 | 220,038 | |||
Baker Hughes, Inc. | 30,400 | 1,278,928 | |||
*Basic Energy Services, Inc. | 4,350 | 30,450 | |||
Berry Petroleum Corp. Class A | 4,900 | 124,264 | |||
*Bill Barrett Corp. | 4,720 | 146,226 | |||
BJ Services Co. | 25,800 | 495,360 | |||
*Bolt Technology Corp. | 1,050 | 10,678 | |||
#*BPZ Resources, Inc. | 7,200 | 45,360 | |||
*Brigham Exploration Co. | 7,900 | 75,050 | |||
*Bristow Group, Inc. | 3,356 | 97,827 | |||
*Bronco Drilling Co., Inc. | 3,500 | 22,120 | |||
Cabot Oil & Gas Corp. | 11,500 | 442,405 | |||
*Cal Dive International, Inc. | 11,637 | 89,372 | |||
*Cameron International Corp. | 22,600 | 835,522 | |||
CARBO Ceramics, Inc. | 3,050 | 178,089 | |||
*Carrizo Oil & Gas, Inc. | 3,100 | 71,858 | |||
*Cheniere Energy, Inc. | 6,400 | 14,912 | |||
Chesapeake Energy Corp. | 49,838 | 1,221,031 | |||
Chevron Corp. | 205,614 | 15,737,696 | |||
Cimarex Energy Co. | 7,133 | 279,328 | |||
*Clayton Williams Energy, Inc. | 1,100 | 28,820 | |||
*Clean Energy Fuels Corp. | 6,800 | 78,880 | |||
*CNX Gas Corp. | 15,301 | 426,286 | |||
*Comstock Resources, Inc. | 5,500 | 225,995 | |||
*Concho Resources, Inc. | 10,600 | 403,966 | |||
ConocoPhillips | 118,739 | 5,958,323 | |||
CONSOL Energy, Inc. | 18,100 | 774,861 | |||
*Contango Oil & Gas Co. | 1,700 | 81,005 | |||
#*Continental Resources, Inc. | 15,192 | 565,294 | |||
*CREDO Petroleum Corp. | 1,676 | 16,324 | |||
*Crosstex Energy, Inc. | 5,400 | 30,348 | |||
*CVR Energy, Inc. | 5,100 | 53,652 | |||
*Dawson Geophysical Co. | 600 | 14,490 | |||
Delek US Holdings, Inc. | 6,500 | 43,875 | |||
#*Denbury Resources, Inc. | 26,400 | 385,440 | |||
Devon Energy Corp. | 46,006 | 2,977,048 | |||
#Diamond Offshore Drilling, Inc. | 14,300 | 1,362,075 | |||
*Double Eagle Petroleum Co. | 267 | 1,263 | |||
*Dresser-Rand Group, Inc. | 7,800 | 229,866 | |||
*Dril-Quip, Inc. | 4,000 | 194,360 | |||
191
THE TAX-MANAGED U.S. EQUITY SERIES
CONTINUED
| Shares | Value† | ||||
Energy — (Continued) | |||||
El Paso Corp. | 48,283 | $ | 473,656 | ||
*Encore Acquisition Co. | 6,225 | 230,761 | |||
*ENGlobal Corp. | 3,900 | 11,505 | |||
#ENSCO International, Inc. | 14,091 | 645,227 | |||
EOG Resources, Inc. | 25,900 | 2,114,994 | |||
*Evolution Petroleum Corp. | 4,053 | 13,821 | |||
*EXCO Resources, Inc. | 20,250 | 316,305 | |||
#*Exterran Holdings, Inc. | 6,418 | 131,120 | |||
Exxon Mobil Corp. | 530,943 | 38,052,685 | |||
#*FMC Technologies, Inc. | 12,382 | 651,293 | |||
*Forest Oil Corp. | 8,689 | 170,304 | |||
#Frontier Oil Corp. | 11,517 | 159,626 | |||
*FX Energy, Inc. | 5,900 | 15,694 | |||
#General Maritime Corp. | 4,776 | 32,907 | |||
*Geokinetics, Inc. | 900 | 14,472 | |||
#*GeoResources, Inc. | 2,107 | 23,367 | |||
*Global Industries, Ltd. | 11,300 | 82,377 | |||
#*GMX Resources, Inc. | 400 | 5,092 | |||
*Goodrich Petroleum Corp. | 2,870 | 73,673 | |||
Gulf Island Fabrication, Inc. | 1,100 | 21,032 | |||
*GulfMark Offshore, Inc. | 2,800 | 77,476 | |||
*Gulfport Energy Corp. | 4,900 | 37,387 | |||
Halliburton Co. | 82,523 | 2,410,497 | |||
*Harvest Natural Resources, Inc. | 4,500 | 24,705 | |||
#*Helix Energy Solutions Group, Inc. | 10,266 | 140,952 | |||
Helmerich & Payne, Inc. | 11,191 | 425,482 | |||
*Hercules Offshore, Inc. | 6,900 | 35,397 | |||
Hess Corp. | 33,400 | 1,828,316 | |||
*HKN, Inc. | 866 | 2,858 | |||
#Holly Corp. | 5,500 | 159,555 | |||
*Hornbeck Offshore Services, Inc. | 2,700 | 65,637 | |||
#*International Coal Group, Inc. | 9,782 | 40,008 | |||
#*ION Geophysical Corp. | 9,200 | 35,236 | |||
*James River Coal Co. | 2,490 | 47,285 | |||
*Key Energy Services, Inc. | 13,200 | 96,492 | |||
Lufkin Industries, Inc. | 1,700 | 96,985 | |||
Marathon Oil Corp. | 72,984 | 2,333,298 | |||
#*Mariner Energy, Inc. | 9,953 | 126,801 | |||
Massey Energy Co. | 8,200 | 238,538 | |||
*Matrix Service Co. | 2,900 | 25,723 | |||
#*McMoran Exploration Co. | 2,131 | 16,387 | |||
*Mitcham Industries, Inc. | 1,600 | 11,600 | |||
Murphy Oil Corp. | 19,424 | 1,187,583 | |||
#*Nabors Industries, Ltd. | 25,457 | 530,269 | |||
*NATCO Group, Inc. Class A | 2,030 | 88,467 | |||
*National-Oilwell, Inc. | 40,632 | 1,665,506 | |||
*Natural Gas Services Group, Inc. | 1,600 | 26,992 | |||
*Newfield Exploration Co. | 13,600 | 557,872 | |||
*Newpark Resources, Inc. | 9,500 | 28,595 | |||
Noble Energy, Inc. | 17,842 | 1,170,970 | |||
*Northern Oil & Gas, Inc. | 3,400 | 31,008 | |||
Occidental Petroleum Corp. | 84,088 | 6,380,597 | |||
*Oceaneering International, Inc. | 5,600 | 286,160 | |||
*Oil States International, Inc. | 6,100 | 210,084 | |||
Overseas Shipholding Group, Inc. | 2,700 | 105,975 | |||
Panhandle Oil & Gas, Inc. | 600 | 11,796 | |||
*Parker Drilling Co. | 11,381 | 59,181 | |||
#*Patriot Coal Corp. | 7,492 | 84,660 | |||
Patterson-UTI Energy, Inc. | 15,495 | 241,412 | |||
Peabody Energy Corp. | 27,433 | 1,086,072 | |||
Penn Virginia Corp. | 2,200 | 44,550 | |||
192
THE TAX-MANAGED U.S. EQUITY SERIES
CONTINUED
| Shares | Value† | ||||
Energy — (Continued) | |||||
*Petrohawk Energy Corp. | 30,804 | $ | 724,510 | ||
*Petroleum Development Corp. | 800 | 13,360 | |||
*PHI, Inc. Non-Voting | 1,795 | 30,838 | |||
*Pioneer Drilling Co. | 3,200 | 21,408 | |||
Pioneer Natural Resources Co. | 11,907 | 489,497 | |||
*Plains Exploration & Production Co. | 12,593 | 333,714 | |||
*Pride International, Inc. | 19,306 | 570,685 | |||
#*Quicksilver Resources, Inc. | 16,800 | 204,960 | |||
#Range Resources Corp. | 16,500 | 825,825 | |||
*Rex Energy Corp. | 4,000 | 32,360 | |||
*Rosetta Resources, Inc. | 5,600 | 75,768 | |||
Rowan Cos., Inc. | 9,800 | 227,850 | |||
RPC, Inc. | 10,300 | 96,305 | |||
#*SandRidge Energy, Inc. | 18,700 | 191,301 | |||
Schlumberger, Ltd. | 119,648 | 7,442,106 | |||
*SEACOR Holdings, Inc. | 2,000 | 162,540 | |||
*Seahawk Drilling, Inc. | 1,319 | 35,613 | |||
#Smith International, Inc. | 19,981 | 554,073 | |||
Southern Union Co. | 12,348 | 241,651 | |||
*Southwestern Energy Co. | 34,140 | 1,487,821 | |||
Spectra Energy Corp. | 34,832 | 665,988 | |||
St. Mary Land & Exploration Co. | 7,000 | 238,700 | |||
Sunoco, Inc. | 12,087 | 372,280 | |||
*Superior Energy Services, Inc. | 8,200 | 177,202 | |||
#*Superior Well Services, Inc. | 2,100 | 22,281 | |||
*Swift Energy Corp. | 2,030 | 42,995 | |||
*T-3 Energy Services, Inc. | 2,800 | 56,056 | |||
#Tesoro Petroleum Corp. | 13,900 | 196,546 | |||
*Tetra Technologies, Inc. | 8,150 | 77,099 | |||
*TGC Industries, Inc. | 2,467 | 10,731 | |||
Tidewater, Inc. | 5,500 | 229,185 | |||
*Union Drilling, Inc. | 1,000 | 7,640 | |||
#*Unit Corp. | 4,600 | 179,768 | |||
#*USEC, Inc. | 15,699 | 60,598 | |||
VAALCO Energy, Inc. | 7,100 | 30,246 | |||
Valero Energy Corp. | 54,604 | 988,332 | |||
*Venoco, Inc. | 5,701 | 71,833 | |||
W&T Offshore, Inc. | 6,300 | 73,395 | |||
#*Western Refining, Inc. | 9,500 | 53,295 | |||
*Westmoreland Coal Co. | 937 | 6,175 | |||
*Whiting Petroleum Corp. | 5,250 | 296,100 | |||
#*Willbros Group, Inc. | 4,500 | 59,130 | |||
Williams Cos., Inc. (The) | 48,300 | 910,455 | |||
#World Fuel Services Corp. | 3,475 | 176,704 | |||
XTO Energy, Inc. | 59,373 | 2,467,542 | |||
Total Energy | 129,135,479 | ||||
Financials — (11.8%) | |||||
1st Source Corp. | 2,550 | 37,791 | |||
Abington Bancorp, Inc. | 3,523 | 24,168 | |||
Advance America Cash Advance Centers, Inc. | 5,900 | 29,146 | |||
#*Affiliated Managers Group, Inc. | 4,050 | 257,134 | |||
*Affirmative Insurance Holdings, Inc. | 1,600 | 6,400 | |||
Aflac, Inc. | 38,694 | 1,605,414 | |||
*Allegheny Corp. | 859 | 214,750 | |||
Allied World Assurance Co. Holdings, Ltd. | 5,300 | 237,228 | |||
Allstate Corp. | 48,167 | 1,424,298 | |||
*Altisource Portfolio Solutions SA | 2,966 | 45,231 | |||
*American Equity Investment Life Holding Co. | 3,790 | 24,900 | |||
American Express Co. | 97,805 | 3,407,526 | |||
American Financial Group, Inc. | 13,698 | 336,971 | |||
193
THE TAX-MANAGED U.S. EQUITY SERIES
CONTINUED
| Shares | Value† | ||||
Financials — (Continued) | |||||
American National Insurance Co. | 2,477 | $ | 206,805 | ||
American Physicians Capital, Inc. | 1,200 | 33,936 | |||
American River Bankshares | 882 | 5,398 | |||
*American Safety Insurance Holdings, Ltd. | 1,000 | 14,820 | |||
#*AmeriCredit Corp. | 15,090 | 266,338 | |||
Ameriprise Financial, Inc. | 20,740 | 719,056 | |||
Ameris Bancorp | 1,914 | 11,273 | |||
*AMERISAFE, Inc. | 2,988 | 55,398 | |||
*AmeriServe Financial, Inc. | 100 | 175 | |||
AmTrust Financial Services, Inc. | 7,200 | 81,216 | |||
AON Corp. | 29,735 | 1,145,095 | |||
*Arch Capital Group, Ltd. | 6,070 | 408,936 | |||
*Argo Group International Holdings, Ltd. | 4,380 | 148,745 | |||
Arrow Financial Corp. | 1,334 | 33,924 | |||
Aspen Insurance Holdings, Ltd. | 9,590 | 247,422 | |||
#*Asset Acceptance Capital Corp. | 3,597 | 26,150 | |||
Associated Banc-Corp. | 13,842 | 177,316 | |||
Assurant, Inc. | 12,600 | 377,118 | |||
#Assured Guaranty, Ltd. | 11,500 | 190,670 | |||
ASTA Funding, Inc. | 400 | 2,612 | |||
Astoria Financial Corp. | 7,820 | 78,044 | |||
Atlantic Coast Federal Corp. | 1,599 | 2,319 | |||
*Avatar Holdings, Inc. | 1,000 | 16,300 | |||
Axis Capital Holdings, Ltd. | 16,440 | 474,952 | |||
#*B of I Holding, Inc. | 900 | 7,506 | |||
BancFirst Corp. | 1,800 | 64,998 | |||
*Bancorp, Inc. | 1,400 | 7,140 | |||
BancorpSouth, Inc. | 9,703 | 219,094 | |||
#BancTrust Financial Group, Inc. | 2,903 | 9,319 | |||
Bank Mutual Corp. | 6,120 | 42,962 | |||
Bank of America Corp. | 803,514 | 11,715,234 | |||
*Bank of Florida Corp. | 900 | 1,314 | |||
Bank of Hawaii Corp. | 4,800 | 213,120 | |||
Bank of New York Mellon Corp. | 119,414 | 3,183,577 | |||
Bank of the Ozarks, Inc. | 1,900 | 43,225 | |||
BankFinancial Corp. | 2,730 | 25,771 | |||
#Banner Corp. | 1,600 | 4,912 | |||
BB&T Corp. | 67,175 | 1,606,154 | |||
*Beneficial Mutual Bancorp, Inc. | 8,400 | 77,700 | |||
Berkshire Hills Bancorp, Inc. | 1,568 | 32,222 | |||
BGC Partners, Inc. Class A | 4,100 | 19,803 | |||
#BlackRock, Inc. | 5,112 | 1,106,697 | |||
#BOK Financial Corp. | 7,669 | 329,537 | |||
Boston Private Financial Holdings, Inc. | 7,520 | 44,744 | |||
*Broadpoint Gleacher Securities, Inc. | 11,995 | 76,408 | |||
Brookline Bancorp, Inc. | 6,300 | 61,677 | |||
Brooklyn Federal Bancorp, Inc. | 100 | 1,198 | |||
Brown & Brown, Inc. | 14,995 | 275,458 | |||
Cadence Financial Corp. | 303 | 500 | |||
Camden National Corp. | 900 | 27,657 | |||
Capital City Bank Group, Inc. | 1,069 | 12,550 | |||
Capital One Financial Corp. | 45,101 | 1,650,697 | |||
Capital Southwest Corp. | 344 | 25,545 | |||
CapitalSource, Inc. | 800 | 2,848 | |||
Capitol Federal Financial | 7,889 | 239,273 | |||
Cardinal Financial Corp. | 3,905 | 31,826 | |||
*Cardtronics, Inc. | 3,500 | 34,825 | |||
Cascade Financial Corp. | 200 | 396 | |||
Cash America International, Inc. | 2,635 | 79,735 | |||
Cathay General Bancorp | 2,550 | 22,516 | |||
#*CB Richard Ellis Group, Inc. | 25,065 | 259,423 | |||
194
THE TAX-MANAGED U.S. EQUITY SERIES
CONTINUED
| Shares | Value† | ||||
Financials — (Continued) | |||||
Center Bancorp, Inc. | 1,915 | $ | 14,899 | ||
*Center Financial Corp. | 2,200 | 9,262 | |||
CenterState Banks of Florida, Inc. | 400 | 3,012 | |||
*Central Jersey Bancorp | 1,260 | 6,111 | |||
Charles Schwab Corp. (The) | 116,900 | 2,027,046 | |||
Chemical Financial Corp. | 3,399 | 74,608 | |||
Chubb Corp. | 37,547 | 1,821,780 | |||
Cincinnati Financial Corp. | 17,267 | 437,891 | |||
Citigroup, Inc. | 462,202 | 1,890,406 | |||
Citizens Community Bancorp, Inc. | 600 | 2,418 | |||
#*Citizens, Inc. | 6,415 | 38,682 | |||
City Holding Co. | 1,500 | 45,855 | |||
City National Corp. | 3,500 | 131,845 | |||
Clifton Savings Bancorp, Inc. | 4,183 | 38,567 | |||
CME Group, Inc. | 5,700 | 1,724,877 | |||
#*CNA Financial Corp. | 26,036 | 566,804 | |||
*CNA Surety Corp. | 5,300 | 76,638 | |||
CoBiz Financial, Inc. | 3,100 | 14,787 | |||
Cohen & Steers, Inc. | 4,200 | 81,186 | |||
Columbia Banking System, Inc. | 2,213 | 32,531 | |||
Comerica, Inc. | 16,300 | 452,325 | |||
Commerce Bancshares, Inc. | 7,555 | 289,810 | |||
Community Bank System, Inc. | 3,381 | 62,920 | |||
Community Trust Bancorp, Inc. | 1,590 | 39,146 | |||
#*CompuCredit Holdings Corp. | 5,700 | 18,696 | |||
Consolidated-Tokoma Land Co. | 681 | 23,426 | |||
*Credit Acceptance Corp. | 1,600 | 54,992 | |||
Cullen Frost Bankers, Inc. | 6,720 | 314,429 | |||
CVB Financial Corp. | 5,813 | 46,562 | |||
Danvers Bancorp, Inc. | 2,435 | 33,433 | |||
Delphi Financial Group, Inc. Class A | 4,900 | 106,330 | |||
*Diamond Hill Investment Group, Inc. | 293 | 15,371 | |||
Dime Community Bancshares, Inc. | 2,700 | 29,673 | |||
Discover Financial Services | 51,300 | 725,382 | |||
#*Dollar Financial Corp. | 1,400 | 26,278 | |||
Donegal Group, Inc. Class A | 3,297 | 48,136 | |||
#*Doral Financial Corp. | 3,300 | 9,372 | |||
Duff & Phelps Corp. | 2,200 | 37,818 | |||
East West Bancorp, Inc. | 3,446 | 31,117 | |||
Eastern Insurance Holdings, Inc. | 1,500 | 10,590 | |||
Eaton Vance Corp. | 12,070 | 342,667 | |||
#*eHealth, Inc. | 2,800 | 39,844 | |||
EMC Insurance Group, Inc. | 1,000 | 20,580 | |||
#Employers Holdings, Inc. | 3,900 | 57,798 | |||
*Encore Bancshares, Inc. | 300 | 2,310 | |||
*Encore Capital Group, Inc. | 2,822 | 42,245 | |||
Endurance Specialty Holdings, Ltd. | 6,500 | 233,935 | |||
*Enstar Group, Ltd. | 1,100 | 67,100 | |||
Enterprise Financial Services Corp. | 1,766 | 15,064 | |||
Erie Indemnity Co. | 4,600 | 162,150 | |||
ESSA Bancorp, Inc. | 2,588 | 30,978 | |||
Evercore Partners, Inc. Class A | 1,300 | 42,432 | |||
Everest Re Group, Ltd. | 7,400 | 647,426 | |||
F.N.B. Corp. | 5,009 | 35,464 | |||
Federal Agricultural Mortgage Corp. | 1,781 | 14,301 | |||
Federated Investors, Inc. | 9,762 | 256,252 | |||
Fidelity National Financial, Inc. | 22,699 | 308,025 | |||
*Fidelity Southern Corp. | 1,025 | 3,988 | |||
Fifth Third Bancorp | 67,100 | 599,874 | |||
Financial Federal Corp. | 2,800 | 57,176 | |||
Financial Institutions, Inc. | 600 | 6,336 | |||
195
THE TAX-MANAGED U.S. EQUITY SERIES
CONTINUED
| Shares | Value† | ||||
Financials — (Continued) | |||||
*First Acceptance Corp. | 6,550 | $ | 14,410 | ||
First American Corp. | 9,976 | 303,171 | |||
#First Bancorp (318672102) | 10,000 | 18,900 | |||
First Bancorp (318910106) | 1,500 | 20,340 | |||
First Busey Corp. | 2,279 | 8,820 | |||
*First Cash Financial Services, Inc. | 3,522 | 60,508 | |||
First Citizens BancShares, Inc. | 100 | 14,900 | |||
First Commonwealth Financial Corp. | 7,969 | 41,837 | |||
First Community Bancshares, Inc. | 1,100 | 12,804 | |||
First Defiance Financial Corp. | 1,738 | 25,062 | |||
First Financial Bancorp | 4,812 | 61,016 | |||
First Financial Bankshares, Inc. | 2,990 | 144,866 | |||
First Financial Corp. | 1,700 | 47,141 | |||
First Financial Holdings, Inc. | 1,825 | 24,619 | |||
First Financial Northwest, Inc. | 3,660 | 21,667 | |||
*First Horizon National Corp. | 22,076 | 261,159 | |||
*First Marblehead Corp. (The) | 700 | 1,372 | |||
First Merchants Corp. | 1,745 | 10,679 | |||
First Mercury Financial Corp. | 2,596 | 32,969 | |||
First Midwest Bancorp, Inc. | 1,400 | 14,560 | |||
First Niagara Financial Group, Inc. | 16,396 | 210,525 | |||
First Place Financial Corp. | 1,829 | 5,560 | |||
First Security Group, Inc. | 1,628 | 4,396 | |||
First South Bancorp, Inc. | 1,785 | 18,903 | |||
FirstMerit Corp. | 8,666 | 164,221 | |||
Flagstone Reinsurance Holdings, Ltd. | 6,700 | 73,365 | |||
Flushing Financial Corp. | 1,928 | 21,651 | |||
#FNB United Corp. | 237 | 391 | |||
*Forest City Enterprises, Inc. Class A | 12,804 | 111,651 | |||
*Forest City Enterprises, Inc. Class B | 3,286 | 28,950 | |||
*FPIC Insurance Group, Inc. | 867 | 29,331 | |||
Franklin Resources, Inc. | 27,480 | 2,875,232 | |||
Fulton Financial Corp. | 7,359 | 60,785 | |||
*GAINSCO, Inc. | 93 | 1,196 | |||
Gallagher (Arthur J.) & Co. | 11,325 | 252,661 | |||
GAMCO Investors, Inc. | 767 | 32,360 | |||
Genworth Financial, Inc. | 41,000 | 435,420 | |||
German American Bancorp, Inc. | 1,900 | 28,576 | |||
GFI Group, Inc. | 12,500 | 64,375 | |||
Glacier Bancorp, Inc. | 5,234 | 68,513 | |||
Goldman Sachs Group, Inc. | 50,600 | 8,610,602 | |||
#Great Southern Bancorp, Inc. | 1,583 | 36,282 | |||
#*Greene Bancshares, Inc. | 700 | 2,898 | |||
Greenhill & Co., Inc. | 3,000 | 258,690 | |||
*Greenlight Capital Re, Ltd. | 3,500 | 65,310 | |||
*Guaranty Bancorp | 507 | 664 | |||
*Hallmark Financial Services, Inc. | 2,534 | 19,436 | |||
Hampden Bancorp, Inc. | 504 | 5,468 | |||
#Hampton Roads Bankshares, Inc. | 1,803 | 3,696 | |||
Hancock Holding Co. | 3,400 | 123,318 | |||
Hanover Insurance Group, Inc. | 5,130 | 215,768 | |||
Harleysville Group, Inc. | 3,895 | 122,030 | |||
Harleysville National Corp. | 2,611 | 15,039 | |||
*Harris & Harris Group, Inc. | 3,600 | 15,444 | |||
Hartford Financial Services Group, Inc. | 34,300 | 841,036 | |||
HCC Insurance Holdings, Inc. | 12,525 | 330,535 | |||
Heartland Financial USA, Inc. | 2,289 | 29,391 | |||
*Heritage Commerce Corp. | 1,741 | 4,596 | |||
*Heritage Financial Corp. | 905 | 11,322 | |||
Heritage Financial Group | 1,785 | 14,476 | |||
*HFF, Inc. | 400 | 2,200 | |||
196
THE TAX-MANAGED U.S. EQUITY SERIES
CONTINUED
| Shares | Value† | ||||
Financials — (Continued) | |||||
*Hilltop Holdings, Inc. | 7,200 | $ | 85,248 | ||
Home Bancshares, Inc. | 2,684 | 58,055 | |||
Home Federal Bancorp, Inc. | 2,521 | 29,118 | |||
HopFed Bancorp, Inc. | 200 | 2,028 | |||
Horace Mann Educators Corp. | 2,800 | 34,804 | |||
Hudson City Bancorp, Inc. | 54,732 | 719,178 | |||
Huntington Bancshares, Inc. | 59,900 | 228,219 | |||
IBERIABANK Corp. | 1,925 | 83,372 | |||
Independence Holding Co. | 2,500 | 13,875 | |||
Independent Bank Corp. | 1,972 | 41,944 | |||
Infinity Property & Casualty Corp. | 800 | 30,936 | |||
*Interactive Brokers Group, Inc. | 4,380 | 70,124 | |||
#*IntercontinentalExchange, Inc. | 7,263 | 727,680 | |||
*International Assets Holding Corp. | 815 | 14,662 | |||
International Bancshares Corp. | 7,740 | 114,939 | |||
#*Intervest Bancshares Corp. | 254 | 841 | |||
Invesco, Ltd. | 41,268 | 872,818 | |||
*Investment Technology Group, Inc. | 3,824 | 82,484 | |||
*Investors Bancorp, Inc. | 10,052 | 108,964 | |||
#Janus Capital Group, Inc. | 17,000 | 223,040 | |||
#*Jefferies Group, Inc. | 17,253 | 450,303 | |||
JMP Group, Inc. | 2,391 | 20,132 | |||
Jones Lang LaSalle, Inc. | 3,200 | 149,920 | |||
JPMorgan Chase & Co. | �� | 409,432 | 17,101,975 | ||
*KBW, Inc. | 3,585 | 100,380 | |||
Kearny Financial Corp. | 11,100 | 109,335 | |||
#KeyCorp | 74,200 | 399,938 | |||
K-Fed Bancorp | 1,291 | 11,529 | |||
*Knight Capital Group, Inc. | 9,475 | 159,654 | |||
Lakeland Bancorp, Inc. | 2,835 | 17,237 | |||
Lakeland Financial Corp. | 1,700 | 34,969 | |||
Legacy Bancorp, Inc. | 1,200 | 11,472 | |||
Legg Mason, Inc. | 12,040 | 350,484 | |||
*Leucadia National Corp. | 23,300 | 523,551 | |||
#Life Partners Holdings, Inc. | 1,625 | 27,609 | |||
Lincoln National Corp. | 25,550 | 608,856 | |||
Loews Corp. | 45,700 | 1,512,670 | |||
*Louisiana Bancorp, Inc. | 200 | 2,856 | |||
#M&T Bank Corp. | 9,986 | 627,620 | |||
#*Macatawa Bank Corp. | 4,110 | 7,891 | |||
MainSource Financial Group, Inc. | 1,600 | 9,328 | |||
#*Markel Corp. | 1,093 | 352,711 | |||
*Market Leader, Inc. | 900 | 1,800 | |||
*MarketAxess Holdings, Inc. | 3,416 | 40,582 | |||
*Marlin Business Services Corp. | 2,700 | 18,117 | |||
#Marsh & McLennan Cos., Inc. | 49,187 | 1,153,927 | |||
Marshall & Ilsley Corp. | 19,160 | 101,931 | |||
Max Capital Group, Ltd. | 2,600 | 53,690 | |||
MB Financial, Inc. | 2,100 | 37,548 | |||
*MBIA, Inc. | 25,900 | 105,154 | |||
MBT Financial Corp. | 1,485 | 3,015 | |||
*MCG Capital Corp. | 4,800 | 19,152 | |||
Meadowbrook Insurance Group, Inc. | 7,513 | 50,562 | |||
Medallion Financial Corp. | 3,100 | 24,335 | |||
Mercer Insurance Group, Inc. | 1,116 | 20,735 | |||
Merchants Bancshares, Inc. | 894 | 20,222 | |||
Mercury General Corp. | 6,241 | 227,547 | |||
*Meridian Interstate Bancorp, Inc. | 2,501 | 21,509 | |||
MetLife, Inc. | 81,244 | 2,764,733 | |||
*Metro Bancorp, Inc. | 200 | 2,366 | |||
*MF Global, Ltd. | 12,100 | 86,152 | |||
197
THE TAX-MANAGED U.S. EQUITY SERIES
CONTINUED
| Shares | Value† | ||||
Financials — (Continued) | |||||
#*MGIC Investment Corp. | 11,500 | $ | 49,565 | ||
MidSouth Bancorp, Inc. | 900 | 13,005 | |||
Montpelier Re Holdings, Ltd. | 9,900 | 159,984 | |||
#Moody’s Corp. | 23,770 | 562,874 | |||
Morgan Stanley | 125,943 | 4,045,289 | |||
*MSCI, Inc. | 9,977 | 303,301 | |||
*Nara Bancorp, Inc. | 106 | 780 | |||
*NASDAQ OMX Group, Inc. (The) | 18,830 | 340,070 | |||
*National Financial Partners Corp. | 3,900 | 31,785 | |||
National Interstate Corp. | 1,900 | 34,409 | |||
National Penn Bancshares, Inc. | 3,344 | 18,793 | |||
*Navigators Group, Inc. | 1,900 | 100,833 | |||
NBT Bancorp, Inc. | 3,984 | 86,851 | |||
*Nelnet, Inc. Class A | 2,640 | 37,039 | |||
New England Bancshares, Inc. | 1,000 | 5,300 | |||
New Westfield Financial, Inc. | 4,099 | 32,997 | |||
#New York Community Bancorp, Inc. | 32,863 | 354,920 | |||
NewAlliance Bancshares, Inc. | 11,700 | 129,636 | |||
*NewStar Financial, Inc. | 3,503 | 8,793 | |||
Northeast Community Bancorp, Inc. | 1,876 | 12,569 | |||
Northern Trust Corp. | 24,300 | 1,221,075 | |||
Northfield Bancorp, Inc. | 5,398 | 67,097 | |||
Northrim Bancorp, Inc. | 600 | 9,024 | |||
Northwest Bancorp, Inc. | 4,671 | 102,762 | |||
NYMAGIC, Inc. | 100 | 1,429 | |||
NYSE Euronext, Inc. | 23,893 | 617,634 | |||
OceanFirst Financial Corp. | 300 | 2,850 | |||
*Ocwen Financial Corp. | 8,900 | 97,277 | |||
Old National Bancorp | 7,636 | 79,185 | |||
Old Republic International Corp. | 27,487 | 293,561 | |||
#Old Second Bancorp, Inc. | 700 | 3,745 | |||
OneBeacon Insurance Group, Ltd. | 2,900 | 34,568 | |||
optionsXpress Holdings, Inc. | 5,834 | 91,185 | |||
Oriental Financial Group, Inc. | 2,300 | 24,495 | |||
Oritani Financial Corp. | 5,647 | 72,338 | |||
#Pacific Capital Bancorp | 91 | 117 | |||
*Pacific Mercantile Bancorp | 1,425 | 4,232 | |||
#PacWest Bancorp | 2,792 | 47,408 | |||
Park National Corp. | 1,300 | 75,504 | |||
PartnerRe, Ltd. | 6,200 | 474,176 | |||
Patriot National Bancorp | 200 | 383 | |||
Peapack-Gladstone Financial Corp. | 1,228 | 16,185 | |||
*Penson Worldwide, Inc. | 2,800 | 27,300 | |||
Peoples Bancorp, Inc. | 1,197 | 12,856 | |||
People’s United Financial, Inc. | 37,400 | 599,522 | |||
#*PHH Corp, | 8,304 | 134,193 | |||
*PICO Holdings, Inc. | 1,800 | 61,092 | |||
*Pinnacle Financial Partners, Inc. | 2,100 | 26,670 | |||
*Piper Jaffray Cos., Inc. | 1,004 | 46,576 | |||
Platinum Underwriters Holdings, Ltd. | 5,687 | 203,424 | |||
*PMA Capital Corp. | 4,497 | 21,496 | |||
#*PMI Group, Inc. (The) | 6,810 | 16,480 | |||
PNC Financial Services Group, Inc. | 46,218 | 2,261,909 | |||
*Popular, Inc. | 11,400 | 24,624 | |||
#*Portfolio Recovery Associates, Inc. | 2,000 | 92,280 | |||
*Preferred Bank | 1,269 | 3,211 | |||
Presidential Life Corp. | 3,200 | 29,856 | |||
Principal Financial Group, Inc. | 31,700 | 793,768 | |||
PrivateBancorp, Inc. | 2,700 | 24,651 | |||
*ProAssurance Corp. | 3,800 | 191,064 | |||
*Progressive Corp. | 69,836 | 1,117,376 | |||
198
THE TAX-MANAGED U.S. EQUITY SERIES
CONTINUED
| Shares | Value† | ||||
Financials — (Continued) | |||||
Prosperity Bancshares, Inc. | 4,800 | $ | 171,792 | ||
Protective Life Corp. | 6,000 | 115,500 | |||
Provident Financial Holdings, Inc. | 100 | 700 | |||
Provident Financial Services, Inc. | 5,262 | 56,566 | |||
Provident New York Bancorp | 4,135 | 35,272 | |||
Prudential Financial, Inc. | 45,790 | 2,071,082 | |||
QC Holdings, Inc. | 2,796 | 14,539 | |||
#Radian Group, Inc. | 8,700 | 50,373 | |||
#Raymond James Financial, Inc. | 10,975 | 259,120 | |||
Regions Financial Corp. | 91,312 | 441,950 | |||
Reinsurance Group of America, Inc. | 8,390 | 386,779 | |||
RenaissanceRe Holdings, Ltd. | 6,600 | 346,500 | |||
Renasant Corp. | 2,222 | 32,530 | |||
Republic Bancorp, Inc. Class A | 105 | 1,931 | |||
*Republic First Bancorp, Inc. | 1,100 | 4,840 | |||
Resource America, Inc. | 2,228 | 8,600 | |||
*RiskMetrics Group, Inc. | 6,100 | 89,609 | |||
*Riverview Bancorp, Inc. | 1,705 | 5,473 | |||
RLI Corp. | 3,030 | 151,500 | |||
Rockville Financial, Inc. | 2,463 | 25,492 | |||
Roma Financial Corp. | 4,086 | 50,626 | |||
Rome Bancorp, Inc. | 497 | 4,162 | |||
S&T Bancorp, Inc. | 2,951 | 46,478 | |||
S.Y. Bancorp, Inc. | 2,030 | 45,370 | |||
Safety Insurance Group, Inc. | 2,200 | 73,634 | |||
Sanders Morris Harris Group, Inc. | 3,300 | 19,173 | |||
Sandy Spring Bancorp, Inc. | 1,969 | 22,762 | |||
SCBT Financial Corp. | 933 | 24,137 | |||
*Seabright Insurance Holdings | 2,360 | 26,385 | |||
Seacoast Banking Corp. of Florida | 1,900 | 2,831 | |||
SEI Investments Co. | 18,378 | 321,064 | |||
Selective Insurance Group, Inc. | 5,100 | 78,132 | |||
SI Financial Group, Inc. | 1,500 | 6,525 | |||
*Signature Bank | 3,760 | 118,666 | |||
Simmons First National Corp. Class A | 1,872 | 54,775 | |||
*SLM Corp. | 35,168 | 341,130 | |||
Smithtown Bancorp, Inc. | 1,563 | 16,177 | |||
Somerset Hills Bancorp | 945 | 7,475 | |||
*Southern Community Financial Corp. | 900 | 2,097 | |||
Southside Bancshares, Inc. | 1,793 | 37,276 | |||
Southwest Bancorp, Inc. | 1,600 | 15,744 | |||
*Specialty Underwriters’ Alliance, Inc. | 792 | 5,401 | |||
#*St. Joe Co. (The) | 9,102 | 217,902 | |||
*StanCorp Financial Group, Inc. | 4,400 | 161,524 | |||
State Auto Financial Corp. | 4,848 | 78,828 | |||
State Bancorp, Inc. | 2,047 | 15,639 | |||
State Street Corp. | 47,540 | 1,995,729 | |||
StellarOne Corp. | 2,851 | 30,249 | |||
Sterling Bancorp | 1,499 | 10,088 | |||
Sterling Bancshares, Inc. | 8,000 | 44,560 | |||
#*Sterling Financial Corp. | 3,920 | 3,136 | |||
*Stewart Information Services Corp. | 900 | 8,046 | |||
*Stifel Financial Corp. | 3,621 | 188,147 | |||
Student Loan Corp. | 2,000 | 84,100 | |||
Suffolk Bancorp | 900 | 25,164 | |||
*Sun Bancorp, Inc. | 2,137 | 8,676 | |||
#SunTrust Banks, Inc. | 48,201 | 921,121 | |||
Susquehanna Bancshares, Inc. | 6,230 | 34,327 | |||
#*SVB Financial Group | 3,491 | 144,004 | |||
SWS Group, Inc. | 1,770 | 23,683 | |||
*Synovus Financial Corp. | 12,100 | 26,862 | |||
199
THE TAX-MANAGED U.S. EQUITY SERIES
CONTINUED
| Shares | Value† | ||||
Financials — (Continued) | |||||
T. Rowe Price Group, Inc. | 26,125 | $ | 1,273,071 | ||
#*Taylor Capital Group, Inc. | 730 | 4,161 | |||
TCF Financial Corp. | 12,396 | 146,645 | |||
#*TD Ameritrade Holding Corp. | 57,659 | 1,112,819 | |||
*Tejon Ranch Co. | 1,300 | 33,878 | |||
*Tennessee Commerce Bancorp, Inc. | 700 | 3,717 | |||
•#Teton Advisors, Inc. | 5 | — | |||
*Texas Capital Bancshares, Inc. | 4,203 | 61,238 | |||
TFS Financial Corp. | 33,220 | 387,345 | |||
*Thomas Weisel Partners Group, Inc. | 3,004 | 13,608 | |||
*TIB Financial Corp. | 954 | 1,011 | |||
*TierOne Corp. | 400 | 796 | |||
Tompkins Financial Corp. | 1,449 | 62,843 | |||
#Torchmark Corp. | 8,400 | 341,040 | |||
Tower Group, Inc. | 4,700 | 115,526 | |||
#TowneBank | 1,400 | 16,156 | |||
*TradeStation Group, Inc. | 5,240 | 40,453 | |||
Transatlantic Holdings, Inc. | 5,779 | 291,840 | |||
Travelers Cos., Inc. (The) | 61,140 | 3,044,161 | |||
*Tree.com, Inc. | 721 | 5,631 | |||
TriCo Bancshares | 1,628 | 23,801 | |||
TrustCo Bank Corp. | 6,000 | 35,700 | |||
Trustmark Corp. | 7,848 | 148,720 | |||
U.S. Bancorp | 153,715 | 3,569,262 | |||
#UMB Financial Corp. | 4,200 | 167,034 | |||
Umpqua Holdings Corp. | 6,773 | 67,120 | |||
Union Bankshares Corp. | 2,179 | 26,845 | |||
*United America Indemnity, Ltd. | 1,553 | 10,887 | |||
United Bankshares, Inc. | 3,800 | 67,830 | |||
*United Community Banks, Inc. | 4,124 | 16,743 | |||
*United Community Financial Corp. | 1,363 | 2,044 | |||
United Financial Bancorp, Inc. | 2,642 | 33,950 | |||
United Fire & Casualty Co. | 2,765 | 48,332 | |||
*United Security Bancshares | 1,896 | 4,740 | |||
Unitrin, Inc. | 3,100 | 60,760 | |||
Universal Insurance Holdings, Inc. | 3,536 | 18,776 | |||
Univest Corp. of Pennsylvania | 1,893 | 36,402 | |||
Unum Group | 35,400 | 706,230 | |||
*Validus Holdings, Ltd. | 13,955 | 353,061 | |||
#Valley National Bancorp | 11,811 | 156,850 | |||
ViewPoint Financial Group | 2,523 | 33,808 | |||
#*Virginia Commerce Bancorp, Inc. | 2,610 | 10,492 | |||
*Virtus Investment Partners, Inc. | 205 | 3,005 | |||
W. R. Berkley Corp. | 17,930 | 443,230 | |||
Waddell & Reed Financial, Inc. | 9,300 | 260,958 | |||
Washington Banking Co. | 959 | 9,034 | |||
Washington Federal, Inc. | 8,578 | 147,113 | |||
Washington Trust Bancorp, Inc. | 1,700 | 25,534 | |||
*Waterstone Financial, Inc. | 2,561 | 8,733 | |||
Webster Financial Corp. | 3,300 | 37,323 | |||
Wells Fargo & Co. | 461,728 | 12,706,755 | |||
WesBanco, Inc. | 2,565 | 36,295 | |||
Wesco Financial Corp. | 817 | 267,976 | |||
West Bancorporation | 2,033 | 8,945 | |||
Westamerica Bancorporation | 3,200 | 152,960 | |||
#*Western Alliance Bancorp | 4,026 | 17,513 | |||
Westwood Holdings Group, Inc. | 1,000 | 35,290 | |||
White Mountains Insurance Group, Ltd. | 500 | 155,085 | |||
Whitney Holding Corp. | 4,100 | 32,923 | |||
Wilmington Trust Corp. | 3,700 | 44,585 | |||
Wilshire Bancorp, Inc. | 4,528 | 31,877 | |||
200
THE TAX-MANAGED U.S. EQUITY SERIES
CONTINUED
| Shares | Value† | ||||
Financials — (Continued) | |||||
Wintrust Financial Corp. | 2,250 | $ | 63,472 | ||
#*World Acceptance Corp. | 1,700 | 42,653 | |||
Yadkin Valley Financial Corp. | 671 | 2,469 | |||
Zenith National Insurance Corp. | 3,400 | 97,002 | |||
#Zions Bancorporation | 7,500 | 106,200 | |||
*ZipRealty, Inc. | 3,331 | 12,491 | |||
Total Financials | 147,846,452 | ||||
Health Care — (11.6%) | |||||
*A.D.A.M., Inc. | 575 | 1,886 | |||
#*Abaxis, Inc. | 2,563 | 58,488 | |||
Abbott Laboratories | 159,127 | 8,047,052 | |||
#*ABIOMED, Inc. | 2,981 | 26,978 | |||
#*Abraxis Bioscience, Inc. | 100 | 3,122 | |||
*Accelrys, Inc. | 3,112 | 16,898 | |||
*Accuray, Inc. | 5,600 | 32,312 | |||
*Acorda Therapeutics, Inc. | 3,200 | 69,536 | |||
*Adolor Corp. | 778 | 1,128 | |||
Aetna, Inc. | 37,600 | 978,728 | |||
*Affymax, Inc. | 2,611 | 52,586 | |||
#*Affymetrix, Inc. | 8,729 | 45,653 | |||
#*Air Methods Corp. | 1,457 | 44,497 | |||
*Albany Molecular Research, Inc. | 3,400 | 27,676 | |||
*Alexion Pharmaceuticals, Inc. | 8,800 | 390,808 | |||
*Alexza Pharmaceuticals, Inc. | 1,456 | 3,116 | |||
*Align Technology, Inc. | 8,300 | 130,476 | |||
#*Alkermes, Inc. | 8,370 | 66,709 | |||
Allergan, Inc. | 30,570 | 1,719,562 | |||
*Alliance HealthCare Services, Inc. | 5,000 | 27,200 | |||
*Allion Healthcare, Inc. | 3,300 | 21,252 | |||
#*Allos Therapeutics, Inc. | 10,300 | 58,195 | |||
#*Allscripts-Misys Healthcare Solutions, Inc. | 16,100 | 313,950 | |||
*Almost Family, Inc. | 812 | 24,644 | |||
*Alnylam Pharmaceuticals, Inc. | 3,400 | 57,936 | |||
*Alphatec Holdings, Inc. | 3,400 | 16,252 | |||
#*AMAG Pharmaceuticals, Inc. | 2,000 | 75,560 | |||
#*Amedisys, Inc. | 2,934 | 116,744 | |||
America Services Group, Inc. | 1,200 | 15,744 | |||
*American Caresource Holding, Inc. | 400 | 1,068 | |||
*American Dental Partners, Inc. | 1,985 | 23,602 | |||
#*American Medical Systems Holdings, Inc. | 9,000 | 138,780 | |||
*AMERIGROUP Corp. | 6,100 | 134,505 | |||
AmerisourceBergen Corp. | 32,420 | 718,103 | |||
*Amgen, Inc. | 106,871 | 5,742,179 | |||
*AMICAS, Inc. | 4,500 | 14,175 | |||
#*Amicus Therapeutics, Inc. | 1,205 | 4,627 | |||
*AMN Healthcare Services, Inc. | 6,328 | 52,649 | |||
#*Amsurg Corp. | 3,550 | 74,798 | |||
*Amylin Pharmaceuticals, Inc. | 11,780 | 130,051 | |||
*Anadys Pharmaceuticals, Inc. | 3,300 | 6,435 | |||
Analogic Corp. | 1,641 | 61,275 | |||
*AngioDynamics, Inc. | 3,150 | 47,565 | |||
*Anika Therapeutics, Inc. | 1,888 | 13,820 | |||
*Ardea Biosciences, Inc. | 1,242 | 16,767 | |||
*Arena Pharmaceuticals, Inc. | 9,661 | 34,103 | |||
*Arqule, Inc. | 6,533 | 21,886 | |||
*Array BioPharma, Inc. | 2,900 | 5,191 | |||
*Aspect Medical Systems, Inc. | 1,900 | 22,762 | |||
*Assisted Living Concepts, Inc. | 915 | 18,959 | |||
#*athenahealth, Inc. | 2,400 | 90,264 | |||
*AtriCure, Inc. | 1,383 | 5,643 | |||
201
THE TAX-MANAGED U.S. EQUITY SERIES
CONTINUED
| Shares | Value† | ||||
Health Care — (Continued) | |||||
*ATS Medical, Inc. | 12,306 | $ | 33,103 | ||
*Auxilium Pharmaceuticals, Inc. | 3,800 | 119,548 | |||
Bard (C.R.), Inc. | 12,030 | 903,092 | |||
Baxter International, Inc. | 60,765 | 3,284,956 | |||
Beckman Coulter, Inc. | 6,500 | 418,145 | |||
Becton Dickinson & Co. | 24,000 | 1,640,640 | |||
*BioClinica, Inc. | 2,162 | 9,643 | |||
#*BioCryst Pharmaceuticals, Inc. | 3,400 | 30,362 | |||
*Biodel, Inc. | 3,100 | 12,958 | |||
*Biogen Idec, Inc. | 30,375 | 1,279,699 | |||
#*BioMarin Pharmaceutical, Inc. | 9,600 | 149,376 | |||
*BioMimetic Therapeutics, Inc. | 2,915 | 34,019 | |||
*Bio-Rad Laboratories, Inc. | 2,213 | 197,820 | |||
#*Bio-Reference Laboratories, Inc. | 1,400 | 45,262 | |||
*BioSante Pharmaceuticals, Inc. | 3,484 | 5,296 | |||
*BioScrip, Inc. | 2,900 | 21,866 | |||
#*BioSphere Medical, Inc. | 2,293 | 6,489 | |||
#*BMP Sunstone Corp. | 3,063 | 11,149 | |||
*Boston Scientific Corp. | 121,711 | 988,293 | |||
*Bovie Medical Corp. | 2,540 | 20,345 | |||
Bristol-Myers Squibb Co. | 204,650 | 4,461,370 | |||
*Brookdale Senior Living, Inc. | 10,600 | 178,504 | |||
*Bruker BioSciences Corp. | 14,990 | 162,492 | |||
#*BSD Medical Corp. | 2,800 | 6,496 | |||
#*Cadence Pharmaceuticals, Inc. | 4,900 | 44,247 | |||
*Cambrex Corp. | 3,827 | 22,962 | |||
*Cantel Medical Corp. | 2,444 | 39,251 | |||
*Capital Senior Living Corp. | 3,849 | 20,361 | |||
*Caraco Pharmaceutical Laboratories, Ltd. | 3,597 | 13,237 | |||
*Cardiac Science Corp. | 3,085 | 10,798 | |||
Cardinal Health, Inc. | 27,284 | 773,229 | |||
*Cardiovascular Systems, Inc. | 200 | 978 | |||
*CareFusion Corp. | 7,067 | 158,089 | |||
#*CAS Medical Systems, Inc. | 1,900 | 3,078 | |||
*Catalyst Health Solutions, Inc. | 3,800 | 119,206 | |||
*Celera Corp. | 9,599 | 59,418 | |||
*Celgene Corp. | 45,682 | 2,332,066 | |||
*Celldex Therapeutics, Inc. | 2,100 | 9,156 | |||
*Celsion Corp. | 1,300 | 4,043 | |||
*Centene Corp. | 4,800 | 85,584 | |||
*Cephalon, Inc. | 8,295 | 452,741 | |||
#*Cepheid, Inc. | 4,900 | 65,023 | |||
#*Cerner Corp. | 8,500 | 646,340 | |||
#*Charles River Laboratories International, Inc. | 6,400 | 233,728 | |||
Chemed Corp. | 2,300 | 104,236 | |||
Cigna Corp. | 27,500 | 765,600 | |||
*Clinical Data, Inc. | 2,347 | 37,036 | |||
*CombiMatrix Corp. | 1,107 | 7,029 | |||
#*Community Health Systems, Inc. | 8,800 | 275,264 | |||
Computer Programs & Systems, Inc. | 1,556 | 65,725 | |||
*Conceptus, Inc. | 3,600 | 63,144 | |||
*CONMED Corp. | 2,235 | 47,360 | |||
*Continucare Corp. | 6,300 | 16,506 | |||
#Cooper Cos., Inc. | 4,865 | 136,269 | |||
*Corvel Corp. | 1,400 | 39,900 | |||
#*Covance, Inc. | 6,600 | 341,088 | |||
*Coventry Health Care, Inc. | 15,263 | 302,665 | |||
*Cross Country Healthcare, Inc. | 1,700 | 14,042 | |||
*CryoLife, Inc. | 3,061 | 18,366 | |||
*Cubist Pharmaceuticals, Inc. | 7,273 | 123,205 | |||
*Cutera, Inc. | 1,850 | 16,668 | |||
202
THE TAX-MANAGED U.S. EQUITY SERIES
CONTINUED
| Shares | Value† | ||||
Health Care — (Continued) | |||||
#*Cyberonics, Inc. | 2,300 | $ | 33,258 | ||
*Cynosure, Inc. | 1,600 | 16,032 | |||
#*Cypress Bioscience, Inc. | 3,390 | 20,815 | |||
*Cytokinetics, Inc. | 3,764 | 12,007 | |||
*DaVita, Inc. | 10,970 | 581,739 | |||
#*Dendreon Corp. | 11,251 | 284,313 | |||
#DENTSPLY International, Inc. | 14,600 | 481,216 | |||
*DepoMed, Inc. | 3,900 | 12,129 | |||
#*Dexcom, Inc. | 5,000 | 34,300 | |||
*Dialysis Corp. of America | 2,100 | 14,490 | |||
*Dionex Corp. | 1,950 | 132,366 | |||
*Durect Corp. | 7,649 | 16,139 | |||
*Dyax Corp. | 9,809 | 30,800 | |||
*Dynacq Healthcare, Inc. | 300 | 966 | |||
*Eclipsys Corp. | 5,300 | 99,375 | |||
#*Edwards Lifesciences Corp. | 6,603 | 508,035 | |||
Eli Lilly & Co. | 105,275 | 3,580,403 | |||
*Emergency Medical Services Corp. Class A | 1,700 | 81,634 | |||
*Emergent BioSolutions, Inc. | 3,179 | 45,841 | |||
*Emergent Group, Inc. | 1,300 | 8,756 | |||
#*Emeritus Corp. | 3,747 | 69,919 | |||
*Endo Pharmaceuticals Holdings, Inc. | 13,481 | 301,974 | |||
•*Endo Pharmaceuticals Solutions | 8,600 | 8,514 | |||
*Endologix, Inc. | 4,500 | 21,420 | |||
Ensign Group, Inc. | 3,000 | 44,340 | |||
#*Enzon Pharmaceuticals, Inc. | 4,617 | 38,737 | |||
*eResearch Technology, Inc. | 4,700 | 34,780 | |||
*ev3, Inc. | 10,059 | 118,495 | |||
#*Exactech, Inc. | 1,400 | 21,000 | |||
*Exelixis, Inc. | 10,300 | 62,624 | |||
*Express Scripts, Inc. | 27,254 | 2,178,140 | |||
*Facet Biotech Corp. | 3,443 | 58,979 | |||
*Forest Laboratories, Inc. | 29,798 | 824,511 | |||
*Fresenius Kabi Pharmaceuticals Holding, Inc. | 17,749 | 8,253 | |||
#*Genomic Health, Inc. | 2,998 | 55,673 | |||
*Genoptix, Inc. | 1,900 | 66,101 | |||
*Gen-Probe, Inc. | 4,794 | 200,006 | |||
*Gentiva Health Services, Inc. | 3,177 | 76,248 | |||
*Genzyme Corp. | 28,068 | 1,420,241 | |||
#*Geron Corp. | 9,900 | 60,489 | |||
#*Gilead Sciences, Inc. | 101,750 | 4,329,462 | |||
#*Greatbatch, Inc. | 2,910 | 57,240 | |||
#*GTx, Inc. | 2,703 | 24,273 | |||
*Haemonetics Corp. | 3,002 | 154,603 | |||
*Halozyme Therapeutics, Inc. | 7,600 | 46,056 | |||
*Hanger Orthopedic Group, Inc. | 1,800 | 24,912 | |||
*Hansen Medical, Inc. | 700 | 1,792 | |||
*Harvard Bioscience, Inc. | 4,139 | 14,983 | |||
*Health Grades, Inc. | 4,492 | 19,495 | |||
*Health Management Associates, Inc. | 23,724 | 144,716 | |||
*Health Net, Inc. | 8,693 | 129,613 | |||
#*HEALTHSOUTH Corp. | 9,122 | 133,272 | |||
*HealthSpring, Inc. | 4,800 | 68,784 | |||
*HealthStream, Inc. | 2,809 | 10,787 | |||
*Healthways, Inc. | 3,100 | 49,848 | |||
#*Hemispherx Biopharma, Inc. | 4,500 | 6,525 | |||
#*Henry Schein, Inc. | 9,900 | 523,017 | |||
Hill-Rom Holdings, Inc. | 7,105 | 139,187 | |||
*Hi-Tech Pharmacal Co., Inc. | 1,129 | 20,593 | |||
*HMS Holdings Corp. | 2,900 | 124,497 | |||
*Hologic, Inc. | 28,078 | 414,993 | |||
203
THE TAX-MANAGED U.S. EQUITY SERIES
CONTINUED
| Shares | Value† | ||||
Health Care — (Continued) | |||||
*Home Diagnostics, Inc. | 3,161 | $ | 19,756 | ||
*Hospira, Inc. | 15,814 | 705,937 | |||
#*Human Genome Sciences, Inc. | 16,300 | 304,647 | |||
#*Humana, Inc. | 15,900 | 597,522 | |||
*ICU Medical, Inc. | 1,750 | 61,250 | |||
*Idenix Pharmaceuticals, Inc. | 6,900 | 15,318 | |||
*Idera Pharmaceuticals, Inc. | 3,193 | 17,051 | |||
#*IDEXX Laboratories, Inc. | 5,800 | 296,496 | |||
*Illumina, Inc. | 11,746 | 377,047 | |||
*Immucor, Inc. | 8,325 | 148,851 | |||
*ImmunoGen, Inc. | 6,184 | 41,371 | |||
*Immunomedics, Inc. | 6,470 | 23,033 | |||
IMS Health, Inc. | 18,090 | 296,495 | |||
#*Incyte Corp. | 10,564 | 62,222 | |||
*Infinity Pharmaceuticals, Inc. | 3,056 | 17,052 | |||
*Inspire Pharmaceuticals, Inc. | 7,300 | 32,631 | |||
*Insulet Corp. | 5,800 | 64,380 | |||
*Integra LifeSciences Holdings Corp. | 2,600 | 79,404 | |||
*IntegraMed America, Inc. | 1,494 | 12,699 | |||
*InterMune, Inc. | 4,162 | 50,277 | |||
#*Intuitive Surgical, Inc. | 3,738 | 920,856 | |||
#Invacare Corp. | 3,000 | 67,290 | |||
*InVentiv Health, Inc. | 2,663 | 45,218 | |||
*Inverness Medical Innovations, Inc. | 8,565 | 325,556 | |||
*IPC The Hospitalist Co. | 2,600 | 78,780 | |||
*IRIS International, Inc. | 2,045 | 20,736 | |||
#*Isis Pharmaceuticals, Inc. | 10,843 | 137,381 | |||
*ISTA Pharmaceuticals, Inc. | 2,153 | 7,880 | |||
Johnson & Johnson | 292,484 | 17,271,180 | |||
#*Kendle International, Inc. | 1,300 | 21,944 | |||
*Kensey Nash Corp. | 1,443 | 34,502 | |||
*Kindred Healthcare, Inc. | 4,200 | 61,740 | |||
#*Kinetic Concepts, Inc. | 5,800 | 192,502 | |||
*King Pharmaceuticals, Inc. | 27,935 | 282,982 | |||
*K-V Pharmaceutical Co. | 300 | 1,140 | |||
#*Laboratory Corp. of America Holdings | 10,900 | 750,901 | |||
Landauer, Inc. | 1,220 | 63,184 | |||
*Lannet Co., Inc. | 3,087 | 20,745 | |||
*LCA-Vision, Inc. | 3,050 | 13,725 | |||
#*LHC Group, Inc. | 2,363 | 65,951 | |||
*Life Technologies Corp. | 18,827 | 888,070 | |||
#*LifePoint Hospitals, Inc. | 6,445 | 182,587 | |||
*Ligand Pharmaceuticals, Inc. Class B | 11,936 | 20,291 | |||
#*Lincare Holdings, Inc. | 5,672 | 178,158 | |||
#*Luminex Corp. | 4,334 | 63,796 | |||
*Magellan Health Services, Inc. | 3,965 | 127,395 | |||
*MAKO Surgical Corp. | 2,300 | 20,815 | |||
#*Mannkind Corp. | 13,673 | 71,373 | |||
*Martek Biosciences Corp. | 3,448 | 61,926 | |||
#*Masimo Corp. | 5,290 | 140,555 | |||
#*Matrixx Initiatives, Inc. | 1,300 | 5,850 | |||
*Maxygen, Inc. | 3,953 | 22,058 | |||
McKesson Corp. | 27,810 | 1,633,281 | |||
*MDRNA, Inc. | 4,100 | 4,264 | |||
*MedAssets, Inc. | 6,600 | 144,804 | |||
*MedCath Corp. | 1,848 | 15,172 | |||
*Medco Health Solutions, Inc. | 57,745 | 3,240,649 | |||
*Medical Action Industries, Inc. | 2,396 | 26,212 | |||
*Medicines Co. (The) | 1,500 | 10,785 | |||
*MediciNova, Inc. | 740 | 4,592 | |||
Medicis Pharmaceutical Corp. Class A | 4,326 | 91,581 | |||
204
THE TAX-MANAGED U.S. EQUITY SERIES
CONTINUED
| Shares | Value† | ||||
Health Care — (Continued) | |||||
#*Medivation, Inc. | 3,240 | $ | 82,685 | ||
*Mednax, Inc. | 4,400 | 228,448 | |||
*MEDTOX Scientific, Inc. | 377 | 3,762 | |||
Medtronic, Inc. | 110,304 | 3,937,853 | |||
#Merck & Co., Inc. | 217,914 | 6,740,080 | |||
*Merge Healthcare, Inc. | 5,633 | 20,166 | |||
Meridian Bioscience, Inc. | 4,275 | 94,862 | |||
*Merit Medical Systems, Inc. | 3,211 | 54,523 | |||
*Metabolix, Inc. | 1,609 | 16,315 | |||
*Metropolitan Health Networks, Inc. | 1,125 | 2,295 | |||
#*Mettler Toledo International, Inc. | 3,245 | 316,388 | |||
*Micromet, Inc. | 6,715 | 34,314 | |||
#*Millipore Corp. | 6,917 | 463,508 | |||
#*Molecular Insight Pharmaceuticals, Inc. | 3,450 | 16,560 | |||
*Molina Healthcare, Inc. | 3,094 | 57,920 | |||
*Momenta Pharmaceuticals, Inc. | 3,101 | 28,281 | |||
*MTS Medication Technologies, Inc. | 320 | 1,755 | |||
*MWI Veterinary Supply, Inc. | 1,200 | 42,480 | |||
#*Mylan, Inc. | 29,350 | 476,644 | |||
*Myriad Genetics, Inc. | 11,200 | 271,936 | |||
*Myriad Pharmaceuticals, Inc. | 3,247 | 17,923 | |||
*Nabi Biopharmaceuticals | 6,490 | 21,092 | |||
*Nanosphere, Inc. | 300 | 2,004 | |||
#National Healthcare Corp. | 1,784 | 64,170 | |||
National Research Corp. | 200 | 4,614 | |||
*Natus Medical, Inc. | 1,980 | 27,502 | |||
*Nektar Therapeutics | 8,118 | 65,918 | |||
*Neogen Corp. | 1,950 | 61,815 | |||
*Neurocrine Biosciences, Inc. | 2,000 | 4,440 | |||
#*NovaMed, Inc. | 3,861 | 15,560 | |||
*NPS Pharmaceuticals, Inc. | 5,995 | 19,004 | |||
#*NuVasive, Inc. | 3,900 | 141,531 | |||
*NxStage Medical, Inc. | 5,192 | 28,971 | |||
*Obagi Medical Products, Inc. | 2,655 | 27,134 | |||
*Odyssey Healthcare, Inc. | 4,400 | 61,336 | |||
Omnicare, Inc. | 12,240 | 265,241 | |||
*Omnicell, Inc. | 2,600 | 25,584 | |||
*Oncothyreon, Inc. | 2,700 | 9,531 | |||
#*Onyx Pharmaceuticals, Inc. | 5,800 | 154,280 | |||
*Optimer Pharmaceuticals, Inc. | 3,500 | 40,460 | |||
*OraSure Technologies, Inc. | 6,438 | 20,988 | |||
*Orexigen Therapeutics, Inc. | 4,000 | 25,840 | |||
*Orthovita, Inc. | 8,000 | 28,000 | |||
#*OSI Pharmaceuticals, Inc. | 6,400 | 206,208 | |||
#*Osiris Therapeutics, Inc. | 3,300 | 20,955 | |||
*Osteotech, Inc. | 1,415 | 6,113 | |||
Owens & Minor, Inc. | 5,000 | 204,450 | |||
*Pain Therapeutics, Inc. | 5,300 | 26,871 | |||
*Palomar Medical Technologies, Inc. | 1,396 | 14,183 | |||
*Par Pharmaceutical Cos., Inc. | 4,600 | 96,462 | |||
*Parexel International Corp. | 5,425 | 67,921 | |||
#*Patterson Cos., Inc. | 12,000 | 306,360 | |||
*PDI, Inc. | 1,874 | 9,407 | |||
#PDL BioPharma, Inc. | 10,316 | 86,758 | |||
*Penwest Pharmaceuticals Co. | 1,400 | 3,024 | |||
PerkinElmer, Inc. | 12,800 | 238,208 | |||
#Perrigo Co. | 9,276 | 344,974 | |||
Pfizer, Inc. | 798,203 | 13,593,397 | |||
Pharmaceutical Products Development Service, Inc. | 10,000 | 215,500 | |||
*Pharmasset, Inc. | 3,200 | 60,096 | |||
*PharmAthene, Inc. | 1,400 | 5,180 | |||
205
THE TAX-MANAGED U.S. EQUITY SERIES
CONTINUED
| Shares | Value† | ||||
Health Care — (Continued) | |||||
#*PharMerica Corp. | 2,600 | $ | 40,118 | ||
*Phase Forward, Inc. | 3,793 | 49,726 | |||
*Poniard Pharmaceuticals, Inc. | 3,109 | 20,364 | |||
*Pozen, Inc. | 2,100 | 11,928 | |||
*Progenics Pharmaceuticals, Inc. | 2,600 | 10,894 | |||
*Prospect Medical Holdings, Inc. | 1,283 | 5,132 | |||
*Providence Service Corp. | 2,200 | 27,412 | |||
#*PSS World Medical, Inc. | 6,816 | 137,820 | |||
#*Psychiatric Solutions, Inc. | 5,300 | 109,392 | |||
*QuadraMed Corp. | 680 | 4,964 | |||
#Quality Systems, Inc. | 3,699 | 225,713 | |||
Quest Diagnostics, Inc. | 18,734 | 1,047,793 | |||
#*Quidel Corp. | 3,900 | 55,770 | |||
*Quigley Corp. | 1,100 | 2,310 | |||
*Regeneration Technologies, Inc. | 5,098 | 19,984 | |||
*Regeneron Pharmaceuticals, Inc. | 7,500 | 117,750 | |||
*RehabCare Group, Inc. | 2,500 | 46,875 | |||
*Repligen Corp. | 3,600 | 17,568 | |||
*Res-Care, Inc. | 3,700 | 44,511 | |||
*ResMed, Inc. | 7,200 | 354,312 | |||
#*Rigel Pharmaceuticals, Inc. | 3,200 | 20,512 | |||
*Rochester Medical Corp. | 1,592 | 16,095 | |||
*Rockwell Medical Technologies, Inc. | 1,400 | 9,450 | |||
*Salix Pharmaceuticals, Ltd. | 6,200 | 114,018 | |||
*Sangamo BioSciences, Inc. | 2,700 | 14,364 | |||
#*Savient Pharmaceuticals, Inc. | 4,100 | 51,660 | |||
Schering-Plough Corp. | 208,323 | 5,874,709 | |||
*Seattle Genetics, Inc. | 9,820 | 89,166 | |||
*SenoRx, Inc. | 800 | 3,168 | |||
#*Sequenom, Inc. | 6,679 | 18,434 | |||
#*Sirona Dental Systems, Inc. | 5,800 | 156,078 | |||
*Skilled Healthcare Group, Inc. | 2,400 | 19,296 | |||
*Somanetics Corp. | 1,600 | 23,920 | |||
*SonoSite, Inc. | 2,400 | 59,496 | |||
*Spectranetics Corp. | 4,200 | 23,940 | |||
*Spectrum Pharmaceuticals, Inc. | 2,250 | 9,338 | |||
*St. Jude Medical, Inc. | 35,955 | 1,225,346 | |||
*Stereotaxis, Inc. | 4,700 | 16,967 | |||
Steris Corp. | 6,600 | 193,116 | |||
*Strategic Diagnostics, Inc. | 3,091 | 5,224 | |||
Stryker Corp. | 39,450 | 1,814,700 | |||
*Sucampo Pharmaceuticals, Inc. | 900 | 3,933 | |||
*Sun Healthcare Group, Inc. | 4,100 | 37,228 | |||
#*Sunrise Senior Living, Inc. | 100 | 416 | |||
*SuperGen, Inc. | 6,537 | 15,297 | |||
#*SurModics, Inc. | 1,100 | 28,171 | |||
*Symmetry Medical, Inc. | 3,300 | 26,400 | |||
*Synovis Life Technologies, Inc. | 1,397 | 16,848 | |||
*Targacept, Inc. | 2,777 | 52,069 | |||
Techne Corp. | 4,233 | 264,605 | |||
Teleflex, Inc. | 4,020 | 199,995 | |||
*Tenet Healthcare Corp. | 43,900 | 224,768 | |||
#*Theravance, Inc. | 6,800 | 94,996 | |||
*Thermo Fisher Scientific, Inc. | 43,096 | 1,939,320 | |||
#*Thoratec Corp. | 6,400 | 168,064 | |||
*Tomotherapy, Inc. | 6,900 | 22,908 | |||
*TranS1, Inc. | 2,100 | 8,337 | |||
*Transcend Services, Inc. | 800 | 14,600 | |||
*Transcept Pharmaceuticals, Inc. | 133 | 730 | |||
*Triple-S Management Corp. | 2,900 | 48,430 | |||
*Trubion Pharmaceuticals, Inc. | 100 | 436 | |||
206
THE TAX-MANAGED U.S. EQUITY SERIES
CONTINUED
| Shares | Value† | ||||
Health Care — (Continued) | |||||
*U.S. Physical Therapy, Inc. | 902 | $ | 12,664 | ||
#*United Therapeutics Corp. | 5,760 | 245,030 | |||
UnitedHealth Group, Inc. | 117,355 | 3,045,362 | |||
*Universal American Corp. | 8,200 | 82,000 | |||
Universal Health Services, Inc. | 5,800 | 322,770 | |||
Utah Medical Products, Inc. | 276 | 8,070 | |||
#*Valeant Pharmaceuticals International | 7,965 | 234,171 | |||
*Vanda Pharmaceuticals, Inc. | 2,400 | 24,480 | |||
#*Varian Medical Systems, Inc. | 11,800 | 483,564 | |||
*Varian, Inc. | 3,300 | 168,960 | |||
*Vascular Solutions, Inc. | 2,700 | 20,844 | |||
#*VCA Antech, Inc. | 8,100 | 192,942 | |||
#*Vertex Pharmaceuticals, Inc. | 19,400 | 651,064 | |||
*Vical, Inc. | 2,858 | 8,803 | |||
*Viropharma, Inc. | 4,000 | 30,160 | |||
#*Virtual Radiologic Corp. | 1,486 | 19,095 | |||
*Vital Images, Inc. | 2,220 | 25,330 | |||
#*Vivus, Inc. | 5,800 | 45,820 | |||
#*Volcano Corp. | 6,070 | 87,104 | |||
#*Warner Chilcott P.L.C. | 7,753 | 171,729 | |||
*Waters Corp. | 9,400 | 539,842 | |||
*Watson Pharmaceuticals, Inc. | 12,540 | 431,627 | |||
*WellCare Health Plans, Inc. | 600 | 15,678 | |||
*WellPoint, Inc. | 52,121 | 2,437,178 | |||
West Pharmaceutical Services, Inc. | 3,695 | 145,842 | |||
#*Wright Medical Group, Inc. | 3,195 | 51,919 | |||
*XenoPort, Inc. | 1,700 | 28,407 | |||
Young Innovations, Inc. | 1,000 | 23,650 | |||
*Zimmer Holdings, Inc. | 22,280 | 1,171,260 | |||
*Zoll Medical Corp. | 1,200 | 23,304 | |||
*Zymogenetics, Inc. | 5,400 | 25,110 | |||
Total Health Care | 145,558,451 | ||||
Industrials — (9.9%) | |||||
*3D Systems Corp. | 3,119 | 27,510 | |||
3M Co. | 60,323 | 4,437,963 | |||
A.O. Smith Corp. | 2,300 | 91,149 | |||
#AAON, Inc. | 2,050 | 36,920 | |||
*AAR Corp. | 4,715 | 92,461 | |||
ABM Industries, Inc. | 6,078 | 114,145 | |||
*Acacia Technologies Group | 3,410 | 25,916 | |||
*ACCO Brands Corp. | 5,418 | 32,833 | |||
Aceto Corp. | 1,500 | 8,310 | |||
Actuant Corp. | 4,600 | 71,806 | |||
Acuity Brands, Inc. | 3,882 | 122,904 | |||
Administaff, Inc. | 3,000 | 74,460 | |||
*Advisory Board Co. (The) | 2,600 | 64,064 | |||
#*Aecom Technology Corp. | 10,600 | 267,544 | |||
*AeroVironment, Inc. | 1,600 | 42,656 | |||
*AGCO Corp. | 8,600 | 241,746 | |||
Aircastle, Ltd. | 11,300 | 89,496 | |||
#*AirTran Holdings, Inc. | 11,106 | 46,978 | |||
Alamo Group, Inc. | 789 | 10,809 | |||
*Alaska Air Group, Inc. | 2,416 | 62,140 | |||
Albany International Corp. | 2,000 | 33,320 | |||
Alexander & Baldwin, Inc. | 3,730 | 107,536 | |||
#*Allegiant Travel Co. | 2,700 | 101,817 | |||
#*Alliant Techsystems, Inc. | 3,650 | 283,897 | |||
*Allied Defense Group, Inc. | 700 | 4,410 | |||
*Amerco, Inc. | 2,700 | 114,129 | |||
#*American Commercial Lines, Inc. | 1,000 | 21,450 | |||
207
THE TAX-MANAGED U.S. EQUITY SERIES
CONTINUED
| Shares | Value† | ||||
Industrials — (Continued) | |||||
American Ecology Corp. | 2,200 | $ | 36,564 | ||
American Railcar Industries, Inc. | 2,374 | 23,740 | |||
*American Reprographics Co. | 5,000 | 30,000 | |||
American Science & Engineering, Inc. | 1,100 | 72,732 | |||
*American Superconductor Corp. | 5,154 | 172,762 | |||
American Woodmark Corp. | 1,214 | 23,879 | |||
Ameron International Corp. | 1,000 | 58,980 | |||
Ametek, Inc. | 10,500 | 366,345 | |||
Ampco-Pittsburgh Corp. | 1,064 | 28,622 | |||
*AMR Corp. | 15,600 | 84,084 | |||
*APAC Customer Services, Inc. | 6,100 | 39,345 | |||
Apogee Enterprises, Inc. | 3,000 | 39,720 | |||
Applied Industrial Technologies, Inc. | 4,975 | 100,644 | |||
Applied Signal Technologies, Inc. | 1,500 | 30,735 | |||
*Argan, Inc. | 1,600 | 19,760 | |||
*Argon ST, Inc. | 2,139 | 39,785 | |||
Arkansas Best Corp. | 3,000 | 77,460 | |||
#*Armstrong World Industries, Inc. | 6,000 | 223,500 | |||
#*Astec Industries, Inc. | 2,360 | 54,280 | |||
*AT Cross Co. | 845 | 3,169 | |||
*ATC Technology Corp. | 2,100 | 43,890 | |||
*Atlas Air Worldwide Holdings, Inc. | 2,341 | 61,545 | |||
Avery Dennison Corp. | 9,001 | 320,886 | |||
#*Avis Budget Group, Inc. | 1,900 | 15,960 | |||
#*AZZ, Inc. | 1,630 | 55,844 | |||
B.F. Goodrich Co. | 13,100 | 711,985 | |||
#Badger Meter, Inc. | 1,600 | 59,632 | |||
*Baker (Michael) Corp. | 1,199 | 42,804 | |||
#Baldor Electric Co. | 5,200 | 134,420 | |||
Barnes Group, Inc. | 5,809 | 92,073 | |||
Barrett Business Services, Inc. | 1,861 | 21,588 | |||
#*BE Aerospace, Inc. | 9,300 | 164,889 | |||
#*Beacon Roofing Supply, Inc. | 5,790 | 83,144 | |||
Belden, Inc. | 4,700 | 107,865 | |||
#*Blount International, Inc. | 5,248 | 47,442 | |||
#*BlueLinx Holdings, Inc. | 3,154 | 9,241 | |||
Boeing Co. | 72,650 | 3,472,670 | |||
*Bowne & Co., Inc. | 2,923 | 19,087 | |||
Brady Co. Class A | 6,190 | 167,625 | |||
Briggs & Stratton Corp. | 4,900 | 91,630 | |||
Brink’s Co. (The) | 4,700 | 111,531 | |||
*BTU International, Inc. | 600 | 3,048 | |||
Bucyrus International, Inc. | 4,800 | 213,216 | |||
*Builders FirstSource, Inc. | 357 | 1,389 | |||
Burlington Northern Santa Fe Corp. | 35,170 | 2,649,004 | |||
#*C&D Technologies, Inc. | 2,200 | 4,026 | |||
C.H. Robinson Worldwide, Inc. | 16,900 | 931,359 | |||
Carlisle Cos., Inc. | 6,900 | 214,176 | |||
Cascade Corp. | 1,095 | 27,200 | |||
*Casella Waste Systems, Inc. | 925 | 2,581 | |||
Caterpillar, Inc. | 61,609 | 3,392,192 | |||
#*CBIZ, Inc. | 8,700 | 61,248 | |||
CDI Corp. | 2,400 | 29,232 | |||
*Celadon Group, Inc. | 3,569 | 34,833 | |||
#*Cenveo, Inc. | 4,900 | 34,692 | |||
*Ceradyne, Inc. | 3,475 | 56,017 | |||
*Chart Industries, Inc. | 3,900 | 77,103 | |||
*Chase Corp. | 1,500 | 18,000 | |||
Cintas Corp. | 13,630 | 377,415 | |||
CIRCOR International, Inc. | 1,580 | 43,055 | |||
CLAROC, Inc. | 5,878 | 172,990 | |||
208
THE TAX-MANAGED U.S. EQUITY SERIES
CONTINUED
| Shares | Value† | ||||
Industrials — (Continued) | |||||
*Clean Harbors, Inc. | 2,500 | $ | 141,125 | ||
*Columbus McKinnon Corp. | 2,000 | 33,100 | |||
Comfort Systems USA, Inc. | 5,229 | 56,996 | |||
*Command Security Corp. | 1,831 | 3,937 | |||
*COMSYS IT Partners, Inc. | 1,740 | 11,919 | |||
*Consolidated Graphics, Inc. | 700 | 14,042 | |||
#*Continental Airlines, Inc. | 12,598 | 144,877 | |||
Con-way, Inc. | 4,223 | 139,317 | |||
Cooper Industries P.L.C. | 16,181 | 626,043 | |||
*Copart, Inc. | 10,287 | 330,933 | |||
*Cornell Cos., Inc. | 1,700 | 38,828 | |||
Corporate Executive Board Co. | 2,488 | 59,737 | |||
#*Corrections Corp. of America | 11,900 | 284,886 | |||
#*CoStar Group, Inc. | 2,156 | 83,696 | |||
Courier Corp. | 1,460 | 21,652 | |||
#*Covanta Holding Corp. | 18,435 | 316,713 | |||
*Covenant Transportation Group, Inc. | 100 | 504 | |||
*CPI Aerostructures, Inc. | 541 | 3,700 | |||
*CRA International, Inc. | 1,100 | 27,225 | |||
#Crane Co. | 5,100 | 142,035 | |||
CSX Corp. | 46,100 | 1,944,498 | |||
Cubic Corp. | 3,035 | 105,345 | |||
Cummins, Inc. | 20,900 | 899,954 | |||
Curtiss-Wright Corp. | 4,800 | 143,136 | |||
Danaher Corp. | 33,360 | 2,276,153 | |||
Deere & Co. | 43,291 | 1,971,905 | |||
*Delta Air Lines, Inc. | 65,262 | 465,971 | |||
Deluxe Corp. | 5,100 | 72,573 | |||
Diamond Management & Technology Consultants, Inc. | 2,700 | 15,984 | |||
#*Dollar Thrifty Automotive Group, Inc. | 1,800 | 33,318 | |||
#Donaldson Co., Inc. | 7,600 | 271,092 | |||
Dover Corp. | 19,380 | 730,238 | |||
Ducommun, Inc. | 1,500 | 25,530 | |||
#Dun & Bradstreet Corp. (The) | 6,100 | 467,016 | |||
*DXP Enterprises, Inc. | 1,614 | 18,529 | |||
*Dycom Industries, Inc. | 3,734 | 36,892 | |||
*Dynamex, Inc. | 890 | 16,492 | |||
Dynamic Materials Corp. | 900 | 17,352 | |||
*DynCorp International, Inc. Class A | 6,480 | 110,160 | |||
Eastern Co. | 600 | 9,582 | |||
Eaton Corp. | 16,720 | 1,010,724 | |||
*EMCOR Group, Inc. | 6,800 | 160,616 | |||
Emerson Electric Co. | 76,140 | 2,874,285 | |||
#Encore Wire Corp. | 2,625 | 54,469 | |||
#*Ener1, Inc. | 12,646 | 63,104 | |||
#*Energy Conversion Devices, Inc. | 3,300 | 35,541 | |||
EnergySolutions, Inc. | 10,900 | 90,906 | |||
*EnerNOC, Inc. | 1,700 | 48,841 | |||
*EnerSys, Inc. | 5,700 | 125,970 | |||
Ennis, Inc. | 3,000 | 45,450 | |||
#*EnPro Industries, Inc. | 1,500 | 33,870 | |||
Equifax, Inc. | 13,079 | 358,103 | |||
#*ESCO Technologies, Inc. | 3,386 | 133,002 | |||
*Esterline Technologies Corp. | 4,660 | 196,233 | |||
#*Evergreen Solar, Inc. | 7,622 | 11,052 | |||
#Expeditors International of Washington, Inc. | 20,936 | 674,558 | |||
*Exponent, Inc. | 1,900 | 49,419 | |||
#Fastenal Co. | 14,900 | 514,050 | |||
Federal Signal Corp. | 5,637 | 34,611 | |||
FedEx Corp. | 31,043 | 2,256,516 | |||
*First Advantage Corp. | 700 | 12,320 | |||
209
THE TAX-MANAGED U.S. EQUITY SERIES
CONTINUED
| Shares | Value† | ||||
Industrials — (Continued) | |||||
*First Solar, Inc. | 7,350 | $ | 896,186 | ||
*Flanders Corp. | 3,983 | 20,074 | |||
Flowserve Corp. | 5,800 | 569,618 | |||
Fluor Corp. | 19,136 | 850,021 | |||
Forward Air Corp. | 3,046 | 65,002 | |||
Franklin Electric Co., Inc. | 2,922 | 79,712 | |||
#Freightcar America, Inc. | 1,200 | 28,296 | |||
*FTI Consulting, Inc. | 5,469 | 223,190 | |||
*Fuel Tech, Inc. | 1,700 | 19,669 | |||
#*FuelCell Energy, Inc. | 5,374 | 17,895 | |||
*Furmanite Corp. | 2,500 | 8,950 | |||
G & K Services, Inc. Class A | 1,900 | 42,085 | |||
*Gardner Denver Machinery, Inc. | 6,000 | 215,460 | |||
GATX Corp. | 4,600 | 125,028 | |||
#*Genco Shipping & Trading, Ltd. | 2,800 | 55,692 | |||
*Gencor Industries, Inc. | 400 | 3,000 | |||
*GenCorp, Inc. | 8,470 | 63,017 | |||
*General Cable Corp. | 4,500 | 140,130 | |||
General Dynamics Corp. | 40,759 | 2,555,589 | |||
General Electric Co. | 1,043,623 | 14,882,064 | |||
#*Genesee & Wyoming, Inc. | 3,920 | 113,719 | |||
*GEO Group, Inc. (The) | 5,545 | 117,277 | |||
#*GeoEye, Inc. | 1,926 | 48,863 | |||
*Gibraltar Industries, Inc. | 3,140 | 33,975 | |||
Gorman-Rupp Co. (The) | 1,563 | 38,590 | |||
*GP Strategies Corp. | 1,842 | 12,968 | |||
Graco, Inc. | 4,525 | 124,618 | |||
*Graftech International, Ltd. | 11,300 | 152,550 | |||
Graham Corp. | 1,800 | 25,506 | |||
Granite Construction, Inc. | 4,300 | 122,808 | |||
Great Lakes Dredge & Dock Corp. | 6,976 | 42,763 | |||
*Greenbrier Cos., Inc. | 1,200 | 10,656 | |||
*Griffon Corp. | 5,806 | 50,919 | |||
*H&E Equipment Services, Inc. | 3,900 | 41,340 | |||
Hardinge, Inc. | 700 | 3,675 | |||
Harsco Corp. | 6,888 | 216,903 | |||
*Hawaiian Holdings, Inc. | 6,792 | 48,155 | |||
Healthcare Services Group, Inc. | 5,270 | 104,082 | |||
#Heartland Express, Inc. | 10,719 | 145,778 | |||
HEICO Corp. | 1,300 | 49,439 | |||
HEICO Corp. Class A | 1,925 | 59,406 | |||
Heidrick & Struggles International, Inc. | 1,861 | 50,917 | |||
Herman Miller, Inc. | 5,553 | 85,794 | |||
*Hertz Global Holdings, Inc. | 38,000 | 353,780 | |||
#*Hexcel Corp. | 8,270 | 90,970 | |||
*Hill International, Inc. | 4,200 | 28,224 | |||
Hi-Shear Technology Corp. | 1,200 | 23,052 | |||
HNI Corp. | 3,473 | 91,409 | |||
#*Hoku Scientific, Inc. | 1,382 | 3,040 | |||
Honeywell International, Inc. | 76,530 | 2,746,662 | |||
Horizon Lines, Inc. | 2,800 | 14,700 | |||
Houston Wire & Cable Co. | 2,097 | 25,353 | |||
*Hub Group, Inc. Class A | 3,214 | 79,900 | |||
Hubbell, Inc. Class B | 5,742 | 244,207 | |||
*Hurco Cos., Inc. | 883 | 14,040 | |||
*Huron Consulting Group, Inc. | 1,650 | 38,280 | |||
*ICF International, Inc. | 1,750 | 50,138 | |||
*ICT Group, Inc. | 3,200 | 50,720 | |||
IDEX Corp. | 8,975 | 255,159 | |||
#*IHS, Inc. | 6,800 | 351,968 | |||
*II-VI, Inc. | 3,748 | 99,210 | |||
210
THE TAX-MANAGED U.S. EQUITY SERIES
CONTINUED
| Shares | Value† | ||||
Industrials — (Continued) | |||||
Illinois Tool Works, Inc. | 50,598 | $ | 2,323,460 | ||
Ingersoll-Rand P.L.C. | 23,720 | 749,315 | |||
*InnerWorkings, Inc. | 5,800 | 29,870 | |||
*Innovative Solutions & Support, Inc. | 3,312 | 15,103 | |||
*Insituform Technologies, Inc. Class A | 4,000 | 84,800 | |||
Insteel Industries, Inc. | 2,000 | 22,240 | |||
#*Integrated Electrical Services, Inc. | 1,807 | 11,890 | |||
Interface, Inc. Class A | 5,100 | 39,576 | |||
*Interline Brands, Inc. | 4,639 | 67,729 | |||
International Shipholding Corp. | 933 | 30,929 | |||
*Intersections, Inc. | 2,400 | 13,680 | |||
#*Iron Mountain, Inc. | 24,378 | 595,555 | |||
ITT Industries, Inc. | 18,000 | 912,600 | |||
#J.B. Hunt Transport Services, Inc. | 12,500 | 375,750 | |||
#*Jacobs Engineering Group, Inc. | 12,800 | 541,312 | |||
#*JetBlue Airways Corp. | 26,500 | 131,440 | |||
John Bean Technologies Corp. | 3,100 | 50,902 | |||
#Joy Global, Inc. | 10,025 | 505,360 | |||
*Kadant, Inc. | 900 | 11,601 | |||
Kaman Corp. Class A | 1,816 | 37,519 | |||
#*Kansas City Southern | 9,500 | 230,185 | |||
Kaydon Corp. | 3,790 | 132,612 | |||
KBR, Inc. | 17,390 | 355,973 | |||
*Kelly Services, Inc. Class A | 2,711 | 30,038 | |||
Kennametal, Inc. | 7,000 | 164,920 | |||
*Key Technology, Inc. | 844 | 9,157 | |||
*Kforce, Inc. | 4,567 | 53,571 | |||
Kimball International, Inc. Class B | 2,500 | 18,750 | |||
#*Kirby Corp. | 5,750 | 194,350 | |||
Knight Transportation, Inc. | 10,118 | 162,293 | |||
Knoll, Inc. | 3,400 | 33,320 | |||
*Korn/Ferry International | 5,170 | 82,513 | |||
*K-Tron International, Inc. | 315 | 29,941 | |||
L-3 Communications Holdings, Inc. | 12,119 | 876,083 | |||
*LaBarge, Inc. | 1,598 | 17,738 | |||
*Ladish Co., Inc. | 2,000 | 25,920 | |||
Landstar System, Inc. | 5,510 | 194,172 | |||
*Layne Christensen Co. | 1,700 | 44,030 | |||
*LECG Corp. | 2,849 | 9,829 | |||
#Lennox International, Inc. | 5,883 | 198,081 | |||
Lincoln Electric Holdings, Inc. | 4,597 | 218,082 | |||
Lindsay Corp. | 1,000 | 32,830 | |||
*LMI Aerospace, Inc. | 2,000 | 21,540 | |||
Lockheed Martin Corp. | 39,000 | 2,682,810 | |||
LSI Industries, Inc. | 2,400 | 16,776 | |||
*Lydall, Inc. | 600 | 3,000 | |||
*M&F Worldwide Corp. | 2,000 | 42,560 | |||
#Manitowoc Co., Inc. (The) | 9,600 | 87,744 | |||
#Manpower, Inc. | 10,127 | 480,121 | |||
*Marten Transport, Ltd. | 3,337 | 58,531 | |||
Masco Corp. | 33,368 | 392,074 | |||
*Mastec, Inc. | 8,158 | 96,264 | |||
*McDermott International, Inc. | 19,520 | 433,930 | |||
McGrath Rentcorp | 2,686 | 53,048 | |||
*Metalico, Inc. | 4,600 | 18,584 | |||
Met-Pro Corp. | 1,935 | 17,802 | |||
*MFRI, Inc. | 1,091 | 7,332 | |||
#*Microvision, Inc. | 6,200 | 23,002 | |||
*Middleby Corp. | 2,000 | 90,620 | |||
*Miller Industries, Inc. | 1,376 | 13,829 | |||
Mine Safety Appliances Co. | 3,895 | 99,284 | |||
211
THE TAX-MANAGED U.S. EQUITY SERIES
CONTINUED
| Shares | Value† | ||||
Industrials — (Continued) | |||||
*Mobile Mini, Inc. | 4,138 | $ | 60,001 | ||
#*Monster Worldwide, Inc. | 12,900 | 187,308 | |||
*Moog, Inc. | 3,995 | 99,755 | |||
*MPS Group, Inc. | 10,600 | 143,312 | |||
MSC Industrial Direct Co., Inc. Class A | 4,600 | 198,030 | |||
Mueller Industries, Inc. | 4,400 | 104,104 | |||
Mueller Water Products, Inc. | 9,010 | 40,365 | |||
Multi-Color Corp. | 1,486 | 19,719 | |||
NACCO Industries, Inc. Class A | 533 | 31,767 | |||
National Technical Systems, Inc. | 1,200 | 6,816 | |||
*Navigant Consulting, Inc. | 4,323 | 61,560 | |||
*Navistar International Corp. | 7,060 | 233,968 | |||
Nordson Corp. | 3,485 | 183,903 | |||
Norfolk Southern Corp. | 38,700 | 1,804,194 | |||
*North American Galvanizing & Coating, Inc. | 2,666 | 13,383 | |||
Northrop Grumman Corp. | 32,928 | 1,650,681 | |||
*Northwest Pipe Co. | 1,100 | 33,110 | |||
#*Ocean Power Technologies, Inc. | 300 | 1,818 | |||
*Old Dominion Freight Line, Inc. | 4,050 | 105,260 | |||
*Omega Flex, Inc. | 1,444 | 22,454 | |||
*On Assignment, Inc. | 4,296 | 25,948 | |||
*Orbital Sciences Corp. | 6,400 | 82,432 | |||
*Orion Marine Group, Inc. | 1,900 | 36,176 | |||
*Oshkosh Truck Corp. Class B | 8,600 | 268,836 | |||
Otter Tail Corp. | 2,201 | 51,195 | |||
*Owens Corning, Inc. | 11,159 | 246,725 | |||
*P.A.M. Transportation Services, Inc. | 492 | 3,818 | |||
Paccar, Inc. | 37,314 | 1,395,917 | |||
Pall Corp. | 12,600 | 399,924 | |||
Parker Hannifin Corp. | 18,340 | 971,286 | |||
*Park-Ohio Holdings Corp. | 1,300 | 8,086 | |||
Pentair, Inc. | 10,700 | 311,370 | |||
*Pike Electric Corp. | 3,998 | 50,175 | |||
Pitney Bowes, Inc. | 16,238 | 397,831 | |||
*PMFG, Inc. | 400 | 5,788 | |||
*Polypore International, Inc. | 5,100 | 55,896 | |||
Portec Rail Products, Inc. | 1,021 | 8,893 | |||
*Powell Industries, Inc. | 1,300 | 47,814 | |||
*PowerSecure International, Inc. | 1,800 | 14,976 | |||
Precision Castparts Corp. | 14,308 | 1,364,697 | |||
*PRG-Schultz International, Inc. | 2,100 | 10,878 | |||
*Protection One, Inc. | 3,076 | 16,549 | |||
#*Quanta Services, Inc. | 19,413 | 411,556 | |||
#*Quixote Corp. | 1,000 | 2,060 | |||
R. R. Donnelley & Sons Co. | 15,280 | 306,822 | |||
Raven Industries, Inc. | 1,804 | 44,559 | |||
Raytheon Co. | 40,475 | 1,832,708 | |||
*RBC Bearings, Inc. | 1,040 | 22,370 | |||
#Regal-Beloit Corp. | 3,564 | 167,080 | |||
*Republic Airways Holdings, Inc. | 1,900 | 15,219 | |||
Republic Services, Inc. | 38,124 | 987,793 | |||
*Resources Connection, Inc. | 3,900 | 67,353 | |||
Robbins & Myers, Inc. | 3,100 | 71,920 | |||
Robert Half International, Inc. | 15,855 | 367,836 | |||
Rockwell Automation, Inc. | 15,350 | 628,582 | |||
Rockwell Collins, Inc. | 15,100 | 760,738 | |||
Rollins, Inc. | 12,880 | 232,870 | |||
Roper Industries, Inc. | 10,400 | 525,720 | |||
*RSC Holdings, Inc. | 12,300 | 82,902 | |||
*Rush Enterprises, Inc. Class A | 3,300 | 36,036 | |||
Ryder System, Inc. | 4,950 | 200,722 | |||
212
THE TAX-MANAGED U.S. EQUITY SERIES
CONTINUED
| Shares | Value† | ||||
Industrials — (Continued) | |||||
*Saia, Inc. | 1,550 | $ | 22,723 | ||
Schawk, Inc. | 2,653 | 26,052 | |||
#*School Specialty, Inc. | 1,749 | 38,915 | |||
*Shaw Group, Inc. | 8,600 | 220,676 | |||
*SIFCO Industries, Inc. | 100 | 1,335 | |||
Simpson Manufacturing Co., Inc. | 4,779 | 111,781 | |||
SkyWest, Inc. | 4,800 | 67,056 | |||
*SL Industries, Inc. | 856 | 7,019 | |||
Southwest Airlines Co. | 49,413 | 415,069 | |||
*Sparton Corp. | 400 | 1,660 | |||
*Spire Corp. | 1,300 | 6,097 | |||
#*Spirit AeroSystems Holdings, Inc. Class A | 10,200 | 162,384 | |||
#SPX Corp. | 5,600 | 295,568 | |||
*Standard Parking Corp. | 2,200 | 38,720 | |||
Standex International Corp. | 1,920 | 33,754 | |||
#*Stanley, Inc. | 4,300 | 121,475 | |||
Steelcase, Inc. Class A | 4,600 | 26,542 | |||
#*Stericycle, Inc. | 9,700 | 507,989 | |||
*Sterling Construction Co., Inc. | 1,200 | 19,356 | |||
Sun Hydraulics, Inc. | 1,690 | 32,211 | |||
*SunPower Corp. Class A | 600 | 14,886 | |||
#*SunPower Corp. Class B | 2,984 | 64,633 | |||
Superior Uniform Group, Inc. | 162 | 1,426 | |||
*Sykes Enterprises, Inc. | 4,500 | 106,830 | |||
*Taser International, Inc. | 5,800 | 23,722 | |||
*Team, Inc. | 1,100 | 17,853 | |||
*Tecumseh Products Co. Class A | 900 | 9,405 | |||
*Teledyne Technologies, Inc. | 3,500 | 119,560 | |||
Tennant Co. | 2,300 | 61,318 | |||
#*Terex Corp. | 9,500 | 192,090 | |||
#*Tetra Tech, Inc. | 5,900 | 151,807 | |||
#Textainer Group Holdings, Ltd. | 3,800 | 57,228 | |||
*Thomas & Betts Corp. | 5,500 | 188,155 | |||
Timken Co. | 10,020 | 220,741 | |||
Titan International, Inc. | 3,675 | 30,870 | |||
*Titan Machinery, Inc. | 2,100 | 22,533 | |||
Todd Shipyards Corp. | 700 | 11,676 | |||
Toro Co. | 3,240 | 119,945 | |||
*Trailer Bridge, Inc. | 1,126 | 4,527 | |||
*TransDigm Group, Inc. | 5,100 | 199,818 | |||
*TRC Cos., Inc. | 3,000 | 9,510 | |||
Tredegar Industries, Inc. | 3,454 | 47,078 | |||
*Trex Co., Inc. | 1,800 | 28,638 | |||
*Trimas Corp. | 4,700 | 21,150 | |||
Trinity Industries, Inc. | 8,400 | 141,792 | |||
Triumph Group, Inc. | 1,961 | 91,794 | |||
#*TrueBlue, Inc. | 4,532 | 54,837 | |||
*Tutor Perini Corp. | 5,554 | 98,028 | |||
Twin Disc, Inc. | 1,800 | 16,902 | |||
Tyco International, Ltd. | 32,324 | 1,084,470 | |||
*U.S. Home Systems, Inc. | 1,400 | 3,304 | |||
*UAL Corp. | 11,900 | 77,469 | |||
*Ultralife Corp. | 2,100 | 7,686 | |||
#Union Pacific Corp. | 52,522 | 2,896,063 | |||
United Parcel Service, Inc. | 69,650 | 3,738,812 | |||
*United Rentals, Inc. | 6,800 | 64,532 | |||
*United Stationers, Inc. | 2,686 | 126,618 | |||
United Technologies Corp. | 96,270 | 5,915,792 | |||
Universal Forest Products, Inc. | 2,253 | 80,387 | |||
Universal Truckload Services, Inc. | 2,099 | 34,508 | |||
*URS Corp. | 10,740 | 417,356 | |||
213
THE TAX-MANAGED U.S. EQUITY SERIES
CONTINUED
| Shares | Value† | ||||
Industrials — (Continued) | |||||
#*US Airways Group, Inc. | 11,183 | $ | 34,220 | ||
*USA Truck, Inc. | 1,545 | 17,350 | |||
#*USG Corp. | 9,900 | 130,086 | |||
#UTI Worldwide, Inc. | 8,800 | 109,736 | |||
#Valmont Industries, Inc. | 2,600 | 187,902 | |||
*Versar, Inc. | 1,500 | 5,760 | |||
Viad Corp. | 1,350 | 23,625 | |||
*Vicor Corp. | 4,135 | 28,201 | |||
Virco Manufacturing Corp. | 1,718 | 4,776 | |||
*Volt Information Sciences, Inc. | 2,100 | 17,031 | |||
VSE Corp. | 800 | 35,032 | |||
W.W. Grainger, Inc. | 7,800 | 731,094 | |||
Wabtec Corp. | 4,860 | 178,654 | |||
*Waste Connections, Inc. | 8,050 | 253,012 | |||
#Waste Management, Inc. | 49,092 | 1,466,869 | |||
*Waste Services, Inc. | 5,100 | 33,456 | |||
Watsco, Inc. Class A | 2,900 | 148,538 | |||
Watson Wyatt Worldwide, Inc. | 4,950 | 215,721 | |||
Watts Water Technologies, Inc. | 3,070 | 86,728 | |||
*WCA Waste Corp. | 2,800 | 11,228 | |||
Werner Enterprises, Inc. | 9,092 | 170,475 | |||
*WESCO International, Inc. | 4,462 | 114,049 | |||
*Willis Lease Finance Corp. | 400 | 5,092 | |||
Woodward Governor Co. | 6,000 | 141,060 | |||
Total Industrials | 125,079,078 | ||||
Information Technology — (17.6%) | |||||
*3Com Corp. | 44,000 | 226,160 | |||
*3PAR, Inc. | 6,700 | 63,047 | |||
*Accenture, Ltd. | 57,800 | 2,143,224 | |||
*ACI Worldwide, Inc. | 3,900 | 62,751 | |||
*Acme Packet, Inc. | 6,500 | 63,635 | |||
*Actel Corp. | 2,800 | 33,376 | |||
*ActivIdentity Corp. | 6,106 | 13,861 | |||
*Activision Blizzard, Inc. | 123,516 | 1,337,678 | |||
*Actuate Corp. | 6,100 | 30,561 | |||
*Acxiom Corp. | 11,819 | 135,682 | |||
*Adaptec, Inc. | 10,595 | 33,798 | |||
*ADDvantage Technologies Group, Inc. | 400 | 940 | |||
#*Adobe Systems, Inc. | 51,158 | 1,685,145 | |||
Adtran, Inc. | 7,300 | 168,192 | |||
*Advanced Analogic Technologies, Inc. | 5,128 | 16,153 | |||
#*Advanced Energy Industries, Inc. | 5,498 | 67,131 | |||
#*Advanced Micro Devices, Inc. | 51,448 | 236,661 | |||
#*Advent Software, Inc. | 3,600 | 137,592 | |||
*Affiliated Computer Services, Inc. Class A | 9,882 | 514,753 | |||
*Agilent Technologies, Inc. | 36,500 | 903,010 | |||
Agilysys, Inc. | 2,000 | 9,420 | |||
*Airvana, Inc. | 8,600 | 52,546 | |||
#*Akamai Technologies, Inc. | 18,300 | 402,600 | |||
*Alliance Data Systems Corp. | 6,300 | 346,374 | |||
Altera Corp. | 31,010 | 613,688 | |||
#*Amdocs, Ltd. | 21,611 | 544,597 | |||
American Software, Inc. Class A | 2,776 | 18,044 | |||
#*Amkor Technology, Inc. | 13,000 | 71,630 | |||
Amphenol Corp. | 17,400 | 698,088 | |||
*Anadigics, Inc. | 8,617 | 27,661 | |||
Analog Devices, Inc. | 30,600 | 784,278 | |||
*Anaren, Inc. | 1,739 | 25,424 | |||
#*Anixter International, Inc. | 3,900 | 163,215 | |||
*Ansys, Inc. | 9,480 | 384,698 | |||
214
THE TAX-MANAGED U.S. EQUITY SERIES
CONTINUED
| Shares | Value† | ||||
Information Technology — (Continued) | |||||
*Apple, Inc. | 88,060 | $ | 16,599,310 | ||
Applied Materials, Inc. | 138,879 | 1,694,324 | |||
*Applied Micro Circuits Corp. | 8,159 | 63,803 | |||
*ArcSight, Inc. | 3,300 | 81,576 | |||
#*Ariba, Inc. | 8,600 | 101,652 | |||
#*Arris Group, Inc. | 17,900 | 183,654 | |||
*Arrow Electronics, Inc. | 13,900 | 352,226 | |||
*Art Technology Group, Inc. | 9,440 | 38,893 | |||
*Aruba Networks, Inc. | 8,900 | 69,598 | |||
#*Atheros Communications, Inc. | 6,451 | 158,824 | |||
*Atmel Corp. | 49,043 | 182,440 | |||
#*ATMI, Inc. | 3,922 | 59,418 | |||
*Autodesk, Inc. | 21,900 | 545,967 | |||
Automatic Data Processing, Inc. | 50,647 | 2,015,751 | |||
*Avid Technology, Inc. | 3,971 | 50,154 | |||
*Avnet, Inc. | 15,383 | 381,191 | |||
*Avocent Corp. | 4,754 | 118,232 | |||
AVX Corp. | 20,993 | 237,641 | |||
*Aware, Inc. | 2,752 | 6,440 | |||
Bel Fuse, Inc. Class B | 1,398 | 25,304 | |||
*Benchmark Electronics, Inc. | 7,392 | 124,186 | |||
*BigBand Networks, Inc. | 6,604 | 24,435 | |||
Black Box Corp. | 2,047 | 54,266 | |||
Blackbaud, Inc. | 3,996 | 88,671 | |||
*Blackboard, Inc. | 2,900 | 102,863 | |||
*Blue Coat Systems, Inc. | 3,000 | 66,840 | |||
*BMC Software, Inc. | 19,695 | 731,866 | |||
*Bottomline Technologies, Inc. | 2,019 | 29,639 | |||
*Brightpoint, Inc. | 7,278 | 53,639 | |||
*Broadcom Corp. | 43,250 | 1,150,882 | |||
Broadridge Financial Solutions, Inc. | 14,230 | 296,126 | |||
*Brocade Communications Systems, Inc. | 40,529 | 347,739 | |||
*Brooks Automation, Inc. | 4,641 | 31,930 | |||
CA, Inc. | 53,730 | 1,124,032 | |||
*Cabot Microelectronics Corp. | 2,700 | 86,346 | |||
#*CACI International, Inc. Class A | 3,035 | 144,527 | |||
*Cadence Design Systems, Inc. | 17,700 | 108,147 | |||
*California Micro Devices Corp. | 1,797 | 5,373 | |||
*Callidus Software, Inc. | 3,480 | 10,614 | |||
*Cascade Microtech, Inc. | 1,242 | 6,707 | |||
Cass Information Systems, Inc. | 1,300 | 38,649 | |||
*Cavium Networks, Inc. | 3,724 | 70,607 | |||
*CEVA, Inc. | 2,500 | 25,325 | |||
*Checkpoint Systems, Inc. | 4,385 | 59,504 | |||
*Chordiant Software, Inc. | 4,958 | 17,254 | |||
*Ciber, Inc. | 2,700 | 8,694 | |||
#*Ciena Corp. | 9,843 | 115,458 | |||
*Cirrus Logic, Inc. | 7,408 | 35,855 | |||
*Cisco Sytems, Inc. | 596,400 | 13,627,740 | |||
#*Citrix Systems, Inc. | 19,100 | 702,116 | |||
*Cogent, Inc. | 10,960 | 105,764 | |||
Cognex Corp. | 3,680 | 59,211 | |||
*Cognizant Technology Solutions Corp. | 27,190 | 1,050,894 | |||
Cohu, Inc. | 1,500 | 17,070 | |||
#*CommScope, Inc. | 6,800 | 183,736 | |||
Communications Systems, Inc. | 1,155 | 12,682 | |||
*CommVault Systems, Inc. | 4,405 | 86,778 | |||
*Computer Sciences Corp. | 16,200 | 821,502 | |||
#*Compuware Corp. | 25,329 | 178,823 | |||
*comScore, Inc. | 3,175 | 48,673 | |||
*Comtech Telecommunications Corp. | 2,516 | 80,814 | |||
215
THE TAX-MANAGED U.S. EQUITY SERIES
CONTINUED
| Shares | Value† | ||||
Information Technology — (Continued) | |||||
*Comverge, Inc. | 2,600 | $ | 29,666 | ||
*Concur Technologies, Inc. | 5,550 | 197,802 | |||
*Constant Contact, Inc. | 2,570 | 42,585 | |||
*Convergys Corp. | 13,000 | 141,050 | |||
Corning, Inc. | 153,724 | 2,245,908 | |||
*CPI International, Inc. | 2,100 | 20,790 | |||
*Cray, Inc. | 3,050 | 22,753 | |||
#*Cree, Inc. | 9,450 | 397,845 | |||
*CSG Systems International, Inc. | 3,600 | 58,824 | |||
CTS Corp. | 800 | 7,168 | |||
*CyberOptics Corp. | 1,199 | 7,230 | |||
#*CyberSource Corp. | 7,888 | 129,205 | |||
#*Cymer, Inc. | 3,800 | 130,112 | |||
*Cypress Semiconductor Corp. | 16,538 | 139,415 | |||
Daktronics, Inc. | 3,790 | 28,501 | |||
*Datalink Corp. | 2,266 | 9,019 | |||
*DDi Corp. | 2,858 | 11,575 | |||
*DealerTrack Holdings, Inc. | 7,590 | 125,083 | |||
*Dell, Inc. | 176,971 | 2,564,310 | |||
*Deltek, Inc. | 5,000 | 35,750 | |||
*DemandTec, Inc. | 2,562 | 22,520 | |||
*DG FastChannel, Inc. | 2,800 | 58,716 | |||
*Dice Holdings, Inc. | 3,600 | 21,636 | |||
Diebold, Inc. | 5,900 | 178,416 | |||
*Digi International, Inc. | 3,200 | 25,440 | |||
*Digimarc Corp. | 922 | 12,908 | |||
*Digital River, Inc. | 3,500 | 79,905 | |||
*Diodes, Inc. | 3,050 | 49,959 | |||
*DivX, Inc. | 3,993 | 19,206 | |||
*Dolby Laboratories, Inc. | 5,760 | 241,574 | |||
*Double-Take Software, Inc. | 1,500 | 13,905 | |||
*DSP Group, Inc. | 3,285 | 18,987 | |||
*DST Systems, Inc. | 5,200 | 216,892 | |||
*DTS, Inc. | 2,000 | 56,500 | |||
*Dynamics Research Corp. | 1,200 | 15,372 | |||
EarthLink, Inc. | 11,100 | 89,910 | |||
*eBay, Inc. | 111,640 | 2,486,223 | |||
#*Ebix, Inc. | 1,607 | 98,991 | |||
*Echelon Corp. | 4,566 | 62,326 | |||
*EchoStar Corp. | 4,501 | 81,738 | |||
*Edgewater Technology, Inc. | 1,000 | 2,850 | |||
Electro Rent Corp. | 2,590 | 27,739 | |||
*Electro Scientific Industries, Inc. | 1,924 | 21,049 | |||
*Electronic Arts, Inc. | 30,203 | 550,903 | |||
*Electronics for Imaging, Inc. | 5,985 | 69,785 | |||
*eLoyalty Corp. | 1,000 | 7,800 | |||
*EMC Corp. | 222,763 | 3,668,907 | |||
*EMS Technologies, Inc. | 2,478 | 43,192 | |||
*Emulex Corp. | 5,100 | 51,510 | |||
#*Epicor Software Corp. | 9,000 | 69,480 | |||
#*EPIQ Systems, Inc. | 5,558 | 70,086 | |||
*ePlus, Inc. | 1,000 | 15,040 | |||
*Equinix, Inc. | 4,030 | 343,840 | |||
*Euronet Worldwide, Inc. | 5,430 | 128,420 | |||
*Exar Corp. | 100 | 690 | |||
*ExlService Holdings, Inc. | 2,510 | 34,161 | |||
*F5 Networks, Inc. | 8,150 | 365,854 | |||
FactSet Research Systems, Inc. | 4,950 | 317,048 | |||
Fair Isaac Corp. | 5,166 | 105,025 | |||
*Fairchild Semiconductor Corp. Class A | 12,759 | 95,437 | |||
*FalconStor Software, Inc. | 5,118 | 17,043 | |||
216
THE TAX-MANAGED U.S. EQUITY SERIES
CONTINUED
| Shares | Value† | ||||
Information Technology — (Continued) | |||||
*Faro Technologies, Inc. | 2,400 | $ | 37,104 | ||
#*FEI Co. | 5,630 | 134,050 | |||
Fidelity National Information Services, Inc. | 41,907 | 911,896 | |||
#*Fiserv, Inc. | 16,500 | 756,855 | |||
#*FLIR Systems, Inc. | 16,200 | 450,522 | |||
*FormFactor, Inc. | 7,600 | 129,124 | |||
*Forrester Research, Inc. | 2,750 | 69,658 | |||
*Frequency Electronics, Inc. | 798 | 3,511 | |||
*Gartner Group, Inc. | 8,800 | 163,856 | |||
*Gerber Scientific, Inc. | 2,901 | 13,403 | |||
*Global Cash Access, Inc. | 9,450 | 59,818 | |||
Global Payments, Inc. | 8,401 | 413,581 | |||
*Globecomm Systems, Inc. | 2,474 | 16,724 | |||
*Google, Inc. | 22,737 | 12,189,760 | |||
*GSE Systems, Inc. | 1,745 | 10,505 | |||
#*GSI Commerce, Inc. | 6,646 | 126,075 | |||
*GSI Technology, Inc. | 3,200 | 11,552 | |||
*GTSI Corp. | 200 | 1,490 | |||
*Hackett Group, Inc. | 5,500 | 17,160 | |||
*Harmonic, Inc. | 13,000 | 68,250 | |||
Harris Corp. | 12,440 | 518,997 | |||
*Harris Stratex Networks, Inc. Class A | 6,079 | 38,298 | |||
Heartland Payment Systems, Inc. | 1,856 | 22,810 | |||
*Hewitt Associates, Inc. Class A | 10,036 | 356,479 | |||
Hewlett-Packard Co. | 242,700 | 11,518,542 | |||
*Hittite Microwave Corp. | 2,787 | 102,562 | |||
*I.D. Systems, Inc. | 2,203 | 8,041 | |||
#*i2 Technologies, Inc. | 2,400 | 37,776 | |||
*IAC/InterActiveCorp. | 17,700 | 335,238 | |||
*ICx Technologies, Inc. | 2,581 | 13,034 | |||
*iGATE Corp. | 5,402 | 47,700 | |||
*Imation Corp. | 2,340 | 20,639 | |||
Imergent, Inc. | 1,526 | 10,148 | |||
*Immersion Corp. | 2,800 | 10,276 | |||
#*Infinera Corp. | 10,000 | 74,300 | |||
*infoGROUP, Inc. | 6,344 | 41,617 | |||
#*Informatica Corp. | 9,800 | 208,054 | |||
*InfoSpace, Inc. | 2,980 | 25,539 | |||
*Ingram Micro, Inc. | 16,870 | 297,756 | |||
*Innodata Isogen, Inc. | 4,054 | 26,270 | |||
*Insight Enterprises, Inc. | 4,020 | 42,290 | |||
#*Integral Systems, Inc. | 2,600 | 21,840 | |||
*Integrated Device Technology, Inc. | 18,100 | 106,428 | |||
*Integrated Silicon Solution, Inc. | 3,810 | 13,335 | |||
Intel Corp. | 557,770 | 10,658,985 | |||
*Intellon Corp. | 4,200 | 28,854 | |||
*Interactive Intelligence, Inc. | 1,900 | 31,863 | |||
#*InterDigital, Inc. | 4,300 | 88,408 | |||
*Intermec, Inc. | 4,663 | 57,448 | |||
*Internap Network Services Corp. | 4,500 | 14,400 | |||
International Business Machines Corp. | 142,483 | 17,184,875 | |||
*International Rectifier Corp. | 8,100 | 148,068 | |||
*Internet Brands, Inc. | 5,000 | 37,200 | |||
*Internet Capital Group, Inc. | 3,900 | 28,353 | |||
*Interphase Corp. | 590 | 1,404 | |||
Intersil Corp. | 10,040 | 126,002 | |||
*Intevac, Inc. | 2,384 | 24,317 | |||
*IntriCon Corp. | 800 | 2,700 | |||
*Intuit, Inc. | 33,430 | 971,810 | |||
#*IPG Photonics Corp. | 3,900 | 53,274 | |||
*Isilon Systems, Inc. | 5,504 | 28,896 | |||
217
THE TAX-MANAGED U.S. EQUITY SERIES
CONTINUED
| Shares | Value† | ||||
Information Technology — (Continued) | |||||
*Iteris, Inc. | 1,900 | $ | 2,698 | ||
#*Itron, Inc. | 4,100 | 246,164 | |||
*Ixia | 5,379 | 35,770 | |||
*IXYS Corp. | 3,900 | 26,130 | |||
*j2 Global Communications, Inc. | 5,183 | 105,992 | |||
Jabil Circuit, Inc. | 21,112 | 282,479 | |||
Jack Henry & Associates, Inc. | 8,590 | 198,171 | |||
*JDA Software Group, Inc. | 4,349 | 86,284 | |||
*JDS Uniphase Corp. | 18,500 | 103,415 | |||
#*Juniper Networks, Inc. | 54,080 | 1,379,581 | |||
Keithley Instruments, Inc. | 578 | 1,884 | |||
*Keynote Systems, Inc. | 2,200 | 22,484 | |||
KLA-Tencor Corp. | 20,080 | 652,801 | |||
*Knot, Inc. (The) | 4,484 | 47,844 | |||
*Kopin Corp. | 8,696 | 38,610 | |||
*Kulicke & Soffa Industries, Inc. | 4,600 | 21,390 | |||
*KVH Industries, Inc. | 2,000 | 21,000 | |||
*L-1 Identity Solutions, Inc. | 8,600 | 50,826 | |||
#*Lam Research Corp. | 13,100 | 441,732 | |||
*LaserCard Corp. | 1,299 | 8,703 | |||
*Lattice Semiconductor Corp. | 8,400 | 16,044 | |||
*Lawson Software, Inc. | 17,502 | 110,438 | |||
Lender Processing Services, Inc. | 10,111 | 402,418 | |||
#*Lexmark International, Inc. | 6,234 | 158,967 | |||
*Limelight Networks, Inc. | 11,900 | 41,531 | |||
Linear Technology Corp. | 22,400 | 579,712 | |||
*Liquidity Services, Inc. | 2,738 | 26,340 | |||
*Littlefuse, Inc. | 1,700 | 46,852 | |||
*LoJack Corp. | 2,400 | 10,128 | |||
#*LoopNet, Inc. | 2,156 | 18,822 | |||
*Loral Space & Communications, Inc. | 2,374 | 62,721 | |||
*LSI Corp. | 64,644 | 330,977 | |||
#*Manhattan Associates, Inc. | 2,194 | 50,352 | |||
*ManTech International Corp. Class A | 2,440 | 107,018 | |||
Marchex, Inc. Class B | 2,983 | 13,513 | |||
MasterCard, Inc. Class A | 11,140 | 2,439,883 | |||
Maxim Integrated Products, Inc. | 25,460 | 424,418 | |||
Maximus, Inc. | 1,900 | 87,894 | |||
*Maxwell Technologies, Inc. | 2,670 | 47,873 | |||
*McAfee, Inc. | 17,728 | 742,449 | |||
*Measurement Specialties, Inc. | 200 | 1,542 | |||
*MEMC Electronic Materials, Inc. | 20,920 | 259,826 | |||
*Mentor Graphics Corp. | 9,800 | 71,540 | |||
*Mercury Computer Systems, Inc. | 2,500 | 26,750 | |||
Mesa Laboratories, Inc. | 300 | 7,200 | |||
Methode Electronics, Inc. | 4,169 | 30,225 | |||
Micrel, Inc. | 9,400 | 70,218 | |||
Microchip Technology, Inc. | 17,860 | 427,926 | |||
*Micron Technology, Inc. | 66,874 | 454,074 | |||
*Micros Systems, Inc. | 10,400 | 279,968 | |||
*Microsemi Corp. | 5,100 | 67,881 | |||
Microsoft Corp. | 844,660 | 23,422,422 | |||
*MicroStrategy, Inc. | 700 | 61,089 | |||
*MIPS Technologies, Inc. | 5,600 | 22,120 | |||
Mocon, Inc. | 535 | 4,307 | |||
*ModusLink Global Solutions, Inc. | 5,100 | 41,922 | |||
Molex, Inc. Class A | 9,090 | 150,440 | |||
#*Monolithic Power Systems, Inc. | 4,520 | 90,355 | |||
*Monotype Imaging Holdings, Inc. | 4,300 | 32,336 | |||
*MoSys, Inc. | 3,000 | 7,080 | |||
#Motorola, Inc. | 181,950 | 1,559,312 | |||
218
THE TAX-MANAGED U.S. EQUITY SERIES
CONTINUED
| Shares | Value† | ||||
Information Technology — (Continued) | |||||
*Move, Inc. | 13,425 | $ | 27,521 | ||
MTS Systems Corp. | 1,900 | 50,350 | |||
*Multi-Fineline Electronix, Inc. | 2,568 | 69,978 | |||
National Instruments Corp. | 6,970 | 186,099 | |||
#National Semiconductor Corp. | 22,300 | 288,562 | |||
*NCI, Inc. | 1,200 | 32,292 | |||
*NCR Corp. | 11,970 | 121,496 | |||
*NetApp, Inc. | 32,060 | 867,223 | |||
*NETGEAR, Inc. | 3,800 | 69,274 | |||
*NetLogic Microsystems, Inc. | 2,400 | 91,224 | |||
*NetScout Systems, Inc. | 4,708 | 57,861 | |||
*NetSuite, Inc. | 5,000 | 69,850 | |||
*Network Equipment Technologies, Inc. | 2,600 | 8,580 | |||
*NeuStar, Inc. | 6,500 | 150,150 | |||
*Newport Corp. | 2,670 | 19,865 | |||
*NIC, Inc. | 5,368 | 47,024 | |||
*Novatel Wireless, Inc. | 4,993 | 44,538 | |||
*Novell, Inc. | 34,000 | 139,060 | |||
*Novellus Systems, Inc. | 11,582 | 238,358 | |||
*Nu Horizons Electronics Corp. | 1,300 | 5,057 | |||
#*Nuance Communications, Inc. | 26,930 | 353,052 | |||
*NumereX Corp. Class A | 700 | 3,339 | |||
*Nvidia Corp. | 54,400 | 650,624 | |||
*Occam Networks, Inc. | 571 | 1,702 | |||
*OmniVision Technologies, Inc. | 5,200 | 63,752 | |||
#*ON Semiconductor Corp. | 40,765 | 272,718 | |||
*Online Resources Corp. | 4,610 | 24,202 | |||
*Onvia, Inc. | 389 | 2,198 | |||
*Oplink Communications, Inc. | 1,500 | 22,245 | |||
OPNET Technologies, Inc. | 3,284 | 35,796 | |||
*Opnext, Inc. | 4,784 | 11,769 | |||
*Optical Cable Corp. | 1,500 | 4,530 | |||
Oracle Corp. | 507,951 | 10,717,766 | |||
*OSI Systems, Inc. | 2,528 | 49,625 | |||
*Palm, Inc. | 16,525 | 191,855 | |||
*PAR Technology Corp. | 1,750 | 9,538 | |||
*Parametric Technology Corp. | 11,060 | 164,905 | |||
Park Electrochemical Corp. | 2,544 | 57,189 | |||
#*ParkerVision, Inc. | 3,300 | 9,141 | |||
Paychex, Inc. | 35,850 | 1,018,498 | |||
*PC Connection, Inc. | 1,900 | 11,172 | |||
*PC Mall, Inc. | 2,400 | 17,016 | |||
*PC-Tel, Inc. | 2,700 | 15,822 | |||
*PDF Solutions, Inc. | 2,729 | 9,661 | |||
Pegasystems, Inc. | 5,500 | 157,685 | |||
*Perficient, Inc. | 2,900 | 23,606 | |||
*Performance Technologies, Inc. | 1,357 | 3,813 | |||
*Pericom Semiconductor Corp. | 2,935 | 27,618 | |||
*Perot Systems Corp. | 14,020 | 419,759 | |||
*Pervasive Software, Inc. | 2,700 | 13,230 | |||
*Phoenix Technologies, Ltd. | 3,700 | 8,658 | |||
#*Photronics, Inc. | 4,200 | 17,556 | |||
Plantronics, Inc. | 3,799 | 91,594 | |||
*PLATO Learning, Inc. | 1,763 | 7,792 | |||
*Plexus Corp. | 4,363 | 110,384 | |||
*PLX Technology, Inc. | 3,500 | 10,990 | |||
*PMC-Sierra, Inc. | 21,900 | 186,588 | |||
#*Polycom, Inc. | 8,600 | 184,642 | |||
Power Integrations, Inc. | 2,500 | 78,000 | |||
*Presstek, Inc. | 266 | 452 | |||
•*Price Communications Liquidation Trust | 3,605 | 492 | |||
219
THE TAX-MANAGED U.S. EQUITY SERIES
CONTINUED
| Shares | Value† | ||||
Information Technology — (Continued) | |||||
*Progress Software Corp. | 4,500 | $ | 103,950 | ||
*PROS Holdings, Inc. | 1,999 | 17,971 | |||
QAD, Inc. | 5,238 | 23,885 | |||
*QLogic Corp. | 13,400 | 235,036 | |||
QUALCOMM, Inc. | 165,920 | 6,870,747 | |||
Qualstar Corp. | 900 | 1,719 | |||
*Quest Software, Inc. | 8,528 | 143,015 | |||
*Radiant Systems, Inc. | 3,908 | 38,455 | |||
*RadiSys Corp. | 2,460 | 20,935 | |||
#*Rambus, Inc. | 8,384 | 134,144 | |||
*RealNetworks, Inc. | 12,200 | 43,554 | |||
#*Red Hat, Inc. | 17,650 | 455,546 | |||
Renaissance Learning, Inc. | 3,378 | 30,672 | |||
#*RF Micro Devices, Inc. | 25,500 | 101,490 | |||
Richardson Electronics, Ltd. | 2,200 | 12,430 | |||
*RightNow Technologies, Inc. | 2,400 | 36,624 | |||
*Rimage Corp. | 1,691 | 31,114 | |||
#*Riverbed Technology, Inc. | 7,600 | 155,724 | |||
*Rofin-Sinar Technologies, Inc. | 3,700 | 79,365 | |||
*Rogers Corp. | 1,286 | 33,372 | |||
#*Rovi Corp. | 10,313 | 284,123 | |||
#*Rubicon Technology, Inc. | 1,800 | 27,216 | |||
*Rudolph Technologies, Inc. | 2,537 | 16,085 | |||
*S1 Corp. | 7,390 | 44,340 | |||
*Saba Software, Inc. | 3,400 | 14,586 | |||
#*SAIC, Inc. | 23,000 | 407,330 | |||
#*Salesforce.com, Inc. | 11,850 | 672,488 | |||
*Sandisk Corp. | 21,220 | 434,586 | |||
*Sapient Corp. | 13,000 | 105,820 | |||
*SAVVIS, Inc. | 5,160 | 76,316 | |||
*ScanSource, Inc. | 2,584 | 65,608 | |||
*Scientific Learning Corp. | 187 | 944 | |||
*SCM Microsystems, Inc. | 1,092 | 2,752 | |||
*SeaChange International, Inc. | 4,800 | 32,496 | |||
#*Seagate Technology LLC | 43,680 | 609,336 | |||
*Semitool, Inc. | 4,900 | 34,594 | |||
*Semtech Corp. | 7,320 | 113,240 | |||
*ShoreTel, Inc. | 4,940 | 32,456 | |||
#*Sigma Designs, Inc. | 2,500 | 30,025 | |||
*Silicon Graphics International Corp. | 2,152 | 12,826 | |||
*Silicon Image, Inc. | 7,300 | 15,403 | |||
#*Silicon Laboratories, Inc. | 5,820 | 243,858 | |||
*Silicon Storage Technology, Inc. | 11,000 | 22,330 | |||
#*Skyworks Solutions, Inc. | 18,521 | 193,174 | |||
*Smart Modular Technologies (WWH), Inc. | 4,400 | 17,864 | |||
*Smith Micro Software, Inc. | 3,600 | 32,688 | |||
Solera Holdings, Inc. | 6,892 | 222,060 | |||
#*Sonic Solutions, Inc. | 1,207 | 5,866 | |||
*SonicWALL, Inc. | 7,100 | 56,374 | |||
*Sonus Networks, Inc. | 200 | 384 | |||
*Sourcefire, Inc. | 2,700 | 54,810 | |||
*Spark Networks, Inc. | 3,300 | 8,943 | |||
*Spectrum Control, Inc. | 2,000 | 16,900 | |||
*SRA International, Inc. | 6,760 | 126,818 | |||
*SRS Labs, Inc. | 2,843 | 18,451 | |||
*Standard Microsystems Corp. | 2,342 | 45,107 | |||
*Starent Networks Corp. | 6,523 | 220,086 | |||
*StarTek, Inc. | 2,385 | 13,833 | |||
*STEC, Inc. | 6,224 | 132,696 | |||
#*Stratasys, Inc. | 2,463 | 38,866 | |||
#*SuccessFactors, Inc. | 5,100 | 77,979 | |||
220
THE TAX-MANAGED U.S. EQUITY SERIES
CONTINUED
| Shares | Value† | ||||
Information Technology — (Continued) | |||||
*Sun Microsystems, Inc. | 24,701 | $ | 202,054 | ||
*Super Micro Computer, Inc. | 1,591 | 12,823 | |||
*Supertex, Inc. | 1,500 | 36,375 | |||
*Support.com, Inc. | 4,350 | 10,440 | |||
*Switch & Data Facilities Co., Inc. | 3,549 | 59,375 | |||
#*Sybase, Inc. | 10,735 | 424,677 | |||
*Sycamore Networks, Inc. | 39,887 | 113,678 | |||
*Symantec Corp. | 83,515 | 1,468,194 | |||
*Symmetricom, Inc. | 5,609 | 26,867 | |||
*Symyx Technologies, Inc. | 4,500 | 26,415 | |||
#*Synaptics, Inc. | 3,300 | 74,250 | |||
*Synchronoss Technologies, Inc. | 3,200 | 36,512 | |||
*SYNNEX Corp. | 4,888 | 125,768 | |||
*Synopsys, Inc. | 15,829 | 348,238 | |||
Syntel, Inc. | 5,200 | 186,316 | |||
#*Take-Two Interactive Software, Inc. | 2,800 | 30,716 | |||
*Taleo Corp. Class A | 2,973 | 64,633 | |||
*Tech Data Corp. | 5,300 | 203,679 | |||
Technitrol, Inc. | 4,200 | 32,718 | |||
*TechTarget, Inc. | 2,981 | 18,780 | |||
*TechTeam Global, Inc. | 1,479 | 11,581 | |||
*Techwell, Inc. | 1,671 | 17,345 | |||
#*Tekelec | 8,700 | 130,674 | |||
*TeleCommunication Systems, Inc. | 4,200 | 37,548 | |||
*TeleTech Holdings, Inc. | 6,000 | 107,340 | |||
*Tellabs, Inc. | 46,263 | 278,503 | |||
*Teradata Corp. | 17,185 | 479,118 | |||
#*Teradyne, Inc. | 18,500 | 154,845 | |||
#*Terremark Worldwide, Inc. | 9,400 | 60,066 | |||
Tessco Technologies, Inc. | 876 | 14,848 | |||
*Tessera Technologies, Inc. | 1,700 | 37,587 | |||
Texas Instruments, Inc. | 136,530 | 3,201,628 | |||
#*THQ, Inc. | 7,619 | 39,847 | |||
*TIBCO Software, Inc. | 20,000 | 175,000 | |||
*Tier Technologies, Inc. Class B | 2,100 | 17,178 | |||
*TiVo, Inc. | 11,800 | 128,384 | |||
#*TNS, Inc. | 2,000 | 56,520 | |||
*Tollgrade Communications, Inc. | 1,200 | 7,140 | |||
Total System Services, Inc. | 18,883 | 301,562 | |||
*Travelzoo, Inc. | 1,041 | 14,387 | |||
#*Trimble Navigation, Ltd. | 13,948 | 292,490 | |||
*Triquint Semiconductor, Inc. | 17,700 | 95,403 | |||
*TTM Technologies, Inc. | 4,100 | 41,697 | |||
#*Tyler Technologies, Inc. | 4,700 | 89,394 | |||
#*Ultimate Software Group, Inc. | 2,396 | 61,122 | |||
*Ultratech, Inc. | 2,881 | 37,223 | |||
*Unica Corp. | 2,600 | 18,096 | |||
United Online, Inc. | 9,350 | 74,800 | |||
#*Universal Display Corp. | 4,458 | 50,643 | |||
#*ValueClick, Inc. | 8,200 | 80,688 | |||
*Varian Semiconductor Equipment Associates, Inc. | 6,597 | 187,289 | |||
#*Veeco Instruments, Inc. | 1,600 | 38,960 | |||
*VeriFone Holdings, Inc. | 6,500 | 86,450 | |||
#*VeriSign, Inc. | 18,532 | 422,715 | |||
*Viasat, Inc. | 4,100 | 119,515 | |||
*Vicon Industries, Inc. | 900 | 6,075 | |||
*Video Display Corp. | 1,359 | 6,639 | |||
*Virage Logic Corp. | 1,005 | 5,930 | |||
*Virtusa Corp. | 3,400 | 30,532 | |||
Visa, Inc. | 56,500 | 4,280,440 | |||
*Vishay Intertechnology, Inc. | 17,193 | 107,112 | |||
221
THE TAX-MANAGED U.S. EQUITY SERIES
CONTINUED
| Shares | Value† | ||||
Information Technology — (Continued) | |||||
*VistaPrint NV | 3,400 | $ | 173,570 | ||
#*VMware, Inc. Class A | 9,557 | 367,276 | |||
*Vocus, Inc. | 1,300 | 23,530 | |||
*Volterra Semiconductor Corp. | 1,900 | 26,315 | |||
Wayside Technology Group, Inc. | 252 | 1,928 | |||
*Web.com Group, Inc. | 2,905 | 20,451 | |||
#*WebMD Health Corp. | 5,912 | 201,363 | |||
*Websense, Inc. | 5,331 | 85,616 | |||
*Western Digital Corp. | 23,200 | 781,376 | |||
Western Union Co. | 69,627 | 1,265,123 | |||
*Wright Express Corp. | 3,640 | 101,592 | |||
#Xerox Corp. | 66,330 | 498,802 | |||
Xilinx, Inc. | 28,930 | 629,228 | |||
*Yahoo!, Inc. | 114,150 | 1,814,985 | |||
*Zebra Technologies Corp. Class A | 5,280 | 132,000 | |||
*ZiLOG, Inc. | 2,600 | 7,020 | |||
*Zoran Corp. | 10,989 | 97,472 | |||
*Zygo Corp. | 165 | 1,140 | |||
Total Information Technology | 220,602,473 | ||||
Materials — (3.6%) | |||||
A. Schulman, Inc. | 3,300 | 57,321 | |||
A.M. Castle & Co. | 1,388 | 15,643 | |||
*AEP Industries, Inc. | 800 | 27,904 | |||
Air Products & Chemicals, Inc. | 21,500 | 1,658,295 | |||
Airgas, Inc. | 8,840 | 392,142 | |||
AK Steel Holding Corp. | 10,900 | 172,983 | |||
Albemarle Corp. | 10,000 | 315,800 | |||
Alcoa, Inc. | 76,038 | 944,392 | |||
#Allegheny Technologies, Inc. | 10,321 | 318,506 | |||
#AMCOL International Corp. | 2,861 | 74,500 | |||
*American Pacific Corp. | 300 | 2,124 | |||
American Vanguard Corp. | 2,950 | 24,485 | |||
AptarGroup, Inc. | 7,700 | 271,887 | |||
*Arabian American Development Co. | 700 | 1,806 | |||
Arch Chemicals, Inc. | 2,400 | 66,456 | |||
Ashland, Inc. | 7,707 | 266,200 | |||
*Balchem Corp. | 2,275 | 62,767 | |||
Ball Corp. | 10,022 | 494,385 | |||
Bemis Co., Inc. | 9,991 | 258,068 | |||
*Brush Engineered Materials, Inc. | 2,740 | 50,553 | |||
*Buckeye Technologies, Inc. | 3,300 | 29,568 | |||
*BWAY Holding Co. | 4,700 | 83,519 | |||
Cabot Corp. | 5,800 | 127,194 | |||
*Calgon Carbon Corp. | 5,700 | 90,288 | |||
Carpenter Technology Corp. | 4,775 | 100,418 | |||
Celanese Corp. Class A | 13,500 | 370,575 | |||
CF Industries Holdings, Inc. | 5,947 | 495,088 | |||
#Cliffs Natural Resources, Inc. | 12,600 | 448,182 | |||
#*Coeur d’Alene Mines Corp. | 6,300 | 126,504 | |||
Commercial Metals Co. | 13,600 | 201,824 | |||
Compass Minerals International, Inc. | 2,800 | 174,496 | |||
*Core Molding Technologies, Inc. | 389 | 1,093 | |||
*Crown Holdings, Inc. | 17,500 | 466,375 | |||
Cytec Industries, Inc. | 5,200 | 172,484 | |||
Deltic Timber Corp. | 1,300 | 55,250 | |||
Dow Chemical Co. | 80,325 | 1,886,031 | |||
du Pont (E.I.) de Nemours & Co. | 73,070 | 2,325,087 | |||
#Eagle Materials, Inc. | 4,719 | 117,267 | |||
Eastman Chemical Co. | 6,600 | 346,566 | |||
Ecolab, Inc. | 24,425 | 1,073,723 | |||
222
THE TAX-MANAGED U.S. EQUITY SERIES
CONTINUED
| Shares | Value† | ||||
Materials — (Continued) | |||||
FMC Corp. | 6,800 | $ | 347,480 | ||
Freeport-McMoRan Copper & Gold, Inc. Class B | 39,280 | 2,881,581 | |||
Friedman Industries, Inc. | 1,199 | 6,918 | |||
*General Moly, Inc. | 6,400 | 14,080 | |||
Greif, Inc. Class A | 2,500 | 133,800 | |||
H.B. Fuller Co. | 4,800 | 91,728 | |||
Hawkins, Inc. | 888 | 18,666 | |||
*Haynes International, Inc. | 1,800 | 50,976 | |||
*Headwaters, Inc. | 7,000 | 28,840 | |||
#*Hecla Mining Co. | 24,200 | 99,462 | |||
*Horsehead Holding Corp. | 3,700 | 35,261 | |||
Huntsman Corp. | 19,800 | 157,410 | |||
*ICO, Inc. | 1,200 | 4,608 | |||
Innophos Holdings, Inc. | 2,500 | 48,375 | |||
*Innospec, Inc. | 1,700 | 20,094 | |||
International Flavors & Fragrances, Inc. | 8,730 | 332,526 | |||
International Paper Co. | 32,200 | 718,382 | |||
Kaiser Aluminum Corp. | 2,300 | 91,885 | |||
*KapStone Paper & Packaging Corp. | 1,000 | 6,940 | |||
KMG Chemicals, Inc. | 1,500 | 18,450 | |||
Koppers Holdings, Inc. | 1,700 | 44,404 | |||
*Kronos Worldwide, Inc. | 5,583 | 74,645 | |||
*Landec Corp. | 3,992 | 26,108 | |||
#*Louisiana-Pacific Corp. | 11,400 | 59,850 | |||
*LSB Industries, Inc. | 1,900 | 23,560 | |||
Lubrizol Corp. | 7,800 | 519,168 | |||
Martin Marietta Materials, Inc. | 4,500 | 374,940 | |||
MeadWestavco Corp. | 18,410 | 420,300 | |||
Minerals Technologies, Inc. | 1,600 | 78,816 | |||
#*Mines Management, Inc. | 1,170 | 2,761 | |||
Monsanto Co. | 51,870 | 3,484,627 | |||
Mosaic Co. (The) | 39,660 | 1,853,312 | |||
Myers Industries, Inc. | 3,866 | 33,905 | |||
Nalco Holding Co. | 11,333 | 239,693 | |||
NewMarket Corp. | 1,989 | 185,972 | |||
Newmont Mining Corp. | 49,160 | 2,136,494 | |||
NL Industries, Inc. | 5,704 | 35,365 | |||
*Northern Technologies International Corp. | 300 | 2,325 | |||
Nucor Corp. | 32,580 | 1,298,313 | |||
Olin Corp. | 8,155 | 124,527 | |||
Olympic Steel, Inc. | 1,600 | 40,480 | |||
*OM Group, Inc. | 3,200 | 86,464 | |||
*Omnova Solutions, Inc. | 3,300 | 21,153 | |||
*Owens-Illinois, Inc. | 17,800 | 567,464 | |||
P.H. Glatfelter Co. | 5,000 | 52,850 | |||
#Packaging Corp. of America | 9,400 | 171,832 | |||
*Pactiv Corp. | 13,900 | 320,951 | |||
*Penford Corp. | 1,928 | 11,375 | |||
*PolyOne Corp. | 12,400 | 69,192 | |||
PPG Industries, Inc. | 16,335 | 921,784 | |||
Praxair, Inc. | 30,400 | 2,414,976 | |||
Quaker Chemical Corp. | 900 | 18,540 | |||
*Ready Mix, Inc. | 800 | 2,480 | |||
Reliance Steel & Aluminum Co. | 7,700 | 280,896 | |||
Rock-Tenn Co. Class A | 4,400 | 192,720 | |||
#*Rockwood Holdings, Inc. | 7,780 | 154,666 | |||
Royal Gold, Inc. | 4,600 | 203,182 | |||
RPM International, Inc. | 14,000 | 246,680 | |||
*RTI International Metals, Inc. | 2,100 | 43,491 | |||
#Schnitzer Steel Industries, Inc. Class A | 2,724 | 117,786 | |||
Schweitzer-Maudoit International, Inc. | 2,340 | 120,861 | |||
223
THE TAX-MANAGED U.S. EQUITY SERIES
CONTINUED
| Shares | Value† | ||||
Materials — (Continued) | |||||
Scotts Miracle-Gro Co. Class A (The) | 6,660 | $ | 270,529 | ||
Sealed Air Corp. | 14,860 | 285,758 | |||
*Senomyx, Inc. | 701 | 2,692 | |||
Sensient Technologies Corp. | 6,202 | 156,849 | |||
#Sigma-Aldrich Corp. | 12,100 | 628,353 | |||
Silgan Holdings, Inc. | 3,800 | 204,250 | |||
#*Solitario Exploration & Royalty Corp. | 400 | 760 | |||
*Solutia, Inc. | 6,700 | 73,700 | |||
Sonoco Products Co. | 11,272 | 301,526 | |||
Southern Copper Corp. | 83,000 | 2,614,500 | |||
*Spartech Corp. | 2,300 | 22,011 | |||
Steel Dynamics, Inc. | 21,700 | 290,563 | |||
Stepan Co. | 1,391 | 79,621 | |||
#*Stillwater Mining Co. | 9,500 | 58,900 | |||
*Synalloy Corp. | 1,037 | 9,374 | |||
Temple-Inland, Inc. | 11,100 | 171,495 | |||
Terra Industries, Inc. | 9,200 | 292,284 | |||
Texas Industries, Inc. | 3,200 | 106,528 | |||
#*Titanium Metals Corp. | 20,417 | 175,586 | |||
*U.S. Gold Corp. | 8,900 | 24,030 | |||
*United States Lime & Minerals, Inc. | 804 | 28,196 | |||
United States Steel Corp. | 13,400 | 462,166 | |||
*Universal Stainless & Alloy Products, Inc. | 300 | 4,527 | |||
Valhi, Inc. | 9,895 | 92,914 | |||
Valspar Corp. | 10,400 | 263,848 | |||
Vulcan Materials Co. | 10,183 | 468,723 | |||
Walter Energy, Inc. | 5,000 | 292,500 | |||
*Wausau Paper Corp. | 5,223 | 45,806 | |||
Westlake Chemical Corp. | 6,200 | 150,598 | |||
Weyerhaeuser Co. | 19,641 | 713,754 | |||
Worthington Industries, Inc. | 8,100 | 89,505 | |||
*WR Grace & Co. | 7,500 | 164,175 | |||
Zep, Inc. | 2,526 | 43,195 | |||
#*Zoltek Cos., Inc. | 3,087 | 27,505 | |||
Total Materials | 44,970,840 | ||||
Other — (0.0%) | |||||
—*MAIR Holdings, Inc. Escrow Shares | 700 | — | |||
—*Petrocorp, Inc. Escrow Shares | 100 | 6 | |||
Total Other | 6 | ||||
Telecommunication Services — (2.5%) | |||||
Alaska Communications Systems Group, Inc. | 4,500 | 35,010 | |||
*American Tower Corp. | 48,404 | 1,782,235 | |||
*Arbinet Corp. | 3,000 | 6,570 | |||
AT&T, Inc. | 568,312 | 14,588,569 | |||
Atlantic Tele-Network, Inc. | 1,473 | 67,522 | |||
#*Cbeyond, Inc. | 2,162 | 28,863 | |||
*Centennial Communications Corp. | 13,500 | 114,210 | |||
CenturyTel, Inc. | 27,711 | 899,499 | |||
*Cincinnati Bell, Inc. | 28,300 | 87,164 | |||
#*Cogent Communications Group, Inc. | 4,400 | 44,572 | |||
Consolidated Communications Holdings, Inc. | 3,313 | 45,786 | |||
*Crown Castle International Corp. | 27,100 | 818,962 | |||
D&E Communications, Inc. | 1,799 | 20,149 | |||
Frontier Communications Corp. | 30,100 | 215,817 | |||
*General Communications, Inc. Class A | 4,600 | 28,290 | |||
*Global Crossing, Ltd. | 4,800 | 54,720 | |||
HickoryTech Corp. | 2,200 | 19,822 | |||
#Iowa Telecommunications Services, Inc. | 2,200 | 25,894 | |||
*iPCS, Inc. | 1,800 | 42,966 | |||
224
THE TAX-MANAGED U.S. EQUITY SERIES
CONTINUED
| Shares | Value† | ||||
Telecommunication Services — (Continued) | |||||
#*Leap Wireless International, Inc. | 7,825 | $ | 103,446 | ||
#*MetroPCS Communications, Inc. | 33,360 | 207,833 | |||
*Neutral Tandem, Inc. | 2,700 | 56,943 | |||
*NII Holdings, Inc. | 15,552 | 418,815 | |||
#NTELOS Holdings Corp. | 4,000 | 60,400 | |||
*PAETEC Holding Corp. | 10,500 | 34,020 | |||
*Premiere Global Services, Inc. | 5,500 | 41,085 | |||
Qwest Communications International, Inc. | 176,960 | 635,286 | |||
#*SBA Communications Corp. | 12,000 | 338,520 | |||
*Shenandoah Telecommunications Co. | 3,100 | 51,739 | |||
*Sprint Nextel Corp. | 131,869 | 390,332 | |||
*SureWest Communications | 2,098 | 18,504 | |||
*Syniverse Holdings, Inc. | 7,480 | 128,132 | |||
Telephone & Data Systems, Inc. | 5,600 | 165,872 | |||
Telephone & Data Systems, Inc. Special Shares | 5,700 | 157,320 | |||
*tw telecom, inc. | 10,000 | 126,000 | |||
*United States Cellular Corp. | 4,856 | 177,778 | |||
*USA Mobility, Inc. | 3,500 | 38,150 | |||
Verizon Communications, Inc. | 300,825 | 8,901,412 | |||
Windstream Corp. | 45,208 | 435,805 | |||
*Xeta Corp. | 1,100 | 2,722 | |||
Total Telecommunication Services | 31,416,734 | ||||
Utilities — (3.2%) | |||||
*AES Corp. | 72,993 | 954,018 | |||
AGL Resources, Inc. | 6,200 | 216,752 | |||
Allegheny Energy, Inc. | 16,900 | 385,658 | |||
ALLETE, Inc. | 2,600 | 88,010 | |||
Alliant Energy Corp. | 11,000 | 292,160 | |||
#Ameren Corp. | 21,700 | 528,178 | |||
American Electric Power Co., Inc. | 47,578 | 1,437,807 | |||
American States Water Co. | 1,900 | 62,985 | |||
Aqua America, Inc. | 12,267 | 189,525 | |||
Artesian Resources Corp. | 471 | 7,635 | |||
Atmos Energy Corp. | 9,030 | 251,485 | |||
Avista Corp. | 3,900 | 73,944 | |||
#*Cadiz, Inc. | 104 | 1,112 | |||
California Water Service Group | 1,914 | 69,995 | |||
*Calpine Corp. | 42,412 | 476,711 | |||
CenterPoint Energy, Inc. | 36,100 | 454,860 | |||
Central Vermont Public Service Corp. | 1,249 | 24,218 | |||
CH Energy Group, Inc. | 1,800 | 74,538 | |||
Chesapeake Utilities Corp. | 600 | 19,008 | |||
Cleco Corp. | 6,582 | 162,904 | |||
CMS Energy Corp. | 22,800 | 303,240 | |||
Connecticut Water Services, Inc. | 300 | 6,690 | |||
Consolidated Edison, Inc. | 28,000 | 1,139,040 | |||
Constellation Energy Group, Inc. | 12,400 | 383,408 | |||
Delta Natural Gas Co., Inc. | 360 | 9,857 | |||
#Dominion Resources, Inc. | 54,703 | 1,864,825 | |||
DPL, Inc. | 8,400 | 212,856 | |||
DTE Energy Co. | 16,400 | 606,472 | |||
Duke Energy Corp. | 129,364 | 2,046,538 | |||
*Dynegy, Inc. | 37,300 | 74,600 | |||
Edison International, Inc. | 24,900 | 792,318 | |||
*El Paso Electric Co. | 3,400 | 63,750 | |||
Empire District Electric Co. | 3,470 | 62,668 | |||
Energen Corp. | 5,400 | 236,952 | |||
Energy, Inc. | 1,050 | 9,324 | |||
Entergy Corp. | 20,000 | 1,534,400 | |||
EQT Corp. | 7,792 | 326,173 | |||
225
THE TAX-MANAGED U.S. EQUITY SERIES
CONTINUED
| Shares | Value† | ||||
Utilities — (Continued) | |||||
Exelon Corp. | 49,600 | $ | 2,329,216 | ||
FirstEnergy Corp. | 30,400 | 1,315,712 | |||
FPL Group, Inc. | 39,026 | 1,916,177 | |||
Great Plains Energy, Inc. | 12,200 | 211,060 | |||
#Hawaiian Electric Industries, Inc. | 8,700 | 155,295 | |||
IDACORP, Inc. | 2,600 | 73,034 | |||
Integrys Energy Group, Inc. | 6,301 | 218,015 | |||
ITC Holdings Corp. | 5,700 | 253,194 | |||
Laclede Group, Inc. | 2,600 | 79,846 | |||
MDU Resources Group, Inc. | 18,500 | 383,875 | |||
MGE Energy, Inc. | 2,398 | 83,978 | |||
Middlesex Water Co. | 1,920 | 29,549 | |||
*Mirant Corp. | 15,500 | 216,690 | |||
National Fuel Gas Co. | 6,600 | 299,244 | |||
New Jersey Resources Corp. | 4,800 | 168,960 | |||
Nicor, Inc. | 4,300 | 159,444 | |||
NiSource, Inc. | 11,100 | 143,412 | |||
Northeast Utilities, Inc. | 17,140 | 395,077 | |||
Northwest Natural Gas Co. | 2,997 | 125,305 | |||
NorthWestern Corp. | 3,000 | 72,450 | |||
*NRG Energy, Inc. | 25,300 | 581,647 | |||
NSTAR | 10,100 | 312,595 | |||
NV Energy, Inc. | 22,100 | 253,266 | |||
OGE Energy Corp. | 9,600 | 318,912 | |||
Oneok, Inc. | 10,500 | 380,205 | |||
#Ormat Technologies, Inc. | 5,400 | 204,120 | |||
Pennichuck Corp. | 600 | 13,602 | |||
Pepco Holdings, Inc. | 15,800 | 235,894 | |||
PG&E Corp. | 39,000 | 1,594,710 | |||
Piedmont Natural Gas Co. | 7,900 | 183,912 | |||
Pinnacle West Capital Corp. | 9,415 | 294,878 | |||
PNM Resources, Inc. | 6,720 | 72,038 | |||
Portland General Electric Co. | 3,719 | 69,136 | |||
PPL Corp. | 29,700 | 874,368 | |||
Progress Energy, Inc. | 28,450 | 1,067,728 | |||
*Public Service Enterprise Group, Inc. | 53,091 | 1,582,112 | |||
Questar Corp. | 18,900 | 752,976 | |||
RGC Resources, Inc. | 100 | 2,820 | |||
#*RRI Energy, Inc. | 36,499 | 192,350 | |||
SCANA Corp. | 11,820 | 399,989 | |||
Sempra Energy | 24,600 | 1,265,670 | |||
SJW Corp. | 2,556 | 55,644 | |||
South Jersey Industries, Inc. | 3,300 | 116,457 | |||
Southern Co. | 80,900 | 2,523,271 | |||
Southwest Gas Corp. | 3,400 | 84,966 | |||
Southwest Water Co. | 2,170 | 12,087 | |||
#TECO Energy, Inc. | 12,400 | 177,816 | |||
UGI Corp. | 11,600 | 277,008 | |||
UIL Holdings Corp. | 1,833 | 47,071 | |||
Unisource Energy Corp. | 3,300 | 95,304 | |||
Vectren Corp. | 8,200 | 184,828 | |||
Westar Energy, Inc. | 9,300 | 178,095 | |||
WGL Holdings, Inc. | 4,707 | 155,613 | |||
Wisconsin Energy Corp. | 12,590 | 549,805 | |||
Xcel Energy, Inc. | 42,000 | 791,280 | |||
Total Utilities | 39,976,320 | ||||
TOTAL COMMON STOCKS | 1,135,753,719 | ||||
226
THE TAX-MANAGED U.S. EQUITY SERIES
CONTINUED
| Shares | Value† | |||||
TEMPORARY CASH INVESTMENTS — (0.4%) | ||||||
BlackRock Liquidity Funds Tempcash Portfolio - Institutional Shares | 4,739,449 | $ | 4,739,449 | |||
| Shares/ Face Amount | ||||||
| (000) | ||||||
SECURITIES LENDING COLLATERAL — (9.2%) | ||||||
§@DFA Short Term Investment Fund LP | 114,652,240 | 114,652,240 | ||||
@Repurchase Agreement, Deutsche Bank Securities 0.08%, 11/02/09 (Collateralized by $1,068,374 FHLMC 5.793%(r), 01/01/37, valued at $600,169) to be repurchased at $582,692 | $ | 583 | 582,688 | |||
TOTAL SECURITIES LENDING COLLATERAL | 115,234,928 | |||||
TOTAL INVESTMENTS — (100.0%) | $ | 1,255,728,096 | ||||
See accompanying Notes to Financial Statements.
227
Report of Independent Registered Public Accounting Firm
To the Board of Trustees and Shareholders of
The DFA Investment Trust Company
We have audited, in accordance with the standards of the Public Company Accounting Oversight Board (United States), the financial statements of The U.S. Large Cap Value Series, The DFA International Value Series, The DFA Emerging Markets Small Cap Series, The Canadian Small Company Series, The Japanese Small Company Series, The United Kingdom Small Company Series, The Continental Small Company Series, The Asia Pacific Small Company Series, The U.S. Large Company Series, The Emerging Markets Series, The Tax-Managed U.S. Equity Series, and The Tax-Managed U.S. Marketwide Value Series (constituting series within The DFA Investment Trust Company, hereafter referred to as the “Series”) as of October 31, 2009, and for the year then ended and have issued our unqualified report thereon dated December 23, 2009 (which report and financial statements are included in Item 1 of this Certified Shareholder Report on Form N-CSR). Our audits included an audit of the Series’ investment portfolios (the “Portfolios”) as of October 31, 2009 appearing in Item 6 of this Form N-CSR. These Portfolios are the responsibility of the Series’ management. Our responsibility is to express an opinion on these Portfolios based on our audits. In our opinion, the Portfolios referred to above, when read in conjunction with the financial statements of the Series referred to above, present fairly, in all material respects, the information set forth therein.
PricewaterhouseCoopers LLP
Philadelphia, Pennsylvania
December 23, 2009
| (b) | Not applicable. |
| ITEM 7. | DISCLOSURE OF PROXY VOTING POLICIES AND PROCEDURES FOR CLOSED-END MANAGEMENT INVESTMENT COMPANIES. |
This item is not applicable to the Registrant, which is an open-end management investment company.
| ITEM 8. | PORTFOLIO MANAGERS OF CLOSED-END MANAGEMENT INVESTMENT COMPANIES. |
This item is not applicable to the Registrant, which is an open-end management investment company.
| ITEM 9. | PURCHASES OF EQUITY SECURITIES BY CLOSED-END MANAGEMENT INVESTMENT COMPANY AND AFFILIATED PURCHASERS. |
This item is not applicable to the Registrant, which is an open-end management investment company.
| ITEM 10. | SUBMISSION OF MATTERS TO A VOTE OF SECURITY HOLDERS. |
None.
| ITEM 11. | CONTROLS AND PROCEDURES. |
| (a) | Based on their evaluation of the Registrant’s disclosure controls and procedures as of a date within 90 days of the filing date of this Form N-CSR (the “Report”), the Registrant’s Principal Executive Officer and Principal Financial Officer believe that the disclosure controls and procedures (as defined in Rule 30a-3(c) under the Investment Company Act of 1940, as amended) are effectively designed to ensure that information required to be disclosed by the Registrant in the Report is recorded, processed, summarized and reported by the filing date, including ensuring that information required to be disclosed in the Report is accumulated and communicated to the Registrant’s officers that are making certifications in the Report, as appropriate, to allow timely decisions regarding required disclosure. The Registrant’s management, including the Principal Executive Officer and the Principal Financial Officer, recognizes that any set of controls and procedures, no matter how well designed and operated, can provide only reasonable assurance of achieving the desired control objectives. |
| (b) | There were no changes in the Registrant’s internal control over financial reporting (as defined in Rule 30a-3(d) under the Investment Company Act of 1940, as amended) that occurred during the second fiscal quarter of the period covered by this Report |
that have materially affected, or are reasonably likely to materially affect, the Registrant’s internal control over financial reporting. |
| ITEM 12. | EXHIBITS. |
| (a)(1) | Code of Ethics is filed herewith. |
| (a)(2) | Certifications pursuant to Section 302 of the Sarbanes-Oxley Act of 2002 are filed herewith. |
| (a)(3) | This item is not applicable. |
| (b) | Certifications pursuant to Section 906 of the Sarbanes-Oxley Act of 2002 are filed herewith. |
SIGNATURES
Pursuant to the requirements of the Securities Exchange Act of 1934 and the Investment Company Act of 1940, the Registrant has duly caused this Report to be signed on its behalf by the undersigned, thereunto duly authorized.
The DFA Investment Trust Company
By: | /s/ DAVID G. BOOTH | |
| David G. Booth | ||
Chairman, Trustee, President and Chief Executive Officer |
Date: January 4, 2010
Pursuant to the requirements of the Securities Exchange Act of 1934 and the Investment Company Act of 1940, this Report has been signed below by the following persons on behalf of the Registrant and in the capacities and on the dates indicated.
| By: | /s/ DAVID G. BOOTH | |
| David G. Booth | ||
| Principal Executive Officer | ||
| The DFA Investment Trust Company |
Date: January 4, 2010
| By: | /s/ DAVID R. MARTIN | |
| David R. Martin | ||
| Principal Financial Officer | ||
| The DFA Investment Trust Company |
Date: January 4, 2010