UNITED STATES
SECURITIES AND EXCHANGE COMMISSION
Washington, D.C. 20549
FORM N-CSR
CERTIFIED SHAREHOLDER REPORT OF REGISTERED
MANAGEMENT INVESTMENT COMPANIES
Investment Company Act file number 811-7436
THE DFA INVESTMENT TRUST COMPANY
(Exact name of registrant as specified in charter)
6300 Bee Cave Road, Building One, Austin, TX 78746
(Address of principal executive offices) (Zip code)
Catherine L. Newell, Esquire, President and General Counsel
The DFA Investment Trust Company,
6300 Bee Cave Road, Building One, Austin, TX 78746
(Name and address of agent for service)
Registrant’s telephone number, including area code: 512-306-7400
Date of fiscal year end: October 31
Date of reporting period: October 31, 2022
| ITEM 1. | REPORTS TO STOCKHOLDERS. |

Annual Report
Year Ended: October 31, 2022
DFA INVESTMENT DIMENSIONS GROUP INC. / DIMENSIONAL INVESTMENT GROUP INC. / THE DFA INVESTMENT TRUST COMPANY
DFA Investment Dimensions Group Inc.
| | | | |
| | |
| Enhanced U.S. Large Company Portfolio | | U.S. Core Equity 1 Portfolio | | U.S. Micro Cap Portfolio |
| | |
| U.S. Large Cap Equity Portfolio | | U.S. Core Equity 2 Portfolio | | U.S. High Relative Profitability Portfolio |
| | |
| U.S. Large Cap Value Portfolio | | U.S. Vector Equity Portfolio | | DFA Real Estate Securities Portfolio |
| | |
| U.S. Targeted Value Portfolio | | U.S. Small Cap Portfolio | | DFA Commodity Strategy Portfolio |
| | |
| U.S. Small Cap Value Portfolio | | | | |
Dimensional Investment Group Inc.
U.S. Large Company Portfolio
The DFA Investment Trust Company
The U.S. Large Cap Value Series

December 2022
Dear Shareholder,
For more than four decades, Dimensional has been innovating on behalf of investors, using financial science to pursue higher expected returns across a range of market conditions.
We start with what clients are seeking and determine how best to deliver strategies to meet those needs through a systematic approach designed to add value over indexing. Every day, we manage our strategies through a flexible process that allows us to consistently focus on reducing costs and controlling risks. We believe in sensible ideas that we can implement well. And we’re committed to continuing to enhance the investment solutions and services we provide to empower financial professionals.
On behalf of everyone at Dimensional, we thank you for entrusting us with your investments.
| | |
Sincerely, | | |
 | |  |
| David P. Butler | | Gerard O’Reilly |
| CO-CHIEF EXECUTIVE OFFICER | | CO-CHIEF EXECUTIVE OFFICER and |
| | CHIEF INVESTMENT OFFICER |
[THIS PAGE INTENTIONALLY LEFT BLANK]
ANNUAL REPORT
Table of Contents
i
TABLE OF CONTENTS
CONTINUED
This report is submitted for the information of the Portfolio’s shareholders. It is not authorized for distribution to prospective investors unless preceded or accompanied by an effective prospectus.
ii
DFA INVESTMENT DIMENSIONS GROUP INC.
DIMENSIONAL INVESTMENT GROUP INC.
THE DFA INVESTMENT TRUST COMPANY
DEFINITIONS OF ABBREVIATIONS AND FOOTNOTES
Schedules of Investments/Summary Schedules of Portfolio Holdings
| | |
| Investment Abbreviations | | |
SA | | Special Assessment |
REIT | | Real Estate Investment Trust |
SOFR | | Secured Overnight Financing Rate |
AUD | | Australian Dollars |
CAD | | Canadian Dollars |
DKK | | Danish Krone |
EUR | | Euro |
GBP | | British Pounds |
SEK | | Swedish Krona |
USD | | United States Dollar |
NOK | | Norwegian Krone |
NZD | | New Zealand Dollars |
| | |
| Investment Footnotes | | |
^ | | Denominated in USD, unless otherwise noted. |
† | | See Note B to Financial Statements. |
W | | Rule 144A, Section 4(2), or other security that is restricted as to resale to institutional investors. This security has been deemed liquid based upon the Fund’s Liquidity Guidelines. The liquidity determination is unaudited. |
# | | Total or Partial Securities on Loan. |
@ | | Security purchased with cash collateral received from Securities on Loan. |
§ | | Affiliated Fund. |
‡ | | Calculated as a percentage of total net assets. Percentages shown parenthetically next to the category headings have been calculated as a percentage of total investments. “Other Securities” are those securities that are not among the top 50 holdings in unaffiliated issuers of the Fund or do not represent more than 1.0% of the net assets of the Fund. Some of the individual securities within this category may include Total or Partial Securities on Loan and/or Non-Income Producing Securities. |
* | | Non-Income Producing Securities. |
(r) | | The adjustable rate shown is effective as of October 31, 2022. |
~ | | Security pledged as collateral for Swap Agreements. |
« | | Security pledged as collateral for Futures Contracts. |
1
DEFINITIONS OF ABBREVIATIONS AND FOOTNOTES
CONTINUED
Financial Highlights
| | ** | The Net Investment Income (Loss) per share and the ratio of Net Investment Income to Average Net Assets includes the effect of an estimation related to a one time distribution from a real estate investment trust. Net Investment Income (Loss) per share, Net Gain (Loss) per share and the ratio of Net Investment Income to Average Net Assets for the DFA Real Estate Securities Portfolio would have been $0.92, $7.69 and 2.43%, respectively had the effect of this estimation not been considered. |
| | (A) | Computed using average shares outstanding. |
| | (B) | Represents the combined ratios for the respective Portfolio and its respective pro-rata share of its Master Fund(s). |
All Statements, Schedules and Notes to Financial Statements
| | |
| — | | Amounts designated as — are either zero, rounded to zero, or less than $500. |
| SEC | | Securities and Exchange Commission |
2
DFA INVESTMENT DIMENSIONS GROUP INC.
PERFORMANCE CHARTS
(Unaudited)
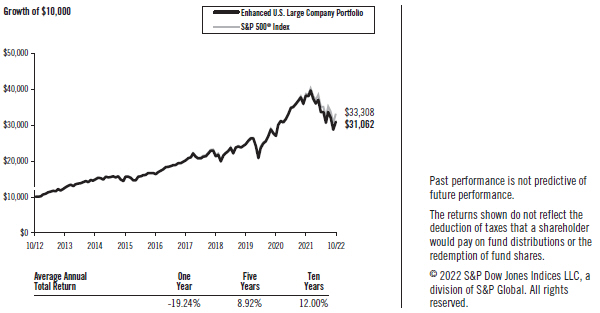
Enhanced U.S. Large Company Portfolio vs.
S&P 500® Index
October 31, 2012-October 31, 2022
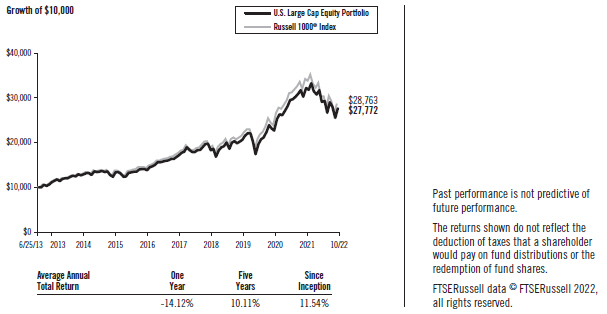
U.S. Large Cap Equity Portfolio vs.
Russell 1000® Index
June 25, 2013-October 31, 2022
3
DFA INVESTMENT DIMENSIONS GROUP INC.
PERFORMANCE CHARTS
(Unaudited)
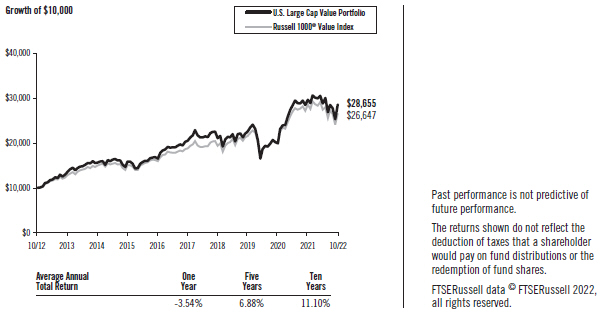
U.S. Large Cap Value Portfolio vs.
Russell 1000® Value Index
October 31, 2012-October 31, 2022
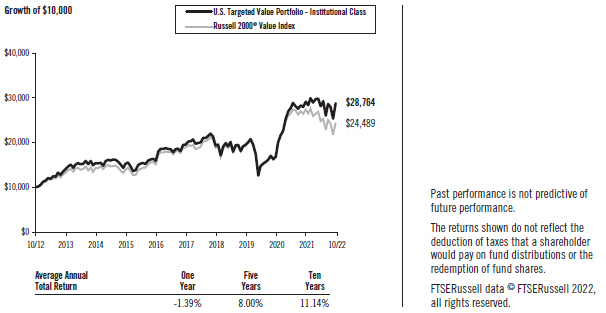
U.S. Targeted Value Portfolio — Institutional Class vs.
Russell 2000® Value Index
October 31, 2012-October 31, 2022
4
DFA INVESTMENT DIMENSIONS GROUP INC.
PERFORMANCE CHARTS
(Unaudited)
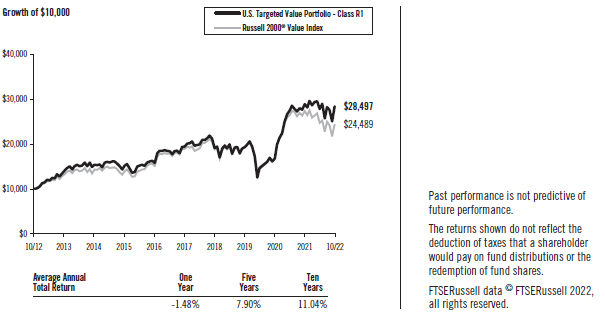
U.S. Targeted Value Portfolio — Class R1 vs.
Russell 2000® Value Index
October 31, 2012-October 31, 2022
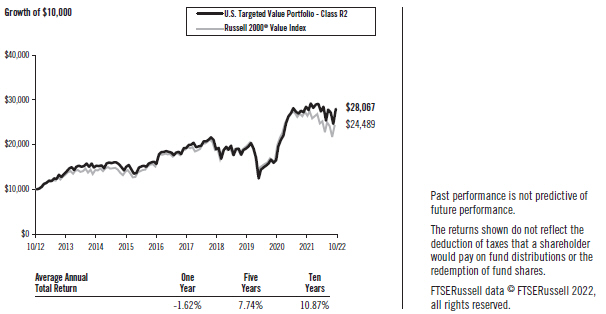
U.S. Targeted Value Portfolio — Class R2 vs.
Russell 2000® Value Index
October 31, 2012-October 31, 2022
5
DFA INVESTMENT DIMENSIONS GROUP INC.
PERFORMANCE CHARTS
(Unaudited)
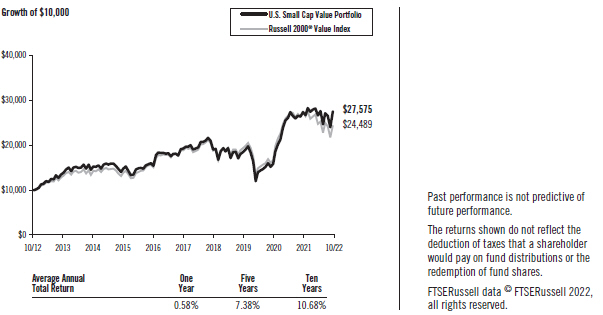
U.S. Small Cap Value Portfolio vs.
Russell 2000® Value Index
October 31, 2012-October 31, 2022
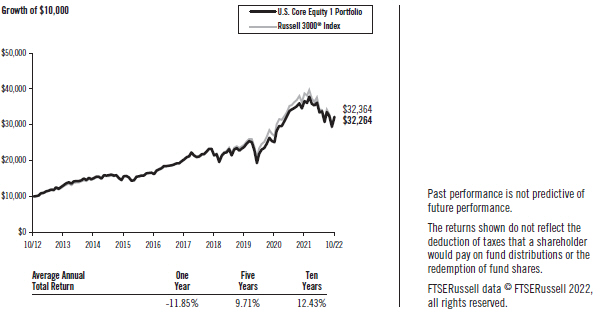
U.S. Core Equity 1 Portfolio vs.
Russell 3000® Index
October 31, 2012-October 31, 2022
6
DFA INVESTMENT DIMENSIONS GROUP INC.
PERFORMANCE CHARTS
(Unaudited)
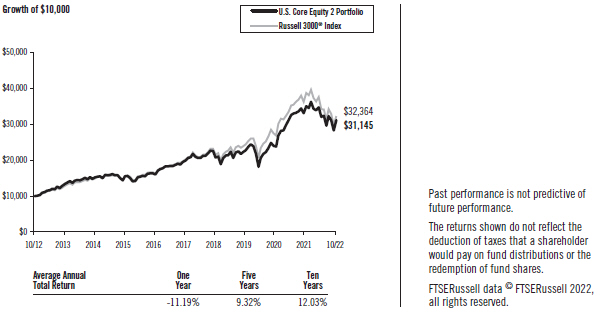
U.S. Core Equity 2 Portfolio vs.
Russell 3000® Index
October 31, 2012-October 31, 2022
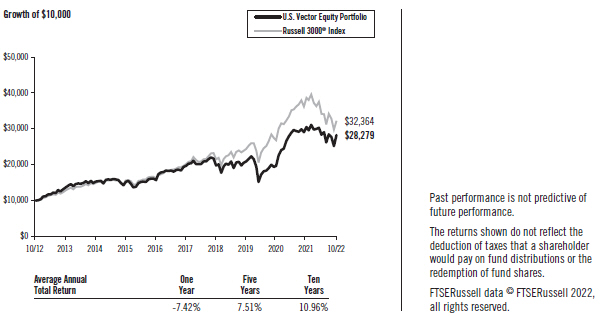
U.S. Vector Equity Portfolio vs.
Russell 3000® Index
October 31, 2012-October 31, 2022
7
DFA INVESTMENT DIMENSIONS GROUP INC.
PERFORMANCE CHARTS
(Unaudited)
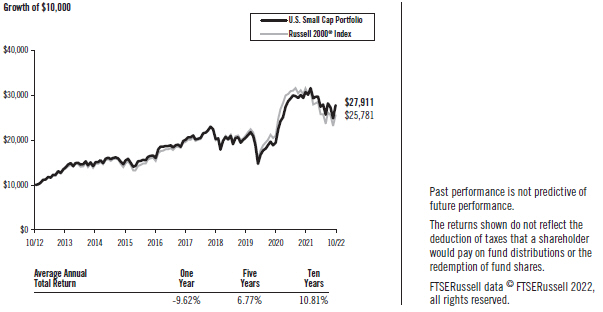
U.S. Small Cap Portfolio vs.
Russell 2000® Index
October 31, 2012-October 31, 2022
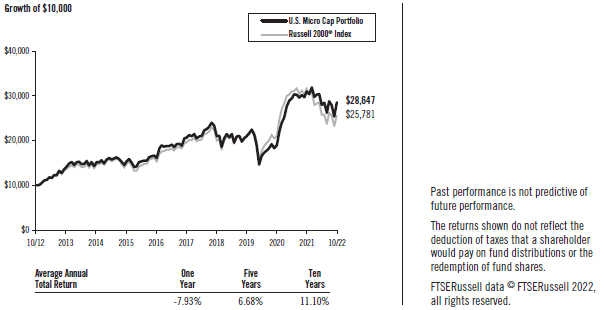
U.S. Micro Cap Portfolio vs.
Russell 2000® Index
October 31, 2012-October 31, 2022
8
DFA INVESTMENT DIMENSIONS GROUP INC.
PERFORMANCE CHARTS
(Unaudited)
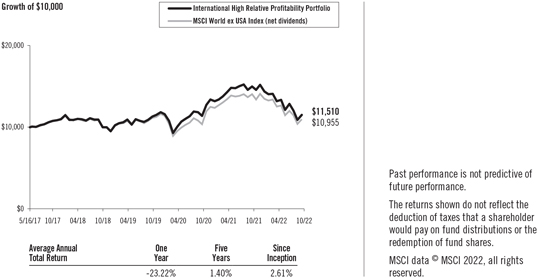
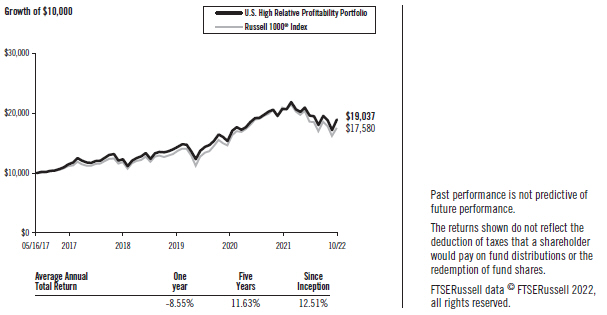
U.S. High Relative Profitability Portfolio vs.
Russell 1000® Index
May 16, 2017-October 31, 2022
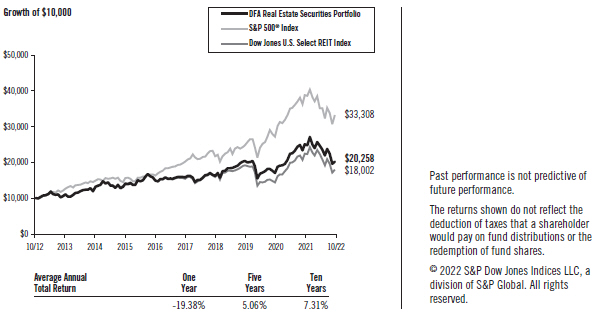
DFA Real Estate Securities Portfolio vs.
S&P 500® Index, Dow Jones U.S. Select REIT Index
October 31, 2012-October 31, 2022
9
MANAGEMENT’S DISCUSSION AND ANALYSIS
| | |
| U.S. Equity Market Review | | 12 Months Ended October 31, 2022 |
U.S. equities had negative returns for the period. The broad U.S. equity market, as measured by the Russell 3000® Index, lost approximately -16.52%. As measured by Russell indices, small-cap stocks underperformed large-cap stocks, and mid-cap stocks, a subset of the large-cap universe, underperformed large-cap stocks but outperformed small-cap stocks. Value stocks outperformed growth stocks as measured by the Russell indices.
Total Return for 12 Months Ended October 31, 2022
| | | | |
Russell 3000® Index | | | -16.52 | % |
Russell 1000® Index (large-cap stocks) | | | -16.38 | % |
Russell Midcap® Index (mid-cap stocks) | | | -17.17 | % |
Russell 2000® Index (small-cap stocks) | | | -18.54 | % |
Russell Microcap® Index (micro-cap stocks) | | | -22.29 | % |
Dow Jones U.S. Select REIT Index SM | | | -19.97 | % |
Total Return for 12 Months Ended October 31, 2022
| | | | |
Russell 1000® Value Index (large-cap value stocks) | | | -7.00 | % |
Russell 1000® Growth Index (large-cap growth stocks) | | | -24.60 | % |
Russell 2000® Value Index (small-cap value stocks) | | | -10.73 | % |
Russell 2000® Growth Index (small-cap growth stocks) | | | -26.02 | % |
Source: Frank Russell Company is the source and owner of the trademarks, service marks, and copyrights related to the Russell Indexes.
Enhanced U.S. Large Company Portfolio
The Enhanced U.S. Large Company Portfolio seeks to outperform the total return of the S&P 500® Index. This strategy uses S&P 500® Index futures contracts, swaps, and/or ETFs in conjunction with short-term investment grade fixed income instruments. As of October 31, 2022, 100% of the equity exposure consisted of S&P 500® Index futures contracts. The behavior of S&P 500® Index futures contracts is determined principally by the performance of the S&P 500® Index.
For the 12 months ended October 31, 2022, total returns were -19.24% for the Portfolio and -14.61% for the S&P 500® Index, the Portfolio’s benchmark. The Portfolio’s underperformance relative to the benchmark was primarily due to the performance of the fixed income component of the Portfolio. Realized term premiums were generally negative during the period. As a result, the fixed income component’s allocation to securities with maturities longer than one-year detracted from performance. Realized credit premiums were also generally negative during the period, resulting in the fixed income component’s allocation to corporate securities also detracting from performance. As such, the fixed income component underperformed the financing cost of the S&P 500® Index futures contracts that the Portfolio held throughout the year.
10
U.S. Large Cap Equity Portfolio
The U.S. Large Cap Equity Portfolio invests in a broadly diversified group of U.S. large-cap securities with increased exposure to stocks with smaller market capitalization, lower relative price (value), and higher profitability. The investment strategy is process driven, emphasizing broad diversification. As of October 31, 2022, the Portfolio held approximately 640 securities. Average cash exposure throughout the year was less than 1% of the Portfolio’s assets.
For the 12 months ended October 31, 2022, total returns were -14.12% for the Portfolio and -16.38% for the Russell 1000® Index, the Portfolio’s benchmark. With low relative price (value) stocks outperforming high relative price (growth) stocks, the Portfolio’s emphasis on value stocks contributed positively to relative performance. The Portfolio’s emphasis on higher-profitability stocks also contributed positively to relative performance, as higher-profitability value stocks outperformed lower-profitability growth stocks. Additionally, the Portfolio’s emphasis on stocks with smaller market capitalizations contributed positively to relative performance, as these stocks outperformed.
U.S. Large Cap Value Portfolio
The U.S. Large Cap Value Portfolio is designed to capture the returns of U.S. large-cap value stocks by purchasing shares of The U.S. Large Cap Value Series, a Master Fund managed by Dimensional that invests in such stocks. The investment strategy is process driven, emphasizing broad diversification with increased exposure to stocks with smaller market capitalizations, lower relative price (value), and higher profitability within the large-cap value segment of the U.S. market. As of October 31, 2022, the Master Fund held approximately 350 securities. Average cash exposure throughout the year was less than 1% of the Portfolio’s assets.
For the 12 months ended October 31, 2022, total returns were -3.54% for the Portfolio and -7.00% for the Russell 1000® Value Index, the Portfolio’s benchmark. With low relative price (value) stocks outperforming high relative price (growth) stocks, the Master Fund’s greater emphasis on value stocks as compared to the benchmark contributed positively to the Portfolio’s relative performance. The Master Fund’s emphasis on higher-profitability stocks within the large-cap value segment of the U.S. market also contributed positively to relative performance, as these stocks outperformed. Additionally, the Master Fund’s exclusion of real estate investment trusts (REITs) contributed positively to relative performance, as REITs generally underperformed.
U.S. Targeted Value Portfolio
The U.S. Targeted Value Portfolio invests in a broadly diversified group of U.S. small- and mid-cap value stocks with higher profitability. Additionally, the Portfolio generally excludes certain companies with high asset growth. The investment strategy is process driven, emphasizing broad diversification. As of October 31, 2022, the Portfolio held approximately 1,370 securities. In general, average cash exposure throughout the year was less than 1% of the Portfolio’s assets.
For the 12 months ended October 31, 2022, total returns were -1.48% for the Portfolio’s Class R1 shares, -1.62% for the Portfolio’s Class R2 shares, -1.39% for the Portfolio’s Institutional Class shares, and -10.73% for the Russell 2000® Value Index, the Portfolio’s benchmark. The Portfolio’s emphasis on higher-profitability stocks within the small- and mid-cap value segment of the U.S. market contributed positively to relative performance, as these stocks outperformed. With low relative price (value) stocks outperforming high relative price (growth) stocks for the period, the Portfolio’s greater emphasis on value stocks as compared to the benchmark also contributed positively to the Portfolio’s relative performance. Additionally, the Portfolio’s exclusion of real estate investment trusts (REITs) contributed positively to relative performance, as REITs generally underperformed. The Portfolio’s exclusion of stocks with high asset growth also contributed positively to relative performance, as those stocks underperformed.
11
U.S. Small Cap Value Portfolio
The U.S. Small Cap Value Portfolio invests in a broadly diversified group of U.S. small-cap value stocks with higher profitability. Additionally, the Portfolio generally excludes certain companies with high asset growth. The investment strategy is process driven, emphasizing broad diversification. As of October 31, 2022, the Portfolio held approximately 970 securities. Average cash exposure throughout the year was less than 1% of the Portfolio’s assets.
For the 12 months ended October 31, 2022, total returns were 0.58% for the Portfolio and -10.73% for the Russell 2000® Value Index, the Portfolio’s benchmark. With low relative price (value) stocks outperforming high relative price (growth) stocks for the period, the Portfolio’s greater emphasis on value stocks as compared to the benchmark contributed positively to the Portfolio’s relative performance. The Portfolio’s emphasis on higher-profitability stocks within the small-value segment of the U.S. market also contributed positively to relative performance, as these stocks outperformed. Additionally, the Portfolio’s exclusion of real estate investment trusts (REITs) contributed positively to relative performance, as REITs generally underperformed. The Portfolio’s exclusion of stocks with high asset growth also contributed positively to relative performance, as those stocks underperformed.
U.S. Core Equity 1 Portfolio
The U.S. Core Equity 1 Portfolio invests in a broadly diversified group of U.S. securities with increased exposure to smaller market capitalization stocks, lower relative price (value) stocks, and higher-profitability stocks relative to the market. The investment strategy is process driven, emphasizing broad diversification. As of October 31, 2022, the Portfolio held approximately 2,650 securities. Average cash exposure throughout the year was less than 1% of the Portfolio’s assets.
For the 12 months ended October 31, 2022, total returns were -11.85% for the Portfolio and -16.52% for the Russell 3000® Index, the Portfolio’s benchmark. With low relative price (value) stocks outperforming high relative price (growth) stocks, the Portfolio’s emphasis on value stocks contributed positively to relative performance. The Portfolio’s emphasis on higher-profitability stocks also contributed positively to relative performance, as higher-profitability value stocks outperformed lower-profitability growth stocks.
U.S. Core Equity 2 Portfolio
The U.S. Core Equity 2 Portfolio invests in a broadly diversified group of U.S. securities with increased exposure to smaller market capitalization stocks, lower relative price (value) stocks, and higher-profitability stocks relative to the U.S. Core Equity 1 Portfolio and the market. The investment strategy is process driven, emphasizing broad diversification. As of October 31, 2022, the Portfolio held approximately 2,650 securities. In general, average cash exposure throughout the year was less than 1% of the Portfolio’s assets.
12
For the 12 months ended October 31, 2022, total returns were -11.19% for the Portfolio and -16.52% for the Russell 3000® Index, the Portfolio’s benchmark. With low relative price (value) stocks outperforming high relative price (growth) stocks, the Portfolio’s emphasis on value stocks contributed positively to relative performance. The Portfolio’s emphasis on higher-profitability stocks also contributed positively to relative performance, as higher-profitability value stocks outperformed lower-profitability growth stocks.
U.S. Vector Equity Portfolio
The U.S. Vector Equity Portfolio invests in a broadly diversified group of U.S. securities with increased exposure to smaller market capitalization stocks, lower relative price (value) stocks, and higher-profitability stocks relative to the market. The Portfolio’s increased exposure to small-cap and value stocks may be achieved by decreasing the allocation to or excluding the largest high relative price (growth) stocks in the U.S. market. The investment strategy is process driven, emphasizing broad diversification. As of October 31, 2022, the Portfolio held approximately 2,500 securities. Average cash exposure throughout the year was less than 1% of the Portfolio’s assets.
For the 12 months ended October 31, 2022, total returns were -7.42% for the Portfolio and -16.52% for the Russell 3000® Index, the Portfolio’s benchmark. With low relative price (value) stocks outperforming high relative price (growth) stocks, the Portfolio’s emphasis on value stocks contributed positively to relative performance.
U.S. Small Cap Portfolio
The U.S. Small Cap Portfolio invests in a broadly diversified group of U.S. small-cap stocks. The Portfolio generally excludes stocks with the lowest profitability and highest relative price. Additionally, the Portfolio generally excludes certain companies with high asset growth. The investment strategy is process driven, emphasizing broad diversification. As of October 31, 2022, the Portfolio held approximately 1,930 securities. Average cash exposure throughout the year was less than 1% of the Portfolio’s assets.
For the 12 months ended October 31, 2022, total returns were -9.62% for the Portfolio and -18.54% for the Russell 2000® Index, the Portfolio’s benchmark. The Portfolio’s exclusion of stocks with the lowest profitability and highest relative price contributed positively to performance relative to the benchmark, as those stocks underperformed. The Portfolio’s exclusion of stocks with high asset growth also contributed positively to relative performance, as those stocks underperformed.
U.S. Micro Cap Portfolio
The U.S. Micro Cap Portfolio invests in a broadly diversified group of U.S. micro-cap companies. The Portfolio generally excludes stocks with the lowest profitability and highest relative price. Additionally, the Portfolio generally excludes certain companies with high asset growth. The investment strategy is process driven, emphasizing broad diversification. As of October 31, 2022, the Portfolio held approximately 1,560 securities. Average cash exposure throughout the year was less than 1% of the Portfolio’s assets.
For the 12 months ended October 31, 2022, total returns were -7.93% for the Portfolio and -18.54% for the Russell 2000® Index, the Portfolio’s benchmark. The Portfolio’s exclusion of stocks with the lowest profitability and highest relative price contributed positively to relative performance, as those stocks underperformed. Additionally, the Portfolio’s exclusion of stocks with high asset growth contributed positively to relative performance, as those stocks underperformed.
13
U.S. High Relative Profitability Portfolio
The U.S. High Relative Profitability Portfolio seeks to capture the returns of U.S. large-cap stocks with higher profitability. The investment strategy is process driven, emphasizing broad diversification with increased exposure to stocks with smaller market capitalizations, lower relative price (value), and higher profitability within the large-cap high relative profitability segment of the U.S. market. As of October 31, 2022, the Portfolio held approximately 170 securities. Average cash exposure throughout the year was less than 1% of the Portfolio’s assets.
For the 12 months ended October 31, 2022, total returns were -8.55% for the Portfolio and -16.38% for the Russell 1000® Index, the Portfolio’s benchmark. The Portfolio’s focus on stocks with high profitability contributed positively to performance relative to the benchmark, as stocks with high profitability generally outperformed stocks with low profitability for the period.
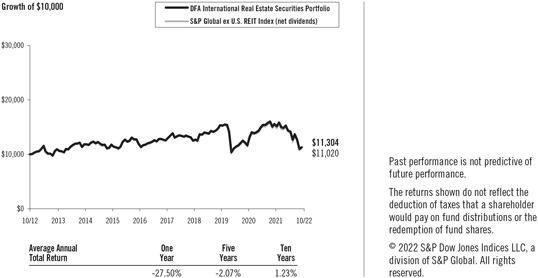
DFA Real Estate Securities Portfolio
The DFA Real Estate Securities Portfolio invests in a broadly diversified group of U.S. real estate securities. As of October 31, 2022, the Portfolio held approximately 140 securities. Average cash exposure throughout the year was less than 1% of the Portfolio’s assets.
For the 12 months ended October 31, 2022, total returns were -19.38% for the Portfolio, -14.61% for the S&P 500® Index, and -19.97% for the Dow Jones U.S. Select REIT Index, the Portfolio’s benchmarks. Differences in REIT eligibility between the Portfolio and the Dow Jones U.S. Select REIT Index contributed positively to the Portfolio’s performance relative to the benchmark, most notably among entertainment and data center REITs. The Portfolio includes entertainment and data center REITs, which are held by the benchmark at a lower weight, and these securities generally outperformed.
14
DFA INVESTMENT DIMENSIONS GROUP INC.
DISCLOSURE OF FUND EXPENSES
(Unaudited)
The following Expense Tables are shown so that you can understand the impact of fees on your investment. All mutual funds have operating expenses. As a shareholder of the fund, you incur ongoing costs, which include costs for portfolio management, administrative services, and shareholder reports, among others. Operating expenses and legal and audit services, which are deducted from a fund’s gross income, directly reduce the investment return of the fund. A fund’s expenses are expressed as a percentage of its average net assets. This figure is known as the expense ratio. The following examples are intended to help you understand the ongoing costs, in dollars, of investing in the fund and to compare these costs with those of other mutual funds. The examples are based on an investment of $1,000 made at the beginning of the period shown and held for the entire period.
The Expense Tables below illustrate your fund’s costs in two ways.
Actual Fund Return
This section helps you to estimate the actual expenses after fee waivers that you paid over the period. The “Ending Account Value” shown is derived from the fund’s actual return, and “Expenses Paid During Period” reflects the dollar amount that would have been paid by an investor who started with $1,000 in the fund. You may use the information here, together with the amount you invested, to estimate the expenses that you paid over the period.
To do so, simply divide your account value by $1,000 (for example, a $7,500 account value divided by $1,000 = 7.5), then multiply the result by the number given for your fund under the heading “Expenses Paid During Period.”
Hypothetical Example for Comparison Purposes
This section is intended to help you compare your fund’s costs with those of other mutual funds. The hypothetical “Ending Account Value” and “Expenses Paid During Period” are derived from the fund’s actual expense ratio and an assumed 5% annual return before expenses. In this case, because the return used is not the fund’s actual return, the results do not apply to your investment. The example is useful in making comparisons because the SEC requires all mutual funds to calculate expenses based on a 5% annual return. You can assess your fund’s costs by comparing this hypothetical example with the hypothetical examples that appear in shareholder reports of other funds.
Please note that the expenses shown in the tables are meant to highlight and help you compare ongoing costs only and do not reflect any transactional costs, if applicable. The “Annualized Expense Ratio” represents the actual expenses for the six-month period indicated.
Six Months Ended October 31, 2022
| | | | | | | | | | | | | | | | |
| EXPENSE TABLES | | | | | | | | | | | | |
| | | Beginning
Account
Value
05/01/22 | | | Ending
Account
Value
10/31/22 | | | Annualized
Expense
Ratio (1) | | | Expenses
Paid
During
Period (1) | |
Enhanced U.S. Large Company Portfolio | | | | | | | | | | | | | | | | |
Actual Fund Return | | $ | 1,000.00 | | | $ | 921.70 | | | | 0.15 | % | | $ | 0.73 | |
Hypothetical 5% Annual Return | | $ | 1,000.00 | | | $ | 1,024.45 | | | | 0.15 | % | | $ | 0.77 | |
U.S. Large Cap Equity Portfolio | | | | | | | | | | | | | | | | |
Actual Fund Return | | $ | 1,000.00 | | | $ | 951.80 | | | | 0.13 | % | | $ | 0.64 | |
Hypothetical 5% Annual Return | | $ | 1,000.00 | | | $ | 1,024.55 | | | | 0.13 | % | | $ | 0.66 | |
15
DISCLOSURE OF FUND EXPENSES
CONTINUED
| | | | | | | | | | | | | | | | |
| | | Beginning
Account
Value
05/01/22 | | | Ending
Account
Value
10/31/22 | | | Annualized
Expense
Ratio (1) | | | Expenses
Paid
During
Period (1) | |
U.S. Large Cap Value Portfolio (2) | | | | | | | | | | | | | | | | |
Actual Fund Return | | $ | 1,000.00 | | | $ | 993.40 | | | | 0.21 | % | | $ | 1.06 | |
Hypothetical 5% Annual Return | | $ | 1,000.00 | | | $ | 1,024.15 | | | | 0.21 | % | | $ | 1.07 | |
U.S. Targeted Value Portfolio | | | | | | | | | | | | | | | | |
Actual Fund Return | | | | | | | | | | | | | | | | |
Class R1 Shares | | $ | 1,000.00 | | | $ | 1,021.80 | | | | 0.40 | % | | $ | 2.04 | |
Class R2 Shares | | $ | 1,000.00 | | | $ | 1,021.20 | | | | 0.54 | % | | $ | 2.75 | |
Institutional Class Shares | | $ | 1,000.00 | | | $ | 1,022.00 | | | | 0.30 | % | | $ | 1.53 | |
Hypothetical 5% Annual Return | | | | | | | | | | | | | | | | |
Class R1 Shares | | $ | 1,000.00 | | | $ | 1,023.19 | | | | 0.40 | % | | $ | 2.04 | |
Class R2 Shares | | $ | 1,000.00 | | | $ | 1,022.48 | | | | 0.54 | % | | $ | 2.75 | |
Institutional Class Shares | | $ | 1,000.00 | | | $ | 1,023.69 | | | | 0.30 | % | | $ | 1.53 | |
U.S. Small Cap Value Portfolio | | | | | | | | | | | | | | | | |
Actual Fund Return | | $ | 1,000.00 | | | $ | 1,035.30 | | | | 0.33 | % | | $ | 1.69 | |
Hypothetical 5% Annual Return | | $ | 1,000.00 | | | $ | 1,023.54 | | | | 0.33 | % | | $ | 1.68 | |
U.S. Core Equity 1 Portfolio | | | | | | | | | | | | | | | | |
Actual Fund Return | | $ | 1,000.00 | | | $ | 965.80 | | | | 0.14 | % | | $ | 0.69 | |
Hypothetical 5% Annual Return | | $ | 1,000.00 | | | $ | 1,024.50 | | | | 0.14 | % | | $ | 0.71 | |
U.S. Core Equity 2 Portfolio | | | | | | | | | | | | | | | | |
Actual Fund Return | | $ | 1,000.00 | | | $ | 969.10 | | | | 0.18 | % | | $ | 0.89 | |
Hypothetical 5% Annual Return | | $ | 1,000.00 | | | $ | 1,024.30 | | | | 0.18 | % | | $ | 0.92 | |
U.S. Vector Equity Portfolio | | | | | | | | | | | | | | | | |
Actual Fund Return | | $ | 1,000.00 | | | $ | 996.10 | | | | 0.28 | % | | $ | 1.41 | |
Hypothetical 5% Annual Return | | $ | 1,000.00 | | | $ | 1,023.79 | | | | 0.28 | % | | $ | 1.43 | |
U.S. Small Cap Portfolio | | | | | | | | | | | | | | | | |
Actual Fund Return | | $ | 1,000.00 | | | $ | 1,011.40 | | | | 0.29 | % | | $ | 1.47 | |
Hypothetical 5% Annual Return | | $ | 1,000.00 | | | $ | 1,023.74 | | | | 0.29 | % | | $ | 1.48 | |
U.S. Micro Cap Portfolio | | | | | | | | | | | | | | | | |
Actual Fund Return | | $ | 1,000.00 | | | $ | 1,019.40 | | | | 0.41 | % | | $ | 2.09 | |
Hypothetical 5% Annual Return | | $ | 1,000.00 | | | $ | 1,023.14 | | | | 0.41 | % | | $ | 2.09 | |
U.S. High Relative Profitability Portfolio | | | | | | | | | | | | | | | | |
Actual Fund Return | | $ | 1,000.00 | | | $ | 967.70 | | | | 0.23 | % | | $ | 1.14 | |
Hypothetical 5% Annual Return | | $ | 1,000.00 | | | $ | 1,024.05 | | | | 0.23 | % | | $ | 1.17 | |
16
DISCLOSURE OF FUND EXPENSES
CONTINUED
| | | | | | | | | | | | | | | | |
| | | Beginning
Account
Value
05/01/22 | | | Ending
Account
Value
10/31/22 | | | Annualized
Expense
Ratio (1) | | | Expenses
Paid
During
Period (1) | |
DFA Real Estate Securities Portfolio | | | | | | | | | | | | | | | | |
Actual Fund Return | | $ | 1,000.00 | | | $ | 818.30 | | | | 0.18 | % | | $ | 0.82 | |
Hypothetical 5% Annual Return | | $ | 1,000.00 | | | $ | 1,024.30 | | | | 0.18 | % | | $ | 0.92 | |
| (1) | Expenses are equal to the fund’s annualized expense ratio for the six-month period, multiplied by the average account value over the period, multiplied by the number of days in the most recent six-month period (184), then divided by the number of days in the year (365) to reflect the six-month period. |
| (2) | The Portfolio is a Feeder Fund. The expenses shown reflect the direct expenses of the Feeder Fund and the allocation of the Feeder Fund’s portion of the expenses of its Master Fund (Affiliated Investment Company). |
17
DFA INVESTMENT DIMENSIONS GROUP INC.
DISCLOSURE OF PORTFOLIO HOLDINGS
(Unaudited)
The SEC requires that all funds file a complete Schedule of Investments with the SEC for their first and third fiscal quarters as an exhibit to their reports on Form N-PORT. For DFA Investment Dimensions Group Inc., this would be for the fiscal quarters ending January 31 and July 31. Such Form N-PORT filing must be made within 60 days of the end of the quarter. DFA Investment Dimensions Group Inc. filed its most recent Form N-PORT with the SEC on September 28, 2022. They are available upon request, without charge, by calling collect: (512) 306-7400; by mailing a request to Dimensional Fund Advisors LP, 6300 Bee Cave Road, Building One, Austin, TX 78746; or by visiting the SEC’s website at http://www.sec.gov.
SEC regulations permit a fund to include in its reports to shareholders a “Summary Schedule of Portfolio Holdings” in lieu of a full Schedule of Investments. The Summary Schedule of Portfolio Holdings reports the fund’s 50 largest holdings in unaffiliated issuers and any investments that exceed one percent of the fund’s net assets at the end of the reporting period. The regulations also require that the Summary Schedule of Portfolio Holdings identify each category of investments that are held.
A fund is required to file a complete Schedule of Investments with the SEC on Form N-CSR within ten days after mailing the annual and semi-annual reports to shareholders. It will be available upon request, without charge, by calling collect: (512) 306-7400; by mailing a request to Dimensional Fund Advisors LP, 6300 Bee Cave Road, Building One, Austin, TX 78746; or by visiting the SEC’s website at http://www.sec.gov.
PORTFOLIO HOLDINGS
The SEC requires that all funds present their categories of portfolio holdings in a table, chart, or graph format in their annual and semi-annual shareholder reports, whether or not a Schedule of Investments is used. The following table, which presents portfolio holdings as a percentage of total investments before short-term investments and collateral for loaned securities, is provided in compliance with this requirement. The categories shown below represent broad industry sectors. Each industry sector consists of one or more specific industry classifications.
The categories of industry classification for the Affiliated Investment Company are represented in its Disclosure of Portfolio Holdings, which is included elsewhere in the report. Refer to the Summary Schedule of Portfolio Holdings for the Affiliated Investment Company’s holdings, which reflect the investments by category or country.
FEEDER FUND
| | | | |
| | | Affiliated Investment Company | |
U.S. Large Cap Value Portfolio | | | 100.0 | % |
ENHANCED DOMESTIC EQUITY PORTFOLIO
| | | | |
| Enhanced U.S. Large Company Portfolio | |
Basic Materials | | | 1.6 | % |
Communications | | | 0.4 | % |
Consumer, Cyclical | | | 7.9 | % |
Consumer, Non-cyclical | | | 11.9 | % |
Energy | | | 5.7 | % |
Financial | | | 38.5 | % |
Foreign Government | | | 5.0 | % |
Industrial | | | 2.1 | % |
Supranational | | | 0.9 | % |
Technology | | | 2.0 | % |
U.S. Government | | | 22.4 | % |
Utilities | | | 1.6 | % |
| | | | |
| | | 100.0 | % |
18
DOMESTIC EQUITY PORTFOLIOS
| | | | |
| U.S. Large Cap Equity Portfolio | |
Communication Services | | | 7.2 | % |
Consumer Discretionary | | | 10.0 | % |
Consumer Staples | | | 7.4 | % |
Energy | | | 7.3 | % |
Financials | | | 12.7 | % |
Health Care | | | 14.8 | % |
Industrials | | | 10.4 | % |
Information Technology | | | 23.8 | % |
Materials | | | 3.9 | % |
Real Estate | | | 0.1 | % |
Utilities | | | 2.4 | % |
| | | | |
| | | 100.0 | % |
| | | | |
| U.S. Targeted Value Portfolio | |
Communication Services | | | 2.5 | % |
Consumer Discretionary | | | 11.6 | % |
Consumer Staples | | | 4.2 | % |
Energy | | | 9.9 | % |
Financials | | | 29.3 | % |
Health Care | | | 5.0 | % |
Industrials | | | 18.5 | % |
Information Technology | | | 9.2 | % |
Materials | | | 8.4 | % |
Real Estate | | | 0.9 | % |
Utilities | | | 0.5 | % |
| | | | |
| | | 100.0 | % |
| | | | |
| U.S. Small Cap Value Portfolio | |
Communication Services | | | 2.2 | % |
Consumer Discretionary | | | 12.4 | % |
Consumer Staples | | | 4.6 | % |
Energy | | | 11.3 | % |
Financials | | | 29.6 | % |
Health Care | | | 4.3 | % |
Industrials | | | 19.8 | % |
Information Technology | | | 7.7 | % |
Materials | | | 7.1 | % |
Real Estate | | | 0.7 | % |
Utilities | | | 0.3 | % |
| | | | |
| | | 100.0 | % |
| | | | |
| U.S. Core Equity 1 Portfolio | |
Communication Services | | | 6.3 | % |
Consumer Discretionary | | | 11.2 | % |
Consumer Staples | | | 6.7 | % |
Energy | | | 7.1 | % |
Financials | | | 14.5 | % |
Health Care | | | 12.9 | % |
Industrials | | | 12.3 | % |
Information Technology | | | 21.7 | % |
Materials | | | 4.4 | % |
Real Estate | | | 0.2 | % |
Utilities | | | 2.7 | % |
| | | | |
| | | 100.0 | % |
| | | | |
| U.S. Core Equity 2 Portfolio | |
Communication Services | | | 5.6 | % |
Consumer Discretionary | | | 10.2 | % |
Consumer Staples | | | 6.5 | % |
Energy | | | 6.7 | % |
Financials | | | 15.2 | % |
Health Care | | | 12.8 | % |
Industrials | | | 14.1 | % |
Information Technology | | | 21.8 | % |
Materials | | | 4.8 | % |
Real Estate | | | 0.3 | % |
Utilities | | | 2.0 | % |
| | | | |
| | | 100.0 | % |
| | | | |
| U.S. Vector Equity Portfolio | |
Communication Services | | | 5.1 | % |
Consumer Discretionary | | | 10.0 | % |
Consumer Staples | | | 5.0 | % |
Energy | | | 10.9 | % |
Financials | | | 23.1 | % |
Health Care | | | 10.2 | % |
Industrials | | | 16.5 | % |
Information Technology | | | 9.9 | % |
Materials | | | 7.6 | % |
Real Estate | | | 0.5 | % |
Utilities | | | 1.2 | % |
| | | | |
| | | 100.0 | % |
| | | | |
| U.S. Small Cap Portfolio | |
Communication Services | | | 2.7 | % |
Consumer Discretionary | | | 12.1 | % |
Consumer Staples | | | 4.4 | % |
Energy | | | 6.2 | % |
Financials | | | 22.0 | % |
Health Care | | | 10.5 | % |
Industrials | | | 20.3 | % |
Information Technology | | | 11.7 | % |
Materials | | | 6.3 | % |
Real Estate | | | 0.4 | % |
Utilities | | | 3.4 | % |
| | | | |
| | | 100.0 | % |
| | | | |
| U.S. Micro Cap Portfolio | |
Communication Services | | | 2.6 | % |
Consumer Discretionary | | | 11.7 | % |
Consumer Staples | | | 5.3 | % |
Energy | | | 7.7 | % |
Financials | | | 22.5 | % |
Health Care | | | 11.2 | % |
Industrials | | | 18.1 | % |
Information Technology | | | 12.3 | % |
Materials | | | 5.3 | % |
Real Estate | | | 0.8 | % |
Utilities | | | 2.5 | % |
| | | | |
| | | 100.0 | % |
| | | | |
| U.S. High Relative Profitability Portfolio | |
Communication Services | | | 2.7 | % |
Consumer Discretionary | | | 15.0 | % |
Consumer Staples | | | 12.1 | % |
Energy | | | 3.3 | % |
Financials | | | 4.0 | % |
Health Care | | | 15.0 | % |
Industrials | | | 12.6 | % |
Information Technology | | | 32.5 | % |
Materials | | | 2.7 | % |
Utilities | | | 0.1 | % |
| | | | |
| | | 100.0 | % |
| | | | |
| DFA Real Estate Securities Portfolio | |
Real Estate | | | 100.0 | % |
| | | | |
| | | 100.0 | % |
19
ENHANCED U.S. LARGE COMPANY PORTFOLIO
SCHEDULE OF INVESTMENTS
October 31, 2022
| | | | | | | | | | | | |
| | | Face
Amount^ | | | Value† | |
| | | (000) | | | | |
BONDS — (75.6%) | | | | | | | | |
AUSTRALIA — (1.0%) | | | | | | | | |
Glencore Funding LLC | | | | | | | | | | |
W | | 4.125%, 05/30/23 | | | | | 1,000 | | | $ | 989,339 | |
| | 4.125%, 05/30/23 | | | | | 500 | | | | 494,669 | |
W | | 4.625%, 04/29/24 | | | | | 1,150 | | | | 1,130,394 | |
| | | | | | | | | | |
TOTAL AUSTRALIA | | | | | | | | | 2,614,402 | |
| | | | | | | | | | |
CANADA — (6.0%) | | | | | | | | | | |
Bank of Nova Scotia | | | | | | | | | | |
| | 0.700%, 04/15/24 | | | | | 3,000 | | | | 2,800,091 | |
Canadian Imperial Bank of Commerce | | | | | | | | | | |
| | 3.100%, 04/02/24 | | | | | 2,750 | | | | 2,664,940 | |
Canadian Natural Resources Ltd. | | | | | | | | | | |
| | 3.900%, 02/01/25 | | | | | 2,450 | | | | 2,362,592 | |
Enbridge, Inc. | | | | | | | | | | |
| | 2.150%, 02/16/24 | | | | | 500 | | | | 480,760 | |
Toronto-Dominion Bank | | | | | | | | | | |
| | 2.850%, 03/08/24 | | CAD | | | 9,500 | | | | 6,764,884 | |
| | | | | | | | | | |
TOTAL CANADA | | | | | | | 15,073,267 | |
| | | | | | | | | | |
DENMARK — (0.2%) | | | | | | | | |
Denmark Government Bond | | | | | | | | | | |
| | 0.000%, 11/15/24 | | DKK | | | 5,000 | | | | 634,445 | |
| | | | | | | | | | |
FRANCE — (3.8%) | | | | | | | | |
BNP Paribas SA | | | | | | | | | | |
W | | 3.375%, 01/09/25 | | | | | 1,900 | | | | 1,796,118 | |
BPCE SA | | | | | | | | | | |
W | | 2.375%, 01/14/25 | | | | | 2,265 | | | | 2,077,966 | |
Credit Agricole SA | | | | | | | | | | |
#W | | 3.875%, 04/15/24 | | | | | 3,300 | | | | 3,230,489 | |
Societe Generale SA | | | | | | | | | | |
W | | 3.875%, 03/28/24 | | | | | 500 | | | | 481,303 | |
#W | | 2.625%, 10/16/24 | | | | | 2,000 | | | | 1,865,430 | |
| | | | | | | | | | |
TOTAL FRANCE | | | | | | | 9,451,306 | |
| | | | | | | | | | |
GERMANY — (6.1%) | | | | | | | | |
Bayer U.S. Finance LLC | | | | | | | | | | |
W | | 3.375%, 10/08/24 | | | | | 2,500 | | | | 2,403,458 | |
BMW U.S. Capital LLC | | | | | | | | | | |
W | | 0.750%, 08/12/24 | | | | | 458 | | | | 422,969 | |
W | | 3.900%, 04/09/25 | | | | | 2,022 | | | | 1,953,886 | |
| | 3.900%, 04/09/25 | | | | | 253 | | | | 244,478 | |
Daimler Trucks Finance North America LLC | | | | | | | | | | |
W | | 3.500%, 04/07/25 | | | | | 1,871 | | | | 1,770,546 | |
Deutsche Bank AG | | | | | | | | | | |
| | 3.950%, 02/27/23 | | | | | 2,350 | | | | 2,333,727 | |
| | | | | | | | | | | | | | |
| | | Face
Amount^ | | | Value† | |
| | | (000) | | | | |
GERMANY — (Continued) | | | | | | | | | |
EMD Finance LLC | | | | | | | | | | | | |
W | | 3.250%, 03/19/25 | | | | | | | 2,886 | | | $ | 2,750,276 | |
Mercedes-Benz Finance North America LLC | | | | | | | | | | | | |
#W | | 3.250%, 08/01/24 | | | | | | | 1,750 | | | | 1,688,064 | |
Volkswagen Group of America Finance LLC | | | | | | | | | | | | |
W | | 0.875%, 11/22/23 | | | | | | | 2,000 | | | | 1,903,859 | |
| | | | | | | | | | | | |
TOTAL GERMANY | | | | | | | | 15,471,263 | |
| | | | | | | | | |
IRELAND — (1.2%) | | | | | | | | | |
AerCap Ireland Capital DAC/AerCap Global Aviation Trust | | | | | | | | | | | | |
| | 2.875%, 08/14/24 | | | | | | | 2,300 | | | | 2,155,096 | |
Ireland Government Bond | | | | | | | | | | | | |
| | 5.400%, 03/13/25 | | | EUR | | | | 900 | | | | 956,313 | |
| | | | | | | | | | | | |
TOTAL IRELAND | | | | | | | | 3,111,409 | |
| | | | | | | | | |
ITALY — (1.7%) | | | | | | | | | |
Intesa Sanpaolo SpA | | | | | | | | | | | | |
W | | 3.250%, 09/23/24 | | | | | | | 2,202 | | | | 2,055,482 | |
Republic of Italy Government International Bond | | | | | | | | | | | | |
| | 2.375%, 10/17/24 | | | | | | | 2,500 | | | | 2,330,005 | |
| | | | | | | | | | | | |
TOTAL ITALY | | | | | | | | 4,385,487 | |
| | | | | | | | | |
JAPAN — (5.1%) | | | | | | | | | |
Aircastle Ltd. | | | | | | | | | | | | |
# | | 4.125%, 05/01/24 | | | | | | | 2,400 | | | | 2,287,214 | |
American Honda Finance Corp. | | | | | | | | | | | | |
| | 0.550%, 07/12/24 | | | | | | | 1,000 | | | | 927,037 | |
Nomura Holdings, Inc. | | | | | | | | | | | | |
| | 2.648%, 01/16/25 | | | | | | | 2,500 | | | | 2,340,100 | |
Sumitomo Mitsui Financial Group, Inc. | | | | | | | | | | | | |
# | | 3.748%, 07/19/23 | | | | | | | 2,000 | | | | 1,977,102 | |
| | 2.696%, 07/16/24 | | | | | | | 1,100 | | | | 1,047,596 | |
Sumitomo Mitsui Trust Bank Ltd. | | | | | | | | | | | | |
| | 0.850%, 03/25/24 | | | | | | | 2,000 | | | | 1,872,108 | |
Toyota Motor Credit Corp. | | | | | | | | | | | | |
| | 0.625%, 09/13/24 | | | | | | | 1,000 | | | | 924,637 | |
# | | 1.450%, 01/13/25 | | | | | | | 1,500 | | | | 1,389,717 | |
| | | | | | | | | | | | |
TOTAL JAPAN | | | | | | | | 12,765,511 | |
| | | | | | | | | | | | |
20
ENHANCED U.S. LARGE COMPANY PORTFOLIO
CONTINUED
| | | | | | | | | | | | | | |
| | | Face
Amount^ | | | Value† | |
| | | (000) | | | | |
NETHERLANDS — (4.1%) | | | | | | | | | |
BNG Bank NV | | | | | | | | | |
| | 2.000%, 04/12/24 | | | GBP | | | | 500 | | | $ | 557,045 | |
| | 5.250%, 05/20/24 | | | AUD | | | | 10,000 | | | | 6,505,124 | |
Cooperatieve Rabobank UA | | | | | | | | | |
W | | 2.625%, 07/22/24 | | | | | | | 3,500 | | | | 3,333,660 | |
| | | | | | | | | |
TOTAL NETHERLANDS | | | | | | | | 10,395,829 | |
| | | | | | | | | |
NORWAY — (1.4%) | | | | | | | | | |
Kommunalbanken AS | | | | | | | | | |
| | 5.250%, 07/15/24 | | | AUD | | | | 5,300 | | | | 3,448,554 | |
| | | | | | | | | |
SPAIN — (0.8%) | | | | | | | | | |
Banco Santander SA | | | | | | | | | |
| | 2.706%, 06/27/24 | | | | | | | 1,200 | | | | 1,139,132 | |
Santander Holdings USA, Inc. | | | | | | | | | |
| | 3.500%, 06/07/24 | | | | | | | 1,000 | | | | 958,950 | |
| | | | | | | | | |
TOTAL SPAIN | | | | | | | | 2,098,082 | |
| | | | | | | | | |
SUPRANATIONAL ORGANIZATION OBLIGATIONS — (0.9%) | | | | | |
European Union | | | | | | | | | |
| | 0.800%, 07/04/25 | | | EUR | | | | 1,000 | | | | 946,311 | |
International Finance Corp. | | | | | | | | | |
| | 1.450%, 07/22/24 | | | AUD | | | | 2,000 | | | | 1,224,994 | |
| | | | | | | | | |
TOTAL SUPRANATIONAL ORGANIZATION OBLIGATIONS | | | | | | | | 2,171,305 | |
| | | | | | | | | |
SWEDEN — (2.0%) | | | | | | | | | |
Kommuninvest I Sverige AB | | | | | | | | | |
| | 1.000%, 10/02/24 | | | SEK | | | | 50,000 | | | | 4,329,480 | |
Sweden Government Bond | | | | | | | | | |
| | 2.500%, 05/12/25 | | | SEK | | | | 7,500 | | | | 680,558 | |
| | | | | | | | | |
TOTAL SWEDEN | | | | | | | | 5,010,038 | |
| | | | | | | | | |
SWITZERLAND — (1.4%) | | | | | | | | | |
UBS AG | | | | | | | | | |
W | | 0.700%, 08/09/24 | | | | | | | 3,750 | | | | 3,445,254 | |
| | | | | | | | | |
UNITED KINGDOM — (4.3%) | | | | | | | | | |
BAT Capital Corp. | | | | | | | | | |
| | 3.222%, 08/15/24 | | | | | | | 1,000 | | | | 955,758 | |
CNH Industrial Capital LLC | | | | | | | | | |
| | 1.950%, 07/02/23 | | | | | | | 1,094 | | | | 1,068,313 | |
HSBC USA, Inc. | | | | | | | | | |
| | 3.500%, 06/23/24 | | | | | | | 1,100 | | | | 1,060,181 | |
Nationwide Building Society | | | | | | | | | |
W | | 0.550%, 01/22/24 | | | | | | | 1,475 | | | | 1,383,731 | |
NatWest Markets PLC | | | | | | | | | |
W | | 2.375%, 05/21/23 | | | | | | | 2,000 | | | | 1,956,712 | |
W | | 0.800%, 08/12/24 | | | | | | | 1,650 | | | | 1,507,288 | |
| | | | | | | | | | | | |
| | | Face
Amount^ | | | Value† | |
| | | (000) | | | | |
UNITED KINGDOM — (Continued) | | | | | | | | |
Reckitt Benckiser Treasury Services PLC | | | | | | | | | | |
| | 2.750%, 06/26/24 | | | | | 2,000 | | | $ | 1,917,899 | |
W | | 2.750%, 06/26/24 | | | | | 958 | | | | 918,674 | |
| | | | | | | | |
TOTAL UNITED KINGDOM | | | | | | | 10,768,556 | |
| | | | | | | | |
UNITED STATES — (35.6%) | | | | | | | | |
Air Lease Corp. | | | | | | | | |
| | 2.250%, 01/15/23 | | | | | 1,610 | | | | 1,599,012 | |
Allstate Corp. | | | | | | | | |
# | | 3.150%, 06/15/23 | | | | | 852 | | | | 842,667 | |
Ally Financial, Inc. | | | | | | | | |
| | 3.875%, 05/21/24 | | | | | 484 | | | | 467,393 | |
American Express Co. | | | | | | | | |
| | 3.375%, 05/03/24 | | | | | 2,075 | | | | 2,012,545 | |
American Tower Corp. | | | | | | | | |
# | | 0.600%, 01/15/24 | | | | | 500 | | | | 472,479 | |
American Water Capital Corp. | | | | | | | | |
| | 3.400%, 03/01/25 | | | | | 2,600 | | | | 2,496,746 | |
Ameriprise Financial, Inc. | | | | | | | | |
| | 3.000%, 04/02/25 | | | | | 1,814 | | | | 1,721,646 | |
Amgen, Inc. | | | | | | | | |
# | | 3.125%, 05/01/25 | | | | | 3,000 | | | | 2,867,580 | |
Ares Capital Corp. | | | | | | | | |
# | | 4.200%, 06/10/24 | | | | | 2,500 | | | | 2,405,074 | |
Arrow Electronics, Inc. | | | | | | | | |
| | 3.250%, 09/08/24 | | | | | 1,500 | | | | 1,431,182 | |
Boardwalk Pipelines LP | | | | | | | | |
| | 4.950%, 12/15/24 | | | | | 1,500 | | | | 1,483,190 | |
Brixmor Operating Partnership LP | | | | | | | | |
| | 3.850%, 02/01/25 | | | | | 1,800 | | | | 1,719,827 | |
Capital One Financial Corp. | | | | | | | | |
| | 3.200%, 02/05/25 | | | | | 600 | | | | 567,232 | |
Cardinal Health, Inc. | | | | | | | | |
| | 3.079%, 06/15/24 | | | | | 2,750 | | | | 2,650,396 | |
Chubb INA Holdings, Inc. | | | | | | | | |
| | 3.150%, 03/15/25 | | | | | 1,500 | | | | 1,432,053 | |
Cigna Corp. | | | | | | | | |
| | 3.750%, 07/15/23 | | | | | 1,082 | | | | 1,070,837 | |
| | 3.250%, 04/15/25 | | | | | 1,900 | | | | 1,811,787 | |
Discover Bank | | | | | | | | |
| | 2.450%, 09/12/24 | | | | | 750 | | | | 703,845 | |
Discover Financial Services | | | | | | | | |
| | 3.950%, 11/06/24 | | | | | 1,500 | | | | 1,445,629 | |
Edison International | | | | | | | | |
| | 3.550%, 11/15/24 | | | | | 1,500 | | | | 1,438,231 | |
Elevance Health, Inc. | | | | | | | | |
| | 3.500%, 08/15/24 | | | | | 200 | | | | 194,078 | |
| | 2.375%, 01/15/25 | | | | | 2,800 | | | | 2,631,231 | |
Energy Transfer LP | | | | | | | | |
| | 2.900%, 05/15/25 | | | | | 2,000 | | | | 1,856,560 | |
EOG Resources, Inc. | | | | | | | | |
| | 3.150%, 04/01/25 | | | | | 2,107 | | | | 2,018,788 | |
21
ENHANCED U.S. LARGE COMPANY PORTFOLIO
CONTINUED
| | | | | | | | | | | | |
| | | Face
Amount^ | | | Value† | |
| | | (000) | | | | |
UNITED STATES — (Continued) | | | | | | | | |
ERAC USA Finance LLC | | | | | | | | | | |
W | | 3.850%, 11/15/24 | | | | | 3,000 | | | $ | 2,892,053 | |
Fidelity National Information Services, Inc. | | | | | | | | | | |
| | 0.600%, 03/01/24 | | | | | 2,500 | | | | 2,350,888 | |
General Motors Financial Co., Inc. | | | | | | | | | | |
| | 1.050%, 03/08/24 | | | | | 500 | | | | 468,859 | |
| | 3.800%, 04/07/25 | | | | | 1,500 | | | | 1,417,706 | |
Gilead Sciences, Inc. | | | | | | | | | | |
| | 3.500%, 02/01/25 | | | | | 1,000 | | | | 965,277 | |
Global Payments, Inc. | | | | | | | | | | |
| | 3.750%, 06/01/23 | | | | | 1,000 | | | | 989,772 | |
| | 4.000%, 06/01/23 | | | | | 1,500 | | | | 1,487,892 | |
International Business Machines Corp. | | | | | | | | | | |
| | 3.000%, 05/15/24 | | | | | 2,700 | | | | 2,619,916 | |
JPMorgan Chase & Co. | | | | | | | | | | |
| | 3.625%, 05/13/24 | | | | | 474 | | | | 464,320 | |
Kilroy Realty LP | | | | | | | | | | |
| | 3.450%, 12/15/24 | | | | | 900 | | | | 851,289 | |
Kinder Morgan Energy Partners LP | | | | | | | | | | |
# | | 4.250%, 09/01/24 | | | | | 1,500 | | | | 1,464,409 | |
Lazard Group LLC | | | | | | | | | | |
| | 3.750%, 02/13/25 | | | | | 1,500 | | | | 1,442,785 | |
Lincoln National Corp. | | | | | | | | | | |
# | | 4.000%, 09/01/23 | | | | | 1,500 | | | | 1,487,096 | |
MPLX LP | | | | | | | | | | |
| | 4.875%, 12/01/24 | | | | | 1,250 | | | | 1,227,067 | |
Mylan, Inc. | | | | | | | | | | |
W | | 3.125%, 01/15/23 | | | | | 2,650 | | | | 2,633,544 | |
Nuveen Finance LLC | | | | | | | | | | |
W | | 4.125%, 11/01/24 | | | | | 2,500 | | | | 2,421,231 | |
Omnicom Group, Inc./Omnicom Capital, Inc. | | | | | | | | | | |
| | 3.650%, 11/01/24 | | | | | 1,004 | | | | 968,664 | |
ONEOK, Inc. | | | | | | | | | | |
| | 2.750%, 09/01/24 | | | | | 360 | | | | 341,584 | |
Penske Truck Leasing Co. LP/PTL Finance Corp. | | | | | | | | | | |
W | | 4.125%, 08/01/23 | | | | | 578 | | | | 570,505 | |
W | | 2.700%, 11/01/24 | | | | | 1,183 | | | | 1,106,753 | |
Phillips 66 | | | | | | | | | | |
# | | 3.850%, 04/09/25 | | | | | 2,500 | | | | 2,419,034 | |
PNC Financial Services Group, Inc. | | | | | | | | | | |
| | 2.200%, 11/01/24 | | | | | 248 | | | | 233,832 | |
Realty Income Corp. | | | | | | | | | | |
| | 3.875%, 07/15/24 | | | | | 2,500 | | | | 2,441,734 | |
| | | | | | | | | | | | |
| | | Face
Amount^ | | | Value† | |
| | | (000) | | | | |
UNITED STATES — (Continued) | | | | | | | | |
Schlumberger Holdings Corp. | | | | | | | | |
W | | 3.750%, 05/01/24 | | | | | 400 | | | $ | 391,231 | |
Sherwin-Williams Co. | | | | | | | | |
# | | 4.050%, 08/08/24 | | | | | 1,389 | | | | 1,362,739 | |
Simon Property Group LP | | | | | | | | |
| | 2.000%, 09/13/24 | | | | | 3,650 | | | | 3,430,293 | |
Stellantis NV | | | | | | | | |
| | 5.250%, 04/15/23 | | | | | 1,000 | | | | 996,270 | |
Truist Bank | | | | | | | | |
| | 1.500%, 03/10/25 | | | | | 1,000 | | | | 913,844 | |
Ventas Realty LP | | | | | | | | |
| | 3.500%, 02/01/25 | | | | | 400 | | | | 379,764 | |
VF Corp. | | | | | | | | |
| | 2.400%, 04/23/25 | | | | | 3,000 | | | | 2,788,073 | |
Vornado Realty LP | | | | | | | | |
| | 3.500%, 01/15/25 | | | | | 2,565 | | | | 2,384,002 | |
Walgreens Boots Alliance, Inc. | | | | | | | | |
| | 3.800%, 11/18/24 | | | | | 2,500 | | | | 2,427,204 | |
Waste Management, Inc. | | | | | | | | |
| | 2.400%, 05/15/23 | | | | | 900 | | | | 889,058 | |
Wells Fargo & Co. | | | | | | | | |
| | 3.300%, 09/09/24 | | | | | 3,000 | | | | 2,897,972 | |
| | | | | | | | |
TOTAL UNITED STATES | | | | | | | 89,466,668 | |
| | | | | | | | |
TOTAL BONDS | | | | | | | 190,311,376 | |
| | | | | | | | |
U.S. TREASURY OBLIGATIONS — (21.8%) | | | | | |
U.S. Treasury Notes | | | | | | | | |
| | 0.875%, 01/31/24 | | | | | 5,900 | | | | 5,629,199 | |
| | 0.375%, 04/15/24 | | | | | 52,300 | | | | 49,168,129 | |
| | | | | | | | |
TOTAL U.S. TREASURY OBLIGATIONS | | | | 54,797,328 | |
| | | | | | | | |
TOTAL INVESTMENT SECURITIES
(Cost $257,901,337) | | | | 245,108,704 | |
| | | | | | | | |
| | |
| | | Shares | | | | |
SECURITIES LENDING COLLATERAL — (2.6%) | |
@§ | | The DFA Short Term Investment Fund | | | 561,410 | | | | 6,490,463 | |
| | | | | | | | |
TOTAL INVESTMENTS — (100.0%)
(Cost $264,394,210) | | | $ | 251,599,167 | |
| | | | | | | | |
22
ENHANCED U.S. LARGE COMPANY PORTFOLIO
CONTINUED
As of October 31, 2022, Enhanced U.S. Large Company Portfolio had entered into the following forward currency contracts and the net unrealized forward currency gain (loss) is reflected in the accompanying financial statements:
| | | | | | | | | | | | | | | | | | | | |
Currency Purchased | | | Currency Sold | | | Counterparty | | Settlement
Date | | | Unrealized
Foreign
Exchange
Appreciation
(Depreciation) | |
USD | | | 5,035,537 | | | SEK | | | 53,435,779 | | | Bank of America Corp. | | | 11/29/22 | | | $ | 187,408 | |
USD | | | 217,745 | | | SEK | | | 2,325,834 | | | Citibank, N.A. | | | 11/29/22 | | | | 6,726 | |
USD | | | 16,073,816 | | | CAD | | | 21,123,846 | | | Bank of America Corp. | | | 12/01/22 | | | | 565,831 | |
CAD | | | 4,969,938 | | | USD | | | 3,620,243 | | | Bank of America Corp. | | | 12/01/22 | | | | 28,417 | |
EUR | | | 2,497,738 | | | USD | | | 2,443,097 | | | Bank of America Corp. | | | 12/15/22 | | | | 33,853 | |
USD | | | 2,549,965 | | | EUR | | | 2,535,119 | | | Citibank, N.A. | | | 12/15/22 | | | | 35,946 | |
EUR | | | 66,732 | | | USD | | | 65,407 | | | Citibank, N.A. | | | 12/15/22 | | | | 770 | |
USD | | | 2,005,986 | | | EUR | | | 1,996,097 | | | State Street Bank and Trust | | | 12/15/22 | | | | 26,502 | |
USD | | | 653,102 | | | DKK | | | 4,826,118 | | | Bank of America Corp. | | | 12/19/22 | | | | 9,910 | |
DKK | | | 53,414 | | | USD | | | 6,927 | | | Citibank, N.A. | | | 12/19/22 | | | | 191 | |
NOK | | | 50,903,572 | | | USD | | | 4,776,774 | | | Bank of America Corp. | | | 12/22/22 | | | | 128,182 | |
USD | | | 6,286 | | | GBP | | | 5,401 | | | Citibank, N.A. | | | 01/17/23 | | | | 76 | |
| | | | | | | | | | | | | | | | | | | | |
Total Appreciation | | | | | | | | | | | | $ | 1,023,812 | |
CAD | | | 6,887,521 | | | USD | | | 5,257,754 | | | NatWest Markets PLC | | | 12/01/22 | | | $ | (201,308 | ) |
USD | | | 4,740,728 | | | NOK | | | 50,903,572 | | | Bank of America Corp. | | | 12/22/22 | | | | (164,228 | ) |
USD | | | 555,654 | | | GBP | | | 488,974 | | | Citibank, N.A. | | | 01/17/23 | | | | (6,609 | ) |
USD | | | 11,111,861 | | | AUD | | | 17,524,964 | | | UBS AG | | | 01/24/23 | | | | (129,780 | ) |
| | | | | | | | | | | | | | | | | | | | |
Total (Depreciation) | | | | | | | | | $ | (501,925 | ) |
| | | | | | | | | | | |
Total Appreciation (Depreciation) | | | | | | | | | $ | 521,887 | |
| | | | | | | | | | | | | | | | | | | | |
As of October 31, 2022, Enhanced U.S. Large Company Portfolio had entered into the following outstanding futures contracts:
| | | | | | | | | | | | | | | | | | | | |
Description | | Number of
Contracts | | | Expiration
Date | | | Notional
Value | | | Market
Value | | | Unrealized
Appreciation
(Depreciation) | |
Long Position Contracts: | | | | | | | | | | | | | | | | | | | | |
S&P 500® Emini Index | | | 1,351 | | | | 12/16/22 | | | $ | 279,825,603 | | | $ | 262,296,650 | | | $ | (17,528,953 | ) |
| | | | | | | | | | | | | | | | | | | | |
Total Futures Contracts | | | | | | | | | | $ | 279,825,603 | | | $ | 262,296,650 | | | $ | (17,528,953 | ) |
| | | | | | | | | | | | | | | | | | | | |
Summary of the Portfolio’s investments as of October 31, 2022, based on their valuation inputs, is as follows (see Security Valuation Note):
| | | | | | | | | | | | | | | | |
| | | Investments in Securities (Market Value) | |
| | | Level 1 | | | Level 2 | | | Level 3 | | | Total | |
Bonds | | | | | | | | | | | | | | | | |
Australia | | | — | | | $ | 2,614,402 | | | | — | | | $ | 2,614,402 | |
Canada | | | — | | | | 15,073,267 | | | | — | | | | 15,073,267 | |
Denmark | | | — | | | | 634,445 | | | | — | | | | 634,445 | |
France | | | — | | | | 9,451,306 | | | | — | | | | 9,451,306 | |
Germany | | | — | | | | 15,471,263 | | | | — | | | | 15,471,263 | |
Ireland | | | — | | | | 3,111,409 | | | | — | | | | 3,111,409 | |
Italy | | | — | | | | 4,385,487 | | | | — | | | | 4,385,487 | |
Japan | | | — | | | | 12,765,511 | | | | — | | | | 12,765,511 | |
Netherlands | | | — | | | | 10,395,829 | | | | — | | | | 10,395,829 | |
Norway | | | — | | | | 3,448,554 | | | | — | | | | 3,448,554 | |
23
ENHANCED U.S. LARGE COMPANY PORTFOLIO
CONTINUED
| | | | | | | | | | | | | | | | |
| | | Investments in Securities (Market Value) | |
| | | Level 1 | | | Level 2 | | | Level 3 | | | Total | |
Spain | | | — | | | $ | 2,098,082 | | | | — | | | $ | 2,098,082 | |
Supranational Organization Obligations | | | — | | | | 2,171,305 | | | | — | | | | 2,171,305 | |
Sweden | | | — | | | | 5,010,038 | | | | — | | | | 5,010,038 | |
Switzerland | | | — | | | | 3,445,254 | | | | — | | | | 3,445,254 | |
United Kingdom | | | — | | | | 10,768,556 | | | | — | | | | 10,768,556 | |
United States | | | — | | | | 89,466,668 | | | | — | | | | 89,466,668 | |
U.S. Treasury Obligations | | | — | | | | 54,797,328 | | | | — | | | | 54,797,328 | |
Securities Lending Collateral | | | — | | | | 6,490,463 | | | | — | | | | 6,490,463 | |
Forward Currency Contracts** | | | — | | | | 521,887 | | | | — | | | | 521,887 | |
Futures Contracts** | | $ | (17,528,953 | ) | | | — | | | | — | | | | (17,528,953 | ) |
| | | | | | | | | | | | | | | | |
TOTAL | | $ | (17,528,953 | ) | | $ | 252,121,054 | | | | — | | | $ | 234,592,101 | |
| | | | | | | | | | | | | | | | |
| ** | Valued at the unrealized appreciation/(depreciation) on the investment. |
See accompanying Notes to Financial Statements.
24
U.S. LARGE CAP EQUITY PORTFOLIO
SUMMARY SCHEDULE OF PORTFOLIO HOLDINGS
October 31, 2022
| | | | | | | | | | | | | | |
| | | | | Shares | | | Value† | | | Percentage
of Net Assets‡ | |
COMMON STOCKS — (99.4%) | | | | | | | | | | | | |
COMMUNICATION SERVICES — (7.1%) | | | | | | | | | | | | |
* | | Alphabet, Inc., Class A | | | 247,880 | | | $ | 23,427,139 | | | | 1.5 | % |
* | | Alphabet, Inc., Class C | | | 244,680 | | | | 23,161,409 | | | | 1.4 | % |
| | AT&T, Inc. | | | 327,534 | | | | 5,970,945 | | | | 0.4 | % |
| | Comcast Corp., Class A | | | 202,364 | | | | 6,423,033 | | | | 0.4 | % |
* | | Meta Platforms, Inc., Class A | | | 111,797 | | | | 10,415,009 | | | | 0.7 | % |
| | Verizon Communications, Inc. | | | 260,444 | | | | 9,732,792 | | | | 0.6 | % |
* | | Walt Disney Co. | | | 66,764 | | | | 7,113,037 | | | | 0.4 | % |
| | Other Securities | | | | | | | 29,258,944 | | | | 1.8 | % |
| | | | | | | | | | | | | | |
TOTAL COMMUNICATION SERVICES | | | | | | | 115,502,308 | | | | 7.2 | % |
| | | | | | | | | | | | | | |
CONSUMER DISCRETIONARY — (10.0%) | | | | | | | | | | | | |
* | | Amazon.com, Inc. | | | 340,423 | | | | 34,872,932 | | | | 2.2 | % |
| | Home Depot, Inc. | | | 37,872 | | | | 11,215,035 | | | | 0.7 | % |
| | McDonald’s Corp. | | | 27,606 | | | | 7,527,052 | | | | 0.5 | % |
* | | Tesla, Inc. | | | 78,014 | | | | 17,751,306 | | | | 1.1 | % |
| | Other Securities | | | | | | | 89,560,002 | | | | 5.5 | % |
| | | | | | | | | | | | | | |
TOTAL CONSUMER DISCRETIONARY | | | | | | | 160,926,327 | | | | 10.0 | % |
| | | | | | | | | | | | | | |
CONSUMER STAPLES — (7.4%) | | | | | | | | | | | | |
| | Coca-Cola Co. | | | 195,899 | | | | 11,724,555 | | | | 0.7 | % |
| | Costco Wholesale Corp. | | | 19,258 | | | | 9,657,887 | | | | 0.6 | % |
| | PepsiCo, Inc. | | | 67,647 | | | | 12,283,342 | | | | 0.8 | % |
| | Procter & Gamble Co. | | | 124,570 | | | | 16,775,842 | | | | 1.0 | % |
| | Walmart, Inc. | | | 81,268 | | | | 11,566,874 | | | | 0.7 | % |
| | Other Securities | | | | | | | 57,294,337 | | | | 3.6 | % |
| | | | | | | | | | | | | | |
TOTAL CONSUMER STAPLES | | | | | | | 119,302,837 | | | | 7.4 | % |
| | | | | | | | | | | | | | |
ENERGY — (7.2%) | | | | | | | | | | | | |
| | Chevron Corp. | | | 83,248 | | | | 15,059,563 | | | | 0.9 | % |
| | ConocoPhillips | | | 81,906 | | | | 10,327,527 | | | | 0.6 | % |
| | Exxon Mobil Corp. | | | 208,006 | | | | 23,049,145 | | | | 1.4 | % |
| | Occidental Petroleum Corp. | | | 86,582 | | | | 6,285,853 | | | | 0.4 | % |
| | Other Securities | | | | | | | 61,829,610 | | | | 3.9 | % |
| | | | | | | | | | | | | | |
TOTAL ENERGY | | | | | | | 116,551,698 | | | | 7.2 | % |
| | | | | | | | | | | | | | |
FINANCIALS — (12.6%) | | | | | | | | | | | | |
| | Bank of America Corp. | | | 264,974 | | | | 9,549,663 | | | | 0.6 | % |
* | | Berkshire Hathaway, Inc., Class B | | | 64,967 | | | | 19,171,112 | | | | 1.2 | % |
| | JPMorgan Chase & Co. | | | 129,476 | | | | 16,298,439 | | | | 1.0 | % |
| | Wells Fargo & Co. | | | 129,052 | | | | 5,935,101 | | | | 0.4 | % |
| | Other Securities | | | | | | | 153,193,881 | | | | 9.5 | % |
| | | | | | | | | | | | | | |
TOTAL FINANCIALS | | | | | | | 204,148,196 | | | | 12.7 | % |
| | | | | | | | | | | | | | |
HEALTH CARE — (14.7%) | | | | | | | | | | | | |
| | Abbott Laboratories | | | 64,829 | | | | 6,414,181 | | | | 0.4 | % |
| | AbbVie, Inc. | | | 83,873 | | | | 12,279,007 | | | | 0.8 | % |
| | Amgen, Inc. | | | 25,355 | | | | 6,854,724 | | | | 0.4 | % |
| | Bristol-Myers Squibb Co. | | | 139,451 | | | | 10,803,269 | | | | 0.7 | % |
| | Danaher Corp. | | | 24,535 | | | | 6,174,723 | | | | 0.4 | % |
| | Eli Lilly & Co. | | | 40,436 | | | | 14,641,471 | | | | 0.9 | % |
| | Johnson & Johnson | | | 117,383 | | | | 20,421,121 | | | | 1.3 | % |
25
U.S. LARGE CAP EQUITY PORTFOLIO
CONTINUED
| | | | | | | | | | | | | | |
| | | | | Shares | | | Value† | | | Percentage
of Net Assets‡ | |
HEALTH CARE — (Continued) | | | | | | | | | | | | |
| | Merck & Co., Inc. | | | 127,000 | | | $ | 12,852,400 | | | | 0.8 | % |
| | Pfizer, Inc. | | | 274,999 | | | | 12,801,203 | | | | 0.8 | % |
| | Thermo Fisher Scientific, Inc. | | | 15,127 | | | | 7,774,824 | | | | 0.5 | % |
| | UnitedHealth Group, Inc. | | | 34,736 | | | | 19,283,690 | | | | 1.2 | % |
| | Other Securities | | | | | | | 107,836,890 | | | | 6.6 | % |
| | | | | | | | | | | | | | |
TOTAL HEALTH CARE | | | | | | | 238,137,503 | | | | 14.8 | % |
| | | | | | | | | | | | | | |
INDUSTRIALS — (10.3%) | | | | | | | | | | | | |
| | Caterpillar, Inc. | | | 27,838 | | | | 6,025,814 | | | | 0.4 | % |
| | Deere & Co. | | | 15,154 | | | | 5,998,256 | | | | 0.4 | % |
| | Honeywell International, Inc. | | | 30,366 | | | | 6,195,271 | | | | 0.4 | % |
| | Union Pacific Corp. | | | 30,201 | | | | 5,953,825 | | | | 0.4 | % |
| | United Parcel Service, Inc., Class B | | | 36,051 | | | | 6,048,276 | | | | 0.4 | % |
| | Other Securities | | | | | | | 136,805,608 | | | | 8.3 | % |
| | | | | | | | | | | | | | |
TOTAL INDUSTRIALS | | | | | | | 167,027,050 | | | | 10.3 | % |
| | | | | | | | | | | | | | |
INFORMATION TECHNOLOGY — (23.7%) | | | | | | | | | | | | |
| | Accenture PLC, Class A | | | 31,098 | | | | 8,828,722 | | | | 0.6 | % |
| | Apple, Inc. | | | 551,638 | | | | 84,588,171 | | | | 5.2 | % |
| | Broadcom, Inc. | | | 19,205 | | | | 9,028,655 | | | | 0.6 | % |
| | Cisco Systems, Inc. | | | 204,190 | | | | 9,276,352 | | | | 0.6 | % |
| | Mastercard, Inc., Class A | | | 43,149 | | | | 14,160,639 | | | | 0.9 | % |
| | Microsoft Corp. | | | 305,889 | | | | 71,006,014 | | | | 4.4 | % |
| | NVIDIA Corp. | | | 88,334 | | | | 11,922,440 | | | | 0.7 | % |
| | QUALCOMM, Inc. | | | 55,147 | | | | 6,488,596 | | | | 0.4 | % |
| | Texas Instruments, Inc. | | | 43,768 | | | | 7,030,454 | | | | 0.4 | % |
# | | Visa, Inc., Class A | | | 70,849 | | | | 14,677,079 | | | | 0.9 | % |
| | Other Securities | | | | | | | 146,236,339 | | | | 9.0 | % |
| | | | | | | | | | | | | | |
TOTAL INFORMATION TECHNOLOGY | | | | | | | 383,243,461 | | | | 23.7 | % |
| | | | | | | | | | | | | | |
MATERIALS — (3.8%) | | | | | | | | | | | | |
| | Other Securities | | | | | | | 61,923,513 | | | | 3.8 | % |
| | | | | | | | | | | | | | |
REAL ESTATE — (0.2%) | | | | | | | | | | | | |
| | Other Securities | | | | | | | 2,387,112 | | | | 0.1 | % |
| | | | | | | | | | | | | | |
UTILITIES — (2.4%) | | | | | | | | | | | | |
| | Other Securities | | | | | | | 38,607,339 | | | | 2.4 | % |
| | | | | | | | | | | | | | |
TOTAL COMMON STOCKS
(Cost $856,972,321) | | | | | | | 1,607,757,344 | | | | 99.6 | % |
| | | | | | | | | | | | | | |
TEMPORARY CASH INVESTMENTS — (0.2%) | | | | | | | | | | | | |
| | State Street Institutional U.S. Government Money Market Fund , 3.010% | | | 2,643,219 | | | | 2,643,219 | | | | 0.2 | % |
| | | | | | | | | | | | | | |
SECURITIES LENDING COLLATERAL — (0.4%) | | | | | | | | | | | | |
@§ | | The DFA Short Term Investment Fund | | | 634,320 | | | | 7,333,371 | | | | 0.4 | % |
| | | | | | | | | | | | | | |
TOTAL INVESTMENTS—(100.0%)
(Cost $866,951,554) | | | | | | $ | 1,617,733,934 | | | | 100.2 | % |
| | | | | | | | | | | | | | |
26
U.S. LARGE CAP EQUITY PORTFOLIO
CONTINUED
Summary of the Portfolio’s investments as of October 31, 2022, based on their valuation inputs, is as follows (see Security Valuation Note):
| | | | | | | | | | | | | | | | |
| | | Investments in Securities (Market Value) | |
| | | Level 1 | | | Level 2 | | | Level 3 | | | Total | |
Common Stocks | | | | | | | | | | | | | | | | |
Communication Services | | $ | 115,502,308 | | | | — | | | | — | | | $ | 115,502,308 | |
Consumer Discretionary | | | 160,926,327 | | | | — | | | | — | | | | 160,926,327 | |
Consumer Staples | | | 119,302,837 | | | | — | | | | — | | | | 119,302,837 | |
Energy | | | 116,551,698 | | | | — | | | | — | | | | 116,551,698 | |
Financials | | | 204,148,196 | | | | — | | | | — | | | | 204,148,196 | |
Health Care | | | 238,137,503 | | | | — | | | | — | | | | 238,137,503 | |
Industrials | | | 167,027,050 | | | | — | | | | — | | | | 167,027,050 | |
Information Technology | | | 383,243,461 | | | | — | | | | — | | | | 383,243,461 | |
Materials | | | 61,923,513 | | | | — | | | | — | | | | 61,923,513 | |
Real Estate | | | 2,387,112 | | | | — | | | | — | | | | 2,387,112 | |
Utilities | | | 38,607,339 | | | | — | | | | — | | | | 38,607,339 | |
Temporary Cash Investments | | | 2,643,219 | | | | — | | | | — | | | | 2,643,219 | |
Securities Lending Collateral | | | — | | | $ | 7,333,371 | | | | — | | | | 7,333,371 | |
| | | | | | | | | | | | | | | | |
TOTAL | | $ | 1,610,400,563 | | | $ | 7,333,371 | | | | — | | | $ | 1,617,733,934 | |
| | | | | | | | | | | | | | | | |
See accompanying Notes to Financial Statements.
27
U.S. LARGE CAP VALUE PORTFOLIO
SCHEDULE OF INVESTMENTS
October 31, 2022
| | | | |
| | | Value† | |
AFFILIATED INVESTMENT COMPANIES — (100.0%) | | | | |
Investment in The U.S. Large Cap Value Series of The DFA Investment Trust Company | | $ | 23,311,526,782 | |
| | | | |
TOTAL INVESTMENTS IN AFFILIATED INVESTMENT COMPANIES | | $ | 23,311,526,782 | |
| | | | |
Summary of the Portfolio’s Master Fund’s investments as of October 31, 2022, based on their valuation inputs, is located in this report (See Security Valuation Note).
See accompanying Notes to Financial Statements.
28
U.S. TARGETED VALUE PORTFOLIO
SUMMARY SCHEDULE OF PORTFOLIO HOLDINGS
October 31, 2022
| | | | | | | | | | | | | | |
| | | | | Shares | | | Value† | | | Percentage
of Net Assets‡ | |
COMMON STOCKS — (92.2%) | | | | | | | | | | | | |
COMMUNICATION SERVICES — (2.3%) | | | | | | | | | | | | |
# | | Nexstar Media Group, Inc., Class A | | | 313,260 | | | $ | 53,661,438 | | | | 0.5 | % |
| | Other Securities | | | | | | | 239,309,849 | | | | 2.0 | % |
| | | | | | | | | | | | | | |
TOTAL COMMUNICATION SERVICES | | | | | | | 292,971,287 | | | | 2.5 | % |
| | | | | | | | | | | | | | |
CONSUMER DISCRETIONARY — (10.7%) | | | | | | | | | | | | |
#* | | AutoNation, Inc. | | | 613,475 | | | | 65,218,527 | | | | 0.6 | % |
| | BorgWarner, Inc. | | | 1,734,241 | | | | 65,086,065 | | | | 0.6 | % |
# | | Dillard’s, Inc., Class A | | | 166,142 | | | | 54,625,828 | | | | 0.5 | % |
# | | Penske Automotive Group, Inc. | | | 522,178 | | | | 58,285,508 | | | | 0.5 | % |
| | Toll Brothers, Inc. | | | 1,187,844 | | | | 51,172,320 | | | | 0.4 | % |
| | Other Securities | | | | | | | 1,069,086,708 | | | | 8.9 | % |
| | | | | | | | | | | | | | |
TOTAL CONSUMER DISCRETIONARY | | | | | | | 1,363,474,956 | | | | 11.5 | % |
| | | | | | | | | | | | | | |
CONSUMER STAPLES — (3.9%) | | | | | | | | | | | | |
# | | Molson Coors Beverage Co., Class B | | | 1,044,889 | | | | 52,693,752 | | | | 0.5 | % |
* | | Post Holdings, Inc. | | | 490,446 | | | | 44,346,127 | | | | 0.4 | % |
| | Other Securities | | | | | | | 396,750,151 | | | | 3.3 | % |
| | | | | | | | | | | | | | |
TOTAL CONSUMER STAPLES | | | | | | | 493,790,030 | | | | 4.2 | % |
| | | | | | | | | | | | | | |
ENERGY — (9.2%) | | | | | | | | | | | | |
# | | EQT Corp. | | | 1,036,269 | | | | 43,357,495 | | | | 0.4 | % |
| | HF Sinclair Corp. | | | 1,452,267 | | | | 88,835,172 | | | | 0.8 | % |
# | | Matador Resources Co. | | | 841,863 | | | | 55,941,796 | | | | 0.5 | % |
# | | Murphy Oil Corp. | | | 1,454,666 | | | | 70,565,848 | | | | 0.6 | % |
* | | PBF Energy, Inc., Class A | | | 1,099,741 | | | | 48,663,539 | | | | 0.4 | % |
# | | PDC Energy, Inc. | | | 844,689 | | | | 60,935,864 | | | | 0.5 | % |
| | Range Resources Corp. | | | 2,123,103 | | | | 60,465,973 | | | | 0.5 | % |
| | SM Energy Co. | | | 933,660 | | | | 41,996,027 | | | | 0.4 | % |
| | Other Securities | | | | | | | 693,650,793 | | | | 5.7 | % |
| | | | | | | | | | | | | | |
TOTAL ENERGY | | | | | | | 1,164,412,507 | | | | 9.8 | % |
| | | | | | | | | | | | | | |
FINANCIALS — (27.0%) | | | | | | | | | | | | |
# | | Bank OZK | | | 1,161,169 | | | | 49,907,044 | | | | 0.4 | % |
| | Everest Re Group Ltd. | | | 161,381 | | | | 52,071,193 | | | | 0.4 | % |
| | First Horizon Corp. | | | 3,817,193 | | | | 93,559,400 | | | | 0.8 | % |
# | | Invesco Ltd. | | | 3,332,133 | | | | 51,048,278 | | | | 0.4 | % |
| | M&T Bank Corp. | | | 275,945 | | | | 46,460,860 | | | | 0.4 | % |
| | Old National Bancorp | | | 2,170,768 | | | | 42,460,222 | | | | 0.4 | % |
| | Old Republic International Corp. | | | 1,964,925 | | | | 45,605,909 | | | | 0.4 | % |
| | Popular, Inc. | | | 712,592 | | | | 50,394,506 | | | | 0.4 | % |
| | Reinsurance Group of America, Inc. | | | 358,439 | | | | 52,751,468 | | | | 0.5 | % |
| | United Bankshares, Inc. | | | 1,035,724 | | | | 43,862,911 | | | | 0.4 | % |
| | Unum Group | | | 1,531,145 | | | | 69,804,901 | | | | 0.6 | % |
# | | Voya Financial, Inc. | | | 911,052 | | | | 62,279,515 | | | | 0.5 | % |
| | Zions Bancorp NA | | | 927,029 | | | | 48,149,886 | | | | 0.4 | % |
| | Other Securities | | | | | | | 2,726,712,928 | | | | 23.0 | % |
| | | | | | | | | | | | | | |
TOTAL FINANCIALS | | | | | | | 3,435,069,021 | | | | 29.0 | % |
| | | | | | | | | | | | | | |
HEALTH CARE — (4.6%) | | | | | | | | | | | | |
* | | Acadia Healthcare Co., Inc. | | | 731,391 | | | | 59,462,088 | | | | 0.5 | % |
29
U.S. TARGETED VALUE PORTFOLIO
CONTINUED
| | | | | | | | | | | | | | |
| | | | | Shares | | | Value† | | | Percentage
of Net Assets‡ | |
HEALTH CARE — (Continued) | | | | | | | | | | | | |
| | Other Securities | | | | | | $ | 520,557,595 | | | | 4.4 | % |
| | | | | | | | | | | | | | |
TOTAL HEALTH CARE | | | | 580,019,683 | | | | 4.9 | % |
| | | | | | | | | | | | | | |
INDUSTRIALS — (17.0%) | | | | | | | | | | | | |
| | AGCO Corp. | | | 369,245 | | | | 45,849,152 | | | | 0.4 | % |
| | Air Lease Corp. | | | 1,251,656 | | | | 44,170,940 | | | | 0.4 | % |
| | AMERCO | | | 99,942 | | | | 57,485,639 | | | | 0.5 | % |
* | | Builders FirstSource, Inc. | | | 683,763 | | | | 42,160,827 | | | | 0.4 | % |
| | Knight-Swift Transportation Holdings, Inc. | | | 1,354,350 | | | | 65,049,431 | | | | 0.6 | % |
# | | Triton International Ltd. | | | 702,859 | | | | 42,656,513 | | | | 0.4 | % |
* | | WESCO International, Inc. | | | 364,471 | | | | 50,213,170 | | | | 0.4 | % |
| | Other Securities | | | | | | | 1,814,297,834 | | | | 15.1 | % |
| | | | | | | | | | | | | | |
TOTAL INDUSTRIALS | | | | 2,161,883,506 | | | | 18.2 | % |
| | | | | | | | | | | | | | |
INFORMATION TECHNOLOGY — (8.4%) | | | | | | | | | | | | |
# | | Amkor Technology, Inc. | | | 2,293,308 | | | | 47,677,873 | | | | 0.4 | % |
* | | Arrow Electronics, Inc. | | | 718,921 | | | | 72,797,940 | | | | 0.6 | % |
* | | First Solar, Inc. | | | 383,688 | | | | 55,853,462 | | | | 0.5 | % |
* | | Flex Ltd. | | | 2,308,000 | | | | 45,190,640 | | | | 0.4 | % |
| | Other Securities | | | | | | | 850,686,881 | | | | 7.1 | % |
| | | | | | | | | | | | | | |
TOTAL INFORMATION TECHNOLOGY | | | | 1,072,206,796 | | | | 9.0 | % |
| | | | | | | | | | | | | | |
MATERIALS — (7.8%) | | | | | | | | | | | | |
| | Alcoa Corp. | | | 1,140,009 | | | | 44,494,551 | | | | 0.4 | % |
| | Commercial Metals Co. | | | 1,098,131 | | | | 49,964,960 | | | | 0.4 | % |
| | Huntsman Corp. | | | 2,107,477 | | | | 56,396,085 | | | | 0.5 | % |
| | Olin Corp. | | | 1,005,237 | | | | 53,227,299 | | | | 0.5 | % |
| | Reliance Steel & Aluminum Co. | | | 529,742 | | | | 106,732,418 | | | | 0.9 | % |
| | Steel Dynamics, Inc. | | | 793,920 | | | | 74,668,176 | | | | 0.6 | % |
# | | Westlake Corp. | | | 504,897 | | | | 48,798,295 | | | | 0.4 | % |
| | Other Securities | | | | | | | 553,180,830 | | | | 4.6 | % |
| | | | | | | | | | | | | | |
TOTAL MATERIALS | | | | 987,462,614 | | | | 8.3 | % |
| | | | | | | | | | | | | | |
REAL ESTATE — (0.8%) | | | | | | | | | | | | |
* | | Jones Lang LaSalle, Inc. | | | 280,292 | | | | 44,591,654 | | | | 0.4 | % |
| | Other Securities | | | | | | | 58,054,080 | | | | 0.5 | % |
| | | | | | | | | | | | | | |
TOTAL REAL ESTATE | | | | 102,645,734 | | | | 0.9 | % |
| | | | | | | | | | | | | | |
UTILITIES — (0.5%) | | | | | | | | | | | | |
| | Other Securities | | | | | | | 60,557,538 | | | | 0.5 | % |
| | | | | | | | | | | | | | |
TOTAL COMMON STOCKS | | | | 11,714,493,672 | | | | 98.8 | % |
| | | | | | | | | | | | | | |
PREFERRED STOCKS — (0.1%) | | | | | | | | | | | | |
COMMUNICATION SERVICES — (0.0%) | | | | | | | | | | | | |
| | Other Security | | | | | | | 381,897 | | | | 0.0 | % |
| | | | | | | | | | | | | | |
CONSUMER DISCRETIONARY — (0.0%) | | | | | | | | | | | | |
| | Other Security | | | | | | | 348,438 | | | | 0.0 | % |
| | | | | | | | | | | | | | |
INDUSTRIALS — (0.1%) | | | | | | | | | | | | |
| | Other Security | | | | | | | 4,713,795 | | | | 0.1 | % |
| | | | | | | | | | | | | | |
TOTAL PREFERRED STOCKS | | | | 5,444,130 | | | | 0.1 | % |
| | | | | | | | | | | | | | |
30
U.S. TARGETED VALUE PORTFOLIO
CONTINUED
| | | | | | | | | | | | |
| | | Shares | | | Value† | | | Percentage
of Net Assets‡ | |
RIGHTS/WARRANTS — (0.0%) | | | | | | | | | | | | |
INDUSTRIALS — (0.0%) | | | | | | | | | | | | |
Other Security | | | | | | $ | 78,296 | | | | 0.0 | % |
| | | | | | | | | | | | |
TOTAL RIGHTS/WARRANTS | | | | | | | 78,296 | | | | 0.0 | % |
| | | | | | | | | | | | |
TOTAL INVESTMENT SECURITIES
(Cost $7,947,185,135) | | | | | | | 11,720,016,098 | | | | | |
| | | | | | | | | | | | |
TEMPORARY CASH INVESTMENTS — (1.0%) | | | | | | | | | | | | |
State Street Institutional U.S. Government Money Market Fund, 3.010% | | | 125,772,732 | | | | 125,772,732 | | | | 1.1 | % |
| | | | | | | | | | | | |
SECURITIES LENDING COLLATERAL — (6.7%) | | | | | | | | | | | | |
@§ The DFA Short Term Investment Fund | | | 74,059,114 | | | | 856,197,418 | | | | 7.2 | % |
| | | | | | | | | | | | |
TOTAL INVESTMENTS—(100.0%)
(Cost $8,929,470,746) | | | | | | $ | 12,701,986,248 | | | | 107.2 | % |
| | | | | | | | | | | | |
As of October 31, 2022, U.S. Targeted Value Portfolio had entered into the following outstanding futures contracts:
| | | | | | | | | | | | | | | | | | | | |
| Description | | Number of
Contracts | | | Expiration
Date | | | Notional
Value | | | Market
Value | | | Unrealized
Appreciation
(Depreciation) | |
Long Position Contracts: | | | | | | | | | | | | | | | | | | | | |
S&P 500® Emini Index | | | 668 | | | | 12/16/22 | | | $ | 126,532,018 | | | $ | 129,692,200 | | | $ | 3,160,182 | |
| | | | | | | | | | | | | | | | | | | | |
Total Futures Contracts | | | | | | | | | | $ | 126,532,018 | | | $ | 129,692,200 | | | $ | 3,160,182 | |
| | | | | | | | | | | | | | | | | | | | |
Summary of the Portfolio’s investments as of October 31, 2022, based on their valuation inputs, is as follows (see Security Valuation Note):
| | | | | | | | | | | | | | | | |
| | | Investments in Securities (Market Value) | |
| | | Level 1 | | | Level 2 | | | Level 3 | | | Total | |
Common Stocks | | | | | | | | | | | | | | | | |
Communication Services | | $ | 292,971,287 | | | | — | | | | — | | | $ | 292,971,287 | |
Consumer Discretionary | | | 1,363,451,293 | | | | — | | | $ | 23,663 | | | | 1,363,474,956 | |
Consumer Staples | | | 493,778,081 | | | $ | 11,949 | | | | — | | | | 493,790,030 | |
Energy | | | 1,164,412,507 | | | | — | | | | — | | | | 1,164,412,507 | |
Financials | | | 3,434,956,776 | | | | 112,245 | | | | — | | | | 3,435,069,021 | |
Health Care | | | 574,880,260 | | | | — | | | | 5,139,423 | | | | 580,019,683 | |
Industrials | | | 2,161,799,530 | | | | 83,976 | | | | — | | | | 2,161,883,506 | |
Information Technology | | | 1,072,206,796 | | | | — | | | | — | | | | 1,072,206,796 | |
Materials | | | 987,462,614 | | | | — | | | | ��� | | | | 987,462,614 | |
Real Estate | | | 102,645,734 | | | | — | | | | — | | | | 102,645,734 | |
Utilities | | | 60,557,538 | | | | — | | | | — | | | | 60,557,538 | |
Preferred Stocks | | | | | | | | | | | | | | | | |
Communication Services | | | 381,897 | | | | — | | | | — | | | | 381,897 | |
Consumer Discretionary | | | 348,438 | | | | — | | | | — | | | | 348,438 | |
Industrials | | | 4,713,795 | | | | — | | | | — | | | | 4,713,795 | |
Rights/Warrants | | | | | | | | | | | | | | | | |
Industrials | | | — | | | | — | | | | 78,296 | | | | 78,296 | |
Temporary Cash Investments | | | 125,772,732 | | | | — | | | | — | | | | 125,772,732 | |
31
U.S. TARGETED VALUE PORTFOLIO
CONTINUED
| | | | | | | | | | | | | | | | |
| | | Investments in Securities (Market Value) | |
| | | Level 1 | | | Level 2 | | | Level 3 | | | Total | |
Securities Lending Collateral | | | — | | | $ | 856,197,418 | | | | — | | | $ | 856,197,418 | |
Futures Contracts** | | $ | 3,160,182 | | | | — | | | | — | | | | 3,160,182 | |
| | | | | | | | | | | | | | | | |
TOTAL | | $ | 11,843,499,460 | | | $ | 856,405,588 | | | $ | 5,241,382 | ^ | | $ | 12,705,146,430 | |
| | | | | | | | | | | | | | | | |
| ** | Valued at the unrealized appreciation/(depreciation) on the investment. |
| ^ | A reconciliation of Level 3 investments is presented when the Fund had a significant amount of Level 3 investments at the beginning and/or end of the reporting period in relation to net assets. |
See accompanying Notes to Financial Statements.
32
U.S. SMALL CAP VALUE PORTFOLIO
SUMMARY SCHEDULE OF PORTFOLIO HOLDINGS
October 31, 2022
| | | | | | | | | | | | | | |
| | | | | Shares | | | Value† | | | Percentage
of Net Assets‡ | |
COMMON STOCKS — (93.0%) | | | | | | | | | | | | |
COMMUNICATION SERVICES — (2.0%) | | | | | | | | | | | | |
| | Other Securities | | | | | | $ | 304,944,430 | | | | 2.1 | % |
CONSUMER DISCRETIONARY — (11.5%) | | | | | | | | | | | | |
# | | Dillard’s, Inc., Class A | | | 277,204 | | | | 91,141,903 | | | | 0.7 | % |
* | | Goodyear Tire & Rubber Co. | | | 6,506,480 | | | | 82,632,296 | | | | 0.6 | % |
# | | Group 1 Automotive, Inc. | | | 405,902 | | | | 70,221,046 | | | | 0.5 | % |
# | | Penske Automotive Group, Inc. | | | 809,749 | | | | 90,384,183 | | | | 0.6 | % |
#* | | Taylor Morrison Home Corp. | | | 2,911,839 | | | | 76,697,839 | | | | 0.5 | % |
| | Other Securities | | | | | | | 1,343,387,024 | | | | 9.3 | % |
| | | | | | | | | | | | | | |
TOTAL CONSUMER DISCRETIONARY | | | | | | | 1,754,464,291 | | | | 12.2 | % |
| | | | | | | | | | | | | | |
CONSUMER STAPLES — (4.3%) | | | | | | | | | | | | |
#* | | Hostess Brands, Inc. | | | 2,976,455 | | | | 78,816,528 | | | | 0.6 | % |
| | Seaboard Corp. | | | 17,242 | | | | 64,595,084 | | | | 0.5 | % |
| | Other Securities | | | | | | | 517,021,302 | | | | 3.5 | % |
| | | | | | | | | | | | | | |
TOTAL CONSUMER STAPLES | | | | | | | 660,432,914 | | | | 4.6 | % |
| | | | | | | | | | | | | | |
ENERGY — (10.5%) | | | | | | | | | | | | |
#* | | Antero Resources Corp. | | | 2,885,292 | | | | 105,774,805 | | | | 0.7 | % |
#* | | CNX Resources Corp. | | | 4,881,877 | | | | 82,064,352 | | | | 0.6 | % |
# | | Helmerich & Payne, Inc. | | | 1,496,863 | | | | 74,109,687 | | | | 0.5 | % |
| | HF Sinclair Corp. | | | 1,754,256 | | | | 107,307,840 | | | | 0.8 | % |
# | | Matador Resources Co. | | | 1,315,903 | | | | 87,441,754 | | | | 0.6 | % |
# | | Murphy Oil Corp. | | | 3,064,220 | | | | 148,645,312 | | | | 1.0 | % |
#* | | PBF Energy, Inc., Class A | | | 1,753,292 | | | | 77,583,171 | | | | 0.6 | % |
| | PDC Energy, Inc. | | | 1,569,453 | | | | 113,220,339 | | | | 0.8 | % |
| | Other Securities | | | | | | | 805,900,676 | | | | 5.6 | % |
| | | | | | | | | | | | | | |
TOTAL ENERGY. | | | | | | | 1,602,047,936 | | | | 11.2 | % |
| | | | | | | | | | | | | | |
FINANCIALS — (27.6%) | | | | | | | | | | | | |
| | American Equity Investment Life Holding Co. | | | 2,377,506 | | | | 102,422,959 | | | | 0.7 | % |
# | | Associated Banc-Corp. | | | 3,681,267 | | | | 89,638,851 | | | | 0.6 | % |
| | Assured Guaranty Ltd. | | | 1,358,868 | | | | 80,431,397 | | | | 0.6 | % |
| | Bank OZK | | | 2,270,088 | | | | 97,568,382 | | | | 0.7 | % |
* | | Brighthouse Financial, Inc. | | | 1,310,595 | | | | 74,795,657 | | | | 0.5 | % |
# | | First BanCorp. | | | 4,126,206 | | | | 65,152,793 | | | | 0.5 | % |
# | | FNB Corp. | | | 8,069,732 | | | | 116,607,627 | | | | 0.8 | % |
| | Fulton Financial Corp. | | | 4,075,852 | | | | 74,302,782 | | | | 0.5 | % |
| | Hancock Whitney Corp. | | | 1,428,089 | | | | 79,787,332 | | | | 0.6 | % |
# | | International Bancshares Corp. | | | 1,341,748 | | | | 66,550,701 | | | | 0.5 | % |
| | Nelnet, Inc., Class A | | | 731,282 | | | | 65,149,913 | | | | 0.5 | % |
| | Old National Bancorp | | | 4,755,433 | | | | 93,016,270 | | | | 0.7 | % |
# | | Popular, Inc. | | | 1,234,677 | | | | 87,316,357 | | | | 0.6 | % |
# | | United Bankshares, Inc. | | | 2,073,146 | | | | 87,797,733 | | | | 0.6 | % |
| | Unum Group | | | 3,118,080 | | | | 142,153,267 | | | | 1.0 | % |
# | | Valley National Bancorp | | | 5,597,605 | | | | 66,443,571 | | | | 0.5 | % |
| | Washington Federal, Inc. | | | 1,793,494 | | | | 69,408,218 | | | | 0.5 | % |
# | | White Mountains Insurance Group Ltd. | | | 45,091 | | | | 63,855,620 | | | | 0.5 | % |
| | Other Securities | | | | | | | 2,691,501,521 | | | | 18.5 | % |
| | | | | | | | | | | | | | |
TOTAL FINANCIALS | | | | | | | 4,213,900,951 | | | | 29.4 | % |
| | | | | | | | | | | | | | |
33
U.S. SMALL CAP VALUE PORTFOLIO
CONTINUED
| | | | | | | | | | | | | | |
| | | | | Shares | | | Value† | | | Percentage
of Net Assets‡ | |
HEALTH CARE — (4.0%) | | | | | | | | | | | | |
* | | Acadia Healthcare Co., Inc. | | | 1,486,886 | | | $ | 120,883,832 | | | | 0.8 | % |
| | Perrigo Co. PLC | | | 2,252,909 | | | | 90,747,175 | | | | 0.6 | % |
| | Other Securities | | | | | | | 400,582,330 | | | | 2.9 | % |
| | | | | | | | | | | | | | |
TOTAL HEALTH CARE | | | | 612,213,337 | | | | 4.3 | % |
| | | | | | | | | | | | | | |
INDUSTRIALS — (18.4%) | | | | | | | | | | | | |
| | Air Lease Corp. | | | 2,041,374 | | | | 72,040,088 | | | | 0.5 | % |
#* | | Atlas Air Worldwide Holdings, Inc. | | | 714,190 | | | | 72,233,177 | | | | 0.5 | % |
#* | | Beacon Roofing Supply, Inc. | | | 1,168,859 | | | | 65,865,205 | | | | 0.5 | % |
# | | Encore Wire Corp. | | | 496,557 | | | | 68,321,278 | | | | 0.5 | % |
| | GATX Corp. | | | 794,080 | | | | 83,148,117 | | | | 0.6 | % |
# | | Triton International Ltd. | | | 1,492,492 | | | | 90,579,340 | | | | 0.6 | % |
* | | WESCO International, Inc. | | | 828,443 | | | | 114,134,592 | | | | 0.8 | % |
| | Other Securities | | | | | | | 2,240,622,901 | | | | 15.6 | % |
| | | | | | | | | | | | | | |
TOTAL INDUSTRIALS | | | | 2,806,944,698 | | | | 19.6 | % |
| | | | | | | | | | | | | | |
INFORMATION TECHNOLOGY — (7.2%) | | | | | | | | | | | | |
# | | Amkor Technology, Inc. | | | 5,440,115 | | | | 113,099,991 | | | | 0.8 | % |
| | Avnet, Inc. | | | 2,044,013 | | | | 82,148,882 | | | | 0.6 | % |
#* | | NetScout Systems, Inc. | | | 1,831,566 | | | | 65,789,851 | | | | 0.5 | % |
* | | Sanmina Corp. | | | 1,485,715 | | | | 83,274,326 | | | | 0.6 | % |
# | | Vishay Intertechnology, Inc. | | | 3,103,708 | | | | 64,898,534 | | | | 0.5 | % |
| | Other Securities | | | | | | | 686,783,374 | | | | 4.6 | % |
| | | | | | | | | | | | | | |
TOTAL INFORMATION TECHNOLOGY | | | | 1,095,994,958 | | | | 7.6 | % |
| | | | | | | | | | | | | | |
MATERIALS — (6.6%) | | | | | | | | | | | | |
# | | Commercial Metals Co. | | | 2,565,468 | | | | 116,728,794 | | | | 0.8 | % |
# | | Element Solutions, Inc. | | | 5,243,398 | | | | 90,186,446 | | | | 0.6 | % |
| | Other Securities | | | | | | | 806,849,032 | | | | 5.7 | % |
| | | | | | | | | | | | | | |
TOTAL MATERIALS | | | | 1,013,764,272 | | | | 7.1 | % |
| | | | | | | | | | | | | | |
REAL ESTATE — (0.6%) | | | | | | | | | | | | |
| | Other Securities | | | | | | | 101,554,150 | | | | 0.7 | % |
| | | | | | | | | | | | | | |
UTILITIES — (0.3%) | | | | | | | | | | | | |
| | Other Securities | | | | | | | 45,133,898 | | | | 0.3 | % |
| | | | | | | | | | | | | | |
TOTAL COMMON STOCKS | | | | 14,211,395,835 | | | | 99.1 | % |
| | | | | | | | | | | | | | |
PREFERRED STOCKS — (0.1%) | | | | | | | | | | | | |
COMMUNICATION SERVICES — (0.0%) | | | | | | | | | | | | |
| | Other Security | | | | | | | 300,614 | | | | 0.0 | % |
| | | | | | | | | | | | | | |
CONSUMER DISCRETIONARY — (0.0%) | | | | | | | | | | | | |
| | Other Security | | | | | | | 3,270,136 | | | | 0.0 | % |
| | | | | | | | | | | | | | |
INDUSTRIALS — (0.1%) | | | | | | | | | | | | |
| | Other Security | | | | | | | 7,599,879 | | | | 0.1 | % |
| | | | | | | | | | | | | | |
TOTAL PREFERRED STOCKS | | | | 11,170,629 | | | | 0.1 | % |
| | | | | | | | | | | | | | |
TOTAL INVESTMENT SECURITIES
(Cost $9,287,200,978) | | | | | | | 14,222,566,464 | | | | | |
| | | | | | | | | | | | | | |
34
U.S. SMALL CAP VALUE PORTFOLIO
CONTINUED
| | | | | | | | | | | | | | |
| | | | | Shares | | | Value† | | | Percentage
of Net Assets‡ | |
TEMPORARY CASH INVESTMENTS — (0.8%) | | | | | | | | | | | | |
| | State Street Institutional U.S. Government Money Market Fund, 3.010% | | | 115,129,797 | | | $ | 115,129,797 | | | | 0.8 | % |
| | | | | | | | | | | | | | |
SECURITIES LENDING COLLATERAL — (6.1%) | | | | | | | | | | | | |
@§ | | The DFA Short Term Investment Fund | | | 81,222,527 | | | | 939,013,630 | | | | 6.5 | % |
| | | | | | | | | | | | | | |
TOTAL INVESTMENTS—(100.0%)
(Cost $10,341,663,547) | | | | | | $ | 15,276,709,891 | | | | 106.5 | % |
| | | | | | | | | | | | | | |
As of October 31, 2022, U.S. Small Cap Value Portfolio had entered into the following outstanding futures contracts:
| | | | | | | | | | | | | | | | | | | | |
Description | | Number of
Contracts | | | Expiration
Date | | | Notional
Value | | | Market
Value | | | Unrealized
Appreciation
(Depreciation) | |
Long Position Contracts: | | | | | | | | | | | | | | | | | | | | |
S&P 500® Emini Index | | | 604 | | | | 12/16/22 | | | $ | 109,493,638 | | | $ | 117,266,600 | | | $ | 7,772,962 | |
| | | | | | | | | | | | | | | | | | | | |
Total Futures Contracts | | | | | | | | | | $ | 109,493,638 | | | $ | 117,266,600 | | | $ | 7,772,962 | |
| | | | | | | | | | | | | | | | | | | | |
Summary of the Portfolio’s investments as of October 31, 2022, based on their valuation inputs, is as follows (see Security Valuation Note):
| | | | | | | | | | | | | | | | |
| | | Investments in Securities (Market Value) | |
| | | Level 1 | | | Level 2 | | | Level 3 | | | Total | |
Common Stocks | | | | | | | | | | | | | | | | |
Communication Services | | $ | 304,944,430 | | | | — | | | | — | | | $ | 304,944,430 | |
Consumer Discretionary | | | 1,754,080,330 | | | $ | 363,565 | | | $ | 20,396 | | | | 1,754,464,291 | |
Consumer Staples | | | 658,914,370 | | | | 1,518,544 | | | | — | | | | 660,432,914 | |
Energy | | | 1,602,047,936 | | | | — | | | | — | | | | 1,602,047,936 | |
Financials | | | 4,212,911,835 | | | | 989,116 | | | | — | | | | 4,213,900,951 | |
Health Care | | | 608,926,711 | | | | — | | | | 3,286,626 | | | | 612,213,337 | |
Industrials | | | 2,806,850,231 | | | | 94,467 | | | | — | | | | 2,806,944,698 | |
Information Technology | | | 1,095,994,958 | | | | — | | | | — | | | | 1,095,994,958 | |
Materials | | | 1,012,692,911 | | | | 1,071,361 | | | | — | | | | 1,013,764,272 | |
Real Estate | | | 101,554,150 | | | | — | | | | — | | | | 101,554,150 | |
Utilities | | | 45,133,898 | | | | — | | | | — | | | | 45,133,898 | |
Preferred Stocks | | | | | | | | | | | | | | | | |
Communication Services | | | 300,614 | | | | — | | | | — | | | | 300,614 | |
Consumer Discretionary | | | 3,270,136 | | | | — | | | | — | | | | 3,270,136 | |
Industrials | | | 7,599,879 | | | | — | | | | — | | | | 7,599,879 | |
Temporary Cash Investments | | | 115,129,797 | | | | — | | | | — | | | | 115,129,797 | |
Securities Lending Collateral | | | — | | | | 939,013,630 | | | | — | | | | 939,013,630 | |
Futures Contracts** | | | 7,772,962 | | | | — | | | | — | | | | 7,772,962 | |
| | | | | | | | | | | | | | | | |
TOTAL | | $ | 14,338,125,148 | | | $ | 943,050,683 | | | $ | 3,307,022 | ^ | | $ | 15,284,482,853 | |
| | | | | | | | | | | | | | | | |
| ** | Valued at the unrealized appreciation/(depreciation) on the investment. |
| ^ | A reconciliation of Level 3 investments is presented when the Fund had a significant amount of Level 3 investments at the beginning and/or end of the reporting period in relation to net assets. |
See accompanying Notes to Financial Statements.
35
U.S. CORE EQUITY 1 PORTFOLIO
SUMMARY SCHEDULE OF PORTFOLIO HOLDINGS
October 31, 2022
| | | | | | | | | | | | | | |
| | | | | Shares | | | Value† | | | Percentage
of Net Assets‡ | |
COMMON STOCKS — (95.0%) | | | | | | | | | | | | |
COMMUNICATION SERVICES — (6.0%) | | | | | | | | | | | | |
* | | Alphabet, Inc., Class A | | | 3,212,000 | | | $ | 303,566,120 | | | | 1.1 | % |
* | | Alphabet, Inc., Class C | | | 2,978,380 | | | | 281,933,451 | | | | 1.0 | % |
| | AT&T, Inc. | | | 5,201,851 | | | | 94,829,744 | | | | 0.4 | % |
| | Comcast Corp., Class A | | | 3,555,567 | | | | 112,853,697 | | | | 0.4 | % |
* | | Meta Platforms, Inc., Class A | | | 1,474,881 | | | | 137,399,914 | | | | 0.5 | % |
| | Verizon Communications, Inc. | | | 4,468,777 | | | | 166,998,196 | | | | 0.6 | % |
| | Other Securities | | | | | | | 650,380,315 | | | | 2.2 | % |
| | | | | | | | | | | | | | |
TOTAL COMMUNICATION SERVICES | | | | | | | 1,747,961,437 | | | | 6.2 | % |
| | | | | | | | | | | | | | |
CONSUMER DISCRETIONARY — (10.6%) | | | | | | | | | | | | |
* | | Amazon.com, Inc. | | | 4,693,460 | | | | 480,798,042 | | | | 1.7 | % |
| | Home Depot, Inc. | | | 578,985 | | | | 171,454,828 | | | | 0.6 | % |
| | McDonald’s Corp. | | | 392,232 | | | | 106,945,977 | | | | 0.4 | % |
* | | Tesla, Inc. | | | 1,117,865 | | | | 254,359,002 | | | | 0.9 | % |
| | Other Securities | | | | | | | 2,077,068,540 | | | | 7.4 | % |
| | | | | | | | | | | | | | |
TOTAL CONSUMER DISCRETIONARY | | | | | | | 3,090,626,389 | | | | 11.0 | % |
| | | | | | | | | | | | | | |
CONSUMER STAPLES — (6.4%) | | | | | | | | | | | | |
| | Coca-Cola Co. | | | 2,554,882 | | | | 152,909,688 | | | | 0.6 | % |
| | Costco Wholesale Corp. | | | 266,821 | | | | 133,810,731 | | | | 0.5 | % |
| | PepsiCo, Inc. | | | 1,155,131 | | | | 209,748,687 | | | | 0.8 | % |
| | Procter & Gamble Co. | | | 1,579,025 | | | | 212,647,297 | | | | 0.8 | % |
| | Walmart, Inc. | | | 863,854 | | | | 122,952,340 | | | | 0.4 | % |
| | Other Securities | | | | | | | 1,032,869,469 | | | | 3.6 | % |
| | | | | | | | | | | | | | |
TOTAL CONSUMER STAPLES | | | | | | | 1,864,938,212 | | | | 6.7 | % |
| | | | | | | | | | | | | | |
ENERGY — (6.7%) | | | | | | | | | | | | |
| | Chevron Corp. | | | 1,226,964 | | | | 221,957,788 | | | | 0.8 | % |
| | ConocoPhillips | | | 1,164,407 | | | | 146,820,079 | | | | 0.5 | % |
| | Exxon Mobil Corp. | | | 3,168,500 | | | | 351,101,485 | | | | 1.3 | % |
| | Occidental Petroleum Corp. | | | 1,257,584 | | | | 91,300,598 | | | | 0.3 | % |
| | Other Securities | | | | | | | 1,150,723,721 | | | | 4.1 | % |
| | | | | | | | | | | | | | |
TOTAL ENERGY | | | | | | | 1,961,903,671 | | | | 7.0 | % |
| | | | | | | | | | | | | | |
FINANCIALS — (13.8%) | | | | | | | | | | | | |
| | Bank of America Corp. | | | 3,912,478 | | | | 141,005,671 | | | | 0.5 | % |
* | | Berkshire Hathaway, Inc., Class B | | | 954,456 | | | | 281,650,421 | | | | 1.0 | % |
| | Goldman Sachs Group, Inc. | | | 249,229 | | | | 85,861,883 | | | | 0.3 | % |
| | JPMorgan Chase & Co. | | | 2,201,688 | | | | 277,148,485 | | | | 1.0 | % |
| | Morgan Stanley | | | 1,062,417 | | | | 87,298,805 | | | | 0.3 | % |
| | Wells Fargo & Co. | | | 2,169,645 | | | | 99,781,974 | | | | 0.4 | % |
| | Other Securities | | | | | | | 3,035,367,537 | | | | 10.8 | % |
| | | | | | | | | | | | | | |
TOTAL FINANCIALS | | | | | | | 4,008,114,776 | | | | 14.3 | % |
| | | | | | | | | | | | | | |
HEALTH CARE — (12.2%) | | | | | | | | | | | | |
| | AbbVie, Inc. | | | 1,217,399 | | | | 178,227,214 | | | | 0.7 | % |
| | Amgen, Inc. | | | 395,045 | | | | 106,800,416 | | | | 0.4 | % |
| | Bristol-Myers Squibb Co. | | | 1,399,024 | | | | 108,382,389 | | | | 0.4 | % |
| | Cigna Corp. | | | 265,948 | | | | 85,917,161 | | | | 0.3 | % |
| | CVS Health Corp. | | | 1,042,089 | | | | 98,685,828 | | | | 0.4 | % |
| | Eli Lilly & Co. | | | 520,601 | | | | 188,504,416 | | | | 0.7 | % |
36
U.S. CORE EQUITY 1 PORTFOLIO
CONTINUED
| | | | | | | | | | | | | | |
| | | Shares | | | Value† | | | Percentage
of Net Assets‡ | |
HEALTH CARE — (Continued) | | | | | | | | | | | | |
| | Gilead Sciences, Inc. | | | 1,123,050 | | | $ | 88,114,503 | | | | 0.3 | % |
| | Johnson & Johnson | | | 1,583,776 | | | | 275,529,511 | | | | 1.0 | % |
| | Merck & Co., Inc. | | | 1,532,708 | | | | 155,110,050 | | | | 0.6 | % |
| | Pfizer, Inc. | | | 3,138,575 | | | | 146,100,666 | | | | 0.5 | % |
| | UnitedHealth Group, Inc. | | | 442,851 | | | | 245,848,733 | | | | 0.9 | % |
| | Other Securities | | | | | | | 1,889,479,968 | | | | 6.5 | % |
| | | | | | | | | | | | | | |
TOTAL HEALTH CARE | | | | | | | 3,566,700,855 | | | | 12.7 | % |
| | | | | | | | | | | | | | |
INDUSTRIALS — (11.7%) | | | | | | | | | | | | |
| | Lockheed Martin Corp. | | | 186,232 | | | | 90,635,390 | | | | 0.3 | % |
| | Union Pacific Corp. | | | 458,821 | | | | 90,451,972 | | | | 0.3 | % |
| | United Parcel Service, Inc., Class B | | | 521,453 | | | | 87,484,170 | | | | 0.3 | % |
| | Other Securities | | | | | | | 3,151,453,330 | | | | 11.3 | % |
| | | | | | | | | | | | | | |
TOTAL INDUSTRIALS | | | | | | | 3,420,024,862 | | | | 12.2 | % |
| | | | | | | | | | | | | | |
INFORMATION TECHNOLOGY — (20.6%) | | | | | | | | | | | | |
| | Accenture PLC, Class A | | | 421,535 | | | | 119,673,786 | | | | 0.4 | % |
| | Apple, Inc. | | | 9,026,207 | | | | 1,384,078,581 | | | | 4.9 | % |
| | Broadcom, Inc. | | | 323,073 | | | | 151,883,079 | | | | 0.6 | % |
| | Cisco Systems, Inc. | | | 2,518,417 | | | | 114,411,684 | | | | 0.4 | % |
| | Mastercard, Inc., Class A | | | 587,619 | | | | 192,844,803 | | | | 0.7 | % |
| | Microsoft Corp. | | | 4,150,122 | | | | 963,367,820 | | | | 3.4 | % |
| | NVIDIA Corp. | | | 1,138,596 | | | | 153,676,302 | | | | 0.6 | % |
| | QUALCOMM, Inc. | | | 829,776 | | | | 97,631,444 | | | | 0.4 | % |
| | Texas Instruments, Inc. | | | 750,861 | | | | 120,610,802 | | | | 0.4 | % |
# | | Visa, Inc., Class A | | | 933,069 | | | | 193,294,574 | | | | 0.7 | % |
| | Other Securities | | | | | | | 2,517,282,051 | | | | 8.9 | % |
| | | | | | | | | | | | | | |
TOTAL INFORMATION TECHNOLOGY | | | | | | | 6,008,754,926 | | | | 21.4 | % |
| | | | | | | | | | | | | | |
MATERIALS — (4.2%) | | | | | | | | | | | | |
| | Other Securities | | | | | | | 1,225,634,383 | | | | 4.4 | % |
| | | | | | | | | | | | | | |
REAL ESTATE — (0.2%) | | | | | | | | | | | | |
| | Other Securities | | | | | | | 65,744,933 | | | | 0.2 | % |
| | | | | | | | | | | | | | |
UTILITIES — (2.6%) | | | | | | | | | | | | |
| | Other Securities | | | | | | | 740,106,070 | | | | 2.6 | % |
| | | | | | | | | | | | | | |
TOTAL COMMON STOCKS | | | | | | | 27,700,510,514 | | | | 98.7 | % |
| | | | | | | | | | | | | | |
PREFERRED STOCKS — (0.0%) | | | | | | | | | | | | |
COMMUNICATION SERVICES — (0.0%) | | | | | | | | | | | | |
| | Other Security | | | | | | | 343,723 | | | | 0.0 | % |
| | | | | | | | | | | | | | |
CONSUMER DISCRETIONARY — (0.0%) | | | | | | | | | | | | |
| | Other Security | | | | | | | 475,353 | | | | 0.0 | % |
| | | | | | | | | | | | | | |
INDUSTRIALS — (0.0%) | | | | | | | | | | | | |
| | Other Security | | | | | | | 1,455,840 | | | | 0.0 | % |
| | | | | | | | | | | | | | |
TOTAL PREFERRED STOCKS | | | | | | | 2,274,916 | | | | 0.0 | % |
| | | | | | | | | | | | | | |
37
U.S. CORE EQUITY 1 PORTFOLIO
CONTINUED
| | | | | | | | | | | | | | |
| | | Shares | | | Value† | | | Percentage
of Net Assets‡ | |
RIGHTS/WARRANTS — (0.0%) | | | | | | | | | | | | |
INDUSTRIALS — (0.0%) | | | | | | | | | | | | |
| | Other Security | | | | | | $ | 23,961 | | | | 0.0 | % |
| | | | | | | | | | | | | | |
TOTAL RIGHTS/WARRANTS | | | | | | | 23,961 | | | | 0.0 | % |
| | | | | | | | | | | | | | |
TOTAL INVESTMENT SECURITIES
(Cost $13,059,889,382) | | | | | | | 27,702,809,391 | | | | | |
| | | | | | | | | | | | | | |
TEMPORARY CASH INVESTMENTS — (0.9%) | | | | | | | | | | | | |
| | State Street Institutional U.S. Government Money Market Fund, 3.010% | | | 248,087,015 | | | | 248,087,015 | | | | 0.9 | % |
| | | | | | | | | | | | | | |
SECURITIES LENDING COLLATERAL — (4.1%) | | | | | | | | | | | | |
@§ The DFA Short Term Investment Fund | | | 103,556,037 | | | | 1,197,211,347 | | | | 4.3 | % |
| | | | | | | | | | | | | | |
TOTAL INVESTMENTS—(100.0%)
(Cost $14,505,588,592) | | | | | | $ | 29,148,107,753 | | | | 103.9 | % |
| | | | | | | | | | | | | | |
As of October 31, 2022, U.S. Core Equity 1 Portfolio had entered into the following outstanding futures contracts:
| | | | | | | | | | | | | | | | | | | | |
Description | | Number of
Contracts | | | Expiration
Date | | | Notional
Value | | | Market
Value | | | Unrealized
Appreciation
(Depreciation) | |
Long Position Contracts: | | | | | | | | | | | | | | | | | | | | |
S&P 500® Emini Index | | | 1,616 | | | | 12/16/22 | | | $ | 322,362,519 | | | $ | 313,746,400 | | | $ | (8,616,119 | ) |
| | | | | | | | | | | | | | | | | | | | |
Total Futures Contracts | | | | | | | | | | $ | 322,362,519 | | | $ | 313,746,400 | | | $ | (8,616,119 | ) |
| | | | | | | | | | | | | | | | | | | | |
Summary of the Portfolio’s investments as of October 31, 2022, based on their valuation inputs, is as follows (see Security Valuation Note):
| | | | | | | | | | | | | | | | |
| | | Investments in Securities (Market Value) | |
| | | Level 1 | | | Level 2 | | | Level 3 | | | Total | |
Common Stocks | | | | | | | | | | | | | | | | |
Communication Services | | $ | 1,747,952,953 | | | $ | 8,484 | | | | — | | | $ | 1,747,961,437 | |
Consumer Discretionary | | | 3,090,621,403 | | | | — | | | $ | 4,986 | | | | 3,090,626,389 | |
Consumer Staples | | | 1,864,843,825 | | | | 94,387 | | | | — | | | | 1,864,938,212 | |
Energy | | | 1,961,903,671 | | | | — | | | | — | | | | 1,961,903,671 | |
Financials | | | 4,008,109,526 | | | | 5,250 | | | | — | | | | 4,008,114,776 | |
Health Care | | | 3,565,356,114 | | | | — | | | | 1,344,741 | | | | 3,566,700,855 | |
Industrials | | | 3,419,367,777 | | | | 657,085 | | | | — | | | | 3,420,024,862 | |
Information Technology | | | 6,008,754,926 | | | | — | | | | — | | | | 6,008,754,926 | |
Materials | | | 1,225,634,383 | | | | — | | | | — | | | | 1,225,634,383 | |
Real Estate | | | 65,705,171 | | | | 39,762 | | | | — | | | | 65,744,933 | |
Utilities | | | 740,106,070 | | | | — | | | | — | | | | 740,106,070 | |
Preferred Stocks | | | | | | | | | | | | | | | | |
Communication Services | | | 343,723 | | | | — | | | | — | | | | 343,723 | |
Consumer Discretionary | | | 475,353 | | | | — | | | | — | | | | 475,353 | |
Industrials | | | 1,455,840 | | | | — | | | | — | | | | 1,455,840 | |
Rights/Warrants | | | | | | | | | | | | | | | | |
Industrials | | | — | | | | — | | | | 23,961 | | | | 23,961 | |
Temporary Cash Investments | | | 248,087,015 | | | | — | | | | — | | | | 248,087,015 | |
38
U.S. CORE EQUITY 1 PORTFOLIO
CONTINUED
| | | | | | | | | | | | | | | | |
| | | Investments in Securities (Market Value) | |
| | | Level 1 | | | Level 2 | | | Level 3 | | | Total | |
Securities Lending Collateral | | | — | | | $ | 1,197,211,347 | | | | — | | | $ | 1,197,211,347 | |
Futures Contracts** | | $ | (8,616,119 | ) | | | — | | | | — | | | | (8,616,119 | ) |
| | | | | | | | | | | | | | | | |
TOTAL | | $ | 27,940,101,631 | | | $ | 1,198,016,315 | | | $ | 1,373,688 | ^ | | $ | 29,139,491,634 | |
| | | | | | | | | | | | | | | | |
| ** | Valued at the unrealized appreciation/(depreciation) on the investment. |
| ^ | A reconciliation of Level 3 investments is presented when the Fund had a significant amount of Level 3 investments at the beginning and/or end of the reporting period in relation to net assets. |
See accompanying Notes to Financial Statements.
39
U.S. CORE EQUITY 2 PORTFOLIO
SUMMARY SCHEDULE OF PORTFOLIO HOLDINGS
October 31, 2022
| | | | | | | | | | | | | | |
| | | Shares | | | Value† | | | Percentage
of Net Assets‡ | |
COMMON STOCKS — (95.6%) | | | | | | | | | | | | |
COMMUNICATION SERVICES — (5.4%) | | | | | | | | | | | | |
* | | Alphabet, Inc., Class A | | | 2,447,900 | | | $ | 231,351,029 | | | | 0.8 | % |
* | | Alphabet, Inc., Class C | | | 2,361,300 | | | | 223,520,658 | | | | 0.8 | % |
| | AT&T, Inc. | | | 4,477,834 | | | | 81,630,914 | | | | 0.3 | % |
| | Comcast Corp., Class A | | | 3,103,081 | | | | 98,491,791 | | | | 0.3 | % |
* | | Meta Platforms, Inc., Class A | | | 1,750,602 | | | | 163,086,082 | | | | 0.6 | % |
| | Verizon Communications, Inc. | | | 3,894,696 | | | | 145,544,790 | | | | 0.5 | % |
| | Other Securities | | | | | | | 682,752,780 | | | | 2.3 | % |
| | | | | | | | | | | | | | |
TOTAL COMMUNICATION SERVICES | | | | | | | 1,626,378,044 | | | | 5.6 | % |
| | | | | | | | | | | | | | |
CONSUMER DISCRETIONARY — (9.7%) | | | | | | | | | | | | |
* | | Amazon.com, Inc. | | | 3,049,564 | | | | 312,397,336 | | | | 1.1 | % |
| | Home Depot, Inc. | | | 417,086 | | | | 123,511,677 | | | | 0.4 | % |
| | Target Corp. | | | 489,359 | | | | 80,377,216 | | | | 0.3 | % |
| | Other Securities | | | | | | | 2,428,343,528 | | | | 8.3 | % |
| | | | | | | | | | | | | | |
TOTAL CONSUMER DISCRETIONARY | | | | | | | 2,944,629,757 | | | | 10.1 | % |
| | | | | | | | | | | | | | |
CONSUMER STAPLES — (6.2%) | | | | | | | | | | | | |
| | Coca-Cola Co. | | | 2,356,465 | | | | 141,034,430 | | | | 0.5 | % |
| | Costco Wholesale Corp. | | | 257,234 | | | | 129,002,851 | | | | 0.4 | % |
| | PepsiCo, Inc. | | | 1,083,200 | | | | 196,687,456 | | | | 0.7 | % |
| | Procter & Gamble Co. | | | 1,659,570 | | | | 223,494,292 | | | | 0.8 | % |
| | Walmart, Inc. | | | 754,200 | | | | 107,345,286 | | | | 0.4 | % |
| | Other Securities | | | | | | | 1,089,547,591 | | | | 3.6 | % |
| | | | | | | | | | | | | | |
TOTAL CONSUMER STAPLES | | | | | | | 1,887,111,906 | | | | 6.4 | % |
| | | | | | | | | | | | | | |
ENERGY — (6.4%) | | | | | | | | | | | | |
| | Chevron Corp. | | | 1,074,238 | | | | 194,329,654 | | | | 0.7 | % |
| | ConocoPhillips | | | 1,162,116 | | | | 146,531,206 | | | | 0.5 | % |
| | Exxon Mobil Corp. | | | 3,060,838 | | | | 339,171,459 | | | | 1.2 | % |
| | Other Securities | | | | | | | 1,275,702,318 | | | | 4.3 | % |
| | | | | | | | | | | | | | |
TOTAL ENERGY | | | | | | | 1,955,734,637 | | | | 6.7 | % |
| | | | | | | | | | | | | | |
FINANCIALS — (14.6%) | | | | | | | | | | | | |
| | American Express Co. | | | 617,346 | | | | 91,645,014 | | | | 0.3 | % |
| | Bank of America Corp. | | | 3,352,938 | | | | 120,839,922 | | | | 0.4 | % |
* | | Berkshire Hathaway, Inc., Class B | | | 840,748 | | | | 248,096,327 | | | | 0.9 | % |
| | JPMorgan Chase & Co. | | | 1,979,363 | | | | 249,162,214 | | | | 0.9 | % |
| | Wells Fargo & Co. | | | 1,749,162 | | | | 80,443,960 | | | | 0.3 | % |
| | Other Securities | | | | | | | 3,628,152,220 | | | | 12.3 | % |
| | | | | | | | | | | | | | |
TOTAL FINANCIALS | | | | | | | 4,418,339,657 | | | | 15.1 | % |
| | | | | | | | | | | | | | |
HEALTH CARE — (12.3%) | | | | | | | | | | | | |
| | AbbVie, Inc. | | | 1,169,550 | | | | 171,222,120 | | | | 0.6 | % |
| | Amgen, Inc. | | | 465,289 | | | | 125,790,881 | | | | 0.4 | % |
| | Bristol-Myers Squibb Co. | | | 1,487,212 | | | | 115,214,314 | | | | 0.4 | % |
| | Cigna Corp. | | | 249,677 | | | | 80,660,652 | | | | 0.3 | % |
| | CVS Health Corp. | | | 829,846 | | | | 78,586,416 | | | | 0.3 | % |
| | Elevance Health, Inc. | | | 165,540 | | | | 90,512,306 | | | | 0.3 | % |
| | Eli Lilly & Co. | | | 538,596 | | | | 195,020,226 | | | | 0.7 | % |
| | Johnson & Johnson | | | 1,534,785 | | | | 267,006,546 | | | | 0.9 | % |
| | Merck & Co., Inc. | | | 1,861,625 | | | | 188,396,450 | | | | 0.7 | % |
40
U.S. CORE EQUITY 2 PORTFOLIO
CONTINUED
| | | | | | | | | | | | | | |
| | | Shares | | | Value† | | | Percentage
of Net Assets‡ | |
HEALTH CARE — (Continued) | | | | | | | | | | | | |
| | Pfizer, Inc. | | | 3,866,146 | | | $ | 179,969,096 | | | | 0.6 | % |
| | Thermo Fisher Scientific, Inc. | | | 172,804 | | | | 88,816,072 | | | | 0.3 | % |
| | UnitedHealth Group, Inc. | | | 416,565 | | | | 231,256,060 | | | | 0.8 | % |
| | Other Securities | | | | | | | 1,913,162,499 | | | | 6.4 | % |
| | | | | | | | | | | | | | |
TOTAL HEALTH CARE | | | | | | | 3,725,613,638 | | | | 12.7 | % |
| | | | | | | | | | | | | | |
INDUSTRIALS — (13.4%) | | | | | | | | | | | | |
| | Caterpillar, Inc. | | | 434,771 | | | | 94,110,531 | | | | 0.3 | % |
| | Deere & Co. | | | 214,381 | | | | 84,856,287 | | | | 0.3 | % |
| | Lockheed Martin Corp. | | | 161,715 | | | | 78,703,456 | | | | 0.3 | % |
| | Union Pacific Corp. | | | 574,109 | | | | 113,179,848 | | | | 0.4 | % |
| | Other Securities | | | | | | | 3,706,707,754 | | | | 12.6 | % |
| | | | | | | | | | | | | | |
TOTAL INDUSTRIALS | | | | | | | 4,077,557,876 | | | | 13.9 | % |
| | | | | | | | | | | | | | |
INFORMATION TECHNOLOGY — (20.8%) | | | | | | | | | | | | |
| | Accenture PLC, Class A | | | 449,831 | | | | 127,707,021 | | | | 0.5 | % |
| | Apple, Inc. | | | 9,633,318 | | | | 1,477,172,982 | | | | 5.1 | % |
| | Broadcom, Inc. | | | 284,762 | | | | 133,872,311 | | | | 0.5 | % |
| | Cisco Systems, Inc. | | | 2,308,415 | | | | 104,871,293 | | | | 0.4 | % |
| | Intel Corp. | | | 3,268,769 | | | | 92,931,103 | | | | 0.3 | % |
| | International Business Machines Corp. | | | 704,432 | | | | 97,415,901 | | | | 0.3 | % |
| | Mastercard, Inc., Class A | | | 587,552 | | | | 192,822,815 | | | | 0.7 | % |
| | Microsoft Corp. | | | 4,624,552 | | | | 1,073,497,256 | | | | 3.7 | % |
| | QUALCOMM, Inc. | | | 817,724 | | | | 96,213,406 | | | | 0.3 | % |
| | Texas Instruments, Inc. | | | 676,325 | | | | 108,638,085 | | | | 0.4 | % |
# | | Visa, Inc., Class A | | | 921,563 | | | | 190,910,991 | | | | 0.7 | % |
| | Other Securities | | | | | | | 2,622,825,195 | | | | 8.7 | % |
| | | | | | | | | | | | | | |
TOTAL INFORMATION TECHNOLOGY | | | | | | | 6,318,878,359 | | | | 21.6 | % |
| | | | | | | | | | | | | | |
MATERIALS — (4.6%) | | | | | | | | | | | | |
| | Other Securities | | | | | | | 1,383,197,697 | | | | 4.7 | % |
| | | | | | | | | | | | | | |
REAL ESTATE — (0.3%) | | | | | | | | | | | | |
| | Other Securities | | | | | | | 85,739,181 | | | | 0.3 | % |
| | | | | | | | | | | | | | |
UTILITIES — (1.9%) | | | | | | | | | | | | |
| | Other Securities | | | | | | | 570,220,524 | | | | 2.0 | % |
| | | | | | | | | | | | | | |
TOTAL COMMON STOCKS | | | | | | | 28,993,401,276 | | | | 99.1 | % |
| | | | | | | | | | | | | | |
PREFERRED STOCKS — (0.0%) | | | | | | | | | | | | |
COMMUNICATION SERVICES — (0.0%) | | | | | | | | | | | | |
| | Other Security | | | | | | | 486,617 | | | | 0.0 | % |
| | | | | | | | | | | | | | |
CONSUMER DISCRETIONARY — (0.0%) | | | | | | | | | | | | |
| | Other Security | | | | | | | 754,305 | | | | 0.0 | % |
| | | | | | | | | | | | | | |
INDUSTRIALS — (0.0%) | | | | | | | | | | | | |
| | Other Security | | | | | | | 1,986,525 | | | | 0.0 | % |
| | | | | | | | | | | | | | |
TOTAL PREFERRED STOCKS | | | | | | | 3,227,447 | | | | 0.0 | % |
| | | | | | | | | | | | | | |
41
U.S. CORE EQUITY 2 PORTFOLIO
CONTINUED
| | | | | | | | | | | | | | |
| | | Shares | | | Value† | | | Percentage
of Net Assets‡ | |
RIGHTS/WARRANTS — (0.0%) | | | | | | | | | | | | |
INDUSTRIALS — (0.0%) | | | | | | | | | | | | |
| | Other Security | | | | | | $ | 23,431 | | | | 0.0 | % |
| | | | | | | | | | | | | | |
TOTAL RIGHTS/WARRANTS | | | | | | | 23,431 | | | | 0.0 | % |
| | | | | | | | | | | | | | |
TOTAL INVESTMENT SECURITIES
(Cost $13,737,376,934) | | | | | | | 28,996,652,154 | | | | | |
| | | | | | | | | | | | | | |
TEMPORARY CASH INVESTMENTS — (0.9%) | | | | | | | | | | | | |
| | State Street Institutional U.S. Government Money Market Fund, 3.010% | | | 272,587,862 | | | | 272,587,862 | | | | 0.9 | % |
| | | | | | | | | | | | | | |
SECURITIES LENDING COLLATERAL — (3.5%) | | | | | | | | | | | | |
@§ | | The DFA Short Term Investment Fund | | | 93,154,375 | | | | 1,076,957,724 | | | | 3.7 | % |
| | | | | | | | | | | | | | |
TOTAL INVESTMENTS—(100.0%)
(Cost $15,087,266,108) | | | | | | $ | 30,346,197,740 | | | | 103.7 | % |
| | | | | | | | | | | | | | |
As of October 31, 2022, U.S. Core Equity 2 Portfolio had entered into the following outstanding futures contracts:
| | | | | | | | | | | | | | | | | | | | |
| | | | | | | | | | | | | | | Unrealized | |
| | | Number of | | | Expiration | | | Notional | | | Market | | | Appreciation | |
Description | | Contracts | | | Date | | | Value | | | Value | | | (Depreciation) | |
Long Position Contracts: | | | | | | | | | | | | | | | | | | | | |
S&P 500® Emini Index | | | 1,279 | | | | 12/16/22 | | | $ | 252,780,580 | | | $ | 248,317,850 | | | $ | (4,462,730 | ) |
| | | | | | | | | | | | | | | | | | | | |
Total Futures Contracts | | | | | | | | | | $ | 252,780,580 | | | $ | 248,317,850 | | | $ | (4,462,730 | ) |
| | | | | | | | | | | | | | | | | | | | |
Summary of the Portfolio’s investments as of October 31, 2022, based on their valuation inputs, is as follows (see Security Valuation Note):
| | | | | | | | | | | | | | | | |
| | | Investments in Securities (Market Value) | |
| | | Level 1 | | | Level 2 | | | Level 3 | | | Total | |
Common Stocks | | | | | | | | | | | | | | | | |
Communication Services | | $ | 1,626,242,103 | | | $ | 135,941 | | | | — | | | $ | 1,626,378,044 | |
Consumer Discretionary | | | 2,944,622,949 | | | | — | | | $ | 6,808 | | | | 2,944,629,757 | |
Consumer Staples | | | 1,886,985,529 | | | | 126,377 | | | | — | | | | 1,887,111,906 | |
Energy | | | 1,955,734,637 | | | | — | | | | — | | | | 1,955,734,637 | |
Financials | | | 4,418,239,836 | | | | 99,821 | | | | — | | | | 4,418,339,657 | |
Health Care | | | 3,723,517,292 | | | | — | | | | 2,096,346 | | | | 3,725,613,638 | |
Industrials | | | 4,076,132,929 | | | | 1,424,947 | | | | — | | | | 4,077,557,876 | |
Information Technology | | | 6,318,877,797 | | | | — | | | | 562 | | | | 6,318,878,359 | |
Materials | | | 1,383,197,697 | | | | — | | | | — | | | | 1,383,197,697 | |
Real Estate | | | 85,619,321 | | | | 119,860 | | | | — | | | | 85,739,181 | |
Utilities | | | 570,220,524 | | | | — | | | | — | | | | 570,220,524 | |
Preferred Stocks | | | | | | | | | | | | | | | | |
Communication Services | | | 486,617 | | | | — | | | | — | | | | 486,617 | |
Consumer Discretionary | | | 754,305 | | | | — | | | | — | | | | 754,305 | |
Industrials | | | 1,986,525 | | | | — | | | | — | | | | 1,986,525 | |
Rights/Warrants | | | | | | | | | | | | | | | | |
Industrials | | | — | | | | — | | | | 23,431 | | | | 23,431 | |
Temporary Cash Investments | | | 272,587,862 | | | | — | | | | — | | | | 272,587,862 | |
42
U.S. CORE EQUITY 2 PORTFOLIO
CONTINUED
| | | | | | | | | | | | | | | | |
| | | Investments in Securities (Market Value) | |
| | | Level 1 | | | Level 2 | | | Level 3 | | | Total | |
Securities Lending Collateral | | | — | | | $ | 1,076,957,724 | | | | — | | | $ | 1,076,957,724 | |
Futures Contracts** | | $ | (4,462,730 | ) | | | — | | | | — | | | | (4,462,730 | ) |
| | | | | | | | | | | | | | | | |
TOTAL | | $ | 29,260,743,193 | | | $ | 1,078,864,670 | | | $ | 2,127,147 | ^ | | $ | 30,341,735,010 | |
| | | | | | | | | | | | | | | | |
| ** | Valued at the unrealized appreciation/(depreciation) on the investment. |
| ^ | A reconciliation of Level 3 investments is presented when the Fund had a significant amount of Level 3 investments at the beginning and/or end of the reporting period in relation to net assets. |
See accompanying Notes to Financial Statements.
43
U.S. VECTOR EQUITY PORTFOLIO
SUMMARY SCHEDULE OF PORTFOLIO HOLDINGS
October 31, 2022
| | | | | | | | | | | | | | |
| | | | | Shares | | | Value† | | | Percentage
of Net Assets‡ | |
COMMON STOCKS — (94.3%) | | | | | | | | | | | | |
COMMUNICATION SERVICES — (4.8%) | | | | | | | | | | | | |
* | | Alphabet, Inc., Class A | | | 204,320 | | | $ | 19,310,283 | | | | 0.5 | % |
* | | Alphabet, Inc., Class C | | | 174,880 | | | | 16,554,141 | | | | 0.4 | % |
| | AT&T, Inc. | | | 591,989 | | | | 10,791,959 | | | | 0.3 | % |
| | Comcast Corp., Class A | | | 542,795 | | | | 17,228,313 | | | | 0.4 | % |
* | | Meta Platforms, Inc., Class A | | | 172,392 | | | | 16,060,039 | | | | 0.4 | % |
| | Verizon Communications, Inc. | | | 361,078 | | | | 13,493,485 | | | | 0.3 | % |
| | Other Securities | | | | | | | 129,665,322 | | | | 2.7 | % |
| | | | | | | | | | | | | | |
TOTAL COMMUNICATION SERVICES | | | | 223,103,542 | | | | 5.0 | % |
| | | | | | | | | | | | | | |
CONSUMER DISCRETIONARY — (9.4%) | | | | | | | | | | | | |
| | Murphy USA, Inc. | | | 35,401 | | | | 11,133,969 | | | | 0.3 | % |
| | Penske Automotive Group, Inc. | | | 101,131 | | | | 11,288,242 | | | | 0.3 | % |
| | Other Securities | | | | | | | 415,238,079 | | | | 9.3 | % |
| | | | | | | | | | | | | | |
TOTAL CONSUMER DISCRETIONARY | | | | 437,660,290 | | | | 9.9 | % |
| | | | | | | | | | | | | | |
CONSUMER STAPLES — (4.7%) | | | | | | | | | | | | |
| | Bunge Ltd. | | | 114,831 | | | | 11,333,820 | | | | 0.3 | % |
| | Procter & Gamble Co. | | | 90,151 | | | | 12,140,635 | | | | 0.3 | % |
| | Walmart, Inc. | | | 92,764 | | | | 13,203,100 | | | | 0.3 | % |
| | Other Securities | | | | | | | 183,081,780 | | | | 4.1 | % |
| | | | | | | | | | | | | | |
TOTAL CONSUMER STAPLES | | | | 219,759,335 | | | | 5.0 | % |
| | | | | | | | | | | | | | |
ENERGY — (10.3%) | | | | | | | | | | | | |
| | Chevron Corp. | | | 168,142 | | | | 30,416,888 | | | | 0.7 | % |
| | ConocoPhillips | | | 192,034 | | | | 24,213,567 | | | | 0.6 | % |
| | Coterra Energy, Inc. | | | 441,905 | | | | 13,756,503 | | | | 0.3 | % |
| | Devon Energy Corp. | | | 333,906 | | | | 25,827,629 | | | | 0.6 | % |
| | Diamondback Energy, Inc. | | | 77,163 | | | | 12,123,079 | | | | 0.3 | % |
| | EOG Resources, Inc. | | | 108,097 | | | | 14,757,402 | | | | 0.3 | % |
| | Exxon Mobil Corp. | | | 427,728 | | | | 47,396,540 | | | | 1.1 | % |
| | Marathon Petroleum Corp. | | | 137,887 | | | | 15,666,721 | | | | 0.4 | % |
| | Occidental Petroleum Corp. | | | 202,911 | | | | 14,731,339 | | | | 0.3 | % |
| | Valero Energy Corp. | | | 96,071 | | | | 12,061,714 | | | | 0.3 | % |
| | Other Securities | | | | | | | 267,114,486 | | | | 5.9 | % |
| | | | | | | | | | | | | | |
TOTAL ENERGY | | | | 478,065,868 | | | | 10.8 | % |
| | | | | | | | | | | | | | |
FINANCIALS — (21.8%) | | | | | | | | | | | | |
| | Aflac, Inc. | | | 208,954 | | | | 13,604,995 | | | | 0.3 | % |
| | Allstate Corp. | | | 86,090 | | | | 10,868,862 | | | | 0.3 | % |
| | Bank of America Corp. | | | 491,054 | | | | 17,697,586 | | | | 0.4 | % |
* | | Berkshire Hathaway, Inc., Class B | | | 110,049 | | | | 32,474,359 | | | | 0.7 | % |
| | Discover Financial Services | | | 118,381 | | | | 12,366,079 | | | | 0.3 | % |
| | First Horizon Corp. | | | 432,866 | | | | 10,609,546 | | | | 0.3 | % |
| | JPMorgan Chase & Co. | | | 273,311 | | | | 34,404,389 | | | | 0.8 | % |
| | M&T Bank Corp. | | | 67,444 | | | | 11,355,546 | | | | 0.3 | % |
| | Morgan Stanley | | | 152,000 | | | | 12,489,840 | | | | 0.3 | % |
| | Travelers Cos., Inc. | | | 60,909 | | | | 11,235,274 | | | | 0.3 | % |
| | Wells Fargo & Co. | | | 236,095 | | | | 10,858,009 | | | | 0.3 | % |
| | Other Securities | | | | | | | 833,448,489 | | | | 18.6 | % |
| | | | | | | | | | | | | | |
TOTAL FINANCIALS | | | | 1,011,412,974 | | | | 22.9 | % |
| | | | | | | | | | | | | | |
44
U.S. VECTOR EQUITY PORTFOLIO
CONTINUED
| | | | | | | | | | | | | | |
| | | | | Shares | | | Value† | | | Percentage
of Net Assets‡ | |
HEALTH CARE — (9.6%) | | | | | | | | | | | | |
| | Bristol-Myers Squibb Co. | | | 141,192 | | | $ | 10,938,144 | | | | 0.3 | % |
| | Cigna Corp. | | | 32,953 | | | | 10,645,796 | | | | 0.3 | % |
| | CVS Health Corp. | | | 118,113 | | | | 11,185,301 | | | | 0.3 | % |
| | Johnson & Johnson | | | 105,798 | | | | 18,405,678 | | | | 0.4 | % |
| | Merck & Co., Inc. | | | 111,689 | | | | 11,302,927 | | | | 0.3 | % |
| | Pfizer, Inc. | | | 341,124 | | | | 15,879,322 | | | | 0.4 | % |
| | UnitedHealth Group, Inc. | | | 36,788 | | | | 20,422,858 | | | | 0.5 | % |
| | Other Securities | | | | | | | 348,975,389 | | | | 7.6 | % |
| | | | | | | | | | | | | | |
TOTAL HEALTH CARE | | | | | | | 447,755,415 | | | | 10.1 | % |
| | | | | | | | | | | | | | |
INDUSTRIALS — (15.5%) | | | | | | | | | | | | |
* | | Builders FirstSource, Inc. | | | 197,853 | | | | 12,199,616 | | | | 0.3 | % |
| | Raytheon Technologies Corp. | | | 115,471 | | | | 10,948,960 | | | | 0.3 | % |
| | Other Securities | | | | | | | 698,192,830 | | | | 15.7 | % |
| | | | | | | | | | | | | | |
TOTAL INDUSTRIALS | | | | | | | 721,341,406 | | | | 16.3 | % |
| | | | | | | | | | | | | | |
INFORMATION TECHNOLOGY — (9.4%) | | | | | | | | | | | | |
* | | First Solar, Inc. | | | 83,806 | | | | 12,199,639 | | | | 0.3 | % |
| | Other Securities | | | | | | | 422,358,258 | | | | 9.5 | % |
| | | | | | | | | | | | | | |
TOTAL INFORMATION TECHNOLOGY | | | | | | | 434,557,897 | | | | 9.8 | % |
| | | | | | | | | | | | | | |
MATERIALS — (7.2%) | | | | | | | | | | | | |
| | Corteva, Inc. | | | 201,895 | | | | 13,191,819 | | | | 0.3 | % |
| | Dow, Inc. | | | 316,807 | | | | 14,807,559 | | | | 0.3 | % |
| | LyondellBasell Industries NV, Class A | | | 148,186 | | | | 11,328,820 | | | | 0.3 | % |
| | Newmont Corp. | | | 272,674 | | | | 11,539,564 | | | | 0.3 | % |
# | | Nucor Corp. | | | 188,942 | | | | 24,823,200 | | | | 0.6 | % |
| | Reliance Steel & Aluminum Co. | | | 62,227 | | | | 12,537,496 | | | | 0.3 | % |
| | Steel Dynamics, Inc. | | | 170,812 | | | | 16,064,869 | | | | 0.4 | % |
| | Other Securities | | | | | | | 228,643,996 | | | | 5.0 | % |
| | | | | | | | | | | | | | |
TOTAL MATERIALS | | | | | | | 332,937,323 | | | | 7.5 | % |
| | | | | | | | | | | | | | |
REAL ESTATE — (0.5%) | | | | | | | | | | | | |
| | Other Securities | | | | | | | 22,470,126 | | | | 0.5 | % |
| | | | | | | | | | | | | | |
UTILITIES — (1.1%) | | | | | | | | | | | | |
| | Other Securities | | | | | | | 50,547,951 | | | | 1.2 | % |
| | | | | | | | | | | | | | |
TOTAL COMMON STOCKS | | | | | | | 4,379,612,127 | | | | 99.0 | % |
| | | | | | | | | | | | | | |
PREFERRED STOCKS — (0.0%) | | | | | | | | | | | | |
COMMUNICATION SERVICES — (0.0%) | | | | | | | | | | | | |
| | Other Security | | | | | | | 331,508 | | | | 0.0 | % |
| | | | | | | | | | | | | | |
CONSUMER DISCRETIONARY — (0.0%) | | | | | | | | | | | | |
| | Other Security | | | | | | | 231,938 | | | | 0.0 | % |
| | | | | | | | | | | | | | |
INDUSTRIALS — (0.0%) | | | | | | | | | | | | |
| | Other Security | | | | | | | 794,799 | | | | 0.0 | % |
| | | | | | | | | | | | | | |
TOTAL PREFERRED STOCKS | | | | | | | 1,358,245 | | | | 0.0 | % |
| | | | | | | | | | | | | | |
45
U.S. VECTOR EQUITY PORTFOLIO
CONTINUED
| | | | | | | | | | | | | | |
| | | | | Shares | | | Value† | | | Percentage
of Net Assets‡ | |
RIGHTS/WARRANTS — (0.0%) | | | | | | | | | | | | |
INDUSTRIALS — (0.0%) | | | | | | | | | | | | |
| | Other Security | | | | | | $ | 10,984 | | | | 0.0 | % |
| | | | | | | | | | | | | | |
TOTAL RIGHTS/WARRANTS | | | | | | | 10,984 | | | | 0.0 | % |
| | | | | | | | | | | | | | |
TOTAL INVESTMENT SECURITIES
(Cost $2,236,989,633) | | | | | | | 4,380,981,356 | | | | | |
| | | | | | | | | | | | | | |
TEMPORARY CASH INVESTMENTS — (0.8%) | | | | | | | | | | | | |
| | State Street Institutional U.S. Government Money Market Fund, 3.010% | | | 37,532,662 | | | | 37,532,662 | | | | 0.9 | % |
| | | | | | | | | | | | | | |
SECURITIES LENDING COLLATERAL — (4.9%) | | | | | | | | | | | | |
@§ | | The DFA Short Term Investment Fund | | | 19,687,236 | | | | 227,604,132 | | | | 5.1 | % |
| | | | | | | | | | | | | | |
TOTAL INVESTMENTS—(100.0%)
(Cost $2,502,230,004) | | | | | | $ | 4,646,118,150 | | | | 105.0 | % |
| | | | | | | | | | | | | | |
As of October 31, 2022, U.S. Vector Equity Portfolio had entered into the following outstanding futures contracts:
| | | | | | | | | | | | | | | | | | | | |
Description | | Number of
Contracts | | | Expiration
Date | | | Notional
Value | | | Market
Value | | | Unrealized
Appreciation
(Depreciation) | |
Long Position Contracts: | | | | | | | | | | | | | | | | | | | | |
S&P 500® Emini Index | | | 181 | | | | 12/16/22 | | | $ | 36,251,048 | | | $ | 35,141,150 | | | $ | (1,109,898 | ) |
| | | | | | | | | | | | | | | | | | | | |
Total Futures Contracts | | | | | | | | | | $ | 36,251,048 | | | $ | 35,141,150 | | | $ | (1,109,898 | ) |
| | | | | | | | | | | | | | | | | | | | |
Summary of the Portfolio’s investments as of October 31, 2022, based on their valuation inputs, is as follows (see Security Valuation Note):
| | | | | | | | | | | | | | | | |
| | | Investments in Securities (Market Value) | |
| | | Level 1 | | | Level 2 | | | Level 3 | | | Total | |
Common Stocks | | | | | | | | | | | | | | | | |
Communication Services | | $ | 223,080,276 | | | $ | 23,266 | | | | — | | | $ | 223,103,542 | |
Consumer Discretionary | | | 437,633,283 | | | | 24,728 | | | $ | 2,279 | | | | 437,660,290 | |
Consumer Staples | | | 219,680,247 | | | | 79,088 | | | | — | | | | 219,759,335 | |
Energy | | | 478,065,868 | | | | — | | | | — | | | | 478,065,868 | |
Financials | | | 1,011,349,694 | | | | 63,280 | | | | — | | | | 1,011,412,974 | |
Health Care | | | 446,330,154 | | | | — | | | | 1,425,261 | | | | 447,755,415 | |
Industrials | | | 720,993,032 | | | | 348,374 | | | | — | | | | 721,341,406 | |
Information Technology | | | 434,557,897 | | | | — | | | | — | | | | 434,557,897 | |
Materials | | | 332,937,323 | | | | — | | | | — | | | | 332,937,323 | |
Real Estate | | | 22,470,126 | | | | — | | | | — | | | | 22,470,126 | |
Utilities | | | 50,547,951 | | | | — | | | | — | | | | 50,547,951 | |
Preferred Stocks | | | | | | | | | | | | | | | | |
Communication Services | | | 331,508 | | | | — | | | | — | | | | 331,508 | |
Consumer Discretionary | | | 231,938 | | | | — | | | | — | | | | 231,938 | |
Industrials | | | 794,799 | | | | — | | | | — | | | | 794,799 | |
Rights/Warrants | | | | | | | | | | | | | | | | |
Industrials | | | — | | | | — | | | | 10,984 | | | | 10,984 | |
Temporary Cash Investments | | | 37,532,662 | | | | — | | | | — | | | | 37,532,662 | |
46
U.S. VECTOR EQUITY PORTFOLIO
CONTINUED
| | | | | | | | | | | | | | | | |
| | | Investments in Securities (Market Value) | |
| | | Level 1 | | | Level 2 | | | Level 3 | | | Total | |
Securities Lending Collateral | | | — | | | $ | 227,604,132 | | | | — | | | $ | 227,604,132 | |
Futures Contracts** | | $ | (1,109,898 | ) | | | — | | | | — | | | | (1,109,898 | ) |
| | | | | | | | | | | | | | | | |
TOTAL | | $ | 4,415,426,860 | | | $ | 228,142,868 | | | $ | 1,438,524 | ^ | | $ | 4,645,008,252 | |
| | | | | | | | | | | | | | | | |
| ** | Valued at the unrealized appreciation/(depreciation) on the investment. |
| ^ | A reconciliation of Level 3 investments is presented when the Fund had a significant amount of Level 3 investments at the beginning and/or end of the reporting period in relation to net assets. |
See accompanying Notes to Financial Statements.
47
U.S. SMALL CAP PORTFOLIO
SUMMARY SCHEDULE OF PORTFOLIO HOLDINGS
October 31, 2022
| | | | | | | | | | | | | | |
| | | | | Shares | | | Value† | | | Percentage
of Net Assets‡ | |
COMMON STOCKS — (89.4%) | | | | | | | | | | | | |
COMMUNICATION SERVICES — (2.4%) | | | | | | | | | | | | |
* | | Iridium Communications, Inc. | | | 696,920 | | | $ | 35,912,288 | | | | 0.3 | % |
# | | Nexstar Media Group, Inc., Class A | | | 267,672 | | | | 45,852,214 | | | | 0.3 | % |
| | Other Securities | | | | | | | 290,606,265 | | | | 2.1 | % |
| | | | | | | | | | | | | | |
TOTAL COMMUNICATION SERVICES | | | | | | | 372,370,767 | | | | 2.7 | % |
| | | | | | | | | | | | | | |
CONSUMER DISCRETIONARY — (10.8%) | | | | | | | | | | | | |
# | | Murphy USA, Inc. | | | 187,244 | | | | 58,890,110 | | | | 0.4 | % |
# | | Penske Automotive Group, Inc. | | | 420,059 | | | | 46,886,986 | | | | 0.3 | % |
| | Texas Roadhouse, Inc. | | | 336,612 | | | | 33,307,757 | | | | 0.3 | % |
| | Other Securities | | | | | | | 1,533,426,592 | | | | 11.0 | % |
| | | | | | | | | | | | | | |
TOTAL CONSUMER DISCRETIONARY | | | | 1,672,511,445 | | | | 12.0 | % |
| | | | | | | | | | | | | | |
CONSUMER STAPLES — (3.9%) | | | | | | | | | | | | |
* | | BJ’s Wholesale Club Holdings, Inc. | | | 477,746 | | | | 36,977,540 | | | | 0.3 | % |
| | Other Securities | | | | | | | 568,042,519 | | | | 4.0 | % |
| | | | | | | | | | | | | | |
TOTAL CONSUMER STAPLES | | | | 605,020,059 | | | | 4.3 | % |
| | | | | | | | | | | | | | |
ENERGY — (5.6%) | | | | | | | | | | | | |
# | | Matador Resources Co. | | | 734,685 | | | | 48,819,818 | | | | 0.4 | % |
# | | Murphy Oil Corp. | | | 833,447 | | | | 40,430,514 | | | | 0.3 | % |
# | | PDC Energy, Inc. | | | 673,577 | | | | 48,591,845 | | | | 0.4 | % |
| | Range Resources Corp. | | | 1,648,690 | | | | 46,954,691 | | | | 0.4 | % |
| | SM Energy Co. | | | 751,637 | | | | 33,808,632 | | | | 0.3 | % |
| | Other Securities | | | | | | | 639,161,629 | | | | 4.4 | % |
| | | | | | | | | | | | | | |
TOTAL ENERGY | | | | 857,767,129 | | | | 6.2 | % |
| | | | | | | | | | | | | | |
FINANCIALS — (19.7%) | | | | | | | | | | | | |
| | Cadence Bank | | | 1,282,964 | | | | 35,473,955 | | | | 0.3 | % |
# | | Glacier Bancorp, Inc. | | | 783,244 | | | | 44,864,216 | | | | 0.3 | % |
| | Old National Bancorp | | | 2,096,773 | | | | 41,012,880 | | | | 0.3 | % |
| | RLI Corp. | | | 312,890 | | | | 40,697,602 | | | | 0.3 | % |
# | | Selective Insurance Group, Inc. | | | 438,122 | | | | 42,971,006 | | | | 0.3 | % |
| | SouthState Corp. | | | 480,323 | | | | 43,435,609 | | | | 0.3 | % |
# | | United Bankshares, Inc. | | | 917,556 | | | | 38,858,497 | | | | 0.3 | % |
# | | Valley National Bancorp | | | 2,970,010 | | | | 35,254,031 | | | | 0.3 | % |
| | Other Securities | | | | | | | 2,716,701,974 | | | | 19.5 | % |
| | | | | | | | | | | | | | |
TOTAL FINANCIALS | | | | 3,039,269,770 | | | | 21.9 | % |
| | | | | | | | | | | | | | |
HEALTH CARE — (9.3%) | | | | | | | | | | | | |
* | | Acadia Healthcare Co., Inc. | | | 616,865 | | | | 50,151,124 | | | | 0.4 | % |
#* | | AMN Healthcare Services, Inc. | | | 408,806 | | | | 51,305,153 | | | | 0.4 | % |
# | | Ensign Group, Inc. | | | 459,736 | | | | 41,275,098 | | | | 0.3 | % |
#* | | Lantheus Holdings, Inc. | | | 494,601 | | | | 36,595,528 | | | | 0.3 | % |
#* | | Medpace Holdings, Inc. | | | 234,721 | | | | 52,103,368 | | | | 0.4 | % |
| | Other Securities | | | | | | | 1,209,252,086 | | | | 8.6 | % |
| | | | | | | | | | | | | | |
TOTAL HEALTH CARE | | | | 1,440,682,357 | | | | 10.4 | % |
| | | | | | | | | | | | | | |
INDUSTRIALS — (18.2%) | | | | | | | | | | | | |
* | | Aerojet Rocketdyne Holdings, Inc. | | | 707,916 | | | | 34,298,530 | | | | 0.3 | % |
| | Applied Industrial Technologies, Inc. | | | 272,046 | | | | 33,837,081 | | | | 0.2 | % |
#* | | Casella Waste Systems, Inc., Class A | | | 415,573 | | | | 33,998,027 | | | | 0.3 | % |
48
U.S. SMALL CAP PORTFOLIO
CONTINUED
| | | | | | | | | | | | | | |
| | | | | Shares | | | Value† | | | Percentage
of Net Assets‡ | |
INDUSTRIALS — (Continued) | | | | | | | | | | | | |
#* | | Chart Industries, Inc. | | | 257,176 | | | $ | 57,319,387 | | | | 0.4 | % |
* | | Clean Harbors, Inc. | | | 368,546 | | | | 45,132,143 | | | | 0.3 | % |
| | Comfort Systems USA, Inc. | | | 299,106 | | | | 36,873,788 | | | | 0.3 | % |
| | Exponent, Inc. | | | 422,177 | | | | 40,216,581 | | | | 0.3 | % |
#* | | FTI Consulting, Inc. | | | 246,773 | | | | 38,405,282 | | | | 0.3 | % |
# | | KBR, Inc. | | | 768,073 | | | | 38,226,993 | | | | 0.3 | % |
| | MSA Safety, Inc. | | | 265,964 | | | | 35,703,007 | | | | 0.3 | % |
#* | | Saia, Inc. | | | 198,107 | | | | 39,395,558 | | | | 0.3 | % |
| | Tetra Tech, Inc. | | | 289,234 | | | | 40,862,979 | | | | 0.3 | % |
| | Timken Co. | | | 467,224 | | | | 33,308,399 | | | | 0.2 | % |
| | Valmont Industries, Inc. | | | 151,578 | | | | 48,386,729 | | | | 0.4 | % |
* | | WESCO International, Inc. | | | 371,573 | | | | 51,191,612 | | | | 0.4 | % |
| | Other Securities | | | | | | | 2,194,626,525 | | | | 15.6 | % |
| | | | | | | | | | | | | | |
TOTAL INDUSTRIALS | | | | 2,801,782,621 | | | | 20.2 | % |
| | | | | | | | | | | | | | |
INFORMATION TECHNOLOGY — (10.5%) | | | | | | | | | | | | |
# | | Amkor Technology, Inc. | | | 1,892,325 | | | | 39,341,437 | | | | 0.3 | % |
* | | Calix, Inc. | | | 492,912 | | | | 36,298,040 | | | | 0.3 | % |
* | | ExlService Holdings, Inc. | | | 267,223 | | | | 48,594,503 | | | | 0.4 | % |
* | | Lattice Semiconductor Corp. | | | 698,136 | | | | 33,866,577 | | | | 0.3 | % |
#* | | Novanta, Inc. | | | 254,279 | | | | 35,955,051 | | | | 0.3 | % |
* | | Qualys, Inc. | | | 271,023 | | | | 38,637,039 | | | | 0.3 | % |
| | Other Securities | | | | | | | 1,386,879,238 | | | | 9.8 | % |
| | | | | | | | | | | | | | |
TOTAL INFORMATION TECHNOLOGY | | | | 1,619,571,885 | | | | 11.7 | % |
| | | | | | | | | | | | | | |
MATERIALS — (5.6%) | | | | | | | | | | | | |
# | | Commercial Metals Co. | | | 878,039 | | | | 39,950,775 | | | | 0.3 | % |
# | | Louisiana-Pacific Corp. | | | 649,884 | | | | 36,815,929 | | | | 0.3 | % |
| | Olin Corp. | | | 694,011 | | | | 36,747,882 | | | | 0.3 | % |
| | Valvoline, Inc. | | | 1,130,165 | | | | 33,181,644 | | | | 0.2 | % |
| | Other Securities | | | | | | | 715,100,087 | | | | 5.1 | % |
| | | | | | | | | | | | | | |
TOTAL MATERIALS | | | | 861,796,317 | | | | 6.2 | % |
| | | | | | | | | | | | | | |
REAL ESTATE — (0.4%) | | | | | | | | | | | | |
| | Other Securities | | | | | | | 58,876,790 | | | | 0.4 | % |
| | | | | | | | | | | | | | |
UTILITIES — (3.0%) | | | | | | | | | | | | |
| | Other Securities | | | | | | | 460,997,992 | | | | 3.3 | % |
| | | | | | | | | | | | | | |
TOTAL COMMON STOCKS | | | | 13,790,647,132 | | | | 99.3 | % |
| | | | | | | | | | | | | | |
PREFERRED STOCKS — (0.0%) | | | | | | | | | | | | |
COMMUNICATION SERVICES — (0.0%) | | | | | | | | | | | | |
| | Other Security | | | | | | | 487,236 | | | | 0.0 | % |
| | | | | | | | | | | | | | |
CONSUMER DISCRETIONARY — (0.0%) | | | | | | | | | | | | |
| | Other Security | | | | | | | 424,047 | | | | 0.0 | % |
| | | | | | | | | | | | | | |
INDUSTRIALS — (0.0%) | | | | | | | | | | | | |
| | Other Security | | | | | | | 3,575,934 | | | | 0.0 | % |
| | | | | | | | | | | | | | |
TOTAL PREFERRED STOCKS | | | | 4,487,217 | | | | 0.0 | % |
| | | | | | | | | | | | | | |
49
U.S. SMALL CAP PORTFOLIO
CONTINUED
| | | | | | | | | | | | | | |
| | | | | Shares | | | Value† | | | Percentage
of Net Assets‡ | |
RIGHTS/WARRANTS — (0.0%) | | | | | | | | | | | | |
INDUSTRIALS — (0.0%) | | | | | | | | | | | | |
| | Other Security | | | | | | $ | 26,316 | | | | 0.0 | % |
| | | | | | | | | | | | | | |
TOTAL RIGHTS/WARRANTS | | | | | | | 26,316 | | | | 0.0 | % |
| | | | | | | | | | | | | | |
TOTAL INVESTMENT SECURITIES
(Cost $7,784,404,921) | | | | | | | 13,795,160,665 | | | | | |
| | | | | | | | | | | | | | |
TEMPORARY CASH INVESTMENTS — (0.6%) | | | | | | | | | | | | |
| | State Street Institutional U.S. Government Money Market Fund, 3.010% | | | 92,669,607 | | | | 92,669,607 | | | | 0.7 | % |
| | | | | | | | | | | | | | |
SECURITIES LENDING COLLATERAL — (10.0%) | | | | | | | | | | | | |
@§ | | The DFA Short Term Investment Fund | | | 133,261,268 | | | | 1,540,633,516 | | | | 11.1 | % |
| | | | | | | | | | | | | | |
TOTAL INVESTMENTS—(100.0%)
(Cost $9,418,213,618) | | | | | | $ | 15,428,463,788 | | | | 111.1 | % |
| | | | | | | | | | | | | | |
As of October 31, 2022, U.S. Small Cap Portfolio had entered into the following outstanding futures contracts:
| | | | | | | | | | | | | | | | | | | | |
Description | | Number of
Contracts | | | Expiration
Date | | | Notional
Value | | | Market
Value | | | Unrealized
Appreciation
(Depreciation) | |
Long Position Contracts: | | | | | | | | | | | | | | | | | | | | |
S&P 500® Emini Index | | | 470 | | | | 12/16/22 | | | $ | 87,334,270 | | | $ | 91,250,500 | | | $ | 3,916,230 | |
| | | | | | | | | | | | | | | | | | | | |
Total Futures Contracts | | | | | | | | | | $ | 87,334,270 | | | $ | 91,250,500 | | | $ | 3,916,230 | |
| | | | | | | | | | | | | | | | | | | | |
Summary of the Portfolio’s investments as of October 31, 2022, based on their valuation inputs, is as follows (see Security Valuation Note):
| | | | | | | | | | | | | | | | |
| | | Investments in Securities (Market Value) | |
| | | Level 1 | | | Level 2 | | | Level 3 | | | Total | |
Common Stocks | | | | | | | | | | | | | | | | |
Communication Services | | $ | 372,314,690 | | | $ | 56,077 | | | | — | | | $ | 372,370,767 | |
Consumer Discretionary | | | 1,672,480,554 | | | | — | | | $ | 30,891 | | | | 1,672,511,445 | |
Consumer Staples | | | 604,843,422 | | | | 176,637 | | | | — | | | | 605,020,059 | |
Energy | | | 857,767,129 | | | | — | | | | — | | | | 857,767,129 | |
Financials | | | 3,039,078,133 | | | | 191,637 | | | | — | | | | 3,039,269,770 | |
Health Care | | | 1,433,468,839 | | | | 462 | | | | 7,213,056 | | | | 1,440,682,357 | |
Industrials | | | 2,801,772,518 | | | | 10,103 | | | | — | | | | 2,801,782,621 | |
Information Technology | | | 1,619,560,581 | | | | — | | | | 11,304 | | | | 1,619,571,885 | |
Materials | | | 861,743,259 | | | | — | | | | 53,058 | | | | 861,796,317 | |
Real Estate | | | 58,867,954 | | | | 8,836 | | | | — | | | | 58,876,790 | |
Utilities | | | 460,997,992 | | | | — | | | | — | | | | 460,997,992 | |
Preferred Stocks | | | | | | | | | | | | | | | | |
Communication Services | | | 487,236 | | | | — | | | | — | | | | 487,236 | |
Consumer Discretionary | | | 424,047 | | | | — | | | | — | | | | 424,047 | |
Industrials | | | 3,575,934 | | | | — | | | | — | | | | 3,575,934 | |
Rights/Warrants | | | | | | | | | | | | | | | | |
Industrials | | | — | | | | — | | | | 26,316 | | | | 26,316 | |
Temporary Cash Investments | | | 92,669,607 | | | | — | | | | — | | | | 92,669,607 | |
50
U.S. SMALL CAP PORTFOLIO
CONTINUED
| | | | | | | | | | | | | | | | |
| | | Investments in Securities (Market Value) | |
| | | Level 1 | | | Level 2 | | | Level 3 | | | Total | |
Securities Lending Collateral | | | — | | | $ | 1,540,633,516 | | | | — | | | $ | 1,540,633,516 | |
Futures Contracts** | | $ | 3,916,230 | | | | — | | | | — | | | | 3,916,230 | |
| | | | | | | | | | | | | | | | |
TOTAL. | | $ | 13,883,968,125 | | | $ | 1,541,077,268 | | | $ | 7,334,625 | ^ | | $ | 15,432,380,018 | |
| | | | | | | | | | | | | | | | |
| ** | Valued at the unrealized appreciation/(depreciation) on the investment. |
| ^ | A reconciliation of Level 3 investments is presented when the Fund had a significant amount of Level 3 investments at the beginning and/or end of the reporting period in relation to net assets. |
See accompanying Notes to Financial Statements.
51
U.S. MICRO CAP PORTFOLIO
SUMMARY SCHEDULE OF PORTFOLIO HOLDINGS
October 31, 2022
| | | | | | | | | | | | | | |
| | | | | Shares | | | Value† | | | Percentage
of Net Assets‡ | |
COMMON STOCKS — (91.5%) | | | | | | | | | | | | |
COMMUNICATION SERVICES — (2.4%) | | | | | | | | | | | | |
| | Other Securities | | | | | | $ | 166,691,244 | | | | 2.6 | % |
| | | | | | | | | | | | | | |
CONSUMER DISCRETIONARY — (10.8%) | | | | | | | | | | | | |
| | Group 1 Automotive, Inc. | | | 109,460 | | | | 18,936,580 | | | | 0.3 | % |
| | Other Securities | | | | | | | 736,471,578 | | | | 11.4 | % |
| | | | | | | | | | | | | | |
TOTAL CONSUMER DISCRETIONARY | | | | | | | 755,408,158 | | | | 11.7 | % |
| | | | | | | | | | | | | | |
CONSUMER STAPLES — (4.8%) | | | | | | | | | | | | |
* | | Hostess Brands, Inc. | | | 659,960 | | | | 17,475,741 | | | | 0.3 | % |
| | Inter Parfums, Inc. | | | 227,178 | | | | 18,374,157 | | | | 0.3 | % |
# | | MGP Ingredients, Inc. | | | 143,333 | | | | 16,060,463 | | | | 0.3 | % |
# | | Weis Markets, Inc. | | | 196,657 | | | | 18,420,861 | | | | 0.3 | % |
| | Other Securities | | | | | | | 268,711,872 | | | | 4.0 | % |
| | | | | | | | | | | | | | |
TOTAL CONSUMER STAPLES | | | | 339,043,094 | | | | 5.2 | % |
| | | | | | | | | | | | | | |
ENERGY — (7.0%) | | | | | | | | | | | | |
| | Chord Energy Corp. | | | 118,744 | | | | 18,178,519 | | | | 0.3 | % |
#* | | CNX Resources Corp. | | | 1,161,237 | | | | 19,520,394 | | | | 0.3 | % |
* | | Comstock Resources, Inc. | | | 875,184 | | | | 16,435,956 | | | | 0.3 | % |
| | Patterson-UTI Energy, Inc | | | 926,930 | | | | 16,360,314 | | | | 0.3 | % |
* | | PBF Energy, Inc., Class A | | | 491,690 | | | | 21,757,282 | | | | 0.3 | % |
| | Other Securities | | | | | | | 400,890,826 | | | | 6.1 | % |
| | | | | | | | | | | | | | |
TOTAL ENERGY | | | | 493,143,291 | | | | 7.6 | % |
| | | | | | | | | | | | | | |
FINANCIALS — (20.6%) | | | | | | | | | | | | |
# | | BancFirst Corp. | | | 239,834 | | | | 22,980,894 | | | | 0.4 | % |
| | Banner Corp. | | | 263,148 | | | | 19,670,313 | | | | 0.3 | % |
| | First BanCorp. | | | 1,576,127 | | | | 24,887,045 | | | | 0.4 | % |
| | First Merchants Corp. | | | 362,517 | | | | 16,277,013 | | | | 0.3 | % |
| | Pacific Premier Bancorp, Inc. | | | 436,115 | | | | 15,878,947 | | | | 0.3 | % |
| | Piper Sandler Cos | | | 134,207 | | | | 17,174,470 | | | | 0.3 | % |
| | Trustmark Corp. | | | 421,873 | | | | 15,427,896 | | | | 0.2 | % |
| | Walker & Dunlop, Inc. | | | 182,775 | | | | 16,442,439 | | | | 0.3 | % |
| | WesBanco, Inc. | | | 421,523 | | | | 17,046,390 | | | | 0.3 | % |
| | WSFS Financial Corp. | | | 473,204 | | | | 22,032,378 | | | | 0.3 | % |
| | Other Securities | | | | | | | 1,260,518,834 | | | | 19.3 | % |
| | | | | | | | | | | | | | |
TOTAL FINANCIALS | | | | 1,448,336,619 | | | | 22.4 | % |
| | | | | | | | | | | | | | |
HEALTH CARE — (10.3%) | | | | | | | | | | | | |
* | | CorVel Corp. | | | 184,423 | | | | 30,284,101 | | | | 0.5 | % |
* | | Lantheus Holdings, Inc. | | | 305,585 | | | | 22,610,234 | | | | 0.4 | % |
* | | Prestige Consumer Healthcare, Inc. | | | 310,082 | | | | 16,893,267 | | | | 0.3 | % |
| | Other Securities | | | | | | | 649,873,873 | | | | 9.9 | % |
| | | | | | | | | | | | | | |
TOTAL HEALTH CARE | | | | 719,661,475 | | | | 11.1 | % |
| | | | | | | | | | | | | | |
INDUSTRIALS — (16.5%) | | | | | | | | | | | | |
| | Albany International Corp., Class A | | | 210,236 | | | | 19,261,822 | | | | 0.3 | % |
| | Boise Cascade Co. | | | 282,825 | | | | 18,884,225 | | | | 0.3 | % |
* | | CBIZ, Inc. | | | 406,188 | | | | 20,163,172 | | | | 0.3 | % |
# | | Comfort Systems USA, Inc. | | | 251,515 | | | | 31,006,769 | | | | 0.5 | % |
| | Encore Wire Corp. | | | 157,161 | | | | 21,623,782 | | | | 0.3 | % |
52
U.S. MICRO CAP PORTFOLIO
CONTINUED
| | | | | | | | | | | | | | |
| | | | | Shares | | | Value† | | | Percentage
of Net Assets‡ | |
INDUSTRIALS — (Continued) | | | | | | | | | | | | |
| | Federal Signal Corp. | | | 439,096 | | | $ | 20,483,828 | | | | 0.3 | % |
| | Forward Air Corp. | | | 191,213 | | | | 20,243,720 | | | | 0.3 | % |
* | | Hub Group, Inc., Class A | | | 220,852 | | | | 17,138,115 | | | | 0.3 | % |
| | ICF International, Inc. | | | 129,423 | | | | 15,482,874 | | | | 0.2 | % |
| | Matson, Inc. | | | 225,848 | | | | 16,617,896 | | | | 0.3 | % |
| | McGrath RentCorp. | | | 184,266 | | | | 17,330,217 | | | | 0.3 | % |
* | | Veritiv Corp. | | | 173,696 | | | | 20,193,897 | | | | 0.3 | % |
| | Other Securities | | | | | | | 921,171,789 | | | | 14.2 | % |
| | | | | | | | | | | | | | |
TOTAL INDUSTRIALS | | | | 1,159,602,106 | | | | 17.9 | % |
| | | | | | | | | | | | | | |
INFORMATION TECHNOLOGY — (11.3%) | | | | | | | | | |
| | Badger Meter, Inc. | | | 199,391 | | | | 22,427,500 | | | | 0.4 | % |
* | | Calix, Inc. | | | 341,891 | | | | 25,176,853 | | | | 0.4 | % |
* | | Fabrinet | | | 156,606 | | | | 17,915,726 | | | | 0.3 | % |
#* | | Insight Enterprises, Inc. | | | 195,134 | | | | 18,442,114 | | | | 0.3 | % |
# | | Kulicke & Soffa Industries, Inc. | | | 372,420 | | | | 15,619,295 | | | | 0.2 | % |
#* | | NetScout Systems, Inc. | | | 429,733 | | | | 15,436,009 | | | | 0.2 | % |
* | | Plexus Corp. | | | 205,049 | | | | 20,176,822 | | | | 0.3 | % |
* | | Rambus, Inc. | | | 705,710 | | | | 21,284,214 | | | | 0.3 | % |
* | | Rogers Corp. | | | 77,667 | | | | 18,277,375 | | | | 0.3 | % |
* | | Sanmina Corp. | | | 275,638 | | | | 15,449,510 | | | | 0.2 | % |
| | Other Securities | | | | | | | 601,302,331 | | | | 9.3 | % |
| | | | | | | | | | | | | | |
TOTAL INFORMATION TECHNOLOGY | | | | 791,507,749 | | | | 12.2 | % |
| | | | | | | | | | | | | | |
MATERIALS — (4.8%) | | | | | | | | | |
| | Innospec, Inc. | | | 180,162 | | | | 18,014,398 | | | | 0.3 | % |
| | Stepan Co. | | | 166,116 | | | | 17,349,155 | | | | 0.3 | % |
| | Other Securities | | | | | | | 302,700,334 | | | | 4.6 | % |
| | | | | | | | | | | | | | |
TOTAL MATERIALS | | | | 338,063,887 | | | | 5.2 | % |
| | | | | | | | | | | | | | |
REAL ESTATE — (0.7%) | | | | | | | | | |
| | Other Securities | | | | | | | 51,069,739 | | | | 0.8 | % |
| | | | | | | | | | | | | | |
UTILITIES — (2.3%) | | | | | | | | | |
| | California Water Service Group | | | 291,215 | | | | 18,072,803 | | | | 0.3 | % |
| | Otter Tail Corp. | | | 297,207 | | | | 20,037,696 | | | | 0.3 | % |
| | Other Securities | | | | | | | 121,068,262 | | | | 1.9 | % |
| | | | | | | | | | | | | | |
TOTAL UTILITIES | | | | 159,178,761 | | | | 2.5 | % |
| | | | | | | | | | | | | | |
TOTAL COMMON STOCKS | | | | 6,421,706,123 | | | | 99.2 | % |
| | | | | | | | | | | | | | |
PREFERRED STOCKS — (0.0%) | | | | | | | | | |
COMMUNICATION SERVICES — (0.0%) | | | | | | | | | |
| | Other Security | | | | | | | 404,094 | | | | 0.0 | % |
| | | | | | | | | | | | | | |
ENERGY — (0.0%) | | | | | | | | | |
| | Other Security | | | | | | | 123,827 | | | | 0.0 | % |
| | | | | | | | | | | | | | |
INDUSTRIALS — (0.0%) | | | | | | | | | |
| | Other Security | | | | | | | 1,499,148 | | | | 0.0 | % |
| | | | | | | | | | | | | | |
TOTAL PREFERRED STOCKS | | | | 2,027,069 | | | | 0.0 | % |
| | | | | | | | | | | | | | |
53
U.S. MICRO CAP PORTFOLIO
CONTINUED
| | | | | | | | | | | | | | |
| | | | | Shares | | | Value† | | | Percentage
of Net Assets‡ | |
RIGHTS/WARRANTS — (0.0%) | | | | | | | | | | | | |
INDUSTRIALS — (0.0%) | | | | | | | | | | | | |
| | Other Security | | | | | | $ | 98,615 | | | | 0.0 | % |
| | | | | | | | | | | | | | |
TOTAL RIGHTS/WARRANTS | | | | | | | 98,615 | | | | 0.0 | % |
| | | | | | | | | | | | | | |
TOTAL INVESTMENT SECURITIES
(Cost $3,758,697,220) | | | | 6,423,831,807 | | | | | |
| | | | | | | | | | | | | | |
TEMPORARY CASH INVESTMENTS — (0.7%) | | | | | | | | | |
| | State Street Institutional U.S. Government Money Market Fund, 3.010% | | | 50,273,230 | | | | 50,273,230 | | | | 0.8 | % |
| | | | | | | | | | | | | | |
SECURITIES LENDING COLLATERAL — (7.8%) | | | | | | | | | | | | |
@§ | | The DFA Short Term Investment Fund | | | 47,056,334 | | | | 544,018,282 | | | | 8.4 | % |
| | | | | | | | | | | | | | |
TOTAL INVESTMENTS—(100.0%)
(Cost $4,353,222,041) | | | | | | $ | 7,018,123,319 | | | | 108.4 | % |
| | | | | | | | | | | | | | |
As of October 31, 2022, U.S. Micro Cap Portfolio had entered into the following outstanding futures contracts:
| | | | | | | | | | | | | | | | | | | | |
Description | | Number of
Contracts | | | Expiration
Date | | | Notional
Value | | | Market
Value | | | Unrealized
Appreciation
(Depreciation) | |
Long Position Contracts: | | | | | | | | | | | | | | | | | | | | |
S&P 500® Emini Index | | | 281 | | | | 12/16/22 | | | $ | 52,577,937 | | | $ | 54,556,150 | | | $ | 1,978,213 | |
| | | | | | | | | | | | | | | | | | | | |
Total Futures Contracts | | | | | | | | | | $ | 52,577,937 | | | $ | 54,556,150 | | | $ | 1,978,213 | |
| | | | | | | | | | | | | | | | | | | | |
Summary of the Portfolio’s investments as of October 31, 2022, based on their valuation inputs, is as follows (see Security Valuation Note):
| | | | | | | | | | | | | | | | |
| | | Investments in Securities (Market Value) | |
| | | Level 1 | | | Level 2 | | | Level 3 | | | Total | |
Common Stocks | | | | | | | | | | | | | | | | |
Communication Services | | $ | 166,457,081 | | | $ | 234,163 | | | | — | | | $ | 166,691,244 | |
Consumer Discretionary | | | 755,254,620 | | | | 139,573 | | | $ | 13,965 | | | | 755,408,158 | |
Consumer Staples | | | 338,340,088 | | | | 703,006 | | | | — | | | | 339,043,094 | |
Energy | | | 493,143,291 | | | | — | | | | — | | | | 493,143,291 | |
Financials | | | 1,447,739,193 | | | | 597,426 | | | | — | | | | 1,448,336,619 | |
Health Care | | | 716,573,393 | | | | — | | | | 3,088,082 | | | | 719,661,475 | |
Industrials | | | 1,159,602,106 | | | | — | | | | — | | | | 1,159,602,106 | |
Information Technology | | | 791,503,070 | | | | — | | | | 4,679 | | | | 791,507,749 | |
Materials | | | 338,054,305 | | | | — | | | | 9,582 | | | | 338,063,887 | |
Real Estate | | | 50,950,453 | | | | 119,286 | | | | — | | | | 51,069,739 | |
Utilities | | | 159,178,761 | | | | — | | | | — | | | | 159,178,761 | |
Preferred Stocks | | | | | | | | | | | | | | | | |
Communication Services | | | 404,094 | | | | — | | | | — | | | | 404,094 | |
Energy | | | 123,827 | | | | — | | | | — | | | | 123,827 | |
Industrials | | | 1,499,148 | | | | — | | | | — | | | | 1,499,148 | |
Rights/Warrants | | | | | | | | | | | | | | | | |
Industrials | | | — | | | | — | | | | 98,615 | | | | 98,615 | |
Temporary Cash Investments | | | 50,273,230 | | | | — | | | | — | | | | 50,273,230 | |
54
U.S. MICRO CAP PORTFOLIO
CONTINUED
| | | | | | | | | | | | | | | | |
| | | Investments in Securities (Market Value) | |
| | | Level 1 | | | Level 2 | | | Level 3 | | | Total | |
Securities Lending Collateral | | | — | | | $ | 544,018,282 | | | | — | | | $ | 544,018,282 | |
Futures Contracts** | | $ | 1,978,213 | | | | — | | | | — | | | | 1,978,213 | |
| | | | | | | | | | | | | | | | |
TOTAL | | $ | 6,471,074,873 | | | $ | 545,811,736 | | | $ | 3,214,923 | ^ | | $ | 7,020,101,532 | |
| | | | | | | | | | | | | | | | |
| ** | Valued at the unrealized appreciation/(depreciation) on the investment. |
| ^ | A reconciliation of Level 3 investments is presented when the Fund had a significant amount of Level 3 investments at the beginning and/or end of the reporting period in relation to net assets. |
See accompanying Notes to Financial Statements.
55
U.S. HIGH RELATIVE PROFITABILITY PORTFOLIO
SUMMARY SCHEDULE OF PORTFOLIO HOLDINGS
October 31, 2022
| | | | | | | | | | | | | | |
| | | | | Shares | | | Value† | | | Percentage
of Net Assets‡ | |
COMMON STOCKS — (99.2%) | | | | | | | | | | | | |
COMMUNICATION SERVICES — (2.6%) | | | | | | | | | | | | |
| | Verizon Communications, Inc. | | | 2,295,603 | | | $ | 85,786,684 | | | | 1.8 | % |
| | Other Securities | | | | | | | 37,585,447 | | | | 0.8 | % |
| | | | | | | | | | | | | | |
TOTAL COMMUNICATION SERVICES | | | | 123,372,131 | | | | 2.6 | % |
| | | | | | | | | | | | | | |
CONSUMER DISCRETIONARY — (14.9%) | | | | | | | | | | | | |
* | | Amazon.com, Inc. | | | 876,336 | | | | 89,771,860 | | | | 1.9 | % |
| | Dollar General Corp. | | | 104,446 | | | | 26,638,952 | | | | 0.6 | % |
| | Home Depot, Inc. | | | 481,459 | | | | 142,574,454 | | | | 3.1 | % |
| | Lowe’s Cos., Inc. | | | 318,826 | | | | 62,155,129 | | | | 1.3 | % |
| | NIKE, Inc., Class B | | | 575,931 | | | | 53,377,285 | | | | 1.1 | % |
* | | O’Reilly Automotive, Inc. | | | 42,428 | | | | 35,519,449 | | | | 0.8 | % |
| | Ross Stores, Inc. | | | 348,574 | | | | 33,355,046 | | | | 0.7 | % |
| | Target Corp. | | | 269,232 | | | | 44,221,356 | | | | 1.0 | % |
| | TJX Cos., Inc. | | | 600,719 | | | | 43,311,840 | | | | 0.9 | % |
| | Other Securities | | | | | | | 163,286,181 | | | | 3.5 | % |
| | | | | | | | | | | | | | |
TOTAL CONSUMER DISCRETIONARY | | | | 694,211,552 | | | | 14.9 | % |
| | | | | | | | | | | | | | |
CONSUMER STAPLES — (12.0%) | | | | | | | | | | | | |
| | Altria Group, Inc. | | | 940,393 | | | | 43,511,984 | | | | 0.9 | % |
| | Coca-Cola Co. | | | 1,449,059 | | | | 86,726,181 | | | | 1.9 | % |
| | Costco Wholesale Corp. | | | 167,842 | | | | 84,172,763 | | | | 1.8 | % |
| | Kroger Co. | | | 743,305 | | | | 35,150,893 | | | | 0.7 | % |
| | PepsiCo, Inc. | | | 701,377 | | | | 127,356,036 | | | | 2.7 | % |
| | Procter & Gamble Co. | | | 452,798 | | | | 60,978,307 | | | | 1.3 | % |
| | Other Securities | | | | | | | 121,740,099 | | | | 2.7 | % |
| | | | | | | | | | | | | | |
TOTAL CONSUMER STAPLES | | | | 559,636,263 | | | | 12.0 | % |
| | | | | | | | | | | | | | |
ENERGY — (3.3%) | | | | | | | | | | | | |
| | ConocoPhillips | | | 417,327 | | | | 52,620,762 | | | | 1.1 | % |
| | Occidental Petroleum Corp. | | | 1,054,159 | | | | 76,531,943 | | | | 1.6 | % |
| | Other Securities | | | | | | | 22,639,942 | | | | 0.6 | % |
| | | | | | | | | | | | | | |
TOTAL ENERGY | | | | 151,792,647 | | | | 3.3 | % |
| | | | | | | | | | | | | | |
FINANCIALS — (4.0%) | | | | | | | | | | | | |
| | American Express Co. | | | 354,187 | | | | 52,579,060 | | | | 1.1 | % |
| | Ameriprise Financial, Inc. | | | 106,466 | | | | 32,910,770 | | | | 0.7 | % |
| | Other Securities | | | | | | | 98,511,983 | | | | 2.1 | % |
| | | | | | | | | | | | | | |
TOTAL FINANCIALS | | | | 184,001,813 | | | | 3.9 | % |
| | | | | | | | | | | | | | |
HEALTH CARE — (14.9%) | | | | | | | | | | | | |
| | AbbVie, Inc. | | | 828,039 | | | | 121,224,910 | | | | 2.6 | % |
| | Amgen, Inc. | | | 295,444 | | | | 79,873,285 | | | | 1.7 | % |
| | Bristol-Myers Squibb Co. | | | 669,834 | | | | 51,892,040 | | | | 1.1 | % |
| | Eli Lilly & Co. | | | 410,332 | | | | 148,577,114 | | | | 3.2 | % |
| | Gilead Sciences, Inc. | | | 694,162 | | | | 54,463,951 | | | | 1.2 | % |
| | Merck & Co., Inc. | | | 493,090 | | | | 49,900,708 | | | | 1.1 | % |
| | Zoetis, Inc. | | | 201,953 | | | | 30,450,473 | | | | 0.7 | % |
| | Other Securities | | | | | | | 157,061,398 | | | | 3.3 | % |
| | | | | | | | | | | | | | |
TOTAL HEALTH CARE | | | | 693,443,879 | | | | 14.9 | % |
| | | | | | | | | | | | | | |
56
U.S. HIGH RELATIVE PROFITABILITY PORTFOLIO
CONTINUED
| | | | | | | | | | | | | | |
| | | | | Shares | | | Value† | | | Percentage
of Net Assets‡ | |
INDUSTRIALS — (12.5%) | | | | | | | | | | | | |
| | 3M Co. | | | 310,822 | | | $ | 39,098,299 | | | | 0.8 | % |
| | Caterpillar, Inc. | | | 274,386 | | | | 59,393,593 | | | | 1.3 | % |
| | Deere & Co. | | | 150,390 | | | | 59,527,370 | | | | 1.3 | % |
| | Illinois Tool Works, Inc. | | | 135,400 | | | | 28,911,962 | | | | 0.6 | % |
| | Lockheed Martin Corp. | | | 131,316 | | | | 63,908,871 | | | | 1.4 | % |
| | Union Pacific Corp. | | | 360,313 | | | | 71,032,105 | | | | 1.5 | % |
| | United Parcel Service, Inc., Class B | | | 394,779 | | | | 66,232,073 | | | | 1.4 | % |
| | Waste Management, Inc. | | | 218,335 | | | | 34,577,714 | | | | 0.7 | % |
| | Other Securities | | | | | | | 158,450,764 | | | | 3.5 | % |
| | | | | | | | | | | | | | |
TOTAL INDUSTRIALS | | | | | | | 581,132,751 | | | | 12.5 | % |
| | | | | | | | | | | | | | |
INFORMATION TECHNOLOGY — (32.2%) | | | | | | | | | | | | |
| | Accenture PLC, Class A | | | 311,576 | | | | 88,456,426 | | | | 1.9 | % |
| | Apple, Inc. | | | 1,471,447 | | | | 225,631,683 | | | | 4.8 | % |
| | Applied Materials, Inc. | | | 522,179 | | | | 46,103,184 | | | | 1.0 | % |
| | Automatic Data Processing, Inc. | | | 196,951 | | | | 47,603,057 | | | | 1.0 | % |
| | Broadcom, Inc. | | | 211,162 | | | | 99,271,479 | | | | 2.1 | % |
| | International Business Machines Corp. | | | 559,508 | | | | 77,374,361 | | | | 1.7 | % |
| | Lam Research Corp. | | | 72,492 | | | | 29,343,312 | | | | 0.6 | % |
| | Mastercard, Inc., Class A | | | 352,677 | | | | 115,741,538 | | | | 2.5 | % |
| | Microsoft Corp. | | | 896,664 | | | | 208,142,614 | | | | 4.5 | % |
| | Oracle Corp. | | | 1,054,524 | | | | 82,326,689 | | | | 1.8 | % |
| | QUALCOMM, Inc. | | | 560,047 | | | | 65,895,130 | | | | 1.4 | % |
| | Texas Instruments, Inc. | | | 528,220 | | | | 84,847,979 | | | | 1.8 | % |
| | Visa, Inc., Class A | | | 571,060 | | | | 118,300,790 | | | | 2.5 | % |
| | Other Securities | | | | | | | 210,148,402 | | | | 4.6 | % |
| | | | | | | | | | | | | | |
TOTAL INFORMATION TECHNOLOGY | | | | | | | 1,499,186,644 | | | | 32.2 | % |
| | | | | | | | | | | | | | |
MATERIALS — (2.6%) | | | | | | | | | | | | |
# | | Nucor Corp. | | | 249,069 | | | | 32,722,685 | | | | 0.7 | % |
| | Other Securities | | | | | | | 90,600,901 | | | | 1.9 | % |
| | | | | | | | | | | | | | |
TOTAL MATERIALS | | | | | | | 123,323,586 | | | | 2.6 | % |
| | | | | | | | | | | | | | |
UTILITIES — (0.2%) | | | | | | | | | | | | |
| | Other Security | | | | | | | 7,344,470 | | | | 0.2 | % |
| | | | | | | | | | | | | | |
TOTAL COMMON STOCKS
(Cost $3,694,848,408) | | | | | | | 4,617,445,736 | | | | 99.1 | % |
| | | | | | | | | | | | | | |
TEMPORARY CASH INVESTMENTS — (0.8%) | | | | | | | | | | | | |
| | State Street Institutional U.S. Government Money Market Fund, 3.010% | | | 36,049,994 | | | | 36,049,994 | | | | 0.8 | % |
| | | | | | | | | | | | | | |
SECURITIES LENDING COLLATERAL — (0.0%) | | | | | | | | | | | | |
@§ | | The DFA Short Term Investment Fund | | | 241,134 | | | | 2,787,749 | | | | 0.0 | % |
| | | | | | | | | | | | | | |
TOTAL INVESTMENTS—(100.0%)
(Cost $3,733,686,613) | | | | | | $ | 4,656,283,479 | | | | 99.9 | % |
| | | | | | | | | | | | | | |
57
U.S. HIGH RELATIVE PROFITABILITY PORTFOLIO
CONTINUED
As of October 31, 2022, U.S. High Relative Profitability Portfolio had entered into the following outstanding futures contracts:
| | | | | | | | | | | | | | | | | | | | |
Description | | Number of
Contracts | | | Expiration
Date | | | Notional
Value | | | Market
Value | | | Unrealized
Appreciation
(Depreciation) | |
Long Position Contracts: | | | | | | | | | | | | | | | | | | | | |
S&P 500® Emini Index | | | 165 | | | | 12/16/22 | | | $ | 33,471,267 | | | $ | 32,034,750 | | | $ | (1,436,517 | ) |
| | | | | | | | | | | | | | | | | | | | |
Total Futures Contracts | | | | | | | | | | $ | 33,471,267 | | | $ | 32,034,750 | | | $ | (1,436,517 | ) |
| | | | | | | | | | | | | | | | | | | | |
Summary of the Portfolio’s investments as of October 31, 2022, based on their valuation inputs, is as follows (see Security Valuation Note):
| | | | | | | | | | | | | | | | |
| | | Investments in Securities (Market Value) | |
| | | Level 1 | | | Level 2 | | | Level 3 | | | Total | |
Common Stocks | | | | | | | | | | | | | | | | |
Communication Services | | $ | 123,372,131 | | | | — | | | | — | | | $ | 123,372,131 | |
Consumer Discretionary | | | 694,211,552 | | | | — | | | | — | | | | 694,211,552 | |
Consumer Staples | | | 559,636,263 | | | | — | | | | — | | | | 559,636,263 | |
Energy | | | 151,792,647 | | | | — | | | | — | | | | 151,792,647 | |
Financials | | | 184,001,813 | | | | — | | | | — | | | | 184,001,813 | |
Health Care | | | 693,443,879 | | | | — | | | | — | | | | 693,443,879 | |
Industrials | | | 581,132,751 | | | | — | | | | — | | | | 581,132,751 | |
Information Technology | | | 1,499,186,644 | | | | — | | | | — | | | | 1,499,186,644 | |
Materials | | | 123,323,586 | | | | — | | | | — | | | | 123,323,586 | |
Utilities | | | 7,344,470 | | | | — | | | | — | | | | 7,344,470 | |
Temporary Cash Investments | | | 36,049,994 | | | | — | | | | — | | | | 36,049,994 | |
Securities Lending Collateral | | | — | | | $ | 2,787,749 | | | | — | | | | 2,787,749 | |
Futures Contracts** | | | (1,436,517 | ) | | | — | | | | — | | | | (1,436,517 | ) |
| | | | | | | | | | | | | | | | |
TOTAL | | $ | 4,652,059,213 | | | $ | 2,787,749 | | | | — | | | $ | 4,654,846,962 | |
| | | | | | | | | | | | | | | | |
| ** | Valued at the unrealized appreciation/(depreciation) on the investment. |
See accompanying Notes to Financial Statements.
58
DFA REAL ESTATE SECURITIES PORTFOLIO
SUMMARY SCHEDULE OF PORTFOLIO HOLDINGS
October 31, 2022
| | | | | | | | | | | | | | |
| | | | | Shares | | | Value† | | | Percentage
of Net Assets‡ | |
COMMON STOCKS — (94.2%) | | | | | | | | | | | | |
REAL ESTATE — (94.2%) | | | | | | | | | | | | |
# | | Agree Realty Corp. | | | 545,571 | | | $ | 37,480,728 | | | | 0.5 | % |
| | Alexandria Real Estate Equities, Inc. | | | 1,081,627 | | | | 157,160,403 | | | | 1.9 | % |
# | | American Homes 4 Rent, Class A | | | 2,156,016 | | | | 68,863,151 | | | | 0.9 | % |
| | American Tower Corp. | | | 3,257,589 | | | | 674,939,865 | | | | 8.4 | % |
| | Apartment Income REIT Corp. | | | 1,080,915 | | | | 41,539,563 | | | | 0.5 | % |
| | AvalonBay Communities, Inc. | | | 982,480 | | | | 172,051,898 | | | | 2.1 | % |
| | Boston Properties, Inc. | | | 1,038,979 | | | | 75,533,773 | | | | 0.9 | % |
| | Brixmor Property Group, Inc. | | | 2,091,030 | | | | 44,559,849 | | | | 0.6 | % |
| | Camden Property Trust | | | 703,641 | | | | 81,305,718 | | | | 1.0 | % |
| | Crown Castle, Inc. | | | 3,028,608 | | | | 403,592,302 | | | | 5.0 | % |
| | CubeSmart | | | 1,563,701 | | | | 65,472,161 | | | | 0.8 | % |
| | Digital Realty Trust, Inc. | | | 2,005,474 | | | | 201,048,768 | | | | 2.5 | % |
| | EastGroup Properties, Inc. | | | 302,831 | | | | 47,450,589 | | | | 0.6 | % |
| | Equinix, Inc. | | | 634,214 | | | | 359,244,178 | | | | 4.5 | % |
| | Equity LifeStyle Properties, Inc. | | | 1,245,105 | | | | 79,636,916 | | | | 1.0 | % |
| | Equity Residential | | | 2,509,241 | | | | 158,132,368 | | | | 2.0 | % |
| | Essex Property Trust, Inc. | | | 459,462 | | | | 102,110,835 | | | | 1.3 | % |
| | Extra Space Storage, Inc. | | | 919,925 | | | | 163,231,492 | | | | 2.0 | % |
| | Federal Realty Investment Trust | | | 508,104 | | | | 50,292,134 | | | | 0.6 | % |
# | | First Industrial Realty Trust, Inc. | | | 932,866 | | | | 44,432,408 | | | | 0.5 | % |
| | Gaming & Leisure Properties, Inc. | | | 1,769,659 | | | | 88,695,309 | | | | 1.1 | % |
# | | Healthcare Realty Trust, Inc., Class A | | | 2,643,894 | | | | 53,750,365 | | | | 0.7 | % |
| | Healthpeak Properties, Inc. | | | 3,707,009 | | | | 87,967,324 | | | | 1.1 | % |
| | Host Hotels & Resorts, Inc. | | | 4,931,543 | | | | 93,107,532 | | | | 1.2 | % |
| | Invitation Homes, Inc. | | | 4,260,702 | | | | 135,021,646 | | | | 1.7 | % |
# | | Iron Mountain, Inc. | | | 2,014,924 | | | | 100,887,245 | | | | 1.2 | % |
| | Kimco Realty Corp. | | | 4,290,583 | | | | 91,732,665 | | | | 1.1 | % |
| | Lamar Advertising Co., Class A | | | 600,787 | | | | 55,410,585 | | | | 0.7 | % |
| | Life Storage, Inc. | | | 587,234 | | | | 64,953,953 | | | | 0.8 | % |
# | | Medical Properties Trust, Inc. | | | 4,071,424 | | | | 46,617,805 | | | | 0.6 | % |
| | Mid-America Apartment Communities, Inc. | | | 813,302 | | | | 128,054,400 | | | | 1.6 | % |
| | National Retail Properties, Inc. | | | 1,234,127 | | | | 51,870,358 | | | | 0.6 | % |
# | | Omega Healthcare Investors, Inc. | | | 1,615,109 | | | | 51,328,164 | | | | 0.6 | % |
| | Prologis, Inc. | | | 6,486,833 | | | | 718,416,755 | | | | 8.9 | % |
| | Public Storage | | | 1,113,219 | | | | 344,819,585 | | | | 4.3 | % |
# | | Realty Income Corp. | | | 4,309,331 | | | | 268,342,041 | | | | 3.3 | % |
| | Regency Centers Corp. | | | 1,072,350 | | | | 64,887,898 | | | | 0.8 | % |
| | Rexford Industrial Realty, Inc. | | | 1,197,298 | | | | 66,186,633 | | | | 0.8 | % |
| | SBA Communications Corp. | | | 754,403 | | | | 203,613,370 | | | | 2.5 | % |
| | Simon Property Group, Inc. | | | 2,260,275 | | | | 246,324,769 | | | | 3.1 | % |
| | Spirit Realty Capital, Inc. | | | 951,913 | | | | 36,962,782 | | | | 0.5 | % |
| | STAG Industrial, Inc. | | | 1,250,532 | | | | 39,504,306 | | | | 0.5 | % |
| | STORE Capital Corp. | | | 1,803,795 | | | | 57,360,681 | | | | 0.7 | % |
| | Sun Communities, Inc. | | | 859,809 | | | | 115,945,244 | | | | 1.4 | % |
| | UDR, Inc. | | | 2,267,249 | | | | 90,145,820 | | | | 1.1 | % |
| | Ventas, Inc. | | | 2,778,270 | | | | 108,713,705 | | | | 1.3 | % |
| | VICI Properties, Inc. | | | 6,661,659 | | | | 213,306,321 | | | | 2.6 | % |
| | Welltower, Inc. | | | 3,233,300 | | | | 197,360,632 | | | | 2.4 | % |
# | | WP Carey, Inc. | | | 1,338,317 | | | | 102,113,587 | | | | 1.3 | % |
| | Other Securities | | | | | | | 1,000,811,127 | | | | 12.4 | % |
| | | | | | | | | | | | | | |
TOTAL COMMON STOCKS
(Cost $5,253,633,866) | | | | | | | 7,952,291,706 | | | | 98.5 | % |
| | | | | | | | | | | | | | |
59
DFA REAL ESTATE SECURITIES PORTFOLIO
CONTINUED
| | | | | | | | | | | | | | |
| | | | | Shares | | | Value† | | | Percentage
of Net Assets‡ | |
TEMPORARY CASH INVESTMENTS — (1.5%) | | | | | | | | | | | | |
| | State Street Institutional U.S. Government Money Market Fund, 3.010% | | | 124,840,173 | | | $ | 124,840,173 | | | | 1.6 | % |
| | | | | | | | | | | | | | |
SECURITIES LENDING COLLATERAL — (4.3%) | | | | | | | | | | | | |
@§ | | The DFA Short Term Investment Fund | | | 31,631,386 | | | | 365,690,456 | | | | 4.5 | % |
| | | | | | | | | | | | | | |
TOTAL INVESTMENTS—(100.0%)
(Cost $5,744,323,273) | | | | | | $ | 8,442,822,335 | | | | 104.6 | % |
| | | | | | | | | | | | | | |
As of October 31, 2022, DFA Real Estate Securities Portfolio had entered into the following outstanding futures contracts:
| | | | | | | | | | | | | | | | | | | | |
Description | | Number of
Contracts | | | Expiration
Date | | | Notional
Value | | | Market
Value | | | Unrealized
Appreciation
(Depreciation) | |
Long Position Contracts: | | | | | | | | | | | | | | | | | | | | |
S&P 500® Emini Index | | | 619 | | | | 12/16/22 | | | $ | 117,458,517 | | | $ | 120,178,850 | | | $ | 2,720,333 | |
| | | | | | | | | | | | | | | | | | | | |
Total Futures Contracts | | | | | | | | | | $ | 117,458,517 | | | $ | 120,178,850 | | | $ | 2,720,333 | |
| | | | | | | | | | | | | | | | | | | | |
Summary of the Portfolio’s investments as of October 31, 2022, based on their valuation inputs, is as follows (see Security Valuation Note):
| | | | | | | | | | | | | | | | |
| | | Investments in Securities (Market Value) | |
| | | Level 1 | | | Level 2 | | | Level 3 | | | Total | |
Common Stocks | | | | | | | | | | | | | | | | |
Real Estate | | $ | 7,952,291,706 | | | | — | | | | — | | | $ | 7,952,291,706 | |
Temporary Cash Investments | | | 124,840,173 | | | | — | | | | — | | | | 124,840,173 | |
Securities Lending Collateral | | | — | | | $ | 365,690,456 | | | | — | | | | 365,690,456 | |
Futures Contracts** | | | 2,720,333 | | | | — | | | | — | | | | 2,720,333 | |
| | | | | | | | | | | | | | | | |
TOTAL | | $ | 8,079,852,212 | | | $ | 365,690,456 | | | | — | | | $ | 8,445,542,668 | |
| | | | | | | | | | | | | | | | |
| ** | Valued at the unrealized appreciation/(depreciation) on the investment. |
See accompanying Notes to Financial Statements.
60
DFA INVESTMENT DIMENSIONS GROUP INC.
STATEMENTS OF ASSETS AND LIABILITIES
OCTOBER 31, 2022
(Amounts in thousands, except share and per share amounts)
| | | | | | | | | | | | | | | | |
| | | Enhanced U.S.
Large
Company
Portfolio* | | | U.S. Large Cap
Equity
Portfolio* | | | U.S. Large Cap
Value Portfolio | | | U.S. Targeted
Value Portfolio* | |
ASSETS: | | | | | | | | | | | | | | | | |
Investments in Affiliated Investment Companies at Value | | | — | | | | — | | | $ | 23,311,527 | | | | — | |
Investment Securities at Value (including $6,346, $33,009, $0 and $956,565 of securities on loan, respectively) | | $ | 245,109 | | | $ | 1,607,757 | | | | — | | | $ | 11,720,016 | |
Temporary Cash Investments at Value & Cost | | | — | | | | 2,643 | | | | — | | | | 125,773 | |
Collateral from Securities on Loan Invested in Affiliate at Value (including cost of $6,493, $7,336, $0 and $856,513, respectively) | | | 6,490 | | | | 7,333 | | | | — | | | | 856,197 | |
Segregated Cash for Futures Contracts | | | — | | | | — | | | | — | | | | 6,680 | |
Foreign Currencies at Value | | | 2 | | | | — | | | | — | | | | — | |
Cash | | | 13,538 | | | | 2,037 | | | | — | | | | — | |
Receivables: | | | | | | | | | | | | | | | | |
Investment Securities Sold | | | 278 | | | | 2,978 | | | | — | | | | 3,723 | |
Dividends and Interest | | | 1,676 | | | | 1,353 | | | | — | | | | 4,964 | |
Securities Lending Income | | | 3 | | | | 8 | | | | — | | | | 254 | |
Fund Shares Sold | | | 216 | | | | 523 | | | | 11,590 | | | | 7,688 | |
Unrealized Gain on Forward Currency Contracts | | | 1,024 | | | | — | | | | — | | | | — | |
Prepaid Expenses and Other Assets | | | 21 | | | | 17 | | | | 106 | | | | 59 | |
| | | | | | | | | | | | | | | | |
Total Assets | | | 268,357 | | | | 1,624,649 | | | | 23,323,223 | | | | 12,725,354 | |
| | | | | | | | | | | | | | | | |
LIABILITIES: | | | | | | | | | | | | | | | | |
Payables: | | | | | | | | | | | | | | | | |
Due to Custodian | | | — | | | | — | | | | — | | | | 1,509 | |
Upon Return of Securities Loaned | | | 6,770 | | | | 8,220 | | | | — | | | | 700,628 | |
Investment Securities Purchased | | | — | | | | 1,129 | | | | — | | | | 156,310 | |
Fund Shares Redeemed | | | 475 | | | | 1,274 | | | | 25,955 | | | | 9,922 | |
Due to Advisor | | | 30 | | | | 133 | | | | 1,668 | | | | 2,556 | |
Futures Margin Variation | | | 1,908 | | | | — | | | | — | | | | 388 | |
Unrealized Loss on Forward Currency Contracts | | | 502 | | | | — | | | | — | | | | — | |
Accrued Expenses and Other Liabilities | | | 31 | | | | 95 | | | | 713 | | | | 606 | |
| | | | | | | | | | | | | | | | |
Total Liabilities | | | 9,716 | | | | 10,851 | | | | 28,336 | | | | 871,919 | |
| | | | | | | | | | | | | | | | |
NET ASSETS | | $ | 258,641 | | | $ | 1,613,798 | | | $ | 23,294,887 | | | $ | 11,853,435 | |
| | | | | | | | | | | | | | | | |
NET ASSET VALUE, OFFERING AND REDEMPTION PRICE PER SHARE: | | | | | | | | | | | | | | | | |
Class R1 Shares — based on net assets of $0; $0; $0 and $32,553 and shares outstanding of 0, 0, 0 and 1,132,785, respectively | | | N/A | | | | N/A | | | | N/A | | | $ | 28.74 | |
| | | | | | | | | | | | | | | | |
NUMBER OF SHARES AUTHORIZED | | | N/A | | | | N/A | | | | N/A | | | | 200,000,000 | |
| | | | | | | | | | | | | | | | |
Class R2 Shares — based on net assets of $0; $0; $0 and $74,146 and shares outstanding of 0, 0, 0 and 2,594,370, respectively | | | N/A | | | | N/A | | | | N/A | | | $ | 28.58 | |
| | | | | | | | | | | | | | | | |
NUMBER OF SHARES AUTHORIZED | | | N/A | | | | N/A | | | | N/A | | | | 200,000,000 | |
| | | | | | | | | | | | | | | | |
Institutional Class Shares — based on net assets of $258,641; $1,613,798; $23,294,887 and $11,746,736 and shares outstanding of 24,955,777, 69,849,585, 550,964,102 and 408,705,991, respectively | | $ | 10.36 | | | $ | 23.10 | | | $ | 42.28 | | | $ | 28.74 | |
| | | | | | | | | | | | | | | | |
NUMBER OF SHARES AUTHORIZED | | | 1,000,000,000 | | | | 1,000,000,000 | | | | 4,000,000,000 | | | | 1,500,000,000 | |
| | | | | | | | | | | | | | | | |
Investment Securities at Cost | | $ | 257,901 | | | $ | 856,972 | | | | N/A | | | $ | 7,947,185 | |
| | | | | | | | | | | | | | | | |
Foreign Currencies at Cost | | $ | 2 | | | $ | — | | | $ | — | | | $ | — | |
| | | | | | | | | | | | | | | | |
NET ASSETS CONSIST OF: | | | | | | | | | | | | | | | | |
Paid-In Capital | | $ | 332,703 | | | $ | 814,887 | | | $ | 13,975,569 | | | $ | 7,665,859 | |
Total Distributable Earnings (Loss) | | | (74,062 | ) | | | 798,911 | | | | 9,319,318 | | | | 4,187,576 | |
| | | | | | | | | | | | | | | | |
NET ASSETS | | $ | 258,641 | | | $ | 1,613,798 | | | $ | 23,294,887 | | | $ | 11,853,435 | |
| | | | | | | | | | | | | | | | |
| * | See Note K in the Notes to Financial Statements for additional information about securities lending collateral. |
See accompanying Notes to Financial Statements.
61
DFA INVESTMENT DIMENSIONS GROUP INC.
STATEMENTS OF ASSETS AND LIABILITIES
OCTOBER 31, 2022
(Amounts in thousands, except share and per share amounts)
| | | | | | | | | | | | | | | | |
| | | | | | U.S. Core | | | U.S. Core | | | U.S. Vector | |
| | | U.S. Small Cap | | | Equity 1 | | | Equity 2 | | | Equity | |
| | | Value Portfolio* | | | Portfolio* | | | Portfolio* | | | Portfolio* | |
ASSETS: | | | | | | | | | | | | | | | | |
Investment Securities at Value (including $1,054,810, $1,386,939, $1,530,820 and $303,032 of securities on loan, respectively) | | $ | 14,222,566 | | | $ | 27,702,809 | | | $ | 28,996,652 | | | $ | 4,380,981 | |
Temporary Cash Investments at Value & Cost | | | 115,130 | | | | 248,087 | | | | 272,588 | | | | 37,533 | |
Collateral from Securities on Loan Invested in Affiliate at Value (including cost of $939,333, $1,197,612, $1,077,301 and $227,708, respectively) | | | 939,014 | | | | 1,197,211 | | | | 1,076,958 | | | | 227,604 | |
Segregated Cash for Futures Contracts | | | 6,040 | | | | 16,160 | | | | 12,790 | | | | 1,810 | |
Cash | | | — | | | | 14,055 | | | | 8,513 | | | | 1,502 | |
Receivables: | | | | | | | | | | | | | | | | |
Investment Securities Sold | | | 31,562 | | | | 76,745 | | | | 36,333 | | | | 6,371 | |
Dividends and Interest | | | 7,184 | | | | 22,078 | | | | 21,565 | | | | 2,693 | |
Securities Lending Income | | | 323 | | | | 429 | | | | 468 | | | | 102 | |
Fund Shares Sold | | | 8,919 | | | | 10,467 | | | | 8,738 | | | | 2,336 | |
Prepaid Expenses and Other Assets | | | 102 | | | | 222 | | | | 155 | | | | 34 | |
| | | | | | | | | | | | | | | | |
Total Assets | | | 15,330,840 | | | | 29,288,263 | | | | 30,434,760 | | | | 4,660,966 | |
| | | | | | | | | | | | | | | | |
LIABILITIES: | | | | | | | | | | | | | | | | |
Payables: | | | | | | | | | | | | | | | | |
Due to Custodian | | | 1,274 | | | | — | | | | — | | | | — | |
Upon Return of Securities Loaned | | | 969,028 | | | | 1,131,496 | | | | 1,108,626 | | | | 227,703 | |
Investment Securities Purchased | | | — | | | | 66,660 | | | | 16,180 | | | | 3,970 | |
Fund Shares Redeemed | | | 11,261 | | | | 26,116 | | | | 29,142 | | | | 2,848 | |
Due to Advisor | | | 3,195 | | | | 2,731 | | | | 3,790 | | | | 890 | |
Futures Margin Variation | | | 853 | | | | 4,781 | | | | 1,807 | | | | 256 | |
Accrued Expenses and Other Liabilities | | | 791 | | | | 1,197 | | | | 1,268 | | | | 239 | |
| | | | | | | | | | | | | | | | |
Total Liabilities | | | 986,402 | | | | 1,232,981 | | | | 1,160,813 | | | | 235,906 | |
| | | | | | | | | | | | | | | | |
NET ASSETS | | $ | 14,344,438 | | | $ | 28,055,282 | | | $ | 29,273,947 | | | $ | 4,425,060 | |
| | | | | | | | | | | | | | | | |
NET ASSET VALUE, OFFERING AND REDEMPTION PRICE PER SHARE: | | | | | | | | | | | | | | | | |
Institutional Class Shares — based on net assets of $14,344,438; $28,055,282; $29,273,947 and $4,425,060 and shares outstanding of 341,473,278, 913,841,700, 1,045,136,809 and 198,910,828, respectively | | $ | 42.01 | | | $ | 30.70 | | | $ | 28.01 | | | $ | 22.25 | |
| | | | | | | | | | | | | | | | |
NUMBER OF SHARES AUTHORIZED | | | 3,400,000,000 | | | | 3,000,000,000 | | | | 4,600,000,000 | | | | 2,000,000,000 | |
| | | | | | | | | | | | | | | | |
Investment Securities at Cost | | $ | 9,287,201 | | | $ | 13,059,889 | | | $ | 13,737,377 | | | $ | 2,236,989 | |
| | | | | | | | | | | | | | | | |
NET ASSETS CONSIST OF: | | | | | | | | | | | | | | | | |
Paid-In Capital | | $ | 8,737,206 | | | $ | 12,721,176 | | | $ | 13,170,523 | | | $ | 2,135,719 | |
Total Distributable Earnings (Loss) | | | 5,607,232 | | | | 15,334,106 | | | | 16,103,424 | | | | 2,289,341 | |
| | | | | | | | | | | | | | | | |
NET ASSETS | | $ | 14,344,438 | | | $ | 28,055,282 | | | $ | 29,273,947 | | | $ | 4,425,060 | |
| | | | | | | | | | | | | | | | |
| * | See Note K in the Notes to Financial Statements for additional information about securities lending collateral. |
See accompanying Notes to Financial Statements.
62
DFA INVESTMENT DIMENSIONS GROUP INC.
STATEMENTS OF ASSETS AND LIABILITIES
OCTOBER 31, 2022
(Amounts in thousands, except share and per share amounts)
| | | | | | | | | | | | | | | | |
| | | | | | | | | U.S. High | | | DFA Real | |
| | | | | | | | | Relative | | | Estate | |
| | | U.S. Small Cap | | | U.S. Micro Cap | | | Profitability | | | Securities | |
| | | Portfolio* | | | Portfolio* | | | Portfolio* | | | Portfolio* | |
ASSETS: | | | | | | | | | | | | | | | | |
Investment Securities at Value (including $1,765,485, $648,270, $36,288 and $454,251 of securities on loan, respectively) | | $ | 13,795,160 | | | $ | 6,423,832 | | | $ | 4,617,446 | | | $ | 7,952,292 | |
Temporary Cash Investments at Value & Cost | | | 92,670 | | | | 50,273 | | | | 36,050 | | | | 124,840 | |
Collateral from Securities on Loan Invested in Affiliate at Value (including cost of $1,541,139, $544,252, $2,788 and $365,849, respectively) | | | 1,540,634 | | | | 544,018 | | | | 2,788 | | | | 365,690 | |
Segregated Cash for Futures Contracts | | | 5,170 | | | | 2,810 | | | | 1,650 | | | | 6,190 | |
Cash | | | 1,063 | | | | 807 | | | | — | | | | — | |
Receivables: | | | | | | | | | | | | | | | | |
Investment Securities Sold | | | 138,111 | | | | 1,340 | | | | 3,272 | | | | 436 | |
Dividends and Interest | | | 4,659 | | | | 2,762 | | | | 6,568 | | | | 4,500 | |
Securities Lending Income | | | 432 | | | | 205 | | | | 7 | | | | 125 | |
Fund Shares Sold | | | 6,247 | | | | 1,383 | | | | 2,455 | | | | 2,988 | |
Futures Margin Variation | | | 128 | | | | — | | | | — | | | | — | |
Prepaid Expenses and Other Assets | | | 55 | | | | 67 | | | | 46 | | | | 59 | |
| | | | | | | | | | | | | | | | |
Total Assets | | | 15,584,329 | | | | 7,027,497 | | | | 4,670,282 | | | | 8,457,120 | |
| | | | | | | | | | | | | | | | |
LIABILITIES: | | | | | | | | | | | | | | | | |
Payables: | | | | | | | | | | | | | | | | |
Upon Return of Securities Loaned | | | 1,677,242 | | | | 534,124 | | | | 2,860 | | | | 364,037 | |
Investment Securities Purchased | | | — | | | | 10,299 | | | | 666 | | | | 7,747 | |
Fund Shares Redeemed | | | 19,986 | | | | 4,924 | | | | 3,258 | | | | 13,984 | |
Due to Advisor | | | 2,790 | | | | 1,962 | | | | 715 | | | | 1,024 | |
Futures Margin Variation | | | — | | | | 397 | | | | 233 | | | | 874 | |
Accrued Expenses and Other Liabilities | | | 709 | | | | 357 | | | | 252 | | | | 528 | |
| | | | | | | | | | | | | | | | |
Total Liabilities | | | 1,700,727 | | | | 552,063 | | | | 7,984 | | | | 388,194 | |
| | | | | | | | | | | | | | | | |
NET ASSETS | | $ | 13,883,602 | | | $ | 6,475,434 | | | $ | 4,662,298 | | | $ | 8,068,926 | |
| | | | | | | | | | | | | | | | |
NET ASSET VALUE, OFFERING AND REDEMPTION PRICE PER SHARE: | | | | | | | | | | | | | | | | |
Institutional Class Shares - based on net assets of $13,883,602; $6,475,434; $4,662,298 and $8,068,926 and shares outstanding of 338,118,885, 264,805,350, 270,531,925 and 210,180,866, respectively | | $ | 41.06 | | | $ | 24.45 | | | $ | 17.23 | | | $ | 38.39 | |
| | | | | | | | | | | | | | | | |
NUMBER OF SHARES AUTHORIZED | | | 2,000,000,000 | | | | 3,000,000,000 | | | | 500,000,000 | | | | 1,700,000,000 | |
| | | | | | | | | | | | | | | | |
Investment Securities at Cost | | $ | 7,784,405 | | | $ | 3,758,697 | | | $ | 3,694,848 | | | $ | 5,253,634 | |
| | | | | | | | | | | | | | | | |
NET ASSETS CONSIST OF: | | | | | | | | | | | | | | | | |
Paid-In Capital | | $ | 7,359,672 | | | $ | 3,567,492 | | | $ | 3,648,595 | | | $ | 5,067,575 | |
Total Distributable Earnings (Loss) | | | 6,523,930 | | | | 2,907,942 | | | | 1,013,703 | | | | 3,001,351 | |
| | | | | | | | | | | | | | | | |
NET ASSETS | | $ | 13,883,602 | | | $ | 6,475,434 | | | $ | 4,662,298 | | | $ | 8,068,926 | |
| | | | | | | | | | | | | | | | |
| * | See Note K in the Notes to Financial Statements for additional information about securities lending collateral. |
See accompanying Notes to Financial Statements.
63
DFA INVESTMENT DIMENSIONS GROUP INC.
STATEMENTS OF OPERATIONS
FOR THE YEAR ENDED OCTOBER 31, 2022
(Amounts in thousands)
| | | | | | | | | | | | | | | | |
| | | Enhanced U.S. | | | | | | | | | | |
| | | Large | | | U.S. Large Cap | | | | | | | |
| | | Company | | | Equity | | | U.S. Large Cap | | | U.S. Targeted | |
| | | Portfolio# | | | Portfolio# | | | Value Portfolio* | | | Value Portfolio# | |
Investment Income | | | | | | | | | | | | | | | | |
Net Investment Income Allocated from Affiliated Investment Companies | | | | | | | | | | | | | | | | |
Dividends (Net of Foreign Taxes Withheld of $0, $0, $38 and $0, respectively) | | | — | | | | — | | | $ | 553,562 | | | | — | |
Income from Securities Lending | | | — | | | | — | | | | 561 | | | | — | |
Expenses Allocated from Affiliated Investment Companies | | | — | | | | — | | | | (25,288 | ) | | | — | |
| | | | | | | | | | | | | | | | |
Total Net Investment Income Allocated and/or Distributions Received from Affiliated Investment Companies | | | — | | | | — | | | | 528,835 | | | | — | |
| | | | | | | | | | | | | | | | |
Fund Investment Income | | | | | | | | | | | | | | | | |
Dividends (Net of Foreign Taxes Withheld of $0, $5, $0 and $297, respectively) | | | — | | | $ | 29,715 | | | | — | | | $ | 212,967 | |
Interest | | $ | 4,722 | | | | — | | | | — | | | | — | |
Income from Securities Lending | | | 11 | | | | 67 | | | | — | | | | 1,302 | |
| | | | | | | | | | | | | | | | |
Total Fund Investment Income | | | 4,733 | | | | 29,782 | | | | — | | | | 214,269 | |
| | | | | | | | | | | | | | | | |
Fund Expenses | | | | | | | | | | | | | | | | |
Investment Management Fees | | | 404 | | | | 1,887 | | | | 45,731 | | | | 33,964 | |
Accounting & Transfer Agent Fees | | | 32 | | | | 272 | | | | 3,332 | | | | 921 | |
S&P 500® Fees | | | 45 | | | | — | | | | — | | | | — | |
Custodian Fees | | | 20 | | | | 28 | | | | — | | | | 187 | |
Shareholder Servicing Fees | | | | | | | | | | | | | | | | |
Class R1 Shares | | | — | | | | — | | | | — | | | | 47 | |
Class R2 Shares | | | — | | | | — | | | | — | | | | 164 | |
Filing Fees | | | 24 | | | | 33 | | | | 223 | | | | 196 | |
Shareholders’ Reports | | | 26 | | | | 61 | | | | 348 | | | | 390 | |
Directors’/Trustees’ Fees & Expenses | | | 1 | | | | 14 | | | | 114 | | | | 62 | |
Professional Fees | | | 4 | | | | 25 | | | | 305 | | | | 167 | |
Previously Waived Fees Recovered by Advisor (Note C) | | | 11 | | | | — | | | | — | | | | — | |
Other | | | 4 | | | | 66 | | | | 177 | | | | 383 | |
| | | | | | | | | | | | | | | | |
Total Fund Expenses | | | 571 | | | | 2,386 | | | | 50,230 | | | | 36,481 | |
| | | | | | | | | | | | | | | | |
Fees Waived, Expenses Reimbursed by Advisor (Note C) | | | 65 | | | | — | | | | 24,071 | | | | — | |
Fees Paid Indirectly (Note C) | | | 8 | | | | — | | | | — | | | | — | |
| | | | | | | | | | | | | | | | |
Net Expenses | | | 498 | | | | 2,386 | | | | 26,159 | | | | 36,481 | |
| | | | | | | | | | | | | | | | |
Net Investment Income (Loss) | | | 4,235 | | | | 27,396 | | | | 502,676 | | | | 177,788 | |
| | | | | | | | | | | | | | | | |
Realized and Unrealized Gain (Loss) | | | | | | | | | | | | | | | | |
Net Realized Gain (Loss) on: | | | | | | | | | | | | | | | | |
Investment Securities Sold** | | | (18,469 | ) | | | 55,532 | | | | — | | | | 481,149 | |
Affiliated Investment Companies Shares Sold | | | 2 | | | | (4 | ) | | | — | | | | (183 | ) |
Transactions Allocated from Affiliated Investment Company** | | | — | | | | — | | | | 638,941 | | | | — | |
Futures | | | (26,807 | ) | | | 107 | | | | — | | | | (21,845 | ) |
Foreign Currency Transactions | | | (30 | ) | | | — | | | | — | | | | — | |
Forward Currency Contracts | | | 8,012 | | | | — | | | | — | | | | — | |
Change in Unrealized Appreciation (Depreciation) of: | | | | | | | | | | | | | | | | |
Investment Securities and Foreign Currency | | | (10,721 | ) | | | (370,165 | ) | | | — | | | | (802,130 | ) |
Affiliated Investment Companies Shares | | | (2 | ) | | | (5 | ) | | | — | | | | (345 | ) |
Transactions Allocated from Affiliated Investment Company | | | — | | | | — | | | | (2,005,602 | ) | | | — | |
Futures | | | (30,214 | ) | | | — | | | | — | | | | 398 | |
Translation of Foreign Currency-Denominated Amounts | | | (23 | ) | | | — | | | | — | | | | — | |
Forward Currency Contracts | | | 3,153 | | | | — | | | | — | | | | — | |
| | | | | | | | | | | | | | | | |
Net Realized and Unrealized Gain (Loss) | | | (75,099 | ) | | | (314,535 | ) | | | (1,366,661 | ) | | | (342,956 | ) |
| | | | | | | | | | | | | | | | |
Net Increase (Decrease) in Net Assets Resulting from Operations | | $ | (70,864 | ) | | $ | (287,139 | ) | | $ | (863,985 | ) | | $ | (165,168 | ) |
| | | | | | | | | | | | | | | | |
| ** | Net of foreign capital gain taxes withheld of $0, $0, $0 and $0, respectively. |
| * | Investment Income and Realized and Unrealized Gain (Loss) were allocated from the Portfolio’s Master Fund (Affiliated Investment Company). |
| # | Portion of income is from investment in affiliated fund. |
See accompanying Notes to Financial Statements.
64
DFA INVESTMENT DIMENSIONS GROUP INC.
STATEMENTS OF OPERATIONS
FOR THE YEAR ENDED OCTOBER 31, 2022
(Amounts in thousands)
| | | | | | | | | | | | | | | | |
| | | U.S. Small Cap
Value Portfolio# | | | U.S. Core
Equity 1
Portfolio# | | | U.S. Core
Equity 2
Portfolio# | | | U.S. Vector
Equity
Portfolio# | |
Investment Income | | | | | | | | | | | | | | | | |
Dividends (Net of Foreign Taxes Withheld of $686, $103, $140 and $38, respectively) | | $ | 277,641 | | | $ | 491,360 | | | $ | 504,013 | | | $ | 82,494 | |
Income from Securities Lending | | | 1,443 | | | | 2,027 | | | | 2,347 | | | | 483 | |
| | | | | | | | | | | | | | | | |
Total Investment Income | | | 279,084 | | | | 493,387 | | | | 506,360 | | | | 82,977 | |
| | | | | | | | | | | | | | | | |
Expenses | | | | | | | | | | | | | | | | |
Investment Management Fees | | | 44,129 | | | | 36,483 | | | | 50,809 | | | | 11,712 | |
Accounting & Transfer Agent Fees | | | 1,830 | | | | 4,887 | | | | 4,600 | | | | 799 | |
Custodian Fees | | | 232 | | | | 374 | | | | 396 | | | | 73 | |
Filing Fees | | | 176 | | | | 356 | | | | 356 | | | | 78 | |
Shareholders’ Reports | | | 287 | | | | 567 | | | | 584 | | | | 101 | |
Directors’/Trustees’ Fees & Expenses | | | 67 | | | | 168 | | | | 144 | | | | 22 | |
Professional Fees | | | 170 | | | | 410 | | | | 429 | | | | 60 | |
Other | | | 354 | | | | 747 | | | | 785 | | | | 123 | |
| | | | | | | | | | | | | | | | |
Total Expenses | | | 47,245 | | | | 43,992 | | | | 58,103 | | | | 12,968 | |
| | | | | | | | | | | | | | | | |
Net Expenses | | | 47,245 | | | | 43,992 | | | | 58,103 | | | | 12,968 | |
| | | | | | | | | | | | | | | | |
Net Investment Income (Loss) | | | 231,839 | | | | 449,395 | | | | 448,257 | | | | 70,009 | |
| | | | | | | | | | | | | | | | |
Realized and Unrealized Gain (Loss) | | | | | | | | | | | | | | | | |
Net Realized Gain (Loss) on: | | | | | | | | | | | | | | | | |
Investment Securities Sold** | | | 724,122 | | | | 746,757 | | | | 908,780 | | | | 159,333 | |
Affiliated Investment Companies Shares Sold | | | (244 | ) | | | (228 | ) | | | (225 | ) | | | (49 | ) |
Futures | | | (14,918 | ) | | | (31,585 | ) | | | (34,730 | ) | | | (5,485 | ) |
Change in Unrealized Appreciation (Depreciation) of: | | | | | | | | | | | | | | | | |
Investment Securities and Foreign Currency | | | (849,358 | ) | | | (5,000,570 | ) | | | (5,092,843 | ) | | | (594,083 | ) |
Affiliated Investment Companies Shares | | | (387 | ) | | | (421 | ) | | | (384 | ) | | | (121 | ) |
Futures | | | 4,538 | | | | (15,318 | ) | | | (11,179 | ) | | | (1,963 | ) |
| | | | | | | | | | | | | | | | |
Net Realized and Unrealized Gain (Loss) | | | (136,247 | ) | | | (4,301,365 | ) | | | (4,230,581 | ) | | | (442,368 | ) |
| | | | | | | | | | | | | | | | |
Net Increase (Decrease) in Net Assets Resulting from Operations | | $ | 95,592 | | | $ | (3,851,970 | ) | | $ | (3,782,324 | ) | | $ | (372,359 | ) |
| | | | | | | | | | | | | | | | |
| ** | Net of foreign capital gain taxes withheld of $0, $0, $0 and $0, respectively. |
| # | Portion of income is from investment in affiliated fund. |
See accompanying Notes to Financial Statements.
65
DFA INVESTMENT DIMENSIONS GROUP INC.
STATEMENTS OF OPERATIONS
FOR THE YEAR ENDED OCTOBER 31, 2022
(Amounts in thousands)
| | | | | | | | | | | | | | | | |
| | | U.S. Small Cap
Portfolio# | | | U.S. Micro Cap
Portfolio# | | | U.S. High
Relative
Profitability
Portfolio# | | | DFA Real
Estate
Securities
Portfolio# | |
Investment Income | | | | | | | | | | | | | | | | |
Dividends (Net of Foreign Taxes Withheld of $172, $125, $1 and $0, respectively) | | $ | 203,156 | | | $ | 98,972 | | | $ | 96,082 | | | $ | 212,523 | |
Income from Securities Lending | | | 2,232 | | | | 1,152 | | | | 68 | | | | 499 | |
| | | | | | | | | | | | | | | | |
Total Investment Income | | | 205,388 | | | | 100,124 | | | | 96,150 | | | | 213,022 | |
| | | | | | | | | | | | | | | | |
Fund Expenses | | | | | | | | | | | | | | | | |
Investment Management Fees | | | 39,156 | | | | 26,213 | | | | 10,155 | | | | 16,905 | |
Accounting & Transfer Agent Fees | | | 1,334 | | | | 852 | | | | 918 | | | | 1,408 | |
Custodian Fees | | | 264 | | | | 131 | | | | 72 | | | | 123 | |
Filing Fees | | | 149 | | | | 115 | | | | 151 | | | | 124 | |
Shareholders’ Reports | | | 280 | | | | 144 | | | | 261 | | | | 344 | |
Directors’/Trustees’ Fees & Expenses | | | 67 | | | | 31 | | | | 62 | | | | 43 | |
Professional Fees | | | 173 | | | | 83 | | | | 75 | | | | 141 | |
Previously Waived Fees Recovered by Advisor (Note C) | | | — | | | | — | | | | — | | | | 79 | |
Other | | | 391 | | | | 168 | | | | 155 | | | | 236 | |
| | | | | | | | | | | | | | | | |
Total Fund Expenses | | | 41,814 | | | | 27,737 | | | | 11,849 | | | | 19,403 | |
| | | | | | | | | | | | | | | | |
Fees Waived, Expenses Reimbursed by Advisor (Note C) | | | — | | | | — | | | | — | | | | 1,502 | |
| | | | | | | | | | | | | | | | |
Net Expenses | | | 41,814 | | | | 27,737 | | | | 11,849 | | | | 17,901 | |
| | | | | | | | | | | | | | | | |
Net Investment Income (Loss) | | | 163,574 | | | | 72,387 | | | | 84,301 | | | | 195,121 | |
| | | | | | | | | | | | | | | | |
Realized and Unrealized Gain (Loss) | | | | | | | | | | | | | | | | |
Net Realized Gain (Loss) on: | | | | | | | | | | | | | | | | |
Investment Securities Sold** | | | 597,912 | | | | 280,167 | | | | 113,487 | | | | 343,226 | |
Affiliated Investment Companies Shares Sold | | | (303 | ) | | | (141 | ) | | | (7 | ) | | | (91 | ) |
Futures | | | (21,083 | ) | | | (16,098 | ) | | | (7,134 | ) | | | (10,229 | ) |
In-Kind Redemptions | | | — | | | | 37,518 | | | | — | | | | — | |
Change in Unrealized Appreciation (Depreciation) of: | | | | | | | | | | | | | | | | |
Investment Securities and Foreign Currency | | | (2,273,036 | ) | | | (939,247 | ) | | | (678,479 | ) | | | (2,500,744 | ) |
Affiliated Investment Companies Shares | | | (567 | ) | | | (266 | ) | | | — | | | | (185 | ) |
Futures | | | (1,773 | ) | | | 119 | | | | (2,379 | ) | | | 323 | |
| | | | | | | | | | | | | | | | |
Net Realized and Unrealized Gain (Loss) | | | (1,698,850 | ) | | | (637,948 | ) | | | (574,512 | ) | | | (2,167,700 | ) |
| | | | | | | | | | | | | | | | |
Net Increase (Decrease) in Net Assets Resulting from Operations | | $ | (1,535,276 | ) | | $ | (565,561 | ) | | $ | (490,211 | ) | | $ | (1,972,579 | ) |
| | | | | | | | | | | | | | | | |
| ** | Net of foreign capital gain taxes withheld of $0, $0, $0 and $0, respectively. |
| # | Portion of income is from investment in affiliated fund. |
See accompanying Notes to Financial Statements.
66
DFA INVESTMENT DIMENSIONS GROUP INC.
STATEMENTS OF CHANGES IN NET ASSETS
(Amounts in thousands)
| | | | | | | | | | | | | | | | | | | | | | | | |
| | | Enhanced U.S. Large
Company Portfolio | | | U.S. Large Cap Equity
Portfolio | | | U.S. Large Cap Value
Portfolio*** | |
| | | Year
Ended
Oct 31,
2022 | | | Year
Ended
Oct 31,
2021 | | | Year
Ended
Oct 31,
2022 | | | Year
Ended
Oct 31,
2021 | | | Year
Ended
Oct 31,
2022 | | | Year
Ended
Oct 31,
2021 | |
Increase (Decrease) in Net Assets | | | | | | | | | | | | | | | | | | | | | | | | |
Operations: | | | | | | | | | | | | | | | | | | | | | | | | |
Net Investment Income (Loss) | | $ | 4,235 | | | $ | 2,465 | | | $ | 27,396 | | | $ | 27,055 | | | $ | 502,676 | | | $ | 429,517 | |
Net Realized Gain (Loss) on: | | | | | | | | | | | | | | | | | | | | | | | | |
Investment Securities Sold*,** | | | (18,469 | ) | | | 8,383 | | | | 55,532 | | | | 77,747 | | | | — | | | | — | |
Affiliated Investment Companies Shares Sold | | | 2 | | | | — | | | | (4 | ) | | | (3 | ) | | | — | | | | — | |
Transactions Allocated from Affiliated Investment Company*,** | | | — | | | | — | | | | — | | | | — | | | | 638,941 | | | | 1,197,847 | |
Futures | | | (26,807 | ) | | | 121,329 | | | | 107 | | | | — | | | | — | | | | — | |
Foreign Currency Transactions | | | (30 | ) | | | (56 | ) | | | — | | | | — | | | | — | | | | — | |
Forward Currency Contracts | | | 8,012 | | | | (2,075 | ) | | | — | | | | — | | | | — | | | | — | |
In-Kind Redemptions | | | — | | | | — | | | | — | | | | 11,793 | | | | — | | | | — | |
Change in Unrealized Appreciation (Depreciation) of: | | | | | | | | | | | | | | | | | | | | | | | | |
Investment Securities and Foreign Currency | | | (10,721 | ) | | | (6,769 | ) | | | (370,165 | ) | | | 578,484 | | | | — | | | | — | |
Affiliated Investment Companies Shares | | | (2 | ) | | | — | | | | (5 | ) | | | (2 | ) | | | — | | | | — | |
Transactions Allocated from Affiliated Investment Company | | | — | | | | — | | | | — | | | | — | | | | (2,005,602 | ) | | | 7,131,104 | |
Futures | | | (30,214 | ) | | | 29,567 | | | | — | | | | — | | | | — | | | | — | |
Translation of Foreign Currency-Denominated Amounts | | | (23 | ) | | | (4 | ) | | | — | | | | — | | | | — | | | | — | |
Forward Currency Contracts | | | 3,153 | | | | (3,235 | ) | | | — | | | | — | | | | — | | | | — | |
| | | | | | | | | | | | | | | | | | | | | | | | |
Net Increase (Decrease) in Net Assets Resulting from Operations | | | (70,864 | ) | | | 149,605 | | | | (287,139 | ) | | | 695,074 | | | | (863,985 | ) | | | 8,758,468 | |
| | | | | | | | | | | | | | | | | | | | | | | | |
Distributions: | | | | | | | | | | | | | | | | | | | | | | | | |
Institutional Class Shares | | | (133,571 | ) | | | (30,328 | ) | | | (90,612 | ) | | | (27,774 | ) | | | (1,117,729 | ) | | | (401,298 | ) |
Capital Share Transactions (1): | | | | | | | | | | | | | | | | | | | | | | | | |
Shares Issued | | | 48,491 | | | | 57,957 | | | | 213,960 | | | | 291,004 | | | | 4,190,043 | | | | 4,217,940 | |
Shares Issued in Lieu of Cash Distributions | | | 133,398 | | | | 30,299 | | | | 81,512 | | | | 24,838 | | | | 1,033,573 | | | | 375,792 | |
Shares Redeemed | | | (145,680 | ) | | | (213,988 | ) | | | (504,737 | ) | | | (475,766 | ) | | | (5,256,718 | ) | | | (6,356,276 | ) |
| | | | | | | | | | | | | | | | | | | | | | | | |
Net Increase (Decrease) from Capital Share Transactions | | | 36,209 | | | | (125,732 | ) | | | (209,265 | ) | | | (159,924 | ) | | | (33,102 | ) | | | (1,762,544 | ) |
| | | | | | | | | | | | | | | | | | | | | | | | |
Total Increase (Decrease) in Net Assets | | | (168,226 | ) | | | (6,455 | ) | | | (587,016 | ) | | | 507,376 | | | | (2,014,816 | ) | | | 6,594,626 | |
Net Assets | | | | | | | | | | | | | | | | | | | | | | | | |
Beginning of Year | | | 426,867 | | | | 433,322 | | | | 2,200,814 | | | | 1,693,438 | | | | 25,309,703 | | | | 18,715,077 | |
| | | | | | | | | | | | | | | | | | | | | | | | |
End of Year | | $ | 258,641 | | | $ | 426,867 | | | $ | 1,613,798 | | | $ | 2,200,814 | | | $ | 23,294,887 | | | $ | 25,309,703 | |
| | | | | | | | | | | | | | | | | | | | | | | | |
(1) Shares Issued and Redeemed: | | | | | | | | | | | | | | | | | | | | | | | | |
Shares Issued | | | 3,691 | | | | 3,614 | | | | 8,558 | | | | 11,836 | | | | 96,435 | | | | 99,361 | |
Shares Issued in Lieu of Cash Distributions | | | 10,160 | | | | 2,042 | | | | 3,061 | | | | 994 | | | | 23,697 | | | | 8,865 | |
Shares Redeemed | | | (11,934 | ) | | | (13,433 | ) | | | (20,072 | ) | | | (19,169 | ) | | | (120,437 | ) | | | (152,905 | ) |
| | | | | | | | | | | | | | | | | | | | | | | | |
Net Increase (Decrease) from Shares Issued and Redeemed | | | 1,917 | | | | (7,777 | ) | | | (8,453 | ) | | | (6,339 | ) | | | (305 | ) | | | (44,679 | ) |
| | | | | | | | | | | | | | | | | | | | | | | | |
| * | Net of foreign capital gain taxes withheld for the fiscal year ended October 31, 2022 of $0, $0 and $0, respectively. |
| ** | Net of foreign capital gain taxes withheld for the fiscal year ended October 31, 2021 of $0, $0 and $0, respectively. |
| *** | Investment Income and Realized and Unrealized Gain (Loss) were allocated from the Portfolio’s Master Fund (Affiliated Investment Company). |
See accompanying Notes to Financial Statements.
67
DFA INVESTMENT DIMENSIONS GROUP INC.
STATEMENTS OF CHANGES IN NET ASSETS
(Amounts in thousands)
| | | | | | | | | | | | | | | | | | | | | | | | |
| | | U.S. Targeted Value
Portfolio | | | U.S. Small Cap Value
Portfolio | | | U.S. Core Equity 1
Portfolio | |
| | | Year
Ended
Oct 31,
2022 | | | Year
Ended
Oct 31,
2021 | | | Year
Ended
Oct 31,
2022 | | | Year
Ended
Oct 31,
2021 | | | Year
Ended
Oct 31,
2022 | | | Year
Ended
Oct 31,
2021 | |
Increase (Decrease) in Net Assets | | | | | | | | | | | | | | | | | | | | | | | | |
Operations: | | | | | | | | | | | | | | | | | | | | | | | | |
Net Investment Income (Loss) | | $ | 177,788 | | | $ | 198,730 | | | $ | 231,839 | | | $ | 282,263 | | | $ | 449,395 | | | $ | 410,758 | |
Net Realized Gain (Loss) on: | | | | | | | | | | | | | | | | | | | | | | | | |
Investment Securities Sold*,** | | | 481,149 | | | | 1,091,327 | | | | 724,122 | | | | 1,961,127 | | | | 746,757 | | | | 975,666 | |
Affiliated Investment Companies Shares Sold | | | (183 | ) | | | (19 | ) | | | (244 | ) | | | (6 | ) | | | (228 | ) | | | 6 | |
Futures | | | (21,845 | ) | | | 31,099 | | | | (14,918 | ) | | | 35,883 | | | | (31,585 | ) | | | 74,671 | |
Change in Unrealized Appreciation (Depreciation) of: | | | | | | | | | | | | | | | | | | | | | | | | |
Investment Securities and Foreign Currency | | | (802,130 | ) | | | 4,695,607 | | | | (849,358 | ) | | | 4,964,267 | | | | (5,000,570 | ) | | | 9,374,964 | |
Affiliated Investment Companies Shares | | | (345 | ) | | | (24 | ) | | | (387 | ) | | | (18 | ) | | | (421 | ) | | | (42 | ) |
Futures | | | 398 | | | | 5,644 | | | | 4,538 | | | | 6,558 | | | | (15,318 | ) | | | 12,449 | |
| | | | | | | | | | | | | | | | | | | | | | | | |
Net Increase (Decrease) in Net Assets Resulting from Operations | | | (165,168 | ) | | | 6,022,364 | | | | 95,592 | | | | 7,250,074 | | | | (3,851,970 | ) | | | 10,848,472 | |
| | | | | | | | | | | | | | | | | | | | | | | | |
Distributions: | | | | | | | | | | | | | | | | | | | | | | | | |
Class R1 Shares | | | (5,129 | ) | | | (889 | ) | | | — | | | | — | | | | — | | | | — | |
Class R2 Shares | | | (5,446 | ) | | | (922 | ) | | | — | | | | — | | | | — | | | | — | |
Institutional Class Shares | | | (964,425 | ) | | | (186,950 | ) | | | (1,470,644 | ) | | | (282,350 | ) | | | (1,269,285 | ) | | | (396,374 | ) |
| | | | | | | | | | | | | | | | | | | | | | | | |
Total Distributions | | | (975,000 | ) | | | (188,761 | ) | | | (1,470,644 | ) | | | (282,350 | ) | | | (1,269,285 | ) | | | (396,374 | ) |
| | | | | | | | | | | | | | | | | | | | | | | | |
Capital Share Transactions (1): | | | | | | | | | | | | | | | | | | | | | | | | |
Shares Issued | | | 2,691,895 | | | | 2,413,093 | | | | 2,634,579 | | | | 2,353,153 | | | | 4,313,735 | | | | 3,731,277 | |
Shares Issued in Lieu of Cash Distributions | | | 935,419 | | | | 181,306 | | | | 1,344,674 | | | | 257,340 | | | | 1,221,541 | | | | 385,732 | |
Shares Redeemed | | | (3,369,049 | ) | | | (4,489,318 | ) | | | (3,405,110 | ) | | | (4,913,927 | ) | | | (5,743,780 | ) | | | (5,612,000 | ) |
| | | | | | | | | | | | | | | | | | | | | | | | |
Net Increase (Decrease) from Capital Share Transactions | | | 258,265 | | | | (1,894,919 | ) | | | 574,143 | | | | (2,303,434 | ) | | | (208,504 | ) | | | (1,494,991 | ) |
| | | | | | | | | | | | | | | | | | | | | | | | |
Total Increase (Decrease) in Net Assets | | | (881,903 | ) | | | 3,938,684 | | | | (800,909 | ) | | | 4,664,290 | | | | (5,329,759 | ) | | | 8,957,107 | |
Net Assets | | | | | | | | | | | | | | | | | | | | | | | | |
Beginning of Year | | | 12,735,338 | | | | 8,796,654 | | | | 15,145,347 | | | | 10,481,057 | | | | 33,385,041 | | | | 24,427,934 | |
| | | | | | | | | | | | | | | | | | | | | | | | |
End of Year | | $ | 11,853,435 | | | $ | 12,735,338 | | | $ | 14,344,438 | | | $ | 15,145,347 | | | $ | 28,055,282 | | | $ | 33,385,041 | |
| | | | | | | | | | | | | | | | | | | | | | | | |
(1) Shares Issued and Redeemed: | | | | | | | | | | | | | | | | | | | | | | | | |
Shares Issued | | | 93,255 | | | | 85,084 | | | | 63,267 | | | | 56,798 | | | | 132,367 | | | | 115,212 | |
Shares Issued in Lieu of Cash Distributions | | | 32,294 | | | | 6,639 | | | | 32,160 | | | | 6,840 | | | | 35,760 | | | | 11,903 | |
Shares Redeemed | | | (116,048 | ) | | | (162,459 | ) | | | (80,833 | ) | | | (120,183 | ) | | | (175,289 | ) | | | (173,808 | ) |
| | | | | | | | | | | | | | | | | | | | | | | | |
Net Increase (Decrease) from Shares Issued and Redeemed | | | 9,501 | | | | (70,736 | ) | | | 14,594 | | | | (56,545 | ) | | | (7,162 | ) | | | (46,693 | ) |
| | | | | | | | | | | | | | | | | | | | | | | | |
| * | Net of foreign capital gain taxes withheld for the fiscal year ended October 31, 2022 of $0, $0 and $0, respectively. |
| ** | Net of foreign capital gain taxes withheld for the fiscal year ended October 31, 2021 of $0, $0 and $0, respectively. |
See accompanying Notes to Financial Statements.
68
DFA INVESTMENT DIMENSIONS GROUP INC.
STATEMENTS OF CHANGES IN NET ASSETS
(Amounts in thousands)
| | | | | | | | | | | | | | | | | | | | | | | | |
| | | U.S. Core Equity 2 Portfolio | | | U.S. Vector Equity Portfolio | | | U.S. Small Cap Portfolio | |
| | | Year
Ended
Oct 31,
2022 | | | Year
Ended
Oct 31,
2021 | | | Year
Ended
Oct 31,
2022 | | | Year
Ended
Oct 31,
2021 | | | Year
Ended
Oct 31,
2022 | | | Year
Ended
Oct 31,
2021 | |
Increase (Decrease) in Net Assets | | | | | | | | | | | | | | | | | | | | | | | | |
Operations: | | | | | | | | | | | | | | | | | | | | | | | | |
Net Investment Income (Loss) | | $ | 448,257 | | | $ | 416,576 | | | $ | 70,009 | | | $ | 63,055 | | | $ | 163,574 | | | $ | 187,098 | |
Net Realized Gain (Loss) on: | | | | | | | | | | | | | | | | | | | | | | | | |
Investment Securities Sold*,** | | | 908,780 | | | | 1,429,312 | | | | 159,333 | | | | 359,202 | | | | 597,912 | | | | 1,236,222 | |
Affiliated Investment Companies Shares Sold | | | (225 | ) | | | 5 | | | | (49 | ) | | | (10 | ) | | | (303 | ) | | | (15 | ) |
Futures | | | (34,730 | ) | | | 77,878 | | | | (5,485 | ) | | | 10,622 | | | | (21,083 | ) | | | 29,482 | |
Change in Unrealized Appreciation (Depreciation) of: | | | | | | | | | | | | | | | | | | | | | | | | |
Investment Securities and Foreign Currency | | | (5,092,843 | ) | | | 9,830,032 | | | | (594,083 | ) | | | 1,496,357 | | | | (2,273,036 | ) | | | 5,738,332 | |
Affiliated Investment Companies Shares | | | (384 | ) | | | (46 | ) | | | (121 | ) | | | (6 | ) | | | (567 | ) | | | (46 | ) |
Futures | | | (11,179 | ) | | | 10,410 | | | | (1,963 | ) | | | 1,490 | | | | (1,773 | ) | | | 7,732 | |
| | | | | | | | | | | | | | | | | | | | | | | | |
Net Increase (Decrease) in Net Assets Resulting from Operations | | | (3,782,324 | ) | | | 11,764,167 | | | | (372,359 | ) | | | 1,930,710 | | | | (1,535,276 | ) | | | 7,198,805 | |
| | | | | | | | | | | | | | | | | | | | | | | | |
Distributions: | | | | | | | | | | | | | | | | | | | | | | | | |
Institutional Class Shares | | | (1,676,395 | ) | | | (403,127 | ) | | | (387,023 | ) | | | (59,880 | ) | | | (1,001,810 | ) | | | (191,245 | ) |
Capital Share Transactions (1): | | | | | | | | | | | | | | | | | | | | | | | | |
Shares Issued | | | 3,998,679 | | | | 4,280,791 | | | | 667,556 | | | | 622,066 | | | | 2,418,174 | | | | 1,966,837 | |
Shares Issued in Lieu of Cash Distributions | | | 1,650,798 | | | | 396,434 | | | | 381,930 | | | | 59,202 | | | | 944,361 | | | | 180,123 | |
Shares Redeemed | | | (6,065,708 | ) | | | (6,559,673 | ) | | | (1,047,819 | ) | | | (982,039 | ) | | | (3,689,252 | ) | | | (5,596,845 | ) |
| | | | | | | | | | | | | | | | | | | | | | | | |
Net Increase (Decrease) from Capital Share Transactions | | | (416,231 | ) | | | (1,882,448 | ) | | | 1,667 | | | | (300,771 | ) | | | (326,717 | ) | | | (3,449,885 | ) |
| | | | | | | | | | | | | | | | | | | | | | | | |
Total Increase (Decrease) in Net Assets | | | (5,874,950 | ) | | | 9,478,592 | | | | (757,715 | ) | | | 1,570,059 | | | | (2,863,803 | ) | | | 3,557,675 | |
Net Assets | | | | | | | | | | | | | | | | | | | | | | | | |
Beginning of Year | | | 35,148,897 | | | | 25,670,305 | | | | 5,182,775 | | | | 3,612,716 | | | | 16,747,405 | | | | 13,189,730 | |
| | | | | | | | | | | | | | | | | | | | | | | | |
End of Year | | $ | 29,273,947 | | | $ | 35,148,897 | | | $ | 4,425,060 | | | $ | 5,182,775 | | | $ | 13,883,602 | | | $ | 16,747,405 | |
| | | | | | | | | | | | | | | | | | | | | | | | |
(1) Shares Issued and Redeemed: | | | | | | | | | | | | | | | | | | | | | | | | |
Shares Issued | | | 134,993 | | | | 144,078 | | | | 28,984 | | | | 26,612 | | | | 57,023 | | | | 44,774 | |
Shares Issued in Lieu of Cash Distributions. | | | 52,814 | | | | 13,361 | | | | 16,017 | | | | 2,515 | | | | 21,166 | | | | 4,260 | |
Shares Redeemed | | | (202,581 | ) | | | (224,097 | ) | | | (45,273 | ) | | | (42,433 | ) | | | (85,366 | ) | | | (129,256 | ) |
| | | | | | | | | | | | | | | | | | | | | | | | |
Net Increase (Decrease) from Shares Issued and Redeemed | | | (14,774 | ) | | | (66,658 | ) | | | (272 | ) | | | (13,306 | ) | | | (7,177 | ) | | | (80,222 | ) |
| | | | | | | | | | | | | | | | | | | | | | | | |
| * | Net of foreign capital gain taxes withheld for the fiscal year ended October 31, 2022 of $0, $0 and $0, respectively. |
| ** | Net of foreign capital gain taxes withheld for the fiscal year ended October 31, 2021 of $0, $0 and $0, respectively. |
See accompanying Notes to Financial Statements.
69
DFA INVESTMENT DIMENSIONS GROUP INC.
STATEMENTS OF CHANGES IN NET ASSETS
(Amounts in thousands)
| | | | | | | | | | | | | | | | | | | | | | | | |
| | | U.S. Micro Cap Portfolio | | | U.S. High Relative
Profitability Portfolio | | | DFA Real Estate Securities
Portfolio | |
| | | Year
Ended
Oct 31,
2022 | | | Year
Ended
Oct 31,
2021 | | | Year
Ended
Oct 31,
2022 | | | Year
Ended
Oct 31,
2021 | | | Year
Ended
Oct 31,
2022 | | | Year
Ended
Oct 31,
2021 | |
Increase (Decrease) in Net Assets | | | | | | | | | | | | | | | | | | | | | | | | |
Operations: | | | | | | | | | | | | | | | | | | | | | | | | |
Net Investment Income (Loss) | | $ | 72,387 | | | $ | 62,481 | | | $ | 84,301 | | | $ | 73,782 | | | $ | 195,121 | | | $ | 210,998 | |
Net Realized Gain (Loss) on: | | | | | | | | | | | | | | | | | | | | | | | | |
Investment Securities Sold*,** | | | 280,167 | | | | 742,238 | | | | 113,487 | | | | 131,919 | | | | 343,226 | | | | 148,206 | |
Affiliated Investment Companies Shares Sold | | | (141 | ) | | | (21 | ) | | | (7 | ) | | | — | | | | (91 | ) | | | (14 | ) |
Futures | | | (16,098 | ) | | | 16,057 | | | | (7,134 | ) | | | 10,476 | | | | (10,229 | ) | | | 21,701 | |
In-Kind Redemptions | | | 37,518 | | | | 7,153 | | | | — | | | | — | | | | — | | | | — | |
Change in Unrealized Appreciation (Depreciation) of: | | | | | | | | | | | | | | | | | | | | | | | | |
Investment Securities and Foreign Currency | | | (939,247 | ) | | | 2,315,847 | | | | (678,479 | ) | | | 1,189,688 | | | | (2,500,744 | ) | | | 3,314,181 | |
Affiliated Investment Companies Shares | | | (266 | ) | | | (10 | ) | | | — | | | | (1 | ) | | | (185 | ) | | | (7 | ) |
Futures | | | 119 | | | | 3,108 | | | | (2,379 | ) | | | 1,528 | | | | 323 | | | | 3,785 | |
| | | | | | | | | | | | | | | | | | | | | | | | |
Net Increase (Decrease) in Net Assets Resulting from Operations | | | (565,561 | ) | | | 3,146,853 | | | | (490,211 | ) | | | 1,407,392 | | | | (1,972,579 | ) | | | 3,698,850 | |
| | | | | | | | | | | | | | | | | | | | | | | | |
Distributions: | | | | | | | | | | | | | | | | | | | | | | | | |
Institutional Class Shares | | | (741,898 | ) | | | (65,321 | ) | | | (193,881 | ) | | | (70,633 | ) | | | (291,803 | ) | | | (250,605 | ) |
Capital Share Transactions (1): | | | | | | | | | | | | | | | | | | | | | | | | |
Shares Issued | | | 1,087,837 | | | | 707,002 | | | | 1,190,255 | | | | 1,659,760 | | | | 1,555,500 | | | | 1,673,718 | |
Shares Issued in Lieu of Cash Distributions | | | 683,212 | | | | 60,120 | | | | 193,188 | | | | 70,349 | | | | 263,575 | | | | 221,041 | |
Shares Redeemed | | | (1,442,021 | ) | | | (1,515,047 | ) | | | (1,872,690 | ) | | | (860,356 | ) | | | (2,700,865 | ) | | | (2,265,461 | ) |
| | | | | | | | | | | | | | | | | | | | | | | | |
Net Increase (Decrease) from Capital Share Transactions | | | 329,028 | | | | (747,925 | ) | | | (489,247 | ) | | | 869,753 | | | | (881,790 | ) | | | (370,702 | ) |
| | | | | | | | | | | | | | | | | | | | | | | | |
Total Increase (Decrease) in Net Assets | | | (978,431 | ) | | | 2,333,607 | | | | (1,173,339 | ) | | | 2,206,512 | | | | (3,146,172 | ) | | | 3,077,543 | |
Net Assets | | | | | | | | | | | | | | | | | | | | | | | | |
Beginning of Year | | | 7,453,865 | | | | 5,120,258 | | | | 5,835,637 | | | | 3,629,125 | | | | 11,215,098 | | | | 8,137,555 | |
| | | | | | | | | | | | | | | | | | | | | | | | |
End of Year | | $ | 6,475,434 | | | $ | 7,453,865 | | | $ | 4,662,298 | | | $ | 5,835,637 | | | $ | 8,068,926 | | | $ | 11,215,098 | |
| | | | | | | | | | | | | | | | | | | | | | | | |
(1) Shares Issued and Redeemed: | | | | | | | | | | | | | | | | | | | | | | | | |
Shares Issued | | | 43,512 | | | | 26,537 | | | | 65,459 | | | | 95,038 | | | | 34,851 | | | | 40,000 | |
Shares Issued in Lieu of Cash Distributions | | | 25,842 | | | | 2,311 | | | | 10,217 | | | | 3,936 | | | | 5,474 | | | | 5,800 | |
Shares Redeemed | | | (56,767 | ) | | | (58,103 | ) | | | (104,293 | ) | | | (48,305 | ) | | | (59,493 | ) | | | (54,340 | ) |
| | | | | | | | | | | | | | | | | | | | | | | | |
Net Increase (Decrease) from Shares Issued and Redeemed | | | 12,587 | | | | (29,255 | ) | | | (28,617 | ) | | | 50,669 | | | | (19,168 | ) | | | (8,540 | ) |
| | | | | | | | | | | | | | | | | | | | | | | | |
| * | Net of foreign capital gain taxes withheld for the fiscal year ended October 31, 2022 of $0, $0 and $0, respectively. |
| ** | Net of foreign capital gain taxes withheld for the fiscal year ended October 31, 2021 of $0, $0 and $0, respectively. |
See accompanying Notes to Financial Statements.
70
DFA INVESTMENT DIMENSIONS GROUP INC.
FINANCIAL HIGHLIGHTS
(for a share outstanding throughout each period)
| | | | | | | | | | | | | | | | | | | | | | | | | | | | | | | | | | | | | | | | |
| | | Enhanced U.S. Large Company Portfolio | | | U.S. Large Cap Equity Portfolio | |
| | | Year
Ended
Oct 31,
2022 | | | Year
Ended
Oct 31,
2021 | | | Year
Ended
Oct 31,
2020 | | | Year
Ended
Oct 31,
2019 | | | Year
Ended
Oct 31,
2018 | | | Year
Ended
Oct 31,
2022 | | | Year
Ended
Oct 31,
2021 | | | Year
Ended
Oct 31,
2020 | | | Year
Ended
Oct 31,
2019 | | | Year
Ended
Oct 31,
2018 | |
Net Asset Value, Beginning of Year | | $ | 18.53 | | | $ | 14.06 | | | $ | 14.02 | | | $ | 13.03 | | | $ | 14.54 | | | $ | 28.11 | | | $ | 20.01 | | | $ | 18.61 | | | $ | 16.75 | | | $ | 15.93 | |
| | | | | | | | | | | | | | | | | | | | | | | | | | | | | | | | | | | | | | | | |
Income from Investment Operations (A) | | | | | | | | | | | | | | | | | | | | | | | | | | | | | | | | | | | | | | | | |
Net Investment Income (Loss) | | | 0.15 | | | | 0.10 | | | | 0.12 | | | | 0.26 | | | | 0.26 | | | | 0.37 | | | | 0.33 | | | | 0.32 | | | | 0.31 | | | | 0.28 | |
Net Gains (Losses) on Securities (Realized and Unrealized) | | | (2.48 | ) | | | 5.49 | | | | 1.17 | | | | 1.60 | | | | 0.52 | | | | (4.19 | ) | | | 8.11 | | | | 1.42 | | | | 1.86 | | | | 0.81 | |
| | | | | | | | | | | | | | | | | | | | | | | | | | | | | | | | | | | | | | | | |
Total from Investment Operations | | | (2.33 | ) | | | 5.59 | | | | 1.29 | | | | 1.86 | | | | 0.78 | | | | (3.82 | ) | | | 8.44 | | | | 1.74 | | | | 2.17 | | | | 1.09 | |
| | | | | | | | | | | | | | | | | | | | | | | | | | | | | | | | | | | | | | | | |
Less Distributions: | | | | | | | | | | | | | | | | | | | | | | | | | | | | | | | | | | | | | | | | |
Net Investment Income | | | (0.11 | ) | | | (0.13 | ) | | | (0.11 | ) | | | (0.30 | ) | | | (0.25 | ) | | | (0.34 | ) | | | (0.34 | ) | | | (0.31 | ) | | | (0.31 | ) | | | (0.27 | ) |
Net Realized Gains | | | (5.73 | ) | | | (0.99 | ) | | | (1.14 | ) | | | (0.57 | ) | | | (2.04 | ) | | | (0.85 | ) | | | — | | | | (0.03 | ) | | | — | | | | — | |
| | | | | | | | | | | | | | | | | | | | | | | | | | | | | | | | | | | | | | | | |
Total Distributions | | | (5.84 | ) | | | (1.12 | ) | | | (1.25 | ) | | | (0.87 | ) | | | (2.29 | ) | | | (1.19 | ) | | | (0.34 | ) | | | (0.34 | ) | | | (0.31 | ) | | | (0.27 | ) |
| | | | | | | | | | | | | | | | | | | | | | | | | | | | | | | | | | | | | | | | |
Net Asset Value, End of Year | | $ | 10.36 | | | $ | 18.53 | | | $ | 14.06 | | | $ | 14.02 | | | $ | 13.03 | | | $ | 23.10 | | | $ | 28.11 | | | $ | 20.01 | | | $ | 18.61 | | | $ | 16.75 | |
| | | | | | | | | | | | | | | | | | | | | | | | | | | | | | | | | | | | | | | | |
Total Return | | | (19.24 | %) | | | 41.82 | % | | | 9.55 | % | | | 15.67 | % | | | 5.62 | % | | | (14.12 | %) | | | 42.42 | % | | | 9.52 | % | | | 13.13 | % | | | 6.82 | % |
| | | | | | | | | | | | | | | | | | | | | | | | | | | | | | | | | | | | | | | | |
Net Assets, End of Year (thousands) | | $ | 258,641 | | | $ | 426,867 | | | $ | 433,322 | | | $ | 386,750 | | | $ | 327,063 | | | $ | 1,613,798 | | | $ | 2,200,814 | | | $ | 1,693,438 | | | $ | 1,611,529 | | | $ | 1,457,218 | |
Ratio of Expenses to Average Net Assets | | | 0.15 | % | | | 0.15 | % | | | 0.15 | % | | | 0.15 | % | | | 0.15 | % | | | 0.13 | % | | | 0.14 | % | | | 0.16 | % | | | 0.19 | % | | | 0.17 | % |
Ratio of Expenses to Average Net Assets (Excluding Fees Waived, Expenses Reimbursed by Advisor and Fees Paid Indirectly) | | | 0.17 | % | | | 0.17 | % | | | 0.22 | % | | | 0.25 | % | | | 0.23 | % | | | 0.13 | % | | | 0.14 | % | | | 0.16 | % | | | 0.19 | % | | | 0.17 | % |
Ratio of Net Investment Income to Average Net Assets | | | 1.26 | % | | | 0.59 | % | | | 0.89 | % | | | 1.98 | % | | | 1.94 | % | | | 1.45 | % | | | 1.32 | % | | | 1.68 | % | | | 1.77 | % | | | 1.64 | % |
Portfolio Turnover Rate | | | 118 | % | | | 70 | % | | | 90 | % | | | 109 | % | | | 91 | % | | | 7 | % | | | 7 | % | | | 20 | % | | | 22 | % | | | 7 | % |
See page 1-2 for the Definitions of Abbreviations and Footnotes.
See accompanying Notes to Financial Statements.
71
DFA INVESTMENT DIMENSIONS GROUP INC.
FINANCIAL HIGHLIGHTS
(for a share outstanding throughout each period)
| | | | | | | | | | | | | | | | | | | | |
| | | U.S. Large Cap Value Portfolio | |
| | | Year
Ended
Oct 31,
2022 | | | Year
Ended
Oct 31,
2021 | | | Year
Ended
Oct 31,
2020 | | | Year
Ended
Oct 31,
2019 | | | Year
Ended
Oct 31,
2018 | |
Net Asset Value, Beginning of Year | | $ | 45.91 | | | $ | 31.40 | | | $ | 37.13 | | | $ | 37.41 | | | $ | 38.84 | |
| | | | | | | | | | | | | | | | | | | | |
Income from Investment Operations (A) | | | | | | | | | | | | | | | | | | | | |
Net Investment Income (Loss) | | | 0.91 | | | | 0.76 | | | | 0.79 | | | | 0.83 | | | | 0.78 | |
Net Gains (Losses) on Securities (Realized and Unrealized) | | | (2.50 | ) | | | 14.46 | | | | (4.98 | ) | | | 1.45 | | | | 0.35 | |
| | | | | | | | | | | | | | | | | | | | |
Total from Investment Operations | | | (1.59 | ) | | | 15.22 | | | | (4.19 | ) | | | 2.28 | | | | 1.13 | |
| | | | | | | | | | | | | | | | | | | | |
Less Distributions: | | | | | | | | | | | | | | | | | | | | |
Net Investment Income | | | (0.82 | ) | | | (0.71 | ) | | | (0.73 | ) | | | (0.76 | ) | | | (0.73 | ) |
Net Realized Gains | | | (1.22 | ) | | | — | | | | (0.81 | ) | | | (1.80 | ) | | | (1.83 | ) |
| | | | | | | | | | | | | | | | | | | | |
Total Distributions | | | (2.04 | ) | | | (0.71 | ) | | | (1.54 | ) | | | (2.56 | ) | | | (2.56 | ) |
| | | | | | | | | | | | | | | | | | | | |
Net Asset Value, End of Year | | $ | 42.28 | | | $ | 45.91 | | | $ | 31.40 | | | $ | 37.13 | | | $ | 37.41 | |
| | | | | | | | | | | | | | | | | | | | |
Total Return | | | (3.54 | %) | | | 48.68 | % | | | (11.56 | %) | | | 6.97 | % | | | 2.79 | % |
| | | | | | | | | | | | | | | | | | | | |
Net Assets, End of Year (thousands) | | $ | 23,294,887 | | | $ | 25,309,703 | | | $ | 18,715,077 | | | $ | 25,656,577 | | | $ | 25,268,336 | |
Ratio of Expenses to Average Net Assets (B) | | | 0.21 | % | | | 0.23 | % | | | 0.27 | % | | | 0.28 | % | | | 0.27 | % |
Ratio of Expenses to Average Net Assets (Excluding Fees Waived, Expenses Reimbursed by Advisor) (B) | | | 0.31 | % | | | 0.33 | % | | | 0.37 | % | | | 0.38 | % | | | 0.37 | % |
Ratio of Net Investment Income to Average Net Assets | | | 2.09 | % | | | 1.80 | % | | | 2.38 | % | | | 2.33 | % | | | 1.98 | % |
See page 1-2 for the Definitions of Abbreviations and Footnotes.
See accompanying Notes to Financial Statements.
72
DFA INVESTMENT DIMENSIONS GROUP INC.
FINANCIAL HIGHLIGHTS
(for a share outstanding throughout each period)
| | | | | | | | | | | | | | | | | | | | |
| | | U.S. Targeted Value Portfolio-Class R1 Shares | |
| | | Year
Ended
Oct 31,
2022 | | | Year
Ended
Oct 31,
2021 | | | Year
Ended
Oct 31,
2020 | | | Year
Ended
Oct 31,
2019 | | | Year
Ended
Oct 31,
2018 | |
Net Asset Value, Beginning of Year | | $ | 31.60 | | | $ | 18.57 | | | $ | 22.30 | | | $ | 23.45 | | | $ | 25.15 | |
| | | | | | | | | | | | | | | | | | | | |
Income from Investment Operations (A) | | | | | | | | | | | | | | | | | | | | |
Net Investment Income (Loss) | | | 0.41 | | | | 0.44 | | | | 0.30 | | | | 0.30 | | | | 0.28 | |
Net Gains (Losses) on Securities (Realized and Unrealized) | | | (0.88 | ) | | | 13.00 | | | | (3.19 | ) | | | (0.24 | ) | | | (0.63 | ) |
| | | | | | | | | | | | | | | | | | | | |
Total from Investment Operations | | | (0.47 | ) | | | 13.44 | | | | (2.89 | ) | | | 0.06 | | | | (0.35 | ) |
| | | | | | | | | | | | | | | | | | | | |
Less Distributions: | | | | | | | | | | | | | | | | | | | | |
Net Investment Income | | | (0.36 | ) | | | (0.41 | ) | | | (0.27 | ) | | | (0.27 | ) | | | (0.26 | ) |
Net Realized Gains | | | (2.03 | ) | | | — | | | | (0.57 | ) | | | (0.94 | ) | | | (1.09 | ) |
| | | | | | | | | | | | | | | | | | | | |
Total Distributions | | | (2.39 | ) | | | (0.41 | ) | | | (0.84 | ) | | | (1.21 | ) | | | (1.35 | ) |
| | | | | | | | | | | | | | | | | | | | |
Net Asset Value, End of Year | | $ | 28.74 | | | $ | 31.60 | | | $ | 18.57 | | | $ | 22.30 | | | $ | 23.45 | |
| | | | | | | | | | | | | | | | | | | | |
Total Return | | | (1.48 | %) | | | 72.74 | % | | | (13.34 | %) | | | 0.78 | % | | | (1.61 | %) |
| | | | | | | | | | | | | | | | | | | | |
Net Assets, End of Year (thousands) | | $ | 32,553 | | | $ | 70,291 | | | $ | 31,832 | | | $ | 56,378 | | | $ | 47,848 | |
Ratio of Expenses to Average Net Assets | | | 0.40 | % | | | 0.43 | % | | | 0.47 | % | | | 0.48 | % | | | 0.47 | % |
Ratio of Net Investment Income to Average Net Assets | | | 1.38 | % | | | 1.52 | % | | | 1.56 | % | | | 1.34 | % | | | 1.10 | % |
Portfolio Turnover Rate | | | 18 | % | | | 13 | % | | | 20 | % | | | 16 | % | | | 23 | % |
See page 1-2 for the Definitions of Abbreviations and Footnotes.
See accompanying Notes to Financial Statements.
73
DFA INVESTMENT DIMENSIONS GROUP INC.
FINANCIAL HIGHLIGHTS
(for a share outstanding throughout each period)
| | | | | | | | | | | | | | | | | | | | |
| | | U.S. Targeted Value Portfolio-Class R2 Shares | |
| | | Year
Ended
Oct 31,
2022 | | | Year
Ended
Oct 31,
2021 | | | Year
Ended
Oct 31,
2020 | | | Year
Ended
Oct 31,
2019 | | | Year
Ended
Oct 31,
2018 | |
Net Asset Value, Beginning of Year | | $ | 31.44 | | | $ | 18.48 | | | $ | 22.18 | | | $ | 23.32 | | | $ | 25.03 | |
| | | | | | | | | | | | | | | | | | | | |
Income from Investment Operations (A) | | | | | | | | | | | | | | | | | | | | |
Net Investment Income (Loss) | | | 0.36 | | | | 0.39 | | | | 0.27 | | | | 0.27 | | | | 0.24 | |
Net Gains (Losses) on Securities (Realized and Unrealized) | | | (0.86 | ) | | | 12.94 | | | | (3.16 | ) | | | (0.23 | ) | | | (0.63 | ) |
| | | | | | | | | | | | | | | | | | | | |
Total from Investment Operations | | | (0.50 | ) | | | 13.33 | | | | (2.89 | ) | | | 0.04 | | | | (0.39 | ) |
| | | | | | | | | | | | | | | | | | | | |
Less Distributions: | | | | | | | | | | | | | | | | | | | | |
Net Investment Income | | | (0.33 | ) | | | (0.37 | ) | | | (0.24 | ) | | | (0.24 | ) | | | (0.23 | ) |
| | | | | | | | | | | | | | | | | | | | |
Net Realized Gains | | | (2.03 | ) | | | — | | | | (0.57 | ) | | | (0.94 | ) | | | (1.09 | ) |
| | | | | | | | | | | | | | | | | | | | |
Total Distributions | | | (2.36 | ) | | | (0.37 | ) | | | (0.81 | ) | | | (1.18 | ) | | | (1.32 | ) |
| | | | | | | | | | | | | | | | | | | | |
Net Asset Value, End of Year | | $ | 28.58 | | | $ | 31.44 | | | $ | 18.48 | | | $ | 22.18 | | | $ | 23.32 | |
| | | | | | | | | | | | | | | | | | | | |
Total Return | | | (1.62 | %) | | | 72.45 | % | | | (13.42 | %) | | | 0.64 | % | | | (1.79 | %) |
Net Assets, End of Year (thousands) | | $ | 74,146 | | | $ | 73,279 | | | $ | 52,931 | | | $ | 72,669 | | | $ | 108,168 | |
Ratio of Expenses to Average Net Assets | | | 0.54 | % | | | 0.58 | % | | | 0.62 | % | | | 0.63 | % | | | 0.62 | % |
Ratio of Net Investment Income to Average Net Assets | | | 1.24 | % | | | 1.41 | % | | | 1.39 | % | | | 1.21 | % | | | 0.95 | % |
Portfolio Turnover Rate | | | 18 | % | | | 13 | % | | | 20 | % | | | 16 | % | | | 23 | % |
See page 1-2 for the Definitions of Abbreviations and Footnotes.
See accompanying Notes to Financial Statements.
74
DFA INVESTMENT DIMENSIONS GROUP INC.
FINANCIAL HIGHLIGHTS
(for a share outstanding throughout each period)
| | | | | | | | | | | | | | | | | | | | |
| | | U.S. Targeted Value Portfolio-Institutional Class Shares | |
| | | Year
Ended
Oct 31,
2022 | | | Year
Ended
Oct 31,
2021 | | | Year
Ended
Oct 31,
2020 | | | Year
Ended
Oct 31,
2019 | | | Year
Ended
Oct 31,
2018 | |
Net Asset Value, Beginning of Year | | $ | 31.61 | | | $ | 18.57 | | | $ | 22.31 | | | $ | 23.46 | | | $ | 25.16 | |
| | | | | | | | | | | | | | | | | | | | |
Income from Investment Operations (A) | | | | | | | | | | | | | | | | | | | | |
Net Investment Income (Loss) | | | 0.43 | | | | 0.46 | | | | 0.31 | | | | 0.32 | | | | 0.30 | |
Net Gains (Losses) on Securities (Realized and Unrealized) | | | (0.87 | ) | | | 13.02 | | | | (3.19 | ) | | | (0.23 | ) | | | (0.63 | ) |
| | | | | | | | | | | | | | | | | | | | |
Total from Investment Operations | | | (0.44 | ) | | | 13.48 | | | | (2.88 | ) | | | 0.09 | | | | (0.33 | ) |
| | | | | | | | | | | | | | | | | | | | |
Less Distributions: | | | | | | | | | | | | | | | | | | | | |
Net Investment Income | | | (0.40 | ) | | | (0.44 | ) | | | (0.29 | ) | | | (0.30 | ) | | | (0.28 | ) |
Net Realized Gains | | | (2.03 | ) | | | — | | | | (0.57 | ) | | | (0.94 | ) | | | (1.09 | ) |
| | | | | | | | | | | | | | | | | | | | |
Total Distributions | | | (2.43 | ) | | | (0.44 | ) | | | (0.86 | ) | | | (1.24 | ) | | | (1.37 | ) |
| | | | | | | | | | | | | | | | | | | | |
Net Asset Value, End of Year | | $ | 28.74 | | | $ | 31.61 | | | $ | 18.57 | | | $ | 22.31 | | | $ | 23.46 | |
| | | | | | | | | | | | | | | | | | | | |
Total Return | | | (1.39 | %) | | | 72.95 | % | | | (13.27 | %) | | | 0.88 | % | | | (1.52 | %) |
| | | | | | | | | | | | | | | | | | | | |
Net Assets, End of Year (thousands) | | $ | 11,746,736 | | | $ | 12,591,768 | | | $ | 8,711,891 | | | $ | 10,655,324 | | | $ | 10,307,146 | |
Ratio of Expenses to Average Net Assets | | | 0.30 | % | | | 0.33 | % | | | 0.37 | % | | | 0.38 | % | | | 0.37 | % |
Ratio of Net Investment Income to Average Net Assets | | | 1.47 | % | | | 1.65 | % | | | 1.65 | % | | | 1.45 | % | | | 1.20 | % |
Portfolio Turnover Rate | | | 18 | % | | | 13 | % | | | 20 | % | | | 16 | % | | | 23 | % |
See page 1-2 for the Definitions of Abbreviations and Footnotes.
See accompanying Notes to Financial Statements.
75
DFA INVESTMENT DIMENSIONS GROUP INC.
FINANCIAL HIGHLIGHTS
(for a share outstanding throughout each period)
| | | | | | | | | | | | | | | | | | | | | | | | | | | | | | | | | | | | | | | | |
| | | U.S. Small Cap Value Portfolio | | | U.S. Core Equity 1 Portfolio | |
| | | Year
Ended
Oct 31,
2022 | | | Year
Ended
Oct 31,
2021 | | | Year
Ended
Oct 31,
2020 | | | Year
Ended
Oct 31,
2019 | | | Year
Ended
Oct 31,
2018 | | | Year
Ended
Oct 31,
2022 | | | Year
Ended
Oct 31,
2021 | | | Year
Ended
Oct 31,
2020 | | | Year
Ended
Oct 31,
2019 | | | Year
Ended
Oct 31,
2018 | |
Net Asset Value, Beginning of Year | | $ | 46.33 | | | $ | 27.34 | | | $ | 32.79 | | | $ | 36.39 | | | $ | 39.07 | | | $ | 36.25 | | | $ | 25.24 | | | $ | 24.71 | | | $ | 22.77 | | | $ | 22.01 | |
| | | | | | | | | | | | | | | | | | | | | | | | | | | | | | | | | | | | | | | | |
Income from Investment Operations (A) | | | | | | | | | | | | | | | | | | | | | | | | | | | | | | | | | | | | | | | | |
Net Investment Income (Loss) | | | 0.68 | | | | 0.80 | | | | 0.44 | | | | 0.42 | | | | 0.39 | | | | 0.49 | | | | 0.44 | | | | 0.41 | | | | 0.40 | | | | 0.36 | |
Net Gains (Losses) on Securities (Realized and Unrealized) | | | (0.47 | ) | | | 18.98 | | | | (4.95 | ) | | | (1.69 | ) | | | (0.90 | ) | | | (4.65 | ) | | | 10.99 | | | | 0.93 | | | | 2.08 | | | | 0.88 | |
| | | | | | | | | | | | | | | | | | | | | | | | | | | | | | | | | | | | | | | | |
Total from Investment Operations | | | 0.21 | | | | 19.78 | | | | (4.51 | ) | | | (1.27 | ) | | | (0.51 | ) | | | (4.16 | ) | | | 11.43 | | | | 1.34 | | | | 2.48 | | | | 1.24 | |
| | | | | | | | | | | | | | | | | | | | | | | | | | | | | | | | | | | | | | | | |
Less Distributions: | | | | | | | | | | | | | | | | | | | | | | | | | | | | | | | | | | | | | | | | |
Net Investment Income | | | (0.67 | ) | | | (0.79 | ) | | | (0.38 | ) | | | (0.38 | ) | | | (0.37 | ) | | | (0.45 | ) | | | (0.42 | ) | | | (0.39 | ) | | | (0.40 | ) | | | (0.35 | ) |
Net Realized Gains | | | (3.86 | ) | | | — | | | | (0.56 | ) | | | (1.95 | ) | | | (1.80 | ) | | | (0.94 | ) | | | — | | | | (0.42 | ) | | | (0.14 | ) | | | (0.13 | ) |
| | | | | | | | | | | | | | | | | | | | | | | | | | | | | | | | | | | | | | | | |
Total Distributions | | | (4.53 | ) | | | (0.79 | ) | | | (0.94 | ) | | | (2.33 | ) | | | (2.17 | ) | | | (1.39 | ) | | | (0.42 | ) | | | (0.81 | ) | | | (0.54 | ) | | | (0.48 | ) |
| | | | | | | | | | | | | | | | | | | | | | | | | | | | | | | | | | | | | | | | |
Net Asset Value, End of Year | | $ | 42.01 | | | $ | 46.33 | | | $ | 27.34 | | | $ | 32.79 | | | $ | 36.39 | | | $ | 30.70 | | | $ | 36.25 | | | $ | 25.24 | | | $ | 24.71 | | | $ | 22.77 | |
| | | | | | | | | | | | | | | | | | | | | | | | | | | | | | | | | | | | | | | | |
Total Return | | | 0.58 | % | | | 73.01 | % | | | (14.11 | %) | | | (3.04 | %) | | | (1.48 | %) | | | (11.85 | %) | | | 45.50 | % | | | 5.55 | % | | | 11.18 | % | | | 5.59 | % |
| | | | | | | | | | | | | | | | | | | | | | | | | | | | | | | | | | | | | | | | |
Net Assets, End of Year (thousands) | | $ | 14,344,438 | | | $ | 15,145,347 | | | $ | 10,481,057 | | | $ | 13,766,513 | | | $ | 14,732,615 | | | $ | 28,055,282 | | | $ | 33,385,041 | | | $ | 24,427,934 | | | $ | 26,592,058 | | | $ | 23,629,726 | |
Ratio of Expenses to Average Net Assets | | | 0.33 | % | | | 0.42 | % | | | 0.52 | % | | | 0.53 | % | | | 0.52 | % | | | 0.14 | % | | | 0.15 | % | | | 0.18 | % | | | 0.20 | % | | | 0.19 | % |
Ratio of Expenses to Average Net Assets (Excluding Fees Waived, Expenses Reimbursed) | | | 0.33 | % | | | 0.42 | % | | | 0.52 | % | | | 0.53 | % | | | 0.52 | % | | | 0.14 | % | | | 0.15 | % | | | 0.18 | % | | | 0.20 | % | | | 0.19 | % |
Ratio of Net Investment Income to Average Net Assets | | | 1.62 | % | | | 1.94 | % | | | 1.56 | % | | | 1.26 | % | | | 1.00 | % | | | 1.48 | % | | | 1.34 | % | | | 1.69 | % | | | 1.72 | % | | | 1.55 | % |
Portfolio Turnover Rate | | | 23 | % | | | 22 | % | | | 18 | % | | | 19 | % | | | 27 | % | | | 5 | % | | | 4 | % | | | 3 | % | | | 5 | % | | | 3 | % |
See page 1-2 for the Definitions of Abbreviations and Footnotes.
See accompanying Notes to Financial Statements.
76
DFA INVESTMENT DIMENSIONS GROUP INC.
FINANCIAL HIGHLIGHTS
(for a share outstanding throughout each period)
| | | | | | | | | | | | | | | | | | | | | | | | | | | | | | | | | | | | | | | | |
| | | U.S. Core Equity 2 Portfolio | | | U.S. Vector Equity Portfolio | |
| | | Year
Ended
Oct 31,
2022 | | | Year
Ended
Oct 31,
2021 | | | Year
Ended
Oct 31,
2020 | | | Year
Ended
Oct 31,
2019 | | | Year
Ended
Oct 31,
2018 | | | Year
Ended
Oct 31,
2022 | | | Year
Ended
Oct 31,
2021 | | | Year
Ended
Oct 31,
2020 | | | Year
Ended
Oct 31,
2019 | | | Year
Ended
Oct 31,
2018 | |
Net Asset Value, Beginning of Year | | $ | 33.16 | | | $ | 22.79 | | | $ | 22.66 | | | $ | 21.25 | | | $ | 20.90 | | | $ | 26.02 | | | $ | 17.00 | | | $ | 18.71 | | | $ | 18.40 | | | $ | 19.16 | |
| | | | | | | | | | | | | | | | | | | | | | | | | | | | | | | | | | | | | | | | |
Income from Investment Operations (A) | | | | | | | | | | | | | | | | | | | | | | | | | | | | | | | | | | | | | | | | |
Net Investment Income (Loss) | | | 0.42 | | | | 0.39 | | | | 0.36 | | | | 0.36 | | | | 0.34 | | | | 0.35 | | | | 0.31 | | | | 0.27 | | | | 0.28 | | | | 0.26 | |
Net Gains (Losses) on Securities (Realized and Unrealized) | | | (3.98 | ) | | | 10.35 | | | | 0.60 | | | | 1.65 | | | | 0.53 | | | | (2.17 | ) | | | 9.00 | | | | (1.40 | ) | | | 0.72 | | | | (0.10 | ) |
| | | | | | | | | | | | | | | | | | | | | | | | | | | | | | | | | | | | | | | | |
Total from Investment Operations | | | (3.56 | ) | | | 10.74 | | | | 0.96 | | | | 2.01 | | | | 0.87 | | | | (1.82 | ) | | | 9.31 | | | | (1.13 | ) | | | 1.00 | | | | 0.16 | |
| | | | | | | | | | | | | | | | | | | | | | | | | | | | | | | | | | | | | | | | |
Less Distributions: | | | | | | | | | | | | | | | | | | | | | | | | | | | | | | | | | | | | | | | | |
Net Investment Income | | | (0.39 | ) | | | (0.37 | ) | | | (0.33 | ) | | | (0.37 | ) | | | (0.32 | ) | | | (0.32 | ) | | | (0.29 | ) | | | (0.25 | ) | | | (0.27 | ) | | | (0.25 | ) |
Net Realized Gains | | | (1.20 | ) | | | — | | | | (0.50 | ) | | | (0.23 | ) | | | (0.20 | ) | | | (1.63 | ) | | | — | | | | (0.33 | ) | | | (0.42 | ) | | | (0.67 | ) |
| | | | | | | | | | | | | | | | | | | | | | | | | | | | | | | | | | | | | | | | |
Total Distributions | | | (1.59 | ) | | | (0.37 | ) | | | (0.83 | ) | | | (0.60 | ) | | | (0.52 | ) | | | (1.95 | ) | | | (0.29 | ) | | | (0.58 | ) | | | (0.69 | ) | | | (0.92 | ) |
| | | | | | | | | | | | | | | | | | | | | | | | | | | | | | | | | | | | | | | | |
Net Asset Value, End of Year | | $ | 28.01 | | | $ | 33.16 | | | $ | 22.79 | | | $ | 22.66 | | | $ | 21.25 | | | $ | 22.25 | | | $ | 26.02 | | | $ | 17.00 | | | $ | 18.71 | | | $ | 18.40 | |
| | | | | | | | | | | | | | | | | | | | | | | | | | | | | | | | | | | | | | | | |
Total Return | | | (11.19 | %) | | | 47.35 | % | | | 4.37 | % | | | 9.78 | % | | | 4.16 | % | | | (7.42 | %) | | | 54.98 | % | | | (6.12 | %) | | | 5.92 | % | | | 0.69 | % |
| | | | | | | | | | | | | | | | | | | | | | | | | | | | | | | | | | | | | | | | |
Net Assets, End of Year (thousands) | | $ | 29,273,947 | | | $ | 35,148,897 | | | $ | 25,670,305 | | | $ | 27,829,155 | | | $ | 24,677,650 | | | $ | 4,425,060 | | | $ | 5,182,775 | | | $ | 3,612,716 | | | $ | 4,583,612 | | | $ | 4,610,769 | |
Ratio of Expenses to Average Net Assets | | | 0.18 | % | | | 0.19 | % | | | 0.21 | % | | | 0.22 | % | | | 0.22 | % | | | 0.28 | % | | | 0.29 | % | | | 0.32 | % | | | 0.33 | % | | | 0.32 | % |
Ratio of Expenses to Average Net Assets (Excluding Fees Waived, Expenses Reimbursed) | | | 0.18 | % | | | 0.19 | % | | | 0.21 | % | | | 0.22 | % | | | 0.22 | % | | | 0.28 | % | | | 0.29 | % | | | 0.32 | % | | | 0.33 | % | | | 0.32 | % |
Ratio of Net Investment Income to Average Net Assets | | | 1.41 | % | | | 1.29 | % | | | 1.63 | % | | | 1.69 | % | | | 1.53 | % | | | 1.49 | % | | | 1.31 | % | | | 1.59 | % | | | 1.53 | % | | | 1.35 | % |
Portfolio Turnover Rate | | | 5 | % | | | 5 | % | | | 3 | % | | | 6 | % | | | 5 | % | | | 10 | % | | | 10 | % | | | 13 | % | | | 6 | % | | | 10 | % |
See page 1-2 for the Definitions of Abbreviations and Footnotes.
See accompanying Notes to Financial Statements.
77
DFA INVESTMENT DIMENSIONS GROUP INC.
FINANCIAL HIGHLIGHTS
(for a share outstanding throughout each period)
| | | | | | | | | | | | | | | | | | | | | | | | | | | | | | | | | | | | | | | | |
| | | U.S. Small Cap Portfolio | | | U.S. Micro Cap Portfolio | |
| | | Year
Ended
Oct 31,
2022 | | | Year
Ended
Oct 31,
2021 | | | Year
Ended
Oct 31,
2020 | | | Year
Ended
Oct 31,
2019 | | | Year
Ended
Oct 31,
2018 | | | Year
Ended
Oct 31,
2022 | | | Year
Ended
Oct 31,
2021 | | | Year
Ended
Oct 31,
2020 | | | Year
Ended
Oct 31,
2019 | | | Year
Ended
Oct 31,
2018 | |
Net Asset Value, Beginning of Year | | $ | 48.50 | | | $ | 31.00 | | | $ | 33.80 | | | $ | 35.02 | | | $ | 36.48 | | | $ | 29.55 | | | $ | 18.19 | | | $ | 20.78 | | | $ | 21.88 | | | $ | 22.76 | |
| | | | | | | | | | | | | | | | | | | | | | | | | | | | | | | | | | | | | | | | |
Income from Investment Operations (A) | | | | | | | | | | | | | | | | | | | | | | | | | | | | | | | | | | | | | | | | |
Net Investment Income (Loss) | | | 0.48 | | | | 0.50 | | | | 0.35 | | | | 0.38 | | | | 0.39 | | | | 0.27 | | | | 0.24 | | | | 0.18 | | | | 0.20 | | | | 0.17 | |
Net Gains (Losses) on Securities (Realized and Unrealized) | | | (4.93 | ) | | | 17.50 | | | | (2.02 | ) | | | (0.05 | ) | | | (0.08 | ) | | | (2.41 | ) | | | 11.37 | | | | (2.18 | ) | | | (0.26 | ) | | | 0.12 | |
| | | | | | | | | | | | | | | | | | | | | | | | | | | | | | | | | | | | | | | | |
Total from Investment Operations | | | (4.45 | ) | | | 18.00 | | | | (1.67 | ) | | | 0.33 | | | | 0.31 | | | | (2.14 | ) | | | 11.61 | | | | (2.00 | ) | | | (0.06 | ) | | | 0.29 | |
| | | | | | | | | | | | | | | | | | | | | | | | | | | | | | | | | | | | | | | | |
Less Distributions: | | | | | | | | | | | | | | | | | | | | | | | | | | | | | | | | | | | | | | | | |
Net Investment Income | | | (0.45 | ) | | | (0.50 | ) | | | (0.32 | ) | | | (0.35 | ) | | | (0.37 | ) | | | (0.26 | ) | | | (0.25 | ) | | | (0.16 | ) | | | (0.18 | ) | | | (0.16 | ) |
Net Realized Gains | | | (2.54 | ) | | | — | | | | (0.81 | ) | | | (1.20 | ) | | | (1.40 | ) | | | (2.70 | ) | | | — | | | | (0.43 | ) | | | (0.86 | ) | | | (1.01 | ) |
| | | | | | | | | | | | | | | | | | | | | | | | | | | | | | | | | | | | | | | | |
Total Distributions | | | (2.99 | ) | | | (0.50 | ) | | | (1.13 | ) | | | (1.55 | ) | | | (1.77 | ) | | | (2.96 | ) | | | (0.25 | ) | | | (0.59 | ) | | | (1.04 | ) | | | (1.17 | ) |
| | | | | | | | | | | | | | | | | | | | | | | | | | | | | | | | | | | | | | | | |
Net Asset Value, End of Year | | $ | 41.06 | | | $ | 48.50 | | | $ | 31.00 | | | $ | 33.80 | | | $ | 35.02 | | | $ | 24.45 | | | $ | 29.55 | | | $ | 18.19 | | | $ | 20.78 | | | $ | 21.88 | |
| | | | | | | | | | | | | | | | | | | | | | | | | | | | | | | | | | | | | | | | |
Total Return | | | (9.62 | %) | | | 58.30 | % | | | (5.08 | %) | | | 1.41 | % | | | 0.77 | % | | | (7.93 | %) | | | 64.00 | % | | | (9.87 | %) | | | 0.24 | % | | | 1.29 | % |
| | | | | | | | | | | | | | | | | | | | | | | | | | | | | | | | | | | | | | | | |
Net Assets, End of Year (thousands) | | $ | 13,883,602 | | | $ | 16,747,405 | | | $ | 13,189,730 | | | $ | 17,392,495 | | | $ | 17,303,451 | | | $ | 6,475,434 | | | $ | 7,453,865 | | | $ | 5,120,258 | | | $ | 6,351,299 | | | $ | 6,478,316 | |
Ratio of Expenses to Average Net Assets | | | 0.29 | % | | | 0.33 | % | | | 0.36 | % | | | 0.37 | % | | | 0.37 | % | | | 0.41 | % | | | 0.46 | % | | | 0.52 | % | | | 0.53 | % | | | 0.52 | % |
Ratio of Expenses to Average Net Assets (Excluding Fees Waived, Expenses Reimbursed) | | | 0.29 | % | | | 0.33 | % | | | 0.36 | % | | | 0.37 | % | | | 0.37 | % | | | 0.41 | % | | | 0.46 | % | | | 0.52 | % | | | 0.53 | % | | | 0.52 | % |
Ratio of Net Investment Income to Average Net Assets | | | 1.12 | % | | | 1.13 | % | | | 1.15 | % | | | 1.13 | % | | | 1.06 | % | | | 1.08 | % | | | 0.90 | % | | | 1.00 | % | | | 0.98 | % | | | 0.74 | % |
Portfolio Turnover Rate | | | 13 | % | | | 12 | % | | | 3 | % | | | 8 | % | | | 13 | % | | | 22 | % | | | 20 | % | | | 11 | % | | | 15 | % | | | 19 | % |
See page 1-2 for the Definitions of Abbreviations and Footnotes.
See accompanying Notes to Financial Statements.
78
DFA INVESTMENT DIMENSIONS GROUP INC.
FINANCIAL HIGHLIGHTS
(for a share outstanding throughout each period)
| | | | | | | | | | | | | | | | | | | | | | | | | | | | | | | | | | | | | | | | |
| | | U.S. High Relative Profitability Portfolio | | | DFA Real Estate Securities Portfolio | |
| | | Year
Ended
Oct 31,
2022 | | | Year
Ended
Oct 31,
2021 | | | Year
Ended
Oct 31,
2020 | | | Year
Ended
Oct 31,
2019 | | | Year
Ended
Oct 31,
2018 | | | Year
Ended
Oct 31,
2022 | | | Year
Ended
Oct 31,
2021 | | | Year
Ended
Oct 31,
2020 | | | Year
Ended
Oct 31,
2019 | | | Year
Ended
Oct 31,
2018 | |
Net Asset Value, Beginning of Year | | $ | 19.51 | | | $ | 14.61 | | | $ | 13.51 | | | $ | 11.85 | | | $ | 10.93 | | | $ | 48.90 | | | $ | 34.21 | | | $ | 41.90 | | | $ | 34.14 | | | $ | 34.99 | |
| | | | | | | | | | | | | | | | | | | | | | | | | | | | | | | | | | | | | | | | |
Income from Investment Operations (A) | | | | | | | | | | | | | | | | | | | | | | | | | | | | | | | | | | | | | | | | |
Net Investment Income (Loss) | | | 0.29 | | | | 0.26 | | | | 0.25 | | | | 0.22 | | | | 0.19 | | | | 0.89 | | | | 0.90 | | | | 1.01 | | | | 0.52 | ** | | | 1.60 | |
Net Gains (Losses) on Securities (Realized and Unrealized) | | | (1.91 | ) | | | 4.89 | | | | 1.07 | | | | 1.64 | | | | 0.89 | | | | (10.10 | ) | | | 14.86 | | | | (7.77 | ) | | | 8.09 | ** | | | (0.69 | ) |
| | | | | | | | | | | | | | | | | | | | | | | | | | | | | | | | | | | | | | | | |
Total from Investment Operations | | | (1.62 | ) | | | 5.15 | | | | 1.32 | | | | 1.86 | | | | 1.08 | | | | (9.21 | ) | | | 15.76 | | | | (6.76 | ) | | | 8.61 | | | | 0.91 | |
| | | | | | | | | | | | | | | | | | | | | | | | | | | | | | | | | | | | | | | | |
Less Distributions: | | | | | | | | | | | | | | | | | | | | | | | | | | | | | | | | | | | | | | | | |
Net Investment Income | | | (0.27 | ) | | | (0.25 | ) | | | (0.22 | ) | | | (0.20 | ) | | | (0.16 | ) | | | (0.79 | ) | | | (0.95 | ) | | | (0.87 | ) | | | (0.85 | ) | | | (1.65 | ) |
Net Realized Gains | | | (0.39 | ) | | | — | | | | — | | | | — | | | | — | | | | (0.51 | ) | | | (0.12 | ) | | | (0.06 | ) | | | — | | | | (0.11 | ) |
| | | | | | | | | | | | | | | | | | | | | | | | | | | | | | | | | | | | | | | | |
Total Distributions | | | (0.66 | ) | | | (0.25 | ) | | | (0.22 | ) | | | (0.20 | ) | | | (0.16 | ) | | | (1.30 | ) | | | (1.07 | ) | | | (0.93 | ) | | | (0.85 | ) | | | (1.76 | ) |
| | | | | | | | | | | | | | | | | | | | | | | | | | | | | | | | | | | | | | | | |
Net Asset Value, End of Year | | $ | 17.23 | | | $ | 19.51 | | | $ | 14.61 | | | $ | 13.51 | | | $ | 11.85 | | | $ | 38.39 | | | $ | 48.90 | | | $ | 34.21 | | | $ | 41.90 | | | $ | 34.14 | |
| | | | | | | | | | | | | | | | | | | | | | | | | | | | | | | | | | | | | | | | |
Total Return | | | (8.55 | %) | | | 35.42 | % | | | 9.90 | % | | | 15.88 | % | | | 9.88 | % | | | (19.38 | %) | | | 47.01 | % | | | (16.27 | %) | | | 25.64 | % | | | 2.63 | % |
| | | | | | | | | | | | | | | | | | | | | | | | | | | | | | | | | | | | | | | | |
Net Assets, End of Year (thousands) | | $ | 4,662,298 | | | $ | 5,835,637 | | | $ | 3,629,125 | | | $ | 1,703,302 | | | $ | 722,728 | | | $ | 8,068,926 | | | $ | 11,215,098 | | | $ | 8,137,555 | | | $ | 10,671,437 | | | $ | 8,577,658 | |
Ratio of Expenses to Average Net Assets | | | 0.23 | % | | | 0.24 | % | | | 0.25 | % | | | 0.25 | % | | | 0.25 | % | | | 0.18 | % | | | 0.18 | % | | | 0.18 | % | | | 0.18 | % | | | 0.18 | % |
Ratio of Expenses to Average Net Assets (Excluding Fees Waived, Expenses Reimbursed by Advisor) | | | 0.23 | % | | | 0.24 | % | | | 0.25 | % | | | 0.25 | % | | | 0.27 | % | | | 0.20 | % | | | 0.20 | % | | | 0.20 | % | | | 0.20 | % | | | 0.19 | % |
Ratio of Net Investment Income to Average Net Assets | | | 1.61 | % | | | 1.46 | % | | | 1.76 | % | | | 1.73 | % | | | 1.58 | % | | | 1.96 | % | | | 2.12 | % | | | 2.73 | % | | | 1.38 | %** | | | 4.66 | % |
Portfolio Turnover Rate | | | 20 | % | | | 12 | % | | | 0 | % | | | 4 | % | | | 7 | % | | | 3 | % | | | 5 | % | | | 5 | % | | | 3 | % | | | 3 | % |
See page 1-2 for the Definitions of Abbreviations and Footnotes.
See accompanying Notes to Financial Statements.
79
DFA INVESTMENT DIMENSIONS GROUP INC.
NOTES TO FINANCIAL STATEMENTS
A. Organization:
DFA Investment Dimensions Group Inc. (the “Fund”) is an open-end management investment company registered under the Investment Company Act of 1940 (the “1940 Act”), whose shares are generally offered to institutional investors, retirement plans and clients of registered investment advisors. The Fund consists of one hundred and two operational portfolios, of which twelve (the “Portfolios”) are included in this section of the report. The remaining operational portfolios are presented in separate reports. The Portfolios are investment companies, and accordingly, follow the accounting and reporting guidance under the Financial Accounting Standards Board (“FASB”) Accounting Standards Codification (“ASC”), Topic 946, “Financial Services-Investment Companies.”
Of the Portfolios, one (the “Feeder Fund”) invests all of its assets in a corresponding series (the “Master Fund” which is treated as a partnership for federal income tax purposes) of The DFA Investment Trust Company (“DFAITC”). As of October 31, 2022, the Feeder Fund was the owner of record of the approximate percentage of the total outstanding shares of the Master Fund as detailed below:
| | | | | | |
Feeder Fund | | Master Fund | | Percentage
Ownership
at 10/31/22 | |
U.S. Large Cap Value Portfolio | | The U.S. Large Cap Value Series | | | 86 | % |
To achieve its investment objective, the Feeder Fund invests substantially all of its assets in the Master Fund as indicated above. The Feeder Fund also invests in short-term temporary cash investments and futures.
The financial statements of the Master Fund are included elsewhere in this report and should be read in conjunction with the financial statements of the Feeder Fund.
B. Significant Accounting Policies:
The following significant accounting policies are in conformity with accounting principles generally accepted in the United States of America (“GAAP”). Such policies are consistently followed by the Fund in preparation of its financial statements. The preparation of financial statements in accordance with GAAP requires management to make estimates and assumptions that affect the fair value of investments, the reported amounts of assets and liabilities, the disclosure of contingent assets and liabilities at the date of the financial statements, and the reported amounts of increases and decreases in net assets from operations during the reporting period. Actual results could differ from those estimates, and those differences could be material.
1. Security Valuation: The Portfolios use a fair value hierarchy, which prioritizes the inputs-to-valuation techniques used to measure fair value into three broad levels described below:
| | • | | Level 1 – inputs are quoted prices in active markets for identical securities (including equity securities, open-end investment companies, and futures contracts) |
| | • | | Level 2 – other significant observable inputs (including quoted prices for similar securities, interest rates, prepayment speeds, credit risk, etc.) |
| | • | | Level 3 – significant unobservable inputs (including the Portfolios’ own assumptions in determining the fair value of investments) |
Securities held by Enhanced U.S. Large Company Portfolio, U.S. Large Cap Equity Portfolio, U.S. Targeted Value Portfolio, U.S. Small Cap Value Portfolio, U.S. Core Equity 1 Portfolio, U.S. Core Equity 2 Portfolio, U.S. Vector Equity Portfolio, U.S. Small Cap Portfolio, U.S. Micro Cap Portfolio, DFA Real Estate Securities Portfolio and U.S. High Relative Profitability Portfolio (collectively, the “Domestic Equity Portfolios”) including over-the-counter securities, are valued at the last quoted sale price of the day. Securities held by the Domestic Equity Portfolios that are listed on Nasdaq are valued at the Nasdaq Official Closing Price (“NOCP”). If there is no last reported sale price or NOCP for the day, the Domestic Equity Portfolios value the securities within the range of the most recent quoted
80
bid and ask prices. Price information on listed securities is taken from the exchange where the security is primarily traded. Generally, securities issued by open-end management investment companies are valued using their respective net asset values or public offering prices, as appropriate, for purchase orders placed at the close of the New York Stock Exchange (NYSE). These securities are generally categorized as Level 1 in the hierarchy.
Securities for which no market quotations are readily available (including restricted securities), or for which market quotations have become unreliable, are valued in good faith at fair value in accordance with Rule 2a-5 under the 1940 Act pursuant to procedures approved by the Board of Directors of the Fund. Fair value pricing may also be used if events that have a significant effect on the value of an investment (as determined in the discretion of Dimensional Fund Advisors LP) occur before the net asset value of the Portfolio is calculated. When fair value pricing is used, the prices of securities used by the Domestic Equity Portfolios may differ from the quoted or published prices for the same securities on their primary markets or exchanges. These securities are generally categorized as Level 2 or Level 3 in the hierarchy.
Debt securities held by the Portfolios are valued on the basis of evaluated prices provided by one or more pricing services or other reasonably reliable sources including broker/dealers that typically handle the purchase and sale of such securities. Securities that are traded over-the-counter and on a stock exchange generally will be valued according to the broadest and most representative market, and it is expected that for bonds and other fixed income securities, this ordinarily will be the over-the-counter market. These valuations are generally categorized as Level 2 or Level 3 in the hierarchy.
Listed derivatives, such as futures, that are actively traded are valued based on quoted prices from the exchange and are categorized as Level 1 in the hierarchy. Over-the-counter derivative contracts, which include forward currency contracts, do not require material subjectivity as pricing inputs are observed from quoted markets and are categorized as Level 2 in the hierarchy.
Shares held by the Portfolios in other investment companies (such as the Master Fund) are valued at their respective daily net asset values as reported by their administrator. The Feeder Fund’s investment in the Master Fund reflects its proportionate interest in the net assets of the Master Fund. These valuations are classified as Level 1 in the hierarchy.
A summary of the inputs used to value the Portfolios’ investments by each major security type, industry and/or country is disclosed previously in this note. A valuation hierarchy table has been included at the end of the Summary Schedule of Portfolio Holdings/Schedule of Investments (except for the Feeder Fund). The methodology or inputs used for valuing securities are not necessarily an indication of the risk associated with investing in those securities.
2. Foreign Currency Translation: Securities and other assets and liabilities of the Enhanced U.S. Large Company Portfolio whose values are initially expressed in foreign currencies are translated to U.S. dollars using the mean between the most recent bid and ask prices for the U.S. dollar as quoted by generally recognized reliable sources. To facilitate the translation, the Portfolio enters into foreign currency contracts. A foreign currency contract is a spot agreement between two parties to buy and sell currencies at current market exchange rates, for settlement generally within two business days. Dividend and interest income and certain expenses are translated to U.S. dollars at the rate of exchange on their respective accrual dates. Receivables and payables denominated in foreign currencies are marked-to-market daily based on daily exchange rates and exchange gains or losses are realized upon ultimate receipt or disbursement. The Portfolio also enters into forward currency contracts solely for the purpose of hedging against fluctuations in currency exchange rates. These contracts are marked-to-market daily based on daily forward exchange rates.
The Enhanced U.S. Large Company Portfolio isolates the effect of foreign currency rate fluctuations when determining the realized gain or loss upon the sale or maturity of foreign currency-denominated debt obligations pursuant to U.S. Federal income tax regulations; such amounts are categorized as foreign exchange gain or loss for income tax reporting purposes.
81
Realized gains or losses on foreign currency transactions represent net foreign exchange gains or losses from the disposition of foreign currencies, currency gains or losses realized between the trade and settlement dates of securities transactions, and the difference between amounts of interest, dividends and any foreign withholding taxes recorded on the books of the Enhanced U.S. Large Company Portfolio and the U.S. dollar equivalent amounts actually received or paid.
3. Deferred Compensation Plan: Each eligible Director of the Fund may elect to participate in the Fee Deferral Plan for Independent Directors and Trustees (the “Plan”). Under the Plan, effective January 1, 2002, such Directors may defer payment of all or a portion of their total fees earned as a Director. These deferred amounts may be treated as though such amounts had been invested in shares of the following funds: the U.S. Large Cap Value Portfolio, U.S. Core Equity 1 Portfolio, U.S. Large Company Portfolio, U.S. Vector Equity Portfolio, U.S. Micro Cap Portfolio, DFA International Value Portfolio, International Core Equity Portfolio, Emerging Markets Portfolio, Emerging Markets Core Equity Portfolio, DFA Inflation-Protected Securities Portfolio, and/or DFA Two-Year Global Fixed Income Portfolio. Contributions made under the Plan and the change in unrealized appreciation (depreciation) and income are included in Directors’/ Trustees’ Fees & Expenses.
The Directors may receive their distributions of proceeds by one of the following methods: lump sum, annual installments over a period of agreed-upon years, or quarterly installments over a period of agreed-upon years. Each Director shall have the right in a notice of election (the “Notice”) to defer the receipt of the Director’s deferred compensation until a date specified by such Director in the Notice. The date may not be sooner than the earlier of: (i) the first business day of January following the year in which such Director ceases to be a member of the Board of Directors of the Fund; and (ii) five years following the effective date of the Director’s first deferral election. If a Director who elects to defer fees fails to designate in the Notice a time or date as of which payment of the Director’s deferred fee account shall commence, payment of such amount shall commence as of the first business day of January following the year in which the Director ceases to be a member of the Board (unless the Director files an amended Notice selecting a different distribution date).
4. Other: Security transactions are accounted for as of the trade date. Costs used in determining realized gains and losses on the sale of investment securities/affiliated investment companies and foreign currency are accounted for on the basis of identified cost. Dividend income and distributions to shareholders are recorded on the ex-dividend date. Distributions received on securities and from the investment in affiliated investment companies that represent a return of capital or capital gains are recorded as a reduction of cost of investments or as a realized gain, respectively. The Portfolios estimate the character of received distributions that may be considered return of capital distributions. Interest income is recorded on an accrual basis. Discount and premium on debt securities purchased are amortized over the lives of the respective securities, using the effective interest method. Expenses directly attributable to a Portfolio are directly charged. Common expenses of the Fund or the Portfolios are allocated using methods approved by the Board, generally based on average net assets.
Organizational costs are expensed during the fiscal year of inception of the Portfolios. Offering costs are amortized over a twelve-month period from the inception of the Portfolios.
Class R1 Shares, Class R2 Shares and Institutional Class Shares have equal rights to assets and earnings of a Portfolio. Income, gains and losses, and common expenses of a Portfolio are allocated to each class of shares based on its relative net assets. Each class will bear its own class-specific expenses, if any.
The Feeder Fund recognizes its pro-rata shares of net investment income and realized and unrealized gains/losses on a daily basis from its Master Fund within DFAITC, which is treated as a partnership for federal income tax purposes.
The Portfolios may be subject to taxes imposed by countries in which they invest with respect to their investments in issuers existing or operating in such countries. Such taxes are generally based on income earned or repatriated and capital gains realized on the sale of such investments. The Portfolios accrue such taxes when the related income or capital gains are earned or throughout the holding period. Some countries require governmental approval for the repatriation of investment income, capital or the proceeds of sales earned by foreign investors. Additionally, if there is a deterioration in a country’s balance of payments or for other reasons, a country may impose temporary restrictions on foreign capital remittances abroad.
82
C. Investment Advisor:
The Advisor, Dimensional Fund Advisors LP, provides investment management services to the Portfolios. For the year ended October 31, 2022, the Portfolios’ investment management fees were accrued daily and paid monthly to the Advisor based on the following effective annual rates of average daily net assets:
| | | | |
Enhanced U.S. Large Company Portfolio | | | 0.12 | % |
U.S. Large Cap Equity Portfolio | | | 0.10 | % |
U.S. Large Cap Value Portfolio | | | 0.19 | % |
U.S. Targeted Value Portfolio | | | 0.28 | %* |
U.S. Small Cap Value Portfolio | | | 0.31 | %* |
U.S. Core Equity 1 Portfolio | | | 0.12 | % |
U.S. Core Equity 2 Portfolio | | | 0.16 | % |
U.S. Vector Equity Portfolio | | | 0.25 | % |
U.S. Small Cap Portfolio | | | 0.27 | %* |
U.S. Micro Cap Portfolio | | | 0.39 | %* |
U.S. High Relative Profitability Portfolio | | | 0.19 | %* |
DFA Real Estate Securities Portfolio | | | 0.17 | % |
| * | Effective as of February 28, 2022, the management fees payable by the following Portfolios were reduced as follows: |
| | | | | | | | |
| Portfolio | | Management Fee Prior to February 28, 2022 | | | Management Fee Effective February 28, 2022 | |
U.S. Targeted Value Portfolio | | | 0.30 | % | | | 0.27 | % |
U.S. Small Cap Value Portfolio | | | 0.36 | % | | | 0.28 | % |
U.S. Small Cap Portfolio | | | 0.30 | % | | | 0.25 | % |
U.S. Micro Cap Portfolio | | | 0.41 | % | | | 0.38 | % |
U.S. High Relative Profitability Portfolio | | | 0.20 | % | | | 0.19 | % |
Pursuant to Amended and Restated Fee Waiver and/or Expense Assumption Agreements (each, a “Fee Waiver Agreement”), the Advisor has contractually agreed to waive certain fees, and in certain instances, assume certain expenses of the Portfolios, as described in the notes below. The Fee Waiver Agreements for the non-feeder Portfolios will remain in effect through February 28, 2023, may only be terminated by the Fund’s Board of Directors prior to that date and shall continue in effect from year to year thereafter unless terminated by the Fund or the Advisor. The Fee Waiver Agreement with respect to the total management fees paid by the Feeder Fund, as described in the notes below, will remain in effect permanently, unless terminated by the Fund. During the year ended October 31, 2022, the non-feeder Portfolios had expense limits based on a percentage of average net assets on an annualized basis, and the Advisor recovered previously waived fees and/or assumed expenses (amounts in thousands), as listed below. The net amount of waived fees/expenses assumed (recovered previously waived fees/expenses assumed) during the year ended October 31, 2022, and the previously waived fees/expenses assumed subject to future recovery by the Advisor as of October 31, 2022, are also reflected below (amounts in thousands). At any time that the Portfolio Expenses (defined below) of a class of a Portfolio are less than the applicable Expense Limitation Amount listed below, the Advisor retains the right to recover fees previously waived and/or expenses previously assumed to the extent that the expense ratio following such recovery would be less than the Expense Limitation Amount that was in place when such prior year fees were waived and/or expenses assumed, and less than the current Expense Limitation Amount in place for the Portfolio. The Advisor, however, will not be reimbursed by the Feeder Fund in connection with its Permanent Fee Waiver (defined below). The Fund, on behalf of a Portfolio, is also not obligated to reimburse the Advisor for fees previously waived or expenses previously assumed by the Advisor more than thirty-six months before the date of recovery.
83
| | | | | | | | | | | | | | | | | | | | |
Institutional Class Shares | | Expense
Limitation
Amount | | | Total
Management
Fee Limit | | | Recovery
of Previously
Waived Fees/
Expenses Assumed | | | Waived Fees/
Expenses
Assumed | | | Previously
Waived Fees/
Expenses Assumed
Subject to Future
Recovery | |
Enhanced U.S. Large Company Portfolio (1) | | | 0.15 | % | | | — | | | $ | 11 | | | $ | 65 | | | $ | 416 | |
U.S. Large Cap Equity Portfolio (1) | | | 0.19 | % | | | — | | | | — | | | | — | | | | — | |
U.S. Large Cap Value Portfolio (2) | | | — | | | | 0.19 | % | | | — | | | | 24,071 | | | | — | |
U.S. Targeted Value Portfolio (3) | | | 0.50 | % | | | — | | | | — | | | | — | | | | — | |
U.S. Core Equity 1 Portfolio (1) | | | 0.23 | % | | | — | | | | — | | | | — | | | | — | |
U.S. Core Equity 2 Portfolio (1) | | | 0.26 | % | | | — | | | | — | | | | — | | | | — | |
U.S. Vector Equity Portfolio (1) | | | 0.36 | % | | | — | | | | — | | | | — | | | | — | |
U.S. High Relative Profitability Portfolio (4) | | | 0.25 | % | | | — | | | | — | | | | — | | | | — | |
DFA Real Estate Securities Portfolio (1) | | | 0.18 | % | | | — | | | | 79 | | | | 1,502 | | | | 5,024 | |
Class R1 Shares | | | | | | | | | | | | | | | | | | | | |
U.S. Targeted Value Portfolio (5) | | | 0.62 | % | | | — | | | | — | | | | — | | | | — | |
Class R2 Shares | | | | | | | | | | | | | | | | | | | | |
U.S. Targeted Value Portfolio (5) | | | 0.77 | % | | | — | | | | — | | | | — | | | | — | |
| (1) | The Advisor has contractually agreed to waive all or a portion of its management fee and assume the Portfolio’s ordinary operating expenses (excluding the expenses the Portfolio incurs indirectly through investment in other investment companies) (“Portfolio Expenses”) to the extent necessary to limit the Portfolio Expenses of the Portfolio to the rate listed above as a percentage of average net assets on an annualized basis (the “Expense Limitation Amount”). |
| (2) | Effective February 28, 2021, the Advisor has contractually agreed to permanently waive all or a portion of the management fee of the Portfolio to the extent necessary to limit the total management fees paid to the Advisor by the Portfolio, including the proportionate share of the management fees the Portfolio pays indirectly through its investment in other funds managed by the Advisor, except for the fees paid indirectly through its investment of securities lending cash collateral in The DFA Short Term Investment Fund (the “Money Market Series”), to the rate listed above as a percentage of the average net assets of a class of the Portfolio on an annualized basis (the “Permanent Fee Waiver”). From February 28, 2020 to February 27, 2021, the Permanent Fee Waiver Limit was 0.23%. From July 21, 2015 to February 27, 2020, the Permanent Fee Waiver Limit was 0.25%. |
| (3) | The Advisor has contractually agreed to waive its management fee and to assume the Portfolio’s Institutional Class Shares’ expenses (excluding the expenses the Portfolio incurs indirectly through investment in other investment companies) (“Portfolio Expenses”) to the extent necessary to limit the Portfolio Expenses of the Institutional Class Shares of the Portfolio to the rate listed above for such class of shares as a percentage of average net assets on an annualized basis (the “Expense Limitation Amount”). |
| (4) | The Advisor has contractually agreed to waive all or a portion of its management fee and to assume the ordinary operating expenses of a class of the Portfolio (including the expenses that the Portfolio bears as a shareholder of other funds managed by the Advisor, excluding money market funds, but excluding the expenses that the Portfolio incurs indirectly through its investment in unaffiliated investment companies) (“Portfolio Expenses”) to the extent necessary to limit the Portfolio Expenses of a class of the Portfolio to the rate listed above as a percentage of the average net assets of a class of the Portfolio on an annualized basis (the “Expense Limitation Amount”). |
| (5) | The Advisor has contractually agreed to reduce all or a portion of its management fee and to assume the direct and indirect expenses of the Class R1 shares and Class R2 shares of the Portfolio (excluding the expenses the Portfolio incurs indirectly through investment in other investment companies) (“Portfolio Expenses”) to the extent necessary to limit the Portfolio Expenses of the Class R1 shares and Class R2 shares of the Portfolio to the rate listed above for such class of shares as a percentage of average net assets (the “Expense Limitation Amount”). |
84
Earned Income Credit:
Additionally, the following Portfolio has entered into an arrangement with its custodian whereby net interest earned on uninvested cash balances was used to reduce a portion of the Portfolio’s custody expenses. Custody expense in the accompanying financial statements is presented before reduction for credits. The impact of such credits is generally less than one basis point of the Portfolio’s net assets. During the year ended October 31, 2022, expenses reduced were as follows (amount in thousands):
| | | | |
| | | Fees Paid
Indirectly | |
Enhanced U.S. Large Company Portfolio | | $ | 8 | |
Fees Paid to Officers and Directors/Trustees:
Certain Officers and Directors of the Advisor are also Officers and Directors of the Fund; however, such Officers and Directors (with the exception of the Chief Compliance Officer (“CCO”)) receive no compensation from the Fund. For the year ended October 31, 2022, the total related amount paid by the Fund to the CCO was $166 (in thousands). The total related amounts paid by each of the Portfolios are included in Other Expenses on the Statements of Operations.
D. Deferred Compensation:
As of October 31, 2022, the total liability for deferred compensation to Directors is included in Accrued Expenses and Other Liabilities on the Statements of Assets and Liabilities as follows (amounts in thousands):
| | | | |
Enhanced U.S. Large Company Portfolio | | $ | 3 | |
U.S. Large Cap Equity Portfolio | | | — | |
U.S. Large Cap Value Portfolio | | | 120 | |
U.S. Targeted Value Portfolio | | | 23 | |
U.S. Small Cap Value Portfolio | | | 136 | |
U.S. Core Equity 1 Portfolio | | | — | |
U.S. Core Equity 2 Portfolio | | | 12 | |
U.S. Vector Equity Portfolio | | | 27 | |
U.S. Small Cap Portfolio | | | 77 | |
U.S. Micro Cap Portfolio | | | 61 | |
U.S. High Relative Profitability Portfolio | | | — | |
DFA Real Estate Securities Portfolio | | | 31 | |
E. Purchases and Sales of Securities:
For the year ended October 31, 2022, the Portfolios’ transactions related to investment securities, other than short-term securities, in-kind redemptions and U.S. government securities (with respect to the Equity Portfolios) (amounts in thousands), were as follows:
| | | | | | | | | | | | | | | | |
| | | U.S. Government Securities | | | Other Investment Securities | |
| | | Purchases | | | Sales | | | Purchases | | | Sales | |
Enhanced U.S. Large Company Portfolio | | $ | 207,556 | | | $ | 243,604 | | | $ | 179,779 | | | $ | 277,670 | |
U.S. Large Cap Equity Portfolio | | | — | | | | — | | | | 134,744 | | | | 399,523 | |
U.S. Targeted Value Portfolio | | | — | | | | — | | | | 2,141,785 | | | | 2,404,116 | |
U.S. Small Cap Value Portfolio | | | — | | | | — | | | | 3,301,544 | | | | 3,541,661 | |
U.S. Core Equity 1 Portfolio | | | — | | | | — | | | | 1,437,032 | | | | 2,257,940 | |
U.S. Core Equity 2 Portfolio | | | — | | | | — | | | | 1,419,127 | | | | 2,750,289 | |
U.S. Vector Equity Portfolio | | | — | | | | — | | | | 477,298 | | | | 711,533 | |
85
| | | | | | | | | | | | | | | | |
| | | U.S. Government
Securities | | | Other Investment Securities | |
| | | Purchases | | | Sales | | | Purchases | | | Sales | |
U.S. Small Cap Portfolio | | | — | | | | — | | | $ | 1,916,049 | | | $ | 2,717,169 | |
U.S. Micro Cap Portfolio | | | — | | | | — | | | | 1,482,243 | | | | 1,443,183 | |
U.S. High Relative Profitability Portfolio | | | — | | | | — | | | | 1,017,352 | | | | 1,608,748 | |
DFA Real Estate Securities Portfolio | | | — | | | | — | | | | 264,820 | | | | 966,805 | |
There were no purchases or sales of long-term U.S. government securities by the Equity Portfolios.
For the year ended October 31, 2022, transactions related to Affiliated Investment Companies, excluding in-kind redemptions, are presented below.
The amounts presented below may differ from the respective amounts presented in the corresponding Schedule of Investments/Summary Schedule of Portfolio Holdings, Statements of Assets and Liabilities or Statements of Operations due to rounding. The amounts are as follows (amounts in thousands):
| | | | | | | | | | | | | | | | | | | | | | | | | | | | | | | | | | | | |
| | | Balance at
October 31, 2021 | | | Purchases
at Cost | | | Proceeds
from Sales | | | Net Realized
Gain/(Loss)
on Sales | | | Change in
Unrealized
Appreciation/
Depreciation | | | Balance at
October 31, 2022 | | | Shares as of
October 31, 2022 | | | Dividend
Income | | | Capital Gain
Distributions | |
Enhanced U.S. Large Company Portfolio | | | | | | | | | | | | | | | | | | | | | | | | | | | | | | | | | | | | |
The DFA Short Term Investment Fund | | $ | 3,664 | | | $ | 110,048 | | | $ | 107,222 | | | $ | 2 | | | $ | (2 | ) | | $ | 6,490 | | | | 561 | | | $ | 106 | | | | — | |
| | | | | | | | | | | | | | | | | | | | | | | | | | | | | | | | | | | | |
Total | | $ | 3,664 | | | $ | 110,048 | | | $ | 107,222 | | | $ | 2 | | | $ | (2 | ) | | $ | 6,490 | | | | 561 | | | $ | 106 | | | | — | |
| | | | | | | | | | | | | | | | | | | | | | | | | | | | | | | | | | | | |
U.S. Large Cap Equity Portfolio | | | | | | | | | | | | | | | | | | | | | | | | | | | | | | | | | | | | |
The DFA Short Term Investment Fund | | $ | 10,657 | | | $ | 123,916 | | | $ | 127,231 | | | $ | (4 | ) | | $ | (5 | ) | | $ | 7,333 | | | | 634 | | | $ | 95 | | | | — | |
| | | | | | | | | | | | | | | | | | | | | | | | | | | | | | | | | | | | |
Total | | $ | 10,657 | | | $ | 123,916 | | | $ | 127,231 | | | $ | (4 | ) | | $ | (5 | ) | | $ | 7,333 | | | | 634 | | | $ | 95 | | | | — | |
| | | | | | | | | | | | | | | | | | | | | | | | | | | | | | | | | | | | |
U.S. Targeted Value Portfolio | | | | | | | | | | | | | | | | | | | | | | | | | | | | | | | | | | | | |
The DFA Short Term Investment Fund | | $ | 538,730 | | | $ | 5,092,746 | | | $ | 4,774,751 | | | $ | (183 | ) | | $ | (345 | ) | | $ | 856,197 | | | | 74,059 | | | $ | 7,213 | | | | — | |
| | | | | | | | | | | | | | | | | | | | | | | | | | | | | | | | | | | | |
Total | | $ | 538,730 | | | $ | 5,092,746 | | | $ | 4,774,751 | | | $ | (183 | ) | | $ | (345 | ) | | $ | 856,197 | | | | 74,059 | | | $ | 7,213 | | | | — | |
| | | | | | | | | | | | | | | | | | | | | | | | | | | | | | | | | | | | |
U.S. Small Cap Value Portfolio | | | | | | | | | | | | | | | | | | | | | | | | | | | | | | | | | | | | |
The DFA Short Term Investment Fund | | $ | 408,417 | | | $ | 5,526,231 | | | $ | 4,995,003 | | | $ | (244 | ) | | $ | (387 | ) | | $ | 939,014 | | | | 81,223 | | | $ | 8,336 | | | | — | |
| | | | | | | | | | | | | | | | | | | | | | | | | | | | | | | | | | | | |
Total | | $ | 408,417 | | | $ | 5,526,231 | | | $ | 4,995,003 | | | $ | (244 | ) | | $ | (387 | ) | | $ | 939,014 | | | | 81,223 | | | $ | 8,336 | | | | — | |
| | | | | | | | | | | | | | | | | | | | | | | | | | | | | | | | | | | | |
U.S. Core Equity 1 Portfolio | | | | | | | | | | | | | | | | | | | | | | | | | | | | | | | | | | | | |
The DFA Short Term Investment Fund | | $ | 402,032 | | | $ | 5,934,176 | | | $ | 5,138,348 | | | $ | (228 | ) | | $ | (421 | ) | | $ | 1,197,211 | | | | 103,556 | | | $ | 8,859 | | | | — | |
| | | | | | | | | | | | | | | | | | | | | | | | | | | | | | | | | | | | |
Total | | $ | 402,032 | | | $ | 5,934,176 | | | $ | 5,138,348 | | | $ | (228 | ) | | $ | (421 | ) | | $ | 1,197,211 | | | | 103,556 | | | $ | 8,859 | | | | — | |
| | | | | | | | | | | | | | | | | | | | | | | | | | | | | | | | | | | | |
86
| | | | | | | | | | | | | | | | | | | | | | | | | | | | | | | | | | | | |
| | | Balance at
October 31, 2021 | | | Purchases
at Cost | | | Proceeds
from Sales | | | Net Realized
Gain/(Loss)
on Sales | | | Change in
Unrealized
Appreciation/
Depreciation | | | Balance at
October 31, 2022 | | | Shares as of
October 31, 2022 | | | Dividend
Income | | | Capital Gain
Distributions | |
U.S. Core Equity 2 Portfolio | | | | | | | | | | | | | | | | | | | | | | | | | | | | | | | | | | | | |
The DFA Short Term Investment Fund | | $ | 540,697 | | | $ | 6,733,127 | | | $ | 6,196,257 | | | $ | (225 | ) | | $ | (384 | ) | | $ | 1,076,958 | | | | 93,154 | | | $ | 9,364 | | | | — | |
| | | | | | | | | | | | | | | | | | | | | | | | | | | | | | | | | | | | |
Total | | $ | 540,697 | | | $ | 6,733,127 | | | $ | 6,196,257 | | | $ | (225 | ) | | $ | (384 | ) | | $ | 1,076,958 | | | | 93,154 | | | $ | 9,364 | | | | — | |
| | | | | | | | | | | | | | | | | | | | | | | | | | | | | | | | | | | | |
U.S. Vector Equity Portfolio | | | | | | | | | | | | | | | | | | | | | | | | | | | | | | | | | | | | |
The DFA Short Term Investment Fund | | $ | 133,996 | | | $ | 1,556,907 | | | $ | 1,463,129 | | | $ | (49 | ) | | $ | (121 | ) | | $ | 227,604 | | | | 19,687 | | | $ | 2,089 | | | | — | |
| | | | | | | | | | | | | | | | | | | | | | | | | | | | | | | | | | | | |
Total | | $ | 133,996 | | | $ | 1,556,907 | | | $ | 1,463,129 | | | $ | (49 | ) | | $ | (121 | ) | | $ | 227,604 | | | | 19,687 | | | $ | 2,089 | | | | — | |
| | | | | | | | | | | | | | | | | | | | | | | | | | | | | | | | | | | | |
U.S. Small Cap Portfolio | | | | | | | | | | | | | | | | | | | | | | | | | | | | | | | | | | | | |
The DFA Short Term Investment Fund | | $ | 729,470 | | | $ | 7,805,935 | | | $ | 6,993,901 | | | $ | (303 | ) | | $ | (567 | ) | | $ | 1,540,634 | | | | 133,261 | | | $ | 10,929 | | | | — | |
| | | | | | | | | | | | | | | | | | | | | | | | | | | | | | | | | | | | |
Total | | $ | 729,470 | | | $ | 7,805,935 | | | $ | 6,993,901 | | | $ | (303 | ) | | $ | (567 | ) | | $ | 1,540,634 | | | | 133,261 | | | $ | 10,929 | | | | — | |
| | | | | | | | | | | | | | | | | | | | | | | | | | | | | | | | | | | | |
U.S. Micro Cap Portfolio | | | | | | | | | | | | | | | | | | | | | | | | | | | | | | | | | | | | |
The DFA Short Term Investment Fund | | $ | 421,895 | | | $ | 3,081,829 | | | $ | 2,959,299 | | | $ | (141 | ) | | $ | (266 | ) | | $ | 544,018 | | | | 47,056 | | | $ | 5,370 | | | | — | |
| | | | | | | | | | | | | | | | | | | | | | | | | | | | | | | | | | | | |
Total | | $ | 421,895 | | | $ | 3,081,829 | | | $ | 2,959,299 | | | $ | (141 | ) | | $ | (266 | ) | | $ | 544,018 | | | | 47,056 | | | $ | 5,370 | | | | — | |
| | | | | | | | | | | | | | | | | | | | | | | | | | | | | | | | | | | | |
U.S. High Relative Profitability Portfolio | | | | | | | | | | | | | | | | | | | | | | | | | | | | | | | | | | | | |
The DFA Short Term Investment Fund | | | — | | | $ | 119,030 | | | $ | 116,235 | | | $ | (7 | ) | | | — | | | $ | 2,788 | | | | 241 | | | | — | | | | — | |
| | | | | | | | | | | | | | | | | | | | | | | | | | | | | | | | | | | | |
Total | | | — | | | $ | 119,030 | | | $ | 116,235 | | | $ | (7 | ) | | | — | | | $ | 2,788 | | | | 241 | | | | — | | | | — | |
| | | | | | | | | | | | | | | | | | | | | | | | | | | | | | | | | | | | |
DFA Real Estate Securities Portfolio | | | | | | | | | | | | | | | | | | | | | | | | | | | | | | | | | | | | |
The DFA Short Term Investment Fund | | $ | 186,190 | | | $ | 2,408,040 | | | $ | 2,228,264 | | | $ | (91 | ) | | $ | (185 | ) | | $ | 365,690 | | | | 31,631 | | | $ | 2,536 | | | | — | |
| | | | | | | | | | | | | | | | | | | | | | | | | | | | | | | | | | | | |
Total | | $ | 186,190 | | | $ | 2,408,040 | | | $ | 2,228,264 | | | $ | (91 | ) | | $ | (185 | ) | | $ | 365,690 | | | | 31,631 | | | $ | 2,536 | | | | — | |
| | | | | | | | | | | | | | | | | | | | | | | | | | | | | | | | | | | | |
F. Federal Income Taxes:
Each Portfolio has qualified and intends to continue to qualify as a regulated investment company under Subchapter M of the Internal Revenue Code for federal income tax purposes and to distribute substantially all of its taxable income and net capital gains to its shareholders. Accordingly, no provision has been made for federal income taxes.
Distributions from net investment income and net realized capital gains are determined in accordance with U.S. federal income tax regulations, which may differ from those amounts determined under GAAP. These book/tax differences are either temporary or permanent in nature. To the extent that these differences are permanent, they are charged or credited to paid-in capital or distributable earnings, undistributed net investment income, accumulated net realized gains or losses, or unrealized appreciation, as appropriate, in the period that the differences arise. Accordingly, the permanent differences as of October 31, 2022, can occur as a result of realized gains on securities considered to be “passive foreign investment companies,” non-deductible expenses, realized foreign capital gains
87
tax, the use of accumulated earnings and profits distributed to shareholders on redemptions of shares as part of the dividends paid deduction for income tax purposes, net foreign currency gains/losses, distributions received from real estate investment trusts and distribution redesignations, and were reclassified to the accounts mentioned above. These reclassifications had no effect on net assets or net asset value per share.
The tax character of dividends and distributions declared and paid during the years ended October 31, 2021, and October 31, 2022, were as follows (amounts in thousands):
| | | | | | | | | | | | | | | | |
| | | Net Investment
Income and
Short-Term
Capital Gains | | | Long-Term
Capital Gains | | | Tax Exempt
Income | | | Total | |
Enhanced U.S. Large Company Portfolio | | | | | | | | | | | | | | | | |
2021 | | $ | 13,853 | | | $ | 16,475 | | | | — | | | $ | 30,328 | |
2022 | | | 56,965 | | | | 76,606 | | | | — | | | | 133,571 | |
U.S. Large Cap Equity Portfolio | | | | | | | | | | | | | | | | |
2021 | | | 27,774 | | | | — | | | | — | | | | 27,774 | |
2022 | | | 25,100 | | | | 65,512 | | | | — | | | | 90,612 | |
U.S. Large Cap Value Portfolio | | | | | | | | | | | | | | | | |
2021 | | | 401,298 | | | | — | | | | — | | | | 401,298 | |
2022 | | | 452,232 | | | | 665,497 | | | | — | | | | 1,117,729 | |
U.S. Targeted Value Portfolio | | | | | | | | | | | | | | | | |
2021 | | | 188,761 | | | | — | | | | — | | | | 188,761 | |
2022 | | | 248,278 | | | | 726,722 | | | | — | | | | 975,000 | |
U.S. Small Cap Value Portfolio | | | | | | | | | | | | | | | | |
2021 | | | 282,350 | | | | — | | | | — | | | | 282,350 | |
2022 | | | 322,497 | | | | 1,148,147 | | | | — | | | | 1,470,644 | |
U.S. Core Equity 1 Portfolio | | | | | | | | | | | | | | | | |
2021 | | | 396,375 | | | | — | | | | — | | | | 396,375 | |
2022 | | | 411,055 | | | | 858,230 | | | | — | | | | 1,269,285 | |
U.S. Core Equity 2 Portfolio | | | | | | | | | | | | | | | | |
2021 | | | 403,126 | | | | — | | | | — | | | | 403,126 | |
2022 | | | 433,070 | | | | 1,243,325 | | | | — | | | | 1,676,395 | |
U.S. Vector Equity Portfolio | | | | | | | | | | | | | | | | |
2021 | | | 59,880 | | | | — | | | | — | | | | 59,880 | |
2022 | | | 77,716 | | | | 309,307 | | | | — | | | | 387,023 | |
U.S. Small Cap Portfolio | | | | | | | | | | | | | | | | |
2021 | | | 191,244 | | | | — | | | | — | | | | 191,244 | |
2022 | | | 153,059 | | | | 848,752 | | | | — | | | | 1,001,811 | |
U.S. Micro Cap Portfolio | | | | | | | | | | | | | | | | |
2021 | | | 65,320 | | | | — | | | | — | | | | 65,320 | |
2022 | | | 67,157 | | | | 674,741 | | | | — | | | | 741,898 | |
U.S. High Relative Profitability Portfolio | | | | | | | | | | | | | | | | |
2021 | | | 70,633 | | | | — | | | | — | | | | 70,633 | |
2022 | | | 83,850 | | | | 110,031 | | | | — | | | | 193,881 | |
DFA Real Estate Securities Portfolio | | | | | | | | | | | | | | | | |
2021 | | | 222,133 | | | | 28,472 | | | | — | | | | 250,605 | |
2022 | | | 195,676 | | | | 96,127 | | | | — | | | | 291,803 | |
88
As of October 31, 2022, the following net investment income and short-term capital gains and long-term capital gains distributions designated for federal income tax purposes are due to the use of accumulated earnings and profits distributed to shareholders upon redemption of shares (amounts in thousands):
| | | | | | | | | | | | |
| | | Net Investment
Income and
Short-Term
Capital Gains | | | Long-Term
Capital Gains | | | Total | |
Enhanced U.S. Large Company Portfolio | | $ | (391 | ) | | | — | | | $ | (391 | ) |
U.S. Large Cap Equity Portfolio | | | (2,217 | ) | | $ | (4,989 | ) | | | (7,206 | ) |
U.S. Large Cap Value Portfolio | | | (48,533 | ) | | | (19,035 | ) | | | (67,568 | ) |
U.S. Targeted Value Portfolio | | | (6,887 | ) | | | (53,342 | ) | | | (60,229 | ) |
U.S. Small Cap Value Portfolio | | | (19,932 | ) | | | (57,085 | ) | | | (77,017 | ) |
U.S. Core Equity 1 Portfolio | | | (36,753 | ) | | | (30,868 | ) | | | (67,621 | ) |
U.S. Core Equity 2 Portfolio | | | (29,015 | ) | | | (49,664 | ) | | | (78,679 | ) |
U.S. Vector Equity Portfolio | | | (3,237 | ) | | | (11,705 | ) | | | (14,942 | ) |
U.S. Small Cap Portfolio | | | (9,371 | ) | | | (51,542 | ) | | | (60,913 | ) |
U.S. Micro Cap Portfolio | | | (4,621 | ) | | | (18,795 | ) | | | (23,416 | ) |
U.S. High Relative Profitability Portfolio | | | (7,544 | ) | | | (12,049 | ) | | | (19,593 | ) |
DFA Real Estate Securities Portfolio | | | (21,969 | ) | | | (21,454 | ) | | | (43,423 | ) |
As of October 31, 2022, the components of distributable earnings (accumulated losses) were as follows (amounts in thousands):
| | | | | | | | | | | | | | | | | | | | |
| | | Undistributed
Net Investment
Income and
Short-Term
Capital Gains | | | Undistributed
Long-Term
Capital Gains | | | Capital Loss
Carryforwards | | | Unrealized
Appreciation
(Depreciation) | | | Total Net
Distributable
Earnings
(Accumulated
Losses) | |
Enhanced U.S. Large Company Portfolio | | $ | 3,104 | | | | — | | | $ | (66,260 | ) | | $ | (10,917 | ) | | $ | (74,073 | ) |
U.S. Large Cap Equity Portfolio | | | — | | | $ | 50,244 | | | | — | | | | 748,666 | | | | 798,910 | |
U.S. Large Cap Value Portfolio | | | — | | | | 566,416 | | | | — | | | | 8,753,023 | | | | 9,319,439 | |
U.S. Targeted Value Portfolio | | | — | | | | 428,661 | | | | — | | | | 3,758,950 | | | | 4,187,611 | |
U.S. Small Cap Value Portfolio | | | — | | | | 712,309 | | | | — | | | | 4,895,057 | | | | 5,607,366 | |
U.S. Core Equity 1 Portfolio | | | — | | | | 673,222 | | | | — | | | | 14,660,884 | | | | 15,334,106 | |
U.S. Core Equity 2 Portfolio | | | — | | | | 817,058 | | | | — | | | | 15,286,267 | | | | 16,103,325 | |
U.S. Vector Equity Portfolio | | | — | | | | 143,187 | | | | — | | | | 2,146,182 | | | | 2,289,369 | |
U.S. Small Cap Portfolio | | | — | | | | 525,081 | | | | — | | | | 5,998,924 | | | | 6,524,005 | |
U.S. Micro Cap Portfolio | | | — | | | | 245,316 | | | | — | | | | 2,662,679 | | | | 2,907,995 | |
U.S. High Relative Profitability Portfolio | | | — | | | | 91,499 | | | | — | | | | 922,203 | | | | 1,013,702 | |
DFA Real Estate Securities Portfolio | | | 86,131 | | | | 275,577 | | | | — | | | | 2,639,674 | | | | 3,001,382 | |
For federal income tax purposes, the Fund measures its capital loss carryforwards annually at October 31, its fiscal year end. Capital loss carryforwards may be carried forward and applied against future capital gains. As of October 31, 2022, the Portfolios had the following capital loss carryforwards available to offset future realized capital gains with no expiration date (amounts in thousands):
| | | | | | | | |
| | | Unlimited | | | Total | |
Enhanced U.S. Large Company Portfolio | | $ | 66,260 | | | $ | 66,260 | |
During the year ended October 31, 2022, the Portfolios did not use capital loss carryforwards to offset realized capital gains for federal income tax purposes.
89
As of October 31, 2022, the total cost and aggregate gross unrealized appreciation (depreciation) of securities for federal income tax purposes were different from amounts reported for financial reporting purposes, as follows (amounts in thousands):
| | | | | | | | | | | | | | | | |
| | | Federal
Tax Cost | | | Unrealized
Appreciation | | | Unrealized
(Depreciation) | | | Net
Unrealized
Appreciation
(Depreciation) | |
Enhanced U.S. Large Company Portfolio | | $ | 262,509 | | | | — | | | $ | (10,388 | ) | | $ | (10,388 | ) |
U.S. Large Cap Equity Portfolio | | | 869,065 | | | $ | 771,284 | | | | (22,618 | ) | | | 748,666 | |
U.S. Large Cap Value Portfolio | | | 14,552,142 | | | | 8,759,385 | | | | — | | | | 8,759,385 | |
U.S. Targeted Value Portfolio | | | 8,943,036 | | | | 4,066,342 | | | | (307,392 | ) | | | 3,758,950 | |
U.S. Small Cap Value Portfolio | | | 10,381,654 | | | | 5,191,404 | | | | (296,348 | ) | | | 4,895,056 | |
U.S. Core Equity 1 Portfolio | | | 14,486,822 | | | | 15,330,204 | | | | (669,320 | ) | | | 14,660,884 | |
U.S. Core Equity 2 Portfolio | | | 15,059,587 | | | | 16,054,479 | | | | (768,212 | ) | | | 15,286,267 | |
U.S. Vector Equity Portfolio | | | 2,499,937 | | | | 2,252,714 | | | | (106,532 | ) | | | 2,146,182 | |
U.S. Small Cap Portfolio | | | 9,429,036 | | | | 6,193,927 | | | | (195,003 | ) | | | 5,998,924 | |
U.S. Micro Cap Portfolio | | | 4,355,445 | | | | 2,775,625 | | | | (112,948 | ) | | | 2,662,677 | |
U.S. High Relative Profitability Portfolio | | | 3,734,080 | | | | 1,108,365 | | | | (186,161 | ) | | | 922,204 | |
DFA Real Estate Securities Portfolio | | | 5,803,149 | | | | 3,022,066 | | | | (382,393 | ) | | | 2,639,673 | |
The difference between GAAP-basis and tax-basis unrealized gains (losses) can occur as a result of wash sales and net mark-to-market gains (losses) on regulated futures contracts, net mark-to-market gains (losses) on foreign currency contracts, and differences in the tax treatment of passive foreign investment company investments or other investments.
ASC 740 Accounting for Uncertainty in Income Taxes sets forth a minimum threshold for financial statement recognition of the benefit of a tax position taken or expected to be taken in a tax return. Management has analyzed the Portfolios’ tax positions and has concluded that no additional provision for income tax is required in the Portfolios’ financial statements. The Portfolios are not aware of any tax positions for which it is more likely than not that the total amounts of unrecognized tax benefits will significantly change in the next twelve months. The Portfolios’ federal tax returns for the prior three fiscal years remain subject to examination by the Internal Revenue Service.
G. Capital Share Transactions:
The capital share transactions by class were as follows (amounts in thousands):
| | | | | | | | | | | | | | | | |
| | | Year Ended
October 31, 2022 | | | Year Ended
October 31, 2021 | |
| | | Amount | | | Shares | | | Amount | | | Shares | |
U.S. Targeted Value Portfolio | | | | | | | | | | | | | | | | |
Class R1 Shares | | | | | | | | | | | | | | | | |
Shares Issued | | $ | 15,262 | | | | 517 | | | $ | 40,799 | | | | 1,490 | |
Shares Issued in Lieu of Cash Distributions | | | 5,129 | | | | 176 | | | | 889 | | | | 32 | |
Shares Redeemed | | | (54,316 | ) | | | (1,784 | ) | | | (28,559 | ) | | | (1,012 | ) |
| | | | | | | | | | | | | | | | |
Net Increase (Decrease) — Class R1 Shares | | $ | (33,925 | ) | | | (1,091 | ) | | $ | 13,129 | | | | 510 | |
| | | | | | | | | | | | | | | | |
90
| | | | | | | | | | | | | | | | |
| | | Year Ended
October 31, 2022 | | | Year Ended
October 31, 2021 | |
| | | Amount | | | Shares | | | Amount | | | Shares | |
Class R2 Shares | | | | | | | | | | | | | | | | |
Shares Issued | | $ | 27,453 | | | | 959 | | | $ | 17,230 | | | | 605 | |
Shares Issued in Lieu of Cash Distributions | | | 5,446 | | | | 189 | | | | 922 | | | | 34 | |
Shares Redeemed | | | (25,828 | ) | | | (885 | ) | | | (31,502 | ) | | | (1,173 | ) |
| | | | | | | | | | | | | | | | |
Net Increase (Decrease) — Class R2 Shares | | $ | 7,071 | | | | 263 | | | $ | (13,350 | ) | | | (534 | ) |
| | | | | | | | | | | | | | | | |
Institutional Class Shares | | | | | | | | | | | | | | | | |
Shares Issued | | $ | 2,649,180 | | | | 91,779 | | | $ | 2,355,064 | | | | 82,989 | |
Shares Issued in Lieu of Cash Distributions | | | 924,844 | | | | 31,929 | | | | 179,495 | | | | 6,573 | |
Shares Redeemed | | | (3,288,905 | ) | | | (113,379 | ) | | | (4,429,257 | ) | | | (160,274 | ) |
| | | | | | | | | | | | | | | | |
Net Increase (Decrease) — Institutional Class Shares | | $ | 285,119 | | | | 10,329 | | | $ | (1,894,698 | ) | | | (70,712 | ) |
| | | | | | | | | | | | | | | | |
H. Financial Instruments:
In accordance with the Portfolios’ investment objectives and policies, the Portfolios may invest either directly or indirectly (through their investments in a corresponding Master Fund), in certain financial instruments that have off-balance sheet risk in excess of the amounts recognized in the financial statements and concentrations of credit and market risk. These instruments and their significant corresponding risks are described below:
Derivative Financial Instruments:
Summarized below are the specific types of derivative instruments used by the Portfolios.
1. Forward Currency Contracts: The Enhanced U.S. Large Company Portfolio may acquire and sell forward currency contracts to hedge against adverse changes in the relationship of the U.S. dollar to foreign currencies (foreign exchange rate risk) or to transfer balances from one currency to another currency. The Enhanced U.S. Large Company Portfolio may hedge some or all of the currency exposure of its foreign securities by entering into forward currency contracts. The decision to hedge the Enhanced U.S. Large Company Portfolio’s currency exposure with respect to a foreign market will be based primarily on the Portfolio’s existing exposure to a given foreign currency. The Enhanced U.S. Large Company Portfolio typically hedges its foreign currency exposure. Each contract is valued daily and the change in value is recorded by the Portfolio as an unrealized gain or loss, which is presented in the Statements of Operations as the change in unrealized appreciation or depreciation of forward currency contracts. When the contract is closed or offset with the same counterparty, the Portfolio records a realized gain or loss equal to the change in the value of the contract when it was opened and the value at the time it was closed or offset. This is presented in the Statements of Operations as a net realized gain or loss on forward currency contracts. Risks may arise upon entering into these contracts from the potential inability of counterparties to meet the terms of their contracts and from unanticipated movements in the value of foreign currency relative to the U.S. dollar.
2. Futures Contracts: Each Portfolio listed below may purchase or sell futures contracts and options on futures contracts for equity securities and indices to increase or decrease market exposure based on actual or expected cash inflows to or outflows from the Portfolio. The Enhanced U.S. Large Company Portfolio may also use futures contracts and options thereon to hedge against securities prices or as part of its overall investment strategy. Upon entering into a futures contract, the Portfolios deposit cash or pledge U.S. Government securities to a broker in an amount equal to the minimum “initial margin” requirements of the exchange on which the contract is traded. Subsequent payments are received from or paid to the broker each day, based on the daily fluctuation in the market value of the contract. These receipts or payments are known as “variation margin” and are recorded daily by the Portfolios as unrealized gains or losses until the contracts are closed. When the contracts are closed, the Portfolios record a realized gain or loss, which is presented in the Statements of Operations as a net realized gain or loss on futures, equal to the difference between the value of the contract at the time it was opened and the value at the time it was closed.
91
Risks may arise upon entrance into futures contracts from potential imperfect price correlations between the futures contracts and the underlying securities, from the possibility of an illiquid secondary market for these instruments and from the possibility that the Portfolio could lose more than the initial margin requirements. The Portfolios entering into stock index futures are subject to equity price risk from those futures contracts. Counterparty credit risk related to exchange-traded futures is minimal because the exchange’s clearinghouse, as counterparty to all exchange-traded futures, guarantees the futures against default.
Securities have been segregated as collateral for open futures contracts.
The average volume (based on the open positions at each fiscal month-end) of derivative activity for the year ended October 31, 2022 was as follows (amounts in thousands):
| | | | | | | | |
| | | Forward
Currency
Contracts* | | | Futures** | |
Enhanced U.S. Large Company Portfolio | | $ | 143,034 | | | $ | 347,039 | |
U.S. Targeted Value Portfolio | | | — | | | | 129,499 | |
U.S. Small Cap Value Portfolio | | | — | | | | 158,076 | |
U.S. Core Equity 1 Portfolio | | | — | | | | 274,195 | |
U.S. Core Equity 2 Portfolio | | | — | | | | 276,079 | |
U.S. Vector Equity Portfolio | | | — | | | | 37,048 | |
U.S. Small Cap Portfolio | | | — | | | | 140,502 | |
U.S. Micro Cap Portfolio | | | — | | | | 68,096 | |
U.S. High Relative Profitability Portfolio | | | — | | | | 41,873 | |
DFA Real Estate Securities Portfolio | | | — | | | | 97,355 | |
| * | Average amount of Currency Purchased/Sold in USD. |
| ** | Average Notional Value of futures contracts. |
The following is a summary of the Portfolios’ derivative instrument holdings categorized by primary risk exposure as of October 31, 2022 (amounts in thousands):
| | | | | | | | | | | | |
| | | Asset Derivatives Value | |
| | | Total Value
at
October 31, 2022 | | | Forward
Currency
Contracts (1) | | | Equity
Contracts *,(2) | |
Enhanced U.S. Large Company Portfolio | | $ | 1,024 | | | $ | 1,024 | | | | — | |
U.S. Targeted Value Portfolio | | | 3,160 | | | | — | | | $ | 3,160 | |
U.S. Small Cap Value Portfolio | | | 7,773 | | | | — | | | | 7,773 | |
U.S. Small Cap Portfolio | | | 3,916 | | | | — | | | | 3,916 | |
U.S. Micro Cap Portfolio | | | 1,978 | | | | — | | | | 1,978 | |
DFA Real Estate Securities Portfolio | | | 2,720 | | | | — | | | | 2,720 | |
| | | | | | | | | | | | |
| | | Liability Derivatives Value | |
| | | Total Value
at
October 31, 2022 | | | Forward
Currency
Contracts (3) | | | Equity
Contracts *,(4) | |
Enhanced U.S. Large Company Portfolio | | $ | (18,031 | ) | | $ | (502 | ) | | $ | (17,529 | ) |
U.S. Core Equity 1 Portfolio | | | (8,616 | ) | | | — | | | | (8,616 | ) |
U.S. Core Equity 2 Portfolio | | | (4,463 | ) | | | — | | | | (4,463 | ) |
U.S. Vector Equity Portfolio | | | (1,110 | ) | | | — | | | | (1,110 | ) |
U.S. High Relative Profitability Portfolio | | | (1,437 | ) | | | — | | | | (1,437 | ) |
92
| (1) | Presented on Statements of Assets and Liabilities as Unrealized Gain on Forward Currency Contracts. |
| (2) | Presented on Statements of Assets and Liabilities as Receivables: Futures Margin Variation. |
| (3) | Presented on Statements of Assets and Liabilities as Unrealized Loss on Forward Currency Contracts. |
| (4) | Presented on Statements of Assets and Liabilities as Payables: Futures Margin Variation. |
| * | Includes cumulative appreciation (depreciation) of futures contracts. Only current day’s margin variation is reported within the Statements of Assets and Liabilities. |
The following is a summary of the realized and change in unrealized gains and losses from the Portfolios’ derivative instrument holdings categorized by primary risk exposure for the year ended October 31, 2022 (amounts in thousands):
| | | | | | | | | | | | |
| | | Realized Gain (Loss) on
Derivatives | |
| | | Total | | | Forward
Currency
Contracts (1) | | | Equity
Contracts (2) | |
Enhanced U.S. Large Company Portfolio | | $ | (18,795 | ) | | $ | 8,012 | | | $ | (26,807 | ) |
U.S. Large Cap Equity Portfolio | | | 107 | | | | — | | | | 107 | * |
U.S. Targeted Value Portfolio | | | (21,845 | ) | | | — | | | | (21,845 | ) |
U.S. Small Cap Value Portfolio | | | (14,918 | ) | | | — | | | | (14,918 | ) |
U.S. Core Equity 1 Portfolio | | | (31,585 | ) | | | — | | | | (31,585 | ) |
U.S. Core Equity 2 Portfolio | | | (34,730 | ) | | | — | | | | (34,730 | ) |
U.S. Vector Equity Portfolio | | | (5,485 | ) | | | — | | | | (5,485 | ) |
U.S. Small Cap Portfolio | | | (21,083 | ) | | | — | | | | (21,083 | ) |
U.S. Micro Cap Portfolio | | | (16,098 | ) | | | — | | | | (16,098 | ) |
U.S. High Relative Profitability Portfolio | | | (7,134 | ) | | | — | | | | (7,134 | ) |
DFA Real Estate Securities Portfolio | | | (10,229 | ) | | | — | | | | (10,229 | ) |
| | | | | | | | | | | | |
| | | Change in Unrealized Appreciation
(Depreciation) on Derivatives | |
| | | Total | | | Forward
Currency
Contracts (3) | | | Equity
Contracts (4) | |
Enhanced U.S. Large Company Portfolio | | $ | (27,061 | ) | | $ | 3,153 | | | $ | (30,214 | ) |
U.S. Targeted Value Portfolio | | | 398 | | | | — | | | | 398 | |
U.S. Small Cap Value Portfolio | | | 4,538 | | | | — | | | | 4,538 | |
U.S. Core Equity 1 Portfolio | | | (15,318 | ) | | | — | | | | (15,318 | ) |
U.S. Core Equity 2 Portfolio | | | (11,179 | ) | | | — | | | | (11,179 | ) |
U.S. Vector Equity Portfolio | | | (1,963 | ) | | | — | | | | (1,963 | ) |
U.S. Small Cap Portfolio | | | (1,773 | ) | | | — | | | | (1,773 | ) |
U.S. Micro Cap Portfolio | | | 119 | | | | — | | | | 119 | |
U.S. High Relative Profitability Portfolio | | | (2,379 | ) | | | — | | | | (2,379 | ) |
DFA Real Estate Securities Portfolio | | | 323 | | | | — | | | | 323 | |
| (1) | Presented on Statements of Operations as Net Realized Gain (Loss) on: Forward Currency Contracts. |
| (2) | Presented on Statements of Operations as Net Realized Gain (Loss) on: Futures. |
| (3) | Presented on Statements of Operations as Change in Unrealized Appreciation (Depreciation) of: Forward Currency Contracts. |
| (4) | Presented on Statements of Operations as Change in Unrealized Appreciation (Depreciation) of: Futures. |
| * | As of October 31, 2022, there were no futures contracts outstanding. During the year ended October 31, 2022, the Portfolio had limited activity in futures contracts. |
93
Offsetting of Derivative Assets and Derivative Liabilities:
In order to better define its contractual rights and to secure rights that will help the Fund mitigate its counterparty risk, the Fund entered into an International Swaps and Derivatives Association, Inc. Master Agreement (ISDA Master Agreement) or a similar agreement with certain of its derivative contract counterparties. An ISDA Master Agreement is a bilateral agreement between the Fund and a counterparty that governs over-the-counter (OTC) derivatives and forward currency contracts and typically contains, among other things, provisions in the event of a default and/or termination event and may also include collateral posting items. Under an ISDA Master Agreement, the Fund may, under certain circumstances, offset with the counterparty certain derivative financial instruments’ payables and/or receivables with collateral held and/or posted, if any, and create one single net payment. The provisions of the ISDA Master Agreement typically permit a single net payment in the event of a default (close-out), including the bankruptcy or insolvency of the counterparty. However, bankruptcy or insolvency laws of a particular jurisdiction may impose restrictions on or prohibitions against the right of offset in bankruptcy, insolvency, or other events.
For financial reporting purposes, the Fund does not offset derivative assets and derivative liabilities that are subject to netting arrangements in the Statements of Assets and Liabilities.
The following table presents the Portfolios’ gross and net amount of assets and liabilities available for offset under netting arrangements as well as any related collateral received or pledged by the Portfolios as of October 31, 2022 (amounts in thousands):
| | | | | | | | | | | | | | | | | | | | | | | | | | | | | | | | | | | | | | | | | | | | | | | | |
| | | | | | Net
Amounts
of
Assets
Presented
in the
Statements
of Assets
and
Liabilities | | | Gross Amounts Not
Offset in the
Statements of Assets
and Liabilities | | | | | | | | | Net
Amounts
of
Liabilities
Presented
in the
Statements
of Assets
and
Liabilities | | | Gross Amounts Not
Offset in the
Statements of Assets
and Liabilities | | | | |
Description | | Gross
Amounts of
Recognized
Assets
(a) | | | Financial
Instruments
(b) | | | Non-Cash
Collateral
Received | | | Cash
Collateral
Received | | | Net
Amount
(c) | | | Gross
Amounts of
Recognized
Liabilities
(a) | | | Financial
Instruments
(d) | | | Non-Cash
Collateral
Pledged | | | Cash
Collateral
Pledged | | | Net
Amount
(e) | |
| | | | | | | | | | | | | | | | | | | | | | | | | | | | | | | | | | | | | |
| | | Assets | | | Liabilities | |
Enhanced U.S. Large Company Portfolio | | | | | | | | | | | | | | | | | | | | | | | | | | | | | | | | | | | | | |
Bank of America Corp | | $ | 953 | | | $ | 953 | | | $ | (164 | ) | | | — | | | | — | | | $ | 789 | | | $ | 164 | | | $ | 164 | | | $ | (164 | ) | | | — | | | | — | | | | — | |
NatWest Markets PLC | | | — | | | | — | | | | — | | | | — | | | | — | | | | — | | | | 201 | | | | 201 | | | | — | | | | — | | | | — | | | $ | 201 | |
State Street Bank and Trust | | | 27 | | | | 27 | | | | — | | | | — | | | | — | | | | 27 | | | | — | | | | — | | | | — | | | | — | | | | — | | | | — | |
Citibank, N.A | | | 44 | | | | 44 | | | | (7 | ) | | | — | | | | — | | | | 37 | | | | 7 | | | | 7 | | | | (7 | ) | | | — | | | | — | | | | — | |
UBS AG | | | — | | | | — | | | | — | | | | — | | | | — | | | | — | | | | 130 | | | | 130 | | | | — | | | | — | | | | — | | | | 130 | |
| | | | | | | | | | | | | | | | | | | | | | | | | | | | | | | | | | | | | | | | | | | | | | | | |
Total | | $ | 1,024 | | | $ | 1,024 | | | $ | (171 | ) | | | — | | | | — | | | $ | 853 | | | $ | 502 | | | $ | 502 | | | $ | (171 | ) | | | — | | | | — | | | $ | 331 | |
| | | | | | | | | | | | | | | | | | | | | | | | | | | | | | | | | | | | | | | | | | | | | | | | |
| (a) | No amounts have been netted against the gross amounts recognized in the Statements of Assets and Liabilities. |
| (b) | Represents the amount of assets that could be offset by liabilities with the same counterparty under master netting or similar agreements that management elects not to offset on the Statements of Assets and Liabilities. |
| (c) | Represents the net amount due from counterparties in the event of default. |
| (d) | Represents the amount of liabilities that could be offset by assets with the same counterparty under master netting or similar agreements that management elects not to offset on the Statements of Assets and Liabilities. |
| (e) | Represents the net amount due to counterparties in the event of default. |
94
I. Line of Credit and Interfund Lending Program:
The Fund, together with other Dimensional-advised portfolios, has entered into a $500 million uncommitted, unsecured discretionary line of credit effective April 6, 2022, with its domestic custodian bank. A line of credit with similar terms was in effect through April 6, 2022. Each portfolio is permitted to borrow, subject to its investment limitations, up to a maximum of $250 million, as long as total borrowings under the line of credit do not exceed $500 million in the aggregate. Borrowings under the line of credit are charged interest at rates agreed upon by the parties at the time of borrowing. Each portfolio is individually, and not jointly, liable for its particular advances under the line of credit. There is no commitment fee on the unused portion of the line of credit. The agreement for the discretionary line of credit may be terminated by either party at any time. The agreement for the line of credit expires on April 5, 2023.
The Fund, together with other Dimensional-advised portfolios, has also entered into an additional $700 million unsecured line of credit with its international custodian bank effective January 2, 2022. A line of credit with similar terms was in effect through January 1, 2022. Each portfolio is permitted to borrow, subject to its investment limitations, up to the lower of one-quarter of such portfolio’s net assets or $500 million, as long as total borrowings under the line of credit do not exceed $700 million in the aggregate. Each portfolio is individually, and not jointly, liable for its particular advances under the line of credit. Borrowings under the line of credit are charged interest at rates agreed upon by the parties at the time of borrowing. There is no commitment fee on the unused portion of the line of credit. The line of credit agreement expires on January 1, 2023.
For the year ended October 31, 2022, borrowings by the following Portfolios under the lines of credit were as follows (amounts in thousands, except percentages and days):
| | | | | | | | | | | | | | | | | | | | | | | | |
| | | Weighted
Average
Interest Rate | | | Weighted
Average
Loan Balance | | | Number of
Days
Outstanding* | | | Interest
Expense
Incurred | | | Maximum Amount
Borrowed During
the Period | | | Outstanding
Borrowings
as of 10/31/2022 | |
U.S. Large Cap Equity Portfolio | | | 2.56 | % | | $ | 6,038 | | | | 32 | | | $ | 13 | | | $ | 19,900 | | | | — | |
U.S. Vector Equity Portfolio | | | 1.08 | % | | | 1,245 | | | | 4 | | | | — | | | | 1,245 | | | | — | |
U.S. High Relative Profitability Portfolio | | | 1.58 | % | | | 15,371 | | | | 1 | | | | 1 | | | | 15,371 | | | | — | |
DFA Real Estate Securities Portfolio | | | 3.83 | % | | | 8,536 | | | | 1 | | | | 1 | | | | 8,536 | | | | — | |
| * | Number of Days Outstanding represents the total of single or consecutive days during the year ended October 31, 2022, that each Portfolio’s available line of credit was used. |
Pursuant to an exemptive order issued by the SEC (the “Order”), the Portfolios may participate in an interfund lending program among certain portfolios managed by the Advisor (portfolios that operate as feeder funds do not participate in the program). The program allows the participating portfolios to borrow money from and loan money to each other for temporary or emergency purposes, subject to the conditions in the Order. A loan can only be made through the program if the interfund loan rate on that day is more favorable to both the borrowing and lending portfolios as compared to rates available through short-term bank loans or investments in overnight repurchase agreements and money market funds, respectively, as detailed in the Order. Further, a portfolio may participate in the program only if and to the extent that such participation is consistent with its investment objectives and limitations. Interfund loans have a maximum duration of seven days and may be called on one business day’s notice.
95
For the year ended October 31, 2022, activity by the Portfolios under the interfund lending program was as follows (amounts in thousands, except percentages and days):
| | | | | | | | | | | | | | | | | | | | | | | | | | | | |
| | | Borrower or
Lender | | | Weighted
Average
Interest Rate | | | Weighted
Average Loan
Balance | | | Number of
Days
Outstanding* | | | Interest
Expense/
Income | | | Maximum Amount
Borrowed/Loaned
During the Period | | | Outstanding
Borrowings
as of 10/31/2022 | |
U.S. Large Cap Equity Portfolio | | | Borrower | | | | 0.44 | % | | $ | 50,231 | | | | 4 | | | $ | 2 | | | $ | 51,969 | | | | — | |
U.S. High Relative Profitability Portfolio | | | Borrower | | | | 1.19 | % | | | 136,696 | | | | 2 | | | | 9 | | | | 175,411 | | | | — | |
| * | Number of Days Outstanding represents the total of single or consecutive days during the year ended October 31, 2022 that the Portfolio utilized the interfund lending program. |
J. Affiliated Trades:
Cross trades for the year ended October 31, 2022, if any, were executed by the Portfolios pursuant to procedures adopted by the Board of Directors of the Fund to ensure compliance with Rule 17a-7 under the 1940 Act. Cross trading is the buying or selling of portfolio securities between series of investment companies, or between a series of an investment company and another entity, that are or could be considered affiliates by virtue of having a common investment advisor (or affiliated investment advisors), common Directors and/or common Officers. At its regularly scheduled meetings, the CCO certifies to the Board that the 17a-7 transactions entered into by the Portfolios complied with the Rule 17a-7 Procedures adopted by the Board of Directors of the Fund.
For the year ended October 31, 2022, cross trades by the Portfolios under Rule 17a-7 were as follows (amounts in thousands):
| | | | | | | | | | | | |
Portfolio | | Purchases | | | Sales | | | Realized Gain (Loss) | |
U.S. Large Cap Equity Portfolio | | $ | 18,885 | | | $ | 54,712 | | | $ | (33 | ) |
U.S. Targeted Value Portfolio | | | 367,533 | | | | 342,270 | | | | (131,035 | ) |
U.S. Small Cap Value Portfolio | | | 490,426 | | | | 609,569 | | | | (95,907 | ) |
U.S. Core Equity 1 Portfolio | | | 206,881 | | | | 188,763 | | | | (4,834 | ) |
U.S. Core Equity 2 Portfolio | | | 256,255 | | | | 132,867 | | | | 8,626 | |
U.S. Vector Equity Portfolio | | | 95,862 | | | | 109,515 | | | | (38,683 | ) |
U.S. Small Cap Portfolio | | | 172,827 | | | | 407,411 | | | | (111,392 | ) |
U.S. Micro Cap Portfolio | | | 200,453 | | | | 159,721 | | | | (50,174 | ) |
U.S. High Relative Profitability Portfolio | | | 123,570 | | | | 74,089 | | | | 1,719 | |
DFA Real Estate Securities Portfolio | | | 21 | | | | 54,094 | | | | 8,695 | |
96
K. Securities Lending:
As of October 31, 2022, some of the Portfolios had securities on loan to brokers/dealers, for which each such Portfolio received cash collateral. In addition, the Portfolios received non-cash collateral consisting of short- and/or long-term U.S. Treasuries and U.S. government agency securities as follows (amounts in thousands):
| | | | |
| | | Non-Cash
Collateral
Market
Value | |
U.S. Large Cap Equity Portfolio | | $ | 26,444 | |
U.S. Targeted Value Portfolio | | | 124,777 | |
U.S. Small Cap Value Portfolio | | | 143,035 | |
U.S. Core Equity 1 Portfolio | | | 228,672 | |
U.S. Core Equity 2 Portfolio | | | 493,460 | |
U.S. Vector Equity Portfolio | | | 83,265 | |
U.S. Small Cap Portfolio | | | 270,549 | |
U.S. Micro Cap Portfolio | | | 123,190 | |
U.S. High Relative Profitability Portfolio | | | 34,330 | |
DFA Real Estate Securities Portfolio | | | 100,836 | |
Each Portfolio invests the cash collateral, as described below, and records a liability for the return of the collateral, during the period the securities are on loan. Loans of securities are expected at all times to be secured by collateral in an amount (i) equal to at least 100% of the current market value of the loaned securities with respect to securities of the U.S. government or its agencies, (ii) generally equal to 102% of the current market value of the loaned securities with respect to U.S. securities, and (iii) generally equal to 105% of the current market value of the loaned securities with respect to foreign securities. However, daily market fluctuations could cause the Portfolio’s collateral to be lower or higher than the expected thresholds. If this were to occur, the collateral would be adjusted the next business day to ensure adequate collateralization. In the event of default or bankruptcy by the other party to the agreement, realization and/or retention of the collateral may be subject to legal proceedings. If the borrower fails to return loaned securities, cash collateral being maintained by the borrower is insufficient to cover the value of loaned securities, and such collateral insufficiency is not the result of investment losses, the lending agent has agreed to pay the amount of the shortfall to the Portfolio or, at the option of the lending agent, to replace the securities. In the event of the bankruptcy of the borrower, a Portfolio could experience delay in recovering the loaned securities or only recover cash or a security of equivalent value.
Subject to their stated investment policies, each Portfolio with securities on loan will generally invest the cash collateral received for the loaned securities in The DFA Short Term Investment Fund (the “Money Market Series”), an affiliated registered money market fund advised by the Advisor for which the Advisor receives a management fee of 0.05% of the average daily net assets of the Money Market Series. Income received from the Money Market Series is netted with fees for securities lending and collateral investment expenses and with other payments to and from borrowers of securities. Each Portfolio also may invest the cash collateral received for the loaned securities in securities of the U.S. government or its agencies, repurchase agreements collateralized by securities of the U.S. government or its agencies, and affiliated or unaffiliated money market funds that are registered or unregistered. For purposes of this paragraph, agencies include both agency debentures and agency mortgage-backed securities. Additionally, each Portfolio will be able to terminate the loan at any time and will receive reasonable interest on the loan, as well as amounts equal to any dividends, interest or, other distributions on the loaned securities. However, dividend income received from loaned securities may not be eligible for taxation at qualified dividend income rates.
97
The following table reflects a breakdown of transactions accounted for as secured borrowings, the gross obligation by the type of collateral pledged, and the remaining contractual maturity of those transactions as of October 31, 2022 (amounts in thousands):
| | | | | | | | | | | | | | | | | | | | |
| | | Remaining Contractual Maturity of the Agreements
As of October 31, 2022 | |
| | | Overnight and
Continuous | | | <30 days | | | Between
30 & 90 days | | | >90 days | | | Total | |
Securities Lending Transactions | | | | | | | | | | | | | | | | | | | | |
Enhanced U.S. Large Company Portfolio Bonds | | $ | 6,770 | | | | — | | | | — | | | | — | | | $ | 6,770 | |
U.S. Large Cap Equity Portfolio Common Stocks | | | 8,220 | | | | — | | | | — | | | | — | | | | 8,220 | |
U.S. Targeted Value Portfolio Common Stocks, Preferred Stocks | | | 700,628 | | | | — | | | | — | | | | — | | | | 700,628 | |
U.S. Small Cap Value Portfolio Common Stocks, Preferred Stocks | | | 969,028 | | | | — | | | | — | | | | — | | | | 969,028 | |
U.S. Core Equity 1 Portfolio Common Stocks, Preferred Stocks | | | 1,131,496 | | | | — | | | | — | | | | — | | | | 1,131,496 | |
U.S. Core Equity 2 Portfolio Common Stocks, Preferred Stocks | | | 1,108,626 | | | | — | | | | — | | | | — | | | | 1,108,626 | |
U.S. Vector Equity Portfolio Common Stocks, Preferred Stocks | | | 227,703 | | | | — | | | | — | | | | — | | | | 227,703 | |
U.S. Small Cap Portfolio Common Stocks, Preferred Stocks, Rights/Warrants | | | 1,677,242 | | | | — | | | | — | | | | — | | | | 1,677,242 | |
U.S. Micro Cap Portfolio Common Stocks, Preferred Stocks, Rights/Warrants | | | 534,124 | | | | — | | | | — | | | | — | | | | 534,124 | |
U.S. High Relative Profitability Portfolio Common Stocks | | | 2,860 | | | | — | | | | — | | | | — | | | | 2,860 | |
DFA Real Estate Securities Portfolio Common Stocks | | | 364,037 | | | | — | | | | — | | | | — | | | | 364,037 | |
L. Shareholder Servicing Fees:
The Class R1 Shares pay a shareholder servicing fee in an amount up to 0.10% and Class R2 Shares pay a shareholder servicing fee in an amount up to 0.25% of their annual average net assets to compensate service agents that provide shareholder servicing, record keeping, account maintenance and other services to investors in U.S. Targeted Value Portfolio Class R1 and Class R2 Shares.
M. Indemnitees; Contractual Obligations:
Under the Fund’s organizational documents, its Officers and Directors are indemnified against certain liabilities arising out of the performance of their duties to the Fund.
In the normal course of business, the Fund enters into contracts that contain a variety of representations and warranties that provide general indemnification. The Fund’s maximum exposure under these arrangements is unknown, as this would involve future claims that may be made against the Fund and/or its affiliates that have not yet occurred. However, based on experience, the Fund expects the risk of loss to be remote.
98
N. In-Kind Redemptions:
During the year ended October 31, 2022, the Portfolio listed below realized net gains (losses) on in-kind redemptions as follows (amounts in thousands):
| | | | |
U.S. Micro Cap Portfolio | | $ | 37,518 | |
O. Recently Issued Accounting Standards and Regulations:
In March 2020, the Financial Accounting Standards Board (FASB) issued Accounting Standards Update (ASU) No. 2020-04, Reference Rate Reform (Topic 848) – Facilitation of the Effects of Reference Rate Reform on Financial Reporting. In January 2021, the FASB issued ASU No. 2021-01, with further amendments to Topic 848. The amendments in the ASUs provide optional temporary accounting recognition and financial reporting relief from the effect of certain types of contract modifications due to the planned discontinuation of the LIBOR and other interbank-offered based reference rates as of the end of 2021 and 2023. The ASUs are effective for certain reference rate-related contract modifications that occur during the period March 12, 2020 through December 31, 2022. Management has reviewed the requirements and believes the adoption of these ASUs will not have a material impact on the Portfolios’ financial statements.
In October 2020, the SEC adopted new regulations governing the use of derivatives by registered investment companies. Rule 18f-4 (the “Derivatives Rule”) imposes limits on the amount of derivatives contracts the Portfolios could enter, eliminates the asset segregation framework previously used by the Portfolios to comply with Section 18 of the 1940 Act, and requires funds whose use of derivatives is more than a limited specified exposure to establish and maintain a derivatives risk management program and appoint a derivatives risk manager. The Derivatives Rule became effective February 19, 2021 and the Portfolios began complying with the Derivatives Rule on August 19, 2022.
On December 3, 2020, the SEC adopted new Rule 2a-5 (the “Valuation Rule”) under the 1940 Act, establishing an updated regulatory framework for fund valuation. The Valuation Rule, in part, provides a framework for good faith fair value determination and permits a Board to designate fair value determinations to a fund’s investment adviser. Further, the SEC rescinded previously issued guidance on related issues. The Valuation Rule became effective on March 8, 2021 and the Portfolios began complying with the Valuation Rule on August 1, 2022.
P. Other:
As of October 31, 2022, the following number of shareholders held the following approximate percentages of the Portfolios’ outstanding shares. One or more of the shareholders may be omnibus accounts, which typically hold shares for the benefit of several other underlying investors.
| | | | | | | | |
| | | Number of
Shareholders | | | Approximate
Percentage
of Outstanding
Shares | |
Enhanced U.S. Large Company Portfolio-Institutional Class | | | 3 | | | | 62 | % |
U.S. Large Cap Equity Portfolio-Institutional Class | | | 4 | | | | 83 | % |
U.S. Large Cap Value Portfolio-Institutional Class | | | 3 | | | | 66 | % |
U.S. Targeted Value Portfolio-Class R1 | | | 6 | | | | 90 | % |
U.S. Targeted Value Portfolio-Class R2 | | | 6 | | | | 53 | % |
U.S. Targeted Value Portfolio-Institutional Class | | | 3 | | | | 88 | % |
U.S. Small Cap Value Portfolio-Institutional Class | | | 4 | | | | 75 | % |
U.S. Core Equity 1 Portfolio-Institutional Class | | | 4 | | | | 73 | % |
U.S. Core Equity 2 Portfolio-Institutional Class | | | 5 | | | | 82 | % |
U.S. Vector Equity Portfolio-Institutional Class | | | 4 | | | | 80 | % |
99
| | | | | | | | |
| | | Number of
Shareholders | | | Approximate
Percentage
of Outstanding
Shares | |
U.S. Small Cap Portfolio-Institutional Class | | | 3 | | | | 56 | % |
U.S. Micro Cap Portfolio-Institutional Class | | | 4 | | | | 78 | % |
U.S. High Relative Profitability Portfolio-Institutional Class | | | 3 | | | | 84 | % |
DFA Real Estate Securities Portfolio-Institutional Class | | | 3 | | | | 64 | % |
The Portfolios are subject to claims and suits that arise from time to time in the ordinary course of business (for example, claw back litigation against former shareholders of portfolio companies that filed for bankruptcy, such as the now ended litigation involving The Tribune Company and the ongoing litigation involving Nine West). Although management currently believes that resolving claims against the Portfolios, individually or in aggregate, will not have a material adverse impact on the Portfolios’ financial position, results of operations, or cash flows, these matters are subject to inherent uncertainties and management’s view of these matters may change in the future.
Q. Subsequent Event Evaluations:
Management has evaluated the impact of all subsequent events on the Portfolios through the date on which the financial statements were issued and has determined that there are no subsequent events requiring recognition or disclosure in the financial statements.
100

Report of Independent Registered Public Accounting Firm
To the Board of Directors of DFA Investment Dimensions Group Inc. and Shareholders of Enhanced U.S. Large Company Portfolio, U.S. Large Cap Equity Portfolio, U.S. Large Cap Value Portfolio, U.S. Targeted Value Portfolio, U.S. Small Cap Value Portfolio, U.S. Core Equity 1 Portfolio, U.S. Core Equity 2 Portfolio, U.S. Vector Equity Portfolio, U.S. Small Cap Portfolio, U.S. Micro Cap Portfolio, U.S. High Relative Profitability Portfolio and DFA Real Estate Securities Portfolio
Opinions on the Financial Statements
We have audited the accompanying statements of assets and liabilities, including the schedules of investments of Enhanced U.S. Large Company Portfolio and U.S. Large Cap Value Portfolio and summary schedules of portfolio holdings of U.S. Large Cap Equity Portfolio, U.S. Targeted Value Portfolio, U.S. Small Cap Value Portfolio, U.S. Core Equity 1 Portfolio, U.S. Core Equity 2 Portfolio, U.S. Vector Equity Portfolio, U.S. Small Cap Portfolio, U.S. Micro Cap Portfolio, U.S. High Relative Profitability Portfolio and DFA Real Estate Securities Portfolio (twelve of the portfolios constituting DFA Investment Dimensions Group Inc., hereafter collectively referred to as the “Portfolios”) as of October 31, 2022, the related statements of operations for the year ended October 31, 2022, the statements of changes in net assets for each of the two years in the period ended October 31, 2022, including the related notes, and the financial highlights for each of the five years in the period ended October 31, 2022 (collectively referred to as the “financial statements”). In our opinion, the financial statements present fairly, in all material respects, the financial position of each of the Portfolios as of October 31, 2022, the results of each of their operations for the year then ended, the changes in each of their net assets for each of the two years in the period ended October 31, 2022, and each of the financial highlights for each of the five years in the period ended October 31, 2022 in conformity with accounting principles generally accepted in the United States of America.
Basis for Opinions
These financial statements are the responsibility of the Portfolios’ management. Our responsibility is to express an opinion on the Portfolios’ financial statements based on our audits. We are a public accounting firm registered with the Public Company Accounting Oversight Board (United States) (PCAOB) and are required to be independent with respect to the Portfolios in accordance with the U.S. federal securities laws and the applicable rules and regulations of the Securities and Exchange Commission and the PCAOB.
We conducted our audits of these financial statements in accordance with the standards of the PCAOB. Those standards require that we plan and perform the audit to obtain reasonable assurance about whether the financial statements are free of material misstatement, whether due to error or fraud.
Our audits included performing procedures to assess the risks of material misstatement of the financial statements, whether due to error or fraud, and performing procedures that respond to those risks. Such procedures included examining, on a test basis, evidence regarding the amounts and disclosures in the financial statements. Our audits also included evaluating the accounting principles used and significant estimates made by management, as well as evaluating the overall presentation of the financial statements. Our procedures included confirmation of securities owned as of October 31, 2022 by correspondence with the custodians, brokers and transfer agents of the investee funds; when replies were not received from brokers, we performed other auditing procedures. We believe that our audits provide a reasonable basis for our opinions.
|
| /s/PricewaterhouseCoopers LLP |
| Philadelphia, Pennsylvania |
101
December 22, 2022
We have served as the auditor of one or more investment companies in Dimensional Fund Advisors L.P. investment company group since 1981.
102
DFA INVESTMENT DIMENSIONS GROUP INC.
PERFORMANCE CHARTS
(Unaudited)
DFA Commodity Strategy Portfolio vs.
Bloomberg Commodity Total Return Index
October 31, 2012-October 31, 2022
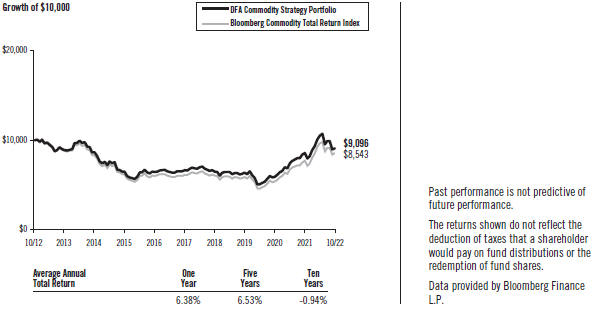
103
MANAGEMENT’S DISCUSSION AND ANALYSIS
| | |
| Commodity Market Review | | 12 Months Ended October 31, 2022 |
For the 12 months ended October 31, 2022, the Bloomberg Commodity Index Total Return returned 11.15%. Energy, agriculture, and livestock returned 33.25%, 17.72%, and 9.21%, respectively. Precious metals and industrial metals were the only sectors with negative returns for the period, with a return of -11.46% and -13.39%, respectively.
DFA Commodity Strategy Portfolio
The DFA Commodity Strategy Portfolio seeks total return consisting of capital appreciation and current income. The Portfolio generally invests in commodity-linked derivative instruments and fixed income investments. The Portfolio, through its wholly owned subsidiary, Dimensional Cayman Commodity Fund I LTD, gains exposure to commodities markets by investing in derivative instruments such as commodity swap contracts, commodity futures, and other commodity-linked instruments. In pursuing the fixed income portion of the Portfolio’s investment strategy, Dimensional identifies a broadly diversified universe of eligible U.S. and foreign fixed income securities with defined maturity ranges and credit quality characteristics and then seeks to purchase a broad and diverse portfolio of securities meeting these aforementioned standards. The investment strategy uses a variable maturity approach and shifts maturities based on changes in the yield curve. The strategy uses current yields and identifies favorable maturity ranges of expected returns based on potential buy and sell strategies. The weighted average duration of the Portfolio’s fixed income securities was 1.43 years as of October 31, 2022, compared to 1.89 years as of October 31, 2021.
For the 12 months ended October 31, 2022, total returns were 6.38% for the Portfolio and 11.15% for the Bloomberg Commodity Index Total Return. The late rebalance, pre-roll, and varying the commodity weights relative to the benchmark contributed positively to relative performance. The collateral component and varying the expirations of the individual commodity contracts detracted from performance relative to the benchmark. The collateral component of the Portfolio had a longer duration than the three-month U.S. Treasury bill rate payable in the commodity swap contracts. As a result, the Portfolio’s longer duration detracted from performance relative to the benchmark as longer duration securities generally underperformed shorter duration securities during the period.
104
DFA INVESTMENT DIMENSIONS GROUP INC.
DFA COMMODITY STRATEGY PORTFOLIO
CONSOLIDATED DISCLOSURE OF FUND EXPENSES
(Unaudited)
The following Expense Table is shown so that you can understand the impact of fees on your investment. All mutual funds have operating expenses. As a shareholder of the fund, you incur ongoing costs, which include costs for portfolio management, administrative services, and shareholder reports, among others. Operating expenses and legal and audit services, which are deducted from a fund’s gross income, directly reduce the investment return of the fund. A fund’s expenses are expressed as a percentage of its average net assets. This figure is known as the expense ratio. The following examples are intended to help you understand the ongoing costs, in dollars, of investing in the fund and to compare these costs with those of other mutual funds. The examples are based on an investment of $1,000 made at the beginning of the period shown and held for the entire period.
The Expense Table below illustrates your fund’s costs in two ways.
Actual Fund Return
This section helps you to estimate the actual expenses after fee waivers that you paid over the period. The “Ending Account Value” shown is derived from the fund’s actual return, and “Expenses Paid During Period” reflects the dollar amount that would have been paid by an investor who started with $1,000 in the fund. You may use the information here, together with the amount you invested, to estimate the expenses that you paid over the period.
To do so, simply divide your account value by $1,000 (for example, a $7,500 account value divided by $1,000 = 7.5), then multiply the result by the number given for your fund under the heading “Expenses Paid During Period.”
Hypothetical Example for Comparison Purposes
This section is intended to help you compare your fund’s costs with those of other mutual funds. The hypothetical “Ending Account Value” and “Expenses Paid During Period” are derived from the fund’s actual expense ratio and an assumed 5% annual return before expenses. In this case, because the return used is not the fund’s actual return, the results do not apply to your investment. The example is useful in making comparisons because the SEC requires all mutual funds to calculate expenses based on a 5% annual return. You can assess your fund’s costs by comparing this hypothetical example with the hypothetical examples that appear in shareholder reports of other funds.
Please note that the expenses shown in the table is meant to highlight and help you compare ongoing costs only and do not reflect any transactional costs, if applicable. The “Annualized Expense Ratio” represents the actual expenses for the six-month period indicated.
Six Months Ended October 31, 2022
EXPENSE TABLE
| | | | | | | | | | | | | | | | |
| | | Beginning
Account
Value
05/01/22 | | | Ending
Account
Value
10/31/22 | | | Annualized
Expense
Ratio (1) | | | Expenses
Paid
During
Period (1) | |
DFA Commodity Strategy Portfolio | | | | | | | | | | | | | | | | |
Actual Fund Return | | $ | 1,000.00 | | | $ | 864.40 | | | | 0.30 | % | | $ | 1.41 | |
105
CONSOLIDATED DISCLOSURE OF FUND EXPENSES
CONTINUED
| | | | | | | | | | | | | | | | |
| | | Beginning
Account
Value
05/01/22 | | | Ending
Account
Value
10/31/22 | | | Annualized
Expense
Ratio (1) | | | Expenses
Paid
During
Period (1) | |
Hypothetical 5% Annual Return | | $ | 1,000.00 | | | $ | 1,023.69 | | | | 0.30 | % | | $ | 1.53 | |
| (1) | DFA Commodity Strategy Portfolio wholly owns Dimensional Cayman Commodity Fund I, LTD. The expenses shown reflect the consolidated expenses of Dimensional Cayman Commodity Fund I, LTD. and DFA Commodity Strategy Portfolio. Expenses are equal to the fund’s annualized expense ratio for the six-month period, multiplied by the average account value over the period, multiplied by the number of days in the most recent six-month period (184), then divided by the number of days in the year (365) to reflect the six-month period. |
106
DFA INVESTMENT DIMENSIONS GROUP INC.
DFA COMMODITY STRATEGY PORTFOLIO
CONSOLIDATED DISCLOSURE OF PORTFOLIO HOLDINGS
(Unaudited)
The SEC requires that all funds file a complete Schedule of Investments with the SEC for their first and third fiscal quarters as an exhibit to their reports on Form N-PORT. For DFA Investment Dimensions Group Inc., this would be for the fiscal quarters ending January 31 and July 31. Such Form N-PORT filing must be made within 60 days of the end of the quarter. DFA Investment Dimensions Group Inc. filed its most recent Form N-PORT with the SEC on September 28, 2022. They are available upon request, without charge, by calling collect: (512) 306-7400; by mailing a request to Dimensional Fund Advisors LP, 6300 Bee Cave Road, Building One, Austin, TX 78746; or by visiting the SEC’s website at http://www.sec.gov.
PORTFOLIO HOLDINGS
The SEC requires that all funds present their categories of portfolio holdings in a table, chart, or graph format in their annual and semi-annual shareholder reports, whether or not a Schedule of Investments is used. The following table, which presents portfolio holdings as a percentage of total investments before short-term investments and collateral for loaned securities, is provided in compliance with this requirement. The categories shown below represent broad industry sectors. Each industry sector consists of one or more specific industry classifications.
| | | | |
| DFA Commodity Strategy Portfolio | |
Basic Materials | | | 0.9 | % |
Communications | | | 1.7 | % |
Consumer, Cyclical | | | 4.9 | % |
Consumer, Non-cyclical | | | 7.5 | % |
Energy | | | 4.4 | % |
Financial | | | 31.4 | % |
Foreign Government | | | 4.2 | % |
Industrial | | | 2.7 | % |
Supranational | | | 1.9 | % |
Technology | | | 3.1 | % |
U.S. Government | | | 33.9 | % |
Utilities | | | 3.4 | % |
| | | | |
| | | 100.0 | % |
107
DFA COMMODITY STRATEGY PORTFOLIO
CONSOLIDATED SCHEDULE OF INVESTMENTS
October 31, 2022
| | | | | | | | | | | | | | |
| | | Face
Amount^ | | | Value† | |
| | | (000) | | | | |
BONDS — (65.4%) | | | | | | | | | | | | |
AUSTRALIA — (3.8%) | | | | | | | | | | | | |
APA Infrastructure Ltd. | | | | | | | | | | | | |
W | | 4.200%, 03/23/25 | | | | | | | 4,000 | | | $ | 3,814,172 | |
Australia Government Bond | | | | | | | | | | | | |
| | 2.750%, 04/21/24 | | | AUD | | | | 14,000 | | | | 8,903,099 | |
Bank of New Zealand | | | | | | | | | | | | |
W | | 3.500%, 02/20/24 | | | | | | | 5,250 | | | | 5,133,724 | |
Glencore Funding LLC | | | | | | | | | | | | |
W | | 4.125%, 03/12/24 | | | | | | | 2,225 | | | | 2,179,816 | |
W | | 4.625%, 04/29/24 | | | | | | | 7,350 | | | | 7,224,691 | |
Macquarie Bank Ltd. | | | | | | | | | | | | |
#W | | 2.300%, 01/22/25 | | | | | | | 2,390 | | | | 2,232,507 | |
#W | | 3.231%, 03/21/25 | | | | | | | 15,225 | | | | 14,516,601 | |
New South Wales Treasury Corp. | | | | | | | | | | | | |
| | 5.000%, 08/20/24 | | | AUD | | | | 13,500 | | | | 8,825,584 | |
Queensland Treasury Corp. | | | | | | | | | | | | |
| | 5.750%, 07/22/24 | | | AUD | | | | 4,800 | | | | 3,175,767 | |
Westpac Banking Corp. | | | | | | | | | | | | |
| | 3.250%, 11/16/23 | | | AUD | | | | 10,000 | | | | 6,324,494 | |
| | | | | | | | | | | | | | |
TOTAL AUSTRALIA | | | | | | | | | | | 62,330,455 | |
| | | | | | | | | | | | | | |
AUSTRIA — (0.1%) | | | | | | | | | | | | |
Oesterreichische Kontrollbank AG | | | | | | | | | | | | |
| | 0.500%, 09/16/24 | | | | | | | 1,500 | | | | 1,388,828 | |
| | | | | | | | | | | | | | |
CANADA — (7.0%) | | | | | | | | | | | | |
Bank of Montreal | | | | | | | | | | | | |
# | | 2.500%, 06/28/24 | | | | | | | 3,000 | | | | 2,864,598 | |
| | 0.625%, 07/09/24 | | | | | | | 1,350 | | | | 1,247,670 | |
Bank of Montreal, Floating Rate Note, SOFR + 0.320%, FRN | | | | | | | | | | | | |
#(r) | | 3.378%, 07/09/24 | | | | | | | 2,000 | | | | 1,966,240 | |
Bank of Nova Scotia | | | | | | | | | | | | |
| | 0.700%, 04/15/24 | | | | | | | 11,620 | | | | 10,845,685 | |
| | 0.650%, 07/31/24 | | | | | | | 600 | | | | 552,423 | |
# | | 3.450%, 04/11/25 | | | | | | | 2,000 | | | | 1,905,822 | |
Bank of Nova Scotia, Floating Rate Note, SOFR + 0.380%, FRN | | | | | | | | | | | | |
#(r) | | 3.442%, 07/31/24 | | | | | | | 1,000 | | | | 987,029 | |
Brookfield Asset Management, Inc. | | | | | | | | | | | | |
# | | 4.000%, 01/15/25 | | | | | | | 6,200 | | | | 6,010,729 | |
Canadian Imperial Bank of Commerce | | | | | | | | | | | | |
# | | 3.100%, 04/02/24 | | | | | | | 4,500 | | | | 4,360,811 | |
| | 1.000%, 10/18/24 | | | | | | | 5,000 | | | | 4,589,130 | |
# | | 2.250%, 01/28/25 | | | | | | | 5,000 | | | | 4,657,101 | |
| | | | | | | | | | | | | | |
| | | Face
Amount^ | | | Value† | |
| | | (000) | | | | |
CANADA — (Continued) | | | | | | | | | | | | |
Canadian Imperial Bank of Commerce, Floating Rate Note, SOFR + 0.400%, FRN | | | | | | | | | | | | |
(r) | | 3.363%, 12/14/23 | | | | | | | 3,000 | | | $ | 2,980,470 | |
Canadian Natural Resources Ltd. | | | | | | | | | | | | |
| | 2.950%, 01/15/23 | | | | | | | 750 | | | | 747,046 | |
| | 3.900%, 02/01/25 | | | | | | | 8,300 | | | | 8,003,884 | |
Enbridge, Inc. | | | | | | | | | | | | |
# | | 4.000%, 10/01/23 | | | | | | | 7,000 | | | | 6,903,834 | |
| | 2.500%, 01/15/25 | | | | | | | 2,000 | | | | 1,874,162 | |
ITC Holdings Corp. | | | | | | | | | | | | |
| | 3.650%, 06/15/24 | | | | | | | 9,000 | | | | 8,729,516 | |
National Bank of Canada | | | | | | | | | | | | |
| | 2.100%, 02/01/23 | | | | | | | 2,500 | | | | 2,481,943 | |
# | | 0.750%, 08/06/24 | | | | | | | 9,350 | | | | 8,590,172 | |
Quebec, Province of Canada | | | | | | | | | | | | |
| | 4.200%, 03/10/25 | | | AUD | | | | 2,000 | | | | 1,275,175 | |
Royal Bank of Canada | | | | | | | | | | | | |
| | 2.333%, 12/05/23 | | | CAD | | | | 5,000 | | | | 3,570,338 | |
# | | 0.650%, 07/29/24 | | | | | | | 1,750 | | | | 1,614,510 | |
Royal Bank of Canada, Floating Rate Note, SOFR + 0.360%, FRN | | | | | | | | | | | | |
#(r) | | 3.421%, 07/29/24 | | | | | | | 7,750 | | | | 7,645,973 | |
Thomson Reuters Corp. | | | | | | | | | | | | |
| | 3.850%, 09/29/24 | | | | | | | 5,000 | | | | 4,818,690 | |
Toronto-Dominion Bank | | | | | | | | | | | | |
| | 2.850%, 03/08/24 | | | CAD | | | | 10,000 | | | | 7,120,931 | |
| | 0.700%, 09/10/24 | | | | | | | 4,500 | | | | 4,128,476 | |
Toronto-Dominion Bank, Floating Rate Note, SOFR + 0.240%, FRN | | | | | | | | | | | | |
(r) | | 3.298%, 01/06/23 | | | | | | | 3,296 | | | | 3,294,016 | |
| | | | | | | | | | | | | | |
TOTAL CANADA | | | | | | | | | | | 113,766,374 | |
| | | | | | | | | | | | | | |
DENMARK — (0.4%) | | | | | | | | | | | | |
Danske Bank AS | | | | | | | | | | | | |
W | | 5.375%, 01/12/24 | | | | | | | 6,132 | | | | 6,042,941 | |
| | 5.375%, 01/12/24 | | | | | | | 1,000 | | | | 985,476 | |
| | | | | | | | | | | | | | |
TOTAL DENMARK | | | | | | | | | | | 7,028,417 | |
| | | | | | | | | | | | | | |
FRANCE — (3.6%) | | | | | | | | | | | | |
Banque Federative du Credit Mutuel SA | | | | | | | | | | | | |
W | | 2.375%, 11/21/24 | | | | | | | 5,000 | | | | 4,678,542 | |
BNP Paribas SA | | | | | | | | | �� | | | |
W | | 3.375%, 01/09/25 | | | | | | | 7,000 | | | | 6,617,275 | |
BPCE SA | | | | | | | | | | | | |
| | 4.000%, 04/15/24 | | | | | | | 500 | | | | 486,542 | |
W | | 2.375%, 01/14/25 | | | | | | | 7,985 | | | | 7,325,634 | |
108
DFA COMMODITY STRATEGY PORTFOLIO
CONTINUED
| | | | | | | | | | | | | | |
| | | Face
Amount^ | | | Value† | |
| | | (000) | | | | |
FRANCE — (Continued) | | | | | | | | | | | | |
# | | 2.375%, 01/14/25 | | | | | | | 6,500 | | | $ | 5,963,258 | |
Credit Agricole SA | | | | | | | | | | | | |
W | | 3.875%, 04/15/24 | | | | | | | 3,550 | | | | 3,475,223 | |
| | 3.250%, 10/04/24 | | | | | | | 5,000 | | | | 4,749,239 | |
Societe Generale SA | | | | | | | | | | | | |
W | | 3.875%, 03/28/24 | | | | | | | 10,500 | | | | 10,107,369 | |
W | | 2.625%, 01/22/25 | | | | | | | 2,640 | | | | 2,421,170 | |
TotalEnergies Capital International SA | | | | | | | | | | | | |
| | 3.750%, 04/10/24 | | | | | | | 13,004 | | | | 12,813,750 | |
| | | | | | | | | | | | | | |
TOTAL FRANCE | | | | | | | | | | | 58,638,002 | |
| | | | | | | | | | | | | | |
GERMANY — (3.6%) | | | | | | | | | | | | |
Bayer U.S. Finance II LLC | | | | | | | | | | | | |
W | | 3.875%, 12/15/23 | | | | | | | 3,500 | | | | 3,432,078 | |
Bayer U.S. Finance LLC | | | | | | | | | | | | |
W | | 3.375%, 10/08/24 | | | | | | | 6,000 | | | | 5,768,298 | |
BMW U.S. Capital LLC | | | | | | | | | | | | |
W | | 0.800%, 04/01/24 | | | | | | | 2,000 | | | | 1,881,687 | |
W | | 0.750%, 08/12/24 | | | | | | | 2,290 | | | | 2,114,844 | |
BMW U.S. Capital LLC, Floating Rate Note, SOFR + 0.530%, FRN | | | | | | | | | | | | |
(r)W | | 3.584%, 04/01/24 | | | | | | | 8,000 | | | | 7,964,396 | |
Deutsche Bank AG | | | | | | | | | | | | |
| | 3.950%, 02/27/23 | | | | | | | 1,695 | | | | 1,683,263 | |
EMD Finance LLC | | | | | | | | | | | | |
| | 3.250%, 03/19/25 | | | | | | | 5,697 | | | | 5,429,080 | |
Kreditanstalt fuer Wiederaufbau | | | | | | | | | | | | |
| | 5.000%, 03/19/24 | | | AUD | | | | 2,000 | | | | 1,297,050 | |
| | 1.500%, 07/24/24 | | | AUD | | | | 8,800 | | | | 5,394,720 | |
| | 4.000%, 02/27/25 | | | AUD | | | | 5,000 | | | | 3,199,079 | |
Landwirtschaftliche Rentenbank | | | | | | | | | | | | |
| | 4.750%, 04/08/24 | | | AUD | | | | 15,000 | | | | 9,696,653 | |
Mercedes-Benz Finance North America LLC | | | | | | | | | | | | |
#W | | 2.125%, 03/10/25 | | | | | | | 9,560 | | | | 8,839,389 | |
NRW Bank | | | | | | | | | | | | |
| | 1.600%, 07/31/24 | | | AUD | | | | 4,000 | | | | 2,440,525 | |
| | | | | | | | | | | | | | |
TOTAL GERMANY | | | | | | | | | | | 59,141,062 | |
| | | | | | | | | | | | | | |
IRELAND — (0.8%) | | | | | | | | | | | | |
AerCap Ireland Capital DAC/AerCap Global Aviation Trust | | | | | | | | | | | | |
# | | 4.875%, 01/16/24 | | | | | | | 7,500 | | | | 7,361,275 | |
| | 2.875%, 08/14/24 | | | | | | | 2,450 | | | | 2,295,646 | |
# | | 3.500%, 01/15/25 | | | | | | | 3,000 | | | | 2,815,001 | |
| | | | | | | | | | | | | | |
TOTAL IRELAND | | | | | | | | | | | 12,471,922 | |
| | | | | | | | | | | | | | |
| | | | | | | | | | | | | | |
| | | Face
Amount^ | | | Value† | |
| | | (000) | | | | |
ITALY — (0.6%) | | | | | | | | | | | | |
Republic of Italy Government International Bond | | | | | | | | | | | | |
| | 0.875%, 05/06/24 | | | | | | | 8,000 | | | $ | 7,400,464 | |
| | 2.375%, 10/17/24 | | | | | | | 2,000 | | | | 1,864,004 | |
| | | | | | | | | | | | | | |
TOTAL ITALY | | | | | | | | | | | 9,264,468 | |
| | | | | | | | | | | | | | |
JAPAN — (5.8%) | | | | | | | | | | | | |
Aircastle Ltd. | | | | | | | | | | | | |
# | | 4.125%, 05/01/24 | | | | | | | 8,900 | | | | 8,481,751 | |
American Honda Finance Corp. | | | | | | | | | | | | |
| | 3.550%, 01/12/24 | | | | | | | 3,000 | | | | 2,945,172 | |
| | 0.550%, 07/12/24 | | | | | | | 10,000 | | | | 9,270,372 | |
Mitsubishi UFJ Financial Group, Inc. | | | | | | | | | | | | |
| | 2.193%, 02/25/25 | | | | | | | 12,600 | | | | 11,622,618 | |
MUFG Bank Ltd. | | | | | | | | | | | | |
#W | | 3.250%, 09/08/24 | | | | | | | 2,000 | | | | 1,917,560 | |
Nissan Motor Acceptance Co. LLC | | | | | | | | | | | | |
W | | 1.125%, 09/16/24 | | | | | | | 10,750 | | | | 9,598,266 | |
Nomura Holdings, Inc. | | | | | | | | | | | | |
| | 2.648%, 01/16/25 | | | | | | | 8,390 | | | | 7,853,377 | |
| | 5.099%, 07/03/25 | | | | | | | 3,000 | | | | 2,936,835 | |
ORIX Corp. | | | | | | | | | | | | |
# | | 3.250%, 12/04/24 | | | | | | | 5,000 | | | | 4,779,272 | |
Sumitomo Mitsui Financial Group, Inc. | | | | | | | | | | | | |
| | 2.696%, 07/16/24 | | | | | | | 9,500 | | | | 9,047,416 | |
| | 2.348%, 01/15/25 | | | | | | | 5,500 | | | | 5,119,811 | |
Sumitomo Mitsui Trust Bank Ltd. | | | | | | | | | | | | |
#W | | 0.800%, 09/12/23 | | | | | | | 9,500 | | | | 9,129,104 | |
#W | | 0.850%, 03/25/24 | | | | | | | 750 | | | | 702,040 | |
W | | 0.800%, 09/16/24 | | | | | | | 643 | | | | 588,918 | |
Toyota Motor Credit Corp. | | | | | | | | | | | | |
| | 2.500%, 03/22/24 | | | | | | | 10,000 | | | | 9,663,297 | |
# | | 0.625%, 09/13/24 | | | | | | | 2,000 | | | | 1,849,275 | |
| | | | | | | | | | | | | | |
TOTAL JAPAN | | | | | | | | | | | 95,505,084 | |
| | | | | | | | | | | | | | |
NETHERLANDS — (0.7%) | | | | | | | | | | | | |
Cooperatieve Rabobank UA | | | | | | | | | | | | |
W | | 2.625%, 07/22/24 | | | | | | | 6,940 | | | | 6,610,171 | |
ING Groep NV | | | | | | | | | | | | |
| | 3.550%, 04/09/24 | | | | | | | 5,000 | | | | 4,854,500 | |
| | | | | | | | | | | | | | |
TOTAL NETHERLANDS | | | | | | | | | | | 11,464,671 | |
| | | | | | | | | | | | | | |
NEW ZEALAND — (1.6%) | | | | | | | | | | | | |
New Zealand Government Bond | | | | | | | | | | | | |
| | 0.500%, 05/15/24 | | | NZD | | | | 45,900 | | | | 25,186,496 | |
109
DFA COMMODITY STRATEGY PORTFOLIO
CONTINUED
| | | | | | | | | | | | | | |
| | | Face
Amount^ | | | Value† | |
| | | (000) | | | | |
NEW ZEALAND — (Continued) | |
New Zealand Local Government Funding Agency Bond | | | | | | | | | | | | |
| | 2.250%, 04/15/24 | | | NZD | | | | 1,500 | | | $ | 836,349 | |
| | | | | | | | | | | | | | |
TOTAL NEW ZEALAND | | | | | | | | | | | 26,022,845 | |
| | | | | | | | | | | | | | |
SPAIN — (0.8%) | | | | | | | | | | | | |
Banco Santander SA | | | | | | | | | | | | |
| | 3.496%, 03/24/25 | | | | | | | 7,000 | | | | 6,645,166 | |
Santander Holdings USA, Inc. | | | | | | | | | | | | |
| | 3.400%, 01/18/23 | | | | | | | 2,000 | | | | 1,991,112 | |
| | 3.500%, 06/07/24 | | | | | | | 5,000 | | | | 4,794,751 | |
| | | | | | | | | | | | | | |
TOTAL SPAIN | | | | | | | | | | | 13,431,029 | |
| | | | | | | | | | | | | | |
SUPRANATIONAL ORGANIZATION OBLIGATIONS — (1.9%) | |
African Development Bank | | | | | | | | | | | | |
| | 4.750%, 03/06/24 | | | AUD | | | | 12,000 | | | | 7,741,313 | |
Asian Development Bank | | | | | | | | | | | | |
| | 1.100%, 08/15/24 | | | AUD | | | | 6,200 | | | | 3,763,017 | |
European Investment Bank | | | | | | | | | | | | |
| | 4.750%, 08/07/24 | | | AUD | | | | 1,000 | | | | 647,342 | |
Inter-American Development Bank | | | | | | | | | | | | |
| | 4.750%, 08/27/24 | | | AUD | | | | 1,000 | | | | 646,356 | |
International Finance Corp. | | | | | | | | | | | | |
| | 1.450%, 07/22/24 | | | AUD | | | | 4,000 | | | | 2,449,988 | |
Nordic Investment Bank | | | | | | | | | | | | |
| | 4.750%, 02/28/24 | | | AUD | | | | 13,500 | | | | 8,713,285 | |
| | 0.375%, 09/20/24 | | | | | | | 7,550 | | | | 6,973,784 | |
| | | | | | | | | | | | | | |
TOTAL SUPRANATIONAL ORGANIZATION OBLIGATIONS | | | | 30,935,085 | |
| | | | | | | | | | | | | | |
SWEDEN — (2.1%) | | | | | | | | | | | | |
Skandinaviska Enskilda Banken AB | | | | | | | | | | | | |
W | | 0.650%, 09/09/24 | | | | | | | 26,136 | | | | 23,924,058 | |
Svensk Exportkredit AB | | | | | | | | | | | | |
| | 0.625%, 10/07/24 | | | | | | | 10,600 | | | | 9,803,410 | |
| | | | | | | | | | | | | | |
TOTAL SWEDEN | | | | | | | | | | | 33,727,468 | |
| | | | | | | | | | | | | | |
SWITZERLAND — (0.8%) | | | | | | | | | | | | |
Credit Suisse AG | | | | | | | | | | | | |
| | 3.625%, 09/09/24 | | | | | | | 6,560 | | | | 6,096,513 | |
| | 2.950%, 04/09/25 | | | | | | | 5,000 | | | | 4,474,977 | |
UBS AG | | | | | | | | | | | | |
W | | 1.375%, 01/13/25 | | | | | | | 3,000 | | | | 2,744,768 | |
| | | | | | | | | | | | | | |
TOTAL SWITZERLAND | | | | | | | | 13,316,258 | |
| | | | | | | | | | | | | | |
UNITED KINGDOM — (2.3%) | | | | | |
BAT Capital Corp. | | | | | | | | | | | | |
| | 3.222%, 08/15/24 | | | | | | | 10,700 | | | | 10,226,613 | |
| | | | | | | | | | | | | | |
| | | Face
Amount^ | | | Value† | |
| | | (000) | | | | |
UNITED KINGDOM — (Continued) | |
CNH Industrial Capital LLC | | | | | | | | | | | | |
| | 1.950%, 07/02/23 | | | | | | | 4,000 | | | $ | 3,906,081 | |
HSBC Holdings PLC | | | | | | | | | | | | |
| | 3.600%, 05/25/23 | | | | | | | 2,000 | | | | 1,979,185 | |
Lloyds Banking Group PLC | | | | | | | | | | | | |
| | 4.450%, 05/08/25 | | | | | | | 7,000 | | | | 6,709,166 | |
NatWest Markets PLC | | | | | | | | | | | | |
#W | | 2.375%, 05/21/23 | | | | | | | 2,900 | | | | 2,837,233 | |
W | | 0.800%, 08/12/24 | | | | | | | 12,000 | | | | 10,962,090 | |
Reckitt Benckiser Treasury Services PLC | | | | | | | | | | | | |
#W | | 2.750%, 06/26/24 | | | | | | | 658 | | | | 630,989 | |
| | | | | | | | | | | | | | |
TOTAL UNITED KINGDOM | | | | | | | | 37,251,357 | |
| | | | | | | | | | | | | | |
UNITED STATES — (29.5%) | | | | | |
AbbVie, Inc. | | | | | | | | | | | | |
| | 2.900%, 11/06/22 | | | | | | | 6,500 | | | | 6,497,660 | |
Aetna, Inc. | | | | | | | | | | | | |
| | 3.500%, 11/15/24 | | | | | | | 1,600 | | | | 1,545,326 | |
Air Lease Corp. | | | | | | | | | | | | |
| | 2.250%, 01/15/23 | | | | | | | 2,414 | | | | 2,397,524 | |
Ally Financial, Inc. | | | | | | | | | | | | |
| | 3.875%, 05/21/24 | | | | | | | 2,500 | | | | 2,414,221 | |
| | 5.125%, 09/30/24 | | | | | | | 7,000 | | | | 6,896,053 | |
Amcor Flexibles North America, Inc. | | | | | | | | | | | | |
| | 4.000%, 05/17/25 | | | | | | | 3,200 | | | | 3,077,682 | |
American Express Co. | | | | | | | | | | | | |
| | 2.250%, 03/04/25 | | | | | | | 10,000 | | | | 9,285,010 | |
American Tower Corp. | | | | | | | | | | | | |
| | 3.375%, 05/15/24 | | | | | | | 1,900 | | | | 1,841,158 | |
| | 4.000%, 06/01/25 | | | | | | | 6,600 | | | | 6,312,757 | |
Ameriprise Financial, Inc. | | | | | | | | | | | | |
| | 3.000%, 04/02/25 | | | | | | | 5,000 | | | | 4,745,440 | |
Apple, Inc. | | | | | | | | | | | | |
| | 3.350%, 01/10/24 | | | AUD | | | | 1,500 | | | | 949,734 | |
Ares Capital Corp. | | | | | | | | | | | | |
# | | 4.200%, 06/10/24 | | | | | | | 9,320 | | | | 8,966,117 | |
Arizona Public Service Co. | | | | | | | | | | | | |
| | 3.350%, 06/15/24 | | | | | | | 4,328 | | | | 4,178,808 | |
Arrow Electronics, Inc. | | | | | | | | | | | | |
| | 3.250%, 09/08/24 | | | | | | | 1,500 | | | | 1,431,182 | |
Bank of America Corp. | | | | | | | | | | | | |
| | 3.300%, 01/11/23 | | | | | | | 2,000 | | | | 1,995,923 | |
| | 4.125%, 01/22/24 | | | | | | | 5,000 | | | | 4,940,721 | |
Boeing Co. | | | | | | | | | | | | |
| | 2.800%, 03/01/23 | | | | | | | 4,000 | | | | 3,967,524 | |
Booking Holdings, Inc. | | | | | | | | | | | | |
| | 3.650%, 03/15/25 | | | | | | | 10,000 | | | | 9,642,997 | |
Boston Scientific Corp. | | | | | | | | | | | | |
# | | 3.450%, 03/01/24 | | | | | | | 875 | | | | 854,723 | |
Broadcom Corp./Broadcom Cayman Finance Ltd. | | | | | | | | | | | | |
| | 3.625%, 01/15/24 | | | | | | | 8,000 | | | | 7,834,973 | |
110
DFA COMMODITY STRATEGY PORTFOLIO
CONTINUED
| | | | | | | | | | | | | | |
| | | Face
Amount^ | | | Value† | |
| | | (000) | | | | |
UNITED STATES — (Continued) | | | | | |
Campbell Soup Co. | | | | | | | | | | | | |
| | 3.300%, 03/19/25 | | | | | | | 10,000 | | | $ | 9,510,773 | |
Capital One Financial Corp. | | | | | | | | | | | | |
| | 3.300%, 10/30/24 | | | | | | | 1,486 | | | | 1,416,639 | |
| | 3.200%, 02/05/25 | | | | | | | 6,400 | | | | 6,050,479 | |
Cardinal Health, Inc. | | | | | | | | | | | | |
| | 3.079%, 06/15/24 | | | | | | | 9,750 | | | | 9,396,860 | |
Carrier Global Corp. | | | | | | | | | | | | |
| | 2.242%, 02/15/25 | | | | | | | 1,244 | | | | 1,157,683 | |
Charles Schwab Corp., Floating Rate Note, SOFR + 0.500%, FRN | | | | | | | | | | | | |
(r) | | 3.489%, 03/18/24 | | | | | | | 3,073 | | | | 3,053,377 | |
Cigna Corp. | | | | | | | | | | | | |
| | 3.750%, 07/15/23 | | | | | | | 1,163 | | | | 1,151,001 | |
| | 3.500%, 06/15/24 | | | | | | | 3,723 | | | | 3,625,582 | |
Cintas Corp. No. 2 | | | | | | | | | | | | |
| | 3.450%, 05/01/25 | | | | | | | 2,200 | | | | 2,121,372 | |
CNA Financial Corp. | | | | | | | | | | | | |
| | 3.950%, 05/15/24 | | | | | | | 2,000 | | | | 1,952,121 | |
Constellation Energy Generation LLC | | | | | | | | | | | | |
| | 3.250%, 06/01/25 | | | | | | | 14,900 | | | | 14,127,597 | |
Devon Energy Corp. | | | | | | | | | | | | |
| | 5.250%, 09/15/24 | | | | | | | 400 | | | | 399,075 | |
Discover Bank | | | | | | | | | | | | |
| | 2.450%, 09/12/24 | | | | | | | 3,900 | | | | 3,659,994 | |
Discover Financial Services | | | | | | | | | | | | |
| | 3.950%, 11/06/24 | | | | | | | 2,796 | | | | 2,694,652 | |
Discovery Communications LLC | | | | | | | | | | | | |
# | | 3.800%, 03/13/24 | | | | | | | 8,000 | | | | 7,771,235 | |
Eastern Energy Gas Holdings LLC | | | | | | | | | | | | |
| | 2.500%, 11/15/24 | | | | | | | 6,727 | | | | 6,368,263 | |
eBay, Inc. | | | | | | | | | | | | |
| | 2.750%, 01/30/23 | | | | | | | 3,800 | | | | 3,779,456 | |
Edison International | | | | | | | | | | | | |
| | 2.950%, 03/15/23 | | | | | | | 1,522 | | | | 1,509,996 | |
| | 3.550%, 11/15/24 | | | | | | | 3,000 | | | | 2,876,462 | |
| | 4.950%, 04/15/25 | | | | | | | 6,920 | | | | 6,805,485 | |
Elevance Health, Inc. | | | | | | | | | | | | |
| | 3.500%, 08/15/24 | | | | | | | 3,000 | | | | 2,911,172 | |
# | | 2.375%, 01/15/25 | | | | | | | 15,000 | | | | 14,095,879 | |
Energy Transfer LP | | | | | | | | | | | | |
| | 4.050%, 03/15/25 | | | | | | | 5,204 | | | | 4,982,094 | |
Energy Transfer LP/Regency Energy Finance Corp. | | | | | | | | | | | | |
| | 4.500%, 11/01/23 | | | | | | | 9,000 | | | | 8,890,696 | |
Equifax, Inc. | | | | | | | | | | | | |
| | 2.600%, 12/01/24 | | | | | | | 2,600 | | | | 2,454,920 | |
Fidelity & Guaranty Life Holdings, Inc. | | | | | | | | | | | | |
W | | 5.500%, 05/01/25 | | | | | | | 2,000 | | | | 1,955,022 | |
| | | | | | | | | | | | | | |
| | | Face
Amount^ | | | Value† | |
| | | (000) | | | | |
UNITED STATES — (Continued) | | | | | |
Fiserv, Inc. | | | | | | | | | | | | |
| | 2.750%, 07/01/24 | | | | | | | 5,000 | | | $ | 4,779,119 | |
Flex Ltd. | | | | | | | | | | | | |
| | 4.750%, 06/15/25 | | | | | | | 1,000 | | | | 970,168 | |
General Motors Financial Co., Inc. | | | | | | | | | | | | |
| | 3.250%, 01/05/23 | | | | | | | 4,350 | | | | 4,337,302 | |
| | 5.100%, 01/17/24 | | | | | | | 2,000 | | | | 1,982,241 | |
| | 1.200%, 10/15/24 | | | | | | | 2,000 | | | | 1,827,462 | |
| | 3.800%, 04/07/25 | | | | | | | 3,500 | | | | 3,307,980 | |
Georgia-Pacific LLC | | | | | | | | | | | | |
W | | 3.600%, 03/01/25 | | | | | | | 4,000 | | | | 3,851,779 | |
Gilead Sciences, Inc. | | | | | | | | | | | | |
| | 3.500%, 02/01/25 | | | | | | | 10,842 | | | | 10,465,538 | |
GlaxoSmithKline Capital PLC | | | | | | | | | | | | |
# | | 3.000%, 06/01/24 | | | | | | | 4,361 | | | | 4,233,713 | |
Global Payments, Inc. | | | | | | | | | | | | |
| | 3.750%, 06/01/23 | | | | | | | 4,000 | | | | 3,959,089 | |
| | 2.650%, 02/15/25 | | | | | | | 3,000 | | | | 2,783,582 | |
Goldman Sachs Group, Inc. | | | | | | | | | | | | |
# | | 3.625%, 01/22/23 | | | | | | | 1,198 | | | | 1,195,268 | |
| | 3.200%, 02/23/23 | | | | | | | 500 | | | | 497,210 | |
| | 3.500%, 01/23/25 | | | | | | | 5,000 | | | | 4,777,091 | |
| | 3.750%, 05/22/25 | | | | | | | 2,800 | | | | 2,666,275 | |
Harley-Davidson Financial Services, Inc. | | | | | | | | | | | | |
W | | 3.350%, 02/15/23 | | | | | | | 1,200 | | | | 1,192,849 | |
Hewlett Packard Enterprise Co. | | | | | | | | | | | | |
| | 1.450%, 04/01/24 | | | | | | | 10,750 | | | | 10,172,080 | |
International Business Machines Corp. | | | | | | | | | | | | |
# | | 3.625%, 02/12/24 | | | | | | | 1,750 | | | | 1,719,868 | |
| | 3.000%, 05/15/24 | | | | | | | 11,000 | | | | 10,673,733 | |
John Deere Capital Corp. | | | | | | | | | | | | |
# | | 2.050%, 01/09/25 | | | | | | | 7,000 | | | | 6,591,142 | |
JPMorgan Chase & Co. | | | | | | | | | | | | |
| | 3.625%, 05/13/24 | | | | | | | 493 | | | | 482,932 | |
| | 3.125%, 01/23/25 | | | | | | | 8,500 | | | | 8,137,073 | |
Kemper Corp. | | | | | | | | | | | | |
| | 4.350%, 02/15/25 | | | | | | | 7,500 | | | | 7,254,928 | |
Kinder Morgan, Inc. | | | | | | | | | | | | |
W | | 5.625%, 11/15/23 | | | | | | | 4,336 | | | | 4,327,496 | |
L3Harris Technologies, Inc. | | | | | | | | | | | | |
| | 3.832%, 04/27/25 | | | | | | | 3,000 | | | | 2,881,501 | |
Laboratory Corp. of America Holdings | | | | | | | | | | | | |
| | 3.600%, 02/01/25 | | | | | | | 763 | | | | 730,985 | |
Lazard Group LLC | | | | | | | | | | | | |
| | 3.750%, 02/13/25 | | | | | | | 3,085 | | | | 2,967,327 | |
Lennar Corp. | | | | | | | | | | | | |
| | 4.500%, 04/30/24 | | | | | | | 5,000 | | | | 4,909,039 | |
LyondellBasell Industries NV | | | | | | | | | | | | |
| | 5.750%, 04/15/24 | | | | | | | 570 | | | | 571,562 | |
Marathon Petroleum Corp. | | | | | | | | | | | | |
| | 3.625%, 09/15/24 | | | | | | | 7,000 | | | | 6,762,263 | |
111
DFA COMMODITY STRATEGY PORTFOLIO
CONTINUED
| | | | | | | | | | | | | | |
| | | Face
Amount^ | | | Value† | |
| | | (000) | | | | |
UNITED STATES — (Continued) | | | | | |
Morgan Stanley | | | | | | | | | | | | |
| | 3.125%, 01/23/23 | | | | | | | 2,233 | | | $ | 2,225,413 | |
| | 3.875%, 04/29/24 | | | | | | | 7,253 | | | | 7,103,385 | |
MPLX LP | | | | | | | | | | | | |
| | 4.875%, 12/01/24 | | | | | | | 3,750 | | | | 3,681,202 | |
Mylan, Inc. | | | | | | | | | | | | |
W | | 3.125%, 01/15/23 | | | | | | | 5,000 | | | | 4,968,950 | |
NextEra Energy Capital Holdings, Inc., Floating Rate Note, SOFR + 0.540%, FRN | | | | | | | | | | | | |
(r) | | 3.393%, 03/01/23 | | | | | | | 7,000 | | | | 6,990,673 | |
Nuveen Finance LLC | | | | | | | | | | | | |
W | | 4.125%, 11/01/24 | | | | | | | 11,250 | | | | 10,895,541 | |
Oracle Corp. | | | | | | | | | | | | |
| | 2.950%, 11/15/24 | | | | | | | 10,000 | | | | 9,547,230 | |
# | | 2.500%, 04/01/25 | | | | | | | 4,000 | | | | 3,737,213 | |
| | 2.950%, 05/15/25 | | | | | | | 900 | | | | 846,139 | |
Penske Truck Leasing Co. LP/PTL Finance Corp. | | | | | | | | | | | | |
W | | 4.250%, 01/17/23 | | | | | | | 4,000 | | | | 3,992,644 | |
W | | 4.125%, 08/01/23 | | | | | | | 2,022 | | | | 1,995,779 | |
Phillips 66 | | | | | | | | | | | | |
| | 3.850%, 04/09/25 | | | | | | | 2,000 | | | | 1,935,227 | |
Raytheon Technologies Corp. | | | | | | | | | | | | |
# | | 3.200%, 03/15/24 | | | | | | | 4,040 | | | | 3,932,764 | |
Ryder System, Inc. | | | | | | | | | | | | |
# | | 3.650%, 03/18/24 | | | | | | | 8,033 | | | | 7,843,482 | |
Schlumberger Holdings Corp. | | | | | | | | | | | | |
W | | 3.750%, 05/01/24 | | | | | | | 7,600 | | | | 7,433,391 | |
Simon Property Group LP | | | | | | | | | | | | |
| | 2.000%, 09/13/24 | | | | | | | 7,937 | | | | 7,459,243 | |
Stellantis NV | | | | | | | | | | | | |
| | 5.250%, 04/15/23 | | | | | | | 7,040 | | | | 7,013,741 | |
Truist Financial Corp. | | | | | | | | | | | | |
| | 2.500%, 08/01/24 | | | | | | | 280 | | | | 266,812 | |
UnitedHealth Group, Inc. | | | | | | | | | | | | |
# | | 3.500%, 02/15/24 | | | | | | | 12,000 | | | | 11,803,503 | |
Ventas Realty LP | | | | | | | | | | | | |
| | 2.650%, 01/15/25 | | | | | | | 1,000 | | | | 934,633 | |
| | 3.500%, 02/01/25 | | | | | | | 9,600 | | | | 9,114,341 | |
Verizon Communications, Inc., Floating Rate Note, SOFR + 0.500%, FRN | | | | | | | | | | | | |
(r) | | 3.532%, 03/22/24 | | | | | | | 811 | | | | 804,272 | |
| | | | | | | | | | | | | | |
| | | Face
Amount^ | | | Value† | |
| | | (000) | | | | |
UNITED STATES — (Continued) | | | | | |
Vornado Realty LP | | | | | | | | | | | | |
| | 3.500%, 01/15/25 | | | | | | | 10,357 | | | $ | 9,626,163 | |
Waste Management, Inc. | | | | | | | | | | | | |
# | | 2.400%, 05/15/23 | | | | | | | 2,207 | | | | 2,180,169 | |
Wells Fargo & Co. | | | | | | | | | | | | |
# | | 3.300%, 09/09/24 | | | | | | | 10,000 | | | | 9,659,906 | |
| | 3.000%, 02/19/25 | | | | | | | 5,000 | | | | 4,722,322 | |
Williams Cos., Inc. | | | | | | | | | | | | |
| | 3.900%, 01/15/25 | | | | | | | 2,843 | | | | 2,743,569 | |
Zimmer Biomet Holdings, Inc. | | | | | | | | | | | | |
| | 3.550%, 04/01/25 | | | | | | | 3,000 | | | | 2,869,860 | |
| | | | | | | | | | | | | | |
TOTAL UNITED STATES | | | | | | | | 481,829,580 | |
| | | | | | | | | | | | | | |
TOTAL BONDS | | | | | | | | | | | 1,067,512,905 | |
| | | | | | | | | | | | | | |
U.S. TREASURY OBLIGATIONS — (33.5%) | |
U.S. Treasury Notes | | | | | | | | | | | | |
~ | | 0.125%, 07/31/23 | | | | | | | 23,000 | | | | 22,238,125 | |
~ | | 0.125%, 08/15/23 | | | | | | | 40,000 | | | | 38,607,812 | |
~ | | 0.125%, 09/15/23 | | | | | | | 23,000 | | | | 22,115,938 | |
~ | | 0.250%, 11/15/23 | | | | | | | 50,000 | | | | 47,783,203 | |
~ | | 0.500%, 11/30/23 | | | | | | | 96,000 | | | | 91,856,250 | |
~ | | 0.125%, 12/15/23 | | | | | | | 115,000 | | | | 109,389,258 | |
~ | | 0.750%, 12/31/23 | | | | | | | 80,000 | | | | 76,471,875 | |
| | 0.125%, 01/15/24 | | | | | | | 62,000 | | | | 58,718,359 | |
~ | | 0.375%, 04/15/24 | | | | | | | 21,000 | | | | 19,742,461 | |
« | | 0.250%, 05/15/24 | | | | | | | 24,000 | | | | 22,445,625 | |
~ | | 0.250%, 06/15/24 | | | | | | | 8,000 | | | | 7,457,188 | |
~ | | 0.375%, 08/15/24 | | | | | | | 33,000 | | | | 30,624,258 | |
| | | | | | | | | | | | | | |
TOTAL U.S. TREASURY OBLIGATIONS | | | | 547,450,352 | |
| | | | | |
TOTAL INVESTMENT SECURITIES
(Cost $1,698,949,127) | | | | 1,614,963,257 | |
| | | | | | | | | | | | | | |
| | | |
| | | | | | Shares | | | | |
SECURITIES LENDING COLLATERAL — (1.1%) | |
@§ | | The DFA Short Term Investment Fund | | | | 1,542,835 | | | | 17,836,713 | |
| | | | | | | | | | | | | | |
TOTAL INVESTMENTS — (100.0%)
(Cost $1,716,791,746) | | | $ | 1,632,799,970 | |
| | | | | | | | | | | | | | |
112
DFA COMMODITY STRATEGY PORTFOLIO
CONTINUED
As of October 31, 2022, DFA Commodity Strategy Portfolio had entered into the following forward currency contracts and the net unrealized forward currency gain (loss) is reflected in the accompanying consolidated financial statements:
| | | | | | | | | | | | | | | | | | | | | | |
Currency Purchased | | | Currency Sold | | | Counterparty | | Settlement
Date | | | Unrealized
Foreign
Exchange
Appreciation
(Depreciation) | |
USD | | | 11,143,823 | | | | CAD | | | | 14,700,353 | | | Citibank, N.A. | | | 12/06/22 | | | $ | 350,513 | |
USD | | | 77,136,428 | | | | AUD | | | | 118,873,092 | | | State Street Bank and Trust | | | 12/28/22 | | | | 957,660 | |
| | | | | | | | | | | | | | | | | | | | | | |
Total Appreciation | | | | | | | | | | | | | $ | 1,308,173 | |
USD | | | 25,210,145 | | | | NZD | | | | 44,895,279 | | | Bank of America Corp. | | | 01/06/23 | | | $ | (917,361 | ) |
| | | | | | | | | | | | | | | | | | | | | | |
Total (Depreciation) | | | | | | | | | | | | | $ | (917,361 | ) |
| | | | | | | | | | | | | | | | | | | | | | |
Total Appreciation (Depreciation) | | | | | | | | | $ | 390,812 | |
| | | | | | | | | | | | | | | | | | | | | | |
As of October 31, 2022, DFA Commodity Strategy Portfolio had entered into the following outstanding futures contracts:
| | | | | | | | | | | | | | | | | | | | |
Description | | Number of
Contracts | | | Expiration
Date | | | Notional
Value | | | Market
Value | | | Unrealized
Appreciation
(Depreciation) | |
Long Position Contracts: | | | | | | | | | | | | | | | | | | | | |
CBOT Corn Futures | | | 85 | | | | 03/14/23 | | | $ | 2,967,874 | | | $ | 2,961,187 | | | $ | (6,687 | ) |
CBOT Soybean Futures | | | 38 | | | | 01/13/23 | | | | 2,618,791 | | | | 2,697,050 | | | | 78,259 | |
CBOT Soybean Meal Futures | | | 39 | | | | 01/13/23 | | | | 1,557,797 | | | | 1,634,490 | | | | 76,693 | |
CBOT Soybean Oil Futures | | | 41 | | | | 01/13/23 | | | | 1,535,247 | | | | 1,737,006 | | | | 201,759 | |
CBOT Wheat Futures | | | 35 | | | | 03/14/23 | | | | 1,571,136 | | | | 1,573,688 | | | | 2,552 | |
CME Lean Hogs Futures | | | 24 | | | | 02/14/23 | | | | 851,784 | | | | 849,120 | | | | (2,664 | ) |
CME Live Cattle Futures | | | 30 | | | | 02/28/23 | | | | 1,866,445 | | | | 1,869,900 | | | | 3,455 | |
COMEX Copper Futures | | | 23 | | | | 03/29/23 | | | | 1,931,498 | | | | 1,930,563 | | | | (935 | ) |
COMEX Gold 100 Troy Oz. Futures | | | 38 | | | | 12/28/22 | | | | 6,743,240 | | | | 6,234,660 | | | | (508,580 | ) |
COMEX Silver Futures | | | 20 | | | | 03/29/23 | | | | 1,930,733 | | | | 1,929,600 | | | | (1,133 | ) |
ICE Brent Crude Oil Futures | | | 39 | | | | 01/31/23 | | | | 3,490,664 | | | | 3,489,330 | | | | (1,334 | ) |
ICE Gasoil Futures | | | 17 | | | | 01/12/23 | | | | 1,557,241 | | | | 1,678,750 | | | | 121,509 | |
KCBT Hard Red Winter Wheat Futures | | | 20 | | | | 03/14/23 | | | | 969,045 | | | | 974,250 | | | | 5,205 | |
LME Nickel Futures | | | 15 | | | | 01/16/23 | | | | 1,972,868 | | | | 1,961,595 | | | | (11,273 | ) |
LME Nickel Futures | | | 29 | | | | 11/14/22 | | | | 3,903,827 | | | | 3,778,758 | | | | (125,069 | ) |
LME Primary Aluminum Futures | | | 38 | | | | 01/16/23 | | | | 2,113,834 | | | | 2,110,900 | | | | (2,934 | ) |
LME Primary Aluminum Futures | | | 77 | | | | 11/14/22 | | | | 4,593,460 | | | | 4,273,500 | | | | (319,960 | ) |
LME Zinc Futures | | | 23 | | | | 01/16/23 | | | | 1,679,391 | | | | 1,554,225 | | | | (125,166 | ) |
LME Zinc Futures | | | 46 | | | | 11/14/22 | | | | 3,932,507 | | | | 3,134,325 | | | | (798,182 | ) |
NYBOT CSC ’C’ Coffee Futures | | | 14 | | | | 03/21/23 | | | | 908,302 | | | | 913,763 | | | | 5,461 | |
NYBOT CSC No. 11 World Sugar Futures | | | 63 | | | | 02/28/23 | | | | 1,254,970 | | | | 1,267,963 | | | | 12,993 | |
NYBOT CTN No. 2 Cotton Futures | | | 12 | | | | 03/09/23 | | | | 426,969 | | | | 429,839 | | | | 2,870 | |
NYMEX Henry Hub Natural Gas Futures | | | 99 | | | | 12/28/22 | | | | 6,882,408 | | | | 6,540,930 | | | | (341,478 | ) |
NYMEX Light Sweet Crude Oil Futures | | | 47 | | | | 12/20/22 | | | | 3,840,046 | | | | 4,013,800 | | | | 173,754 | |
NYMEX NY Harbor ULSD Futures | | | 9 | | | | 12/30/22 | | | | 1,202,001 | | | | 1,323,189 | | | | 121,188 | |
NYMEX Reformulated Gasoline Blend Futures | | | 10 | | | | 12/30/22 | | | | 981,571 | | | | 1,032,738 | | | | 51,167 | |
| | | | | | | | | | | | | | | | | | | | |
Total | | | | | | | | | | $ | 63,283,649 | | | $ | 61,895,119 | | | $ | (1,388,530 | ) |
Short Position contracts: | | | | | | | | | | | | | | | | | | | | |
LME Nickel Futures | | | (29 | ) | | | 11/14/22 | | | | (3,837,517 | ) | | | (3,778,758 | ) | | | 58,759 | |
LME Nickel Futures | | | (5 | ) | | | 01/16/23 | | | | (655,567 | ) | | | (653,865 | ) | | | 1,702 | |
LME Primary Aluminum Futures | | | (77 | ) | | | 11/14/22 | | | | (4,292,878 | ) | | | (4,273,500 | ) | | | 19,378 | |
LME Primary Aluminum Futures | | | (11 | ) | | | 01/16/23 | | | | (613,675 | ) | | | (611,050 | ) | | | 2,625 | |
LME Zinc Futures | | | (46 | ) | | | 11/14/22 | | | | (3,496,630 | ) | | | (3,134,325 | ) | | | 362,305 | |
113
DFA COMMODITY STRATEGY PORTFOLIO
CONTINUED
| | | | | | | | | | | | | | | | | | | | |
| | | | | | | | | | | | | | | Unrealized | |
| | | Number of | | | Expiration | | | Notional | | | Market | | | Appreciation | |
Description | | Contracts | | | Date | | | Value | | | Value | | | (Depreciation) | |
LME Zinc Futures | | | (7 | ) | | | 01/16/23 | | | $ | (510,868 | ) | | $ | (473,025 | ) | | $ | 37,843 | |
| | | | | | | | | | | | | | | | | | | | |
Total | | | | | | | | | | $ | (13,407,135 | ) | | $ | (12,924,523 | ) | | $ | 482,612 | |
| | | | | | | | | | | | | | | | | | | | |
Total Futures Contracts | | | | | | | | | | $ | 49,876,514 | | | $ | 48,970,596 | | | $ | (905,918 | ) |
| | | | | | | | | | | | | | | | | | | | |
As of October 31, 2022, DFA Commodity Strategy Portfolio had entered into the following outstanding Total Return Swaps:
| | | | | | | | | | | | | | | | | | | | | | | | | | | | | | | | |
Reference Entity* | | Counterparty** | | Notional
Amount | | | Payments
received (paid) by
the Fund*** | | Expiration
Date | | | Upfront
Premiums
Paid | | | Upfront
Premiums
Received | | | Market
Value | | | Unrealized
Appreciation
(Depreciation) | |
BofA Merrill Lynch Commodity MLBXPPDM Total Return Index (1) | | Bank of America Corp. | | | USD | | | | 170,202,543 | | | 3 Month USD UST 13-Week Bill High Discount Rate plus 0.14% | | | 12/24/22 | | | | — | | | | — | | | $ | 2,722,148 | | | $ | 2,722,148 | |
BofA Merrill Lynch Total Return Index (2) | | Bank of America Corp. | | | USD | | | | 178,159,195 | | | 3 Month USD UST 13-Week Bill High Discount Rate plus 0.19% | | | 12/24/22 | | | | — | | | | — | | | | 2,900,476 | | | | 2,900,476 | |
Citi Commodities Pre-Roll RS Total Return Index (3) | | Citibank, N.A. | | | USD | | | | 234,010,046 | | | 3 Month USD UST 13-Week Bill High Discount Rate plus 0.18% | | | 12/30/22 | | | | — | | | | — | | | | 917,472 | | | | 917,472 | |
Citi Custom CIVICS H Total Return Index (4) | | Citibank, N.A. | | | USD | | | | 88,812,427 | | | 3 Month USD UST 13-Week Bill High Discount Rate plus 0.14% | | | 12/30/22 | | | | — | | | | — | | | | 449,427 | | | | 449,427 | |
Credit Suisse Custom 141 Total Return Index (5) | | Credit Suisse | | | USD | | | | 292,789,796 | | | 3 Month USD UST 13-Week Bill High Discount Rate plus 0.18% | | | 11/30/22 | | | | — | | | | — | | | | (1,285,879 | ) | | | (1,285,879 | ) |
Credit Suisse Custom 57 Total Return Index (6) | | Credit Suisse | | | USD | | | | 174,882,012 | | | 3 Month USD UST 13-Week Bill High Discount Rate plus 0.14% | | | 11/30/22 | | | | — | | | | — | | | | (773,335 | ) | | | (773,335 | ) |
UBS UBSIB190 Custom Strategy (7) | | UBS AG | | | USD | | | | 489,306,483 | | | 3 Month USD UST 13-Week Bill High Discount Rate plus 0.14% | | | 01/29/23 | | | | — | | | | — | | | | 529,671 | | | | 529,671 | |
| | | | | | | | | | | | | | | | | | | | | | | | | | | | | | | | |
Total | | | | | | | | | | | | | | | | | | | — | | | | — | | | $ | 5,459,980 | | | $ | 5,459,980 | |
| | | | | | | | | | | | | | | | | | | | | | | | | | | | | | | | |
| * | Portfolio receives the price appreciation of the reference entity at maturity. |
| ** | As of October 31, 2022, the counterparties had deposited in segregated accounts securities with a value of $3,017,311 in connection with open total return swap contracts. |
| *** | Payments received (paid) by the Fund are exchanged at maturity. |
114
DFA COMMODITY STRATEGY PORTFOLIO
CONTINUED
| (1) | The following table represents the individual positions within the Total Return Swap as of October 31, 2022: |
Referenced Commodity — Long Position
| | | | | | | | |
Futures Contract | | % of Index | | | Notional Amount | |
CBOT Soybean Oil Futures | | | 3.54 | % | | $ | 6,034,853 | |
CBOT Corn Futures | | | 6.02 | % | | | 10,239,058 | |
NYMEX Light Sweet Crude Oil Futures | | | 8.11 | % | | | 13,810,660 | |
ICE Brent Crude Oil Futures | | | 7.09 | % | | | 12,060,246 | |
NYBOT CTN No. 2 Cotton Futures | | | 0.88 | % | | | 1,490,027 | |
COMEX Gold 100 Troy Oz. Futures | | | 12.94 | % | | | 22,021,151 | |
COMEX Copper Futures | | | 3.88 | % | | | 6,606,478 | |
NYMEX NY Harbor ULSD Futures | | | 2.74 | % | | | 4,656,239 | |
NYBOT CSC ’C’ Coffee Futures | | | 1.91 | % | | | 3,258,967 | |
KCBT Hard Red Winter Wheat Futures | | | 1.97 | % | | | 3,347,535 | |
LME Primary Aluminum Futures | | | 3.01 | % | | | 5,125,412 | |
CME Live Cattle Futures | | | 3.79 | % | | | 6,447,904 | |
CME Lean Hogs Futures | | | 1.74 | % | | | 2,969,667 | |
LME Nickel Futures | | | 2.70 | % | | | 4,597,353 | |
LME Zinc Futures | | | 2.21 | % | | | 3,756,849 | |
NYMEX Henry Hub Natural Gas Futures | | | 13.35 | % | | | 22,730,398 | |
ICE Gasoil Futures | | | 3.47 | % | | | 5,901,179 | |
CBOT Soybean Futures | | | 5.52 | % | | | 9,401,743 | |
NYBOT CSC No. 11 World Sugar Futures | | | 2.57 | % | | | 4,381,556 | |
COMEX Silver Futures | | | 3.85 | % | | | 6,551,720 | |
CBOT Soybean Meal Futures | | | 3.35 | % | | | 5,697,149 | |
CBOT Wheat Futures | | | 3.20 | % | | | 5,445,873 | |
NYMEX Reformulated Gasoline Blend Futures | | | 2.16 | % | | | 3,670,526 | |
| | | | | | | | |
Total Notional Amount | | | | | | $ | 170,202,543 | |
| | | | | | | | |
| (2) | The following table represents the individual positions within the Total Return Swap as of October 31, 2022: |
Referenced Commodity — Long Position
| | | | | | | | |
Futures Contract | | % of Index | | | Notional Amount | |
CBOT Soybean Oil Futures | | | 4.26 | % | | $ | 7,580,752 | |
CBOT Corn Futures | | | 5.95 | % | | | 10,602,887 | |
NYMEX Light Sweet Crude Oil Futures | | | 8.10 | % | | | 14,434,496 | |
ICE Brent Crude Oil Futures | | | 7.35 | % | | | 13,095,616 | |
NYBOT CTN No. 2 Cotton Futures | | | 0.90 | % | | | 1,598,236 | |
COMEX Gold 100 Troy Oz. Futures | | | 10.27 | % | | | 18,292,388 | |
COMEX Copper Futures | | | 3.90 | % | | | 6,940,651 | |
NYMEX NY Harbor ULSD Futures | | | 3.28 | % | | | 5,848,991 | |
NYBOT CSC ’C’ Coffee Futures | | | 1.97 | % | | | 3,512,019 | |
KCBT Hard Red Winter Wheat Futures | | | 1.96 | % | | | 3,486,161 | |
LME Primary Aluminum Futures | | | 2.41 | % | | | 4,292,232 | |
CME Live Cattle Futures | | | 3.72 | % | | | 6,636,275 | |
CME Lean Hogs Futures | | | 1.41 | % | | | 2,508,359 | |
LME Nickel Futures | | | 2.16 | % | | | 3,850,013 | |
LME Zinc Futures | | | 2.22 | % | | | 3,962,580 | |
NYMEX Henry Hub Natural Gas Futures | | | 15.75 | % | | | 28,064,917 | |
ICE Gasoil Futures | | | 4.14 | % | | | 7,383,026 | |
CBOT Soybean Futures | | | 4.42 | % | | | 7,869,161 | |
NYBOT CSC No. 11 World Sugar Futures | | | 3.06 | % | | | 5,452,866 | |
COMEX Silver Futures | | | 3.05 | % | | | 5,437,657 | |
CBOT Soybean Meal Futures | | | 4.02 | % | | | 7,156,542 | |
115
DFA COMMODITY STRATEGY PORTFOLIO
CONTINUED
| | | | | | | | |
Futures Contract | | % of Index | | | Notional Amount | |
CBOT Wheat Futures | | | 3.11 | % | | | 5,542,595 | |
NYMEX Reformulated Gasoline Blend Futures | | | 2.59 | % | | | 4,610,775 | |
| | | | | | | | |
Total Notional Amount | | | | | | $ | 178,159,195 | |
| | | | | | | | |
| (3) | The following table represents the individual positions within the Total Return Swap as of October 31, 2022: |
Referenced Commodity — Long Position
| | | | | | | | |
Futures Contract | | % of Index | | | Notional Amount | |
CBOT Soybean Oil Futures | | | 4.26 | % | | $ | 9,957,230 | |
CBOT Corn Futures | | | 5.95 | % | | | 13,926,769 | |
NYMEX Light Sweet Crude Oil Futures | | | 8.10 | % | | | 18,959,545 | |
ICE Brent Crude Oil Futures | | | 7.35 | % | | | 17,200,940 | |
NYBOT CTN No. 2 Cotton Futures | | | 0.90 | % | | | 2,099,265 | |
COMEX Gold 100 Troy Oz. Futures | | | 10.27 | % | | | 24,026,840 | |
COMEX Copper Futures | | | 3.90 | % | | | 9,116,465 | |
NYMEX NY Harbor ULSD Futures | | | 3.28 | % | | | 7,682,582 | |
NYBOT CSC ’C’ Coffee Futures | | | 1.97 | % | | | 4,612,997 | |
KCBT Hard Red Winter Wheat Futures | | | 1.96 | % | | | 4,579,032 | |
LME Primary Aluminum Futures | | | 2.41 | % | | | 5,637,797 | |
CME Live Cattle Futures | | | 3.72 | % | | | 8,716,671 | |
CME Lean Hogs Futures | | | 1.41 | % | | | 3,294,700 | |
LME Nickel Futures | | | 2.16 | % | | | 5,056,948 | |
LME Zinc Futures | | | 2.22 | % | | | 5,204,803 | |
NYMEX Henry Hub Natural Gas Futures | | | 15.75 | % | | | 36,862,945 | |
ICE Gasoil Futures | | | 4.14 | % | | | 9,697,519 | |
CBOT Soybean Futures | | | 4.42 | % | | | 10,336,052 | |
NYBOT CSC No. 11 World Sugar Futures | | | 3.06 | % | | | 7,162,277 | |
COMEX Silver Futures | | | 3.05 | % | | | 7,142,299 | |
CBOT Soybean Meal Futures | | | 4.02 | % | | | 9,400,035 | |
CBOT Wheat Futures | | | 3.11 | % | | | 7,280,135 | |
NYMEX Reformulated Gasoline Blend Futures | | | 2.59 | % | | | 6,056,200 | |
| | | | | | | | |
Total Notional Amount | | | | | | $ | 234,010,046 | |
| | | | | | | | |
| (4) | The following table represents the individual positions within the Total Return Swap as of October 31, 2022: |
Referenced Commodity — Long Position
| | | | | | | | |
Futures Contract | | % of Index | | | Notional Amount | |
CBOT Soybean Oil Futures | | | 3.54 | % | | $ | 3,149,013 | |
CBOT Corn Futures | | | 6.02 | % | | | 5,342,785 | |
NYMEX Light Sweet Crude Oil Futures | | | 8.11 | % | | | 7,206,462 | |
ICE Brent Crude Oil Futures | | | 7.09 | % | | | 6,293,089 | |
NYBOT CTN No. 2 Cotton Futures | | | 0.88 | % | | | 777,503 | |
COMEX Gold 100 Troy Oz. Futures | | | 12.94 | % | | | 11,490,732 | |
COMEX Copper Futures | | | 3.88 | % | | | 3,447,289 | |
NYMEX NY Harbor ULSD Futures | | | 2.74 | % | | | 2,429,646 | |
NYBOT CSC ’C’ Coffee Futures | | | 1.91 | % | | | 1,700,543 | |
KCBT Hard Red Winter Wheat Futures | | | 1.97 | % | | | 1,746,758 | |
LME Primary Aluminum Futures | | | 3.01 | % | | | 2,674,462 | |
CME Live Cattle Futures | | | 3.79 | % | | | 3,364,545 | |
CME Lean Hogs Futures | | | 1.74 | % | | | 1,549,585 | |
LME Nickel Futures | | | 2.70 | % | | | 2,398,919 | |
116
DFA COMMODITY STRATEGY PORTFOLIO
CONTINUED
| | | | | | | | |
Futures Contract | | % of Index | | | Notional Amount | |
LME Zinc Futures | | | 2.21 | % | | | 1,960,340 | |
NYMEX Henry Hub Natural Gas Futures | | | 13.35 | % | | | 11,860,821 | |
ICE Gasoil Futures | | | 3.47 | % | | | 3,079,261 | |
CBOT Soybean Futures | | | 5.52 | % | | | 4,905,870 | |
NYBOT CSC No. 11 World Sugar Futures | | | 2.57 | % | | | 2,286,315 | |
COMEX Silver Futures | | | 3.85 | % | | | 3,418,716 | |
CBOT Soybean Meal Futures | | | 3.35 | % | | | 2,972,797 | |
CBOT Wheat Futures | | | 3.20 | % | | | 2,841,680 | |
NYMEX Reformulated Gasoline Blend Futures | | | 2.16 | % | | | 1,915,296 | |
| | | | | | | | |
Total Notional Amount | | | | | | $ | 88,812,427 | |
| | | | | | | | |
| (5) | The following table represents the individual positions within the Total Return Swap as of October 31, 2022: |
Referenced Commodity — Long Position
| | | | | | | | |
Futures Contract | | % of Index | | | Notional Amount | |
CBOT Soybean Oil Futures | | | 4.26 | % | | $ | 12,458,334 | |
CBOT Corn Futures | | | 5.95 | % | | | 17,424,961 | |
NYMEX Light Sweet Crude Oil Futures | | | 8.10 | % | | | 23,721,893 | |
ICE Brent Crude Oil Futures | | | 7.35 | % | | | 21,521,554 | |
NYBOT CTN No. 2 Cotton Futures | | | 0.90 | % | | | 2,626,568 | |
COMEX Gold 100 Troy Oz. Futures | | | 10.27 | % | | | 30,062,016 | |
COMEX Copper Futures | | | 3.90 | % | | | 11,406,382 | |
NYMEX NY Harbor ULSD Futures | | | 3.28 | % | | | 9,612,329 | |
NYBOT CSC ’C’ Coffee Futures | | | 1.97 | % | | | 5,771,711 | |
KCBT Hard Red Winter Wheat Futures | | | 1.96 | % | | | 5,729,215 | |
LME Primary Aluminum Futures | | | 2.41 | % | | | 7,053,925 | |
CME Live Cattle Futures | | | 3.72 | % | | | 10,906,165 | |
CME Lean Hogs Futures | | | 1.41 | % | | | 4,122,278 | |
LME Nickel Futures | | | 2.16 | % | | | 6,327,177 | |
LME Zinc Futures | | | 2.22 | % | | | 6,512,170 | |
NYMEX Henry Hub Natural Gas Futures | | | 15.75 | % | | | 46,122,354 | |
ICE Gasoil Futures | | | 4.14 | % | | | 12,133,388 | |
CBOT Soybean Futures | | | 4.42 | % | | | 12,932,311 | |
NYBOT CSC No. 11 World Sugar Futures | | | 3.06 | % | | | 8,961,331 | |
COMEX Silver Futures | | | 3.05 | % | | | 8,936,336 | |
CBOT Soybean Meal Futures | | | 4.02 | % | | | 11,761,180 | |
CBOT Wheat Futures | | | 3.11 | % | | | 9,108,793 | |
NYMEX Reformulated Gasoline Blend Futures | | | 2.59 | % | | | 7,577,425 | |
| | | | | | | | |
Total Notional Amount | | | | | | $ | 292,789,796 | |
| | | | | | | | |
| (6) | The following table represents the individual positions within the Total Return Swap as of October 31, 2022: |
Referenced Commodity — Long Position
| | | | | | | | |
Futures Contract | | % of Index | | | Notional Amount | |
CBOT Soybean Oil Futures | | | 3.54 | % | | $ | 6,200,773 | |
CBOT Corn Futures | | | 6.02 | % | | | 10,520,565 | |
NYMEX Light Sweet Crude Oil Futures | | | 8.11 | % | | | 14,190,364 | |
ICE Brent Crude Oil Futures | | | 7.09 | % | | | 12,391,825 | |
NYBOT CTN No. 2 Cotton Futures | | | 0.88 | % | | | 1,530,993 | |
COMEX Gold 100 Troy Oz. Futures | | | 12.94 | % | | | 22,626,590 | |
COMEX Copper Futures | | | 3.88 | % | | | 6,788,113 | |
117
DFA COMMODITY STRATEGY PORTFOLIO
CONTINUED
| | | | | | | | |
Futures Contract | | % of Index | | | Notional Amount | |
NYMEX NY Harbor ULSD Futures | | | 2.74 | % | | | 4,784,256 | |
NYBOT CSC ’C’ Coffee Futures | | | 1.91 | % | | | 3,348,567 | |
KCBT Hard Red Winter Wheat Futures | | | 1.97 | % | | | 3,439,571 | |
LME Primary Aluminum Futures | | | 3.01 | % | | | 5,266,328 | |
CME Live Cattle Futures | | | 3.79 | % | | | 6,625,180 | |
CME Lean Hogs Futures | | | 1.74 | % | | | 3,051,314 | |
LME Nickel Futures | | | 2.70 | % | | | 4,723,750 | |
LME Zinc Futures | | | 2.21 | % | | | 3,860,138 | |
NYMEX Henry Hub Natural Gas Futures | | | 13.35 | % | | | 23,355,337 | |
ICE Gasoil Futures | | | 3.47 | % | | | 6,063,424 | |
CBOT Soybean Futures | | | 5.52 | % | | | 9,660,230 | |
NYBOT CSC No. 11 World Sugar Futures | | | 2.57 | % | | | 4,502,020 | |
COMEX Silver Futures | | | 3.85 | % | | | 6,731,849 | |
CBOT Soybean Meal Futures | | | 3.35 | % | | | 5,853,784 | |
CBOT Wheat Futures | | | 3.20 | % | | | 5,595,599 | |
NYMEX Reformulated Gasoline Blend Futures | | | 2.16 | % | | | 3,771,442 | |
| | | | | | | | |
Total Notional Amount | | | | | | $ | 174,882,012 | |
| | | | | | | | |
| (7) | The following table represents the individual positions within the Total Return Swap as of October 31, 2022: |
Referenced Commodity — Long Position
| | | | | | | | |
Futures Contract | | % of Index | | | Notional Amount | |
CBOT Soybean Oil Futures | | | 3.54 | % | | $ | 17,349,287 | |
CBOT Corn Futures | | | 6.02 | % | | | 29,435,737 | |
NYMEX Light Sweet Crude Oil Futures | | | 8.11 | % | | | 39,703,552 | |
ICE Brent Crude Oil Futures | | | 7.09 | % | | | 34,671,379 | |
NYBOT CTN No. 2 Cotton Futures | | | 0.88 | % | | | 4,283,602 | |
COMEX Gold 100 Troy Oz. Futures | | | 12.94 | % | | | 63,307,466 | |
COMEX Copper Futures | | | 3.88 | % | | | 18,992,621 | |
NYMEX NY Harbor ULSD Futures | | | 2.74 | % | | | 13,385,981 | |
NYBOT CSC ’C’ Coffee Futures | | | 1.91 | % | | | 9,369,035 | |
KCBT Hard Red Winter Wheat Futures | | | 1.97 | % | | | 9,623,656 | |
LME Primary Aluminum Futures | | | 3.01 | % | | | 14,734,782 | |
CME Live Cattle Futures | | | 3.79 | % | | | 18,536,747 | |
CME Lean Hogs Futures | | | 1.74 | % | | | 8,537,343 | |
LME Nickel Futures | | | 2.70 | % | | | 13,216,691 | |
LME Zinc Futures | | | 2.21 | % | | | 10,800,370 | |
NYMEX Henry Hub Natural Gas Futures | | | 13.35 | % | | | 65,346,445 | |
ICE Gasoil Futures | | | 3.47 | % | | | 16,964,995 | |
CBOT Soybean Futures | | | 5.52 | % | | | 27,028,585 | |
NYBOT CSC No. 11 World Sugar Futures | | | 2.57 | % | | | 12,596,307 | |
COMEX Silver Futures | | | 3.85 | % | | | 18,835,200 | |
CBOT Soybean Meal Futures | | | 3.35 | % | | | 16,378,439 | |
CBOT Wheat Futures | | | 3.20 | % | | | 15,656,057 | |
NYMEX Reformulated Gasoline Blend Futures | | | 2.16 | % | | | 10,552,206 | |
| | | | | | | | |
Total Notional Amount | | | | | | $ | 489,306,483 | |
| | | | | | | | |
118
DFA COMMODITY STRATEGY PORTFOLIO
CONTINUED
Summary of the Portfolio’s investments as of October 31, 2022, based on their valuation inputs, is as follows (see Security Valuation Note):
| | | | | | | | | | | | | | | | |
| | | Investments in Securities (Market Value) | |
| | | Level 1 | | | Level 2 | | | Level 3 | | | Total | |
Bonds | | | | | | | | | | | | | | | | |
Australia | | | — | | | $ | 62,330,455 | | | | — | | | $ | 62,330,455 | |
Austria | | | — | | | | 1,388,828 | | | | — | | | | 1,388,828 | |
Canada | | | — | | | | 113,766,374 | | | | — | | | | 113,766,374 | |
Denmark | | | — | | | | 7,028,417 | | | | — | | | | 7,028,417 | |
France | | | — | | | | 58,638,002 | | | | — | | | | 58,638,002 | |
Germany | | | — | | | | 59,141,062 | | | | — | | | | 59,141,062 | |
Ireland | | | — | | | | 12,471,922 | | | | — | | | | 12,471,922 | |
Italy | | | — | | | | 9,264,468 | | | | — | | | | 9,264,468 | |
Japan | | | — | | | | 95,505,084 | | | | — | | | | 95,505,084 | |
Netherlands | | | — | | | | 11,464,671 | | | | — | | | | 11,464,671 | |
New Zealand | | | — | | | | 26,022,845 | | | | — | | | | 26,022,845 | |
Spain | | | — | | | | 13,431,029 | | | | — | | | | 13,431,029 | |
Supranational Organization Obligations | | | — | | | | 30,935,085 | | | | — | | | | 30,935,085 | |
Sweden | | | — | | | | 33,727,468 | | | | — | | | | 33,727,468 | |
Switzerland | | | — | | | | 13,316,258 | | | | — | | | | 13,316,258 | |
United Kingdom | | | — | | | | 37,251,357 | | | | — | | | | 37,251,357 | |
United States | | | — | | | | 481,829,580 | | | | — | | | | 481,829,580 | |
U.S. Treasury Obligations | | | — | | | | 547,450,352 | | | | — | | | | 547,450,352 | |
Securities Lending Collateral | | | — | | | | 17,836,713 | | | | — | | | | 17,836,713 | |
Forward Currency Contracts** | | | — | | | | 390,812 | | | | — | | | | 390,812 | |
Futures Contracts** | | $ | (905,918 | ) | | | — | | | | — | | | | (905,918 | ) |
Swap Agreements** | | | — | | | | 5,459,980 | | | | — | | | | 5,459,980 | |
| | | | | | | | | | | | | | | | |
TOTAL | | $ | (905,918 | ) | | $ | 1,638,650,762 | | | | — | | | $ | 1,637,744,844 | |
| | | | | | | | | | | | | | | | |
| ** | Valued at the unrealized appreciation/(depreciation) on the investment. |
See accompanying Notes to Financial Statements.
119
DFA INVESTMENT DIMENSIONS GROUP INC.
CONSOLIDATED STATEMENT OF ASSETS AND LIABILITIES
OCTOBER 31, 2022
(Amounts in thousands, except share and per share amounts)
| | | | |
| | | DFA Commodity Strategy | |
| | | Portfolio* | |
ASSETS: | | | | |
Investment Securities at Value (including $17,455 of securities on loan) | | $ | 1,614,963 | |
Collateral from Securities on Loan Invested in Affiliate at Value (including cost of $17,843) | | | 17,837 | |
Foreign Currencies at Value | | | 125 | |
Segregated Cash for Swaps Contracts | | | 11,148 | |
Cash | | | 54,163 | |
Receivables: | | | | |
Dividends and Interest | | | 8,572 | |
Securities Lending Income | | | 8 | |
Fund Shares Sold | | | 854 | |
Unrealized Gain on Swap Contracts | | | 7,519 | |
Unrealized Gain on Forward Currency Contracts | | | 1,308 | |
Prepaid Expenses and Other Assets | | | 33 | |
| | | | |
Total Assets | | | 1,716,530 | |
| | | | |
LIABILITIES: | | | | |
Payables: | | | | |
Upon Return of Securities Loaned | | | 15,022 | |
Investment Securities Purchased | | | 2,845 | |
Fund Shares Redeemed | | | 2,254 | |
Due to Advisor | | | 405 | |
Due to Broker | | | 1,910 | |
Futures Margin Variation | | | 140 | |
Unrealized Loss on Swap Contracts | | | 2,059 | |
Unrealized Loss on Forward Currency Contracts | | | 917 | |
Payable for Swap Contracts Payments | | | 766 | |
Accrued Expenses and Other Liabilities | | | 123 | |
| | | | |
Total Liabilities | | | 26,441 | |
| | | | |
NET ASSETS | | $ | 1,690,089 | |
| | | | |
SHARES OUTSTANDING, $0.01 PAR VALUE (1) | | | 322,994,800 | |
| | | | |
NET ASSET VALUE, OFFERING AND REDEMPTION PRICE PER SHARE | | $ | 5.23 | |
| | | | |
Investment Securities at Cost | | $ | 1,698,949 | |
| | | | |
Foreign Currencies at Cost | | $ | 125 | |
| | | | |
NET ASSETS CONSIST OF: | | | | |
Paid-In Capital | | $ | 2,334,237 | |
Total Distributable Earnings (Loss) | | | (644,148 | ) |
| | | | |
NET ASSETS | | $ | 1,690,089 | |
| | | | |
(1) NUMBER OF SHARES AUTHORIZED | | | 1,800,000,000 | |
| | | | |
| * | See Note J in the Notes to Financial Statements for additional information about securities lending collateral. |
See accompanying Notes to Financial Statements.
120
DFA INVESTMENT DIMENSIONS GROUP INC.
CONSOLIDATED STATEMENT OF OPERATIONS
FOR THE YEAR ENDED OCTOBER 31, 2022
(Amounts in thousands)
| | | | |
| | | DFA | |
| | | Commodity Strategy | |
| | | Portfolio# | |
Investment Income | | | | |
Interest | | $ | 27,489 | |
Income from Securities Lending | | | 43 | |
| | | | |
Total Investment Income | | | 27,532 | |
| | | | |
Expenses | | | | |
Investment Management Fees | | | 6,263 | |
Accounting & Transfer Agent Fees | | | 142 | |
Custodian Fees | | | 89 | |
Filing Fees | | | 79 | |
Shareholders’ Reports | | | 22 | |
Directors’/Trustees’ Fees & Expenses | | | 11 | |
Professional Fees | | | 30 | |
Other | | | 77 | |
| | | | |
Total Expenses | | | 6,713 | |
| | | | |
Fees Waived, Expenses Reimbursed by Advisor (Note D) | | | 1,298 | |
Fees Paid Indirectly (Note D) | | | 19 | |
| | | | |
Net Expenses | | | 5,396 | |
| | | | |
Net Investment Income (Loss) | | | 22,136 | |
| | | | |
Realized and Unrealized Gain (Loss) | | | | |
Net Realized Gain (Loss) on: | | | | |
Investment Securities Sold** | | | (44,736 | ) |
Affiliated Investment Companies Shares Sold | | | (5 | ) |
Futures | | | 953 | |
Swap Contracts | | | 110,350 | |
Foreign Currency Transactions | | | (22 | ) |
Forward Currency Contracts | | | 21,616 | |
Change in Unrealized Appreciation (Depreciation) of: | | | | |
Investment Securities and Foreign Currency | | | (75,310 | ) |
Affiliated Investment Companies Shares | | | (6 | ) |
Futures | | | (1,625 | ) |
Swap Contracts | | | 35,073 | |
Translation of Foreign Currency-Denominated Amounts | | | (51 | ) |
Forward Currency Contracts | | | 1,633 | |
| | | | |
Net Realized and Unrealized Gain (Loss) | | | 47,870 | |
| | | | |
Net Increase (Decrease) in Net Assets Resulting from Operations | | $ | 70,006 | |
| | | | |
| ** | Net of foreign capital gain taxes withheld of $0. |
| # | Portion of income is from investment in affiliated fund. |
See accompanying Notes to Financial Statements.
121
DFA INVESTMENT DIMENSIONS GROUP INC.
CONSOLIDATED STATEMENTS OF CHANGES IN NET ASSETS
(Amounts in thousands)
| | | | | | | | |
| | | DFA Commodity Strategy | |
| | | Portfolio | |
| | | Year | | | Year | |
| | | Ended | | | Ended | |
| | | Oct 31, | | | Oct 31, | |
| | | 2022 | | | 2021 | |
Increase (Decrease) in Net Assets | | | | | | | | |
Operations: | | | | | | | | |
Net Investment Income (Loss) | | $ | 22,136 | | | $ | 3,378 | |
Net Realized Gain (Loss) on: | | | | | | | | |
Investment Securities Sold*,** | | | (44,736 | ) | | | 4,785 | |
Affiliated Investment Companies Shares Sold | | | (5 | ) | | | — | |
Futures | | | 953 | | | | 40,432 | |
Swap Contracts | | | 110,350 | | | | 505,196 | |
Foreign Currency Transactions | | | (22 | ) | | | 34 | |
Forward Currency Contracts | | | 21,616 | | | | (571 | ) |
Change in Unrealized Appreciation (Depreciation) of: | | | | | | | | |
Investment Securities and Foreign Currency | | | (75,310 | ) | | | (14,473 | ) |
Affiliated Investment Companies Shares | | | (6 | ) | | | — | |
Futures | | | (1,625 | ) | | | 599 | |
Swap Contracts | | | 35,073 | | | | (13,549 | ) |
Translation of Foreign Currency-Denominated Amounts | | | (51 | ) | | | 26 | |
Forward Currency Contracts | | | 1,633 | | | | (1,611 | ) |
| | | | | | | | |
Net Increase (Decrease) in Net Assets Resulting from Operations | | | 70,006 | | | | 524,246 | |
| | | | | | | | |
Distributions: | | | | | | | | |
Institutional Class Shares | | | (500,400 | ) | | | (3,525 | ) |
Capital Share Transactions (1): | | | | | | | | |
Shares Issued | | | 967,055 | | | | 597,773 | |
Shares Issued in Lieu of Cash Distributions | | | 476,866 | | | | 3,293 | |
Shares Redeemed | | | (1,089,224 | ) | | | (452,428 | ) |
| | | | | | | | |
Net Increase (Decrease) from Capital Share Transactions | | | 354,697 | | | | 148,638 | |
| | | | | | | | |
Total Increase (Decrease) in Net Assets | | | (75,697 | ) | | | 669,359 | |
Net Assets | | | | | | | | |
Beginning of Year | | | 1,765,786 | | | | 1,096,427 | |
| | | | | | | | |
End of Year | | $ | 1,690,089 | | | $ | 1,765,786 | |
| | | | | | | | |
(1) Shares Issued and Redeemed: | | | | | | | | |
Shares Issued | | | 173,638 | | | | 96,905 | |
Shares Issued in Lieu of Cash Distributions | | | 104,431 | | | | 622 | |
Shares Redeemed | | | (198,205 | ) | | | (73,709 | ) |
| | | | | | | | |
Net Increase (Decrease) from Shares Issued and Redeemed | | | 79,864 | | | | 23,818 | |
| | | | | | | | |
| * | Net of foreign capital gain taxes withheld for the fiscal year ended October 31, 2022 of $0. |
| ** | Net of foreign capital gain taxes withheld for the fiscal year ended October 31, 2021 of $0. |
See accompanying Notes to Financial Statements.
122
DFA INVESTMENT DIMENSIONS GROUP INC.
CONSOLIDATED FINANCIAL HIGHLIGHTS
(for a share outstanding throughout each period)
| | | | | | | | | | | | | | | | | | | | |
| | | DFA Commodity Strategy Portfolio | |
| | | Year | | | Year | | | Year | | | Year | | | Year | |
| | | Ended | | | Ended | | | Ended | | | Ended | | | Ended | |
| | | Oct 31, | | | Oct 31, | | | Oct 31, | | | Oct 31, | | | Oct 31, | |
| | | 2022 | | | 2021 | | | 2020 | | | 2019 | | | 2018 | |
Net Asset Value, Beginning of Year | | $ | 7.26 | | | $ | 5.00 | | | $ | 5.46 | | | $ | 5.68 | | | $ | 5.98 | |
| | | | | | | | | | | | | | | | | | | | |
Income from Investment Operations (A) | | | | | | | | | | | | | | | | | | | | |
Net Investment Income (Loss) | | | 0.07 | | | | 0.01 | | | | 0.06 | | | | 0.11 | | | | 0.10 | |
Net Gains (Losses) on Securities (Realized and Unrealized) | | | 0.07 | | | | 2.27 | | | | (0.46 | ) | | | (0.22 | ) | | | (0.25 | ) |
| | | | | | | | | | | | | | | | | | | | |
Total from Investment Operations | | | 0.14 | | | | 2.28 | | | | (0.40 | ) | | | (0.11 | ) | | | (0.15 | ) |
| | | | | | | | | | | | | | | | | | | | |
Less Distributions: | | | | | | | | | | | | | | | | | | | | |
Net Investment Income | | | (2.17 | ) | | | (0.02 | ) | | | (0.06 | ) | | | (0.11 | ) | | | (0.15 | ) |
| | | | | | | | | | | | | | | | | | | | |
Total Distributions | | | (2.17 | ) | | | (0.02 | ) | | | (0.06 | ) | | | (0.11 | ) | | | (0.15 | ) |
| | | | | | | | | | | | | | | | | | | | |
Net Asset Value, End of Year | | $ | 5.23 | | | $ | 7.26 | | | $ | 5.00 | | | $ | 5.46 | | | $ | 5.68 | |
| | | | | | | | | | | | | | | | | | | | |
Total Return | | | 6.38 | % | | | 45.67 | % | | | (7.41 | %) | | | (1.99 | %) | | | (2.43 | %) |
| | | | | | | | | | | | | | | | | | | | |
Net Assets, End of Year (thousands) | | $ | 1,690,089 | | | $ | 1,765,786 | | | $ | 1,096,427 | | | $ | 1,579,044 | | | $ | 1,995,988 | |
Ratio of Expenses to Average Net Assets | | | 0.30 | % | | | 0.31 | % | | | 0.33 | % | | | 0.33 | % | | | 0.32 | % |
Ratio of Expenses to Average Net Assets (Excluding Fees Waived, Expenses Reimbursed by Advisor and Fees Paid Indirectly) | | | 0.38 | % | | | 0.40 | % | | | 0.41 | % | | | 0.41 | % | | | 0.39 | % |
Ratio of Net Investment Income to Average Net Assets | | | 1.25 | % | | | 0.24 | % | | | 1.15 | % | | | 1.99 | % | �� | | 1.61 | % |
Portfolio Turnover Rate | | | 134 | % | | | 114 | % | | | 71 | % | | | 38 | % | | | 78 | % |
See page 1-2 for the Definitions of Abbreviations and Footnotes.
See accompanying Notes to Financial Statements.
123
DFA INVESTMENT DIMENSIONS GROUP INC.
NOTES TO CONSOLIDATED FINANCIAL STATEMENTS
A. Organization:
DFA Investment Dimensions Group Inc. (the “Fund”) is an open-end management investment company registered under the Investment Company Act of 1940 (the “1940 Act”), as amended (the “1940 Act”), whose shares are generally offered, without a sales charge, to institutional investors, retirement plans and clients of registered investment advisors. The Fund consists of one hundred and two operational portfolios, one of which, DFA Commodity Strategy Portfolio (the “Portfolio”), is included in this section of the report. The remaining operational portfolios are presented in separate reports. The Portfolio is an investment company, and accordingly, follows the accounting and reporting guidance under the Financial Accounting Standards Board (“FASB”) Accounting Standards Codification (“ASC”), Topic 946, “Financial Services-Investment Companies.”
The Portfolio wholly owns and controls Dimensional Cayman Commodity Fund I, LTD. (the “Subsidiary”), a company organized under the laws of the Cayman Islands. The Subsidiary is not registered as an investment company under the 1940 Act.
B. Significant Accounting Policies:
The following significant accounting policies are in conformity with accounting principles generally accepted in the United States of America (“GAAP”). Such policies are consistently followed by the Fund in preparation of its financial statements. The preparation of financial statements in accordance with GAAP requires management to make estimates and assumptions that affect the fair value of investments, the reported amounts of assets and liabilities, the disclosure of contingent assets and liabilities at the date of the financial statements, and the reported amounts of increases and decreases in net assets from operations during the reporting period. Actual results could differ from those estimates, and those differences could be material.
1. Security Valuation: The Portfolio uses a fair value hierarchy, which prioritizes the inputs-to-valuation techniques used to measure fair value into three broad levels described below:
| | • | | Level 1 – inputs are quoted prices in active markets for identical securities (including equity securities, open-end investment companies, and futures contracts) |
| | • | | Level 2 – other significant observable inputs (including quoted prices for similar securities, interest rates, prepayment speeds, credit risk, etc.) |
| | • | | Level 3 – significant unobservable inputs (including the Portfolio’s own assumptions in determining the fair value of investments) |
Debt securities held by the Portfolio are valued on the basis of evaluated prices provided by one or more pricing services or other reasonably reliable sources including broker/dealers that typically handle the purchase and sale of such securities. Securities that are traded over-the-counter and on a stock exchange generally will be valued according to the broadest and most representative market, and it is expected that for bonds and other fixed income securities, this ordinarily will be the over-the-counter market. These securities are generally categorized as Level 2 in the hierarchy. Securities for which quotations are not readily available (including restricted securities), or for which market quotations have become unreliable, are valued in good faith at fair value in accordance with Rule 2a-5 under the 1940 Act pursuant to procedures approved by the Board of Directors of the Fund. Fair value pricing may also be used if events that have a significant effect on the value of an investment (as determined in the discretion of Dimensional Fund Advisors LP) occur before the net asset value of the Portfolio is calculated. When fair value pricing is used, the prices of securities used by the Portfolio may differ from the quoted or published prices for the same securities on their primary markets or exchanges. These securities are generally categorized as Level 2 or Level 3 in the hierarchy.
Futures contracts held by the Portfolio are valued using the settlement price established each day on the exchange on which they are traded. These valuations are generally categorized as Level 1 in the hierarchy. Swap agreements will be valued at the price provided by an independent third-party pricing service or source. If a price is not available from an independent third-party pricing service or source, the swap agreement will be valued in good faith at fair value in accordance with procedures approved by the Board. These securities are generally categorized as Level 2 in the hierarchy.
124
Over-the-counter derivative contracts, which include forward currency contracts, do not require material subjectivity as pricing inputs are observed from quoted markets and are categorized as Level 2 in the hierarchy.
A summary of the inputs used to value the Portfolio’s investments by each major security type, industry and/or country is disclosed previously in this note. A valuation hierarchy table has been included at the end of the Schedule of Investments. The methodology or inputs used for valuing securities are not necessarily an indication of the risk associated with investing in those securities.
2. Foreign Currency Translation: Securities and other assets and liabilities of the Portfolio whose values are initially expressed in foreign currencies are translated to U.S. dollars using the mean between the most recent bid and ask prices for the U.S. dollar as quoted by generally recognized reliable sources. To facilitate this translation, the Portfolio enters into foreign currency contracts. A foreign currency contract is a spot agreement between two parties to buy and sell currencies at current market exchange rates, for settlement generally within two business days. Dividend and interest income and certain expenses are translated to U.S. dollars at the rate of exchange on their respective accrual dates. Receivables and payables denominated in foreign currencies are marked-to-market daily based on daily exchange rates and exchange gains or losses are realized upon ultimate receipt or disbursement.
3. Deferred Compensation Plan: Each eligible Director of the Fund may elect to participate in the Fee Deferral Plan for Independent Directors and Trustees (the “Plan”). Under the Plan, effective January 1, 2002, such Directors may defer payment of all or a portion of their total fees earned as a Director. These deferred amounts may be treated as though such amounts had been invested in shares of the following funds: the U.S. Large Cap Value Portfolio, U.S. Core Equity 1 Portfolio, U.S. Large Company Portfolio, U.S. Vector Equity Portfolio, U.S. Micro Cap Portfolio, DFA International Value Portfolio, International Core Equity Portfolio, Emerging Markets Portfolio, Emerging Markets Core Equity Portfolio, DFA Inflation-Protected Securities Portfolio, and/or DFA Two-Year Global Fixed Income Portfolio. Contributions made under the Plan and the change in unrealized appreciation (depreciation) and income are included in Directors’/ Trustees’ Fees & Expenses.
The Directors may receive their distributions of proceeds by one of the following methods: lump sum, annual installments over a period of agreed-upon years, or quarterly installments over a period of agreed-upon years. Each Director shall have the right in a notice of election (the “Notice”) to defer the receipt of the Director’s deferred compensation until a date specified by such Director in the Notice. The date may not be sooner than the earlier of: (i) the first business day of January following the year in which such Director ceases to be a member of the Board of Directors of the Fund; and (ii) five years following the effective date of the Director’s first deferral election. If a Director who elects to defer fees fails to designate in the Notice a time or date as of which payment of the Director’s deferred fee account shall commence, payment of such amount shall commence as of the first business day of January following the year in which the Director ceases to be a member of the Board (unless the Director files an amended Notice selecting a different distribution date).
4. Other: Security transactions are accounted for as of the trade date. Costs used in determining realized gains and losses on the sale of investment securities/affiliated investment companies securities and foreign currency are accounted for on the basis of identified cost. Dividend income and distributions to shareholders are recorded on the ex-dividend date. Distributions received on securities that represent a return of capital or capital gains are recorded as a reduction of cost of investments or as a realized gain, respectively. The Portfolio estimates the character of received distributions that may be considered return of capital distributions. Interest income is recorded on an accrual basis. Discount and premium on debt securities purchased are amortized over the lives of the respective securities, using the effective interest method. Expenses directly attributable to the Portfolio are directly charged. Common expenses of the Fund or its portfolios are allocated using methods approved by the Board, generally based on average net assets.
125
C. Basis for Consolidation:
The Subsidiary commenced operations on November 9, 2010. The Portfolio commenced reporting on a consolidated basis as of such commencement date in accordance with the accounting principles relating to reporting of a wholly-owned subsidiary. The Portfolio will seek to gain exposure to commodities, commodities-related instruments, derivatives and other investments by directly investing in those instruments or through investments in the Subsidiary. The Subsidiary participates in the same investment goal as the Portfolio. The Subsidiary pursues its investment goal by investing in commodities, commodities-related instruments, derivatives and other investments. The Subsidiary (unlike the Portfolio) may invest without limitation in these instruments. However, the Subsidiary is otherwise subject to the same fundamental, non-fundamental and certain other investment restrictions as the Portfolio. The portion of the Portfolio’s or Subsidiary’s assets exposed to any particular commodity, derivative or other investment will vary based on market conditions, but from time to time some exposure could be substantial.
To the extent of the Portfolio’s investment through the Subsidiary, it will be subject to the risks associated with the commodities, derivatives and other instruments in which the Subsidiary invests. By investing in the Subsidiary, the Portfolio is indirectly exposed to the risks associated with the Subsidiary’s investments. The derivatives and other investments held by the Subsidiary are generally similar to those that are permitted to be held by the Portfolio and are subject to the same risks that apply to similar investments if held directly by the Portfolio.
The Subsidiary is classified as a controlled foreign corporation under Subchapter N of the Internal Revenue Code. Therefore, the Portfolio is required to increase its taxable income by its share of the Subsidiary’s income. Net investment losses of the Subsidiary cannot be deducted by the Portfolio in the current period nor carried forward to offset taxable income in future periods.
As of October 31, 2022, the Portfolio held a $392,270,247 investment in the Subsidiary, representing 23.21% of the Portfolio’s total net assets. The accompanying consolidated financial statements include all assets, liabilities, revenues and expenses of the Portfolio and its wholly-owned Subsidiary. Intercompany balances and transactions have been eliminated in consolidation.
D. Investment Advisor:
The Advisor, Dimensional Fund Advisors LP, provides investment management services to the Portfolio. For the year ended October 31, 2022, the investment management fee was accrued daily and paid monthly to the Advisor based on the following effective annual rate of average daily net assets:
| | | | |
DFA Commodity Strategy Portfolio | | | 0.28 | % |
Pursuant to an Amended and Restated Fee Waiver and/or Expense Assumption Agreement (the “Fee Waiver Agreement”), the Advisor has contractually agreed to waive all or a portion of the management fee and to assume the expenses of the Portfolio (including the expenses that the Portfolio bears as a shareholder of other funds managed by the Advisor but excluding the expenses that the Portfolio incurs indirectly through investment of its securities lending cash collateral in The DFA Short Term Investment Fund and its investment in unaffiliated investment companies) (“Portfolio Expenses”) to the extent necessary to limit the Portfolio Expenses to no more than 0.55% of the Portfolio’s average net assets on an annualized basis (the “Expense Limitation Amount”). At any time that the Portfolio Expenses of the Portfolio are less than the Expense Limitation Amount, the Advisor retains the right to recover fees previously waived and/or expenses previously assumed to the extent that the expense ratio following such recovery would be less than the Expense Limitation Amount that was in place when such prior year fees were waived and/or expenses assumed, and less than the current Expense Limitation Amount for the Portfolio. The Fund, on behalf of the Portfolio, is also not obligated to reimburse the Advisor for fees previously waived or expenses previously assumed by the Advisor more than thirty-six months before the date of recovery. The Fee Waiver Agreement for the Portfolio will remain in effect through February 28, 2023, and may only be terminated by the Fund’s Board of Directors prior to that date. The Fee Waiver Agreement will continue in effect from year to year thereafter unless terminated by the Fund or the Advisor. As of October 31, 2022, there were no previously waived fees/expenses assumed subject to future recovery by the Advisor.
126
The Subsidiary has entered into a separate contract with the Advisor whereby the Advisor or its affiliates provide investment advisory and other services to the Subsidiary. For the investment advisory services it provides, the Advisor is entitled to a fee from the Subsidiary equal to 0.30% of the Subsidiary’s average net assets on an annualized basis; however, pursuant to a contractual agreement, the Advisor has agreed to waive the management fee of the Subsidiary.
For the year ended October 31, 2022, approximately $1,298 (in thousands) of the Subsidiary’s management fees were waived pursuant to the Subsidiary fee waiver agreement.
Earned Income Credit:
Additionally, the Portfolio has entered into an arrangement with its custodian whereby net interest earned on uninvested cash balances was used to reduce a portion of the Portfolio’s custody expenses. Custody expense in the accompanying financial statements is presented before reduction for credits. The impact of such credits is generally less than one basis point of the Portfolio’s net assets. During the year ended October 31, 2022, expenses reduced were as follows (amount in thousands):
| | | | |
| | | Fees Paid
Indirectly | |
DFA Commodity Strategy Portfolio | | $ | 19 | |
Fees Paid to Officers and Directors/Trustees:
Certain Officers and Directors of the Advisor are also Officers and Directors of the Fund; however, such Officers and Directors (with the exception of the Chief Compliance Officer (“CCO”)) receive no compensation from the Fund. For the year ended October 31, 2022, the total related amount paid by the Fund to the CCO was $166 (in thousands). The total related amounts paid by the Portfolio are included in Other Expenses on the Consolidated Statement of Operations.
E. Deferred Compensation:
As of October 31, 2022, the total liability for deferred compensation to Directors/Trustees is included in Accrued Expenses and Other Liabilities on the Consolidated Statement of Assets and Liabilities as follows (amount in thousands):
| | | | |
DFA Commodity Strategy Portfolio | | $ | 6 | |
F. Purchases and Sales of Securities:
For the year ended October 31, 2022, the Portfolio’s transactions related to investment securities, other than short-term securities and in-kind redemptions (amounts in thousands), were as follows:
| | | | | | | | | | | | | | | | |
| | | U.S. Government Securities | | | Other Investment Securities | |
| | | Purchases | | | Sales | | | Purchases | | | Sales | |
DFA Commodity Strategy Portfolio | | $ | 1,537,538 | | | $ | 1,759,700 | | | $ | 721,830 | | | $ | 441,941 | |
For the year ended October 31, 2022, transactions related to Affiliated Investment Companies, excluding in-kind redemptions, are presented below.
127
The amounts presented below may differ from the respective amounts presented in the corresponding Consolidated Schedule of Investments, Consolidated Statement of Assets and Liabilities or Consolidated Statement of Operations due to rounding. The amounts are as follows (amounts in thousands):
| | | | | | | | | | | | | | | | | | | | | | | | | | | | | | | | | | | | |
| | | Balance at
October 31,
2021 | | | Purchases
at Cost | | | Proceeds
from
Sales | | | Net Realized
Gain/(Loss)
on Sales | | | Change in
Unrealized
Appreciation/
Depreciation | | | Balance at
October 31,
2022 | | | Shares as of
October 31,
2022 | | | Dividend
Income | | | Capital Gain
Distributions | |
DFA Commodity Strategy Portfolio | | | | | | | | | | | | | | | | | | | | | | | | | | | | | | | | | | | | |
The DFA Short Term Investment Fund | | $ | 4,237 | | | $ | 218,493 | | | $ | 204,882 | | | $ | (5 | ) | | $ | (6 | ) | | $ | 17,837 | | | | 1,543 | | | $ | 275 | | | | — | |
| | | | | | | | | | | | | | | | | | | | | | | | | | | | | | | | | | | | |
Total | | $ | 4,237 | | | $ | 218,493 | | | $ | 204,882 | | | $ | (5 | ) | | $ | (6 | ) | | $ | 17,837 | | | | 1,543 | | | $ | 275 | | | | — | |
| | | | | | | | | | | | | | | | | | | | | | | | | | | | | | | | | | | | |
G. Federal Income Taxes:
The Portfolio has qualified and intends to continue to qualify as a regulated investment company under Subchapter M of the Internal Revenue Code for federal income tax purposes and to distribute substantially all of its taxable income and net capital gains to shareholders. Accordingly, no provision has been made for federal income taxes.
Distributions from net investment income and net realized capital gains are determined in accordance with U.S. federal income tax regulations, which may differ from those amounts determined under GAAP. These book/tax differences are either temporary or permanent in nature. To the extent that these differences are permanent, they are charged or credited to paid-in capital or distributable earnings, undistributed net investment income or accumulated net realized gains or losses, as appropriate, in the period that the differences arise. Accordingly, the permanent differences as of October 31, 2022, can occur as a result of financial and tax reporting related to the Subsidiary, the use of accumulated earnings and profits distributed to shareholders on redemptions of shares as part of the dividends paid deduction for tax purposes, reversal of book income/loss from controlled foreign corporation and net foreign currency gains/losses, and were reclassified to the accounts mentioned above. These reclassifications had no effect on net assets or net asset value per share.
The tax character of dividends and distributions declared and paid during the years ended October 31, 2021, and October 31, 2022, were as follows (amounts in thousands):
| | | | | | | | | | | | | | | | |
| | | Net Investment
Income and
Short-Term
Capital Gains | | | Long-Term
Capital Gains | | | Tax Exempt
Income | | | Total | |
DFA Commodity Strategy Portfolio | | | | | | | | | | | | | | | | |
2021 | | $ | 3,525 | | | | — | | | | — | | | $ | 3,525 | |
2022 | | | 500,400 | | | | — | | | | — | | | | 500,400 | |
As of October 31, 2022, the following net investment income and short-term capital gains and long-term capital gains distributions designated for federal income tax purposes are due to the use of accumulated earnings and profits distributed to shareholders upon redemption of shares (amounts in thousands):
| | | | | | | | | | | | |
| | | Net Investment
Income and
Short-Term
Capital Gains | | | Long-Term
Capital Gains | | | Total | |
DFA Commodity Strategy Portfolio | | $ | (12,205 | ) | | | — | | | $ | (12,205 | ) |
128
As of October 31, 2022, the components of distributable earnings (accumulated losses) were as follows (amounts in thousands):
| | | | | | | | | | | | | | | | | | | | |
| | | Undistributed
Net Investment
Income and
Short-Term
Capital Gains | | | Undistributed
Long-Term
Capital Gains | | | Capital Loss
Carryforwards | | | Unrealized
Appreciation
(Depreciation) | | | Total Net
Distributable
Earnings
(Accumulated
Losses) | |
DFA Commodity Strategy Portfolio | | $ | 103,837 | | | | — | | | $ | (33,679 | ) | | $ | (714,299 | ) | | $ | (644,141 | ) |
For federal income tax purposes, the Fund measures its capital loss carryforwards annually at October 31, its fiscal year end. Capital loss carryforwards may be carried forward and applied against future capital gains. As of October 31, 2022, the Portfolio had the following capital loss carryforwards available to offset future realized capital gains with no expiration date (amounts in thousands):
| | | | | | | | |
| | | Unlimited | | | Total | |
DFA Commodity Strategy Portfolio | | $ | 33,679 | | | $ | 33,679 | |
During the year ended October 31, 2022, the Portfolio did not use capital loss carryforwards to offset realized capital gains for federal income tax purposes.
As of October 31, 2022, the total cost and aggregate gross unrealized appreciation (depreciation) of securities for federal income tax purposes were different from amounts reported for financial reporting purposes, as follows (amounts in thousands):
| | | | | | | | | | | | | | | | |
| | | Federal
Tax Cost | | | Unrealized
Appreciation | | | Unrealized
(Depreciation) | | | Net
Unrealized
Appreciation
(Depreciation) | |
DFA Commodity Strategy Portfolio | | $ | 2,353,399 | | | $ | 16,884 | | | $ | (733,914 | ) | | $ | (717,030 | ) |
The difference between GAAP-basis and tax-basis unrealized gains (losses) can occur as a result of wash sales and net mark-to-market gains (losses) on regulated futures contracts, net mark-to-market gains (losses) on foreign currency contracts, and differences in the tax treatment of passive foreign investment company investments or other investments.
ASC 740 Accounting for Uncertainty in Income Taxes sets forth a minimum threshold for financial statement recognition of the benefit of a tax position taken or expected to be taken in a tax return. Management has analyzed the Portfolio’s tax positions and has concluded that no additional provision for income tax is required in the Portfolio’s financial statements. The Portfolio is not aware of any tax positions for which it is more likely than not that the total amounts of unrecognized tax benefits will significantly change in the next twelve months. The Portfolio’s federal tax returns for the prior three fiscal years remain subject to examination by the Internal Revenue Service.
H. Financial Instruments:
In accordance with the Portfolio’s investment objective and policies, the Portfolio may invest in certain financial instruments that have off-balance sheet risk in excess of the amounts recognized in the financial statements and concentrations of credit and market risk. These instruments and their significant corresponding risks are described below:
1. Foreign Market Risks: Investments in foreign markets may involve certain considerations and risks not typically associated with investments in the United States of America, including the possibility of future political and economic developments and the level of foreign governmental supervision and regulation of foreign securities markets. These markets are generally smaller, less liquid and more volatile than the major securities markets in the United States of America. Consequently, acquisition and disposition of international securities held by the Portfolio may be inhibited.
129
Derivative Financial Instruments:
Summarized below are the specific types of derivative instruments used by the Portfolio. The Portfolio may gain exposure to commodity markets by investing up to 25% of the Portfolio’s total assets in the Subsidiary. The Subsidiary may invest without limitation in commodity-linked notes, swap agreements and other commodity-linked derivative instruments, including futures contracts on individual commodities or a subset of commodities and options on commodities. The accompanying consolidated schedule of investments includes investments of the Portfolio and its wholly-owned Subsidiary.
2. Forward Currency Contracts: The Portfolio may acquire and sell forward currency contracts to hedge against adverse changes in the relationship of the U.S. dollar to foreign currencies (foreign exchange rate risk). The decision to hedge the Portfolio’s currency exposure with respect to a foreign market will be based primarily on the Portfolio’s existing exposure to a given foreign currency. Each contract is valued daily and the change in value is recorded by the Portfolio as an unrealized gain or loss, which is presented in the Consolidated Statement of Operations as the change in unrealized appreciation or depreciation of forward currency contracts. When the contract is closed or offset with the same counterparty, the Portfolio records a realized gain or loss equal to the change in the value of the contract when it was opened and the value at the time it was closed or offset. This is presented in the Consolidated Statement of Operations as a net realized gain or loss on forward currency contracts.
3. Commodity-Linked Derivatives: The Portfolio and the Subsidiary invest in commodity-linked derivative instruments, such as swap agreements, commodity options, futures, options on futures, and structured notes. The prices of commodity-linked derivative instruments may move in different directions than investments in traditional equity securities, fixed income securities and commodity spot prices.
4. Swap Agreements: The Portfolio may enter into swap agreements with respect to commodities, interest rates and indexes of commodities or securities, specific securities and commodities, and mortgage, credit and event-linked swaps, and, to the extent the Portfolio may invest in foreign-currency-denominated securities, the Portfolio may enter into swap agreements with respect to foreign currencies.
The Portfolio may enter into swap transactions for any legal purpose consistent with its investment objective and policies, such as for the purpose of attempting to obtain or preserve a particular return or spread at a lower cost than obtaining a return or spread through purchases and/or sales of instruments in other markets, to seek to increase total return (speculation), to protect against currency fluctuations, as a duration management technique, to protect against any increase in the price of securities the Portfolio anticipates purchasing at a later date, or to gain exposure to certain markets in the most economical way possible.
A swap agreement may be negotiated bilaterally and traded over-the-counter between the two parties (for an uncleared swap), while other swaps must be transacted through a futures commission merchant (“FCM”) and cleared through a clearinghouse that serves as a central counterparty (for a cleared swap), and may be traded on swap execution facilities (exchanges). Swap agreements are two-party contracts entered into primarily by institutional investors for periods ranging from a few weeks to more than one year. In a standard “swap” transaction, two parties agree to exchange the returns (or differentials in rates of return) earned or realized on particular predetermined investments or instruments, which may be adjusted for an interest factor. In an uncleared swap, the swap counterparty is typically a brokerage firm, bank or other financial institution. In a cleared swap, the Portfolio’s ultimate counterparty is a central clearinghouse rather than a brokerage firm, bank or other financial institution.
An investment in a commodity swap agreement may involve the exchange of floating-rate interest payments for the total return on a commodity index. In a total return commodity swap, the Portfolio will receive the price appreciation of a commodity index, a portion of the index, or a single commodity in exchange for paying an agreed-upon fee. The Portfolio may also enter into credit default swap agreements. The “buyer” in a credit default contract is obligated to pay the “seller” a periodic stream of payments over the term of the contract provided that no event of default on an underlying reference obligation (whether as a single debt instrument or as part of an index of debt instruments) has occurred. If an event of default occurs, the seller must pay the buyer the full notional value, or “par value,” of the reference obligation in exchange for the reference obligation. The Portfolio may be either the buyer or seller in a credit default swap transaction. Credit default swap transactions involve greater risks than if the Portfolio had invested in the reference obligation directly.
130
Most swap agreements entered into by the Portfolio will calculate the obligations of the parties to the agreement on a “net” basis, which means that the two payment streams are netted out, with the Portfolio receiving or paying, as the case may be, only the net amount of the two payments. The Portfolio’s current obligations under a swap agreement will be accrued daily (offset against any amounts owed to the Portfolio) and any accrued but unpaid net amounts owed to a swap counterparty will be covered by the segregation of assets determined to be liquid to avoid any potential leveraging of the Portfolio’s portfolio.
Uncleared swaps are typically executed bilaterally with a swap dealer rather than traded on exchanges. Parties to uncleared swaps face greater counterparty credit risk than those engaging in cleared swaps since performance of uncleared swap obligations is the responsibility only of the swap counterparty rather than a clearinghouse, as is the case with cleared swaps. As a result, the Portfolio bears the risk of loss of the amount expected to be received under a swap agreement in the event of the default, insolvency or bankruptcy of a swap agreement counterparty beyond any collateral received. In such an event, the Portfolio will have contractual remedies pursuant to the swap agreements, but bankruptcy and insolvency laws could affect the Portfolio’s rights as a creditor. The Portfolio will enter into swap agreements only with counterparties that meet certain standards of creditworthiness as determined by the Advisor’s Investment Committee. To the extent that the Portfolio reasonably expects a swap cannot be sold or disposed of in current market conditions in seven calendar days or less without the sale or disposition significantly changing the market value of investment, the Portfolio will treat the swap as illiquid and subject to its overall limit on illiquid investments of 15% of the Portfolio’s net assets.
The Dodd-Frank Wall Street Reform and Consumer Protection Act of 2010 and implementing rules adopted by the Commodity Futures Trading Commission (“CFTC”) currently require the clearing and exchange-trading of the most common types of credit default index swaps and interest rate swaps, and it is expected that additional categories of swaps will in the future be designated as subject to mandatory clearing and trade execution requirements. Central clearing is intended to reduce counterparty credit risk and increase liquidity, but central clearing does not eliminate these risks completely. There is also a risk of loss by the Portfolio of the initial and variation margin deposits in the event of bankruptcy of the FCM with which the Portfolio has an open position, or the central counterparty in a swap contract. The assets of the Portfolio may not be fully protected in the event of the bankruptcy of the FCM or central counterparty because the Portfolio might be limited to recovering only a pro rata share of all available funds and margin segregated on behalf of an FCM’s customers.
Futures Activities:
The Portfolio may enter into commodity, foreign currency, interest rate and commodity or securities index futures contracts and purchase and write (sell) related options traded on exchanges designated by the CFTC or, consistent with CFTC regulations, on foreign exchanges.
5. Futures Contracts: A commodity futures contract provides for the future sale by one party and the future purchase by the other party of a specified amount of a commodity, such as an energy, agricultural or metal commodity, at a specified price, date, time and place. A foreign currency futures contract provides for the future sale by one party and the future purchase by the other party of a certain amount of a specified non-U.S. currency at a specified price, date, time and place. An interest rate futures contract provides for the future sale by one party and the purchase by the other party of a certain amount of a specific interest rate sensitive financial instrument (debt security) at a specified price, date, time and place. Securities and commodities indexes are typically capitalization or production weighted, respectively. A securities index or commodities index futures contract is an agreement to be settled by delivery of an amount of cash equal to a specified multiplier times the difference between the value of the index at the close of the last trading day on the contract and the price at which the agreement is made. The clearing house of the exchange on which a futures contract is entered into becomes the counterparty to each purchaser and seller of the futures contract.
Payments, known as “variation margin,” to and from the broker, will be made daily as the currency, financial instrument or index underlying the futures contract fluctuates, making the long and short positions in the futures contract more or less valuable, a process known as “marking-to-market.” As a result of the small margin deposit that is required, a small change in the market price of a futures contract can produce major losses.
131
At any time prior to the expiration of a futures contract, the Portfolio may elect to close the position by taking an opposite position, which will operate to terminate the Portfolio’s existing position in the contract. Positions in futures contracts and options on futures contracts (described below) may be closed out only on the exchange on which they were entered into (or through a linked exchange). However, there is no assurance that an active market will exist at any particular time. Once the daily fluctuation limit has been reached in a particular contract, most futures exchanges restrict trades at a price beyond that limit or trading may be suspended for specified periods during the day. Such restrictions prevent prompt liquidation of futures positions at an advantageous price, potentially subjecting the Portfolio to substantial losses. In such event, and in the event of adverse price movements, the Portfolio would be required to make daily cash payments of variation margin. Losses incurred in futures transactions and the costs of these transactions will affect the Portfolio’s performance.
The price volatility of commodity futures contracts has been historically greater than that for traditional securities, such as stocks and bonds, and there are a variety of factors associated with commodity futures contracts which may subject the Portfolio’s investments in the contracts to greater volatility than investments in traditional securities.
6. Options on Futures Contracts: The Portfolio may purchase and write put and call options on foreign currency, interest rate and stock and commodity index futures contracts and may enter into closing transactions with respect to such options to terminate existing positions. There is no guarantee that such closing transactions can be effected; the ability to establish and close out positions on such options will be subject to the existence of a liquid market.
An option on a currency, interest rate or commodity or securities index futures contract, as contrasted with the direct investment in such a contract, gives the purchaser the right, in return for the premium paid, to assume a position in a futures contract at a specified exercise price at any time prior to the expiration date of the option. The writer of the option is required upon exercise to assume an offsetting futures position (a short position if the option is a call and a long position if the option is a put). Upon exercise of an option, the delivery of the futures position by the writer of the option to the holder of the option will be accompanied by delivery of the accumulated balance in the writer’s futures margin account, which represents the amount by which the market price of the futures contract exceeds, in the case of a call, or is less than, in the case of a put, the exercise price of the option on the futures contract. The potential loss related to the purchase of an option on a futures contract is limited to the premium paid for the option (plus transaction costs). The value of the option changes daily, and that change is reflected in the net asset value of the Portfolio.
The Portfolio may enter into options and futures transactions for several purposes, including generating current income to offset expenses or increase return, and as hedges to reduce investment risk, generally by making an investment expected to move in the opposite direction of a portfolio position. A hedge is designed to offset a loss in a portfolio position with a gain in the hedged position; at the same time, however, a properly correlated hedge will result in a gain in the portfolio position being offset by a loss in the hedged position.
The Subsidiary’s securities have been segregated as collateral for open futures contracts and open swaps contracts.
The average volume (based on the open positions at each fiscal month-end) of derivative activity for the year ended October 31, 2022 was as follows (amounts in thousands):
| | | | | | | | | | | | |
| | | Forward
Currency
Contracts* | | | Futures** | | | Swap
Contracts*** | |
DFA Commodity Strategy Portfolio | | $ | 255,197 | | | $ | 108,670 | | | $ | 1,668,342 | |
| * | Average amount of Currency Purchased/Sold in USD. |
| ** | Average Notional Value of futures contracts. |
| *** | Average Notional Value of agreements. |
132
The following is a summary of the Portfolio’s derivative instrument holdings categorized by primary risk exposure as of October 31, 2022 (amounts in thousands):
| | | | | | | | | | | | | | | | |
| | | Asset Derivatives Value | |
| | | Total Value
at
October 31, 2022 | | | Forward
Currency
Contracts (1) | | | Commodity
Futures
Contracts *,(2) | | | Swap
Contracts (3) | |
DFA Commodity Strategy Portfolio | | $ | 10,166 | | | $ | 1,308 | | | $ | 1,339 | | | $ | 7,519 | |
| |
| | | Liability Derivatives Value | |
| | | Total Value
at
October 31, 2022 | | | Forward
Currency
Contracts (4) | | | Commodity
Futures
Contracts *,(5) | | | Swap
Contracts (6) | |
DFA Commodity Strategy Portfolio | | $ | (5,221 | ) | | $ | (917 | ) | | $ | (2,245 | ) | | $ | (2,059 | ) |
| (1) | Presented on Consolidated Statement of Assets and Liabilities as Unrealized Gain on Forward Currency Contracts. |
| (2) | Presented on Consolidated Statement of Assets and Liabilities as Receivables: Futures Margin Variation. |
| (3) | Presented on Consolidated Statement of Assets and Liabilities as Unrealized Gain on Swap Contracts. |
| (4) | Presented on Consolidated Statement of Assets and Liabilities as Unrealized Loss on Forward Currency Contracts. |
| (5) | Presented on Consolidated Statement of Assets and Liabilities as Payables: Futures Margin Variation. |
| (6) | Presented on Consolidated Statement of Assets and Liabilities as Unrealized Loss on Swap Contracts. |
| * | Includes cumulative appreciation (depreciation) of futures contracts. Only current day’s margin variation is reported within the Consolidated Statement of Assets and Liabilities. |
The following is a summary of the realized and change in unrealized gains and losses from the Portfolio’s derivative instrument holdings categorized by primary risk exposure for the year ended October 31, 2022 (amounts in thousands):
| | | | | | | | | | | | | | | | |
| | | Realized Gain (Loss) on
Derivatives | |
| | | Total | | | Forward
Currency
Contracts (1) | | | Commodity
Futures
Contracts (2) | | | Swap
Contracts (3) | |
DFA Commodity Strategy Portfolio | | $ | 132,919 | | | $ | 21,616 | | | $ | 953 | | | $ | 110,350 | |
| |
| | | Change in Unrealized Appreciation
(Depreciation) on Derivatives | |
| | | Total | | | Forward
Currency
Contracts (4) | | | Commodity
Futures
Contracts (5) | | | Swap
Contracts (6) | |
DFA Commodity Strategy Portfolio | | $ | 35,081 | | | $ | 1,633 | | | $ | (1,625 | ) | | $ | 35,073 | |
| (1) | Presented on Consolidated Statement of Operations as Net Realized Gain (Loss) on: Forward Currency Contracts. |
| (2) | Presented on Consolidated Statement of Operations as Net Realized Gain (Loss) on: Futures. |
| (3) | Presented on Consolidated Statement of Operations as Net Realized Gain (Loss) on: Swap Contracts. |
| (4) | Presented on Consolidated Statement of Operations as Change in Unrealized Appreciation (Depreciation) of: Forward Currency Contracts. |
| (5) | Presented on Consolidated Statement of Operations as Change in Unrealized Appreciation (Depreciation) of: Futures. |
| (6) | Presented on Consolidated Statement of Operations as Change in Unrealized Appreciation (Depreciation) of: Swap Contracts. |
133
Offsetting of Derivative Assets and Derivative Liabilities:
In order to better define its contractual rights and to secure rights that will help the Fund mitigate its counterparty risk, the Fund entered into an International Swaps and Derivatives Association, Inc. Master Agreement (ISDA Master Agreement) or a similar agreement with certain of its derivative contract counterparties. An ISDA Master Agreement is a bilateral agreement between the Fund and a counterparty that governs over-the-counter (OTC) derivatives and forward currency contracts and typically contains, among other things, provisions in the event of a default and/or termination event and may also include collateral posting items. Under an ISDA Master Agreement, the Fund may, under certain circumstances, offset with the counterparty certain derivative financial instruments’ payables and/or receivables with collateral held and/or posted, if any, and create one single net payment. The provisions of the ISDA Master Agreement typically permit a single net payment in the event of a default (close-out), including the bankruptcy or insolvency of the counterparty. However, bankruptcy or insolvency laws of a particular jurisdiction may impose restrictions on or prohibitions against the right of offset in bankruptcy, insolvency, or other events.
For financial reporting purposes, the Fund does not offset derivative assets and derivative liabilities that are subject to netting arrangements in the Consolidated Statement of Assets and Liabilities.
The following table presents the Portfolio’s gross and net amount of assets and liabilities available for offset under netting arrangements as well as any related collateral received or pledged by the Portfolio as of October 31, 2022 (amounts in thousands):
| | | | | | | | | | | | | | | | | | | | | | | | | | | | | | | | | | | | | | | | | | | | | | | | |
| | | | | | Net
Amounts
of
Assets
Presented
in the
Consolidated
Statement
of Assets
and
Liabilities | | | Gross Amounts Not
Offset in the
Consolidated
Statement of Assets
and Liabilities | | | | | | | | | Net
Amounts
of
Liabilities
Presented
in the
Consolidated
Statement
of Assets
and
Liabilities | | | Gross Amounts Not
Offset in the
Consolidated
Statement of Assets
and Liabilities | | | | |
Description | | Gross
Amounts of
Recognized
Assets
(a) | | | Financial
Instruments
(b) | | | Non-Cash
Collateral
Received | | | Cash
Collateral
Received | | | Net
Amount
(c) | | | Gross
Amounts of
Recognized
Liabilities
(a) | | | Financial
Instruments
(d) | | | Non-Cash
Collateral
Pledged | | | Cash
Collateral
Pledged | | | Net
Amount
(e) | |
| | | | | | | | | | | | | | | | | | | | | | | | | | | | | | | | | | | | | |
| | | Assets | | | Liabilities | |
DFA Commodity Strategy Portfolio | | | | | | | | | | | | | | | | | | | | | | | | | | | | | | | | | | | | | |
Credit Suisse | | | — | | | | — | | | | — | | | | — | | | | — | | | | — | | | $ | 2,059 | | | $ | 2,059 | | | | — | | | | — | | | $ | (2,059 | ) | | | — | |
Citibank, N.A | | $ | 1,717 | | | $ | 1,717 | | | | — | | | | — | | | $ | (1,170 | ) | | $ | 547 | | | | — | | | | — | | | | — | | | | — | | | | — | | | | — | |
State Street Bank and Trust | | | 958 | | | | 958 | | | | — | | | | — | | | | — | | | | 958 | | | | — | | | | — | | | | — | | | | — | | | | — | | | | — | |
Bank of America Corp | | | 5,622 | | | | 5,622 | | | $ | (917 | ) | | | — | | | | (740 | ) | | | 3,965 | | | | 917 | | | | 917 | | | $ | (917 | ) | | | — | | | | — | | | | — | |
UBS AG | | | 530 | | | | 530 | | | | — | | | $ | (530 | ) | | | — | | | | — | | | | — | | | | — | | | | — | | | | — | | | | — | | | | — | |
| | | | | | | | | | | | | | | | | | | | | | | | | | | | | | | | | | | | | | | | | | | | | | | | |
Total | | $ | 8,827 | | | $ | 8,827 | | | $ | (917 | ) | | $ | (530 | ) | | $ | (1,910 | ) | | $ | 5,470 | | | $ | 2,976 | | | $ | 2,976 | | | $ | (917 | ) | | | — | | | $ | (2,059 | ) | | | — | |
| | | | | | | | | | | | | | | | | | | | | | | | | | | | | | | | | | | | | | | | | | | | | | | | |
| (a) | No amounts have been netted against the gross amounts recognized in the Consolidated Statement of Assets and Liabilities. |
| (b) | Represents the amount of assets that could be offset by liabilities with the same counterparty under master netting or similar agreements that management elects not to offset on the Consolidated Statement of Assets and Liabilities. |
| (c) | Represents the net amount due from counterparties in the event of default. |
| (d) | Represents the amount of liabilities that could be offset by assets with the same counterparty under master netting or similar agreements that management elects not to offset on the Consolidated Statement of Assets and Liabilities. |
| (e) | Represents the net amount due to counterparties in the event of default. |
I. Line of Credit and Interfund Lending Program:
The Fund, together with other Dimensional-advised portfolios, has entered into a $500 million uncommitted, unsecured discretionary line of credit effective April 6, 2022, with its domestic custodian bank. A line of credit with similar terms was in effect through April 6, 2022. Each portfolio is permitted to borrow, subject to its investment limitations, up to a maximum of $250 million, as long as total borrowings under the line of credit do not exceed $500 million in the aggregate. Borrowings under the line of credit are charged interest at rates agreed upon by the parties at the time of borrowing. Each portfolio is individually, and not jointly, liable for its particular advances under the line of credit. There is no commitment fee on the unused portion of the line of credit. The agreement for the discretionary line of credit may be terminated by either party at any time. The agreement for the line of credit expires on April 5, 2023.
134
The Fund, together with other Dimensional-advised portfolios, has also entered into an additional $700 million unsecured line of credit with its international custodian bank effective January 2, 2022. A line of credit with similar terms was in effect through January 1, 2022. Each portfolio is permitted to borrow, subject to its investment limitations, up to the lower of one-quarter of such portfolio’s net assets or $500 million, as long as total borrowings under the line of credit do not exceed $700 million in the aggregate. Each portfolio is individually, and not jointly, liable for its particular advances under the line of credit. Borrowings under the line of credit are charged interest at rates agreed upon by the parties at the time of borrowing. There is no commitment fee on the unused portion of the line of credit. The agreement for the discretionary line of credit may be terminated by either party at any time. The line of credit agreement expires on January 1, 2023.
There were no borrowings by the Portfolio under the lines of credit during the year ended October 31, 2022.
Pursuant to an exemptive order issued by the SEC (the “Order”), the Portfolio may participate in an interfund lending program among certain portfolios managed by the Advisor (portfolios that operate as feeder funds do not participate in the program). The program allows the participating portfolios to borrow money from and loan money to each other for temporary or emergency purposes, subject to the conditions in the Order. A loan can only be made through the program if the interfund loan rate on that day is more favorable to both the borrowing and lending portfolios as compared to rates available through short-term bank loans or investments in overnight repurchase agreements and money market funds, respectively, as detailed in the Order. Further, a portfolio may participate in the program only if and to the extent that such participation is consistent with its investment objectives and limitations. Interfund loans have a maximum duration of seven days and may be called on one business day’s notice.
The Portfolio did not use the interfund lending program during the year ended October 31, 2022.
J. Securities Lending:
As of October 31, 2022, the Portfolio had securities on loan to brokers/dealers, for which the Portfolio received cash collateral. The Portfolio invests the cash collateral, as described below, and records a liability for the return of the collateral, during the period the securities are on loan. Loans of securities are expected at all times to be secured by collateral in an amount (i) equal to at least 100% of the current market value of the loaned securities with respect to securities of the U.S. government or its agencies, (ii) generally equal to 102% of the current market value of the loaned securities with respect to U.S. securities, and (iii) generally equal to 105% of the current market value of the loaned securities with respect to foreign securities. However, daily market fluctuations could cause the Portfolio’s collateral to be lower or higher than the expected thresholds. If this were to occur, the collateral would be adjusted the next business day to ensure adequate collateralization. In the event of default or bankruptcy by the other party to the agreement, realization and/or retention of the collateral may be subject to legal proceedings. If the borrower fails to return loaned securities, cash collateral being maintained by the borrower is insufficient to cover the value of loaned securities, and such collateral insufficiency is not the result of investment losses, the lending agent has agreed to pay the amount of the shortfall to the Portfolio or, at the option of the lending agent, to replace the securities. In the event of the bankruptcy of the borrower, the Portfolio could experience delay in recovering the loaned securities or only recover cash or a security of equivalent value.
135
Subject to its stated investment policies, the Portfolio will generally invest the cash collateral received for the loaned securities in the Money Market Series, an affiliated registered money market fund advised by the Advisor for which the Advisor receives a management fee of 0.05% of the average daily net assets of the Money Market Series. Income received from the Money Market Series is netted with fees for securities lending and collateral investment expenses and with other payments to and from borrowers of securities. The Portfolio also may invest the cash collateral received for the loaned securities in securities of the U.S. government or its agencies, repurchase agreements collateralized by securities of the U.S. government or its agencies, and affiliated or unaffiliated money market funds that are registered or unregistered. For purposes of this paragraph, agencies include both agency debentures and agency mortgage-backed securities. Additionally, the Portfolio will be able to terminate the loan at any time and will receive reasonable interest on the loan, as well as amounts equal to any dividends, interest or, other distributions on the loaned securities. However, dividend income received from loaned securities may not be eligible for taxation at qualified dividend income rates.
The following table reflects a breakdown of transactions accounted for as secured borrowings, the gross obligation by the type of collateral pledged, and the remaining contractual maturity of those transactions as of October 31, 2022 (amounts in thousands):
| | | | | | | | | | | | | | | | | | | | |
| | | Remaining Contractual Maturity of the Agreements
As of October 31, 2022 | |
| | | Overnight and
Continuous | | | <30 days | | | Between
30 & 90 days | | | >90 days | | | Total | |
Securities Lending Transactions | | | | | | | | | | | | | | | | | | | | |
DFA Commodity Strategy Portfolio Bonds | | $ | 15,022 | | | | — | | | | — | | | | — | | | $ | 15,022 | |
K. Indemnitees; Contractual Obligations:
Under the Fund’s organizational documents, its Officers and Directors are indemnified against certain liabilities arising out of the performance of their duties to the Fund.
In the normal course of business, the Fund enters into contracts that contain a variety of representations and warranties that provide general indemnification. The Fund’s maximum exposure under these arrangements is unknown, as this would involve future claims that may be made against the Fund and/or its affiliates that have not yet occurred. However, based on experience, the Fund expects the risk of loss to be remote.
L. Recently Issued Accounting Standards and Regulations:
In March 2020, the Financial Accounting Standards Board (FASB) issued Accounting Standards Update (ASU) No. 2020-04, Reference Rate Reform (Topic 848) – Facilitation of the Effects of Reference Rate Reform on Financial Reporting. In January 2021, the FASB issued ASU No. 2021-01, with further amendments to Topic 848. The amendments in the ASUs provide optional temporary accounting recognition and financial reporting relief from the effect of certain types of contract modifications due to the planned discontinuation of the LIBOR and other interbank-offered based reference rates as of the end of 2021 and 2023. The ASUs are effective for certain reference rate-related contract modifications that occur during the period March 12, 2020 through December 31, 2022. Management has reviewed the requirements and believes the adoption of these ASUs will not have a material impact on the Portfolio’s financial statements.
In October 2020, the SEC adopted new regulations governing the use of derivatives by registered investment companies. Rule 18f-4 (the “Derivatives Rule”) imposes limits on the amount of derivatives contracts the Portfolio could enter, eliminates the asset segregation framework previously used by the Portfolio to comply with Section 18 of the 1940 Act, and requires funds whose use of derivatives is more than a limited specified exposure to establish and maintain a derivatives risk management program and appoint a derivatives risk manager. The Derivatives Rule became effective February 19, 2021 and the Portfolio began complying with the Derivatives Rule on August 19, 2022.
136
On December 3, 2020, the SEC adopted new Rule 2a-5 (the “Valuation Rule”) under the 1940 Act, establishing an updated regulatory framework for fund valuation. The Valuation Rule, in part, provides a framework for good faith fair value determination and permits a Board to designate fair value determinations to a fund’s investment adviser. Further, the SEC rescinded previously issued guidance on related issues. The Valuation Rule became effective on March 8, 2021 and the Portfolio began complying with the Valuation Rule on August 1, 2022.
M. Other:
As of October 31, 2022, the following number of shareholders held the following approximate percentages of the outstanding shares of the Portfolio. One or more of the shareholders may be omnibus accounts, which typically hold shares for the benefit of several other underlying investors.
| | | | | | | | |
| | | Number of
Shareholders | | | Approximate
Percentage
of Outstanding
Shares | |
DFA Commodity Strategy Portfolio-Institutional Class | | | 4 | | | | 61 | % |
The Portfolio is subject to claims and suits that arise from time to time in the ordinary course of business (for example, claw back litigation against former shareholders of portfolio companies that filed for bankruptcy, such as the now ended litigation involving The Tribune Company and the ongoing litigation involving Nine West). Although management currently believes that resolving claims against the Portfolio, individually or in aggregate, will not have a material adverse impact on the Portfolio’s financial position, results of operations, or cash flows, these matters are subject to inherent uncertainties and management’s view of these matters may change in the future.
N. Subsequent Event Evaluations:
Management has evaluated the impact of all subsequent events on the Portfolio through the date on which the financial statements were issued and has determined that there are no subsequent events requiring recognition or disclosure in the financial statements.
137
Report of Independent Registered Public Accounting Firm
To the Board of Directors of DFA Investment Dimensions Group Inc. and Shareholders of DFA Commodity Strategy Portfolio
Opinion on the Consolidated Financial Statements
We have audited the accompanying consolidated statement of assets and liabilities, including the consolidated schedule of investments, of DFA Commodity Strategy Portfolio and its subsidiary (one of the portfolios constituting DFA Investment Dimensions Group Inc., referred to hereafter as the “Portfolio”) as of October 31, 2022, the related consolidated statement of operations for the year ended October 31, 2022, the consolidated statement of changes in net assets for each of the two years in the period ended October 31, 2022, including the related notes, and the consolidated financial highlights for each of the five years in the period ended October 31, 2022 (collectively referred to as the “consolidated financial statements”). In our opinion, the consolidated financial statements present fairly, in all material respects, the financial position of the Portfolio as of October 31, 2022, the results of its operations for the year then ended, the changes in its net assets for each of the two years in the period ended October 31, 2022 and the financial highlights for each of the five years in the period ended October 31, 2022 in conformity with accounting principles generally accepted in the United States of America.
Basis for Opinion
These consolidated financial statements are the responsibility of the Portfolio’s management. Our responsibility is to express an opinion on the Portfolio’s consolidated financial statements based on our audits. We are a public accounting firm registered with the Public Company Accounting Oversight Board (United States) (PCAOB) and are required to be independent with respect to the Portfolio in accordance with the U.S. federal securities laws and the applicable rules and regulations of the Securities and Exchange Commission and the PCAOB.
We conducted our audits of these consolidated financial statements in accordance with the standards of the PCAOB. Those standards require that we plan and perform the audit to obtain reasonable assurance about whether the consolidated financial statements are free of material misstatement, whether due to error or fraud.
Our audits included performing procedures to assess the risks of material misstatement of the consolidated financial statements, whether due to error or fraud, and performing procedures that respond to those risks. Such procedures included examining, on a test basis, evidence regarding the amounts and disclosures in the consolidated financial statements. Our audits also included evaluating the accounting principles used and significant estimates made by management, as well as evaluating the overall presentation of the consolidated financial statements. Our procedures included confirmation of securities owned as of October 31, 2022 by correspondence with the custodian, brokers and transfer agent of the investee fund; when replies were not received from brokers, we performed other auditing procedures. We believe that our audits provide a reasonable basis for our opinion.
|
| /s/PricewaterhouseCoopers LLP |
| Philadelphia, Pennsylvania |
| December 22, 2022 |
We have served as the auditor of one or more investment companies in Dimensional Fund Advisors L.P. investment company group since 1981.
138
DIMENSIONAL INVESTMENT GROUP INC.
PERFORMANCE CHARTS
(Unaudited)
U.S. Large Company Portfolio vs.
S&P 500™ Index
October 31, 2012-October 31, 2022
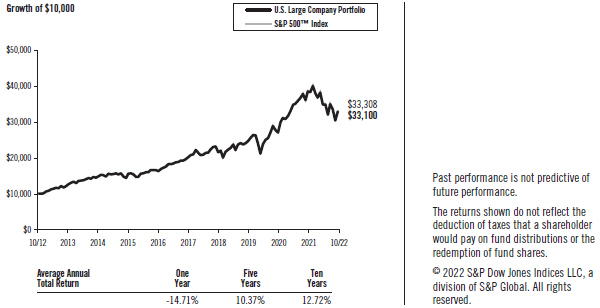
139
MANAGEMENT’S DISCUSSION AND ANALYSIS
| | |
| U.S. Equity Market Review | | 12 Months Ended October 31, 2022 |
U.S. equities had negative returns for the period. The broad U.S. equity market, as measured by the Russell 3000® Index, lost approximately -16.52%. As measured by Russell indices, small-cap stocks underperformed large-cap stocks, and mid-cap stocks, a subset of the large-cap universe, underperformed large-cap stocks but outperformed small-cap stocks. Value stocks outperformed growth stocks as measured by the Russell indices.
| | | | |
Total Return for 12 Months Ended October 31, 2022 | |
Russell 3000® Index | | | -16.52 | % |
Russell 1000® Index (large-cap stocks) | | | -16.38 | % |
Russell Midcap® Index (mid-cap stocks) | | | -17.17 | % |
Russell 2000® Index (small-cap stocks) | | | -18.54 | % |
Russell Microcap® Index (micro-cap stocks) | | | -22.29 | % |
Dow Jones U.S. Select REIT Index SM | | | -19.97 | % |
| | | | |
Total Return for 12 Months Ended October 31, 2022 | |
Russell 1000® Value Index (large-cap value stocks) | | | -7.00 | % |
Russell 1000® Growth Index (large-cap growth stocks) | | | -24.60 | % |
Russell 2000® Value Index (small-cap value stocks) | | | -10.73 | % |
Russell 2000® Growth Index (small-cap growth stocks) | | | -26.02 | % |
Source: Frank Russell Company is the source and owner of the trademarks, service marks, and copyrights related to the Russell Indexes.
U.S. Large Company Portfolio
The U.S. Large Company Portfolio seeks to approximate the returns of the S&P 500® Index by investing in S&P 500® Index securities in approximately the same proportions as they are represented in the S&P 500® Index. As of October 31, 2022, the Portfolio held approximately 500 securities. Average cash exposure throughout the year was less than 1% of the Portfolio’s assets.
For the 12 months ended October 31, 2022, the total return was -14.71% for the Portfolio and -14.61% for the S&P 500® Index, the Portfolio’s benchmark. The Portfolio performed in line with the benchmark before fees and expenses.
140
DIMENSIONAL INVESTMENT GROUP INC.
DISCLOSURE OF FUND EXPENSES
(Unaudited)
The following Expense Table is shown so that you can understand the impact of fees on your investment. All mutual funds have operating expenses. As a shareholder of the fund, you incur ongoing costs, which include costs for portfolio management, administrative services, and shareholder reports, among others. Operating expenses and legal and audit services, which are deducted from a fund’s gross income, directly reduce the investment return of the fund. A fund’s expenses are expressed as a percentage of its average net assets. This figure is known as the expense ratio. The following examples are intended to help you understand the ongoing costs, in dollars, of investing in the fund and to compare these costs with those of other mutual funds. The examples are based on an investment of $1,000 made at the beginning of the period shown and held for the entire period.
The Expense Table below illustrates your fund’s costs in two ways.
Actual Fund Return
This section helps you to estimate the actual expenses after fee waivers that you paid over the period. The “Ending Account Value” shown is derived from the fund’s actual return, and “Expenses Paid During Period” reflects the dollar amount that would have been paid by an investor who started with $1,000 in the fund. You may use the information here, together with the amount you invested, to estimate the expenses that you paid over the period.
To do so, simply divide your account value by $1,000 (for example, a $7,500 account value divided by $1,000 = 7.5), then multiply the result by the number given for your fund under the heading “Expenses Paid During Period.”
Hypothetical Example for Comparison Purposes
This section is intended to help you compare your fund’s costs with those of other mutual funds. The hypothetical “Ending Account Value” and “Expenses Paid During Period” are derived from the fund’s actual expense ratio and an assumed 5% annual return before expenses. In this case, because the return used is not the fund’s actual return, the results do not apply to your investment. The example is useful in making comparisons because the SEC requires all mutual funds to calculate expenses based on a 5% annual return. You can assess your fund’s costs by comparing this hypothetical example with the hypothetical examples that appear in shareholder reports of other funds.
Please note that the expenses shown in the table are meant to highlight and help you compare ongoing costs only and do not reflect any transactional costs, if applicable. The “Annualized Expense Ratio” represents the actual expenses for the six-month period indicated.
Six Months Ended October 31, 2022
EXPENSE TABLE
| | | | | | | | | | | | | | | | |
| | | Beginning
Account
Value
05/01/22 | | | Ending
Account
Value
10/31/22 | | | Annualized
Expense
Ratio (1) | | | Expenses
Paid
During
Period (1) | |
U.S. Large Company Portfolio | | | | | | | | | | | | | | | | |
Actual Fund Return | | $ | 1,000.00 | | | $ | 944.20 | | | | 0.08 | % | | $ | 0.39 | |
Hypothetical 5% Annual Return | | $ | 1,000.00 | | | $ | 1,024.80 | | | | 0.08 | % | | $ | 0.41 | |
| (1) | Expenses are equal to the fund’s annualized expense ratio for the six-month period, multiplied by the average account value over the period, multiplied by the number of days in the most recent six-month period (184), then divided by the number of days in the year (365) to reflect the six-month period. |
141
DIMENSIONAL INVESTMENT GROUP INC.
DISCLOSURE OF PORTFOLIO HOLDINGS
(Unaudited)
The SEC requires that all funds file a complete Schedule of Investments with the SEC for their first and third fiscal quarters as an exhibit to their reports on Form N-PORT. For Dimensional Investment Group Inc., this would be for the fiscal quarters ending January 31 and July 31. Such Form N-PORT filing must be made within 60 days of the end of the quarter. Dimensional Investment Group Inc. filed its most recent Form N-PORT with the SEC on September 28, 2022. They are available upon request, without charge, by calling collect: (512) 306-7400; by mailing a request to Dimensional Fund Advisors LP, 6300 Bee Cave Road, Building One, Austin, TX 78746; or by visiting the SEC’s website at http://www.sec.gov.
SEC regulations permit a fund to include in its reports to shareholders a “Summary Schedule of Portfolio Holdings” in lieu of a full Schedule of Investments. The Summary Schedule of Portfolio Holdings reports the fund’s 50 largest holdings in unaffiliated issuers and any investments that exceed one percent of the fund’s net assets at the end of the reporting period. The regulations also require that the Summary Schedule of Portfolio Holdings identify each category of investments that are held.
A fund is required to file a complete Schedule of Investments with the SEC on Form N-CSR within ten days after mailing the annual and semi-annual reports to shareholders. It will be available upon request, without charge, by calling collect: (512) 306-7400; by mailing a request to Dimensional Fund Advisors LP, 6300 Bee Cave Road, Building One, Austin, TX 78746; or by visiting the SEC’s website at http://www.sec.gov.
PORTFOLIO HOLDINGS
The SEC requires that all funds present their categories of portfolio holdings in a table, chart, or graph format in their annual and semi-annual shareholder reports, whether or not a Schedule of Investments is used. The following table, which presents portfolio holdings as a percentage of total investments before short-term investments and collateral for loaned securities, is provided in compliance with this requirement. The categories shown below represent broad industry sectors. Each industry sector consists of one or more specific industry classifications.
DOMESTIC EQUITY PORTFOLIO
| | | | |
| U.S. Large Company Portfolio | |
Communication Services | | | 7.4 | % |
Consumer Discretionary | | | 10.9 | % |
Consumer Staples | | | 6.9 | % |
Energy | | | 5.4 | % |
Financials | | | 11.4 | % |
Health Care | | | 15.3 | % |
Industrials | | | 8.3 | % |
Information Technology | | | 26.3 | % |
Materials | | | 2.5 | % |
Real Estate | | | 2.6 | % |
Utilities | | | 3.0 | % |
| | | | |
| | | 100.0 | % |
142
U.S. LARGE COMPANY PORTFOLIO
SUMMARY SCHEDULE OF PORTFOLIO HOLDINGS
October 31, 2022
| | | | | | | | | | | | | | |
| | | Shares | | | Value† | | | Percentage
of Net Assets‡ | |
COMMON STOCKS — (98.6%) | | | | | | | | | | | | |
COMMUNICATION SERVICES — (7.3%) | | | | | | | | | | | | |
* | | Alphabet, Inc., Class A | | | 1,794,896 | | | $ | 169,635,621 | | | | 1.7 | % |
* | | Alphabet, Inc., Class C | | | 1,605,138 | | | | 151,942,363 | | | | 1.6 | % |
| | Comcast Corp., Class A | | | 1,320,182 | | | | 41,902,577 | | | | 0.4 | % |
* | | Meta Platforms, Inc., Class A | | | 683,211 | | | | 63,647,937 | | | | 0.7 | % |
| | Verizon Communications, Inc. | | | 1,258,736 | | | | 47,038,964 | | | | 0.5 | % |
* | | Walt Disney Co. | | | 546,237 | | | | 58,196,090 | | | | 0.6 | % |
| | Other Securities | | | | | | | 184,065,897 | | | | 1.8 | % |
| | | | | | | | | | | | | | |
TOTAL COMMUNICATION SERVICES | | | | | | | 716,429,449 | | | | 7.3 | % |
| | | | | | | | | | | | | | |
CONSUMER DISCRETIONARY — (10.7%) | | | | | | | | | | | | |
* | | Amazon.com, Inc. | | | 2,652,722 | | | | 271,744,842 | | | | 2.8 | % |
| | Home Depot, Inc. | | | 307,783 | | | | 91,143,780 | | | | 0.9 | % |
| | McDonald’s Corp. | | | 220,427 | | | | 60,101,626 | | | | 0.6 | % |
* | | Tesla, Inc. | | | 797,281 | | | | 181,413,319 | | | | 1.9 | % |
| | Other Securities | | | | | | | 455,725,969 | | | | 4.6 | % |
| | | | | | | | | | | | | | |
TOTAL CONSUMER DISCRETIONARY | | | | | | | 1,060,129,536 | | | | 10.8 | % |
| | | | | | | | | | | | | | |
CONSUMER STAPLES — (6.8%) | | | | | | | | | | | | |
| | Coca-Cola Co. | | | 1,165,900 | | | | 69,779,115 | | | | 0.7 | % |
| | Costco Wholesale Corp. | | | 132,696 | | | | 66,547,044 | | | | 0.7 | % |
| | PepsiCo, Inc. | | | 413,377 | | | | 75,060,996 | | | | 0.8 | % |
| | Philip Morris International, Inc. | | | 464,695 | | | | 42,682,236 | | | | 0.4 | % |
| | Procter & Gamble Co. | | | 715,573 | | | | 96,366,216 | | | | 1.0 | % |
| | Walmart, Inc. | | | 427,058 | | | | 60,783,165 | | | | 0.6 | % |
| | Other Securities | | | | | | | 263,950,165 | | | | 2.7 | % |
| | | | | | | | | | | | | | |
TOTAL CONSUMER STAPLES | | | | | | | 675,168,937 | | | | 6.9 | % |
| | | | | | | | | | | | | | |
ENERGY — (5.3%) | | | | | | | | | | | | |
| | Chevron Corp. | | | 539,276 | | | | 97,555,028 | | | | 1.0 | % |
| | ConocoPhillips | | | 381,537 | | | | 48,108,000 | | | | 0.5 | % |
| | Exxon Mobil Corp. | | | 1,247,723 | | | | 138,260,186 | | | | 1.4 | % |
| | Other Securities | | | | | | | 237,377,372 | | | | 2.4 | % |
| | | | | | | | | | | | | | |
TOTAL ENERGY | | | | | | | 521,300,586 | | | | 5.3 | % |
| | | | | | | | | | | | | | |
FINANCIALS — (11.3%) | | | | | | | | | | | | |
| | Bank of America Corp. | | | 2,093,900 | | | | 75,464,156 | | | | 0.8 | % |
* | | Berkshire Hathaway, Inc., Class B | | | 540,290 | | | | 159,434,176 | | | | 1.6 | % |
| | JPMorgan Chase & Co. | | | 878,092 | | | | 110,534,221 | | | | 1.1 | % |
| | Wells Fargo & Co. | | | 1,136,657 | | | | 52,274,855 | | | | 0.5 | % |
| | Other Securities | | | | | | | 712,350,855 | | | | 7.3 | % |
| | | | | | | | | | | | | | |
TOTAL FINANCIALS | | | | | | | 1,110,058,263 | | | | 11.3 | % |
| | | | | | | | | | | | | | |
HEALTH CARE — (15.1%) | | | | | | | | | | | | |
| | Abbott Laboratories | | | 524,792 | | | | 51,922,921 | | | | 0.5 | % |
| | AbbVie, Inc. | | | 529,577 | | | | 77,530,073 | | | | 0.8 | % |
| | Amgen, Inc. | | | 160,351 | | | | 43,350,893 | | | | 0.4 | % |
| | Bristol-Myers Squibb Co. | | | 639,938 | | | | 49,575,997 | | | | 0.5 | % |
| | Danaher Corp. | | | 195,639 | | | | 49,236,467 | | | | 0.5 | % |
| | Eli Lilly & Co. | | | 236,194 | | | | 85,523,485 | | | | 0.9 | % |
| | Johnson & Johnson | | | 787,136 | | | | 136,938,050 | | | | 1.4 | % |
| | Merck & Co., Inc. | | | 758,781 | | | | 76,788,637 | | | | 0.8 | % |
143
U.S. LARGE COMPANY PORTFOLIO
CONTINUED
| | | | | | | | | | | | | | |
| | | | | Shares | | | Value† | | | Percentage
of Net Assets‡ | |
HEALTH CARE — (Continued) | | | | | | | | | | | | |
| | Pfizer, Inc. | | | 1,680,969 | | | $ | 78,249,107 | | | | 0.8 | % |
| | Thermo Fisher Scientific, Inc. | | | 117,387 | | | | 60,333,396 | | | | 0.6 | % |
| | UnitedHealth Group, Inc. | | | 280,021 | | | | 155,453,658 | | | | 1.6 | % |
| | Other Securities | | | | | | | 630,015,915 | | | | 6.4 | % |
| | | | | | | | | | | | | | |
TOTAL HEALTH CARE | | | | 1,494,918,599 | | | | 15.2 | % |
| | | | | | | | | | | | | | |
INDUSTRIALS — (8.2%) | | | | | | | | | | | | |
| | Honeywell International, Inc. | | | 201,968 | | | | 41,205,511 | | | | 0.4 | % |
| | Raytheon Technologies Corp. | | | 442,635 | | | | 41,970,651 | | | | 0.4 | % |
| | Other Securities | | | | | | | 722,868,566 | | | | 7.4 | % |
| | | | | | | | | | | | | | |
TOTAL INDUSTRIALS | | | | 806,044,728 | | | | 8.2 | % |
| | | | | | | | | | | | | | |
INFORMATION TECHNOLOGY — (25.9%) | | | | | | | | | |
| | Accenture PLC, Class A | | | 189,544 | | | | 53,811,542 | | | | 0.6 | % |
* | | Adobe, Inc. | | | 140,277 | | | | 44,678,224 | | | | 0.5 | % |
| | Apple, Inc. | | | 4,520,520 | | | | 693,176,690 | | | | 7.1 | % |
| | Broadcom, Inc. | | | 120,996 | | | | 56,882,640 | | | | 0.6 | % |
| | Cisco Systems, Inc. | | | 1,240,783 | | | | 56,368,772 | | | | 0.6 | % |
| | Mastercard, Inc., Class A | | | 255,536 | | | | 83,861,804 | | | | 0.9 | % |
# | | Microsoft Corp. | | | 2,231,811 | | | | 518,070,287 | | | | 5.3 | % |
| | NVIDIA Corp. | | | 749,807 | | | | 101,201,451 | | | | 1.0 | % |
| | QUALCOMM, Inc. | | | 336,689 | | | | 39,614,828 | | | | 0.4 | % |
* | | Salesforce, Inc. | | | 298,208 | | | | 48,485,639 | | | | 0.5 | % |
| | Texas Instruments, Inc. | | | 273,889 | | | | 43,994,790 | | | | 0.5 | % |
# | | Visa, Inc., Class A | | | 489,597 | | | | 101,424,915 | | | | 1.0 | % |
| | Other Securities | | | | | | | 719,858,128 | | | | 7.1 | % |
| | | | | | | | | | | | | | |
TOTAL INFORMATION TECHNOLOGY | | | | 2,561,429,710 | | | | 26.1 | % |
| | | | | | | | | | | | | | |
MATERIALS — (2.5%) | | | | | | | | | |
| | Linde PLC | | | 149,383 | | | | 44,419,035 | | | | 0.5 | % |
| | Other Securities | | | | | | | 203,243,849 | | | | 2.0 | % |
| | | | | | | | | | | | | | |
TOTAL MATERIALS | | | | 247,662,884 | | | | 2.5 | % |
| | | | | | | | | | | | | | |
REAL ESTATE — (2.6%) | | | | | | | | | |
| | Other Securities | | | | | | | 257,921,165 | | | | 2.6 | % |
| | | | | | | | | | | | | | |
UTILITIES — (2.9%) | | | | | | | | | |
| | NextEra Energy, Inc. | | | 588,901 | | | | 45,639,827 | | | | 0.5 | % |
| | Other Securities | | | | | | | 243,505,443 | | | | 2.5 | % |
| | | | | | | | | | | | | | |
TOTAL UTILITIES | | | | 289,145,270 | | | | 3.0 | % |
| | | | | | | | | | | | | | |
TOTAL COMMON STOCKS
(Cost $2,936,651,357) | | | | | | | 9,740,209,127 | | | | 99.2 | % |
| | | | | | | | | | | | | | |
TEMPORARY CASH INVESTMENTS — (0.0%) | | | | | | | | | |
| | State Street Institutional U.S. Government Money Market Fund, 3.010% | | | 3,238,169 | | | | 3,238,169 | | | | 0.0 | % |
| | | | | | | | | | | | | | |
SECURITIES LENDING COLLATERAL — (1.4%) | | | | | |
@§ | | The DFA Short Term Investment Fund | | | 11,703,174 | | | | 135,300,391 | | | | 1.4 | % |
| | | | | | | | | | | | | | |
TOTAL INVESTMENTS—(100.0%)
(Cost $3,075,197,570) | | | $ | 9,878,747,687 | | | | 100.6 | % |
| | | | | | | | | | | | | | |
144
U.S. LARGE COMPANY PORTFOLIO
CONTINUED
As of October 31, 2022, U.S. Large Company Portfolio had entered into the following outstanding futures contracts:
| | | | | | | | | | | | | | | | | | | | |
Description | | Number of
Contracts | | | Expiration
Date | | | Notional
Value | | | Market Value | | | Unrealized
Appreciation
(Depreciation) | |
Long Position Contracts: | | | | | | | | | | | | | | | | | | | | |
S&P 500® Emini Index | | | 337 | | | | 12/16/22 | | | $ | 65,041,056 | | | $ | 65,428,550 | | | $ | 387,494 | |
| | | | | | | | | | | | | | | | | | | | |
Total Futures Contracts | | | | | | | | | | $ | 65,041,056 | | | $ | 65,428,550 | | | $ | 387,494 | |
| | | | | | | | | | | | | | | | | | | | |
Summary of the Portfolio’s investments as of October 31, 2022, based on their valuation inputs, is as follows (see Security Valuation Note):
| | | | | | | | | | | | | | | | |
| | | Investments in Securities (Market Value) | |
| | | Level 1 | | | Level 2 | | | Level 3 | | | Total | |
Common Stocks | | | | | | | | | | | | | | | | |
Communication Services | | $ | 716,429,449 | | | | — | | | | — | | | $ | 716,429,449 | |
Consumer Discretionary | | | 1,060,129,536 | | | | — | | | | — | | | | 1,060,129,536 | |
Consumer Staples | | | 675,168,937 | | | | — | | | | — | | | | 675,168,937 | |
Energy | | | 521,300,586 | | | | — | | | | — | | | | 521,300,586 | |
Financials | | | 1,110,058,263 | | | | — | | | | — | | | | 1,110,058,263 | |
Health Care | | | 1,494,918,599 | | | | — | | | | — | | | | 1,494,918,599 | |
Industrials | | | 806,044,728 | | | | — | | | | — | | | | 806,044,728 | |
Information Technology | | | 2,561,429,710 | | | | — | | | | — | | | | 2,561,429,710 | |
Materials | | | 247,662,884 | | | | — | | | | — | | | | 247,662,884 | |
Real Estate | | | 257,921,165 | | | | — | | | | — | | | | 257,921,165 | |
Utilities | | | 289,145,270 | | | | — | | | | — | | | | 289,145,270 | |
Temporary Cash Investments | | | 3,238,169 | | | | — | | | | — | | | | 3,238,169 | |
Securities Lending Collateral | | | — | | | $ | 135,300,391 | | | | — | | | | 135,300,391 | |
Futures Contracts** | | | 387,494 | | | | — | | | | — | | | | 387,494 | |
| | | | | | | | | | | | | | | | |
TOTAL | | $ | 9,743,834,790 | | | $ | 135,300,391 | | | | — | | | $ | 9,879,135,181 | |
| | | | | | | | | | | | | | | | |
| ** | Valued at the unrealized appreciation/(depreciation) on the investment. |
See accompanying Notes to Financial Statements.
145
DIMENSIONAL INVESTMENT GROUP INC.
STATEMENT OF ASSETS AND LIABILITIES
OCTOBER 31, 2022
(Amounts in thousands, except share and per share amounts)
| | | | |
| | | U.S. Large
Company
Portfolio* | |
ASSETS: | | | | |
Investment Securities at Value (including $200,201 of securities on loan) | | $ | 9,740,210 | |
Temporary Cash Investments at Value & Cost | | | 3,238 | |
Collateral from Securities on Loan Invested in Affiliate at Value (including cost of $135,308) | | | 135,300 | |
Segregated Cash for Futures Contracts | | | 3,370 | |
Cash | | | 11,043 | |
Receivables: | | | | |
Investment Securities Sold | | | 56,078 | |
Dividends and Interest | | | 7,224 | |
Securities Lending Income | | | 19 | |
Fund Shares Sold | | | 4,907 | |
Prepaid Expenses and Other Assets | | | 56 | |
| | | | |
Total Assets | | | 9,961,445 | |
| | | | |
LIABILITIES: | | | | |
Payables: | | | | |
Upon Return of Securities Loaned | | | 74,909 | |
Investment Securities Purchased | | | 60,499 | |
Fund Shares Redeemed | | | 5,154 | |
Due to Advisor | | | 422 | |
Futures Margin Variation | | | 3,074 | |
Accrued Expenses and Other Liabilities | | | 641 | |
| | | | |
Total Liabilities | | | 144,699 | |
| | | | |
NET ASSETS | | $ | 9,816,746 | |
| | | | |
NET ASSET VALUE, OFFERING AND REDEMPTION PRICE PER SHARE: | | | | |
Institutional Class Shares — based on net assets of $9,816,746 and shares outstanding of 356,280,155 | | $ | 27.55 | |
| | | | |
NUMBER OF SHARES AUTHORIZED | | | 900,000,000 | |
| | | | |
Investment Securities at Cost | | $ | 2,936,651 | |
| | | | |
NET ASSETS CONSIST OF: | | | | |
Paid-In Capital | | $ | 2,601,677 | |
Total Distributable Earnings (Loss) | | | 7,215,069 | |
| | | | |
NET ASSETS | | $ | 9,816,746 | |
| | | | |
| * | See Note I in the Notes to Financial Statements for additional information about securities lending collateral. |
See accompanying Notes to Financial Statements.
146
DIMENSIONAL INVESTMENT GROUP INC.
STATEMENT OF OPERATIONS
FOR THE YEAR ENDED OCTOBER 31, 2022
(Amounts in thousands)
| | | | |
| | | U.S. Large
Company
Portfolio# | |
Investment Income | | | | |
Dividends (Net of Foreign Taxes Withheld of $38) | | $ | 168,407 | |
Income from Securities Lending | | | 149 | |
| | | | |
Total Investment Income | | | 168,556 | |
| | | | |
Fund Expenses | | | | |
Investment Management Fees | | | 6,547 | |
Accounting & Transfer Agent Fees | | | 1,684 | |
S&P 500® Fees | | | 183 | |
Custodian Fees | | | 137 | |
Filing Fees | | | 115 | |
Shareholders’ Reports | | | 226 | |
Directors’/Trustees’ Fees & Expenses | | | 49 | |
Professional Fees | | | 153 | |
Previously Waived Fees Recovered by Advisor (Note C) | | | 114 | |
Other | | | 232 | |
| | | | |
Total Fund Expenses | | | 9,440 | |
| | | | |
Fees Waived, Expenses Reimbursed by Advisor (Note C) | | | 711 | |
| | | | |
Net Expenses | | | 8,729 | |
| | | | |
Net Investment Income (Loss) | | | 159,827 | |
| | | | |
Realized and Unrealized Gain (Loss) | | | | |
Net Realized Gain (Loss) on: | | | | |
Investment Securities Sold** | | | 492,366 | |
Affiliated Investment Companies Shares Sold | | | (19 | ) |
Futures | | | (10,134 | ) |
Change in Unrealized Appreciation (Depreciation) of: | | | | |
Investment Securities and Foreign Currency | | | (2,364,904 | ) |
Affiliated Investment Companies Shares | | | (9 | ) |
Futures | | | 36 | |
| | | | |
Net Realized and Unrealized Gain (Loss) | | | (1,882,664 | ) |
| | | | |
Net Increase (Decrease) in Net Assets Resulting from Operations | | $ | (1,722,837 | ) |
| | | | |
| ** | Net of foreign capital gain taxes withheld of $0. |
| # | Portion of income is from investment in affiliated fund. |
See accompanying Notes to Financial Statements.
147
DIMENSIONAL INVESTMENT GROUP INC.
STATEMENTS OF CHANGES IN NET ASSETS
(Amounts in thousands)
| | | | | | | | |
| | | U.S. Large Company Portfolio | |
| | | Year
Ended
Oct 31,
2022 | | | Year
Ended
Oct 31,
2021 | |
Increase (Decrease) in Net Assets | | | | | | | | |
Operations: | | | | | | | | |
Net Investment Income (Loss) | | $ | 159,827 | | | $ | 157,081 | |
Net Realized Gain (Loss) on: | | | | | | | | |
Investment Securities Sold*,** | | | 492,366 | | | | 726,997 | |
Affiliated Investment Companies Shares Sold | | | (19 | ) | | | 1 | |
Futures | | | (10,134 | ) | | | 6,547 | |
Change in Unrealized Appreciation (Depreciation) of: | | | | | | | | |
Investment Securities and Foreign Currency | | | (2,364,904 | ) | | | 3,024,256 | |
Affiliated Investment Companies Shares | | | (9 | ) | | | (6 | ) |
Futures | | | 36 | | | | 758 | |
| | | | | | | | |
Net Increase (Decrease) in Net Assets Resulting from Operations | | | (1,722,837 | ) | | | 3,915,634 | |
| | | | | | | | |
Distributions: | | | | | | | | |
Institutional Class Shares | | | (792,204 | ) | | | (395,160 | ) |
Capital Share Transactions (1): | | | | | | | | |
Shares Issued | | | 1,294,694 | | | | 1,206,555 | |
Shares Issued in Lieu of Cash Distributions | | | 741,569 | | | | 367,657 | |
Shares Redeemed | | | (2,012,336 | ) | | | (2,349,587 | ) |
| | | | | | | | |
Net Increase (Decrease) from Capital Share Transactions | | | 23,927 | | | | (775,375 | ) |
| | | | | | | | |
Total Increase (Decrease) in Net Assets | | | (2,491,114 | ) | | | 2,745,099 | |
Net Assets | | | | | | | | |
Beginning of Year | | | 12,307,860 | | | | 9,562,761 | |
| | | | | | | | |
End of Year | | $ | 9,816,746 | | | $ | 12,307,860 | |
| | | | | | | | |
(1) Shares Issued and Redeemed: | | | | | | | | |
Shares Issued | | | 43,150 | | | | 39,616 | |
Shares Issued in Lieu of Cash Distributions | | | 22,923 | | | | 12,970 | |
Shares Redeemed | | | (65,948 | ) | | | (77,430 | ) |
| | | | | | | | |
Net Increase (Decrease) from Shares Issued and Redeemed | | | 125 | | | | (24,844 | ) |
| | | | | | | | |
| * | Net of foreign capital gain taxes withheld for the fiscal year ended October 31, 2022 of $0. |
| ** | Net of foreign capital gain taxes withheld for the fiscal year ended October 31, 2021 of $0. |
See accompanying Notes to Financial Statements.
148
DIMENSIONAL INVESTMENT GROUP INC.
FINANCIAL HIGHLIGHTS
(for a share outstanding throughout each period)
| | | | | | | | | | | | | | | | | | | | |
| | | U.S. Large Company Portfolio | |
| | | Year | | | Year | | | Year | | | Year | | | Year | |
| | | Ended | | | Ended | | | Ended | | | Ended | | | Ended | |
| | | Oct 31, | | | Oct 31, | | | Oct 31, | | | Oct 31, | | | Oct 31, | |
| | | 2022 | | | 2021 | | | 2020 | | | 2019 | | | 2018 | |
Net Asset Value, Beginning of Year | | $ | 34.56 | | | $ | 25.10 | | | $ | 23.48 | | | $ | 21.06 | | | $ | 20.05 | |
| | | | | | | | | | | | | | | | | | | | |
Income from Investment Operations (A) | | | | | | | | | | | | | | | | | | | | |
Net Investment Income (Loss) | | | 0.44 | | | | 0.43 | | | | 0.44 | | | | 0.44 | | | | 0.41 | |
Net Gains (Losses) on Securities (Realized and Unrealized) | | | (5.21 | ) | | | 10.09 | | | | 1.77 | | | | 2.50 | | | | 1.05 | |
| | | | | | | | | | | | | | | | | | | | |
Total from Investment Operations | | | (4.77 | ) | | | 10.52 | | | | 2.21 | | | | 2.94 | | | | 1.46 | |
| | | | | | | | | | | | | | | | | | | | |
Less Distributions: | | | | | | | | | | | | | | | | | | | | |
Net Investment Income | | | (0.40 | ) | | | (0.43 | ) | | | (0.47 | ) | | | (0.39 | ) | | | (0.39 | ) |
Net Realized Gains | | | (1.84 | ) | | | (0.63 | ) | | | (0.12 | ) | | | (0.13 | ) | | | (0.06 | ) |
| | | | | | | | | | | | | | | | | | | | |
Total Distributions | | | (2.24 | ) | | | (1.06 | ) | | | (0.59 | ) | | | (0.52 | ) | | | (0.45 | ) |
| | | | | | | | | | | | | | | | | | | | |
Net Asset Value, End of Year | | $ | 27.55 | | | $ | 34.56 | | | $ | 25.10 | | | $ | 23.48 | | | $ | 21.06 | |
| | | | | | | | | | | | | | | | | | | | |
Total Return | | | (14.71 | %) | | | 42.87 | % | | | 9.63 | % | | | 14.29 | % | | | 7.25 | % |
| | | | | | | | | | | | | | | | | | | | |
Net Assets, End of Year (thousands) | | $ | 9,816,746 | | | $ | 12,307,860 | | | $ | 9,562,761 | | | $ | 9,786,391 | | | $ | 8,517,069 | |
Ratio of Expenses to Average Net Assets | | | 0.08 | % | | | 0.08 | % | | | 0.08 | % | | | 0.08 | % | | | 0.08 | % |
Ratio of Expenses to Average Net Assets (Excluding Fees Waived, Expenses Reimbursed by Advisor) | | | 0.09 | % | | | 0.09 | % | | | 0.09 | % | | | 0.08 | % | | | 0.08 | % |
Ratio of Net Investment Income to Average Net Assets | | | 1.46 | % | | | 1.39 | % | | | 1.83 | % | | | 2.02 | % | | | 1.90 | % |
Portfolio Turnover Rate | | | 2 | % | | | 4 | % | | | 3 | % | | | 3 | % | | | 5 | % |
See page 1-2 for the Definitions of Abbreviations and Footnotes.
See accompanying Notes to Financial Statements.
149
DIMENSIONAL INVESTMENT GROUP INC.
NOTES TO FINANCIAL STATEMENTS
A. Organization:
Dimensional Investment Group Inc. (the “Fund”) is an open-end management investment company registered under the Investment Company Act of 1940 (the “1940 Act”), whose shares are generally offered to institutional investors, retirement plans and clients of registered investment advisors. The Fund consists of ten portfolios, one of which, the U.S. Large Company Portfolio (the “Portfolio”), is presented in this section of the report. The remaining operational portfolios are presented in separate reports. The Portfolio is an investment company, and accordingly, follows the accounting and reporting guidance under the Financial Accounting Standards Board (“FASB”) Accounting Standards Codification (“ASC”), Topic 946, “Financial Services-Investment Companies.”
B. Significant Accounting Policies:
The following significant accounting policies are in conformity with accounting principles generally accepted in the United States of America (“GAAP”). Such policies are consistently followed by the Fund in preparation of its financial statements. The preparation of financial statements in accordance with GAAP requires management to make estimates and assumptions that affect the fair value of investments, the reported amounts of assets and liabilities, the disclosure of contingent assets and liabilities at the date of the financial statements, and the reported amounts of increases and decreases in net assets from operations during the reporting period. Actual results could differ from those estimates, and those differences could be material.
1. Security Valuation: The Portfolio uses a fair value hierarchy, which prioritizes the inputs-to-valuation techniques used to measure fair value into three broad levels described below:
| | • | | Level 1 – inputs are quoted prices in active markets for identical securities (including equity securities, open-end investment companies, and futures contracts) |
| | • | | Level 2 – other significant observable inputs (including quoted prices for similar securities, interest rates, prepayment speeds, credit risk, etc.) |
| | • | | Level 3 – significant unobservable inputs (including the Portfolio’s own assumptions in determining the fair value of investments) |
Securities held by the Portfolio, including over-the-counter securities, are valued at the last quoted sale price of the day. Securities held by the Portfolio that are listed on Nasdaq are valued at the Nasdaq Official Closing Price (“NOCP”). If there is no last reported sale price or NOCP for the day, the Portfolio values the securities within the range of the most recent quoted bid and ask prices. Price information on listed securities is taken from the exchange where the security is primarily traded. Generally, securities issued by open-end management investment companies are valued using their respective net asset values or public offering prices, as appropriate, for purchase orders placed at the close of the New York Stock Exchange (NYSE). These securities are generally categorized as Level 1 in the hierarchy.
Securities for which no market quotations are readily available (including restricted securities), or for which market quotations have become unreliable, are valued in good faith at fair value in accordance with Rule 2a-5 under the 1940 Act pursuant to procedures approved by the Board of Directors of the Fund. Fair value pricing may also be used if events that have a significant effect on the value of an investment (as determined in the discretion of Dimensional Fund Advisors LP) occur before the net asset value of the Portfolio is calculated. When fair value pricing is used, the prices of securities used by the Portfolio may differ from the quoted or published prices for the same securities on their primary markets or exchanges. These securities are generally categorized as Level 2 or Level 3 in the hierarchy.
Futures contracts held by the Portfolio are valued using the settlement price established each day on the exchange on which they are traded. These valuations are generally categorized as Level 1 in the hierarchy.
150
A summary of the inputs used to value the Portfolio’s investments by each major security type, industry and/or country is disclosed previously in this note. A valuation hierarchy table has been included at the end of the Summary Schedule of Portfolio Holdings. The methodology or inputs used for valuing securities are not necessarily an indication of the risk associated with investing in those securities.
2. Deferred Compensation Plan: Each eligible Director of the Fund may elect to participate in the Fee Deferral Plan for Independent Directors and Trustees (the “Plan”). Under the Plan, effective January 1, 2002, such Directors may defer payment of all or a portion of their total fees earned as a Director. These deferred amounts may be treated as though such amounts had been invested in shares of the following funds: the U.S. Large Cap Value Portfolio, U.S. Core Equity 1 Portfolio, U.S. Large Company Portfolio, U.S. Vector Equity Portfolio, U.S. Micro Cap Portfolio, DFA International Value Portfolio, International Core Equity Portfolio, Emerging Markets Portfolio, Emerging Markets Core Equity Portfolio, DFA Inflation-Protected Securities Portfolio, and/or DFA Two-Year Global Fixed Income Portfolio. Contributions made under the Plan and the change in unrealized appreciation (depreciation) and income are included in Directors’/ Trustees’ Fees & Expenses.
The Directors may receive their distributions of proceeds by one of the following methods: lump sum, annual installments over a period of agreed-upon years, or quarterly installments over a period of agreed-upon years. Each Director shall have the right in a notice of election (the “Notice”) to defer the receipt of the Director’s deferred compensation until a date specified by such Director in the Notice. The date may not be sooner than the earlier of: (i) the first business day of January following the year in which such Director ceases to be a member of the Board of Directors of the Fund; and (ii) five years following the effective date of the Director’s first deferral election. If a Director who elects to defer fees fails to designate in the Notice a time or date as of which payment of the Director’s deferred fee account shall commence, payment of such amount shall commence as of the first business day of January following the year in which the Director ceases to be a member of the Board (unless the Director files an amended Notice selecting a different distribution date).
3. Other: Dividend income and distributions to shareholders are recorded on the ex-dividend date. Distributions received on securities that represent a return of capital or capital gains are recorded as a reduction of cost of investments or as a realized gain, respectively. The Portfolio estimates the character of received distributions that may be considered return of capital distributions. Expenses directly attributable to a Portfolio are directly charged. Common expenses of the Fund or the Portfolios are allocated using methods approved by the Board of Directors, generally based on average net assets.
C. Investment Advisor:
The Advisor, Dimensional Fund Advisors LP, provides investment management services to the Portfolio. For the year ended October 31, 2022, the Portfolio’s investment management fees were accrued daily and paid monthly to the Advisor based on the following effective annual rate of average daily net assets:
| | | | |
U.S. Large Company Portfolio | | | 0.06 | % |
Pursuant to an Amended and Restated Fee Waiver and/or Expense Assumption Agreement (the “Fee Waiver Agreement”), the Advisor has contractually agreed to waive certain fees, and in certain instances, assume certain expenses of the Portfolio, as described in the notes below. The Fee Waiver Agreement for the Portfolio will remain in effect through February 28, 2023, may only be terminated by the Fund’s Board of Directors prior to that date and shall continue in effect from year to year thereafter unless terminated by the Fund or the Advisor. During the year ended October 31, 2022, the Portfolio had an expense limit based on a percentage of average net assets on an annualized basis, and the Advisor recovered previously waived fees and/or assumed expenses (amounts in thousands), as listed below. The net amount of waived fees/expenses assumed (recovered previously waived fees/expenses assumed) during the year ended October 31, 2022, and the previously waived fees/expenses assumed subject to future recovery by the Advisor as of October 31, 2022, are also reflected below (amounts in thousands). At any time that the Annualized Expense Ratio (defined below) of the Portfolio is less than the Expense Limitation Amount listed below, the Advisor retains the right to recover fees previously waived and/or expenses previously assumed to the extent that the expense ratio following such recovery would be less than the Expense Limitation Amount that was in place when such prior year fees were waived and/or expenses assumed, and less than the current Expense Limitation Amount for the Portfolio. The Fund, on behalf of the Portfolio, is also not obligated to reimburse the Advisor for fees previously waived or expenses previously assumed by the Advisor more than thirty-six months before the date of recovery.
151
| | | | | | | | | | | | | | | | |
| | | | | | | | | | | | Previously | |
| | | | | | Recovery | | | | | | Waived Fees/ | |
| | | Expense | | | of Previously | | | Waived Fees/ | | | Expenses Assumed | |
| | | Limitation | | | Waived Fees/ | | | Expenses | | | Subject to Future | |
Institutional Class Shares | | Amount | | | Expenses Assumed | | | Assumed | | | Recovery | |
U.S. Large Company Portfolio (1) | | | 0.08 | % | | $ | 114 | | | $ | 711 | | | $ | 2,538 | |
| (1) | The Advisor has contractually agreed to waive all or a portion of its management fee to the extent necessary to reduce the ordinary operating expenses (excluding expenses incurred through investment in other investment companies) (“Portfolio Expenses”) of the U.S. Large Company Portfolio so that the Portfolio Expenses, on an annualized basis, do not exceed the rate listed above as a percentage of the Portfolio’s average net assets (the “Annualized Expense Ratio”). |
Fees Paid to Officers and Directors/Trustees:
Certain Officers and Directors of the Advisor are also Officers and Directors of the Fund; however, such Officers and Directors (with the exception of the Chief Compliance Officer (“CCO”)) receive no compensation from the Fund. For the year ended October 31, 2022, the total related amounts paid by the Fund to the CCO were $20 (in thousands). The total related amounts paid by the Portfolio are included in Other Expenses on the Statement of Operations.
D. Deferred Compensation:
As of October 31, 2022, the total liability for deferred compensation to Directors is included in Accrued Expenses and Other Liabilities on the Statement of Assets and Liabilities as follows (amount in thousands):
| | | | |
U.S. Large Company Portfolio | | $ | 100 | |
E. Purchases and Sales of Securities:
For the year ended October 31, 2022, the Portfolio’s transactions related to investment securities, other than short-term securities, in-kind redemptions and U.S. Government securities (amounts in thousands), were as follows:
| | | | | | | | |
| | | Purchases | | | Sales | |
U.S. Large Company Portfolio | | $ | 261,637 | | | $ | 906,721 | |
There were no purchases or sales of long-term U.S. government securities.
For the year ended October 31, 2022, transactions related to Affiliated Investment Companies, excluding in-kind redemptions, are presented below.
The amounts presented below may differ from the respective amounts presented in the Summary Schedule of Portfolio Holdings, Statement of Assets and Liabilities or Statement of Operations due to rounding. The amounts are as follows (amounts in thousands):
| | | | | | | | | | | | | | | | | | | | | | | | | | | | | | | | | | | | |
| | | Balance at
October 31, 2021 | | | Purchases
at Cost | | | Proceeds
from
Sales | | | Net Realized
Gain/(Loss)
on Sales | | | Change in
Unrealized
Appreciation/
Depreciation | | | Balance at
October 31, 2022 | | | Shares as of
October 31, 2022 | | | Dividend
Income | | | Capital Gain
Distributions | |
U.S. Large Company Portfolio | | | | | | | | | | | | | | | | | | | | | | | | | | | | | | | | | | | | |
The DFA Short Term Investment Fund | | $ | 5,511 | | | $ | 576,538 | | | $ | 446,721 | | | $ | (19 | ) | | $ | (9 | ) | | $ | 135,300 | | | | 11,703 | | | $ | 395 | | | | — | |
| | | | | | | | | | | | | | | | | | | | | | | | | | | | | | | | | | | | |
Total | | $ | 5,511 | | | $ | 576,538 | | | $ | 446,721 | | | $ | (19 | ) | | $ | (9 | ) | | $ | 135,300 | | | | 11,703 | | | $ | 395 | | | | — | |
| | | | | | | | | | | | | | | | | | | | | | | | | | | | | | | | | | | | |
152
F. Federal Income Taxes:
The Portfolio has qualified and intends to continue to qualify as a regulated investment company under Subchapter M of the Internal Revenue Code for federal income tax purposes and to distribute substantially all of its taxable income and net capital gains to its shareholders. Accordingly, no provision has been made for federal income taxes.
Distributions from net investment income and net realized capital gains are determined in accordance with U.S. federal income tax regulations, which may differ from those amounts determined under GAAP. These book/tax differences are either temporary or permanent in nature. To the extent that these differences are permanent, they are charged or credited to paid-in capital or distributable earnings, undistributed net investment income, accumulated net realized gains or losses, or unrealized appreciation, as appropriate, in the period that the differences arise. Accordingly, the permanent differences as of October 31, 2022, can occur as a result of realized gains on securities considered to be “passive foreign investment companies”, net foreign currency gains/losses, the use of accumulated earnings and profits distributed to shareholders on redemptions of shares as part of the dividends paid deduction for income tax purposes, and foreign capital gains tax reclass, and were reclassified to the accounts mentioned above. These reclassifications had no effect on net assets or net asset value per share.
The tax character of dividends and distributions declared and paid during the years ended October 31, 2021, and October 31, 2022, were as follows (amounts in thousands):
| | | | | | | | | | | | | | | | |
| | | Net Investment | | | | | | | | | | |
| | | Income and | | | | | | | | | | |
| | | Short-Term | | | Long-Term | | | Tax Exempt | | | | |
| | | Capital Gains | | | Capital Gains | | | Income | | | Total | |
U.S. Large Company Portfolio | | | | | | | | | | | | | | | | |
2021 | | $ | 159,251 | | | $ | 235,909 | | | | — | | | $ | 395,160 | |
2022 | | | 147,910 | | | | 644,294 | | | | — | | | | 792,204 | |
As of October 31, 2022, the following net investment income and short-term capital gains and long-term capital gains distributions designated for federal income tax purposes are due to the use of accumulated earnings and profits distributed to shareholders upon redemption of shares (amounts in thousands):
| | | | | | | | | | | | |
| | | Net Investment | | | | | | | |
| | | Income and | | | | | | | |
| | | Short-Term | | | Long-Term | | | | |
| | | Capital Gains | | | Capital Gains | | | Total | |
U.S. Large Company Portfolio | | $ | (12,267 | ) | | $ | (25,689 | ) | | $ | (37,956 | ) |
As of October 31, 2022, the components of distributable earnings (accumulated losses) were as follows (amounts in thousands):
| | | | | | | | | | | | | | | | | | | | |
| | | Undistributed | | | | | | | | | | | | Total Net | |
| | | Net Investment | | | | | | | | | | | | Distributable | |
| | | Income and | | | Undistributed | | | | | | Unrealized | | | Earnings | |
| | | Short-Term | | | Long-Term | | | Capital Loss | | | Appreciation | | | (Accumulated | |
| | | Capital Gains | | | Capital Gains | | | Carryforwards | | | (Depreciation) | | | Losses) | |
U.S. Large Company Portfolio | | | — | | | $ | 426,910 | | | | — | | | $ | 6,788,260 | | | $ | 7,215,170 | |
For federal income tax purposes, the Fund measures its capital loss carryforwards annually at October 31, its fiscal year end. Capital loss carryforwards may be carried forward and applied against future capital gains. As of October 31, 2022, the Portfolio did not have capital loss carryforwards available to offset future realized capital gains.
During the year ended October 31, 2022, the Portfolio did not use capital loss carryforwards to offset realized capital gains for federal income tax purposes.
153
As of October 31, 2022, the total cost and aggregate gross unrealized appreciation (depreciation) of securities for federal income tax purposes were different from amounts reported for financial reporting purposes, as follows (amounts in thousands):
| | | | | | | | | | | | | | | | |
| | | | | | | | | | | | Net | |
| | | | | | | | | | | | Unrealized | |
| | | Federal | | | Unrealized | | | Unrealized | | | Appreciation | |
| | | Tax Cost | | | Appreciation | | | (Depreciation) | | | (Depreciation) | |
U.S. Large Company Portfolio | | $ | 3,090,489 | | | $ | 6,942,574 | | | $ | (154,315 | ) | | $ | 6,788,259 | |
The difference between GAAP-basis and tax-basis unrealized gains (losses) can occur as a result of wash sales and net mark-to-market gains (losses) on regulated futures contracts, net mark-to-market gains (losses) on foreign currency contracts, and differences in the tax treatment of passive foreign investment company investments or other investments.
ASC 740 Accounting for Uncertainty in Income Taxes sets forth a minimum threshold for financial statement recognition of the benefit of a tax position taken or expected to be taken in a tax return. Management has analyzed the Portfolio’s tax positions and has concluded that no additional provision for income tax is required in the Portfolio’s financial statements. The Portfolio is not aware of any tax positions for which it is more likely than not that the total amounts of unrecognized tax benefits will significantly change in the next twelve months. The Portfolio’s federal tax returns for the prior three fiscal years remain subject to examination by the Internal Revenue Service.
G. Financial Instruments:
In accordance with the Portfolio’s investment objectives and policies, the Portfolio may invest in certain financial instruments that have off-balance sheet risk in excess of the amounts recognized in the financial statements and concentrations of credit and market risk. These instruments and their significant corresponding risks are described below:
Derivative Financial Instruments:
Summarized below are the specific types of derivative instruments used by the Portfolio.
1. Futures Contracts: The Portfolio may purchase or sell futures contracts and options on futures contracts for equity securities and indices to increase or decrease market exposure based on actual or expected cash inflows to or outflows from the Portfolio. Upon entering into a futures contract, the Portfolio deposits cash or pledges U.S. government securities to a broker, equal to the minimum “initial margin” requirements of the exchange on which the contract is traded to a broker. Subsequent payments are received from or paid to the broker each day, based on the daily fluctuation in the market value of the contract. These receipts or payments are known as “variation margin” and are recorded daily by the Portfolio as unrealized gains or losses until the contracts are closed. When the contracts are closed, the Portfolio records a realized gain or loss, which is presented in the Statement of Operations as a net realized gain or loss on futures, equal to the difference between the value of the contract at the time it was opened and the value at the time it was closed.
Risks may arise upon entrance into futures contracts from potential imperfect price correlations between the futures contracts and the underlying securities, from the possibility of an illiquid secondary market for these instruments and from the possibility that the Portfolio could lose more than the initial margin requirements. Entering into stock index futures subjects the Portfolio to equity price risk from those futures contracts. Counterparty credit risk related to exchange-traded futures is minimal because the exchange’s clearinghouse, as counterparty to all exchange-traded futures, guarantees the futures against default.
Securities have been segregated as collateral for open futures contracts.
154
The average volume (based on the open positions at each fiscal month-end) of derivative activity for the year ended October 31, 2022 was as follows (amount in thousands):
| | | | |
| | | Futures* | |
U.S. Large Company Portfolio | | $ | 31,275 | |
| * | Average Notional Value of futures contracts. |
The following is a summary of the Portfolio’s derivative instrument holdings categorized by primary risk exposure as of October 31, 2022 (amounts in thousands):
| | | | | | | | |
| | | Asset Derivatives Value | |
| | | Total Value | | | | |
| | | at | | | Equity | |
| | | October 31, 2022 | | | Contracts *,(1) | |
U.S. Large Company Portfolio | | $ | 387 | | | $ | 387 | |
| (1) | Presented on Statement of Assets and Liabilities as Receivables: Futures Margin Variation. |
| * | Includes cumulative appreciation (depreciation) of futures contracts. Only current day’s margin variation is reported within the Statement of Assets and Liabilities. |
The following is a summary of the realized and change in unrealized gains and losses from the Portfolio’s direct investment in derivative instrument holdings categorized by primary risk exposure for the year ended October 31, 2022 (amounts in thousands):
| | | | | | | | |
| | | Realized Gain (Loss) on | |
| | | Derivatives | |
| | | | | | Equity | |
| | | Total | | | Contracts (1) | |
U.S. Large Company Portfolio | | $ | (10,134 | ) | | $ | (10,134 | ) |
| | | | | | | | |
| | | Change in Unrealized Appreciation | |
| | | (Depreciation) on Derivatives | |
| | | | | | Equity | |
| | | Total | | | Contracts (2) | |
U.S. Large Company Portfolio | | $ | 36 | | | $ | 36 | |
| (1) | Presented on Statement of Operations as Net Realized Gain (Loss) on: Futures. |
| (2) | Presented on Statement of Operations as Change in Unrealized Appreciation (Depreciation) of: Futures. |
H. Line of Credit and Interfund Lending Program:
The Fund, together with other Dimensional-advised portfolios, has entered into a $500 million uncommitted, unsecured discretionary line of credit effective April 6, 2022, with its domestic custodian bank. A line of credit with similar terms was in effect through April 6, 2022. Each portfolio is permitted to borrow, subject to its investment limitations, up to a maximum of $250 million, as long as total borrowings under the line of credit do not exceed $500 million in the aggregate. Borrowings under the line of credit are charged interest at rates agreed upon by the parties at the time of borrowing. Each portfolio is individually, and not jointly, liable for its particular advances under the line of credit. There is no commitment fee on the unused portion of the line of credit. The agreement for the discretionary line of credit may be terminated by either party at any time. The agreement for the line of credit expires on April 5, 2023.
155
The Fund, together with other Dimensional-advised portfolios, has also entered into an additional $700 million unsecured line of credit with its international custodian bank effective January 2, 2022. A line of credit with similar terms was in effect through January 1, 2022. Each portfolio is permitted to borrow, subject to its investment limitations, up to the lower of one-quarter of such portfolio’s net assets or $500 million, as long as total borrowings under the line of credit do not exceed $700 million in the aggregate. Each portfolio is individually, and not jointly, liable for its particular advances under the line of credit. Borrowings under the line of credit are charged interest at rates agreed upon by the parties at the time of borrowing. There is no commitment fee on the unused portion of the line of credit. The agreement for the discretionary line of credit may be terminated by either party at any time. The line of credit agreement expires on January 1, 2023.
For the year ended October 31, 2022, borrowings by the Portfolio under the lines of credit were as follows (amounts in thousands, except percentages and days):
| | | | | | | | | | | | | | | | | | | | | | | | |
| | | Weighted | | | Weighted | | | Number of | | | Interest | | | Maximum Amount | | | Outstanding | |
| | | Average | | | Average | | | Days | | | Expense | | | Borrowed During | | | Borrowings | |
| | | Interest Rate | | | Loan Balance | | | Outstanding* | | | Incurred | | | the Period | | | as of 10/31/2022 | |
U.S. Large Company Portfolio | | | 1.46 | % | | $ | 5,523 | | | | 31 | | | $ | 7 | | | $ | 18,454 | | | | — | |
| * | Number of Days Outstanding represents the total of single or consecutive days during the year ended October 31, 2022, that the Portfolio’s available line of credit was used. |
Pursuant to an exemptive order issued by the SEC (the “Order”), the Portfolio may participate in an interfund lending program among certain portfolios managed by the Advisor (portfolios that operate as feeder funds do not participate in the program). The program allows the participating portfolios to borrow money from and loan money to each other for temporary or emergency purposes, subject to the conditions in the Order. A loan can only be made through the program if the interfund loan rate on that day is more favorable to both the borrowing and lending portfolios as compared to rates available through short-term bank loans or investments in overnight repurchase agreements and money market funds, respectively, as detailed in the Order. Further, a portfolio may participate in the program only if and to the extent that such participation is consistent with its investment objectives and limitations. Interfund loans have a maximum duration of seven days and may be called on one business day’s notice.
For the year ended October 31, 2022, activity by the Portfolio under the interfund lending program was as follows (amounts in thousands, except percentages and days):
| | | | | | | | | | | | | | | | | | | | | | | | | | | | |
| | | | | | Weighted | | | Weighted | | | Number of | | | Interest | | | Maximum Amount | | | Outstanding | |
| | | Borrower or | | | Average | | | Average Loan | | | Days | | | Expense/ | | | Borrowed/Loaned | | | Borrowings | |
| | | Lender | | | Interest Rate | | | Balance | | | Outstanding* | | | Income | | | During the Period | | | as of 10/31/2022 | |
U.S. Large Company Portfolio | | | Borrower | | | | 3.44 | % | | $ | 20,000 | | | | 3 | | | $ | 6 | | �� | $ | 20,000 | | | | — | |
| * | Number of Days Outstanding represents the total of single or consecutive days during the year ended October 31, 2022 that the Portfolio utilized the interfund lending program. |
I. Securities Lending:
As of October 31, 2022, the Portfolio had securities on loan to brokers/dealers, for which the Portfolio received cash collateral. In addition, the Portfolio received non-cash collateral consisting of short- and/or long-term U.S. Treasuries and U.S. government agency securities as follows (amounts in thousands):
| | | | |
| | | Non-Cash | |
| | | Collateral | |
| | | Market | |
| | | Value | |
U.S. Large Company Portfolio | | $ | 70,104 | |
156
The Portfolio invests the cash collateral, as described below, and records a liability for the return of the collateral, during the period the securities are on loan. Loans of securities are expected at all times to be secured by collateral in an amount (i) equal to at least 100% of the current market value of the loaned securities with respect to securities of the U.S. government or its agencies, (ii) generally equal to 102% of the current market value of the loaned securities with respect to U.S. securities, and (iii) generally equal to 105% of the current market value of the loaned securities with respect to foreign securities. However, daily market fluctuations could cause the Portfolio’s collateral to be lower or higher than the expected thresholds. If this were to occur, the collateral would be adjusted the next business day to ensure adequate collateralization. In the event of default or bankruptcy by the other party to the agreement, realization and/or retention of the collateral may be subject to legal proceedings. If the borrower fails to return loaned securities, cash collateral being maintained by the borrower is insufficient to cover the value of loaned securities, and such collateral insufficiency is not the result of investment losses, the lending agent has agreed to pay the amount of the shortfall to the Portfolio or, at the option of the lending agent, to replace the securities. In the event of the bankruptcy of the borrower, the Portfolio could experience delay in recovering the loaned securities or only recover cash or a security of equivalent value.
Subject to its stated investment policies, the Portfolio will generally invest the cash collateral received for the loaned securities in The DFA Short Term Investment Fund (the “Money Market Series”), an affiliated registered money market fund advised by the Advisor for which the Advisor receives a management fee of 0.05% of the average daily net assets of the Money Market Series. Income received from the Money Market Series is netted with fees for securities lending and collateral investment expenses and with other payments to and from borrowers of securities. The Portfolio also may invest the cash collateral received for the loaned securities in securities of the U.S. government or its agencies, repurchase agreements collateralized by securities of the U.S. government or its agencies, and affiliated or unaffiliated money market funds that are registered or unregistered. For purposes of this paragraph, agencies include both agency debentures and agency mortgage-backed securities. Additionally, the Portfolio will be able to terminate the loan at any time and will receive reasonable interest on the loan, as well as amounts equal to any dividends, interest or, other distributions on the loaned securities. However, dividend income received from loaned securities may not be eligible for taxation at qualified dividend income rates.
The following table reflects a breakdown of transactions accounted for as secured borrowings, the gross obligation by the type of collateral pledged, and the remaining contractual maturity of those transactions as of October 31, 2022 (amounts in thousands):
| | | | | | | | | | | | | | | | | | | | |
| | | Remaining Contractual Maturity of the Agreements
As of October 31, 2022 | |
| | | Overnight and | | | | | | Between | | | | | | | |
| | | Continuous | | | <30 days | | | 30 & 90 days | | | >90 days | | | Total | |
Securities Lending Transactions | | | | | | | | | | | | | | | | | | | | |
U.S. Large Company Portfolio Common Stocks | | $ | 74,909 | | | | — | | | | — | | | | — | | | $ | 74,909 | |
J. Indemnitees; Contractual Obligations:
Under the Fund’s organizational documents, its Officers and Directors are indemnified against certain liabilities arising out of the performance of their duties to the Fund.
In the normal course of business, the Fund enters into contracts that contain a variety of representations and warranties that provide general indemnification. The Fund’s maximum exposure under these arrangements is unknown, as this would involve future claims that may be made against the Fund and/or its affiliates that have not yet occurred. However, based on experience, the Fund expects the risk of loss to be remote.
K. Recently Issued Accounting Standards and Regulations:
In March 2020, the Financial Accounting Standards Board (FASB) issued Accounting Standards Update (ASU) No. 2020-04, Reference Rate Reform (Topic 848) – Facilitation of the Effects of Reference Rate Reform on Financial Reporting. In January 2021, the FASB issued ASU No. 2021-01, with further amendments to Topic 848. The
157
amendments in the ASUs provide optional temporary accounting recognition and financial reporting relief from the effect of certain types of contract modifications due to the planned discontinuation of the LIBOR and other interbank-offered based reference rates as of the end of 2021 and 2023. The ASUs are effective for certain reference rate-related contract modifications that occur during the period March 12, 2020 through December 31, 2022. Management has reviewed the requirements and believes the adoption of these ASUs will not have a material impact on the Portfolio’s financial statements.
In October 2020, the SEC adopted new regulations governing the use of derivatives by registered investment companies. Rule 18f-4 (the “Derivatives Rule”) imposes limits on the amount of derivatives contracts the Portfolio could enter, eliminates the asset segregation framework previously used by the Portfolio to comply with Section 18 of the 1940 Act, and requires funds whose use of derivatives is more than a limited specified exposure to establish and maintain a derivatives risk management program and appoint a derivatives risk manager. The Derivatives Rule became effective February 19, 2021 and the Portfolio began complying with the Derivatives Rule on August 19, 2022.
On December 3, 2020, the SEC adopted new Rule 2a-5 (the “Valuation Rule”) under the 1940 Act, establishing an updated regulatory framework for fund valuation. The Valuation Rule, in part, provides a framework for good faith fair value determination and permits a Board to designate fair value determinations to a fund’s investment adviser. Further, the SEC rescinded previously issued guidance on related issues. The Valuation Rule became effective on March 8, 2021 and the Portfolio began complying with the Valuation Rule on August 1, 2022.
L. Other:
As of October 31, 2022, the following number of shareholders held the following approximate percentages of the Portfolio’s outstanding shares. One or more of the shareholders may be omnibus accounts, which typically hold shares for the benefit of several other underlying investors.
| | | | | | | | |
| | | | | | Approximate | |
| | | | | | Percentage | |
| | | Number of | | | of Outstanding | |
| | | Shareholders | | | Shares | |
U.S. Large Company Portfolio-Institutional Class | | | 4 | | | | 70 | % |
The Portfolio is subject to claims and suits that arise from time to time in the ordinary course of business (for example, claw back litigation against former shareholders of portfolio companies that filed for bankruptcy, such as the now ended litigation involving The Tribune Company and the ongoing litigation involving Nine West). Although management currently believes that resolving claims against the Portfolio, individually or in aggregate, will not have a material adverse impact on the Portfolio’s financial position, results of operations, or cash flows, these matters are subject to inherent uncertainties and management’s view of these matters may change in the future.
M. Subsequent Event Evaluations:
Management has evaluated the impact of all subsequent events on the Portfolio through the date on which the financial statements were issued and has determined that there are no subsequent events requiring recognition or disclosure in the financial statements.
158
Report of Independent Registered Public Accounting Firm
To the Board of Directors of Dimensional Investment Group Inc. and Shareholders of U.S. Large Company Portfolio
Opinion on the Financial Statements
We have audited the accompanying statement of assets and liabilities, including the summary schedule of portfolio holdings, of U.S. Large Company Portfolio (one of the portfolios constituting Dimensional Investment Group Inc., referred to hereafter as the “Portfolio”) as of October 31, 2022, the related statement of operations for the year ended October 31, 2022, the statement of changes in net assets for each of the two years in the period ended October 31, 2022, including the related notes, and the financial highlights for each of the five years in the period ended October 31, 2022 (collectively referred to as the “financial statements”). In our opinion, the financial statements present fairly, in all material respects, the financial position of the Portfolio as of October 31, 2022, the results of its operations for the year then ended, the changes in its net assets for each of the two years in the period ended October 31, 2022 and the financial highlights for each of the five years in the period ended October 31, 2022 in conformity with accounting principles generally accepted in the United States of America.
Basis for Opinion
These financial statements are the responsibility of the Portfolio’s management. Our responsibility is to express an opinion on the Portfolio’s financial statements based on our audits. We are a public accounting firm registered with the Public Company Accounting Oversight Board (United States) (PCAOB) and are required to be independent with respect to the Portfolio in accordance with the U.S. federal securities laws and the applicable rules and regulations of the Securities and Exchange Commission and the PCAOB.
We conducted our audits of these financial statements in accordance with the standards of the PCAOB. Those standards require that we plan and perform the audit to obtain reasonable assurance about whether the financial statements are free of material misstatement, whether due to error or fraud.
Our audits included performing procedures to assess the risks of material misstatement of the financial statements, whether due to error or fraud, and performing procedures that respond to those risks. Such procedures included examining, on a test basis, evidence regarding the amounts and disclosures in the financial statements. Our audits also included evaluating the accounting principles used and significant estimates made by management, as well as evaluating the overall presentation of the financial statements. Our procedures included confirmation of securities owned as of October 31, 2022 by correspondence with the custodian, brokers and transfer agent of the investee fund; when replies were not received from brokers, we performed other auditing procedures. We believe that our audits provide a reasonable basis for our opinion.
|
| /s/PricewaterhouseCoopers LLP |
| Philadelphia, Pennsylvania |
| December 22, 2022 |
We have served as the auditor of one or more investment companies in Dimensional Fund Advisors L.P. investment company group since 1981.
159
THE DFA INVESTMENT TRUST COMPANY
PERFORMANCE CHARTS
(Unaudited)
The U.S. Large Cap Value Series vs.
Russell 1000™ Value Index
October 31, 2012-October 31, 2022
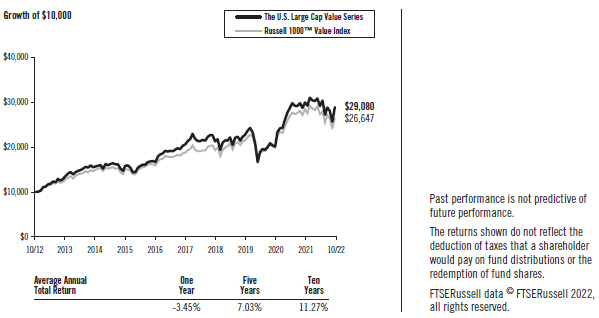
160
MANAGEMENT’S DISCUSSION AND ANALYSIS
| | |
| U.S. Equity Market Review | | 12 Months Ended October 31, 2022 |
U.S. equities had negative returns for the period. The broad U.S. equity market, as measured by the Russell 3000® Index, lost approximately -16.52%. As measured by Russell indices, small-cap stocks underperformed large-cap stocks, and mid-cap stocks, a subset of the large-cap universe, underperformed large-cap stocks but outperformed small-cap stocks. Value stocks outperformed growth stocks as measured by the Russell indices.
Total Return for 12 Months Ended October 31, 2022
| | | | |
Russell 3000® Index | | | -16.52 | % |
Russell 1000® Index (large-cap stocks) | | | -16.38 | % |
Russell Midcap® Index (mid-cap stocks) | | | -17.17 | % |
Russell 2000® Index (small-cap stocks) | | | -18.54 | % |
Russell Microcap® Index (micro-cap stocks) | | | -22.29 | % |
Dow Jones U.S. Select REIT Index SM | | | -19.97 | % |
Total Return for 12 Months Ended October 31, 2022
| | | | |
Russell 1000® Value Index (large-cap value stocks) | | | -7.00 | % |
Russell 1000® Growth Index (large-cap growth stocks) | | | -24.60 | % |
Russell 2000® Value Index (small-cap value stocks) | | | -10.73 | % |
Russell 2000® Growth Index (small-cap growth stocks) | | | -26.02 | % |
Source: Frank Russell Company is the source and owner of the trademarks, service marks, and copyrights related to the Russell Indexes.
U.S. Large Cap Value Series
The U.S. Large Cap Value Series is designed to capture the returns of U.S. large company low relative price (value) stocks. The investment strategy is process driven, emphasizing broad diversification with increased exposure to stocks with smaller market capitalizations, lower relative price (value), and higher profitability within the large-cap value segment of the U.S. market. As of October 31, 2022, the Series held approximately 350 securities. Average cash exposure throughout the year was less than 1% of the Series’ assets.
For the 12 months ended October 31, 2022, total returns were -3.45% for the Series and -7.00% for the Russell 1000® Value Index, the Series’ benchmark. With low relative price (value) stocks outperforming high relative price (growth) stocks, the Series’ greater emphasis on value stocks as compared to the benchmark contributed positively to the Series’ relative performance. The Series’ emphasis on higher-profitability stocks within the large-cap value segment of the U.S. market also contributed positively to relative performance, as these stocks outperformed. Additionally, the Series’ exclusion of real estate investment trusts (REITs) contributed positively to relative performance, as REITs generally underperformed.
161
THE DFA INVESTMENT TRUST COMPANY
DISCLOSURE OF FUND EXPENSES
(Unaudited)
The following Expense Table is shown so that you can understand the impact of fees on your investment. All mutual funds have operating expenses. As a shareholder of the fund, you incur ongoing costs, which include costs for portfolio management, administrative services, and shareholder reports, among others. Operating expenses and legal and audit services, which are deducted from a fund’s gross income, directly reduce the investment return of the fund. A fund’s expenses are expressed as a percentage of its average net assets. This figure is known as the expense ratio. The following examples are intended to help you understand the ongoing costs, in dollars, of investing in the fund and to compare these costs with those of other mutual funds. The examples are based on an investment of $1,000 made at the beginning of the period shown and held for the entire period.
The Expense Table below illustrates your fund’s costs in two ways.
Actual Fund Return
This section helps you to estimate the actual expenses after fee waivers that you paid over the period. The “Ending Account Value” shown is derived from the fund’s actual return, and “Expenses Paid During Period” reflects the dollar amount that would have been paid by an investor who started with $1,000 in the fund. You may use the information here, together with the amount you invested, to estimate the expenses that you paid over the period.
To do so, simply divide your account value by $1,000 (for example, a $7,500 account value divided by $1,000 = 7.5), then multiply the result by the number given for your fund under the heading “Expenses Paid During Period.”
Hypothetical Example for Comparison Purposes
This section is intended to help you compare your fund’s costs with those of other mutual funds. The hypothetical “Ending Account Value” and “Expenses Paid During Period” are derived from the fund’s actual expense ratio and an assumed 5% annual return before expenses. In this case, because the return used is not the fund’s actual return, the results do not apply to your investment. The example is useful in making comparisons because the SEC requires all mutual funds to calculate expenses based on a 5% annual return. You can assess your fund’s costs by comparing this hypothetical example with the hypothetical examples that appear in shareholder reports of other funds.
Please note that the expenses shown in the table are meant to highlight and help you compare ongoing costs only and do not reflect any transactional costs, if applicable. The “Annualized Expense Ratio” represents the actual expenses for the six-month period indicated.
Six Months Ended October 31, 2022
EXPENSE TABLE
| | | | | | | | | | | | | | | | |
| | | Beginning | | | Ending | | | | | | Expenses | |
| | | Account | | | Account | | | Annualized | | | Paid | |
| | | Value | | | Value | | | Expense | | | During | |
| | | 05/01/22 | | | 10/31/22 | | | Ratio (1) | | | Period (1) | |
The U.S. Large Cap Value Series | | | | | | | | | | | | | | | | |
Actual Fund Return | | $ | 1,000.00 | | | $ | 994.00 | | | | 0.11 | % | | $ | 0.55 | |
Hypothetical 5% Annual Return | | $ | 1,000.00 | | | $ | 1,024.65 | | | | 0.11 | % | | $ | 0.56 | |
| (1) | Expenses are equal to the fund’s annualized expense ratio for the six-month period, multiplied by the average account value over the period, multiplied by the number of days in the most recent six-month period (184), then divided by the number of days in the year (365) to reflect the six-month period. |
162
THE DFA INVESTMENT TRUST COMPANY
DISCLOSURE OF PORTFOLIO HOLDINGS
(Unaudited)
The SEC requires that all funds file a complete Schedule of Investments with the SEC for their first and third fiscal quarters as an exhibit to their reports on Form N-PORT. For The DFA Investment Trust Company, this would be for the fiscal quarters ending January 31 and July 31. Such Form N-PORT filing must be made within 60 days of the end of the quarter. The DFA Investment Trust Company filed its most recent Form N-PORT with the SEC on September 28, 2022. They are available upon request, without charge, by calling collect: (512) 306-7400; by mailing a request to Dimensional Fund Advisors LP, 6300 Bee Cave Road, Building One, Austin, TX 78746; or by visiting the SEC’s website at http://www.sec.gov.
SEC regulations permit a fund to include in its reports to shareholders a “Summary Schedule of Portfolio Holdings” in lieu of a full Schedule of Investments. The Summary Schedule of Portfolio Holdings reports the fund’s 50 largest holdings in unaffiliated issuers and any investments that exceed one percent of the fund’s net assets at the end of the reporting period. The regulations also require that the Summary Schedule of Portfolio Holdings identify each category of investments that are held.
A fund is required to file a complete Schedule of Investments with the SEC on Form N-CSR within ten days after mailing the annual and semi-annual reports to shareholders. It will be available upon request, without charge, by calling collect: (512) 306-7400; by mailing a request to Dimensional Fund Advisors LP, 6300 Bee Cave Road, Building One, Austin, TX 78746; or by visiting the SEC’s website at http://www.sec.gov.
PORTFOLIO HOLDINGS
The SEC requires that all funds present their categories of portfolio holdings in a table, chart, or graph format in their annual and semi-annual shareholder reports, whether or not a Schedule of Investments is used. The following table, which presents portfolio holdings as a percentage of total investments before short-term investments and collateral for loaned securities, is provided in compliance with this requirement. The categories shown below represent broad industry sectors. Each industry sector consists of one or more specific industry classifications.
DOMESTIC EQUITY PORTFOLIO
| | | | |
| The U.S. Large Cap Value Series | |
Communication Services | | | 7.6 | % |
Consumer Discretionary | | | 5.2 | % |
Consumer Staples | | | 6.1 | % |
Energy. | | | 16.0 | % |
Financials | | | 19.9 | % |
Health Care. | | | 17.2 | % |
Industrials. | | | 11.6 | % |
Information Technology | | | 7.9 | % |
Materials. | | | 7.8 | % |
Real Estate. | | | 0.4 | % |
Utilities. | | | 0.3 | % |
| | | | |
| | | 100.0 | % |
163
THE U.S. LARGE CAP VALUE SERIES
SUMMARY SCHEDULE OF PORTFOLIO HOLDINGS
October 31, 2022
| | | | | | | | | | | | | | |
| | | | | Shares | | | Value† | | | Percentage
of Net Assets‡ | |
COMMON STOCKS — (97.1%) | | | | | | | | | |
COMMUNICATION SERVICES — (7.4%) | | | | | |
| | AT&T, Inc. | | | 19,723,621 | | | $ | 359,561,611 | | | | 1.3 | % |
| | Comcast Corp., Class A | | | 13,738,104 | | | | 436,047,421 | | | | 1.6 | % |
* | | T-Mobile U.S., Inc. | | | 1,448,419 | | | | 219,522,384 | | | | 0.8 | % |
| | Verizon Communications, Inc. | | | 11,228,072 | | | | 419,593,051 | | | | 1.6 | % |
#* | | Walt Disney Co. | | | 1,947,638 | | | | 207,501,352 | | | | 0.8 | % |
| | Other Securities | | | | | | | 388,431,685 | | | | 1.4 | % |
| | | | | | | | | | | | | | |
TOTAL COMMUNICATION SERVICES | | | | 2,030,657,504 | | | | 7.5 | % |
| | | | | | | | | | | | | | |
CONSUMER DISCRETIONARY — (5.1%) | | | | | | | | | |
# | | DR Horton, Inc. | | | 2,494,501 | | | | 191,777,237 | | | | 0.7 | % |
| | General Motors Co. | | | 4,563,422 | | | | 179,114,313 | | | | 0.7 | % |
| | Other Securities | | | | | | | 1,028,297,049 | | | | 3.8 | % |
| | | | | | | | | | | | | | |
TOTAL CONSUMER DISCRETIONARY | | | | 1,399,188,599 | | | | 5.2 | % |
| | | | | | | | | | | | | | |
CONSUMER STAPLES — (5.9%) | | | | | | | | | |
# | | General Mills, Inc. | | | 2,002,753 | | | | 163,384,590 | | | | 0.6 | % |
| | Kroger Co. | | | 3,345,475 | | | | 158,207,513 | | | | 0.6 | % |
| | Mondelez International, Inc., Class A | | | 3,063,492 | | | | 188,343,488 | | | | 0.7 | % |
| | Walmart, Inc. | | | 3,424,187 | | | | 487,364,536 | | | | 1.8 | % |
| | Other Securities | | | | | | | 636,769,324 | | | | 2.3 | % |
| | | | | | | | | | | | | | |
TOTAL CONSUMER STAPLES | | | | 1,634,069,451 | | | | 6.0 | % |
| | | | | | | | | | | | | | |
ENERGY — (15.5%) | | | | | | | | | |
# | | Chevron Corp. | | | 4,558,886 | | | | 824,702,477 | | | | 3.0 | % |
| | ConocoPhillips | | | 5,185,429 | | | | 653,830,743 | | | | 2.4 | % |
# | | EOG Resources, Inc. | | | 1,168,138 | | | | 159,474,200 | | | | 0.6 | % |
# | | Exxon Mobil Corp. | | | 10,590,425 | | | | 1,173,524,994 | | | | 4.3 | % |
| | Marathon Petroleum Corp. | | | 1,358,505 | | | | 154,353,338 | | | | 0.6 | % |
| | Schlumberger NV | | | 3,057,917 | | | | 159,103,421 | | | | 0.6 | % |
| | Other Securities | | | | | | | 1,163,338,010 | | | | 4.3 | % |
| | | | | | | | | | | | | | |
TOTAL ENERGY. | | | | 4,288,327,183 | | | | 15.8 | % |
| | | | | | | | | | | | | | |
FINANCIALS — (19.3%) | | | | | | | | | |
| | Bank of America Corp. | | | 8,609,381 | | | | 310,282,127 | | | | 1.2 | % |
#* | | Berkshire Hathaway, Inc., Class B | | | 1,859,637 | | | | 548,760,282 | | | | 2.0 | % |
| | Capital One Financial Corp. | | | 1,481,150 | | | | 157,031,523 | | | | 0.6 | % |
# | | Citigroup, Inc. | | | 3,688,797 | | | | 169,168,230 | | | | 0.6 | % |
| | Goldman Sachs Group, Inc. | | | 976,089 | | | | 336,272,421 | | | | 1.2 | % |
| | Hartford Financial Services Group, Inc. | | | 2,234,680 | | | | 161,813,179 | | | | 0.6 | % |
| | JPMorgan Chase & Co. | | | 7,481,873 | | | | 941,818,173 | | | | 3.5 | % |
| | Morgan Stanley | | | 2,962,680 | | | | 243,443,416 | | | | 0.9 | % |
| | Travelers Cos., Inc. | | | 1,083,770 | | | | 199,912,214 | | | | 0.7 | % |
| | Wells Fargo & Co. | | | 5,911,149 | | | | 271,853,743 | | | | 1.0 | % |
| | Other Securities | | | | | | | 1,991,320,994 | | | | 7.4 | % |
| | | | | | | | | | | | | | |
TOTAL FINANCIALS | | | | 5,331,676,302 | | | | 19.7 | % |
| | | | | | | | | | | | | | |
HEALTH CARE — (16.7%) | | | | | | | | | |
# | | Bristol-Myers Squibb Co. | | | 4,546,581 | | | | 352,223,630 | | | | 1.3 | % |
| | Cigna Corp. | | | 998,289 | | | | 322,507,244 | | | | 1.2 | % |
| | CVS Health Corp. | | | 2,930,610 | | | | 277,528,767 | | | | 1.0 | % |
| | Danaher Corp. | | | 936,418 | | | | 235,668,318 | | | | 0.9 | % |
164
THE U.S. LARGE CAP VALUE SERIES
CONTINUED
| | | | | | | | | | | | | | |
| | | Shares | | | Value† | | | Percentage
of Net Assets‡ | |
HEALTH CARE — (Continued) | | | | | | | | | | | | |
Elevance Health, Inc. | | | 771,124 | | | $ | 421,627,470 | | | | 1.6 | % |
Gilead Sciences, Inc. | | | 2,211,205 | | | | 173,491,144 | | | | 0.7 | % |
Humana, Inc. | | | 441,277 | | | | 246,267,868 | | | | 0.9 | % |
Laboratory Corp. of America Holdings | | | 683,569 | | | | 151,656,618 | | | | 0.6 | % |
Medtronic PLC | | | 2,002,037 | | | | 174,857,912 | | | | 0.7 | % |
Pfizer, Inc. | | | 17,020,200 | | | | 792,290,310 | | | | 2.9 | % |
Thermo Fisher Scientific, Inc. | | | 756,496 | | | | 388,816,249 | | | | 1.4 | % |
Other Securities | | | | | | | 1,077,834,540 | | | | 3.9 | % |
| | | | | | | | | | | | | | |
TOTAL HEALTH CARE | | | | | | | 4,614,770,070 | | | | 17.1 | % |
| | | | | | | | | | | | | | |
INDUSTRIALS — (11.3%) | | | | | | | | | | | | |
Eaton Corp. PLC | | | 987,794 | | | | 148,238,246 | | | | 0.6 | % |
Norfolk Southern Corp. | | | 780,147 | | | | 177,928,126 | | | | 0.7 | % |
Raytheon Technologies Corp. | | | 1,827,270 | | | | 173,261,741 | | | | 0.6 | % |
Republic Services, Inc. | | | 1,829,777 | | | | 242,665,026 | | | | 0.9 | % |
Other Securities | | | | | | | 2,374,579,574 | | | | 8.7 | % |
| | | | | | | | | | | | | | |
TOTAL INDUSTRIALS | | | | | | | 3,116,672,713 | | | | 11.5 | % |
| | | | | | | | | | | | | | |
INFORMATION TECHNOLOGY — (7.7%) | | | | | | | | | | | | |
# | | HP, Inc. | | | 9,328,511 | | | | 257,653,474 | | | | 1.0 | % |
Intel Corp. | | | 12,556,858 | | | | 356,991,473 | | | | 1.3 | % |
Micron Technology, Inc. | | | 3,751,374 | | | | 202,949,333 | | | | 0.8 | % |
Other Securities | | | | | | | 1,293,571,158 | | | | 4.7 | % |
| | | | | | | | | | | | | | |
TOTAL INFORMATION TECHNOLOGY | | | | | | | 2,111,165,438 | | | | 7.8 | % |
| | | | | | | | | | | | | | |
MATERIALS — (7.5%) | | | | | | | | | | | | |
Freeport-McMoRan, Inc. | | | 5,097,835 | | | | 161,550,391 | | | | 0.6 | % |
* | | Linde PLC | | | 775,637 | | | | 230,635,662 | | | | 0.9 | % |
# | | Nucor Corp. | | | 1,985,067 | | | | 260,798,103 | | | | 1.0 | % |
# | | Steel Dynamics, Inc. | | | 1,686,863 | | | | 158,649,465 | | | | 0.6 | % |
Other Securities | | | | | | | 1,262,064,050 | | | | 4.6 | % |
| | | | | | | | | | | | | | |
TOTAL MATERIALS | | | | | | | 2,073,697,671 | | | | 7.7 | % |
| | | | | | | | | | | | | | |
REAL ESTATE — (0.4%) | | | | | | | | | | | | |
Other Securities | | | | | | | 102,269,222 | | | | 0.4 | % |
| | | | | | | | | | | | | | |
UTILITIES — (0.3%) | | | | | | | | | | | | |
Other Securities | | | | | | | 76,579,795 | | | | 0.3 | % |
| | | | | | | | | | | | | | |
TOTAL COMMON STOCKS
(Cost $16,275,340,734) | | | | | | | 26,779,073,948 | | | | 99.0 | % |
| | | | | | | | | | | | | | |
TEMPORARY CASH INVESTMENTS — (1.0%) | | | | | | | | | | | | |
State Street Institutional U.S. Government Money Market Fund, 3.010% | | | 264,660,566 | | | | 264,660,566 | | | | 1.0 | % |
| | | | | | | | | | | | | �� | |
SECURITIES LENDING COLLATERAL — (1.9%) | | | | | | | | | | | | |
@§ | | The DFA Short Term Investment Fund | | | 45,100,100 | | | | 521,402,250 | | | | 1.9 | % |
| | | | | | | | | | | | | | |
TOTAL INVESTMENTS—(100.0%)
(Cost $17,061,542,735) | | | | | | $ | 27,565,136,764 | | | | 101.9 | % |
| | | | | | | | | | | | | | |
165
THE U.S. LARGE CAP VALUE SERIES
CONTINUED
As of October 31, 2022, The U.S. Large Cap Value Series had entered into the following outstanding futures contracts:
| | | | | | | | | | | | | | | | | | | | |
Description | | Number of
Contracts | | | Expiration
Date | | | Notional Value | | | Market Value | | | Unrealized
Appreciation
(Depreciation) | |
Long Position Contracts: | | | | | | | | | | | | | | | | | | | | |
S&P 500® Emini Index | | | 882 | | | | 12/16/22 | | | $ | 178,906,459 | | | $ | 171,240,300 | | | $ | (7,666,159 | ) |
| | | | | | | | | | | | | | | | | | | | |
Total Futures Contracts | | | | | | | | | | $ | 178,906,459 | | | $ | 171,240,300 | | | $ | (7,666,159 | ) |
| | | | | | | | | | | | | | | | | | | | |
Summary of the Series’ investments as of October 31, 2022, based on their valuation inputs, is as follows (see Security Valuation Note):
| | | | | | | | | | | | | | | | |
| | | Investments in Securities (Market Value) | |
| | | Level 1 | | | Level 2 | | | Level 3 | | | Total | |
Common Stocks | | | | | | | | | | | | | | | | |
Communication Services | | $ | 2,030,657,504 | | | | — | | | | — | | | $ | 2,030,657,504 | |
Consumer Discretionary | | | 1,399,188,599 | | | | — | | | | — | | | | 1,399,188,599 | |
Consumer Staples | | | 1,634,069,451 | | | | — | | | | — | | | | 1,634,069,451 | |
Energy | | | 4,288,327,183 | | | | — | | | | — | | | | 4,288,327,183 | |
Financials | | | 5,331,676,302 | | | | — | | | | — | | | | 5,331,676,302 | |
Health Care | | | 4,614,770,070 | | | | — | | | | — | | | | 4,614,770,070 | |
Industrials | | | 3,116,672,713 | | | | — | | | | — | | | | 3,116,672,713 | |
Information Technology | | | 2,111,165,438 | | | | — | | | | — | | | | 2,111,165,438 | |
Materials | | | 2,073,697,671 | | | | — | | | | — | | | | 2,073,697,671 | |
Real Estate | | | 102,269,222 | | | | — | | | | — | | | | 102,269,222 | |
Utilities | | | 76,579,795 | | | | — | | | | — | | | | 76,579,795 | |
Temporary Cash Investments | | | 264,660,566 | | | | — | | | | — | | | | 264,660,566 | |
Securities Lending Collateral | | | — | | | $ | 521,402,250 | | | | — | | | | 521,402,250 | |
Futures Contracts** | | | (7,666,159 | ) | | | — | | | | — | | | | (7,666,159 | ) |
| | | | | | | | | | | | | | | | |
TOTAL | | $ | 27,036,068,355 | | | $ | 521,402,250 | | | | — | | | $ | 27,557,470,605 | |
| | | | | | | | | | | | | | | | |
| ** | Valued at the unrealized appreciation/(depreciation) on the investment. |
See accompanying Notes to Financial Statements.
166
THE DFA INVESTMENT TRUST COMPANY
STATEMENT OF ASSETS AND LIABILITIES
OCTOBER 31, 2022
(Amounts in thousands)
| | | | |
| | | The U.S. Large
Cap Value
Series* | |
ASSETS: | | | | |
Investment Securities at Value (including $731,508 of securities on loan) | | $ | 26,779,074 | |
Temporary Cash Investments at Value & Cost | | | 264,661 | |
Collateral from Securities on Loan Invested in Affiliate at Value (including cost of $521,541) | | | 521,402 | |
Segregated Cash for Futures Contracts | | | 8,820 | |
Receivables: | | | | |
Investment Securities Sold | | | 6,614 | |
Dividends and Interest | | | 29,653 | |
Securities Lending Income | | | 142 | |
| | | | |
Total Assets | | | 27,610,366 | |
| | | | |
LIABILITIES: | | | | |
Payables: | | | | |
Upon Return of Securities Loaned | | | 513,007 | |
Investment Securities Purchased | | | 47,015 | |
Due to Advisor | | | 2,154 | |
Futures Margin Variation | | | 1,246 | |
Accrued Expenses and Other Liabilities | | | 963 | |
| | | | |
Total Liabilities | | | 564,385 | |
| | | | |
NET ASSETS | | $ | 27,045,981 | |
| | | | |
Investment Securities at Cost | | $ | 16,275,341 | |
| | | | |
| * | See Note J in the Notes to Financial Statements for additional information about securities lending collateral. |
See accompanying Notes to Financial Statements.
167
THE DFA INVESTMENT TRUST COMPANY
STATEMENT OF OPERATIONS
FOR THE YEAR ENDED OCTOBER 31, 2022
(Amounts in thousands)
| | | | |
| | | The U.S. Large
Cap Value
Series# | |
Investment Income | | | | |
Dividends (Net of Foreign Taxes Withheld of $45) | | $ | 645,606 | |
Income from Securities Lending | | | 652 | |
| | | | |
Total Investment Income | | | 646,258 | |
| | | | |
Expenses | | | | |
Investment Management Fees | | | 28,078 | |
Accounting & Transfer Agent Fees | | | 3 | |
Custodian Fees | | | 342 | |
Shareholders’ Reports | | | 38 | |
Directors’/Trustees’ Fees & Expenses | | | 130 | |
Professional Fees | | | 330 | |
Other | | | 573 | |
| | | | |
Total Expenses | | | 29,494 | |
| | | | |
Net Expenses | | | 29,494 | |
| | | | |
Net Investment Income (Loss) | | | 616,764 | |
| | | | |
Realized and Unrealized Gain (Loss) | | | | |
Net Realized Gain (Loss) on: | | | | |
Investment Securities Sold** | | | 753,310 | |
Affiliated Investment Companies Shares Sold | | | (30 | ) |
Futures | | | (16,355 | ) |
Foreign Currency Transactions | | | (2 | ) |
In-Kind Redemptions | | | 46,523 | |
Change in Unrealized Appreciation (Depreciation) of: | | | | |
Investment Securities and Foreign Currency | | | (2,352,364 | ) |
Affiliated Investment Companies Shares | | | (147 | ) |
Futures | | | (16,326 | ) |
| | | | |
Net Realized and Unrealized Gain (Loss) | | | (1,585,391 | ) |
| | | | |
Net Increase (Decrease) in Net Assets Resulting from Operations | | $ | (968,627 | ) |
| | | | |
| ** | Net of foreign capital gain taxes withheld of $0. |
| # | Portion of income is from investment in affiliated fund. |
See accompanying Notes to Financial Statements.
168
THE DFA INVESTMENT TRUST COMPANY
STATEMENTS OF CHANGES IN NET ASSETS
(Amounts in thousands)
| | | | | | | | |
| | | The U.S. Large Cap Value
Series | |
| | | Year
Ended
Oct 31,
2022 | | | Year
Ended
Oct 31,
2021 | |
Increase (Decrease) in Net Assets | | | | | | | | |
Operations: | | | | | | | | |
Net Investment Income (Loss) | | $ | 616,764 | | | $ | 541,698 | |
Net Realized Gain (Loss) on: | | | | | | | | |
Investment Securities Sold*,** | | | 753,310 | | | | 1,388,344 | |
Affiliated Investment Companies Shares Sold | | | (30 | ) | | | 16 | |
Futures | | | (16,355 | ) | | | 49,910 | |
Foreign Currency Transactions | | | (2 | ) | | | — | |
In-Kind Redemptions | | | 46,523 | | | | — | |
Change in Unrealized Appreciation (Depreciation) of: | | | | | | | | |
Investment Securities and Foreign Currency | | | (2,352,364 | ) | | | 8,413,121 | |
Affiliated Investment Companies Shares | | | (147 | ) | | | (20 | ) |
Futures | | | (16,326 | ) | | | 12,740 | |
| | | | | | | | |
Net Increase (Decrease) in Net Assets Resulting from Operations | | | (968,627 | ) | | | 10,405,809 | |
| | | | | | | | |
Transactions in Interest: | | | | | | | | |
Contributions | | | 972,772 | | | | 808,201 | |
Withdrawals | | | (2,778,807 | ) | | | (3,547,772 | ) |
| | | | | | | | |
Net Increase (Decrease) from Transactions in Interest | | | (1,806,035 | ) | | | (2,739,571 | ) |
| | | | | | | | |
Total Increase (Decrease) in Net Assets | | | (2,774,662 | ) | | | 7,666,238 | |
Net Assets | | | | | | | | |
Beginning of Year | | | 29,820,643 | | | | 22,154,405 | |
| | | | | | | | |
End of Year | | $ | 27,045,981 | | | $ | 29,820,643 | |
| | | | | | | | |
| * | Net of foreign capital gain taxes withheld for the fiscal year ended October 31, 2022 of $0. |
| ** | Net of foreign capital gain taxes withheld for the fiscal year ended October 31, 2021 of $0. |
See accompanying Notes to Financial Statements.
169
THE DFA INVESTMENT TRUST COMPANY
FINANCIAL HIGHLIGHTS
| | | | | | | | | | | | | | | | | | | | |
| | | The U.S. Large Cap Value Series | |
| | | Year
Ended
Oct 31,
2022 | | | Year
Ended
Oct 31,
2021 | | | Year
Ended
Oct 31,
2020 | | | Year
Ended
Oct 31,
2019 | | | Year
Ended
Oct 31,
2018 | |
Total Return | | | (3.45 | %) | | | 48.85 | % | | | (11.42 | %) | | | 7.15 | % | | | 2.95 | % |
Net Assets, End of Year (thousands) | | $ | 27,045,981 | | | $ | 29,820,643 | | | $ | 22,154,405 | | | $ | 29,929,678 | | | $ | 29,242,795 | |
Ratio of Expenses to Average Net Assets | | | 0.11 | % | | | 0.11 | % | | | 0.11 | % | | | 0.11 | % | | | 0.11 | % |
Ratio of Expenses to Average Net Assets (Excluding Fees Waived, Expenses Reimbursed) | | | 0.11 | % | | | 0.11 | % | | | 0.11 | % | | | 0.11 | % | | | 0.11 | % |
Ratio of Net Investment Income to Average Net Assets | | | 2.20 | % | | | 1.92 | % | | | 2.53 | % | | | 2.50 | % | | | 2.14 | % |
Portfolio Turnover Rate | | | 10 | % | | | 10 | % | | | 4 | % | | | 10 | % | | | 13 | % |
See page 1-2 for the Definitions of Abbreviations and Footnotes.
See accompanying Notes to Financial Statements.
170
THE DFA INVESTMENT TRUST COMPANY
NOTES TO FINANCIAL STATEMENTS
A. Organization:
The DFA Investment Trust Company (the “Trust”) is an open-end management investment company registered under the Investment Company Act of 1940 (the “1940 Act”). The Trust consists of ten operational portfolios, one of which, The U.S. Large Cap Value Series (the “Series”), is included in this section of the report. The remaining operational portfolios are presented in separate reports. The Series is an investment company, and accordingly, follows the accounting and reporting guidance under the Financial Accounting Standards Board (“FASB”) Accounting Standards Codification (“ASC”), Topic 946, “Financial Services-Investment Companies.”
B. Significant Accounting Policies:
The following significant accounting policies are in conformity with accounting principles generally accepted in the United States of America (“GAAP”). Such policies are consistently followed by the Trust in preparation of its financial statements. The preparation of financial statements in accordance with GAAP requires management to make estimates and assumptions that affect the fair value of investments, the reported amounts of assets and liabilities, the disclosure of contingent assets and liabilities at the date of the financial statements, and the reported amounts of increases and decreases in net assets from operations during the reporting period. Actual results could differ from those estimates, and those differences could be material.
1. Security Valuation: The Series uses a fair value hierarchy, which prioritizes the inputs-to-valuation techniques used to measure fair value into three broad levels described below:
| | • | | Level 1 – inputs are quoted prices in active markets for identical securities (including equity securities, open-end investment companies, and futures contracts) |
| | • | | Level 2 – other significant observable inputs (including quoted prices for similar securities, interest rates, prepayment speeds, credit risk, etc.) |
| | • | | Level 3 – significant unobservable inputs (including the Series’ own assumptions in determining the fair value of investments) |
Securities held by the Series, including over-the-counter securities, are valued at the last quoted sale price of the day. Securities held by the Series that are listed on Nasdaq are valued at the Nasdaq Official Closing Price (“NOCP”). If there is no last reported sale price or NOCP for the day, the Series values the securities within the range of the most recent quoted bid and ask prices. Price information on listed securities is taken from the exchange where the security is primarily traded. Generally, securities issued by open-end management investment companies are valued using their respective net asset values or public offering prices, as appropriate, for purchase orders placed at the close of the New York Stock Exchange (NYSE). These securities are generally categorized as Level 1 in the hierarchy.
Securities for which no market quotations are readily available (including restricted securities), or for which market quotations have become unreliable, are valued in good faith at fair value in accordance with Rule 2a-5 under the 1940 Act pursuant to procedures approved by the Board of Trustees of the Trust. Fair value pricing may also be used if events that have a significant effect on the value of an investment (as determined in the discretion of Dimensional Fund Advisors LP) occur before the net asset value of the Series is calculated. When fair value pricing is used, the prices of securities used by the Series may differ from the quoted or published prices for the same securities on their primary markets or exchanges. These securities are generally categorized as Level 2 or Level 3 in the hierarchy.
Futures contracts held by the Series are valued using the settlement price established each day on the exchange on which they are traded. These valuations are generally categorized as Level 1 in the hierarchy.
Over-the-counter derivative contracts, which include forward currency contracts, do not require material subjectivity as pricing inputs are observed from quoted markets and are categorized as Level 2 in the hierarchy.
171
A summary of the inputs used to value the Series’ investments by each major security type, industry and/or country is disclosed previously in this note. Valuation hierarchy tables have been included at the end of the Summary Schedule of Portfolio Holdings. The methodology or inputs used for valuing securities are not necessarily an indication of the risk associated with investing in those securities.
2. Deferred Compensation Plan: Each eligible Trustee of the Trust may elect to participate in the Fee Deferral Plan for Independent Directors and Trustees (the “Plan”). Under the Plan, effective January 1, 2002, such Trustees may defer payment of all or a portion of their total fees earned as a Trustee. These deferred amounts may be treated as though such amounts had been invested in shares of the following funds: the U.S. Large Cap Value Portfolio, U.S. Core Equity 1 Portfolio, U.S. Large Company Portfolio, U.S. Vector Equity Portfolio, U.S. Micro Cap Portfolio, DFA International Value Portfolio, International Core Equity Portfolio, Emerging Markets Portfolio, Emerging Markets Core Equity Portfolio, DFA Inflation-Protected Securities Portfolio, and/or DFA Two-Year Global Fixed Income Portfolio. Contributions made under the Plan and the change in unrealized appreciation (depreciation) and income are included in Directors’/ Trustees’ Fees & Expenses.
The Trustees may receive their distributions of proceeds by one of the following methods: lump sum, annual installments over a period of agreed-upon years, or quarterly installments over a period of agreed-upon years. Each Trustee shall have the right in a notice of election (the “Notice”) to defer the receipt of the Trustee’s deferred compensation until a date specified by such Trustee in the Notice. The date may not be sooner than the earlier of: (i) the first business day of January following the year in which such Trustee ceases to be a member of the Board of Trustees of the Trust; and (ii) five years following the effective date of the Trustee’s first deferral election. If a Trustee who elects to defer fees fails to designate in the Notice a time or date as of which payment of the Trustee’s deferred fee account shall commence, payment of such amount shall commence as of the first business day of January following the year in which the Trustee ceases to be a member of the Board (unless the Trustee files an amended Notice selecting a different distribution date).
3. Other: Security transactions are accounted for as of the trade date. Costs used in determining realized gains and losses on the sale of investment securities and foreign currency are accounted for on the basis of identified cost. Dividend income and distributions to shareholders are recorded on the ex-dividend date. Distributions received on securities and that represent a return of capital or capital gains are recorded as a reduction of cost of investments or as a realized gain, respectively. The Series estimates the character of received distributions that may be considered return of capital distributions. Interest income is recorded on an accrual basis. Discount and premium on securities purchased are amortized over the lives of the respective securities, using the effective interest method. Expenses directly attributable to the Series are directly charged. Common expenses of the Trust or Series are allocated using methods approved by the Board of Trustees, generally based on average net assets.
C. Investment Advisor:
The Advisor, Dimensional Fund Advisors LP, provides investment management services to the Series. For the year ended October 31, 2022, investment management fees were accrued daily and paid monthly to the Advisor based on the following effective annual rate of average daily net assets:
| | | | |
The U.S. Large Cap Value Series | | | 0.10 | % |
Fees Paid to Officers and Directors/Trustees:
Certain Officers and Trustees of the Advisor are also Officers and Trustees of the Trust; however, such Officers and Trustees (with the exception of the Chief Compliance Officer (“CCO”)) receive no compensation from the Trust. For the year ended October 31, 2022, the total related amounts paid by the Trust to the CCO were $28 (in thousands). The total related amounts paid by the Series are included in Other Expenses on the Statement of Operations.
172
D. Deferred Compensation:
As of October 31, 2022, the total liability for deferred compensation to Trustees is included in Accrued Expenses and Other Liabilities on the Statement of Assets and Liabilities as follows (amount in thousands):
| | | | |
The U.S. Large Cap Value Series | | $ | 156 | |
E. Purchases and Sales of Securities:
For the year ended October 31, 2022, the Series’ transactions related to investment securities, other than short-term securities, in-kind redemptions and U.S. Government securities (amounts in thousands), were as follows:
| | | | | | | | |
| | | Purchases | | | Sales | |
The U.S. Large Cap Value Series | | $ | 2,680,600 | | | $ | 3,677,661 | |
There were no purchases or sales of long-term U.S. government securities.
For the year ended October 31, 2022, transactions related to Affiliated Investment Companies, excluding in-kind redemptions, are presented below.
The amounts presented below may differ from the respective amounts presented in the Summary Schedule of Portfolio Holdings, Statement of Assets and Liabilities or Statement of Operations due to rounding. The amounts are as follows (amounts in thousands):
| | | | | | | | | | | | | | | | | | | | | | | | | | | | | | | | | | | | |
| | | Balance at
October 31, 2021 | | | Purchases
at Cost | | | Proceeds
from
Sales | | | Net Realized
Gain/(Loss)
on Sales | | | Change in
Unrealized
Appreciation/
Depreciation | | | Balance at
October 31, 2022 | | | Shares as of
October 31, 2022 | | | Dividend
Income | | | Capital Gain
Distributions | |
The U.S. Large Cap Value Series | | | | | | | | | | | | | | | | | | | | | | | | | | | | | | | | | | | | |
The DFA Short Term | | | | | | | | | | | | | | | | | | | | | | | | | | | | | | | | | | | | |
Investment Fund | | $ | 155,780 | | | $ | 4,248,436 | | | $ | 3,882,637 | | | $ | (30 | ) | | $ | (147 | ) | | $ | 521,402 | | | | 45,100 | | | $ | 3,799 | | | | — | |
| | | | | | | | | | | | | | | | | | | | | | | | | | | | | | | | | | | | |
Total | | $ | 155,780 | | | $ | 4,248,436 | | | $ | 3,882,637 | | | $ | (30 | ) | | $ | (147 | ) | | $ | 521,402 | | | | 45,100 | | | $ | 3,799 | | | | — | |
| | | | | | | | | | | | | | | | | | | | | | | | | | | | | | | | | | | | |
F. Federal Income Taxes:
No provision for federal income taxes is required since the Series is treated as a partnership for federal income tax purposes. Any net investment income and realized and unrealized gains and losses have been deemed to have been “passed down” to its partners.
As of October 31, 2022, the total cost and aggregate gross unrealized appreciation (depreciation) of securities for federal income tax purposes were different from amounts reported for financial reporting purposes, as follows (amounts in thousands):
| | | | | | | | | | | | | | | | |
| | | Federal Tax
Cost | | | Unrealized
Appreciation | | | Unrealized
(Depreciation) | | | Net
Unrealized
Appreciation
(Depreciation) | |
The U.S. Large Cap Value Series | | $ | 17,036,981 | | | $ | 11,234,320 | | | $ | (713,829 | ) | | $ | 10,520,491 | |
The difference between GAAP-basis and tax-basis unrealized gains (losses) can occur as a result of wash sales and net mark-to-market gains (losses) on regulated futures contracts, net mark-to-market gains (losses) on foreign currency contracts, and differences in the tax treatment of passive foreign investment company investments or other investments.
173
ASC 740 Accounting for Uncertainty in Income Taxes sets forth a minimum threshold for financial statement recognition of the benefit of a tax position taken or expected to be taken in a tax return. Management has analyzed the Series’ tax positions and has concluded that no additional provision for income tax is required in the Series’ financial statements. The Series is not aware of any tax positions for which it is more likely than not that the total amounts of unrecognized tax benefits will significantly change in the next twelve months. The Series’ federal tax returns for the prior three fiscal years remain subject to examination by the Internal Revenue Service.
G. Financial Instruments:
In accordance with the Series’ investment objectives and policies, the Series may invest in certain financial instruments that have off-balance sheet risk in excess of the amounts recognized in the financial statements and concentrations of credit and market risk. These instruments and their significant corresponding risks are described below:
Derivative Financial Instruments:
Summarized below are the specific types of derivative instruments used by the Series.
1. Futures Contracts: The Series may purchase or sell futures contracts and options on futures contracts for equity securities and indices to increase or decrease market exposure based on actual or expected cash inflows to or outflows from the Series. Upon entering into a futures contract, the Series deposits cash or pledges U.S. Government securities to a broker in an amount equal to the minimum “initial margin” requirements of the exchange on which the contract is traded. Subsequent payments are received from or paid to the broker each day, based on the daily fluctuation in the market value of the contract. These receipts or payments are known as “variation margin” and are recorded daily by the Series as unrealized gains or losses until the contracts are closed. When the contracts are closed, the Series records a realized gain or loss, which is presented in the Statement of Operations as a net realized gain or loss on futures, equal to the difference between the value of the contract at the time it was opened and the value at the time it was closed.
Risks may arise upon entrance into futures contracts from potential imperfect price correlations between the futures contracts and the underlying securities, from the possibility of an illiquid secondary market for these instruments and from the possibility that the Series could lose more than the initial margin requirements. Entering into stock index futures subjects the Series to equity price risk from those futures contracts. Counterparty credit risk related to exchange-traded futures is minimal because the exchange’s clearinghouse, as counterparty to all exchange-traded futures, guarantees the futures against default.
Securities have been segregated as collateral for open futures contracts.
The average volume (based on the open positions at each fiscal month-end) of derivative activity for the year ended October 31, 2022 was as follows (amount in thousands):
| | | | |
| | | Futures* | |
The U.S. Large Cap Value Series | | $ | 191,772 | |
| * | Average Notional Value of futures contracts. |
The following is a summary of the Series’ derivative instrument holdings categorized by primary risk exposure as of October 31, 2022 (amounts in thousands):
| | | | | | | | |
| | | Liability Derivatives Value | |
| | | Total Value
at
October 31, 2022 | | | Equity
Contracts *,(1) | |
The U.S. Large Cap Value Series | | $ | (7,665 | ) | | $ | (7,665 | ) |
| (1) | Presented on Statement of Assets and Liabilities as Payables: Futures Margin Variation. |
| * | Includes cumulative appreciation (depreciation) of futures contracts. Only current day’s margin variation is reported within the Statement of Assets and Liabilities. |
174
The following is a summary of the realized and change in unrealized gains and losses from the Series’ derivative instrument holdings categorized by primary risk exposure for the year ended October 31, 2022 (amounts in thousands):
| | | | | | | | |
| | | Realized Gain (Loss) on
Derivatives | |
| | | Total | | | Equity
Contracts (1) | |
The U.S. Large Cap Value Series | | $ | (16,355 | ) | | $ | (16,355 | ) |
| | | | | | | | |
| | | Change in Unrealized Appreciation
(Depreciation) on Derivatives | |
| | | Total | | | Equity
Contracts (2) | |
The U.S. Large Cap Value Series | | $ | (16,326 | ) | | $ | (16,326 | ) |
| (1) | Presented on Statement of Operations as Net Realized Gain (Loss) on: Futures. |
| (2) | Presented on Statement of Operations as Change in Unrealized Appreciation (Depreciation) of: Futures. |
H. Line of Credit and Interfund Lending Program:
The Trust, together with other Dimensional-advised portfolios, has entered into a $500 million uncommitted, unsecured discretionary line of credit effective April 6, 2022, with its domestic custodian bank. A line of credit with similar terms was in effect through April 6, 2022. Each portfolio is permitted to borrow, subject to its investment limitations, up to a maximum of $250 million, as long as total borrowings under the line of credit do not exceed $500 million in the aggregate. Borrowings under the line of credit are charged interest at rates agreed upon by the parties at the time of borrowing. Each portfolio is individually, and not jointly, liable for its particular advances under the line of credit. There is no commitment fee on the unused portion of the line of credit. The agreement for the discretionary line of credit may be terminated by either party at any time. The agreement for the line of credit expires on April 5, 2023.
The Trust, together with other Dimensional-advised portfolios, has also entered into an additional $700 million unsecured line of credit with its international custodian bank effective January 2, 2022. A line of credit with similar terms was in effect through January 1, 2022. Each portfolio is permitted to borrow, subject to its investment limitations, up to the lower of one-quarter of such portfolio’s net assets or $500 million, as long as total borrowings under the line of credit do not exceed $700 million in the aggregate. Each portfolio is individually, and not jointly, liable for its particular advances under the line of credit. Borrowings under the line of credit are charged interest at rates agreed upon by the parties at the time of borrowing. There is no commitment fee on the unused portion of the line of credit. The agreement for the discretionary line of credit may be terminated by either party at any time. The line of credit agreement expires on January 1, 2023.
There were no borrowings by the Series under the lines of credit during the year ended October 31, 2022.
Pursuant to an exemptive order issued by the SEC (the “Order”), the Series may participate in an interfund lending program among certain portfolios managed by the Advisor (portfolios that operate as feeder funds do not participate in the program). The program allows the participating portfolios to borrow money from and loan money to each other for temporary or emergency purposes, subject to the conditions in the Order. A loan can only be made through the program if the interfund loan rate on that day is more favorable to both the borrowing and lending portfolios as compared to rates available through short-term bank loans or investments in overnight repurchase agreements and money market funds, respectively, as detailed in the Order. Further, a portfolio may participate in the program only if and to the extent that such participation is consistent with its investment objectives and limitations. Interfund loans have a maximum duration of seven days and may be called on one business day’s notice.
175
The Series did not use the interfund lending program during the year ended October 31, 2022.
I. Affiliated Trades:
Cross trades for the year ended October 31, 2022, if any, were executed by the Series pursuant to procedures adopted by the Board of Trustees of the Trust to ensure compliance with Rule 17a-7 under the 1940 Act. Cross trading is the buying or selling of portfolio securities between series of investment companies, or between a series of an investment company and another entity, that are or could be considered affiliates by virtue of a common investment advisor (or affiliated investment advisors), common Trustees and/or common Officers. At its regularly scheduled meetings, the CCO certifies to the Board that the 17a-7 transactions entered into by the Series complied with the Rule 17a-7 Procedures adopted by the Board of Trustees of the Trust.
For the year ended October 31, 2022, cross trades by the Series under Rule 17a-7 were as follows (amounts in thousands):
| | | | | | | | | | | | |
Series | | Purchases | | | Sales | | | Realized Gain (Loss) | |
The U.S. Large Cap Value Series | | $ | 275,408 | | | $ | 282,808 | | | $ | 33,436 | |
J. Securities Lending:
As of October 31, 2022, the Series had securities on loan to brokers/dealers, for which the Series received cash collateral. In addition, the Series received non-cash collateral consisting of short- and/or long-term U.S. Treasuries and U.S. government agency securities as follows (amount in thousands):
| | | | |
| | | Non-Cash
Collateral
Market
Value | |
The U.S. Large Cap Value Series | | $ | 227,152 | |
The Series invests the cash collateral, as described below, and records a liability for the return of the collateral, during the period the securities are on loan. Loans of securities are expected at all times to be secured by collateral in an amount (i) equal to at least 100% of the current market value of the loaned securities with respect to securities of the U.S. government or its agencies, (ii) generally equal to 102% of the current market value of the loaned securities with respect to U.S. securities, and (iii) generally equal to 105% of the current market value of the loaned securities with respect to foreign securities. However, daily market fluctuations could cause the Series’ collateral to be lower or higher than the expected thresholds. If this were to occur, the collateral would be adjusted the next business day to ensure adequate collateralization. In the event of default or bankruptcy by the other party to the agreement, realization and/or retention of the collateral may be subject to legal proceedings. If the borrower fails to return loaned securities, cash collateral being maintained by the borrower is insufficient to cover the value of loaned securities, and such collateral insufficiency is not the result of investment losses, the lending agent has agreed to pay the amount of the shortfall to the Series or, at the option of the lending agent, to replace the securities. In the event of the bankruptcy of the borrower, the Series could experience delay in recovering the loaned securities or only recover cash or a security of equivalent value.
176
Subject to its stated investment policies, the Series will generally invest the cash collateral received for the loaned securities in The DFA Short Term Investment Fund (the “Money Market Series”), an affiliated registered money market fund advised by the Advisor for which the Advisor receives a management fee of 0.05% of the average daily net assets of the Money Market Series. Income received from the Money Market Series is netted with fees for securities lending and collateral investment expenses and with other payments to and from borrowers of securities. The Series also may invest the cash collateral received for the loaned securities in securities of the U.S. government or its agencies, repurchase agreements collateralized by securities of the U.S. government or its agencies, and affiliated or unaffiliated money market funds that are registered or unregistered. For purposes of this paragraph, agencies include both agency debentures and agency mortgage-backed securities. Additionally, the Series will be able to terminate the loan at any time and will receive reasonable interest on the loan, as well as amounts equal to any dividends, interest or, other distributions on the loaned securities. However, dividend income received from loaned securities may not be eligible for taxation at qualified dividend income rates.
The following table reflects a breakdown of transactions accounted for as secured borrowings, the gross obligation by the type of collateral pledged, and the remaining contractual maturity of those transactions as of October 31, 2022 (amounts in thousands):
| | | | | | | | | | | | | | | | | | | | |
| | | Remaining Contractual Maturity of the Agreements As of
October 31, 2022 | |
| | | Overnight and
Continuous | | | <30 days | | | Between
30 & 90 days | | | >90 days | | | Total | |
Securities Lending Transactions | | | | | | | | | | | | | | | | | | | | |
The U.S. Large Cap Value Series Common Stocks | | $ | 513,007 | | | | — | | | | — | | | | — | | | $ | 513,007 | |
K. Indemnitees; Contractual Obligations:
Under the Trust’s organizational documents, its Officers and Trustees are indemnified against certain liabilities arising out of the performance of their duties to the Trust.
In the normal course of business, the Trust enters into contracts that contain a variety of representations and warranties that provide general indemnification. The Trust’s maximum exposure under these arrangements is unknown, as this would involve future claims that may be made against the Trust and/or its affiliates that have not yet occurred. However, based on experience, the Trust expects the risk of loss to be remote.
L. In-Kind Redemptions:
During the year ended October 31, 2022, the Series realized net gains (losses) on in-kind redemptions as follows (amount in thousands):
| | | | |
The U.S. Large Cap Value Series | | $ | 46,523 | |
M. Recently Issued Accounting Standards and Regulations:
In March 2020, the Financial Accounting Standards Board (FASB) issued Accounting Standards Update (ASU) No. 2020-04, Reference Rate Reform (Topic 848) – Facilitation of the Effects of Reference Rate Reform on Financial Reporting. In January 2021, the FASB issued ASU No. 2021-01, with further amendments to Topic 848. The amendments in the ASUs provide optional temporary accounting recognition and financial reporting relief from the effect of certain types of contract modifications due to the planned discontinuation of the LIBOR and other interbank-offered based reference rates as of the end of 2021 and 2023. The ASUs are effective for certain reference rate-related contract modifications that occur during the period March 12, 2020 through December 31, 2022. Management has reviewed the requirements and believes the adoption of these ASUs will not have a material impact on the Series’ financial statements.
177
In October 2020, the SEC adopted new regulations governing the use of derivatives by registered investment companies. Rule 18f-4 (the “Derivatives Rule”) imposes limits on the amount of derivatives contracts the Series could enter, eliminates the asset segregation framework previously used by the Series to comply with Section 18 of the 1940 Act, and requires funds whose use of derivatives is more than a limited specified exposure to establish and maintain a derivatives risk management program and appoint a derivatives risk manager. The Derivatives Rule became effective February 19, 2021 and the Series began complying with the Derivatives Rule on August 19, 2022.
On December 3, 2020, the SEC adopted new Rule 2a-5 (the “Valuation Rule”) under the 1940 Act, establishing an updated regulatory framework for fund valuation. The Valuation Rule, in part, provides a framework for good faith fair value determination and permits a Board to designate fair value determinations to a fund’s investment adviser. Further, the SEC rescinded previously issued guidance on related issues. The Valuation Rule became effective on March 8, 2021 and the Series began complying with the Valuation Rule on August 1, 2022.
N. Other:
The Series and the Trust are subject to claims and suits that arise from time to time in the ordinary course of business (for example, claw back litigation against former shareholders of portfolio companies that filed for bankruptcy, such as the now ended litigation involving The Tribune Company and the ongoing litigation involving Nine West). Although management currently believes that resolving claims against the Series and the Trust, individually or in aggregate, will not have a material adverse impact on the Series’ and the Trust’s financial position, results of operations, or cash flows, these matters are subject to inherent uncertainties and management’s view of these matters may change in the future.
O. Subsequent Event Evaluations:
Management has evaluated the impact of all subsequent events on the Series through the date on which the financial statements were issued and has determined that there are no subsequent events requiring recognition or disclosure in the financial statements.
178
Report of Independent Registered Public Accounting Firm
To the Board of Trustees of The DFA Investment Trust Company and Shareholders of The U.S. Large Cap Value Series
Opinion on the Financial Statements
We have audited the accompanying statement of assets and liabilities, including the summary schedule of portfolio holdings, of The U.S. Large Cap Value Series (one of the series constituting The DFA Investment Trust Company, hereafter referred to as the “Series”) as of October 31, 2022, the related statement of operations for the year ended October 31, 2022, the statement of changes in net assets for each of the two years in the period ended October 31, 2022, including the related notes, and the financial highlights for each of the five years in the period ended October 31, 2022 (collectively referred to as the “financial statements”). In our opinion, the financial statements present fairly, in all material respects, the financial position of the Series as of October 31, 2022, the results of its operations for the year then ended, the changes in its net assets for each of the two years in the period ended October 31, 2022 and the financial highlights for each of the five years in the period ended October 31, 2022 in conformity with accounting principles generally accepted in the United States of America.
Basis for Opinion
These financial statements are the responsibility of the Series’ management. Our responsibility is to express an opinion on the Series’ financial statements based on our audits. We are a public accounting firm registered with the Public Company Accounting Oversight Board (United States) (PCAOB) and are required to be independent with respect to the Series in accordance with the U.S. federal securities laws and the applicable rules and regulations of the Securities and Exchange Commission and the PCAOB.
We conducted our audits of these financial statements in accordance with the standards of the PCAOB. Those standards require that we plan and perform the audit to obtain reasonable assurance about whether the financial statements are free of material misstatement, whether due to error or fraud.
Our audits included performing procedures to assess the risks of material misstatement of the financial statements, whether due to error or fraud, and performing procedures that respond to those risks. Such procedures included examining, on a test basis, evidence regarding the amounts and disclosures in the financial statements. Our audits also included evaluating the accounting principles used and significant estimates made by management, as well as evaluating the overall presentation of the financial statements. Our procedures included confirmation of securities owned as of October 31, 2022 by correspondence with the custodian, brokers and transfer agent of the investee fund; when replies were not received from brokers, we performed other auditing procedures. We believe that our audits provide a reasonable basis for our opinion.
|
| /s/PricewaterhouseCoopers LLP |
| Philadelphia, Pennsylvania |
| December 22, 2022 |
We have served as the auditor of one or more investment companies in Dimensional Fund Advisors L.P. investment company group since 1981.
179
FUND MANAGEMENT
(Unaudited)
Trustees/Directors
Each Board of Trustees/Directors (each, the “Board” and collectively, the “Boards”) of The DFA Investment Trust Company (“DFAITC”), DFA Investment Dimensions Group Inc. (“DFAIDG”), Dimensional Investment Group Inc. (“DIG”), Dimensional ETF Trust (“ETF Trust”), and Dimensional Emerging Markets Value Fund (“DEM”) (each, the “Fund” and collectively, the “Funds”) is responsible for establishing the Funds’ policies and for overseeing the management of the Funds. The Trustees/ Directors of the Funds, including all of the disinterested Trustees/Directors, have adopted written procedures to monitor potential conflicts of interest that might develop between portfolios of the Funds (the “Feeder Portfolios”) that invest in certain series of DFAITC or DEM (the “Master Funds”).
Each Board has four standing committees, an Audit Committee, a Nominating and Governance Committee (the “Nominating Committee”), a Mutual Funds-ETF Relations committee and an Investment Strategy Committee (the “Strategy Committee”). The Audit Committee is composed of Reena Aggarwal, George M. Constantinides, Francis A. Longstaff, Abbie J. Smith and Ingrid M. Werner. Each member of the Audit Committee is a disinterested Trustee/Director. The Audit Committee oversees the Fund’s accounting and financial reporting policies and practices, the Fund’s internal controls, the Fund’s financial statements and the independent audits thereof and performs other oversight functions as requested by the Board. The Audit Committee recommends the appointment of each Fund’s independent registered certified public accounting firm and acts as a liaison between the Fund’s independent registered certified public accounting firm and the full Board. There were three Audit Committee meetings held during the fiscal year ended October 31, 2022.
Each Board’s Nominating Committee is composed of Reena Aggarwal, George M. Constantinides, Douglas W. Diamond, Francis A. Longstaff, and Heather E. Tookes. Each member of the Nominating Committee is a disinterested Trustee/Director. The Nominating Committee for each Board makes recommendations for nominations of disinterested and interested members on the Board to the disinterested Board members and to the full Board. The Nominating Committee works closely with the other disinterested Trustees to evaluate a candidate’s qualification for Board membership and the independence of such candidate from the Advisor and other principal service providers. The Nominating Committee also periodically reviews the Board governance practices, policies, procedures, and operations; reviews the membership of each committee of the Board; reviews and makes recommendations regarding the Independent Trustees’ compensation; oversees the annual self-assessment of the Board and each committee; considers and recommends to the Board, the selection of “independent legal counsel” (as that term is defined in the 1940 Act); and monitors and considers corporate governance issues that may arise from time to time. There were three Nominating Committee meetings held during the fiscal year ended October 31, 2022.
Each Board’s Strategy Committee is composed of Gerard K. O’Reilly, Douglas W. Diamond, Darrell Duffie, and Heather E. Tookes. The Strategy Committee assists the Board in carrying out its fiduciary duties with respect to the oversight of the Fund and its performance. At the request of the Board or the Advisor, the Strategy Committee (i) reviews the design of possible new series of the Fund, (ii) reviews performance of existing portfolios of the Funds and discusses and recommends possible enhancements to the portfolios’ investment strategies, (iii) reviews proposals by the Advisor to modify or enhance the investment strategies or policies of each portfolio, and (iv) considers issues relating to investment services for each portfolio of the Fund. There were four Strategy Committee meetings held during the fiscal year ended October 31, 2022.
The Mutual Funds-ETF Relations Committee is comprised of George M. Constantinides, Darrell Duffie, and Ingrid M. Werner. At the request of the Board, the Mutual Funds-ETF Relations Committee (i) reviews any newly-proposed expenses to be borne by the ETFs in the Dimensional ETF Trust (“Dimensional ETFs”), portfolios in the DFA mutual fund complex (“Fund Complex”) or changes to the existing expense allocations among the Dimensional ETFs, portfolios in the Fund Complex, and the Advisor, (ii) considers any conflicts of interest that may arise in the operations of the Dimensional ETFs and the portfolios in the Fund Complex, (iii) reviews and considers relevant information relating to the operations of the Dimensional ETFs, and (iv) considers asset flows and performance differences between the similarly managed mutual funds and ETFs of the Funds. There were two Mutual Funds-ETF Relations Committee meetings held for the Trust during the fiscal year ended October 31, 2022.
180
Certain biographical information for each disinterested Trustee/Director and interested Trustee/Director of the Funds is set forth in the tables below, including a description of each Trustee/Director’s experience as a Trustee/Director of the Funds and as a Director or Trustee of other funds, as well as other recent professional experience.
The statements of additional information (together, “SAI”) of the Funds include additional information about each Trustee/Director. You may obtain copies of the SAI and prospectus of each Fund advised by Dimensional Fund Advisors LP by calling collect (512) 306-7400 or by mailing a request to Dimensional Fund Advisors LP, 6300 Bee Cave Road, Building One, Austin, TX 78746. Prospectuses are also available at http://us.dimensional.com.
181
Disinterested Directors/Trustees
| | | | | | | | | | |
Name, Address and Year of Birth | | Position | | Term of Office1 and Length of Service | | Principal Occupation During Past 5 Years | | Portfolios within the DFA Fund Complex2 Overseen | | Other Directorships of Public Companies Held During Past 5 Years |
Reena Aggarwal c/o Dimensional Fund Advisors LP 6300 Bee Cave Road, Building One Austin, TX 78746 1957 | | Director/ Trustee | | Since December 2021 | | Robert E. McDonough Professor of Business Administration and Finance, McDonough School of Business, Georgetown University (since 2003); Director, Georgetown Center for Financial Markets and Policy (since 2010); and Vice Provost of Faculty (2016-2020), Georgetown University. | | 147 portfolios in 5 investment companies | | Director, Cohen & Steers (asset management firm) (since 2017) and Director, Nuveen Churchill Direct Lending (private business development company) (since 2019). Formerly, Director, New York Life Investment Management IndexIQ (2008- 2021) (22 funds); Director, REAN Cloud (technology) (2015-2018); Director, FBR & Co. (investment banking) (2011- 2017); and Director, Brightwood Capital Advisors, L.P. (private equity) (2013- 2020). |
| | | | | |
George M. Constantinides University of Chicago Booth School of Business 5807 S. Woodlawn Avenue Chicago, IL 60637 1947 | | Director/ Trustee | | DFAIDG – Since 1983; DIG & DEM- Since 1993; DFAITC – Since 1992; ETF Trust – Since 2020 | | Leo Melamed Professor of Finance, University of Chicago Booth School of Business (since 1978). | | 147 portfolios in 5 investment companies | | None |
182
| | | | | | | | | | |
Name, Address and Year of Birth | | Position | | Term of Office1 and Length of Service | | Principal Occupation During Past 5 Years | | Portfolios within the DFA Fund Complex2 Overseen | | Other Directorships of Public Companies Held During Past 5 Years |
| | | | | |
Douglas W. Diamond c/o Dimensional Fund Advisors LP 6300 Bee Cave Road, Building One Austin, TX 78746 1953 | | Director/ Trustee | | DFAIDG, DIG, DEM & DFAITC - Since 2017; ETF Trust – Since 2020 | | Merton H. Miller Distinguished Service Professor of Finance, University of Chicago Booth School of Business (since 1979). Formerly, Visiting Scholar, Federal Reserve Bank of Richmond (1990-2019). | | 147 portfolios in 5 investment companies | | None |
| | | | | |
Darrell Duffie c/o Dimensional Fund Advisors LP 6300 Bee Cave Road, Building One Austin, TX 78746 1954 | | Director/ Trustee | | DFAIDG, DIG, DEM & DFAITC - Since 2019; ETF Trust – Since 2020 | | Adams Distinguished Professor of Management and Professor of Finance, Stanford University (since 1984) and Director, TNB Inc. (bank) (since 2020). | | 147 portfolios in 5 investment companies | | Formerly, Director, Moody’s Corporation (financial information and information technology) (2008- 2018). |
| | | | | |
Francis A. Longstaff c/o Dimensional Fund Advisors LP 6300 Bee Cave Road, Building One Austin, TX 78746 1956 | | Director/ Trustee | | Since December 2021 | | Allstate Professor of Insurance and Finance, UCLA, Anderson School of Management; Consultant, NERA Economic Consulting (since 2018); Consultant, Charles River Associates (economic consulting firm) (since 2013); Consultant, Simplex Holdings, Inc. (technology firm) (since 1998); and Expert Witness, Analysis Group (economic consulting firm) (since 2012). | | 147 portfolios in 5 investment companies | | None |
| | | | | |
Abbie J. Smith University of Chicago Booth School of Business 5807 S. Woodlawn Avenue Chicago, IL 60637 1953 | | Director/ Trustee | | DFAIDG, DIG, DEM & DFAITC - Since 2000; ETF Trust – Since 2020 | | Boris and Irene Stern Distinguished Service Professor of Accounting and James S. Ely, III Faculty Fellow, University of Chicago Booth School of Business (since 1980). | | 147 portfolios in 5 investment companies | | Director (since 2000) and formerly, Lead Director (2014- 2017), HNI Corporation (office furniture); Director, Ryder System Inc. (transportation, logistics and supply-chain management) (since 2003); and Trustee, UBS Funds (2 investment companies within the fund complex) (13 portfolios) (since 2009). |
| | | | | |
Heather E. Tookes Yale School of Management 165 Whitney Avenue New Haven, CT 06511 1974 | | Director/ Trustee | | Since December 2021 | | Professor of Finance, Yale School of Management (since 2004). | | 147 portfolios in 5 investment companies | | Director, Payoneer Inc. (digital payments) (since 2021); Director, Ariel Investments LLC (since 2017); and Director, Community Foundation of Greater New Haven (community foundation and grant-making) (since 2022). Formerly, Director, KCG Holdings (trading company) (January 2017-July 2017). |
183
| | | | | | | | | | |
Name, Address and Year of Birth | | Position | | Term of Office1 and Length of Service | | Principal Occupation During Past 5 Years | | Portfolios within the DFA Fund Complex2 Overseen | | Other Directorships of Public Companies Held During Past 5 Years |
| | | | | |
Ingrid M. Werner c/o Dimensional Fund Advisors LP 6300 Bee Cave Road, Building One Austin, TX 78746 1961 | | Director/ Trustee | | DFAIDG, DIG, DEM & DFAITC - Since 2019; ETF Trust – Since 2020 | | Martin and Andrew Murrer Professor of Finance, Fisher College of Business, The Ohio State University (since 1998). Adjunct Member, the Prize Committee for the Swedish Riksbank Prize in Economic Sciences in Memory of Alfred Nobel (annual award for significant scientific research contribution) (since 2018). Director, American Finance Association (global association of academic researchers and practitioners in finance) (since January 2019). Member, Scientific Board, Leibniz Institute for Financial Research (institute supporting academic research in finance) (since 2020). Chair, Economic Advisory Committee, FINRA (since 2017). Chairman, Scientific Advisory Board, Swedish House of Finance (institute supporting academic research in finance) (since 2014). Member, Scientific Board, Danish Finance Institute (institute supporting academic research in finance) (since 2017). Fellow, Center for Analytical Finance (academic research) (since 2015). Associate Editor, Journal of Finance (since 2016). Formerly, President, Western Finance Association (global association of academic researchers and practitioners in finance) (2018-2019). Formerly, Member, Academic Board, Mistra Financial Systems (organization funding academic research on environment, governance and climate/sustainability in finance) (2016-2021). | | 147 portfolios in 5 investment companies | | Director, Fourth Swedish AP Fund (pension fund asset management) (since 2017). |
184
Interested Directors/Trustees
The following interested Directors are described as such because each is deemed to be an “interested person,” as that term is defined under the 1940 Act, due to his position with the Advisor.
| | | | | | | | | | |
Name, Address and Year of Birth | | Position | | Term of Office1 and Length of Service | | Principal Occupation During Past 5 Years | | Portfolios
within the
DFA Fund
Complex2
Overseen | | Other
Directorships
of Public
Companies
Held During
Past 5 Years |
David P. Butler c/o Dimensional Fund Advisors LP 6300 Bee Cave Road, Building One, Austin, TX 78746 1964 | | Director Co-Chief Executive Officer | | Director since December 2021 Co-Chief Executive Officer since 2017 (DFAIDG, DIG, DEM & DFAITC); 2020 (ETF Trust) | | Co-Chief Executive Officer of Dimensional Emerging Markets Value Fund (“DEM”), DFAIDG, Dimensional Investment Group Inc. (“DIG”), The DFA Investment Trust Company (“DFAITC”), Dimensional Holdings Inc., Dimensional Fund Advisors LP, Dimensional Investment LLC, and DFA Securities LLC (collectively with DEM, DFAIDG, DIG and DFAITC, the “DFA Entities”) (since 2017), DFA Canada LLC (since 2018), Dimensional Holdings LLC (since 2017), and Dimensional ETF Trust (since 2020); Chief Executive Officer of Dimensional Fund Advisors Canada ULC (since 2018); Director (since 2017) of Dimensional Holdings Inc., Dimensional Fund Advisors Canada ULC, Dimensional Japan Ltd., Dimensional Advisors Ltd., Dimensional Fund Advisors Ltd., and DFA Australia Limited; Director and Co-Chief Executive Officer (since 2017) of Dimensional Cayman Commodity Fund I Ltd.; Chief Executive Officer of Dimensional Fund Advisors Canada ULC (since 2018); Head of Global Financial Advisor Services for Dimensional Fund Advisors LP (since 2007) and Dimensional Investment LLC (since 2017); Formerly, Vice President (2007 – 2017) of all the DFA Entities; Formerly, Head of Global Advisor Services for Dimensional Investment LLC (2011-2017). | | 147 portfolios
in 5
investment
companies | | None |
| | | | | |
Gerard K. O’Reilly c/o Dimensional Fund Advisors LP 6300 Bee Cave Road, Building One, Austin, TX 78746 1976 | | Chairman and Director Co-Chief Executive Officer and Chief Investment Officer | | Chairman and Director since December 2021 Co-Chief Executive Officer and Chief Investment Officer since 2017 (DFAIDG, DIG, DEM & DFAITC); 2020 (ETF Trust) | | Co-Chief Executive Officer and Chief Investment Officer of the DFA Entities (since 2017) and Dimensional ETF Trust (since 2020); Co-Chief Executive Officer of Dimensional Canada LLC (since 2018); Chief Investment Officer of Dimensional Fund Advisors Canada ULC (since 2017); Director, Chief Investment Officer (since 2017) and Vice President (since 2014) of DFA Australia Limited; Chief Investment Officer (since 2018) and Vice President (since 2016) of Dimensional Japan Ltd.; Director, Co-Chief Executive Officer and Chief Investment Officer (since 2017) of Dimensional Cayman Commodity Fund I Ltd.; Director of Dimensional Funds plc (since 2014), Dimensional Fund II plc (since 2014), Dimensional Holdings Inc. (since 2017), Dimensional Advisors Ltd. (since 2017), and Dimensional Ireland Limited (since 2018). Formerly, Executive Vice President (2017) and Co-Chief Investment Officer (2014 – 2017) of the DFA Entities; Formerly, Vice President (2007 – 2017) of the DFA Entities; Formerly, Vice President and Co-Chief Investment Officer (2014 – 2017) of Dimensional Fund Advisors Canada ULC. Formerly, Director of Dimensional Fund Advisors Pte. Ltd. (2017-2018) and Dimensional Fund Advisors Ltd. (2018-2021). | | 147 portfolios
in 5
investment
companies | | None |
| 1 | Each Director/Trustee holds office for an indefinite term until his or her successor is elected and qualified. |
| 2 | Each Director/Trustee is a director or trustee of each of the five registered investment companies within the DFA Fund Complex, which include: the Fund; DIG; DFAITC; DEM; and Dimensional ETF Trust. Each disinterested Director/Trustee also serves on the Independent Review Committee of the Dimensional Funds, mutual funds registered in the provinces of Canada and managed by the Advisor’s affiliate, Dimensional Fund Advisors Canada ULC. |
185
Officers
Below is the name, year of birth, information regarding positions with the Funds and the principal occupation for each officer of the Funds. The address of each officer is 6300 Bee Cave Road, Building One, Austin, TX 78746. Each of the officers listed below holds the same office (except as otherwise noted) in the DFA Entities.
| | | | | | |
Name and Year of Birth | | Position | | Term of Office1 and Length of Service | | Principal Occupation During Past 5 Years |
Valerie A. Brown 1967 | | Vice President and Assistant Secretary | | Since 2001 | | Vice President and Assistant Secretary of • all the DFA Entities (since 2001) • DFA Australia Limited (since 2002) • Dimensional Fund Advisors Ltd. (since 2002) • Dimensional Cayman Commodity Fund I Ltd. (since 2010) • Dimensional Fund Advisors Pte. Ltd. (since 2012) • Dimensional Hong Kong Limited (since 2012) • Dimensional ETF Trust (since 2020) Director, Vice President and Assistant Secretary (since 2003) of • Dimensional Fund Advisors Canada ULC |
| | | |
Ryan P. Buechner 1982 | | Vice President and Assistant Secretary | | Since 2019 | | Vice President and Assistant Secretary of • DFAIDG, DIG, DFAITC and DEM (since 2019) • Dimensional ETF Trust (since 2020) Vice President (since January 2018) of • Dimensional Holdings Inc. |
186
| | | | | | |
Name and Year of Birth | | Position | | Term of Office1 and Length of Service | | Principal Occupation During Past 5 Years |
| | | | | �� | • Dimensional Fund Advisors LP • Dimensional Investment LLC • DFA Securities LLC |
| | | |
Stephen A. Clark 1972 | | Executive Vice President | | Since 2017 | | Executive Vice President of • all the DFA Entities (since 2017) • Dimensional ETF Trust (since 2020) Director and Vice President (since 2016) of • Dimensional Japan Ltd. Chairman (since 2018) of • Dimensional Fund Advisors Canada ULC President and Director (since 2016) of • Dimensional Fund Advisors Canada ULC Vice President (since 2008) and Director (since 2016) of • DFA Australia Limited Director (since 2016) of • Dimensional Advisors Ltd. • Dimensional Fund Advisors Pte. Ltd. • Dimensional Hong Kong Limited Vice President of • Dimensional Advisors Ltd. (since 2016) • Dimensional Hong Kong Limited (since 2016) • Dimensional Fund Advisors Pte. Ltd. (since 2019) Formerly, Director (2016-2021) of • Dimensional Fund Advisors Ltd. Formerly, Vice President (2004 – 2017) of • all the DFA Entities Formerly, Vice President (2010 – 2016) of • Dimensional Fund Advisors Canada ULC Formerly, Vice President (2016-2019) of • Dimensional Fund Advisors Pte. Ltd. Formerly, Interim Chief Executive Officer (2019-2020) of • Dimensional Fund Advisors Pte. Ltd. Formerly, Head of Institutional, North America (2012 – 2013) and Head of Global Institutional Services (2014-2018) for • Dimensional Fund Advisors LP |
| | | |
Lisa M. Dallmer 1972 | | Chief Operating Officer | | Since June 2021 | | Chief Operating Officer (since June 2021) of • the DFA Fund Complex Executive Vice President (since January 2020) • Dimensional Holdings Inc. • Dimensional Fund Advisors LP • Dimensional Investment LLC • DFA Securities LLC Chief Operating Officer (since December 2019) • Dimensional Holdings Inc. • Dimensional Fund Advisors LP • Dimensional Investment LLC • DFA Securities LLC Vice President (since 2020) of • DFA Australia Limited • Dimensional Advisors Ltd. • Dimensional Fund Advisors Canada ULC • Dimensional Fund Advisors Pte. Ltd. • Dimensional Ireland Limited • Dimensional Japan Ltd. Formerly, Vice President, Chief Financial Officer, and Treasurer (June 2020-June 2021) of |
187
| | | | | | |
Name and Year of Birth | | Position | | Term of Office1 and Length of Service | | Principal Occupation During Past 5 Years |
| | | |
| | | | | | • the DFA Fund Complex Formerly, Senior Vice President, Business Operations (March 2019 – October 2019) at • Delphix Inc. Formerly, Chief Operating Officer Global Technology & Operations, Managing Director (2014 – 2018) of • BlackRock Inc. |
| | | |
| Bernard J. Grzelak 1971 | | Vice President | | Since June 2021 | | Vice President (since June 2021) of • the DFA Fund Complex Vice President, Chief Financial Officer and Treasurer (since September 2020) of • DFA Australia Limited • Dimensional Fund Advisors Canada ULC • DFA Securities LLC • Dimensional Advisors Ltd. • Dimensional Fund Advisors LP • Dimensional Fund Advisors Ltd. • Dimensional Fund Advisors Pte. Ltd. • Dimensional Holdings Inc. • Dimensional Hong Kong Limited • Dimensional Investment LLC Vice President (since March 2021) of • Dimensional Ireland Limited Formerly, Partner (2008 – 2020), Chief Operating Officer, Global Funds and Risk (2018 – 2020), Chief Operations Officer (2016 – 2018), and Director of Fund Administration (2003 – 2016) of • Lord Abbett & Co. LLC Formerly, Chief Financial Officer (2017 - 2020), and Treasurer (2003 – 2017) of • Lord Abbett Family of Funds |
| | | |
Eric Hall 1978 | | Vice President and Assistant Treasurer | | Since June 2021 | | Vice President and Assistant Treasurer (since June 2021) of • the DFA Fund Complex Formerly, Data Integrity Team Lead (December 2019 – April 2021) of • Clearwater Analytics Formerly, Assistant Vice President and Assistant Treasurer (March 2015 – November 2019) at • INVESCO, U.S. (formerly, OppenheimerFunds, Inc.) |
| | | |
Jeff J. Jeon 1973 | | Vice President | | Since 2004 | | Vice President (since 2004) of • all the DFA Entities Vice President (since 2020) of • Dimensional ETF Trust Vice President and Assistant Secretary (since 2010) of • Dimensional Cayman Commodity Fund I Ltd. Formerly, Assistant Secretary (2017-2019) of • all the DFA Entities |
| | | |
Joy Lopez 1971 | | Vice President and Assistant Treasurer | | Vice President since 2015 and Assistant Treasurer since 2017 | | Vice President of • all the DFA Entities (since 2015) • Dimensional Fund Advisors Ltd. (since 2015) • Dimensional ETF Trust (since 2020) • DFA Australia Limited (since 2020) • Dimensional Fund Advisors Canada ULC (since 2020) • Dimensional Ireland Limited (since 2020) Assistant Treasurer of |
188
| | | | | | |
Name and Year of Birth | | Position | | Term of Office1 and Length of Service | | Principal Occupation During Past 5 Years |
| | | | | | • DFAIDG, DIG, DFAITC and DEM (since 2017) • Dimensional ETF Trust (since 2020) |
| | | |
Kenneth M. Manell 1972 | | Vice President | | Since 2010 | | Vice President of • all the DFA Entities (since 2010) • Dimensional Cayman Commodity Fund I Ltd. (since 2010) • Dimensional ETF Trust (since 2020) |
| | | |
Jan Miller 1963 | | Vice President, Chief Financial Officer, and Treasurer | | Since June 2021 | | Vice President, Chief Financial Officer, and Treasurer (since June 2021) of • the DFA Fund Complex Formerly, Director (May 2019 – January 2021) at • INVESCO, U.S. (formerly, OppenheimerFunds, Inc.) Formerly, Vice President and Assistant Treasurer (September 2012 – May 2019) at • OppenheimerFunds, Inc. |
| | | |
Catherine L. Newell 1964 | | President and General Counsel | | President since 2017 and General Counsel since 2001 | | President of • DFAIDG, DIG, DFAITC and DEM (since 2017) • Dimensional ETF Trust (since 2020) General Counsel of • all the DFA Entities (since 2001) • Dimensional Fund Advisors LP (since 2006) • Dimensional Holdings Inc (since 2006) • Dimensional Investment LLC (since 2009) • DFA Canada LLC (since 2009) • Dimensional ETF Trust (since 2020) Executive Vice President (since 2017) of • Dimensional Fund Advisors LP • Dimensional Holdings Inc. • DFA Securities LLC • Dimensional Investment LLC Secretary of • Dimensional Fund Advisors LP (since 2006) • Dimensional Holdings Inc. (since 2006) • DFA Securities LLC (since 2006) • Dimensional Investment LLC (since 2009) |
| | | |
| | | | | | Vice President (since 1997) and Secretary (since 2002) of • DFA Australia Limited • Dimensional Fund Advisors Ltd. Vice President and Secretary of • Dimensional Fund Advisors Canada ULC (since 2003) • DFA Canada LLC (since 2009) • Dimensional Cayman Commodity Fund I Ltd. (since 2010) • Dimensional Japan Ltd. (since 2012) • Dimensional Advisors Ltd (since 2014) • Dimensional Fund Advisors Pte. Ltd. (since 2012) Vice President and Assistant Secretary (since 2012) of • Dimensional Hong Kong Limited Director of • Dimensional Australia Limited (since 2007) • Dimensional Funds plc (since 2002) • Dimensional Funds II plc (since 2006) • Director of Dimensional Japan Ltd. (since 2012) • Dimensional Advisors Ltd. (since 2012) • Dimensional Fund Advisors Pte. Ltd. (since 2012) • Dimensional Hong Kong Limited (since 2012) |
189
| | | | | | |
Name and Year of Birth | | Position | | Term of Office1 and Length of Service | | Principal Occupation During Past 5 Years |
| | | | | | • Dimensional Ireland Limited (since 2018) Formerly, Vice President and Secretary (2010 – 2014) of • Dimensional Smart Nest (US) LLC Formerly, Vice President (1997 – 2017) and Secretary (2000 – 2017) of • DFAIDG, DIG, DFAITC and DEM Formerly, Vice President of • Dimensional Fund Advisors LP (1997 – 2017) • Dimensional Holdings Inc. (2006 – 2017) • DFA Securities LLC (1997 – 2017) • Dimensional Investment LLC (2009 – 2017) Formerly, Director (2002 – 2021) of • Dimensional Fund Advisors Ltd. |
| | | |
Selwyn J. Notelovitz 1961 | | Vice President | | Since September 2021 | | Vice President (since September 2021) of • the DFA Fund Complex Vice President (since December 2012) and Chief Compliance Officer (since July 2020) of • DFA Securities LLC • Dimensional Fund Advisors LP • Dimensional Holdings Inc. • Dimensional Investment LLC Chief Compliance Officer (since July 2020) of: • DFA Australia Limited • Dimensional Fund Advisors Ltd. • Dimensional Fund Advisors Canada ULC Formerly, Deputy Chief Compliance Officer (2013-2020) of: • DFA Fund Complex • DFA Securities LLC • Dimensional Fund Advisors LP • Dimensional Holdings Inc. • Dimensional Investment LLC Formerly, Vice President (2013-2020) of: • DFA Fund Complex Formerly, Director (2019-2021) of: • Dimensional Ireland Limited |
| | | |
Carolyn L. O 1974 | | Vice President and Secretary | | Vice President since 2010 and Secretary since 2017 | | Vice President and Secretary of • DFAIDG, DIG, DFAITC and DEM (since 2010 and 2017, respectively) • Dimensional ETF Trust (since 2020) Vice President (since 2010) and Assistant Secretary (since 2016) of • Dimensional Fund Advisors LP • Dimensional Holdings Inc. • Dimensional Investment LLC Vice President of • DFA Securities LLC (since 2010) • Dimensional Cayman Commodity Fund I Ltd. (since 2010) • Dimensional Fund Advisors Canada ULC (since 2016) Assistant Secretary (since 2016) of • DFA Securities LLC |
| | | |
Randy C. Olson 1980 | | Chief Compliance Officer | | Since 2020 | | Chief Compliance Officer (since 2020) • the DFA Fund Complex • Vice President (since 2016) of • DFA Securities LLC • Dimensional Fund Advisors LP • Dimensional Holdings Inc. |
190
| | | | | | |
Name and Year of Birth | | Position | | Term of Office1 and Length of Service | | Principal Occupation During Past 5 Years |
| | | | | | • Dimensional Investment LLC Formerly, Vice President – Senior Compliance Officer • Dimensional Investment Advisors LP (January 2020 – August 2020 and July 2014 – March 2017) Formerly, Vice President – Head of Compliance & Operations Asia Ex-Japan • Dimensional Investment Advisors LP (April 2017 – January 2020) |
| | | |
James J. Taylor 1983 | | Vice President and Assistant Treasurer | | Since 2020 | | Vice President and Assistant Treasurer (since 2020) of • the DFA Fund Complex Vice President • Dimensional Holdings Inc. (since 2016) • Dimensional Fund Advisors LP (since 2016) • Dimensional Investment LLC (since 2016) • DFA Securities LLC (since 2016) • Dimensional Fund Advisors Canada ULC (since 2020) |
| 1 | Each officer holds office for an indefinite term at the pleasure of the Board of Directors and until his or her successor is elected and qualified. |
191
VOTING PROXIES ON FUND PORTFOLIO SECURITIES
A description of the policies and procedures that the Fund uses in voting proxies relating to securities held in the portfolio is available (1) without charge, upon request, by calling collect: (512) 306-7400; (2) from the Advisor’s website at http://us.dimensional.com; and (3) on the SEC’s website at http://www.sec.gov. Information regarding how the Advisor votes these proxies is available from the EDGAR database on the SEC’s website at http://www.sec.gov and from the Advisor’s website at https://www.dimensional.com/us-en/who-we-are/investment-stewardship and reflects the twelve-month period beginning July 1st and ending June 30th.
192
TAX NOTICE TO SHAREHOLDERS
(Unaudited)
The following information is solely for informational purposes. Each Portfolio is designating the U.S. federal income tax character of the following items with respect to distributions paid or expected to be paid to shareholders related to the fiscal year ended October 31, 2022. All designations are based on financial information available as of the date of this annual report and, accordingly are subject to change. For each classification below and including “Section 163(j) interest dividends” as defined in Treasury Regulation §1.163(j)-1(b)(35) and “Section 199A dividends” as defined in Treasury Regulation §1.199A -3(d), it is the intent of the Portfolio to designate the maximum amount permitted under the Internal Revenue Code and the regulations thereunder.
For U.S. federal income tax purposes, shareholders generally must report distributions received from a Portfolio on a calendar-year basis, which therefore may include distributions with respect to portions of two fiscal years of the Portfolio. Annual statements needed by shareholders concerning the tax status of distributions received for the calendar year 2022 (e.g., IRS Form 1099-DIV) will be provided in early 2023. Shareholders should refer to these statements in preparing their calendar year 2022 tax returns. Please consult your tax advisor for the proper treatment of this information. Unless otherwise noted, the amounts in the table are expressed as a percentage of the distributions paid with respect to the fiscal year ended October 31, 2022.
| | | | | | | | | | | | | | | | | | | | | | | | | | | | | | | | | | | | | | | | | | | | | | | | | | | | |
DFA
Investment Dimensions
Group Inc. | | Net
Investment
Income
Distributions | | | Short-Term
Capital Gain
Distributions | | | Long-Term
Capital Gain
Distributions | | | Return of
Capital | | | Tax-Exempt
Interest | | | Total
Distributions | | | Qualified
Dividends
(for
Corporate
Dividends
Received
Deduction) (1) | | | Qualified
Dividend
Income (2) | | | U.S.
Government
Interest (3) | | | Foreign
Tax
Credit (4) | | | Foreign
Source
Income (5) | | | Qualified
Net
Interest
Income (6) | | | Qualified
Short-
Term
Capital
Gain (7) | |
Enhanced U.S. Large Company Portfolio | | | 2 | % | | | 41 | % | | | 57 | % | | | — | | | | — | | | | 100 | % | | | — | | | | — | | | | — | | | | — | | | | — | | | | — | | | | 100 | % |
U.S. Large Cap Equity Portfolio | | | 28 | % | | | — | | | | 72 | % | | | — | | | | — | | | | 100 | % | | | 100 | % | | | 100 | % | | | — | | | | — | | | | — | | | | — | | | | — | |
U.S. Large Cap Value Portfolio | | | 40 | % | | | — | | | | 60 | % | | | — | | | | — | | | | 100 | % | | | 100 | % | | | 100 | % | | | — | | | | — | | | | — | | | | — | | | | — | |
U.S. Targeted Value Portfolio | | | 17 | % | | | 9 | % | | | 74 | % | | | — | | | | — | | | | 100 | % | | | 100 | % | | | 100 | % | | | — | | | | — | | | | — | | | | 1 | % | | | 100 | % |
U.S. Small Cap Value Portfolio | | | 15 | % | | | 7 | % | | | 78 | % | | | — | | | | — | | | | 100 | % | | | 100 | % | | | 100 | % | | | — | | | | — | | | | — | | | | 1 | % | | | 100 | % |
U.S. Core Equity 1 Portfolio | | | 32 | % | | | — | | | | 68 | % | | | — | | | | — | | | | 100 | % | | | 100 | % | | | 100 | % | | | — | | | | — | | | | — | | | | 1 | % | | | — | |
U.S. Core Equity 2 Portfolio | | | 25 | % | | | 1 | % | | | 74 | % | | | — | | | | — | | | | 100 | % | | | 100 | % | | | 100 | % | | | — | | | | — | | | | — | | | | 1 | % | | | 100 | % |
U.S. Vector Equity Portfolio | | | 17 | % | | | 3 | % | | | 80 | % | | | — | | | | — | | | | 100 | % | | | 100 | % | | | 100 | % | | | — | | | | — | | | | — | | | | 1 | % | | | 100 | % |
U.S. Small Cap Portfolio | | | 15 | % | | | — | | | | 85 | % | | | — | | | | — | | | | 100 | % | | | 100 | % | | | 100 | % | | | — | | | | — | | | | — | | | | 1 | % | | | — | |
U.S. Micro Cap Portfolio | | | 9 | % | | | — | | | | 91 | % | | | — | | | | — | | | | 100 | % | | | 100 | % | | | 100 | % | | | — | | | | — | | | | — | | | | 1 | % | | | — | |
U.S. High Relative Profitability Portfolio | | | 40 | % | | | 4 | % | | | 56 | % | | | — | | | | — | | | | 100 | % | | | 100 | % | | | 100 | % | | | — | | | | — | | | | — | | | | 1 | % | | | 100 | % |
DFA Real Estate Securities Portfolio | | | 61 | % | | | 7 | % | | | 32 | % | | | — | | | | — | | | | 100 | % | | | — | | | | — | | | | — | | | | — | | | | — | | | | 1 | % | | | 100 | % |
DFA Commodity Strategy Portfolio. | | | 100 | % | | | — | | | | — | | | | — | | | | — | | | | 100 | % | | | — | | | | — | | | | 100 | % | | | — | | | | — | | | | 100 | % | | | — | |
Dimensional Investment Group Inc. | | | | | | | | | | | | | | | | | | | | | | | | | | | | | | | | | | | | | | | | | | | | | | | | | | | | |
U.S. Large Company Portfolio | | | 18 | % | | | — | | | | 82 | % | | | — | | | | — | | | | 100 | % | | | 100 | % | | | 100 | % | | | — | | | | — | | | | — | | | | — | | | | — | |
| (1) | Qualified Dividends represents the amount that qualifies for the corporate dividends-received deduction under Section 243 of the Internal Revenue Code and is reflected as a percentage of estimated ordinary income distributions (the total of short-term capital gain and net investment income distributions) for the calendar year 2022. |
| (2) | Qualified Dividend Income represents the amount that qualifies for the reduced capital gain tax rate under Section 1(h)(11) of the Internal Revenue Code and is reflected as a percentage of estimated ordinary income distributions (the total of short-term capital gain and net investment income distributions) for the calendar year 2022. |
| (3) | U.S. Government Interest represents the amount of interest that was derived from direct U.S. Government obligations and distributed during the fiscal year. This amount is reflected as a percentage of total estimated ordinary income distributions (the total of short-term capital gain and net investment income distributions) for the calendar year 2022. Generally, interest from direct U.S. Government obligations is exempt from state income tax. Please consult your tax advisor for the availability of a state tax exemption based on your individual circumstances. |
See accompanying Notes to Financial Statements.
193
| (4) | Foreign Tax Credit represents the amount of dividends that qualify for the foreign tax credit pass through under Section 853 of the Internal Revenue Code and is reflected as a percentage of “investment company taxable income” (as defined in Section 852(b)(2) of the Internal Revenue Code). |
| (5) | Foreign Source Income represents the amount of dividends derived from foreign sources and is reflected as a percentage of “investment company taxable income” (as defined in Section 852(b)(2) of the Internal Revenue Code). |
| (6) | Qualified Net Interest Income represents the amount of interest income available as interest-related dividends generally exempt from withholding taxes for non-U.S. shareholders under Section 871(k)(1) of the Internal Revenue Code. The information is reflected as a percentage estimated ordinary income distributions (the total of short-term capital gain and net investment income distributions) for the calendar year 2022. |
| (7) | Qualified Short-Term Capital Gain represents the amount available as short-term capital gain dividends generally exempt from withholding taxes for non-U.S. shareholders under Section 871(k)(2) of the Internal Revenue Code. The information is reflected as a percentage of estimated ordinary income distributions (the total of short-term capital gain and net investment income distributions) for the calendar year 2022. |
See accompanying Notes to Financial Statements.
194
| | |
 | | DFA103122-001AD 00281081 |

Annual Report
Year Ended: October 31, 2022
DFA INVESTMENT DIMENSIONS GROUP INC. / DIMENSIONAL INVESTMENT GROUP INC. / THE DFA INVESTMENT TRUST COMPANY / DIMENSIONAL EMERGING MARKETS VALUE FUND
DFA Investment Dimensions Group Inc.
Large Cap International Portfolio
International Core Equity Portfolio
Global Small Company Portfolio
International Small Company Portfolio
Japanese Small Company Portfolio
Asia Pacific Small Company Portfolio
United Kingdom Small Company Portfolio
Continental Small Company Portfolio
DFA International Real Estate Securities Portfolio
DFA Global Real Estate Securities Portfolio
DFA International Small Cap Value Portfolio
International Vector Equity Portfolio
International High Relative Profitability Portfolio
World ex U.S. Value Portfolio
World ex U.S. Core Equity Portfolio
World ex U.S. Targeted Value Portfolio
World Core Equity Portfolio
Selectively Hedged Global Equity Portfolio
Emerging Markets Portfolio
Emerging Markets Small Cap Portfolio
Emerging Markets Value Portfolio
Emerging Markets Core Equity Portfolio
Emerging Markets Targeted Value Portfolio
Emerging Markets ex China Core Equity Portfolio
Dimensional Investment Group Inc.
DFA International Value Portfolio
The DFA Investment Trust Company
The DFA International Value Series
The Japanese Small Company Series
The Asia Pacific Small Company Series
The United Kingdom Small Company Series
The Continental Small Company Series
The Canadian Small Company Series
The Emerging Markets Series
The Emerging Markets Small Cap Series
Dimensional Emerging Markets Value Fund

December 2022
Dear Shareholder,
For more than four decades, Dimensional has been innovating on behalf of investors, using financial science to pursue higher expected returns across a range of market conditions.
We start with what clients are seeking and determine how best to deliver strategies to meet those needs through a systematic approach designed to add value over indexing. Every day, we manage our strategies through a flexible process that allows us to consistently focus on reducing costs and controlling risks. We believe in sensible ideas that we can implement well. And we’re committed to continuing to enhance the investment solutions and services we provide to empower financial professionals.
On behalf of everyone at Dimensional, we thank you for entrusting us with your investments.
| | |
| Sincerely, | | |
| |
 | |  |
| |
| David P. Butler | | Gerard O’Reilly |
| CO-CHIEF EXECUTIVE OFFICER | | CO-CHIEF EXECUTIVE OFFICER and |
| | CHIEF INVESTMENT OFFICER |
[THIS PAGE INTENTIONALLY LEFT BLANK]
ANNUAL REPORT
Table of Contents
i
TABLE OF CONTENTS
CONTINUED
This report is submitted for the information of the Portfolio’s shareholders. It is not authorized for distribution to prospective investors unless preceded or accompanied by an effective prospectus.
ii
DFA INVESTMENT DIMENSIONS GROUP INC.
DIMENSIONAL INVESTMENT GROUP INC.
THE DFA INVESTMENT TRUST COMPANY
DIMENSIONAL EMERGING MARKETS VALUE FUND
DEFINITIONS OF ABBREVIATIONS AND FOOTNOTES
Schedules of Investments/Summary Schedules of Portfolio Holdings
| | |
| Investment Abbreviations |
ADR | | American Depositary Receipt |
SA | | Special Assessment |
REIT | | Real Estate Investment Trust |
GDR | | Global Depositary Receipt |
AUD | | Australian Dollars |
CAD | | Canadian Dollars |
CHF | | Swiss Franc |
DKK | | Danish Krone |
EUR | | Euro |
GBP | | British Pounds |
HKD | | Hong Kong Dollar |
ILS | | Israeli New Shekel |
JPY | | Japanese Yen |
NOK | | Norwegian Krone |
NZD | | New Zealand Dollars |
SEK | | Swedish Krona |
SGD | | Singapore Dollars |
|
| Investment Footnotes |
» | | Securities that have been fair value factored. See Note B to Financial Statements. |
‡ | | Calculated as a percentage of total net assets. Percentages shown parenthetically next to the category headings have been calculated as a percentage of total investments. “Other Securities” are those securities that are not among the top 50 holdings in unaffiliated issuers of the Fund or do not represent more than 1.0% of the net assets of the Fund. Some of the individual securities within this category may include Total or Partial Securities on Loan and/or Non-Income Producing Securities. |
# | | Total or Partial Securities on Loan. |
† | | See Note B to Financial Statements. |
@ | | Security purchased with cash collateral received from Securities on Loan. |
§ | | Affiliated Fund. |
†† | | Security valued using significant unobservable inputs (Level 3). |
* | | Non-Income Producing Securities. |
W | | Rule 144A, Section 4(2), or other security that is restricted as to resale to institutional investors. This security has been deemed liquid based upon the Fund’s Liquidity Guidelines. The liquidity determination is unaudited. |
1
DEFINITIONS OF ABBREVIATIONS AND FOOTNOTES
CONTINUED
| | |
| Financial Highlights | | |
| |
** | | The Net Investment Income (Loss) per share and the ratio of Net Investment Income to Average Net Assets includes the current year effect of an estimation related to a one time distribution from a real estate investment trust. Net Investment Income (Loss) per share, Net Gain (Loss) per share and the ratio of Net Investment Income to Average Net Assets for the DFA Global Real Estate Securities Portfolio would have been $0.39, $2.11 and 3.39%, respectively had the current year effect of this estimation not been considered. |
(A) | | Computed using average shares outstanding. |
(B) | | Represents the combined ratios for the respective Portfolio and its respective pro-rata share of its Master Fund(s) and/or Underlying Fund(s). |
(C) | | Represents the combined ratios for the respective Portfolio and its respective pro-rata share of its Master Fund(s). |
(D) | | Non-Annualized |
(E) | | Annualized |
(F) | | Because of commencement of operations and related preliminary transaction costs, these ratios are not necessarily indicative of future ratios. |
|
All Statements, Schedules and Notes to Financial Statements |
| |
— | | Amounts designated as — are either zero, rounded to zero, or less than $500. |
SEC | | Securities and Exchange Commission |
2
DFA INVESTMENT DIMENSIONS GROUP INC.
PERFORMANCE CHARTS
(Unaudited)
Large Cap International Portfolio vs.
MSCI World ex USA Index (net dividends)
October 31, 2012-October 31, 2022
International Core Equity Portfolio vs.
MSCI World ex USA Index (net dividends)
October 31, 2012-October 31, 2022
3
DFA INVESTMENT DIMENSIONS GROUP INC.
PERFORMANCE CHARTS
(Unaudited)
Global Small Company Portfolio vs.
MSCI All Country World Small Cap Index (net dividends)
January 18, 2017-October 31, 2022
International Small Company Portfolio vs.
MSCI World ex USA Small Cap Index (net dividends)
October 31, 2012-October 31, 2022
4
DFA INVESTMENT DIMENSIONS GROUP INC.
PERFORMANCE CHARTS
(Unaudited)
Japanese Small Company Portfolio vs.
MSCI Japan Small Cap Index (net dividends)
October 31, 2012-October 31, 2022
Asia Pacific Small Company Portfolio vs.
MSCI Pacific ex Japan Small Cap Index (net dividends)
October 31, 2012-October 31, 2022
5
DFA INVESTMENT DIMENSIONS GROUP INC.
PERFORMANCE CHARTS
(Unaudited)
United Kingdom Small Company Portfolio vs.
MSCI United Kingdom Small Cap Index (net dividends)
October 31, 2012-October 31, 2022
Continental Small Company Portfolio vs.
MSCI Europe ex UK Small Cap Index (net dividends)
October 31, 2012-October 31, 2022
6
DFA INVESTMENT DIMENSIONS GROUP INC.
PERFORMANCE CHARTS
(Unaudited)
DFA International Real Estate Securities Portfolio vs.
S&P Global ex U.S. REIT Index (net dividends)
October 31, 2012-October 31, 2022
DFA Global Real Estate Securities Portfolio vs.
S&P Global REIT Index (net dividends)
October 31, 2012-October 31, 2022
7
DFA INVESTMENT DIMENSIONS GROUP INC.
PERFORMANCE CHARTS
(Unaudited)
DFA International Small Cap Value Portfolio vs.
MSCI World ex USA Small Cap Index (net dividends),
MSCI World ex USA Small Value Index (net dividends)
October 31, 2012-October 31, 2022
International Vector Equity Portfolio vs.
MSCI World ex USA Index (net dividends)
October 31, 2012-October 31, 2022
8
DFA INVESTMENT DIMENSIONS GROUP INC.
PERFORMANCE CHARTS
(Unaudited)
International High Relative Profitability Portfolio vs.
MSCI World ex USA Index (net dividends)
May 16, 2017-October 31, 2022
World Ex U.S. Value Portfolio vs.
MSCI All Country World ex USA Index (net dividends),
MSCI All Country World ex USA Value Index (net dividends)
October 31, 2012-October 31, 2022
9
DFA INVESTMENT DIMENSIONS GROUP INC.
PERFORMANCE CHARTS
(Unaudited)
World Ex U.S. Core Equity Portfolio vs.
MSCI All Country World ex USA Index (net dividends)
April 9, 2013-October 31, 2022
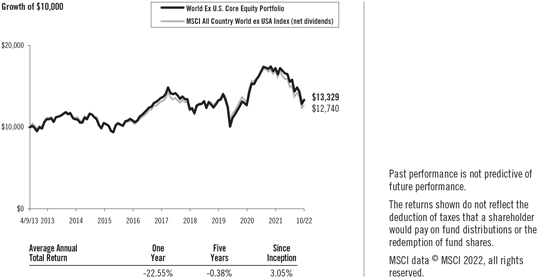
World ex U.S. Targeted Value Portfolio vs.
MSCI All Country World ex USA Small Cap Index (net dividends),
MSCI All Country World ex USA SMID Value Index (net dividends)
November 1, 2012-October 31, 2022
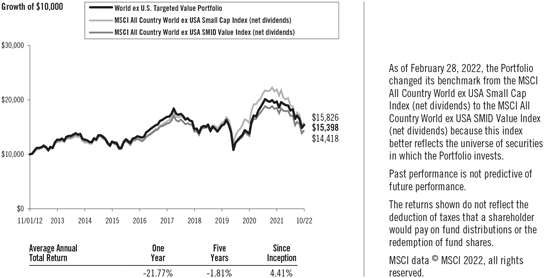
10
DFA INVESTMENT DIMENSIONS GROUP INC.
PERFORMANCE CHARTS
(Unaudited)
World Core Equity Portfolio vs.
MSCI All Country World Index (net dividends)
October 31, 2012-October 31, 2022
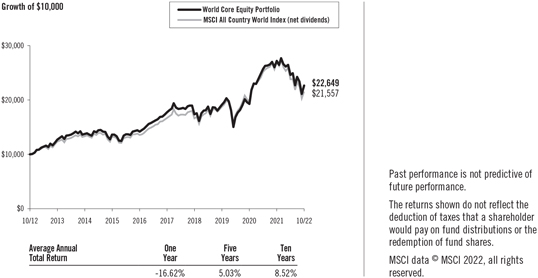
Selectively Hedged Global Equity Portfolio vs.
MSCI All Country World Index (net dividends)
October 31, 2012-October 31, 2022
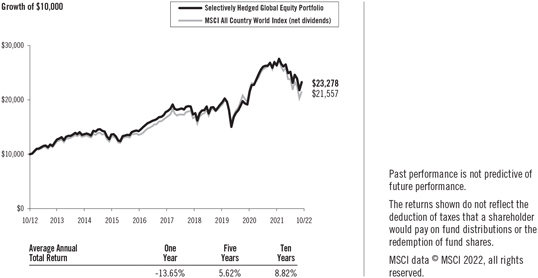
11
DFA INVESTMENT DIMENSIONS GROUP INC.
PERFORMANCE CHARTS
(Unaudited)
Emerging Markets Portfolio vs.
MSCI Emerging Markets Index (net dividends)
October 31, 2012-October 31, 2022
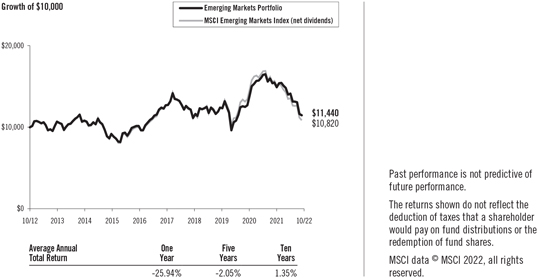
Emerging Markets Small Cap Portfolio vs.
MSCI Emerging Markets Index (net dividends)
October 31, 2012-October 31, 2022
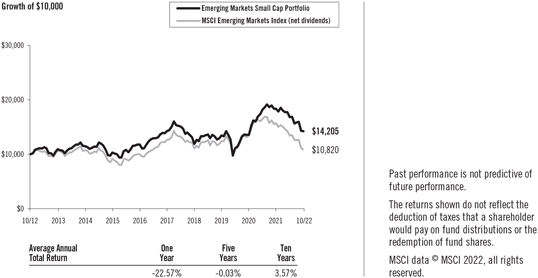
12
DFA INVESTMENT DIMENSIONS GROUP INC.
PERFORMANCE CHARTS
(Unaudited)
Emerging Markets Value Portfolio — Institutional Class vs.
MSCI Emerging Markets Index (net dividends),
MSCI Emerging Markets Value Index (net dividends)
October 31, 2012-October 31, 2022
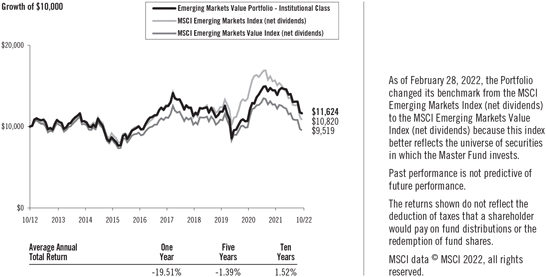
Emerging Markets Value Portfolio — Class R2 vs.
MSCI Emerging Markets Index (net dividends),
MSCI Emerging Markets Value Index (net dividends)
October 31, 2012-October 31, 2022
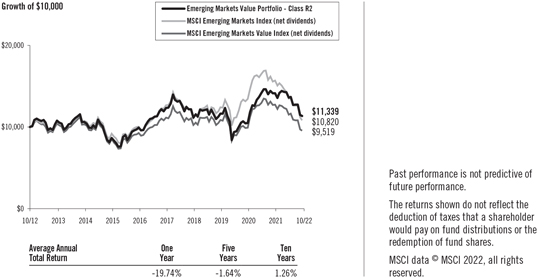
13
DFA INVESTMENT DIMENSIONS GROUP INC.
PERFORMANCE CHARTS
(Unaudited)
Emerging Markets Core Equity Portfolio vs.
MSCI Emerging Markets Index (net dividends)
October 31, 2012-October 31, 2022
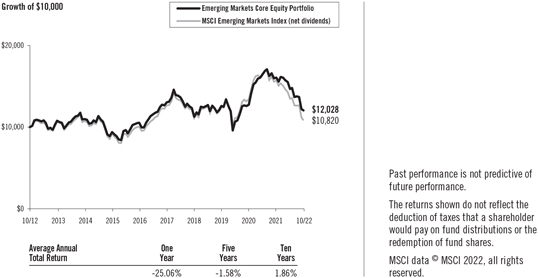
Emerging Markets Targeted Value Portfolio vs.
MSCI Emerging Markets Index (net dividends)
November 14, 2018-October 31, 2022
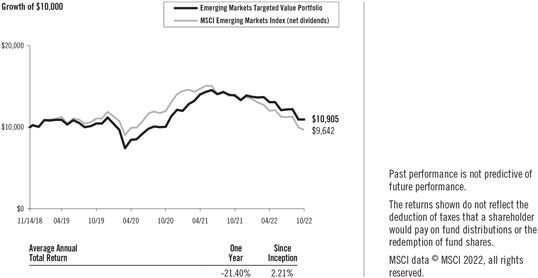
14
DFA INVESTMENT DIMENSIONS GROUP INC.
PERFORMANCE CHARTS
(Unaudited)
Emerging Markets ex China Core Equity Portfolio vs.
MSCI Emerging Markets ex China Index (net dividends)
November 15, 2021-October 31, 2022
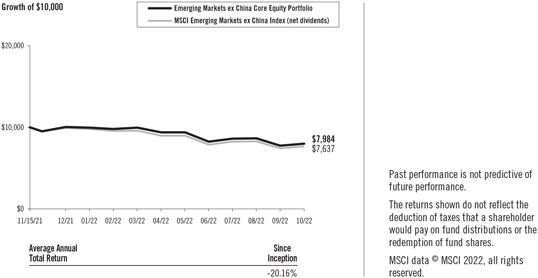
15
MANAGEMENT’S DISCUSSION AND ANALYSIS
| | |
| International Equity Market Review | | 12 Months Ended October 31, 2022 |
Performance of non-U.S. developed markets was negative for the period. As measured by the MSCI World ex USA indices, small-cap stocks underperformed large-cap stocks, and mid-cap stocks, a subset of the large-cap universe, underperformed large-cap stocks but outperformed small-cap stocks. Value stocks outperformed growth stocks as measured by the MSCI World ex USA indices.
Total Return for 12 Months Ended October 31, 2022
| | | | |
| | | Return in U.S. Dollars | |
MSCI World ex USA Index | | | -22.04 | % |
MSCI World ex USA Mid Cap Index | | | -27.57 | % |
MSCI World ex USA Small Cap Index | | | -29.13 | % |
MSCI World ex USA Value Index | | | -15.27 | % |
MSCI World ex USA Growth Index | | | -28.78 | % |
For the 12 Months Ended October 31, 2022, the U.S. dollar appreciated against all non-U.S. developed markets currencies. Overall, currency movements had a negative impact on the U.S. dollar-denominated returns of developed markets.
Total Return for 12 Months Ended October 31, 2022
| | | | | | | | |
Ten Largest Foreign Developed Markets by Market Cap | | Local Return | | | Return in U.S. Dollars | |
Japan | | | -1.81 | % | | | -24.67 | % |
United Kingdom | | | 4.27 | % | | | -12.42 | % |
Canada | | | -5.29 | % | | | -13.94 | % |
France | | | -6.77 | % | | | -20.38 | % |
Switzerland | | | -11.30 | % | | | -19.01 | % |
Australia | | | -0.54 | % | | | -15.30 | % |
Germany | | | -21.22 | % | | | -32.72 | % |
Netherlands | | | -28.51 | % | | | -38.71 | % |
Sweden | | | -16.17 | % | | | -34.85 | % |
Denmark | | | -7.88 | % | | | -21.38 | % |
Source: Returns are of MSCI standard indices net of foreign withholding taxes on dividends. Copyright MSCI 2022, all rights reserved.
Emerging markets had negative performance for the period and underperformed both U.S. and non-U.S. developed markets. As measured by the MSCI Emerging Markets indices, small-cap stocks outperformed large-cap stocks, and mid-cap stocks, a subset of the large-cap universe, outperformed large-cap stocks but underperformed small-cap stocks. Value stocks outperformed growth stocks as measured by the MSCI Emerging Markets indices.
16
Total Return for 12 Months Ended October 31, 2022
| | | | |
| | | Return in U.S. Dollars | |
MSCI Emerging Markets Index | | | -31.03 | % |
MSCI Emerging Markets Mid Cap Index | | | -24.80 | % |
MSCI Emerging Markets Small Cap Index | | | -23.42 | % |
MSCI Emerging Markets Value Index | | | -25.21 | % |
MSCI Emerging Markets Growth Index | | | -36.11 | % |
For the 12 Months Ended October 31, 2022, the U.S. dollar appreciated against most emerging markets currencies and depreciated against others. Overall, currency movements had a negative impact on the U.S. dollar denominated returns of emerging markets.
Total Return for 12 Months Ended October 31, 2022
| | | | | | | | |
Ten Largest Emerging Markets by Market Cap Dollars | | Local Return | | | Return in U.S. | |
China | | | -46.31 | % | | | -47.90 | % |
India | | | 2.93 | % | | | -6.89 | % |
Taiwan | | | -24.11 | % | | | -34.50 | % |
Korea | | | -19.88 | % | | | -34.28 | % |
Brazil | | | 15.95 | % | | | 24.57 | % |
Saudi Arabia | | | 2.18 | % | | | 2.00 | % |
South Africa | | | 0.77 | % | | | -16.66 | % |
Mexico | | | 1.99 | % | | | 5.56 | % |
Indonesia | | | 16.58 | % | | | 5.89 | % |
Thailand | | | 4.97 | % | | | -8.48 | % |
Source: Returns are of MSCI standard indices net of foreign withholding taxes on dividends. Copyright MSCI 2022, all rights reserved.
For Portfolios investing in non-U.S. equities traded outside of the U.S. market time zone, differences in the valuation timing and methodology between a Portfolio and its benchmark index may impact relative performance over the referenced period. The Portfolios price foreign exchange rates at the closing of the U.S. market, while their benchmark indices use rates at 4 p.m. London time. The Portfolios also may use fair value pricing to price certain portfolio securities at the closing of the U.S. market, while benchmark indices may use local market closing prices. For the one-year period ended October 31, 2022, these differences generally detracted from non-US developed markets Portfolios’ relative performance and were not material to emerging markets Portfolios’ relative performance.
Large Cap International Portfolio
The Large Cap International Portfolio invests in developed ex U.S. large company stocks. The investment strategy is process driven, emphasizing broad diversification. with increased exposure to stocks with smaller total market capitalizations, lower relative price (value) stocks, and higher profitability stocks within the large-cap segment of developed ex U.S. markets. As of October 31, 2022, the Portfolio held approximately 1,360 securities in 22 eligible developed markets. Average cash exposure throughout the year was less than 1% of the Portfolio’s assets.
17
For the 12 months ended October 31, 2022, total returns were -21.12% for the Portfolio and -22.04% for the MSCI World ex USA Index (net dividends), the Portfolio’s benchmark. The Portfolio’s emphasis on lower relative price (value) stocks contributed positively to performance relative to the benchmark, as value stocks outperformed higher relative price (growth) stocks in developed ex U.S. markets.
International Core Equity Portfolio
The International Core Equity Portfolio invests in a broadly diversified group of stocks in developed ex U.S. markets, with increased exposure to stocks with smaller market capitalization, lower relative price (value), and higher profitability. The investment strategy is process driven, emphasizing broad diversification. As of October 31, 2022, the Portfolio held approximately 5,280 securities in 22 eligible developed markets. Average cash exposure throughout the year was less than 1% of the Portfolio’s assets.
For the 12 months ended October 31, 2022, total returns were -22.29% for the Portfolio and -22.04% for the MSCI World ex USA Index (net dividends), the Portfolio’s benchmark. With low relative price (value) stocks outperforming high relative price (growth) stocks, the Portfolio’s greater emphasis on value stocks contributed positively to performance relative to the benchmark. Conversely, the Portfolio’s inclusion of and emphasis on stocks with smaller market capitalizations detracted from performance relative to the benchmark, which is composed primarily of large- and mid-cap stocks, as small caps underperformed large caps.
Global Small Company Portfolio
The Global Small Company Portfolio is designed to capture the returns of global small company stocks by purchasing shares of seven funds (which shall be collectively referred to below as the “Underlying Funds”) managed by Dimensional that individually invest in Canada, the United States, the United Kingdom, Europe (including Israel and excluding the U.K.), Japan, the Asia Pacific region (ex-Japan), and emerging markets. The Underlying Funds generally exclude stocks with the lowest profitability and highest relative price. The Underlying Funds also generally exclude certain companies with high asset growth. The investment strategy is process driven, emphasizing broad diversification. As of October 31, 2022, the Underlying Funds collectively held approximately 11,490 securities in 44 eligible developed and emerging markets.
For the 12 months ended October 31, 2022, total returns were -16.32% for the Portfolio and -22.02% for the MSCI All Country World Small Cap Index (net dividends), the Portfolio’s benchmark. The Underlying Funds’ exclusion of stocks with the lowest profitability and highest relative price contributed positively to performance relative to the benchmark, as those stocks underperformed. The Underlying Funds’ exclusion of stocks with high asset growth also contributed positively to relative performance, as those stocks underperformed.
International Small Company Portfolio
The International Small Company Portfolio invests in developed ex U.S. small company stocks by purchasing shares of five Master Funds managed by Dimensional that invest individually in Canada, the United Kingdom, Europe (including Israel and excluding the U.K.), Japan, and the Asia Pacific region (ex-Japan). The Portfolio generally excludes stocks with the lowest profitability and highest relative price. Additionally, the Portfolio generally excludes certain companies with high asset growth. The investment strategy is process driven, emphasizing broad diversification. As of October 31, 2022, the Master Funds collectively held approximately 4,410 securities in 22 eligible developed markets. Average cash exposure throughout the year was less than 1% of the Portfolio’s assets.
18
For the 12 months ended October 31, 2022, total returns were -26.55% for the Portfolio and -29.13% for the MSCI World ex USA Small Cap Index (net dividends), the Portfolio’s benchmark. The Master Funds’ exclusion of stocks with the lowest profitability and highest relative price contributed positively to performance relative to the benchmark, as these stocks underperformed. The Master Funds’ exclusion of stocks with high asset growth also contributed positively to relative performance, as those stocks underperformed.
Japanese Small Company Portfolio
The Japanese Small Company Portfolio invests in Japanese small company stocks by purchasing shares of the Japanese Small Company Series, a Master Fund managed by Dimensional that invests in such securities. The Master Fund generally excludes stocks with the lowest profitability and highest relative price. Additionally, the Master Fund generally excludes certain companies with high asset growth. The investment strategy is process driven, emphasizing broad diversification. As of October 31, 2022, the Master Fund held approximately 1,750 securities. Average cash exposure throughout the year was less than 1% of the Master Fund’s assets.
For the 12 months ended October 31, 2022, total returns were -23.79% for the Portfolio and -24.90% for the MSCI Japan Small Cap Index (net dividends), the Portfolio’s benchmark. The Master Fund’s greater emphasis on stocks with smaller market capitalizations contributed positively to performance relative to the benchmark, as these stocks outperformed. The Master Fund’s exclusion of stocks with the lowest profitability and highest relative price also contributed positively to performance relative to the benchmark, as did the Master Fund’s exclusion of stocks with high asset growth, as those stocks underperformed.
Asia Pacific Small Company Portfolio
The Asia Pacific Small Company Portfolio invests in small company stocks in Australia, Hong Kong, New Zealand, and Singapore by purchasing shares of the Asia Pacific Small Company Series, a Master Fund managed by Dimensional that invests in such securities. The Master Fund generally excludes stocks with the lowest profitability and highest relative price. Additionally, the Master Fund generally excludes certain companies with high asset growth. The investment strategy is process driven, emphasizing broad diversification. As of October 31, 2022, the Master Fund held approximately 840 securities in 4 eligible countries. Average cash exposure throughout the year was less than 1% of the Master Fund’s assets.
For the 12 months ended October 31, 2022, total returns were -26.90% for the Portfolio and -24.10% for the MSCI Pacific ex Japan Small Cap Index (net dividends), the Portfolio’s benchmark. The Master Fund’s emphasis on stocks with smaller market capitalizations, particularly in Australia, detracted from performance relative to the benchmark, as larger stocks held by the benchmark outperformed.
United Kingdom Small Company Portfolio
The United Kingdom Small Company Portfolio invests in small company stocks in the U.K. by purchasing shares of The United Kingdom Small Company Series, a Master Fund managed by Dimensional that invests in such securities. The Master Fund generally excludes stocks with the lowest profitability and highest relative price. Additionally, the Master Fund generally excludes certain
19
companies with high asset growth. The investment strategy is process driven, emphasizing broad diversification. As of October 31, 2022, the Master Fund held approximately 310 securities. Average cash exposure throughout the year was less than 1% of the Master Fund’s assets.
For the 12 months ended October 31, 2022, total returns were -33.62% for the Portfolio and -37.62% for the MSCI United Kingdom Small Cap Index (net dividends), the Portfolio’s benchmark. The Master Fund’s exclusion of stocks with the lowest profitability and highest relative price contributed positively to relative performance, as did the Master Fund’s exclusion of stocks with high asset growth, as those securities underperformed.
Continental Small Company Portfolio
The Continental Small Company Portfolio invests in small company stocks in the developed markets of Europe (excluding the U.K.) and Israel by purchasing shares of the Continental Small Company Series, a Master Fund managed by Dimensional that invests in such securities. The Master Fund generally excludes stocks with the lowest profitability and highest relative price. Additionally, the Master Fund generally excludes certain companies with high asset growth. The investment strategy is process driven, emphasizing broad diversification. As of October 31, 2022, the Master Fund held approximately 1,170 securities in 15 eligible countries. Average cash exposure throughout the year was less than 1% of the Portfolio’s assets.
For the 12 months ended October 31, 2022, total returns were -29.26% for the Portfolio and -34.51% for the MSCI Europe ex U.K. Small Cap Index (net dividends), the Portfolio’s benchmark. Differences in size definitions between the Master Fund and the benchmark led to weight differences between countries, which contributed positively to performance relative to the benchmark. The Master Fund’s exclusion of stocks with the lowest profitability and highest relative price also contributed positively to relative performance, as did the Master Fund’s exclusion of stocks with high asset growth, as those securities underperformed for the year.
| | |
| Global Real Estate Market Review | | 12 Months Ended October 31, 2022 |
Publicly traded global real estate investment trusts (REITs) had negative returns for the period. Global REITs underperformed U.S. equities, performed in line with developed non-U.S. equities, and outperformed emerging markets equities. The U.S. REIT market, the world’s largest, had negative performance for the period and outperformed non-U.S. REITs. Among non-U.S. REIT markets, Turkey, Mexico, and Italy were among the strongest performers, while Korea, Belgium, and the UK lagged. At the REIT industry level, specialized REITs and hotel and resort REITs generally outperformed, while office and industrial REITs generally underperformed.
Total Return for 12 Months Ended October 31, 2022
| | | | |
| | | Return in U.S. Dollars | |
Dow Jones U.S. Select REIT IndexSM | | | -19.97 | % |
S&P Global ex U.S. REIT Index | | | -27.78 | % |
S&P Global REIT Index | | | -22.02 | % |
20
Source: Returns are of Standard and Poor’s (S&P) indices net of foreign withholding taxes on dividends. Copyright S&P, 2022. All rights reserved. Dow Jones and S&P have different REIT eligibility criteria which can result in performance differences across different indices representing the same region.
For Portfolios investing in non-U.S. REITs and REIT-like securities traded outside of the U.S. market time zone, differences in the valuation timing and methodology between a Portfolio and its benchmark index may impact relative performance over the referenced period. The Portfolios price foreign exchange rates at the closing of the U.S. market, while their benchmark indices use rates at 4 p.m. London time. The Portfolios also may use fair value pricing to price certain portfolio securities at the closing of the U.S. market, while benchmark indices may use local market closing prices. For the one-year period ended October 31, 2022, these differences generally contributed positively to the Portfolios’ relative performance.
DFA International Real Estate Securities Portfolio
The DFA International Real Estate Securities Portfolio invests in a broadly diversified portfolio of real estate securities in developed ex U.S. and emerging markets. As of October 31, 2022, the Portfolio held approximately 300 securities in 21 eligible developed ex U.S. and emerging markets. Average cash exposure throughout the year was less than 1% of the Portfolio’s assets.
For the 12 months ended October 31, 2022, total returns were -27.50% for the Portfolio and -27.78% for the S&P Global ex US REIT Index (net dividends), the Portfolio’s benchmark. Withholding tax rate differences between the Portfolio and the benchmark contributed positively to performance relative to the benchmark as the Portfolio’s actual tax rate was lower than the assumed tax rates of the benchmark.
DFA Global Real Estate Securities Portfolio
The DFA Global Real Estate Securities Portfolio invests in a broadly diversified group of real estate securities in domestic and international markets, including emerging markets. During the period covered by this report, the Portfolio’s investments included the DFA International Real Estate Securities Portfolio, the DFA Real Estate Securities Portfolio, and individual securities. As of October 31, 2022, the Portfolio held, either directly or through the underlying portfolios, approximately 450 securities in 22 eligible developed and emerging markets. Average cash exposure throughout the year was less than 1% of the Portfolio’s assets.
For the 12 months ended October 31, 2022, total returns were -22.34% for the Portfolio and -22.02% for the S&P Global REIT Index (net dividends), the Portfolio’s benchmark. Differences in REIT eligibility between the Portfolio and the benchmark detracted from the Portfolio’s performance relative to the benchmark, most notably among tower REITs. The Portfolio includes tower REITs, which are excluded by the benchmark, and these securities generally underperformed.
| | |
| International Equity Market Review | | 12 Months Ended October 31, 2022 |
Performance of non-U.S. developed markets was negative for the period. As measured by the MSCI World ex USA indices, small-cap stocks underperformed large-cap stocks, and mid-cap stocks, a subset of the large-cap universe, underperformed large-cap stocks but outperformed small-cap stocks. Value stocks outperformed growth stocks as measured by the MSCI World ex USA indices.
21
Total Return for 12 Months Ended October 31, 2022
| | | | |
| | | Return in U.S. Dollars | |
MSCI World ex USA Index | | | -22.04 | % |
MSCI World ex USA Mid Cap Index | | | -27.57 | % |
MSCI World ex USA Small Cap Index | | | -29.13 | % |
MSCI World ex USA Value Index | | | -15.27 | % |
MSCI World ex USA Growth Index | | | -28.78 | % |
For the 12 Months Ended October 31, 2022, the U.S. dollar appreciated against all non-U.S. developed markets currencies. Overall, currency movements had a negative impact on the U.S. dollar-denominated returns of developed markets.
Total Return for 12 Months Ended October 31, 2022
| | | | | | | | |
Ten Largest Foreign Developed Markets by Market Cap | | Local Return | | | Return in U.S. Dollars | |
Japan | | | -1.81 | % | | | -24.67 | % |
United Kingdom | | | 4.27 | % | | | -12.42 | % |
Canada | | | -5.29 | % | | | -13.94 | % |
France | | | -6.77 | % | | | -20.38 | % |
Switzerland | | | -11.30 | % | | | -19.01 | % |
Australia | | | -0.54 | % | | | -15.30 | % |
Germany | | | -21.22 | % | | | -32.72 | % |
Netherlands | | | -28.51 | % | | | -38.71 | % |
Sweden | | | -16.17 | % | | | -34.85 | % |
Denmark | | | -7.88 | % | | | -21.38 | % |
Source: Returns are of MSCI standard indices net of foreign withholding taxes on dividends. Copyright MSCI 2022, all rights reserved.
Emerging markets had negative performance for the period and underperformed both U.S. and non-U.S. developed markets. As measured by the MSCI Emerging Markets indices, small-cap stocks outperformed large-cap stocks, and mid-cap stocks, a subset of the large-cap universe, outperformed large-cap stocks but underperformed small-cap stocks. Value stocks outperformed growth stocks as measured by the MSCI Emerging Markets indices.
Total Return for 12 Months Ended October 31, 2022
| | | | |
| | | Return in U.S. Dollars | |
MSCI Emerging Markets Index | | | -31.03 | % |
MSCI Emerging Markets Mid Cap Index | | | -24.80 | % |
MSCI Emerging Markets Small Cap Index | | | -23.42 | % |
MSCI Emerging Markets Value Index | | | -25.21 | % |
MSCI Emerging Markets Growth Index | | | -36.11 | % |
22
For the 12 Months Ended October 31, 2022, the U.S. dollar appreciated against most emerging markets currencies and depreciated against others. Overall, currency movements had a negative impact on the U.S. dollar denominated returns of emerging markets.
Total Return for 12 Months Ended October 31, 2022
| | | | | | | | |
Ten Largest Emerging Markets by Market Cap Dollars | | Local Return | | | Return in U.S. | |
China | | | -46.31 | % | | | -47.90 | % |
India | | | 2.93 | % | | | -6.89 | % |
Taiwan | | | -24.11 | % | | | -34.50 | % |
Korea | | | -19.88 | % | | | -34.28 | % |
Brazil | | | 15.95 | % | | | 24.57 | % |
Saudi Arabia | | | 2.18 | % | | | 2.00 | % |
South Africa | | | 0.77 | % | | | -16.66 | % |
Mexico | | | 1.99 | % | | | 5.56 | % |
Indonesia | | | 16.58 | % | | | 5.89 | % |
Thailand | | | 4.97 | % | | | -8.48 | % |
Source: Returns are of MSCI standard indices net of foreign withholding taxes on dividends. Copyright MSCI 2022, all rights reserved.
For Portfolios investing in non-U.S. equities traded outside of the U.S. market time zone, differences in the valuation timing and methodology between a Portfolio and its benchmark index may impact relative performance over the referenced period. The Portfolios price foreign exchange rates at the closing of the U.S. market, while their benchmark indices use rates at 4 p.m. London time. The Portfolios also may use fair value pricing to price certain portfolio securities at the closing of the U.S. market, while benchmark indices may use local market closing prices. For the one-year period ended October 31, 2022, these differences generally detracted from non-US developed markets Portfolios’ relative performance and were not material to emerging markets Portfolios’ relative performance.
DFA International Small Cap Value Portfolio
The DFA International Small Cap Value Portfolio invests in small-cap value stocks in developed ex U.S. markets, with an emphasis on those with higher profitability. Additionally, the Portfolio generally excludes certain companies with high asset growth. The investment strategy is process driven, emphasizing broad diversification. As of October 31, 2022, the Portfolio held approximately 2,010 securities in 22 eligible developed markets. Average cash exposure throughout the year was less than 1% of the Portfolio’s assets.
For the 12 months ended October 31, 2022, total returns were -20.53% for the Portfolio, -23.26% for the MSCI World ex USA Small Value Index (net dividends), and -29.13% for the MSCI World ex USA Small Cap Index (net dividends). As of February 28, 2022, the Portfolio changed its benchmark from the MSCI World ex USA Small Cap Index (net dividends) to the MSCI World ex USA Small Value Index (net dividends) because this index better reflects the universe of securities in which the Portfolio invests. With low relative price (value) stocks outperforming high relative price (growth) stocks, the
23
Portfolio’s focus on value stocks contributed positively to performance relative to the benchmarks. Additionally, the Portfolio’s emphasis on stocks with higher profitability contributed positively to performance relative to the benchmark, as these stocks outperformed. The Portfolio’s exclusion of real estate investment trusts (REITs) also contributed positively to relative performance, as REITs generally underperformed.
International Vector Equity Portfolio
The International Vector Equity Portfolio invests in a broadly diversified group of stocks in developed ex U.S. markets, with increased exposure to stocks with smaller market capitalization, lower relative price (value), and higher profitability. The Portfolio’s increased exposure to small capitalization and value stocks may be achieved by decreasing the allocation to or excluding the largest high relative price (growth) stocks in developed ex U.S. markets. The investment strategy is process driven, emphasizing broad diversification. As of October 31, 2022, the Portfolio held approximately 4,970 securities in 22 eligible developed markets. Average cash exposure throughout the year was less than 1% of the Portfolio’s assets.
For the 12 months ended October 31, 2022, total returns were -22.16% for the Portfolio and -22.04% for the MSCI World ex USA Index (net dividends), the Portfolio’s benchmark. With low relative price (value) stocks outperforming high relative price (growth) stocks, the Portfolio’s greater emphasis on value stocks contributed positively to performance relative to the benchmark. Conversely, the Portfolio’s inclusion of and emphasis on stocks with smaller market capitalizations detracted from performance relative to the benchmark, which is composed primarily of large- and mid-cap stocks, as small cap stocks underperformed large cap stocks.
International High Relative Profitability Portfolio
The International High Relative Profitability Portfolio invests in developed ex U.S. large-cap stocks with higher profitability. The investment strategy is process driven, emphasizing broad diversification, with increased exposure to stocks with smaller total market capitalizations, lower relative price (value), and higher profitability within the large cap high relative profitability segment of developed ex U.S. markets. As of October 31, 2022, the Portfolio held approximately 520 securities in 22 eligible developed markets. Average cash exposure throughout the year was less than 1% of the Portfolio’s assets.
For the 12 months ended October 31, 2022, total returns were -23.22% for the Portfolio and -22.04% for the MSCI World ex USA Index (net dividends), the Portfolio’s benchmark. The Portfolio’s emphasis on mid-cap stocks with high profitability detracted from performance relative to the benchmark, as mid-cap stocks generally underperformed large-cap stocks within high profitability stocks for the period.
World ex U.S. Value Portfolio
The World ex U.S. Value Portfolio is designed to capture the returns of value stocks across all market capitalizations in developed ex U.S. and emerging markets. The Portfolio may pursue its objective by holding direct securities; by purchasing shares of funds managed by Dimensional: the DFA International Value Series, the DFA International Small Cap Value Portfolio, and the Dimensional Emerging Markets Value Fund (the “Underlying Funds”); or by a combination of securities and Underlying Funds. The investment strategy is process driven, emphasizing broad diversification. As of October 31, 2022, the Portfolio, directly and through the Underlying Funds, held approximately 5,840 securities in 43 eligible developed ex U.S. and emerging markets.
24
For the 12 months ended October 31, 2022, total returns were -16.23% for the Portfolio, -18.13% for the MSCI All Country World ex USA Value Index (net dividends), and -24.73% for the MSCI All Country World ex USA Index (net dividends). As of February 28, 2022, the Portfolio changed its benchmark from the MSCI All Country World ex USA Index (net dividends) to the MSCI All Country World ex USA Value Index (net dividends) because this index better reflects the universe of securities in which the Portfolio invests. The Underlying Funds’ focus on low relative price (value) stocks contributed positively to performance relative to the benchmarks, as value stocks outperformed high relative price (growth) stocks globally.
World ex U.S. Targeted Value Portfolio
The World ex U.S. Targeted Value Portfolio invests in small- and mid-cap value stocks in developed ex U.S. and emerging markets, with an emphasis on those with higher profitability. Additionally, the Portfolio generally excludes certain companies with high asset growth. The investment strategy is process driven, emphasizing broad diversification. As of October 31, 2022, the Portfolio held approximately 5,200 securities in 42 eligible developed ex U.S. and emerging markets. Average cash exposure throughout the year was less than 1% of the Portfolio’s assets.
For the 12 months ended October 31, 2022, total returns were -21.77% for the Portfolio, -22.25% for the MSCI All Country World ex USA SMID Value Index (net dividends), and -27.75% for the MSCI All Country World ex USA Small Cap Index (net dividends). As of February 28, 2022, the Portfolio changed its benchmark from the MSCI All Country World ex USA Small Cap Index (net dividends) to the MSCI All Country World ex USA SMID Value Index (net dividends) because this index better reflects the universe of securities in which the Portfolio invests. With low relative price (value) stocks outperforming high relative price (growth) stocks in developed ex U.S. and emerging markets, the Portfolio’s focus on value stocks contributed positively to performance relative to the benchmarks.
World ex U.S. Core Equity Portfolio
The World ex U.S. Core Equity Portfolio invests in a broadly diversified group of stocks in developed ex U.S. and emerging markets with increased exposure to stocks with smaller market capitalization, lower relative price (value), and higher profitability. The investment strategy is process driven, emphasizing broad diversification. As of October 31, 2022, the Portfolio held approximately 10,930 securities in 45 eligible developed ex U.S. and emerging markets. Average cash exposure throughout the year was less than 1% of the Portfolio’s assets.
For the 12 months ended October 31, 2022, total returns were -22.55% for the Portfolio and -24.73% for the MSCI All Country World ex USA Index (net dividends), the Portfolio’s benchmark. The Portfolio’s greater emphasis on low relative price (value) stocks contributed positively to performance relative to the benchmark, as value stocks outperformed high relative price (growth) stocks in developed ex U.S. and emerging markets.
World Core Equity Portfolio
The World Core Equity Portfolio seeks long-term capital appreciation generally by investing in a combination of mutual funds managed by Dimensional. During the period covered by this report, the Portfolio’s investments included the U.S. Core Equity 1 Portfolio, International Core Equity Portfolio, and
25
Emerging Markets Core Equity Portfolio (collectively, the “Underlying Funds”). The investment strategy is process driven, emphasizing broad diversification. As of October 31, 2022, the Underlying Funds collectively held more than 14,760 equity securities in 46 eligible developed and emerging markets.
For the 12 months ended October 31, 2022, total returns were -16.62% for the Portfolio and -19.96% for the MSCI All Country World Index (net dividends), the Portfolio’s benchmark. With low relative price (value) stocks outperforming high relative price (growth) stocks globally, the Underlying Funds’ greater emphasis on value stocks contributed positively to performance relative to the benchmark.
Selectively Hedged Global Equity Portfolio
The Selectively Hedged Global Equity Portfolio seeks long-term capital appreciation by investing in a combination of other mutual funds managed by Dimensional. During the period covered by this report, the Portfolio invests in the U.S. Core Equity 2 Portfolio, International Core Equity Portfolio, and Emerging Markets Core Equity Portfolio (the “Underlying Funds”). The Portfolio hedges foreign currency exposure on a selective basis to capture positive forward currency premiums. The investment strategy is process driven, emphasizing broad diversification. As of October 31, 2022, the Underlying Funds collectively held approximately 14,750 securities in 46 eligible developed and emerging markets.
For the 12 months ended October 31, 2022, total returns were -13.65% for the Portfolio and -19.96% for the MSCI All Country World Index (net dividends), the Portfolio’s benchmark. With low relative price (value) stocks outperforming high relative price (growth) stocks globally, the Underlying Funds’ greater emphasis on value stocks contributed positively to performance relative to the benchmark. The Portfolio’s strategy of selectively hedging foreign currency exposure also contributed positively to performance relative to the benchmark (which does not hedge currency exposure), as the U.S. dollar generally strengthened against the currencies to which the Portfolio had hedged its exposure.
Emerging Markets Portfolio
The Emerging Markets Portfolio invests in large-cap stocks in emerging markets by purchasing shares of The Emerging Markets Series, a Master Fund managed by Dimensional that invests in such securities. The investment strategy is process driven, emphasizing broad diversification with increased exposure to stocks with smaller market capitalizations, lower relative price (value), and higher profitability within the large-cap segment of emerging markets. As of October 31, 2022, the Master Fund held approximately 1,880 securities in 23 eligible emerging markets. Average cash exposure throughout the year was less than 1% of the Master Fund’s assets.
For the 12 months ended October 31, 2022, total returns were -25.94% for the Portfolio and -31.03% for the MSCI Emerging Markets Index (net dividends), the Portfolio’s benchmark. The Master Fund’s greater emphasis on low relative price (value) stocks contributed positively to performance relative to the benchmark, as value stocks outperformed high relative price (growth) stocks in emerging markets. The Master Fund’s emphasis on stocks with higher profitability also contributed positively to performance relative to the benchmark, as these stocks generally outperformed. At the country level, the Master Fund’s lesser allocation to Russia contributed positively to relative performance, as Russia underperformed the overall benchmark.
26
Emerging Markets Small Cap Portfolio
The Emerging Markets Small Cap Portfolio invests in small company stocks in emerging markets by purchasing shares of The Emerging Markets Small Cap Series, a Master Fund managed by Dimensional that invests in such securities. The Master Fund generally excludes stocks with the lowest profitability and highest relative price. Additionally, the Master Fund generally excludes certain companies that with high asset growth. The Master Fund’s investment strategy is process driven, emphasizing broad diversification. As of October 31, 2022, the Master Fund held approximately 5,150 securities in 20 eligible emerging markets. Average cash exposure throughout the year was less than 1% of the Master Fund’s assets.
For the 12 months ended October 31, 2022, total returns were -22.57% for the Portfolio and -31.03% for the MSCI Emerging Markets Index (net dividends), the Portfolio’s benchmark. With small-cap stocks outperforming large-cap stocks in emerging markets, the Master Fund’s inclusion of stocks with smaller market capitalizations contributed positively to performance relative to the benchmark, which is composed primarily of large- and mid-cap stocks. At the country level, the Master Fund’s lesser allocation to Russia contributed positively to relative performance, as Russia underperformed the overall benchmark.
Emerging Markets Value Portfolio
The Emerging Markets Value Portfolio invests in value stocks of large and small companies in emerging markets by purchasing shares of the Dimensional Emerging Markets Value Fund, a Master Fund managed by Dimensional that invests in such securities. The investment strategy is process driven, emphasizing broad diversification with increased exposure to stocks with smaller market capitalizations, lower relative price (value), and higher profitability within the value segment of emerging markets. As of October 31, 2022, the Master Fund held approximately 3,360 securities in 21 eligible emerging markets. Average cash exposure throughout the year was less than 1% of the Master Fund’s assets.
For the 12 months ended October 31, 2022, total returns were -19.74% for the Portfolio’s Class R2 shares, -19.51% for the Portfolio’s Institutional Class shares, -25.21% for the MSCI Emerging Markets Value Index (net dividends) and -31.03% for the MSCI Emerging Markets Index (net dividends). As of February 28, 2022, the Portfolio changed its benchmark from the MSCI Emerging Markets Index (net dividends) to the MSCI Emerging Markets Value Index (net dividends) because this index better reflects the universe of securities in which the Master Fund invests. The Master Fund’s focus on low relative price (value) stocks contributed positively to performance relative to the benchmarks, as value stocks outperformed high relative price (growth) stocks in emerging markets. At the country level, the Master Fund’s lesser allocation to Russia contributed positively to relative performance, as Russia underperformed the overall benchmark.
Emerging Markets Core Equity Portfolio
The Emerging Markets Core Equity Portfolio invests in a broadly diversified group of stocks in emerging markets, with increased exposure to stocks with smaller market capitalization, lower relative price (value), and higher profitability. The investment strategy is process driven, emphasizing broad diversification. As of October 31, 2022, the Portfolio held approximately 6,830 securities in 23 eligible emerging markets. Average cash exposure throughout the year was less than 1% of the Portfolio’s assets.
27
For the 12 months ended October 31, 2022, total returns were -25.06% for the Portfolio and -31.03% for the MSCI Emerging Markets Index (net dividends), the Portfolio’s benchmark. With low relative price (value) stocks outperforming high relative price (growth) stocks, the Portfolio’s greater emphasis on value stocks contributed positively to performance relative to the benchmark. With small-cap stocks outperforming large-cap stocks in emerging markets, the Portfolio’s inclusion of and emphasis on small-caps also contributed positively to performance relative to the benchmark, which is composed primarily of large- and mid-cap stocks. At the country level, the Portfolio’s lesser allocation to Russia contributed positively to relative performance, as Russia underperformed the overall benchmark.
Emerging Markets Targeted Value Portfolio
The Emerging Markets Targeted Value Portfolio invests in value stocks of small- and mid-cap companies in emerging markets. The investment strategy is process driven, emphasizing broad diversification with increased exposure to smaller total market capitalizations, lower relative price (value) stocks, and higher-profitability stocks within the small- and mid-cap value segment of emerging markets. Additionally, the Portfolio generally excludes certain companies with high asset growth. As of October 31, 2022, the Portfolio held approximately 2,990 securities in 20 eligible emerging markets. Average cash exposure throughout the year was less than 1% of the Portfolio’s assets.
For the 12 months ended October 31, 2022, total returns were -21.40% for the Portfolio and -31.03% for the MSCI Emerging Markets Index (net dividends), the Portfolio’s benchmark. The Portfolio’s focus on low relative price (value) stocks contributed positively to performance relative to the style-neutral benchmark, as value stocks outperformed high relative price (growth) stocks in emerging markets. With small-cap stocks outperforming large-cap stocks in emerging markets, the Portfolio’s inclusion of and emphasis on small-caps also contributed positively to performance relative to the benchmark, which is composed primarily of large- and mid-cap stocks. At the country level, the Portfolio’s lesser allocation to Russia contributed positively to relative performance, as Russia underperformed the overall benchmark.
Emerging Markets ex China Core Equity Portfolio
The Emerging Markets ex China Core Equity Portfolio invests in a broadly diversified group of stocks in emerging markets, excluding China, with increased exposure to stocks with smaller market capitalization, lower relative price (value), and higher profitability. The investment strategy is process driven, emphasizing broad diversification. As of October 31, 2022, the Portfolio held approximately 3,870 securities in 22 eligible emerging markets. Average cash exposure throughout the year was less than 1% of the Portfolio’s assets.
From its inception on November 15, 2021, through October 31, 2022, total returns were -20.16% for the Portfolio and -23.63% for the MSCI Emerging Markets ex China Index (net dividends), the Portfolio’s benchmark. The Portfolio’s emphasis on low relative price (value) stocks contributed positively to performance relative to the benchmark, as value stocks outperformed high relative price (growth) stocks in emerging markets. With small-cap stocks outperforming large-cap stocks in emerging markets, the Portfolio’s inclusion of and emphasis on small-caps also contributed positively to performance relative to the benchmark, which is composed primarily of large- and mid-cap stocks. At the country level, the Portfolio’s lesser allocation to Russia contributed positively to relative performance, as Russia underperformed the overall benchmark.
28
DFA INVESTMENT DIMENSIONS GROUP INC.
DISCLOSURE OF FUND EXPENSES
(Unaudited)
The following Expense Tables are shown so that you can understand the impact of fees on your investment. All mutual funds have operating expenses. As a shareholder of the fund, you incur ongoing costs, which include costs for portfolio management, administrative services, and shareholder reports, among others. Operating expenses and legal and audit services, which are deducted from a fund’s gross income, directly reduce the investment return of the fund. A fund’s expenses are expressed as a percentage of its average net assets. This figure is known as the expense ratio. The following examples are intended to help you understand the ongoing costs, in dollars, of investing in the fund and to compare these costs with those of other mutual funds. The examples are based on an investment of $1,000 made at the beginning of the period shown and held for the entire period.
The Expense Tables below illustrate your fund’s costs in two ways.
Actual Fund Return
This section helps you to estimate the actual expenses after fee waivers that you paid over the period. The “Ending Account Value” shown is derived from the fund’s actual return, and “Expenses Paid During Period” reflects the dollar amount that would have been paid by an investor who started with $1,000 in the fund. You may use the information here, together with the amount you invested, to estimate the expenses that you paid over the period.
To do so, simply divide your account value by $1,000 (for example, a $7,500 account value divided by $1,000 = 7.5), then multiply the result by the number given for your fund under the heading “Expenses Paid During Period.”
Hypothetical Example for Comparison Purposes
This section is intended to help you compare your fund’s costs with those of other mutual funds. The hypothetical “Ending Account Value” and “Expenses Paid During Period” are derived from the fund’s actual expense ratio and an assumed 5% annual return before expenses. In this case, because the return used is not the fund’s actual return, the results do not apply to your investment. The example is useful in making comparisons because the SEC requires all mutual funds to calculate expenses based on a 5% annual return. You can assess your fund’s costs by comparing this hypothetical example with the hypothetical examples that appear in shareholder reports of other funds.
Please note that the expenses shown in the tables are meant to highlight and help you compare ongoing costs only and do not reflect any transactional costs, if applicable. The “Annualized Expense Ratio” represents the actual expenses for the six-month period indicated.
| | | | | | | | | | | | | | | | |
| | | Six Months Ended October 31, 2022 | |
EXPENSE TABLES | | | | | | | | | | | | | | | | |
| | | Beginning
Account
Value
05/01/22 | | | Ending
Account
Value
10/31/22 | | | Annualized
Expense
Ratio (1) | | | Expenses
Paid
During
Period (1) | |
Large Cap International Portfolio | | | | | | | | | | | | | | | | |
Actual Fund Return | | $ | 1,000.00 | | | $ | 883.40 | | | | 0.17 | % | | $ | 0.81 | |
Hypothetical 5% Annual Return | | $ | 1,000.00 | | | $ | 1,024.35 | | | | 0.17 | % | | $ | 0.87 | |
International Core Equity Portfolio | | | | | | | | | | | | | | | | |
Actual Fund Return | | $ | 1,000.00 | | | $ | 873.20 | | | | 0.24 | % | | $ | 1.13 | |
Hypothetical 5% Annual Return | | $ | 1,000.00 | | | $ | 1,024.00 | | | | 0.24 | % | | $ | 1.22 | |
29
DISCLOSURE OF FUND EXPENSES
CONTINUED
| | | | | | | | | | | | | | | | |
| | | Beginning
Account
Value
05/01/22 | | | Ending
Account
Value
10/31/22 | | | Annualized
Expense
Ratio (1) | | | Expenses
Paid
During
Period (1) | |
Global Small Company Portfolio (2) | | | | | | | | | | | | | | | | |
Actual Fund Return | | $ | 1,000.00 | | | $ | 944.20 | | | | 0.44 | % | | $ | 2.16 | |
Hypothetical 5% Annual Return | | $ | 1,000.00 | | | $ | 1,022.99 | | | | 0.44 | % | | $ | 2.24 | |
International Small Company Portfolio (2) | | | | | | | | | | | | | | | | |
Actual Fund Return | | $ | 1,000.00 | | | $ | 854.20 | | | | 0.41 | % | | $ | 1.92 | |
Hypothetical 5% Annual Return | | $ | 1,000.00 | | | $ | 1,023.14 | | | | 0.41 | % | | $ | 2.09 | |
Japanese Small Company Portfolio (3) | | | | | | | | | | | | | | | | |
Actual Fund Return | | $ | 1,000.00 | | | $ | 925.20 | | | | 0.42 | % | | $ | 2.04 | |
Hypothetical 5% Annual Return | | $ | 1,000.00 | | | $ | 1,023.09 | | | | 0.42 | % | | $ | 2.14 | |
Asia Pacific Small Company Portfolio (3) | | | | | | | | | | | | | | | | |
Actual Fund Return | | $ | 1,000.00 | | | $ | 803.60 | | | | 0.42 | % | | $ | 1.91 | |
Hypothetical 5% Annual Return | | $ | 1,000.00 | | | $ | 1,023.09 | | | | 0.42 | % | | $ | 2.14 | |
United Kingdom Small Company Portfolio (3) | | | | | | | | | | | | | | | | |
Actual Fund Return | | $ | 1,000.00 | | | $ | 811.20 | | | | 0.56 | % | | $ | 2.56 | |
Hypothetical 5% Annual Return | | $ | 1,000.00 | | | $ | 1,022.38 | | | | 0.56 | % | | $ | 2.85 | |
Continental Small Company Portfolio (3) | | | | | | | | | | | | | | | | |
Actual Fund Return | | $ | 1,000.00 | | | $ | 836.20 | | | | 0.42 | % | | $ | 1.94 | |
Hypothetical 5% Annual Return | | $ | 1,000.00 | | | $ | 1,023.09 | | | | 0.42 | % | | $ | 2.14 | |
DFA International Real Estate Securities Portfolio | | | | | | | | | | | | | | | | |
Actual Fund Return | | $ | 1,000.00 | | | $ | 786.00 | | | | 0.27 | % | | $ | 1.22 | |
Hypothetical 5% Annual Return | | $ | 1,000.00 | | | $ | 1,023.84 | | | | 0.27 | % | | $ | 1.38 | |
DFA Global Real Estate Securities Portfolio (4) | | | | | | | | | | | | | | | | |
Actual Fund Return | | $ | 1,000.00 | | | $ | 805.60 | | | | 0.24 | % | | $ | 1.09 | |
Hypothetical 5% Annual Return | | $ | 1,000.00 | | | $ | 1,024.00 | | | | 0.24 | % | | $ | 1.22 | |
DFA International Small Cap Value Portfolio | | | | | | | | | | | | | | | | |
Actual Fund Return | | $ | 1,000.00 | | | $ | 862.50 | | | | 0.46 | % | | $ | 2.16 | |
Hypothetical 5% Annual Return | | $ | 1,000.00 | | | $ | 1,022.89 | | | | 0.46 | % | | $ | 2.35 | |
International Vector Equity Portfolio | | | | | | | | | | | | | | | | |
Actual Fund Return | | $ | 1,000.00 | | | $ | 871.50 | | | | 0.36 | % | | $ | 1.70 | |
Hypothetical 5% Annual Return | | $ | 1,000.00 | | | $ | 1,023.39 | | | | 0.36 | % | | $ | 1.84 | |
International High Relative Profitability Portfolio | | | | | | | | | | | | | | | | |
Actual Fund Return | | $ | 1,000.00 | | | $ | 875.00 | | | | 0.30 | % | | $ | 1.42 | |
Hypothetical 5% Annual Return | | $ | 1,000.00 | | | $ | 1,023.69 | | | | 0.30 | % | | $ | 1.53 | |
30
DISCLOSURE OF FUND EXPENSES
CONTINUED
| | | | | | | | | | | | | | | | |
| | | Beginning
Account
Value
05/01/22 | | | Ending
Account
Value
10/31/22 | | | Annualized
Expense
Ratio (1) | | | Expenses
Paid
During
Period (1) | |
World ex U.S. Value Portfolio (2) | | | | | | | | | | | | | | | | |
Actual Fund Return | | $ | 1,000.00 | | | $ | 877.40 | | | | 0.40 | % | | $ | 1.89 | |
Hypothetical 5% Annual Return | | $ | 1,000.00 | | | $ | 1,023.19 | | | | 0.40 | % | | $ | 2.04 | |
World ex U.S. Core Equity Portfolio | | | | | | | | | | | | | | | | |
Actual Fund Return | | $ | 1,000.00 | | | $ | 857.90 | | | | 0.30 | % | | $ | 1.40 | |
Hypothetical 5% Annual Return | | $ | 1,000.00 | | | $ | 1,023.69 | | | | 0.30 | % | | $ | 1.53 | |
World ex U.S. Targeted Value Portfolio | | | | | | | | | | | | | | | | |
Actual Fund Return | | $ | 1,000.00 | | | $ | 854.90 | | | | 0.52 | % | | $ | 2.43 | |
Hypothetical 5% Annual Return | | $ | 1,000.00 | | | $ | 1,022.58 | | | | 0.52 | % | | $ | 2.65 | |
World Core Equity Portfolio (2) | | | | | | | | | | | | | | | | |
Actual Fund Return | | $ | 1,000.00 | | | $ | 920.90 | | | | 0.27 | % | | $ | 1.31 | |
Hypothetical 5% Annual Return | | $ | 1,000.00 | | | $ | 1,023.84 | | | | 0.27 | % | | $ | 1.38 | |
Selectively Hedged Global Equity Portfolio (2) | | | | | | | | | | | | | | | | |
Actual Fund Return | | $ | 1,000.00 | | | $ | 934.40 | | | | 0.31 | % | | $ | 1.51 | |
Hypothetical 5% Annual Return | | $ | 1,000.00 | | | $ | 1,023.64 | | | | 0.31 | % | | $ | 1.58 | |
Emerging Markets Portfolio (3) | | | | | | | | | | | | | | | | |
Actual Fund Return | | $ | 1,000.00 | | | $ | 817.60 | | | | 0.36 | % | | $ | 1.65 | |
Hypothetical 5% Annual Return | | $ | 1,000.00 | | | $ | 1,023.39 | | | | 0.36 | % | | $ | 1.84 | |
Emerging Markets Small Cap Portfolio (3) | | | | | | | | | | | | | | | | |
Actual Fund Return | | $ | 1,000.00 | | | $ | 844.50 | | | | 0.59 | % | | $ | 2.74 | |
Hypothetical 5% Annual Return | | $ | 1,000.00 | | | $ | 1,022.23 | | | | 0.59 | % | | $ | 3.01 | |
Emerging Markets Value Portfolio (3) | | | | | | | | | | | | | | | | |
Actual Fund Return | | | | | | | | | | | | | | | | |
Class R2 Shares | | $ | 1,000.00 | | | $ | 835.30 | | | | 0.69 | % | | $ | 3.19 | |
Institutional Class Shares | | $ | 1,000.00 | | | $ | 836.50 | | | | 0.45 | % | | $ | 2.08 | |
Hypothetical 5% Annual Return | | | | | | | | | | | | | | | | |
Class R2 Shares | | $ | 1,000.00 | | | $ | 1,021.73 | | | | 0.69 | % | | $ | 3.52 | |
Institutional Class Shares | | $ | 1,000.00 | | | $ | 1,022.94 | | | | 0.45 | % | | $ | 2.29 | |
Emerging Markets Core Equity Portfolio | | | | | | | | | | | | | | | | |
Actual Fund Return | | $ | 1,000.00 | | | $ | 822.20 | | | | 0.40 | % | | $ | 1.84 | |
Hypothetical 5% Annual Return | | $ | 1,000.00 | | | $ | 1,023.19 | | | | 0.40 | % | | $ | 2.04 | |
Emerging Markets Targeted Value Portfolio | | | | | | | | | | | | | | | | |
Actual Fund Return | | $ | 1,000.00 | | | $ | 836.90 | | | | 0.66 | % | | $ | 3.06 | |
Hypothetical 5% Annual Return | | $ | 1,000.00 | | | $ | 1,021.88 | | | | 0.66 | % | | $ | 3.36 | |
31
DISCLOSURE OF FUND EXPENSES
CONTINUED
| | | | | | | | | | | | | | | | |
| | | Beginning
Account
Value
05/01/22 | | | Ending
Account
Value
10/31/22 | | | Annualized
Expense
Ratio (1) | | | Expenses
Paid
During
Period (1) | |
Emerging Markets ex China Core Equity Portfolio | | | | | | | | | | | | | | | | |
Actual Fund Return | | $ | 1,000.00 | | | $ | 853.00 | | | | 0.43 | % | | $ | 2.01 | |
Hypothetical 5% Annual Return | | $ | 1,000.00 | | | $ | 1,023.04 | | | | 0.43 | % | | $ | 2.19 | |
| (1) | Expenses are equal to the fund’s annualized expense ratio for the six-month period, multiplied by the average account value over the period, multiplied by the number of days in the most recent six-month period (184), then divided by the number of days in the year (365) to reflect the six-month period. |
| (2) | The Portfolio is a Fund of Funds. The expenses shown reflect the direct expenses of the Fund of Funds and the Fund of Funds’ portion of the expenses of its Underlying Funds (Affiliated Investment Companies). |
| (3) | The Portfolio is a Feeder Fund. The expenses shown reflect the direct expenses of the Feeder Fund and the allocation of the Feeder Fund’s portion of the expenses of its Master Fund (Affiliated Investment Company). |
| (4) | The Portfolio invests directly and indirectly through other funds. The expenses shown reflect the direct expenses of the fund and the fund’s portion of the expenses of its Master and/or Underlying Funds (Affiliated Investment Companies). |
32
DFA INVESTMENT DIMENSIONS GROUP INC.
DISCLOSURE OF PORTFOLIO HOLDINGS
(Unaudited)
The SEC requires that all funds file a complete Schedule of Investments with the SEC for their first and third fiscal quarters as an exhibit to their reports on Form N-PORT. For DFA Investment Dimensions Group Inc., this would be for the fiscal quarters ending January 31 and July 31. Such Form N-PORT filing must be made within 60 days of the end of the quarter. DFA Investment Dimensions Group Inc. filed its most recent Form N-PORT with the SEC on September 28, 2022. They are available upon request, without charge, by calling collect: (512) 306-7400; by mailing a request to Dimensional Fund Advisors LP, 6300 Bee Cave Road, Building One, Austin, TX 78746; or by visiting the SEC’s website at http://www.sec.gov.
SEC regulations permit a fund to include in its reports to shareholders a “Summary Schedule of Portfolio Holdings” in lieu of a full Schedule of Investments. The Summary Schedule of Portfolio Holdings reports the fund’s 50 largest holdings in unaffiliated issuers and any investments that exceed one percent of the fund’s net assets at the end of the reporting period. The regulations also require that the Summary Schedule of Portfolio Holdings identify each category of investments that are held.
A fund is required to file a complete Schedule of Investments with the SEC on Form N-CSR within ten days after mailing the annual and semi-annual reports to shareholders. It will be available upon request, without charge, by calling collect: (512) 306-7400; by mailing a request to Dimensional Fund Advisors LP, 6300 Bee Cave Road, Building One, Austin, TX 78746; or by visiting the SEC’s website at http://www.sec.gov.
PORTFOLIO HOLDINGS
The SEC requires that all funds present their categories of portfolio holdings in a table, chart, or graph format in their annual and semi-annual shareholder reports, whether or not a Schedule of Investments is used. The following table, which presents portfolio holdings as a percentage of total investments before short-term investments and collateral for loaned securities, is provided in compliance with this requirement. The categories shown below represent broad industry sectors. Each industry sector consists of one or more specific industry classifications.
The categories of industry classification for the Affiliated Investment Companies are represented in their Disclosures of Portfolio Holdings, which are included elsewhere in the report. Refer to the Schedule of Investments/Summary Schedule of Portfolio Holdings for each of the underlying Affiliated Investment Company’s holdings, which reflect the investments by category or country.
FEEDER FUNDS
| | | | |
| | | Affiliated Investment Companies | |
Japanese Small Company Portfolio | | | 100.0 | % |
Asia Pacific Small Company Portfolio | | | 100.0 | % |
United Kingdom Small Company Portfolio | | | 100.0 | % |
Continental Small Company Portfolio | | | 100.0 | % |
Emerging Markets Portfolio | | | 100.0 | % |
Emerging Markets Small Cap Portfolio | | | 100.0 | % |
Emerging Markets Value Portfolio | | | 100.0 | % |
| |
FUNDS OF FUNDS | | | | |
| |
| | | Affiliated Investment Companies | |
Global Small Company Portfolio | | | 100.0 | % |
International Small Company Portfolio | | | 100.0 | % |
World ex U.S. Value Portfolio | | | 100.0 | % |
World Core Equity Portfolio | | | 100.0 | % |
Selectively Hedged Global Equity Portfolio | | | 100.0 | % |
33
DISCLOSURE OF PORTFOLIO HOLDINGS
CONTINUED
INTERNATIONAL EQUITY PORTFOLIOS
| | | | |
| Large Cap International Portfolio | |
Communication Services | | | 5.4 | % |
Consumer Discretionary | | | 11.0 | % |
Consumer Staples | | | 9.4 | % |
Energy | | | 7.9 | % |
Financials | | | 17.9 | % |
Health Care | | | 10.4 | % |
Industrials | | | 15.8 | % |
Information Technology | | | 6.9 | % |
Materials | | | 10.4 | % |
Real Estate | | | 1.5 | % |
Utilities | | | 3.4 | % |
| | | | |
| | | 100.0 | % |
| | | | |
| DFA Global Real Estate Securities Portfolio | |
Affiliated Investment Companies | | | 38.8 | % |
Real Estate | | | 61.2 | % |
| | | | |
| | | 100.0 | % |
| | | | |
| | | | |
| | | | |
| | | | |
| | | | |
| | | | |
| | | | |
| | | | |
| | | | |
| | | | |
International High Relative Profitability
Portfolio | |
Communication Services | | | 7.8 | % |
Consumer Discretionary | | | 13.7 | % |
Consumer Staples | | | 10.7 | % |
Energy | | | 8.0 | % |
Financials | | | 4.9 | % |
Health Care | | | 13.4 | % |
Industrials | | | 17.8 | % |
Information Technology | | | 9.9 | % |
Materials | | | 11.4 | % |
Real Estate | | | 0.4 | % |
Utilities | | | 2.0 | % |
| | | | |
| | | 100.0 | % |
| | | | |
| Emerging Markets Core Equity Portfolio | |
Communication Services | | | 6.6 | % |
Consumer Discretionary | | | 10.5 | % |
Consumer Staples | | | 6.6 | % |
Energy | | | 5.7 | % |
Financials | | | 17.5 | % |
Health Care | | | 4.7 | % |
Industrials | | | 9.6 | % |
Information Technology | | | 19.1 | % |
Materials | | | 13.1 | % |
Real Estate | | | 3.0 | % |
Utilities | | | 3.6 | % |
| | | | |
| | | 100.0 | % |
| | | | |
| International Core Equity Portfolio | |
Communication Services | | | 5.3 | % |
Consumer Discretionary | | | 12.0 | % |
Consumer Staples | | | 7.7 | % |
Energy | | | 8.6 | % |
Financials | | | 16.4 | % |
Health Care | | | 7.3 | % |
Industrials | | | 18.3 | % |
Information Technology | | | 6.7 | % |
Materials | | | 12.4 | % |
Real Estate | | | 2.1 | % |
Utilities | | | 3.2 | % |
| | | | |
| | | 100.0 | % |
| | | | |
DFA International Small Cap Value
Portfolio | |
| Communication Services | | | 2.6 | % |
| Consumer Discretionary | | | 11.2 | % |
| Consumer Staples | | | 4.9 | % |
| Energy | | | 11.2 | % |
| Financials | | | 21.2 | % |
| Health Care | | | 2.4 | % |
| Industrials | | | 20.6 | % |
| Information Technology | | | 4.1 | % |
| Materials | | | 17.0 | % |
| Real Estate | | | 3.6 | % |
| Utilities | | | 1.2 | % |
| | | | |
| | | 100.0 | % |
| | | | |
| World ex U.S. Core Equity Portfolio | |
Communication Services | | | 5.4 | % |
Consumer Discretionary | | | 11.5 | % |
Consumer Staples | | | 7.2 | % |
Energy | | | 7.6 | % |
Financials | | | 16.7 | % |
Health Care | | | 6.8 | % |
Industrials | | | 15.6 | % |
Information Technology | | | 10.4 | % |
Materials | | | 12.8 | % |
Real Estate | | | 2.6 | % |
Utilities | | | 3.4 | % |
| | | | |
| | | 100.0 | % |
| | | | |
| | | | |
| Emerging Markets Targeted Value Portfolio | |
Communication Services | | | 3.5 | % |
Consumer Discretionary | | | 11.4 | % |
Consumer Staples | | | 5.3 | % |
Energy | | | 3.6 | % |
Financials | | | 16.9 | % |
Health Care | | | 6.3 | % |
Industrials | | | 15.1 | % |
Information Technology | | | 12.9 | % |
Materials | | | 16.0 | % |
Real Estate | | | 6.3 | % |
Utilities | | | 2.7 | % |
| | | | |
| | | 100.0 | % |
| | | | |
DFA International Real Estate Securities
Portfolio | |
Real Estate | | | 100.0 | % |
| | | | |
| | | 100.0 | % |
| | | | |
| | | | |
| | | | |
| | | | |
| | | | |
| | | | |
| | | | |
| | | | |
| | | | |
| | | | |
| International Vector Equity Portfolio | |
Communication Services | | | 4.8 | % |
Consumer Discretionary | | | 11.3 | % |
Consumer Staples | | | 6.9 | % |
Energy | | | 8.5 | % |
Financials | | | 19.8 | % |
Health Care | | | 5.4 | % |
Industrials | | | 18.9 | % |
Information Technology | | | 6.2 | % |
Materials | | | 13.6 | % |
Real Estate | | | 2.3 | % |
Utilities | | | 2.3 | % |
| | | | |
| | | 100.0 | % |
| | | | |
| World ex U.S. Targeted Value Portfolio | |
Communication Services | | | 3.7 | % |
Consumer Discretionary | | | 11.1 | % |
Consumer Staples | | | 5.4 | % |
Energy | | | 7.1 | % |
Financials | | | 17.6 | % |
Health Care | | | 4.3 | % |
Industrials | | | 20.1 | % |
Information Technology | | | 6.8 | % |
Materials | | | 17.7 | % |
Real Estate | | | 4.4 | % |
Utilities | | | 1.8 | % |
| | | | |
| | | 100.0 | % |
| | | | |
| | | | |
Emerging Markets ex China Core Equity
Portfolio | |
Communication Services | | | 5.1 | % |
Consumer Discretionary | | | 8.4 | % |
Consumer Staples | | | 6.6 | % |
Energy | | | 6.0 | % |
Financials | | | 18.6 | % |
Health Care | | | 4.2 | % |
Industrials | | | 9.6 | % |
Information Technology | | | 22.2 | % |
Materials | | | 14.3 | % |
Real Estate | | | 2.1 | % |
Utilities | | | 2.9 | % |
| | | | |
| | | 100.0 | % |
34
LARGE CAP INTERNATIONAL PORTFOLIO
SUMMARY SCHEDULE OF PORTFOLIO HOLDINGS
October 31, 2022
| | | | | | | | | | | | | | |
| | | | | Shares | | | Value» | | | Percentage
of Net Assets‡ | |
COMMON STOCKS — (94.7%) | | | | | | | | | | | | |
AUSTRALIA — (6.9%) | | | | | | | | | | | | |
| | BHP Group Ltd. | | | 697,375 | | | $ | 16,751,089 | | | | 0.4 | % |
| # | | BHP Group Ltd., Sponsored ADR | | | 298,208 | | | | 14,260,307 | | | | 0.3 | % |
| | Commonwealth Bank of Australia | | | 355,286 | | | | 23,820,770 | | | | 0.5 | % |
| | CSL Ltd. | | | 128,582 | | | | 23,018,159 | | | | 0.5 | % |
| | National Australia Bank Ltd. | | | 811,247 | | | | 16,851,257 | | | | 0.4 | % |
| | Other Securities | | | | | | | 247,757,155 | | | | 5.0 | % |
| | | | | | | | | | | | | | |
TOTAL AUSTRALIA | | | | | | | 342,458,737 | | | | 7.1 | % |
| | | | | | | | | | | | | | |
AUSTRIA — (0.2%) | | | | | | | | | | | | |
| | Other Securities | | | | | | | 7,945,485 | | | | 0.2 | % |
| | | | | | | | | | | | | | |
BELGIUM — (0.9%) | | | | | | | | | | | | |
| | Other Securities | | | | | | | 44,594,579 | | | | 0.9 | % |
| | | | | | | | | | | | | | |
CANADA — (11.5%) | | | | | | | | | | | | |
| | Bank of Montreal | | | 161,778 | | | | 14,896,518 | | | | 0.3 | % |
| | Canadian Natural Resources Ltd. | | | 352,595 | | | | 21,134,544 | | | | 0.4 | % |
| | Nutrien Ltd. | | | 182,823 | | | | 15,448,511 | | | | 0.3 | % |
# | | Royal Bank of Canada | | | 247,435 | | | | 22,893,663 | | | | 0.5 | % |
| | Royal Bank of Canada | | | 206,240 | | | | 19,071,013 | | | | 0.4 | % |
| | Suncor Energy, Inc. | | | 535,689 | | | | 18,422,345 | | | | 0.4 | % |
| | Toronto-Dominion Bank | | | 286,785 | | | | 18,351,372 | | | | 0.4 | % |
| | Other Securities | | | | | | | 441,108,151 | | | | 9.2 | % |
| | | | | | | | | | | | | | |
TOTAL CANADA | | | | | | | 571,326,117 | | | | 11.9 | % |
| | | | | | | | | | | | | | |
CHINA — (0.0%) | | | | | | | | | | | | |
| | Other Securities | | | | | | | 2,214,534 | | | | 0.0 | % |
| | | | | | | | | | | | | | |
DENMARK — (2.3%) | | | | | | | | | | | | |
| | Novo Nordisk AS, Class B | | | 461,515 | | | | 50,181,103 | | | | 1.0 | % |
| | Novo Nordisk AS, Sponsored ADR | | | 45,587 | | | | 4,961,689 | | | | 0.1 | % |
| | Other Securities | | | | | | | 58,458,479 | | | | 1.3 | % |
| | | | | | | | | | | | | | |
TOTAL DENMARK | | | | | | | 113,601,271 | | | | 2.4 | % |
| | | | | | | | | | | | | | |
FINLAND — (1.2%) | | | | | | | | | | | | |
| | Other Securities | | | | | | | 59,105,619 | | | | 1.2 | % |
| | | | | | | | | | | | | | |
FRANCE — (9.1%) | | | | | | | | | | | | |
| | Air Liquide SA | | | 117,776 | | | | 15,406,713 | | | | 0.3 | % |
| | Airbus SE | | | 172,375 | | | | 18,651,615 | | | | 0.4 | % |
| | L’Oreal SA | | | 51,814 | | | | 16,269,812 | | | | 0.3 | % |
| | LVMH Moet Hennessy Louis Vuitton SE | | | 80,391 | | | | 50,726,285 | | | | 1.1 | % |
| | Sanofi | | | 213,213 | | | | 18,348,641 | | | | 0.4 | % |
| | Schneider Electric SE | | | 117,513 | | | | 14,860,260 | | | | 0.3 | % |
| | TotalEnergies SE | | | 869,523 | | | | 47,435,393 | | | | 1.0 | % |
| | TotalEnergies SE, Sponsored ADR | | | 18,895 | | | | 1,034,879 | | | | 0.0 | % |
| | Vinci SA | | | 167,106 | | | | 15,379,926 | | | | 0.3 | % |
| | Other Securities | | | | | | | 255,834,438 | | | | 5.3 | % |
| | | | | | | | | | | | | | |
TOTAL FRANCE | | | | | | | 453,947,962 | | | | 9.4 | % |
| | | | | | | | | | | | | | |
GERMANY — (6.3%) | | | | | | | | | | | | |
| | BASF SE | | | 325,963 | | | | 14,626,168 | | | | 0.3 | % |
35
LARGE CAP INTERNATIONAL PORTFOLIO
CONTINUED
| | | | | | | | | | | | |
| | | Shares | | | Value» | | | Percentage
of Net Assets‡ | |
GERMANY — (Continued) | | | | | | | | | | | | |
Bayer AG | | | 332,314 | | | $ | 17,473,412 | | | | 0.4 | % |
Deutsche Telekom AG | | | 1,271,712 | | | | 24,004,181 | | | | 0.5 | % |
Mercedes-Benz Group AG | | | 320,152 | | | | 18,530,894 | | | | 0.4 | % |
SAP SE | | | 198,474 | | | | 19,103,671 | | | | 0.4 | % |
Siemens AG | | | 159,085 | | | | 17,373,507 | | | | 0.4 | % |
Other Securities | | | | | | | 200,252,255 | | | | 4.1 | % |
| | | | | | | | | | | | |
TOTAL GERMANY | | | | | | | 311,364,088 | | | | 6.5 | % |
| | | | | | | | | | | | |
HONG KONG — (1.9%) | | | | | | | | | | | | |
AIA Group Ltd. | | | 3,249,000 | | | | 24,610,493 | | | | 0.5 | % |
Other Securities | | | | | | | 68,407,931 | | | | 1.4 | % |
| | | | | | | | | | | | |
TOTAL HONG KONG | | | | | | | 93,018,424 | | | | 1.9 | % |
| | | | | | | | | | | | |
IRELAND — (0.7%) | | | | | | | | | | | | |
# CRH PLC, Sponsored ADR | | | 391,067 | | | | 14,160,536 | | | | 0.3 | % |
Other Securities | | | | | | | 21,979,488 | | | | 0.5 | % |
| | | | | | | | | | | | |
TOTAL IRELAND | | | | | | | 36,140,024 | | | | 0.8 | % |
| | | | | | | | | | | | |
ISRAEL — (0.8%) | | | | | | | | | | | | |
Other Securities | | | | | | | 40,665,737 | | | | 0.8 | % |
| | | | | | | | | | | | |
ITALY — (2.0%) | | | | | | | | | | | | |
Other Securities | | | | | | | 102,080,542 | | | | 2.1 | % |
| | | | | | | | | | | | |
JAPAN — (19.8%) | | | | | | | | | | | | |
KDDI Corp. | | | 584,600 | | | | 17,279,005 | | | | 0.4 | % |
Keyence Corp. | | | 41,604 | | | | 15,687,414 | | | | 0.3 | % |
Sony Group Corp. | | | 367,700 | | | | 24,795,715 | | | | 0.5 | % |
Toyota Motor Corp. | | | 2,420,615 | | | | 33,585,063 | | | | 0.7 | % |
Other Securities | | | | | | | 897,341,143 | | | | 18.6 | % |
| | | | | | | | | | | | |
TOTAL JAPAN | | | | | | | 988,688,340 | | | | 20.5 | % |
| | | | | | | | | | | | |
NETHERLANDS — (3.4%) | | | | | | | | | | | | |
ASML Holding NV | | | 30,871 | | | | 14,481,052 | | | | 0.3 | % |
ASML Holding NV | | | 82,305 | | | | 38,882,528 | | | | 0.8 | % |
Other Securities | | | | | | | 117,764,759 | | | | 2.5 | % |
| | | | | | | | | | | | |
TOTAL NETHERLANDS | | | | | | | 171,128,339 | | | | 3.6 | % |
| | | | | | | | | | | | |
NEW ZEALAND — (0.3%) | | | | | | | | | | | | |
Other Securities | | | | | | | 17,028,804 | | | | 0.4 | % |
| | | | | | | | | | | | |
NORWAY — (0.9%) | | | | | | | | | | | | |
Other Securities | | | | | | | 43,483,751 | | | | 0.9 | % |
| | | | | | | | | | | | |
PORTUGAL — (0.2%) | | | | | | | | | | | | |
Other Securities | | | | | | | 11,374,446 | | | | 0.2 | % |
| | | | | | | | | | | | |
SINGAPORE — (1.1%) | | | | | | | | | | | | |
Other Securities | | | | | | | 52,708,342 | | | | 1.1 | % |
| | | | | | | | | | | | |
SPAIN — (2.0%) | | | | | | | | | | | | |
Other Securities | | | | | | | 97,372,177 | | | | 2.0 | % |
| | | | | | | | | | | | |
36
LARGE CAP INTERNATIONAL PORTFOLIO
CONTINUED
| | | | | | | | | | | | |
| | | Shares | | | Value» | | | Percentage
of Net Assets‡ | |
SWEDEN — (2.6%) | | | | | | | | | | | | |
Other Securities | | | | | | $ | 129,986,054 | | | | 2.7 | % |
| | | | | | | | | | | | |
| | | |
SWITZERLAND — (7.8%) | | | | | | | | | | | | |
ABB Ltd. | | | 562,377 | | | | 15,617,377 | | | | 0.3 | % |
Nestle SA | | | 671,534 | | | | 73,102,387 | | | | 1.5 | % |
Novartis AG | | | 362,502 | | | | 29,323,044 | | | | 0.6 | % |
Novartis AG, Sponsored ADR | | | 229,302 | | | | 18,603,271 | | | | 0.4 | % |
Roche Holding AG | | | 7,438 | | | | 3,019,010 | | | | 0.1 | % |
Roche Holding AG | | | 205,381 | | | | 68,145,030 | | | | 1.4 | % |
Other Securities | | | | | | | 180,492,430 | | | | 3.8 | % |
| | | | | | | | | | | | |
TOTAL SWITZERLAND | | | | | | | 388,302,549 | | | | 8.1 | % |
| | | | | | | | | | | | |
| | | |
UNITED KINGDOM — (12.8%) | | | | | | | | | | | | |
AstraZeneca PLC | | | 126,555 | | | | 14,848,966 | | | | 0.3 | % |
AstraZeneca PLC, Sponsored ADR | | | 326,058 | | | | 19,175,471 | | | | 0.4 | % |
# BP PLC, Sponsored ADR | | | 637,244 | | | | 21,207,497 | | | | 0.4 | % |
British American Tobacco PLC | | | 446,549 | | | | 17,635,759 | | | | 0.4 | % |
# Diageo PLC, Sponsored ADR | | | 105,239 | | | | 17,571,756 | | | | 0.4 | % |
Glencore PLC | | | 3,343,533 | | | | 19,168,702 | | | | 0.4 | % |
# HSBC Holdings PLC, Sponsored ADR | | | 551,216 | | | | 14,282,007 | | | | 0.3 | % |
# Rio Tinto PLC, Sponsored ADR | | | 267,962 | | | | 14,295,773 | | | | 0.3 | % |
Shell PLC | | | 36,838 | | | | 1,020,458 | | | | 0.0 | % |
Shell PLC, Sponsored ADR | | | 1,101,940 | | | | 61,300,922 | | | | 1.3 | % |
# Unilever PLC, Sponsored ADR | | | 406,480 | | | | 18,498,905 | | | | 0.4 | % |
Other Securities | | | | | | | 418,796,480 | | | | 8.6 | % |
| | | | | | | | | | | | |
TOTAL UNITED KINGDOM | | | | | | | 637,802,696 | | | | 13.2 | % |
| | | | | | | | | | | | |
TOTAL COMMON STOCKS | | | | | | | 4,716,338,617 | | | | 97.9 | % |
| | | | | | | | | | | | |
PREFERRED STOCKS — (0.4%) | | | | | | | | | | | | |
GERMANY — (0.4%) | | | | | | | | | | | | |
Other Securities | | | | | | | 20,314,109 | | | | 0.4 | % |
| | | | | | | | | | | | |
TOTAL INVESTMENT SECURITIES
(Cost $4,069,491,698) | | | | | | | 4,736,652,726 | | | | | |
| | | | | | | | | | | | |
| | | | | | Value† | | | | |
SECURITIES LENDING COLLATERAL — (4.9%) | | | | | | | | | | | | |
@§ The DFA Short Term Investment Fund | | | 21,285,432 | | | | 246,080,882 | | | | 5.1 | % |
| | | | | | | | | | | | |
TOTAL INVESTMENTS—(100.0%)
(Cost $4,315,666,744) | | | | | | $ | 4,982,733,608 | | | | 103.4 | % |
| | | | | | | | | | | | |
As of October 31, 2022, Large Cap International Portfolio had entered into the following outstanding futures contracts:
| | | | | | | | | | | | | | | | | | | | |
Description | | Number of
Contracts | | | Expiration
Date | | | Notional
Value | | | Market
Value | | | Unrealized
Appreciation
(Depreciation) | |
Long Position Contracts: | | | | | | | | | | | | | | | | | | | | |
S&P 500® Emini Index | | | 263 | | | | 12/16/22 | | | $ | 49,629,745 | | | $ | 51,061,450 | | | $ | 1,431,705 | |
| | | | | | | | | | | | | | �� | | | | | | |
Total Futures Contracts | | | | | | | | | | $ | 49,629,745 | | | $ | 51,061,450 | | | $ | 1,431,705 | |
| | | | | | | | | | | | | | | | | | | | |
37
LARGE CAP INTERNATIONAL PORTFOLIO
CONTINUED
Summary of the Portfolio’s investments as of October 31, 2022, based on their valuation inputs, is as follows (see Security Valuation Note):
| | | | | | | | | | | | | | | | |
| | | Investments in Securities (Market Value) | |
| | | Level 1 | | | Level 2 | | | Level 3 | | | Total | |
Common Stocks | | | | | | | | | | | | | | | | |
Australia | | $ | 20,281,436 | | | $ | 322,177,301 | | | | — | | | $ | 342,458,737 | |
Austria | | | — | | | | 7,945,485 | | | | — | | | | 7,945,485 | |
Belgium | | | 77,586 | | | | 44,516,993 | | | | — | | | | 44,594,579 | |
Canada | | | 569,256,168 | | | | 2,069,949 | | | | — | | | | 571,326,117 | |
China | | | — | | | | 2,214,534 | | | | — | | | | 2,214,534 | |
Denmark | | | 4,961,689 | | | | 108,639,582 | | | | — | | | | 113,601,271 | |
Finland | | | — | | | | 59,105,619 | | | | — | | | | 59,105,619 | |
France | | | 2,677,737 | | | | 451,270,225 | | | | — | | | | 453,947,962 | |
Germany | | | 11,627,562 | | | | 299,736,526 | | | | — | | | | 311,364,088 | |
Hong Kong | | | — | | | | 93,018,424 | | | | — | | | | 93,018,424 | |
Irelan. | | | 14,160,536 | | | | 21,979,488 | | | | — | | | | 36,140,024 | |
Israel | | | 5,425,139 | | | | 35,240,598 | | | | — | | | | 40,665,737 | |
Italy | | | 1,693,915 | | | | 100,386,627 | | | | — | | | | 102,080,542 | |
Japan | | | 15,920,714 | | | | 972,767,626 | | | | — | | | | 988,688,340 | |
Netherlands | | | 49,620,924 | | | | 121,507,415 | | | | — | | | | 171,128,339 | |
New Zealand | | | — | | | | 17,028,804 | | | | — | | | | 17,028,804 | |
Norway | | | 402,750 | | | | 43,081,001 | | | | — | | | | 43,483,751 | |
Portugal | | | — | | | | 11,374,446 | | | | — | | | | 11,374,446 | |
Singapore | | | — | | | | 52,708,342 | | | | — | | | | 52,708,342 | |
Spain | | | 4,019,628 | | | | 93,352,549 | | | | — | | | | 97,372,177 | |
Sweden | | | — | | | | 129,986,054 | | | | — | | | | 129,986,054 | |
Switzerland | | | 43,020,945 | | | | 345,281,604 | | | | — | | | | 388,302,549 | |
United Kingdom | | | 204,305,909 | | | | 433,496,787 | | | | — | | | | 637,802,696 | |
Preferred Stocks | | | | | | | | | | | | | | | | |
Germany | | | — | | | | 20,314,109 | | | | — | | | | 20,314,109 | |
Securities Lending Collateral | | | — | | | | 246,080,882 | | | | — | | | | 246,080,882 | |
Futures Contracts** | | | 1,431,705 | | | | — | | | | — | | | | 1,431,705 | |
| | | | | | | | | | | | | | | | |
TOTAL | | $ | 948,884,343 | | | $ | 4,035,280,970 | | | | — | | | $ | 4,984,165,313 | |
| | | | | | | | | | | | | | | | |
| ** | Valued at the unrealized appreciation/(depreciation) on the investment. |
See accompanying Notes to Financial Statements.
38
INTERNATIONAL CORE EQUITY PORTFOLIO
SUMMARY SCHEDULE OF PORTFOLIO HOLDINGS
October 31, 2022
| | | | | | | | | | | | |
| | | Shares | | | Value» | | | Percentage
of Net Assets‡ | |
COMMON STOCKS — (94.1%) | | | | | | | | | | | | |
AUSTRALIA — (6.6%) | | | | | | | | | | | | |
BHP Group Ltd. | | | 4,074,214 | | | $ | 97,863,449 | | | | 0.4 | % |
# BHP Group Ltd., Sponsored ADR | | | 1,283,423 | | | | 61,373,288 | | | | 0.2 | % |
Commonwealth Bank of Australia | | | 931,529 | | | | 62,455,985 | | | | 0.3 | % |
National Australia Bank Ltd. | | | 2,773,071 | | | | 57,602,348 | | | | 0.2 | % |
Woodside Energy Group Ltd. | | | 2,416,669 | | | | 55,869,636 | | | | 0.2 | % |
Other Securities | | | | | | | 1,456,544,194 | | | | 5.5 | % |
| | | | | | | | | | | | |
TOTAL AUSTRALIA | | | | | | | 1,791,708,900 | | | | 6.8 | % |
| | | | | | | | | | | | |
AUSTRIA — (0.5%) | | | | | | | | | | | | |
Other Securities | | | | | | | 135,307,750 | | | | 0.5 | % |
| | | | | | | | | | | | |
BELGIUM — (1.2%) | | | | | | | | | | | | |
Other Securities | | | | | | | 321,830,389 | | | | 1.2 | % |
| | | | | | | | | | | | |
CANADA — (11.6%) | | | | | | | | | | | | |
# Bank of Montreal | | | 973,887 | | | | 89,675,515 | | | | 0.4 | % |
# Canadian Natural Resources Ltd. | | | 2,454,221 | | | | 147,106,007 | | | | 0.6 | % |
National Bank of Canada | | | 884,154 | | | | 60,200,481 | | | | 0.2 | % |
Nutrien Ltd. | | | 694,495 | | | | 58,684,861 | | | | 0.2 | % |
# Royal Bank of Canada | | | 725,121 | | | | 67,091,057 | | | | 0.3 | % |
# Royal Bank of Canada | | | 1,213,029 | | | | 112,168,792 | | | | 0.4 | % |
Suncor Energy, Inc. | | | 2,892,169 | | | | 99,461,692 | | | | 0.4 | % |
Tourmaline Oil Corp. | | | 1,205,985 | | | | 67,949,799 | | | | 0.3 | % |
Other Securities | | | | | | | 2,469,900,469 | | | | 9.3 | % |
| | | | | | | | | | | | |
TOTAL CANADA | | | | | | | 3,172,238,673 | | | | 12.1 | % |
| | | | | | | | | | | | |
CHINA — (0.1%) | | | | | | | | | | | | |
Other Securities | | | | | | | 20,817,651 | | | | 0.1 | % |
| | | | | | | | | | | | |
DENMARK — (2.1%) | | | | | | | | | | | | |
Novo Nordisk AS, Class B | | | 891,477 | | | | 96,931,408 | | | | 0.4 | % |
Novo Nordisk AS, Sponsored ADR | | | 595,283 | | | | 64,790,602 | | | | 0.3 | % |
Other Securities | | | | | | | 420,688,017 | | | | 1.5 | % |
| | | | | | | | | | | | |
TOTAL DENMARK | | | | | | | 582,410,027 | | | | 2.2 | % |
| | | | | | | | | | | | |
FINLAND — (1.5%) | | | | | | | | | | | | |
Other Securities | | | | | | | 411,217,134 | | | | 1.6 | % |
| | | | | | | | | | | | |
FRANCE — (7.4%) | | | | | | | | | | | | |
LVMH Moet Hennessy Louis Vuitton SE | | | 248,440 | | | | 156,764,294 | | | | 0.6 | % |
Orange SA | | | 7,384,067 | | | | 70,354,742 | | | | 0.3 | % |
# TotalEnergies SE | | | 4,096,102 | | | | 223,456,089 | | | | 0.9 | % |
Vinci SA | | | 723,766 | | | | 66,613,213 | | | | 0.3 | % |
Other Securities | | | | | | | 1,516,041,641 | | | | 5.7 | % |
| | | | | | | | | | | | |
TOTAL FRANCE | | | | | | | 2,033,229,979 | | | | 7.8 | % |
| | | | | | | | | | | | |
GERMANY — (5.9%) | | | | | | | | | | | | |
BASF SE | | | 1,423,690 | | | | 63,881,877 | | | | 0.3 | % |
Bayer AG | | | 1,509,264 | | | | 79,358,652 | | | | 0.3 | % |
Deutsche Telekom AG | | | 6,078,458 | | | | 114,733,846 | | | | 0.5 | % |
E.ON SE | | | 7,301,301 | | | | 61,140,973 | | | | 0.2 | % |
Mercedes-Benz Group AG | | | 1,688,994 | | | | 97,761,591 | | | | 0.4 | % |
39
INTERNATIONAL CORE EQUITY PORTFOLIO
CONTINUED
| | | | | | | | | | | | |
| | | Shares | | | Value» | | | Percentage
of Net Assets‡ | |
GERMANY — (Continued) | | | | | | | | | | | | |
Other Securities | | | | | | $ | 1,201,288,079 | | | | 4.5 | % |
| | | | | | | | | | | | |
TOTAL GERMANY | | | | | | | 1,618,165,018 | | | | 6.2 | % |
| | | | | | | | | | | | |
HONG KONG — (1.9%) | | | | | | | | | | | | |
AIA Group Ltd. | | | 11,640,800 | | | | 88,176,618 | | | | 0.4 | % |
Other Securities | | | | | | | 420,768,433 | | | | 1.6 | % |
| | | | | | | | | | | | |
TOTAL HONG KONG | | | | | | | 508,945,051 | | | | 2.0 | % |
| | | | | | | | | | | | |
IRELAND — (0.7%) | | | | | | | | | | | | |
Other Securities | | | | | | | 193,150,611 | | | | 0.7 | % |
| | | | | | | | | | | | |
ISRAEL — (1.1%) | | | | | | | | | | | | |
Other Securities | | | | | | | 290,161,312 | | | | 1.1 | % |
| | | | | | | | | | | | |
ITALY — (2.5%) | | | | | | | | | | | | |
Eni SpA | | | 4,317,248 | | | | 56,701,518 | | | | 0.2 | % |
Stellantis NV | | | 6,495,733 | | | | 87,637,612 | | | | 0.4 | % |
Other Securities | | | | | | | 527,984,980 | | | | 2.0 | % |
| | | | | | | | | | | | |
TOTAL ITALY | | | | | | | 672,324,110 | | | | 2.6 | % |
| | | | | | | | | | | | |
JAPAN — (20.8%) | | | | | | | | | | | | |
Hitachi Ltd. | | | 1,314,685 | | | | 59,652,266 | | | | 0.3 | % |
KDDI Corp. | | | 2,362,200 | | | | 69,819,474 | | | | 0.3 | % |
Sony Group Corp. | | | 1,141,000 | | | | 76,942,917 | | | | 0.3 | % |
Toyota Motor Corp. | | | 7,546,470 | | | | 104,704,247 | | | | 0.4 | % |
Other Securities | | | | | | | 5,381,293,266 | | | | 20.4 | % |
| | | | | | | | | | | | |
TOTAL JAPAN | | | | | | | 5,692,412,170 | | | | 21.7 | % |
| | | | | | | | | | | | |
NETHERLANDS — (3.0%) | | | | | | | | | | | | |
# ASML Holding NV | | | 127,591 | | | | 59,851,227 | | | | 0.2 | % |
ASML Holding NV | | | 182,526 | | | | 86,228,933 | | | | 0.3 | % |
Koninklijke Ahold Delhaize NV | | | 3,020,738 | | | | 84,243,143 | | | | 0.3 | % |
Wolters Kluwer NV | | | 586,422 | | | | 62,312,331 | | | | 0.2 | % |
Other Securities | | | | | | | 531,890,773 | | | | 2.2 | % |
| | | | | | | | | | | | |
TOTAL NETHERLANDS | | | | | | | 824,526,407 | | | | 3.2 | % |
| | | | | | | | | | | | |
NEW ZEALAND — (0.4%) | | | | | | | | | | | | |
Other Securities | | | | | | | 107,098,777 | | | | 0.4 | % |
| | | | | | | | | | | | |
NORWAY — (1.0%) | | | | | | | | | | | | |
Equinor ASA | | | 1,582,273 | | | | 57,648,090 | | | | 0.2 | % |
Other Securities | | | | | | | 209,839,801 | | | | 0.8 | % |
| | | | | | | | | | | | |
TOTAL NORWAY | | | | | | | 267,487,891 | | | | 1.0 | % |
| | | | | | | | | | | | |
PORTUGAL — (0.3%) | | | | | | | | | | | | |
Other Securities | | | | | | | 77,992,012 | | | | 0.3 | % |
| | | | | | | | | | | | |
SINGAPORE — (1.0%) | | | | | | | | | | | | |
Other Securities | | | | | | | 267,458,374 | | | | 1.0 | % |
| | | | | | | | | | | | |
SPAIN — (2.0%) | | | | | | | | | | | | |
Repsol SA | | | 4,909,248 | | | | 66,787,692 | | | | 0.3 | % |
Telefonica SA | | | 15,552,229 | | | | 53,611,548 | | | | 0.2 | % |
40
INTERNATIONAL CORE EQUITY PORTFOLIO
CONTINUED
| | | | | | | | | | | | |
| | | Shares | | | Value» | | | Percentage
of Net Assets‡ | |
SPAIN — (Continued) | | | | | | | | | | | | |
Other Securities | | | | | | $ | 439,132,304 | | | | 1.6 | % |
| | | | | | | | | | | | |
TOTAL SPAIN | | | | | | | 559,531,544 | | | | 2.1 | % |
| | | | | | | | | | | | |
SWEDEN — (2.6%) | | | | | | | | | | | | |
Other Securities | | | | | | | 720,851,653 | | | | 2.8 | % |
| | | | | | | | | | | | |
| | | |
SWITZERLAND — (7.3%) | | | | | | | | | | | | |
# ABB Ltd. | | | 3,085,634 | | | | 85,688,979 | | | | 0.3 | % |
Nestle SA | | | 1,728,150 | | | | 188,124,338 | | | | 0.7 | % |
Novartis AG, Sponsored ADR | | | 2,012,205 | | | | 163,250,192 | | | | 0.6 | % |
Roche Holding AG | | | 634,350 | | | | 210,476,138 | | | | 0.8 | % |
Other Securities | | | | | | | 1,350,704,803 | | | | 5.2 | % |
| | | | | | | | | | | | |
TOTAL SWITZERLAND | | | | | | | 1,998,244,450 | | | | 7.6 | % |
| | | | | | | | | | | | |
UNITED KINGDOM — (12.6%) | | | | | | | | | | | | |
Anglo American PLC | | | 2,478,239 | | | | 74,233,667 | | | | 0.3 | % |
BP PLC | | | 11,071,577 | | | | 61,254,620 | | | | 0.2 | % |
# BP PLC, Sponsored ADR | | | 3,594,991 | | | | 119,641,300 | | | | 0.5 | % |
Glencore PLC | | | 17,549,994 | | | | 100,615,323 | | | | 0.4 | % |
# HSBC Holdings PLC, Sponsored ADR | | | 3,036,261 | | | | 78,669,523 | | | | 0.3 | % |
Imperial Brands PLC | | | 2,613,500 | | | | 63,662,426 | | | | 0.3 | % |
# Rio Tinto PLC, Sponsored ADR | | | 1,258,607 | | | | 67,146,683 | | | | 0.3 | % |
Shell PLC, Sponsored ADR | | | 3,855,807 | | | | 214,498,543 | | | | 0.8 | % |
Other Securities | | | | | | | 2,650,012,641 | | | | 10.0 | % |
| | | | | | | | | | | | |
TOTAL UNITED KINGDOM | | | | | | | 3,429,734,726 | | | | 13.1 | % |
| | | | | | | | | | | | |
UNITED STATES — (0.0%) | | | | | | | | | | | | |
Other Securities | | | | | | | 8,564,035 | | | | 0.0 | % |
| | | | | | | | | | | | |
TOTAL COMMON STOCKS | | | | | | | 25,705,408,644 | | | | 98.1 | % |
| | | | | | | | | | | | |
PREFERRED STOCKS — (0.5%) | | | | | | | | | | | | |
GERMANY — (0.5%) | | | | | | | | | | | | |
Other Securities | | | | | | | 124,130,155 | | | | 0.5 | % |
| | | | | | | | | | | | |
RIGHTS/WARRANTS — (0.0%) | | | | | | | | | | | | |
AUSTRALIA — (0.0%) | | | | | | | | | | | | |
Other Securities | | | | | | | 2,288 | | | | 0.0 | % |
| | | | | | | | | | | | |
HONG KONG — (0.0%) | | | | | | | | | | | | |
Other Security | | | | | | | 1,200 | | | | 0.0 | % |
| | | | | | | | | | | | |
TOTAL RIGHTS/WARRANTS | | | | | | | 3,488 | | | | 0.0 | % |
| | | | | | | | | | | | |
TOTAL INVESTMENT SECURITIES
(Cost $25,579,746,667) | | | | | | | 25,829,542,287 | | | | | |
| | | | | | | | | | | | |
| | | |
| | | | | | Value† | | | | |
SECURITIES LENDING COLLATERAL — (5.4%) | | | | | | | | | | | | |
@§ The DFA Short Term Investment Fund | | | 127,723,864 | | | | 1,476,615,596 | | | | 5.6 | % |
| | | | | | | | | | | | |
TOTAL INVESTMENTS—(100.0%)
(Cost $27,056,971,072) | | | | | | $ | 27,306,157,883 | | | | 104.2 | % |
| | | | | | | | | | | | |
41
INTERNATIONAL CORE EQUITY PORTFOLIO
CONTINUED
As of October 31, 2022, International Core Equity Portfolio had entered into the following outstanding futures contracts:
| | | | | | | | | | | | | | | | | | | | |
Description | | Number of
Contracts | | | Expiration
Date | | | Notional
Value | | | Market
Value | | | Unrealized
Appreciation
(Depreciation) | |
Long Position Contracts: | | | | | | | | | | | | | | | | | | | | |
S&P 500® Emini Index | | | 1,254 | | | | 12/16/22 | | | | $237,568,175 | | | | $243,464,100 | | | | $5,895,925 | |
| | | | | | | | | | | | | | | | | | | | |
Total Futures Contracts | | | | | | | | | | | $237,568,175 | | | | $243,464,100 | | | | $5,895,925 | |
| | | | | | | | | | | | | | | | | | | | |
Summary of the Portfolio’s investments as of October 31, 2022, based on their valuation inputs, is as follows (see Security Valuation Note):
| | | | | | | | | | | | | | | | |
| | | Investments in Securities (Market Value) | |
| | | Level 1 | | | Level 2 | | | Level 3 | | | Total | |
Common Stocks | | | | | | | | | | | | | | | | |
Australia | | $ | 93,576,689 | | | $ | 1,698,129,372 | | | $ | 2,839 | | | $ | 1,791,708,900 | |
Austria | | | 485,980 | | | | 134,821,770 | | | | — | | | | 135,307,750 | |
Belgium | | | 11,946,108 | | | | 309,884,281 | | | | — | | | | 321,830,389 | |
Canada | | | 3,163,854,986 | | | | 8,383,687 | | | | — | | | | 3,172,238,673 | |
China | | | 6,136,434 | | | | 14,681,217 | | | | — | | | | 20,817,651 | |
Denmark | | | 64,790,602 | | | | 517,619,425 | | | | — | | | | 582,410,027 | |
Finland | | | 11,027,487 | | | | 400,189,647 | | | | — | | | | 411,217,134 | |
France | | | 26,286,560 | | | | 2,006,921,075 | | | | 22,344 | | | | 2,033,229,979 | |
Germany | | | 38,273,094 | | | | 1,579,891,924 | | | | — | | | | 1,618,165,018 | |
Hong Kong | | | 260,405 | | | | 508,113,962 | | | | 570,684 | | | | 508,945,051 | |
Ireland | | | 43,399,387 | | | | 149,751,224 | | | | — | | | | 193,150,611 | |
Israel | | | 23,848,066 | | | | 266,313,246 | | | | — | | | | 290,161,312 | |
Italy | | | 7,092,442 | | | | 665,231,668 | | | | — | | | | 672,324,110 | |
Japan | | | 99,590,987 | | | | 5,592,821,183 | | | | — | | | | 5,692,412,170 | |
Netherlands | | | 141,851,447 | | | | 682,674,960 | | | | — | | | | 824,526,407 | |
New Zealand | | | 242,879 | | | | 106,855,898 | | | | — | | | | 107,098,777 | |
Norway | | | 5,642,396 | | | | 261,845,495 | | | | — | | | | 267,487,891 | |
Portugal | | | 314,475 | | | | 77,677,537 | | | | — | | | | 77,992,012 | |
Singapore | | | 40,661 | | | | 267,245,237 | | | | 172,476 | | | | 267,458,374 | |
Spain | | | 7,924,954 | | | | 551,606,590 | | | | — | | | | 559,531,544 | |
Sweden | | | 1,816,871 | | | | 719,034,782 | | | | — | | | | 720,851,653 | |
Switzerland | | | 219,863,426 | | | | 1,778,381,024 | | | | — | | | | 1,998,244,450 | |
United Kingdom | | | 740,200,484 | | | | 2,689,491,454 | | | | 42,788 | | | | 3,429,734,726 | |
United States | | | 4,643,735 | | | | 3,920,300 | | | | — | | | | 8,564,035 | |
Preferred Stocks | | | | | | | | | | | | | | | | |
Germany | | | — | | | | 124,130,155 | | | | — | | | | 124,130,155 | |
Rights/Warrants | | | | | | | | | | | | | | | | |
Australia | | | — | | | | 2,288 | | | | — | | | | 2,288 | |
Hong Kong | | | — | | | | 1,200 | | | | — | | | | 1,200 | |
Securities Lending Collateral | | | — | | | | 1,476,615,596 | | | | — | | | | 1,476,615,596 | |
Futures Contracts** | | | 5,895,925 | | | | — | | | | — | | | | 5,895,925 | |
| | | | | | | | | | | | | | | | |
TOTAL | | | $ 4,719,006,480 | | | | $ 22,592,236,197 | | | | $ 811,131^ | | | | $ 27,312,053,808 | |
| | | | | | | | | | | | | | | | |
| ** | Valued at the unrealized appreciation/(depreciation) on the investment. |
| ^ | A reconciliation of Level 3 investments is presented when the Fund had a significant amount of Level 3 investments at the beginning and/or end of the reporting period in relation to net assets. |
See accompanying Notes to Financial Statements.
42
GLOBAL SMALL COMPANY PORTFOLIO
SCHEDULE OF INVESTMENTS
October 31, 2022
| | | | | | | | |
| | | Shares | | | Value† | |
AFFILIATED INVESTMENT COMPANIES — (100.0%) | | | | | | | | |
Investment in U.S. Small Cap Portfolio of
DFA Investment Dimensions Group Inc. | | | 1,253,645 | | | $ | 51,474,667 | |
Investment in The Continental Small Company Series of
The DFA Investment Trust Company | | | | | | | 9,029,892 | |
Investment in The Emerging Markets Small Cap Series of
The DFA Investment Trust Company | | | | | | | 8,941,424 | |
Investment in The Japanese Small Company Series of
The DFA Investment Trust Company | | | | | | | 5,401,958 | |
Investment in The Canadian Small Company Series of
The DFA Investment Trust Company | | | | | | | 2,954,230 | |
Investment in The United Kingdom Small Company Series of
The DFA Investment Trust Company | | | | | | | 2,762,973 | |
Investment in The Asia Pacific Small Company Series of
The DFA Investment Trust Company | | | | | | | 2,315,196 | |
| | | | | | | | |
TOTAL INVESTMENTS IN AFFILIATED INVESTMENT COMPANIES
(Cost $79,349,948) | | | | | | $ | 82,880,340 | |
| | | | | | | | |
Summary of the Portfolio’s investments as of October 31, 2022, based on their valuation inputs, is as follows (see Security Valuation Note):
| | | | | | | | | | | | | | | | |
| | | Investments in Securities (Market Value) | |
| | | Level 1 | | | Level 2 | | | Level 3 | | | Total | |
Affiliated Investment Companies | | $ | 82,880,340 | | | | — | | | | — | | | $ | 82,880,340 | |
| | | | | | | | | | | | | | | | |
TOTAL | | $ | 82,880,340 | | | | — | | | | — | | | $ | 82,880,340 | |
| | | | | | | | | | | | | | | | |
See accompanying Notes to Financial Statements.
43
INTERNATIONAL SMALL COMPANY PORTFOLIO
SCHEDULE OF INVESTMENTS
October 31, 2022
| | | | | | | | |
| | | | | | Value† | |
AFFILIATED INVESTMENT COMPANIES — (99.3%) | | | | | | | | |
Investment in The Continental Small Company Series of
The DFA Investment Trust Company | | | | | | $ | 3,721,052,938 | |
Investment in The Japanese Small Company Series of
The DFA Investment Trust Company | | | | | | | 2,247,239,833 | |
Investment in The Canadian Small Company Series of
The DFA Investment Trust Company | | | | | | | 1,173,860,681 | |
Investment in The United Kingdom Small Company Series of
The DFA Investment Trust Company | | | | | | | 1,146,678,426 | |
Investment in The Asia Pacific Small Company Series of
The DFA Investment Trust Company | | | | | | | 961,398,453 | |
| | | | | | | | |
TOTAL INVESTMENTS IN AFFILIATED INVESTMENT COMPANIES | | | | | | $ | 9,250,230,331 | |
| | | | | | | | |
| | |
| | | Shares | | | | |
TEMPORARY CASH INVESTMENTS — (0.7%) | | | | | | | | |
State Street Institutional U.S. Government Money Market Fund, 3.010%
(Cost $60,673,803) | | | 60,673,803 | | | | 60,673,803 | |
| | | | | | | | |
TOTAL INVESTMENTS — (100.0%)
(Cost $10,083,101,056) | | | | | | $ | 9,310,904,134 | |
| | | | | | | | |
As of October 31, 2022, International Small Company Portfolio had entered into the following outstanding futures contracts:
| | | | | | | | | | | | | | | | | | | | |
Description | | Number of
Contracts | | | Expiration
Date | | | Notional
Value | | | Market
Value | | | Unrealized
Appreciation
(Depreciation) | |
Long Position Contracts: | | | | | | | | | | | | | | | | | | | | |
S&P 500® Emini Index | | | 282 | | | | 12/16/22 | | | $ | 52,337,807 | | | $ | 54,750,300 | | | $ | 2,412,493 | |
| | | | | | | | | | | | | | | | | | | | |
Total Futures Contracts | | | | | | | | | | $ | 52,337,807 | | | $ | 54,750,300 | | | $ | 2,412,493 | |
| | | | | | | | | | | | | | | | | | | | |
Summary of the Portfolio’s investments as of October 31, 2022, based on their valuation inputs, is as follows (see Security Valuation Note):
| | | | | | | | | | | | | | | | |
| | | Investments in Securities (Market Value) | |
| | | Level 1 | | | Level 2 | | | Level 3 | | | Total | |
Affiliated Investment Companies | | $ | 9,250,230,331 | | | | — | | | | — | | | $ | 9,250,230,331 | |
Temporary Cash Investments | | | 60,673,803 | | | | — | | | | — | | | | 60,673,803 | |
Futures Contracts** | | | 2,412,493 | | | | — | | | | — | | | | 2,412,493 | |
| | | | | | | | | | | | | | | | |
TOTAL | | $ | 9,313,316,627 | | | | — | | | | — | | | $ | 9,313,316,627 | |
| | | | | | | | | | | | | | | | |
| ** | Valued at the unrealized appreciation/(depreciation) on the investment. |
See accompanying Notes to Financial Statements.
44
JAPANESE SMALL COMPANY PORTFOLIO
SCHEDULE OF INVESTMENTS
October 31, 2022
| | | | |
| | | Value† | |
AFFILIATED INVESTMENT COMPANIES — (100.0%) | | | | |
Investment in The Japanese Small Company Series of
The DFA Investment Trust Company | | $ | 267,616,503 | |
| | | | |
TOTAL INVESTMENTS IN AFFILIATED INVESTMENT COMPANIES | | $ | 267,616,503 | |
| | | | |
Summary of the Portfolio’s Master Fund’s investments as of October 31, 2022, based on their valuation inputs, is located in this report (See Security Valuation Note).
See accompanying Notes to Financial Statements.
45
ASIA PACIFIC SMALL COMPANY PORTFOLIO
SCHEDULE OF INVESTMENTS
October 31, 2022
| | | | |
| | | Value† | |
AFFILIATED INVESTMENT COMPANIES — (100.0%) | | | | |
Investment in The Asia Pacific Small Company Series of
The DFA Investment Trust Company | | $ | 230,258,109 | |
| | | | |
TOTAL INVESTMENTS IN AFFILIATED INVESTMENT COMPANIES | | $ | 230,258,109 | |
| | | | |
Summary of the Portfolio’s Master Fund’s investments as of October 31, 2022, based on their valuation inputs, is located in this report (See Security Valuation Note).
See accompanying Notes to Financial Statements.
46
UNITED KINGDOM SMALL COMPANY PORTFOLIO
SCHEDULE OF INVESTMENTS
October 31, 2022
| | | | |
| | | Value† | |
AFFILIATED INVESTMENT COMPANIES — (100.0%) | | | | |
Investment in The United Kingdom Small Company Series of
The DFA Investment Trust Company | | $ | 18,405,761 | |
| | | | |
TOTAL INVESTMENTS IN AFFILIATED INVESTMENT COMPANIES | | $ | 18,405,761 | |
| | | | |
Summary of the Portfolio’s Master Fund’s investments as of October 31, 2022, based on their valuation inputs, is located in this report (See Security Valuation Note).
See accompanying Notes to Financial Statements.
47
CONTINENTAL SMALL COMPANY PORTFOLIO
SCHEDULE OF INVESTMENTS
October 31, 2022
| | | | |
| | | Value† | |
AFFILIATED INVESTMENT COMPANIES — (100.0%) | | | | |
Investment in The Continental Small Company Series of
The DFA Investment Trust Company | | $ | 616,480,091 | |
| | | | |
TOTAL INVESTMENTS IN AFFILIATED INVESTMENT COMPANIES | | $ | 616,480,091 | |
| | | | |
Summary of the Portfolio’s Master Fund’s investments as of October 31, 2022, based on their valuation inputs, is located in this report (See Security Valuation Note).
See accompanying Notes to Financial Statements.
48
DFA INTERNATIONAL REAL ESTATE SECURITIES PORTFOLIO
SUMMARY SCHEDULE OF PORTFOLIO HOLDINGS
October 31, 2022
| | | | | | | | | | | | | | |
| | | | | Shares | | | Value» | | | Percentage
of Net Assets‡ | |
COMMON STOCKS — (94.4%) | | | | | | | | | | | | |
AUSTRALIA — (19.3%) | | | | | | | | | | | | |
| | Charter Hall Group | | | 5,556,846 | | | $ | 46,126,501 | | | | 1.0 | % |
| | Dexus | | | 12,663,151 | | | | 63,101,769 | | | | 1.4 | % |
| | Goodman Group | | | 19,802,843 | | | | 215,468,888 | | | | 4.8 | % |
| | GPT Group | | | 22,010,883 | | | | 60,828,518 | | | | 1.4 | % |
†† | | GPT Group | | | 38,018,670 | | | | 114,298 | | | | 0.0 | % |
| | Mirvac Group | | | 45,916,507 | | | | 60,837,775 | | | | 1.4 | % |
| | Scentre Group | | | 60,755,944 | | | | 113,068,070 | | | | 2.5 | % |
| | Stockland | | | 27,777,850 | | | | 64,002,904 | | | | 1.4 | % |
| | Vicinity Ltd. | | | 44,636,710 | | | | 55,646,940 | | | | 1.3 | % |
| | Other Securities | | | | | | | 215,658,507 | | | | 4.9 | % |
| | | | | | | | | | | | | | |
TOTAL AUSTRALIA | | | | | | | 894,854,170 | | | | 20.1 | % |
| | | | | | | | | | | | | | |
BELGIUM — (3.1%) | | | | | | | | | | | | |
| | Aedifica SA | | | 421,895 | | | | 32,174,865 | | | | 0.7 | % |
# | | Cofinimmo SA | | | 360,138 | | | | 29,868,198 | | | | 0.7 | % |
| | Warehouses De Pauw CVA | | | 1,692,699 | | | | 43,444,676 | | | | 1.0 | % |
| | Other Securities | | | | | | | 38,958,763 | | | | 0.9 | % |
| | | | | | | | | | | | | | |
TOTAL BELGIUM | | | | | | | 144,446,502 | | | | 3.3 | % |
| | | | | | | | | | | | | | |
CANADA — (5.5%) | | | | | | | | | | | | |
# | | Canadian Apartment Properties REIT | | | 956,292 | | | | 29,614,974 | | | | 0.7 | % |
# | | RioCan Real Estate Investment Trust | | | 1,707,034 | | | | 24,320,865 | | | | 0.5 | % |
| | Other Securities | | | | | | | 201,601,360 | | | | 4.5 | % |
| | | | | | | | | | | | | | |
TOTAL CANADA | | | | | | | 255,537,199 | | | | 5.7 | % |
| | | | | | | | | | | | | | |
CHINA — (0.1%) | | | | | | | | | | | | |
| | Other Securities | | | | | | | 5,936,930 | | | | 0.1 | % |
| | | | | | | | | | | | | | |
FRANCE — (3.6%) | | | | | | | | | | | | |
| | Covivio | | | 563,975 | | | | 30,196,121 | | | | 0.7 | % |
| | Gecina SA | | | 512,893 | | | | 45,726,482 | | | | 1.0 | % |
| | Klepierre SA | | | 2,407,296 | | | | 48,382,433 | | | | 1.1 | % |
| | Other Securities | | | | | | | 43,851,844 | | | | 1.0 | % |
| | | | | | | | | | | | | | |
TOTAL FRANCE | | | | | | | 168,156,880 | | | | 3.8 | % |
| | | | | | | | | | | | | | |
GERMANY — (0.2%) | | | | | | | | | | | | |
| | Other Security | | | | | | | 8,314,393 | | | | 0.2 | % |
| | | | | | | | | | | | | | |
HONG KONG — (3.7%) | | | | | | | | | | | | |
| | Link REIT | | | 24,349,827 | | | | 143,922,397 | | | | 3.2 | % |
| | Other Securities | | | | | | | 27,041,684 | | | | 0.6 | % |
| | | | | | | | | | | | | | |
TOTAL HONG KONG | | | | | | | 170,964,081 | | | | 3.8 | % |
| | | | | | | | | | | | | | |
IRELAND — (0.1%) | | | | | | | | | | | | |
| | Other Security | | | | | | | 5,939,219 | | | | 0.1 | % |
| | | | | | | | | | | | | | |
ITALY — (0.1%) | | | | | | | | | | | | |
| | Other Security | | | | | | | 2,378,527 | | | | 0.1 | % |
| | | | | | | | | | | | | | |
JAPAN — (25.6%) | | | | | | | | | | | | |
| | Activia Properties, Inc. | | | 8,378 | | | | 24,816,095 | | �� | | 0.6 | % |
49
DFA INTERNATIONAL REAL ESTATE SECURITIES PORTFOLIO
CONTINUED
| | | | | | | | | | | | | | |
| | | | | Shares | | | Value» | | | Percentage
of Net Assets‡ | |
JAPAN — (Continued) | | | | | | | | | | | | |
| | Advance Residence Investment Corp. | | | 15,568 | | | $ | 36,244,836 | | | | 0.8 | % |
| | Daiwa House REIT Investment Corp. | | | 26,015 | | | | 52,505,949 | | | | 1.2 | % |
| | GLP J-Reit | | | 51,948 | | | | 53,874,350 | | | | 1.2 | % |
| | Japan Hotel REIT Investment Corp. | | | 52,856 | | | | 27,847,536 | | | | 0.6 | % |
| | Japan Metropolitan Fund Invest | | | 83,690 | | | | 61,656,874 | | | | 1.4 | % |
| | Japan Prime Realty Investment Corp. | | | 10,123 | | | | 27,492,493 | | | | 0.6 | % |
| | Japan Real Estate Investment Corp. | | | 14,931 | | | | 62,565,179 | | | | 1.4 | % |
| | Nippon Building Fund, Inc. | | | 18,583 | | | | 82,605,957 | | | | 1.9 | % |
| | Nippon Prologis REIT, Inc. | | | 25,579 | | | | 53,672,217 | | | | 1.2 | % |
| | Nomura Real Estate Master Fund, Inc. | | | 49,895 | | | | 56,921,787 | | | | 1.3 | % |
| | Orix JREIT, Inc. | | | 30,668 | | | | 41,144,686 | | | | 0.9 | % |
# | | Sekisui House Reit, Inc. | | | 50,622 | | | | 27,277,248 | | | | 0.6 | % |
| | United Urban Investment Corp. | | | 35,634 | | | | 37,701,753 | | | | 0.8 | % |
| | Other Securities | | | | | | | 540,290,191 | | | | 12.2 | % |
| | | | | | | | | | | | | | |
TOTAL JAPAN | | | | | | | 1,186,617,151 | | | | 26.7 | % |
| | | | | | | | | | | | | | |
MALAYSIA — (0.5%) | | | | | | | | | | | | |
| | Other Securities | | | | | | | 22,357,021 | | | | 0.5 | % |
| | | | | | | | | | | | | | |
MEXICO — (2.0%) | | | | | | | | | | | | |
| | Fibra Uno Administracion SA de CV | | | 33,891,372 | | | | 39,565,307 | | | | 0.9 | % |
| | Other Securities | | | | | | | 52,585,411 | | | | 1.2 | % |
| | | | | | | | | | | | | | |
TOTAL MEXICO | | | | | | | 92,150,718 | | | | 2.1 | % |
| | | | | | | | | | | | | | |
NETHERLANDS — (2.2%) | | | | | | | | | | | | |
#* | | Unibail-Rodamco-Westfield | | | 6,534,333 | | | | 15,361,581 | | | | 0.4 | % |
* | | Unibail-Rodamco-Westfield | | | 1,143,546 | | | | 54,043,496 | | | | 1.2 | % |
| | Other Securities | | | | | | | 30,875,241 | | | | 0.7 | % |
| | | | | | | | | | | | | | |
TOTAL NETHERLANDS | | | | | | | 100,280,318 | | | | 2.3 | % |
| | | | | | | | | | | | | | |
NEW ZEALAND — (1.3%) | | | | | | | | | | | | |
| | Other Securities | | | | | | | 58,283,644 | | | | 1.3 | % |
| | | | | | | | | | | | | | |
SINGAPORE — (10.2%) | | | | | | | | | | | | |
# | | CapitaLand Ascendas REIT | | | 40,054,380 | | | | 74,108,243 | | | | 1.7 | % |
| | CapitaLand Integrated Commercial Trust | | | 60,346,311 | | | | 80,088,840 | | | | 1.8 | % |
| | Frasers Logistics & Commercial Trust | | | 32,823,633 | | | | 25,510,033 | | | | 0.6 | % |
| | Mapletree Industrial Trust | | | 22,971,658 | | | | 35,719,257 | | | | 0.8 | % |
# | | Mapletree Logistics Trust | | | 38,481,647 | | | | 41,301,170 | | | | 0.9 | % |
| | Mapletree Pan Asia Commercial Trust | | | 25,357,006 | | | | 28,455,859 | | | | 0.6 | % |
| | Other Securities | | | | | | | 187,574,331 | | | | 4.2 | % |
| | | | | | | | | | | | | | |
TOTAL SINGAPORE | | | | | | | 472,757,733 | | | | 10.6 | % |
| | | | | | | | | | | | | | |
SOUTH AFRICA — (1.9%) | | | | | | | | | | | | |
# | | Growthpoint Properties Ltd. | | | 39,459,664 | | | | 27,826,389 | | | | 0.6 | % |
| | Other Securities | | | | | | | 60,278,017 | | | | 1.4 | % |
| | | | | | | | | | | | | | |
TOTAL SOUTH AFRICA | | | | | | | 88,104,406 | | | | 2.0 | % |
| | | | | | | | | | | | | | |
SOUTH KOREA — (0.2%) | | | | | | | | | | | | |
| | Other Securities | | | | | | | 10,133,289 | | | | 0.2 | % |
| | | | | | | | | | | | | | |
SPAIN — (1.2%) | | | | | | | | | | | | |
| | Merlin Properties Socimi SA | | | 3,784,812 | | | | 32,082,241 | | | | 0.7 | % |
50
DFA INTERNATIONAL REAL ESTATE SECURITIES PORTFOLIO
CONTINUED
| | | | | | | | | | | | |
| | | Shares | | | Value» | | | Percentage
of Net Assets‡ | |
SPAIN — (Continued) | | | | | | | | | | | | |
Other Securities | | | | | | $ | 22,364,456 | | | | 0.5 | % |
| | | | | | | | | | | | |
TOTAL SPAIN | | | | | | | 54,446,697 | | | | 1.2 | % |
| | | | | | | | | | | | |
TAIWAN — (0.3%) | | | | | | | | | | | | |
Other Securities | | | | | | | 14,548,960 | | | | 0.3 | % |
| | | | | | | | | | | | |
TURKEY — (0.4%) | | | | | | | | | | | | |
Other Securities | | | | | | | 19,393,016 | | | | 0.4 | % |
| | | | | | | | | | | | |
UNITED KINGDOM — (12.9%) | | | | | | | | | | | | |
Big Yellow Group PLC | | | 2,268,487 | | | | 29,189,892 | | | | 0.7 | % |
British Land Co. PLC | | | 11,252,563 | | | | 47,203,244 | | | | 1.1 | % |
Derwent London PLC | | | 1,239,724 | | | | 30,682,288 | | | | 0.7 | % |
Land Securities Group PLC | | | 8,760,590 | | | | 57,284,485 | | | | 1.3 | % |
LondonMetric Property PLC | | | 12,296,949 | | | | 26,369,879 | | | | 0.6 | % |
Safestore Holdings PLC | | | 2,769,829 | | | | 28,696,480 | | | | 0.6 | % |
Segro PLC | | | 15,068,209 | | | | 135,613,869 | | | | 3.1 | % |
Tritax Big Box REIT PLC | | | 23,378,269 | | | | 37,590,912 | | | | 0.8 | % |
UNITE Group PLC | | | 4,193,305 | | | | 42,834,393 | | | | 1.0 | % |
Other Securities | | | | | | | 164,025,697 | | | | 3.6 | % |
| | | | | | | | | | | | |
TOTAL UNITED KINGDOM | | | | | | | 599,491,139 | | | | 13.5 | % |
| | | | | | | | | | | | |
TOTAL COMMON STOCKS
(Cost $5,316,255,361) | | | | | | | 4,375,091,993 | | | | 98.3 | % |
| | | | | | | | | | | | |
| | | |
| | | | | | Value† | | | | |
SECURITIES LENDING COLLATERAL — (5.6%) | | | | | | | | | | | | |
@§ The DFA Short Term Investment Fund | | | 22,487,650 | | | | 259,979,719 | | | | 5.8 | % |
| | | | | | | | | | | | |
TOTAL INVESTMENTS—(100.0%)
(Cost $5,576,312,168) | | | | | | $ | 4,635,071,712 | | | | 104.1 | % |
| | | | | | | | | | | | |
As of October 31, 2022, DFA International Real Estate Securities Portfolio had entered into the following outstanding futures contracts:
| | | | | | | | | | | | | | | | | | | | |
Description | | Number of
Contracts | | | Expiration
Date | | | Notional
Value | | | Market
Value | | | Unrealized
Appreciation
(Depreciation) | |
Long Position Contracts: | | | | | | | | | | | | | | | | | | | | |
S&P 500® Emini Index | | | 213 | | | | 12/16/22 | | | $ | 39,773,173 | | | $ | 41,353,950 | | | $ | 1,580,777 | |
| | | | | | | | | | | | | | | | | | | | |
Total Futures Contracts | | | | | | | | | | $ | 39,773,173 | | | $ | 41,353,950 | | | $ | 1,580,777 | |
| | | | | | | | | | | | | | | | | | | | |
Summary of the Portfolio’s investments as of October 31, 2022, based on their valuation inputs, is as follows (see Security Valuation Note):
| | | | | | | | | | | | | | | | |
| | | Investments in Securities (Market Value) | |
| | | Level 1 | | | Level 2 | | | Level 3 | | | Total | |
Common Stocks | | | | | | | | | | | | | | | | |
Australia | | $ | 264,342 | | | $ | 894,475,530 | | | $ | 114,298 | | | $ | 894,854,170 | |
Belgium | | | — | | | | 144,446,502 | | | | — | | | | 144,446,502 | |
Canada | | | 255,537,199 | | | | — | | | | — | | | | 255,537,199 | |
China | | | — | | | | 5,936,930 | | | | — | | | | 5,936,930 | |
51
DFA INTERNATIONAL REAL ESTATE SECURITIES PORTFOLIO
CONTINUED
| | | | | | | | | | | | | | | | |
| | | Investments in Securities (Market Value) | |
| | | Level 1 | | | Level 2 | | | Level 3 | | | Total | |
France | | | — | | | $ | 168,156,880 | | | | — | | | $ | 168,156,880 | |
Germany | | | — | | | | 8,314,393 | | | | — | | | | 8,314,393 | |
Hong Kong | | | — | | | | 170,964,081 | | | | — | | | | 170,964,081 | |
Ireland | | | — | | | | 5,939,219 | | | | — | | | | 5,939,219 | |
Italy | | | — | | | | 2,378,527 | | | | — | | | | 2,378,527 | |
Japan | | | — | | | | 1,186,617,151 | | | | — | | | | 1,186,617,151 | |
Malaysia | | | — | | | | 22,357,021 | | | | — | | | | 22,357,021 | |
Mexico | | $ | 92,150,718 | | | | — | | | | — | | | | 92,150,718 | |
Netherlands | | | — | | | | 100,280,318 | | | | — | | | | 100,280,318 | |
New Zealand | | | — | | | | 58,283,644 | | | | — | | | | 58,283,644 | |
Singapore | | | — | | | | 472,757,733 | | | | — | | | | 472,757,733 | |
South Africa | | | — | | | | 88,104,406 | | | | — | | | | 88,104,406 | |
South Korea | | | — | | | | 10,133,289 | | | | — | | | | 10,133,289 | |
Spain | | | — | | | | 54,446,697 | | | | — | | | | 54,446,697 | |
Taiwan | | | — | | | | 14,548,960 | | | | — | | | | 14,548,960 | |
Turkey | | | — | | | | 19,393,016 | | | | — | | | | 19,393,016 | |
United Kingdom | | | — | | | | 599,491,139 | | | | — | | | | 599,491,139 | |
Securities Lending Collateral | | | — | | | | 259,979,719 | | | | — | | | | 259,979,719 | |
Futures Contracts** | | | 1,580,777 | | | | — | | | | — | | | | 1,580,777 | |
| | | | | | | | | | | | | | | | |
TOTAL. | | $ | 349,533,036 | | | $ | 4,287,005,155 | | | $ | 114,298 | ^ | | $ | 4,636,652,489 | |
| | | | | | | | | | | | | | | | |
| ** | Valued at the unrealized appreciation/(depreciation) on the investment. |
| ^ | A reconciliation of Level 3 investments is presented when the Fund had a significant amount of Level 3 investments at the beginning and/or end of the reporting period in relation to net assets. |
See accompanying Notes to Financial Statements.
52
DFA GLOBAL REAL ESTATE SECURITIES PORTFOLIO
SUMMARY SCHEDULE OF PORTFOLIO HOLDINGS
October 31, 2022
| | | | | | | | | | | | | | |
| | | | | Shares | | | Value» | | | Percentage
of Net Assets‡ | |
COMMON STOCKS — (59.7%) | | | | | | | | | | | | |
UNITED STATES — (59.7%) | | | | | | | | | | | | |
# | | Alexandria Real Estate Equities, Inc. | | | 647,118 | | | $ | 94,026,245 | | | | 1.2 | % |
# | | American Homes 4 Rent, Class A | | | 1,320,901 | | | | 42,189,591 | | | | 0.5 | % |
| | American Tower Corp. | | | 1,939,983 | | | | 401,945,078 | | | | 5.1 | % |
| | Apartment Income REIT Corp. | | | 693,847 | | | | 26,664,542 | | | | 0.3 | % |
| | AvalonBay Communities, Inc. | | | 595,358 | | | | 104,259,093 | | | | 1.3 | % |
| | Boston Properties, Inc. | | | 625,689 | | | | 45,487,590 | | | | 0.6 | % |
| | Brixmor Property Group, Inc. | | | 1,329,571 | | | | 28,333,158 | | | | 0.4 | % |
| | Camden Property Trust | | | 442,654 | | | | 51,148,670 | | | | 0.7 | % |
| | Crown Castle, Inc. | | | 1,840,638 | | | | 245,283,420 | | | | 3.1 | % |
# | | CubeSmart | | | 917,306 | | | | 38,407,602 | | | | 0.5 | % |
| | Digital Realty Trust, Inc. | | | 1,197,763 | | | | 120,075,721 | | | | 1.5 | % |
| | EastGroup Properties, Inc. | | | 172,932 | | | | 27,096,715 | | | | 0.3 | % |
| | Equinix, Inc. | | | 386,875 | | | | 219,141,475 | | | | 2.8 | % |
| | Equity LifeStyle Properties, Inc. | | | 734,982 | | | | 47,009,449 | | | | 0.6 | % |
| | Equity Residential | | | 1,579,900 | | | | 99,565,298 | | | | 1.3 | % |
| | Essex Property Trust, Inc. | | | 277,372 | | | | 61,643,153 | | | | 0.8 | % |
| | Extra Space Storage, Inc. | | | 569,724 | | | | 101,091,827 | | | | 1.3 | % |
# | | Federal Realty Investment Trust | | | 317,280 | | | | 31,404,374 | | | | 0.4 | % |
| | First Industrial Realty Trust, Inc. | | | 583,397 | | | | 27,787,199 | | | | 0.4 | % |
| | Gaming & Leisure Properties, Inc. | | | 1,020,218 | | | | 51,133,326 | | | | 0.6 | % |
| | Healthcare Realty Trust, Inc., Class A | | | 1,599,116 | | | | 32,510,028 | | | | 0.4 | % |
| | Healthpeak Properties, Inc. | | | 2,267,390 | | | | 53,805,165 | | | | 0.7 | % |
| | Host Hotels & Resorts, Inc. | | | 2,986,477 | | | | 56,384,686 | | | | 0.7 | % |
# | | Invitation Homes, Inc. | | | 2,588,181 | | | | 82,019,451 | | | | 1.0 | % |
# | | Iron Mountain, Inc. | | | 1,222,372 | | | | 61,204,166 | | | | 0.8 | % |
| | Kimco Realty Corp. | | | 2,602,365 | | | | 55,638,570 | | | | 0.7 | % |
| | Lamar Advertising Co., Class A | | | 383,771 | | | | 35,395,199 | | | | 0.5 | % |
# | | Life Storage, Inc. | | | 356,502 | | | | 39,432,631 | | | | 0.5 | % |
# | | Medical Properties Trust, Inc. | | | 2,519,997 | | | | 28,853,966 | | | | 0.4 | % |
| | Mid-America Apartment Communities, Inc. | | | 490,009 | | | | 77,151,841 | | | | 1.0 | % |
| | National Retail Properties, Inc. | | | 748,456 | | | | 31,457,606 | | | | 0.4 | % |
# | | Omega Healthcare Investors, Inc. | | | 1,017,510 | | | | 32,336,473 | | | | 0.4 | % |
| | Prologis, Inc. | | | 3,920,213 | | | | 434,163,557 | | | | 5.5 | % |
| | Public Storage | | | 672,049 | | | | 208,167,178 | | | | 2.6 | % |
| | Realty Income Corp. | | | 2,508,477 | | | | 156,202,845 | | | | 2.0 | % |
| | Regency Centers Corp. | | | 682,674 | | | | 41,308,580 | | | | 0.5 | % |
| | Rexford Industrial Realty, Inc. | | | 699,123 | | | | 38,647,519 | | | | 0.5 | % |
| | SBA Communications Corp. | | | 465,813 | | | | 125,722,929 | | | | 1.6 | % |
| | Simon Property Group, Inc. | | | 1,375,574 | | | | 149,910,054 | | | | 1.9 | % |
| | Spirit Realty Capital, Inc. | | | 553,969 | | | | 21,510,624 | | | | 0.3 | % |
| | STAG Industrial, Inc. | | | 687,773 | | | | 21,726,749 | | | | 0.3 | % |
# | | STORE Capital Corp. | | | 1,120,845 | | | | 35,642,871 | | | | 0.5 | % |
| | Sun Communities, Inc. | | | 506,508 | | | | 68,302,604 | | | | 0.9 | % |
| | UDR, Inc. | | | 1,343,079 | | | | 53,400,821 | | | | 0.7 | % |
| | Ventas, Inc. | | | 1,679,645 | | | | 65,724,523 | | | | 0.8 | % |
# | | VICI Properties, Inc. | | | 3,442,758 | | | | 110,237,096 | | | | 1.4 | % |
| | Welltower, Inc. | | | 1,919,936 | | | | 117,192,893 | | | | 1.5 | % |
| | WP Carey, Inc. | | | 863,529 | | | | 65,887,263 | | | | 0.8 | % |
| | Other Securities | | | | | | | 624,705,446 | | | | 7.8 | % |
| | | | | | | | | | | | | | |
TOTAL UNITED STATES | | | | | | | 4,788,336,860 | | | | 60.8 | % |
| | | | | | | | | | | | | | |
TOTAL COMMON STOCKS | | | | | | | 4,788,336,860 | | | | 60.8 | % |
| | | | | | | | | | | | | | |
53
DFA GLOBAL REAL ESTATE SECURITIES PORTFOLIO
CONTINUED
| | | | | | | | | | | | | | |
| | | | | Shares | | | Value† | | | Percentage
of Net Assets‡ | |
AFFILIATED INVESTMENT COMPANIES — (37.9%) | | | | | | | | | | | | |
| | DFA International Real Estate Securities Portfolio of
DFA Investment Dimensions Group, Inc. | | | 815,281,171 | | | $ | 2,755,650,355 | | | | 35.0 | % |
| | DFA Real Estate Securities Portfolio of DFA Investment
Dimensions Group, Inc. | | | 7,325,273 | | | | 281,217,222 | | | | 3.6 | % |
| | | | | | | | | | | | | | |
TOTAL INVESTMENTS IN AFFILIATED INVESTMENT
COMPANIES | | | | | | | 3,036,867,577 | | | | 38.6 | % |
| | | | | | | | | | | | | | |
TOTAL INVESTMENT SECURITIES
(Cost $8,264,551,787) | | | | | | | 7,825,204,437 | | | | | |
| | | | | | | | | | | | | | |
SECURITIES LENDING COLLATERAL — (2.4%) | | | | | | | | | | | | |
@§ | | The DFA Short Term Investment Fund | | | 16,808,621 | | | | 194,324,473 | | | | 2.5 | % |
| | | | | | | | | | | | | | |
TOTAL INVESTMENTS—(100.0%)
(Cost $8,458,944,245) | | | | | | $ | 8,019,528,910 | | | | 101.9 | % |
| | | | | | | | | | | | | | |
As of October 31, 2022, DFA Global Real Estate Securities Portfolio had entered into the following outstanding futures contracts:
| | | | | | | | | | | | | | | | | | | | |
| | | | | | | | | | | | | | | Unrealized | |
| | | Number of | | | Expiration | | | Notional | | | Market | | | Appreciation | |
Description | | Contracts | | | Date | | | Value | | | Value | | | (Depreciation) | |
Long Position Contracts: | | | | | | | | | | | | | | | | | | | | |
S&P 500® Emini Index | | | 172 | | | | 12/16/22 | | | $ | 32,249,888 | | | $ | 33,393,800 | | | $ | 1,143,912 | |
| | | | | | | | | | | | | | | | | | | | |
Total Futures Contracts | | | | | | | | | | $ | 32,249,888 | | | $ | 33,393,800 | | | $ | 1,143,912 | |
| | | | | | | | | | | | | | | | | | | | |
Summary of the Portfolio’s investments as of October 31, 2022, based on their valuation inputs, is as follows (see Security Valuation Note):
| | | | | | | | | | | | | | | | |
| | | Investments in Securities (Market Value) | |
| | | Level 1 | | | Level 2 | | | Level 3 | | | Total | |
Common Stocks | | | | | | | | | | | | | | | | |
United States | | $ | 4,788,336,860 | | | | — | | | | — | | | $ | 4,788,336,860 | |
Affiliated Investment Companies | | | 3,036,867,577 | | | | — | | | | — | | | | 3,036,867,577 | |
Securities Lending Collateral | | | — | | | $ | 194,324,473 | | | | — | | | | 194,324,473 | |
Futures Contracts** | | | 1,143,912 | | | | — | | | | — | | | | 1,143,912 | |
| | | | | | | | | | | | | | | | |
TOTAL | | $ | 7,826,348,349 | | | $ | 194,324,473 | | | | — | | | $ | 8,020,672,822 | |
| | | | | | | | | | | | | | | | |
| ** | Valued at the unrealized appreciation/(depreciation) on the investment. |
See accompanying Notes to Financial Statements.
54
DFA INTERNATIONAL SMALL CAP VALUE PORTFOLIO
SUMMARY SCHEDULE OF PORTFOLIO HOLDINGS
October 31, 2022
| | | | | | | | | | | | | | |
| | | | | | | | | | | Percentage | |
| | | | | Shares | | | Value» | | | of Net Assets‡ | |
COMMON STOCKS — (97.0%) | | | | | | | | | | | | |
AUSTRALIA — (6.8%) | | | | | | | | | | | | |
| | Whitehaven Coal Ltd. | | | 12,373,145 | | | $ | 71,873,065 | | | | 0.8 | % |
| | Other Securities | | | | | | | 591,744,114 | | | | 6.1 | % |
| | | | | | | | | | | | | | |
TOTAL AUSTRALIA | | | | | | | 663,617,179 | | | | 6.9 | % |
| | | | | | | | | | | | | | |
AUSTRIA — (0.8%) | | | | | | | | | | | | |
| | Other Securities | | | | | | | 74,968,388 | | | | 0.8 | % |
| | | | | | | | | | | | | | |
BELGIUM — (1.9%) | | | | | | | | | | | | |
| | Ackermans & van Haaren NV | | | 319,855 | | | | 44,562,652 | | | | 0.5 | % |
| | Euronav NV | | | 3,409,575 | | | | 59,441,792 | | | | 0.6 | % |
| | Other Securities | | | | | | | 82,512,686 | | | | 0.8 | % |
| | | | | | | | | | | | | | |
TOTAL BELGIUM | | | | | | | 186,517,130 | | | | 1.9 | % |
| | | | | | | | | | | | | | |
CANADA — (12.9%) | | | | | | | | | | | | |
| # | | Alamos Gold, Inc., Class A | | | 7,396,140 | | | | 58,361,291 | | | | 0.6 | % |
| # | | Birchcliff Energy Ltd. | | | 5,486,552 | | | | 42,648,795 | | | | 0.4 | % |
| # | | Canadian Western Bank | | | 1,817,290 | | | | 31,614,323 | | | | 0.3 | % |
| # | | Crescent Point Energy Corp. | | | 6,629,597 | | | | 51,826,042 | | | | 0.5 | % |
| # | | Crescent Point Energy Corp. | | | 3,894,900 | | | | 30,497,067 | | | | 0.3 | % |
| # | | Linamar Corp. | | | 965,007 | | | | 41,303,305 | | | | 0.4 | % |
| * | | MEG Energy Corp. | | | 5,253,777 | | | | 78,555,024 | | | | 0.8 | % |
| # | | Whitecap Resources, Inc. | | | 7,500,963 | | | | 58,142,303 | | | | 0.6 | % |
| # | | Yamana Gold, Inc. | | | 12,243,267 | | | | 53,741,503 | | | | 0.6 | % |
| | Other Securities | | | | | | | 807,819,169 | | | | 8.5 | % |
| | | | | | | | | | | | | | |
TOTAL CANADA | | | | | | | 1,254,508,822 | | | | 13.0 | % |
| | | | | | | | | | | | | | |
CHINA — (0.1%) | | | | | | | | | | | | |
| | Other Securities | | | | | | | 10,064,505 | | | | 0.1 | % |
| | | | | | | | | | | | | | |
DENMARK — (2.9%) | | | | | | | | | | | | |
| * | | Jyske Bank AS | | | 1,195,095 | | | | 64,498,265 | | | | 0.7 | % |
| | Sydbank AS | | | 1,477,986 | | | | 45,005,189 | | | | 0.5 | % |
| | Other Securities | | | | | | | 177,961,595 | | | | 1.8 | % |
| | | | | | | | | | | | | | |
TOTAL DENMARK | | | | | | | 287,465,049 | | | | 3.0 | % |
| | | | | | | | | | | | | | |
FINLAND — (2.0%) | | | | | | | | | | | | |
| | Cargotec Oyj, Class B | | | 921,950 | | | | 34,674,199 | | | | 0.4 | % |
| # | | Kemira Oyj | | | 2,771,507 | | | | 36,596,020 | | | | 0.4 | % |
| # | | TietoEVRY Oyj | | | 1,319,138 | | | | 31,447,219 | | | | 0.3 | % |
| | Other Securities | | | | | | | 91,841,570 | | | | 0.9 | % |
| | | | | | | | | | | | | | |
TOTAL FINLAND | | | | | | | 194,559,008 | | | | 2.0 | % |
| | | | | | | | | | | | | | |
FRANCE — (3.8%) | | | | | | | | | | | | |
| | Elis SA | | | 3,427,793 | | | | 39,254,759 | | | | 0.4 | % |
| | Rexel SA | | | 2,338,636 | | | | 41,733,646 | | | | 0.4 | % |
| | SES SA | | | 5,373,290 | | | | 38,112,461 | | | | 0.4 | % |
| | Other Securities | | | | | | | 255,507,564 | | | | 2.7 | % |
| | | | | | | | | | | | | | |
TOTAL FRANCE | | | | | | | 374,608,430 | | | | 3.9 | % |
| | | | | | | | | | | | | | |
GERMANY — (5.8%) | | | | | | | | | | | | |
| * | | Aareal Bank AG | | | 1,191,446 | | | | 37,676,355 | | | | 0.4 | % |
55
DFA INTERNATIONAL SMALL CAP VALUE PORTFOLIO
CONTINUED
| | | | | | | | | | | | |
| | | Shares | | | Value» | | | Percentage
of Net Assets‡ | |
GERMANY — (Continued) | | | | | | | | | | | | |
Aurubis AG | | | 936,015 | | | $ | 59,062,786 | | | | 0.6 | % |
Freenet AG | | | 1,705,503 | | | | 33,523,671 | | | | 0.4 | % |
K&S AG | | | 3,796,021 | | | | 83,812,305 | | | | 0.9 | % |
Lanxess AG | | | 1,057,257 | | | | 35,754,071 | | | | 0.4 | % |
Rheinmetall AG | | | 195,846 | | | | 31,835,087 | | | | 0.3 | % |
Other Securities | | | | | | | 279,272,505 | | | | 2.8 | % |
| | | | | | | | | | | | |
TOTAL GERMANY | | | | | | | 560,936,780 | | | | 5.8 | % |
| | | | | | | | | | | | |
GREECE — (0.0%) | | | | | | | | | | | | |
Other Securities | | | | | | | 1,698 | | | | 0.0 | % |
| | | | | | | | | | | | |
HONG KONG — (2.1%) | | | | | | | | | | | | |
Other Securities | | | | | | | 205,643,458 | | | | 2.1 | % |
| | | | | | | | | | | | |
IRELAND — (0.5%) | | | | | | | | | | | | |
Bank of Ireland Group PLC | | | 5,511,654 | | | | 39,687,335 | | | | 0.4 | % |
Other Securities | | | | | | | 10,722,764 | | | | 0.1 | % |
| | | | | | | | | | | | |
TOTAL IRELAND | | | | | | | 50,410,099 | | | | 0.5 | % |
| | | | | | | | | | | | |
ISRAEL — (1.3%) | | | | | | | | | | | | |
Other Securities | | | | | | | 126,829,931 | | | | 1.3 | % |
| | | | | | | | | | | | |
ITALY — (3.8%) | | | | | | | | | | | | |
Banco BPM SpA | | | 21,588,080 | | | | 65,315,073 | | | | 0.7 | % |
Leonardo SpA | | | 4,980,957 | | | | 40,017,465 | | | | 0.4 | % |
Unipol Gruppo SpA | | | 8,415,530 | | | | 36,219,081 | | | | 0.4 | % |
Other Securities | | | | | | | 232,704,422 | | | | 2.4 | % |
| | | | | | | | | | | | |
TOTAL ITALY | | | | | | | 374,256,041 | | | | 3.9 | % |
| | | | | | | | | | | | |
JAPAN — (25.0%) | | | | | | | | | | | | |
Other Securities | | | | | | | 2,435,962,994 | | | | 25.2 | % |
| | | | | | | | | | | | |
NETHERLANDS — (2.5%) | | | | | | | | | | | | |
ASR Nederland NV | | | 2,288,728 | | | | 100,779,267 | | | | 1.0 | % |
# SBM Offshore NV | | | 4,336,093 | | | | 58,682,149 | | | | 0.6 | % |
Other Securities | | | | | | | 84,596,700 | | | | 0.9 | % |
| | | | | | | | | | | | |
TOTAL NETHERLANDS | | | | | | | 244,058,116 | | | | 2.5 | % |
| | | | | | | | | | | | |
NEW ZEALAND — (0.3%) | | | | | | | | | | | | |
Other Securities | | | | | | | 29,873,647 | | | | 0.3 | % |
| | | | | | | | | | | | |
NORWAY — (1.3%) | | | | | | | | | | | | |
Other Securities | | | | | | | 131,487,640 | | | | 1.4 | % |
| | | | | | | | | | | | |
PORTUGAL — (0.2%) | | | | | | | | | | | | |
Other Securities | | | | | | | 22,020,666 | | | | 0.2 | % |
| | | | | | | | | | | | |
SINGAPORE — (0.9%) | | | | | | | | | | | | |
Other Securities | | | | | | | 86,182,468 | | | | 0.9 | % |
| | | | | | | | | | | | |
SPAIN — (2.8%) | | | | | | | | | | | | |
Banco de Sabadell SA | | | 93,126,420 | | | | 73,272,231 | | | | 0.8 | % |
# Bankinter SA | | | 12,295,019 | | | | 74,372,052 | | | | 0.8 | % |
56
DFA INTERNATIONAL SMALL CAP VALUE PORTFOLIO
CONTINUED
| | | | | | | | | | | | |
| | | Shares | | | Value» | | | Percentage
of Net Assets‡ | |
SPAIN — (Continued) | | | | | | | | | | | | |
Other Securities | | | | | | $ | 125,749,493 | | | | 1.2 | % |
| | | | | | | | | | | | |
TOTAL SPAIN | | | | | | | 273,393,776 | | | | 2.8 | % |
| | | | | | | | | | | | |
SWEDEN — (2.3%) | | | | | | | | | | | | |
Other Securities | | | | | | | 225,374,205 | | | | 2.3 | % |
| | | | | | | | | | | | |
SWITZERLAND — (6.2%) | | | | | | | | | | | | |
Adecco Group AG | | | 1,142,686 | | | | 35,761,459 | | | | 0.4 | % |
Allreal Holding AG | | | 297,965 | | | | 42,682,438 | | | | 0.4 | % |
Baloise Holding AG | | | 352,704 | | | | 48,187,170 | | | | 0.5 | % |
Helvetia Holding AG | | | 645,552 | | | | 64,104,812 | | | | 0.7 | % |
Siegfried Holding AG | | | 63,680 | | | | 37,907,305 | | | | 0.4 | % |
Swiss Prime Site AG | | | 679,052 | | | | 54,794,690 | | | | 0.6 | % |
Other Securities | | | | | | | 319,017,279 | | | | 3.2 | % |
| | | | | | | | | | | | |
TOTAL SWITZERLAND | | | | | | | 602,455,153 | | | | 6.2 | % |
| | | | | | | | | | | | |
UNITED KINGDOM — (10.5%) | | | | | | | | | | | | |
Bellway PLC | | | 1,802,661 | | | | 38,337,467 | | | | 0.4 | % |
Close Brothers Group PLC | | | 3,353,167 | | | | 37,777,068 | | | | 0.4 | % |
Drax Group PLC | | | 5,687,826 | | | | 33,965,517 | | | | 0.4 | % |
Grafton Group PLC | | | 5,205,358 | | | | 41,212,135 | | | | 0.4 | % |
Man Group PLC | | | 12,541,246 | | | | 31,197,686 | | | | 0.3 | % |
Mediclinic International PLC | | | 6,245,108 | | | | 35,526,683 | | | | 0.4 | % |
Paragon Banking Group PLC | | | 6,577,529 | | | | 32,180,697 | | | | 0.3 | % |
Redrow PLC | | | 6,765,614 | | | | 32,556,262 | | | | 0.3 | % |
Travis Perkins PLC | | | 3,671,580 | | | | 34,604,591 | | | | 0.4 | % |
# Vistry Group PLC | | | 5,254,832 | | | | 36,360,710 | | | | 0.4 | % |
Other Securities | | | | | | | 668,810,003 | | | | 6.9 | % |
| | | | | | | | | | | | |
TOTAL UNITED KINGDOM | | | | | | | 1,022,528,819 | | | | 10.6 | % |
| | | | | | | | | | | | |
UNITED STATES — (0.3%) | | | | | | | | | | | | |
Other Securities | | | | | | | 25,986,456 | | | | 0.3 | % |
| | | | | | | | | | | | |
TOTAL COMMON STOCKS | | | | | | | 9,463,710,458 | | | | 97.9 | % |
| | | | | | | | | | | | |
PREFERRED STOCKS — (0.1%) | | | | | | | | | | | | |
GERMANY — (0.1%) | | | | | | | | | | | | |
Other Securities | | | | | | | 14,392,685 | | | | 0.2 | % |
| | | | | | | | | | | | |
TOTAL INVESTMENT SECURITIES
(Cost $10,024,140,317) | | | | | | | 9,478,103,143 | | | | | |
| | | | | | | | | | | | |
| | | |
| | | | | | Value† | | | | |
SECURITIES LENDING COLLATERAL — (2.9%) | | | | | | | | | | | | |
@§ The DFA Short Term Investment Fund | | | 24,153,176 | | | | 279,234,867 | | | | 2.9 | % |
| | | | | | | | | | | | |
TOTAL INVESTMENTS—(100.0%)
(Cost $10,303,495,096) | | | | | | $ | 9,757,338,010 | | | | 101.0 | % |
| | | | | | | | | | | | |
57
DFA INTERNATIONAL SMALL CAP VALUE PORTFOLIO
CONTINUED
As of October 31, 2022, DFA International Small Cap Value Portfolio had entered into the following outstanding futures contracts:
| | | | | | | | | | | | | | | | | | | | |
Description | | Number of
Contracts | | | Expiration
Date | | | Notional
Value | | | Market
Value | | | Unrealized
Appreciation
(Depreciation) | |
Long Position Contracts: | | | | | | | | | | | | | | | | | | | | |
S&P 500® Emini Index | | | 618 | | | | 12/16/22 | | | $ | 116,562,477 | | | $ | 119,984,700 | | | $ | 3,422,223 | |
| | | | | | | | | | | | | | | | | | | | |
Total Futures Contracts | | | | | | | | | | $ | 116,562,477 | | | $ | 119,984,700 | | | $ | 3,422,223 | |
| | | | | | | | | | | | | | | | | | | | |
Summary of the Portfolio’s investments as of October 31, 2022, based on their valuation inputs, is as follows (see Security Valuation Note):
| | | | | | | | | | | | | | | | |
| | | Investments in Securities (Market Value) | |
| | | Level 1 | | | Level 2 | | | Level 3 | | | Total | |
Common Stocks | | | | | | | | | | | | | | | | |
Australia | | | — | | | $ | 663,617,179 | | | | — | | | $ | 663,617,179 | |
Austria | | | — | | | | 74,968,388 | | | | — | | | | 74,968,388 | |
Belgium | | $ | 3,109,047 | | | | 183,408,083 | | | | — | | | | 186,517,130 | |
Canada | | | 1,254,084,150 | | | | 424,672 | | | | — | | | | 1,254,508,822 | |
China | | | 7,388,355 | | | | 2,676,150 | | | | — | | | | 10,064,505 | |
Denmark | | | — | | | | 287,465,049 | | | | — | | | | 287,465,049 | |
Finland | | | — | | | | 194,559,008 | | | | — | | | | 194,559,008 | |
France | | | — | | | | 374,608,430 | | | | — | | | | 374,608,430 | |
Germany | | | — | | | | 560,936,780 | | | | — | | | | 560,936,780 | |
Greece | | | — | | | | — | | | $ | 1,698 | | | | 1,698 | |
Hong Kong | | | — | | | | 204,675,078 | | | | 968,380 | | | | 205,643,458 | |
Ireland | | | — | | | | 50,410,099 | | | | — | | | | 50,410,099 | |
Israel | | | 149,834 | | | | 126,680,097 | | | | — | | | | 126,829,931 | |
Italy | | | — | | | | 374,256,041 | | | | — | | | | 374,256,041 | |
Japan | | | 3,487,186 | | | | 2,432,475,808 | | | | — | | | | 2,435,962,994 | |
Netherlands | | | — | | | | 244,058,116 | | | | — | | | | 244,058,116 | |
New Zealand | | | — | | | | 29,873,647 | | | | — | | | | 29,873,647 | |
Norway | | | 1,956,470 | | | | 129,531,170 | | | | — | | | | 131,487,640 | |
Portugal | | | — | | | | 22,020,666 | | | | — | | | | 22,020,666 | |
Singapore | | | 855,094 | | | | 85,308,487 | | | | 18,887 | | | | 86,182,468 | |
Spain | | | — | | | | 273,393,776 | | | | — | | | | 273,393,776 | |
Sweden | | | 1,401,452 | | | | 223,972,753 | | | | — | | | | 225,374,205 | |
Switzerland | | | — | | | | 602,455,153 | | | | — | | | | 602,455,153 | |
United Kingdom | | | — | | | | 1,022,528,819 | | | | — | | | | 1,022,528,819 | |
United States | | | 5,255,649 | | | | 20,730,807 | | | | — | | | | 25,986,456 | |
Preferred Stocks | | | | | | | | | | | | | | | | |
Germany | | | — | | | | 14,392,685 | | | | — | | | | 14,392,685 | |
Securities Lending Collateral | | | — | | | | 279,234,867 | | | | — | | | | 279,234,867 | |
Futures Contracts** | | | 3,422,223 | | | | — | | | | — | | | | 3,422,223 | |
| | | | | | | | | | | | | | | | |
TOTAL | | $ | 1,281,109,460 | | | $ | 8,478,661,808 | | | $ | 988,965 | ^ | | $ | 9,760,760,233 | |
| | | | | | | | | | | | | | | | |
| ** | Valued at the unrealized appreciation/(depreciation) on the investment. |
| ^ | A reconciliation of Level 3 investments is presented when the Fund had a significant amount of Level 3 investments at the beginning and/or end of the reporting period in relation to net assets. |
See accompanying Notes to Financial Statements.
58
INTERNATIONAL VECTOR EQUITY PORTFOLIO
SUMMARY SCHEDULE OF PORTFOLIO HOLDINGS
October 31, 2022
| | | | | | | | | | | | |
| | | Shares | | | Value» | | | Percentage
of Net Assets‡ | |
COMMON STOCKS — (94.3%) | | | | | | | | | | | | |
AUSTRALIA — (6.2%) | | | | | | | | | | | | |
National Australia Bank Ltd. | | | 297,280 | | | $ | 6,175,113 | | | | 0.2 | % |
Whitehaven Coal Ltd. | | | 881,890 | | | | 5,122,718 | | | | 0.2 | % |
Other Securities | | | | | | | 176,231,868 | | | | 6.1 | % |
| | | | | | | | | | | | |
TOTAL AUSTRALIA | | | | | | | 187,529,699 | | | | 6.5 | % |
| | | | | | | | | | | | |
AUSTRIA — (0.6%) | | | | | | | | | | | | |
Other Securities | | | | | | | 17,908,912 | | | | 0.6 | % |
| | | | | | | | | | | | |
BELGIUM — (1.3%) | | | | | | | | | | | | |
Solvay SA | | | 74,041 | | | | 6,681,523 | | | | 0.2 | % |
Other Securities | | | | | | | 32,593,315 | | | | 1.2 | % |
| | | | | | | | | | | | |
TOTAL BELGIUM | | | | | | | 39,274,838 | | | | 1.4 | % |
| | | | | | | | | | | | |
CANADA — (11.9%) | | | | | | | | | | | | |
# Bank of Montreal | | | 71,894 | | | | 6,620,000 | | | | 0.2 | % |
Canadian Natural Resources Ltd. | | | 99,485 | | | | 5,963,131 | | | | 0.2 | % |
Fairfax Financial Holdings Ltd. | | | 12,821 | | | | 6,296,769 | | | | 0.2 | % |
# Royal Bank of Canada | | | 61,845 | | | | 5,722,144 | | | | 0.2 | % |
Sun Life Financial, Inc. | | | 130,490 | | | | 5,539,300 | | | | 0.2 | % |
Suncor Energy, Inc. | | | 242,441 | | | | 8,337,546 | | | | 0.3 | % |
# Teck Resources Ltd., Class B | | | 304,989 | | | | 9,283,865 | | | | 0.3 | % |
Tourmaline Oil Corp. | | | 187,536 | | | | 10,566,494 | | | | 0.4 | % |
West Fraser Timber Co. Ltd. | | | 67,811 | | | | 5,091,510 | | | | 0.2 | % |
Other Securities | | | | | | | 293,805,569 | | | | 10.2 | % |
| | | | | | | | | | | | |
TOTAL CANADA | | | | | | | 357,226,328 | | | | 12.4 | % |
| | | | | | | | | | | | |
CHINA — (0.1%) | | | | | | | | | | | | |
Other Securities | | | | | | | 1,997,864 | | | | 0.1 | % |
| | | | | | | | | | | | |
DENMARK — (2.2%) | | | | | | | | | | | | |
Novo Nordisk AS, Class B | | | 47,591 | | | | 5,174,629 | | | | 0.2 | % |
Other Securities | | | | | | | 60,164,218 | | | | 2.1 | % |
| | | | | | | | | | | | |
TOTAL DENMARK | | | | | | | 65,338,847 | | | | 2.3 | % |
| | | | | | | | | | | | |
FINLAND — (1.5%) | | | | | | | | | | | | |
Other Securities | | | | | | | 44,643,849 | | | | 1.5 | % |
| | | | | | | | | | | | |
FRANCE — (7.0%) | | | | | | | | | | | | |
BNP Paribas SA | | | 106,510 | | | | 4,994,667 | | | | 0.2 | % |
Bouygues SA | | | 199,685 | | | | 5,697,242 | | | | 0.2 | % |
# Carrefour SA | | | 319,239 | | | | 5,138,295 | | | | 0.2 | % |
Cie de Saint-Gobain | | | 139,932 | | | | 5,720,550 | | | | 0.2 | % |
Cie Generale des Etablissements Michelin SCA | | | 337,352 | | | | 8,597,095 | | | | 0.3 | % |
Engie SA | | | 420,294 | | | | 5,461,028 | | | | 0.2 | % |
Orange SA | | | 1,286,762 | | | | 12,260,155 | | | | 0.4 | % |
TotalEnergies SE | | | 378,407 | | | | 20,643,370 | | | | 0.7 | % |
Other Securities | | | | | | | 141,054,476 | | | | 4.9 | % |
| | | | | | | | | | | | |
TOTAL FRANCE | | | | | | | 209,566,878 | | | | 7.3 | % |
| | | | | | | | | | | | |
GERMANY — (5.8%) | | | | | | | | | | | | |
Allianz SE | | | 36,707 | | | | 6,603,752 | | | | 0.2 | % |
59
INTERNATIONAL VECTOR EQUITY PORTFOLIO
CONTINUED
| | | | | | | | | | | | |
| | | Shares | | | Value» | | | Percentage
of Net Assets‡ | |
GERMANY — (Continued) | | | | | | | | | | | | |
BASF SE | | | 137,484 | | | $ | 6,168,995 | | | | 0.2 | % |
* Commerzbank AG | | | 955,930 | | | | 7,637,592 | | | | 0.3 | % |
W Covestro AG | | | 160,868 | | | | 5,460,827 | | | | 0.2 | % |
Mercedes-Benz Group AG | | | 126,187 | | | | 7,303,899 | | | | 0.3 | % |
Other Securities | | | | | | | 140,245,901 | | | | 4.8 | % |
| | | | | | | | | | | | |
TOTAL GERMANY | | | | | | | 173,420,966 | | | | 6.0 | % |
| | | | | | | | | | | | |
HONG KONG — (1.8%) | | | | | | | | | | | | |
Other Securities | | | | | | | 55,499,011 | | | | 1.9 | % |
| | | | | | | | | | | | |
IRELAND — (0.7%) | | | | | | | | | | | | |
# CRH PLC, Sponsored ADR | | | 179,187 | | | | 6,488,361 | | | | 0.2 | % |
Other Securities | | | | | | | 13,696,883 | | | | 0.5 | % |
| | | | | | | | | | | | |
TOTAL IRELAND | | | | | | | 20,185,244 | | | | 0.7 | % |
| | | | | | | | | | | | |
ISRAEL — (1.2%) | | | | | | | | | | | | |
Other Securities | | | | | | | 37,342,505 | | | | 1.3 | % |
| | | | | | | | | | | | |
ITALY — (2.4%) | | | | | | | | | | | | |
UniCredit SpA | | | 476,352 | | | | 5,907,363 | | | | 0.2 | % |
Other Securities | | | | | | | 65,407,539 | | | | 2.3 | % |
| | | | | | | | | | | | |
TOTAL ITALY | | | | | | | 71,314,902 | | | | 2.5 | % |
| | | | | | | | | | | | |
JAPAN — (22.2%) | | | | | | | | | | | | |
ENEOS Holdings, Inc. | | | 2,151,970 | | | | 7,098,607 | | | | 0.3 | % |
Mitsubishi UFJ Financial Group, Inc. | | | 1,117,000 | | | | 5,276,539 | | | | 0.2 | % |
SoftBank Group Corp. | | | 158,600 | | | | 6,808,096 | | | | 0.3 | % |
Toyota Motor Corp. | | | 430,090 | | | | 5,967,326 | | | | 0.2 | % |
Other Securities | | | | | | | 643,991,158 | | | | 22.2 | % |
| | | | | | | | | | | | |
TOTAL JAPAN | | | | | | | 669,141,726 | | | | 23.2 | % |
| | | | | | | | | | | | |
NETHERLANDS — (3.2%) | | | | | | | | | | | | |
Aegon NV | | | 1,327,980 | | | | 6,147,428 | | | | 0.2 | % |
ASR Nederland NV | | | 149,446 | | | | 6,580,537 | | | | 0.2 | % |
Koninklijke Ahold Delhaize NV | | | 545,232 | | | | 15,205,575 | | | | 0.5 | % |
Other Securities | | | | | | | 69,373,530 | | | | 2.5 | % |
| | | | | | | | | | | | |
TOTAL NETHERLANDS | | | | | | | 97,307,070 | | | | 3.4 | % |
| | | | | | | | | | | | |
NEW ZEALAND — (0.4%) | | | | | | | | | | | | |
Other Securities | | | | | | | 12,251,735 | | | | 0.4 | % |
| | | | | | | | | | | | |
NORWAY — (1.0%) | | | | | | | | | | | | |
Other Securities | | | | | | | 30,315,895 | | | | 1.0 | % |
| | | | | | | | | | | | |
PORTUGAL — (0.3%) | | | | | | | | | | | | |
Other Securities | | | | | | | 10,122,894 | | | | 0.3 | % |
| | | | | | | | | | | | |
SINGAPORE — (1.0%) | | | | | | | | | | | | |
Other Securities | | | | | | | 30,255,778 | | | | 1.0 | % |
| | | | | | | | | | | | |
SPAIN — (2.2%) | | | | | | | | | | | | |
Banco Bilbao Vizcaya Argentaria SA | | | 1,438,737 | | | | 7,422,139 | | | | 0.3 | % |
Repsol SA | | | 415,110 | | | | 5,647,349 | | | | 0.2 | % |
60
INTERNATIONAL VECTOR EQUITY PORTFOLIO
CONTINUED
| | | | | | | | | | | | |
| | | Shares | | | Value» | | | Percentage
of Net Assets‡ | |
SPAIN — (Continued) | | | | | | | | | | | | |
Other Securities | | | | | | $ | 51,949,890 | | | | 1.8 | % |
| | | | | | | | | | | | |
TOTAL SPAIN | | | | | | | 65,019,378 | | | | 2.3 | % |
| | | | | | | | | | | | |
SWEDEN — (2.4%) | | | | | | | | | | | | |
Other Securities | | | | | | | 73,654,417 | | | | 2.6 | % |
| | | | | | | | | | | | |
SWITZERLAND — (7.3%) | | | | | | | | | | | | |
Julius Baer Group Ltd. | | | 127,245 | | | | 6,105,070 | | | | 0.2 | % |
Nestle SA | | | 126,847 | | | | 13,808,412 | | | | 0.5 | % |
Novartis AG, Sponsored ADR | | | 112,884 | | | | 9,158,279 | | | | 0.3 | % |
Swiss Life Holding AG | | | 10,701 | | | | 5,181,660 | | | | 0.2 | % |
Swisscom AG | | | 15,415 | | | | 7,611,759 | | | | 0.3 | % |
Zurich Insurance Group AG | | | 14,535 | | | | 6,194,437 | | | | 0.2 | % |
Other Securities | | | | | | | 172,472,657 | | | | 5.9 | % |
| | | | | | | | | | | | |
TOTAL SWITZERLAND | | | | | | | 220,532,274 | | | | 7.6 | % |
| | | | | | | | | | | | |
UNITED KINGDOM — (11.5%) | | | | | | | | | | | | |
3i Group PLC | | | 398,043 | | | | 5,301,281 | | | | 0.2 | % |
BP PLC | | | 1,487,940 | | | | 8,232,179 | | | | 0.3 | % |
British American Tobacco PLC | | | 154,373 | | | | 6,096,722 | | | | 0.2 | % |
BT Group PLC | | | 4,467,397 | | | | 6,657,451 | | | | 0.2 | % |
Glencore PLC | | | 873,439 | | | | 5,007,488 | | | | 0.2 | % |
# HSBC Holdings PLC, Sponsored ADR | | | 320,826 | | | | 8,312,602 | | | | 0.3 | % |
Shell PLC, Sponsored ADR | | | 333,674 | | | | 18,562,285 | | | | 0.7 | % |
Other Securities | | | | | | | 287,483,824 | | | | 9.9 | % |
| | | | | | | | | | | | |
TOTAL UNITED KINGDOM. | | | | | | | 345,653,832 | | | | 12.0 | % |
| | | | | | | | | | | | |
UNITED STATES — (0.1%) | | | | | | | | | | | | |
Other Securities | | | | | | | 2,160,139 | | | | 0.1 | % |
| | | | | | | | | | | | |
TOTAL COMMON STOCKS | | | | | | | 2,837,664,981 | | | | 98.4 | % |
| | | | | | | | | | | | |
PREFERRED STOCKS — (0.4%) | | | | | | | | | | | | |
GERMANY — (0.4%) | | | | | | | | | | | | |
Other Securities | | | | | | | 10,803,933 | | | | 0.4 | % |
| | | | | | | | | | | | |
RIGHTS/WARRANTS — (0.0%) | | | | | | | | | | | | |
AUSTRALIA — (0.0%) | | | | | | | | | | | | |
Other Securities | | | | | | | 1,491 | | | | 0.0 | % |
| | | | | | | | | | | | |
CANADA — (0.0%) | | | | | | | | | | | | |
Other Securities | | | | | | | 54,197 | | | | 0.0 | % |
| | | | | | | | | | | | |
HONG KONG — (0.0%) | | | | | | | | | | | | |
Other Security | | | | | | | 186 | | | | 0.0 | % |
| | | | | | | | | | | | |
TOTAL RIGHTS/WARRANTS | | | | | | | 55,874 | | | | 0.0 | % |
| | | | | | | | | | | | |
TOTAL INVESTMENT SECURITIES
(Cost $2,790,321,925) | | | | | | | 2,848,524,788 | | | | | |
| | | | | | | | | | | | |
61
INTERNATIONAL VECTOR EQUITY PORTFOLIO
CONTINUED
| | | | | | | | | | | | |
| | | Shares | | | Value† | | | Percentage
of Net Assets‡ | |
SECURITIES LENDING COLLATERAL — (5.3%) | | | | | | | | | | | | |
@§ The DFA Short Term Investment Fund | | | 13,790,366 | | | $ | 159,430,421 | | | | 5.5 | % |
| | | | | | | | | | | | |
TOTAL INVESTMENTS—(100.0%)
(Cost $2,949,818,119) | | | | | | $ | 3,007,955,209 | | | | 104.3 | % |
| | | | | | | | | | | | |
As of October 31, 2022, International Vector Equity Portfolio had entered into the following outstanding futures contracts:
| | | | | | | | | | | | | | | | | | | | |
Description | | Number of
Contracts | | | Expiration
Date | | | Notional
Value | | | Market
Value | | | Unrealized
Appreciation
(Depreciation) | |
Long Position Contracts: | | | | | | | | | | | | | | | | | | | | |
S&P 500® Emini Index | | | 90 | | | | 12/16/22 | | | $ | 17,034,449 | | | $ | 17,473,500 | | | $ | 439,051 | |
| | | | | | | | | | | | | | | | | | | | |
Total Futures Contracts | | | | | | | | | | $ | 17,034,449 | | | $ | 17,473,500 | | | $ | 439,051 | |
| | | | | | | | | | | | | | | | | | | | |
Summary of the Portfolio’s investments as of October 31, 2022, based on their valuation inputs, is as follows (see Security Valuation Note):
| | | | | | | | | | | | | | | | |
| | | Investments in Securities (Market Value) | |
| | | Level 1 | | | Level 2 | | | Level 3 | | | Total | |
Common Stocks | | | | | | | | | | | | | | | | |
Australia | | $ | 4,348,097 | | | $ | 183,139,455 | | | $ | 42,147 | | | $ | 187,529,699 | |
Austria | | | 42,430 | | | | 17,866,482 | | | | — | | | | 17,908,912 | |
Belgium | | | 3,021,855 | | | | 36,252,983 | | | | — | | | | 39,274,838 | |
Canada | | | 356,310,408 | | | | 915,920 | | | | — | | | | 357,226,328 | |
China | | | 562,780 | | | | 1,435,084 | | | | — | | | | 1,997,864 | |
Denmark | | | — | | | | 65,338,847 | | | | — | | | | 65,338,847 | |
Finland | | | — | | | | 44,643,849 | | | | — | | | | 44,643,849 | |
France | | | 405,489 | | | | 209,159,773 | | | | 1,616 | | | | 209,566,878 | |
Germany | | | 5,976,454 | | | | 167,444,512 | | | | — | | | | 173,420,966 | |
Hong Kong | | | — | | | | 55,378,352 | | | | 120,659 | | | | 55,499,011 | |
Ireland | | | 6,488,361 | | | | 13,696,883 | | | | — | | | | 20,185,244 | |
Israel | | | 4,424,117 | | | | 32,918,388 | | | | — | | | | 37,342,505 | |
Italy | | | 1,841,896 | | | | 69,473,006 | | | | — | | | | 71,314,902 | |
Japan | | | 9,691,387 | | | | 659,450,339 | | | | — | | | | 669,141,726 | |
Netherlands | | | 10,120,177 | | | | 87,186,893 | | | | — | | | | 97,307,070 | |
New Zealand | | | 10,700 | | | | 12,241,035 | | | | — | | | | 12,251,735 | |
Norway | | | 307,540 | | | | 30,008,355 | | | | — | | | | 30,315,895 | |
Portugal | | | — | | | | 10,122,894 | | | | — | | | | 10,122,894 | |
Singapore | | | 20,133 | | | | 30,234,581 | | | | 1,064 | | | | 30,255,778 | |
Spain | | | 1,797,257 | | | | 63,222,121 | | | | — | | | | 65,019,378 | |
Sweden | | | 206,058 | | | | 73,448,359 | | | | — | | | | 73,654,417 | |
Switzerland | | | 19,678,114 | | | | 200,854,160 | | | | — | | | | 220,532,274 | |
United Kingdom | | | 49,109,740 | | | | 296,523,328 | | | | 20,764 | | | | 345,653,832 | |
United States | | | 769,182 | | | | 1,390,957 | | | | — | | | | 2,160,139 | |
Preferred Stocks | | | | | | | | | | | | | | | | |
Germany | | | — | | | | 10,803,933 | | | | — | | | | 10,803,933 | |
Rights/Warrants | | | | | | | | | | | | | | | | |
Australia | | | — | | | | 1,491 | | | | — | | | | 1,491 | |
Canada | | | — | | | | 54,197 | | | | — | | | | 54,197 | |
Hong Kong | | | — | | | | 186 | | | | — | | | | 186 | |
62
INTERNATIONAL VECTOR EQUITY PORTFOLIO
CONTINUED
| | | | | | | | | | | | | | | | |
| | | Investments in Securities (Market Value) | |
| | | Level 1 | | | Level 2 | | | Level 3 | | | Total | |
Securities Lending Collateral | | | — | | | $ | 159,430,421 | | | | — | | | $ | 159,430,421 | |
Futures Contracts** | | $ | 439,051 | | | | — | | | | — | | | | 439,051 | |
| | | | | | | | | | | | | | | | |
TOTAL | | $ | 475,571,226 | | | $ | 2,532,636,784 | | | $ | 186,250 | ^ | | $ | 3,008,394,260 | |
| | | | | | | | | | | | | | | | |
| ** | Valued at the unrealized appreciation/(depreciation) on the investment. |
| ^ | A reconciliation of Level 3 investments is presented when the Fund had a significant amount of Level 3 investments at the beginning and/or end of the reporting period in relation to net assets. |
See accompanying Notes to Financial Statements.
63
INTERNATIONAL HIGH RELATIVE PROFITABILITY PORTFOLIO
SUMMARY SCHEDULE OF PORTFOLIO HOLDINGS
October 31, 2022
| | | | | | | | | | | | | | |
| | | | | Shares | | | Value» | | | Percentage
of Net Assets‡ | |
COMMON STOCKS — (92.9%) | | | | | | | | | | | | |
AUSTRALIA — (7.2%) | | | | | | | | | | | | |
| | BHP Group Ltd. | | | 260,623 | | | $ | 6,260,217 | | | | 0.4 | % |
| | BHP Group Ltd. | | | 242,244 | | | | 5,782,310 | | | | 0.4 | % |
| # | | BHP Group Ltd., Sponsored ADR | | | 439,796 | | | | 21,031,045 | | | | 1.3 | % |
| | Other Securities | | | | | | | 89,700,297 | | | | 5.5 | % |
| | | | | | | | | | | | | | |
TOTAL AUSTRALIA | | | | | | | 122,773,869 | | | | 7.6 | % |
| | | | | | | | | | | | | | |
AUSTRIA — (0.2%) | | | | | | | | | | | | |
| | Other Securities | | | | | | | 2,776,158 | | | | 0.2 | % |
| | | | | | | | | | | | | | |
BELGIUM — (0.6%) | | | | | | | | | | | | |
| | Other Securities | | | | | | | 10,348,979 | | | | 0.7 | % |
| | | | | | | | | | | | | | |
CANADA — (11.1%) | | | | | | | | | | | | |
| | Alimentation Couche-Tard, Inc. | | | 184,394 | | | | 8,256,347 | | | | 0.5 | % |
| | Canadian National Railway Co. | | | 103,129 | | | | 12,217,874 | | | | 0.8 | % |
| | Canadian National Railway Co. | | | 52,046 | | | | 6,164,328 | | | | 0.4 | % |
| # | | Canadian Natural Resources Ltd. | | | 277,342 | | | | 16,623,879 | | | | 1.0 | % |
| | Constellation Software, Inc. | | | 6,141 | | | | 8,879,579 | | | | 0.6 | % |
| | National Bank of Canada | | | 139,276 | | | | 9,483,056 | | | | 0.6 | % |
| # | | Royal Bank of Canada | | | 128,018 | | | | 11,844,731 | | | | 0.7 | % |
| | Suncor Energy, Inc. | | | 311,402 | | | | 10,709,115 | | | | 0.7 | % |
| | Other Securities | | | | | | | 105,724,303 | | | | 6.5 | % |
| | | | | | | | | | | | | | |
TOTAL CANADA | | | | | | | 189,903,212 | | | | 11.8 | % |
| | | | | | | | | | | | | | |
CHINA — (0.0%) | | | | | | | | | | | | |
| | Other Securities | | | | | | | 562,875 | | | | 0.0 | % |
| | | | | | | | | | | | | | |
DENMARK — (3.3%) | | | | | | | | | | | | |
| | Novo Nordisk AS, Class B | | | 490,008 | | | | 53,279,182 | | | | 3.3 | % |
| | Other Securities | | | | | | | 2,886,381 | | | | 0.2 | % |
| | | | | | | | | | | | | | |
TOTAL DENMARK | | | | | | | 56,165,563 | | | | 3.5 | % |
| | | | | | | | | | | | | | |
FINLAND — (1.1%) | | | | | | | | | | | | |
| | Other Securities | | | | | | | 18,946,685 | | | | 1.2 | % |
| | | | | | | | | | | | | | |
FRANCE — (8.2%) | | | | | | | | | | | | |
| | Airbus SE | | | 114,996 | | | | 12,442,994 | | | | 0.8 | % |
| | Hermes International | | | 6,104 | | | | 7,900,926 | | | | 0.5 | % |
| | Kering SA | | | 19,489 | | | | 8,925,199 | | | | 0.6 | % |
| | LVMH Moet Hennessy Louis Vuitton SE | | | 67,951 | | | | 42,876,713 | | | | 2.7 | % |
| | Teleperformance | | | 29,391 | | | | 7,874,726 | | | | 0.5 | % |
| # | | TotalEnergies SE | | | 425,414 | | | | 23,207,759 | | | | 1.4 | % |
| | Other Securities | | | | | | | 36,736,800 | | | | 2.2 | % |
| | | | | | | | | | | | | | |
TOTAL FRANCE | | | | | | | 139,965,117 | | | | 8.7 | % |
| | | | | | | | | | | | | | |
GERMANY — (5.5%) | | | | | | | | | | | | |
| | Bayer AG | | | 221,721 | | | | 11,658,318 | | | | 0.7 | % |
| | Deutsche Telekom AG | | | 866,133 | | | | 16,348,681 | | | | 1.0 | % |
| | E.ON SE | | | 948,865 | | | | 7,945,780 | | | | 0.5 | % |
| | Mercedes-Benz Group AG | | | 193,985 | | | | 11,228,152 | | | | 0.7 | % |
64
INTERNATIONAL HIGH RELATIVE PROFITABILITY PORTFOLIO
CONTINUED
| | | | | | | | | | | | | | |
| | | | | Shares | | | Value» | | | Percentage
of Net Assets‡ | |
GERMANY — (Continued) | | | | | | | | | | | | |
| | Other Securities | | | | | | $ | 46,781,070 | | | | 3.0 | % |
| | | | | | | | | | | | | | |
TOTAL GERMANY | | | | | | | 93,962,001 | | | | 5.9 | % |
| | | | | | | | | | | | | | |
HONG KONG — (1.7%) | | | | | | | | | | | | |
| | Hong Kong Exchanges & Clearing Ltd. | | | 293,437 | | | | 7,788,874 | | | | 0.5 | % |
| | Other Securities | | | | | | | 21,738,418 | | | | 1.3 | % |
| | | | | | | | | | | | | | |
TOTAL HONG KONG | | | | | | | 29,527,292 | | | | 1.8 | % |
| | | | | | | | | | | | | | |
IRELAND — (0.5%) | | | | | | | | | | | | |
| | Other Securities | | | | | | | 8,423,333 | | | | 0.5 | % |
| | | | | | | | | | | | | | |
ISRAEL — (0.7%) | | | | | | | | | | | | |
| | Other Securities | | | | | | | 11,578,328 | | | | 0.7 | % |
| | | | | | | | | | | | | | |
ITALY — (1.8%) | | | | | | | | | | | | |
| | Stellantis NV | | | 716,336 | | | | 9,664,495 | | | | 0.6 | % |
| | Other Securities | | | | | | | 21,705,890 | | | | 1.4 | % |
| | | | | | | | | | | | | | |
TOTAL ITALY | | | | | | | 31,370,385 | | | | 2.0 | % |
| | | | | | | | | | | | | | |
JAPAN — (18.4%) | | | | | | | | | | | | |
| | Fast Retailing Co. Ltd. | | | 14,000 | | | | 7,799,976 | | | | 0.5 | % |
| | Hitachi Ltd. | | | 264,700 | | | | 12,010,447 | | | | 0.7 | % |
| | KDDI Corp. | | | 492,100 | | | | 14,544,985 | | | | 0.9 | % |
| | Nintendo Co. Ltd. | | | 265,000 | | | | 10,758,760 | | | | 0.7 | % |
| | Recruit Holdings Co. Ltd. | | | 267,200 | | | | 8,222,056 | | | | 0.5 | % |
| | Sony Group Corp. | | | 328,700 | | | | 22,165,764 | | | | 1.4 | % |
| | Tokyo Electron Ltd. | | | 33,900 | | | | 8,918,969 | | | | 0.6 | % |
| | Other Securities | | | | | | | 231,845,918 | | | | 14.4 | % |
| | | | | | | | | | | | | | |
TOTAL JAPAN | | | | | | | 316,266,875 | | | | 19.7 | % |
| | | | | | | | | | | | | | |
NETHERLANDS — (3.6%) | | | | | | | | | | | | |
| | ASML Holding NV | | | 25,123 | | | | 11,784,863 | | | | 0.7 | % |
| | ASML Holding NV | | | 66,262 | | | | 31,303,494 | | | | 1.9 | % |
| | Wolters Kluwer NV | | | 98,091 | | | | 10,423,004 | | | | 0.7 | % |
| | Other Securities | | | | | | | 8,696,272 | | | | 0.6 | % |
| | | | | | | | | | | | | | |
TOTAL NETHERLANDS | | | | | | | 62,207,633 | | | | 3.9 | % |
| | | | | | | | | | | | | | |
NEW ZEALAND — (0.3%) | | | | | | | | | | | | |
| | Other Securities | | | | | | | 5,502,090 | | | | 0.3 | % |
| | | | | | | | | | | | | | |
NORWAY — (1.0%) | | | | | | | | | | | | |
| | Equinor ASA | | | 304,550 | | | | 11,095,889 | | | | 0.7 | % |
| | Other Securities | | | | | | | 6,816,324 | | | | 0.4 | % |
| | | | | | | | | | | | | | |
TOTAL NORWAY | | | | | | | 17,912,213 | | | | 1.1 | % |
| | | | | | | | | | | | | | |
PORTUGAL — (0.1%) | | | | | | | | | | | | |
| | Other Securities | | | | | | | 2,472,556 | | | | 0.2 | % |
| | | | | | | | | | | | | | |
SINGAPORE — (1.0%) | | | | | | | | | | | | |
| | DBS Group Holdings Ltd. | | | 386,358 | | | | 9,340,708 | | | | 0.6 | % |
| | Other Securities | | | | | | | 7,523,948 | | | | 0.5 | % |
| | | | | | | | | | | | | | |
TOTAL SINGAPORE | | | | | | | 16,864,656 | | | | 1.1 | % |
| | | | | | | | | | | | | | |
65
INTERNATIONAL HIGH RELATIVE PROFITABILITY PORTFOLIO
CONTINUED
| | | | | | | | | | | | | | |
| | | | | Shares | | | Value» | | | Percentage
of Net Assets‡ | |
SPAIN — (1.6%) | | | | | | | | | | | | |
| | Repsol SA | | | 593,804 | | | $ | 8,078,386 | | | | 0.5 | % |
| | Other Securities | | | | | | | 19,069,819 | | | | 1.2 | % |
| | | | | | | | | | | | |
TOTAL SPAIN | | | | | | | 27,148,205 | | | | 1.7 | % |
| | | | | | | | | | | | |
SWEDEN — (2.5%) | | | | | | | | | | | | |
| | Other Securities | | | | | | | 42,420,867 | | | | 2.6 | % |
| | | | | | | | | | | | |
SWITZERLAND — (8.2%) | | | | | | | | | | | | |
| | Givaudan SA | | | 3,610 | | | | 10,782,851 | | | | 0.7 | % |
| | Roche Holding AG | | | 8,192 | | | | 3,325,052 | | | | 0.2 | % |
| | Roche Holding AG | | | 183,630 | | | | 60,928,089 | | | | 3.8 | % |
| | Sika AG | | | 49,049 | | | | 11,059,359 | | | | 0.7 | % |
| | Other Securities | | | | | | | 54,162,814 | | | | 3.3 | % |
| | | | | | | | | | | | |
TOTAL SWITZERLAND | | | | | | | 140,258,165 | | | | 8.7 | % |
| | | | | | | | | | | | |
UNITED KINGDOM — (14.3%) | | | | | | | | | | | | |
| | Anglo American PLC | | | 335,117 | | | | 10,038,162 | | | | 0.6 | % |
| | Ashtead Group PLC | | | 224,550 | | | | 11,697,488 | | | | 0.7 | % |
| | BAE Systems PLC | | | 967,945 | | | | 9,053,735 | | | | 0.6 | % |
| | Diageo PLC | | | 80,730 | | | | 3,322,238 | | | | 0.2 | % |
# | | Diageo PLC, Sponsored ADR | | | 106,135 | | | | 17,721,361 | | | | 1.1 | % |
| | Ferguson PLC | | | 94,077 | | | | 10,259,936 | | | | 0.6 | % |
| | Glencore PLC | | | 1,388,177 | | | | 7,958,514 | | | | 0.5 | % |
| | GSK PLC. | | | 1,204,965 | | | | 19,738,624 | | | | 1.2 | % |
| | Imperial Brands PLC | | | 553,895 | | | | 13,492,366 | | | | 0.8 | % |
| | Reckitt Benckiser Group PLC | | | 131,666 | | | | 8,737,877 | | | | 0.5 | % |
# | | RELX PLC, Sponsored ADR | | | 334,644 | | | | 9,022,002 | | | | 0.6 | % |
| | Rio Tinto PLC | | | 94,176 | | | | 4,921,790 | | | | 0.3 | % |
# | | Rio Tinto PLC, Sponsored ADR | | | 251,488 | | | | 13,416,885 | | | | 0.8 | % |
| | SSE PLC | | | 648,002 | | | | 11,580,364 | | | | 0.7 | % |
| | Unilever PLC | | | 48,760 | | | | 2,216,354 | | | | 0.1 | % |
| | Unilever PLC | | | 62,170 | | | | 2,837,577 | | | | 0.2 | % |
# | | Unilever PLC, Sponsored ADR | | | 587,080 | | | | 26,718,011 | | | | 1.7 | % |
| | Other Securities | | | | | | | 61,732,778 | | | | 4.0 | % |
| | | | | | | | | | | | |
TOTAL UNITED KINGDOM | | | | | | | 244,466,062 | | | | 15.2 | % |
| | | | | | | | | | | | |
TOTAL COMMON STOCKS | | | | | | | 1,591,823,119 | | | | 99.1 | % |
| | | | | | | | | | | | |
PREFERRED STOCKS — (0.5%) | | | | | | | | | | | | |
GERMANY — (0.5%) | | | | | | | | | | | | |
| | Other Securities | | | | | | | 8,380,467 | | | | 0.5 | % |
| | | | | | | | | | | | |
TOTAL INVESTMENT SECURITIES
(Cost $1,645,167,059) | | | | | | | 1,600,203,586 | | | | | |
| | | | | | | | | | | | |
| | | | |
| | | | | | | | Value† | | | | |
SECURITIES LENDING COLLATERAL — (6.6%) | | | | | | | | | | | | |
@§ | | The DFA Short Term Investment Fund | | | 9,844,627 | | | | 113,813,732 | | | | 7.1 | % |
| | | | | | | | | | | | |
TOTAL INVESTMENTS—(100.0%)
(Cost $1,759,023,239) | | | | | | $ | 1,714,017,318 | | | | 106.7 | % |
| | | | | | | | | | | | |
66
INTERNATIONAL HIGH RELATIVE PROFITABILITY PORTFOLIO
CONTINUED
Summary of the Portfolio’s investments as of October 31, 2022, based on their valuation inputs, is as follows (see Security Valuation Note):
| | | | | | | | | | | | | | | | |
| | | Investments in Securities (Market Value) | |
| | | Level 1 | | | Level 2 | | | Level 3 | | | Total | |
Common Stocks | | | | | | | | | | | | | | | | |
Australia | | $ | 25,548,895 | | | $ | 97,224,974 | | | | — | | | $ | 122,773,869 | |
Austria | | | — | | | | 2,776,158 | | | | — | | | | 2,776,158 | |
Belgium | | | — | | | | 10,348,979 | | | | — | | | | 10,348,979 | |
Canada | | | 189,903,212 | | | | — | | | | — | | | | 189,903,212 | |
China | | | — | | | | 562,875 | | | | — | | | | 562,875 | |
Denmark | | | — | | | | 56,165,563 | | | | — | | | | 56,165,563 | |
Finland | | | — | | | | 18,946,685 | | | | — | | | | 18,946,685 | |
France | | | 1,942,479 | | | | 138,022,638 | | | | — | | | | 139,965,117 | |
Germany | | | — | | | | 93,962,001 | | | | — | | | | 93,962,001 | |
Hong Kong | | | — | | | | 29,527,292 | | | | — | | | | 29,527,292 | |
Ireland | | | 3,049,317 | | | | 5,374,016 | | | | — | | | | 8,423,333 | |
Israel | | | 1,412,677 | | | | 10,165,651 | | | | — | | | | 11,578,328 | |
Italy | | | 3,589,675 | | | | 27,780,710 | | | | — | | | | 31,370,385 | |
Japan | | | — | | | | 316,266,875 | | | | — | | | | 316,266,875 | |
Netherlands | | | 31,303,494 | | | | 30,904,139 | | | | — | | | | 62,207,633 | |
New Zealand | | | — | | | | 5,502,090 | | | | — | | | | 5,502,090 | |
Norway | | | — | | | | 17,912,213 | | | | — | | | | 17,912,213 | |
Portugal | | | — | | | | 2,472,556 | | | | — | | | | 2,472,556 | |
Singapore | | | — | | | | 16,864,656 | | | | — | | | | 16,864,656 | |
Spain | | | — | | | | 27,148,205 | | | | — | | | | 27,148,205 | |
Sweden | | | — | | | | 42,420,867 | | | | — | | | | 42,420,867 | |
Switzerland | | | 3,623,423 | | | | 136,634,742 | | | | — | | | | 140,258,165 | |
United Kingdom | | | 69,713,115 | | | | 174,752,947 | | | | — | | | | 244,466,062 | |
Preferred Stocks | | | | | | | | | | | | | | | | |
Germany | | | — | | | | 8,380,467 | | | | — | | | | 8,380,467 | |
Securities Lending Collateral | | | — | | | | 113,813,732 | | | | — | | | | 113,813,732 | |
| | | | | | | | | | | | | | | | |
TOTAL | | $ | 330,086,287 | | | $ | 1,383,931,031 | | | | — | | | $ | 1,714,017,318 | |
| | | | | | | | | | | | | | | | |
See accompanying Notes to Financial Statements.
67
WORLD EX U.S. VALUE PORTFOLIO
SCHEDULE OF INVESTMENTS
October 31, 2022
| | | | | | | | |
| | | Shares | | | Value† | |
AFFILIATED INVESTMENT COMPANIES — (100.0%) | | | | | | | | |
Investment in The DFA International Value Series of
The DFA Investment Trust Company | | | | | | $ | 119,817,346 | |
Investment in Dimensional Emerging Markets Value Fund | | | | | | | 58,079,423 | |
Investment in DFA International Small Cap Value Portfolio of
DFA Investment Dimensions Group Inc | | | 960,882 | | | | 16,152,426 | |
| | | | | | | | |
TOTAL INVESTMENTS IN AFFILIATED INVESTMENT COMPANIES
(Cost $194,249,127) | | | | | | $ | 194,049,195 | |
| | | | | | | | |
Summary of the Portfolio’s investments as of October 31, 2022, based on their valuation inputs, is as follows (see Security Valuation Note):
| | | | | | | | | | | | | | | | |
| | | Investments in Securities (Market Value) | |
| | | Level 1 | | | Level 2 | | | Level 3 | | | Total | |
Affiliated Investment Companies | | $ | 194,049,195 | | | | — | | | | — | | | $ | 194,049,195 | |
| | | | | | | | | | | | | | | | |
TOTAL | | $ | 194,049,195 | | | | — | | | | — | | | $ | 194,049,195 | |
| | | | | | | | | | | | | | | | |
See accompanying Notes to Financial Statements.
68
WORLD EX U.S. CORE EQUITY PORTFOLIO
SUMMARY SCHEDULE OF PORTFOLIO HOLDINGS
October 31, 2022
| | | | | | | | | | | | |
| | | Shares | | | Value» | | | Percentage
of Net Assets‡ | |
COMMON STOCKS — (94.2%) | | | | | | | | | | | | |
AUSTRALIA — (4.5%) | | | | | | | | | | | | |
BHP Group Ltd. | | | 352,621 | | | $ | 8,470,028 | | | | 0.3 | % |
Commonwealth Bank of Australia | | | 87,813 | | | | 5,887,576 | | | | 0.2 | % |
Other Securities | | | | | | | 130,988,672 | | | | 4.2 | % |
| | | | | | | | | | | | |
TOTAL AUSTRALIA | | | | | | | 145,346,276 | | | | 4.7 | % |
| | | | | | | | | | | | |
AUSTRIA — (0.3%) | | | | | | | | | | | | |
Other Securities | | | | | | | 10,876,886 | | | | 0.4 | % |
| | | | | | | | | | | | |
BELGIUM — (0.8%) | | | | | | | | | | | | |
Other Securities | | | | | | | 24,505,995 | | | | 0.8 | % |
| | | | | | | | | | | | |
BRAZIL — (1.6%) | | | | | | | | | | | | |
Vale SA | | | 558,139 | | | | 7,253,483 | | | | 0.3 | % |
Other Securities | | | | | | | 43,819,411 | | | | 1.3 | % |
| | | | | | | | | | | | |
TOTAL BRAZIL | | | | | | | 51,072,894 | | | | 1.6 | % |
| | | | | | | | | | | | |
CANADA — (8.0%) | | | | | | | | | | | | |
Bank of Montreal | | | 69,809 | | | | 6,428,013 | | | | 0.2 | % |
Canadian National Railway Co. | | | 42,191 | | | | 4,997,102 | | | | 0.2 | % |
Canadian Natural Resources Ltd. | | | 152,688 | | | | 9,152,119 | | | | 0.3 | % |
Nutrien Ltd. | | | 65,469 | | | | 5,532,108 | | | | 0.2 | % |
Royal Bank of Canada | | | 93,782 | | | | 8,677,081 | | | | 0.3 | % |
Royal Bank of Canada | | | 97,598 | | | | 9,024,887 | | | | 0.3 | % |
Suncor Energy, Inc. | | | 165,422 | | | | 5,688,863 | | | | 0.2 | % |
Toronto-Dominion Bank | | | 89,325 | | | | 5,715,907 | | | | 0.2 | % |
Other Securities | | | | | | | 204,390,427 | | | | 6.4 | % |
| | | | | | | | | | | | |
TOTAL CANADA | | | | | | | 259,606,507 | | | | 8.3 | % |
| | | | | | | | | | | | |
CHILE — (0.1%) | | | | | | | | | | | | |
Other Securities | | | | | | | 4,431,245 | | | | 0.1 | % |
| | | | | | | | | | | | |
CHINA — (7.1%) | | | | | | | | | | | | |
China Construction Bank Corp., Class H | | | 12,746,000 | | | | 6,764,152 | | | | 0.2 | % |
Tencent Holdings Ltd. | | | 442,200 | | | | 11,619,589 | | | | 0.4 | % |
Other Securities | | | | | | | 213,438,944 | | | | 6.8 | % |
| | | | | | | | | | | | |
TOTAL CHINA | | | | | | | 231,822,685 | | | | 7.4 | % |
| | | | | | | | | | | | |
COLOMBIA — (0.0%) | | | | | | | | | | | | |
Other Securities | | | | | | | 1,025,541 | | | | 0.0 | % |
| | | | | | | | | | | | |
CZECH REPUBLIC — (0.0%) | | | | | | | | | | | | |
Other Securities | | | | | | | 1,198,559 | | | | 0.0 | % |
| | | | | | | | | | | | |
DENMARK — (1.5%) | | | | | | | | | | | | |
Novo Nordisk AS, Class B | | | 142,160 | | | | 15,457,234 | | | | 0.5 | % |
Other Securities | | | | | | | 34,183,772 | | | | 1.1 | % |
| | | | | | | | | | | | |
TOTAL DENMARK | | | | | | | 49,641,006 | | | | 1.6 | % |
| | | | | | | | | | | | |
EGYPT — (0.0%) | | | | | | | | | | | | |
Other Securities | | | | | | | 162,722 | | | | 0.0 | % |
| | | | | | | | | | | | |
69
WORLDEX U.S. CORE EQUITY PORTFOLIO
CONTINUED
| | | | | | | | | | | | |
| | | Shares | | | Value» | | | Percentage
of Net Assets‡ | |
FINLAND — (1.0%) | | | | | | | | | | | | |
Other Securities | | | | | | $ | 32,274,591 | | | | 1.0 | % |
| | | | | | | | | | | | |
FRANCE — (5.2%) | | | | | | | | | | | | |
LVMH Moet Hennessy Louis Vuitton SE | | | 21,810 | | | | 13,761,992 | | | | 0.5 | % |
Orange SA | | | 575,945 | | | | 5,487,553 | | | | 0.2 | % |
# TotalEnergies SE | | | 355,054 | | | | 19,369,385 | | | | 0.6 | % |
Vinci SA | | | 66,104 | | | | 6,084,010 | | | | 0.2 | % |
Other Securities | | | | | | | 123,807,332 | | | | 3.9 | % |
| | | | | | | | | | | | |
TOTAL FRANCE | | | | | | | 168,510,272 | | | | 5.4 | % |
| | | | | | | | | | | | |
GERMANY — (4.1%) | | | | | | | | | | | | |
BASF SE | | | 130,893 | | | | 5,873,252 | | | | 0.2 | % |
Bayer AG | | | 122,338 | | | | 6,432,658 | | | | 0.2 | % |
Deutsche Telekom AG | | | 482,206 | | | | 9,101,872 | | | | 0.3 | % |
Mercedes-Benz Group AG | | | 117,589 | | | | 6,806,234 | | | | 0.2 | % |
Other Securities | | | | | | | 106,747,629 | | | | 3.4 | % |
| | | | | | | | | | | | |
TOTAL GERMANY | | | | | | | 134,961,645 | | | | 4.3 | % |
| | | | | | | | | | | | |
GREECE — (0.1%) | | | | | | | | | | | | |
Other Securities | | | | | | | 2,638,296 | | | | 0.1 | % |
| | | | | | | | | | | | |
HONG KONG — (1.3%) | | | | | | | | | | | | |
AIA Group Ltd. | | | 833,400 | | | | 6,312,830 | | | | 0.2 | % |
Other Securities | | | | | | | 34,809,623 | | | | 1.1 | % |
| | | | | | | | | | | | |
TOTAL HONG KONG | | | | | | | 41,122,453 | | | | 1.3 | % |
| | | | | | | | | | | | |
HUNGARY — (0.0%) | | | | | | | | | | | | |
Other Securities | | | | | | | 1,633,284 | | | | 0.1 | % |
| | | | | | | | | | | | |
INDIA — (5.7%) | | | | | | | | | | | | |
Infosys Ltd. | | | 301,896 | | | | 5,632,610 | | | | 0.2 | % |
Reliance Industries Ltd. | | | 235,961 | | | | 7,270,140 | | | | 0.3 | % |
Other Securities | | | | | | | 171,251,207 | | | | 5.4 | % |
| | | | | | | | | | | | |
TOTAL INDIA | | | | | | | 184,153,957 | | | | 5.9 | % |
| | | | | | | | | | | | |
INDONESIA — (0.7%) | | | | | | | | | | | | |
Other Securities | | | | | | | 22,761,801 | | | | 0.7 | % |
| | | | | | | | | | | | |
IRELAND — (0.5%) | | | | | | | | | | | | |
# CRH PLC, Sponsored ADR | | | 191,724 | | | | 6,942,326 | | | | 0.2 | % |
Other Securities | | | | | | | 10,486,714 | | | | 0.4 | % |
| | | | | | | | | | | | |
TOTAL IRELAND | | | | | | | 17,429,040 | | | | 0.6 | % |
| | | | | | | | | | | | |
ISRAEL — (0.7%) | | | | | | | | | | | | |
Other Securities | | | | | | | 24,275,886 | | | | 0.8 | % |
| | | | | | | | | | | | |
ITALY — (1.8%) | | | | | | | | | | | | |
Eni SpA | | | 388,066 | | | | 5,096,749 | | | | 0.2 | % |
Stellantis NV | | | 476,957 | | | | 6,434,897 | | | | 0.2 | % |
Other Securities | | | | | | | 45,535,683 | | | | 1.4 | % |
| | | | | | | | | | | | |
TOTAL ITALY | | | | | | | 57,067,329 | | | | 1.8 | % |
| | | | | | | | | | | | |
70
WORLDEX U.S. CORE EQUITY PORTFOLIO
CONTINUED
| | | | | | | | | | | | |
| | | Shares | | | Value» | | | Percentage
of Net Assets‡ | |
JAPAN — (14.1%) | | | | | | | | | | | | |
Hitachi Ltd. | | | 119,200 | | | $ | 5,408,558 | | | | 0.2 | % |
Sony Group Corp. | | | 104,000 | | | | 7,013,202 | | | | 0.3 | % |
Toyota Motor Corp. | | | 907,715 | | | | 12,594,182 | | | | 0.4 | % |
Other Securities | | | | | | | 435,126,738 | | | | 13.8 | % |
| | | | | | | | | | | | |
TOTAL JAPAN | | | | | | | 460,142,680 | | | | 14.7 | % |
| | | | | | | | | | | | |
MALAYSIA — (0.5%) | | | | | | | | | | | | |
Other Securities | | | | | | | 16,846,749 | | | | 0.5 | % |
| | | | | | | | | | | | |
MEXICO — (0.8%) | | | | | | | | | | | | |
Other Securities | | | | | | | 25,482,157 | | | | 0.8 | % |
| | | | | | | | | | | | |
NETHERLANDS — (2.0%) | | | | | | | | | | | | |
ASML Holding NV | | | 20,610 | | | | 9,736,576 | | | | 0.3 | % |
Koninklijke Ahold Delhaize NV | | | 198,063 | | | | 5,523,626 | | | | 0.2 | % |
Other Securities | | | | | | | 48,603,742 | | | | 1.6 | % |
| | | | | | | | | | | | |
TOTAL NETHERLANDS | | | | | | | 63,863,944 | | | | 2.1 | % |
| | | | | | | | | | | | |
NEW ZEALAND — (0.3%) | | | | | | | | | | | | |
Other Securities | | | | | | | 8,487,603 | | | | 0.3 | % |
| | | | | | | | | | | | |
NORWAY — (0.7%) | | | | | | | | | | | | |
Other Securities | | | | | | | 22,459,223 | | | | 0.7 | % |
| | | | | | | | | | | | |
PERU — (0.0%) | | | | | | | | | | | | |
Other Securities | | | | | | | 341,571 | | | | 0.0 | % |
| | | | | | | | | | | | |
PHILIPPINES — (0.2%) | | | | | | | | | | | | |
Other Securities | | | | | | | 7,707,820 | | | | 0.3 | % |
| | | | | | | | | | | | |
POLAND — (0.2%) | | | | | | | | | | | | |
Other Securities | | | | | | | 7,137,048 | | | | 0.2 | % |
| | | | | | | | | | | | |
PORTUGAL — (0.2%) | | | | | | | | | | | | |
Other Securities | | | | | | | 6,189,656 | | | | 0.2 | % |
| | | | | | | | | | | | |
QATAR — (0.3%) | | | | | | | | | | | | |
Other Securities | | | | | | | 10,724,413 | | | | 0.3 | % |
| | | | | | | | | | | | |
SAUDI ARABIA — (1.1%) | | | | | | | | | | | | |
Other Securities | | | | | | | 35,711,761 | | | | 1.2 | % |
| | | | | | | | | | | | |
SINGAPORE — (0.7%) | | | | | | | | | | | | |
Other Securities | | | | | | | 22,860,164 | | | | 0.7 | % |
| | | | | | | | | | | | |
SOUTH AFRICA — (1.3%) | | | | | | | | | | | | |
Other Securities | | | | | | | 43,126,097 | | | | 1.4 | % |
| | | | | | | | | | | | |
SOUTH KOREA — (3.6%) | | | | | | | | | | | | |
Samsung Electronics Co. Ltd. | | | 661,530 | | | | 27,532,762 | | | | 0.9 | % |
Other Securities | | | | | | | 89,359,031 | | | | 2.9 | % |
| | | | | | | | | | | | |
TOTAL SOUTH KOREA | | | | | | | 116,891,793 | | | | 3.8 | % |
| | | | | | | | | | | | |
SPAIN — (1.5%) | | | | | | | | | | | | |
Repsol SA | | | 395,910 | | | | 5,386,144 | | | | 0.2 | % |
71
WORLDEX U.S. CORE EQUITY PORTFOLIO
CONTINUED
| | | | | | | | | | | | |
| | | Shares | | | Value» | | | Percentage
of Net Assets‡ | |
SPAIN — (Continued) | | | | | | | | | | | | |
Other Securities | | | | | | $ | 41,923,084 | | | | 1.3 | % |
| | | | | | | | | | | | |
TOTAL SPAIN | | | | | | | 47,309,228 | | | | 1.5 | % |
| | | | | | | | | | | | |
SWEDEN — (1.8%) | | | | | | | | | | | | |
Other Securities | | | | | | | 59,696,629 | | | | 1.9 | % |
| | | | | | | | | | | | |
SWITZERLAND — (5.1%) | | | | | | | | | | | | |
ABB Ltd. | | | 223,366 | | | | 6,202,941 | | | | 0.2 | % |
Givaudan SA | | | 1,803 | | | | 5,385,452 | | | | 0.2 | % |
Nestle SA | | | 146,245 | | | | 15,920,055 | | | | 0.5 | % |
Novartis AG | | | 88,289 | | | | 7,141,760 | | | | 0.2 | % |
Novartis AG, Sponsored ADR | | | 61,524 | | | | 4,991,442 | | | | 0.2 | % |
Roche Holding AG | | | 58,789 | | | | 19,506,080 | | | | 0.6 | % |
Other Securities | | | | | | | 105,807,368 | | | | 3.4 | % |
| | | | | | | | | | | | |
TOTAL SWITZERLAND | | | | | | | 164,955,098 | | | | 5.3 | % |
| | | | | | | | | | | | |
TAIWAN — (4.8%) | | | | | | | | | | | | |
Taiwan Semiconductor Manufacturing Co. Ltd. | | | 1,170,000 | | | | 14,065,978 | | | | 0.5 | % |
Taiwan Semiconductor Manufacturing Co. Ltd., Sponsored ADR | | | 129,369 | | | | 7,962,662 | | | | 0.3 | % |
Other Securities | | | | | | | 134,878,966 | | | | 4.2 | % |
| | | | | | | | | | | | |
TOTAL TAIWAN | | | | | | | 156,907,606 | | | | 5.0 | % |
| | | | | | | | | | | | |
THAILAND — (0.8%) | | | | | | | | | | | | |
Other Securities. | | | | | | | 24,416,349 | | | | 0.8 | % |
| | | | | | | | | | | | |
TURKEY — (0.3%) | | | | | | | | | | | | |
Other Securities | | | | | | | 8,632,922 | | | | 0.3 | % |
| | | | | | | | | | | | |
UNITED ARAB EMIRATES — (0.4%) | | | | | | | | | | | | |
Other Securities | | | | | | | 11,966,771 | | | | 0.4 | % |
| | | | | | | | | | | | |
UNITED KINGDOM — (8.5%) | | | | | | | | | | | | |
BP PLC, Sponsored ADR | | | 338,022 | | | | 11,249,372 | | | | 0.4 | % |
British American Tobacco PLC | | | 141,356 | | | | 5,582,636 | | | | 0.2 | % |
Glencore PLC | | | 1,482,781 | | | | 8,500,885 | | | | 0.3 | % |
# HSBC Holdings PLC, Sponsored ADR | | | 230,666 | | | | 5,976,556 | | | | 0.2 | % |
# Rio Tinto PLC, Sponsored ADR | | | 172,914 | | | | 9,224,962 | | | | 0.3 | % |
Shell PLC, Sponsored ADR | | | 428,414 | | | | 23,832,671 | | | | 0.8 | % |
# Unilever PLC, Sponsored ADR | | | 116,930 | | | | 5,321,484 | | | | 0.2 | % |
Other Securities | | | | | | | 205,281,455 | | | | 6.4 | % |
| | | | | | | | | | | | |
TOTAL UNITED KINGDOM | | | | | | | 274,970,021 | | | | 8.8 | % |
| | | | | | | | | | | | |
UNITED STATES — (0.0%) | | | | | | | | | | | | |
Other Securities | | | | | | | 945,358 | | | | 0.0 | % |
| | | | | | | | | | | | |
TOTAL COMMON STOCKS | | | | | | | 3,064,291,531 | | | | 98.1 | % |
| | | | | | | | | | | | |
PREFERRED STOCKS — (0.7%) | | | | | | | | | | | | |
BRAZIL — (0.4%) | | | | | | | | | | | | |
Other Securities | | | | | | | 11,626,826 | | | | 0.4 | % |
| | | | | | | | | | | | |
CHILE — (0.0%) | | | | | | | | | | | | |
Other Securities | | | | | | | 168,225 | | | | 0.0 | % |
| | | | | | | | | | | | |
72
WORLDEX U.S. CORE EQUITY PORTFOLIO
CONTINUED
| | | | | | | | | | | | |
| | | Shares | | | Value» | | | Percentage
of Net Assets‡ | |
COLOMBIA — (0.0%) | | | | | | | | | | | | |
Other Securities | | | | | | $ | 168,281 | | | | 0.0 | % |
| | | | | | | | | | | | |
GERMANY — (0.3%) | | | | | | | | | | | | |
Other Securities | | | | | | | 9,081,770 | | | | 0.3 | % |
| | | | | | | | | | | | |
PHILIPPINES — (0.0%) | | | | | | | | | | | | |
Other Security | | | | | | | 34,233 | | | | 0.0 | % |
| | | | | | | | | | | | |
SOUTH KOREA — (0.0%) | | | | | | | | | | | | |
Other Security | | | | | | | 278 | | | | 0.0 | % |
| | | | | | | | | | | | |
THAILAND — (0.0%) | | | | | | | | | | | | |
Other Security | | | | | | | 115,176 | | | | 0.0 | % |
| | | | | | | | | | | | |
TOTAL PREFERRED STOCKS. | | | | | | | 21,194,789 | | | | 0.7 | % |
| | | | | | | | | | | | |
RIGHTS/WARRANTS — (0.0%) | | | | | | | | | | | | |
AUSTRALIA — (0.0%) | | | | | | | | | | | | |
Other Securities | | | | | | | 285 | | | | 0.0 | % |
| | | | | | | | | | | | |
BRAZIL — (0.0%) | | | | | | | | | | | | |
Other Securities | | | | | | | 3,311 | | | | 0.0 | % |
| | | | | | | | | | | | |
HONG KONG — (0.0%) | | | | | | | | | | | | |
Other Security | | | | | | | 103 | | | | 0.0 | % |
| | | | | | | | | | | | |
INDIA — (0.0%) | | | | | | | | | | | | |
Other Security | | | | | | | 9,300 | | | | 0.0 | % |
| | | | | | | | | | | | |
INDONESIA — (0.0%) | | | | | | | | | | | | |
Other Security | | | | | | | 479 | | | | 0.0 | % |
| | | | | | | | | | | | |
MALAYSIA — (0.0%) | | | | | | | | | | | | |
Other Security | | | | | | | 4,387 | | | | 0.0 | % |
| | | | | | | | | | | | |
SAUDI ARABIA — (0.0%) | | | | | | | | | | | | |
Other Security | | | | | | | 3,245 | | | | 0.0 | % |
| | | | | | | | | | | | |
SOUTH KOREA — (0.0%) | | | | | | | | | | | | |
Other Securities | | | | | | | 2,167 | | | | 0.0 | % |
| | | | | | | | | | | | |
TAIWAN — (0.0%) | | | | | | | | | | | | |
Other Securities | | | | | | | 10,035 | | | | 0.0 | % |
| | | | | | | | | | | | |
THAILAND — (0.0%) | | | | | | | | | | | | |
Other Securities | | | | | | | 462 | | | | 0.0 | % |
| | | | | | | | | | | | |
TOTAL RIGHTS/WARRANTS | | | | | | | 33,774 | | | | 0.0 | % |
| | | | | | | | | | | | |
TOTAL INVESTMENT SECURITIES
(Cost $3,168,683,871) | | | | | | | 3,085,520,094 | | | | | |
| | | | | | | | | | | | |
73
WORLDEX U.S. CORE EQUITY PORTFOLIO
CONTINUED
| | | | | | | | | | | | |
| | | Shares | | | Value† | | | Percentage
of Net Assets‡ | |
SECURITIES LENDING COLLATERAL — (5.1%) | | | | | | | | | | | | |
@§ The DFA Short Term Investment Fund | | | 14,470,830 | | | $ | 167,297,264 | | | | 5.4 | % |
| | | | | | | | | | | | |
TOTAL INVESTMENTS—(100.0%)
(Cost $3,336,052,772) | | | | | | $ | 3,252,817,358 | | | | 104.2 | % |
| | | | | | | | | | | | |
As of October 31, 2022, World ex U.S. Core Equity Portfolio had entered into the following outstanding futures contracts:
| | | | | | | | | | | | | | | | | | | | |
Description | | Number of
Contracts | | | Expiration
Date | | | Notional
Value | | | Market
Value | | | Unrealized
Appreciation
(Depreciation) | |
Long Position Contracts: | | | | | | | | | | | | | | | | | | | | |
S&P 500® Emini Index | | | 128 | | | | 12/16/22 | | | $ | 23,984,116 | | | $ | 24,851,200 | | | $ | 867,084 | |
| | | | | | | | | | | | | | | | | | | | |
Total Futures Contracts | | | | | | | | | | $ | 23,984,116 | | | $ | 24,851,200 | | | $ | 867,084 | |
| | | | | | | | | | | | | | | | | | | | |
Summary of the Portfolio’s investments as of October 31, 2022, based on their valuation inputs, is as follows (see Security Valuation Note):
| | | | | | | | | | | | | | | | |
| | | Investments in Securities (Market Value) | |
| | | Level 1 | | | Level 2 | | | Level 3 | | | Total | |
Common Stocks | | | | | | | | | | | | | | | | |
Australia | | $ | 7,272,824 | | | $ | 138,068,634 | | | $ | 4,818 | | | $ | 145,346,276 | |
Austria | | | 41,465 | | | | 10,835,421 | | | | — | | | | 10,876,886 | |
Belgium | | | 537,208 | | | | 23,968,787 | | | | — | | | | 24,505,995 | |
Brazil | | | 50,798,514 | | | | 274,380 | | | | — | | | | 51,072,894 | |
Canada | | | 258,904,825 | | | | 701,682 | | | | — | | | | 259,606,507 | |
Chile | | | 922,918 | | | | 3,508,327 | | | | — | | | | 4,431,245 | |
China | | | 16,040,899 | | | | 214,973,516 | | | | 808,270 | | | | 231,822,685 | |
Colombia | | | 964,595 | | | | 60,946 | | | | — | | | | 1,025,541 | |
Czech Republic | | | — | | | | 1,198,559 | | | | — | | | | 1,198,559 | |
Denmark | | | — | | | | 49,641,006 | | | | — | | | | 49,641,006 | |
Egypt | | | 77,097 | | | | 85,625 | | | | — | | | | 162,722 | |
Finland | | | 548,244 | | | | 31,726,347 | | | | — | | | | 32,274,591 | |
France | | | 368,182 | | | | 168,140,162 | | | | 1,928 | | | | 168,510,272 | |
Germany | | | 1,507,363 | | | | 133,454,282 | | | | — | | | | 134,961,645 | |
Greece | | | 7,253 | | | | 2,629,812 | | | | 1,231 | | | | 2,638,296 | |
Hong Kong | | | 467,105 | | | | 40,604,384 | | | | 50,964 | | | | 41,122,453 | |
Hungary | | | — | | | | 1,633,284 | | | | — | | | | 1,633,284 | |
India | | | 3,291,919 | | | | 180,861,771 | | | | 267 | | | | 184,153,957 | |
Indonesia | | | 174,624 | | | | 22,545,712 | | | | 41,465 | | | | 22,761,801 | |
Ireland | | | 6,942,326 | | | | 10,486,714 | | | | — | | | | 17,429,040 | |
Israel | | | 2,949,430 | | | | 21,326,456 | | | | — | | | | 24,275,886 | |
Italy | | | 578,714 | | | | 56,488,615 | | | | — | | | | 57,067,329 | |
Japan | | | 1,732,396 | | | | 458,410,284 | | | | — | | | | 460,142,680 | |
Malaysia | | | — | | | | 16,846,592 | | | | 157 | | | | 16,846,749 | |
Mexico | | | 25,352,685 | | | | 129,267 | | | | 205 | | | | 25,482,157 | |
Netherlands | | | 11,290,855 | | | | 52,573,089 | | | | — | | | | 63,863,944 | |
New Zealand | | | — | | | | 8,487,603 | | | | — | | | | 8,487,603 | |
Norway | | | 31,689 | | | | 22,427,534 | | | | — | | | | 22,459,223 | |
Peru | | | 341,544 | | | | — | | | | 27 | | | | 341,571 | |
Philippines | | | 23,089 | | | | 7,684,731 | | | | — | | | | 7,707,820 | |
Poland | | | — | | | | 7,137,048 | | | | — | | | | 7,137,048 | |
Portugal | | | — | | | | 6,189,656 | | | | — | | | | 6,189,656 | |
Qatar | | | — | | | | 10,724,413 | | | | — | | | | 10,724,413 | |
74
WORLDEX U.S. CORE EQUITY PORTFOLIO
CONTINUED
| | | | | | | | | | | | | | | | |
| | | Investments in Securities (Market Value) | |
| | | Level 1 | | | Level 2 | | | Level 3 | | | Total | |
Saudi Arabia | | $ | 35,081 | | | $ | 35,676,680 | | | | — | | | $ | 35,711,761 | |
Singapore | | | — | | | | 22,845,150 | | | $ | 15,014 | | | | 22,860,164 | |
South Africa | | | 4,254,717 | | | | 38,871,380 | | | | — | | | | 43,126,097 | |
South Korea | | | 560,925 | | | | 116,240,174 | | | | 90,694 | | | | 116,891,793 | |
Spain | | | 426,884 | | | | 46,882,344 | | | | — | | | | 47,309,228 | |
Sweden | | | 113,903 | | | | 59,582,726 | | | | — | | | | 59,696,629 | |
Switzerland | | | 12,061,310 | | | | 152,893,788 | | | | — | | | | 164,955,098 | |
Taiwan | | | 8,199,731 | | | | 148,686,595 | | | | 21,280 | | | | 156,907,606 | |
Thailand | | | 23,832,210 | | | | 584,139 | | | | — | | | | 24,416,349 | |
Turkey | | | — | | | | 8,632,922 | | | | — | | | | 8,632,922 | |
United Arab Emirates | | | — | | | | 11,966,771 | | | | — | | | | 11,966,771 | |
United Kingdom | | | 72,790,913 | | | | 202,175,231 | | | | 3,877 | | | | 274,970,021 | |
United States | | | 301,845 | | | | 643,513 | | | | — | | | | 945,358 | |
Preferred Stocks | | | | | | | | | | | | | | | | |
Brazil | | | 11,606,098 | | | | 20,728 | | | | — | | | | 11,626,826 | |
Chile | | | — | | | | 168,225 | | | | — | | | | 168,225 | |
Colombia | | | 168,281 | | | | — | | | | — | | | | 168,281 | |
Germany | | | — | | | | 9,081,770 | | | | — | | | | 9,081,770 | |
Philippines | | | — | | | | 34,233 | | | | — | | | | 34,233 | |
South Korea | | | — | | | | 278 | | | | — | | | | 278 | |
Thailand | | | 115,176 | | | | — | | | | — | | | | 115,176 | |
Rights/Warrants | | | | | | | | | | | | | | | | |
Australia | | | — | | | | 285 | | | | — | | | | 285 | |
Brazil | | | — | | | | 3,311 | | | | — | | | | 3,311 | |
Hong Kong | | | — | | | | 103 | | | | — | | | | 103 | |
India | | | — | | | | 9,300 | | | | — | | | | 9,300 | |
Indonesia | | | — | | | | 479 | | | | — | | | | 479 | |
Malaysia | | | — | | | | 4,387 | | | | — | | | | 4,387 | |
Saudi Arabia | | | — | | | | 3,245 | | | | — | | | | 3,245 | |
South Korea | | | — | | | | 2,167 | | | | — | | | | 2,167 | |
Taiwan | | | — | | | | 10,035 | | | | — | | | | 10,035 | |
Thailand | | | — | | | | 462 | | | | — | | | | 462 | |
Securities Lending Collateral | | | — | | | | 167,297,264 | | | | — | | | | 167,297,264 | |
Futures Contracts** | | | 867,084 | | | | — | | | | — | | | | 867,084 | |
| | | | | | | | | | | | | | | | |
TOTAL | | $ | 526,501,921 | | | $ | 2,726,142,324 | | | $ | 1,040,197 | ^ | | $ | 3,253,684,442 | |
| | | | | | | | | | | | | | | | |
| ** | Valued at the unrealized appreciation/(depreciation) on the investment. |
| ^ | A reconciliation of Level 3 investments is presented when the Fund had a significant amount of Level 3 investments at the beginning and/or end of the reporting period in relation to net assets. |
See accompanying Notes to Financial Statements.
75
WORLD EX U.S. TARGETED VALUE PORTFOLIO
SUMMARY SCHEDULE OF PORTFOLIO HOLDINGS
October 31, 2022
| | | | | | | | | | | | |
| | | Shares | | | Value» | | | Percentage
of Net Assets‡ | |
COMMON STOCKS — (99.3%) | | | | | | | | | | | | |
AUSTRALIA — (5.1%) | | | | | | | | | | | | |
Incitec Pivot Ltd. | | | 445,077 | | | $ | 1,070,388 | | | | 0.2 | % |
OZ Minerals Ltd. | | | 93,959 | | | | 1,454,860 | | | | 0.3 | % |
Whitehaven Coal Ltd. | | | 222,477 | | | | 1,292,323 | | | | 0.2 | % |
Other Securities | | | | | | | 25,062,003 | | | | 4.4 | % |
| | | | | | | | | | | | |
TOTAL AUSTRALIA | | | | | | | 28,879,574 | | | | 5.1 | % |
| | | | | | | | | | | | |
AUSTRIA — (0.6%) | | | | | | | | | | | | |
Other Securities | | | | | | | 3,602,917 | | | | 0.6 | % |
| | | | | | | | | | | | |
BELGIUM — (1.3%) | | | | | | | | | | | | |
Ageas SA | | | 52,470 | | | | 1,816,416 | | | | 0.3 | % |
Other Securities | | | | | | | 5,353,515 | | | | 1.0 | % |
| | | | | | | | | | | | |
TOTAL BELGIUM | | | | | | | 7,169,931 | | | | 1.3 | % |
| | | | | | | | | | | | |
BRAZIL — (1.5%) | | | | | | | | | | | | |
Other Securities | | | | | | | 8,436,425 | | | | 1.5 | % |
| | | | | | | | | | | | |
CANADA — (8.9%) | | | | | | | | | | | | |
AltaGas Ltd | | | 69,373 | | | | 1,251,143 | | | | 0.2 | % |
ARC Resources Ltd. | | | 157,602 | | | | 2,218,817 | | | | 0.4 | % |
iA Financial Corp., Inc. | | | 30,644 | | | | 1,705,456 | | | | 0.3 | % |
* MEG Energy Corp. | | | 81,109 | | | | 1,212,750 | | | | 0.2 | % |
Shaw Communications, Inc., Class B | | | 49,246 | | | | 1,265,130 | | | | 0.2 | % |
Tourmaline Oil Corp. | | | 49,686 | | | | 2,799,499 | | | | 0.5 | % |
West Fraser Timber Co. Ltd. | | | 20,594 | | | | 1,546,269 | | | | 0.3 | % |
Whitecap Resources, Inc. | | | 159,435 | | | | 1,235,828 | | | | 0.2 | % |
Yamana Gold, Inc. | | | 275,277 | | | | 1,208,321 | | | | 0.2 | % |
Other Securities | | | | | | | 36,116,827 | | | | 6.4 | % |
| | | | | | | | | | | | |
TOTAL CANADA | | | | | | | 50,560,040 | | | | 8.9 | % |
| | | | | | | | | | | | |
CHILE — (0.1%) | | | | | | | | | | | | |
Other Securities | | | | | | | 633,668 | | | | 0.1 | % |
| | | | | | | | | | | | |
CHINA — (5.8%) | | | | | | | | | | | | |
Other Securities | | | | | | | 32,973,778 | | | | 5.8 | % |
| | | | | | | | | | | | |
COLOMBIA — (0.0%) | | | | | | | | | | | | |
Other Securities | | | | | | | 132,549 | | | | 0.0 | % |
| | | | | | | | | | | | |
DENMARK — (1.7%) | | | | | | | | | | | | |
Other Securities | | | | | | | 9,498,918 | | | | 1.7 | % |
| | | | | | | | | | | | |
FINLAND — (1.4%) | | | | | | | | | | | | |
Valmet Oyj | | | 47,799 | | | | 1,087,104 | | | | 0.2 | % |
Other Securities | | | | | | | 6,922,780 | | | | 1.2 | % |
| | | | | | | | | | | | |
TOTAL FINLAND | | | | | | | 8,009,884 | | | | 1.4 | % |
| | | | | | | | | | | | |
FRANCE — (3.9%) | | | | | | | | | | | | |
Alstom SA | | | 68,483 | | | | 1,409,464 | | | | 0.3 | % |
Bouygues SA | | | 39,233 | | | | 1,119,362 | | | | 0.2 | % |
Carrefour SA | | | 63,770 | | | | 1,026,407 | | | | 0.2 | % |
Eiffage SA | | | 20,030 | | | | 1,811,148 | | | | 0.3 | % |
76
WORLDEX U.S. TARGETED VALUE PORTFOLIO
CONTINUED
| | | | | | | | | | | | |
| | | Shares | | | Value» | | | Percentage
of Net Assets‡ | |
FRANCE — (Continued) | | | | | | | | | | | | |
* Renault SA | | | 55,113 | | | $ | 1,696,885 | | | | 0.3 | % |
Other Securities | | | | | | | 14,833,545 | | | | 2.6 | % |
| | | | | | | | | | | | |
TOTAL FRANCE | | | | 21,896,811 | | | | 3.9 | % |
| | | | | | | | | | | | |
GERMANY — (5.1%) | | | | | | | | | | | | |
* Commerzbank AG | | | 337,220 | | | | 2,694,286 | | | | 0.5 | % |
W Covestro AG | | | 58,959 | | | | 2,001,423 | | | | 0.4 | % |
Fresenius Medical Care AG & Co. KGaA | | | 47,923 | | | | 1,325,578 | | | | 0.2 | % |
HeidelbergCement AG | | | 41,205 | | | | 1,894,885 | | | | 0.3 | % |
K&S AG | | | 63,951 | | | | 1,411,973 | | | | 0.3 | % |
Rheinmetall AG | | | 7,900 | | | | 1,284,158 | | | | 0.2 | % |
Other Securities | | | | | | | 18,202,261 | | | | 3.2 | % |
| | | | | | | | | | | | |
TOTAL GERMANY | | | | 28,814,564 | | | | 5.1 | % |
| | | | | | | | | | | | |
GREECE — (0.1%) | | | | | | | | | | | | |
Other Securities | | | | | | | 616,920 | | | | 0.1 | % |
| | | | | | | | | | | | |
HONG KONG — (1.5%) | | | | | | | | | | | | |
Other Securities | | | | | | | 8,626,606 | | | | 1.5 | % |
| | | | | | | | | | | | |
HUNGARY — (0.0%) | | | | | | | | | | | | |
Other Security | | | | | | | 148,573 | | | | 0.0 | % |
| | | | | | | | | | | | |
INDIA — (6.2%) | | | | | | | | | | | | |
UPL Ltd | | | 117,632 | | | | 1,041,029 | | | | 0.2 | % |
Other Securities | | | | | | | 34,424,112 | | | | 6.0 | % |
| | | | | | | | | | | | |
TOTAL INDIA | | | | 35,465,141 | | | | 6.2 | % |
| | | | | | | | | | | | |
INDONESIA — (0.7%) | | | | | | | | | | | | |
Other Securities | | | | | | | 3,980,281 | | | | 0.7 | % |
| | | | | | | | | | | | |
IRELAND — (0.8%) | | | | | | | | | | | | |
Bank of Ireland Group PLC | | | 330,642 | | | | 2,380,825 | | | | 0.4 | % |
Other Securities | | | | | | | 2,158,573 | | | | 0.4 | % |
| | | | | | | | | | | | |
TOTAL IRELAND | | | | 4,539,398 | | | | 0.8 | % |
| | | | | | | | | | | | |
ISRAEL — (1.3%) | | | | | | | | | | | | |
Other Securities | | | | | | | 7,177,292 | | | | 1.3 | % |
| | | | | | | | | | | | |
ITALY — (2.6%) | | | | | | | | | | | | |
Banco BPM SpA | | | 394,306 | | | | 1,192,980 | | | | 0.2 | % |
Mediobanca Banca di Credito Finanziario SpA | | | 168,607 | | | | 1,527,509 | | | | 0.3 | % |
Other Securities | | | | | | | 11,846,773 | | | | 2.1 | % |
| | | | | | | | | | | | |
TOTAL ITALY | | | | 14,567,262 | | | | 2.6 | % |
| | | | | | | | | | | | |
JAPAN — (17.2%) | | | | | | | | | | | | |
Concordia Financial Group Ltd. | | | 366,700 | | | | 1,118,883 | | | | 0.2 | % |
Sojitz Corp. | | | 72,740 | | | | 1,072,330 | | | | 0.2 | % |
Other Securities | | | | | | | 95,329,039 | | | | 16.8 | % |
| | | | | | | | | | | | |
TOTAL JAPAN | | | | 97,520,252 | | | | 17.2 | % |
| | | | | | | | | | | | |
MALAYSIA — (0.6%) | | | | | | | | | | | | |
Other Securities | | | | | | | 3,122,991 | | | | 0.6 | % |
| | | | | | | | | | | | |
77
WORLDEX U.S. TARGETED VALUE PORTFOLIO
CONTINUED
| | | | | | | | | | | | |
| | | Shares | | | Value» | | | Percentage
of Net Assets‡ | |
MEXICO — (0.8%) | | | | | | | | | | | | |
Other Securities | | | | | | $ | 4,250,539 | | | | 0.8 | % |
| | | | | | | | | | | | |
NETHERLANDS — (1.9%) | | | | | | | | | | | | |
W ABN AMRO Bank NV | | | 112,128 | | | | 1,102,289 | | | | 0.2 | % |
Aegon NV | | | 419,896 | | | | 1,943,765 | | | | 0.4 | % |
ASR Nederland NV | | | 43,712 | | | | 1,924,765 | | | | 0.3 | % |
Other Securities | | | | | | | 5,939,140 | | | | 1.0 | % |
| | | | | | | | | | | | |
TOTAL NETHERLANDS | | | | 10,909,959 | | | | 1.9 | % |
| | | | | | | | | | | | |
NEW ZEALAND — (0.2%) | | | | | | | | | | | | |
Other Securities | | | | | | | 1,385,842 | | | | 0.2 | % |
| | | | | | | | | | | | |
NORWAY — (0.9%) | | | | | | | | | | | | |
Other Securities | | | | | | | 4,990,076 | | | | 0.9 | % |
| | | | | | | | | | | | |
PHILIPPINES — (0.2%) | | | | | | | | | | | | |
Other Securities | | | | | | | 1,137,782 | | | | 0.2 | % |
| | | | | | | | | | | | |
POLAND — (0.2%) | | | | | | | | | | | | |
Other Securities | | | | | | | 1,009,810 | | | | 0.2 | % |
| | | | | | | | | | | | |
PORTUGAL — (0.3%) | | | | | | | | | | | | |
Other Securities | | | | | | | 1,971,152 | | | | 0.3 | % |
| | | | | | | | | | | | |
QATAR — (0.2%) | | | | | | | | | | | | |
Other Securities | | | | | | | 1,273,087 | | | | 0.2 | % |
| | | | | | | | | | | | |
SAUDI ARABIA — (1.3%) | | | | | | | | | | | | |
Other Securities | | | | | | | 7,309,539 | | | | 1.3 | % |
| | | | | | | | | | | | |
SINGAPORE — (0.7%) | | | | | | | | | | | | |
Other Securities | | | | | | | 3,951,060 | | | | 0.7 | % |
| | | | | | | | | | | | |
SOUTH AFRICA — (1.1%) | | | | | | | | | | | | |
Other Securities | | | | | | | 5,999,431 | | | | 1.1 | % |
| | | | | | | | | | | | |
SOUTH KOREA — (3.2%) | | | | | | | | | | | | |
Other Securities | | | | | | | 18,341,470 | | | | 3.2 | % |
| | | | | | | | | | | | |
SPAIN — (1.3%) | | | | | | | | | | | | |
Banco de Sabadell SA | | | 1,583,992 | | | | 1,246,291 | | | | 0.2 | % |
Bankinter SA | | | 197,117 | | | | 1,192,352 | | | | 0.2 | % |
Other Securities | | | | | | | 5,040,325 | | | | 0.9 | % |
| | | | | | | | | | | | |
TOTAL SPAIN | | | | 7,478,968 | | | | 1.3 | % |
| | | | | | | | | | | | |
SWEDEN — (1.5%) | | | | | | | | | | | | |
Other Securities | | | | | | | 8,644,257 | | | | 1.5 | % |
| | | | | | | | | | | | |
SWITZERLAND — (3.9%) | | | | | | | | | | | | |
Baloise Holding AG | | | 13,916 | | | | 1,901,233 | | | | 0.3 | % |
Julius Baer Group Ltd. | | | 31,228 | | | | 1,498,284 | | | | 0.3 | % |
Swatch Group AG | | | 7,058 | | | | 1,585,999 | | | | 0.3 | % |
Swiss Prime Site AG | | | 16,975 | | | | 1,369,762 | | | | 0.3 | % |
Other Securities | | | | | | | 15,801,712 | | | | 2.7 | % |
| | | | | | | | | | | | �� |
TOTAL SWITZERLAND | | | | 22,156,990 | | | | 3.9 | % |
| | | | | | | | | | | | |
78
WORLDEX U.S. TARGETED VALUE PORTFOLIO
CONTINUED
| | | | | | | | | | | | |
| | | Shares | | | Value» | | | Percentage
of Net Assets‡ | |
TAIWAN — (5.1%) | | | | | | | | | | | | |
Other Securities | | | | | | $ | 29,148,900 | | | | 5.1 | % |
| | | | | | | | | | | | |
THAILAND — (0.7%) | | | | | | | | | | | | |
Other Securities | | | | | | | 3,912,834 | | | | 0.7 | % |
| | | | | | | | | | | | |
TURKEY — (0.2%) | | | | | | | | | | | | |
Other Securities | | | | | | | 1,296,493 | | | | 0.2 | % |
| | | | | | | | | | | | |
UNITED ARAB EMIRATES — (0.4%) | | | | | | | | | | | | |
Emaar Properties PJSC | | | 908,458 | | | | 1,499,641 | | | | 0.3 | % |
Other Securities | | | | | | | 1,009,511 | | | | 0.1 | % |
| | | | | | | | | | | | |
TOTAL UNITED ARAB EMIRATES | | | | | | | 2,509,152 | | | | 0.4 | % |
| | | | | | | | | | | | |
UNITED KINGDOM — (8.7%) | | | | | | | | | | | | |
Barratt Developments PLC | | | 294,947 | | | | 1,272,132 | | | | 0.2 | % |
Beazley PLC | | | 157,957 | | | | 1,132,838 | | | | 0.2 | % |
Centrica PLC | | | 1,480,134 | | | | 1,300,610 | | | | 0.2 | % |
DS Smith PLC | | | 398,008 | | | | 1,327,325 | | | | 0.2 | % |
J Sainsbury PLC | | | 524,764 | | | | 1,169,748 | | | | 0.2 | % |
Johnson Matthey PLC | | | 46,446 | | | | 1,030,989 | | | | 0.2 | % |
Kingfisher PLC | | | 587,635 | | | | 1,476,393 | | | | 0.3 | % |
Melrose Industries PLC | | | 1,024,099 | | | | 1,373,709 | | | | 0.3 | % |
Taylor Wimpey PLC | | | 1,049,610 | | | | 1,128,465 | | | | 0.2 | % |
Other Securities | | | | | | | 38,162,505 | | | | 6.7 | % |
| | | | | | | | | | | | |
TOTAL UNITED KINGDOM | | | | | | | 49,374,714 | | | | 8.7 | % |
| | | | | | | | | | | | |
UNITED STATES — (0.1%) | | | | | | | | | | | | |
Other Securities | | | | | | | 600,952 | | | | 0.1 | % |
| | | | | | | | | | | | |
TOTAL COMMON STOCKS | | | | | | | 564,026,782 | | | | 99.3 | % |
| | | | | | | | | | | | |
PREFERRED STOCKS — (0.4%) | | | | | | | | | | | | |
BRAZIL — (0.1%) | | | | | | | | | | | | |
Other Securities | | | | | | | 733,993 | | | | 0.1 | % |
| | | | | | | | | | | | |
GERMANY — (0.3%) | | | | | | | | | | | | |
Other Securities | | | | | | | 1,361,468 | | | | 0.3 | % |
| | | | | | | | | | | | |
PHILIPPINES — (0.0%) | | | | | | | | | | | | |
Other Security | | | | | | | 13,984 | | | | 0.0 | % |
| | | | | | | | | | | | |
SOUTH KOREA — (0.0%) | | | | | | | | | | | | |
Other Securities | | | | | | | 10,073 | | | | 0.0 | % |
| | | | | | | | | | | | |
THAILAND — (0.0%) | | | | | | | | | | | | |
Other Security | | | | | | | 44,710 | | | | 0.0 | % |
| | | | | | | | | | | | |
TOTAL PREFERRED STOCKS | | | | | | | 2,164,228 | | | | 0.4 | % |
| | | | | | | | | | | | |
RIGHTS/WARRANTS — (0.0%) | | | | | | | | | | | | |
INDONESIA — (0.0%) | | | | | | | | | | | | |
Other Security | | | | | | | 371 | | | | 0.0 | % |
| | | | | | | | | | | | |
MALAYSIA — (0.0%) | | | | | | | | | | | | |
Other Securities | | | | | | | 3,004 | | | | 0.0 | % |
| | | | | | | | | | | | |
79
WORLDEX U.S. TARGETED VALUE PORTFOLIO
CONTINUED
| | | | | | | | | | | | |
| | | Shares | | | Value» | | | Percentage
of Net Assets‡ | |
SOUTH KOREA — (0.0%) | | | | | | | | | | | | |
Other Security | | | | | | $ | 3,118 | | | | 0.0 | % |
| | | | | | | | | | | | |
TAIWAN — (0.0%) | | | | | | | | | | | | |
Other Securities | | | | | | | 1,238 | | | | 0.0 | % |
| | | | | | | | | | | | |
THAILAND — (0.0%) | | | | | | | | | | | | |
Other Securities | | | | | | | 477 | | | | 0.0 | % |
| | | | | | | | | | | | |
TOTAL RIGHTS/WARRANTS | | | | | | | 8,208 | | | | 0.0 | % |
| | | | | | | | | | | | |
TOTAL INVESTMENT SECURITIES
(Cost $652,274,007) | | | | | | | 566,199,218 | | | | | |
| | | | | | | | | | | | |
| | | |
| | | | | | Value† | | | | |
SECURITIES LENDING COLLATERAL — (0.3%) | | | | | | | | | | | | |
@§ The DFA Short Term Investment Fund | | | 138,334 | | | | 1,599,274 | | | | 0.3 | % |
| | | | | | | | | | | | |
TOTAL INVESTMENTS—(100.0%)
(Cost $653,873,721) | | | | | | $ | 567,798,492 | | | | 100.0 | % |
| | | | | | | | | | | | |
Summary of the Portfolio’s investments as of October 31, 2022, based on their valuation inputs, is as follows (see Security Valuation Note):
| | | | | | | | | | | | | | | | |
| | | Investments in Securities (Market Value) | |
| | | Level 1 | | | Level 2 | | | Level 3 | | | Total | |
Common Stocks | | | | | | | | | | | | | | | | |
Australia | | $ | 130,232 | | | $ | 28,749,342 | | | | — | | | $ | 28,879,574 | |
Austria | | | — | | | | 3,602,917 | | | | — | | | | 3,602,917 | |
Belgium | | | 493,178 | | | | 6,676,753 | | | | — | | | | 7,169,931 | |
Brazil | | | 8,328,731 | | | | 107,694 | | | | — | | | | 8,436,425 | |
Canada | | | 50,544,558 | | | | 15,482 | | | | — | | | | 50,560,040 | |
Chile | | | — | | | | 633,668 | | | | — | | | | 633,668 | |
China | | | 1,098,697 | | | | 31,467,344 | | | $ | 407,737 | | | | 32,973,778 | |
Colombia | | | 132,549 | | | | — | | | | — | | | | 132,549 | |
Denmark | | | — | | | | 9,498,918 | | | | — | | | | 9,498,918 | |
Finland | | | — | | | | 8,009,884 | | | | — | | | | 8,009,884 | |
France | | | — | | | | 21,896,811 | | | | — | | | | 21,896,811 | |
Germany | | | — | | | | 28,814,564 | | | | — | | | | 28,814,564 | |
Greece | | | 1,075 | | | | 615,845 | | | | — | | | | 616,920 | |
Hong Kong | | | 179,447 | | | | 8,413,363 | | | | 33,796 | | | | 8,626,606 | |
Hungary | | | — | | | | 148,573 | | | | — | | | | 148,573 | |
India | | | 47,950 | | | | 35,417,021 | | | | 170 | | | | 35,465,141 | |
Indonesia | | | — | | | | 3,971,559 | | | | 8,722 | | | | 3,980,281 | |
Ireland | | | — | | | | 4,539,398 | | | | — | | | | 4,539,398 | |
Israel | | | 125,586 | | | | 7,051,706 | | | | — | | | | 7,177,292 | |
Italy | | | 840,988 | | | | 13,726,274 | | | | — | | | | 14,567,262 | |
Japan | | | 169,817 | | | | 97,350,435 | | | | — | | | | 97,520,252 | |
Malaysia | | | — | | | | 3,122,991 | | | | — | | | | 3,122,991 | |
Mexico | | | 4,127,575 | | | | 122,964 | | | | — | | | | 4,250,539 | |
Netherlands | | | 546,460 | | | | 10,363,499 | | | | — | | | | 10,909,959 | |
New Zealand | | | — | | | | 1,385,842 | | | | — | | | | 1,385,842 | |
Norway | | | 152,505 | | | | 4,837,571 | | | | — | | | | 4,990,076 | |
Philippines | | | — | | | | 1,137,782 | | | | — | | | | 1,137,782 | |
Poland | | | — | | | | 1,009,810 | | | | — | | | | 1,009,810 | |
Portugal | | | — | | | | 1,971,152 | | | | — | | | | 1,971,152 | |
Qatar | | | — | | | | 1,273,087 | | | | — | | | | 1,273,087 | |
80
WORLDEX U.S. TARGETED VALUE PORTFOLIO
CONTINUED
| | | | | | | | | | | | | | | | |
| | | Investments in Securities (Market Value) | |
| | | Level 1 | | | Level 2 | | | Level 3 | | | Total | |
Saudi Arabia | | $ | 41,012 | | | $ | 7,268,527 | | | | — | | | $ | 7,309,539 | |
Singapore | | | — | | | | 3,950,379 | | | $ | 681 | | | | 3,951,060 | |
South Africa | | | 500,752 | | | | 5,498,679 | | | | — | | | | 5,999,431 | |
South Korea | | | — | | | | 18,311,267 | | | | 30,203 | | | | 18,341,470 | |
Spain | | | — | | | | 7,478,968 | | | | — | | | | 7,478,968 | |
Sweden | | | 9,497 | | | | 8,634,760 | | | | — | | | | 8,644,257 | |
Switzerland | | | — | | | | 22,156,990 | | | | — | | | | 22,156,990 | |
Taiwan | | | 21,964 | | | | 29,116,678 | | | | 10,258 | | | | 29,148,900 | |
Thailand | | | 3,851,514 | | | | 61,320 | | | | — | | | | 3,912,834 | |
Turkey | | | — | | | | 1,296,493 | | | | — | | | | 1,296,493 | |
United Arab Emirates | | | — | | | | 2,509,152 | | | | — | | | | 2,509,152 | |
United Kingdom | | | 50,807 | | | | 49,318,348 | | | | 5,559 | | | | 49,374,714 | |
United States | | | 339,801 | | | | 261,151 | | | | — | | | | 600,952 | |
Preferred Stocks | | | | | | | | | | | | | | | | |
Brazil | | | 719,339 | | | | 14,654 | | | | — | | | | 733,993 | |
Germany | | | — | | | | 1,361,468 | | | | — | | | | 1,361,468 | |
Philippines | | | — | | | | 13,984 | | | | — | | | | 13,984 | |
South Korea | | | — | | | | 10,073 | | | | — | | | | 10,073 | |
Thailand | | | 44,710 | | | | — | | | | — | | | | 44,710 | |
Rights/Warrants | | | | | | | | | | | | | | | | |
Indonesia | | | — | | | | 371 | | | | — | | | | 371 | |
Malaysia | | | — | | | | 3,004 | | | | — | | | | 3,004 | |
South Korea | | | — | | | | 3,118 | | | | — | | | | 3,118 | |
Taiwan | | | — | | | | 1,238 | | | | — | | | | 1,238 | |
Thailand | | | — | | | | 477 | | | | — | | | | 477 | |
Securities Lending Collateral | | | — | | | | 1,599,274 | | | | — | | | | 1,599,274 | |
| | | | | | | | | | | | | | | | |
TOTAL | | $ | 72,498,744 | | | $ | 494,802,622 | | | $ | 497,126 | ^ | | $ | 567,798,492 | |
| | | | | | | | | | | | | | | | |
| ^ | A reconciliation of Level 3 investments is presented when the Fund had a significant amount of Level 3 investments at the beginning and/or end of the reporting period in relation to net assets. |
See accompanying Notes to Financial Statements.
81
WORLD CORE EQUITY PORTFOLIO
SCHEDULE OF INVESTMENTS
October 31, 2022
| | | | | | | | |
| | | Shares | | | Value† | |
AFFILIATED INVESTMENT COMPANIES — (100.0%) | | | | | | | | |
Investment in U.S. Core Equity 1 Portfolio of
DFA Investment Dimensions Group, Inc. | | | 19,085,265 | | | $ | 585,917,648 | |
Investment in International Core Equity Portfolio of
DFA Investment Dimensions Group, Inc. | | | 21,323,624 | | | | 260,574,682 | |
Investment in Emerging Markets Core Equity Portfolio of
DFA Investment Dimensions Group, Inc. | | | 5,689,986 | | | | 103,159,443 | |
| | | | | | | | |
TOTAL INVESTMENTS IN AFFILIATED INVESTMENT COMPANIES
(Cost $755,679,500) | | | | | | $ | 949,651,773 | |
| | | | | | | | |
Summary of the Portfolio’s investments as of October 31, 2022, based on their valuation inputs, is as follows (see Security Valuation Note):
| | | | | | | | | | | | | | | | |
| | | Investments in Securities (Market Value) | |
| | | Level 1 | | | Level 2 | | | Level 3 | | | Total | |
Affiliated Investment Companies | | $ | 949,651,773 | | | | — | | | | — | | | $ | 949,651,773 | |
| | | | | | | | | | | | | | | | |
TOTAL | | $ | 949,651,773 | | | | — | | | | — | | | $ | 949,651,773 | |
| | | | | | | | | | | | | | | | |
See accompanying Notes to Financial Statements.
82
SELECTIVELY HEDGED GLOBAL EQUITY PORTFOLIO
SCHEDULE OF INVESTMENTS
October 31, 2022
| | | | | | | | |
| | | Shares | | | Value† | |
AFFILIATED INVESTMENT COMPANIES — (100.0%) | | | | | | | | |
Investment in U.S. Core Equity 2 Portfolio of
DFA Investment Dimensions Group, Inc. | | | 5,479,170 | | | $ | 153,471,531 | |
Investment in International Core Equity Portfolio of
DFA Investment Dimensions Group, Inc. | | | 5,713,866 | | | | 69,823,446 | |
Investment in Emerging Markets Core Equity Portfolio of
DFA Investment Dimensions Group, Inc. | | | 2,437,800 | | | | 44,197,317 | |
| | | | | | | | |
TOTAL INVESTMENTS IN AFFILIATED INVESTMENT COMPANIES
(Cost $185,731,491) | | | | | | $ | 267,492,294 | |
| | | | | | | | |
As of October 31, 2022, Selectively Hedged Global Equity Portfolio had entered into the following forward currency contracts and the net unrealized forward currency gain (loss) is reflected in the accompanying financial statements:
| | | | | | | | | | | | | | | | | | | | |
Currency Purchased | | | Currency Sold | | | Counterparty | | Settlement
Date | | | Unrealized
Foreign
Exchange
Appreciation
(Depreciation) | |
| USD | | | 9,217,982 | | | HKD | | | 72,313,000 | | | Societe Generale | | | 11/14/22 | | | $ | 3,468 | |
| USD | | | 259,057 | | | NZD | | | 433,658 | | | Citibank, N.A. | | | 11/15/22 | | | | 6,870 | |
| NZD | | | 22,030 | | | USD | | | 12,596 | | | Citibank, N.A. | | | 11/15/22 | | | | 215 | |
| SEK | | | 941,913 | | | USD | | | 83,956 | | | Citibank, N.A. | | | 11/17/22 | | | | 1,435 | |
| USD | | | 110,820 | | | SEK | | | 1,210,000 | | | Citibank, N.A. | | | 11/17/22 | | | | 1,125 | |
| USD | | | 1,754,501 | | | SEK | | | 18,850,040 | | | UBS AG | | | 11/17/22 | | | | 45,610 | |
| USD | | | 631,811 | | | SGD | | | 886,401 | | | Societe Generale | | | 12/12/22 | | | | 5,493 | |
| USD | | | 289,162 | | | CHF | | | 285,000 | | | Bank of America Corp. | | | 12/22/22 | | | | 2,795 | |
| USD | | | 248,862 | | | CAD | | | 336,000 | | | Citibank, N.A. | | | 12/22/22 | | | | 2,083 | |
| USD | | | 4,583,010 | | | CHF | | | 4,451,940 | | | State Street Bank and Trust | | | 12/22/22 | | | | 109,726 | |
| USD | | | 1,303,483 | | | DKK | | | 9,699,626 | | | State Street Bank and Trust | | | 01/03/23 | | | | 8,717 | |
| USD | | | 13,697,640 | | | JPY | | | 1,974,668,222 | | | UBS AG | | | 01/10/23 | | | | 295,436 | |
| | | | | | | | | | | | | | | | | | | | |
Total Appreciation | | | | | | | | | | | | $ | 482,973 | |
| HKD | | | 5,775,000 | | | USD | | | 735,945 | | | Societe Generale | | | 11/14/22 | | | $ | (63 | ) |
| USD | | | 4,399,343 | | | CAD | | | 6,041,449 | | | State Street Bank and Trust | | | 12/22/22 | | | | (37,871 | ) |
| USD | | | 83,474 | | | DKK | | | 626,000 | | | HSBC Bank | | | 01/03/23 | | | | (88 | ) |
| USD | | | 633,623 | | | ILS | | | 2,253,832 | | | HSBC Bank | | | 01/10/23 | | | | (8,133 | ) |
| USD | | | 619,497 | | | NOK | | | 6,527,873 | | | Bank of America Corp. | | | 01/17/23 | | | | (10,097 | ) |
| USD | | | 15,922,865 | | | EUR | | | 16,173,803 | | | State Street Bank and Trust | | | 01/18/23 | | | | (165,274 | ) |
| USD | | | 4,097,495 | | | AUD | | | 6,461,192 | | | Morgan Stanley and Co. International | | | 01/19/23 | | | | (46,399 | ) |
| USD | | | 7,930,686 | | | GBP | | | 6,992,402 | | | Citibank, N.A. | | | 01/23/23 | | | | (111,036 | ) |
| | | | | | | | | | | | | | | | | | | | |
Total (Depreciation) | | | | | | | | | | | | $ | (378,961 | ) |
| | | | | | | | | | | | | | | | | | | | |
Total Appreciation (Depreciation) | | | | | | | | | | | | $ | 104,012 | |
| | | | | | | | | | | | | | | | | | | | |
As of October 31, 2022, Selectively Hedged Global Equity Portfolio had entered into the following outstanding futures contracts:
| | | | | | | | | | | | | | | | | | | | |
Description | | Number of
Contracts | | | Expiration
Date | | | Notional
Value | | | Market
Value | | | Unrealized
Appreciation
(Depreciation) | |
Long Position Contracts: | | | | | | | | | | | | | | | | | | | | |
S&P 500® Emini Index | | | 17 | | | | 12/16/22 | | | $ | 3,432,613 | | | $ | 3,300,550 | | | $ | (132,063 | ) |
| | | | | | | | | | | | | | | | | | | | |
Total Futures Contracts | | | | | | | | | | $ | 3,432,613 | | | $ | 3,300,550 | | | $ | (132,063 | ) |
| | | | | | | | | | | | | | | | | | | | |
83
SELECTIVELY HEDGED GLOBAL EQUITY PORTFOLIO
CONTINUED
Summary of the Portfolio’s investments as of October 31, 2022, based on their valuation inputs, is as follows (see Security Valuation Note):
| | | | | | | | | | | | | | | | |
| | | Investments in Securities (Market Value) | |
| | | Level 1 | | | Level 2 | | | Level 3 | | | Total | |
Affiliated Investment Companies | | $ | 267,492,294 | | | | — | | | | — | | | $ | 267,492,294 | |
Forward Currency Contracts** | | | — | | | $ | 104,012 | | | | — | | | | 104,012 | |
Futures Contracts** | | | (132,063 | ) | | | — | | | | — | | | | (132,063 | ) |
| | | | | | | | | | | | | | | | |
TOTAL | | $ | 267,360,231 | | | $ | 104,012 | | | | — | | | $ | 267,464,243 | |
| | | | | | | | | | | | | | | | |
| ** | Valued at the unrealized appreciation/(depreciation) on the investment. |
See accompanying Notes to Financial Statements.
84
EMERGING MARKETS PORTFOLIO
SCHEDULE OF INVESTMENTS
October 31, 2022
| | | | |
| | | Value† | |
AFFILIATED INVESTMENT COMPANIES — (100.0%) | | | | |
Investment in The Emerging Markets Series of The
DFA Investment Trust Company | | $ | 3,941,855,313 | |
| | | | |
TOTAL INVESTMENTS IN AFFILIATED INVESTMENT COMPANIES | | $ | 3,941,855,313 | |
| | | | |
Summary of the Portfolio’s Master Fund’s investments as of October 31, 2022, based on their valuation inputs, is located in this report (See Security Valuation Note).
See accompanying Notes to Financial Statements.
85
EMERGING MARKETS SMALL CAP PORTFOLIO
SCHEDULE OF INVESTMENTS
October 31, 2022
| | | | |
| | | Value† | |
AFFILIATED INVESTMENT COMPANIES — (100.0%) | | | | |
Investment in The Emerging Markets Small Cap Series of
The DFA Investment Trust Company | | $ | 3,511,977,837 | |
| | | | |
TOTAL INVESTMENTS IN AFFILIATED INVESTMENT COMPANIES | | $ | 3,511,977,837 | |
| | | | |
Summary of the Portfolio’s Master Fund’s investments as of October 31, 2022, based on their valuation inputs, is located in this report (See Security Valuation Note).
See accompanying Notes to Financial Statements.
86
EMERGING MARKETS VALUE PORTFOLIO
SCHEDULE OF INVESTMENTS
October 31, 2022
| | | | |
| | | Value† | |
AFFILIATED INVESTMENT COMPANIES — (100.0%) | | | | |
Investment in Dimensional Emerging Markets Value Fund | | $ | 9,618,712,511 | |
| | | | |
TOTAL INVESTMENTS IN AFFILIATED INVESTMENT COMPANIES | | $ | 9,618,712,511 | |
| | | | |
Summary of the Portfolio’s Master Fund’s investments as of October 31, 2022, based on their valuation inputs, is located in this report (See Security Valuation Note).
See accompanying Notes to Financial Statements.
87
EMERGING MARKETS CORE EQUITY PORTFOLIO
SUMMARY SCHEDULE OF PORTFOLIO HOLDINGS
October 31, 2022
| | | | | | | | | | | | | | |
| | | | | Shares | | | Value» | | | Percentage
of Net Assets‡ | |
COMMON STOCKS — (96.6%) | | | | | | | | | | | | |
BRAZIL — (4.7%) | | | | | | | | | | | | |
| | Petroleo Brasileiro SA | | | 16,003,488 | | | $ | 103,044,432 | | | | 0.5 | % |
| | Petroleo Brasileiro SA, Sponsored ADR | | | 776,944 | | | | 8,942,625 | | | | 0.1 | % |
| | Petroleo Brasileiro SA, Sponsored ADR | | | 1,228,197 | | | | 15,745,486 | | | | 0.1 | % |
| | Vale SA | | | 12,770,281 | | | | 165,960,503 | | | | 0.8 | % |
| | Other Securities | | | | | | | 715,852,064 | | | | 3.3 | % |
| | | | | | | | | | | | | | |
TOTAL BRAZIL | | | | 1,009,545,110 | | | | 4.8 | % |
| | | | | | | | | | | | | | |
CHILE — (0.5%) | | | | | | | | | | | | |
| | Other Securities | | | | | | | 107,394,133 | | | | 0.5 | % |
| | | | | | | | | | | | | | |
CHINA — (23.9%) | | | | | | | | | | | | |
* | | Alibaba Group Holding Ltd. | | | 9,442,600 | | | | 73,415,334 | | | | 0.4 | % |
* | | Alibaba Group Holding Ltd., Sponsored ADR | | | 2,168,694 | | | | 137,885,565 | | | | 0.7 | % |
| | Bank of China Ltd., Class H | | | 204,333,702 | | | | 65,811,219 | | | | 0.3 | % |
| | China Construction Bank Corp., Class H | | | 370,130,302 | | | | 196,423,801 | | | | 1.0 | % |
| | China Merchants Bank Co. Ltd., Class H | | | 15,457,146 | | | | 50,605,146 | | | | 0.3 | % |
| | China Petroleum & Chemical Corp., Class H | | | 144,228,400 | | | | 57,161,513 | | | | 0.3 | % |
| | China Resources Land Ltd. | | | 15,028,610 | | | | 47,021,260 | | | | 0.2 | % |
| | CSPC Pharmaceutical Group Ltd. | | | 47,200,400 | | | | 48,482,432 | | | | 0.3 | % |
| | Industrial & Commercial Bank of China Ltd., Class H | | | 189,988,725 | | | | 82,486,520 | | | | 0.4 | % |
| | Lenovo Group Ltd. | | | 54,200,000 | | | | 43,317,052 | | | | 0.2 | % |
| | PetroChina Co. Ltd., Class H | | | 141,510,000 | | | | 54,131,395 | | | | 0.3 | % |
| | Ping An Insurance Group Co. of China Ltd., Class H | | | 29,572,500 | | | | 118,390,265 | | | | 0.6 | % |
| | Tencent Holdings Ltd. | | | 15,853,500 | | | | 416,578,820 | | | | 2.0 | % |
# | | Yum China Holdings, Inc. | | | 1,340,150 | | | | 55,415,202 | | | | 0.3 | % |
| | Other Securities | | | | | | | 3,637,141,287 | | | | 17.0 | % |
| | | | | | | | | | | | | | |
TOTAL CHINA | | | | 5,084,266,811 | | | | 24.3 | % |
| | | | | | | | | | | | | | |
COLOMBIA — (0.1%) | | | | | | | | | | | | |
| | Other Securities | | | | | | | 23,264,568 | | | | 0.1 | % |
| | | | | | | | | | | | | | |
CZECH REPUBLIC — (0.1%) | | | | | | | | | | | | |
| | Other Securities | | | | | | | 26,171,069 | | | | 0.1 | % |
| | | | | | | | | | | | | | |
EGYPT — (0.0%) | | | | | | | | | | | | |
| | Other Securities | | | | | | | 8,280,521 | | | | 0.1 | % |
| | | | | | | | | | | | | | |
GREECE — (0.3%) | | | | | | | | | | | | |
| | Other Securities | | | | | | | 58,707,459 | | | | 0.3 | % |
| | | | | | | | | | | | | | |
HONG KONG — (0.0%) | | | | | | | | | | | | |
| | Other Securities | | | | | | | 1,022,743 | | | | 0.0 | % |
| | | | | | | | | | | | | | |
HUNGARY — (0.1%) | | | | | | | | | | | | |
| | Other Securities | | | | | | | 27,091,905 | | | | 0.1 | % |
| | | | | | | | | | | | | | |
INDIA — (18.3%) | | | | | | | | | | | | |
* | | Adani Transmission Ltd. | | | 1,316,212 | | | | 53,352,277 | | | | 0.3 | % |
| | Axis Bank Ltd. | | | 6,691,329 | | | | 73,380,307 | | | | 0.4 | % |
| | Bharti Airtel Ltd. | | | 6,547,243 | | | | 65,844,249 | | | | 0.3 | % |
| | HCL Technologies Ltd. | | | 3,068,049 | | | | 38,529,778 | | | | 0.2 | % |
| | HDFC Bank Ltd. | | | 5,287,973 | | | | 95,917,177 | | | | 0.5 | % |
| | Housing Development Finance Corp. Ltd. | | | 2,180,150 | | | | 65,189,060 | | | | 0.3 | % |
88
EMERGING MARKETS CORE EQUITY PORTFOLIO
CONTINUED
| | | | | | | | | | | | | | |
| | | | | Shares | | | Value» | | | Percentage
of Net Assets‡ | |
INDIA — (Continued) | | | | | | | | | | | | |
# | | ICICI Bank Ltd., Sponsored ADR | | | 4,405,288 | | | $ | 97,092,548 | | | | 0.5 | % |
| | Infosys Ltd. | | | 7,880,895 | | | | 147,037,423 | | | | 0.7 | % |
# | | Infosys Ltd., Sponsored ADR | | | 3,016,528 | | | | 56,499,569 | | | | 0.3 | % |
| | ITC Ltd. | | | 9,263,717 | | | | 39,086,898 | | | | 0.2 | % |
| | Larsen & Toubro Ltd. | | | 1,777,002 | | | | 43,686,111 | | | | 0.2 | % |
| | Mahindra & Mahindra Ltd. | | | 2,550,757 | | | | 41,671,110 | | | | 0.2 | % |
| | Reliance Industries Ltd. | | | 5,435,465 | | | | 167,470,856 | | | | 0.8 | % |
| | Tata Consultancy Services Ltd. | | | 2,268,008 | | | | 87,173,506 | | | | 0.4 | % |
| | Other Securities | | | | | | | 2,825,166,968 | | | | 13.3 | % |
| | | | | | | | | | | | | | |
TOTAL INDIA | | | | 3,897,097,837 | | | | 18.6 | % |
| | | | | | | | | | | | | | |
INDONESIA — (2.4%) | | | | | | | | | | | | |
| | Bank Central Asia Tbk PT | | | 88,689,000 | | | | 50,133,884 | | | | 0.3 | % |
| | Other Securities | | | | | | | 461,099,656 | | | | 2.1 | % |
| | | | | | | | | | | | | | |
TOTAL INDONESIA | | | | 511,233,540 | | | | 2.4 | % |
| | | | | | | | | | | | | | |
MALAYSIA — (1.7%) | | | | | | | | | | | | |
| | Other Securities | | | | | | | 354,089,493 | | | | 1.7 | % |
| | | | | | | | | | | | | | |
MEXICO — (2.7%) | | | | | | | | | | | | |
# | | America Movil SAB de CV, Sponsored ADR, Class L | | | 3,735,424 | | | | 70,263,325 | | | | 0.3 | % |
# | | Grupo Financiero Banorte SAB de CV, Class O | | | 5,618,112 | | | | 45,734,881 | | | | 0.2 | % |
| | Other Securities | | | | | | | 457,703,720 | | | | 2.2 | % |
| | | | | | | | | | | | | | |
TOTAL MEXICO | | | | 573,701,926 | | | | 2.7 | % |
| | | | | | | | | | | | | | |
PERU — (0.1%) | | | | | | | | | | | | |
| | Other Securities | | | | | | | 22,996,071 | | | | 0.1 | % |
| | | | | | | | | | | | | | |
PHILIPPINES — (0.8%) | | | | | | | | | | | | |
| | Other Securities | | | | | | | 175,483,284 | | | | 0.8 | % |
| | | | | | | | | | | | | | |
POLAND — (0.7%) | | | | | | | | | | | | |
| | Other Securities | | | | | | | 145,889,285 | | | | 0.7 | % |
| | | | | | | | | | | | | | |
QATAR — (0.8%) | | | | | | | | | | | | |
| | Qatar National Bank QPSC | | | 7,622,173 | | | | 41,736,328 | | | | 0.2 | % |
| | Other Securities | | | | | | | 127,923,282 | | | | 0.6 | % |
| | | | | | | | | | | | | | |
TOTAL QATAR | | | | 169,659,610 | | | | 0.8 | % |
| | | | | | | | | | | | | | |
SAUDI ARABIA — (4.3%) | | | | | | | | | | | | |
* | | Al Rajhi Bank | | | 2,891,961 | | | | 65,577,726 | | | | 0.3 | % |
* | | Saudi Arabian Mining Co. | | | 2,208,717 | | | | 49,162,117 | | | | 0.2 | % |
| | Saudi Basic Industries Corp. | | | 1,804,653 | | | | 42,374,183 | | | | 0.2 | % |
| | Saudi Telecom Co. | | | 3,909,678 | | | | 42,004,778 | | | | 0.2 | % |
| | Other Securities | | | | | | | 716,866,692 | | | | 3.5 | % |
| | | | | | | | | | | | | | |
TOTAL SAUDI ARABIA | | | | 915,985,496 | | | | 4.4 | % |
| | | | | | | | | | | | | | |
SOUTH AFRICA — (3.9%) | | | | | | | | | | | | |
| | MTN Group Ltd. | | | 9,331,749 | | | | 65,951,691 | | | | 0.3 | % |
| | Other Securities | | | | | | | 758,242,670 | | | | 3.6 | % |
| | | | | | | | | | | | | | |
TOTAL SOUTH AFRICA | | | | 824,194,361 | | | | 3.9 | % |
| | | | | | | | | | | | | | |
89
EMERGING MARKETS CORE EQUITY PORTFOLIO
CONTINUED
| | | | | | | | | | | | | | |
| | | | | Shares | | | Value» | | | Percentage
of Net Assets‡ | |
SOUTH KOREA — (11.6%) | | | | | | | | | | | | |
| | Hyundai Motor Co. | | | 333,785 | | | $ | 38,464,869 | | | | 0.2 | % |
| | KB Financial Group, Inc. | | | 1,155,887 | | | | 38,894,509 | | | | 0.2 | % |
# | | Samsung Electronics Co. Ltd. | | | 15,458,884 | | | | 643,396,027 | | | | 3.1 | % |
# | | SK Hynix, Inc. | | | 2,150,179 | | | | 124,477,108 | | | | 0.6 | % |
| | Other Securities | | | | | | | 1,625,762,773 | | | | 7.7 | % |
| | | | | | | | | | | | | | |
TOTAL SOUTH KOREA | | | | 2,470,995,286 | | | | 11.8 | % |
| | | | | | | | | | | | | | |
TAIWAN — (15.3%) | | | | | | | | | | | | |
# | | Hon Hai Precision Industry Co. Ltd. | | | 20,491,403 | | | | 65,082,262 | | | | 0.3 | % |
| | MediaTek, Inc. | | | 3,483,823 | | | | 63,503,801 | | | | 0.3 | % |
| | Taiwan Semiconductor Manufacturing Co. Ltd. | | | 41,439,652 | | | | 498,195,913 | | | | 2.4 | % |
Sponsored ADR | | Taiwan Semiconductor Manufacturing Co. Ltd., Sponsored ADR | | | 3,502,836 | | | | 215,599,556 | | | | 1.1 | % |
# | | United Microelectronics Corp. | | | 35,252,441 | | | | 42,389,687 | | | | 0.2 | % |
| | Other Securities | | | | | | | 2,380,820,232 | | | | 11.3 | % |
| | | | | | | | | | | | | | |
TOTAL TAIWAN | | | | 3,265,591,451 | | | | 15.6 | % |
| | | | | | | | | | | | | | |
THAILAND — (2.5%) | | | | | | | | | | | | |
| | Other Securities | | | | | | | 538,182,738 | | | | 2.6 | % |
| | | | | | | | | | | | | | |
TURKEY — (0.7%) | | | | | | | | | | | | |
| | Other Securities | | | | | | | 157,024,803 | | | | 0.8 | % |
| | | | | | | | | | | | | | |
UNITED ARAB EMIRATES — (1.1%) | | | | | | | | | | | | |
| | Other Securities | | | | | | | 227,165,659 | | | | 1.1 | % |
| | | | | | | | | | | | | | |
UNITED KINGDOM — (0.0%) | | | | | | | | | | | | |
| | Other Security | | | | | | | 47,262 | | | | 0.0 | % |
| | | | | | | | | | | | | | |
UNITED STATES — (0.0%) | | | | | | | | | | | | |
| | Other Security | | | | | | | 5,482,691 | | | | 0.0 | % |
| | | | | | | | | | | | | | |
TOTAL COMMON STOCKS | | | | 20,600,565,112 | | | | 98.3 | % |
| | | | | | | | | | | | | | |
PREFERRED STOCKS — (1.4%) | | | | | | | | | | | | |
BRAZIL — (1.4%) | | | | | | | | | | | | |
| | Itau Unibanco Holding SA | | | 8,752,363 | | | | 51,509,406 | | | | 0.3 | % |
| | Petroleo Brasileiro SA | | | 22,001,222 | | | | 126,968,624 | | | | 0.6 | % |
| | Other Securities | | | | | | | 105,277,168 | | | | 0.5 | % |
| | | | | | | | | | | | | | |
TOTAL BRAZIL | | | | 283,755,198 | | | | 1.4 | % |
| | | | | | | | | | | | | | |
CHILE — (0.0%) | | | | | | | | | | | | |
| | Other Securities | | | | | | | 2,311,051 | | | | 0.0 | % |
| | | | | | | | | | | | | | |
COLOMBIA — (0.0%) | | | | | | | | | | | | |
| | Other Securities | | | | | | | 5,490,540 | | | | 0.0 | % |
| | | | | | | | | | | | | | |
PHILIPPINES — (0.0%) | | | | | | | | | | | | |
| | Other Security | | | | | | | 737,556 | | | | 0.0 | % |
| | | | | | | | | | | | | | |
SOUTH KOREA — (0.0%) | | | | | | | | | | | | |
| | Other Security | | | | | | | 156,164 | | | | 0.0 | % |
| | | | | | | | | | | | | | |
TAIWAN — (0.0%) | | | | | | | | | | | | |
| | Other Security | | | | | | | 657,263 | | | | 0.0 | % |
| | | | | | | | | | | | | | |
90
EMERGING MARKETS CORE EQUITY PORTFOLIO
CONTINUED
| | | | | | | | | | | | | | |
| | | | | Shares | | | Value» | | | Percentage
of Net Assets‡ | |
THAILAND — (0.0%) | | | | | | | | | | | | |
Other Security. | | | | | | $ | 780,921 | | | | 0.0 | % |
| | | | | | | | | | | | | | |
TOTAL PREFERRED STOCKS | | | | | | | 293,888,693 | | | | 1.4 | % |
| | | | | | | | | | | | | | |
RIGHTS/WARRANTS — (0.0%) | | | | | | | | | | | | |
BRAZIL — (0.0%) | | | | | | | | | | | | |
| | Other Securities | | | | | | | 74,716 | | | | 0.0 | % |
| | | | | | | | | | | | | | |
INDIA — (0.0%) | | | | | | | | | | | | |
| | Other Security | | | | | | | 154,070 | | | | 0.0 | % |
| | | | | | | | | | | | | | |
INDONESIA — (0.0%) | | | | | | | | | | | | |
| | Other Security | | | | | | | 8,990 | | | | 0.0 | % |
| | | | | | | | | | | | | | |
MALAYSIA — (0.0%) | | | | | | | | | | | | |
| | Other Security | | | | | | | 93,515 | | | | 0.0 | % |
| | | | | | | | | | | | | | |
SAUDI ARABIA — (0.0%) | | | | | | | | | | | | |
| | Other Security | | | | | | | 234,726 | | | | 0.0 | % |
| | | | | | | | | | | | | | |
SOUTH KOREA — (0.0%) | | | | | | | | | | | | |
| | Other Securities | | | | | | | 80,678 | | | | 0.0 | % |
| | | | | | | | | | | | | | |
TAIWAN — (0.0%) | | | | | | | | | | | | |
| | Other Securities | | | | | | | 73,176 | | | | 0.0 | % |
| | | | | | | | | | | | | | |
THAILAND — (0.0%) | | | | | | | | | | | | |
| | Other Securities | | | | | | | 9,133 | | | | 0.0 | % |
| | | | | | | | | | | | | | |
TOTAL RIGHTS/WARRANTS | | | | | | | 729,004 | | | | 0.0 | % |
| | | | | | | | | | | | | | |
TOTAL INVESTMENT SECURITIES | | | | | | | | | | | | |
| | (Cost $19,809,570,804) | | | | | | | 20,895,182,809 | | | | | |
| | | | | | | | | | | | | | |
| | | | |
| | | | | | | | Value† | | | | |
SECURITIES LENDING COLLATERAL — (2.0%) | | | | | | | | | | | | |
@§ | | The DFA Short Term Investment Fund | | | 36,710,117 | | | | 424,405,666 | | | | 2.0 | % |
| | | | | | | | | | | | | | |
TOTAL INVESTMENTS—(100.0%)
(Cost $20,234,153,262) | | | | | | $ | 21,319,588,475 | | | | 101.7 | % |
| | | | | | | | | | | | | | |
As of October 31, 2022, Emerging Markets Core Equity Portfolio had entered into the following outstanding futures contracts:
| | | | | | | | | | | | | | | | | | | | |
Description | | Number of
Contracts | | | Expiration
Date | | | Notional
Value | | | Market
Value | | | Unrealized
Appreciation
(Depreciation) | |
Long Position Contracts: | | | | | | | | | | | | | | | | | | | | |
S&P 500® Emini Index | | | 942 | | | | 12/16/22 | | | $ | 177,158,776 | | | $ | 182,889,300 | | | $ | 5,730,524 | |
| | | | | | | | | | | | | | | | | | | | |
Total Futures Contracts | | | | | | | | | | $ | 177,158,776 | | | $ | 182,889,300 | | | $ | 5,730,524 | |
| | | | | | | | | | | | | | | | | | | | |
91
EMERGING MARKETS CORE EQUITY PORTFOLIO
CONTINUED
Summary of the Portfolio’s investments as of October 31, 2022, based on their valuation inputs, is as follows (see Security Valuation Note):
| | | | | | | | | | | | | | | | |
| | | Investments in Securities (Market Value) | |
| | | Level 1 | | | Level 2 | | | Level 3 | | | Total | |
Common Stocks | | | | | | | | | | | | | | | | |
Brazil | | $ | 1,006,117,558 | | | $ | 3,427,552 | | | | — | | | $ | 1,009,545,110 | |
Chile | | | 32,172,806 | | | | 75,221,327 | | | | — | | | | 107,394,133 | |
China | | | 422,148,177 | | | | 4,646,599,282 | | | $ | 15,519,352 | | | | 5,084,266,811 | |
Colombia | | | 21,797,059 | | | | 1,467,509 | | | | — | | | | 23,264,568 | |
Czech Republic | | | — | | | | 26,171,069 | | | | — | | | | 26,171,069 | |
Egypt | | | 115,492 | | | | 8,165,029 | | | | — | | | | 8,280,521 | |
Greece | | | 280,106 | | | | 58,287,844 | | | | 139,509 | | | | 58,707,459 | |
Hong Kong | | | — | | | | 1,022,743 | | | | — | | | | 1,022,743 | |
Hungary | | | — | | | | 27,091,905 | | | | — | | | | 27,091,905 | |
India | | | 175,548,277 | | | | 3,721,536,277 | | | | 13,283 | | | | 3,897,097,837 | |
Indonesia | | | 13,080,475 | | | | 497,547,027 | | | | 606,038 | | | | 511,233,540 | |
Malaysia | | | — | | | | 354,089,343 | | | | 150 | | | | 354,089,493 | |
Mexico | | | 570,637,306 | | | | 3,041,887 | | | | 22,733 | | | | 573,701,926 | |
Peru | | | 22,995,632 | | | | — | | | | 439 | | | | 22,996,071 | |
Philippines | | | 3,665,802 | | | | 171,816,792 | | | | 690 | | | | 175,483,284 | |
Poland | | | — | | | | 145,889,285 | | | | — | | | | 145,889,285 | |
Qatar | | | — | | | | 169,659,610 | | | | — | | | | 169,659,610 | |
Saudi Arabia | | | 1,208,258 | | | | 914,762,028 | | | | 15,210 | | | | 915,985,496 | |
South Africa | | | 73,897,560 | | | | 750,296,801 | | | | — | | | | 824,194,361 | |
South Korea | | | 45,765,657 | | | | 2,423,349,654 | | | | 1,879,975 | | | | 2,470,995,286 | |
Taiwan | | | 224,060,888 | | | | 3,040,998,613 | | | | 531,950 | | | | 3,265,591,451 | |
Thailand | | | 523,565,825 | | | | 14,616,913 | | | | — | | | | 538,182,738 | |
Turkey | | | 26,011 | | | | 156,998,792 | | | | — | | | | 157,024,803 | |
United Arab Emirates | | | — | | | | 227,165,659 | | | | — | | | | 227,165,659 | |
United Kingdom | | | — | | | | 47,262 | | | | — | | | | 47,262 | |
United States | | | — | | | | 5,482,691 | | | | — | | | | 5,482,691 | |
Preferred Stocks | | | | | | | | | | | | | | | | |
Brazil | | | 283,425,480 | | | | 329,718 | | | | — | | | | 283,755,198 | |
Chile | | | — | | | | 2,311,051 | | | | — | | | | 2,311,051 | |
Colombia | | | 5,490,540 | | | | — | | | | — | | | | 5,490,540 | |
Philippines | | | — | | | | 737,556 | | | | — | | | | 737,556 | |
South Korea | | | — | | | | 156,164 | | | | — | | | | 156,164 | |
Taiwan | | | — | | | | 657,263 | | | | — | | | | 657,263 | |
Thailand | | | 780,921 | | | | — | | | | — | | | | 780,921 | |
Rights/Warrants | | | | | | | | | | | | | | | | |
Brazil | | | — | | | | 74,716 | | | | — | | | | 74,716 | |
India | | | — | | | | 154,070 | | | | — | | | | 154,070 | |
Indonesia | | | — | | | | 8,990 | | | | — | | | | 8,990 | |
Malaysia | | | — | | | | 93,515 | | | | — | | | | 93,515 | |
Saudi Arabia | | | — | | | | 234,726 | | | | — | | | | 234,726 | |
South Korea | | | — | | | | 80,678 | | | | — | | | | 80,678 | |
Taiwan | | | — | | | | 73,176 | | | | — | | | | 73,176 | |
Thailand | | | — | | | | 9,133 | | | | — | | | | 9,133 | |
Securities Lending Collateral | | | — | | | | 424,405,666 | | | | — | | | | 424,405,666 | |
Futures Contracts** | | | 5,730,524 | | | | — | | | | — | | | | 5,730,524 | |
| | | | | | | | | | | | | | | | |
TOTAL | | $ | 3,432,510,354 | | | $ | 17,874,079,316 | | | $ | 18,729,329 | ^ | | $ | 21,325,318,999 | |
| | | | | | | | | | | | | | | | |
| ** | Valued at the unrealized appreciation/(depreciation) on the investment. |
| ^ | A reconciliation of Level 3 investments is presented when the Fund had a significant amount of Level 3 investments at the beginning and/or end of the reporting period in relation to net assets. |
See accompanying Notes to Financial Statements.
92
EMERGING MARKETS TARGETED VALUE PORTFOLIO
SUMMARY SCHEDULE OF PORTFOLIO HOLDINGS
October 31, 2022
| | | | | | | | | | | | | | |
| | | | | Shares | | | Value» | | | Percentage
of Net Assets‡ | |
COMMON STOCKS — (98.7%) | | | | | | | | | | | | |
BRAZIL — (5.4%) | | | | | | | | | | | | |
| | Hypera SA | | | 51,100 | | | $ | 502,641 | | | | 0.3 | % |
| | Rumo SA | | | 176,928 | | | | 758,336 | | | | 0.4 | % |
| | Vibra Energia SA | | | 182,505 | | | | 644,800 | | | | 0.4 | % |
| | Other Securities | | | | | | | 8,434,086 | | | | 4.3 | % |
| | | | | | | | | | | | | | |
TOTAL BRAZIL | | | | | | | 10,339,863 | | | | 5.4 | % |
| | | | | | | | | | | | | | |
CHILE — (0.4%) | | | | | | | | | | | | |
| | Other Securities | | | | | | | 818,273 | | | | 0.4 | % |
| | | | | | | | | | | | | | |
CHINA — (20.9%) | | | | | | | | | | | | |
| | China National Building Material Co. Ltd., Class H | | | 788,000 | | | | 457,565 | | | | 0.3 | % |
| | Geely Automobile Holdings Ltd. | | | 865,000 | | | | 930,897 | | | | 0.5 | % |
| | Kingsoft Corp. Ltd. | | | 164,200 | | | | 497,221 | | | | 0.3 | % |
| | Shandong Weigao Group Medical Polymer Co. Ltd., Class H | | | 313,200 | | | | 431,522 | | | | 0.2 | % |
| | Sinopharm Group Co. Ltd., Class H | | | 263,200 | | | | 499,320 | | | | 0.3 | % |
* | | Trip.com Group Ltd. | | | 53,700 | | | | 1,206,226 | | | | 0.7 | % |
| | Wharf Holdings Ltd. | | | 220,000 | | | | 629,969 | | | | 0.4 | % |
| | Other Securities | | | | | | | 35,799,610 | | | | 18.6 | % |
| | | | | | | | | | | | | | |
TOTAL CHINA | | | | | | | 40,452,330 | | | | 21.3 | % |
| | | | | | | | | | | | | | |
COLOMBIA — (0.0%) | | | | | | | | | | | | |
| | Other Securities | | | | | | | 100,700 | | | | 0.1 | % |
| | | | | | | | | | | | | | |
GREECE — (0.4%) | | | | | | | | | | | | |
| | Other Securities | | | | | | | 750,795 | | | | 0.4 | % |
| | | | | | | | | | | | | | |
INDIA — (20.3%) | | | | | | | | | | | | |
* | | Adani Transmission Ltd. | | | 25,846 | | | | 1,047,660 | | | | 0.6 | % |
| | Bharat Electronics Ltd. | | | 428,979 | | | | 554,901 | | | | 0.3 | % |
| | Cholamandalam Investment & Finance Co. Ltd. | | | 54,401 | | | | 468,371 | | | | 0.3 | % |
| | Cipla Ltd. | | | 57,177 | | | | 807,122 | | | | 0.4 | % |
| | Dr Reddy’s Laboratories Ltd., ADR | | | 14,776 | | | | 802,485 | | | | 0.4 | % |
| | Federal Bank Ltd. | | | 279,886 | | | | 444,947 | | | | 0.2 | % |
| | GAIL India Ltd. | | | 419,667 | | | | 461,082 | | | | 0.3 | % |
| | Hero MotoCorp Ltd. | | | 16,291 | | | | 527,932 | | | | 0.3 | % |
| | IndusInd Bank Ltd. | | | 46,184 | | | | 638,799 | | | | 0.4 | % |
| | JSW Energy Ltd. | | | 106,314 | | | | 432,885 | | | | 0.2 | % |
| | Shriram Transport Finance Co. Ltd. | | | 33,751 | | | | 501,056 | | | | 0.3 | % |
| | Tata Consumer Products Ltd. | | | 81,284 | | | | 757,134 | | | | 0.4 | % |
| | UPL Ltd. | | | 78,979 | | | | 698,955 | | | | 0.4 | % |
| | Zee Entertainment Enterprises Ltd. | | | 155,262 | | | | 493,052 | | | | 0.3 | % |
| | Other Securities | | | | | | | 30,513,929 | | | | 15.8 | % |
| | | | | | | | | | | | | | |
TOTAL INDIA | | | | | | | 39,150,310 | | | | 20.6 | % |
| | | | | | | | | | | | | | |
INDONESIA — (2.5%) | | | | | | | | | | | | |
| | Other Securities | | | | | | | 4,790,159 | | | | 2.5 | % |
| | | | | | | | | | | | | | |
MALAYSIA — (1.8%) | | | | | | | | | | | | |
| | Other Securities | | | | | | | 3,504,747 | | | | 1.9 | % |
| | | | | | | | | | | | | | |
MEXICO — (2.2%) | | | | | | | | | | | | |
| | Other Securities | | | | | | | 4,251,029 | | | | 2.2 | % |
| | | | | | | | | | | | | | |
93
EMERGING MARKETS TARGETED VALUE PORTFOLIO
CONTINUED
| | | | | | | | | | | | | | |
| | | | | | | | | | | Percentage | |
| | | | | Shares | | | Value» | | | of Net Assets‡ | |
PHILIPPINES — (0.7%) | | | | | | | | | | | | |
| | Other Securities | | | | | | $ | 1,385,004 | | | | 0.7 | % |
| | | | | | | | | | | | | | |
POLAND — (0.6%) | | | | | | | | | | | | |
| | Other Securities | | | | | | | 1,202,377 | | | | 0.6 | % |
| | | | | | | | | | | | | | |
QATAR — (1.1%) | | | | | | | | | | | | |
| | Other Securities | | | | | | | 2,194,062 | | | | 1.2 | % |
| | | | | | | | | | | | | | |
SAUDI ARABIA — (4.5%) | | | | | | | | | | | | |
| | Arab National Bank | | | 107,826 | | | | 925,879 | | | | 0.5 | % |
| | Bank Al-Jazira | | | 85,886 | | | | 534,358 | | | | 0.3 | % |
| | Etihad Etisalat Co. | | | 69,362 | | | | 675,279 | | | | 0.4 | % |
| | Sahara International Petrochemical Co. | | | 54,473 | | | | 586,449 | | | | 0.3 | % |
| | Saudi Investment Bank | | | 98,381 | | | | 474,588 | | | | 0.3 | % |
* | | Saudi Kayan Petrochemical Co. | | | 156,893 | | | | 549,596 | | | | 0.3 | % |
| | Yanbu National Petrochemical Co. | | | 41,887 | | | | 498,033 | | | | 0.3 | % |
| | Other Securities | | | | | | | 4,456,664 | | | | 2.2 | % |
| | | | | | | | | | | | | | |
TOTAL SAUDI ARABIA | | | | | | | 8,700,846 | | | | 4.6 | % |
| | | | | | | | | | | | | | |
SOUTH AFRICA — (3.7%) | | | | | | | | | | | | |
| | Aspen Pharmacare Holdings Ltd. | | | 60,599 | | | | 498,483 | | | | 0.3 | % |
| | Nedbank Group Ltd. | | | 62,252 | | | | 736,989 | | | | 0.4 | % |
| | Other Securities | | | | | | | 5,820,377 | | | | 3.0 | % |
TOTAL SOUTH AFRICA | | | | | | | 7,055,849 | | | | 3.7 | % |
SOUTH KOREA — (11.3%) | | | | | | | | | | | | |
* | | Hanwha Solutions Corp. | | | 16,504 | | | | 545,435 | | | | 0.3 | % |
| | Other Securities | | | | | | | 21,247,101 | | | | 11.2 | % |
| | | | | | | | | | | | | | |
TOTAL SOUTH KOREA | | | | | | | 21,792,536 | | | | 11.5 | % |
| | | | | | | | | | | | | | |
TAIWAN — (17.6%) | | | | | | | | | | | | |
| | Asia Cement Corp. | | | 410,000 | | | | 474,077 | | | | 0.3 | % |
| | AUO Corp. | | | 1,236,000 | | | | 645,051 | | | | 0.4 | % |
| | Catcher Technology Co. Ltd. | | | 107,000 | | | | 562,078 | | | | 0.3 | % |
# | | Compal Electronics, Inc. | | | 784,000 | | | | 512,790 | | | | 0.3 | % |
| | Far Eastern New Century Corp. | | | 561,000 | | | | 559,153 | | | | 0.3 | % |
| | Innolux Corp. | | | 1,648,005 | | | | 604,376 | | | | 0.3 | % |
| | Lite-On Technology Corp. | | | 265,000 | | | | 524,761 | | | | 0.3 | % |
| | Pegatron Corp. | | | 360,000 | | | | 658,108 | | | | 0.4 | % |
| | Shanghai Commercial & Savings Bank Ltd. | | | 302,000 | | | | 434,670 | | | | 0.2 | % |
| | Shin Kong Financial Holding Co. Ltd. | | | 2,347,698 | | | | 582,046 | | | | 0.3 | % |
| | SinoPac Financial Holdings Co. Ltd. | | | 1,557,420 | | | | 777,082 | | | | 0.4 | % |
| | Taishin Financial Holding Co. Ltd. | | | 1,726,532 | | | | 708,556 | | | | 0.4 | % |
| | Walsin Lihwa Corp. | | | 437,607 | | | | 484,068 | | | | 0.3 | % |
| | Yageo Corp. | | | 54,122 | | | | 613,581 | | | | 0.3 | % |
| | Other Securities | | | | | | | 25,795,665 | | | | 13.4 | % |
| | | | | | | | | | | | | | |
TOTAL TAIWAN | | | | | | | 33,936,062 | | | | 17.9 | % |
| | | | | | | | | | | | | | |
THAILAND — (2.3%) | | | | | | | | | | | | |
| | Other Securities | | | | | | | 4,403,992 | | | | 2.3 | % |
| | | | | | | | | | | | | | |
TURKEY — (1.0%) | | | | | | | | | | | | |
| | Other Securities | | | | | | | 1,895,539 | | | | 1.0 | % |
| | | | | | | | | | | | | | |
94
EMERGING MARKETS TARGETED VALUE PORTFOLIO
CONTINUED
| | | | | | | | | | | | | | |
| | | | | | | | | | | Percentage | |
| | | | | Shares | | | Value» | | | of Net Assets‡ | |
UNITED ARAB EMIRATES — (2.0%) | | | | | | | | | | | | |
| | Aldar Properties PJSC | | | 631,225 | | | $ | 742,492 | | | | 0.4 | % |
| | Emaar Properties PJSC | | | 777,690 | | | | 1,283,775 | | | | 0.7 | % |
| | Other Securities | | | | | | | 1,777,186 | | | | 0.9 | % |
| | | | | | | | | | | | | | |
TOTAL UNITED ARAB EMIRATES | | | | | | | 3,803,453 | | | | 2.0 | % |
| | | | | | | | | | | | | | |
TOTAL COMMON STOCKS | | | | | | | 190,527,926 | | | | 100.3 | % |
| | | | | | | | | | | | | | |
PREFERRED STOCKS — (0.4%) | | | | | | | | | | | | |
BRAZIL — (0.4%) | | | | | | | | | | | | |
| | Other Securities | | | | | | | 785,297 | | | | 0.4 | % |
| | | | | | | | | | | | | | |
PHILIPPINES — (0.0%) | | | | | | | | | | | | |
| | Other Security | | | | | | | 13,120 | | | | 0.0 | % |
| | | | | | | | | | | | | | |
THAILAND — (0.0%) | | | | | | | | | | | | |
| | Other Security | | | | | | | 85,386 | | | | 0.1 | % |
| | | | | | | | | | | | | | |
TOTAL PREFERRED STOCKS | | | | | | | 883,803 | | | | 0.5 | % |
| | | | | | | | | | | | | | |
RIGHTS/WARRANTS — (0.0%) | | | | | | | | | | | | |
INDONESIA — (0.0%) | | | | | | | | | | | | |
| | Other Security | | | | | | | 233 | | | | 0.0 | % |
| | | | | | | | | | | | | | |
MALAYSIA — (0.0%) | | | | | | | | | | | | |
| | Other Security | | | | | | | 2,374 | | | | 0.0 | % |
| | | | | | | | | | | | | | |
SOUTH KOREA — (0.0%) | | | | | | | | | | | | |
| | Other Securities | | | | | | | 1,778 | | | | 0.0 | % |
| | | | | | | | | | | | | | |
TAIWAN — (0.0%) | | | | | | | | | | | | |
| | Other Securities | | | | | | | 9,210 | | | | 0.0 | % |
| | | | | | | | | | | | | | |
TOTAL RIGHTS/WARRANTS | | | | | | | 13,595 | | | | 0.0 | % |
| | | | | | | | | | | | | | |
TOTAL INVESTMENT SECURITIES
(Cost $204,323,991) | | | | | | | 191,425,324 | | | | | |
| | | | | | | | | | | | | | |
| | | |
| | | | | | Value† | | | | |
SECURITIES LENDING COLLATERAL — (0.9%) | | | | | | | | | | | | |
@§ | | The DFA Short Term Investment Fund | | | 144,101 | | | | 1,665,954 | | | | 0.9 | % |
| | | | | | | | | | | | | | |
TOTAL INVESTMENTS—(100.0%)
(Cost $205,990,546) | | | | | | $ | 193,091,278 | | | | 101.7 | % |
| | | | | | | | | | | | | | |
Summary of the Portfolio’s investments as of October 31, 2022, based on their valuation inputs, is as follows (see Security Valuation Note):
| | | | | | | | | | | | | | | | |
| | | Investments in Securities (Market Value) | |
| | | Level 1 | | | Level 2 | | | Level 3 | | | Total | |
Common Stocks | | | | | | | | | | | | | | | | |
Brazil | | $ | 10,267,333 | | | $ | 72,530 | | | | — | | | $ | 10,339,863 | |
Chile | | | — | | | | 818,273 | | | | — | | | | 818,273 | |
China | | | 1,842,332 | | | | 38,335,145 | | | $ | 274,853 | | | | 40,452,330 | |
Colombia | | | 100,700 | | | | — | | | | — | | | | 100,700 | |
Greece | | | 1,241 | | | | 749,554 | | | | — | | | | 750,795 | |
95
EMERGING MARKETS TARGETED VALUE PORTFOLIO
CONTINUED
| | | | | | | | | | | | | | | | |
| | | Investments in Securities (Market Value) | |
| | | Level 1 | | | Level 2 | | | Level 3 | | | Total | |
India | | $ | 967,941 | | | $ | 38,182,369 | | | | — | | | $ | 39,150,310 | |
Indonesia | | | — | | | | 4,783,535 | | | $ | 6,624 | | | | 4,790,159 | |
Malaysia | | | — | | | | 3,504,747 | | | | — | | | | 3,504,747 | |
Mexico | | | 3,954,965 | | | | 296,064 | | | | — | | | | 4,251,029 | |
Philippines | | | — | | | | 1,385,004 | | | | — | | | | 1,385,004 | |
Poland | | | — | | | | 1,202,377 | | | | — | | | | 1,202,377 | |
Qatar | | | — | | | | 2,194,062 | | | | — | | | | 2,194,062 | |
Saudi Arabia | | | 17,844 | | | | 8,683,002 | | | | — | | | | 8,700,846 | |
South Africa | | | 231,595 | | | | 6,824,254 | | | | — | | | | 7,055,849 | |
South Korea | | | — | | | | 21,760,523 | | | | 32,013 | | | | 21,792,536 | |
Taiwan | | | 19,960 | | | | 33,901,463 | | | | 14,639 | | | | 33,936,062 | |
Thailand | | | 4,337,608 | | | | 66,384 | | | | — | | | | 4,403,992 | |
Turkey | | | — | | | | 1,895,539 | | | | — | | | | 1,895,539 | |
United Arab Emirates | | | — | | | | 3,793,994 | | | | 9,459 | | | | 3,803,453 | |
Preferred Stocks | | | | | | | | | | | | | | | | |
Brazil | | | 785,297 | | | | — | | | | — | | | | 785,297 | |
Philippines | | | — | | | | 13,120 | | | | — | | | | 13,120 | |
Thailand | | | 85,386 | | | | — | | | | — | | | | 85,386 | |
Rights/Warrants | | | | | | | | | | | | | | | | |
Indonesia | | | — | | | | 233 | | | | — | | | | 233 | |
Malaysia | | | — | | | | 2,374 | | | | — | | | | 2,374 | |
South Korea | | | — | | | | 1,778 | | | | — | | | | 1,778 | |
Taiwan | | | — | | | | 9,210 | | | | — | | | | 9,210 | |
Securities Lending Collateral | | | — | | | | 1,665,954 | | | | — | | | | 1,665,954 | |
| | | | | | | | | | | | | | | | |
TOTAL | | $ | 22,612,202 | | | $ | 170,141,488 | | | $ | 337,588 | ^ | | $ | 193,091,278 | |
| | | | | | | | | | | | | | | | |
| ^ | A reconciliation of Level 3 investments is presented when the Fund had a significant amount of Level 3 investments at the beginning and/or end of the reporting period in relation to net assets. |
See accompanying Notes to Financial Statements.
96
EMERGING MARKETS EX CHINA CORE EQUITY PORTFOLIO
SUMMARY SCHEDULE OF PORTFOLIO HOLDINGS
October 31, 2022
| | | | | | | | | | | | | | |
| | | | | | | | | | | Percentage | |
| | | | | Shares | | | Value» | | | of Net Assets‡ | |
COMMON STOCKS — (97.0%) | | | | | | | | | | | | |
BRAZIL — (6.8%) | | | | | | | | | | | | |
| | Petroleo Brasileiro SA | | | 322,824 | | | $ | 2,078,623 | | | | 0.5 | % |
| | Petroleo Brasileiro SA, Sponsored ADR | | | 116,653 | | | | 1,342,676 | | | | 0.3 | % |
| | Petroleo Brasileiro SA, Sponsored ADR | | | 83,286 | | | | 1,067,727 | | | | 0.3 | % |
# | | Vale SA, Sponsored ADR | | | 258,814 | | | | 3,349,053 | | | | 0.8 | % |
| | Other Securities | | | | | | | 21,327,422 | | | | 5.0 | % |
| | | | | | | | | | | | | | |
TOTAL BRAZIL | | | | | | | 29,165,501 | | | | 6.9 | % |
| | | | | | | | | | | | | | |
CHILE — (0.7%) | | | | | | | | | | | | |
| | Other Securities | | | | | | | 2,899,353 | | | | 0.7 | % |
| | | | | | | | | | | | | | |
COLOMBIA — (0.2%) | | | | | | | | | | | | |
| | Other Securities | | | | | | | 670,002 | | | | 0.2 | % |
| | | | | | | | | | | | | | |
CZECH REPUBLIC — (0.1%) | | | | | | | | | | | | |
| | Other Securities | | | | | | | 585,166 | | | | 0.1 | % |
| | | | | | | | | | | | | | |
EGYPT — (0.0%) | | | | | | | | | | | | |
| | Other Security | | | | | | | 126,476 | | | | 0.0 | % |
| | | | | | | | | | | | | | |
GREECE — (0.4%) | | | | | | | | | | | | |
| | Other Securities | | | | | | | 1,742,300 | | | | 0.4 | % |
| | | | | | | | | | | | | | |
HUNGARY — (0.2%) | | | | | | | | | | | | |
| | Other Securities | | | | | | | 785,146 | | | | 0.2 | % |
| | | | | | | | | | | | | | |
INDIA — (24.2%) | | | | | | | | | | | | |
| | Axis Bank Ltd. | | | 191,239 | | | | 2,097,218 | | | | 0.5 | % |
| | Bajaj Finance Ltd. | | | 13,464 | | | | 1,164,138 | | | | 0.3 | % |
| | Bharti Airtel Ltd. | | | 211,484 | | | | 2,126,850 | | | | 0.5 | % |
| | HCL Technologies Ltd. | | | 83,557 | | | | 1,049,342 | | | | 0.3 | % |
| | HDFC Bank Ltd. | | | 133,718 | | | | 2,425,476 | | | | 0.6 | % |
| | Housing Development Finance Corp. Ltd. | | | 66,733 | | | | 1,995,396 | | | | 0.5 | % |
| | ICICI Bank Ltd., Sponsored ADR | | | 119,069 | | | | 2,624,281 | | | | 0.6 | % |
| | Infosys Ltd. | | | 240,612 | | | | 4,489,207 | | | | 1.1 | % |
| | Infosys Ltd., Sponsored ADR | | | 66,993 | | | | 1,254,779 | | | | 0.3 | % |
| | ITC Ltd. | | | 254,201 | | | | 1,072,564 | | | | 0.3 | % |
| | Kotak Mahindra Bank Ltd. | | | 41,798 | | | | 962,200 | | | | 0.2 | % |
| | Larsen & Toubro Ltd. | | | 58,735 | | | | 1,443,951 | | | | 0.4 | % |
| | Mahindra & Mahindra Ltd. | | | 60,182 | | | | 983,179 | | | | 0.2 | % |
| | Reliance Industries Ltd. | | | 45,741 | | | | 1,409,315 | | | | 0.3 | % |
W | | Reliance Industries Ltd., GDR | | | 38,821 | | | | 2,370,022 | | | | 0.6 | % |
| | Tata Consultancy Services Ltd. | | | 51,433 | | | | 1,976,887 | | | | 0.5 | % |
| | Tata Steel Ltd. | | | 838,000 | | | | 1,023,263 | | | | 0.3 | % |
| | Titan Co. Ltd. | | | 28,688 | | | | 958,476 | | | | 0.2 | % |
| | Other Securities | | | | | | | 72,922,110 | | | | 16.9 | % |
| | | | | | | | | | | | | | |
TOTAL INDIA | | | | | | | 104,348,654 | | | | 24.6 | % |
| | | | | | | | | | | | | | |
INDONESIA — (3.3%) | | | | | | | | | | | | |
| | Bank Central Asia Tbk PT | | | 1,991,500 | | | | 1,125,750 | | | | 0.3 | % |
| | Bank Mandiri Persero Tbk PT | | | 1,802,300 | | | | 1,217,549 | | | | 0.3 | % |
| | Other Securities | | | | | | | 11,833,856 | | | | 2.7 | % |
| | | | | | | | | | | | | | |
TOTAL INDONESIA | | | | | | | 14,177,155 | | | | 3.3 | % |
| | | | | | | | | | | | | | |
97
EMERGING MARKETSEX CHINA CORE EQUITY PORTFOLIO
CONTINUED
| | | | | | | | | | | | | | |
| | | | | | | | | | | Percentage | |
| | | | | Shares | | | Value» | | | of Net Assets‡ | |
MALAYSIA — (2.1%) | | | | | | | | | | | | |
| | Other Securities | | | | | | $ | 8,961,785 | | | | 2.1 | % |
| | | | | | | | | | | | | | |
MEXICO — (2.8%) | | | | | | | | | | | | |
| | America Movil SAB de CV, Sponsored ADR, Class L | | | 104,835 | | | | 1,971,946 | | | | 0.5 | % |
| | Grupo Financiero Banorte SAB de CV, Class O | | | 162,996 | | | | 1,326,888 | | | | 0.3 | % |
| | Other Securities | | | | | | | 8,962,693 | | | | 2.1 | % |
| | | | | | | | | | | | | | |
TOTAL MEXICO | | | | | | | 12,261,527 | | | | 2.9 | % |
| | | | | | | | | | | | | | |
PERU — (0.1%) | | | | | | | | | | | | |
| | Other Securities | | | | | | | 237,093 | | | | 0.1 | % |
| | | | | | | | | | | | | | |
PHILIPPINES — (1.0%) | | | | | | | | | | | | |
| | Other Securities | | | | | | | 4,112,812 | | | | 1.0 | % |
| | | | | | | | | | | | | | |
POLAND — (0.8%) | | | | | | | | | | | | |
| | Other Securities | | | | | | | 3,537,189 | | | | 0.8 | % |
| | | | | | | | | | | | | | |
QATAR — (1.6%) | | | | | | | | | | | | |
| | Qatar National Bank QPSC | | | 329,993 | | | | 1,806,925 | | | | 0.4 | % |
| | Other Securities | | | | | | | 5,216,024 | | | | 1.3 | % |
| | | | | | | | | | | | | | |
TOTAL QATAR. | | | | | | | 7,022,949 | | | | 1.7 | % |
| | | | | | | | | | | | | | |
SAUDI ARABIA — (5.9%) | | | | | | | | | | | | |
* | | Al Rajhi Bank | | | 89,608 | | | | 2,031,939 | | | | 0.5 | % |
* | | Saudi Arabian Mining Co. | | | 68,181 | | | | 1,517,588 | | | | 0.4 | % |
W | | Saudi Arabian Oil Co. | | | 133,379 | | | | 1,237,826 | | | | 0.3 | % |
| | Saudi Basic Industries Corp. | | | 69,634 | | | | 1,635,042 | | | | 0.4 | % |
| | Saudi Telecom Co. | | | 127,633 | | | | 1,371,263 | | | | 0.3 | % |
| | Other Securities | | | | | | | 17,744,710 | | | | 4.1 | % |
| | | | | | | | | | | | | | |
TOTAL SAUDI ARABIA | | | | | | | 25,538,368 | | | | 6.0 | % |
| | | | | | | | | | | | | | |
SOUTH AFRICA — (4.6%) | | | | | | | | | | | | |
| | Sasol Ltd. | | | 59,057 | | | | 992,751 | | | | 0.2 | % |
| | Other Securities | | | | | | | 18,745,655 | | | | 4.4 | % |
| | | | | | | | | | | | | | |
TOTAL SOUTH AFRICA | | | | | | | 19,738,406 | | | | 4.6 | % |
| | | | | | | | | | | | | | |
SOUTH KOREA — (15.2%) | | | | | | | | | | | | |
| | Hyundai Motor Co. | | | 10,521 | | | | 1,212,424 | | | | 0.3 | % |
| | KB Financial Group, Inc. | | | 29,343 | | | | 987,365 | | | | 0.3 | % |
| | Kia Corp. | | | 26,819 | | | | 1,246,300 | | | | 0.3 | % |
| | POSCO Holdings, Inc. | | | 7,405 | | | | 1,290,623 | | | | 0.3 | % |
| | Samsung Electronics Co. Ltd. | | | 262,210 | | | | 10,913,134 | | | | 2.6 | % |
| | Samsung Electronics Co. Ltd., GDR | | | 5,450 | | | | 5,632,575 | | | | 1.4 | % |
| | Shinhan Financial Group Co. Ltd. | | | 46,251 | | | | 1,175,541 | | | | 0.3 | % |
| | SK Hynix, Inc. | | | 60,505 | | | | 3,502,726 | | | | 0.8 | % |
| | Other Securities | | | | | | | 39,357,126 | | | | 9.1 | % |
| | | | | | | | | | | | | | |
TOTAL SOUTH KOREA | | | | | | | 65,317,814 | | | | 15.4 | % |
| | | | | | | | | | | | | | |
TAIWAN — (20.4%) | | | | | | | | | | | | |
| | ASE Technology Holding Co. Ltd. | | | 391,000 | | | | 965,437 | | | | 0.2 | % |
| | CTBC Financial Holding Co. Ltd. | | | 1,750,000 | | | | 1,105,539 | | | | 0.3 | % |
| | Hon Hai Precision Industry Co. Ltd. | | | 485,000 | | | | 1,540,397 | | | | 0.4 | % |
| | MediaTek, Inc. | | | 122,000 | | | | 2,223,840 | | | | 0.5 | % |
| | Taiwan Semiconductor Manufacturing Co. Ltd. | | | 1,544,000 | | | | 18,562,282 | | | | 4.4 | % |
98
EMERGING MARKETSEX CHINA CORE EQUITY PORTFOLIO
CONTINUED
| | | | | | | | | | | | | | |
| | | | | | | | | | | Percentage | |
| | | | | Shares | | | Value» | | | of Net Assets‡ | |
TAIWAN — (Continued) | | | | | | | | | | | | |
| | Other Securities | | | | | | $ | 63,673,583 | | | | 14.9 | % |
| | | | | | | | | | | | | | |
TOTAL TAIWAN | | | | | | | 88,071,078 | | | | 20.7 | % |
| | | | | | | | | | | | | | |
THAILAND — (3.3%) | | | | | | | | | | | | |
| | PTT PCL | | | 1,000,500 | | | | 946,348 | | | | 0.2 | % |
| | Other Securities | | | | | | | 13,291,591 | | | | 3.2 | % |
| | | | | | | | | | | | | | |
TOTAL THAILAND | | | | | | | 14,237,939 | | | | 3.4 | % |
| | | | | | | | | | | | | | |
TURKEY — (1.4%) | | | | | | | | | | | | |
| | Other Securities | | | | | | | 5,854,911 | | | | 1.4 | % |
| | | | | | | | | | | | | | |
UNITED ARAB EMIRATES — (1.9%) | | | | | | | | | | | | |
| | Emirates Telecommunications Group Co. PJSC | | | 193,788 | | | | 1,361,953 | | | | 0.3 | % |
| | | | | | | | | | | | | | |
| | Other Securities | | | | | | | 6,750,905 | | | | 1.6 | % |
| | | | | | | | | | | | | | |
TOTAL UNITED ARAB EMIRATES | | | | | | | 8,112,858 | | | | 1.9 | % |
| | | | | | | | | | | | | | |
TOTAL COMMON STOCKS | | | | | | | 417,504,482 | | | | 98.4 | % |
| | | | | | | | | | | | | | |
PREFERRED STOCKS — (1.5%) | | | | | | | | | | | | |
BRAZIL — (1.5%) | | | | | | | | | | | | |
| | Itau Unibanco Holding SA | | | 229,500 | | | | 1,350,653 | | | | 0.3 | % |
| | Petroleo Brasileiro SA | | | 393,214 | | | | 2,269,230 | | | | 0.6 | % |
| | Other Securities | | | | | | | 2,618,132 | | | | 0.6 | % |
| | | | | | | | | | | | | | |
TOTAL BRAZIL | | | | | | | 6,238,015 | | | | 1.5 | % |
| | | | | | | | | | | | | | |
CHILE — (0.0%) | | | | | | | | | | | | |
| | Other Securities | | | | | | | 160,446 | | | | 0.0 | % |
| | | | | | | | | | | | | | |
COLOMBIA — (0.0%) | | | | | | | | | | | | |
| | Other Securities | | | | | | | 50,643 | | | | 0.0 | % |
| | | | | | | | | | | | | | |
TOTAL PREFERRED STOCKS. | | | | | | | 6,449,104 | | | | 1.5 | % |
| | | | | | | | | | | | | | |
RIGHTS/WARRANTS — (0.0%) | | | | | | | | | | | | |
BRAZIL — (0.0%) | | | | | | | | | | | | |
| | Other Securities | | | | | | | 1,566 | | | | 0.0 | % |
| | | | | | | | | | | | | | |
INDIA — (0.0%) | | | | | | | | | | | | |
| | Other Security | | | | | | | 3,126 | | | | 0.0 | % |
| | | | | | | | | | | | | | |
INDONESIA — (0.0%) | | | | | | | | | | | | |
| | Other Security | | | | | | | 179 | | | | 0.0 | % |
| | | | | | | | | | | | | | |
MALAYSIA — (0.0%) | | | | | | | | | | | | |
| | Other Security | | | | | | | 1,996 | | | | 0.0 | % |
| | | | | | | | | | | | | | |
SAUDI ARABIA — (0.0%) | | | | | | | | | | | | |
| | Other Security | | | | | | | 5,664 | | | | 0.0 | % |
| | | | | | | | | | | | | | |
SOUTH KOREA — (0.0%) | | | | | | | | | | | | |
| | Other Securities | | | | | | | 4,477 | | | | 0.0 | % |
| | | | | | | | | | | | | | |
99
EMERGING MARKETSEX CHINA CORE EQUITY PORTFOLIO
CONTINUED
| | | | | | | | | | | | | | |
| | | | | | | | | | | Percentage | |
| | | | | Shares | | | Value» | | | of Net Assets‡ | |
TAIWAN — (0.0%) | | | | | | | | | | | | |
| | Other Securities | | | | | | $ | 5,466 | | | | 0.0 | % |
| | | | | | | | | | | | | | |
TOTAL RIGHTS/WARRANTS | | | | | | | 22,474 | | | | 0.0 | % |
| | | | | | | | | | | | | | |
TOTAL INVESTMENT SECURITIES
(Cost $500,395,215) | | | | | | | 423,976,060 | | | | | |
| | | | | | | | | | | | | | |
| | | | |
| | | | | | | | Value† | | | | |
SECURITIES LENDING COLLATERAL — (1.5%) | | | | | | | | | | | | |
@§ | | The DFA Short Term Investment Fund | | | 574,173 | | | | 6,638,018 | | | | 1.6 | % |
| | | | | | | | | | | | | | |
TOTAL INVESTMENTS—(100.0%)
(Cost $507,035,752) | | | | | | $ | 430,614,078 | | | | 101.5 | % |
| | | | | | | | | | | | | | |
Summary of the Portfolio’s investments as of October 31, 2022, based on their valuation inputs, is as follows (see Security Valuation Note):
| | | | | | | | | | | | | | | | |
| | | Investments in Securities (Market Value) | |
| | | Level 1 | | | Level 2 | | | Level 3 | | | Total | |
Common Stocks | | | | | | | | | | | | | | | | |
Brazil | | $ | 29,003,617 | | | $ | 161,884 | | | | — | | | $ | 29,165,501 | |
Chile | | | 1,017,344 | | | | 1,882,009 | | | | — | | | | 2,899,353 | |
Colombia | | | 654,172 | | | | 15,830 | | | | — | | | | 670,002 | |
Czech Republic | | | — | | | | 585,166 | | | | — | | | | 585,166 | |
Egypt | | | 126,476 | | | | — | | | | — | | | | 126,476 | |
Greece | | | 1,253 | | | | 1,741,047 | | | | — | | | | 1,742,300 | |
Hungary | | | — | | | | 785,146 | | | | — | | | | 785,146 | |
India | | | 9,276,266 | | | | 95,072,388 | | | | — | | | | 104,348,654 | |
Indonesia | | | 107,496 | | | | 14,066,877 | | | $ | 2,782 | | | | 14,177,155 | |
Malaysia | | | — | | | | 8,961,785 | | | | — | | | | 8,961,785 | |
Mexico | | | 12,261,527 | | | | — | | | | — | | | | 12,261,527 | |
Peru | | | 237,093 | | | | — | | | | — | | | | 237,093 | |
Philippines | | | 120,730 | | | | 3,992,082 | | | | — | | | | 4,112,812 | |
Poland | | | — | | | | 3,537,189 | | | | — | | | | 3,537,189 | |
Qatar | | | — | | | | 7,022,949 | | | | — | | | | 7,022,949 | |
Saudi Arabia | | | 24,185 | | | | 25,514,183 | | | | — | | | | 25,538,368 | |
South Africa | | | 2,040,160 | | | | 17,698,246 | | | | — | | | | 19,738,406 | |
South Korea | | | 6,281,726 | | | | 58,994,492 | | | | 41,596 | | | | 65,317,814 | |
Taiwan | | | 810,599 | | | | 87,260,479 | | | | — | | | | 88,071,078 | |
Thailand | | | 13,768,163 | | | | 469,776 | | | | — | | | | 14,237,939 | |
Turkey | | | — | | | | 5,854,911 | | | | — | | | | 5,854,911 | |
United Arab Emirates | | | — | | | | 8,112,858 | | | | — | | | | 8,112,858 | |
Preferred Stocks | | | | | | | | | | | | | | | | |
Brazil | | | 6,219,649 | | | | 18,366 | | | | — | | | | 6,238,015 | |
Chile | | | — | | | | 160,446 | | | | — | | | | 160,446 | |
Colombia | | | 50,643 | | | | — | | | | — | | | | 50,643 | |
Rights/Warrants | | | | | | | | | | | | | | | | |
Brazil | | | — | | | | 1,566 | | | | — | | | | 1,566 | |
India | | | — | | | | 3,126 | | | | — | | | | 3,126 | |
Indonesia | | | — | | | | 179 | | | | — | | | | 179 | |
Malaysia | | | — | | | | 1,996 | | | | — | | | | 1,996 | |
Saudi Arabia | | | — | | | | 5,664 | | | | — | | | | 5,664 | |
South Korea | | | — | | | | 4,477 | | | | — | | | | 4,477 | |
100
EMERGING MARKETSEX CHINA CORE EQUITY PORTFOLIO
CONTINUED
| | | | | | | | | | | | | | | | |
| | | Investments in Securities (Market Value) | |
| | | Level 1 | | | Level 2 | | | Level 3 | | | Total | |
Taiwan | | | — | | | $ | 5,466 | | | | — | | | $ | 5,466 | |
Securities Lending Collateral | | | — | | | | 6,638,018 | | | | — | | | | 6,638,018 | |
| | | | | | | | | | | | | | | | |
TOTAL | | $ | 82,001,099 | | | $ | 348,568,601 | | | $ | 44,378 | ^ | | $ | 430,614,078 | |
| | | | | | | | | | | | | | | | |
| ^ | A reconciliation of Level 3 investments is presented when the Fund had a significant amount of Level 3 investments at the beginning and/or end of the reporting period in relation to net assets. |
See accompanying Notes to Financial Statements.
101
DFA INVESTMENT DIMENSIONS GROUP INC.
STATEMENTS OF ASSETS AND LIABILITIES
OCTOBER 31, 2022
(Amounts in thousands, except share and per share amounts)
| | | | | | | | | | | | | | | | |
| | | Large Cap
International
Portfolio* | | | International
Core Equity
Portfolio* | | | Global Small
Company
Portfolio | | | International
Small
Company
Portfolio | |
ASSETS: | | | | | | | | | | | | | | | | |
Investments in Affiliated Investment Companies at Value | | | — | | | | — | | | $ | 82,880 | | | $ | 9,250,230 | |
Investment Securities at Value (including $271,051, $1,674,248, $0 and $0 of securities on loan, respectively) | | $ | 4,736,653 | | | $ | 25,829,542 | | | | — | | | | — | |
Temporary Cash Investments at Value & Cost | | | — | | | | — | | | | — | | | | 60,674 | |
Collateral from Securities on Loan Invested in Affiliate at Value (including cost of $246,175, $1,477,224, $0 and $0, respectively) | | | 246,081 | | | | 1,476,616 | | | | — | | | | — | |
Segregated Cash for Futures Contracts | | | 2,630 | | | | 12,540 | | | | — | | | | 2,820 | |
Foreign Currencies at Value | | | 34,338 | | | | 194,770 | | | | — | | | | — | |
Cash | | | 5,714 | | | | 58,431 | | | | 51 | | | | — | |
Receivables: | | | | | | | | | | | | | | | | |
Investment Securities Sold | | | 22,789 | | | | 115,742 | | | | — | | | | — | |
Dividends, Interest and Tax Reclaims | | | 22,495 | | | | 124,940 | | | | — | | | | 172 | |
Securities Lending Income | | | 208 | | | | 1,580 | | | | — | | | | — | |
Fund Shares Sold | | | 5,574 | | | | 18,797 | | | | 1 | | | | 18,258 | |
Unrealized Gain on Foreign Currency Contracts | | | 8 | | | | — | | | | — | | | | — | |
Prepaid Expenses and Other Assets | | | 33 | | | | 239 | | | | 3 | | | | 63 | |
| | | | | | | | | | | | | | | | |
Total Assets | | | 5,076,523 | | | | 27,833,197 | | | | 82,935 | | | | 9,332,217 | |
| | | | | | | | | | | | | | | | |
LIABILITIES: | | | | | | | | | | | | | | | | |
Payables: | | | | | | | | | | | | | | | | |
Upon Return of Securities Loaned | | | 249,563 | | | | 1,565,282 | | | | — | | | | — | |
Investment Securities Purchased | | | — | | | | 15,669 | | | | — | | | | — | |
Fund Shares Redeemed | | | 4,704 | | | | 36,527 | | | | — | | | | 9,425 | |
Due to Advisor | | | 560 | | | | 4,344 | | | | 10 | | | | 1,934 | |
Futures Margin Variation | | | 727 | | | | 1,771 | | | | — | | | | 398 | |
Unrealized Loss on Foreign Currency Contracts | | | 7 | | | | — | | | | — | | | | — | |
Accrued Expenses and Other Liabilities | | | 284 | | | | 1,398 | | | | 5 | | | | 365 | |
| | | | | | | | | | | | | | | | |
Total Liabilities | | | 255,845 | | | | 1,624,991 | | | | 15 | | | | 12,122 | |
| | | | | | | | | | | | | | | | |
NET ASSETS | | $ | 4,820,678 | | | $ | 26,208,206 | | | $ | 82,920 | | | $ | 9,320,095 | |
| | | | | | | | | | | | | | | | |
NET ASSET VALUE, OFFERING AND REDEMPTION PRICE PER SHARE: | | | | | | | | | | | | | | | | |
Institutional Class Shares - based on net assets of $4,820,678; $26,208,206; $82,920 and $9,320,095 and shares outstanding of 228,945,808, 2,144,659,375, 6,620,977 and 585,184,804, respectively | | $ | 21.06 | | | $ | 12.22 | | | $ | 12.52 | | | $ | 15.93 | |
| | | | | | | | | | | | | | | | |
NUMBER OF SHARES AUTHORIZED | | | 1,500,000,000 | | | | 7,000,000,000 | | | | 100,000,000 | | | | 3,000,000,000 | |
| | | | | | | | | | | | | | | | |
Investments in Affiliated Investment Companies at Cost | | $ | — | | | $ | — | | | $ | 79,350 | | | | N/A | |
| | | | | | | | | | | | | | | | |
Investment Securities at Cost | | $ | 4,069,492 | | | $ | 25,579,747 | | | | N/A | | | | N/A | |
| | | | | | | | | | | | | | | | |
Foreign Currencies at Cost | | $ | 34,350 | | | $ | 197,143 | | | $ | — | | | $ | — | |
| | | | | | | | | | | | | | | | |
NET ASSETS CONSIST OF: | | | | | | | | | | | | | | | | |
Paid-In Capital | | $ | 4,638,134 | | | $ | 27,030,210 | | | $ | 80,078 | | | $ | 10,058,928 | |
Total Distributable Earnings (Loss) | | | 182,544 | | | | (822,004 | ) | | | 2,842 | | | | (738,833 | ) |
| | | | | | | | | | | | | | | | |
NET ASSETS | | $ | 4,820,678 | | | $ | 26,208,206 | | | $ | 82,920 | | | $ | 9,320,095 | |
| | | | | | | | | | | | | | | | |
| * | See Note K in the Notes to Financial Statements for additional information about securities lending collateral. |
See accompanying Notes to Financial Statements.
102
DFA INVESTMENT DIMENSIONS GROUP INC.
STATEMENTS OF ASSETS AND LIABILITIES
OCTOBER 31, 2022
(Amounts in thousands, except share and per share amounts)
| | | | | | | | | | | | | | | | |
| | | Japanese Small
Company
Portfolio | | | Asia Pacific
Small
Company
Portfolio | | | United
Kingdom Small
Company
Portfolio | | | Continental
Small
Company
Portfolio | |
ASSETS: | | | | | | | | | | | | | | | | |
Investments in Affiliated Investment Companies at Value | | $ | 267,617 | | | $ | 230,258 | | | $ | 18,406 | | | $ | 616,480 | |
Receivables: | | | | | | | | | | | | | | | | |
Fund Shares Sold | | | — | | | | — | | | | — | | | | 15 | |
Prepaid Expenses and Other Assets | | | 9 | | | | 8 | | | | 8 | | | | 9 | |
| | | | | | | | | | | | | | | | |
Total Assets | | | 267,626 | | | | 230,266 | | | | 18,414 | | | | 616,504 | |
| | | | | | | | | | | | | | | | |
LIABILITIES: | | | | | | | | | | | | | | | | |
Payables: | | | | | | | | | | | | | | | | |
Fund Shares Redeemed | | | — | | | | — | | | | 6 | | | | 32 | |
Due to Advisor | | | 56 | | | | 49 | | | | 7 | | | | 125 | |
Accrued Expenses and Other Liabilities | | | 19 | | | | 15 | | | | 3 | | | | 24 | |
| | | | | | | | | | | | | | | | |
Total Liabilities | | | 75 | | | | 64 | | | | 16 | | | | 181 | |
| | | | | | | | | | | | | | | | |
NET ASSETS | | $ | 267,551 | | | $ | 230,202 | | | $ | 18,398 | | | $ | 616,323 | |
| | | | | | | | | | | | | | | | |
NET ASSET VALUE, OFFERING AND REDEMPTION PRICE PER SHARE: | | | | | | | | | | | | | | | | |
Institutional Class Shares — based on net assets of $267,551; $230,202; $18,398 and $616,323 and shares outstanding of 14,318,191, 13,233,989, 925,079 and 25,955,141, respectively | | $ | 18.69 | | | $ | 17.39 | | | $ | 19.89 | | | $ | 23.75 | |
| | | | | | | | | | | | | | | | |
NUMBER OF SHARES AUTHORIZED | | | 1,000,000,000 | | | | 1,000,000,000 | | | | 1,000,000,000 | | | | 1,000,000,000 | |
| | | | | | | | | | | | | | | | |
NET ASSETS CONSIST OF: | | | | | | | | | | | | | | | | |
Paid-In Capital | | $ | 284,996 | | | $ | 283,447 | | | $ | 25,349 | | | $ | 667,576 | |
Total Distributable Earnings (Loss) | | | (17,445 | ) | | | (53,245 | ) | | | (6,951 | ) | | | (51,253 | ) |
| | | | | | | | | | | | | | | | |
NET ASSETS | | $ | 267,551 | | | $ | 230,202 | | | $ | 18,398 | | | $ | 616,323 | |
| | | | | | | | | | | | | | | | |
See accompanying Notes to Financial Statements.
103
DFA INVESTMENT DIMENSIONS GROUP INC.
STATEMENTS OF ASSETS AND LIABILITIES
OCTOBER 31, 2022
(Amounts in thousands, except share and per share amounts)
| | | | | | | | | | | | | | | | |
| | | DFA
International
Real Estate
Securities
Portfolio* | | | DFA Global
Real Estate
Securities
Portfolio* | | | DFA
International
Small Cap
Value Portfolio* | | | International
Vector Equity
Portfolio* | |
ASSETS: | | | | | | | | | | | | | | | | |
Investments in Affiliated Investment Companies at Value | | | — | | | $ | 3,036,868 | | | | — | | | | — | |
Investment Securities at Value (including $278,311, $189,598, $355,881 and $193,585 of securities on loan, respectively) | | $ | 4,375,092 | | | | 4,788,337 | | | $ | 9,478,103 | | | $ | 2,848,525 | |
Collateral from Securities on Loan Invested in Affiliate at Value (including cost of $260,057, $194,392, $279,355 and $159,496, respectively) | | | 259,980 | | | | 194,324 | | | | 279,235 | | | | 159,430 | |
Segregated Cash for Futures Contracts | | | 2,130 | | | | 1,720 | | | | 6,798 | | | | 900 | |
Foreign Currencies at Value | | | 35,964 | | | | — | | | | 92,939 | | | | 3,314 | |
Cash | | | 10,399 | | | | 44,231 | | | | 24,751 | | | | 20,867 | |
Receivables: | | | | | | | | | | | | | | | | |
Investment Securities Sold | | | 39,092 | | | | 13,536 | | | | 17,417 | | | | 6,569 | |
Dividends, Interest and Tax Reclaims | | | 21,545 | | | | 3,323 | | | | 60,938 | | | | 14,708 | |
Securities Lending Income | | | 285 | | | | 53 | | | | 348 | | | | 213 | |
Fund Shares Sold | | | 11,321 | | | | 16,303 | | | | 9,704 | | | | 4,690 | |
Prepaid Expenses and Other Assets | | | 14 | | | | 65 | | | | 75 | | | | 75 | |
| | | | | | | | | | | | | | | | |
Total Assets | | | 4,755,822 | | | | 8,098,760 | | | | 9,970,308 | | | | 3,059,291 | |
| | | | | | | | | | | | | | | | |
LIABILITIES: | | | | | | | | | | | | | | | | |
Payables: | | | | | | | | | | | | | | | | |
Upon Return of Securities Loaned | | | 299,241 | | | | 207,964 | | | | 294,176 | | | | 165,207 | |
Investment Securities Purchased | | | — | | | | 11,647 | | | | — | | | | 122 | |
Fund Shares Redeemed | | | 2,569 | | | | 6,679 | | | | 6,032 | | | | 9,629 | |
Due to Advisor | | | 877 | | | | 779 | | | | 3,137 | | | | 714 | |
Futures Margin Variation | | | 794 | | | | 243 | | | | 1,312 | | | | 470 | |
Accrued Expenses and Other Liabilities | | | 193 | | | | 375 | | | | 951 | | | | 218 | |
| | | | | | | | | | | | | | | | |
Total Liabilities | | | 303,674 | | | | 227,687 | | | | 305,608 | | | | 176,360 | |
| | | | | | | | | | | | | | | | |
NET ASSETS | | $ | 4,452,148 | | | $ | 7,871,073 | | | $ | 9,664,700 | | | $ | 2,882,931 | |
| | | | | | | | | | | | | | | | |
NET ASSET VALUE, OFFERING AND REDEMPTION PRICE PER SHARE: | | | | | | | | | | | | | | | | |
Institutional Class Shares — based on net assets of $4,452,148; $7,871,073; $9,664,700 and $2,882,931 and shares outstanding of 1,317,084,678, 798,063,859, 575,085,885 and 270,161,942, respectively | | $ | 3.38 | | | $ | 9.86 | | | $ | 16.81 | | | $ | 10.67 | |
| | | | | | | | | | | | | | | | |
NUMBER OF SHARES AUTHORIZED | | | 4,000,000,000 | | | | 3,000,000,000 | | | | 4,600,000,000 | | | | 1,500,000,000 | |
| | | | | | | | | | | | | | | | |
Investments in Affiliated Investment Companies at Cost | | $ | — | | | $ | 3,904,561 | | | $ | — | | | $ | — | |
| | | | | | | | | | | | | | | | |
Investment Securities at Cost | | $ | 5,316,255 | | | $ | 4,359,991 | | | $ | 10,024,140 | | | $ | 2,790,322 | |
| | | | | | | | | | | | | | | | |
Foreign Currencies at Cost | | $ | 36,138 | | | $ | — | | | $ | 91,827 | | | $ | 3,304 | |
| | | | | | | | | | | | | | | | |
NET ASSETS CONSIST OF: | | | | | | | | | | | | | | | | |
Paid-In Capital | | $ | 6,452,281 | | | $ | 8,122,995 | | | $ | 10,331,070 | | | $ | 2,852,170 | |
Total Distributable Earnings (Loss) | | | (2,000,133 | ) | | | (251,922 | ) | | | (666,370 | ) | | | 30,761 | |
| | | | | | | | | | | | | | | | |
NET ASSETS | | $ | 4,452,148 | | | $ | 7,871,073 | | | $ | 9,664,700 | | | $ | 2,882,931 | |
| | | | | | | | | | | | | | | | |
| * | See Note K in the Notes to Financial Statements for additional information about securities lending collateral. |
See accompanying Notes to Financial Statements.
104
DFA INVESTMENT DIMENSIONS GROUP INC.
STATEMENTS OF ASSETS AND LIABILITIES
OCTOBER 31, 2022
(Amounts in thousands, except share and per share amounts)
| | | | | | | | | | | | | | | | |
| | | International
High Relative
Profitability
Portfolio* | | | World ex U.S.
Value Portfolio | | | World ex U.S.
Core Equity
Portfolio* | | | World ex U.S.
Targeted Value
Portfolio* | |
ASSETS: | | | | | | | | | | | | | | | | |
Investments in Affiliated Investment Companies at Value | | | — | | | $ | 194,049 | | | | — | | | | — | |
Investment Securities at Value (including $118,618, $0, $205,779 and $4,638 of securities on loan, respectively) | | $ | 1,600,204 | | | | — | | | $ | 3,085,520 | | | $ | 566,199 | |
Collateral from Securities on Loan Invested in Affiliate at Value (including cost of $113,856, $0, $167,369 and $1,600, respectively) | | | 113,814 | | | | — | | | | 167,297 | | | | 1,599 | |
Segregated Cash for Futures Contracts | | | — | | | | — | | | | 1,280 | | | | — | |
Foreign Currencies at Value | | | 1,460 | | | | — | | | | 19,235 | | | | 409 | |
Cash | | | 272 | | | | 232 | | | | — | | | | 683 | |
Receivables: | | | | | | | | | | | | | | | | |
Investment Securities Sold | | | 14,747 | | | | — | | | | 19,579 | | | | 364 | |
Dividends, Interest and Tax Reclaims | | | 6,017 | | | | — | | | | 11,497 | | | | 2,815 | |
Securities Lending Income | | | 82 | | | | — | | | | 236 | | | | 13 | |
Fund Shares Sold | | | 1,384 | | | | 10 | | | | 1,950 | | | | 710 | |
Futures Margin Variation | | | 44 | | | | — | | | | — | | | | — | |
Unrealized Gain on Foreign Currency Contracts | | | — | | | | — | | | | 3 | | | | — | |
Prepaid Expenses and Other Assets | | | 21 | | | | 16 | | | | 14 | | | | 23 | |
| | | | | | | | | | | | | | | | |
Total Assets | | | 1,738,045 | | | | 194,307 | | | | 3,306,611 | | | | 572,815 | |
| | | | | | | | | | | | | | | | |
LIABILITIES: | | | | | | | | | | | | | | | | |
Payables: | | | | | | | | | | | | | | | | |
Upon Return of Securities Loaned | | | 128,519 | | | | — | | | | 175,641 | | | | 1,876 | |
Investment Securities Purchased | | | — | | | | — | | | | 95 | | | | 4 | |
Fund Shares Redeemed | | | 2,434 | | | | 19 | | | | 954 | | | | 2,415 | |
Due to Advisor | | | 337 | | | | 22 | | | | 654 | | | | 192 | |
Futures Margin Variation | | | — | | | | — | | | | 363 | | | | — | |
Unrealized Loss on Foreign Currency Contracts | | | — | | | | — | | | | 1 | | | | — | |
Deferred Taxes Payable | | | — | | | | — | | | | 6,517 | | | | 676 | |
Accrued Expenses and Other Liabilities | | | 121 | | | | 7 | | | | 326 | | | | 95 | |
| | | | | | | | | | | | | | | | |
Total Liabilities | | | 131,411 | | | | 48 | | | | 184,551 | | | | 5,258 | |
| | | | | | | | | | | | | | | | |
NET ASSETS | | $ | 1,606,634 | | | $ | 194,259 | | | $ | 3,122,060 | | | $ | 567,557 | |
| | | | | | | | | | | | | | | | |
NET ASSET VALUE, OFFERING AND REDEMPTION PRICE PER SHARE: | | | | | | | | | | | | | | | | |
Institutional Class Shares — based on net assets of $1,606,634; $194,259; $3,122,060 and $567,557 and shares outstanding of 158,787,777, 19,167,782, 301,635,921 and 51,502,884, respectively | | $ | 10.12 | | | $ | 10.14 | | | $ | 10.35 | | | $ | 11.02 | |
| | | | | | | | | | | | | | | | |
NUMBER OF SHARES AUTHORIZED | | | 500,000,000 | | | | 1,000,000,000 | | | | 1,500,000,000 | | | | 1,000,000,000 | |
| | | | | | | | | | | | | | | | |
Investments in Affiliated Investment Companies at Cost | | $ | — | | | $ | 194,249 | | | $ | — | | | $ | — | |
| | | | | | | | | | | | | | | | |
Investment Securities at Cost | | $ | 1,645,167 | | | | N/A | | | $ | 3,168,684 | | | $ | 652,274 | |
| | | | | | | | | | | | | | | | |
Foreign Currencies at Cost | | $ | 1,468 | | | $ | — | | | $ | 19,871 | | | $ | 394 | |
| | | | | | | | | | | | | | | | |
NET ASSETS CONSIST OF: | | | | | | | | | | | | | | | | |
Paid-In Capital | | $ | 1,707,462 | | | $ | 204,707 | | | $ | 3,250,371 | | | $ | 665,983 | |
Total Distributable Earnings (Loss) | | | (100,828 | ) | | | (10,448 | ) | | | (128,311 | ) | | | (98,426 | ) |
| | | | | | | | | | | | | | | | |
NET ASSETS | | $ | 1,606,634 | | | $ | 194,259 | | | $ | 3,122,060 | | | $ | 567,557 | |
| | | | | | | | | | | | | | | | |
| * | See Note K in the Notes to Financial Statements for additional information about securities lending collateral. |
See accompanying Notes to Financial Statements.
105
DFA INVESTMENT DIMENSIONS GROUP INC.
STATEMENTS OF ASSETS AND LIABILITIES
OCTOBER 31, 2022
(Amounts in thousands, except share and per share amounts)
| | | | | | | | | | | | | | | | |
| | | World Core
Equity
Portfolio | | | Selectively
Hedged Global
Equity
Portfolio | | | Emerging
Markets
Portfolio | | | Emerging
Markets Small
Cap Portfolio | |
ASSETS: | | | | | | | | | | | | | | | | |
Investments in Affiliated Investment Companies at Value | | $ | 949,652 | | | $ | 267,492 | | | $ | 3,941,855 | | | $ | 3,511,978 | |
Segregated Cash for Futures Contracts | | | — | | | | 170 | | | | — | | | | — | |
Cash | | | — | | | | 2,999 | | | | — | | | | — | |
Receivables: | | | | | | | | | | | | | | | | |
Investment Securities/Affiliated Investment Companies Sold | | | 743 | | | | — | | | | — | | | | — | |
Dividends and Interest | | | 1 | | | | — | | | | — | | | | — | |
Fund Shares Sold | | | 516 | | | | 17 | | | | 7,231 | | | | 3,878 | |
Unrealized Gain on Forward Currency Contracts | | | — | | | | 483 | | | | — | | | | — | |
Prepaid Expenses and Other Assets | | | 8 | | | | 18 | | | | 49 | | | | 30 | |
| | | | | | | | | | | | | | | | |
Total Assets | | | 950,920 | | | | 271,179 | | | | 3,949,135 | | | | 3,515,886 | |
| | | | | | | | | | | | | | | | |
LIABILITIES: | | | | | | | | | | | | | | | | |
Payables: | | | | | | | | | | | | | | | | |
Due to Custodian | | | 50 | | | | — | | | | — | | | | — | |
Fund Shares Redeemed | | | 1,787 | | | | 46 | | | | 9,508 | | | | 2,829 | |
Due to Advisor | | | 36 | | | | 10 | | | | 638 | | | | 979 | |
Futures Margin Variation | | | — | | | | 24 | | | | — | | | | — | |
Unrealized Loss on Forward Currency Contracts | | | — | | | | 379 | | | | — | | | | — | |
Accrued Expenses and Other Liabilities | | | 30 | | | | 12 | | | | 208 | | | | 169 | |
| | | | | | | | | | | | | | | | |
Total Liabilities | | | 1,903 | | | | 471 | | | | 10,354 | | | | 3,977 | |
| | | | | | | | | | | | | | | | |
NET ASSETS | | $ | 949,017 | | | $ | 270,708 | | | $ | 3,938,781 | | | $ | 3,511,909 | |
| | | | | | | | | | | | | | | | |
NET ASSET VALUE, OFFERING AND REDEMPTION PRICE PER SHARE: | | | | | | | | | | | | | | | | |
Institutional Class Shares — based on net assets of $949,017; $270,708; $3,938,781 and $3,511,909 and shares outstanding of 52,015,659, 14,966,292, 172,920,833 and 187,198,138, respectively | | $ | 18.24 | | | $ | 18.09 | | | $ | 22.78 | | | $ | 18.76 | |
| | | | | | | | | | | | | | | | |
NUMBER OF SHARES AUTHORIZED | | | 1,000,000,000 | | | | 1,000,000,000 | | | | 1,500,000,000 | | | | 1,500,000,000 | |
| | | | | | | | | | | | | | | | |
Investments in Affiliated Investment Companies at Cost | | $ | 755,680 | | | $ | 185,731 | | | | N/A | | | | N/A | |
| | | | | | | | | | | | | | | | |
NET ASSETS CONSIST OF: | | | | | | | | | | | | | | | | |
Paid-In Capital | | $ | 770,696 | | | $ | 170,614 | | | $ | 3,097,945 | | | $ | 3,681,224 | |
Total Distributable Earnings (Loss) | | | 178,321 | | | | 100,094 | | | | 840,836 | | | | (169,315 | ) |
| | | | | | | | | | | | | | | | |
NET ASSETS | | $ | 949,017 | | | $ | 270,708 | | | $ | 3,938,781 | | | $ | 3,511,909 | |
| | | | | | | | | | | | | | | | |
See accompanying Notes to Financial Statements.
106
DFA INVESTMENT DIMENSIONS GROUP INC.
STATEMENTS OF ASSETS AND LIABILITIES
OCTOBER 31, 2022
(Amounts in thousands, except share and per share amounts)
| | | | | | | | | | | | | | | | |
| | | Emerging
Markets Value
Portfolio | | | Emerging
Markets Core
Equity
Portfolio* | | | Emerging
Markets Targeted
Value Portfolio* | | | Emerging
Markets ex China Core
Equity Portfolio* | |
ASSETS: | | | | | | | | | | | | | | | | |
Investments in Affiliated Investment Companies at Value | | $ | 9,618,713 | | | | — | | | | — | | | | — | |
Investment Securities at Value (including $0, $1,050,726, $3,524 and $6,684 of securities on loan, respectively) | | | — | | | $ | 20,895,182 | | | $ | 191,425 | | | $ | 423,976 | |
Collateral from Securities on Loan Invested in Affiliate at Value (including cost of $0, $424,582, $1,667 and $6,641, respectively) | | | — | | | | 424,406 | | | | 1,666 | | | | 6,638 | |
Segregated Cash for Futures Contracts | | | — | | | | 9,420 | | | | — | | | | — | |
Foreign Currencies at Value | | | — | | | | 170,221 | | | | 501 | | | | 936 | |
Cash | | | — | | | | 29,782 | | | | — | | | | 1,557 | |
Receivables: | | | | | | | | | | | | | | | | |
Investment Securities/Affiliated Investment Companies Sold | | | — | | | | 37,153 | | | | 1,162 | | | | 281 | |
Dividends and Interest | | | — | | | | 24,426 | | | | 175 | | | | 373 | |
Securities Lending Income | | | — | | | | 3,213 | | | | 13 | | | | 8 | |
Fund Shares Sold | | | 17,320 | | | | 48,382 | | | | 444 | | | | 1,096 | |
Due from Advisor | | | — | | | | — | | | | — | | | | 76 | |
Unrealized Gain on Foreign Currency Contracts | | | — | | | | — | | | | — | | | | 1 | |
Deferred Offering Costs | | | — | | | | — | | | | — | | | | 4 | |
Prepaid Expenses and Other Assets | | | 71 | | | | 174 | | | | 19 | | | | 29 | |
| | | | | | | | | | | | | | | | |
Total Assets | | | 9,636,104 | | | | 21,642,359 | | | | 195,405 | | | | 434,975 | |
| | | | | | | | | | | | | | | | |
LIABILITIES: | | | | | | | | | | | | | | | | |
Payables: | | | | | | | | | | | | | | | | |
Due to Custodian | | | — | | | | — | | | | 8 | | | | — | |
Upon Return of Securities Loaned | | | — | | | | 436,254 | | | | 1,691 | | | | 6,829 | |
Investment Securities/Affiliated Investment Companies Purchased | | | — | | | | 6,762 | | | | 85 | | | | 1,330 | |
Fund Shares Redeemed | | | 20,166 | | | | 69,671 | | | | 1,448 | | | | 2,275 | |
Due to Advisor | | | 2,344 | | | | 6,036 | | | | 86 | | | | — | |
Line of Credit | | | — | | | | — | | | | 916 | | | | — | |
Futures Margin Variation | | | — | | | | 1,330 | | | | — | | | | — | |
Unrealized Loss on Foreign Currency Contracts | | | — | | | | 1 | | | | 1 | | | | 1 | |
Deferred Taxes Payable | | | —�� | | | | 150,588 | | | | 1,201 | | | | — | |
Accrued Expenses and Other Liabilities | | | 513 | | | | 3,142 | | | | 43 | | | | 93 | |
| | | | | | | | | | | | | | | | |
Total Liabilities | | | 23,023 | | | | 673,784 | | | | 5,479 | | | | 10,528 | |
| | | | | | | | | | | | | | | | |
NET ASSETS | | $ | 9,613,081 | | | $ | 20,968,575 | | | $ | 189,926 | | | $ | 424,447 | |
| | | | | | | | | | | | | | | | |
NET ASSET VALUE, OFFERING AND REDEMPTION PRICE PER SHARE: | | | | | | | | | | | | | | | | |
Class R2 Shares — based on net assets of $12,956; $0; $0 and $0 and shares outstanding of 541,782, 0, 0 and 0, respectively | | $ | 23.91 | | | | N/A | | | | N/A | | | | N/A | |
| | | | | | | | | | | | | | | | |
NUMBER OF SHARES AUTHORIZED | | | 200,000,000 | | | | N/A | | | | N/A | | | | N/A | |
| | | | | | | | | | | | | | | | |
Institutional Class Shares — based on net assets of $9,600,125; $20,968,575; $189,926 and $424,447 and shares outstanding of 398,774,576, 1,156,722,142, 20,443,999 and 54,695,607, respectively | | $ | 24.08 | | | $ | 18.13 | | | $ | 9.29 | | | $ | 7.76 | |
| | | | | | | | | | | | | | | | |
NUMBER OF SHARES AUTHORIZED | | | 3,000,000,000 | | | | 5,000,000,000 | | | | 500,000,000 | | | | 500,000,000 | |
| | | | | | | | | | | | | | | | |
Investment Securities at Cost | | | N/A | | | $ | 19,809,571 | | | $ | 204,324 | | | $ | 500,395 | |
| | | | | | | | | | | | | | | | |
Foreign Currencies at Cost | | $ | — | | | $ | 171,829 | | | $ | 529 | | | $ | 936 | |
| | | | | | | | | | | | | | | | |
NET ASSETS CONSIST OF: | | | | | | | | | | | | | | | | |
Paid-In Capital | | $ | 11,465,637 | | | $ | 22,326,559 | | | $ | 198,484 | | | $ | 521,039 | |
Total Distributable Earnings (Loss) | | | (1,852,556 | ) | | | (1,357,984 | ) | | | (8,558 | ) | | | (96,592 | ) |
| | | | | | | | | | | | | | | | |
NET ASSETS | | $ | 9,613,081 | | | $ | 20,968,575 | | | $ | 189,926 | | | $ | 424,447 | |
| | | | | | | | | | | | | | | | |
| * | See Note K in the Notes to Financial Statements for additional information about securities lending collateral. |
See accompanying Notes to Financial Statements.
107
DFA INVESTMENT DIMENSIONS GROUP INC.
STATEMENTS OF OPERATIONS
FOR THE YEAR ENDED OCTOBER 31, 2022
(Amounts in thousands)
| | | | | | | | | | | | | | | | |
| | | Large Cap
International
Portfolio# | | | International
Core Equity
Portfolio# | | | Global Small
Company
Portfolio* | | | International
Small
Company
Portfolio* | |
Investment Income | | | | | | | | | | | | | | | | |
Net Investment Income Allocated from Affiliated Investment Companies | | | | | | | | | | | | | | | | |
Dividends (Net of Foreign Taxes Withheld of $0, $0, $118 and $32,864, respectively) | | | — | | | | — | | | $ | 1,111 | | | $ | 351,462 | |
Income from Securities Lending | | | — | | | | — | | | | 66 | | | | 11,450 | |
Expenses Allocated from Affiliated Investment Companies | | | — | | | | — | | | | (59 | ) | | | (13,461 | ) |
| | | | | | | | | | | | | | | | |
Income Distributions Received from Affiliated Investment Companies | | | — | | | | — | | | | 562 | | | | — | |
| | | | | | | | | | | | | | | | |
Total Net Investment Income Allocated and/or Distributions Received from Affiliated Investment Companies | | | — | | | | — | | | | 1,680 | | | | 349,451 | |
| | | | | | | | | | | | | | | | |
Fund Investment Income | | | | | | | | | | | | | | | | |
Dividends (Net of Foreign Taxes Withheld of $16,759, $96,986, $0 and $0, respectively) | | $ | 180,893 | | | $ | 1,071,227 | | | | — | | | | — | |
Income from Securities Lending | | | 1,993 | | | | 17,140 | | | | — | | | | — | |
| | | | | | | | | | | | | | | | |
Total Fund Investment Income | | | 182,886 | | | | 1,088,367 | | | | — | | | | — | |
| | | | | | | | | | | | | | | | |
Fund Expenses | | | | | | | | | | | | | | | | |
Investment Management Fees | | | 7,664 | | | | 62,092 | | | | 332 | | | | 30,411 | |
Accounting & Transfer Agent Fees | | | 766 | | | | 4,813 | | | | 17 | | | | 1,604 | |
Custodian Fees | | | 486 | | | | 3,126 | | | | 3 | | | | — | |
Filing Fees | | | 70 | | | | 378 | | | | 22 | | | | 216 | |
Shareholders’ Reports | | | 113 | | | | 685 | | | | 7 | | | | 584 | |
Directors’/Trustees’ Fees & Expenses | | | 25 | | | | 137 | | | | 2 | | | | 46 | |
Professional Fees | | | 124 | | | | 695 | | | | 1 | | | | 100 | |
Previously Waived Fees Recovered by Advisor (Note C) | | | — | | | | — | | | | 2 | | | | — | |
Other | | | 203 | | | | 1,066 | | | | 3 | | | | 203 | |
| | | | | | | | | | | | | | | | |
Total Fund Expenses | | | 9,451 | | | | 72,992 | | | | 389 | | | | 33,164 | |
| | | | | | | | | | | | | | | | |
Fees Waived, Expenses Reimbursed by Advisor (Note C) | | | — | | | | — | | | | 205 | | | | — | |
Fees Paid Indirectly (Note C) | | | 197 | | | | 624 | | | | 1 | | | | — | |
| | | | | | | | | | | | | | | | |
Net Expenses | | | 9,254 | | | | 72,368 | | | | 183 | | | | 33,164 | |
| | | | | | | | | | | | | | | | |
Net Investment Income (Loss) | | | 173,632 | | | | 1,015,999 | | | | 1,497 | | | | 316,287 | |
| | | | | | | | | | | | | | | | |
Realized and Unrealized Gain (Loss) | | | | | | | | | | | | | | | | |
Capital Gain Distributions Received from Investment Securities | | | — | | | | — | | | | 3,071 | | | | — | |
Net Realized Gain (Loss) on: | | | | | | | | | | | | | | | | |
Investment Securities Sold** | | | (72,788 | ) | | | 425,701 | | | | — | | | | — | |
Affiliated Investment Companies Shares Sold | | | (41 | ) | | | (333 | ) | | | (1,418 | ) | | | — | |
Transactions Allocated from Affiliated Investment Company** | | | — | | | | — | | | | (2,875 | ) | | | 164,767 | |
Futures | | | (12,682 | ) | | | (44,185 | ) | | | 34 | | | | (19,889 | ) |
Foreign Currency Transactions | | | (5,948 | ) | | | (47,812 | ) | | | — | | | | — | |
Change in Unrealized Appreciation (Depreciation) of: | | | | | | | | | | | | | | | | |
Investment Securities and Foreign Currency | | | (1,377,779 | ) | | | (9,090,912 | ) | | | — | | | | — | |
Affiliated Investment Companies Shares | | | (125 | ) | | | (769 | ) | | | (7,951 | ) | | | — | |
Transactions Allocated from Affiliated Investment Company | | | — | | | | — | | | | (8,701 | ) | | | (3,930,327 | ) |
Futures | | | (202 | ) | | | (3,107 | ) | | | — | | | | 271 | |
Translation of Foreign Currency-Denominated Amounts | | | (977 | ) | | | (7,919 | ) | | | — | | | | — | |
| | | | | | | | | | | | | | | | |
Net Realized and Unrealized Gain (Loss) | | | (1,470,542 | ) | | | (8,769,336 | ) | | | (17,840 | ) | | | (3,785,178 | ) |
| | | | | | | | | | | | | | | | |
Net Increase (Decrease) in Net Assets Resulting from Operations | | $ | (1,296,910 | ) | | $ | (7,753,337 | ) | | $ | (16,343 | ) | | $ | (3,468,891 | ) |
| | | | | | | | | | | | | | | | |
| ** | Net of foreign capital gain taxes withheld of $0, $0, $22 and $0, respectively. |
| * | Investment Income and Realized and Unrealized Gain (Loss) were allocated from the Portfolio’s Master Fund (Affiliated Investment Company). |
| # | Portion of income is from investment in affiliated fund. |
See accompanying Notes to Financial Statements.
108
DFA INVESTMENT DIMENSIONS GROUP INC.
STATEMENTS OF OPERATIONS
FOR THE YEAR ENDED OCTOBER 31, 2022
(Amounts in thousands)
| | | | | | | | | | | | | | | | |
| | | Japanese Small
Company
Portfolio* | | | Asia Pacific
Small
Company
Portfolio* | | | United
Kingdom Small
Company
Portfolio* | | | Continental
Small
Company
Portfolio* | |
Investment Income | | | | | | | | | | | | | | | | |
Net Investment Income Allocated from Affiliated Investment Companies | | | | | | | | | | | | | | | | |
Dividends (Net of Foreign Taxes Withheld of $928, $150, $6 and $3,259, respectively) | | $ | 8,375 | | | $ | 13,262 | | | $ | 1,155 | | | $ | 22,414 | |
Income from Securities Lending | | | 173 | | | | 864 | | | | 2 | | | | 846 | |
Expenses Allocated from Affiliated Investment Companies | | | (384 | ) | | | (400 | ) | | | (31 | ) | | | (963 | ) |
| | | | | | | | | | | | | | | | |
Total Net Investment Income Allocated and/or Distributions Received from Affiliated Investment Companies | | | 8,164 | | | | 13,726 | | | | 1,126 | | | | 22,297 | |
| | | | | | | | | | | | | | | | |
Fund Expenses | | | | | | | | | | | | | | | | |
Investment Management Fees | | | 1,184 | | | | 1,191 | | | | 104 | | | | 2,836 | |
Accounting & Transfer Agent Fees | | | 51 | | | | 52 | | | | 7 | | | | 123 | |
Filing Fees | | | 20 | | | | 20 | | | | 15 | | | | 20 | |
Shareholders’ Reports | | | 9 | | | | 8 | | | | 4 | | | | 12 | |
Directors’/Trustees’ Fees & Expenses | | | 2 | | | | 2 | | | | — | | | | 5 | |
Professional Fees | | | 4 | | | | 5 | | | | — | | | | 9 | |
Previously Waived Fees Recovered by Advisor (Note C) | | | — | | | | — | | | | 27 | | | | — | |
Other | | | 3 | | | | 5 | | | | 2 | | | | 8 | |
| | | | | | | | | | | | | | | | |
Total Fund Expenses | | | 1,273 | | | | 1,283 | | | | 159 | | | | 3,013 | |
| | | | | | | | | | | | | | | | |
Fees Waived, Expenses Reimbursed by Advisor (Note C) | | | 321 | | | | 324 | | | | 36 | | | | 770 | |
| | | | | | | | | | | | | | | | |
Net Expenses | | | 952 | | | | 959 | | | | 123 | | | | 2,243 | |
| | | | | | | | | | | | | | | | |
Net Investment Income (Loss) | | | 7,212 | | | | 12,767 | | | | 1,003 | | | | 20,054 | |
| | | | | | | | | | | | | | | | |
Realized and Unrealized Gain (Loss) | | | | | | | | | | | | | | | | |
Net Realized Gain (Loss) on: | | | | | | | | | | | | | | | | |
Transactions Allocated from Affiliated Investment Company** | | | 12,397 | | | | 14,514 | | | | (2,989 | ) | | | (26,021 | ) |
Change in Unrealized Appreciation (Depreciation) of: | | | | | | | | | | | | | | | | |
Transactions Allocated from Affiliated Investment Company | | | (107,385 | ) | | | (124,402 | ) | | | (9,155 | ) | | | (261,540 | ) |
| | | | | | | | | | | | | | | | |
Net Realized and Unrealized Gain (Loss) | | | (94,988 | ) | | | (109,888 | ) | | | (12,144 | ) | | | (287,561 | ) |
| | | | | | | | | | | | | | | | |
Net Increase (Decrease) in Net Assets Resulting from Operations | | $ | (87,776 | ) | | $ | (97,121 | ) | | $ | (11,141 | ) | | $ | (267,507 | ) |
| | | | | | | | | | | | | | | | |
| ** | Net of foreign capital gain taxes withheld of $0, $0, $0 and $0, respectively. |
| * | Investment Income and Realized and Unrealized Gain (Loss) were allocated from the Portfolio’s Master Fund (Affiliated Investment Company). |
See accompanying Notes to Financial Statements.
109
DFA INVESTMENT DIMENSIONS GROUP INC.
STATEMENTS OF OPERATIONS
FOR THE YEAR ENDED OCTOBER 31, 2022
(Amounts in thousands)
| | | | | | | | | | | | | | | | |
| | | DFA
International
Real Estate
Securities
Portfolio# | | | DFA Global
Real Estate
Securities
Portfolio# | | | DFA
International
Small Cap
Value Portfolio# | | | International
Vector Equity
Portfolio# | |
Investment Income | | | | | | | | | | | | | | | | |
Net Investment Income Allocated from Affiliated Investment Companies | | | | | | | | | | | | | | | | |
Income Distributions Received from Affiliated Investment Companies | | | — | | | $ | 286,842 | | | | — | | | | — | |
| | | | | | | | | | | | | | | | |
Total Net Investment Income Allocated and/or Distributions Received from Affiliated Investment Companies | | | — | | | | 286,842 | | | | — | | | | — | |
| | | | | | | | | | | | | | | | |
Fund Investment Income | | | | | | | | | | | | | | | | |
Dividends (Net of Foreign Taxes Withheld of $26,518, $0, $38,277 and $11,032, respectively) | | $ | 211,565 | | | | 123,483 | | | $ | 405,509 | | | $ | 115,262 | |
Income from Securities Lending | | | 2,682 | | | | 172 | | | | 3,973 | | | | 2,307 | |
| | | | | | | | | | | | | | | | |
Total Fund Investment Income | | | 214,247 | | | | 123,655 | | | | 409,482 | | | | 117,569 | |
| | | | | | | | | | | | | | | | |
Fund Expenses | | | | | | | | | | | | | | | | |
Investment Management Fees | | | 13,090 | | | | 19,216 | | | | 47,060 | | | | 10,613 | |
Accounting & Transfer Agent Fees | | | 393 | | | | 1,581 | | | | 1,593 | | | | 600 | |
Custodian Fees | | | 698 | | | | 42 | | | | 2,368 | | | | 522 | |
Filing Fees | | | 43 | | | | 147 | | | | 152 | | | | 81 | |
Shareholders’ Reports | | | 61 | | | | 346 | | | | 185 | | | | 84 | |
Directors’/Trustees’ Fees & Expenses | | | 24 | | | | 64 | | | | 50 | | | | 17 | |
Professional Fees | | | 91 | | | | 115 | | | | 285 | | | | 72 | |
Previously Waived Fees Recovered by Advisor (Note C) | | | — | | | | 68 | | | | — | | | | — | |
Other | | | 145 | | | | 131 | | | | 400 | | | | 124 | |
| | | | | | | | | | | | | | | | |
Total Fund Expenses | | | 14,545 | | | | 21,710 | | | | 52,093 | | | | 12,113 | |
| | | | | | | | | | | | | | | | |
Fees Waived, Expenses Reimbursed by Advisor (Note C) | | | — | | | | 8,559 | | | | — | | | | — | |
Fees Paid Indirectly (Note C) | | | 211 | | | | 30 | | | | 101 | | | | 107 | |
| | | | | | | | | | | | | | | | |
Net Expenses | | | 14,334 | | | | 13,121 | | | | 51,992 | | | | 12,006 | |
| | | | | | | | | | | | | | | | |
Net Investment Income (Loss) | | | 199,913 | | | | 397,376 | | | | 357,490 | | | | 105,563 | |
| | | | | | | | | | | | | | | | |
Realized and Unrealized Gain (Loss) | | | | | | | | | | | | | | | | |
Capital Gain Distributions Received from Investment Securities | | | — | | | | 8,517 | | | | — | | | | — | |
Net Realized Gain (Loss) on: | | | | | | | | | | | | | | | | |
Investment Securities Sold** | | | (97,218 | ) | | | 71,264 | | | | 16,007 | | | | (2,689 | ) |
Affiliated Investment Companies Shares Sold | | | (101 | ) | | | 196,468 | | | | 9 | | | | (9 | ) |
Futures | | | (4,273 | ) | | | 174 | | | | (36,186 | ) | | | (3,680 | ) |
Foreign Currency Transactions | | | (5,807 | ) | | | — | | | | (19,023 | ) | | | (5,208 | ) |
Change in Unrealized Appreciation (Depreciation) of: | | | | | | | | | | | | | | | | |
Investment Securities and Foreign Currency | | | (1,783,196 | ) | | | (1,350,594 | ) | | | (2,899,988 | ) | | | (921,097 | ) |
Affiliated Investment Companies Shares | | | (106 | ) | | | (1,630,271 | ) | | | (167 | ) | | | (86 | ) |
Futures | | | 171 | | | | 1,144 | | | | (1,079 | ) | | | (387 | ) |
Translation of Foreign Currency-Denominated Amounts | | | (1,176 | ) | | | — | | | | (2,550 | ) | | | (575 | ) |
| | | | | | | | | | | | | | | | |
Net Realized and Unrealized Gain (Loss) | | | (1,891,706 | ) | | | (2,703,298 | ) | | | (2,942,977 | ) | | | (933,731 | ) |
| | | | | | | | | | | | | | | | |
Net Increase (Decrease) in Net Assets Resulting from Operations | | $ | (1,691,793 | ) | | $ | (2,305,922 | ) | | $ | (2,585,487 | ) | | $ | (828,168 | ) |
| | | | | | | | | | | | | | | | |
| ** | Net of foreign capital gain taxes withheld of $0, $0, $0 and $0, respectively. |
| # | Portion of income is from investment in affiliated fund. |
See accompanying Notes to Financial Statements.
110
DFA INVESTMENT DIMENSIONS GROUP INC.
STATEMENTS OF OPERATIONS
FOR THE YEAR ENDED OCTOBER 31, 2022
(Amounts in thousands)
| | | | | | | | | | | | | | | | |
| | | International
High Relative
Profitability
Portfolio# | | | World ex U.S.
Value Portfolio* | | | World ex U.S.
Core Equity
Portfolio# | | | World ex U.S.
Targeted Value
Portfolio# | |
Investment Income | | | | | | | | | | | | | | | | |
Net Investment Income Allocated from Affiliated Investment Companies | | | | | | | | | | | | | | | | |
Dividends (Net of Foreign Taxes Withheld of $0, $972, $0 and $0, respectively) | | | — | | | $ | 9,534 | | | | — | | | | — | |
Income from Securities Lending | | | — | | | | 129 | | | | — | | | | — | |
Expenses Allocated from Affiliated Investment Companies | | | — | | | | (416 | ) | | | — | | | | — | |
| | | | | | | | | | | | | | | | |
Income Distributions Received from Affiliated Investment Companies | | | — | | | | 807 | | | | — | | | | — | |
| | | | | | | | | | | | | | | | |
Total Net Investment Income Allocated and/or Distributions Received from Affiliated Investment Companies | | | — | | | | 10,054 | | | | — | | | | — | |
| | | | | | | | | | | | | | | | |
Fund Investment Income | | | | | | | | | | | | | | | | |
Dividends (Net of Foreign Taxes Withheld of $5,664, $0, $13,158 and $2,745, respectively) | | $ | 68,642 | | | | — | | | $ | 126,791 | | | $ | 24,077 | |
Income from Securities Lending | | | 685 | | | | — | | | | 2,677 | | | | 197 | |
| | | | | | | | | | | | | | | | |
Total Fund Investment Income | | | 69,327 | | | | — | | | | 129,468 | | | | 24,274 | |
| | | | | | | | | | | | | | | | |
Fund Expenses | | | | | | | | | | | | | | | | |
Investment Management Fees | | | 5,033 | | | | 815 | | | | 9,126 | | | | 2,895 | |
Accounting & Transfer Agent Fees | | | 370 | | | | 8 | | | | 584 | | | | 156 | |
Custodian Fees | | | 208 | | | | 25 | | | | 835 | | | | 376 | |
Filing Fees | | | 60 | | | | 23 | | | | 47 | | | | 36 | |
Shareholders’ Reports | | | 137 | | | | 10 | | | | 65 | | | | 50 | |
Directors’/Trustees’ Fees & Expenses | | | 24 | | | | 1 | | | | 27 | | | | 6 | |
Professional Fees | | | 42 | | | | 4 | | | | 136 | | | | 52 | |
Other | | | 90 | | | | 5 | | | | 171 | | | | 53 | |
| | | | | | | | | | | | | | | | |
Total Fund Expenses | | | 5,964 | | | | 891 | | | | 10,991 | | | | 3,624 | |
| | | | | | | | | | | | | | | | |
Fees Waived, Expenses Reimbursed by Advisor (Note C) | | | — | | | | 447 | | | | — | | | | — | |
Fees Paid Indirectly (Note C) | | | 19 | | | | — | | | | 34 | | | | 21 | |
| | | | | | | | | | | | | | | | |
Net Expenses | | | 5,945 | | | | 444 | | | | 10,957 | | | | 3,603 | |
| | | | | | | | | | | | | | | | |
Net Investment Income (Loss) | | | 63,382 | | | | 9,610 | | | | 118,511 | | | | 20,671 | |
| | | | | | | | | | | | | | | | |
Realized and Unrealized Gain (Loss) | | | | | | | | | | | | | | | | |
Capital Gain Distributions Received from Investment Securities | | | — | | | | 195 | | | | — | | | | — | |
Net Realized Gain (Loss) on: | | | | | | | | | | | | | | | | |
Investment Securities Sold** | | | (55,920 | ) | | | — | | | | 77,983 | | | | (12,143 | ) |
Affiliated Investment Companies Shares Sold | | | (25 | ) | | | 636 | | | | (24 | ) | | | (1 | ) |
Transactions Allocated from Affiliated Investment Company** | | | — | | | | (201 | ) | | | — | | | | — | |
Futures | | | 291 | | | | (44 | ) | | | (3,864 | ) | | | 174 | |
Foreign Currency Transactions | | | (936 | ) | | | — | | | | (4,896 | ) | | | (839 | ) |
Change in Unrealized Appreciation (Depreciation) of: | | | | | | | | | | | | | | | | |
Investment Securities and Foreign Currency | | | (536,106 | ) | | | — | | | | (1,093,022 | ) | | | (177,379 | ) |
Affiliated Investment Companies Shares | | | (47 | ) | | | (6,125 | ) | | | (95 | ) | | | (1 | ) |
Transactions Allocated from Affiliated Investment Company | | | — | | | | (42,768 | ) | | | — | | | | — | |
Futures | | | — | | | | — | | | | (167 | ) | | | (46 | ) |
Translation of Foreign Currency-Denominated Amounts | | | (283 | ) | | | — | | | | (568 | ) | | | 71 | |
| | | | | | | | | | | | | | | | |
Net Realized and Unrealized Gain (Loss) | | | (593,026 | ) | | | (48,307 | ) | | | (1,024,653 | ) | | | (190,164 | ) |
| | | | | | | | | | | | | | | | |
Net Increase (Decrease) in Net Assets Resulting from Operations | | $ | (529,644 | ) | | $ | (38,697 | ) | | $ | (906,142 | ) | | $ | (169,493 | ) |
| | | | | | | | | | | | | | | | |
| ** | Net of foreign capital gain taxes withheld of $0, $75, $223 and $429, respectively. |
| * | Investment Income and Realized and Unrealized Gain (Loss) were allocated from the Portfolio’s Master Fund (Affiliated Investment Company). |
| # | Portion of income is from investment in affiliated fund. |
See accompanying Notes to Financial Statements.
111
DFA INVESTMENT DIMENSIONS GROUP INC.
STATEMENTS OF OPERATIONS
FOR THE YEAR ENDED OCTOBER 31, 2022
(Amounts in thousands)
| | | | | | | | | | | | | | | | |
| | | World Core
Equity
Portfolio | | | Selectively
Hedged Global
Equity
Portfolio | | | Emerging
Markets
Portfolio* | | | Emerging
Markets Small
Cap Portfolio* | |
Investment Income | | | | | | | | | | | | | | | | |
Net Investment Income Allocated from Affiliated Investment Companies | | | | | | | | | | | | | | | | |
Dividends (Net of Foreign Taxes Withheld of $0, $0, $21,119 and $17,151, respectively) | | | — | | | $ | 12 | | | $ | 171,152 | | | $ | 124,897 | |
Income from Securities Lending | | | — | | | | — | | | | 4,373 | | | | 16,543 | |
Expenses Allocated from Affiliated Investment Companies | | | — | | | | — | | | | (7,914 | ) | | | (11,593 | ) |
| | | | | | | | | | | | | | | | |
Income Distributions Received from Affiliated Investment Companies | | $ | 23,655 | | | | 7,067 | | | | — | | | | — | |
| | | | | | | | | | | | | | | | |
Total Net Investment Income Allocated and/or Distributions Received from Affiliated Investment Companies | | | 23,655 | | | | 7,079 | | | | 167,611 | | | | 129,847 | |
| | | | | | | | | | | | | | | | |
Fund Expenses | | | | | | | | | | | | | | | | |
Investment Management Fees | | | 2,274 | | | | 732 | | | | 14,892 | | | | 23,202 | |
Accounting & Transfer Agent Fees | | | 156 | | | | 58 | | | | 664 | | | | 468 | |
Custodian Fees | | | 2 | | | | 1 | | | | — | | | | — | |
Filing Fees | | | 25 | | | | 23 | | | | 110 | | | | 51 | |
Shareholders’ Reports | | | 28 | | | | 11 | | | | 173 | | | | 48 | |
Directors’/Trustees’ Fees & Expenses | | | 8 | | | | 2 | | | | 22 | | | | 20 | |
Professional Fees | | | 10 | | | | 1 | | | | 67 | | | | 54 | |
Previously Waived Fees Recovered by Advisor (Note C) | | | 34 | | | | — | | | | — | | | | — | |
Other | | | 16 | | | | 5 | | | | 55 | | | | 35 | |
| | | | | | | | | | | | | | | | |
Total Fund Expenses | | | 2,553 | | | | 833 | | | | 15,983 | | | | 23,878 | |
| | | | | | | | | | | | | | | | |
Fees Waived, Expenses Reimbursed by Advisor (Note C) | | | 1,860 | | | | 608 | | | | 5,136 | | | | 8,926 | |
Fees Paid Indirectly (Note C) | | | — | | | | 2 | | | | — | | | | — | |
| | | | | | | | | | | | | | | | |
Net Expenses | | | 693 | | | | 223 | | | | 10,847 | | | | 14,952 | |
| | | | | | | | | | | | | | | | |
Net Investment Income (Loss) | | | 22,962 | | | | 6,856 | | | | 156,764 | | | | 114,895 | |
| | | | | | | | | | | | | | | | |
Realized and Unrealized Gain (Loss) | | | | | | | | | | | | | | | | |
Capital Gain Distributions Received from Affiliated Investment Companies | | | 16,695 | | | | 6,687 | | | | — | | | | — | |
Net Realized Gain (Loss) on: | | | | | | | | | | | | | | | | |
Affiliated Investment Companies Shares Sold | | | (8,828 | ) | | | 3,300 | | | | — | | | | — | |
Transactions Allocated from Affiliated Investment Company** | | | — | | | | — | | | | 17,009 | | | | 98,361 | |
Futures | | | (6 | ) | | | (251 | ) | | | — | | | | — | |
Forward Currency Contracts | | | — | | | | 11,432 | | | | — | | | | — | |
Change in Unrealized Appreciation (Depreciation) of: | | | | | | | | | | | | | | | | |
Affiliated Investment Companies Shares | | | (213,117 | ) | | | (71,420 | ) | | | — | | | | — | |
Transactions Allocated from Affiliated Investment Company | | | — | | | | — | | | | (1,618,027 | ) | | | (1,298,644 | ) |
Futures | | | — | | | | (234 | ) | | | — | | | | — | |
Forward Currency Contracts | | | — | | | | (243 | ) | | | — | | | | — | |
| | | | | | | | | | | | | | | | |
Net Realized and Unrealized Gain (Loss) | | | (205,256 | ) | | | (50,729 | ) | | | (1,601,018 | ) | | | (1,200,283 | ) |
| | | | | | | | | | | | | | | | |
Net Increase (Decrease) in Net Assets Resulting from Operations | | $ | (182,294 | ) | | $ | (43,873 | ) | | $ | (1,444,254 | ) | | $ | (1,085,388 | ) |
| | | | | | | | | | | | | | | | |
| ** | Net of foreign capital gain taxes withheld of $0, $0, $4,859 and $9,037, respectively. |
| * | Investment Income and Realized and Unrealized Gain (Loss) were allocated from the Portfolio’s Master Fund (Affiliated Investment Company). |
See accompanying Notes to Financial Statements.
112
DFA INVESTMENT DIMENSIONS GROUP INC.
STATEMENTS OF OPERATIONS
FOR THE YEAR ENDED OCTOBER 31, 2022
(Amounts in thousands)
| | | | | | | | | | | | | | | | |
| | | Emerging
Markets Value
Portfolio* | | | Emerging
Markets Core
Equity
Portfolio# | | | Emerging
Markets Targeted
Value Portfolio# | | | Emerging
Markets ex China Core
Equity Portfolioʊ# | |
Investment Income | | | | | | | | | | | | | | | | |
Net Investment Income Allocated from Affiliated Investment Companies | | | | | | | | | | | | | | | | |
Dividends (Net of Foreign Taxes Withheld of $62,596, $0, $0 and $0,respectively) | | $ | 571,745 | | | | — | | | | — | | | | — | |
Interest | | | 312 | | | | — | | | | — | | | | — | |
Income from Securities Lending | | | 12,239 | | | | — | | | | — | | | | — | |
Expenses Allocated from Affiliated Investment Companies | | | (17,755 | ) | | | — | | | | — | | | | — | |
| | | | | | | | | | | | | | | | |
Total Net Investment Income Allocated and/or Distributions Received from Affiliated Investment Companies | | | 566,541 | | | | — | | | | — | | | | — | |
| | | | | | | | | | | | | | | | |
Fund Investment Income | | | | | | | | | | | | | | | | |
Dividends (Net of Foreign Taxes Withheld of $0, $109,966, $996 and $1,862,respectively) | | | — | | | $ | 952,313 | | | $ | 6,904 | | | $ | 12,546 | |
Income from Securities Lending | | | — | | | | 38,970 | | | | 185 | | | | 58 | |
| | | | | | | | | | | | | | | | |
Total Fund Investment Income | | | — | | | | 991,283 | | | | 7,089 | | | | 12,604 | |
| | | | | | | | | | | | | | | | |
Fund Expenses | | | | | | | | | | | | | | | | |
Investment Management Fees | | | 46,138 | | | | 87,610 | | | | 1,092 | | | | 1,146 | |
Accounting & Transfer Agent Fees | | | 1,056 | | | | 3,691 | | | | 45 | | | | 78 | |
Custodian Fees | | | — | | | | 13,276 | | | | 138 | | | | 438 | |
Shareholder Servicing Fees | | | | | | | | | | | | | | | | |
Class R2 Shares | | | 34 | | | | — | | | | — | | | | — | |
Filing Fees | | | 140 | | | | 314 | | | | 29 | | | | 18 | |
Shareholders’ Reports | | | 152 | | | | 780 | | | | 23 | | | | 21 | |
Directors’/Trustees’ Fees & Expenses | | | 59 | | | | 123 | | | | 2 | | | | 6 | |
Professional Fees | | | 139 | | | | 493 | | | | 38 | | | | 16 | |
Organizational & Offering Costs | | | — | | | | — | | | | — | | | | 105 | |
Other | | | 78 | | | | 1,554 | | | | 11 | | | | 57 | |
| | | | | | | | | | | | | | | | |
Total Fund Expenses | | | 47,796 | | | | 107,841 | | | | 1,378 | | | | 1,885 | |
| | | | | | | | | | | | | | | | |
Fees Waived, Expenses Reimbursed by Advisor (Note C) | | | — | | | | — | | | | — | | | | 384 | |
Class R2 Shares | | | 14 | | | | — | | | | — | | | | — | |
Institutional Class Shares | | | 11,796 | | | | — | | | | — | | | | — | |
Fees Paid Indirectly (Note C) | | | — | | | | 150 | | | | 10 | | | | 13 | |
| | | | | | | | | | | | | | | | |
Net Expenses | | | 35,986 | | | | 107,691 | | | | 1,368 | | | | 1,488 | |
| | | | | | | | | | | | | | | | |
Net Investment Income (Loss) | | | 530,555 | | | | 883,592 | | | | 5,721 | | | | 11,116 | |
| | | | | | | | | | | | | | | | |
Realized and Unrealized Gain (Loss) | | | | | | | | | | | | | | | | |
Net Realized Gain (Loss) on: | | | | | | | | | | | | | | | | |
Investment Securities Sold** | | | — | | | | 75,499 | | | | 5,284 | | | | (19,163 | ) |
Affiliated Investment Companies Shares Sold | | | — | | | | (37 | ) | | | (1 | ) | | | — | |
Transactions Allocated from Affiliated Investment Company** | | | 351,369 | | | | — | | | | — | | | | — | |
Futures | | | — | | | | (37,872 | ) | | | (135 | ) | | | (495 | ) |
Foreign Currency Transactions | | | — | | | | (25,138 | ) | | | (127 | ) | | | (256 | ) |
Change in Unrealized Appreciation (Depreciation) of: | | | | | | | | | | | | | | | | |
Investment Securities and Foreign Currency | | | — | | | | (8,179,321 | ) | | | (60,418 | ) | | | (76,418 | ) |
Affiliated Investment Companies Shares | | | — | | | | (254 | ) | | | (1 | ) | | | (3 | ) |
Transactions Allocated from Affiliated Investment Company | | | (3,262,606 | ) | | | — | | | | — | | | | — | |
Futures | | | — | | | | (2,325 | ) | | | (54 | ) | | | — | |
Translation of Foreign Currency-Denominated Amounts | | | — | | | | (7 | ) | | | 259 | | | | (1 | ) |
| | | | | | | | | | | | | | | | |
Net Realized and Unrealized Gain (Loss) | | | (2,911,237 | ) | | | (8,169,455 | ) | | | (55,193 | ) | | | (96,336 | ) |
| | | | | | | | | | | | | | | | |
Net Increase (Decrease) in Net Assets Resulting from Operations | | $ | (2,380,682 | ) | | $ | (7,285,863 | ) | | $ | (49,472 | ) | | $ | (85,220 | ) |
| | | | | | | | | | | | | | | | |
| ** | Net of foreign capital gain taxes withheld of $11,422, $11,895, $349 and $6, respectively. |
| ʊ | The Portfolio commenced operations on November 15, 2021. |
| * | Investment Income and Realized and Unrealized Gain (Loss) were allocated from the Portfolio’s Master Fund (Affiliated Investment Company). |
| # | Portion of income is from investment in affiliated fund. |
See accompanying Notes to Financial Statements.
113
DFA INVESTMENT DIMENSIONS GROUP INC.
STATEMENTS OF CHANGES IN NET ASSETS
(Amounts in thousands)
| | | | | | | | | | | | | | | | | | | | | | | | |
| | | Large Cap International
Portfolio | | | International Core Equity
Portfolio | | | Global Small Company
Portfolio*** | |
| | | Year | | | Year | | | Year | | | Year | | | Year | | | Year | |
| | | Ended | | | Ended | | | Ended | | | Ended | | | Ended | | | Ended | |
| | | Oct 31, | | | Oct 31, | | | Oct 31, | | | Oct 31, | | | Oct 31, | | | Oct 31, | |
| | | 2022 | | | 2021 | | | 2022 | | | 2021 | | | 2022 | | | 2021 | |
Increase (Decrease) in Net Assets | | | | | | | | | | | | | | | | | | | | | | | | |
Operations: | | | | | | | | | | | | | | | | | | | | | | | | |
Net Investment Income (Loss) | | $ | 173,632 | | | $ | 152,804 | | | $ | 1,015,999 | | | $ | 828,078 | | | $ | 1,497 | | | $ | 1,172 | |
Capital Gain Distributions Received from Investment Securities | | | — | | | | — | | | | — | | | | — | | | | 3,071 | | | | — | |
Net Realized Gain (Loss) on: | | | | | | | | | | | | | | | | | | | | | | | | |
Investment Securities Sold*,** | | | (72,788 | ) | | | 88,328 | | | | 425,701 | | | | 210,041 | | | | — | | | | — | |
Affiliated Investment Companies Shares Sold | | | (41 | ) | | | (10 | ) | | | (333 | ) | | | (21 | ) | | | (1,418 | ) | | | 336 | |
Transactions Allocated from Affiliated Investment Company*,** | | | — | | | | — | | | | — | | | | — | | | | (2,875 | ) | | | 2,035 | |
Futures | | | (12,682 | ) | | | 14,606 | | | | (44,185 | ) | | | 79,338 | | | | 34 | | | | 35 | |
Foreign Currency Transactions | | | (5,948 | ) | | | 515 | | | | (47,812 | ) | | | 769 | | | | — | | | | — | |
Change in Unrealized Appreciation (Depreciation) of: | | | | | | | | | | | | | | | | | | | | | | | | |
Investment Securities and Foreign Currency | | | (1,377,779 | ) | | | 1,375,966 | | | | (9,090,912 | ) | | | 8,427,366 | | | | — | | | | — | |
Affiliated Investment Companies Shares | | | (125 | ) | | | (9 | ) | | | (769 | ) | | | (71 | ) | | | (7,951 | ) | | | 14,525 | |
Transactions Allocated from Affiliated Investment Company | | | — | | | | — | | | | — | | | | — | | | | (8,701 | ) | | | 5,844 | |
Futures | | | (202 | ) | | | 2,380 | | | | (3,107 | ) | | | 10,863 | | | | — | | | | — | |
Translation of Foreign Currency-Denominated Amounts | | | (977 | ) | | | (315 | ) | | | (7,919 | ) | | | (1,813 | ) | | | — | | | | — | |
| | | | | | | | | | | | | | | | | | | | | | | | |
Net Increase (Decrease) in Net Assets Resulting from Operations | | | (1,296,910 | ) | | | 1,634,265 | | | | (7,753,337 | ) | | | 9,554,550 | | | | (16,343 | ) | | | 23,947 | |
| | | | | | | | | | | | | | | | | | | | | | | | |
Distributions: | | | | | | | | | | | | | | | | | | | | | | | | |
Institutional Class Shares | | | (180,306 | ) | | | (144,492 | ) | | | (1,137,900 | ) | | | (761,635 | ) | | | (3,556 | ) | | | (727 | ) |
Capital Share Transactions (1): | | | | | | | | | | | | | | | | | | | | | | | | |
Shares Issued | | | 1,451,460 | | | | 711,780 | | | | 6,677,971 | | | | 5,674,163 | | | | 23,030 | | | | 44,864 | |
Shares Issued in Lieu of Cash Distributions | | | 166,053 | | | | 134,111 | | | | 1,093,925 | | | | 732,468 | | | | 3,556 | | | | 727 | |
Shares Redeemed | | | (1,351,800 | ) | | | (1,003,971 | ) | | | (7,302,036 | ) | | | (5,535,524 | ) | | | (23,398 | ) | | | (12,748 | ) |
| | | | | | | | | | | | | | | | | | | | | | | | |
Net Increase (Decrease) from Capital Share Transactions | | | 265,713 | | | | (158,080 | ) | | | 469,860 | | | | 871,107 | | | | 3,188 | | | | 32,843 | |
| | | | | | | | | | | | | | | | | | | | | | | | |
Total Increase (Decrease) in Net Assets | | | (1,211,503 | ) | | | 1,331,693 | | | | (8,421,377 | ) | | | 9,664,022 | | | | (16,711 | ) | | | 56,063 | |
Net Assets | | | | | | | | | | | | | | | | | | | | | | | | |
Beginning of Year | | | 6,032,181 | | | | 4,700,488 | | | | 34,629,583 | | | | 24,965,561 | | | | 99,631 | | | | 43,568 | |
| | | | | | | | | | | | | | | | | | | | | | | | |
End of Year | | $ | 4,820,678 | | | $ | 6,032,181 | | | $ | 26,208,206 | | | $ | 34,629,583 | | | $ | 82,920 | | | $ | 99,631 | |
| | | | | | | | | | | | | | | | | | | | | | | | |
(1) Shares Issued and Redeemed: | | | | | | | | | | | | | | | | | | | | | | | | |
Shares Issued | | | 60,402 | | | | 26,957 | | | | 474,529 | | | | 365,542 | | | | 1,720 | | | | 3,098 | |
Shares Issued in Lieu of Cash Distributions | | | 7,097 | | | | 5,054 | | | | 80,934 | | | | 47,003 | | | | 241 | | | | 58 | |
Shares Redeemed | | | (56,865 | ) | | | (38,575 | ) | | | (529,452 | ) | | | (359,922 | ) | | | (1,759 | ) | | | (886 | ) |
| | | | | | | | | | | | | | | | | | | | | | | | |
Net Increase (Decrease) from Shares Issued and Redeemed | | | 10,634 | | | | (6,564 | ) | | | 26,011 | | | | 52,623 | | | | 202 | | | | 2,270 | |
| | | | | | | | | | | | | | | | | | | | | | | | |
| * | Net of foreign capital gain taxes withheld for the fiscal year ended October 31, 2022 of $0, $0 and $22, respectively. |
| ** | Net of foreign capital gain taxes withheld for the fiscal year ended October 31, 2021 of $0, $0 and $5, respectively. |
| *** | Investment Income and Realized and Unrealized Gain (Loss) were allocated from the Portfolio’s Master Fund (Affiliated Investment Company). |
See accompanying Notes to Financial Statements.
114
DFA INVESTMENT DIMENSIONS GROUP INC.
STATEMENTS OF CHANGES IN NET ASSETS
(Amounts in thousands)
| | | | | | | | | | | | | | | | | | | | | | | | |
| | | International Small | | | Japanese Small | | | Asia Pacific Small | |
| | | Company Portfolio*** | | | Company Portfolio*** | | | Company Portfolio*** | |
| | | Year | | | Year | | | Year | | | Year | | | Year | | | Year | |
| | | Ended | | | Ended | | | Ended | | | Ended | | | Ended | | | Ended | |
| | | Oct 31, | | | Oct 31, | | | Oct 31, | | | Oct 31, | | | Oct 31, | | | Oct 31, | |
| | | 2022 | | | 2021 | | | 2022 | | | 2021 | | | 2022 | | | 2021 | |
Increase (Decrease) in Net Assets | | | | | | | | | | | | | | | | | | | | | | | | |
Operations: | | | | | | | | | | | | | | | | | | | | | | | | |
Net Investment Income (Loss) | | $ | 316,287 | | | $ | 238,915 | | | $ | 7,212 | | | $ | 8,010 | | | $ | 12,767 | | | $ | 13,100 | |
Net Realized Gain (Loss) on: | | | | | | | | | | | | | | | | | | | | | | | | |
Transactions Allocated from Affiliated Investment Company*,** | | | 164,767 | | | | 837,220 | | | | 12,397 | | | | 17,921 | | | | 14,514 | | | | 49,285 | |
Futures | | | (19,889 | ) | | | 26,350 | | | | — | | | | — | | | | — | | | | — | |
Change in Unrealized Appreciation (Depreciation) of: | | | | | | | | | | | | | | | | | | | | | | | | |
Transactions Allocated from Affiliated Investment Company | | | (3,930,327 | ) | | | 2,927,439 | | | | (107,385 | ) | | | 31,604 | | | | (124,402 | ) | | | 75,175 | |
Futures | | | 271 | | | | 3,416 | | | | — | | | | — | | | | — | | | | — | |
| | | | | | | | | | | | | | | | | | | | | | | | |
Net Increase (Decrease) in Net Assets Resulting from Operations | | | (3,468,891 | ) | | | 4,033,340 | | | | (87,776 | ) | | | 57,535 | | | | (97,121 | ) | | | 137,560 | |
| | | | | | | | | | | | | | | | | | | | | | | | |
Distributions: | | | | | | | | | | | | | | | | | | | | | | | | |
Institutional Class Shares | | | (851,167 | ) | | | (220,133 | ) | | | (18,487 | ) | | | (10,581 | ) | | | (42,269 | ) | | | (12,808 | ) |
Capital Share Transactions (1): | | | | | | | | | | | | | | | | | | | | | | | | |
Shares Issued | | | 2,335,205 | | | | 2,604,837 | | | | 25,594 | | | | 19,129 | | | | 4,042 | | | | 13,533 | |
Shares Issued in Lieu of Cash Distributions | | | 834,024 | | | | 214,868 | | | | 18,485 | | | | 10,580 | | | | 42,264 | | | | 12,805 | |
Shares Redeemed | | | (2,994,929 | ) | | | (3,315,191 | ) | | | (50,102 | ) | | | (163,522 | ) | | | (58,204 | ) | | | (148,282 | ) |
| | | | | | | | | | | | | | | | | | | | | | | | |
Net Increase (Decrease) from Capital Share Transactions | | | 174,300 | | | | (495,486 | ) | | | (6,023 | ) | | | (133,813 | ) | | | (11,898 | ) | | | (121,944 | ) |
| | | | | | | | | | | | | | | | | | | | | | | | |
Total Increase (Decrease) in Net Assets | | | (4,145,758 | ) | | | 3,317,721 | | | | (112,286 | ) | | | (86,859 | ) | | | (151,288 | ) | | | 2,808 | |
Net Assets | | | | | | | | | | | | | | | | | | | | | | | | |
Beginning of Year | | | 13,465,853 | | | | 10,148,132 | | | | 379,837 | | | | 466,696 | | | | 381,490 | | | | 378,682 | |
| | | | | | | | | | | | | | | | | | | | | | | | |
End of Year | | $ | 9,320,095 | | | $ | 13,465,853 | | | $ | 267,551 | | | $ | 379,837 | | | $ | 230,202 | | | $ | 381,490 | |
| | | | | | | | | | | | | | | | | | | | | | | | |
(1) Shares Issued and Redeemed: | | | | | | | | | | | | | | | | | | | | | | | | |
Shares Issued | | | 123,348 | | | | 116,406 | | | | 1,240 | | | | 736 | | | | 194 | | | | 520 | |
Shares Issued in Lieu of Cash Distributions | | | 41,490 | | | | 10,453 | | | | 765 | | | | 418 | | | | 1,874 | | | | 559 | |
Shares Redeemed | | | (157,815 | ) | | | (151,391 | ) | | | (2,408 | ) | | | (6,381 | ) | | | (2,997 | ) | | | (5,727 | ) |
| | | | | | | | | | | | | | | | | | | | | | | | |
Net Increase (Decrease) from Shares Issued and Redeemed | | | 7,023 | | | | (24,532 | ) | | | (403 | ) | | | (5,227 | ) | | | (929 | ) | | | (4,648 | ) |
| | | | | | | | | | | | | | | | | | | | | | | | |
| * | Net of foreign capital gain taxes withheld for the fiscal year ended October 31, 2022 of $0, $0 and $0, respectively. |
| ** | Net of foreign capital gain taxes withheld for the fiscal year ended October 31, 2021 of $0, $0 and $0, respectively. |
| *** | Investment Income and Realized and Unrealized Gain (Loss) were allocated from the Portfolio’s Master Fund (Affiliated Investment Company). |
See accompanying Notes to Financial Statements.
115
DFA INVESTMENT DIMENSIONS GROUP INC.
STATEMENTS OF CHANGES IN NET ASSETS
(Amounts in thousands)
| | | | | | | | | | | | | | | | | | | | | | | | |
| | | United Kingdom Small
Company Portfolio*** | | | Continental Small Company
Portfolio*** | | | DFA International Real
Estate Securities Portfolio | |
| | | Year | | | Year | | | Year | | | Year | | | Year | | | Year | |
| | | Ended | | | Ended | | | Ended | | | Ended | | | Ended | | | Ended | |
| | | Oct 31, | | | Oct 31, | | | Oct 31, | | | Oct 31, | | | Oct 31, | | | Oct 31, | |
| | | 2022 | | | 2021 | | | 2022 | | | 2021 | | | 2022 | | | 2021 | |
Increase (Decrease) in Net Assets | | | | | | | | | | | | | | | | | | | | | | | | |
Operations: | | | | | | | | | | | | | | | | | | | | | | | | |
Net Investment Income (Loss) | | $ | 1,003 | | | $ | 658 | | | $ | 20,054 | | | $ | 13,506 | | | $ | 199,913 | | | $ | 185,202 | |
Net Realized Gain (Loss) on: | | | | | | | | | | | | | | | | | | | | | | | | |
Investment Securities Sold*,** | | | — | | | | — | | | | — | | | | — | | | | (97,218 | ) | | | (56,022 | ) |
Affiliated Investment Companies Shares Sold | | | — | | | | — | | | | — | | | | — | | | | (101 | ) | | | (43 | ) |
Transactions Allocated from Affiliated Investment Company*,** | | | (2,989 | ) | | | 1,117 | | | | (26,021 | ) | | | 44,052 | | | | — | | | | — | |
Futures | | | — | | | | — | | | | — | | | | — | | | | (4,273 | ) | | | 13,260 | |
Foreign Currency Transactions | | | — | | | | — | | | | — | | | | — | | | | (5,807 | ) | | | (485 | ) |
Change in Unrealized Appreciation (Depreciation) of: | | | | | | | | | | | | | | | | | | | | | | | | |
Investment Securities and Foreign Currency | | | — | | | | — | | | | — | | | | — | | | | (1,783,196 | ) | | | 1,378,475 | |
Affiliated Investment Companies Shares | | | — | | | | — | | | | — | | | | — | | | | (106 | ) | | | (2 | ) |
Transactions Allocated from Affiliated Investment Company | | | (9,155 | ) | | | 7,530 | | | | (261,540 | ) | | | 216,160 | | | | — | | | | — | |
Futures | | | — | | | | — | | | | — | | | | — | | | | 171 | | | | 3,086 | |
Translation of Foreign Currency-Denominated Amounts | | | — | | | | — | | | | — | | | | — | | | | (1,176 | ) | | | (414 | ) |
| | | | | | | | | | | | | | | | | | | | | | | | |
Net Increase (Decrease) in Net Assets Resulting from Operations | | | (11,141 | ) | | | 9,305 | | | | (267,507 | ) | | | 273,718 | | | | (1,691,793 | ) | | | 1,523,057 | |
| | | | | | | | | | | | | | | | | | | | | | | | |
Distributions: | | | | | | | | | | | | | | | | | | | | | | | | |
Institutional Class Shares | | | (1,908 | ) | | | (589 | ) | | | (37,480 | ) | | | (13,461 | ) | | | (447,007 | ) | | | — | |
Capital Share Transactions (1): | | | | | | | | | | | | | | | | | | | | | | | | |
Shares Issued | | | 2,169 | | | | 26,424 | | | | 69,996 | | | | 76,760 | | | | 1,001,675 | | | | 714,047 | |
Shares Issued in Lieu of Cash Distributions | | | 1,908 | | | | 588 | | | | 37,477 | | | | 13,460 | | | | 444,430 | | | | — | |
Shares Redeemed | | | (16,763 | ) | | | (8,462 | ) | | | (53,922 | ) | | | (20,462 | ) | | | (842,621 | ) | | | (896,488 | ) |
| | | | | | | | | | | | | | | | | | | | | | | | |
Net Increase (Decrease) from Capital Share Transactions | | | (12,686 | ) | | | 18,550 | | | | 53,551 | | | | 69,758 | | | | 603,484 | | | | (182,441 | ) |
| | | | | | | | | | | | | | | | | | | | | | | | |
Total Increase (Decrease) in Net Assets | | | (25,735 | ) | | | 27,266 | | | | (251,436 | ) | | | 330,015 | | | | (1,535,316 | ) | | | 1,340,616 | |
Net Assets | | | | | | | | | | | | | | | | | | | | | | | | |
Beginning of Year | | | 44,133 | | | | 16,867 | | | | 867,759 | | | | 537,744 | | | | 5,987,464 | | | | 4,646,848 | |
| | | | | | | | | | | | | | | | | | | | | | | | |
End of Year | | $ | 18,398 | | | $ | 44,133 | | | $ | 616,323 | | | $ | 867,759 | | | $ | 4,452,148 | | | $ | 5,987,464 | |
| | | | | | | | | | | | | | | | | | | | | | | | |
(1) Shares Issued and Redeemed: | | | | | | | | | | | | | | | | | | | | | | | | |
Shares Issued | | | 97 | | | | 855 | | | | 2,142 | | | | 2,229 | | | | 242,147 | | | | 148,690 | |
Shares Issued in Lieu of Cash Distributions | | | 71 | | | | 20 | | | | 1,270 | | | | 418 | | | | 96,826 | | | | — | |
Shares Redeemed | | | (634 | ) | | | (274 | ) | | | (2,058 | ) | | | (622 | ) | | | (209,429 | ) | | | (192,731 | ) |
| | | | | | | | | | | | | | | | | | | | | | | | |
Net Increase (Decrease) from Shares Issued and Redeemed | | | (466 | ) | | | 601 | | | | 1,354 | | | | 2,025 | | | | 129,544 | | | | (44,041 | ) |
| | | | | | | | | | | | | | | | | | | | | | | | |
| * | Net of foreign capital gain taxes withheld for the fiscal year ended October 31, 2022 of $0, $0 and $0, respectively. |
| ** | Net of foreign capital gain taxes withheld for the fiscal year ended October 31, 2021 of $0, $0 and $0, respectively. |
| *** | Investment Income and Realized and Unrealized Gain (Loss) were allocated from the Portfolio’s Master Fund (Affiliated Investment Company). |
See accompanying Notes to Financial Statements.
116
DFA INVESTMENT DIMENSIONS GROUP INC.
STATEMENTS OF CHANGES IN NET ASSETS
(Amounts in thousands)
| | | | | | | | | | | | | | | | | | | | | | | | |
| | | DFA Global Real Estate
Securities Portfolio | | | DFA International Small Cap
Value Portfolio | | | International Vector Equity
Portfolio | |
| | | Year | | | Year | | | Year | | | Year | | | Year | | | Year | |
| | | Ended | | | Ended | | | Ended | | | Ended | | | Ended | | | Ended | |
| | | Oct 31, | | | Oct 31, | | | Oct 31, | | | Oct 31, | | | Oct 31, | | | Oct 31, | |
| | | 2022 | | | 2021 | | | 2022 | | | 2021 | | | 2022 | | | 2021 | |
Increase (Decrease) in Net Assets | | | | | | | | | | | | | | | | | | | | | | | | |
Operations: | | | | | | | | | | | | | | | | | | | | | | | | |
Net Investment Income (Loss) | | $ | 397,376 | | | $ | 124,365 | | | $ | 357,490 | | | $ | 261,889 | | | $ | 105,563 | | | $ | 82,679 | |
Capital Gain Distributions Received from Investment Securities | | | 8,517 | | | | 1,045 | | | | — | | | | — | | | | — | | | | — | |
Net Realized Gain (Loss) on: | | | | | | | | | | | | | | | | | | | | | | | | |
Investment Securities Sold*,** | | | 71,264 | | | | 43,747 | | | | 16,007 | | | | 541,397 | | | | (2,689 | ) | | | 191,536 | |
Affiliated Investment Companies Shares Sold | | | 196,468 | | | | 60,992 | | | | 9 | | | | (1 | ) | | | (9 | ) | | | (7 | ) |
Futures | | | 174 | | | | 1,671 | | | | (36,186 | ) | | | 26,234 | | | | (3,680 | ) | | | (437 | ) |
Foreign Currency Transactions | | | — | | | | — | | | | (19,023 | ) | | | 1,071 | | | | (5,208 | ) | | | 49 | |
Change in Unrealized Appreciation (Depreciation) of: | | | | | | | | | | | | | | | | | | | | | | | | |
Investment Securities and Foreign Currency | | | (1,350,594 | ) | | | 1,755,986 | | | | (2,899,988 | ) | | | 3,392,048 | | | | (921,097 | ) | | | 860,557 | |
Affiliated Investment Companies Shares | | | (1,630,271 | ) | | | 1,097,358 | | | | (167 | ) | | | (25 | ) | | | (86 | ) | | | (8 | ) |
Futures | | | 1,144 | | | | — | | | | (1,079 | ) | | | 9,695 | | | | (387 | ) | | | 826 | |
Translation of Foreign Currency-Denominated Amounts | | | — | | | | — | | | | (2,550 | ) | | | (1,012 | ) | | | (575 | ) | | | (279 | ) |
| | | | | | | | | | | | | | | | | | | | | | | | |
Net Increase (Decrease) in Net Assets Resulting from Operations | | | (2,305,922 | ) | | | 3,085,164 | | | | (2,585,487 | ) | | | 4,231,296 | | | | (828,168 | ) | | | 1,134,916 | |
| | | | | | | | | | | | | | | | | | | | | | | | |
Distributions: | | | | | | | | | | | | | | | | | | | | | | | | |
Institutional Class Shares | | | (480,433 | ) | | | (186,953 | ) | | | (516,572 | ) | | | (258,254 | ) | | | (187,309 | ) | | | (74,200 | ) |
Capital Share Transactions (1): | | | | | | | | | | | | | | | | | | | | | | | | |
Shares Issued | | | 2,104,042 | | | | 2,211,113 | | | | 2,106,642 | | | | 1,538,249 | | | | 877,531 | | | | 397,948 | |
Shares Issued in Lieu of Cash Distributions | | | 461,594 | | | | 179,038 | | | | 455,244 | | | | 226,985 | | | | 186,180 | | | | 73,824 | |
Shares Redeemed | | | (2,445,794 | ) | | | (1,976,601 | ) | | | (2,579,838 | ) | | | (2,841,493 | ) | | | (882,093 | ) | | | (538,557 | ) |
| | | | | | | | | | | | | | | | | | | | | | | | |
Net Increase (Decrease) from Capital Share Transactions | | | 119,842 | | | | 413,550 | | | | (17,952 | ) | | | (1,076,259 | ) | | | 181,618 | | | | (66,785 | ) |
| | | | | | | | | | | | | | | | | | | | | | | | |
Total Increase (Decrease) in Net Assets | | | (2,666,513 | ) | | | 3,311,761 | | | | (3,120,011 | ) | | | 2,896,783 | | | | (833,859 | ) | | | 993,931 | |
Net Assets | | | | | | | | | | | | | | | | | | | | | | | | |
Beginning of Year | | | 10,537,586 | | | | 7,225,825 | | | | 12,784,711 | | | | 9,887,928 | | | | 3,716,790 | | | | 2,722,859 | |
| | | | | | | | | | | | | | | | | | | | | | | | |
End of Year | | $ | 7,871,073 | | | $ | 10,537,586 | | | $ | 9,664,700 | | | $ | 12,784,711 | | | $ | 2,882,931 | | | $ | 3,716,790 | |
| | | | | | | | | | | | | | | | | | | | | | | | |
(1) Shares Issued and Redeemed: | | | | | | | | | | | | | | | | | | | | | | | | |
Shares Issued | | | 180,469 | | | | 189,077 | | | | 109,457 | | | | 74,227 | | | | 73,372 | | | | 29,258 | |
Shares Issued in Lieu of Cash Distributions | | | 35,644 | | | | 16,811 | | | | 23,531 | | | | 11,757 | | | | 14,949 | | | | 5,458 | |
Shares Redeemed | | | (210,655 | ) | | | (168,470 | ) | | | (135,322 | ) | | | (140,273 | ) | | | (74,366 | ) | | | (39,764 | ) |
| | | | | | | | | | | | | | | | | | | | | | | | |
Net Increase (Decrease) from Shares Issued and Redeemed | | | 5,458 | | | | 37,418 | | | | (2,334 | ) | | | (54,289 | ) | | | 13,955 | | | | (5,048 | ) |
| | | | | | | | | | | | | | | | | | | | | | | | |
| * | Net of foreign capital gain taxes withheld for the fiscal year ended October 31, 2022 of $0, $0 and $0, respectively. |
| ** | Net of foreign capital gain taxes withheld for the fiscal year ended October 31, 2021 of $0, $0 and $0, respectively. |
See accompanying Notes to Financial Statements.
117
DFA INVESTMENT DIMENSIONS GROUP INC.
STATEMENTS OF CHANGES IN NET ASSETS
(Amounts in thousands)
| | | | | | | | | | | | | | | | | | | | | | | | |
| | | International High Relative
Profitability Portfolio | | | World ex U.S.Value
Portfolio*** | | | World ex U.S. Core Equity
Portfolio | |
| | | Year | | | Year | | | Year | | | Year | | | Year | | | Year | |
| | | Ended | | | Ended | | | Ended | | | Ended | | | Ended | | | Ended | |
| | | Oct 31, | | | Oct 31, | | | Oct 31, | | | Oct 31, | | | Oct 31, | | | Oct 31, | |
| | | 2022 | | | 2021 | | | 2022 | | | 2021 | | | 2022 | | | 2021 | |
Increase (Decrease) in Net Assets | | | | | | | | | | | | | | | | | | | | | | | | |
Operations: | | | | | | | | | | | | | | | | | | | | | | | | |
Net Investment Income (Loss) | | $ | 63,382 | | | $ | 45,392 | | | $ | 9,610 | | | $ | 9,084 | | | $ | 118,511 | | | $ | 98,566 | |
Capital Gain Distributions Received from Investment Securities | | | — | | | | — | | | | 195 | | | | — | | | | — | | | | — | |
Net Realized Gain (Loss) on: | | | | | | | | | | | | | | | | | | | | | | | | |
Investment Securities Sold*,** | | | (55,920 | ) | | | 43,197 | | | | — | | | | — | | | | 77,983 | | | | 21,498 | |
Affiliated Investment Companies Shares Sold | | | (25 | ) | | | (6 | ) | | | 636 | | | | 252 | | | | (24 | ) | | | (2 | ) |
Transactions Allocated from Affiliated Investment Company*,** | | | — | | | | — | | | | (201 | ) | | | 8,125 | | | | — | | | | — | |
Futures | | | 291 | | | | 2,062 | | | | (44 | ) | | | — | | | | (3,864 | ) | | | 8,882 | |
Foreign Currency Transactions | | | (936 | ) | | | (81 | ) | | | — | | | | — | | | | (4,896 | ) | | | (357 | ) |
Change in Unrealized Appreciation (Depreciation) of: | | | | | | | | | | | | | | | | | | | | | | | | |
Investment Securities and Foreign Currency | | | (536,106 | ) | | | 399,054 | | | | — | | | | — | | | | (1,093,022 | ) | | | 991,909 | |
Affiliated Investment Companies Shares | | | (47 | ) | | | (2 | ) | | | (6,125 | ) | | | 7,908 | | | | (95 | ) | | | (6 | ) |
Transactions Allocated from Affiliated Investment Company | | | — | | | | — | | | | (42,768 | ) | | | 68,735 | | | | — | | | | — | |
Futures | | | — | | | | 145 | | | | — | | | | — | | | | (167 | ) | | | 1,632 | |
Translation of Foreign Currency-Denominated Amounts | | | (283 | ) | | | (61 | ) | | | — | | | | — | | | | (568 | ) | | | (210 | ) |
| | | | | | | | | | | | | | | | | | | | | | | | |
Net Increase (Decrease) in Net Assets Resulting from Operations | | | (529,644 | ) | | | 489,700 | | | | (38,697 | ) | | | 94,104 | | | | (906,142 | ) | | | 1,121,912 | |
| | | | | | | | | | | | | | | | | | | | | | | | |
Distributions: | | | | | | | | | | | | | | | | | | | | | | | | |
Institutional Class Shares | | | (79,006 | ) | | | (43,180 | ) | | | (10,666 | ) | | | (8,755 | ) | | | (119,142 | ) | | | (98,429 | ) |
Capital Share Transactions (1): | | | | | | | | | | | | | | | | | | | | | | | | |
Shares Issued | | | 699,881 | | | | 559,296 | | | | 40,039 | | | | 60,323 | | | | 732,628 | | | | 608,060 | |
Shares Issued in Lieu of Cash Distributions | | | 77,582 | | | | 42,393 | | | | 10,666 | | | | 8,749 | | | | 118,577 | | | | 97,865 | |
Shares Redeemed | | | (745,903 | ) | | | (339,830 | ) | | | (115,749 | ) | | | (52,670 | ) | | | (793,027 | ) | | | (850,479 | ) |
| | | | | | | | | | | | | | | | | | | | | | | | |
Net Increase (Decrease) from Capital Share Transactions | | | 31,560 | | | | 261,859 | | | | (65,044 | ) | | | 16,402 | | | | 58,178 | | | | (144,554 | ) |
| | | | | | | | | | | | | | | | | | | | | | | | |
Total Increase (Decrease) in Net Assets | | | (577,090 | ) | | | 708,379 | | | | (114,407 | ) | | | 101,751 | | | | (967,106 | ) | | | 878,929 | |
Net Assets | | | | | | | | | | | | | | | | | | | | | | | | |
Beginning of Year | | | 2,183,724 | | | | 1,475,345 | | | | 308,666 | | | | 206,915 | | | | 4,089,166 | | | | 3,210,237 | |
| | | | | | | | | | | | | | | | | | | | | | | | |
End of Year | | $ | 1,606,634 | | | $ | 2,183,724 | | | $ | 194,259 | | | $ | 308,666 | | | $ | 3,122,060 | | | $ | 4,089,166 | |
| | | | | | | | | | | | | | | | | | | | | | | | |
(1) Shares Issued and Redeemed: | | | | | | | | | | | | | | | | | | | | | | | | |
Shares Issued | | | 57,992 | | | | 42,975 | | | | 3,535 | | | | 4,967 | | | | 60,965 | | | | 45,421 | |
Shares Issued in Lieu of Cash Distributions | | | 6,680 | | | | 3,204 | | | | 952 | | | | 723 | | | | 10,302 | | | | 7,267 | |
Shares Redeemed | | | (64,934 | ) | | | (25,822 | ) | | | (9,687 | ) | | | (4,335 | ) | | | (65,101 | ) | | | (64,633 | ) |
| | | | | | | | | | | | | | | | | | | | | | | | |
Net Increase (Decrease) from Shares Issued and Redeemed | | | (262 | ) | | | 20,357 | | | | (5,200 | ) | | | 1,355 | | | | 6,166 | | | | (11,945 | ) |
| | | | | | | | | | | | | | | | | | | | | | | | |
| * | Net of foreign capital gain taxes withheld for the fiscal year ended October 31, 2022 of $0, $75 and $223, respectively. |
| ** | Net of foreign capital gain taxes withheld for the fiscal year ended October 31, 2021 of $0, $84 and $16, respectively. |
| *** | Investment Income and Realized and Unrealized Gain (Loss) were allocated from the Portfolio’s Master Fund (Affiliated Investment Company). |
See accompanying Notes to Financial Statements.
118
DFA INVESTMENT DIMENSIONS GROUP INC.
STATEMENTS OF CHANGES IN NET ASSETS
(Amounts in thousands)
| | | | | | | | | | | | | | | | | | | | | | | | |
| | | World ex U.S. Targeted
Value Portfolio | | | World Core Equity
Portfolio | | | Selectively Hedged
Global Equity Portfolio | |
| | | Year | | | Year | | | Year | | | Year | | | Year | | | Year | |
| | | Ended | | | Ended | | | Ended | | | Ended | | | Ended | | | Ended | |
| | | Oct 31, | | | Oct 31, | | | Oct 31, | | | Oct 31, | | | Oct 31, | | | Oct 31, | |
| | | 2022 | | | 2021 | | | 2022 | | | 2021 | | | 2022 | | | 2021 | |
Increase (Decrease) in Net Assets | | | | | | | | | | | | | | | | | | | | | | | | |
Operations: | | | | | | | | | | | | | | | | | | | | | | | | |
Net Investment Income (Loss) | | $ | 20,671 | | | $ | 15,690 | | | $ | 22,962 | | | $ | 16,261 | | | $ | 6,856 | | | $ | 5,395 | |
Capital Gain Distributions Received from Investment Securities | | | — | | | | — | | | | 16,695 | | | | — | | | | 6,687 | | | | — | |
Net Realized Gain (Loss) on: | | | | | | | | | | | | | | | | | | | | | | | | |
Investment Securities Sold*,** | | | (12,143 | ) | | | 42,367 | | | | — | | | | — | | | | — | | | | — | |
Affiliated Investment Companies Shares Sold | | | (1 | ) | | | — | | | | (8,828 | ) | | | 10,552 | | | | 3,300 | | | | 15,611 | |
Futures | | | 174 | | | | 81 | | | | (6 | ) | | | (18 | ) | | | (251 | ) | | | 1,247 | |
Foreign Currency Transactions | | | (839 | ) | | | (148 | ) | | | — | | | | — | | | | — | | | | — | |
Forward Currency Contracts | | | — | | | | — | | | | — | | | | — | | | | 11,432 | | | | 694 | |
Change in Unrealized Appreciation (Depreciation) of: | | | | | | | | | | | | | | | | | | | | | | | | |
Investment Securities and Foreign Currency | | | (177,379 | ) | | | 161,265 | | | | — | | | | — | | | | — | | | | (19 | ) |
Affiliated Investment Companies Shares | | | (1 | ) | | | 1 | | | | (213,117 | ) | | | 283,947 | | | | (71,420 | ) | | | 88,688 | |
Futures | | | (46 | ) | | | 46 | | | | — | | | | — | | | | (234 | ) | | | 196 | |
Translation of Foreign Currency-Denominated Amounts | | | 71 | | | | (40 | ) | | | — | | | | — | | | | — | | | | — | |
Forward Currency Contracts | | | — | | | | — | | | | — | | | | — | | | | (243 | ) | | | 121 | |
| | | | | | | | | | | | | | | | | | | | | | | | |
Net Increase (Decrease) in Net Assets Resulting from Operations | | | (169,493 | ) | | | 219,262 | | | | (182,294 | ) | | | 310,742 | | | | (43,873 | ) | | | 111,933 | |
| | | | | | | | | | | | | | | | | | | | | | | | |
Distributions: | | | | | | | | | | | | | | | | | | | | | | | | |
Institutional Class Shares | | | (56,676 | ) | | | (13,862 | ) | | | (31,168 | ) | | | (16,210 | ) | | | (21,529 | ) | | | (6,934 | ) |
Capital Share Transactions (1): | | | | | | | | | | | | | | | | | | | | | | | | |
Shares Issued | | | 303,674 | | | | 137,451 | | | | 287,694 | | | | 205,873 | | | | 39,834 | | | | 40,778 | |
Shares Issued in Lieu of Cash Distributions. | | | 56,609 | | | | 13,840 | | | | 30,117 | | | | 15,000 | | | | 21,408 | | | | 6,900 | |
Shares Redeemed | | | (340,881 | ) | | | (90,425 | ) | | | (244,046 | ) | | | (196,293 | ) | | | (73,839 | ) | | | (92,479 | ) |
| | | | | | | | | | | | | | | | | | | | | | | | |
Net Increase (Decrease) from Capital Share Transactions | | | 19,402 | | | | 60,866 | | | | 73,765 | | | | 24,580 | | | | (12,597 | ) | | | (44,801 | ) |
| | | | | | | | | | | | | | | | | | | | | | | | |
Total Increase (Decrease) in Net Assets | | | (206,767 | ) | | | 266,266 | | | | (139,697 | ) | | | 319,112 | | | | (77,999 | ) | | | 60,198 | |
Net Assets | | | | | | | | | | | | | | | | | | | | | | | | |
Beginning of Year | | | 774,324 | | | | 508,058 | | | | 1,088,714 | | | | 769,602 | | | | 348,707 | | | | 288,509 | |
| | | | | | | | | | | | | | | | | | | | | | | | |
End of Year | | $ | 567,557 | | | $ | 774,324 | | | $ | 949,017 | | | $ | 1,088,714 | | | $ | 270,708 | | | $ | 348,707 | |
| | | | | | | | | | | | | | | | | | | | | | | | |
(1) Shares Issued and Redeemed: | | | | | | | | | | | | | | | | | | | | | | | | |
Shares Issued | | | 24,012 | | | | 9,413 | | | | 14,000 | | | | 9,724 | | | | 2,058 | | | | 2,016 | |
Shares Issued in Lieu of Cash Distributions | | | 4,258 | | | | 921 | | | | 1,512 | | | | 711 | | | | 1,017 | | | | 372 | |
Shares Redeemed | | | (27,420 | ) | | | (6,235 | ) | | | (11,765 | ) | | | (9,418 | ) | | | (3,709 | ) | | | (4,584 | ) |
| | | | | | | | | | | | | | | | | | | | | | | | |
Net Increase (Decrease) from Shares Issued and Redeemed | | | 850 | | | | 4,099 | | | | 3,747 | | | | 1,017 | | | | (634 | ) | | | (2,196 | ) |
| | | | | | | | | | | | | | | | | | | | | | | | |
| * | Net of foreign capital gain taxes withheld for the fiscal year ended October 31, 2022 of $429, $0 and $0, respectively. |
| ** | Net of foreign capital gain taxes withheld for the fiscal year ended October 31, 2021 of $341, $0 and $0, respectively. |
See accompanying Notes to Financial Statements.
119
DFA INVESTMENT DIMENSIONS GROUP INC.
STATEMENTS OF CHANGES IN NET ASSETS
(Amounts in thousands)
| | | | | | | | | | | | | | | | | | | | | | | | |
| | | Emerging Markets
Portfolio*** | | | Emerging Markets Small Cap
Portfolio*** | | | Emerging Markets Value
Portfolio*** | |
| | | Year | | | Year | | | Year | | | Year | | | Year | | | Year | |
| | | Ended | | | Ended | | | Ended | | | Ended | | | Ended | | | Ended | |
| | | Oct 31, | | | Oct 31, | | | Oct 31, | | | Oct 31, | | | Oct 31, | | | Oct 31, | |
| | | 2022 | | | 2021 | | | 2022 | | | 2021 | | | 2022 | | | 2021 | |
Increase (Decrease) in Net Assets | | | | | | | | | | | | | | | | | | | | | | | | |
Operations: | | | | | | | | | | | | | | | | | | | | | | | | |
Net Investment Income (Loss) | | $ | 156,764 | | | $ | 140,092 | | | $ | 114,895 | | | $ | 114,098 | | | $ | 530,555 | | | $ | 420,462 | |
Net Realized Gain (Loss) on: | | | | | | | | | | | | | | | | | | | | | | | | |
Transactions Allocated from Affiliated Investment Company*,** | | | 17,009 | | | | 398,700 | | | | 98,361 | | | | 592,687 | | | | 351,369 | | | | 675,824 | |
Change in Unrealized Appreciation (Depreciation) of: | | | | | | | | | | | | | | | | | | | | | | | | |
Transactions Allocated from Affiliated Investment Company | | | (1,618,027 | ) | | | 691,616 | | | | (1,298,644 | ) | | | 923,652 | | | | (3,262,606 | ) | | | 3,251,339 | |
| | | | | | | | | | | | | | | | | | | | | | | | |
Net Increase (Decrease) in Net Assets Resulting from Operations | | | (1,444,254 | ) | | | 1,230,408 | | | | (1,085,388 | ) | | | 1,630,437 | | | | (2,380,682 | ) | | | 4,347,625 | |
| | | | | | | | | | | | | | | | | | | | | | | | |
Distributions: | | | | | | | | | | | | | | | | | | | | | | | | |
Class R2 Shares | | | — | | | | — | | | | — | | | | — | | | | (643 | ) | | | (349 | ) |
Institutional Class Shares | | | (372,779 | ) | | | (122,695 | ) | | | (329,169 | ) | | | (128,503 | ) | | | (558,273 | ) | | | (381,943 | ) |
| | | | | | | | | | | | | | | | | | | | | | | | |
Total Distributions | | | (372,779 | ) | | | (122,695 | ) | | | (329,169 | ) | | | (128,503 | ) | | | (558,916 | ) | | | (382,292 | ) |
| | | | | | | | | | | | | | | | | | | | | | | | |
Capital Share Transactions (1): | | | | | | | | | | | | | | | | | | | | | | | | |
Shares Issued | | | 1,486,746 | | | | 1,466,367 | | | | 598,832 | | | | 453,465 | | | | 1,872,666 | | | | 1,803,325 | |
Shares Issued in Lieu of Cash Distributions | | | 359,767 | | | | 118,246 | | | | 308,292 | | | | 120,830 | | | | 536,547 | | | | 368,413 | |
Shares Redeemed | | | (2,315,886 | ) | | | (2,119,497 | ) | | | (1,096,582 | ) | | | (1,840,038 | ) | | | (3,128,244 | ) | | | (5,474,850 | ) |
| | | | | | | | | | | | | | | | | | | | | | | | |
Net Increase (Decrease) from Capital Share Transactions | | | (469,373 | ) | | | (534,884 | ) | | | (189,458 | ) | | | (1,265,743 | ) | | | (719,031 | ) | | | (3,303,112 | ) |
| | | | | | | | | | | | | | | | | | | | | | | | |
Total Increase (Decrease) in Net Assets | | | (2,286,406 | ) | | | 572,829 | | | | (1,604,015 | ) | | | 236,191 | | | | (3,658,629 | ) | | | 662,221 | |
Net Assets | | | | | | | | | | | | | | | | | | | | | | | | |
Beginning of Year | | | 6,225,187 | | | | 5,652,358 | | | | 5,115,924 | | | | 4,879,733 | | | | 13,271,710 | | | | 12,609,489 | |
| | | | | | | | | | | | | | | | | | | | | | | | |
End of Year | | $ | 3,938,781 | | | $ | 6,225,187 | | | $ | 3,511,909 | | | $ | 5,115,924 | | | $ | 9,613,081 | | | $ | 13,271,710 | |
| | | | | | | | | | | | | | | | | | | | | | | | |
(1) Shares Issued and Redeemed: | | | | | | | | | | | | | | | | | | | | | | | | |
Shares Issued | | | 53,138 | | | | 43,254 | | | | 26,598 | | | | 18,380 | | | | 64,891 | | | | 58,117 | |
Shares Issued in Lieu of Cash Distributions | | | 12,564 | | | | 3,525 | | | | 13,241 | | | | 5,119 | | | | 19,778 | | | | 12,138 | |
Shares Redeemed | | | (81,119 | ) | | | (62,966 | ) | | | (49,181 | ) | | | (75,078 | ) | | | (106,929 | ) | | | (175,638 | ) |
| | | | | | | | | | | | | | | | | | | | | | | | |
Net Increase (Decrease) from Shares Issued and Redeemed | | | (15,417 | ) | | | (16,187 | ) | | | (9,342 | ) | | | (51,579 | ) | | | (22,260 | ) | | | (105,383 | ) |
| | | | | | | | | | | | | | | | | | | | | | | | |
| * | Net of foreign capital gain taxes withheld for the fiscal year ended October 31, 2022 of $4,859, $9,037 and $11,422, respectively. |
| ** | Net of foreign capital gain taxes withheld for the fiscal year ended October 31, 2021 of $49, $2,304 and $11,984, respectively. |
| *** | Investment Income and Realized and Unrealized Gain (Loss) were allocated from the Portfolio’s Master Fund (Affiliated Investment Company). |
See accompanying Notes to Financial Statements.
120
DFA INVESTMENT DIMENSIONS GROUP INC.
STATEMENTS OF CHANGES IN NET ASSETS
(Amounts in thousands)
| | | | | | | | | | | | | | | | | | | | |
| | | Emerging Markets Core Equity
Portfolio | | | Emerging Markets Targeted
Value Portfolio | | | Emerging Markets ex China Core
Equity Portfolio | |
| | | | | | | | | | | | | | | Period | |
| | | | | | | | | | | | | | | Nov 15, | |
| | | Year | | | Year | | | Year | | | Year | | | 2021 ʊ | |
| | | Ended | | | Ended | | | Ended | | | Ended | | | to | |
| | | Oct 31, | | | Oct 31, | | | Oct 31, | | | Oct 31, | | | Oct 31, | |
| | | 2022 | | | 2021 | | | 2022 | | | 2021 | | | 2022 | |
Increase (Decrease) in Net Assets | | | | | | | | | | | | | | | | | | | | |
Operations: | | | | | | | | | | | | | | | | | | | | |
Net Investment Income (Loss) | | $ | 883,592 | | | $ | 670,994 | | | $ | 5,721 | | | $ | 5,084 | | | $ | 11,116 | |
Net Realized Gain (Loss) on: | | | | | | | | | | | | | | | | | | | | |
Investment Securities Sold*,** | | | 75,499 | | | | 544,729 | | | | 5,284 | | | | 17,753 | | | | (19,163 | ) |
Affiliated Investment Companies Shares Sold | | | (37 | ) | | | (14 | ) | | | (1 | ) | | | — | | | | — | |
Futures | | | (37,872 | ) | | | 67,395 | | | | (135 | ) | | | 348 | | | | (495 | ) |
Foreign Currency Transactions | | | (25,138 | ) | | | (15,240 | ) | | | (127 | ) | | | (82 | ) | | | (256 | ) |
Change in Unrealized Appreciation (Depreciation) of: | | | | | | | | | | | | | | | | | | | | |
Investment Securities and Foreign Currency | | | (8,179,321 | ) | | | 5,134,175 | | | | (60,418 | ) | | | 42,862 | | | | (76,418 | ) |
Affiliated Investment Companies Shares | | | (254 | ) | | | (32 | ) | | | (1 | ) | | | — | | | | (3 | ) |
Futures | | | (2,325 | ) | | | 15,950 | | | | (54 | ) | | | 67 | | | | — | |
Translation of Foreign Currency-Denominated Amounts | | | (7 | ) | | | 100 | | | | 259 | | | | 2 | | | | (1 | ) |
| | | | | | | | | | | | | | | | | | | | |
Net Increase (Decrease) in Net Assets Resulting from Operations | | | (7,285,863 | ) | | | 6,418,057 | | | | (49,472 | ) | | | 66,034 | | | | (85,220 | ) |
| | | | | | | | | | | | | | | | | | | | |
Distributions: | | | | | | | | | | | | | | | | | | | | |
Institutional Class Shares | | | (942,726 | ) | | | (590,306 | ) | | | (22,133 | ) | | | (4,500 | ) | | | (10,224 | ) |
Capital Share Transactions (1): | | | | | | | | | | | | | | | | | | | | |
Shares Issued | | | 7,057,849 | | | | 4,891,169 | | | | 87,606 | | | | 53,547 | | | | 729,801 | |
Shares Issued in Lieu of Cash Distributions | | | 895,345 | | | | 560,095 | | | | 21,501 | | | | 4,385 | | | | 9,316 | |
Shares Redeemed | | | (7,911,399 | ) | | | (6,904,346 | ) | | | (82,497 | ) | | | (54,708 | ) | | | (219,226 | ) |
| | | | | | | | | | | | | | | | | | | | |
Net Increase (Decrease) from Capital Share Transactions | | | 41,795 | | | | (1,453,082 | ) | | | 26,610 | | | | 3,224 | | | | 519,891 | |
| | | | | | | | | | | | | | | | | | | | |
Total Increase (Decrease) in Net Assets | | | (8,186,794 | ) | | | 4,374,669 | | | | (44,995 | ) | | | 64,758 | | | | 424,447 | |
Net Assets | | | | | | | | | | | | | | | | | | | | |
Beginning of Year | | | 29,155,369 | | | | 24,780,700 | | | | 234,921 | | | | 170,163 | | | | — | |
| | | | | | | | | | | | | | | | | | | | |
End of Year | | $ | 20,968,575 | | | $ | 29,155,369 | | | $ | 189,926 | | | $ | 234,921 | | | $ | 424,447 | |
| | | | | | | | | | | | | | | | | | | | |
(1) Shares Issued and Redeemed: | | | | | | | | | | | | | | | | | | | | |
Shares Issued | | | 315,242 | | | | 191,908 | | | | 8,132 | | | | 4,233 | | | | 79,414 | |
Shares Issued in Lieu of Cash Distributions | | | 43,699 | | | | 22,111 | | | | 1,847 | | | | 389 | | | | 1,143 | |
Shares Redeemed | | | (361,196 | ) | | | (273,309 | ) | | | (7,430 | ) | | | (4,246 | ) | | | (25,861 | ) |
| | | | | | | | | | | | | | | | | | | | |
Net Increase (Decrease) from Shares Issued and Redeemed | | | (2,255 | ) | | | (59,290 | ) | | | 2,549 | | | | 376 | | | | 54,696 | |
| | | | | | | | | | | | | | | | | | | | |
| * | Net of foreign capital gain taxes withheld for the fiscal year ended October 31, 2022 of $11,895, $349 and $6, respectively. |
| ** | Net of foreign capital gain taxes withheld for the fiscal year ended October 31, 2021 of $257, $239 and $0, respectively. |
See accompanying Notes to Financial Statements.
121
DFA INVESTMENT DIMENSIONS GROUP INC.
FINANCIAL HIGHLIGHTS
(for a share outstanding throughout each period)
| | | | | | | | | | | | | | | | | | | | | | | | | | | | | | | | | | | | | | | | | | |
| | | Large Cap International Portfolio | | | | | International Core Equity Portfolio | |
| | | Year | | | Year | | | Year | | | Year | | | Year | | | | | Year | | | Year | | | Year | | | Year | | | Year | |
| | | Ended | | | Ended | | | Ended | | | Ended | | | Ended | | | | | Ended | | | Ended | | | Ended | | | Ended | | | Ended | |
| | | Oct 31, | | | Oct 31, | | | Oct 31, | | | Oct 31, | | | Oct 31, | | | | | Oct 31, | | | Oct 31, | | | Oct 31, | | | Oct 31, | | | Oct 31, | |
| | | 2022 | | | 2021 | | | 2020 | | | 2019 | | | 2018 | | | | | 2022 | | | 2021 | | | 2020 | | | 2019 | | | 2018 | |
Net Asset Value, Beginning of Year | | $ | 27.63 | | | $ | 20.90 | | | $ | 22.78 | | | $ | 21.29 | | | $ | 23.52 | | | | | $ | 16.35 | | | $ | 12.08 | | | $ | 13.19 | | | $ | 12.65 | | | $ | 14.23 | |
| | | | | | | | | | | | | | | | | | | | | | | | | | | | | | | | | | | | | | | | | | |
Income from Investment Operations (A) | | | | | | | | | | | | | | | | | | | | | | | | | | | | | | | | | | | | | | | | | | |
Net Investment Income (Loss) | | | 0.78 | | | | 0.70 | | | | 0.49 | | | | 0.70 | | | | 0.66 | | | | | | 0.47 | | | | 0.40 | | | | 0.28 | | | | 0.41 | | | | 0.38 | |
Net Gains (Losses) on Securities (Realized and Unrealized) | | | (6.54 | ) | | | 6.70 | | | | (1.87 | ) | | | 1.47 | | | | (2.25 | ) | | | | | (4.07 | ) | | | 4.24 | | | | (1.11 | ) | | | 0.53 | | | | (1.60 | ) |
| | | | | | | | | | | | | | | | �� | | | | | | | | | | | | | | | | | | | | | | | | | | |
Total from Investment Operations | | | (5.76 | ) | | | 7.40 | | | | (1.38 | ) | | | 2.17 | | | | (1.59 | ) | | | | | (3.60 | ) | | | 4.64 | | | | (0.83 | ) | | | 0.94 | | | | (1.22 | ) |
| | | | | | | | | | | | | | | | | | | | | | | | | | | | | | | | | | | | | | | | | | |
Less Distributions: | | | | | | | | | | | | | | | | | | | | | | | | | | | | | | | | | | | | | | | | | | |
Net Investment Income | | | (0.81 | ) | | | (0.67 | ) | | | (0.50 | ) | | | (0.68 | ) | | | (0.64 | ) | | | | | (0.53 | ) | | | (0.37 | ) | | | (0.28 | ) | | | (0.40 | ) | | | (0.36 | ) |
| | | | | | | | | | | | | | | | | | | | | | | | | | | | | | | | | | | | | | | | | | |
Total Distributions | | | ( 0.81 | ) | | | (0.67 | ) | | | (0.50 | ) | | | (0.68 | ) | | | (0.64 | ) | | | | | (0.53 | ) | | | (0.37 | ) | | | (0.28 | ) | | | (0.40 | ) | | | (0.36 | ) |
| | | | | | | | | | | | | | | | | | | | | | | | | | | | | | | | | | | | | | | | | | |
Net Asset Value, End of Year | | $ | 21.06 | | | $ | 27.63 | | | $ | 20.90 | | | $ | 22.78 | | | $ | 21.29 | | | | | $ | 12.22 | | | $ | 16.35 | | | $ | 12.08 | | | $ | 13.19 | | | $ | 12.65 | |
| | | | | | | | | | | | | | | | | | | | | | | | | | | | | | | | | | | | | | | | | | |
Total Return | | | (21.12 | %) | | | 35.55 | % | | | (6.05 | %) | | | 10.38 | % | | | (6.97 | %) | | | | | (22.29 | %) | | | 38.56 | % | | | (6.32 | %) | | | 7.67 | % | | | (8.79 | %) |
| | | | | | | | | | | | | | | | | | | | | | | | | | | | | | | | | | | | | | | | | | |
Net Assets, End of Year (thousands) | | $ | 4,820,678 | | | $ | 6,032,181 | | | $ | 4,700,488 | | | $ | 5,356,475 | | | $ | 4,587,406 | | | | | $ | 26,208,206 | | | $ | 34,629,583 | | | $ | 24,965,561 | | | $ | 30,559,427 | | | $ | 27,174,589 | |
Ratio of Expenses to Average Net Assets | | | 0.17 | % | | | 0.19 | % | | | 0.22 | % | | | 0.23 | % | | | 0.23 | % | | | | | 0.24 | % | | | 0.25 | % | | | 0.30 | % | | | 0.29 | % | | | 0.30 | % |
Ratio of Expenses to Average Net Assets (Excluding Fees Waived, Expenses Reimbursed by Advisor and Fees Paid Indirectly) | | | 0.17 | % | | | 0.19 | % | | | 0.23 | % | | | 0.24 | % | | | 0.23 | % | | | | | 0.24 | % | | | 0.25 | % | | | 0.30 | % | | | 0.31 | % | | | 0.30 | % |
Ratio of Net Investment Income to Average Net Assets | | | 3.17 | % | | | 2.65 | % | | | 2.31 | % | | | 3.22 | % | | | 2.78 | % | | | | | 3.27 | % | | | 2.56 | % | | | 2.24 | % | | | 3.21 | % | | | 2.67 | % |
Portfolio Turnover Rate | | | 9 | % | | | 14 | % | | | 19 | % | | | 7 | % | | | 8 | % | | | | | 11 | % | | | 8 | % | | | 4 | % | | | 6 | % | | | 4 | % |
| | | | | | | | | | | | | | | | | | | | | | | | | | | | | | | | | | | | | | | | | | |
See page 1-2 for the Definitions of Abbreviations and Footnotes.
See accompanying Notes to Financial Statements.
122
DFA INVESTMENT DIMENSIONS GROUP INC.
FINANCIAL HIGHLIGHTS
(for a share outstanding throughout each period)
| | | | | | | | | | | | | | | | | | | | | | | | | | | | | | | | | | | | | | | | | | | | |
| | | Global Small Company Portfolio | | | | | | International Small Company Portfolio | |
| | | Year | | | Year | | | Year | | | Year | | | Year | | | | | | Year | | | Year | | | Year | | | Year | | | Year | |
| | | Ended | | | Ended | | | Ended | | | Ended | | | Ended | | | | | | Ended | | | Ended | | | Ended | | | Ended | | | Ended | |
| | | Oct 31, | | | Oct 31, | | | Oct 31, | | | Oct 31, | | | Oct 31, | | | | | | Oct 31, | | | Oct 31, | | | Oct 31, | | | Oct 31, | | | Oct 31, | |
| | | 2022 | | | 2021 | | | 2020 | | | 2019 | | | 2018 | | | | | | 2022 | | | 2021 | | | 2020 | | | 2019 | | | 2018 | |
Net Asset Value, Beginning of Year | | $ | 15.52 | | | $ | 10.50 | | | $ | 11.07 | | | $ | 10.73 | | | $ | 11.53 | | | | | | | $ | 23.29 | | | $ | 16.84 | | | $ | 18.21 | | | $ | 18.46 | | | $ | 21.52 | |
| | | | | | | | | | | | | | | | | | | | | | | | | | | | | | | | | | | | | | | | | | | | |
Income from Investment Operations (A) | | | | | | | | | | | | | | | | | | | | | | | | | | | | | | | | | | | | | | | | | | | | |
Net Investment Income (Loss) | | | 0.23 | | | | 0.22 | | | | 0.15 | | | | 0.18 | | | | 0.19 | | | | | | | | 0.54 | | | | 0.41 | | | | 0.33 | | | | 0.43 | | | | 0.46 | |
Net Gains (Losses) on Securities (Realized and Unrealized) | | | (2.68 | ) | | | 4.97 | | | | (0.55 | ) | | | 0.27 | | | | (0.75 | ) | | | | | | | (6.44 | ) | | | 6.42 | | | | (0.93 | ) | | | 0.58 | | | | (2.41 | ) |
| | | | | | | | | | | | | | | | | | | | | | | | | | | | | | | | | | | | | | | | | | | | |
Total from Investment Operations | | | (2.45 | ) | | | 5.19 | | | | (0.40 | ) | | | 0.45 | | | | (0.56 | ) | | | | | | | (5.90 | ) | | | 6.83 | | | | (0.60 | ) | | | 1.01 | | | | (1.95 | ) |
| | | | | | | | | | | | | | | | | | | | | | | | | | | | | | | | | | | | | | | | | | | | |
Less Distributions: | | | | | | | | | | | | | | | | | | | | | | | | | | | | | | | | | | | | | | | | | | | | |
Net Investment Income | | | (0.25 | ) | | | (0.17 | ) | | | (0.17 | ) | | | (0.11 | ) | | | (0.17 | ) | | | | | | | (0.67 | ) | | | (0.38 | ) | | | (0.37 | ) | | | (0.44 | ) | | | (0.44 | ) |
Net Realized Gains | | | (0.30 | ) | | | — | | | | — | | | | — | | | | (0.07 | ) | | | | | | | (0.79 | ) | | | — | | | | (0.40 | ) | | | (0.82 | ) | | | (0.67 | ) |
| | | | | | | | | | | | | | | | | | | | | | | | | | | | | | | | | | | | | | | | | | | | |
Total Distributions | | | (0.55 | ) | | | (0.17 | ) | | | (0.17 | ) | | | (0.11 | ) | | | (0.24 | ) | | | | | | | (1.46 | ) | | | (0.38 | ) | | | (0.77 | ) | | | (1.26 | ) | | | (1.11 | ) |
| | | | | | | | | | | | | | | | | | | | | | | | | | | | | | | | | | | | | | | | | | | | |
Net Asset Value, End of Year. | | $ | 12.52 | | | $ | 15.52 | | | $ | 10.50 | | | $ | 11.07 | | | $ | 10.73 | | | | | | | $ | 15.93 | | | $ | 23.29 | | | $ | 16.84 | | | $ | 18.21 | | | $ | 18.46 | |
| | | | | | | | | | | | | | | | | | | | | | | | | | | | | | | | | | | | | | | | | | | | |
Total Return | | | (16.32 | %) | | | 49.81 | % | | | (3.75 | %) | | | 4.29 | % | | | (5.02 | %) | | | | | | | (26.55 | %) | | | 40.83 | % | | | (3.64 | %) | | | 6.44 | % | | | (9.54 | %) |
| | | | | | | | | | | | | | | | | | | | | | | | | | | | | | | | | | | | | | | | | | | | |
Net Assets, End of Year (thousands) | | $ | 82,920 | | | $ | 99,631 | | | $ | 43,568 | | | $ | 41,286 | | | $ | 31,380 | | | | | | | $ | 9,320,095 | | | $ | 13,465,853 | | | $ | 10,148,132 | | | $ | 12,750,110 | | | $ | 12,656,204 | |
Ratio of Expenses to Average Net Assets *(B) | | | 0.44 | % | | | 0.47 | % | | | 0.47 | % | | | 0.49 | % | | | 0.49 | % | | | | | | | 0.41 | % | | | 0.46 | % | | | 0.53 | % | | | 0.54 | % | | | 0.53 | % |
Ratio of Expenses to Average Net Assets (Excluding Fees Waived, Expenses Reimbursed by Advisor) *(B) | | | 0.66 | % | | | 0.71 | % | | | 0.85 | % | | | 0.93 | % | | | 0.90 | % | | | | | | | 0.41 | % | | | 0.46 | % | | | 0.53 | % | | | 0.54 | % | | | 0.53 | % |
Ratio of Net Investment Income to Average Net Assets | | | 1.66 | % | | | 1.49 | % | | | 1.50 | % | | | 1.69 | % | | | 1.58 | % | | | | | | | 2.79 | % | | | 1.90 | % | | | 1.96 | % | | | 2.44 | % | | | 2.18 | % |
| | | | | | | | | | | | | | | | | | | | | | | | | | | | | | | | | | | | | | | | | | | | |
* The Ratio of Expenses to Average Net Assets is inclusive of acquired fund fees and expenses incurred by the Portfolio indirectly as a result of Portfolio’s investment in Underlying Funds as follows: | | | 0.22 | % | | | 0.24 | % | | | 0.27 | % | | | 0.27 | % | | | 0.26 | % | | | | | | | 0.12 | % | | | 0.12 | % | | | 0.12 | % | | | 0.12 | % | | | 0.12 | % |
| | | | | | | | | | | | | | | | | | | | | | | | | | | | | | | | | | | | | | | | | | | | |
See page 1-2 for the Definitions of Abbreviations and Footnotes.
See accompanying Notes to Financial Statements.
123
DFA INVESTMENT DIMENSIONS GROUP INC.
FINANCIAL HIGHLIGHTS
(for a share outstanding throughout each period)
| | | | | | | | | | | | | | | | | | | | | | | | | | | | | | | | | | | | | | | | | | | | |
| | | Japanese Small Company Portfolio | | | | | | Asia Pacific Small Company Portfolio | |
| | | Year | | | Year | | | Year | | | Year | | | Year | | | | | | Year | | | Year | | | Year | | | Year | | | Year | |
| | | Ended | | | Ended | | | Ended | | | Ended | | | Ended | | | | | | Ended | | | Ended | | | Ended | | | Ended | | | Ended | |
| | | Oct 31, | | | Oct 31, | | | Oct 31, | | | Oct 31, | | | Oct 31, | | | | | | Oct 31, | | | Oct 31, | | | Oct 31, | | | Oct 31, | | | Oct 31, | |
| | | 2022 | | | 2021 | | | 2020 | | | 2019 | | | 2018 | | | | | | 2022 | | | 2021 | | | 2020 | | | 2019 | | | 2018 | |
Net Asset Value, Beginning of Year | | $ | 25.80 | | | $ | 23.39 | | | $ | 24.89 | | | $ | 25.70 | | | $ | 28.56 | | | | | | | $ | 26.94 | | | $ | 20.13 | | | $ | 21.11 | | | $ | 20.83 | | | $ | 23.71 | |
| | | | | | | | | | | | | | | | | | | | | | | | | | | | | | | | | | | | | | | | | | | | |
Income from Investment Operations (A) | | | | | | | | | | | | | | | | | | | | | | | | | | | | | | | | | | | | | | | | | | | | |
Net Investment Income (Loss) | | | 0.48 | | | | 0.44 | | | | 0.40 | | | | 0.45 | | | | 0.43 | | | | | | | | 0.84 | | | | 0.75 | | | | 0.75 | | | | 0.77 | | | | 0.84 | |
Net Gains (Losses) on Securities (Realized and Unrealized) | | | (6.33 | ) | | | 2.51 | | | | (0.91 | ) | | | 0.37 | | | | (2.59 | ) | | | | | | | (7.40 | ) | | | 6.74 | | | | (0.77 | ) | | | 0.19 | | | | (2.76 | ) |
| | | | | | | | | | | | | | | | | | | | | | | | | | | | | | | | | | | | | | | | | | | | |
Total from Investment Operations | | | (5.85 | ) | | | 2.95 | | | | (0.51 | ) | | | 0.82 | | | | (2.16 | ) | | | | | | | (6.56 | ) | | | 7.49 | | | | (0.02 | ) | | | 0.96 | | | | (1.92 | ) |
Less Distributions: | | | | | | | | | | | | | | | | | | | | | | | | | | | | | | | | | | | | | | | | | | | | |
Net Investment Income | | | (0.53 | ) | | | (0.54 | ) | | | (0.61 | ) | | | (0.28 | ) | | | (0.70 | ) | | | | | | | (1.07 | ) | | | (0.68 | ) | | | (0.96 | ) | | | (0.68 | ) | | | (0.96 | ) |
Net Realized Gains | | | (0.73 | ) | | | — | | | | (0.38 | ) | | | (1.35 | ) | | | — | | | | | | | | (1.92 | ) | | | — | | | | — | | | | — | | | | — | |
| | | | | | | | | | | | | | | | | | | | | | | | | | | | | | | | | | | | | | | | | | | | |
Total Distributions | | | (1.26 | ) | | | (0.54 | ) | | | (0.99 | ) | | | (1.63 | ) | | | (0.70 | ) | | | | | | | (2.99 | ) | | | (0.68 | ) | | | (0.96 | ) | | | (0.68 | ) | | | (0.96 | ) |
| | | | | | | | | | | | | | | | | | | | | | | | | | | | | | | | | | | | | | | | | | | | |
Net Asset Value, End of Year | | $ | 18.69 | | | $ | 25.80 | | | $ | 23.39 | | | $ | 24.89 | | | $ | 25.70 | | | | | | | $ | 17.39 | | | $ | 26.94 | | | $ | 20.13 | | | $ | 21.11 | | | $ | 20.83 | |
| | | | | | | | | | | | | | | | | | | | | | | | | | | | | | | | | | | | | | | | | | | | |
Total Return | | | (23.79 | %) | | | 12.66 | % | | | (2.32 | %) | | | 4.01 | % | | | (7.82 | %) | | | | | | | (26.90 | %) | | | 37.81 | % | | | (0.23 | %) | | | 4.81 | % | | | (8.51 | %) |
| | | | | | | | | | | | | | | | | | | | | | | | | | | | | | | | | | | | | | | | | | | | |
Net Assets, End of Year (thousands) | | $ | 267,551 | | | $ | 379,837 | | | $ | 466,696 | | | $ | 640,068 | | | $ | 622,650 | | | | | | | $ | 230,202 | | | $ | 381,490 | | | $ | 378,682 | | | $ | 340,649 | | | $ | 346,335 | |
Ratio of Expenses to Average Net Assets (C) | | | 0.42 | % | | | 0.47 | % | | | 0.54 | % | | | 0.55 | % | | | 0.53 | % | | | | | | | 0.42 | % | | | 0.48 | % | | | 0.54 | % | | | 0.57 | % | | | 0.54 | % |
Ratio of Expenses to Average Net Assets (Excluding Fees Waived, Expenses Reimbursed by Advisor) (C) | | | 0.52 | % | | | 0.57 | % | | | 0.64 | % | | | 0.65 | % | | | 0.63 | % | | | | | | | 0.52 | % | | | 0.58 | % | | | 0.64 | % | | | 0.67 | % | | | 0.64 | % |
Ratio of Net Investment Income to Average Net Assets | | | 2.24 | % | | | 1.69 | % | | | 1.74 | % | | | 1.91 | % | | | 1.49 | % | | | | | | | 3.95 | % | | | 3.01 | % | | | 3.92 | % | | | 3.65 | % | | | 3.57 | % |
| | | | | | | | | | | | | | | | | | | | | | | | | | | | | | | | | | | | | | | | | | | | |
See page 1-2 for the Definitions of Abbreviations and Footnotes.
See accompanying Notes to Financial Statements.
124
DFA INVESTMENT DIMENSIONS GROUP INC.
FINANCIAL HIGHLIGHTS
(for a share outstanding throughout each period)
| | | | | | | | | | | | | | | | | | | | | | | | | | | | | | | | | | | | | | | | |
| | | United Kingdom Small Company Portfolio | | | Continental Small Company Portfolio | |
| | | Year
Ended
Oct 31,
2022 | | | Year
Ended
Oct 31,
2021 | | | Year
Ended
Oct 31,
2020 | | | Year
Ended
Oct 31,
2019 | | | Year
Ended
Oct 31,
2018 | | | Year
Ended
Oct 31,
2022 | | | Year
Ended
Oct 31,
2021 | | | Year
Ended
Oct 31,
2020 | | | Year
Ended
Oct 31,
2019 | | | Year
Ended
Oct 31,
2018 | |
Net Asset Value, Beginning of Year | | $ | 31.72 | | | $ | 21.35 | | | $ | 27.85 | | | $ | 26.95 | | | $ | 32.67 | | | $ | 35.27 | | | $ | 23.82 | | | $ | 24.84 | | | $ | 24.37 | | | $ | 28.24 | |
| | | | | | | | | | | | | | | | | | | | | | | | | | | | | | | | | | | | | | | | |
Income from Investment Operations (A) | | | | | | | | | | | | | | | | | | | | | | | | | | | | | | | | | | | | | | | | |
Net Investment Income (Loss) | | | 0.94 | | | | 0.58 | | | | 0.43 | | | | 0.76 | | | | 0.85 | | | | 0.76 | | | | 0.57 | | | | 0.40 | | | | 0.55 | | | | 0.61 | |
Net Gains (Losses) on Securities (Realized and Unrealized) | | | (11.25 | ) | | | 10.31 | | | | (4.00 | ) | | | 1.68 | | | | (3.65 | ) | | | (10.80 | ) | | | 11.45 | | | | (1.04 | ) | | | 1.23 | | | | (3.68 | ) |
| | | | | | | | | | | | | | | | | | | | | | | | | | | | | | | | | | | | | | | | |
Total from Investment Operations | | | (10.31 | ) | | | 10.89 | | | | (3.57 | ) | | | 2.44 | | | | (2.80 | ) | | | (10.04 | ) | | | 12.02 | | | | (0.64 | ) | | | 1.78 | | | | (3.07 | ) |
| | | | | | | | | | | | | | | | | | | | | | | | | | | | | | | | | | | | | | | | |
Less Distributions: | | | | | | | | | | | | | | | | | | | | | | | | | | | | | | | | | | | | | | | | |
Net Investment Income | | | (0.97 | ) | | | (0.52 | ) | | | (0.68 | ) | | | (0.47 | ) | | | (0.79 | ) | | | (0.80 | ) | | | (0.57 | ) | | | (0.38 | ) | | | (0.51 | ) | | | (0.59 | ) |
Net Realized Gains | | | (0.55 | ) | | | — | | | | (2.25 | ) | | | (1.07 | ) | | | (2.13 | ) | | | (0.68 | ) | | | — | | | | — | | | | (0.80 | ) | | | (0.21 | ) |
Total Distributions | | | (1.52 | ) | | | (0.52 | ) | | | (2.93 | ) | | | (1.54 | ) | | | (2.92 | ) | | | (1.48 | ) | | | (0.57 | ) | | | (0.38 | ) | | | (1.31 | ) | | | (0.80 | ) |
| | | | | | | | | | | | | | | | | | | | | | | | | | | | | | | | | | | | | | | | |
Net Asset Value, End of Year | | $ | 19.89 | | | $ | 31.72 | | | $ | 21.35 | | | $ | 27.85 | | | $ | 26.95 | | | $ | 23.75 | | | $ | 35.27 | | | $ | 23.82 | | | $ | 24.84 | | | $ | 24.37 | |
| | | | | | | | | | | | | | | | | | | | | | | | | | | | | | | | | | | | | | | | |
Total Return | | | (33.62 | %) | | | 51.31 | % | | | (15.27 | %) | | | 10.14 | % | | | (9.34 | %) | | | (29.26 | %) | | | 50.70 | % | | | (2.63 | %) | | | 7.94 | % | | | (11.14 | %) |
| | | | | | | | | | | | | | | | | | | | | | | | | | | | | | | | | | | | | | | | |
Net Assets, End of Year (thousands) | | $ | 18,398 | | | $ | 44,133 | | | $ | 16,867 | | | $ | 26,540 | | | $ | 36,351 | | | $ | 616,323 | | | $ | 867,759 | | | $ | 537,744 | | | $ | 657,105 | | | $ | 645,651 | |
Ratio of Expenses to Average Net Assets (C) | | | 0.56 | % | | | 0.59 | % | | | 0.59 | % | | | 0.59 | % | | | 0.58 | % | | | 0.42 | % | | | 0.47 | % | | | 0.54 | % | | | 0.56 | % | | | 0.54 | % |
Ratio of Expenses to Average Net Assets (Excluding Fees Waived, Expenses Reimbursed by Advisor) (C) | | | 0.66 | % | | | 0.74 | % | | | 0.86 | % | | | 0.82 | % | | | 0.68 | % | | | 0.52 | % | | | 0.57 | % | | | 0.64 | % | | | 0.66 | % | | | 0.64 | % |
Ratio of Net Investment Income to Average Net Assets | | | 3.62 | % | | | 1.88 | % | | | 1.89 | % | | | 2.92 | % | | | 2.75 | % | | | 2.61 | % | | | 1.76 | % | | | 1.68 | % | | | 2.30 | % | | | 2.16 | % |
| | | | | | | | | | | | | | | | | | | | | | | | | | | | | | | | | | | | | | | | |
See page 1-2 for the Definitions of Abbreviations and Footnotes.
See accompanying Notes to Financial Statements.
125
DFA INVESTMENT DIMENSIONS GROUP INC.
FINANCIAL HIGHLIGHTS
(for a share outstanding throughout each period)
| | | | | | | | | | | | | | | | | | | | | | | | | | | | | | | | | | | | | | | | |
| | | DFA International Real Estate Securities Portfolio | | | DFA Global Real Estate Securities Portfolio | |
| | | Year
Ended
Oct 31,
2022 | | | Year
Ended
Oct 31,
2021 | | | Year
Ended
Oct 31,
2020 | | | Year
Ended
Oct 31,
2019 | | | Year
Ended
Oct 31,
2018 | | | Year
Ended
Oct 31,
2022 | | | Year
Ended
Oct 31,
2021 | | | Year
Ended
Oct 31,
2020 | | | Year
Ended
Oct 31,
2019 | | | Year
Ended
Oct 31,
2018 | |
Net Asset Value, Beginning of Year | | $ | 5.04 | | | $ | 3.77 | | | $ | 5.61 | | | $ | 4.85 | | | $ | 5.07 | | | $ | 13.29 | | | $ | 9.57 | | | $ | 12.71 | | | $ | 10.71 | | | $ | 10.90 | |
| | | | | | | | | | | | | | | | | | | | | | | | | | | | | | | | | | | | | | | | |
Income from Investment Operations (A) | | | | | | | | | | | | | | | | | | | | | | | | | | | | | | | | | | | | | | | | |
Net Investment Income (Loss) | | | 0.15 | | | | 0.16 | | | | 0.15 | | | | 0.20 | | | | 0.22 | | | | 0.49 | | | | 0.16 | | | | 0.68 | | | | 0.34 | ** | | | 0.48 | |
Net Gains (Losses) on Securities (Realized and Unrealized) | | | (1.44 | ) | | | 1.11 | | | | (1.35 | ) | | | 0.83 | | | | (0.22 | ) | | | (3.32 | ) | | | 3.80 | | | | (3.00 | ) | | | 2.16 | ** | | | (0.26 | ) |
| | | | | | | | | | | | | | | | | | | | | | | | | | | | | | | | | | | | | | | | |
Total from Investment Operations | | | (1.29 | ) | | | 1.27 | | | | (1.20 | ) | | | 1.03 | | | | — | | | | (2.83 | ) | | | 3.96 | | | | (2.32 | ) | | | 2.50 | | | | 0.22 | |
| | | | | | | | | | | | | | | | | | | | | | | | | | | | | | | | | | | | | | | | |
Less Distributions: | | | | | | | | | | | | | | | | | | | | | | | | | | | | | | | | | | | | | | | | |
Net Investment Income | | | (0.37 | ) | | | — | | | | (0.64 | ) | | | (0.27 | ) | | | (0.22 | ) | | | (0.48 | ) | | | (0.20 | ) | | | (0.70 | ) | | | (0.50 | ) | | | (0.34 | ) |
Net Realized Gains | | | — | | | | — | | | | — | | | | — | | | | — | | | | (0.12 | ) | | | (0.04 | ) | | | (0.12 | ) | | | (— | ) | | | (0.07 | ) |
| | | | | | | | | | | | | | | | | | | | | | | | | | | | | | | | | | | | | | | | |
Total Distributions | | | (0.37 | ) | | | — | | | | (0.64 | ) | | | (0.27 | ) | | | (0.22 | ) | | | (0.60 | ) | | | (0.24 | ) | | | (0.82 | ) | | | (0.50 | ) | | | (0.41 | ) |
| | | | | | | | | | | | | | | | | | | | | | | | | | | | | | | | | | | | | | | | |
Net Asset Value, End of Year | | $ | 3.38 | | | $ | 5.04 | | | $ | 3.77 | | | $ | 5.61 | | | $ | 4.85 | | | $ | 9.86 | | | $ | 13.29 | | | $ | 9.57 | | | $ | 12.71 | | | $ | 10.71 | |
| | | | | | | | | | | | | | | | | | | | | | | | | | | | | | | | | | | | | | | | |
Total Return | | | (27.50 | %) | | | 33.69 | % | | | (23.98 | %) | | | 22.54 | % | | | (0.24 | %) | | | (22.34 | %) | | | 42.08 | % | | | (19.28 | %) | | | 24.55 | % | | | 1.91 | % |
| | | | | | | | | | | | | | | | | | | | | | | | | | | | | | | | | | | | | | | | |
Net Assets, End of Year (thousands) | | $ | 4,452,148 | | | $ | 5,987,464 | | | $ | 4,646,848 | | | $ | 6,297,963 | | | $ | 5,442,507 | | | $ | 7,871,073 | | | $ | 10,537,586 | | | $ | 7,225,825 | | | $ | 9,269,011 | | | $ | 7,475,924 | |
Ratio of Expenses to Average Net Assets * | | | 0.27 | % | | | 0.27 | % | | | 0.26 | % | | | 0.27 | % | | | 0.28 | % | | | 0.24 | %(B) | | | 0.24 | %(B) | | | 0.24 | %(B) | | | 0.24 | %(B) | | | 0.24 | %(B) |
Ratio of Expenses to Average Net Assets (Excluding Fees Waived, Expenses | | | | | | | | | | | | | | | | | | | | | | | | | | | | | | | | | | | | | | | | |
Reimbursed by Advisor and Fees Paid Indirectly) * | | | 0.27 | % | | | 0.27 | % | | | 0.27 | % | | | 0.28 | % | | | 0.28 | % | | | 0.33 | %(B) | | | 0.34 | %(B) | | | 0.34 | %(B) | | | 0.35 | %(B) | | | 0.35 | %(B) |
Ratio of Net Investment Income to Average Net Assets | | | 3.67 | % | | | 3.29 | % | | | 3.61 | % | | | 4.01 | % | | | 4.27 | % | | | 4.14 | % | | | 1.33 | % | | | 6.44 | % | | | 2.95 | %** | | | 4.42 | % |
Portfolio Turnover Rate | | | 6 | % | | | 8 | % | | | 12 | % | | | 8 | % | | | 5 | % | | | 1 | % | | | 1 | % | | | 0 | % | | | 0 | % | | | 3 | % |
| | | | | | | | | | | | | | | | | | | | | | | | | | | | | | | | | | | | | | | | |
* The Ratio of Expenses to Average Net Assets is inclusive of acquired fund feesand expenses incurred by the Portfolio indirectly as a result of Portfolio’sinvestment in Underlying Funds as follows: | | | N/A | | | | N/A | | | | N/A | | | | N/A | | | | N/A | | | | 0.10 | % | | | 0.11 | % | | | 0.12 | % | | | 0.13 | % | | | 0.13 | % |
| | | | | | | | | | | | | | | | | | | | | | | | | | | | | | | | | | | | | | | | |
See page 1-2 for the Definitions of Abbreviations and Footnotes.
See accompanying Notes to Financial Statements.
126
DFA INVESTMENT DIMENSIONS GROUP INC.
FINANCIAL HIGHLIGHTS
(for a share outstanding throughout each period)
| | | | | | | | | | | | | | | | | | | | | | | | | | | | | | | | | | | | | | | | |
| | | DFA International Small Cap Value Portfolio | | | International Vector Equity Portfolio | |
| | | Year
Ended
Oct 31,
2022 | | | Year
Ended
Oct 31,
2021 | | | Year
Ended
Oct 31,
2020 | | | Year
Ended
Oct 31,
2019 | | | Year
Ended
Oct 31,
2018 | | | Year
Ended
Oct 31,
2022 | | | Year
Ended
Oct 31,
2021 | | | Year
Ended
Oct 31,
2020 | | | Year
Ended
Oct 31,
2019 | | | Year
Ended
Oct 31,
2018 | |
Net Asset Value, Beginning of Year | | $ | 22.14 | | | $ | 15.65 | | | $ | 18.58 | | | $ | 19.24 | | | $ | 23.51 | | | $ | 14.51 | | | $ | 10.42 | | | $ | 11.62 | | | $ | 11.74 | | | $ | 13.33 | |
| | | | | | | | | | | | | | | | | | | | | | | | | | | | | | | | | | | | | | | | |
Income from Investment Operations (A) | | | | | | | | | | | | | | | | | | | | | | | | | | | | | | | | | | | | | | | | |
Net Investment Income (Loss) | | | 0.61 | | | | 0.44 | | | | 0.33 | | | | 0.45 | | | | 0.47 | | | | 0.40 | | | | 0.32 | | | | 0.23 | | | | 0.33 | | | | 0.32 | |
Net Gains (Losses) on Securities (Realized and Unrealized) | | | (5.05 | ) | | | 6.48 | | | | (2.65 | ) | | | (0.01 | ) | | | (3.44 | ) | | | (3.52 | ) | | | 4.06 | | | | (1.20 | ) | | | 0.24 | | | | (1.56 | ) |
| | | | | | | | | | | | | | | | | | | | | | | | | | | | | | | | | | | | | | | | |
Total from Investment Operations | | | (4.44 | ) | | | 6.92 | | | | (2.32 | ) | | | 0.44 | | | | (2.97 | ) | | | (3.12 | ) | | | 4.38 | | | | (0.97 | ) | | | 0.57 | | | | (1.24 | ) |
| | | | | | | | | | | | | | | | | | | | | | | | | | | | | | | | | | | | | | | | |
Less Distributions: | | | | | | | | | | | | | �� | | | | | | | | | | | | | | | | | | | | | | | | | | | |
Net Investment Income | | | (0.73 | ) | | | (0.43 | ) | | | (0.32 | ) | | | (0.48 | ) | | | (0.56 | ) | | | (0.45 | ) | | | (0.29 | ) | | | (0.23 | ) | | | (0.34 | ) | | | (0.30 | ) |
Net Realized Gains | | | (0.16 | ) | | | — | | | | (0.29 | ) | | | (0.62 | ) | | | (0.74 | ) | | | (0.27 | ) | | | — | | | | — | | | | (0.35 | ) | | | (0.05 | ) |
| | | | | | | | | | | | | | | | | | | | | | | | | | | | | | | | | | | | | | | | |
Total Distributions | | | (0.89 | ) | | | (0.43 | ) | | | (0.61 | ) | | | (1.10 | ) | | | (1.30 | ) | | | (0.72 | ) | | | (0.29 | ) | | | (0.23 | ) | | | (0.69 | ) | | | (0.35 | ) |
| | | | | | | | | | | | | | | | | | | | | | | | | | | | | | | | | | | | | | | | |
Net Asset Value, End of Year | | $ | 16.81 | | | $ | 22.14 | | | $ | 15.65 | | | $ | 18.58 | | | $ | 19.24 | | | $ | 10.67 | | | $ | 14.51 | | | $ | 10.42 | | | $ | 11.62 | | | $ | 11.74 | |
| | | | | | | | | | | | | | | | | | | | | | | | | | | | | | | | | | | | | | | | |
Total Return | | | (20.53 | %) | | | 44.61 | % | | | (13.03 | %) | | | 2.94 | % | | | (13.37 | %) | | | (22.16 | %) | | | 42.24 | % | | | (8.41 | %) | | | 5.49 | % | | | (9.52 | %) |
| | | | | | | | | | | | | | | | | | | | | | | | | | | | | | | | | | | | | | | | |
Net Assets, End of Year (thousands) | | $ | 9,664,700 | | | $ | 12,784,711 | | | $ | 9,887,928 | | | $ | 13,428,084 | | | $ | 13,787,695 | | | $ | 2,882,931 | | | $ | 3,716,790 | | | $ | 2,722,859 | | | $ | 2,578,134 | | | $ | 2,441,217 | |
Ratio of Expenses to Average Net Assets | | | 0.46 | % | | | 0.53 | % | | | 0.65 | % | | | 0.68 | % | | | 0.68 | % | | | 0.36 | % | | | 0.42 | % | | | 0.47 | % | | | 0.50 | % | | | 0.48 | % |
Ratio of Expenses to Average Net Assets (Excluding Fees Paid Indirectly) | | | 0.46 | % | | | 0.53 | % | | | 0.66 | % | | | 0.69 | % | | | 0.68 | % | | | 0.36 | % | | | 0.42 | % | | | 0.48 | % | | | 0.50 | % | | | 0.48 | % |
Ratio of Net Investment Income to Average Net Assets | | | 3.13 | % | | | 2.13 | % | | | 2.02 | % | | | 2.48 | % | | | 2.10 | % | | | 3.16 | % | | | 2.35 | % | | | 2.20 | % | | | 2.94 | % | | | 2.40 | % |
Portfolio Turnover Rate | | | 24 | % | | | 15 | % | | | 14 | % | | | 18 | % | | | 23 | % | | | 17 | % | | | 15 | % | | | 18 | % | | | 17 | % | | | 12 | % |
| | | | | | | | | | | | | | | | | | | | | | | | | | | | | | | | | | | | | | | | |
See page 1-2 for the Definitions of Abbreviations and Footnotes.
See accompanying Notes to Financial Statements.
127
DFA INVESTMENT DIMENSIONS GROUP INC.
FINANCIAL HIGHLIGHTS
(for a share outstanding throughout each period)
| | | | | | | | | | | | | | | | | | | | | | | | | | | | | | | | | | | | | | | | | | |
| | | International High Relative Profitability Portfolio | | | | | World Ex U.S. Value Portfolio | |
| | | Year
Ended
Oct 31,
2022 | | | Year
Ended
Oct 31,
2021 | | | Year
Ended
Oct 31,
2020 | | | Year
Ended
Oct 31,
2019 | | | Year
Ended
Oct 31,
2018 | | | | | Year
Ended
Oct 31,
2022 | | | Year
Ended
Oct 31,
2021 | | | Year
Ended
Oct 31,
2020 | | | Year
Ended
Oct 31,
2019 | | | Year
Ended
Oct 31,
2018 | |
Net Asset Value, Beginning of Year | | $ | 13.73 | | | $ | 10.64 | | | $ | 10.74 | | | $ | 9.71 | | | $ | 10.68 | | | | | $ | 12.67 | | | $ | 8.99 | | | $ | 10.97 | | | $ | 11.16 | | | $ | 12.71 | |
| | | | | | | | | | | | | | | | | | | | | | | | | | | | | | | | | | | | | | | | | | |
Income from Investment Operations (A) | | | | | | | | | | | | | | | | | | | | | | | | | | | | | | | | | | | | | | | | | | |
Net Investment Income (Loss) | | | 0.38 | | | | 0.30 | | | | 0.21 | | | | 0.27 | | | | 0.26 | | | | | | 0.47 | | | | 0.38 | | | | 0.25 | | | | 0.35 | | | | 0.34 | |
Net Gains (Losses) on Securities (Realized and Unrealized) | | | (3.51 | ) | | | 3.08 | | | | (0.13 | ) | | | 1.00 | | | | (1.01 | ) | | | | | (2.49 | ) | | | 3.66 | | | | (1.96 | ) | | | 0.04 | | | | (1.48 | ) |
| | | | | | | | | | | | | | | | | | | | | | | | | | | | | | | | | | | | | | | | | | |
Total from Investment Operations | | | (3.13 | ) | | | 3.38 | | | | 0.08 | | | | 1.27 | | | | (0.75 | ) | | | | | (2.02 | ) | | | 4.04 | | | | (1.71 | ) | | | 0.39 | | | | (1.14 | ) |
| | | | | | | | | | | | | | | | | | | | | | | | | | | | | | | | | | | | | | | | | | |
Less Distributions: | | | | | | | | | | | | | | | | | | | | | | | | | | | | | | | | | | | | | | | | | | |
Net Investment Income | | | (0.37 | ) | | | (0.29 | ) | | | (0.18 | ) | | | (0.24 | ) | | | (0.22 | ) | | | | | (0.51 | ) | | | (0.36 | ) | | | (0.27 | ) | | | (0.35 | ) | | | (0.41 | ) |
Net Realized Gains | | | (0.11 | ) | | | — | | | | — | | | | — | | | | — | | | | | | — | | | | — | | | | — | | | | (0.23 | ) | | | — | |
| | | | | | | | | | | | | | | | | | | | | | | | | | | | | | | | | | | | | | | | | | |
Total Distributions | | | (0.48 | ) | | | (0.29 | ) | | | (0.18 | ) | | | (0.24 | ) | | | (0.22 | ) | | | | | (0.51 | ) | | | (0.36 | ) | | | (0.27 | ) | | | (0.58 | ) | | | (0.41 | ) |
| | | | | | | | | | | | | | | | | | | | | | | | | | | | | | | | | | | | | | | | | | |
Net Asset Value, End of Year | | $ | 10.12 | | | $ | 13.73 | | | $ | 10.64 | | | $ | 10.74 | | | $ | 9.71 | | | | | $ | 10.14 | | | $ | 12.67 | | | $ | 8.99 | | | $ | 10.97 | | | $ | 11.16 | |
| | | | | | | | | | | | | | | | | | | | | | | | | | | | | | | | | | | | | | | | | | |
Total Return | | | (23.22 | %) | | | 31.85 | % | | | 0.80 | % | | | 13.19 | % | | | (7.20 | %) | | | | | (16.23 | %) | | | 45.23 | % | | | (15.76 | %) | | | 3.75 | % | | | (9.22 | %) |
| | | | | | | | | | | | | | | | | | | | | | | | | | | | | | | | | | | | | | | | | | |
Net Assets, End of Year (thousands) | | $ | 1,606,634 | | | $ | 2,183,724 | | | $ | 1,475,345 | | | $ | 658,448 | | | $ | 266,868 | | | | | $ | 194,259 | | | $ | 308,666 | | | $ | 206,915 | | | $ | 302,369 | | | $ | 240,668 | |
Ratio of Expenses to Average Net Assets* | | | 0.30 | % | | | 0.30 | % | | | 0.30 | % | | | 0.33 | % | | | 0.35 | % | | | | | 0.40 | %(B) | | | 0.44 | %(B) | | | 0.50 | %(B) | | | 0.54 | %(B) | | | 0.52 | %(B) |
Ratio of Expenses to Average Net Assets (Excluding Fees Waived, Expenses Reimbursed by | | | | | | | | | | | | | | | | | | | | | | | | | | | | | | | | | | | | | | | | | | |
Advisor and Fees Paid Indirectly) * | | | 0.30 | % | | | 0.30 | % | | | 0.31 | % | | | 0.34 | % | | | 0.35 | % | | | | | 0.59 | %(B) | | | 0.64 | %(B) | | | 0.71 | %(B) | | | 0.76 | %(B) | | | 0.74 | %(B) |
Ratio of Net Investment Income to Average Net Assets | | | 3.15 | % | | | 2.30 | % | | | 1.97 | % | | | 2.69 | % | | | 2.41 | % | | | | | 4.02 | % | | | 3.14 | % | | | 2.56 | % | | | 3.25 | % | | | 2.72 | % |
Portfolio Turnover Rate | | | 22 | % | | | 15 | % | | | 15 | % | | | 9 | % | | | 9 | % | | | | | N/A | | | | N/A | | | | N/A | | | | N/A | | | | N/A | |
| | | | | | | | | | | | | | | | | | | | | | | | | | | | | | | | | | | | | | | | | | |
* The Ratio of Expenses to Average Net Assets is inclusive of acquired fund fees and expenses incurred by the Portfolio indirectly as a result of Portfolio’s investment in Underlying Funds as follows:. | | | N/A | | | | N/A | | | | N/A | | | | N/A | | | | N/A | | | | | | 0.19 | % | | | 0.20 | % | | | 0.23 | % | | | 0.24 | % | | | 0.24 | % |
| | | | | | | | | | | | | | | | | | | | | | | | | | | | | | | | | | | | | | | | | | |
See page 1-2 for the Definitions of Abbreviations and Footnotes.
See accompanying Notes to Financial Statements.
128
DFA INVESTMENT DIMENSIONS GROUP INC.
FINANCIAL HIGHLIGHTS
(for a share outstanding throughout each period)
| | | | | | | | | | | | | | | | | | | | | | | | | | | | | | | | | | | | | | | | | | | | |
| | | World Ex U.S. Core Equity Portfolio | | | | | | World Ex U.S. Targeted Value Portfolio | |
| | | Year
Ended
Oct 31,
2022 | | | Year
Ended
Oct 31,
2021 | | | Year
Ended
Oct 31,
2020 | | | Year
Ended
Oct 31,
2019 | | | Year
Ended
Oct 31,
2018 | | | | | | Year
Ended
Oct 31,
2022 | | | Year
Ended
Oct 31,
2021 | | | Year
Ended
Oct 31,
2020 | | | Year
Ended
Oct 31,
2019 | | | Year
Ended
Oct 31,
2018 | |
Net Asset Value, Beginning of Year. | | $ | 13.84 | | | $ | 10.44 | | | $ | 11.17 | | | $ | 10.65 | | | $ | 12.15 | | | | | | | $ | 15.29 | | | $ | 10.91 | | | $ | 12.45 | | | $ | 12.52 | | | $ | 15.06 | |
| | | | | | | | | | | | | | | | | | | | | | | | | | | | | | | | | | | | | | | | | | | | |
Income from Investment Operations (A) | | | | | | | | | | | | | | | | | | | | | | | | | | | | | | | | | | | | | | | | | | | | |
Net Investment Income (Loss) | | | 0.40 | | | | 0.33 | | | | 0.24 | | | | 0.33 | | | | 0.31 | | | | | | | | 0.39 | | | | 0.32 | | | | 0.23 | | | | 0.32 | | | | 0.31 | |
Net Gains (Losses) on Securities (Realized and Unrealized) | | | (3.48 | ) | | | 3.40 | | | | (0.74 | ) | | | 0.56 | | | | (1.52 | ) | | | | | | | (3.55 | ) | | | 4.34 | | | | (1.45 | ) | | | 0.26 | | | | (2.29 | ) |
| | | | | | | | | | | | | | | | | | | | | | | | | | | | | | | | | | | | | | | | | | | | |
Total from Investment Operations | | | (3.08 | ) | | | 3.73 | | | | (0.50 | ) | | | 0.89 | | | | (1.21 | ) | | | | | | | (3.16 | ) | | | 4.66 | | | | (1.22 | ) | | | 0.58 | | | | (1.98 | ) |
| | | | | | | | | | | | | | | | | | | | | | | | | | | | | | | | | | | | | | | | | | | | |
Less Distributions: | | | | | | | | | | | | | | | | | | | | | | | | | | | | | | | | | | | | | | | | | | | | |
Net Investment Income | | | (0.41 | ) | | | (0.33 | ) | | | (0.23 | ) | | | (0.32 | ) | | | (0.29 | ) | | | | | | | (0.39 | ) | | | (0.28 | ) | | | (0.21 | ) | | | (0.29 | ) | | | (0.30 | ) |
Net Realized Gains | | | — | | | | — | | | | — | | | | (0.05 | ) | | | — | | | | | | | | (0.72 | ) | | | — | | | | (0.11 | ) | | | (0.36 | ) | | | (0.26 | ) |
| | | | | | | | | | | | | | | | | | | | | | | | | | | | | | | | | | | | | | | | | | | | |
Total Distributions | | | (0.41 | ) | | | (0.33 | ) | | | (0.23 | ) | | | (0.37 | ) | | | (0.29 | ) | | | | | | | (1.11 | ) | | | (0.28 | ) | | | (0.32 | ) | | | (0.65 | ) | | | (0.56 | ) |
| | | | | | | | | | | | | | | | | | | | | | | | | | | | | | | | | | | | | | | | | | | | |
Net Asset Value, End of Year | | $ | 10.35 | | | $ | 13.84 | | | $ | 10.44 | | | $ | 11.17 | | | $ | 10.65 | | | | | | | $ | 11.02 | | | $ | 15.29 | | | $ | 10.91 | | | $ | 12.45 | | | $ | 12.52 | |
| | | | | | | | | | | | | | | | | | | | | | | | | | | | | | | | | | | | | | | | | | | | |
Total Return | | | (22.55 | %) | | | 35.87 | % | | | (4.42 | %) | | | 8.64 | % | | | (10.22 | %) | | | | | | | (21.77 | %) | | | 42.81 | % | | | (9.96 | %) | | | 4.99 | % | | | (13.56 | %) |
| | | | | | | | | | | | | | | | | | | | | | | | | | | | | | | | | | | | | | | | | | | | |
Net Assets, End of Year (thousands) | | $ | 3,122,060 | | | $ | 4,089,166 | | | $ | 3,210,237 | | | $ | 3,719,313 | | | $ | 3,129,791 | | | | | | | $ | 567,557 | | | $ | 774,324 | | | $ | 508,058 | | | $ | 533,046 | | | $ | 460,155 | |
Ratio of Expenses to Average Net Assets | | | 0.30 | % | | | 0.32 | % | | | 0.35 | % | | | 0.37 | % | | | 0.39 | % | | | | | | | 0.52 | % | | | 0.55 | % | | | 0.64 | % | | | 0.68 | % | | | 0.66 | % |
Ratio of Expenses to Average Net Assets (Excluding Fees Waived, Expenses Reimbursed by Advisor and Fees Paid Indirectly) | | | 0.30 | % | | | 0.32 | % | | | 0.36 | % | | | 0.38 | % | | | 0.37 | % | | | | | | | 0.52 | % | | | 0.55 | % | | | 0.64 | % | | | 0.69 | % | | | 0.66 | % |
Ratio of Net Investment Income to Average Net Assets | | | 3.25 | % | | | 2.49 | % | | | 2.26 | % | | | 3.02 | % | | | 2.56 | % | | | | | | | 2.98 | % | | | 2.20 | % | | | 2.02 | % | | | 2.58 | % | | | 2.08 | % |
Portfolio Turnover Rate | | | 12 | % | | | 6 | % | | | 13 | % | | | 8 | % | | | 4 | % | | | | | | | 35 | % | | | 28 | % | | | 22 | % | | | 27 | % | | | 24 | % |
| | | | | | | | | | | | | | | | | | | | | | | | | | | | | | | | | | | | | | | | | | | | |
See page 1-2 for the Definitions of Abbreviations and Footnotes.
See accompanying Notes to Financial Statements.
129
DFA INVESTMENT DIMENSIONS GROUP INC.
FINANCIAL HIGHLIGHTS
(for a share outstanding throughout each period)
| | | | | | | | | | | | | | | | | | | | | | | | | | | | | | | | | | | | | | | | | | | | |
| | | World Core Equity Portfolio | | | | | | Selectively Hedged Global Equity Portfolio | |
| | | Year
Ended
Oct 31,
2022 | | | Year
Ended
Oct 31,
2021 | | | Year
Ended
Oct 31,
2020 | | | Year
Ended
Oct 31,
2019 | | | Year
Ended
Oct 31,
2018 | | | | | | Year
Ended
Oct 31,
2022 | | | Year
Ended
Oct 31,
2021 | | | Year
Ended
Oct 31,
2020 | | | Year
Ended
Oct 31,
2019 | | | Year
Ended
Oct 31,
2018 | |
Net Asset Value, Beginning of Year. | | $ | 22.56 | | | $ | 16.29 | | | $ | 16.42 | | | $ | 15.40 | | | $ | 16.06 | | | | | | | $ | 22.35 | | | $ | 16.21 | | | $ | 16.54 | | | $ | 15.71 | | | $ | 16.52 | |
| | | | | | | | | | | | | | | | | | | | | | | | | | | | | | | | | | | | | | | | | | | | |
Income from Investment Operations (A) | | | | | | | | | | | | | | | | | | | | | | | | | | | | | | | | | | | | | | | | | | | | |
Net Investment Income (Loss) | | | 0.45 | | | | 0.34 | | | | 0.29 | | | | 0.35 | | | | 0.31 | | | | | | | | 0.44 | | | | 0.33 | | | | 0.28 | | | | 0.35 | | | | 0.31 | |
Net Gains (Losses) on Securities (Realized and Unrealized) | | | (4.15 | ) | | | 6.27 | | | | (0.10 | ) | | | 1.13 | | | | (0.64 | ) | | | | | | | (3.29 | ) | | | 6.21 | | | | (0.18 | ) | | | 1.12 | | | | (0.66 | ) |
| | | | | | | | | | | | | | | | | | | | | | | | | | | | | | | | | | | | | | | | | | | | |
Total from Investment Operations | | | (3.70 | ) | | | 6.61 | | | | 0.19 | | | | 1.48 | | | | (0.33 | ) | | | | | | | (2.85 | ) | | | 6.54 | | | | 0.10 | | | | 1.47 | | | | (0.35 | ) |
| | | | | | | | | | | | | | | | | | | | | | | | | | | | | | | | | | | | | | | | | | | | |
Less Distributions: | | | | | | | | | | | | | | | | | | | | | | | | | | | | | | | | | | | | | | | | | | | | |
Net Investment Income | | | (0.45 | ) | | | (0.34 | ) | | | (0.29 | ) | | | (0.35 | ) | | | (0.30 | ) | | | | | | | (0.44 | ) | | | (0.20 | ) | | | (0.43 | ) | | | (0.44 | ) | | | (0.27 | ) |
Net Realized Gains | | | (0.17 | ) | | | — | | | | (0.03 | ) | | | (0.11 | ) | | | (0.03 | ) | | | | | | | (0.97 | ) | | | (0.20 | ) | | | — | | | | (0.20 | ) | | | (0.19 | ) |
| | | | | | | | | | | | | | | | | | | | | | | | | | | | | | | | | | | | | | | | | | | | |
Total Distributions | | | (0.62 | ) | | | (0.34 | ) | | | (0.32 | ) | | | (0.46 | ) | | | (0.33 | ) | | | | | | | (1.41 | ) | | | (0.40 | ) | | | (0.43 | ) | | | (0.64 | ) | | | (0.46 | ) |
| | | | | | | | | | | | | | | | | | | | | | | | | | | | | | | | | | | | | | | | | | | | |
Net Asset Value, End of Year | | $ | 18.24 | | | $ | 22.56 | | | $ | 16.29 | | | $ | 16.42 | | | $ | 15.40 | | | | | | | $ | 18.09 | | | $ | 22.35 | | | $ | 16.21 | | | $ | 16.54 | | | $ | 15.71 | |
| | | | | | | | | | | | | | | | | | | | | | | | | | | | | | | | | | | | | | | | | | | | |
Total Return | | | (16.62 | %) | | | 40.75 | % | | | 1.25 | % | | | 9.94 | % | | | (2.16 | %) | | | | | | | (13.65 | %) | | | 40.81 | % | | | 0.47 | % | | | 10.10 | % | | | (2.28 | %) |
| | | | | | | | | | | | | | | | | | | | | | | | | | | | | | | | | | | | | | | | | | | | |
Net Assets, End of Year (thousands) | | $ | 949,017 | | | $ | 1,088,714 | | | $ | 769,602 | | | $ | 879,553 | | | $ | 741,512 | | | | | | | $ | 270,708 | | | $ | 348,707 | | | $ | 288,509 | | | $ | 375,832 | | | $ | 403,195 | |
Ratio of Expenses to Average Net Assets *(B) | | | 0.27 | % | | | 0.28 | % | | | 0.32 | % | | | 0.33 | % | | | 0.35 | % | | | | | | | 0.31 | % | | | 0.32 | % | | | 0.36 | % | | | 0.37 | % | | | 0.34 | % |
Ratio of Expenses to Average Net Assets (Excluding Fees Waived, Expenses Reimbursed by Advisor) *(B) | | | 0.45 | % | | | 0.46 | % | | | 0.56 | % | | | 0.60 | % | | | 0.59 | % | | | | | | | 0.51 | % | | | 0.53 | % | | | 0.61 | % | | | 0.63 | % | | | 0.60 | % |
Ratio of Net Investment Income to Average Net Assets | | | 2.22 | % | | | 1.64 | % | | | 1.81 | % | | | 2.23 | % | | | 1.89 | % | | | | | | | 2.25 | % | | | 1.60 | % | | | 1.78 | % | | | 2.25 | % | | | 1.87 | % |
| | | | | | | | | | | | | | | | | | | | | | | | | | | | | | | | | | | | | | | | | | | | |
* The Ratio of Expenses to Average Net Assets is inclusive of acquired fund fees and expenses incurred by the Portfolio indirectly as a result of Portfolio’s investment in Underlying Funds as follows: | | | 0.20 | % | | | 0.22 | % | | | 0.25 | % | | | 0.27 | % | | | 0.27 | % | | | | | | | 0.24 | % | | | 0.25 | % | | | 0.28 | % | | | 0.30 | % | | | 0.29 | % |
| | | | | | | | | | | | | | | | | | | | | | | | | | | | | | | | | | | | | | | | | | | | |
See page 1-2 for the Definitions of Abbreviations and Footnotes.
See accompanying Notes to Financial Statements.
130
DFA INVESTMENT DIMENSIONS GROUP INC.
FINANCIAL HIGHLIGHTS
(for a share outstanding throughout each period)
| | | | | | | | | | | | | | | | | | | | | | | | | | | | | | | | | | | | | | | | |
| | | Emerging Markets Portfolio | | | Emerging Markets Small Cap Portfolio | |
| | | Year Ended
Oct 31,
2022 | | | Year Ended
Oct 31,
2021 | | | Year Ended
Oct 31,
2020 | | | Year Ended
Oct 31,
2019 | | | Year Ended
Oct 31,
2018 | | | Year Ended
Oct 31,
2022 | | | Year Ended
Oct 31,
2021 | | | Year Ended
Oct 31,
2020 | | | Year Ended
Oct 31,
2019 | | | Year Ended
Oct 31,
2018 | |
Net Asset Value, Beginning of Year | | $ | 33.05 | | | $ | 27.64 | | | $ | 27.56 | | | $ | 25.46 | | | $ | 29.55 | | | $ | 26.03 | | | $ | 19.67 | | | $ | 20.07 | | | $ | 18.72 | | | $ | 23.49 | |
| | | | | | | | | | | | | | | | | | | | | | | | | | | | | | | | | | | | | | | | |
| Income from Investment Operations (A) | | | | | | | | | | | | | | | | | | | | | | | | | | | | | | | | | | | | | | | | |
Net Investment Income (Loss) | | | 0.88 | | | | 0.74 | | | | 0.55 | | | | 0.73 | | | | 0.61 | | | | 0.59 | | | | 0.52 | | | | 0.41 | | | | 0.48 | | | | 0.53 | |
Net Gains (Losses) on Securities (Realized and Unrealized) | | | (9.07 | ) | | | 5.32 | | | | 0.07 | | | | 2.05 | | | | (4.14 | ) | | | (6.16 | ) | | | 6.41 | | | | (0.24 | ) | | | 1.87 | | | | (4.22 | ) |
| | | | | | | | | | | | | | | | | | | | | | | | | | | | | | | | | | | | | | | | |
Total from Investment Operations | | | (8.19 | ) | | | 6.06 | | | | 0.62 | | | | 2.78 | | | | (3.53 | ) | | | (5.57 | ) | | | 6.93 | | | | 0.17 | | | | 2.35 | | | | (3.69 | ) |
| | | | | | | | | | | | | | | | | | | | | | | | | | | | | | | | | | | | | | | | |
| Less Distributions: | | | | | | | | | | | | | | | | | | | | | | | | | | | | | | | | | | | | | | | | |
Net Investment Income | | | (0.91 | ) | | | (0.65 | ) | | | (0.54 | ) | | | (0.68 | ) | | | (0.56 | ) | | | (1.00 | ) | | | (0.57 | ) | | | (0.44 | ) | | | (0.46 | ) | | | (0.53 | ) |
Net Realized Gains | | | (1.17 | ) | | | — | | | | — | | | | — | | | | — | | | | (0.70 | ) | | | — | | | | (0.13 | ) | | | (0.54 | ) | | | (0.55 | ) |
| | | | | | | | | | | | | | | | | | | | | | | | | | | | | | | | | | | | | | | | |
Total Distributions | | | (2.08 | ) | | | (0.65 | ) | | | (0.54 | ) | | | (0.68 | ) | | | (0.56 | ) | | | (1.70 | ) | | | (0.57 | ) | | | (0.57 | ) | | | (1.00 | ) | | | (1.08 | ) |
| | | | | | | | | | | | | | | | | | | | | | | | | | | | | | | | | | | | | | | | |
Net Asset Value, End of Year | | $ | 22.78 | | | $ | 33.05 | | | $ | 27.64 | | | $ | 27.56 | | | $ | 25.46 | | | $ | 18.76 | | | $ | 26.03 | | | $ | 19.67 | | | $ | 20.07 | | | $ | 18.72 | |
| | | | | | | | | | | | | | | | | | | | | | | | | | | | | | | | | | | | | | | | |
Total Return | | | (25.94 | %) | | | 21.91 | % | | | 2.36 | % | | | 11.06 | % | | | (12.14 | %) | | | (22.57 | %) | | | 35.51 | % | | | 0.81 | % | | | 12.96 | % | | | (16.45 | %) |
| | | | | | | | | | | | | | | | | | | | | | | | | | | | | | | | | | | | | | | | |
Net Assets, End of Year (thousands) | | $ | 3,938,781 | | | $ | 6,225,187 | | | $ | 5,652,358 | | | $ | 5,968,318 | | | $ | 5,394,188 | | | $ | 3,511,909 | | | $ | 5,115,924 | | | $ | 4,879,733 | | | $ | 6,423,859 | | | $ | 6,304,406 | |
Ratio of Expenses to Average Net Assets (C) | | | 0.36 | % | | | 0.39 | % | | | 0.44 | % | | | 0.48 | % | | | 0.47 | % | | | 0.59 | % | | | 0.63 | % | | | 0.69 | % | | | 0.72 | % | | | 0.70 | % |
Ratio of Expenses to Average Net Assets (Excluding Fees Waived, Expenses Reimbursed by Advisor) (C) | | | 0.46 | % | | | 0.49 | % | | | 0.54 | % | | | 0.58 | % | | | 0.57 | % | | | 0.79 | % | | | 0.83 | % | | | 0.89 | % | | | 0.92 | % | | | 0.90 | % |
Ratio of Net Investment Income to Average Net Assets | | | 3.05 | % | | | 2.19 | % | | | 2.07 | % | | | 2.70 | % | | | 2.08 | % | | | 2.57 | % | | | 2.10 | % | | | 2.20 | % | | | 2.44 | % | | | 2.31 | % |
| | | | | | | | | | | | | | | | | | | | | | | | | | | | | | | | | | | | | | | | |
See page 1-2 for the Definitions of Abbreviations and Footnotes.
See accompanying Notes to Financial Statements.
131
DFA INVESTMENT DIMENSIONS GROUP INC.
FINANCIAL HIGHLIGHTS
(for a share outstanding throughout each period)
| | | | | | | | | | | | | | | | | | | | |
| | | Emerging Markets Value Portfolio-Class R2 Shares | |
| | | Year | | | Year | | | Year | | | Year | | | Year | |
| | | Ended | | | Ended | | | Ended | | | Ended | | | Ended | |
| | | Oct 31, | | | Oct 31, | | | Oct 31, | | | Oct 31, | | | Oct 31, | |
| | | 2022 | | | 2021 | | | 2020 | | | 2019 | | | 2018 | |
Net Asset Value, Beginning of Year | | $ | 31.28 | | | $ | 23.78 | | | $ | 27.16 | | | $ | 26.64 | | | $ | 30.13 | |
| | | | | | | | | | | | | | | | | | | | |
Income from Investment Operations (A) | | | | | | | | | | | | | | | | | | | | |
Net Investment Income (Loss) | | | 1.26 | | | | 0.82 | | | | 0.59 | | | | 0.63 | | | | 0.63 | |
Net Gains (Losses) on Securities (Realized and Unrealized) | | | (7.31 | ) | | | 7.45 | | | | (3.27 | ) | | | 0.56 | | | | (3.48 | ) |
| | | | | | | | | | | | | | | | | | | | |
Total from Investment Operations | | | (6.05 | ) | | | 8.27 | | | | (2.68 | ) | | | 1.19 | | | | (2.85 | ) |
| | | | | | | | | | | | | | | | | | | | |
Less Distributions: | | | | | | | | | | | | | | | | | | | | |
Net Investment Income | | | (1.32 | ) | | | (0.77 | ) | | | (0.70 | ) | | | (0.67 | ) | | | (0.64 | ) |
| | | | | | | | | | | | | | | | | | | | |
Total Distributions | | | (1.32 | ) | | | (0.77 | ) | | | (0.70 | ) | | | (0.67 | ) | | | (0.64 | ) |
| | | | | | | | | | | | | | | | | | | | |
Net Asset Value, End of Year | | $ | 23.91 | | | $ | 31.28 | | | $ | 23.78 | | | $ | 27.16 | | | $ | 26.64 | |
| | | | | | | | | | | | | | | | | | | | |
Total Return | | | (19.74 | %) | | | 34.91 | % | | | (9.98 | %) | | | 4.57 | % | | | (9.66 | %) |
| | | | | | | | | | | | | | | | | | | | |
Net Assets, End of Year (thousands) | | $ | 12,956 | | | $ | 13,709 | | | $ | 12,587 | | | $ | 29,146 | | | $ | 25,150 | |
Ratio of Expenses to Average Net Assets (C) | | | 0.69 | % | | | 0.74 | % | | | 0.77 | % | | | 0.81 | % | | | 0.80 | % |
Ratio of Expenses to Average Net Assets (Excluding Fees Waived, Expenses Reimbursed by Advisor) (C) | | | 0.79 | % | | | 0.84 | % | | | 0.87 | % | | | 0.91 | % | | | 0.90 | % |
Ratio of Net Investment Income to Average Net Assets | | | 4.34 | % | | | 2.68 | % | | | 2.41 | % | | | 2.29 | % | | | 2.07 | % |
| | | | | | | | | | | | | | | | | | | | |
See page 1-2 for the Definitions of Abbreviations and Footnotes.
See accompanying Notes to Financial Statements.
132
DFA INVESTMENT DIMENSIONS GROUP INC.
FINANCIAL HIGHLIGHTS
(for a share outstanding throughout each period)
| | | | | | | | | | | | | | | | | | | | |
| | | Emerging Markets Value Portfolio-Institutional Class Shares | |
| | | Year
Ended
Oct 31,
2022 | | | Year
Ended
Oct 31,
2021 | | | Year
Ended
Oct 31,
2020 | | | Year
Ended
Oct 31,
2019 | | | Year
Ended
Oct 31,
2018 | |
Net Asset Value, Beginning of Year | | $ | 31.48 | | | $ | 23.93 | | | $ | 27.34 | | | $ | 26.81 | | | $ | 30.32 | |
| | | | | | | | | | | | | | | | | | | | |
Income from Investment Operations (A) | | | | | | | | | | | | | | | | | | | | |
Net Investment Income (Loss) | | | 1.32 | | | | 0.90 | | | | 0.71 | | | | 0.70 | | | | 0.73 | |
Net Gains (Losses) on Securities (Realized and Unrealized) | | | (7.34 | ) | | | 7.50 | | | | (3.35 | ) | | | 0.57 | | | | (3.53 | ) |
| | | | | | | | | | | | | | | | | | | | |
Total from Investment Operations | | | (6.02 | ) | | | 8.40 | | | | (2.64 | ) | | | 1.27 | | | | (2.80 | ) |
| | | | | | | | | | | | | | | | | | | | |
Less Distributions: | | | | | | | | | | | | | | | | | | | | |
Net Investment Income | | | (1.39 | ) | | | (0.85 | ) | | | (0.77 | ) | | | (0.74 | ) | | | (0.71 | ) |
| | | | | | | | | | | | | | | | | | | | |
Total Distributions | | | (1.39 | ) | | | (0.85 | ) | | | (0.77 | ) | | | (0.74 | ) | | | (0.71 | ) |
| | | | | | | | | | | | | | | | | | | | |
Net Asset Value, End of Year | | $ | 24.08 | | | $ | 31.48 | | | $ | 23.93 | | | $ | 27.34 | | | $ | 26.81 | |
| | | | | | | | | | | | | | | | | | | | |
Total Return | | | (19.51 | %) | | | 35.24 | % | | | (9.75 | %) | | | 4.83 | % | | | (9.45 | %) |
| | | | | | | | | | | | | | | | | | | | |
Net Assets, End of Year (thousands) | | $ | 9,600,125 | | | $ | 13,258,001 | | | $ | 12,596,902 | | | $ | 17,161,936 | | | $ | 16,431,410 | |
Ratio of Expenses to Average Net Assets (C) | | | 0.45 | % | | | 0.49 | % | | | 0.52 | % | | | 0.56 | % | | | 0.54 | % |
Ratio of Expenses to Average Net Assets (Excluding Fees Waived, Expenses Reimbursed by Advisor) (C) | | | 0.55 | % | | | 0.59 | % | | | 0.62 | % | | | 0.66 | % | | | 0.64 | % |
Ratio of Net Investment Income to Average Net Assets | | | 4.49 | % | | | 2.92 | % | | | 2.87 | % | | | 2.54 | % | | | 2.37 | % |
| | | | | | | | | | | | | | | | | | | | |
See page 1-2 for the Definitions of Abbreviations and Footnotes.
See accompanying Notes to Financial Statements.
133
DFA INVESTMENT DIMENSIONS GROUP INC.
FINANCIAL HIGHLIGHTS
(for a share outstanding throughout each period)
| | | | | | | | | | | | | | | | | | | | | | | | | | | | | | | | | | | | |
| | | Emerging Markets Core Equity Portfolio | | | Emerging Markets Targeted Value Portfolio | |
| | | Year
Ended
Oct 31,
2022 | | | Year
Ended
Oct 31,
2021 | | | Year
Ended
Oct 31,
2020 | | | Year
Ended
Oct 31,
2019 | | | Year
Ended
Oct 31,
2018 | | | Year
Ended
Oct 31,
2022 | | | Year
Ended
Oct 31,
2021 | | | Year
Ended
Oct 31,
2020 | | | Period
Nov 14,
2018 ʊ to
Oct 31,
2019 | |
Net Asset Value, Beginning of Period | | $ | 25.16 | | | $ | 20.34 | | | $ | 20.59 | | | $ | 18.95 | | | $ | 22.38 | | | $ | 13.13 | | | $ | 9.71 | | | $ | 10.43 | | | $ | 10.00 | |
| | | | | | | | | | | | | | | | | | | | | | | | | | | | | | | | | | | | |
Income from Investment Operations (A) | | | | | | | | | | | | | | | | | | | | | | | | | | | | | | | | | | | | |
Net Investment Income (Loss) | | | 0.75 | | | | 0.57 | | | | 0.43 | | | | 0.53 | | | | 0.50 | | | | 0.30 | | | | 0.28 | | | | 0.21 | | | | 0.24 | |
Net Gains (Losses) on Securities (Realized and Unrealized) | | | (6.97 | ) | | | 4.76 | | | | (0.22 | ) | | | 1.64 | | | | (3.47 | ) | | | (2.85 | ) | | | 3.39 | | | | (0.59 | ) | | | 0.20 | |
| | | | | | | | | | | | | | | | | | | | | | | | | | | | | | | | | | | | |
Total from Investment Operations | | | (6.22 | ) | | | 5.33 | | | | 0.21 | | | | 2.17 | | | | (2.97 | ) | | | (2.55 | ) | | | 3.67 | | | | (0.38 | ) | | | 0.44 | |
| | | | | | | | | | | | | | | | | | | | | | | | | | | | | | | | | | | | |
Less Distributions: | | | | | | | | | | | | | | | | | | | | | | | | | | | | | | | | | | | | |
Net Investment Income | | | (0.81 | ) | | | (0.51 | ) | | | (0.46 | ) | | | (0.53 | ) | | | (0.46 | ) | | | (0.42 | ) | | | (0.23 | ) | | | (0.23 | ) | | | (0.01 | ) |
Net Realized Gains | | | — | | | | — | | | | — | | | | — | | | | — | | | | (0.87 | ) | | | (0.02 | ) | | | (0.11 | ) | | | — | |
| | | | | | | | | | | | | | | | | | | | | | | | | | | | | | | | | | | | |
Total Distributions | | | (0.81 | ) | | | (0.51 | ) | | | (0.46 | ) | | | (0.53 | ) | | | (0.46 | ) | | | (1.29 | ) | | | (0.25 | ) | | | (0.34 | ) | | | (0.01 | ) |
| | | | | | | | | | | | | | | | | | | | | | | | | | | | | | | | | | | | |
Net Asset Value, End of Period | | $ | 18.13 | | | $ | 25.16 | | | $ | 20.34 | | | $ | 20.59 | | | $ | 18.95 | | | $ | 9.29 | | | $ | 13.13 | | | $ | 9.71 | | | $ | 10.43 | |
| | | | | | | | | | | | | | | | | | | | | | | | | | | | | | | | | | | | |
Total Return | | | (25.06 | %) | | | 26.19 | % | | | 1.13 | % | | | 11.61 | % | | | (13.48 | %) | | | (21.40 | %) | | | 38.29 | % | | | (3.89 | %) | | | 4.38 | %(D) |
| | | | | | | | | | | | | | | | | | | | | | | | | | | | | | | | | | | | |
Net Assets, End of Period (thousands) | | $ | 20,968,575 | | | $ | 29,155,369 | | | $ | 24,780,700 | | | $ | 28,622,610 | | | $ | 25,372,759 | | | $ | 189,926 | | | $ | 234,921 | | | $ | 170,163 | | | $ | 114,360 | |
Ratio of Expenses to Average Net Assets | | | 0.40 | % | | | 0.42 | % | | | 0.49 | % | | | 0.52 | % | | | 0.52 | % | | | 0.66 | % | | | 0.72 | % | | | 0.84 | % | | | 0.85 | %(E)(F) |
Ratio of Expenses to Average Net Assets (Excluding Fees Waived, Expenses Reimbursed by Advisor and Fees Paid Indirectly) | | | 0.40 | % | | | 0.42 | % | | | 0.50 | % | | | 0.53 | % | | | 0.52 | % | | | 0.66 | % | | | 0.72 | % | | | 0.87 | % | | | 0.95 | %(E)(F) |
Ratio of Net Investment Income to Average Net Assets | | | 3.33 | % | | | 2.26 | % | | | 2.19 | % | | | 2.62 | % | | | 2.25 | % | | | 2.72 | % | | | 2.19 | % | | | 2.26 | % | | | 2.30 | %(E)(F) |
Portfolio Turnover Rate | | | 14 | % | | | 10 | % | | | 15 | % | | | 4 | % | | | 4 | % | | | 28 | % | | | 29 | % | | | 34 | % | | | 12 | %(D) |
| | | | | | | | | | | | | | | | | | | | | | | | | | | | | | | | | | | | |
See page 1-2 for the Definitions of Abbreviations and Footnotes.
See accompanying Notes to Financial Statements.
134
DFA INVESTMENT DIMENSIONS GROUP INC.
FINANCIAL HIGHLIGHTS
(for a share outstanding throughout each period)
| | | | |
| | | Emerging
Markets Ex China Core
Equity Portfolio | |
| | | Period
Nov 15,
2021 ʊ to
Oct 31,
2022 | |
Net Asset Value, Beginning of Period | | $ | 10.00 | |
| | | | |
Income from Investment Operations (A) | | | | |
Net Investment Income (Loss) | | | 0.28 | |
Net Gains (Losses) on Securities (Realized and Unrealized) | | | (2.28 | ) |
| | | | |
Total from Investment Operations | | | (2.00 | ) |
| | | | |
Less Distributions: | | | | |
Net Investment Income | | | (0.24 | ) |
| | | | |
Total Distributions | | | (0.24 | ) |
| | | | |
Net Asset Value, End of Period | | $ | 7.76 | |
| | | | |
Total Return | | | (20.16 | %)(D) |
| | | | |
Net Assets, End of Period (thousands) | | $ | 424,447 | |
Ratio of Expenses to Average Net Assets | | | 0.43 | %(E) |
Ratio of Expenses to Average Net Assets (Excluding Fees Waived, Expenses Reimbursed by Advisor and Fees Paid Indirectly) | | | 0.54 | %(E) |
Ratio of Net Investment Income to Average Net Assets | | | 3.20 | %(E) |
Portfolio Turnover Rate | | | 41 | %(D) |
| | | | |
See page 1-2 for the Definitions of Abbreviations and Footnotes.
See accompanying Notes to Financial Statements.
135
DFA INVESTMENT DIMENSIONS GROUP INC.
NOTES TO FINANCIAL STATEMENTS
A. Organization:
DFA Investment Dimensions Group Inc. (the “Fund”) is an open-end management investment company registered under the Investment Company Act of 1940 (the “1940 Act”), whose shares are generally offered to institutional investors, retirement plans and clients of registered investment advisors. The Fund consists of one hundred and two operational portfolios, of which twenty-four (the “Portfolios”) are included in this section of the report. The remaining operational portfolios are presented in separate reports. The Portfolios are investment companies, and accordingly, follow the accounting and reporting guidance under the Financial Accounting Standards Board (“FASB”) Accounting Standards Codification (“ASC”), Topic 946, “Financial Services-Investment Companies.”
Of the Portfolios, seven invest all of their assets in a corresponding series or fund (each such Portfolio, a “Feeder Fund”). Of the Feeder Funds, six invest all of their assets in a corresponding series of The DFA Investment Trust Company (“DFAITC”) and one invests all of its assets in the Dimensional Emerging Markets Value Fund (“DEM”) (each such series within DFAITC and DEM, a “Master Fund”, treated as partnerships for federal income tax purposes). Six of the Portfolios generally allocate their assets among other funds managed by Dimensional Fund Advisors LP (each such Portfolio, a “Fund of Funds”). The Fund of Funds may also invest in affiliated and unaffiliated registered and unregistered money market funds. The International Small Company Portfolio invests in five Master Funds within DFAITC. The Global Small Company Portfolio invests in six Master Funds within DFAITC and one underlying fund within the Fund (each such underlying fund within the Fund, an “Underlying Fund”). The DFA Global Real Estate Securities Portfolio invests in two Underlying Funds within the Fund and directly in securities. The World ex U.S. Value Portfolio invests in three Master/Underlying Funds within the Fund, DFAITC, and DEM. The World Core Equity Portfolio and Selectively Hedged Global Equity Portfolio each invest in three Underlying Funds within the Fund. As of October 31, 2022, the following Portfolios were the owner of record of the following approximate percentages of the total outstanding shares of the following Master/Underlying Funds as detailed below:
| | | | | | |
Feeder Funds | | Master/Underlying Funds | | Percentage
Ownership
at 10/31/22 | |
Japanese Small Company Portfolio | | The Japanese Small Company Series | | | 11 | % |
Asia Pacific Small Company Portfolio | | The Asia Pacific Small Company Series | | | 19 | % |
United Kingdom Small Company Portfolio | | The United Kingdom Small Company Series | | | 2 | % |
Continental Small Company Portfolio | | The Continental Small Company Series | | | 14 | % |
Emerging Markets Portfolio | | The Emerging Markets Series | | | 99 | % |
Emerging Markets Small Cap Portfolio | | The Emerging Markets Small Cap Series | | | 99 | % |
Emerging Markets Value Portfolio | | Dimensional Emerging Markets Value Fund | | | 99 | % |
| | | | | | |
Funds of Funds | | Underlying Funds | | Percentage
Ownership
at 10/31/22 | |
International Small Company Portfolio | | The Continental Small Company Series | | | 86 | % |
| | The Japanese Small Company Series | | | 89 | % |
| | The United Kingdom Small Company Series | | | 98 | % |
| | The Asia Pacific Small Company Series | | | 81 | % |
| | The Canadian Small Company Series | | | 97 | % |
Global Small Company Portfolio | | U.S. Small Cap Portfolio | | | — | |
| | The Continental Small Company Series | | | — | |
| | The Japanese Small Company Series | | | — | |
| | The Asia Pacific Small Company Series | | | — | |
136
| | | | | | |
Funds of Funds | | Underlying Funds | | Percentage
Ownership
at 10/31/22 | |
| | The Canadian Small Company Series | | | — | |
| | The Emerging Markets Small Cap Series | | | — | |
| | The United Kingdom Small Company Series | | | — | |
DFA Global Real Estate Securities Portfolio* | | DFA Real Estate Securities Portfolio | | | 3 | % |
| | DFA International Real Estate Securities Portfolio | | | 62 | % |
World ex U.S. Value Portfolio | | Dimensional Emerging Markets Value Fund | | | 1 | % |
| | DFA International Small Cap Value Portfolio | | | — | |
| | The DFA International Value Series | | | 1 | % |
World Core Equity Portfolio | | U.S. Core Equity 1 Portfolio | | | 2 | % |
| | International Core Equity Portfolio | | | 1 | % |
| | Emerging Markets Core Equity Portfolio | | | — | |
Selectively Hedged Global Equity Portfolio | | U.S. Core Equity 2 Portfolio | | | 1 | % |
| | International Core Equity Portfolio | | | — | |
| | Emerging Markets Core Equity Portfolio | | | — | |
| * | DFA Global Real Estate Securities Portfolio invests in two Underlying Funds as indicated and securities listed on its Summary Schedule of Investments. |
To achieve its investment objective, each Feeder Fund and Fund of Funds invests substantially all of its assets in corresponding Master and/or Underlying Funds as indicated above. The DFA Global Real Estate Securities Portfolio may pursue its investment objective by investing its assets in its Underlying Funds and/or directly in securities of companies in the real estate industry. Each Feeder Fund and Fund of Funds also invests in short-term temporary cash investments and futures. In addition, each Fund of Funds may engage in forward currency contracts.
The financial statements of the Feeder Funds’ Master Funds are included elsewhere in this report and should be read in conjunction with the financial statements of the Feeder Funds.
B. Significant Accounting Policies:
The following significant accounting policies are in conformity with accounting principles generally accepted in the United States of America (“GAAP”). Such policies are consistently followed by the Fund in preparation of its financial statements. The preparation of financial statements in accordance with GAAP requires management to make estimates and assumptions that affect the fair value of investments, the reported amounts of assets and liabilities, the disclosure of contingent assets and liabilities at the date of the financial statements, and the reported amounts of increases and decreases in net assets from operations during the reporting period. Actual results could differ from those estimates, and those differences could be material.
1. Security Valuation: The Portfolios use a fair value hierarchy, which prioritizes the inputs-to-valuation techniques used to measure fair value into three broad levels described below:
| | • | | Level 1 – inputs are quoted prices in active markets for identical securities (including equity securities, open-end investment companies, and futures contracts) |
| | • | | Level 2 – other significant observable inputs (including quoted prices for similar securities, interest rates, prepayment speeds, credit risk, etc.) |
| | • | | Level 3 – significant unobservable inputs (including the Portfolios’ own assumptions in determining the fair value of investments) |
137
Securities held by Large Cap International Portfolio, International Core Equity Portfolio, DFA International Real Estate Securities Portfolio, DFA Global Real Estate Securities Portfolio, DFA International Small Cap Value Portfolio, International Vector Equity Portfolio, World ex U.S. Core Equity Portfolio, World ex U.S. Targeted Value Portfolio, Emerging Markets Core Equity Portfolio, International High Relative Profitability Portfolio, Emerging Markets Targeted Value Portfolio and Emerging Markets ex China Core Equity Portfolio (the “International Equity Portfolios”), including over-the-counter securities, are valued at the last quoted sale price of the day. International equity securities are subject to a fair value factor, as described later in this note. Securities held by the International Equity Portfolios that are listed on Nasdaq are valued at the Nasdaq Official Closing Price (“NOCP”). If there is no last reported sale price or NOCP for the day, the International Equity Portfolios value the securities within the range of the most recent quoted bid and ask prices. Price information on listed securities is taken from the exchange where the security is primarily traded. Generally, securities issued by open-end management investment companies are valued using their respective net asset values or public offering prices, as appropriate, for purchase orders placed at the close of the New York Stock Exchange (NYSE). These securities are generally categorized as Level 1 in the hierarchy.
Securities for which no market quotations are readily available (including restricted securities), or for which market quotations have become unreliable, are valued in good faith at fair value in accordance with Rule 2a-5 under the 1940 Act pursuant to procedures approved by the Board of Directors of the Fund. Fair value pricing may also be used if events that have a significant effect on the value of an investment (as determined in the discretion of Dimensional Fund Advisors LP) occur before the net asset value of the Portfolio is calculated. When fair value pricing is used, the prices of securities used by the International Equity Portfolios may differ from the quoted or published prices for the same securities on their primary markets or exchanges. These securities are generally categorized as Level 2 or Level 3 in the hierarchy.
The International Equity Portfolios will also apply a fair value price in the circumstances described below. Generally, trading in foreign securities markets is completed each day at various times prior to the close of the NYSE. For example, trading in the Japanese securities markets is completed each day at the close of the Tokyo Stock Exchange (normally, 2:00 a.m. ET), which is fourteen hours before the close of the NYSE (normally, 4:00 p.m. ET) and the time at which the net asset values of the International Equity Portfolios are computed. Due to the time differences between the closings of the relevant foreign securities exchanges and the pricing of the International Equity Portfolios’ shares (at the close of the NYSE), the International Equity Portfolios will fair-value their foreign investments when it is determined that the market quotations for the foreign investments are either unreliable or not readily available. The fair value prices will attempt to reflect the impact of the U.S. financial markets’ perceptions and trading activities on the International Equity Portfolios’ foreign investments since the last calculated closing prices of the foreign investments on their primary foreign securities markets or exchanges. For these purposes, Dimensional Fund Advisors LP has determined that movements in relevant indices or other appropriate market indicators, after the close of the Tokyo Stock Exchange or the London Stock Exchange, demonstrate that market quotations may be unreliable. Fair valuation of portfolio securities may occur on a daily basis. The fair value pricing by the International Equity Portfolios uses data furnished by an independent pricing service (and that data draws upon, among other information, the market values of foreign investments). When an International Equity Portfolio uses fair value pricing, the values assigned to the International Equity Portfolio’s foreign investments may not be the quoted or published prices of the investments on their primary markets or exchanges. These securities are generally categorized as Level 2 in the hierarchy.
Debt securities held by the Portfolios are valued on the basis of evaluated prices provided by one or more pricing services or other reasonably reliable sources including broker/dealers that typically handle the purchase and sale of such securities. Securities that are traded over-the-counter and on a stock exchange generally will be valued according to the broadest and most representative market, and it is expected that for bonds and other fixed income securities, this ordinarily will be the over-the-counter market. These securities are generally categorized as Level 2 or Level 3 in the hierarchy.
138
Listed derivatives, such as futures, that are actively traded are valued based on quoted prices from the exchange and are categorized as Level 1 in the hierarchy. Over-the-counter derivative contracts, which include forward currency contracts, do not require material subjectivity as pricing inputs are observed from quoted markets and are categorized as Level 2 in the hierarchy.
Shares held by the Portfolios in other investment companies (such as the Master/Underlying Funds) are valued at their respective daily net asset values as reported by their administrator. The Feeder Funds’, International Small Company Portfolio’s, Global Small Company Portfolio’s and World ex U.S. Value Portfolio’s investments in series of either DFAITC or DEM reflect their proportionate interest in the net assets of such corresponding Master Fund(s). These valuations are classified as Level 1 in the hierarchy.
A summary of the inputs used to value the Portfolios’ investments by each major security type, industry and/or country is disclosed previously in this note. A valuation hierarchy table has been included at the end of the Summary Schedule of Portfolio Holdings/Schedule of Investments (except for the Feeder Funds). The methodology or inputs used for valuing securities are not necessarily an indication of the risk associated with investing in those securities.
2. Foreign Currency Translation: Securities and other assets and liabilities of the Portfolios whose values are initially expressed in foreign currencies are translated to U.S. dollars using the mean between the most recent bid and ask prices for the U.S. dollar as quoted by generally recognized reliable sources. To facilitate the translation, the Portfolios enter into foreign currency contracts. A foreign currency contract is a spot agreement between two parties to buy and sell currencies at current market exchange rates, for settlement generally within two business days. Dividend and interest income and certain expenses are translated to U.S. dollars at the rate of exchange on their respective accrual dates. Receivables and payables denominated in foreign currencies are marked-to-market daily based on daily exchange rates and exchange gains or losses are realized upon ultimate receipt or disbursement. The Portfolios also enter into forward currency contracts for the purpose of hedging against fluctuations in currency exchange rates. These contracts are marked-to-market daily based on daily forward exchange rates.
The International Equity Portfolios do not isolate the effect of foreign exchange rate fluctuations from the effect of fluctuations in the market prices of securities, whether realized or unrealized. However, the Selectively Hedged Global Equity Portfolio does isolate the effect of foreign currency rate fluctuations when determining the realized gain or loss upon the sale or maturity of foreign currency-denominated debt obligations pursuant to U.S. Federal income tax regulations; such amounts are categorized as foreign exchange gain or loss for income tax reporting purposes.
Realized gains or losses on foreign currency transactions represent net foreign exchange gains or losses from the disposition of foreign currencies, currency gains or losses realized between the trade and settlement dates of securities transactions, and the difference between amounts of interest, dividends and any foreign withholding taxes recorded on the books of the International Equity Portfolios and Selectively Hedged Global Equity Portfolio and the U.S. dollar equivalent amounts actually received or paid.
3. Deferred Compensation Plan: Each eligible Director of the Fund may elect to participate in the Fee Deferral Plan for Independent Directors and Trustees (the “Plan”). Under the Plan, effective January 1, 2002, such Directors may defer payment of all or a portion of their total fees earned as a Director. These deferred amounts may be treated as though such amounts had been invested in shares of the following funds: the U.S. Large Cap Value Portfolio, U.S. Core Equity 1 Portfolio, U.S. Large Company Portfolio, U.S. Vector Equity Portfolio, U.S. Micro Cap Portfolio, DFA International Value Portfolio, International Core Equity Portfolio, Emerging Markets Portfolio, Emerging Markets Core Equity Portfolio, DFA Inflation-Protected Securities Portfolio, and/or DFA Two-Year Global Fixed Income Portfolio. Contributions made under the Plan and the change in unrealized appreciation (depreciation) and income are included in Directors’/ Trustees’ Fees & Expenses.
The Directors may receive their distributions of proceeds by one of the following methods: lump sum, annual installments over a period of agreed-upon years, or quarterly installments over a period of agreed-upon years. Each Director shall have the right in a notice of election (the “Notice”) to defer the receipt of the Director’s deferred compensation until a date specified by such Director in the Notice. The date may not be sooner than the earlier of: (i) the first business day of January following the year in which such Director ceases to be a member of the Board of Directors of the Fund; and (ii) five years following the effective date of the Director’s first deferral election. If a Director who elects to defer fees fails to designate in the Notice a time or date as of which payment of the Director’s deferred fee account shall commence, payment of such amount shall commence as of the first business day of January following the year in which the Director ceases to be a member of the Board (unless the Director files an amended Notice selecting a different distribution date).
139
4. Other: Security transactions are accounted for as of the trade date. Costs used in determining realized gains and losses on the sale of investment securities/affiliated investment companies and foreign currency are accounted for on the basis of identified cost. Dividend income and distributions to shareholders are recorded on the ex-dividend date. Distributions received on securities and from the investment in affiliated investment companies that represent a return of capital or capital gains are recorded as a reduction of cost of investments or as a realized gain, respectively. The Portfolios estimate the character of received distributions that may be considered return of capital distributions. Interest income is recorded on an accrual basis. Discount and premium on debt securities purchased are amortized over the lives of the respective securities, using the effective interest method. Expenses directly attributable to a Portfolio are directly charged. Common expenses of the Fund or the Portfolios are allocated using methods approved by the Board, generally based on average net assets.
Organizational costs are expensed during the fiscal year of inception of the Portfolios. Offering costs are amortized over a twelve-month period from the inception of the Portfolios.
Class R2 Shares and Institutional Class Shares have equal rights to assets and earnings of a Portfolio. Income, gains and losses, and common expenses of a Portfolio are allocated to each class of shares based on its relative net assets. Each class will bear its own class-specific expenses, if any.
The Feeder Funds, International Small Company Portfolio, Global Small Company Portfolio, and World ex U.S. Value Portfolio recognize their pro-rata shares of net investment income and realized and unrealized gains/losses on a daily basis from their respective Master Fund(s) within DFAITC or DEM, which are treated as partnerships for federal income tax purposes.
The Portfolios may be subject to taxes imposed by countries in which they invest with respect to their investments in issuers existing or operating in such countries. Such taxes are generally based on income earned or repatriated and capital gains realized on the sale of such investments. The Portfolios accrue such taxes when the related income or capital gains are earned or throughout the holding period. Some countries require governmental approval for the repatriation of investment income, capital or the proceeds of sales earned by foreign investors. Additionally, if there is a deterioration in a country’s balance of payments or for other reasons, a country may impose temporary restrictions on foreign capital remittances abroad.
The Emerging Markets Portfolio, Emerging Markets Small Cap Portfolio, Emerging Markets Value Portfolio, World ex U.S. Core Portfolio, World ex U.S. Targeted Value Portfolio, Emerging Markets Core Equity Portfolio, Emerging Markets Targeted Value Portfolio and Emerging Markets ex China Core Equity Portfolio are subject to tax on short-term and long-term capital gains for investments in India. Such taxes are accrued on a daily basis and due upon sale of individual securities.
C. Investment Advisor:
The Advisor, Dimensional Fund Advisors LP, provides investment management services to the Portfolios. For the year ended October 31, 2022, the Portfolios’ investment management fees were accrued daily and paid monthly to the Advisor based on the following effective annual rates of average daily net assets:
| | | | |
Large Cap International Portfolio | | | 0.14 | % |
International Core Equity Portfolio | | | 0.20 | % |
Global Small Company Portfolio | | | 0.37 | %* |
International Small Company Portfolio | | | 0.27 | %* |
Japanese Small Company Portfolio | | | 0.37 | %* |
Asia Pacific Small Company Portfolio | | | 0.37 | %* |
United Kingdom Small Company Portfolio | | | 0.37 | %* |
Continental Small Company Portfolio | | | 0.37 | %* |
DFA International Real Estate Securities Portfolio | | | 0.24 | % |
140
| | | | |
DFA Global Real Estate Securities Portfolio | | | 0.20 | % |
DFA International Small Cap Value Portfolio | | | 0.41 | %* |
International Vector Equity Portfolio | | | 0.32 | %* |
International High Relative Profitability Portfolio | | | 0.25 | % |
World ex U.S. Value Portfolio | | | 0.34 | %* |
World ex U.S. Core Equity Portfolio | | | 0.25 | % |
World ex U.S. Targeted Value Portfolio | | | 0.42 | %* |
World Core Equity Portfolio | | | 0.22 | % |
Selectively Hedged Global Equity Portfolio | | | 0.24 | % |
Emerging Markets Portfolio | | | 0.29 | % |
Emerging Markets Small Cap Portfolio | | | 0.52 | % |
Emerging Markets Value Portfolio | | | 0.39 | %* |
Emerging Markets Core Equity Portfolio | | | 0.33 | % |
Emerging Markets Targeted Value Portfolio | | | 0.52 | % |
Emerging Markets ex China Core Equity Portfolio | | | 0.33 | % |
| * | Effective as of February 28, 2022, the management fees payable by the following Portfolios were reduced as follows: |
| | | | | | | | |
| Portfolio | | Management Fee Prior to
February 28, 2022 | | | Management Fee Effective
February 28, 2022 | |
Global Small Company Portfolio | | | 0.40 | % | | | 0.35 | % |
International Small Company Portfolio | | | 0.30 | % | | | 0.25 | % |
Japanese Small Company Portfolio | | | 0.40 | % | | | 0.35 | % |
Asia Pacific Small Company Portfolio | | | 0.40 | % | | | 0.35 | % |
United Kingdom Small Company Portfolio | | | 0.40 | % | | | 0.35 | % |
Continental Small Company Portfolio | | | 0.40 | % | | | 0.35 | % |
DFA International Small Cap Value Portfolio | | | 0.45 | % | | | 0.39 | % |
International Vector Equity Portfolio | | | 0.35 | % | | | 0.30 | % |
World ex U.S. Value Portfolio | | | 0.37 | % | | | 0.32 | % |
World ex U.S. Targeted Value Portfolio | | | 0.45 | % | | | 0.40 | % |
Emerging Markets Value Portfolio | | | 0.41 | % | | | 0.38 | % |
Pursuant to Amended and Restated Fee Waiver and/or Expense Assumption Agreements (each, a “Fee Waiver Agreement”), the Advisor has contractually agreed to waive certain fees, and in certain instances, assume certain expenses of the Portfolios, as described in the notes below. The Fee Waiver Agreements for the non-Feeder Funds, and a portion of the Fee Waiver Agreement for certain Feeder Funds below, will remain in effect through February 28, 2023, may only be terminated by the Fund’s Board of Directors prior to that date and shall continue in effect from year to year thereafter unless terminated by the Fund or the Advisor. The Fee Waiver Agreement with respect to the total management fees paid by the Feeder Funds, as described in the notes below, will remain in effect permanently, unless terminated by a Feeder Fund. During the year ended October 31, 2022, the Portfolios had expense limits based on a percentage of average net assets on an annualized basis, and the Advisor recovered previously waived fees and/or assumed expenses (amounts in thousands), as listed below. The net amount of waived fees/expenses assumed (recovered previously waived fees/expenses assumed) during the year ended October 31, 2022, and the previously waived fees/expenses assumed subject to future recovery by the Advisor as of October 31, 2022, are also reflected below (amounts in thousands). At any time that the Portfolio Expenses (defined below) of a class of a Portfolio are less than the applicable Expense Limitation Amount/Total Management Fee Limit listed below, the Advisor retains the right to recover fees previously waived and/or expenses previously assumed to the extent that the expense ratio following such recovery would be less than the Expense Limitation Amount/Total Management Fee Limit that was in place when such prior year fees were waived and/or expenses assumed, and less than the current Expense Limitation Amount/Total Management Fee Limit in place for the Portfolio. The Advisor, however, will not be reimbursed by a Feeder Portfolio in connection with its Permanent Fee Waiver. The Fund, on behalf of a Portfolio, is also not obligated to reimburse the Advisor for fees previously waived or expenses previously assumed by the
141
Advisor more than thirty-six months before the date of recovery. With respect to the World ex U.S. Value Portfolio, World Core Equity Portfolio, World ex U.S. Targeted Value Portfolio and Selectively Hedged Global Equity Portfolio, the Advisor shall also not be reimbursed for any management fees previously waived to offset a Portfolio’s proportionate share of the management fees paid by such Portfolio through its investment in other funds managed by the Advisor.
| | | | | | | | | | | | | | | | | | | | |
Institutional Class Shares | | Expense
Limitation
Amount | | | Total
Management
Fee Limit | | | Recovery
of Previously
Waived Fees/
Expenses Assumed | | | Waived Fees/
Expenses
Assumed | | | Previously
Waived Fees/
ExpensesAssumed
Subject to Future
Recovery | |
Large Cap International Portfolio (1) | | | 0.24 | % | | | — | | | | — | | | | — | | | | — | |
International Core Equity Portfolio (1) | | | 0.30 | % | | | — | | | | — | | | | — | | | | — | |
Global Small Company Portfolio (2) | | | 0.42 | % | | | — | | | $ | 2 | | | $ | 205 | | | $ | 581 | |
International Small Company Portfolio (3) | | | 0.45 | % | | | — | | | | — | | | | — | | | | — | |
Japanese Small Company Portfolio (4) | | | 0.42 | % | | | 0.35 | % | | | — | | | | 321 | | | | — | |
Asia Pacific Small Company Portfolio (4) | | | 0.42 | % | | | 0.35 | % | | | — | | | | 324 | | | | — | |
United Kingdom Small Company Portfolio (4) | | | 0.42 | % | | | 0.35 | % | | | 27 | | | | 36 | | | | 23 | |
Continental Small Company Portfolio (4) | | | 0.42 | % | | | 0.35 | % | | | — | | | | 770 | | | | — | |
DFA International Real Estate Securities Portfolio (1) | | | 0.29 | % | | | — | | | | — | | | | — | | | | — | |
DFA Global Real Estate Securities Portfolio (5) | | | 0.24 | % | | | — | | | | 68 | | | | 8,559 | | | | 25,717 | |
International Vector Equity Portfolio (1) | | | 0.60 | % | | | — | | | | — | | | | — | | | | — | |
International High Relative Profitability Portfolio (2) | | | 0.35 | % | | | — | | | | — | | | | — | | | | — | |
World ex U.S. Value Portfolio (6) | | | 0.60 | % | | | 0.32 | % | | | — | | | | 447 | | | | — | |
World ex U.S. Core Equity Portfolio (7) | | | 0.39 | % | | | — | | | | — | | | | — | | | | — | |
World ex U.S. Targeted Value Portfolio (8) | | | 0.80 | % | | | 0.40 | % | | | — | | | | — | | | | — | |
World Core Equity Portfolio (9) | | | 0.27 | % | | | 0.22 | % | | | 34 | | | | 1,860 | | | | 594 | |
Selectively Hedged Global Equity Portfolio (10) | | | 0.40 | % | | | 0.24 | % | | | — | | | | 608 | | | | — | |
Emerging Markets Portfolio (11) | | | 0.49 | % | | | 0.29 | % | | | — | | | | 5,136 | | | | — | |
Emerging Markets Small Cap Portfolio (12) | | | — | | | | 0.52 | % | | | — | | | | 8,926 | | | | — | |
Emerging Markets Value Portfolio (12) | | | — | | | | 0.38 | % | | | — | | | | 11,796 | | | | — | |
Emerging Markets Core Equity Portfolio (1) | | | 0.54 | % | | | — | | | | — | | | | — | | | | — | |
142
| | | | | | | | | | | | | | | | | | | | |
Institutional Class Shares | | Expense
Limitation
Amount | | | Total
Management
Fee Limit | | | Recovery
of Previously
Waived Fees/
Expenses Assumed | | | Waived Fees/
Expenses
Assumed | | | Previously
Waived Fees/
Expenses Assumed
Subject to Future
Recovery | |
Emerging Markets Targeted Value Portfolio (2) | | | 0.85 | % | | | — | | | | — | | | | — | | | | — | |
Emerging Markets ex China Core Equity Portfolio (2) | | | 0.43 | % | | | — | | | | — | | | $ | 384 | | | $ | 384 | |
Class R2 Shares | | | | | | | | | | | | | | | | | | | | |
Emerging Markets Value Portfolio (13) | | | 0.96 | % | | | 0.38 | % | | | — | | | | 14 | | | | — | |
| (1) | The Advisor has contractually agreed to waive all or a portion of its management fee and assume each Portfolio’s ordinary operating expenses (excluding the expenses a Portfolio incurs indirectly through investment in other investment companies) (“Portfolio Expenses”) to the extent necessary to limit the Portfolio Expenses of each Portfolio to the rates listed above as a percentage of average net assets on an annualized basis (the “Expense Limitation Amount”). The Fee Waiver Agreement for the Large Cap International Portfolio became effective on January 1, 2017. |
| (2) | The Advisor has contractually agreed to waive all or a portion of its management fee and to assume the ordinary operating expenses of a class of the Portfolio (including the expenses that the Portfolio bears as a shareholder of other funds managed by the Advisor, excluding money market funds, but excluding the expenses that the Portfolio incurs indirectly through its investment in unaffiliated investment companies) (“Portfolio Expenses”) to the extent necessary to limit the Portfolio Expenses of a class of the Portfolio to the rate listed above as a percentage of the average net assets of a class of the Portfolio on an annualized basis (the “Expense Limitation Amount”). Prior to February 28, 2022, the Expense Limitation Amount for the Global Small Company Portfolio was 0.47% of the average net assets of such class of the Portfolio on an annualized basis. |
| (3) | The Advisor has contractually agreed to waive all or a portion of its management fee and to assume the other direct expenses of a class of the Portfolio (excluding expenses incurred through its investment in other investment companies) (“Portfolio Expenses”) to the extent necessary to limit the Portfolio Expenses of a class of the Portfolio to the rate listed above as a percentage of the average net assets of a class of the Portfolio on an annualized basis (the “Expense Limitation Amount”). |
| (4) | Effective February 28, 2022, the Advisor has contractually agreed to permanently waive all or a portion of the management fee of each Portfolio to the extent necessary to limit the total management fees paid to the Advisor by each Portfolio, including the proportionate share of the management fees a Portfolio pays indirectly through its investment in other funds managed by the Advisor, except for the fees paid indirectly through its investment of securities lending cash collateral in the Money Market Series, to 0.35% of the average net assets of a class of a Portfolio on an annualized basis (the “Permanent Fee Waiver”). From February 28, 2021 to February 27, 2022, the Permanent Fee Waiver Limit was 0.40%. From February 28, 2020 to February 27, 2021, the Permanent Fee Waiver Limit was 0.47%. From July 21, 2015 to February 27, 2020, the Permanent Fee Waiver Limit was 0.50%. In addition to the Permanent Fee Waiver, the Advisor has contractually agreed to further waive all or a portion of its management fee and to assume the other direct expenses of a class of each Portfolio (excluding expenses incurred through its investment in other investment companies managed by the Advisor) (“Portfolio Expenses”) to the extent necessary to limit the Portfolio Expenses of each class of a Portfolio to the rates listed above as a percentage of the average net assets of each class of such Portfolios on an annualized basis (the “Expense Limitation Amount”). |
| (5) | The Advisor has contractually agreed to waive all or a portion of its management fee and to assume the expenses of the Portfolio (including the expenses that the Portfolio bears as a shareholder of its Master/Underlying Funds but excluding the expenses that the Portfolio incurs indirectly through investment of its securities lending cash collateral in the Money Market Series and its investment in unaffiliated investment companies) (“Portfolio Expenses”) to the extent necessary to limit the Portfolio Expenses of the Portfolio to the rate listed above as a percentage of the Portfolio’s average net assets on an annualized basis (the “Expense Limitation Amount”). |
| (6) | Effective February 28, 2022, the Advisor has contractually agreed to waive up to the full amount of the Portfolio’s management fee of 0.32% to the extent necessary to offset the proportionate share of the management fees paid by the Portfolio through its investment in its Master/Underlying Funds, except for the fees paid through its investment of securities lending cash collateral in the Money Market Series (the “Total Management Fee Limit”). From February 28, 2021 to February 27, 2022, the Total Management Fee Limit was 0.37%. From February 28, 2020 to February 27, 2021, the Total Management Fee Limit was 0.43%. Prior to February 28, 2020, the Total Management Fee Limit was 0.47%. In addition, under the Fee Waiver Agreement, the Advisor also has agreed to waive all or a portion of the management fee that remains payable by the Portfolio (i.e., the management fee remaining after the proportionate share of the Master/Underlying Funds’ management fees have been offset (the “Remaining Management Fee”)) to the extent necessary to reduce the Portfolio’s ordinary operating expenses (including expenses incurred through its investment in other investment companies but excluding the expenses that the Portfolio incurs indirectly through investment of its securities lending cash collateral in the Money Market Series) (“Portfolio Expenses”) to the rate listed above as a percentage of average net assets on an annualized basis (the “Expense Limitation Amount”). The maximum amount that may be waived to limit Portfolio Expenses is the amount of the Remaining Management Fee. |
| (7) | The Advisor has contractually agreed to waive all or a portion of its management fee and to assume the expenses of a class of the Portfolio (including the expenses that the Portfolio bears as a shareholder of its Master/ Underlying Funds but excluding the expenses that the Portfolio incurs indirectly through its investment of its securities lending cash collateral in the Money Market Series and its investment in unaffiliated investment companies) (“Portfolio Expenses”) to the extent necessary to limit the Portfolio Expenses of a class of the Portfolio to the rate listed above as a percentage of average net assets of a class of the Portfolio on an annualized basis (the “Expense Limitation Amount”). |
143
| (8) | Effective February 28, 2022, the Advisor has contractually agreed to waive up to the full amount of the Portfolio’s management fee of 0.40% to the extent necessary to offset the proportionate share of the management fees paid by the Portfolio through its investment in other funds managed by the Advisor, except for the fees paid through its investment of securities lending cash collateral in the Money Market Series (the “Total Management Fee Limit”). From February 28, 2021 to February 27, 2022, the Total Management Fee Limit was 0.45%. From February 28, 2020 to February 27, 2021, the Total Management Fee Limit was 0.53%. Prior to February 28, 2020, the Total Management Fee Limit was 0.58%. In addition, under the Fee Waiver Agreement, the Advisor has also agreed to waive all or a portion of the management fee and to assume the ordinary operating expenses of a class of the Portfolio (including expenses incurred through its investment in other investment companies but excluding the expenses that the Portfolio incurs indirectly through investment of its securities lending cash collateral in the Money Market Series) (“Portfolio Expenses”) to the extent necessary to limit the Portfolio Expenses of a class of the Portfolio to the rate listed above as a percentage of the average net assets of a class of the Portfolio on an annualized basis (the “Expense Limitation Amount”). |
| (9) | Effective February 28, 2021, the Advisor has contractually agreed to waive up to the full amount of the Portfolio’s management fee of 0.22% to the extent necessary to offset the proportionate share of the management fees paid by the Portfolio through its investment in its Master/Underlying Funds, except for the fees paid through its investment of securities lending cash collateral in the Money Market Series (including the Portfolio’s proportionate share of any management fees that a Master/Underlying Fund paid through its investment in an affiliated cash management fund) (the “Total Management Fee Limit”). From February 28, 2020 to February 27, 2021, the Total Management Fee Limit was 0.27%. Prior to February 28, 2020, the Total Management Fee Limit was 0.30%. In addition, under the Fee Waiver Agreement, the Advisor has also agreed to assume the expenses of a class of the Portfolio to the extent necessary to reduce the ordinary operating expenses (including expenses incurred through its investment in other investment companies but excluding the expenses that the Portfolio incurs indirectly through investment of its securities lending cash collateral in the Money Market Series) (“Portfolio Expenses”) of a class of the Portfolio so that such Portfolio Expenses do not exceed the rate listed above as a percentage of the average net assets of a class of the Portfolio on an annualized basis (the “Expense Limitation Amount”). From February 28, 2019 to February 27, 2021, the Expense Limitation Amount was 0.32% of the average net assets of such class of the Portfolio on an annualized basis. From June 27, 2014 to February 27, 2019, the Expense Limitation Amount was 0.35% of the average net assets of such class of the Portfolio on an annualized basis. |
| (10) | Effective February 28, 2021, the Advisor has contractually agreed to waive up to the full amount of the Portfolio’s management fee of 0.24% to the extent necessary to offset the proportionate share of the management fees paid by the Portfolio through its investment in its Master/Underlying Funds, except for the fees paid through its investment of securities lending cash collateral in the Money Market Series (the “Total Management Fee Limit”). From February 28, 2020 to February 27, 2021, the Total Management Fee Limit was 0.28%. Prior to February 28, 2020, the Total Management Fee Limit was 0.30%. In addition, under the Fee Waiver Agreement, the Advisor has also agreed to waive all or a portion of the management fee and to assume the expenses of a class of the Portfolio to the extent necessary to reduce the ordinary operating expenses (including expenses incurred through its investment in other investment companies but excluding the expenses that the Portfolio incurs indirectly through investment of its securities lending cash collateral in the Money Market Series) (“Portfolio Expenses”) of the Portfolio to the rate listed above as a percentage of average net assets of a class of the Portfolio on an annualized basis (the “Expense Limitation Amount”). |
| (11) | Effective February 28, 2021, the Advisor has contractually agreed to permanently waive all or a portion of the management fee of the Portfolio to the extent necessary to limit the total management fees paid to the Advisor by the Portfolio, including the proportionate share of the management fees the Portfolio pays indirectly through its investment in other funds managed by the Advisor, except for the fees paid indirectly through its investment of securities lending cash collateral in the Money Market Series, to 0.29% of the average net assets of a class of the Portfolio on an annualized basis (the “Permanent Fee Waiver”). From February 28, 2020 to February 27, 2021, the Permanent Fee Waiver Limit was 0.37%. From July 21, 2015 to February 27, 2020, the Permanent Fee Waiver Limit was 0.42%. Effective January 1, 2017, in addition to the Permanent Fee Waiver, the Advisor has contractually agreed to further waive all or a portion of its management fee and to assume the other direct expenses of a class of the Portfolio (excluding expenses incurred through its investment in other investment companies managed by the Advisor) (“Portfolio Expenses”) to the extent necessary to limit the Portfolio Expenses of each class of the Portfolio to the rate listed above as a percentage of the average net assets of a class of the Portfolio on an annualized basis (the “Expense Limitation Amount”). |
| (12) | Effective February 28, 2021 (February 28, 2022, with respect to the Emerging Markets Value Portfolio), the Advisor has contractually agreed to permanently waive all or a portion of the management fee of each Portfolio to the extent necessary to limit the total management fees paid to the Advisor by a Portfolio, including the proportionate share of the management fees a Portfolio pays indirectly through its investment in other funds managed by the Advisor, except for the fees paid indirectly through its investment of securities lending cash collateral in The DFA Short Term Investment Fund (the “Money Market Series”), to the rate listed above as a percentage of the average net assets of a class of a Portfolio on an annualized basis (the“Permanent Fee Waiver”). From February 28, 2021 to February 27, 2022, the Permanent Fee Waiver Limit for the Emerging Markets Value Portfolio was 0.41%. From February 28, 2020 to February 27, 2021, the Permanent Fee Waiver Limits for the Emerging Markets Small Cap Portfolio and Emerging Markets Value Portfolio were 0.60% and 0.45%, respectively. From July 21, 2015 to February 27, 2020, the Permanent Fee Waiver Limits for the Emerging Markets Small Cap Portfolio and Emerging Markets Value Portfolio were 0.65% and 0.50%, respectively. |
| (13) | Effective February 28, 2022, the Advisor has contractually agreed to permanently waive all or a portion of the management fee of the Portfolio to the extent necessary to limit the total management fees paid to the Advisor by the Portfolio, including the proportionate share of the management fees the Portfolio pays indirectly through its investment in other funds managed by the Advisor, except for the fees paid indirectly through its investment of securities lending cash collateral in the Money Market Series, to 0.38% of the average net assets of a class of the Portfolio on an annualized basis (the “Permanent Fee Waiver”). From February 28, 2021 to February 27, 2022, the Permanent Fee Waiver Limit was 0.41%. From February 28, 2020 to February 27, 2021, the Permanent Fee Waiver Limit for the Emerging Markets Value Portfolio was 0.45%. From July 21, 2015 to February 27, 2020, the Permanent Fee Waiver Limit was 0.50%. In addition to the Permanent Fee Waiver, the Advisor has contractually agreed to assume the direct expenses of the Class R2 shares of the Portfolio (excluding management fees and custodian fees) to the extent necessary to limit the annualized expenses of the Class R2 shares of the Portfolio (excluding the expenses the Portfolio incurs indirectly through investment in other investment companies) to the rate listed above as a percentage of the average net assets of the Class R2 shares of the Portfolio (the “Annualized Expense Ratio”). |
144
Earned Income Credit:
Additionally, Portfolios have entered into arrangements with their custodian whereby net interest earned on uninvested cash balances was used to reduce a portion of the Portfolios’ custody expenses. Custody expense in the accompanying financial statements is presented before reduction for credits. The impact of such credits is generally less than one basis point of each Portfolio’s net assets. During the year ended October 31, 2022, expenses reduced were as follows (amounts in thousands):
| | | | |
| | | Fees Paid | |
| | | Indirectly | |
Large Cap International Portfolio | | $ | 197 | |
International Core Equity Portfolio | | | 624 | |
Global Small Company Portfolio | | | 1 | |
DFA International Real Estate Securities Portfolio | | | 211 | |
DFA Global Real Estate Securities Portfolio | | | 30 | |
DFA International Small Cap Value Portfolio | | | 101 | |
International Vector Equity Portfolio | | | 107 | |
International High Relative Profitability Portfolio | | | 19 | |
World ex U.S. Core Equity Portfolio | | | 34 | |
World ex U.S. Targeted Value Portfolio | | | 21 | |
Selectively Hedged Global Equity Portfolio | | | 2 | |
Emerging Markets Core Equity Portfolio | | | 150 | |
Emerging Markets Targeted Value Portfolio | | | 10 | |
Emerging Markets ex China Core Equity Portfolio | | | 13 | |
Fees Paid to Officers and Directors/Trustees:
Certain Officers and Directors of the Advisor are also Officers and Directors of the Fund; however, such Officers and Directors (with the exception of the Chief Compliance Officer (“CCO”)) receive no compensation from the Fund. For the year ended October 31, 2022, the total related amount paid by the Fund to the CCO was $166 (in thousands). The total related amounts paid by each of the Portfolios are included in Other Expenses on the Statements of Operations.
D. Deferred Compensation:
As of October 31, 2022, the total liability for deferred compensation to Directors is included in Accrued Expenses and Other Liabilities on the Statements of Assets and Liabilities as follows (amounts in thousands):
| | | | |
Large Cap International Portfolio | | $ | 25 | |
International Core Equity Portfolio | | | 3 | |
Global Small Company Portfolio | | | — | |
International Small Company Portfolio | | | 96 | |
Japanese Small Company Portfolio | | | 7 | |
Asia Pacific Small Company Portfolio | | | 3 | |
United Kingdom Small Company Portfolio | | | 1 | |
Continental Small Company Portfolio | | | — | |
DFA International Real Estate Securities Portfolio | | | 11 | |
DFA Global Real Estate Securities Portfolio | | | — | |
DFA International Small Cap Value Portfolio | | | 165 | |
International Vector Equity Portfolio | | | 1 | |
International High Relative Profitability Portfolio | | | — | |
World ex U.S. Value Portfolio | | | — | |
World ex U.S. Core Equity Portfolio | | | — | |
145
| | | | |
World ex U.S. Targeted Value Portfolio | | | — | |
World Core Equity Portfolio | | | — | |
Selectively Hedged Global Equity Portfolio | | $ | 1 | |
Emerging Markets Portfolio | | | 51 | |
Emerging Markets Small Cap Portfolio | | | 47 | |
Emerging Markets Value Portfolio | | | 256 | |
Emerging Markets Core Equity Portfolio | | | 69 | |
Emerging Markets Targeted Value Portfolio | | | — | |
Emerging Markets ex China Core Equity Portfolio | | | — | |
E. Purchases and Sales of Securities:
For the year ended October 31, 2022, the Portfolios’ transactions related to investment securities, other than short-term securities, in-kind redemptions and U.S. government securities (amounts in thousands), were as follows:
| | | | | | | | |
| | | Purchases | | | Sales | |
Large Cap International Portfolio | | $ | 720,929 | | | $ | 479,717 | |
International Core Equity Portfolio | | $ | 3,808,915 | | | $ | 3,327,491 | |
DFA International Real Estate Securities Portfolio | | $ | 781,335 | | | $ | 332,146 | |
DFA Global Real Estate Securities Portfolio | | $ | 318,157 | | | $ | 81,730 | |
DFA International Small Cap Value Portfolio | | $ | 2,629,179 | | | $ | 2,817,617 | |
International Vector Equity Portfolio | | $ | 679,802 | | | $ | 563,709 | |
International High Relative Profitability Portfolio | | $ | 447,300 | | | $ | 430,303 | |
World ex U.S. Core Equity Portfolio | | $ | 513,809 | | | $ | 442,555 | |
World ex U.S. Targeted Value Portfolio | | $ | 240,725 | | | $ | 247,687 | |
Emerging Markets Core Equity Portfolio | | $ | 3,736,935 | | | $ | 3,764,509 | |
Emerging Markets Targeted Value Portfolio | | $ | 71,838 | | | $ | 58,488 | |
Emerging Markets ex China Core Equity Portfolio | | $ | 663,524 | | | $ | 143,971 | |
There were no purchases or sales of long-term U.S. government securities.
For the year ended October 31, 2022, transactions related to Affiliated Investment Companies, excluding in-kind redemptions, are presented below.
The amounts presented below may differ from the respective amounts presented in the corresponding Schedule of Investments/Summary Schedule of Portfolio Holdings, Statements of Assets and Liabilities or Statements of Operations due to rounding. The amounts are as follows (amounts in thousands):
| | | | | | | | | | | | | | | | | | | | | | | | | | | | | | | | | | | | |
| | | Balance at
October 31, 2021 | | | Purchases
at Cost | | | Proceeds
from Sales | | | Net Realized
Gain/(Loss)
on Sales | | | Change in
Unrealized
Appreciation/
Depreciation | | | Balance at
October 31, 2022 | | | Shares as of
October 31, 2022 | | | Dividend
Income | | | Capital Gain
Distributions | |
Large Cap International Portfolio | | | | | | | | | | | | | | | | | | | | | | | | | | | | | | | | | | | | |
The DFA Short Term Investment Fund | | $ | 301,125 | | | $ | 1,691,303 | | | $ | 1,746,181 | | | $ | (41 | ) | | $ | (125 | ) | | $ | 246,081 | | | | 21,285 | | | $ | 3,098 | | | | — | |
| | | | | | | | | | | | | | | | | | | | | | | | | | | | | | | | | | | | |
Total | | $ | 301,125 | | | $ | 1,691,303 | | | $ | 1,746,181 | | | $ | (41 | ) | | $ | (125 | ) | | $ | 246,081 | | | | 21,285 | | | $ | 3,098 | | | | — | |
| | | | | | | | | | | | | | | | | | | | | | | | | | | | | | | | | | | | |
| | | | | | | | | | | | | | | | | | | | | | | | | | | | | | | | | | | | |
146
| | | | | | | | | | | | | | | | | | | | | | | | | | | | | | | | | | | | |
| | | Balance at
October 31, 2021 | | | Purchases
at Cost | | | Proceeds
from Sales | | | Net Realized
Gain/(Loss)
on Sales | | | Change in
Unrealized
Appreciation/
Depreciation | | | Balance at
October 31, 2022 | | | Shares as of
October 31, 2022 | | | Dividend
Income | | | Capital Gain
Distributions | |
International Core Equity Portfolio | | | | | | | | | | | | | | | | | | | | | | | | | | | | | | | | | | | | |
The DFA Short Term Investment Fund | | $ | 1,595,008 | | | $ | 6,875,549 | | | $ | 6,992,839 | | | $ | (333 | ) | | $ | (769 | ) | | $ | 1,476,616 | | | | 127,724 | | | $ | 18,823 | | | | — | |
| | | | | | | | | | | | | | | | | | | | | | | | | | | | | | | | | | | | |
Total | | $ | 1,595,008 | | | $ | 6,875,549 | | | $ | 6,992,839 | | | $ | (333 | ) | | $ | (769 | ) | | $ | 1,476,616 | | | | 127,724 | | | $ | 18,823 | | | | — | |
| | | | | | | | | | | | | | | | | | | | | | | | | | | | | | | | | | | | |
Global Small Company Portfolio | | | | | | | | | | | | | | | | | | | | | | | | | | | | | | | | | | | | |
U.S. Small Cap Portfolio | | $ | 58,397 | | | $ | 13,064 | | | $ | 10,616 | | | $ | (1,419 | ) | | $ | (7,951 | ) | | $ | 51,475 | | | | 1,254 | | | $ | 562 | | | $ | 3,071 | |
| | | | | | | | | | | | | | | | | | | | | | | | | | | | | | | | | | | | |
Total | | $ | 58,397 | | | $ | 13,064 | | | $ | 10,616 | | | $ | (1,419 | ) | | $ | (7,951 | ) | | $ | 51,475 | | | | 1,254 | | | $ | 562 | | | $ | 3,071 | |
| | | | | | | | | | | | | | | | | | | | | | | | | | | | | | | | | | | | |
DFA International Real Estate Securities Portfolio | | | | | | | | | | | | | | | | | | | | | | | | | | | | | | | | | | | | |
The DFA Short Term Investment Fund | | $ | 310,546 | | | $ | 2,745,456 | | | $ | 2,795,815 | | | $ | (101 | ) | | $ | (106 | ) | | $ | 259,980 | | | | 22,488 | | | $ | 2,027 | | | | — | |
| | | | | | | | | | | | | | | | | | | | | | | | | | | | | | | | | | | | |
Total | | $ | 310,546 | | | $ | 2,745,456 | | | $ | 2,795,815 | | | $ | (101 | ) | | $ | (106 | ) | | $ | 259,980 | | | | 22,488 | | | $ | 2,027 | | | | — | |
| | | | | | | | | | | | | | | | | | | | | | | | | | | | | | | | | | | | |
DFA Global Real Estate Securities Portfolio | | | | | | | | | | | | | | | | | | | | | | | | | | | | | | | | | | | | |
DFA International Real Estate Securities Portfolio | | $ | 3,666,704 | | | $ | 656,341 | | | $ | 244,904 | | | $ | (83,062 | ) | | $ | (1,239,429 | ) | | $ | 2,755,650 | | | | 815,281 | | | $ | 275,009 | | | | — | |
DFA Real Estate Securities Portfolio | | | 839,611 | | | | — | | | | 447,129 | | | | 279,500 | | | | (390,765 | ) | | | 281,217 | | | | 7,325 | | | | 11,833 | | | $ | 8,517 | |
The DFA Short Term Investment Fund | | | 217,045 | | | | 1,892,149 | | | | 1,914,823 | | | | 30 | | | | (77 | ) | | | 194,324 | | | | 16,809 | | | | 1,369 | | | | — | |
| | | | | | | | | | | | | | | | | | | | | | | | | | | | | | | | | | | | |
Total | | $ | 4,723,360 | | | $ | 2,548,490 | | | $ | 2,606,856 | | | $ | 196,468 | | | $ | (1,630,271 | ) | | $ | 3,231,191 | | | | 839,415 | | | $ | 288,211 | | | $ | 8,517 | |
| | | | | | | | | | | | | | | | | | | | | | | | | | | | | | | | | | | | |
DFA International Small Cap Value Portfolio | | | | | | | | | | | | | | | | | | | | | | | | | | | | | | | | | | | | |
The DFA Short Term Investment Fund | | $ | 383,591 | | | $ | 1,696,732 | | | $ | 1,800,930 | | | $ | 9 | | | $ | (167 | ) | | $ | 279,235 | | | | 24,153 | | | $ | 3,525 | | | | — | |
| | | | | | | | | | | | | | | | | | | | | | | | | | | | | | | | | | | | |
Total | | $ | 383,591 | | | $ | 1,696,732 | | | $ | 1,800,930 | | | $ | 9 | | | $ | (167 | ) | | $ | 279,235 | | | | 24,153 | | | $ | 3,525 | | | | — | |
| | | | | | | | | | | | | | | | | | | | | | | | | | | | | | | | | | | | |
International Vector Equity Portfolio | | | | | | | | | | | | | | | | | | | | | | | | | | | | | | | | | | | | |
The DFA Short Term Investment Fund | | $ | 142,988 | | | $ | 740,175 | | | $ | 723,638 | | | $ | (9 | ) | | $ | (86 | ) | | $ | 159,430 | | | | 13,790 | | | $ | 2,074 | | | | — | |
| | | | | | | | | | | | | | | | | | | | | | | | | | | | | | | | | | | | |
Total | | $ | 142,988 | | | $ | 740,175 | | | $ | 723,638 | | | $ | (9 | ) | | $ | (86 | ) | | $ | 159,430 | | | | 13,790 | | | $ | 2,074 | | | | — | |
| | | | | | | | | | | | | | | | | | | | | | | | | | | | | | | | | | | | |
International High Relative Profitability Portfolio | | | | | | | | | | | | | | | | | | | | | | | | | | | | | | | | | | | | |
The DFA Short Term Investment Fund | | $ | 96,296 | | | $ | 918,542 | | | $ | 900,952 | | | $ | (25 | ) | | $ | (47 | ) | | $ | 113,814 | | | | 9,845 | | | | — | | | | — | |
| | | | | | | | | | | | | | | | | | | | | | | | | | | | | | | | | | | | |
Total | | $ | 96,296 | | | $ | 918,542 | | | $ | 900,952 | | | $ | (25 | ) | | $ | (47 | ) | | $ | 113,814 | | | | 9,845 | | | | — | | | | — | |
| | | | | | | | | | | | | | | | | | | | | | | | | | | | | | | | | | | | |
147
| | | | | | | | | | | | | | | | | | | | | | | | | | | | | | | | | | | | |
| | | Balance at
October 31, 2021 | | | Purchases
at Cost | | | Proceeds
from Sales | | | Net Realized
Gain/(Loss)
on Sales | | | Change in
Unrealized
Appreciation/
Depreciation | | | Balance at
October 31, 2022 | | | Shares as of
October 31, 2022 | | | Dividend
Income | | | Capital Gain
Distributions | |
World ex U.S. Value Portfolio | | | | | | | | | | | | | | | | | | | | | | | | | | | | | | | | | | | | |
DFA International Small Cap Value Portfolio | | $ | 27,414 | | | $ | 3,615 | | | $ | 9,388 | | | $ | 636 | | | $ | (6,125 | ) | | $ | 16,152 | | | | 961 | | | $ | 807 | | | $ | 195 | |
| | | | | | | | | | | | | | | | | | | | | | | | | | | | | | | | | | | | |
Total | | $ | 27,414 | | | $ | 3,615 | | | $ | 9,388 | | | $ | 636 | | | $ | (6,125 | ) | | $ | 16,152 | | | | 961 | | | $ | 807 | | | $ | 195 | |
| | | | | | | | | | | | | | | | | | | | | | | | | | | | | | | | | | | | |
World ex U.S. Core Equity Portfolio | | | | | | | | | | | | | | | | | | | | | | | | | | | | | | | | | | | | |
The DFA Short Term Investment Fund | | $ | 144,554 | | | $ | 762,962 | | | $ | 740,100 | | | $ | (24 | ) | | $ | (95 | ) | | $ | 167,297 | | | | 14,471 | | | $ | 1,725 | | | | — | |
| | | | | | | | | | | | | | | | | | | | | | | | | | | | | | | | | | | | |
Total | | $ | 144,554 | | | $ | 762,962 | | | $ | 740,100 | | | $ | (24 | ) | | $ | (95 | ) | | $ | 167,297 | | | | 14,471 | | | $ | 1,725 | | | | — | |
| | | | | | | | | | | | | | | | | | | | | | | | | | | | | | | | | | | | |
World ex U.S. Targeted Value Portfolio | | | | | | | | | | | | | | | | | | | | | | | | | | | | | | | | | | | | |
The DFA Short Term Investment Fund | | $ | 5,135 | | | $ | 22,241 | | | $ | 25,775 | | | $ | (1 | ) | | $ | (1 | ) | | $ | 1,599 | | | | 138 | | | $ | 24 | | | | — | |
| | | | | | | | | | | | | | | | | | | | | | | | | | | | | | | | | | | | |
Total | | $ | 5,135 | | | $ | 22,241 | | | $ | 25,775 | | | $ | (1 | ) | | $ | (1 | ) | | $ | 1,599 | | | | 138 | | | $ | 24 | | | | — | |
| | | | | | | | | | | | | | | | | | | | | | | | | | | | | | | | | | | | |
World Core Equity Portfolio | | | | | | | | | | | | | | | | | | | | | | | | | | | | | | | | | | | | |
U.S. Core Equity 1 Portfolio | | $ | 643,173 | | | $ | 146,269 | | | $ | 102,980 | | | $ | (4,405 | ) | | $ | (96,139 | ) | | $ | 585,918 | | | | 19,085 | | | $ | 8,369 | | | $ | 16,695 | |
International Core Equity Portfolio | | | 315,518 | | | | 70,511 | | | | 42,238 | | | | (2,732 | ) | | | (80,484 | ) | | | 260,575 | | | | 21,324 | | | | 10,826 | | | | — | |
Emerging Markets Core Equity Portfolio | | | 131,060 | | | | 31,993 | | | | 21,709 | | | | (1,691 | ) | | | (36,494 | ) | | | 103,159 | | | | 5,690 | | | | 4,461 | | | | — | |
| | | | | | | | | | | | | | | | | | | | | | | | | | | | | | | | | | | | |
Total | | $ | 1,089,751 | | | $ | 248,773 | | | $ | 166,927 | | | $ | (8,828 | ) | | $ | (213,117 | ) | | $ | 949,652 | | | | 46,099 | | | $ | 23,656 | | | $ | 16,695 | |
| | | | | | | | | | | | | | | | | | | | | | | | | | | | | | | | | | | | |
Selectively Hedged Global Equity Portfolio | | | | | | | | | | | | | | | | | | | | | | | | | | | | | | | | | | | | |
U.S. Core Equity 2 Portfolio | | $ | 187,179 | | | $ | 23,710 | | | $ | 28,907 | | | $ | 2,167 | | | $ | (30,677 | ) | | $ | 153,472 | | | | 5,479 | | | $ | 2,142 | | | $ | 6,687 | |
International Core Equity Portfolio | | | 93,920 | | | | 16,638 | | | | 17,950 | | | | 878 | | | | (23,663 | ) | | | 69,823 | | | | 5,714 | | | | 2,974 | | | | — | |
Emerging Markets Core Equity Portfolio | | | 62,856 | | | | 13,584 | | | | 15,418 | | | | 255 | | | | (17,080 | ) | | | 44,197 | | | | 2,438 | | | | 1,951 | | | | — | |
| | | | | | | | | | | | | | | | | | | | | | | | | | | | | | | | | | | | |
Total | | $ | 343,955 | | | $ | 53,932 | | | $ | 62,275 | | | $ | 3,300 | | | $ | (71,420 | ) | | $ | 267,492 | | | | 13,631 | | | $ | 7,067 | | | $ | 6,687 | |
| | | | | | | | | | | | | | | | | | | | | | | | | | | | | | | | | | | | |
Emerging Markets Core Equity Portfolio | | | | | | | | | | | | | | | | | | | | | | | | | | | | | | | | | | | | |
The DFA Short Term Investment Fund | | $ | 524,680 | | | $ | 2,343,571 | | | $ | 2,443,554 | | | $ | (37 | ) | | $ | (254 | ) | | $ | 424,406 | | | | 36,710 | | | $ | 4,599 | | | | — | |
| | | | | | | | | | | | | | | | | | | | | | | | | | | | | | | | | | | | |
Total | | $ | 524,680 | | | $ | 2,343,571 | | | $ | 2,443,554 | | | $ | (37 | ) | | $ | (254 | ) | | $ | 424,406 | | | | 36,710 | | | $ | 4,599 | | | | — | |
| | | | | | | | | | | | | | | | | | | | | | | | | | | | | | | | | | | | |
148
| | | | | | | | | | | | | | | | | | | | | | | | | | | | | | | | | | | | |
| | | Balance at
October 31, 2021 | | | Purchases
at Cost | | | Proceeds
from
Sales | | | Net Realized
Gain/(Loss)
on Sales | | | Change in
Unrealized
Appreciation/
Depreciation | | | Balance at
October 31, 2022 | | | Shares as of
October 31, 2022 | | | Dividend
Income | | | Capital Gain
Distributions | |
Emerging Markets Targeted Value Portfolio | | | | | | | | | | | | | | | | | | | | | | | | | | | | | | | | | | | | |
The DFA Short Term Investment Fund | | $ | 3,070 | | | $ | 17,630 | | | $ | 19,032 | | | $ | (1 | ) | | $ | (1 | ) | | $ | 1,666 | | | | 144 | | | | — | | | | — | |
| | | | | | | | | | | | | | | | | | | | | | | | | | | | | | | | | | | | |
Total | | $ | 3,070 | | | $ | 17,630 | | | $ | 19,032 | | | $ | (1 | ) | | $ | (1 | ) | | $ | 1,666 | | | | 144 | | | | — | | | | — | |
| | | | | | | | | | | | | | | | | | | | | | | | | | | | | | | | | | | | |
Emerging Markets ex China Core Equity Portfolio | | | | | | | | | | | | | | | | | | | | | | | | | | | | | | | | | | | | |
DFA Short Term Investment Fund | | | — | | | $ | 30,936 | | | $ | 24,295 | | | | — | | | $ | (3 | ) | | $ | 6,638 | | | | 574 | | | $ | 31 | | | | — | |
| | | | | | | | | | | | | | | | | | | | | | | | | | | | | | | | | | | | |
Total | | | — | | | $ | 30,936 | | | $ | 24,295 | | | | — | | | $ | (3 | ) | | $ | 6,638 | | | | 574 | | | $ | 31 | | | | — | |
| | | | | | | | | | | | | | | | | | | | | | | | | | | | | | | | | | | | |
F. Federal Income Taxes:
Each Portfolio has qualified and intends to continue to qualify as a regulated investment company under Subchapter M of the Internal Revenue Code for federal income tax purposes and to distribute substantially all of its taxable income and net capital gains to its shareholders. Accordingly, no provision has been made for federal income taxes.
Distributions from net investment income and net realized capital gains are determined in accordance with U.S. federal income tax regulations, which may differ from those amounts determined under GAAP. These book/tax differences are either temporary or permanent in nature. To the extent that these differences are permanent, they are charged or credited to paid-in capital or distributable earnings, undistributed net investment income, accumulated net realized gains or losses, or unrealized appreciation, as appropriate, in the period that the differences arise. Accordingly, the permanent differences as of October 31, 2022, can occur as a result of realized gains on securities considered to be “passive foreign investment companies,” non-deductible expenses, realized foreign capital gains tax, the use of accumulated earnings and profits distributed to shareholders on redemptions of shares as part of the dividends paid deduction for income tax purposes, net foreign currency gains/losses, distributions received from real estate investment trusts and distribution redesignations, and were reclassified to the accounts mentioned above. These reclassifications had no effect on net assets or net asset value per share.
The tax character of dividends and distributions declared and paid during the years ended October 31, 2021, and October 31, 2022, were as follows (amounts in thousands):
| | | | | | | | | | | | | | | | |
| | | Net Investment
Income and
Short-Term
Capital Gains | | | Long-Term
Capital Gains | | | Tax Exempt
Income | | | Total | |
Large Cap International Portfolio | | | | | | | | | | | | | | | | |
2021 | | $ | 144,492 | | | | — | | | | — | | | $ | 144,492 | |
2022 | | | 180,306 | | | | — | | | | — | | | | 180,306 | |
International Core Equity Portfolio | | | | | | | | | | | | | | | | |
2021 | | | 761,635 | | | | — | | | | — | | | | 761,635 | |
2022 | | | 1,137,901 | | | | — | | | | — | | | | 1,137,901 | |
Global Small Company Portfolio | | | | | | | | | | | | | | | | |
2021 | | | 727 | | | | — | | | | — | | | | 727 | |
2022 | | | 1,603 | | | $ | 1,952 | | | | — | | | | 3,555 | |
| | | | | | | | | | | | | | | | |
149
| | | | | | | | | | | | | | | | |
| | | Net Investment
Income and
Short-Term
Capital Gains | | | Long-Term
Capital Gains | | | Tax Exempt
Income | | | Total | |
International Small Company Portfolio | | | | | | | | | | | | | | | | |
2021 | | $ | 220,133 | | | | — | | | | — | | | $ | 220,133 | |
2022 | | | 483,283 | | | $ | 367,884 | | | | — | | | | 851,167 | |
Japanese Small Company Portfolio | | | | | | | | | | | | | | | | |
2021 | | | 10,581 | | | | — | | | | — | | | | 10,581 | |
2022 | | | 9,064 | | | | 9,423 | | | | — | | | | 18,487 | |
Asia Pacific Small Company Portfolio | | | | | | | | | | | | | | | | |
2021 | | | 12,808 | | | | — | | | | — | | | | 12,808 | |
2022 | | | 15,273 | | | | 26,996 | | | | — | | | | 42,269 | |
United Kingdom Small Company Portfolio | | | | | | | | | | | | | | | | |
2021 | | | 588 | | | | — | | | | — | | | | 588 | |
2022 | | | 1,165 | | | | 742 | | | | — | | | | 1,907 | |
Continental Small Company Portfolio | | | | | | | | | | | | | | | | |
2021 | | | 13,462 | | | | — | | | | — | | | | 13,462 | |
2022 | | | 24,283 | | | | 13,197 | | | | — | | | | 37,480 | |
DFA International Real Estate Securities Portfolio | | | | | | | | | | | | | | | | |
2021 | | | — | | | | — | | | | — | | | | — | |
2022 | | | 447,007 | | | | — | | | | — | | | | 447,007 | |
DFA Global Real Estate Securities Portfolio | | | | | | | | | | | | | | | | |
2021 | | | 153,865 | | | | 33,088 | | | | — | | | | 186,953 | |
2022 | | | 384,272 | | | | 96,161 | | | | — | | | | 480,433 | |
DFA International Small Cap Value Portfolio | | | | | | | | | | | | | | | | |
2021 | | | 258,254 | | | | — | | | | — | | | | 258,254 | |
2022 | | | 477,746 | | | | 38,826 | | | | — | | | | 516,572 | |
International Vector Equity Portfolio | | | | | | | | | | | | | | | | |
2021 | | | 74,200 | | | | — | | | | — | | | | 74,200 | |
2022 | | | 118,326 | | | | 68,984 | | | | — | | | | 187,310 | |
International High Relative Profitability Portfolio | | | | | | | | | | | | | | | | |
2021 | | | 43,180 | | | | — | | | | — | | | | 43,180 | |
2022 | | | 68,053 | | | | 10,953 | | | | — | | | | 79,006 | |
World ex U.S. Value Portfolio | | | | | | | | | | | | | | | | |
2021 | | | 8,755 | | | | — | | | | — | | | | 8,755 | |
2022 | | | 10,666 | | | | — | | | | — | | | | 10,666 | |
World ex U.S. Core Equity Portfolio | | | | | | | | | | | | | | | | |
2021 | | | 98,429 | | | | — | | | | — | | | | 98,429 | |
2022 | | | 119,143 | | | | — | | | | — | | | | 119,143 | |
World ex U.S. Targeted Value Portfolio | | | | | | | | | | | | | | | | |
2021 | | | 13,860 | | | | — | | | | — | | | | 13,860 | |
2022 | | | 20,430 | | | | 36,246 | | | | — | | | | 56,676 | |
World Core Equity Portfolio | | | | | | | | | | | | | | | | |
2021 | | | 16,210 | | | | — | | | | — | | | | 16,210 | |
2022 | | | 22,839 | | | | 8,329 | | | | — | | | | 31,168 | |
Selectively Hedged Global Equity Portfolio | | | | | | | | | | | | | | | | |
2021 | | | 3,648 | | | | 3,286 | | | | — | | | | 6,934 | |
150
| | | | | | | | | | | | | | | | |
| | | Net Investment
Income and
Short-Term
Capital Gains | | | Long-Term
Capital Gains | | | Tax Exempt
Income | | | Total | |
2022 | | $ | 7,741 | | | $ | 13,787 | | | | — | | | $ | 21,528 | |
Emerging Markets Portfolio | | | | | | | | | | | | | | | | |
2021 | | | 122,695 | | | | — | | | | — | | | | 122,695 | |
2022 | | | 157,133 | | | | 215,646 | | | | — | | | | 372,779 | |
Emerging Markets Small Cap Portfolio | | | | | | | | | | | | | | | | |
2021 | | | 128,503 | | | | — | | | | — | | | | 128,503 | |
2022 | | | 235,523 | | | | 93,647 | | | | — | | | | 329,170 | |
Emerging Markets Value Portfolio | | | | | | | | | | | | | | | | |
2021 | | | 382,292 | | | | — | | | | — | | | | 382,292 | |
2022 | | | 558,916 | | | | — | | | | — | | | | 558,916 | |
Emerging Markets Core Equity Portfolio | | | | | | | | | | | | | | | | |
2021 | | | 590,306 | | | | — | | | | — | | | | 590,306 | |
2022 | | | 942,726 | | | | — | | | | — | | | | 942,726 | |
Emerging Markets Targeted Value Portfolio | | | | | | | | | | | | | | | | |
2021 | | | 4,500 | | | | — | | | | — | | | | 4,500 | |
2022 | | | 11,192 | | | | 10,941 | | | | — | | | | 22,133 | |
Emerging Markets ex China Core Equity Portfolio | | | | | | | | | | | | | | | | |
2022 | | | 10,224 | | | | — | | | | — | | | | 10,224 | |
The Emerging Markets ex China Core Equity Portfolio commenced operations on November 15, 2021, and did not pay any distributions for the year ended October 31, 2021.
As of October 31, 2022, the following net investment income and short-term capital gains and long-term capital gains distributions designated for federal income tax purposes are due to the use of accumulated earnings and profits distributed to shareholders upon redemption of shares (amounts in thousands):
| | | | | | | | | | | | |
| | | Net Investment
Income and
Short-Term
Capital Gains | | | Long-Term
Capital Gains | | | Total | |
Large Cap International Portfolio | | $ | (5,894 | ) | | | — | | | $ | (5,894 | ) |
International Core Equity Portfolio | | | (36,300 | ) | | | — | | | | (36,300 | ) |
Global Small Company Portfolio | | | (91 | ) | | | — | | | | (91 | ) |
International Small Company Portfolio | | | (27,229 | ) | | $ | (4,799 | ) | | | (32,028 | ) |
Japanese Small Company Portfolio | | | (403 | ) | | | (338 | ) | | | (741 | ) |
Asia Pacific Small Company Portfolio | | | (625 | ) | | | — | | | | (625 | ) |
United Kingdom Small Company Portfolio | | | — | | | | — | | | | — | |
Continental Small Company Portfolio | | | (133 | ) | | | — | | | | (133 | ) |
DFA International Real Estate Securities Portfolio | | | — | | | | — | | | | — | |
DFA Global Real Estate Securities Portfolio | | | (29,561 | ) | | | — | | | | (29,561 | ) |
DFA International Small Cap Value Portfolio | | | (15,129 | ) | | | — | | | | (15,129 | ) |
International Vector Equity Portfolio | | | (5,066 | ) | | | — | | | | (5,066 | ) |
International High Relative Profitability Portfolio | | | (3,243 | ) | | | — | | | | (3,243 | ) |
World ex U.S. Value Portfolio | | | (395 | ) | | | — | | | | (395 | ) |
World ex U.S. Core Equity Portfolio | | | (4,426 | ) | | | — | | | | (4,426 | ) |
World ex U.S. Targeted Value Portfolio | | | (1,545 | ) | | | — | | | | (1,545 | ) |
151
| | | | | | | | | | | | |
| | | Net Investment
Income and
Short-Term
Capital Gains | | | Long-Term
Capital Gains | | | Total | |
World Core Equity Portfolio | | $ | (111 | ) | | $ | (1,455 | ) | | $ | (1,566 | ) |
Selectively Hedged Global Equity Portfolio | | | (1,825 | ) | | | (576 | ) | | | (2,401 | ) |
Emerging Markets Portfolio | | | (17,451 | ) | | | (4,966 | ) | | | (22,417 | ) |
Emerging Markets Small Cap Portfolio | | | (9,776 | ) | | | (4,687 | ) | | | (14,463 | ) |
Emerging Markets Value Portfolio | | | (29,129 | ) | | | — | | | | (29,129 | ) |
Emerging Markets Core Equity Portfolio | | | (72,610 | ) | | | — | | | | (72,610 | ) |
Emerging Markets Targeted Value Portfolio | | | (491 | ) | | | (863 | ) | | | (1,354 | ) |
Emerging Markets ex China Core Equity Portfolio | | | (1,148 | ) | | | — | | | | (1,148 | ) |
As of October 31, 2022, the components of distributable earnings (accumulated losses) were as follows (amounts in thousands):
| | | | | | | | | | | | | | | | | | | | |
| | | Undistributed
Net Investment
Income and
Short-Term
Capital Gains | | | Undistributed
Long-Term
Capital Gains | | | Capital Loss
Carryforwards | | | Unrealized
Appreciation
(Depreciation) | | | Total Net
Distributable
Earnings
(Accumulated
Losses) | |
Large Cap International Portfolio | | $ | 11,634 | | | | — | | | $ | (472,554 | ) | | $ | 643,490 | | | $ | 182,570 | |
International Core Equity Portfolio | | | 17,601 | | | | — | | | | (913,989 | ) | | | 74,387 | | | | (822,001 | ) |
Global Small Company Portfolio | | | 753 | | | $ | 38 | | | | — | | | | 2,050 | | | | 2,841 | |
International Small Company Portfolio | | | 68,133 | | | | 121,673 | | | | — | | | | (928,518 | ) | | | (738,712 | ) |
Japanese Small Company Portfolio | | | 3,187 | | | | 11,988 | | | | — | | | | (32,606 | ) | | | (17,431 | ) |
Asia Pacific Small Company Portfolio | | | 6,344 | | | | 15,727 | | | | — | | | | (75,313 | ) | | | (53,242 | ) |
United Kingdom Small Company Portfolio | | | — | | | | — | | | | (2,765 | ) | | | (4,185 | ) | | | (6,950 | ) |
Continental Small Company Portfolio | | | 2,643 | | | | — | | | | (25,916 | ) | | | (27,990 | ) | | | (51,263 | ) |
DFA International Real Estate Securities Portfolio | | | — | | | | — | | | | (657,909 | ) | | | (1,342,213 | ) | | | (2,000,122 | ) |
DFA Global Real Estate Securities Portfolio | | | 41,604 | | | | 312,816 | | | | — | | | | (606,343 | ) | | | (251,923 | ) |
DFA International Small Cap Value Portfolio | | | 68,218 | | | | — | | | | (57,347 | ) | | | (677,076 | ) | | | (666,205 | ) |
International Vector Equity Portfolio | | | 8,361 | | | | — | | | | (12,557 | ) | | | 34,959 | | | | 30,763 | |
International High Relative Profitability Portfolio | | | 457 | | | | — | | | | (55,801 | ) | | | (45,485 | ) | | | (100,829 | ) |
World ex U.S. Value Portfolio | | | 1,370 | | | | — | | | | (9,831 | ) | | | (1,980 | ) | | | (10,441 | ) |
World ex U.S. Core Equity Portfolio | | | 10,324 | | | | — | | | | (29,962 | ) | | | (108,673 | ) | | | (128,311 | ) |
World ex U.S. Targeted Value Portfolio | | | 1,200 | | | | — | | | | (12,457 | ) | | | (87,169 | ) | | | (98,426 | ) |
World Core Equity Portfolio | | | — | | | | 13,462 | | | | — | | | | 164,859 | | | | 178,321 | |
Selectively Hedged Global Equity Portfolio | | | 14,094 | | | | 8,996 | | | | — | | | | 77,009 | | | | 100,099 | |
Emerging Markets Portfolio | | | 21,663 | | | | 10,992 | | | | — | | | | 807,386 | | | | 840,041 | |
Emerging Markets Small Cap Portfolio | | | 6,751 | | | | 76,813 | | | | — | | | | (252,803 | ) | | | (169,239 | ) |
Emerging Markets Value Portfolio | | | 79,331 | | | | — | | | | (1,360,368 | ) | | | (570,999 | ) | | | (1,852,036 | ) |
Emerging Markets Core Equity Portfolio | | | 96,334 | | | | — | | | | (2,133,382 | ) | | | 678,979 | | | | (1,358,069 | ) |
152
| | | | | | | | | | | | | | | | | | | | |
| | | Undistributed
Net Investment
Income and
Short-Term
Capital Gains | | | Undistributed
Long-Term
Capital Gains | | | Capital Loss
Carryforwards | | | Unrealized
Appreciation
(Depreciation) | | | Total Net
Distributable
Earnings
(Accumulated
Losses) | |
Emerging Markets Targeted Value Portfolio | | $ | 4,020 | | | $ | 3,675 | | | | — | | | $ | (16,252 | ) | | $ | (8,557 | ) |
Emerging Markets ex China Core Equity Portfolio | | | 105 | | | | — | | | $ | (9,242 | ) | | | (87,455 | ) | | | (96,592 | ) |
For federal income tax purposes, the Fund measures its capital loss carryforwards annually at October 31, its fiscal year end. Capital loss carryforwards may be carried forward and applied against future capital gains. As of October 31, 2022, the Portfolios had the following capital loss carryforwards available to offset future realized capital gains with no expiration date (amounts in thousands):
| | | | | | | | |
| | | Unlimited | | | Total | |
Large Cap International Portfolio | | $ | 472,554 | | | $ | 472,554 | |
International Core Equity Portfolio | | | 913,989 | | | | 913,989 | |
United Kingdom Small Company Portfolio | | | 2,765 | | | | 2,765 | |
Continental Small Company Portfolio | | | 25,916 | | | | 25,916 | |
DFA International Real Estate Securities Portfolio | | | 657,909 | | | | 657,909 | |
DFA International Small Cap Value Portfolio | | | 57,347 | | | | 57,347 | |
International Vector Equity Portfolio | | | 12,557 | | | | 12,557 | |
International High Relative Profitability Portfolio | | | 55,801 | | | | 55,801 | |
World ex U.S. Value Portfolio | | | 9,831 | | | | 9,831 | |
World ex U.S. Core Equity Portfolio | | | 29,962 | | | | 29,962 | |
World ex U.S. Targeted Value Portfolio | | | 12,457 | | | | 12,457 | |
Emerging Markets Value Portfolio | | | 1,360,368 | | | | 1,360,368 | |
Emerging Markets Core Equity Portfolio | | | 2,133,382 | | | | 2,133,382 | �� |
Emerging Markets ex China Core Equity Portfolio | | | 9,242 | | | | 9,242 | |
During the year ended October 31, 2022, the following Portfolios used the following capital loss carryforwards to offset realized capital gains for federal income tax purposes (amounts in thousands):
| | | | |
International Core Equity Portfolio | | $ | 351,020 | |
World ex U.S. Value Portfolio | | | 49 | |
World ex U.S. Core Equity Portfolio | | | 70,379 | |
Emerging Markets Value Portfolio | | | 349,233 | |
Emerging Markets Core Equity Portfolio | | | 14,600 | |
As of October 31, 2022, the total cost and aggregate gross unrealized appreciation (depreciation) of securities for federal income tax purposes were different from amounts reported for financial reporting purposes, as follows (amounts in thousands):
| | | | | | | | | | | | | | | | |
| | | Federal
Tax Cost | | | Unrealized
Appreciation | | | Unrealized
(Depreciation) | | | Net
Unrealized
Appreciation
(Depreciation) | |
Large Cap International Portfolio | | $ | 4,338,136 | | | $ | 1,135,170 | | | $ | (490,572 | ) | | $ | 644,598 | |
International Core Equity Portfolio | | | 27,220,758 | | | | 4,822,759 | | | | (4,737,359 | ) | | | 85,400 | |
Global Small Company Portfolio | | | 80,761 | | | | 2,109 | | | | — | | | | 2,109 | |
International Small Company Portfolio | | | 10,236,196 | | | | — | | | | (925,265 | ) | | | (925,265 | ) |
153
| | | | | | | | | | | | | | | | |
| | | Federal
Tax Cost | | | Unrealized
Appreciation | | | Unrealized
(Depreciation) | | | Net
Unrealized
Appreciation
(Depreciation) | |
Japanese Small Company Portfolio | | $ | 300,127 | | | | — | | | $ | (32,510 | ) | | $ | (32,510 | ) |
Asia Pacific Small Company Portfolio | | | 305,564 | | | | — | | | | (75,306 | ) | | | (75,306 | ) |
United Kingdom Small Company Portfolio | | | 22,595 | | | | — | | | | (4,189 | ) | | | (4,189 | ) |
Continental Small Company Portfolio | | | 755,766 | | | | — | | | | (139,286 | ) | | | (139,286 | ) |
DFA International Real Estate Securities Portfolio | | | 6,011,628 | | | $ | 355,222 | | | | (1,695,813 | ) | | | (1,340,591 | ) |
DFA Global Real Estate Securities Portfolio | | | 8,625,872 | | | | 1,133,036 | | | | (1,739,379 | ) | | | (606,343 | ) |
DFA International Small Cap Value Portfolio | | | 10,432,581 | | | | 1,379,301 | | | | (2,054,544 | ) | | | (675,243 | ) |
International Vector Equity Portfolio | | | 2,972,309 | | | | 483,094 | | | | (447,448 | ) | | | 35,646 | |
International High Relative Profitability Portfolio | | | 1,759,210 | | | | 172,160 | | | | (217,353 | ) | | | (45,193 | ) |
World ex U.S. Value Portfolio | | | 195,640 | | | | — | | | | (1,591 | ) | | | (1,591 | ) |
World ex U.S. Core Equity Portfolio | | | 3,358,143 | | | | 564,526 | | | | (669,923 | ) | | | (105,397 | ) |
World ex U.S. Targeted Value Portfolio | | | 654,172 | | | | 51,891 | | | | (138,264 | ) | | | (86,373 | ) |
World Core Equity Portfolio | | | 784,795 | | | | 168,740 | | | | (3,882 | ) | | | 164,858 | |
Selectively Hedged Global Equity Portfolio | | | 190,492 | | | | 76,936 | | | | — | | | | 76,936 | |
Emerging Markets Portfolio | | | 3,130,085 | | | | 807,386 | | | | — | | | | 807,386 | |
Emerging Markets Small Cap Portfolio | | | 3,731,854 | | | | — | | | | (223,049 | ) | | | (223,049 | ) |
Emerging Markets Value Portfolio | | | 10,126,974 | | | | — | | | | (508,262 | ) | | | (508,262 | ) |
Emerging Markets Core Equity Portfolio | | | 20,488,138 | | | | 5,647,945 | | | | (4,816,494 | ) | | | 831,451 | |
Emerging Markets Targeted Value Portfolio | | | 208,109 | | | | 27,800 | | | | (42,817 | ) | | | (15,017 | ) |
Emerging Markets ex China Core Equity Portfolio | | | 518,068 | | | | 16,875 | | | | (104,329 | ) | | | (87,454 | ) |
The difference between GAAP-basis and tax-basis unrealized gains (losses) can occur as a result of wash sales and net mark-to-market gains (losses) on regulated futures contracts, net mark-to-market gains (losses) on foreign currency contracts, and differences in the tax treatment of passive foreign investment company investments or other investments.
ASC 740 Accounting for Uncertainty in Income Taxes sets forth a minimum threshold for financial statement recognition of the benefit of a tax position taken or expected to be taken in a tax return. Management has analyzed the Portfolios’ tax positions and has concluded that no additional provision for income tax is required in the Portfolios’ financial statements. The Portfolios are not aware of any tax positions for which it is more likely than not that the total amounts of unrecognized tax benefits will significantly change in the next twelve months. The Portfolios’ federal tax returns for the prior three fiscal years remain subject to examination by the Internal Revenue Service.
G. Capital Share Transactions:
The capital share transactions by class were as follows (amounts in thousands):
| | | | | | | | | | | | | | | | |
| | | Year Ended
October 31, 2022 | | | Year Ended
October 31, 2021 | |
| | | Amount | | | Shares | | | Amount | | | Shares | |
Emerging Markets Value Portfolio | | | | | | | | | | | | | | | | |
Class R2 Shares | | | | | | | | | | | | | | | | |
Shares Issued | | $ | 3,651 | | | | 126 | | | $ | 1,397 | | | | 45 | |
Shares Issued in Lieu of Cash Distributions | | | 643 | | | | 24 | | | | 349 | | | | 12 | |
Shares Redeemed | | | (1,372 | ) | | | (47 | ) | | | (4,468 | ) | | | (148 | ) |
| | | | | | | | | | | | | | | | |
Net Increase (Decrease) — Class R2 Shares | | $ | 2,922 | | | | 103 | | | $ | (2,722 | ) | | | (91 | ) |
| | | | | | | | | | | | | | | | |
154
| | | | | | | | | | | | | | | | |
| | | Year Ended
October 31, 2022 | | | Year Ended
October 31, 2021 | |
| | | Amount | | | Shares | | | Amount | | | Shares | |
Institutional Class Shares | | | | | | | | | | | | | | | | |
Shares Issued | | $ | 1,869,015 | | | | 64,765 | | | $ | 1,801,928 | | | | 58,072 | |
Shares Issued in Lieu of Cash Distributions | | | 535,904 | | | | 19,754 | | | | 368,063 | | | | 12,127 | |
Shares Redeemed | | | (3,126,872 | ) | | | (106,882 | ) | | | (5,470,382 | ) | | | (175,490 | ) |
| | | | | | | | | | | | | | | | |
Net Increase (Decrease) — Institutional Class Shares | | $ | (721,953 | ) | | | (22,363 | ) | | $ | (3,300,391 | ) | | | (105,291 | ) |
| | | | | | | | | | | | | | | | |
H. Financial Instruments:
In accordance with the Portfolios’ investment objectives and policies, the Portfolios may invest either directly or indirectly (through their investments in corresponding Master/Underlying Funds), in certain financial instruments that have off-balance sheet risk in excess of the amounts recognized in the financial statements and concentrations of credit and market risk. These instruments and their significant corresponding risks are described below:
1. Foreign Market Risks: Investments in foreign markets may involve certain considerations and risks not typically associated with investments in the United States of America, including the possibility of future political and economic developments and the level of foreign governmental supervision and regulation of foreign securities markets. These markets are generally smaller, less liquid and more volatile than the major securities markets in the United States of America. Consequently, acquisition and disposition of international securities held by the Portfolios may be inhibited.
Portfolios that have significant exposure to certain countries, such as the United Kingdom Small Company Portfolio’s Master Fund that concentrates investments in the United Kingdom, can be expected to be impacted by the political and economic conditions within such countries. For example, there is continuing uncertainty around the future of the euro and the European Union (EU) following the United Kingdom’s (UK) exit from the EU (referred to as “Brexit”). Brexit may cause greater market volatility and illiquidity, currency fluctuations, deterioration in economic activity, a decrease in business confidence, and increased likelihood of a recession in the UK. While it is not possible to determine the precise impact these events may have on the Portfolios, during this period and beyond, the impact on the UK, EU countries, other countries or parties that transact with the UK and EU, and the broader global economy could be significant and could adversely affect the value and liquidity of the Portfolios’ investments.
Derivative Financial Instruments:
Summarized below are the specific types of derivative instruments used by the Portfolios.
2. Forward Currency Contracts: The Portfolios listed below may enter into foreign currency exchange transactions, including foreign currency forward contracts, in connection with the settlement of foreign securities or to transfer cash balances from one currency to another currency. The Selectively Hedged Global Equity Portfolio may hedge some or all of the currency exposure of its foreign securities by entering into forward currency contracts. The decision to hedge the Selectively Hedged Global Equity Portfolio’s currency exposure with respect to a foreign market will be based primarily on the Portfolio’s existing exposure to a given foreign currency. Each contract is valued daily and the change in value is recorded by the Portfolio as an unrealized gain or loss, which is presented in the Statements of Operations as the change in unrealized appreciation or depreciation of forward currency contracts. When the contract is closed or offset with the same counterparty, the Portfolio records a realized gain or loss equal to the change in the value of the contract when it was opened and the value at the time it was closed or offset. This is presented in the Statements of Operations as a net realized gain or loss on forward currency contracts. Risks may arise upon entering into these contracts from the potential inability of counterparties to meet the terms of their contracts and from unanticipated movements in the value of foreign currency relative to the U.S. dollar.
155
3. Futures Contracts: Each Portfolio listed below may purchase or sell futures contracts and options on futures contracts for equity securities and indices to increase or decrease market exposure based on actual or expected cash inflows to or outflows from the Portfolio. The Selectively Hedged Global Equity Portfolio may also use futures contracts to hedge some or all of the currency exposure of its foreign securities. Upon entering into a futures contract, the Portfolios deposit cash or pledge U.S. Government securities to a broker in an amount equal to the minimum “initial margin” requirements of the exchange on which the contract is traded. Subsequent payments are received from or paid to the broker each day, based on the daily fluctuation in the market value of the contract. These receipts or payments are known as “variation margin” and are recorded daily by the Portfolios as unrealized gains or losses until the contracts are closed. When the contracts are closed, the Portfolios record a realized gain or loss, which is presented in the Statements of Operations as a net realized gain or loss on futures, equal to the difference between the value of the contract at the time it was opened and the value at the time it was closed.
Risks may arise upon entrance into futures contracts from potential imperfect price correlations between the futures contracts and the underlying securities, from the possibility of an illiquid secondary market for these instruments and from the possibility that the Portfolio could lose more than the initial margin requirements. The Portfolios entering into stock index futures are subject to equity price risk from those futures contracts. Counterparty credit risk related to exchange-traded futures is minimal because the exchange’s clearinghouse, as counterparty to all exchange-traded futures, guarantees the futures against default.
Securities have been segregated as collateral for open futures contracts.
The average volume (based on the open positions at each fiscal month-end) of derivative activity for the year ended October 31, 2022 was as follows (amounts in thousands):
| | | | | | | | |
| | | Forward
Currency
Contracts* | | | Futures** | |
Large Cap International Portfolio | | $ | — | | | $ | 63,262 | |
International Core Equity Portfolio | | | — | | | | 276,847 | |
International Small Company Portfolio | | | — | | | | 98,398 | |
DFA International Real Estate Securities Portfolio | | | — | | | | 49,453 | |
DFA Global Real Estate Securities Portfolio | | | — | | | | 2,481 | |
DFA International Small Cap Value Portfolio | | | — | | | | 164,150 | |
International Vector Equity Portfolio | | | — | | | | 26,927 | |
International High Relative Profitability Portfolio | | | — | | | | 5,525 | |
World ex U.S. Core Equity Portfolio | | | — | | | | 31,765 | |
World ex U.S. Targeted Value Portfolio | | | — | | | | 1,825 | |
Selectively Hedged Global Equity Portfolio | | | 83,655 | | | | 3,601 | |
Emerging Markets Core Equity Portfolio | | | — | | | | 223,852 | |
Emerging Markets Targeted Value Portfolio | | | — | | | | 1,496 | |
Emerging Markets ex China Core Equity Portfolio | | | — | | | | 1,233 | |
| * | Average amount of Currency Purchased/Sold in USD. |
| ** | Average Notional Value of futures contracts. |
The following is a summary of the Portfolios’ derivative instrument holdings categorized by primary risk exposure as of October 31, 2022 (amounts in thousands):
| | | | | | | | | | | | |
| | | Asset Derivatives Value | |
| | | Total Value
at
October 31, 2022 | | | Forward
Currency
Contracts (1) | | | Equity
Contracts *,(2) | |
Large Cap International Portfolio | | $ | 1,432 | | | | — | | | $ | 1,432 | |
156
| | | | | | | | | | | | |
| | | Asset Derivatives Value | |
| | | Total Value
at
October 31, 2022 | | | Forward
Currency
Contracts (1) | | | Equity
Contracts *,(2) | |
International Core Equity Portfolio | | $ | 5,896 | | | | — | | | $ | 5,896 | |
International Small Company Portfolio | | | 2,412 | | | | — | | | | 2,412 | |
DFA International Real Estate Securities Portfolio | | | 1,581 | | | | — | | | | 1,581 | |
DFA Global Real Estate Securities Portfolio | | | 1,144 | | | | — | | | | 1,144 | |
DFA International Small Cap Value Portfolio | | | 3,422 | | | | — | | | | 3,422 | |
International Vector Equity Portfolio | | | 439 | | | | — | | | | 439 | |
World ex U.S. Core Equity Portfolio | | | 867 | | | | — | | | | 867 | |
Selectively Hedged Global Equity Portfolio | | | 483 | | | $ | 483 | | | | — | |
Emerging Markets Core Equity Portfolio | | | 5,731 | | | | — | | | | 5,731 | |
| | | | | | | | | | | | |
| | | Liability Derivatives Value | |
| | | Total Value
at October 31, 2022 | | | Forward
Currency
Contracts (3) | | | Equity
Contracts *,(4) | |
Selectively Hedged Global Equity Portfolio | | $ | (511 | ) | | $ | (379 | ) | | $ | (132 | ) |
| (1) | Presented on Statements of Assets and Liabilities as Unrealized Gain on Forward Currency Contracts. |
| (2) | Presented on Statements of Assets and Liabilities as Receivables: Futures Margin Variation. |
| (3) | Presented on Statements of Assets and Liabilities as Unrealized Loss on Forward Currency Contracts. |
| (4) | Presented on Statements of Assets and Liabilities as Payables: Futures Margin Variation. |
| * | Includes cumulative appreciation (depreciation) of futures contracts. Only current day’s margin variation is reported within the Statements of Assets and Liabilities. |
The following is a summary of the realized and change in unrealized gains and losses from the Portfolios’ derivative instrument holdings categorized by primary risk exposure for the year ended October 31, 2022 (amounts in thousands):
| | | | | | | | | | | | |
| | | Realized Gain (Loss) on
Derivatives | |
| | | Total | | | Forward
Currency
Contracts (1) | | | Equity
Contracts (2) | |
Large Cap International Portfolio | | $ | (12,682 | ) | | | — | | | $ | (12,682 | ) |
International Core Equity Portfolio | | | (44,185 | ) | | | — | | | | (44,185 | ) |
Global Small Company Portfolio | | | 34 | | | | — | | | | 34 | * |
International Small Company Portfolio | | | (19,889 | ) | | | — | | | | (19,889 | ) |
DFA International Real Estate Securities Portfolio | | | (4,273 | ) | | | — | | | | (4,273 | ) |
DFA Global Real Estate Securities Portfolio | | | 174 | | | | — | | | | 174 | |
DFA International Small Cap Value Portfolio | | | (36,186 | ) | | | — | | | | (36,186 | ) |
International Vector Equity Portfolio | | | (3,680 | ) | | | — | | | | (3,680 | ) |
International High Relative Profitability Portfolio | | | 291 | | | | — | | | | 291 | * |
World ex U.S. Value Portfolio | | | (44 | ) | | | — | | | | (44 | )* |
World ex U.S. Core Equity Portfolio | | | (3,864 | ) | | | — | | | | (3,864 | ) |
World ex U.S. Targeted Value Portfolio | | | 174 | | | | — | | | | 174 | * |
157
| | | | | | | | | | | | |
| | | Realized Gain (Loss) on
Derivatives | |
| | | Total | | | Forward
Currency
Contracts (1) | | | Equity
Contracts (2) | |
World Core Equity Portfolio | | $ | (6 | ) | | | — | | | $ | (6 | )* |
Selectively Hedged Global Equity Portfolio | | | 11,181 | | | $ | 11,432 | | | | (251 | ) |
Emerging Markets Core Equity Portfolio | | | (37,872 | ) | | | — | | | | (37,872 | ) |
Emerging Markets Targeted Value Portfolio | | | (135 | ) | | | — | | | | (135 | ) |
Emerging Markets ex China Core Equity Portfolio | | | (495 | ) | | | — | | | | (495 | )* |
| | | | | | | | | | | | |
| | | Change in Unrealized Appreciation
(Depreciation) on Derivatives | |
| | | Total | | | Forward
Currency
Contracts (3) | | | Equity
Contracts (4) | |
Large Cap International Portfolio | | $ | (202 | ) | | | — | | | $ | (202 | ) |
International Core Equity Portfolio | | | (3,107 | ) | | | — | | | | (3,107 | ) |
International Small Company Portfolio | | | 271 | | | | — | | | | 271 | |
DFA International Real Estate Securities Portfolio | | | 171 | | | | — | | | | 171 | |
DFA Global Real Estate Securities Portfolio | | | 1,144 | | | | — | | | | 1,144 | |
DFA International Small Cap Value Portfolio | | | (1,079 | ) | | | — | | | | (1,079 | ) |
International Vector Equity Portfolio | | | (387 | ) | | | — | | | | (387 | ) |
World ex U.S. Core Equity Portfolio | | | (167 | ) | | | — | | | | (167 | ) |
World ex U.S. Targeted Value Portfolio | | | (46 | ) | | | — | | | | (46 | ) |
Selectively Hedged Global Equity Portfolio | | | (477 | ) | | $ | (243 | ) | | | (234 | ) |
Emerging Markets Core Equity Portfolio | | | (2,325 | ) | | | — | | | | (2,325 | ) |
Emerging Markets Targeted Value Portfolio | | | (54 | ) | | | — | | | | (54 | ) |
| (1) | Presented on Statements of Operations as Net Realized Gain (Loss) on: Forward Currency Contracts. |
| (2) | Presented on Statements of Operations as Net Realized Gain (Loss) on: Futures. |
| (3) | Presented on Statements of Operations as Change in Unrealized Appreciation (Depreciation) of: Forward Currency Contracts. |
| (4) | Presented on Statements of Operations as Change in Unrealized Appreciation (Depreciation) of: Futures. |
| * | As of October 31, 2022, there were no futures contracts outstanding. During the year ended October 31, 2022, the Portfolio had limited activity in futures contracts. |
Offsetting of Derivative Assets and Derivative Liabilities:
In order to better define its contractual rights and to secure rights that will help a Portfolio mitigate its counterparty risk, the Fund on behalf of applicable Portfolios entered into an International Swaps and Derivatives Association, Inc. Master Agreement (ISDA Master Agreement) or a similar agreement with certain of its derivative contract counterparties. An ISDA Master Agreement is a bilateral agreement between the Fund, on behalf of a Portfolio, and a counterparty that governs over-the-counter (OTC) derivatives and forward currency contracts and typically contains, among other things, provisions in the event of a default and/or termination event and may also include collateral posting items. Under an ISDA Master Agreement, a Portfolio may, under certain circumstances, offset with the counterparty certain derivative financial instruments’ payables and/or receivables with collateral held and/or posted, if any, and create one single net payment. The provisions of the ISDA Master Agreement typically permit a single net payment in the event of a default (close-out), including the bankruptcy or insolvency of the counterparty. However, bankruptcy or insolvency laws of a particular jurisdiction may impose restrictions on or prohibitions against the right of offset in bankruptcy, insolvency, or other events.
158
For financial reporting purposes, the Portfolios do not offset derivative assets and derivative liabilities that are subject to netting arrangements in the Statements of Assets and Liabilities.
The following table presents the Portfolios’ gross and net amount of assets and liabilities available for offset under netting arrangements as well as any related collateral received or pledged by the Portfolios as of October 31, 2022 (amounts in thousands):
| | | | | | | | | | | | | | | | | | | | | | | | | | | | | | | | | | | | | | | | | | | | | | | | |
| | | | | | Net | | | Gross Amounts Not | | | | | | | | | Net | | | Gross Amounts Not | | | | |
| | | | | | Amounts | | | Offset in the | | | | | | | | | Amounts | | | Offset in the | | | | |
| | | | | | of | | | Statements of Assets | | | | | | | | | of | | | Statements of Assets | | | | |
| | | | | | Assets | | | and Liabilities | | | | | | | | | Liabilities | | | and Liabilities | | | | |
| | | | | | Presented | | | | | | | | | | | | | | | | | | Presented | | | | | | | | | | | | | |
| | | Gross | | | in the | | | | | | | | | | | | | | | Gross | | | in the | | | | | | | | | | | | | |
| | | Amounts of | | | Statements | | | | | | | | | | | | | | | Amounts of | | | Statements | | | | | | | | | | | | | |
| | | Recognized | | | of Assets | | | Financial | | | Non-Cash | | | Cash | | | Net | | | Recognized | | | of Assets | | | Financial | | | Non-Cash | | | Cash | | | Net | |
| | | Assets | | | and | | | Instruments | | | Collateral | | | Collateral | | | Amount | | | Liabilities | | | and | | | Instruments | | | Collateral | | | Collateral | | | Amount | |
Description | | (a) | | | Liabilities | | | (b) | | | Received | | | Received | | | (c) | | | (a) | | | Liabilities | | | (d) | | | Pledged | | | Pledged | | | (e) | |
| | | Assets | | | Liabilities | |
Selectively Hedged Global Equity Portfolio | | | | | | | | | | | | | | | | | | | | | | | | | | | | | | | | | | | | | | | | | | | | | | | | |
Societe Generale | | $ | 9 | | | $ | 9 | | | | — | | | | — | | | | — | | | $ | 9 | | | | — | | | | — | | | | — | | | | — | | | | — | | | | — | |
Citibank, N.A | | | 12 | | | | 12 | | | $ | (12 | ) | | | — | | | | — | | | | — | | | $ | 111 | | | $ | 111 | | | $ | (12 | ) | | | — | | | | — | | | $ | 99 | |
UBS AG | | | 341 | | | | 341 | | | | — | | | | — | | | | — | | | | 341 | | | | — | | | | — | | | | — | | | | — | | | | — | | | | — | |
State Street Bank and Trust | | | 118 | | | | 118 | | | | (118 | ) | | | — | | | | — | | | | — | | | | 203 | | | | 203 | | | | (118 | ) | | | — | | | | — | | | | 85 | |
HSBC Bank | | | — | | | | | | | | — | | | | — | | | | — | | | | — | | | | 8 | | | | 8 | | | | — | | | | — | | | | — | | | | 8 | |
Bank of America Corp | | | 3 | | | | 3 | | | | (3 | ) | | | — | | | | — | | | | — | | | | 10 | | | | 10 | | | | (3 | ) | | | — | | | | — | | | | 7 | |
Morgan Stanley and Co. International | | | — | | | | — | | | | — | | | | — | | | | — | | | | — | | | | 47 | | | | 47 | | | | — | | | | — | | | | — | | | | 47 | |
| | | | | | | | | | | | | | | | | | | | | | | | | | | | | | | | | | | | | | | | | | | | | | | | |
Total | | $ | 483 | | | $ | 483 | | | $ | (133 | ) | | | — | | | | — | | | $ | 350 | | | $ | 379 | | | $ | 379 | | | $ | (133 | ) | | | — | | | | — | | | $ | 246 | |
| | | | | | | | | | | | | | | | | | | | | | | | | | | | | | | | | | | | | | | | | | | | | | | | |
| (a) | No amounts have been netted against the gross amounts recognized in the Statements of Assets and Liabilities. |
| (b) | Represents the amount of assets that could be offset by liabilities with the same counterparty under master netting or similar agreements that management elects not to offset on the Statements of Assets and Liabilities. |
| (c) | Represents the net amount due from counterparties in the event of default. |
| (d) | Represents the amount of liabilities that could be offset by assets with the same counterparty under master netting or similar agreements that management elects not to offset on the Statements of Assets and Liabilities. |
| (e) | Represents the net amount due to counterparties in the event of default. |
I. Line of Credit and Interfund Lending Program:
The Fund, together with other Dimensional-advised portfolios, has entered into a $500 million uncommitted, unsecured discretionary line of credit effective April 6, 2022, with its domestic custodian bank. A line of credit with similar terms was in effect through April 6, 2022. Each portfolio is permitted to borrow, subject to its investment limitations, up to a maximum of $250 million, as long as total borrowings under the line of credit do not exceed $500 million in the aggregate. Borrowings under the line of credit are charged interest at rates agreed upon by the parties at the time of borrowing. Each portfolio is individually, and not jointly, liable for its particular advances under the line of credit. There is no commitment fee on the unused portion of the line of credit. The agreement for the discretionary line of credit may be terminated by either party at any time. The agreement for the line of credit expires on April 5, 2023.
The Fund, together with other Dimensional-advised portfolios, has also entered into an additional $700 million unsecured line of credit with its international custodian bank effective January 2, 2022. A line of credit with similar terms was in effect through January 1, 2022. Each portfolio is permitted to borrow, subject to its investment limitations, up to the lower of one-quarter of such portfolio’s net assets or $500 million, as long as total borrowings under the line of credit do not exceed $700 million in the aggregate. Each portfolio is individually, and not jointly, liable for its particular advances under the line of credit. Borrowings under the line of credit are charged interest at rates agreed upon by the parties at the time of borrowing. There is no commitment fee on the unused portion of the line of credit. The line of credit agreement expires on January 1, 2023.
159
For the year ended October 31, 2022, borrowings by the following Portfolios under the lines of credit were as follows (amounts in thousands, except percentages and days):
| | | | | | | | | | | | | | | | | | | | | | | | |
| | | Weighted
Average
Interest Rate | | | Weighted
Average
Loan Balance | | | Number of
Days
Outstanding* | | | Interest
Expense
Incurred | | | Maximum Amount
Borrowed During
the Period | | | Outstanding
Borrowings
as of 10/31/2022 | |
Large Cap International Portfolio | | | 3.83 | % | | $ | 5,269 | | | | 4 | | | $ | 2 | | | $ | 6,982 | | | | — | |
International Core Equity Portfolio | | | 3.83 | % | | | 3,969 | | | | 2 | | | | 1 | | | | 5,274 | | | | — | |
Global Small Company Portfolio | | | 1.82 | % | | | 223 | | | | 46 | | | | — | | | | 1,760 | | | | — | |
International Small Company Portfolio | | | 1.08 | % | | | 23,176 | | | | 4 | | | | 3 | | | | 27,039 | | | | — | |
DFA International Real Estate Securities Portfolio | | | 2.15 | % | | | 6,674 | | | | 15 | | | | 5 | | | | 18,809 | | | | — | |
DFA Global Real Estate Securities Portfolio | | | 1.92 | % | | | 4,360 | | | | 25 | | | | 5 | | | | 16,645 | | | | — | |
DFA International Small Cap Value Portfolio | | | 2.48 | % | | | 1,824 | | | | 5 | | | | 1 | | | | 3,221 | | | | — | |
International Vector Equity Portfolio | | | 3.27 | % | | | 1,964 | | | | 4 | | | | 1 | | | | 7,845 | | | | — | |
International High Relative Profitability Portfolio | | | 2.56 | % | | | 4,156 | | | | 61 | | | | 16 | | | | 27,171 | | | | — | |
World ex U.S. Value Portfolio | | | 1.80 | % | | | 200 | | | | 30 | | | | — | | | | 1,071 | | | | — | |
World ex U.S. Core Equity Portfolio | | | 1.83 | % | | | 1,261 | | | | 14 | | | | 1 | | | | 2,927 | | | | — | |
World ex U.S. Targeted Value Portfolio | | | 2.24 | % | | | 2,983 | | | | 77 | | | | 16 | | | | 10,833 | | | | — | |
World Core Equity Portfolio | | | 1.40 | % | | | 897 | | | | 120 | | | | 4 | | | | 8,460 | | | | — | |
Selectively Hedged Global Equity Portfolio | | | 2.72 | % | | | 749 | | | | 14 | | | | — | | | | 2,051 | | | | — | |
Emerging Markets Core Equity Portfolio | | | 2.27 | % | | | 2,127 | | | | 12 | | | | 2 | | | | 6,636 | | | | — | |
Emerging Markets Targeted Value Portfolio | | | 1.97 | % | | | 1,155 | | | | 25 | | | | 2 | | | | 2,439 | | | $ | 916 | |
Emerging Markets ex China Core Equity Portfolio | | | 2.21 | % | | | 9,510 | | | | 34 | | | | 16 | | | | 31,278 | | | | — | |
| * | Number of Days Outstanding represents the total of single or consecutive days during the year ended October 31, 2022, that each Portfolio’s available line of credit was used. |
Pursuant to an exemptive order issued by the SEC (the “Order”), the Portfolios may participate in an interfund lending program among certain portfolios managed by the Advisor (portfolios that operate as feeder funds do not participate in the program). The program allows the participating portfolios to borrow money from and loan money to each other for temporary or emergency purposes, subject to the conditions in the Order. A loan can only be made
160
through the program if the interfund loan rate on that day is more favorable to both the borrowing and lending portfolios as compared to rates available through short-term bank loans or investments in overnight repurchase agreements and money market funds, respectively, as detailed in the Order. Further, a portfolio may participate in the program only if and to the extent that such participation is consistent with its investment objectives and limitations. Interfund loans have a maximum duration of seven days and may be called on one business day’s notice.
For the year ended October 31, 2022, activity by the Portfolios under the interfund lending program was as follows (amounts in thousands, except percentages and days):
| | | | | | | | | | | | | | | | | | | | | | | | | | |
| | | Borrower or
Lender | | Weighted
Average
Interest Rate | | | Weighted
Average Loan
Balance | | | Number of
Days
Outstanding* | | | Interest
Expense/
Income | | | Maximum Amount
Borrowed/Loaned
During the Period | | | Outstanding
Borrowings
as of 10/31/2022 | |
DFA International Real Estate Securities Portfolio | | Borrower | | | 3.44 | % | | $ | 48,486 | | | | 1 | | | $ | 5 | | | $ | 48,486 | | | | — | |
Emerging Markets Core Equity Portfolio | | Borrower | | | 3.44 | % | | | 20,000 | | | | 3 | | | | 6 | | | | 20,000 | | | | — | |
Emerging Markets ex China Core Equity Portfolio | | Borrower | | | 1.94 | % | | | 43,054 | | | | 4 | | | | 9 | | | | 43,178 | | | | — | |
| * | Number of Days Outstanding represents the total of single or consecutive days during the year ended October 31, 2022 that the Portfolio utilized the interfund lending program. |
J. Affiliated Trades:
Cross trades for the year ended October 31, 2022, if any, were executed by the Portfolios pursuant to procedures adopted by the Board of Directors of the Fund to ensure compliance with Rule 17a-7 under the 1940 Act. Cross trading is the buying or selling of portfolio securities between series of investment companies, or between a series of an investment company and another entity, that are or could be considered affiliates by virtue of having a common investment advisor (or affiliated investment advisors), common Directors and/or common Officers. At its regularly scheduled meetings, the CCO certifies to the Board that the 17a-7 transactions entered into by the Portfolios complied with the Rule 17a-7 Procedures adopted by the Board of Directors of the Fund.
For the year ended October 31, 2022, cross trades by the Portfolios under Rule 17a-7 were as follows (amounts in thousands):
| | | | | | | | | | | | |
Portfolio | | Purchases | | | Sales | | | Realized Gain (Loss) | |
Large Cap International Portfolio | | $ | 65,316 | | | $ | 49,754 | | | $ | (17,757 | ) |
International Core Equity Portfolio | | | 231,336 | | | | 138,743 | | | | (6,854 | ) |
DFA Global Real Estate Securities Portfolio | | | 29,992 | | | | 287 | | | | (481 | ) |
DFA International Small Cap Value Portfolio | | | 182,554 | | | | 406,702 | | | | (130,631 | ) |
International Vector Equity Portfolio | | | 50,537 | | | | 95,090 | | | | 6,759 | |
International High Relative Profitability Portfolio | | | 76,151 | | | | 66,961 | | | | (7,786 | ) |
World ex U.S. Core Equity Portfolio | | | 15,251 | | | | 17,741 | | | | 1,232 | |
World ex U.S. Targeted Value Portfolio | | | 19,278 | | | | 34,098 | | | | (4,174 | ) |
161
| | | | | | | | | | | | |
Portfolio | | Purchases | | | Sales | | | Realized Gain (Loss) | |
Emerging Markets Core Equity Portfolio | | $ | 15,882 | | | $ | 7,870 | | | $ | (1,254 | ) |
Emerging Markets Targeted Value Portfolio | | | 180 | | | | 219 | | | | 34 | |
Emerging Markets ex China Core Equity Portfolio | | | 1,169 | | | | 62 | | | | 8 | |
K. Securities Lending:
As of October 31, 2022, some of the Portfolios had securities on loan to brokers/dealers, for which each such Portfolio received cash collateral. The Portfolios also received non-cash collateral consisting of short- and/or long-term U.S. Treasuries and U.S. government agency securities as follows (amounts in thousands):
| | | | |
| | | Non-Cash
Collateral
Market
Value | |
Large Cap International Portfolio | | $ | 40,583 | |
International Core Equity Portfolio | | | 284,799 | |
DFA International Real Estate Securities Portfolio | | | 23,713 | |
DFA International Small Cap Value Portfolio | | | 101,708 | |
International Vector Equity Portfolio | | | 43,708 | |
International High Relative Profitability Portfolio | | | 10,421 | |
World ex U.S. Core Equity Portfolio | | | 51,359 | |
World ex U.S. Targeted Value Portfolio | | | 3,786 | |
Emerging Markets Core Equity Portfolio | | | 696,482 | |
Emerging Markets Targeted Value Portfolio | | | 2,339 | |
Emerging Markets ex China Core Equity Portfolio | | | 280 | |
Each Portfolio invests the cash collateral, as described below, and records a liability for the return of the collateral, during the period the securities are on loan. Loans of securities are expected at all times to be secured by collateral in an amount (i) equal to at least 100% of the current market value of the loaned securities with respect to securities of the U.S. government or its agencies, (ii) generally equal to 102% of the current market value of the loaned securities with respect to U.S. securities, and (iii) generally equal to 105% of the current market value of the loaned securities with respect to foreign securities. However, daily market fluctuations could cause the Portfolio’s collateral to be lower or higher than the expected thresholds. If this were to occur, the collateral would be adjusted the next business day to ensure adequate collateralization. In the event of default or bankruptcy by the other party to the agreement, realization and/or retention of the collateral may be subject to legal proceedings. If the borrower fails to return loaned securities, cash collateral being maintained by the borrower is insufficient to cover the value of loaned securities, and such collateral insufficiency is not the result of investment losses, the lending agent has agreed to pay the amount of the shortfall to the Portfolio or, at the option of the lending agent, to replace the securities. In the event of the bankruptcy of the borrower, a Portfolio could experience delay in recovering the loaned securities or only recover cash or a security of equivalent value.
162
Subject to their stated investment policies, each Portfolio with securities on loan will generally invest the cash collateral received for the loaned securities in the Money Market Series, an affiliated registered money market fund advised by the Advisor for which the Advisor receives a management fee of 0.05% of the average daily net assets of the Money Market Series. Income received from the Money Market Series is netted with fees for securities lending and collateral investment expenses and with other payments to and from borrowers of securities. Each Portfolio also may invest the cash collateral received for the loaned securities in securities of the U.S. government or its agencies, repurchase agreements collateralized by securities of the U.S. government or its agencies, and affiliated or unaffiliated money market funds that are registered or unregistered. For purposes of this paragraph, agencies include both agency debentures and agency mortgage-backed securities. Additionally, each Portfolio will be able to terminate the loan at any time and will receive reasonable interest on the loan, as well as amounts equal to any dividends, interest or, other distributions on the loaned securities. However, dividend income received from loaned securities may not be eligible for taxation at qualified dividend income rates.
The following table reflects a breakdown of transactions accounted for as secured borrowings, the gross obligation by the type of collateral pledged, and the remaining contractual maturity of those transactions as of October 31, 2022 (amounts in thousands):
| | | | | | | | | | | | | | | | | | | | |
| | | Remaining Contractual Maturity of the Agreements
As of October 31, 2022 | |
| | | Overnight and
Continuous | | | <30 days | | | Between
30 & 90 days | | | >90 days | | | Total | |
Securities Lending Transactions | | | | | | | | | | | | | | | | | | | | |
Large Cap International Portfolio Common Stocks | | $ | 249,563 | | | | — | | | | — | | | | — | | | $ | 249,563 | |
International Core Equity Portfolio Common Stocks, Rights/Warrants | | | 1,565,282 | | | | — | | | | — | | | | — | | | | 1,565,282 | |
DFA International Real Estate Securities Portfolio Common Stocks | | | 299,241 | | | | — | | | | — | | | | — | | | | 299,241 | |
DFA Global Real Estate Securities Portfolio Common Stocks | | | 207,964 | | | | — | | | | — | | | | — | | | | 207,964 | |
DFA International Small Cap Value Portfolio Common Stocks | | | 294,176 | | | | — | | | | — | | | | — | | | | 294,176 | |
International Vector Equity Portfolio Common Stocks, Rights/Warrants | | | 165,207 | | | | — | | | | — | | | | — | | | | 165,207 | |
International High Relative Profitability Portfolio Common Stocks | | | 128,519 | | | | — | | | | — | | | | — | | | | 128,519 | |
World ex U.S. Core Equity Portfolio Common Stocks | | | 175,641 | | | | — | | | | — | | | | — | | | | 175,641 | |
World ex U.S. Targeted Value Portfolio Common Stocks, Preferred Stocks, Rights/Warrants | | | 1,876 | | | | — | | | | — | | | | — | | | | 1,876 | |
Emerging Markets Core Equity Portfolio Common Stocks | | | 436,254 | | | | — | | | | — | | | | — | | | | 436,254 | |
Emerging Markets Targeted Value Portfolio Common Stocks | | | 1,691 | | | | — | | | | — | | | | — | | | | 1,691 | |
Emerging Markets ex China Core Equity Portfolio Common Stocks | | | 6,829 | | | | — | | | | — | | | | — | | | | 6,829 | |
163
L. Shareholder Servicing Fees:
The Class R2 Shares pay a shareholder servicing fee in an amount up to 0.25% of their annual average net assets to compensate service agents that provide shareholder servicing, record keeping, account maintenance and other services to investors in Emerging Markets Value Portfolio Class R2 Shares.
M. Indemnitees; Contractual Obligations:
Under the Fund’s organizational documents, its Officers and Directors are indemnified against certain liabilities arising out of the performance of their duties to the Fund.
In the normal course of business, the Fund enters into contracts that contain a variety of representations and warranties that provide general indemnification. The Fund’s maximum exposure under these arrangements is unknown, as this would involve future claims that may be made against the Fund and/or its affiliates that have not yet occurred. However, based on experience, the Fund expects the risk of loss to be remote.
N. Recently Issued Accounting Standards and Regulations:
In March 2020, the Financial Accounting Standards Board (FASB) issued Accounting Standards Update (ASU) No. 2020-04, Reference Rate Reform (Topic 848) – Facilitation of the Effects of Reference Rate Reform on Financial Reporting. In January 2021, the FASB issued ASU No. 2021-01, with further amendments to Topic 848. The amendments in the ASUs provide optional temporary accounting recognition and financial reporting relief from the effect of certain types of contract modifications due to the planned discontinuation of the LIBOR and other interbank-offered based reference rates as of the end of 2021 and 2023. The ASUs are effective for certain reference rate-related contract modifications that occur during the period March 12, 2020 through December 31, 2022. Management has reviewed the requirements and believes the adoption of these ASUs will not have a material impact on the Portfolios’ financial statements.
In October 2020, the SEC adopted new regulations governing the use of derivatives by registered investment companies. Rule 18f-4 (the “Derivatives Rule”) imposes limits on the amount of derivatives contracts the Portfolios could enter, eliminates the asset segregation framework previously used by the Portfolios to comply with Section 18 of the 1940 Act, and requires funds whose use of derivatives is more than a limited specified exposure to establish and maintain a derivatives risk management program and appoint a derivatives risk manager. The Derivatives Rule became effective February 19, 2021 and the Portfolios began complying with the Derivatives Rule on August 19, 2022.
On December 3, 2020, the SEC adopted new Rule 2a-5 (the “Valuation Rule”) under the 1940 Act, establishing an updated regulatory framework for fund valuation. The Valuation Rule, in part, provides a framework for good faith fair value determination and permits a Board to designate fair value determinations to a fund’s investment adviser. Further, the SEC rescinded previously issued guidance on related issues. The Valuation Rule became effective on March 8, 2021 and the Portfolios began complying with the Valuation Rule on August 1, 2022.
O. Other:
As of October 31, 2022, the following number of shareholders held the following approximate percentages of the Portfolios’ outstanding shares. One or more of the shareholders may be omnibus accounts, which typically hold shares for the benefit of several other underlying investors.
| | | | | | |
| | | Number of
Shareholders | | Approximate
Percentage
of Outstanding
Shares | |
Large Cap International Portfolio-Institutional Class | | 4 | | | 74 | % |
International Core Equity Portfolio-Institutional Class | | 4 | | | 71 | % |
Global Small Company Portfolio-Institutional Class | | 4 | | | 95 | % |
International Small Company Portfolio-Institutional Class | | 4 | | | 79 | % |
164
| | | | | | |
| | | Number of
Shareholders | | Approximate
Percentage
of Outstanding
Shares | |
Japanese Small Company Portfolio-Institutional Class | | 3 | | | 87 | % |
Asia Pacific Small Company Portfolio-Institutional Class | | 2 | | | 91 | % |
United Kingdom Small Company Portfolio-Institutional Class | | 4 | | | 94 | % |
Continental Small Company Portfolio-Institutional Class | | 2 | | | 91 | % |
DFA International Real Estate Securities Portfolio-Institutional Class | | 4 | | | 93 | % |
DFA Global Real Estate Securities Portfolio-Institutional Class | | 3 | | | 69 | % |
DFA International Small Cap Value Portfolio-Institutional Class | | 4 | | | 75 | % |
International Vector Equity Portfolio-Institutional Class | | 3 | | | 83 | % |
International High Relative Profitability Portfolio-Institutional Class | | 3 | | | 87 | % |
World ex U.S. Value Portfolio-Institutional Class | | 5 | | | 76 | % |
World ex U.S. Core Equity Portfolio-Institutional Class | | 3 | | | 74 | % |
World ex U.S. Targeted Value Portfolio-Institutional Class | | 3 | | | 98 | % |
World Core Equity Portfolio-Institutional Class | | 6 | | | 86 | % |
Selectively Hedged Global Equity Portfolio-Institutional Class | | 3 | | | 85 | % |
Emerging Markets Portfolio-Institutional Class | | 3 | | | 67 | % |
Emerging Markets Small Cap Portfolio-Institutional Class | | 3 | | | 62 | % |
Emerging Markets Value Portfolio-Class R2 | | 1 | | | 41 | % |
Emerging Markets Value Portfolio-Institutional Class | | 2 | | | 97 | % |
Emerging Markets Core Equity Portfolio-Institutional Class | | 3 | | | 64 | % |
Emerging Markets Targeted Value Portfolio-Institutional Class | | 3 | | | 93 | % |
Emerging Markets ex China Core Equity Portfolio-Institutional Class | | 4 | | | 98 | % |
The Portfolios are subject to claims and suits that arise from time to time in the ordinary course of business (for example, claw back litigation against former shareholders of portfolio companies that filed for bankruptcy, such as the now ended litigation involving The Tribune Company and the ongoing litigation involving Nine West). Although management currently believes that resolving claims against the Portfolios, individually or in aggregate, will not have a material adverse impact on the Portfolios’ financial position, results of operations, or cash flows, these matters are subject to inherent uncertainties and management’s view of these matters may change in the future.
P. Subsequent Event Evaluations:
Management has evaluated the impact of all subsequent events on the Portfolios through the date on which the financial statements were issued and has determined that there are no subsequent events requiring recognition or disclosure in the financial statements.
165

Report of Independent Registered Public Accounting Firm
To the Board of Directors of DFA Investment Dimensions Group Inc. and Shareholders of each of the twenty-four portfolios listed in the table below
Opinions on the Financial Statements
We have audited the accompanying statements of assets and liabilities, including the summary schedules of portfolio holdings or schedules of investments, of each of the portfolios indicated in the table below (twenty-four of the portfolios constituting DFA Investment Dimensions Group Inc., hereafter collectively referred to as the “Portfolios”) as of October 31, 2022, the related statements of operations and of changes in net assets for each of the periods indicated in the table below, including the related notes, and the financial highlights for each of the periods indicated in the table below (collectively referred to as the “financial statements”). In our opinion, the financial statements present fairly, in all material respects, the financial position of each of the Portfolios as of October 31, 2022, the results of each of their operations, the changes in each of their net assets, and each of the financial highlights for each of the periods indicated in the table below, in conformity with accounting principles generally accepted in the United States of America.
| | | | | | |
Portfolio | | Statement of operations | | Statement of changes in net assets | | Financial
highlights |
Large Cap International Portfolio (1) International Core Equity Portfolio (1) Global Small Company Portfolio (2) International Small Company Portfolio (2) Japanese Small Company Portfolio (2) Asia Pacific Small Company Portfolio (2) United Kingdom Small Company Portfolio (2) Continental Small Company Portfolio (2) DFA International Real Estate Securities Portfolio (1) DFA Global Real Estate Securities Portfolio (1) DFA International Small Cap Value Portfolio (1) International Vector Equity Portfolio (1) International High Relative Profitability Portfolio (1) World ex U.S. Value Portfolio (2) World ex U.S. Core Equity Portfolio (1) World ex U.S. Targeted Value Portfolio (1) World Core Equity Portfolio (2) Selectively Hedged Global Equity Portfolio (2) Emerging Markets Portfolio (2) Emerging Markets Small Cap Portfolio (2) Emerging Markets Value Portfolio (2) Emerging Markets Core Equity Portfolio (1) Emerging Markets Targeted Value Portfolio (1) | | For the year ended October 31, 2022 | | For the years ended October 31, 2022 and 2021 | | For each of the periods indicated therein |
| |
| Emerging Markets ex China Core Equity Portfolio (1) | | For the period November 15, 2021 (commencement of operations) through October 31, 2022 |
| (1) | Summary schedule of portfolio holdings |
| (2) | Schedule of investments |
166
Basis for Opinions
These financial statements are the responsibility of the Portfolios’ management. Our responsibility is to express an opinion on the Portfolios’ financial statements based on our audits. We are a public accounting firm registered with the Public Company Accounting Oversight Board (United States) (PCAOB) and are required to be independent with respect to the Portfolios in accordance with the U.S. federal securities laws and the applicable rules and regulations of the Securities and Exchange Commission and the PCAOB.
We conducted our audits of these financial statements in accordance with the standards of the PCAOB. Those standards require that we plan and perform the audit to obtain reasonable assurance about whether the financial statements are free of material misstatement, whether due to error or fraud.
Our audits included performing procedures to assess the risks of material misstatement of the financial statements, whether due to error or fraud, and performing procedures that respond to those risks. Such procedures included examining, on a test basis, evidence regarding the amounts and disclosures in the financial statements. Our audits also included evaluating the accounting principles used and significant estimates made by management, as well as evaluating the overall presentation of the financial statements. Our procedures included confirmation of securities owned as of October 31, 2022 by correspondence with the custodians, brokers and transfer agent of the investee fund; when replies were not received from brokers, we performed other auditing procedures. We believe that our audits provide a reasonable basis for our opinions.
|
| /s/PricewaterhouseCoopers LLP |
| Philadelphia, Pennsylvania |
| December 22, 2022 |
We have served as the auditor of one or more investment companies in Dimensional Fund Advisors L.P. investment company group since 1981.
167
DIMENSIONAL INVESTMENT GROUP INC.
PERFORMANCE CHARTS
(Unaudited)
DFA International Value Portfolio — Class R2 vs.
MSCI World ex USA Index (net dividends),
MSCI World ex USA Value Index (net dividends)
October 31, 2012-October 31, 2022
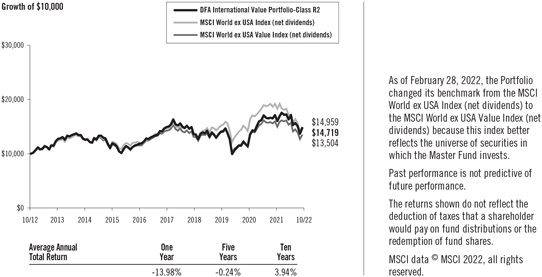
DFA International Value Portfolio — Institutional Class vs.
MSCI World ex USA Index (net dividends),
MSCI World ex USA Value Index (net dividends)
October 31, 2012-October 31, 2022
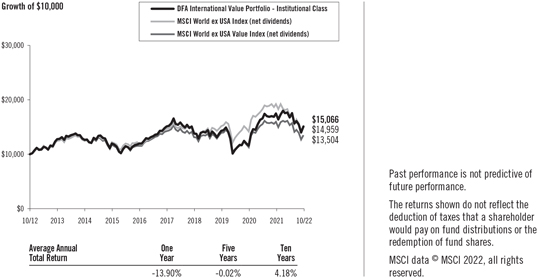
168
MANAGEMENT’S DISCUSSION AND ANALYSIS
| | |
| International Equity Market Review | | 12 Months Ended October 31, 2022 |
Performance of non-U.S. developed markets was negative for the period. As measured by the MSCI World ex USA indices, small-cap stocks underperformed large-cap stocks, and mid-cap stocks, a subset of the large-cap universe, underperformed large-cap stocks but outperformed small-cap stocks. Value stocks outperformed growth stocks as measured by the MSCI World ex USA indices.
| | | | |
Total Return for 12 Months Ended October 31, 2022 | |
| |
| | | Return in U.S. Dollars | |
MSCI World ex USA Index | | | -22.04 | % |
MSCI World ex USA Mid Cap Index | | | -27.57 | % |
MSCI World ex USA Small Cap Index | | | -29.13 | % |
MSCI World ex USA Value Index | | | -15.27 | % |
MSCI World ex USA Growth Index | | | -28.78 | % |
For the 12 Months Ended October 31, 2022, the U.S. dollar appreciated against all non-U.S. developed markets currencies. Overall, currency movements had a negative impact on the U.S. dollar-denominated returns of developed markets.
| | | | | | | | |
Total Return for 12 Months Ended October 31, 2022 | |
| | |
Ten Largest Foreign Developed Markets by Market Cap | | Local Return | | | Return in U.S. Dollars | |
Japan | | | -1.81 | % | | | -24.67 | % |
United Kingdom | | | 4.27 | % | | | -12.42 | % |
Canada | | | -5.29 | % | | | -13.94 | % |
France | | | -6.77 | % | | | -20.38 | % |
Switzerland | | | -11.30 | % | | | -19.01 | % |
Australia | | | -0.54 | % | | | -15.30 | % |
Germany | | | -21.22 | % | | | -32.72 | % |
Netherlands | | | -28.51 | % | | | -38.71 | % |
Sweden | | | -16.17 | % | | | -34.85 | % |
Denmark | | | -7.88 | % | | | -21.38 | % |
Source: Returns are of MSCI standard indices net of foreign withholding taxes on dividends. Copyright MSCI 2022, all rights reserved.
Emerging markets had negative performance for the period and underperformed both U.S. and non-U.S. developed markets. As measured by the MSCI Emerging Markets indices, small-cap stocks outperformed large-cap stocks, and mid-cap stocks, a subset of the large-cap universe, outperformed large-cap stocks but underperformed small-cap stocks. Value stocks outperformed growth stocks as measured by the MSCI Emerging Markets indices.
169
Total Return for 12 Months Ended October 31, 2022
| | | | |
| | | Return in U.S. Dollars | |
MSCI Emerging Markets Index | | | -31.03 | % |
MSCI Emerging Markets Mid Cap Index | | | -24.80 | % |
MSCI Emerging Markets Small Cap Index | | | -23.42 | % |
MSCI Emerging Markets Value Index | | | -25.21 | % |
MSCI Emerging Markets Growth Index | | | -36.11 | % |
For the 12 Months Ended October 31, 2022, the U.S. dollar appreciated against most emerging markets currencies and depreciated against others. Overall, currency movements had a negative impact on the U.S. dollar denominated returns of emerging markets.
Total Return for 12 Months Ended October 31, 2022
| | | | | | | | |
Ten Largest Emerging Markets by Market Cap | | Local Return | | | Return in U.S. | |
Dollars | | | | | | | | |
China | | | -46.31 | % | | | -47.90 | % |
India | | | 2.93 | % | | | -6.89 | % |
Taiwan | | | -24.11 | % | | | -34.50 | % |
Korea | | | -19.88 | % | | | -34.28 | % |
Brazil | | | 15.95 | % | | | 24.57 | % |
Saudi Arabia | | | 2.18 | % | | | 2.00 | % |
South Africa | | | 0.77 | % | | | -16.66 | % |
Mexico | | | 1.99 | % | | | 5.56 | % |
Indonesia | | | 16.58 | % | | | 5.89 | % |
Thailand | | | 4.97 | % | | | -8.48 | % |
Source: Returns are of MSCI standard indices net of foreign withholding taxes on dividends. Copyright MSCI 2022, all rights reserved.
For Portfolios investing in non-U.S. equities traded outside of the U.S. market time zone, differences in the valuation timing and methodology between a Portfolio and its benchmark index may impact relative performance over the referenced period. The Portfolios price foreign exchange rates at the closing of the U.S. market, while their benchmark indices use rates at 4 p.m. London time. The Portfolios also may use fair value pricing to price certain portfolio securities at the closing of the U.S. market, while benchmark indices may use local market closing prices. For the one-year period ended October 31, 2022, these differences generally detracted from non-US developed markets Portfolios’ relative performance and were not material to emerging markets Portfolios’ relative performance.
DFA International Value Portfolio
The DFA International Value Portfolio invests in developed ex U.S. large company value stocks by purchasing shares of the DFA International Value Series, a Master Fund managed by Dimensional that invests in such securities. The investment strategy is process driven, emphasizing broad diversification, with increased exposure to stocks with smaller total market capitalizations, lower relative price (value), and higher-profitability within the large-cap value segment of developed ex U.S. markets. As of October 31, 2022, the Master Fund held approximately 550 securities in 22 eligible developed markets. Average cash exposure throughout the year was less than 1% of the Master Fund’s assets.
170
For the 12 months ended October 31, 2022, total returns were -13.98% for the Portfolio’s Class R2 shares, -13.90% for the Portfolio’s Institutional Class shares, -15.27% for the MSCI World ex USA Value Index, and -22.04% for the MSCI World ex USA Index (net dividends). As of February 28, 2022, the Portfolio changed its benchmark from the MSCI World ex USA Index (net dividends) to the MSCI World ex USA Value Index (net dividends) because this index better reflects the universe of securities in which the Master Fund invests. With low relative price (value) stocks outperforming high relative price (growth) stocks, the Master Fund’s focus on value stocks contributed positively to performance relative to the benchmarks. The Master Fund’s exclusion of real estate investment trusts (REITs) also contributed positively to relative performance, as those stocks generally underperformed.
171
DIMENSIONAL INVESTMENT GROUP INC.
DISCLOSURE OF FUND EXPENSES
(Unaudited)
The following Expense Table is shown so that you can understand the impact of fees on your investment. All mutual funds have operating expenses. As a shareholder of the fund, you incur ongoing costs, which include costs for portfolio management, administrative services, and shareholder reports, among others. Operating expenses and legal and audit services, which are deducted from a fund’s gross income, directly reduce the investment return of the fund. A fund’s expenses are expressed as a percentage of its average net assets. This figure is known as the expense ratio. The following examples are intended to help you understand the ongoing costs, in dollars, of investing in the fund and to compare these costs with those of other mutual funds. The examples are based on an investment of $1,000 made at the beginning of the period shown and held for the entire period.
The Expense Table below illustrates your fund’s costs in two ways.
Actual Fund Return
This section helps you to estimate the actual expenses after fee waivers that you paid over the period. The “Ending Account Value” shown is derived from the fund’s actual return, and “Expenses Paid During Period” reflects the dollar amount that would have been paid by an investor who started with $1,000 in the fund. You may use the information here, together with the amount you invested, to estimate the expenses that you paid over the period.
To do so, simply divide your account value by $1,000 (for example, a $7,500 account value divided by $1,000 = 7.5), then multiply the result by the number given for your fund under the heading “Expenses Paid During Period.”
Hypothetical Example for Comparison Purposes
This section is intended to help you compare your fund’s costs with those of other mutual funds. The hypothetical “Ending Account Value” and “Expenses Paid During Period” are derived from the fund’s actual expense ratio and an assumed 5% annual return before expenses. In this case, because the return used is not the fund’s actual return, the results do not apply to your investment. The example is useful in making comparisons because the SEC requires all mutual funds to calculate expenses based on a 5% annual return. You can assess your fund’s costs by comparing this hypothetical example with the hypothetical examples that appear in shareholder reports of other funds.
Please note that the expenses shown in the table are meant to highlight and help you compare ongoing costs only and do not reflect any transactional costs, if applicable. The “Annualized Expense Ratio” represents the actual expenses for the six-month period indicated.
172
| | |
DISCLOSURE OF FUND EXPENSES | | |
CONTINUED | | |
| | Six Months Ended October 31, 2022 |
EXPENSE TABLE | | |
| | | | | | | | | | | | | | | | |
| | | Beginning
Account
Value
05/01/22 | | | Ending
Account
Value
10/31/22 | | | Annualized
Expense
Ratio (1) | | | Expenses
Paid
During
Period (1) | |
DFA International Value Portfolio (2) | | | | | | | | | | | | | | | | |
Actual Fund Return | | | | | | | | | | | | | | | | |
Class R2 Shares | | $ | 1,000.00 | | | $ | 901.00 | | | | 0.42 | % | | $ | 2.01 | |
Institutional Class Shares | | $ | 1,000.00 | | | $ | 900.70 | | | | 0.30 | % | | $ | 1.44 | |
Hypothetical 5% Annual Return | | | | | | | | | | | | | | | | |
Class R2 Shares | | $ | 1,000.00 | | | $ | 1,023.09 | | | | 0.42 | % | | $ | 2.14 | |
Institutional Class Shares | | $ | 1,000.00 | | | $ | 1,023.69 | | | | 0.30 | % | | $ | 1.53 | |
| (1) | Expenses are equal to the fund’s annualized expense ratio for the six-month period, multiplied by the average account value over the period, multiplied by the number of days in the most recent six-month period (184), then divided by the number of days in the year (365) to reflect the six-month period. |
| (2) | The Portfolio is a Feeder Fund. The expenses shown reflect the direct expenses of the Feeder Fund and the allocation of the Feeder Fund’s portion of the expenses of its Master Fund (Affiliated Investment Company). |
173
DIMENSIONAL INVESTMENT GROUP INC.
DISCLOSURE OF PORTFOLIO HOLDINGS
(Unaudited)
The SEC requires that all funds file a complete Schedule of Investments with the SEC for their first and third fiscal quarters as an exhibit to their reports on Form N-PORT. For Dimensional Investment Group Inc., this would be for the fiscal quarters ending January 31 and July 31. Such Form N-PORT filing must be made within 60 days of the end of the quarter. Dimensional Investment Group Inc. filed its most recent Form N-PORT with the SEC on September 28, 2022. They are available upon request, without charge, by calling collect: (512) 306-7400; by mailing a request to Dimensional Fund Advisors LP, 6300 Bee Cave Road, Building One, Austin, TX 78746; or by visiting the SEC’s website at http://www.sec.gov.
PORTFOLIO HOLDINGS
The SEC requires that all funds present their categories of portfolio holdings in a table, chart, or graph format in their annual and semi-annual shareholder reports, whether or not a Schedule of Investments is used. The following table, which presents portfolio holdings as a percentage of total investments before short-term investments and collateral for loaned securities, is provided in compliance with this requirement.
The categories of industry classification for the Affiliated Investment Company are represented in its Disclosure of Portfolio Holdings, which is included elsewhere in the report. Refer to the Summary Schedule of Portfolio Holdings for the underlying Affiliated Investment Company’s holdings, which reflect the investments by category.
FEEDER FUND
| | | | |
| | | Affiliated Investment Company | |
DFA International Value Portfolio | | | 100.0 | % |
174
DFA INTERNATIONAL VALUE PORTFOLIO
SCHEDULE OF INVESTMENTS
October 31, 2022
| | | | |
| | | Value† | |
AFFILIATED INVESTMENT COMPANIES — (100.0%) | | | | |
Investment in The DFA International Value Series of
The DFA Investment Trust Company | | $ | 7,491,601,659 | |
| | | | |
TOTAL INVESTMENTS IN AFFILIATED INVESTMENT COMPANIES | | $ | 7,491,601,659 | |
| | | | |
Summary of the Portfolio’s Master Fund’s investments as of October 31, 2022, based on their valuation inputs, is located in this report (See Security Valuation Note).
See accompanying Notes to Financial Statements.
175
DIMENSIONAL INVESTMENT GROUP INC.
STATEMENT OF ASSETS AND LIABILITIES
OCTOBER 31, 2022
(Amounts in thousands, except share and per share amounts)
| | | | |
| | | DFA
International
Value Portfolio | |
ASSETS: | | | | |
Investments in Affiliated Investment Company at Value | | $ | 7,491,602 | |
Receivables: | | | | |
Fund Shares Sold | | | 10,027 | |
Prepaid Expenses and Other Assets | | | 118 | |
| | | | |
Total Assets | | | 7,501,747 | |
| | | | |
LIABILITIES: | | | | |
Payables: | | | | |
Fund Shares Redeemed | | | 7,226 | |
Due to Advisor | | | 308 | |
Accrued Expenses and Other Liabilities | | | 291 | |
| | | | |
Total Liabilities | | | 7,825 | |
| | | | |
NET ASSETS | | $ | 7,493,922 | |
| | | | |
NET ASSET VALUE, OFFERING AND REDEMPTION PRICE PER SHARE: | | | | |
Class R2 Shares — based on net assets of $1,425 and shares outstanding of 88,283 | | $ | 16.14 | |
| | | | |
NUMBER OF SHARES AUTHORIZED | | | 100,000,000 | |
| | | | |
Institutional Class Shares — based on net assets of $7,492,497 and shares outstanding of 462,867,608 | | $ | 16.19 | |
| | | | |
NUMBER OF SHARES AUTHORIZED | | | 1,500,000,000 | |
| | | | |
NET ASSETS CONSIST OF: | | | | |
Paid-In Capital | | $ | 8,007,682 | |
Total Distributable Earnings (Loss) | | | (513,760 | ) |
| | | | |
NET ASSETS | | $ | 7,493,922 | |
| | | | |
See accompanying Notes to Financial Statements.
176
DIMENSIONAL INVESTMENT GROUP INC.
STATEMENT OF OPERATIONS
FOR THE YEAR ENDED OCTOBER 31, 2022
(Amounts in thousands)
| | | | |
| | | DFA
International
Value Portfolio* | |
Investment Income | | | | |
Net Investment Income Allocated from Affiliated Investment Companies: | | | | |
Dividends (Net of Foreign Taxes Withheld of $38,360) | | $ | 371,656 | |
Income from Securities Lending | | | 3,222 | |
Expenses Allocated from Affiliated Investment Companies | | | (17,250 | ) |
| | | | |
Total Net Investment Income Allocated and/or Distributions Received from Affiliated Investment Companies | | | 357,628 | |
| | | | |
Fund Expenses | | | | |
Investment Management Fees | | | 21,746 | |
Accounting & Transfer Agent Fees | | | 1,098 | |
Shareholder Servicing Fees | | | | |
Class R2 Shares | | | 2 | |
Filing Fees | | | 192 | |
Shareholders’ Reports | | | 137 | |
Directors’/Trustees’ Fees & Expenses | | | 42 | |
Professional Fees | | | 98 | |
Other | | | 51 | |
| | | | |
Total Fund Expenses | | | 23,366 | |
| | | | |
Fees Waived, Expenses Reimbursed by Advisor (Note C) | | | | |
Class R2 Shares | | | 3 | |
Institutional Class Shares | | | 16,302 | |
| | | | |
Net Expenses | | | 7,061 | |
| | | | |
Net Investment Income (Loss) | | | 350,567 | |
| | | | |
Realized and Unrealized Gain (Loss) | | | | |
Net Realized Gain (Loss) on: | | | | |
Transactions Allocated from Affiliated Investment Company** | | | (7,444 | ) |
Change in Unrealized Appreciation (Depreciation) of: | | | | |
Transactions Allocated from Affiliated Investment Company | | | (1,569,559 | ) |
| | | | |
Net Realized and Unrealized Gain (Loss) | | | (1,577,003 | ) |
| | | | |
Net Increase (Decrease) in Net Assets Resulting from Operations | | $ | (1,226,436 | ) |
| | | | |
| ** | Net of foreign capital gain taxes withheld of $0. |
| * | Investment Income and Realized and Unrealized Gain (Loss) were allocated from the Portfolio’s Master Fund (Affiliated Investment Company). |
See accompanying Notes to Financial Statements.
177
DIMENSIONAL INVESTMENT GROUP INC.
STATEMENTS OF CHANGES IN NET ASSETS
(Amounts in thousands)
| | | | | | | | |
| | | DFA International Value
Portfolio*** | |
| | | Year
Ended
Oct 31,
2022 | | | Year
Ended
Oct 31,
2021 | |
Increase (Decrease) in Net Assets | | | | | | | | |
Operations: | | | | | | | | |
Net Investment Income (Loss) | | $ | 350,567 | | | $ | 275,625 | |
Net Realized Gain (Loss) on: | | | | | | | | |
Transactions Allocated from Affiliated Investment Company*,** | | | (7,444 | ) | | | 377,980 | |
Change in Unrealized Appreciation (Depreciation) of: | | | | | | | | |
Transactions Allocated from Affiliated Investment Company | | | (1,569,559 | ) | | | 2,522,431 | |
| | | | | | | | |
Net Increase (Decrease) in Net Assets Resulting from Operations | | | (1,226,436 | ) | | | 3,176,036 | |
| | | | | | | | |
Distributions: | | | | | | | | |
Class R2 Shares | | | (78 | ) | | | (43 | ) |
Institutional Class Shares | | | (402,623 | ) | | | (258,413 | ) |
| | | | | | | | |
Total Distributions | | | (402,701 | ) | | | (258,456 | ) |
| | | | | | | | |
Capital Share Transactions (1): | | | | | | | | |
Shares Issued | | | 2,471,605 | | | | 1,043,206 | |
Shares Issued in Lieu of Cash Distributions | | | 396,749 | | | | 254,720 | |
Shares Redeemed | | | (2,059,528 | ) | | | (2,459,596 | ) |
| | | | | | | | |
Net Increase (Decrease) from Capital Share Transactions | | | 808,826 | | | | (1,161,670 | ) |
| | | | | | | | |
Total Increase (Decrease) in Net Assets | | | (820,311 | ) | | | 1,755,910 | |
Net Assets | | | | | | | | |
Beginning of Year | | | 8,314,233 | | | | 6,558,323 | |
| | | | | | | | |
End of Year | | $ | 7,493,922 | | | $ | 8,314,233 | |
| | | | | | | | |
(1) Shares Issued and Redeemed: | | | | | | | | |
Shares Issued | | | 134,715 | | | | 56,340 | |
Shares Issued in Lieu of Cash Distributions | | | 22,689 | | | | 13,672 | |
Shares Redeemed | | | (114,398 | ) | | | (134,474 | ) |
| | | | | | | | |
Net Increase (Decrease) from Shares Issued and Redeemed | | | 43,006 | | | | (64,462 | ) |
| | | | | | | | |
| * | Net of foreign capital gain taxes withheld for the fiscal year ended October 31, 2022 of $0. |
| ** | Net of foreign capital gain taxes withheld for the fiscal year ended October 31, 2021 of $0. |
| *** | Investment Income and Realized and Unrealized Gain (Loss) were allocated from the Portfolio’s Master Fund (Affiliated Investment Company). |
See accompanying Notes to Financial Statements.
178
DIMENSIONAL INVESTMENT GROUP INC.
FINANCIAL HIGHLIGHTS
(for a share outstanding throughout each period)
| | | | | | | | | | | | | | | | | | | | |
| | | DFA International Value Portfolio-Class R2 Shares | |
| | | Year
Ended
Oct 31,
2022 | | | Year
Ended
Oct 31,
2021 | | | Year
Ended
Oct 31,
2020 | | | Year
Ended
Oct 31,
2019 | | | Year
Ended
Oct 31,
2018 | |
Net Asset Value, Beginning of Year | | $ | 19.74 | | | $ | 13.50 | | | $ | 17.13 | | | $ | 17.68 | | | $ | 19.89 | |
| | | | | | | | | | | | | | | | | | | | |
Income from Investment Operations (A) | | | | | | | | | | | | | | | | | | | | |
Net Investment Income (Loss) | | | 0.78 | | | | 0.62 | | | | 0.38 | | | | 0.58 | | | | 0.54 | |
Net Gains (Losses) on Securities (Realized and Unrealized) | | | (3.49 | ) | | | 6.17 | | | | (3.61 | ) | | | (0.10 | ) | | | (2.21 | ) |
| | | | | | | | | | | | | | | | | | | | |
Total from Investment Operations | | | (2.71 | ) | | | 6.79 | | | | (3.23 | ) | | | 0.48 | | | | (1.67 | ) |
| | | | | | | | | | | | | | | | | | | | |
Less Distributions: | | | | | | | | | | | | | | | | | | | | |
Net Investment Income | | | (0.85 | ) | | | (0.55 | ) | | | (0.40 | ) | | | (0.51 | ) | | | (0.54 | ) |
Net Realized Gains | | | (0.04 | ) | | | — | | | | — | | | | (0.52 | ) | | | — | |
| | | | | | | | | | | | | | | | | | | | |
Total Distributions | | | (0.89 | ) | | | (0.55 | ) | | | (0.40 | ) | | | (1.03 | ) | | | (0.54 | ) |
| | | | | | | | | | | | | | | | | | | | |
Net Asset Value, End of Year | | $ | 16.14 | | | $ | 19.74 | | | $ | 13.50 | | | $ | 17.13 | | | $ | 17.68 | |
| | | | | | | | | | | | | | | | | | | | |
Total Return | | | (13.98 | %) | | | 50.55 | % | | | (19.08 | %) | | | 3.13 | % | | | (8.59 | %) |
| | | | | | | | | | | | | | | | | | | | |
Net Assets, End of Year (thousands) | | $ | 1,425 | | | $ | 1,753 | | | $ | 835 | | | $ | 1,191 | | | $ | 1,477 | |
Ratio of Expenses to Average Net Assets (C) | | | 0.42 | % | | | 0.60 | % | | | 0.65 | % | | | 0.69 | % | | | 0.68 | % |
Ratio of Expenses to Average Net Assets (Excluding Fees Waived, Expenses Reimbursed by Advisor) (C) | | | 0.62 | % | | | 0.80 | % | | | 0.85 | % | | | 0.89 | % | | | 0.88 | % |
Ratio of Net Investment Income to Average Net Assets | | | 4.26 | % | | | 3.31 | % | | | 2.56 | % | | | 3.43 | % | | | 2.72 | % |
See page 1-2 for the Definitions of Abbreviations and Footnotes.
See accompanying Notes to Financial Statements.
179
DIMENSIONAL INVESTMENT GROUP INC.
FINANCIAL HIGHLIGHTS
(for a share outstanding throughout each period)
| | | | | | | | | | | | | | | | | | | | |
| | | DFA International Value Portfolio-Institutional Class Shares | |
| | | Year
Ended
Oct 31,
2022 | | | Year
Ended
Oct 31,
2021 | | | Year
Ended
Oct 31,
2020 | | | Year
Ended
Oct 31,
2019 | | | Year
Ended
Oct 31,
2018 | |
Net Asset Value, Beginning of Year | | $ | 19.80 | | | $ | 13.54 | | | $ | 17.18 | | | $ | 17.74 | | | $ | 19.94 | |
| | | | | | | | | | | | | | | | | | | | |
Income from Investment Operations (A) | | | | | | | | | | | | | | | | | | | | |
Net Investment Income (Loss) | | | 0.79 | | | | 0.62 | | | | 0.38 | | | | 0.63 | | | | 0.60 | |
Net Gains (Losses) on Securities (Realized and Unrealized) | | | (3.49 | ) | | | 6.23 | | | | (3.58 | ) | | | (0.11 | ) | | | (2.21 | ) |
| | | | | | | | | | | | | | | | | | | | |
Total from Investment Operations | | | (2.70 | ) | | | 6.85 | | | | (3.20 | ) | | | 0.52 | | | | (1.61 | ) |
| | | | | | | | | | | | | | | | | | | | |
Less Distributions: | | | | | | | | | | | | | | | | | | | | |
Net Investment Income | | | (0.87 | ) | | | (0.59 | ) | | | (0.44 | ) | | | (0.56 | ) | | | (0.59 | ) |
Net Realized Gains | | | (0.04 | ) | | | — | | | | — | | | | (0.52 | ) | | | — | |
| | | | | | | | | | | | | | | | | | | | |
Total Distributions | | | (0.91 | ) | | | (0.59 | ) | | | (0.44 | ) | | | (1.08 | ) | | | (0.59 | ) |
| | | | | | | | | | | | | | | | | | | | |
Net Asset Value, End of Year | | $ | 16.19 | | | $ | 19.80 | | | $ | 13.54 | | | $ | 17.18 | | | $ | 17.74 | |
| | | | | | | | | | | | | | | | | | | | |
Total Return | | | (13.90 | %) | | | 50.90 | % | | | (18.87 | %) | | | 3.37 | % | | | (8.32 | %) |
| | | | | | | | | | | | | | | | | | | | |
Net Assets, End of Year (thousands) | | $ | 7,492,497 | | | $ | 8,312,480 | | | $ | 6,557,488 | | | $ | 9,173,478 | | | $ | 9,421,965 | |
Ratio of Expenses to Average Net Assets (C) | | | 0.30 | % | | | 0.36 | % | | | 0.40 | % | | | 0.44 | % | | | 0.43 | % |
Ratio of Expenses to Average Net Assets (Excluding Fees Waived, Expenses Reimbursed by Advisor) (C) | | | 0.50 | % | | | 0.56 | % | | | 0.60 | % | | | 0.64 | % | | | 0.63 | % |
Ratio of Net Investment Income to Average Net Assets | | | 4.30 | % | | | 3.36 | % | | | 2.57 | % | | | 3.70 | % | | | 3.01 | % |
See page 1-2 for the Definitions of Abbreviations and Footnotes.
See accompanying Notes to Financial Statements.
180
DIMENSIONAL INVESTMENT GROUP INC.
NOTES TO FINANCIAL STATEMENTS
A. Organization:
Dimensional Investment Group Inc. (the “Fund”) is an open-end management investment company registered under the Investment Company Act of 1940 (the “1940 Act”), whose shares are generally offered to institutional investors, retirement plans and clients of registered investment advisors. The Fund consists of ten portfolios, one of which, the DFA International Value Portfolio (the “Portfolio”), is presented in this section of the report. The remaining operational portfolios are presented in separate reports. The Portfolio is an investment company, and accordingly, follows the accounting and reporting guidance under the Financial Accounting Standards Board (“FASB”) Accounting Standards Codification (“ASC”), Topic 946, “Financial Services-Investment Companies.”
The Portfolio invests substantially all of its assets in The DFA International Value Series (the “Series”), a corresponding series of The DFA Investment Trust Company. As of October 31, 2022, the Portfolio owned 71% of the Series. The financial statements of the Series are included elsewhere in this report and should be read in conjunction with the financial statements of the Portfolio.
B. Significant Accounting Policies:
The following significant accounting policies are in conformity with accounting principles generally accepted in the United States of America (“GAAP”). Such policies are consistently followed by the Fund in preparation of its financial statements. The preparation of financial statements in accordance with GAAP requires management to make estimates and assumptions that affect the fair value of investments, the reported amounts of assets and liabilities, the disclosure of contingent assets and liabilities at the date of the financial statements, and the reported amounts of increases and decreases in net assets from operations during the reporting period. Actual results could differ from those estimates, and those differences could be material.
1. Security Valuation: The Portfolio uses a fair value hierarchy, which prioritizes the inputs-to-valuation techniques used to measure fair value into three broad levels described below:
| | • | | Level 1 – inputs are quoted prices in active markets for identical securities (including equity securities, open-end investment companies, and futures contracts) |
| | • | | Level 2 – other significant observable inputs (including quoted prices for similar securities, interest rates, prepayment speeds, credit risk, etc.) |
| | • | | Level 3 – significant unobservable inputs (including the Portfolio’s own assumptions in determining the fair value of investments) |
The Portfolio’s investment reflects its proportionate interests in the net assets of the Series. The valuation is classified as Level 1 in the hierarchy.
Securities for which no market quotations are readily available (including restricted securities), or for which market quotations have become unreliable, are valued in good faith at fair value in accordance with Rule 2a-5 under the 1940 Act pursuant to procedures approved by the Board of Directors of the Fund. Fair value pricing may also be used if events that have a significant effect on the value of an investment (as determined in the discretion of Dimensional Fund Advisors LP) occur before the net asset value of the Portfolio is calculated. When fair value pricing is used, the prices of securities used by the Portfolio may differ from the quoted or published prices for the same securities on their primary markets or exchanges. These securities are generally categorized as Level 2 or Level 3 in the hierarchy.
A summary of the inputs used to value the Portfolio’s investments by each major security type, industry and/or country is disclosed previously in this note. A valuation hierarchy table has been included at the end of the Schedule of Investments. The methodology or inputs used for valuing securities are not necessarily an indication of the risk associated with investing in those securities.
181
2. Deferred Compensation Plan: Each eligible Director of the Fund may elect to participate in the Fee Deferral Plan for Independent Directors and Trustees (the “Plan”). Under the Plan, effective January 1, 2002, such Directors may defer payment of all or a portion of their total fees earned as a Director. These deferred amounts may be treated as though such amounts had been invested in shares of the following funds: the U.S. Large Cap Value Portfolio, U.S. Core Equity 1 Portfolio, U.S. Large Company Portfolio, U.S. Vector Equity Portfolio, U.S. Micro Cap Portfolio, DFA International Value Portfolio, International Core Equity Portfolio, Emerging Markets Portfolio, Emerging Markets Core Equity Portfolio, DFA Inflation-Protected Securities Portfolio, and/or DFA Two-Year Global Fixed Income Portfolio. Contributions made under the Plan and the change in unrealized appreciation (depreciation) and income are included in Directors’/ Trustees’ Fees & Expenses.
The Directors may receive their distributions of proceeds by one of the following methods: lump sum, annual installments over a period of agreed-upon years, or quarterly installments over a period of agreed-upon years. Each Director shall have the right in a notice of election (the “Notice”) to defer the receipt of the Director’s deferred compensation until a date specified by such Director in the Notice. The date may not be sooner than the earlier of: (i) the first business day of January following the year in which such Director ceases to be a member of the Board of Directors of the Fund; and (ii) five years following the effective date of the Director’s first deferral election. If a Director who elects to defer fees fails to designate in the Notice a time or date as of which payment of the Director’s deferred fee account shall commence, payment of such amount shall commence as of the first business day of January following the year in which the Director ceases to be a member of the Board (unless the Director files an amended Notice selecting a different distribution date).
3. Other: The Portfolio recognizes its pro-rata share, on a daily basis, of net investment income and realized and unrealized gains and losses of investment securities from the Series, which is treated as a partnership for federal income tax purposes. Dividend income and distributions to shareholders are recorded on the ex-dividend date. Distributions received on securities that represent a return of capital or capital gains are recorded as a reduction of cost of investments or as a realized gain, respectively. The Portfolio estimates the character of received distributions that may be considered return of capital distributions. Expenses directly attributable to the Portfolio are directly charged. Common expenses of the Fund or the Portfolio are allocated using methods approved by the Board of Directors, generally based on average net assets.
Class R2 Shares and Institutional Class Shares have equal rights to assets and earnings of the Portfolio. Income, gains and losses, and common expenses of the Portfolio are allocated to each class of shares based on its relative net assets. Each class will bear its own class-specific expenses, if any.
C. Investment Advisor:
The Advisor, Dimensional Fund Advisors LP, provides investment management services to the Portfolio. For the year ended October 31, 2022, the Portfolio’s investment management fees were accrued daily and paid monthly to the Advisor based on the following effective annual rate of average daily net assets:
| | |
DFA International Value Portfolio | | 0.27%* |
| * | Effective as of February 28, 2022, the management fee payable by the Portfolio was reduced from 0.30% to 0.25%. |
Pursuant to an Amended and Restated Fee Waiver and/or Expense Assumption Agreement (the “Fee Waiver Agreement”), the Advisor has contractually agreed to waive certain fees, and in certain instances, assume certain expenses of the Portfolio, as described in the notes below. A portion of the Fee Waiver Agreement for the Portfolio will remain in effect through February 28, 2023, may only be terminated by the Fund’s Board of Directors prior to that date and shall continue in effect from year to year thereafter unless terminated by the Fund or the Advisor. The Fee Waiver Agreement with respect to the total management fees paid by the Portfolio, as described in the notes below, will remain in effect permanently, unless terminated by the Portfolio. During the year ended October 31, 2022, the Portfolio had expense limits based on a percentage of average net assets on an annualized basis, and the Advisor recovered previously waived fees and/or assumed expenses (amounts in thousands), as listed below. The net amount of waived fees/expenses assumed (recovered previously waived fees/expenses assumed) during the year ended October 31, 2022, and the previously waived fees/expenses assumed subject to future recovery by the
182
Advisor as of October 31, 2022, are also reflected below (amounts in thousands). At any time that the Annualized Expense Ratio (defined below) of the Class R2 shares of the Portfolio are less than the Expense Limitation Amount listed below, the Advisor retains the right to recover fees previously waived and/or expenses previously assumed to the extent that the expense ratio following such recovery would be less than the Expense Limitation Amount that was in place when such prior year fees were waived and/or expenses assumed, and less than the current Expense Limitation Amount for the Portfolio. The Advisor, however, will not be reimbursed by the Portfolio in connection with its Permanent Fee Waiver. The Fund, on behalf of the Portfolio, is also not obligated to reimburse the Advisor for fees previously waived or expenses previously assumed by the Advisor more than thirty-six months before the date of recovery.
| | | | | | | | | | | | | | | | | | | | |
Institutional Class Shares | | Expense
Limitation
Amount | | | Total
Management
Fee Limit | | | Recovery
of Previously
Waived Fees/
Expenses Assumed | | | Waived Fees/
Expenses
Assumed | | | Previously
Waived Fees/
Expenses Assumed
Subject to Future
Recovery | |
DFA International Value Portfolio (1) | | | — | | | | 0.25 | % | | | — | | | $ | 16,302 | | | | — | |
Class R2 Shares | | | | | | | | | | | | | | | | | | | | |
DFA International Value Portfolio (2) | | | 0.79 | % | | | 0.25 | % | | | — | | | | 3 | | | | — | |
| (1) | Effective February 28, 2022, the Advisor has contractually agreed to permanently waive all or a portion of the management fee of the Portfolio to the extent necessary to limit the total management fees paid to the Advisor by the Portfolio, including the proportionate share of the management fees the Portfolio pays indirectly through its investment in other funds managed by the Advisor, except for the fees paid indirectly through its investment of securities lending cash collateral in The DFA Short Term Investment Fund, to the rate listed above as a percentage of the average net assets of the Institutional Class of the Portfolio on an annualized basis (the “Permanent Fee Waiver”). From February 28, 2021 to February 27, 2022, the Permanent Fee Waiver Limit was 0.30%. From February 28, 2020 to February 27, 2021, the Permanent Fee Waiver Limit was 0.35%. From July 21, 2015 to February 27, 2020, the Permanent Fee Waiver Limit was 0.40%. |
| (2) | Effective February 28, 2022, the Advisor has contractually agreed to permanently waive all or a portion of the management fee of the DFA International Value Portfolio to the extent necessary to limit the total management fees paid to the Advisor by the Portfolio, including the proportionate share of the management fees the Portfolio pays indirectly through its investment in other funds managed by the Advisor, except for the fees paid indirectly through its investment of securities lending cash collateral in The DFA Short Term Investment Fund, to the rate listed above as a percentage of the average net assets of a class of the Portfolio on an annualized basis (the “Permanent Fee Waiver”). From February 28, 2021 to February 27, 2022, the Permanent Fee Waiver Limit was 0.30%. From February 28, 2020 to February 27, 2021, the Permanent Fee Waiver Limit was 0.35%. From July 21, 2015 to February 27, 2020, the Permanent Fee Waiver Limit was 0.40%. In addition to the Permanent Fee Waiver, the Advisor has contractually agreed to assume the direct expenses of Class R2 shares of the Portfolio (excluding management fees and custodian fees), to the extent necessary to limit the annualized expenses of Class R2 shares of the Portfolio (excluding the expenses the Portfolio incurs indirectly through investment in other investment companies) to the rate listed above (the “Annualized Expense Ratio”). |
Fees Paid to Officers and Directors/Trustees:
Certain Officers and Directors of the Advisor are also Officers and Directors of the Fund; however, such Officers and Directors (with the exception of the Chief Compliance Officer (“CCO”)) receive no compensation from the Fund. For the year ended October 31, 2022, the total related amounts paid by the Fund to the CCO were $20 (in thousands). The total related amounts paid by the Portfolio are included in Other Expenses on the Statement of Operations.
D. Deferred Compensation:
As of October 31, 2022, the total liability for deferred compensation to Directors is included in Accrued Expenses and Other Liabilities on the Statement of Assets and Liabilities as follows (amount in thousands):
| | | | |
DFA International Value Portfolio | | $ | 102 | |
183
E. Federal Income Taxes:
The Portfolio has qualified and intends to continue to qualify as a regulated investment company under Subchapter M of the Internal Revenue Code for federal income tax purposes and to distribute substantially all of its taxable income and net capital gains to its shareholders. Accordingly, no provision has been made for federal income taxes.
Distributions from net investment income and net realized capital gains are determined in accordance with U.S. federal income tax regulations, which may differ from those amounts determined under GAAP. These book/tax differences are either temporary or permanent in nature. To the extent that these differences are permanent, they are charged or credited to paid-in capital or distributable earnings, undistributed net investment income, accumulated net realized gains or losses, or unrealized appreciation, as appropriate, in the period that the differences arise. Accordingly, the permanent differences as of October 31, 2022, can occur as a result of realized gains on securities considered to be “passive foreign investment companies”, non-deductible expenses, realized foreign capital gains tax, the use of accumulated earnings and profits distributed to shareholders on redemptions of shares as part of the dividends paid deduction for income tax purposes, net foreign currency gains/losses, distributions received from real estate investment trusts and distribution redesignations, and were reclassified to the accounts mentioned above.
The tax character of dividends and distributions declared and paid during the years ended October 31, 2021, and October 31, 2022, were as follows (amounts in thousands):
| | | | | | | | | | | | | | | | |
| | | Net Investment
Income and
Short-Term
Capital Gains | | | Long-Term
Capital Gains | | | Tax Exempt
Income | | | Total | |
DFA International Value Portfolio | | | | | | | | | | | | | | | | |
2021 | | $ | 258,456 | | | | — | | | | — | | | $ | 258,456 | |
2022 | | | 402,701 | | | | — | | | | — | | | | 402,701 | |
As of October 31, 2022, the following net investment income and short-term capital gains and long-term capital gains distributions designated for federal income tax purposes are due to the use of accumulated earnings and profits distributed to shareholders upon redemption of shares (amounts in thousands):
| | | | | | | | | | | | |
| | | Net Investment
Income and
Short-Term
Capital Gains | | | Long-Term
Capital Gains | | | Total | |
DFA International Value Portfolio | | $ | (769 | ) | | | — | | | $ | (769 | ) |
As of October 31, 2022, the components of distributable earnings (accumulated losses) were as follows (amounts in thousands):
| | | | | | | | | | | | | | | | | | | | |
| | | Undistributed
Net Investment
Income and
Short-Term
Capital Gains | | | Undistributed
Long-Term
Capital Gains | | | Capital Loss
Carryforwards | | | Unrealized
Appreciation
(Depreciation) | | | Total Net
Distributable
Earnings
(Accumulated
Losses) | |
DFA International Value Portfolio | | $ | 31,309 | | | | — | | | $ | (11,138 | ) | | $ | (533,823 | ) | | $ | (513,652 | ) |
For federal income tax purposes, the Fund measures its capital loss carryforwards annually at October 31, its fiscal year end. Capital loss carryforwards may be carried forward and applied against future capital gains. As of October 31, 2022, the Portfolio had the following capital loss carryforwards available to offset future realized capital gains with no expiration date (amounts in thousands):
| | | | | | | | |
| | | Unlimited | | | Total | |
DFA International Value Portfolio | | $ | 11,138 | | | $ | 11,138 | |
184
During the year ended October 31, 2022, the Portfolio did not use capital loss carryforwards to offset realized capital gains for federal income tax purposes.
As of October 31, 2022, the total cost and aggregate gross unrealized appreciation (depreciation) of securities for federal income tax purposes were different from amounts reported for financial reporting purposes, as follows (amounts in thousands):
| | | | | | | | | | | | | | | | |
| | | Federal
Tax Cost | | | Unrealized
Appreciation | | | Unrealized
(Depreciation) | | | Net
Unrealized
Appreciation
(Depreciation) | |
DFA International Value Portfolio | | $ | 8,022,124 | | | | — | | | $ | (530,331 | ) | | $ | (530,331 | ) |
The difference between GAAP-basis and tax-basis unrealized gains (losses) can occur as a result of wash sales and net mark-to-market gains (losses) on regulated futures contracts, net mark-to-market gains (losses) on foreign currency contracts, and differences in the tax treatment of passive foreign investment company investments or other investments.
ASC 740 Accounting for Uncertainty in Income Taxes sets forth a minimum threshold for financial statement recognition of the benefit of a tax position taken or expected to be taken in a tax return. Management has analyzed the Portfolio’s tax positions and has concluded that no additional provision for income tax is required in the Portfolio’s financial statements. The Portfolio is not aware of any tax positions for which it is more likely than not that the total amounts of unrecognized tax benefits will significantly change in the next twelve months. The Portfolio’s federal tax returns for the prior three fiscal years remain subject to examination by the Internal Revenue Service.
F. Capital Share Transactions:
The capital share transactions by class were as follows (amounts in thousands):
| | | | | | | | | | | | | | | | |
| | | Year Ended
October 31, 2022 | | | Year Ended
October 31, 2021 | |
| | | Amount | | | Shares | | | Amount | | | Shares | |
DFA International Value Portfolio | | | | | | | | | | | | | | | | |
Class R2 Shares | | | | | | | | | | | | | | | | |
Shares Issued | | $ | 712 | | | | 37 | | | $ | 1,954 | | | | 104 | |
Shares Issued in Lieu of Cash Distributions | | | 77 | | | | 4 | | | | 43 | | | | 2 | |
Shares Redeemed | | | (787 | ) | | | (42 | ) | | | (1,495 | ) | | | (80 | ) |
| | | | | | | | | | | | | | | | |
Net Increase (Decrease) — Class R2 Shares | | $ | 2 | | | | (1 | ) | | $ | 502 | | | | 26 | |
| | | | | | | | | | | | | | | | |
Institutional Class Shares | | | | | | | | | | | | | | | | |
Shares Issued | | $ | 2,470,893 | | | | 134,678 | | | $ | 1,041,251 | | | | 56,236 | |
Shares Issued in Lieu of Cash Distributions | | | 396,672 | | | | 22,685 | | | | 254,677 | | | | 13,670 | |
Shares Redeemed | | | (2,058,741 | ) | | | (114,356 | ) | | | (2,458,101 | ) | | | (134,394 | ) |
| | | | | | | | | | | | | | | | |
Net Increase (Decrease) — Institutional Class Shares | | $ | 808,824 | | | | 43,007 | | | $ | (1,162,173 | ) | | | (64,488 | ) |
| | | | | | | | | | | | | | | | |
G. Shareholder Servicing Fees:
The Class R2 Shares pay a shareholder servicing fee in an amount up to 0.25% of their annual average net assets to compensate service agents that provide shareholder servicing, record keeping, account maintenance and other services to investors in the DFA International Value Portfolio’s Class R2 Shares.
185
H. Indemnitees; Contractual Obligations:
Under the Fund’s organizational documents, its Officers and Directors are indemnified against certain liabilities arising out of the performance of their duties to the Fund.
In the normal course of business, the Fund enters into contracts that contain a variety of representations and warranties that provide general indemnification. The Fund’s maximum exposure under these arrangements is unknown, as this would involve future claims that may be made against the Fund and/or its affiliates that have not yet occurred. However, based on experience, the Fund expects the risk of loss to be remote.
I. Recently Issued Accounting Standards and Regulations:
In March 2020, the Financial Accounting Standards Board (FASB) issued Accounting Standards Update (ASU) No. 2020-04, Reference Rate Reform (Topic 848) – Facilitation of the Effects of Reference Rate Reform on Financial Reporting. In January 2021, the FASB issued ASU No. 2021-01, with further amendments to Topic 848. The amendments in the ASUs provide optional temporary accounting recognition and financial reporting relief from the effect of certain types of contract modifications due to the planned discontinuation of the LIBOR and other interbank-offered based reference rates as of the end of 2021 and 2023. The ASUs are effective for certain reference rate-related contract modifications that occur during the period March 12, 2020 through December 31, 2022. Management has reviewed the requirements and believes the adoption of these ASUs will not have a material impact on the Portfolio’s financial statements.
In October 2020, the SEC adopted new regulations governing the use of derivatives by registered investment companies. Rule 18f-4 (the “Derivatives Rule”) imposes limits on the amount of derivatives contracts the Portfolio could enter, eliminates the asset segregation framework previously used by the Portfolio to comply with Section 18 of the 1940 Act, and requires funds whose use of derivatives is more than a limited specified exposure to establish and maintain a derivatives risk management program and appoint a derivatives risk manager. The Derivatives Rule became effective February 19, 2021 and the Portfolio began complying with the Derivatives Rule on August 19, 2022.
On December 3, 2020, the SEC adopted new Rule 2a-5 (the “Valuation Rule”) under the 1940 Act, establishing an updated regulatory framework for fund valuation. The Valuation Rule, in part, provides a framework for good faith fair value determination and permits a Board to designate fair value determinations to a fund’s investment adviser. Further, the SEC rescinded previously issued guidance on related issues. The Valuation Rule became effective on March 8, 2021 and the Portfolio began complying with the Valuation Rule on August 1, 2022.
J. Other:
As of October 31, 2022, the following number of shareholders held the following approximate percentages of the Portfolio’s outstanding shares. One or more of the shareholders may be omnibus accounts, which typically hold shares for the benefit of several other underlying investors.
| | | | | | |
| | | Number of
Shareholders | | Approximate
Percentage
of Outstanding
Shares | |
DFA International Value Portfolio-Class R2 | | 5 | | | 71 | % |
DFA International Value Portfolio-Institutional Class | | 4 | | | 91 | % |
The Portfolio is subject to claims and suits that arise from time to time in the ordinary course of business (for example, claw back litigation against former shareholders of portfolio companies that filed for bankruptcy, such as the now ended litigation involving The Tribune Company and the ongoing litigation involving Nine West). Although management currently believes that resolving claims against the Portfolio, individually or in aggregate, will not have a material adverse impact on the Portfolio’s financial position, results of operations, or cash flows, these matters are subject to inherent uncertainties and management’s view of these matters may change in the future.
186
K. Subsequent Event Evaluations:
Management has evaluated the impact of all subsequent events on the Portfolio through the date on which the financial statements were issued and has determined that there are no subsequent events requiring recognition or disclosure in the financial statements.
187
Report of Independent Registered Public Accounting Firm
To the Board of Directors of Dimensional Investment Group Inc. and Shareholders of DFA International Value Portfolio
Opinion on the Financial Statements
We have audited the accompanying statement of assets and liabilities, including the schedule of investments, of DFA International Value Portfolio (one of the portfolios constituting Dimensional Investment Group Inc., referred to hereafter as the “Portfolio”) as of October 31, 2022, the related statement of operations for the year ended October 31, 2022, the statement of changes in net assets for each of the two years in the period ended October 31, 2022, including the related notes, and the financial highlights for each of the five years in the period ended October 31, 2022 (collectively referred to as the “financial statements”). In our opinion, the financial statements present fairly, in all material respects, the financial position of the Portfolio as of October 31, 2022, the results of its operations for the year then ended, the changes in its net assets for each of the two years in the period ended October 31, 2022 and the financial highlights for each of the five years in the period ended October 31, 2022 in conformity with accounting principles generally accepted in the United States of America.
Basis for Opinion
These financial statements are the responsibility of the Portfolio’s management. Our responsibility is to express an opinion on the Portfolio’s financial statements based on our audits. We are a public accounting firm registered with the Public Company Accounting Oversight Board (United States) (PCAOB) and are required to be independent with respect to the Portfolio in accordance with the U.S. federal securities laws and the applicable rules and regulations of the Securities and Exchange Commission and the PCAOB.
We conducted our audits of these financial statements in accordance with the standards of the PCAOB. Those standards require that we plan and perform the audit to obtain reasonable assurance about whether the financial statements are free of material misstatement, whether due to error or fraud.
Our audits included performing procedures to assess the risks of material misstatement of the financial statements, whether due to error or fraud, and performing procedures that respond to those risks. Such procedures included examining, on a test basis, evidence regarding the amounts and disclosures in the financial statements. Our audits also included evaluating the accounting principles used and significant estimates made by management, as well as evaluating the overall presentation of the financial statements. Our procedures included confirmation of the security owned as of October 31, 2022 by correspondence with the transfer agent of the investee fund. We believe that our audits provide a reasonable basis for our opinion.
|
| /s/ PricewaterhouseCoopers LLP |
| Philadelphia, Pennsylvania |
| December 22, 2022 |
We have served as the auditor of one or more investment companies in Dimensional Fund Advisors L.P. investment company group since 1981.
188
THE DFA INVESTMENT TRUST COMPANY
PERFORMANCE CHARTS
(Unaudited)
The DFA International Value Series vs.
MSCI World ex USA Index (net dividends),
MSCI World ex USA Value Index (net dividends)
October 31, 2012-October 31, 2022
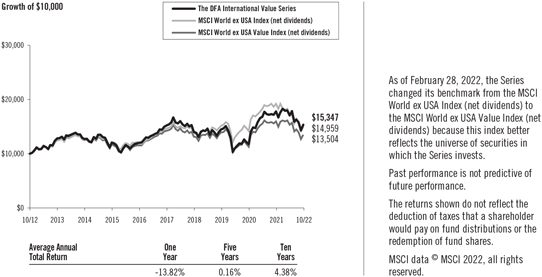
The Japanese Small Company Series vs.
MSCI Japan Small Cap Index (net dividends)
October 31, 2012-October 31, 2022
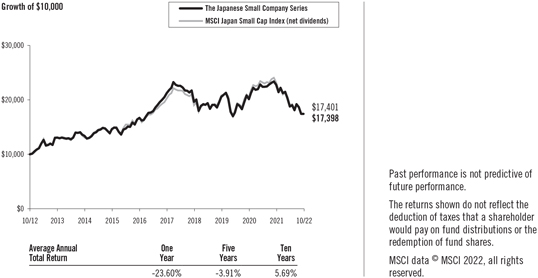
189
THE DFA INVESTMENT TRUST COMPANY
PERFORMANCE CHARTS
(Unaudited)
The Asia Pacific Small Company Series vs.
MSCI Pacific ex Japan Small Cap Index (net dividends)
October 31, 2012-October 31, 2022

The United Kingdom Small Company Series vs.
MSCI United Kingdom Small Cap Index (net dividends)
October 31, 2012-October 31, 2022
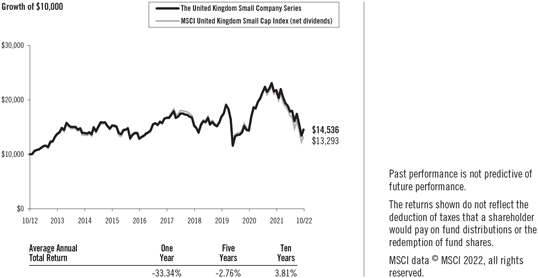
190
THE DFA INVESTMENT TRUST COMPANY
PERFORMANCE CHARTS
(Unaudited)
The Continental Small Company Series vs.
MSCI Europe ex UK Small Cap Index (net dividends)
October 31, 2012-October 31, 2022
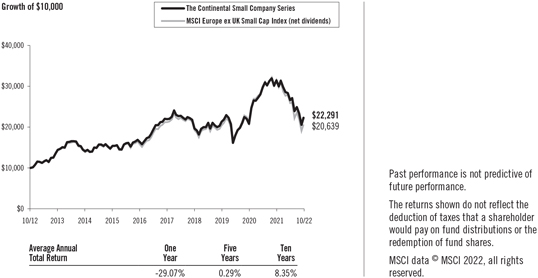
The Canadian Small Company Series vs.
MSCI Canada Small Cap Index (net dividends)
October 31, 2012-October 31, 2022
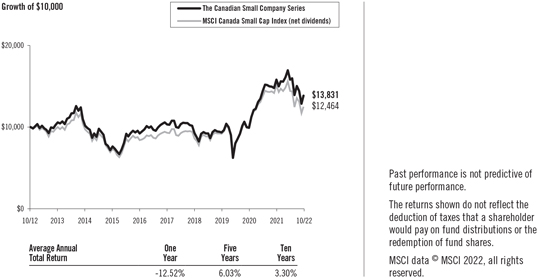
191
THE DFA INVESTMENT TRUST COMPANY
PERFORMANCE CHARTS
(Unaudited)
The Emerging Markets Series vs.
MSCI Emerging Markets Index (net dividends)
October 31, 2012-October 31, 2022
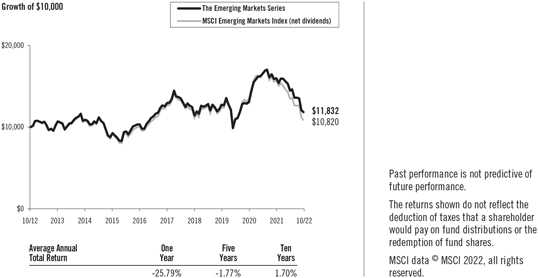
The Emerging Markets Small Cap Series vs.
MSCI Emerging Markets Index (net dividends)
October 31, 2012-October 31, 2022
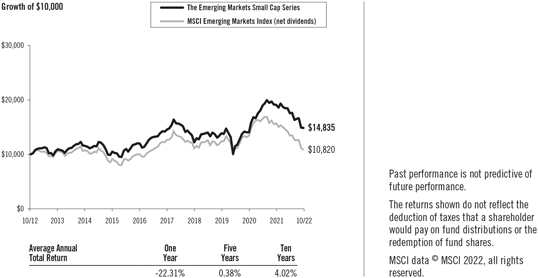
192
MANAGEMENT’S DISCUSSION AND ANALYSIS
| | |
| International Equity Market Review | | 12 Months Ended October 31, 2022 |
Performance of non-U.S. developed markets was negative for the period. As measured by the MSCI World ex USA indices, small-cap stocks underperformed large-cap stocks, and mid-cap stocks, a subset of the large-cap universe, underperformed large-cap stocks but outperformed small-cap stocks. Value stocks outperformed growth stocks as measured by the MSCI World ex USA indices.
| | | | |
Total Return for 12 Months Ended October 31, 2022 | |
| |
| | | Return in U.S. Dollars | |
MSCI World ex USA Index | | | -22.04 | % |
MSCI World ex USA Mid Cap Index | | | -27.57 | % |
MSCI World ex USA Small Cap Index | | | -29.13 | % |
MSCI World ex USA Value Index | | | -15.27 | % |
MSCI World ex USA Growth Index | | | -28.78 | % |
For the 12 Months Ended October 31, 2022, the U.S. dollar appreciated against all non-U.S. developed markets currencies. Overall, currency movements had a negative impact on the U.S. dollar-denominated returns of developed markets.
| | | | | | | | |
| Total Return for 12 Months Ended October 31, 2022 | |
| | |
Ten Largest Foreign Developed Markets by Market Cap | | Local Return | | | Return in U.S. Dollars | |
Japan | | | -1.81 | % | | | -24.67 | % |
United Kingdom | | | 4.27 | % | | | -12.42 | % |
Canada | | | -5.29 | % | | | -13.94 | % |
France | | | -6.77 | % | | | -20.38 | % |
Switzerland | | | -11.30 | % | | | -19.01 | % |
Australia | | | -0.54 | % | | | -15.30 | % |
Germany | | | -21.22 | % | | | -32.72 | % |
Netherlands | | | -28.51 | % | | | -38.71 | % |
Sweden | | | -16.17 | % | | | -34.85 | % |
Denmark | | | -7.88 | % | | | -21.38 | % |
Source: Returns are of MSCI standard indices net of foreign withholding taxes on dividends. Copyright MSCI 2022, all rights reserved.
Emerging markets had negative performance for the period and underperformed both U.S. and non-U.S. developed markets. As measured by the MSCI Emerging Markets indices, small-cap stocks outperformed large-cap stocks, and mid-cap stocks, a subset of the large-cap universe, outperformed large-cap stocks but underperformed small-cap stocks. Value stocks outperformed growth stocks as measured by the MSCI Emerging Markets indices.
193
| | | | |
Total Return for 12 Months Ended October 31, 2022 | |
| |
| | | Return in U.S. Dollars | |
MSCI Emerging Markets Index | | | -31.03 | % |
MSCI Emerging Markets Mid Cap Index | | | -24.80 | % |
MSCI Emerging Markets Small Cap Index | | | -23.42 | % |
MSCI Emerging Markets Value Index | | | -25.21 | % |
MSCI Emerging Markets Growth Index | | | -36.11 | % |
For the 12 Months Ended October 31, 2022, the U.S. dollar appreciated against most emerging markets currencies and depreciated against others. Overall, currency movements had a negative impact on the U.S. dollar denominated returns of emerging markets.
| | | | | | | | |
Total Return for 12 Months Ended October 31, 2022 | |
| | |
Ten Largest Emerging Markets by Market Cap | | Local Return | | | Return in U.S. Dollars | |
China | | | -46.31 | % | | | -47.90 | % |
India | | | 2.93 | % | | | -6.89 | % |
Taiwan | | | -24.11 | % | | | -34.50 | % |
Korea | | | -19.88 | % | | | -34.28 | % |
Brazil | | | 15.95 | % | | | 24.57 | % |
Saudi Arabia | | | 2.18 | % | | | 2.00 | % |
South Africa | | | 0.77 | % | | | -16.66 | % |
Mexico | | | 1.99 | % | | | 5.56 | % |
Indonesia | | | 16.58 | % | | | 5.89 | % |
Thailand | | | 4.97 | % | | | -8.48 | % |
Source: Returns are of MSCI standard indices net of foreign withholding taxes on dividends. Copyright MSCI 2022, all rights reserved.
For Portfolios investing in non-U.S. equities traded outside of the U.S. market time zone, differences in the valuation timing and methodology between a Portfolio and its benchmark index may impact relative performance over the referenced period. The Portfolios price foreign exchange rates at the closing of the U.S. market, while their benchmark indices use rates at 4 p.m. London time. The Portfolios also may use fair value pricing to price certain portfolio securities at the closing of the U.S. market, while benchmark indices may use local market closing prices. For the one-year period ended October 31, 2022, these differences generally detracted from non-US developed markets Portfolios’ relative performance and were not material to emerging markets Portfolios’ relative performance.
The DFA International Value Series
The DFA International Value Series invests in developed ex U.S. large company value stocks. The investment strategy is process driven, emphasizing broad diversification, with increased exposure to stocks with smaller total market capitalizations, lower relative price (value), and higher-profitability within the large-cap value segment of developed ex U.S. markets. As of October 31, 2022, the Series held approximately 550 securities in 22 eligible developed markets. Average cash exposure throughout the year was less than 1% of the Series’ assets.
194
For the 12 months ended October 31, 2022, total returns were -13.82% for the Series, -15.27% for the MSCI World ex USA Value Index, and -22.04% for the MSCI World ex USA Index (net dividends). As of February 28, 2022, the Series changed its benchmark from the MSCI World ex USA Index (net dividends) to the MSCI World ex USA Value Index (net dividends) because this index better reflects the universe of securities in which the Series invests. With low relative price (value) stocks outperforming high relative price (growth) stocks, the Series’ focus on value stocks contributed positively to performance relative to the benchmarks. The Series’ exclusion of real estate investment trusts (REITs) also contributed positively to relative performance, as those stocks generally underperformed.
The Japanese Small Company Series
The Japanese Small Company Series invests in Japanese small company stocks. The Series generally excludes stocks with the lowest profitability and highest relative price. Additionally, the Series generally excludes certain companies with high asset growth. The investment strategy is process driven, emphasizing broad diversification. As of October 31, 2022, the Series held approximately 1,750 securities. Average cash exposure throughout the year was less than 1% of the Series’ assets.
For the 12 months ended October 31, 2022, total returns were -23.60% for the Series and -24.90% for the MSCI Japan Small Cap Index (net dividends), the Series’ benchmark. The Series’ greater emphasis on stocks with smaller market capitalizations contributed positively to performance relative to the benchmark, as these stocks outperformed. The Series’ exclusion of stocks with the lowest profitability and highest relative price also contributed positively to performance relative to the benchmark, as did the Series’ exclusion of stocks with high asset growth, as those stocks underperformed.
The Asia Pacific Small Company Series
The Asia Pacific Small Company Series invests in small company stocks in Australia, Hong Kong, New Zealand, and Singapore. The Series generally excludes stocks with the lowest profitability and highest relative price. Additionally, the Series generally excludes certain companies with high asset growth. The investment strategy is process driven, emphasizing broad diversification. As of October 31, 2022, the Series held approximately 840 securities in 4 eligible countries. Average cash exposure throughout the year was less than 1% of the Series’ assets.
For the 12 months ended October 31, 2022, total returns were -26.65% for the Series and -24.10% for the MSCI Pacific ex Japan Small Cap Index (net dividends), the Series’ benchmark. The Series’ emphasis on stocks with smaller market capitalizations, particularly in Australia, detracted from relative performance, as larger stocks held by the benchmark outperformed.
The United Kingdom Small Company Series
The United Kingdom Small Company Series invests in small company stocks in the U.K. The Series generally excludes stocks with the lowest profitability and highest relative price. Additionally, the Series generally excludes certain companies with high asset growth. The investment strategy is process driven, emphasizing broad diversification. As of October 31, 2022, the Series held approximately 310 securities. Average cash exposure throughout the year was less than 1% of the Series’ assets.
195
For the 12 months ended October 31, 2022, total returns were -33.34% for the Series and - 37.62% for the MSCI United Kingdom Small Cap Index (net dividends), the Series’ benchmark. The Series’ exclusion of stocks with the lowest profitability and highest relative price contributed positively to relative performance, as did the Series’ exclusion of stocks with high asset growth, as those securities underperformed.
The Continental Small Company Series
The Continental Small Company Series invests in small company stocks in the developed markets of Europe (excluding the U.K.) and Israel. The Series generally excludes stocks with the lowest profitability and highest relative price. Additionally, the Series generally excludes certain companies with high asset growth. The investment strategy is process driven, emphasizing broad diversification. As of October 31, 2022, the Series held approximately 1,170 securities in 15 eligible countries. Average cash exposure throughout the year was less than 1% of the Series’ assets.
For the 12 months ended October 31, 2022, total returns were -29.07% for the Series and - 34.51% for the MSCI Europe ex U.K. Small Cap Index (net dividends), the Series’ benchmark. Differences in size definitions between the Series and the benchmark led to weight differences between countries, which contributed positively to performance relative to the benchmark. The Series’ exclusion of stocks with the lowest profitability and highest relative price also contributed positively to relative performance, as did the Series’ exclusion of stocks with high asset growth, as those securities underperformed for the year.
The Canadian Small Company Series
The Canadian Small Company Series invests in small company stocks in Canada. The Series generally excludes stocks with the lowest profitability and highest relative price. The Series also generally excludes certain companies with high asset growth. The investment strategy is process-driven, emphasizing broad diversification. As of October 31, 2022, the Series held approximately 350 securities. Average cash exposure throughout the year was less than 1% of the Series’ assets.
For the 12 months ended October 31, 2022, total returns were -12.52% for the Series and -17.55% for the MSCI Canada Small Cap Index (net dividends), the Series’ benchmark. The Series’ exclusion of stocks with the lowest profitability and highest relative price contributed positively to performance relative to the benchmark, as did the Series’ exclusion of stocks with high asset growth, as those securities underperformed. Additionally, the Series’ exclusion of real estate investment trusts (REITs) also contributed positively to performance relative to the benchmark, as REITs generally underperformed.
The Emerging Markets Series
The Emerging Markets Series invests in large-cap stocks in emerging markets. The investment strategy is process driven, emphasizing broad diversification with increased exposure to stocks with smaller market capitalizations, lower relative price (value), and higher-profitability within the large-cap segment of emerging markets. As of October 31, 2022, the Series held approximately 1,880 securities in 23 eligible emerging markets. Average cash exposure throughout the year was less than 1% of the Series’ assets.
196
For the 12 months ended October 31, 2022, total returns were -25.79% for the Series and -31.03% for the MSCI Emerging Markets Index (net dividends), the Series’ benchmark. The Series’ greater emphasis on low relative price (value) stocks contributed positively to performance relative to the benchmark, as value stocks outperformed high relative price (growth) stocks in emerging markets. The Portfolio’s emphasis on stocks with higher profitability also contributed positively to performance relative to the benchmark, as these stocks generally outperformed. At the country level, the Portfolio’s lesser allocation to Russia contributed positively to relative performance, as Russia underperformed the overall benchmark.
The Emerging Markets Small Cap Series
The Emerging Markets Small Cap Series invests in small company stocks in emerging markets. The Series generally excludes stocks with the lowest profitability and highest relative price. Additionally, the Series generally excludes certain companies with high asset growth. The investment strategy is process driven, emphasizing broad diversification. As of October 31, 2022, the Series held approximately 5,150 securities in 20 eligible emerging markets. Average cash exposure throughout the year was less than 1% of the Series’ assets.
For the 12 months ended October 31, 2022, total returns were -22.31% for the Series and -31.03% for the MSCI Emerging Markets Index (net dividends), the Series’ benchmark. With small-cap stocks outperforming large-cap stocks in emerging markets, the Series’ inclusion of stocks with smaller market capitalizations contributed positively to performance relative to the benchmark, which is composed primarily of large- and mid-cap stocks. At the country level, the Series lesser allocation to Russia contributed positively to relative performance, as Russia underperformed the overall benchmark.
197
THE DFA INVESTMENT TRUST COMPANY
DISCLOSURE OF FUND EXPENSES
(Unaudited)
The following Expense Tables are shown so that you can understand the impact of fees on your investment. All mutual funds have operating expenses. As a shareholder of the fund, you incur ongoing costs, which include costs for portfolio management, administrative services, and shareholder reports, among others. Operating expenses and legal and audit services, which are deducted from a fund’s gross income, directly reduce the investment return of the fund. Afund’s expenses are expressed as a percentage of its average net assets. This figure is known as the expense ratio. The following examples are intended to help you understand the ongoing costs, in dollars, of investing in the fund and to compare these costs with those of other mutual funds. The examples are based on an investment of $1,000 made at the beginning of the period shown and held for the entire period.
The Expense Tables below illustrate your fund’s costs in two ways.
Actual Fund Return
This section helps you to estimate the actual expenses after fee waivers that you paid over the period. The “Ending Account Value” shown is derived from the fund’s actual return, and “Expenses Paid During Period” reflects the dollar amount that would have been paid by an investor who started with $1,000 in the fund. You may use the information here, together with the amount you invested, to estimate the expenses that you paid over the period.
To do so, simply divide your account value by $1,000 (for example, a $7,500 account value divided by $1,000 = 7.5), then multiply the result by the number given for your fund under the heading “Expenses Paid During Period.”
Hypothetical Example for Comparison Purposes
This section is intended to help you compare your fund’s costs with those of other mutual funds. The hypothetical “Ending Account Value” and “Expenses Paid During Period” are derived from the fund’s actual expense ratio and an assumed 5% annual return before expenses. In this case, because the return used is not the fund’s actual return, the results do not apply to your investment. The example is useful in making comparisons because the SEC requires all mutual funds to calculate expenses based on a 5% annual return. You can assess your fund’s costs by comparing this hypothetical example with the hypothetical examples that appear in shareholder reports of other funds.
Please note that the expenses shown in the tables are meant to highlight and help you compare ongoing costs only and do not reflect any transactional costs, if applicable. The “Annualized Expense Ratio” represents the actual expenses for the six-month period indicated.
Six Months Ended October 31, 2022
EXPENSE TABLES
| | | | | | | | | | | | | | | | |
| | | Beginning
Account
Value
05/01/22 | | | Ending
Account
Value
10/31/22 | | | Annualized
Expense
Ratio (1) | | | Expenses
Paid
During
Period (1) | |
The DFA International Value Series | | | | | | | | | | | | | | | | |
Actual Fund Return | | $ | 1,000.00 | | | $ | 900.90 | | | | 0.21 | % | | $ | 1.01 | |
Hypothetical 5% Annual Return | | $ | 1,000.00 | | | $ | 1,024.15 | | | | 0.21 | % | | $ | 1.07 | |
| | | | |
The Japanese Small Company Series | | | | | | | | | | | | | | | | |
Actual Fund Return | | $ | 1,000.00 | | | $ | 926.50 | | | | 0.12 | % | | $ | 0.58 | |
Hypothetical 5% Annual Return | | $ | 1,000.00 | | | $ | 1,024.60 | | | | 0.12 | % | | $ | 0.61 | |
198
DISCLOSURE OF FUND EXPENSES
CONTINUED
| | | | | | | | | | | | | | | | |
| | | Beginning
Account
Value
05/01/22 | | | Ending
Account
Value
10/31/22 | | | Annualized
Expense
Ratio (1) | | | Expenses
Paid
During
Period (1) | |
The Asia Pacific Small Company Series | | | | | | | | | | | | | | | | |
Actual Fund Return | | $ | 1,000.00 | | | $ | 805.00 | | | | 0.12 | % | | $ | 0.55 | |
Hypothetical 5% Annual Return | | $ | 1,000.00 | | | $ | 1,024.60 | | | | 0.12 | % | | $ | 0.61 | |
The United Kingdom Small Company Series | | | | | | | | | | | | | | | | |
Actual Fund Return | | $ | 1,000.00 | | | $ | 812.90 | | | | 0.11 | % | | $ | 0.50 | |
Hypothetical 5% Annual Return | | $ | 1,000.00 | | | $ | 1,024.65 | | | | 0.11 | % | | $ | 0.56 | |
The Continental Small Company Series | | | | | | | | | | | | | | | | |
Actual Fund Return | | $ | 1,000.00 | | | $ | 837.30 | | | | 0.13 | % | | $ | 0.60 | |
Hypothetical 5% Annual Return | | $ | 1,000.00 | | | $ | 1,024.55 | | | | 0.13 | % | | $ | 0.66 | |
The Canadian Small Company Series | | | | | | | | | | | | | | | | |
Actual Fund Return | | $ | 1,000.00 | | | $ | 876.80 | | | | 0.11 | % | | $ | 0.52 | |
Hypothetical 5% Annual Return | | $ | 1,000.00 | | | $ | 1,024.65 | | | | 0.11 | % | | $ | 0.56 | |
The Emerging Markets Series | | | | | | | | | | | | | | | | |
Actual Fund Return | | $ | 1,000.00 | | | $ | 818.30 | | | | 0.15 | % | | $ | 0.69 | |
Hypothetical 5% Annual Return | | $ | 1,000.00 | | | $ | 1,024.45 | | | | 0.15 | % | | $ | 0.77 | |
The Emerging Markets Small Cap Series | | | | | | | | | | | | | | | | |
Actual Fund Return | | $ | 1,000.00 | | | $ | 845.90 | | | | 0.26 | % | | $ | 1.21 | |
Hypothetical 5% Annual Return | | $ | 1,000.00 | | | $ | 1,023.90 | | | | 0.26 | % | | $ | 1.33 | |
| (1) | Expenses are equal to the fund’s annualized expense ratio for the six-month period, multiplied by the average account value over the period, multiplied by the number of days in the most recent six-month period (184), then divided by the number of days in the year (365) to reflect the six-month period. |
199
THE DFA INVESTMENT TRUST COMPANY
DISCLOSURE OF PORTFOLIO HOLDINGS
(Unaudited)
The SEC requires that all funds file a complete Schedule of Investments with the SEC for their first and third fiscal quarters as an exhibit to their reports on Form N-PORT. For The DFA Investment Trust Company, this would be for the fiscal quarters ending January 31 and July 31. Such Form N-PORT filing must be made within 60 days of the end of the quarter. The DFA Investment Trust Company filed its most recent Form N-PORT with the SEC on September 28, 2022. They are available upon request, without charge, by calling collect: (512) 306-7400; by mailing a request to Dimensional Fund Advisors LP, 6300 Bee Cave Road, Building One, Austin, TX 78746; or by visiting the SEC’s website at http://www.sec.gov.
SEC regulations permit a fund to include in its reports to shareholders a “Summary Schedule of Portfolio Holdings” in lieu of a full Schedule of Investments. The Summary Schedule of Portfolio Holdings reports the fund’s 50 largest holdings in unaffiliated issuers and any investments that exceed one percent of the fund’s net assets at the end of the reporting period. The regulations also require that the Summary Schedule of Portfolio Holdings identify each category of investments that are held.
A fund is required to file a complete Schedule of Investments with the SEC on Form N-CSR within ten days after mailing the annual and semi-annual reports to shareholders. It will be available upon request, without charge, by calling collect: (512) 306-7400; by mailing a request to Dimensional Fund Advisors LP, 6300 Bee Cave Road, Building One, Austin, TX 78746; or by visiting the SEC’s website at http://www.sec.gov.
PORTFOLIO HOLDINGS
The SEC requires that all funds present their categories of portfolio holdings in a table, chart, or graph format in their annual and semi-annual shareholder reports, whether or not a Schedule of Investments is used. The following table, which presents portfolio holdings as a percentage of total investments before short-term investments and collateral for loaned securities, is provided in compliance with this requirement. The categories shown below represent broad industry sectors. Each industry sector consists of one or more specific industry classifications.
INTERNATIONAL EQUITY PORTFOLIOS
| | | | |
| The DFA International Value Series | |
Communication Services | | | 3.4 | % |
Consumer Discretionary | | | 12.3 | % |
Consumer Staples | | | 4.8 | % |
Energy | | | 15.9 | % |
Financials | | | 28.7 | % |
Health Care | | | 5.5 | % |
Industrials | | | 11.1 | % |
Information Technology | | | 1.3 | % |
Materials | | | 14.0 | % |
Real Estate | | | 2.2 | % |
Utilities | | | 0.8 | % |
| | | | |
| | | 100.0 | % |
| | | | |
| The Japanese Small Company Series | |
Communication Services | | | 2.4 | % |
Consumer Discretionary | | | 14.7 | % |
Consumer Staples | | | 7.9 | % |
Energy | | | 0.8 | % |
Financials | | | 9.0 | % |
Health Care | | | 5.1 | % |
Industrials | | | 28.9 | % |
Information Technology | | | 15.6 | % |
Materials | | | 12.4 | % |
Real Estate | | | 1.5 | % |
Utilities | | | 1.7 | % |
| | | | |
| | | 100.0 | % |
| | | | |
| The Asia Pacific Small Company Series | |
Communication Services | | | 4.9 | % |
Consumer Discretionary | | | 18.9 | % |
Consumer Staples | | | 8.6 | % |
Energy | | | 6.3 | % |
Financials | | | 13.0 | % |
Health Care | | | 5.7 | % |
Industrials | | | 11.8 | % |
Information Technology | | | 7.8 | % |
Materials | | | 15.3 | % |
Real Estate | | | 6.9 | % |
Utilities | | | 0.8 | % |
| | | | |
| | | 100.0 | % |
200
DISCLOSURE OF PORTFOLIO HOLDINGS
CONTINUED
| | | | |
| The United Kingdom Small Company Series | |
Communication Services | | | 3.7 | % |
Consumer Discretionary | | | 16.8 | % |
Consumer Staples | | | 7.2 | % |
Energy | | | 4.3 | % |
Financials | | | 18.9 | % |
Health Care | | | 5.0 | % |
Industrials | | | 22.8 | % |
Information Technology | | | 8.7 | % |
Materials | | | 5.3 | % |
Real Estate | | | 3.0 | % |
Utilities | | | 4.3 | % |
| | | | |
| | | 100.0 | % |
| | | | |
| The Continental Small Company Series | |
| Communication Services | | | 4.8 | % |
| Consumer Discretionary | | | 8.4 | % |
| Consumer Staples | | | 4.3 | % |
| Energy | | | 4.4 | % |
| Financials | | | 16.6 | % |
| Health Care | | | 6.0 | % |
| Industrials | | | 27.0 | % |
| Information Technology | | | 10.2 | % |
| Materials | | | 9.1 | % |
| Real Estate | | | 4.9 | % |
| Utilities | | | 4.3 | % |
| | | | |
| | | 100.0 | % |
| | | | |
| The Canadian Small Company Series | |
| Communication Services | | | 1.3 | % |
| Consumer Discretionary | | | 5.5 | % |
| Consumer Staples | | | 4.9 | % |
| Energy | | | 28.7 | % |
| Financials | | | 9.3 | % |
| Health Care | | | 1.5 | % |
| Industrials | | | 11.0 | % |
| Information Technology | | | 3.3 | % |
| Materials | | | 23.8 | % |
| Real Estate | | | 2.6 | % |
Utilities | | | 8.1 | % |
| | | | |
| | | 100.0 | % |
| | | | |
| The Emerging Markets Series | |
Communication Services | | | 7.8 | % |
Consumer Discretionary | | | 10.4 | % |
Consumer Staples | | | 6.7 | % |
Energy | | | 6.0 | % |
Financials | | | 21.8 | % |
Health Care | | | 4.3 | % |
Industrials | | | 7.4 | % |
Information Technology | | | 19.0 | % |
Materials | | | 11.7 | % |
Real Estate | | | 1.9 | % |
Utilities | | | 3.0 | % |
| | | | |
| | | 100.0 | % |
| | | | |
| The Emerging Markets Small Cap Series | |
Communication Services | | | 3.3 | % |
Consumer Discretionary | | | 13.8 | % |
Consumer Staples | | | 6.9 | % |
Energy | | | 2.1 | % |
Financials | | | 9.5 | % |
Health Care | | | 8.3 | % |
Industrials | | | 15.8 | % |
Information Technology | | | 14.8 | % |
Materials | | | 14.8 | % |
Real Estate | | | 5.7 | % |
Utilities | | | 5.0 | % |
| | | | |
| | | 100.0 | % |
201
THE DFA INTERNATIONAL VALUE SERIES
SUMMARY SCHEDULE OF PORTFOLIO HOLDINGS
October 31, 2022
| | | | | | | | | | | | | | |
| | | | | Shares | | | Value» | | | Percentage
of Net Assets‡ | |
COMMON STOCKS — (94.7%) | | | | | | | | | | | | |
AUSTRALIA — (7.6%) | | | | | | | | | | | | |
# | | Australia & New Zealand Banking Group Ltd. | | | 7,347,638 | | | $ | 120,381,777 | | | | 1.1 | % |
| | National Australia Bank Ltd. | | | 5,345,044 | | | | 111,027,479 | | | | 1.1 | % |
| | Westpac Banking Corp. | | | 7,338,308 | | | | 113,310,525 | | | | 1.1 | % |
| | Woodside Energy Group Ltd | | | 3,456,203 | | | | 79,902,049 | | | | 0.8 | % |
| | Other Securities | | | | | | | 392,173,877 | | | | 3.7 | % |
| | | | | | | | | | | | | | |
TOTAL AUSTRALIA | | | | | | | 816,795,707 | | | | 7.8 | % |
| | | | | | | | | | | | | | |
AUSTRIA — (0.1%) | | | | | | | | | | | | |
| | Other Securities | | | | | | | 6,220,806 | | | | 0.1 | % |
| | | | | | | | | | | | | | |
BELGIUM — (0.6%) | | | | | | | | | | | | |
| | Other Securities | | | | | | | 58,799,281 | | | | 0.6 | % |
| | | | | | | | | | | | | | |
CANADA — (10.1%) | | | | | | | | | | | | |
| | Bank of Montreal | | | 1,789 | | | | 164,790 | | | | 0.0 | % |
# | | Bank of Montreal | | | 1,331,345 | | | | 122,590,248 | | | | 1.2 | % |
| | Bank of Nova Scotia | | | 443,447 | | | | 21,434,275 | | | | 0.2 | % |
| | Bank of Nova Scotia | | | 2,098,551 | | | | 101,401,984 | | | | 1.0 | % |
| | Canadian Imperial Bank of Commerce | | | 1,446,994 | | | | 65,714,037 | | | | 0.6 | % |
| | Canadian Natural Resources Ltd. | | | 806,380 | | | | 48,334,417 | | | | 0.5 | % |
| | Fairfax Financial Holdings Ltd. | | | 97,836 | | | | 48,050,126 | | | | 0.4 | % |
| | Nutrien Ltd. | | | 944,511 | | | | 79,811,163 | | | | 0.8 | % |
| | Suncor Energy, Inc. | | | 1,317,132 | | | | 45,304,678 | | | | 0.4 | % |
| | Suncor Energy, Inc. | | | 2,013,309 | | | | 69,237,696 | | | | 0.7 | % |
# | | Teck Resources Ltd., Class B | | | 2,050,761 | | | | 62,425,165 | | | | 0.6 | % |
| | Other Securities | | | | | | | 425,965,154 | | | | 4.0 | % |
| | | | | | | | | | | | | | |
TOTAL CANADA | | | | | | | 1,090,433,733 | | | | 10.4 | % |
| | | | | | | | | | | | | | |
CHINA — (0.0%) | | | | | | | | | | | | |
| | Other Securities | | | | | | | 3,578,225 | | | | 0.0 | % |
| | | | | | | | | | | | | | |
DENMARK — (1.9%) | | | | | | | | | | | | |
| | DSV AS | | | 379,252 | | | | 51,247,654 | | | | 0.5 | % |
| | Other Securities | | | | | | | 150,557,322 | | | | 1.4 | % |
| | | | | | | | | | | | | | |
TOTAL DENMARK | | | | | | | 201,804,976 | | | | 1.9 | % |
| | | | | | | | | | | | | | |
FINLAND — (1.1%) | | | | | | | | | | | | |
| | Other Securities | | | | | | | 113,789,895 | | | | 1.1 | % |
| | | | | | | | | | | | | | |
FRANCE — (10.2%) | | | | | | | | | | | | |
| | AXA SA | | | 2,421,503 | | | | 59,798,721 | | | | 0.6 | % |
| | BNP Paribas SA | | | 1,819,966 | | | | 85,345,265 | | | | 0.8 | % |
| | Cie de Saint-Gobain | | | 1,784,858 | | | | 72,966,654 | | | | 0.7 | % |
| | Cie Generale des Etablissements Michelin SCA | | | 2,521,000 | | | | 64,245,287 | | | | 0.6 | % |
| | Engie SA | | | 3,701,762 | | | | 48,098,296 | | | | 0.5 | % |
| | Orange SA | | | 7,137,374 | | | | 68,004,272 | | | | 0.6 | % |
| | Sanofi | | | 682,839 | | | | 58,763,618 | | | | 0.6 | % |
# | | TotalEnergies SE | | | 6,840,726 | | | | 373,184,524 | | | | 3.5 | % |
| | Other Securities | | | | | | | 264,876,509 | | | | 2.5 | % |
| | | | | | | | | | | | | | |
TOTAL FRANCE | | | | | | | 1,095,283,146 | | | | 10.4 | % |
| | | | | | | | | | | | | | |
202
THE DFA INTERNATIONAL VALUE SERIES
CONTINUED
| | | | | | | | | | | | | | |
| | | | | Shares | | | Value» | | | Percentage
of Net Assets‡ | |
GERMANY — (5.5%) | | | | | | | | | | | | |
| | BASF SE | | | 1,819,157 | | | $ | 81,626,734 | | | | 0.8 | % |
| | Bayerische Motoren Werke AG | | | 1,003,964 | | | | 78,803,005 | | | | 0.7 | % |
| | Mercedes-Benz Group AG | | | 2,636,283 | | | | 152,592,147 | | | | 1.5 | % |
| | Other Securities | | | | | | | 281,533,549 | | | | 2.6 | % |
| | | | | | | | | | | | | | |
TOTAL GERMANY | | | | | | | 594,555,435 | | | | 5.6 | % |
| | | | | | | | | | | | | | |
HONG KONG — (2.0%) | | | | | | | | | | | | |
| | Other Securities | | | | | | | 214,006,034 | | | | 2.0 | % |
| | | | | | | | | | | | | | |
IRELAND — (0.4%) | | | | | | | | | | | | |
| | Other Securities | | | | | | | 46,570,809 | | | | 0.4 | % |
| | | | | | | | | | | | | | |
ISRAEL — (0.6%) | | | | | | | | | | | | |
| | Other Securities | | | | | | | 64,808,590 | | | | 0.6 | % |
| | | | | | | | | | | | | | |
ITALY — (2.0%) | | | | | | | | | | | | |
# | | Intesa Sanpaolo SpA | | | 26,193,710 | | | | 49,939,026 | | | | 0.5 | % |
| | UniCredit SpA | | | 3,981,409 | | | | 49,374,501 | | | | 0.5 | % |
| | Other Securities | | | | | | | 114,595,246 | | | | 1.0 | % |
| | | | | | | | | | | | | | |
TOTAL ITALY | | | | | | | 213,908,773 | | | | 2.0 | % |
| | | | | | | | | | | | | | |
JAPAN — (18.6%) | | | | | | | | | | | | |
| | Honda Motor Co. Ltd. | | | 3,522,000 | | | | 80,310,312 | | | | 0.8 | % |
| | Mitsubishi Corp. | | | 1,963,400 | | | | 53,186,304 | | | | 0.5 | % |
| | Mitsubishi UFJ Financial Group, Inc. | | | 10,193,750 | | | | 48,153,735 | | | | 0.5 | % |
| | Takeda Pharmaceutical Co. Ltd. | | | 2,595,871 | | | | 68,554,353 | | | | 0.7 | % |
| | Toyota Motor Corp. | | | 12,080,750 | | | | 167,615,564 | | | | 1.6 | % |
| | Other Securities | | | | | | | 1,581,578,322 | | | | 14.9 | % |
| | | | | | | | | | | | | | |
TOTAL JAPAN | | | | | | | 1,999,398,590 | | | | 19.0 | % |
| | | | | | | | | | | | | | |
NETHERLANDS — (3.8%) | | | | | | | | | | | | |
| | ING Groep NV | | | 4,971,616 | | | | 48,918,640 | | | | 0.5 | % |
| | Koninklijke Ahold Delhaize NV | | | 4,054,901 | | | | 113,084,163 | | | | 1.1 | % |
| | Other Securities | | | | | | | 243,026,322 | | | | 2.2 | % |
| | | | | | | | | | | | | | |
TOTAL NETHERLANDS | | | | | | | 405,029,125 | | | | 3.8 | % |
| | | | | | | | | | | | | | |
NEW ZEALAND — (0.2%) | | | | | | | | | | | | |
| | Other Securities | | | | | | | 23,565,859 | | | | 0.2 | % |
| | | | | | | | | | | | | | |
NORWAY — (0.9%) | | | | | | | | | | | | |
| | Other Securities | | | | | | | 101,097,179 | | | | 1.0 | % |
| | | | | | | | | | | | | | |
PORTUGAL — (0.1%) | | | | | | | | | | | | |
| | Other Securities | | | | | | | 14,011,161 | | | | 0.1 | % |
| | | | | | | | | | | | | | |
SINGAPORE — (1.1%) | | | | | | | | | | | | |
| | Other Securities | | | | | | | 118,180,815 | | | | 1.1 | % |
| | | | | | | | | | | | | | |
SPAIN — (1.9%) | | | | | | | | | | | | |
# | | Banco Santander SA | | | 31,583,925 | | | | 81,912,138 | | | | 0.8 | % |
| | Repsol SA | | | 4,619,638 | | | | 62,847,702 | | | | 0.6 | % |
| | Other Securities | | | | | | | 54,102,853 | | | | 0.5 | % |
| | | | | | | | | | | | | | |
TOTAL SPAIN | | | | | | | 198,862,693 | | | | 1.9 | % |
| | | | | | | | | | | | | | |
203
THE DFA INTERNATIONAL VALUE SERIES
CONTINUED
| | | | | | | | | | | | | | |
| | | | | Shares | | | Value» | | | Percentage
of Net Assets‡ | |
SWEDEN — (2.5%) | | | | | | | | | | | | |
| | Other Securities | | | | | | $ | 270,126,175 | | | | 2.6 | % |
| | | | | | | | | | | | | | |
SWITZERLAND — (8.8%) | | | | | | | | | | | | |
| | Cie Financiere Richemont SA, Class A | | | 922,306 | | | | 90,140,218 | | | | 0.9 | % |
| | Novartis AG | | | 1,706,093 | | | | 138,007,072 | | | | 1.3 | % |
# | | Novartis AG, Sponsored ADR | | | 1,596,183 | | | | 129,498,327 | | | | 1.2 | % |
| | UBS Group AG | | | 6,030,163 | | | | 95,603,120 | | | | 0.9 | % |
* | | UBS Group AG | | | 1,233,581 | | | | 19,564,595 | | | | 0.2 | % |
| | Zurich Insurance Group AG | | | 348,909 | | | | 148,695,901 | | | | 1.4 | % |
| | Other Securities | | | | | | | 327,812,902 | | | | 3.1 | % |
| | | | | | | | | | | | | | |
TOTAL SWITZERLAND | | | | | | | 949,322,135 | | | | 9.0 | % |
| | | | | | | | | | | | | | |
UNITED KINGDOM — (14.7%) | | | | | | | | | | | | |
# | | Barclays PLC, Sponsored ADR | | | 7,035,082 | | | | 48,682,767 | | | | 0.5 | % |
| | BP PLC | | | 7,690,578 | | | | 42,548,901 | | | | 0.4 | % |
# | | BP PLC, Sponsored ADR | | | 2,518,588 | | | | 83,818,609 | | | | 0.8 | % |
| | British American Tobacco PLC | | | 3,024,009 | | | | 119,428,540 | | | | 1.1 | % |
# | | British American Tobacco PLC, Sponsored ADR | | | 838,885 | | | | 33,236,624 | | | | 0.3 | % |
| | Glencore PLC | | | 23,897,614 | | | | 137,006,665 | | | | 1.3 | % |
| | HSBC Holdings PLC | | | 13,535,003 | | | | 69,462,304 | | | | 0.7 | % |
# | | HSBC Holdings PLC, Sponsored ADR | | | 2,324,211 | | | | 60,220,307 | | | | 0.6 | % |
| | Lloyds Banking Group PLC | | | 164,752,825 | | | | 79,125,348 | | | | 0.8 | % |
| | Shell PLC | | | 307,658 | | | | 8,522,614 | | | | 0.1 | % |
| | Shell PLC, Sponsored ADR | | | 9,015,405 | | | | 501,526,980 | | | | 4.8 | % |
| | Vodafone Group PLC | | | 51,300,878 | | | | 59,888,735 | | | | 0.6 | % |
| | Other Securities | | | | | | | 342,384,465 | | | | 3.1 | % |
| | | | | | | | | | | | | | |
TOTAL UNITED KINGDOM | | | | | | | 1,585,852,859 | | | | 15.1 | % |
| | | | | | | | | | | | | | |
TOTAL COMMON STOCKS | | | | | | | 10,186,002,001 | | | | 96.7 | % |
| | | | | | | | | | | | | | |
PREFERRED STOCKS — (0.8%) | | | | | | | | | | | | |
GERMANY — (0.8%) | | | | | | | | | | | | |
| | Volkswagen AG | | | 489,153 | | | | 62,612,238 | | | | 0.6 | % |
| | Other Securities | | | | | | | 28,392,993 | | | | 0.3 | % |
| | | | | | | | | | | | | | |
TOTAL GERMANY | | | | | | | 91,005,231 | | | | 0.9 | % |
| | | | | | | | | | | | | | |
TOTAL INVESTMENT SECURITIES
(Cost $10,555,431,050) | | | | | | | 10,277,007,232 | | | | | |
| | | | | | | | | | | | | | |
| | | | |
| | | | | | | | Value† | | | | |
SECURITIES LENDING COLLATERAL — (4.5%) | | | | | | | | | | | | |
@§ | | The DFA Short Term Investment Fund | | | 41,765,646 | | | | 482,852,631 | | | | 4.6 | % |
| | | | | | | | | | | | | | |
TOTAL INVESTMENTS—(100.0%)
(Cost $11,038,476,605) | | | | | | $ | 10,759,859,863 | | | | 102.2 | % |
| | | | | | | | | | | | | | |
204
THE DFA INTERNATIONAL VALUE SERIES
CONTINUED
As of October 31, 2022, The DFA International Value Series had entered into the following outstanding futures contracts:
| | | | | | | | | | | | | | | | | | | | |
Description | | Number of
Contracts | | | Expiration
Date | | | Notional
Value | | | Market
Value | | | Unrealized
Appreciation
(Depreciation) | |
Long Position Contracts: | | | | | | | | | | | | | | | | | | | | |
S&P 500® Emini Index | | | 842 | | | | 12/16/22 | | | $ | 157,956,087 | | | $ | 163,474,300 | | | $ | 5,518,213 | |
| | | | | | | | | | | | | | | | | | | | |
Total Futures Contracts | | | | | | | | | | $ | 157,956,087 | | | $ | 163,474,300 | | | $ | 5,518,213 | |
| | | | | | | | | | | | | | | | | | | | |
Summary of the Series’ investments as of October 31, 2022, based on their valuation inputs, is as follows (see Security Valuation Note):
| | | | | | | | | | | | | | | | |
| | | Investments in Securities (Market Value) | |
| | | Level 1 | | | Level 2 | | | Level 3 | | | Total | |
Common Stocks | | | | | | | | | | | | | | | | |
Australia | | | — | | | $ | 816,795,707 | | | | — | | | $ | 816,795,707 | |
Austria | | | — | | | | 6,220,806 | | | | — | | | | 6,220,806 | |
Belgium | | | — | | | | 58,799,281 | | | | — | | | | 58,799,281 | |
Canada | | $ | 1,090,433,733 | | | | — | | | | — | | | | 1,090,433,733 | |
China | | | — | | | | 3,578,225 | | | | — | | | | 3,578,225 | |
Denmark | | | — | | | | 201,804,976 | | | | — | | | | 201,804,976 | |
Finland | | | 5,856,638 | | | | 107,933,257 | | | | — | | | | 113,789,895 | |
France | | | — | | | | 1,095,283,146 | | | | — | | | | 1,095,283,146 | |
Germany | | | 14,207,408 | | | | 580,348,027 | | | | — | | | | 594,555,435 | |
Hong Kong | | | — | | | | 214,006,034 | | | | — | | | | 214,006,034 | |
Ireland | | | 26,386,842 | | | | 20,183,967 | | | | — | | | | 46,570,809 | |
Israel | | | 11,032,764 | | | | 53,775,826 | | | | — | | | | 64,808,590 | |
Italy | | | 24,863,308 | | | | 189,045,465 | | | | — | | | | 213,908,773 | |
Japan | | | 13,905,475 | | | | 1,985,493,115 | | | | — | | | | 1,999,398,590 | |
Netherlands | | | 26,051,464 | | | | 378,977,661 | | | | — | | | | 405,029,125 | |
New Zealand | | | — | | | | 23,565,859 | | | | — | | | | 23,565,859 | |
Norway | | | — | | | | 101,097,179 | | | | — | | | | 101,097,179 | |
Portugal | | | — | | | | 14,011,161 | | | | — | | | | 14,011,161 | |
Singapore | | | — | | | | 118,180,815 | | | | — | | | | 118,180,815 | |
Spain | | | 6,210,086 | | | | 192,652,607 | | | | — | | | | 198,862,693 | |
Sweden | | | — | | | | 270,126,175 | | | | — | | | | 270,126,175 | |
Switzerland | | | 158,548,612 | | | | 790,773,523 | | | | — | | | | 949,322,135 | |
United Kingdom | | | 766,554,481 | | | | 819,298,378 | | | | — | | | | 1,585,852,859 | |
Preferred Stocks | | | | | | | | | | | | | | | | |
Germany | | | — | | | | 91,005,231 | | | | — | | | | 91,005,231 | |
Securities Lending Collateral | | | — | | | | 482,852,631 | | | | — | | | | 482,852,631 | |
Futures Contracts** | | | 5,518,213 | | | | — | | | | — | | | | 5,518,213 | |
| | | | | | | | | | | | | | | | |
TOTAL | | $ | 2,149,569,024 | | | $ | 8,615,809,052 | | | | — | | | $ | 10,765,378,076 | |
| | | | | | | | | | | | | | | | |
| ** | Valued at the unrealized appreciation/(depreciation) on the investment. |
See accompanying Notes to Financial Statements.
205
THE JAPANESE SMALL COMPANY SERIES
SUMMARY SCHEDULE OF PORTFOLIO HOLDINGS
October 31, 2022
| | | | | | | | | | | | | | |
| | | | | Shares | | | Value» | | | Percentage
of Net Assets‡ | |
COMMON STOCKS — (97.8%) | | | | | | | | | | | | |
COMMUNICATION SERVICES — (2.4%) | | | | | | | | | | | | |
| | Other Securities | | | | | | $ | 60,456,006 | | | | 2.4 | % |
| | | | | | | | | | | | | | |
CONSUMER DISCRETIONARY — (14.4%) | | | | | | | | | | | | |
| | Resorttrust, Inc. | | | 521,964 | | | | 8,033,803 | | | | 0.3 | % |
| | Other Securities | | | | | | | 358,737,144 | | | | 14.2 | % |
| | | | | | | | | | | | | | �� |
TOTAL CONSUMER DISCRETIONARY | | | | | | | 366,770,947 | | | | 14.5 | % |
| | | | | | | | | | | | | | |
CONSUMER STAPLES — (7.8%) | | | | | | | | | | | | |
| | Milbon Co. Ltd. | | | 164,552 | | | | 6,785,094 | | | | 0.3 | % |
| | Nippon Suisan Kaisha Ltd. | | | 1,893,700 | | | | 6,745,679 | | | | 0.3 | % |
| | Pigeon Corp. | | | 573,125 | | | | 7,507,397 | | | | 0.3 | % |
| | Sapporo Holdings Ltd. | | | 385,720 | | | | 8,507,745 | | | | 0.3 | % |
| | Other Securities | | | | | | | 168,517,053 | | | | 6.6 | % |
| | | | | | | | | | | | | | |
TOTAL CONSUMER STAPLES | | | | | | | 198,062,968 | | | | 7.8 | % |
| | | | | | | | | | | | | | |
ENERGY — (0.7%) | | | | | | | | | | | | |
| | Other Securities | | | | | | | 19,204,938 | | | | 0.8 | % |
| | | | | | | | | | | | | | |
FINANCIALS — (8.8%) | | | | | | | | | | | | |
| | Fuyo General Lease Co. Ltd. | | | 114,800 | | | | 6,380,157 | | | | 0.3 | % |
| | Hachijuni Bank Ltd. | | | 1,994,500 | | | | 6,360,770 | | | | 0.3 | % |
| | Hirogin Holdings, Inc. | | | 1,534,800 | | | | 6,331,737 | | | | 0.3 | % |
| | JAFCO Group Co. Ltd. | | | 588,100 | | | | 9,023,388 | | | | 0.4 | % |
| | Yamaguchi Financial Group, Inc. | | | 1,237,672 | | | | 6,517,904 | | | | 0.3 | % |
| | Other Securities | | | | | | | 188,749,126 | | | | 7.3 | % |
| | | | | | | | | | | | | | |
TOTAL FINANCIALS | | | | | | | 223,363,082 | | | | 8.9 | % |
| | | | | | | | | | | | | | |
HEALTH CARE — (5.0%) | | | | | | | | | | | | |
| | H.U. Group Holdings, Inc. | | | 348,800 | | | | 6,492,843 | | | | 0.3 | % |
| | Nipro Corp. | | | 839,500 | | | | 6,328,382 | | | | 0.3 | % |
| | Ship Healthcare Holdings, Inc. | | | 346,200 | | | | 6,639,723 | | | | 0.3 | % |
| | Other Securities | | | | | | | 108,331,555 | | | | 4.2 | % |
| | | | | | | | | | | | | | |
TOTAL HEALTH CARE | | | | | | | 127,792,503 | | | | 5.1 | % |
| | | | | | | | | | | | | | |
INDUSTRIALS — (28.2%) | | | | | | | | | | | | |
| | Daiseki Co. Ltd. | | | 290,755 | | | | 8,984,172 | | | | 0.4 | % |
| | DMG Mori Co. Ltd. | | | 731,800 | | | | 8,468,845 | | | | 0.3 | % |
| | Fujikura Ltd. | | | 1,559,000 | | | | 9,230,804 | | | | 0.4 | % |
| | Furukawa Electric Co. Ltd. | | | 424,300 | | | | 6,546,029 | | | | 0.3 | % |
# | | Hazama Ando Corp. | | | 1,162,500 | | | | 6,737,422 | | | | 0.3 | % |
| | Hitachi Zosen Corp. | | | 1,041,679 | | | | 6,005,282 | | | | 0.2 | % |
| | Inaba Denki Sangyo Co. Ltd. | | | 322,900 | | | | 6,027,512 | | | | 0.2 | % |
| | Mabuchi Motor Co. Ltd. | | | 249,034 | | | | 6,757,392 | | | | 0.3 | % |
| | Meitec Corp. | | | 484,000 | | | | 8,152,392 | | | | 0.3 | % |
| | Nagase & Co. Ltd. | | | 584,600 | | | | 7,964,771 | | | | 0.3 | % |
# | | Nishimatsu Construction Co. Ltd. | | | 313,800 | | | | 7,640,054 | | | | 0.3 | % |
| | Nisshinbo Holdings, Inc. | | | 911,180 | | | | 6,316,101 | | | | 0.3 | % |
| | OSG Corp. | | | 526,900 | | | | 6,698,620 | | | | 0.3 | % |
| | Penta-Ocean Construction Co. Ltd. | | | 1,589,800 | | | | 7,906,395 | | | | 0.3 | % |
| | Ushio, Inc. | | | 622,400 | | | | 6,463,241 | | | | 0.3 | % |
206
THE JAPANESE SMALL COMPANY SERIES
CONTINUED
| | | | | | | | | | | | | | |
| | | | | Shares | | | Value» | | | Percentage
of Net Assets‡ | |
INDUSTRIALS — (Continued) | | | | | | | | | | | | |
| | Other Securities | | | | | | $ | 610,194,505 | | | | 24.1 | % |
| | | | | | | | | | | | | | |
TOTAL INDUSTRIALS | | | | | | | 720,093,537 | | | | 28.6 | % |
| | | | | | | | | | | | | | |
INFORMATION TECHNOLOGY — (15.3%) | | | | | | | | | | | | |
| | Alps Alpine Co. Ltd. | | | 788,800 | | | | 6,776,241 | | | | 0.3 | % |
| | Anritsu Corp. | | | 849,300 | | | | 8,548,093 | | | | 0.3 | % |
| | Citizen Watch Co. Ltd. | | | 1,669,800 | | | | 7,012,673 | | | | 0.3 | % |
| | Daiwabo Holdings Co. Ltd. | | | 581,600 | | | | 7,504,581 | | | | 0.3 | % |
| | Dexerials Corp. | | | 345,400 | | | | 8,044,653 | | | | 0.3 | % |
| | DTS Corp. | | | 254,000 | | | | 6,038,755 | | | | 0.2 | % |
| | Konica Minolta, Inc. | | | 2,014,100 | | | | 6,136,873 | | | | 0.3 | % |
| | Macnica Holdings, Inc. | | | 335,450 | | | | 6,709,361 | | | | 0.3 | % |
| | Maruwa Co. Ltd. | | | 57,700 | | | | 6,779,271 | | | | 0.3 | % |
| | NET One Systems Co. Ltd. | | | 383,900 | | | | 7,884,792 | | | | 0.3 | % |
| | NSD Co. Ltd. | | | 489,360 | | | | 8,362,456 | | | | 0.3 | % |
| | Tokyo Seimitsu Co. Ltd. | | | 248,700 | | | | 7,479,548 | | | | 0.3 | % |
| | Topcon Corp. | | | 676,700 | | | | 7,401,971 | | | | 0.3 | % |
| | Ulvac, Inc. | | | 225,700 | | | | 8,897,322 | | | | 0.4 | % |
| | Other Securities | | | | | | | 285,987,560 | | | | 11.2 | % |
| | | | | | | | | | | | | | |
TOTAL INFORMATION TECHNOLOGY | | | | | | | 389,564,150 | | | | 15.4 | % |
| | | | | | | | | | | | | | |
MATERIALS — (12.1%) | | | | | | | | | | | | |
| | ADEKA Corp. | | | 508,800 | | | | 7,606,774 | | | | 0.3 | % |
| | Asahi Holdings, Inc. | | | 472,200 | | | | 6,022,117 | | | | 0.2 | % |
| | Daicel Corp. | | | 1,608,100 | | | | 9,175,525 | | | | 0.4 | % |
| | Kureha Corp. | | | 103,950 | | | | 6,674,583 | | | | 0.3 | % |
| | Mitsui Mining & Smelting Co. Ltd. | | | 366,200 | | | | 7,396,353 | | | | 0.3 | % |
| | Tokai Carbon Co. Ltd. | | | 1,004,500 | | | | 6,555,281 | | | | 0.3 | % |
| | UBE Corp. | | | 611,100 | | | | 7,881,843 | | | | 0.3 | % |
| | Other Securities | | | | | | | 257,679,027 | | | | 10.2 | % |
| | | | | | | | | | | | | | |
TOTAL MATERIALS. | | | | | | | 308,991,503 | | | | 12.3 | % |
| | | | | | | | | | | | | | |
REAL ESTATE — (1.4%) | | | | | | | | | | | | |
| | Other Securities | | | | | | | 36,414,839 | | | | 1.4 | % |
| | | | | | | | | | | | | | |
UTILITIES — (1.7%) | | | | | | | | | | | | |
| | Nippon Gas Co. Ltd. | | | 684,000 | | | | 9,936,468 | | | | 0.4 | % |
| | Other Securities | | | | | | | 32,350,517 | | | | 1.3 | % |
| | | | | | | | | | | | | | |
TOTAL UTILITIES | | | | | | | 42,286,985 | | | | 1.7 | % |
| | | | | | | | | | | | | | |
TOTAL COMMON STOCKS
(Cost $2,854,128,543) | | | | | | | 2,493,001,458 | | | | 98.9 | % |
| | | | | | | | | | | | | | |
| | | | | | | | Value† | | | | |
SECURITIES LENDING COLLATERAL — (2.2%) | | | | | | | | | | | | |
@§ | | The DFA Short Term Investment Fund | | | 4,804,517 | | | | 55,545,021 | | | | 2.2 | % |
| | | | | | | | | | | | | | |
TOTAL INVESTMENTS—(100.0%)
(Cost $2,909,692,756) | | | | | | $ | 2,548,546,479 | | | | 101.1 | % |
| | | | | | | | | | | | | | |
207
THE JAPANESE SMALL COMPANY SERIES
CONTINUED
Summary of the Series’ investments as of October 31, 2022, based on their valuation inputs, is as follows (see Security Valuation Note):
| | | | | | | | | | | | | | | | |
| | | Investments in Securities (Market Value) | |
| | | Level 1 | | | Level 2 | | | Level 3 | | | Total | |
Common Stocks | | | | | | | | | | | | | | | | |
Communication Services | | | — | | | $ | 60,456,006 | | | | — | | | $ | 60,456,006 | |
Consumer Discretionary | | | — | | | | 366,770,947 | | | | — | | | | 366,770,947 | |
Consumer Staples | | | — | | | | 198,062,968 | | | | — | | | | 198,062,968 | |
Energy | | | — | | | | 19,204,938 | | | | — | | | | 19,204,938 | |
Financials | | $ | 2,856,753 | | | | 220,506,329 | | | | — | | | | 223,363,082 | |
Health Care | | | — | | | | 127,792,503 | | | | — | | | | 127,792,503 | |
Industrials | | | — | | | | 720,093,537 | | | | — | | | | 720,093,537 | |
Information Technology | | | — | | | | 389,564,150 | | | | — | | | | 389,564,150 | |
Materials | | | — | | | | 308,991,503 | | | | — | | | | 308,991,503 | |
Real Estate | | | — | | | | 36,414,839 | | | | — | | | | 36,414,839 | |
Utilities | | | — | | | | 42,286,985 | | | | — | | | | 42,286,985 | |
Securities Lending Collateral | | | — | | | | 55,545,021 | | | | — | | | | 55,545,021 | |
| | | | | | | | | | | | | | | | |
TOTAL | | $ | 2,856,753 | | | $ | 2,545,689,726 | | | | — | | | $ | 2,548,546,479 | |
| | | | | | | | | | | | | | | | |
See accompanying Notes to Financial Statements.
208
THE ASIA PACIFIC SMALL COMPANY SERIES
SUMMARY SCHEDULE OF PORTFOLIO HOLDINGS
October 31, 2022
| | | | | | | | | | | | | | |
| | | | | Shares | | | Value» | | | Percentage
of Net Assets‡ | |
COMMON STOCKS — (98.6%) | | | | | | | | | | | | |
AUSTRALIA — (64.4%) | | | | | | | | | | | | |
* | | AMP Ltd. | | | 12,919,775 | | | $ | 10,418,866 | | | | 0.9 | % |
# | | Ansell Ltd. | | | 667,221 | | | | 12,045,403 | | | | 1.0 | % |
# | | ARB Corp. Ltd. | | | 515,315 | | | | 9,567,925 | | | | 0.8 | % |
| | AUB Group Ltd. | | | 762,060 | | | | 10,083,242 | | | | 0.9 | % |
| | Bapcor Ltd. | | | 2,227,045 | | | | 9,417,379 | | | | 0.8 | % |
| | Beach Energy Ltd. | | | 8,737,409 | | | | 8,934,529 | | | | 0.8 | % |
# | | Breville Group Ltd. | | | 652,020 | | | | 8,261,901 | | | | 0.7 | % |
| | Brickworks Ltd. | | | 469,394 | | | | 6,646,000 | | | | 0.6 | % |
# | | Corporate Travel Management Ltd. | | | 706,149 | | | | 7,883,899 | | | | 0.7 | % |
| | CSR Ltd. | | | 3,109,441 | | | | 9,211,011 | | | | 0.8 | % |
| | Downer EDI Ltd. | | | 3,274,403 | | | | 9,410,422 | | | | 0.8 | % |
| | Eagers Automotive Ltd. | | | 941,185 | | | | 7,461,464 | | | | 0.6 | % |
| | Elders Ltd. | | | 1,009,369 | | | | 8,415,415 | | | | 0.7 | % |
#* | | Flight Centre Travel Group Ltd. | | | 718,191 | | | | 7,643,947 | | | | 0.6 | % |
# | | Gold Road Resources Ltd. | | | 7,605,514 | | | | 6,572,387 | | | | 0.6 | % |
| | GrainCorp Ltd., Class A | | | 1,517,016 | | | | 8,155,207 | | | | 0.7 | % |
| | Healius Ltd. | | | 3,665,521 | | | | 8,029,741 | | | | 0.7 | % |
| | HUB24 Ltd. | | | 461,678 | | | | 7,485,853 | | | | 0.6 | % |
# | | Insignia Financial Ltd. | | | 4,120,661 | | | | 8,306,842 | | | | 0.7 | % |
| | IPH Ltd. | | | 1,331,405 | | | | 8,467,477 | | | | 0.7 | % |
| | IRESS Ltd. | | | 1,215,703 | | | | 7,890,780 | | | | 0.7 | % |
| | Lifestyle Communities Ltd. | | | 578,173 | | | | 6,490,474 | | | | 0.5 | % |
| | Metcash Ltd. | | | 2,899,744 | | | | 7,612,203 | | | | 0.6 | % |
# | | New Hope Corp. Ltd. | | | 2,341,365 | | | | 8,505,399 | | | | 0.7 | % |
| | nib holdings Ltd. | | | 2,992,914 | | | | 12,806,819 | | | | 1.1 | % |
| | Nufarm Ltd. | | | 2,098,872 | | | | 7,480,120 | | | | 0.6 | % |
#* | | Omni Bridgeway Ltd. | | | 2,355,720 | | | | 6,782,068 | | | | 0.6 | % |
| | Orora Ltd. | | | 5,992,474 | | | | 11,628,555 | | | | 1.0 | % |
#* | | Paladin Energy Ltd. | | | 16,033,988 | | | | 8,680,653 | | | | 0.7 | % |
# | | Pendal Group Ltd. | | | 2,058,779 | | | | 6,466,738 | | | | 0.5 | % |
# | | Perseus Mining Ltd. | | | 8,114,950 | | | | 9,451,479 | | | | 0.8 | % |
| | Premier Investments Ltd. | | | 410,666 | | | | 6,576,580 | | | | 0.6 | % |
| | Reliance Worldwide Corp. Ltd. | | | 4,255,179 | | | | 8,742,677 | | | | 0.7 | % |
| | Sims Ltd. | | | 1,106,977 | | | | 8,654,727 | | | | 0.7 | % |
* | | Star Entertainment Group Ltd. | | | 5,751,661 | | | | 10,819,618 | | | | 0.9 | % |
# | | Super Retail Group Ltd. | | | 1,057,351 | | | | 6,952,302 | | | | 0.6 | % |
#* | | Syrah Resources Ltd. | | | 4,792,786 | | | | 7,321,076 | | | | 0.6 | % |
| | Technology One Ltd. | | | 1,296,361 | | | | 9,972,913 | | | | 0.8 | % |
W | | Viva Energy Group Ltd. | | | 3,776,327 | | | | 6,854,919 | | | | 0.6 | % |
#* | | Webjet Ltd. | | | 2,329,981 | | | | 7,868,307 | | | | 0.7 | % |
| | Whitehaven Coal Ltd. | | | 3,623,702 | | | | 21,049,343 | | | | 1.8 | % |
| | Other Securities | | | | | | | 417,169,018 | | | | 34.7 | % |
| | | | | | | | | | | | | | |
TOTAL AUSTRALIA | | | | | | | 778,195,678 | | | | 65.2 | % |
| | | | | | | | | | | | | | |
CHINA — (0.1%) | | | | | | | | | | | | |
| | Other Securities | | | | | | | 1,050,669 | | | | 0.1 | % |
| | | | | | | | | | | | | | |
HONG KONG — (18.7%) | | | | | | | | | | | | |
| | ASMPT Ltd. | | | 1,590,200 | | | | 8,746,899 | | | | 0.7 | % |
| | Kerry Logistics Network Ltd. | | | 4,063,500 | | | | 6,450,213 | | | | 0.6 | % |
| | Luk Fook Holdings International Ltd. | | | 3,509,000 | | | | 7,622,920 | | | | 0.6 | % |
| | VTech Holdings Ltd. | | | 1,292,000 | | | | 6,877,585 | | | | 0.6 | % |
209
THE ASIA PACIFIC SMALL COMPANY SERIES
CONTINUED
| | | | | | | | | | | | | | |
| | | | | Shares | | | Value» | | | Percentage
of Net Assets‡ | |
HONG KONG — (Continued) | | | | | | | | | | | | |
| | Other Securities | | | | | | $ | 195,738,785 | | | | 16.4 | % |
| | | | | | | | | | | | | | |
TOTAL HONG KONG | | | | | | | 225,436,402 | | | | 18.9 | % |
| | | | | | | | | | | | | | |
NEW ZEALAND — (4.6%) | | | | | | | | | | | | |
| | Chorus Ltd. | | | 2,451,723 | | | | 11,836,205 | | | | 1.0 | % |
* | | SKYCITY Entertainment Group Ltd. | | | 4,246,632 | | | | 7,159,611 | | | | 0.6 | % |
| | Other Securities | | | | | | | 35,984,180 | | | | 3.0 | % |
| | | | | | | | | | | | | | |
TOTAL NEW ZEALAND | | | | | | | 54,979,996 | | | | 4.6 | % |
| | | | | | | | | | | | | | |
SINGAPORE — (10.8%) | | | | | | | | | | | | |
| | ComfortDelGro Corp. Ltd. | | | 9,120,200 | | | | 8,187,132 | | | | 0.7 | % |
| | Golden Agri-Resources Ltd. | | | 31,541,800 | | | | 6,467,918 | | | | 0.5 | % |
| | Keppel Infrastructure Trust | | | 18,468,846 | | | | 6,911,022 | | | | 0.6 | % |
| | Other Securities | | | | | | | 109,293,171 | | | | 9.1 | % |
| | | | | | | | | | | | | | |
TOTAL SINGAPORE | | | | | | | 130,859,243 | | | | 10.9 | % |
| | | | | | | | | | | | | | |
TOTAL COMMON STOCKS | | | | | | | 1,190,521,988 | | | | 99.7 | % |
| | | | | | | | | | | | | | |
RIGHTS/WARRANTS — (0.0%) | | | | | | | | | | | | |
AUSTRALIA — (0.0%) | | | | | | | | | | | | |
| | Other Securities | | | | | | | 21,319 | | | | 0.0 | % |
| | | | | | | | | | | | | | |
HONG KONG — (0.0%) | | | | | | | | | | | | |
| | Other Security | | | | | | | 5,255 | | | | 0.0 | % |
| | | | | | | | | | | | | | |
TOTAL RIGHTS/WARRANTS | | | | | | | 26,574 | | | | 0.0 | % |
| | | | | | | | | | | | | | |
TOTAL INVESTMENT SECURITIES
(Cost $1,539,796,503) | | | | | | | 1,190,548,562 | | | | | |
| | | | | | | | | | | | | | |
| | | | |
| | | | | | | | Value† | | | | |
SECURITIES LENDING COLLATERAL — (1.4%) | | | | | | | | | | | | |
@§ | | The DFA Short Term Investment Fund | | | 1,496,806 | | | | 17,304,573 | | | | 1.5 | % |
| | | | | | | | | | | | | | |
| | | |
TOTAL INVESTMENTS—(100.0%)
(Cost $1,557,108,416) | | | | | | $ | 1,207,853,135 | | | | 101.2 | % |
| | | | | | | | | | | | | | |
Summary of the Series’ investments as of October 31, 2022, based on their valuation inputs, is as follows (see Security Valuation Note):
| | | | | | | | | | | | | | | | |
| | | Investments in Securities (Market Value) | |
| | | Level 1 | | | Level 2 | | | Level 3 | | | Total | |
Common Stocks | | | | | | | | | | | | | | | | |
Australia | | $ | 8,084 | | | $ | 777,796,648 | | | $ | 390,946 | | | $ | 778,195,678 | |
China | | | — | | | | 1,050,669 | | | | — | | | | 1,050,669 | |
Hong Kong | | | — | | | | 224,321,261 | | | | 1,115,141 | | | | 225,436,402 | |
New Zealand | | | — | | | | 54,979,996 | | | | — | | | | 54,979,996 | |
Singapore | | | 637,539 | | | | 129,841,227 | | | | 380,477 | | | | 130,859,243 | |
Rights/Warrants | | | | | | | | | | | | | | | | |
Australia | | | — | | | | 21,319 | | | | — | | | | 21,319 | |
Hong Kong | | | — | | | | 5,255 | | | | — | | | | 5,255 | |
Securities Lending Collateral | | | — | | | | 17,304,573 | | | | — | | | | 17,304,573 | |
| | | | | | | | | | | | | | | | |
TOTAL | | $ | 645,623 | | | $ | 1,205,320,948 | | | $ | 1,886,564 | ^ | | $ | 1,207,853,135 | |
| | | | | | | | | | | | | | | | |
| ^ | A reconciliation of Level 3 investments is presented when the Fund had a significant amount of Level 3 investments at the beginning and/or end of the reporting period in relation to net assets. |
See accompanying Notes to Financial Statements.
210
THE UNITED KINGDOM SMALL COMPANY SERIES
SUMMARY SCHEDULE OF PORTFOLIO HOLDINGS
October 31, 2022
| | | | | | | | | | | | | | |
| | | | | Shares | | | Value» | | | Percentage
of Net Assets‡ | |
COMMON STOCKS — (97.5%) | | | | | | | | | | | | |
COMMUNICATION SERVICES — (3.6%) | | | | | | | | | | | | |
| | Euromoney Institutional Investor PLC | | | 592,842 | | | $ | 9,845,186 | | | | 0.8 | % |
| | Other Securities | | | | | | | 33,354,764 | | | | 2.9 | % |
| | | | | | | | | | | | | | |
TOTAL COMMUNICATION SERVICES | | | | | | | 43,199,950 | | | | 3.7 | % |
| | | | | | | | | | | | | | |
CONSUMER DISCRETIONARY — (16.3%) | | | | | | | | | | | | |
| | Bellway PLC | | | 429,828 | | | | 9,141,218 | | | | 0.8 | % |
* | | Frasers Group PLC | | | 1,220,486 | | | | 9,056,198 | | | | 0.8 | % |
| | Games Workshop Group PLC | | | 176,198 | | | | 12,933,595 | | | | 1.1 | % |
| | Greggs PLC | | | 604,556 | | | | 14,014,474 | | | | 1.2 | % |
| | Inchcape PLC | | | 2,415,336 | | | | 20,604,988 | | | | 1.8 | % |
| | Pets at Home Group PLC | | | 3,042,980 | | | | 10,061,388 | | | | 0.9 | % |
* | | Playtech PLC | | | 1,947,421 | | | | 11,571,872 | | | | 1.0 | % |
# | | Vistry Group PLC | | | 1,228,992 | | | | 8,503,987 | | | | 0.7 | % |
| | Other Securities | | | | | | | 98,610,384 | | | | 8.4 | % |
| | | | | | | | | | | | | | |
TOTAL CONSUMER DISCRETIONARY | | | | | | | 194,498,104 | | | | 16.7 | % |
| | | | | | | | | | | | | | |
CONSUMER STAPLES — (7.0%) | | | | | | | | | | | | |
| | Britvic PLC | | | 1,626,728 | | | | 13,586,475 | | | | 1.2 | % |
| | Cranswick PLC | | | 365,093 | | | | 12,464,969 | | | | 1.1 | % |
* | | Marks & Spencer Group PLC | | | 7,566,588 | | | | 9,163,708 | | | | 0.8 | % |
| | Tate & Lyle PLC | | | 2,060,165 | | | | 16,553,803 | | | | 1.4 | % |
| | Other Securities | | | | | | | 31,665,598 | | | | 2.6 | % |
| | | | | | | | | | | | | | |
TOTAL CONSUMER STAPLES | | | | | | | 83,434,553 | | | | 7.1 | % |
| | | | | | | | | | | | | | |
ENERGY — (4.2%) | | | | | | | | | | | | |
* | | Capricorn Energy PLC | | | 4,040,365 | | | | 11,477,115 | | | | 1.0 | % |
| | Other Securities | | | | | | | 38,574,608 | | | | 3.3 | % |
| | | | | | | | | | | | | | |
TOTAL ENERGY | | | | | | | 50,051,723 | | | | 4.3 | % |
| | | | | | | | | | | | | | |
FINANCIALS — (18.4%) | | | | | | | | | | | | |
| | Beazley PLC | | | 3,081,626 | | | | 22,100,836 | | | | 1.9 | % |
| | Close Brothers Group PLC | | | 898,617 | | | | 10,123,897 | | | | 0.9 | % |
| | Hiscox Ltd. | | | 1,420,362 | | | | 14,632,152 | | | | 1.2 | % |
| | Lancashire Holdings Ltd. | | | 1,670,143 | | | | 9,478,286 | | | | 0.8 | % |
| | Man Group PLC | | | 7,662,342 | | | | 19,060,892 | | | | 1.6 | % |
| | OSB Group PLC | | | 2,135,454 | | | | 10,176,648 | | | | 0.9 | % |
| | Paragon Banking Group PLC | | | 1,934,045 | | | | 9,462,355 | | | | 0.8 | % |
| | Plus500 Ltd. | | | 525,338 | | | | 10,868,092 | | | | 0.9 | % |
W | | Quilter PLC | | | 8,070,566 | | | | 8,945,685 | | | | 0.8 | % |
| | TP ICAP Group PLC | | | 4,137,686 | | | | 8,726,393 | | | | 0.7 | % |
| | Virgin Money UK PLC | | | 6,368,888 | | | | 9,926,426 | | | | 0.8 | % |
| | Other Securities | | | | | | | 86,017,639 | | | | 7.5 | % |
| | | | | | | | | | | | | | |
TOTAL FINANCIALS | | | | | | | 219,519,301 | | | | 18.8 | % |
| | | | | | | | | | | | | | |
| | HEALTH CARE — (4.9%) | | | | | | | | | | | | |
| | CVS Group PLC | | | 413,530 | | | | 8,938,783 | | | | 0.8 | % |
| | Indivior PLC | | | 771,895 | | | | 14,621,023 | | | | 1.2 | % |
# | | Mediclinic International PLC | | | 2,400,508 | | | | 13,655,822 | | | | 1.2 | % |
| | Other Securities | | | | | | | 20,957,862 | | | | 1.8 | % |
| | | | | | | | | | | | | | |
TOTAL HEALTH CARE | | | | | | | 58,173,490 | | | | 5.0 | % |
| | | | | | | | | | | | | | |
211
THE UNITED KINGDOM SMALL COMPANY SERIES
CONTINUED
| | | | | | | | | | | | | | |
| | | | | Shares | | | Value» | | | Percentage
of Net Assets‡ | |
INDUSTRIALS — (22.3%) | | | | | | | | | | | | |
* | | Babcock International Group PLC | | | 2,860,700 | | | $ | 9,035,971 | | | | 0.8 | % |
| | Balfour Beatty PLC | | | 3,610,310 | | | | 12,369,652 | | | | 1.1 | % |
| | Diploma PLC | | | 427,629 | | | | 12,162,994 | | | | 1.0 | % |
| | Grafton Group PLC | | | 1,499,770 | | | | 11,874,058 | | | | 1.0 | % |
| | Hays PLC | | | 9,235,636 | | | | 11,644,369 | | | | 1.0 | % |
| | Pagegroup PLC | | | 1,968,311 | | | | 9,493,890 | | | | 0.8 | % |
| | QinetiQ Group PLC | | | 3,269,929 | | | | 13,478,205 | | | | 1.2 | % |
| | Rotork PLC | | | 4,427,553 | | | | 12,977,500 | | | | 1.1 | % |
| | Serco Group PLC | | | 5,072,076 | | | | 9,486,190 | | | | 0.8 | % |
| | Travis Perkins PLC | | | 1,187,192 | | | | 11,189,269 | | | | 1.0 | % |
| | Other Securities | | | | | | | 151,227,680 | | | | 12.9 | % |
| | | | | | | | | | | | | | |
TOTAL INDUSTRIALS | | | | | | | 264,939,778 | | | | 22.7 | % |
| | | | | | | | | | | | | | |
INFORMATION TECHNOLOGY — (8.5%) | | | | | | | | | | | | |
| | Computacenter PLC | | | 501,179 | | | | 10,398,774 | | | | 0.9 | % |
| | Micro Focus International PLC | | | 1,571,570 | | | | 9,370,682 | | | | 0.8 | % |
| | Softcat PLC | | | 677,739 | | | | 8,707,891 | | | | 0.7 | % |
| | Spectris PLC | | | 462,131 | | | | 16,016,986 | | | | 1.4 | % |
| | Spirent Communications PLC | | | 4,065,908 | | | | 12,069,222 | | | | 1.0 | % |
| | Other Securities | | | | | | | 44,097,451 | | | | 3.8 | % |
| | | | | | | | | | | | | | |
TOTAL INFORMATION TECHNOLOGY | | | | | | | 100,661,006 | | | | 8.6 | % |
| | | | | | | | | | | | | | |
MATERIALS — (5.1%) | | | | | | | | | | | | |
| | Victrex PLC | | | 545,312 | | | | 10,356,993 | | | | 0.9 | % |
| | Other Securities | | | | | | | 50,618,342 | | | | 4.3 | % |
| | | | | | | | | | | | | | |
TOTAL MATERIALS | | | | | | | 60,975,335 | | | | 5.2 | % |
| | | | | | | | | | | | | | |
REAL ESTATE — (3.0%) | | | | | | | | | | | | |
| | Grainger PLC | | | 4,237,552 | | | | 11,018,013 | | | | 0.9 | % |
| | Savills PLC | | | 965,499 | | | | 9,122,034 | | | | 0.8 | % |
| | Other Securities | | | | | | | 15,177,252 | | | | 1.3 | % |
| | | | | | | | | | | | | | |
TOTAL REAL ESTATE | | | | | | | 35,317,299 | | | | 3.0 | % |
| | | | | | | | | | | | | | |
UTILITIES — (4.2%) | | | | | | | | | | | | |
| | Centrica PLC | | | 12,351,821 | | | | 10,853,682 | | | | 0.9 | % |
| | Drax Group PLC | | | 2,494,304 | | | | 14,895,027 | | | | 1.3 | % |
| | Pennon Group PLC | | | 1,360,703 | | | | 13,075,947 | | | | 1.1 | % |
| | Telecom Plus PLC | | | 427,882 | | | | 10,401,875 | | | | 0.9 | % |
| | Other Security | | | | | | | 539,940 | | | | 0.1 | % |
| | | | | | | | | | | | | | |
TOTAL UTILITIES | | | | | | | 49,766,471 | | | | 4.3 | % |
| | | | | | | | | | | | | | |
TOTAL COMMON STOCKS
(Cost $1,400,292,665) | | | | | | | 1,160,537,010 | | | | 99.4 | % |
| | | | | | | | | | | | | | |
| | | | | | | | Value† | | | | |
SECURITIES LENDING COLLATERAL — (2.5%) | | | | | | | | | | | | |
@§ | | The DFA Short Term Investment Fund | | | 2,548,908 | | | | 29,467,920 | | | | 2.5 | % |
| | | | | | | | | | | | | | |
TOTAL INVESTMENTS—(100.0%)
(Cost $1,429,768,069) | | | | | | $ | 1,190,004,930 | | | | 101.9 | % |
| | | | | | | | | | | | | | |
212
THE UNITED KINGDOM SMALL COMPANY SERIES
CONTINUED
Summary of the Series’ investments as of October 31, 2022, based on their valuation inputs, is as follows (see Security Valuation Note):
| | | | | | | | | | | | | | | | |
| | | Investments in Securities (Market Value) | |
| | | Level 1 | | | Level 2 | | | Level 3 | | | Total | |
Common Stocks | | | | | | | | | | | | | | | | |
Communication Services | | $ | 23,016 | | | $ | 43,176,934 | | | | — | | | $ | 43,199,950 | |
Consumer Discretionary | | | — | | | | 194,388,958 | | | $ | 109,146 | | | | 194,498,104 | |
Consumer Staples | | | — | | | | 83,434,553 | | | | — | | | | 83,434,553 | |
Energy | | | — | | | | 50,051,723 | | | | — | | | | 50,051,723 | |
Financials | | | — | | | | 219,518,781 | | | | 520 | | | | 219,519,301 | |
Health Care | | | — | | | | 58,167,401 | | | | 6,089 | | | | 58,173,490 | |
Industrials | | | 160,252 | | | | 264,779,526 | | | | — | | | | 264,939,778 | |
Information Technology | | | — | | | | 100,661,006 | | | | — | | | | 100,661,006 | |
Materials | | | — | | | | 60,975,335 | | | | — | | | | 60,975,335 | |
Real Estate | | | — | | | | 35,317,299 | | | | — | | | | 35,317,299 | |
Utilities | | | — | | | | 49,766,471 | | | | — | | | | 49,766,471 | |
Securities Lending Collateral | | | — | | | | 29,467,920 | | | | — | | | | 29,467,920 | |
| | | | | | | | | | | | | | | | |
TOTAL | | $ | 183,268 | | | $ | 1,189,705,907 | | | $ | 115,755 | ^ | | $ | 1,190,004,930 | |
| | | | | | | | | | | | | | | | |
| ^ | A reconciliation of Level 3 investments is presented when the Fund had a significant amount of Level 3 investments at the beginning and/or end of the reporting period in relation to net assets. |
See accompanying Notes to Financial Statements.
213
THE CONTINENTAL SMALL COMPANY SERIES
SUMMARY SCHEDULE OF PORTFOLIO HOLDINGS
October 31, 2022
| | | | | | | | | | | | | | |
| | | | | Shares | | | Value» | | | Percentage
of Net Assets‡ | |
COMMON STOCKS — (93.7%) | | | | | | | | | | | | |
AUSTRIA — (3.1%) | | | | | | | | | | | | |
| | ANDRITZ AG | | | 444,373 | | | $ | 20,652,912 | | | | 0.5 | % |
W | | BAWAG Group AG | | | 344,403 | | | | 16,626,330 | | | | 0.4 | % |
| | Other Securities | | | | | | | 104,285,328 | | | | 2.4 | % |
| | | | | | | | | | | | | | |
TOTAL AUSTRIA | | | | | | | 141,564,570 | | | | 3.3 | % |
| | | | | | | | | | | | | | |
BELGIUM — (4.4%) | | | | | | | | | | | | |
| | Ackermans & van Haaren NV | | | 172,739 | | | | 24,066,242 | | | | 0.6 | % |
| | D’ieteren Group | | | 122,666 | | | | 20,415,062 | | | | 0.5 | % |
| | Euronav NV | | | 1,306,429 | | | | 22,776,000 | | | | 0.5 | % |
| | Other Securities | | | | | | | 132,956,790 | | | | 3.0 | % |
| | | | | | | | | | | | | | |
TOTAL BELGIUM | | | | | | | 200,214,094 | | | | 4.6 | % |
| | | | | | | | | | | | | | |
DENMARK — (6.2%) | | | | | | | | | | | | |
#* | | ISS AS | | | 927,711 | | | | 17,037,438 | | | | 0.4 | % |
* | | Jyske Bank AS | | | 445,581 | | | | 24,047,629 | | | | 0.6 | % |
| | Ringkjoebing Landbobank AS | | | 197,936 | | | | 21,527,994 | | | | 0.5 | % |
| | Royal Unibrew AS | | | 312,072 | | | | 17,826,861 | | | | 0.4 | % |
| | Topdanmark AS | | | 367,737 | | | | 16,972,205 | | | | 0.4 | % |
| | Other Securities | | | | | | | 187,427,684 | | | | 4.2 | % |
| | | | | | | | | | | | | | |
TOTAL DENMARK | | | | | | | 284,839,811 | | | | 6.5 | % |
| | | | | | | | | | | | | | |
FINLAND — (5.3%) | | | | | | | | | | | | |
| | Huhtamaki Oyj | | | 643,085 | | | | 23,112,067 | | | | 0.5 | % |
| | Orion Oyj, Class B | | | 676,382 | | | | 31,125,885 | | | | 0.7 | % |
| | Valmet Oyj | | | 1,002,259 | | | | 22,794,608 | | | | 0.5 | % |
| | Other Securities | | | | | | | 164,215,005 | | | | 3.8 | % |
| | | | | | | | | | | | | | |
TOTAL FINLAND | | | | | | | 241,247,565 | | | | 5.5 | % |
| | | | | | | | | | | | | | |
FRANCE — (10.4%) | | | | | | | | | | | | |
| | Gaztransport Et Technigaz SA | | | 161,171 | | | | 18,750,394 | | | | 0.4 | % |
| | Nexans SA | | | 198,522 | | | | 18,537,701 | | | | 0.4 | % |
| | Rexel SA | | | 1,687,054 | | | | 30,105,974 | | | | 0.7 | % |
* | | SOITEC | | | 136,660 | | | | 17,498,496 | | | | 0.4 | % |
| | SPIE SA | | | 887,677 | | | | 20,765,906 | | | | 0.5 | % |
| | Other Securities | | | | | | | 368,603,169 | | | | 8.5 | % |
| | | | | | | | | | | | | | |
TOTAL FRANCE | | | | | | | 474,261,640 | | | | 10.9 | % |
| | | | | | | | | | | | | | |
GERMANY — (13.4%) | | | | | | | | | | | | |
* | | Aareal Bank AG | | | 523,741 | | | | 16,561,936 | | | | 0.4 | % |
| | Aurubis AG | | | 287,683 | | | | 18,152,871 | | | | 0.4 | % |
| | Freenet AG | | | 962,168 | | | | 18,912,546 | | | | 0.4 | % |
| | Hugo Boss AG | | | 426,713 | | | | 19,653,270 | | | | 0.5 | % |
| | K&S AG | | | 1,269,799 | | | | 28,035,878 | | | | 0.7 | % |
| | Lanxess AG | | | 577,941 | | | | 19,544,674 | | | | 0.5 | % |
| | Rheinmetall AG | | | 186,043 | | | | 30,241,593 | | | | 0.7 | % |
| | Other Securities | | | | | | | 460,058,281 | | | | 10.5 | % |
| | | | | | | | | | | | | | |
TOTAL GERMANY | | | | | | | 611,161,049 | | | | 14.1 | % |
| | | | | | | | | | | | | | |
IRELAND — (1.5%) | | | | | | | | | | | | |
| | Bank of Ireland Group PLC | | | 5,945,531 | | | | 42,811,519 | | | | 1.0 | % |
214
THE CONTINENTAL SMALL COMPANY SERIES
CONTINUED
| | | | | | | | | | | | | | |
| | | | | Shares | | | Value» | | | Percentage
of Net Assets‡ | |
IRELAND — (Continued) | | | | | | | | | | | | |
| | Other Securities | | | | | | $ | 24,848,912 | | | | 0.6 | % |
| | | | | | | | | | | | | | |
TOTAL IRELAND | | | | | | | 67,660,431 | | | | 1.6 | % |
| | | | | | | | | | | | | | |
ISRAEL — (3.6%) | | | | | | | | | | | | |
| | Other Securities | | | | | | | 162,740,149 | | | | 3.7 | % |
| | | | | | | | | | | | | | |
ITALY — (8.4%) | | | | | | | | | | | | |
| | Banco BPM SpA | | | 10,252,032 | | | | 31,017,683 | | | | 0.7 | % |
| | Italgas SpA | | | 3,535,826 | | | | 18,217,452 | | | | 0.4 | % |
| | Leonardo SpA | | | 2,965,480 | | | | 23,824,938 | | | | 0.6 | % |
| | Other Securities | | | | | | | 310,831,433 | | | | 7.1 | % |
| | | | | | | | | | | | | | |
TOTAL ITALY | | | | | | | 383,891,506 | | | | 8.8 | % |
| | | | | | | | | | | | | | |
NETHERLANDS — (5.6%) | | | | | | | | | | | | |
| | Aalberts NV | | | 686,131 | | | | 23,803,028 | | | | 0.6 | % |
| | Arcadis NV | | | 533,103 | | | | 18,091,946 | | | | 0.4 | % |
| | ASR Nederland NV | | | 672,922 | | | | 29,630,688 | | | | 0.7 | % |
| | BE Semiconductor Industries NV | | | 405,420 | | | | 20,662,135 | | | | 0.5 | % |
# | | OCI NV | | | 554,235 | | | | 21,198,317 | | | | 0.5 | % |
W | | Signify NV | | | 711,679 | | | | 19,717,182 | | | | 0.5 | % |
| | Other Securities | | | | | | | 123,236,655 | | | | 2.7 | % |
| | | | | | | | | | | | | | |
TOTAL NETHERLANDS | | | | | | | 256,339,951 | | | | 5.9 | % |
| | | | | | | | | | | | | | |
NORWAY — (2.4%) | | | | | | | | | | | | |
| | Other Securities | | | | | | | 111,438,926 | | | | 2.6 | % |
| | | | | | | | | | | | | | |
PORTUGAL — (1.0%) | | | | | | | | | | | | |
| | Other Securities | | | | | | | 43,915,237 | | | | 1.0 | % |
| | | | | | | | | | | | | | |
SPAIN — (5.7%) | | | | | | | | | | | | |
| | Banco de Sabadell SA | | | 36,362,876 | | | | 28,610,453 | | | | 0.7 | % |
| | Bankinter SA | | | 4,326,671 | | | | 26,171,851 | | | | 0.6 | % |
# | | Enagas SA | | | 1,457,648 | | | | 23,663,312 | | | | 0.5 | % |
| | Other Securities | | | | | | | 184,347,363 | | | | 4.2 | % |
| | | | | | | | | | | | | | |
TOTAL SPAIN | | | | | | | 262,792,979 | | | | 6.0 | % |
| | | | | | | | | | | | | | |
SWEDEN — (5.9%) | | | | | | | | | | | | |
| | Other Securities | | | | | | | 270,528,558 | | | | 6.2 | % |
| | | | | | | | | | | | | | |
SWITZERLAND — (16.5%) | | | | | | | | | | | | |
| | Allreal Holding AG | | | 125,251 | | | | 17,941,765 | | | | 0.4 | % |
| | Belimo Holding AG | | | 65,574 | | | | 26,708,771 | | | | 0.6 | % |
| | BKW AG | | | 163,805 | | | | 19,109,935 | | | | 0.4 | % |
| | Bucher Industries AG | | | 54,335 | | | | 18,319,886 | | | | 0.4 | % |
| | Clariant AG | | | 1,125,574 | | | | 18,088,884 | | | | 0.4 | % |
| | DKSH Holding AG | | | 235,948 | | | | 17,021,421 | | | | 0.4 | % |
* | | Flughafen Zurich AG | | | 147,702 | | | | 22,913,924 | | | | 0.5 | % |
| | Georg Fischer AG | | | 630,511 | | | | 34,920,705 | | | | 0.8 | % |
| | Helvetia Holding AG | | | 266,750 | | | | 26,488,894 | | | | 0.6 | % |
| | PSP Swiss Property AG | | | 340,600 | | | | 36,386,222 | | | | 0.8 | % |
| | Siegfried Holding AG | | | 32,909 | | | | 19,590,005 | | | | 0.5 | % |
W | | VAT Group AG | | | 114,674 | | | | 26,180,212 | | | | 0.6 | % |
| | Other Securities | | | | | | | 470,666,378 | | | | 11.0 | % |
| | | | | | | | | | | | | | |
TOTAL SWITZERLAND | | | | | | | 754,337,002 | | | | 17.4 | % |
| | | | | | | | | | | | | | |
215
THE CONTINENTAL SMALL COMPANY SERIES
CONTINUED
| | | | | | | | | | | | |
| | | Shares | | | Value» | | | Percentage
of Net Assets‡ | |
UNITED STATES — (0.3%) | | | | | | | | | | | | |
Other Securities | | | | | | $ | 12,849,060 | | | | 0.3 | % |
| | | | | | | | | | | | |
TOTAL COMMON STOCKS | | | | | | | 4,279,782,528 | | | | 98.4 | % |
| | | | | | | | | |
PREFERRED STOCKS — (0.7%) | | | | | | | | | | | | |
GERMANY — (0.7%) | | | | | | | | | | | | |
Other Securities | | | | | | | 33,294,751 | | | | 0.8 | % |
| | | | | | | | | | | | |
TOTAL INVESTMENT SECURITIES
(Cost $4,398,989,975) | | | | | | | 4,313,077,279 | | | | | |
| | | | | | | | | | | | |
| | | |
| | | | | | Value† | | | | |
SECURITIES LENDING COLLATERAL — (5.6%) | | | | | | | | | | | | |
@§ The DFA Short Term Investment Fund | | | 22,188,427 | | | | 256,520,399 | | | | 5.9 | % |
| | | | | | | | | | | | |
TOTAL INVESTMENTS—(100.0%)
(Cost $4,655,611,905) | | | | | | $ | 4,569,597,678 | | | | 105.1 | % |
| | | | | | | | | | | | |
Summary of the Series’ investments as of October 31, 2022, based on their valuation inputs, is as follows (see Security Valuation Note):
| | | | | | | | | | | | | | | | |
| | | | | | Investments in Securities (Market Value) | | | | |
| | | Level 1 | | | Level 2 | | | Level 3 | | | Total | |
Common Stocks | | | | | | | | | | | | | | | | |
Austria | | $ | 376,173 | | | $ | 141,188,397 | | | | — | | | $ | 141,564,570 | |
Belgium | | | 792,151 | | | | 199,421,943 | | | | — | | | | 200,214,094 | |
Denmark | | | — | | | | 284,839,811 | | | | — | | | | 284,839,811 | |
Finland | | | — | | | | 241,247,565 | | | | — | | | | 241,247,565 | |
France | | | 127,704 | | | | 474,099,006 | | | $ | 34,930 | | | | 474,261,640 | |
Germany | | | — | | | | 611,161,049 | | | | — | | | | 611,161,049 | |
Ireland | | | — | | | | 67,660,431 | | | | — | | | | 67,660,431 | |
Israel | | | 585,758 | | | | 162,154,391 | | | | — | | | | 162,740,149 | |
Italy | | | — | | | | 383,891,506 | | | | — | | | | 383,891,506 | |
Netherlands | | | — | | | | 256,339,951 | | | | — | | | | 256,339,951 | |
Norway | | | 239,412 | | | | 111,199,514 | | | | — | | | | 111,438,926 | |
Portugal | | | — | | | | 43,915,237 | | | | — | | | | 43,915,237 | |
Spain | | | — | | | | 262,792,979 | | | | — | | | | 262,792,979 | |
Sweden | | | 704,204 | | | | 269,824,354 | | | | — | | | | 270,528,558 | |
Switzerland | | | — | | | | 754,337,002 | | | | — | | | | 754,337,002 | |
United States | | | 5,487,656 | | | | 7,361,404 | | | | — | | | | 12,849,060 | |
Preferred Stocks | | | | | | | | | | | | | | | | |
Germany | | | — | | | | 33,294,751 | | | | — | | | | 33,294,751 | |
Securities Lending Collateral | | | — | | | | 256,520,399 | | | | — | | | | 256,520,399 | |
| | | | | | | | | | | | | | | | |
TOTAL | | $ | 8,313,058 | | | $ | 4,561,249,690 | | | $ | 34,930 | ^ | | $ | 4,569,597,678 | |
| | | | | | | | | | | | | | | | |
| ^ | A reconciliation of Level 3 investments is presented when the Fund had a significant amount of Level 3 investments at the beginning and/or end of the reporting period in relation to net assets. |
See accompanying Notes to Financial Statements.
216
THE CANADIAN SMALL COMPANY SERIES
SUMMARY SCHEDULE OF PORTFOLIO HOLDINGS
October 31, 2022
| | | | | | | | | | | | | | |
| | | | | Shares | | | Value» | | | Percentage
of Net Assets‡ | |
COMMON STOCKS — (85.9%) | | | | | | | | | | | | |
COMMUNICATION SERVICES — (1.1%) | | | | | | | | | | | | |
| | Other Securities | | | | | | $ | 15,273,446 | | | | 1.2 | % |
| | | | | | | | | | | | | | |
CONSUMER DISCRETIONARY — (4.7%) | | | | | | | | | | | | |
#* | | Aritzia, Inc. | | | 461,040 | | | | 17,881,861 | | | | 1.5 | % |
| | Linamar Corp. | | | 255,634 | | | | 10,941,402 | | | | 0.9 | % |
| | Other Securities | | | | | | | 38,001,319 | | | | 3.1 | % |
| | | | | | | | | | | | | | |
TOTAL CONSUMER DISCRETIONARY | | | | | | | 66,824,582 | | | | 5.5 | % |
| | | | | | | | | | | | | | |
CONSUMER STAPLES — (4.2%) | | | | | | | | | | | | |
# | | North West Co., Inc. | | | 291,156 | | | | 7,576,232 | | | | 0.6 | % |
# | | Premium Brands Holdings Corp. | | | 227,466 | | | | 13,419,050 | | | | 1.1 | % |
| | Primo Water Corp. | | | 93,425 | | | | 1,363,071 | | | | 0.1 | % |
| | Primo Water Corp. | | | 799,922 | | | | 11,661,064 | | | | 1.0 | % |
| | Other Securities | | | | | | | 25,055,883 | | | | 2.1 | % |
| | | | | | | | | | | | | | |
TOTAL CONSUMER STAPLES | | | | 59,075,300 | | | | 4.9 | % |
| | | | | | | | | | | | | | |
ENERGY — (24.7%) | | | | | | | | | | | | |
* | | Advantage Energy Ltd. | | | 1,194,867 | | | | 9,033,751 | | | | 0.7 | % |
* | | Baytex Energy Corp. | | | 2,341,875 | | | | 12,720,575 | | | | 1.0 | % |
# | | Birchcliff Energy Ltd. | | | 1,610,417 | | | | 12,518,307 | | | | 1.0 | % |
# | | Crescent Point Energy Corp. | | | 2,943,000 | | | | 23,006,533 | | | | 1.9 | % |
# | | Crescent Point Energy Corp. | | | 346,792 | | | | 2,715,381 | | | | 0.2 | % |
# | | Enerplus Corp. | | | 1,294,755 | | | | 22,448,059 | | | | 1.9 | % |
| | Enerplus Corp. | | | 28,353 | | | | 490,790 | | | | 0.0 | % |
# | | Freehold Royalties Ltd. | | | 652,441 | | | | 8,117,499 | | | | 0.7 | % |
# | | Gibson Energy, Inc. | | | 899,205 | | | | 15,345,922 | | | | 1.3 | % |
#* | | MEG Energy Corp. | | | 2,167,763 | | | | 32,412,620 | | | | 2.7 | % |
* | | NuVista Energy Ltd. | | | 1,111,528 | | | | 11,022,676 | | | | 0.9 | % |
# | | Paramount Resources Ltd., Class A | | | 405,621 | | | | 8,592,673 | | | | 0.7 | % |
| | Parex Resources, Inc. | | | 774,607 | | | | 11,815,124 | | | | 1.0 | % |
| | Parkland Corp. | | | 836,660 | | | | 16,913,140 | | | | 1.4 | % |
# | | Peyto Exploration & Development Corp. | | | 965,837 | | | | 9,017,834 | | | | 0.7 | % |
# | | PrairieSky Royalty Ltd. | | | 1,182,767 | | | | 18,370,720 | | | | 1.5 | % |
| | Secure Energy Services, Inc. | | | 1,849,956 | | | | 9,709,094 | | | | 0.8 | % |
# | | Vermilion Energy, Inc. | | | 716,524 | | | | 16,719,858 | | | | 1.4 | % |
| | Vermilion Energy, Inc. | | | 233,451 | | | | 5,441,743 | | | | 0.5 | % |
# | | Whitecap Resources, Inc. | | | 2,696,209 | | | | 20,899,159 | | | | 1.7 | % |
| | Other Securities | | | | | | | 81,074,025 | | | | 6.7 | % |
| | | | | | | | | | | | | | |
TOTAL ENERGY | | | | | | | 348,385,483 | | | | 28.7 | % |
| | | | | | | | | | | | | | |
FINANCIALS — (8.0%) | | | | | | | | | | | | |
# | | Canadian Western Bank | | | 498,863 | | | | 8,678,426 | | | | 0.7 | % |
# | | CI Financial Corp. | | | 1,010,158 | | | | 10,113,814 | | | | 0.8 | % |
| | Element Fleet Management Corp. | | | 2,180,348 | | | | 29,047,834 | | | | 2.4 | % |
# | | Laurentian Bank of Canada | | | 370,975 | | | | 8,278,078 | | | | 0.7 | % |
| | Other Securities | | | | | | | 56,710,772 | | | | 4.7 | % |
| | | | | | | | | | | | | | |
TOTAL FINANCIALS | | | | | | | 112,828,924 | | | | 9.3 | % |
| | | | | | | | | | | | | | |
HEALTH CARE — (1.3%) | | | | | | | | | | | | |
| | Other Securities | | | | | | | 18,737,939 | | | | 1.5 | % |
| | | | | | | | | | | | | | |
217
THE CANADIAN SMALL COMPANY SERIES
CONTINUED
| | | | | | | | | | | | | | |
| | | | | Shares | | | Value» | | | Percentage
of Net Assets‡ | |
INDUSTRIALS — (9.4%) | | | | | | | | | | | | |
* | | ATS Automation Tooling Systems, Inc. | | | 416,536 | | | $ | 13,177,745 | | | | 1.1 | % |
#* | | Bombardier, Inc., Class A | | | 13,989 | | | | 415,455 | | | | 0.0 | % |
#* | | Bombardier, Inc., Class B | | | 435,248 | | | | 12,782,522 | | | | 1.1 | % |
# | | Boyd Group Services, Inc. | | | 87,102 | | | | 12,394,461 | | | | 1.0 | % |
| | Finning International, Inc. | | | 809,489 | | | | 17,213,562 | | | | 1.4 | % |
| | Richelieu Hardware Ltd. | | | 316,493 | | | | 8,495,724 | | | | 0.7 | % |
# | | Russel Metals, Inc. | | | 345,023 | | | | 7,146,878 | | | | 0.6 | % |
# | | SNC-Lavalin Group, Inc. | | | 888,433 | | | | 15,383,811 | | | | 1.3 | % |
| | Other Securities | | | | | | | 46,315,708 | | | | 3.8 | % |
| | | | | | | | | | | | | | |
TOTAL INDUSTRIALS | | | | | | | 133,325,866 | | | | 11.0 | % |
| | | | | | | | | | | | | | |
INFORMATION TECHNOLOGY — (2.8%) | | | | | | | | | | | | |
| | Other Securities | | | | | | | 39,577,541 | | | | 3.2 | % |
| | | | | | | | | | | | | | |
MATERIALS — (20.5%) | | | | | | | | | | | | |
| | Alamos Gold, Inc., Class A | | | 2,191,494 | | | | 17,292,586 | | | | 1.4 | % |
| | Alamos Gold, Inc., Class A | | | 23,683 | | | | 186,859 | | | | 0.0 | % |
| | B2Gold Corp. | | | 523,630 | | | | 1,598,929 | | | | 0.1 | % |
| | B2Gold Corp. | | | 4,206,445 | | | | 12,913,786 | | | | 1.1 | % |
| | Lundin Mining Corp. | | | 1,333,672 | | | | 6,989,700 | | | | 0.6 | % |
# | | Methanex Corp. | | | 214,217 | | | | 7,476,800 | | | | 0.6 | % |
# | | Methanex Corp. | | | 126,782 | | | | 4,423,424 | | | | 0.4 | % |
| | Pan American Silver Corp. | | | 30,283 | | | | 483,470 | | | | 0.0 | % |
# | | Pan American Silver Corp. | | | 807,720 | | | | 12,907,366 | | | | 1.1 | % |
# | | SSR Mining, Inc. | | | 847,686 | | | | 11,672,908 | | | | 1.0 | % |
| | SSR Mining, Inc. | | | 262,936 | | | | 3,628,517 | | | | 0.3 | % |
# | | Stella-Jones, Inc. | | | 312,231 | | | | 9,403,485 | | | | 0.8 | % |
| | Turquoise Hill Resources Ltd. | | | 237,010 | | | | 6,662,351 | | | | 0.6 | % |
#* | | Turquoise Hill Resources Ltd. | | | 259,936 | | | | 7,319,089 | | | | 0.6 | % |
# | | Yamana Gold, Inc. | | | 3,875,378 | | | | 17,010,871 | | | | 1.4 | % |
| | Yamana Gold, Inc. | | | 588,814 | | | | 2,579,005 | | | | 0.2 | % |
| | Other Securities | | | | | | | 166,659,300 | | | | 13.6 | % |
| | | | | | | | | | | | | | |
TOTAL MATERIALS | | | | | | | 289,208,446 | | | | 23.8 | % |
| | | | | | | | | | | | | | |
REAL ESTATE — (2.3%) | | | | | | | | | | | | |
# | | Altus Group Ltd. | | | 244,093 | | | | 8,673,647 | | | | 0.7 | % |
# | | Tricon Residential, Inc. | | | 1,203,306 | | | | 10,139,797 | | | | 0.8 | % |
| | Tricon Residential, Inc. | | | 103,827 | | | | 875,262 | | | | 0.1 | % |
| | Other Securities | | | | | | | 12,011,086 | | | | 1.0 | % |
| | | | | | | | | | | | | | |
TOTAL REAL ESTATE | | | | | | | 31,699,792 | | | | 2.6 | % |
| | | | | | | | | | | | | | |
UTILITIES — (6.9%) | | | | | | | | | | | | |
| | Atco Ltd., Class I | | | 397,742 | | | | 12,349,607 | | | | 1.0 | % |
| | Boralex, Inc., Class A | | | 499,461 | | | | 14,162,424 | | | | 1.2 | % |
# | | Brookfield Infrastructure Corp., Class A | | | 205,538 | | | | 8,868,171 | | | | 0.7 | % |
| | Capital Power Corp. | | | 724,520 | | | | 24,250,825 | | | | 2.0 | % |
# | | Innergex Renewable Energy, Inc. | | | 748,951 | | | | 8,246,239 | | | | 0.7 | % |
| | TransAlta Corp. | | | 1,758,255 | | | | 15,487,254 | | | | 1.3 | % |
218
THE CANADIAN SMALL COMPANY SERIES
CONTINUED
| | | | | | | | | | | | | | |
| | | | | Shares | | | Value» | | | Percentage
of Net Assets‡ | |
UTILITIES — (Continued) | | | | | | | | | | | | |
Other Securities | | | | | | $ | 14,633,883 | | | | 1.2 | % |
| | | | | | | | | | | | | | |
TOTAL UTILITIES | | | | | | | 97,998,403 | | | | 8.1 | % |
| | | | | | | | | | | | | | |
TOTAL COMMON STOCKS
(Cost $1,129,103,652) | | | | | | | 1,212,935,722 | | | | 99.8 | % |
| | | | | | | | | | | | | | |
TOTAL RIGHTS/WARRANTS
(Cost $) | | | | | | | 0 | | | | 0.0 | % |
| | | | | | | | | | | | | | |
TOTAL INVESTMENT SECURITIES
(Cost $1,129,103,652) | | | | | | | 1,212,935,722 | | | | | |
| | | | | | | | | | | | | | |
| | | | |
| | | | | | | | Value† | | | | |
SECURITIES LENDING COLLATERAL — (14.1%) | | | | | | | | | | | | |
@ § | | The DFA Short Term Investment Fund | | | 17,275,482 | | | | 199,721,843 | | | | 16.5 | % |
| | | | | | | | | | | | | | |
TOTAL INVESTMENTS—(100.0%)
(Cost $1,328,909,530) | | | | | | $ | 1,412,657,565 | | | | 116.3 | % |
| | | | | | | | | | | | | | |
Summary of the Series’ investments as of October 31, 2022, based on their valuation inputs, is as follows (see Security Valuation Note):
| | | | | | | | | | | | | | | | |
| | | Investments in Securities (Market Value) | |
| | | Level 1 | | | Level 2 | | | Level 3 | | | Total | |
Common Stocks | | | | | | | | | | | | | | | | |
Communication Services | | $ | 11,643,215 | | | $ | 3,630,231 | | | | — | | | $ | 15,273,446 | |
Consumer Discretionary | | | 66,824,582 | | | | — | | | | — | | | | 66,824,582 | |
Consumer Staples | | | 59,075,300 | | | | — | | | | — | | | | 59,075,300 | |
Energy | | | 348,385,483 | | | | — | | | | — | | | | 348,385,483 | |
Financials | | | 112,828,924 | | | | — | | | | — | | | | 112,828,924 | |
Health Care | | | 18,723,050 | | | | 14,889 | | | | — | | | | 18,737,939 | |
Industrials | | | 133,325,866 | | | | — | | | | — | | | | 133,325,866 | |
Information Technology | | | 39,577,541 | | | | — | | | | — | | | | 39,577,541 | |
Materials | | | 289,169,935 | | | | 38,511 | | | | — | | | | 289,208,446 | |
Real Estate | | | 31,699,792 | | | | — | | | | — | | | | 31,699,792 | |
Utilities | | | 97,998,403 | | | | — | | | | — | | | | 97,998,403 | |
Securities Lending Collateral | | | — | | | | 199,721,843 | | | | — | | | | 199,721,843 | |
| | | | | | | | | | | | | | | | |
TOTAL | | $ | 1,209,252,091 | | | $ | 203,405,474 | | | | — | | | $ | 1,412,657,565 | |
| | | | | | | | | | | | | | | | |
See accompanying Notes to Financial Statements.
219
THE EMERGING MARKETS SERIES
SUMMARY SCHEDULE OF PORTFOLIO HOLDINGS
October 31, 2022
| | | | | | | | | | | | | | |
| | | | | Shares | | | Value» | | | Percentage
of Net Assets‡ | |
COMMON STOCKS — (96.1%) | | | | | | | | | | | | |
BRAZIL — (4.5%) | | | | | | | | | | | | |
| | Petroleo Brasileiro SA | | | 2,733,556 | | | $ | 17,601,021 | | | | 0.4 | % |
| | Petroleo Brasileiro SA, Sponsored ADR | | | 511,889 | | | | 5,891,842 | | | | 0.1 | % |
| | Petroleo Brasileiro SA, Sponsored ADR | | | 227,883 | | | | 2,921,460 | | | | 0.1 | % |
| | Vale SA | | | 2,364,713 | | | | 30,731,421 | | | | 0.8 | % |
| | Other Securities | | | | | | | 124,887,653 | | | | 3.2 | % |
| | | | | | | | | | | | | | |
TOTAL BRAZIL | | | | | | | 182,033,397 | | | | 4.6 | % |
| | | | | | | | | | | | | | |
CHILE — (0.5%) | | | | | | | | | | | | |
| | Other Securities | | | | | | | 21,724,736 | | | | 0.5 | % |
| | | | | | | | | | | | | | |
CHINA — (23.4%) | | | | | | | | | | | | |
* | | Alibaba Group Holding Ltd. | | | 714,100 | | | | 5,552,061 | | | | 0.2 | % |
* | | Alibaba Group Holding Ltd., Sponsored ADR | | | 835,875 | | | | 53,144,932 | | | | 1.4 | % |
* | | Baidu, Inc., Class A | | | 1,268,100 | | | | 12,157,268 | | | | 0.3 | % |
| | Bank of China Ltd., Class H | | | 43,912,181 | | | | 14,143,111 | | | | 0.4 | % |
| | China Construction Bank Corp., Class H | | | 59,766,590 | | | | 31,717,427 | | | | 0.8 | % |
| | China Resources Land Ltd. | | | 4,798,666 | | | | 15,013,985 | | | | 0.4 | % |
| | CSPC Pharmaceutical Group Ltd. | | | 11,629,200 | | | | 11,945,066 | | | | 0.3 | % |
| | Industrial & Commercial Bank of China Ltd., Class H | | | 30,774,185 | | | | 13,361,085 | | | | 0.4 | % |
| | Lenovo Group Ltd. | | | 13,043,278 | | | | 10,424,287 | | | | 0.3 | % |
*W | | Meituan, Class B | | | 1,133,000 | | | | 18,139,936 | | | | 0.5 | % |
# | | NetEase, Inc., ADR | | | 193,704 | | | | 10,773,816 | | | | 0.3 | % |
| | Ping An Insurance Group Co. of China Ltd., Class H | | | 3,693,500 | | | | 14,786,523 | | | | 0.4 | % |
| | Tencent Holdings Ltd. | | | 3,556,400 | | | | 93,450,715 | | | | 2.4 | % |
#*W | | Xiaomi Corp., Class B | | | 12,403,400 | | | | 13,929,917 | | | | 0.4 | % |
# | | Yum China Holdings, Inc. | | | 363,986 | | | | 15,050,821 | | | | 0.4 | % |
| | Other Securities | | | | | | | 618,214,698 | | | | 14.9 | % |
| | | | | | | | | | | | | | |
TOTAL CHINA | | | | | | | 951,805,648 | | | | 23.8 | % |
| | | | | | | | | | | | | | |
COLOMBIA — (0.1%) | | | | | | | | | | | | |
| | Other Securities | | | | | | | 5,030,142 | | | | 0.1 | % |
| | | | | | | | | | | | | | |
CZECH REPUBLIC — (0.2%) | | | | | | | | | | | | |
| | Other Securities | | | | | | | 7,199,868 | | | | 0.2 | % |
| | | | | | | | | | | | | | |
EGYPT — (0.0%) | | | | | | | | | | | | |
| | Other Securities | | | | | | | 1,920,708 | | | | 0.1 | % |
| | | | | | | | | | | | | | |
GREECE — (0.3%) | | | | | | | | | | | | |
| | Other Securities | | | | | | | 13,238,603 | | | | 0.3 | % |
| | | | | | | | | | | | | | |
HUNGARY — (0.2%) | | | | | | | | | | | | |
| | Other Securities | | | | | | | 8,953,846 | | | | 0.2 | % |
| | | | | | | | | | | | | | |
INDIA — (18.0%) | | | | | | | | | | | | |
| | Axis Bank Ltd. | | | 1,721,283 | | | | 18,876,411 | | | | 0.5 | % |
| | Bajaj Finance Ltd. | | | 131,798 | | | | 11,395,650 | | | | 0.3 | % |
| | Bharti Airtel Ltd. | | | 1,493,167 | | | | 15,016,466 | | | | 0.4 | % |
| | HDFC Bank Ltd. | | | 1,512,827 | | | | 27,440,778 | | | | 0.7 | % |
| | Hindalco Industries Ltd. | | | 2,222,008 | | | | 10,881,758 | | | | 0.3 | % |
| | Hindustan Unilever Ltd. | | | 440,646 | | | | 13,635,504 | | | | 0.3 | % |
| | Housing Development Finance Corp. Ltd. | | | 698,934 | | | | 20,898,952 | | | | 0.5 | % |
| | ICICI Bank Ltd. | | | 1,390,129 | | | | 15,285,795 | | | | 0.4 | % |
220
THE EMERGING MARKETS SERIES
CONTINUED
| | | | | | | | | | | | | | |
| | | | | Shares | | | Value» | | | Percentage
of Net Assets‡ | |
INDIA — (Continued) | | | | | | | | | | | | |
# | | ICICI Bank Ltd., Sponsored ADR | | | 649,989 | | | $ | 14,325,747 | | | | 0.4 | % |
| | Infosys Ltd. | | | 1,779,532 | | | | 33,201,533 | | | | 0.8 | % |
# | | Infosys Ltd., Sponsored ADR | | | 500,328 | | | | 9,371,143 | | | | 0.2 | % |
| | JSW Steel Ltd. | | | 1,422,439 | | | | 11,597,295 | | | | 0.3 | % |
| | Mahindra & Mahindra Ltd. | | | 905,189 | | | | 14,787,857 | | | | 0.4 | % |
| | Reliance Industries Ltd. | | | 1,374,995 | | | | 42,364,653 | | | | 1.1 | % |
| | Tata Consultancy Services Ltd. | | | 572,990 | | | | 22,023,536 | | | | 0.6 | % |
* | | Tata Motors Ltd. | | | 2,234,196 | | | | 11,170,004 | | | | 0.3 | % |
| | Tata Steel Ltd. | | | 11,675,250 | | | | 14,256,387 | | | | 0.4 | % |
| | Other Securities | | | | | | | 425,896,974 | | | | 10.5 | % |
| | | | | | | | | | | | | | |
TOTAL INDIA | | | | | | | 732,426,443 | | | | 18.4 | % |
| | | | | | | | | | | | | | |
INDONESIA — (2.4%) | | | | | | | | | | | | |
| | Bank Central Asia Tbk PT | | | 30,668,300 | | | | 17,336,096 | | | | 0.4 | % |
| | Other Securities | | | | | | | 80,236,504 | | | | 2.0 | % |
| | | | | | | | | | | | | | |
TOTAL INDONESIA | | | | | | | 97,572,600 | | | | 2.4 | % |
| | | | | | | | | | | | | | |
MALAYSIA — (1.7%) | | | | | | | | | | | | |
| | Other Securities | | | | | | | 70,536,471 | | | | 1.8 | % |
| | | | | | | | | | | | | | |
MEXICO — (2.6%) | | | | | | | | | | | | |
| | America Movil SAB de CV | | | 17,462,580 | | | | 16,481,615 | | | | 0.4 | % |
| | Grupo Financiero Banorte SAB de CV, Class O | | | 1,806,062 | | | | 14,702,455 | | | | 0.4 | % |
| | Other Securities | | | | | | | 72,766,011 | | | | 1.8 | % |
| | | | | | | | | | | | | | |
TOTAL MEXICO | | | | | | | 103,950,081 | | | | 2.6 | % |
| | | | | | | | | | | | | | |
PERU — (0.2%) | | | | | | | | | | | | |
| | Other Securities | | | | | | | 6,210,439 | | | | 0.2 | % |
| | | | | | | | | | | | | | |
PHILIPPINES — (0.8%) | | | | | | | | | | | | |
| | Other Securities | | | | | | | 31,534,552 | | | | 0.8 | % |
| | | | | | | | | | | | | | |
POLAND — (0.6%) | | | | | | | | | | | | |
| | Other Securities | | | | | | | 25,584,214 | | | | 0.6 | % |
| | | | | | | | | | | | | | |
QATAR — (1.0%) | | | | | | | | | | | | |
| | Qatar National Bank QPSC | | | 2,505,254 | | | | 13,717,886 | | | | 0.3 | % |
| | Other Securities | | | | | | | 28,854,876 | | | | 0.8 | % |
| | | | | | | | | | | | | | |
TOTAL QATAR | | | | | | | 42,572,762 | | | | 1.1 | % |
| | | | | | | | | | | | | | |
SAUDI ARABIA — (4.7%) | | | | | | | | | | | | |
* | | Al Rajhi Bank | | | 1,085,108 | | | | 24,605,766 | | | | 0.6 | % |
* | | Saudi Arabian Mining Co. | | | 512,286 | | | | 11,402,576 | | | | 0.3 | % |
| | Saudi National Bank | | | 945,913 | | | | 14,950,375 | | | | 0.4 | % |
| | Saudi Telecom Co. | | | 1,007,500 | | | | 10,824,373 | | | | 0.3 | % |
| | Other Securities | | | | | | | 131,529,877 | | | | 3.2 | % |
| | | | | | | | | | | | | | |
TOTAL SAUDI ARABIA | | | | | | | 193,312,967 | | | | 4.8 | % |
| | | | | | | | | | | | | | |
SOUTH AFRICA — (3.5%) | | | | | | | | | | | | |
| | MTN Group Ltd. | | | 1,570,195 | | | | 11,097,278 | | | | 0.3 | % |
| | Other Securities | | | | | | | 129,896,408 | | | | 3.2 | % |
| | | | | | | | | | | | | | |
TOTAL SOUTH AFRICA | | | | | | | 140,993,686 | | | | 3.5 | % |
| | | | | | | | | | | | | | |
221
THE EMERGING MARKETS SERIES
CONTINUED
| | | | | | | | | | | | | | |
| | | | | Shares | | | Value» | | | Percentage
of Net Assets‡ | |
SOUTH KOREA — (11.7%) | | | | | | | | | | | | |
| | KB Financial Group, Inc. | | | 309,585 | | | $ | 10,417,236 | | | | 0.3 | % |
| | Samsung Electronics Co. Ltd. | | | 3,140,501 | | | | 130,707,098 | | | | 3.3 | % |
| | SK Hynix, Inc. | | | 384,714 | | | | 22,271,674 | | | | 0.6 | % |
| | Other Securities | | | | | | | 310,821,368 | | | | 7.7 | % |
| | | | | | | | | | | | | | |
TOTAL SOUTH KOREA | | | | | | | 474,217,376 | | | | 11.9 | % |
| | | | | | | | | | | | | | |
TAIWAN — (15.0%) | | | | | | | | | | | | |
| | Hon Hai Precision Industry Co. Ltd. | | | 5,794,322 | | | | 18,403,209 | | | | 0.5 | % |
# | | MediaTek, Inc. | | | 799,995 | | | | 14,582,464 | | | | 0.4 | % |
| | Taiwan Semiconductor Manufacturing Co. Ltd. | | | 13,416,808 | | | | 161,299,590 | | | | 4.0 | % |
| | Other Securities | | | | | | | 415,194,442 | | | | 10.4 | % |
| | | | | | | | | | | | | | |
TOTAL TAIWAN | | | | | | | 609,479,705 | | | | 15.3 | % |
| | | | | | | | | | | | | | |
THAILAND — (2.5%) | | | | | | | | | | | | |
| | Other Securities | | | | | | | 100,451,044 | | | | 2.5 | % |
| | | | | | | | | | | | | | |
TURKEY — (0.7%) | | | | | | | | | | | | |
| | Other Securities | | | | | | | 28,045,003 | | | | 0.7 | % |
| | | | | | | | | | | | | | |
UNITED ARAB EMIRATES — (1.5%) | | | | | | | | | | | | |
| | Emirates Telecommunications Group Co. PJSC | | | 1,754,520 | | | | 12,330,867 | | | | 0.3 | % |
| | Other Securities | | | | | | | 50,250,860 | | | | 1.3 | % |
| | | | | | | | | | | | | | |
TOTAL UNITED ARAB EMIRATES | | | | | | | 62,581,727 | | | | 1.6 | % |
| | | | | | | | | | | | | | |
UNITED STATES — (0.0%) | | | | | | | | | | | | |
| | Other Security | | | | | | | 1,338,052 | | | | 0.0 | % |
| | | | | | | | | | | | | | |
TOTAL COMMON STOCKS | | | | | | | 3,912,714,070 | | | | 98.0 | % |
| | | | | | | | | | | | | | |
PREFERRED STOCKS — (1.3%) | | | | | | | | | | | | |
BRAZIL — (1.2%) | | | | | | | | | | | | |
| | Itau Unibanco Holding SA | | | 2,317,176 | | | | 13,637,044 | | | | 0.4 | % |
| | Petroleo Brasileiro SA | | | 2,952,047 | | | | 17,036,206 | | | | 0.4 | % |
| | Other Securities | | | | | | | 18,830,811 | | | | 0.5 | % |
| | | | | | | | | | | | | | |
| | TOTAL BRAZIL | | | | | | | 49,504,061 | | | | 1.3 | % |
| | | | | | | | | | | | | | |
CHILE — (0.0%) | | | | | | | | | | | | |
| | Other Security | | | | | | | 753,310 | | | | 0.0 | % |
| | | | | | | | | | | | | | |
COLOMBIA — (0.1%) | | | | | | | | | | | | |
| | Other Securities | | | | | | | 762,616 | | | | 0.0 | % |
| | | | | | | | | | | | | | |
SOUTH KOREA — (0.0%) | | | | | | | | | | | | |
| | Other Security | | | | | | | 39,130 | | | | 0.0 | % |
| | | | | | | | | | | | | | |
TAIWAN — (0.0%) | | | | | | | | | | | | |
| | Other Security | | | | | | | 276,224 | | | | 0.0 | % |
| | | | | | | | | | | | | | |
TOTAL PREFERRED STOCKS | | | | | | | 51,335,341 | | | | 1.3 | % |
| | | | | | | | | | | | | | |
RIGHTS/WARRANTS — (0.0%) | | | | | | | | | | | | |
MALAYSIA — (0.0%) | | | | | | | | | | | | |
| | Other Security | | | | | | | 16,218 | | | | 0.0 | % |
| | | | | | | | | | | | | | |
222
THE EMERGING MARKETS SERIES
CONTINUED
| | | | | | | | | | | | | | |
| | | | | Shares | | | Value» | | | Percentage
of Net Assets‡ | |
SOUTH KOREA — (0.0%) | | | | | | | | | | | | |
| | Other Security | | | | | | $ | 39,126 | | | | 0.0 | % |
| | | | | | | | | | | | | | |
TAIWAN — (0.0%) | | | | | | | | | | | | |
| | Other Security | | | | | | | 59,429 | | | | 0.0 | % |
| | | | | | | | | | | | | | |
TOTAL RIGHTS/WARRANTS | | | | | | | 114,773 | | | | 0.0 | % |
| | | | | | | | | | | | | | |
TOTAL INVESTMENT SECURITIES
(Cost $3,031,692,639) | | | | | | | 3,964,164,184 | | | | | |
| | | | | | | | | | | | | | |
| | | | |
| | | | | | | | Value† | | | | |
SECURITIES LENDING COLLATERAL — (2.6%) | | | | | | | | | | | | |
@§ | | The DFA Short Term Investment Fund | | | 9,232,721 | | | | 106,739,492 | | | | 2.7 | % |
| | | | | | | | | | | | | | |
TOTAL INVESTMENTS—(100.0%)
(Cost $3,138,466,170) | | | | | | $ | 4,070,903,676 | | | | 102.0 | % |
| | | | | | | | | | | | | | |
As of October 31, 2022, The Emerging Markets Series had entered into the following outstanding futures contracts:
| | | | | | | | | | | | | | | | | | | | |
Description | | Number of
Contracts | | | Expiration
Date | | | Notional
Value | | | Market
Value | | | Unrealized
Appreciation
(Depreciation) | |
Long Position Contracts: | | | | | | | | | | | | | | | | | | | | |
E-Mini MSCI Emerging Markets Index | | | 644 | | | | 12/16/22 | | | $ | 29,866,714 | | | $ | 27,485,920 | | | $ | (2,380,794 | ) |
S&P 500® Emini Index | | | 73 | | | | 12/16/22 | | | | 13,941,096 | | | | 14,172,950 | | | | 231,854 | |
| | | | | | | | | | | | | | | | | | | | |
Total Futures Contracts | | | | | | | | | | $ | 43,807,810 | | | $ | 41,658,870 | | | $ | (2,148,940 | ) |
| | | | | | | | | | | | | | | | | | | | |
Summary of the Series’ investments as of October 31, 2022, based on their valuation inputs, is as follows (see Security Valuation Note):
| | | | | | | | | | | | | | | | |
| | | Investments in Securities (Market Value) | |
| | | Level 1 | | | Level 2 | | | Level 3 | | | Total | |
Common Stocks | | | | | | | | | | | | | | | | |
Brazil | | $ | 182,023,797 | | | $ | 9,600 | | | | — | | | $ | 182,033,397 | |
Chile | | | 11,803,006 | | | | 9,921,730 | | | | — | | | | 21,724,736 | |
China | | | 123,031,320 | | | | 828,774,328 | | | | — | | | | 951,805,648 | |
Colombia | | | 4,717,484 | | | | 312,658 | | | | — | | | | 5,030,142 | |
Czech Republic | | | — | | | | 7,199,868 | | | | — | | | | 7,199,868 | |
Egypt | | | 1,962 | | | | 1,918,746 | | | | — | | | | 1,920,708 | |
Greece | | | 10,252 | | | | 13,217,128 | | | $ | 11,223 | | | | 13,238,603 | |
Hungary | | | — | | | | 8,953,846 | | | | — | | | | 8,953,846 | |
India | | | 31,593,723 | | | | 700,832,720 | | | | — | | | | 732,426,443 | |
Indonesia | | | — | | | | 97,572,600 | | | | — | | | | 97,572,600 | |
Malaysia | | | — | | | | 70,536,471 | | | | — | | | | 70,536,471 | |
Mexico | | | 103,950,081 | | | | — | | | | — | | | | 103,950,081 | |
Peru | | | 6,210,439 | | | | — | | | | — | | | | 6,210,439 | |
Philippines | | | 548,996 | | | | 30,985,556 | | | | — | | | | 31,534,552 | |
Poland | | | — | | | | 25,584,214 | | | | — | | | | 25,584,214 | |
Qatar | | | — | | | | 42,572,762 | | | | — | | | | 42,572,762 | |
Saudi Arabia | | | — | | | | 193,312,967 | | | | — | | | | 193,312,967 | |
South Africa | | | 22,218,169 | | | | 118,775,517 | | | | — | | | | 140,993,686 | |
South Korea | | | 4,855,920 | | | | 469,361,456 | | | | — | | | | 474,217,376 | |
Taiwan | | | 4,177,320 | | | | 605,295,946 | | | | 6,439 | | | | 609,479,705 | |
Thailand | | | 98,389,048 | | | | 2,061,996 | | | | — | | | | 100,451,044 | |
223
THE EMERGING MARKETS SERIES
CONTINUED
| | | | | | | | | | | | | | | | |
| | | Investments in Securities (Market Value) | |
| | | Level 1 | | | Level 2 | | | Level 3 | | | Total | |
Turkey | | | — | | | $ | 28,045,003 | | | | — | | | $ | 28,045,003 | |
United Arab Emirates | | | — | | | | 62,581,727 | | | | — | | | | 62,581,727 | |
United States | | | — | | | | 1,338,052 | | | | — | | | | 1,338,052 | |
Preferred Stocks | | | | | | | | | | | | | | | | |
Brazil | | $ | 49,504,061 | | | | — | | | | — | | | | 49,504,061 | |
Chile | | | — | | | | 753,310 | | | | — | | | | 753,310 | |
Colombia | | | 762,616 | | | | — | | | | — | | | | 762,616 | |
South Korea | | | — | | | | 39,130 | | | | — | | | | 39,130 | |
Taiwan | | | — | | | | 276,224 | | | | — | | | | 276,224 | |
Rights/Warrants | | | | | | | | | | | | | | | | |
Malaysia | | | — | | | | 16,218 | | | | — | | | | 16,218 | |
South Korea | | | — | | | | 39,126 | | | | — | | | | 39,126 | |
Taiwan | | | — | | | | 59,429 | | | | — | | | | 59,429 | |
Securities Lending Collateral | | | — | | | | 106,739,492 | | | | — | | | | 106,739,492 | |
Futures Contracts** | | | (2,148,940 | ) | | | — | | | | — | | | | (2,148,940 | ) |
| | | | | | | | | | | | | | | | |
TOTAL | | $ | 641,649,254 | | | $ | 3,427,087,820 | | | $ | 17,662^ | | | $ | 4,068,754,736 | |
| | | | | | | | | | | | | | | | |
| ** | Valued at the unrealized appreciation/(depreciation) on the investment. |
| ^ | A reconciliation of Level 3 investments is presented when the Fund had a significant amount of Level 3 investments at the beginning and/or end of the reporting period in relation to net assets. |
See accompanying Notes to Financial Statements.
224
THE EMERGING MARKETS SMALL CAP SERIES
SUMMARY SCHEDULE OF PORTFOLIO HOLDINGS
October 31, 2022
| | | | | | | | | | | | | | |
| | | | | Shares | | | Value» | | | Percentage
of Net Assets‡ | |
COMMON STOCKS — (97.3%) | | | | | | | | | | | | |
BELGIUM — (0.0%) | | | | | | | | | | | | |
| | Other Security | | | | | | $ | 14,557 | | | | 0.0 | % |
| | | | | | | | | | | | | | |
BRAZIL — (5.7%) | | | | | | | | | | | | |
| | TOTVS SA | | | 1,646,258 | | | | 10,568,178 | | | | 0.3 | % |
| | Transmissora Alianca de Energia Eletrica SA | | | 1,318,523 | | | | 10,258,724 | | | | 0.3 | % |
| | Other Securities | | | | | | | 181,842,977 | | | | 5.2 | % |
| | | | | | | | | | | | | | |
TOTAL BRAZIL | | | | 202,669,879 | | | | 5.8 | % |
| | | | | | | | | | | | | | |
CHILE — (0.6%) | | | | | | | | | | | | |
| | Other Securities | | | | | | | 22,580,410 | | | | 0.6 | % |
| | | | | | | | | | | | | | |
CHINA — (21.9%) | | | | | | | | | | | | |
| | BYD Electronic International Co. Ltd. | | | 1,940,500 | | | | 5,639,059 | | | | 0.2 | % |
| | China Conch Venture Holdings Ltd. | | | 4,615,500 | | | | 6,807,382 | | | | 0.2 | % |
| | China Medical System Holdings Ltd. | | | 5,342,500 | | | | 5,838,944 | | | | 0.2 | % |
| | China Merchants Port Holdings Co. Ltd. | | | 4,575,230 | | | | 5,363,986 | | | | 0.2 | % |
| | China Power International Development Ltd. | | | 18,883,333 | | | | 5,457,077 | | | | 0.2 | % |
| | Chinasoft International Ltd. | | | 9,542,000 | | | | 6,322,273 | | | | 0.2 | % |
| | Far East Horizon Ltd. | | | 6,976,000 | | | | 5,387,074 | | | | 0.2 | % |
| | Hengan International Group Co. Ltd. | | | 2,254,500 | | | | 8,741,258 | | | | 0.3 | % |
#* | | JinkoSolar Holding Co. Ltd., ADR | | | 157,507 | | | | 7,478,432 | | | | 0.2 | % |
| | Kingboard Holdings Ltd. | | | 2,624,421 | | | | 6,478,798 | | | | 0.2 | % |
| | Kingsoft Corp. Ltd. | | | 3,307,600 | | | | 10,015,883 | | | | 0.3 | % |
| | Kunlun Energy Co. Ltd. | | | 12,020,000 | | | | 7,183,987 | | | | 0.2 | % |
| | Minth Group Ltd. | | | 2,963,000 | | | | 5,842,632 | | | | 0.2 | % |
| | Shandong Weigao Group Medical Polymer Co. Ltd., | | | | | | | | | | | | |
| | Class H | | | 6,050,400 | | | | 8,336,151 | | | | 0.3 | % |
| | Sinopharm Group Co. Ltd., Class H | | | 3,677,200 | | | | 6,976,059 | | | | 0.2 | % |
W | | Yadea Group Holdings Ltd. | | | 4,400,000 | | | | 6,718,272 | | | | 0.2 | % |
| | Other Securities | | | | | | | 674,286,363 | | | | 18.7 | % |
| | | | | | | | | | | | | | |
TOTAL CHINA. | | | | 782,873,630 | | | | 22.2 | % |
| | | | | | | | | | | | | | |
COLOMBIA — (0.1%) | | | | | | | | | | | | |
| | Other Securities | | | | | | | 3,508,664 | | | | 0.1 | % |
| | | | | | | | | | | | | | |
GREECE — (0.4%) | | | | | | | | | | | | |
| | Other Securities | | | | | | | 12,870,333 | | | | 0.4 | % |
| | | | | | | | | | | | | | |
HONG KONG — (0.0%) | | | | | | | | | | | | |
| | Other Securities | | | | | | | 603,989 | | | | 0.0 | % |
| | | | | | | | | | | | | | |
HUNGARY — (0.0%) | | | | | | | | | | | | |
| | Other Securities | | | | | | | 1,366,524 | | | | 0.0 | % |
| | | | | | | | | | | | | | |
INDIA — (19.2%) | | | | | | | | | | | | |
| | Adani Enterprises Ltd. | | | 132,085 | | | | 5,349,994 | | | | 0.2 | % |
* | | Adani Power Ltd. | | | 1,298,946 | | | | 5,278,915 | | | | 0.2 | % |
* | | Adani Transmission Ltd. | | | 257,725 | | | | 10,446,809 | | | | 0.3 | % |
| | AIA Engineering Ltd. | | | 176,351 | | | | 5,759,750 | | | | 0.2 | % |
| | Atul Ltd. | | | 55,580 | | | | 5,679,275 | | | | 0.2 | % |
| | Crompton Greaves Consumer Electricals Ltd. | | | 1,633,503 | | | | 7,149,511 | | | | 0.2 | % |
| | Federal Bank Ltd. | | | 5,370,459 | | | | 8,537,661 | | | | 0.3 | % |
* | | Fortis Healthcare Ltd. | | | 1,720,585 | | | | 5,777,317 | | | | 0.2 | % |
225
THE EMERGING MARKETS SMALL CAP SERIES
CONTINUED
| | | | | | | | | | | | | | |
| | | | | Shares | | | Value» | | | Percentage
of Net Assets‡ | |
INDIA — (Continued) | | | | | | | | | | | | |
| | Gujarat Fluorochemicals Ltd. | | | 132,935 | | | $ | 6,079,642 | | | | 0.2 | % |
| | Indian Hotels Co. Ltd. | | | 2,496,258 | | | | 10,070,893 | | | | 0.3 | % |
| | KPIT Technologies Ltd. | | | 689,000 | | | | 5,930,463 | | | | 0.2 | % |
| | Persistent Systems Ltd. | | | 209,899 | | | | 9,370,830 | | | | 0.3 | % |
| | Phoenix Mills Ltd. | | | 331,488 | | | | 5,729,067 | | | | 0.2 | % |
| | Schaeffler India Ltd. | | | 160,300 | | | | 5,371,315 | | | | 0.2 | % |
| | Supreme Industries Ltd. | | | 209,572 | | | | 5,492,082 | | | | 0.2 | % |
| | Tata Elxsi Ltd. | | | 72,466 | | | | 6,148,163 | | | | 0.2 | % |
| | Tube Investments of India Ltd. | | | 410,776 | | | | 13,507,760 | | | | 0.4 | % |
| | Zee Entertainment Enterprises Ltd. | | | 2,035,315 | | | | 6,463,376 | | | | 0.2 | % |
| | Other Securities | | | | | | | 558,019,401 | | | | 15.3 | % |
| | | | | | | | | | | | | | |
TOTAL INDIA | | | | 686,162,224 | | | | 19.5 | % |
| | | | | | | | | | | | | | |
INDONESIA — (2.4%) | | | | | | | | | | | | |
| | Other Securities | | | | | | | 84,409,677 | | | | 2.4 | % |
| | | | | | | | | | | | | | |
MALAYSIA — (1.6%) | | | | | | | | | | | | |
| | Other Securities | | | | | | | 58,092,744 | | | | 1.7 | % |
| | | | | | | | | | | | | | |
MEXICO — (3.1%) | | | | | | | | | | | | |
W | | Banco del Bajio SA | | | 2,573,919 | | | | 7,246,414 | | | | 0.2 | % |
| | Grupo Comercial Chedraui SA de CV | | | 1,754,925 | | | | 7,093,925 | | | | 0.2 | % |
* | | Grupo Simec SAB de CV, Class B | | | 954,497 | | | | 9,538,707 | | | | 0.3 | % |
* | | Industrias CH SAB de CV, Class B | | | 1,752,132 | | | | 19,365,158 | | | | 0.6 | % |
| | La Comer SAB de CV | | | 3,003,626 | | | | 5,518,194 | | | | 0.2 | % |
| | Other Securities | | | | | | | 63,096,833 | | | | 1.7 | % |
| | | | | | | | | | | | | | |
TOTAL MEXICO | | | | 111,859,231 | | | | 3.2 | % |
| | | | | | | | | | | | | | |
PHILIPPINES — (1.0%) | | | | | | | | | | | | |
| | Other Securities | | | | | | | 36,898,462 | | | | 1.1 | % |
| | | | | | | | | | | | | | |
POLAND — (0.9%) | | | | | | | | | | | | |
| | Grupa Kety SA | | | 54,943 | | | | 5,668,090 | | | | 0.2 | % |
| | Other Securities | | | | | | | 26,522,826 | | | | 0.7 | % |
| | | | | | | | | | | | | | |
TOTAL POLAND | | | | 32,190,916 | | | | 0.9 | % |
| | | | | | | | | | | | | | |
QATAR — (0.9%) | | | | | | | | | | | | |
| | Other Securities | | | | | | | 31,471,396 | | | | 0.9 | % |
| | | | | | | | | | | | | | |
SAUDI ARABIA — (3.9%) | | | | | | | | | | | | |
* | | Dar Al Arkan Real Estate Development Co. | | | 1,798,980 | | | | 6,436,392 | | | | 0.2 | % |
| | Other Securities | | | | | | | 132,119,560 | | | | 3.7 | % |
| | | | | | | | | | | | | | |
TOTAL SAUDI ARABIA | | | | 138,555,952 | | | | 3.9 | % |
| | | | | | | | | | | | | | |
SOUTH AFRICA — (3.8%) | | | | | | | | | | | | |
| | Foschini Group Ltd. | | | 907,837 | | | | 5,675,989 | | | | 0.2 | % |
| | Woolworths Holdings Ltd. | | | 2,234,195 | | | | 7,661,480 | | | | 0.2 | % |
| | Other Securities | | | | | | | 122,354,989 | | | | 3.5 | % |
| | | | | | | | | | | | | | |
TOTAL SOUTH AFRICA | | | | 135,692,458 | | | | 3.9 | % |
| | | | | | | | | | | | | | |
SOUTH KOREA — (11.3%) | | | | | | | | | | | | |
| | Other Securities | | | | | | | 402,710,105 | | | | 11.4 | % |
| | | | | | | | | | | | | | |
226
THE EMERGING MARKETS SMALL CAP SERIES
CONTINUED
| | | | | | | | | | | | |
| | | Shares | | | Value» | | | Percentage
of Net Assets‡ | |
TAIWAN — (15.7%) | | | | | | | | | | | | |
TA Chen Stainless Pipe | | | 4,850,504 | | | $ | 5,667,713 | | | | 0.2 | % |
Taichung Commercial Bank Co. Ltd. | | | 15,973,893 | | | | 6,212,649 | | | | 0.2 | % |
Other Securities | | | | | | | 548,850,145 | | | | 15.5 | % |
| | | | | | | | | | | | |
TOTAL TAIWAN. | | | | | | | 560,730,507 | | | | 15.9 | % |
| | | | | | | | | | | | |
THAILAND — (2.6%) | | | | | | | | | | | | |
Other Securities | | | | | | | 93,749,823 | | | | 2.7 | % |
| | | | | | | | | | | | |
TURKEY — (1.3%) | | | | | | | | | | | | |
#* Sasa Polyester Sanayi AS | | | 1,429,621 | | | | 9,207,695 | | | | 0.3 | % |
Other Securities | | | | | | | 37,953,231 | | | | 1.0 | % |
| | | | | | | | | | | | |
TOTAL TURKEY | | | | | | | 47,160,926 | | | | 1.3 | % |
| | | | | | | | | | | | |
UNITED ARAB EMIRATES — (0.9%) | | | | | | | | | | | | |
Abu Dhabi Islamic Bank PJSC | | | 2,965,487 | | | | 7,672,903 | | | | 0.2 | % |
Other Securities | | | | | | | 25,577,712 | | | | 0.7 | % |
| | | | | | | | | | | | |
TOTAL UNITED ARAB EMIRATES | | | | | | | 33,250,615 | | | | 0.9 | % |
| | | | | | | | | | | | |
TOTAL COMMON STOCKS | | | | | | | 3,479,423,022 | | | | 98.8 | % |
| | | | | | | | | | | | |
PREFERRED STOCKS — (0.9%) | | | | | | | | | | | | |
BRAZIL — (0.8%) | | | | | | | | | | | | |
Unipar Carbocloro SA | | | 265,449 | | | | 5,487,809 | | | | 0.2 | % |
Other Securities | | | | | | | 21,750,780 | | | | 0.6 | % |
| | | | | | | | | | | | |
TOTAL BRAZIL | | | | | | | 27,238,589 | | | | 0.8 | % |
| | | | | | | | | | | | |
CHILE — (0.0%) | | | | | | | | | | | | |
Other Securities | | | | | | | 707,061 | | | | 0.0 | % |
| | | | | | | | | | | | |
COLOMBIA — (0.0%) | | | | | | | | | | | | |
Other Security | | | | | | | 51,644 | | | | 0.0 | % |
| | | | | | | | | | | | |
PHILIPPINES — (0.0%) | | | | | | | | | | | | |
Other Security | | | | | | | 400,488 | | | | 0.0 | % |
| | | | | | | | | | | | |
THAILAND — (0.1%) | | | | | | | | | | | | |
Other Security | | | | | | | 1,341,790 | | | | 0.1 | % |
| | | | | | | | | | | | |
TOTAL PREFERRED STOCKS | | | | | | | 29,739,572 | | | | 0.9 | % |
| | | | | | | | | | | | |
RIGHTS/WARRANTS — (0.0%) | | | | | | | | | | | | |
BRAZIL — (0.0%) | | | | | | | | | | | | |
Other Securities | | | | | | | 36,347 | | | | 0.0 | % |
| | | | | | | | | | | | |
INDIA — (0.0%) | | | | | | | | | | | | |
Other Security | | | | | | | 149,656 | | | | 0.0 | % |
| | | | | | | | | | | | |
INDONESIA — (0.0%) | | | | | | | | | | | | |
Other Security | | | | | | | 3,503 | | | | 0.0 | % |
| | | | | | | | | | | | |
MALAYSIA — (0.0%) | | | | | | | | | | | | |
Other Security | | | | | | | 26,642 | | | | 0.0 | % |
| | | | | | | | | | | | |
227
THE EMERGING MARKETS SMALL CAP SERIES
CONTINUED
| | | | | | | | | | | | |
| | | Shares | | | Value» | | | Percentage
of Net Assets‡ | |
SAUDI ARABIA — (0.0%) | | | | | | | | | | | | |
Other Security | | | | | | $ | 115,159 | | | | 0.0 | % |
| | | | | | | | | | | | |
SOUTH KOREA — (0.0%) | | | | | | | | | | | | |
Other Securities | | | | | | | 1,889 | | | | 0.0 | % |
| | | | | | | | | | | | |
TAIWAN — (0.0%) | | | | | | | | | | | | |
Other Securities | | | | | | | 22,016 | | | | 0.0 | % |
| | | | | | | | | | | | |
THAILAND — (0.0%) | | | | | | | | | | | | |
Other Securities | | | | | | | 591 | | | | 0.0 | % |
| | | | | | | | | | | | |
TOTAL RIGHTS/WARRANTS | | | | | | | 355,803 | | | | 0.0 | % |
| | | | | | | | | | | | |
TOTAL INVESTMENT SECURITIES
(Cost $3,641,873,380) | | | | | | | 3,509,518,397 | | | | | |
| | | | | | | | | | | | |
| | | |
| | | | | | Value† | | | | |
SECURITIES LENDING COLLATERAL — (1.8%) | | | | | | | | | | | | |
@§ The DFA Short Term Investment Fund | | | 5,706,428 | | | | 65,972,009 | | | | 1.8 | % |
| | | | | | | | | | | | |
TOTAL INVESTMENTS—(100.0%)
(Cost $3,707,870,867) | | | | | | $ | 3,575,490,406 | | | | 101.5 | % |
| | | | | | | | | | | | |
As of October 31, 2022, The Emerging Markets Small Cap Series had entered into the following outstanding futures contracts:
| | | | | | | | | | | | | | | | | | | | |
Description | | Number of
Contracts | | | Expiration
Date | | | Notional
Value | | | Market
Value | | | Unrealized
Appreciation
(Depreciation) | |
Long Position Contracts: | | | | | | | | | | | | | | | | | | | | |
E-Mini MSCI Emerging Markets Index | | | 572 | | | | 12/16/22 | | | $ | 27,594,377 | | | $ | 24,412,960 | | | $ | (3,181,417 | ) |
| | | | | | | | | | | | | | | | | | | | |
Total Futures Contracts | | | | | | | | | | $ | 27,594,377 | | | $ | 24,412,960 | | | $ | (3,181,417 | ) |
| | | | | | | | | | | | | | | | | | | | |
Summary of the Series’ investments as of October 31, 2022, based on their valuation inputs, is as follows (see Security Valuation Note):
| | | | | | | | | | | | | | | | |
| | | Investments in Securities (Market Value) | |
| | | Level 1 | | | Level 2 | | | Level 3 | | | Total | |
Common Stocks | | | | | | | | | | | | | | | | |
Belgium | | | — | | | $ | 14,557 | | | | — | | | $ | 14,557 | |
Brazil | | $ | 200,556,578 | | | | 2,113,301 | | | | — | | | | 202,669,879 | |
Chile | | | 56,743 | | | | 22,523,667 | | | | — | | | | 22,580,410 | |
China | | | 30,708,728 | | | | 744,535,093 | | | $ | 7,629,809 | | | | 782,873,630 | |
Colombia | | | 2,857,262 | | | | 651,402 | | | | — | | | | 3,508,664 | |
Greece | | | 47,143 | | | | 12,823,190 | | | | — | | | | 12,870,333 | |
Hong Kong | | | — | | | | 603,989 | | | | — | | | | 603,989 | |
Hungary | | | — | | | | 1,366,524 | | | | — | | | | 1,366,524 | |
India | | | 328,042 | | | | 685,825,728 | | | | 8,454 | | | | 686,162,224 | |
Indonesia | | | 211,331 | | | | 83,744,145 | | | | 454,201 | | | | 84,409,677 | |
Malaysia | | | — | | | | 58,091,500 | | | | 1,244 | | | | 58,092,744 | |
Mexico | | | 105,709,485 | | | | 6,131,488 | | | | 18,258 | | | | 111,859,231 | |
Philippines | | | — | | | | 36,892,926 | | | | 5,536 | | | | 36,898,462 | |
Poland | | | — | | | | 32,190,916 | | | | — | | | | 32,190,916 | |
Qatar | | | — | | | | 31,471,396 | | | | — | | | | 31,471,396 | |
Saudi Arabia | | | 495,984 | | | | 138,059,968 | | | | — | | | | 138,555,952 | |
228
THE EMERGING MARKETS SMALL CAP SERIES
CONTINUED
| | | | | | | | | | | | | | | | |
| | | Investments in Securities (Market Value) | |
| | | Level 1 | | | Level 2 | | | Level 3 | | | Total | |
South Africa | | $ | 4,776,263 | | | $ | 130,916,195 | | | | — | | | $ | 135,692,458 | |
South Korea | | | 30,295 | | | | 400,895,469 | | | $ | 1,784,341 | | | | 402,710,105 | |
Taiwan | | | 499,088 | | | | 559,929,711 | | | | 301,708 | | | | 560,730,507 | |
Thailand | | | 91,364,773 | | | | 2,379,782 | | | | 5,268 | | | | 93,749,823 | |
Turkey | | | — | | | | 47,160,926 | | | | — | | | | 47,160,926 | |
United Arab Emirates | | | — | | | | 33,250,615 | | | | — | | | | 33,250,615 | |
Preferred Stocks | | | | | | | | | | | | | | | | |
Brazil | | | 27,142,205 | | | | 96,384 | | | | — | | | | 27,238,589 | |
Chile | | | — | | | | 707,061 | | | | — | | | | 707,061 | |
Colombia | | | 51,644 | | | | — | | | | — | | | | 51,644 | |
Philippines | | | — | | | | 400,488 | | | | — | | | | 400,488 | |
Thailand | | | 1,341,790 | | | | — | | | | — | | | | 1,341,790 | |
Rights/Warrants | | | | | | | | | | | | | | | | |
Brazil | | | — | | | | 36,347 | | | | — | | | | 36,347 | |
India | | | — | | | | 149,656 | | | | — | | | | 149,656 | |
Indonesia | | | — | | | | 3,503 | | | | — | | | | 3,503 | |
Malaysia | | | — | | | | 26,642 | | | | — | | | | 26,642 | |
Saudi Arabia | | | — | | | | 115,159 | | | | — | | | | 115,159 | |
South Korea | | | — | | | | 1,889 | | | | — | | | | 1,889 | |
Taiwan | | | — | | | | 22,016 | | | | — | | | | 22,016 | |
Thailand | | | — | | | | 591 | | | | — | | | | 591 | |
Securities Lending Collateral | | | — | | | | 65,972,009 | | | | — | | | | 65,972,009 | |
Futures Contracts** | | | (3,181,417 | ) | | | — | | | | — | | | | (3,181,417 | ) |
| | | | | | | | | | | | | | | | |
TOTAL | | $ | 462,995,937 | | | $ | 3,099,104,233 | | | $ | 10,208,819^ | | | $ | 3,572,308,989 | |
| | | | | | | | | | | | | | | | |
| ** | Valued at the unrealized appreciation/(depreciation) on the investment. |
| ^ | A reconciliation of Level 3 investments is presented when the Fund had a significant amount of Level 3 investments at the beginning and/or end of the reporting period in relation to net assets. |
See accompanying Notes to Financial Statements.
229
THE DFA INVESTMENT TRUST COMPANY
STATEMENTS OF ASSETS AND LIABILITIES
OCTOBER 31, 2022
(Amounts in thousands)
| | | | | | | | | | | | | | | | |
| | | The DFA
International
Value Series* | | | The Japanese
Small
Company
Series* | | | The Asia
Pacific Small
Company
Series* | | | The United
Kingdom Small
Company
Series* | |
ASSETS: | | | | | | | | | | | | | | | | |
Investment Securities at Value (including $520,457, $134,496, $112,812 and $27,667 of securities on loan, respectively) | | $ | 10,277,007 | | | $ | 2,493,001 | | | $ | 1,190,549 | | | $ | 1,160,537 | |
Collateral from Securities on Loan Invested in Affiliate at Value (including cost of $483,046, $55,564, $17,312 and $29,475,respectively) | | | 482,853 | | | | 55,545 | | | | 17,305 | | | | 29,468 | |
Segregated Cash for Futures Contracts | | | 8,420 | | | | — | | | | — | | | | — | |
Foreign Currencies at Value | | | 128,438 | | | | 174 | | | | 1,718 | | | | 1,035 | |
Cash | | | 37,517 | | | | 975 | | | | 210 | | | | 8 | |
Receivables: | | | | | | | | | | | | | | | | |
Investment Securities Sold | | | 5,068 | | | | 4,450 | | | | 126 | | | | 1,867 | |
Dividends, Interest and Tax Reclaims | | | 77,741 | | | | 23,051 | | | | 1,315 | | | | 5,013 | |
Securities Lending Income | | | 367 | | | | 164 | | | | 337 | | | | 20 | |
Unrealized Gain on Foreign Currency Contracts | | | — | | | | 4 | | | | 5 | | | | — | |
Prepaid Expenses and Other Assets | | | 1 | | | | — | | | | — | | | | — | |
| | | | | | | | | | | | | | | | |
Total Assets | | | 11,017,412 | | | | 2,577,364 | | | | 1,211,565 | | | | 1,197,948 | |
| | | | | | | | | | | | | | | | |
LIABILITIES: | | | | | | | | | | | | | | | | |
Payables: | | | | | | | | | | | | | | | | |
Upon Return of Securities Loaned | | | 486,408 | | | | 56,630 | | | | 17,192 | | | | 29,920 | |
Investment Securities Purchased | | | — | | | | — | | | | 148 | | | | — | |
Due to Advisor | | | 1,732 | | | | 215 | | | | 102 | | | | 96 | |
Futures Margin Variation | | | 1,659 | | | | — | | | | — | | | | — | |
Accrued Expenses and Other Liabilities | | | 480 | | | | 176 | | | | 102 | | | | 85 | |
| | | | | | | | | | | | | | | | |
Total Liabilities | | | 490,279 | | | | 57,021 | | | | 17,544 | | | | 30,101 | |
| | | | | | | | | | | | | | | | |
NET ASSETS | | $ | 10,527,133 | | | $ | 2,520,343 | | | $ | 1,194,021 | | | $ | 1,167,847 | |
| | | | | | | | | | | | | | | | |
Investment Securities at Cost | | $ | 10,555,431 | | | $ | 2,854,129 | | | $ | 1,539,797 | | | $ | 1,400,293 | |
| | | | | | | | | | | | | | | | |
Foreign Currencies at Cost | | $ | 130,216 | | | $ | 175 | | | $ | 1,705 | | | $ | 1,040 | |
| | | | | | | | | | | | | | | | |
| * | See Note J in the Notes to Financial Statements for additional information about securities lending collateral. |
See accompanying Notes to Financial Statements.
230
THE DFA INVESTMENT TRUST COMPANY
STATEMENTS OF ASSETS AND LIABILITIES
OCTOBER 31, 2022
(Amounts in thousands)
| | | | | | | | | | | | | | | | |
| | | The
Continental
Small
Company
Series* | | | The Canadian
Small
Company
Series* | | | The Emerging
Markets
Series* | | | The Emerging
Markets Small
Cap Series* | |
ASSETS: | | | | | | | | | | | | | | | | |
Investment Securities at Value (including $232,134, $211,169, $181,828 and $272,505 of securities on loan, respectively) | | $ | 4,313,078 | | | $ | 1,212,936 | | | $ | 3,964,164 | | | $ | 3,509,518 | |
Collateral from Securities on Loan Invested in Affiliate at Value (including cost of $256,622, $199,806, $106,774 and $65,997,respectively) | | | 256,520 | | | | 199,722 | | | | 106,739 | | | | 65,972 | |
Segregated Cash for Futures Contracts | | | — | | | | — | | | | 2,116 | | | | 1,231 | |
Foreign Currencies at Value | | | 1,400 | | | | 1,520 | | | | 41,719 | | | | 25,680 | |
Cash | | | 526 | | | | — | | | | 76,319 | | | | 9,943 | |
Receivables: | | | | | | | | | | | | | | | | |
Investment Securities Sold | | | 14,246 | | | | 22,504 | | | | 1,311 | | | | 3,266 | |
Dividends, Interest and Tax Reclaims | | | 28,879 | | | | 719 | | | | 3,308 | | | | 3,828 | |
Securities Lending Income | | | 375 | | | | 166 | | | | 353 | | | | 1,123 | |
Futures Margin Variation | | | — | | | | — | | | | 529 | | | | — | |
Unrealized Gain on Foreign Currency Contracts | | | — | | | | — | | | | 42 | | | | 3 | |
Prepaid Expenses and Other Assets | | | — | | | | 1 | | | | 2 | | | | — | |
| | | | | | | | | | | | | | | | |
Total Assets | | | 4,615,024 | | | | 1,437,568 | | | | 4,196,602 | | | | 3,620,564 | |
| | | | | | | | | | | | | | | | |
LIABILITIES: | | | | | | | | | | | | | | | | |
Payables: | | | | | | | | | | | | | | | | |
Due to Custodian | | | — | | | | 122 | | | | — | | | | — | |
Upon Return of Securities Loaned | | | 267,759 | | | | 222,227 | | | | 91,531 | | | | 67,037 | |
Investment Securities Purchased | | | — | | | | — | | | | 74,714 | | | | 1,675 | |
Due to Advisor | | | 354 | | | | 100 | | | | 341 | | | | 615 | |
Futures Margin Variation | | | — | | | | — | | | | — | | | | 58 | |
Unrealized Loss on Foreign Currency Contracts | | | — | | | | — | | | | 13 | | | | — | |
Deferred Taxes Payable | | | — | | | | — | | | | 37,032 | | | | 29,704 | |
Accrued Expenses and Other Liabilities | | | 348 | | | | 59 | | | | 543 | | | | 556 | |
| | | | | | | | | | | | | | | | |
Total Liabilities | | | 268,461 | | | | 222,508 | | | | 204,174 | | | | 99,645 | |
| | | | | | | | | | | | | | | | |
NET ASSETS | | $ | 4,346,563 | | | $ | 1,215,060 | | | $ | 3,992,428 | | | $ | 3,520,919 | |
| | | | | | | | | | | | | | | | |
Investment Securities at Cost | | $ | 4,398,990 | | | $ | 1,129,104 | | | $ | 3,031,693 | | | $ | 3,641,873 | |
| | | | | | | | | | | | | | | | |
Foreign Currencies at Cost | | $ | 1,406 | | | $ | 1,516 | | | $ | 42,155 | | | $ | 25,839 | |
| | | | | | | | | | | | | | | | |
| * | See Note J in the Notes to Financial Statements for additional information about securities lending collateral. |
See accompanying Notes to Financial Statements.
231
THE DFA INVESTMENT TRUST COMPANY
STATEMENTS OF OPERATIONS
FOR THE YEAR ENDED OCTOBER 31, 2022
(Amounts in thousands)
| | | | | | | | | | | | | | | | |
| | | The DFA
International
Value Series# | | | The Japanese
Small
Company
Series# | | | The Asia
Pacific Small
Company
Series# | | | The United
Kingdom Small
Company
Series# | |
Investment Income | | | | | | | | | | | | | | | | |
Dividends (Net of Foreign Taxes Withheld of $54,334, $8,447, $724 and $332, respectively) | | $ | 528,788 | | | $ | 76,219 | | | $ | 63,499 | | | $ | 63,674 | |
Income from Securities Lending | | | 4,573 | | | | 1,562 | | | | 4,162 | | | | 102 | |
| | | | | | | | | | | | | | | | |
Total Investment Income | | | 533,361 | | | | 77,781 | | | | 67,661 | | | | 63,776 | |
| | | | | | | | | | | | | | | | |
Expenses | | | | | | | | | | | | | | | | |
Investment Management Fees | | | 23,325 | | | | 2,900 | | | | 1,555 | | | | 1,523 | |
Accounting & Transfer Agent Fees | | | 2 | | | | — | | | | 4 | | | | — | |
Custodian Fees | | | 1,012 | | | | 419 | | | | 272 | | | | 106 | |
Shareholders’ Reports | | | 25 | | | | 18 | | | | 17 | | | | 17 | |
Directors’/Trustees’ Fees & Expenses | | | 54 | | | | 13 | | | | 7 | | | | 6 | |
Professional Fees | | | 275 | | | | 39 | | | | 19 | | | | 20 | |
Other | | | 353 | | | | 93 | | | | 49 | | | | 49 | |
| | | | | | | | | | | | | | | | |
Total Expenses | | | 25,046 | | | | 3,482 | | | | 1,923 | | | | 1,721 | |
| | | | | | | | | | | | | | | | |
Fees Paid Indirectly (Note C) | | | 373 | | | | 23 | | | | 5 | | | | 12 | |
| | | | | | | | | | | | | | | | |
Net Expenses | | | 24,673 | | | | 3,459 | | | | 1,918 | | | | 1,709 | |
| | | | | | | | | | | | | | | | |
Net Investment Income (Loss) | | | 508,688 | | | | 74,322 | | | | 65,743 | | | | 62,067 | |
| | | | | | | | | | | | | | | | |
Realized and Unrealized Gain (Loss) | | | | | | | | | | | | | | | | |
Net Realized Gain (Loss) on: | | | | | | | | | | | | | | | | |
Investment Securities Sold** | | | 6,848 | | | | 5,574 | | | | 33,519 | | | | (4,763 | ) |
Affiliated Investment Companies Shares Sold | | | 36 | | | | (8 | ) | | | (10 | ) | | | (3 | ) |
Futures | | | (16,735 | ) | | | — | | | | 349 | | | | — | |
Foreign Currency Transactions | | | (13,407 | ) | | | (5,554 | ) | | | (731 | ) | | | (1,687 | ) |
Change in Unrealized Appreciation (Depreciation) of: | | | | | | | | | | | | | | | | |
Investment Securities and Foreign Currency | | | (2,198,406 | ) | | | (862,888 | ) | | | (565,107 | ) | | | (665,322 | ) |
Affiliated Investment Companies Shares | | | (280 | ) | | | (32 | ) | | | (12 | ) | | | (11 | ) |
Futures | | | 2,503 | | | | — | | | | — | | | | — | |
Translation of Foreign Currency-Denominated Amounts | | | (4,633 | ) | | | (284 | ) | | | (8 | ) | | | (66 | ) |
| | | | | | | | | | | | | | | | |
Net Realized and Unrealized Gain (Loss) | | | (2,224,074 | ) | | | (863,192 | ) | | | (532,000 | ) | | | (671,852 | ) |
| | | | | | | | | | | | | | | | |
Net Increase (Decrease) in Net Assets Resulting from Operations | | $ | (1,715,386 | ) | | $ | (788,870 | ) | | $ | (466,257 | ) | | $ | (609,785 | ) |
| | | | | | | | | | | | | | | | |
| ** | Net of foreign capital gain taxes withheld of $0, $0, $0 and $0, respectively. |
| # | Portion of income is from investment in affiliated fund. |
See accompanying Notes to Financial Statements.
232
THE DFA INVESTMENT TRUST COMPANY
STATEMENTS OF OPERATIONS
FOR THE YEAR ENDED OCTOBER 31, 2022
(Amounts in thousands)
| | | | | | | | | | | | | | | | |
| | | The
Continental
Small
Company
Series# | | | The Canadian
Small
Company
Series# | | | The Emerging
Markets
Series# | | | The Emerging
Markets Small
Cap Series# | |
Investment Income | | | | | | | | | | | | | | | | |
Dividends (Net of Foreign Taxes Withheld of $22,430, $5,523, $21,392 and $17,193, respectively) | | $ | 154,725 | | | $ | 39,740 | | | $ | 173,353 | | | $ | 125,202 | |
Income from Securities Lending | | | 5,905 | | | | 1,683 | | | | 4,430 | | | | 16,583 | |
| | | | | | | | | | | | | | | | |
Total Investment Income | | | 160,630 | | | | 41,423 | | | | 177,783 | | | | 141,785 | |
| | | | | | | | | | | | | | | | |
Expenses | | | | | | | | | | | | | | | | |
Investment Management Fees | | | 5,401 | | | | 1,333 | | | | 5,202 | | | | 8,948 | |
Accounting & Transfer Agent Fees | | | 8 | | | | 7 | | | | — | | | | — | |
Custodian Fees | | | 1,013 | | | | 76 | | | | 2,474 | | | | 2,145 | |
Shareholders’ Reports | | | 21 | | | | 17 | | | | 21 | | | | 19 | |
Directors’/Trustees’ Fees & Expenses | | | 21 | | | | 6 | | | | 22 | | | | 19 | |
Professional Fees | | | 144 | | | | 14 | | | | 131 | | | | 237 | |
Other | | | 180 | | | | 37 | | | | 291 | | | | 352 | |
| | | | | | | | | | | | | | | | |
Total Expenses | | | 6,788 | | | | 1,490 | | | | 8,141 | | | | 11,720 | |
| | | | | | | | | | | | | | | | |
Fees Paid Indirectly (Note C) | | | 29 | | | | 9 | | | | 124 | | | | 98 | |
| | | | | | | | | | | | | | | | |
Net Expenses | | | 6,759 | | | | 1,481 | | | | 8,017 | | | | 11,622 | |
| | | | | | | | | | | | | | | | |
Net Investment Income (Loss) | | | 153,871 | | | | 39,942 | | | | 169,766 | | | | 130,163 | |
| | | | | | | | | | | | | | | | |
Realized and Unrealized Gain (Loss) | | | | | | | | | | | | | | | | |
Net Realized Gain (Loss) on: | | | | | | | | | | | | | | | | |
Investment Securities Sold** | | | 53,125 | | | | 84,639 | | | | 37,299 | | | | 106,869 | |
Affiliated Investment Companies Shares Sold | | | (59 | ) | | | (66 | ) | | | (29 | ) | | | (18 | ) |
Futures | | | — | | | | 27 | | | | (15,196 | ) | | | (6,942 | ) |
Foreign Currency Transactions | | | (2,690 | ) | | | (101 | ) | | | (2,541 | ) | | | (2,550 | ) |
Change in Unrealized Appreciation (Depreciation) of: | | | | | | | | | | | | | | | | |
Investment Securities and Foreign Currency | | | (2,054,707 | ) | | | (295,189 | ) | | | (1,639,645 | ) | | | (1,297,378 | ) |
Affiliated Investment Companies Shares | | | (130 | ) | | | (101 | ) | | | (47 | ) | | | (41 | ) |
Futures | | | — | | | | — | | | | (1,197 | ) | | | (3,235 | ) |
Translation of Foreign Currency-Denominated Amounts | | | (3,148 | ) | | | (9 | ) | | | 8 | | | | 80 | |
| | | | | | | | | | | | | | | | |
Net Realized and Unrealized Gain (Loss) | | | (2,007,609 | ) | | | (210,800 | ) | | | (1,621,348 | ) | | | (1,203,215 | ) |
| | | | | | | | | | | | | | | | |
Net Increase (Decrease) in Net Assets Resulting from Operations | | $ | (1,853,738 | ) | | $ | (170,858 | ) | | $ | (1,451,582 | ) | | $ | (1,073,052 | ) |
| | | | | | | | | | | | | | | | |
| ** | Net of foreign capital gain taxes withheld of $0, $0, $4,922 and $9,059, respectively. |
| # | Portion of income is from investment in affiliated fund. |
See accompanying Notes to Financial Statements.
233
THE DFA INVESTMENT TRUST COMPANY
STATEMENTS OF CHANGES IN NET ASSETS
(Amounts in thousands)
| | | | | | | | | | | | | | | | | | | | | | | | |
| | | The DFA International | | | The Japanese Small | | | The Asia Pacific Small | |
| | | Value Series | | | Company Series | | | Company Series | |
| | | Year
Ended
Oct 31,
2022 | | | Year
Ended
Oct 31,
2021 | | | Year
Ended
Oct 31,
2022 | | | Year
Ended
Oct 31,
2021 | | | Year
Ended
Oct 31,
2022 | | | Year
Ended
Oct 31,
2021 | |
Increase (Decrease) in Net Assets | | | | | | | | | | | | | | | | | | | | | | | | |
Operations: | | | | | | | | | | | | | | | | | | | | | | | | |
Net Investment Income (Loss) | | $ | 508,688 | | | $ | 420,963 | | | $ | 74,322 | | | $ | 67,580 | | | $ | 65,743 | | | $ | 62,661 | |
Net Realized Gain (Loss) on: | | | | | | | | | | | | | | | | | | | | | | | | |
Investment Securities Sold*,** | | | 6,848 | | | | 468,390 | | | | 5,574 | | | | 106,212 | | | | 33,519 | | | | 188,465 | |
Affiliated Investment Companies Shares Sold | | | 36 | | | | (27 | ) | | | (8 | ) | | | 4 | | | | (10 | ) | | | (3 | ) |
Futures | | | (16,735 | ) | | | 29,155 | | | | — | | | | — | | | | 349 | | | | — | |
Foreign Currency Transactions | | | (13,407 | ) | | | 4,495 | | | | (5,554 | ) | | | (32 | ) | | | (731 | ) | | | (238 | ) |
Change in Unrealized Appreciation (Depreciation) of: | | | | | | | | | | | | | | | | | | | | | | | | |
Investment Securities and Foreign Currency | | | (2,198,406 | ) | | | 3,710,810 | | | | (862,888 | ) | | | 204,124 | | | | (565,107 | ) | | | 322,334 | |
Affiliated Investment Companies Shares | | | (280 | ) | | | (30 | ) | | | (32 | ) | | | (6 | ) | | | (12 | ) | | | (1 | ) |
Futures | | | 2,503 | | | | 5,251 | | | | — | | | | — | | | | — | | | | — | |
Translation of Foreign Currency-Denominated Amounts | | | (4,633 | ) | | | (1,694 | ) | | | (284 | ) | | | (657 | ) | | | (8 | ) | | | 8 | |
| | | | | | | | | | | | | | | | | | | | | | | | |
Net Increase (Decrease) in Net Assets Resulting from Operations | | | (1,715,386 | ) | | | 4,637,313 | | | | (788,870 | ) | | | 377,225 | | | | (466,257 | ) | | | 573,226 | |
| | | | | | | | | | | | | | | | | | | | | | | | |
Transactions in Interest: | | | | | | | | | | | | | | | | | | | | | | | | |
Contributions | | | 1,269,316 | | | | 152,792 | | | | 112,114 | | | | 441,236 | | | | 49,404 | | | | 105,831 | |
Withdrawals. | | | (1,324,290 | ) | | | (1,974,162 | ) | | | (219,045 | ) | | | (345,470 | ) | | | (212,093 | ) | | | (383,104 | ) |
| | | | | | | | | | | | | | | | | | | | | | | | |
Net Increase (Decrease) from Transactions in Interest | | | (54,974 | ) | | | (1,821,370 | ) | | | (106,931 | ) | | | 95,766 | | | | (162,689 | ) | | | (277,273 | ) |
| | | | | | | | | | | | | | | | | | | | | | | | |
Total Increase (Decrease) in Net Assets | | | (1,770,360 | ) | | | 2,815,943 | | | | (895,801 | ) | | | 472,991 | | | | (628,946 | ) | | | 295,953 | |
Net Assets | | | | | | | | | | | | | | | | | | | | | | | | |
Beginning of Year | | | 12,297,493 | | | | 9,481,550 | | | | 3,416,144 | | | | 2,943,153 | | | | 1,822,967 | | | | 1,527,014 | |
| | | | | | | | | | | | | | | | | | | | | | | | |
End of Year | | $ | 10,527,133 | | | $ | 12,297,493 | | | $ | 2,520,343 | | | $ | 3,416,144 | | | $ | 1,194,021 | | | $ | 1,822,967 | |
| | | | | | | | | | | | | | | | | | | | | | | | |
| * | Net of foreign capital gain taxes withheld for the fiscal year ended October 31, 2022 of $0, $0 and $0, respectively. |
| ** | Net of foreign capital gain taxes withheld for the fiscal year ended October 31, 2021 of $0, $0 and $0, respectively. |
See accompanying Notes to Financial Statements.
234
THE DFA INVESTMENT TRUST COMPANY
STATEMENTS OF CHANGES IN NET ASSETS
(Amounts in thousands)
| | | | | | | | | | | | | | | | | | | | | | | | |
| | | The United Kingdom Small | | | The Continental Small | | | The Canadian Small | |
| | | Company Series | | | Company Series | | | Company Series | |
| | | Year
Ended
Oct 31,
2022 | | | Year
Ended
Oct 31,
2021 | | | Year
Ended
Oct 31,
2022 | | | Year
Ended
Oct 31,
2021 | | | Year
Ended
Oct 31,
2022 | | | Year
Ended
Oct 31,
2021 | |
Increase (Decrease) in Net Assets | | | | | | | | | | | | | | | | | | | | | | | | |
Operations: | | | | | | | | | | | | | | | | | | | | | | | | |
Net Investment Income (Loss) | | $ | 62,067 | | | $ | 43,588 | | | $ | 153,871 | | | $ | 125,991 | | | $ | 39,942 | | | $ | 24,914 | |
Net Realized Gain (Loss) on: | | | | | | | | | | | | | | | | | | | | | | | | |
Investment Securities Sold*,** | | | (4,763 | ) | | | 99,258 | | | | 53,125 | | | | 392,015 | | | | 84,639 | | | | 167,819 | |
Affiliated Investment Companies Shares Sold | | | (3 | ) | | | 1 | | | | (59 | ) | | | 2 | | | | (66 | ) | | | (11 | ) |
Futures | | | — | | | | (120 | ) | | | — | | | | — | | | | 27 | | | | 42 | |
Foreign Currency Transactions | | | (1,687 | ) | | | 291 | | | | (2,690 | ) | | | (1,344 | ) | | | (101 | ) | | | 445 | |
Change in Unrealized Appreciation (Depreciation) of: | | | | | | | | | | | | | | | | | | | | | | | | |
Investment Securities and Foreign Currency | | | (665,322 | ) | | | 602,698 | | | | (2,054,707 | ) | | | 1,753,296 | | | | (295,189 | ) | | | 390,372 | |
Affiliated Investment Companies Shares | | | (11 | ) | | | (3 | ) | | | (130 | ) | | | (21 | ) | | | (101 | ) | | | (6 | ) |
Translation of Foreign Currency-Denominated Amounts | | | (66 | ) | | | 25 | | | | (3,148 | ) | | | (445 | ) | | | (9 | ) | | | 3 | |
| | | | | | | | | | | | | | | | | | | | | | | | |
Net Increase (Decrease) in Net Assets Resulting from Operations | | | (609,785 | ) | | | 745,738 | | | | (1,853,738 | ) | | | 2,269,494 | | | | (170,858 | ) | | | 583,578 | |
| | | | | | | | | | | | | | | | | | | | | | | | |
Transactions in Interest: | | | | | | | | | | | | | | | | | | | | | | | | |
Contributions | | | 38,338 | | | | 46,399 | | | | 179,167 | | | | 513,046 | | | | 51,681 | | | | 164,451 | |
Withdrawals | | | (157,982 | ) | | | (370,643 | ) | | | (517,971 | ) | | | (845,380 | ) | | | (117,171 | ) | | | (267,504 | ) |
| | | | | | | | | | | | | | | | | | | | | | | | |
Net Increase (Decrease) from Transactions in Interest | | | (119,644 | ) | | | (324,244 | ) | | | (338,804 | ) | | | (332,334 | ) | | | (65,490 | ) | | | (103,053 | ) |
| | | | | | | | | | | | | | | | | | | | | | | | |
Total Increase (Decrease) in Net Assets | | | (729,429 | ) | | | 421,494 | | | | (2,192,542 | ) | | | 1,937,160 | | | | (236,348 | ) | | | 480,525 | |
Net Assets | | | | | | | | | | | | | | | | | | | | | | | | |
Beginning of Year | | | 1,897,276 | | | | 1,475,782 | | | | 6,539,105 | | | | 4,601,945 | | | | 1,451,408 | | | | 970,883 | |
| | | | | | | | | | | | | | | | | | | | | | | | |
End of Year | | $ | 1,167,847 | | | $ | 1,897,276 | | | $ | 4,346,563 | | | $ | 6,539,105 | | | $ | 1,215,060 | | | $ | 1,451,408 | |
| | | | | | | | | | | | | | | | | | | | | | | | |
| * | Net of foreign capital gain taxes withheld for the fiscal year ended October 31, 2022 of $0, $0 and $0, respectively. |
| ** | Net of foreign capital gain taxes withheld for the fiscal year ended October 31, 2021 of $0, $0 and $0, respectively. |
See accompanying Notes to Financial Statements.
235
THE DFA INVESTMENT TRUST COMPANY
STATEMENTS OF CHANGES IN NET ASSETS
(Amounts in thousands)
| | | | | | | | | | | | | | | | |
| | | The Emerging Markets | | | The Emerging Markets | |
| | | Series | | | Small Cap Series | |
| | | Year
Ended
Oct 31,
2022 | | | Year
Ended
Oct 31,
2021 | | | Year
Ended
Oct 31,
2022 | | | Year
Ended
Oct 31,
2021 | |
Increase (Decrease) in Net Assets | | | | | | | | | | | | | | | | |
Operations: | | | | | | | | | | | | | | | | |
Net Investment Income (Loss) | | $ | 169,766 | | | $ | 157,220 | | | $ | 130,163 | | | $ | 134,168 | |
Net Realized Gain (Loss) on: | | | | | | | | | | | | | | | | |
Investment Securities Sold*,** | | | 37,299 | | | | 399,802 | | | | 106,869 | | | | 591,471 | |
Affiliated Investment Companies Shares Sold | | | (29 | ) | | | — | | | | (18 | ) | | | (4 | ) |
Futures | | | (15,196 | ) | | | 13,167 | | | | (6,942 | ) | | | 5,812 | |
Foreign Currency Transactions | | | (2,541 | ) | | | (3,699 | ) | | | (2,550 | ) | | | (3,794 | ) |
Change in Unrealized Appreciation (Depreciation) of: | | | | | | | | | | | | | | | | |
Investment Securities and Foreign Currency | | | (1,639,645 | ) | | | 694,801 | | | | (1,297,378 | ) | | | 925,173 | |
Affiliated Investment Companies Shares | | | (47 | ) | | | (10 | ) | | | (41 | ) | | | (6 | ) |
Futures | | | (1,197 | ) | | | (990 | ) | | | (3,235 | ) | | | (191 | ) |
Translation of Foreign Currency-Denominated Amounts | | | 8 | | | | (9 | ) | | | 80 | | | | (6 | ) |
| | | | | | | | | | | | | | | | |
Net Increase (Decrease) in Net Assets Resulting from Operations | | | (1,451,582 | ) | | | 1,260,282 | | | | (1,073,052 | ) | | | 1,652,623 | |
| | | | | | | | | | | | | | | | |
Transactions in Interest: | | | | | | | | | | | | | | | | |
Contributions | | | 434,631 | | | | 553,796 | | | | 283,303 | | | | 95,865 | |
Withdrawals | | | (1,299,951 | ) | | | (1,229,073 | ) | | | (818,051 | ) | | | (1,526,723 | ) |
| | | | | | | | | | | | | | | | |
Net Increase (Decrease) from Transactions in Interest | | | (865,320 | ) | | | (675,277 | ) | | | (534,748 | ) | | | (1,430,858 | ) |
| | | | | | | | | | | | | | | | |
Total Increase (Decrease) in Net Assets | | | (2,316,902 | ) | | | 585,005 | | | | (1,607,800 | ) | | | 221,765 | |
Net Assets | | | | | | | | | | | | | | | | |
Beginning of Year | | | 6,309,330 | | | | 5,724,325 | | | | 5,128,719 | | | | 4,906,954 | |
| | | | | | | | | | | | | | | | |
End of Year | | $ | 3,992,428 | | | $ | 6,309,330 | | | $ | 3,520,919 | | | $ | 5,128,719 | |
| | | | | | | | | | | | | | | | |
| * | Net of foreign capital gain taxes withheld for the fiscal year ended October 31, 2022 of $4,922 and $9,059, respectively. |
| ** | Net of foreign capital gain taxes withheld for the fiscal year ended October 31, 2021 of $50 and $2,309, respectively. |
See accompanying Notes to Financial Statements.
236
THE DFA INVESTMENT TRUST COMPANY
FINANCIAL HIGHLIGHTS
| | | | | | | | | | | | | | | | | | | | | | | | | | | | | | | | | | | | | | | | |
| | | The DFA International Value Series | | | The Japanese Small Company Series | |
| | | Year
Ended
Oct 31,
2022 | | | Year
Ended
Oct 31,
2021 | | | Year
Ended
Oct 31,
2020 | | | Year
Ended
Oct 31,
2019 | | | Year
Ended
Oct 31,
2018 | | | Year
Ended
Oct 31,
2022 | | | Year
Ended
Oct 31,
2021 | | | Year
Ended
Oct 31,
2020 | | | Year
Ended
Oct 31,
2019 | | | Year
Ended
Oct 31,
2018 | |
Total Return | | | (13.82 | %) | | | 51.09 | % | | | (18.68 | %) | | | 3.60 | % | | | (8.10 | %) | | | (23.60 | %) | | | 13.08 | % | | | (1.93 | %) | | | 4.47 | % | | | (7.46 | %) |
| | | | | | | | | | | | | | | | | | | | | | | | | | | | | | | | | | | | | | | | |
Net Assets, End of Year (thousands) | | $ | 10,527,133 | | | $ | 12,297,493 | | | $ | 9,481,550 | | | $ | 12,420,850 | | | $ | 12,153,340 | | | $ | 2,520,343 | | | $ | 3,416,144 | | | $ | 2,943,153 | | | $ | 3,748,177 | | | $ | 3,834,097 | |
Ratio of Expenses to Average Net Assets | | | 0.21 | % | | | 0.22 | % | | | 0.21 | % | | | 0.21 | % | | | 0.22 | % | | | 0.12 | % | | | 0.12 | % | | | 0.13 | % | | | 0.12 | % | | | 0.12 | % |
Ratio of Expenses to Average Net Assets (Excluding Fees Paid Indirectly) | | | 0.21 | % | | | 0.22 | % | | | 0.22 | % | | | 0.22 | % | | | 0.22 | % | | | 0.12 | % | | | 0.12 | % | | | 0.13 | % | | | 0.12 | % | | | 0.12 | % |
Ratio of Net Investment Income to Average Net Assets | | | 4.36 | % | | | 3.50 | % | | | 2.77 | % | | | 3.92 | % | | | 3.21 | % | | | 2.56 | % | | | 2.11 | % | | | 2.13 | % | | | 2.32 | % | | | 1.90 | % |
Portfolio Turnover Rate | | | 15 | % | | | 9 | % | | | 12 | % | | | 16 | % | | | 20 | % | | | 11 | % | | | 11 | % | | | 5 | % | | | 12 | % | | | 17 | % |
| | | | | | | | | | | | | | | | | | | | | | | | | | | | | | | | | | | | | | | | |
See page 1-2 for the Definitions of Abbreviations and Footnotes.
See accompanying Notes to Financial Statements.
237
THE DFA INVESTMENT TRUST COMPANY
FINANCIAL HIGHLIGHTS
| | | | | | | | | | | | | | | | | | | | | | | | | | | | | | | | | | | | | | | | |
| | | The Asia Pacific Small Company Series | | | The United Kingdom Small Company Series | |
| | | Year
Ended
Oct 31,
2022 | | | Year
Ended
Oct 31,
2021 | | | Year
Ended
Oct 31,
2020 | | | Year
Ended
Oct 31,
2019 | | | Year
Ended
Oct 31,
2018 | | | Year
Ended
Oct 31,
2022 | | | Year
Ended
Oct 31,
2021 | | | Year
Ended
Oct 31,
2020 | | | Year
Ended
Oct 31,
2019 | | | Year
Ended
Oct 31,
2018 | |
Total Return | | | (26.65 | %) | | | 38.31 | % | | | 0.14 | % | | | 5.27 | % | | | (8.14 | %) | | | (33.34 | %) | | | 51.93 | % | | | (14.87 | %) | | | 10.67 | % | | | (8.90 | %) |
| | | | | | | | | | | | | | | | | | | | | | | | | | | | | | | | | | | | | | | | |
Net Assets, End of Year (thousands) | | $ | 1,194,021 | | | $ | 1,822,967 | | | $ | 1,527,014 | | | $ | 1,641,843 | | | $ | 1,730,371 | | | $ | 1,167,847 | | | $ | 1,897,276 | | | $ | 1,475,782 | | | $ | 2,277,451 | | | $ | 2,188,825 | |
Ratio of Expenses to Average Net Assets | | | 0.12 | % | | | 0.12 | % | | | 0.13 | % | | | 0.13 | % | | | 0.13 | % | | | 0.11 | % | | | 0.12 | % | | | 0.12 | % | | | 0.11 | % | | | 0.11 | % |
Ratio of Expenses to Average Net Assets (Excluding Fees Paid Indirectly) | | | 0.12 | % | | | 0.12 | % | | | 0.13 | % | | | 0.13 | % | | | 0.13 | % | | | 0.11 | % | | | 0.12 | % | | | 0.12 | % | | | 0.12 | % | | | 0.11 | % |
Ratio of Net Investment Income to Average Net Assets | | | 4.23 | % | | | 3.42 | % | | | 4.21 | % | | | 4.11 | % | | | 3.96 | % | | | 4.07 | % | | | 2.27 | % | | | 2.38 | % | | | 3.43 | % | | | 3.23 | % |
Portfolio Turnover Rate | | | 19 | % | | | 19 | % | | | 18 | % | | | 18 | % | | | 18 | % | | | 14 | % | | | 12 | % | | | 9 | % | | | 18 | % | | | 14 | % |
| | | | | | | | | | | | | | | | | | | | | | | | | | | | | | | | | | | | | | | | |
See page 1-2 for the Definitions of Abbreviations and Footnotes.
See accompanying Notes to Financial Statements.
238
THE DFA INVESTMENT TRUST COMPANY
FINANCIAL HIGHLIGHTS
| | | | | | | | | | | | | | | | | | | | | | | | | | | | | | | | | | | | | | | | | | |
| | | The Continental Small Company Series | | | | | The Canadian Small Company Series | |
| | | Year | | | Year | | | Year | | | Year | | | Year | | | | | Year | | | Year | | | Year | | | Year | | | Year | |
| | | Ended | | | Ended | | | Ended | | | Ended | | | Ended | | | | | Ended | | | Ended | | | Ended | | | Ended | | | Ended | |
| | | Oct 31, | | | Oct 31, | | | Oct 31, | | | Oct 31, | | | Oct 31, | | | | | Oct 31, | | | Oct 31, | | | Oct 31, | | | Oct 31, | | | Oct 31, | |
| | | 2022 | | | 2021 | | | 2020 | | | 2019 | | | 2018 | | | | | 2022 | | | 2021 | | | 2020 | | | 2019 | | | 2018 | |
Total Return | | | (29.07 | %) | | | 51.24 | % | | | (2.23 | %) | | | 8.43 | % | | | (10.78 | %) | | | | | (12.52 | %) | | | 59.72 | % | | | 6.02 | % | | | 1.00 | % | | | (10.44 | %) |
| | | | | | | | | | | | | | | | | | | | | | | | | | | | | | | | | | | | | | | | | | |
Net Assets, End of Year (thousands) | | $ | 4,346,563 | | | $ | 6,539,105 | | | $ | 4,601,945 | | | $ | 5,607,495 | | | $ | 5,422,260 | | | | | $ | 1,215,060 | | | $ | 1,451,408 | | | $ | 970,883 | | | $ | 1,148,615 | | | $ | 1,146,811 | |
Ratio of Expenses to Average Net Assets | | | 0.13 | % | | | 0.12 | % | | | 0.12 | % | | | 0.12 | % | | | 0.12 | % | | | | | 0.11 | % | | | 0.12 | % | | | 0.12 | % | | | 0.12 | % | | | 0.12 | % |
Ratio of Expenses to Average Net Assets (Excluding Fees Paid Indirectly) | | | 0.13 | % | | | 0.12 | % | | | 0.12 | % | | | 0.13 | % | | | 0.12 | % | | | | | 0.11 | % | | | 0.12 | % | | | 0.12 | % | | | 0.12 | % | | | 0.12 | % |
Ratio of Net Investment Income to Average Net Assets | | | 2.85 | % | | | 2.11 | % | | | 2.15 | % | | | 2.74 | % | | | 2.51 | % | | | | | 3.00 | % | | | 1.90 | % | | | 2.08 | % | | | 2.37 | % | | | 2.11 | % |
Portfolio Turnover Rate | | | 11 | % | | | 17 | % | | | 8 | % | | | 17 | % | | | 15 | % | | | | | 15 | % | | | 27 | % | | | 18 | % | | | 12 | % | | | 14 | % |
| | | | | | | | | | | | | | | | | | | | | | | | | | | | | | | | | | | | | | | | | | |
See page 1-2 for the Definitions of Abbreviations and Footnotes.
See accompanying Notes to Financial Statements.
239
THE DFA INVESTMENT TRUST COMPANY
FINANCIAL HIGHLIGHTS
| | | | | | | | | | | | | | | | | | | | | | | | | | | | | | | | | | | | | | | | | | |
| | | The Emerging Markets Series | | | | | The Emerging Markets Small Cap Series | |
| | | Year | | | Year | | | Year | | | Year | | | Year | | | | | Year | | | Year | | | Year | | | Year | | | Year | |
| | | Ended | | | Ended | | | Ended | | | Ended | | | Ended | | | | | Ended | | | Ended | | | Ended | | | Ended | | | Ended | |
| | | Oct 31, | | | Oct 31, | | | Oct 31, | | | Oct 31, | | | Oct 31, | | | | | Oct 31, | | | Oct 31, | | | Oct 31, | | | Oct 31, | | | Oct 31, | |
| | | 2022 | | | 2021 | | | 2020 | | | 2019 | | | 2018 | | | | | 2022 | | | 2021 | | | 2020 | | | 2019 | | | 2018 | |
Total Return | | | (25.79 | %) | | | 22.22 | % | | | 2.67 | % | | | 11.40 | % | | | (11.83 | %) | | | | | (22.31 | %) | | | 36.03 | % | | | 1.25 | % | | | 13.47 | % | | | (16.06 | %) |
| | | | | | | | | | | | | | | | | | | | | | | | | | | | | | | | | | | | | | | | | | |
Net Assets, End of Year (thousands) | | $ | 3,992,428 | | | $ | 6,309,330 | | | $ | 5,724,325 | | | $ | 6,034,162 | | | $ | 5,469,649 | | | | | $ | 3,520,919 | | | $ | 5,128,719 | | | $ | 4,906,954 | | | $ | 6,430,367 | | | $ | 6,306,302 | |
Ratio of Expenses to Average Net Assets | | | 0.15 | % | | | 0.15 | % | | | 0.13 | % | | | 0.14 | % | | | 0.14 | % | | | | | 0.26 | % | | | 0.27 | % | | | 0.25 | % | | | 0.24 | % | | | 0.24 | % |
Ratio of Expenses to Average Net Assets (Excluding Fees Paid Indirectly) | | | 0.16 | % | | | 0.15 | % | | | 0.14 | % | | | 0.15 | % | | | 0.14 | % | | | | | 0.26 | % | | | 0.27 | % | | | 0.26 | % | | | 0.25 | % | | | 0.24 | % |
Ratio of Net Investment Income to Average Net Assets | | | 3.26 | % | | | 2.42 | % | | | 2.38 | % | | | 3.04 | % | | | 2.40 | % | | | | | 2.91 | % | | | 2.47 | % | | | 2.64 | % | | | 2.90 | % | | | 2.77 | % |
Portfolio Turnover Rate | | | 10 | % | | | 19 | % | | | 22 | % | | | 9 | % | | | 12 | % | | | | | 12 | % | | | 16 | % | | | 18 | % | | | 12 | % | | | 12 | % |
| | | | | | | | | | | | | | | | | | | | | | | | | | | | | | | | | | | | | | | | | | |
See page 1-2 for the Definitions of Abbreviations and Footnotes.
See accompanying Notes to Financial Statements.
240
THE DFA INVESTMENT TRUST COMPANY
NOTES TO FINANCIAL STATEMENTS
A. Organization:
The DFA Investment Trust Company (the “Trust”) is an open-end management investment company registered under the Investment Company Act of 1940 (the “1940 Act”), The Trust consists of ten operational portfolios, eight of which, The DFA International Value Series, The Japanese Small Company Series, The Asia Pacific Small Company Series, The United Kingdom Small Company Series, The Continental Small Company Series, The Canadian Small Company Series, The Emerging Markets Series and The Emerging Markets Small Cap Series are included in this section of the report (collectively, the “Series”). The remaining operational portfolios are presented in separate reports. The Series are investment companies, and accordingly, follow the accounting and reporting guidance under the Financial Accounting Standards Board (“FASB”) Accounting Standards Codification (“ASC”), Topic 946, “Financial Services-Investment Companies.”
B. Significant Accounting Policies:
The following significant accounting policies are in conformity with accounting principles generally accepted in the United States of America (“GAAP”). Such policies are consistently followed by the Trust in preparation of its financial statements. The preparation of financial statements in accordance with GAAP requires management to make estimates and assumptions that affect the fair value of investments, the reported amounts of assets and liabilities, the disclosure of contingent assets and liabilities at the date of the financial statements, and the reported amounts of increases and decreases in net assets from operations during the reporting period. Actual results could differ from those estimates, and those differences could be material.
1. Security Valuation: The Series use a fair value hierarchy, which prioritizes the inputs-to-valuation techniques used to measure fair value into three broad levels described below:
| | • | | Level 1 – inputs are quoted prices in active markets for identical securities (including equity securities, open-end investment companies, and futures contracts) |
| | • | | Level 2 – other significant observable inputs (including quoted prices for similar securities, interest rates, prepayment speeds, credit risk, etc.) |
| | • | | Level 3 – significant unobservable inputs (including the Series’ own assumptions in determining the fair value of investments) |
Securities held by the Series, including over-the-counter securities, are valued at the last quoted sale price of the day. International equity securities are subject to a fair value factor, as described later in this note. Securities held by the Series that are listed on Nasdaq are valued at the Nasdaq Official Closing Price (“NOCP”). If there is no last reported sale price or NOCP for the day, the Series value the securities within the range of the most recent quoted bid and ask prices. Price information on listed securities is taken from the exchange where the security is primarily traded. Generally, securities issued by open-end management investment companies are valued using their respective net asset values or public offering prices, as appropriate, for purchase orders placed at the close of the New York Stock Exchange (NYSE). These securities are generally categorized as Level 1 in the hierarchy.
Securities for which no market quotations are readily available (including restricted securities), or for which market quotations have become unreliable, are valued in good faith at fair value in accordance with Rule 2a-5 under the 1940 Act pursuant to procedures approved by the Board of Trustees of the Trust. Fair value pricing may also be used if events that have a significant effect on the value of an investment (as determined in the discretion of Dimensional Fund Advisors LP) occur before the net asset value of the Series is calculated. When fair value pricing is used, the prices of securities used by the Series may differ from the quoted or published prices for the same securities on their primary markets or exchanges. These securities are generally categorized as Level 2 or Level 3 in the hierarchy.
241
The Series will also apply a fair value price in the circumstances described below. Generally, trading in foreign securities markets is completed each day at various times prior to the close of the NYSE. For example, trading in the Japanese securities markets is completed each day at the close of the Tokyo Stock Exchange (normally, 2:00 a.m. ET), which is fourteen hours before the close of the NYSE (normally, 4:00 p.m. ET) and the time that the net asset values of the Series are computed. Due to the time differences between the closings of the relevant foreign securities exchanges and the time the Series price their shares at the close of the NYSE, the Series will fair-value their foreign investments when it is determined that the market quotations for the foreign investments are either unreliable or not readily available. The fair value prices will attempt to reflect the impact of the U.S. financial markets’ perceptions and trading activities on the Series’ foreign investments since the last closing prices of the foreign investments were calculated on their primary foreign securities markets or exchanges. For these purposes, Dimensional Fund Advisors LP has determined that movements in relevant indices or other appropriate market indicators, after the close of the Tokyo Stock Exchange or the London Stock Exchange, demonstrate that market quotations may be unreliable. Fair valuation of portfolio securities may occur on a daily basis. The fair value pricing by the Series uses data furnished by an independent pricing service (and that data draws upon, among other information, the market values of foreign investments). When a Series uses fair value pricing, the values assigned to the Series’ foreign investments may not be the quoted or published prices of the investments on their primary markets or exchanges. These securities are generally categorized as Level 2 in the hierarchy.
Futures contracts held by the Series are valued using the settlement price established each day on the exchange on which they are traded. These valuations are generally categorized as Level 1 in the hierarchy.
Over-the-counter derivative contracts, which include forward currency contracts, do not require material subjectivity as pricing inputs are observed from quoted markets and are categorized as Level 2 in the hierarchy.
A summary of the inputs used to value the Series’ investments by each major security type, industry and/or country is disclosed previously in this note. Valuation hierarchy tables have been included at the end of the Summary Schedules of Portfolio Holdings. The methodology or inputs used for valuing securities are not necessarily an indication of the risk associated with investing in those securities.
2. Foreign Currency Translation: Securities and other assets and liabilities of the Series, whose values are initially expressed in foreign currencies are translated to U.S. dollars using the mean between the most recent bid and ask prices for the U.S. dollar as quoted by generally recognized reliable sources. To facilitate the translation, the Series enter into foreign currency contracts. A foreign currency contract is a spot agreement between two parties to buy and sell currencies at current market exchange rates, for settlement generally within two business days. Dividend and interest income and certain expenses are translated to U.S. dollars at the rate of exchange on their respective accrual dates. Receivables and payables denominated in foreign currencies are marked-to-market daily based on daily exchange rates and exchange gains or losses are realized upon ultimate receipt or disbursement.
The Series do not isolate the effect of foreign currency rate fluctuations when determining the realized gain or loss upon the sale or maturity of foreign currency-denominated debt obligations pursuant to U.S. Federal income tax regulations; such amounts are categorized as foreign exchange gain or loss for income tax reporting purposes.
Realized gains or losses on foreign currency transactions represent net foreign exchange gains or losses from the disposition of foreign currencies, currency gains or losses realized between the trade and settlement dates of securities transactions, and the difference between amounts of interest, dividends and any foreign withholding taxes recorded on the books of the Series and the U.S. dollar equivalent amounts actually received or paid.
3. Deferred Compensation Plan: Each eligible Trustee of the Trust may elect to participate in the Fee Deferral Plan for Independent Directors and Trustees (the “Plan”). Under the Plan, effective January 1, 2002, such Trustees may defer payment of all or a portion of their total fees earned as a Trustee. These deferred amounts may be treated as though such amounts had been invested in shares of the following funds: the U.S. Large Cap Value Portfolio, U.S. Core Equity 1 Portfolio, U.S. Large Company Portfolio, U.S. Vector Equity Portfolio, U.S. Micro Cap Portfolio, DFA International Value Portfolio, International Core Equity Portfolio, Emerging Markets Portfolio, Emerging Markets Core Equity Portfolio, DFA Inflation-Protected Securities Portfolio, and/or DFA Two-Year Global Fixed Income Portfolio. Contributions made under the Plan and the change in unrealized appreciation (depreciation) and income are included in Directors’/ Trustees’ Fees & Expenses.
242
The Trustees may receive their distributions of proceeds by one of the following methods: lump sum, annual installments over a period of agreed-upon years, or quarterly installments over a period of agreed-upon years. Each Trustee shall have the right in a notice of election (the “Notice”) to defer the receipt of the Trustee’s deferred compensation until a date specified by such Trustee in the Notice. The date may not be sooner than the earlier of: (i) the first business day of January following the year in which such Trustee ceases to be a member of the Board of Trustees of the Trust; and (ii) five years following the effective date of the Trustee’s first deferral election. If a Trustee who elects to defer fees fails to designate in the Notice a time or date as of which payment of the Trustee’s deferred fee account shall commence, payment of such amount shall commence as of the first business day of January following the year in which the Trustee ceases to be a member of the Board (unless the Trustee files an amended Notice selecting a different distribution date).
4. Other: Security transactions are accounted for as of the trade date. Costs used in determining realized gains and losses on the sale of investment securities and foreign currency are accounted for on the basis of identified cost. Dividend income and distributions to shareholders are recorded on the ex-dividend date. Distributions received on securities and that represent a return of capital or capital gains are recorded as a reduction of cost of investments or as a realized gain, respectively. The Series estimate the character of received distributions that may be considered return of capital distributions. Interest income is recorded on an accrual basis. Discount and premium on securities purchased are amortized over the lives of the respective securities, using the effective interest method. Expenses directly attributable to a Series are directly charged. Common expenses of the Trust or Series are allocated using methods approved by the Board of Trustees, generally based on average net assets.
The Series may be subject to taxes imposed by countries in which they invest with respect to their investments in issuers existing or operating in such countries. Such taxes are generally based on income earned or repatriated and capital gains realized on the sale of such investments. The Series accrue such taxes when the related income or capital gains are earned or throughout the holding period. Some countries require governmental approval for the repatriation of investment income, capital or the proceeds of sales earned by foreign investors. Additionally, if there is a deterioration in a country’s balance of payments or for other reasons, a country may impose temporary restrictions on foreign capital remittances abroad.
The Emerging Markets Series and The Emerging Markets Small Cap Series are subject to tax on short-term and long-term capital gains for investments in India. Such taxes are accrued on a daily basis and due upon sale of individual securities.
C. Investment Advisor:
The Advisor, Dimensional Fund Advisors LP, provides investment management services to the Series. For the year ended October 31, 2022, investment management fees were accrued daily and paid monthly to the Advisor based on the following effective annual rates of average daily net assets:
| | | | |
The DFA International Value Series | | | 0.20 | % |
The Japanese Small Company Series | | | 0.10 | % |
The Asia Pacific Small Company Series | | | 0.10 | % |
The United Kingdom Small Company Series | | | 0.10 | % |
The Continental Small Company Series | | | 0.10 | % |
The Canadian Small Company Series | | | 0.10 | % |
The Emerging Markets Series | | | 0.10 | % |
The Emerging Markets Small Cap Series | | | 0.20 | % |
243
Earned Income Credit:
Additionally, the Series have entered into arrangements with their custodian whereby net interest earned on uninvested cash balances was used to reduce a portion of the Series’ custody expenses. Custody expense in the accompanying financial statements is presented before reduction for credits. The impact of such credits is generally less than one basis point of each Series’ net assets. During the year ended October 31, 2022, expenses reduced were as follows (amounts in thousands):
| | | | |
| | | Fees Paid
Indirectly | |
The DFA International Value Series | | $ | 373 | |
The Japanese Small Company Series | | | 23 | |
The Asia Pacific Small Company Series | | | 5 | |
The United Kingdom Small Company Series | | | 12 | |
The Continental Small Company Series | | | 29 | |
The Canadian Small Company Series | | | 9 | |
The Emerging Markets Series | | | 124 | |
The Emerging Markets Small Cap Series | | | 98 | |
Fees Paid to Officers and Directors/Trustees:
Certain Officers and Trustees of the Advisor are also Officers and Trustees of the Trust; however, such Officers and Trustees (with the exception of the Chief Compliance Officer (“CCO”)) receive no compensation from the Trust. For the year ended October 31, 2022, the total related amounts paid by the Trust to the CCO were $28 (in thousands). The total related amounts paid by each of the Series are included in Other Expenses on the Statements of Operations.
D. Deferred Compensation:
As of October 31, 2022, the total liability for deferred compensation to Trustees is included in Accrued Expenses and Other Liabilities on the Statements of Assets and Liabilities as follows (amounts in thousands):
| | | | |
The DFA International Value Series | | $ | 132 | |
The Japanese Small Company Series | | | 35 | |
The Asia Pacific Small Company Series | | | 16 | |
The United Kingdom Small Company Series | | | 23 | |
The Continental Small Company Series | | | 25 | |
The Canadian Small Company Series | | | 7 | |
The Emerging Markets Series | | | 54 | |
The Emerging Markets Small Cap Series | | | 48 | |
E. Purchases and Sales of Securities:
For the year ended October 31, 2022, the Series’ transactions related to investment securities, other than short-term securities, in-kind redemptions and U.S. Government securities (amounts in thousands), were as follows:
| | | | | | | | |
| | | Purchases | | | Sales | |
The DFA International Value Series | | $ | 2,114,747 | | | $ | 1,740,164 | |
The Japanese Small Company Series | | $ | 321,472 | | | $ | 359,611 | |
The Asia Pacific Small Company Series | | $ | 291,315 | | | $ | 329,566 | |
The United Kingdom Small Company Series | | $ | 224,491 | | | $ | 206,460 | |
The Continental Small Company Series | | $ | 577,020 | | | $ | 760,337 | |
The Canadian Small Company Series | | $ | 206,110 | | | $ | 202,538 | |
244
| | | | | | | | |
| | | Purchases | | | Sales | |
The Emerging Markets Series | | $ | 518,861 | | | $ | 1,244,835 | |
The Emerging Markets Small Cap Series | | $ | 533,168 | | | $ | 954,259 | |
There were no purchases or sales of long-term U.S. government securities.
For the year ended October 31, 2022, transactions related to Affiliated Investment Companies, excluding in-kind redemptions, are presented below.
The amounts presented below may differ from the respective amounts presented in the corresponding Summary Schedule of Portfolio Holdings, Statement of Assets and Liabilities or Statement of Operations due to rounding. The amounts are as follows (amounts in thousands):
| | | | | | | | | | | | | | | | | | | | | | | | | | | | | | | | | | | | |
| | | Balance at
October 31, 2021 | | | Purchases
at Cost | | | Proceeds
from Sales | | | Net Realized
Gain/(Loss)
on Sales | | | Change in
Unrealized
Appreciation/
Depreciation | | | Balance at
October 31, 2022 | | | Shares as of
October 31, 2022 | | | Dividend
Income | | | Capital Gain
Distributions | |
The DFA International Value Series | | | | | | | | | | | | | | | | | | | | | | | | | | | | | | | | | | | | |
The DFA Short Term Investment Fund | | $ | 495,353 | | | $ | 4,952,552 | | | $ | 4,964,808 | | | $ | 36 | | | $ | (280 | ) | | $ | 482,853 | | | | 41,766 | | | $ | 5,866 | | | | — | |
| | | | | | | | | | | | | | | | | | | | | | | | | | | | | | | | | | | | |
Total | | $ | 495,353 | | | $ | 4,952,552 | | | $ | 4,964,808 | | | $ | 36 | | | $ | (280 | ) | | $ | 482,853 | | | | 41,766 | | | $ | 5,866 | | | | — | |
| | | | | | | | | | | | | | | | | | | | | | | | | | | | | | | | | | | | |
The Japanese Small Company Series | | | | | | | | | | | | | | | | | | | | | | | | | | | | | | | | | | | | |
The DFA Short Term Investment Fund | | $ | 61,490 | | | $ | 427,535 | | | $ | 433,440 | | | $ | (8 | ) | | $ | (32 | ) | | $ | 55,545 | | | | 4,805 | | | $ | 583 | | | | — | |
| | | | | | | | | | | | | | | | | | | | | | | | | | | | | | | | | | | | |
Total | | $ | 61,490 | | | $ | 427,535 | | | $ | 433,440 | | | $ | (8 | ) | | $ | (32 | ) | | $ | 55,545 | | | | 4,805 | | | $ | 583 | | | | — | |
| | | | | | | | | | | | | | | | | | | | | | | | | | | | | | | | | | | | |
The Asia Pacific Small Company Series | | | | | | | | | | | | | | | | | | | | | | | | | | | | | | | | | | | | |
The DFA Short Term Investment Fund | | $ | 40,607 | | | $ | 119,787 | | | $ | 143,067 | | | $ | (10 | ) | | $ | (12 | ) | | $ | 17,305 | | | | 1,497 | | | $ | 213 | | | | — | |
| | | | | | | | | | | | | | | | | | | | | | | | | | | | | | | | | | | | |
Total | | $ | 40,607 | | | $ | 119,787 | | | $ | 143,067 | | | $ | (10 | ) | | $ | (12 | ) | | $ | 17,305 | | | | 1,497 | | | $ | 213 | | | | — | |
| | | | | | | | | | | | | | | | | | | | | | | | | | | | | | | | | | | | |
The United Kingdom Small Company Series | | | | | | | | | | | | | | | | | | | | | | | | | | | | | | | | | | | | |
The DFA Short Term Investment Fund | | $ | 15,631 | | | $ | 98,187 | | | $ | 84,336 | | | $ | (3 | ) | | $ | (11 | ) | | $ | 29,468 | | | | 2,549 | | | $ | 151 | | | | — | |
| | | | | | | | | | | | | | | | | | | | | | | | | | | | | | | | | | | | |
Total | | $ | 15,631 | | | $ | 98,187 | | | $ | 84,336 | | | $ | (3 | ) | | $ | (11 | ) | | $ | 29,468 | | | | 2,549 | | | $ | 151 | | | | — | |
| | | | | | | | | | | | | | | | | | | | | | | | | | | | | | | | | | | | |
The Continental Small Company Series | | | | | | | | | | | | | | | | | | | | | | | | | | | | | | | | | | | | |
The DFA Short Term Investment Fund | | $ | 297,271 | | | $ | 1,289,178 | | | $ | 1,329,740 | | | $ | (59 | ) | | $ | (130 | ) | | $ | 256,520 | | | | 22,188 | | | $ | 3,144 | | | | — | |
| | | | | | | | | | | | | | | | | | | | | | | | | | | | | | | | | | | | |
Total | | $ | 297,271 | | | $ | 1,289,178 | | | $ | 1,329,740 | | | $ | (59 | ) | | $ | (130 | ) | | $ | 256,520 | | | | 22,188 | | | $ | 3,144 | | | | — | |
| | | | | | | | | | | | | | | | | | | | | | | | | | | | | | | | | | | | |
The Canadian Small Company Series | | | | | | | | | | | | | | | | | | | | | | | | | | | | | | | | | | | | |
The DFA Short Term Investment Fund | | $ | 276,415 | | | $ | 770,364 | | | $ | 846,890 | | | $ | (66 | ) | | $ | (101 | ) | | $ | 199,722 | | | | 17,275 | | | $ | 2,371 | | | | — | |
| | | | | | | | | | | | | | | | | | | | | | | | | | | | | | | | | | | | |
Total | | $ | 276,415 | | | $ | 770,364 | | | $ | 846,890 | | | $ | (66 | ) | | $ | (101 | ) | | $ | 199,722 | | | | 17,275 | | | $ | 2,371 | | | | — | |
| | | | | | | | | | | | | | | | | | | | | | | | | | | | | | | | | | | | |
245
| | | | | | | | | | | | | | | | | | | | | | | | | | | | | | | | | | | | |
| | | Balance at
October 31, 2021 | | | Purchases
at Cost | | | Proceeds
from Sales | | | Net Realized
Gain/(Loss)
on Sales | | | Change in
Unrealized
Appreciation/
Depreciation | | | Balance at
October 31, 2022 | | | Shares as of
October 31, 2022 | | | Dividend
Income | | | Capital Gain
Distributions | |
The Emerging Markets Series | | | | | | | | | | | | | | | | | | | | | | | | | | | | | | | | | | | | |
The DFA Short Term Investment Fund | | $ | 107,885 | | | $ | 645,325 | | | $ | 646,395 | | | $ | (29 | ) | | $ | (47 | ) | | $ | 106,739 | | | | 9,233 | | | $ | 921 | | | | — | |
| | | | | | | | | | | | | | | | | | | | | | | | | | | | | | | | | | | | |
Total | | $ | 107,885 | | | $ | 645,325 | | | $ | 646,395 | | | $ | (29 | ) | | $ | (47 | ) | | $ | 106,739 | | | | 9,233 | | | $ | 921 | | | | — | |
| | | | | | | | | | | | | | | | | | | | | | | | | | | | | | | | | | | | |
The Emerging Markets Small Cap Series | | | | | | | | | | | | | | | | | | | | | | | | | | | | | | | | | | | | |
The DFA Short Term Investment Fund | | $ | 143,180 | | | $ | 360,713 | | | $ | 437,862 | | | $ | (18 | ) | | $ | (41 | ) | | $ | 65,972 | | | | 5,706 | | | $ | 752 | | | | — | |
| | | | | | | | | | | | | | | | | | | | | | | | | | | | | | | | | | | | |
Total | | $ | 143,180 | | | $ | 360,713 | | | $ | 437,862 | | | $ | (18 | ) | | $ | (41 | ) | | $ | 65,972 | | | | 5,706 | | | $ | 752 | | | | — | |
| | | | | | | | | | | | | | | | | | | | | | | | | | | | | | | | | | | | |
F. Federal Income Taxes:
No provision for federal income taxes is required since the Series are treated as partnerships for federal income tax purposes. Any net investment income and realized and unrealized gains and losses have been deemed to have been “passed down” to their respective partners.
As of October 31, 2022, the total cost and aggregate gross unrealized appreciation (depreciation) of securities for federal income tax purposes were different from amounts reported for financial reporting purposes, as follows (amounts in thousands):
| | | | | | | | | | | | | | | | |
| | | Federal
Tax Cost | | | Unrealized
Appreciation | | | Unrealized
(Depreciation) | | | Net
Unrealized
Appreciation
(Depreciation) | |
The DFA International Value Series | | $ | 11,067,112 | | | $ | 1,350,477 | | | $ | (1,657,729 | ) | | $ | (307,252 | ) |
The Japanese Small Company Series | | | 2,969,111 | | | | 334,789 | | | | (755,354 | ) | | | (420,565 | ) |
The Asia Pacific Small Company Series | | | 1,584,563 | | | | 177,560 | | | | (554,270 | ) | | | (376,710 | ) |
The United Kingdom Small Company Series | | | 1,439,003 | | | | 187,762 | | | | (436,759 | ) | | | (248,997 | ) |
The Continental Small Company Series | | | 4,686,399 | | | | 958,768 | | | | (1,075,569 | ) | | | (116,801 | ) |
The Canadian Small Company Series | | | 1,365,752 | | | | 287,544 | | | | (240,639 | ) | | | 46,905 | |
The Emerging Markets Series | | | 3,186,275 | | | | 1,471,582 | | | | (586,954 | ) | | | 884,628 | |
The Emerging Markets Small Cap Series | | | 3,797,243 | | | | 964,553 | | | | (1,186,305 | ) | | | (221,752 | ) |
The difference between GAAP-basis and tax-basis unrealized gains (losses) can occur as a result of wash sales and net mark-to-market gains (losses) on regulated futures contracts, net mark-to-market gains (losses) on foreign currency contracts, and differences in the tax treatment of passive foreign investment company investments or other investments.
ASC 740 Accounting for Uncertainty in Income Taxes sets forth a minimum threshold for financial statement recognition of the benefit of a tax position taken or expected to be taken in a tax return. Management has analyzed the Series’ tax positions and has concluded that no additional provision for income tax is required in any Series’ financial statements. The Series are not aware of any tax positions for which it is more likely than not that the total amounts of unrecognized tax benefits will significantly change in the next twelve months. The Series’ federal tax returns for the prior three fiscal years remain subject to examination by the Internal Revenue Service.
246
G. Financial Instruments:
In accordance with the Series’ investment objectives and policies, the Series may invest in certain financial instruments that have off-balance sheet risk in excess of the amounts recognized in the financial statements and concentrations of credit and market risk. These instruments and their significant corresponding risks are described below:
1. Foreign Market Risks: Investments in foreign markets may involve certain considerations and risks not typically associated with investments in the United States of America, including the possibility of future political and economic developments and the level of foreign governmental supervision and regulation of foreign securities markets. These markets are generally smaller, less liquid and more volatile than the major securities markets in the United States of America. Consequently, acquisition and disposition of international securities held by the Series may be inhibited.
Series that have significant exposure to certain countries, such as The United Kingdom Small Company Series that concentrates investments in the United Kingdom, can be expected to be impacted by the political and economic conditions within such countries. For example, there is continuing uncertainty around the future of the euro and the European Union (EU) following the United Kingdom’s (UK) exit from the EU (referred to as “Brexit”). Brexit may cause greater market volatility and illiquidity, currency fluctuations, deterioration in economic activity, a decrease in business confidence, and increased likelihood of a recession in the UK. While it is not possible to determine the precise impact these events may have on the Series, during this period and beyond, the impact on the UK, EU countries, other countries or parties that transact with the UK and EU, and the broader global economy could be significant and could adversely affect the value and liquidity of the Series’ investments.
Derivative Financial Instruments:
Summarized below are the specific types of derivative instruments used by the Series.
2. Futures Contracts: The Series listed below may purchase or sell futures contracts and options on futures contracts for equity securities and indices to increase or decrease market exposure based on actual or expected cash inflows to or outflows from the Series. Upon entering into a futures contract, a Series deposits cash or pledges U.S. Government securities to a broker in an amount equal to the minimum “initial margin” requirements of the exchange on which the contract is traded. Subsequent payments are received from or paid to the broker each day, based on the daily fluctuation in the market value of the contract. These receipts or payments are known as “variation margin” and are recorded daily by the Series as unrealized gains or losses until the contracts are closed. When the contracts are closed, the Series records a realized gain or loss, which is presented in the Statements of Operations as a net realized gain or loss on futures, equal to the difference between the value of the contract at the time it was opened and the value at the time it was closed.
Risks may arise upon entrance into futures contracts from potential imperfect price correlations between the futures contracts and the underlying securities, from the possibility of an illiquid secondary market for these instruments and from the possibility that the Series could lose more than the initial margin requirements. Entering into stock index futures subjects the Series to equity price risk from those futures contracts. Counterparty credit risk related to exchange-traded futures is minimal because the exchange’s clearinghouse, as counterparty to all exchange-traded futures, guarantees the futures against default.
Securities have been segregated as collateral for open futures contracts.
The average volume (based on the open positions at each fiscal month-end) of derivative activity for the year ended October 31, 2022 was as follows (amounts in thousands):
| | | | |
| | | Futures* | |
The DFA International Value Series | | $ | 121,433 | |
The Asia Pacific Small Company Series | | | 1,325 | |
The Canadian Small Company Series | | | 734 | |
The Emerging Markets Series | | | 32,655 | |
The Emerging Markets Small Cap Series | | | 35,294 | |
| * | Average Notional Value of futures contracts. |
247
The following is a summary of the Series’ derivative instrument holdings categorized by primary risk exposure as of October 31, 2022 (amounts in thousands):
| | | | | | | | |
| | | Asset Derivatives Value | |
| | | Total Value
at
October 31, 2022 | | | Equity
Contracts *,(1) | |
The DFA International Value Series | | $ | 5,518 | | | $ | 5,518 | |
The Emerging Markets Series | | | 232 | | | | 232 | |
| |
| | | Liability Derivatives Value | |
| | | Total Value
at
October 31, 2022 | | | Equity
Contracts *,(2) | |
The Emerging Markets Series | | $ | (2,381 | ) | | $ | (2,381 | ) |
The Emerging Markets Small Cap Series | | | (3,181 | ) | | | (3,181 | ) |
| (1) | Presented on Statements of Assets and Liabilities as Receivables: Futures Margin Variation. |
| (2) | Presented on Statements of Assets and Liabilities as Payables: Futures Margin Variation. |
| * | Includes cumulative appreciation (depreciation) of futures contracts. Only current day’s margin variation is reported within the Statements of Assets and Liabilities. |
The following is a summary of the realized and change in unrealized gains and losses from the Series’ derivative instrument holdings categorized by primary risk exposure for the year ended October 31, 2022 (amounts in thousands):
| | | | | | | | |
| | | Realized Gain (Loss) on
Derivatives | |
| | | Total | | | Equity
Contracts (1) | |
The DFA International Value Series | | $ | (16,735 | ) | | $ | (16,735 | ) |
The Asia Pacific Small Company Series | | | 349 | | | | 349 | * |
The Canadian Small Company Series | | | 27 | | | | 27 | * |
The Emerging Markets Series | | | (15,196 | ) | | | (15,196 | ) |
The Emerging Markets Small Cap Series | | | (6,942 | ) | | | (6,942 | ) |
| | | | | | | | |
| | | Change in Unrealized Appreciation
(Depreciation) on Derivatives | |
| | | Total | | | Equity
Contracts (2) | |
The DFA International Value Series | | $ | 2,503 | | | $ | 2,503 | |
The Emerging Markets Series | | | (1,197 | ) | | | (1,197 | ) |
The Emerging Markets Small Cap Series | | | (3,235 | ) | | | (3,235 | ) |
| (1) | Presented on Statements of Operations as Net Realized Gain (Loss) on: Futures. |
| (2) | Presented on Statements of Operations as Change in Unrealized Appreciation (Depreciation) of: Futures. |
| * | As of October 31, 2022, there were no futures contracts outstanding. During the year ended October 31, 2022, the Series had limited activity in futures contracts. |
248
H. Line of Credit and Interfund Lending Program:
The Trust, together with other Dimensional-advised portfolios, has entered into a $500 million uncommitted, unsecured discretionary line of credit effective April 6, 2022, with its domestic custodian bank. A line of credit with similar terms was in effect through April 6, 2022. Each portfolio is permitted to borrow, subject to its investment limitations, up to a maximum of $250 million, as long as total borrowings under the line of credit do not exceed $500 million in the aggregate. Borrowings under the line of credit are charged interest at rates agreed upon by the parties at the time of borrowing. Each portfolio is individually, and not jointly, liable for its particular advances under the line of credit. There is no commitment fee on the unused portion of the line of credit. The agreement for the discretionary line of credit may be terminated by either party at any time. The agreement for the line of credit expires on April 5, 2023.
The Trust, together with other Dimensional-advised portfolios, has also entered into an additional $700 million unsecured line of credit with its international custodian bank effective January 2, 2022. A line of credit with similar terms was in effect through January 1, 2022. Each portfolio is permitted to borrow, subject to its investment limitations, up to the lower of one-quarter of such portfolio’s net assets or $500 million, as long as total borrowings under the line of credit do not exceed $700 million in the aggregate. Each portfolio is individually, and not jointly, liable for its particular advances under the line of credit. Borrowings under the line of credit are charged interest at rates agreed upon by the parties at the time of borrowing. There is no commitment fee on the unused portion of the line of credit. The agreement for the discretionary line of credit may be terminated by either party at any time. The line of credit agreement expires on January 1, 2023.
For the year ended October 31, 2022, borrowings by the following Series under the lines of credit were as follows (amounts in thousands, except percentages and days):
| | | | | | | | | | | | | | | | | | | | | | | | |
| | | Weighted
Average
Interest Rate | | | Weighted
Average
Loan Balance | | | Number of
Days
Outstanding* | | | Interest
Expense
Incurred | | | Maximum Amount
Borrowed During
the Period | | | Outstanding
Borrowings
as of 10/31/2022 | |
The DFA International Value Series | | | 1.84 | % | | $ | 6,495 | | | | 20 | | | $ | 6 | | | $ | 34,971 | | | | — | |
The Japanese Small Company Series | | | 1.72 | % | | | 1,701 | | | | 18 | | | | 2 | | | | 11,233 | | | | — | |
The Asia Pacific Small Company Series | | | 2.09 | % | | | 862 | | | | 48 | | | | 3 | | | | 15,068 | | | | — | |
The United Kingdom Small Company Series | | | 1.03 | % | | | 913 | | | | 27 | | | | 1 | | | | 3,521 | | | | — | |
The Continental Small Company Series | | | 2.20 | % | | | 3,006 | | | | 30 | | | | 7 | | | | 11,952 | | | | — | |
The Canadian Small Company Series | | | 1.04 | % | | | 89 | | | | 14 | | | | — | | | | 428 | | | | — | |
The Emerging Markets Series | | | 1.80 | % | | | 6,505 | | | | 25 | | | | 5 | | | | 16,316 | | | | — | |
The Emerging Markets Small Cap Series | | | 1.83 | % | | | 2,622 | | | | 6 | | | | 1 | | | | 8,774 | | | | — | |
| * | Number of Days Outstanding represents the total of single or consecutive days during the year ended October 31, 2022, that the Series’ available line of credit was used. |
249
Pursuant to an exemptive order issued by the SEC (the “Order”), the Series may participate in an interfund lending program among certain portfolios managed by the Advisor (portfolios that operate as feeder funds do not participate in the program). The program allows the participating portfolios to borrow money from and loan money to each other for temporary or emergency purposes, subject to the conditions in the Order. A loan can only be made through the program if the interfund loan rate on that day is more favorable to both the borrowing and lending portfolios as compared to rates available through short-term bank loans or investments in overnight repurchase agreements and money market funds, respectively, as detailed in the Order. Further, a portfolio may participate in the program only if and to the extent that such participation is consistent with its investment objectives and limitations. Interfund loans have a maximum duration of seven days and may be called on one business day’s notice.
For the year ended October 31, 2022, activity by the Series under the interfund lending program was as follows (amounts in thousands, except percentages and days):
| | | | | | | | | | | | | | | | | | | | | | | | | | | | |
| | | Borrower or
Lender | | | Weighted
Average
Interest Rate | | | Weighted
Average Loan
Balance | | | Number of
Days
Outstanding* | | | Interest
Expense/
Income | | | Maximum Amount
Borrowed/Loaned
During the Period | | | Outstanding
Borrowings
as of 10/31/2022 | |
The DFA International Value Series | | | Borrower | | | | 0.44 | % | | $ | 49,829 | | | | 1 | | | $ | 1 | | | $ | 49,829 | | | | — | |
The Emerging Markets Series | | | Borrower | | | | 0.69 | % | | | 123,189 | | | | 6 | | | | 14 | | | | 147,127 | | | | — | |
| * | Number of Days Outstanding represents the total of single or consecutive days during the year ended October 31, 2022 that the Series utilized the interfund lending program. |
I. Affiliated Trades:
Cross trades for the year ended October 31, 2022, if any, were executed by the Series pursuant to procedures adopted by the Board of Trustees of the Trust to ensure compliance with Rule 17a-7 under the 1940 Act. Cross trading is the buying or selling of portfolio securities between series of investment companies, or between a series of an investment company and another entity, that are or could be considered affiliates by virtue of a common investment advisor (or affiliated investment advisors), common Trustees and/or common Officers. At its regularly scheduled meetings, the CCO certifies to the Board that the 17a-7 transactions entered into by the Series complied with the Rule 17a-7 Procedures adopted by the Board of Trustees of the Trust.
For the year ended October 31, 2022, cross trades by the Series under Rule 17a-7 were as follows (amounts in thousands):
| | | | | | | | | | | | |
Series | | Purchases | | | Sales | | | Realized Gain (Loss) | |
The DFA International Value Series | | $ | 225,947 | | | $ | 77,938 | | | $ | (18,829 | ) |
The Japanese Small Company Series | | | 42,494 | | | | 31,791 | | | | (2,373 | ) |
The Asia Pacific Small Company Series | | | 14,105 | | | | 30,116 | | | | 2,231 | |
The United Kingdom Small Company Series | | | 32,010 | | | | 19,557 | | | | 3,055 | |
The Continental Small Company Series | | | 31,836 | | | | 62,380 | | | | 12,864 | |
The Canadian Small Company Series | | | 24,172 | | | | 33,685 | | | | 10,646 | |
The Emerging Markets Series | | | 6,156 | | | | 2,559 | | | | (198 | ) |
The Emerging Markets Small Cap Series | | | 116 | | | | 11,364 | | | | (397 | ) |
250
J. Securities Lending:
As of October 31, 2022, each Series had securities on loan to brokers/dealers, for which each such Series received cash collateral. The Series also received non-cash collateral consisting of short- and/or long-term U.S. Treasuries and U.S. government agency securities as follows (amounts in thousands):
| | | | |
| | | Non-Cash
Collateral
Market
Value | |
The DFA International Value Series | | $ | 74,049 | |
The Japanese Small Company Series | | | 86,329 | |
The Asia Pacific Small Company Series | | | 102,694 | |
The Continental Small Company Series | | | 217 | |
The Canadian Small Company Series | | | 22,524 | |
The Emerging Markets Series | | | 84,911 | |
The Emerging Markets Small Cap Series | | | 227,524 | |
Each Series invests the cash collateral, as described below, and records a liability for the return of the collateral, during the period the securities are on loan. Loans of securities are expected at all times to be secured by collateral in an amount (i) equal to at least 100% of the current market value of the loaned securities with respect to securities of the U.S. government or its agencies, (ii) generally equal to 102% of the current market value of the loaned securities with respect to U.S. securities, and (iii) generally equal to 105% of the current market value of the loaned securities with respect to foreign securities. However, daily market fluctuations could cause the Series’ collateral to be lower or higher than the expected thresholds. If this were to occur, the collateral would be adjusted the next business day to ensure adequate collateralization. In the event of default or bankruptcy by the other party to the agreement, realization and/or retention of the collateral may be subject to legal proceedings. If the borrower fails to return loaned securities, cash collateral being maintained by the borrower is insufficient to cover the value of loaned securities, and such collateral insufficiency is not the result of investment losses, the lending agent has agreed to pay the amount of the shortfall to the Series or, at the option of the lending agent, to replace the securities. In the event of the bankruptcy of the borrower, the Series could experience delay in recovering the loaned securities or only recover cash or a security of equivalent value.
Subject to their stated investment policies, each Series will generally invest the cash collateral received for the loaned securities in The DFA Short Term Investment Fund (the “Money Market Series”), an affiliated registered money market fund advised by the Advisor for which the Advisor receives a management fee of 0.05% of the average daily net assets of the Money Market Series. Income received from the Money Market Series is netted with fees for securities lending and collateral investment expenses and with other payments to and from borrowers of securities. The Series also may invest the cash collateral received for the loaned securities in securities of the U.S. government or its agencies, repurchase agreements collateralized by securities of the U.S. government or its agencies, and affiliated or unaffiliated money market funds that are registered or unregistered. For purposes of this paragraph, agencies include both agency debentures and agency mortgage-backed securities. Additionally, each Series will be able to terminate the loan at any time and will receive reasonable interest on the loan, as well as amounts equal to any dividends, interest or, other distributions on the loaned securities. However, dividend income received from loaned securities may not be eligible for taxation at qualified dividend income rates.
251
The following table reflects a breakdown of transactions accounted for as secured borrowings, the gross obligation by the type of collateral pledged, and the remaining contractual maturity of those transactions as of October 31, 2022 (amounts in thousands):
| | | | | | | | | | | | | | | | | | | | |
| | | Remaining Contractual Maturity of the Agreements
As of October 31, 2022 | |
| | | Overnight and
Continuous | | | <30 days | | | Between
30 & 90 days | | | >90 days | | | Total | |
Securities Lending Transactions | | | | | | | | | | | | | | | | | | | | |
The DFA International Value Series Common Stocks | | $ | 486,408 | | | | — | | | | — | | | | — | | | $ | 486,408 | |
The Japanese Small Company Series Common Stocks | | | 56,630 | | | | — | | | | — | | | | — | | | | 56,630 | |
The Asia Pacific Small Company Series Common Stocks | | | 17,192 | | | | — | | | | — | | | | — | | | | 17,192 | |
The United Kingdom Small Company Series Common Stocks | | | 29,920 | | | | — | | | | — | | | | — | | | | 29,920 | |
The Continental Small Company Series Common Stocks, Rights/Warrants | | | 267,759 | | | | — | | | | — | | | | — | | | | 267,759 | |
The Canadian Small Company Series Common Stocks, Rights/Warrants | | | 222,227 | | | | — | | | | — | | | | — | | | | 222,227 | |
The Emerging Markets Series Common Stocks | | | 91,531 | | | | — | | | | — | | | | — | | | | 91,531 | |
The Emerging Markets Small Cap Series Common Stocks | | | 67,037 | | | | — | | | | — | | | | — | | | | 67,037 | |
K. Indemnitees; Contractual Obligations:
Under the Trust’s organizational documents, its Officers and Trustees are indemnified against certain liabilities arising out of the performance of their duties to the Trust.
In the normal course of business, the Trust enters into contracts that contain a variety of representations and warranties that provide general indemnification. The Trust’s maximum exposure under these arrangements is unknown, as this would involve future claims that may be made against the Trust and/or its affiliates that have not yet occurred. However, based on experience, the Trust expects the risk of loss to be remote.
L. Recently Issued Accounting Standards and Regulations:
In March 2020, the Financial Accounting Standards Board (FASB) issued Accounting Standards Update (ASU) No. 2020-04, Reference Rate Reform (Topic 848) – Facilitation of the Effects of Reference Rate Reform on Financial Reporting. In January 2021, the FASB issued ASU No. 2021-01, with further amendments to Topic 848. The amendments in the ASUs provide optional temporary accounting recognition and financial reporting relief from the effect of certain types of contract modifications due to the planned discontinuation of the LIBOR and other interbank-offered based reference rates as of the end of 2021 and 2023. The ASUs are effective for certain reference rate-related contract modifications that occur during the period March 12, 2020 through December 31, 2022. Management has reviewed the requirements and believes the adoption of these ASUs will not have a material impact on the Series’ financial statements.
In October 2020, the SEC adopted new regulations governing the use of derivatives by registered investment companies. Rule 18f-4 (the “Derivatives Rule”) imposes limits on the amount of derivatives contracts the Series could enter, eliminates the asset segregation framework previously used by the Series to comply with Section 18 of the
252
1940 Act, and requires funds whose use of derivatives is more than a limited specified exposure to establish and maintain a derivatives risk management program and appoint a derivatives risk manager. The Derivatives Rule became effective February 19, 2021 and the Series began complying with the Derivatives Rule on August 19, 2022.
On December 3, 2020, the SEC adopted new Rule 2a-5 (the “Valuation Rule”) under the 1940 Act, establishing an updated regulatory framework for fund valuation. The Valuation Rule, in part, provides a framework for good faith fair value determination and permits a Board to designate fair value determinations to a fund’s investment adviser. Further, the SEC rescinded previously issued guidance on related issues. The Valuation Rule became effective on March 8, 2021 and the Series began complying with the Valuation Rule on August 1, 2022.
M. Other:
The Series and the Trust are subject to claims and suits that arise from time to time in the ordinary course of business (for example, claw back litigation against former shareholders of portfolio companies that filed for bankruptcy, such as the now ended litigation involving The Tribune Company and the ongoing litigation involving Nine West). Although management currently believes that resolving claims against the Series and the Trust, individually or in aggregate, will not have a material adverse impact on the Series’ and the Trust’s financial position, results of operations, or cash flows, these matters are subject to inherent uncertainties and management’s view of these matters may change in the future.
N. Subsequent Event Evaluations:
Management has evaluated the impact of all subsequent events on the Series through the date on which the financial statements were issued and has determined that there are no subsequent events requiring recognition or disclosure in the financial statements.
253
Report of Independent Registered Public Accounting Firm
To the Board of Trustees of The DFA Investment Trust Company and Shareholders of The DFA International Value Series, The Japanese Small Company Series, The Asia Pacific Small Company Series, The United Kingdom Small Company Series, The Continental Small Company Series, The Canadian Small Company Series, The Emerging Markets Series and The Emerging Markets Small Cap Series
Opinions on the Financial Statements
We have audited the accompanying statements of assets and liabilities, including the summary schedules of portfolio holdings, of The DFA International Value Series, The Japanese Small Company Series, The Asia Pacific Small Company Series, The United Kingdom Small Company Series, The Continental Small Company Series, The Canadian Small Company Series, The Emerging Markets Series and The Emerging Markets Small Cap Series (eight of the series constituting The DFA Investment Trust Company, hereafter collectively referred to as the “Series”) as of October 31, 2022, the related statements of operations for the year ended October 31, 2022, the statements of changes in net assets for each of the two years in the period ended October 31, 2022, including the related notes, and the financial highlights for each of the five years in the period ended October 31, 2022 (collectively referred to as the “financial statements”). In our opinion, the financial statements present fairly, in all material respects, the financial position of each of the Series as of October 31, 2022, the results of each of their operations for the year then ended, the changes in each of their net assets for each of the two years in the period ended October 31, 2022, and each of the financial highlights for each of the five years in the period ended October 31, 2022 in conformity with accounting principles generally accepted in the United States of America.
Basis for Opinions
These financial statements are the responsibility of the Series’ management. Our responsibility is to express an opinion on the Series’ financial statements based on our audits. We are a public accounting firm registered with the Public Company Accounting Oversight Board (United States) (PCAOB) and are required to be independent with respect to the Series in accordance with the U.S. federal securities laws and the applicable rules and regulations of the Securities and Exchange Commission and the PCAOB.
We conducted our audits of these financial statements in accordance with the standards of the PCAOB. Those standards require that we plan and perform the audit to obtain reasonable assurance about whether the financial statements are free of material misstatement, whether due to error or fraud.
Our audits included performing procedures to assess the risks of material misstatement of the financial statements, whether due to error or fraud, and performing procedures that respond to those risks. Such procedures included examining, on a test basis, evidence regarding the amounts and disclosures in the financial statements. Our audits also included evaluating the accounting principles used and significant estimates made by management, as well as evaluating the overall presentation of the financial statements. Our procedures included confirmation of securities owned as of October 31, 2022 by correspondence with the custodian, brokers and transfer agent of the investee fund; when replies were not received from brokers, we performed other auditing procedures. We believe that our audits provide a reasonable basis for our opinions.
/s/ PricewaterhouseCoopers LLP
Philadelphia, Pennsylvania
December 22, 2022
We have served as the auditor of one or more investment companies in Dimensional Fund Advisors L.P. investment company group since 1981.
254
DIMENSIONAL EMERGING MARKETS VALUE FUND
PERFORMANCE CHARTS
(Unaudited)
Dimensional Emerging Markets Value Fund vs.
MSCI Emerging Markets Index (net dividends),
MSCI Emerging Markets Value Index (net dividends)
October 31, 2012-October 31, 2022

255
MANAGEMENT’S DISCUSSION AND ANALYSIS
| | |
| International Equity Market Review | | 12 Months Ended October 31, 2022 |
Performance of non-U.S. developed markets was negative for the period. As measured by the MSCI World ex USA indices, small-cap stocks underperformed large-cap stocks, and mid-cap stocks, a subset of the large-cap universe, underperformed large-cap stocks but outperformed small-cap stocks. Value stocks outperformed growth stocks as measured by the MSCI World ex USA indices.
Total Return for 12 Months Ended October 31, 2022
| | | | |
| | | Return in U.S. Dollars | |
MSCI World ex USA Index | | | -22.04 | % |
MSCI World ex USA Mid Cap Index | | | -27.57 | % |
MSCI World ex USA Small Cap Index | | | -29.13 | % |
MSCI World ex USA Value Index | | | -15.27 | % |
MSCI World ex USA Growth Index | | | -28.78 | % |
For the 12 Months Ended October 31, 2022, the U.S. dollar appreciated against all non-U.S. developed markets currencies. Overall, currency movements had a negative impact on the U.S. dollar-denominated returns of developed markets.
Total Return for 12 Months Ended October 31, 2022
| | | | | | | | |
Ten Largest Foreign Developed Markets by Market Cap | | Local Return | | | Return in U.S. Dollars | |
Japan | | | -1.81 | % | | | -24.67 | % |
United Kingdom | | | 4.27 | % | | | -12.42 | % |
Canada | | | -5.29 | % | | | -13.94 | % |
France | | | -6.77 | % | | | -20.38 | % |
Switzerland | | | -11.30 | % | | | -19.01 | % |
Australia | | | -0.54 | % | | | -15.30 | % |
Germany | | | -21.22 | % | | | -32.72 | % |
Netherlands | | | -28.51 | % | | | -38.71 | % |
Sweden | | | -16.17 | % | | | -34.85 | % |
Denmark | | | -7.88 | % | | | -21.38 | % |
Source: Returns are of MSCI standard indices net of foreign withholding taxes on dividends. Copyright MSCI 2022, all rights reserved.
Emerging markets had negative performance for the period and underperformed both U.S. and non-U.S. developed markets. As measured by the MSCI Emerging Markets indices, small-cap stocks outperformed large-cap stocks, and mid-cap stocks, a subset of the large-cap universe, outperformed large-cap stocks but underperformed small-cap stocks. Value stocks outperformed growth stocks as measured by the MSCI Emerging Markets indices.
256
Total Return for 12 Months Ended October 31, 2022
| | | | |
| | | Return in U.S. Dollars | |
MSCI Emerging Markets Index | | | -31.03 | % |
MSCI Emerging Markets Mid Cap Index | | | -24.80 | % |
MSCI Emerging Markets Small Cap Index | | | -23.42 | % |
MSCI Emerging Markets Value Index | | | -25.21 | % |
MSCI Emerging Markets Growth Index | | | -36.11 | % |
For the 12 Months Ended October 31, 2022, the U.S. dollar appreciated against most emerging markets currencies and depreciated against others. Overall, currency movements had a negative impact on the U.S. dollar denominated returns of emerging markets.
Total Return for 12 Months Ended October 31, 2022
| | | | | | | | |
Ten Largest Emerging Markets by Market Cap | | Local Return | | | Return in U.S. Dollars | |
China | | | -46.31 | % | | | -47.90 | % |
India | | | 2.93 | % | | | -6.89 | % |
Taiwan | | | -24.11 | % | | | -34.50 | % |
Korea | | | -19.88 | % | | | -34.28 | % |
Brazil | | | 15.95 | % | | | 24.57 | % |
Saudi Arabia | | | 2.18 | % | | | 2.00 | % |
South Africa | | | 0.77 | % | | | -16.66 | % |
Mexico | | | 1.99 | % | | | 5.56 | % |
Indonesia | | | 16.58 | % | | | 5.89 | % |
Thailand | | | 4.97 | % | | | -8.48 | % |
Source: Returns are of MSCI standard indices net of foreign withholding taxes on dividends. Copyright MSCI 2022, all rights reserved.
For Portfolios investing in non-U.S. equities traded outside of the U.S. market time zone, differences in the valuation timing and methodology between a Portfolio and its benchmark index may impact relative performance over the referenced period. The Portfolios price foreign exchange rates at the closing of the U.S. market, while their benchmark indices use rates at 4 p.m. London time. The Portfolios also may use fair value pricing to price certain portfolio securities at the closing of the U.S. market, while benchmark indices may use local market closing prices. For the one-year period ended October 31, 2022, these differences generally detracted from non-US developed markets Portfolios’ relative performance and were not material to emerging markets Portfolios’ relative performance.
Dimensional Emerging Markets Value Fund
The Dimensional Emerging Markets Value Fund invests in value stocks of large and small companies in emerging markets. The investment strategy is process driven, emphasizing broad diversification with increased exposure to stocks with smaller market capitalizations, lower relative price (value), and higher profitability within the value segment of emerging markets. As of October 31, 2022, the Fund held approximately 3,360 securities in 21 eligible emerging markets. Average cash exposure throughout the year was less than 1% of the Fund’s assets.
257
For the 12 months ended October 31, 2022, total returns were -19.27% for the Fund, -25.21% for the MSCI Emerging Markets Value Index (net dividends), and -31.03% for the MSCI Emerging Markets Index (net dividends). As of February 28, 2022, the Fund changed its benchmark from the MSCI Emerging Markets Index (net dividends) to the MSCI Emerging Markets Value Index (net dividends) because this index better reflects the universe of securities in which the Master Fund invests. The Fund’s focus on low relative price (value) stocks contributed positively to performance relative to the benchmarks, as value stocks outperformed high relative price (growth) stocks in emerging markets. At the country level, the Fund’s lesser allocation to Russia contributed positively to relative performance, as Russia underperformed the overall benchmark.
258
DIMENSIONAL EMERGING MARKETS VALUE FUND
DISCLOSURE OF FUND EXPENSES
(Unaudited)
The following Expense Table is shown so that you can understand the impact of fees on your investment. All mutual funds have operating expenses. As a shareholder of the fund, you incur ongoing costs, which include costs for portfolio management, administrative services, and shareholder reports, among others. Operating expenses and legal and audit services, which are deducted from a fund’s gross income, directly reduce the investment return of the fund. A fund’s expenses are expressed as a percentage of its average net assets. This figure is known as the expense ratio. The following examples are intended to help you understand the ongoing costs, in dollars, of investing in the fund and to compare these costs with those of other mutual funds. The examples are based on an investment of $1,000 made at the beginning of the period shown and held for the entire period.
The Expense Table below illustrates your fund’s costs in two ways.
Actual Fund Return
This section helps you to estimate the actual expenses after fee waivers that you paid over the period. The “Ending Account Value” shown is derived from the fund’s actual return, and “Expenses Paid During Period” reflects the dollar amount that would have been paid by an investor who started with $1,000 in the fund. You may use the information here, together with the amount you invested, to estimate the expenses that you paid over the period.
To do so, simply divide your account value by $1,000 (for example, a $7,500 account value divided by $1,000 = 7.5), then multiply the result by the number given for your fund under the heading “Expenses Paid During Period.”
Hypothetical Example for Comparison Purposes
This section is intended to help you compare your fund’s costs with those of other mutual funds. The hypothetical “Ending Account Value” and “Expenses Paid During Period” are derived from the fund’s actual expense ratio and an assumed 5% annual return before expenses. In this case, because the return used is not the fund’s actual return, the results do not apply to your investment. The example is useful in making comparisons because the SEC requires all mutual funds to calculate expenses based on a 5% annual return. You can assess your fund’s costs by comparing this hypothetical example with the hypothetical examples that appear in shareholder reports of other funds.
Please note that the expenses shown in the table are meant to highlight and help you compare ongoing costs only and do not reflect any transactional costs, if applicable. The “Annualized Expense Ratio” represents the actual expenses for the six-month period indicated.
259
DISCLOSURE OF FUND EXPENSES
CONTINUED
Six Months Ended October 31, 2022
EXPENSE TABLE
| | | | | | | | | | | | | | | | |
| | | Beginning
Account
Value
05/01/22 | | | Ending
Account
Value
10/31/22 | | | Annualized
Expense
Ratio (1) | | | Expenses
Paid
During
Period (1) | |
Dimensional Emerging Markets Value Fund | | | | | | | | | | | | |
Actual Fund Return Institutional Class Shares | | $ | 1,000.00 | | | $ | 837.60 | | | | 0.15 | % | | $ | 0.69 | |
Hypothetical 5% Annual Return Institutional Class Shares | | $ | 1,000.00 | | | $ | 1,024.45 | | | | 0.15 | % | | $ | 0.77 | |
| (1) | Expenses are equal to the fund’s annualized expense ratio for the six-month period, multiplied by the average account value over the period, multiplied by the number of days in the most recent six-month period (184), then divided by the number of days in the year (365) to reflect the six-month period. |
260
DIMENSIONAL EMERGING MARKETS VALUE FUND
DISCLOSURE OF PORTFOLIO HOLDINGS
(Unaudited)
The SEC requires that all funds file a complete Schedule of Investments with the SEC for their first and third fiscal quarters as an exhibit to their reports on Form N-PORT. For the Dimensional Emerging Markets Value Fund, this would be for the fiscal quarters ending January 31 and July 31. Such Form N-PORT filing must be made within 60 days of the end of the quarter. Dimensional Emerging Markets Value Fund filed its most recent Form N-PORT with the SEC on September 28, 2022. They are available upon request, without charge, by calling collect: (512) 306-7400; by mailing a request to Dimensional Fund Advisors LP, 6300 Bee Cave Road, Building One, Austin, TX 78746; by visiting the SEC’s website at http://www.sec.gov; or by visiting the SEC’s Public Reference Room in Washington, D.C. (call 1-800-732-0330 for information on the operation of the Public Reference Room).
SEC regulations permit a fund to include in its reports to shareholders a “Summary Schedule of Portfolio Holdings” in lieu of a full Schedule of Investments. The Summary Schedule of Portfolio Holdings reports the fund’s 50 largest holdings in unaffiliated issuers and any investments that exceed one percent of the fund’s net assets at the end of the reporting period. The regulations also require that the Summary Schedule of Portfolio Holdings identify each category of investments that are held.
A fund is required to file a complete Schedule of Investments with the SEC on Form N-CSR within ten days after mailing the annual and semi-annual reports to shareholders. It will be available upon request, without charge, by calling collect: (512) 306-7400; by mailing a request to Dimensional Fund Advisors LP, 6300 Bee Cave Road, Building One, Austin, TX 78746; or by visiting the SEC’s website at http://www.sec.gov.
PORTFOLIO HOLDINGS
The SEC requires that all funds present their categories of portfolio holdings in a table, chart, or graph format in their annual and semi-annual shareholder reports, whether or not a Schedule of Investments is used. The following table, which presents portfolio holdings as a percentage of total investments before short-term investments and collateral for loaned securities, is provided in compliance with this requirement. The categories shown below represent broad industry sectors. Each industry sector consists of one or more specific industry classifications.
Dimensional Emerging Markets Value Fund
| | | | |
Communication Services | | | 2.6 | % |
Consumer Discretionary | | | 8.4 | % |
Consumer Staples | | | 3.2 | % |
Energy | | | 11.2 | % |
Financials | | | 30.3 | % |
Health Care | | | 2.7 | % |
Industrials | | | 9.4 | % |
Information Technology | | | 11.5 | % |
Materials | | | 15.0 | % |
Real Estate | | | 4.2 | % |
Utilities | | | 1.5 | % |
| | | | |
| | | 100.0 | % |
261
DIMENSIONAL EMERGING MARKETS VALUE FUND
SUMMARY SCHEDULE OF PORTFOLIO HOLDINGS
October 31, 2022
| | | | | | | | | | | | |
| | | Shares | | | Value» | | | Percentage
of Net Assets‡ | |
COMMON STOCKS — (97.2%) | | | | | | | | | | | | |
BRAZIL — (4.4%) | | | | | | | | | | | | |
Petroleo Brasileiro SA | | | 10,301,883 | | | $ | 66,332,519 | | | | 0.7 | % |
Petroleo Brasileiro SA, Sponsored ADR | | | 10,372,552 | | | | 119,388,074 | | | | 1.2 | % |
Petroleo Brasileiro SA, Sponsored ADR | | | 4,446,951 | | | | 57,009,912 | | | | 0.6 | % |
Other Securities | | | | | | | 197,601,271 | | | | 2.0 | % |
| | | | | | | | | | | | |
TOTAL BRAZIL | | | | | | | 440,331,776 | | | | 4.5 | % |
| | | | | | | | | | | | |
CHILE — (0.5%) | | | | | | | | | | | | |
Other Securities | | | | | | | 53,080,525 | | | | 0.5 | % |
| | | | | | | | | | | | |
CHINA — (24.6%) | | | | | | | | | | | | |
* Alibaba Group Holding Ltd. | | | 8,685,000 | | | | 67,525,064 | | | | 0.7 | % |
* Baidu, Inc., Sponsored ADR | | | 714,105 | | | | 54,679,020 | | | | 0.6 | % |
Bank of China Ltd., Class H | | | 270,116,817 | | | | 86,998,458 | | | | 0.9 | % |
China Construction Bank Corp., Class H | | | 437,755,101 | | | | 232,311,487 | | | | 2.4 | % |
China Merchants Bank Co. Ltd., Class H | | | 15,432,500 | | | | 50,524,458 | | | | 0.5 | % |
China Overseas Land & Investment Ltd. | | | 19,311,000 | | | | 36,901,751 | | | | 0.4 | % |
# China Resources Land Ltd. | | | 17,288,000 | | | | 54,090,402 | | | | 0.6 | % |
China Shenhua Energy Co. Ltd., Class H | | | 15,790,500 | | | | 41,479,393 | | | | 0.4 | % |
Industrial & Commercial Bank of China Ltd., Class H | | | 221,136,996 | | | | 96,010,020 | | | | 1.0 | % |
PetroChina Co. Ltd., Class H | | | 107,982,000 | | | | 41,306,030 | | | | 0.4 | % |
Ping An Insurance Group Co. of China Ltd., Class H | | | 27,792,500 | | | | 111,264,230 | | | | 1.2 | % |
#* Trip.com Group Ltd., ADR | | | 1,678,716 | | | | 37,989,343 | | | | 0.4 | % |
*W Xiaomi Corp., Class B | | | 30,268,800 | | | | 33,994,057 | | | | 0.4 | % |
Other Securities | | | | | | | 1,502,862,583 | | | | 15.2 | % |
| | | | | | | | | | | | |
TOTAL CHINA | | | | | | | 2,447,936,296 | | | | 25.1 | % |
| | | | | | | | | | | | |
COLOMBIA — (0.1%) | | | | | | | | | | | | |
Other Securities | | | | | | | 4,556,575 | | | | 0.1 | % |
| | | | | | | | | | | | |
CZECH REPUBLIC — (0.1%) | | | | | | | | | | | | |
Other Securities | | | | | | | 12,356,491 | | | | 0.1 | % |
| | | | | | | | | | | | |
GREECE — (0.3%) | | | | | | | | | | | | |
Other Securities | | | | | | | 30,892,405 | | | | 0.3 | % |
| | | | | | | | | | | | |
HONG KONG — (0.0%) | | | | | | | | | | | | |
Other Securities | | | | | | | 425,561 | | | | 0.0 | % |
| | | | | | | | | | | | |
HUNGARY — (0.2%) | | | | | | | | | | | | |
Other Securities | | | | | | | 19,035,517 | | | | 0.2 | % |
| | | | | | | | | | | | |
INDIA — (18.2%) | | | | | | | | | | | | |
Axis Bank Ltd. | | | 9,710,222 | | | | 106,486,929 | | | | 1.1 | % |
Hindalco Industries Ltd. | | | 8,603,538 | | | | 42,133,791 | | | | 0.4 | % |
Housing Development Finance Corp. Ltd. | | | 2,568,550 | | | | 76,802,678 | | | | 0.8 | % |
ICICI Bank Ltd. | | | 864,565 | | | | 9,506,718 | | | | 0.1 | % |
# ICICI Bank Ltd., Sponsored ADR | | | 4,024,863 | | | | 88,707,978 | | | | 0.9 | % |
JSW Steel Ltd. | | | 4,657,007 | | | | 37,969,068 | | | | 0.4 | % |
Larsen & Toubro Ltd. | | | 2,418,042 | | | | 59,445,528 | | | | 0.6 | % |
Mahindra & Mahindra Ltd. | | | 3,949,734 | | | | 64,525,865 | | | | 0.7 | % |
Reliance Industries Ltd. | | | 11,583,938 | | | | 356,910,040 | | | | 3.7 | % |
State Bank of India | | | 7,219,632 | | | | 50,110,773 | | | | 0.5 | % |
Sun Pharmaceutical Industries Ltd. | | | 2,629,464 | | | | 32,331,405 | | | | 0.3 | % |
262
DIMENSIONAL EMERGING MARKETS VALUE FUND
CONTINUED
| | | | | | | | | | | | |
| | | Shares | | | Value» | | | Percentage
of Net Assets‡ | |
INDIA — (Continued) | | | | | | | | | | | | |
* Tata Motors Ltd. | | | 7,653,556 | | | $ | 38,264,438 | | | | 0.4 | % |
Other Securities | | | | | | | 843,658,113 | | | | 8.6 | % |
| | | | | | | | | | | | |
TOTAL INDIA | | | | | | | 1,806,853,324 | | | | 18.5 | % |
| | | | | | | | | | | | |
INDONESIA — (2.3%) | | | | | | | | | | | | |
Other Securities | | | | | | | 228,901,223 | | | | 2.3 | % |
| | | | | | | | | | | | |
MALAYSIA — (2.0%) | | | | | | | | | | | | |
Other Securities | | | | | | | 195,613,000 | | | | 2.0 | % |
| | | | | | | | | | | | |
MEXICO — (2.9%) | | | | | | | | | | | | |
Grupo Financiero Banorte SAB de CV, Class O | | | 5,909,135 | | | | 48,103,995 | | | | 0.5 | % |
Grupo Mexico SAB de CV, Class B | | | 8,966,449 | | | | 32,298,767 | | | | 0.3 | % |
Other Securities | | | | | | | 208,585,658 | | | | 2.2 | % |
| | | | | | | | | | | | |
TOTAL MEXICO | | | | | | | 288,988,420 | | | | 3.0 | % |
| | | | | | | | | | | | |
PHILIPPINES — (1.0%) | | | | | | | | | | | | |
Other Securities | | | | | | | 96,366,514 | | | | 1.0 | % |
| | | | | | | | | | | | |
POLAND — (0.6%) | | | | | | | | | | | | |
Other Securities | | | | | | | 61,964,407 | | | | 0.6 | % |
| | | | | | | | | | | | |
QATAR — (0.7%) | | | | | | | | | | | | |
Other Securities | | | | | | | 71,921,044 | | | | 0.7 | % |
| | | | | | | | | | | | |
SAUDI ARABIA — (4.2%) | | | | | | | | | | | | |
Saudi Basic Industries Corp. | | | 3,400,714 | | | | 79,850,518 | | | | 0.8 | % |
Saudi British Bank | | | 3,218,956 | | | | 37,287,035 | | | | 0.4 | % |
Saudi National Bank | | | 2,368,512 | | | | 37,434,883 | | | | 0.4 | % |
Other Securities | | | | | | | 260,769,015 | | | | 2.7 | % |
| | | | | | | | | | | | |
TOTAL SAUDI ARABIA | | | | | | | 415,341,451 | | | | 4.3 | % |
| | | | | | | | | | | | |
SOUTH AFRICA — (3.7%) | | | | | | | | | | | | |
Absa Group Ltd. | | | 3,114,038 | | | | 33,816,033 | | | | 0.4 | % |
Impala Platinum Holdings Ltd. | | | 3,454,876 | | | | 35,373,305 | | | | 0.4 | % |
Standard Bank Group Ltd. | | | 4,288,338 | | | | 40,032,656 | | | | 0.4 | % |
Other Securities | | | | | | | 254,486,732 | | | | 2.5 | % |
| | | | | | | | | | | | |
TOTAL SOUTH AFRICA | | | | | | | 363,708,726 | | | | 3.7 | % |
| | | | | | | | | | | | |
SOUTH KOREA — (11.5%) | | | | | | | | | | | | |
Hana Financial Group, Inc. | | | 1,199,113 | | | | 34,667,994 | | | | 0.4 | % |
# Hyundai Motor Co. | | | 371,214 | | | | 42,778,130 | | | | 0.5 | % |
KB Financial Group, Inc., ADR | | | 2,132,213 | | | | 71,514,424 | | | | 0.7 | % |
Kia Corp. | | | 1,032,241 | | | | 47,969,051 | | | | 0.5 | % |
# POSCO Holdings, Inc., Sponsored ADR | | | 903,713 | | | | 39,203,070 | | | | 0.4 | % |
# Samsung Electronics Co. Ltd. | | | 2,272,366 | | | | 94,575,472 | | | | 1.0 | % |
SK Hynix, Inc. | | | 1,932,360 | | | | 111,867,237 | | | | 1.2 | % |
Other Securities | | | | | | | 700,977,051 | | | | 7.0 | % |
| | | | | | | | | | | | |
TOTAL SOUTH KOREA | | | | | | | 1,143,552,429 | | | | 11.7 | % |
| | | | | | | | | | | | |
TAIWAN — (15.5%) | | | | | | | | | | | | |
# Cathay Financial Holding Co. Ltd. | | | 37,255,459 | | | | 43,600,333 | | | | 0.5 | % |
# China Steel Corp. | | | 58,950,320 | | | | 49,071,448 | | | | 0.5 | % |
# CTBC Financial Holding Co. Ltd. | | | 74,971,073 | | | | 47,361,988 | | | | 0.5 | % |
263
DIMENSIONAL EMERGING MARKETS VALUE FUND
CONTINUED
| | | | | | | | | | | | |
| | | Shares | | | Value» | | | Percentage
of Net Assets‡ | |
TAIWAN — (Continued) | | | | | | | | | | | | |
# Fubon Financial Holding Co. Ltd. | | | 34,744,681 | | | $ | 54,880,391 | | | | 0.6 | % |
Hon Hai Precision Industry Co. Ltd. | | | 39,997,192 | | | | 127,034,142 | | | | 1.3 | % |
# United Microelectronics Corp. | | | 35,190,681 | | | | 42,315,423 | | | | 0.5 | % |
Other Securities | | | | | | | 1,175,770,226 | | | | 11.9 | % |
| | | | | | | | | | | | |
TOTAL TAIWAN | | | | | | | 1,540,033,951 | | | | 15.8 | % |
| | | | | | | | | | | | |
THAILAND — (2.3%) | | | | | | | | | | | | |
PTT PCL | | | 47,991,600 | | | | 45,394,051 | | | | 0.5 | % |
Other Securities | | | | | | | 187,444,560 | | | | 1.9 | % |
| | | | | | | | | | | | |
TOTAL THAILAND | | | | | | | 232,838,611 | | | | 2.4 | % |
| | | | | | | | | | | | |
TURKEY — (0.9%) | | | | | | | | | | | | |
Other Securities | | | | | | | 84,289,608 | | | | 0.9 | % |
| | | | | | | | | | | | |
UNITED ARAB EMIRATES — (1.2%) | | | | | | | | | | | | |
Emaar Properties PJSC | | | 20,549,179 | | | | 33,921,653 | | | | 0.4 | % |
Other Securities | | | | | | | 82,832,309 | | | | 0.8 | % |
| | | | | | | | | | | | |
TOTAL UNITED ARAB EMIRATES | | | | | | | 116,753,962 | | | | 1.2 | % |
| | | | | | | | | | | | |
UNITED KINGDOM — (0.0%) | | | | | | | | | | | | |
Other Security | | | | | | | 17,465 | | | | 0.0 | % |
| | | | | | | | | | | | |
TOTAL COMMON STOCKS | | | | | | | 9,655,759,281 | | | | 98.9 | % |
| | | | | | | | | | | | |
PREFERRED STOCKS — (0.7%) | | | | | | | | | | | | |
BRAZIL — (0.7%) | | | | | | | | | | | | |
Petroleo Brasileiro SA | | | 4,448,873 | | | | 25,674,359 | | | | 0.3 | % |
Other Securities | | | | | | | 45,204,967 | | | | 0.4 | % |
| | | | | | | | | | | | |
TOTAL BRAZIL | | | | | | | 70,879,326 | | | | 0.7 | % |
| | | | | | | | | | | | |
COLOMBIA — (0.0%) | | | | | | | | | | | | |
Other Securities | | | | | | | 2,771,304 | | | | 0.1 | % |
| | | | | | | | | | | | |
PHILIPPINES — (0.0%) | | | | | | | | | | | | |
Other Security | | | | | | | 542,610 | | | | 0.0 | % |
| | | | | | | | | | | | |
SOUTH KOREA — (0.0%) | | | | | | | | | | | | |
Other Security | | | | | | | 65,707 | | | | 0.0 | % |
| | | | | | | | | | | | |
TAIWAN — (0.0%) | | | | | | | | | | | | |
Other Security | | | | | | | 1,149,424 | | | | 0.0 | % |
| | | | | | | | | | | | |
TOTAL PREFERRED STOCKS | | | | | | | 75,408,371 | | | | 0.8 | % |
| | | | | | | | | | | | |
RIGHTS/WARRANTS — (0.0%) | | | | | | | | | | | | |
INDONESIA — (0.0%) | | | | | | | | | | | | |
Other Security | | | | | | | 2,645 | | | | 0.0 | % |
| | | | | | | | | | | | |
MALAYSIA — (0.0%) | | | | | | | | | | | | |
Other Security | | | | | | | 5,746 | | | | 0.0 | % |
| | | | | | | | | | | | |
264
DIMENSIONAL EMERGING MARKETS VALUE FUND
CONTINUED
| | | | | | | | | | | | |
| | | Shares | | | Value» | | | Percentage
of Net Assets‡ | |
TAIWAN — (0.0%) | | | | | | | | | | | | |
Other Securities | | | | | | $ | 57,510 | | | | 0.0 | % |
| | | | | | | | | | | | |
TOTAL RIGHTS/WARRANTS | | | | | | | 65,901 | | | | 0.0 | % |
| | | | | | | | | | | | |
TOTAL INVESTMENT SECURITIES
(Cost $10,057,793,951) | | | | | | | 9,731,233,553 | | | | | |
| | | | | | | | | | | | |
| | | |
| | | | | | Value† | | | | |
SECURITIES LENDING COLLATERAL — (2.1%) | | | | | | | | | | | | |
@§ The DFA Short Term Investment Fund | | | 17,667,347 | | | | 204,252,200 | | | | 2.1 | % |
| | | | | | | | | | | | |
TOTAL INVESTMENTS—(100.0%)
(Cost $10,262,128,455) | | | | | | $ | 9,935,485,753 | | | | 101.8 | % |
| | | | | | | | | | | | |
As of October 31, 2022, Dimensional Emerging Markets Value Fund had entered into the following outstanding futures contracts:
| | | | | | | | | | | | | | | | | | | | |
Description | | Number of
Contracts | | | Expiration
Date | | | Notional
Value | | | Market
Value | | | Unrealized
Appreciation
(Depreciation) | |
Long Position Contracts: | | | | | | | | | | | | | | | | | | | | |
E-Mini MSCI Emerging Markets Index | | | 650 | | | | 12/16/22 | | | $ | 31,358,076 | | | $ | 27,742,000 | | | $ | (3,616,076 | ) |
S&P 500® Emini Index | | | 221 | | | | 12/16/22 | | | | 41,423,830 | | | | 42,907,150 | | | | 1,483,320 | |
| | | | | | | | | | | | | | | | | | | | |
Total Futures Contracts | | | | | | | | | | $ | 72,781,906 | | | $ | 70,649,150 | | | $ | (2,132,756 | ) |
| | | | | | | | | | | | | | | | | | | | |
Summary of the Fund’s investments as of October 31, 2022, based on their valuation inputs, is as follows (see Security Valuation Note):
| | | | | | | | | | | | | | | | |
| | | Investments in Securities (Market Value) | |
| | | Level 1 | | | Level 2 | | | Level 3 | | | Total | |
Common Stocks | | | | | | | | | | | | | | | | |
Brazil | | $ | 439,385,473 | | | $ | 946,303 | | | | — | | | $ | 440,331,776 | |
Chile | | | — | | | | 53,080,525 | | | | — | | | | 53,080,525 | |
China | | | 134,285,528 | | | | 2,300,064,871 | | | $ | 13,585,897 | | | | 2,447,936,296 | |
Colombia | | | 4,546,580 | | | | 9,995 | | | | — | | | | 4,556,575 | |
Czech Republic | | | — | | | | 12,356,491 | | | | — | | | | 12,356,491 | |
Greece | | | 40,841 | | | | 30,851,564 | | | | — | | | | 30,892,405 | |
Hong Kong | | | — | | | | 425,561 | | | | — | | | | 425,561 | |
Hungary | | | — | | | | 19,035,517 | | | | — | | | | 19,035,517 | |
India | | | 97,336,595 | | | | 1,709,490,833 | | | | 25,896 | | | | 1,806,853,324 | |
Indonesia | | | — | | | | 228,487,269 | | | | 413,954 | | | | 228,901,223 | |
Malaysia | | | — | | | | 195,612,456 | | | | 544 | | | | 195,613,000 | |
Mexico | | | 281,171,954 | | | | 7,816,466 | | | | — | | | | 288,988,420 | |
Philippines | | | — | | | | 96,354,080 | | | | 12,434 | | | | 96,366,514 | |
Poland | | | — | | | | 61,964,407 | | | | — | | | | 61,964,407 | |
Qatar | | | — | | | | 71,921,044 | | | | — | | | | 71,921,044 | |
Saudi Arabia | | | 463,943 | | | | 414,877,508 | | | | — | | | | 415,341,451 | |
South Africa | | | 41,737,706 | | | | 321,971,020 | | | | — | | | | 363,708,726 | |
South Korea | | | 149,048,720 | | | | 993,102,735 | | | | 1,400,974 | | | | 1,143,552,429 | |
Taiwan | | | 24,522,673 | | | | 1,514,956,130 | | | | 555,148 | | | | 1,540,033,951 | |
Thailand | | | 225,292,169 | | | | 7,546,442 | | | | — | | | | 232,838,611 | |
Turkey | | | — | | | | 84,289,608 | | | | — | | | | 84,289,608 | |
United Arab Emirates | | | — | | | | 116,753,962 | | | | — | | | | 116,753,962 | |
United Kingdom | | | — | | | | 17,465 | | | | — | | | | 17,465 | |
265
DIMENSIONAL EMERGING MARKETS VALUE FUND
CONTINUED
| | | | | | | | | | | | | | | | |
| | | Investments in Securities (Market Value) | |
| | | Level 1 | | | Level 2 | | | Level 3 | | | Total | |
Preferred Stocks | | | | | | | | | | | | | | | | |
Brazil | | $ | 70,808,225 | | | $ | 71,101 | | | | — | | | $ | 70,879,326 | |
Colombia | | | 2,771,304 | | | | — | | | | — | | | | 2,771,304 | |
Philippines | | | — | | | | 542,610 | | | | — | | | | 542,610 | |
South Korea | | | — | | | | 65,707 | | | | — | | | | 65,707 | |
Taiwan | | | — | | | | 1,149,424 | | | | — | | | | 1,149,424 | |
Rights/Warrants | | | | | | | | | | | | | | | | |
Indonesia | | | — | | | | 2,645 | | | | — | | | | 2,645 | |
Malaysia | | | — | | | | 5,746 | | | | — | | | | 5,746 | |
Taiwan | | | — | | | | 57,510 | | | | — | | | | 57,510 | |
Securities Lending Collateral | | | — | | | | 204,252,200 | | | | — | | | | 204,252,200 | |
Futures Contracts** | | | (2,132,756 | ) | | | — | | | | — | | | | (2,132,756 | ) |
| | | | | | | | | | | | | | | | |
TOTAL | | $ | 1,469,278,955 | | | $ | 8,448,079,195 | | | $ | 15,994,847^ | | | $ | 9,933,352,997 | |
| | | | | | | | | | | | | | | | |
| ** | Valued at the unrealized appreciation/(depreciation) on the investment. |
| ^ | A reconciliation of Level 3 investments is presented when the Fund had a significant amount of Level 3 investments at the beginning and/or end of the reporting period in relation to net assets. |
See accompanying Notes to Financial Statements.
266
DIMENSIONAL EMERGING MARKETS VALUE FUND
STATEMENT OF ASSETS AND LIABILITIES
OCTOBER 31, 2022
(Amounts in thousands)
| | | | |
| | | Dimensional
Emerging
Markets
Value Fund | |
ASSETS: | | | | |
Investment Securities at Value (including $420,497 of securities on loan)* | | $ | 9,731,234 | |
Collateral from Securities on Loan Invested in Affiliate at Value (including cost of $204,335) | | | 204,252 | |
Segregated Cash for Futures Contracts | | | 3,609 | |
Foreign Currencies at Value | | | 78,427 | |
Cash | | | 4,739 | |
Receivables: | | | | |
Investment Securities Sold | | | 14,965 | |
Dividends, Interest and Tax Reclaims | | | 9,483 | |
Securities Lending Income | | | 964 | |
Unrealized Gain on Foreign Currency Contracts | | | 2 | |
| | | | |
Total Assets | | | 10,047,675 | |
| | | | |
LIABILITIES: | | | | |
Payables: | | | | |
Upon Return of Securities Loaned | | | 192,484 | |
Investment Securities Purchased | | | 12,090 | |
Due to Advisor | | | 850 | |
Futures Margin Variation | | | 378 | |
Deferred Taxes Payable | | | 66,350 | |
Accrued Expenses and Other Liabilities | | | 15,384 | |
| | | | |
Total Liabilities | | | 287,536 | |
| | | | |
NET ASSETS | | $ | 9,760,139 | |
| | | | |
Investment Securities at Cost | | $ | 10,057,793 | |
| | | | |
Foreign Currencies at Cost | | $ | 82,669 | |
| | | | |
| * | See Note I in the Notes to Financial Statements for additional information about securities lending collateral. |
See accompanying Notes to Financial Statements.
267
DIMENSIONAL EMERGING MARKETS VALUE FUND
STATEMENT OF OPERATIONS
FOR THE YEAR ENDED OCTOBER 31, 2022
(Amounts in thousands)
| | | | |
| | | Dimensional
Emerging
Markets
Value Fund# | |
Investment Income | | | | |
Dividends (Net of Foreign Taxes Withheld of $63,558) | | $ | 580,947 | |
Income from Securities Lending | | | 12,445 | |
| | | | |
Total Investment Income | | | 593,392 | |
| | | | |
Expenses | | | | |
Investment Management Fees | | | 12,011 | |
Accounting & Transfer Agent Fees | | | 22 | |
Custodian Fees | | | 5,002 | |
Shareholders’ Reports | | | 23 | |
Directors’/Trustees’ Fees & Expenses | | | 54 | |
Professional Fees | | | 309 | |
Other | | | 944 | |
| | | | |
Total Expenses | | | 18,365 | |
| | | | |
Fees Paid Indirectly (Note C) | | | 313 | |
| | | | |
Net Expenses | | | 18,052 | |
| | | | |
Net Investment Income (Loss) | | | 575,340 | |
| | | | |
Realized and Unrealized Gain (Loss) | | | | |
Net Realized Gain (Loss) on: | | | | |
Investment Securities Sold** | | | 390,078 | |
Affiliated Investment Companies Shares Sold | | | 6 | |
Futures | | | (15,965 | ) |
Foreign Currency Transactions | | | (11,657 | ) |
Change in Unrealized Appreciation (Depreciation) of: | | | | |
Investment Securities and Foreign Currency | | | (3,314,774 | ) |
Affiliated Investment Companies Shares | | | (133 | ) |
Futures | | | (2,584 | ) |
Translation of Foreign Currency-Denominated Amounts | | | (62 | ) |
| | | | |
Net Realized and Unrealized Gain (Loss) | | | (2,955,091 | ) |
| | | | |
Net Increase (Decrease) in Net Assets Resulting from Operations | | $ | (2,379,751 | ) |
| | | | |
| ** | Net of foreign capital gain taxes withheld of $11,622. |
| # | Portion of income is from investment in affiliated fund. |
See accompanying Notes to Financial Statements.
268
DIMENSIONAL EMERGING MARKETS VALUE FUND
STATEMENTS OF CHANGES IN NET ASSETS
(Amounts in thousands)
| | | | | | | | |
| | | Dimensional Emerging | |
| | | Markets Value Fund | |
| | | Year | | | Year | |
| | | Ended | | | Ended | |
| | | Oct 31, | | | Oct 31, | |
| | | 2022 | | | 2021 | |
Increase (Decrease) in Net Assets | | | | | | | | |
Operations: | | | | | | | | |
Net Investment Income (Loss) | | $ | 575,340 | | | $ | 478,456 | |
Net Realized Gain (Loss) on: | | | | | | | | |
Investment Securities Sold*,** | | | 390,078 | | | | 651,370 | |
Affiliated Investment Companies Shares Sold | | | 6 | | | | (2 | ) |
Futures | | | (15,965 | ) | | | 40,443 | |
Foreign Currency Transactions | | | (11,657 | ) | | | (4,609 | ) |
Change in Unrealized Appreciation (Depreciation) of: | | | | | | | | |
Investment Securities and Foreign Currency | | | (3,314,774 | ) | | | 3,305,387 | |
Affiliated Investment Companies Shares | | | (133 | ) | | | (21 | ) |
Futures | | | (2,584 | ) | | | 840 | |
Translation of Foreign Currency-Denominated Amounts | | | (62 | ) | | | 12 | |
| | | | | | | | |
Net Increase (Decrease) in Net Assets Resulting from Operations | | | (2,379,751 | ) | | | 4,471,876 | |
| | | | | | | | |
Transactions in Interest: | | | | | | | | |
Contributions | | | 611,182 | | | | 568,216 | |
Withdrawals | | | (1,940,997 | ) | | | (4,440,642 | ) |
| | | | | | | | |
Net Increase (Decrease) from Transactions in Interest | | | (1,329,815 | ) | | | (3,872,426 | ) |
| | | | | | | | |
Total Increase (Decrease) in Net Assets | | | (3,709,566 | ) | | | 599,450 | |
Net Assets | | | | | | | | |
Beginning of Year | | | 13,469,705 | | | | 12,870,255 | |
| | | | | | | | |
End of Year | | $ | 9,760,139 | | | $ | 13,469,705 | |
| | | | | | | | |
| * | Net of foreign capital gain taxes withheld for the fiscal year ended October 31, 2022 of $11,622. |
| ** | Net of foreign capital gain taxes withheld for the fiscal year ended October 31, 2021 of $12,230. |
See accompanying Notes to Financial Statements.
269
DIMENSIONAL EMERGING MARKETS VALUE FUND
FINANCIAL HIGHLIGHTS
| | | | | | | | | | | | | | | | | | | | |
| | | Dimensional Emerging Markets Value Fund | |
| | | Year | | | Year | | | Year | | | Year | | | Year | |
| | | Ended | | | Ended | | | Ended | | | Ended | | | Ended | |
| | | Oct 31, | | | Oct 31, | | | Oct 31, | | | Oct 31, | | | Oct 31, | |
| | | 2022 | | | 2021 | | | 2020 | | | 2019 | | | 2018 | |
Total Return | | | (19.27 | %) | | | 35.69 | % | | | (9.41 | %) | | | 5.24 | % | | | (9.06 | %) |
| | | | | | | | | | | | | | | | | | | | |
Net Assets, End of Year (thousands) | | $ | 9,760,139 | | | $ | 13,469,705 | | | $ | 12,870,255 | | | $ | 17,426,097 | | | $ | 16,684,907 | |
Ratio of Expenses to Average Net Assets | | | 0.15 | % | | | 0.14 | % | | | 0.14 | % | | | 0.13 | % | | | 0.14 | % |
Ratio of Expenses to Average Net Assets (Excluding Fees Paid Indirectly) | | | 0.15 | % | | | 0.14 | % | | | 0.14 | % | | | 0.15 | % | | | 0.14 | % |
Ratio of Net Investment Income to Average Net Assets | | | 4.79 | % | | | 3.26 | % | | | 3.25 | % | | | 2.95 | % | | | 2.78 | % |
Portfolio Turnover Rate | | | 14 | % | | | 14 | % | | | 20 | % | | | 14 | % | | | 13 | % |
| | | | | | | | | | | | | | | | | | | | |
See page 1-2 for the Definitions of Abbreviations and Footnotes.
See accompanying Notes to Financial Statements.
270
DIMENSIONAL EMERGING MARKETS VALUE FUND
NOTES TO FINANCIAL STATEMENTS
A. Organization:
Dimensional Emerging Markets Value Fund (the “Fund”) is an open-end management investment company registered under the Investment Company Act of 1940 (the “1940 Act”). The Fund meets the definition as an investment company and follows the accounting and reporting guidance under Financial Accounting Standards Board (“FASB”) Accounting Standards Codification (“ASC”) Topic 946, “Financial Services-Investment Companies.” The Fund consists of one series.
B. Significant Accounting Policies:
The following significant accounting policies are in conformity with accounting principles generally accepted in the United States of America (“GAAP”). Such policies are consistently followed by the Fund in preparation of its financial statements. The preparation of financial statements in accordance with GAAP requires management to make estimates and assumptions that affect the fair value of investments, the reported amounts of assets and liabilities, the disclosure of contingent assets and liabilities at the date of the financial statements, and the reported amounts of increases and decreases in net assets from operations during the reporting period. Actual results could differ from those estimates, and those differences could be material.
1. Security Valuation: The Fund uses a fair value hierarchy, which prioritizes the inputs-to-valuation techniques used to measure fair value into three broad levels described below:
| | • | | Level 1 – inputs are quoted prices in active markets for identical securities (including equity securities, open-end investment companies, and futures contracts) |
| | • | | Level 2 – other significant observable inputs (including quoted prices for similar securities, interest rates, prepayment speeds, credit risk, etc.) |
| | • | | Level 3 – significant unobservable inputs (including the Fund’s own assumptions in determining the fair value of investments) |
Securities held by the Fund, including over-the-counter securities, are valued at the last quoted sale price of the day. International equity securities are subject to a fair value factor, as described later in this note.
Securities held by the Fund that are listed on Nasdaq are valued at the Nasdaq Official Closing Price (“NOCP”). If there is no last reported sale price or NOCP for the day, the Fund values the securities within the range of the most recent quoted bid and ask prices. Price information on listed securities is taken from the exchange where the security is primarily traded. Generally, securities issued by open-end management investment companies are valued using their respective net asset values or public offering prices, as appropriate, for purchase orders placed at the close of the New York Stock Exchange (NYSE). These securities are generally categorized as Level 1 in the hierarchy.
Securities for which no market quotations are readily available (including restricted securities), or for which market quotations have become unreliable, are valued in good faith at fair value in accordance with Rule 2a-5 under the 1940 Act pursuant to procedures approved by the Board of Trustees of the Fund. Fair value pricing may also be used if events that have a significant effect on the value of an investment (as determined in the discretion of Dimensional Fund Advisors LP) occur before the net asset value of the Fund is calculated. When fair value pricing is used, the prices of securities used by the Fund may differ from the quoted or published prices for the same securities on their primary markets or exchanges. These securities are generally categorized as Level 2 or Level 3 in the hierarchy.
The Fund will also apply a fair value price in the circumstances described below. Generally, trading in foreign securities markets is completed each day at various times prior to the close of the NYSE. For example, trading in the Japanese securities markets is completed each day at the close of the Tokyo Stock Exchange (normally, 2:00 a.m. ET), which is fourteen hours before the close of the NYSE (normally, 4:00 p.m. ET) and the time at which the net asset value of the Fund is computed. Due to the time differences between the closings of the relevant foreign securities
271
exchanges and the pricing of the Fund’s shares (at the close of the NYSE), the Fund will fair-value its foreign investments when it is determined that the market quotations for the foreign investments are either unreliable or not readily available. The fair value prices will attempt to reflect the impact of the U.S. financial markets’ perceptions and trading activities on the Fund’s foreign investments since the last calculated closing prices of the foreign investments on their primary foreign securities markets or exchanges. For these purposes, Dimensional Fund Advisors LP has determined that movements in relevant indices or other appropriate market indicators, after the close of the Tokyo Stock Exchange or the London Stock Exchange, demonstrate that market quotations may be unreliable. Fair valuation of portfolio securities may occur on a daily basis. The fair value pricing by the Fund uses data furnished by an independent pricing service (and that data draws upon, among other information, the market values of foreign investments). When the Fund uses fair value pricing, the values assigned to the Fund’s foreign investments may not be the quoted or published prices of the investments on their primary markets or exchanges. These securities are generally categorized as Level 2 in the hierarchy.
Futures contracts held by the Fund are valued using the settlement price established each day on the exchange on which they are traded. These valuations are generally categorized as Level 1 in the hierarchy.
A summary of the inputs used to value the Fund’s investments by each major security type, industry and/or country is disclosed previously in this note. A valuation hierarchy table has been included at the end of the Summary Schedule of Portfolio Holdings. The methodology or inputs used for valuing securities are not necessarily an indication of the risk associated with investing in those securities.
2. Foreign Currency Translation: Securities and other assets and liabilities of the Fund whose values are initially expressed in foreign currencies are translated to U.S. dollars using the mean between the most recent bid and ask prices for the U.S. dollar as quoted by generally recognized reliable sources. To facilitate the translation, the Fund enters into foreign currency contracts. A foreign currency contract is a spot agreement between two parties to buy and sell currencies at current market exchange rates, for settlement generally within two business days. Dividend and interest income and certain expenses are translated to U.S. dollars at the rate of exchange on their respective accrual dates. Receivables and payables denominated in foreign currencies are marked-to-market daily based on daily exchange rates and exchange gains or losses are realized upon ultimate receipt or disbursement. The Fund does not isolate the effect of foreign exchange rate fluctuations from the effect of fluctuations in the market prices of securities, whether realized or unrealized.
Realized gains or losses on foreign currency transactions represent net foreign exchange gains or losses from the disposition of foreign currencies, currency gains or losses realized between the trade and settlement dates of securities transactions, and the difference between amounts of interest, dividends and any foreign withholding taxes recorded on the books of the Fund and the U.S. dollar equivalent amounts actually received or paid.
3. Deferred Compensation Plan: Each eligible Trustee of the Fund may elect to participate in the Fee Deferral Plan for Independent Directors and Trustees (the “Plan”). Under the Plan, effective January 1, 2002, such Trustees may defer payment of all or a portion of their total fees earned as a Trustee. These deferred amounts may be treated as though such amounts had been invested in shares of the following funds: the U.S. Large Cap Value Portfolio, U.S. Core Equity 1 Portfolio, U.S. Large Company Portfolio, U.S. Vector Equity Portfolio, U.S. Micro Cap Portfolio, DFA International Value Portfolio, International Core Equity Portfolio, Emerging Markets Portfolio, Emerging Markets Core Equity Portfolio, DFA Inflation-Protected Securities Portfolio, and/or DFA Two-Year Global Fixed Income Portfolio. Contributions made under the Plan and the change in unrealized appreciation (depreciation) and income are included in Directors’/ Trustees’ Fees & Expenses. As of October 31, 2022, the total liability for deferred compensation to Trustees is included in Accrued Expenses and Other Liabilities on the Statement of Assets and Liabilities in the amount of $264 (in thousands).
The Trustees may receive their distributions of proceeds by one of the following methods: lump sum, annual installments over a period of agreed-upon years, or quarterly installments over a period of agreed-upon years. Each Trustee shall have the right in a notice of election (the “Notice”) to defer the receipt of the Trustee’s deferred compensation until a date specified by such Trustee in the Notice. The date may not be sooner than the earlier of: (i) the first business day of January following the year in which such Trustee ceases to be a member of the Board of Trustees of the Fund; and (ii) five years following the effective date of the Trustee’s first deferral election. If a Trustee who elects to defer fees fails to designate in the Notice a time or date as of which payment of the Trustee’s deferred fee account shall commence, payment of such amount shall commence as of the first business day of January following the year in which the Trustee ceases to be a member of the Board (unless the Trustee files an amended Notice selecting a different distribution date).
272
4. Other: Security transactions are accounted for as of the trade date. Costs used in determining realized gains and losses on the sale of investment securities and foreign currency are accounted for on the basis of identified cost. Dividend income and distributions to shareholders are recorded on the ex-dividend date. Distributions received on securities that represent a return of capital or capital gains are recorded as a reduction of cost of investments or as a realized gain, respectively. The Fund estimates the character of received distributions that may be considered return of capital distributions. Interest income is recorded on an accrual basis. Expenses directly attributable to the Fund are directly charged. The Fund may be subject to taxes imposed by countries in which it invests, with respect to its investments in issuers existing or operating in such countries. Such taxes are generally based on income earned or repatriated and capital gains realized on the sale of such investments. The Fund accrues such taxes when the related income or capital gains are earned or throughout the holding period. Some countries require governmental approval for the repatriation of investment income, capital or the proceeds of sales earned by foreign investors. Additionally, if there is a deterioration in a country’s balance of payments or for other reasons, a country may impose temporary restrictions on foreign capital remittances abroad.
The Fund’s investments in Chile are subject to governmental taxes on investment income. Such taxes are due when currencies are repatriated from the country. The Fund accrues for taxes on income as the income is earned. The Fund is subject to tax on short-term and long-term capital gains for investments in India. Such taxes are accrued on a daily basis and due upon sale of individual securities.
C. Investment Advisor:
The Advisor, Dimensional Fund Advisors LP, provides investment management services to the Fund.
For the year ended October 31, 2022, the Fund’s investment management fee was accrued daily and paid monthly to the Advisor based on the following effective annual rate of average daily net assets:
| | | | |
Dimensional Emerging Markets Value Fund | | | 0.10 | % |
Earned Income Credit:
Additionally, the Fund has entered into arrangements with its custodian whereby net interest earned on uninvested cash balances was used to reduce a portion of the Fund’s custody expense. Custody expense in the accompanying financial statements is presented before reduction for credits. The impact of such credits is generally less than one basis point of the Fund’s net assets. During the year ended October 31, 2022, expenses reduced were the following (amount in thousands):
| | | | |
| | | Fees Paid | |
| | | Indirectly | |
Dimensional Emerging Markets Value Fund | | $ | 313 | |
Fees Paid to Officers and Directors/Trustees:
Certain Officers and Trustees of the Advisor are also Officers and Trustees of the Fund; however, such Officers and Trustees (with the exception of the Chief Compliance Officer (“CCO”)) receive no compensation from the Fund. For the year ended October 31, 2022, the total related amounts paid by the Fund to the CCO were $5 (in thousands) and are included in Other Expenses on the Statement of Operations.
273
D. Purchases and Sales of Securities:
For the year ended October 31, 2022, the Fund’s transactions related to investment securities, other than short-term securities, in-kind redemptions and U.S. Government securities (amounts in thousands), were as follows:
| | | | | | | | |
| | | Purchases | | | Sales | |
Dimensional Emerging Markets Value Fund | | $ | 1,695,400 | | | $ | 2,437,474 | |
There were no purchases or sales of long-term U.S. government securities.
For the year ended October 31, 2022, transactions related to Affiliated Investment Companies, excluding in-kind redemptions, are presented below.
The amounts presented below may differ from the respective amounts presented in the corresponding Summary Schedule of Portfolio Holdings, Statement of Assets and Liabilities or Statement of Operations due to rounding. The amounts are as follows (amounts in thousands):
| | | | | | | | | | | | | | | | | | | | | | | | | | | | | | | | | | | | |
| | | Balance at
October 31,
2021 | | | Purchases
at Cost | | | Proceeds
from Sales | | | Net Realized
Gain/(Loss)
on Sales | | | Change in
Unrealized
Appreciation/
Depreciation | | | Balance at
October 31,
2022 | | | Shares as of
October 31,
2022 | | | Dividend
Income | | | Capital Gain
Distributions | |
Dimensional Emerging Markets Value Fund | | | | | | | | | | | | | | | | | | | | | | | | | | | | | | | | | | | | |
The DFA Short Term Investment Fund | | $ | 226,407 | | | $ | 1,504,449 | | | $ | 1,526,477 | | | $ | 6 | | | $ | (133 | ) | | $ | 204,252 | | | | 17,667 | | | $ | 2,150 | | | | — | |
| | | | | | | | | | | | | | | | | | | | | | | | | | | | | | | | | | | | |
Total | | $ | 226,407 | | | $ | 1,504,449 | | | $ | 1,526,477 | | | $ | 6 | | | $ | (133 | ) | | $ | 204,252 | | | | 17,667 | | | $ | 2,150 | | | | — | |
| | | | | | | | | | | | | | | | | | | | | | | | | | | | | | | | | | | | |
E. Federal Income Taxes:
No provision for federal income taxes is required since the Fund is treated as a partnership for federal income tax purposes. Any net investment income and realized and unrealized gains and losses have been deemed to have been “passed down” to their respective partners.
As of October 31, 2022, the total cost and aggregate gross unrealized appreciation (depreciation) of securities for federal income tax purposes were different from amounts reported for financial reporting purposes, as follows (amounts in thousands):
| | | | | | | | | | | | | | | | |
| | | Federal
Tax Cost | | | Unrealized
Appreciation | | | Unrealized
(Depreciation) | | | Net
Unrealized
Appreciation
(Depreciation) | |
Dimensional Emerging Markets Value Fund | | $ | 10,390,667 | | | $ | 2,322,204 | | | $ | (2,777,385 | ) | | $ | (455,181 | ) |
The difference between GAAP-basis and tax basis unrealized gains (losses) can occur as a result of wash sales and net mark-to-market gains (losses) on regulated futures contracts, net mark-to-market gains (losses) on foreign currency contracts, and differences in tax treatment of passive foreign investment company investments or other investments.
ASC 740 Accounting for Uncertainty in Income Taxes sets forth a minimum threshold for financial statement recognition of the benefit of a tax position taken or expected to be taken in a tax return. Management has analyzed the Fund’s tax positions and has concluded that no additional provision for income tax is required in the Fund’s financial statements. The Fund is not aware of any tax positions for which it is more likely than not that the total amounts of unrecognized tax benefits will significantly change in the next twelve months. The Fund’s federal tax returns for the prior three fiscal years remain subject to examination by the Internal Revenue Service.
274
F. Financial Instruments:
In accordance with the Fund’s investment objective and policies, the Fund may invest in certain financial instruments that have off-balance sheet risk in excess of the amounts recognized in the financial statements and concentrations of credit and market risk. These instruments and their significant corresponding risks are described below:
1. Foreign Market Risks: Investments in foreign markets may involve certain considerations and risks not typically associated with investments in the United States of America, including the possibility of future political and economic developments and the level of foreign governmental supervision and regulation of foreign securities markets. These markets are generally smaller, less liquid and more volatile than the major securities markets in the United States of America. Consequently, acquisition and disposition of securities held by the Fund may be inhibited.
Derivative Financial Instruments:
Summarized below are the specific types of derivative instruments used by the Fund.
2. Futures Contracts: The Fund may purchase or sell futures contracts and options on futures contracts for foreign or U.S. equity securities and indices, to increase or decrease market exposure based on actual or expected cash inflows to or outflows from the Fund. Upon entering into a futures contract, the Fund deposits cash or pledges U.S. government securities to a broker in an amount equal to the minimum “initial margin” requirements of the exchange on which the contract is traded. Subsequent payments are received from or paid to the broker each day, based on the daily fluctuation in the market value of the contract. These receipts or payments are known as “variation margin” and are recorded daily by the Fund as unrealized gains or losses until the contracts are closed. When the contracts are closed, the Fund records a realized gain or loss, which is presented in the Statement of Operations as a net realized gain or loss on futures, equal to the difference between the value of the contract at the time it was opened and the value at the time it was closed.
Risks may arise upon entrance into futures contracts from potential imperfect price correlations between the futures contracts and the underlying securities or indices, from the possibility of an illiquid secondary market for these instruments and from the possibility that the Fund could lose more than the initial margin requirements. Entering into stock index futures subjects the Fund to equity price risk from those futures contracts. Counterparty credit risk related to exchange-traded futures is minimal because the exchange’s clearinghouse, as counterparty to all exchange-traded futures, guarantees the futures against default.
Securities have been segregated as collateral for open futures contracts.
The average volume (based on the open positions at each fiscal month-end) of derivative activity for the year ended October 31, 2022 was as follows (amount in thousands):
| | | | |
| | | Futures* | |
Dimensional Emerging Markets Value Fund | | $ | 89,532 | |
| * | Average Notional Value of futures contracts. |
The following is a summary of the Fund’s derivative instrument holdings categorized by primary risk exposure as of October 31, 2022 (amounts in thousands):
| | | | | | | | |
| | | Asset Derivatives Value | |
| | | Total Value
at
October 31, 2022 | | | Equity
Contracts *,(1) | |
| | | | | | | | |
Dimensional Emerging Markets Value Fund | | $ | 1,483 | | | $ | 1,483 | |
275
| | | | | | | | |
| | | Liability Derivatives Value | |
| | | Total Value
at
October 31, 2022 | | | Equity
Contracts*,(2) | |
| | | | | | | |
Dimensional Emerging Markets Value Fund | | | $(3,616) | | | | $(3,616) | |
| (1) | Presented on Statement of Assets and Liabilities as Receivables: Futures Margin Variation. |
| (2) | Presented on Statement of Assets and Liabilities as Payables: Futures Margin Variation. |
| * | Includes cumulative appreciation (depreciation) of futures contracts. Only current day’s margin variation is reported within the Statement of Assets and Liabilities. |
The following is a summary of the realized and change in unrealized gains and losses from the Fund’s derivative instrument holdings categorized by primary risk exposure for the year ended October 31, 2022 (amounts in thousands):
| | | | | | | | |
| | | Realized Gain (Loss) on
Derivatives | |
| | | Total | | | Equity
Contracts (1) | |
Dimensional Emerging Markets Value Fund | | $ | (15,965 | ) | | $ | (15,965 | ) |
| | | | | | | | |
| | | Change in Unrealized Appreciation
(Depreciation) on Derivatives | |
| | | | | | Equity | |
| | | Total | | | Contracts (2) | |
Dimensional Emerging Markets Value Fund | | $ | (2,584 | ) | | $ | (2,584 | ) |
| (1) | Presented on Statement of Operations as Net Realized Gain (Loss) on: Futures. |
| (2) | Presented on Statement of Operations as Change in Unrealized Appreciation (Depreciation) of: Futures. |
G. Line of Credit and Interfund Lending Program:
The Fund, together with other Dimensional-advised portfolios, has entered into a $500 million uncommitted, unsecured discretionary line of credit effective April 6, 2022, with its domestic custodian bank. A line of credit with similar terms was in effect through April 6, 2022. Each portfolio is permitted to borrow, subject to its investment limitations, up to a maximum of $250 million, as long as total borrowings under the line of credit do not exceed $500 million in the aggregate. Borrowings under the line of credit are charged interest at rates agreed upon by the parties at the time of borrowing. Each portfolio is individually, and not jointly, liable for its particular advances under the line of credit. There is no commitment fee on the unused portion of the line of credit. The agreement for the discretionary line of credit may be terminated by either party at any time. The agreement for the line of credit expires on April 5, 2023.
The Fund, together with other Dimensional-advised portfolios, has also entered into an additional $700 million unsecured line of credit with its international custodian bank effective January 2, 2022. A line of credit with similar terms was in effect through January 1, 2022. Each portfolio is permitted to borrow, subject to its investment limitations, up to the lower of one-quarter of such portfolio’s net assets or $500 million, as long as total borrowings under the line of credit do not exceed $700 million in the aggregate. Each portfolio is individually, and not jointly, liable for its particular advances under the line of credit. Borrowings under the line of credit are charged interest at rates agreed upon by the parties at the time of borrowing. There is no commitment fee on the unused portion of the line of credit. The agreement for the discretionary line of credit may be terminated by either party at any time. The line of credit agreement expires on January 1, 2023.
276
For the year ended October 31, 2022, borrowings by the Fund under the lines of credit were as follows (amounts in thousands, except percentages and days):
| | | | | | | | | | | | | | | | | | | | | | | | |
| | | Weighted | | | Weighted | | | Number of | | | Interest | | | Maximum
Amount | | | Outstanding | |
| | | Average | | | Average | | | Days | | | Expense | | | Borrowed During | | | Borrowings | |
| | | Interest Rate | | | Loan Balance | | | Outstanding* | | | Incurred | | | the Period | | | as of 10/31/2022 | |
Dimensional Emerging Markets Value Fund | | | 0.83 | % | | $ | 216 | | | | 2 | | | | — | | | $ | 216 | | | | — | |
| * | Number of Days Outstanding represents the total of single or consecutive days during the year ended October 31, 2022, that the Fund’s available line of credit was used. |
Pursuant to an exemptive order issued by the SEC (the “Order”), the Fund may participate in an interfund lending program among certain portfolios managed by the Advisor (portfolios that operate as feeder funds do not participate in the program). The program allows the participating portfolios to borrow money from and loan money to each other for temporary or emergency purposes, subject to the conditions in the Order. A loan can only be made through the program if the interfund loan rate on that day is more favorable to both the borrowing and lending portfolios as compared to rates available through short-term bank loans or investments in overnight repurchase agreements and money market funds, respectively, as detailed in the Order. Further, a portfolio may participate in the program only if and to the extent that such participation is consistent with its investment objectives and limitations. Interfund loans have a maximum duration of seven days and may be called on one business day’s notice.
For the year ended October 31, 2022, activity by the Fund under the interfund lending program was as follows (amounts in thousands, except percentages and days):
| | | | | | | | | | | | | | | | | | | | | | | | | | | | |
| | | | | | Weighted | | | Weighted | | | Number of | | | Interest | | | Maximum Amount | | | Outstanding | |
| | | Borrower or | | | Average | | | Average Loan | | | Days | | | Expense/ | | | Borrowed/Loaned | | | Borrowings | |
| | | Lender | | | Interest Rate | | | Balance | | | Outstanding* | | | Income | | | During the Period | | | as of 10/31/2022 | |
Dimensional Emerging Markets Value Fund | | | Borrower | | | | 0.44 | % | | $ | 103,598 | | | | 3 | | | $ | 4 | | | $ | 103,598 | | | | — | |
| * | Number of Days Outstanding represents the total of single or consecutive days during the year ended October 31, 2022 that the Fund utilized the interfund lending program. |
H. Affiliated Trades:
Cross trades for the year ended October 31, 2022, if any, were executed by the Fund pursuant to procedures adopted by the Board of Trustees of the Fund to ensure compliance with Rule 17a-7 under the 1940 Act. Cross trading is the buying or selling of portfolio securities between series of investment companies, or between a series of an investment company and another entity, that are or could be considered affiliates by virtue of a common investment advisor (or affiliated investment advisors), common Trustees and/or common Officers. At its regularly scheduled meetings, the CCO certifies to the Board that the 17a-7 transactions entered into by the Fund complied with the Rule 17a-7 Procedures adopted by the Board of Trustees of the Fund.
For the year ended October 31, 2022, cross trades by the Fund under Rule 17a-7 were as follows (amounts in thousands):
| | | | | | | | | | | | |
Portfolio | | Purchases | | | Sales | | | Realized Gain (Loss) | |
Dimensional Emerging Markets Value Fund | | $ | 6,942 | | | $ | 11,967 | | | $ | 3,149 | |
277
I. Securities Lending:
As of October 31, 2022, the Fund had securities on loan to brokers/dealers, for which the Fund received cash collateral. The Fund also received non-cash collateral consisting of short- and/or long-term U.S. Treasuries and U.S. government agency securities as follows (amount in thousands):
| | | | |
| | | Non-Cash | |
| | | Collateral | |
| | | Market | |
| | | Value | |
Dimensional Emerging Markets Value Fund | | $ | 360,932 | |
The Fund invests the cash collateral, as described below, and records a liability for the return of the collateral, during the period the securities are on loan. Loans of securities are expected at all times to be secured by collateral in an amount (i) equal to at least 100% of the current market value of the loaned securities with respect to securities of the U.S. government or its agencies, (ii) generally equal to 102% of the current market value of the loaned securities with respect to U.S. securities, and (iii) generally equal to 105% of the current market value of the loaned securities with respect to foreign securities. However, daily market fluctuations could cause the Fund’s collateral to be lower or higher than the expected thresholds. If this were to occur, the collateral would be adjusted the next business day to ensure adequate collateralization. In the event of default or bankruptcy by the other party to the agreement, realization and/or retention of the collateral may be subject to legal proceedings. If the borrower fails to return loaned securities, cash collateral being maintained by the borrower is insufficient to cover the value of loaned securities, and such collateral insufficiency is not the result of investment losses, the lending agent has agreed to pay the amount of the shortfall to the Fund or, at the option of the lending agent, to replace the securities. In the event of the bankruptcy of the borrower, the Fund could experience delay in recovering the loaned securities or only recover cash or a security of equivalent value.
Subject to its stated investment policies, the Fund will generally invest the cash collateral received for the loaned securities in The DFA Short Term Investment Fund (the “Money Market Series”), an affiliated registered money market fund advised by the Advisor for which the Advisor receives a management fee of 0.05% of the average daily net assets of the Money Market Series. Income received from the Money Market Series is netted with fees for securities lending and collateral investment expenses and with other payments to and from borrowers of securities. The Fund also may invest the cash collateral received for the loaned securities in securities of the U.S. government or its agencies, repurchase agreements collateralized by securities of the U.S. government or its agencies, and affiliated or unaffiliated money market funds that are registered or unregistered. For purposes of this paragraph, agencies include both agency debentures and agency mortgage-backed securities. Additionally, the Fund will be able to terminate the loan at any time and will receive reasonable interest on the loan, as well as amounts equal to any dividends, interest or, other distributions on the loaned securities. However, dividend income received from loaned securities may not be eligible for taxation at qualified dividend income rates.
The following table reflects a breakdown of transactions accounted for as secured borrowings, the gross obligation by the type of collateral pledged, and the remaining contractual maturity of those transactions as of October 31, 2022 (amounts in thousands):
| | | | | | | | | | | | | | | | | | | | |
| | | Remaining Contractual Maturity of the Agreements
As of October 31, 2022 | |
| | | Overnight and | | | | | | Between | | | | | | | |
| | | Continuous | | | <30 days | | | 30 & 90 days | | | >90 days | | | Total | |
Securities Lending Transactions | | | | | | | | | | | | | | | | | | | | |
Dimensional Emerging Markets Value Fund Common Stocks | | $ | 192,484 | | | | — | | | | — | | | | — | | | $ | 192,484 | |
278
J. Indemnitees; Contractual Obligations:
Under the Fund’s organizational documents, its Officers and Trustees are indemnified against certain liabilities arising out of the performance of their duties to the Fund.
In the normal course of business, the Fund enters into contracts that contain a variety of representations and warranties that provide general indemnification. The Fund’s maximum exposure under these arrangements is unknown, as this would involve future claims that may be made against the Fund and/or its affiliates that have not yet occurred. However, based on experience, the Fund expects the risk of loss to be remote.
K. Recently Issued Accounting Standards and Regulations:
In March 2020, the Financial Accounting Standards Board (FASB) issued Accounting Standards Update (ASU) No. 2020-04, Reference Rate Reform (Topic 848) – Facilitation of the Effects of Reference Rate Reform on Financial Reporting. In January 2021, the FASB issued ASU No. 2021-01, with further amendments to Topic 848. The amendments in the ASUs provide optional temporary accounting recognition and financial reporting relief from the effect of certain types of contract modifications due to the planned discontinuation of the LIBOR and other interbank-offered based reference rates as of the end of 2021 and 2023. The ASUs are effective for certain reference rate-related contract modifications that occur during the period March 12, 2020 through December 31, 2022. Management has reviewed the requirements and believes the adoption of these ASUs will not have a material impact on the Fund’s financial statements.
In October 2020, the SEC adopted new regulations governing the use of derivatives by registered investment companies. Rule 18f-4 (the “Derivatives Rule”) imposes limits on the amount of derivatives contracts the Fund could enter, eliminates the asset segregation framework previously used by the Fund to comply with Section 18 of the 1940 Act, and requires funds whose use of derivatives is more than a limited specified exposure to establish and maintain a derivatives risk management program and appoint a derivatives risk manager. The Derivatives Rule became effective February 19, 2021 and the Fund began complying with the Derivatives Rule on August 19, 2022.
On December 3, 2020, the SEC adopted new Rule 2a-5 (the “Valuation Rule”) under the 1940 Act, establishing an updated regulatory framework for fund valuation. The Valuation Rule, in part, provides a framework for good faith fair value determination and permits a Board to designate fair value determinations to a fund’s investment adviser. Further, the SEC rescinded previously issued guidance on related issues. The Valuation Rule became effective on March 8, 2021 and the Fund began complying with the Valuation Rule on August 1, 2022.
L. Other:
The Fund is subject to claims and suits that arise from time to time in the ordinary course of business (for example, claw back litigation against former shareholders of portfolio companies that filed for bankruptcy, such as the now ended litigation involving The Tribune Company and the ongoing litigation involving Nine West). Although management currently believes that resolving claims against the Fund, individually or in aggregate, will not have a material adverse impact on the Fund’s financial position, results of operations, or cash flows, these matters are subject to inherent uncertainties and management’s view of these matters may change in the future.
M. Subsequent Event Evaluations:
Management has evaluated the impact of all subsequent events on the Fund through the date on which the financial statements were issued and has determined that there are no subsequent events requiring recognition or disclosure in the financial statements.
279
Report of Independent Registered Public Accounting Firm
To the Board of Trustees and Shareholders of Dimensional Emerging Markets Value Fund
Opinion on the Financial Statements
We have audited the accompanying statement of assets and liabilities, including the summary schedule of portfolio holdings, of Dimensional Emerging Markets Value Fund (the “Fund”) as of October 31, 2022, the related statement of operations for the year ended October 31, 2022, the statement of changes in net assets for each of the two years in the period ended October 31, 2022, including the related notes, and the financial highlights for each of the five years in the period ended October 31, 2022 (collectively referred to as the “financial statements”). In our opinion, the financial statements present fairly, in all material respects, the financial position of the Fund as of October 31, 2022, the results of its operations for the year then ended, the changes in its net assets for each of the two years in the period ended October 31, 2022 and the financial highlights for each of the five years in the period ended October 31, 2022 in conformity with accounting principles generally accepted in the United States of America.
Basis for Opinion
These financial statements are the responsibility of the Fund’s management. Our responsibility is to express an opinion on the Fund’s financial statements based on our audits. We are a public accounting firm registered with the Public Company Accounting Oversight Board (United States) (PCAOB) and are required to be independent with respect to the Fund in accordance with the U.S. federal securities laws and the applicable rules and regulations of the Securities and Exchange Commission and the PCAOB.
We conducted our audits of these financial statements in accordance with the standards of the PCAOB. Those standards require that we plan and perform the audit to obtain reasonable assurance about whether the financial statements are free of material misstatement, whether due to error or fraud.
Our audits included performing procedures to assess the risks of material misstatement of the financial statements, whether due to error or fraud, and performing procedures that respond to those risks. Such procedures included examining, on a test basis, evidence regarding the amounts and disclosures in the financial statements. Our audits also included evaluating the accounting principles used and significant estimates made by management, as well as evaluating the overall presentation of the financial statements. Our procedures included confirmation of securities owned as of October 31, 2022 by correspondence with the custodian, brokers and transfer agent of the investee fund; when replies were not received from brokers, we performed other auditing procedures. We believe that our audits provide a reasonable basis for our opinion.
/s/ PricewaterhouseCoopers LLP
Philadelphia, Pennsylvania
December 22, 2022
We have served as the auditor of one or more investment companies in Dimensional Fund Advisors L.P. investment company group since 1981.
280
FUND MANAGEMENT
(Unaudited)
Trustees/Directors
Each Board of Trustees/Directors (each, the “Board” and collectively, the “Boards”) of The DFA Investment Trust Company (“DFAITC”), DFA Investment Dimensions Group Inc. (“DFAIDG”), Dimensional Investment Group Inc. (“DIG”), Dimensional ETF Trust (“ETF Trust”), and Dimensional Emerging Markets Value Fund (“DEM”) (each, the “Fund” and collectively, the “Funds”) is responsible for establishing the Funds’ policies and for overseeing the management of the Funds. The Trustees/ Directors of the Funds, including all of the disinterested Trustees/Directors, have adopted written procedures to monitor potential conflicts of interest that might develop between portfolios of the Funds (the “Feeder Portfolios”) that invest in certain series of DFAITC or DEM (the “Master Funds”).
Each Board has four standing committees, an Audit Committee, a Nominating and Governance Committee (the “Nominating Committee”), a Mutual Funds-ETF Relations committee and an Investment Strategy Committee (the “Strategy Committee”). The Audit Committee is composed of Reena Aggarwal, George M. Constantinides, Francis A. Longstaff, Abbie J. Smith and Ingrid M. Werner. Each member of the Audit Committee is a disinterested Trustee/Director. The Audit Committee oversees the Fund’s accounting and financial reporting policies and practices, the Fund’s internal controls, the Fund’s financial statements and the independent audits thereof and performs other oversight functions as requested by the Board. The Audit Committee recommends the appointment of each Fund’s independent registered certified public accounting firm and acts as a liaison between the Fund’s independent registered certified public accounting firm and the full Board. There were three Audit Committee meetings held during the fiscal year ended October 31, 2022.
Each Board’s Nominating Committee is composed of Reena Aggarwal, George M. Constantinides, Douglas W. Diamond, Francis A. Longstaff, and Heather E. Tookes. Each member of the Nominating Committee is a disinterested Trustee/Director. The Nominating Committee for each Board makes recommendations for nominations of disinterested and interested members on the Board to the disinterested Board members and to the full Board. The Nominating Committee works closely with the other disinterested Trustees to evaluate a candidate’s qualification for Board membership and the independence of such candidate from the Advisor and other principal service providers. The Nominating Committee also periodically reviews the Board governance practices, policies, procedures, and operations; reviews the membership of each committee of the Board; reviews and makes recommendations regarding the Independent Trustees’ compensation; oversees the annual self-assessment of the Board and each committee; considers and recommends to the Board, the selection of “independent legal counsel” (as that term is defined in the 1940 Act); and monitors and considers corporate governance issues that may arise from time to time. There were three Nominating Committee meetings held during the fiscal year ended October 31, 2022.
Each Board’s Strategy Committee is composed of Gerard K. O’Reilly, Douglas W. Diamond, Darrell Duffie, and Heather E. Tookes. The Strategy Committee assists the Board in carrying out its fiduciary duties with respect to the oversight of the Fund and its performance. At the request of the Board or the Advisor, the Strategy Committee (i) reviews the design of possible new series of the Fund, (ii) reviews performance of existing portfolios of the Funds and discusses and recommends possible enhancements to the portfolios’ investment strategies, (iii) reviews proposals by the Advisor to modify or enhance the investment strategies or policies of each portfolio, and (iv) considers issues relating to investment services for each portfolio of the Fund. There were four Strategy Committee meetings held during the fiscal year ended October 31, 2022.
The Mutual Funds-ETF Relations Committee is comprised of George M. Constantinides, Darrell Duffie, and Ingrid M. Werner. At the request of the Board, the Mutual Funds-ETF Relations Committee (i) reviews any newly-proposed expenses to be borne by the ETFs in the Dimensional ETF Trust (“Dimensional ETFs”), portfolios in the DFA mutual fund complex (“Fund Complex”) or changes to the existing expense allocations among the Dimensional ETFs, portfolios in the Fund Complex, and the Advisor, (ii) considers any conflicts of interest that may arise in the operations of the Dimensional ETFs and the portfolios in the Fund Complex, (iii) reviews and considers relevant information relating to the operations of the Dimensional ETFs, and (iv) considers asset flows and performance differences between the similarly managed mutual funds and ETFs of the Funds. There were two Mutual Funds-ETF Relations Committee meetings held for the Trust during the fiscal year ended October 31, 2022.
281
Certain biographical information for each disinterested Trustee/Director and interested Trustee/Director of the Funds is set forth in the tables below, including a description of each Trustee/Director’s experience as a Trustee/Director of the Funds and as a Director or Trustee of other funds, as well as other recent professional experience.
The statements of additional information (together, “SAI”) of the Funds include additional information about each Trustee/Director. You may obtain copies of the SAI and prospectus of each Fund advised by Dimensional Fund Advisors LP by calling collect (512) 306-7400 or by mailing a request to Dimensional Fund Advisors LP, 6300 Bee Cave Road, Building One, Austin, TX 78746. Prospectuses are also available at http://us.dimensional.com.
282
Disinterested Directors/Trustees
| | | | | | | | | | |
Name, Address and Year of Birth | | Position | | Term of Office1 and Length of Service | | Principal Occupation During Past 5 Years | | Portfolios
within the
DFA Fund
Complex2
Overseen | | Other
Directorships of
Public Companies Held During Past 5 Years |
Reena Aggarwal c/o Dimensional Fund Advisors LP 6300 Bee Cave Road, Building One Austin, TX 78746 1957 | | Director/ Trustee | | Since December 2021 | | Robert E. McDonough Professor of Business Administration and Finance, McDonough School of Business, Georgetown University (since 2003); Director, Georgetown Center for Financial Markets and Policy (since 2010); and Vice Provost of Faculty (2016-2020), Georgetown University. | | 147 portfolios in 5 investment companies | | Director, Cohen & Steers (asset management firm) (since 2017) and Director, Nuveen Churchill Direct Lending (private business development company) (since 2019). Formerly, Director, New York Life Investment Management IndexIQ (2008- 2021) (22 funds); Director, REAN Cloud (technology) (2015-2018); Director, FBR & Co. (investment banking) (2011- 2017); and Director, Brightwood Capital Advisors, L.P. (private equity) (2013- 2020). |
| | | | | |
George M. Constantinides University of Chicago Booth School of Business 5807 S. Woodlawn Avenue Chicago, IL 60637 1947 | | Director/ Trustee | | DFAIDG – Since 1983; DIG & DEM- Since 1993; DFAITC – Since 1992; ETF Trust – Since 2020 | | Leo Melamed Professor of Finance, University of Chicago Booth School of Business (since 1978). | | 147 portfolios in 5 investment companies | | None |
283
| | | | | | | | | | |
Name, Address and
Year of Birth | | Position | | Term of Office1 and Length of Service | | Principal Occupation During Past 5 Years | | Portfolios
within the
DFA Fund
Complex2
Overseen | | Other
Directorships of
Public Companies
Held During Past
5 Years |
Douglas W. Diamond c/o Dimensional Fund Advisors LP 6300 Bee Cave Road, Building One Austin, TX 78746 1953 | | Director/ Trustee | | DFAIDG, DIG, DEM & DFAITC - Since 2017; ETF Trust – Since 2020 | | Merton H. Miller Distinguished Service Professor of Finance, University of Chicago Booth School of Business (since 1979). Formerly, Visiting Scholar, Federal Reserve Bank of Richmond (1990-2019). | | 147 portfolios in 5 investment companies | | None |
| | | | | |
Darrell Duffie c/o Dimensional Fund Advisors LP 6300 Bee Cave Road, Building One Austin, TX 78746 1954 | | Director/ Trustee | | DFAIDG, DIG, DEM & DFAITC - Since 2019; ETF Trust – Since 2020 | | Adams Distinguished Professor of Management and Professor of Finance, Stanford University (since 1984) and Director, TNB Inc. (bank) (since 2020). | | 147 portfolios in 5 investment companies | | Formerly, Director, Moody’s Corporation (financial information and information technology) (2008- 2018). |
| | | | | |
Francis A. Longstaff c/o Dimensional Fund Advisors LP 6300 Bee Cave Road, Building One Austin, TX 78746 1956 | | Director/ Trustee | | Since December 2021 | | Allstate Professor of Insurance and Finance, UCLA, Anderson School of Management; Consultant, NERA Economic Consulting (since 2018); Consultant, Charles River Associates (economic consulting firm) (since 2013); Consultant, Simplex Holdings, Inc. (technology firm) (since 1998); and Expert Witness, Analysis Group (economic consulting firm) (since 2012). | | 147 portfolios in 5 investment companies | | None |
| | | | | |
Abbie J. Smith University of Chicago Booth School of Business 5807 S. Woodlawn Avenue Chicago, IL 60637 1953 | | Director/ Trustee | | DFAIDG, DIG, DEM & DFAITC - Since 2000; ETF Trust – Since 2020 | | Boris and Irene Stern Distinguished Service Professor of Accounting and James S. Ely, III Faculty Fellow, University of Chicago Booth School of Business (since 1980). | | 147 portfolios in 5 investment companies | | Director (since 2000) and formerly, Lead Director (2014- 2017), HNI Corporation (office furniture); Director, Ryder System Inc. (transportation, logistics and supply-chain management) (since 2003); and Trustee, UBS Funds (2 investment companies within the fund complex) (13 portfolios) (since 2009). |
| | | | | |
Heather E. Tookes Yale School of Management 165 Whitney Avenue New Haven, CT 06511 1974 | | Director/ Trustee | | Since December 2021 | | Professor of Finance, Yale School of Management (since 2004). | | 147 portfolios in 5 investment companies | | Director, Payoneer Inc. (digital payments) (since 2021); Director, Ariel Investments LLC (since 2017); and Director, Community Foundation of Greater New Haven (community foundation and grant-making) (since 2022). Formerly, Director, KCG Holdings (trading company) (January 2017-July 2017). |
284
| | | | | | | | | | |
| | | | | | | | | | | |
Name, Address and Year of Birth | | Position | | Term of Office1 and Length of Service | | Principal Occupation During Past 5 Years | | Portfolios within the
DFA Fund
Complex2
Overseen | | Other Directorships of
Public Companies
Held During Past
5 Years |
Ingrid M. Werner c/o Dimensional Fund Advisors LP 6300 Bee Cave Road, Building One Austin, TX 78746 1961 | | Director/ Trustee | | DFAIDG, DIG, DEM & DFAITC - Since 2019; ETF Trust – Since 2020 | | Martin and Andrew Murrer Professor of Finance, Fisher College of Business, The Ohio State University (since 1998). Adjunct Member, the Prize Committee for the Swedish Riksbank Prize in Economic Sciences in Memory of Alfred Nobel (annual award for significant scientific research contribution) (since 2018). Director, American Finance Association (global association of academic researchers and practitioners in finance) (since January 2019). Member, Scientific Board, Leibniz Institute for Financial Research (institute supporting academic research in finance) (since 2020). Chair, Economic Advisory Committee, FINRA (since 2017). Chairman, Scientific Advisory Board, Swedish House of Finance (institute supporting academic research in finance) (since 2014). Member, Scientific Board, Danish Finance Institute (institute supporting academic research in finance) (since 2017). Fellow, Center for Analytical Finance (academic research) (since 2015). Associate Editor, Journal of Finance (since 2016). Formerly, President, Western Finance Association (global association of academic researchers and practitioners in finance) (2018-2019). Formerly, Member, Academic Board, Mistra Financial Systems (organization funding academic research on environment, governance and climate/sustainability in finance) (2016-2021). | | 147 portfolios in 5 investment companies | | Director, Fourth Swedish AP Fund (pension fund asset management) (since 2017). |
285
Interested Directors/Trustees
The following interested Directors are described as such because each is deemed to be an “interested person,” as that term is defined under the 1940 Act, due to his position with the Advisor.
| | | | | | | | | | |
Name, Address and Year of Birth | | Position | | Term of Office1
and Length of
Service | | Principal Occupation During Past 5 Years | | Portfolios
within the
DFA Fund
Complex2
Overseen | | Other Directorships of Public Companies Held During Past 5 Years |
David P. Butler c/o Dimensional Fund Advisors LP 6300 Bee Cave Road, Building One, Austin, TX 78746 1964 | | Director Co-Chief Executive Officer | | Director since December 2021 Co-Chief Executive Officer since 2017 (DFAIDG, DIG,DEM & DFAITC); 2020 (ETF Trust) | | Co-Chief Executive Officer of Dimensional Emerging Markets Value Fund (“DEM”), DFAIDG, Dimensional Investment Group Inc. (“DIG”), The DFA Investment Trust Company (“DFAITC”), Dimensional Holdings Inc., Dimensional Fund Advisors LP, Dimensional Investment LLC, and DFA Securities LLC (collectively with DEM, DFAIDG, DIG and DFAITC, the “DFA Entities”) (since 2017), DFA Canada LLC (since 2018), Dimensional Holdings LLC (since 2017), and Dimensional ETF Trust (since 2020); Chief Executive Officer of Dimensional Fund Advisors Canada ULC (since 2018); Director (since 2017) of Dimensional Holdings Inc., Dimensional Fund Advisors Canada ULC, Dimensional Japan Ltd., Dimensional Advisors Ltd., Dimensional Fund Advisors Ltd., and DFA Australia Limited; Director and Co-Chief Executive Officer (since 2017) of Dimensional Cayman Commodity Fund I Ltd.; Chief Executive Officer of Dimensional Fund Advisors Canada ULC (since 2018); Head of Global Financial Advisor Services for Dimensional Fund Advisors LP (since 2007) and Dimensional Investment LLC (since 2017); Formerly, Vice President (2007 – 2017) of all the DFA Entities; Formerly, Head of Global Advisor Services for Dimensional Investment LLC (2011-2017). | | 147 portfolios in 5 investment companies | | None |
Gerard K. O’Reilly c/o Dimensional Fund Advisors LP 6300 Bee Cave Road, Building One, Austin, TX 78746 1976 | | Chairman and Director Co-Chief Executive Officer and Chief Investment Officer | | Chairman and Director since December 2021 Co-Chief Executive Officer and Chief Investment Officer since 2017 (DFAIDG, DIG, DEM & DFAITC);2020 (ETF Trust) | | Co-Chief Executive Officer and Chief Investment Officer of the DFA Entities (since 2017) and Dimensional ETF Trust (since 2020); Co-Chief Executive Officer of Dimensional Canada LLC (since 2018); Chief Investment Officer of Dimensional Fund Advisors Canada ULC (since 2017); Director, Chief Investment Officer (since 2017) and Vice President (since 2014) of DFA Australia Limited; Chief Investment Officer (since 2018) and Vice President (since 2016) of Dimensional Japan Ltd.; Director, Co-Chief Executive Officer and Chief Investment Officer (since 2017) of Dimensional Cayman Commodity Fund I Ltd.; Director of Dimensional Funds plc (since 2014), Dimensional Fund II plc (since 2014), Dimensional Holdings Inc. (since 2017), Dimensional Advisors Ltd. (since 2017), and Dimensional Ireland Limited (since 2018). Formerly, Executive Vice President (2017) and Co-Chief Investment Officer (2014 – 2017) of the DFA Entities; Formerly, Vice President (2007 – 2017) of the DFA Entities; Formerly, Vice President and Co-Chief Investment Officer (2014 – 2017) of Dimensional Fund Advisors Canada ULC. Formerly, Director of Dimensional Fund Advisors Pte. Ltd. (2017-2018) and Dimensional Fund Advisors Ltd. (2018-2021). | | 147 portfolios in 5 investment companies | | None |
| 1 | Each Director/Trustee holds office for an indefinite term until his or her successor is elected and qualified. |
286
| 2 | Each Director/Trustee is a director or trustee of each of the five registered investment companies within the DFA Fund Complex, which include: the Fund; DIG; DFAITC; DEM; and Dimensional ETF Trust. Each disinterested Director/Trustee also serves on the Independent Review Committee of the Dimensional Funds, mutual funds registered in the provinces of Canada and managed by the Advisor’s affiliate, Dimensional Fund Advisors Canada ULC. |
Officers
Below is the name, year of birth, information regarding positions with the Funds and the principal occupation for each officer of the Funds. The address of each officer is 6300 Bee Cave Road, Building One, Austin, TX 78746. Each of the officers listed below holds the same office (except as otherwise noted) in the DFA Entities.
| | | | | | |
Name and Year of Birth | | Position | | Term of Office1 and Length of Service | | Principal Occupation During Past 5 Years |
Valerie A. Brown 1967 | | Vice President and Assistant Secretary | | Since 2001 | | Vice President and Assistant Secretary of • all the DFA Entities (since 2001) • DFA Australia Limited (since 2002) • Dimensional Fund Advisors Ltd. (since 2002) • Dimensional Cayman Commodity Fund I Ltd. (since 2010) • Dimensional Fund Advisors Pte. Ltd. (since 2012) • Dimensional Hong Kong Limited (since 2012) • Dimensional ETF Trust (since 2020) Director, Vice President and Assistant Secretary (since 2003) of • Dimensional Fund Advisors Canada ULC |
| | | |
Ryan P. Buechner 1982 | | Vice President and Assistant Secretary | | Since 2019 | | Vice President and Assistant Secretary of • DFAIDG, DIG, DFAITC and DEM (since 2019) • Dimensional ETF Trust (since 2020) Vice President (since January 2018) of • Dimensional Holdings Inc. |
287
| | | | | | |
Name and Year of Birth | | Position | | Term of Office1 and Length of Service | | Principal Occupation During Past 5 Years |
| | | |
| | | | | | • Dimensional Fund Advisors LP • Dimensional Investment LLC • DFA Securities LLC |
| | | |
Stephen A. Clark 1972 | | Executive Vice President | | Since 2017 | | Executive Vice President of • all the DFA Entities (since 2017) • Dimensional ETF Trust (since 2020) Director and Vice President (since 2016) of • Dimensional Japan Ltd. Chairman (since 2018) of • Dimensional Fund Advisors Canada ULC President and Director (since 2016) of • Dimensional Fund Advisors Canada ULC Vice President (since 2008) and Director (since 2016) of • DFA Australia Limited Director (since 2016) of • Dimensional Advisors Ltd. • Dimensional Fund Advisors Pte. Ltd. • Dimensional Hong Kong Limited Vice President of • Dimensional Advisors Ltd. (since 2016) • Dimensional Hong Kong Limited (since 2016) • Dimensional Fund Advisors Pte. Ltd. (since 2019) Formerly, Director (2016-2021) of • Dimensional Fund Advisors Ltd. Formerly, Vice President (2004 – 2017) of |
| | | |
| | | | | | • all the DFA Entities Formerly, Vice President (2010 – 2016) of • Dimensional Fund Advisors Canada ULC Formerly, Vice President (2016-2019) of • Dimensional Fund Advisors Pte. Ltd. Formerly, Interim Chief Executive Officer (2019-2020) of • Dimensional Fund Advisors Pte. Ltd. Formerly, Head of Institutional, North America (2012 – 2013) and Head of Global Institutional Services (2014-2018) for • Dimensional Fund Advisors LP |
| | | |
Lisa M. Dallmer 1972 | | Chief Operating Officer | | Since June 2021 | | Chief Operating Officer (since June 2021) of • the DFA Fund Complex Executive Vice President (since January 2020) • Dimensional Holdings Inc. • Dimensional Fund Advisors LP • Dimensional Investment LLC • DFA Securities LLC Chief Operating Officer (since December 2019) • Dimensional Holdings Inc. • Dimensional Fund Advisors LP • Dimensional Investment LLC • DFA Securities LLC Vice President (since 2020) of • DFA Australia Limited • Dimensional Advisors Ltd. • Dimensional Fund Advisors Canada ULC • Dimensional Fund Advisors Pte. Ltd. • Dimensional Ireland Limited • Dimensional Japan Ltd. |
288
| | | | | | |
Name and Year of Birth | | Position | | Term of Office1 and Length of Service | | Principal Occupation During Past 5 Years |
| | | | | | Formerly, Vice President, Chief Financial Officer, and Treasurer (June 2020- June 2021) of • the DFA Fund Complex Formerly, Senior Vice President, Business Operations (March 2019 – October 2019) at • Delphix Inc. Formerly, Chief Operating Officer Global Technology & Operations, Managing Director (2014 – 2018) of • BlackRock Inc. |
| | | |
Bernard J. Grzelak 1971 | | Vice President | | Since June 2021 | | Vice President (since June 2021) of • the DFA Fund Complex Vice President, Chief Financial Officer and Treasurer (since September 2020) of • DFA Australia Limited • Dimensional Fund Advisors Canada ULC • DFA Securities LLC • Dimensional Advisors Ltd. • Dimensional Fund Advisors LP • Dimensional Fund Advisors Ltd. • Dimensional Fund Advisors Pte. Ltd. • Dimensional Holdings Inc. • Dimensional Hong Kong Limited • Dimensional Investment LLC Vice President (since March 2021) of • Dimensional Ireland Limited Formerly, Partner (2008 – 2020), Chief Operating Officer, Global Funds and Risk (2018 – 2020), Chief Operations Officer (2016 – 2018), and Director of Fund Administration (2003 – 2016) of • Lord Abbett & Co. LLC Formerly, Chief Financial Officer (2017 – 2020), and Treasurer (2003 – 2017)of • Lord Abbett Family of Funds |
| | | |
Eric Hall 1978 | | Vice President and Assistant Treasurer | | Since June 2021 | | Vice President and Assistant Treasurer (since June 2021) of • the DFA Fund Complex Formerly, Data Integrity Team Lead (December 2019 – April 2021) of • Clearwater Analytics Formerly, Assistant Vice President and Assistant Treasurer (March 2015 – November 2019) at • INVESCO, U.S. (formerly, OppenheimerFunds, Inc.) |
| | | |
Jeff J. Jeon 1973 | | Vice President | | Since 2004 | | Vice President (since 2004) of • all the DFA Entities Vice President (since 2020) of • Dimensional ETF Trust Vice President and Assistant Secretary (since 2010) of • Dimensional Cayman Commodity Fund I Ltd. Formerly, Assistant Secretary (2017-2019) of • all the DFA Entities |
| | | |
Joy Lopez 1971 | | Vice President and Assistant Treasurer | | Vice President since 2015 and Assistant Treasurer since 2017 | | Vice President of • all the DFA Entities (since 2015) • Dimensional Fund Advisors Ltd. (since 2015) • Dimensional ETF Trust (since 2020) • DFA Australia Limited (since 2020) • Dimensional Fund Advisors Canada ULC (since 2020) • Dimensional Ireland Limited (since 2020) |
289
| | | | | | |
Name and Year of Birth | | Position | | Term of Office1 and Length of Service | | Principal Occupation During Past 5 Years |
| | | | | | Assistant Treasurer of • DFAIDG, DIG, DFAITC and DEM (since 2017) • Dimensional ETF Trust (since 2020) |
| | | |
Kenneth M. Manell 1972 | | Vice President | | Since 2010 | | Vice President of • all the DFA Entities (since 2010) • Dimensional Cayman Commodity Fund I Ltd. (since 2010) • Dimensional ETF Trust (since 2020) |
| | | |
Jan Miller 1963 | | Vice President, Chief Financial Officer, and Treasurer | | Since June 2021 | | Vice President, Chief Financial Officer, and Treasurer (since June 2021) of • the DFA Fund Complex Formerly, Director (May 2019 – January 2021) at • INVESCO, U.S. (formerly, OppenheimerFunds, Inc.) Formerly, Vice President and Assistant Treasurer (September 2012 – May 2019) at • OppenheimerFunds, Inc. |
| | | |
Catherine L. Newell 1964 | | President and General Counsel | | President since 2017 and General Counsel since 2001 | | President of |
| | • DFAIDG, DIG, DFAITC and DEM (since 2017) |
| | • Dimensional ETF Trust (since 2020) |
| | General Counsel of |
| | • all the DFA Entities (since 2001) |
| | • Dimensional Fund Advisors LP (since 2006) |
| | • Dimensional Holdings Inc (since 2006) |
| | • Dimensional Investment LLC (since 2009) |
| | • DFA Canada LLC (since 2009) |
| | • Dimensional ETF Trust (since 2020) |
| | | |
| | | | | | Executive Vice President (since 2017) of |
| | | | | | • Dimensional Fund Advisors LP |
| | | | | | • Dimensional Holdings Inc. |
| | | | | | • DFA Securities LLC |
| | | | | | • Dimensional Investment LLC |
| | | |
| | | | | | Secretary of |
| | | |
| | | | | | • Dimensional Fund Advisors LP (since 2006) |
| | | |
| | | | | | • Dimensional Holdings Inc. (since 2006) |
| | | |
| | | | | | • DFA Securities LLC (since 2006) |
| | | |
| | | | | | • Dimensional Investment LLC (since 2009) |
| | | |
| | | | | | Vice President (since 1997) and Secretary (since 2002) of |
| | | |
| | | | | | • DFA Australia Limited |
| | | |
| | | | | | • Dimensional Fund Advisors Ltd. |
| | | |
| | | | | | Vice President and Secretary of |
| | | |
| | | | | | • Dimensional Fund Advisors Canada ULC (since 2003) |
| | | |
| | | | | | • DFA Canada LLC (since 2009) |
| | | |
| | | | | | • Dimensional Cayman Commodity Fund I Ltd. (since 2010) |
| | | |
| | | | | | • Dimensional Japan Ltd. (since 2012) |
| | | |
| | | | | | • Dimensional Advisors Ltd (since 2014) |
| | | |
| | | | | | • Dimensional Fund Advisors Pte. Ltd. (since 2012) |
| | | |
| | | | | | Vice President and Assistant Secretary (since 2012) of |
| | | |
| | | | | | • Dimensional Hong Kong Limited |
| | | |
| | | | | | Director of |
| | | |
| | | | | | • Dimensional Australia Limited (since 2007) |
| | | |
| | | | | | • Dimensional Funds plc (since 2002) |
| | | |
| | | | | | • Dimensional Funds II plc (since 2006) |
| | | |
| | | | | | • Director of Dimensional Japan Ltd. (since 2012) |
| | | |
| | | | | | • Dimensional Advisors Ltd. (since 2012) |
| | | |
| | | | | | • Dimensional Fund Advisors Pte. Ltd. (since 2012) |
| | | |
| | | | | | • Dimensional Hong Kong Limited (since 2012) |
| | | |
| | | | | | • Dimensional Ireland Limited (since 2018) |
290
| | | | | | |
Name and Year of Birth | | Position | | Term of Office1 and Length of Service | | Principal Occupation During Past 5 Years |
| | | | | | Formerly, Vice President and Secretary (2010 – 2014) of • Dimensional SmartNest (US) LLC Formerly, Vice President (1997 – 2017) and Secretary (2000 – 2017) of • DFAIDG, DIG, DFAITC and DEM |
| | | |
| | | | | | Formerly, Vice President of • Dimensional Fund Advisors LP (1997 – 2017) • Dimensional Holdings Inc. (2006 – 2017) • DFA Securities LLC (1997 – 2017) • Dimensional Investment LLC (2009 – 2017) |
| | | | | | Formerly, Director (2002 – 2021) of • Dimensional Fund Advisors Ltd. |
Selwyn J. Notelovitz 1961 | | Vice President | | Since September 2021 | | Vice President (since September 2021) of • the DFA Fund Complex |
| | | | | | Vice President (since December 2012) and Chief Compliance Officer (since July 2020) of • DFA Securities LLC • Dimensional Fund Advisors LP • Dimensional Holdings Inc. • Dimensional Investment LLC |
| | | | | | Chief Compliance Officer (since July 2020) of: • DFA Australia Limited • Dimensional Fund Advisors Ltd. • Dimensional Fund Advisors Canada ULC |
| | | | | | Formerly, Deputy Chief Compliance Officer (2013-2020) of: • DFA Fund Complex • DFA Securities LLC • Dimensional Fund Advisors LP • Dimensional Holdings Inc. • Dimensional Investment LLC |
| | | | | | Formerly, Vice President (2013-2020) of: • DFA Fund Complex |
| | | | | | Formerly, Director (2019-2021) of: • Dimensional Ireland Limited |
Carolyn L. O 1974 | | Vice President and Secretary | | Vice President since 2010 and Secretary since 2017 | | Vice President and Secretary of • DFAIDG, DIG, DFAITC and DEM (since 2010 and 2017, respectively) • Dimensional ETF Trust (since 2020) |
| | | | | | Vice President (since 2010) and Assistant Secretary (since 2016) of • Dimensional Fund Advisors LP • Dimensional Holdings Inc. • Dimensional Investment LLC |
| | | | | | Vice President of • DFA Securities LLC (since 2010) • Dimensional Cayman Commodity Fund I Ltd. (since 2010) • Dimensional Fund Advisors Canada ULC (since 2016) |
| | | | | | Assistant Secretary (since 2016) of • DFA Securities LLC |
Randy C. Olson 1980 | | Chief Compliance Officer | | Since 2020 | | Chief Compliance Officer (since 2020) • the DFA Fund Complex • Vice President (since 2016) of • DFA Securities LLC • Dimensional Fund Advisors LP • Dimensional Holdings Inc. • Dimensional Investment LLC |
291
| | | | | | |
Name and Year of Birth | | Position | | Term of Office1 and Length of Service | | Principal Occupation During Past 5 Years |
| | | | | | Formerly, Vice President – Senior Compliance Officer • Dimensional Investment Advisors LP (January 2020 – August 2020 and July 2014 – March 2017) Formerly, Vice President – Head of Compliance & Operations Asia Ex-Japan • Dimensional Investment Advisors LP (April 2017 – January 2020) |
James J. Taylor 1983 | | Vice President and Assistant Treasurer | | Since 2020 | | Vice President and Assistant Treasurer (since 2020) of • the DFA Fund Complex Vice President • Dimensional Holdings Inc. (since 2016) • Dimensional Fund Advisors LP (since 2016) • Dimensional Investment LLC (since 2016) • DFA Securities LLC (since 2016) • Dimensional Fund Advisors Canada ULC (since 2020) |
| 1 | Each officer holds office for an indefinite term at the pleasure of the Board of Directors and until his or her successor is elected and qualified. |
292
VOTING PROXIES ON FUND PORTFOLIO SECURITIES
A description of the policies and procedures that the Fund uses in voting proxies relating to securities held in the portfolio is available (1) without charge, upon request, by calling collect: (512) 306-7400; (2) from the Advisor’s website at http://us.dimensional.com; and (3) on the SEC’s website at http://www.sec.gov. Information regarding how the Advisor votes these proxies is available from the EDGAR database on the SEC’s website at http://www.sec.gov and from the Advisor’s website at https://www.dimensional.com/us-en/who-we-are/investment-stewardship and reflects the twelve-month period beginning July 1st and ending June 30th.
293
TAX NOTICE TO SHAREHOLDERS
(Unaudited)
The following information is solely for informational purposes. Each Portfolio is designating the U.S. federal income tax character of the following items with respect to distributions paid or expected to be paid to shareholders related to the fiscal year ended October 31, 2022. All designations are based on financial information available as of the date of this annual report and, accordingly are subject to change. For each classification below and including “Section 163(j) interest dividends” as defined in Treasury Regulation §1.163(j)-1(b)(35) and “Section 199A dividends” as defined in Treasury Regulation §1.199A -3(d), it is the intent of the Portfolio to designate the maximum amount permitted under the Internal Revenue Code and the regulations thereunder.
For U.S. federal income tax purposes, shareholders generally must report distributions received from a Portfolio on a calendar-year basis, which therefore may include distributions with respect to portions of two fiscal years of the Portfolio. Annual statements needed by shareholders concerning the tax status of distributions received for the calendar year 2022 (e.g., IRS Form 1099-DIV) will be provided in early 2023. Shareholders should refer to these statements in preparing their calendar year 2022 tax returns. Please consult your tax advisor for the proper treatment of this information. Unless otherwise noted, the amounts in the table are expressed as a percentage of the distributions paid with respect to the fiscal year ended October 31, 2022.
| | | | | | | | | | | | | | | | | | | | | | | | | | | | | | | | | | | | | | | | | | | | | | | | | | | | |
DFA Investment Dimensions Group Inc. | | Net
Investment
Income
Distributions | | | Short-Term
Capital Gain
Distributions | | | Long-Term
Capital Gain
Distributions | | | Return of
Capital | | | Tax-Exempt
Interest | | | Total
Distributions | | | Qualified
Dividends
(for
Corporate
Dividends
Received
Deduction) (1) | | | Qualified
Dividend
Income (2) | | | U.S.
Government
Interest (3) | | | Foreign
Tax
Credit (4) | | | Foreign
Source
Income (5) | | | Qualified
Net
Interest
Income (6) | | | Qualified
Short-
Term
Capital
Gain (7) | |
Large Cap International Portfolio | | | 100 | % | | | — | | | | — | | | | — | | | | — | | | | 100 | % | | | — | | | | 100 | % | | | — | | | | 7 | % | | | 100 | % | | | — | | | | — | |
International Core Equity Portfolio | | | 100 | % | | | — | | | | — | | | | — | | | | — | | | | 100 | % | | | — | | | | 100 | % | | | — | | | | 8 | % | | | 100 | % | | | — | | | | — | |
Global Small Company Portfolio | | | 45 | % | | | — | | | | 55 | % | | | — | | | | — | | | | 100 | % | | | 57 | % | | | 100 | % | | | — | | | | 7 | % | | | 66 | % | | | — | | | | — | |
International Small Company Portfolio | | | 46 | % | | | 11 | % | | | 43 | % | | | — | | | | — | | | | 100 | % | | | — | | | | 100 | % | | | — | | | | 10 | % | | | 100 | % | | | 1 | % | | | 100 | % |
Japanese Small Company Portfolio | | | 42 | % | | | 7 | % | | | 51 | % | | | — | | | | — | | | | 100 | % | | | — | | | | 100 | % | | | — | | | | 20 | % | | | 100 | % | | | — | | | | 100 | % |
Asia Pacific Small Company Portfolio | | | 36 | % | | | — | | | | 64 | % | | | — | | | | — | | | | 100 | % | | | — | | | | 66 | % | | | — | | | | 1 | % | | | 100 | % | | | — | | | | — | |
United Kingdom Small Company Portfolio | | | 61 | % | | | — | | | | 39 | % | | | — | | | | — | | | | 100 | % | | | 2 | % | | | 100 | % | | | — | | | | 1 | % | | | 100 | % | | | — | | | | — | |
Continental Small Company Portfolio | | | 55 | % | | | 9 | % | | | 36 | % | | | — | | | | — | | | | 100 | % | | | — | | | | 100 | % | | | — | | | | 15 | % | | | 100 | % | | | — | | | | 100 | % |
DFA International Real Estate Securities Portfolio | | | 100 | % | | | — | | | | — | | | | — | | | | — | | | | 100 | % | | | — | | | | — | | | | — | | | | — | | | | — | | | | — | | | | — | |
DFA Global Real Estate Securities Portfolio | | | 80 | % | | | — | | | | 20 | % | | | — | | | | — | | | | 100 | % | | | — | | | | — | | | | — | | | | — | | | | — | | | | — | | | | — | |
DFA International Small Cap Value Portfolio | | | 82 | % | | | 10 | % | | | 8 | % | | | — | | | | — | | | | 100 | % | | | — | | | | 100 | % | | | — | | | | 11 | % | | | 100 | % | | | — | | | | 100 | % |
International Vector Equity Portfolio | | | 63 | % | | | — | | | | 37 | % | | | — | | | | — | | | | 100 | % | | | — | | | | 100 | % | | | — | | | | 9 | % | | | 100 | % | | | — | | | | — | |
International High Relative Profitability Portfolio | | | 78 | % | | | 8 | % | | | 14 | % | | | — | | | | — | | | | 100 | % | | | — | | | | 100 | % | | | — | | | | 7 | % | | | 100 | % | | | — | | | | 100 | % |
World ex U.S. Value Portfolio | | | 100 | % | | | — | | | | — | | | | — | | | | — | | | | 100 | % | | | — | | | | 100 | % | | | — | | | | 7 | % | | | 99 | % | | | — | | | | — | |
World ex U.S. Core Equity Portfolio | | | 100 | % | | | — | | | | — | | | | — | | | | — | | | | 100 | % | | | — | | | | 82 | % | | | — | | | | 8 | % | | | 100 | % | | | — | | | | — | |
World ex U.S. Targeted Value Portfolio | | | 36 | % | | | — | | | | 64 | % | | | — | | | | — | | | | 100 | % | | | — | | | | 100 | % | | | — | | | | 11 | % | | | 100 | % | | | — | | | | — | |
World Core Equity Portfolio | | | 73 | % | | | — | | | | 27 | % | | | — | | | | — | | | | 100 | % | | | 43 | % | | | 94 | % | | | — | | | | — | | | | 32 | % | | | — | | | | — | |
Selectively Hedged Global Equity Portfolio | | | 31 | % | | | 5 | % | | | 64 | % | | | — | | | | — | | | | 100 | % | | | 15 | % | | | 35 | % | | | — | | | | — | | | | 13 | % | | | — | | | | 100 | % |
See accompanying Notes to Financial Statements.
294
| | | | | | | | | | | | | | | | | | | | | | | | | | | | | | | | | | | | | | | | | | | | | | | | | | | | |
DFA Investment Dimensions Group Inc. | | Net
Investment
Income
Distributions | | | Short-Term
Capital Gain
Distributions | | | Long-Term
Capital Gain
Distributions | | | Return of
Capital | | | Tax-Exempt
Interest | | | Total
Distributions | | | Qualified
Dividends
(for
Corporate
Dividends
Received
Deduction) (1) | | | Qualified
Dividend
Income (2) | | | U.S.
Government
Interest (3) | | | Foreign
Tax
Credit (4) | | | Foreign
Source
Income (5) | | | Qualified
Net
Interest
Income (6) | | | Qualified
Short-
Term
Capital
Gain (7) | |
Emerging Markets Portfolio | | | 42 | % | | | — | | | | 58 | % | | | — | | | | — | | | | 100 | % | | | — | | | | 56 | % | | | — | | | | 6 | % | | | 84 | % | | | — | | | | — | |
Emerging Markets Small Cap Portfolio | | | 59 | % | | | 13 | % | | | 28 | % | | | — | | | | — | | | | 100 | % | | | — | | | | 53 | % | | | — | | | | 8 | % | | | 64 | % | | | — | | | | 100 | % |
Emerging Markets Value Portfolio | | | 100 | % | | | — | | | | — | | | | — | | | | — | | | | 100 | % | | | — | | | | 78 | % | | | — | | | | 7 | % | | | 100 | % | | | — | | | | — | |
Emerging Markets Core Equity Portfolio | | | 100 | % | | | — | | | | — | | | | — | | | | — | | | | 100 | % | | | — | | | | 50 | % | | | — | | | | 6 | % | | | 97 | % | | | — | | | | — | |
Emerging Markets Targeted Value Portfolio | | | 32 | % | | | 18 | % | | | 50 | % | | | — | | | | — | | | | 100 | % | | | — | | | | 72 | % | | | — | | | | 10 | % | | | 100 | % | | | — | | | | 100 | % |
Emerging Markets ex China Core Equity Portfolio | | | 100 | % | | | — | | | | — | | | | — | | | | — | | | | 100 | % | | | — | | | | 70 | % | | | — | | | | 7 | % | | | 100 | % | | | — | | | | — | |
| | | | | | | | | | | | | |
Dimensional
Investment Group Inc. | | | | | | | | | | | | | | | | | | | | | | | | | | | | | | | | | | | | | | | |
DFA International Value Portfolio | | | 96 | % | | | 4 | % | | | — | | | | — | | | | — | | | | 100 | % | | | — | | | | 96 | % | | | — | | | | 8 | % | | | 100 | % | | | — | | | | 100 | % |
| (1) | Qualified Dividends represents the amount that qualifies for the corporate dividends-received deduction under Section 243 of the Internal Revenue Code and is reflected as a percentage of estimated ordinary income distributions (the total of short-term capital gain and net investment income distributions) for the calendar year 2022. |
| (2) | Qualified Dividend Income represents the amount that qualifies for the reduced capital gain tax rate under Section 1(h)(11) of the Internal Revenue Code and is reflected as a percentage of estimated ordinary income distributions (the total of short-term capital gain and net investment income distributions) for the calendar year 2022. |
| (3) | U.S. Government Interest represents the amount of interest that was derived from direct U.S. Government obligations and distributed during the fiscal year. This amount is reflected as a percentage of total estimated ordinary income distributions (the total of short-term capital gain and net investment income distributions) for the calendar year 2022. Generally, interest from direct U.S. Government obligations is exempt from state income tax. Please consult your tax advisor for the availability of a state tax exemption based on your individual circumstances. |
| (4) | Foreign Tax Credit represents the amount of dividends that qualify for the foreign tax credit pass through under Section 853 of the Internal Revenue Code and is reflected as a percentage of “investment company taxable income” (as defined in Section 852(b)(2) of the Internal Revenue Code). |
| (5) | Foreign Source Income represents the amount of dividends derived from foreign sources and is reflected as a percentage of “investment company taxable income” (as defined in Section 852(b)(2) of the Internal Revenue Code). |
| (6) | Qualified Net Interest Income represents the amount of interest income available as interest-related dividends generally exempt from withholding taxes for non-U.S. shareholders under Section 871(k)(1) of the Internal Revenue Code. The information is reflected as a percentage estimated ordinary income distributions (the total of short-term capital gain and net investment income distributions) for the calendar year 2022. |
| (7) | Qualified Short-Term Capital Gain represents the amount available as short-term capital gain dividends generally exempt from withholding taxes for non-U.S. shareholders under Section 871(k)(2) of the Internal Revenue Code. The information is reflected as a percentage of estimated ordinary income distributions (the total of short-term capital gain and net investment income distributions) for the calendar year 2022. |
See accompanying Notes to Financial Statements.
295
| | |
 | | DFA103122-001AI 00281080 |
THE DFA SHORT TERM INVESTMENT FUND
ANNUAL REPORT
YEAR ENDED OCTOBER 31, 2022
TABLE OF CONTENTS
THE DFA SHORT TERM INVESTMENT FUND
Investment Summary (Unaudited)
Average Annual Total Returns and 7-Day Yield as of 10/31/2022
| | | | | | | | | | | | | | | | | | | | |
| | | 1 Year | | | 5 Year | | | 10 Year | | | Since
Inception | | | 7-Day
Yield | |
The DFA Short Term Investment Fund | | | 0.99 | % | | | 1.20 | % | | | 0.76 | % | | | 0.64 | % | | | 3.45 | % |
FTSE One-Month U.S. Treasury Bill Index | | | 0.84 | % | | | 1.10 | % | | | 0.64 | % | | | 0.52 | % | | | — | |
The performance data quoted represents past performance and is no guarantee of future results. Current performance may be higher or lower than the performance data quoted.
An investment in a money market fund is not insured or guaranteed by the FDIC or any other government agency.
Total return equals income return and assumes reinvestment of all net investment income and realized capital gain distributions. The total returns quoted do not reflect adjustments made to the enclosed financial statements in accordance with U.S. generally accepted accounting principles or the deduction of taxes that a shareholder would pay on fund distributions or the redemption of fund shares. Yields and returns fluctuate. The seven-day yield quotation more closely reflects current earnings of the Fund than the total return quotation.
3
THE DFA SHORT TERM INVESTMENT FUND
Schedule of Portfolio Holdings
October 31, 2022
The following table indicates the allocation of investments among the asset classes in the Fund as of October 31, 2022:
| | | | |
Security Allocation | | Percent of
Investments | |
U.S. Treasury Obligations | | | 26.7 | % |
Commercial Paper | | | 25.4 | |
Repurchase Agreements | | | 20.9 | |
Yankee Certificates of Deposit | | | 16.3 | |
U.S. Government Agency Securities | | | 10.7 | |
| | | | |
Total Investments | | | 100.0 | % |
See accompanying Notes to Financial Statements.
4
THE DFA SHORT TERM INVESTMENT FUND
Schedule of Investments
October 31, 2022
| | | | | | | | | | | | | | |
Security Description | | Rate | | Maturity | | | Face Amount $ | | | Fair Value $ | |
COMMERCIAL PAPER - 25.4% | |
(r)++ANZ Banking Group, Ltd. | | 3.47% (SOFR + 42 bps) | | | 12/19/22 | | | | 150,000,000 | | | | 150,019,061 | |
(r)++ANZ Banking Group, Ltd. | | 3.37% (SOFR + 32 bps) | | | 02/03/23 | | | | 100,000,000 | | | | 99,946,764 | |
(r)++ANZ Banking Group, Ltd. | | 3.47% (SOFR + 42 bps) | | | 05/05/23 | | | | 50,000,000 | | | | 49,953,430 | |
(r)++ANZ Banking Group, Ltd. | | 3.66% (SOFR + 61 bps) | | | 09/29/23 | | | | 125,000,000 | | | | 124,825,568 | |
(y)++Archer-Daniels-Midland | | 3.10% | | | 11/01/22 | | | | 100,000,000 | | | | 99,991,481 | |
(y)++Archer-Daniels-Midland | | 3.08% | | | 11/02/22 | | | | 21,350,000 | | | | 21,346,283 | |
(r)++Canadian Imperial Bank of Commerce | | 3.24% (SOFR + 19 bps) | | | 11/04/22 | | | | 75,000,000 | | | | 75,001,062 | |
(r)++Commonwealth Bank of Australia | | 3.45% (SOFR + 40 bps) | | | 04/11/23 | | | | 50,000,000 | | | | 49,957,533 | |
(r)++Commonwealth Bank of Australia | | 3.41% (SOFR + 36 bps) | | | 04/28/23 | | | | 100,000,000 | | | | 99,862,200 | |
(r)++Commonwealth Bank of Australia | | 3.71% (SOFR + 66 bps) | | | 05/02/23 | | | | 40,000,000 | | | | 40,000,000 | |
(r)++Commonwealth Bank of Australia | | 3.66% (SOFR + 61 bps) | | | 09/25/23 | | | | 150,000,000 | | | | 149,792,709 | |
(y)Credit Agricole CIB NY | | 3.04% | | | 11/03/22 | | | | 300,000,000 | | | | 299,919,975 | |
(y)++DNB NORBANK ASA | | 3.09% | | | 11/07/22 | | | | 300,000,000 | | | | 299,804,118 | |
(r)++DNB NORBANK ASA | | 3.50% (SOFR + 45 bps) | | | 02/13/23 | | | | 100,000,000 | | | | 100,001,229 | |
(y)++Hydro-Quebec | | 3.09% | | | 11/01/22 | | | | 39,800,000 | | | | 39,796,654 | |
(y)++Hydro-Quebec | | 3.09% | | | 11/02/22 | | | | 95,000,000 | | | | 94,983,670 | |
(y)++Hydro-Quebec | | 3.11% | | | 11/04/22 | | | | 150,000,000 | | | | 149,946,183 | |
(y)++Mizuho Bank, Ltd. | | 3.14% | | | 11/02/22 | | | | 300,000,000 | | | | 299,947,851 | |
(r)++National Australia Bank, Ltd. | | 3.46% (SOFR + 41 bps) | | | 12/05/22 | | | | 100,000,000 | | | | 100,021,218 | |
(r)++National Australia Bank, Ltd. | | 3.45% (SOFR + 40 bps) | | | 01/20/23 | | | | 125,000,000 | | | | 124,973,726 | |
(r)++National Australia Bank, Ltd. | | 3.55% (SOFR + 50 bps) | | | 03/08/23 | | | | 150,000,000 | | | | 149,997,085 | |
(r)++National Australia Bank, Ltd. | | 3.53% (SOFR + 48 bps) | | | 06/01/23 | | | | 50,000,000 | | | | 49,949,732 | |
(y)++Province of Quebec Canada | | 3.08% | | | 11/03/22 | | | | 125,000,000 | | | | 124,967,697 | |
(r)++Royal Bank of Canada NY | | 3.60% (SOFR + 55 bps) | | | 05/26/23 | | | | 35,000,000 | | | | 34,970,094 | |
(r)++Royal Bank of Canada NY | | 3.78% (SOFR + 73 bps) | | | 08/08/23 | | | | 100,000,000 | | | | 99,978,685 | |
(r)++Royal Bank of Canada NY | | 3.68% (SOFR + 63 bps) | | | 09/29/23 | | | | 125,000,000 | | | | 124,802,950 | |
(r)++Svenska Handelsbank, Inc. | | 3.44% (SOFR + 40 bps) | | | 03/01/23 | | | | 100,000,000 | | | | 99,933,300 | |
(r)++Svenska Handelsbank, Inc. | | 3.59% (SOFR + 55 bps) | | | 06/08/23 | | | | 55,000,000 | | | | 54,950,380 | |
(r)++Toronto Dominion Bank NY | | 3.49% (SOFR + 45 bps) | | | 04/06/23 | | | | 100,000,000 | | | | 99,915,162 | |
(r)++Toronto Dominion Bank NY | | 3.76% (SOFR + 72 bps) | | | 08/10/23 | | | | 100,000,000 | | | | 99,961,401 | |
(r)++United Overseas Bank, Ltd. | | 3.24% (SOFR + 20 bps) | | | 11/28/22 | | | | 100,000,000 | | | | 100,003,940 | |
(r)++United Overseas Bank, Ltd. | | 3.42% (SOFR + 38 bps) | | | 03/01/23 | | | | 50,000,000 | | | | 49,963,300 | |
(r)++United Overseas Bank, Ltd. | | 3.54% (SOFR + 50 bps) | | | 03/16/23 | | | | 40,000,000 | | | | 39,999,296 | |
(r)++United Overseas Bank, Ltd. | | 3.58% (SOFR + 54 bps) | | | 04/19/23 | | | | 100,000,000 | | | | 99,998,344 | |
(r)++Westpac Banking Corp. | | 3.54% (SOFR + 49 bps) | | | 03/17/23 | | | | 150,000,000 | | | | 149,967,948 | |
(r)++Westpac Banking Corp. | | 3.48% (SOFR + 43 bps) | | | 03/29/23 | | | | 70,000,000 | | | | 69,965,750 | |
(r)++Westpac Banking Corp. | | 3.45% (SOFR + 40 bps) | | | 05/11/23 | | | | 75,000,000 | | | | 74,896,313 | |
| | | | | | | | | | | | | | |
TOTAL COMMERCIAL PAPER
(Cost $3,995,808,758) | | | | | | | 3,996,150,000 | | | | 3,994,312,092 | |
| | | | | | | | | | | | |
YANKEE CERTIFICATES OF DEPOSIT - 16.3% | |
(r)Bank of Montreal Chicago | | 3.34% (SOFR + 29 bps) | | | 02/28/23 | | | | 125,000,000 | | | | 124,886,729 | |
(r)Bank of Montreal Chicago | | 3.45% (SOFR + 40 bps) | | | 03/02/23 | | | | 50,000,000 | | | | 49,972,830 | |
(r)Bank of Montreal Chicago | | 3.77% (SOFR + 72 bps) | | | 03/15/23 | | | | 150,000,000 | | | | 150,097,108 | |
(r)Bank of Montreal Chicago | | 3.69% (SOFR + 64 bps) | | | 10/04/23 | | | | 100,000,000 | | | | 99,867,738 | |
(r)Bank of Montreal Chicago | | 3.79% (SOFR + 74 bps) | | | 10/13/23 | | | | 35,000,000 | | | | 34,984,669 | |
(r)Bank of Nova Scotia | | 3.23% (SOFR + 18 bps) | | | 11/09/22 | | | | 100,000,000 | | | | 100,001,993 | |
(r)Bank of Nova Scotia | | 3.57% (SOFR + 52 bps) | | | 02/09/23 | | | | 100,000,000 | | | | 100,009,008 | |
(r)Bank of Nova Scotia | | 3.57% (SOFR + 52 bps) | | | 03/14/23 | | | | 50,000,000 | | | | 49,996,745 | |
(r)Bank of Nova Scotia | | 3.73% (SOFR + 68 bps) | | | 05/22/23 | | | | 85,000,000 | | | | 84,985,100 | |
(r)Bank of Nova Scotia | | 3.77% (SOFR + 72 bps) | | | 05/26/23 | | | | 25,000,000 | | | | 25,000,533 | |
(r)Bank of Nova Scotia | | 3.75% (SOFR + 70 bps) | | | 08/10/23 | | | | 100,000,000 | | | | 99,949,861 | |
(r)Canadian Imperial Bank of Commerce | | 3.48% (SOFR + 43 bps) | | | 01/03/23 | | | | 30,000,000 | | | | 30,001,471 | |
(r)Canadian Imperial Bank of Commerce | | 3.30% (SOFR + 25 bps) | | | 02/06/23 | | | | 50,000,000 | | | | 49,969,227 | |
(r)Canadian Imperial Bank of Commerce | | 3.45% (SOFR + 40 bps) | | | 03/01/23 | | | | 150,000,000 | | | | 149,964,424 | |
(r)Canadian Imperial Bank of Commerce | | 3.56% (SOFR + 51 bps) | | | 03/13/23 | | | | 40,000,000 | | | | 40,003,868 | |
(r)Canadian Imperial Bank of Commerce | | 3.60% (SOFR + 55 bps) | | | 05/31/23 | | | | 75,000,000 | | | | 74,934,142 | |
(r)Canadian Imperial Bank of Commerce | | 3.85% (SOFR + 80 bps) | | | 10/20/23 | | | | 50,000,000 | | | | 50,001,314 | |
(r)Commonwealth Bank of Australia | | 3.62% (SOFR + 57 bps) | | | 11/21/22 | | | | 50,000,000 | | | | 50,012,425 | |
(r)Nordea Bank AB | | 3.44% (SOFR + 40 bps) | | | 12/02/22 | | | | 76,000,000 | | | | 76,015,775 | |
(r)Nordea Bank AB | | 3.27% (SOFR + 23 bps) | | | 02/15/23 | | | | 75,000,000 | | | | 74,935,488 | |
(r)Nordea Bank AB | | 3.44% (SOFR + 39 bps) | | | 03/24/23 | | | | 75,000,000 | | | | 74,945,170 | |
(r)Nordea Bank AB | | 3.66% (SOFR + 61 bps) | | | 04/20/23 | | | | 40,000,000 | | | | 39,995,767 | |
(r)Nordea Bank AB | | 3.39% (SOFR + 34 bps) | | | 04/27/23 | | | | 100,000,000 | | | | 99,850,197 | |
(r)Nordea Bank AB | | 3.69% (SOFR + 64 bps) | | | 04/28/23 | | | | 90,000,000 | | | | 89,996,218 | |
(r)Royal Bank of Canada NY | | 3.75% (SOFR + 70 bps) | | | 10/06/23 | | | | 50,000,000 | | | | 49,950,165 | |
(r)Royal Bank of Canada NY | | 3.80% (SOFR + 75 bps) | | | 10/19/23 | | | | 60,000,000 | | | | 59,963,153 | |
(r)Skandinaviska Enskilda Banken AB | | 3.54% (SOFR + 50 bps) | | | 03/17/23 | | | | 150,000,000 | | | | 149,948,698 | |
See accompanying Notes to Financial Statements.
5
THE DFA SHORT TERM INVESTMENT FUND
Schedule of Investments (continued)
October 31, 2022
| | | | | | | | | | | | | | |
Security Description | | Rate | | Maturity | | | Face Amount $ | | | Fair Value $ | |
YANKEE CERTIFICATES OF DEPOSIT - 16.3% (continued) | |
(r)Svenska Handelsbank, Inc. | | 3.29% (SOFR + 25 bps) | | | 12/02/22 | | | | 100,000,000 | | | | 100,007,326 | |
(r)Svenska Handelsbank, Inc. | | 3.47% (SOFR + 43 bps) | | | 12/29/22 | | | | 100,000,000 | | | | 100,001,741 | |
(r)Svenska Handelsbank, Inc. | | 3.69% (SOFR + 65 bps) | | | 07/14/23 | | | | 100,000,000 | | | | 99,915,686 | |
(r)Toronto Dominion Bank NY | | 3.43% (SOFR + 39 bps) | | | 02/28/23 | | | | 125,000,000 | | | | 124,936,194 | |
(r)Westpac Banking Corp. | | 3.28% (SOFR + 23 bps) | | | 02/16/23 | | | | 60,000,000 | | | | 59,945,878 | |
| | | | | | | | | | | | | | |
TOTAL YANKEE CERTIFICATES OF DEPOSIT
(Cost $2,566,006,273) | | | | 2,566,000,000 | | | | 2,565,046,641 | |
| | | | | | | | | | | | |
U.S. GOVERNMENT AGENCY SECURITIES - 10.7% | |
(y)Federal Home Loan Bank | | 3.59% | | | 12/14/22 | | | | 150,000,000 | | | | 149,293,840 | |
(y)Federal Home Loan Bank | | 2.61% | | | 11/14/22 | | | | 200,000,000 | | | | 199,732,212 | |
(y)Federal Home Loan Bank | | 3.15% | | | 11/16/22 | | | | 122,000,000 | | | | 121,811,538 | |
(y)Federal Home Loan Bank | | 3.17% | | | 11/18/22 | | | | 150,000,000 | | | | 149,737,416 | |
(y)Federal Home Loan Bank | | 3.22% | | | 11/23/22 | | | | 200,000,000 | | | | 199,539,064 | |
(y)Federal Home Loan Bank | | 3.24% | | | 11/25/22 | | | | 350,000,000 | | | | 349,135,332 | |
(y)Federal Home Loan Bank | | 3.22% | | | 12/01/22 | | | | 250,000,000 | | | | 249,192,225 | |
(y)Federal Home Loan Bank | | 3.25% | | | 12/06/22 | | | | 193,625,000 | | | | 192,895,303 | |
(y)Federal Home Loan Bank | | 3.42% | | | 12/13/22 | | | | 75,000,000 | | | | 74,660,954 | |
| | | | | | | | �� | | | | | | |
TOTAL U.S. GOVERNMENT AGENCY SECURITIES
(Cost $1,686,705,465) | | | | 1,690,625,000 | | | | 1,685,997,884 | |
| | | | | | | | | | | | |
REPURCHASE AGREEMENTS - 21.0% | |
Barclays Bank PLC (Purchased on 10/31/22, proceeds at maturity $300,025,417, collateralized by various U.S. Treasury Obligations, (0.88% - 2.75%), (6/30/26 - 5/31/29), market value $306,000,025) | | 3.05% | | | 11/01/22 | | | | 300,000,000 | | | | 300,000,000 | |
BofA Securities, Inc. (Purchased on 10/31/22, proceeds at maturity $100,008,333, collateralized by U.S. Treasury Obligation, (0.75%), (5/31/26), market value $102,000,065) | | 3.00% | | | 11/01/22 | | | | 100,000,000 | | | | 100,000,000 | |
Federal Reserve Bank NY (Purchased on 10/31/22, proceeds at maturity $1,250,105,903, collateralized by various U.S. Treasury Obligations, (0.25% - 1.63%), (4/15/24 - 8/15/29), market value $1,250,105,968) | | 3.05% | | | 11/01/22 | | | | 1,250,000,000 | | | | 1,250,000,000 | |
Goldman Sachs & Co. LLC (Purchased on 10/31/22, proceeds at maturity $450,037,250, collateralized by various U.S. Agency Obligations, (2.48% - 5.50%), (6/20/28 - 6/15/62), market value $459,000,000) | | 2.98% | | | 11/01/22 | | | | 450,000,000 | | | | 450,000,000 | |
J.P. Morgan Securities LLC (Purchased on 10/31/22, proceeds at maturity $350,029,167, collateralized by various U.S. Agency Obligations, (1.50% - 7.00%), (6/20/24 - 10/20/62), market value $357,000,001) | | 3.00% | | | 11/01/22 | | | | 350,000,000 | | | | 350,000,000 | |
Mizuho Securities USA LLC (Purchased on 10/31/22, proceeds at maturity $50,004,153, collateralized by various U.S. Treasury Obligations, (1.38% - 2.75%), (3/31/24 - 11/15/31), market value $51,000,095) | | 2.99% | | | 11/01/22 | | | | 50,000,000 | | | | 50,000,000 | |
RBC Dominion Securities Inc. (Purchased on 10/31/22, proceeds at maturity $450,037,500, collateralized by various U.S. Treasury Obligations, (0.13% - 6.88%), (2/15/23 - 5/15/32), market value $459,000,018) | | 3.00% | | | 11/01/22 | | | | 450,000,000 | | | | 450,000,000 | |
TD Securities (USA) LLC (Purchased on 10/31/22, proceeds at maturity $350,029,653, collateralized by various U.S. Agency Obligations, (3.00% - 4.50%), (8/20/51 - 9/20/52), market value $357,000,000) | | 3.05% | | | 11/01/22 | | | | 350,000,000 | | | | 350,000,000 | |
| | | | | | | | | | | | | | |
TOTAL REPURCHASE AGREEMENTS (Cost $3,300,000,000) | | | | | | | 3,300,000,000 | | | | 3,300,000,000 | |
| | | | | | | | | | | | |
U.S. TREASURY OBLIGATIONS - 26.6% | |
(y)U.S. Treasury Bill | | 3.04% | | | 11/22/22 | | | | 200,000,000 | | | | 199,614,222 | |
(y)U.S. Treasury Bill | | 3.41% | | | 12/06/22 | | | | 250,000,000 | | | | 249,144,748 | |
(y)U.S. Treasury Bill | | 3.14% | | | 12/20/22 | | | | 500,000,000 | | | | 497,478,655 | |
(y)U.S. Treasury Bill | | 3.22% | | | 12/22/22 | | | | 750,000,000 | | | | 746,123,205 | |
(y)U.S. Treasury Bill | | 3.21% | | | 12/27/22 | | | | 400,000,000 | | | | 397,621,556 | |
(y)U.S. Treasury Bill | | 3.29% | | | 12/29/22 | | | | 650,000,000 | | | | 645,999,614 | |
(y)U.S. Treasury Bill | | 3.28% | | | 01/03/23 | | | | 650,000,000 | | | | 645,666,125 | |
(r)U.S. Treasury Note | | 4.07% (USBMMY3M + 3 bps) | | | 07/31/23 | | | | 50,000,000 | | | | 50,040,630 | |
(r)U.S. Treasury Note | | 4.03% (USBMMY3M - 2 bps) | | | 01/31/24 | | | | 200,000,000 | | | | 199,965,020 | |
(r)U.S. Treasury Note | | 3.97% (USBMMY3M - 8 bps) | | | 04/30/24 | | | | 375,000,000 | | | | 374,428,028 | |
(r)U.S. Treasury Note | | 4.08% (USBMMY3M + 4 bps) | | | 07/31/24 | | | | 200,000,000 | | | | 199,788,456 | |
| | | | | | | | | | | | | | |
TOTAL U.S. TREASURY OBLIGATIONS (Cost $4,209,066,381) | | | | 4,225,000,000 | | | | 4,205,870,259 | |
| | | | | | | | | | | | |
TOTAL INVESTMENTS (Cost $15,757,586,877) - 100.0% | | | | | | | $ | 15,751,226,876 | |
| | | | | | | | | | | | | | |
See accompanying Notes to Financial Statements.
6
THE DFA SHORT TERM INVESTMENT FUND
Schedule of Investments (concluded)
October 31, 2022
SOFR—Secured Overnight Financing Rate
USBMMY3M—U.S. Treasury 3 Month Bill Money Market Yield
| ++ | Rule 144A, Section 4(2), or other security which is restricted as to resale to institutional investors. The Fund’s Advisor has deemed this security to be liquid based upon procedures approved by the Board of Directors/Trustees. The aggregate value of these securities at October 31, 2022 was $3,694,392,117 which represented 23.5% of the total investments of the Fund. |
| (r) | The adjustable/variable rate shown is effective as of October 31, 2022. |
| (y) | The rate shown is the effective yield. |
See accompanying Notes to Financial Statements.
7
THE DFA SHORT TERM INVESTMENT FUND
STATEMENT OF ASSETS AND LIABILITIES
OCTOBER 31, 2022
| | | | |
ASSETS: | | | | |
Investments, at value | | $ | 12,451,226,876 | |
Repurchase agreements, at value | | | 3,300,000,000 | |
| | | | |
Total Investments | | | 15,751,226,876 | |
| | | | |
Cash | | | 905,876,135 | |
Interest receivable | | | 15,695,328 | |
Receivable for capital shares issued | | | 20,621,439 | |
Prepaid expenses | | | 347,647 | |
| | | | |
Total Assets | | | 16,693,767,425 | |
| | | | |
LIABILITIES: | | | | |
Payable for investments purchased | | | 40,000,000 | |
Distributions payable | | | 45,429,125 | |
Accrued expenses and other payables: | | | | |
Investment Management Fees | | | 666,468 | |
CCO Fees | | | 2,682 | |
Insurance | | | 167 | |
Professional Fees | | | 8,155 | |
Transfer Agent Fees | | | 21,897 | |
Trustee Fees | | | 447,313 | |
Other Expenses | | | 36,371 | |
| | | | |
Total Liabilities | | | 86,612,178 | |
| | | | |
Net Assets | | $ | 16,607,155,247 | |
| | | | |
NET ASSETS CONSIST OF: | | | | |
Capital | | $ | 16,619,269,084 | |
Total Distributable Earnings (Loss) | | | (12,113,837 | ) |
| | | | |
NET ASSETS | | $ | 16,607,155,247 | |
| | | | |
Shares of Beneficial Interest (unlimited number of shares authorized, no par value) | | | 1,436,432,929 | |
| | | | |
Net Asset Value (offering and redemption price per share) | | $ | 11.5614 | (a) |
| | | | |
Investments at cost | | $ | 15,757,586,877 | |
| (a) | Per share amounts may not recalculate due to rounding of net assets and shares outstanding. |
See accompanying Notes to Financial Statements.
8
THE DFA SHORT TERM INVESTMENT FUND
STATEMENT OF OPERATIONS
FOR THE YEAR ENDED OCTOBER 31, 2022
| | | | |
INVESTMENT INCOME: | | | | |
Interest | | $ | 160,950,493 | |
| | | | |
Total Investment Income | | | 160,950,493 | |
| | | | |
EXPENSES: | | | | |
Investment Management Fees | | | 6,963,624 | |
Administration Fees | | | 814,744 | |
CCO Fees | | | 6,864 | |
Professional Fees | | | 91,396 | |
Transfer Agent Fees | | | 132,465 | |
Trustee Fees | | | 120,742 | |
Other Expenses | | | 195,030 | |
| | | | |
Total Expenses Before Fee Reductions | | | 8,324,865 | |
| | | | |
Fees Paid Indirectly | | | (814,744 | ) |
| | | | |
Net Expenses | | | 7,510,121 | |
| | | | |
Net Investment Income | | | 153,440,372 | |
| | | | |
REALIZED/UNREALIZED GAINS (LOSSES) FROM INVESTMENTS | | | | |
Net Realized Losses from Investment Transactions | | | (2,184,383 | ) |
Net Change in Unrealized Depreciation on Investments | | | (6,543,539 | ) |
| | | | |
Net Realized and Unrealized Losses from Investments | | | (8,727,922 | ) |
| | | | |
CHANGE IN NET ASSETS RESULTING FROM OPERATIONS | | $ | 144,712,450 | |
| | | | |
See accompanying Notes to Financial Statements.
9
THE DFA SHORT TERM INVESTMENT FUND
STATEMENTS OF CHANGES IN NET ASSETS
| | | | | | | | |
| | | For the Year
Ended
October 31, 2022 | | | For the Year
Ended
October 31, 2021 | |
FROM INVESTMENT ACTIVITIES: | | | | | | | | |
OPERATIONS: | | | | | | | | |
Net Investment Income | | $ | 153,440,372 | | | $ | 6,593,409 | |
Net Realized Gains (Losses) from Investment Transactions | | | (2,184,383 | ) | | | 252,518 | |
Net Change in Unrealized Depreciation on Investments | | | (6,543,539 | ) | | | (1,702,800 | ) |
| | | | | | | | |
Change in net assets resulting from operations | | | 144,712,450 | | | | 5,143,127 | |
| | | | | | | | |
DISTRIBUTIONS TO SHAREHOLDERS: | | | | | | | | |
Total Distributions Paid | | | (154,033,391 | ) | | | (6,593,409 | ) |
| | | | | | | | |
Change in Net Assets from Distributions to Shareholders | | | (154,033,391 | ) | | | (6,593,409 | ) |
| | | | | | | | |
CAPITAL TRANSACTIONS: | | | | | | | | |
Proceeds from Shares Issued | | | 99,547,811,990 | | | | 74,119,274,573 | |
Dividends Reinvested | | | 27,320 | | | | 845 | |
Cost of Shares Redeemed | | | (94,934,520,328 | ) | | | (70,898,717,300 | ) |
| | | | | | | | |
Change in Net Assets from Capital Transactions | | | 4,613,318,982 | | | | 3,220,558,118 | |
| | | | | | | | |
Change in Net Assets | | | 4,603,998,041 | | | | 3,219,107,836 | |
NET ASSETS: | | | | | | | | |
Beginning of Period | | | 12,003,157,206 | | | | 8,784,049,370 | |
| | | | | | | | |
End of Period | | $ | 16,607,155,247 | | | $ | 12,003,157,206 | |
| | | | | | | | |
SHARES TRANSACTIONS: | | | | | | | | |
Shares Issued | | | 8,606,378,346 | | | | 6,406,047,948 | |
Reinvested | | | 2,423 | | | | 73 | |
Shares Redeemed | | | (8,207,428,773 | ) | | | (6,127,703,226 | ) |
| | | | | | | | |
Change in Shares | | | 398,951,996 | | | | 278,344,795 | |
| | | | | | | | |
See accompanying Notes to Financial Statements.
10
THE DFA SHORT TERM INVESTMENT FUND
FINANCIAL HIGHLIGHTS
(for a share outstanding throughout each year)
| | | | | | | | | | | | | | | | | | | | |
| | | For the
Year Ended
October 31,
2022 | | | For the
Year Ended
October 31,
2021 | | | For the
Year Ended
October 31,
2020 | | | For the
Year Ended
October 31,
2019 | | | For the
Year Ended
October 31,
2018 | |
NET ASSET VALUE, BEGINNING OF PERIOD | | $ | 11.5695 | | | $ | 11.5711 | | | $ | 11.5707 | | | $ | 11.5703 | | | $ | 11.5715 | |
| | | | | | | | | | | | | | | | | | | | |
INVESTMENT ACTIVITIES: | | | | | | | | | | | | | | | | | | | | |
Net Investment Income | | | 0.1229 | | | | 0.0074 | | | | 0.0888 | | | | 0.2746 | | | | 0.2041 | |
Net Realized and Unrealized Gain (Losses) on Investments | | | (0.0077 | ) | | | (0.0017 | ) | | | 0.0004 | | | | 0.0004 | | | | (0.0012 | ) |
| | | | | | | | | | | | | | | | | | | | |
Total from Investment Activities | | | 0.1152 | | | | 0.0057 | | | | 0.0892 | | | | 0.2750 | | | | 0.2029 | |
| | | | | | | | | | | | | | | | | | | | |
DISTRIBUTIONS TO SHAREHOLDERS FROM: | | | | | | | | | | | | | | | | | | | | |
Net Investment Income | | | (0.1233 | ) | | | (0.0073 | ) | | | (0.0888 | ) | | | (0.2746 | ) | | | (0.2041 | ) |
Net Realized Gains | | | — | | | | — | | | | — | (a) | | | — | (a) | | | — | (a) |
| | | | | | | | | | | | | | | | | | | | |
TOTAL DISTRIBUTIONS | | | (0.1233 | ) | | | (0.0073 | ) | | | (0.0888 | ) | | | (0.2746 | ) | | | (0.2041 | ) |
| | | | | | | | | | | | | | | | | | | | |
Net Asset Value, End of Period | | $ | 11.5614 | | | $ | 11.5695 | | | $ | 11.5711 | | | $ | 11.5707 | | | $ | 11.5703 | |
| | | | | | | | | | | | | | | | | | | | |
Total Return | | | 0.99 | % | | | 0.05 | % | | | 0.77 | % | | | 2.41 | % | | | 1.77 | % |
SUPPLEMENTAL DATA: | | | | | | | | | | | | | | | | | | | | |
NET ASSETS, END OF PERIOD (000’s) | | $ | 16,607,155 | | | $ | 12,003,157 | | | $ | 8,784,049 | | | $ | 16,363,197 | | | $ | 20,777,502 | |
Ratios to Average Net Assets: | | | | | | | | | | | | | | | | | | | | |
Net Investment Income | | | 1.10 | % | | | 0.06 | % | | | 0.88 | % | | | 2.38 | % | | | 1.74 | % |
Gross Expenses | | | 0.06 | % | | | 0.06 | % | | | 0.06 | % | | | 0.06 | % | | | 0.06 | % |
Net Expenses(b) | | | 0.05 | % | | | 0.06 | % | | | 0.05 | % | | | 0.05 | % | | | 0.05 | % |
| (a) | Amount less than $0.005. |
| (b) | Ratio as disclosed reflects the impact of custody fee credits earned by the fund on cash balances. |
See accompanying Notes to Financial Statements.
11
THE DFA SHORT TERM INVESTMENT FUND
Notes to Financial Statements
October 31, 2022
A. ORGANIZATION
The DFA Investment Trust Company (the “Trust”) is an open-end management investment company registered under the Investment Company Act of 1940 (the “1940 Act”). The Trust consists of ten series, one of which, The DFA Short Term Investment Fund (the “Fund”), is included in this report. The remaining series are presented in separate reports. The Fund is an investment company and, accordingly, follows the accounting and reporting guidance under Financial Accounting Standards Board (“FASB”) Accounting Standards Codification (“ASC”) Topic 946, “Financial Services – Investment Companies.”
The investment objective of the Fund is to seek to provide a high level of current income consistent with liquidity and the preservation of capital. As a money market fund, the Fund will pursue its investment objective by investing in U.S. dollar-denominated short-term debt securities that meet the strict standards established by the Board of Trustees of the Trust (the “Board”), which are in accordance with Rule 2a-7 under the 1940 Act.
The Board is responsible for establishing the Trust’s policies and for overseeing the management of the Trust. Under the Trust’s organizational documents, its officers and trustees are indemnified against certain liabilities arising out of the performance of their duties to the Trust. In the normal course of business, the Trust enters into contracts that contain a variety of representations and warranties that provide general indemnification. The Trust’s maximum exposure under these arrangements is unknown as this would involve future claims that may be made against the Trust and/or its affiliates that have not yet occurred. However, based on prior experience, the Trust expects the risk of loss to be remote.
B. SIGNIFICANT ACCOUNTING POLICIES
The following significant accounting policies are in conformity with accounting principles generally accepted in the United States of America (“U.S. GAAP”). Such policies are consistently followed by the Trust in preparation of its financial statements. The preparation of financial statements in accordance with U.S. GAAP requires management to make estimates and assumptions that affect the reported amounts of assets and liabilities and disclosure of contingent assets and liabilities at the date of the financial statements and the reported amounts of increases and decreases in net assets from operations during the reporting period. Actual results could differ from those estimates and those differences could be material.
1. SECURITY VALUATION – The Fund utilizes a fair value hierarchy which prioritizes the inputs to valuation techniques used to measure fair value into three broad levels described below:
| | | | |
| • Level 1 | | – | | Inputs are quoted prices in active markets for identical securities. |
| | |
| • Level 2 | | – | | Other significant observable inputs (including quoted prices for similar securities, interest rates, prepayment speeds, credit risk, etc.). |
| | |
| • Level 3 | | – | | Significant unobservable inputs (including the Fund’s own assumptions in determining the fair value of investments). |
The securities held by the Fund are valued at market value or fair value as described below. Debt securities are valued on the basis of evaluated prices provided by one or more pricing services or other reasonably reliable sources, including broker/dealers that typically handle the purchase and sale of such securities.
Securities for which no market quotations are readily available (including restricted securities), or for which market quotations have become unreliable, are valued in good faith at fair value in accordance with Rule 2a-5 under the 1940 Act pursuant to procedures approved by the Board. These valuations are generally categorized as Level 2 or Level 3 in the hierarchy.
A summary of the inputs used to value the Fund’s investments is disclosed previously in this Note. A valuation hierarchy table has been provided below. The inputs or methodology used for valuing securities are not necessarily an indication of the risk associated with investing in those securities.
When determining the fair value of the Fund’s investments, additional consideration is given to those assets or liabilities that have experienced a decrease in the volume or level of activity or have identified circumstances that indicate that a transaction is not orderly.
12
THE DFA SHORT TERM INVESTMENT FUND
Notes to Financial Statements - (continued)
October 31, 2022
The following table provides the fair value measurements of the Fund’s investments by level within the fair value hierarchy as of October 31, 2022:
| | | | | | | | | | | | |
| | | LEVEL 1
INVESTMENTS
IN SECURITIES | | | LEVEL 2
INVESTMENTS
IN SECURITIES | | | LEVEL 3
INVESTMENTS
IN SECURITIES | |
THE DFA SHORT TERM INVESTMENT FUND | | | | | | | | | |
Commercial Paper | | $ | — | | | $ | 3,994,312,092 | | | $ | — | |
Yankee Certificates of Deposit | | | — | | | | 2,565,046,641 | | | | — | |
U.S. Government Agency Securities | | | — | | | | 1,685,997,884 | | | | — | |
Repurchase Agreements | | | — | | | | 3,300,000,000 | | | | — | |
U.S. Treasury Obligations | | | — | | | | 4,205,870,259 | | | | — | |
| | | | | | | | | | | | |
Total Investments | | $ | — | | | $ | 15,751,226,876 | | | $ | — | |
| | | | | | | | | | | | |
2. DEFERRED COMPENSATION PLAN – Each eligible trustee (each a “Trustee” and collectively, the “Trustees”) of the Trust may elect to participate in the Fee Deferral Plan for Independent Trustees (the “Plan”). Under the Plan effective January 1, 2002, such Trustees may defer payment of all or a portion of their total fees earned as a Trustee. These deferred amounts may be treated as though such amounts had been invested in shares of the following funds: U.S. Large Cap Value Portfolio; U.S. Core Equity 1 Portfolio; U.S. Large Company Portfolio; U.S. Vector Equity Portfolio; U.S. Micro Cap Portfolio; DFA International Value Portfolio; International Core Equity Portfolio; Emerging Markets Portfolio; Emerging Markets Core Equity Portfolio; DFA Inflation-Protected Securities Portfolio and/or DFA Two-Year Global Fixed Income Portfolio. Contributions made under the Plan and the change in unrealized appreciation (depreciation) and income are included in Trustee Fees.
Each Trustee has the option to receive the distribution of proceeds in one of the following methods: lump sum; annual installments over a period of agreed-upon years; or quarterly installments over a period of agreed-upon years. Each Trustee shall have the right in a notice of election (the “Notice”) to defer the receipt of the Trustee’s deferred compensation until a date specified by such Trustee in the Notice, which date may not be sooner than the earlier of: (i) the first business day of January following the year in which such Trustee ceases to be a member of the Board; and (ii) five years following the effective date of the Trustee’s first deferral election. If a Trustee who elects to defer fees fails to designate in the Notice a time or date as of which payment of the Trustee’s deferred fee account shall commence, payment of such amount shall commence as of the first business day of January following the year in which the Trustee ceases to be a member of the Board (unless the Trustee files an amended Notice selecting a different distribution date).
At October 31, 2022, the Fund’s total liability of $447,313 for deferred compensation to Trustees is included in the “Trustee Fees” payable (a line item which also includes Trustee fees/expenses) on the Statement of Assets and Liabilities.
3. SECURITY TRANSACTIONS AND RELATED INCOME – Security transactions are accounted for as of the trade date. Costs used in determining realized gains and losses on the sale of investment securities are on the basis of identified cost. Dividend income and distributions to shareholders are recorded on the ex-dividend date. The Fund generally declares distributions from net investment income on a daily basis and pays dividends monthly. Any capital gains are distributed at least annually. The Fund does not expect to realize any long-term capital gains and losses. The Fund may distribute such income dividends and capital gains more frequently, if necessary, in order to reduce or eliminate federal excise or income taxes on the Fund. Interest income is recognized on an accrual basis and includes amortization or accretion of premia or discount using the straight-line method. Costs used in determining net realized gains and losses on the sales of investment securities are those of the specific securities sold, adjusted for the accretion or amortization of purchase discounts or premia during the respective holding period.
4. ALLOCATIONS – The Trust bears all of its own fees, expenses, charges, assessments, taxes, and other costs incurred in its operation, whether incurred directly by the Trust or by Dimensional Fund Advisors LP, the Fund’s investment adviser (the “Advisor” or “DFA”), on its behalf. Expenses directly attributable to the Fund are charged to the Fund. Expenses not directly attributable to the Fund are allocated among the respective portfolios in the Trust on the basis of their relative net assets.
13
THE DFA SHORT TERM INVESTMENT FUND
Notes to Financial Statements - (continued)
October 31, 2022
C. FEDERAL INCOME TAXES
The Fund is classified as a regulated investment company for tax purposes. As a regulated investment company, the Fund generally pays no U.S. federal income tax on the income and gains that the Fund distributes to shareholders.
Distributions from net investment income and net realized capital gains are determined in accordance with U.S. federal income tax regulation, which may differ from those amounts determined under U.S. GAAP. These book/tax differences are either temporary (e.g., wash sale losses) or permanent (e.g., reclassification of certain gain/loss and distributions) in nature. To the extent these differences are permanent, they are charged or credited to paid-in capital, undistributed net investment income or accumulated net realized gains, as appropriate, in the period that the differences arise. There were no permanent differences as of October 31, 2022, attributable to distribution redesignations.
As of October 31, 2022, the tax cost of securities and the breakdown of unrealized appreciation and depreciation of securities for federal income tax purposes are as follows:
| | | | | | | | | | | | | | | | |
| | | Tax Cost of
Securities | | | Unrealized
Appreciation | | | Unrealized
Depreciation | | | Net Unrealized
Appreciation /
(Depreciation) | |
The DFA Short Term Investment Fund | | $ | 15,757,586,877 | | | $ | 238,193 | | | $ | (6,598,194 | ) | | $ | (6,360,001 | ) |
ACCOUNTING FOR UNCERTAINTY IN INCOME TAXES sets forth a minimum threshold for financial statement recognition of the benefit of a tax position taken or expected to be taken in a tax return.
For all open tax years and all major taxing jurisdictions, management of the Fund has concluded that there are no significant uncertain tax positions that would require recognition in the Fund’s financial statements. The Fund is not aware of any tax positions for which it is more likely than not that the total amounts of unrecognized tax benefits will significantly change in the next twelve months. Each of the Fund’s federal tax returns for the prior three fiscal years remains subject to examination by the Internal Revenue Service.
The tax character of distributions paid to shareholders during the years ended October 31, 2021 and October 31, 2022 were as follows:
| | | | | | | | | | | | |
| | | Distributions Paid From | |
| | | Net Investment
Income | | | Long-
Term
Capital
Gains | | | Total
Distributions Paid | |
The DFA Short Term Investment Fund | | | | | | | | | | | | |
2022 | | $ | 154,383,414 | | | $ | — | | | $ | 154,383,414 | |
2021 | | | 7,211,693 | | | | — | | | | 7,211,693 | |
As of October 31, 2022, the components of distributable earnings (accumulated losses) on a tax basis were as follows:
| | | | | | | | | | | | | | | | | | | | | | | | | | | | |
| | | Undistributed | |
| | | Ordinary
Income | | | Long-
Term
Capital
Gains | | | Accumulated
Earnings | | | Distributions
Payable | | | Accumulated
Capital And
Other Losses | | | Unrealized
Appreciation
(Depreciation) | | | Total
Accumulated
Earnings (Deficit) | |
The DFA Short Term Investment Fund | | $ | 45,267,861 | | | $ | — | | | $ | 45,267,861 | | | $ | (45,429,125 | ) | | $ | (4,994,508 | ) | | $ | (6,360,001 | ) | | $ | (11,515,773 | ) |
14
THE DFA SHORT TERM INVESTMENT FUND
Notes to Financial Statements - (continued)
October 31, 2022
D. FINANCIAL INSTRUMENTS
REPURCHASE AGREEMENTS – The Fund may engage in repurchase agreement (“RA”) transactions with counterparties with creditworthiness and other characteristics deemed appropriate by the Advisor. The Fund, through its custodian, receives delivery of underlying securities collateralizing an RA. Collateral for certain tri-party RAs is held at the counterparty’s custodian in a segregated account for the benefit of the Fund and the counterparty. The counterparty will be required to maintain collateral with a value at least equal, at all times, to the value of the repurchase obligation including interest. RA transactions involve certain risks in the event of default or insolvency of the counterparty. These risks include possible delay or restrictions upon the Fund’s ability to dispose of the collateral and a possible decline in the value of the collateral during the period while the Fund seeks to assert its rights.
RAs permit the Fund, under certain circumstances including an event of default (such as bankruptcy or insolvency), to offset payables and/or receivables under the RA with collateral held and/or posted to the counterparty and create one single net payment due to or from the Fund. However, bankruptcy or insolvency laws of a particular jurisdiction may impose restrictions on or prohibitions against such a right of offset in the event of the RA counterparty’s bankruptcy or insolvency. Pursuant to the terms of the RA, the Fund receives securities as collateral with a market value in excess of the repurchase price to be received by the Fund upon the maturity of the repurchase transaction. Upon a bankruptcy or insolvency of the RA counterparty, the Fund would recognize a liability with respect to such excess collateral to reflect the Fund’s obligation under bankruptcy law to return the excess to the counterparty.
E. RELATED PARTY TRANSACTIONS
INVESTMENT MANAGER – Dimensional Fund Advisors LP serves as investment advisor to the Fund. Pursuant to an investment management agreement with the Trust with respect to the Fund (the “Investment Management Agreement”), the Advisor manages the investment and reinvestment of the Fund’s assets. DFA has served as the Fund’s investment advisor since the Fund’s commencement of operations. Pursuant to the terms of the investment management agreement, the Advisor receives a management fee calculated daily and payable monthly from the Fund at an annual rate of 0.05% of the average daily net assets.
FEES PAID TO OFFICERS AND TRUSTEES – Certain Officers and Trustees of the Advisor are also Officers and Trustees of the Trust; however, such Officers and Trustees (with the exception of the Chief Compliance Officer (“CCO”)) receive no compensation from the Trust. Amounts paid to the Trust’s CCO are reflected on the Statement of Operations as “CCO Fees”.
At October 31, 2022, the following number of shareholders held the approximate percentage of the Fund’s outstanding shares:
| | | | | | | | |
| | | Number of
Shareholders | | | Approximate Percentage
of Outstanding Shares | |
The DFA Short Term Investment Fund | | | 6 | | | | 43 | % |
F. INTEREST RATE AND CREDIT RISKS
The Fund invests primarily in money market instruments maturing in 397 calendar days or less and which are considered Eligible Securities (as defined in Rule 2a-7 under the 1940 Act). The ability of the issuers of the securities held by the Fund to meet their obligations may be affected by economic developments in a specific industry, state or region. Fixed income securities are subject to interest rate risk because the prices of fixed income securities tend to move in the opposite direction of interest rates. When interest rates rise, fixed income security prices fall. When interest rates fall, fixed income security prices rise. When interest rates are very low, the Fund’s expenses could absorb all or a portion of the Fund’s income and yield. When interest rates fall, certain obligations will be paid off by the obligor more quickly than originally anticipated, and the Fund may have to invest the proceeds in securities with lower yields. Changes in monetary policy made by central banks and/or their governments may affect interest rates.
15
THE DFA SHORT TERM INVESTMENT FUND
Notes to Financial Statements - (continued)
October 31, 2022
The Fund is subject to the risk that the Advisor’s security selection and expectations regarding interest rate trends will cause the yields of the Fund to lag the performance of other mutual funds with similar investment objectives or the performance of short-term debt instruments. The emphasis of the Fund on quality and liquidity also could cause the Fund to underperform when compared to other money market funds, particularly those that take greater maturity and credit risks.
G. LINE OF CREDIT AND INTERFUND LENDING PROGRAM
The Fund, together with other Dimensional-advised portfolios, has entered into a $700 million unsecured line of credit with its custodian bank effective January 2, 2022. A similar line of credit for $700 million was in effect through January 1, 2022. Each portfolio is permitted to borrow, subject to its investment limitations, up to a maximum of the lower of one-quarter of such portfolio’s net assets or $500 million, as long as total borrowings under the line of credit do not exceed $700 million in the aggregate. Each portfolio is individually, and not jointly, liable for its particular advances under the line of credit. Borrowings under the line of credit are charged interest at rates agreed to by the parties at the time of borrowing. There is no commitment fee on the unused portion of the line of credit. The agreement for the line of credit expires on January 1, 2023. There were no borrowings by the Fund under this line of credit during the year ended October 31, 2022.
Pursuant to an exemptive order issued by the SEC (the “Order”), the Fund may participate in an interfund lending program among certain portfolios managed by the Advisor (portfolios that operate as feeder funds do not participate in the program). The program allows the participating portfolios to borrow money from and loan money to each other for temporary or emergency purposes, subject to the conditions in the Order. A loan can only be made through the program if the interfund loan rate on that day is more favorable to both the borrowing and lending portfolios as compared to rates available through short-term bank loans or investments in overnight repurchase agreements and money market funds, respectively, as detailed in the Order. Further, a portfolio may participate in the program only if and to the extent that such participation is consistent with its investment objective and limitations. Interfund loans have a maximum duration of seven days and may be called on one business day’s notice.
For the year ended October 31, 2022, activity by the Fund under the interfund lending program was as follows (amounts in thousands, except percentages and days):
| | | | | | | | | | | | | | | | |
Lender | | Weighted
Average Loan
Balance | | | Number of Days
Outstanding* | | | Weighted Average
Annualized
Interest Rate | | | Interest Income
(Expense) | |
The DFA Short Term Investment Fund | | $ | 70,918 | | | | 27 | | | | 1.05 | % | | $ | 55 | |
| * | Number of Days Outstanding represents the total of single or consecutive days during the year ended October 31, 2022, that the Fund utilized the interfund lending program. |
H. RECENTLY ISSUED ACCOUNTING STANDARDS
In March 2020, the Financial Accounting Standards Board (FASB) issued Accounting Standards Update (ASU) No. 2020-04, Reference Rate Reform (Topic 848) – Facilitation of the Effects of Reference Rate Reform on Financial Reporting. In January 2021, the FASB issued ASU No. 2021-01, with further amendments to Topic 848. The amendments in the ASUs provide optional temporary accounting recognition and financial reporting relief from the effect of certain types of contract modifications due to the planned discontinuation of the LIBOR and other interbank-offered based reference rates as of the end of 2021 and 2023. The ASUs are effective for certain reference rate-related contract modifications that occur during the period March 12, 2020 through December 31, 2022. Management has reviewed the requirements and determined the adoption of these ASUs will not have a material impact on the Fund’s financial statements.
In October 2020, the SEC adopted new regulations governing the use of derivatives by registered investment companies. Rule 18f-4 (the “Derivatives Rule”) imposes limits on the amount of derivatives contracts the Fund could enter, eliminate the asset segregation framework currently used by the Fund to comply with Section 18 of the 1940 Act, and require funds whose use of derivatives is more than a limited specified exposure to establish and maintain a derivatives risk management program and appoint a derivatives risk manager. The Derivatives Rule became effective February 19, 2021 and the Fund began complying with the Derivatives Rule on August 19, 2022.
16
THE DFA SHORT TERM INVESTMENT FUND
Notes to Financial Statements - (concluded)
October 31, 2022
On December 3, 2020, the SEC adopted new Rule 2a-5 (the “Valuation Rule”) under the Investment Company Act of 1940, establishing an updated regulatory framework for fund valuation. The Valuation Rule, in part, provides a framework for good faith fair value determination and permits a Board to designate fair value determinations to a fund’s investment adviser. Further, the SEC rescinded previously issued guidance on related issues. The Valuation Rule became effective on March 8, 2021 and the Fund began complying with the Valuation Rule on August 1, 2022.
I. SUBSEQUENT EVENTS
Management has evaluated the impact of all subsequent events on the Fund through the date these financials statements were issued and has determined that there are no subsequent events requiring recognition or disclosure in the financial statements.
17

Report of Independent Registered Public Accounting Firm
To the Board of Trustees of The DFA Investment Trust Company and Shareholders of The DFA Short Term Investment Fund
Opinion on the Financial Statements
We have audited the accompanying statement of assets and liabilities, including the schedule of investments, of The DFA Short Term Investment Fund (one of the funds constituting The DFA Investment Trust Company, referred to hereafter as the “Fund”) as of October 31, 2022, the related statement of operations for the year ended October 31, 2022, the statement of changes in net assets for each of the two years in the period ended October 31, 2022, including the related notes, and the financial highlights for each of the five years in the period ended October 31, 2022 (collectively referred to as the “financial statements”). In our opinion, the financial statements present fairly, in all material respects, the financial position of the Fund as of October 31, 2022, the results of its operations for the year then ended, the changes in its net assets for each of the two years in the period ended October 31, 2022 and the financial highlights for each of the five years in the period ended October 31, 2022 in conformity with accounting principles generally accepted in the United States of America.
Basis for Opinion
These financial statements are the responsibility of the Fund’s management. Our responsibility is to express an opinion on the Fund’s financial statements based on our audits. We are a public accounting firm registered with the Public Company Accounting Oversight Board (United States) (PCAOB) and are required to be independent with respect to the Fund in accordance with the U.S. federal securities laws and the applicable rules and regulations of the Securities and Exchange Commission and the PCAOB.
We conducted our audits of these financial statements in accordance with the standards of the PCAOB. Those standards require that we plan and perform the audit to obtain reasonable assurance about whether the financial statements are free of material misstatement, whether due to error or fraud.
Our audits included performing procedures to assess the risks of material misstatement of the financial statements, whether due to error or fraud, and performing procedures that respond to those risks. Such procedures included examining, on a test basis, evidence regarding the amounts and disclosures in the financial statements. Our audits also included evaluating the accounting principles used and significant estimates made by management, as well as evaluating the overall presentation of the financial statements. Our procedures included confirmation of securities owned as of October 31, 2022 by correspondence with the custodian and brokers; when replies were not received from brokers, we performed other auditing procedures. We believe that our audits provide a reasonable basis for our opinion.
/s/ PricewaterhouseCoopers LLP
Philadelphia, Pennsylvania
December 22, 2022
We have served as the auditor of one or more investment companies in Dimensional Fund Advisors L.P. investment company group since 1981.
18
THE DFA SHORT TERM INVESTMENT FUND
Supplemental Information
October 31, 2022 – (Unaudited)
EXPENSE EXAMPLES
The following Expense Table is shown so that you can understand the impact of fees on your investment. All mutual funds have operating expenses. As a shareholder of the Fund, you incur ongoing costs, which include costs for portfolio management, administrative services, and shareholder reports, among others. Operating expenses, legal and audit services, which are deducted from a fund’s gross income, directly reduce the investment return of the fund. A fund’s expenses are expressed as a percentage of its average net assets. This figure is known as the expense ratio. The following examples are intended to help you understand the ongoing costs, in dollars, of investing in the Fund and to compare these costs with those of other mutual funds. The example is based on an investment of $1,000 invested at the beginning of the period shown and held for the entire period.
The Expense Table below illustrates your fund’s costs in two ways.
Actual Fund Return
This section helps you to estimate the actual expenses after fee waivers that you paid over the period. The “Ending Account Value” shown is derived from the fund’s actual return and “Expenses Paid During Period” reflects the dollar amount that would have been paid by an investor who started with $1,000 in the fund. You may use the information here, together with the amount you invested, to estimate the expenses that you paid over the period. To do so, simply divide your account value by $1,000 (for example, a $7,500 account value divided by $1,000 = 7.5), then multiply the result by the number in the table under the heading “Expenses Paid During Period.”
Hypothetical Example for Comparison Purposes
This section is intended to help you compare your fund’s costs with those of other mutual funds. The hypothetical “Ending Account Value” and “Expenses Paid During Period” are derived from the fund’s actual expense ratio and an assumed 5% annual return before expenses. In this case, because the return used is not the fund’s actual return, the results do not apply to your investment. The example is useful in making comparisons because the SEC requires all mutual funds to calculate expenses based on a 5% annual return. You can assess your fund’s costs by comparing this hypothetical example with the hypothetical examples that appear in shareholder reports of other funds.
Please note that the expenses shown in the table are meant to highlight and help you compare ongoing costs only and do not reflect any transactional costs, if applicable. The “Annualized Expense Ratio” represents the actual expenses for the six-month period indicated.
| | | | | | | | | | | | | | | | | | |
| | | | | Beginning
Account Value
5/1/22 | | | Ending
Account Value
10/31/22 | | | Expenses Paid
During Period(1)
5/1/22-10/31/22 | | | Annualized
Expense Ratio
During Period
5/1/22-10/31/22 | |
The DFA Short Term | | Actual | | $ | 1,000.00 | | | $ | 1,009.40 | | | $ | 0.25 | | | | 0.05 | % |
Investment Fund | | Hypothetical | | | 1,000.00 | | | | 1,024.95 | | | | 0.26 | | | | 0.05 | |
| (1) | Expenses are equal to the Fund’s annualized expense ratio multiplied by the average account value over the period, multiplied by the number of days in the most recent six- month period (184), then divided by the number of days in the year (365) to reflect the six-month period. |
19
THE DFA SHORT TERM INVESTMENT FUND
Supplemental Information – (concluded)
October 31, 2022 – (Unaudited)
VOTING PROXIES ON FUND PORTFOLIO SECURITIES
A description of the policies and procedures that the Fund and the Trust use in voting proxies relating to securities held in the portfolios is available (1) without charge, upon request, by calling collect: (512) 306-7400 (2) from the Advisor’s website at http://us.dimensional.com; and (3) on the SEC’s website at http://www.sec.gov. Information regarding how the Advisor votes these proxies is available from the EDGAR database on the SEC’s website at http://www.sec.gov and from the Advisor’s website at https://www.dimensional.com/us-en/who-we-are/investment-stewardship and reflects the twelve-month period beginning July 1st and ending June 30th.
PORTFOLIO HOLDINGS INFORMATION
The SEC requires that all money market funds publish their holdings on a monthly basis on the fund’s website and file a complete Schedule of Investments with the SEC monthly on Form N-MFP. Such Form N-MFP filing must be made within five business days of the end of the month. They are available on the Fund’s website at http://us.dimensional.com/dfa-short-term-investment-fund, or by visiting the SEC’s website at http://www.sec.gov.
20
THE DFA SHORT TERM INVESTMENT FUND
Fund Management
October 31, 2022 – (Unaudited)
Trustees/Directors
Each Board of Trustees/Directors (each, the “Board” and collectively, the “Boards”) of The DFA Investment Trust Company (“DFAITC”), DFA Investment Dimensions Group Inc. (“DFAIDG”), Dimensional Investment Group Inc. (“DIG”), Dimensional ETF Trust (“ETF Trust”), and Dimensional Emerging Markets Value Fund (“DEM”) (each, the “Fund” and collectively, the “Funds”) is responsible for establishing the Funds’ policies and for overseeing the management of the Funds. The Trustees/ Directors of the Funds, including all of the disinterested Trustees/Directors, have adopted written procedures to monitor potential conflicts of interest that might develop between portfolios of the Funds (the “Feeder Portfolios”) that invest in certain series of DFAITC or DEM (the “Master Funds”).
Each Board has four standing committees, an Audit Committee, a Nominating and Governance Committee (the “Nominating Committee”), a Mutual Funds-ETF Relations Committee, and an Investment Strategy Committee (the “Strategy Committee”). The Audit Committee is composed of Reena Aggarwal, George M. Constantinides, Francis A. Longstaff, Abbie J. Smith and Ingrid M. Werner. Each member of the Audit Committee is a disinterested Trustee/Director. The Audit Committee oversees the Fund’s accounting and financial reporting policies and practices, the Fund’s internal controls, the Fund’s financial statements and the independent audits thereof and performs other oversight functions as requested by the Board. The Audit Committee recommends the appointment of each Fund’s independent registered certified public accounting firm and acts as a liaison between the Fund’s independent registered certified public accounting firm and the full Board. There were three Audit Committee meetings held during the fiscal year ended October 31, 2022.
Each Board’s Nominating Committee is composed of Reena Aggarwal, George M. Constantinides, Douglas W. Diamond, Francis A. Longstaff, and Heather E. Tookes. Each member of the Nominating Committee is a disinterested Trustee/Director. The Nominating Committee for each Board makes recommendations for nominations of disinterested and interested members on the Board to the disinterested Board members and to the full Board. The Nominating Committee works closely with other disinterested Trustees to evaluate a candidate’s qualification for Board membership and the independence of such candidate from the Advisor and other principal service providers. The Nominating Committee also periodically reviews the Board governance practices, policies, procedures, and operations; reviews the membership of each committee of the Board; reviews and makes recommendations regarding the Independent Trustees’ compensation; oversees the annual self-assessment of the Board and each committee; considers and recommends to the Board, the selection of “independent legal counsel” (as that term is defined in the 1940 Act); and monitors and considers corporate governance issues that may arise from time to time. There were three Nominating Committee meetings held during the fiscal year ended October 31, 2022.
Each Board’s Strategy Committee is composed of Gerard K. O’Reilly, Douglas W. Diamond, Darrell Duffie, and Heather E. Tookes. The Strategy Committee assists the Board in carrying out its fiduciary duties with respect to the oversight of the Fund and its performance. At the request of the Board or the Advisor, the Strategy Committee (i) reviews the design of possible new series of the Fund, (ii) reviews performance of existing portfolios of the Funds and discusses and recommends possible enhancements to the portfolios’ investment strategies, (iii) reviews proposals by the Advisor to modify or enhance the investment strategies or policies of each portfolio, and (iv) considers issues relating to investment services for each portfolio of the Fund. There were four Strategy Committee meetings held during the fiscal year ended October 31, 2022.
The Mutual Funds-ETF Relations Committee is comprised of George M. Constantinides, Darrell Duffie, and Ingrid M. Werner. At the request of the Board, the Mutual Funds-ETF Relations Committee (i) reviews any newly-proposed expenses to be borne by the ETFs in Dimensional ETF Trust (“Dimensional ETFs”), portfolios in the DFA mutual fund complex (“Fund Complex”) or changes to the existing expense allocations among the Dimensional ETFs, portfolios in the Fund Complex, and the Advisor, (ii) considers any conflicts of interest that may arise in the operations of the Dimensional ETFs and the portfolios in the Fund Complex, (iii) reviews and considers relevant information relating to the operations of the Dimensional ETFs, and (iv) considers asset flows and performance differences between the similarly managed mutual funds and ETFs of the Funds. There were two Mutual Funds-ETF Relations Committee meetings held for the Trust during the fiscal year ended October 31, 2022.
Certain biographical information for each disinterested Trustee/Director and interested Trustee/Director of the Funds is set forth in the tables below, including a description of each Trustee/Director’s experience as a Trustee/ Director of the Funds and as a Director or Trustee of other funds, as well as other recent professional experience.
21
THE DFA SHORT TERM INVESTMENT FUND
Fund Management – (continued)
October 31, 2022 – (Unaudited)
The statements of additional information (together, “SAI”) of the Funds include additional information about each Trustee/Director. You may obtain copies of the SAI and prospectus of each Fund advised by Dimensional Fund Advisors LP by calling collect (512) 306-7400 or by mailing a request to Dimensional Fund Advisors LP, 6300 Bee Cave Road, Building One, Austin, TX 78746. Prospectuses are also available at http://us.dimensional.com.
22
THE DFA SHORT TERM INVESTMENT FUND
Fund Management – (continued)
October 31, 2022 – (Unaudited)
Disinterested Directors/Trustees
| | | | | | | | | | |
Name, Address and
Year of Birth | | Position | | Term of Office1 and Length of Service | | Principal Occupation During Past 5 Years | | Portfolios within the DFA Fund
Complex2 Overseen | | Other Directorships of
Public Companies Held During Past 5 Years |
Reena Aggarwal c/o Dimensional Fund Advisors LP 6300 Bee Cave Road, Building One Austin, TX 78746 1957 | | Director/
Trustee | | Since December 2021 | | Robert E. McDonough Professor of Business Administration and Finance, McDonough School of Business, Georgetown University (since 2003); Director, Georgetown Center for Financial Markets and Policy (since 2010); and Vice Provost of Faculty (2016-2020), Georgetown University. | | 147 portfolios in 5 investment companies | | Director, Cohen & Steers (asset management firm) (since 2017) and Director, Nuveen Churchill Direct Lending (private business development company) (since 2019). Formerly, Director, New York Life Investment Management IndexIQ (2008- 2021) (22 funds); Director, REAN Cloud (technology) (2015-2018); Director, FBR & Co. (investment banking) (2011- 2017); and Director, Brightwood Capital Advisors, L.P. (private equity) (2013- 2020). |
| | | | | |
George M. Constantinides University of Chicago Booth School of Business 5807 S. Woodlawn Avenue Chicago, IL 60637 1947 | | Director/
Trustee | | DFAIDG – Since 1983; DIG & DEM- Since 1993; DFAITC – Since 1992; ETF Trust – Since 2020 | | Leo Melamed Professor of Finance, University of Chicago Booth School of Business (since 1978). | | 147 portfolios in 5 investment companies | | None |
23
THE DFA SHORT TERM INVESTMENT FUND
Fund Management – (continued)
October 31, 2022 – (Unaudited)
| | | | | | | | | | |
Name, Address and
Year of Birth | | Position | | Term of Office1 and Length of Service | | Principal Occupation During Past 5 Years | | Portfolios within the DFA Fund
Complex2 Overseen | | Other Directorships of
Public Companies Held During Past 5 Years |
Douglas W. Diamond c/o Dimensional Fund Advisors LP 6300 Bee Cave Road, Building One Austin, TX 78746 1953 | | Director/
Trustee | | DFAIDG, DIG, DEM & DFAITC - Since 2017; ETF Trust – Since 2020 | | Merton H. Miller Distinguished Service Professor of Finance, University of Chicago Booth School of Business (since 1979). Formerly, Visiting Scholar, Federal Reserve Bank of Richmond (1990-2019). | | 147 portfolios in 5 investment companies | | None |
| | | | | |
Darrell Duffie c/o Dimensional Fund Advisors LP 6300 Bee Cave Road, Building One Austin, TX 78746 1954 | | Director/
Trustee | | DFAIDG, DIG, DEM & DFAITC - Since 2019; ETF Trust – Since 2020 | | Adams Distinguished Professor of Management and Professor of Finance, Stanford University (since 1984) and Director, TNB Inc. (bank) (since 2020). | | 147 portfolios in 5 investment companies | | Formerly, Director, Moody’s Corporation (financial information and information technology) (2008- 2018). |
| | | | | |
Francis A. Longstaff c/o Dimensional Fund Advisors LP 6300 Bee Cave Road, Building One Austin, TX 78746 1956 | | Director/
Trustee | | Since December 2021 | | Allstate Professor of Insurance and Finance, UCLA, Anderson School of Management; Consultant, NERA Economic Consulting (since 2018); Consultant, Charles River Associates (economic consulting firm) (since 2013); Consultant, Simplex Holdings, Inc. (technology firm) (since 1998); and Expert Witness, Analysis Group (economic consulting firm) (since 2012). | | 147 portfolios in 5 investment companies | | None |
| | | | | |
Abbie J. Smith University of Chicago Booth School of Business 5807 S. Woodlawn Avenue Chicago, IL 60637 1953 | | Director/
Trustee | | DFAIDG, DIG, DEM & DFAITC - Since 2000; ETF Trust – Since 2020 | | Boris and Irene Stern Distinguished Service Professor of Accounting and James S. Ely, III Faculty Fellow, University of Chicago Booth School of Business (since 1980). | | 147 portfolios in 5 investment companies | | Director (since 2000) and formerly, Lead Director (2014- 2017), HNI Corporation (office furniture); Director, Ryder System Inc. (transportation, logistics and supply-chain management) (since 2003); and Trustee, UBS Funds (2 investment companies within the fund complex) (13 portfolios) (since 2009). |
| | | | | |
Heather E. Tookes Yale School of Management 165 Whitney Avenue New Haven, CT 06511 1974 | | Director/
Trustee | | Since December 2021 | | Professor of Finance, Yale School of Management (since 2004). | | 147 portfolios in 5 investment companies | | Director, Payoneer Inc. (digital payments) (since 2021); Director, Ariel Investments LLC (since 2017); and Director, Community Foundation of Greater New Haven (community foundation and grant-making) (since 2022). Formerly, Director, KCG Holdings (trading company) (January 2017-July 2017). |
24
THE DFA SHORT TERM INVESTMENT FUND
Fund Management – (continued)
October 31, 2022 – (Unaudited)
| | | | | | | | | | |
Name, Address and
Year of Birth | | Position | | Term of Office1 and Length of Service | | Principal Occupation During Past 5 Years | | Portfolios within the DFA Fund
Complex2 Overseen | | Other Directorships of
Public Companies Held During Past 5 Years |
Ingrid M. Werner c/o Dimensional Fund Advisors LP 6300 Bee Cave Road, Building One Austin, TX 78746 1961 | | Director/
Trustee | | DFAIDG, DIG, DEM & DFAITC - Since 2019; ETF Trust – Since 2020 | | Martin and Andrew Murrer Professor of Finance, Fisher College of Business, The Ohio State University (since 1998). Adjunct Member, the Prize Committee for the Swedish Riksbank Prize in Economic Sciences in Memory of Alfred Nobel (annual award for significant scientific research contribution) (since 2018). Director, American Finance Association (global association of academic researchers and practitioners in finance) (since January 2019). Member, Scientific Board, Leibniz Institute for Financial Research (institute supporting academic research in finance) (since 2020). Chair, Economic Advisory Committee, FINRA (since 2017). Chairman, Scientific Advisory Board, Swedish House of Finance (institute supporting academic research in finance) (since 2014). Member, Scientific Board, Danish Finance Institute (institute supporting academic research in finance) (since 2017). Fellow, Center for Analytical Finance (academic research) (since 2015). Associate Editor, Journal of Finance (since 2016). Formerly, President, Western Finance Association (global association of academic researchers and practitioners in finance) (2018-2019). Formerly, Member, Academic Board, Mistra Financial Systems (organization funding academic research on environment, governance and climate/sustainability in finance) (2016-2021). | | 147 portfolios in 5 investment companies | | Director, Fourth Swedish AP Fund (pension fund asset management) (since 2017). |
25
THE DFA SHORT TERM INVESTMENT FUND
Fund Management – (continued)
October 31, 2022 – (Unaudited)
Interested Directors/Trustees
The following interested Directors are described as such because each is deemed to be an “interested person,” as that term is defined under the 1940 Act, due to his position with the Advisor.
| | | | | | | | | | |
Name, Address and
Year of Birth | | Position | | Term of Office1 and Length of Service | | Principal Occupation During Past 5 Years | | Portfolios within the DFA Fund Complex2 Overseen | | Other Directorships of Public Companies Held During Past 5 Years |
David P. Butler c/o Dimensional Fund Advisors LP 6300 Bee Cave Road, Building One, Austin, TX 78746 1964 | | Director Co-Chief Executive Officer | | Director since December 2021 Co-Chief Executive Officer since 2017 (DFAIDG, DIG, DEM & DFAITC); 2020 (ETF Trust) | | Co-Chief Executive Officer of Dimensional Emerging Markets Value Fund (“DEM”), DFAIDG, Dimensional Investment Group Inc. (“DIG”), The DFA Investment Trust Company (“DFAITC”), Dimensional Holdings Inc., Dimensional Fund Advisors LP, Dimensional Investment LLC, and DFA Securities LLC (collectively with DEM, DFAIDG, DIG and DFAITC, the “DFA Entities”) (since 2017), DFA Canada LLC (since 2018), Dimensional Holdings LLC (since 2017), and Dimensional ETF Trust (since 2020); Chief Executive Officer of Dimensional Fund Advisors Canada ULC (since 2018); Director (since 2017) of Dimensional Holdings Inc., Dimensional Fund Advisors Canada ULC, Dimensional Japan Ltd., Dimensional Advisors Ltd., Dimensional Fund Advisors Ltd., and DFA Australia Limited; Director and Co-Chief Executive Officer (since 2017) of Dimensional Cayman Commodity Fund I Ltd.; Chief Executive Officer of Dimensional Fund Advisors Canada ULC (since 2018); Head of Global Financial Advisor Services for Dimensional Fund Advisors LP (since 2007) and Dimensional Investment LLC (since 2017); Formerly, Vice President (2007 – 2017) of all the DFA Entities; Formerly, Head of Global Advisor Services for Dimensional Investment LLC (2011-2017). | | 147 portfolios in 5 investment companies | | None |
| | | | | |
Gerard K. O’Reilly c/o Dimensional Fund Advisors LP 6300 Bee Cave Road, Building One, Austin, TX 78746 1976 | | Chairman and Director Co-Chief Executive Officer and Chief Investment Officer | | Chairman and Director since December 2021 Co-Chief Executive Officer and Chief Investment Officer since 2017 (DFAIDG, DIG, DEM & DFAITC); 2020 (ETF Trust) | | Co-Chief Executive Officer and Chief Investment Officer of the DFA Entities (since 2017) and Dimensional ETF Trust (since 2020); Co-Chief Executive Officer of Dimensional Canada LLC (since 2018); Chief Investment Officer of Dimensional Fund Advisors Canada ULC (since 2017); Director, Chief Investment Officer (since 2017) and Vice President (since 2014) of DFA Australia Limited; Chief Investment Officer (since 2018) and Vice President (since 2016) of Dimensional Japan Ltd.; Director, Co-Chief Executive Officer and Chief Investment Officer (since 2017) of Dimensional Cayman Commodity Fund I Ltd.; Director of Dimensional Funds plc (since 2014), Dimensional Fund II plc (since 2014), Dimensional Holdings Inc. (since 2017), Dimensional Advisors Ltd. (since 2017), and Dimensional Ireland Limited (since 2018). Formerly, Executive Vice President (2017) and Co-Chief Investment Officer (2014 – 2017) of the DFA Entities; Formerly, Vice President (2007 – 2017) of the DFA Entities; Formerly, Vice President and Co-Chief Investment Officer (2014 – 2017) of Dimensional Fund Advisors Canada ULC. Formerly, Director of Dimensional Fund Advisors Pte. Ltd. (2017-2018) and Dimensional Fund Advisors Ltd. (2018-2021). | | 147 portfolios in 5 investment companies | | None |
| 1 | Each Director/Trustee holds office for an indefinite term until his or her successor is elected and qualified. |
| 2 | Each Director/Trustee is a director or trustee of each of the five registered investment companies within the DFA Fund Complex, which include: the Fund; DIG; DFAITC; DEM; and Dimensional ETF Trust. Each disinterested Director/Trustee also serves on the Independent Review Committee of the Dimensional Funds, mutual funds registered in the provinces of Canada and managed by the Advisor’s affiliate, Dimensional Fund Advisors Canada ULC. |
26
THE DFA SHORT TERM INVESTMENT FUND
Fund Management – (continued)
October 31, 2022 – (Unaudited)
Officers
Below is the name, year of birth, information regarding positions with the Funds and the principal occupation for each officer of the Funds. The address of each officer is 6300 Bee Cave Road, Building One, Austin, TX 78746. Each of the officers listed below holds the same office (except as otherwise noted) in the DFA Entities.
| | | | | | |
Name and Year of Birth | | Position | | Term of Office1 and Length of Service | | Principal Occupation During Past 5 Years |
Valerie A. Brown 1967 | | Vice President and Assistant Secretary | | Since 2001 | | Vice President and Assistant Secretary of • all the DFA Entities (since 2001) • DFA Australia Limited (since 2002) • Dimensional Fund Advisors Ltd. (since 2002) • Dimensional Cayman Commodity Fund I Ltd. (since 2010) • Dimensional Fund Advisors Pte. Ltd. (since 2012) • Dimensional Hong Kong Limited (since 2012) • Dimensional ETF Trust (since 2020) Director, Vice President and Assistant Secretary (since 2003) of • Dimensional Fund Advisors Canada ULC |
| | | |
Ryan P. Buechner 1982 | | Vice President and Assistant Secretary | | Since 2019 | | Vice President and Assistant Secretary of • DFAIDG, DIG, DFAITC and DEM (since 2019) • Dimensional ETF Trust (since 2020) Vice President (since January 2018) of • Dimensional Holdings Inc. • Dimensional Fund Advisors LP • Dimensional Investment LLC • DFA Securities LLC |
27
THE DFA SHORT TERM INVESTMENT FUND
Fund Management – (continued)
October 31, 2022 – (Unaudited)
| | | | | | |
Name and Year of Birth | | Position | | Term of Office1 and Length of Service | | Principal Occupation During Past 5 Years |
| Stephen A. Clark 1972 | | Executive Vice President | | Since 2017 | | Executive Vice President of • all the DFA Entities (since 2017) • Dimensional ETF Trust (since 2020) Director and Vice President (since 2016) of • Dimensional Japan Ltd. Chairman (since 2018) of • Dimensional Fund Advisors Canada ULC President and Director (since 2016) of • Dimensional Fund Advisors Canada ULC Vice President (since 2008) and Director (since 2016) of • DFA Australia Limited Director (since 2016) of • Dimensional Advisors Ltd. • Dimensional Fund Advisors Pte. Ltd. • Dimensional Hong Kong Limited Vice President of • Dimensional Advisors Ltd. (since 2016) • Dimensional Hong Kong Limited (since 2016) • Dimensional Fund Advisors Pte. Ltd. (since 2019) Formerly, Director (2016-2021) of • Dimensional Fund Advisors Ltd. Formerly, Vice President (2004 – 2017) of • all the DFA Entities Formerly, Vice President (2010 – 2016) of • Dimensional Fund Advisors Canada ULC Formerly, Vice President (2016-2019) of • Dimensional Fund Advisors Pte. Ltd. Formerly, Interim Chief Executive Officer (2019-2020) of • Dimensional Fund Advisors Pte. Ltd. Formerly, Head of Institutional, North America (2012 – 2013) and Head of Global Institutional Services (2014-2018) for • Dimensional Fund Advisors LP |
| | | |
| Lisa M. Dallmer 1972 | | Chief Operating Officer | | Since June 2021 | | Chief Operating Officer (since June 2021) of • the DFA Fund Complex Executive Vice President (since January 2020) • Dimensional Holdings Inc. • Dimensional Fund Advisors LP • Dimensional Investment LLC • DFA Securities LLC Chief Operating Officer (since December 2019) • Dimensional Holdings Inc. • Dimensional Fund Advisors LP • Dimensional Investment LLC • DFA Securities LLC Vice President (since 2020) of • DFA Australia Limited • Dimensional Advisors Ltd. • Dimensional Fund Advisors Canada ULC • Dimensional Fund Advisors Pte. Ltd. • Dimensional Ireland Limited • Dimensional Japan Ltd. |
28
THE DFA SHORT TERM INVESTMENT FUND
Fund Management – (continued)
October 31, 2022 – (Unaudited)
| | | | | | |
Name and Year of Birth | | Position | | Term of Office1 and Length of Service | | Principal Occupation During Past 5 Years |
| | | | | | Formerly, Vice President, Chief Financial Officer, and Treasurer (June 2020-June 2021) of • the DFA Fund Complex Formerly, Senior Vice President, Business Operations (March 2019 – October 2019) at • Delphix Inc. Formerly, Chief Operating Officer Global Technology & Operations, Managing Director (2014 – 2018) of • BlackRock Inc. |
| | | |
Bernard J. Grzelak 1971 | | Vice President | | Since June 2021 | | Vice President (since June 2021) of • the DFA Fund Complex Vice President, Chief Financial Officer and Treasurer (since September 2020) of • DFA Australia Limited • Dimensional Fund Advisors Canada ULC • DFA Securities LLC • Dimensional Advisors Ltd. • Dimensional Fund Advisors LP • Dimensional Fund Advisors Ltd. • Dimensional Fund Advisors Pte. Ltd. • Dimensional Holdings Inc. • Dimensional Hong Kong Limited • Dimensional Investment LLC Vice President (since March 2021) of • Dimensional Ireland Limited Formerly, Partner (2008 – 2020), Chief Operating Officer, Global Funds and Risk (2018 – 2020), Chief Operations Officer (2016 – 2018), and Director of Fund Administration (2003 – 2016) of • Lord Abbett & Co. LLC Formerly, Chief Financial Officer (2017 - 2020), and Treasurer (2003 – 2017) of • Lord Abbett Family of Funds |
| | | |
Eric Hall 1978 | | Vice President and Assistant Treasurer | | Since June 2021 | | Vice President and Assistant Treasurer (since June 2021) of • the DFA Fund Complex Formerly, Data Integrity Team Lead (December 2019 – April 2021) of • Clearwater Analytics Formerly, Assistant Vice President and Assistant Treasurer (March 2015 – November 2019) at • INVESCO, U.S. (formerly, OppenheimerFunds, Inc.) |
| | | |
Jeff J. Jeon 1973 | | Vice President | | Since 2004 | | Vice President (since 2004) of • all the DFA Entities Vice President (since 2020) of • Dimensional ETF Trust Vice President and Assistant Secretary (since 2010) of • Dimensional Cayman Commodity Fund I Ltd. Formerly, Assistant Secretary (2017-2019) of • all the DFA Entities |
| | | |
Joy Lopez 1971 | | Vice President and Assistant Treasurer | | Vice President since 2015 and Assistant Treasurer since 2017 | | Vice President of • all the DFA Entities (since 2015) • Dimensional Fund Advisors Ltd. (since 2015) • Dimensional ETF Trust (since 2020) • DFA Australia Limited (since 2020) • Dimensional Fund Advisors Canada ULC (since 2020) • Dimensional Ireland Limited (since 2020) Assistant Treasurer of |
29
THE DFA SHORT TERM INVESTMENT FUND
Fund Management – (continued)
October 31, 2022 – (Unaudited)
| | | | | | |
Name and Year of Birth | | Position | | Term of Office1 and Length of Service | | Principal Occupation During Past 5 Years |
| | | | | | • DFAIDG, DIG, DFAITC and DEM (since 2017) • Dimensional ETF Trust (since 2020) |
| | | |
Kenneth M. Manell 1972 | | Vice President | | Since 2010 | | Vice President of • all the DFA Entities (since 2010) • Dimensional Cayman Commodity Fund I Ltd. (since 2010) • Dimensional ETF Trust (since 2020) |
| | | |
Jan Miller 1963 | | Vice President, Chief Financial Officer, and Treasurer | | Since June 2021 | | Vice President, Chief Financial Officer, and Treasurer (since June 2021) of • the DFA Fund Complex Formerly, Director (May 2019 – January 2021) at • INVESCO, U.S. (formerly, OppenheimerFunds, Inc.) Formerly, Vice President and Assistant Treasurer (September 2012 – May 2019) at • OppenheimerFunds, Inc. |
| | | |
Catherine L. Newell 1964 | | President and General Counsel | | President since 2017 and General Counsel since 2001 | | President of • DFAIDG, DIG, DFAITC and DEM (since 2017) • Dimensional ETF Trust (since 2020) General Counsel of • all the DFA Entities (since 2001) • Dimensional Fund Advisors LP (since 2006) • Dimensional Holdings Inc (since 2006) • Dimensional Investment LLC (since 2009) • DFA Canada LLC (since 2009) • Dimensional ETF Trust (since 2020) Executive Vice President (since 2017) of • Dimensional Fund Advisors LP • Dimensional Holdings Inc. • DFA Securities LLC • Dimensional Investment LLC |
| | | |
| | | | | | Secretary of • Dimensional Fund Advisors LP (since 2006) • Dimensional Holdings Inc. (since 2006) • DFA Securities LLC (since 2006) • Dimensional Investment LLC (since 2009) Vice President (since 1997) and Secretary (since 2002) of • DFA Australia Limited • Dimensional Fund Advisors Ltd. Vice President and Secretary of • Dimensional Fund Advisors Canada ULC (since 2003) • DFA Canada LLC (since 2009) • Dimensional Cayman Commodity Fund I Ltd. (since 2010) • Dimensional Japan Ltd. (since 2012) • Dimensional Advisors Ltd (since 2014) • Dimensional Fund Advisors Pte. Ltd. (since 2012) Vice President and Assistant Secretary (since 2012) of • Dimensional Hong Kong Limited Director of • Dimensional Australia Limited (since 2007) • Dimensional Funds plc (since 2002) • Dimensional Funds II plc (since 2006) • Director of Dimensional Japan Ltd. (since 2012) • Dimensional Advisors Ltd. (since 2012) • Dimensional Fund Advisors Pte. Ltd. (since 2012) • Dimensional Hong Kong Limited (since 2012) |
30
THE DFA SHORT TERM INVESTMENT FUND
Fund Management – (continued)
October 31, 2022 – (Unaudited)
| | | | | | |
Name and Year of Birth | | Position | | Term of Office1 and Length of Service | | Principal Occupation During Past 5 Years |
| | | | | | • Dimensional Ireland Limited (since 2018) Formerly, Vice President and Secretary (2010 – 2014) of • Dimensional SmartNest (US) LLC Formerly, Vice President (1997 – 2017) and Secretary (2000 – 2017) of • DFAIDG, DIG, DFAITC and DEM Formerly, Vice President of • Dimensional Fund Advisors LP (1997 – 2017) • Dimensional Holdings Inc. (2006 – 2017) • DFA Securities LLC (1997 – 2017) • Dimensional Investment LLC (2009 – 2017) Formerly, Director (2002 – 2021) of • Dimensional Fund Advisors Ltd. |
| | | |
Selwyn J. Notelovitz 1961 | | Vice President | | Since September 2021 | | Vice President (since September 2021) of • the DFA Fund Complex Vice President (since December 2012) and Chief Compliance Officer (since July 2020) of • DFA Securities LLC • Dimensional Fund Advisors LP • Dimensional Holdings Inc. • Dimensional Investment LLC |
| | | |
| | | | | | Chief Compliance Officer (since July 2020) of: • DFA Australia Limited • Dimensional Fund Advisors Ltd. • Dimensional Fund Advisors Canada ULC Formerly, Deputy Chief Compliance Officer (2013-2020) of: • DFA Fund Complex • DFA Securities LLC • Dimensional Fund Advisors LP • Dimensional Holdings Inc. • Dimensional Investment LLC Formerly, Vice President (2013-2020) of: • DFA Fund Complex Formerly, Director (2019-2021) of: • Dimensional Ireland Limited |
| | | |
Carolyn L. O 1974 | | Vice President and Secretary | | Vice President since 2010 and Secretary since 2017 | | Vice President and Secretary of • DFAIDG, DIG, DFAITC and DEM (since 2010 and 2017, respectively) • Dimensional ETF Trust (since 2020) Vice President (since 2010) and Assistant Secretary (since 2016) of • Dimensional Fund Advisors LP • Dimensional Holdings Inc. • Dimensional Investment LLC Vice President of • DFA Securities LLC (since 2010) • Dimensional Cayman Commodity Fund I Ltd. (since 2010) • Dimensional Fund Advisors Canada ULC (since 2016) Assistant Secretary (since 2016) of • DFA Securities LLC |
| | | |
Randy C. Olson 1980 | | Chief Compliance Officer | | Since 2020 | | Chief Compliance Officer (since 2020) • the DFA Fund Complex • Vice President (since 2016) of • DFA Securities LLC • Dimensional Fund Advisors LP • Dimensional Holdings Inc. |
31
THE DFA SHORT TERM INVESTMENT FUND
Fund Management – (concluded)
October 31, 2022 – (Unaudited)
| | | | | | |
Name and Year of Birth | | Position | | Term of Office1 and Length of Service | | Principal Occupation During Past 5 Years |
| | | | | | • Dimensional Investment LLC Formerly, Vice President – Senior Compliance Officer • Dimensional Investment Advisors LP (January 2020 – August 2020 and July 2014 – March 2017) Formerly, Vice President – Head of Compliance & Operations Asia Ex-Japan • Dimensional Investment Advisors LP (April 2017 – January 2020) |
| | | |
| James J. Taylor 1983 | | Vice President and Assistant Treasurer | | Since 2020 | | Vice President and Assistant Treasurer (since 2020) of • the DFA Fund Complex Vice President • Dimensional Holdings Inc. (since 2016) • Dimensional Fund Advisors LP (since 2016) • Dimensional Investment LLC (since 2016) • DFA Securities LLC (since 2016) • Dimensional Fund Advisors Canada ULC (since 2020) |
| 1 | Each officer holds office for an indefinite term at the pleasure of the Board of Directors and until his or her successor is elected and qualified. |
32
The Registrant has adopted, as of the end of the period covered by this Form N-CSR (the “Report”), a code of ethics that applies to the Registrant’s Co-Principal Executive Officers and Principal Financial Officer (the “Code of Business Ethics”). The Registrant has not made any substantive amendments to the Code of Business Ethics during the period covered by this Report. The Registrant also has not granted any waiver from any provisions of the Code of Business Ethics during the period covered by this Report. A copy of the Code of Business Ethics is filed as an exhibit to this Report.
| ITEM 3. | AUDIT COMMITTEE FINANCIAL EXPERT. |
The Registrant’s Board of Trustees has determined that Abbie J. Smith possesses the technical attributes to qualify as an “audit committee financial expert” serving on the Registrant’s Audit Committee and has designated Ms. Smith as the “audit committee financial expert.” Ms. Smith
earned a Ph.D. in Accounting, and has taught Accounting at the graduate level since 1980. Ms. Smith’s education and career have provided her with an understanding of generally accepted accounting principles and financial statements; the ability to assess the general application of such principles in connection with the accounting for estimates, accruals and reserves; and experience preparing, analyzing and evaluating financial statements that present a breadth and level of complexity of issues that can reasonably be expected to be raised by the Registrant’s financial statements. In addition, Ms. Smith has served on the boards of directors and audit committees of entities other than the Registrant. Ms. Smith is independent under the standards set forth in Item 3 of Form N-CSR.
| ITEM 4. | PRINCIPAL ACCOUNTANT FEES AND SERVICES. |
Fiscal Year Ended October 31, 2022: $424,084
Fiscal Year Ended October 31, 2021: $399,146
| | |
Fees for Registrant – | | Fiscal Year Ended October 31, 2022: $34,300 |
| | Fiscal Year Ended October 31, 2021: $32,385 |
For fiscal years ended October 31, 2022 and October 31, 2021, Audit-Related Fees included fees for services related to limited procedures performed in connection with the production of the Registrant’s semi-annual financial statements.
Audit-Related Fees required to be approved pursuant to paragraph (c)(7)(ii) of Rule 2-01 of Regulation S-X
| | |
| | Fiscal Year Ended October 31, 2022: $225,000 |
| | Fiscal Year Ended October 31, 2021: $220,000 |
For the fiscal years ended October 31, 2022 and October 31, 2021, Audit-Related Fees required to be approved pursuant to paragraph (c)(7)(ii) of Rule 2-01 of Regulation S-X included fees for services rendered in connection with the issuance of a Type II SSAE 16 over controls at the Registrant’s investment adviser.
| | |
Fees for Registrant – | | Fiscal Year Ended October 31, 2022: $3,495 |
| | Fiscal Year Ended October 31, 2021: $3,495 |
For the fiscal years ended October 31, 2022 and October 31, 2021, Tax Fees included, fees for tax services in connection with the Registrant’s excise tax calculations, review of the Registrant’s applicable tax returns and review of the Registrant’s tax equalization calculations.
There were no Tax Fees required to be approved pursuant to paragraph (c)(7)(ii) of Rule 2-01 of Regulation S-X during the fiscal years indicated above.
| | |
Fees for Registrant – | | Fiscal Year Ended October 31, 2022: $0 |
| | Fiscal Year Ended October 31, 2021: $0 |
There were no “All Other Fees” required to be approved pursuant to paragraph (c)(7)(ii) of Rule 2-01 of Regulation S-X during the fiscal years indicated above.
| | (e) (1) | Audit Committee’s Pre-Approval Policies and Procedures |
Pre-Approval Policies and Procedures
as adopted by the
Audit Committees
of
DFA Investment Dimensions Group Inc.
Dimensional Emerging Markets Value Fund
Dimensional Investment Group Inc.
The DFA Investment Trust Company
(together, the “Funds”)
The Sarbanes-Oxley Act of 2002 (the “Act”) and the rules (the “Rules”) adopted by the U.S. Securities and Exchange Commission (the “SEC”) require that the Funds’ Audit Committees (together, the “Committee”) pre-approve all audit services and non-audit services provided to the Funds by their independent registered public accounting firm (the “Auditor”). The Act and the Rules also require that the Committee pre-approve all non-audit services provided by the Auditor to Dimensional Fund Advisors LP (“Dimensional”), the Funds’ investment advisor, and to affiliates of Dimensional that provide ongoing services to the Funds (with Dimensional, together the “Service Affiliates”) if the services directly impact the Funds’ operations and financial reporting.
The following policies and procedures govern the ways in which the Committee will pre-approve audit and various types of non-audit services that the Auditor provides to the Funds and to Service Affiliates. These policies and procedures do not apply in the case of audit services that the Auditor provides to Service Affiliates, nor do they apply to services that an audit firm other than the Auditor provides to such entities.
These policies and procedures comply with the requirements for pre-approval, but also provide mechanisms by which management of the Funds may request and secure pre-approval of audit and non-audit services in an orderly manner with minimal disruption to normal business operations. Pre-approval of non-audit services may be achieved through a combination of the procedures described in Sections C and D below.
| | 1. | The Committee must pre-approve all audit services and non-audit services that the Auditor provides to the Funds. |
| | 2. | The Committee must pre-approve any engagement of the Auditor to provide non-audit services to any Service Affiliate during the period of the Auditor’s engagement to provide audit services to the Funds, if the non-audit services to the Service Affiliate directly impact the Funds’ operations and financial reporting. |
| | B. | Pre-Approval of Audit Services to the Funds |
| | 1. | The Committee shall approve the engagement of an independent registered public accounting firm to certify the Funds’ financial statements for each fiscal year (the “Engagement”). The approval of the Engagement shall not be delegated to a Designated Member (as that term is defined in Section D below). In approving the Engagement, the Committee shall obtain, review and consider sufficient information concerning the proposed Auditor to enable the Committee to make a reasonable evaluation of the Auditor’s qualifications and independence. The Committee also shall consider the Auditor’s proposed fees for the Engagement, in light of the scope and nature of the audit services that the Funds will receive. |
| | 2. | The Committee shall report to the Boards of Directors/Trustees of the Funds (together, the “Board”) regarding its approval of the Engagement and of the proposed fees for the Engagement, and the basis for such approval. |
| | 3. | Unless otherwise in accordance with applicable law, the Engagement, in any event, shall require that the Auditor be selected by the vote, cast in person, of a majority of the members of the Board who are not “interested persons” of the Funds (as that term is defined in Section 2(a)(19) of the Investment Company Act of 1940) (the “Independent Directors”). |
| | C. | Pre-Approval of Non-Audit Services to the Funds and to Service Affiliates—by Types of Services |
| | 1. | The Committee may pre-approve types of non-audit services (including tax services) to the Funds and their Service Affiliates pursuant to this Section C. |
| | 2. | Annually, at such time as the Committee considers the Engagement of the Auditor, management of the Funds, in consultation with the Auditor, shall provide to the Committee, for its consideration and action, the following: (a) a list of those types of non-audit services, if any, that the Funds may request from the Auditor during the fiscal year; and (b) a list of those types of non-audit services directly impacting the Funds’ operations and financial reporting that Service Affiliates may request from the Auditor during the fiscal year. |
| | 3. | The lists submitted to the Committee shall describe the types of non-audit services in reasonable detail (which may include a range of tax services) and shall include an estimated budget (or budgeted range) of fees, where possible, and such other information as the Committee may request. If management and the Auditor desire the Committee to preapprove the furnishing of a range of tax services, the Auditor shall provide an estimated range of fees for such tax services for the consideration and approval by the Committee. |
| | 4. | The Committee’s pre-approval of the types of non-audit services submitted pursuant to this Section C shall constitute authorization for management of the Funds to utilize the Auditor for the types of non-audit services so pre-approved, if needed or desired during the fiscal year. |
| | 5. | A list of the types of non-audit services pre-approved by the Committee pursuant to this Section C will be distributed to management of the Service Affiliates and the appropriate partners of the Auditor. Periodically, the Auditor will discuss with the Committee those non-audit services that have been or are being provided pursuant to this Section C. |
| | D. | Pre-Approval of Non-Audit Services to the Funds and to Service Affiliates—Project-by-Project Basis |
| | 1. | The Committee also may pre-approve non-audit services on a project-by-project basis pursuant to this Section D. |
| | 2. | Management of the Funds, in consultation with the Auditor, may submit either to the Committee or to the Designated Member, as provided in this Section D, for their consideration and action, a pre-approval request identifying one or more non-audit service projects. The request so submitted shall describe the project(s) in reasonable detail and shall include an estimated budget (or budgeted range) of fees and such other information as the Committee or the Designated Member, as appropriate, shall request. |
| | 3. | The Committee, from time to time, shall designate one or more of its members who are Independent Directors (each a “Designated Member”) to consider, on the Committee’s behalf, any non-audit services, whether to the Funds or to any Service Affiliate, that have not been pre-approved by the Committee. The Designated Member also shall review, on the Committee’s behalf, any proposed material change in the nature or extent of any non-audit services previously approved. The Funds’ management, in consultation with the Auditor, shall explain why such non-audit services or material change in non-audit services are necessary and appropriate and the anticipated costs thereof. |
| | 4. | The Designated Member will review the requested non-audit services or proposed material change in such services and will either: |
| | (a) | pre-approve, pre-approve subject to conditions, or disapprove any such requested services, or any proposed material change in services, whether to the Funds or to a Service Affiliate; or |
| | (b) | refer such matter to the full Committee for its consideration and action. |
In considering any requested non-audit services or proposed material change in such services, the Designated Member’s authority shall be limited to approving non-audit services or proposed material changes that do not exceed $10,000 in value.
| | 5. | The Designated Member’s pre-approval (or pre-approval subject to conditions) of the requested non-audit services or proposed material change in services pursuant to this Section D shall constitute authorization for the management of the Funds or the Service Affiliate, as the case may be, to utilize the Auditor for the non-audit services so pre-approved. Any action by the Designated Member in approving a requested non-audit service shall be presented for ratification by the Committee not later than at its next scheduled meeting. If the Designated Member does not approve the Auditor providing the requested non-audit service, the matter may be presented to the full Committee for its consideration and action. |
| | E. | Amendment; Annual Review |
| | 1. | The Committee may amend these procedures from time to time. |
| | 2. | These procedures shall be reviewed annually by the Committee. |
| | 1. | The Funds shall maintain a written record of all decisions made by the Committee or by a Designated Member pursuant to these procedures, together with appropriate supporting materials. |
| | 2. | In connection with the approval of any non-audit service pursuant to the de minimis exception provided in the Rules, a record shall be made indicating that each of the conditions for this exception, as set forth in the Rules, has been satisfied. |
| | 3. | A copy of these Procedures (and of any amendments to these Procedures) shall be maintained and preserved permanently in an easily accessible place. The written records referred to in paragraphs 1 and 2 of this Section F shall be maintained and preserved for six years from the end of the fiscal year in which the actions recorded were taken, for at least the first two years in an easily accessible location. |
| | (e)(2) | The fees disclosed in Items 4(b), 4(c) or 4(d) were approved by the Registrant’s Audit Committee but not pursuant to paragraph (c)(7)(i)(C) of Rule 2-01 of Regulation S-X. |
| | (f) | The percentage of hours expended on the principal accountant’s engagement to audit the Registrant’s financial statements for the fiscal year ended October 31, 2022 that were attributed to work performed by persons other than the principal accountant’s full time, permanent employees was not greater than 50%. |
| | (g) | Aggregate Non-Audit Fees |
| | |
| | Fiscal Year Ended October 31, 2022: $1,680,200 |
| | Fiscal Year Ended October 31, 2021: $1,355,006 |
| | (h) | The Registrant’s Audit Committee has considered whether the provision of non-audit services that were rendered to the Registrant’s investment adviser, and any entity controlling, controlled by, or under common control with the investment adviser that provides ongoing services to the Registrant, that were not pre-approved pursuant to paragraph (c)(7)(ii) of Rule 2-01 of Regulation S-X is compatible with maintaining the principal accountant’s independence. |
| ITEM 5. | AUDIT COMMITTEE OF LISTED REGISTRANTS. |
This item is not applicable to the Registrant because it is not a listed issuer.
(a) Please see the schedules of investments contained in the reports to stockholders included under Item 1 of this Report except as discussed below. Provided below is a complete schedule of investments for each series of the Registrant that provided a summary schedule of portfolio holdings in a report to stockholders included under Item 1 in lieu of a complete schedule of investments. The schedules of investments for the following series are provided below:
| | |
Name of Entity for which Schedule of Investments is Provided | | |
| |
| The U.S. Large Cap Value Series | | |
| |
| The DFA International Value Series | | |
| |
| The Japanese Small Company Series | | |
| |
| The Asia Pacific Small Company Series | | |
| |
| The United Kingdom Small Company Series | | |
| | |
| The Continental Small Company Series | | |
| |
| The Canadian Small Company Series | | |
| |
| The Emerging Markets Series | | |
| |
| The Emerging Markets Small Cap Series | | |
THE U.S. LARGE CAP VALUE SERIES
SCHEDULE OF INVESTMENTS
October 31, 2022
| | | | | | | | | | |
| | | | | Shares | | | Value† | |
COMMON STOCKS — (97.1%) | | | | | | | | |
COMMUNICATION SERVICES — (7.4%) | | | | | | | | |
| | Activision Blizzard, Inc. | | | 911,090 | | | $ | 66,327,352 | |
| | AT&T, Inc. | | | 19,723,621 | | | | 359,561,611 | |
# * | | Charter Communications, Inc., Class A | | | 796 | | | | 292,625 | |
| | Comcast Corp., Class A | | | 13,738,104 | | | | 436,047,421 | |
# * | | DISH Network Corp., Class A | | | 110,428 | | | | 1,646,481 | |
| | Electronic Arts, Inc. | | | 9,653 | | | | 1,215,892 | |
# | | Fox Corp., Class A | | | 1,008,994 | | | | 29,129,657 | |
| | Fox Corp., Class B | | | 397,338 | | | | 10,807,594 | |
| | Interpublic Group of Cos., Inc. | | | 972,476 | | | | 28,970,060 | |
# * | | Liberty Broadband Corp., Class A | | | 27,366 | | | | 2,334,867 | |
* | | Liberty Broadband Corp., Class C | | | 199,990 | | | | 16,885,156 | |
# * | | Liberty Media Corp.-Liberty Formula One, Class A | | | 39,281 | | | | 2,043,398 | |
# * | | Liberty Media Corp.-Liberty Formula One, Class C | | | 78,309 | | | | 4,520,779 | |
* | | Liberty Media Corp.-Liberty SiriusXM, Class A | | | 156,619 | | | | 6,646,910 | |
* | | Liberty Media Corp.-Liberty SiriusXM, Class C | | | 357,358 | | | | 15,076,934 | |
# | | Lumen Technologies, Inc. | | | 4,018,696 | | | | 29,577,602 | |
# * | | Madison Square Garden Entertainment Corp. | | | 8,266 | | | | 405,282 | |
* | | Meta Platforms, Inc., Class A | | | 977,197 | | | | 91,035,672 | |
| | News Corp., Class A | | | 577,757 | | | | 9,746,761 | |
# | | News Corp., Class B | | | 64,856 | | | | 1,110,983 | |
# | | Omnicom Group, Inc. | | | 60,457 | | | | 4,398,247 | |
# | | Paramount Global, Class B | | | 1,489,752 | | | | 27,292,257 | |
* | | Take-Two Interactive Software, Inc. | | | 24,929 | | | | 2,953,588 | |
* | | T-Mobile U.S., Inc. | | | 1,448,419 | | | | 219,522,384 | |
| | Verizon Communications, Inc. | | | 11,228,072 | | | | 419,593,051 | |
# * | | Walt Disney Co. | | | 1,947,638 | | | | 207,501,352 | |
* | | Warner Bros Discovery, Inc. | | | 2,770,276 | | | | 36,013,588 | |
| | | | | | | | | | |
TOTAL COMMUNICATION SERVICES | | | | 2,030,657,504 | |
| | | | | | | | | | |
CONSUMER DISCRETIONARY — (5.1%) | | | | | | | | |
# | | Advance Auto Parts, Inc. | | | 260,009 | | | | 49,380,909 | |
* | | Aptiv PLC | | | 231,684 | | | | 21,099,462 | |
| | Aramark | | | 803,405 | | | | 29,324,282 | |
# | | Autoliv, Inc. | | | 269,146 | | | | 21,625,881 | |
| | BorgWarner, Inc. | | | 1,102,997 | | | | 41,395,477 | |
# * | | Capri Holdings Ltd. | | | 26,730 | | | | 1,221,026 | |
# * | | CarMax, Inc. | | | 385,771 | | | | 24,307,431 | |
# | | Dick’s Sporting Goods, Inc. | | | 20,800 | | | | 2,366,208 | |
# * | | Dollar Tree, Inc. | | | 568,740 | | | | 90,145,290 | |
# | | DR Horton, Inc. | | | 2,494,501 | | | | 191,777,237 | |
| | eBay, Inc. | | | 334,052 | | | | 13,308,632 | |
| | Ford Motor Co. | | | 7,869,237 | | | | 105,211,699 | |
# | | Garmin Ltd. | | | 537,770 | | | | 47,345,271 | |
| | General Motors Co. | | | 4,563,422 | | | | 179,114,313 | |
# | | Gentex Corp. | | | 994,834 | | | | 26,353,153 | |
| | Genuine Parts Co. | | | 7,025 | | | | 1,249,467 | |
# | | Hasbro, Inc. | | | 65,998 | | | | 4,306,370 | |
# * | | Hyatt Hotels Corp., Class A | | | 127,405 | | | | 12,002,825 | |
| | Lear Corp. | | | 317,608 | | | | 44,055,406 | |
# | | Lennar Corp., Class A | | | 1,097,746 | | | | 88,588,102 | |
# | | Lennar Corp., Class B | | | 37,985 | | | | 2,477,382 | |
# | | Lithia Motors, Inc. | | | 2,694 | | | | 533,816 | |
| | LKQ Corp. | | | 1,699,192 | | | | 94,543,043 | |
| | MGM Resorts International | | | 1,566,881 | | | | 55,733,957 | |
* | | Mohawk Industries, Inc. | | | 347,126 | | | | 32,890,188 | |
THE U.S. LARGE CAP VALUE SERIES
CONTINUED
| | | | | | | | | | |
| | | | | Shares | | | Value† | |
CONSUMER DISCRETIONARY — (Continued) | |
# | | Penske Automotive Group, Inc. | | | 50,142 | | | $ | 5,596,850 | |
# | | PulteGroup, Inc. | | | 2,092,976 | | | | 83,698,110 | |
# | | Qurate Retail, Inc., Class A | | | 63,525 | | | | 148,649 | |
# | | Ralph Lauren Corp. | | | 233,423 | | | | 21,635,978 | |
# * | | Royal Caribbean Cruises Ltd. | | | 572,051 | | | | 30,536,082 | |
| | Tapestry, Inc. | | | 358,209 | | | | 11,348,061 | |
# | | Whirlpool Corp. | | | 476,476 | | | | 65,868,042 | |
| | | | | | | | | | |
TOTAL CONSUMER DISCRETIONARY | | | | 1,399,188,599 | |
| | | | | | | | | | |
CONSUMER STAPLES — (5.9%) | |
| | Archer-Daniels-Midland Co. | | | 1,129,118 | | | | 109,501,864 | |
# * | | BellRing Brands, Inc. | | | 100,936 | | | | 2,444,670 | |
| | Bunge Ltd. | | | 584,509 | | | | 57,691,038 | |
# | | Campbell Soup Co. | | | 75,598 | | | | 3,999,890 | |
| | Conagra Brands, Inc. | | | 711,380 | | | | 26,107,646 | |
| | Constellation Brands, Inc., Class A | | | 303,632 | | | | 75,021,394 | |
* | | Darling Ingredients, Inc. | | | 495,295 | | | | 38,870,752 | |
# | | General Mills, Inc. | | | 2,002,753 | | | | 163,384,590 | |
# | | Hormel Foods Corp. | | | 256,007 | | | | 11,891,525 | |
# | | Ingredion, Inc. | | | 6,180 | | | | 550,762 | |
| | J M Smucker Co. | | | 640,719 | | | | 96,530,724 | |
| | Keurig Dr Pepper, Inc. | | | 148,220 | | | | 5,756,865 | |
| | Kroger Co. | | | 3,345,475 | | | | 158,207,513 | |
# | | McCormick & Co., Inc. | | | 34,185 | | | | 2,688,308 | |
# | | Molson Coors Beverage Co., Class B | | | 450,930 | | | | 22,740,400 | |
| | Mondelez International, Inc., Class A | | | 3,063,492 | | | | 188,343,488 | |
# * | | Pilgrim’s Pride Corp. | | | 6,211 | | | | 143,163 | |
# * | | Post Holdings, Inc. | | | 79,359 | | | | 7,175,641 | |
| | Seaboard Corp. | | | 13 | | | | 48,703 | |
| | Tyson Foods, Inc., Class A | | | 1,698,335 | | | | 116,081,197 | |
# * | | U.S. Foods Holding Corp. | | | 808,080 | | | | 24,048,461 | |
# | | Walgreens Boots Alliance, Inc. | | | 971,954 | | | | 35,476,321 | |
| | Walmart, Inc. | | | 3,424,187 | | | | 487,364,536 | |
| | | | | | | | | | |
TOTAL CONSUMER STAPLES | | | | 1,634,069,451 | |
| | | | | | | | | | |
ENERGY — (15.5%) | |
# * | | Antero Resources Corp. | | | 543,816 | | | | 19,936,295 | |
| | Baker Hughes Co. | | | 95,536 | | | | 2,642,526 | |
# | | Chesapeake Energy Corp. | | | 198,413 | | | | 20,291,697 | |
# | | Chevron Corp. | | | 4,558,886 | | | | 824,702,477 | |
| | ConocoPhillips | | | 5,185,429 | | | | 653,830,743 | |
# | | Continental Resources, Inc. | | | 7,637 | | | | 564,909 | |
# | | Coterra Energy, Inc. | | | 965,221 | | | | 30,047,330 | |
# | | Devon Energy Corp. | | | 764,639 | | | | 59,144,827 | |
| | Diamondback Energy, Inc. | | | 197,360 | | | | 31,007,230 | |
# | | EOG Resources, Inc. | | | 1,168,138 | | | | 159,474,200 | |
# | | EQT Corp. | | | 356,304 | | | | 14,907,759 | |
# | | Exxon Mobil Corp. | | | 10,590,425 | | | | 1,173,524,994 | |
| | Halliburton Co. | | | 1,785,450 | | | | 65,026,089 | |
# | | Hess Corp. | | | 1,023,208 | | | | 144,354,185 | |
| | HF Sinclair Corp. | | | 253,216 | | | | 15,489,223 | |
# | | Kinder Morgan, Inc. | | | 4,324,626 | | | | 78,362,223 | |
# | | Marathon Oil Corp. | | | 1,245,245 | | | | 37,917,710 | |
| | Marathon Petroleum Corp. | | | 1,358,505 | | | | 154,353,338 | |
# | | Occidental Petroleum Corp. | | | 1,487,423 | | | | 107,986,910 | |
# | | ONEOK, Inc. | | | 1,039,865 | | | | 61,684,792 | |
# | | Ovintiv, Inc. | | | 158,193 | | | | 8,012,475 | |
| | Phillips 66 | | | 744,812 | | | | 77,676,443 | |
THE U.S. LARGE CAP VALUE SERIES
CONTINUED
| | | | | | | | | | |
| | | | | Shares | | | Value† | |
ENERGY — (Continued) | |
# | | Pioneer Natural Resources Co. | | | 481,859 | | | $ | 123,553,466 | |
| | Schlumberger NV | | | 3,057,917 | | | | 159,103,421 | |
# | | Targa Resources Corp. | | | 436,846 | | | | 29,867,161 | |
# | | Valero Energy Corp. | | | 900,872 | | | | 113,104,480 | |
| | Williams Cos., Inc. | | | 3,720,143 | | | | 121,760,280 | |
| | | | | | | | | | |
TOTAL ENERGY | | | | 4,288,327,183 | |
| | | | | | | | | | |
FINANCIALS — (19.3%) | |
| | Aflac, Inc. | | | 1,547,828 | | | | 100,779,081 | |
# | | Allstate Corp. | | | 876,965 | | | | 110,716,831 | |
# | | Ally Financial, Inc. | | | 2,648,489 | | | | 72,992,357 | |
| | American Financial Group, Inc. | | | 321,589 | | | | 46,665,780 | |
| | American International Group, Inc. | | | 1,389,809 | | | | 79,219,113 | |
# | | Apollo Global Management, Inc. | | | 140,437 | | | | 7,774,592 | |
* | | Arch Capital Group Ltd. | | | 521,287 | | | | 29,974,003 | |
| | Assurant, Inc. | | | 224,836 | | | | 30,546,219 | |
| | Axis Capital Holdings Ltd. | | | 3,443 | | | | 188,229 | |
| | Bank of America Corp. | | | 8,609,381 | | | | 310,282,127 | |
| | Bank of New York Mellon Corp. | | | 2,360,323 | | | | 99,393,202 | |
# * | | Berkshire Hathaway, Inc., Class B | | | 1,859,637 | | | | 548,760,282 | |
# | | BOK Financial Corp. | | | 6,114 | | | | 673,702 | |
| | Capital One Financial Corp. | | | 1,481,150 | | | | 157,031,523 | |
# | | Charles Schwab Corp. | | | 3,700 | | | | 294,779 | |
| | Chubb Ltd. | | | 586,765 | | | | 126,089,931 | |
| | Cincinnati Financial Corp. | | | 11,885 | | | | 1,227,958 | |
# | | Citigroup, Inc. | | | 3,688,797 | | | | 169,168,230 | |
| | Citizens Financial Group, Inc. | | | 922,786 | | | | 37,741,947 | |
| | CNA Financial Corp. | | | 187,747 | | | | 7,829,050 | |
# | | Comerica, Inc. | | | 154,602 | | | | 10,899,441 | |
# | | East West Bancorp, Inc. | | | 105,184 | | | | 7,528,019 | |
| | Equitable Holdings, Inc. | | | 10,374 | | | | 317,652 | |
# | | Everest Re Group Ltd. | | | 88,971 | | | | 28,707,383 | |
# | | Fidelity National Financial, Inc. | | | 121,493 | | | | 4,784,394 | |
| | Fifth Third Bancorp | | | 3,471,314 | | | | 123,891,197 | |
| | First Citizens BancShares, Inc., Class A | | | 2,552 | | | | 2,098,050 | |
# | | First Horizon Corp. | | | 75,600 | | | | 1,852,956 | |
# | | Franklin Resources, Inc. | | | 271,081 | | | | 6,356,850 | |
| | Globe Life, Inc. | | | 11,967 | | | | 1,382,428 | |
| | Goldman Sachs Group, Inc. | | | 976,089 | | | | 336,272,421 | |
| | Hartford Financial Services Group, Inc. | | | 2,234,680 | | | | 161,813,179 | |
# | | Huntington Bancshares, Inc. | | | 3,221,658 | | | | 48,904,769 | |
# | | Jefferies Financial Group, Inc. | | | 302,462 | | | | 10,407,717 | |
| | JPMorgan Chase & Co. | | | 7,481,873 | | | | 941,818,173 | |
| | KeyCorp. | | | 3,701,040 | | | | 66,137,585 | |
# | | Lincoln National Corp. | | | 388,182 | | | | 20,911,364 | |
| | Loews Corp. | | | 909,290 | | | | 51,847,716 | |
| | M&T Bank Corp. | | | 213,565 | | | | 35,957,939 | |
# * | | Markel Corp. | | | 3,473 | | | | 4,188,785 | |
| | MetLife, Inc. | | | 945,286 | | | | 69,204,388 | |
| | Morgan Stanley | | | 2,962,680 | | | | 243,443,416 | |
| | Northern Trust Corp. | | | 33,684 | | | | 2,841,245 | |
# | | Old Republic International Corp. | | | 745,739 | | | | 17,308,602 | |
| | PNC Financial Services Group, Inc. | | | 578,982 | | | | 93,696,657 | |
# | | Principal Financial Group, Inc. | | | 1,433,986 | | | | 126,377,186 | |
# | | Prosperity Bancshares, Inc. | | | 10,200 | | | | 730,014 | |
| | Prudential Financial, Inc. | | | 586,680 | | | | 61,712,869 | |
# | | Raymond James Financial, Inc. | | | 2,229 | | | | 263,334 | |
| | Regions Financial Corp. | | | 5,559,337 | | | | 122,027,447 | |
| | Reinsurance Group of America, Inc. | | | 12,100 | | | | 1,780,757 | |
THE U.S. LARGE CAP VALUE SERIES
CONTINUED
| | | | | | | | | | |
| | | | | Shares | | | Value† | |
FINANCIALS — (Continued) | |
| | RenaissanceRe Holdings Ltd. | | | 3,923 | | | $ | 606,810 | |
| | Signature Bank | | | 400 | | | | 63,412 | |
| | State Street Corp. | | | 530,279 | | | | 39,240,646 | |
# | | Synchrony Financial | | | 1,227,307 | | | | 43,643,037 | |
| | Synovus Financial Corp. | | | 13,039 | | | | 519,604 | |
| | Travelers Cos., Inc. | | | 1,083,770 | | | | 199,912,214 | |
| | Truist Financial Corp. | | | 2,880,479 | | | | 129,016,654 | |
| | U.S. Bancorp | | | 1,433,273 | | | | 60,842,439 | |
# | | Unum Group | | | 30,296 | | | | 1,381,195 | |
| | Wells Fargo & Co. | | | 5,911,149 | | | | 271,853,743 | |
| | WR Berkley Corp. | | | 49,696 | | | | 3,696,389 | |
| | Zions Bancorp NA | | | 733,294 | | | | 38,087,290 | |
| | | | | | | | | | |
TOTAL FINANCIALS | | | | 5,331,676,302 | |
| | | | | | | | | | |
HEALTH CARE — (16.7%) | |
| | Abbott Laboratories | | | 136,436 | | | | 13,498,978 | |
| | AbbVie, Inc. | | | 6,916 | | | | 1,012,502 | |
| | Baxter International, Inc. | | | 771,310 | | | | 41,920,699 | |
| | Becton Dickinson & Co. | | | 268,042 | | | | 63,249,871 | |
# * | | Biogen, Inc. | | | 493,640 | | | | 139,917,322 | |
* | | Bio-Rad Laboratories, Inc., Class A | | | 28,517 | | | | 10,029,714 | |
* | | Boston Scientific Corp. | | | 50,481 | | | | 2,176,236 | |
# | | Bristol-Myers Squibb Co. | | | 4,546,581 | | | | 352,223,630 | |
* | | Catalent, Inc. | | | 154,991 | | | | 10,187,558 | |
* | | Centene Corp. | | | 1,084,335 | | | | 92,309,439 | |
* | | Charles River Laboratories International, Inc. | | | 2,300 | | | | 488,175 | |
| | Cigna Corp. | | | 998,289 | | | | 322,507,244 | |
| | Cooper Cos., Inc. | | | 16,950 | | | | 4,633,961 | |
| | CVS Health Corp. | | | 2,930,610 | | | | 277,528,767 | |
| | Danaher Corp. | | | 936,418 | | | | 235,668,318 | |
# * | | DaVita, Inc. | | | 78,875 | | | | 5,758,664 | |
| | Elevance Health, Inc. | | | 771,124 | | | | 421,627,470 | |
# | | Embecta Corp. | | | 43,883 | | | | 1,356,862 | |
* | | Envista Holdings Corp. | | | 11,130 | | | | 367,401 | |
| | Gilead Sciences, Inc. | | | 2,211,205 | | | | 173,491,144 | |
# * | | Henry Schein, Inc. | | | 212,239 | | | | 14,529,882 | |
* | | Hologic, Inc. | | | 298,056 | | | | 20,208,197 | |
| | Humana, Inc. | | | 441,277 | | | | 246,267,868 | |
* | | Incyte Corp. | | | 57,883 | | | | 4,303,022 | |
* | | Jazz Pharmaceuticals PLC | | | 215,487 | | | | 30,984,876 | |
| | Laboratory Corp. of America Holdings | | | 683,569 | | | | 151,656,618 | |
| | McKesson Corp. | | | 122,974 | | | | 47,882,386 | |
| | Medtronic PLC | | | 2,002,037 | | | | 174,857,912 | |
| | Merck & Co., Inc. | | | 54,535 | | | | 5,518,942 | |
* | | Moderna, Inc. | | | 488,200 | | | | 73,391,106 | |
| | PerkinElmer, Inc. | | | 120,811 | | | | 16,137,933 | |
| | Pfizer, Inc. | | | 17,020,200 | | | | 792,290,310 | |
# | | Quest Diagnostics, Inc. | | | 939,317 | | | | 134,932,887 | |
# * | | Regeneron Pharmaceuticals, Inc. | | | 149,397 | | | | 111,861,004 | |
| | STERIS PLC | | | 208,557 | | | | 35,992,767 | |
* | | Syneos Health, Inc. | | | 13,905 | | | | 700,534 | |
| | Thermo Fisher Scientific, Inc. | | | 756,496 | | | | 388,816,249 | |
* | | United Therapeutics Corp. | | | 40,059 | | | | 9,234,801 | |
| | UnitedHealth Group, Inc. | | | 5,974 | | | | 3,316,466 | |
| | Universal Health Services, Inc., Class B | | | 474,671 | | | | 55,000,129 | |
* | | Vertex Pharmaceuticals, Inc. | | | 181,037 | | | | 56,483,544 | |
| | Viatris, Inc. | | | 2,860,265 | | | | 28,974,484 | |
| | Zimmer Biomet Holdings, Inc. | | | 365,895 | | | | 41,474,198 | |
| | | | | | | | | | |
TOTAL HEALTH CARE | | | | 4,614,770,070 | |
| | | | | | | | | | |
THE U.S. LARGE CAP VALUE SERIES
CONTINUED
| | | | | | | | | | |
| | | | | Shares | | | Value† | |
INDUSTRIALS — (11.3%) | |
# | | AECOM | | | 513,326 | | | $ | 38,643,181 | |
| | AGCO Corp. | | | 253,428 | | | | 31,468,155 | |
# | | AMERCO | | | 84,288 | | | | 48,481,615 | |
| | AMETEK, Inc. | | | 157,969 | | | | 20,482,261 | |
| | Arcosa, Inc. | | | 75,166 | | | | 4,825,657 | |
* | | Builders FirstSource, Inc. | | | 589,989 | | | | 36,378,722 | |
* | | CACI International, Inc., Class A | | | 2,200 | | | | 668,866 | |
| | Carlisle Cos., Inc. | | | 315,528 | | | | 75,348,086 | |
| | Carrier Global Corp. | | | 2,101,873 | | | | 83,570,470 | |
| | CSX Corp. | | | 1,796,603 | | | | 52,209,283 | |
| | Cummins, Inc. | | | 542,409 | | | | 132,624,425 | |
# | | Deere & Co. | | | 1,688 | | | | 668,144 | |
# | | Dover Corp. | | | 413,060 | | | | 53,982,811 | |
| | Eaton Corp. PLC | | | 987,794 | | | | 148,238,246 | |
| | Emerson Electric Co. | | | 243,605 | | | | 21,096,193 | |
| | FedEx Corp. | | | 569,614 | | | | 91,297,732 | |
| | Fortive Corp. | | | 269,682 | | | | 17,232,680 | |
| | Fortune Brands Home & Security, Inc. | | | 519,705 | | | | 31,348,606 | |
| | General Dynamics Corp. | | | 428,065 | | | | 106,930,637 | |
| | General Electric Co. | | | 1,195,941 | | | | 93,056,169 | |
# * | | GXO Logistics, Inc. | | | 765,507 | | | | 27,971,626 | |
| | Howmet Aerospace, Inc. | | | 1,593,760 | | | | 56,658,168 | |
| | Hubbell, Inc. | | | 31,089 | | | | 7,383,016 | |
| | Huntington Ingalls Industries, Inc. | | | 41,674 | | | | 10,713,135 | |
| | Ingersoll Rand, Inc. | | | 795,802 | | | | 40,188,001 | |
| | Jacobs Solutions, Inc. | | | 284,566 | | | | 32,787,695 | |
| | Johnson Controls International PLC | | | 1,557,033 | | | | 90,058,789 | |
| | L3Harris Technologies, Inc. | | | 251,122 | | | | 61,894,039 | |
| | Leidos Holdings, Inc. | | | 734,246 | | | | 74,592,051 | |
| | ManpowerGroup, Inc. | | | 2,452 | | | | 192,090 | |
# | | MDU Resources Group, Inc. | | | 20,335 | | | | 579,141 | |
# * | | Middleby Corp. | | | 49,207 | | | | 6,882,091 | |
| | Norfolk Southern Corp. | | | 780,147 | | | | 177,928,126 | |
| | Northrop Grumman Corp. | | | 130,994 | | | | 71,917,016 | |
# | | nVent Electric PLC | | | 13,164 | | | | 480,486 | |
| | Oshkosh Corp. | | | 2,394 | | | | 210,672 | |
| | Otis Worldwide Corp. | | | 1,224,040 | | | | 86,466,186 | |
# | | Owens Corning | | | 520,448 | | | | 44,555,553 | |
| | PACCAR, Inc. | | | 1,173,311 | | | | 113,611,704 | |
| | Parker-Hannifin Corp. | | | 389,870 | | | | 113,304,019 | |
# | | Pentair PLC | | | 1,018,855 | | | | 43,759,822 | |
# | | Quanta Services, Inc. | | | 679,004 | | | | 96,445,728 | |
| | Raytheon Technologies Corp. | | | 1,827,270 | | | | 173,261,741 | |
# | | Regal Rexnord Corp. | | | 41,600 | | | | 5,264,064 | |
| | Republic Services, Inc. | | | 1,829,777 | | | | 242,665,026 | |
| | Sensata Technologies Holding PLC | | | 669,936 | | | | 26,938,127 | |
# | | Snap-on, Inc. | | | 313,561 | | | | 69,626,220 | |
* | | Southwest Airlines Co. | | | 938,430 | | | | 34,111,931 | |
# | | Stanley Black & Decker, Inc. | | | 766,509 | | | | 60,163,291 | |
# * | | Sunrun, Inc. | | | 36,102 | | | | 812,656 | |
| | Textron, Inc. | | | 1,334,982 | | | | 91,366,168 | |
| | Trane Technologies PLC | | | 315,207 | | | | 50,316,493 | |
# | | TransUnion | | | 86,859 | | | | 5,148,133 | |
* | | United Airlines Holdings, Inc. | | | 73,630 | | | | 3,171,980 | |
* | | United Rentals, Inc. | | | 245,310 | | | | 77,446,820 | |
# | | Westinghouse Air Brake Technologies Corp. | | | 313,561 | | | | 29,248,970 | |
| | | | | | | | | | |
TOTAL INDUSTRIALS | | | | 3,116,672,713 | |
| | | | | | | | | | |
THE U.S. LARGE CAP VALUE SERIES
CONTINUED
| | | | | | | | | | |
| | | | | Shares | | | Value† | |
INFORMATION TECHNOLOGY — (7.7%) | |
* | | Advanced Micro Devices, Inc. | | | 213,458 | | | $ | 12,820,287 | |
# * | | Akamai Technologies, Inc. | | | 121,238 | | | | 10,708,953 | |
| | Amdocs Ltd. | | | 718,388 | | | | 62,004,068 | |
| | Analog Devices, Inc. | | | 605,521 | | | | 86,359,405 | |
* | | Arrow Electronics, Inc. | | | 388,892 | | | | 39,379,204 | |
# | | Avnet, Inc. | | | 5,178 | | | | 208,104 | |
# * | | Cerence, Inc. | | | 658 | | | | 11,318 | |
# * | | Ciena Corp. | | | 76,253 | | | | 3,652,519 | |
| | Cognizant Technology Solutions Corp., Class A | | | 1,704,834 | | | | 106,125,917 | |
# | | Concentrix Corp. | | | 93,788 | | | | 11,463,707 | |
| | Corning, Inc. | | | 3,991,170 | | | | 128,395,939 | |
| | Dolby Laboratories, Inc., Class A | | | 16,857 | | | | 1,126,722 | |
* | | DXC Technology Co. | | | 324,844 | | | | 9,339,265 | |
| | Fidelity National Information Services, Inc. | | | 754,435 | | | | 62,610,561 | |
* | | First Solar, Inc. | | | 93,364 | | | | 13,590,997 | |
* | | Fiserv, Inc. | | | 507,819 | | | | 52,173,324 | |
# * | | Flex Ltd. | | | 1,338,622 | | | | 26,210,219 | |
| | Global Payments, Inc. | | | 247,994 | | | | 28,335,794 | |
# | | Hewlett Packard Enterprise Co. | | | 7,063,734 | | | | 100,799,484 | |
# | | HP, Inc. | | | 9,328,511 | | | | 257,653,474 | |
| | Intel Corp. | | | 12,556,858 | | | | 356,991,473 | |
| | International Business Machines Corp. | | | 194,565 | | | | 26,906,394 | |
| | Jabil, Inc. | | | 219,026 | | | | 14,072,421 | |
| | Juniper Networks, Inc. | | | 922,810 | | | | 28,237,986 | |
* | | Kyndryl Holdings, Inc. | | | 59,502 | | | | 575,384 | |
| | Marvell Technology, Inc. | | | 1,003,660 | | | | 39,825,229 | |
| | Microchip Technology, Inc. | | | 2,564 | | | | 158,301 | |
| | Micron Technology, Inc. | | | 3,751,374 | | | | 202,949,333 | |
| | MKS Instruments, Inc. | | | 1,502 | | | | 123,389 | |
# * | | ON Semiconductor Corp. | | | 938,498 | | | | 57,651,932 | |
* | | Qorvo, Inc. | | | 511,928 | | | | 44,066,762 | |
| | Roper Technologies, Inc. | | | 14,446 | | | | 5,988,445 | |
* | | Salesforce, Inc. | | | 633,045 | | | | 102,926,787 | |
| | Skyworks Solutions, Inc. | | | 307,882 | | | | 26,480,931 | |
# | | SS&C Technologies Holdings, Inc. | | | 382,266 | | | | 19,656,118 | |
# | | TD SYNNEX Corp. | | | 93,788 | | | | 8,582,540 | |
# | | TE Connectivity Ltd. | | | 984,671 | | | | 120,356,336 | |
* | | Teledyne Technologies, Inc. | | | 30,542 | | | | 12,155,105 | |
* | | Western Digital Corp. | | | 887,149 | | | | 30,491,311 | |
| | | | | | | | | | |
TOTAL INFORMATION TECHNOLOGY | | | | 2,111,165,438 | |
| | | | | | | | | | |
MATERIALS — (7.5%) | |
| | Air Products & Chemicals, Inc. | | | 378,095 | | | | 94,674,988 | |
# | | Albemarle Corp. | | | 499,343 | | | | 139,751,125 | |
# | | Amcor PLC | | | 1,177,510 | | | | 13,635,566 | |
# * | | Arconic Corp. | | | 21,469 | | | | 445,696 | |
# | | Ball Corp. | | | 644 | | | | 31,807 | |
# | | Celanese Corp. | | | 56,404 | | | | 5,421,553 | |
| | CF Industries Holdings, Inc. | | | 607,999 | | | | 64,605,974 | |
# * | | Cleveland-Cliffs, Inc. | | | 409,416 | | | | 5,318,314 | |
| | Corteva, Inc. | | | 1,069,916 | | | | 69,908,312 | |
| | Dow, Inc. | | | 2,820,364 | | | | 131,823,813 | |
| | DuPont de Nemours, Inc. | | | 544,663 | | | | 31,154,724 | |
| | Eastman Chemical Co. | | | 838,344 | | | | 64,393,203 | |
THE U.S. LARGE CAP VALUE SERIES
CONTINUED
| | | | | | | | | | |
| | | | | Shares | | | Value† | |
MATERIALS — (Continued) | |
| | FMC Corp. | | | 25,480 | | | $ | 3,029,572 | |
| | Freeport-McMoRan, Inc. | | | 5,097,835 | | | | 161,550,391 | |
| | Huntsman Corp. | | | 8,221 | | | | 219,994 | |
| | International Flavors & Fragrances, Inc. | | | 367,438 | | | | 35,865,623 | |
# | | International Paper Co. | | | 2,073,880 | | | | 69,703,107 | |
* | | Linde PLC | | | 775,637 | | | | 230,635,662 | |
# | | LyondellBasell Industries NV, Class A | | | 1,089,374 | | | | 83,282,642 | |
| | Martin Marietta Materials, Inc. | | | 207,284 | | | | 69,643,278 | |
| | Mosaic Co. | | | 838,015 | | | | 45,043,306 | |
| | Newmont Corp. | | | 2,114,647 | | | | 89,491,861 | |
# | | Nucor Corp. | | | 1,985,067 | | | | 260,798,103 | |
# | | Packaging Corp. of America | | | 118,167 | | | | 14,204,855 | |
| | PPG Industries, Inc. | | | 2,452 | | | | 279,969 | |
| | Reliance Steel & Aluminum Co. | | | 434,112 | | | | 87,464,886 | |
# | | Royal Gold, Inc. | | | 6,364 | | | | 604,326 | |
# | | Sonoco Products Co. | | | 14,629 | | | | 908,168 | |
# | | Steel Dynamics, Inc. | | | 1,686,863 | | | | 158,649,465 | |
# | | Sylvamo Corp. | | | 171,249 | | | | 8,249,064 | |
| | Valvoline, Inc. | | | 230,719 | | | | 6,773,910 | |
| | Vulcan Materials Co. | | | 428,397 | | | | 70,128,589 | |
# | | Westlake Corp. | | | 370,962 | | | | 35,853,477 | |
| | WestRock Co. | | | 591,672 | | | | 20,152,348 | |
| | | | | | | | | | |
TOTAL MATERIALS | | | | 2,073,697,671 | |
| | | | | | | | | | |
REAL ESTATE — (0.4%) | |
* | | CBRE Group, Inc., Class A | | | 956,134 | | | | 67,828,146 | |
# * | | Jones Lang LaSalle, Inc. | | | 216,488 | | | | 34,441,076 | |
| | | | | | | | | | |
TOTAL REAL ESTATE | | | | 102,269,222 | |
| | | | | | | | | | |
UTILITIES — (0.3%) | |
# | | NRG Energy, Inc. | | | 1,165,655 | | | | 51,755,082 | |
| | Vistra Corp. | | | 1,080,745 | | | | 24,824,713 | |
| | | | | | | | | | |
TOTAL UTILITIES | | | | 76,579,795 | |
| | | | | | | | | | |
TOTAL COMMON STOCKS
Cost ($ 16,275,340,734) | | | | 26,779,073,948 | |
| | | | | | | | | | |
TEMPORARY CASH INVESTMENTS — (1.0%) | |
| | State Street Institutional U.S. Government Money Market Fund 3.010% | | | 264,660,566 | | | | 264,660,566 | |
| | | | | | | | | | |
SECURITIES LENDING COLLATERAL — (1.9%) | |
@ § | | The DFA Short Term Investment Fund | | | 45,100,100 | | | | 521,402,250 | |
| | | | | | | | | | |
TOTAL INVESTMENTS — (100.0%)
(Cost $ 17,061,542,735) | | | $ | 27,565,136,764 | |
| | | | | | | | | | |
| † | See Note B to Financial Statements. |
| # | Total or Partial Securities on Loan. |
| * | Non-Income Producing Securities. |
| @ | Security purchased with cash collateral received from Securities on Loan. |
THE U.S. LARGE CAP VALUE SERIES
CONTINUED
As of October 31, 2022, The U.S. Large Cap Value Series had entered into the following outstanding futures contracts:
| | | | | | | | | | | | | | | | | | | | |
Description | | Number of
Contracts | | | Expiration
Date | | | Notional
Value | | | Market
Value | | | Unrealized
Appreciation
(Depreciation) | |
Long Position Contracts: | | | | | | | | | | | | | | | | | | | | |
S&P 500® Emini Index | | | 882 | | | | 12/16/22 | | | $ | 178,906,459 | | | $ | 171,240,300 | | | $ | (7,666,159 | ) |
| | | | | | | | | | | | | | | | | | | | |
Total Futures Contracts | | | | | | | | | | $ | 178,906,459 | | | $ | 171,240,300 | | | $ | (7,666,159 | ) |
| | | | | | | | | | | | | | | | | | | | |
Summary of the Series’ investments as of October 31, 2022, based on their valuation inputs, is as follows (see Security Valuation Note):
| | | | | | | | | | | | | | | | |
| | | Investments in Securities (Market Value) | |
| | | Level 1 | | | Level 2 | | | Level 3 | | | Total | |
Common Stocks | | | | | | | | | | | | | | | | |
Communication Services | | $ | 2,030,657,504 | | | | — | | | | — | | | $ | 2,030,657,504 | |
Consumer Discretionary | | | 1,399,188,599 | | | | — | | | | — | | | | 1,399,188,599 | |
Consumer Staples | | | 1,634,069,451 | | | | — | | | | — | | | | 1,634,069,451 | |
Energy | | | 4,288,327,183 | | | | — | | | | — | | | | 4,288,327,183 | |
Financials | | | 5,331,676,302 | | | | — | | | | — | | | | 5,331,676,302 | |
Health Care | | | 4,614,770,070 | | | | — | | | | — | | | | 4,614,770,070 | |
Industrials | | | 3,116,672,713 | | | | — | | | | — | | | | 3,116,672,713 | |
Information Technology | | | 2,111,165,438 | | | | — | | | | — | | | | 2,111,165,438 | |
Materials | | | 2,073,697,671 | | | | — | | | | — | | | | 2,073,697,671 | |
Real Estate | | | 102,269,222 | | | | — | | | | — | | | | 102,269,222 | |
Utilities | | | 76,579,795 | | | | — | | | | — | | | | 76,579,795 | |
Temporary Cash Investments | | | 264,660,566 | | | | — | | | | — | | | | 264,660,566 | |
Securities Lending Collateral | | | — | | | $ | 521,402,250 | | | | — | | | | 521,402,250 | |
Futures Contracts** | | | (7,666,159 | ) | | | — | | | | — | | | | (7,666,159 | ) |
| | | | | | | | | | | | | | | | |
TOTAL | | $ | 27,036,068,355 | | | $ | 521,402,250 | | | | — | | | $ | 27,557,470,605 | |
| | | | | | | | | | | | | | | | |
| ** | Valued at the unrealized appreciation/(depreciation) on the investment. |
See accompanying Notes to Financial Statements.
THE DFA INTERNATIONAL VALUE SERIES
SCHEDULE OF INVESTMENTS
October 31, 2022
| | | | | | | | | | |
| | | | | Shares | | | Value» | |
COMMON STOCKS — (94.7%) | | | | | | | | |
AUSTRALIA — (7.6%) | | | | | | | | |
* | | AMP Ltd. | | | 2,083,483 | | | $ | 1,680,179 | |
| | Ampol Ltd. | | | 2,567 | | | | 44,773 | |
| | Ansell Ltd. | | | 38,888 | | | | 702,049 | |
| | Aurizon Holdings Ltd. | | | 8,111,517 | | | | 18,797,360 | |
# | | Australia & New Zealand Banking Group Ltd. | | | 7,347,638 | | | | 120,381,777 | |
# | | Bank of Queensland Ltd. | | | 1,687,416 | | | | 7,946,519 | |
| | Beach Energy Ltd. | | | 5,340,476 | | | | 5,460,960 | |
# | | Bendigo & Adelaide Bank Ltd. | | | 1,066,408 | | | | 6,155,959 | |
| | BlueScope Steel Ltd. | | | 3,217,376 | | | | 32,398,894 | |
| | Boral Ltd. | | | 1 | | | | 2 | |
| | Challenger Ltd. | | | 782,323 | | | | 3,515,234 | |
| | Cleanaway Waste Management Ltd. | | | 6,684,980 | | | | 11,563,210 | |
| | Downer EDI Ltd. | | | 2,494,087 | | | | 7,167,844 | |
| | Evolution Mining Ltd. | | | 4,135,415 | | | | 5,485,833 | |
| | Fortescue Metals Group Ltd. | | | 240,333 | | | | 2,264,178 | |
# | | Harvey Norman Holdings Ltd. | | | 2,695,782 | | | | 7,171,559 | |
| | IGO Ltd. | | | 185,805 | | | | 1,817,163 | |
| | Incitec Pivot Ltd. | | | 7,095,295 | | | | 17,063,831 | |
| | Lendlease Corp. Ltd. | | | 1,303,875 | | | | 7,250,535 | |
| | National Australia Bank Ltd. | | | 5,345,044 | | | | 111,027,479 | |
# | | New Hope Corp. Ltd. | | | 534,238 | | | | 1,940,709 | |
| | Newcrest Mining Ltd. | | | 1,789,020 | | | | 19,813,890 | |
| | Nine Entertainment Co. Holdings Ltd. | | | 1,462,623 | | | | 1,931,565 | |
| | Northern Star Resources Ltd. | | | 1,370,043 | | | | 7,646,345 | |
| | Orica Ltd. | | | 657,206 | | | | 5,846,003 | |
| | Origin Energy Ltd. | | | 3,364,446 | | | | 12,019,742 | |
| | OZ Minerals Ltd. | | | 779,352 | | | | 12,067,506 | |
| | Premier Investments Ltd. | | | 19,252 | | | | 308,310 | |
| | QBE Insurance Group Ltd. | | | 976,946 | | | | 7,654,334 | |
| | Qube Holdings Ltd. | | | 608,346 | | | | 1,059,102 | |
| | Rio Tinto Ltd. | | | 539,889 | | | | 30,638,482 | |
| | Santos Ltd. | | | 9,204,868 | | | | 44,935,003 | |
# | | Seven Group Holdings Ltd. | | | 186,936 | | | | 2,192,090 | |
| | Sims Ltd. | | | 175,120 | | | | 1,369,148 | |
| | Sonic Healthcare Ltd. | | | 112,263 | | | | 2,350,280 | |
| | South32 Ltd. | | | 13,513,440 | | | | 31,003,450 | |
| | Suncorp Group Ltd. | | | 3,892,309 | | | | 28,472,278 | |
| | Tabcorp Holdings Ltd. | | | 2,857,127 | | | | 1,763,935 | |
| | TPG Telecom Ltd. | | | 450,905 | | | | 1,414,489 | |
W | | Viva Energy Group Ltd. | | | 2,028,036 | | | | 3,681,361 | |
| | Westpac Banking Corp. | | | 7,338,308 | | | | 113,310,525 | |
| | Whitehaven Coal Ltd. | | | 5,022,173 | | | | 29,172,774 | |
| | Woodside Energy Group Ltd. | | | 3,456,203 | | | | 79,902,049 | |
| | Worley Ltd. | | | 905,249 | | | | 8,268,646 | |
# | | Yancoal Australia Ltd. | | | 41,805 | | | | 138,353 | |
| | | | | | | | | | |
TOTAL AUSTRALIA | | | | 816,795,707 | |
| | | | | | | | | | |
AUSTRIA — (0.1%) | | | | | | | | |
| | Erste Group Bank AG | | | 238,396 | | | | 5,875,253 | |
| | Raiffeisen Bank International AG | | | 24,847 | | | | 345,553 | |
| | | | | | | | | | |
TOTAL AUSTRIA | | | | 6,220,806 | |
| | | | | | | | | | |
BELGIUM — (0.6%) | | | | | | | | |
# | | Ageas SA | | | 382,351 | | | | 13,236,295 | |
| | KBC Group NV | | | 557,629 | | | | 27,945,987 | |
| | Solvay SA | | | 195,222 | | | | 17,616,999 | |
| | | | | | | | | | |
TOTAL BELGIUM | | | | 58,799,281 | |
| | | | | | | | | | |
THE DFA INTERNATIONAL VALUE SERIES
CONTINUED
| | | | | | | | | | |
| | | | | Shares | | | Value» | |
CANADA — (10.1%) | | | | | | | | |
# | | Agnico Eagle Mines Ltd. | | | 607,528 | | | $ | 26,706,931 | |
| | AltaGas Ltd. | | | 424,078 | | | | 7,648,252 | |
# | | ARC Resources Ltd. | | | 1,055,555 | | | | 14,860,752 | |
# | | Bank of Montreal | | | 1,333,134 | | | | 122,755,038 | |
| | Bank of Nova Scotia | | | 2,541,998 | | | | 122,836,259 | |
# | | Barrick Gold Corp. | | | 2,761,104 | | | | 41,503,841 | |
# | | Canadian Imperial Bank of Commerce | | | 1,943,976 | | | | 88,281,990 | |
| | Canadian Natural Resources Ltd. | | | 806,380 | | | | 48,334,417 | |
# | | Cenovus Energy, Inc. | | | 1,089,694 | | | | 22,013,596 | |
# | | Endeavour Mining PLC | | | 791,919 | | | | 14,084,631 | |
| | Fairfax Financial Holdings Ltd. | | | 97,836 | | | | 48,050,126 | |
| | First Quantum Minerals Ltd. | | | 1,697,220 | | | | 29,936,647 | |
| | Great-West Lifeco, Inc. | | | 464,849 | | | | 10,761,799 | |
| | iA Financial Corp., Inc. | | | 312,246 | | | | 17,377,687 | |
| | IGM Financial, Inc. | | | 17,720 | | | | 474,363 | |
| | Imperial Oil Ltd. | | | 543,164 | | | | 29,591,575 | |
# | | Kinross Gold Corp. | | | 4,622,914 | | | | 16,763,090 | |
| | Lundin Mining Corp. | | | 2,996,201 | | | | 15,702,921 | |
# | | Magna International, Inc. | | | 694,429 | | | | 38,700,528 | |
# | | Manulife Financial Corp. | | | 2,453,743 | | | | 40,622,680 | |
* | | MEG Energy Corp. | | | 90,475 | | | | 1,352,792 | |
| | Nutrien Ltd. | | | 944,511 | | | | 79,811,163 | |
| | Onex Corp. | | | 183,522 | | | | 9,237,056 | |
| | Saputo, Inc. | | | 46,660 | | | | 1,135,718 | |
| | Sun Life Financial, Inc. | | | 262,957 | | | | 11,162,525 | |
| | Suncor Energy, Inc. | | | 3,330,441 | | | | 114,542,374 | |
# | | Teck Resources Ltd.,Class B | | | 2,053,944 | | | | 62,522,056 | |
| | Tourmaline Oil Corp. | | | 409,329 | | | | 23,063,159 | |
# * | | Turquoise Hill Resources Ltd. | | | 55,248 | | | | 1,553,021 | |
| | West Fraser Timber Co. Ltd. | | | 247,686 | | | | 18,596,954 | |
# | | Whitecap Resources, Inc. | | | 1,348,132 | | | | 10,449,792 | |
| | | | | | | | | | |
TOTAL CANADA | | | | 1,090,433,733 | |
| | | | | | | | | | |
CHINA — (0.0%) | | | | | | | | |
W | | BOC Aviation Ltd. | | | 388,400 | | | | 2,599,145 | |
| | Orient Overseas International Ltd. | | | 67,000 | | | | 979,080 | |
| | | | | | | | | | |
TOTAL CHINA | | | | 3,578,225 | |
| | | | | | | | | | |
DENMARK — (1.9%) | | | | | | | | |
| | AP Moller - Maersk AS, Class A | | | 6,364 | | | | 12,732,356 | |
| | AP Moller - Maersk AS, Class B | | | 7,912 | | | | 16,529,522 | |
| | Carlsberg AS, Class B | | | 348,558 | | | | 41,041,170 | |
# | | Chr Hansen Holding AS | | | 154,310 | | | | 8,570,536 | |
| | Danske Bank AS | | | 945,349 | | | | 15,249,409 | |
# * | | Demant AS | | | 108,509 | | | | 2,963,083 | |
| | DSV AS | | | 379,252 | | | | 51,247,654 | |
* | | Genmab AS | | | 17,930 | | | | 6,906,771 | |
| | ROCKWOOL AS, Class A | | | 91 | | | | 17,946 | |
| | Tryg AS | | | 336,476 | | | | 7,277,718 | |
# | | Vestas Wind Systems AS | | | 1,991,959 | | | | 39,268,811 | |
| | | | | | | | | | |
TOTAL DENMARK | | | | 201,804,976 | |
| | | | | | | | | | |
THE DFA INTERNATIONAL VALUE SERIES
CONTINUED
| | | | | | | | | | |
| | | | | Shares | | | Value» | |
FINLAND — (1.1%) | | | | | | | | |
| | Nokia Oyj | | | 4,351,573 | | | $ | 19,338,011 | |
| | Nokia Oyj, Sponsored ADR | | | 1,331,054 | | | | 5,856,638 | |
| | Nordea Bank Abp | | | 4,491,932 | | | | 42,914,468 | |
| | Stora Enso Oyj, Class R | | | 1,696,368 | | | | 22,118,614 | |
| | UPM-Kymmene Oyj | | | 700,891 | | | | 23,562,164 | |
| | | | | | | | | | |
TOTAL FINLAND | | | | 113,789,895 | |
| | | | | | | | | | |
FRANCE — (10.2%) | | | | | | | | |
* | | Accor SA | | | 268,063 | | | | 6,423,178 | |
# | | Alstom SA | | | 339,734 | | | | 6,992,142 | |
W | | Amundi SA | | | 62,742 | | | | 2,960,161 | |
| | Arkema SA | | | 235,866 | | | | 18,665,970 | |
| | AXA SA | | | 2,421,503 | | | | 59,798,721 | |
| | BNP Paribas SA | | | 1,819,966 | | | | 85,345,265 | |
| | Bollore SE | | | 1,793,750 | | | | 8,971,512 | |
| | Bouygues SA | | | 1,023,747 | | | | 29,208,676 | |
# | | Carrefour SA | | | 2,495,917 | | | | 40,172,903 | |
| | Cie de Saint-Gobain | | | 1,784,858 | | | | 72,966,654 | |
| | Cie Generale des Etablissements Michelin SCA | | | 2,521,000 | | | | 64,245,287 | |
| | Credit Agricole SA | | | 1,088,951 | | | | 9,880,769 | |
| | Eiffage SA | | | 259,883 | | | | 23,499,081 | |
| | Electricite de France SA | | | 117,821 | | | | 1,391,460 | |
| | Engie SA | | | 3,701,762 | | | | 48,098,296 | |
| | Eurazeo SE | | | 21,491 | | | | 1,226,393 | |
* | | Euroapi SA | | | 29,687 | | | | 519,491 | |
* | | Faurecia SE | | | 61,470 | | | | 916,322 | |
| | Orange SA | | | 7,137,374 | | | | 68,004,272 | |
| | Publicis Groupe SA | | | 702,589 | | | | 39,348,057 | |
* | | Renault SA | | | 540,715 | | | | 16,648,184 | |
| | Rexel SA | | | 204,641 | | | | 3,651,879 | |
| | Sanofi | | | 682,839 | | | | 58,763,618 | |
| | Societe Generale SA | | | 2,080,067 | | | | 47,710,538 | |
# | | TotalEnergies SE | | | 6,840,726 | | | | 373,184,524 | |
| | Vinci SA | | | 24,438 | | | | 2,249,199 | |
| | Vivendi SE | | | 324,425 | | | | 2,655,410 | |
* W | | Worldline SA | | | 40,901 | | | | 1,785,184 | |
| | | | | | | | | | |
TOTAL FRANCE | | | | 1,095,283,146 | |
| | | | | | | | | | |
GERMANY — (5.5%) | | | | | | | | |
| | BASF SE | | | 1,819,157 | | | | 81,626,734 | |
| | Bayer AG | | | 748,346 | | | | 39,348,802 | |
| | Bayerische Motoren Werke AG | | | 1,003,964 | | | | 78,803,005 | |
* | | Commerzbank AG | | | 4,359,162 | | | | 34,828,398 | |
# | | Continental AG | | | 251,046 | | | | 13,003,094 | |
W | | Covestro AG | | | 638,137 | | | | 21,662,206 | |
# * | | Daimler Truck Holding AG | | | 1,284,137 | | | | 34,251,242 | |
| | Deutsche Bank AG | | | 3,421,901 | | | | 32,688,246 | |
# * | | Deutsche Lufthansa AG | | | 524,114 | | | | 3,583,370 | |
W | | DWS Group GmbH & Co. KGaA | | | 17,259 | | | | 466,620 | |
| | E.ON SE | | | 142,220 | | | | 1,190,948 | |
| | Evonik Industries AG | | | 449,221 | | | | 8,275,420 | |
# | | Fresenius Medical Care AG & Co. KGaA | | | 334,517 | | | | 9,252,932 | |
| | Fresenius SE & Co. KGaA | | | 862,748 | | | | 19,854,539 | |
# | | HeidelbergCement AG | | | 448,245 | | | | 20,613,343 | |
| | K&S AG | | | 30,775 | | | | 679,481 | |
| | Mercedes-Benz Group AG | | | 2,636,283 | | | | 152,592,147 | |
| | Muenchener Rueckversicherungs-Gesellschaft AG in Muenchen | | | 7,068 | | | | 1,865,781 | |
| | RTL Group SA | | | 3,228 | | | | 109,577 | |
THE DFA INTERNATIONAL VALUE SERIES
CONTINUED
| | | | | | | | | | |
| | | | | Shares | | | Value» | |
GERMANY — (Continued) | | | | | | | | |
* | | Siemens Energy AG | | | 410,242 | | | $ | 4,782,444 | |
* | | Talanx AG | | | 162,600 | | | | 6,106,338 | |
# | | Telefonica Deutschland Holding AG | | | 4,563,070 | | | | 9,942,468 | |
| | Volkswagen AG | | | 111,321 | | | | 19,028,300 | |
| | | | | | | | | | |
TOTAL GERMANY | | | | 594,555,435 | |
| | | | | | | | | | |
HONG KONG — (2.0%) | | | | | | | | |
| | Bank of East Asia Ltd. | | | 510,881 | | | | 489,621 | |
| | BOC Hong Kong Holdings Ltd. | | | 6,049,000 | | | | 18,796,094 | |
# * | | Cathay Pacific Airways Ltd. | | | 7,360,999 | | | | 6,675,161 | |
| | CK Asset Holdings Ltd. | | | 4,895,803 | | | | 27,066,771 | |
| | CK Hutchison Holdings Ltd. | | | 7,469,484 | | | | 37,181,816 | |
| | CK Infrastructure Holdings Ltd. | | | 743,000 | | | | 3,529,785 | |
| | Hang Lung Properties Ltd. | | | 6,065,000 | | | | 7,629,545 | |
| | Hang Seng Bank Ltd. | | | 368,300 | | | | 5,184,846 | |
| | Henderson Land Development Co. Ltd. | | | 2,620,485 | | | | 6,415,628 | |
| | HKT Trust & HKT Ltd. | | | 1,300,000 | | | | 1,470,227 | |
| | MTR Corp. Ltd. | | | 2,867,933 | | | | 12,619,448 | |
| | New World Development Co. Ltd. | | | 4,946,042 | | | | 10,117,002 | |
| | Sino Land Co. Ltd. | | | 11,469,651 | | | | 12,247,473 | |
| | Sun Hung Kai Properties Ltd. | | | 3,517,920 | | | | 37,804,682 | |
| | Swire Pacific Ltd., Class A | | | 1,036,500 | | | | 6,875,633 | |
| | Swire Pacific Ltd., Class B | | | 2,672,500 | | | | 2,753,875 | |
W | | WH Group Ltd. | | | 30,841,696 | | | | 15,575,397 | |
| | Xinyi Glass Holdings Ltd. | | | 1,224,000 | | | | 1,573,030 | |
| | | | | | | | | | |
TOTAL HONG KONG | | | | 214,006,034 | |
| | | | | | | | | | |
IRELAND — (0.4%) | | | | | | | | |
| | AIB Group PLC | | | 220,530 | | | | 637,974 | |
| | Bank of Ireland Group PLC | | | 509,669 | | | | 3,669,934 | |
| | CRH PLC | | | 293,793 | | | | 10,581,784 | |
# | | CRH PLC, Sponsored ADR | | | 728,717 | | | | 26,386,842 | |
# * | | Flutter Entertainment PLC | | | 39,961 | | | | 5,294,275 | |
| | | | | | | | | | |
TOTAL IRELAND | | | | 46,570,809 | |
| | | | | | | | | | |
ISRAEL — (0.6%) | | | | | | | | |
| | Bank Hapoalim BM | | | 1,986,735 | | | | 19,150,643 | |
| | Bank Leumi Le-Israel BM | | | 493,637 | | | | 4,709,171 | |
| | Harel Insurance Investments & Financial Services Ltd. | | | 600,083 | | | | 5,776,383 | |
| | Israel Discount Bank Ltd., Class A | | | 2,663,342 | | | | 15,143,995 | |
| | Migdal Insurance & Financial Holdings Ltd. | | | 303,753 | | | | 364,346 | |
| | Phoenix Holdings Ltd. | | | 796,823 | | | | 8,631,288 | |
# * | | Teva Pharmaceutical Industries Ltd., Sponsored ADR | | | 1,236,857 | | | | 11,032,764 | |
| | | | | | | | | | |
TOTAL ISRAEL | | | | 64,808,590 | |
| | | | | | | | | | |
ITALY — (2.0%) | | | | | | | | |
| | Eni SpA | | | 2,863,752 | | | | 37,611,711 | |
# | | Intesa Sanpaolo SpA | | | 26,193,710 | | | | 49,939,026 | |
| | Mediobanca Banca di Credito Finanziario SpA | | | 830,884 | | | | 7,527,464 | |
| | Stellantis NV | | | 3,233,234 | | | | 43,621,391 | |
| | Stellantis NV | | | 1,607,929 | | | | 21,739,200 | |
* | | Telecom Italia SpA | | | 3,714,140 | | | | 726,641 | |
* | | Telecom Italia SpA, Sponsored ADR | | | 1,610,365 | | | | 3,124,108 | |
| | UniCredit SpA | | | 3,981,409 | | | | 49,374,501 | |
| | UnipolSai Assicurazioni SpA | | | 108,539 | | | | 244,731 | |
| | | | | | | | | | |
TOTAL ITALY | | | | 213,908,773 | |
| | | | | | | | | | |
THE DFA INTERNATIONAL VALUE SERIES
CONTINUED
| | | | | | | | | | |
| | | | | Shares | | | Value» | |
JAPAN — (18.6%) | | | | | | | | |
| | Acom Co. Ltd. | | | 117,400 | | | $ | 256,478 | |
| | AEON Financial Service Co. Ltd. | | | 34,400 | | | | 336,659 | |
| | AGC, Inc. | | | 895,500 | | | | 28,060,450 | |
| | Air Water, Inc. | | | 37,000 | | | | 413,098 | |
| | Aisin Corp. | | | 609,000 | | | | 15,632,867 | |
| | Alfresa Holdings Corp. | | | 202,200 | | | | 2,327,903 | |
| | Alps Alpine Co. Ltd. | | | 312,378 | | | | 2,683,505 | |
| | Amada Co. Ltd. | | | 907,100 | | | | 6,380,151 | |
| | Aozora Bank Ltd. | | | 253,300 | | | | 4,357,206 | |
| | Asahi Group Holdings Ltd. | | | 147,200 | | | | 4,118,763 | |
| | Asahi Kasei Corp. | | | 2,388,200 | | | | 15,312,932 | |
| | Bank of Kyoto Ltd. | | | 113,679 | | | | 4,096,514 | |
| | Bridgestone Corp. | | | 601,100 | | | | 21,739,651 | |
| | Brother Industries Ltd. | | | 498,800 | | | | 8,497,509 | |
| | Canon Marketing Japan, Inc. | | | 158,500 | | | | 3,344,666 | |
| | Canon, Inc. | | | 652,000 | | | | 13,820,757 | |
| | Chiba Bank Ltd. | | | 1,064,000 | | | | 5,829,785 | |
| | Coca-Cola Bottlers Japan Holdings, Inc. | | | 205,857 | | | | 1,859,907 | |
| | COMSYS Holdings Corp. | | | 23,300 | | | | 381,721 | |
| | Concordia Financial Group Ltd. | | | 2,530,100 | | | | 7,719,893 | |
# | | Cosmo Energy Holdings Co. Ltd. | | | 273,700 | | | | 7,050,333 | |
| | Credit Saison Co. Ltd. | | | 393,600 | | | | 4,206,937 | |
| | Dai Nippon Printing Co. Ltd. | | | 457,000 | | | | 9,154,042 | |
| | Daicel Corp. | | | 457,800 | | | | 2,612,123 | |
| | Dai-ichi Life Holdings, Inc. | | | 1,226,047 | | | | 19,472,990 | |
| | Daiwa House Industry Co. Ltd. | | | 444,500 | | | | 8,955,489 | |
| | Daiwa Securities Group, Inc. | | | 3,723,000 | | | | 14,525,920 | |
| | DeNA Co. Ltd. | | | 29,600 | | | | 386,057 | |
| | Denka Co. Ltd. | | | 234,800 | | | | 5,439,389 | |
| | DIC Corp. | | | 246,600 | | | | 4,140,504 | |
| | Dowa Holdings Co. Ltd. | | | 195,100 | | | | 6,194,821 | |
| | Ebara Corp. | | | 13,400 | | | | 435,394 | |
| | ENEOS Holdings, Inc. | | | 8,814,203 | | | | 29,075,018 | |
| | Ezaki Glico Co. Ltd. | | | 8,100 | | | | 182,234 | |
| | Fuji Media Holdings, Inc. | | | 30,600 | | | | 212,826 | |
| | FUJIFILM Holdings Corp. | | | 24,800 | | | | 1,134,597 | |
| | Fujikura Ltd. | | | 47,500 | | | | 281,246 | |
| | Fukuoka Financial Group, Inc. | | | 386,600 | | | | 6,578,234 | |
| | Hankyu Hanshin Holdings, Inc. | | | 581,700 | | | | 17,276,918 | |
| | Haseko Corp. | | | 510,100 | | | | 5,253,122 | |
* | | Hino Motors Ltd. | | | 840,100 | | | | 3,491,268 | |
| �� | Hitachi Construction Machinery Co. Ltd. | | | 209,100 | | | | 4,090,837 | |
| | Hitachi Ltd. | | | 253,600 | | | | 11,506,798 | |
| | Honda Motor Co. Ltd. | | | 3,522,000 | | | | 80,310,312 | |
| | House Foods Group, Inc. | | | 2,800 | | | | 52,367 | |
| | Hulic Co. Ltd. | | | 28,500 | | | | 207,034 | |
| | Idemitsu Kosan Co. Ltd. | | | 602,938 | | | | 13,192,422 | |
| | IHI Corp. | | | 83,100 | | | | 1,853,463 | |
| | Iida Group Holdings Co. Ltd. | | | 674,550 | | | | 9,366,371 | |
| | Inpex Corp. | | | 2,704,683 | | | | 27,296,730 | |
| | Isetan Mitsukoshi Holdings Ltd. | | | 549,300 | | | | 4,878,955 | |
| | Isuzu Motors Ltd. | | | 1,471,000 | | | | 17,298,458 | |
| | ITOCHU Corp. | | | 658,700 | | | | 17,023,796 | |
| | Iwatani Corp. | | | 79,600 | | | | 2,930,985 | |
| | J Front Retailing Co. Ltd. | | | 712,300 | | | | 5,757,543 | |
| | Japan Post Bank Co., Ltd. | | | 56,300 | | | | 375,134 | |
| | Japan Post Holdings Co. Ltd. | | | 1,397,610 | | | | 9,398,335 | |
| | Japan Post Insurance Co. Ltd. | | | 134,400 | | | | 1,989,543 | |
| | JFE Holdings, Inc. | | | 1,387,295 | | | | 12,709,171 | |
THE DFA INTERNATIONAL VALUE SERIES
CONTINUED
| | | | | | | | | | |
| | | | | Shares | | | Value» | |
JAPAN — (Continued) | | | | | | | | |
| | JGC Holdings Corp. | | | 257,700 | | | $ | 3,099,501 | |
# | | JTEKT Corp. | | | 572,800 | | | | 4,043,872 | |
| | Kajima Corp. | | | 814,700 | | | | 7,668,918 | |
| | Kamigumi Co. Ltd. | | | 342,200 | | | | 6,507,510 | |
| | Kaneka Corp. | | | 231,308 | | | | 5,735,815 | |
| | Kawasaki Heavy Industries Ltd. | | | 677,300 | | | | 11,519,110 | |
# | | Kawasaki Kisen Kaisha Ltd. | | | 101,100 | | | | 1,532,999 | |
| | Kewpie Corp. | | | 7,000 | | | | 110,511 | |
| | Kinden Corp. | | | 222,800 | | | | 2,267,070 | |
| | Kobe Steel Ltd. | | | 60,200 | | | | 246,874 | |
| | Koito Manufacturing Co. Ltd. | | | 61,600 | | | | 874,525 | |
| | Kokuyo Co. Ltd. | | | 20,200 | | | | 250,551 | |
| | Komatsu Ltd. | | | 1,056,900 | | | | 20,704,869 | |
| | Konica Minolta, Inc. | | | 5,300 | | | | 16,149 | |
| | K’s Holdings Corp. | | | 403,300 | | | | 3,160,424 | |
| | Kuraray Co. Ltd. | | | 1,408,691 | | | | 9,686,908 | |
| | Kyocera Corp. | | | 179,600 | | | | 8,697,386 | |
| | Lixil Corp. | | | 961,800 | | | | 14,528,256 | |
| | Mabuchi Motor Co. Ltd. | | | 73,100 | | | | 1,983,526 | |
| | Makita Corp. | | | 122,700 | | | | 2,242,160 | |
| | Marubeni Corp. | | | 2,948,900 | | | | 25,814,415 | |
| | Maruichi Steel Tube Ltd. | | | 15,500 | | | | 292,573 | |
| | Mazda Motor Corp. | | | 944,400 | | | | 6,358,607 | |
| | Mebuki Financial Group, Inc. | | | 1,302,120 | | | | 2,532,211 | |
| | Medipal Holdings Corp. | | | 329,250 | | | | 4,082,057 | |
| | Mitsubishi Chemical Group Corp. | | | 3,775,900 | | | | 17,057,065 | |
| | Mitsubishi Corp. | | | 1,963,400 | | | | 53,186,304 | |
| | Mitsubishi Electric Corp. | | | 2,250,900 | | | | 19,804,783 | |
| | Mitsubishi Estate Co. Ltd. | | | 84,800 | | | | 1,066,385 | |
| | Mitsubishi Gas Chemical Co., Inc. | | | 727,100 | | | | 9,239,413 | |
| | Mitsubishi HC Capital, Inc. | | | 2,653,300 | | | | 11,385,461 | |
| | Mitsubishi Heavy Industries Ltd. | | | 724,500 | | | | 24,954,718 | |
| | Mitsubishi Logistics Corp. | | | 89,600 | | | | 1,966,127 | |
| | Mitsubishi Materials Corp. | | | 79,200 | | | | 1,035,182 | |
* | | Mitsubishi Motors Corp. | | | 1,740,000 | | | | 5,861,598 | |
# | | Mitsubishi UFJ Financial Group, Inc., Sponsored ADR | | | 1,968,045 | | | | 9,269,492 | |
| | Mitsubishi UFJ Financial Group, Inc. | | | 10,193,750 | | | | 48,153,735 | |
| | Mitsui & Co. Ltd., Sponsored ADR | | | 10,506 | | | | 4,635,983 | |
| | Mitsui & Co. Ltd. | | | 1,738,400 | | | | 38,469,354 | |
| | Mitsui Chemicals, Inc. | | | 823,660 | | | | 15,245,060 | |
| | Mitsui Fudosan Co. Ltd. | | | 940,400 | | | | 18,007,122 | |
# | | Mitsui OSK Lines Ltd. | | | 885,300 | | | | 17,524,680 | |
| | Mizuho Financial Group, Inc. | | | 2,369,480 | | | | 25,627,020 | |
| | MS&AD Insurance Group Holdings, Inc. | | | 445,453 | | | | 11,796,132 | |
| | Nagase & Co. Ltd. | | | 21,700 | | | | 295,647 | |
| | NEC Corp. | | | 780,910 | | | | 25,848,818 | |
| | NGK Insulators Ltd. | | | 296,700 | | | | 3,461,320 | |
| | NGK Spark Plug Co. Ltd. | | | 315,000 | | | | 5,746,877 | |
| | NH Foods Ltd. | | | 317,767 | | | | 7,572,856 | |
| | Nikon Corp. | | | 695,200 | | | | 6,723,370 | |
| | Nippon Electric Glass Co. Ltd. | | | 131,500 | | | | 2,277,000 | |
| | Nippon Express Holdings, Inc. | | | 308,324 | | | | 15,492,628 | |
| | Nippon Shokubai Co. Ltd. | | | 84,400 | | | | 3,027,491 | |
# | | Nippon Steel Corp. | | | 1,185,793 | | | | 16,267,325 | |
# | | Nippon Yusen KK | | | 709,500 | | | | 12,852,207 | |
| | Nissan Motor Co. Ltd. | | | 4,749,500 | | | | 15,138,096 | |
| | Nisshin Seifun Group, Inc. | | | 188,500 | | | | 2,036,858 | |
| | Nomura Holdings, Inc. | | | 3,219,302 | | | | 10,417,526 | |
| | Nomura Real Estate Holdings, Inc. | | | 521,500 | | | | 11,787,885 | |
THE DFA INTERNATIONAL VALUE SERIES
CONTINUED
| | | | | | | | | | |
| | | | | Shares | | | Value» | |
JAPAN — (Continued) | | | | | | | | |
| | NSK Ltd. | | | 1,027,500 | | | $ | 5,430,571 | |
| | Obayashi Corp. | | | 2,342,282 | | | | 15,034,320 | |
| | Oji Holdings Corp. | | | 3,568,100 | | | | 12,369,618 | |
| | ORIX Corp. | | | 2,086,100 | | | | 30,639,991 | |
| | Otsuka Holdings Co. Ltd. | | | 146,200 | | | | 4,686,367 | |
| | Panasonic Holdings Corp. | | | 3,551,799 | | | | 25,298,082 | |
| | Resona Holdings, Inc. | | | 2,821,139 | | | | 10,632,736 | |
# | | Ricoh Co. Ltd. | | | 1,414,100 | | | | 10,362,225 | |
| | Rinnai Corp. | | | 12,700 | | | | 864,429 | |
| | Rohm Co. Ltd. | | | 93,500 | | | | 6,569,738 | |
| | Sankyo Co. Ltd. | | | 30,300 | | | | 1,000,562 | |
| | Santen Pharmaceutical Co. Ltd. | | | 156,700 | | | | 1,072,298 | |
| | SBI Holdings, Inc. | | | 248,599 | | | | 4,490,707 | |
| | Seiko Epson Corp. | | | 794,400 | | | | 10,784,898 | |
| | Seino Holdings Co. Ltd. | | | 437,400 | | | | 3,360,897 | |
| | Sekisui Chemical Co. Ltd. | | | 206,700 | | | | 2,581,275 | |
| | Sekisui House Ltd. | | | 1,537,800 | | | | 25,531,783 | |
| | Shimamura Co. Ltd. | | | 61,300 | | | | 4,957,170 | |
| | Shimizu Corp. | | | 936,400 | | | | 4,672,627 | |
| | Shinsei Bank Ltd. | | | 61,300 | | | | 912,185 | |
| | Shizuoka Financial Group, Inc. | | | 851,000 | | | | 5,373,911 | |
# | | Showa Denko KK | | | 515,700 | | | | 7,528,473 | |
| | Sohgo Security Services Co. Ltd. | | | 15,800 | | | | 393,853 | |
| | Sojitz Corp. | | | 666,340 | | | | 9,823,159 | |
| | Sompo Holdings, Inc. | | | 490,056 | | | | 20,431,555 | |
| | Stanley Electric Co. Ltd. | | | 335,400 | | | | 5,701,966 | |
| | Subaru Corp. | | | 1,010,984 | | | | 15,802,509 | |
| | Sumitomo Chemical Co. Ltd. | | | 8,266,400 | | | | 27,835,099 | |
| | Sumitomo Corp. | | | 1,312,600 | | | | 16,688,087 | |
| | Sumitomo Electric Industries Ltd. | | | 2,834,000 | | | | 29,616,198 | |
| | Sumitomo Forestry Co. Ltd. | | | 598,600 | | | | 9,364,241 | |
| | Sumitomo Heavy Industries Ltd. | | | 487,894 | | | | 9,247,903 | |
| | Sumitomo Metal Mining Co. Ltd. | | | 584,364 | | | | 16,380,210 | |
| | Sumitomo Mitsui Financial Group, Inc. | | | 1,282,500 | | | | 36,014,598 | |
| | Sumitomo Mitsui Trust Holdings, Inc. | | | 467,344 | | | | 13,445,014 | |
| | Sumitomo Pharma Co. Ltd. | | | 333,431 | | | | 2,322,650 | |
# | | Sumitomo Realty & Development Co. Ltd. | | | 350,800 | | | | 8,045,215 | |
| | Sumitomo Rubber Industries Ltd. | | | 756,200 | | | | 6,487,361 | |
| | Suzuken Co. Ltd. | | | 85,000 | | | | 1,892,418 | |
| | Suzuki Motor Corp. | | | 428,500 | | | | 14,487,502 | |
| | T&D Holdings, Inc. | | | 1,301,400 | | | | 12,871,108 | |
| | Taiheiyo Cement Corp. | | | 130,700 | | | | 1,776,099 | |
| | Taisei Corp. | | | 184,000 | | | | 5,012,274 | |
| | Taisho Pharmaceutical Holdings Co. Ltd. | | | 38,900 | | | | 1,403,046 | |
| | Takeda Pharmaceutical Co. Ltd. | | | 2,595,871 | | | | 68,554,353 | |
| | TBS Holdings, Inc. | | | 70,800 | | | | 733,409 | |
| | TDK Corp. | | | 361,500 | | | | 11,292,665 | |
| | Teijin Ltd. | | | 818,590 | | | | 7,431,976 | |
| | THK Co. Ltd. | | | 92,400 | | | | 1,611,445 | |
| | Toda Corp. | | | 717,800 | | | | 3,587,751 | |
| | Tokai Carbon Co. Ltd. | | | 40,000 | | | | 261,037 | |
| | Tokyo Century Corp. | | | 100,200 | | | | 3,417,560 | |
| | Tokyo Tatemono Co. Ltd. | | | 870,300 | | | | 11,968,649 | |
| | Tokyu Fudosan Holdings Corp. | | | 2,556,700 | | | | 12,971,603 | |
| | Toppan, Inc. | | | 599,800 | | | | 8,945,517 | |
| | Toray Industries, Inc. | | | 2,891,600 | | | | 14,045,510 | |
| | Tosoh Corp. | | | 1,241,700 | | | | 13,509,050 | |
| | Toyo Seikan Group Holdings Ltd. | | | 416,349 | | | | 4,761,967 | |
| | Toyo Tire Corp. | | | 52,000 | | | | 610,036 | |
THE DFA INTERNATIONAL VALUE SERIES
CONTINUED
| | | | | | | | | | |
| | | | | Shares | | | Value» | |
JAPAN — (Continued) | | | | | | | | |
| | Toyoda Gosei Co. Ltd. | | | 272,500 | | | $ | 4,356,385 | |
| | Toyota Boshoku Corp. | | | 47,400 | | | | 603,145 | |
| | Toyota Industries Corp. | | | 155,700 | | | | 8,020,918 | |
| | Toyota Motor Corp. | | | 12,080,750 | | | | 167,615,564 | |
| | Toyota Tsusho Corp. | | | 584,300 | | | | 19,612,549 | |
| | Tsumura & Co. | | | 24,700 | | | | 515,893 | |
| | UBE Corp. | | | 71,800 | | | | 926,062 | |
| | Yamada Holdings Co. Ltd. | | | 1,918,800 | | | | 6,183,357 | |
| | Yamaha Motor Co. Ltd. | | | 893,600 | | | | 18,446,185 | |
| | Yamato Kogyo Co. Ltd. | | | 9,200 | | | | 267,166 | |
| | Yamazaki Baking Co. Ltd. | | | 325,600 | | | | 3,317,644 | |
| | Yokohama Rubber Co. Ltd. | | | 563,500 | | | | 8,811,511 | |
| | Z Holdings Corp. | | | 1,456,300 | | | | 3,758,358 | |
| | Zeon Corp. | | | 404,300 | | | | 3,407,951 | |
| | | | | | | | | | |
TOTAL JAPAN | | | | 1,999,398,590 | |
| | | | | | | | | | |
NETHERLANDS — (3.8%) | | | | | | | | |
W | | ABN AMRO Bank NV | | | 509,108 | | | | 5,004,853 | |
| | Aegon NV | | | 3,153,912 | | | | 14,599,955 | |
| | Aegon NV, Class NY | | | 413,726 | | | | 1,907,277 | |
# | | Akzo Nobel NV | | | 420,445 | | | | 25,956,335 | |
| | ArcelorMittal SA | | | 652,213 | | | | 14,579,331 | |
# | | ArcelorMittal SA | | | 931,574 | | | | 20,913,839 | |
| | ASR Nederland NV | | | 366,024 | | | | 16,117,088 | |
| | Coca-Cola Europacific Partners PLC | | | 84,349 | | | | 3,981,556 | |
# | | Heineken NV | | | 169,387 | | | | 14,149,606 | |
| | ING Groep NV | | | 4,971,616 | | | | 48,918,640 | |
| | JDE Peet’s NV | | | 244,766 | | | | 7,006,451 | |
| | Koninklijke Ahold Delhaize NV | | | 4,054,901 | | | | 113,084,163 | |
| | Koninklijke DSM NV | | | 327,831 | | | | 38,562,867 | |
| | Koninklijke KPN NV | | | 4,007,248 | | | | 11,208,695 | |
| | Koninklijke Philips NV | | | 991,539 | | | | 12,577,551 | |
| | Koninklijke Philips NV | | | 33,022 | | | | 417,728 | |
# | | NN Group NV | | | 695,023 | | | | 29,428,966 | |
# | | OCI NV | | | 84,204 | | | | 3,220,625 | |
| | Prosus NV | | | 85,856 | | | | 3,712,556 | |
| | Randstad NV | | | 338,457 | | | | 16,868,423 | |
| | Stellantis NV | | | 208,034 | | | | 2,812,620 | |
| | | | | | | | | | |
TOTAL NETHERLANDS | | | | 405,029,125 | |
| | | | | | | | | | |
NEW ZEALAND — (0.2%) | | | | | | | | |
* | | Auckland International Airport Ltd. | | | 1,979,607 | | | | 8,849,674 | |
| | Chorus Ltd. | | | 297,294 | | | | 1,435,249 | |
| | EBOS Group Ltd. | | | 228,415 | | | | 4,979,690 | |
| | Fletcher Building Ltd. | | | 1,485,793 | | | | 4,436,475 | |
# | | Fonterra Co-operative Group Ltd. | | | 293,628 | | | | 508,560 | |
| | Ryman Healthcare Ltd. | | | 183,927 | | | | 895,777 | |
| | Summerset Group Holdings Ltd. | | | 437,306 | | | | 2,460,434 | |
| | | | | | | | | | |
TOTAL NEW ZEALAND | | | | 23,565,859 | |
| | | | | | | | | | |
NORWAY — (0.9%) | | | | | | | | |
* | | Adevinta ASA | | | 53,248 | | | | 364,502 | |
# | | Aker ASA, Class A | | | 9,016 | | | | 636,202 | |
| | Austevoll Seafood ASA | | | 164,785 | | | | 1,221,061 | |
| | DNB Bank ASA | | | 1,885,402 | | | | 33,346,874 | |
W | | Elkem ASA | | | 763,849 | | | | 2,537,700 | |
# | | Frontline Ltd. | | | 84,273 | | | | 1,053,179 | |
# | | Golden Ocean Group Ltd. | | | 787,356 | | | | 6,463,225 | |
THE DFA INTERNATIONAL VALUE SERIES
CONTINUED
| | | | | | | | | | |
| | | | | Shares | | | Value» | |
NORWAY — (Continued) | | | | | | | | |
| | Norsk Hydro ASA | | | 2,813,185 | | | $ | 17,853,372 | |
| | Orkla ASA | | | 344,624 | | | | 2,324,543 | |
| | Schibsted ASA, Class A | | | 14,016 | | | | 216,323 | |
| | Schibsted ASA, Class B | | | 16,720 | | | | 248,579 | |
| | SpareBank 1 SR-Bank ASA | | | 329,406 | | | | 3,354,402 | |
| | Storebrand ASA | | | 1,260,839 | | | | 9,808,510 | |
| | Subsea 7 SA | | | 453,890 | | | | 4,528,412 | |
| | Wallenius Wilhelmsen ASA | | | 587,212 | | | | 4,174,824 | |
| | Yara International ASA | | | 290,501 | | | | 12,965,471 | |
| | | | | | | | | | |
TOTAL NORWAY | | | | 101,097,179 | |
| | | | | | | | | | |
PORTUGAL — (0.1%) | | | | | | | | |
* †† | | Banco Espirito Santo SA | | | 2,631,973 | | | | 0 | |
| | EDP Renovaveis SA | | | 398,808 | | | | 8,391,909 | |
| | Galp Energia SGPS SA | | | 553,452 | | | | 5,619,252 | |
| | | | | | | | | | |
TOTAL PORTUGAL | | | | 14,011,161 | |
| | | | | | | | | | |
SINGAPORE — (1.1%) | | | | | | | | |
| | City Developments Ltd. | | | 1,511,600 | | | | 8,149,960 | |
| | Frasers Property Ltd. | | | 492,700 | | | | 311,574 | |
| | Hongkong Land Holdings Ltd. | | | 2,134,200 | | | | 8,216,422 | |
| | Keppel Corp. Ltd. | | | 6,501,200 | | | | 31,999,025 | |
| | Olam Group Ltd. | | | 399,410 | | | | 378,142 | |
| | Oversea-Chinese Banking Corp. Ltd. | | | 2,424,400 | | | | 20,811,249 | |
* | | Singapore Airlines Ltd. | | | 3,794,200 | | | | 14,073,850 | |
| | Singapore Land Group Ltd. | | | 987,470 | | | | 1,516,206 | |
| | UOL Group Ltd. | | | 1,698,674 | | | | 7,419,450 | |
| | Wilmar International Ltd. | | | 6,663,900 | | | | 18,256,101 | |
| | Yangzijiang Shipbuilding Holdings Ltd. | | | 8,315,000 | | | | 7,048,836 | |
| | | | | | | | | | |
TOTAL SINGAPORE | | | | 118,180,815 | |
| | | | | | | | | | |
SPAIN — (1.9%) | | | | | | | | |
# | | Banco Bilbao Vizcaya Argentaria SA | | | 7,144,740 | | | | 36,858,199 | |
# | | Banco Bilbao Vizcaya Argentaria SA, Sponsored ADR | | | 1,205,842 | | | | 6,210,086 | |
# | | Banco Santander SA | | | 31,583,925 | | | | 81,912,138 | |
| | CaixaBank SA | | | 3,327,631 | | | | 11,034,568 | |
| | Repsol SA | | | 4,619,638 | | | | 62,847,702 | |
| | | | | | | | | | |
TOTAL SPAIN | | | | 198,862,693 | |
| | | | | | | | | | |
SWEDEN — (2.5%) | | | | | | | | |
| | Billerud AB | | | 643,038 | | | | 8,301,425 | |
| | Boliden AB | | | 1,135,291 | | | | 33,015,282 | |
| | Bure Equity AB | | | 95,599 | | | | 1,844,873 | |
W | | Dometic Group AB | | | 200,998 | | | | 1,150,809 | |
# | | Electrolux AB, Class B | | | 367,325 | | | | 4,531,753 | |
| | Essity AB, Class B | | | 97,665 | | | | 2,063,501 | |
| | Getinge AB, Class B | | | 79,109 | | | | 1,605,357 | |
| | Holmen AB, Class A | | | 5,562 | | | | 209,122 | |
| | Holmen AB, Class B | | | 176,174 | | | | 6,393,428 | |
# | | Husqvarna AB, Class B | | | 324,042 | | | | 1,923,885 | |
# | | Intrum AB | | | 175,698 | | | | 2,210,666 | |
| | Loomis AB | | | 81,723 | | | | 2,288,123 | |
* | | Millicom International Cellular SA, SDR | | | 349,452 | | | | 3,792,748 | |
* | | Pandox AB | | | 106,891 | | | | 1,309,002 | |
| | Peab AB, Class B | | | 334,177 | | | | 1,733,923 | |
| | Saab AB, Class B | | | 158,640 | | | | 5,605,391 | |
# | | Securitas AB, Class B | | | 531,310 | | | | 4,341,231 | |
THE DFA INTERNATIONAL VALUE SERIES
CONTINUED
| | | | | | | | | | |
| | | | | Shares | | | Value» | |
SWEDEN — (Continued) | | | | | | | | |
| | Skandinaviska Enskilda Banken AB, Class A | | | 2,605,519 | | | $ | 27,471,007 | |
# | | Skandinaviska Enskilda Banken AB, Class C | | | 14,462 | | | | 164,955 | |
| | Skanska AB, Class B | | | 802,330 | | | | 12,477,311 | |
| | SKF AB, Class B | | | 1,179,544 | | | | 17,074,621 | |
| | SSAB AB, Class A | | | 729,061 | | | | 3,506,832 | |
| | SSAB AB, Class B | | | 2,046,233 | | | | 9,507,659 | |
| | Svenska Cellulosa AB SCA, Class A | | | 34,534 | | | | 416,780 | |
| | Svenska Cellulosa AB SCA, Class B | | | 581,885 | | | | 6,864,953 | |
| | Svenska Handelsbanken AB, Class A | | | 1,224,329 | | | | 11,375,275 | |
# | | Svenska Handelsbanken AB, Class B | | | 37,204 | | | | 406,824 | |
# | | Swedbank AB, Class A | | | 973,315 | | | | 14,510,227 | |
| | Tele2 AB, Class B | | | 109,932 | | | | 901,004 | |
| | Telefonaktiebolaget LM Ericsson, Class B | | | 1,113,229 | | | | 6,188,823 | |
# | | Telia Co. AB | | | 6,786,020 | | | | 17,981,356 | |
| | Trelleborg AB, Class B | | | 788,808 | | | | 17,368,807 | |
| | Volvo AB, Class A | | | 268,270 | | | | 4,582,489 | |
| | Volvo AB, Class B | | | 2,261,068 | | | | 37,006,733 | |
| | | | | | | | | | |
TOTAL SWEDEN | | | | 270,126,175 | |
| | | | | | | | | | |
SWITZERLAND — (8.8%) | | | | | | | | |
| | ABB Ltd. | | | 912,685 | | | | 25,345,535 | |
| | Accelleron Industries AG | | | 45,634 | | | | 773,825 | |
| | Alcon, Inc. | | | 571,377 | | | | 34,773,531 | |
| | Baloise Holding AG | | | 105,344 | | | | 14,392,321 | |
| | Barry Callebaut AG | | | 484 | | | | 915,685 | |
| | Cie Financiere Richemont SA, Class A | | | 922,306 | | | | 90,140,218 | |
# | | Credit Suisse Group AG | | | 1,363,427 | | | | 5,647,941 | |
# | | Credit Suisse Group AG, Sponsored ADR | | | 1,042,624 | | | | 4,295,611 | |
| | Holcim AG | | | 1,372,633 | | | | 62,257,051 | |
| | Julius Baer Group Ltd. | | | 716,015 | | | | 34,353,585 | |
# | | Novartis AG, Sponsored ADR | | | 1,596,183 | | | | 129,498,327 | |
| | Novartis AG | | | 1,706,093 | | | | 138,007,072 | |
| | SIG Group AG | | | 479,021 | | | | 9,208,255 | |
| | Swatch Group AG | | | 47,812 | | | | 10,743,806 | |
| | Swatch Group AG | | | 123,912 | | | | 5,176,883 | |
| | Swiss Life Holding AG | | | 69,548 | | | | 33,676,676 | |
| | Swiss Prime Site AG | | | 120,516 | | | | 9,724,788 | |
| | Swiss Re AG | | | 399,672 | | | | 29,689,539 | |
| | Swisscom AG | | | 94,854 | | | | 46,837,870 | |
* | | UBS Group AG | | | 7,263,744 | | | | 115,167,715 | |
| | Zurich Insurance Group AG | | | 348,909 | | | | 148,695,901 | |
| | | | | | | | | | |
TOTAL SWITZERLAND | | | | 949,322,135 | |
| | | | | | | | | | |
UNITED KINGDOM — (14.7%) | | | | | | | | |
| | 3i Group PLC | | | 795,146 | | | | 10,590,043 | |
| | Abrdn Plc | | | 1,691,534 | | | | 3,082,278 | |
| | Airtel Africa PLC | | | 31,927 | | | | 41,326 | |
| | Anglo American PLC | | | 1,391,761 | | | | 41,689,088 | |
| | Associated British Foods PLC | | | 371,994 | | | | 5,765,637 | |
| | Aviva PLC | | | 9,753,485 | | | | 46,783,804 | |
# | | Barclays PLC, Sponsored ADR | | | 7,035,082 | | | | 48,682,767 | |
| | Barclays PLC | | | 191,609 | | | | 325,592 | |
| | Barratt Developments PLC | | | 1,021,479 | | | | 4,405,726 | |
| | Bellway PLC | | | 17,101 | | | | 363,690 | |
| | Berkeley Group Holdings PLC | | | 7,801 | | | | 310,381 | |
# | | BP PLC, Sponsored ADR | | | 2,518,588 | | | | 83,818,609 | |
| | BP PLC | | | 7,690,578 | | | | 42,548,901 | |
# | | British American Tobacco PLC, Sponsored ADR | | | 838,885 | | | | 33,236,624 | |
THE DFA INTERNATIONAL VALUE SERIES
CONTINUED
| | | | | | | | | | |
| | | | | Shares | | | Value» | |
UNITED KINGDOM — (Continued) | | | | | | | | |
| | British American Tobacco PLC | | | 3,024,009 | | | $ | 119,428,540 | |
| | BT Group PLC | | | 22,408,140 | | | | 33,393,292 | |
| | DS Smith PLC | | | 2,580,437 | | | | 8,605,552 | |
| | Glencore PLC | | | 23,897,614 | | | | 137,006,665 | |
* | | Haleon PLC | | | 10,146 | | | | 31,112 | |
| | HSBC Holdings PLC | | | 13,535,003 | | | | 69,462,304 | |
# | | HSBC Holdings PLC, Sponsored ADR | | | 2,324,211 | | | | 60,220,307 | |
| | Investec PLC | | | 1,183,350 | | | | 5,930,587 | |
| | J Sainsbury PLC | | | 7,868,098 | | | | 17,538,720 | |
| | Johnson Matthey PLC | | | 31,950 | | | | 709,213 | |
| | Kingfisher PLC | | | 7,975,671 | | | | 20,038,335 | |
| | Lloyds Banking Group PLC | | | 164,752,825 | | | | 79,125,348 | |
# | | Lloyds Banking Group PLC, ADR | | | 1,844,768 | | | | 3,523,507 | |
| | M&G PLC | | | 2,956,890 | | | | 5,942,237 | |
| | Melrose Industries PLC | | | 4,376,981 | | | | 5,871,206 | |
| | NatWest Group PLC | | | 5,527,508 | | | | 14,887,243 | |
# | | NatWest Group PLC, Sponsored ADR | | | 637,445 | | | | 3,454,952 | |
| | Pearson PLC | | | 309,149 | | | | 3,417,059 | |
# | | Pearson PLC, Sponsored ADR | | | 1,015,920 | | | | 11,297,030 | |
| | Phoenix Group Holdings PLC | | | 710,707 | | | | 4,423,421 | |
| | Shell PLC | | | 307,658 | | | | 8,522,614 | |
| | Shell PLC, Sponsored ADR | | | 9,015,405 | | | | 501,526,980 | |
| | Standard Chartered PLC | | | 5,983,569 | | | | 35,750,245 | |
| | Taylor Wimpey PLC | | | 1,897,348 | | | | 2,039,892 | |
| | Tesco PLC | | | 12,704,903 | | | | 31,379,592 | |
| | Vodafone Group PLC | | | 51,300,878 | | | | 59,888,735 | |
# | | Vodafone Group PLC, Sponsored ADR | | | 1,760,686 | | | | 20,793,705 | |
| | | | | | | | | | |
TOTAL UNITED KINGDOM | | | | 1,585,852,859 | |
| | | | | | | | | | |
TOTAL COMMON STOCKS | | | | 10,186,002,001 | |
| | | | | | | | | | |
PREFERRED STOCKS — (0.8%) | | | | | | | | |
| | |
GERMANY — (0.8%) | | | | | | | | |
| | Bayerische Motoren Werke AG | | | 152,008 | | | | 11,209,656 | |
| | Porsche Automobil Holding SE | | | 307,547 | | | | 17,183,337 | |
| | Volkswagen AG | | | 489,153 | | | | 62,612,238 | |
| | | | | | | | | | |
TOTAL GERMANY | | | | 91,005,231 | |
| | | | | | | | | | |
TOTAL INVESTMENT SECURITIES
(Cost $10,555,431,050) | | | | 10,277,007,232 | |
| | | | | | | | | | |
| | | |
| | | | | | | | Value† | |
SECURITIES LENDING COLLATERAL — (4.5%) | | | | | | | | |
@ § | | The DFA Short Term Investment Fund | | | 41,765,646 | | | | 482,852,631 | |
| | | | | | | | | | |
TOTAL INVESTMENTS — (100.0%)
(Cost $11,038,476,605) | | | $ | 10,759,859,863 | |
| | | | | | | | | | |
| ADR | American Depositary Receipt |
| » | Securities that have been fair value factored. See Note B to Financial Statements. |
| * | Non-Income Producing Securities. |
| # | Total or Partial Securities on Loan. |
| W | Rule 144A, Section 4(2), or other security that is restricted as to resale to institutional investors. This security has been deemed liquid based upon the Fund’s Liquidity Guidelines. The liquidity determination is unaudited. |
| †† | Security valued using significant unobservable inputs (Level 3). |
| † | See Note B to Financial Statements. |
| @ | Security purchased with cash collateral received from Securities on Loan. |
THE DFA INTERNATIONAL VALUE SERIES
CONTINUED
As of October 31, 2022, The DFA International Value Series had entered into the following outstanding futures contracts:
| | | | | | | | | | | | | | | | | | | | |
Description | | Number of
Contracts | | | Expiration
Date | | | Notional
Value | | | Market
Value | | | Unrealized
Appreciation
(Depreciation) | |
Long Position Contracts: | | | | | | | | | | | | | | | | | | | | |
S&P 500® Emini Index | | | 842 | | | | 12/16/22 | | | $ | 157,956,087 | | | $ | 163,474,300 | | | $ | 5,518,213 | |
| | | | | | | | | | | | | | | | | | | | |
Total Futures Contracts | | | | | | | | | | $ | 157,956,087 | | | $ | 163,474,300 | | | $ | 5,518,213 | |
| | | | | | | | | | | | | | | | | | | | |
Summary of the Series’ investments as of October 31, 2022, based on their valuation inputs, is as follows (see Security Valuation Note):
| | | | | | | | | | | | | | | | |
| | | Investments in Securities (Market Value) | |
| | | Level 1 | | | Level 2 | | | Level 3 | | | Total | |
Common Stocks | | | | | | | | | | | | | | | | |
Australia | | | — | | | $ | 816,795,707 | | | | — | | | $ | 816,795,707 | |
Austria | | | — | | | | 6,220,806 | | | | — | | | | 6,220,806 | |
Belgium | | | — | | | | 58,799,281 | | | | — | | | | 58,799,281 | |
Canada | | $ | 1,090,433,733 | | | | — | | | | — | | | | 1,090,433,733 | |
China | | | — | | | | 3,578,225 | | | | — | | | | 3,578,225 | |
Denmark | | | — | | | | 201,804,976 | | | | — | | | | 201,804,976 | |
Finland | | | 5,856,638 | | | | 107,933,257 | | | | — | | | | 113,789,895 | |
France | | | — | | | | 1,095,283,146 | | | | — | | | | 1,095,283,146 | |
Germany | | | 14,207,408 | | | | 580,348,027 | | | | — | | | | 594,555,435 | |
Hong Kong | | | — | | | | 214,006,034 | | | | — | | | | 214,006,034 | |
Ireland | | | 26,386,842 | | | | 20,183,967 | | | | — | | | | 46,570,809 | |
Israel | | | 11,032,764 | | | | 53,775,826 | | | | — | | | | 64,808,590 | |
Italy | | | 24,863,308 | | | | 189,045,465 | | | | — | | | | 213,908,773 | |
Japan | | | 13,905,475 | | | | 1,985,493,115 | | | | — | | | | 1,999,398,590 | |
Netherlands | | | 26,051,464 | | | | 378,977,661 | | | | — | | | | 405,029,125 | |
New Zealand | | | — | | | | 23,565,859 | | | | — | | | | 23,565,859 | |
Norway | | | — | | | | 101,097,179 | | | | — | | | | 101,097,179 | |
Portugal | | | — | | | | 14,011,161 | | | | — | | | | 14,011,161 | |
Singapore | | | — | | | | 118,180,815 | | | | — | | | | 118,180,815 | |
Spain | | | 6,210,086 | | | | 192,652,607 | | | | — | | | | 198,862,693 | |
Sweden | | | — | | | | 270,126,175 | | | | — | | | | 270,126,175 | |
Switzerland | | | 158,548,612 | | | | 790,773,523 | | | | — | | | | 949,322,135 | |
United Kingdom | | | 766,554,481 | | | | 819,298,378 | | | | — | | | | 1,585,852,859 | |
Preferred Stocks | | | | | | | | | | | | | | | | |
Germany | | | — | | | | 91,005,231 | | | | — | | | | 91,005,231 | |
Securities Lending Collateral | | | — | | | | 482,852,631 | | | | — | | | | 482,852,631 | |
Futures Contracts** | | | 5,518,213 | | | | — | | | | — | | | | 5,518,213 | |
| | | | | | | | | | | | | | | | |
TOTAL | | $ | 2,149,569,024 | | | $ | 8,615,809,052 | | | | — | | | $ | 10,765,378,076 | |
| | | | | | | | | | | | | | | | |
| ** | Valued at the unrealized appreciation/(depreciation) on the investment. |
THE JAPANESE SMALL COMPANY SERIES
SCHEDULE OF INVESTMENTS
October 31, 2022
| | | | | | | | | | |
| | | | | Shares | | | Value» | |
COMMON STOCKS — (97.8%) | |
COMMUNICATION SERVICES — (2.4%) | |
# | | Accrete, Inc. | | | 20,600 | | | $ | 328,627 | |
| | Aiming, Inc. | | | 51,100 | | | | 103,442 | |
| | Akatsuki, Inc. | | | 45,400 | | | | 659,526 | |
* | | Allied Architects, Inc. | | | 30,400 | | | | 215,866 | |
* | | AlphaPolis Co. Ltd. | | | 13,000 | | | | 199,377 | |
| | Amuse, Inc. | | | 34,600 | | | | 419,694 | |
| | ARTERIA Networks Corp. | | | 86,500 | | | | 698,461 | |
| | Asahi Broadcasting Group Holdings Corp. | | | 57,600 | | | | 240,106 | |
# | | Asahi Net, Inc. | | | 109,100 | | | | 443,832 | |
* | | Atrae, Inc. | | | 96,000 | | | | 989,561 | |
| | Avex, Inc. | | | 234,900 | | | | 2,633,117 | |
# * | | Bengo4.com, Inc. | | | 46,600 | | | | 993,005 | |
| | Broadmedia Corp. | | | 5,520 | | | | 36,968 | |
| | Broccoli Co. Ltd. | | | 4,400 | | | | 33,579 | |
# | | Carta Holdings, Inc. | | | 38,100 | | | | 436,506 | |
# | | Ceres, Inc. | | | 18,800 | | | | 105,734 | |
* | | COLOPL, Inc. | | | 179,900 | | | | 847,346 | |
# * | | COOKPAD, Inc. | | | 190,600 | | | | 264,899 | |
# | | Cross Marketing Group, Inc. | | | 22,900 | | | | 133,801 | |
| | DeNA Co. Ltd. | | | 411,700 | | | | 5,369,580 | |
| | Digital Holdings, Inc. | | | 60,500 | | | | 467,103 | |
| | Direct Marketing MiX, Inc. | | | 38,200 | | | | 431,648 | |
| | Drecom Co. Ltd. | | | 24,400 | | | | 125,642 | |
# | | Enjin Co. Ltd. | | | 6,600 | | | | 90,566 | |
# | | Faith, Inc. | | | 56,010 | | | | 215,334 | |
# | | Fibergate, Inc. | | | 22,300 | | | | 136,877 | |
# * | | FreakOut Holdings, Inc. | | | 23,400 | | | | 210,831 | |
| | Freebit Co. Ltd. | | | 63,100 | | | | 466,821 | |
| | Fuji Media Holdings, Inc. | | | 132,700 | | | | 922,941 | |
| | Gakken Holdings Co. Ltd. | | | 132,500 | | | | 873,711 | |
| | GungHo Online Entertainment, Inc. | | | 291,600 | | | | 4,310,169 | |
| | Imagica Group, Inc. | | | 112,500 | | | | 669,172 | |
| | Imagineer Co. Ltd. | | | 1,600 | | | | 9,854 | |
# | | i-mobile Co. Ltd. | | | 6,600 | | | | 52,689 | |
| | Infocom Corp. | | | 146,900 | | | | 2,108,505 | |
| | Intage Holdings, Inc. | | | 215,000 | | | | 2,365,514 | |
| | IPS, Inc. | | | 17,200 | | | | 348,610 | |
| | ITmedia, Inc. | | | 56,800 | | | | 656,707 | |
* | | Japan Communications, Inc. | | | 903,800 | | | | 1,359,588 | |
| | J-Stream, Inc. | | | 32,200 | | | | 130,236 | |
| | Kamakura Shinsho Ltd. | | | 25,700 | | | | 138,325 | |
* | | LIFULL Co. Ltd. | | | 444,000 | | | | 491,356 | |
# * | | Macbee Planet, Inc. | | | 3,400 | | | | 197,110 | |
| | Macromill, Inc. | | | 243,197 | | | | 1,812,692 | |
| | MarkLines Co. Ltd. | | | 72,900 | | | | 1,254,183 | |
| | Marvelous, Inc. | | | 195,700 | | | | 887,884 | |
# | | Members Co. Ltd. | | | 50,400 | | | | 924,566 | |
| | Mixi, Inc. | | | 256,400 | | | | 4,019,585 | |
# * | | Mobile Factory, Inc. | | | 10,500 | | | | 72,001 | |
| | MTI Ltd. | | | 49,200 | | | | 168,128 | |
* | | NexTone, Inc. | | | 31,200 | | | | 918,765 | |
| | Okinawa Cellular Telephone Co. | | | 161,600 | | | | 3,055,947 | |
# | | Orchestra Holdings, Inc. | | | 4,800 | | | | 80,582 | |
| | Oricon, Inc. | | | 27,800 | | | | 180,791 | |
* | | PR Times, Inc. | | | 11,900 | | | | 191,267 | |
THE JAPANESE SMALL COMPANY SERIES
CONTINUED
| | | | | | | | | | |
| | | | | Shares | | | Value» | |
COMMUNICATION SERVICES — (Continued) | |
| | Proto Corp. | | | 157,900 | | | $ | 1,236,791 | |
* | | Shobunsha Holdings, Inc. | | | 28,100 | | | | 55,955 | |
| | SKY Perfect JSAT Holdings, Inc. | | | 917,800 | | | | 3,214,623 | |
| | Toei Co. Ltd. | | | 700 | | | | 85,982 | |
| | Tohokushinsha Film Corp. | | | 94,800 | | | | 407,399 | |
| | Tokyu Recreation Co. Ltd. | | | 19,200 | | | | 792,840 | |
# | | Tow Co. Ltd. | | | 226,900 | | | | 468,347 | |
| | Trenders, Inc. | | | 13,300 | | | | 163,263 | |
| | TV Asahi Holdings Corp. | | | 98,500 | | | | 922,637 | |
| | Tv Tokyo Holdings Corp. | | | 67,800 | | | | 866,986 | |
| | Usen-Next Holdings Co. Ltd. | | | 79,900 | | | | 1,224,187 | |
* | | UUUM Co. Ltd. | | | 11,600 | | | | 75,801 | |
| | ValueCommerce Co. Ltd. | | | 105,000 | | | | 1,531,721 | |
# | | V-Cube, Inc. | | | 80,700 | | | | 547,236 | |
| | Vector, Inc. | | | 201,500 | | | | 1,497,424 | |
| | Wowow, Inc. | | | 37,900 | | | | 318,920 | |
| | Zenrin Co. Ltd. | | | 215,250 | | | | 1,266,974 | |
| | ZIGExN Co. Ltd. | | | 113,900 | | | | 280,193 | |
| | | | | | | | | | |
TOTAL COMMUNICATION SERVICES | | | | 60,456,006 | |
| | | | | | | | | | |
CONSUMER DISCRETIONARY — (14.4%) | |
| | &Do Holdings Co. Ltd. | | | 59,500 | | | | 351,394 | |
| | Adastria Co. Ltd. | | | 148,840 | | | | 2,021,266 | |
# | | Adventure, Inc. | | | 8,800 | | | | 644,036 | |
# | | Aeon Fantasy Co. Ltd. | | | 48,932 | | | | 969,939 | |
# | | Ahresty Corp. | | | 141,200 | | | | 349,867 | |
| | Ainavo Holdings Co. Ltd. | | | 5,600 | | | | 33,565 | |
# * | | Airtrip Corp. | | | 85,100 | | | | 1,419,101 | |
| | Aisan Industry Co. Ltd. | | | 213,700 | | | | 1,012,902 | |
* | | Akebono Brake Industry Co. Ltd. | | | 610,100 | | | | 713,627 | |
| | Alleanza Holdings Co. Ltd. | | | 80,800 | | | | 516,370 | |
| | Alpen Co. Ltd. | | | 98,500 | | | | 1,338,680 | |
# | | Alpha Corp. | | | 31,700 | | | | 201,134 | |
| | Amiyaki Tei Co. Ltd. | | | 28,200 | | | | 551,515 | |
| | AOKI Holdings, Inc. | | | 234,900 | | | | 1,135,373 | |
| | Aoyama Trading Co. Ltd. | | | 245,000 | | | | 1,709,104 | |
| | Arata Corp. | | | 87,800 | | | | 2,424,229 | |
# | | Arcland Service Holdings Co. Ltd. | | | 94,800 | | | | 1,389,652 | |
# | | ARCLANDS Corp. | | | 31,200 | | | | 309,449 | |
| | Asahi Co. Ltd. | | | 110,100 | | | | 957,115 | |
| | Ashimori Industry Co. Ltd. | | | 29,499 | | | | 205,361 | |
| | ASKUL Corp. | | | 241,600 | | | | 2,523,197 | |
| | Asti Corp. | | | 19,400 | | | | 266,924 | |
* | | Atsugi Co. Ltd. | | | 18,000 | | | | 44,758 | |
| | Aucnet, Inc. | | | 65,100 | | | | 978,522 | |
| | Autobacs Seven Co. Ltd. | | | 436,500 | | | | 4,151,823 | |
# | | Avantia Co. Ltd. | | | 66,500 | | | | 347,842 | |
# | | Baroque Japan Ltd. | | | 90,200 | | | | 478,368 | |
# | | Beauty Garage, Inc. | | | 21,700 | | | | 392,195 | |
* | | Beenos, Inc. | | | 30,500 | | | | 554,320 | |
| | Belluna Co. Ltd. | | | 323,600 | | | | 1,559,495 | |
| | Benesse Holdings, Inc. | | | 362,043 | | | | 5,341,033 | |
# | | Bic Camera, Inc. | | | 557,300 | | | | 4,332,829 | |
# | | Bike O & Co. Ltd. | | | 33,600 | | | | 248,966 | |
# | | Bookoff Group Holdings Ltd. | | | 66,600 | | | | 510,618 | |
| | Central Automotive Products Ltd. | | | 80,500 | | | | 1,214,441 | |
| | Central Sports Co. Ltd. | | | 45,200 | | | | 728,186 | |
| | Chiyoda Co. Ltd. | | | 110,800 | | | | 546,574 | |
| | Chofu Seisakusho Co. Ltd. | | | 122,400 | | | | 1,671,554 | |
THE JAPANESE SMALL COMPANY SERIES
CONTINUED
| | | | | | | | | | |
| | | | | Shares | | | Value» | |
CONSUMER DISCRETIONARY — (Continued) | | | | | | | | |
| | Chuo Spring Co. Ltd. | | | 81,700 | | | $ | 379,850 | |
| | Cleanup Corp. | | | 139,400 | | | | 569,903 | |
# | | Colowide Co. Ltd. | | | 238,500 | | | | 2,926,658 | |
# | | Corona Corp. | | | 97,200 | | | | 551,543 | |
# | | Create Restaurants Holdings, Inc. | | | 619,500 | | | | 3,910,501 | |
* | | CROOZ, Inc. | | | 9,100 | | | | 62,127 | |
* | | CrowdWorks, Inc. | | | 4,200 | | | | 49,876 | |
| | Curves Holdings Co. Ltd. | | | 186,100 | | | | 1,081,571 | |
| | Daido Metal Co. Ltd. | | | 227,200 | | | | 782,335 | |
# | | Daikoku Denki Co. Ltd. | | | 50,900 | | | | 488,700 | |
| | Daikyonishikawa Corp. | | | 258,900 | | | | 1,043,926 | |
| | Daimaruenawin Co. Ltd. | | | 3,400 | | | | 26,265 | |
| | Dainichi Co. Ltd. | | | 67,100 | | | | 293,205 | |
| | DCM Holdings Co. Ltd. | | | 729,200 | | | | 5,681,710 | |
| | Doshisha Co. Ltd. | | | 134,600 | | | | 1,368,151 | |
| | Doutor Nichires Holdings Co. Ltd. | | | 186,086 | | | | 2,076,002 | |
| | Eagle Industry Co. Ltd. | | | 168,200 | | | | 1,247,497 | |
| | EAT & Holdings Co. Ltd. | | | 33,000 | | | | 475,343 | |
# | | EDION Corp. | | | 526,900 | | | | 4,182,106 | |
| | Enigmo, Inc. | | | 152,100 | | | | 561,332 | |
# | | ES-Con Japan Ltd. | | | 44,600 | | | | 243,060 | |
# | | Eslead Corp. | | | 47,700 | | | | 602,930 | |
| | Exedy Corp. | | | 184,900 | | | | 2,167,661 | |
| | FCC Co. Ltd. | | | 231,100 | | | | 2,246,969 | |
| | Felissimo Corp. | | | 20,600 | | | | 135,468 | |
# | | First Juken Co. Ltd. | | | 46,400 | | | | 324,625 | |
| | First-corp, Inc. | | | 45,300 | | | | 218,743 | |
| | FJ Next Holdings Co. Ltd. | | | 106,600 | | | | 711,252 | |
| | Food & Life Cos. Ltd. | | | 265,000 | | | | 4,457,576 | |
| | Foster Electric Co. Ltd. | | | 143,200 | | | | 748,344 | |
# | | F-Tech, Inc. | | | 42,300 | | | | 147,843 | |
# | | Fuji Corp. | | | 72,800 | | | | 620,617 | |
| | Fuji Corp. Ltd. | | | 171,000 | | | | 715,114 | |
| | Fuji Kyuko Co. Ltd. | | | 66,500 | | | | 2,056,314 | |
| | Fujibo Holdings, Inc. | | | 64,800 | | | | 1,467,291 | |
| | Fujikura Composites, Inc. | | | 119,200 | | | | 648,185 | |
| | Fujishoji Co. Ltd. | | | 52,700 | | | | 308,913 | |
| | FuKoKu Co. Ltd. | | | 66,400 | | | | 461,178 | |
| | Furukawa Battery Co. Ltd. | | | 88,000 | | | | 621,455 | |
| | Furyu Corp. | | | 115,400 | | | | 906,576 | |
| | Futaba Industrial Co. Ltd. | | | 341,300 | | | | 856,661 | |
# | | Gakkyusha Co. Ltd. | | | 49,300 | | | | 547,369 | |
# | | Genki Sushi Co. Ltd. | | | 32,500 | | | | 677,158 | |
| | Geo Holdings Corp. | | | 186,600 | | | | 2,441,418 | |
| | Gift Holdings, Inc. | | | 23,300 | | | | 541,902 | |
| | GLOBERIDE, Inc. | | | 106,198 | | | | 1,659,874 | |
| | Golf Digest Online, Inc. | | | 64,100 | | | | 626,687 | |
| | GSI Creos Corp. | | | 63,184 | | | | 610,561 | |
| | G-Tekt Corp. | | | 143,700 | | | | 1,284,523 | |
| | Gunze Ltd. | | | 98,000 | | | | 2,517,312 | |
| | H2O Retailing Corp. | | | 542,045 | | | | 4,561,538 | |
# | | Hagihara Industries, Inc. | | | 77,700 | | | | 532,948 | |
# | | Hamee Corp. | | | 36,100 | | | | 206,798 | |
| | Handsman Co. Ltd. | | | 43,500 | | | | 247,333 | |
| | Happinet Corp. | | | 99,600 | | | | 1,370,083 | |
# | | Hard Off Corp. Co. Ltd. | | | 58,800 | | | | 501,016 | |
| | Heian Ceremony Service Co. Ltd. | | | 8,300 | | | | 42,004 | |
| | Heiwa Corp. | | | 271,000 | | | | 4,372,086 | |
# | | HI-LEX Corp. | | | 121,700 | | | | 865,469 | |
THE JAPANESE SMALL COMPANY SERIES
CONTINUED
| | | | | | | | | | |
| | | | | Shares | | | Value» | |
CONSUMER DISCRETIONARY — (Continued) | |
# | | Himaraya Co. Ltd. | | | 32,100 | | | $ | 197,076 | |
| | H-One Co. Ltd. | | | 123,200 | | | | 497,270 | |
| | Honeys Holdings Co. Ltd. | | | 118,640 | | | | 962,314 | |
| | Hoosiers Holdings Co. Ltd. | | | 213,000 | | | | 1,120,216 | |
| | Hotland Co. Ltd. | | | 44,200 | | | | 416,975 | |
| | IBJ, Inc. | | | 125,900 | | | | 806,776 | |
| | Ichibanya Co. Ltd. | | | 30,658 | | | | 945,986 | |
| | Ichikoh Industries Ltd. | | | 194,100 | | | | 554,177 | |
| | IDOM, Inc. | | | 367,100 | | | | 1,837,748 | |
| | IJTT Co. Ltd. | | | 133,980 | | | | 455,811 | |
# | | Imasen Electric Industrial | | | 37,400 | | | | 138,577 | |
# * | | Istyle, Inc. | | | 147,000 | | | | 483,807 | |
* †† | | Izuhakone Railway Co. Ltd. | | | 300 | | | | 0 | |
| | Izumi Co. Ltd. | | | 124,600 | | | | 2,513,563 | |
| | JANOME Corp. | | | 109,400 | | | | 465,989 | |
# | | Japan Best Rescue System Co. Ltd. | | | 55,600 | | | | 298,321 | |
| | Japan Wool Textile Co. Ltd. | | | 312,600 | | | | 2,095,641 | |
| | JINS Holdings, Inc. | | | 82,900 | | | | 2,492,946 | |
# * | | Joban Kosan Co. Ltd. | | | 41,499 | | | | 325,060 | |
| | Joshin Denki Co. Ltd. | | | 108,200 | | | | 1,392,763 | |
| | Joyful Honda Co. Ltd. | | | 146,300 | | | | 1,783,292 | |
| | JP-Holdings, Inc. | | | 360,900 | | | | 724,743 | |
| | JVCKenwood Corp. | | | 1,051,800 | | | | 1,527,000 | |
# * | | Kasai Kogyo Co. Ltd. | | | 103,300 | | | | 133,251 | |
| | Kawai Musical Instruments Manufacturing Co. Ltd. | | | 36,600 | | | | 650,373 | |
| | Keiyo Co. Ltd. | | | 245,000 | | | | 1,492,695 | |
| | KeyHolder, Inc. | | | 2,100 | | | | 11,357 | |
# | | KFC Holdings Japan Ltd. | | | 87,300 | | | | 1,633,893 | |
# | | King Co. Ltd. | | | 54,100 | | | | 161,402 | |
# * | | Kintetsu Department Store Co. Ltd. | | | 1,300 | | | | 21,980 | |
| | Ki-Star Real Estate Co. Ltd. | | | 55,900 | | | | 1,733,144 | |
| | Kohnan Shoji Co. Ltd. | | | 157,700 | | | | 3,301,934 | |
# | | Kojima Co. Ltd. | | | 197,700 | | | | 818,506 | |
| | Komatsu Matere Co. Ltd. | | | 195,000 | | | | 1,068,121 | |
| | KOMEDA Holdings Co. Ltd. | | | 301,900 | | | | 5,042,132 | |
# | | Komehyo Holdings Co. Ltd. | | | 42,400 | | | | 932,635 | |
| | Komeri Co. Ltd. | | | 202,100 | | | | 3,525,826 | |
# | | Konaka Co. Ltd. | | | 163,506 | | | | 366,453 | |
# | | Kotobukiya Co. Ltd. | | | 1,800 | | | | 102,848 | |
| | K’s Holdings Corp. | | | 243,000 | | | | 1,904,248 | |
| | KU Holdings Co. Ltd. | | | 115,500 | | | | 920,428 | |
| | Kurabo Industries Ltd. | | | 113,200 | | | | 1,584,167 | |
| | KYB Corp. | | | 117,200 | | | | 2,563,859 | |
# | | Kyoritsu Maintenance Co. Ltd. | | | 63,200 | | | | 2,603,586 | |
| | LEC, Inc. | | | 142,200 | | | | 840,330 | |
# | | LITALICO, Inc. | | | 117,100 | | | | 2,474,639 | |
* | | Locondo, Inc. | | | 21,000 | | | | 175,622 | |
| | Look Holdings, Inc. | | | 37,100 | | | | 510,830 | |
| | Mars Group Holdings Corp. | | | 80,600 | | | | 987,972 | |
# | | Maruzen CHI Holdings Co. Ltd. | | | 106,300 | | | | 229,414 | |
| | Matsuoka Corp. | | | 10,200 | | | | 62,651 | |
| | Media Do Co. Ltd. | | | 54,200 | | | | 772,253 | |
| | Meiko Network Japan Co. Ltd. | | | 36,400 | | | | 148,292 | |
# | | Meiwa Estate Co. Ltd. | | | 73,200 | | | | 300,478 | |
# | | Mikuni Corp. | | | 147,800 | | | | 313,626 | |
# | | Mitsuba Corp. | | | 204,690 | | | | 540,402 | |
| | Mizuno Corp. | | | 114,900 | | | | 1,967,077 | |
| | Monogatari Corp. | | | 66,300 | | | | 3,037,493 | |
| | Morito Co. Ltd. | | | 107,800 | | | | 544,715 | |
THE JAPANESE SMALL COMPANY SERIES
CONTINUED
| | | | | | | | | | |
| | | | | Shares | | | Value» | |
CONSUMER DISCRETIONARY — (Continued) | |
| | MrMax Holdings Ltd. | | | 159,300 | | | $ | 732,355 | |
| | Murakami Corp. | | | 31,800 | | | | 482,409 | |
| | Musashi Seimitsu Industry Co. Ltd. | | | 299,300 | | | | 3,454,289 | |
| | Nafco Co. Ltd. | | | 54,200 | | | | 574,897 | |
| | Nagahori Corp. | | | 200 | | | | 2,226 | |
| | Nagase Brothers, Inc. | | | 200 | | | | 7,346 | |
# | | Nagawa Co. Ltd. | | | 31,800 | | | | 1,587,130 | |
| | Nakayamafuku Co. Ltd. | | | 41,800 | | | | 87,435 | |
| | New Art Holdings Co. Ltd. | | | 31,734 | | | | 322,322 | |
| | Nextage Co. Ltd. | | | 287,000 | | | | 5,531,782 | |
| | NHK Spring Co. Ltd. | | | 903,756 | | | | 5,006,892 | |
| | Nichirin Co. Ltd. | | | 61,160 | | | | 693,311 | |
# | | Nihon House Holdings Co. Ltd. | | | 239,600 | | | | 672,936 | |
# | | Nihon Plast Co. Ltd. | | | 100,700 | | | | 288,328 | |
| | Nihon Tokushu Toryo Co. Ltd. | | | 80,400 | | | | 460,308 | |
| | Nippon Felt Co. Ltd. | | | 84,000 | | | | 223,640 | |
| | Nippon Piston Ring Co. Ltd. | | | 49,800 | | | | 393,207 | |
| | Nippon Seiki Co. Ltd. | | | 326,000 | | | | 1,657,047 | |
| | Nishikawa Rubber Co. Ltd. | | | 38,500 | | | | 306,207 | |
# | | Nishimatsuya Chain Co. Ltd. | | | 253,100 | | | | 2,320,273 | |
| | Nissan Shatai Co. Ltd. | | | 477,300 | | | | 2,748,178 | |
| | Nissan Tokyo Sales Holdings Co. Ltd. | | | 166,400 | | | | 311,951 | |
| | NITTAN Corp. | | | 93,500 | | | | 167,315 | |
| | Nojima Corp. | | | 398,000 | | | | 3,314,681 | |
| | NOK Corp. | | | 342,980 | | | | 2,805,643 | |
| | Ohashi Technica, Inc. | | | 67,600 | | | | 653,300 | |
| | Ohsho Food Service Corp. | | | 65,100 | | | | 2,775,736 | |
| | Onward Holdings Co. Ltd. | | | 616,100 | | | | 1,283,860 | |
# | | Ozu Corp. | | | 22,200 | | | | 219,784 | |
| | Pacific Industrial Co. Ltd. | | | 270,300 | | | | 1,903,854 | |
| | PAL GROUP Holdings Co. Ltd. | | | 136,800 | | | | 1,953,407 | |
| | PALTAC Corp. | | | 21,200 | | | | 602,203 | |
# | | PAPYLESS Co. Ltd. | | | 19,200 | | | | 133,939 | |
# | | Paris Miki Holdings, Inc. | | | 115,700 | | | | 202,085 | |
# | | PC Depot Corp. | | | 177,381 | | | | 332,762 | |
* | | PIA Corp. | | | 1,700 | | | | 37,992 | |
# | | Piolax, Inc. | | | 179,700 | | | | 2,234,465 | |
| | Plenus Co. Ltd. | | | 83,700 | | | | 1,482,699 | |
| | Poppins Corp. | | | 2,100 | | | | 22,361 | |
# | | Premium Water Holdings, Inc. | | | 8,100 | | | | 133,032 | |
# | | Press Kogyo Co. Ltd. | | | 598,500 | | | | 1,673,759 | |
| | Pressance Corp. | | | 109,900 | | | | 1,127,391 | |
| | QB Net Holdings Co. Ltd. | | | 58,700 | | | | 518,537 | |
# | | Raccoon Holdings, Inc. | | | 111,700 | | | | 924,775 | |
| | Regal Corp. | | | 1,500 | | | | 18,570 | |
| | Renaissance, Inc. | | | 3,500 | | | | 21,992 | |
| | Resorttrust, Inc. | | | 521,964 | | | | 8,033,803 | |
| | Rhythm Co. Ltd. | | | 43,600 | | | | 484,251 | |
# | | Riberesute Corp. | | | 46,100 | | | | 247,022 | |
| | Ride On Express Holdings Co. Ltd. | | | 46,900 | | | | 325,247 | |
* | | Right On Co. Ltd. | | | 92,925 | | | | 381,385 | |
| | Riken Corp. | | | 58,300 | | | | 888,524 | |
| | Riso Kyoiku Co. Ltd. | | | 692,900 | | | | 1,433,489 | |
# | | Rock Field Co. Ltd. | | | 94,800 | | | | 920,318 | |
| | Roland Corp. | | | 57,600 | | | | 1,634,450 | |
| | Round One Corp. | | | 931,500 | | | | 3,963,450 | |
# | | Sac’s Bar Holdings, Inc. | | | 122,950 | | | | 582,541 | |
| | San Holdings, Inc. | | | 59,900 | | | | 668,381 | |
* | | Sanden Corp. | | | 10,400 | | | | 14,688 | |
THE JAPANESE SMALL COMPANY SERIES
CONTINUED
| | | | | | | | | | |
| | | | | Shares | | | Value» | |
CONSUMER DISCRETIONARY — (Continued) | |
| | Sanei Architecture Planning Co. Ltd. | | | 55,200 | | | $ | 574,977 | |
| | Sangetsu Corp. | | | 291,250 | | | | 3,083,932 | |
| | Sankyo Co. Ltd. | | | 140,900 | | | | 4,652,778 | |
| | Sankyo Seiko Co. Ltd. | | | 232,800 | | | | 737,940 | |
| | Sanoh Industrial Co. Ltd. | | | 154,900 | | | | 706,434 | |
| | Sanyo Electric Railway Co. Ltd. | | | 109,898 | | | | 1,671,916 | |
# * | | Sanyo Shokai Ltd. | | | 59,599 | | | | 470,926 | |
| | Scroll Corp. | | | 189,200 | | | | 877,457 | |
| | Seiko Group Corp. | | | 165,882 | | | | 3,513,558 | |
# | | Seiren Co. Ltd. | | | 284,000 | | | | 4,448,320 | |
| | Senshukai Co. Ltd. | | | 174,600 | | | | 468,178 | |
| | Seria Co. Ltd. | | | 197,724 | | | | 3,230,123 | |
# | | Shidax Corp. | | | 149,800 | | | | 573,197 | |
| | Shikibo Ltd. | | | 75,600 | | | | 427,810 | |
| | Shin-Nihon Tatemono Co. Ltd. | | | 29,800 | | | | 86,881 | |
| | Shoei Co. Ltd. | | | 154,200 | | | | 5,686,653 | |
* | | Silver Life Co. Ltd. | | | 15,300 | | | | 153,706 | |
# | | Snow Peak, Inc. | | | 182,900 | | | | 2,406,334 | |
# | | SNT Corp. | | | 158,100 | | | | 229,449 | |
# | | Soft99 Corp. | | | 84,400 | | | | 620,427 | |
| | Sotoh Co. Ltd. | | | 49,100 | | | | 270,693 | |
| | SPK Corp. | | | 48,600 | | | | 462,800 | |
# | | Sprix Ltd. | | | 34,300 | | | | 228,737 | |
| | St. Marc Holdings Co. Ltd. | | | 111,200 | | | | 1,213,519 | |
| | Step Co. Ltd. | | | 60,800 | | | | 789,198 | |
# | | Suminoe Textile Co. Ltd. | | | 26,300 | | | | 314,431 | |
| | Sumitomo Riko Co. Ltd. | | | 252,100 | | | | 994,077 | |
| | Suncall Corp. | | | 127,200 | | | | 568,935 | |
* | | SuRaLa Net Co. Ltd. | | | 2,700 | | | | 15,107 | |
| | Syuppin Co. Ltd. | | | 134,200 | | | | 1,349,741 | |
| | T RAD Co. Ltd. | | | 42,900 | | | | 783,465 | |
| | Tachikawa Corp. | | | 71,600 | | | | 509,153 | |
| | Tachi-S Co. Ltd. | | | 195,940 | | | | 1,452,927 | |
# | | Taiho Kogyo Co. Ltd. | | | 109,900 | | | | 510,827 | |
| | Takashimaya Co. Ltd. | | | 426,400 | | | | 5,274,740 | |
# | | Takasho Co. Ltd. | | | 15,400 | | | | 70,265 | |
* | | Take & Give Needs Co. Ltd. | | | 11,400 | | | | 120,295 | |
# | | Takihyo Co. Ltd. | | | 19,200 | | | | 95,653 | |
# | | Tama Home Co. Ltd. | | | 100,000 | | | | 1,567,715 | |
| | Tamron Co. Ltd. | | | 103,400 | | | | 2,296,895 | |
# | | Tbk Co. Ltd. | | | 155,300 | | | | 290,128 | |
| | Tear Corp. | | | 57,300 | | | | 162,676 | |
| | Temairazu, Inc. | | | 14,900 | | | | 571,967 | |
| | T-Gaia Corp. | | | 136,400 | | | | 1,518,273 | |
# | | Tigers Polymer Corp. | | | 79,800 | | | | 209,201 | |
| | Toa Corp. | | | 144,900 | | | | 758,182 | |
| | Tokai Rika Co. Ltd. | | | 326,000 | | | | 3,401,970 | |
| | Token Corp. | | | 45,950 | | | | 2,422,229 | |
* | | Tokyo Base Co. Ltd. | | | 35,500 | | | | 83,535 | |
| | Tokyo Individualized Educational Institute, Inc. | | | 103,700 | | | | 358,158 | |
| | Tokyo Radiator Manufacturing Co. Ltd. | | | 24,300 | | | | 99,950 | |
| | Tokyotokeiba Co. Ltd. | | | 98,100 | | | | 2,731,225 | |
| | Tomy Co. Ltd. | | | 564,293 | | | | 4,954,976 | |
| | Topre Corp. | | | 219,800 | | | | 1,737,990 | |
# | | Toridoll Holdings Corp. | | | 301,500 | | | | 5,862,325 | |
| | Tosho Co. Ltd. | | | 4,400 | | | | 33,695 | |
| | Toyo Tire Corp. | | | 280,200 | | | | 3,287,156 | |
| | Toyoda Gosei Co. Ltd. | | | 38,900 | | | | 621,884 | |
| | TPR Co. Ltd. | | | 150,662 | | | | 1,264,699 | |
THE JAPANESE SMALL COMPANY SERIES
CONTINUED
| | | | | | | | | | |
| | | | | Shares | | | Value» | |
CONSUMER DISCRETIONARY — (Continued) | |
| | Treasure Factory Co. Ltd. | | | 10,300 | | | $ | 154,349 | |
| | TS Tech Co. Ltd. | | | 449,686 | | | | 4,702,681 | |
| | TSI Holdings Co. Ltd. | | | 301,095 | | | | 911,236 | |
* | | Tsukada Global Holdings, Inc. | | | 86,100 | | | | 212,971 | |
# | | Tsutsumi Jewelry Co. Ltd. | | | 39,000 | | | | 545,933 | |
# | | Twinbird Corp. | | | 9,200 | | | | 37,966 | |
| | Unipres Corp. | | | 224,297 | | | | 1,310,909 | |
# * | | Unitika Ltd. | | | 373,200 | | | | 686,839 | |
# * | | Universal Entertainment Corp. | | | 99,600 | | | | 1,343,868 | |
| | Valuence Holdings, Inc. | | | 1,600 | | | | 31,416 | |
* | | Village Vanguard Co. Ltd. | | | 36,600 | | | | 264,820 | |
| | VT Holdings Co. Ltd. | | | 492,000 | | | | 1,593,974 | |
| | Wacoal Holdings Corp. | | | 267,700 | | | | 4,310,530 | |
# | | Waseda Academy Co. Ltd. | | | 43,600 | | | | 335,524 | |
# | | Watts Co. Ltd. | | | 52,100 | | | | 224,229 | |
| | Weds Co. Ltd. | | | 14,500 | | | | 48,369 | |
| | World Co. Ltd. | | | 94,100 | | | | 883,077 | |
| | Xebio Holdings Co. Ltd. | | | 159,896 | | | | 1,084,452 | |
# | | Yachiyo Industry Co. Ltd. | | | 48,100 | | | | 206,971 | |
| | Yagi & Co. Ltd. | | | 18,600 | | | | 145,334 | |
| | Yamae Group Holdings Co. Ltd. | | | 9,400 | | | | 95,594 | |
| | Yamato International, Inc. | | | 31,900 | | | | 51,000 | |
# | | Yasunaga Corp. | | | 33,300 | | | | 137,589 | |
| | Yellow Hat Ltd. | | | 221,700 | | | | 2,658,050 | |
| | Yondoshi Holdings, Inc. | | | 101,520 | | | | 1,161,464 | |
| | Yonex Co. Ltd. | | | 74,600 | | | | 691,099 | |
| | Yorozu Corp. | | | 126,100 | | | | 732,136 | |
# | | Yoshinoya Holdings Co. Ltd. | | | 280,100 | | | | 4,402,292 | |
| | Yutaka Giken Co. Ltd. | | | 8,700 | | | | 100,043 | |
| | Zojirushi Corp. | | | 14,700 | | | | 148,222 | |
| | | | | | | | | | |
TOTAL CONSUMER DISCRETIONARY | | | | 366,770,947 | |
| | | | | | | | | | |
CONSUMER STAPLES — (7.8%) | |
# | | Aeon Hokkaido Corp. | | | 178,900 | | | | 1,413,526 | |
| | AFC-HD AMS Life Science Co. Ltd. | | | 53,800 | | | | 261,503 | |
| | Ain Holdings, Inc. | | | 119,800 | | | | 5,032,786 | |
| | Albis Co. Ltd. | | | 38,700 | | | | 599,489 | |
| | Arcs Co. Ltd. | | | 269,000 | | | | 3,585,571 | |
| | Artnature, Inc. | | | 116,400 | | | | 603,269 | |
| | Axial Retailing, Inc. | | | 108,000 | | | | 2,459,402 | |
# * | | Axxzia, Inc. | | | 4,800 | | | | 43,422 | |
| | Belc Co. Ltd. | | | 67,200 | | | | 2,570,597 | |
| | Bourbon Corp. | | | 54,800 | | | | 774,801 | |
| | Bull-Dog Sauce Co. Ltd. | | | 3,000 | | | | 33,861 | |
| | Cawachi Ltd. | | | 79,400 | | | | 1,098,891 | |
| | C’BON COSMETICS Co. Ltd. | | | 10,800 | | | | 117,171 | |
| | Chubu Shiryo Co. Ltd. | | | 132,400 | | | | 901,671 | |
| | Chuo Gyorui Co. Ltd. | | | 9,800 | | | | 194,008 | |
| | Como Co. Ltd. | | | 2,600 | | | | 47,063 | |
# | | Cota Co. Ltd. | | | 113,591 | | | | 1,224,900 | |
| | Create SD Holdings Co. Ltd. | | | 137,500 | | | | 2,929,190 | |
# | | Daikokutenbussan Co. Ltd. | | | 34,800 | | | | 1,061,447 | |
| | Delica Foods Holdings Co. Ltd. | | | 66,400 | | | | 227,102 | |
| | DyDo Group Holdings, Inc. | | | 58,700 | | | | 1,791,178 | |
| | Earth Corp. | | | 47,200 | | | | 1,633,763 | |
| | Ebara Foods Industry, Inc. | | | 30,900 | | | | 669,815 | |
# | | Eco’s Co. Ltd. | | | 45,800 | | | | 560,562 | |
# | | Ensuiko Sugar Refining Co. Ltd. | | | 86,200 | | | | 113,565 | |
| | Ezaki Glico Co. Ltd. | | | 194,800 | | | | 4,382,607 | |
THE JAPANESE SMALL COMPANY SERIES
CONTINUED
| | | | | | | | | | |
| | | | | Shares | | | Value» | |
CONSUMER STAPLES — (Continued) | |
| | Feed One Co. Ltd. | | | 153,348 | | | $ | 692,542 | |
# | | Fuji Co. Ltd. | | | 118,700 | | | | 1,467,980 | |
| | Fuji Oil Holdings, Inc. | | | 240,200 | | | | 3,781,633 | |
| | Fujicco Co. Ltd. | | | 122,300 | | | | 1,563,944 | |
| | Fujiya Co. Ltd. | | | 70,000 | | | | 1,202,255 | |
| | G-7 Holdings, Inc. | | | 141,300 | | | | 1,352,874 | |
| | Genky DrugStores Co. Ltd. | | | 51,000 | | | | 1,298,377 | |
# | | HABA Laboratories, Inc. | | | 15,000 | | | | 248,760 | |
| | Hagoromo Foods Corp. | | | 17,900 | | | | 366,983 | |
| | Halows Co. Ltd. | | | 56,100 | | | | 1,126,830 | |
| | Heiwado Co. Ltd. | | | 190,100 | | | | 2,405,669 | |
| | Hokkaido Coca-Cola Bottling Co. Ltd. | | | 18,699 | | | | 521,194 | |
| | Hokuto Corp. | | | 139,200 | | | | 1,796,736 | |
# | | Ichimasa Kamaboko Co. Ltd. | | | 46,500 | | | | 230,065 | |
| | Imuraya Group Co. Ltd. | | | 61,500 | | | | 904,898 | |
# | | Inageya Co. Ltd. | | | 44,600 | | | | 337,751 | |
* | | I-NE Co. Ltd. | | | 6,800 | | | | 196,999 | |
| | Itochu-Shokuhin Co. Ltd. | | | 35,100 | | | | 1,151,568 | |
| | Itoham Yonekyu Holdings, Inc. | | | 706,300 | | | | 3,158,441 | |
| | Iwatsuka Confectionery Co. Ltd. | | | 8,700 | | | | 235,130 | |
| | JM Holdings Co. Ltd. | | | 77,000 | | | | 877,490 | |
| | J-Oil Mills, Inc. | | | 122,300 | | | | 1,300,880 | |
| | Kadoya Sesame Mills, Inc. | | | 15,600 | | | | 366,592 | |
| | Kakiyasu Honten Co. Ltd. | | | 53,400 | | | | 797,988 | |
# | | Kameda Seika Co. Ltd. | | | 66,800 | | | | 2,064,117 | |
# | | Kaneko Seeds Co. Ltd. | | | 44,700 | | | | 438,571 | |
| | Kanemi Co. Ltd. | | | 1,200 | | | | 22,315 | |
| | Kansai Food Market Ltd. | | | 6,800 | | | | 63,888 | |
| | Kato Sangyo Co. Ltd. | | | 150,800 | | | | 3,524,560 | |
| | Kenko Mayonnaise Co. Ltd. | | | 73,300 | | | | 827,348 | |
# | | Kibun Foods, Inc. | | | 12,200 | | | | 73,242 | |
# | | Kitanotatsujin Corp. | | | 380,600 | | | | 737,804 | |
| | Koike-ya, Inc. | | | 300 | | | | 10,793 | |
| | Kotobuki Spirits Co. Ltd. | | | 29,600 | | | | 1,517,414 | |
| | Kusuri no Aoki Holdings Co. Ltd. | | | 83,800 | | | | 4,039,402 | |
| | Kyokuyo Co. Ltd. | | | 59,999 | | | | 1,457,625 | |
| | Lacto Japan Co. Ltd. | | | 47,000 | | | | 673,507 | |
| | Life Corp. | | | 81,400 | | | | 1,213,263 | |
| | Mandom Corp. | | | 216,800 | | | | 2,193,346 | |
# | | Marudai Food Co. Ltd. | | | 129,900 | | | | 1,224,712 | |
| | Maruha Nichiro Corp. | | | 216,707 | | | | 3,341,573 | |
# | | Maxvalu Tokai Co. Ltd. | | | 47,000 | | | | 886,186 | |
| | Medical System Network Co. Ltd. | | | 152,000 | | | | 411,307 | |
| | Megmilk Snow Brand Co. Ltd. | | | 277,000 | | | | 3,016,618 | |
# | | Meito Sangyo Co. Ltd. | | | 54,100 | | | | 579,801 | |
| | Milbon Co. Ltd. | | | 164,552 | | | | 6,785,094 | |
# | | Ministop Co. Ltd. | | | 90,500 | | | | 859,581 | |
| | Mitsubishi Shokuhin Co. Ltd. | | | 103,900 | | | | 2,103,069 | |
| | Mitsui DM Sugar Holdings Co. Ltd. | | | 110,870 | | | | 1,416,405 | |
| | Miyoshi Oil & Fat Co. Ltd. | | | 34,400 | | | | 229,396 | |
| | Morinaga & Co. Ltd. | | | 215,699 | | | | 5,395,101 | |
| | Morinaga Milk Industry Co. Ltd. | | | 145,400 | | | | 4,125,043 | |
| | Morozoff Ltd. | | | 37,400 | | | | 925,951 | |
# | | MTG Co. Ltd. | | | 24,700 | | | | 187,157 | |
# | | Nagatanien Holdings Co. Ltd. | | | 74,900 | | | | 1,008,356 | |
| | Nakamuraya Co. Ltd. | | | 26,699 | | | | 560,207 | |
| | Natori Co. Ltd. | | | 65,000 | | | | 902,759 | |
| | Nichimo Co. Ltd. | | | 16,300 | | | | 264,845 | |
# | | Nihon Chouzai Co. Ltd. | | | 73,420 | | | | 651,954 | |
THE JAPANESE SMALL COMPANY SERIES
CONTINUED
| | | | | | | | | | |
| | | | | Shares | | | Value» | |
CONSUMER STAPLES — (Continued) | |
| | Niitaka Co. Ltd. | | | 12,960 | | | $ | 180,610 | |
| | Nippn Corp. | | | 346,000 | | | | 3,641,987 | |
| | Nippon Beet Sugar Manufacturing Co. Ltd. | | | 65,500 | | | | 722,361 | |
| | Nippon Suisan Kaisha Ltd. | | | 1,893,700 | | | | 6,745,679 | |
| | Nishimoto Co. Ltd. | | | 19,500 | | | | 545,936 | |
| | Nisshin Oillio Group Ltd. | | | 154,600 | | | | 3,314,748 | |
| | Nissin Sugar Co. Ltd. | | | 98,300 | | | | 1,123,746 | |
| | Nitto Fuji Flour Milling Co. Ltd. | | | 16,200 | | | | 475,925 | |
| | Noevir Holdings Co. Ltd. | | | 85,800 | | | | 3,171,684 | |
| | Oenon Holdings, Inc. | | | 294,200 | | | | 559,659 | |
# | | OIE Sangyo Co. Ltd. | | | 22,000 | | | | 123,116 | |
# * | | Oisix ra daichi, Inc. | | | 171,900 | | | | 1,939,184 | |
| | Okuwa Co. Ltd. | | | 155,300 | | | | 960,244 | |
| | Olympic Group Corp. | | | 28,600 | | | | 98,476 | |
| | OUG Holdings, Inc. | | | 21,300 | | | | 334,901 | |
| | Pickles Holdings Co. Ltd. | | | 56,900 | | | | 394,495 | |
| | Pigeon Corp. | | | 573,125 | | | | 7,507,397 | |
| | Prima Meat Packers Ltd. | | | 177,300 | | | | 2,346,234 | |
# | | Qol Holdings Co. Ltd. | | | 164,500 | | | | 1,357,079 | |
| | Retail Partners Co. Ltd. | | | 107,600 | | | | 886,473 | |
| | Riken Vitamin Co. Ltd. | | | 143,000 | | | | 1,812,339 | |
| | Rokko Butter Co. Ltd. | | | 84,200 | | | | 796,538 | |
| | S Foods, Inc. | | | 114,862 | | | | 2,102,455 | |
| | S&B Foods, Inc. | | | 42,798 | | | | 1,059,329 | |
# | | Sagami Rubber Industries Co. Ltd. | | | 56,000 | | | | 284,988 | |
| | San-A Co. Ltd. | | | 118,000 | | | | 3,441,632 | |
| | Sapporo Holdings Ltd. | | | 385,720 | | | | 8,507,745 | |
| | Sato Foods Co. Ltd. | | | 800 | | | | 26,533 | |
| | Satudora Holdings Co. Ltd. | | | 3,900 | | | | 17,511 | |
# | | Shinnihonseiyaku Co. Ltd. | | | 42,700 | | | | 449,873 | |
| | Shinobu Foods Products Co. Ltd. | | | 1,600 | | | | 6,637 | |
# | | Shoei Foods Corp. | | | 67,600 | | | | 1,865,613 | |
| | Showa Sangyo Co. Ltd. | | | 114,300 | | | | 1,942,731 | |
| | Soiken Holdings, Inc. | | | 39,400 | | | | 92,738 | |
| | ST Corp. | | | 37,100 | | | | 373,982 | |
| | Starzen Co. Ltd. | | | 89,900 | | | | 1,245,921 | |
| | Takara Holdings, Inc. | | | 554,400 | | | | 3,856,353 | |
| | Toho Co. Ltd. | | | 49,900 | | | | 573,954 | |
# | | Torigoe Co. Ltd. | | | 94,500 | | | | 391,234 | |
# | | Transaction Co. Ltd. | | | 89,700 | | | | 681,925 | |
# | | United Super Markets Holdings, Inc. | | | 350,600 | | | | 2,468,602 | |
| | Valor Holdings Co. Ltd. | | | 220,700 | | | | 2,552,048 | |
| | Warabeya Nichiyo Holdings Co. Ltd. | | | 86,460 | | | | 1,022,334 | |
| | Watahan & Co. Ltd. | | | 94,100 | | | | 874,626 | |
# | | Yaizu Suisankagaku Industry Co. Ltd. | | | 62,100 | | | | 335,173 | |
| | YAKUODO Holdings Co. Ltd. | | | 69,400 | | | | 1,298,552 | |
# | | YA-MAN Ltd. | | | 194,200 | | | | 1,455,590 | |
| | Yamatane Corp. | | | 59,000 | | | | 639,164 | |
# | | Yamaya Corp. | | | 23,500 | | | | 388,534 | |
# | | Yamazawa Co. Ltd. | | | 11,800 | | | | 91,850 | |
| | Yaoko Co. Ltd. | | | 55,300 | | | | 2,405,719 | |
| | Yokorei Co. Ltd. | | | 306,400 | | | | 1,858,464 | |
| | Yomeishu Seizo Co. Ltd. | | | 48,700 | | | | 590,252 | |
* | | Yoshimura Food Holdings KK | | | 29,300 | | | | 96,207 | |
# | | Yuasa Funashoku Co. Ltd. | | | 14,300 | | | | 246,467 | |
| | Yukiguni Maitake Co. Ltd. | | | 39,400 | | | | 282,187 | |
| | Yutaka Foods Corp. | | | 3,900 | | | | 50,185 | |
| | | | | | | | | | |
TOTAL CONSUMER STAPLES | | | | 198,062,968 | |
| | | | | | | | | | |
THE JAPANESE SMALL COMPANY SERIES
CONTINUED
| | | | | | | | | | |
| | | | | Shares | | | Value» | |
ENERGY — (0.7%) | |
# | | BP Castrol KK | | | 44,100 | | | $ | 284,991 | |
| | Fuji Kosan Co. Ltd. | | | 4,400 | | | | 34,312 | |
# | | Fuji Oil Co. Ltd. | | | 287,900 | | | | 587,124 | |
| | Itochu Enex Co. Ltd. | | | 354,900 | | | | 2,442,298 | |
| | Japan Oil Transportation Co. Ltd. | | | 15,500 | | | | 227,370 | |
| | Japan Petroleum Exploration Co. Ltd. | | | 221,700 | | | | 5,760,410 | |
| | Mitsuuroko Group Holdings Co. Ltd. | | | 197,500 | | | | 1,359,610 | |
| | Nippon Coke & Engineering Co. Ltd. | | | 978,100 | | | | 532,242 | |
| | Sala Corp. | | | 322,100 | | | | 1,708,339 | |
| | San-Ai Obbli Co. Ltd. | | | 389,000 | | | | 3,213,029 | |
| | Sinanen Holdings Co. Ltd. | | | 46,500 | | | | 1,271,173 | |
# | | Toa Oil Co. Ltd. | | | 46,200 | | | | 978,312 | |
| | Toyo Kanetsu KK | | | 48,700 | | | | 805,728 | |
| | | | | | | | | | |
TOTAL ENERGY | | | | 19,204,938 | |
| | | | | | | | | | |
FINANCIALS — (8.8%) | |
| | 77 Bank Ltd. | | | 363,152 | | | | 4,400,716 | |
# | | Advance Create Co. Ltd. | | | 63,400 | | | | 426,754 | |
| | AEON Financial Service Co. Ltd. | | | 124,500 | | | | 1,218,433 | |
| | Aichi Financial Group, Inc. | | | 223,571 | | | | 2,856,753 | |
| | Aiful Corp. | | | 1,422,100 | | | | 3,873,175 | |
# | | Aizawa Securities Group Co. Ltd. | | | 200,800 | | | | 878,425 | |
| | Akatsuki Corp. | | | 144,000 | | | | 307,124 | |
| | Akita Bank Ltd. | | | 88,440 | | | | 945,162 | |
| | Anicom Holdings, Inc. | | | 108,300 | | | | 432,702 | |
# * | | Aruhi Corp. | | | 174,700 | | | | 1,641,229 | |
| | Asax Co. Ltd. | | | 9,300 | | | | 36,547 | |
| | Awa Bank Ltd. | | | 232,100 | | | | 2,917,685 | |
# | | Bank of Iwate Ltd. | | | 82,982 | | | | 1,001,223 | |
# | | Bank of Kochi Ltd. | | | 56,100 | | | | 234,676 | |
| | Bank of Nagoya Ltd. | | | 75,630 | | | | 1,549,265 | |
| | Bank of Saga Ltd. | | | 80,920 | | | | 844,576 | |
| | Bank of the Ryukyus Ltd. | | | 273,780 | | | | 1,432,411 | |
# | | Bank of Toyama Ltd. | | | 14,500 | | | | 160,724 | |
# | | Casa, Inc. | | | 28,400 | | | | 161,608 | |
| | Chiba Kogyo Bank Ltd. | | | 284,858 | | | | 551,486 | |
| | Chugin Financial Group, Inc. | | | 691,400 | | | | 4,167,742 | |
| | Credit Saison Co. Ltd. | | | 264,600 | | | | 2,828,139 | |
| | Daishi Hokuetsu Financial Group, Inc. | | | 262,500 | | | | 4,636,054 | |
| | Daito Bank Ltd. | | | 54,200 | | | | 222,152 | |
| | eGuarantee, Inc. | | | 221,400 | | | | 3,575,889 | |
# | | Ehime Bank Ltd. | | | 198,673 | | | | 1,142,937 | |
# | | Entrust, Inc. | | | 54,900 | | | | 237,426 | |
| | FIDEA Holdings Co. Ltd. | | | 124,790 | | | | 1,086,427 | |
| | Financial Products Group Co. Ltd. | | | 236,800 | | | | 1,850,521 | |
| | First Bank of Toyama Ltd. | | | 319,000 | | | | 882,186 | |
# | | First Brothers Co. Ltd. | | | 34,600 | | | | 201,043 | |
| | Fukui Bank Ltd. | | | 123,200 | | | | 1,126,239 | |
| | Fukushima Bank Ltd. | | | 17,200 | | | | 24,043 | |
| | Fuyo General Lease Co. Ltd. | | | 114,800 | | | | 6,380,157 | |
# | | GMO Financial Holdings, Inc. | | | 249,100 | | | | 956,764 | |
| | Gunma Bank Ltd. | | | 2,072,540 | | | | 5,652,782 | |
| | Hachijuni Bank Ltd. | | | 1,994,500 | | | | 6,360,770 | |
| | Hirogin Holdings, Inc. | | | 1,534,800 | | | | 6,331,737 | |
| | Hirose Tusyo, Inc. | | | 20,800 | | | | 339,965 | |
# | | Hokkoku Financial Holdings, Inc. | | | 145,200 | | | | 4,433,538 | |
| | Hokuhoku Financial Group, Inc. | | | 808,700 | | | | 4,858,472 | |
| | HS Holdings Co. Ltd. | | | 152,200 | | | | 1,095,593 | |
| | Hyakugo Bank Ltd. | | | 1,393,709 | | | | 3,085,078 | |
THE JAPANESE SMALL COMPANY SERIES
CONTINUED
| | | | | | | | | | |
| | | | | Shares | | | Value» | |
FINANCIALS — (Continued) | |
| | Hyakujushi Bank Ltd. | | | 134,700 | | | $ | 1,510,140 | |
| | Ichiyoshi Securities Co. Ltd. | | | 224,000 | | | | 907,209 | |
# | | IwaiCosmo Holdings, Inc. | | | 123,900 | | | | 1,049,074 | |
| | Iyogin Holdings, Inc. | | | 1,270,418 | | | | 5,960,544 | |
# | | J Trust Co. Ltd. | | | 345,400 | | | | 1,516,754 | |
| | Jaccs Co. Ltd. | | | 147,700 | | | | 3,581,598 | |
| | JAFCO Group Co. Ltd. | | | 588,100 | | | | 9,023,388 | |
| | Japan Investment Adviser Co. Ltd. | | | 70,300 | | | | 658,607 | |
# | | Japan Securities Finance Co. Ltd. | | | 581,200 | | | | 3,481,519 | |
# | | Jimoto Holdings, Inc. | | | 102,150 | | | | 282,804 | |
| | J-Lease Co. Ltd. | | | 31,900 | | | | 559,135 | |
| | Juroku Financial Group, Inc. | | | 191,700 | | | | 3,220,920 | |
| | Keiyo Bank Ltd. | | | 664,300 | | | | 2,333,373 | |
| | Kita-Nippon Bank Ltd. | | | 43,506 | | | | 550,258 | |
| | Kiyo Bank Ltd. | | | 416,190 | | | | 4,007,900 | |
| | Kyokuto Securities Co. Ltd. | | | 152,800 | | | | 641,045 | |
| | Kyushu Financial Group, Inc. | | | 1,975,137 | | | | 4,994,387 | |
# | | Kyushu Leasing Service Co. Ltd. | | | 34,000 | | | | 141,908 | |
* | | M&A Capital Partners Co. Ltd. | | | 92,100 | | | | 2,343,455 | |
# | | Marusan Securities Co. Ltd. | | | 336,700 | | | | 939,227 | |
# | | Matsui Securities Co. Ltd. | | | 568,800 | | | | 3,029,067 | |
| | Mercuria Holdings Co. Ltd. | | | 58,400 | | | | 236,199 | |
# | | Minkabu The Infonoid, Inc. | | | 21,700 | | | | 309,520 | |
# | | Mito Securities Co. Ltd. | | | 359,500 | | | | 555,715 | |
| | Miyazaki Bank Ltd. | | | 102,900 | | | | 1,542,970 | |
| | Mizuho Leasing Co. Ltd. | | | 180,700 | | | | 3,937,159 | |
# | | Monex Group, Inc. | | | 1,037,500 | | | | 3,604,082 | |
# | | Money Partners Group Co. Ltd. | | | 149,100 | | | | 274,454 | |
| | Morningstar Japan KK | | | 131,300 | | | | 409,555 | |
# | | Mortgage Service Japan Ltd. | | | 26,100 | | | | 147,277 | |
| | Musashino Bank Ltd. | | | 183,200 | | | | 2,115,592 | |
| | Nagano Bank Ltd. | | | 48,599 | | | | 382,904 | |
| | Nanto Bank Ltd. | | | 176,700 | | | | 2,532,005 | |
| | NEC Capital Solutions Ltd. | | | 60,200 | | | | 863,550 | |
| | Nishi-Nippon Financial Holdings, Inc. | | | 779,700 | | | | 3,976,627 | |
| | North Pacific Bank Ltd. | | | 1,785,600 | | | | 2,836,341 | |
# * | | OAK Capital Corp. | | | 297,500 | | | | 152,113 | |
| | Ogaki Kyoritsu Bank Ltd. | | | 232,100 | | | | 2,740,005 | |
| | Oita Bank Ltd. | | | 90,399 | | | | 1,096,297 | |
# | | Okasan Securities Group, Inc. | | | 964,900 | | | | 2,295,123 | |
| | Okinawa Financial Group, Inc. | | | 143,060 | | | | 1,981,285 | |
| | Orient Corp. | | | 280,890 | | | | 2,275,167 | |
| | Premium Group Co. Ltd. | | | 163,200 | | | | 1,934,314 | |
| | Procrea Holdings, Inc. | | | 238,972 | | | | 3,366,026 | |
| | Ricoh Leasing Co. Ltd. | | | 97,600 | | | | 2,383,123 | |
| | San ju San Financial Group, Inc. | | | 118,793 | | | | 1,162,272 | |
| | San-In Godo Bank Ltd. | | | 963,500 | | | | 4,588,458 | |
* | | SBI Insurance Group Co. Ltd. | | | 7,600 | | | | 40,535 | |
| | Senshu Ikeda Holdings, Inc. | | | 1,298,928 | | | | 1,861,564 | |
| | Seven Bank Ltd. | | | 501,400 | | | | 904,423 | |
| | Shiga Bank Ltd. | | | 288,700 | | | | 4,887,278 | |
| | Shikoku Bank Ltd. | | | 239,000 | | | | 1,394,610 | |
| | Shimizu Bank Ltd. | | | 58,200 | | | | 557,874 | |
# | | Sparx Group Co. Ltd. | | | 118,060 | | | | 1,189,903 | |
| | Strike Co. Ltd. | | | 51,700 | | | | 1,593,577 | |
| | Suruga Bank Ltd. | | | 900,700 | | | | 2,385,896 | |
# | | Taiko Bank Ltd. | | | 41,800 | | | | 314,026 | |
| | Tochigi Bank Ltd. | | | 565,200 | | | | 1,150,754 | |
| | Toho Bank Ltd. | | | 1,304,200 | | | | 1,797,764 | |
THE JAPANESE SMALL COMPANY SERIES
CONTINUED
| | | | | | | | | | |
| | | | | Shares | | | Value» | |
FINANCIALS — (Continued) | |
# | | Tohoku Bank Ltd. | | | 63,300 | | | $ | 402,681 | |
| | Tokai Tokyo Financial Holdings, Inc. | | | 1,334,300 | | | | 3,058,672 | |
| | Tokyo Kiraboshi Financial Group, Inc. | | | 170,738 | | | | 2,448,757 | |
| | Tomato Bank Ltd. | | | 50,400 | | | | 326,735 | |
| | TOMONY Holdings, Inc. | | | 956,950 | | | | 2,079,139 | |
# | | Tottori Bank Ltd. | | | 53,100 | | | | 379,681 | |
# | | Towa Bank Ltd. | | | 262,300 | | | | 916,377 | |
| | Toyo Securities Co. Ltd. | | | 390,800 | | | | 598,805 | |
| | Traders Holdings Co. Ltd. | | | 13,720 | | | | 45,978 | |
| | Tsukuba Bank Ltd. | | | 494,300 | | | | 634,760 | |
# | | Yamagata Bank Ltd. | | | 143,600 | | | | 985,489 | |
| | Yamaguchi Financial Group, Inc. | | | 1,237,672 | | | | 6,517,904 | |
| | Yamanashi Chuo Bank Ltd. | | | 162,526 | | | | 1,113,127 | |
| | | | | | | | | | |
TOTAL FINANCIALS | | | | 223,363,082 | |
| | | | | | | | | | |
HEALTH CARE — (5.0%) | |
| | Amvis Holdings, Inc. | | | 35,600 | | | | 688,165 | |
| | As One Corp. | | | 74,500 | | | | 3,176,858 | |
| | ASKA Pharmaceutical Holdings Co. Ltd. | | | 141,700 | | | | 1,115,346 | |
| | Astena Holdings Co. Ltd. | | | 194,800 | | | | 549,661 | |
| | BML, Inc. | | | 147,600 | | | | 3,336,562 | |
# | | Carenet, Inc. | | | 130,800 | | | | 1,198,656 | |
| | CE Holdings Co. Ltd. | | | 9,500 | | | | 30,925 | |
# * | | CellSource Co. Ltd. | | | 21,100 | | | | 622,331 | |
| | Charm Care Corp. KK | | | 113,900 | | | | 804,070 | |
| | CMIC Holdings Co. Ltd. | | | 63,200 | | | | 713,879 | |
| | Create Medic Co. Ltd. | | | 38,700 | | | | 226,083 | |
# | | Daiken Medical Co. Ltd. | | | 112,400 | | | | 347,729 | |
| | Daito Pharmaceutical Co. Ltd. | | | 77,580 | | | | 1,334,353 | |
| | Eiken Chemical Co. Ltd. | | | 205,400 | | | | 2,536,991 | |
| | Elan Corp. | | | 208,600 | | | | 1,602,058 | |
| | EM Systems Co. Ltd. | | | 24,900 | | | | 164,726 | |
| | FALCO HOLDINGS Co. Ltd. | | | 53,300 | | | | 633,837 | |
| | FINDEX, Inc. | | | 94,500 | | | | 392,145 | |
| | France Bed Holdings Co. Ltd. | | | 158,600 | | | | 991,617 | |
| | Fuji Pharma Co. Ltd. | | | 97,600 | | | | 702,755 | |
| | Fukuda Denshi Co. Ltd. | | | 63,200 | | | | 3,299,287 | |
# | | Fuso Pharmaceutical Industries Ltd. | | | 42,600 | | | | 590,589 | |
| | H.U. Group Holdings, Inc. | | | 348,800 | | | | 6,492,843 | |
# | | Hogy Medical Co. Ltd. | | | 76,000 | | | | 1,685,603 | |
# | | Hoshi Iryo-Sanki Co. Ltd. | | | 9,600 | | | | 242,275 | |
| | I’rom Group Co. Ltd. | | | 38,400 | | | | 666,368 | |
* | | Japan Animal Referral Medical Center Co. Ltd. | | | 7,400 | | | | 94,655 | |
* | | Japan Hospice Holdings, Inc. | | | 12,400 | | | | 173,022 | |
| | Japan Lifeline Co. Ltd. | | | 392,500 | | | | 2,646,755 | |
| | Japan Medical Dynamic Marketing, Inc. | | | 104,500 | | | | 831,456 | |
| | Jeol Ltd. | | | 21,000 | | | | 768,457 | |
| | JMS Co. Ltd. | | | 104,457 | | | | 370,810 | |
| | Kaken Pharmaceutical Co. Ltd. | | | 116,400 | | | | 2,979,288 | |
| | Kanamic Network Co. Ltd. | | | 139,700 | | | | 582,786 | |
| | Kissei Pharmaceutical Co. Ltd. | | | 175,800 | | | | 3,105,392 | |
| | Koa Shoji Holdings Co. Ltd. | | | 4,100 | | | | 16,702 | |
| | KYORIN Holdings, Inc. | | | 261,400 | | | | 3,234,542 | |
# | | Linical Co. Ltd. | | | 69,400 | | | | 345,282 | |
| | Mani, Inc. | | | 358,900 | | | | 5,228,305 | |
| | Medical Data Vision Co. Ltd. | | | 168,300 | | | | 1,251,818 | |
| | Medikit Co. Ltd. | | | 2,000 | | | | 32,526 | |
| | Medius Holdings Co. Ltd. | | | 68,500 | | | | 334,399 | |
# * | | MedPeer, Inc. | | | 84,200 | | | | 865,354 | |
THE JAPANESE SMALL COMPANY SERIES
CONTINUED
| | | | | | | | | | |
| | | | | Shares | | | Value» | |
HEALTH CARE — (Continued) | |
| | Menicon Co. Ltd. | | | 267,900 | | | $ | 4,574,112 | |
# | | Mizuho Medy Co. Ltd. | | | 22,400 | | | | 471,202 | |
| | Mochida Pharmaceutical Co. Ltd. | | | 56,798 | | | | 1,307,918 | |
| | Nakanishi, Inc. | | | 327,600 | | | | 5,977,400 | |
| | Nihon Kohden Corp. | | | 195,900 | | | | 4,386,618 | |
| | Nippon Chemiphar Co. Ltd. | | | 7,700 | | | | 88,729 | |
| | Nipro Corp. | | | 839,500 | | | | 6,328,382 | |
| | Paramount Bed Holdings Co. Ltd. | | | 254,000 | | | | 4,521,662 | |
* | | PeptiDream, Inc. | | | 143,700 | | | | 1,572,123 | |
| | Rion Co. Ltd. | | | 54,600 | | | | 747,913 | |
| | Sawai Group Holdings Co. Ltd. | | | 161,200 | | | | 4,653,068 | |
# | | Seed Co. Ltd. | | | 68,100 | | | | 227,446 | |
| | Seikagaku Corp. | | | 233,700 | | | | 1,425,159 | |
| | Shin Nippon Biomedical Laboratories Ltd. | | | 134,300 | | | | 2,459,207 | |
| | Ship Healthcare Holdings, Inc. | | | 346,200 | | | | 6,639,723 | |
# | | Shofu, Inc. | | | 69,900 | | | | 1,184,422 | |
# | | Software Service, Inc. | | | 18,800 | | | | 1,039,868 | |
| | Solasto Corp. | | | 331,500 | | | | 1,996,042 | |
# | | St-Care Holding Corp. | | | 81,600 | | | | 461,106 | |
# * | | SymBio Pharmaceuticals Ltd. | | | 62,300 | | | | 291,005 | |
| | Takara Bio, Inc. | | | 150,900 | | | | 1,765,467 | |
| | Techno Medica Co. Ltd. | | | 14,700 | | | | 161,147 | |
| | Toho Holdings Co. Ltd. | | | 303,300 | | | | 4,124,712 | |
| | Tokai Corp. | | | 134,700 | | | | 1,710,306 | |
| | Torii Pharmaceutical Co. Ltd. | | | 89,800 | | | | 1,822,203 | |
# | | Towa Pharmaceutical Co. Ltd. | | | 173,300 | | | | 2,608,497 | |
# | | Trans Genic, Inc. | | | 51,100 | | | | 108,912 | |
| | Tsumura & Co. | | | 213,118 | | | | 4,451,261 | |
| | Value HR Co. Ltd. | | | 92,800 | | | | 957,108 | |
| | Vital KSK Holdings, Inc. | | | 262,800 | | | | 1,321,670 | |
# * | | Wakamoto Pharmaceutical Co. Ltd. | | | 85,300 | | | | 128,286 | |
# | | WIN-Partners Co. Ltd. | | | 106,100 | | | | 691,603 | |
| | ZERIA Pharmaceutical Co. Ltd. | | | 39,000 | | | | 580,965 | |
| | | | | | | | | | |
TOTAL HEALTH CARE | | | | 127,792,503 | |
| | | | | | | | | | |
INDUSTRIALS — (28.2%) | |
| | Advan Group Co. Ltd. | | | 144,200 | | | | 849,606 | |
| | Aeon Delight Co. Ltd. | | | 107,400 | | | | 2,146,691 | |
| | Aichi Corp. | | | 223,100 | | | | 1,184,592 | |
| | Aida Engineering Ltd. | | | 310,500 | | | | 1,803,983 | |
| | Airtech Japan Ltd. | | | 2,000 | | | | 15,065 | |
| | AIT Corp. | | | 8,100 | | | | 82,031 | |
| | Ajis Co. Ltd. | | | 28,900 | | | | 387,234 | |
| | Alconix Corp. | | | 143,100 | | | | 1,316,276 | |
# | | Alinco, Inc. | | | 80,500 | | | | 536,259 | |
| | Alps Logistics Co. Ltd. | | | 110,100 | | | | 811,786 | |
# | | Altech Corp. | | | 101,970 | | | | 1,375,764 | |
| | Anest Iwata Corp. | | | 220,200 | | | | 1,320,750 | |
| | Asahi Diamond Industrial Co. Ltd. | | | 342,800 | | | | 1,712,302 | |
| | Asahi Kogyosha Co. Ltd. | | | 51,400 | | | | 708,164 | |
| | Asanuma Corp. | | | 84,200 | | | | 1,549,052 | |
# | | Asukanet Co. Ltd. | | | 31,200 | | | | 206,738 | |
# | | AZ-COM MARUWA Holdings, Inc. | | | 169,000 | | | | 1,605,771 | |
| | Bando Chemical Industries Ltd. | | | 210,500 | | | | 1,495,825 | |
# | | Br Holdings Corp. | | | 221,200 | | | | 516,001 | |
| | Bunka Shutter Co. Ltd. | | | 351,900 | | | | 2,530,218 | |
| | Canare Electric Co. Ltd. | | | 21,200 | | | | 198,020 | |
| | Careerlink Co. Ltd. | | | 21,900 | | | | 356,091 | |
| | Central Glass Co. Ltd. | | | 217,900 | | | | 5,145,194 | |
THE JAPANESE SMALL COMPANY SERIES
CONTINUED
| | | | | | | | | | |
| | | | | Shares | | | Value» | |
INDUSTRIALS — (Continued) | |
| | Central Security Patrols Co. Ltd. | | | 53,000 | | | $ | 913,611 | |
| | Chilled & Frozen Logistics Holdings Co. Ltd. | | | 98,500 | | | | 798,859 | |
* | | Chiyoda Corp. | | | 906,000 | | | | 2,244,269 | |
| | Chiyoda Integre Co. Ltd. | | | 67,900 | | | | 1,045,981 | |
| | Chori Co. Ltd. | | | 73,000 | | | | 956,485 | |
| | Chudenko Corp. | | | 187,800 | | | | 2,592,100 | |
# | | Chugai Ro Co. Ltd. | | | 37,600 | | | | 395,433 | |
# | | Chuo Warehouse Co. Ltd. | | | 21,000 | | | | 130,077 | |
| | CKD Corp. | | | 239,900 | | | | 2,942,215 | |
| | CMC Corp. | | | 30,200 | | | | 228,805 | |
| | Cosel Co. Ltd. | | | 146,800 | | | | 841,110 | |
| | Creek & River Co. Ltd. | | | 67,100 | | | | 921,305 | |
| | CTI Engineering Co. Ltd. | | | 70,300 | | | | 1,380,634 | |
| | CTS Co. Ltd. | | | 157,100 | | | | 846,132 | |
| | Dai-Dan Co. Ltd. | | | 89,200 | | | | 1,272,397 | |
# | | Daido Kogyo Co. Ltd. | | | 43,200 | | | | 205,118 | |
| | Daihatsu Diesel Manufacturing Co. Ltd. | | | 119,100 | | | | 434,300 | |
| | Daihen Corp. | | | 128,100 | | | | 3,303,286 | |
| | Daiho Corp. | | | 71,100 | | | | 2,016,269 | |
| | Dai-Ichi Cutter Kogyo KK | | | 46,300 | | | | 377,214 | |
| | Daiichi Jitsugyo Co. Ltd. | | | 52,000 | | | | 1,365,530 | |
# | | Daiichi Kensetsu Corp. | | | 35,200 | | | | 343,208 | |
| | Daiki Axis Co. Ltd. | | | 41,900 | | | | 190,723 | |
| | Daiseki Co. Ltd. | | | 290,755 | | | | 8,984,172 | |
# | | Daiseki Eco. Solution Co. Ltd. | | | 39,159 | | | | 210,554 | |
| | Daisue Construction Co. Ltd. | | | 48,200 | | | | 374,969 | |
| | Daiwa Industries Ltd. | | | 196,200 | | | | 1,645,230 | |
| | Denyo Co. Ltd. | | | 96,400 | | | | 944,822 | |
| | Dip Corp. | | | 198,900 | | | | 5,568,555 | |
| | DMG Mori Co. Ltd. | | | 731,800 | | | | 8,468,845 | |
| | DMW Corp. | | | 4,800 | | | | 95,962 | |
| | Duskin Co. Ltd. | | | 265,400 | | | | 5,089,178 | |
| | Ebara Jitsugyo Co. Ltd. | | | 64,800 | | | | 948,350 | |
# | | Eidai Co. Ltd. | | | 184,700 | | | | 268,165 | |
# | | EJ Holdings, Inc. | | | 30,100 | | | | 263,371 | |
| | en Japan, Inc. | | | 188,308 | | | | 3,271,088 | |
| | Endo Lighting Corp. | | | 56,300 | | | | 284,770 | |
# | | Envipro Holdings, Inc. | | | 34,400 | | | | 173,270 | |
# | | ERI Holdings Co. Ltd. | | | 14,100 | | | | 98,940 | |
| | Escrow Agent Japan, Inc. | | | 63,300 | | | | 62,029 | |
| | EXEO Group, Inc. | | | 270,800 | | | | 3,967,640 | |
| | F&M Co. Ltd. | | | 44,400 | | | | 652,042 | |
* | | FDK Corp. | | | 64,298 | | | | 388,982 | |
| | Forum Engineering, Inc. | | | 24,500 | | | | 151,530 | |
| | Freund Corp. | | | 75,600 | | | | 356,618 | |
| | Frontier Management, Inc. | | | 7,200 | | | | 60,636 | |
| | Fudo Tetra Corp. | | | 101,380 | | | | 1,006,838 | |
| | Fuji Corp. | | | 357,900 | | | | 4,725,770 | |
| | Fuji Die Co. Ltd. | | | 55,300 | | | | 212,494 | |
| | Fuji Furukawa Engineering & Construction Co. Ltd. | | | 1,800 | | | | 43,410 | |
| | Fujikura Ltd. | | | 1,559,000 | | | | 9,230,804 | |
| | Fujisash Co. Ltd. | | | 573,900 | | | | 262,469 | |
| | Fukuda Corp. | | | 53,200 | | | | 1,733,873 | |
| | Fukushima Galilei Co. Ltd. | | | 82,400 | | | | 2,266,031 | |
| | Fukuvi Chemical Industry Co. Ltd. | | | 10,600 | | | | 39,809 | |
| | Fukuyama Transporting Co. Ltd. | | | 94,357 | | | | 2,058,735 | |
| | FULLCAST Holdings Co. Ltd. | | | 126,600 | | | | 2,532,220 | |
| | Funai Soken Holdings, Inc. | | | 241,570 | | | | 4,306,066 | |
| | Furukawa Co. Ltd. | | | 194,000 | | | | 1,701,051 | |
THE JAPANESE SMALL COMPANY SERIES
CONTINUED
| | | | | | | | | | |
| | | | | Shares | | | Value» | |
INDUSTRIALS — (Continued) | |
| | Furukawa Electric Co. Ltd. | | | 424,300 | | | $ | 6,546,029 | |
| | Futaba Corp. | | | 208,200 | | | | 842,449 | |
# | | Gakujo Co. Ltd. | | | 5,600 | | | | 54,149 | |
| | Gecoss Corp. | | | 95,900 | | | | 514,490 | |
| | Giken Ltd. | | | 5,400 | | | | 116,347 | |
| | Glory Ltd. | | | 288,855 | | | | 4,453,748 | |
| | gremz, Inc. | | | 25,500 | | | | 294,888 | |
| | GS Yuasa Corp. | | | 393,683 | | | | 5,993,468 | |
| | Hamakyorex Co. Ltd. | | | 102,600 | | | | 2,291,807 | |
| | Hanwa Co. Ltd. | | | 172,200 | | | | 4,164,477 | |
| | Hashimoto Sogyo Holdings Co. Ltd. | | | 8,140 | | | | 53,856 | |
# | | Hazama Ando Corp. | | | 1,162,500 | | | | 6,737,422 | |
| | Helios Techno Holding Co. Ltd. | | | 109,800 | | | | 351,067 | |
| | Hibiya Engineering Ltd. | | | 109,900 | | | | 1,406,600 | |
| | Hirakawa Hewtech Corp. | | | 70,800 | | | | 516,020 | |
# | | Hirano Tecseed Co. Ltd. | | | 59,400 | | | | 699,421 | |
# | | Hirata Corp. | | | 31,900 | | | | 933,189 | |
| | Hisaka Works Ltd. | | | 127,300 | | | | 723,037 | |
| | Hitachi Zosen Corp. | | | 1,041,679 | | | | 6,005,282 | |
| | Hito Communications Holdings, Inc. | | | 43,900 | | | | 491,246 | |
# | | Hokuetsu Industries Co. Ltd. | | | 139,500 | | | | 1,049,824 | |
# | | Hokuriku Electrical Construction Co. Ltd. | | | 89,040 | | | | 406,020 | |
| | Hosokawa Micron Corp. | | | 89,300 | | | | 1,620,366 | |
| | Howa Machinery Ltd. | | | 65,100 | | | | 376,444 | |
# | | Ichikawa Co. Ltd. | | | 1,000 | | | | 8,813 | |
# | | Ichiken Co. Ltd. | | | 33,600 | | | | 405,687 | |
# | | Ichinen Holdings Co. Ltd. | | | 125,100 | | | | 1,071,182 | |
| | Idec Corp. | | | 191,700 | | | | 4,105,978 | |
| | Ihara Science Corp. | | | 52,900 | | | | 799,168 | |
# | | Iino Kaiun Kaisha Ltd. | | | 513,400 | | | | 2,555,042 | |
# | | Impact HD, Inc. | | | 20,500 | | | | 549,791 | |
| | Imura Envelope Co., Inc. | | | 13,700 | | | | 75,532 | |
| | Inaba Denki Sangyo Co. Ltd. | | | 322,900 | | | | 6,027,512 | |
# | | Inaba Seisakusho Co. Ltd. | | | 61,700 | | | | 569,807 | |
| | Inabata & Co. Ltd. | | | 287,700 | | | | 4,753,205 | |
| | INFRONEER Holdings, Inc. | | | 757,388 | | | | 5,250,448 | |
| | Insource Co. Ltd. | | | 147,650 | | | | 2,981,420 | |
| | Inui Global Logistics Co. Ltd. | | | 80,380 | | | | 1,025,739 | |
| | IR Japan Holdings Ltd. | | | 56,500 | | | | 826,108 | |
| | Iseki & Co. Ltd. | | | 116,500 | | | | 962,537 | |
| | Ishii Iron Works Co. Ltd. | | | 11,000 | | | | 181,899 | |
| | Itoki Corp. | | | 213,100 | | | | 607,982 | |
| | Iwaki Co. Ltd. | | | 56,100 | | | | 532,631 | |
| | Iwasaki Electric Co. Ltd. | | | 42,200 | | | | 741,415 | |
| | JAC Recruitment Co. Ltd. | | | 105,100 | | | | 1,788,160 | |
| | Japan Elevator Service Holdings Co. Ltd. | | | 366,800 | | | | 4,326,577 | |
# | | Japan Foundation Engineering Co. Ltd. | | | 122,400 | | | | 343,891 | |
| | Japan Pulp & Paper Co. Ltd. | | | 72,600 | | | | 2,240,129 | |
| | Japan Steel Works Ltd. | | | 146,500 | | | | 3,025,000 | |
| | Japan Transcity Corp. | | | 244,600 | | | | 813,890 | |
| | JDC Corp. | | | 73,700 | | | | 284,323 | |
| | JK Holdings Co. Ltd. | | | 92,940 | | | | 680,648 | |
# | | Juki Corp. | | | 174,000 | | | | 853,958 | |
| | Kamei Corp. | | | 148,700 | | | | 1,106,719 | |
| | Kanaden Corp. | | | 113,500 | | | | 819,833 | |
# | | Kanagawa Chuo Kotsu Co. Ltd. | | | 42,800 | | | | 955,235 | |
| | Kaname Kogyo Co. Ltd. | | | 1,300 | | | | 6,683 | |
# | | Kanamoto Co. Ltd. | | | 200,700 | | | | 2,897,308 | |
| | Kandenko Co. Ltd. | | | 621,700 | | | | 3,494,540 | |
THE JAPANESE SMALL COMPANY SERIES
CONTINUED
| | | | | | | | | | |
| | | | | Shares | | | Value» | |
INDUSTRIALS — (Continued) | | | | | | | | |
| | Kanematsu Corp. | | | 506,325 | | | $ | 5,009,720 | |
| | Katakura Industries Co. Ltd. | | | 151,500 | | | | 2,072,845 | |
# | | Kato Works Co. Ltd. | | | 58,000 | | | | 277,627 | |
| | Kawada Technologies, Inc. | | | 32,300 | | | | 786,690 | |
| | Kawagishi Bridge Works Co. Ltd. | | | 8,700 | | | | 159,195 | |
# | | Kawata Manufacturing Co. Ltd. | | | 23,300 | | | | 130,923 | |
| | Keihin Co. Ltd. | | | 15,700 | | | | 146,428 | |
| | KFC Ltd. | | | 8,700 | | | | 88,784 | |
# | | Kimura Chemical Plants Co. Ltd. | | | 98,900 | | | | 480,816 | |
# | | Kimura Unity Co. Ltd. | | | 47,000 | | | | 244,606 | |
| | King Jim Co. Ltd. | | | 59,600 | | | | 366,237 | |
| | Kinki Sharyo Co. Ltd. | | | 299 | | | | 1,896 | |
| | Kitagawa Corp. | | | 50,300 | | | | 425,316 | |
| | Kitano Construction Corp. | | | 24,072 | | | | 389,953 | |
| | Kitz Corp. | | | 407,200 | | | | 2,414,022 | |
* | | Kobe Electric Railway Co. Ltd. | | | 37,299 | | | | 813,081 | |
| | Koike Sanso Kogyo Co. Ltd. | | | 13,400 | | | | 180,150 | |
| | Kokuyo Co. Ltd. | | | 449,525 | | | | 5,575,684 | |
| | KOMAIHALTEC, Inc. | | | 18,200 | | | | 191,063 | |
| | Komatsu Wall Industry Co. Ltd. | | | 49,300 | | | | 605,752 | |
| | Komori Corp. | | | 299,000 | | | | 1,627,599 | |
| | Kondotec, Inc. | | | 114,200 | | | | 774,868 | |
| | Konoike Transport Co. Ltd. | | | 174,500 | | | | 1,836,376 | |
# | | Kosaido Holdings Co. Ltd. | | | 124,800 | | | | 1,273,748 | |
| | Kozo Keikaku Engineering, Inc. | | | 22,000 | | | | 420,306 | |
# | | KPP Group Holdings Co. Ltd. | | | 87,100 | | | | 475,493 | |
| | KRS Corp. | | | 75,600 | | | | 534,767 | |
| | Kumagai Gumi Co. Ltd. | | | 227,800 | | | | 3,851,023 | |
| | Kuroda Precision Industries Ltd. | | | 700 | | | | 8,239 | |
| | Kyodo Printing Co. Ltd. | | | 45,800 | | | | 777,068 | |
# | | Kyokuto Boeki Kaisha Ltd. | | | 66,000 | | | | 572,004 | |
| | Kyokuto Kaihatsu Kogyo Co. Ltd. | | | 205,600 | | | | 1,910,529 | |
# | | KYORITSU Co. Ltd. | | | 151,200 | | | | 116,855 | |
| | Kyudenko Corp. | | | 207,400 | | | | 4,399,039 | |
| | LIKE, Inc. | | | 68,700 | | | | 967,160 | |
# | | Link & Motivation, Inc. | | | 252,500 | | | | 1,524,342 | |
| | Lonseal Corp. | | | 2,900 | | | | 23,149 | |
* | | LTS, Inc. | | | 2,100 | | | | 43,703 | |
| | Mabuchi Motor Co. Ltd. | | | 249,034 | | | | 6,757,392 | |
# | | Maezawa Industries, Inc. | | | 49,000 | | | | 198,975 | |
# | | Maezawa Kasei Industries Co. Ltd. | | | 84,000 | | | | 754,965 | |
| | Maezawa Kyuso Industries Co. Ltd. | | | 122,700 | | | | 756,248 | |
| | Makino Milling Machine Co. Ltd. | | | 148,300 | | | | 4,582,257 | |
# | | Management Solutions Co. Ltd. | | | 51,700 | | | | 1,019,088 | |
| | Marufuji Sheet Piling Co. Ltd. | | | 11,800 | | | | 152,432 | |
| | MARUKA FURUSATO Corp. | | | 45,807 | | | | 1,138,117 | |
# | | Marumae Co. Ltd. | | | 31,900 | | | | 381,849 | |
# | | Maruyama Manufacturing Co., Inc. | | | 18,800 | | | | 180,034 | |
| | Maruzen Co. Ltd. | | | 65,800 | | | | 791,292 | |
| | Maruzen Showa Unyu Co. Ltd. | | | 80,600 | | | | 1,644,883 | |
# | | Matching Service Japan Co. Ltd. | | | 52,000 | | | | 284,553 | |
| | Matsuda Sangyo Co. Ltd. | | | 79,782 | | | | 1,190,207 | |
# | | Matsui Construction Co. Ltd. | | | 125,500 | | | | 475,699 | |
| | Max Co. Ltd. | | | 163,000 | | | | 2,323,037 | |
| | Meidensha Corp. | | | 222,710 | | | | 2,962,999 | |
| | Meiho Facility Works Ltd. | | | 36,100 | | | | 163,415 | |
| | Meiji Electric Industries Co. Ltd. | | | 52,500 | | | | 367,944 | |
# | | Meiji Shipping Co. Ltd. | | | 94,000 | | | | 486,187 | |
| | Meisei Industrial Co. Ltd. | | | 222,200 | | | | 1,053,693 | |
THE JAPANESE SMALL COMPANY SERIES
CONTINUED
| | | | | | | | | | |
| | | | | Shares | | | Value» | |
INDUSTRIALS — (Continued) | | | | | | | | |
| | Meitec Corp. | | | 484,000 | | | $ | 8,152,392 | |
# * | | Meiwa Corp. | | | 145,600 | | | | 715,476 | |
# * | | MetaReal Corp. | | | 22,800 | | | | 162,583 | |
| | METAWATER Co. Ltd. | | | 114,300 | | | | 1,462,752 | |
# | | Midac Holdings Co. Ltd. | | | 28,600 | | | | 710,687 | |
# | | Mie Kotsu Group Holdings, Inc. | | | 346,700 | | | | 1,199,250 | |
| | Mirai Industry Co. Ltd. | | | 4,600 | | | | 46,633 | |
| | Mirait One Corp. | | | 577,635 | | | | 5,550,860 | |
| | Mitani Corp. | | | 294,600 | | | | 2,930,934 | |
| | Mitani Sangyo Co. Ltd. | | | 145,000 | | | | 292,626 | |
# | | Mitsubishi Kakoki Kaisha Ltd. | | | 39,000 | | | | 561,699 | |
| | Mitsubishi Logisnext Co. Ltd. | | | 186,600 | | | | 961,659 | |
| | Mitsubishi Logistics Corp. | | | 97,000 | | | | 2,128,508 | |
| | Mitsubishi Pencil Co. Ltd. | | | 132,100 | | | | 1,285,723 | |
| | Mitsuboshi Belting Ltd. | | | 150,300 | | | | 3,197,218 | |
* | | Mitsui E&S Holdings Co. Ltd. | | | 298,581 | | | | 837,703 | |
# | | Mitsui Matsushima Holdings Co. Ltd. | | | 74,400 | | | | 1,199,178 | |
| | Mitsui-Soko Holdings Co. Ltd. | | | 128,400 | | | | 2,676,659 | |
| | Miyaji Engineering Group, Inc. | | | 37,517 | | | | 827,261 | |
| | Mori-Gumi Co. Ltd. | | | 69,500 | | | | 136,959 | |
| | Morita Holdings Corp. | | | 209,700 | | | | 1,798,398 | |
# | | NAC Co. Ltd. | | | 61,300 | | | | 383,319 | |
| | Nachi-Fujikoshi Corp. | | | 89,900 | | | | 2,355,080 | |
| | Nadex Co. Ltd. | | | 40,600 | | | | 208,440 | |
| | Nagase & Co. Ltd. | | | 584,600 | | | | 7,964,771 | |
| | Naigai Trans Line Ltd. | | | 41,700 | | | | 576,957 | |
| | Nakabayashi Co. Ltd. | | | 113,400 | | | | 404,195 | |
| | Nakakita Seisakusho Co. Ltd. | | | 3,700 | | | | 50,602 | |
| | Nakamoto Packs Co. Ltd. | | | 33,300 | | | | 333,095 | |
* | | Nakamura Choukou Co. Ltd. | | | 6,600 | | | | 26,109 | |
| | Nakanishi Manufacturing Co. Ltd. | | | 5,700 | | | | 59,374 | |
# | | Nakano Corp. | | | 107,000 | | | | 218,447 | |
# * | | Namura Shipbuilding Co. Ltd. | | | 268,528 | | | | 985,454 | |
| | Nankai Electric Railway Co. Ltd. | | | 85,900 | | | | 1,737,700 | |
| | Narasaki Sangyo Co. Ltd. | | | 25,400 | | | | 288,961 | |
| | Nice Corp. | | | 32,100 | | | | 288,556 | |
| | Nichias Corp. | | | 382,800 | | | | 5,905,869 | |
# | | Nichiban Co. Ltd. | | | 68,100 | | | | 777,790 | |
| | Nichiden Corp. | | | 97,100 | | | | 1,147,874 | |
| | Nichiha Corp. | | | 163,980 | | | | 3,105,207 | |
| | Nichireki Co. Ltd. | | | 153,000 | | | | 1,342,850 | |
| | Nihon Dengi Co. Ltd. | | | 30,800 | | | | 597,025 | |
| | Nihon Flush Co. Ltd. | | | 122,000 | | | | 793,741 | |
| | Nikkiso Co. Ltd. | | | 307,500 | | | | 2,049,150 | |
# | | Nikko Co. Ltd. | | | 168,400 | | | | 691,554 | |
| | Nikkon Holdings Co. Ltd. | | | 377,400 | | | | 5,895,645 | |
| | Nippi, Inc. | | | 11,900 | | | | 276,371 | |
# | | Nippon Air Conditioning Services Co. Ltd. | | | 187,100 | | | | 915,052 | |
| | Nippon Aqua Co. Ltd. | | | 55,400 | | | | 273,380 | |
| | Nippon Carbon Co. Ltd. | | | 66,200 | | | | 1,873,960 | |
| | Nippon Concept Corp. | | | 39,500 | | | | 459,302 | |
| | Nippon Densetsu Kogyo Co. Ltd. | | | 224,600 | | | | 2,512,855 | |
| | Nippon Dry-Chemical Co. Ltd. | | | 11,300 | | | | 107,593 | |
| | Nippon Filcon Co. Ltd. | | | 15,700 | | | | 47,846 | |
| | Nippon Hume Corp. | | | 137,300 | | | | 566,441 | |
| | Nippon Koei Co. Ltd. | | | 74,200 | | | | 1,660,002 | |
# | | Nippon Parking Development Co. Ltd. | | | 1,330,600 | | | | 2,309,812 | |
| | Nippon Rietec Co. Ltd. | | | 26,400 | | | | 133,344 | |
| | Nippon Road Co. Ltd. | | | 20,400 | | | | 839,601 | |
THE JAPANESE SMALL COMPANY SERIES
CONTINUED
| | | | | | | | | | |
| | | | | Shares | | | Value» | |
INDUSTRIALS — (Continued) | | | | | | | | |
| | Nippon Seisen Co. Ltd. | | | 14,800 | | | $ | 414,430 | |
| | Nippon Sharyo Ltd. | | | 40,999 | | | | 546,016 | |
* | | Nippon Sheet Glass Co. Ltd. | | | 425,600 | | | | 1,587,319 | |
| | Nippon Steel Trading Corp. | | | 96,960 | | | | 3,336,100 | |
| | Nippon Thompson Co. Ltd. | | | 346,400 | | | | 1,235,466 | |
| | Nippon Tungsten Co. Ltd. | | | 6,699 | | | | 108,258 | |
# | | Nishimatsu Construction Co. Ltd. | | | 313,800 | | | | 7,640,054 | |
| | Nishi-Nippon Railroad Co. Ltd. | | | 244,600 | | | | 4,797,523 | |
| | Nishio Rent All Co. Ltd. | | | 123,800 | | | | 2,489,156 | |
| | Nissei ASB Machine Co. Ltd. | | | 51,100 | | | | 1,274,417 | |
| | Nissei Plastic Industrial Co. Ltd. | | | 105,100 | | | | 676,996 | |
| | Nisshinbo Holdings, Inc. | | | 911,180 | | | | 6,316,101 | |
| | Nissin Corp. | | | 92,500 | | | | 1,196,965 | |
| | Nissin Electric Co. Ltd. | | | 323,700 | | | | 3,004,613 | |
| | Nisso Corp. | | | 69,000 | | | | 261,542 | |
| | Nitta Corp. | | | 126,200 | | | | 2,448,744 | |
| | Nitto Boseki Co. Ltd. | | | 72,600 | | | | 1,076,076 | |
| | Nitto Kogyo Corp. | | | 169,300 | | | | 2,801,962 | |
| | Nitto Kohki Co. Ltd. | | | 69,900 | | | | 740,827 | |
| | Nitto Seiko Co. Ltd. | | | 186,200 | | | | 646,747 | |
| | Nittoc Construction Co. Ltd. | | | 121,600 | | | | 716,131 | |
| | NJS Co. Ltd. | | | 36,800 | | | | 512,918 | |
| | Noda Corp. | | | 118,500 | | | | 986,841 | |
| | Nomura Co. Ltd. | | | 61,400 | | | | 448,489 | |
# | | Nomura Micro Science Co. Ltd. | | | 39,900 | | | | 999,761 | |
| | Noritake Co. Ltd. | | | 58,900 | | | | 1,635,100 | |
| | Noritsu Koki Co. Ltd. | | | 118,900 | | | | 2,140,483 | |
| | Noritz Corp. | | | 175,100 | | | | 1,797,319 | |
# | | NS Tool Co. Ltd. | | | 105,300 | | | | 816,579 | |
# | | NS United Kaiun Kaisha Ltd. | | | 59,600 | | | | 1,483,340 | |
| | NTN Corp. | | | 2,686,900 | | | | 4,783,020 | |
# | | Obara Group, Inc. | | | 73,700 | | | | 1,709,048 | |
# | | Ochi Holdings Co. Ltd. | | | 8,900 | | | | 71,791 | |
| | Odawara Engineering Co. Ltd. | | | 9,900 | | | | 101,151 | |
| | Ohba Co. Ltd. | | | 76,500 | | | | 351,008 | |
| | Ohmoto Gumi Co. Ltd. | | | 4,100 | | | | 165,426 | |
| | Oiles Corp. | | | 143,970 | | | | 1,446,659 | |
| | Okabe Co. Ltd. | | | 233,200 | | | | 1,102,530 | |
| | Okada Aiyon Corp. | | | 42,800 | | | | 413,360 | |
| | Okamoto Machine Tool Works Ltd. | | | 25,299 | | | | 803,711 | |
| | Okamura Corp. | | | 374,000 | | | | 3,442,741 | |
| | OKUMA Corp. | | | 150,100 | | | | 5,024,552 | |
| | Okumura Corp. | | | 187,880 | | | | 3,552,776 | |
| | Onoken Co. Ltd. | | | 107,500 | | | | 1,039,655 | |
| | Organo Corp. | | | 168,400 | | | | 2,905,489 | |
| | Oriental Consultants Holdings Co. Ltd. | | | 6,100 | | | | 106,955 | |
| | Oriental Shiraishi Corp. | | | 754,400 | | | | 1,358,990 | |
# | | Origin Co. Ltd. | | | 24,900 | | | | 217,236 | |
| | OSG Corp. | | | 526,900 | | | | 6,698,620 | |
| | Outsourcing, Inc. | | | 731,600 | | | | 5,699,249 | |
| | Oyo Corp. | | | 126,400 | | | | 1,918,971 | |
# | | Paraca, Inc. | | | 35,900 | | | | 459,991 | |
| | Parker Corp. | | | 34,000 | | | | 112,790 | |
# | | Pasco Corp. | | | 11,200 | | | | 96,976 | |
| | Pasona Group, Inc. | | | 143,100 | | | | 1,968,420 | |
| | Pegasus Sewing Machine Manufacturing Co. Ltd. | | | 139,900 | | | | 814,580 | |
| | Penta-Ocean Construction Co. Ltd. | | | 1,589,800 | | | | 7,906,395 | |
| | People Dreams & Technologies Group Co. Ltd. | | | 23,700 | | | | 430,931 | |
| | Pilot Corp. | | | 128,200 | | | | 4,984,322 | |
THE JAPANESE SMALL COMPANY SERIES
CONTINUED
| | | | | | | | | | |
| | | | | Shares | | | Value» | |
INDUSTRIALS — (Continued) | | | | | | | | |
| | Prestige International, Inc. | | | 650,300 | | | $ | 3,141,019 | |
| | Pronexus, Inc. | | | 104,900 | | | | 675,811 | |
| | PS Mitsubishi Construction Co. Ltd. | | | 203,300 | | | | 841,978 | |
| | Punch Industry Co. Ltd. | | | 88,700 | | | | 239,575 | |
| | Quick Co. Ltd. | | | 77,000 | | | | 1,000,847 | |
| | Raito Kogyo Co. Ltd. | | | 287,200 | | | | 3,917,848 | |
| | Raiznext Corp. | | | 271,700 | | | | 2,275,738 | |
# | | Rasa Corp. | | | 63,200 | | | | 424,363 | |
| | Rheon Automatic Machinery Co. Ltd. | | | 120,500 | | | | 943,271 | |
# | | Rix Corp. | | | 17,300 | | | | 242,328 | |
| | Ryobi Ltd. | | | 154,540 | | | | 1,370,104 | |
# | | S LINE Co. Ltd. | | | 23,800 | | | | 126,255 | |
| | Sakai Heavy Industries Ltd. | | | 23,300 | | | | 468,173 | |
| | Sakai Moving Service Co. Ltd. | | | 71,800 | | | | 2,269,503 | |
# * | | Sanix, Inc. | | | 16,900 | | | | 25,993 | |
| | Sanki Engineering Co. Ltd. | | | 270,600 | | | | 2,929,221 | |
| | Sanko Gosei Ltd. | | | 134,300 | | | | 420,921 | |
| | Sanko Metal Industrial Co. Ltd. | | | 16,200 | | | | 314,209 | |
# | | Sankyo Tateyama, Inc. | | | 174,274 | | | | 636,624 | |
| | Sankyu, Inc. | | | 189,600 | | | | 5,653,246 | |
| | Sansei Technologies, Inc. | | | 64,500 | | | | 329,642 | |
| | Sansha Electric Manufacturing Co. Ltd. | | | 62,600 | | | | 380,207 | |
| | Sanyo Denki Co. Ltd. | | | 53,600 | | | | 1,961,995 | |
| | Sanyo Engineering & Construction, Inc. | | | 60,200 | | | | 252,434 | |
| | Sanyo Industries Ltd. | | | 9,900 | | | | 106,610 | |
| | Sanyo Trading Co. Ltd. | | | 138,600 | | | | 966,967 | |
# | | Sata Construction Co. Ltd. | | | 86,199 | | | | 234,544 | |
| | Sato Holdings Corp. | | | 177,900 | | | | 2,194,616 | |
| | Sato Shoji Corp. | | | 86,800 | | | | 673,044 | |
| | SBS Holdings, Inc. | | | 119,400 | | | | 2,324,819 | |
# | | SEC Carbon Ltd. | | | 10,900 | | | | 502,953 | |
| | Seibu Electric & Machinery Co. Ltd. | | | 10,300 | | | | 102,754 | |
| | Seika Corp. | | | 56,700 | | | | 623,571 | |
# | | Seikitokyu Kogyo Co. Ltd. | | | 185,330 | | | | 1,020,196 | |
| | Seiko Electric Co. Ltd. | | | 4,900 | | | | 31,853 | |
| | Seino Holdings Co. Ltd. | | | 396,900 | | | | 3,049,703 | |
| | Sekisui Jushi Corp. | | | 197,500 | | | | 2,261,455 | |
| | Senko Group Holdings Co. Ltd. | | | 704,600 | | | | 4,706,661 | |
# | | Senshu Electric Co. Ltd. | | | 59,600 | | | | 1,079,804 | |
| | Shibaura Machine Co. Ltd. | | | 130,900 | | | | 2,541,074 | |
| | Shibusawa Warehouse Co. Ltd. | | | 59,200 | | | | 815,012 | |
| | Shibuya Corp. | | | 93,700 | | | | 1,617,143 | |
| | Shima Seiki Manufacturing Ltd. | | | 169,000 | | | | 2,357,841 | |
# | | Shimojima Co. Ltd. | | | 48,800 | | | | 344,922 | |
| | Shin Maint Holdings Co. Ltd. | | | 14,600 | | | | 125,415 | |
| | Shin Nippon Air Technologies Co. Ltd. | | | 85,480 | | | | 1,091,162 | |
# | | Shinki Bus Co. Ltd. | | | 1,900 | | | | 43,120 | |
| | Shinmaywa Industries Ltd. | | | 367,000 | | | | 2,502,819 | |
| | Shinnihon Corp. | | | 164,700 | | | | 801,514 | |
| | Shinsho Corp. | | | 31,100 | | | | 835,292 | |
| | Shinwa Co. Ltd. | | | 62,300 | | | | 833,478 | |
| | Shinwa Co. Ltd. | | | 24,800 | | | | 132,282 | |
# | | SIGMAXYZ Holdings, Inc. | | | 220,000 | | | | 1,766,989 | |
| | Sinfonia Technology Co. Ltd. | | | 137,100 | | | | 1,247,318 | |
| | Sinko Industries Ltd. | | | 124,500 | | | | 1,296,374 | |
| | Sintokogio Ltd. | | | 273,000 | | | | 1,260,572 | |
| | SMS Co. Ltd. | | | 199,000 | | | | 4,565,230 | |
# | | Soda Nikka Co. Ltd. | | | 105,700 | | | | 401,722 | |
| | Sodick Co. Ltd. | | | 286,600 | | | | 1,489,569 | |
THE JAPANESE SMALL COMPANY SERIES
CONTINUED
| | | | | | | | | | |
| | | | | Shares | | | Value» | |
INDUSTRIALS — (Continued) | | | | | | | | |
| | Sotetsu Holdings, Inc. | | | 145,600 | | | $ | 2,204,991 | |
# | | Space Co. Ltd. | | | 96,562 | | | | 570,156 | |
| | S-Pool, Inc. | | | 410,600 | | | | 2,621,976 | |
| | Star Micronics Co. Ltd. | | | 217,000 | | | | 2,485,741 | |
# | | Studio Alice Co. Ltd. | | | 56,600 | | | | 790,285 | |
| | Subaru Enterprise Co. Ltd. | | | 6,300 | | | | 355,395 | |
# | | Sugimoto & Co. Ltd. | | | 61,600 | | | | 808,128 | |
# | | Sumiseki Holdings, Inc. | | | 320,200 | | | | 449,852 | |
| | Sumitomo Densetsu Co. Ltd. | | | 110,600 | | | | 1,945,707 | |
| | Sumitomo Mitsui Construction Co. Ltd. | | | 976,140 | | | | 2,867,603 | |
# | | Sumitomo Precision Products Co. Ltd. | | | 17,284 | | | | 287,658 | |
| | Sumitomo Warehouse Co. Ltd. | | | 350,900 | | | | 4,762,665 | |
| | Suzumo Machinery Co. Ltd. | | | 4,400 | | | | 29,192 | |
| | SWCC Showa Holdings Co. Ltd. | | | 154,100 | | | | 1,851,183 | |
# | | Tacmina Corp. | | | 14,700 | | | | 116,506 | |
| | Tadano Ltd. | | | 694,500 | | | | 4,245,262 | |
| | Taihei Dengyo Kaisha Ltd. | | | 91,000 | | | | 2,008,633 | |
# | | Taiheiyo Kouhatsu, Inc. | | | 43,500 | | | | 198,126 | |
| | Taikisha Ltd. | | | 161,000 | | | | 3,798,621 | |
| | Taisei Oncho Co. Ltd. | | | 14,900 | | | | 184,359 | |
| | Takamatsu Construction Group Co. Ltd. | | | 103,300 | | | | 1,347,045 | |
| | Takamatsu Machinery Co. Ltd. | | | 34,000 | | | | 132,110 | |
| | Takamiya Co. Ltd. | | | 137,800 | | | | 377,156 | |
| | Takano Co. Ltd. | | | 50,700 | | | | 223,268 | |
| | Takaoka Toko Co. Ltd. | | | 65,620 | | | | 809,895 | |
# | | Takara & Co. Ltd. | | | 47,155 | | | | 684,742 | |
| | Takara Standard Co. Ltd. | | | 202,100 | | | | 1,735,407 | |
| | Takasago Thermal Engineering Co. Ltd. | | | 297,900 | | | | 3,623,971 | |
| | Takashima & Co. Ltd. | | | 25,200 | | | | 452,228 | |
| | Takeuchi Manufacturing Co. Ltd. | | | 225,200 | | | | 4,541,602 | |
| | Takigami Steel Construction Co. Ltd. | | | 5,300 | | | | 256,196 | |
# | | Takisawa Machine Tool Co. Ltd. | | | 36,300 | | | | 260,108 | |
| | Takuma Co. Ltd. | | | 179,900 | | | | 1,493,576 | |
| | Tanabe Consulting Group Co. Ltd. | | | 2,400 | | | | 9,962 | |
| | Tanabe Engineering Corp. | | | 39,500 | | | | 239,381 | |
| | Tanseisha Co. Ltd. | | | 249,249 | | | | 1,343,406 | |
| | Tatsuta Electric Wire & Cable Co. Ltd. | | | 241,100 | | | | 713,406 | |
| | TECHNO ASSOCIE Co. Ltd. | | | 50,100 | | | | 353,359 | |
| | Techno Ryowa Ltd. | | | 68,690 | | | | 404,034 | |
| | Techno Smart Corp. | | | 49,500 | | | | 405,312 | |
| | Teikoku Electric Manufacturing Co. Ltd. | | | 108,100 | | | | 1,437,818 | |
| | Teikoku Sen-I Co. Ltd. | | | 113,000 | | | | 1,210,413 | |
| | Tekken Corp. | | | 83,400 | | | | 988,900 | |
| | Tenox Corp. | | | 2,800 | | | | 16,945 | |
| | Teraoka Seisakusho Co. Ltd. | | | 51,000 | | | | 109,697 | |
| | Terasaki Electric Co. Ltd. | | | 25,500 | | | | 161,829 | |
# | | Tess Holdings Co. Ltd. | | | 29,200 | | | | 200,126 | |
| | Toa Corp. | | | 93,100 | | | | 1,522,129 | |
| | TOA ROAD Corp. | | | 25,500 | | | | 1,031,603 | |
| | Toba, Inc. | | | 9,800 | | | | 179,666 | |
| | Tobishima Corp. | | | 120,270 | | | | 839,055 | |
| | Tocalo Co. Ltd. | | | 383,600 | | | | 3,064,814 | |
| | Toda Corp. | | | 752,400 | | | | 3,760,691 | |
| | Toenec Corp. | | | 54,000 | | | | 1,276,473 | |
| | Togami Electric Manufacturing Co. Ltd. | | | 17,800 | | | | 204,060 | |
| | TOKAI Holdings Corp. | | | 645,200 | | | | 3,853,322 | |
| | Tokai Lease Co. Ltd. | | | 18,800 | | | | 181,512 | |
| | Tokyo Energy & Systems, Inc. | | | 144,700 | | | | 899,147 | |
| | Tokyo Keiki, Inc. | | | 71,022 | | | | 610,864 | |
THE JAPANESE SMALL COMPANY SERIES
CONTINUED
| | | | | | | | | | |
| | | | | Shares | | | Value» | |
INDUSTRIALS — (Continued) | | | | | | | | |
| | Tokyo Sangyo Co. Ltd. | | | 126,500 | | | $ | 687,822 | |
| | Tokyu Construction Co. Ltd. | | | 535,700 | | | | 2,248,165 | |
| | Toli Corp. | | | 282,400 | | | | 379,706 | |
| | Tomoe Corp. | | | 155,100 | | | | 365,758 | |
# | | Tomoe Engineering Co. Ltd. | | | 47,900 | | | | 760,986 | |
| | Tonami Holdings Co. Ltd. | | | 37,500 | | | | 889,273 | |
| | Torishima Pump Manufacturing Co. Ltd. | | | 120,300 | | | | 1,042,145 | |
| | Totech Corp. | | | 49,200 | | | | 1,156,030 | |
| | Totetsu Kogyo Co. Ltd. | | | 156,200 | | | | 2,593,126 | |
# | | Totoku Electric Co. Ltd. | | | 17,700 | | | | 261,840 | |
| | Toyo Construction Co. Ltd. | | | 492,600 | | | | 2,976,455 | |
| | Toyo Denki Seizo KK | | | 22,850 | | | | 130,681 | |
# * | | Toyo Engineering Corp. | | | 194,378 | | | | 764,599 | |
| | Toyo Logistics Co. Ltd. | | | 85,100 | | | | 147,680 | |
| | Toyo Machinery & Metal Co. Ltd. | | | 100,000 | | | | 349,009 | |
| | Toyo Tanso Co. Ltd. | | | 80,600 | | | | 2,017,110 | |
# | | Toyo Wharf & Warehouse Co. Ltd. | | | 24,100 | | | | 182,938 | |
| | Trancom Co. Ltd. | | | 48,200 | | | | 2,469,638 | |
| | TRE Holdings Corp. | | | 57,612 | | | | 621,366 | |
| | Trinity Industrial Corp. | | | 36,000 | | | | 162,038 | |
| | Trusco Nakayama Corp. | | | 231,800 | | | | 3,104,859 | |
| | Tsubaki Nakashima Co. Ltd. | | | 261,300 | | | | 2,164,612 | |
| | Tsubakimoto Chain Co. | | | 164,740 | | | | 3,527,042 | |
| | Tsubakimoto Kogyo Co. Ltd. | | | 28,400 | | | | 729,979 | |
| | Tsugami Corp. | | | 279,800 | | | | 2,095,476 | |
| | Tsukishima Kikai Co. Ltd. | | | 165,000 | | | | 1,118,578 | |
| | Tsurumi Manufacturing Co. Ltd. | | | 117,500 | | | | 1,745,667 | |
# | | Ueki Corp. | | | 60,800 | | | | 503,837 | |
# | | Union Tool Co. | | | 46,900 | | | | 1,129,028 | |
| | Ushio, Inc. | | | 622,400 | | | | 6,463,241 | |
| | UT Group Co. Ltd. | | | 183,200 | | | | 2,986,375 | |
| | Waida Manufacturing Co. Ltd. | | | 800 | | | | 5,004 | |
| | Wakachiku Construction Co. Ltd. | | | 76,000 | | | | 1,283,013 | |
| | Wakita & Co. Ltd. | | | 220,000 | | | | 1,736,766 | |
# | | WDB Holdings Co. Ltd. | | | 64,600 | | | | 1,114,126 | |
| | Weathernews, Inc. | | | 36,200 | | | | 1,885,412 | |
| | Welbe, Inc. | | | 59,100 | | | | 378,906 | |
| | Will Group, Inc. | | | 98,000 | | | | 938,231 | |
# | | World Holdings Co. Ltd. | | | 50,700 | | | | 889,243 | |
| | Yahagi Construction Co. Ltd. | | | 172,600 | | | | 870,086 | |
| | YAMABIKO Corp. | | | 219,428 | | | | 1,689,654 | |
| | YAMADA Consulting Group Co. Ltd. | | | 64,900 | | | | 531,708 | |
| | Yamashina Corp. | | | 245,700 | | | | 107,345 | |
| | Yamashin-Filter Corp. | | | 30,600 | | | | 85,482 | |
| | Yamato Corp. | | | 108,400 | | | | 487,299 | |
# | | Yamaura Corp. | | | 12,700 | | | | 84,513 | |
| | Yamazen Corp. | | | 362,500 | | | | 2,253,691 | |
| | Yasuda Logistics Corp. | | | 99,100 | | | | 611,974 | |
| | Yokogawa Bridge Holdings Corp. | | | 203,700 | | | | 2,707,094 | |
| | Yondenko Corp. | | | 54,120 | | | | 658,300 | |
| | Yuasa Trading Co. Ltd. | | | 106,400 | | | | 2,648,335 | |
| | Yuken Kogyo Co. Ltd. | | | 20,000 | | | | 234,858 | |
| | Yurtec Corp. | | | 257,400 | | | | 1,232,008 | |
| | Yushin Precision Equipment Co. Ltd. | | | 29,800 | | | | 140,836 | |
| | Zaoh Co. Ltd. | | | 25,900 | | | | 285,730 | |
| | Zenitaka Corp. | | | 19,200 | | | | 363,301 | |
| | Zuiko Corp. | | | 94,600 | | | | 425,975 | |
| | | | | | | | | | |
TOTAL INDUSTRIALS | | | | 720,093,537 | |
| | | | | | | | | | |
THE JAPANESE SMALL COMPANY SERIES
CONTINUED
| | | | | | | | | | |
| | | | | Shares | | | Value» | |
INFORMATION TECHNOLOGY — (15.3%) | | | | | | | | |
# | | A&D HOLON Holdings Co. Ltd. | | | 129,500 | | | $ | 797,049 | |
* | | Access Co. Ltd. | | | 155,800 | | | | 822,226 | |
# | | Ad-sol Nissin Corp. | | | 47,200 | | | | 484,122 | |
| | Adtec Plasma Technology Co. Ltd. | | | 25,000 | | | | 260,300 | |
* | | Advanced Media, Inc. | | | 40,600 | | | | 266,606 | |
# | | AGS Corp. | | | 13,000 | | | | 53,695 | |
| | Ai Holdings Corp. | | | 244,900 | | | | 3,625,125 | |
| | Aichi Tokei Denki Co. Ltd. | | | 53,600 | | | | 468,017 | |
| | Aiphone Co. Ltd. | | | 66,800 | | | | 898,920 | |
# * | | Allied Telesis Holdings KK | | | 191,200 | | | | 118,234 | |
| | Alpha Systems, Inc. | | | 29,220 | | | | 843,389 | |
| | Alps Alpine Co. Ltd. | | | 788,800 | | | | 6,776,241 | |
| | Amano Corp. | | | 291,800 | | | | 4,993,395 | |
| | Anritsu Corp. | | | 849,300 | | | | 8,548,093 | |
| | AOI Electronics Co. Ltd. | | | 27,700 | | | | 358,540 | |
| | Argo Graphics, Inc. | | | 105,300 | | | | 2,742,401 | |
| | Arisawa Manufacturing Co. Ltd. | | | 210,800 | | | | 1,780,553 | |
| | Artiza Networks, Inc. | | | 14,900 | | | | 104,008 | |
| | Asahi Intelligence Service Co. Ltd. | | | 1,300 | | | | 9,543 | |
| | Ascentech KK | | | 21,700 | | | | 73,280 | |
# | | Asteria Corp. | | | 76,600 | | | | 419,784 | |
# | | Atled Corp. | | | 15,700 | | | | 161,476 | |
| | Aval Data Corp. | | | 3,200 | | | | 52,808 | |
# | | Avant Group Corp. | | | 127,700 | | | | 1,266,705 | |
| | Axell Corp. | | | 23,100 | | | | 196,809 | |
| | Base Co. Ltd. | | | 15,600 | | | | 447,857 | |
| | Bell System24 Holdings, Inc. | | | 218,600 | | | | 2,030,603 | |
* | | BrainPad, Inc. | | | 87,600 | | | | 532,471 | |
| | Broadband Tower, Inc. | | | 116,500 | | | | 135,290 | |
| | Broadleaf Co. Ltd. | | | 300,300 | | | | 1,100,160 | |
| | Business Brain Showa-Ota, Inc. | | | 39,600 | | | | 399,718 | |
# | | Business Engineering Corp. | | | 4,400 | | | | 61,432 | |
| | CAC Holdings Corp. | | | 75,200 | | | | 760,407 | |
| | Canon Electronics, Inc. | | | 125,200 | | | | 1,321,970 | |
# | | CDS Co. Ltd. | | | 15,500 | | | | 189,335 | |
| | Celsys, Inc. | | | 206,000 | | | | 1,089,049 | |
# | | Change, Inc. | | | 90,200 | | | | 1,204,884 | |
| | Chino Corp. | | | 45,000 | | | | 518,578 | |
| | Citizen Watch Co. Ltd. | | | 1,669,800 | | | | 7,012,673 | |
| | CMK Corp. | | | 278,600 | | | | 1,002,777 | |
| | Computer Engineering & Consulting Ltd. | | | 170,100 | | | | 1,783,297 | |
# | | Computer Institute of Japan Ltd. | | | 113,639 | | | | 626,460 | |
| | Comture Corp. | | | 143,900 | | | | 2,341,277 | |
| | CONEXIO Corp. | | | 98,700 | | | | 755,423 | |
| | Core Corp. | | | 45,800 | | | | 455,180 | |
# | | Cresco Ltd. | | | 86,500 | | | | 1,006,697 | |
# | | Cross Cat Co. Ltd. | | | 8,200 | | | | 79,537 | |
# | | Cube System, Inc. | | | 60,600 | | | | 407,163 | |
| | Cyber Com Co. Ltd. | | | 10,600 | | | | 102,807 | |
| | Cyberlinks Co. Ltd. | | | 32,400 | | | | 287,383 | |
| | Cybernet Systems Co. Ltd. | | | 6,500 | | | | 45,740 | |
| | Cybozu, Inc. | | | 150,100 | | | | 1,917,683 | |
| | Daiko Denshi Tsushin Ltd. | | | 23,100 | | | | 73,631 | |
# | | Daishinku Corp. | | | 160,896 | | | | 1,002,762 | |
| | Daitron Co. Ltd. | | | 55,600 | | | | 794,275 | |
| | Daiwabo Holdings Co. Ltd. | | | 581,600 | | | | 7,504,581 | |
| | Dawn Corp. | | | 4,000 | | | | 50,156 | |
# | | Densan System Holdings Co. Ltd. | | | 43,600 | | | | 689,528 | |
| | Dexerials Corp. | | | 345,400 | | | | 8,044,653 | |
THE JAPANESE SMALL COMPANY SERIES
CONTINUED
| | | | | | | | | | |
| | | | | Shares | | | Value» | |
INFORMATION TECHNOLOGY — (Continued) | | | | | | | | |
| | Digital Arts, Inc. | | | 75,200 | | | $ | 3,160,207 | |
| | Digital Garage, Inc. | | | 168,200 | | | | 4,027,495 | |
# | | Digital Hearts Holdings Co. Ltd. | | | 74,800 | | | | 1,025,407 | |
| | Digital Information Technologies Corp. | | | 61,700 | | | | 725,684 | |
| | DKK Co. Ltd. | | | 63,400 | | | | 1,021,897 | |
# | | DKK-Toa Corp. | | | 31,400 | | | | 180,891 | |
| | Double Standard, Inc. | | | 42,500 | | | | 749,187 | |
| | DTS Corp. | | | 254,000 | | | | 6,038,755 | |
| | Ebase Co. Ltd. | | | 125,600 | | | | 464,521 | |
# * | | E-Guardian, Inc. | | | 62,600 | | | | 1,279,105 | |
| | Eizo Corp. | | | 100,300 | | | | 2,439,949 | |
| | Elecom Co. Ltd. | | | 256,300 | | | | 2,374,323 | |
| | Elematec Corp. | | | 118,242 | | | �� | 1,232,490 | |
| | Enomoto Co. Ltd. | | | 30,200 | | | | 362,824 | |
| | Enplas Corp. | | | 48,600 | | | | 1,327,884 | |
| | ESPEC Corp. | | | 117,700 | | | | 1,509,342 | |
| | Fenwal Controls of Japan Ltd. | | | 20,500 | | | | 193,041 | |
| | Ferrotec Holdings Corp. | | | 237,000 | | | | 4,015,993 | |
| | Fixstars Corp. | | | 105,300 | | | | 795,723 | |
| | Focus Systems Corp. | | | 53,700 | | | | 364,514 | |
# | | Forval Corp. | | | 51,100 | | | | 322,612 | |
| | FTGroup Co. Ltd. | | | 51,000 | | | | 289,489 | |
| | Fuji Soft, Inc. | | | 61,000 | | | | 3,318,540 | |
| | Fukui Computer Holdings, Inc. | | | 58,900 | | | | 1,375,125 | |
| | Furuno Electric Co. Ltd. | | | 157,500 | | | | 1,135,861 | |
# | | Furuya Metal Co. Ltd. | | | 16,500 | | | | 885,058 | |
| | Future Corp. | | | 296,700 | | | | 3,329,714 | |
| | Future Innovation Group, Inc. | | | 11,900 | | | | 31,413 | |
# | | Gig Works, Inc. | | | 34,700 | | | | 73,494 | |
# | | GL Sciences, Inc. | | | 44,500 | | | | 660,934 | |
# | | Glosel Co. Ltd. | | | 113,200 | | | | 316,259 | |
# | | GMO Financial Gate, Inc. | | | 6,800 | | | | 634,544 | |
| | GMO GlobalSign Holdings KK | | | 33,800 | | | | 1,050,657 | |
# | | GMO Pepabo, Inc. | | | 7,300 | | | | 98,712 | |
| | Hagiwara Electric Holdings Co. Ltd. | | | 48,300 | | | | 733,075 | |
# | | Hakuto Co. Ltd. | | | 84,900 | | | | 2,187,068 | |
# * | | Hennge KK | | | 13,200 | | | | 93,127 | |
| | Himacs Ltd. | | | 960 | | | | 9,492 | |
| | Hioki EE Corp. | | | 63,000 | | | | 3,007,169 | |
| | Hochiki Corp. | | | 91,500 | | | | 876,933 | |
| | Hokuriku Electric Industry Co. Ltd. | | | 21,839 | | | | 154,484 | |
| | Horiba Ltd. | | | 92,500 | | | | 3,795,042 | |
| | Hosiden Corp. | | | 320,100 | | | | 3,376,367 | |
# * | | Hotto Link, Inc. | | | 55,800 | | | | 146,177 | |
# | | HPC Systems, Inc. | | | 17,700 | | | | 242,056 | |
| | Icom, Inc. | | | 54,900 | | | | 922,934 | |
| | ID Holdings Corp. | | | 79,450 | | | | 484,207 | |
| | I’ll, Inc. | | | 28,500 | | | | 354,646 | |
| | Ines Corp. | | | 125,400 | | | | 1,275,718 | |
# | | I-Net Corp. | | | 76,490 | | | | 687,238 | |
| | Infomart Corp. | | | 761,600 | | | | 2,463,794 | |
| | Information Services International-Dentsu Ltd. | | | 80,000 | | | | 2,446,775 | |
| | Innotech Corp. | | | 96,100 | | | | 810,917 | |
| | Intelligent Wave, Inc. | | | 50,500 | | | | 281,845 | |
| | Inter Action Corp. | | | 58,500 | | | | 559,511 | |
| | I-PEX, Inc. | | | 72,100 | | | | 620,165 | |
| | Iriso Electronics Co. Ltd. | | | 131,700 | | | | 3,815,611 | |
| | ISB Corp. | | | 51,700 | | | | 454,495 | |
* | | ITbook Holdings Co. Ltd. | | | 72,300 | | | | 199,196 | |
THE JAPANESE SMALL COMPANY SERIES
CONTINUED
| | | | | | | | | | |
| | | | | Shares | | | Value» | |
INFORMATION TECHNOLOGY — (Continued) | | | | | | | | |
| | Itfor, Inc. | | | 172,600 | | | $ | 889,505 | |
# | | Iwatsu Electric Co. Ltd. | | | 53,100 | | | | 268,412 | |
| | Japan Aviation Electronics Industry Ltd. | | | 303,200 | | | | 4,718,969 | |
| | Japan Cash Machine Co. Ltd. | | | 141,800 | | | | 662,469 | |
| | Japan Electronic Materials Corp. | | | 61,600 | | | | 597,540 | |
| | Japan Material Co. Ltd. | | | 434,600 | | | | 5,721,773 | |
| | Japan System Techniques Co. Ltd. | | | 30,400 | | | | 307,068 | |
| | Jastec Co. Ltd. | | | 72,900 | | | | 630,468 | |
# | | JBCC Holdings, Inc. | | | 92,300 | | | | 1,203,324 | |
| | JFE Systems, Inc. | | | 10,000 | | | | 150,149 | |
# * | | JIG-SAW, Inc. | | | 18,500 | | | | 546,502 | |
| | Justsystems Corp. | | | 125,000 | | | | 2,629,073 | |
| | Kaga Electronics Co. Ltd. | | | 109,300 | | | | 3,239,303 | |
| | Kanematsu Electronics Ltd. | | | 78,100 | | | | 2,320,130 | |
* | | Kaonavi, Inc. | | | 2,800 | | | | 48,089 | |
| | KEL Corp. | | | 27,900 | | | | 303,063 | |
| | Koa Corp. | | | 195,100 | | | | 2,809,910 | |
| | Konica Minolta, Inc. | | | 2,014,100 | | | | 6,136,873 | |
| | KSK Co. Ltd. | | | 3,000 | | | | 44,103 | |
# | | Kyoden Co. Ltd. | | | 116,100 | | | | 426,143 | |
| | Kyosan Electric Manufacturing Co. Ltd. | | | 257,600 | | | | 694,140 | |
| | Kyowa Electronic Instruments Co. Ltd. | | | 129,800 | | | | 289,601 | |
# | | LAC Co. Ltd. | | | 100,100 | | | | 526,901 | |
| | Macnica Holdings, Inc. | | | 335,450 | | | | 6,709,361 | |
# | | Marubun Corp. | | | 108,900 | | | | 630,445 | |
| | Maruwa Co. Ltd. | | | 57,700 | | | | 6,779,271 | |
| | Maxell Ltd. | | | 300,200 | | | | 2,490,441 | |
| | MCJ Co. Ltd. | | | 430,200 | | | | 2,716,869 | |
| | Megachips Corp. | | | 111,500 | | | | 1,908,583 | |
| | Meiko Electronics Co. Ltd. | | | 131,900 | | | | 2,338,271 | |
# | | Melco Holdings, Inc. | | | 35,600 | | | | 747,880 | |
* | | Metaps, Inc. | | | 2,500 | | | | 9,672 | |
| | Micronics Japan Co. Ltd. | | | 148,500 | | | | 1,372,842 | |
| | MIMAKI ENGINEERING Co. Ltd. | | | 113,200 | | | | 559,164 | |
| | Mimasu Semiconductor Industry Co. Ltd. | | | 110,981 | | | | 1,716,236 | |
| | Miraial Co. Ltd. | | | 42,100 | | | | 448,331 | |
| | Miroku Jyoho Service Co. Ltd. | | | 112,800 | | | | 1,132,354 | |
| | Mitachi Co. Ltd. | | | 7,900 | | | | 50,159 | |
| | Mitsubishi Research Institute, Inc. | | | 50,700 | | | | 1,770,820 | |
| | m-up Holdings, Inc. | | | 178,500 | | | | 1,884,010 | |
# | | Mutoh Holdings Co. Ltd. | | | 9,300 | | | | 113,086 | |
| | Nagano Keiki Co. Ltd. | | | 86,800 | | | | 633,526 | |
| | Naigai Tec Corp. | | | 7,900 | | | | 132,096 | |
| | Nakayo, Inc. | | | 22,900 | | | | 163,512 | |
| | NEC Networks & System Integration Corp. | | | 160,608 | | | | 1,721,082 | |
| | NET One Systems Co. Ltd. | | | 383,900 | | | | 7,884,792 | |
| | NF Holdings Corp. | | | 18,200 | | | | 115,912 | |
| | Nichicon Corp. | | | 308,300 | | | | 2,902,293 | |
| | Nihon Dempa Kogyo Co. Ltd. | | | 108,100 | | | | 1,185,286 | |
| | Nihon Denkei Co. Ltd. | | | 43,300 | | | | 414,893 | |
| | Nippon Ceramic Co. Ltd. | | | 8,900 | | | | 154,637 | |
* | | Nippon Chemi-Con Corp. | | | 120,900 | | | | 1,520,554 | |
# | | Nippon Computer Dynamics Co. Ltd. | | | 36,200 | | | | 168,742 | |
# * | | Nippon Denkai Ltd. | | | 1,200 | | | | 23,023 | |
| | Nippon Electric Glass Co. Ltd. | | | 338,236 | | | | 5,856,755 | |
# | | Nippon Information Development Co. Ltd. | | | 12,600 | | | | 136,244 | |
# | | Nippon Kodoshi Corp. | | | 51,600 | | | | 729,263 | |
| | Nippon Signal Company Ltd. | | | 290,400 | | | | 1,968,387 | |
| | Nissha Co. Ltd. | | | 242,900 | | | | 2,859,753 | |
THE JAPANESE SMALL COMPANY SERIES
CONTINUED
| | | | | | | | | | |
| | | | | Shares | | | Value» | |
INFORMATION TECHNOLOGY — (Continued) | | | | | | | | |
| | Nohmi Bosai Ltd. | | | 145,100 | | | $ | 1,565,219 | |
| | NSD Co. Ltd. | | | 489,360 | | | | 8,362,456 | |
| | NSW, Inc. | | | 48,600 | | | | 694,351 | |
# | | Ohara, Inc. | | | 48,700 | | | | 396,399 | |
# | | Ohizumi Mfg. Co. Ltd. | | | 7,001 | | | | 40,625 | |
| | Oki Electric Industry Co. Ltd. | | | 519,356 | | | | 2,574,653 | |
* | | ONO Sokki Co. Ltd. | | | 25,600 | | | | 64,344 | |
| | Optex Group Co. Ltd. | | | 174,820 | | | | 2,406,716 | |
* | | Optim Corp. | | | 86,500 | | | | 524,687 | |
| | Optorun Co. Ltd. | | | 110,300 | | | | 1,566,218 | |
| | Oro Co. Ltd. | | | 37,200 | | | | 418,940 | |
| | Osaki Electric Co. Ltd. | | | 281,800 | | | | 988,140 | |
# | | Oval Corp. | | | 35,600 | | | | 108,552 | |
* | | Oxide Corp. | | | 3,200 | | | | 131,299 | |
# | | PCA Corp. | | | 40,900 | | | | 313,669 | |
| | PCI Holdings, Inc. | | | 45,300 | | | | 315,956 | |
| | Pole To Win Holdings, Inc. | | | 201,400 | | | | 1,281,396 | |
# | | Pro-Ship, Inc. | | | 51,100 | | | | 521,627 | |
| | Relia, Inc. | | | 244,300 | | | | 1,639,399 | |
| | Restar Holdings Corp. | | | 111,400 | | | | 1,579,928 | |
* | | Ricksoft Co. Ltd. | | | 2,000 | | | | 24,428 | |
# | | Riken Keiki Co. Ltd. | | | 88,700 | | | | 2,438,857 | |
| | Riso Kagaku Corp. | | | 68,700 | | | | 1,091,246 | |
# | | River Eletec Corp. | | | 35,300 | | | | 243,995 | |
| | Roland DG Corp. | | | 82,600 | | | | 1,770,517 | |
| | Rorze Corp. | | | 68,500 | | | | 3,442,220 | |
| | RS Technologies Co. Ltd. | | | 13,400 | | | | 664,558 | |
| | Ryoden Corp. | | | 94,800 | | | | 1,057,813 | |
| | Ryosan Co. Ltd. | | | 130,000 | | | | 2,298,926 | |
| | Saison Information Systems Co. Ltd. | | | 27,400 | | | | 325,362 | |
| | Sakura Internet, Inc. | | | 131,700 | | | | 468,624 | |
| | Sanken Electric Co. Ltd. | | | 103,000 | | | | 3,528,190 | |
| | Sanshin Electronics Co. Ltd. | | | 75,000 | | | | 971,280 | |
| | Santec Corp. | | | 3,600 | | | | 73,093 | |
# | | Satori Electric Co. Ltd. | | | 75,680 | | | | 666,401 | |
| | Saxa Holdings, Inc. | | | 30,600 | | | | 256,533 | |
# | | SB Technology Corp. | | | 64,400 | | | | 936,870 | |
# | | Scala, Inc. | | | 102,100 | | | | 509,699 | |
| | Seikoh Giken Co. Ltd. | | | 23,900 | | | | 252,988 | |
# | | SEMITEC Corp. | | | 8,000 | | | | 501,353 | |
| | SERAKU Co. Ltd. | | | 21,300 | | | | 172,160 | |
# | | Shibaura Electronics Co. Ltd. | | | 45,000 | | | | 1,412,687 | |
| | Shibaura Mechatronics Corp. | | | 23,100 | | | | 1,516,463 | |
| | Shindengen Electric Manufacturing Co. Ltd. | | | 45,700 | | | | 1,128,630 | |
| | Shinko Shoji Co. Ltd. | | | 236,000 | | | | 1,576,910 | |
# | | Shizuki Electric Co., Inc. | | | 121,600 | | | | 397,507 | |
| | Showa Shinku Co. Ltd. | | | 24,400 | | | | 233,245 | |
# | | Sigma Koki Co. Ltd. | | | 28,900 | | | | 289,300 | |
| | Siix Corp. | | | 188,000 | | | | 1,449,454 | |
| | SK-Electronics Co. Ltd. | | | 49,000 | | | | 413,419 | |
# * | | Smaregi, Inc. | | | 6,500 | | | | 62,325 | |
| | SMK Corp. | | | 27,599 | | | | 491,155 | |
| | Softcreate Holdings Corp. | | | 48,200 | | | | 1,095,999 | |
| | Soliton Systems KK | | | 54,100 | | | | 385,344 | |
| | Solxyz Co. Ltd. | | | 41,000 | | | | 102,478 | |
# * | | Speee, Inc. | | | 3,600 | | | | 60,971 | |
| | SRA Holdings | | | 70,400 | | | | 1,518,767 | |
| | Sumida Corp. | | | 158,549 | | | | 1,048,720 | |
# * | | Sun*, Inc. | | | 19,500 | | | | 117,864 | |
THE JAPANESE SMALL COMPANY SERIES
CONTINUED
| | | | | | | | | | |
| | | Shares | | | Value» | |
INFORMATION TECHNOLOGY — (Continued) | | | | | | | | |
| | Sun-Wa Technos Corp. | | | 75,500 | | | $ | 760,475 | |
| | Suzuden Corp. | | | 800 | | | | 12,770 | |
| | Suzuki Co. Ltd. | | | 73,200 | | | | 435,476 | |
| | System D, Inc. | | | 1,100 | | | | 11,006 | |
| | System Information Co. Ltd. | | | 57,600 | | | | 384,347 | |
| | System Research Co. Ltd. | | | 29,800 | | | | 403,106 | |
| | System Support, Inc. | | | 20,700 | | | | 200,163 | |
| | Systems Engineering Consultants Co. Ltd. | | | 6,600 | | | | 99,654 | |
| | Systena Corp. | | | 1,578,800 | | | | 4,425,184 | |
| | Tachibana Eletech Co. Ltd. | | | 103,460 | | | | 1,148,649 | |
# | | Takachiho Koheki Co. Ltd. | | | 40,900 | | | | 563,145 | |
# | | TAKEBISHI Corp. | | | 52,200 | | | | 538,241 | |
| | Tamura Corp. | | | 444,000 | | | | 2,208,583 | |
| | Tazmo Co. Ltd. | | | 3,500 | | | | 36,669 | |
| | TDC Soft, Inc. | | | 93,400 | | | | 801,493 | |
| | TechMatrix Corp. | | | 244,300 | | | | 2,774,675 | |
| | Techno Horizon Co. Ltd. | | | 61,800 | | | | 211,913 | |
| | Tecnos Japan, Inc. | | | 46,100 | | | | 139,571 | |
| | Teikoku Tsushin Kogyo Co. Ltd. | | | 51,500 | | | | 521,305 | |
# * | | Terilogy Co. Ltd. | | | 20,900 | | | | 47,367 | |
| | TESEC Corp. | | | 22,600 | | | | 361,933 | |
| | TKC Corp. | | | 185,800 | | | | 4,742,901 | |
| | Tobila Systems, Inc. | | | 1,600 | | | | 10,453 | |
| | Toho System Science Co. Ltd. | | | 2,700 | | | | 17,529 | |
| | Tokyo Electron Device Ltd. | | | 44,400 | | | | 2,095,177 | |
| | Tokyo Seimitsu Co. Ltd. | | | 248,700 | | | | 7,479,548 | |
| | Tomen Devices Corp. | | | 17,800 | | | | 623,311 | |
| | Topcon Corp. | | | 676,700 | | | | 7,401,971 | |
# | | Torex Semiconductor Ltd. | | | 52,900 | | | | 1,033,374 | |
| | Toshiba TEC Corp. | | | 107,200 | | | | 2,775,331 | |
| | Toukei Computer Co. Ltd. | | | 6,810 | | | | 272,043 | |
# | | Towa Corp. | | | 136,200 | | | | 1,643,733 | |
| | Toyo Corp. | | | 149,600 | | | | 1,305,839 | |
| | Transcosmos, Inc. | | | 115,700 | | | | 2,659,856 | |
# | | Tri Chemical Laboratories, Inc. | | | 154,500 | | | | 2,310,426 | |
| | Tsuzuki Denki Co. Ltd. | | | 42,800 | | | | 387,008 | |
| | Ubicom Holdings, Inc. | | | 30,800 | | | | 501,690 | |
| | Uchida Yoko Co. Ltd. | | | 46,900 | | | | 1,430,809 | |
| | ULS Group, Inc. | | | 13,300 | | | | 280,225 | |
| | Ulvac, Inc. | | | 225,700 | | | | 8,897,322 | |
# | | UNITED, Inc. | | | 24,200 | | | | 212,191 | |
| | User Local, Inc. | | | 9,200 | | | | 99,479 | |
| | V Technology Co. Ltd. | | | 56,900 | | | | 1,070,238 | |
# | | VINX Corp. | | | 25,600 | | | | 272,990 | |
| | Wacom Co. Ltd. | | | 980,900 | | | | 4,256,399 | |
# | | Wellnet Corp. | | | 54,900 | | | | 236,403 | |
# | | WILLs, Inc. | | | 34,200 | | | | 152,013 | |
| | WingArc1st, Inc. | | | 1,400 | | | | 22,454 | |
# | | YAC Holdings Co. Ltd. | | | 59,500 | | | | 513,122 | |
| | Yamaichi Electronics Co. Ltd. | | | 146,000 | | | | 2,096,711 | |
# | | Yashima Denki Co. Ltd. | | | 119,500 | | | | 815,486 | |
| | YE DIGITAL Corp. | | | 14,400 | | | | 39,001 | |
| | Yokowo Co. Ltd. | | | 111,075 | | | | 1,513,972 | |
| | | | | | | | | | |
TOTAL INFORMATION TECHNOLOGY | | | | | | | 389,564,150 | |
| | | | | | | | | | |
MATERIALS — (12.1%) | | | | | | | | |
| | Achilles Corp. | | | 80,500 | | | | 742,495 | |
| | ADEKA Corp. | | | 508,800 | | | | 7,606,774 | |
| | Agro-Kanesho Co. Ltd. | | | 2,300 | | | | 20,932 | |
THE JAPANESE SMALL COMPANY SERIES
CONTINUED
| | | | | | | | | | |
| | | | | Shares | | | Value» | |
MATERIALS — (Continued) | | | | | | | | |
| | Aica Kogyo Co. Ltd. | | | 179,900 | | | $ | 3,866,512 | |
| | Aichi Steel Corp. | | | 65,365 | | | | 914,118 | |
| | Arakawa Chemical Industries Ltd. | | | 106,400 | | | | 676,783 | |
| | Araya Industrial Co. Ltd. | | | 21,400 | | | | 272,907 | |
| | Asahi Holdings, Inc. | | | 472,200 | | | | 6,022,117 | |
| | Asahi Printing Co. Ltd. | | | 25,700 | | | | 144,539 | |
| | ASAHI YUKIZAI Corp. | | | 89,600 | | | | 1,438,665 | |
| | Asahipen Corp. | | | 2,100 | | | | 27,598 | |
| | Asia Pile Holdings Corp. | | | 210,800 | | | | 715,038 | |
# | | C Uyemura & Co. Ltd. | | | 71,500 | | | | 3,270,202 | |
| | Carlit Holdings Co. Ltd. | | | 128,900 | | | | 595,635 | |
| | Chuetsu Pulp & Paper Co. Ltd. | | | 32,800 | | | | 204,004 | |
# | | Chugoku Marine Paints Ltd. | | | 323,800 | | | | 1,988,522 | |
| | CI Takiron Corp. | | | 284,700 | | | | 983,704 | |
# | | CK-San-Etsu Co. Ltd. | | | 22,800 | | | | 628,714 | |
| | Dai Nippon Toryo Co. Ltd. | | | 130,200 | | | | 642,301 | |
| | Daicel Corp. | | | 1,608,100 | | | | 9,175,525 | |
| | Daido Steel Co. Ltd. | | | 164,600 | | | | 4,267,591 | |
# | | Daiichi Kigenso Kagaku-Kogyo Co. Ltd. | | | 125,200 | | | | 1,058,158 | |
| | Daiken Corp. | | | 62,200 | | | | 832,816 | |
| | Daiki Aluminium Industry Co. Ltd. | | | 177,300 | | | | 1,526,650 | |
| | Dainichiseika Color & Chemicals Manufacturing Co. Ltd. | | | 76,800 | | | | 908,605 | |
| | Daio Paper Corp. | | | 315,700 | | | | 2,329,224 | |
| | Daito Chemix Corp. | | | 17,200 | | | | 65,203 | |
| | DIC Corp. | | | 341,600 | | | | 5,735,589 | |
| | DKS Co. Ltd. | | | 47,000 | | | | 586,204 | |
| | Dynapac Co. Ltd. | | | 8,500 | | | | 72,595 | |
# | | FP Corp. | | | 87,200 | | | | 2,074,531 | |
| | Fuji Seal International, Inc. | | | 243,828 | | | | 2,856,412 | |
| | Fujikura Kasei Co. Ltd. | | | 162,600 | | | | 427,104 | |
| | Fujimi, Inc. | | | 76,800 | | | | 3,206,486 | |
| | Fujimori Kogyo Co. Ltd. | | | 104,000 | | | | 2,172,411 | |
| | Fuso Chemical Co. Ltd. | | | 117,200 | | | | 2,647,288 | |
| | Geostr Corp. | | | 33,400 | | | | 64,246 | |
| | Godo Steel Ltd. | | | 59,700 | | | | 685,802 | |
| | Gun-Ei Chemical Industry Co. Ltd. | | | 29,000 | | | | 468,323 | |
| | Hakudo Co. Ltd. | | | 41,600 | | | | 688,472 | |
| | Harima Chemicals Group, Inc. | | | 93,100 | | | | 516,951 | |
| | Hodogaya Chemical Co. Ltd. | | | 43,000 | | | | 827,277 | |
| | Hokkan Holdings Ltd. | | | 58,100 | | | | 510,304 | |
| | Hokko Chemical Industry Co. Ltd. | | | 115,300 | | | | 734,161 | |
# | | Hokuetsu Corp. | | | 775,199 | | | | 4,021,313 | |
| | Ise Chemicals Corp. | | | 13,000 | | | | 456,642 | |
| | Ishihara Chemical Co. Ltd. | | | 72,000 | | | | 601,057 | |
| | Ishihara Sangyo Kaisha Ltd. | | | 218,650 | | | | 1,505,916 | |
| | Ishizuka Glass Co. Ltd. | | | 12,900 | | | | 127,019 | |
| | Japan Pure Chemical Co. Ltd. | | | 500 | | | | 8,091 | |
| | JCU Corp. | | | 132,700 | | | | 2,509,542 | |
| | JSP Corp. | | | 79,400 | | | | 776,060 | |
| | Kaneka Corp. | | | 182,500 | | | | 4,525,500 | |
| | Kanto Denka Kogyo Co. Ltd. | | | 281,200 | | | | 1,793,755 | |
| | Katakura & Co-op Agri Corp. | | | 21,500 | | | | 171,685 | |
| | KeePer Technical Laboratory Co. Ltd. | | | 91,700 | | | | 2,528,767 | |
| | KEIWA, Inc. | | | 25,600 | | | | 623,351 | |
# | | KH Neochem Co. Ltd. | | | 227,300 | | | | 3,879,649 | |
| | Kimoto Co. Ltd. | | | 181,500 | | | | 285,324 | |
| | Koatsu Gas Kogyo Co. Ltd. | | | 185,393 | | | | 785,417 | |
| | Kobe Steel Ltd. | | | 1,343,885 | | | | 5,511,129 | |
| | Kohsoku Corp. | | | 70,200 | | | | 746,631 | |
THE JAPANESE SMALL COMPANY SERIES
CONTINUED
| | | | | | | | | | |
| | | Shares | | | Value» | |
MATERIALS — (Continued) | | | | | | | | |
| | Konishi Co. Ltd. | | | 208,800 | | | $ | 2,439,098 | |
# | | Konoshima Chemical Co. Ltd. | | | 37,500 | | | | 293,954 | |
| | Krosaki Harima Corp. | | | 30,100 | | | | 934,735 | |
# | | Kumiai Chemical Industry Co. Ltd. | | | 321,187 | | | | 2,110,879 | |
# | | Kunimine Industries Co. Ltd. | | | 41,700 | | | | 201,010 | |
| | Kureha Corp. | | | 103,950 | | | | 6,674,583 | |
| | Kurimoto Ltd. | | | 60,500 | | | | 660,669 | |
| | Kuriyama Holdings Corp. | | | 78,000 | | | | 502,350 | |
| | Kyoei Steel Ltd. | | | 141,500 | | | | 1,249,433 | |
| | Kyowa Leather Cloth Co. Ltd. | | | 78,800 | | | | 269,211 | |
| | Lintec Corp. | | | 265,900 | | | | 3,989,456 | |
| | Maeda Kosen Co. Ltd. | | | 118,600 | | | | 2,408,916 | |
| | Maruichi Steel Tube Ltd. | | | 204,800 | | | | 3,865,739 | |
| | MEC Co. Ltd. | | | 97,900 | | | | 1,564,805 | |
# | | Mipox Corp. | | | 19,600 | | | | 82,397 | |
# | | Mitani Sekisan Co. Ltd. | | | 66,000 | | | | 1,696,819 | |
| | Mitsubishi Materials Corp. | | | 369,500 | | | | 4,829,542 | |
* | | Mitsubishi Paper Mills Ltd. | | | 235,100 | | | | 433,184 | |
# | | Mitsubishi Steel Manufacturing Co. Ltd. | | | 60,400 | | | | 370,654 | |
| | Mitsui Mining & Smelting Co. Ltd. | | | 366,200 | | | | 7,396,353 | |
# | | Molitec Steel Co. Ltd. | | | 58,800 | | | | 129,281 | |
| | MORESCO Corp. | | | 39,800 | | | | 275,165 | |
| | Moriroku Holdings Co. Ltd. | | | 13,500 | | | | 153,574 | |
| | Mory Industries, Inc. | | | 33,200 | | | | 594,947 | |
# | | Nakayama Steel Works Ltd. | | | 169,700 | | | | 726,241 | |
# | | Nasu Denki Tekko Co. Ltd. | | | 3,000 | | | | 144,528 | |
| | Neturen Co. Ltd. | | | 217,300 | | | | 976,470 | |
# | | New Japan Chemical Co. Ltd. | | | 111,300 | | | | 203,666 | |
| | Nicca Chemical Co. Ltd. | | | 45,700 | | | | 269,675 | |
# | | Nichia Steel Works Ltd. | | | 94,300 | | | | 142,756 | |
| | Nihon Kagaku Sangyo Co. Ltd. | | | 81,300 | | | | 552,834 | |
| | Nihon Nohyaku Co. Ltd. | | | 243,500 | | | | 1,503,812 | |
| | Nihon Parkerizing Co. Ltd. | | | 521,900 | | | | 3,392,719 | |
# * | | Nihon Yamamura Glass Co. Ltd. | | | 58,200 | | | | 226,460 | |
| | Nippon Carbide Industries Co., Inc. | | | 46,200 | | | | 398,047 | |
| | Nippon Chemical Industrial Co. Ltd. | | | 49,500 | | | | 623,019 | |
| | Nippon Concrete Industries Co. Ltd. | | | 284,700 | | | | 461,161 | |
| | Nippon Denko Co. Ltd. | | | 687,014 | | | | 1,567,493 | |
# | | Nippon Fine Chemical Co. Ltd. | | | 82,800 | | | | 1,161,519 | |
| | Nippon Kayaku Co. Ltd. | | | 581,500 | | | | 4,618,913 | |
| | Nippon Light Metal Holdings Co. Ltd. | | | 369,390 | | | | 3,599,892 | |
| | Nippon Paper Industries Co. Ltd. | | | 560,900 | | | | 3,265,363 | |
| | Nippon Pillar Packing Co. Ltd. | | | 118,500 | | | | 1,941,368 | |
| | Nippon Shokubai Co. Ltd. | | | 98,600 | | | | 3,536,855 | |
| | Nippon Soda Co. Ltd. | | | 147,700 | | | | 4,406,305 | |
# | | Nippon Yakin Kogyo Co. Ltd. | | | 89,049 | | | | 1,692,819 | |
# | | Nitta Gelatin, Inc. | | | 85,500 | | | | 557,106 | |
| | Nittetsu Mining Co. Ltd. | | | 70,600 | | | | 1,404,596 | |
| | Nozawa Corp. | | | 47,500 | | | | 224,180 | |
| | Oat Agrio Co. Ltd. | | | 49,200 | | | | 571,986 | |
| | Okamoto Industries, Inc. | | | 70,500 | | | | 1,758,233 | |
| | Okura Industrial Co. Ltd. | | | 54,600 | | | | 687,840 | |
| | Osaka Organic Chemical Industry Ltd. | | | 101,200 | | | | 1,352,211 | |
| | Osaka Soda Co. Ltd. | | | 85,499 | | | | 2,077,959 | |
| | Osaka Steel Co. Ltd. | | | 89,300 | | | | 639,238 | |
| | Pacific Metals Co. Ltd. | | | 92,999 | | | | 1,148,603 | |
| | Pack Corp. | | | 87,200 | | | | 1,378,838 | |
| | Rasa Industries Ltd. | | | 44,400 | | | | 657,228 | |
| | Rengo Co. Ltd. | | | 980,600 | | | | 5,447,837 | |
THE JAPANESE SMALL COMPANY SERIES
CONTINUED
| | | | | | | | | | |
| | | Shares | | | Value» | |
MATERIALS — (Continued) | | | | | | | | |
| | Riken Technos Corp. | | | 231,800 | | | $ | 803,638 | |
| | Sakai Chemical Industry Co. Ltd. | | | 86,300 | | | | 1,140,331 | |
| | Sakata INX Corp. | | | 263,400 | | | | 1,884,938 | |
| | Sanyo Chemical Industries Ltd. | | | 85,200 | | | | 2,413,055 | |
# | | Sanyo Special Steel Co. Ltd. | | | 127,360 | | | | 1,634,153 | |
| | Seiko PMC Corp. | | | 64,500 | | | | 226,343 | |
| | Sekisui Kasei Co. Ltd. | | | 150,000 | | | | 390,399 | |
| | Shikoku Chemicals Corp. | | | 226,800 | | | | 1,974,413 | |
| | Shinagawa Refractories Co. Ltd. | | | 35,900 | | | | 952,272 | |
| | Shin-Etsu Polymer Co. Ltd. | | | 283,900 | | | | 2,366,330 | |
| | SK Kaken Co. Ltd. | | | 1,300 | | | | 332,123 | |
| | Soken Chemical & Engineering Co. Ltd. | | | 48,400 | | | | 619,447 | |
| | Stella Chemifa Corp. | | | 64,600 | | | | 1,158,850 | |
| | Sumitomo Bakelite Co. Ltd. | | | 194,100 | | | | 5,253,564 | |
| | Sumitomo Osaka Cement Co. Ltd. | | | 212,499 | | | | 4,524,274 | |
| | Sumitomo Seika Chemicals Co. Ltd. | | | 56,400 | | | | 1,125,799 | |
# | | T Hasegawa Co. Ltd. | | | 137,900 | | | | 2,933,405 | |
# | | T&K Toka Co. Ltd. | | | 128,100 | | | | 823,514 | |
| | Taiheiyo Cement Corp. | | | 394,800 | | | | 5,364,979 | |
| | Taisei Lamick Co. Ltd. | | | 36,900 | | | | 743,965 | |
| | Taiyo Holdings Co. Ltd. | | | 229,200 | | | | 4,042,270 | |
| | Takasago International Corp. | | | 83,900 | | | | 1,576,446 | |
| | Takemoto Yohki Co. Ltd. | | | 43,800 | | | | 215,246 | |
# * | | Tanaka Chemical Corp. | | | 13,400 | | | | 162,793 | |
# | | Taoka Chemical Co. Ltd. | | | 19,100 | | | | 97,602 | |
| | Tayca Corp. | | | 97,400 | | | | 824,168 | |
| | Teijin Ltd. | | | 109,300 | | | | 992,334 | |
| | Tenma Corp. | | | 111,300 | | | | 1,547,360 | |
| | Toagosei Co. Ltd. | | | 700,600 | | | | 5,382,878 | |
* | | Toda Kogyo Corp. | | | 4,300 | | | | 86,884 | |
# | | Toho Acetylene Co. Ltd. | | | 12,700 | | | | 92,096 | |
| | Toho Chemical Industry Co. Ltd. | | | 47,000 | | | | 154,601 | |
| | Toho Titanium Co. Ltd. | | | 215,600 | | | | 3,249,047 | |
| | Toho Zinc Co. Ltd. | | | 88,099 | | | | 1,260,209 | |
| | Tohoku Steel Co. Ltd. | | | 16,300 | | | | 177,054 | |
| | Tokai Carbon Co. Ltd. | | | 1,004,500 | | | | 6,555,281 | |
| | Tokushu Tokai Paper Co. Ltd. | | | 59,158 | | | | 1,163,542 | |
| | Tokuyama Corp. | | | 380,397 | | | | 4,435,576 | |
| | Tokyo Ohka Kogyo Co. Ltd. | | | 26,700 | | | | 1,151,082 | |
| | Tokyo Printing Ink Manufacturing Co. Ltd. | | | 10,200 | | | | 180,917 | |
# | | Tokyo Rope Manufacturing Co. Ltd. | | | 46,000 | | | | 270,028 | |
| | Tokyo Steel Manufacturing Co. Ltd. | | | 569,500 | | | | 4,889,561 | |
| | Tokyo Tekko Co. Ltd. | | | 61,900 | | | | 557,904 | |
| | Tomoku Co. Ltd. | | | 70,600 | | | | 712,618 | |
| | Topy Industries Ltd. | | | 98,200 | | | | 1,049,448 | |
# | | Toyo Gosei Co. Ltd. | | | 31,100 | | | | 1,598,494 | |
| | Toyo Ink SC Holdings Co. Ltd. | | | 233,400 | | | | 3,005,221 | |
| | Toyobo Co. Ltd. | | | 511,000 | | | | 3,569,449 | |
| | TYK Corp. | | | 148,500 | | | | 254,456 | |
| | UACJ Corp. | | | 208,841 | | | | 2,969,458 | |
| | UBE Corp. | | | 611,100 | | | | 7,881,843 | |
| | Ultrafabrics Holdings Co. Ltd. | | | 2,600 | | | | 87,002 | |
| | Valqua Ltd. | | | 107,799 | | | | 1,906,788 | |
| | Vertex Corp. | | | 126,294 | | | | 1,082,669 | |
| | Wavelock Holdings Co. Ltd. | | | 30,900 | | | | 124,471 | |
| | Wood One Co. Ltd. | | | 30,597 | | | | 190,820 | |
| | Yamato Kogyo Co. Ltd. | | | 92,100 | | | | 2,674,568 | |
| | Yodogawa Steel Works Ltd. | | | 138,500 | | | | 2,251,448 | |
| | Yotai Refractories Co. Ltd. | | | 115,400 | | | | 1,072,445 | |
| | Yushiro Chemical Industry Co. Ltd. | | | 60,500 | | | | 328,774 | |
| | | | | | | | | | |
TOTAL MATERIALS | | | | | | | 308,991,503 | |
| | | | | | | | | | |
THE JAPANESE SMALL COMPANY SERIES
CONTINUED
| | | | | | | | | | |
| | | Shares | | | Value» | |
REAL ESTATE — (1.4%) | | | | | | | | |
# | | AD Works Group Co. Ltd. | | | 47,879 | | | $ | 52,433 | |
| | Airport Facilities Co. Ltd. | | | 143,970 | | | | 517,780 | |
# | | Anabuki Kosan, Inc. | | | 16,400 | | | | 213,771 | |
| | Aoyama Zaisan Networks Co. Ltd. | | | 92,000 | | | | 568,151 | |
| | Apaman Co. Ltd. | | | 75,900 | | | | 243,990 | |
| | Ardepro Co. Ltd. | | | 7,070 | | | | 19,886 | |
| | Arealink Co. Ltd. | | | 31,173 | | | | 395,537 | |
# | | B-Lot Co. Ltd. | | | 25,800 | | | | 96,176 | |
| | Cosmos Initia Co. Ltd. | | | 93,700 | | | | 346,094 | |
# | | CRE, Inc. | | | 31,500 | | | | 288,156 | |
# | | Dear Life Co. Ltd. | | | 152,600 | | | | 639,414 | |
| | Goldcrest Co. Ltd. | | | 102,470 | | | | 1,202,665 | |
# | | Good Com Asset Co. Ltd. | | | 93,000 | | | | 437,837 | |
| | Grandy House Corp. | | | 95,600 | | | | 355,871 | |
| | Heiwa Real Estate Co. Ltd. | | | 129,200 | | | | 3,582,545 | |
| | Ichigo, Inc. | | | 133,800 | | | | 301,123 | |
# | | Japan Property Management Center Co. Ltd. | | | 86,300 | | | | 589,451 | |
| | JINUSHI Co. Ltd. | | | 77,900 | | | | 1,073,478 | |
# | | JSB Co. Ltd. | | | 24,700 | | | | 639,684 | |
| | Katitas Co. Ltd. | | | 177,900 | | | | 3,980,978 | |
| | Keihanshin Building Co. Ltd. | | | 200,200 | | | | 1,777,955 | |
| | LA Holdings Co. Ltd. | | | 3,900 | | | | 87,331 | |
# * | | Leopalace21 Corp. | | | 526,000 | | | | 1,000,886 | |
# | | Loadstar Capital KK | | | 9,200 | | | | 99,293 | |
# | | Mirainovate Co. Ltd. | | | 120,340 | | | | 195,278 | |
| | Mirarth Holdings, Inc. | | | 547,800 | | | | 1,472,651 | |
| | Mugen Estate Co. Ltd. | | | 64,200 | | | | 202,824 | |
| | Nisshin Group Holdings Co. Ltd. | | | 205,500 | | | | 594,391 | |
# | | Raysum Co. Ltd. | | | 90,800 | | | | 982,802 | |
| | SAMTY Co. Ltd. | | | 183,150 | | | | 2,894,559 | |
| | Sankyo Frontier Co. Ltd. | | | 24,600 | | | | 577,162 | |
| | Sansei Landic Co. Ltd. | | | 29,100 | | | | 164,849 | |
# * | | SRE Holdings Corp. | | | 11,500 | | | | 291,249 | |
| | Star Mica Holdings Co. Ltd. | | | 85,900 | | | | 809,617 | |
| | Starts Corp., Inc. | | | 211,600 | | | | 3,737,588 | |
| | Sun Frontier Fudousan Co. Ltd. | | | 187,900 | | | | 1,450,771 | |
| | Sunnexta Group, Inc. | | | 11,100 | | | | 70,108 | |
| | Tenpo Innovation Co. Ltd. | | | 3,100 | | | | 19,198 | |
| | TOC Co. Ltd. | | | 296,050 | | | | 1,538,638 | |
| | Tokyo Rakutenchi Co. Ltd. | | | 19,800 | | | | 565,352 | |
# | | Tokyo Theatres Co., Inc. | | | 47,099 | | | | 353,383 | |
| | Tosei Corp. | | | 187,900 | | | | 1,792,005 | |
| | Urbanet Corp. Co. Ltd. | | | 92,700 | | | | 191,929 | |
| | | | | | | | | | |
TOTAL REAL ESTATE | | | | | | | 36,414,839 | |
| | | | | | | | | | |
UTILITIES — (1.7%) | | | | | | | | |
| | Chugoku Electric Power Co., Inc. | | | 252,599 | | | | 1,185,088 | |
# | | EF-ON, Inc. | | | 88,520 | | | | 381,147 | |
| | eRex Co. Ltd. | | | 185,100 | | | | 3,132,521 | |
| | Hiroshima Gas Co. Ltd. | | | 322,200 | | | | 747,072 | |
| | Hokkaido Electric Power Co., Inc. | | | 1,146,900 | | | | 3,489,987 | |
| | Hokkaido Gas Co. Ltd. | | | 92,600 | | | | 1,060,063 | |
| | Hokuriku Electric Power Co. | | | 1,052,600 | | | | 3,524,273 | |
# | | Hokuriku Gas Co. Ltd. | | | 10,100 | | | | 197,729 | |
THE JAPANESE SMALL COMPANY SERIES
CONTINUED
| | | | | | | | | | |
| | | Shares | | | Value» | |
UTILITIES — (Continued) | | | | | | | | |
| | K&O Energy Group, Inc. | | | 93,000 | | | $ | 1,295,821 | |
| | Nippon Gas Co. Ltd. | | | 684,000 | | | | 9,936,468 | |
| | Okinawa Electric Power Co., Inc. | | | 284,216 | | | | 1,972,425 | |
# * | | RENOVA, Inc. | | | 118,700 | | | | 2,605,165 | |
| | Saibu Gas Holdings Co. Ltd. | | | 215,600 | | | | 2,499,980 | |
| | Shikoku Electric Power Co., Inc. | | | 749,500 | | | | 3,605,731 | |
| | Shizuoka Gas Co. Ltd. | | | 319,000 | | | | 2,336,657 | |
# | | Toell Co. Ltd. | | | 57,500 | | | | 285,467 | |
# | | West Holdings Corp. | | | 134,903 | | | | 4,031,391 | |
| | | | | | | | | | |
TOTAL UTILITIES | | | | | | | 42,286,985 | |
| | | | | | | | | | |
TOTAL COMMON STOCKS
Cost ($ 2,854,128,543) | | | | | | | 2,493,001,458 | |
| | | | | | | | | | |
| | |
| | | | | | Value† | |
SECURITIES LENDING COLLATERAL — (2.2%) | | | | | | | | |
@ § | | The DFA Short Term Investment Fund | | | 4,804,517 | | | | 55,545,021 | |
| | | | | | | | | | |
TOTAL INVESTMENTS — (100.0%)
(Cost $ 2,909,692,756) | | | | | | $ | 2,548,546,479 | |
| | | | | | | | | | |
ST Special Tax
| » | Securities that have been fair value factored. See Note B to Financial Statements. |
| # | Total or Partial Securities on Loan. |
| * | Non-Income Producing Securities. |
| †† | Security valued using significant unobservable inputs (Level 3). |
| † | See Note B to Financial Statements. |
| @ | Security purchased with cash collateral received from Securities on Loan. |
Summary of the Series’ investments as of October 31, 2022, based on their valuation inputs, is as follows (see Security Valuation Note):
| | | | | | | | | | | | | | | | |
| | | Investments in Securities (Market Value) | |
| | | Level 1 | | | Level 2 | | | Level 3 | | | Total | |
Common Stocks | | | | | | | | | | | | | | | | |
Communication Services | | | — | | | $ | 60,456,006 | | | | — | | | $ | 60,456,006 | |
Consumer Discretionary | | | — | | | | 366,770,947 | | | | — | | | | 366,770,947 | |
Consumer Staples | | | — | | | | 198,062,968 | | | | — | | | | 198,062,968 | |
Energy | | | — | | | | 19,204,938 | | | | — | | | | 19,204,938 | |
Financials | | $ | 2,856,753 | | | | 220,506,329 | | | | — | | | | 223,363,082 | |
Health Care | | | — | | | | 127,792,503 | | | | — | | | | 127,792,503 | |
Industrials | | | — | | | | 720,093,537 | | | | — | | | | 720,093,537 | |
Information Technology | | | — | | | | 389,564,150 | | | | — | | | | 389,564,150 | |
Materials | | | — | | | | 308,991,503 | | | | — | | | | 308,991,503 | |
Real Estate | | | — | | | | 36,414,839 | | | | — | | | | 36,414,839 | |
Utilities | | | — | | | | 42,286,985 | | | | — | | | | 42,286,985 | |
Securities Lending Collateral | | | — | | | | 55,545,021 | | | | — | | | | 55,545,021 | |
| | | | | | | | | | | | | | | | |
TOTAL | | $ | 2,856,753 | | | $ | 2,545,689,726 | | | | — | | | $ | 2,548,546,479 | |
| | | | | | | | | | | | | | | | |
THE ASIA PACIFIC SMALL COMPANY SERIES
SCHEDULE OF INVESTMENTS
October 31, 2022
| | | | | | | | | | |
| | | Shares | | | Value» | |
COMMON STOCKS — (98.6%) | | | | | | | | |
AUSTRALIA — (64.4%) | | | | | | | | |
| | 29Metals Ltd. | | | 46,048 | | | $ | 54,521 | |
* | | 3P Learning Ltd. | | | 93,233 | | | | 74,930 | |
* | | 4DMedical Ltd. | | | 44,717 | | | | 18,400 | |
* | | A2B Australia Ltd. | | | 511,111 | | | | 378,556 | |
| | Accent Group Ltd. | | | 2,684,944 | | | | 2,540,735 | |
* †† | | ACN Ltd. | | | 1,687 | | | | 1 | |
| | Acrow Formwork & Construction Services Ltd. | | | 271,826 | | | | 93,052 | |
# * | | Actinogen Medical Ltd. | | | 729,727 | | | | 60,409 | |
# | | Adairs Ltd. | | | 1,192,185 | | | | 1,624,292 | |
| | Adbri Ltd. | | | 2,615,546 | | | | 2,636,964 | |
# * | | Advance Zinctek Ltd. | | | 9,653 | | | | 13,440 | |
# * | | Aeris Resources Ltd. | | | 148,241 | | | | 30,196 | |
* | | Ainsworth Game Technology Ltd. | | | 557,129 | | | | 294,886 | |
# * | | Alcidion Group Ltd. | | | 643,486 | | | | 59,791 | |
* | | Alkane Resources Ltd. | | | 2,972,923 | | | | 1,300,793 | |
# * | | Alliance Aviation Services Ltd. | | | 423,816 | | | | 875,907 | |
# * | | Alligator Energy Ltd. | | | 8,107,416 | | | | 268,283 | |
* | | Altech Chemicals Ltd. | | | 174,277 | | | | 11,145 | |
# * | | AMA Group Ltd. | | | 6,256,289 | | | | 974,275 | |
* | | AMP Ltd. | | | 12,919,775 | | | | 10,418,866 | |
* | | Andromeda Metals Ltd. | | | 1,579,203 | | | | 40,370 | |
# | | Ansell Ltd. | | | 667,221 | | | | 12,045,403 | |
# * | | Antipa Minerals Ltd. | | | 2,985,349 | | | | 47,451 | |
| | Antipa Minerals Ltd. | | | 282,735 | | | | 4,521 | |
# | | Appen Ltd. | | | 755,130 | | | | 1,223,392 | |
# * | | Arafura Resources Ltd. | | | 10,931,149 | | | | 2,067,965 | |
# | | ARB Corp. Ltd. | | | 515,315 | | | | 9,567,925 | |
# * | | Archer Materials Ltd. | | | 514,440 | | | | 230,436 | |
* | | Ardea Resources Ltd. | | | 132,809 | | | | 74,687 | |
# | | Ardent Leisure Group Ltd. | | | 3,349,117 | | | | 1,048,764 | |
# * | | Argosy Minerals Ltd. | | | 1,030,094 | | | | 338,851 | |
* | | Aroa Biosurgery Ltd. | | | 89,237 | | | | 48,707 | |
| | AUB Group Ltd. | | | 762,060 | | | | 10,083,242 | |
* | | Audinate Group Ltd. | | | 143,037 | | | | 744,856 | |
# * | | Aura Energy Ltd. | | | 259,286 | | | | 48,886 | |
# * | | Aurelia Metals Ltd. | | | 8,352,759 | | | | 561,196 | |
* | | Ausgold Ltd. | | | 420,326 | | | | 11,815 | |
# * | | Aussie Broadband Ltd. | | | 739,376 | | | | 1,105,201 | |
| | Austal Ltd. | | | 2,416,185 | | | | 3,846,909 | |
| | Austin Engineering Ltd. | | | 548,794 | | | | 126,640 | |
* | | Australian Agricultural Co. Ltd. | | | 2,850,244 | | | | 3,192,052 | |
# | | Australian Clinical Labs Ltd. | | | 229,483 | | | | 496,694 | |
| | Australian Ethical Investment Ltd. | | | 301,621 | | | | 892,085 | |
# | | Australian Finance Group Ltd. | | | 1,909,811 | | | | 2,053,686 | |
# * | | Australian Strategic Materials Ltd. | | | 565,588 | | | | 714,512 | |
# * | | Australian Vanadium Ltd. | | | 13,984,327 | | | | 286,412 | |
# | | Australian Vintage Ltd. | | | 2,778,613 | | | | 1,165,139 | |
* | | Australis Oil & Gas Ltd. | | | 643,590 | | | | 14,486 | |
# | | Auswide Bank Ltd. | | | 173,480 | | | | 631,612 | |
* | | Auteco Minerals Ltd. | | | 247,992 | | | | 7,150 | |
# | | AVJennings Ltd. | | | 5,407,981 | | | | 1,366,352 | |
# * †† | | AVZ Minerals Ltd. | | | 263,719 | | | | 110,604 | |
* | | Azure Minerals Ltd. | | | 24,167 | | | | 3,472 | |
# | | Baby Bunting Group Ltd. | | | 813,374 | | | | 1,456,418 | |
# * | | Bannerman Energy Ltd. | | | 95,393 | | | | 126,781 | |
| | Bapcor Ltd. | | | 2,227,045 | | | | 9,417,379 | |
| | Base Resources Ltd. | | | 1,712,813 | | | | 268,178 | |
THE ASIA PACIFIC SMALL COMPANY SERIES
CONTINUED
| | | | | | | | | | |
| | | | | Shares | | | Value» | |
AUSTRALIA — (Continued) | | | | | | | | |
* | | BCI Minerals Ltd. | | | 2,716,101 | | | $ | 374,193 | |
| | Beach Energy Ltd. | | | 8,737,409 | | | | 8,934,529 | |
| | Beacon Lighting Group Ltd. | | | 447,480 | | | | 564,269 | |
| | Beacon Minerals Ltd. | | | 2,446,902 | | | | 39,079 | |
| | Bega Cheese Ltd. | | | 1,973,378 | | | | 4,052,947 | |
# | | Bell Financial Group Ltd. | | | 734,391 | | | | 432,321 | |
# * | | Bellevue Gold Ltd. | | | 6,976,028 | | | | 3,293,075 | |
* | | Berkeley Energia Ltd. | | | 37,692 | | | | 6,248 | |
# * | | Betmakers Technology Group Ltd. | | | 2,293,199 | | | | 402,514 | |
| | Bgv1Nyp | | | 512,124 | | | | 37,672 | |
# * | | Bigtincan Holdings Ltd. | | | 1,280,517 | | | | 597,699 | |
* | | Bionomics Ltd. | | | 160,677 | | | | 6,358 | |
# * | | Black Rock Mining Ltd. | | | 2,860,513 | | | | 292,127 | |
| | Blackmores Ltd. | | | 101,297 | | | | 4,402,413 | |
* | | Blackstone Minerals Ltd. | | | 110,079 | | | | 11,269 | |
# | | Boral Ltd. | | | 1,411,795 | | | | 2,601,336 | |
* | | Boss Energy Ltd. | | | 298,324 | | | | 500,894 | |
* | | Botanix Pharmaceuticals Ltd. | | | 688,967 | | | | 28,774 | |
# * | | Bowen Coking Coal Ltd. | | | 453,269 | | | | 85,347 | |
# | | Bravura Solutions Ltd. | | | 1,692,017 | | | | 1,320,876 | |
# | | Breville Group Ltd. | | | 652,020 | | | | 8,261,901 | |
| | Brickworks Ltd. | | | 469,394 | | | | 6,646,000 | |
# * | | Bubs Australia Ltd. | | | 968,640 | | | | 231,335 | |
* | | Buru Energy Ltd. | | | 713,223 | | | | 40,132 | |
# | | BWX Ltd. | | | 1,255,210 | | | | 505,824 | |
* | | Byron Energy Ltd. | | | 275,427 | | | | 23,766 | |
* | | Calidus Resources Ltd. | | | 1,265,624 | | | | 278,061 | |
| | Calima Energy Ltd. | | | 1,950,890 | | | | 181,640 | |
# * | | Calix Ltd. | | | 364,636 | | | | 949,228 | |
| | Capitol Health Ltd. | | | 5,725,035 | | | | 1,206,924 | |
| | Capral Ltd. | | | 57,850 | | | | 282,534 | |
* | | Capricorn Metals Ltd. | | | 2,026,381 | | | | 4,394,902 | |
# * | | Carbon Revolution Ltd. | | | 173,560 | | | | 42,187 | |
# * | | Carnarvon Energy Ltd. | | | 7,925,626 | | | | 734,548 | |
# | | Cash Converters International Ltd. | | | 2,819,818 | | | | 427,806 | |
# * | | Catapult Group International Ltd. | | | 510,098 | | | | 271,632 | |
* †† | | CDS Technologies Ltd. | | | 13,276 | | | | 0 | |
| | Cedar Woods Properties Ltd. | | | 454,649 | | | | 1,148,673 | |
* | | Central Petroleum Ltd. | | | 759,474 | | | | 41,593 | |
* †† | | Centrebet International Ltd. | | | 162,672 | | | | 0 | |
* | | Chalice Mining Ltd. | | | 1,281,375 | | | | 3,498,836 | |
* | | Challenger Exploration Ltd. | | | 103,805 | | | | 9,598 | |
| | Challenger Ltd. | | | 824,265 | | | | 3,703,694 | |
| | Champion Iron Ltd. | | | 1,940,027 | | | | 5,835,444 | |
# * | | City Chic Collective Ltd. | | | 1,254,668 | | | | 1,043,684 | |
* | | Clean Seas Seafood Ltd. | | | 247,494 | | | | 90,257 | |
| | ClearView Wealth Ltd. | | | 156,351 | | | | 55,429 | |
# | | Clinuvel Pharmaceuticals Ltd. | | | 254,660 | | | | 3,179,606 | |
# | | Clover Corp. Ltd. | | | 757,373 | | | | 573,754 | |
# * | | Cobalt Blue Holdings Ltd. | | | 650,479 | | | | 266,109 | |
# | | Codan Ltd. | | | 663,689 | | | | 1,644,112 | |
| | COG Financial Services Ltd. | | | 10,563 | | | | 9,929 | |
* | | Cogstate Ltd. | | | 261,421 | | | | 317,715 | |
* †† | | Collection House Ltd. | | | 428,104 | | | | 0 | |
| | Collins Foods Ltd. | | | 803,502 | | | | 4,824,456 | |
* | | Comet Ridge Ltd. | | | 1,055,453 | | | | 114,978 | |
* | | Cooper Energy Ltd. | | | 18,056,814 | | | | 2,430,440 | |
# * | | Core Lithium Ltd. | | | 798,506 | | | | 705,991 | |
# | | Corporate Travel Management Ltd. | | | 706,149 | | | | 7,883,899 | |
THE ASIA PACIFIC SMALL COMPANY SERIES
CONTINUED
| | | | | | | | | | |
| | | | | Shares | | | Value» | |
AUSTRALIA — (Continued) | | | | | | | | |
# | | Costa Group Holdings Ltd. | | | 2,781,429 | | | $ | 4,526,008 | |
# | | Credit Corp. Group Ltd. | | | 455,264 | | | | 5,411,838 | |
* | | Creso Pharma Ltd. | | | 39,292 | | | | 779 | |
| | CSR Ltd. | | | 3,109,441 | | | | 9,211,011 | |
* | | Cynata Therapeutics Ltd. | | | 111,132 | | | | 22,243 | |
* | | Danakali Ltd. | | | 765,567 | | | | 187,217 | |
| | Data#3 Ltd. | | | 1,162,707 | | | | 5,122,114 | |
# * | | De Grey Mining Ltd. | | | 7,339,733 | | | | 4,965,237 | |
# * | | Deep Yellow Ltd. | | | 2,018,775 | | | | 1,016,583 | |
| | Deterra Royalties Ltd. | | | 2,006,311 | | | | 5,264,446 | |
| | Dicker Data Ltd. | | | 427,631 | | | | 2,947,224 | |
| | Domain Holdings Australia Ltd. | | | 1,706,726 | | | | 3,637,335 | |
| | Downer EDI Ltd. | | | 3,274,403 | | | | 9,410,422 | |
# * | | Dreadnought Resources Ltd. | | | 7,262,887 | | | | 532,505 | |
| | Eagers Automotive Ltd. | | | 941,185 | | | | 7,461,464 | |
| | Earlypay Ltd. | | | 993,696 | | | | 279,458 | |
* | | Eclipx Group Ltd. | | | 2,460,384 | | | | 2,942,692 | |
# * | | Ecograf Ltd. | | | 1,581,731 | | | | 348,395 | |
| | Elanor Investor Group | | | 444,530 | | | | 462,745 | |
| | Elders Ltd. | | | 1,009,369 | | | | 8,415,415 | |
# * | | Electro Optic Systems Holdings Ltd. | | | 80,313 | | | | 26,150 | |
* | | Elementos Ltd. | | | 135,772 | | | | 26,031 | |
# * | | Elevate Uranium Ltd. | | | 172,343 | | | | 55,235 | |
# * | | Elixir Energy Ltd. | | | 2,250,692 | | | | 209,218 | |
# * | | Elmo Software Ltd. | | | 107,791 | | | | 319,446 | |
# | | Emeco Holdings Ltd. | | | 2,400,372 | | | | 1,206,268 | |
* | | Emerald Resources NL | | | 448,151 | | | | 324,647 | |
# * | | EML Payments Ltd. | | | 1,986,286 | | | | 512,007 | |
| | Enero Group Ltd. | | | 280,272 | | | | 503,923 | |
# * | | EnviroSuite Ltd. | | | 1,131,191 | | | | 90,611 | |
| | EQT Holdings Ltd. | | | 172,699 | | | | 2,780,673 | |
| | Estia Health Ltd. | | | 1,674,576 | | | | 2,454,961 | |
| | Eureka Group Holdings Ltd. | | | 28,507 | | | | 8,520 | |
| | Eureka Group Holdings Ltd. | | | 7,208 | | | | 2,144 | |
# * | | European Lithium Ltd. | | | 3,882,196 | | | | 223,994 | |
| | Euroz Hartleys Group Ltd. | | | 357,406 | | | | 276,718 | |
* | | EVT Ltd. | | | 632,219 | | | | 6,035,937 | |
* | | Experience Co. Ltd. | | | 102,579 | | | | 15,068 | |
| | Fenix Resources Ltd. | | | 735,489 | | | | 98,820 | |
| | Finbar Group Ltd. | | | 337,695 | | | | 144,883 | |
# * †† | | Firefinch Ltd. | | | 1,569,275 | | | | 150,568 | |
| | Fleetwood Ltd. | | | 654,067 | | | | 719,354 | |
# * | | Flight Centre Travel Group Ltd. | | | 718,191 | | | | 7,643,947 | |
* | | Fluence Corp. Ltd. | | | 116,395 | | | | 14,558 | |
# * | | Frontier Digital Ventures Ltd. | | | 1,022,562 | | | | 458,076 | |
# * | | FYI Resources Ltd. | | | 452,463 | | | | 41,895 | |
| | G8 Education Ltd. | | | 5,687,070 | | | | 3,510,555 | |
# * | | Galan Lithium Ltd. | | | 1,812,595 | | | | 1,758,627 | |
* | | Gascoyne Resources Ltd. | | | 160,800 | | | | 23,568 | |
| | Genesis Minerals Ltd. | | | 119,996 | | | | 88,269 | |
# * | | Genetic Signatures Ltd. | | | 171,373 | | | | 76,232 | |
# * | | Genex Power Ltd. | | | 1,098,842 | | | | 144,082 | |
| | Genworth Mortgage Insurance Australia Ltd. | | | 2,681,235 | | | | 4,654,209 | |
# | | Gold Road Resources Ltd. | | | 7,605,514 | | | | 6,572,387 | |
| | GR Engineering Services Ltd. | | | 281,577 | | | | 401,515 | |
| | GrainCorp Ltd., Class A | | | 1,517,016 | | | | 8,155,207 | |
# | | Grange Resources Ltd. | | | 3,909,204 | | | | 1,551,024 | |
# * | | Greenland Minerals Ltd. | | | 1,881,748 | | | | 59,970 | |
| | GTN Ltd. | | | 15,394 | | | | 4,001 | |
THE ASIA PACIFIC SMALL COMPANY SERIES
CONTINUED
| | | | | | | | | | |
| | | | | Shares | | | Value» | |
AUSTRALIA — (Continued) | | | | | | | | |
| | GUD Holdings Ltd. | | | 1,090,319 | | | $ | 5,608,095 | |
| | GWA Group Ltd. | | | 1,533,388 | | | | 1,990,779 | |
| | Hansen Technologies Ltd. | | | 1,246,947 | | | | 3,926,800 | |
# * | | Hastings Technology Metals Ltd. | | | 50,199 | | | | 114,163 | |
| | Healius Ltd. | | | 3,665,521 | | | | 8,029,741 | |
| | Healthia Ltd. | | | 131,677 | | | | 116,760 | |
* | | Helios Energy Ltd. | | | 817,342 | | | | 46,002 | |
# | | Helloworld Travel Ltd. | | | 51,370 | | | | 67,047 | |
* | | Highfield Resources Ltd. | | | 512,345 | | | | 276,413 | |
* | | Hillgrove Resources Ltd. | | | 391,399 | | | | 9,266 | |
* | | Hipages Group Holdings Ltd. | | | 10,335 | | | | 7,142 | |
| | Horizon Oil Ltd. | | | 1,935,787 | | | | 161,409 | |
* | | Hot Chili Ltd. | | | 169,686 | | | | 106,021 | |
# | | HT&E Ltd. | | | 1,709,119 | | | | 1,306,706 | |
| | HUB24 Ltd. | | | 461,678 | | | | 7,485,853 | |
# | | Humm Group Ltd. | | | 2,462,818 | | | | 755,064 | |
| | Iluka Resources Ltd. | | | 784,796 | | | | 4,348,186 | |
| | Image Resources NL | | | 946,902 | | | | 90,569 | |
| | Imdex Ltd. | | | 2,620,667 | | | | 3,420,813 | |
# * | | Immutep Ltd. | | | 1,570,398 | | | | 290,939 | |
* | | Immutep Ltd., Sponsored ADR | | | 4,516 | | | | 8,084 | |
# * | | ImpediMed Ltd. | | | 417,437 | | | | 23,691 | |
| | Infomedia Ltd. | | | 3,087,927 | | | | 2,427,419 | |
# | | Inghams Group Ltd. | | | 3,281,221 | | | | 5,308,442 | |
# | | Insignia Financial Ltd. | | | 4,120,661 | | | | 8,306,842 | |
| | Integral Diagnostics Ltd. | | | 1,567,781 | | | | 2,636,496 | |
# * | | Integrated Research Ltd. | | | 566,516 | | | | 134,232 | |
# * | | Investigator Resources Ltd. | | | 686,170 | | | | 20,504 | |
# | | InvoCare Ltd. | | | 921,115 | | | | 6,023,702 | |
* | | ioneer Ltd. | | | 10,310,733 | | | | 3,654,124 | |
| | IPH Ltd. | | | 1,331,405 | | | | 8,467,477 | |
| | IRESS Ltd. | | | 1,215,703 | | | | 7,890,780 | |
| | IVE Group Ltd. | | | 628,751 | | | | 970,439 | |
# * | | Jervois Global Ltd. | | | 291,514 | | | | 91,417 | |
# | | Johns Lyng Group Ltd. | | | 1,066,692 | | | | 4,435,184 | |
| | Jumbo Interactive Ltd. | | | 208,843 | | | | 1,818,371 | |
# | | Jupiter Mines Ltd. | | | 5,672,731 | | | | 706,191 | |
* | | Karoon Energy Ltd. | | | 4,257,466 | | | | 5,789,332 | |
| | Kelly Partners Group Holdings Ltd. | | | 3,572 | | | | 11,062 | |
| | Kelsian Group Ltd. | | | 598,234 | | | | 1,790,342 | |
* | | KGL Resources Ltd. | | | 310,205 | | | | 64,718 | |
# * | | Kingsgate Consolidated Ltd. | | | 355,002 | | | | 382,875 | |
* | | Koba Resources Ltd. | | | 34,188 | | | | 3,725 | |
# * | | Kogan.com Ltd. | | | 468,030 | | | | 981,734 | |
# * | | Lake Resources NL | | | 2,607,188 | | | | 1,758,323 | |
# * | | Lark Distilling Co. Ltd. | | | 65,368 | | | | 87,143 | |
* †† | | Lednium Technology Pty Ltd. | | | 195,019 | | | | 0 | |
# * | | Legend Mining Ltd. | | | 2,176,273 | | | | 47,370 | |
* | | Leo Lithium Ltd. | | | 1,120,910 | | | | 441,981 | |
# * | | Lepidico Ltd. | | | 2,895,993 | | | | 35,113 | |
| | Lifestyle Communities Ltd. | | | 578,173 | | | | 6,490,474 | |
| | Link Administration Holdings Ltd. | | | 2,294,865 | | | | 5,018,649 | |
| | Li-S Energy Ltd. | | | 3,944 | | | | 1,059 | |
* | | Lithium Australia Ltd. | | | 423,984 | | | | 12,727 | |
# * | | Lithium Power International Ltd. | | | 304,819 | | | | 109,784 | |
| | Lithium Power International Ltd. | | | 36,643 | | | | 13,243 | |
| | Lovisa Holdings Ltd. | | | 345,675 | | | | 5,381,648 | |
* | | Lucapa Diamond Co. Ltd. | | | 2,713,021 | | | | 88,400 | |
# | | Lycopodium Ltd. | | | 64,242 | | | | 280,927 | |
THE ASIA PACIFIC SMALL COMPANY SERIES
CONTINUED
| | | | | | | | | | |
| | | | | Shares | | | Value» | |
AUSTRALIA — (Continued) | | | | | | | | |
| | MA Financial Group Ltd. | | | 421,175 | | | $ | 1,194,328 | |
| | Maas Group Holdings Ltd. | | | 79,884 | | | | 116,310 | |
# * | | Mach7 Technologies Ltd. | | | 42,643 | | | | 15,230 | |
| | Macmahon Holdings Ltd. | | | 5,829,463 | | | | 521,699 | |
# * | | Macquarie Telecom Group Ltd. | | | 21,478 | | | | 785,528 | |
# | | Mader Group Ltd. | | | 59,629 | | | | 135,049 | |
# | | Magellan Financial Group Ltd. | | | 225,138 | | | | 1,427,558 | |
* | | Maggie Beer Holdings Ltd. | | | 243,446 | | | | 41,821 | |
# * | | Magnetite Mines Ltd. | | | 2,125,737 | | | | 23,103 | |
†† | | Mallee Resources Ltd. | | | 49,486 | | | | 13,295 | |
| | MaxiPARTS Ltd. | | | 87,262 | | | | 117,550 | |
# * | | Mayne Pharma Group Ltd. | | | 9,810,900 | | | | 1,694,817 | |
| | McMillan Shakespeare Ltd. | | | 540,444 | | | | 4,528,976 | |
# | | McPherson’s Ltd. | | | 653,702 | | | | 284,273 | |
# * | | Medical Developments International Ltd. | | | 167,262 | | | | 169,124 | |
# * | | Megaport Ltd. | | | 219,532 | | | | 851,558 | |
# * | | Mesoblast Ltd. | | | 2,382,780 | | | | 1,392,950 | |
# * | | Metals X Ltd. | | | 4,545,392 | | | | 740,736 | |
| | Metcash Ltd. | | | 2,899,744 | | | | 7,612,203 | |
# | | Michael Hill International Ltd. | | | 1,522,713 | | | | 1,170,778 | |
* | | Micro-X Ltd. | | | 261,656 | | | | 21,798 | |
* | | Mincor Resources NL | | | 1,758,033 | | | | 1,509,729 | |
* | | MMA Offshore Ltd. | | | 1,671,171 | | | | 733,068 | |
| | Monadelphous Group Ltd. | | | 696,927 | | | | 6,092,684 | |
| | Monash IVF Group Ltd. | | | 2,169,736 | | | | 1,309,092 | |
| | Money3 Corp. Ltd. | | | 1,393,763 | | | | 1,740,519 | |
* | | MoneyMe Ltd. | | | 73,889 | | | | 17,450 | |
* †† | | Morning Star Gold NL | | | 332,749 | | | | 0 | |
| | MotorCycle Holdings Ltd. | | | 109,445 | | | | 170,498 | |
# * | | Mount Gibson Iron Ltd. | | | 4,569,374 | | | | 1,097,210 | |
| | Myer Holdings Ltd. | | | 5,293,540 | | | | 2,148,012 | |
| | MyState Ltd. | | | 744,487 | | | | 1,942,688 | |
# * | | Nanosonics Ltd. | | | 1,618,777 | | | | 4,243,292 | |
| | National Tyre & Wheel Ltd. | | | 97,940 | | | | 39,185 | |
# * | | Navarre Minerals Ltd. | | | 1,777,444 | | | | 54,046 | |
| | Navigator Global Investments Ltd. | | | 1,208,364 | | | | 865,318 | |
* | | Nearmap Ltd. | | | 3,659,647 | | | | 4,811,378 | |
# * | | Neometals Ltd. | | | 1,542,276 | | | | 1,090,829 | |
| | Netwealth Group Ltd. | | | 741,359 | | | | 5,757,315 | |
# * | | Neurizer Ltd. | | | 522,952 | | | | 36,899 | |
# * | | New Century Resources Ltd. | | | 163,453 | | | | 107,022 | |
# | | New Hope Corp. Ltd. | | | 2,341,365 | | | | 8,505,399 | |
# * | | New World Resources Ltd. | | | 3,157,128 | | | | 64,687 | |
| | nib holdings Ltd. | | | 2,992,914 | | | | 12,806,819 | |
# | | Nick Scali Ltd. | | | 443,203 | | | | 2,854,327 | |
# | | Nickel Industries Ltd. | | | 5,750,030 | | | | 2,687,321 | |
| | Nine Entertainment Co. Holdings Ltd. | | | 1,139,910 | | | | 1,505,384 | |
# * | | Nitro Software Ltd. | | | 166,147 | | | | 220,106 | |
# * | | Norwest Energy NL | | | 1,011,292 | | | | 30,399 | |
# * | | Nova Minerals Ltd. | | | 108,288 | | | | 47,916 | |
# * | | Novonix Ltd. | | | 505,440 | | | | 863,028 | |
* | | Noxopharm Ltd. | | | 100,077 | | | | 10,193 | |
| | NRW Holdings Ltd. | | | 3,407,843 | | | | 5,561,148 | |
| | Nufarm Ltd. | | | 2,098,872 | | | | 7,480,120 | |
| | Objective Corp. Ltd. | | | 89,428 | | | | 848,797 | |
* | | OFX Group Ltd. | | | 2,016,311 | | | | 3,429,122 | |
# | | OM Holdings Ltd. | | | 676,887 | | | | 273,032 | |
# * | | Omni Bridgeway Ltd. | | | 2,355,720 | | | | 6,782,068 | |
| | oOh!media Ltd. | | | 3,377,627 | | | | 2,732,018 | |
THE ASIA PACIFIC SMALL COMPANY SERIES
CONTINUED
| | | | | | | | | | |
| | | | | Shares | | | Value» | |
AUSTRALIA — (Continued) | | | | | | | | |
# * | | Opthea Ltd. | | | 1,338,240 | | | $ | 831,657 | |
* | | Ora Banda Mining Ltd. | | | 734,777 | | | | 35,578 | |
* | | OreCorp Ltd. | | | 192,088 | | | | 41,082 | |
| | Orora Ltd. | | | 5,992,474 | | | | 11,628,555 | |
| | Pacific Current Group Ltd. | | | 333,540 | | | | 1,790,668 | |
# * | | Pacific Smiles Group Ltd. | | | 272,678 | | | | 251,148 | |
# | | Pact Group Holdings Ltd. | | | 1,337,110 | | | | 1,226,660 | |
# * | | Paladin Energy Ltd. | | | 16,033,988 | | | | 8,680,653 | |
# * | | Panoramic Resources Ltd. | | | 10,364,998 | | | | 964,694 | |
# * | | Pantoro Ltd. | | | 4,862,382 | | | | 433,192 | |
# * | | Paradigm Biopharmaceuticals Ltd. | | | 47,760 | | | | 43,904 | |
| | Paragon Care Ltd. | | | 335,469 | | | | 73,965 | |
# | | Peak Rare Earths Ltd. | | | 22,422 | | | | 6,188 | |
| | Peet Ltd. | | | 1,364,417 | | | | 959,674 | |
# | | Pendal Group Ltd. | | | 2,058,779 | | | | 6,466,738 | |
# * | | Peninsula Energy Ltd. | | | 3,332,209 | | | | 360,129 | |
| | PeopleIN Ltd. | | | 472,602 | | | | 992,419 | |
# | | Pepper Money Ltd. | | | 217,431 | | | | 198,311 | |
# * | | Perenti Global Ltd. | | | 5,379,892 | | | | 3,296,994 | |
# | | Perpetual Ltd. | | | 376,124 | | | | 5,993,607 | |
# | | Perseus Mining Ltd. | | | 8,114,950 | | | | 9,451,479 | |
* | | PEXA Group Ltd. | | | 6,091 | | | | 60,185 | |
# | | Pinnacle Investment Management Group Ltd. | | | 729,200 | | | | 3,789,811 | |
| | Platinum Asset Management Ltd. | | | 2,494,709 | | | | 2,856,048 | |
# * | | PointsBet Holdings Ltd. | | | 340,283 | | | | 442,902 | |
# * | | PolyNovo Ltd. | | | 1,143,433 | | | | 1,456,682 | |
* | | Poseidon Nickel Ltd. | | | 12,683,800 | | | | 357,240 | |
* | | PPK Group Ltd. | | | 3,668 | | | | 3,391 | |
* | | PPK Mining Equipment Group Pty Ltd. | | | 22,761 | | | | 0 | |
# | | Praemium Ltd. | | | 2,977,411 | | | | 1,586,577 | |
# * | | Predictive Discovery Ltd. | | | 1,997,557 | | | | 191,708 | |
| | Premier Investments Ltd. | | | 410,666 | | | | 6,576,580 | |
# * | | Prescient Therapeutics Ltd. | | | 430,367 | | | | 43,876 | |
# | | Probiotec Ltd. | | | 78,596 | | | | 109,415 | |
| | Propel Funeral Partners Ltd. | | | 179,941 | | | | 534,052 | |
* | | Prophecy International Holdings Ltd. | | | 24,007 | | | | 11,438 | |
# * | | Province Resources Ltd. | | | 889,179 | | | | 45,561 | |
| | PSC Insurance Group Ltd. | | | 254,780 | | | | 782,190 | |
* | | PTB Group Ltd. | | | 96,597 | | | | 98,790 | |
| | PWR Holdings Ltd. | | | 592,023 | | | | 3,803,073 | |
# * | | PYC Therapeutics Ltd. | | | 389,981 | | | | 18,487 | |
| | QANTM Intellectual Property Ltd. | | | 112,211 | | | | 69,294 | |
# | | Ramelius Resources Ltd. | | | 7,074,261 | | | | 3,320,224 | |
* | | ReadyTech Holdings Ltd. | | | 260,516 | | | | 539,248 | |
| | Reckon Ltd. | | | 391,834 | | | | 323,289 | |
# * | | Red 5 Ltd. | | | 18,690,353 | | | | 1,905,206 | |
# * | | Red Dirt Metals Ltd. | | | 39,345 | | | | 13,568 | |
* | | Red River Resources Ltd. | | | 480,964 | | | | 22,458 | |
# * | | Redbubble Ltd. | | | 1,256,028 | | | | 412,505 | |
| | Regal Partners Ltd. | | | 9,488 | | | | 16,088 | |
# | | Regis Healthcare Ltd. | | | 1,048,714 | | | | 1,368,670 | |
# | | Regis Resources Ltd. | | | 4,694,041 | | | | 4,576,765 | |
# * | | Reject Shop Ltd. | | | 186,973 | | | | 558,512 | |
| | Reliance Worldwide Corp. Ltd. | | | 4,255,179 | | | | 8,742,677 | |
# * | | Renascor Resources Ltd. | | | 727,091 | | | | 99,618 | |
# | | Resimac Group Ltd. | | | 124,613 | | | | 71,329 | |
# * | | Resolute Mining Ltd. | | | 7,380,066 | | | | 945,251 | |
* | | Retail Food Group Ltd. | | | 12,168,489 | | | | 419,885 | |
* | | Rex Minerals Ltd. | | | 142,808 | | | | 13,267 | |
THE ASIA PACIFIC SMALL COMPANY SERIES
CONTINUED
| | | | | | | | | | |
| | | | | Shares | | | Value» | |
AUSTRALIA — (Continued) | | | | | | | | |
| | Ridley Corp. Ltd. | | | 1,958,399 | | | $ | 2,617,666 | |
* | | RPMGlobal Holdings Ltd. | | | 1,103,233 | | | | 1,340,719 | |
# * | | Rumble Resources Ltd. | | | 178,014 | | | | 24,974 | |
* †† | | Salmat Ltd. | | | 667,137 | | | | 0 | |
| | Sandfire Resources Ltd. | | | 2,800,720 | | | | 6,237,432 | |
* | | SciDev Ltd. | | | 144,186 | | | | 29,420 | |
# | | Select Harvests Ltd. | | | 865,608 | | | | 2,936,890 | |
# | | Servcorp Ltd. | | | 348,243 | | | | 760,491 | |
| | Service Stream Ltd. | | | 4,084,976 | | | | 1,919,009 | |
* | | Seven West Media Ltd. | | | 6,816,169 | | | | 2,042,363 | |
| | SG Fleet Group Ltd. | | | 639,084 | | | | 821,356 | |
| | Shaver Shop Group Ltd. | | | 677,094 | | | | 472,191 | |
* | | Sheffield Resources Ltd. | | | 249,376 | | | | 80,945 | |
| | Shine Justice Ltd. | | | 59,739 | | | | 44,426 | |
| | Shriro Holdings Ltd. | | | 24,206 | | | | 11,232 | |
* | | Sierra Rutile Holdings Ltd. | | | 1,588,118 | | | | 210,189 | |
| | Sigma Healthcare Ltd. | | | 6,618,255 | | | | 2,681,918 | |
# * | | Silex Systems Ltd. | | | 80,327 | | | | 151,597 | |
# * | | Silver Lake Resources Ltd. | | | 5,791,755 | | | | 4,101,458 | |
# * | | Silver Mines Ltd. | | | 3,864,903 | | | | 430,828 | |
| | Sims Ltd. | | | 1,106,977 | | | | 8,654,727 | |
| | SmartGroup Corp. Ltd. | | | 905,773 | | | | 2,855,717 | |
* | | SomnoMed Ltd. | | | 25,160 | | | | 24,107 | |
| | Southern Cross Electrical Engineering Ltd. | | | 831,537 | | | | 350,744 | |
| | Southern Cross Media Group Ltd. | | | 1,561,488 | | | | 964,216 | |
* †† | | SpeedCast International Ltd. | | | 1,497,915 | | | | 0 | |
| | SRG Global Ltd. | | | 796,277 | | | | 355,560 | |
# * | | St Barbara Ltd. | | | 5,695,784 | | | | 1,854,335 | |
* | | Star Entertainment Group Ltd. | | | 5,751,661 | | | | 10,819,618 | |
# * | | Starpharma Holdings Ltd. | | | 262,161 | | | | 89,694 | |
| | Steadfast Group Ltd. | | | 500,976 | | | | 1,623,035 | |
* | | Strandline Resources Ltd. | | | 27,563 | | | | 6,879 | |
# * | | Strike Energy Ltd. | | | 6,153,921 | | | | 947,398 | |
| | Strike Energy Ltd. | | | 373,188 | | | | 57,290 | |
| | Sunland Group Ltd. | | | 1,125,311 | | | | 1,766,531 | |
* | | Sunrise Energy Metals Ltd. | | | 8,693 | | | | 11,210 | |
# * | | Sunstone Metals Ltd. | | | 7,298,573 | | | | 149,318 | |
# | | Super Retail Group Ltd. | | | 1,057,351 | | | | 6,952,302 | |
# * | | Superloop Ltd. | | | 2,325,808 | | | | 1,114,895 | |
| | Symbio Holdings Ltd. | | | 318,710 | | | | 652,193 | |
# * | | Syrah Resources Ltd. | | | 4,792,786 | | | | 7,321,076 | |
| | Tabcorp Holdings Ltd. | | | 5,305,886 | | | | 3,275,751 | |
| | Tassal Group Ltd. | | | 1,531,815 | | | | 5,086,484 | |
| | Technology One Ltd. | | | 1,296,361 | | | | 9,972,913 | |
# * | | Temple & Webster Group Ltd. | | | 540,805 | | | | 1,925,138 | |
| | Ten Sixty Four Ltd. | | | 1,044,721 | | | | 382,921 | |
| | Terracom Ltd. | | | 2,067,614 | | | | 1,162,858 | |
# * | | Tesserent Ltd. | | | 322,736 | | | | 23,792 | |
* | | Tietto Minerals Ltd. | | | 498,494 | | | | 222,607 | |
| | Tribune Resources Ltd. | | | 14,725 | | | | 28,286 | |
# * | | Tyro Payments Ltd. | | | 2,067,445 | | | | 2,018,312 | |
| | United Malt Grp Ltd. | | | 1,827,063 | | | | 3,635,200 | |
# | | Universal Store Holdings Ltd. | | | 19,109 | | | | 65,021 | |
* †† | | Virgin Australia Holdings Pty. Ltd. | | | 7,648,897 | | | | 0 | |
| | Vita Group Ltd. | | | 374,239 | | | | 26,394 | |
# * | | Vital Metals Ltd. | | | 246,694 | | | | 5,017 | |
W | | Viva Energy Group Ltd. | | | 3,776,327 | | | | 6,854,919 | |
# * | | Viva Leisure Ltd. | | | 84,215 | | | | 62,564 | |
* | | Vmoto Ltd. | | | 267,457 | | | | 71,008 | |
THE ASIA PACIFIC SMALL COMPANY SERIES
CONTINUED
| | | | | | | | | | |
| | | | | Shares | | | Value» | |
AUSTRALIA — (Continued) | | | | | | | | |
# * | | Volpara Health Technologies Ltd. | | | 225,102 | | | $ | 96,949 | |
# * | | VRX Silica Ltd. | | | 1,325,475 | | | | 114,573 | |
# * | | Wagners Holding Co. Ltd. | | | 137,096 | | | | 68,622 | |
* †† | | Walkabout Resources Ltd. | | | 1,129,282 | | | | 116,478 | |
# * | | Warrego Energy Ltd. | | | 86,865 | | | | 7,762 | |
# * | | Webjet Ltd. | | | 2,329,981 | | | | 7,868,307 | |
* | | West African Resources Ltd. | | | 6,322,943 | | | | 4,186,654 | |
* | | Westgold Resources Ltd. | | | 3,708,234 | | | | 1,731,985 | |
# * | | Whispir Ltd. | | | 121,430 | | | | 34,066 | |
| | Whitehaven Coal Ltd. | | | 3,623,702 | | | | 21,049,343 | |
* | | Widgie Nickel Ltd. | | | 265,653 | | | | 48,451 | |
* | | Wiluna Mining Corp. Ltd. | | | 248,265 | | | | 32,555 | |
# * | | Zip Co. Ltd. | | | 2,250,758 | | | | 874,393 | |
| | | | | | | | | | |
TOTAL AUSTRALIA | | | | 778,195,678 | |
| | | | | | | | | | |
CHINA — (0.1%) | | | | | | | | |
W | | BOC Aviation Ltd. | | | 43,800 | | | | 293,106 | |
| | BOE Varitronix Ltd. | | | 65,293 | | | | 96,818 | |
| | Fountain SET Holdings Ltd. | | | 4,142,000 | | | | 395,666 | |
| | GDH Guangnan Holdings Ltd. | | | 1,599,600 | | | | 112,159 | |
* | | Goodbaby International Holdings Ltd. | | | 340,000 | | | | 21,684 | |
* | | Neo-Neon Holdings Ltd. | | | 2,315,500 | | | | 131,236 | |
| | | | | | | | | | |
TOTAL CHINA | | | | 1,050,669 | |
| | | | | | | | | | |
HONG KONG — (18.7%) | | | | | | | | |
* | | Aceso Life Science Group Ltd. | | | 7,436,400 | | | | 86,862 | |
| | Aeon Credit Service Asia Co. Ltd. | | | 1,024,000 | | | | 598,956 | |
| | Allied Group Ltd. | | | 11,740,000 | | | | 2,543,367 | |
| | Analogue Holdings Ltd. | | | 842,000 | | | | 119,146 | |
| | APAC Resources Ltd. | | | 4,519,815 | | | | 585,894 | |
# * | | Apollo Future Mobility Group Ltd. | | | 8,436,000 | | | | 225,640 | |
* | | Applied Development Holdings Ltd. | | | 10,735,000 | | | | 119,019 | |
| | Asia Financial Holdings Ltd. | | | 2,030,908 | | | | 778,956 | |
* | | Asia Standard Hotel Group Ltd. | | | 2,371,654 | | | | 20,264 | |
* | | Asia Standard International Group Ltd. | | | 11,076,917 | | | | 535,832 | |
| | Asiasec Properties Ltd. | | | 1,371,000 | | | | 35,725 | |
| | ASMPT Ltd. | | | 1,590,200 | | | | 8,746,899 | |
| | Associated International Hotels Ltd. | | | 952,000 | | | | 1,204,089 | |
| | Bank of East Asia Ltd. | | | 2,661,377 | | | | 2,550,626 | |
* †† | | Bel Global Resources Holdings Ltd. | | | 2,576,000 | | | | 0 | |
| | Best Mart 360 Holdings Ltd. | | | 984,000 | | | | 255,886 | |
| | BOCOM International Holdings Co. Ltd. | | | 2,371,000 | | | | 119,443 | |
# | | Bright Smart Securities & Commodities Group Ltd. | | | 122,000 | | | | 17,098 | |
†† | | Brightoil Petroleum Holdings Ltd. | | | 9,034,000 | | | | 323,742 | |
| | Build King Holdings Ltd. | | | 630,000 | | | | 51,394 | |
†† | | Burwill Holdings Ltd. | | | 37,300,960 | | | | 63,201 | |
| | Cafe de Coral Holdings Ltd. | | | 2,966,000 | | | | 3,461,436 | |
* | | Century City International Holdings Ltd. | | | 7,111,460 | | | | 249,548 | |
| | Chen Hsong Holdings | | | 1,296,000 | | | | 256,063 | |
| | Cheuk Nang Holdings Ltd. | | | 771,714 | | | | 209,715 | |
| | Chevalier International Holdings Ltd. | | | 820,989 | | | | 708,943 | |
* | | China Baoli Technologies Holdings Ltd. | | | 114,750 | | | | 1,067 | |
* | | China Best Group Holding Ltd. | | | 1,124,998 | | | | 81,694 | |
* | | China Energy Development Holdings Ltd. | | | 49,560,000 | | | | 808,565 | |
| | China Motor Bus Co. Ltd. | | | 80,000 | | | | 672,952 | |
# * | | China Star Entertainment Ltd. | | | 11,170,000 | | | | 1,053,035 | |
# * | | China Strategic Holdings Ltd. | | | 83,051,250 | | | | 244,107 | |
* | | China Tonghai International Financial Ltd. | | | 1,300,000 | | | | 29,786 | |
THE ASIA PACIFIC SMALL COMPANY SERIES
CONTINUED
| | | | | | | | | | |
| | | | | Shares | | | Value» | |
HONG KONG — (Continued) | | | | | | | | |
* | | Chinese Estates Holdings Ltd. | | | 2,943,500 | | | $ | 532,647 | |
| | Chinney Investments Ltd. | | | 1,180,000 | | | | 163,153 | |
| | Chow Sang Sang Holdings International Ltd. | | | 2,353,000 | | | | 2,170,061 | |
| | Chuang’s China Investments Ltd. | | | 8,811,407 | | | | 272,643 | |
| | Chuang’s Consortium International Ltd. | | | 7,519,043 | | | | 722,297 | |
| | CITIC Telecom International Holdings Ltd. | | | 12,077,125 | | | | 3,569,463 | |
# | | CK Life Sciences International Holdings, Inc. | | | 17,214,000 | | | | 1,292,991 | |
# | | CMBC Capital Holdings Ltd. | | | 440,999 | | | | 86,560 | |
* | | C-Mer Eye Care Holdings Ltd. | | | 2,346,000 | | | | 972,052 | |
| | CNT Group Ltd. | | | 7,979,264 | | | | 360,983 | |
| | Convenience Retail Asia Ltd. | | | 1,026,000 | | | | 98,023 | |
#†† | | Convoy, Inc. | | | 32,922,000 | | | | 131,274 | |
* | | Cowell e Holdings, Inc. | | | 540,000 | | | | 660,717 | |
W | | Crystal International Group Ltd. | | | 304,000 | | | | 77,513 | |
| | CSI Properties Ltd. | | | 47,866,383 | | | | 714,637 | |
* †† | | CW Group Holdings Ltd. | | | 1,361,500 | | | | 0 | |
# | | Dah Sing Banking Group Ltd. | | | 3,645,916 | | | | 2,173,926 | |
| | Dah Sing Financial Holdings Ltd. | | | 1,399,344 | | | | 2,769,024 | |
| | Dickson Concepts International Ltd. | | | 1,591,000 | | | | 658,035 | |
* | | Digital Domain Holdings Ltd. | | | 581,000 | | | | 20,385 | |
* | | Dingyi Group Investment Ltd. | | | 300,000 | | | | 2,447 | |
| | Dynamic Holdings Ltd. | | | 198,000 | | | | 163,674 | |
| | Eagle Nice International Holdings Ltd. | | | 2,022,000 | | | | 1,148,672 | |
# | | EC Healthcare | | | 1,648,097 | | | | 850,145 | |
†† | | EcoGreen International Group Ltd. | | | 1,994,640 | | | | 362,100 | |
* | | Elegance Optical International Holdings Ltd. | | | 1,160,000 | | | | 70,161 | |
* | | Emperor Capital Group Ltd. | | | 2,979,000 | | | | 15,954 | |
| | Emperor Entertainment Hotel Ltd. | | | 3,445,000 | | | | 192,904 | |
| | Emperor International Holdings Ltd. | | | 10,584,753 | | | | 674,953 | |
| | Emperor Watch & Jewellery Ltd. | | | 25,160,000 | | | | 365,618 | |
* | | Energy International Investments Holdings Ltd. | | | 12,000 | | | | 611 | |
* | | ENM Holdings Ltd. | | | 13,248,000 | | | | 599,014 | |
* | | Esprit Holdings Ltd. | | | 10,440,325 | | | | 810,457 | |
# | | ESR Group Ltd. | | | 58,522 | | | | 99,801 | |
* | | Eternity Investment Ltd. | | | 820,000 | | | | 16,637 | |
| | EuroEyes International Eye Clinic Ltd., Class C | | | 331,000 | | | | 184,295 | |
# | | Fairwood Holdings Ltd. | | | 805,600 | | | | 927,565 | |
| | Far East Consortium International Ltd. | | | 13,169,612 | | | | 2,967,702 | |
| | First Pacific Co. Ltd. | | | 15,292,000 | | | | 4,049,399 | |
* W | | FIT Hon Teng Ltd. | | | 2,381,000 | | | | 278,678 | |
* W | | Fosun Tourism Group | | | 37,800 | | | | 33,021 | |
| | Four Seas Mercantile Holdings Ltd. | | | 610,000 | | | | 200,074 | |
* W | | Frontage Holdings Corp. | | | 2,962,000 | | | | 667,543 | |
# | | FSE Lifestyle Services Ltd. | | | 639,000 | | | | 367,190 | |
* | | Fullwealth International Group Holdings Ltd. | | | 448,000 | | | | 105,516 | |
* †† | | Genting Hong Kong Ltd. | | | 5,824,000 | | | | 115,446 | |
| | Get Nice Financial Group Ltd. | | | 2,438,600 | | | | 214,592 | |
| | Giordano International Ltd. | | | 8,456,000 | | | | 1,401,129 | |
| | Glorious Sun Enterprises Ltd. | | | 3,932,000 | | | | 335,524 | |
# * | | Gold Fin Holdings | | | 9,580,000 | | | | 0 | |
* | | Gold Peak Technology Group Ltd., Class L | | | 3,029,642 | | | | 224,374 | |
| | Golden Resources Development International Ltd. | | | 4,082,500 | | | | 231,441 | |
| | Goodresources | | | 6,860,000 | | | | 13,895 | |
* | | GR Properties Ltd. | | | 1,962,000 | | | | 249,697 | |
| | Great Eagle Holdings Ltd. | | | 1,180,472 | | | | 2,164,855 | |
* | | Greentech Technology International Ltd. | | | 2,594,000 | | | | 155,435 | |
| | G-Resources Group Ltd. | | | 2,817,810 | | | | 712,659 | |
| | Guoco Group Ltd. | | | 2,000 | | | | 17,566 | |
| | Guotai Junan International Holdings Ltd. | | | 27,391,797 | | | | 1,952,023 | |
THE ASIA PACIFIC SMALL COMPANY SERIES
CONTINUED
| | | | | | | | | | |
| | | | | Shares | | | Value» | |
HONG KONG — (Continued) | | | | | | | | |
# * | | Haitong International Securities Group Ltd. | | | 13,193,640 | | | $ | 957,536 | |
| | Hang Lung Group Ltd. | | | 2,959,000 | | | | 3,838,084 | |
| | Hanison Construction Holdings Ltd. | | | 2,713,649 | | | | 338,967 | |
* | | Hans Energy Co. Ltd. | | | 84,000 | | | | 1,164 | |
* | | Harbour Centre Development Ltd. | | | 935,500 | | | | 757,119 | |
| | HKBN Ltd. | | | 4,235,500 | | | | 2,860,634 | |
| | HKR International Ltd. | | | 7,078,969 | | | | 1,776,554 | |
| | HKT Trust & HKT Ltd. | | | 8,950 | | | | 10,122 | |
| | Hon Kwok Land Investment Co. Ltd. | | | 388,800 | | | | 93,414 | |
# * | | Hong Kong ChaoShang Group Ltd. | | | 1,320,000 | | | | 134,924 | |
| | Hong Kong Ferry Holdings Co. Ltd. | | | 1,007,300 | | | | 771,251 | |
| | Hong Kong Technology Venture Co. Ltd. | | | 2,235,000 | | | | 1,168,053 | |
# * | | Hongkong & Shanghai Hotels Ltd. | | | 3,625,989 | | | | 2,844,521 | |
| | Hongkong Chinese Ltd. | | | 5,038,000 | | | | 307,770 | |
W | | Honma Golf Ltd. | | | 1,097,500 | | | | 461,345 | |
# *†† | | Hsin Chong Group Holdings Ltd. | | | 10,243,403 | | | | 0 | |
| | Hung Hing Printing Group Ltd. | | | 2,940,000 | | | | 365,300 | |
# * | | Huobi Technology Holdings Ltd. | | | 340,000 | | | | 152,783 | |
| | Hutchison Telecommunications Hong Kong Holdings Ltd. | | | 11,450,000 | | | | 1,516,818 | |
* | | Hypebeast Ltd. | | | 2,772,500 | | | | 171,459 | |
| | Hysan Development Co. Ltd. | | | 2,634,000 | | | | 5,741,054 | |
* | | IGG, Inc. | | | 6,455,000 | | | | 1,678,166 | |
* | | Imagi International Holdings Ltd. | | | 2,516,984 | | | | 101,749 | |
W | | Impro Precision Industries Ltd. | | | 386,000 | | | | 100,288 | |
# | | International Housewares Retail Co. Ltd. | | | 1,999,000 | | | | 662,559 | |
* | | IPE Group Ltd. | | | 3,345,000 | | | | 276,905 | |
# * | | IRC Ltd. | | | 35,846,266 | | | | 529,562 | |
| | ITC Properties Group Ltd. | | | 5,543,292 | | | | 664,968 | |
| | Jacobson Pharma Corp. Ltd. | | | 3,580,000 | | | | 342,394 | |
| | Johnson Electric Holdings Ltd. | | | 2,307,554 | | | | 2,377,318 | |
| | K Wah International Holdings Ltd. | | | 1,670,000 | | | | 467,678 | |
* | | Kader Holdings Co. Ltd. | | | 112,000 | | | | 5,546 | |
| | Karrie International Holdings Ltd. | | | 2,932,000 | | | | 444,591 | |
| | Keck Seng Investments Hong Kong Ltd. | | | 912,600 | | | | 224,687 | |
| | Kerry Logistics Network Ltd. | | | 4,063,500 | | | | 6,450,213 | |
| | Kerry Properties Ltd. | | | 2,556,500 | | | | 4,044,088 | |
| | Kingmaker Footwear Holdings Ltd. | | | 1,878,955 | | | | 203,306 | |
# | | Kowloon Development Co. Ltd. | | | 3,067,000 | | | | 2,721,630 | |
# * | | KuangChi Science Ltd. | | | 3,714,000 | | | | 44,922 | |
* | | Kwoon Chung Bus Holdings Ltd. | | | 44,000 | | | | 9,030 | |
* | | Lai Sun Development Co. Ltd. | | | 2,556,894 | | | | 1,010,955 | |
* | | Lai Sun Garment International Ltd. | | | 998,295 | | | | 420,996 | |
| | Lam Soon Hong Kong Ltd. | | | 326,310 | | | | 423,788 | |
* | | Landing International Development Ltd. | | | 6,932,800 | | | | 122,614 | |
* | | Landsea Green Management Ltd. | | | 1,508,000 | | | | 30,258 | |
| | Langham Hospitality Investments & Langham Hospitality Investments Ltd. | | | 4,040,750 | | | | 386,557 | |
* | | Lifestyle International Holdings Ltd. | | | 2,792,000 | | | | 1,655,435 | |
| | Lippo China Resources Ltd. | | | 17,982,000 | | | | 263,392 | |
| | Lippo Ltd. | | | 1,161,700 | | | | 390,100 | |
| | Liu Chong Hing Investment Ltd. | | | 1,531,200 | | | | 1,317,785 | |
| | L’Occitane International SA | | | 1,845,750 | | | | 4,531,721 | |
| | Luk Fook Holdings International Ltd. | | | 3,509,000 | | | | 7,622,920 | |
| | Lung Kee Bermuda Holdings | | | 1,491,875 | | | | 455,391 | |
* | | Magnificent Hotel Investment Ltd. | | | 13,170,000 | | | | 171,875 | |
# | | Man Wah Holdings Ltd. | | | 2,474,000 | | | | 1,380,446 | |
* | | Mason Group Holdings Ltd. | | | 111,713,399 | | | | 384,297 | |
| | Master Glory GP | | | 972,981 | | | | 6,049 | |
| | Matrix Holdings Ltd. | | | 1,067,414 | | | | 381,047 | |
# | | MECOM Power & Construction Ltd. | | | 7,876,000 | | | | 1,606,771 | |
THE ASIA PACIFIC SMALL COMPANY SERIES
CONTINUED
| | | | | | | | | | |
| | | | | Shares | | | Value» | |
HONG KONG — (Continued) | | | | | | | | |
| | Melbourne Enterprises Ltd. | | | 39,500 | | | $ | 526,332 | |
* | | Melco International Development Ltd. | | | 3,354,000 | | | | 1,753,698 | |
# * †† | | MH Development NPV | | | 3,238,000 | | | | 0 | |
* | | Midland Holdings Ltd. | | | 2,901,987 | | | | 196,057 | |
# | | Miramar Hotel & Investment | | | 1,152,000 | | | | 1,588,752 | |
# | | Modern Dental Group Ltd. | | | 2,190,000 | | | | 455,038 | |
# * | | Mongolian Mining Corp. | | | 975,000 | | | | 243,432 | |
* | | NagaCorp Ltd. | | | 4,832,946 | | | | 2,203,989 | |
| | Nameson Holdings Ltd. | | | 7,692,000 | | | | 377,287 | |
| | Nanyang Holdings Ltd. | | | 133,500 | | | | 461,221 | |
| | National Electronics Holdings | | | 2,668,600 | | | | 326,377 | |
* †† | | National United Resources Holdings Ltd. | | | 1,828,000 | | | | 24,491 | |
* | | New Times Energy Corp. Ltd. | | | 994,000 | | | | 10,639 | |
* †† | | NewOcean Energy Holdings Ltd. | | | 7,246,000 | | | | 27,047 | |
| | Nissin Foods Co. Ltd. | | | 1,438,000 | | | | 1,153,640 | |
| | NWS Holdings Ltd. | | | 6,789,000 | | | | 4,814,429 | |
| | Oriental Watch Holdings | | | 2,877,611 | | | | 1,232,113 | |
# * | | Oshidori International Holdings Ltd. | | | 20,024,400 | | | | 637,735 | |
†† | | Pacific Andes International Holdings Ltd. | | | 19,435,067 | | | | 67,840 | |
| | Pacific Basin Shipping Ltd. | | | 26,113,000 | | | | 6,322,033 | |
* | | Pacific Century Premium Developments Ltd. | | | 457,240 | | | | 17,214 | |
| | Pacific Textiles Holdings Ltd. | | | 5,849,000 | | | | 1,744,051 | |
* | | Paliburg Holdings Ltd. | | | 3,180,830 | | | | 616,057 | |
* | | Paradise Entertainment Ltd. | | | 3,672,000 | | | | 290,107 | |
# | | PC Partner Group Ltd. | | | 1,524,000 | | | | 728,367 | |
| | PCCW Ltd. | | | 13,651,545 | | | | 5,215,594 | |
# *†† | | Peace Mark Holdings Ltd. | | | 2,479,870 | | | | 0 | |
| | Pegasus International Holdings Ltd. | | | 36,000 | | | | 3,257 | |
| | Pentamaster International Ltd. | | | 1,550,000 | | | | 142,205 | |
# | | Perfect Medical Health Management Ltd. | | | 3,087,000 | | | | 1,093,842 | |
| | Pico Far East Holdings Ltd. | | | 5,142,000 | | | | 700,576 | |
| | Playmates Holdings Ltd. | | | 7,082,000 | | | | 505,336 | |
| | Plover Bay Technologies Ltd. | | | 2,224,000 | | | | 518,988 | |
| | Pokfulam Development Co. Ltd. | | | 62,000 | | | | 71,888 | |
* | | PT International Development Co. Ltd. | | | 8,347,150 | | | | 189,655 | |
| | Public Financial Holdings Ltd. | | | 2,848,000 | | | | 765,874 | |
* †† | | Pyxis Group Ltd. | | | 1,936,000 | | | | 0 | |
* | | Regal Hotels International Holdings Ltd. | | | 2,897,800 | | | | 942,113 | |
# W | | Regina Miracle International Holdings Ltd. | | | 1,983,000 | | | | 772,553 | |
# * | | Sa Sa International Holdings Ltd. | | | 4,010,960 | | | | 424,235 | |
| | Safety Godown Co. Ltd. | | | 1,200,000 | | | | 366,361 | |
* W | | Samsonite International SA | | | 603,900 | | | | 1,297,447 | |
| | SAS Dragon Holdings Ltd. | | | 2,178,000 | | | | 905,404 | |
| | SEA Holdings Ltd. | | | 1,657,523 | | | | 710,432 | |
* | | Shangri-La Asia Ltd. | | | 3,754,000 | | | | 2,077,153 | |
* | | Shenwan Hongyuan HK Ltd. | | | 3,286,250 | | | | 169,169 | |
* | | Shun Ho Property Investments Ltd. | | | 1,254,757 | | | | 145,219 | |
* | | Shun Tak Holdings Ltd. | | | 10,715,419 | | | | 1,391,445 | |
| | Singamas Container Holdings Ltd. | | | 8,800,000 | | | | 672,440 | |
* | | SJM Holdings Ltd. | | | 12,588,750 | | | | 3,928,319 | |
| | SmarTone Telecommunications Holdings Ltd. | | | 1,939,981 | | | | 958,936 | |
# | | Solomon Systech International Ltd. | | | 10,238,000 | | | | 469,570 | |
| | Soundwill Holdings Ltd. | | | 600,500 | | | | 478,488 | |
* | | South China Holdings Co. Ltd. | | | 17,774,503 | | | | 105,311 | |
* | | Space Group Holdings Ltd. | | | 190,000 | | | | 83,516 | |
| | Stella International Holdings Ltd. | | | 2,678,500 | | | | 2,594,078 | |
# | | Sun Hung Kai & Co. Ltd. | | | 4,852,429 | | | | 1,694,455 | |
* | | Suncorp Technologies Ltd. | | | 210,000 | | | | 8,806 | |
| | SUNeVision Holdings Ltd. | | | 2,729,000 | | | | 1,445,724 | |
THE ASIA PACIFIC SMALL COMPANY SERIES
CONTINUED
| | | | | | | | | | |
| | | | | Shares | | | Value» | |
HONG KONG — (Continued) | | | | | | | | |
| | TAI Cheung Holdings Ltd. | | | 2,329,000 | | | $ | 1,172,888 | |
# | | Tai Hing Group Holdings Ltd. | | | 221,000 | | | | 21,676 | |
| | Tai Sang Land Development Ltd. | | | 798,910 | | | | 381,797 | |
# | | Tan Chong International Ltd. | | | 1,176,000 | | | | 247,206 | |
| | Tao Heung Holdings Ltd. | | | 1,396,000 | | | | 131,668 | |
* | | Television Broadcasts Ltd. | | | 1,992,500 | | | | 686,236 | |
* | | Termbray Industries International Holdings Ltd. | | | 94,900 | | | | 4,891 | |
| | Texhong Textile Group Ltd. | | | 293,500 | | | | 189,031 | |
| | Texwinca Holdings Ltd. | | | 4,008,000 | | | | 525,886 | |
| | Tian Teck Land Ltd. | | | 1,024,000 | | | | 476,664 | |
* | | TOM Group Ltd. | | | 416,000 | | | | 34,185 | |
| | Town Health International Medical Group Ltd. | | | 4,442,115 | | | | 201,751 | |
| | Tradelink Electronic Commerce Ltd. | | | 6,126,000 | | | | 576,883 | |
| | Transport International Holdings Ltd. | | | 1,584,202 | | | | 1,673,347 | |
| | United Laboratories International Holdings Ltd. | | | 5,916,000 | | | | 2,479,542 | |
* | | Universal Technologies Holdings Ltd. | | | 1,730,000 | | | | 26,051 | |
| | Untrade.China Solar | | | 1,669,500 | | | | 7,178 | |
* †† | | Up Energy Development Group Ltd. | | | 3,929,000 | | | | 0 | |
* | | Value Convergence Holdings Ltd. | | | 2,448,000 | | | | 50,976 | |
# | | Value Partners Group Ltd. | | | 5,213,000 | | | | 1,241,651 | |
| | Vanke Overseas Investment Holding Co. Ltd. | | | 16,000 | | | | 3,812 | |
| | Vedan International Holdings Ltd. | | | 3,576,000 | | | | 307,786 | |
* | | Vitasoy International Holdings Ltd. | | | 3,373,000 | | | | 5,759,826 | |
#* W | | VPower Group International Holdings Ltd., Class H | | | 2,997,397 | | | | 206,686 | |
| | VSTECS Holdings Ltd. | | | 5,839,600 | | | | 2,807,820 | |
| | VTech Holdings Ltd. | | | 1,292,000 | | | | 6,877,585 | |
| | Wai Kee Holdings Ltd. | | | 5,620,738 | | | | 1,123,489 | |
| | Wang On Group Ltd. | | | 41,740,000 | | | | 228,873 | |
# * | | Wealthking Investments Ltd. | | | 7,296,000 | | | | 380,873 | |
| | Wing On Co. International Ltd. | | | 759,000 | | | | 1,234,055 | |
# | | Wing Tai Properties Ltd. | | | 2,187,331 | | | | 955,634 | |
* | | YT Realty Group Ltd. | | | 1,968,124 | | | | 173,519 | |
| | YTO Express Holdings Ltd. | | | 776,000 | | | | 174,290 | |
| | Yue Yuen Industrial Holdings Ltd. | | | 2,712,500 | | | | 2,757,654 | |
# * | | Yunfeng Financial Group Ltd. | | | 612,000 | | | | 68,706 | |
# * | | Zensun Enterprises Ltd. | | | 1,154,000 | | | | 170,410 | |
* | | Zhaobangji Properties Holdings Ltd. | | | 1,688,000 | | | | 80,572 | |
| | | | | | | | | | |
TOTAL HONG KONG | | | | 225,436,402 | |
| | | | | | | | | | |
NEW ZEALAND — (4.6%) | | | | | | | | |
* | | AFT Pharmaceuticals Ltd. | | | 34,226 | | | | 73,851 | |
* | | Air New Zealand Ltd. | | | 2,841,438 | | | | 1,288,837 | |
| | Arvida Group Ltd. | | | 1,179,235 | | | | 863,217 | |
# | | Briscoe Group Ltd. | | | 34,115 | | | | 99,087 | |
* | | Channel Infrastructure NZ Ltd. | | | 895,413 | | | | 754,976 | |
| | Chorus Ltd. | | | 2,451,723 | | | | 11,836,205 | |
| | Colonial Motor Co. Ltd. | | | 144,588 | | | | 819,592 | |
| | Comvita Ltd. | | | 50,282 | | | | 93,583 | |
| | Delegat Group Ltd. | | | 6,400 | | | | 37,332 | |
# * | | Eroad Ltd. | | | 24,092 | | | | 17,941 | |
# | | Freightways Ltd. | | | 900,023 | | | | 5,407,973 | |
| | Genesis Energy Ltd. | | | 161,189 | | | | 265,066 | |
* | | Gentrack Group Ltd. | | | 71,302 | | | | 63,502 | |
# | | Hallenstein Glasson Holdings Ltd. | | | 307,057 | | | | 952,328 | |
| | Heartland Group Holdings Ltd. | | | 2,385,492 | | | | 2,369,642 | |
# | | Investore Property Ltd. | | | 634,503 | | | | 568,542 | |
| | KMD Brands Ltd. | | | 2,468,331 | | | | 1,549,615 | |
# | | Manawa Energy Ltd. | | | 237,979 | | | | 728,556 | |
# | | Millennium & Copthorne Hotels New Zealand Ltd. | | | 354,679 | | | | 391,870 | |
THE ASIA PACIFIC SMALL COMPANY SERIES
CONTINUED
| | | | | | | | | | |
| | | | | Shares | | | Value» | |
NEW ZEALAND — (Continued) | | | | | | | | |
# | | Napier Port Holdings Ltd. | | | 46,155 | | | $ | 76,208 | |
# | | NZME Ltd. | | | 945,851 | | | | 613,651 | |
# | | NZX Ltd. | | | 1,535,149 | | | | 1,070,639 | |
| | Oceania Healthcare Ltd. | | | 1,384,448 | | | | 691,359 | |
# * | | Pacific Edge Ltd. | | | 1,212,223 | | | | 302,854 | |
| | PGG Wrightson Ltd. | | | 120,785 | | | | 288,016 | |
* | | Pushpay Holdings Ltd. | | | 2,847,906 | | | | 2,065,797 | |
* | | Rakon Ltd. | | | 182,922 | | | | 128,422 | |
| | Restaurant Brands New Zealand Ltd. | | | 145,379 | | | | 604,216 | |
* †† | | RPNZ Ltd. | | | 274,180 | | | | 0 | |
* | | Sanford Ltd. | | | 362,156 | | | | 856,879 | |
# | | Scales Corp. Ltd. | | | 436,710 | | | | 1,202,276 | |
# | | Scott Technology Ltd. | | | 52,367 | | | | 85,572 | |
* | | Serko Ltd. | | | 125,518 | | | | 216,920 | |
| | Skellerup Holdings Ltd. | | | 846,136 | | | | 2,604,339 | |
| | SKY Network Television Ltd. | | | 386,493 | | | | 487,265 | |
* | | SKYCITY Entertainment Group Ltd. | | | 4,246,632 | | | | 7,159,611 | |
| | Steel & Tube Holdings Ltd. | | | 575,667 | | | | 434,849 | |
| | Summerset Group Holdings Ltd. | | | 626,265 | | | | 3,523,582 | |
* | | Synlait Milk Ltd. | | | 447,922 | | | | 811,693 | |
# * | | Tourism Holdings Ltd. | | | 683,001 | | | | 1,464,474 | |
| | TOWER Ltd. | | | 1,895,126 | | | | 721,610 | |
# | | Turners Automotive Group Ltd. | | | 109,772 | | | | 226,600 | |
# * | | Vista Group International Ltd. | | | 516,999 | | | | 463,137 | |
| | Warehouse Group Ltd. | | | 387,506 | | | | 698,312 | |
| | | | | | | | | | |
TOTAL NEW ZEALAND | | | | 54,979,996 | |
| | | | | | | | | | |
SINGAPORE — (10.8%) | | | | | | | | |
* †† | | Abterra Ltd. | | | 230,320 | | | | 0 | |
# | | AEM Holdings Ltd. | | | 940,200 | | | | 2,132,166 | |
| | Amara Holdings Ltd. | | | 974,800 | | | | 227,882 | |
# * | | Avarga Ltd. | | | 2,626,500 | | | | 454,880 | |
| | Aztech Global Ltd. | | | 202,500 | | | | 112,355 | |
# * | | Banyan Tree Holdings Ltd. | | | 887,700 | | | | 172,425 | |
# *†† | | Best World International Ltd. | | | 514,383 | | | | 370,635 | |
# | | Bonvests Holdings Ltd. | | | 950,000 | | | | 637,539 | |
| | Boustead Singapore Ltd. | | | 2,084,782 | | | | 1,156,536 | |
| | BRC Asia Ltd. | | | 26,900 | | | | 30,780 | |
# | | Bukit Sembawang Estates Ltd. | | | 1,176,003 | | | | 3,373,547 | |
| | Bund Center Investment Ltd. | | | 659,825 | | | | 205,257 | |
| | Capitaland India Trust | | | 4,303,400 | | | | 3,405,672 | |
# | | Centurion Corp. Ltd. | | | 1,405,100 | | | | 326,932 | |
# | | China Aviation Oil Singapore Corp. Ltd. | | | 2,355,399 | | | | 1,106,497 | |
| | China Sunsine Chemical Holdings Ltd. | | | 3,341,800 | | | | 993,553 | |
| | Chip Eng Seng Corp. Ltd. | | | 2,669,600 | | | | 1,358,032 | |
| | Chuan Hup Holdings Ltd. | | | 3,341,700 | | | | 533,437 | |
| | Civmec Ltd. | | | 162,700 | | | | 69,493 | |
| | ComfortDelGro Corp. Ltd. | | | 9,120,200 | | | | 8,187,132 | |
* | | COSCO Shipping International Singapore Co. Ltd. | | | 6,429,100 | | | | 736,245 | |
# * | | Creative Technology Ltd. | | | 285,050 | | | | 259,224 | |
# | | CSE Global Ltd. | | | 2,232,300 | | | | 552,553 | |
| | Dasin Retail Trust | | | 296,700 | | | | 58,677 | |
# | | Del Monte Pacific Ltd. | | | 2,302,364 | | | | 479,655 | |
# | | Delfi Ltd. | | | 1,075,400 | | | | 535,473 | |
* †† | | DMX Technologies Group Ltd. | | | 2,096,000 | | | | 0 | |
* | | Dyna-Mac Holdings Ltd. | | | 1,390,900 | | | | 175,547 | |
# *†† | | Ezion Holdings Ltd. | | | 9,845,878 | | | | 0 | |
# *†† | | Ezra Holdings Ltd. | | | 6,762,986 | | | | 9,842 | |
| | Far East Orchard Ltd. | | | 1,191,395 | | | | 876,638 | |
THE ASIA PACIFIC SMALL COMPANY SERIES
CONTINUED
| | | | | | | | | | |
| | | | | Shares | | | Value» | |
SINGAPORE — (Continued) | | | | | | | | |
| | First Resources Ltd. | | | 3,080,000 | | | $ | 3,235,952 | |
# | | First Sponsor Group Ltd. | | | 484,728 | | | | 422,109 | |
| | Food Empire Holdings Ltd. | | | 1,334,200 | | | | 471,787 | |
| | Fraser & Neave Ltd. | | | 314,800 | | | | 268,908 | |
| | Frasers Property Ltd. | | | 13,400 | | | | 8,474 | |
# | | Frencken Group Ltd. | | | 1,328,900 | | | | 788,686 | |
| | Fu Yu Corp. Ltd. | | | 3,671,500 | | | | 518,697 | |
# * | | Gallant Venture Ltd. | | | 5,386,600 | | | | 490,799 | |
| | Geo Energy Resources Ltd. | | | 2,078,300 | | | | 571,916 | |
| | GK Goh Holdings Ltd. | | | 1,315,065 | | | | 835,890 | |
| | Golden Agri-Resources Ltd. | | | 31,541,800 | | | | 6,467,918 | |
# * | | Golden Energy & Resources Ltd. | | | 2,543,400 | | | | 1,560,517 | |
| | GP Industries Ltd. | | | 181,509 | | | | 76,477 | |
| | Grand Venture Technology Ltd. | | | 34,200 | | | | 11,857 | |
# | | GuocoLand Ltd. | | | 1,697,314 | | | | 1,860,364 | |
# * | | Halcyon Agri Corp. Ltd. | | | 1,635,533 | | | | 283,108 | |
# | | Haw Par Corp. Ltd. | | | 405,500 | | | | 2,707,119 | |
| | Hiap Hoe Ltd. | | | 498,000 | | | | 259,111 | |
# | | Ho Bee Land Ltd. | | | 1,505,100 | | | | 2,457,285 | |
# | | Hong Fok Corp. Ltd. | | | 2,553,594 | | | | 1,678,609 | |
# | | Hong Leong Asia Ltd. | | | 1,675,100 | | | | 746,295 | |
# | | Hong Leong Finance Ltd. | | | 1,014,200 | | | | 1,690,724 | |
# | | Hotel Grand Central Ltd. | | | 1,611,854 | | | | 1,110,757 | |
# | | Hour Glass Ltd. | | | 1,390,232 | | | | 1,916,626 | |
| | HRnetgroup Ltd. | | | 260,800 | | | | 134,550 | |
| | Hutchison Port Holdings Trust | | | 24,607,400 | | | | 4,018,979 | |
# *†† | | Hyflux Ltd. | | | 3,238,900 | | | | 0 | |
# | | iFAST Corp. Ltd. | | | 757,600 | | | | 2,170,587 | |
# | | Indofood Agri Resources Ltd. | | | 2,701,700 | | | | 562,267 | |
# | | InnoTek Ltd. | | | 336,600 | | | | 102,236 | |
# | | ISDN Holdings Ltd. | | | 412,544 | | | | 106,474 | |
# | | Japfa Ltd. | | | 2,345,710 | | | | 844,913 | |
# *†† | | Jurong Technologies Industrial Corp. Ltd. | | | 2,227,680 | | | | 0 | |
| | Keppel Infrastructure Trust | | | 18,468,846 | | | | 6,911,022 | |
# | | KSH Holdings Ltd. | | | 1,278,300 | | | | 306,159 | |
# | | Low Keng Huat Singapore Ltd. | | | 949,800 | | | | 275,282 | |
* | | Mandarin Oriental International Ltd. | | | 1,452,700 | | | | 2,393,091 | |
# * | | Marco Polo Marine Ltd. | | | 4,046,400 | | | | 105,208 | |
# | | Metro Holdings Ltd. | | | 2,946,592 | | | | 1,300,210 | |
| | Mewah International, Inc. | | | 89,000 | | | | 19,691 | |
| | Micro-Mechanics Holdings Ltd. | | | 115,800 | | | | 225,080 | |
# *†† | | Midas Holdings Ltd. | | | 8,576,553 | | | | 0 | |
# * | | mm2 Asia Ltd. | | | 5,969,400 | | | | 181,701 | |
| | Nanofilm Technologies International Ltd. | | | 451,500 | | | | 555,509 | |
| | Netlink NBN Trust | | | 797,000 | | | | 481,425 | |
# | | NSL Ltd. | | | 409,900 | | | | 234,832 | |
# * | | Oceanus Group Ltd. | | | 6,540,800 | | | | 50,863 | |
| | OUE Ltd. | | | 2,004,600 | | | | 1,784,873 | |
# | | Oxley Holdings Ltd. | | | 7,186,441 | | | | 752,104 | |
| | Pacific Century Regional Developments Ltd. | | | 179,000 | | | | 48,051 | |
# | | Pan-United Corp. Ltd. | | | 1,866,350 | | | | 534,434 | |
# | | Propnex Ltd. | | | 386,300 | | | | 354,822 | |
# | | PSC Corp. Ltd. | | | 1,339,819 | | | | 322,649 | |
# | | Q&M Dental Group Singapore Ltd. | | | 1,136,160 | | | | 268,629 | |
| | QAF Ltd. | | | 1,484,380 | | | | 839,002 | |
# * | | Raffles Education Ltd. | | | 2,803,923 | | | | 100,851 | |
| | Raffles Medical Group Ltd. | | | 6,097,932 | | | | 5,729,364 | |
# | | Riverstone Holdings Ltd. | | | 341,500 | | | | 130,129 | |
| | Samudera Shipping Line Ltd. | | | 213,100 | | | | 130,178 | |
THE ASIA PACIFIC SMALL COMPANY SERIES
CONTINUED
| | | | | | | | | | |
| | | | | Shares | | | Value» | |
SINGAPORE — (Continued) | | | | | | | | |
* | | SATS Ltd. | | | 416,700 | | | $ | 804,343 | |
# | | SBS Transit Ltd. | | | 796,600 | | | | 1,457,087 | |
* | | Sembcorp Marine Ltd. | | | 37,571,400 | | | | 3,366,908 | |
| | Sheng Siong Group Ltd. | | | 3,904,500 | | | | 4,306,374 | |
* | | SHS Holdings Ltd. | | | 2,175,300 | | | | 221,561 | |
* | | SIA Engineering Co. Ltd. | | | 1,657,700 | | | | 2,530,694 | |
# | | SIIC Environment Holdings Ltd. | | | 5,686,720 | | | | 591,935 | |
| | Silverlake Axis Ltd. | | | 794,700 | | | | 182,280 | |
| | Sinarmas Land Ltd. | | | 7,118,700 | | | | 954,899 | |
# | | Sing Holdings Ltd. | | | 1,470,400 | | | | 369,921 | |
| | Sing Investments & Finance Ltd. | | | 350,675 | | | | 363,886 | |
| | Singapore Land Group Ltd. | | | 111,369 | | | | 171,001 | |
| | Singapore Post Ltd. | | | 9,550,100 | | | | 3,646,761 | |
| | Singapore Shipping Corp. Ltd. | | | 1,573,200 | | | | 282,969 | |
# | | Stamford Land Corp. Ltd. | | | 5,782,218 | | | | 1,530,327 | |
| | StarHub Ltd. | | | 4,724,700 | | | | 3,571,851 | |
| | Straco Corp. Ltd. | | | 130,000 | | | | 35,743 | |
# | | Straits Trading Co. Ltd. | | | 476,248 | | | | 693,264 | |
# * †† | | Swiber Holdings Ltd. | | | 2,895,250 | | | | 0 | |
| | Thomson Medical Group Ltd. | | | 1,408,700 | | | | 76,614 | |
| | Tiong Woon Corp. Holding Ltd. | | | 26,600 | | | | 8,496 | |
# | | Tuan Sing Holdings Ltd. | | | 4,214,136 | | | | 909,850 | |
# | | UMS Holdings Ltd. | | | 2,312,968 | | | | 1,462,921 | |
| | United Overseas Insurance Ltd. | | | 168,150 | | | | 751,660 | |
| | UOB-Kay Hian Holdings Ltd. | | | 2,574,498 | | | | 2,420,203 | |
# | | Valuetronics Holdings Ltd. | | | 2,647,550 | | | | 832,465 | |
# | | Vicom Ltd. | | | 557,500 | | | | 740,815 | |
# | | Wee Hur Holdings Ltd. | | | 2,614,200 | | | | 362,690 | |
# | | Wing Tai Holdings Ltd. | | | 3,717,167 | | | | 3,996,514 | |
| | Yangzijiang Shipbuilding Holdings Ltd. | | | 3,719,600 | | | | 3,153,199 | |
| | Yeo Hiap Seng Ltd. | | | 228,759 | | | | 108,258 | |
| | | | | | | | | | |
TOTAL SINGAPORE | | | | 130,859,243 | |
| | | | | | | | | | |
TOTAL COMMON STOCKS | | | | 1,190,521,988 | |
| | | | | | | | | | |
RIGHTS/WARRANTS — (0.0%) | | | | | | | | |
| | |
AUSTRALIA — (0.0%) | | | | | | | | |
* | | Arafura Resources Ltd. Warrants 2/25/24 | | | 472,767 | | | | 16,028 | |
* | | Australian Mines Ltd. Warrants 05/30/24 | | | 120,864 | | | | 889 | |
* | | Decmil Group Ltd. Warrants 09/06/23 | | | 5,306 | | | | 0 | |
* | | Eureka Group Holdings Ltd. Rights 11/18/22 | | | 7,127 | | | | 0 | |
* | | European Lithium Ltd. Warrants 3/31/25 | | | 323,975 | | | | 3,937 | |
# * | | Medical Developments International Ltd. Warrants 9/30/24 | | | 5,820 | | | | 465 | |
# * | | PointsBet Holdings Ltd. Warrants 07/08/24 | | | 6,189 | | | | 0 | |
| | | | | | | | | | |
TOTAL AUSTRALIA | | | | 21,319 | |
| | | | | | | | | | |
HONG KONG — (0.0%) | | | | | | | | |
# * | | MECOM Power & Construction Ltd. Warrants 05/16/23 | | | 528,800 | | | | 5,255 | |
| | | | | | | | | | |
SINGAPORE — (0.0%) | | | | | | | | |
# * | | Ezion Holdings Ltd. Warrants 04/16/23 | | | 5,659,201 | | | | 0 | |
| | | | | | | | | | |
TOTAL RIGHTS/WARRANTS | | | | 26,574 | |
| | | | | | | | | | |
TOTAL INVESTMENT SECURITIES
(Cost $1,539,796,503) | | | | 1,190,548,562 | |
| | | | | | | | | | |
THE ASIA PACIFIC SMALL COMPANY SERIES
CONTINUED
| | | | | | | | | | |
| | | | | Shares | | | Value† | |
SECURITIES LENDING COLLATERAL — (1.4%) | | | | | | | | |
@ § | | The DFA Short Term Investment Fund | | | 1,496,806 | | | $ | 17,304,573 | |
| | | | | | | | | | |
TOTAL INVESTMENTS — (100.0%)
(Cost $1,557,108,416) | | | | | | $ | 1,207,853,135 | |
| | | | | | | | | | |
| ADR | American Depositary Receipt |
| » | Securities that have been fair value factored. See Note B to Financial Statements. |
| * | Non-Income Producing Securities. |
| †† | Security valued using significant unobservable inputs (Level 3). |
| # | Total or Partial Securities on Loan. |
| W | Rule 144A, Section 4(2), or other security that is restricted as to resale to institutional investors. This security has been deemed liquid based upon the Fund’s Liquidity Guidelines. The liquidity determination is unaudited. |
| † | See Note B to Financial Statements. |
| @ | Security purchased with cash collateral received from Securities on Loan. |
Summary of the Series’ investments as of October 31, 2022, based on their valuation inputs, is as follows (see Security Valuation Note):
| | | | | | | | | | | | | | | | |
| | | Investments in Securities (Market Value) | |
| | | Level 1 | | | Level 2 | | | Level 3 | | | Total | |
Common Stocks | | | | | | | | | | | | | | | | |
Australia | | $ | 8,084 | | | $ | 777,796,648 | | | $ | 390,946 | | | $ | 778,195,678 | |
China | | | — | | | | 1,050,669 | | | | — | | | | 1,050,669 | |
Hong Kong | | | — | | | | 224,321,261 | | | | 1,115,141 | | | | 225,436,402 | |
New Zealand | | | — | | | | 54,979,996 | | | | — | | | | 54,979,996 | |
Singapore | | | 637,539 | | | | 129,841,227 | | | | 380,477 | | | | 130,859,243 | |
Rights/Warrants | | | | | | | | | | | | | | | | |
Australia | | | — | | | | 21,319 | | | | — | | | | 21,319 | |
Hong Kong | | | — | | | | 5,255 | | | | — | | | | 5,255 | |
Securities Lending Collateral | | | — | | | | 17,304,573 | | | | — | | | | 17,304,573 | |
| | | | | | | | | | | | | | | | |
TOTAL | | $ | 645,623 | | | $ | 1,205,320,948 | | | $ | 1,886,564 | ^ | | $ | 1,207,853,135 | |
| | | | | | | | | | | | | | | | |
| ^ | A reconciliation of Level 3 investments is presented when the Fund had a significant amount of Level 3 investments at the beginning and/or end of the reporting period in relation to net assets. |
THE UNITED KINGDOM SMALL COMPANY SERIES
SCHEDULE OF INVESTMENTS
October 31, 2022
| | | | | | | | | | |
| | | | | Shares | | | Value» | |
COMMON STOCKS — (97.5%) | | | | | | | | |
COMMUNICATION SERVICES — (3.6%) | | | | | | | | |
| | 4imprint Group PLC | | | 163,055 | | | $ | 6,501,702 | |
* | | Ascential PLC | | | 1,604,885 | | | | 3,534,828 | |
| | Bloomsbury Publishing PLC | | | 316,806 | | | | 1,678,089 | |
| | Centaur Media PLC | | | 254,249 | | | | 116,638 | |
| | Euromoney Institutional Investor PLC | | | 592,842 | | | | 9,845,186 | |
# * | | Frontier Developments PLC | | | 55,575 | | | | 844,491 | |
| | Future PLC | | | 70,814 | | | | 992,430 | |
| | Gamma Communications PLC | | | 184,405 | | | | 2,257,681 | |
* | | Helios Towers PLC | | | 1,927,385 | | | | 2,769,253 | |
# * | | Hyve Group PLC | | | 1,575,593 | | | | 966,924 | |
| | ITV PLC | | | 3,365,215 | | | | 2,591,070 | |
| | Moneysupermarket.com Group PLC | | | 3,160,889 | | | | 6,648,926 | |
| | Next Fifteen Communications Group PLC | | | 128,193 | | | | 1,289,413 | |
| | Reach PLC | | | 2,094,224 | | | | 2,214,936 | |
* | | S4 Capital PLC | | | 109,011 | | | | 219,596 | |
| | STV Group PLC | | | 4,918 | | | | 14,885 | |
* | | Tremor International Ltd. | | | 176,315 | | | | 690,886 | |
# * | | Tremor International Ltd., ADR | | | 2,906 | | | | 23,016 | |
| | | | | | | | | | |
TOTAL COMMUNICATION SERVICES | | | | 43,199,950 | |
| | | | | | | | | | |
CONSUMER DISCRETIONARY — (16.3%) | | | | | | | | |
| | 888 Holdings PLC | | | 2,213,314 | | | | 2,355,813 | |
* | | AO World PLC | | | 11,902 | | | | 6,110 | |
# * | | ASOS PLC | | | 70,017 | | | | 450,854 | |
* W | | Aston Martin Lagonda Global Holdings PLC | | | 676,550 | | | | 817,588 | |
| | Bellway PLC | | | 429,828 | | | | 9,141,218 | |
# * | | boohoo Group PLC | | | 980,423 | | | | 455,638 | |
* | | Card Factory PLC | | | 1,169,822 | | | | 637,960 | |
* | | Cazoo Group Ltd. | | | 576,666 | | | | 184,533 | |
| | Coats Group PLC | | | 4,921,327 | | | | 3,414,230 | |
#* W | | Countryside Partnerships PLC | | | 2,712,258 | | | | 6,607,743 | |
| | Crest Nicholson Holdings PLC | | | 1,872,966 | | | | 4,341,472 | |
| | Currys PLC | | | 5,993,730 | | | | 4,476,581 | |
* W | | Deliveroo PLC | | | 332,794 | | | | 333,286 | |
# | | DFS Furniture PLC | | | 1,258,487 | | | | 1,768,140 | |
# * | | Dignity PLC | | | 219,230 | | | | 1,167,045 | |
| | Domino’s Pizza Group PLC | | | 3,131,085 | | | | 8,097,879 | |
| | Dr Martens PLC | | | 207,083 | | | | 588,922 | |
| | Dunelm Group PLC | | | 693,916 | | | | 6,888,146 | |
* | | Frasers Group PLC | | | 1,220,486 | | | | 9,056,198 | |
| | Fuller Smith & Turner PLC, Class A | | | 151,287 | | | | 775,859 | |
| | Games Workshop Group PLC | | | 176,198 | | | | 12,933,595 | |
| | Greggs PLC | | | 604,556 | | | | 14,014,474 | |
* W | | Gym Group PLC | | | 975,013 | | | | 1,292,302 | |
| | Halfords Group PLC | | | 1,428,759 | | | | 2,884,630 | |
| | Headlam Group PLC | | | 502,271 | | | | 1,386,892 | |
| | Henry Boot PLC | | | 541,758 | | | | 1,484,117 | |
| | Hollywood Bowl Group PLC | | | 311,048 | | | | 712,672 | |
* W | | Hostelworld Group PLC | | | 206,214 | | | | 212,552 | |
| | Inchcape PLC | | | 2,415,336 | | | | 20,604,988 | |
* | | J D Wetherspoon PLC | | | 456,701 | | | | 2,370,562 | |
* W | | Just Eat Takeaway.com NV | | | 3,190 | | | | 54,717 | |
| | Lookers PLC | | | 1,488,558 | | | | 1,361,541 | |
* | | Marston’s PLC | | | 4,029,229 | | | | 1,614,354 | |
| | Me Group International PLC | | | 1,529,544 | | | | 1,626,243 | |
THE UNITED KINGDOM SMALL COMPANY SERIES
CONTINUED
| | | | | | | | | | |
| | | | | Shares | | | Value» | |
CONSUMER DISCRETIONARY — (Continued) | | | | | | | | |
* | | Mitchells & Butlers PLC | | | 2,002,591 | | | $ | 2,669,646 | |
| | MJ Gleeson PLC | | | 240,572 | | | | 1,028,076 | |
* | | Moonpig Group PLC | | | 113,485 | | | | 178,397 | |
* | | Motorpoint group PLC | | | 51,520 | | | | 85,491 | |
# * | | N Brown Group PLC | | | 949,432 | | | | 222,324 | |
* W | | On the Beach Group PLC | | | 86,559 | | | | 102,551 | |
* | | Pendragon PLC | | | 5,100,308 | | | | 1,594,317 | |
| | Pets at Home Group PLC | | | 3,042,980 | | | | 10,061,388 | |
* | | Playtech PLC | | | 1,947,421 | | | | 11,571,872 | |
| | PPHE Hotel Group Ltd. | | | 15,424 | | | | 223,270 | |
* | | Rank Group PLC | | | 1,027,396 | | | | 618,034 | |
| | Redrow PLC | | | 1,679,801 | | | | 8,083,236 | |
* | | Restaurant Group PLC | | | 1,278,080 | | | | 465,977 | |
| | Smiths News PLC | | | 23,379 | | | | 9,717 | |
| | Sportech PLC | | | 119,311 | | | | 23,632 | |
* | | SSP Group PLC | | | 3,079,441 | | | | 7,160,450 | |
# †† | | Studio Retail Group PLC | | | 220,669 | | | | 109,146 | |
* | | Superdry PLC | | | 337,189 | | | | 425,429 | |
# * | | THG PLC | | | 272,308 | | | | 166,021 | |
W | | TI Fluid Systems PLC | | | 342,278 | | | | 543,489 | |
| | Topps Tiles PLC | | | 786,772 | | | | 345,971 | |
| | Vertu Motors PLC | | | 1,326,258 | | | | 696,657 | |
| | VIDENDUM PLC | | | 217,201 | | | | 3,199,226 | |
# | | Vistry Group PLC | | | 1,228,992 | | | | 8,503,987 | |
* W | | Watches of Switzerland Group PLC | | | 396,502 | | | | 3,535,464 | |
* | | WH Smith PLC | | | 401,628 | | | | 5,429,758 | |
| | Wickes Group PLC | | | 2,176,225 | | | | 3,168,675 | |
| | Young & Co’s Brewery PLC, Class A | | | 14,543 | | | | 157,049 | |
| | | | | | | | | | |
TOTAL CONSUMER DISCRETIONARY | | | | 194,498,104 | |
| | | | | | | | | | |
CONSUMER STAPLES — (7.0%) | | | | | | | | |
| | AG Barr PLC | | | 726,615 | | | | 3,744,390 | |
| | Anglo-Eastern Plantations PLC | | | 124,523 | | | | 1,142,311 | |
W | | Bakkavor Group PLC | | | 121,093 | | | | 126,403 | |
| | Britvic PLC | | | 1,626,728 | | | | 13,586,475 | |
* | | C&C Group PLC | | | 1,925,624 | | | | 3,613,001 | |
| | Carr’s Group PLC | | | 349,511 | | | | 419,685 | |
| | Cranswick PLC | | | 365,093 | | | | 12,464,969 | |
| | Devro PLC | | | 1,358,722 | | | | 2,788,550 | |
# | | Fevertree Drinks PLC | | | 421,689 | | | | 4,609,763 | |
* | | Greencore Group PLC | | | 3,651,826 | | | | 2,811,597 | |
| | Hilton Food Group PLC | | | 350,941 | | | | 2,459,522 | |
* | | Marks & Spencer Group PLC | | | 7,566,588 | | | | 9,163,708 | |
* | | McBride PLC | | | 895,746 | | | | 246,051 | |
| | MP Evans Group PLC | | | 7,544 | | | | 70,063 | |
# * | | Naked Wines PLC | | | 32,906 | | | | 41,129 | |
# | | Nichols PLC | | | 2,884 | | | | 36,277 | |
| | Premier Foods PLC | | | 4,727,225 | | | | 5,619,404 | |
| | PZ Cussons PLC | | | 1,717,225 | | | | 3,937,452 | |
| | Tate & Lyle PLC | | | 2,060,165 | | | | 16,553,803 | |
| | | | | | | | | | |
TOTAL CONSUMER STAPLES | | | | 83,434,553 | |
| | | | | | | | | | |
ENERGY — (4.2%) | | | | | | | | |
* | | Capricorn Energy PLC | | | 4,040,365 | | | | 11,477,115 | |
| | Diversified Energy Co. PLC | | | 3,440,766 | | | | 4,967,328 | |
| | Energean PLC | | | 308,711 | | | | 5,074,229 | |
* | | EnQuest PLC | | | 12,456,788 | | | | 3,863,068 | |
| | Genel Energy PLC | | | 934,783 | | | | 1,361,171 | |
THE UNITED KINGDOM SMALL COMPANY SERIES
CONTINUED
| | | | | | | | | | |
| | | | | Shares | | | Value» | |
ENERGY — (Continued) | | | | | | | | |
| | Gulf Keystone Petroleum Ltd. | | | 1,529,511 | | | $ | 3,666,757 | |
| | Hunting PLC | | | 841,827 | | | | 2,577,990 | |
* | | IGas Energy PLC | | | 61,631 | | | | 17,957 | |
* | | John Wood Group PLC | | | 3,814,872 | | | | 6,133,815 | |
# * | | Petrofac Ltd. | | | 2,580,763 | | | | 3,187,606 | |
* | | Pharos Energy PLC | | | 1,842,454 | | | | 559,758 | |
* | | Savannah Energy PLC | | | 388,799 | | | | 122,184 | |
| | Serica Energy PLC | | | 1,069,552 | | | | 3,694,684 | |
# * | | Tullow Oil PLC | | | 7,204,010 | | | | 3,348,061 | |
| | | | | | | | | | |
TOTAL ENERGY | | | | 50,051,723 | |
| | | | | | | | | | |
FINANCIALS — (18.4%) | | | | | | | | |
| | AJ Bell PLC | | | 884,994 | | | | 3,291,663 | |
| | Ashmore Group PLC | | | 2,540,311 | | | | 6,015,733 | |
| | Bank of Georgia Group PLC | | | 283,322 | | | | 6,912,953 | |
| | Beazley PLC | | | 3,081,626 | | | | 22,100,836 | |
| | Brooks Macdonald Group PLC | | | 628 | | | | 13,697 | |
| | Burford Capital Ltd. | | | 958,135 | | | | 7,745,879 | |
| | Chesnara PLC | | | 863,650 | | | | 2,635,353 | |
| | Close Brothers Group PLC | | | 898,617 | | | | 10,123,897 | |
W | | CMC Markets PLC | | | 1,052,192 | | | | 2,961,640 | |
| | Direct Line Insurance Group PLC | | | 3,377,275 | | | | 7,802,979 | |
* W | | Funding Circle Holdings PLC | | | 104,248 | | | | 58,460 | |
* | | Georgia Capital PLC | | | 29,520 | | | | 211,438 | |
| | Hiscox Ltd. | | | 1,420,362 | | | | 14,632,152 | |
| | IG Group Holdings PLC | | | 568,289 | | | | 5,183,510 | |
| | Impax Asset Management Group PLC | | | 191,845 | | | | 1,471,636 | |
| | IntegraFin Holdings PLC | | | 536,992 | | | | 1,549,184 | |
| | International Personal Finance PLC | | | 1,421,817 | | | | 1,269,000 | |
| | Investec PLC | | | 959,278 | | | | 4,807,607 | |
| | IP Group PLC | | | 6,416,521 | | | | 4,324,230 | |
| | Jupiter Fund Management PLC | | | 2,622,791 | | | | 3,120,482 | |
| | Just Group PLC | | | 7,078,503 | | | | 4,701,777 | |
| | Lancashire Holdings Ltd. | | | 1,670,143 | | | | 9,478,286 | |
| | Liontrust Asset Management PLC | | | 113,589 | | | | 1,112,511 | |
| | Man Group PLC | | | 7,662,342 | | | | 19,060,892 | |
* | | Metro Bank PLC | | | 198,857 | | | | 161,490 | |
| | Mortgage Advice Bureau Holdings Ltd. | | | 3,857 | | | | 28,532 | |
| | Ninety One PLC | | | 1,874,430 | | | | 4,359,726 | |
| | Numis Corp. PLC | | | 311,926 | | | | 647,162 | |
| | OSB Group PLC | | | 2,135,454 | | | | 10,176,648 | |
| | Paragon Banking Group PLC | | | 1,934,045 | | | | 9,462,355 | |
| | Plus500 Ltd. | | | 525,338 | | | | 10,868,092 | |
| | Polar Capital Holdings PLC | | | 248,040 | | | | 1,197,996 | |
| | Provident Financial PLC | | | 1,503,647 | | | | 2,818,550 | |
W | | Quilter PLC | | | 8,070,566 | | | | 8,945,685 | |
| | Rathbones Group PLC | | | 357,843 | | | | 7,691,235 | |
| | Record PLC | | | 18,948 | | | | 16,311 | |
| | S&U PLC | | | 29,239 | | | | 726,003 | |
W | | Sabre Insurance Group PLC | | | 417,265 | | | | 430,029 | |
* | | Saga PLC | | | 781,370 | | | | 774,231 | |
| | TBC Bank Group PLC | | | 91,121 | | | | 1,967,522 | |
| | TP ICAP Group PLC | | | 4,137,686 | | | | 8,726,393 | |
| | Virgin Money UK PLC | | | 6,368,888 | | | | 9,926,426 | |
†† | | Waterloo Investment Holdings Ltd. | | | 4,000 | | | | 520 | |
| | XPS Pensions Group PLC | | | 6,312 | | | | 8,600 | |
| | | | | | | | | | |
TOTAL FINANCIALS | | | | 219,519,301 | |
| | | | | | | | | | |
THE UNITED KINGDOM SMALL COMPANY SERIES
CONTINUED
| | | | | | | | | | |
| | | | | Shares | | | Value» | |
HEALTH CARE — (4.9%) | | | | | | | | |
* †† | | 4d pharma PLC | | | 42,478 | | | $ | 6,089 | |
| | Advanced Medical Solutions Group PLC | | | 401,543 | | | | 1,257,132 | |
| | Alliance Pharma PLC | | | 2,372,960 | | | | 1,687,748 | |
| | CVS Group PLC | | | 413,530 | | | | 8,938,783 | |
| | EKF Diagnostics Holdings PLC | | | 79,384 | | | | 39,934 | |
| | EMIS Group PLC | | | 328,823 | | | | 7,003,787 | |
* | | Ergomed PLC | | | 47,132 | | | | 662,321 | |
| | Hikma Pharmaceuticals PLC | | | 264,710 | | | | 3,799,971 | |
| | Indivior PLC | | | 771,895 | | | | 14,621,023 | |
W | | Integrated Diagnostics Holdings PLC | | | 1,249,693 | | | | 961,470 | |
# | | Mediclinic International PLC | | | 2,400,508 | | | | 13,655,822 | |
* | | NIOX GROUP PLC | | | 202,629 | | | | 88,790 | |
* | | Oxford Biomedica PLC | | | 2,667 | | | | 9,866 | |
* | | PureTech Health PLC | | | 342,938 | | | | 910,495 | |
* W | | Spire Healthcare Group PLC | | | 1,823,481 | | | | 4,529,794 | |
* | | Trellus Health PLC | | | 1,632 | | | | 211 | |
* | | Verici Dx PLC | | | 1,587 | | | | 254 | |
| | | | | | | | | | |
TOTAL HEALTH CARE | | | | 58,173,490 | |
| | | | | | | | | | |
INDUSTRIALS — (22.3%) | | | | | | | | |
| | Avon Protection PLC | | | 185,963 | | | | 2,215,270 | |
* | | Babcock International Group PLC | | | 2,860,700 | | | | 9,035,971 | |
| | Balfour Beatty PLC | | | 3,610,310 | | | | 12,369,652 | |
| | Begbies Traynor Group PLC | | | 60,262 | | | | 89,424 | |
W | | Biffa PLC | | | 1,510,258 | | | | 7,107,390 | |
| | Bodycote PLC | | | 1,201,080 | | | | 6,831,497 | |
| | BRAEMAR PLC | | | 91,109 | | | | 309,146 | |
| | Chemring Group PLC | | | 1,906,169 | | | | 6,607,992 | |
| | Clarkson PLC | | | 212,943 | | | | 6,739,908 | |
* | | Costain Group PLC | | | 237,261 | | | | 96,481 | |
# * | | De La Rue PLC | | | 498,978 | | | | 537,362 | |
# * | | Dialight PLC | | | 89,929 | | | | 293,257 | |
| | Diploma PLC | | | 427,629 | | | | 12,162,994 | |
| | DiscoverIE Group PLC | | | 594,505 | | | | 5,078,646 | |
* | | easyJet PLC | | | 916,028 | | | | 3,647,334 | |
# * | | Esken Ltd. | | | 1,707,178 | | | | 108,033 | |
# | | Firstgroup PLC | | | 2,617,521 | | | | 3,142,543 | |
| | Galliford Try Holdings PLC | | | 663,973 | | | | 1,263,452 | |
| | Genuit Group PLC | | | 1,449,475 | | | | 4,235,995 | |
| | Goodwin PLC | | | 383 | | | | 13,915 | |
| | Grafton Group PLC | | | 1,499,770 | | | | 11,874,058 | |
#,* | | GXO Logistics, Inc. | | | 4,386 | | | | 160,252 | |
| | Hays PLC | | | 9,235,636 | | | | 11,644,369 | |
| | HomeServe PLC | | | 313,380 | | | | 4,265,265 | |
| | IMI PLC | | | 286,976 | | | | 4,042,592 | |
* †† | | Industrial & Commercial Bank of China Ltd. | | | 5,000 | | | | 0 | |
| | International Distributions Services PLC | | | 2,105,859 | | | | 4,871,650 | |
* | | James Fisher & Sons PLC | | | 203,822 | | | | 607,474 | |
# | | James Halstead PLC | | | 122,173 | | | | 265,718 | |
* | | JET2 PLC | | | 813,756 | | | | 7,936,226 | |
| | Johnson Service Group PLC | | | 616,502 | | | | 653,642 | |
| | Keller Group PLC | | | 436,991 | | | | 3,144,711 | |
* | | Kier Group PLC | | | 1,662,440 | | | | 1,139,230 | |
W | | Luceco PLC | | | 278,939 | | | | 250,588 | |
| | Mears Group PLC | | | 682,577 | | | | 1,483,434 | |
| | Mitie Group PLC | | | 7,620,122 | | | | 6,256,099 | |
| | Morgan Advanced Materials PLC | | | 1,908,978 | | | | 5,379,107 | |
| | Morgan Sindall Group PLC | | | 256,662 | | | | 4,528,818 | |
* | | National Express Group PLC | | | 3,054,001 | | | | 5,920,211 | |
THE UNITED KINGDOM SMALL COMPANY SERIES
CONTINUED
| | | | | | | | | | |
| | | | | Shares | | | Value» | |
INDUSTRIALS — (Continued) | | | | | | | | |
| | Norcros PLC | | | 155,421 | | | $ | 320,315 | |
| | Pagegroup PLC | | | 1,968,311 | | | | 9,493,890 | |
| | Porvair PLC | | | 18,060 | | | | 111,837 | |
| | QinetiQ Group PLC | | | 3,269,929 | | | | 13,478,205 | |
| | Redde Northgate PLC | | | 1,393,933 | | | | 5,331,142 | |
| | Renew Holdings PLC | | | 72,048 | | | | 507,597 | |
* | | Renewi PLC | | | 600,858 | | | | 3,640,202 | |
| | Ricardo PLC | | | 310,737 | | | | 1,569,647 | |
| | Robert Walters PLC | | | 396,868 | | | | 2,277,961 | |
| | Rotork PLC | | | 4,427,553 | | | | 12,977,500 | |
| | RPS Group PLC | | | 1,020,701 | | | | 2,590,860 | |
| | RWS Holdings PLC | | | 131,987 | | | | 464,039 | |
| | Senior PLC | | | 2,397,255 | | | | 3,576,127 | |
| | Serco Group PLC | | | 5,072,076 | | | | 9,486,190 | |
| | Severfield PLC | | | 1,107,512 | | | | 622,891 | |
* | | SIG PLC | | | 4,224,897 | | | | 1,511,674 | |
| | Smart Metering Systems PLC | | | 541,910 | | | | 4,546,260 | |
| | Speedy Hire PLC | | | 3,288,866 | | | | 1,457,569 | |
| | SThree PLC | | | 872,133 | | | | 3,714,135 | |
| | TClarke PLC | | | 64,836 | | | | 90,489 | |
| | Travis Perkins PLC | | | 1,187,192 | | | | 11,189,269 | |
| | Trifast PLC | | | 524,611 | | | | 379,064 | |
| | Tyman PLC | | | 1,020,064 | | | | 2,244,550 | |
| | Vesuvius PLC | | | 1,540,577 | | | | 5,984,894 | |
| | Volex PLC | | | 465,064 | | | | 1,318,575 | |
| | Volution Group PLC | | | 752,219 | | | | 2,662,652 | |
| | Vp PLC | | | 153,784 | | | | 1,259,224 | |
| | Wilmington PLC | | | 334,384 | | | | 1,113,132 | |
| | Wincanton PLC | | | 700,232 | | | | 2,653,922 | |
| | XP Power Ltd. | | | 102,251 | | | | 2,056,260 | |
| | | | | | | | | | |
TOTAL INDUSTRIALS | | | | 264,939,778 | |
| | | | | | | | | | |
INFORMATION TECHNOLOGY — (8.5%) | | | | | | | | |
* | | accesso Technology Group PLC | | | 14,495 | | | | 103,125 | |
| | Bytes Technology Group PLC | | | 575,106 | | | | 2,368,363 | |
* | | Capita PLC | | | 10,274,296 | | | | 2,858,779 | |
* | | CentralNic Group PLC | | | 22,135 | | | | 33,160 | |
| | Computacenter PLC | | | 501,179 | | | | 10,398,774 | |
| | dotdigital group PLC | | | 438,664 | | | | 381,243 | |
* | | FD Technologies PLC | | | 32,908 | | | | 506,070 | |
| | FDM Group Holdings PLC | | | 476,786 | | | | 3,440,080 | |
| | GB Group PLC | | | 174,978 | | | | 763,830 | |
| | Gooch & Housego PLC | | | 2,781 | | | | 15,380 | |
| | IDOX PLC | | | 140,149 | | | | 98,170 | |
| | iomart Group PLC | | | 279,306 | | | | 432,000 | |
# * | | IQE PLC | | | 2,163,920 | | | | 1,038,585 | |
| | Kainos Group PLC | | | 478,788 | | | | 6,798,170 | |
| | Keywords Studios PLC | | | 1,958 | | | | 54,145 | |
* | | Kin & Carta PLC | | | 280,359 | | | | 692,815 | |
| | Learning Technologies Group PLC | | | 829,270 | | | | 1,021,916 | |
| | Micro Focus International PLC | | | 1,571,570 | | | | 9,370,682 | |
| | NCC Group PLC | | | 1,818,657 | | | | 4,159,096 | |
* W | | Network International Holdings PLC | | | 234,622 | | | | 878,618 | |
| | Oxford Instruments PLC | | | 348,518 | | | | 7,622,631 | |
| | PayPoint PLC | | | 461,831 | | | | 3,067,941 | |
| | Renishaw PLC | | | 117,624 | | | | 4,719,863 | |
# | | RM PLC | | | 358,749 | | | | 108,806 | |
| | Softcat PLC | | | 677,739 | | | | 8,707,891 | |
| | Spectris PLC | | | 462,131 | | | | 16,016,986 | |
THE UNITED KINGDOM SMALL COMPANY SERIES
CONTINUED
| | | | | | | | | | |
| | | | | Shares | | | Value» | |
INFORMATION TECHNOLOGY — (Continued) | | | | | | | | |
| | Spirent Communications PLC | | | 4,065,908 | | | $ | 12,069,222 | |
# | | Strix Group PLC | | | 162,410 | | | | 201,069 | |
| | TT Electronics PLC | | | 1,084,117 | | | | 1,677,168 | |
* | | Xaar PLC | | | 539,952 | | | | 1,056,428 | |
| | | | | | | | | | |
TOTAL INFORMATION TECHNOLOGY | | | | 100,661,006 | |
| | | | | | | | | | |
MATERIALS — (5.1%) | | | | | | | | |
* | | Accsys Technologies PLC | | | 9,505 | | | | 7,489 | |
| | Breedon Group PLC | | | 2,323,004 | | | | 1,393,445 | |
| | Capital Ltd. | | | 59,308 | | | | 55,799 | |
| | Castings PLC | | | 172,368 | | | | 630,187 | |
| | Centamin PLC | | | 8,251,207 | | | | 8,388,129 | |
| | Central Asia Metals PLC | | | 719,628 | | | | 1,762,981 | |
| | Ecora Resources PLC | | | 1,243,076 | | | | 2,184,177 | |
* | | Elementis PLC | | | 3,385,183 | | | | 3,578,676 | |
| | Essentra PLC | | | 1,720,465 | | | | 4,429,271 | |
| | Ferrexpo PLC | | | 232,253 | | | | 272,403 | |
W | | Forterra PLC | | | 1,574,753 | | | | 3,939,978 | |
| | Gem Diamonds Ltd. | | | 413,552 | | | | 141,567 | |
| | Hill & Smith Holdings PLC | | | 549,355 | | | | 6,209,866 | |
| | Hochschild Mining PLC | | | 1,822,730 | | | | 1,113,715 | |
W | | Ibstock PLC | | | 2,968,140 | | | | 5,291,670 | �� |
| | Marshalls PLC | | | 1,374,930 | | | | 3,978,368 | |
| | Pan African Resources PLC | | | 5,291,713 | | | | 1,024,684 | |
* | | Petra Diamonds Ltd. | | | 17,532 | | | | 22,964 | |
| | RHI Magnesita NV | | | 132,739 | | | | 2,821,488 | |
# * | | SolGold PLC | | | 1,288,015 | | | | 235,685 | |
| | Synthomer PLC | | | 2,154,069 | | | | 2,786,722 | |
| | Victrex PLC | | | 545,312 | | | | 10,356,993 | |
| | Zotefoams PLC | | | 103,100 | | | | 349,078 | |
| | | | | | | | | | |
TOTAL MATERIALS | | | | 60,975,335 | |
| | | | | | | | | | |
REAL ESTATE — (3.0%) | | | | | | | | |
| | CLS Holdings PLC | | | 4,103 | | | | 6,734 | |
| | Foxtons Group PLC | | | 1,351,763 | | | | 465,017 | |
| | Grainger PLC | | | 4,237,552 | | | | 11,018,013 | |
| | Harworth Group PLC | | | 30,381 | | | | 36,087 | |
| | Helical PLC | | | 846,617 | | | | 3,202,729 | |
* | | IWG PLC | | | 4,139,249 | | | | 6,256,661 | |
| | LSL Property Services PLC | | | 445,897 | | | | 1,172,340 | |
| | Phoenix Spree Deutschland Ltd. | | | 15,813 | | | | 47,899 | |
| | Savills PLC | | | 965,499 | | | | 9,122,034 | |
| | Sirius Real Estate Ltd. | | | 3,658,372 | | | | 2,959,759 | |
| | Watkin Jones PLC | | | 961,788 | | | | 1,030,026 | |
| | | | | | | | | | |
TOTAL REAL ESTATE | | | | 35,317,299 | |
| | | | | | | | | | |
UTILITIES — (4.2%) | | | | | | | | |
| | Centrica PLC | | | 12,351,821 | | | | 10,853,682 | |
W | | ContourGlobal PLC | | | 186,518 | | | | 539,940 | |
| | Drax Group PLC | | | 2,494,304 | | | | 14,895,027 | |
| | Pennon Group PLC | | | 1,360,703 | | | | 13,075,947 | |
| | Telecom Plus PLC | | | 427,882 | | | | 10,401,875 | |
| | | | | | | | | | |
TOTAL UTILITIES | | | | 49,766,471 | |
| | | | | | | | | | |
TOTAL COMMON STOCKS
Cost ($1,400,292,665) | | | | 1,160,537,010 | |
| | | | | | | | | | |
THE UNITED KINGDOM SMALL COMPANY SERIES
CONTINUED
| | | | | | | | | | |
| | | | | Shares | | | Value† | |
SECURITIES LENDING COLLATERAL — (2.5%) | | | | | | | | |
@ § | | The DFA Short Term Investment Fund | | | 2,548,908 | | | $ | 29,467,920 | |
| | | | | | | | | | |
TOTAL INVESTMENTS — (100.0%)
(Cost $1,429,768,069) | | | | | | $ | 1,190,004,930 | |
| | | | | | | | | | |
| ADR | American Depositary Receipt |
| » | Securities that have been fair value factored. See Note B to Financial Statements. |
| * | Non-Income Producing Securities. |
| # | Total or Partial Securities on Loan. |
| W | Rule 144A, Section 4(2), or other security that is restricted as to resale to institutional investors. This security has been deemed liquid based upon the Fund’s Liquidity Guidelines. The liquidity determination is unaudited. |
| †† | Security valued using significant unobservable inputs (Level 3). |
| † | See Note B to Financial Statements. |
| @ | Security purchased with cash collateral received from Securities on Loan. |
Summary of the Series’ investments as of October 31, 2022, based on their valuation inputs, is as follows (see Security Valuation Note):
| | | | | | | | | | | | | | | | |
| | | Investments in Securities (Market Value) | |
| | | Level 1 | | | Level 2 | | | Level 3 | | | Total | |
Common Stocks | | | | | | | | | | | | | | | | |
Communication Services | | $ | 23,016 | | | $ | 43,176,934 | | | | — | | | $ | 43,199,950 | |
Consumer Discretionary | | | — | | | | 194,388,958 | | | $ | 109,146 | | | | 194,498,104 | |
Consumer Staples | | | — | | | | 83,434,553 | | | | — | | | | 83,434,553 | |
Energy | | | — | | | | 50,051,723 | | | | — | | | | 50,051,723 | |
Financials | | | — | | | | 219,518,781 | | | | 520 | | | | 219,519,301 | |
Health Care | | | — | | | | 58,167,401 | | | | 6,089 | | | | 58,173,490 | |
Industrials | | | 160,252 | | | | 264,779,526 | | | | — | | | | 264,939,778 | |
Information Technology | | | — | | | | 100,661,006 | | | | — | | | | 100,661,006 | |
Materials | | | — | | | | 60,975,335 | | | | — | | | | 60,975,335 | |
Real Estate | | | — | | | | 35,317,299 | | | | — | | | | 35,317,299 | |
Utilities | | | — | | | | 49,766,471 | | | | — | | | | 49,766,471 | |
Securities Lending Collateral | | | — | | | | 29,467,920 | | | | — | | | | 29,467,920 | |
| | | | | | | | | | | | | | | | |
TOTAL | | $ | 183,268 | | | $ | 1,189,705,907 | | | $ | 115,755 | ^ | | $ | 1,190,004,930 | |
| | | | | | | | | | | | | | | | |
| ^ | A reconciliation of Level 3 investments is presented when the Fund had a significant amount of Level 3 investments at the beginning and/or end of the reporting period in relation to net assets. |
See accompanying Notes to Financial Statements.
THE CONTINENTAL SMALL COMPANY SERIES
SCHEDULE OF INVESTMENTS
October 31, 2022
| | | | | | | | | | |
| | | | | Shares | | | Value» | |
COMMON STOCKS — (93.7%) | | | | | | | | |
AUSTRIA — (3.1%) | | | | | | | | |
| | Agrana Beteiligungs AG | | | 83,141 | | | $ | 1,125,094 | |
| | ANDRITZ AG | | | 444,373 | | | | 20,652,912 | |
# | | AT&S Austria Technologie & Systemtechnik AG | | | 196,167 | | | | 6,058,605 | |
W | | BAWAG Group AG | | | 344,403 | | | | 16,626,330 | |
| | CA Immobilien Anlagen AG | | | 88,590 | | | | 2,798,056 | |
# * | | DO & Co. AG | | | 46,272 | | | | 3,636,929 | |
| | EVN AG | | | 246,314 | | | | 4,097,758 | |
# * | | FACC AG | | | 141,355 | | | | 907,268 | |
| | Flughafen Wien AG | | | 12,084 | | | | 376,173 | |
* | | Immofinanz AG | | | 681,828 | | | | 0 | |
* | | Josef Manner & Comp AG | | | 870 | | | | 88,813 | |
# * | | Kapsch TrafficCom AG | | | 29,728 | | | | 339,889 | |
# | | Lenzing AG | | | 86,455 | | | | 4,136,358 | |
# | | Mayr Melnhof Karton AG | | | 56,930 | | | | 8,101,074 | |
| | Oberbank AG | | | 23,479 | | | | 2,378,393 | |
# | | Oesterreichische Post AG | | | 120,333 | | | | 3,423,854 | |
| | Palfinger AG | | | 105,663 | | | | 2,441,553 | |
# | | POLYTEC Holding AG | | | 109,361 | | | | 507,676 | |
| | Porr AG | | | 100,602 | | | | 1,037,907 | |
| | Raiffeisen Bank International AG | | | 196,772 | | | | 2,736,551 | |
# | | Rosenbauer International AG | | | 21,100 | | | | 725,140 | |
| | Schoeller-Bleckmann Oilfield Equipment AG | | | 73,217 | | | | 4,027,635 | |
# | | Semperit AG Holding | | | 71,506 | | | | 1,413,874 | |
| | Strabag SE | | | 106,594 | | | | 4,092,721 | |
| | Telekom Austria AG | | | 1,164,981 | | | | 6,771,953 | |
| | UBM Development AG | | | 21,002 | | | | 579,473 | |
| | UNIQA Insurance Group AG | | | 993,598 | | | | 6,439,352 | |
| | Vienna Insurance Group AG Wiener Versicherung Gruppe | | | 299,448 | | | | 6,697,412 | |
| | voestalpine AG | | | 591,159 | | | | 12,834,228 | |
| | Wienerberger AG | | | 681,129 | | | | 15,569,801 | |
| | Zumtobel Group AG | | | 155,917 | | | | 941,788 | |
| | | | | | | | | | |
TOTAL AUSTRIA | | | | 141,564,570 | |
| | | | | | | | | | |
BELGIUM — (4.4%) | | | | | | | | |
| | Ackermans & van Haaren NV | | | 172,739 | | | | 24,066,242 | |
* | | AGFA-Gevaert NV | | | 1,252,462 | | | | 3,786,601 | |
| | Atenor | | | 22,537 | | | | 933,504 | |
| | Banque Nationale de Belgique | | | 54 | | | | 44,777 | |
| | Barco NV | | | 470,132 | | | | 10,150,273 | |
| | Bekaert SA | | | 256,170 | | | | 7,138,803 | |
#* W | | Biocartis Group NV | | | 227,423 | | | | 273,942 | |
# | | bpost SA | | | 371,051 | | | | 1,834,137 | |
# * | | Cie d’Entreprises CFE | | | 49,898 | | | | 529,761 | |
| | Deceuninck NV | | | 480,813 | | | | 978,639 | |
* | | Deme Group NV | | | 49,898 | | | | 5,559,142 | |
| | D’ieteren Group | | | 122,666 | | | | 20,415,062 | |
# | | Econocom Group SA | | | 727,792 | | | | 1,977,981 | |
| | Elia Group SA | | | 80,342 | | | | 10,157,822 | |
| | Etablissements Franz Colruyt NV | | | 132,925 | | | | 3,204,039 | |
* | | Euronav NV | | | 1,350,857 | | | | 23,568,151 | |
| | EVS Broadcast Equipment SA | | | 69,287 | | | | 1,416,084 | |
| | Exmar NV | | | 148,598 | | | | 1,397,991 | |
| | Fagron | | | 316,324 | | | | 3,937,951 | |
* | | Galapagos NV | | | 207,089 | | | | 9,445,349 | |
| | Gimv NV | | | 126,391 | | | | 5,396,107 | |
* | | Greenyard NV | | | 2,890 | | | | 19,128 | |
# | | Immobel SA | | | 23,226 | | | | 950,928 | |
THE CONTINENTAL SMALL COMPANY SERIES
CONTINUED
| | | | | | | | | | |
| | | | | Shares | | | Value» | |
BELGIUM — (Continued) | | | | | | | | |
| | Ion Beam Applications | | | 136,652 | | | $ | 1,908,543 | |
| | Jensen-Group NV | | | 20,961 | | | | 584,538 | |
* | | Kinepolis Group NV | | | 94,932 | | | | 3,578,632 | |
# | | Lotus Bakeries NV | | | 2,011 | | | | 11,184,721 | |
# * | | MDxHealth SA | | | 69,016 | | | | 52,482 | |
# | | Melexis NV | | | 122,609 | | | | 8,432,581 | |
# * | | Ontex Group NV | | | 562,200 | | | | 3,315,844 | |
| | Picanol | | | 10,868 | | | | 751,386 | |
| | Proximus SADP | | | 807,234 | | | | 8,462,819 | |
| | Recticel SA | | | 306,705 | | | | 4,238,379 | |
| | Roularta Media Group NV | | | 19,318 | | | | 317,881 | |
| | Shurgard Self Storage SA | | | 57,755 | | | | 2,514,706 | |
| | Sipef NV | | | 38,999 | | | | 2,199,722 | |
| | Telenet Group Holding NV | | | 243,024 | | | | 3,705,202 | |
| | TER Beke SA | | | 3,765 | | | | 331,211 | |
* | | Tessenderlo Group SA | | | 205,166 | | | | 6,218,568 | |
| | Van de Velde NV | | | 47,376 | | | | 1,494,830 | |
| | VGP NV | | | 24,918 | | | | 1,889,391 | |
| | Viohalco SA | | | 498,361 | | | | 1,850,244 | |
| | | | | | | | | | |
TOTAL BELGIUM | | | | 200,214,094 | |
| | | | | | | | | | |
DENMARK — (6.2%) | | | | | | | | |
* | | ALK-Abello AS | | | 918,859 | | | | 15,192,293 | |
| | Alm Brand AS | | | 5,914,829 | | | | 8,083,326 | |
# * | | Bang & Olufsen AS | | | 635,976 | | | | 739,586 | |
| | BankNordik P/F | | | 10,800 | | | | 172,021 | |
* | | Bavarian Nordic AS | | | 457,765 | | | | 14,566,205 | |
# * | | Brodrene Hartmann AS | | | 16,148 | | | | 492,694 | |
# | | cBrain AS | | | 18,289 | | | | 400,109 | |
# | | Chemometec AS | | | 81,365 | | | | 7,669,511 | |
# | | Columbus AS | | | 490,087 | | | | 448,570 | |
| | D/S Norden AS | | | 203,501 | | | | 10,532,200 | |
| | Dfds AS | | | 260,309 | | | | 7,899,593 | |
# | | Djurslands Bank AS | | | 6,232 | | | | 253,006 | |
| | FLSmidth & Co. AS | | | 319,467 | | | | 7,383,934 | |
| | Fluegger Group AS | | | 4,198 | | | | 250,940 | |
# | | GN Store Nord AS | | | 165,746 | | | | 3,522,321 | |
| | GronlandsBANKEN AS | | | 1,125 | | | | 84,345 | |
| | H Lundbeck AS | | | 1,391,862 | | | | 5,207,911 | |
* | | H Lundbeck AS, Class A | | | 14,791 | | | | 50,268 | |
* | | H+H International AS, Class B | | | 131,547 | | | | 2,028,921 | |
* | | Harboes Bryggeri AS, Class B | | | 5,094 | | | | 46,807 | |
# * | | ISS AS | | | 927,711 | | | | 17,037,438 | |
| | Jeudan AS | | | 40,046 | | | | 1,418,588 | |
* | | Jyske Bank AS | | | 445,581 | | | | 24,047,629 | |
# | | Lan & Spar Bank | | | 4,895 | | | | 419,099 | |
| | Matas AS | | | 287,314 | | | | 2,749,889 | |
#* W | | Netcompany Group AS | | | 70,537 | | | | 2,418,327 | |
* | | Nilfisk Holding AS | | | 154,895 | | | | 2,881,653 | |
* | | NKT AS | | | 285,928 | | | | 14,269,861 | |
#* W | | NNIT AS | | | 71,567 | | | | 518,877 | |
| | North Media AS | | | 5,372 | | | | 46,002 | |
* | | NTG Nordic Transport Group AS, Class A | | | 13,802 | | | | 447,686 | |
# * | | Parken Sport & Entertainment AS | | | 13,669 | | | | 133,769 | |
| | Per Aarsleff Holding AS | | | 134,378 | | | | 3,753,160 | |
| | Ringkjoebing Landbobank AS | | | 197,936 | | | | 21,527,994 | |
# | | Rockwool AS, Class B | | | 19,172 | | | | 3,818,180 | |
| | ROCKWOOL AS, Class A | | | 421 | | | | 83,024 | |
| | Royal Unibrew AS | | | 312,072 | | | | 17,826,861 | |
THE CONTINENTAL SMALL COMPANY SERIES
CONTINUED
| | | | | | | | | | |
| | | | | Shares | | | Value» | |
DENMARK — (Continued) | | | | | | | | |
# * | | RTX AS | | | 54,444 | | | $ | 917,742 | |
W | | Scandinavian Tobacco Group AS, Class A | | | 455,260 | | | | 7,625,907 | |
| | Schouw & Co. AS | | | 95,182 | | | | 6,038,837 | |
| | SimCorp AS | | | 257,158 | | | | 15,355,075 | |
| | Solar AS, Class B | | | 42,715 | | | | 3,221,288 | |
| | SP Group AS | | | 4,788 | | | | 161,626 | |
| | Spar Nord Bank AS | | | 609,820 | | | | 7,383,542 | |
| | Sparekassen Sjaelland-Fyn AS | | | 1,651 | | | | 37,903 | |
| | Sydbank AS | | | 469,010 | | | | 14,281,518 | |
| | TCM Group AS | | | 2,578 | | | | 24,389 | |
# * | | Tivoli AS | | | 9,878 | | | | 1,022,684 | |
| | Topdanmark AS | | | 367,737 | | | | 16,972,205 | |
| | TORM PLC, Class A | | | 195,257 | | | | 5,224,515 | |
| | UIE PLC | | | 103,360 | | | | 2,538,584 | |
# * | | Zealand Pharma AS | | | 217,874 | | | | 5,611,398 | |
| | | | | | | | | | |
TOTAL DENMARK | | | | 284,839,811 | |
| | | | | | | | | | |
FINLAND — (5.3%) | | | | | | | | |
| | Aktia Bank Oyj | | | 344,733 | | | | 3,427,298 | |
# | | Alandsbanken Abp, Class B | | | 23,036 | | | | 728,344 | |
| | Alma Media Oyj | | | 133,889 | | | | 1,109,278 | |
| | Apetit Oyj | | | 21,105 | | | | 212,633 | |
| | Aspo Oyj | | | 106,324 | | | | 840,659 | |
# | | Atria Oyj | | | 98,413 | | | | 918,123 | |
# | | Bittium Oyj | | | 204,447 | | | | 775,741 | |
| | Cargotec Oyj, Class B | | | 269,125 | | | | 10,121,692 | |
| | Caverion Oyj | | | 645,461 | | | | 2,868,462 | |
# | | Citycon Oyj | | | 452,512 | | | | 2,819,270 | |
| | Digia Oyj | | | 85,054 | | | | 500,054 | |
# W | | Enento Group Oyj | | | 4,290 | | | | 89,083 | |
# * | | Finnair Oyj | | | 4,568,940 | | | | 1,934,619 | |
| | Fiskars Oyj Abp | | | 215,530 | | | | 3,104,401 | |
* | | F-Secure Oyj | | | 730,842 | | | | 2,066,827 | |
| | Glaston OYJ ABP | | | 9,217 | | | | 7,883 | |
# | | Harvia Oyj | | | 70,873 | | | | 1,005,445 | |
# | | HKScan Oyj, Class A | | | 234,984 | | | | 220,865 | |
| | Huhtamaki Oyj | | | 643,085 | | | | 23,112,067 | |
| | Ilkka Oyj | | | 58,887 | | | | 210,257 | |
# | | Kamux Corp. | | | 59,097 | | | | 285,821 | |
| | Kemira Oyj | | | 751,311 | | | | 9,920,593 | |
| | Kojamo Oyj | | | 622,080 | | | | 8,096,129 | |
| | Konecranes Oyj | | | 414,845 | | | | 10,437,680 | |
# | | Lassila & Tikanoja Oyj | | | 219,184 | | | | 2,152,778 | |
| | Marimekko Oyj | | | 35,459 | | | | 320,170 | |
| | Metsa Board Oyj, Class B | | | 1,216,871 | | | | 9,153,818 | |
| | Metso Outotec Oyj | | | 182,863 | | | | 1,387,764 | |
| | Musti Group Oyj | | | 68,620 | | | | 1,289,166 | |
| | Nokian Renkaat Oyj | | | 796,563 | | | | 8,982,697 | |
| | Olvi Oyj, Class A | | | 99,753 | | | | 3,081,826 | |
| | Oma Saastopankki Oyj | | | 8,486 | | | | 166,833 | |
| | Oriola Oyj, Class A | | | 6,054 | | | | 11,218 | |
| | Oriola Oyj, Class B | | | 880,807 | | | | 1,597,787 | |
| | Orion Oyj, Class B | | | 676,382 | | | | 31,125,885 | |
# | | Outokumpu Oyj | | | 2,443,351 | | | | 9,806,064 | |
| | Pihlajalinna Oyj | | | 80,774 | | | | 745,778 | |
# | | Ponsse Oyj | | | 71,199 | | | | 1,769,032 | |
# * | | QT Group Oyj | | | 56,665 | | | | 2,420,179 | |
| | Raisio Oyj, Class V | | | 985,362 | | | | 1,907,264 | |
| | Rapala VMC Oyj | | | 116,693 | | | | 494,262 | |
THE CONTINENTAL SMALL COMPANY SERIES
CONTINUED
| | | | | | | | | | |
| | | | | Shares | | | Value» | |
FINLAND — (Continued) | | | | | | | | |
| | Revenio Group Oyj | | | 141,280 | | | $ | 5,254,758 | |
# W | | Rovio Entertainment Oyj | | | 42,808 | | | | 244,000 | |
| | Sanoma Oyj | | | 722,281 | | | | 8,455,336 | |
| | Taaleri Oyj | | | 8,120 | | | | 76,871 | |
# | | Talenom Oyj | | | 7,120 | | | | 63,392 | |
| | Teleste Oyj | | | 52,966 | | | | 187,298 | |
W | | Terveystalo Oyj | | | 139,213 | | | | 861,014 | |
| | TietoEVRY Oyj | | | 552,526 | | | | 13,171,788 | |
| | Tokmanni Group Corp. | | | 348,970 | | | | 4,219,442 | |
| | Uponor Oyj | | | 391,564 | | | | 5,200,923 | |
| | Vaisala Oyj, Class A | | | 125,217 | | | | 4,874,144 | |
| | Valmet Oyj | | | 1,002,259 | | | | 22,794,608 | |
# | | Verkkokauppa.com Oyj | | | 13,945 | | | | 43,253 | |
# * | | Viking Line Abp | | | 11,073 | | | | 129,680 | |
| | Wartsila OYJ Abp | | | 1,509,439 | | | | 10,290,257 | |
* | | WithSecure Oyj | | | 730,842 | | | | 1,182,590 | |
# | | YIT Oyj | | | 1,185,347 | | | | 2,972,466 | |
| | | | | | | | | | |
TOTAL FINLAND | | | | 241,247,565 | |
| | | | | | | | | | |
FRANCE — (10.4%) | | | | | | | | |
| | ABC arbitrage | | | 185,857 | | | | 1,200,864 | |
* | | Air France-KLM | | | 1,611,431 | | | | 2,118,888 | |
| | AKWEL | | | 68,408 | | | | 993,993 | |
# W | | ALD SA | | | 128,220 | | | | 1,367,989 | |
| | Altamir | | | 136,094 | | | | 3,213,074 | |
| | Alten SA | | | 124,188 | | | | 14,508,910 | |
| | Assystem SA | | | 61,561 | | | | 2,257,769 | |
# * | | Atos SE | | | 337,963 | | | | 3,297,948 | |
| | Aubay | | | 52,444 | | | | 2,295,330 | |
# | | Axway Software SA | | | 38,973 | | | | 605,146 | |
# | | Bastide le Confort Medical | | | 18,680 | | | | 531,525 | |
| | Beneteau SA | | | 251,906 | | | | 2,791,691 | |
# | | Bigben Interactive | | | 101,428 | | | | 761,730 | |
| | Boiron SA | | | 38,341 | | | | 1,750,362 | |
# | | Bonduelle SCA | | | 99,470 | | | | 1,155,839 | |
* †† | | Bourbon Corp. | | | 28,851 | | | | 0 | |
| | Burelle SA | | | 833 | | | | 350,623 | |
# * | | Casino Guichard Perrachon SA | | | 265,777 | | | | 2,556,352 | |
# | | Catana Group | | | 47,853 | | | | 237,293 | |
# | | Catering International Services | | | 12,144 | | | | 112,942 | |
# | | Cegedim SA | | | 41,834 | | | | 648,484 | |
* | | CGG SA | | | 4,492,509 | | | | 3,816,286 | |
# | | Chargeurs SA | | | 144,516 | | | | 1,910,256 | |
* | | Cie des Alpes | | | 137,830 | | | | 1,698,870 | |
| | Cie Plastic Omnium SA | | | 411,439 | | | | 5,765,073 | |
# * | | Claranova SE | | | 66,462 | | | | 154,850 | |
* | | Coface SA | | | 765,331 | | | | 8,519,779 | |
| | Derichebourg SA | | | 739,624 | | | | 3,229,701 | |
# * | | Ekinops SAS | | | 7,393 | | | | 50,913 | |
| | Electricite de Strasbourg SA | | | 21,112 | | | | 1,960,362 | |
#* W | | Elior Group SA | | | 767,831 | | | | 1,704,412 | |
| | Elis SA | | | 1,251,812 | | | | 14,335,632 | |
| | Equasens | | | 8,599 | | | | 603,849 | |
| | Eramet SA | | | 79,089 | | | | 5,181,243 | |
# * | | Esso SA Francaise | | | 4,117 | | | | 220,731 | |
| | Etablissements Maurel et Prom SA | | | 385,475 | | | | 1,732,633 | |
| | Eurazeo SE | | | 106,784 | | | | 6,093,674 | |
# | | Eutelsat Communications SA | | | 1,235,151 | | | | 12,398,627 | |
| | Exel Industries, Class A | | | 10,459 | | | | 411,392 | |
THE CONTINENTAL SMALL COMPANY SERIES
CONTINUED
| | | | | | | | | | |
| | | | | Shares | | | Value» | |
FRANCE — (Continued) | | | | | | | | |
* | | Faurecia SE | | | 784,980 | | | $ | 11,719,007 | |
# | | Fnac Darty SA | | | 96,249 | | | | 2,973,451 | |
* | | Gaumont SA | | | 10,715 | | | | 1,062,811 | |
| | Gaztransport Et Technigaz SA | | | 161,171 | | | | 18,750,394 | |
# | | GEA | | | 2,433 | | | | 188,823 | |
* | | Genfit | | | 11,113 | | | | 44,240 | |
* | | GL Events | | | 58,364 | | | | 907,658 | |
| | Groupe Crit | | | 22,187 | | | | 1,290,838 | |
* | | Groupe Gorge SA | | | 4,320 | | | | 84,714 | |
| | Groupe SFPI | | | 21,754 | | | | 47,097 | |
| | Guerbet | | | 37,446 | | | | 642,002 | |
# | | Guillemot Corp. | | | 2,527 | | | | 29,349 | |
# | | Haulotte Group SA | | | 73,020 | | | | 198,786 | |
| | HEXAOM | | | 15,908 | | | | 303,377 | |
* | | ID Logistics Group | | | 14,970 | | | | 4,021,878 | |
| | Imerys SA | | | 231,218 | | | | 9,464,145 | |
| | Infotel SA | | | 637 | | | | 31,853 | |
# * | | Innate Pharma SA | | | 15,558 | | | | 32,524 | |
| | Interparfums SA | | | 953 | | | | 45,943 | |
| | IPSOS | | | 296,328 | | | | 14,344,406 | |
| | Jacquet Metals SACA | | | 93,637 | | | | 1,456,368 | |
* | | JCDecaux SE | | | 271,301 | | | | 3,425,266 | |
# | | Kaufman & Broad SA | | | 123,411 | | | | 2,998,720 | |
| | Korian SA | | | 474,465 | | | | 4,483,143 | |
| | Laurent-Perrier | �� | | 13,997 | | | | 1,364,025 | |
| | Lectra | | | 150,063 | | | | 4,801,682 | |
| | Linedata Services | | | 16,071 | | | | 746,447 | |
| | LISI | | | 124,665 | | | | 2,461,930 | |
# | | LNA Sante SA | | | 33,206 | | | | 968,015 | |
# W | | Maisons du Monde SA | | | 178,143 | | | | 1,746,218 | |
| | Manitou BF SA | | | 69,984 | | | | 1,428,050 | |
| | Manutan International | | | 15,102 | | | | 1,514,373 | |
| | Mersen SA | | | 128,079 | | | | 4,143,989 | |
| | Metropole Television SA | | | 253,936 | | | | 2,626,339 | |
# * | | Nacon SA | | | 44,739 | | | | 112,492 | |
W | | Neoen SA | | | 37,275 | | | | 1,300,157 | |
| | Nexans SA | | | 198,522 | | | | 18,537,701 | |
| | Nexity SA | | | 259,379 | | | | 5,195,429 | |
# * | | Nicox | | | 145,865 | | | | 255,158 | |
| | NRJ Group | | | 87,189 | | | | 561,642 | |
# | | Oeneo SA | | | 128,172 | | | | 1,773,460 | |
* | | OL Groupe SA | | | 10,735 | | | | 29,307 | |
# * | | Onxeo SA | | | 48,958 | | | | 8,189 | |
# * | | Orpea SA | | | 45,620 | | | | 369,974 | |
# | | Plastiques Du Val De Loire | | | 14,341 | | | | 48,217 | |
* | | Prodways Group SA | | | 6,480 | | | | 23,739 | |
| | Quadient SA | | | 220,547 | | | | 3,102,935 | |
# * | | Rallye SA | | | 6,989 | | | | 17,923 | |
# * †† | | Recylex SA | | | 102,008 | | | | 34,930 | |
| | Rexel SA | | | 1,687,054 | | | | 30,105,974 | |
| | Robertet SA | | | 1,246 | | | | 1,038,210 | |
| | Rothschild & Co. | | | 141,560 | | | | 5,020,250 | |
| | Rubis SCA | | | 601,544 | | | | 13,660,662 | |
# | | Samse SA | | | 7,930 | | | | 1,335,689 | |
| | Savencia SA | | | 35,032 | | | | 1,941,962 | |
| | SCOR SE | | | 685,317 | | | | 10,305,884 | |
| | SEB SA | | | 16,229 | | | | 1,056,533 | |
| | Seche Environnement SA | | | 21,328 | | | | 1,810,725 | |
| | SES SA | | | 1,765,998 | | | | 12,526,130 | |
THE CONTINENTAL SMALL COMPANY SERIES
CONTINUED
| | | | | | | | | | |
| | | | | Shares | | | Value» | |
FRANCE — (Continued) | | | | | | | | |
* W | | SMCP SA | | | 71,339 | | | $ | 448,432 | |
| | Societe BIC SA | | | 178,902 | | | | 10,270,068 | |
| | Societe des Bains de Mer et du Cercle des Etrangers a Monaco | | | 37,677 | | | | 3,147,406 | |
| | Societe pour I’Informatique Industrielle | | | 56,188 | | | | 2,602,693 | |
* | | SOITEC | | | 136,660 | | | | 17,498,496 | |
# * | | Solocal Group | | | 681,417 | | | | 457,624 | |
| | Somfy SA | | | 88,329 | | | | 9,409,088 | |
| | Sopra Steria Group SACA | | | 120,286 | | | | 15,921,347 | |
| | SPIE SA | | | 887,677 | | | | 20,765,906 | |
# * W | | SRP Groupe SA | | | 56,827 | | | | 91,552 | |
| | Stef SA | | | 25,714 | | | | 2,048,595 | |
| | Sword Group | | | 37,202 | | | | 1,401,826 | |
| | Synergie SE | | | 67,143 | | | | 1,814,348 | |
* | | Technicolor Creative Studios SA | | | 81,942 | | | | 127,704 | |
| | Technip Energies NV | | | 366,826 | | | | 4,735,268 | |
# | | Television Francaise 1 | | | 412,012 | | | | 2,615,479 | |
# | | TFF Group | | | 9,347 | | | | 336,188 | |
| | Thermador Groupe | | | 37,127 | | | | 3,088,545 | |
# | | Tikehau Capital SCA | | | 31,518 | | | | 765,737 | |
| | Totalenergies EP Gabon | | | 4,026 | | | | 652,358 | |
| | Trigano SA | | | 62,717 | | | | 6,419,541 | |
* | | Ubisoft Entertainment SA | | | 271,667 | | | | 7,453,429 | |
# | | Union Financiere de France BQE SA | | | 18,515 | | | | 239,661 | |
| | Valeo | | | 736,515 | | | | 12,132,592 | |
* | | Vallourec SA | | | 577,711 | | | | 6,146,670 | |
* | | Vantiva SA | | | 81,942 | | | | 60,982 | |
W | | Verallia SA | | | 187,176 | | | | 5,303,612 | |
| | Vetoquinol SA | | | 15,514 | | | | 1,288,950 | |
# | | Vicat SA | | | 115,287 | | | | 2,642,752 | |
| | VIEL & Cie SA | | | 156,945 | | | | 899,381 | |
| | Vilmorin & Cie SA | | | 35,845 | | | | 1,588,335 | |
| | Virbac SA | | | 28,641 | | | | 7,018,432 | |
* | | Voltalia SA | | | 11,960 | | | | 227,774 | |
| | Vranken-Pommery Monopole SA | | | 16,787 | | | | 263,847 | |
| | Wavestone | | | 9,891 | | | | 426,173 | |
* W | | X-Fab Silicon Foundries SE | | | 168,469 | | | | 872,162 | |
* | | Xilam Animation SA | | | 415 | | | | 12,519 | |
| | | | | | | | | | |
TOTAL FRANCE | | | | 474,261,640 | |
| | | | | | | | | | |
GERMANY — (13.4%) | | | | | | | | |
| | 1&1 AG | | | 253,564 | | | | 3,340,401 | |
| | 7C Solarparken AG | | | 139,107 | | | | 604,770 | |
* | | Aareal Bank AG | | | 523,741 | | | | 16,561,936 | |
| | Adesso SE | | | 7,240 | | | | 716,808 | |
| | AIXTRON SE | | | 405,671 | | | | 9,968,807 | |
| | All for One Group SE | | | 4,503 | | | | 176,726 | |
| | Allgeier SE | | | 58,776 | | | | 1,700,463 | |
| | Amadeus Fire AG | | | 10,622 | | | | 1,072,046 | |
# | | Aroundtown SA | | | 673,419 | | | | 1,334,881 | |
| | Atoss Software AG | | | 16,166 | | | | 1,968,270 | |
| | Aurubis AG | | | 287,683 | | | | 18,152,871 | |
# * W | | Auto1 Group SE | | | 15,108 | | | | 101,609 | |
| | Basler AG | | | 108,156 | | | | 2,935,858 | |
# * | | Bauer AG | | | 99,166 | | | | 646,855 | |
| | BayWa AG | | | 105,190 | | | | 4,746,562 | |
| | BayWa AG | | | 124 | | | | 7,275 | |
# | | Bechtle AG | | | 115,608 | | | | 3,993,857 | |
W | | Befesa SA | | | 88,473 | | | | 3,072,874 | |
| | Bertrandt AG | | | 38,449 | | | | 1,145,057 | |
THE CONTINENTAL SMALL COMPANY SERIES
CONTINUED
| | | | | | | | | | |
| | | | | Shares | | | Value» | |
GERMANY — (Continued) | | | | | | | | |
* | | bet-at-home.com AG | | | 6,853 | | | $ | 30,091 | |
* | | Bijou Brigitte AG | | | 23,422 | | | | 805,023 | |
# | | Bilfinger SE | | | 207,655 | | | | 5,776,727 | |
# * | | Borussia Dortmund GmbH & Co. KGaA | | | 665,682 | | | | 2,460,956 | |
| | CANCOM SE | | | 253,430 | | | | 6,262,736 | |
# | | CECONOMY AG | | | 1,120,535 | | | | 1,823,567 | |
| | CENIT AG | | | 57,781 | | | | 754,172 | |
| | Cewe Stiftung & Co. KGAA | | | 45,952 | | | | 3,599,497 | |
| | CompuGroup Medical SE & Co. KgaA | | | 192,725 | | | | 6,088,962 | |
| | CropEnergies AG | | | 187,944 | | | | 2,995,251 | |
* | | CTS Eventim AG & Co. KGaA | | | 124,540 | | | | 5,945,103 | |
| | Data Modul AG Produktion Und Vertrieb Von Elektronischen Systemen | | | 11,455 | | | | 656,367 | |
| | Dermapharm Holding SE | | | 78,722 | | | | 2,993,040 | |
| | Deutsche Beteiligungs AG | | | 115,972 | | | | 2,938,902 | |
W | | Deutsche Pfandbriefbank AG | | | 1,147,894 | | | | 8,549,660 | |
| | Deutz AG | | | 858,725 | | | | 3,242,034 | |
| | DIC Asset AG | | | 383,365 | | | | 2,642,774 | |
| | DMG Mori AG | | | 4,196 | | | | 170,839 | |
# | | Dr Hoenle AG | | | 35,520 | | | | 547,938 | |
| | Draegerwerk AG & Co. KGaA | | | 20,476 | | | | 739,253 | |
# | | Duerr AG | | | 393,605 | | | | 10,404,052 | |
W | | DWS Group GmbH & Co. KGaA | | | 4,604 | | | | 124,475 | |
| | Eckert & Ziegler Strahlen- und Medizintechnik AG | | | 102,697 | | | | 4,059,993 | |
| | EDAG Engineering Group AG | | | 51,353 | | | | 517,974 | |
| | Elmos Semiconductor SE | | | 7,537 | | | | 344,531 | |
| | ElringKlinger AG | | | 192,671 | | | | 1,379,091 | |
| | Encavis AG | | | 499,231 | | | | 9,294,543 | |
| | Energiekontor AG | | | 14,403 | | | | 1,278,950 | |
* | | Evotec SE | | | 7,644 | | | | 145,794 | |
| | Fabasoft AG | | | 509 | | | | 9,039 | |
# | | Fielmann AG | | | 154,321 | | | | 4,916,129 | |
# * | | flatexDEGIRO AG | | | 107,566 | | | | 940,134 | |
* | | Fraport AG Frankfurt Airport Services Worldwide | | | 208,969 | | | | 8,050,768 | |
| | Freenet AG | | | 962,168 | | | | 18,912,546 | |
| | Fuchs Petrolub SE | | | 117,437 | | | | 2,831,459 | |
| | GEA Group AG | | | 131,212 | | | | 4,586,442 | |
| | Gerresheimer AG | | | 240,843 | | | | 13,797,563 | |
| | Gesco AG | | | 55,404 | | | | 1,378,889 | |
| | GFT Technologies SE | | | 168,983 | | | | 5,509,230 | |
* | | GK Software SE | | | 581 | | | | 70,037 | |
* | | Global Fashion Group SA | | | 76,275 | | | | 128,456 | |
# | | Grand City Properties SA | | | 814,875 | | | | 7,926,771 | |
# | | GRENKE AG | | | 9,184 | | | | 187,306 | |
* | | H&R GmbH & Co. KGaA | | | 71,674 | | | | 464,763 | |
| | Hamburger Hafen und Logistik AG | | | 189,581 | | | | 2,220,451 | |
| | Hawesko Holding AG | | | 313 | | | | 12,279 | |
# * | | Heidelberger Druckmaschinen AG | | | 1,919,276 | | | | 2,649,143 | |
# * | | HelloFresh SE | | | 230,100 | | | | 4,599,506 | |
| | Hensoldt AG | | | 101,947 | | | | 2,395,232 | |
* | | Highlight Communications AG | | | 98,406 | | | | 380,211 | |
| | Hochtief AG | | | 45,854 | | | | 2,435,944 | |
| | Hornbach Holding AG & Co. KGaA | | | 56,348 | | | | 3,840,990 | |
| | Hugo Boss AG | | | 426,713 | | | | 19,653,270 | |
# * | | Hypoport SE | | | 7,011 | | | | 684,803 | |
| | Indus Holding AG | | | 138,578 | | | | 2,734,593 | |
W | | Instone Real Estate Group SE | | | 48,824 | | | | 355,372 | |
| | IVU Traffic Technologies AG | | | 51,403 | | | | 718,621 | |
| | Jenoptik AG | | | 405,384 | | | | 8,887,262 | |
W | | JOST Werke AG | | | 7,900 | | | | 337,132 | |
THE CONTINENTAL SMALL COMPANY SERIES
CONTINUED
| | | | | | | | | | |
| | | | | Shares | | | Value» | |
GERMANY — (Continued) | | | | | | | | |
| | K&S AG | | | 1,269,799 | | | $ | 28,035,878 | |
# | | KION Group AG | | | 93,598 | | | | 2,075,094 | |
# | | Kloeckner & Co. SE | | | 485,557 | | | | 3,805,391 | |
# | | Knaus Tabbert AG | | | 1,753 | | | | 47,795 | |
# * | | Koenig & Bauer AG | | | 89,315 | | | | 1,120,254 | |
# | | Kontron AG | | | 346,499 | | | | 5,015,038 | |
| | Krones AG | | | 112,799 | | | | 10,446,698 | |
| | KSB SE & Co. KGaA | | | 3,293 | | | | 1,301,411 | |
| | KWS Saat SE & Co. KGaA | | | 83,735 | | | | 4,861,268 | |
| | Lanxess AG | | | 577,941 | | | | 19,544,674 | |
# | | LEG Immobilien SE | | | 61,876 | | | | 4,039,586 | |
# | | Leifheit AG | | | 59,026 | | | | 838,024 | |
# * | | Leoni AG | | | 176,283 | | | | 1,240,731 | |
# * | | Manz AG | | | 25,270 | | | | 661,801 | |
* | | Mediclin AG | | | 82,946 | | | | 294,934 | |
* | | Medigene AG | | | 116,971 | | | | 259,979 | |
* | | METRO AG | | | 1,012,891 | | | | 7,726,721 | |
| | MLP SE | | | 440,536 | | | | 2,045,867 | |
# * | | Nagarro SE | | | 61,364 | | | | 6,104,668 | |
| | New Work SE | | | 20,199 | | | | 2,530,611 | |
| | Nexus AG | | | 99,836 | | | | 5,354,218 | |
# * | | Nordex SE | | | 967,673 | | | | 9,020,804 | |
| | Norma Group SE | | | 219,343 | | | | 3,477,165 | |
| | OHB SE | | | 38,571 | | | | 1,082,039 | |
| | PATRIZIA SE | | | 348,340 | | | | 2,556,645 | |
| | Pfeiffer Vacuum Technology AG | | | 48,041 | | | | 6,786,723 | |
# | | PNE AG | | | 491,579 | | | | 9,355,701 | |
| | Progress-Werk Oberkirch AG | | | 8,558 | | | | 209,655 | |
| | ProSiebenSat.1 Media SE | | | 1,391,977 | | | | 9,459,330 | |
| | PSI Software AG | | | 70,343 | | | | 1,607,838 | |
* | | PVA TePla AG | | | 86,836 | | | | 1,454,999 | |
* | | q.beyond AG | | | 718,542 | | | | 594,211 | |
* | | R Stahl AG | | | 14,952 | | | | 208,209 | |
# | | Rational AG | | | 40 | | | | 22,548 | |
| | Rheinmetall AG | | | 186,043 | | | | 30,241,593 | |
| | RTL Group SA | | | 762 | | | | 25,867 | |
| | SAF-Holland SE | | | 297,427 | | | | 2,201,823 | |
# | | Salzgitter AG | | | 264,670 | | | | 5,914,992 | |
| | Schloss Wachenheim AG | | | 6,929 | | | | 113,705 | |
# W | | Scout24 SE | | | 302,097 | | | | 15,480,950 | |
# | | Secunet Security Networks AG | | | 8,338 | | | | 1,828,997 | |
# * | | SGL Carbon SE | | | 337,757 | | | | 2,395,657 | |
# * W | | Shop Apotheke Europe NV | | | 9,889 | | | | 409,500 | |
| | Siltronic AG | | | 146,283 | | | | 9,097,040 | |
| | Sixt SE | | | 96,820 | | | | 9,081,096 | |
# * | | SMA Solar Technology AG | | | 59,742 | | | | 2,890,339 | |
* | | SNP Schneider-Neureither & Partner SE | | | 3,170 | | | | 47,447 | |
| | Softing AG | | | 10,587 | | | | 53,700 | |
# | | Software AG | | | 393,922 | | | | 8,617,826 | |
| | Stabilus SE | | | 175,916 | | | | 9,650,722 | |
| | STRATEC SE | | | 33,736 | | | | 2,828,038 | |
# | | Stroeer SE & Co. KGaA | | | 203,324 | | | | 8,289,296 | |
| | Suedzucker AG | | | 526,208 | | | | 6,705,946 | |
# | | SUESS MicroTec SE | | | 146,951 | | | | 1,661,276 | |
| | Surteco Group SE | | | 47,139 | | | | 889,610 | |
# | | Synlab AG | | | 13,980 | | | | 180,007 | |
# | | TAG Immobilien AG | | | 1,209,596 | | | | 7,575,458 | |
# | | Takkt AG | | | 250,065 | | | | 3,238,606 | |
* W | | TeamViewer AG | | | 509,264 | | | | 4,890,457 | |
THE CONTINENTAL SMALL COMPANY SERIES
CONTINUED
| | | | | | | | | | |
| | | | | Shares | | | Value» | |
GERMANY — (Continued) | | | | | | | | |
| | Technotrans SE | | | 46,673 | | | $ | 1,174,178 | |
# * | | thyssenkrupp AG | | | 1,953,574 | | | | 10,283,477 | |
| | Traffic Systems SE | | | 37,280 | | | | 666,353 | |
| | United Internet AG | | | 91,555 | | | | 1,711,444 | |
# * | | va-Q-tec AG | | | 2,370 | | | | 30,419 | |
# | | Varta AG | | | 24,311 | | | | 651,501 | |
# | | VERBIO Vereinigte BioEnergie AG | | | 169,400 | | | | 13,344,165 | |
* | | Vitesco Technologies Group AG, Class A | | | 10,364 | | | | 554,563 | |
# | | Vossloh AG | | | 76,106 | | | | 2,731,054 | |
| | Wacker Chemie AG | | | 16,328 | | | | 1,900,994 | |
| | Wacker Neuson SE | | | 227,890 | | | | 3,592,802 | |
| | Washtec AG | | | 86,629 | | | | 3,253,446 | |
# * | | Westwing Group SE | | | 41,567 | | | | 282,363 | |
| | Wuestenrot & Wuerttembergische AG | | | 119,837 | | | | 1,690,731 | |
| | Zeal Network SE | | | 53,966 | | | | 1,362,541 | |
| | | | | | | | | | |
TOTAL GERMANY | | | | 611,161,049 | |
| | | | | | | | | | |
GREECE — (0.0%) | | | | | | | | |
* †† | | Alfa Alfa Energy SA | | | 3,810 | | | | 0 | |
* †† | | Neorion Holdings SA | | | 14,991 | | | | 0 | |
| | | | | | | | | | |
IRELAND — (1.5%) | | | | | | | | |
| | AIB Group PLC | | | 885,140 | | | | 2,560,633 | |
| | Bank of Ireland Group PLC | | | 5,945,531 | | | | 42,811,519 | |
| | Cairn Homes PLC | | | 1,908,875 | | | | 1,848,135 | |
* | | Dalata Hotel Group PLC | | | 287,904 | | | | 923,643 | |
| | FBD Holdings PLC | | | 142,812 | | | | 1,396,895 | |
| | Glanbia PLC | | | 1,151,741 | | | | 13,421,247 | |
* W | | Glenveagh Properties PLC | | | 957,454 | | | | 936,548 | |
| | Irish Continental Group PLC | | | 820,853 | | | | 3,315,296 | |
* | | Permanent TSB Group Holdings PLC | | | 268,168 | | | | 446,515 | |
| | | | | | | | | | |
TOTAL IRELAND | | | | 67,660,431 | |
| | | | | | | | | | |
ISRAEL — (3.6%) | | | | | | | | |
# | | Adgar Investment & Development Ltd. | | | 105,459 | | | | 179,779 | |
| | Afcon Holdings Ltd. | | | 3,064 | | | | 144,816 | |
# | | AFI Properties Ltd. | | | 100,052 | | | | 2,999,563 | |
| | Africa Israel Residences Ltd. | | | 13,924 | | | | 558,786 | |
* | | Airport City Ltd. | | | 113,983 | | | | 1,887,228 | |
# * | | Allot Ltd. | | | 189,485 | | | | 746,566 | |
# | | Alrov Properties & Lodgings Ltd. | | | 49,832 | | | | 2,547,777 | |
# | | Arad Ltd. | | | 28,474 | | | | 365,024 | |
| | Ashtrom Group Ltd. | | | 107,315 | | | | 2,335,601 | |
| | AudioCodes Ltd. | | | 25,159 | | | | 512,064 | |
| | Aura Investments Ltd. | | | 334,602 | | | | 591,150 | |
| | Automatic Bank Services Ltd. | | | 11,760 | | | | 52,574 | |
* | | Avgol Industries 1953 Ltd. | | | 468,925 | | | | 277,045 | |
| | Azorim-Investment Development & Construction Co. Ltd. | | | 575,905 | | | | 2,003,942 | |
# * | | Bet Shemesh Engines Holdings 1997 Ltd. | | | 30,236 | | | | 726,956 | |
| | Blue Square Real Estate Ltd. | | | 37,333 | | | | 2,478,883 | |
* | | Brack Capital Properties NV | | | 18,347 | | | | 1,952,680 | |
# * | | Brainsway Ltd. | | | 17,217 | | | | 30,440 | |
# * | | Camtek Ltd. | | | 23,329 | | | | 526,199 | |
| | Carasso Motors Ltd. | | | 132,164 | | | | 829,746 | |
* | | Cellcom Israel Ltd. | | | 497,683 | | | | 2,491,521 | |
* | | Ceragon Networks Ltd. | | | 266,244 | | | | 479,239 | |
* | | Clal Insurance Enterprises Holdings Ltd. | | | 321,004 | | | | 5,539,393 | |
# * | | Compugen Ltd. | | | 113,943 | | | | 102,552 | |
THE CONTINENTAL SMALL COMPANY SERIES
CONTINUED
| | | | | | | | | | |
| | | | | Shares | | | Value» | |
ISRAEL — (Continued) | | | | | | | | |
| | Danel Adir Yeoshua Ltd. | | | 24,002 | | | $ | 2,781,987 | |
# | | Delek Automotive Systems Ltd. | | | 260,248 | | | | 3,350,973 | |
* | | Delek Group Ltd. | | | 30,697 | | | | 4,673,839 | |
| | Delta Galil Industries Ltd. | | | 75,453 | | | | 3,416,178 | |
| | Dor Alon Energy in Israel 1988 Ltd. | | | 17,532 | | | | 606,425 | |
# | | Duniec Brothers Ltd. | | | 1,094 | | | | 56,623 | |
# | | Electra Consumer Products 1970 Ltd. | | | 43,403 | | | | 1,502,313 | |
| | Electra Ltd. | | | 8,299 | | | | 4,828,874 | |
| | Electra Real Estate Ltd. | | | 44,441 | | | | 545,652 | |
* | | Ellomay Capital Ltd. | | | 2,597 | | | | 48,433 | |
| | Energix-Renewable Energies Ltd. | | | 79,976 | | | | 279,210 | |
* | | Enlight Renewable Energy Ltd. | | | 2,358,065 | | | | 4,775,758 | |
# * | | Equital Ltd. | | | 130,022 | | | | 4,009,564 | |
* | | Fattal Holdings 1998 Ltd. | | | 6,068 | | | | 616,336 | |
| | FMS Enterprises Migun Ltd. | | | 19,186 | | | | 635,932 | |
| | Formula Systems 1985 Ltd. | | | 64,555 | | | | 5,239,737 | |
| | Formula Systems 1985 Ltd., Sponsored ADR | | | 640 | | | | 52,154 | |
| | Fox Wizel Ltd. | | | 46,883 | | | | 5,715,489 | |
| | Gav-Yam Lands Corp. Ltd. | | | 423,939 | | | | 3,595,477 | |
# * | | Gilat Satellite Networks Ltd. | | | 236,247 | | | | 1,417,418 | |
* | | Hagag Group Real Estate Development | | | 16,780 | | | | 91,345 | |
| | Harel Insurance Investments & Financial Services Ltd. | | | 448,124 | | | | 4,313,629 | |
| | Hilan Ltd. | | | 106,225 | | | | 5,562,285 | |
| | IDI Insurance Co. Ltd. | | | 47,574 | | | | 1,270,471 | |
| | IES Holdings Ltd. | | | 1,354 | | | | 94,672 | |
| | Ilex Medical Ltd. | | | 4,067 | | | | 103,032 | |
# | | Infinya Ltd. | | | 21,885 | | | | 2,114,085 | |
| | Inrom Construction Industries Ltd. | | | 367,899 | | | | 1,501,587 | |
| | Isracard Ltd. | | | 167,634 | | | | 495,670 | |
| | Israel Canada T.R Ltd. | | | 220,206 | | | | 634,811 | |
# | | Israel Land Development - Urban Renewal Ltd. | | | 81,564 | | | | 1,059,796 | |
| | Isras Investment Co. Ltd. | | | 5,893 | | | | 1,109,587 | |
# | | Issta Lines Ltd. | | | 16,402 | | | | 450,986 | |
# * | | Kamada Ltd. | | | 212,977 | | | | 979,238 | |
| | Kardan Real Estate Enterprise & Development Ltd. | | | 24,718 | | | | 24,101 | |
| | Kenon Holdings Ltd. | | | 76,497 | | | | 2,930,736 | |
| | Kerur Holdings Ltd. | | | 33,018 | | | | 714,288 | |
# | | Klil Industries Ltd. | | | 5,696 | | | | 475,964 | |
| | Lahav L.R. Real Estate Ltd. | | | 9,407 | | | | 10,486 | |
| | Levinstein Properties Ltd. | | | 377 | | | | 9,753 | |
| | M Yochananof & Sons Ltd. | | | 5,479 | | | | 322,551 | |
| | Magic Software Enterprises Ltd. | | | 152,541 | | | | 2,371,658 | |
# | | Malam - Team Ltd. | | | 10,222 | | | | 232,342 | |
| | Matrix IT Ltd. | | | 225,871 | | | | 4,872,593 | |
| | Max Stock Ltd. | | | 7,391 | | | | 10,562 | |
# | | Maytronics Ltd. | | | 165,369 | | | | 1,783,096 | |
# | | Mediterranean Towers Ltd. | | | 434,044 | | | | 1,252,438 | |
| | Mega Or Holdings Ltd. | | | 85,860 | | | | 2,496,386 | |
* | | Mehadrin Ltd. | | | 1,666 | | | | 67,111 | |
# * | | Meitav Investment House Ltd. | | | 132,413 | | | | 463,683 | |
* | | Menora Mivtachim Holdings Ltd. | | | 186,995 | | | | 3,810,425 | |
| | Meshulam Levinstein Contracting & Engineering Ltd. | | | 310 | | | | 28,849 | |
| | Migdal Insurance & Financial Holdings Ltd. | | | 2,008,915 | | | | 2,409,658 | |
| | Mivtach Shamir Holdings Ltd. | | | 30,255 | | | | 720,232 | |
| | Mizrahi Tefahot Bank Ltd. | | | 1 | | | | 39 | |
# * | | Naphtha Israel Petroleum Corp. Ltd. | | | 244,337 | | | | 1,265,600 | |
| | Nawi Brothers Ltd. | | | 68,328 | | | | 494,499 | |
* | | Neto Malinda Trading Ltd. | | | 4,663 | | | | 157,004 | |
| | Neto ME Holdings Ltd. | | | 12,167 | | | | 511,310 | |
THE CONTINENTAL SMALL COMPANY SERIES
CONTINUED
| | | | | | | | | | |
| | | | | Shares | | | Value» | |
ISRAEL — (Continued) | | | | | | | | |
| | Novolog Ltd. | | | 200,415 | | | $ | 165,538 | |
* | | NR Spuntech Industries Ltd. | | | 76,176 | | | | 84,034 | |
| | Oil Refineries Ltd. | | | 12,221,338 | | | | 4,551,410 | |
| | One Software Technologies Ltd. | | | 48,820 | | | | 675,836 | |
* | | OPC Energy Ltd. | | | 76,073 | | | | 935,331 | |
| | Palram Industries 1990 Ltd. | | | 1,112 | | | | 10,889 | |
* | | Partner Communications Co. Ltd. | | | 859,128 | | | | 6,476,302 | |
* | | Paz Oil Co. Ltd. | | | 61,942 | | | | 7,399,803 | |
* | | Perion Network Ltd. | | | 101,332 | | | | 2,324,408 | |
| | Plasson Industries Ltd. | | | 21,191 | | | | 1,032,914 | |
# | | Prashkovsky Investments & Construction Ltd. | | | 10,063 | | | | 241,651 | |
# * | | Priortech Ltd. | | | 9,623 | | | | 176,966 | |
# | | Rami Levy Chain Stores Hashikma Marketing 2006 Ltd. | | | 52,258 | | | | 3,624,016 | |
| | Retailors Ltd. | | | 1,167 | | | | 22,445 | |
| | Scope Metals Group Ltd. | | | 47,147 | | | | 2,115,682 | |
| | Summit Real Estate Holdings Ltd. | | | 222,691 | | | | 3,103,033 | |
| | Suny Cellular Communication Ltd. | | | 312,529 | | | | 156,505 | |
| | Tadiran Group Ltd. | | | 16,763 | | | | 2,271,424 | |
# W | | Tamar Petroleum Ltd. | | | 38,322 | | | | 118,218 | |
| | Tel Aviv Stock Exchange Ltd. | | | 21,464 | | | | 126,490 | |
* | | Tera Light Ltd. | | | 86,179 | | | | 143,301 | |
# | | Tiv Taam Holdings 1 Ltd. | | | 39,749 | | | | 83,571 | |
# * | | Victory Supermarket Chain Ltd. | | | 5,213 | | | | 66,156 | |
| | YH Dimri Construction & Development Ltd. | | | 18,253 | | | | 1,109,772 | |
| | | | | | | | | | |
TOTAL ISRAEL | | | | 162,740,149 | |
| | | | | | | | | | |
ITALY — (8.4%) | | | | | | | | |
| | A2A SpA | | | 10,137,181 | | | | 11,240,491 | |
| | ACEA SpA | | | 380,238 | | | | 4,791,188 | |
# * | | Aeffe SpA | | | 177,250 | | | | 218,988 | |
W | | Anima Holding SpA | | | 1,967,662 | | | | 6,094,177 | |
| | Aquafil SpA | | | 83,333 | | | | 453,493 | |
| | Arnoldo Mondadori Editore SpA | | | 1,122,764 | | | | 1,891,862 | |
| | Ascopiave SpA | | | 477,634 | | | | 1,130,029 | |
* | | Autogrill SpA | | | 102,824 | | | | 642,726 | |
| | Autostrade Meridionali SpA | | | 3,917 | | | | 143,171 | |
# | | Avio SpA | | | 110,432 | | | | 1,233,182 | |
| | Azimut Holding SpA | | | 813,168 | | | | 13,093,679 | |
# | | Banca Generali SpA | | | 462,600 | | | | 13,828,812 | |
| | Banca IFIS SpA | | | 251,013 | | | | 2,963,938 | |
| | Banca Mediolanum SpA | | | 891,514 | | | | 6,670,224 | |
| | Banca Popolare di Sondrio SPA | | | 3,275,345 | | | | 11,748,855 | |
| | Banca Profilo SpA | | | 1,711,765 | | | | 326,502 | |
W | | Banca Sistema SpA | | | 414,926 | | | | 608,336 | |
| | Banco BPM SpA | | | 10,252,032 | | | | 31,017,683 | |
| | Banco di Desio e della Brianza SpA | | | 241,954 | | | | 674,121 | |
| | Be Shaping The Future SpA | | | 473,718 | | | | 1,610,384 | |
W | | BFF Bank SpA | | | 706,708 | | | | 4,985,522 | |
| | Biesse SpA | | | 11,036 | | | | 132,918 | |
| | BPER Banca | | | 7,525,929 | | | | 13,925,204 | |
| | Brembo SpA | | | 860,785 | | | | 8,998,978 | |
| | Brunello Cucinelli SpA | | | 248,717 | | | | 14,417,102 | |
| | Buzzi Unicem SpA | | | 651,090 | | | | 10,806,005 | |
| | Cairo Communication SpA | | | 601,468 | | | | 977,634 | |
W | | Carel Industries SpA | | | 37,717 | | | | 821,505 | |
| | Cementir Holding NV | | | 361,114 | | | | 2,101,822 | |
# * | | CIR SpA-Compagnie Industriali | | | 2,423,159 | | | | 1,023,043 | |
| | Credito Emiliano SpA | | | 616,798 | | | | 3,657,014 | |
* | | d’Amico International Shipping SA | | | 2,548,506 | | | | 732,669 | |
THE CONTINENTAL SMALL COMPANY SERIES
CONTINUED
| | | | | | | | | | |
| | | | | Shares | | | Value» | |
ITALY — (Continued) | | | | | | | | |
| | Danieli & C Officine Meccaniche SpA | | | 98,559 | | | $ | 1,353,759 | |
# | | Danieli & C Officine Meccaniche SpA | | | 104,538 | | | | 2,133,675 | |
| | Datalogic SpA | | | 16,509 | | | | 125,625 | |
| | De’ Longhi SpA | | | 398,689 | | | | 6,878,891 | |
| | DeA Capital SpA | | | 697,876 | | | | 740,883 | |
# | | Digital Bros SpA | | | 37,586 | | | | 885,730 | |
W | | doValue SpA | | | 80,786 | | | | 465,287 | |
| | Elica SpA | | | 166,709 | | | | 442,901 | |
| | Emak SpA | | | 565,182 | | | | 603,745 | |
W | | Enav SpA | | | 335,472 | | | | 1,297,282 | |
| | ERG SpA | | | 352,598 | | | | 11,059,880 | |
| | Esprinet SpA | | | 227,113 | | | | 1,512,873 | |
* | | Eurotech SpA | | | 207,209 | | | | 640,776 | |
# | | Fila SpA | | | 145,425 | | | | 991,417 | |
# * | | Fincantieri SpA | | | 3,504,948 | | | | 1,781,985 | |
# *†† | | Finmatica SpA | | | 5,960 | | | | 0 | |
* | | FNM SpA | | | 1,412,345 | | | | 642,066 | |
| | Gefran SpA | | | 35,925 | | | | 301,444 | |
# * | | Geox SpA | | | 356,231 | | | | 283,803 | |
| | GPI SpA | | | 16,644 | | | | 212,002 | |
| | Gruppo MutuiOnline SpA | | | 172,390 | | | | 3,812,891 | |
#*W | | GVS SpA | | | 11,552 | | | | 59,267 | |
| | Hera SpA | | | 5,590,996 | | | | 13,321,559 | |
| | IMMSI SpA | | | 1,372,199 | | | | 538,477 | |
| | Interpump Group SpA | | | 116,858 | | | | 4,524,214 | |
| | Iren SpA | | | 4,667,503 | | | | 6,936,290 | |
| | Italgas SpA | | | 3,535,826 | | | | 18,217,452 | |
| | Italmobiliare SpA | | | 77,432 | | | | 1,979,415 | |
* | | Iveco Group NV | | | 87,854 | | | | 474,734 | |
| | IVS Group SA | | | 140,888 | | | | 533,297 | |
* | | Juventus Football Club SpA | | | 782,303 | | | | 213,584 | |
# * | | KME Group SpA | | | 1,885,608 | | | | 1,040,426 | |
| | Leonardo SpA | | | 2,965,480 | | | | 23,824,938 | |
| | LU-VE SpA | | | 5,064 | | | | 103,620 | |
# | | Maire Tecnimont SpA | | | 1,261,206 | | | | 3,913,271 | |
# * †† | | Mariella Burani Fashion Group SpA | | | 22,744 | | | | 0 | |
| | MFE-MediaForEurope NV, Class A | | | 7,493,411 | | | | 2,628,718 | |
# | | MFE-MediaForEurope NV, Class A | | | 3,057,306 | | | | 1,526,952 | |
* | | Newlat Food SpA | | | 22,549 | | | | 101,570 | |
| | Openjobmetis SpA agenzia per il lavoro | | | 63,079 | | | | 487,161 | |
| | Orsero SpA | | | 19,188 | | | | 274,640 | |
#W | | OVS SpA | | | 1,486,934 | | | | 2,775,899 | |
| | Pharmanutra SpA | | | 4,175 | | | | 279,789 | |
| | Piaggio & CSpA | | | 1,327,755 | | | | 3,411,196 | |
W | | Pirelli & C SpA | | | 2,538,628 | | | | 9,575,853 | |
# | | Prima Industrie SpA | | | 33,228 | | | | 810,470 | |
W | | RAI Way SpA | | | 618,828 | | | | 2,964,485 | |
| | Reply SpA | | | 147,173 | | | | 16,008,528 | |
| | Rizzoli Corriere Della Sera Mediagroup SpA | | | 956,821 | | | | 642,770 | |
| | Sabaf SpA | | | 63,964 | | | | 1,182,054 | |
# | | SAES Getters SpA | | | 900 | | | | 19,401 | |
* | | Safilo Group SpA | | | 220,553 | | | | 311,262 | |
# | | Salvatore Ferragamo SpA | | | 173,061 | | | | 2,543,833 | |
| | Sanlorenzo SpA/Ameglia | | | 2,695 | | | | 86,449 | |
* | | Saras SpA | | | 4,182,418 | | | | 5,054,873 | |
| | Sesa SpA | | | 57,481 | | | | 6,224,992 | |
# * | | Sogefi SpA | | | 342,301 | | | | 278,776 | |
| | SOL SpA | | | 225,916 | | | | 4,063,829 | |
* | | Spaxs SpA | | | 218,758 | | | | 1,487,727 | |
THE CONTINENTAL SMALL COMPANY SERIES
CONTINUED
| | | | | | | | | | |
| | | | | Shares | | | Value» | |
ITALY — (Continued) | | | | | | | | |
| | Tamburi Investment Partners SpA | | | 858,326 | | | $ | 6,035,504 | |
W | | Technogym SpA | | | 848,966 | | | | 5,836,646 | |
# * | | Telecom Italia SpA | | | 6,393,165 | | | | 1,250,770 | |
# * | | Tesmec SpA | | | 313,747 | | | | 40,196 | |
| | Tinexta SpA | | | 138,460 | | | | 2,787,419 | |
# * | | Tiscali SpA | | | 25,776 | | | | 21,240 | |
* | | TXT e-solutions SpA | | | 73,775 | | | | 893,972 | |
#W | | Unieuro SpA | | | 145,452 | | | | 1,569,806 | |
| | Unipol Gruppo SpA | | | 3,175,802 | | | | 13,668,138 | |
| | UnipolSai Assicurazioni SpA | | | 42,994 | | | | 96,942 | |
# | | Webuild SpA | | | 1,307,308 | | | | 1,778,969 | |
# | | Zignago Vetro SpA | | | 187,606 | | | | 2,361,961 | |
| | | | | | | | | | |
TOTAL ITALY | | | | 383,891,506 | |
| | | | | | | | | | |
NETHERLANDS — (5.6%) | | | | | | | | |
| | Aalberts NV | | | 686,131 | | | | 23,803,028 | |
| | Acomo NV | | | 40,189 | | | | 751,005 | |
* | | AFC Ajax NV | | | 13,955 | | | | 158,763 | |
* W | | Alfen Beheer BV | | | 64,588 | | | | 6,851,410 | |
| | AMG Advanced Metallurgical Group NV | | | 214,731 | | | | 6,708,819 | |
| | APERAM SA | | | 322,482 | | | | 8,420,437 | |
| | Arcadis NV | | | 533,103 | | | | 18,091,946 | |
| | ASR Nederland NV | | | 672,922 | | | | 29,630,688 | |
* | | Avantium NV | | | 12,128 | | | | 39,801 | |
W | | B&S Group Sarl | | | 10,048 | | | | 52,604 | |
#*W | | Basic-Fit NV | | | 294,493 | | | | 7,417,087 | |
| | BE Semiconductor Industries NV | | | 405,420 | | | | 20,662,135 | |
| | Beter Bed Holding NV | | | 27,380 | | | | 79,735 | |
| | Brunel International NV | | | 155,477 | | | | 1,432,142 | |
| | Corbion NV | | | 390,957 | | | | 10,410,850 | |
W | | CTP NV | | | 5,742 | | | | 59,556 | |
# W | | Flow Traders | | | 226,947 | | | | 5,460,660 | |
| | ForFarmers NV | | | 214,677 | | | | 581,933 | |
* | | Fugro NV | | | 567,199 | | | | 7,367,443 | |
| | Heijmans NV | | | 167,350 | | | | 1,695,790 | |
* W | | Intertrust NV | | | 472,154 | | | | 9,314,137 | |
| | Kendrion NV | | | 96,304 | | | | 1,392,853 | |
* | | Koninklijke BAM Groep NV | | | 1,821,442 | | | | 3,975,151 | |
| | Koninklijke Vopak NV | | | 305,260 | | | | 6,237,071 | |
* W | | Lucas Bols NV | | | 24,022 | | | | 237,146 | |
| | Nedap NV | | | 33,400 | | | | 1,796,594 | |
# | | OCI NV | | | 554,235 | | | | 21,198,317 | |
| | Ordina NV | | | 637,656 | | | | 2,449,766 | |
# * | | Pharming Group NV | | | 1,219,229 | | | | 1,261,398 | |
# | | PostNL NV | | | 3,721,701 | | | | 5,827,026 | |
| | SBM Offshore NV | | | 1,043,174 | | | | 14,117,707 | |
# | | SIF Holding NV | | | 34,182 | | | | 350,378 | |
W | | Signify NV | | | 711,679 | | | | 19,717,182 | |
| | Sligro Food Group NV | | | 143,176 | | | | 2,077,046 | |
# *†† | | SRH NV | | | 705,718 | | | | 0 | |
| | TKH Group NV | | | 271,678 | | | | 9,607,139 | |
# * | | TomTom NV | | | 465,526 | | | | 3,639,043 | |
| | Van Lanschot Kempen NV | | | 158,577 | | | | 3,422,382 | |
* | | Vivoryon Therapeutics NV | | | 5,400 | | | | 43,783 | |
| | | | | | | | | | |
TOTAL NETHERLANDS | | | | 256,339,951 | |
| | | | | | | | | | |
THE CONTINENTAL SMALL COMPANY SERIES
CONTINUED
| | | | | | | | | | |
| | | | | Shares | | | Value» | |
NORWAY — (2.4%) | | | | | | | | |
| | 2020 Bulkers Ltd. | | | 65,237 | | | $ | 490,937 | |
| | ABG Sundal Collier Holding ASA | | | 2,506,062 | | | | 1,329,800 | |
| | AF Gruppen ASA | | | 877 | | | | 12,703 | |
# * | | Akastor ASA | | | 787,389 | | | | 772,955 | |
* | | Aker BioMarine ASA | | | 10,134 | | | | 41,659 | |
* | | Aker Carbon Capture ASA | | | 136,636 | | | | 153,760 | |
| | Aker Solutions ASA | | | 1,516,028 | | | | 5,788,269 | |
| | AMSC ASA | | | 255,057 | | | | 929,361 | |
* | | ArcticZymes Technologies ASA | | | 77,341 | | | | 498,295 | |
* | | Asetek AS | | | 19,672 | | | | 34,798 | |
| | Atea ASA | | | 370,118 | | | | 4,118,491 | |
# * | | Atlantic Sapphire ASA | | | 67,633 | | | | 42,982 | |
| | Austevoll Seafood ASA | | | 11,018 | | | | 81,644 | |
W | | Avance Gas Holding Ltd. | | | 19,594 | | | | 112,605 | |
# * | | Axactor ASA | | | 839,168 | | | | 483,447 | |
| | B2Holding ASA | | | 1,258,346 | | | | 948,916 | |
| | Belships ASA | | | 332,823 | | | | 465,483 | |
* | | Bergenbio ASA | | | 51,404 | | | | 36,347 | |
| | Bonheur ASA | | | 144,049 | | | | 4,098,598 | |
# * | | Borr Drilling Ltd. | | | 158,072 | | | | 769,081 | |
| | Borregaard ASA | | | 472,245 | | | | 6,349,480 | |
| | Bouvet ASA | | | 66,121 | | | | 349,724 | |
* | | BW Energy Ltd. | | | 352,705 | | | | 888,750 | |
W | | BW LPG Ltd. | | | 648,398 | | | | 5,246,013 | |
| | BW Offshore Ltd. | | | 753,331 | | | | 1,914,129 | |
* | | Cadeler AS | | | 63,427 | | | | 203,302 | |
* | | Cloudberry Clean Energy ASA | | | 19,690 | | | | 24,461 | |
#*W | | Crayon Group Holding ASA | | | 169,173 | | | | 1,402,546 | |
# | | DNO ASA | | | 3,131,136 | | | | 4,072,772 | |
| | Elopak ASA | | | 6,452 | | | | 14,517 | |
W | | Europris ASA | | | 1,169,092 | | | | 6,960,964 | |
| | FLEX LNG Ltd. | | | 217,647 | | | | 6,760,350 | |
# | | Frontline Ltd. | | | 475,587 | | | | 5,943,530 | |
| | Grieg Seafood ASA | | | 350,555 | | | | 2,427,597 | |
| | Hafnia Ltd. | | | 262,985 | | | | 1,354,340 | |
# * | | Hexagon Composites ASA | | | 714,855 | | | | 1,642,480 | |
| | Hunter Group ASA | | | 384,083 | | | | 80,102 | |
# * | | IDEX Biometrics ASA | | | 594,228 | | | | 48,169 | |
# * | | Kahoot! ASA | | | 318,608 | | | | 679,336 | |
# W | | Kid ASA | | | 35,988 | | | | 270,034 | |
# | | Kitron ASA | | | 515,690 | | | | 1,155,537 | |
W | | Klaveness Combination Carriers ASA | | | 2,957 | | | | 18,215 | |
* | | Komplett Bank ASA | | | 33,724 | | | | 16,500 | |
* | | Kongsberg Automotive ASA | | | 4,586,574 | | | | 1,204,549 | |
* | | LINK Mobility Group Holding ASA | | | 51,820 | | | | 40,235 | |
* | | Magnora ASA | | | 118,220 | | | | 256,964 | |
| | Medistim ASA | | | 2,163 | | | | 50,243 | |
| | MPC Container Ships ASA | | | 1,639,898 | | | | 2,586,935 | |
W | | Multiconsult ASA | | | 2,534 | | | | 30,319 | |
# * | | Nordic Nanovector ASA | | | 376,386 | | | | 46,687 | |
*W | | Norske Skog ASA | | | 249,340 | | | | 1,537,001 | |
* | | Northern Ocean Ltd. | | | 60,674 | | | | 65,681 | |
* | | Norway Royal Salmon ASA | | | 93,951 | | | | 1,194,433 | |
* | | Norwegian Air Shuttle ASA | | | 751,099 | | | | 601,448 | |
* | | Norwegian Energy Co. ASA | | | 15,882 | | | | 587,309 | |
* | | NRC Group ASA | | | 38,228 | | | | 64,819 | |
* | | Odfjell Drilling Ltd. | | | 645,965 | | | | 1,688,122 | |
| | Odfjell SE, Class A | | | 140,676 | | | | 926,158 | |
* | | Odfjell Technology Ltd. | | | 97,767 | | | | 213,846 | |
| | OKEA ASA | | | 66,689 | | | | 271,728 | |
THE CONTINENTAL SMALL COMPANY SERIES
CONTINUED
| | | | | | | | | | |
| | | | | Shares | | | Value» | |
NORWAY — (Continued) | | | | | | | | |
W | | Okeanis Eco Tankers Corp. | | | 16,989 | | | $ | 276,134 | |
| | Olav Thon Eiendomsselskap ASA | | | 72,175 | | | | 1,208,947 | |
| | Otello Corp. ASA | | | 27,272 | | | | 21,935 | |
* | | Panoro Energy ASA | | | 33,298 | | | | 108,831 | |
| | Pareto Bank ASA | | | 47,843 | | | | 216,457 | |
# * | | PGS ASA | | | 3,070,778 | | | | 1,978,929 | |
* | | PhotoCure ASA | | | 18,163 | | | | 160,971 | |
#* W | | poLight ASA | | | 4,600 | | | | 10,122 | |
# * | | Prosafe SE | | | 6,125 | | | | 107,813 | |
| | Protector Forsikring ASA | | | 438,078 | | | | 5,215,857 | |
* | | Q-Free ASA | | | 32,883 | | | | 19,275 | |
# * | | REC Silicon ASA | | | 1,976,404 | | | | 3,797,197 | |
# W | | Scatec ASA | | | 113,961 | | | | 807,259 | |
* | | SD Standard ETC PLC | | | 271,994 | | | | 52,503 | |
| | Selvaag Bolig ASA | | | 325,020 | | | | 1,051,718 | |
* W | | Shelf Drilling Ltd. | | | 124,843 | | | | 269,354 | |
* | | Siem Offshore, Inc. | | | 10,249 | | | | 12,390 | |
* | | Solstad Offshore ASA | | | 29,716 | | | | 74,173 | |
| | Sparebank 1 Oestlandet | | | 25,056 | | | | 270,898 | |
| | SpareBank 1 Sorost-Norge | | | 1,788 | | | | 8,871 | |
| | Stolt-Nielsen Ltd. | | | 192,640 | | | | 4,620,246 | |
| | TGS ASA | | | 188,751 | | | | 2,569,808 | |
| | Treasure ASA | | | 316,195 | | | | 504,172 | |
# * | | Ultimovacs ASA | | | 24,075 | | | | 181,751 | |
| | Veidekke ASA | | | 640,408 | | | | 5,326,615 | |
* | | Volue ASA | | | 168 | | | | 437 | |
| | Wilh Wilhelmsen Holding ASA, Class A | | | 68,304 | | | | 1,589,155 | |
W | | XXL ASA | | | 1,327,985 | | | | 577,652 | |
| | | | | | | | | | |
TOTAL NORWAY | | | | 111,438,926 | |
| | | | | | | | | | |
PORTUGAL — (1.0%) | | | | | | | | |
| | Altri SGPS SA | | | 520,559 | | | | 2,896,725 | |
# | | Banco Comercial Portugues SA, Class R | | | 57,721,798 | | | | 8,223,912 | |
* †† | | Banco Espirito Santo SA | | | 4,777,921 | | | | 0 | |
| | Corticeira Amorim SGPS SA | | | 116,151 | | | | 1,122,361 | |
# | | CTT-Correios de Portugal SA | | | 698,830 | | | | 2,157,086 | |
* | | Greenvolt-Energias Renovaveis SA | | | 125,818 | | | | 966,452 | |
# | | Ibersol SGPS SA | | | 52,494 | | | | 306,333 | |
# | | Mota-Engil SGPS SA | | | 641,747 | | | | 768,983 | |
| | Navigator Co. SA | | | 1,800,273 | | | | 6,858,770 | |
# | | NOS SGPS SA | | | 1,562,222 | | | | 6,118,871 | |
# | | Novabase SGPS SA | | | 72,649 | | | | 301,254 | |
# | | REN - Redes Energeticas Nacionais SGPS SA | | | 2,950,023 | | | | 7,635,306 | |
| | Sonae SGPS SA | | | 6,829,681 | | | | 6,559,184 | |
| | | | | | | | | | |
TOTAL PORTUGAL | | | | 43,915,237 | |
| | | | | | | | | | |
SPAIN — (5.7%) | | | | | | | | |
| | Acerinox SA | | | 1,095,358 | | | | 9,599,762 | |
# * †† | | Adveo Group International SA | | | 84,445 | | | | 0 | |
W | | Aedas Homes SA | | | 27,692 | | | | 363,666 | |
| | Alantra Partners SA | | | 70,997 | | | | 903,781 | |
| | Almirall SA | | | 475,919 | | | | 4,434,360 | |
# * | | Amper SA | | | 6,893,962 | | | | 1,018,421 | |
| | Applus Services SA | | | 925,350 | | | | 5,464,230 | |
| | Atresmedia Corp. de Medios de Comunicacion SA | | | 574,350 | | | | 1,657,505 | |
| | Azkoyen SA | | | 67,253 | | | | 405,342 | |
| | Banco de Sabadell SA | | | 36,362,876 | | | | 28,610,453 | |
| | Bankinter SA | | | 4,326,671 | | | | 26,171,851 | |
THE CONTINENTAL SMALL COMPANY SERIES
CONTINUED
| | | | | | | | | | |
| | | | | Shares | | | Value» | |
SPAIN — (Continued) | | | | | | | | |
# * †† | | Caja de Ahorros del Mediterraneo | | | 116,412 | | | $ | 0 | |
| | Cia de Distribucion Integral Logista Holdings SA | | | 429,838 | | | | 8,889,682 | |
| | CIE Automotive SA | | | 376,909 | | | | 9,601,073 | |
| | Construcciones y Auxiliar de Ferrocarriles SA | | | 129,981 | | | | 3,393,626 | |
# * | | Deoleo SA | | | 37,749 | | | | 8,893 | |
* | | Distribuidora Internacional de Alimentacion SA | | | 3,729,910 | | | | 45,298 | |
# | | Ebro Foods SA | | | 526,136 | | | | 8,204,123 | |
* | | eDreams ODIGEO SA | | | 427,530 | | | | 1,768,463 | |
| | Elecnor SA | | | 200,108 | | | | 1,998,253 | |
# | | Enagas SA | | | 1,457,648 | | | | 23,663,312 | |
| | Ence Energia y Celulosa SA | | | 1,042,979 | | | | 3,572,054 | |
| | Ercros SA | | | 643,000 | | | | 2,064,341 | |
| | Faes Farma SA | | | 2,130,572 | | | | 8,041,813 | |
# | | Fluidra SA | | | 367,354 | | | | 4,988,981 | |
| | Fomento de Construcciones y Contratas SA | | | 381,903 | | | | 3,181,584 | |
W | | Gestamp Automocion SA | | | 762,851 | | | | 2,686,219 | |
W | | Global Dominion Access SA | | | 695,411 | | | | 2,552,065 | |
* | | Grenergy Renovables SA | | | 9,966 | | | | 307,422 | |
| | Grupo Catalana Occidente SA | | | 270,353 | | | | 7,342,557 | |
# | | Grupo Empresarial San Jose SA | | | 151,317 | | | | 550,324 | |
| | Iberpapel Gestion SA | | | 47,911 | | | | 634,292 | |
| | Indra Sistemas SA | | | 928,400 | | | | 8,303,301 | |
| | Laboratorio Reig Jofre SA | | | 14,851 | | | | 34,969 | |
| | Laboratorios Farmaceuticos Rovi SA | | | 125,881 | | | | 5,725,346 | |
# | | Linea Directa Aseguradora SA Cia de Seguros y Reaseguros | | | 3,862,215 | | | | 3,619,793 | |
# | | Mapfre SA | | | 3,059,999 | | | | 5,248,481 | |
* | | Melia Hotels International SA | | | 762,631 | | | | 3,545,684 | |
# W | | Metrovacesa SA | | | 25,204 | | | | 178,310 | |
| | Miquel y Costas & Miquel SA | | | 193,707 | | | | 2,053,323 | |
W | | Neinor Homes SA | | | 90,425 | | | | 722,917 | |
# * | | Obrascon Huarte Lain SA | | | 1,665,246 | | | | 707,653 | |
# * | | Oryzon Genomics SA | | | 35,547 | | | | 74,694 | |
| | Pharma Mar SA | | | 37,278 | | | | 2,233,623 | |
| | Prim SA | | | 40,283 | | | | 441,439 | |
* | | Promotora de Informaciones SA, Class A | | | 1,330,083 | | | | 439,889 | |
# W | | Prosegur Cash SA | | | 445,278 | | | | 268,313 | |
| | Prosegur Cia de Seguridad SA | | | 1,211,235 | | | | 2,255,613 | |
* | | Realia Business SA | | | 1,667,905 | | | | 1,665,269 | |
| | Renta 4 Banco SA | | | 442 | | | | 4,089 | |
# | | Sacyr SA | | | 2,967,489 | | | | 7,279,618 | |
* | | Solaria Energia y Medio Ambiente SA | | | 519,113 | | | | 8,210,355 | |
* | | Soltec Power Holdings SA | | | 28,469 | | | | 119,915 | |
# W | | Talgo SA | | | 598,613 | | | | 1,661,052 | |
# * | | Tecnicas Reunidas SA | | | 188,993 | | | | 1,348,926 | |
* | | Tubacex SA | | | 738,150 | | | | 1,621,059 | |
# * | | Tubos Reunidos SA | | | 34,204 | | | | 7,511 | |
W | | Unicaja Banco SA | | | 7,996,906 | | | | 7,089,166 | |
| | Vidrala SA | | | 123,392 | | | | 9,432,195 | |
| | Viscofan SA | | | 271,401 | | | | 16,161,112 | |
| | Vocento SA | | | 352,577 | | | | 215,618 | |
| | | | | | | | | | |
TOTAL SPAIN | | | | 262,792,979 | |
| | | | | | | | | | |
SWEDEN — (5.9%) | | | | | | | | |
W | | AcadeMedia AB | | | 448,737 | | | | 1,920,422 | |
| | AddLife AB, Class B | | | 23,039 | | | | 215,377 | |
| | AddNode Group AB, Class B | | | 432,724 | | | | 3,764,682 | |
| | AFRY AB | | | 286,051 | | | | 3,841,317 | |
# W | | Alimak Group AB | | | 245,042 | | | | 1,536,415 | |
| | Alligo AB, Class B | | | 137,415 | | | | 1,015,741 | |
THE CONTINENTAL SMALL COMPANY SERIES
CONTINUED
| | | | | | | | | | |
| | | | | Shares | | | Value» | |
SWEDEN — (Continued) | | | | | | | | |
W | | Ambea AB | | | 196,916 | | | $ | 696,532 | |
* | | Annehem Fastigheter AB, Class B | | | 142,899 | | | | 278,897 | |
| | AQ Group AB | | | 1,510 | | | | 38,758 | |
* | | Arise AB | | | 102,189 | | | | 455,946 | |
| | Arjo AB, Class B | | | 1,033,502 | | | | 4,122,623 | |
| | Atrium Ljungberg AB, Class B | | | 206,092 | | | | 2,756,293 | |
#* W | | Attendo AB | | | 690,203 | | | | 1,424,827 | |
| | Balco Group AB | | | 979 | | | | 4,110 | |
| | BE Group AB | | | 3,385 | | | | 21,031 | |
| | Beijer Alma AB | | | 304,748 | | | | 4,260,838 | |
| | Beijer Electronics Group AB | | | 93,898 | | | | 778,220 | |
| | Bergman & Beving AB | | | 207,826 | | | | 1,707,771 | |
| | Bergs Timber AB, Class B | | | 6,227 | | | | 16,965 | |
| | Besqab AB | | | 21,962 | | | | 197,024 | |
| | Betsson AB, Class B | | | 893,660 | | | | 6,498,898 | |
# * | | Better Collective AS | | | 79,678 | | | | 1,035,835 | |
* | | BHG Group AB | | | 351,076 | | | | 588,330 | |
| | Bilia AB, Class A | | | 588,495 | | | | 6,233,477 | |
| | BioGaia AB, Class B | | | 73,000 | | | | 578,494 | |
* | | BioInvent International AB | | | 39,595 | | | | 141,305 | |
| | Biotage AB | | | 377,166 | | | | 6,190,580 | |
| | Bjorn Borg AB | | | 13,009 | | | | 32,629 | |
| | Bonava AB, Class B | | | 801,220 | | | | 2,343,526 | |
#* W | | Boozt AB | | | 212,829 | | | | 1,552,100 | |
W | | Bravida Holding AB | | | 671,431 | | | | 6,290,583 | |
| | Bufab AB | | | 233,559 | | | | 4,414,225 | |
# | | Bulten AB | | | 115,761 | | | | 651,854 | |
| | Bure Equity AB | | | 324,485 | | | | 6,261,924 | |
| | Byggmax Group AB | | | 525,366 | | | | 2,198,686 | |
| | Catella AB | | | 89,746 | | | | 322,396 | |
| | Catena AB | | | 166,530 | | | | 5,655,836 | |
# * | | Catena Media PLC | | | 330,046 | | | | 850,347 | |
* | | Cavotec SA | | | 79,682 | | | | 119,075 | |
| | Cellavision AB | | | 38,088 | | | | 714,219 | |
| | Cibus Nordic Real Estate AB | | | 13,536 | | | | 184,893 | |
| | Clas Ohlson AB, Class B | | | 278,624 | | | | 1,860,677 | |
| | Cloetta AB, Class B | | | 1,961,165 | | | | 3,584,894 | |
* | | Collector Bank AB | | | 288,079 | | | | 704,204 | |
| | Concentric AB | | | 343,567 | | | | 5,691,095 | |
W | | Coor Service Management Holding AB | | | 406,687 | | | | 2,160,720 | |
| | Corem Property Group AB, Class B | | | 3,839,342 | | | | 2,389,988 | |
| | Dedicare AB, Class B | | | 4,184 | | | | 44,074 | |
| | Dios Fastigheter AB | | | 782,055 | | | | 5,135,570 | |
W | | Dometic Group AB | | | 27,906 | | | | 159,775 | |
* | | Doro AB | | | 127,096 | | | | 184,314 | |
* | | Duni AB | | | 217,519 | | | | 1,463,803 | |
# W | | Dustin Group AB | | | 511,987 | | | | 2,130,291 | |
| | Eastnine AB | | | 126,421 | | | | 1,170,988 | |
| | Elanders AB, Class B | | | 73,298 | | | | 999,937 | |
| | Electrolux Professional AB, Class B | | | 463,954 | | | | 1,751,584 | |
* W | | Eltel AB | | | 206,068 | | | | 138,044 | |
# * | | Enea AB | | | 104,284 | | | | 744,008 | |
# | | Eolus Vind AB, Class B | | | 37,209 | | | | 442,833 | |
| | eWork Group AB | | | 38,130 | | | | 405,894 | |
| | Fagerhult AB | | | 300,931 | | | | 1,199,509 | |
# | | FastPartner AB, Class A | | | 19,405 | | | | 118,563 | |
| | FastPartner AB, Class D | | | 35 | | | | 200 | |
# | | Fenix Outdoor International AG | | | 19,605 | | | | 1,594,531 | |
# * | | Fingerprint Cards AB, Class B | | | 414,711 | | | | 196,158 | |
THE CONTINENTAL SMALL COMPANY SERIES
CONTINUED
| | | | | | | | | | |
| | | | | Shares | | | Value» | |
SWEDEN — (Continued) | | | | | | | | |
# | | G5 Entertainment AB | | | 42,727 | | | $ | 701,241 | |
| | GARO AB | | | 23,361 | | | | 235,535 | |
| | Granges AB | | | 830,363 | | | | 5,611,350 | |
| | Hanza AB | | | 30,446 | | | | 132,360 | |
# | | Heba Fastighets AB, Class B | | | 269,814 | | | | 770,578 | |
| | Hexatronic Group AB | | | 352,315 | | | | 4,767,930 | |
| | HMS Networks AB | | | 129,149 | | | | 3,322,807 | |
* W | | Hoist Finance AB | | | 379,338 | | | | 871,076 | |
* | | Humana AB | | | 135,681 | | | | 516,549 | |
* | | IAR Systems Group AB | | | 1,213 | | | | 14,194 | |
* | | Immunovia AB | | | 8,077 | | | | 25,550 | |
# | | Instalco AB | | | 501,901 | | | | 2,013,287 | |
* | | International Petroleum Corp. | | | 409,767 | | | | 4,060,430 | |
| | Inwido AB | | | 455,135 | | | | 4,088,487 | |
| | JM AB | | | 431,178 | | | | 6,492,204 | |
# * | | John Mattson Fastighetsforetagen AB | | | 8,700 | | | | 54,948 | |
* | | Karnov Group AB | | | 83,905 | | | | 447,323 | |
# * | | K-fast Holding AB | | | 9,734 | | | | 20,000 | |
| | Kindred Group PLC, SDR | | | 271,612 | | | | 2,356,188 | |
| | KNOW IT AB | | | 177,051 | | | | 3,523,824 | |
# | | Lagercrantz Group AB, Class B | | | 1,069,709 | | | | 9,163,188 | |
| | Lime Technologies AB | | | 15,348 | | | | 280,396 | |
| | Lindab International AB | | | 627,739 | | | | 6,677,353 | |
| | Loomis AB | | | 388,741 | | | | 10,884,173 | |
* | | Maha Energy AB | | | 148,058 | | | | 163,721 | |
* | | Medcap AB | | | 6,064 | | | | 114,828 | |
| | MEKO AB | | | 299,806 | | | | 2,833,121 | |
* | | Midsona AB, Class B | | | 8,545 | | | | 6,339 | |
# | | MIPS AB | | | 61,750 | | | | 1,997,126 | |
| | Modern Times Group MTG AB, Class B | | | 604,885 | | | | 4,534,744 | |
* | | Momentum Group AB | | | 137,415 | | | | 731,800 | |
W | | Munters Group AB | | | 198,554 | | | | 1,549,087 | |
| | Mycronic AB | | | 436,033 | | | | 6,843,129 | |
# | | NCAB Group AB | | | 85,408 | | | | 372,318 | |
| | NCC AB, Class B | | | 428,640 | | | | 3,571,620 | |
| | Nederman Holding AB | | | 33,980 | | | | 464,627 | |
* | | Net Insight AB, Class B | | | 2,560,497 | | | | 1,353,071 | |
| | New Wave Group AB, Class B | | | 426,925 | | | | 5,933,551 | |
| | Nilorngruppen AB, Class B | | | 7,191 | | | | 48,995 | |
| | Nobia AB | | | 832,268 | | | | 1,385,944 | |
| | Nolato AB, Class B | | | 1,479,720 | | | | 6,241,219 | |
| | Nordic Paper Holding AB | | | 14,413 | | | | 38,716 | |
| | Nordic Waterproofing Holding AB | | | 83,900 | | | | 1,085,160 | |
* | | Note AB | | | 56,156 | | | | 811,284 | |
# | | NP3 Fastigheter AB | | | 178,739 | | | | 2,840,196 | |
| | Nyfosa AB | | | 1,209,815 | | | | 7,229,996 | |
| | OEM International AB, Class B | | | 296,140 | | | | 1,477,365 | |
# | | Orron Energy AB | | | 283,199 | | | | 587,484 | |
* | | Ovzon AB | | | 1,938 | | | | 7,007 | |
| | Peab AB, Class B | | | 40,736 | | | | 211,364 | |
| | Platzer Fastigheter Holding AB, Class B | | | 250,352 | | | | 1,551,829 | |
| | Prevas AB, Class B | | | 8,542 | | | | 89,315 | |
| | Pricer AB, Class B | | | 892,974 | | | | 1,543,393 | |
| | Proact IT Group AB | | | 191,163 | | | | 1,548,031 | |
| | Profilgruppen AB, Class B | | | 287 | | | | 2,545 | |
| | Ratos AB, Class B | | | 1,560,795 | | | | 5,842,186 | |
* | | RaySearch Laboratories AB | | | 160,684 | | | | 835,305 | |
| | Rejlers AB | | | 948 | | | | 11,126 | |
W | | Resurs Holding AB | | | 932,730 | | | | 2,026,789 | |
THE CONTINENTAL SMALL COMPANY SERIES
CONTINUED
| | | | | | | | | | |
| | | | | Shares | | | Value» | |
SWEDEN — (Continued) | | | | | | | | |
# | | Rottneros AB | | | 672,020 | | | $ | 780,164 | |
* | | Scandi Standard AB | | | 397,762 | | | | 1,825,845 | |
* W | | Scandic Hotels Group AB | | | 978,372 | | | | 3,102,641 | |
* | | Sdiptech AB, Class B | | | 16,632 | | | | 320,697 | |
| | Sectra AB, Class B | | | 170,156 | | | | 2,255,736 | |
* | | Sensys Gatso Group AB | | | 3,512,360 | | | | 362,877 | |
| | SkiStar AB | | | 324,208 | | | | 3,102,375 | |
* | | Solid Forsakring AB | | | 86,686 | | | | 412,825 | |
# * | | Stendorren Fastigheter AB | | | 5,750 | | | | 99,916 | |
* | | Stillfront Group AB | | | 458,631 | | | | 892,657 | |
| | Systemair AB | | | 360,836 | | | | 1,909,347 | |
| | Tethys Oil AB | | | 125,374 | | | | 773,853 | |
| | TF Bank AB | | | 5,604 | | | | 83,724 | |
* | | Tobii AB | | | 14,796 | | | | 24,487 | |
| | Troax Group AB | | | 227,770 | | | | 3,380,530 | |
| | VBG Group AB, Class B | | | 28,343 | | | | 331,103 | |
| | Vitec Software Group AB, Class B | | | 45,648 | | | | 1,674,967 | |
| | Volati AB | | | 5,223 | | | | 47,800 | |
| | XANO Industri AB, Class B | | | 5,023 | | | | 47,057 | |
| | | | | | | | | | |
TOTAL SWEDEN | | | | 270,528,558 | |
| | | | | | | | | | |
SWITZERLAND — (16.5%) | | | | | | | | |
| | Adecco Group AG | | | 290,101 | | | | 9,078,990 | |
| | Allreal Holding AG | | | 125,251 | | | | 17,941,765 | |
| | ALSO Holding AG | | | 46,851 | | | | 7,363,433 | |
* | | Aluflexpack AG | | | 721 | | | | 11,443 | |
* | | ams-OSRAM AG | | | 1,474,621 | | | | 8,346,870 | |
| | APG SGA SA | | | 9,203 | | | | 1,502,983 | |
| | Arbonia AG | | | 345,431 | | | | 4,198,510 | |
* | | Aryzta AG | | | 6,500,102 | | | | 6,663,249 | |
# | | Ascom Holding AG | | | 200,120 | | | | 1,230,522 | |
# | | Autoneum Holding AG | | | 21,715 | | | | 2,076,905 | |
| | Baloise Holding AG | | | 98,975 | | | | 13,522,175 | |
| | Banque Cantonale de Geneve | | | 9,528 | | | | 1,712,786 | |
| | Banque Cantonale du Jura SA | | | 3,848 | | | | 211,425 | |
# | | Banque Cantonale Vaudoise | | | 119,980 | | | | 10,677,685 | |
* | | Basilea Pharmaceutica AG | | | 896 | | | | 41,215 | |
| | Belimo Holding AG | | | 65,574 | | | | 26,708,771 | |
| | Bell Food Group AG | | | 14,632 | | | | 3,568,236 | |
| | Bellevue Group AG | | | 57,974 | | | | 2,011,247 | |
| | Berner Kantonalbank AG | | | 31,172 | | | | 6,865,951 | |
| | BKW AG | | | 163,805 | | | | 19,109,935 | |
| | Bossard Holding AG, Class A | | | 46,504 | | | | 9,232,864 | |
| | Bucher Industries AG | | | 54,335 | | | | 18,319,886 | |
| | Burckhardt Compression Holding AG | | | 5,451 | | | | 2,358,093 | |
| | Burkhalter Holding AG | | | 29,873 | | | | 2,327,204 | |
| | Bystronic AG | | | 9,740 | | | | 5,594,616 | |
| | Calida Holding AG | | | 40,721 | | | | 1,728,548 | |
| | Carlo Gavazzi Holding AG | | | 3,115 | | | | 818,051 | |
| | Cembra Money Bank AG | | | 195,981 | | | | 14,212,363 | |
# * | | Cicor Technologies Ltd. | | | 15,422 | | | | 649,650 | |
| | Cie Financiere Tradition SA | | | 11,329 | | | | 1,182,779 | |
| | Clariant AG | | | 1,125,574 | | | | 18,088,884 | |
| | Coltene Holding AG | | | 27,288 | | | | 2,183,016 | |
| | Comet Holding AG | | | 19,878 | | | | 3,164,532 | |
# | | COSMO Pharmaceuticals NV | | | 9,195 | | | | 536,982 | |
| | Daetwyler Holding AG | | | 10,404 | | | | 1,846,443 | |
| | DKSH Holding AG | | | 235,948 | | | | 17,021,421 | |
| | dormakaba Holding AG | | | 24,531 | | | | 7,786,524 | |
THE CONTINENTAL SMALL COMPANY SERIES
CONTINUED
| | | | | | | | | | |
| | | | | Shares | | | Value» | |
SWITZERLAND — (Continued) | | | | | | | | |
# * | | Dufry AG | | | 394,700 | | | $ | 13,020,173 | |
| | EFG International AG | | | 683,675 | | | | 5,595,391 | |
| | Emmi AG | | | 15,919 | | | | 12,702,654 | |
| | Energiedienst Holding AG | | | 83,637 | | | | 3,425,213 | |
# * | | Evolva Holding SA | | | 3,349,123 | | | | 281,191 | |
# | | Feintool International Holding AG | | | 46,525 | | | | 933,909 | |
* | | Flughafen Zurich AG | | | 147,702 | | | | 22,913,924 | |
| | Forbo Holding AG | | | 8,660 | | | | 10,483,111 | |
| | Fundamenta Real Estate AG | | | 3,191 | | | | 49,854 | |
W | | Galenica AG | | | 217,849 | | | | 15,652,018 | |
# * | | GAM Holding AG | | | 1,195,762 | | | | 904,278 | |
| | Georg Fischer AG | | | 630,511 | | | | 34,920,705 | |
# | | Gurit Holding AG, Class BR | | | 28,958 | | | | 2,675,563 | |
| | Helvetia Holding AG | | | 266,750 | | | | 26,488,894 | |
| | Hiag Immobilien Holding AG | | | 22,952 | | | | 1,847,445 | |
# * | | HOCHDORF Holding AG | | | 6,697 | | | | 171,058 | |
| | Huber & Suhner AG | | | 108,834 | | | | 9,694,013 | |
| | Hypothekarbank Lenzburg AG | | | 6 | | | | 24,799 | |
# * | | Implenia AG | | | 106,354 | | | | 3,992,652 | |
# * | | Ina Invest Holding AG | | | 29,730 | | | | 582,245 | |
| | Inficon Holding AG | | | 14,941 | | | | 11,879,817 | |
| | Interroll Holding AG | | | 5,083 | | | | 10,708,261 | |
| | Intershop Holding AG | | | 10,830 | | | | 6,586,822 | |
| | Investis Holding SA | | | 5,818 | | | | 589,720 | |
* | | Jungfraubahn Holding AG | | | 18,335 | | | | 2,078,995 | |
| | Kardex Holding AG | | | 49,726 | | | | 7,604,173 | |
| | Komax Holding AG | | | 22,553 | | | | 5,293,111 | |
# | | Kudelski SA | | | 217,692 | | | | 593,540 | |
# | | Landis & Gyr Group AG | | | 94,470 | | | | 5,444,017 | |
| | LEM Holding SA | | | 3,961 | | | | 6,594,867 | |
| | Liechtensteinische Landesbank AG | | | 64,467 | | | | 3,520,140 | |
| | Luzerner Kantonalbank AG | | | 20,239 | | | | 8,344,316 | |
W | | Medacta Group SA | | | 7,980 | | | | 717,552 | |
W | | Medmix AG | | | 143,103 | | | | 2,519,214 | |
# | | Meier Tobler Group AG | | | 45,826 | | | | 1,447,452 | |
| | Metall Zug AG, Class B | | | 1,139 | | | | 2,111,151 | |
| | Mikron Holding AG | | | 8,692 | | | | 76,196 | |
| | Mobilezone Holding AG | | | 305,439 | | | | 4,844,156 | |
| | Mobimo Holding AG | | | 63,088 | | | | 14,715,792 | |
| | Novavest Real Estate AG | | | 1,614 | | | | 65,515 | |
| | OC Oerlikon Corp. AG | | | 1,694,495 | | | | 10,944,954 | |
# * | | Orascom Development Holding AG | | | 93,520 | | | | 700,611 | |
# | | Orell Fuessli AG | | | 5,028 | | | | 411,260 | |
| | Orior AG | | | 38,352 | | | | 2,673,532 | |
| | Phoenix Mecano AG | | | 4,517 | | | | 1,478,243 | |
# | | Plazza AG, Class A | | | 6,993 | | | | 2,172,449 | |
| | PSP Swiss Property AG | | | 340,600 | | | | 36,386,222 | |
| | Rieter Holding AG | | | 23,266 | | | | 1,939,266 | |
| | Romande Energie Holding SA | | | 2,670 | | | | 2,986,258 | |
| | Schaffner Holding AG | | | 3,129 | | | | 840,770 | |
| | Schweiter Technologies AG | | | 7,284 | | | | 4,879,749 | |
| | Schweizerische Nationalbank | | | 23 | | | | 97,524 | |
* W | | Sensirion Holding AG | | | 32,043 | | | | 2,915,344 | |
| | SFS Group AG | | | 127,036 | | | | 11,487,665 | |
| | Siegfried Holding AG | | | 32,909 | | | | 19,590,005 | |
| | SIG Group AG | | | 80,424 | | | | 1,545,996 | |
| | Softwareone Holding AG | | | 221,469 | | | | 2,492,461 | |
| | St Galler Kantonalbank AG | | | 17,617 | | | | 8,293,666 | |
# | | Stadler Rail AG | | | 7,173 | | | | 211,070 | |
THE CONTINENTAL SMALL COMPANY SERIES
CONTINUED
| | | | | | | | | | |
| | | | | Shares | | | Value» | |
SWITZERLAND — (Continued) | | | | | | | | |
| | Sulzer AG | | | 141,392 | | | $ | 9,430,093 | |
| | Swiss Prime Site AG | | | 182,651 | | | | 14,738,643 | |
* | | Swiss Steel Holding AG | | | 3,362,368 | | | | 757,047 | |
| | Swissquote Group Holding SA | | | 83,234 | | | | 9,859,161 | |
| | Temenos AG | | | 121,898 | | | | 7,260,094 | |
| | Thurgauer Kantonalbank | | | 3,152 | | | | 369,918 | |
# | | Tornos Holding AG | | | 26,632 | | | | 149,478 | |
| | TX Group AG | | | 20,220 | | | | 2,809,547 | |
| | u-blox Holding AG | | | 55,196 | | | | 5,651,199 | |
| | Valiant Holding AG | | | 111,863 | | | | 10,956,697 | |
W | | VAT Group AG | | | 114,674 | | | | 26,180,212 | |
| | Vaudoise Assurances Holding SA | | | 6,800 | | | | 2,717,990 | |
| | Vetropack Holding AG | | | 67,815 | | | | 2,168,340 | |
# * | | Von Roll Holding AG | | | 378,198 | | | | 302,420 | |
| | Vontobel Holding AG | | | 227,580 | | | | 12,806,081 | |
| | VP Bank AG, Class A | | | 24,056 | | | | 2,087,430 | |
| | VZ Holding AG | | | 91,061 | | | | 6,279,952 | |
* | | V-ZUG Holding AG | | | 10,820 | | | | 780,856 | |
| | Walliser Kantonalbank | | | 19,368 | | | | 2,079,571 | |
| | Warteck Invest AG | | | 56 | | | | 123,069 | |
| | Ypsomed Holding AG | | | 5,162 | | | | 830,226 | |
| | Zehnder Group AG | | | 86,886 | | | | 4,679,113 | |
| | Zug Estates Holding AG, Class B | | | 1,186 | | | | 1,977,829 | |
| | Zuger Kantonalbank AG | | | 704 | | | | 5,186,165 | |
# * | | Zur Rose Group AG | | | 4,404 | | | | 118,977 | |
| | | | | | | | | | |
TOTAL SWITZERLAND | | | | 754,337,002 | |
| | | | | | | | | | |
UNITED STATES — (0.3%) | | | | | | | | |
# | | ADTRAN Holdings, Inc. | | | 325,096 | | | | 7,361,404 | |
| | Noble Corp. PLC | | | 154,390 | | | | 5,487,656 | |
| | | | | | | | | | |
TOTAL UNITED STATES | | | | 12,849,060 | |
| | | | | | | | | | |
TOTAL COMMON STOCKS | | | | 4,279,782,528 | |
| | | | | | | | | | |
PREFERRED STOCKS — (0.7%) | | | | | | | | |
| | |
GERMANY — (0.7%) | | | | | | | | |
| | Draegerwerk AG & Co. KGaA | | | 65,509 | | | | 2,635,900 | |
| | Fuchs Petrolub SE | | | 417,973 | | | | 11,970,344 | |
| | Jungheinrich AG | | | 355,303 | | | | 8,829,655 | |
| | Sixt SE | | | 119,957 | | | | 6,986,943 | |
| | STO SE & Co. KGaA | | | 16,969 | | | | 2,185,756 | |
| | Villeroy & Boch AGSeries A | | | 41,086 | | | | 686,153 | |
| | | | | | | | | | |
TOTAL GERMANY | | | | 33,294,751 | |
| | | | | | | | | | |
RIGHTS/WARRANTS — (0.0%) | | | | | | | | |
| | |
AUSTRIA — (0.0%) | | | | | | | | |
* †† | | CA Immobilien Anlagen AG Rights 07/26/22 | | | 497,492 | | | | 0 | |
* | | S Immo AG 8/11/23 | | | 346,922 | | | | 0 | |
| | | | | | | | | | |
ITALY — (0.0%) | | | | | | | | |
# * | | Webuild SpA Warrants 08/02/30 | | | 116,038 | | | | 0 | |
| | | | | | | | | | |
TOTAL RIGHTS/WARRANTS | | | | 0 | |
| | | | | | | | | | |
TOTAL INVESTMENT SECURITIES
(Cost $4,398,989,975) | | | | 4,313,077,279 | |
| | | | | | | | | | |
THE CONTINENTAL SMALL COMPANY SERIES
CONTINUED
| | | | | | | | | | |
| | | | | Shares | | | Value† | |
SECURITIES LENDING COLLATERAL — (5.6%) | | | | | | | | |
@ § | | The DFA Short Term Investment Fund. | | | 22,188,427 | | | $ | 256,520,399 | |
| | | | | | | | | | |
TOTAL INVESTMENTS — (100.0%)
(Cost $4,655,611,905) | | | | | | $ | 4,569,597,678 | |
| | | | | | | | | | |
| ADR | American Depositary Receipt |
| » | Securities that have been fair value factored. See Note B to Financial Statements. |
| # | Total or Partial Securities on Loan. |
| W | Rule 144A, Section 4(2), or other security that is restricted as to resale to institutional investors. This security has been deemed liquid based upon the Fund’s Liquidity Guidelines. The liquidity determination is unaudited. |
| * | Non-Income Producing Securities. |
| †† | Security valued using significant unobservable inputs (Level 3). |
| † | See Note B to Financial Statements. |
| @ | Security purchased with cash collateral received from Securities on Loan. |
Summary of the Series’ investments as of October 31, 2022, based on their valuation inputs, is as follows (see Security Valuation Note):
| | | | | | | | | | | | | | | | |
| | | Investments in Securities (Market Value) | |
| | | Level 1 | | | Level 2 | | | Level 3 | | | Total | |
Common Stocks | | | | | | | | | | | | | | | | |
Austria | | $ | 376,173 | | | $ | 141,188,397 | | | | — | | | $ | 141,564,570 | |
Belgium | | | 792,151 | | | | 199,421,943 | | | | — | | | | 200,214,094 | |
Denmark | | | — | | | | 284,839,811 | | | | — | | | | 284,839,811 | |
Finland | | | — | | | | 241,247,565 | | | | — | | | | 241,247,565 | |
France | | | 127,704 | | | | 474,099,006 | | | $ | 34,930 | | | | 474,261,640 | |
Germany | | | — | | | | 611,161,049 | | | | — | | | | 611,161,049 | |
Ireland | | | — | | | | 67,660,431 | | | | — | | | | 67,660,431 | |
Israel | | | 585,758 | | | | 162,154,391 | | | | — | | | | 162,740,149 | |
Italy | | | — | | | | 383,891,506 | | | | — | | | | 383,891,506 | |
Netherlands | | | — | | | | 256,339,951 | | | | — | | | | 256,339,951 | |
Norway | | | 239,412 | | | | 111,199,514 | | | | — | | | | 111,438,926 | |
Portugal | | | — | | | | 43,915,237 | | | | — | | | | 43,915,237 | |
Spain | | | — | | | | 262,792,979 | | | | — | | | | 262,792,979 | |
Sweden | | | 704,204 | | | | 269,824,354 | | | | — | | | | 270,528,558 | |
Switzerland | | | — | | | | 754,337,002 | | | | — | | | | 754,337,002 | |
United States | | | 5,487,656 | | | | 7,361,404 | | | | — | | | | 12,849,060 | |
Preferred Stocks | | | | | | | | | | | | | | | | |
Germany | | | — | | | | 33,294,751 | | | | — | | | | 33,294,751 | |
Securities Lending Collateral | | | — | | | | 256,520,399 | | | | — | | | | 256,520,399 | |
| | | | | | | | | | | | | | | | |
TOTAL | | $ | 8,313,058 | | | $ | 4,561,249,690 | | | $ | 34,930 | ^ | | $ | 4,569,597,678 | |
| | | | | | | | | | | | | | | | |
| ^ | A reconciliation of Level 3 investments is presented when the Fund had a significant amount of Level 3 investments at the beginning and/or end of the reporting period in relation to net assets. |
See accompanying Notes to Financial Statements.
THE CANADIAN SMALL COMPANY SERIES
SCHEDULE OF INVESTMENTS
October 31, 2022
| | | | | | | | | | |
| | | | | Shares | | | Value» | |
COMMON STOCKS — (85.9%) | | | | | | | | |
COMMUNICATION SERVICES — (1.1%) | | | | | | | | |
* | | AcuityAds Holdings, Inc. | | | 9,419 | | | $ | 14,865 | |
# * | | Aimia, Inc. | | | 732,996 | | | | 1,990,740 | |
* | | Cineplex, Inc. | | | 28,690 | | | | 195,008 | |
# | | Cogeco Communications, Inc. | | | 84,282 | | | | 4,298,391 | |
| | Cogeco, Inc. | | | 36,634 | | | | 1,560,175 | |
# | | Corus Entertainment, Inc., Class B | | | 1,137,421 | | | | 1,795,027 | |
* | | Enthusiast Gaming Holdings, Inc. | | | 18,353 | | | | 12,124 | |
* | | Enthusiast Gaming Holdings, Inc., Class I | | | 9,000 | | | | 6,013 | |
| | TELUS Corp. | | | 173,836 | | | | 3,630,231 | |
* | | TeraGo, Inc. | | | 2,400 | | | | 5,056 | |
# * | | WildBrain Ltd. | | | 612,863 | | | | 931,205 | |
# | | Yellow Pages Ltd. | | | 84,100 | | | | 834,611 | |
| | | | | | | | | | |
TOTAL COMMUNICATION SERVICES | | | | 15,273,446 | |
| | | | | | | | | | |
CONSUMER DISCRETIONARY — (4.7%) | | | | | | | | |
# * | | Aritzia, Inc. | | | 461,040 | | | | 17,881,861 | |
* | | AutoCanada, Inc. | | | 126,941 | | | | 1,980,964 | |
# | | BMTC Group, Inc. | | | 20,581 | | | | 186,571 | |
# * | | Bragg Gaming Group, Inc. | | | 4,700 | | | | 17,905 | |
# * | | Canada Goose Holdings, Inc. | | | 266,505 | | | | 4,360,058 | |
# | | Dorel Industries, Inc., Class B | | | 149,777 | | | | 589,829 | |
# | | Exco Technologies Ltd. | | | 164,124 | | | | 834,866 | |
| | Gamehost, Inc. | | | 89,999 | | | | 520,235 | |
| | Leon’s Furniture Ltd. | | | 167,479 | | | | 2,096,023 | |
| | Linamar Corp. | | | 255,634 | | | | 10,941,402 | |
# | | Martinrea International, Inc. | | | 483,433 | | | | 3,097,860 | |
# | | MTY Food Group, Inc. | | | 103,015 | | | | 4,175,518 | |
| | Park Lawn Corp. | | | 183,743 | | | | 2,852,545 | |
| | Pizza Pizza Royalty Corp. | | | 162,278 | | | | 1,508,012 | |
# | | Pollard Banknote Ltd. | | | 49,129 | | | | 602,595 | |
* | | Recipe Unlimited Corp. | | | 23,985 | | | | 364,788 | |
# W | | Sleep Country Canada Holdings, Inc. | | | 208,190 | | | | 3,426,153 | |
W | | Spin Master Corp. | | | 155,322 | | | | 4,799,836 | |
* | | Uni-Select, Inc. | | | 242,884 | | | | 6,587,561 | |
| | | | | | | | | | |
TOTAL CONSUMER DISCRETIONARY | | | | 66,824,582 | |
| | | | | | | | | | |
CONSUMER STAPLES — (4.2%) | | | | | | | | |
# | | Andrew Peller Ltd., Class A | | | 168,200 | | | | 616,081 | |
* | | CareRx Corp. | | | 2,700 | | | | 5,846 | |
| | Corby Spirit & Wine Ltd. | | | 85,367 | | | | 1,058,981 | |
| | High Liner Foods, Inc. | | | 106,744 | | | | 1,027,989 | |
W | | Jamieson Wellness, Inc. | | | 254,326 | | | | 6,222,106 | |
# | | KP Tissue, Inc. | | | 47,200 | | | | 351,311 | |
| | Lassonde Industries, Inc., Class A | | | 18,000 | | | | 1,553,654 | |
# | | Maple Leaf Foods, Inc. | | | 445,946 | | | | 6,608,911 | |
| | Neighbourly Pharmacy, Inc. | | | 1,426 | | | | 24,294 | |
# | | North West Co., Inc. | | | 291,156 | | | | 7,576,232 | |
# | | Premium Brands Holdings Corp. | | | 227,466 | | | | 13,419,050 | |
| | Primo Water Corp. | | | 893,347 | | | | 13,024,135 | |
# | | Rogers Sugar, Inc. | | | 693,819 | | | | 3,050,593 | |
# * | | SunOpta, Inc. | | | 403,480 | | | | 4,536,117 | |
| | | | | | | | | | |
TOTAL CONSUMER STAPLES | | | | 59,075,300 | |
| | | | | | | | | | |
THE CANADIAN SMALL COMPANY SERIES
CONTINUED
| | | | | | | | | | |
| | | | | Shares | | | Value» | |
ENERGY — (24.7%) | | | | | | | | |
* | | Advantage Energy Ltd. | | | 1,194,867 | | | $ | 9,033,751 | |
| | Africa Oil Corp. | | | 1,333,299 | | | | 3,268,777 | |
* | | AKITA Drilling Ltd., Class A | | | 400 | | | | 543 | |
* | | Athabasca Oil Corp. | | | 2,177,410 | | | | 4,395,256 | |
* | | Baytex Energy Corp. | | | 2,341,875 | | | | 12,720,575 | |
# | | Birchcliff Energy Ltd. | | | 1,610,417 | | | | 12,518,307 | |
* | | Bonterra Energy Corp. | | | 62,003 | | | | 405,510 | |
* | | Calfrac Well Services Ltd. | | | 3,700 | | | | 20,315 | |
# | | Canacol Energy Ltd. | | | 933,510 | | | | 1,377,294 | |
# | | Cardinal Energy Ltd. | | | 665,476 | | | | 4,513,521 | |
| | CES Energy Solutions Corp. | | | 1,361,989 | | | | 2,869,240 | |
| | Computer Modelling Group Ltd. | | | 452,045 | | | | 1,791,789 | |
# | | Crescent Point Energy Corp. | | | 3,289,792 | | | | 25,721,914 | |
* | | Crew Energy, Inc. | | | 556,020 | | | | 2,456,961 | |
# * | | Denison Mines Corp. | | | 3,853,823 | | | | 4,865,545 | |
# | | Enerflex Ltd. | | | 616,865 | | | | 3,187,675 | |
# * | | Energy Fuels, Inc. | | | 175,574 | | | | 1,269,425 | |
# | | Enerplus Corp. | | | 1,323,108 | | | | 22,938,849 | |
* | | Ensign Energy Services, Inc. | | | 741,132 | | | | 1,898,595 | |
# * | | Fission Uranium Corp. | | | 1,962,000 | | | | 1,022,513 | |
# | | Freehold Royalties Ltd. | | | 652,441 | | | | 8,117,499 | |
* | | Frontera Energy Corp. | | | 280,837 | | | | 2,350,014 | |
| | Gear Energy Ltd. | | | 201,778 | | | | 202,911 | |
# | | Gibson Energy, Inc. | | | 899,205 | | | | 15,345,922 | |
* | | Gran Tierra Energy, Inc. | | | 2,209,295 | | | | 3,048,757 | |
* | | Greenlane Renewables, Inc. | | | 17,100 | | | | 6,653 | |
# * | | Headwater Exploration, Inc. | | | 648,910 | | | | 3,439,006 | |
* | | InPlay Oil Corp. | | | 29,169 | | | | 72,369 | |
* | | Journey Energy, Inc. | | | 22,652 | | | | 100,594 | |
* | | Kelt Exploration Ltd. | | | 959,669 | | | | 4,149,044 | |
# | | Keyera Corp. | | | 179,269 | | | | 3,842,372 | |
* | | Kolibri Global Energy, Inc. | | | 5,600 | | | | 12,208 | |
* †† | | Lightstream Resources Ltd. | | | 687,816 | | | | 0 | |
# * | | MEG Energy Corp. | | | 2,167,763 | | | | 32,412,620 | |
| | North American Construction Group Ltd. | | | 152,233 | | | | 1,899,480 | |
* | | NuVista Energy Ltd. | | | 1,111,528 | | | | 11,022,676 | |
* | | Obsidian Energy Ltd. | | | 48,098 | | | | 439,616 | |
# | | Paramount Resources Ltd., Class A | | | 405,621 | | | | 8,592,673 | |
| | Parex Resources, Inc. | | | 774,607 | | | | 11,815,124 | |
| | Parkland Corp. | | | 836,660 | | | | 16,913,140 | |
| | Pason Systems, Inc. | | | 434,525 | | | | 4,615,243 | |
* | | Petrus Resources Ltd. | | | 4,900 | | | | 10,502 | |
# | | Peyto Exploration & Development Corp. | | | 965,837 | | | | 9,017,834 | |
| | PHX Energy Services Corp. | | | 106,006 | | | | 651,279 | |
* | | Pieridae Energy Ltd. | | | 21,800 | | | | 20,642 | |
| | Pine Cliff Energy Ltd. | | | 87,000 | | | | 107,924 | |
* | | Pipestone Energy Corp. | | | 63,055 | | | | 190,227 | |
# | | PrairieSky Royalty Ltd. | | | 1,182,767 | | | | 18,370,720 | |
* | | Precision Drilling Corp. | | | 79,933 | | | | 5,898,631 | |
# * | | Questerre Energy Corp., Class A | | | 797,460 | | | | 134,632 | |
| | Secure Energy Services, Inc. | | | 1,849,956 | | | | 9,709,094 | |
* | | ShawCor Ltd. | | | 386,078 | | | | 2,816,909 | |
* W | | STEP Energy Services Ltd. | | | 21,460 | | | | 99,396 | |
# | | Surge Energy, Inc. | | | 40,642 | | | | 305,182 | |
| | Tamarack Valley Energy Ltd. | | | 1,603,208 | | | | 6,178,179 | |
| | TerraVest Industries, Inc. | | | 5,000 | | | | 86,982 | |
| | Tidewater Midstream & Infrastructure Ltd. | | | 1,358,267 | | | | 1,146,553 | |
| | Total Energy Services, Inc. | | | 256,662 | | | | 1,477,030 | |
# * | | Touchstone Exploration, Inc. | | | 28,397 | | | | 24,179 | |
THE CANADIAN SMALL COMPANY SERIES
CONTINUED
| | | | | | | | | | |
| | | | | Shares | | | Value» | |
ENERGY — (Continued) | | | | | | | | |
* | | Trican Well Service Ltd. | | | 1,267,327 | | | $ | 3,367,508 | |
# | | VAALCO Energy, Inc. | | | 63,978 | | | | 329,485 | |
# | | Vermilion Energy, Inc. | | | 949,975 | | | | 22,161,601 | |
# | | Whitecap Resources, Inc. | | | 2,696,209 | | | | 20,899,159 | |
# * | | Yangarra Resources Ltd. | | | 323,471 | | | | 707,559 | |
| | | | | | | | | | |
TOTAL ENERGY | | | | 348,385,483 | |
| | | | | | | | | | |
FINANCIALS — (8.0%) | | | | | | | | |
| | AGF Management Ltd., Class B | | | 351,328 | | | | 1,627,247 | |
# | | Alaris Equity Partners Income | | | 153,883 | | | | 1,784,675 | |
# | | Canaccord Genuity Group, Inc. | | | 480,207 | | | | 2,460,341 | |
# | | Canadian Western Bank | | | 498,863 | | | | 8,678,426 | |
# | | Chesswood Group Ltd. | | | 56,542 | | | | 459,856 | |
# | | CI Financial Corp. | | | 1,010,158 | | | | 10,113,814 | |
| | Clairvest Group, Inc. | | | 1,900 | | | | 99,194 | |
| | ECN Capital Corp. | | | 2,283,938 | | | | 6,890,289 | |
| | E-L Financial Corp. Ltd. | | | 7,278 | | | | 4,701,171 | |
| | Element Fleet Management Corp. | | | 2,180,348 | | | | 29,047,834 | |
# | | EQB, Inc. | | | 135,984 | | | | 4,819,105 | |
# | | Fiera Capital Corp. | | | 356,949 | | | | 2,271,625 | |
| | Firm Capital Mortgage Investment Corp. | | | 186,421 | | | | 1,595,529 | |
# | | First National Financial Corp. | | | 82,019 | | | | 2,058,979 | |
# | | goeasy Ltd. | | | 61,859 | | | | 5,018,736 | |
# * | | GoldMoney, Inc. | | | 125,000 | | | | 155,063 | |
| | Guardian Capital Group Ltd., Class A | | | 93,214 | | | | 1,778,958 | |
# | | Home Capital Group, Inc. | | | 284,804 | | | | 5,506,469 | |
| | Kingsway Financial Services, Inc. | | | 13,070 | | | | 89,531 | |
# | | Laurentian Bank of Canada | | | 370,975 | | | | 8,278,078 | |
| | Onex Corp. | | | 33,086 | | | | 1,665,289 | |
* | | RF Capital Group, Inc. | | | 17,024 | | | | 179,941 | |
# | | Sprott, Inc. | | | 133,740 | | | | 4,794,041 | |
# | | Timbercreek Financial Corp. | | | 518,190 | | | | 2,925,005 | |
* | | Trisura Group Ltd. | | | 199,610 | | | | 5,806,543 | |
| | VersaBank | | | 3,400 | | | | 23,185 | |
| | | | | | | | | | |
TOTAL FINANCIALS | | | | 112,828,924 | |
| | | | | | | | | | |
HEALTH CARE — (1.3%) | | | | | | | | |
# | | Andlauer Healthcare Group, Inc. | | | 54,458 | | | | 2,087,420 | |
# * | | Aptose Biosciences, Inc. | | | 75,121 | | | | 34,615 | |
# * | | Aurora Cannabis, Inc. | | | 763,275 | | | | 1,093,124 | |
# * | | Bausch Health Cos., Inc. | | | 96,300 | | | | 625,950 | |
# * | | Canopy Growth Corp. | | | 313,200 | | | | 1,169,573 | |
# * | | Charlottes Web Holdings, Inc. | | | 49,894 | | | | 39,187 | |
# * | | Cronos Group, Inc. | | | 386,929 | | | | 1,280,735 | |
* | | dentalcorp Holdings Ltd. | | | 10,873 | | | | 60,576 | |
* | | Dialogue Health Technologies, Inc. | | | 100 | | | | 187 | |
# | | Extendicare, Inc. | | | 474,539 | | | | 2,441,750 | |
# * | | HEXO Corp. | | | 77,100 | | | | 14,803 | |
# | | HLS Therapeutics, Inc. | | | 20,104 | | | | 140,928 | |
* | | Knight Therapeutics, Inc. | | | 778,243 | | | | 3,170,440 | |
| | Medical Facilities Corp. | | | 164,317 | | | | 1,319,505 | |
* | | Oncolytics Biotech, Inc. | | | 33,485 | | | | 42,191 | |
# * | | Organigram Holdings, Inc. | | | 1,127,585 | | | | 1,150,322 | |
# | | Sienna Senior Living, Inc. | | | 398,686 | | | | 3,438,588 | |
* | | Viemed Healthcare, Inc. | | | 85,210 | | | | 557,851 | |
* | | Well Health Technologies Corp. | | | 25,803 | | | | 55,305 | |
| | Zenith Capital Corp. | | | 111,820 | | | | 14,889 | |
| | | | | | | | | | |
TOTAL HEALTH CARE | | | | 18,737,939 | |
| | | | | | | | | | |
THE CANADIAN SMALL COMPANY SERIES
CONTINUED
| | | | | | | | | | |
| | | | | Shares | | | Value» | |
INDUSTRIALS — (9.4%) | | | | | | | | |
# | | Aecon Group, Inc. | | | 350,074 | | | $ | 2,482,266 | |
# | | AG Growth International, Inc. | | | 124,923 | | | | 3,200,215 | |
# | | Algoma Central Corp. | | | 48,800 | | | | 602,858 | |
* | | ATS Automation Tooling Systems, Inc. | | | 416,536 | | | | 13,177,745 | |
# | | Badger Infrastructure Solutions Ltd. | | | 178,983 | | | | 3,781,063 | |
# * | | Ballard Power Systems, Inc. | | | 698,602 | | | | 3,961,073 | |
# | | Bird Construction, Inc. | | | 278,076 | | | | 1,253,266 | |
| | Black Diamond Group Ltd. | | | 237,417 | | | | 758,075 | |
# * | | Bombardier, Inc., Class A | | | 13,989 | | | | 415,455 | |
# * | | Bombardier, Inc., Class B | | | 435,248 | | | | 12,782,522 | |
# | | Boyd Group Services, Inc. | | | 87,102 | | | | 12,394,461 | |
# | | Calian Group Ltd. | | | 55,592 | | | | 2,344,710 | |
| | Dexterra Group, Inc. | | | 168,743 | | | | 658,944 | |
* | | DIRTT Environmental Solutions | | | 225,557 | | | | 92,716 | |
# | | Doman Building Materials Group Ltd. | | | 344,034 | | | | 1,396,490 | |
# | | Exchange Income Corp. | | | 96,953 | | | | 3,238,053 | |
| | Finning International, Inc. | | | 809,489 | | | | 17,213,562 | |
* | | GDI Integrated Facility Services, Inc. | | | 54,239 | | | | 1,864,036 | |
* | | Heroux-Devtek, Inc. | | | 243,053 | | | | 2,244,362 | |
| | K-Bro Linen, Inc. | | | 62,086 | | | | 1,362,624 | |
| | Magellan Aerospace Corp. | | | 114,378 | | | | 591,893 | |
* | | MDA Ltd. | | | 25,771 | | | | 126,552 | |
# | | Mullen Group Ltd. | | | 475,225 | | | | 4,775,447 | |
# | | NFI Group, Inc. | | | 340,794 | | | | 2,201,334 | |
* | | Patriot One Technologies, Inc. | | | 120,000 | | | | 51,088 | |
| | Richelieu Hardware Ltd. | | | 316,493 | | | | 8,495,724 | |
# | | Russel Metals, Inc. | | | 345,023 | | | | 7,146,878 | |
# | | Savaria Corp. | | | 230,245 | | | | 2,197,075 | |
# | | SNC-Lavalin Group, Inc. | | | 888,433 | | | | 15,383,811 | |
# | | Stantec, Inc. | | | 19,723 | | | | 964,973 | |
| | Wajax Corp. | | | 104,085 | | | | 1,408,836 | |
# * | | Westport Fuel Systems, Inc. | | | 73,881 | | | | 66,451 | |
# | | Westshore Terminals Investment Corp. | | | 262,257 | | | | 4,691,308 | |
| | | | | | | | | | |
TOTAL INDUSTRIALS | | | | 133,325,866 | |
| | | | | | | | | | |
INFORMATION TECHNOLOGY — (2.8%) | | | | | | | | |
# * | | BlackBerry Ltd. | | | 1,483,773 | | | | 6,914,382 | |
* | | Celestica, Inc. | | | 620,813 | | | | 6,812,109 | |
* | | Converge Technology Solutions Corp. | | | 77,539 | | | | 317,589 | |
# | | Dye & Durham Ltd. | | | 16,633 | | | | 183,990 | |
| | Enghouse Systems Ltd. | | | 249,746 | | | | 5,552,763 | |
| | Evertz Technologies Ltd. | | | 148,543 | | | | 1,288,786 | |
* | | Kinaxis, Inc. | | | 48,398 | | | | 5,165,745 | |
# * | | Lightspeed Commerce, Inc. | | | 311,038 | | | | 5,959,488 | |
| | Quarterhill, Inc. | | | 624,896 | | | | 766,012 | |
* | | Sangoma Technologies Corp. | | | 4,200 | | | | 23,708 | |
* | | Sierra Wireless, Inc. | | | 202,824 | | | | 6,025,094 | |
| | Softchoice Corp. | | | 13,390 | | | | 171,706 | |
| | TECSYS, Inc. | | | 14,563 | | | | 319,406 | |
| | Vecima Networks, Inc. | | | 6,059 | | | | 76,763 | |
| | | | | | | | | | |
TOTAL INFORMATION TECHNOLOGY | | | | 39,577,541 | |
| | | | | | | | | | |
MATERIALS — (20.5%) | | | | | | | | |
# * | | 5N Plus, Inc. | | | 420,567 | | | | 728,548 | |
# | | Acadian Timber Corp. | | | 65,067 | | | | 720,234 | |
# | | AirBoss of America Corp. | | | 94,697 | | | | 497,692 | |
| | Alamos Gold, Inc.,Class A | | | 2,215,177 | | | | 17,479,445 | |
# | | Altius Minerals Corp. | | | 274,538 | | | | 4,296,363 | |
THE CANADIAN SMALL COMPANY SERIES
CONTINUED
| | | | | | | | | | |
| | | | | Shares | | | Value» | |
MATERIALS — (Continued) | | | | | | | | |
# * | | Americas Gold & Silver Corp. | | | 86,596 | | | $ | 39,410 | |
| | Amerigo Resources Ltd. | | | 227,887 | | | | 170,620 | |
* | | Argonaut Gold, Inc. | | | 1,730,006 | | | | 507,948 | |
* | | Ascot Resources Ltd. | | | 71,438 | | | | 22,548 | |
* | | Aya Gold & Silver, Inc. | | | 16,800 | | | | 97,420 | |
| | B2Gold Corp. | | | 4,730,075 | | | | 14,512,715 | |
* | | Calibre Mining Corp. | | | 231,489 | | | | 117,244 | |
# * | | Canfor Corp. | | | 347,829 | | | | 5,226,307 | |
# * | | Canfor Pulp Products, Inc. | | | 144,351 | | | | 527,668 | |
# * | | Capstone Mining Corp. | | | 2,311,783 | | | | 5,362,230 | |
# | | Cascades, Inc. | | | 518,809 | | | | 3,366,441 | |
# | | Centerra Gold, Inc. | | | 1,153,585 | | | | 5,359,999 | |
| | China Gold International Resources Corp. Ltd. | | | 1,379,942 | | | | 3,190,676 | |
# * | | Copper Mountain Mining Corp. | | | 984,419 | | | | 1,322,338 | |
| | Dundee Precious Metals, Inc. | | | 1,031,781 | | | | 4,680,447 | |
# * | | Eldorado Gold Corp. | | | 968,248 | | | | 5,409,716 | |
* | | Endeavour Silver Corp. | | | 506,479 | | | | 1,724,147 | |
# * | | Equinox Gold Corp. | | | 1,286,872 | | | | 4,257,644 | |
# * | | ERO Copper Corp. | | | 299,122 | | | | 3,405,426 | |
# | | First Majestic Silver Corp. | | | 1,202,622 | | | | 10,126,146 | |
# * | | First Mining Gold Corp. | | | 749,400 | | | | 112,766 | |
# * | | Fortuna Silver Mines, Inc. | | | 1,503,545 | | | | 4,181,677 | |
# * | | Freegold Ventures Ltd. | | | 9,000 | | | | 3,435 | |
# * | | Galiano Gold, Inc. | | | 696,057 | | | | 342,319 | |
* | | GoGold Resources, Inc. | | | 180,275 | | | | 199,813 | |
* †† | | Hanfeng Evergreen, Inc. | | | 45,837 | | | | 0 | |
# | | Hudbay Minerals, Inc. | | | 1,208,976 | | | | 4,588,738 | |
# * | | IAMGOLD Corp. | | | 2,853,315 | | | | 4,184,282 | |
# * | | Imperial Metals Corp. | | | 381,250 | | | | 680,029 | |
# * | | Interfor Corp. | | | 350,741 | | | | 6,230,361 | |
* | | K92 Mining, Inc. | | | 67,111 | | | | 304,927 | |
* | | Karora Resources, Inc. | | | 555,631 | | | | 1,162,365 | |
| | Kinross Gold Corp. | | | 1,399,636 | | | | 5,079,022 | |
# | | Labrador Iron Ore Royalty Corp. | | | 315,769 | | | | 6,545,540 | |
# * | | Largo, Inc. | | | 70,585 | | | | 445,247 | |
# * | | Lucara Diamond Corp. | | | 1,635,773 | | | | 648,378 | |
# | | Lundin Gold, Inc. | | | 202,997 | | | | 1,466,209 | |
| | Lundin Mining Corp. | | | 1,333,672 | | | | 6,989,700 | |
# * | | MAG Silver Corp. | | | 192,125 | | | | 2,553,341 | |
* | | Major Drilling Group International, Inc. | | | 668,976 | | | | 4,026,574 | |
* | | Mandalay Resources Corp. | | | 464 | | | | 582 | |
* | | Marathon Gold Corp. | | | 147,500 | | | | 90,946 | |
# | | Maverix Metals, Inc. | | | 96,425 | | | | 307,265 | |
# | | Methanex Corp. | | | 340,999 | | | | 11,900,224 | |
| | Neo Performance Materials, Inc. | | | 16,755 | | | | 130,857 | |
* | | New Gold, Inc. | | | 3,469,405 | | | | 3,132,358 | |
# * | | New Pacific Metals Corp. | | | 1,200 | | | | 2,880 | |
| | Newcrest Mining Ltd. | | | 175,355 | | | | 1,932,958 | |
# * | | Northern Dynasty Minerals Ltd. | | | 76,877 | | | | 18,622 | |
* | | OceanaGold Corp. | | | 3,792,013 | | | | 5,511,202 | |
* †† | | Orbite Technologies, Inc. | | | 73,500 | | | | 0 | |
* | | Orla Mining Ltd. | | | 76,865 | | | | 242,470 | |
# | | Osisko Gold Royalties Ltd. | | | 867,687 | | | | 9,308,707 | |
# * | | Osisko Mining, Inc. | | | 1,251,029 | | | | 2,607,936 | |
# | | Pan American Silver Corp. | | | 838,003 | | | | 13,390,836 | |
* | | PolyMet Mining Corp. | | | 64,208 | | | | 191,349 | |
* | | Sabina Gold & Silver Corp. | | | 1,438,714 | | | | 1,172,219 | |
# | | Sandstorm Gold Ltd. | | | 1,145,735 | | | | 5,649,032 | |
# * | | Seabridge Gold, Inc. | | | 333,519 | | | | 3,566,188 | |
THE CANADIAN SMALL COMPANY SERIES
CONTINUED
| | | | | | | | | | |
| | | | | Shares | | | Value» | |
MATERIALS — (Continued) | | | | | | | | |
# * | | SilverCrest Metals, Inc. | | | 167,445 | | | $ | 840,020 | |
# | | SSR Mining, Inc. | | | 1,110,622 | | | | 15,301,425 | |
# | | Stelco Holdings, Inc. | | | 264,376 | | | | 6,658,157 | |
# | | Stella-Jones, Inc. | | | 312,231 | | | | 9,403,485 | |
# * | | Taseko Mines Ltd. | | | 1,642,585 | | | | 1,832,664 | |
* | | Torex Gold Resources, Inc. | | | 465,118 | | | | 3,168,272 | |
# | | Transcontinental, Inc., Class A | | | 415,053 | | | | 4,737,457 | |
* | | Trevali Mining Corp. | | | 255,929 | | | | 38,511 | |
| | Triple Flag Precious Metals Corp. | | | 1,600 | | | | 17,922 | |
# * | | Turquoise Hill Resources Ltd. | | | 496,946 | | | | 13,981,440 | |
* | | Victoria Gold Corp. | | | 23,206 | | | | 117,022 | |
# * | | Wallbridge Mining Co. Ltd. | | | 350,615 | | | | 43,751 | |
# * | | Wesdome Gold Mines Ltd. | | | 740,091 | | | | 4,438,319 | |
* | | Western Copper & Gold Corp. | | | 27,900 | | | | 36,248 | |
| | Western Forest Products, Inc. | | | 1,786,410 | | | | 1,612,863 | |
# | | Winpak Ltd. | | | 175,225 | | | | 5,340,288 | |
# | | Yamana Gold, Inc. | | | 4,464,192 | | | | 19,589,876 | |
| | | | | | | | | | |
TOTAL MATERIALS | | | | 289,208,446 | |
| | | | | | | | | | |
REAL ESTATE — (2.3%) | | | | | | | | |
# | | Altus Group Ltd. | | | 244,093 | | | | 8,673,647 | |
| | Bridgemarq Real Estate Services | | | 53,069 | | | | 532,501 | |
| | Colliers International Group, Inc. | | | 3,592 | | | | 337,433 | |
| | DREAM Unlimited Corp., Class A | | | 232,598 | | | | 4,242,713 | |
| | Information Services Corp. | | | 32,705 | | | | 561,268 | |
# * | | Invesque, Inc. | | | 191,266 | | | | 214,218 | |
* | | Mainstreet Equity Corp. | | | 31,349 | | | | 2,589,885 | |
| | Melcor Developments Ltd. | | | 55,340 | | | | 434,238 | |
| | Morguard Corp. | | | 22,684 | | | | 1,864,705 | |
# * | | Real Matters, Inc. | | | 363,920 | | | | 1,234,125 | |
# | | Tricon Residential, Inc. | | | 1,307,133 | | | | 11,015,059 | |
| | | | | | | | | | |
TOTAL REAL ESTATE | | | | 31,699,792 | |
| | | | | | | | | | |
UTILITIES — (6.9%) | | | | | | | | |
* | | Altius Renewable Royalties Corp. | | | 4,704 | | | | 29,971 | |
| | Atco Ltd., Class I | | | 397,742 | | | | 12,349,607 | |
| | Boralex, Inc., Class A | | | 499,461 | | | | 14,162,424 | |
# | | Brookfield Infrastructure Corp., Class A | | | 205,538 | | | | 8,868,171 | |
| | Capital Power Corp. | | | 724,520 | | | | 24,250,825 | |
# | | Innergex Renewable Energy, Inc. | | | 748,951 | | | | 8,246,239 | |
* | | Maxim Power Corp. | | | 61,434 | | | | 154,673 | |
| | Polaris Renewable Energy, Inc. | | | 107,795 | | | | 1,313,463 | |
# | | Superior Plus Corp. | | | 885,902 | | | | 6,736,848 | |
| | TransAlta Corp. | | | 8,389 | | | | 73,991 | |
| | TransAlta Corp. | | | 1,758,255 | | | | 15,487,254 | |
# | | TransAlta Renewables, Inc. | | | 588,980 | | | | 6,324,937 | |
| | | | | | | | | | |
TOTAL UTILITIES | | | | 97,998,403 | |
| | | | | | | | | | |
TOTAL COMMON STOCKS | | | | 1,212,935,722 | |
| | | | | | | | | | |
RIGHTS/WARRANTS — (0.0%) | | | | | | | | |
| | |
MATERIALS — (0.0%) | | | | | | | | |
* | | Treasury Metals, Inc. Warrants 08/07/23 | | | 1 | | | | 0 | |
| | | | | | | | | | |
TOTAL INVESTMENT SECURITIES
(Cost $1,129,103,652) | | | | 1,212,935,722 | |
| | | | | | | | | | |
THE CANADIAN SMALL COMPANY SERIES
CONTINUED
| | | | | | | | | | |
| | | | | Shares | | | Value† | |
SECURITIES LENDING COLLATERAL — (14.1%) | | | | | | | | |
@ § | | The DFA Short Term Investment Fund | | | 17,275,482 | | | $ | 199,721,843 | |
| | | | | | | | | | |
TOTAL INVESTMENTS — (100.0%)
(Cost $1,328,909,530) | | | | | | $ | 1,412,657,565 | |
| | | | | | | | | | |
| » | Securities that have been fair value factored. See Note B to Financial Statements. |
| * | Non-Income Producing Securities. |
| # | Total or Partial Securities on Loan. |
| W | Rule 144A, Section 4(2), or other security that is restricted as to resale to institutional investors. This security has been deemed liquid based upon the Fund’s Liquidity Guidelines. The liquidity determination is unaudited. |
| †† | Security valued using significant unobservable inputs (Level 3). |
| † | See Note B to Financial Statements. |
| @ | Security purchased with cash collateral received from Securities on Loan. |
Summary of the Series’ investments as of October 31, 2022, based on their valuation inputs, is as follows (see Security Valuation Note):
| | | | | | | | | | | | | | | | |
| | | Investments in Securities (Market Value) | |
| | | Level 1 | | | Level 2 | | | Level 3 | | | Total | |
Common Stocks | | | | | | | | | | | | | | | | |
Communication Services | | $ | 11,643,215 | | | $ | 3,630,231 | | | | — | | | $ | 15,273,446 | |
Consumer Discretionary | | | 66,824,582 | | | | — | | | | — | | | | 66,824,582 | |
Consumer Staples | | | 59,075,300 | | | | — | | | | — | | | | 59,075,300 | |
Energy | | | 348,385,483 | | | | — | | | | — | | | | 348,385,483 | |
Financials | | | 112,828,924 | | | | — | | | | — | | | | 112,828,924 | |
Health Care | | | 18,723,050 | | | | 14,889 | | | | — | | | | 18,737,939 | |
Industrials | | | 133,325,866 | | | | — | | | | — | | | | 133,325,866 | |
Information Technology | | | 39,577,541 | | | | — | | | | — | | | | 39,577,541 | |
Materials | | | 289,169,935 | | | | 38,511 | | | | — | | | | 289,208,446 | |
Real Estate | | | 31,699,792 | | | | — | | | | — | | | | 31,699,792 | |
Utilities | | | 97,998,403 | | | | — | | | | — | | | | 97,998,403 | |
Securities Lending Collateral | | | — | | | | 199,721,843 | | | | — | | | | 199,721,843 | |
| | | | | | | | | | | | | | | | |
TOTAL | | $ | 1,209,252,091 | | | $ | 203,405,474 | | | | — | | | $ | 1,412,657,565 | |
| | | | | | | | | | | | | | | | |
See accompanying Notes to Financial Statements.
THE EMERGING MARKETS SERIES
SCHEDULE OF INVESTMENTS
October 31, 2022
| | | | | | | | | | |
| | | | | Shares | | | Value» | |
COMMON STOCKS — (96.1%) | | | | | | | | |
BRAZIL — (4.5%) | | | | | | | | |
| | Ambev SA, ADR | | | 1,642,569 | | | $ | 4,993,410 | |
| | Americanas SA | | | 90,148 | | | | 271,203 | |
| | Atacadao SA | | | 384,789 | | | | 1,449,617 | |
| | B3 SA - Brasil Bolsa Balcao | | | 2,392,171 | | | | 6,965,105 | |
| | Banco Bradesco SA | | | 755,221 | | | | 2,432,848 | |
| | Banco BTG Pactual SA | | | 518,104 | | | | 2,902,706 | |
| | Banco do Brasil SA | | | 396,250 | | | | 2,839,836 | |
| | Banco Santander Brasil SA | | | 214,624 | | | | 1,237,344 | |
| | BB Seguridade Participacoes SA | | | 353,143 | | | | 2,029,778 | |
| | Braskem SA, Sponsored ADR, Class A | | | 57,171 | | | | 739,221 | |
* | | BRF SA | | | 873,661 | | | | 2,124,321 | |
| | Caixa Seguridade Participacoes S/A | | | 242,195 | | | | 413,544 | |
| | CCR SA | | | 1,407,986 | | | | 3,532,572 | |
| | Centrais Eletricas Brasileiras SA | | | 244,933 | | | | 2,362,320 | |
| | Cia de Saneamento Basico do Estado de Sao Paulo | | | 163,344 | | | | 1,900,489 | |
# | | Cia de Saneamento Basico do Estado de Sao Paulo, ADR | | | 40,965 | | | | 473,555 | |
| | Cia Energetica de Minas Gerais | | | 215,832 | | | | 722,435 | |
| | Cia Paranaense de Energia | | | 114,600 | | | | 155,521 | |
# | | Cia Paranaense de Energia, Sponsored ADR | | | 17,400 | | | | 123,018 | |
| | Cia Paranaense de Energia | | | 39,800 | | | | 283,466 | |
# | | Cia Siderurgica Nacional SA, Sponsored ADR | | | 545,056 | | | | 1,313,585 | |
| | Cia Siderurgica Nacional SA | | | 517,465 | | | | 1,230,175 | |
| | Cosan SA | | | 477,300 | | | | 1,557,889 | |
| | CPFL Energia SA | | | 123,300 | | | | 845,472 | |
| | Energisa SA | | | 228,135 | | | | 2,141,567 | |
* | | Eneva SA | | | 273,981 | | | | 752,115 | |
| | Engie Brasil Energia SA | | | 116,476 | | | | 906,914 | |
| | Equatorial Energia SA | | | 966,386 | | | | 5,618,153 | |
| | Gerdau SA, Sponsored ADR | | | 905,703 | | | | 4,510,401 | |
| | Getnet Adquirencia e Servicos para Meios de Pagamento SA | | | 53,656 | | | | 49,859 | |
W | | Hapvida Participacoes e Investimentos SA | | | 2,559,330 | | | | 3,864,636 | |
| | Hypera SA | | | 368,936 | | | | 3,629,008 | |
| | Itau Unibanco Holding SA | | | 217,203 | | | | 1,068,880 | |
| | JBS SA | | | 926,800 | | | | 4,478,352 | |
| | Klabin SA | | | 1,174,814 | | | | 4,917,138 | |
| | Localiza Rent a Car SA | | | 229,414 | | | | 3,132,875 | |
| | Localiza Rent a Car SA | | | 703 | | | | 9,600 | |
| | Lojas Renner SA | | | 659,267 | | | | 3,943,733 | |
* | | Magazine Luiza SA | | | 1,501,902 | | | | 1,299,681 | |
| | Natura & Co. Holding SA | | | 928,510 | | | | 2,687,295 | |
| | Neoenergia SA | | | 95,100 | | | | 305,432 | |
* | | Petro Rio SA | | | 567,905 | | | | 3,890,845 | |
| | Petroleo Brasileiro SA, Sponsored ADR | | | 511,889 | | | | 5,891,842 | |
| | Petroleo Brasileiro SA, Sponsored ADR | | | 227,883 | | | | 2,921,460 | |
| | Petroleo Brasileiro SA | | | 2,733,556 | | | | 17,601,021 | |
| | Porto Seguro SA | | | 149,774 | | | | 673,845 | |
| | Raia Drogasil SA | | | 443,885 | | | | 2,260,888 | |
W | | Rede D’Or Sao Luiz SA | | | 63,700 | | | | 396,715 | |
| | Rumo SA | | | 661,006 | | | | 2,833,157 | |
| | Sendas Distribuidora SA | | | 848,688 | | | | 3,256,412 | |
| | Suzano SA | | | 519,807 | | | | 5,353,544 | |
# | | Suzano SA, Sponsored ADR | | | 10,979 | | | | 112,973 | |
| | Telefonica Brasil SA | | | 248,062 | | | | 1,983,824 | |
| | TIM SA | | | 1,144,280 | | | | 2,924,111 | |
| | TOTVS SA | | | 323,491 | | | | 2,076,655 | |
| | Ultrapar Participacoes SA | | | 204,563 | | | | 531,060 | |
# | | Vale SA, Sponsored ADR | | | 332,416 | | | | 4,301,470 | |
THE EMERGING MARKETS SERIES
CONTINUED
| | | | | | | | | | |
| | | | | Shares | | | Value» | |
BRAZIL — (Continued) | | | | | | | | |
| | Vale SA | | | 2,364,713 | | | $ | 30,731,421 | |
| | Vibra Energia SA | | | 979,605 | | | | 3,460,999 | |
| | WEG SA | | | 591,966 | | | | 4,616,086 | |
| | | | | | | | | | |
TOTAL BRAZIL | | | | 182,033,397 | |
| | | | | | | | | | |
CHILE — (0.5%) | | | | | | | | |
| | Banco de Chile, ADR | | | 105,420 | | | | 1,896,511 | |
| | Banco de Credito e Inversiones SA | | | 44,204 | | | | 1,231,647 | |
# | | Banco Santander Chile, ADR | | | 78,503 | | | | 1,132,798 | |
| | Banco Santander Chile | | | 557,071 | | | | 19,973 | |
| | CAP SA | | | 63,313 | | | | 338,452 | |
| | Cencosud SA | | | 2,002,798 | | | | 2,692,444 | |
| | Cencosud Shopping SA | | | 333,351 | | | | 364,292 | |
| | Cia Cervecerias Unidas SA | | | 25,688 | | | | 140,998 | |
| | Cia Cervecerias Unidas SA, Sponsored ADR | | | 22,534 | | | | 243,593 | |
| | Cia Sud Americana de Vapores SA | | | 15,213,678 | | | | 1,056,590 | |
| | Embotelladora Andina SA, ADR, Class B | | | 15,787 | | | | 162,606 | |
| | Empresa Nacional de Telecomunicaciones SA | | | 23,075 | | | | 71,973 | |
| | Empresas CMPC SA | | | 935,741 | | | | 1,485,003 | |
| | Empresas COPEC SA | | | 227,255 | | | | 1,566,746 | |
| | Enel Americas SA | | | 643,354 | | | | 63,747 | |
| | Enel Chile SA | | | 887,163 | | | | 31,223 | |
| | Falabella SA | | | 330,135 | | | | 644,786 | |
| | Itau CorpBanca Chile SA | | | 31,276,064 | | | | 60,961 | |
| | Plaza SA | | | 176,521 | | | | 152,895 | |
# | | Sociedad Quimica y Minera de Chile SA, Sponsored ADR | | | 89,320 | | | | 8,367,498 | |
| | | | | | | | | | |
TOTAL CHILE | | | | 21,724,736 | |
| | | | | | | | | | |
CHINA — (23.4%) | | | | | | | | |
| | 360 Security Technology, Inc., Class A | | | 409,600 | | | | 397,930 | |
| | 37 Interactive Entertainment Network Technology Group Co. Ltd., Class A | | | 189,863 | | | | 377,847 | |
| | ADAMA Ltd., Class A | | | 58,600 | | | | 68,543 | |
| | Addsino Co. Ltd., Class A | | | 92,500 | | | | 132,925 | |
| | AECC Aero-Engine Control Co. Ltd., Class A | | | 68,057 | | | | 280,360 | |
| | AECC Aviation Power Co. Ltd., Class A | | | 79,700 | | | | 532,985 | |
| | Agile Group Holdings Ltd. | | | 1,094,000 | | | | 208,080 | |
| | Agricultural Bank of China Ltd., Class H | | | 14,534,000 | | | | 4,148,487 | |
| | Aier Eye Hospital Group Co. Ltd., Class A | | | 293,917 | | | | 997,426 | |
* | | Air China Ltd., Class H | | | 1,158,000 | | | | 805,894 | |
* | | Alibaba Group Holding Ltd., Sponsored ADR | | | 835,875 | | | | 53,144,932 | |
* | | Alibaba Group Holding Ltd. | | | 714,100 | | | | 5,552,061 | |
* | | Alibaba Health Information Technology Ltd. | | | 2,566,000 | | | | 1,085,942 | |
| | All Winner Technology Co. Ltd., Class A | | | 18,600 | | | | 49,853 | |
| | Aluminum Corp. of China Ltd., Class H | | | 7,864,000 | | | | 2,241,882 | |
* | | Amlogic Shanghai Co. Ltd., Class A | | | 30,504 | | | | 239,856 | |
| | Angel Yeast Co. Ltd., Class A | | | 49,300 | | | | 245,172 | |
| | Anhui Conch Cement Co. Ltd., Class H | | | 1,881,000 | | | | 4,841,566 | |
| | Anhui Guangxin Agrochemical Co. Ltd., Class A | | | 61,420 | | | | 249,702 | |
| | Anhui Gujing Distillery Co. Ltd., Class A | | | 11,716 | | | | 317,242 | |
| | Anhui Honglu Steel Construction Group Co. Ltd., Class A | | | 68,664 | | | | 321,216 | |
| | Anhui Jinhe Industrial Co. Ltd., Class A | | | 65,100 | | | | 293,400 | |
| | Anhui Kouzi Distillery Co. Ltd., Class A | | | 71,000 | | | | 394,381 | |
| | Anhui Yingjia Distillery Co. Ltd., Class A | | | 38,000 | | | | 245,682 | |
| | Anhui Zhongding Sealing Parts Co. Ltd., Class A | | | 106,800 | | | | 214,741 | |
| | Anji Microelectronics Technology Shanghai Co. Ltd., Class A | | | 2,493 | | | | 76,192 | |
| | Anjoy Foods Group Co. Ltd., Class A | | | 14,400 | | | | 265,521 | |
| | Anker Innovations Technology Co. Ltd., Class A | | | 19,400 | | | | 143,966 | |
| | ANTA Sports Products Ltd. | | | 612,400 | | | | 5,383,986 | |
THE EMERGING MARKETS SERIES
CONTINUED
| | | | | | | | | | |
| | | | | Shares | | | Value» | |
CHINA — (Continued) | | | | | | | | |
| | Apeloa Pharmaceutical Co. Ltd., Class A | | | 136,420 | | | $ | 389,076 | |
* | | Asia - Potash International Investment Guangzhou Co. Ltd., Class A | | | 47,574 | | | | 166,018 | |
| | Asymchem Laboratories Tianjin Co. Ltd., Class A | | | 17,770 | | | | 346,889 | |
| | Avary Holding Shenzhen Co. Ltd., Class A | | | 140,276 | | | | 573,198 | |
| | AVIC Industry-Finance Holdings Co. Ltd., Class A | | | 327,700 | | | | 136,243 | |
| | AVICOPTER PLC, Class A | | | 22,704 | | | | 136,849 | |
| | Bafang Electric Suzhou Co. Ltd., Class A | | | 7,500 | | | | 119,794 | |
* | | Baidu, Inc., Sponsored ADR | | | 25,812 | | | | 1,976,425 | |
* | | Baidu, Inc., Class A | | | 1,268,100 | | | | 12,157,268 | |
| | Bank of Beijing Co. Ltd., Class A | | | 697,408 | | | | 386,268 | |
| | Bank of Changsha Co. Ltd., Class A | | | 629,584 | | | | 556,129 | |
| | Bank of Chengdu Co. Ltd., Class A | | | 190,950 | | | | 356,688 | |
| | Bank of China Ltd., Class H | | | 43,912,181 | | | | 14,143,111 | |
| | Bank of Communications Co. Ltd., Class H | | | 5,656,515 | | | | 2,759,920 | |
| | Bank of Guiyang Co. Ltd., Class A | | | 572,423 | | | | 408,876 | |
| | Bank of Hangzhou Co. Ltd., Class A | | | 242,404 | | | | 402,184 | |
| | Bank of Jiangsu Co. Ltd., Class A | | | 742,270 | | | | 704,478 | |
| | Bank of Nanjing Co. Ltd., Class A | | | 454,780 | | | | 643,900 | |
| | Bank of Ningbo Co. Ltd., Class A | | | 317,342 | | | | 1,035,747 | |
| | Bank of Shanghai Co. Ltd., Class A | | | 458,383 | | | | 350,741 | |
| | Bank of Suzhou Co. Ltd., Class A | | | 415,260 | | | | 391,139 | |
| | Baoshan Iron & Steel Co. Ltd., Class A | | | 1,014,500 | | | | 669,898 | |
* | | BeiGene Ltd. | | | 255,700 | | | | 3,297,117 | |
| | Beijing Bei Mo Gao Ke Friction Material Co. Ltd., Class A | | | 24,020 | | | | 171,215 | |
| | Beijing Capital Eco-Environment Protection Group Co. Ltd., Class A | | | 818,160 | | | | 309,700 | |
* | | Beijing Compass Technology Development Co. Ltd., Class A | | | 27,300 | | | | 166,173 | |
* | | Beijing Dabeinong Technology Group Co. Ltd., Class A | | | 202,052 | | | | 254,080 | |
| | Beijing Dahao Technology Corp. Ltd., Class A | | | 26,100 | | | | 57,988 | |
| | Beijing Easpring Material Technology Co. Ltd., Class A | | | 24,700 | | | | 200,684 | |
| | Beijing Enlight Media Co. Ltd., Class A | | | 258,706 | | | | 238,939 | |
| | Beijing GeoEnviron Engineering & Technology, Inc., Class A | | | 88,140 | | | | 113,028 | |
| | Beijing Huafeng Test & Control Technology Co. Ltd., Class A | | | 6,116 | | | | 222,195 | |
| | Beijing Jingyuntong Technology Co. Ltd., Class A | | | 100,200 | | | | 99,016 | |
| | Beijing Kingsoft Office Software, Inc., Class A | | | 7,538 | | | | 301,106 | |
| | Beijing New Building Materials PLC, Class A | | | 130,703 | | | | 355,842 | |
| | Beijing Oriental Yuhong Waterproof Technology Co. Ltd., Class A | | | 132,362 | | | | 445,473 | |
| | Beijing Originwater Technology Co. Ltd., Class A | | | 461,047 | | | | 297,662 | |
| | Beijing Roborock Technology Co. Ltd., Class A | | | 6,593 | | | | 213,111 | |
| | Beijing Shiji Information Technology Co. Ltd., Class A | | | 93,560 | | | | 162,436 | |
| | Beijing Shougang Co. Ltd., Class A | | | 257,300 | | | | 120,482 | |
| | Beijing Shunxin Agriculture Co. Ltd., Class A | | | 48,400 | | | | 136,022 | |
| | Beijing Sinnet Technology Co. Ltd., Class A | | | 116,888 | | | | 138,881 | |
| | Beijing Tiantan Biological Products Corp. Ltd., Class A | | | 77,216 | | | | 219,596 | |
| | Beijing Tongrentang Co. Ltd., Class A | | | 36,400 | | | | 243,529 | |
| | Beijing United Information Technology Co. Ltd., Class A | | | 20,155 | | | | 342,883 | |
| | Beijing Wantai Biological Pharmacy Enterprise Co. Ltd., Class A | | | 23,700 | | | | 407,705 | |
| | Beijing Yanjing Brewery Co. Ltd., Class A | | | 126,900 | | | | 148,468 | |
| | Beijing Yuanliu Hongyuan Electronic Technology Co. Ltd., Class A | | | 17,400 | | | | 273,218 | |
| | Beijing Zhong Ke San Huan High-Tech Co. Ltd., Class A | | | 82,575 | | | | 145,498 | |
| | Beijing-Shanghai High Speed Railway Co. Ltd., Class A | | | 1,062,900 | | | | 650,401 | |
| | Bethel Automotive Safety Systems Co. Ltd., Class A | | | 9,700 | | | | 116,026 | |
| | Betta Pharmaceuticals Co. Ltd., Class A | | | 24,206 | | | | 151,500 | |
| | BGI Genomics Co. Ltd., Class A | | | 34,100 | | | | 258,915 | |
* | | Bilibili, Inc., Class Z | | | 84,420 | | | | 752,300 | |
| | Bloomage Biotechnology Corp. Ltd., Class A | | | 6,559 | | | | 95,658 | |
| | BOC International China Co. Ltd., Class A | | | 89,700 | | | | 130,073 | |
| | BOE Technology Group Co. Ltd., Class A | | | 2,001,800 | | | | 918,269 | |
| | Bosideng International Holdings Ltd. | | | 3,360,000 | | | | 1,451,206 | |
| | Bright Dairy & Food Co. Ltd., Class A | | | 24,800 | | | | 32,187 | |
THE EMERGING MARKETS SERIES
CONTINUED
| | | | | | | | | | |
| | | | | Shares | | | Value» | |
CHINA — (Continued) | | | | | | | | |
| | BTG Hotels Group Co. Ltd., Class A | | | 92,300 | | | $ | 275,001 | |
| | BYD Co. Ltd., Class H | | | 403,886 | | | | 9,048,310 | |
| | BYD Electronic International Co. Ltd. | | | 1,259,000 | | | | 3,658,632 | |
| | By-health Co. Ltd., Class A | | | 124,793 | | | | 300,113 | |
| | Caitong Securities Co. Ltd., Class A | | | 547,690 | | | | 537,639 | |
| | CECEP Solar Energy Co. Ltd., Class A | | | 241,000 | | | | 224,052 | |
| | CECEP Wind-Power Corp., Class A | | | 381,200 | | | | 224,109 | |
| | Centre Testing International Group Co. Ltd., Class A | | | 27,300 | | | | 70,128 | |
W | | CGN Power Co. Ltd., Class H | | | 4,899,000 | | | | 992,378 | |
| | Changchun High & New Technology Industry Group, Inc., Class A | | | 20,900 | | | | 465,044 | |
| | Changjiang Securities Co. Ltd., Class A | | | 435,670 | | | | 311,932 | |
| | Changzhou Xingyu Automotive Lighting Systems Co. Ltd., Class A | | | 9,700 | | | | 162,948 | |
| | Chaozhou Three-Circle Group Co. Ltd., Class A | | | 139,705 | | | | 544,008 | |
| | Chengdu CORPRO Technology Co. Ltd., Class A | | | 36,800 | | | | 149,682 | |
| | Chengdu Kanghong Pharmaceutical Group Co. Ltd., Class A | | | 15,800 | | | | 38,248 | |
| | Chengtun Mining Group Co. Ltd., Class A | | | 308,000 | | | | 234,501 | |
| | Chengxin Lithium Group Co. Ltd., Class A | | | 43,229 | | | | 257,249 | |
* | | Chifeng Jilong Gold Mining Co. Ltd., Class A | | | 53,800 | | | | 139,350 | |
| | China Automotive Engineering Research Institute Co. Ltd., Class A | | | 72,700 | | | | 187,765 | |
| | China Baoan Group Co. Ltd., Class A | | | 146,334 | | | | 232,073 | |
| | China Cinda Asset Management Co. Ltd., Class H | | | 7,009,000 | | | | 651,075 | |
| | China CITIC Bank Corp. Ltd., Class H | | | 9,190,928 | | | | 3,464,589 | |
| | China Coal Energy Co. Ltd., Class H | | | 3,825,777 | | | | 2,813,489 | |
| | China Conch Venture Holdings Ltd. | | | 128,000 | | | | 188,787 | |
| | China Construction Bank Corp., Class H | | | 59,766,590 | | | | 31,717,427 | |
| | China CSSC Holdings Ltd., Class A | | | 45,800 | | | | 166,892 | |
* | | China Eastern Airlines Corp. Ltd., ADR | | | 8,745 | | | | 144,292 | |
* | | China Eastern Airlines Corp. Ltd., Class H | | | 1,516,000 | | | | 500,217 | |
| | China Energy Engineering Corp. Ltd. | | | 2,502,824 | | | | 785,360 | |
# | | China Energy Engineering Corp. Ltd., Class H | | | 1,632,000 | | | | 164,120 | |
| | China Everbright Bank Co. Ltd., Class H | | | 3,836,000 | | | | 991,814 | |
# W | | China Feihe Ltd. | | | 5,746,000 | | | | 3,310,012 | |
| | China Galaxy Securities Co. Ltd., Class H | | | 5,155,500 | | | | 1,930,513 | |
| | China Gas Holdings Ltd. | | | 5,520,800 | | | | 4,899,596 | |
| | China Great Wall Securities Co. Ltd., Class A | | | 196,900 | | | | 218,555 | |
| | China Greatwall Technology Group Co. Ltd., Class A | | | 182,800 | | | | 279,844 | |
| | China Green Electricity Investment of Tianjin Co. Ltd., Class A | | | 101,800 | | | | 184,451 | |
# | | China Hongqiao Group Ltd. | | | 4,665,000 | | | | 3,301,647 | |
W | | China International Capital Corp. Ltd., Class H | | | 1,813,600 | | | | 2,520,394 | |
| | China International Marine Containers Group Co. Ltd., Class H | | | 1,018,230 | | | | 648,141 | |
| | China Jushi Co. Ltd., Class A | | | 477,798 | | | | 767,048 | |
| | China Kings Resources Group Co. Ltd., Class A | | | 32,040 | | | | 201,655 | |
| | China Life Insurance Co. Ltd., Class H | | | 2,339,000 | | | | 2,550,578 | |
| | China Longyuan Power Group Corp. Ltd., Class H | | | 1,404,000 | | | | 1,604,309 | |
| | China Meheco Co. Ltd., Class A | | | 69,411 | | | | 119,976 | |
| | China Mengniu Dairy Co. Ltd. | | | 2,204,000 | | | | 7,055,331 | |
| | China Merchants Bank Co. Ltd., Class H | | | 2,884,554 | | | | 9,443,741 | |
| | China Merchants Energy Shipping Co. Ltd., Class A | | | 607,440 | | | | 582,494 | |
| | China Merchants Port Holdings Co. Ltd. | | | 394,271 | | | | 462,242 | |
| | China Merchants Property Operation & Service Co. Ltd., Class A | | | 64,100 | | | | 118,323 | |
W | | China Merchants Securities Co. Ltd., Class H | | | 486,460 | | | | 451,097 | |
| | China Merchants Shekou Industrial Zone Holdings Co. Ltd., Class A | | | 325,873 | | | | 587,484 | |
# | | China Minsheng Banking Corp. Ltd., Class H | | | 4,818,600 | | | | 1,399,439 | |
| | China National Building Material Co. Ltd., Class H | | | 10,206,000 | | | | 5,926,277 | |
| | China National Nuclear Power Co. Ltd., Class A | | | 1,023,390 | | | | 847,030 | |
| | China Northern Rare Earth Group High-Tech Co. Ltd., Class A | | | 144,800 | | | | 482,327 | |
| | China Oilfield Services Ltd., Class H | | | 1,960,000 | | | | 2,206,409 | |
| | China Overseas Land & Investment Ltd. | | | 4,761,000 | | | | 9,097,884 | |
| | China Pacific Insurance Group Co. Ltd., Class H | | | 2,763,800 | | | | 4,455,226 | |
THE EMERGING MARKETS SERIES
CONTINUED
| | | | | | | | | | |
| | | | | Shares | | | Value» | |
CHINA — (Continued) | | | | | | | | |
| | China Petroleum & Chemical Corp., Class H | | | 17,726,800 | | | $ | 7,025,598 | |
| | China Power International Development Ltd. | | | 740,000 | | | | 213,852 | |
| | China Railway Group Ltd., Class H | | | 4,311,000 | | | | 1,874,487 | |
W | | China Railway Signal & Communication Corp. Ltd., Class H | | | 1,920,000 | | | | 547,246 | |
* | | China Rare Earth Resources & Technology Co. Ltd., Class A | | | 36,891 | | | | 146,092 | |
| | China Resources Beer Holdings Co. Ltd. | | | 859,611 | | | | 4,056,113 | |
| | China Resources Boya Bio-pharmaceutical Group Co Ltd, Class A | | | 32,400 | | | | 133,453 | |
| | China Resources Cement Holdings Ltd. | | | 4,938,000 | | | | 1,784,919 | |
| | China Resources Double Crane Pharmaceutical Co. Ltd., Class A | | | 99,800 | | | | 245,769 | |
| | China Resources Gas Group Ltd. | | | 1,798,000 | | | | 4,604,982 | |
| | China Resources Land Ltd. | | | 4,798,666 | | | | 15,013,985 | |
| | China Resources Microelectronics Ltd., Class A | | | 28,998 | | | | 201,637 | |
| | China Resources Power Holdings Co. Ltd. | | | 1,598,517 | | | | 2,322,762 | |
| | China Resources Sanjiu Medical & Pharmaceutical Co. Ltd., Class A | | | 68,058 | | | | 509,037 | |
| | China Shenhua Energy Co. Ltd., Class H | | | 2,649,500 | | | | 6,959,859 | |
| | China South Publishing & Media Group Co. Ltd., Class A | | | 59,000 | | | | 77,174 | |
* | | China Southern Airlines Co. Ltd., Class H | | | 1,716,000 | | | | 885,874 | |
| | China Southern Power Grid Energy Efficiency & Clean Energy Co. Ltd.,Class A | | | 171,400 | | | | 135,465 | |
| | China State Construction Engineering Corp. Ltd., Class A | | | 1,922,400 | | | | 1,250,067 | |
# | | China Suntien Green Energy Corp. Ltd., Class H | | | 673,000 | | | | 255,229 | |
| | China Tourism Group Duty Free Corp. Ltd., Class A | | | 91,500 | | | | 2,010,562 | |
W | | China Tower Corp. Ltd., Class H | | | 67,974,000 | | | | 6,149,938 | |
| | China Tungsten & Hightech Materials Co. Ltd., Class A | | | 62,600 | | | | 123,634 | |
| | China Vanke Co. Ltd., Class H | | | 2,747,520 | | | | 3,525,967 | |
| | China Yangtze Power Co. Ltd., Class A | | | 748,847 | | | | 2,083,975 | |
| | China Zhenhua Group Science & Technology Co. Ltd., Class A | | | 21,800 | | | | 403,540 | |
* | | China Zheshang Bank Co. Ltd., Class H | | | 82,000 | | | | 28,290 | |
| | Chongqing Brewery Co. Ltd., Class A | | | 21,500 | | | | 257,307 | |
| | Chongqing Changan Automobile Co. Ltd., Class A | | | 260,130 | | | | 402,572 | |
| | Chongqing Fuling Zhacai Group Co. Ltd., Class A | | | 47,200 | | | | 145,762 | |
| | Chongqing Rural Commercial Bank Co. Ltd., Class H | | | 2,634,000 | | | | 798,367 | |
| | Chongqing Zhifei Biological Products Co. Ltd., Class A | | | 83,314 | | | | 974,462 | |
| | CITIC Ltd. | | | 4,725,000 | | | | 4,228,139 | |
| | CITIC Securities Co. Ltd., Class H | | | 2,178,800 | | | | 3,255,463 | |
| | CMOC Group Ltd., Class H | | | 5,673,966 | | | | 1,826,744 | |
| | CNNC Hua Yuan Titanium Dioxide Co. Ltd., Class A | | | 209,235 | | | | 191,774 | |
| | CNOOC Energy Technology & Services Ltd., Class A | | | 597,700 | | | | 233,113 | |
| | CNSIG Inner Mongolia Chemical Industry Co. Ltd. | | | 102,400 | | | | 190,648 | |
| | COFCO Biotechnology Co. Ltd., Class A | | | 114,467 | | | | 126,539 | |
| | Contemporary Amperex Technology Co. Ltd., Class A | | | 70,420 | | | | 3,613,934 | |
# * | | COSCO SHIPPING Energy Transportation Co. Ltd., Class H | | | 940,000 | | | | 684,728 | |
| | COSCO SHIPPING Holdings Co. Ltd., Class H | | | 4,410,299 | | | | 4,752,853 | |
| | Country Garden Holdings Co. Ltd. | | | 5,569,067 | | | | 717,805 | |
| | Country Garden Services Holdings Co. Ltd. | | | 1,433,492 | | | | 1,252,909 | |
W | | CSC Financial Co. Ltd., Class H | | | 1,140,500 | | | | 826,862 | |
| | CSG Holding Co. Ltd., Class A | | | 313,839 | | | | 295,149 | |
| | CSPC Pharmaceutical Group Ltd. | | | 11,629,200 | | | | 11,945,066 | |
| | Daan Gene Co. Ltd., Class A | | | 171,580 | | | | 419,667 | |
W | | Dali Foods Group Co. Ltd. | | | 4,344,000 | | | | 1,788,130 | |
| | Daqin Railway Co. Ltd., Class A | | | 883,060 | | | | 775,564 | |
| | DaShenLin Pharmaceutical Group Co. Ltd., Class A | | | 78,510 | | | | 391,390 | |
* | | Datang International Power Generation Co. Ltd., Class H | | | 1,784,000 | | | | 227,021 | |
* | | Deppon Logistics Co. Ltd., Class A | | | 78,900 | | | | 186,800 | |
| | DHC Software Co. Ltd., Class A | | | 290,300 | | | | 245,769 | |
| | Dian Diagnostics Group Co. Ltd., Class A | | | 67,701 | | | | 258,228 | |
| | Do-Fluoride Chemicals Co. Ltd., Class A | | | 64,409 | | | | 275,425 | |
| | Dong-E-E-Jiao Co. Ltd., Class A | | | 42,611 | | | | 219,221 | |
| | Dongfang Electric Corp. Ltd., Class H | | | 305,200 | | | | 460,302 | |
THE EMERGING MARKETS SERIES
CONTINUED
| | | | | | | | | | |
| | | | | Shares | | | Value» | |
CHINA — (Continued) | | | | | | | | |
| | Dongfeng Motor Group Co. Ltd., Class H | | | 1,426,000 | | | $ | 645,128 | |
| | Dongxing Securities Co. Ltd., Class A | | | 323,718 | | | | 345,002 | |
| | East Group Co. Ltd., Class A | | | 152,100 | | | | 144,863 | |
| | East Money Information Co. Ltd., Class A | | | 453,728 | | | | 972,653 | |
| | Ecovacs Robotics Co. Ltd., Class A | | | 28,300 | | | | 227,150 | |
| | Electric Connector Technology Co. Ltd., Class A | | | 28,200 | | | | 142,270 | |
| | ENN Energy Holdings Ltd. | | | 378,200 | | | | 3,760,081 | |
| | ENN Natural Gas Co. Ltd., Class A | | | 245,000 | | | | 521,930 | |
| | Eternal Asia Supply Chain Management Ltd., Class A | | | 113,500 | | | | 81,359 | |
| | Eve Energy Co. Ltd., Class A | | | 38,105 | | | | 434,849 | |
# W | | Everbright Securities Co. Ltd., Class H | | | 442,400 | | | | 239,413 | |
* | | Fangda Carbon New Material Co. Ltd., Class A | | | 374,324 | | | | 308,550 | |
| | Fangda Special Steel Technology Co. Ltd., Class A | | | 289,000 | | | | 225,996 | |
| | FAW Jiefang Group Co. Ltd., Class A | | | 112,300 | | | | 107,211 | |
| | Fiberhome Telecommunication Technologies Co. Ltd., Class A | | | 49,300 | | | | 93,337 | |
| | Financial Street Holdings Co. Ltd., Class A | | | 180,200 | | | | 114,509 | |
| | First Capital Securities Co. Ltd., Class A | | | 320,000 | | | | 244,077 | |
# | | Flat Glass Group Co. Ltd., Class H | | | 406,000 | | | | 952,316 | |
| | Focus Media Information Technology Co. Ltd., Class A | | | 727,597 | | | | 447,729 | |
| | Foryou Corp. | | | 16,200 | | | | 78,856 | |
| | Foshan Haitian Flavouring & Food Co. Ltd., Class A | | | 158,223 | | | | 1,296,783 | |
| | Fosun International Ltd. | | | 3,138,722 | | | | 1,918,079 | |
| | Founder Securities Co. Ltd., Class A | | | 411,200 | | | | 357,118 | |
| | Foxconn Industrial Internet Co. Ltd., Class A | | | 389,600 | | | | 438,427 | |
| | Fujian Funeng Co. Ltd., Class A | | | 116,900 | | | | 171,742 | |
| | Fujian Sunner Development Co. Ltd., Class A | | | 77,263 | | | | 232,503 | |
W | | Fuyao Glass Industry Group Co. Ltd., Class H | | | 754,800 | | | | 2,704,980 | |
| | Gan & Lee Pharmaceuticals Co. Ltd., Class A | | | 30,040 | | | | 145,758 | |
# W | | Ganfeng Lithium Group Co. Ltd., Class H | | | 176,399 | | | | 1,193,095 | |
| | Gaona Aero Material Co. Ltd., Class A | | | 17,800 | | | | 130,472 | |
| | G-bits Network Technology Xiamen Co. Ltd., Class A | | | 8,400 | | | | 293,596 | |
| | GCL Energy Technology Co. Ltd. | | | 130,300 | | | | 243,127 | |
| | GCL New Energy Holdings Ltd. | | | 321,005 | | | | 21,674 | |
* | | GCL System Integration Technology Co. Ltd., Class A | | | 241,200 | | | | 108,136 | |
* | | GCL Technology Holdings Ltd. | | | 20,189,000 | | | | 5,117,041 | |
* | | GD Power Development Co. Ltd., Class A | | | 524,300 | | | | 314,199 | |
* | | GDS Holdings Ltd., Class A | | | 189,000 | | | | 210,953 | |
| | Geely Automobile Holdings Ltd. | | | 6,653,000 | | | | 7,159,834 | |
| | GEM Co. Ltd., Class A | | | 188,176 | | | | 191,870 | |
| | Gemdale Corp., Class A | | | 343,800 | | | | 370,054 | |
| | GF Securities Co. Ltd., Class H | | | 1,068,800 | | | | 1,087,406 | |
| | Giant Network Group Co. Ltd., Class A | | | 85,600 | | | | 90,960 | |
| | GigaDevice Semiconductor, Inc., Class A | | | 50,974 | | | | 576,117 | |
| | Ginlong Technologies Co. Ltd., Class A | | | 18,825 | | | | 482,695 | |
| | Glarun Technology Co. Ltd., Class A | | | 69,600 | | | | 138,588 | |
| | GoerTek, Inc., Class A | | | 198,500 | | | | 589,265 | |
| | Gongniu Group Co. Ltd., Class A | | | 4,200 | | | | 68,950 | |
| | Gotion High-tech Co. Ltd., Class A | | | 73,700 | | | | 304,719 | |
| | Grandblue Environment Co. Ltd., Class A | | | 40,300 | | | | 99,006 | |
| | Great Wall Motor Co. Ltd., Class H | | | 1,683,500 | | | | 1,839,058 | |
| | Gree Electric Appliances, Inc. of Zhuhai, Class A | | | 160,333 | | | | 631,404 | |
* | | Greenland Holdings Corp. Ltd., Class A | | | 472,831 | | | | 170,247 | |
| | GRG Banking Equipment Co. Ltd., Class A | | | 284,000 | | | | 366,717 | |
* | | Guangdong Create Century Intelligent Equipment Group Corp. Ltd., Class A | | | 127,900 | | | | 182,365 | |
| | Guangdong Haid Group Co. Ltd., Class A | | | 55,800 | | | | 441,807 | |
| | Guangdong HEC Technology Holding Co. Ltd., Class A | | | 204,200 | | | | 260,267 | |
| | Guangdong Hongda Holdings Group Co. Ltd., Class A | | | 61,700 | | | | 230,832 | |
| | Guangdong Investment Ltd. | | | 2,600,000 | | | | 1,639,239 | |
THE EMERGING MARKETS SERIES
CONTINUED
| | | | | | | | | | |
| | | | | Shares | | | Value» | |
CHINA — (Continued) | | | | | | | | |
| | Guangdong Kinlong Hardware Products Co. Ltd., Class A | | | 13,200 | | | $ | 143,592 | |
| | Guangdong Xinbao Electrical Appliances Holdings Co. Ltd., Class A | | | 59,500 | | | | 130,491 | |
| | Guangdong Zhongsheng Pharmaceutical Co. Ltd., Class A | | | 43,000 | | | | 125,254 | |
| | Guanghui Energy Co. Ltd., Class A | | | 422,000 | | | | 594,676 | |
| | Guangxi Guiguan Electric Power Co. Ltd., Class A | | | 34,400 | | | | 29,531 | |
| | Guangzhou Automobile Group Co. Ltd., Class H | | | 2,287,162 | | | | 1,393,799 | |
| | Guangzhou Baiyunshan Pharmaceutical Holdings Co. Ltd., Class H | | | 218,000 | | | | 486,334 | |
| | Guangzhou Great Power Energy & Technology Co. Ltd., Class A | | | 13,400 | | | | 115,993 | |
| | Guangzhou Haige Communications Group, Inc. Co., Class A | | | 222,052 | | | | 257,574 | |
| | Guangzhou Kingmed Diagnostics Group Co. Ltd., Class A | | | 48,901 | | | | 505,050 | |
| | Guangzhou Shiyuan Electronic Technology Co. Ltd., Class A | | | 34,000 | | | | 303,160 | |
| | Guangzhou Tinci Materials Technology Co. Ltd., Class A | | | 74,340 | | | | 433,156 | |
| | Guangzhou Wondfo Biotech Co. Ltd., Class A | | | 47,700 | | | | 197,294 | |
| | Guangzhou Yuexiu Financial Holdings Group Co. Ltd., Class A | | | 261,404 | | | | 199,840 | |
| | Guangzhou Zhujiang Brewery Co. Ltd., Class A | | | 26,000 | | | | 23,086 | |
| | Guizhou Panjiang Refined Coal Co. Ltd., Class A | | | 246,900 | | | | 227,002 | |
* | | Guocheng Mining Co. Ltd., Class A | | | 44,900 | | | | 97,490 | |
| | Guosen Securities Co. Ltd., Class A | | | 186,700 | | | | 221,007 | |
W | | Guotai Junan Securities Co. Ltd., Class H | | | 474,400 | | | | 479,284 | |
| | Guoyuan Securities Co. Ltd., Class A | | | 308,740 | | | | 264,496 | |
| | H World Group Ltd., ADR | | | 102,031 | | | | 2,762,999 | |
| | H World Group Ltd. | | | 5,500 | | | | 15,005 | |
| | Haier Smart Home Co. Ltd., Class A | | | 258,200 | | | | 736,928 | |
| | Haier Smart Home Co. Ltd., Class H | | | 2,489,400 | | | | 6,230,932 | |
| | Haitong Securities Co. Ltd., Class H | | | 2,434,800 | | | | 1,190,199 | |
* | | Hang Zhou Great Star Industrial Co. Ltd., Class A | | | 73,900 | | | | 194,884 | |
| | Hangjin Technology Co. Ltd., Class A | | | 47,700 | | | | 191,453 | |
| | Hangzhou Binjiang Real Estate Group Co. Ltd., Class A | | | 235,800 | | | | 289,515 | |
| | Hangzhou Chang Chuan Technology Co. Ltd., Class A | | | 14,494 | | | | 118,907 | |
| | Hangzhou First Applied Material Co. Ltd., Class A | | | 45,311 | | | | 400,843 | |
| | Hangzhou Lion Electronics Co. Ltd., Class A | | | 36,668 | | | | 215,776 | |
| | Hangzhou Oxygen Plant Group Co. Ltd., Class A | | | 54,900 | | | | 316,355 | |
| | Hangzhou Robam Appliances Co. Ltd., Class A | | | 80,121 | | | | 225,162 | |
| | Hangzhou Silan Microelectronics Co. Ltd., Class A | | | 70,122 | | | | 302,557 | |
| | Hangzhou Tigermed Consulting Co. Ltd., Class A | | | 12,100 | | | | 138,274 | |
W | | Hangzhou Tigermed Consulting Co. Ltd., Class H | | | 95,600 | | | | 649,263 | |
| | Han’s Laser Technology Industry Group Co. Ltd., Class A | | | 198,117 | | | | 689,786 | |
W | | Hansoh Pharmaceutical Group Co. Ltd. | | | 980,000 | | | | 1,514,968 | |
| | Haohua Chemical Science & Technology Co. Ltd., Class A | | | 15,000 | | | | 88,233 | |
| | Hebei Hengshui Laobaigan Liquor Co. Ltd., Class A | | | 20,900 | | | | 60,914 | |
| | Hefei Meiya Optoelectronic Technology, Inc., Class A | | | 84,295 | | | | 274,448 | |
| | Heilongjiang Agriculture Co. Ltd., Class A | | | 174,805 | | | | 330,754 | |
| | Henan Shenhuo Coal & Power Co. Ltd., Class A | | | 211,900 | | | | 407,591 | |
| | Henan Shuanghui Investment & Development Co. Ltd., Class A | | | 195,129 | | | | 609,477 | |
| | Hengan International Group Co. Ltd. | | | 1,126,500 | | | | 4,367,721 | |
| | Hengdian Group DMEGC Magnetics Co. Ltd., Class A | | | 119,121 | | | | 289,547 | |
| | Hengli Petrochemical Co. Ltd., Class A | | | 403,700 | | | | 850,671 | |
| | Hengtong Optic-electric Co. Ltd., Class A | | | 125,000 | | | | 334,413 | |
| | Hengyi Petrochemical Co. Ltd., Class A | | | 347,388 | | | | 319,501 | |
| | Hesteel Co. Ltd., Class A | | | 1,698,653 | | | | 504,769 | |
| | Hithink RoyalFlush Information Network Co. Ltd., Class A | | | 31,881 | | | | 372,723 | |
| | Hongfa Technology Co. Ltd., Class A | | | 60,890 | | | | 287,047 | |
| | Hongta Securities Co. Ltd., Class A | | | 96,320 | | | | 94,590 | |
| | Huaan Securities Co. Ltd., Class A | | | 249,210 | | | | 150,677 | |
# | | Huadian Power International Corp. Ltd., Class H | | | 288,000 | | | | 86,493 | |
| | Huadong Medicine Co. Ltd., Class A | | | 70,000 | | | | 393,840 | |
| | Huafon Chemical Co. Ltd., Class A | | | 485,983 | | | | 444,192 | |
| | Huagong Tech Co. Ltd., Class A | | | 60,800 | | | | 140,171 | |
| | Huaibei Mining Holdings Co. Ltd., Class A | | | 247,300 | | | | 440,972 | |
THE EMERGING MARKETS SERIES
CONTINUED
| | | | | | | | | | |
| | | | | Shares | | | Value» | |
CHINA — (Continued) | | | | | | | | |
| | Hualan Biological Engineering, Inc., Class A | | | 139,800 | | | $ | 340,156 | |
# * | | Huaneng Power International, Inc., Class H | | | 2,302,000 | | | | 823,709 | |
W | | Huatai Securities Co. Ltd., Class H | | | 1,361,000 | | | | 1,332,769 | |
| | Huaxi Securities Co. Ltd., Class A | | | 334,000 | | | | 336,829 | |
| | Huaxia Bank Co. Ltd., Class A | | | 644,456 | | | | 423,379 | |
| | Huaxin Cement Co. Ltd., Class A | | | 206,300 | | | | 379,422 | |
| | Huayu Automotive Systems Co. Ltd., Class A | | | 153,600 | | | | 353,072 | |
| | Hubei Biocause Pharmaceutical Co. Ltd., Class A | | | 297,745 | | | | 117,554 | |
| | Hubei Dinglong Co. Ltd., Class A | | | 44,900 | | | | 129,442 | |
| | Hubei Energy Group Co. Ltd., Class A | | | 199,271 | | | | 114,457 | |
| | Hubei Feilihua Quartz Glass Co. Ltd., Class A | | | 12,600 | | | | 116,309 | |
| | Hubei Jumpcan Pharmaceutical Co. Ltd., Class A | | | 101,848 | | | | 455,208 | |
| | Hubei Xingfa Chemicals Group Co. Ltd., Class A | | | 112,400 | | | | 436,390 | |
| | Huizhou Desay Sv Automotive Co. Ltd., Class A | | | 16,600 | | | | 235,764 | |
| | Humanwell Healthcare Group Co. Ltd., Class A | | | 141,200 | | | | 388,767 | |
| | Hunan Gold Corp. Ltd., Class A | | | 99,000 | | | | 179,641 | |
| | Hunan Valin Steel Co. Ltd., Class A | | | 933,000 | | | | 511,725 | |
| | Hundsun Technologies, Inc., Class A | | | 41,729 | | | | 238,975 | |
| | Iflytek Co. Ltd., Class A | | | 70,100 | | | | 337,369 | |
| | IKD Co. Ltd., Class A | | | 20,000 | | | | 51,971 | |
| | Imeik Technology Development Co. Ltd., Class A | | | 3,800 | | | | 219,496 | |
| | Industrial & Commercial Bank of China Ltd., Class H | | | 30,774,185 | | | | 13,361,085 | |
| | Industrial Bank Co. Ltd., Class A | | | 643,039 | | | | 1,326,449 | |
* | | Industrial Securities Co. Ltd., Class A | | | 652,548 | | | | 488,948 | |
| | Infore Environment Technology Group Co. Ltd., Class A | | | 82,224 | | | | 52,579 | |
| | Ingenic Semiconductor Co. Ltd., Class A | | | 18,000 | | | | 167,577 | |
| | Inner Mongolia BaoTou Steel Union Co. Ltd., Class A | | | 1,386,020 | | | | 334,628 | |
| | Inner Mongolia Dian Tou Energy Corp. Ltd., Class A | | | 299,500 | | | | 507,390 | |
| | Inner Mongolia ERDOS Resources Co. Ltd., Class A | | | 145,040 | | | | 277,232 | |
| | Inner Mongolia Junzheng Energy & Chemical Industry Group Co. Ltd., Class A | | | 810,103 | | | | 431,879 | |
| | Inner Mongolia Yili Industrial Group Co. Ltd., Class A | | | 318,000 | | | | 1,101,863 | |
| | Inner Mongolia Yuan Xing Energy Co. Ltd., Class A | | | 495,200 | | | | 438,076 | |
| | Inspur Electronic Information Industry Co. Ltd., Class A | | | 77,684 | | | | 245,204 | |
| | Intco Medical Technology Co. Ltd., Class A | | | 89,442 | | | | 261,051 | |
| | JA Solar Technology Co. Ltd., Class A | | | 71,103 | | | | 610,558 | |
| | Jafron Biomedical Co. Ltd., Class A | | | 28,865 | | | | 125,436 | |
| | Jason Furniture Hangzhou Co. Ltd., Class A | | | 67,080 | | | | 278,221 | |
| | JCET Group Co. Ltd., Class A | | | 185,200 | | | | 611,869 | |
* W | | JD Health International, Inc. | | | 353,350 | | | | 1,938,507 | |
| | JD.com, Inc., ADR | | | 124,763 | | | | 4,652,412 | |
| | JD.com, Inc., Class A | | | 501,921 | | | | 9,140,238 | |
| | Jiangsu Azure Corp., Class A | | | 75,000 | | | | 154,084 | |
| | Jiangsu Changshu Rural Commercial Bank Co. Ltd., Class A | | | 310,469 | | | | 298,214 | |
| | Jiangsu Eastern Shenghong Co. Ltd., Class A | | | 138,440 | | | | 233,481 | |
| | Jiangsu Expressway Co. Ltd., Class H | | | 1,020,000 | | | | 719,448 | |
| | Jiangsu GoodWe Power Supply Technology Co. Ltd., Class A | | | 3,252 | | | | 149,614 | |
| | Jiangsu Guotai International Group Co. Ltd., Class A | | | 123,263 | | | | 136,677 | |
* | | Jiangsu Guoxin Corp., Ltd., Class A | | | 88,700 | | | | 70,009 | |
| | Jiangsu Hengli Hydraulic Co. Ltd., Class A | | | 70,098 | | | | 529,996 | |
| | Jiangsu Hengrui Medicine Co. Ltd., Class A | | | 159,955 | | | | 882,892 | |
| | Jiangsu Jiejie Microelectronics Co. Ltd., Class A | | | 51,900 | | | | 132,042 | |
| | Jiangsu King’s Luck Brewery JSC Ltd., Class A | | | 85,912 | | | | 440,503 | |
* | | Jiangsu Lihua Animal Husbandry Stock Co. Ltd., Class A | | | 24,653 | | | | 123,286 | |
| | Jiangsu Linyang Energy Co. Ltd., Class A | | | 178,367 | | | | 180,718 | |
| | Jiangsu Nata Opto-electronic Material Co. Ltd., Class A | | | 26,990 | | | | 121,047 | |
| | Jiangsu Nhwa Pharmaceutical Co. Ltd., Class A | | | 21,800 | | | | 60,413 | |
| | Jiangsu Provincial Agricultural Reclamation & Development Corp. | | | 157,000 | | | | 271,457 | |
| | Jiangsu Shuangxing Color Plastic New Materials Co. Ltd., Class A | | | 157,300 | | | | 253,966 | |
THE EMERGING MARKETS SERIES
CONTINUED
| | | | | | | | | | |
| | | | | Shares | | | Value» | |
CHINA — (Continued) | | | | | | | | |
| | Jiangsu ToLand Alloy Co. Ltd., Class A | | | 13,900 | | | $ | 103,238 | |
| | Jiangsu Yanghe Brewery Joint-Stock Co. Ltd., Class A | | | 56,690 | | | | 1,016,600 | |
| | Jiangsu Yangnong Chemical Co. Ltd., Class A | | | 29,505 | | | | 373,644 | |
| | Jiangsu Yoke Technology Co. Ltd., Class A | | | 12,862 | | | | 103,578 | |
| | Jiangsu Yuyue Medical Equipment & Supply Co. Ltd., Class A | | | 84,400 | | | | 376,284 | |
| | Jiangsu Zhongtian Technology Co. Ltd., Class A | | | 93,400 | | | | 281,587 | |
| | Jiangxi Copper Co. Ltd., Class H | | | 1,471,000 | | | | 1,607,452 | |
| | Jilin Aodong Pharmaceutical Group Co. Ltd., Class A | | | 67,500 | | | | 127,950 | |
* | | Jilin Electric Power Co. Ltd., Class A | | | 127,000 | | | | 103,112 | |
| | Jingjin Equipment, Inc., Class A | | | 50,780 | | | | 215,792 | |
| | JiuGui Liquor Co. Ltd., Class A | | | 11,500 | | | | 161,041 | |
| | Jizhong Energy Resources Co. Ltd., Class A | | | 453,000 | | | | 376,819 | |
| | JL Mag Rare-Earth Co. Ltd., Class A | | | 46,600 | | | | 197,767 | |
| | Joincare Pharmaceutical Group Industry Co. Ltd., Class A | | | 194,455 | | | | 311,505 | |
| | Joinn Laboratories China Co. Ltd., Class A | | | 11,396 | | | | 89,412 | |
| | Jointown Pharmaceutical Group Co. Ltd., Class A | | | 227,867 | | | | 392,848 | |
| | Jonjee Hi-Tech Industrial & Commercial Holding Co. Ltd., Class A | | | 45,900 | | | | 170,863 | |
| | Juewei Food Co. Ltd., Class A | | | 37,944 | | | | 246,173 | |
* | | Juneyao Airlines Co. Ltd., Class A | | | 70,540 | | | | 132,383 | |
* | | Kaishan Group Co. Ltd., Class A | | | 65,100 | | | | 149,289 | |
| | KBC Corp. Ltd., Class A | | | 6,057 | | | | 204,984 | |
| | Keboda Technology Co. Ltd., Class A | | | 8,000 | | | | 65,642 | |
| | Kehua Data Co. Ltd., Class A | | | 34,200 | | | | 200,331 | |
| | KingClean Electric Co. Ltd., Class A | | | 17,100 | | | | 76,877 | |
| | Kingfa Sci & Tech Co. Ltd., Class A | | | 425,087 | | | | 564,954 | |
| | Kingsoft Corp. Ltd. | | | 541,000 | | | | 1,638,225 | |
| | Konfoong Materials International Co. Ltd., Class A | | | 9,500 | | | | 114,715 | |
* | | Kuang-Chi Technologies Co. Ltd., Class A | | | 102,600 | | | | 243,599 | |
| | Kunlun Energy Co. Ltd. | | | 6,412,000 | | | | 3,832,256 | |
| | Kunlun Tech Co. Ltd., Class A | | | 52,600 | | | | 94,005 | |
| | Kweichow Moutai Co. Ltd., Class A | | | 55,993 | | | | 10,378,523 | |
| | KWG Living Group Holdings Ltd. | | | 258,250 | | | | 24,321 | |
| | Lao Feng Xiang Co. Ltd., Class A | | | 26,700 | | | | 140,630 | |
| | Laobaixing Pharmacy Chain JSC, Class A | | | 62,190 | | | | 299,779 | |
| | LB Group Co. Ltd., Class A | | | 223,200 | | | | 471,122 | |
| | Lenovo Group Ltd. | | | 13,043,278 | | | | 10,424,287 | |
| | Lens Technology Co. Ltd., Class A | | | 316,800 | | | | 433,518 | |
| | Lepu Medical Technology Beijing Co. Ltd., Class A | | | 120,977 | | | | 419,434 | |
| | Levima Advanced Materials Corp., Class A | | | 27,200 | | | | 122,033 | |
| | Leyard Optoelectronic Co. Ltd., Class A | | | 105,400 | | | | 81,501 | |
# * | | Li Auto, Inc., ADR | | | 128,166 | | | | 1,745,621 | |
* | | Li Auto, Inc., Class A | | | 135,900 | | | | 927,104 | |
| | Li Ning Co. Ltd. | | | 1,311,000 | | | | 6,781,697 | |
| | Lianhe Chemical Technology Co. Ltd., Class A | | | 56,700 | | | | 145,762 | |
| | Lier Chemical Co. Ltd., Class A | | | 74,940 | | | | 187,170 | |
* | | Lingyi iTech Guangdong Co., Class A | | | 556,018 | | | | 360,629 | |
| | Lizhong Sitong Light Alloys Group Co. Ltd., Class A | | | 40,800 | | | | 155,952 | |
W | | Longfor Group Holdings Ltd. | | | 2,585,500 | | | | 3,294,403 | |
| | LONGi Green Energy Technology Co. Ltd., Class A | | | 335,888 | | | | 2,218,261 | |
| | Longshine Technology Group Co. Ltd., Class A | | | 89,002 | | | | 314,853 | |
| | Luenmei Quantum Co. Ltd., Class A | | | 120,500 | | | | 102,960 | |
| | Luoyang Xinqianglian Slewing Bearing Co. Ltd., Class A | | | 8,160 | | | | 78,341 | |
| | Luxi Chemical Group Co. Ltd., Class A | | | 305,700 | | | | 476,936 | |
| | Luxshare Precision Industry Co. Ltd., Class A | | | 308,224 | | | | 1,199,233 | |
| | Luzhou Laojiao Co. Ltd., Class A | | | 73,529 | | | | 1,577,260 | |
| | Mango Excellent Media Co. Ltd., Class A | | | 179,192 | | | | 540,226 | |
| | Maxscend Microelectronics Co., Ltd., Class A | | | 22,900 | | | | 289,830 | |
* | | Meinian Onehealth Healthcare Holdings Co. Ltd., Class A | | | 287,557 | | | | 168,336 | |
* W | | Meituan, Class B | | | 1,133,000 | | | | 18,139,936 | |
THE EMERGING MARKETS SERIES
CONTINUED
| | | | | | | | | | |
| | | | | Shares | | | Value» | |
CHINA — (Continued) | | | | | | | | |
| | Metallurgical Corp. of China Ltd., Class H | | | 4,641,000 | | | $ | 738,998 | |
* | | Mianyang Fulin Precision Co. Ltd., Class A | | | 62,463 | | | | 120,660 | |
| | Midea Group Co. Ltd., Class A | | | 479,784 | | | | 2,643,065 | |
| | Milkyway Chemical Supply Chain Service Co. Ltd., Class A | | | 13,700 | | | | 215,852 | |
| | Ming Yang Smart Energy Group Ltd., Class A | | | 120,504 | | | | 412,456 | |
| | Montage Technology Co. Ltd., Class A | | | 27,314 | | | | 211,711 | |
| | Muyuan Foods Co. Ltd., Class A | | | 134,987 | | | | 869,608 | |
| | Nanjing Hanrui Cobalt Co. Ltd., Class A | | | 22,847 | | | | 125,588 | |
| | Nanjing Iron & Steel Co. Ltd., Class A | | | 670,400 | | | | 280,576 | |
| | Nanjing King-Friend Biochemical Pharmaceutical Co. Ltd., Class A | | | 75,346 | | | | 168,251 | |
| | Nanjing Securities Co. Ltd., Class A | | | 248,900 | | | | 270,671 | |
| | Nanjing Yunhai Special Metals Co. Ltd., Class A | | | 60,200 | | | | 156,175 | |
| | Nantong Jianghai Capacitor Co. Ltd., Class A | | | 48,864 | | | | 169,632 | |
| | NARI Technology Co. Ltd., Class A | | | 249,552 | | | | 838,138 | |
* | | National Silicon Industry Group Co. Ltd., Class A | | | 105,089 | | | | 292,773 | |
| | NAURA Technology Group Co. Ltd., Class A | | | 10,700 | | | | 388,483 | |
| | NavInfo Co. Ltd., Class A | | | 105,850 | | | | 172,203 | |
# | | NetEase, Inc., ADR | | | 193,704 | | | | 10,773,816 | |
| | NetEase, Inc. | | | 159,100 | | | | 1,765,254 | |
| | New China Life Insurance Co. Ltd., Class H | | | 1,091,400 | | | | 1,733,226 | |
* | | New Hope Liuhe Co. Ltd., Class A | | | 159,700 | | | | 283,095 | |
| | Ninestar Corp., Class A | | | 44,351 | | | | 348,171 | |
| | Ningbo Haitian Precision Machinery Co. Ltd., Class A | | | 22,600 | | | | 87,515 | |
* | | Ningbo Joyson Electronic Corp., Class A | | | 126,400 | | | | 266,021 | |
| | Ningbo Orient Wires & Cables Co. Ltd., Class A | | | 31,142 | | | | 328,728 | |
| | Ningbo Ronbay New Energy Technology Co. Ltd., Class A | | | 19,771 | | | | 214,186 | |
| | Ningbo Sanxing Medical Electric Co. Ltd., Class A | | | 108,100 | | | | 204,059 | |
| | Ningbo Tuopu Group Co. Ltd., Class A | | | 43,648 | | | | 387,843 | |
| | Ningbo Xusheng Auto Technology Co. Ltd., Class A | | | 26,000 | | | | 122,521 | |
| | Ningbo Zhoushan Port Co. Ltd., Class A | | | 449,700 | | | | 214,002 | |
| | Ningxia Baofeng Energy Group Co. Ltd., Class A | | | 320,300 | | | | 503,777 | |
* | | NIO, Inc., ADR | | | 368,459 | | | | 3,562,999 | |
| | North Industries Group Red Arrow Co. Ltd., Class A | | | 63,400 | | | | 178,977 | |
* | | Offcn Education Technology Co. Ltd., Class A | | | 80,212 | | | | 47,964 | |
| | Offshore Oil Engineering Co. Ltd., Class A | | | 310,100 | | | | 199,659 | |
* | | OFILM Group Co. Ltd., Class A | | | 214,300 | | | | 137,651 | |
| | Oppein Home Group, Inc., Class A | | | 24,595 | | | | 274,723 | |
# | | Orient Overseas International Ltd. | | | 27,500 | | | | 401,861 | |
# W | | Orient Securities Co. Ltd., Class H | | | 1,012,800 | | | | 377,955 | |
| | Ovctek China, Inc., Class A | | | 22,152 | | | | 90,192 | |
* | | Pangang Group Vanadium Titanium & Resources Co. Ltd., Class A | | | 470,200 | | | | 291,774 | |
* | | Pengdu Agriculture & Animal Husbandry Co. Ltd., Class A | | | 600,300 | | | | 214,285 | |
| | People’s Insurance Co. Group of China Ltd. , Class H | | | 7,590,000 | | | | 2,097,570 | |
| | Perfect World Co. Ltd., Class A | | | 141,585 | | | | 220,866 | |
| | PetroChina Co. Ltd., Class H | | | 15,206,000 | | | | 5,816,705 | |
| | PharmaBlock Sciences Nanjing, Inc., Class A | | | 3,300 | | | | 39,837 | |
W | | Pharmaron Beijing Co. Ltd., Class H | | | 159,050 | | | | 536,287 | |
| | PICC Property & Casualty Co. Ltd., Class H | | | 7,201,198 | | | | 6,641,745 | |
* | | Pinduoduo, Inc., ADR | | | 122,979 | | | | 6,742,939 | |
| | Ping An Bank Co. Ltd., Class A | | | 722,500 | | | | 1,025,620 | |
| | Ping An Insurance Group Co. of China Ltd., Class H | | | 3,693,500 | | | | 14,786,523 | |
| | Pingdingshan Tianan Coal Mining Co. Ltd., Class A | | | 360,800 | | | | 546,397 | |
| | Poly Developments & Holdings Group Co. Ltd., Class A | | | 448,683 | | | | 852,534 | |
# W | | Postal Savings Bank of China Co. Ltd., Class H | | | 4,462,000 | | | | 2,069,298 | |
| | Power Construction Corp. of China Ltd., Class A | | | 583,011 | | | | 563,372 | |
| | Proya Cosmetics Co. Ltd., Class A | | | 21,980 | | | | 503,610 | |
| | Qingdao Haier Biomedical Co. Ltd., Class A | | | 5,788 | | | | 61,199 | |
# W | | Qingdao Port International Co. Ltd., Class H | | | 69,000 | | | | 28,932 | |
| | Qingdao Rural Commercial Bank Corp., Class A | | | 691,706 | | | | 262,648 | |
THE EMERGING MARKETS SERIES
CONTINUED
| | | | | | | | | | |
| | | | | Shares | | | Value» | |
CHINA — (Continued) | | | | | | | | |
| | Qingdao Sentury Tire Co. Ltd., Class A | | | 43,800 | | | $ | 155,891 | |
| | Qingdao TGOOD Electric Co. Ltd., Class A | | | 78,000 | | | | 160,437 | |
| | Quectel Wireless Solutions Co. Ltd., Class A | | | 13,090 | | | | 184,891 | |
| | Raytron Technology Co. Ltd., Class A | | | 17,317 | | | | 113,068 | |
| | Red Avenue New Materials Group Co. Ltd., Class A | | | 23,300 | | | | 114,895 | |
* | | Risen Energy Co. Ltd., Class A | | | 59,604 | | | | 201,898 | |
| | Riyue Heavy Industry Co. Ltd., Class A | | | 76,100 | | | | 230,886 | |
| | Rockchip Electronics Co. Ltd., Class A | | | 18,100 | | | | 162,360 | |
| | Rongsheng Petrochemical Co. Ltd., Class A | | | 567,694 | | | | 834,092 | |
* | | Roshow Technology Co., Ltd., Class A | | | 125,900 | | | | 178,161 | |
| | SAIC Motor Corp. Ltd., Class A | | | 236,045 | | | | 445,589 | |
| | Sailun Group Co. Ltd., Class A | | | 221,600 | | | | 263,965 | |
| | Sanan Optoelectronics Co. Ltd., Class A | | | 114,600 | | | | 271,554 | |
| | Sangfor Technologies, Inc., Class A | | | 11,300 | | | | 195,037 | |
| | Sanquan Food Co. Ltd., Class A | | | 82,800 | | | | 159,656 | |
| | Sansure Biotech, Inc., Class A | | | 55,890 | | | | 195,389 | |
| | Sany Heavy Industry Co. Ltd., Class A | | | 323,734 | | | | 600,734 | |
| | Satellite Chemical Co. Ltd., Class A | | | 345,661 | | | | 588,218 | |
| | SDIC Power Holdings Co. Ltd., Class A | | | 251,000 | | | | 347,223 | |
| | Sealand Securities Co. Ltd., Class A | | | 328,190 | | | | 146,349 | |
* | | Seazen Holdings Co. Ltd., Class A | | | 173,200 | | | | 313,518 | |
| | SF Holding Co. Ltd., Class A | | | 151,261 | | | | 1,001,932 | |
| | SG Micro Corp., Class A | | | 12,050 | | | | 247,666 | |
| | Shaanxi Coal Industry Co. Ltd., Class A | | | 694,700 | | | | 1,888,146 | |
| | Shan Xi Hua Yang Group New Energy Co. Ltd., Class A | | | 260,300 | | | | 602,783 | |
| | Shandong Buchang Pharmaceuticals Co. Ltd., Class A | | | 57,400 | | | | 151,125 | |
| | Shandong Denghai Seeds Co. Ltd., Class A | | | 35,800 | | | | 102,030 | |
| | Shandong Dongyue Organosilicon Material Co. Ltd., Class A | | | 106,300 | | | | 181,200 | |
# W | | Shandong Gold Mining Co. Ltd., Class H | | | 547,250 | | | | 869,811 | |
| | Shandong Himile Mechanical Science & Technology Co. Ltd., Class A | | | 50,100 | | | | 173,987 | |
| | Shandong Hi-speed Co. Ltd., Class A | | | 111,700 | | | | 84,100 | |
| | Shandong Hualu Hengsheng Chemical Co. Ltd., Class A | | | 189,250 | | | | 679,886 | |
| | Shandong Linglong Tyre Co. Ltd., Class A | | | 130,200 | | | | 292,801 | |
| | Shandong Nanshan Aluminum Co. Ltd., Class A | | | 910,010 | | | | 384,999 | |
| | Shandong Pharmaceutical Glass Co. Ltd., Class A | | | 39,500 | | | | 149,439 | |
| | Shandong Sun Paper Industry JSC Ltd., Class A | | | 230,150 | | | | 331,441 | |
| | Shandong Weigao Group Medical Polymer Co. Ltd., Class H | | | 3,303,200 | | | | 4,551,100 | |
| | Shanghai Bairun Investment Holding Group Co. Ltd., Class A | | | 34,836 | | | | 145,785 | |
| | Shanghai Baosight Software Co. Ltd., Class A | | | 62,166 | | | | 361,973 | |
| | Shanghai Construction Group Co. Ltd., Class A | | | 770,676 | | | | 271,544 | |
* | | Shanghai Electric Group Co. Ltd., Class H | | | 2,990,000 | | | | 582,273 | |
* | | Shanghai Electric Power Co. Ltd., Class A | | | 119,200 | | | | 150,101 | |
| | Shanghai Fosun Pharmaceutical Group Co. Ltd., Class H | | | 350,000 | | | | 883,836 | |
# | | Shanghai Fudan Microelectronics Group Co. Ltd., Class H | | | 135,000 | | | | 583,917 | |
* | | Shanghai International Airport Co. Ltd., Class A | | | 28,100 | | | | 205,617 | |
| | Shanghai International Port Group Co. Ltd., Class A | | | 334,000 | | | | 236,892 | |
| | Shanghai Jinjiang International Hotels Co. Ltd., Class A | | | 44,100 | | | | 330,223 | |
#* W | | Shanghai Junshi Biosciences Co. Ltd., Class H | | | 64,000 | | | | 223,532 | |
| | Shanghai Liangxin Electrical Co. Ltd., Class A | | | 50,500 | | | | 77,962 | |
| | Shanghai Lingang Holdings Corp. Ltd., Class A | | | 144,260 | | | | 226,867 | |
| | Shanghai Lujiazui Finance & Trade Zone Development Co. Ltd., Class A | | | 103,420 | | | | 129,338 | |
| | Shanghai M&G Stationery, Inc., Class A | | | 51,069 | | | | 282,572 | |
| | Shanghai Pharmaceuticals Holding Co. Ltd., Class H | | | 1,000,000 | | | | 1,355,260 | |
| | Shanghai Pudong Development Bank Co. Ltd., Class A | | | 882,471 | | | | 804,337 | |
| | Shanghai Putailai New Energy Technology Co. Ltd., Class A | | | 46,522 | | | | 318,443 | |
| | Shanghai RAAS Blood Products Co. Ltd., Class A | | | 400,600 | | | | 298,441 | |
| | Shanghai Tunnel Engineering Co. Ltd., Class A | | | 303,500 | | | | 216,654 | |
| | Shanghai Wanye Enterprises Co. Ltd., Class A | | | 56,200 | | | | 144,727 | |
| | Shanghai Yuyuan Tourist Mart Group Co. Ltd., Class A | | | 252,259 | | | | 217,006 | |
THE EMERGING MARKETS SERIES
CONTINUED
| | | | | | | | | | |
| | | | | Shares | | | Value» | |
CHINA — (Continued) | | | | | | | | |
| | Shanghai Zhangjiang High-Tech Park Development Co. Ltd., Class A | | | 181,800 | | | $ | 280,460 | |
| | Shanxi Coking Coal Energy Group Co. Ltd., Class A | | | 547,530 | | | | 853,565 | |
| | Shanxi Lu’an Environmental Energy Development Co. Ltd., Class A | | | 324,730 | | | | 748,243 | |
| | Shanxi Meijin Energy Co. Ltd., Class A | | | 523,517 | | | | 628,918 | |
| | Shanxi Securities Co. Ltd., Class A | | | 216,280 | | | | 153,091 | |
| | Shanxi Taigang Stainless Steel Co. Ltd., Class A | | | 538,600 | | | | 292,674 | |
| | Shanxi Xinghuacun Fen Wine Factory Co. Ltd., Class A | | | 55,507 | | | | 1,770,540 | |
| | Shenghe Resources Holding Co. Ltd., Class A | | | 151,600 | | | | 278,394 | |
| | Shengyi Technology Co. Ltd., Class A | | | 162,200 | | | | 308,750 | |
| | Shennan Circuits Co. Ltd., Class A | | | 25,382 | | | | 261,393 | |
# W | | Shenwan Hongyuan Group Co. Ltd., Class H | | | 2,064,000 | | | | 336,586 | |
| | Shenzhen Capchem Technology Co. Ltd., Class A | | | 58,240 | | | | 288,767 | |
| | Shenzhen Desay Battery Technology Co., Class A | | | 17,000 | | | | 116,015 | |
| | Shenzhen Dynanonic Co. Ltd., Class A | | | 6,440 | | | | 228,023 | |
| | Shenzhen Energy Group Co. Ltd., Class A | | | 235,019 | | | | 183,869 | |
| | Shenzhen Envicool Technology Co. Ltd., Class A | | | 14,300 | | | | 66,658 | |
| | Shenzhen Fastprint Circuit Tech Co. Ltd., Class A | | | 104,800 | | | | 169,042 | |
| | Shenzhen Gas Corp. Ltd., Class A | | | 150,500 | | | | 134,811 | |
| | Shenzhen H&T Intelligent Control Co. Ltd., Class A | | | 23,400 | | | | 47,420 | |
| | Shenzhen Inovance Technology Co. Ltd., Class A | | | 92,000 | | | | 842,891 | |
| | Shenzhen Kaifa Technology Co. Ltd., Class A | | | 66,000 | | | | 103,519 | |
| | Shenzhen Kangtai Biological Products Co. Ltd., Class A | | | 58,040 | | | | 247,739 | |
| | Shenzhen Kedali Industry Co. Ltd., Class A | | | 14,566 | | | | 183,476 | |
| | Shenzhen Kinwong Electronic Co. Ltd., Class A | | | 62,764 | | | | 175,116 | |
| | Shenzhen Kstar Science & Technology Co. Ltd., Class A | | | 23,000 | | | | 157,879 | |
| | Shenzhen Mindray Bio-Medical Electronics Co. Ltd., Class A | | | 49,673 | | | | 2,220,507 | |
* | | Shenzhen MTC Co. Ltd., Class A | | | 192,700 | | | | 91,281 | |
| | Shenzhen Overseas Chinese Town Co. Ltd., Class A | | | 626,380 | | | | 361,745 | |
| | Shenzhen Salubris Pharmaceuticals Co. Ltd., Class A | | | 71,100 | | | | 301,781 | |
| | Shenzhen SC New Energy Technology Corp., Class A | | | 12,566 | | | | 234,487 | |
| | Shenzhen SED Industry Co. Ltd., Class A | | | 30,800 | | | | 89,780 | |
| | Shenzhen Senior Technology Material Co. Ltd., Class A | | | 75,301 | | | | 191,265 | |
| | Shenzhen Sunlord Electronics Co. Ltd., Class A | | | 92,900 | | | | 272,904 | |
| | Shenzhen Sunway Communication Co. Ltd., Class A | | | 27,400 | | | | 63,050 | |
| | Shenzhen Topband Co. Ltd., Class A | | | 28,600 | | | | 44,136 | |
| | Shenzhen Transsion Holdings Co. Ltd., Class A | | | 64,148 | | | | 548,299 | |
| | Shenzhen Yinghe Technology Co. Ltd., Class A | | | 29,900 | | | | 81,667 | |
| | Shenzhen YUTO Packaging Technology Co. Ltd., Class A | | | 93,271 | | | | 416,354 | |
| | Shenzhen Zhongjin Lingnan Nonfemet Co. Ltd., Class A | | | 360,714 | | | | 190,519 | |
| | Shenzhou International Group Holdings Ltd. | | | 917,400 | | | | 6,369,505 | |
| | Shijiazhuang Yiling Pharmaceutical Co. Ltd., Class A | | | 122,156 | | | | 509,055 | |
| | Shinghwa Advanced Material Group Co. Ltd., Class A | | | 16,300 | | | | 217,013 | |
| | Sichuan Chuantou Energy Co. Ltd., Class A | | | 149,500 | | | | 226,456 | |
* | | Sichuan Development Lomon Co. Ltd., Class A | | | 167,000 | | | | 254,810 | |
| | Sichuan Hebang Biotechnology Co. Ltd., Class A | | | 841,100 | | | | 332,875 | |
| | Sichuan Kelun Pharmaceutical Co. Ltd., Class A | | | 129,301 | | | | 439,556 | |
* | | Sichuan New Energy Power Co., Ltd. | | | 86,800 | | | | 224,258 | |
| | Sichuan Road & Bridge Group Co. Ltd., Class A | | | 573,200 | | | | 885,539 | |
| | Sichuan Shuangma Cement Co. Ltd., Class A | | | 36,500 | | | | 100,978 | |
| | Sichuan Swellfun Co. Ltd., Class A | | | 23,700 | | | | 184,305 | |
| | Sichuan Teway Food Group Co. Ltd., Class A | | | 6,000 | | | | 23,105 | |
| | Sichuan Yahua Industrial Group Co. Ltd., Class A | | | 80,400 | | | | 295,192 | |
| | Sieyuan Electric Co. Ltd., Class A | | | 63,100 | | | | 289,754 | |
| | Sino Biopharmaceutical Ltd. | | | 12,922,500 | | | | 6,270,456 | |
| | Sinofibers Technology Co. Ltd., Class A | | | 17,400 | | | | 131,862 | |
| | Sinolink Securities Co. Ltd., Class A | | | 232,100 | | | | 251,495 | |
| | Sinoma International Engineering Co., Class A | | | 308,200 | | | | 361,666 | |
| | Sinoma Science & Technology Co. Ltd., Class A | | | 190,294 | | | | 467,443 | |
| | Sinopharm Group Co. Ltd., Class H | | | 2,426,400 | | | | 4,603,152 | |
THE EMERGING MARKETS SERIES
CONTINUED
| | | | | | | | | | |
| | | | | Shares | | | Value» | |
CHINA — (Continued) | | | | | | | | |
* | | Skshu Paint Co. Ltd., Class A | | | 7,648 | | | $ | 91,316 | |
| | Skyworth Digital Co. Ltd., Class A | | | 76,793 | | | | 156,904 | |
W | | Smoore International Holdings Ltd. | | | 2,325,000 | | | | 2,474,953 | |
| | Songcheng Performance Development Co. Ltd., Class A | | | 170,500 | | | | 269,318 | |
| | SooChow Securities Co. Ltd., Class A | | | 334,850 | | | | 300,999 | |
| | Southwest Securities Co. Ltd., Class A | | | 779,936 | | | | 396,137 | |
* | | Spring Airlines Co. Ltd., Class A | | | 48,500 | | | | 323,375 | |
| | State Grid Information & Communication Co. Ltd., Class A | | | 75,800 | | | | 155,718 | |
* | | STO Express Co. Ltd., Class A | | | 94,000 | | | | 144,537 | |
| | Sungrow Power Supply Co. Ltd., Class A | | | 31,600 | | | | 567,742 | |
| | Sunny Optical Technology Group Co. Ltd. | | | 719,500 | | | | 6,235,183 | |
| | Sunresin New Materials Co. Ltd., Class A | | | 16,350 | | | | 171,392 | |
| | Sunwoda Electronic Co. Ltd., Class A | | | 74,600 | | | | 237,881 | |
| | Suofeiya Home Collection Co. Ltd., Class A | | | 27,570 | | | | 52,842 | |
| | Suplet Power Co. Ltd., Class A | | | 26,600 | | | | 191,853 | |
| | Suzhou Dongshan Precision Manufacturing Co. Ltd., Class A | | | 209,200 | | | | 724,360 | |
| | Suzhou Maxwell Technologies Co. Ltd., Class A | | | 3,476 | | | | 228,716 | |
| | Suzhou TA&A Ultra Clean Technology Co. Ltd., Class A | | | 31,900 | | | | 270,963 | |
| | Tangshan Jidong Cement Co. Ltd., Class A | | | 155,000 | | | | 161,448 | |
| | TangShan Port Group Co. Ltd., Class A | | | 454,800 | | | | 156,594 | |
| | TBEA Co. Ltd., Class A | | | 217,400 | | | | 609,232 | |
| | TCL Technology Group Corp., Class A | | | 1,321,080 | | | | 709,569 | |
| | TCL Zhonghuan Renewable Energy Technology Co. Ltd., Class A | | | 112,100 | | | | 607,757 | |
| | Tencent Holdings Ltd. | | | 3,556,400 | | | | 93,450,715 | |
* | | Tencent Music Entertainment Group, ADR | | | 730,433 | | | | 2,636,863 | |
| | Thunder Software Technology Co. Ltd., Class A | | | 13,300 | | | | 180,156 | |
| | Tian Di Science & Technology Co. Ltd., Class A | | | 399,320 | | | | 268,455 | |
| | Tianjin 712 Communication & Broadcasting Co. Ltd., Class A | | | 28,400 | | | | 153,173 | |
| | Tianjin Chase Sun Pharmaceutical Co. Ltd., Class A | | | 193,100 | | | | 186,951 | |
| | Tianjin Pharmaceutical Da Re Tang Group Corp. Ltd., Class A | | | 30,300 | | | | 115,017 | |
| | Tianma Microelectronics Co. Ltd., Class A | | | 161,455 | | | | 195,866 | |
| | Tianshan Aluminum Group Co. Ltd., Class A | | | 216,300 | | | | 185,276 | |
| | Tianshui Huatian Technology Co. Ltd., Class A | | | 305,000 | | | | 368,401 | |
* | | Tibet Summit Resources Co. Ltd., Class A | | | 86,100 | | | | 247,047 | |
| | Tingyi Cayman Islands Holding Corp. | | | 2,592,000 | | | | 4,051,549 | |
| | Titan Wind Energy Suzhou Co. Ltd., Class A | | | 124,100 | | | | 200,050 | |
| | Tofflon Science & Technology Group Co. Ltd., Class A | | | 65,800 | | | | 255,270 | |
| | Toly Bread Co. Ltd., Class A | | | 151,865 | | | | 234,737 | |
* | | TongFu Microelectronics Co. Ltd., Class A | | | 167,000 | | | | 431,042 | |
| | Tongkun Group Co. Ltd., Class A | | | 157,809 | | | | 262,574 | |
| | Tongling Nonferrous Metals Group Co. Ltd., Class A | | | 1,091,500 | | | | 377,872 | |
| | Tongwei Co. Ltd., Class A | | | 209,300 | | | | 1,251,476 | |
* | | Topchoice Medical Corp., Class A | | | 13,300 | | | | 224,038 | |
W | | Topsports International Holdings Ltd. | | | 979,000 | | | | 493,648 | |
| | Transfar Zhilian Co. Ltd., Class A | | | 287,626 | | | | 195,005 | |
| | TravelSky Technology Ltd., Class H | | | 183,000 | | | | 266,106 | |
| | Trina Solar Co. Ltd., Class A | | | 26,178 | | | | 238,908 | |
# * | | Trip.com Group Ltd., ADR | | | 412,258 | | | | 9,329,399 | |
* | | Trip.com Group Ltd. | | | 99,700 | | | | 2,239,492 | |
| | Tsingtao Brewery Co. Ltd., Class H | | | 418,000 | | | | 2,926,456 | |
| | Unigroup Guoxin Microelectronics Co. Ltd., Class A | | | 37,799 | | | | 851,736 | |
| | Unisplendour Corp. Ltd., Class A | | | 164,160 | | | | 386,236 | |
| | Universal Scientific Industrial Shanghai Co. Ltd., Class A | | | 110,389 | | | | 263,838 | |
| | Valiant Co. Ltd., Class A | | | 56,000 | | | | 106,564 | |
* | | Vipshop Holdings Ltd., ADR | | | 720,998 | | | | 5,025,356 | |
| | Walvax Biotechnology Co. Ltd., Class A | | | 55,500 | | | | 293,166 | |
| | Wanhua Chemical Group Co. Ltd., Class A | | | 203,200 | | | | 2,242,604 | |
| | Want Want China Holdings Ltd. | | | 6,370,000 | | | | 4,184,356 | |
| | Wanxiang Qianchao Co. Ltd., Class A | | | 189,000 | | | | 128,629 | |
THE EMERGING MARKETS SERIES
CONTINUED
| | | | | | | | | | |
| | | | | Shares | | | Value» | |
CHINA — (Continued) | | | | | | | | |
* | | Weibo Corp., Sponsored ADR | | | 51,476 | | | $ | 582,708 | |
| | Weichai Power Co. Ltd., Class H | | | 2,877,800 | | | | 2,756,476 | |
| | Weifu High-Technology Group Co. Ltd., Class A | | | 52,714 | | | | 124,340 | |
| | Weihai Guangwei Composites Co. Ltd., Class A | | | 20,829 | | | | 221,594 | |
* | | Wens Foodstuffs Group Co. Ltd., Class A | | | 164,980 | | | | 405,489 | |
| | Western Securities Co. Ltd., Class A | | | 568,600 | | | | 465,836 | |
| | Western Superconducting Technologies Co. Ltd., Class A | | | 14,442 | | | | 230,796 | |
| | Westone Information Industry, Inc., Class A | | | 33,300 | | | | 166,071 | |
| | Wharf Holdings Ltd. | | | 995,000 | | | | 2,849,177 | |
| | Will Semiconductor Co. Ltd., Class A | | | 54,421 | | | | 548,489 | |
| | Wingtech Technology Co. Ltd., Class A | | | 47,900 | | | | 314,184 | |
| | Winning Health Technology Group Co. Ltd., Class A | | | 183,700 | | | | 244,265 | |
| | Wolong Electric Group Co. Ltd., Class A | | | 143,200 | | | | 244,251 | |
| | Wuchan Zhongda Group Co. Ltd., Class A | | | 615,250 | | | | 351,960 | |
| | Wuhan DR Laser Technology Corp. Ltd., Class A | | | 3,460 | | | | 77,021 | |
| | Wuhan Guide Infrared Co. Ltd., Class A | | | 106,841 | | | | 170,448 | |
* | | Wuhan Raycus Fiber Laser Technologies Co. Ltd., Class A | | | 9,400 | | | | 36,818 | |
| | Wuhu Token Science Co. Ltd., Class A | | | 200,630 | | | | 172,043 | |
| | Wuliangye Yibin Co. Ltd., Class A | | | 174,006 | | | | 3,189,306 | |
| | WUS Printed Circuit Kunshan Co. Ltd., Class A | | | 159,200 | | | | 237,312 | |
W | | WuXi AppTec Co. Ltd., Class H | | | 159,060 | | | | 1,276,652 | |
* W | | Wuxi Biologics Cayman, Inc. | | | 1,131,500 | | | | 5,091,345 | |
| | Wuxi Lead Intelligent Equipment Co. Ltd., Class A | | | 17,680 | | | | 121,556 | |
| | Wuxi NCE Power Co. Ltd., Class A | | | 14,040 | | | | 156,356 | |
| | Wuxi Shangji Automation Co. Ltd., Class A | | | 27,080 | | | | 455,187 | |
| | XCMG Construction Machinery Co. Ltd., Class A | | | 472,203 | | | | 299,843 | |
| | Xiamen C & D, Inc., Class A | | | 153,900 | | | | 253,189 | |
| | Xiamen Faratronic Co. Ltd., Class A | | | 12,100 | | | | 292,930 | |
| | Xiamen Intretech, Inc., Class A | | | 78,460 | | | | 185,514 | |
| | Xiamen ITG Group Corp. Ltd., Class A | | | 163,430 | | | | 139,497 | |
| | Xiamen Tungsten Co. Ltd., Class A | | | 107,480 | | | | 295,798 | |
| | Xiamen Xiangyu Co. Ltd., Class A | | | 179,500 | | | | 243,266 | |
| | Xi’an Triangle Defense Co. Ltd., Class A | | | 32,400 | | | | 207,574 | |
| | Xianhe Co. Ltd., Class A | | | 39,900 | | | | 133,084 | |
#* W | | Xiaomi Corp., Class B | | | 12,403,400 | | | | 13,929,917 | |
| | Xinfengming Group Co. Ltd., Class A | | | 153,500 | | | | 170,939 | |
| | Xinjiang Goldwind Science & Technology Co. Ltd., Class H | | | 891,559 | | | | 772,542 | |
| | Xinjiang Tianshan Cement Co. Ltd., Class A | | | 90,800 | | | | 96,085 | |
| | Xinjiang Zhongtai Chemical Co. Ltd., Class A | | | 416,100 | | | | 335,543 | |
| | Xinxiang Richful Lube Additive Co. Ltd., Class A | | | 5,500 | | | | 109,325 | |
| | Xinxing Ductile Iron Pipes Co. Ltd., Class A | | | 244,900 | | | | 116,541 | |
| | Xinyangfeng Agricultural Technology Co. Ltd., Class A | | | 105,900 | | | | 160,335 | |
| | Xinyi Solar Holdings Ltd. | | | 6,243,103 | | | | 6,198,140 | |
| | Xuji Electric Co. Ltd., Class A | | | 77,400 | | | | 188,854 | |
W | | Yadea Group Holdings Ltd. | | | 526,000 | | | | 803,139 | |
| | Yangling Metron New Material, Inc., Class A | | | 27,640 | | | | 188,045 | |
| | Yangzhou Yangjie Electronic Technology Co. Ltd., Class A | | | 52,200 | | | | 367,264 | |
| | Yankuang Energy Group Co. Ltd., Class H | | | 1,594,000 | | | | 4,481,556 | |
| | Yantai Changyu Pioneer Wine Co. Ltd., Class A | | | 8,400 | | | | 31,186 | |
| | Yantai Jereh Oilfield Services Group Co. Ltd., Class A | | | 56,455 | | | | 232,817 | |
| | Yealink Network Technology Corp. Ltd., Class A | | | 41,840 | | | | 395,987 | |
| | Yifeng Pharmacy Chain Co. Ltd., Class A | | | 58,834 | | | | 452,811 | |
| | Yintai Gold Co. Ltd., Class A | | | 195,817 | | | | 385,600 | |
| | Yixintang Pharmaceutical Group Co. Ltd., Class A | | | 18,200 | | | | 69,267 | |
| | YongXing Special Materials Technology Co. Ltd., Class A | | | 17,100 | | | | 273,186 | |
| | Yonyou Network Technology Co. Ltd., Class A | | | 83,500 | | | | 280,534 | |
| | Youngor Group Co. Ltd., Class A | | | 340,604 | | | | 279,241 | |
* | | Youngy Co., Ltd., Class A | | | 10,200 | | | | 154,531 | |
| | YTO Express Group Co. Ltd., Class A | | | 174,400 | | | | 451,272 | |
THE EMERGING MARKETS SERIES
CONTINUED
| | | | | | | | | | |
| | | | | Shares | | | Value» | |
CHINA — (Continued) | | | | | | | | |
* | | Yuan Longping High-tech Agriculture Co. Ltd., Class A | | | 80,100 | | | $ | 159,205 | |
# | | Yum China Holdings, Inc. | | | 363,986 | | | | 15,050,821 | |
| | Yunda Holding Co. Ltd., Class A | | | 227,590 | | | | 412,106 | |
| | Yunnan Aluminium Co. Ltd., Class A | | | 373,200 | | | | 469,469 | |
| | Yunnan Baiyao Group Co. Ltd., Class A | | | 54,740 | | | | 409,488 | |
| | Yunnan Copper Co. Ltd., Class A | | | 383,300 | | | | 578,878 | |
| | Yunnan Energy New Material Co. Ltd., Class A | | | 30,462 | | | | 617,783 | |
| | Yunnan Tin Co. Ltd., Class A | | | 179,800 | | | | 280,999 | |
| | Zhangzhou Pientzehuang Pharmaceutical Co. Ltd., Class A | | | 25,050 | | | | 783,005 | |
| | Zhefu Holding Group Co. Ltd., Class A | | | 607,423 | | | | 326,336 | |
* | | Zhejiang Century Huatong Group Co. Ltd., Class A | | | 458,400 | | | | 232,615 | |
| | Zhejiang China Commodities City Group Co. Ltd., Class A | | | 697,879 | | | | 400,994 | |
| | Zhejiang Chint Electrics Co. Ltd., Class A | | | 125,484 | | | | 437,788 | |
| | Zhejiang Crystal-Optech Co. Ltd., Class A | | | 92,800 | | | | 153,567 | |
| | Zhejiang Dahua Technology Co. Ltd., Class A | | | 297,413 | | | | 472,108 | |
| | Zhejiang Dingli Machinery Co. Ltd., Class A | | | 46,470 | | | | 286,643 | |
| | Zhejiang Hailiang Co. Ltd., Class A | | | 143,800 | | | | 228,464 | |
| | Zhejiang HangKe Technology, Inc. Co., Class A | | | 17,887 | | | | 122,823 | |
| | Zhejiang Huahai Pharmaceutical Co. Ltd., Class A | | | 99,240 | | | | 272,016 | |
| | Zhejiang Huayou Cobalt Co. Ltd., Class A | | | 42,881 | | | | 320,683 | |
| | Zhejiang Jingsheng Mechanical & Electrical Co. Ltd., Class A | | | 54,000 | | | | 528,542 | |
| | Zhejiang JIULI Hi-tech Metals Co. Ltd., Class A | | | 80,500 | | | | 187,170 | |
| | Zhejiang Juhua Co. Ltd., Class A | | | 126,000 | | | | 271,389 | |
| | Zhejiang Longsheng Group Co. Ltd., Class A | | | 316,700 | | | | 392,357 | |
* | | Zhejiang Narada Power Source Co. Ltd., Class A | | | 56,700 | | | | 142,621 | |
| | Zhejiang NHU Co. Ltd., Class A | | | 264,988 | | | | 650,383 | |
| | Zhejiang Supor Co. Ltd., Class A | | | 47,603 | | | | 261,330 | |
| | Zhejiang Weiming Environment Protection Co. Ltd., Class A | | | 94,503 | | | | 244,722 | |
| | Zhejiang Weixing New Building Materials Co. Ltd., Class A | | | 125,034 | | | | 298,516 | |
| | Zhejiang Wolwo Bio-Pharmaceutical Co. Ltd., Class A | | | 35,300 | | | | 227,455 | |
| | Zhejiang Xinan Chemical Industrial Group Co. Ltd., Class A | | | 177,154 | | | | 363,145 | |
| | Zhejiang Yongtai Technology Co. Ltd., Class A | | | 60,300 | | | | 181,018 | |
| | Zheshang Securities Co. Ltd., Class A | | | 270,063 | | | | 377,151 | |
| | Zhongji Innolight Co. Ltd., Class A | | | 55,527 | | | | 222,981 | |
| | Zhongjin Gold Corp. Ltd., Class A | | | 428,700 | | | | 437,988 | |
| | Zhongsheng Group Holdings Ltd. | | | 1,088,500 | | | | 4,131,192 | |
| | Zhuzhou CRRC Times Electric Co. Ltd. | | | 588,600 | | | | 2,553,642 | |
| | Zhuzhou Hongda Electronics Corp. Ltd., Class A | | | 42,700 | | | | 259,579 | |
| | Zhuzhou Kibing Group Co. Ltd., Class A | | | 352,001 | | | | 379,238 | |
* | | Zibo Qixiang Tengda Chemical Co. Ltd., Class A | | | 386,760 | | | | 361,547 | |
# | | Zijin Mining Group Co. Ltd., Class H | | | 6,627,000 | | | | 6,321,085 | |
| | Zoomlion Heavy Industry Science & Technology Co. Ltd., Class H | | | 1,859,600 | | | | 599,297 | |
| | ZTE Corp., Class H | | | 1,138,285 | | | | 2,030,522 | |
# | | ZTO Express Cayman, Inc., ADR | | | 290,097 | | | | 4,899,738 | |
# | | ZTO Express Cayman, Inc. | | | 1,050 | | | | 17,865 | |
| | | | | | | | | | |
TOTAL CHINA | | | | 951,805,648 | |
| | | | | | | | | | |
COLOMBIA — (0.1%) | | | | | | | | |
* | | BAC Holding International Corp. | | | 7,858,220 | | | | 312,658 | |
| | Banco de Bogota SA | | | 32,600 | | | | 171,622 | |
| | Bancolombia SA, Sponsored ADR | | | 39,205 | | | | 994,631 | |
| | Bancolombia SA | | | 108,694 | | | | 781,298 | |
| | Ecopetrol SA | | | 2,140,333 | | | | 1,061,770 | |
| | Grupo Argos SA | | | 357,079 | | | | 741,090 | |
| | Grupo Aval Acciones y Valores SA, ADR | | | 5,840 | | | | 12,965 | |
| | Grupo Energia Bogota SA ESP | | | 501,293 | | | | 167,174 | |
| | Interconexion Electrica SA ESP | | | 201,685 | | | | 786,934 | |
| | | | | | | | | | |
TOTAL COLOMBIA | | | | 5,030,142 | |
| | | | | | | | | | |
THE EMERGING MARKETS SERIES
CONTINUED
| | | | | | | | | | |
| | | | | Shares | | | Value» | |
CZECH REPUBLIC — (0.2%) | | | | | | | | |
| | CEZ AS | | | 119,036 | | | $ | 3,890,179 | |
| | Komercni Banka AS | | | 72,622 | | | | 2,079,914 | |
W | | Moneta Money Bank AS | | | 421,608 | | | | 1,229,775 | |
| | | | | | | | | | |
TOTAL CZECH REPUBLIC | | | | 7,199,868 | |
| | | | | | | | | | |
EGYPT — (0.0%) | | | | | | | | |
| | Commercial International Bank Egypt SAE,GDR | | | 1,513,486 | | | | 1,920,708 | |
| | | | | | | | | | |
GREECE — (0.3%) | | | | | | | | |
* | | Alpha Services & Holdings SA | | | 1,298,257 | | | | 1,202,309 | |
* | | Eurobank Ergasias Services & Holdings SA, Class A | | | 1,373,666 | | | | 1,356,086 | |
* †† | | FF Group | | | 12,618 | | | | 11,223 | |
| | Galaxy Cosmos Mezz PLC | | | 48,084 | | | | 7,765 | |
| | Hellenic Energy Holdings SA | | | 63,899 | | | | 436,843 | |
| | Hellenic Telecommunications Organization SA | | | 145,052 | | | | 2,277,975 | |
| | JUMBO SA | | | 91,113 | | | | 1,294,131 | |
* | | LAMDA Development SA | | | 7,667 | | | | 46,452 | |
| | Motor Oil Hellas Corinth Refineries SA | | | 85,551 | | | | 1,470,366 | |
| | Mytilineos SA | | | 72,048 | | | | 1,208,116 | |
* | | National Bank of Greece SA | | | 290,272 | | | | 1,051,735 | |
| | OPAP SA | | | 110,434 | | | | 1,353,164 | |
* | | Piraeus Financial Holdings SA | | | 215,062 | | | | 265,129 | |
* | | Public Power Corp. SA | | | 53,369 | | | | 336,874 | |
| | Sunrisemezz PLC | | | 30,723 | | | | 2,487 | |
| | Terna Energy SA | | | 49,394 | | | | 917,948 | |
| | | | | | | | | | |
TOTAL GREECE | | | | 13,238,603 | |
| | | | | | | | | | |
HONG KONG — (0.0%) | | | | | | | | |
* †† | | China Common Rich Renewable Energy Investments Ltd. | | | 5,416,000 | | | | 0 | |
| | | | | | | | | | |
HUNGARY — (0.2%) | | | | | | | | |
| | MOL Hungarian Oil & Gas PLC | | | 840,922 | | | | 5,048,973 | |
# | | OTP Bank Nyrt | | | 103,748 | | | | 2,263,349 | |
| | Richter Gedeon Nyrt | | | 82,986 | | | | 1,641,524 | |
| | | | | | | | | | |
TOTAL HUNGARY | | | | 8,953,846 | |
| | | | | | | | | | |
INDIA — (18.0%) | | | | | | | | |
| | Aarti Industries Ltd. | | | 231,928 | | | | 1,955,086 | |
| | Aarti Pharmalabs Ltd. | | | 57,982 | | | | 265,613 | |
| | ABB India Ltd. | | | 45,775 | | | | 1,691,933 | |
| | ACC Ltd. | | | 106,088 | | | | 3,066,940 | |
| | Adani Enterprises Ltd. | | | 134,677 | | | | 5,454,980 | |
* | | Adani Green Energy Ltd. | | | 89,876 | | | | 2,289,621 | |
| | Adani Ports & Special Economic Zone Ltd. | | | 464,142 | | | | 4,631,940 | |
* | | Adani Power Ltd. | | | 748,312 | | | | 3,041,139 | |
| | Adani Total Gas Ltd. | | | 102,479 | | | | 4,509,790 | |
* | | Adani Transmission Ltd. | | | 219,644 | | | | 8,903,207 | |
* | | Aditya Birla Capital Ltd. | | | 391,081 | | | | 551,389 | |
| | Alkem Laboratories Ltd. | | | 32,515 | | | | 1,239,882 | |
| | Ambuja Cements Ltd. | | | 553,447 | | | | 3,570,030 | |
| | APL Apollo Tubes Ltd. | | | 7,651 | | | | 99,833 | |
| | Apollo Hospitals Enterprise Ltd. | | | 77,348 | | | | 4,216,487 | |
| | Ashok Leyland Ltd. | | | 1,199,908 | | | | 2,221,974 | |
| | Asian Paints Ltd. | | | 220,693 | | | | 8,316,379 | |
| | Astral Ltd. | | | 84,526 | | | | 2,081,831 | |
| | Atul Ltd. | | | 2,391 | | | | 244,317 | |
W | | AU Small Finance Bank Ltd. | | | 174,230 | | | | 1,242,086 | |
| | Aurobindo Pharma Ltd. | | | 407,142 | | | | 2,641,766 | |
THE EMERGING MARKETS SERIES
CONTINUED
| | | | | | | | | | |
| | | | | Shares | | | Value» | |
INDIA — (Continued) | | | | | | | | |
* W | | Avenue Supermarts Ltd. | | | 53,575 | | | $ | 2,800,161 | |
| | Axis Bank Ltd. | | | 1,721,283 | | | | 18,876,411 | |
| | Bajaj Auto Ltd. | | | 60,754 | | | | 2,700,693 | |
| | Bajaj Finance Ltd. | | | 131,798 | | | | 11,395,650 | |
| | Bajaj Finserv Ltd. | | | 159,010 | | | | 3,244,751 | |
| | Bajaj Holdings & Investment Ltd. | | | 45,088 | | | | 3,623,841 | |
| | Balkrishna Industries Ltd. | | | 115,271 | | | | 2,739,535 | |
* W | | Bandhan Bank Ltd. | | | 603,569 | | | | 1,749,182 | |
| | Bank of Baroda | | | 1,064,648 | | | | 1,902,732 | |
| | Berger Paints India Ltd. | | | 186,084 | | | | 1,320,621 | |
| | Bharat Electronics Ltd. | | | 4,884,543 | | | | 6,318,346 | |
| | Bharat Forge Ltd. | | | 271,888 | | | | 2,730,626 | |
| | Bharat Petroleum Corp. Ltd. | | | 427,867 | | | | 1,570,814 | |
| | Bharti Airtel Ltd. | | | 1,493,167 | | | | 15,016,466 | |
| | Biocon Ltd. | | | 396,886 | | | | 1,298,940 | |
| | Bosch Ltd. | | | 4,913 | | | | 978,153 | |
| | Britannia Industries Ltd. | | | 54,714 | | | | 2,489,318 | |
| | Canara Bank | | | 364,746 | | | | 1,283,075 | |
* | | CG Power & Industrial Solutions Ltd. | | | 114,992 | | | | 361,812 | |
| | Cholamandalam Investment & Finance Co. Ltd. | | | 539,910 | | | | 4,648,411 | |
| | Cipla Ltd. | | | 657,406 | | | | 9,280,072 | |
| | Coal India Ltd. | | | 649,232 | | | | 1,927,681 | |
| | Colgate-Palmolive India Ltd. | | | 122,914 | | | | 2,424,311 | |
| | Container Corp. of India Ltd. | | | 294,357 | | | | 2,834,831 | |
| | Coromandel International Ltd. | | | 56,910 | | | | 661,343 | |
| | CRISIL Ltd. | | | 667 | | | | 24,168 | |
| | Crompton Greaves Consumer Electricals Ltd. | | | 170,496 | | | | 746,226 | |
| | Cummins India Ltd. | | | 55,131 | | | | 896,769 | |
| | Dabur India Ltd. | | | 338,762 | | | | 2,278,236 | |
| | Dalmia Bharat Ltd. | | | 44,184 | | | | 852,713 | |
| | Deepak Nitrite Ltd. | | | 86,786 | | | | 2,428,457 | |
| | Divi’s Laboratories Ltd. | | | 72,911 | | | | 3,178,899 | |
| | Dixon Technologies India Ltd. | | | 2,979 | | | | 162,749 | |
| | DLF Ltd. | | | 530,091 | | | | 2,467,536 | |
# | | Dr Reddy’s Laboratories Ltd., ADR | | | 102,286 | | | | 5,555,153 | |
| | Dr Reddy’s Laboratories Ltd. | | | 31,975 | | | | 1,718,684 | |
| | Eicher Motors Ltd. | | | 93,424 | | | | 4,358,089 | |
| | Federal Bank Ltd. | | | 142,671 | | | | 226,811 | |
| | GAIL India Ltd. | | | 2,303,665 | | | | 2,531,004 | |
| | GAIL India Ltd., GDR | | | 153,552 | | | | 1,027,556 | |
| | GlaxoSmithKline Pharmaceuticals Ltd. | | | 32,553 | | | | 543,155 | |
* | | Godrej Consumer Products Ltd. | | | 251,241 | | | | 2,526,855 | |
* | | Godrej Properties Ltd. | | | 82,253 | | | | 1,259,074 | |
| | Grasim Industries Ltd. | | | 247,208 | | | | 5,162,859 | |
| | Gujarat Fluorochemicals Ltd. | | | 6,906 | | | | 315,839 | |
| | Gujarat Gas Ltd. | | | 139,066 | | | | 874,279 | |
| | Havells India Ltd. | | | 137,674 | | | | 2,030,143 | |
| | HCL Technologies Ltd. | | | 708,997 | | | | 8,903,865 | |
W | | HDFC Asset Management Co. Ltd. | | | 49,414 | | | | 1,240,369 | |
| | HDFC Bank Ltd. | | | 1,512,827 | | | | 27,440,778 | |
W | | HDFC Life Insurance Co. Ltd. | | | 341,801 | | | | 2,233,925 | |
| | Hero MotoCorp Ltd. | | | 174,353 | | | | 5,650,144 | |
| | Hindalco Industries Ltd. | | | 2,222,008 | | | | 10,881,758 | |
| | Hindustan Aeronautics Ltd. | | | 73,506 | | | | 2,245,995 | |
| | Hindustan Petroleum Corp. Ltd. | | | 614,890 | | | | 1,586,642 | |
| | Hindustan Unilever Ltd. | | | 440,646 | | | | 13,635,504 | |
| | Honeywell Automation India Ltd. | | | 1,617 | | | | 768,016 | |
| | Housing Development Finance Corp. Ltd. | | | 698,934 | | | | 20,898,952 | |
# | | ICICI Bank Ltd., Sponsored ADR | | | 649,989 | | | | 14,325,747 | |
THE EMERGING MARKETS SERIES
CONTINUED
| | | | | | | | | | |
| | | | | Shares | | | Value» | |
INDIA — (Continued) | | | | | | | | |
| | ICICI Bank Ltd. | | | 1,390,129 | | | $ | 15,285,795 | |
W | | ICICI Lombard General Insurance Co. Ltd. | | | 132,332 | | | | 1,874,249 | |
W | | ICICI Prudential Life Insurance Co. Ltd. | | | 169,973 | | | | 1,046,001 | |
* | | IDFC First Bank Ltd. | | | 3,037,968 | | | | 2,064,225 | |
| | Indian Hotels Co. Ltd. | | | 373,713 | | | | 1,507,706 | |
| | Indian Oil Corp. Ltd. | | | 1,397,934 | | | | 1,153,779 | |
* | | Indian Overseas Bank | | | 1,569,149 | | | | 352,865 | |
| | Indian Railway Catering & Tourism Corp. Ltd. | | | 315,471 | | | | 2,824,196 | |
W | | Indian Railway Finance Corp. Ltd. | | | 193,243 | | | | 52,871 | |
| | Indraprastha Gas Ltd. | | | 248,390 | | | | 1,283,351 | |
| | Indus Towers Ltd. | | | 1,064,122 | | | | 2,389,762 | |
| | IndusInd Bank Ltd. | | | 317,938 | | | | 4,397,592 | |
| | Info Edge India Ltd. | | | 41,683 | | | | 1,972,413 | |
# | | Infosys Ltd., Sponsored ADR | | | 500,328 | | | | 9,371,143 | |
| | Infosys Ltd. | | | 1,779,532 | | | | 33,201,533 | |
* W | | InterGlobe Aviation Ltd. | | | 51,183 | | | | 1,104,849 | |
| | Ipca Laboratories Ltd. | | | 58,404 | | | | 637,518 | |
| | ITC Ltd. | | | 1,903,270 | | | | 8,030,571 | |
| | Jindal Steel & Power Ltd. | | | 801,679 | | | | 4,465,891 | |
| | JSW Energy Ltd. | | | 309,078 | | | | 1,258,491 | |
| | JSW Steel Ltd. | | | 1,422,439 | | | | 11,597,295 | |
| | Jubilant Foodworks Ltd. | | | 480,298 | | | | 3,561,998 | |
| | Kansai Nerolac Paints Ltd. | | | 114,122 | | | | 666,096 | |
| | Kotak Mahindra Bank Ltd. | | | 406,367 | | | | 9,354,657 | |
W | | L&T Technology Services Ltd. | | | 29,195 | | | | 1,247,680 | |
W | | Larsen & Toubro Infotech Ltd. | | | 40,803 | | | | 2,336,124 | |
| | Larsen & Toubro Ltd. | | | 390,209 | | | | 9,592,960 | |
W | | Laurus Labs Ltd. | | | 355,427 | | | | 1,955,241 | |
| | Linde India Ltd. | | | 2,782 | | | | 103,092 | |
| | Lupin Ltd. | | | 260,207 | | | | 2,195,302 | |
| | Mahindra & Mahindra Ltd. | | | 905,189 | | | | 14,787,857 | |
| | Marico Ltd. | | | 535,354 | | | | 3,405,764 | |
| | Maruti Suzuki India Ltd. | | | 42,433 | | | | 4,895,914 | |
* | | Max Financial Services Ltd. | | | 154,648 | | | | 1,323,112 | |
* | | Max Healthcare Institute Ltd. | | | 223,862 | | | | 1,233,248 | |
| | Mindtree Ltd. | | | 77,849 | | | | 3,199,425 | |
| | Motherson Sumi Wiring India Ltd. | | | 1,325,504 | | | | 1,354,133 | |
| | Mphasis Ltd. | | | 126,795 | | | | 3,036,671 | |
| | MRF Ltd. | | | 2,316 | | | | 2,534,212 | |
| | Muthoot Finance Ltd. | | | 242,710 | | | | 3,066,984 | |
| | Nestle India Ltd. | | | 20,232 | | | | 4,976,646 | |
| | NHPC Ltd. | | | 1,327,907 | | | | 685,266 | |
| | NMDC Ltd. | | | 1,251,805 | | | | 1,503,514 | |
| | Nmdc Steel Ltd. | | | 1,251,805 | | | | 582,217 | |
| | NTPC Ltd. | | | 1,541,570 | | | | 3,233,532 | |
| | Oberoi Realty Ltd. | | | 85,578 | | | | 960,204 | |
| | Oil & Natural Gas Corp. Ltd. | | | 877,424 | | | | 1,417,903 | |
| | Oracle Financial Services Software Ltd. | | | 32,810 | | | | 1,157,566 | |
| | Page Industries Ltd. | | | 8,044 | | | | 4,842,885 | |
| | Persistent Systems Ltd. | | | 41,548 | | | | 1,854,889 | |
| | Petronet LNG Ltd. | | | 1,564,099 | | | | 3,879,853 | |
| | PI Industries Ltd. | | | 68,216 | | | | 2,674,539 | |
| | Pidilite Industries Ltd. | | | 87,949 | | | | 2,757,340 | |
| | Piramal Enterprises Ltd. | | | 117,594 | | | | 1,209,343 | |
* | | Piramal Pharma Ltd. | | | 470,376 | | | | 945,270 | |
| | Polycab India Ltd. | | | 9,594 | | | | 321,997 | |
| | Power Finance Corp. Ltd. | | | 2,196,312 | | | | 3,053,182 | |
| | Power Grid Corp. of India Ltd. | | | 1,541,802 | | | | 4,242,761 | |
| | Procter & Gamble Hygiene & Health Care Ltd. | | | 10,621 | | | | 1,801,872 | |
THE EMERGING MARKETS SERIES
CONTINUED
| | | | | | | | | | |
| | | | | Shares | | | Value» | |
INDIA — (Continued) | | | | | | | | |
| | Punjab National Bank | | | 1,966,565 | | | $ | 1,019,645 | |
| | REC Ltd. | | | 1,685,443 | | | | 2,093,372 | |
| | Relaxo Footwears Ltd. | | | 18,573 | | | | 217,623 | |
| | Reliance Industries Ltd. | | | 1,374,995 | | | | 42,364,653 | |
| | Samvardhana Motherson International Ltd. | | | 1,988,257 | | | | 1,553,560 | |
| | SBI Cards & Payment Services Ltd. | | | 79,899 | | | | 798,204 | |
W | | SBI Life Insurance Co. Ltd. | | | 143,303 | | | | 2,196,016 | |
| | Schaeffler India Ltd. | | | 10,805 | | | | 362,053 | |
| | Shree Cement Ltd. | | | 7,834 | | | | 2,153,796 | |
| | Shriram Transport Finance Co. Ltd. | | | 254,074 | | | | 3,771,894 | |
| | Siemens Ltd. | | | 33,599 | | | | 1,186,441 | |
| | Solar Industries India Ltd. | | | 4,601 | | | | 216,269 | |
| | SRF Ltd. | | | 132,025 | | | | 4,083,465 | |
| | State Bank of India | | | 933,814 | | | | 6,481,513 | |
| | State Bank of India, GDR | | | 3,115 | | | | 214,312 | |
| | Steel Authority of India Ltd. | | | 2,218,861 | | | | 2,109,344 | |
| | Sun Pharmaceutical Industries Ltd. | | | 598,582 | | | | 7,360,059 | |
| | Sundaram Finance Holdings Ltd. | | | 40,687 | | | | 43,943 | |
| | Sundaram Finance Ltd. | | | 964 | | | | 27,076 | |
| | Supreme Industries Ltd. | | | 12,166 | | | | 318,824 | |
| | Tata Chemicals Ltd. | | | 33,210 | | | | 454,689 | |
| | Tata Communications Ltd. | | | 108,655 | | | | 1,649,439 | |
| | Tata Consultancy Services Ltd. | | | 572,990 | | | | 22,023,536 | |
| | Tata Consumer Products Ltd. | | | 546,708 | | | | 5,092,380 | |
| | Tata Elxsi Ltd. | | | 32,921 | | | | 2,793,084 | |
# * | | Tata Motors Ltd., Sponsored ADR | | | 47,265 | | | | 1,182,098 | |
* | | Tata Motors Ltd. | | | 2,234,196 | | | | 11,170,004 | |
| | Tata Power Co. Ltd. | | | 771,887 | | | | 2,111,151 | |
| | Tata Steel Ltd. | | | 11,675,250 | | | | 14,256,387 | |
| | Tech Mahindra Ltd. | | | 590,572 | | | | 7,595,637 | |
| | Thermax Ltd. | | | 1,412 | | | | 37,280 | |
| | Titan Co. Ltd. | | | 181,344 | | | | 6,058,766 | |
| | Torrent Pharmaceuticals Ltd. | | | 152,170 | | | | 3,029,268 | |
| | Trent Ltd. | | | 96,354 | | | | 1,776,320 | |
| | Tube Investments of India Ltd. | | | 47,225 | | | | 1,552,924 | |
| | TVS Motor Co. Ltd. | | | 199,478 | | | | 2,762,580 | |
| | UltraTech Cement Ltd. | | | 61,077 | | | | 4,957,393 | |
| | Union Bank of India Ltd. | | | 739,695 | | | | 481,076 | |
| | United Breweries Ltd. | | | 45,973 | | | | 917,818 | |
* | | United Spirits Ltd. | | | 259,011 | | | | 2,806,346 | |
| | UNO Minda Ltd. | | | 73,811 | | | | 477,875 | |
| | UPL Ltd. | | | 1,057,811 | | | | 9,361,501 | |
| | Varun Beverages Ltd. | | | 249,699 | | | | 3,166,734 | |
| | Vedanta Ltd. | | | 1,416,252 | | | | 4,803,331 | |
* | | Vodafone Idea Ltd. | | | 7,119,524 | | | | 740,987 | |
| | Voltas Ltd. | | | 162,390 | | | | 1,722,180 | |
| | Wipro Ltd. | | | 857,062 | | | | 4,009,544 | |
| | Zee Entertainment Enterprises Ltd. | | | 7,924 | | | | 25,164 | |
| | Zydus Lifesciences Ltd. | | | 310,331 | | | | 1,624,596 | |
| | | | | | | | | | |
TOTAL INDIA | | | | 732,426,443 | |
| | | | | | | | | | |
INDONESIA — (2.4%) | | | | | | | | |
| | Adaro Energy Indonesia Tbk PT | | | 26,638,800 | | | | 6,796,053 | |
* | | Allo Bank Indonesia Tbk PT | | | 285,800 | | | | 42,153 | |
| | Aneka Tambang Tbk PT | | | 7,413,500 | | | | 877,522 | |
| | Astra International Tbk PT | | | 16,277,210 | | | | 6,955,749 | |
| | Bank Central Asia Tbk PT | | | 30,668,300 | | | | 17,336,096 | |
* | | Bank Jago Tbk PT | | | 1,709,200 | | | | 559,590 | |
| | Bank Mandiri Persero Tbk PT | | | 9,252,634 | | | | 6,250,645 | |
THE EMERGING MARKETS SERIES
CONTINUED
| | | | | | | | | | |
| | | | | Shares | | | Value» | |
INDONESIA — (Continued) | | | | | | | | |
| | Bank Negara Indonesia Persero Tbk PT | | | 5,902,722 | | | $ | 3,558,946 | |
| | Bank Pan Indonesia Tbk PT | | | 307,900 | | | | 47,435 | |
| | Bank Rakyat Indonesia Persero Tbk PT | | | 29,651,176 | | | | 8,845,927 | |
| | Bank Syariah Indonesia Tbk PT | | | 4,614,000 | | | | 414,162 | |
| | Barito Pacific Tbk PT | | | 17,543,900 | | | | 928,188 | |
| | Bukit Asam Tbk PT | | | 7,340,300 | | | | 1,838,312 | |
* | | Capital Financial Indonesia Tbk PT | | | 3,491,300 | | | | 170,018 | |
| | Charoen Pokphand Indonesia Tbk PT | | | 5,302,800 | | | | 1,894,452 | |
| | Elang Mahkota Teknologi Tbk PT | | | 8,468,400 | | | | 839,532 | |
| | Gudang Garam Tbk PT | | | 590,900 | | | | 913,178 | |
| | Indah Kiat Pulp & Paper Tbk PT | | | 3,417,500 | | | | 2,102,985 | |
| | Indo Tambangraya Megah Tbk PT | | | 637,600 | | | | 1,836,708 | |
| | Indocement Tunggal Prakarsa Tbk PT | | | 1,530,800 | | | | 910,591 | |
| | Indofood CBP Sukses Makmur Tbk PT | | | 1,227,000 | | | | 765,865 | |
| | Indofood Sukses Makmur Tbk PT | | | 6,125,100 | | | | 2,534,348 | |
| | Indosat Tbk PT | | | 968,600 | | | | 420,348 | |
* | | Jasa Marga Persero Tbk PT | | | 314,813 | | | | 68,831 | |
| | Kalbe Farma Tbk PT | | | 26,423,900 | | | | 3,474,908 | |
| | Mayora Indah Tbk PT | | | 2,611,225 | | | | 401,356 | |
* | | Merdeka Copper Gold Tbk PT | | | 3,606,495 | | | | 873,264 | |
| | Mitra Keluarga Karyasehat Tbk PT | | | 4,337,300 | | | | 768,305 | |
* | | MNC Studios International Tbk PT | | | 169,100 | | | | 54,437 | |
| | Perusahaan Gas Negara Tbk PT | | | 9,214,200 | | | | 1,167,528 | |
| | Sarana Menara Nusantara Tbk PT | | | 22,264,500 | | | | 1,648,117 | |
| | Semen Indonesia Persero Tbk PT | | | 3,768,500 | | | | 1,922,349 | |
| | Sinar Mas Agro Resources & Technology Tbk PT | | | 1,019,900 | | | | 302,617 | |
* | | Smartfren Telecom Tbk PT | | | 100,723,200 | | | | 502,773 | |
| | Sumber Alfaria Trijaya Tbk PT | | | 11,117,200 | | | | 2,008,884 | |
| | Telkom Indonesia Persero Tbk PT | | | 22,978,700 | | | | 6,453,586 | |
| | Tower Bersama Infrastructure Tbk PT | | | 2,421,400 | | | | 382,375 | |
| | Transcoal Pacific Tbk PT | | | 870,200 | | | | 573,132 | |
| | Unilever Indonesia Tbk PT | | | 4,594,500 | | | | 1,366,884 | |
| | United Tractors Tbk PT | | | 3,132,496 | | | | 6,479,680 | |
* | | Vale Indonesia Tbk PT | | | 2,888,500 | | | | 1,206,497 | |
| | XL Axiata Tbk PT | | | 6,670,600 | | | | 1,078,274 | |
| | | | | | | | | | |
TOTAL INDONESIA | | | | 97,572,600 | |
| | | | | | | | | | |
MALAYSIA — (1.7%) | | | | | | | | |
| | Alliance Bank Malaysia Bhd | | | 659,500 | | | | 515,961 | |
| | AMMB Holdings Bhd | | | 2,258,559 | | | | 1,954,307 | |
| | Axiata Group Bhd | | | 1,981,532 | | | | 1,192,504 | |
| | Batu Kawan Bhd | | | 117,300 | | | | 520,174 | |
# | | BIMB Holdings Bhd | | | 963,955 | | | | 516,928 | |
| | Bursa Malaysia Bhd | | | 325,200 | | | | 443,659 | |
| | Carlsberg Brewery Malaysia Bhd, Class B | | | 142,900 | | | | 673,229 | |
| | CIMB Group Holdings Bhd | | | 2,885,948 | | | | 3,371,143 | |
| | D&O Green Technologies Bhd | | | 461,100 | | | | 379,506 | |
| | Dialog Group Bhd | | | 2,084,818 | | | | 908,557 | |
| | DiGi.Com Bhd | �� | | 1,985,320 | | | | 1,592,453 | |
| | FGV Holdings Bhd | | | 168,700 | | | | 47,105 | |
| | Fraser & Neave Holdings Bhd | | | 135,400 | | | | 587,861 | |
| | Gamuda Bhd | | | 2,068,727 | | | | 1,683,207 | |
| | Genting Bhd | | | 1,808,100 | | | | 1,699,111 | |
| | Genting Malaysia Bhd | | | 2,150,900 | | | | 1,247,772 | |
| | Genting Plantations Bhd | | | 294,500 | | | | 381,233 | |
| | HAP Seng Consolidated Bhd | | | 792,800 | | | | 1,079,314 | |
# | | Hartalega Holdings Bhd | | | 3,107,000 | | | | 1,418,455 | |
# | | Heineken Malaysia Bhd | | | 142,000 | | | | 692,849 | |
| | Hong Leong Bank Bhd | | | 259,166 | | | | 1,161,718 | |
THE EMERGING MARKETS SERIES
CONTINUED
| | | | | | | | | | |
| | | | | Shares | | | Value» | |
MALAYSIA — (Continued) | | | | | | | | |
| | Hong Leong Financial Group Bhd | | | 307,783 | | | $ | 1,243,478 | |
| | IHH Healthcare Bhd | | | 744,900 | | | | 937,649 | |
| | IJM Corp. Bhd | | | 1,900,700 | | | | 654,851 | |
| | Inari Amertron Bhd | | | 2,621,400 | | | | 1,383,566 | |
| | IOI Corp. Bhd | | | 1,432,105 | | | | 1,235,898 | |
| | IOI Properties Group Bhd | | | 1,450,429 | | | | 316,113 | |
| | Kuala Lumpur Kepong Bhd | | | 376,546 | | | | 1,723,966 | |
| | Malayan Banking Bhd | | | 2,464,719 | | | | 4,477,296 | |
* | | Malaysia Airports Holdings Bhd | | | 768,241 | | | | 971,338 | |
| | Malaysian Pacific Industries Bhd | | | 77,600 | | | | 395,212 | |
# | | Maxis Bhd | | | 1,355,100 | | | | 1,103,045 | |
| | MISC Bhd | | | 629,598 | | | | 963,454 | |
# W | | MR DIY Group M Bhd | | | 526,850 | | | | 225,241 | |
| | My EG Services Bhd | | | 5,751,538 | | | | 1,076,761 | |
| | Nestle Malaysia Bhd | | | 43,200 | | | | 1,215,166 | |
| | Petronas Chemicals Group Bhd | | | 1,202,900 | | | | 2,217,697 | |
| | Petronas Dagangan Bhd | | | 165,700 | | | | 760,366 | |
| | Petronas Gas Bhd | | | 397,700 | | | | 1,438,357 | |
| | PPB Group Bhd | | | 495,880 | | | | 1,751,010 | |
| | Press Metal Aluminium Holdings Bhd | | | 1,958,700 | | | | 1,803,060 | |
| | Public Bank Bhd | | | 8,022,870 | | | | 7,587,220 | |
| | QL Resources Bhd | | | 932,285 | | | | 1,009,961 | |
| | RHB Bank Bhd | | | 1,664,929 | | | | 2,016,214 | |
| | Scientex Bhd | | | 251,200 | | | | 173,222 | |
| | Sime Darby Bhd | | | 4,489,961 | | | | 2,137,908 | |
| | Sime Darby Plantation Bhd | | | 1,349,221 | | | | 1,256,150 | |
# | | Sunway Bhd | | | 2,102,182 | | | | 711,531 | |
| | Telekom Malaysia Bhd | | | 517,329 | | | | 608,437 | |
| | Tenaga Nasional Bhd | | | 985,950 | | | | 1,755,801 | |
| | TIME dotCom Bhd | | | 1,062,500 | | | | 1,022,868 | |
# | | Top Glove Corp. Bhd | | | 9,558,800 | | | | 1,608,897 | |
# | | United Plantations Bhd | | | 124,500 | | | | 375,295 | |
| | ViTrox Corp. Bhd | | | 242,100 | | | | 364,225 | |
| | Westports Holdings Bhd | | | 718,400 | | | | 509,505 | |
| | Yinson Holdings Bhd | | | 1,423,240 | | | | 638,304 | |
| | YTL Corp. Bhd | | | 6,697,612 | | | | 800,363 | |
| | | | | | | | | | |
TOTAL MALAYSIA | | | | 70,536,471 | |
| | | | | | | | | | |
MEXICO — (2.6%) | | | | | | | | |
| | Alfa SAB de CV, Class A | | | 8,597,258 | | | | 5,710,388 | |
| | America Movil SAB de CV | | | 17,462,580 | | | | 16,481,615 | |
| | Arca Continental SAB de CV | | | 368,914 | | | | 3,013,800 | |
| | Becle SAB de CV | | | 199,974 | | | | 423,505 | |
* | | Cemex SAB de CV | | | 11,428,443 | | | | 4,453,015 | |
* | | Cemex SAB de CV, Sponsored ADR | | | 27,210 | | | | 105,031 | |
| | Coca-Cola Femsa SAB de CV, Sponsored ADR | | | 3,923 | | | | 246,325 | |
| | Coca-Cola Femsa SAB de CV | | | 415,925 | | | | 2,616,089 | |
| | El Puerto de Liverpool SAB de CV, Class C1 | | | 158,233 | | | | 808,455 | |
# | | Fomento Economico Mexicano SAB de CV | | | 748,304 | | | | 5,368,391 | |
| | Gruma SAB de CV, Class B | | | 252,563 | | | | 2,914,679 | |
# | | Grupo Aeroportuario del Pacifico SAB de CV, ADR | | | 5,030 | | | | 779,952 | |
| | Grupo Aeroportuario del Pacifico SAB de CV, Class B | | | 214,220 | | | | 3,322,664 | |
| | Grupo Aeroportuario del Sureste SAB de CV, ADR | | | 10,474 | | | | 2,444,841 | |
| | Grupo Aeroportuario del Sureste SAB de CV, Class B | | | 2,990 | | | | 70,169 | |
| | Grupo Bimbo SAB de CV, Class A | | | 997,325 | | | | 3,866,377 | |
| | Grupo Carso SAB de CV | | | 511,112 | | | | 2,061,164 | |
# | | Grupo Elektra SAB de CV | | | 50,113 | | | | 2,516,653 | |
| | Grupo Financiero Banorte SAB de CV, Class O | | | 1,806,062 | | | | 14,702,455 | |
# * | | Grupo Financiero Inbursa SAB de CV, Class O | | | 2,047,375 | | | | 3,764,492 | |
THE EMERGING MARKETS SERIES
CONTINUED
| | | | | | | | | | |
| | | | | Shares | | | Value» | |
MEXICO — (Continued) | | | | | | | | |
| | Grupo Mexico SAB de CV, Class B | | | 2,030,191 | | | $ | 7,313,114 | |
| | Grupo Televisa SAB, Sponsored ADR | | | 46,299 | | | | 243,070 | |
| | Grupo Televisa SAB | | | 1,867,160 | | | | 1,979,022 | |
# | | Industrias Penoles SAB de CV | | | 183,600 | | | | 2,057,287 | |
| | Kimberly-Clark de Mexico SAB de CV, Class A | | | 1,548,097 | | | | 2,439,388 | |
| | Orbia Advance Corp. SAB de CV | | | 2,213,800 | | | | 3,724,118 | |
| | Organizacion Soriana SAB de CV, Class B | | | 383,357 | | | | 585,300 | |
# * | | Sitios Latinoamerica SAB de CV | | | 873,128 | | | | 258,682 | |
# | | Wal-Mart de Mexico SAB de CV | | | 2,505,757 | | | | 9,680,040 | |
| | | | | | | | | | |
TOTAL MEXICO | | | | 103,950,081 | |
| | | | | | | | | | |
PERU — (0.2%) | | | | | | | | |
* | | Aenza SAA, Sponsored ADR | | | 42,218 | | | | 39,022 | |
* | | Cementos Pacasmayo SAA, ADR | | | 16,712 | | | | 89,411 | |
# | | Cia de Minas Buenaventura SAA, ADR | | | 53,274 | | | | 369,722 | |
| | Credicorp Ltd. | | | 39,029 | | | | 5,712,284 | |
| | | | | | | | | | |
TOTAL PERU | | | | 6,210,439 | |
| | | | | | | | | | |
PHILIPPINES — (0.8%) | | | | | | | | |
| | Aboitiz Equity Ventures, Inc. | | | 815,740 | | | | 801,730 | |
| | Aboitiz Power Corp. | | | 1,370,000 | | | | 750,471 | |
| | ACEN Corp. | | | 3,064,506 | | | | 333,217 | |
| | Ayala Corp. | | | 117,302 | | | | 1,361,266 | |
| | Ayala Land, Inc. | | | 3,424,218 | | | | 1,519,631 | |
| | Bank of the Philippine Islands | | | 1,507,742 | | | | 2,507,470 | |
| | BDO Unibank, Inc. | | | 1,553,962 | | | | 3,434,854 | |
* | | Converge Information & Communications Technology Solutions, Inc. | | | 95,300 | | | | 20,411 | |
| | DMCI Holdings, Inc. | | | 393,900 | | | | 64,932 | |
* | | Emperador, Inc. | | | 1,390,700 | | | | 470,589 | |
* †† | | Fwbc Holdings, Inc. | | | 2,006,957 | | | | 0 | |
| | Globe Telecom, Inc. | | | 21,677 | | | | 873,918 | |
| | International Container Terminal Services, Inc. | | | 623,010 | | | | 1,867,577 | |
| | JG Summit Holdings, Inc. | | | 2,422,589 | | | | 1,813,487 | |
| | Jollibee Foods Corp. | | | 284,210 | | | | 1,140,058 | |
| | Manila Electric Co. | | | 109,980 | | | | 573,424 | |
| | Metro Pacific Investments Corp. | | | 4,297,700 | | | | 271,918 | |
| | Metropolitan Bank & Trust Co. | | | 2,744,218 | | | | 2,463,708 | |
| | PLDT, Inc., Sponsored ADR | | | 19,949 | | | | 548,996 | |
| | PLDT, Inc. | | | 102,335 | | | | 2,885,840 | |
| | San Miguel Corp. | | | 1,213,110 | | | | 2,016,296 | |
| | San Miguel Food & Beverage, Inc. | | | 85,800 | | | | 54,249 | |
| | Semirara Mining & Power Corp. | | | 387,700 | | | | 235,711 | |
| | SM Investments Corp. | | | 102,383 | | | | 1,459,200 | |
| | SM Prime Holdings, Inc. | | | 4,214,410 | | | | 2,301,586 | |
| | Union Bank of the Philippines | | | 2,107 | | | | 2,808 | |
| | Universal Robina Corp. | | | 775,650 | | | | 1,640,957 | |
| | Wilcon Depot, Inc. | | | 236,600 | | | | 120,248 | |
| | | | | | | | | | |
TOTAL PHILIPPINES | | | | 31,534,552 | |
| | | | | | | | | | |
POLAND — (0.6%) | | | | | | | | |
#* W | | Allegro.eu SA | | | 105,206 | | | | 510,265 | |
| | Asseco Poland SA | | | 45,345 | | | | 652,422 | |
| | Bank Handlowy w Warszawie SA | | | 19,571 | | | | 253,303 | |
* | | Bank Millennium SA | | | 124,117 | | | | 113,060 | |
| | Bank Polska Kasa Opieki SA | | | 117,069 | | | | 1,918,697 | |
| | Budimex SA | | | 3,960 | | | | 198,813 | |
# | | CD Projekt SA | | | 33,657 | | | | 894,292 | |
| | Cyfrowy Polsat SA | | | 260,132 | | | | 973,956 | |
THE EMERGING MARKETS SERIES
CONTINUED
| | | | | | | | | | |
| | | | | Shares | | | Value» | |
POLAND — (Continued) | | | | | | | | |
* W | | Dino Polska SA | | | 30,321 | | | $ | 1,979,122 | |
| | Grupa Kety SA | | | 1,845 | | | | 190,336 | |
| | ING Bank Slaski SA | | | 21,579 | | | | 751,873 | |
| | Inter Cars SA | | | 114 | | | | 8,590 | |
* | | Jastrzebska Spolka Weglowa SA | | | 13,839 | | | | 120,020 | |
| | KGHM Polska Miedz SA | | | 112,453 | | | | 2,248,217 | |
| | KRUK SA | | | 1,908 | | | | 111,108 | |
| | LPP SA | | | 714 | | | | 1,237,183 | |
* | | mBank SA | | | 18,089 | | | | 1,012,599 | |
| | Orange Polska SA | | | 653,211 | | | | 823,581 | |
* | | PGE Polska Grupa Energetyczna SA | | | 675,732 | | | | 770,164 | |
| | Polski Koncern Naftowy Orlen SA | | | 453,542 | | | | 5,208,255 | |
* | | Polskie Gornictwo Naftowe i Gazownictwo SA | | | 904,182 | | | | 974,996 | |
| | Powszechna Kasa Oszczednosci Bank Polski SA | | | 336,889 | | | | 1,835,834 | |
| | Powszechny Zaklad Ubezpieczen SA | | | 323,904 | | | | 1,814,611 | |
| | Santander Bank Polska SA | | | 18,511 | | | | 982,917 | |
| | | | | | | | | | |
TOTAL POLAND | | | | 25,584,214 | |
| | | | | | | | | | |
QATAR — (1.0%) | | | | | | | | |
| | Barwa Real Estate Co. | | | 45,574 | | | | 42,526 | |
| | Commercial Bank PSQC | | | 1,021,572 | | | | 1,765,816 | |
| | Industries Qatar QSC | | | 748,482 | | | | 3,240,190 | |
| | Masraf Al Rayan QSC | | | 3,533,707 | | | | 3,723,242 | |
| | Mesaieed Petrochemical Holding Co. | | | 3,448,812 | | | | 2,150,991 | |
| | Ooredoo QPSC | | | 1,353,316 | | | | 3,628,229 | |
| | Qatar Electricity & Water Co. QSC | | | 382,308 | | | | 1,941,731 | |
| | Qatar Fuel QSC | | | 331,230 | | | | 1,735,336 | |
| | Qatar Gas Transport Co. Ltd. | | | 3,816,139 | | | | 4,296,413 | |
| | Qatar International Islamic Bank QSC | | | 559,434 | | | | 1,776,922 | |
| | Qatar Islamic Bank SAQ | | | 680,495 | | | | 4,553,480 | |
| | Qatar National Bank QPSC | | | 2,505,254 | | | | 13,717,886 | |
| | | | | | | | | | |
TOTAL QATAR | | | | 42,572,762 | |
| | | | | | | | | | |
RUSSIA — (0.0%) | | | | | | | | |
* †† | | Gazprom PJSC,Sponsored ADR | | | 1,293,312 | | | | 0 | |
* †† | | Lukoil PJSC, Sponsored ADR | | | 128,002 | | | | 0 | |
* †† | | Magnitogorsk Iron & Steel Works PJSC, GDR | | | 172,148 | | | | 0 | |
* †† | | MMC Norilsk Nickel PJSC, ADR | | | 205,087 | | | | 0 | |
* †† | | Mobile TeleSystems PJSC, ADR | | | 294,338 | | | | 0 | |
* †† | | Novatek PJSC, GDR | | | 15,415 | | | | 0 | |
* †† | | Novolipetsk Steel PJSC, GDR | | | 60,064 | | | | 0 | |
* †† | | PhosAgro PJSC | | | 582 | | | | 0 | |
* †† | | PhosAgro PJSC, GDR | | | 90,265 | | | | 0 | |
* †† | | Polyus PJSC, GDR | | | 20,177 | | | | 0 | |
* †† | | Rosneft Oil Co. PJSC, GDR | | | 275,526 | | | | 0 | |
* †† | | Rostelecom PJSC,Sponsored ADR | | | 88,099 | | | | 0 | |
* †† | | RusHydro PJSC, ADR | | | 808,023 | | | | 0 | |
* †† | | Sberbank of Russia PJSC, Sponsored ADR | | | 948,237 | | | | 0 | |
* †† | | Severstal PAO, GDR | | | 67,875 | | | | 0 | |
* †† | | Tatneft PJSC,Sponsored ADR | | | 122,269 | | | | 0 | |
* †† | | VK Co. Ltd., GDR | | | 9,666 | | | | 0 | |
* †† | | VTB Bank PJSC, GDR | | | 1,705,908 | | | | 0 | |
* †† | | X5 Retail Group NV, GDR | | | 81,764 | | | | 0 | |
| | | | | | | | | | |
SAUDI ARABIA — (4.7%) | | | | | | | | |
| | Abdullah Al Othaim Markets Co. | | | 53,471 | | | | 1,615,343 | |
| | Advanced Petrochemical Co. | | | 123,833 | | | | 1,457,469 | |
* | | Al Rajhi Bank | | | 1,085,108 | | | | 24,605,766 | |
THE EMERGING MARKETS SERIES
CONTINUED
| | | | | | | | | | |
| | | | | Shares | | | Value» | |
SAUDI ARABIA — (Continued) | | | | | | | | |
| | Alinma Bank | | | 765,866 | | | $ | 7,640,252 | |
| | Almarai Co. JSC | | | 151,980 | | | | 2,275,921 | |
| | Arab National Bank | | | 471,307 | | | | 4,047,013 | |
| | Arabian Centres Co. Ltd. | | | 120,619 | | | | 626,718 | |
* | | Bank AlBilad | | | 379,651 | | | | 5,126,953 | |
| | Bank Al-Jazira | | | 473,561 | | | | 2,946,359 | |
| | Banque Saudi Fransi | | | 470,724 | | | | 5,410,962 | |
| | Bupa Arabia for Cooperative Insurance Co. | | | 48,595 | | | | 2,495,855 | |
* | | Dar Al Arkan Real Estate Development Co. | | | 584,678 | | | | 2,091,862 | |
| | Dr Sulaiman Al Habib Medical Services Group Co. | | | 40,198 | | | | 2,424,856 | |
* | | Emaar Economic City | | | 186,198 | | | | 475,435 | |
| | Etihad Etisalat Co. | | | 943,798 | | | | 9,188,419 | |
| | Jarir Marketing Co. | | | 73,421 | | | | 3,202,523 | |
* | | Mobile Telecommunications Co. Saudi Arabia | | | 996,100 | | | | 3,440,421 | |
| | Mouwasat Medical Services Co. | | | 52,804 | | | | 3,073,886 | |
* | | National Industrialization Co. | | | 358,846 | | | | 1,275,783 | |
* | | Rabigh Refining & Petrochemical Co. | | | 649,687 | | | | 2,355,300 | |
| | Riyad Bank | | | 967,941 | | | | 9,250,996 | |
| | SABIC Agri-Nutrients Co. | | | 152,786 | | | | 6,455,496 | |
| | Sahara International Petrochemical Co. | | | 608,267 | | | | 6,548,522 | |
* | | Saudi Arabian Mining Co. | | | 512,286 | | | | 11,402,576 | |
W | | Saudi Arabian Oil Co. | | | 1,032,167 | | | | 9,579,044 | |
| | Saudi Basic Industries Corp. | | | 442,004 | | | | 10,378,482 | |
| | Saudi British Bank | | | 712,216 | | | | 8,250,011 | |
| | Saudi Electricity Co. | | | 366,509 | | | | 2,631,711 | |
| | Saudi Industrial Investment Group | | | 463,238 | | | | 2,767,528 | |
| | Saudi Investment Bank | | | 413,525 | | | | 1,994,838 | |
* | | Saudi Kayan Petrochemical Co. | | | 1,216,330 | | | | 4,260,800 | |
| | Saudi National Bank | | | 945,913 | | | | 14,950,375 | |
* | | Saudi Research & Media Group | | | 46,206 | | | | 2,475,135 | |
| | Saudi Telecom Co. | | | 1,007,500 | | | | 10,824,373 | |
| | Savola Group | | | 305,124 | | | | 2,377,204 | |
| | Southern Province Cement Co. | | | 14,117 | | | | 205,756 | |
| | Yanbu National Petrochemical Co. | | | 267,708 | | | | 3,183,024 | |
| | | | | | | | | | |
TOTAL SAUDI ARABIA | | | | 193,312,967 | |
| | | | | | | | | | |
SOUTH AFRICA — (3.5%) | | | | | | | | |
| | Absa Group Ltd. | | | 539,065 | | | | 5,853,827 | |
| | African Rainbow Minerals Ltd. | | | 35,825 | | | | 504,492 | |
| | Anglo American Platinum Ltd. | | | 30,706 | | | | 2,444,997 | |
| | AngloGold Ashanti Ltd., Sponsored ADR | | | 416,896 | | | | 5,440,493 | |
| | Aspen Pharmacare Holdings Ltd. | | | 422,830 | | | | 3,478,168 | |
| | Bid Corp. Ltd. | | | 191,129 | | | | 3,075,681 | |
| | Bidvest Group Ltd. | | | 364,485 | | | | 4,211,317 | |
| | Capitec Bank Holdings Ltd. | | | 41,839 | | | | 4,332,296 | |
# | | Clicks Group Ltd. | | | 277,963 | | | | 4,709,390 | |
* | | Discovery Ltd. | | | 488,952 | | | | 3,198,150 | |
| | Exxaro Resources Ltd. | | | 326,361 | | | | 3,636,710 | |
| | FirstRand Ltd. | | | 2,693,023 | | | | 9,414,756 | |
# | | Gold Fields Ltd., Sponsored ADR | | | 802,892 | | | | 6,326,789 | |
| | Impala Platinum Holdings Ltd. | | | 739,263 | | | | 7,569,063 | |
| | Investec Ltd. | | | 262,805 | | | | 1,292,125 | |
| | Kumba Iron Ore Ltd. | | | 34,502 | | | | 649,069 | |
| | Mr Price Group Ltd. | | | 256,073 | | | | 2,464,642 | |
| | MTN Group Ltd. | | | 1,570,195 | | | | 11,097,278 | |
| | MultiChoice Group | | | 429,429 | | | | 2,806,665 | |
| | Naspers Ltd., Class N | | | 50,967 | | | | 5,253,770 | |
| | Nedbank Group Ltd. | | | 460,235 | | | | 5,448,627 | |
| | NEPI Rockcastle NV | | | 348,853 | | | | 1,753,394 | |
THE EMERGING MARKETS SERIES
CONTINUED
| | | | | | | | | | |
| | | | | Shares | | | Value» | |
SOUTH AFRICA — (Continued) | | | | | | | | |
| | Ninety One Ltd. | | | 225,714 | | | $ | 530,755 | |
* | | Northam Platinum Holdings Ltd. | | | 303,245 | | | | 2,836,896 | |
| | Old Mutual Ltd. | | | 7,858,201 | | | | 4,460,566 | |
W | | Pepkor Holdings Ltd. | | | 1,217,627 | | | | 1,504,853 | |
| | Sanlam Ltd. | | | 1,479,776 | | | | 4,313,461 | |
# | | Sasol Ltd., Sponsored ADR | | | 501,115 | | | | 8,433,765 | |
| | Shoprite Holdings Ltd. | | | 295,830 | | | | 3,765,488 | |
| | Sibanye Stillwater Ltd. | | | 2,439,984 | | | | 5,714,989 | |
# | | Sibanye Stillwater Ltd., ADR | | | 214,816 | | | | 2,017,122 | |
| | Standard Bank Group Ltd. | | | 688,647 | | | | 6,428,683 | |
| | Vodacom Group Ltd. | | | 315,489 | | | | 2,148,956 | |
| | Woolworths Holdings Ltd. | | | 1,130,428 | | | | 3,876,453 | |
| | | | | | | | | | |
TOTAL SOUTH AFRICA | | | | 140,993,686 | |
| | | | | | | | | | |
SOUTH KOREA — (11.7%) | | | | | | | | |
* | | Alteogen, Inc. | | | 18,172 | | | | 466,583 | |
| | Amorepacific Corp. | | | 10,122 | | | | 657,184 | |
# | | Amorepacific Group | | | 32,258 | | | | 558,518 | |
| | BGF retail Co. Ltd. | | | 9,471 | | | | 1,238,542 | |
| | BNK Financial Group, Inc. | | | 332,888 | | | | 1,495,963 | |
| | Caregen Co. Ltd. | | | 975 | | | | 65,055 | |
# | | Celltrion Healthcare Co. Ltd. | | | 27,674 | | | | 1,346,439 | |
* | | Celltrion Pharm, Inc. | | | 11,394 | | | | 540,508 | |
| | Celltrion, Inc. | | | 44,288 | | | | 5,953,137 | |
| | Cheil Worldwide, Inc. | | | 69,463 | | | | 1,190,267 | |
# | | Chunbo Co. Ltd. | | | 2,789 | | | | 426,585 | |
# | | CJ CheilJedang Corp. | | | 8,824 | | | | 2,561,976 | |
| | CJ Corp. | | | 24,910 | | | | 1,253,699 | |
| | CJ ENM Co. Ltd. | | | 20,351 | | | | 1,046,418 | |
* | | CJ Logistics Corp. | | | 12,469 | | | | 767,899 | |
| | Com2uSCorp. | | | 2,949 | | | | 146,734 | |
* | | CosmoAM&T Co. Ltd. | | | 12,486 | | | | 586,279 | |
| | Coway Co. Ltd. | | | 56,244 | | | | 2,180,911 | |
# | | CS Wind Corp. | | | 16,801 | | | | 692,108 | |
| | Daeduck Electronics Co. Ltd. | | | 12,770 | | | | 219,813 | |
| | Daejoo Electronic Materials Co. Ltd. | | | 3,936 | | | | 247,570 | |
| | Daesung Holdings Co. Ltd. | | | 2,439 | | | | 168,967 | |
* | | Daewoo Engineering & Construction Co. Ltd. | | | 313,837 | | | | 924,229 | |
# * | | Daewoo Shipbuilding & Marine Engineering Co. Ltd. | | | 31,106 | | | | 398,947 | |
| | Daewoong Co. Ltd. | | | 1,530 | | | | 22,139 | |
| | Daewoong Pharmaceutical Co. Ltd. | | | 732 | | | | 82,872 | |
# | | DB HiTek Co. Ltd. | | | 45,779 | | | | 1,417,045 | |
| | DB Insurance Co. Ltd. | | | 93,028 | | | | 3,671,436 | |
# | | DL E&C Co. Ltd. | | | 57,621 | | | | 1,390,160 | |
# | | DL Holdings Co. Ltd. | | | 17,437 | | | | 751,412 | |
# | | Dongjin Semichem Co. Ltd. | | | 30,624 | | | | 644,431 | |
| | Dongkuk Steel Mill Co. Ltd. | | | 41,126 | | | | 329,531 | |
| | Dongsuh Cos., Inc. | | | 23,600 | | | | 337,591 | |
* | | Dongwha Enterprise Co. Ltd. | | | 922 | | | | 42,388 | |
| | Dongwon Systems Corp. | | | 1,506 | | | | 48,473 | |
| | Doosan Bobcat, Inc. | | | 59,853 | | | | 1,404,687 | |
* | | Doosan Enerbility Co. Ltd. | | | 217,682 | | | | 2,019,734 | |
# * | | Doosan Fuel Cell Co. Ltd. | | | 28,267 | | | | 539,437 | |
| | Douzone Bizon Co. Ltd. | | | 12,968 | | | | 277,169 | |
| | Ecopro BM Co. Ltd. | | | 19,332 | | | | 1,557,075 | |
# | | Ecopro Co. Ltd. | | | 10,233 | | | | 1,015,850 | |
| | E-MART, Inc. | | | 20,339 | | | | 1,205,750 | |
| | F&F Co. Ltd. | | | 4,455 | | | | 453,911 | |
# | | Fila Holdings Corp. | | | 69,695 | | | | 1,596,208 | |
THE EMERGING MARKETS SERIES
CONTINUED
| | | | | | | | | | |
| | | | | Shares | | | Value» | |
SOUTH KOREA — (Continued) | | | | | | | | |
| | Foosung Co. Ltd. | | | 47,363 | | | $ | 410,845 | |
# | | Green Cross Corp. | | | 4,063 | | | | 362,903 | |
| | GS Engineering & Construction Corp. | | | 80,479 | | | | 1,222,859 | |
| | GS Holdings Corp. | | | 83,334 | | | | 2,687,984 | |
| | GS Retail Co. Ltd. | | | 60,832 | | | | 1,083,204 | |
| | Hana Financial Group, Inc. | | | 337,861 | | | | 9,768,026 | |
* | | Hanjin Kal Corp. | | | 7,798 | | | | 217,391 | |
| | Hankook Tire & Technology Co. Ltd. | | | 82,943 | | | | 2,124,523 | |
| | Hanmi Pharm Co. Ltd. | | | 4,282 | | | | 759,692 | |
# | | Hanmi Science Co. Ltd. | | | 7,614 | | | | 170,847 | |
# | | Hanon Systems | | | 115,792 | | | | 632,722 | |
# | | Hansol Chemical Co. Ltd. | | | 9,131 | | | | 1,185,951 | |
| | Hanwha Aerospace Co. Ltd. | | | 31,151 | | | | 1,450,748 | |
# | | Hanwha Corp. | | | 56,544 | | | | 1,006,095 | |
* | | Hanwha Life Insurance Co. Ltd. | | | 349,192 | | | | 534,602 | |
* | | Hanwha Solutions Corp. | | | 53,323 | | | | 1,762,253 | |
| | HD Hyundai Co. Ltd. | | | 50,425 | | | | 2,152,606 | |
| | Hite Jinro Co. Ltd. | | | 24,304 | | | | 437,001 | |
| | HL Mando Co. Ltd. | | | 37,987 | | | | 1,315,254 | |
# * | | HLB, Inc. | | | 63,504 | | | | 1,800,378 | |
# | | HMM Co. Ltd. | | | 398,652 | | | | 5,332,741 | |
| | Hotel Shilla Co. Ltd. | | | 28,318 | | | | 1,289,523 | |
* | | Hugel, Inc. | | | 2,731 | | | | 213,939 | |
# * | | HYBE Co. Ltd. | | | 4,789 | | | | 405,377 | |
# | | Hyosung Advanced Materials Corp. | | | 2,410 | | | | 538,351 | |
# | | Hyosung Corp. | | | 9,034 | | | | 434,009 | |
| | Hyosung TNC Corp. | | | 175 | | | | 32,065 | |
| | Hyundai Autoever Corp. | | | 3,735 | | | | 309,743 | |
| | Hyundai Department Store Co. Ltd. | | | 6,109 | | | | 231,700 | |
* | | Hyundai Doosan Infracore Co. Ltd. | | | 223,139 | | | | 867,484 | |
| | Hyundai Elevator Co. Ltd. | | | 15,545 | | | | 274,668 | |
| | Hyundai Engineering & Construction Co. Ltd. | | | 84,807 | | | | 2,073,306 | |
| | Hyundai Glovis Co. Ltd. | | | 23,148 | | | | 2,821,445 | |
| | Hyundai Marine & Fire Insurance Co. Ltd. | | | 127,359 | | | | 2,974,231 | |
* | | Hyundai Mipo Dockyard Co. Ltd. | | | 15,813 | | | | 1,017,674 | |
| | Hyundai Mobis Co. Ltd. | | | 40,679 | | | | 6,239,318 | |
| | Hyundai Motor Co. | | | 59,619 | | | | 6,870,402 | |
* | | Hyundai Rotem Co. Ltd. | | | 47,080 | | | | 803,357 | |
| | Hyundai Steel Co. | | | 128,244 | | | | 2,523,561 | |
# | | Hyundai Wia Corp. | | | 16,610 | | | | 710,565 | |
# | | Iljin Materials Co. Ltd. | | | 12,480 | | | | 529,556 | |
| | Industrial Bank of Korea | | | 314,491 | | | | 2,304,781 | |
| | JB Financial Group Co. Ltd. | | | 63,408 | | | | 319,293 | |
| | JYP Entertainment Corp. | | | 24,714 | | | | 960,745 | |
| | Kakao Corp. | | | 86,689 | | | | 3,075,272 | |
* | | Kakao Games Corp. | | | 18,687 | | | | 516,891 | |
* | | Kangwon Land, Inc. | | | 32,321 | | | | 521,123 | |
| | KB Financial Group, Inc. | | | 309,585 | | | | 10,417,236 | |
| | KB Financial Group, Inc., ADR | | | 30,584 | | | | 1,025,787 | |
| | KCC Corp. | | | 4,724 | | | | 806,830 | |
| | KEPCO Engineering & Construction Co., Inc. | | | 6,591 | | | | 229,377 | |
| | KEPCO Plant Service & Engineering Co. Ltd. | | | 13,138 | | | | 293,812 | |
| | KG Dongbu Steel | | | 19,170 | | | | 104,361 | |
| | Kia Corp. | | | 144,165 | | | | 6,699,461 | |
| | KIWOOM Securities Co. Ltd. | | | 27,235 | | | | 1,540,983 | |
* | | KMW Co. Ltd. | | | 13,691 | | | | 226,839 | |
| | Kolon Industries, Inc. | | | 19,334 | | | | 588,749 | |
| | Korea Aerospace Industries Ltd. | | | 25,553 | | | | 848,629 | |
* | | Korea Electric Power Corp., Sponsored ADR | | | 25,248 | | | | 148,206 | |
THE EMERGING MARKETS SERIES
CONTINUED
| | | | | | | | | | |
| | | | | Shares | | | Value» | |
SOUTH KOREA — (Continued) | | | | | | | | |
* | | Korea Electric Power Corp. | | | 92,178 | | | $ | 1,080,925 | |
| | Korea Gas Corp. | | | 24,489 | | | | 597,632 | |
| | Korea Investment Holdings Co. Ltd. | | | 62,842 | | | | 2,181,483 | |
* | | Korea Shipbuilding & Offshore Engineering Co. Ltd. | | | 39,696 | | | | 2,022,170 | |
| | Korea Zinc Co. Ltd. | | | 3,733 | | | | 1,674,073 | |
* | | Korean Air Lines Co. Ltd. | | | 220,303 | | | | 3,567,594 | |
# | | KT Corp., Sponsored ADR | | | 82,100 | | | | 1,043,491 | |
| | KT&G Corp. | | | 70,941 | | | | 4,764,505 | |
| | Kumho Petrochemical Co. Ltd. | | | 35,567 | | | | 3,260,585 | |
* | | L&F Co. Ltd. | | | 8,283 | | | | 1,305,312 | |
# | | LEENO Industrial, Inc. | | | 10,832 | | | | 1,037,787 | |
| | LG Chem Ltd. | | | 21,330 | | | | 9,360,424 | |
| | LG Corp. | | | 73,098 | | | | 4,057,890 | |
# | | LG Display Co. Ltd., ADR | | | 327,393 | | | | 1,453,625 | |
| | LG Display Co. Ltd. | | | 221,348 | | | | 1,975,374 | |
| | LG Electronics, Inc. | | | 157,679 | | | | 9,006,661 | |
| | LG H&H Co. Ltd. | | | 4,994 | | | | 1,784,260 | |
| | LG Innotek Co. Ltd. | | | 9,241 | | | | 1,917,177 | |
| | LG Uplus Corp. | | | 420,444 | | | | 3,376,283 | |
| | LIG Nex1 Co. Ltd. | | | 4,208 | | | | 300,005 | |
# | | Lotte Chemical Corp. | | | 15,371 | | | | 1,592,718 | |
| | Lotte Chilsung Beverage Co. Ltd. | | | 2,724 | | | | 268,243 | |
| | Lotte Corp. | | | 34,062 | | | | 778,424 | |
| | LOTTE Fine Chemical Co. Ltd. | | | 20,046 | | | | 788,279 | |
| | Lotte Shopping Co. Ltd. | | | 12,790 | | | | 783,083 | |
| | LS Corp. | | | 19,269 | | | | 897,830 | |
| | LS Electric Co. Ltd. | | | 17,507 | | | | 674,737 | |
| | LX International Corp. | | | 39,692 | | | | 1,130,560 | |
# | | LX Semicon Co. Ltd. | | | 11,384 | | | | 660,496 | |
| | Macquarie Korea Infrastructure Fund | | | 208,019 | | | | 1,612,185 | |
| | Meritz Financial Group, Inc. | | | 62,223 | | | | 945,721 | |
| | Meritz Fire & Marine Insurance Co. Ltd. | | | 47,853 | | | | 1,054,593 | |
| | Meritz Securities Co. Ltd. | | | 397,797 | | | | 1,031,517 | |
| | Mirae Asset Securities Co. Ltd. | | | 333,586 | | | | 1,484,965 | |
| | NAVER Corp. | | | 38,269 | | | | 4,539,401 | |
# | | NCSoft Corp. | | | 5,915 | | | | 1,615,856 | |
# W | | Netmarble Corp. | | | 22,472 | | | | 702,270 | |
| | NH Investment & Securities Co. Ltd. | | | 177,468 | | | | 1,115,859 | |
# | | NongShim Co. Ltd. | | | 2,906 | | | | 615,554 | |
# | | OCI Co. Ltd. | | | 29,953 | | | | 2,139,393 | |
# | | Orion Corp. | | | 19,068 | | | | 1,356,942 | |
# | | Osstem Implant Co. Ltd. | | | 7,119 | | | | 530,102 | |
| | Ottogi Corp. | | | 1,618 | | | | 501,179 | |
| | Pan Ocean Co. Ltd. | | | 444,419 | | | | 1,338,286 | |
* | | Paradise Co. Ltd. | | | 24,370 | | | | 242,530 | |
* | | Pearl Abyss Corp. | | | 18,229 | | | | 530,749 | |
# | | POSCO Chemical Co. Ltd. | | | 8,327 | | | | 1,162,689 | |
| | POSCO Holdings, Inc. | | | 47,972 | | | | 8,361,075 | |
# | | Posco International Corp. | | | 94,648 | | | | 1,369,403 | |
| | S-1 Corp. | | | 18,026 | | | | 788,931 | |
* W | | Samsung Biologics Co. Ltd. | | | 5,311 | | | | 3,263,807 | |
| | Samsung C&T Corp. | | | 39,138 | | | | 3,248,925 | |
# | | Samsung Card Co. Ltd. | | | 26,138 | | | | 566,644 | |
| | Samsung Electro-Mechanics Co. Ltd. | | | 51,069 | | | | 4,325,111 | |
| | Samsung Electronics Co. Ltd. | | | 3,140,501 | | | | 130,707,098 | |
* | | Samsung Engineering Co. Ltd. | | | 99,972 | | | | 1,670,062 | |
| | Samsung Fire & Marine Insurance Co. Ltd. | | | 40,945 | | | | 5,742,510 | |
* | | Samsung Heavy Industries Co. Ltd. | | | 317,207 | | | | 1,145,153 | |
| | Samsung Life Insurance Co. Ltd. | | | 63,894 | | | | 3,019,486 | |
THE EMERGING MARKETS SERIES
CONTINUED
| | | | | | | | | | |
| | | | | Shares | | | Value» | |
SOUTH KOREA — (Continued) | | | | | | | | |
| | Samsung SDI Co. Ltd. | | | 19,354 | | | $ | 9,985,019 | |
| | Samsung SDS Co. Ltd. | | | 21,777 | | | | 1,907,861 | |
| | Samsung Securities Co. Ltd. | | | 74,696 | | | | 1,661,897 | |
# | | Seegene, Inc. | | | 44,351 | | | | 891,617 | |
| | Seoul City Gas Co. Ltd. | | | 439 | | | | 101,500 | |
| | SFA Engineering Corp. | | | 10,979 | | | | 293,535 | |
| | Shinhan Financial Group Co. Ltd. | | | 380,795 | | | | 9,678,506 | |
| | Shinhan Financial Group Co. Ltd., ADR | | | 46,849 | | | | 1,184,811 | |
| | Shinsegae, Inc. | | | 10,056 | | | | 1,497,282 | |
# * | | SK Biopharmaceuticals Co. Ltd. | | | 12,316 | | | | 501,419 | |
| | SK Chemicals Co. Ltd. | | | 6,497 | | | | 402,508 | |
| | SK Hynix, Inc. | | | 384,714 | | | | 22,271,674 | |
* | | SK Innovation Co. Ltd. | | | 76,816 | | | | 9,301,452 | |
# | | SK Networks Co. Ltd. | | | 242,361 | | | | 684,542 | |
| | SK Telecom Co. Ltd. | | | 55,517 | | | | 1,950,963 | |
| | SK, Inc. | | | 42,871 | | | | 6,424,110 | |
| | SKC Co. Ltd. | | | 12,904 | | | | 934,648 | |
# | | SL Corp. | | | 10,180 | | | | 219,065 | |
# | | SM Entertainment Co. Ltd. | | | 9,331 | | | | 464,777 | |
# | | S-Oil Corp. | | | 33,599 | | | | 2,037,260 | |
| | Solus Advanced Materials Co. Ltd. | | | 5,507 | | | | 129,446 | |
| | Soulbrain Co. Ltd. | | | 4,534 | | | | 650,092 | |
| | Ssangyong C&E Co. Ltd. | | | 107,296 | | | | 427,560 | |
| | ST Pharm Co. Ltd. | | | 3,410 | | | | 198,978 | |
* | | Studio Dragon Corp. | | | 9,633 | | | | 461,409 | |
* | | Taihan Electric Wire Co. Ltd. | | | 275,870 | | | | 289,929 | |
| | Tokai Carbon Korea Co. Ltd. | | | 1,652 | | | | 117,395 | |
# | | Wemade Co. Ltd. | | | 8,431 | | | | 261,379 | |
| | WONIK IPS Co. Ltd. | | | 21,433 | | | | 412,628 | |
| | Woori Financial Group, Inc. | | | 563,198 | | | | 4,647,509 | |
| | Youngone Corp. | | | 24,214 | | | | 802,583 | |
# | | Yuhan Corp. | | | 28,751 | | | | 1,205,496 | |
| | | | | | | | | | |
TOTAL SOUTH KOREA | | | | 474,217,376 | |
| | | | | | | | | | |
TAIWAN — (15.0%) | | | | | | | | |
| | Accton Technology Corp. | | | 390,000 | | | | 2,932,742 | |
# | | Acer, Inc. | | | 4,172,811 | | | | 2,855,205 | |
# | | Advanced Energy Solution Holding Co. Ltd. | | | 18,000 | | | | 312,819 | |
| | Advantech Co. Ltd. | | | 175,190 | | | | 1,587,158 | |
# | | Airtac International Group | | | 132,602 | | | | 3,034,388 | |
| | Alchip Technologies Ltd. | | | 52,000 | | | | 1,041,344 | |
# | | ASE Technology Holding Co. Ltd., ADR | | | 27,294 | | | | 138,928 | |
# | | ASE Technology Holding Co. Ltd. | | | 3,764,782 | | | | 9,295,807 | |
# | | Asia Cement Corp. | | | 2,725,758 | | | | 3,151,751 | |
# | | ASMedia Technology, Inc. | | | 20,000 | | | | 359,050 | |
# | | ASPEED Technology, Inc. | | | 30,300 | | | | 1,570,775 | |
# | | Asustek Computer, Inc. | | | 678,180 | | | | 4,958,354 | |
| | AUO Corp. | | | 9,061,498 | | | | 4,729,067 | |
| | Catcher Technology Co. Ltd. | | | 783,429 | | | | 4,115,401 | |
| | Cathay Financial Holding Co. Ltd. | | | 4,019,340 | | | | 4,703,862 | |
# | | Chailease Holding Co. Ltd. | | | 1,317,016 | | | | 6,074,981 | |
| | Chang Hwa Commercial Bank Ltd. | | | 4,582,777 | | | | 2,358,343 | |
| | Cheng Shin Rubber Industry Co. Ltd. | | | 2,224,965 | | | | 2,226,049 | |
| | Chicony Electronics Co. Ltd. | | | 818,497 | | | | 2,030,631 | |
| | China Airlines Ltd. | | | 6,027,536 | | | | 3,155,290 | |
| | China Development Financial Holding Corp. | | | 13,783,045 | | | | 5,015,315 | |
# | | China Steel Corp. | | | 11,906,932 | | | | 9,911,573 | |
| | Chipbond Technology Corp. | | | 986,000 | | | | 1,661,691 | |
| | Chroma ATE, Inc. | | | 355,000 | | | | 1,938,170 | |
THE EMERGING MARKETS SERIES
CONTINUED
| | | | | | | | | | |
| | | | | Shares | | | Value» | |
TAIWAN — (Continued) | | | | | | | | |
# | | Chung Hung Steel Corp. | | | 940,000 | | | $ | 572,786 | |
# | | Chunghwa Telecom Co. Ltd., Sponsored ADR | | | 117,361 | | | | 4,038,392 | |
| | Chunghwa Telecom Co. Ltd. | | | 683,000 | | | | 2,354,926 | |
| | Compal Electronics, Inc. | | | 5,218,541 | | | | 3,413,282 | |
| | Compeq Manufacturing Co. Ltd. | | | 859,000 | | | | 1,160,447 | |
# | | CTBC Financial Holding Co. Ltd. | | | 16,024,175 | | | | 10,123,062 | |
| | Delta Electronics, Inc. | | | 827,486 | | | | 6,584,150 | |
| | E Ink Holdings, Inc. | | | 270,000 | | | | 1,715,626 | |
# | | E.Sun Financial Holding Co. Ltd. | | | 9,531,922 | | | | 6,850,249 | |
# | | Eclat Textile Co. Ltd. | | | 142,402 | | | | 1,868,700 | |
# | | Elite Material Co. Ltd. | | | 288,000 | | | | 1,302,723 | |
| | eMemory Technology, Inc. | | | 64,000 | | | | 2,122,206 | |
| | Eternal Materials Co. Ltd. | | | 768,161 | | | | 711,769 | |
| | Eva Airways Corp. | | | 4,130,758 | | | | 2,982,912 | |
| | Evergreen Marine Corp. Taiwan Ltd. | | | 1,047,289 | | | | 4,455,481 | |
| | Far Eastern International Bank | | | 488,111 | | | | 160,333 | |
| | Far Eastern New Century Corp. | | | 3,183,085 | | | | 3,172,604 | |
| | Far EasTone Telecommunications Co. Ltd. | | | 1,337,000 | | | | 2,931,507 | |
# | | Faraday Technology Corp. | | | 122,000 | | | | 534,285 | |
| | Farglory Land Development Co. Ltd. | | | 48,000 | | | | 79,197 | |
| | Feng TAY Enterprise Co. Ltd. | | | 352,559 | | | | 1,750,906 | |
| | First Financial Holding Co. Ltd. | | | 9,311,665 | | | | 7,143,005 | |
| | Formosa Chemicals & Fibre Corp. | | | 3,269,518 | | | | 7,047,367 | |
# | | Formosa Petrochemical Corp. | | | 537,000 | | | | 1,381,652 | |
| | Formosa Plastics Corp. | | | 1,804,153 | | | | 4,648,239 | |
| | Formosa Sumco Technology Corp. | | | 91,000 | | | | 409,105 | |
| | Formosa Taffeta Co. Ltd. | | | 699,000 | | | | 555,832 | |
| | Foxconn Technology Co. Ltd. | | | 1,025,627 | | | | 1,435,687 | |
| | Fubon Financial Holding Co. Ltd. | | | 3,783,631 | | | | 5,976,372 | |
# | | Genius Electronic Optical Co. Ltd. | | | 130,695 | | | | 1,212,833 | |
| | Giant Manufacturing Co. Ltd. | | | 394,506 | | | | 2,510,540 | |
| | Gigabyte Technology Co. Ltd. | | | 662,000 | | | | 1,890,112 | |
| | Global Unichip Corp. | | | 76,000 | | | | 1,143,248 | |
| | Globalwafers Co. Ltd. | | | 321,000 | | | | 3,557,943 | |
# | | Highwealth Construction Corp. | | | 1,091,973 | | | | 1,403,307 | |
| | Hiwin Technologies Corp. | | | 386,291 | | | | 1,984,643 | |
| | Hon Hai Precision Industry Co. Ltd. | | | 5,794,322 | | | | 18,403,209 | |
| | Hotai Finance Co. Ltd. | | | 113,000 | | | | 329,512 | |
| | Hotai Motor Co. Ltd. | | | 182,000 | | | | 3,292,822 | |
* | | HTC Corp. | | | 191,000 | | | | 297,907 | |
| | Hua Nan Financial Holdings Co. Ltd. | | | 7,423,500 | | | | 4,842,869 | |
| | Innolux Corp. | | | 12,225,863 | | | | 4,483,610 | |
| | International Games System Co. Ltd. | | | 146,000 | | | | 1,589,576 | |
# | | Inventec Corp. | | | 2,864,550 | | | | 2,166,320 | |
| | King Yuan Electronics Co. Ltd. | | | 1,629,000 | | | | 1,648,169 | |
| | King’s Town Bank Co. Ltd. | | | 329,000 | | | | 313,122 | |
# | | Kinsus Interconnect Technology Corp. | | | 315,000 | | | | 1,015,015 | |
# | | Largan Precision Co. Ltd. | | | 74,860 | | | | 4,282,887 | |
| | Lien Hwa Industrial Holdings Corp. | | | 881,061 | | | | 1,270,406 | |
| | Lite-On Technology Corp. | | | 2,650,410 | | | | 5,248,420 | |
| | Lotes Co. Ltd. | | | 68,139 | | | | 1,635,262 | |
# | | Macronix International Co. Ltd. | | | 2,734,074 | | | | 2,518,876 | |
| | Makalot Industrial Co. Ltd. | | | 238,000 | | | | 1,473,769 | |
# | | MediaTek, Inc. | | | 799,995 | | | | 14,582,464 | |
# | | Mega Financial Holding Co. Ltd. | | | 8,514,028 | | | | 7,887,801 | |
# | | Merida Industry Co. Ltd. | | | 207,287 | | | | 1,129,550 | |
| | Micro-Star International Co. Ltd. | | | 918,000 | | | | 3,109,452 | |
| | momo.com, Inc. | | | 63,000 | | | | 939,937 | |
# | | Nan Ya Plastics Corp. | | | 2,602,599 | | | | 5,514,491 | |
THE EMERGING MARKETS SERIES
CONTINUED
| | | | | | | | | | |
| | | | | Shares | | | Value» | |
TAIWAN — (Continued) | | | | | | | | |
# | | Nan Ya Printed Circuit Board Corp. | | | 417,000 | | | $ | 2,720,598 | |
# | | Nanya Technology Corp. | | | 1,356,010 | | | | 2,286,003 | |
| | Nien Made Enterprise Co. Ltd. | | | 254,000 | | | | 1,958,452 | |
| | Novatek Microelectronics Corp. | | | 839,000 | | | | 6,251,173 | |
# | | Nuvoton Technology Corp. | | | 171,000 | | | | 540,595 | |
# * | | Oneness Biotech Co. Ltd. | | | 141,000 | | | | 995,578 | |
# | | Parade Technologies Ltd. | | | 84,000 | | | | 1,581,887 | |
# | | Pegatron Corp. | | | 1,911,345 | | | | 3,494,088 | |
* | | PharmaEssentia Corp. | | | 91,869 | | | | 1,288,934 | |
# | | Phison Electronics Corp. | | | 152,000 | | | | 1,389,133 | |
# * | | Polaris Group | | | 142,000 | | | | 395,454 | |
| | Pou Chen Corp. | | | 2,710,487 | | | | 2,288,218 | |
| | Powerchip Semiconductor Manufacturing Corp. | | | 3,884,000 | | | | 3,697,371 | |
| | Powertech Technology, Inc. | | | 1,216,819 | | | | 2,810,270 | |
# | | President Chain Store Corp. | | | 347,831 | | | | 2,892,211 | |
| | Qisda Corp. | | | 1,617,000 | | | | 1,229,182 | |
| | Quanta Computer, Inc. | | | 2,513,000 | | | | 5,322,801 | |
| | Radiant Opto-Electronics Corp. | | | 649,000 | | | | 1,977,418 | |
| | Realtek Semiconductor Corp. | | | 722,950 | | | | 5,699,201 | |
| | Ruentex Development Co. Ltd. | | | 1,856,224 | | | | 2,278,533 | |
| | Ruentex Industries Ltd. | | | 715,214 | | | | 1,221,775 | |
| | Shanghai Commercial & Savings Bank Ltd. | | | 2,779,000 | | | | 3,999,825 | |
# | | Shin Kong Financial Holding Co. Ltd. | | | 13,710,712 | | | | 3,399,186 | |
| | Silergy Corp. | | | 205,000 | | | | 2,363,996 | |
| | Simplo Technology Co. Ltd. | | | 240,000 | | | | 1,906,987 | |
| | Sinbon Electronics Co. Ltd. | | | 190,000 | | | | 1,475,463 | |
| | Sino-American Silicon Products, Inc. | | | 758,000 | | | | 2,906,907 | |
# | | SinoPac Financial Holdings Co. Ltd. | | | 10,193,549 | | | | 5,086,121 | |
| | Standard Foods Corp. | | | 442,418 | | | | 530,218 | |
| | Synnex Technology International Corp. | | | 1,370,343 | | | | 2,231,071 | |
# | | TA Chen Stainless Pipe | | | 2,019,823 | | | | 2,360,121 | |
# | | Taichung Commercial Bank Co. Ltd. | | | 3,160,446 | | | | 1,229,177 | |
| | Taishin Financial Holding Co. Ltd. | | | 10,100,425 | | | | 4,145,142 | |
| | Taiwan Business Bank | | | 7,257,274 | | | | 2,686,728 | |
# | | Taiwan Cement Corp. | | | 5,147,701 | | | | 4,826,916 | |
# | | Taiwan Cooperative Financial Holding Co. Ltd. | | | 8,096,365 | | | | 6,273,166 | |
| | Taiwan FamilyMart Co. Ltd. | | | 48,000 | | | | 275,516 | |
| | Taiwan Fertilizer Co. Ltd. | | | 723,000 | | | | 1,172,200 | |
| | Taiwan Glass Industry Corp. | | | 1,402,375 | | | | 885,794 | |
| | Taiwan High Speed Rail Corp. | | | 1,023,000 | | | | 891,204 | |
| | Taiwan Mobile Co. Ltd. | | | 955,300 | | | | 2,816,784 | |
| | Taiwan Secom Co. Ltd. | | | 264,670 | | | | 758,252 | |
| | Taiwan Semiconductor Manufacturing Co. Ltd. | | | 13,416,808 | | | | 161,299,590 | |
* | | Tatung Co. Ltd. | | | 1,748,000 | | | | 1,694,849 | |
| | Teco Electric & Machinery Co. Ltd. | | | 1,902,000 | | | | 1,679,980 | |
| | Tong Hsing Electronic Industries Ltd. | | | 33,000 | | | | 176,438 | |
# | | Tripod Technology Corp. | | | 623,870 | | | | 1,723,802 | |
# | | Tung Ho Steel Enterprise Corp. | | | 321,040 | | | | 491,297 | |
| | U-Ming Marine Transport Corp. | | | 289,000 | | | | 314,783 | |
| | Unimicron Technology Corp. | | | 1,488,000 | | | | 5,717,447 | |
| | Union Bank Of Taiwan | | | 205,000 | | | | 96,215 | |
| | Uni-President Enterprises Corp. | | | 4,631,033 | | | | 9,404,512 | |
# | | United Microelectronics Corp. | | | 6,765,000 | | | | 8,134,649 | |
# | | Vanguard International Semiconductor Corp. | | | 1,550,000 | | | | 3,182,412 | |
| | Voltronic Power Technology Corp. | | | 75,224 | | | | 3,049,891 | |
| | Walsin Lihwa Corp. | | | 2,857,818 | | | | 3,161,237 | |
| | Walsin Technology Corp. | | | 395,000 | | | | 964,136 | |
| | Wan Hai Lines Ltd. | | | 1,145,747 | | | | 2,398,589 | |
# | | Win Semiconductors Corp. | | | 416,034 | | | | 1,569,743 | |
THE EMERGING MARKETS SERIES
CONTINUED
| | | | | | | | | | |
| | | | | Shares | | | Value» | |
TAIWAN — (Continued) | | | | | | | | |
| | Winbond Electronics Corp. | | | 4,548,407 | | | $ | 2,741,592 | |
†† | | Wintek Corp. | | | 604,760 | | | | 6,439 | |
| | Wisdom Marine Lines Co. Ltd. | | | 390,000 | | | | 630,765 | |
| | Wistron Corp. | | | 4,067,699 | | | | 3,284,152 | |
# | | Wiwynn Corp. | | | 94,000 | | | | 2,105,760 | |
| | WPG Holdings Ltd. | | | 1,859,039 | | | | 2,531,186 | |
# | | WT Microelectronics Co. Ltd. | | | 87,000 | | | | 157,137 | |
| | Yageo Corp. | | | 330,055 | | | | 3,741,835 | |
| | Yang Ming Marine Transport Corp. | | | 2,345,000 | | | | 4,365,521 | |
# | | YFY, Inc. | | | 1,334,000 | | | | 1,055,901 | |
| | Yuanta Financial Holding Co. Ltd. | | | 9,319,849 | | | | 5,690,768 | |
| | Yulon Finance Corp. | | | 370,476 | | | | 1,565,211 | |
| | Yulon Motor Co. Ltd. | | | 354,000 | | | | 500,082 | |
| | Zhen Ding Technology Holding Ltd. | | | 971,700 | | | | 3,184,569 | |
| | | | | | | | | | |
TOTAL TAIWAN | | | | 609,479,705 | |
| | | | | | | | | | |
THAILAND — (2.5%) | | | | | | | | |
| | Advanced Info Service PCL | | | 733,300 | | | | 3,679,987 | |
| | AEON Thana Sinsap Thailand PCL | | | 149,100 | | | | 640,511 | |
* | | Airports of Thailand PCL | | | 1,898,400 | | | | 3,691,056 | |
| | Asset World Corp. PCL | | | 5,732,900 | | | | 918,831 | |
| | B Grimm Power PCL | | | 545,900 | | | | 484,081 | |
| | Bangchak Corp. PCL | | | 1,934,400 | | | | 1,550,163 | |
| | Bangkok Bank PCL | | | 529,400 | | | | 2,023,849 | |
| | Bangkok Bank PCL, NVDR | | | 126,700 | | | | 484,363 | |
| | Bangkok Chain Hospital PCL | | | 2,177,500 | | | | 1,058,428 | |
| | Bangkok Commercial Asset Management PCL | | | 1,838,500 | | | | 739,071 | |
| | Bangkok Dusit Medical Services PCL, Class F | | | 4,406,100 | | | | 3,415,133 | |
| | Bangkok Expressway & Metro PCL | | | 3,479,999 | | | | 859,485 | |
| | Bangkok Life Assurance PCL, NVDR | | | 618,200 | | | | 531,951 | |
| | Banpu PCL | | | 8,546,866 | | | | 2,807,037 | |
| | Banpu Power PCL | | | 669,100 | | | | 261,944 | |
| | Berli Jucker PCL | | | 1,097,400 | | | | 987,545 | |
* | | Beyond Securities PCL | | | 723,900 | | | | 264,378 | |
| | BTS Group Holdings PCL | | | 5,069,500 | | | | 1,105,540 | |
| | Bumrungrad Hospital PCL | | | 251,300 | | | | 1,498,820 | |
| | Carabao Group PCL, Class F | | | 163,600 | | | | 387,938 | |
| | Central Pattana PCL | | | 882,500 | | | | 1,594,111 | |
* | | Central Plaza Hotel PCL | | | 364,500 | | | | 486,032 | |
| | Central Retail Corp. PCL | | | 1,073,050 | | | | 1,184,133 | |
| | CH Karnchang PCL | | | 35,800 | | | | 21,822 | |
| | Charoen Pokphand Foods PCL | | | 2,323,200 | | | | 1,541,272 | |
| | Chularat Hospital PCL, Class F | | | 5,791,500 | | | | 538,673 | |
| | CK Power PCL | | | 1,368,200 | | | | 177,586 | |
| | Com7 PCL, Class F | | | 1,312,700 | | | | 1,043,331 | |
| | CP ALL PCL | | | 2,280,200 | | | | 3,594,640 | |
| | Delta Electronics Thailand PCL | | | 115,000 | | | | 1,752,496 | |
| | Dohome PCL | | | 829,600 | | | | 281,183 | |
| | Electricity Generating PCL | | | 120,500 | | | | 539,812 | |
| | Energy Absolute PCL | | | 823,900 | | | | 2,088,974 | |
| | Esso Thailand PCL | | | 1,807,500 | | | | 688,617 | |
| | Forth Corp. PCL | | | 260,000 | | | | 362,060 | |
| | Global Power Synergy PCL, Class F | | | 282,900 | | | | 460,846 | |
| | Gulf Energy Development PCL | | | 1,161,100 | | | | 1,540,608 | |
| | Gunkul Engineering PCL | | | 5,933,900 | | | | 802,932 | |
| | Hana Microelectronics PCL | | | 33,600 | | | | 30,678 | |
| | Home Product Center PCL | | | 3,733,413 | | | | 1,432,155 | |
| | Indorama Ventures PCL | | | 1,401,500 | | | | 1,546,584 | |
| | Intouch Holdings PCL, Class F | | | 356,100 | | | | 673,652 | |
THE EMERGING MARKETS SERIES
CONTINUED
| | | | | | | | | | |
| | | | | Shares | | | Value» | |
THAILAND — (Continued) | | | | | | | | |
| | IRPC PCL | | | 19,703,000 | | | $ | 1,625,523 | |
* | | Jasmine Technology Solution PCL | | | 81,800 | | | | 104,238 | |
| | Jay Mart PCL | | | 380,000 | | | | 451,787 | |
| | JMT Network Services PCL, Class F | | | 248,053 | | | | 423,632 | |
| | Kasikornbank PCL | | | 121,700 | | | | 468,446 | |
| | Kasikornbank PCL, NVDR | | | 5,500 | | | | 21,098 | |
| | KCE Electronics PCL | | | 1,036,100 | | | | 1,143,358 | |
| | Kiatnakin Phatra Bank PCL | | | 389,500 | | | | 747,070 | |
| | Krung Thai Bank PCL | | | 1,429,987 | | | | 657,509 | |
| | Krungthai Card PCL | | | 619,200 | | | | 927,336 | |
| | Land & Houses PCL | | | 6,942,300 | | | | 1,678,118 | |
| | Mega Lifesciences PCL | | | 434,200 | | | | 504,817 | |
* | | Minor International PCL | | | 1,730,783 | | | | 1,284,672 | |
| | MK Restaurants Group PCL | | | 309,800 | | | | 474,142 | |
| | Muangthai Capital PCL | | | 963,600 | | | | 917,775 | |
| | Ngern Tid Lor PCL | | | 24,700 | | | | 16,873 | |
| | Osotspa PCL | | | 1,174,400 | | | | 817,698 | |
* | | PSG Corp. PCL | | | 1,565,000 | | | | 58,389 | |
| | PTT Exploration & Production PCL | | | 1,189,455 | | | | 5,672,257 | |
| | PTT Global Chemical PCL | | | 1,555,872 | | | | 1,778,256 | |
| | PTT Oil & Retail Business PCL | | | 840,700 | | | | 532,340 | |
| | PTT PCL | | | 6,973,400 | | | | 6,595,964 | |
| | Ramkhamhaeng Hospital PCL, Class F | | | 21,700 | | | | 31,643 | |
| | Ratch Group PCL | | | 487,100 | | | | 524,727 | |
| | Regional Container Lines PCL | | | 134,800 | | | | 93,857 | |
| | SCB X PCL | | | 355,366 | | | | 989,721 | |
| | SCG Packaging PCL | | | 753,600 | | | | 1,029,616 | |
| | Siam Cement PCL | | | 347,900 | | | | 2,961,629 | |
| | Siam City Cement PCL | | | 113,989 | | | | 452,242 | |
| | Siam Global House PCL | | | 1,544,492 | | | | 815,667 | |
| | Singer Thailand PCL | | | 118,200 | | | | 112,579 | |
| | Sri Trang Agro-Industry PCL | | | 1,139,508 | | | | 574,844 | |
| | Sri Trang Gloves Thailand PCL | | | 1,277,300 | | | | 372,518 | |
| | Srisawad Corp. PCL | | | 1,258,772 | | | | 1,356,008 | |
| | Star Petroleum Refining PCL | | | 2,954,000 | | | | 923,610 | |
* | | STARK Corp. PCL | | | 3,436,000 | | | | 288,891 | |
| | Supalai PCL | | | 1,627,800 | | | | 898,156 | |
| | Thai Oil PCL | | | 1,979,917 | | | | 2,835,141 | |
| | Thai Union Group PCL, Class F | | | 3,062,540 | | | | 1,448,390 | |
| | Thanachart Capital PCL | | | 441,600 | | | | 464,109 | |
| | Thonburi Healthcare Group PCL | | | 455,000 | | | | 806,950 | |
| | Tisco Financial Group PCL | | | 309,700 | | | | 781,167 | |
| | TMBThanachart Bank PCL | | | 25,424,697 | | | | 908,502 | |
| | TOA Paint Thailand PCL | | | 590,800 | | | | 488,970 | |
| | Total Access Communication PCL | | | 700,700 | | | | 828,468 | |
| | True Corp. PCL | | | 17,144,931 | | | | 2,234,337 | |
| | TTW PCL | | | 1,054,700 | | | | 241,090 | |
| | VGI PCL | | | 3,956,670 | | | | 378,410 | |
| | Vibhavadi Medical Center PCL | | | 746,200 | | | | 56,073 | |
| | WHA Corp. PCL | | | 8,501,900 | | | | 880,123 | |
| | | | | | | | | | |
TOTAL THAILAND | | | | 100,451,044 | |
| | | | | | | | | | |
TURKEY — (0.7%) | | | | | | | | |
| | Akbank TAS | | | 2,934,684 | | | | 2,306,994 | |
| | Aksa Akrilik Kimya Sanayii AS | | | 65,145 | | | | 243,809 | |
# | | Aksa Enerji Uretim AS | | | 237,721 | | | | 528,761 | |
# | | Anadolu Efes Biracilik Ve Malt Sanayii AS | | | 233,645 | | | | 601,198 | |
# | | Arcelik AS | | | 76,332 | | | | 322,613 | |
# | | Aselsan Elektronik Sanayi Ve Ticaret AS | | | 276,008 | | | | 477,840 | |
THE EMERGING MARKETS SERIES
CONTINUED
| | | | | | | | | | |
| | | | | Shares | | | Value» | |
TURKEY — (Continued) | | | | | | | | |
| | BIM Birlesik Magazalar AS | | | 283,141 | | | $ | 2,038,579 | |
| | Borusan Yatirim ve Pazarlama AS | | | 2,256 | | | | 90,035 | |
| | Coca-Cola Icecek AS | | | 53,405 | | | | 493,263 | |
| | Dogus Otomotiv Servis ve Ticaret AS | | | 9,274 | | | | 61,105 | |
# W | | Enerjisa Enerji AS | | | 87,431 | | | | 96,343 | |
| | Enka Insaat ve Sanayi AS | | | 775,859 | | | | 781,482 | |
# | | Eregli Demir ve Celik Fabrikalari TAS | | | 842,011 | | | | 1,341,869 | |
# | | Ford Otomotiv Sanayi AS | | | 45,341 | | | | 884,924 | |
* | | Gubre Fabrikalari TAS | | | 17,401 | | | | 136,327 | |
# * | | Hektas Ticaret TAS | | | 770,209 | | | | 1,184,225 | |
| | Kardemir Karabuk Demir Celik Sanayi ve Ticaret AS, Class D | | | 924,114 | | | | 593,863 | |
| | KOC Holding AS | | | 446,849 | | | | 1,332,999 | |
# | | Koza Altin Isletmeleri AS | | | 22,016 | | | | 230,274 | |
* | | Migros Ticaret AS | | | 18,380 | | | | 119,518 | |
| | Otokar Otomotiv Ve Savunma Sanayi AS | | | 12,650 | | | | 359,573 | |
* | | Oyak Cimento Fabrikalari AS | | | 119,573 | | | | 107,982 | |
* | | Pegasus Hava Tasimaciligi AS | | | 35,848 | | | | 616,571 | |
* | | Petkim Petrokimya Holding AS | | | 1,468,954 | | | | 1,050,831 | |
# * | | Sasa Polyester Sanayi AS | | | 263,986 | | | | 1,700,243 | |
* | | TAV Havalimanlari Holding AS | | | 190,894 | | | | 804,030 | |
| | Tofas Turk Otomobil Fabrikasi AS | | | 74,286 | | | | 391,960 | |
* | | Turk Hava Yollari AO | | | 306,328 | | | | 1,667,273 | |
# | | Turk Telekomunikasyon AS | | | 467,239 | | | | 311,376 | |
| | Turk Traktor ve Ziraat Makineleri AS | | | 7,711 | | | | 157,628 | |
# | | Turkcell Iletisim Hizmetleri AS | | | 972,496 | | | | 1,342,274 | |
* | | Turkiye Halk Bankasi AS | | | 384,954 | | | | 170,471 | |
| | Turkiye Is Bankasi AS, Class C | | | 2,062,210 | | | | 1,033,060 | |
* | | Turkiye Petrol Rafinerileri AS | | | 73,386 | | | | 1,486,644 | |
| | Turkiye Sise ve Cam Fabrikalari AS | | | 582,052 | | | | 1,037,847 | |
# * | | Turkiye Vakiflar Bankasi TAO, Class D | | | 822,870 | | | | 378,619 | |
| | Vestel Beyaz Esya Sanayi ve Ticaret AS | | | 296,319 | | | | 149,332 | |
| | Yapi ve Kredi Bankasi AS | | | 2,854,262 | | | | 1,413,268 | |
| | | | | | | | | | |
TOTAL TURKEY | | | | 28,045,003 | |
| | | | | | | | | | |
UNITED ARAB EMIRATES — (1.5%) | | | | | | | | |
| | Abu Dhabi Commercial Bank PJSC | | | 2,483,364 | | | | 6,392,591 | |
| | Abu Dhabi Islamic Bank PJSC | | | 2,055,881 | | | | 5,319,388 | |
| | Abu Dhabi National Oil Co. for Distribution PJSC | | | 2,078,002 | | | | 2,553,818 | |
| | Aldar Properties PJSC | | | 3,907,903 | | | | 4,596,753 | |
| | Dubai Islamic Bank PJSC | | | 4,462,522 | | | | 7,069,864 | |
| | Emaar Properties PJSC | | | 4,313,170 | | | | 7,119,985 | |
| | Emirates Integrated Telecommunications Co. PJSC | | | 207,413 | | | | 323,562 | |
| | Emirates NBD Bank PJSC | | | 1,188,088 | | | | 4,290,114 | |
| | Emirates Telecommunications Group Co. PJSC | | | 1,754,520 | | | | 12,330,867 | |
| | First Abu Dhabi Bank PJSC | | | 2,034,758 | | | | 9,923,020 | |
* | | International Holding Co. PJSC | | | 24,261 | | | | 2,661,765 | |
| | | | | | | | | | |
TOTAL UNITED ARAB EMIRATES | | | | 62,581,727 | |
| | | | | | | | | | |
UNITED STATES — (0.0%) | | | | | | | | |
| | Sempra Energy | | | 9,588 | | | | 1,338,052 | |
| | | | | | | | | | |
TOTAL COMMON STOCKS | | | | 3,912,714,070 | |
| | | | | | | | | | |
PREFERRED STOCKS — (1.3%) | | | | | | | | |
| | |
BRAZIL — (1.2%) | | | | | | | | |
| | Banco Bradesco SA | | | 2,373,138 | | | | 9,124,096 | |
| | Braskem SA Class A | | | 82,539 | | | | 538,649 | |
| | Centrais Eletricas Brasileiras SA Class B | | | 103,746 | | | | 1,070,900 | |
THE EMERGING MARKETS SERIES
CONTINUED
| | | | | | | | | | |
| | | | | Shares | | | Value» | |
BRAZIL — (Continued) | | | | | | | | |
| | Cia de Transmissao de Energia Eletrica Paulista | | | 122,300 | | | $ | 580,070 | |
| | Cia Energetica de Minas Gerais | | | 1,094,369 | | | | 2,408,861 | |
| | Cia Paranaense de Energia | | | 1,292,740 | | | | 1,851,955 | |
| | Gerdau SA | | | 653,216 | | | | 3,256,280 | |
| | Itau Unibanco Holding SA | | | 2,317,176 | | | | 13,637,044 | |
| | Petroleo Brasileiro SA | | | 2,952,047 | | | | 17,036,206 | |
| | | | | | | | | | |
TOTAL BRAZIL | | | | 49,504,061 | |
| | | | | | | | | | |
CHILE — (0.0%) | | | | | | | | |
| | Embotelladora Andina SA Class B | | | 431,209 | | | | 753,310 | |
| | | | | | | | | | |
COLOMBIA — (0.1%) | | | | | | | | |
| | Banco Davivienda SA | | | 49,344 | | | | 259,771 | |
| | Grupo Aval Acciones y Valores SA | | | 2,461,699 | | | | 269,161 | |
| | Grupo de Inversiones Suramericana SA | | | 84,488 | | | | 233,684 | |
| | | | | | | | | | |
TOTAL COLOMBIA | | | | 762,616 | |
| | | | | | | | | | |
SOUTH KOREA — (0.0%) | | | | | | | | |
| | Hyundai Engineering & Construction Co. Ltd. | | | 985 | | | | 39,130 | |
| | | | | | | | | | |
TAIWAN — (0.0%) | | | | | | | | |
| | China Development Financial Holding Corp. | | | 1,176,143 | | | | 276,224 | |
| | | | | | | | | | |
TOTAL PREFERRED STOCKS | | | | 51,335,341 | |
| | | | | | | | | | |
RIGHTS/WARRANTS — (0.0%) | | | | | | | | |
| | |
MALAYSIA — (0.0%) | | | | | | | | |
* | | Yinson Holdings Bhd Warrants 06/21/25 | | | 174,274 | | | | 16,218 | |
| | | | | | | | | | |
SOUTH KOREA — (0.0%) | | | | | | | | |
* | | HLB, Inc. Rights 12/02/22 | | | 5,687 | | | | 39,126 | |
| | | | | | | | | | |
TAIWAN — (0.0%) | | | | | | | | |
* | | Shanghai Commercial & Savings Bank Ltd. Rights 10/31/22 | | | 203,719 | | | | 59,429 | |
| | | | | | | | | | |
THAILAND — (0.0%) | | | | | | | | |
* | | Singer Thailand PCL Rights 10/31/22 | | | 82,507 | | | | 0 | |
* | | Thai Union Group PCL Rights 11/30/22 | | | 86,840 | | | | 0 | |
| | | | | | | | | | |
TOTAL RIGHTS/WARRANTS | | | | 114,773 | |
| | | | | | | | | | |
TOTAL INVESTMENT SECURITIES
(Cost $3,031,692,639) | | | | | | | 3,964,164,184 | |
| | | | | | | | | | |
| | | |
| | | | | | | | Value† | |
SECURITIES LENDING COLLATERAL — (2.6%) | | | | | | | | |
@ § | | The DFA Short Term Investment Fund | | | 9,232,721 | | | | 106,739,492 | |
| | | | | | | | | | |
TOTAL INVESTMENTS — (100.0%)
(Cost $3,138,466,170) | | | | | | $ | 4,070,903,676 | |
| | | | | | | | | | |
| ADR | American Depositary Receipt |
| CP | Certificate Participation GDR Global Depositary Receipt |
| » | Securities that have been fair value factored. See Note B to Financial Statements. |
| * | Non-Income Producing Securities. |
| # | Total or Partial Securities on Loan. |
THE EMERGING MARKETS SERIES
CONTINUED
| W | Rule 144A, Section 4(2), or other security that is restricted as to resale to institutional investors. This security has been deemed liquid based upon the Fund’s Liquidity Guidelines. The liquidity determination is unaudited. |
| †† | Security valued using significant unobservable inputs (Level 3). |
| † | See Note B to Financial Statements. |
| @ | Security purchased with cash collateral received from Securities on Loan. |
As of October 31, 2022, The Emerging Markets Series had entered into the following outstanding futures contracts:
| | | | | | | | | | | | | | | | | | | | |
Description | | Number of
Contracts | | | Expiration
Date | | | Notional
Value | | | Market
Value | | | Unrealized
Appreciation
(Depreciation) | |
Long Position Contracts: | | | | | | | | | | | | | | | | | | | | |
E-Mini MSCI Emerging Markets Index | | | 644 | | | | 12/16/22 | | | $ | 29,866,714 | | | $ | 27,485,920 | | | $ | (2,380,794 | ) |
S&P 500® Emini Index | | | 73 | | | | 12/16/22 | | | | 13,941,096 | | | | 14,172,950 | | | | 231,854 | |
| | | | | | | | | | | | | | | | | | | | |
Total Futures Contracts | | | | | | | | | | $ | 43,807,810 | | | $ | 41,658,870 | | | $ | (2,148,940 | ) |
| | | | | | | | | | | | | | | | | | | | |
Summary of the Series’ investments as of October 31, 2022, based on their valuation inputs, is as follows (see Security Valuation Note):
| | | | | | | | | | | | | | | | |
| | | Investments in Securities (Market Value) | |
| | | Level 1 | | | Level 2 | | | Level 3 | | | Total | |
Common Stocks | | | | | | | | | | | | | | | | |
Brazil | | $ | 182,023,797 | | | $ | 9,600 | | | | — | | | $ | 182,033,397 | |
Chile | | | 11,803,006 | | | | 9,921,730 | | | | — | | | | 21,724,736 | |
China | | | 123,031,320 | | | | 828,774,328 | | | | — | | | | 951,805,648 | |
Colombia | | | 4,717,484 | | | | 312,658 | | | | — | | | | 5,030,142 | |
Czech Republic | | | — | | | | 7,199,868 | | | | — | | | | 7,199,868 | |
Egypt | | | 1,962 | | | | 1,918,746 | | | | — | | | | 1,920,708 | |
Greece | | | 10,252 | | | | 13,217,128 | | | $ | 11,223 | | | | 13,238,603 | |
Hungary | | | — | | | | 8,953,846 | | | | — | | | | 8,953,846 | |
India | | | 31,593,723 | | | | 700,832,720 | | | | — | | | | 732,426,443 | |
Indonesia | | | — | | | | 97,572,600 | | | | — | | | | 97,572,600 | |
Malaysia | | | — | | | | 70,536,471 | | | | — | | | | 70,536,471 | |
Mexico | | | 103,950,081 | | | | — | | | | — | | | | 103,950,081 | |
Peru | | | 6,210,439 | | | | — | | | | — | | | | 6,210,439 | |
Philippines | | | 548,996 | | | | 30,985,556 | | | | — | | | | 31,534,552 | |
Poland | | | — | | | | 25,584,214 | | | | — | | | | 25,584,214 | |
Qatar | | | — | | | | 42,572,762 | | | | — | | | | 42,572,762 | |
Saudi Arabia | | | — | | | | 193,312,967 | | | | — | | | | 193,312,967 | |
South Africa | | | 22,218,169 | | | | 118,775,517 | | | | — | | | | 140,993,686 | |
South Korea | | | 4,855,920 | | | | 469,361,456 | | | | — | | | | 474,217,376 | |
Taiwan | | | 4,177,320 | | | | 605,295,946 | | | | 6,439 | | | | 609,479,705 | |
Thailand | | | 98,389,048 | | | | 2,061,996 | | | | — | | | | 100,451,044 | |
Turkey | | | — | | | | 28,045,003 | | | | — | | | | 28,045,003 | |
United Arab Emirates | | | — | | | | 62,581,727 | | | | — | | | | 62,581,727 | |
United States | | | — | | | | 1,338,052 | | | | — | | | | 1,338,052 | |
Preferred Stocks | | | | | | | | | | | | | | | | |
Brazil | | | 49,504,061 | | | | — | | | | — | | | | 49,504,061 | |
Chile | | | — | | | | 753,310 | | | | — | | | | 753,310 | |
Colombia | | | 762,616 | | | | — | | | | — | | | | 762,616 | |
South Korea | | | — | | | | 39,130 | | | | — | | | | 39,130 | |
Taiwan | | | — | | | | 276,224 | | | | — | | | | 276,224 | |
Rights/Warrants | | | | | | | | | | | | | | | | |
Malaysia | | | — | | | | 16,218 | | | | — | | | | 16,218 | |
South Korea | | | — | | | | 39,126 | | | | — | | | | 39,126 | |
Taiwan | | | — | | | | 59,429 | | | | — | | | | 59,429 | |
THE EMERGING MARKETS SERIES
CONTINUED
| | | | | | | | | | | | | | | | |
| | | Investments in Securities (Market Value) | |
| | | Level 1 | | | Level 2 | | | Level 3 | | | Total | |
Securities Lending Collateral | | | — | | | $ | 106,739,492 | | | | — | | | $ | 106,739,492 | |
Futures Contracts** | | $ | (2,148,940 | ) | | | — | | | | — | | | | (2,148,940 | ) |
| | | | | | | | | | | | | | | | |
TOTAL | | $ | 641,649,254 | | | $ | 3,427,087,820 | | | $ | 17,662 | ^ | | $ | 4,068,754,736 | |
| | | | | | | | | | | | | | | | |
| ** | Valued at the unrealized appreciation/(depreciation) on the investment. |
| ^ | A reconciliation of Level 3 investments is presented when the Fund had a significant amount of Level 3 investments at the beginning and/or end of the reporting period in relation to net assets. |
See accompanying Notes to Financial Statements.
THE EMERGING MARKETS SMALL CAP SERIES
SCHEDULE OF INVESTMENTS
October 31, 2022
| | | | | | | | | | |
| | | | | Shares | | | Value» | |
COMMON STOCKS — (97.3%) | | | | | | | | |
BELGIUM — (0.0%) | | | | | | | | |
* | | BIODYNE Co. Ltd. | | | 1,150 | | | $ | 14,557 | |
| | | | | | | | | | |
BRAZIL — (5.7%) | | | | | | | | |
* | | 3R Petroleum Oleo E Gas SA | | | 482,334 | | | | 4,341,986 | |
| | AES Brasil Energia SA | | | 1,062,419 | | | | 2,036,192 | |
| | Aliansce Sonae Shopping Centers SA | | | 388,671 | | | | 1,635,046 | |
* | | Alliar Medicos A Frente SA | | | 195,600 | | | | 802,394 | |
| | Allied Tecnologia SA | | | 28,000 | | | | 43,527 | |
| | Alper Consultoria e Corretora de Seguros SA | | | 21,000 | | | | 114,808 | |
| | Alupar Investimento SA | | | 472,751 | | | | 2,587,295 | |
| | Ambipar Participacoes e Empreendimentos S/A | | | 79,900 | | | | 483,685 | |
| | Americanas SA | | | 1,179,132 | | | | 3,547,326 | |
* | | Anima Holding SA | | | 1,034,673 | | | | 1,372,086 | |
| | Arezzo Industria e Comercio SA | | | 166,554 | | | | 3,369,450 | |
| | Auren Energia SA | | | 975,230 | | | | 2,816,849 | |
# * | | Azul SA, ADR | | | 155,377 | | | | 1,458,990 | |
| | Banco Modal SA | | | 224,700 | | | | 113,100 | |
| | Bemobi Mobile Tech SA | | | 164,280 | | | | 531,115 | |
* | | Blau Farmaceutica SA | | | 26,500 | | | | 173,554 | |
| | Boa Safra Sementes SA | | | 22,200 | | | | 54,796 | |
| | Boa Vista Servicos SA | | | 321,870 | | | | 392,562 | |
| | BR Malls Participacoes SA | | | 2,616,867 | | | | 5,142,039 | |
| | BR Properties SA | | | 651,053 | | | | 782,700 | |
| | BrasilAgro - Co. Brasileira de Propriedades Agricolas | | | 218,735 | | | | 1,272,902 | |
* | | BRF SA | | | 2,061,492 | | | | 5,012,552 | |
| | Brisanet Participacoes SA | | | 139,814 | | | | 95,005 | |
* | | C&A MODAS SA | | | 97,220 | | | | 56,839 | |
| | Camil Alimentos SA | | | 516,308 | | | | 1,020,522 | |
| | Cia Brasileira de Aluminio | | | 34,764 | | | | 74,300 | |
| | Cia Brasileira de Distribuicao | | | 523,026 | | | | 2,232,644 | |
| | Cia de Saneamento de Minas Gerais-COPASA | | | 623,774 | | | | 1,854,839 | |
| | Cia de Saneamento do Parana | | | 1,214,637 | | | | 4,500,659 | |
| | Cia de Saneamento do Parana | | | 546,300 | | | | 373,331 | |
| | Cia Paranaense de Energia | | | 445,084 | | | | 604,015 | |
| | Cielo SA | | | 3,398,392 | | | | 3,914,516 | |
* | | Cogna Educacao | | | 5,662,153 | | | | 3,606,327 | |
* | | Construtora Tenda SA | | | 273,378 | | | | 322,306 | |
| | Cruzeiro do Sul Educacional SA | | | 121,300 | | | | 136,200 | |
| | CSU Digital SA | | | 83,114 | | | | 239,744 | |
| | Cury Construtora e Incorporadora SA | | | 291,864 | | | | 704,022 | |
| | Cyrela Brazil Realty SA Empreendimentos e Participacoes | | | 897,468 | | | | 3,231,615 | |
| | Dexco SA | | | 1,069,100 | | | | 2,005,533 | |
| | Diagnosticos da America SA | | | 17,900 | | | | 69,410 | |
| | Dimed SA Distribuidora da Medicamentos | | | 258,632 | | | | 625,864 | |
| | Direcional Engenharia SA | | | 326,075 | | | | 1,080,078 | |
* | | Dommo Energia SA | | | 812,416 | | | | 287,818 | |
* | | EcoRodovias Infraestrutura e Logistica SA | | | 880,278 | | | | 927,057 | |
| | EDP - Energias do Brasil SA | | | 906,678 | | | | 4,049,378 | |
* | | Eletromidia SA | | | 34,100 | | | | 81,858 | |
* | | Embraer SA | | | 1,203,609 | | | | 3,203,876 | |
* | | Embraer SA, Sponsored ADR | | | 382,648 | | | | 4,044,589 | |
* | | Empreendimentos Pague Menos SA | | | 331,722 | | | | 398,156 | |
| | Enauta Participacoes SA | | | 355,424 | | | | 1,048,623 | |
| | Energisa SA | | | 342,800 | | | | 3,217,960 | |
* | | Eneva SA | | | 1,497,022 | | | | 4,109,529 | |
| | Eternit SA | | | 140,900 | | | | 306,322 | |
| | Even Construtora e Incorporadora SA | | | 295,494 | | | | 377,555 | |
THE EMERGING MARKETS SMALL CAP SERIES
CONTINUED
| | | | | | | | | | |
| | | | | Shares | | | Value» | |
BRAZIL — (Continued) | | | | | | | | |
| | Ez Tec Empreendimentos e Participacoes SA | | | 365,756 | | | $ | 1,474,921 | |
| | Fleury SA | | | 644,600 | | | | 2,321,084 | |
| | Fras-Le SA | | | 127,099 | | | | 343,737 | |
| | Gafisa SA | | | 7,812 | | | | 23,493 | |
| | Getnet Adquirencia e Servicos para Meios de Pagamento SA | | | 302,053 | | | | 280,680 | |
# | | Gol Linhas Aereas Inteligentes SA, ADR | | | 225,868 | | | | 835,712 | |
W | | GPS Participacoes e Empreendimentos SA | | | 338,000 | | | | 904,300 | |
| | Grendene SA | | | 883,823 | | | | 1,242,194 | |
* | | Grupo Mateus SA | | | 1,131,600 | | | | 1,599,202 | |
| | Grupo SBF SA | | | 257,424 | | | | 943,880 | |
| | Guararapes Confeccoes SA | | | 374,231 | | | | 705,645 | |
| | Helbor Empreendimentos SA | | | 114,573 | | | | 64,323 | |
* | | Hidrovias do Brasil SA | | | 933,357 | | | | 509,547 | |
* | | Infracommerce CXAAS SA | | | 138,700 | | | | 155,200 | |
| | Instituto Hermes Pardini SA | | | 186,158 | | | | 837,900 | |
| | Intelbras SA Industria de Telecomunicacao Eletronica Brasileira | | | 207,700 | | | | 1,468,436 | |
* | | International Meal Co. Alimentacao SA, Class A | | | 623,142 | | | | 297,969 | |
| | Iochpe-Maxion SA | | | 422,811 | | | | 1,163,948 | |
| | Irani Papel e Embalagem SA | | | 142,517 | | | | 235,620 | |
* | | IRB Brasil Resseguros SA | | | 3,222,983 | | | | 586,507 | |
| | Jalles Machado SA | | | 202,900 | | | | 273,388 | |
| | JHSF Participacoes SA | | | 1,192,106 | | | | 1,693,942 | |
| | JSL SA | | | 187,336 | | | | 276,715 | |
| | Kepler Weber SA | | | 187,812 | | | | 941,696 | |
| | Lavvi Empreendimentos Imobiliarios Ltda | | | 259,400 | | | | 317,879 | |
| | Light SA | | | 1,212,280 | | | | 1,333,027 | |
| | Localiza Rent a Car SA | | | 61,182 | | | | 835,498 | |
| | Localiza Rent a Car SA | | | 853 | | | | 11,649 | |
* W | | Locaweb Servicos de Internet SA | | | 1,004,168 | | | | 2,124,781 | |
| | LOG Commercial Properties e Participacoes SA | | | 157,972 | | | | 696,048 | |
* | | Log-in Logistica Intermodal SA | | | 191,471 | | | | 1,387,057 | |
| | Lojas Quero Quero SA | | | 349,679 | | | | 408,878 | |
| | LPS Brasil Consultoria de Imoveis SA | | | 164,100 | | | | 89,269 | |
| | M Dias Branco SA | | | 288,411 | | | | 2,428,783 | |
| | Mahle-Metal Leve SA | | | 128,012 | | | | 640,122 | |
| | Marcopolo SA | | | 518,000 | | | | 241,677 | |
| | Marfrig Global Foods SA | | | 1,128,320 | | | | 2,337,242 | |
* | | Marisa Lojas SA | | | 923,851 | | | | 370,220 | |
| | Melnick Even Desenvolvimento Imobiliario SA | | | 73,800 | | | | 60,577 | |
| | Mills Estruturas e Servicos de Engenharia SA | | | 568,820 | | | | 1,473,393 | |
| | Minerva SA | | | 910,248 | | | | 2,410,646 | |
W | | Mitre Realty Empreendimentos E Participacoes LTDA | | | 54,400 | | | | 58,976 | |
* | | Moura Dubeux Engenharia SA | | | 137,200 | | | | 196,550 | |
| | Movida Participacoes SA | | | 509,747 | | | | 1,344,062 | |
| | MRV Engenharia e Participacoes SA | | | 1,042,403 | | | | 2,054,334 | |
| | Multilaser Industrial SA | | | 312,283 | | | | 314,973 | |
| | Multiplan Empreendimentos Imobiliarios SA | | | 93,232 | | | | 475,771 | |
| | Neogrid Participacoes SA | | | 32,300 | | | | 9,817 | |
| | Odontoprev SA | | | 1,124,788 | | | | 1,802,971 | |
* | | Omega Energia SA | | | 808,100 | | | | 1,681,749 | |
* | | Orizon Valorizacao de Residuos SA | | | 60,000 | | | | 518,749 | |
* | | Petro Rio SA | | | 604,745 | | | | 4,143,244 | |
| | Petroreconcavo SA | | | 307,555 | | | | 1,867,181 | |
| | Porto Seguro SA | | | 581,834 | | | | 2,617,718 | |
| | Portobello SA | | | 256,777 | | | | 586,081 | |
| | Positivo Tecnologia SA | | | 457,780 | | | | 1,083,854 | |
| | Qualicorp Consultoria e Corretora de Seguros SA | | | 599,143 | | | | 913,996 | |
| | Romi SA | | | 148,060 | | | | 474,377 | |
| | Santos Brasil Participacoes SA | | | 1,247,677 | | | | 2,198,018 | |
THE EMERGING MARKETS SMALL CAP SERIES
CONTINUED
| | | | | | | | | | |
| | | | | Shares | | | Value» | |
BRAZIL — (Continued) | | | | | | | | |
| | Sao Carlos Empreendimentos e Participacoes SA | | | 86,509 | | | $ | 460,555 | |
| | Sao Martinho SA | | | 768,976 | | | | 4,014,961 | |
W | | Ser Educacional SA | | | 208,380 | | | | 343,300 | |
| | SIMPAR SA | | | 1,627,112 | | | | 3,411,407 | |
| | Sinqia SA | | | 83,881 | | | | 332,893 | |
| | SLC Agricola SA | | | 406,879 | | | | 3,619,412 | |
| | Sul America SA | | | 815,303 | | | | 3,762,816 | |
| | SYN prop e tech SA | | | 117,200 | | | | 115,260 | |
| | Tegma Gestao Logistica SA | | | 114,559 | | | | 494,120 | |
| | Terra Santa Propriedades Agricolas SA | | | 9,971 | | | | 57,755 | |
| | TOTVS SA | | | 1,646,258 | | | | 10,568,178 | |
| | Transmissora Alianca de Energia Eletrica SA | | | 1,318,523 | | | | 10,258,724 | |
| | Tres Tentos Agroindustrial SA | | | 40,300 | | | | 98,926 | |
| | Trisul SA | | | 309,282 | | | | 285,003 | |
| | Tupy SA | | | 258,372 | | | | 1,477,555 | |
| | Ultrapar Participacoes SA | | | 2,005,729 | | | | 5,207,013 | |
| | Unipar Carbocloro SA | | | 24,082 | | | | 432,129 | |
| | Usinas Siderurgicas de Minas Gerais SA Usiminas | | | 182,762 | | | | 261,468 | |
| | Valid Solucoes e Servicos de Seguranca em Meios de Pagamento e Identificacao SA | | | 209,750 | | | | 440,574 | |
| | Vamos Locacao de Caminhoes Maquinas e Equipamentos SA | | | 712,949 | | | | 2,224,903 | |
* | | Via SA | | | 2,714,377 | | | | 1,644,758 | |
| | Vivara Participacoes SA | | | 296,793 | | | | 1,540,416 | |
| | Vulcabras Azaleia SA | | | 423,585 | | | | 1,140,658 | |
| | Wilson Sons Holdings Brasil SA | | | 213,000 | | | | 468,019 | |
| | Wiz Solucoes e Corretagem de Seguros SA | | | 219,744 | | | | 331,392 | |
| | YDUQS Participacoes SA | | | 989,037 | | | | 3,088,407 | |
| | Zamp SA | | | 20,600 | | | | 30,628 | |
| | Zamp SA | | | 661,829 | | | | 983,999 | |
| | | | | | | | | | |
TOTAL BRAZIL | | | | 202,669,879 | |
| | | | | | | | | | |
CHILE — (0.6%) | | | | | | | | |
| | Aguas Andinas SA, Class A | | | 1,883,671 | | | | 397,346 | |
| | Besalco SA | | | 2,200,594 | | | | 758,262 | |
* | | Camanchaca SA | | | 1,471,136 | | | | 74,118 | |
| | CAP SA | | | 150,738 | | | | 805,800 | |
| | Cementos BIO BIO SA | | | 352,724 | | | | 241,501 | |
| | Cencosud Shopping SA | | | 30,918 | | | | 33,788 | |
| | Cia Sud Americana de Vapores SA | | | 37,369,997 | | | | 2,595,346 | |
| | Colbun SA | | | 5,269,582 | | | | 517,163 | |
| | Cristalerias de Chile SA | | | 130,323 | | | | 432,648 | |
| | Embotelladora Andina SA, ADR, Class B | | | 5,509 | | | | 56,743 | |
| | Empresa Nacional de Telecomunicaciones SA | | | 461,999 | | | | 1,441,026 | |
| | Empresas Hites SA | | | 1,014,682 | | | | 95,908 | |
| | Empresas Lipigas SA | | | 6,383 | | | | 13,866 | |
| | Empresas Tricot SA | | | 70,631 | | | | 20,747 | |
* | | Engie Energia Chile SA | | | 1,948,129 | | | | 1,145,746 | |
| | Forus SA | | | 414,760 | | | | 446,546 | |
| | Grupo Security SA | | | 4,943,566 | | | | 827,260 | |
| | Hortifrut SA | | | 127,405 | | | | 106,310 | |
| | Instituto de Diagnostico SA | | | 2,928 | | | | 4,307 | |
| | Inversiones Aguas Metropolitanas SA | | | 1,259,734 | | | | 600,903 | |
| | Inversiones La Construccion SA | | | 84,822 | | | | 265,288 | |
| | Masisa SA | | | 3,130,567 | | | | 83,031 | |
| | Multiexport Foods SA | | | 3,785,079 | | | | 860,758 | |
| | Parque Arauco SA | | | 1,976,919 | | | | 1,684,551 | |
| | PAZ Corp. SA | | | 1,106,246 | | | | 375,710 | |
| | Plaza SA | | | 39,231 | | | | 33,980 | |
| | Ripley Corp. SA | | | 2,369,204 | | | | 389,143 | |
THE EMERGING MARKETS SMALL CAP SERIES
CONTINUED
| | | | | | | | | | |
| | | | | Shares | | | Value» | |
CHILE — (Continued) | | | | | | | | |
| | Salfacorp SA | | | 1,233,378 | | | $ | 346,618 | |
| | Sigdo Koppers SA | | | 1,164,083 | | | | 1,398,147 | |
| | SMU SA | | | 5,617,171 | | | | 571,591 | |
| | Sociedad Matriz SAAM SA | | | 35,214,756 | | | | 2,982,590 | |
| | Socovesa SA | | | 2,516,932 | | | | 287,083 | |
| | SONDA SA | | | 1,180,254 | | | | 415,524 | |
| | Vina Concha y Toro SA | | | 2,008,692 | | | | 2,271,062 | |
| | | | | | | | | | |
TOTAL CHILE | | | | 22,580,410 | |
| | | | | | | | | | |
CHINA — (21.9%) | | | | | | | | |
| | 360 DigiTech, Inc., ADR | | | 313,070 | | | | 3,180,791 | |
* | | 361 Degrees International Ltd. | | | 3,755,000 | | | | 1,565,102 | |
W | | 3SBio, Inc. | | | 4,811,500 | | | | 3,397,916 | |
| | 5I5J Holding Group Co. Ltd., Class A | | | 700,900 | | | | 220,469 | |
* †† | | A Metaverse Co. | | | 550,000 | | | | 7,988 | |
# * | | AAC Technologies Holdings, Inc. | | | 2,389,500 | | | | 4,377,039 | |
# W | | AAG Energy Holdings Ltd. | | | 2,416,601 | | | | 366,735 | |
| | Accelink Technologies Co. Ltd., Class A | | | 138,100 | | | | 321,929 | |
* | | Advanced Technology & Materials Co. Ltd., Class A | | | 163,700 | | | | 179,938 | |
| | Aerospace Hi-Tech Holdings Grp Ltd., Class A | | | 279,103 | | | | 327,070 | |
| | Agile Group Holdings Ltd. | | | 4,188,000 | | | | 796,562 | |
| | Ajisen China Holdings Ltd. | | | 2,398,000 | | | | 189,572 | |
W | | Ak Medical Holdings Ltd. | | | 1,776,000 | | | | 1,846,269 | |
* | | Alibaba Pictures Group Ltd. | | | 42,090,000 | | | | 1,555,684 | |
# W | | A-Living Smart City Services Co. Ltd. | | | 2,406,000 | | | | 1,365,304 | |
| | All Winner Technology Co. Ltd., Class A | | | 115,710 | | | | 310,134 | |
| | Allmed Medical Products Co. Ltd., Class A | | | 90,100 | | | | 152,855 | |
* | | Alpha Group, Class A | | | 298,500 | | | | 177,920 | |
| | Amoy Diagnostics Co. Ltd., Class A | | | 95,269 | | | | 306,281 | |
* | | An Hui Wenergy Co. Ltd., Class A | | | 614,902 | | | | 391,927 | |
| | Angang Steel Co. Ltd., Class H | | | 6,056,999 | | | | 1,256,754 | |
| | Anhui Anke Biotechnology Group Co. Ltd., Class A | | | 346,713 | | | | 470,724 | |
| | Anhui Construction Engineering Group Co. Ltd., Class A | | | 666,590 | | | | 420,605 | |
| | Anhui Expressway Co. Ltd., Class H | | | 1,776,000 | | | | 1,135,094 | |
| | Anhui Genuine New Materials Co. Ltd., Class A | | | 91,300 | | | | 134,752 | |
| | Anhui Guangxin Agrochemical Co. Ltd., Class A | | | 14,260 | | | | 57,974 | |
| | Anhui Hengyuan Coal Industry & Electricity Power Co. Ltd., Class A | | | 520,729 | | | | 560,022 | |
| | Anhui Huilong Agricultural Means of Production Co., Ltd., Class A | | | 158,800 | | | | 175,813 | |
| | Anhui Jianghuai Automobile Group Corp. Ltd., Class A | | | 322,119 | | | | 568,292 | |
| | Anhui Jiangnan Chemical Industry Co. Ltd., Class A | | | 706,440 | | | | 467,166 | |
| | Anhui Korrun Co. Ltd., Class A | | | 46,866 | | | | 87,988 | |
* | | Anhui Tatfook Technology Co. Ltd., Class A | | | 82,300 | | | | 94,309 | |
| | Anhui Transport Consulting & Design Institute Co. Ltd., Class A | | | 31,100 | | | | 38,638 | |
| | Anhui Truchum Advanced Materials & Technology Co. Ltd., Class A | | | 368,400 | | | | 371,422 | |
| | Anhui Xinhua Media Co. Ltd., Class A | | | 138,900 | | | | 87,805 | |
| | Anji Microelectronics Technology Shanghai Co. Ltd., Class A | | | 7,218 | | | | 220,598 | |
* W | | Antengene Corp. Ltd. | | | 476,500 | | | | 202,621 | |
* | | Anton Oilfield Services Group | | | 8,368,000 | | | | 303,859 | |
| | Aoshikang Technology Co. Ltd., Class A | | | 82,400 | | | | 290,233 | |
* †† | | Aowei Holdings Ltd. | | | 1,451,000 | | | | 36,748 | |
* †† | | Aoyuan Healthy Life Group Co. Ltd. | | | 194,000 | | | | 34,477 | |
# | | APT Satellite Holdings Ltd. | | | 580,000 | | | | 136,656 | |
* W | | Archosaur Games, Inc. | | | 570,000 | | | | 163,900 | |
| | Art Group Holdings Ltd. | | | 320,000 | | | | 9,834 | |
* W | | Ascletis Pharma, Inc. | | | 551,000 | | | | 161,979 | |
| | Asia Cement China Holdings Corp. | | | 2,216,500 | | | | 773,326 | |
* | | Asia Cuanon Technology Shanghai Co. Ltd., Class A | | | 46,340 | | | | 49,954 | |
W | | AsiaInfo Technologies Ltd. | | | 584,400 | | | | 698,240 | |
* | | Asian Citrus Holdings Ltd. | | | 694,000 | | | | 6,013 | |
THE EMERGING MARKETS SMALL CAP SERIES
CONTINUED
| | | | | | | | | | |
| | | | | Shares | | | Value» | |
CHINA — (Continued) | | | | | | | | |
| | Autel Intelligent Technology Corp. Ltd., Class A | | | 86,389 | | | $ | 471,046 | |
| | AviChina Industry & Technology Co. Ltd., Class H | | | 9,654,000 | | | | 4,228,179 | |
| | Bafang Electric Suzhou Co. Ltd., Class A | | | 17,000 | | | | 271,534 | |
W | | BAIC Motor Corp. Ltd., Class H | | | 6,837,500 | | | | 1,514,812 | |
W | | BAIOO Family Interactive Ltd. | | | 2,912,000 | | | | 137,376 | |
| | Bank of Chongqing Co. Ltd., Class H | | | 2,506,000 | | | | 1,136,793 | |
* | | Bank of Tianjin Co. Ltd., Class H | | | 100,000 | | | | 25,362 | |
#* W | | Bank of Zhengzhou Co. Ltd., Class H | | | 738,100 | | | | 100,681 | |
* | | Baosheng Science & Technology Innovation Co. Ltd., Class A | | | 191,902 | | | | 149,401 | |
* | | Baoye Group Co. Ltd., Class H | | | 1,132,000 | | | | 577,091 | |
# * | | Baozun, Inc., Sponsored ADR | | | 159,879 | | | | 629,923 | |
| | BBMG Corp., Class H | | | 7,209,000 | | | | 743,569 | |
| | Bear Electric Appliance Co. Ltd., Class A | | | 34,847 | | | | 273,667 | |
| | Befar Group Co. Ltd., Class A | | | 623,900 | | | | 428,771 | |
| | Beibuwan Port Co. Ltd., Class A | | | 146,881 | | | | 142,682 | |
| | Beijing Aosaikang Pharmaceutical Co. Ltd., Class A | | | 161,350 | | | | 179,463 | |
| | Beijing Bei Mo Gao Ke Friction Material Co. Ltd., Class A | | | 60,420 | | | | 430,676 | |
| | Beijing Capital Development Co. Ltd., Class A | | | 422,476 | | | | 295,387 | |
* | | Beijing Capital International Airport Co. Ltd., Class H | | | 7,414,000 | | | | 4,014,938 | |
| | Beijing Career International Co. Ltd., Class A | | | 41,600 | | | | 183,627 | |
| | Beijing Certificate Authority Co. Ltd., Class A | | | 77,387 | | | | 293,082 | |
# | | Beijing Chunlizhengda Medical Instruments Co. Ltd., Class H | | | 72,250 | | | | 110,910 | |
| | Beijing Ctrowell Technology Corp. Ltd., Class A | | | 39,400 | | | | 44,920 | |
| | Beijing Dahao Technology Corp. Ltd., Class A | | | 55,777 | | | | 123,924 | |
* | | Beijing E-Hualu Information Technology Co. Ltd., Class A | | | 157,400 | | | | 354,582 | |
# * | | Beijing Energy International Holding Co. Ltd. | | | 19,934,000 | | | | 462,682 | |
| | Beijing Enterprises Holdings Ltd. | | | 1,690,500 | | | | 4,288,627 | |
| | Beijing Enterprises Water Group Ltd. | | | 14,360,000 | | | | 3,017,008 | |
| | Beijing Funshine Culture Media Co. Ltd., Class A | | | 36,000 | | | | 200,633 | |
* †† | | Beijing Gas Blue Sky Holdings Ltd. | | | 13,928,000 | | | | 122,274 | |
| | Beijing GeoEnviron Engineering & Technology, Inc., Class A | | | 368,468 | | | | 472,513 | |
| | Beijing Haixin Energy Technology Co. Ltd., Class A | | | 502,800 | | | | 275,966 | |
* | | Beijing Health Holdings Ltd. | | | 18,966,000 | | | | 172,045 | |
* | | Beijing Hezong Science & Technology Co. Ltd., Class A | | | 202,600 | | | | 144,167 | |
* | | Beijing Hualian Department Store Co. Ltd., Class A | | | 927,300 | | | | 200,511 | |
* | | Beijing Jetsen Technology Co. Ltd., Class A | | | 756,000 | | | | 456,901 | |
| | Beijing Jingneng Clean Energy Co. Ltd., Class H | | | 6,290,000 | | | | 1,169,293 | |
* | | Beijing Jingxi Culture & Tourism Co. Ltd., Class A | | | 189,200 | | | | 96,727 | |
| | Beijing Konruns Pharmaceutical Co. Ltd., Class A | | | 52,954 | | | | 180,338 | |
| | Beijing North Star Co. Ltd., Class H | | | 4,210,000 | | | | 397,416 | |
* | | Beijing Orient Landscape & Environment Co. Ltd., Class A | | | 707,100 | | | | 196,676 | |
* | | Beijing Orient National Communication Science & Technology Co. Ltd., Class A | | | 360,754 | | | | 432,386 | |
* | | Beijing Philisense Technology Co. Ltd., Class A | | | 350,900 | | | | 180,344 | |
| | Beijing Sanlian Hope Shin-Gosen Technical Service Co. Ltd., Class A | | | 57,400 | | | | 129,344 | |
| | Beijing Shunxin Agriculture Co. Ltd., Class A | | | 124,800 | | | | 350,733 | |
| | Beijing Sinnet Technology Co. Ltd., Class A | | | 359,399 | | | | 427,021 | |
| | Beijing SL Pharmaceutical Co. Ltd., Class A | | | 237,600 | | | | 271,103 | |
| | Beijing SPC Environment Protection Tech Co. Ltd., Class A | | | 104,200 | | | | 74,154 | |
| | Beijing Strong Biotechnologies, Inc., Class A | | | 73,000 | | | | 178,597 | |
| | Beijing SuperMap Software Co. Ltd., Class A | | | 130,017 | | | | 337,453 | |
* | | Beijing Thunisoft Corp. Ltd., Class A | | | 191,900 | | | | 186,396 | |
# | | Beijing Tong Ren Tang Chinese Medicine Co. Ltd. | | | 855,000 | | | | 955,952 | |
| | Beijing Ultrapower Software Co. Ltd., Class A | | | 476,050 | | | | 285,198 | |
W | | Beijing Urban Construction Design & Development Group Co. Ltd., Class H | | | 775,000 | | | | 151,179 | |
* | | Beijing Watertek Information Technology Co. Ltd., Class A | | | 246,700 | | | | 107,127 | |
| | Beijing Zhong Ke San Huan High-Tech Co. Ltd., Class A | | | 77,157 | | | | 135,951 | |
| | Beken Corp., Class A | | | 30,400 | | | | 109,583 | |
THE EMERGING MARKETS SMALL CAP SERIES
CONTINUED
| | | | | | | | | | |
| | | | | Shares | | | Value» | |
CHINA — (Continued) | | | | | | | | |
* | | Berry Genomics Co. Ltd., Class A | | | 29,100 | | | $ | 50,589 | |
| | Best Pacific International Holdings Ltd., Class H | | | 978,000 | | | | 139,387 | |
* | | BEST, Inc., ADR | | | 17 | | | | 10 | |
| | Bestsun Energy Co. Ltd., Class A | | | 439,200 | | | | 252,297 | |
| | Better Life Commercial Chain Share Co. Ltd., Class A | | | 186,849 | | | | 126,254 | |
| | Biem.L.Fdlkk Garment Co. Ltd., Class A | | | 149,299 | | | | 447,779 | |
| | BII Railway Transportation Technology Holdings Co. Ltd. | | | 2,452,000 | | | | 84,483 | |
* | | Billion Industrial Holdings Ltd. | | | 44,000 | | | | 27,963 | |
| | Binjiang Service Group Co. Ltd. | | | 244,000 | | | | 410,398 | |
| | Black Peony Group Co. Ltd., Class A | | | 325,649 | | | | 321,649 | |
W | | Blue Moon Group Holdings Ltd. | | | 375,000 | | | | 221,245 | |
* | | Blue Sail Medical Co. Ltd., Class A | | | 252,600 | | | | 284,988 | |
| | Bluefocus Intelligent Communications Group Co. Ltd., Class A | | | 518,700 | | | | 335,244 | |
W | | BOC Aviation Ltd. | | | 250,700 | | | | 1,677,666 | |
| | BOE Varitronix Ltd. | | | 989,000 | | | | 1,466,517 | |
* | | Bohai Leasing Co. Ltd., Class A | | | 1,263,500 | | | | 380,818 | |
| | Bosideng International Holdings Ltd. | | | 10,818,000 | | | | 4,672,365 | |
* | | Boyaa Interactive International Ltd. | | | 621,000 | | | | 25,735 | |
| | Bright Dairy & Food Co. Ltd., Class A | | | 289,400 | | | | 375,601 | |
| | Bright Real Estate Group Co. Ltd., Class A | | | 962,280 | | | | 266,983 | |
| | BrightGene Bio-Medical Technology Co. Ltd., Class A | | | 122,955 | | | | 356,632 | |
* †† | | Brilliance China Automotive Holdings Ltd. | | | 8,928,000 | | | | 3,844,329 | |
| | B-Soft Co. Ltd., Class A | | | 348,631 | | | | 400,195 | |
# * | | Burning Rock Biotech Ltd., ADR | | | 5,945 | | | | 12,247 | |
| | BYD Electronic International Co. Ltd. | | | 1,940,500 | | | | 5,639,059 | |
| | C C Land Holdings Ltd. | | | 12,749,015 | | | | 3,068,349 | |
| | C&D International Investment Group Ltd. | | | 1,389,788 | | | | 2,156,548 | |
| | C&S Paper Co. Ltd., Class A | | | 262,920 | | | | 337,911 | |
| | Cabbeen Fashion Ltd. | | | 1,187,000 | | | | 181,506 | |
| | Camel Group Co. Ltd., Class A | | | 209,035 | | | | 244,647 | |
| | Cangzhou Mingzhu Plastic Co. Ltd., Class A | | | 406,800 | | | | 256,860 | |
| | Canny Elevator Co. Ltd., Class A | | | 162,500 | | | | 147,787 | |
# W | | CanSino Biologics, Inc., Class H | | | 242,600 | | | | 2,255,530 | |
# | | Canvest Environmental Protection Group Co. Ltd. | | | 2,567,000 | | | | 1,580,336 | |
* | | Capital Environment Holdings Ltd. | | | 22,400,000 | | | | 371,069 | |
* | | Capitalonline Data Service Co. Ltd., Class A | | | 130,000 | | | | 192,247 | |
| | Carrianna Group Holdings Co. Ltd. | | | 891,257 | | | | 46,594 | |
| | Castech, Inc., Class A | | | 135,800 | | | | 282,103 | |
# W | | Cathay Media & Education Group, Inc. | | | 158,000 | | | | 21,166 | |
†† | | CECEP COSTIN New Materials Group Ltd. | | | 4,494,000 | | | | 64,407 | |
* | | CECEP Techand Ecology & Environment Co. Ltd., Class A | | | 184,500 | | | | 54,926 | |
| | Central China Management Co. Ltd. | | | 3,912,626 | | | | 269,693 | |
| | Central China New Life Ltd. | | | 828,000 | | | | 234,684 | |
# | | Central China Real Estate Ltd. | | | 4,646,683 | | | | 121,825 | |
# | | Central China Securities Co. Ltd., Class H | | | 4,540,000 | | | | 549,319 | |
| | CETC Digital Technology Co. Ltd., Class A | | | 166,320 | | | | 481,102 | |
# | | CGN New Energy Holdings Co. Ltd. | | | 5,122,000 | | | | 1,375,943 | |
| | CGN Nuclear Technology Development Co. Ltd., Class A | | | 159,900 | | | | 160,762 | |
| | Chacha Food Co. Ltd., Class A | | | 43,510 | | | | 264,160 | |
| | Changchun Faway Automobile Components Co. Ltd., Class A | | | 232,830 | | | | 271,389 | |
#* W | | Changsha Broad Homes Industrial Group Co. Ltd., Class H | | | 86,100 | | | | 73,947 | |
| | Changzhou Qianhong Biopharma Co. Ltd., Class A | | | 299,700 | | | | 239,281 | |
# | | Chaowei Power Holdings Ltd. | | | 2,361,000 | | | | 463,234 | |
* | | Cheetah Mobile, Inc., ADR | | | 28,306 | | | | 51,518 | |
* | | ChemPartner PharmaTech Co. Ltd., Class A | | | 32,200 | | | | 43,973 | |
* | | Chen Lin Education Group Holdings Ltd. | | | 330,000 | | | | 84,543 | |
* | | Cheng De Lolo Co. Ltd., Class A | | | 256,650 | | | | 264,308 | |
| | Chengdu ALD Aviation Manufacturing Corp., Class A | | | 63,840 | | | | 243,425 | |
| | Chengdu CORPRO Technology Co. Ltd., Class A | | | 106,300 | | | | 432,368 | |
THE EMERGING MARKETS SMALL CAP SERIES
CONTINUED
| | | | | | | | | | |
| | | | | Shares | | | Value» | |
CHINA — (Continued) | | | | | | | | |
| | Chengdu Fusen Noble-House Industrial Co. Ltd., Class A | | | 147,800 | | | $ | 241,140 | |
| | Chengdu Galaxy Magnets Co. Ltd., Class A | | | 105,400 | | | | 220,155 | |
| | Chengdu Hongqi Chain Co. Ltd., Class A | | | 308,700 | | | | 195,384 | |
| | Chengdu Jiafaantai Education Technology Co. Ltd., Class A | | | 23,125 | | | | 31,506 | |
| | Chengdu Kanghong Pharmaceutical Group Co. Ltd., Class A | | | 172,895 | | | | 418,535 | |
| | Chengdu Kanghua Biological Products Co. Ltd., Class A | | | 27,100 | | | | 380,284 | |
| | Chengdu Leejun Industrial Co. Ltd., Class A | | | 114,100 | | | | 103,733 | |
| | Chengdu Wintrue Holding Co. Ltd., Class A | | | 168,100 | | | | 261,813 | |
| | Chengdu Xingrong Environment Co. Ltd., Class A | | | 913,299 | | | | 603,904 | |
| | Chenguang Biotech Group Co., Ltd., Class A | | | 56,100 | | | | 124,808 | |
* | | Chengzhi Co. Ltd., Class A | | | 46,000 | | | | 56,277 | |
* | | Chiho Environmental Group Ltd. | | | 172,000 | | | | 14,900 | |
| | China Aerospace International Holdings Ltd. | | | 8,284,500 | | | | 363,817 | |
* | | China Agri-Products Exchange Ltd. | | | 45,605 | | | | 522 | |
| | China Aircraft Leasing Group Holdings Ltd. | | | 1,574,000 | | | | 655,000 | |
* | | China Anchu Energy Storage Gro | | | 1,929,000 | | | | 127,744 | |
| | China Automotive Engineering Research Institute Co. Ltd., Class A | | | 53,961 | | | | 139,367 | |
| | China Bester Group Telecom Co. Ltd., Class A | | | 102,700 | | | | 147,957 | |
| | China BlueChemical Ltd., Class H | | | 7,256,000 | | | | 1,385,020 | |
W | | China Bohai Bank Co. Ltd., Class H | | | 3,052,000 | | | | 377,302 | |
# * | | China Boton Group Co. Ltd. | | | 458,000 | | | | 129,246 | |
| | China CAMC Engineering Co. Ltd., Class A | | | 332,197 | | | | 349,686 | |
| | China Chengtong Development Group Ltd. | | | 734,000 | | | | 10,030 | |
| | China Cinda Asset Management Co. Ltd., Class H | | | 23,132,000 | | | | 2,148,761 | |
| | China Communications Services Corp. Ltd., Class H | | | 9,412,000 | | | | 2,626,270 | |
* | | China Conch Environment Protection Holdings Ltd. | | | 4,587,500 | | | | 1,352,604 | |
| | China Conch Venture Holdings Ltd. | | | 4,615,500 | | | | 6,807,382 | |
* | | China CYTS Tours Holding Co. Ltd., Class A | | | 255,300 | | | | 377,610 | |
| | China Datang Corp. Renewable Power Co. Ltd., Class H | | | 8,310,000 | | | | 2,243,056 | |
* | | China Daye Non-Ferrous Metals Mining Ltd. | | | 7,434,000 | | | | 52,272 | |
| | China Design Group Co. Ltd., Class A | | | 82,800 | | | | 87,342 | |
W | | China Development Bank Financial Leasing Co. Ltd., Class H | | | 110,000 | | | | 12,487 | |
# * | | China Dili Group | | | 12,625,699 | | | | 1,061,571 | |
* | | China Dongxiang Group Co. Ltd. | | | 10,363,985 | | | | 307,641 | |
W | | China East Education Holdings Ltd. | | | 791,500 | | | | 249,290 | |
| | China Education Group Holdings Ltd. | | | 2,302,000 | | | | 1,347,750 | |
| | China Electronics Huada Technology Co. Ltd. | | | 3,400,000 | | | | 268,450 | |
# | | China Electronics Optics Valley Union Holding Co. Ltd. | | | 11,200,000 | | | | 493,731 | |
| | China Enterprise Co. Ltd., Class A | | | 320,883 | | | | 106,257 | |
| | China Everbright Environment Group Ltd. | | | 14,046,000 | | | | 4,672,404 | |
# W | | China Everbright Greentech Ltd. | | | 2,425,000 | | | | 395,322 | |
| | China Everbright Ltd. | | | 3,992,000 | | | | 2,104,837 | |
* | | China Express Airlines Co. Ltd., Class A | | | 49,838 | | | | 72,353 | |
| | China Film Co. Ltd., Class A | | | 14,700 | | | | 21,473 | |
* | | China Finance Investment Holdings Ltd. | | | 14,000 | | | | 9,826 | |
* †† | | China Financial Services Holdings Ltd. | | | 126,200 | | | | 5,125 | |
| | China Foods Ltd. | | | 4,852,000 | | | | 1,236,478 | |
| | China Glass Holdings Ltd. | | | 3,378,000 | | | | 271,171 | |
| | China Gold International Resources Corp. Ltd. | | | 235,700 | | | | 547,691 | |
* | | China Greenland Broad Greenstate Group Co. Ltd. | | | 4,572,000 | | | | 75,272 | |
| | China Hanking Holdings Ltd. | | | 2,777,000 | | | | 255,010 | |
# | | China Harmony Auto Holding Ltd. | | | 3,398,500 | | | | 385,016 | |
| | China Harzone Industry Corp. Ltd., Class A | | | 173,563 | | | | 164,855 | |
* †† | | China High Precision Automation Group Ltd. | | | 1,289,000 | | | | 37,563 | |
* | | China High Speed Railway Technology Co. Ltd., Class A | | | 741,500 | | | | 228,252 | |
* | | China High Speed Transmission Equipment Group Co. Ltd. | | | 1,578,000 | | | | 641,256 | |
*†† W | | China Huarong Asset Management Co. Ltd., Class H | | | 16,447,000 | | | | 469,626 | |
†† | | China Huiyuan Juice Group Ltd. | | | 4,034,500 | | | | 180,199 | |
| | China International Marine Containers Group Co. Ltd., Class H | | | 2,953,080 | | | | 1,879,744 | |
THE EMERGING MARKETS SMALL CAP SERIES
CONTINUED
| | | | | | | | | | |
| | | | | Shares | | | Value» | |
CHINA — (Continued) | | | | | | | | |
| | China Jinmao Holdings Group Ltd. | | | 8,128,000 | | | $ | 1,076,902 | |
| | China Kepei Education Group Ltd. | | | 1,226,000 | | | | 301,485 | |
| | China Kings Resources Group Co. Ltd., Class A | | | 109,096 | | | | 686,634 | |
| | China Leadshine Technology Co. Ltd., Class A | | | 44,000 | | | | 116,784 | |
| | China Lesso Group Holdings Ltd. | | | 4,407,000 | | | | 3,576,932 | |
| | China Lilang Ltd. | | | 2,086,000 | | | | 901,362 | |
* W | | China Literature Ltd. | | | 1,372,000 | | | | 3,701,465 | |
# * | | China Longevity Group Co. Ltd. | | | 1,076,350 | | | | 35,240 | |
* †† | | China Maple Leaf Educational Systems Ltd. | | | 7,090,000 | | | | 240,258 | |
* | | China Medical & HealthCare Group Ltd. | | | 930,000 | | | | 4,434 | |
| | China Medical System Holdings Ltd. | | | 5,342,500 | | | | 5,838,944 | |
| | China Meidong Auto Holdings Ltd. | | | 2,174,000 | | | | 2,855,283 | |
| | China Merchants Land Ltd. | | | 7,804,000 | | | | 547,339 | |
| | China Merchants Port Holdings Co. Ltd. | | | 4,575,230 | | | | 5,363,986 | |
| | China Merchants Property Operation & Service Co. Ltd., Class A | | | 48,400 | | | | 89,342 | |
# * †† | | China Metal Recycling Holdings Ltd. | | | 2,401,686 | | | | 0 | |
# | | China Modern Dairy Holdings Ltd. | | | 10,694,000 | | | | 1,088,619 | |
| | China National Accord Medicines Corp. Ltd., Class A | | | 92,006 | | | | 398,390 | |
| | China National Medicines Corp. Ltd., Class A | | | 95,505 | | | | 343,124 | |
W | | China New Higher Education Group Ltd. | | | 1,994,000 | | | | 457,297 | |
* | | China New Town Development Co. Ltd. | | | 3,308,148 | | | | 21,886 | |
* | | China Nonferrous Metal Industry’s Foreign Engineering & Construction Co. Ltd., Class A | | | 401,000 | | | | 245,871 | |
* | | China Oil & Gas Group Ltd. | | | 23,578,000 | | | | 736,225 | |
| | China Oilfield Services Ltd., Class H | | | 2,884,000 | | | | 3,246,573 | |
| | China Oriental Group Co. Ltd. | | | 4,262,000 | | | | 591,640 | |
| | China Overseas Grand Oceans Group Ltd. | | | 7,737,434 | | | | 2,185,837 | |
| | China Overseas Property Holdings Ltd. | | | 4,970,000 | | | | 3,127,957 | |
| | China Pioneer Pharma Holdings Ltd. | | | 1,781,000 | | | | 438,102 | |
| | China Power International Development Ltd. | | | 18,883,333 | | | | 5,457,077 | |
* †† | | China Properties Group Ltd. | | | 2,045,000 | | | | 20,269 | |
| | China Publishing & Media Co. Ltd., Class A | | | 378,215 | | | | 218,563 | |
* | | China Qinfa Group Ltd. | | | 190,000 | | | | 6,554 | |
W | | China Railway Signal & Communication Corp. Ltd., Class H | | | 5,023,000 | | | | 1,431,675 | |
| | China Railway Tielong Container Logistics Co. Ltd., Class A | | | 220,800 | | | | 157,240 | |
* | | China Rare Earth Holdings Ltd. | | | 6,468,799 | | | | 317,394 | |
| | China Reinsurance Group Corp., Class H | | | 18,771,000 | | | | 992,361 | |
# W | | China Renaissance Holdings Ltd. | | | 721,600 | | | | 547,068 | |
| | China Resources Cement Holdings Ltd. | | | 9,482,000 | | | | 3,427,420 | |
| | China Resources Medical Holdings Co. Ltd. | | | 3,618,000 | | | | 1,728,085 | |
W | | China Resources Pharmaceutical Group Ltd. | | | 5,156,000 | | | | 3,478,136 | |
| | China Risun Group Ltd. | | | 3,430,000 | | | | 1,210,015 | |
| | China Sanjiang Fine Chemicals Co. Ltd. | | | 3,115,000 | | | | 539,720 | |
| | China SCE Group Holdings Ltd. | | | 5,911,200 | | | | 305,364 | |
| | China Science Publishing & Media Ltd., Class A | | | 175,900 | | | | 179,429 | |
# * | | China Shanshui Cement Group Ltd. | | | 30,000 | | | | 6,509 | |
#* W | | China Shengmu Organic Milk Ltd. | | | 11,703,000 | | | | 387,208 | |
| | China Shineway Pharmaceutical Group Ltd. | | | 1,378,200 | | | | 828,243 | |
# | | China Shuifa Singyes Energy Holdings Ltd. | | | 1,753,000 | | | | 172,136 | |
* | | China Silver Group Ltd. | | | 5,404,000 | | | | 178,947 | |
# * | | China South City Holdings Ltd. | | | 17,588,000 | | | | 839,603 | |
| | China South Publishing & Media Group Co. Ltd., Class A | | | 316,400 | | | | 413,864 | |
| | China Starch Holdings Ltd. | | | 7,505,000 | | | | 171,901 | |
| | China State Construction International Holdings Ltd. | | | 286,000 | | | | 257,283 | |
# | | China Sunshine Paper Holdings Co. Ltd. | | | 1,794,000 | | | | 372,331 | |
| | China Suntien Green Energy Corp. Ltd., Class H | | | 6,391,000 | | | | 2,423,732 | |
| | China Taiping Insurance Holdings Co. Ltd. | | | 6,240,600 | | | | 4,321,878 | |
| | China Testing & Certification International Group Co. Ltd., Class A | | | 163,993 | | | | 238,160 | |
* | | China Tianbao Group Development Co. Ltd. | | | 401,000 | | | | 153,139 | |
THE EMERGING MARKETS SMALL CAP SERIES
CONTINUED
| | | | | | | | | | |
| | | | | Shares | | | Value» | |
CHINA — (Continued) | | | | | | | | |
# * | | China Tianrui Group Cement Co. Ltd. | | | 256,000 | | | $ | 192,310 | |
| | China Tianying, Inc., Class A | | | 657,100 | | | | 434,524 | |
# | | China Tobacco International HK Co. Ltd. | | | 479,000 | | | | 461,653 | |
| | China Traditional Chinese Medicine Holdings Co. Ltd. | | | 10,816,000 | | | | 4,675,191 | |
* | | China TransInfo Technology Co. Ltd., Class A | | | 351,400 | | | | 430,488 | |
* | | China Travel International Investment Hong Kong Ltd. | | | 9,845,900 | | | | 1,529,823 | |
| | China Tungsten & Hightech Materials Co. Ltd., Class A | | | 177,400 | | | | 350,362 | |
* W | | China Vast Industrial Urban Development Co. Ltd. | | | 2,122,000 | | | | 642,822 | |
* †† | | China Vered Financial Holding Corp. Ltd. | | | 4,620,000 | | | | 25,190 | |
| | China Water Affairs Group Ltd. | | | 3,782,000 | | | | 2,678,613 | |
| | China West Construction Group Co. Ltd., Class A | | | 135,400 | | | | 123,598 | |
* †† | | China Wood Optimization Holding Ltd. | | | 1,748,000 | | | | 37,589 | |
| | China World Trade Center Co. Ltd., Class A | | | 169,977 | | | | 316,859 | |
| | China XLX Fertiliser Ltd. | | | 1,865,000 | | | | 711,863 | |
| | China Yongda Automobiles Services Holdings Ltd. | | | 2,988,500 | | | | 1,340,482 | |
* W | | China Yuhua Education Corp. Ltd. | | | 5,322,000 | | | | 583,256 | |
* | | China Yurun Food Group Ltd. | | | 1,208,000 | | | | 43,837 | |
# * | | China ZhengTong Auto Services Holdings Ltd. | | | 6,073,000 | | | | 235,714 | |
* | | China Zhonghua Geotechnical Engineering Group Co. Ltd., Class A | | | 387,600 | | | | 151,982 | |
# * †† | | China Zhongwang Holdings Ltd. | | | 8,794,400 | | | | 352,912 | |
| | Chinasoft International Ltd. | | | 9,542,000 | | | | 6,322,273 | |
* | | Chindata Group Holdings Ltd., ADR | | | 41,217 | | | | 218,862 | |
| | Chinese Universe Publishing & Media Group Co. Ltd., Class A | | | 311,600 | | | | 364,833 | |
| | Chongqing Department Store Co. Ltd., Class A | | | 124,000 | | | | 337,980 | |
* | | Chongqing Dima Industry Co. Ltd., Class A | | | 104,100 | | | | 28,822 | |
| | Chongqing Fuling Electric Power Industrial Co. Ltd., Class A | | | 221,088 | | | | 374,404 | |
* | | Chongqing Iron & Steel Co. Ltd., Class H | | | 1,428,000 | | | | 110,909 | |
| | Chongqing Machinery & Electric Co. Ltd., Class H | | | 4,630,000 | | | | 280,082 | |
| | Chongqing Rural Commercial Bank Co. Ltd., Class H | | | 8,561,000 | | | | 2,594,844 | |
| | Chongqing Zaisheng Technology Corp. Ltd., Class A | | | 193,120 | | | | 137,770 | |
| | Chongqing Zongshen Power Machinery Co. Ltd., Class A | | | 392,137 | | | | 345,901 | |
| | Chongyi Zhangyuan Tungsten Industry Co. Ltd., Class A | | | 213,700 | | | | 192,373 | |
| | Chow Tai Seng Jewellery Co. Ltd., Class A | | | 245,100 | | | | 371,812 | |
| | Chu Kong Shipping Enterprises Group Co. Ltd. | | | 1,366,000 | | | | 121,707 | |
| | CIFI Ever Sunshine Services Group Ltd. | | | 2,616,000 | | | | 576,887 | |
| | CIFI Holdings Group Co. Ltd. | | | 8,962,528 | | | | 593,723 | |
| | CIMC Enric Holdings Ltd. | | | 2,970,000 | | | | 2,894,880 | |
W | | CIMC Vehicles Group Co. Ltd., Class H | | | 19,000 | | | | 11,997 | |
| | Cinda Real Estate Co. Ltd., Class A | | | 782,200 | | | | 441,657 | |
| | Cisen Pharmaceutical Co. Ltd., Class A | | | 154,600 | | | | 271,369 | |
| | CITIC Press Corp., Class A | | | 2,200 | | | | 5,651 | |
| | CITIC Resources Holdings Ltd. | | | 11,660,600 | | | | 512,345 | |
| | City Development Environment Co. Ltd., Class A | | | 98,400 | | | | 128,468 | |
* | | Citychamp Watch & Jewellery Group Ltd. | | | 7,234,000 | | | | 939,644 | |
* | | CMGE Technology Group Ltd. | | | 1,000,000 | | | | 156,744 | |
| | CMST Development Co. Ltd., Class A | | | 585,300 | | | | 368,297 | |
* | | CNFinance Holdings Ltd., ADR | | | 46,227 | | | | 78,586 | |
| | CNHTC Jinan Truck Co. Ltd., Class A | | | 196,701 | | | | 305,656 | |
| | CNSIG Inner Mongolia Chemical Industry Co. Ltd. | | | 239,500 | | | | 445,900 | |
| | COFCO Biotechnology Co. Ltd., Class A | | | 280,300 | | | | 309,862 | |
| | COFCO Joycome Foods Ltd. | | | 7,856,000 | | | | 1,650,060 | |
| | COFCO Sugar Holding Co. Ltd., Class A | | | 155,600 | | | | 141,328 | |
* †† | | Colour Life Services Group Co. Ltd. | | | 1,927,604 | | | | 114,188 | |
| | Comba Telecom Systems Holdings Ltd. | | | 6,502,001 | | | | 911,710 | |
| | Concord New Energy Group Ltd. | | | 25,104,964 | | | | 1,918,124 | |
* | | Confidence Intelligence Holdings Ltd. | | | 54,000 | | | | 271,390 | |
| | Consun Pharmaceutical Group Ltd. | | | 2,281,000 | | | | 854,382 | |
| | Contec Medical Systems Co. Ltd., Class A | | | 89,512 | | | | 295,256 | |
# * | | Continental Aerospace Technologies Holding Ltd. | | | 22,083,722 | | | | 222,141 | |
THE EMERGING MARKETS SMALL CAP SERIES
CONTINUED
| | | | | | | | | | |
| | | | | Shares | | | Value» | |
CHINA — (Continued) | | | | | | | | |
* | | Coolpad Group Ltd. | | | 18,540,000 | | | $ | 174,985 | |
| | COSCO SHIPPING Development Co. Ltd., Class H | | | 14,996,000 | | | | 1,737,952 | |
* | | COSCO SHIPPING Energy Transportation Co. Ltd., Class H | | | 1,412,000 | | | | 1,028,549 | |
# | | COSCO SHIPPING International Hong Kong Co. Ltd. | | | 3,405,000 | | | | 993,423 | |
| | COSCO SHIPPING Ports Ltd. | | | 7,743,121 | | | | 3,818,452 | |
* | | Cosmopolitan International Holdings Ltd. | | | 764,000 | | | | 116,745 | |
# | | CPMC Holdings Ltd. | | | 2,299,000 | | | | 1,114,074 | |
| | CQ Pharmaceutical Holding Co. Ltd., Class A | | | 375,000 | | | | 262,509 | |
# * | | Crazy Sports Group Ltd. | | | 10,687,579 | | | | 255,823 | |
| | Crystal Clear Electronic Material Co. Ltd., Class A | | | 96,035 | | | | 211,780 | |
* | | CSG Smart Science&Technology Co. Ltd., Class A | | | 67,600 | | | | 63,640 | |
| | CSPC Innovation Pharmaceutical Co. Ltd., Class A | | | 69,000 | | | | 148,035 | |
# | | CSSC Hong Kong Shipping Co. Ltd. | | | 2,770,000 | | | | 348,712 | |
| | CSSC Science & Technology Co. Ltd., Class A | | | 158,600 | | | | 261,118 | |
| | CTS International Logistics Corp. Ltd., Class A | | | 269,120 | | | | 412,283 | |
* | | CWT International Ltd. | | | 24,080,000 | | | | 171,755 | |
| | Da Ming International Holdings Ltd. | | | 880,000 | | | | 196,418 | |
W | | Dali Foods Group Co. Ltd. | | | 4,370,000 | | | | 1,798,833 | |
* | | Dalian Bio-Chem Co. Ltd., Class A | | | 60,476 | | | | 137,669 | |
| | Dalian Huarui Heavy Industry Group Co. Ltd., Class A | | | 476,300 | | | | 357,223 | |
| | Dalipal Holdings Ltd. | | | 1,198,000 | | | | 369,486 | |
| | Dare Power Dekor Home Co. Ltd., Class A | | | 112,600 | | | | 120,673 | |
| | Dashang Co. Ltd., Class A | | | 103,508 | | | | 221,982 | |
* | | Datang International Power Generation Co. Ltd., Class H | | | 5,314,000 | | | | 676,228 | |
| | Dawnrays Pharmaceutical Holdings Ltd. | | | 4,735,886 | | | | 635,495 | |
| | Dazhong Transportation Group Co. Ltd., Class A | | | 631,520 | | | | 244,068 | |
| | Dazzle Fashion Co. Ltd., Class A | | | 128,728 | | | | 237,616 | |
| | DBG Technology Co. Ltd., Class A | | | 213,483 | | | | 278,621 | |
| | DeHua TB New Decoration Materials Co. Ltd., Class A | | | 152,716 | | | | 154,856 | |
| | Dexin China Holdings Co. Ltd. | | | 2,041,000 | | | | 176,987 | |
# | | Differ Group Auto Ltd. | | | 11,704,000 | | | | 2,340,725 | |
| | Digital China Group Co. Ltd., Class A | | | 223,300 | | | | 818,430 | |
| | Digital China Holdings Ltd. | | | 3,170,500 | | | | 1,255,654 | |
| | Digital China Information Service Co. Ltd., Class A | | | 276,264 | | | | 438,520 | |
| | Dongfang Electric Corp. Ltd., Class H | | | 821,600 | | | | 1,239,136 | |
| | Dongfang Electronics Co. Ltd., Class A | | | 225,500 | | | | 252,751 | |
| | Dongfeng Motor Group Co. Ltd., Class H | | | 8,614,000 | | | | 3,897,009 | |
| | Dongguan Aohai Technology Co. Ltd., Class A | | | 35,400 | | | | 192,906 | |
# | | Dongjiang Environmental Co. Ltd., Class H | | | 780,375 | | | | 205,880 | |
| | Dongyue Group Ltd. | | | 4,980,000 | | | | 4,322,050 | |
# * | | DouYu International Holdings Ltd., ADR | | | 550,357 | | | | 550,302 | |
* | | Duiba Group Ltd. | | | 800 | | | | 49 | |
# | | Dynagreen Environmental Protection Group Co. Ltd., Class H | | | 1,777,000 | | | | 487,159 | |
| | E-Commodities Holdings Ltd. | | | 3,364,000 | | | | 445,526 | |
| | Edan Instruments, Inc., Class A | | | 174,700 | | | | 295,752 | |
| | Edifier Technology Co. Ltd., Class A | | | 196,500 | | | | 218,025 | |
| | Edvantage Group Holdings Ltd. | | | 724,945 | | | | 163,470 | |
| | EEKA Fashion Holdings Ltd. | | | 414,000 | | | | 537,810 | |
| | EIT Environmental Development Group Co. Ltd., Class A | | | 55,432 | | | | 117,037 | |
| | Electric Connector Technology Co. Ltd., Class A | | | 13,913 | | | | 70,192 | |
* | | Elion Energy Co. Ltd., Class A | | | 1,074,661 | | | | 665,885 | |
| | Eoptolink Technology, Inc.Ltd., Class A | | | 122,800 | | | | 436,105 | |
| | Era Co. Ltd., Class A | | | 208,900 | | | | 125,012 | |
# | | Essex Bio-technology Ltd. | | | 1,240,000 | | | | 502,024 | |
| | Eternal Asia Supply Chain Management Ltd., Class A | | | 640,400 | | | | 459,049 | |
# | | EVA Precision Industrial Holdings Ltd. | | | 4,606,435 | | | | 604,283 | |
| | Everbright Jiabao Co. Ltd., Class A | | | 647,600 | | | | 231,198 | |
* | | EverChina International Holdings Co. Ltd. | | | 13,660,000 | | | | 292,509 | |
* W | | Everest Medicines Ltd. | | | 445,000 | | | | 350,711 | |
THE EMERGING MARKETS SMALL CAP SERIES
CONTINUED
| | | | | | | | | | |
| | | | | Shares | | | Value» | |
CHINA — (Continued) | | | | | | | | |
* | | Fang Holdings Ltd., ADR | | | 15,618 | | | $ | 8,277 | |
| | Fangda Special Steel Technology Co. Ltd., Class A | | | 575,000 | | | | 449,646 | |
# | | Fanhua, Inc., Sponsored ADR | | | 169,955 | | | | 820,883 | |
| | Far East Horizon Ltd. | | | 6,976,000 | | | | 5,387,074 | |
| | FAWER Automotive Parts Co. Ltd., Class A | | | 207,900 | | | | 130,050 | |
* | | Feitian Technologies Co. Ltd., Class A | | | 88,100 | | | | 130,343 | |
* W | | Feiyu Technology International Co. Ltd. | | | 1,153,500 | | | | 33,894 | |
| | Fiberhome Telecommunication Technologies Co. Ltd., Class A | | | 262,000 | | | | 496,029 | |
| | Fibocom Wireless, Inc., Class A | | | 123,427 | | | | 317,274 | |
* | | FIH Mobile Ltd. | | | 9,669,000 | | | | 788,399 | |
| | Financial Street Holdings Co. Ltd., Class A | | | 601,498 | | | | 382,226 | |
| | Financial Street Property Co. Ltd., Class H | | | 20,000 | | | | 5,378 | |
| | FinVolution Group, ADR | | | 376,583 | | | | 1,634,370 | |
| | First Tractor Co. Ltd., Class H | | | 1,033,176 | | | | 415,530 | |
| | Foshan Nationstar Optoelectronics Co. Ltd., Class A | | | 30,172 | | | | 33,607 | |
| | Fosun International Ltd. | | | 748,000 | | | | 457,104 | |
* | | Founder Holdings Ltd. | | | 160,000 | | | | 7,139 | |
| | FriendTimes, Inc. | | | 1,044,000 | | | | 137,182 | |
| | Fu Shou Yuan International Group Ltd. | | | 4,095,000 | | | | 2,045,788 | |
| | Fufeng Group Ltd. | | | 6,570,600 | | | | 3,407,497 | |
* †† | | Fuguiniao Co. Ltd. | | | 1,930,000 | | | | 0 | |
| | Fujian Boss Software Development Co. Ltd., Class A | | | 173,994 | | | | 529,314 | |
| | Fujian Longking Co. Ltd., Class A | | | 172,500 | | | | 335,048 | |
| | Fujian Star-net Communication Co. Ltd., Class A | | | 134,073 | | | | 390,072 | |
# * | | Fullshare Holdings Ltd. | | | 41,672,500 | | | | 525,012 | |
| | Fulongma Group Co. Ltd., Class A | | | 133,700 | | | | 161,504 | |
| | Fulu Holdings Ltd. | | | 233,500 | | | | 122,028 | |
| | Fusen Pharmaceutical Co. Ltd. | | | 141,000 | | | | 16,992 | |
* | | Ganglong China Property Group Ltd. | | | 38,000 | | | | 9,918 | |
| | Gansu Jingyuan Coal Industry & Electricity Power Co. Ltd., Class A | | | 797,700 | | | | 343,978 | |
| | Gansu Qilianshan Cement Group Co. Ltd., Class A | | | 149,233 | | | | 197,498 | |
| | Gansu Shangfeng Cement Co. Ltd., Class A | | | 225,361 | | | | 309,550 | |
| | Gaona Aero Material Co. Ltd., Class A | | | 1,200 | | | | 8,796 | |
| | GCL New Energy Holdings Ltd. | | | 1,322,100 | | | | 89,267 | |
* | | GDS Holdings Ltd., Class A | | | 1,423,800 | | | | 1,589,176 | |
| | Gemdale Properties & Investment Corp. Ltd. | | | 26,304,000 | | | | 1,441,239 | |
* | | Gem-Year Industrial Co. Ltd., Class A | | | 126,000 | | | | 80,351 | |
W | | Genertec Universal Medical Group Co. Ltd. | | | 4,196,500 | | | | 1,754,176 | |
* | | Genimous Technology Co. Ltd., Class A | | | 330,115 | | | | 249,040 | |
| | Geovis Technology Co. Ltd., Class A | | | 1,918 | | | | 18,685 | |
| | GEPIC Energy Development Co. Ltd., Class A | | | 193,100 | | | | 133,418 | |
| | Getein Biotech, Inc., Class A | | | 174,696 | | | | 316,697 | |
| | Giant Network Group Co. Ltd., Class A | | | 57,900 | | | | 61,526 | |
* | | Glorious Property Holdings Ltd. | | | 11,042,501 | | | | 156,156 | |
* | | Glory Health Industry Ltd. | | | 5,126,000 | | | | 183,633 | |
# * | | Glory Sun Financial Group Ltd. | | | 17,708,000 | | | | 40,654 | |
| | Goke Microelectronics Co. Ltd., Class A | | | 36,630 | | | | 379,259 | |
| | Goldcard Smart Group Co. Ltd. | | | 147,600 | | | | 197,702 | |
* | | Golden Eagle Retail Group Ltd. | | | 2,637,000 | | | | 1,593,819 | |
W | | Golden Throat Holdings Group Co. Ltd. | | | 863,500 | | | | 181,758 | |
| | GoldenHome Living Co. Ltd., Class A | | | 52,892 | | | | 180,951 | |
| | Goldenmax International Group Ltd., Class A | | | 117,100 | | | | 127,958 | |
| | Goldlion Holdings Ltd. | | | 1,322,962 | | | | 188,864 | |
| | Goldpac Group Ltd. | | | 1,374,000 | | | | 222,076 | |
# * | | GOME Retail Holdings Ltd. | | | 34,090,000 | | | | 556,187 | |
* | | Gosuncn Technology Group Co. Ltd., Class A | | | 352,291 | | | | 158,976 | |
* | | Grand Baoxin Auto Group Ltd. | | | 3,688,492 | | | | 172,279 | |
* | | Grand Industrial Holding Group Co. Ltd. | | | 106,700 | | | | 121,550 | |
# | | Grand Pharmaceutical Group Ltd., Class L | | | 4,069,500 | | | | 1,741,318 | |
THE EMERGING MARKETS SMALL CAP SERIES
CONTINUED
| | | | | | | | | | |
| | | | | Shares | | | Value» | |
CHINA — (Continued) | | | | | | | | |
| | Grandblue Environment Co. Ltd., Class A | | | 155,495 | | | $ | 382,007 | |
* | | Grandjoy Holdings Group Co. Ltd., Class A | | | 650,500 | | | | 281,154 | |
* | | Greattown Holdings Ltd., Class A | | | 778,800 | | | | 335,818 | |
| | Greatview Aseptic Packaging Co. Ltd. | | | 2,628,000 | | | | 368,302 | |
| | Gree Real Estate Co. Ltd., Class A | | | 436,440 | | | | 335,559 | |
| | Greenland Hong Kong Holdings Ltd. | | | 4,401,000 | | | | 226,937 | |
| | Greentown China Holdings Ltd. | | | 3,365,148 | | | | 3,210,590 | |
W | | Greentown Management Holdings Co. Ltd. | | | 1,776,000 | | | | 1,016,726 | |
# | | Greentown Service Group Co. Ltd. | | | 5,616,000 | | | | 2,297,790 | |
| | Guangdong Advertising Group Co. Ltd., Class A | | | 232,900 | | | | 133,905 | |
| | Guangdong Aofei Data Technology Co. Ltd., Class A | | | 225,200 | | | | 287,955 | |
| | Guangdong Baolihua New Energy Stock Co. Ltd., Class A | | | 585,600 | | | | 431,406 | |
* | | Guangdong Create Century Intelligent Equipment Group Corp. Ltd., Class A | | | 200,900 | | | | 286,452 | |
* | | Guangdong Dongfang Precision Science & Technology Co. Ltd., Class A | | | 455,500 | | | | 266,957 | |
| | Guangdong Dongpeng Holdings Co. Ltd. | | | 171,200 | | | | 163,567 | |
| | Guangdong Dowstone Technology Co., Ltd., Class A | | | 142,600 | | | | 279,881 | |
| | Guangdong Ellington Electronics Technology Co. Ltd., Class A | | | 197,000 | | | | 185,844 | |
| | Guangdong Great River Smarter Logistics Co. Ltd., Class A | | | 113,600 | | | | 333,281 | |
* | | Guangdong Highsun Group Co. Ltd., Class A | | | 256,300 | | | | 76,958 | |
| | Guangdong Hongda Holdings Group Co. Ltd., Class A | | | 17,825 | | | | 66,687 | |
* | | Guangdong Huatie Tongda High-speed Railway Equipment Corp., Class A | | | 324,900 | | | | 171,892 | |
| | Guangdong Huiyun Tianium Industry Co. Ltd., Class A | | | 70,200 | | | | 95,904 | |
| | Guangdong Hybribio Biotech Co. Ltd., Class A | | | 47,371 | | | | 132,476 | |
# | | Guangdong Investment Ltd. | | | 4,146,000 | | | | 2,613,955 | |
| | Guangdong Land Holdings Ltd. | | | 1,456,800 | | | | 117,213 | |
| | Guangdong Provincial Expressway Development Co. Ltd., Class A | | | 326,787 | | | | 314,766 | |
| | Guangdong Shirongzhaoye Co. Ltd., Class A | | | 333,100 | | | | 235,042 | |
| | Guangdong Sirio Pharma Co. Ltd., Class A | | | 6,200 | | | | 23,139 | |
| | Guangdong South New Media Co. Ltd., Class A | | | 56,100 | | | | 244,850 | |
| | Guangdong Tapai Group Co. Ltd., Class A | | | 239,500 | | | | 221,597 | |
| | Guangdong Topstar Technology Co. Ltd., Class A | | | 56,500 | | | | 122,077 | |
| | Guangdong Xinbao Electrical Appliances Holdings Co. Ltd., Class A | | | 169,630 | | | | 372,020 | |
| | Guangdong Zhongnan Iron & Steel Co. Ltd., Class A | | | 836,400 | | | | 308,687 | |
| | Guangdong Zhongsheng Pharmaceutical Co. Ltd., Class A | | | 166,200 | | | | 484,122 | |
* | | Guangshen Railway Co. Ltd., Class H | | | 6,028,000 | | | | 784,289 | |
| | Guangxi Liugong Machinery Co. Ltd., Class A | | | 494,020 | | | | 395,312 | |
| | Guangxi LiuYao Group Co. Ltd., Class A | | | 119,980 | | | | 294,992 | |
| | Guangxi Wuzhou Zhongheng Group Co. Ltd., Class A | | | 920,480 | | | | 342,167 | |
| | Guangzhou Baiyunshan Pharmaceutical Holdings Co. Ltd., Class H | | | 602,000 | | | | 1,342,996 | |
| | Guangzhou GRG Metrology & Test Co. Ltd., Class A | | | 92,500 | | | | 216,786 | |
| | Guangzhou Hi-Target Navigation Tech Co. Ltd., Class A | | | 176,900 | | | | 164,057 | |
| | Guangzhou Jet Biofiltration Co., Ltd., Class A | | | 11,490 | | | | 48,253 | |
| | Guangzhou KDT Machinery Co. Ltd., Class A | | | 76,498 | | | | 160,200 | |
| | Guangzhou Restaurant Group Co. Ltd., Class A | | | 66,240 | | | | 184,900 | |
| | Guangzhou Shangpin Home Collection Co. Ltd., Class A | | | 17,951 | | | | 44,783 | |
| | Guangzhou Wondfo Biotech Co. Ltd., Class A | | | 61,900 | | | | 256,027 | |
| | Guangzhou Zhujiang Brewery Co. Ltd., Class A | | | 24,200 | | | | 21,488 | |
* | | Guizhou Bailing Group Pharmaceutical Co. Ltd., Class A | | | 326,400 | | | | 297,624 | |
| | Guizhou Gas Group Corp. Ltd., Class A | | | 223,900 | | | | 229,287 | |
| | Guizhou Panjiang Refined Coal Co. Ltd., Class A | | | 188,200 | | | | 173,032 | |
| | Guizhou Xinbang Pharmaceutical Co. Ltd., Class A | | | 393,900 | | | | 278,473 | |
# | | Guolian Securities Co. Ltd., Class H | | | 1,395,500 | | | | 611,269 | |
| | Guomai Technologies, Inc., Class A | | | 185,400 | | | | 201,352 | |
* | | Guosheng Financial Holding, Inc., Class A | | | 375,600 | | | | 385,529 | |
#* W | | Haichang Ocean Park Holdings Ltd. | | | 5,167,000 | | | | 4,575,650 | |
| | Hailir Pesticides & Chemicals Group Co. Ltd., Class A | | | 58,020 | | | | 200,641 | |
* | | Hainan Development Holdings Nanhai Co. Ltd., Class A | | | 194,300 | | | | 261,386 | |
* | | Hainan Meilan International Airport Co. Ltd., Class H | | | 689,000 | | | | 1,070,112 | |
THE EMERGING MARKETS SMALL CAP SERIES
CONTINUED
| | | | | | | | | | |
| | | | | Shares | | | Value» | |
CHINA — (Continued) | | | | | | | | |
| | Hainan Poly Pharm Co. Ltd., Class A | | | 88,400 | | | $ | 320,564 | |
| | Hainan Strait Shipping Co. Ltd., Class A | | | 370,150 | | | | 237,266 | |
| | Haitian International Holdings Ltd. | | | 2,506,000 | | | | 5,017,409 | |
W | | Haitong UniTrust International Leasing Co. Ltd., Class H | | | 524,000 | | | | 31,729 | |
* | | Hand Enterprise Solutions Co. Ltd., Class A | | | 189,200 | | | | 232,544 | |
| | Hangcha Group Co. Ltd., Class A | | | 239,388 | | | | 539,255 | |
| | Hangxiao Steel Structure Co. Ltd., Class A | | | 584,208 | | | | 313,450 | |
| | Hangzhou Electronic Soul Network Technology Co. Ltd., Class A | | | 27,900 | | | | 76,418 | |
| | Hangzhou Haoyue Personal Care Co., Ltd., Class A | | | 19,539 | | | | 111,317 | |
| | Hangzhou Onechance Tech Corp., Class A | | | 51,270 | | | | 199,572 | |
#* W | | Harbin Bank Co. Ltd., Class H | | | 1,742,000 | | | | 58,817 | |
| | Harbin Boshi Automation Co. Ltd., Class A | | | 272,200 | | | | 570,827 | |
# * | | Harbin Electric Co. Ltd., Class H | | | 3,143,413 | | | | 1,061,306 | |
* | | Harbin Gloria Pharmaceuticals Co. Ltd., Class A | | | 509,600 | | | | 186,125 | |
* | | Harbin Pharmaceutical Group Co. Ltd., Class A | | | 854,900 | | | | 322,107 | |
†† | | Harmonicare Medical Holdings Ltd. | | | 2,321,000 | | | | 113,098 | |
| | HBIS Resources Co. Ltd., Class A | | | 181,600 | | | | 234,298 | |
* W | | HBM Holdings Ltd. | | | 1,037,000 | | | | 118,717 | |
* | | HC Group, Inc. | | | 1,971,000 | | | | 63,280 | |
| | Health & Happiness H&H International Holdings Ltd. | | | 861,000 | | | | 811,790 | |
* | | Healthcare Co., Ltd., Class A | | | 79,400 | | | | 100,795 | |
* | | Hebei Construction Group Corp. Ltd., Class H | | | 105,000 | | | | 8,818 | |
# | | Hello Group, Inc., Sponsored ADR | | | 613,582 | | | | 2,883,835 | |
| | Henan Jindan Lactic Acid Technology Co. Ltd., Class A | | | 38,800 | | | | 115,440 | |
| | Henan Lingrui Pharmaceutical Co., Class A | | | 160,300 | | | | 317,409 | |
| | Henan Pinggao Electric Co. Ltd., Class A | | | 342,000 | | | | 336,273 | |
* | | Henan Senyuan Electric Co. Ltd., Class A | | | 65,900 | | | | 30,705 | |
| | Henan Thinker Automatic Equipment Co. Ltd., Class A | | | 61,387 | | | | 106,737 | |
* | | Henan Yicheng New Energy Co. Ltd., Class A | | | 530,100 | | | | 360,638 | |
| | Henan Yuguang Gold & Lead Co. Ltd., Class A | | | 184,400 | | | | 122,634 | |
* | | Henan Yuneng Holdings Co., Ltd., Class A | | | 144,700 | | | | 100,093 | |
| | Henan Zhongyuan Expressway Co. Ltd., Class A | | | 907,923 | | | | 330,837 | |
| | Henderson Investment Ltd. | | | 2,432,000 | | | | 77,500 | |
| | Hengan International Group Co. Ltd. | | | 2,254,500 | | | | 8,741,258 | |
# * | | Hengdeli Holdings Ltd. | | | 12,009,399 | | | | 374,315 | |
| | Hexing Electrical Co. Ltd., Class A | | | 181,690 | | | | 437,046 | |
* | | Hi Sun Technology China Ltd. | | | 9,243,000 | | | | 890,825 | |
| | Hisense Home Appliances Group Co. Ltd., Class H | | | 1,535,000 | | | | 1,270,026 | |
* | | Holitech Technology Co. Ltd., Class A | | | 776,200 | | | | 282,586 | |
* | | Hongda Xingye Co. Ltd., Class A | | | 712,200 | | | | 320,472 | |
* | | Honghua Group Ltd. | | | 13,583,000 | | | | 337,382 | |
* | | Hongli Zhihui Group Co. Ltd., Class A | | | 165,600 | | | | 164,877 | |
*††W | | Honworld Group Ltd. | | | 1,105,500 | | | | 81,064 | |
W | | Hope Education Group Co. Ltd. | | | 9,156,000 | | | | 565,662 | |
# | | Hopson Development Holdings Ltd. | | | 3,195,815 | | | | 2,562,028 | |
†† | | Hua Han Health Industry Holdings Ltd. | | | 20,183,698 | | | | 144,763 | |
* W | | Hua Hong Semiconductor Ltd. | | | 2,229,000 | | | | 5,221,293 | |
* | | Hua Yin International Holdings Ltd. | | | 865,000 | | | | 53,583 | |
| | Huaan Securities Co. Ltd., Class A | | | 847,366 | | | | 512,333 | |
| | Huadian Power International Corp. Ltd., Class H | | | 4,732,000 | | | | 1,421,132 | |
* | | Huafon Microfibre Shanghai Technology Co. Ltd. | | | 475,200 | | | | 244,615 | |
| | Huafu Fashion Co. Ltd., Class A | | | 522,852 | | | | 216,848 | |
# * | | Huanxi Media Group Ltd. | | | 2,850,000 | | | | 327,038 | |
| | Huapont Life Sciences Co. Ltd., Class A | | | 498,900 | | | | 359,272 | |
* | | Huawen Media Group, Class A | | | 181,300 | | | | 52,259 | |
| | Huaxi Holdings Co. Ltd. | | | 560,000 | | | | 84,962 | |
# | | Huazhong In-Vehicle Holdings Co. Ltd. | | | 2,112,000 | | | | 651,414 | |
| | Hubei Biocause Pharmaceutical Co. Ltd., Class A | | | 664,869 | | | | 262,499 | |
| | Huishang Bank Corp. Ltd., Class H | | | 34,000 | | | | 10,579 | |
THE EMERGING MARKETS SMALL CAP SERIES
CONTINUED
| | | | | | | | | | |
| | | | | Shares | | | Value» | |
CHINA — (Continued) | | | | | | | | |
| | Hunan Aihua Group Co. Ltd., Class A | | | 132,187 | | | $ | 437,933 | |
* | | Hunan Er-Kang Pharmaceutical Co. Ltd., Class A | | | 208,900 | | | | 90,933 | |
| | Hunan Gold Corp. Ltd., Class A | | | 244,800 | | | | 444,203 | |
# * | | HUYA, Inc., ADR | | | 319,901 | | | | 598,215 | |
#*W | | Hygeia Healthcare Holdings Co. Ltd. | | | 1,052,600 | | | | 4,558,756 | |
* | | Hytera Communications Corp. Ltd., Class A | | | 439,400 | | | | 317,477 | |
* | | HyUnion Holding Co. Ltd., Class A | | | 258,400 | | | | 272,008 | |
* | | IAT Automobile Technology Co. Ltd., Class A | | | 31,800 | | | | 50,356 | |
* | | IBO Technology Co. Ltd. | | | 784,000 | | | | 195,662 | |
* W | | iDreamSky Technology Holdings Ltd. | | | 2,198,400 | | | | 827,287 | |
| | IKD Co. Ltd., Class A | | | 76,800 | | | | 199,570 | |
W | | IMAX China Holding, Inc. | | | 406,500 | | | | 233,931 | |
| | Infore Environment Technology Group Co. Ltd., Class A | | | 392,300 | | | | 250,861 | |
#*W | | Ingdan, Inc. | | | 2,236,000 | | | | 361,843 | |
* | | Inkeverse Group Ltd. | | | 267,000 | | | | 26,880 | |
| | Inmyshow Digital Technology Group Co. Ltd., Class A | | | 460,900 | | | | 379,731 | |
| | Inner Mongolia MengDian HuaNeng Thermal Power Corp. Ltd., Class A | | | 1,912,700 | | | | 940,102 | |
* | | Inner Mongolia Xingye Mining Co. Ltd., Class A | | | 372,400 | | | | 293,741 | |
| | Inner Mongolia Yitai Coal Co. Ltd., Class H | | | 538,700 | | | | 642,125 | |
* | | Innuovo Technology Co. Ltd., Class A | | | 364,600 | | | | 325,633 | |
* | | Inspur International Ltd. | | | 1,856,000 | | | | 394,541 | |
* | | Inspur Software Co. Ltd., Class A | | | 10,900 | | | | 21,319 | |
| | Intco Medical Technology Co. Ltd., Class A | | | 148,027 | | | | 432,040 | |
#*W | | International Alliance Financial Leasing Co. Ltd. | | | 2,040,000 | | | | 1,104,429 | |
# | | Intron Technology Holdings Ltd. | | | 355,000 | | | | 147,451 | |
# * | | iQIYI, Inc., ADR | | | 784,425 | | | | 1,584,538 | |
| | IReader Technology Co. Ltd., Class A | | | 103,700 | | | | 203,208 | |
* | | IRICO Group New Energy Co. Ltd., Class H | | | 107,700 | | | | 96,812 | |
| | IVD Medical Holding Ltd. | | | 208,000 | | | | 54,271 | |
| | Jack Technology Co. Ltd., Class A | | | 137,400 | | | | 367,397 | |
* W | | Jacobio Pharmaceuticals Group Co. Ltd. | | | 254,100 | | | | 112,131 | |
| | Jade Bird Fire Co. Ltd., Class A | | | 88,180 | | | | 301,250 | |
| | Jenkem Technology Co. Ltd., Class A | | | 14,415 | | | | 324,947 | |
# * | | JH Educational Technology, Inc. | | | 1,052,000 | | | | 149,252 | |
* | | Jiajiayue Group Co. Ltd., Class A | | | 136,899 | | | | 180,434 | |
| | Jiangling Motors Corp. Ltd., Class A | | | 152,600 | | | | 296,694 | |
* | | Jiangnan Group Ltd. | | | 13,956,000 | | | | 364,602 | |
| | Jiangshan Oupai Door Industry Co. Ltd., Class A | | | 30,620 | | | | 168,068 | |
| | Jiangsu Bioperfectus Technologies Co. Ltd., Class A | | | 6,494 | | | | 91,343 | |
| | Jiangsu Boqian New Materials Stock Co. Ltd., Class A | | | 52,100 | | | | 336,499 | |
| | Jiangsu Canlon Building Materials Co., Ltd., Class A | | | 49,800 | | | | 88,269 | |
| | Jiangsu Chuanzhiboke Education Technology Co. Ltd., Class A | | | 22,300 | | | | 50,373 | |
* | | Jiangsu Etern Co. Ltd., Class A | | | 132,100 | | | | 65,764 | |
| | Jiangsu Expressway Co. Ltd., Class H | | | 2,168,000 | | | | 1,529,181 | |
| | Jiangsu Guomao Reducer Co. Ltd., Class A | | | 88,100 | | | | 235,901 | |
| | Jiangsu Guotai International Group Co. Ltd., Class A | | | 423,995 | | | | 470,135 | |
| | Jiangsu Hengshun Vinegar Industry Co. Ltd., Class A | | | 28,500 | | | | 39,183 | |
| | Jiangsu Huahong Technology Stock Co. Ltd., Class A | | | 93,700 | | | | 186,525 | |
| | Jiangsu Jiangyin Rural Commercial Bank Co. Ltd., Class A | | | 721,920 | | | | 367,615 | |
* | | Jiangsu Kanion Pharmaceutical Co. Ltd., Class A | | | 192,140 | | | | 506,242 | |
* | | Jiangsu Leike Defense Technology Co. Ltd., Class A | | | 231,407 | | | | 159,835 | |
* | | Jiangsu Lihua Animal Husbandry Stock Co. Ltd., Class A | | | 8,500 | | | | 42,507 | |
| | Jiangsu Linyang Energy Co. Ltd., Class A | | | 32,190 | | | | 32,614 | |
| | Jiangsu Nhwa Pharmaceutical Co. Ltd., Class A | | | 93,500 | | | | 259,110 | |
| | Jiangsu Provincial Agricultural Reclamation & Development Corp. | | | 81,552 | | | | 141,006 | |
| | Jiangsu Shagang Co. Ltd., Class A | | | 490,300 | | | | 261,469 | |
| | Jiangsu Sidike New Material Science & Technology Co. Ltd.,Class A | | | 61,427 | | | | 187,804 | |
| | Jiangsu Sopo Chemical Co., Class A | | | 128,801 | | | | 143,005 | |
| | Jiangsu ToLand Alloy Co. Ltd., Class A | | | 41,950 | | | | 311,572 | |
THE EMERGING MARKETS SMALL CAP SERIES
CONTINUED
| | | | | | | | | | |
| | | | | Shares | | | Value» | |
CHINA — (Continued) | | | | | | | | |
| | Jiangsu Zhangjiagang Rural Commercial Bank Co. Ltd., Class A | | | 643,810 | | | $ | 392,634 | |
| | Jiangsu Zijin Rural Commercial Bank Co. Ltd., Class A | | | 1,256,600 | | | | 435,606 | |
| | Jiangxi Bank Co. Ltd., Class H | | | 325,000 | | | | 34,810 | |
| | Jiangxi Huangshanghuang Group Food Co. Ltd., Class A | | | 131,600 | | | | 174,122 | |
| | Jiangxi Wannianqing Cement Co. Ltd., Class A | | | 131,130 | | | | 141,644 | |
| | Jiangxi Xinyu Guoke Technology Co. Ltd., Class A | | | 36,204 | | | | 139,670 | |
* | | Jiangxi Zhengbang Technology Co. Ltd., Class A | | | 538,343 | | | | 258,243 | |
| | Jiangzhong Pharmaceutical Co. Ltd., Class A | | | 196,640 | | | | 408,921 | |
| | Jiaozuo Wanfang Aluminum Manufacturing Co. Ltd., Class A | | | 189,534 | | | | 131,199 | |
* | | Jiayin Group, Inc., ADR | | | 20,615 | | | | 49,270 | |
| | Jiayou International Logistics Co. Ltd., Class A | | | 29,540 | | | | 85,179 | |
| | Jilin Aodong Pharmaceutical Group Co. Ltd., Class A | | | 228,400 | | | | 432,944 | |
* | | Jilin Jiutai Rural Commercial Bank Corp. Ltd., Class H | | | 133,703 | | | | 37,133 | |
* | | Jilin Zixin Pharmaceutical Industrial Co. Ltd., Class A | | | 436,800 | | | | 147,981 | |
# | | Jinchuan Group International Resources Co. Ltd. | | | 11,989,000 | | | | 794,071 | |
| | Jinduicheng Molybdenum Co. Ltd., Class A | | | 443,920 | | | | 509,936 | |
* †† | | Jingrui Holdings Ltd. | | | 2,219,000 | | | | 125,089 | |
| | Jingwei Textile Machinery Co. Ltd., Class A | | | 284,500 | | | | 300,662 | |
| | Jinhui Liquor Co. Ltd., Class A | | | 111,000 | | | | 305,428 | |
# * | | JinkoSolar Holding Co. Ltd., ADR | | | 157,507 | | | | 7,478,432 | |
* | | Jinlei Technology Co. Ltd., Class A | | | 43,600 | | | | 283,054 | |
* | | Jinmao Property Services Co. Ltd. | | | 122,779 | | | | 37,595 | |
| | Jinneng Holding Shanxi Coal Industry Co. Ltd., Class A | | | 722,972 | | | | 1,334,161 | |
* | | Jinneng Holding Shanxi Electric Power Co. Ltd., Class A | | | 538,000 | | | | 249,459 | |
| | Jinneng Science&Technology Co. Ltd., Class A | | | 176,300 | | | | 217,075 | |
| | Jinyuan EP Co. Ltd., Class A | | | 145,600 | | | | 263,014 | |
# W | | Jiumaojiu International Holdings Ltd. | | | 1,949,000 | | | | 3,063,161 | |
| | Jiuzhitang Co. Ltd., Class A | | | 287,600 | | | | 342,211 | |
| | JNBY Design Ltd. | | | 762,000 | | | | 600,170 | |
* | | Jointo Energy Investment Co. Ltd. Hebei, Class A | | | 676,496 | | | | 475,834 | |
* | | Joy City Property Ltd. | | | 19,478,000 | | | | 504,297 | |
# * | | Joy Spreader Group, Inc. | | | 3,229,000 | | | | 583,848 | |
| | Joyoung Co. Ltd., Class A | | | 158,340 | | | | 315,581 | |
# | | JOYY, Inc., ADR | | | 63,257 | | | | 1,595,974 | |
ıW | | JS Global Lifestyle Co. Ltd. | | | 2,505,500 | | | | 2,018,219 | |
| | JSTI Group, Class A | | | 213,888 | | | | 168,889 | |
| | Ju Teng International Holdings Ltd. | | | 4,732,000 | | | | 727,511 | |
| | Jushri Technologies, Inc., Class A | | | 26,080 | | | | 43,438 | |
#* W | | JW Cayman Therapeutics Co. Ltd. | | | 276,000 | | | | 98,458 | |
| | JY Grandmark Holdings Ltd. | | | 431,000 | | | | 68,018 | |
* | | Kaiser China Cultural Co. Ltd., Class A | | | 278,000 | | | | 171,183 | |
* | | Kaishan Group Co. Ltd., Class A | | | 69,300 | | | | 158,920 | |
* W | | Kangda International Environmental Co. Ltd. | | | 3,143,000 | | | | 236,267 | |
| | Kangji Medical Holdings Ltd. | | | 616,000 | | | | 497,547 | |
* | | Kasen International Holdings Ltd. | | | 3,137,000 | | | | 182,095 | |
| | Keda Industrial Group Co. Ltd., Class A | | | 71,400 | | | | 152,627 | |
| | Kehua Data Co. Ltd., Class A | | | 3,600 | | | | 21,088 | |
* | | Keshun Waterproof Technologies Co. Ltd., Class A | | | 259,840 | | | | 341,227 | |
| | Kinetic Development Group Ltd. | | | 2,496,000 | | | | 181,083 | |
| | Kingboard Holdings Ltd. | | | 2,624,421 | | | | 6,478,798 | |
| | Kingboard Laminates Holdings Ltd. | | | 3,856,000 | | | | 3,080,475 | |
| | KingClean Electric Co. Ltd., Class A | | | 14,140 | | | | 63,570 | |
| | Kingsoft Corp. Ltd. | | | 3,307,600 | | | | 10,015,883 | |
* | | Ko Yo Chemical Group Ltd. | | | 808,000 | | | | 18,326 | |
| | Konfoong Materials International Co. Ltd., Class A | | | 4,105 | | | | 49,569 | |
| | Konka Group Co. Ltd., Class A | | | 409,684 | | | | 273,479 | |
| | KPC Pharmaceuticals, Inc., Class A | | | 259,500 | | | | 559,030 | |
| | Kunlun Energy Co. Ltd. | | | 12,020,000 | | | | 7,183,987 | |
| | Kunlun Tech Co. Ltd., Class A | | | 250,655 | | | | 447,961 | |
THE EMERGING MARKETS SMALL CAP SERIES
CONTINUED
| | | | | | | | | | |
| | | | | Shares | | | Value» | |
CHINA — (Continued) | | | | | | | | |
| | Kunming Yunnei Power Co. Ltd., Class A | | | 333,300 | | | $ | 121,320 | |
* | | Kunshan Kersen Science & Technology Co. Ltd., Class A | | | 167,800 | | | | 161,253 | |
* | | Kunwu Jiuding Investment Holdings Co. Ltd., Class A | | | 78,245 | | | | 154,460 | |
| | KWG Group Holdings Ltd. | | | 4,971,450 | | | | 481,099 | |
| | KWG Living Group Holdings Ltd. | | | 3,815,225 | | | | 359,300 | |
* | | Lakala Payment Co. Ltd., Class A | | | 162,100 | | | | 326,086 | |
| | Lanzhou Lishang Guochao Industrial Group Co. Ltd., Class A | | | 310,200 | | | | 270,708 | |
| | Lao Feng Xiang Co. Ltd., Class A | | | 38,400 | | | | 202,254 | |
| | Laobaixing Pharmacy Chain JSC, Class A | | | 43,031 | | | | 207,425 | |
* | | Launch Tech Co. Ltd., Class H | | | 20,000 | | | | 5,931 | |
| | Lee & Man Chemical Co. Ltd. | | | 920,785 | | | | 583,897 | |
| | Lee & Man Paper Manufacturing Ltd. | | | 5,074,000 | | | | 1,538,286 | |
| | Lee’s Pharmaceutical Holdings Ltd. | | | 1,146,000 | | | | 201,591 | |
W | | Legend Holdings Corp., Class H | | | 1,703,100 | | | | 1,431,563 | |
* | | Leo Group Co. Ltd., Class A | | | 1,533,542 | | | | 360,496 | |
* | | LexinFintech Holdings Ltd., ADR | | | 397,731 | | | | 540,914 | |
| | Leyard Optoelectronic Co. Ltd., Class A | | | 582,800 | | | | 450,653 | |
| | Liao Ning Oxiranchem, Inc., Class A | | | 97,100 | | | | 106,944 | |
| | Liaoning Port Co. Ltd., Class H | | | 650,000 | | | | 48,856 | |
| | Lier Chemical Co. Ltd., Class A | | | 168,180 | | | | 420,046 | |
* | | Lifestyle China Group Ltd. | | | 1,804,000 | | | | 128,759 | |
* | | Lifetech Scientific Corp. | | | 15,084,000 | | | | 4,733,415 | |
* | | LingNan Eco&Culture-Tourism Co. Ltd., Class A | | | 408,100 | | | | 144,128 | |
| | Lingyuan Iron & Steel Co. Ltd., Class A | | | 490,702 | | | | 138,271 | |
* †† | | Link Motion, Inc., Sponsored ADR | | | 690,534 | | | | 0 | |
| | Liuzhou Iron & Steel Co. Ltd., Class A | | | 559,680 | | | | 259,901 | |
# | | Livzon Pharmaceutical Group, Inc., Class H | | | 669,103 | | | | 1,751,350 | |
| | LK Technology Holdings Ltd. | | | 1,266,500 | | | | 1,146,582 | |
| | Logan Group Co. Ltd. | | | 507,000 | | | | 20,582 | |
| | Loncin Motor Co. Ltd., Class A | | | 724,300 | | | | 513,909 | |
| | Long Well International Holdings Ltd. | | | 15,232,000 | | | | 42,884 | |
| | Long Yuan Construction Group Co. Ltd., Class A | | | 398,400 | | | | 295,460 | |
| | Longhua Technology Group Luoyang Co. Ltd., Class A | | | 171,400 | | | | 162,854 | |
| | Lonking Holdings Ltd. | | | 9,491,000 | | | | 1,305,747 | |
| | Luenmei Quantum Co. Ltd., Class A | | | 273,312 | | | | 233,529 | |
| | Luolai Lifestyle Technology Co. Ltd., Class A | | | 144,040 | | | | 185,814 | |
* | | Luoniushan Co. Ltd., Class A | | | 181,128 | | | | 156,656 | |
| | Luoxin Pharmaceuticals Group Stock Co. Ltd., Class A | | | 247,500 | | | | 259,740 | |
# * | | Luoyang Glass Co. Ltd., Class H | | | 784,000 | | | | 707,211 | |
| | Lushang Health Industry Development Co. Ltd., Class A | | | 227,000 | | | | 202,978 | |
* W | | Luye Pharma Group Ltd. | | | 6,966,500 | | | | 1,693,515 | |
# * | | LVGEM China Real Estate Investment Co. Ltd. | | | 1,712,000 | | | | 163,630 | |
| | Maanshan Iron & Steel Co. Ltd., Class H | | | 4,056,048 | | | | 650,715 | |
| | Maccura Biotechnology Co. Ltd., Class A | | | 132,661 | | | | 354,641 | |
* W | | Maoyan Entertainment | | | 1,525,600 | | | | 889,724 | |
* | | Maoye International Holdings Ltd. | | | 3,854,000 | | | | 99,180 | |
* | | Markor International Home Furnishings Co. Ltd., Class A | | | 520,780 | | | | 184,289 | |
| | Mayinglong Pharmaceutical Group Co. Ltd., Class A | | | 136,525 | | | | 428,356 | |
#*W | | Meitu, Inc. | | | 8,058,500 | | | | 697,777 | |
| | M-Grass Ecology & Environment Group Co. Ltd., Class A | | | 39,000 | | | | 16,777 | |
W | | Midea Real Estate Holding Ltd. | | | 217,600 | | | | 152,052 | |
| | Min Xin Holdings Ltd. | | | 730,000 | | | | 280,955 | |
# | | Ming Yuan Cloud Group Holdings Ltd. | | | 1,542,000 | | | | 710,216 | |
* | | Mingfa Group International Co. Ltd. | | | 4,181,000 | | | | 209,818 | |
| | Minmetals Land Ltd. | | | 8,218,000 | | | | 465,422 | |
W | | Minsheng Education Group Co. Ltd. | | | 780,000 | | | | 42,690 | |
| | Minth Group Ltd. | | | 2,963,000 | | | | 5,842,632 | |
| | MLS Co. Ltd., Class A | | | 322,200 | | | | 368,686 | |
* | | MMG Ltd. | | | 10,862,999 | | | | 2,142,041 | |
THE EMERGING MARKETS SMALL CAP SERIES
CONTINUED
| | | | | | | | | | |
| | | | | Shares | | | Value» | |
CHINA — (Continued) | | | | | | | | |
| | Monalisa Group Co. Ltd., Class A | | | 93,400 | | | $ | 159,642 | |
* | | Montnets Cloud Technology Group Co. Ltd., Class A | | | 73,670 | | | | 113,975 | |
| | MYS Group Co. Ltd., Class A | | | 215,887 | | | | 102,204 | |
* †† | | Nan Hai Corp. Ltd. | | | 24,100,000 | | | | 80,746 | |
| | NanJi E-Commerce Co. Ltd., Class A | | | 534,600 | | | | 326,951 | |
| | Nanjing Chervon Auto Precision Technology Co. Ltd., Class A | | | 20,700 | | | | 64,417 | |
| | Nanjing Hanrui Cobalt Co. Ltd., Class A | | | 36,500 | | | | 200,638 | |
* | | Nanjing Sample Technology Co. Ltd., Class H | | | 111,500 | | | | 41,065 | |
| | Nanjing Xinjiekou Department Store Co. Ltd., Class A | | | 224,500 | | | | 256,959 | |
| | Nanjing Yunhai Special Metals Co. Ltd., Class A | | | 164,900 | | | | 427,796 | |
| | Natural Food International Holding Ltd., Class H | | | 314,000 | | | | 15,201 | |
| | NetDragon Websoft Holdings Ltd. | | | 973,500 | | | | 1,634,634 | |
| | Netjoy Holdings Ltd. | | | 120,000 | | | | 13,757 | |
* W | | New Century Healthcare Holding Co. Ltd. | | | 35,000 | | | | 3,843 | |
| | New Hope Dairy Co. Ltd., Class A | | | 23,600 | | | | 33,332 | |
* | | New World Department Store China Ltd. | | | 1,787,462 | | | | 127,560 | |
* | | Newborn Town, Inc. | | | 264,000 | | | | 40,214 | |
| | Newland Digital Technology Co. Ltd., Class A | | | 251,800 | | | | 475,622 | |
# | | Nexteer Automotive Group Ltd. | | | 3,410,000 | | | | 1,845,638 | |
| | Nine Dragons Paper Holdings Ltd. | | | 6,261,000 | | | | 3,710,687 | |
| | Ningbo BaoSi Energy Equipment Co. Ltd., Class A | | | 111,814 | | | | 94,479 | |
| | Ningbo Haitian Precision Machinery Co. Ltd., Class A | | | 55,500 | | | | 214,914 | |
| | Ningbo Huaxiang Electronic Co. Ltd., Class A | | | 181,338 | | | | 352,851 | |
* | | Ningbo Jifeng Auto Parts Co. Ltd., Class A | | | 48,600 | | | | 77,069 | |
| | Ningbo Sanxing Medical Electric Co. Ltd., Class A | | | 23,400 | | | | 44,172 | |
| | Ningbo Yunsheng Co. Ltd., Class A | | | 340,100 | | | | 463,470 | |
| | Ningxia Jiaze New Energy Co. Ltd., Class A | | | 574,100 | | | | 303,128 | |
* | | Niu Technologies, Sponsored ADR | | | 109,628 | | | | 287,225 | |
# * | | Noah Holdings Ltd., Sponsored ADR | | | 114,353 | | | | 1,500,311 | |
| | Norinco International Cooperation Ltd., Class A | | | 350,186 | | | | 375,630 | |
| | North Huajin Chemical Industries Co. Ltd., Class A | | | 342,500 | | | | 315,150 | |
| | Northeast Pharmaceutical Group Co. Ltd., Class A | | | 218,903 | | | | 155,963 | |
| | Northeast Securities Co. Ltd., Class A | | | 437,410 | | | | 380,883 | |
| | Northking Information Technology Co. Ltd., Class A | | | 99,966 | | | | 468,033 | |
| | NSFOCUS Technologies Group Co. Ltd., Class A | | | 196,548 | | | | 304,398 | |
# * | | NVC International Holdings Ltd. | | | 1,770,000 | | | | 21,707 | |
| | Ocean’s King Lighting Science & Technology Co. Ltd., Class A | | | 102,380 | | | | 116,581 | |
* | | Oceanwide Holdings Co. Ltd., Class A | | | 1,587,777 | | | | 245,989 | |
* W | | Ocumension Therapeutics | | | 96,500 | | | | 88,945 | |
| | Offshore Oil Engineering Co. Ltd., Class A | | | 251,067 | | | | 161,651 | |
| | Olympic Circuit Technology Co. Ltd., Class C | | | 123,835 | | | | 284,422 | |
| | Opple Lighting Co. Ltd., Class A | | | 104,330 | | | | 224,944 | |
| | ORG Technology Co. Ltd., Class A | | | 660,320 | | | | 429,395 | |
* | | Orient Group, Inc., Class A | | | 758,900 | | | | 260,456 | |
| | Oriental Energy Co. Ltd., Class A | | | 345,700 | | | | 389,674 | |
* | | Ourpalm Co. Ltd., Class A | | | 789,500 | | | | 316,448 | |
* | | Overseas Chinese Town Asia Holdings Ltd. | | | 950,183 | | | | 96,801 | |
| | Pacific Online Ltd. | | | 1,798,365 | | | | 183,206 | |
* | | Pacific Securities Co. Ltd., Class A | | | 1,476,371 | | | | 512,836 | |
| | Pacific Shuanglin Bio-pharmacy Co. Ltd., Class A | | | 150,858 | | | | 375,792 | |
| | PAX Global Technology Ltd. | | | 2,990,000 | | | | 2,349,896 | |
| | PCI Technology Group Co. Ltd., Class A | | | 396,540 | | | | 308,908 | |
* W | | Peijia Medical Ltd. | | | 830,000 | | | | 687,586 | |
| | People.cn Co. Ltd., Class A | | | 103,000 | | | | 134,757 | |
# | | Perennial Energy Holdings Ltd. | | | 1,325,000 | | | | 107,947 | |
| | PharmaBlock Sciences Nanjing, Inc., Class A | | | 17,200 | | | | 207,636 | |
| | PhiChem Corp., Class A | | | 161,226 | | | | 376,746 | |
* | | Phoenix Media Investment Holdings Ltd. | | | 6,320,000 | | | | 233,460 | |
#*W | | Ping An Healthcare & Technology Co. Ltd. | | | 1,341,700 | | | | 2,481,629 | |
THE EMERGING MARKETS SMALL CAP SERIES
CONTINUED
| | | | | | | | | | |
| | | | | Shares | | | Value» | |
CHINA — (Continued) | | | | | | | | |
* | | PNC Process Systems Co. Ltd., Class A | | | 51,500 | | | $ | 276,835 | |
* | | Polaris Bay Group Co. Ltd., Class A | | | 155,400 | | | | 145,928 | |
| | Poly Property Group Co. Ltd. | | | 9,430,500 | | | | 1,477,688 | |
# | | Poly Property Services Co. Ltd., Class H | | | 493,200 | | | | 1,824,303 | |
| | Pou Sheng International Holdings Ltd. | | | 10,648,806 | | | | 536,382 | |
| | Powerlong Real Estate Holdings Ltd. | | | 80,000 | | | | 6,529 | |
# | | Prinx Chengshan Holding Ltd. | | | 149,000 | | | | 129,053 | |
* | | Pujiang International Group Ltd. | | | 288,000 | | | | 78,849 | |
# * | | PW Medtech Group Ltd. | | | 3,468,000 | | | | 290,333 | |
# * | | Q Technology Group Co. Ltd. | | | 1,718,000 | | | | 678,325 | |
| | Qianhe Condiment & Food Co. Ltd., Class A | | | 229,196 | | | | 491,197 | |
| | Qingdao East Steel Tower Stock Co. Ltd., Class A | | | 182,800 | | | | 200,826 | |
| | Qingdao Eastsoft Communication Technology Co. Ltd., Class A | | | 158,122 | | | | 292,709 | |
| | Qingdao Gon Technology Co. Ltd., Class A | | | 87,300 | | | | 308,356 | |
| | Qingdao Hanhe Cable Co. Ltd., Class A | | | 820,300 | | | | 557,156 | |
| | Qingdao Hiron Commercial Cold Chain Co. Ltd., Class A | | | 46,153 | | | | 173,385 | |
# W | | Qingdao Port International Co. Ltd., Class H | | | 461,000 | | | | 193,300 | |
| | Qingdao Rural Commercial Bank Corp., Class A | | | 832,400 | | | | 316,071 | |
| | Qingdao Topscomm Communication, Inc., Class A | | | 182,700 | | | | 224,124 | |
| | Qingling Motors Co. Ltd., Class H | | | 3,834,000 | | | | 430,521 | |
| | Qinhuangdao Port Co. Ltd., Class H | | | 2,885,500 | | | | 356,568 | |
* | | Qudian, Inc., Sponsored ADR | | | 96,525 | | | | 80,116 | |
# | | Radiance Holdings Group Co. Ltd. | | | 90,000 | | | | 37,179 | |
| | Rainbow Digital Commercial Co. Ltd., Class A | | | 356,250 | | | | 244,125 | |
* | | Raisecom Technology Co. Ltd., Class A | | | 133,429 | | | | 129,649 | |
* | | Rastar Group, Class A | | | 295,400 | | | | 115,506 | |
| | Realcan Pharmaceutical Group Co. Ltd., Class A | | | 513,200 | | | | 294,235 | |
W | | Red Star Macalline Group Corp. Ltd., Class H | | | 1,138,720 | | | | 287,781 | |
#*W | | Redco Properties Group Ltd. | | | 5,560,000 | | | | 1,182,653 | |
* | | Redsun Properties Group Ltd. | | | 1,312,000 | | | | 75,469 | |
* W | | Remegen Co. Ltd., Class H | | | 230,000 | | | | 1,447,381 | |
| | Renhe Pharmacy Co. Ltd., Class A | | | 409,700 | | | | 355,087 | |
| | REXLot Holdings Ltd. | | | 98,652,252 | | | | 49,014 | |
| | Rianlon Corp., Class A | | | 37,450 | | | | 316,399 | |
| | Richinfo Technology Co. Ltd., Class A | | | 101,800 | | | | 267,723 | |
* | | RiseSun Real Estate Development Co. Ltd., Class A | | | 982,152 | | | | 269,883 | |
# | | Road King Infrastructure Ltd. | | | 1,160,000 | | | | 331,120 | |
| | Rongan Property Co. Ltd., Class A | | | 916,500 | | | | 328,081 | |
| | Ruida Futures Co. Ltd., Class A | | | 60,000 | | | | 110,999 | |
| | Runjian Co. Ltd., Class A | | | 50,400 | | | | 256,745 | |
| | Sai Micro Electronics, Inc., Class A | | | 70,100 | | | | 166,633 | |
* | | SanFeng Intelligent Equipment Group Co. Ltd., Class A | | | 321,008 | | | | 156,818 | |
| | Sanquan Food Co. Ltd., Class A | | | 186,300 | | | | 359,226 | |
| | Sansteel Minguang Co. Ltd. Fujian, Class A | | | 582,194 | | | | 335,473 | |
| | Sansure Biotech, Inc., Class A | | | 76,320 | | | | 266,812 | |
| | Sanxiang Impression Co. Ltd., Class A | | | 36,100 | | | | 15,816 | |
| | Sany Heavy Equipment International Holdings Co. Ltd. | | | 4,353,000 | | | | 3,569,669 | |
* | | Saurer Intelligent Technology Co. Ltd., Class A | | | 417,200 | | | | 165,827 | |
* | | Seazen Group Ltd. | | | 7,440,571 | | | | 1,195,202 | |
# | | S-Enjoy Service Group Co. Ltd. | | | 922,000 | | | | 422,596 | |
| | Shaan Xi Provincial Natural Gas Co. Ltd., Class A | | | 446,990 | | | | 463,422 | |
| | Shaanxi Construction Machinery Co. Ltd., Class A | | | 134,660 | | | | 83,325 | |
| | Shandong Bohui Paper Industrial Co. Ltd., Class A | | | 222,303 | | | | 198,956 | |
* | | Shandong Chenming Paper Holdings Ltd., Class H | | | 1,649,750 | | | | 466,607 | |
| | Shandong Dawn Polymer Co. Ltd., Class A | | | 71,300 | | | | 170,149 | |
| | Shandong Dongyue Organosilicon Material Co. Ltd., Class A | | | 19,000 | | | | 32,388 | |
| | Shandong Head Group Co. Ltd., Class A | | | 68,160 | | | | 223,798 | |
| | Shandong Himile Mechanical Science & Technology Co. Ltd., Class A | | | 4,300 | | | | 14,933 | |
# * | | Shandong Hi-Speed New Energy Group Ltd. | | | 59,768,570 | | | | 403,597 | |
THE EMERGING MARKETS SMALL CAP SERIES
CONTINUED
| | | | | | | | | | |
| | | | | Shares | | | Value» | |
CHINA — (Continued) | | | | | | | | |
| | Shandong Humon Smelting Co. Ltd., Class A | | | 230,600 | | | $ | 293,087 | |
| | Shandong Jincheng Pharmaceutical Group Co. Ltd., Class A | | | 40,300 | | | | 132,083 | |
* | | Shandong Minhe Animal Husbandry Co. Ltd., Class A | | | 68,500 | | | | 150,265 | |
* | | Shandong Molong Petroleum Machinery Co. Ltd., Class H | | | 752,400 | | | | 239,736 | |
| | Shandong New Beiyang Information Technology Co. Ltd., Class A | | | 207,300 | | | | 218,316 | |
| | Shandong Pharmaceutical Glass Co. Ltd., Class A | | | 45,600 | | | | 172,516 | |
| | Shandong Publishing & Media Co. Ltd., Class A | | | 303,000 | | | | 246,657 | |
| | Shandong Weigao Group Medical Polymer Co. Ltd., Class H | | | 6,050,400 | | | | 8,336,151 | |
# | | Shandong Xinhua Pharmaceutical Co. Ltd., Class H | | | 582,400 | | | | 280,817 | |
| | Shanghai 2345 Network Holding Group Co. Ltd., Class A | | | 1,366,956 | | | | 388,041 | |
| | Shanghai AJ Group Co. Ltd., Class A | | | 426,800 | | | | 304,394 | |
| | Shanghai AtHub Co. Ltd., Class A | | | 77,900 | | | | 278,261 | |
| | Shanghai Baolong Automotive Corp., Class A | | | 24,400 | | | | 138,465 | |
| | Shanghai Belling Co. Ltd., Class A | | | 121,146 | | | | 301,716 | |
| | Shanghai Bright Power Semiconductor Co. Ltd., Class A | | | 13,939 | | | | 193,211 | |
| | Shanghai Daimay Automotive Interior Co. Ltd., Class A | | | 94,439 | | | | 203,490 | |
| | Shanghai Environment Group Co. Ltd., Class A | | | 184,073 | | | | 221,521 | |
| | Shanghai Fengyuzhu Culture & Technology Co. Ltd., Class A | | | 205,282 | | | | 287,508 | |
| | Shanghai Fudan Microelectronics Group Co. Ltd., Class H | | | 787,000 | | | | 3,404,022 | |
# | | Shanghai Fudan-Zhangjiang Bio-Pharmaceutical Co. Ltd., Class H | | | 1,155,000 | | | | 379,658 | |
| | Shanghai Fullhan Microelectronics Co., Ltd., Class A | | | 20,800 | | | | 147,823 | |
| | Shanghai Ganglian E-Commerce Holdings Co. Ltd., Class A | | | 40,600 | | | | 108,986 | |
| | Shanghai Hanbell Precise Machinery Co. Ltd., Class A | | | 83,000 | | | | 303,101 | |
# W | | Shanghai Haohai Biological Technology Co. Ltd., Class H | | | 145,900 | | | | 489,130 | |
| | Shanghai Industrial Development Co. Ltd., Class A | | | 447,650 | | | | 180,172 | |
| | Shanghai Industrial Holdings Ltd. | | | 1,829,000 | | | | 1,784,771 | |
| | Shanghai Industrial Urban Development Group Ltd. | | | 11,071,000 | | | | 627,111 | |
| | Shanghai Jinqiao Export Processing Zone Development Co. Ltd., Class A | | | 179,421 | | | | 249,004 | |
| | Shanghai Kindly Medical Instruments Co. Ltd., Class H | | | 82,800 | | | | 283,206 | |
| | Shanghai Liangxin Electrical Co. Ltd., Class A | | | 162,565 | | | | 250,969 | |
| | Shanghai Maling Aquarius Co. Ltd., Class A | | | 310,225 | | | | 285,687 | |
| | Shanghai Mechanical & Electrical Industry Co. Ltd., Class A | | | 134,034 | | | | 209,830 | |
| | Shanghai MicroPort Endovascular MedTech Group Co. Ltd., Class A | | | 15,743 | | | | 482,322 | |
| | Shanghai Moons’ Electric Co. Ltd., Class A | | | 76,760 | | | | 290,813 | |
| | Shanghai Pharmaceuticals Holding Co. Ltd., Class H | | | 593,300 | | | | 804,076 | |
| | Shanghai Pudong Construction Co. Ltd., Class A | | | 391,992 | | | | 359,724 | |
| | Shanghai QiFan Cable Co. Ltd., Class A | | | 42,500 | | | | 163,656 | |
| | Shanghai Rongtai Health Technology Corp. Ltd., Class A | | | 19,300 | | | | 50,012 | |
* | | Shanghai Runda Medical Technology Co. Ltd., Class A | | | 32,500 | | | | 48,393 | |
| | Shanghai Shyndec Pharmaceutical Co. Ltd., Class A | | | 332,033 | | | | 410,272 | |
| | Shanghai Sinyang Semiconductor Materials Co. Ltd., Class A | | | 41,900 | | | | 176,300 | |
| | Shanghai Tongji Science & Technology Industrial Co. Ltd., Class A | | | 127,300 | | | | 150,063 | |
| | Shanghai Tunnel Engineering Co. Ltd., Class A | | | 81,350 | | | | 58,072 | |
| | Shanghai Waigaoqiao Free Trade Zone Group Co. Ltd., Class A | | | 184,300 | | | | 290,337 | |
| | Shanghai Weaver Network Co. Ltd., Class A | | | 39,329 | | | | 271,231 | |
| | Shanghai Yaoji Technology Co. Ltd., Class A | | | 71,600 | | | | 130,470 | |
| | Shanghai Yongguan Adhesive Products Corp. Ltd., Class A | | | 26,000 | | | | 79,554 | |
| | Shanghai Zijiang Enterprise Group Co. Ltd., Class A | | | 238,400 | | | | 163,277 | |
| | Shanxi Blue Flame Holding Co. Ltd., Class A | | | 189,900 | | | | 218,880 | |
| | Shanxi Coking Co. Ltd., Class A | | | 437,317 | | | | 321,733 | |
| | Shanxi Lanhua Sci-Tech Venture Co. Ltd., Class A | | | 308,400 | | | | 586,301 | |
| | Shanying International Holding Co. Ltd., Class A | | | 1,207,015 | | | | 384,150 | |
* | | Shengda Resources Co. Ltd., Class A | | | 221,907 | | | | 293,277 | |
| | Shenguan Holdings Group Ltd. | | | 1,628,000 | | | | 53,931 | |
| | Shengyuan Environmental Protection Co. Ltd., Class A | | | 62,200 | | | | 142,780 | |
| | Shenyang Xingqi Pharmaceutical Co. Ltd., Class A | | | 21,100 | | | | 302,788 | |
| | Shenzhen Agricultural Products Group Co. Ltd., Class A | | | 473,032 | | | | 332,308 | |
| | Shenzhen Airport Co. Ltd., Class A | | | 609,400 | | | | 527,594 | |
| | Shenzhen Aisidi Co. Ltd., Class A | | | 254,900 | | | | 349,074 | |
THE EMERGING MARKETS SMALL CAP SERIES
CONTINUED
| | | | | | | | | | |
| | | | | Shares | | | Value» | |
CHINA — (Continued) | | | | | | | | |
* | | Shenzhen Bauing Construction Holding Group Co. Ltd., Class A | | | 272,700 | | | $ | 169,733 | |
* | | Shenzhen Center Power Tech Co. Ltd., Class A | | | 76,600 | | | | 196,545 | |
| | Shenzhen Cereals Holdings Co. Ltd., Class A | | | 51,400 | | | | 48,523 | |
| | Shenzhen Changhong Technology Co. Ltd., Class A | | | 139,800 | | | | 364,654 | |
| | Shenzhen Colibri Technologies Co. Ltd., Class A | | | 17,400 | | | | 40,123 | |
* | | Shenzhen Das Intellitech Co. Ltd., Class A | | | 657,611 | | | | 293,216 | |
| | Shenzhen Desay Battery Technology Co., Class A | | | 92,288 | | | | 629,809 | |
| | Shenzhen Envicool Technology Co. Ltd., Class A | | | 69,860 | | | | 325,647 | |
* | | Shenzhen Everwin Precision Technology Co. Ltd., Class A | | | 307,518 | | | | 497,434 | |
| | Shenzhen Expressway Corp. Ltd., Class H | | | 2,710,400 | | | | 1,945,779 | |
| | Shenzhen Fine Made Electronics Group Co. Ltd., Class A | | | 42,068 | | | | 234,875 | |
| | Shenzhen Fortune Trend Technology Co. Ltd., Class A | | | 20,787 | | | | 256,865 | |
| | Shenzhen Gongjin Electronics Co. Ltd., Class A | | | 192,000 | | | | 234,768 | |
| | Shenzhen H&T Intelligent Control Co. Ltd., Class A | | | 97,100 | | | | 196,772 | |
# W | | Shenzhen Hepalink Pharmaceutical Group Co. Ltd., Class H | | | 522,000 | | | | 327,124 | |
| | Shenzhen Heungkong Holding Co. Ltd., Class A | | | 1,466,160 | | | | 337,229 | |
| | Shenzhen International Holdings Ltd. | | | 5,434,792 | | | | 3,655,772 | |
| | Shenzhen Investment Holdings Bay Area Development Co. Ltd. | | | 33,500 | | | | 6,195 | |
| | Shenzhen Investment Ltd. | | | 13,309,720 | | | | 1,813,448 | |
| | Shenzhen Jieshun Science & Technology Industry Co. Ltd., Class A | | | 157,634 | | | | 167,276 | |
| | Shenzhen Jinjia Group Co. Ltd., Class A | | | 309,800 | | | | 305,541 | |
| | Shenzhen Jufei Optoelectronics Co. Ltd., Class A | | | 179,300 | | | | 102,992 | |
| | Shenzhen Kingdom Sci-Tech Co. Ltd., Class A | | | 206,800 | | | | 339,114 | |
| | Shenzhen Laibao Hi-tech Co. Ltd., Class A | | | 63,500 | | | | 67,587 | |
| | Shenzhen Leaguer Co. Ltd., Class A | | | 119,000 | | | | 126,930 | |
| | Shenzhen Megmeet Electrical Co. Ltd., Class A | | | 132,228 | | | | 460,100 | |
| | Shenzhen Microgate Technology Co. Ltd., Class A | | | 188,700 | | | | 208,360 | |
* | | Shenzhen MTC Co. Ltd., Class A | | | 786,800 | | | | 372,701 | |
* | | Shenzhen Neptunus Bioengineering Co. Ltd., Class A | | | 567,300 | | | | 256,020 | |
* | | Shenzhen New Nanshan Holding Group Co. Ltd., Class A | | | 264,600 | | | | 109,938 | |
| | Shenzhen Noposion Agrochemicals Co. Ltd., Class A | | | 186,200 | | | | 132,255 | |
| | Shenzhen Properties & Resources Development Group Ltd., Class A | | | 76,600 | | | | 96,820 | |
* | | Shenzhen SDG Information Co. Ltd., Class A | | | 42,320 | | | | 36,865 | |
| | Shenzhen Sunline Tech Co. Ltd., Class A | | | 229,100 | | | | 418,575 | |
| | Shenzhen Sunnypol Optoelectronics Co. Ltd., Class A | | | 43,608 | | | | 213,207 | |
| | Shenzhen Suntak Circuit Technology Co. Ltd., Class A | | | 299,700 | | | | 437,366 | |
| | Shenzhen Sunway Communication Co. Ltd., Class A | | | 205,882 | | | | 473,751 | |
| | Shenzhen Tagen Group Co. Ltd., Class A | | | 317,710 | | | | 223,871 | |
| | Shenzhen Weiguang Biological Products Co. Ltd., Class A | | | 5,600 | | | | 20,058 | |
| | Shenzhen Woer Heat-Shrinkable Material Co. Ltd., Class A | | | 256,400 | | | | 225,496 | |
* | | Shenzhen World Union Group, Inc., Class A | | | 613,800 | | | | 210,697 | |
| | Shenzhen Yan Tian Port Holding Co. Ltd., Class A | | | 342,768 | | | | 214,343 | |
| | Shenzhen Yinghe Technology Co. Ltd., Class A | | | 14,100 | | | | 38,512 | |
| | Shenzhen Ysstech Info-tech Co. Ltd., Class A | | | 238,000 | | | | 276,061 | |
| | Shenzhen Zhenye Group Co. Ltd., Class A | | | 410,400 | | | | 206,258 | |
| | Shenzhen Zhongjin Lingnan Nonfemet Co. Ltd., Class A | | | 1,072,800 | | | | 566,623 | |
* | | Shijiazhuang Changshan BeiMing Technology Co. Ltd., Class A | | | 362,300 | | | | 311,413 | |
†† | | Shimao Group Holdings Ltd. | | | 1,317,500 | | | | 557,235 | |
| | Shinva Medical Instrument Co. Ltd., Class A | | | 138,680 | | | | 522,433 | |
| | Shoucheng Holdings Ltd. | | | 9,427,600 | | | | 1,715,937 | |
| | Shougang Fushan Resources Group Ltd. | | | 8,357,128 | | | | 2,263,914 | |
* | | Shouhang High-Tech Energy Co. Ltd., Class A | | | 719,800 | | | | 353,565 | |
| | Shui On Land Ltd. | | | 13,955,143 | | | | 1,279,834 | |
| | Sichuan Expressway Co. Ltd., Class H | | | 4,042,000 | | | | 834,573 | |
| | Sichuan Furong Technology Co. Ltd., Class A | | | 55,070 | | | | 113,505 | |
* | | Sichuan Haite High-tech Co. Ltd., Class A | | | 124,976 | | | | 153,202 | |
| | Sichuan Jiuyuan Yinhai Software Co. Ltd., Class A | | | 133,900 | | | | 319,280 | |
* | | Sichuan Lutianhua Co. Ltd., Class A | | | 246,800 | | | | 153,103 | |
| | Sichuan Shuangma Cement Co. Ltd., Class A | | | 176,637 | | | | 488,669 | |
THE EMERGING MARKETS SMALL CAP SERIES
CONTINUED
| | | | | | | | | | |
| | | | | Shares | | | Value» | |
CHINA — (Continued) | | | | | | | | |
| | Sichuan Tianyi Comheart Telecom Co. Ltd., Class A | | | 90,600 | | | $ | 208,401 | |
# | | Sihuan Pharmaceutical Holdings Group Ltd. | | | 14,226,000 | | | | 1,212,720 | |
* | | Silver Grant International Holdings Group Ltd. | | | 6,192,000 | | | | 307,251 | |
W | | Simcere Pharmaceutical Group Ltd. | | | 1,647,000 | | | | 1,827,749 | |
# * | | Sinco Pharmaceuticals Holdings Ltd. | | | 1,976,000 | | | | 61,187 | |
* †† | | Sinic Holdings Group Co. Ltd., Class H | | | 235,000 | | | | 2,808 | |
| | Sino Wealth Electronic Ltd., Class A | | | 69,405 | | | | 297,093 | |
| | Sinocare, Inc., Class A | | | 109,600 | | | | 564,601 | |
| | Sinochem International Corp., Class A | | | 391,600 | | | | 371,374 | |
| | Sinofert Holdings Ltd. | | | 9,033,327 | | | | 897,072 | |
* †† | | Sino-I Technology Ltd. | | | 3,950,000 | | | | 7,548 | |
* | | Sinolink Worldwide Holdings Ltd. | | | 15,827,440 | | | | 333,488 | |
| | Sinoma International Engineering Co., Class A | | | 21,100 | | | | 24,760 | |
| | Sinomach Automobile Co. Ltd., Class A | | | 342,600 | | | | 355,621 | |
| | Sino-Ocean Group Holding Ltd. | | | 12,465,000 | | | | 826,584 | |
| | Sinopec Engineering Group Co. Ltd., Class H | | | 6,117,500 | | | | 2,187,521 | |
| | Sinopec Kantons Holdings Ltd. | | | 4,414,000 | | | | 1,192,043 | |
* | | Sinopec Oilfield Service Corp., Class H | | | 8,470,000 | | | | 507,036 | |
| | Sinopec Shanghai Petrochemical Co. Ltd., Class H | | | 12,030,000 | | | | 1,578,081 | |
| | Sinopharm Group Co. Ltd., Class H | | | 3,677,200 | | | | 6,976,059 | |
| | Sino-Platinum Metals Co. Ltd., Class A | | | 113,142 | | | | 232,643 | |
| | Sinoseal Holding Co. Ltd., Class A | | | 39,200 | | | | 226,785 | |
| | Sinosoft Co. Ltd., Class A | | | 117,121 | | | | 497,504 | |
* | | Sinosoft Technology Group Ltd. | | | 2,214,599 | | | | 91,802 | |
| | Sinosteel Engineering & Technology Co. Ltd., Class A | | | 304,000 | | | | 218,357 | |
| | Sinotrans Ltd., Class H | | | 8,418,000 | | | | 2,049,808 | |
# | | Sinotruk Hong Kong Ltd. | | | 2,630,500 | | | | 2,345,077 | |
| | Skyworth Group Ltd. | | | 6,138,266 | | | | 2,251,578 | |
†† | | SMI Holdings Group Ltd. | | | 6,033,814 | | | | 72,102 | |
| | Sobute New Materials Co. Ltd. | | | 59,005 | | | | 118,553 | |
* | | SOHO China Ltd. | | | 7,927,500 | | | | 1,162,096 | |
* | | Sohu.com Ltd., ADR | | | 28,593 | | | | 404,877 | |
* | | Solargiga Energy Holdings Ltd. | | | 6,367,000 | | | | 188,957 | |
| | Sonoscape Medical Corp., Class A | | | 27,100 | | | | 212,210 | |
# * | | South Manganese Investment Ltd. | | | 2,312,000 | | | | 139,962 | |
* | | So-Young International, Inc., ADR | | | 83,482 | | | | 42,576 | |
| | SSY Group Ltd. | | | 5,857,152 | | | | 2,425,574 | |
* | | Strawbear Entertainment Group | | | 15,000 | | | | 2,311 | |
| | Sumavision Technologies Co. Ltd., Class A | | | 346,900 | | | | 235,780 | |
| | Sun Art Retail Group Ltd. | | | 7,009,000 | | | | 1,115,119 | |
* | | Sun King Technology Group Ltd. | | | 4,158,000 | | | | 735,506 | |
| | Sun-Create Electronics Co. Ltd., Class A | | | 65,390 | | | | 261,837 | |
| | Sunflower Pharmaceutical Group Co. Ltd., Class A | | | 124,322 | | | | 393,620 | |
| | Sunfly Intelligent Technology Co. Ltd., Class A | | | 101,700 | | | | 131,700 | |
| | Suning Universal Co. Ltd., Class A | | | 486,700 | | | | 201,704 | |
* †† W | | Sunshine 100 China Holdings Ltd. | | | 635,000 | | | | 22,448 | |
* | | Sunward Intelligent Equipment Co. Ltd., Class A | | | 187,550 | | | | 157,877 | |
| | Suofeiya Home Collection Co. Ltd., Class A | | | 94,200 | | | | 180,548 | |
| | Suplet Power Co. Ltd., Class A | | | 53,691 | | | | 387,247 | |
| | Suzhou Anjie Technology Co. Ltd., Class A | | | 162,399 | | | | 287,819 | |
* | | Suzhou Gold Mantis Construction Decoration Co. Ltd., Class A | | | 575,700 | | | | 347,679 | |
| | Suzhou Good-Ark Electronics Co. Ltd., Class A | | | 181,300 | | | | 315,795 | |
| | Suzhou Secote Precision Electronic Co. Ltd., Class A | | | 47,200 | | | | 237,436 | |
| | Suzhou SLAC Precision Equipment Co. Ltd., Class A | | | 92,600 | | | | 271,571 | |
| | Suzhou TFC Optical Communication Co. Ltd., Class A | | | 137,000 | | | | 530,747 | |
# | | SY Holdings Group Ltd. | | | 712,000 | | | | 492,494 | |
| | Symphony Holdings Ltd. | | | 7,140,000 | | | | 790,914 | |
* | | SYoung Group Co. Ltd., Class A | | | 44,200 | | | | 67,888 | |
| | T&S Communications Co. Ltd., Class A | | | 66,437 | | | | 151,207 | |
THE EMERGING MARKETS SMALL CAP SERIES
CONTINUED
| | | | | | | | | | |
| | | | | Shares | | | Value» | |
CHINA — (Continued) | | | | | | | | |
| | Taiji Computer Corp. Ltd., Class A | | | 168,856 | | | $ | 625,752 | |
* | | Talkweb Information System Co. Ltd., Class A | | | 185,000 | | | | 187,821 | |
* | | Tangrenshen Group Co. Ltd., Class A | | | 249,427 | | | | 241,342 | |
| | TangShan Port Group Co. Ltd., Class A | | | 1,514,711 | | | | 521,536 | |
| | Tangshan Sanyou Chemical Industries Co. Ltd., Class A | | | 308,900 | | | | 241,289 | |
| | Tansun Technology Co. Ltd., Class A | | | 93,325 | | | | 184,581 | |
| | TCL Electronics Holdings Ltd. | | | 3,348,347 | | | | 1,279,276 | |
†† | | Tech-Pro, Inc. | | | 43,862,000 | | | | 71,523 | |
| | Telling Telecommunication Holding Co. Ltd., Class A | | | 193,500 | | | | 234,874 | |
| | Ten Pao Group Holdings Ltd. | | | 660,000 | | | | 105,209 | |
| | Tenfu Cayman Holdings Co. Ltd. | | | 306,000 | | | | 190,958 | |
| | Three Squirrels, Inc., Class A | | | 73,700 | | | | 171,004 | |
| | Three’s Co. Media Group Co. Ltd., Class A | | | 24,641 | | | | 235,327 | |
| | Tian An China Investment Co. Ltd. | | | 1,719,000 | | | | 806,008 | |
W | | Tian Ge Interactive Holdings Ltd. | | | 1,843,000 | | | | 136,659 | |
# | | Tian Lun Gas Holdings Ltd. | | | 1,185,500 | | | | 424,351 | |
* †† | | Tian Shan Development Holding Ltd. | | | 1,844,000 | | | | 347,087 | |
| | Tiande Chemical Holdings Ltd. | | | 156,000 | | | | 38,695 | |
| | Tiangong International Co. Ltd. | | | 4,308,000 | | | | 1,195,905 | |
| | Tianjin Capital Environmental Protection Group Co. Ltd., Class H | | | 1,632,000 | | | | 548,600 | |
| | Tianjin Chase Sun Pharmaceutical Co. Ltd., Class A | | | 570,000 | | | | 551,848 | |
| | Tianjin Development Holdings Ltd. | | | 2,246,000 | | | | 363,226 | |
| | Tianjin Pharmaceutical Da Re Tang Group Corp. Ltd., Class A | | | 120,400 | | | | 457,033 | |
# | | Tianjin Port Development Holdings Ltd. | | | 11,696,800 | | | | 700,704 | |
| | Tianjin Ringpu Bio-Technology Co. Ltd., Class A | | | 44,835 | | | | 123,362 | |
| | Tianjin Teda Co. Ltd., Class A | | | 244,600 | | | | 129,768 | |
# | | Tianneng Power International Ltd. | | | 2,966,048 | | | | 2,853,818 | |
* †† | | Tianyun International Holdings Ltd. | | | 1,794,000 | | | | 262,256 | |
| | Tibet Cheezheng Tibetan Medicine Co. Ltd., Class A | | | 42,700 | | | | 139,205 | |
| | Tibet Rhodiola Pharmaceutical Holding Co., Class A | | | 46,400 | | | | 236,743 | |
| | Tibet Tianlu Co. Ltd., Class A | | | 122,100 | | | | 74,702 | |
* | | Tibet Water Resources Ltd. | | | 9,150,000 | | | | 484,421 | |
| | Tomson Group Ltd. | | | 2,541,054 | | | | 440,034 | |
| | Tong Ren Tang Technologies Co. Ltd., Class H | | | 2,440,000 | | | | 1,252,112 | |
* | | Tongcheng Travel Holdings Ltd. | | | 3,327,600 | | | | 5,194,145 | |
* | | Tongdao Liepin Group | | | 502,800 | | | | 437,399 | |
| | Tonghua Dongbao Pharmaceutical Co. Ltd., Class A | | | 245,400 | | | | 297,271 | |
* | | Tonghua Golden-Horse Pharmaceutical Industry Co. Ltd., Class A | | | 170,100 | | | | 125,979 | |
| | Tongling Jingda Special Magnet Wire Co. Ltd., Class A | | | 363,380 | | | | 212,237 | |
| | Tongyu Heavy Industry Co. Ltd., Class A | | | 957,253 | | | | 332,510 | |
| | Top Spring International Holdings Ltd. | | | 1,539,500 | | | | 128,092 | |
| | Topsec Technologies Group, Inc., Class A | | | 237,127 | | | | 366,362 | |
W | | Topsports International Holdings Ltd. | | | 3,532,000 | | | | 1,780,966 | |
# | | Towngas Smart Energy Co. Ltd. | | | 4,570,818 | | | | 1,600,902 | |
* | | TPV Technology Co. Ltd., Class A | | | 1,095,200 | | | | 310,488 | |
| | Transfar Zhilian Co. Ltd., Class A | | | 369,541 | | | | 250,542 | |
| | TravelSky Technology Ltd., Class H | | | 3,352,000 | | | | 4,874,252 | |
* | | Trigiant Group Ltd. | | | 4,284,000 | | | | 190,562 | |
* †† | | Trony Solar Holdings Co. Ltd. | | | 1,757,000 | | | | 0 | |
| | TRS Information Technology Corp. Ltd., Class A | | | 170,100 | | | | 277,257 | |
| | Truking Technology Ltd., Class A | | | 68,500 | | | | 157,948 | |
| | Truly International Holdings Ltd. | | | 6,217,573 | | | | 759,886 | |
W | | Tsaker New Energy Tech Co. Ltd. | | | 1,314,500 | | | | 175,830 | |
* | | Tunghsu Optoelectronic Technology Co. Ltd., Class A | | | 970,900 | | | | 246,551 | |
* | | Tuniu Corp., Sponsored ADR | | | 148,809 | | | | 102,678 | |
| | Unilumin Group Co. Ltd., Class A | | | 335,700 | | | | 278,263 | |
| | Uni-President China Holdings Ltd. | | | 5,102,000 | | | | 3,767,925 | |
| | United Energy Group Ltd. | | | 29,828,900 | | | | 2,885,769 | |
| | United Strength Power Holdings Ltd. | | | 188,000 | | | | 247,847 | |
THE EMERGING MARKETS SMALL CAP SERIES
CONTINUED
| | | | | | | | | | |
| | | | | Shares | | | Value» | |
CHINA — (Continued) | | | | | | | | |
†† | | Untrade.CTEG | | | 18,320,000 | | | $ | 148,900 | |
| | Valiant Co. Ltd., Class A | | | 209,551 | | | | 398,759 | |
| | VanJee Technology Co. Ltd., Class A | | | 7,200 | | | | 19,881 | |
| | Vats Liquor Chain Store Management JSC Ltd., Class A | | | 89,000 | | | | 266,597 | |
| | Vatti Corp. Ltd., Class A | | | 188,447 | | | | 146,474 | |
W | | VCredit Holdings Ltd. | | | 159,400 | | | | 53,429 | |
* W | | Venus MedTech Hangzhou, Inc., Class H | | | 144,500 | | | | 177,978 | |
| | Victory Giant Technology Huizhou Co. Ltd., Class A | | | 227,600 | | | | 419,383 | |
| | Vinda International Holdings Ltd. | | | 1,444,000 | | | | 2,708,078 | |
* | | Viomi Technology Co. Ltd., ADR | | | 37,442 | | | | 32,200 | |
* | | Vipshop Holdings Ltd., ADR | | | 604,615 | | | | 4,214,167 | |
| | Visual China Group Co. Ltd., Class A | | | 126,800 | | | | 176,279 | |
* W | | Viva Biotech Holdings | | | 2,995,000 | | | | 453,886 | |
* | | Vnet Group, Inc., ADR | | | 396,255 | | | | 1,660,308 | |
* | | Wanbangde Pharmaceutical Holding Group Co. Ltd., Class A | | | 89,400 | | | | 118,747 | |
| | Wangneng Environment Co. Ltd., Class A | | | 94,545 | | | | 235,404 | |
| | Wangsu Science & Technology Co. Ltd., Class A | | | 594,400 | | | | 439,695 | |
| | Wanguo International Mining Group Ltd. | | | 112,000 | | | | 27,568 | |
| | Want Want China Holdings Ltd. | | | 132,000 | | | | 86,709 | |
| | Wanxiang Qianchao Co. Ltd., Class A | | | 74,708 | | | | 50,845 | |
| | Wasion Holdings Ltd. | | | 2,402,000 | | | | 636,009 | |
| | Wasu Media Holding Co. Ltd., Class A | | | 403,424 | | | | 378,829 | |
* | | Weibo Corp., Sponsored ADR | | | 4,978 | | | | 56,351 | |
* | | Weibo Corp., Class A | | | 11,640 | | | | 133,789 | |
| | Weifu High-Technology Group Co. Ltd., Class A | | | 35,703 | | | | 84,215 | |
# * W | | Weimob, Inc. | | | 4,346,000 | | | | 1,527,859 | |
| | Weiqiao Textile Co., Class H | | | 1,974,000 | | | | 274,296 | |
* | | Wellhope Foods Co. Ltd., Class A | | | 343,680 | | | | 535,590 | |
| | West China Cement Ltd. | | | 9,470,000 | | | | 856,489 | |
| | Wharf Holdings Ltd. | | | 1,192,000 | | | | 3,413,286 | |
| | Winning Health Technology Group Co. Ltd., Class A | | | 261,900 | | | | 348,247 | |
* | | Wison Engineering Services Co. Ltd. | | | 1,334,000 | | | | 46,052 | |
| | WPG Shanghai Smart Water PCL, Class A | | | 56,000 | | | | 67,300 | |
| | Wuhan Fingu Electronic Technology Co. Ltd., Class A | | | 165,100 | | | | 216,362 | |
* | | Wuhan P&S Information Technology Co. Ltd., Class A | | | 405,100 | | | | 242,243 | |
* | | Wuhan Raycus Fiber Laser Technologies Co. Ltd., Class A | | | 97,386 | | | | 381,444 | |
| | Wuhu Token Science Co. Ltd., Class A | | | 74,700 | | | | 64,056 | |
# | | Wuling Motors Holdings Ltd. | | | 1,010,000 | | | | 82,279 | |
| | Wushang Group Co. Ltd., Class A | | | 234,382 | | | | 303,492 | |
| | Wuxi Boton Technology Co. Ltd., Class A | | | 86,152 | | | | 157,744 | |
| | Wuxi Taiji Industry Co. Ltd., Class A | | | 465,900 | | | | 342,028 | |
| | Wuxi Xinje Electric Co. Ltd., Class A | | | 33,200 | | | | 192,803 | |
* | | XGD, Inc., Class A | | | 155,100 | | | | 292,468 | |
W | | Xiabuxiabu Catering Management China Holdings Co. Ltd. | | | 1,777,000 | | | | 917,176 | |
| | Xiamen Comfort Science & Technology Group Co. Ltd., Class A | | | 182,400 | | | | 204,307 | |
| | Xiamen International Airport Co. Ltd., Class A | | | 20,400 | | | | 40,242 | |
| | Xiamen Intretech, Inc., Class A | | | 152,770 | | | | 361,216 | |
| | Xiamen ITG Group Corp. Ltd., Class A | | | 489,000 | | | | 417,390 | |
* | | Xiamen Jihong Technology Co. Ltd., Class A | | | 42,200 | | | | 72,878 | |
| | Xiamen Kingdomway Group Co., Class A | | | 140,400 | | | | 323,667 | |
* | | Xi’an Tian He Defense Technology Co. Ltd., Class A | | | 41,200 | | | | 58,454 | |
| | Xiandai Investment Co. Ltd., Class A | | | 421,994 | | | | 223,958 | |
| | Xianhe Co. Ltd., Class A | | | 12,281 | | | | 40,963 | |
| | Xilinmen Furniture Co. Ltd., Class A | | | 115,900 | | | | 351,724 | |
* | | Xinchen China Power Holdings Ltd. | | | 162,000 | | | | 5,682 | |
| | Xinfengming Group Co. Ltd., Class A | | | 239,100 | | | | 266,265 | |
| | Xingda International Holdings Ltd. | | | 5,961,861 | | | | 1,155,166 | |
| | Xingfa Aluminium Holdings Ltd. | | | 481,000 | | | | 424,311 | |
| | Xinhua Winshare Publishing & Media Co. Ltd., Class H | | | 1,968,103 | | | | 1,188,913 | |
THE EMERGING MARKETS SMALL CAP SERIES
CONTINUED
| | | | | | | | | | |
| | | | | Shares | | | Value» | |
CHINA — (Continued) | | | | | | | | |
| | Xinhuanet Co. Ltd., Class A | | | 120,800 | | | $ | 251,888 | |
| | Xinjiang Goldwind Science & Technology Co. Ltd., Class H | | | 256,000 | | | | 221,826 | |
| | Xinjiang Xintai Natural Gas Co. Ltd., Class A | | | 86,188 | | | | 241,961 | |
* | | Xinjiang Xinxin Mining Industry Co. Ltd., Class H | | | 1,094,000 | | | | 108,569 | |
| | Xinte Energy Co. Ltd., Class H | | | 1,056,000 | | | | 2,060,143 | |
| | Xinxiang Chemical Fiber Co. Ltd., Class A | | | 158,600 | | | | 67,370 | |
| | Xinxing Ductile Iron Pipes Co. Ltd., Class A | | | 605,500 | | | | 288,141 | |
| | Xinyangfeng Agricultural Technology Co. Ltd., Class A | | | 113,000 | | | | 171,084 | |
| | Xinyi Energy Holdings Ltd. | | | 5,855,923 | | | | 1,491,544 | |
| | Xinyu Iron & Steel Co. Ltd., Class A | | | 474,300 | | | | 232,403 | |
# | | Xtep International Holdings Ltd. | | | 5,102,218 | | | | 4,676,557 | |
* | | Xunlei Ltd., ADR | | | 212,469 | | | | 210,790 | |
W | | Yadea Group Holdings Ltd. | | | 4,400,000 | | | | 6,718,272 | |
* | | YaGuang Technology Group Co. Ltd., Class A | | | 278,300 | | | | 236,373 | |
* | | Yanchang Petroleum International Ltd. | | | 12,940,000 | | | | 67,551 | |
W | | Yangtze Optical Fibre & Cable Joint Stock Ltd. Co., Class H | | | 530,500 | | | | 1,122,161 | |
| | Yankershop Food Co. Ltd., Class A | | | 30,795 | | | | 369,857 | |
| | Yantai Changyu Pioneer Wine Co. Ltd., Class A | | | 36,600 | | | | 135,884 | |
| | Yantai China Pet Foods Co. Ltd., Class A | | | 70,300 | | | | 189,954 | |
| | Yantai Dongcheng Pharmaceutical Co. Ltd., Class A | | | 173,113 | | | | 412,381 | |
| | Yantai Eddie Precision Machinery Co. Ltd., Class A | | | 142,392 | | | | 277,329 | |
| | Yantai Tayho Advanced Materials Co. Ltd., Class A | | | 156,934 | | | | 363,010 | |
| | Yantai Zhenghai Bio-tech Co. Ltd. | | | 40,450 | | | | 228,554 | |
* | | Yantai Zhenghai Magnetic Material Co. Ltd., Class A | | | 131,600 | | | | 221,683 | |
* | | Yashili International Holdings Ltd. | | | 5,168,000 | | | | 724,849 | |
* | | Yeahka Ltd. | | | 17,200 | | | | 39,213 | |
# | | Yeebo International Holdings Ltd. | | | 232,000 | | | | 84,256 | |
| | YGSOFT, Inc., Class A | | | 312,360 | | | | 285,343 | |
| | Yibin Tianyuan Group Co. Ltd., Class A | | | 131,200 | | | | 122,086 | |
# * W | | YiChang HEC ChangJiang Pharmaceutical Co. Ltd., Class H | | | 808,600 | | | | 448,038 | |
* | | Yida China Holdings Ltd. | | | 1,148,000 | | | | 32,816 | |
* | | Yifan Pharmaceutical Co. Ltd., Class A | | | 265,766 | | | | 398,056 | |
# | | Yihai International Holding Ltd. | | | 1,661,000 | | | | 2,737,228 | |
| | Yijiahe Technology Co. Ltd., Class A | | | 64,876 | | | | 310,626 | |
* | | Yincheng International Holding Co. Ltd. | | | 462,000 | | | | 81,256 | |
| | Yipinhong Pharmaceutical Co. Ltd., Class A | | | 95,180 | | | | 361,933 | |
| | Yip’s Chemical Holdings Ltd. | | | 1,386,000 | | | | 459,035 | |
* | | Yiren Digital Ltd., Sponsored ADR | | | 220,957 | | | | 178,312 | |
# * W | | Yixin Group Ltd. | | | 1,892,500 | | | | 149,350 | |
| | Yixintang Pharmaceutical Group Co. Ltd., Class A | | | 123,400 | | | | 469,644 | |
| | Yotrio Group Co. Ltd., Class A | | | 677,800 | | | | 307,589 | |
* | | Youzu Interactive Co. Ltd., Class A | | | 266,200 | | | | 282,798 | |
* | | Yuan Heng Gas Holdings Ltd. | | | 3,516,000 | | | | 176,925 | |
| | Yuexiu Property Co. Ltd. | | | 5,545,456 | | | | 4,732,243 | |
| | Yuexiu Transport Infrastructure Ltd. | | | 4,226,018 | | | | 1,654,138 | |
| | Yusys Technologies Co. Ltd., Class A | | | 144,200 | | | | 343,952 | |
| | ZBOM Home Collection Co. Ltd., Class A | | | 100,588 | | | | 287,887 | |
| | Zepp Health Corp., ADR | | | 24,510 | | | | 30,147 | |
# * | | Zhaojin Mining Industry Co. Ltd., Class H | | | 3,867,000 | | | | 3,186,164 | |
| | Zhe Jiang Li Zi Yuan Food Co. Ltd., Class A | | | 58,248 | | | | 131,907 | |
| | Zhejiang Communications Technology Co. Ltd. | | | 463,200 | | | | 327,532 | |
| | Zhejiang Conba Pharmaceutical Co. Ltd., Class A | | | 612,900 | | | | 351,640 | |
| | ZheJiang Dali Technology Co. Ltd., Class A | | | 23,018 | | | | 43,040 | |
# | | Zhejiang Expressway Co. Ltd., Class H | | | 5,774,000 | | | | 3,579,534 | |
| | Zhejiang Garden Bio-Chemical High-tech Co. Ltd., Class A | | | 145,800 | | | | 292,058 | |
# * †† | | Zhejiang Glass Co. Ltd., Class H | | | 445,000 | | | | 0 | |
| | Zhejiang Hailiang Co. Ltd., Class A | | | 17,281 | | | | 27,455 | |
| | Zhejiang Hangmin Co. Ltd., Class A | | | 354,400 | | | | 342,874 | |
| | Zhejiang Hisoar Pharmaceutical Co. Ltd., Class A | | | 430,830 | | | | 395,149 | |
THE EMERGING MARKETS SMALL CAP SERIES
CONTINUED
| | | | | | | | | | |
| | | | | Shares | | | Value» | |
CHINA — (Continued) | | | | | | | | |
| | Zhejiang Huace Film & Television Co. Ltd., Class A | | | 617,000 | | | $ | 355,192 | |
| | Zhejiang Jiahua Energy Chemical Industry Co. Ltd., Class A | | | 287,800 | | | | 333,528 | |
| | Zhejiang Jianfeng Group Co. Ltd., Class A | | | 24,600 | | | | 37,249 | |
| | Zhejiang Jiemei Electronic & Technology Co. Ltd., Class A | | | 116,829 | | | | 359,423 | |
* | | Zhejiang Jingu Co. Ltd., Class A | | | 346,600 | | | | 297,389 | |
| | Zhejiang Jingxin Pharmaceutical Co. Ltd., Class A | | | 287,760 | | | | 519,349 | |
* | | Zhejiang Jinke Tom Culture Industry Co. Ltd., Class A | | | 983,168 | | | | 410,097 | |
| | Zhejiang JIULI Hi-tech Metals Co. Ltd., Class A | | | 123,600 | | | | 287,382 | |
| | Zhejiang Medicine Co. Ltd., Class A | | | 327,500 | | | | 513,283 | |
| | Zhejiang Meida Industrial Co. Ltd., Class A | | | 206,440 | | | | 284,505 | |
| | Zhejiang Orient Financial Holdings Group Co. Ltd., Class A | | | 644,961 | | | | 323,090 | |
* | | Zhejiang Qianjiang Motorcycle Co. Ltd., Class A | | | 93,100 | | | | 245,049 | |
| | Zhejiang Runtu Co. Ltd., Class A | | | 306,134 | | | | 307,469 | |
| | Zhejiang Semir Garment Co. Ltd., Class A | | | 572,400 | | | | 351,966 | |
| | Zhejiang Southeast Space Frame Co. Ltd., Class A | | | 201,700 | | | | 180,226 | |
| | Zhejiang Starry Pharmaceutical Co. Ltd., Class A | | | 76,720 | | | | 183,208 | |
| | Zhejiang Tiantie Industry Co. Ltd., Class A | | | 171,744 | | | | 247,597 | |
| | Zhejiang Tianyu Pharmaceutical Co. Ltd., Class A | | | 104,805 | | | | 332,583 | |
* | | Zhejiang Wanfeng Auto Wheel Co. Ltd., Class A | | | 801,520 | | | | 739,025 | |
* | | Zhejiang Wanliyang Co. Ltd., Class A | | | 323,670 | | | | 333,730 | |
| | Zhejiang Wanma Co. Ltd., Class A | | | 233,200 | | | | 289,449 | |
| | Zhejiang Windey Co. Ltd., Class A | | | 86,500 | | | | 213,477 | |
| | Zhejiang Xianju Pharmaceutical Co. Ltd., Class A | | | 222,600 | | | | 314,230 | |
| | Zhejiang Yankon Group Co. Ltd., Class A | | | 95,500 | | | | 40,753 | |
| | Zhejiang Yasha Decoration Co. Ltd., Class A | | | 389,600 | | | | 228,845 | |
| | Zhejiang Yinlun Machinery Co. Ltd., Class A | | | 132,900 | | | | 224,815 | |
| | Zhende Medical Co. Ltd., Class A | | | 27,693 | | | | 176,025 | |
# | | Zhengzhou Coal Mining Machinery Group Co. Ltd., Class H | | | 1,046,000 | | | | 896,778 | |
* | | Zhong An Group Ltd. | | | 13,063,800 | | | | 307,286 | |
* W | | ZhongAn Online P&C Insurance Co. Ltd., Class H | | | 1,960,300 | | | | 3,654,169 | |
| | Zhongshan Broad Ocean Motor Co. Ltd., Class A | | | 586,600 | | | | 435,022 | |
| | Zhongshan Public Utilities Group Co. Ltd., Class A | | | 438,100 | | | | 389,686 | |
* | | Zhongtian Financial Group Co. Ltd., Class A | | | 1,461,176 | | | | 280,569 | |
# | | Zhongyu Energy Holdings Ltd. | | | 2,066,306 | | | | 1,537,781 | |
W | | Zhou Hei Ya International Holdings Co. Ltd. | | | 3,346,000 | | | | 1,473,704 | |
* | | Zhuguang Holdings Group Co. Ltd. | | | 7,108,000 | | | | 580,459 | |
| | Zhuhai Bojay Electronics Co. Ltd., Class A | | | 26,646 | | | | 130,310 | |
| | Zhuhai Huafa Properties Co. Ltd., Class A | | | 346,280 | | | | 405,898 | |
* | | Zhuhai Orbita Aerospace Science & Technology Co. Ltd., Class A | | | 172,200 | | | | 179,297 | |
| | | | | | | | | | |
TOTAL CHINA | | | | 782,873,630 | |
| | | | | | | | | | |
COLOMBIA — (0.1%) | | | | | | | | |
| | Banco de Bogota SA | | | 4,139 | | | | 21,790 | |
| | Bolsa de Valores de Colombia | | | 63,819 | | | | 99,241 | |
| | Celsia SA ESP | | | 1,835,444 | | | | 1,031,305 | |
| | Cementos Argos SA | | | 839,349 | | | | 565,939 | |
* | | CEMEX Latam Holdings SA | | | 765,979 | | | | 651,402 | |
* | | Corp. Financiera Colombiana SA | | | 268,889 | | | | 876,562 | |
| | Grupo Argos SA | | | 77,734 | | | | 161,331 | |
| | Grupo Aval Acciones y Valores SA, ADR | | | 4,190 | | | | 9,302 | |
| | Mineros SA | | | 243,330 | | | | 82,773 | |
| | Promigas SA ESP | | | 10,240 | | | | 9,019 | |
| | | | | | | | | | |
TOTAL COLOMBIA | | | | 3,508,664 | |
| | | | | | | | | | |
GREECE — (0.4%) | | | | | | | | |
* | | Aegean Airlines SA | | | 137,813 | | | | 680,921 | |
| | Athens Water Supply & Sewage Co. SA | | | 102,231 | | | | 727,928 | |
| | Autohellas Tourist & Trading SA | | | 62,316 | | | | 696,512 | |
THE EMERGING MARKETS SMALL CAP SERIES
CONTINUED
| | | | | | | | | | |
| | | | | Shares | | | Value» | |
GREECE — (Continued) | | | | | | | | |
| | Bank of Greece | | | 115,124 | | | $ | 1,837,498 | |
| | ElvalHalcor SA | | | 87,057 | | | | 123,222 | |
| | Epsilon Net SA | | | 8,900 | | | | 47,143 | |
| | Fourlis Holdings SA | | | 134,999 | | | | 353,460 | |
| | GEK Terna Holding Real Estate Construction SA | | | 253,934 | | | | 2,417,334 | |
| | Hellenic Exchanges - Athens Stock Exchange SA | | | 149,334 | | | | 462,284 | |
| | Holding Co. ADMIE IPTO SA | | | 297,838 | | | | 493,288 | |
| | Intracom Holdings SA | | | 131,176 | | | | 210,097 | |
* | | LAMDA Development SA | | | 145,034 | | | | 878,722 | |
| | Motor Oil Hellas Corinth Refineries SA | | | 24,547 | | | | 421,890 | |
| | Piraeus Port Authority SA | | | 26,723 | | | | 423,771 | |
| | Quest Holdings SA | | | 45,701 | | | | 182,219 | |
| | Sarantis SA | | | 131,589 | | | | 824,875 | |
| | Terna Energy SA | | | 91,994 | | | | 1,709,635 | |
| | Thrace Plastics Holding & Co. | | | 10,140 | | | | 37,838 | |
| | Titan Cement International SA | | | 30,576 | | | | 341,696 | |
| | | | | | | | | | |
TOTAL GREECE | | | | 12,870,333 | |
| | | | | | | | | | |
HONG KONG — (0.0%) | | | | | | | | |
* †† | | Anxin-China Holdings Ltd. | | | 16,347,000 | | | | 0 | |
* †† | | C Fiber Optic | | | 9,639,999 | | | | 0 | |
* †† | | China Animal Healthcare Ltd. | | | 3,671,000 | | | | 0 | |
* †† | | China Common Rich Renewable Energy Investments Ltd. | | | 17,084,000 | | | | 0 | |
* †† | | DBA Telecommunication (Asia) Holdings Ltd. | | | 876,000 | | | | 0 | |
* | | Kai Yuan Holdings Ltd. | | | 11,360,000 | | | | 26,054 | |
* †† | | Karce Co. Ltd. | | | 1,336,000 | | | | 0 | |
| | My Medicare | | | 6,950,000 | | | | 38,160 | |
* †† | | Real Gold Mining Ltd. | | | 300,500 | | | | 0 | |
* | | Realord Group Holdings Ltd. | | | 268,000 | | | | 314,435 | |
* | | Taung Gold International Ltd. | | | 29,340,000 | | | | 85,863 | |
* †† | | Tenwow International Holdings Ltd. | | | 4,023,000 | | | | 0 | |
* | | Tongda Group Holdings Ltd. | | | 14,795,000 | | | | 139,477 | |
* | | Untrade.Lumena Newmat | | | 363,249 | | | | 0 | |
* †† | | Youyuan International Holdings Ltd. | | | 2,698,070 | | | | 0 | |
| | | | | | | | | | |
TOTAL HONG KONG | | | | 603,989 | |
| | | | | | | | | | |
HUNGARY — (0.0%) | | | | | | | | |
| | Magyar Telekom Telecommunications PLC | | | 52,018 | | | | 37,353 | |
* | | Opus Global Nyrt | | | 302,678 | | | | 86,921 | |
| | Richter Gedeon Nyrt | | | 62,801 | | | | 1,242,250 | |
| | | | | | | | | | |
TOTAL HUNGARY | | | | 1,366,524 | |
| | | | | | | | | | |
INDIA — (19.2%) | | | | | | | | |
* | | 3i Infotech Ltd. | | | 34,614 | | | | 18,317 | |
| | Aarti Drugs Ltd. | | | 110,812 | | | | 642,947 | |
| | Aarti Industries Ltd. | | | 452,888 | | | | 3,817,714 | |
| | Aarti Pharmalabs Ltd. | | | 113,222 | | | | 518,665 | |
* | | Aavas Financiers Ltd. | | | 7,808 | | | | 190,323 | |
| | Abbott India Ltd. | | | 15,291 | | | | 3,539,529 | |
| | Accelya Solutions India Ltd. | | | 3,300 | | | | 51,371 | |
| | Action Construction Equipment Ltd. | | | 64,420 | | | | 240,850 | |
| | Adani Enterprises Ltd. | | | 132,085 | | | | 5,349,994 | |
* | | Adani Green Energy Ltd. | | | 65,429 | | | | 1,666,826 | |
* | | Adani Power Ltd. | | | 1,298,946 | | | | 5,278,915 | |
| | Adani Total Gas Ltd. | | | 47,761 | | | | 2,101,817 | |
* | | Adani Transmission Ltd. | | | 257,725 | | | | 10,446,809 | |
| | ADF Foods Ltd. | | | 2,577 | | | | 22,145 | |
* | | Aditya Birla Capital Ltd. | | | 1,042,109 | | | | 1,469,281 | |
THE EMERGING MARKETS SMALL CAP SERIES
CONTINUED
| | | | | | | | | | |
| | | | | Shares | | | Value» | |
INDIA — (Continued) | | | | | | | | |
| | Advanced Enzyme Technologies Ltd. | | | 159,570 | | | $ | 548,236 | |
| | Aegis Logistics Ltd. | | | 508,694 | | | | 1,912,705 | |
| | AGI Greenpac Ltd. | | | 36,450 | | | | 145,624 | |
| | Agro Tech Foods Ltd. | | | 54,802 | | | | 509,842 | |
| | Ahluwalia Contracts India Ltd. | | | 33,616 | | | | 177,617 | |
| | AIA Engineering Ltd. | | | 176,351 | | | | 5,759,750 | |
| | Ajanta Pharma Ltd. | | | 150,573 | | | | 2,336,827 | |
| | Akzo Nobel India Ltd. | | | 43,658 | | | | 1,124,379 | |
| | Alembic Ltd. | | | 269,593 | | | | 230,284 | |
| | Alembic Pharmaceuticals Ltd. | | | 194,229 | | | | 1,291,312 | |
| | Alkyl Amines Chemicals | | | 47,896 | | | | 1,714,418 | |
| | Allcargo Logistics Ltd. | | | 216,315 | | | | 1,131,165 | |
* | | Alok Industries Ltd. | | | 3,273,901 | | | | 612,010 | |
| | Amara Raja Batteries Ltd. | | | 210,978 | | | | 1,302,775 | |
* | | Amber Enterprises India Ltd. | | | 7,262 | | | | 181,524 | |
| | Amrutanjan Health Care Ltd. | | | 18,616 | | | | 165,293 | |
| | Anant Raj Ltd. | | | 206,283 | | | | 284,063 | |
| | Andhra Paper Ltd. | | | 12,953 | | | | 77,258 | |
| | Andhra Sugars Ltd. | | | 121,872 | | | | 207,828 | |
| | Angel One Ltd. | | | 23,208 | | | | 448,931 | |
| | Apar Industries Ltd. | | | 23,756 | | | | 430,539 | |
| | Apcotex Industries Ltd. | | | 14,629 | | | | 86,696 | |
| | APL Apollo Tubes Ltd. | | | 310,593 | | | | 4,052,718 | |
| | Apollo Tyres Ltd. | | | 1,117,624 | | | | 3,920,832 | |
| | Aptech Ltd. | | | 6,495 | | | | 25,311 | |
* | | Arvind Fashions Ltd. | | | 202,670 | | | | 904,924 | |
* | | Arvind Ltd. | | | 529,933 | | | | 595,368 | |
* | | Arvind SmartSpaces Ltd. | | | 24,563 | | | | 74,299 | |
| | Asahi India Glass Ltd. | | | 343,399 | | | | 2,563,868 | |
| | Ashiana Housing Ltd. | | | 55,991 | | | | 107,032 | |
* | | Ashoka Buildcon Ltd. | | | 369,747 | | | | 330,960 | |
| | Asian Granito India Ltd. | | | 85,705 | | | | 58,217 | |
| | Astec Lifesciences Ltd. | | | 11,396 | | | | 298,151 | |
* W | | Aster DM Healthcare Ltd. | | | 171,605 | | | | 513,363 | |
| | Astra Microwave Products Ltd. | | | 138,699 | | | | 509,377 | |
| | Astral Ltd. | | | 33,632 | | | | 828,338 | |
| | AstraZeneca Pharma India Ltd. | | | 14,856 | | | | 592,258 | |
| | Atul Ltd. | | | 55,580 | | | | 5,679,275 | |
W | | AU Small Finance Bank Ltd. | | | 152,487 | | | | 1,087,080 | |
| | Automotive Axles Ltd. | | | 16,733 | | | | 397,243 | |
| | Avanti Feeds Ltd. | | | 152,187 | | | | 812,105 | |
| | Bajaj Consumer Care Ltd. | | | 328,559 | | | | 632,674 | |
| | Bajaj Electricals Ltd. | | | 2,695 | | | | 38,045 | |
* | | Bajaj Hindusthan Sugar Ltd. | | | 1,836,605 | | | | 228,750 | |
| | Bajaj Holdings & Investment Ltd. | | | 40,838 | | | | 3,282,258 | |
| | Balaji Amines Ltd. | | | 42,978 | | | | 1,573,581 | |
| | Balkrishna Industries Ltd. | | | 2,049 | | | | 48,697 | |
| | Balmer Lawrie & Co. Ltd. | | | 230,549 | | | | 315,752 | |
| | Balrampur Chini Mills Ltd. | | | 429,065 | | | | 1,642,753 | |
| | Banco Products India Ltd. | | | 49,687 | | | | 115,352 | |
| | Bank of India | | | 839,490 | | | | 610,418 | |
| | Bank of Maharashtra | | | 986,206 | | | | 243,126 | |
| | Bannari Amman Sugars Ltd. | | | 12,765 | | | | 432,426 | |
| | BASF India Ltd. | | | 45,733 | | | | 1,587,330 | |
| | Bata India Ltd. | | | 145,073 | | | | 3,193,916 | |
| | Bayer CropScience Ltd. | | | 13,354 | | | | 752,981 | |
| | BEML Ltd. | | | 49,660 | | | | 944,765 | |
| | BEML Ltd. | | | 48,307 | | | | 218,812 | |
* | | BF Utilities Ltd. | | | 59,511 | | | | 280,863 | |
THE EMERGING MARKETS SMALL CAP SERIES
CONTINUED
| | | | | | | | | | |
| | | | | Shares | | | Value» | |
INDIA — (Continued) | | | | | | | | |
| | Bhansali Engineering Polymers Ltd. | | | 228,412 | | | $ | 301,731 | |
| | Bharat Bijlee Ltd. | | | 5,189 | | | | 150,744 | |
| | Bharat Dynamics Ltd. | | | 65,479 | | | | 755,842 | |
| | Bharat Electronics Ltd. | | | 2,342,148 | | | | 3,029,659 | |
| | Bharat Forge Ltd. | | | 349,672 | | | | 3,511,826 | |
| | Bharat Heavy Electricals Ltd. | | | 2,493,752 | | | | 2,229,934 | |
| | Bharat Rasayan Ltd. | | | 3,159 | | | | 419,059 | |
| | Birla Corp. Ltd. | | | 94,933 | | | | 1,066,730 | |
| | Birlasoft Ltd. | | | 444,621 | | | | 1,456,584 | |
* | | Black Box Ltd. | | | 12,574 | | | | 24,218 | |
| | Bliss Gvs Pharma Ltd. | | | 106,354 | | | | 97,404 | |
| | Blue Dart Express Ltd. | | | 17,602 | | | | 1,615,806 | |
| | Blue Star Ltd. | | | 104,671 | | | | 1,563,992 | |
| | Bodal Chemicals Ltd. | | | 82,131 | | | | 80,247 | |
| | Bombay Burmah Trading Co. | | | 28,681 | | | | 303,385 | |
* | | Bombay Dyeing & Manufacturing Co. Ltd. | | | 270,409 | | | | 266,178 | |
* | | Borosil Ltd. | | | 10,433 | | | | 52,924 | |
* | | Borosil Renewables Ltd. | | | 125,180 | | | | 852,266 | |
| | Brigade Enterprises Ltd. | | | 308,439 | | | | 1,865,464 | |
| | Brightcom Group Ltd. | | | 65,381 | | | | 26,023 | |
| | BSE Ltd. | | | 229,927 | | | | 1,642,261 | |
* | | Camlin Fine Sciences Ltd. | | | 124,059 | | | | 237,056 | |
| | Can Fin Homes Ltd. | | | 159,590 | | | | 1,010,074 | |
* | | Capacit’e Infraprojects Ltd. | | | 57,331 | | | | 110,694 | |
| | Caplin Point Laboratories Ltd. | | | 72,924 | | | | 638,905 | |
| | Carborundum Universal Ltd. | | | 262,115 | | | | 2,700,141 | |
| | Care Ratings Ltd. | | | 53,698 | | | | 318,120 | |
| | Castrol India Ltd. | | | 566,471 | | | | 855,778 | |
| | CCL Products India Ltd. | | | 278,029 | | | | 1,688,541 | |
| | Ceat Ltd. | | | 86,455 | | | | 1,611,146 | |
* | | Central Bank of India Ltd. | | | 613,272 | | | | 151,121 | |
| | Central Depository Services India Ltd. | | | 196,430 | | | | 2,912,731 | |
| | Century Enka Ltd. | | | 23,231 | | | | 119,101 | |
| | Century Plyboards India Ltd. | | | 204,878 | | | | 1,488,512 | |
| | Century Textiles & Industries Ltd. | | | 142,158 | | | | 1,468,342 | |
| | Cera Sanitaryware Ltd. | | | 17,394 | | | | 1,163,536 | |
| | CESC Ltd. | | | 2,163,177 | | | | 2,007,411 | |
* | | CG Power & Industrial Solutions Ltd. | | | 315,782 | | | | 993,579 | |
* | | Chalet Hotels Ltd. | | | 13,713 | | | | 60,504 | |
| | Chambal Fertilisers & Chemicals Ltd. | | | 549,880 | | | | 2,173,593 | |
| | Chennai Petroleum Corp. Ltd. | | | 157,831 | | | | 397,368 | |
†† | | Chennai Super Kings Cricket Ltd. | | | 1,658,632 | | | | 8,454 | |
| | Cholamandalam Financial Holdings Ltd. | | | 393,015 | | | | 2,984,736 | |
| | Cholamandalam Investment & Finance Co. Ltd. | | | 32,514 | | | | 279,933 | |
| | Cigniti Technologies Ltd. | | | 17,056 | | | | 128,105 | |
| | City Union Bank Ltd. | | | 1,316,807 | | | | 2,955,677 | |
W | | Cochin Shipyard Ltd. | | | 69,239 | | | | 448,683 | |
* W | | Coffee Day Enterprises Ltd. | | | 294,818 | | | | 172,401 | |
| | Coforge Ltd. | | | 86,587 | | | | 3,981,559 | |
| | Computer Age Management Services Ltd. | | | 43,580 | | | | 1,343,262 | |
| | Container Corp. of India Ltd. | | | 107,056 | | | | 1,031,014 | |
| | Coromandel International Ltd. | | | 386,151 | | | | 4,487,404 | |
| | Cosmo First Ltd. | | | 17,181 | | | | 152,250 | |
* | | CreditAccess Grameen Ltd. | | | 74,300 | | | | 876,323 | |
| | CRISIL Ltd. | | | 58,234 | | | | 2,110,003 | |
| | Crompton Greaves Consumer Electricals Ltd. | | | 1,633,503 | | | | 7,149,511 | |
* | | CSB Bank Ltd. | | | 83,201 | | | | 228,628 | |
| | Cummins India Ltd. | | | 225,207 | | | | 3,663,252 | |
| | Cyient Ltd. | | | 175,072 | | | | 1,586,990 | |
THE EMERGING MARKETS SMALL CAP SERIES
CONTINUED
| | | | | | | | | | |
| | | | | Shares | | | Value» | |
INDIA — (Continued) | | | | | | | | |
* | | D B Realty Ltd. | | | 128,165 | | | $ | 158,411 | |
| | Dalmia Bharat Ltd. | | | 142,898 | | | | 2,757,807 | |
| | Dalmia Bharat Sugar & Industries Ltd. | | | 18,178 | | | | 69,667 | |
| | DB Corp. Ltd. | | | 91,735 | | | | 126,397 | |
| | DCB Bank Ltd. | | | 793,332 | | | | 1,034,668 | |
| | DCM Shriram Ltd. | | | 130,253 | | | | 1,646,919 | |
| | DCW Ltd. | | | 242,758 | | | | 175,797 | |
| | Deepak Fertilisers & Petrochemicals Corp. Ltd. | | | 187,415 | | | | 2,189,469 | |
| | Deepak Nitrite Ltd. | | | 110,590 | | | | 3,094,543 | |
| | Delta Corp. Ltd. | | | 446,857 | | | | 1,206,224 | |
* | | DEN Networks Ltd. | | | 277,502 | | | | 110,782 | |
* | | Dhampur Bio Organics Ltd. | | | 121,578 | | | | 239,477 | |
| | Dhampur Sugar Mills Ltd. | | | 99,655 | | | | 238,998 | |
* | | Dhani Services Ltd. | | | 954,221 | | | | 655,528 | |
| | Dhanuka Agritech Ltd. | | | 43,376 | | | | 382,122 | |
W | | Dilip Buildcon Ltd. | | | 141,880 | | | | 370,360 | |
* | | Dish TV India Ltd. | | | 3,313,643 | | | | 636,659 | |
* | | Dishman Carbogen Amcis Ltd. | | | 194,853 | | | | 233,470 | |
| | Dixon Technologies India Ltd. | | | 84,327 | | | | 4,606,947 | |
| | Dollar Industries Ltd. | | | 20,031 | | | | 121,003 | |
W | | Dr Lal PathLabs Ltd. | | | 101,801 | | | | 3,149,897 | |
* | | DRC Systems India Ltd. | | | 21,540 | | | | 7,421 | |
| | Dwarikesh Sugar Industries Ltd. | | | 115,381 | | | | 124,212 | |
| | Dynamatic Technologies Ltd. | | | 3,861 | | | | 112,315 | |
| | eClerx Services Ltd. | | | 98,101 | | | | 1,563,811 | |
| | Edelweiss Financial Services Ltd. | | | 1,598,778 | | | | 1,119,776 | |
| | EID Parry India Ltd. | | | 253,753 | | | | 1,916,124 | |
* | | EIH Associated Hotels | | | 7,709 | | | | 46,315 | |
* | | EIH Ltd. | | | 592,462 | | | | 1,386,175 | |
| | Electrosteel Castings Ltd. | | | 1,066,740 | | | | 517,487 | |
| | Elgi Equipments Ltd. | | | 526,947 | | | | 3,089,695 | |
| | Emami Ltd. | | | 436,992 | | | | 2,522,538 | |
W | | Endurance Technologies Ltd. | | | 50,432 | | | | 825,644 | |
| | Engineers India Ltd. | | | 716,970 | | | | 608,947 | |
| | EPL Ltd. | | | 222,082 | | | | 413,273 | |
* W | | Equitas Small Finance Bank Ltd. | | | 351,490 | | | | 213,178 | |
W | | Eris Lifesciences Ltd. | | | 86,680 | | | | 774,442 | |
| | ESAB India Ltd. | | | 6,485 | | | | 264,724 | |
| | Escorts Kubota Ltd. | | | 65,710 | | | | 1,614,957 | |
* | | Eveready Industries India Ltd. | | | 9,462 | | | | 33,495 | |
| | Everest Industries Ltd. | | | 5,686 | | | | 61,162 | |
| | Everest Kanto Cylinder Ltd. | | | 28,491 | | | | 37,478 | |
| | Excel Industries Ltd. | | | 7,725 | | | | 111,062 | |
| | Exide Industries Ltd. | | | 1,080,287 | | | | 2,161,794 | |
* | | FDC Ltd. | | | 172,443 | | | | 650,138 | |
| | Federal Bank Ltd. | | | 5,370,459 | | | | 8,537,661 | |
* | | Federal-Mogul Goetze India Ltd. | | | 19,259 | | | | 74,728 | |
| | FIEM Industries Ltd. | | | 8,676 | | | | 168,153 | |
| | Filatex India Ltd. | | | 127,280 | | | | 154,177 | |
| | Fine Organic Industries Ltd. | | | 8,143 | | | | 565,747 | |
| | Finolex Cables Ltd. | | | 264,201 | | | | 1,657,988 | |
| | Finolex Industries Ltd. | | | 955,420 | | | | 1,550,827 | |
| | Firstsource Solutions Ltd. | | | 984,127 | | | | 1,234,991 | |
| | Force Motors Ltd. | | | 8,398 | | | | 138,638 | |
* | | Fortis Healthcare Ltd. | | | 1,720,585 | | | | 5,777,317 | |
| | Gabriel India Ltd. | | | 234,396 | | | | 433,982 | |
| | Galaxy Surfactants Ltd. | | | 12,936 | | | | 453,765 | |
* | | Ganesh Housing Corp. Ltd. | | | 6,901 | | | | 28,723 | |
| | Garden Reach Shipbuilders & Engineers Ltd. | | | 32,522 | | | | 175,665 | |
THE EMERGING MARKETS SMALL CAP SERIES
CONTINUED
| | | | | | | | | | |
| | | | | Shares | | | Value» | |
INDIA — (Continued) | | | | | | | | |
| | Garware Technical Fibres Ltd. | | | 35,738 | | | $ | 1,512,912 | |
| | Gateway Distriparks Ltd. | | | 978,876 | | | | 861,903 | |
* | | Gati Ltd. | | | 95,449 | | | | 202,279 | |
* | | GE T&D India Ltd. | | | 196,502 | | | | 304,732 | |
W | | General Insurance Corp. of India | | | 11,497 | | | | 17,226 | |
| | Genus Power Infrastructures Ltd. | | | 135,367 | | | | 145,367 | |
| | Geojit Financial Services Ltd. | | | 27,742 | | | | 16,098 | |
| | GHCL Ltd. | | | 182,273 | | | | 1,423,088 | |
| | GIC Housing Finance Ltd. | | | 81,968 | | | | 132,461 | |
| | Gillette India Ltd. | | | 17,560 | | | | 1,093,763 | |
| | GlaxoSmithKline Pharmaceuticals Ltd. | | | 41,567 | | | | 693,556 | |
| | Glenmark Pharmaceuticals Ltd. | | | 486,775 | | | | 2,368,320 | |
| | GMM Pfaudler Ltd. | | | 16,740 | | | | 373,949 | |
* | | GMR Airports Infrastructure Ltd. | | | 4,522,064 | | | | 2,047,688 | |
| | Godawari Power & Ispat Ltd. | | | 73,133 | | | | 234,118 | |
| | Godfrey Phillips India Ltd. | | | 48,483 | | | | 871,520 | |
W | | Godrej Agrovet Ltd. | | | 38,292 | | | | 231,783 | |
* | | Godrej Industries Ltd. | | | 178,284 | | | | 927,151 | |
| | Goodyear India Ltd. | | | 8,680 | | | | 106,758 | |
| | Granules India Ltd. | | | 480,026 | | | | 2,163,647 | |
| | Graphite India Ltd. | | | 94,696 | | | | 403,805 | |
| | Grauer & Weil India Ltd. | | | 43,156 | | | | 47,773 | |
| | Gravita India Ltd. | | | 16,173 | | | | 71,915 | |
| | Great Eastern Shipping Co. Ltd. | | | 307,104 | | | | 2,059,550 | |
| | Greaves Cotton Ltd. | | | 321,516 | | | | 588,859 | |
| | Greenlam Industries Ltd. | | | 24,742 | | | | 94,954 | |
| | Greenpanel Industries Ltd. | | | 64,267 | | | | 287,235 | |
| | Greenply Industries Ltd. | | | 97,847 | | | | 205,148 | |
| | Grindwell Norton Ltd. | | | 105,759 | | | | 2,721,177 | |
| | Gujarat Alkalies & Chemicals Ltd. | | | 106,190 | | | | 1,149,800 | |
| | Gujarat Ambuja Exports Ltd. | | | 243,558 | | | | 744,041 | |
| | Gujarat Fluorochemicals Ltd. | | | 132,935 | | | | 6,079,642 | |
| | Gujarat Industries Power Co. Ltd. | | | 176,262 | | | | 177,922 | |
| | Gujarat Mineral Development Corp. Ltd. | | | 193,216 | | | | 330,830 | |
| | Gujarat Narmada Valley Fertilizers & Chemicals Ltd. | | | 239,481 | | | | 2,055,001 | |
| | Gujarat Pipavav Port Ltd. | | | 967,972 | | | | 1,003,893 | |
| | Gujarat State Fertilizers & Chemicals Ltd. | | | 454,863 | | | | 678,877 | |
| | Gujarat State Petronet Ltd. | | | 781,576 | | | | 2,137,157 | |
| | Gulf Oil Lubricants India Ltd. | | | 50,156 | | | | 250,333 | |
| | Happiest Minds Technologies Ltd. | | | 25,947 | | | | 304,329 | |
* | | Hathway Cable & Datacom Ltd. | | | 1,004,778 | | | | 194,323 | |
| | Hatsun Agro Product Ltd. | | | 105,358 | | | | 1,217,445 | |
| | HBL Power Systems Ltd. | | | 200,199 | | | | 253,700 | |
* | | HealthCare Global Enterprises Ltd. | | | 37,943 | | | | 132,870 | |
| | HEG Ltd. | | | 27,718 | | | | 354,156 | |
| | HeidelbergCement India Ltd. | | | 205,805 | | | | 477,020 | |
| | Heritage Foods Ltd. | | | 51,381 | | | | 186,822 | |
| | Hester Biosciences Ltd. | | | 11,620 | | | | 277,975 | |
| | HFCL Ltd. | | | 2,094,768 | | | | 2,084,350 | |
| | HG Infra Engineering Ltd. | | | 25,519 | | | | 175,094 | |
| | Hikal Ltd. | | | 178,461 | | | | 711,395 | |
| | HIL Ltd. | | | 14,909 | | | | 513,532 | |
| | Himadri Speciality Chemical Ltd. | | | 539,750 | | | | 675,773 | |
| | Himatsingka Seide Ltd. | | | 66,016 | | | | 74,296 | |
| | Hinduja Global Solutions Ltd. | | | 72,357 | | | | 1,069,523 | |
| | Hindustan Aeronautics Ltd. | | | 8,128 | | | | 248,353 | |
* | | Hindustan Construction Co. Ltd. | | | 2,513,458 | | | | 429,763 | |
| | Hindustan Copper Ltd. | | | 281,976 | | | | 351,447 | |
* | | Hindustan Oil Exploration Co. Ltd. | | | 190,919 | | | | 317,850 | |
THE EMERGING MARKETS SMALL CAP SERIES
CONTINUED
| | | | | | | | | | |
| | | | | Shares | | | Value» | |
INDIA — (Continued) | | | | | | | | |
| | Hindware Home Innovation Ltd. | | | 47,956 | | | $ | 216,122 | |
| | Hle Glascoat Ltd. | | | 13,765 | | | | 110,022 | |
| | Honda India Power Products Ltd. | | | 12,211 | | | | 253,365 | |
| | Honeywell Automation India Ltd. | | | 1,858 | | | | 882,482 | |
| | Huhtamaki India Ltd. | | | 86,236 | | | | 227,331 | |
| | I G Petrochemicals Ltd. | | | 19,600 | | | | 123,329 | |
W | | ICICI Securities Ltd. | | | 152,366 | | | | 953,198 | |
| | ICRA Ltd. | | | 5,986 | | | | 297,115 | |
* | | IDFC First Bank Ltd. | | | 6,440,948 | | | | 4,376,467 | |
| | IDFC Ltd. | | | 3,603,867 | | | | 3,373,667 | |
* | | IFB Industries Ltd. | | | 33,304 | | | | 377,995 | |
* | | Igarashi Motors India Ltd. | | | 2,487 | | | | 12,439 | |
| | IIFL Finance Ltd. | | | 572,417 | | | | 2,904,863 | |
| | IIFL Securities Ltd. | | | 118,038 | | | | 96,725 | |
| | IIFL Wealth Management Ltd. | | | 166,563 | | | | 3,577,208 | |
| | India Cements Ltd. | | | 488,174 | | | | 1,419,356 | |
| | India Glycols Ltd. | | | 49,094 | | | | 443,951 | |
| | India Nippon Electricals Ltd. | | | 1,455 | | | | 7,651 | |
* | | Indiabulls Housing Finance Ltd. | | | 947,333 | | | | 1,474,722 | |
* | | Indiabulls Real Estate Ltd. | | | 592,643 | | | | 559,256 | |
W | | IndiaMart InterMesh Ltd. | | | 8,395 | | | | 466,263 | |
| | Indian Bank | | | 294,130 | | | | 910,355 | |
W | | Indian Energy Exchange Ltd. | | | 750,762 | | | | 1,267,989 | |
| | Indian Hotels Co. Ltd. | | | 2,496,258 | | | | 10,070,893 | |
| | Indian Hume Pipe Co. Ltd. | | | 13,446 | | | | 26,524 | |
| | Indo Count Industries Ltd. | | | 166,243 | | | | 281,434 | |
| | Indoco Remedies Ltd. | | | 110,768 | | | | 475,727 | |
| | Indraprastha Gas Ltd. | | | 347,107 | | | | 1,793,389 | |
| | INEOS Styrolution India Ltd. | | | 15,206 | | | | 155,362 | |
| | Infibeam Avenues Ltd. | | | 2,531,827 | | | | 538,359 | |
| | Ingersoll Rand India Ltd. | | | 16,263 | | | | 430,774 | |
* | | Inox Leisure Ltd. | | | 68,296 | | | | 424,947 | |
* | | Inox Wind Ltd. | | | 140,383 | | | | 252,301 | |
| | Insecticides India Ltd. | | | 12,634 | | | | 110,015 | |
| | Intellect Design Arena Ltd. | | | 224,382 | | | | 1,173,835 | |
| | IOL Chemicals & Pharmaceuticals Ltd. | | | 38,486 | | | | 167,203 | |
| | Ipca Laboratories Ltd. | | | 430,586 | | | | 4,700,129 | |
| | IRB Infrastructure Developers Ltd. | | | 410,883 | | | | 1,164,395 | |
W | | IRCON International Ltd. | | | 462,924 | | | | 246,792 | |
| | ISGEC Heavy Engineering Ltd. | | | 22,633 | | | | 134,376 | |
| | ITD Cementation India Ltd. | | | 240,706 | | | | 351,595 | |
* | | ITI Ltd. | | | 145,880 | | | | 187,076 | |
| | J Kumar Infraprojects Ltd. | | | 70,641 | | | | 229,210 | |
| | Jagran Prakashan Ltd. | | | 288,140 | | | | 231,983 | |
| | Jai Corp. Ltd. | | | 117,016 | | | | 248,005 | |
* | | Jaiprakash Associates Ltd. | | | 2,444,320 | | | | 282,416 | |
* | | Jaiprakash Power Ventures Ltd. | | | 9,087,601 | | | | 824,223 | |
* | | Jammu & Kashmir Bank Ltd. | | | 560,538 | | | | 267,665 | |
| | Jamna Auto Industries Ltd. | | | 584,889 | | | | 793,124 | |
| | JB Chemicals & Pharmaceuticals Ltd. | | | 141,326 | | | | 3,373,458 | |
| | JBM Auto Ltd. | | | 30,720 | | | | 151,396 | |
| | Jindal Poly Films Ltd. | | | 67,148 | | | | 683,904 | |
| | Jindal Saw Ltd. | | | 585,377 | | | | 552,474 | |
* | | Jindal Stainless Hisar Ltd. | | | 342,230 | | | | 1,179,003 | |
* | | Jindal Stainless Ltd. | | | 583,054 | | | | 997,986 | |
| | JK Cement Ltd. | | | 118,052 | | | | 3,884,620 | |
| | JK Lakshmi Cement Ltd. | | | 171,089 | | | | 1,135,410 | |
| | JK Paper Ltd. | | | 272,095 | | | | 1,368,728 | |
| | JK Tyre & Industries Ltd. | | | 333,807 | | | | 704,766 | |
THE EMERGING MARKETS SMALL CAP SERIES
CONTINUED
| | | | | | | | | | |
| | | | | Shares | | | Value» | |
INDIA — (Continued) | | | | | | | | |
| | JM Financial Ltd. | | | 1,482,551 | | | $ | 1,228,800 | |
| | JMC Projects India Ltd. | | | 170,972 | | | | 225,987 | |
* | | Johnson Controls-Hitachi Air Conditioning India Ltd. | | | 30,395 | | | | 436,535 | |
| | JSW Energy Ltd. | | | 710,513 | | | | 2,893,036 | |
| | JTEKT India Ltd. | | | 150,187 | | | | 190,402 | |
| | Jubilant Ingrevia Ltd. | | | 455,030 | | | | 2,841,406 | |
| | Jubilant Pharmova Ltd. | | | 267,938 | | | | 1,203,179 | |
| | Jyothy Labs Ltd. | | | 475,110 | | | | 1,138,160 | |
| | Kajaria Ceramics Ltd. | | | 286,566 | | | | 3,755,041 | |
| | Kalpataru Power Transmission Ltd. | | | 227,054 | | | | 1,304,960 | |
| | Kalyani Steels Ltd. | | | 73,704 | | | | 267,300 | |
| | Kansai Nerolac Paints Ltd. | | | 118,385 | | | | 690,978 | |
| | Karnataka Bank Ltd. | | | 809,672 | | | | 939,477 | |
| | Karur Vysya Bank Ltd. | | | 1,624,247 | | | | 2,044,127 | |
| | Kaveri Seed Co. Ltd. | | | 80,593 | | | | 473,032 | |
| | KCP Ltd. | | | 102,485 | | | | 151,263 | |
| | KEC International Ltd. | | | 358,491 | | | | 1,900,541 | |
| | KEI Industries Ltd. | | | 207,523 | | | | 3,989,961 | |
| | Kennametal India Ltd. | | | 8,679 | | | | 259,765 | |
* | | Kesoram Industries Ltd. | | | 268,910 | | | | 183,793 | |
| | Kewal Kiran Clothing Ltd. | | | 15,442 | | | | 95,272 | |
* | | Kiri Industries Ltd. | | | 76,505 | | | | 487,670 | |
| | Kirloskar Brothers Ltd. | | | 22,472 | | | | 95,051 | |
| | Kirloskar Ferrous Industries Ltd. | | | 38,797 | | | | 123,357 | |
| | Kirloskar Oil Engines Ltd. | | | 196,999 | | | | 623,909 | |
| | Kitex Garments Ltd. | | | 41,078 | | | | 102,044 | |
| | KNR Constructions Ltd. | | | 372,490 | | | | 1,001,185 | |
| | Kolte-Patil Developers Ltd. | | | 49,505 | | | | 206,198 | |
| | KPIT Technologies Ltd. | | | 689,000 | | | | 5,930,463 | |
| | KPR Mill Ltd. | | | 426,884 | | | | 2,840,216 | |
| | KRBL Ltd. | | | 158,822 | | | | 762,569 | |
| | KSB Ltd. | | | 45,773 | | | | 1,174,448 | |
| | L&T Finance Holdings Ltd. | | | 2,318,136 | | | | 2,271,474 | |
| | LA Opala RG Ltd. | | | 124,881 | | | | 588,840 | |
| | Lakshmi Machine Works Ltd. | | | 12,187 | | | | 1,900,454 | |
W | | Laurus Labs Ltd. | | | 773,912 | | | | 4,257,370 | |
* W | | Lemon Tree Hotels Ltd. | | | 876,090 | | | | 895,789 | |
| | LG Balakrishnan & Bros Ltd. | | | 46,615 | | | | 426,621 | |
| | LIC Housing Finance Ltd. | | | 937,053 | | | | 4,595,137 | |
| | Linde India Ltd. | | | 78,446 | | | | 2,906,951 | |
| | LT Foods Ltd. | | | 472,709 | | | | 720,620 | |
| | Lumax Auto Technologies Ltd. | | | 65,818 | | | | 194,641 | |
| | Lumax Industries Ltd. | | | 3,660 | | | | 67,646 | |
| | LUX Industries Ltd. | | | 27,052 | | | | 564,194 | |
| | Mahanagar Gas Ltd. | | | 191,472 | | | | 1,989,747 | |
| | Maharashtra Scooters Ltd. | | | 808 | | | | 51,250 | |
| | Maharashtra Seamless Ltd. | | | 98,993 | | | | 938,492 | |
| | Mahindra & Mahindra Financial Services Ltd. | | | 1,801,604 | | | | 4,411,644 | |
| | Mahindra CIE Automotive Ltd. | | | 439,069 | | | | 1,590,732 | |
* | | Mahindra Holidays & Resorts India Ltd. | | | 232,705 | | | | 799,937 | |
| | Mahindra Lifespace Developers Ltd. | | | 306,556 | | | | 1,486,971 | |
W | | Mahindra Logistics Ltd. | | | 37,839 | | | | 244,474 | |
| | Maithan Alloys Ltd. | | | 10,719 | | | | 125,211 | |
| | Man Infraconstruction Ltd. | | | 166,079 | | | | 165,078 | |
| | Manappuram Finance Ltd. | | | 1,414,710 | | | | 1,799,491 | |
| | Mangalam Cement Ltd. | | | 22,484 | | | | 99,497 | |
* | | Mangalore Refinery & Petrochemicals Ltd. | | | 640,392 | | | | 419,252 | |
| | Marksans Pharma Ltd. | | | 647,499 | | | | 386,226 | |
W | | MAS Financial Services Ltd. | | | 35,635 | | | | 329,297 | |
THE EMERGING MARKETS SMALL CAP SERIES
CONTINUED
| | | | | | | | | | |
| | | | | Shares | | | Value» | |
INDIA — (Continued) | | | | | | | | |
| | Mastek Ltd. | | | 43,609 | | | $ | 893,021 | |
* | | Max Financial Services Ltd. | | | 196,352 | | | | 1,679,916 | |
* | | Max Healthcare Institute Ltd. | | | 446,556 | | | | 2,460,059 | |
* | | Max Ventures & Industries Ltd. | | | 35,700 | | | | 72,774 | |
| | Mayur Uniquoters Ltd. | | | 55,428 | | | | 312,567 | |
| | Mazagon Dock Shipbuilders Ltd. | | | 52,223 | | | | 400,170 | |
* | | Meghmani Finechem Ltd. | | | 47,103 | | | | 747,033 | |
| | Meghmani Organics Ltd. | | | 501,099 | | | | 670,851 | |
W | | Metropolis Healthcare Ltd. | | | 49,264 | | | | 1,006,179 | |
| | Minda Corp. Ltd. | | | 157,745 | | | | 371,616 | |
* | | Mirza International Ltd. | | | 59,678 | | | | 222,460 | |
W | | Mishra Dhatu Nigam Ltd. | | | 76,269 | | | | 219,465 | |
| | MM Forgings Ltd. | | | 11,713 | | | | 112,231 | |
| | MOIL Ltd. | | | 209,131 | | | | 390,370 | |
| | Monte Carlo Fashions Ltd. | | | 20,495 | | | | 178,129 | |
* | | Morepen Laboratories Ltd. | | | 893,603 | | | | 286,795 | |
| | Motilal Oswal Financial Services Ltd. | | | 124,800 | | | | 1,033,648 | |
| | Mphasis Ltd. | | | 5,763 | | | | 138,021 | |
| | MRF Ltd. | | | 2,095 | | | | 2,292,390 | |
| | MSTC Ltd. | | | 43,926 | | | | 143,369 | |
| | Multi Commodity Exchange of India Ltd. | | | 74,864 | | | | 1,386,708 | |
| | Nahar Spinning Mills Ltd. | | | 949 | | | | 3,178 | |
| | Narayana Hrudayalaya Ltd. | | | 98,601 | | | | 937,792 | |
| | Natco Pharma Ltd. | | | 343,970 | | | | 2,493,286 | |
| | National Aluminium Co. Ltd. | | | 2,223,972 | | | | 1,885,490 | |
* | | National Fertilizers Ltd. | | | 16,472 | | | | 9,875 | |
| | Nava Ltd. | | | 237,619 | | | | 566,870 | |
| | Navin Fluorine International Ltd. | | | 65,242 | | | | 3,583,238 | |
| | Navneet Education Ltd. | | | 316,145 | | | | 533,110 | |
| | NBCC India Ltd. | | | 2,133,931 | | | | 840,007 | |
| | NCC Ltd. | | | 1,018,611 | | | | 919,708 | |
| | NCL Industries Ltd. | | | 16,947 | | | | 37,009 | |
| | NELCO Ltd. | | | 36,523 | | | | 366,284 | |
| | Neogen Chemicals Ltd. | | | 16,649 | | | | 301,528 | |
| | NESCO Ltd. | | | 74,111 | | | | 516,158 | |
* | | Network18 Media & Investments Ltd. | | | 392,640 | | | | 304,139 | |
| | Neuland Laboratories Ltd. | | | 8,335 | | | | 150,728 | |
| | Newgen Software Technologies Ltd. | | | 17,273 | | | | 71,887 | |
| | NHPC Ltd. | | | 2,020,565 | | | | 1,042,712 | |
| | NIIT Ltd. | | | 297,159 | | | | 999,189 | |
| | Nilkamal Ltd. | | | 20,926 | | | | 529,335 | |
W | | Nippon Life India Asset Management Ltd. | | | 47,035 | | | | 154,319 | |
| | NLC India Ltd. | | | 685,573 | | | | 639,629 | |
| | NOCIL Ltd. | | | 318,127 | | | | 932,900 | |
| | Novartis India Ltd. | | | 790 | | | | 6,492 | |
| | NRB Bearings Ltd. | | | 160,550 | | | | 328,915 | |
| | Nucleus Software Exports Ltd. | | | 28,161 | | | | 132,069 | |
| | Oberoi Realty Ltd. | | | 150,207 | | | | 1,685,355 | |
| | Oil India Ltd. | | | 888,909 | | | | 2,070,471 | |
| | Olectra Greentech Ltd. | | | 10,905 | | | | 74,017 | |
* | | Omaxe Ltd. | | | 162,081 | | | | 175,557 | |
| | OnMobile Global Ltd. | | | 118,792 | | | | 154,465 | |
| | Oracle Financial Services Software Ltd. | | | 22,203 | | | | 783,342 | |
| | Orient Cement Ltd. | | | 376,080 | | | | 592,013 | |
| | Orient Electric Ltd. | | | 335,916 | | | | 1,094,414 | |
| | Orient Paper & Industries Ltd. | | | 230,841 | | | | 116,712 | |
| | Oriental Carbon & Chemicals Ltd. | | | 13,532 | | | | 142,806 | |
* | | Oriental Hotels Ltd. | | | 82,388 | | | | 71,065 | |
* | | Orissa Minerals Development Co. Ltd. | | | 287 | | | | 9,366 | |
THE EMERGING MARKETS SMALL CAP SERIES
CONTINUED
| | | | | | | | | | |
| | | | | Shares | | | Value» | |
INDIA — (Continued) | | | | | | | | |
| | Page Industries Ltd. | | | 2,608 | | | $ | 1,570,145 | |
| | Paisalo Digital Ltd. | | | 293,160 | | | | 319,822 | |
| | Panama Petrochem Ltd. | | | 34,687 | | | | 118,706 | |
W | | Parag Milk Foods Ltd. | | | 102,740 | | | | 132,269 | |
* | | Patel Engineering Ltd. | | | 327,353 | | | | 86,637 | |
* | | PC Jeweller Ltd. | | | 402,709 | | | | 503,570 | |
| | PCBL Ltd. | | | 555,314 | | | | 855,211 | |
| | Persistent Systems Ltd. | | | 209,899 | | | | 9,370,830 | |
| | Petronet LNG Ltd. | | | 92,651 | | | | 229,827 | |
| | Pfizer Ltd. | | | 35,000 | | | | 1,852,550 | |
| | Phoenix Mills Ltd. | | | 331,488 | | | | 5,729,067 | |
| | Piramal Enterprises Ltd. | | | 149,448 | | | | 1,536,932 | |
* W | | PNB Housing Finance Ltd. | | | 238,767 | | | | 1,269,342 | |
| | PNC Infratech Ltd. | | | 200,145 | | | | 625,996 | |
| | Poly Medicure Ltd. | | | 74,622 | | | | 828,984 | |
| | Polyplex Corp. Ltd. | | | 54,794 | | | | 1,112,424 | |
| | Poonawalla Fincorp Ltd. | | | 450,837 | | | | 1,721,244 | |
| | Power Finance Corp. Ltd. | | | 503,564 | | | | 700,025 | |
| | Power Mech Projects Ltd. | | | 8,680 | | | | 184,622 | |
| | Praj Industries Ltd. | | | 333,173 | | | | 1,666,975 | |
* | | Prakash Industries Ltd. | | | 229,461 | | | | 143,876 | |
W | | Prataap Snacks Ltd. | | | 6,333 | | | | 70,442 | |
| | Precision Camshafts Ltd. | | | 11,815 | | | | 14,843 | |
| | Prestige Estates Projects Ltd. | | | 489,030 | | | | 2,618,913 | |
* | | Pricol Ltd. | | | 150,612 | | | | 350,598 | |
| | Prince Pipes & Fittings Ltd. | | | 71,393 | | | | 457,096 | |
* | | Prism Johnson Ltd. | | | 436,256 | | | | 646,717 | |
| | Privi Speciality Chemicals Ltd. | | | 7,832 | | | | 124,507 | |
| | Procter & Gamble Health Ltd. | | | 29,018 | | | | 1,413,688 | |
| | PSP Projects Ltd. | | | 17,582 | | | | 126,162 | |
* | | PTC India Financial Services Ltd. | | | 554,178 | | | | 93,132 | |
| | PTC India Ltd. | | | 682,213 | | | | 594,554 | |
* | | PVR Ltd. | | | 13,097 | | | | 280,887 | |
W | | Quess Corp. Ltd. | | | 119,824 | | | | 800,058 | |
W | | Quick Heal Technologies Ltd. | | | 5,285 | | | | 12,042 | |
| | Radico Khaitan Ltd. | | | 274,639 | | | | 3,469,312 | |
| | Rain Industries Ltd. | | | 453,064 | | | | 918,982 | |
| | Rajesh Exports Ltd. | | | 217,740 | | | | 1,830,952 | |
| | Rallis India Ltd. | | | 270,348 | | | | 738,193 | |
| | Ramco Cements Ltd. | | | 304,449 | | | | 2,659,131 | |
| | Ramco Industries Ltd. | | | 125,986 | | | | 280,493 | |
* | | Ramco Systems Ltd. | | | 9,219 | | | | 27,467 | |
| | Ramkrishna Forgings Ltd. | | | 92,557 | | | | 256,526 | |
* | | Ramky Infrastructure Ltd. | | | 19,107 | | | | 65,900 | |
| | Rane Holdings Ltd. | | | 10,752 | | | | 119,449 | |
| | Rashtriya Chemicals & Fertilizers Ltd. | | | 520,795 | | | | 640,318 | |
| | Ratnamani Metals & Tubes Ltd. | | | 90,384 | | | | 2,228,687 | |
* | | RattanIndia Power Ltd. | | | 1,234,413 | | | | 63,366 | |
| | Raymond Ltd. | | | 136,741 | | | | 1,957,448 | |
* W | | RBL Bank Ltd. | | | 1,256,045 | | | | 2,051,521 | |
| | REC Ltd. | | | 3,576,327 | | | | 4,441,909 | |
| | Redington Ltd. | | | 1,941,308 | | | | 3,212,866 | |
| | Relaxo Footwears Ltd. | | | 146,811 | | | | 1,720,210 | |
| | Reliance Industrial Infrastructure Ltd. | | | 28,964 | | | | 384,332 | |
* | | Reliance Infrastructure Ltd. | | | 231,015 | | | | 394,993 | |
* | | Reliance Power Ltd. | | | 6,818,615 | | | | 1,333,029 | |
| | Repco Home Finance Ltd. | | | 129,953 | | | | 334,748 | |
* | | Restaurant Brands Asia Ltd. | | | 7,145 | | | | 10,564 | |
| | Rhi Magnesita India Ltd. | | | 10,840 | | | | 85,257 | |
THE EMERGING MARKETS SMALL CAP SERIES
CONTINUED
| | | | | | | | | | |
| | | | | Shares | | | Value» | |
INDIA — (Continued) | | | | | | | | |
| | Rico Auto Industries Ltd. | | | 203,537 | | | $ | 144,237 | |
| | RITES Ltd. | | | 79,722 | | | | 370,165 | |
| | Route Mobile Ltd. | | | 23,074 | | | | 366,238 | |
* | | RPSG Ventures Ltd. | | | 10,147 | | | | 59,154 | |
| | RSWM Ltd. | | | 29,079 | | | | 110,819 | |
| | Rupa & Co. Ltd. | | | 49,237 | | | | 187,426 | |
| | Sagar Cements Ltd. | | | 38,939 | | | | 95,403 | |
| | Sandhar Technologies Ltd. | | | 2,175 | | | | 6,085 | |
| | Sangam India Ltd. | | | 11,303 | | | | 38,063 | |
* | | Sanghi Industries Ltd. | | | 13,652 | | | | 9,282 | |
| | Sanghvi Movers Ltd. | | | 14,588 | | | | 39,393 | |
| | Sanofi India Ltd. | | | 29,481 | | | | 2,006,877 | |
| | Sarda Energy & Minerals Ltd. | | | 15,556 | | | | 158,895 | |
| | Saregama India Ltd. | | | 86,737 | | | | 390,909 | |
| | Sasken Technologies Ltd. | | | 14,843 | | | | 162,118 | |
* | | Satin Creditcare Network Ltd. | | | 34,530 | | | | 59,886 | |
| | Savita Oil Technologies Ltd. | | | 37,195 | | | | 135,148 | |
| | Schaeffler India Ltd. | | | 160,300 | | | | 5,371,315 | |
* | | Schneider Electric Infrastructure Ltd. | | | 162,083 | | | | 341,976 | |
* | | SEAMEC Ltd. | | | 5,590 | | | | 74,643 | |
| | Sequent Scientific Ltd. | | | 244,159 | | | | 288,111 | |
| | Seshasayee Paper & Boards Ltd. | | | 62,672 | | | | 249,421 | |
W | | SH Kelkar & Co. Ltd. | | | 81,859 | | | | 135,406 | |
| | Shakti Pumps India Ltd. | | | 4,523 | | | | 26,307 | |
| | Shankara Building Products Ltd. | | | 17,988 | | | | 154,995 | |
| | Shanthi Gears Ltd. | | | 11,586 | | | | 54,513 | |
| | Sharda Cropchem Ltd. | | | 84,617 | | | | 383,376 | |
| | Sharda Motor Industries Ltd. | | | 3,320 | | | | 30,440 | |
* | | Sheela Foam Ltd. | | | 5,847 | | | | 195,515 | |
| | Shilpa Medicare Ltd. | | | 112,538 | | | | 428,641 | |
| | Shipping Corp. of India Ltd. | | | 469,725 | | | | 736,818 | |
* | | Shoppers Stop Ltd. | | | 111,933 | | | | 1,020,461 | |
* | | Shree Renuka Sugars Ltd. | | | 1,686,032 | | | | 1,097,673 | |
| | Shriram City Union Finance Ltd. | | | 64,781 | | | | 1,424,374 | |
| | Shriram Transport Finance Co. Ltd. | | | 272,259 | | | | 4,041,862 | |
* | | SIS Ltd. | | | 53,307 | | | | 269,972 | |
| | Siyaram Silk Mills Ltd. | | | 27,614 | | | | 146,948 | |
| | SKF India Ltd. | | | 78,344 | | | | 4,159,080 | |
| | Sobha Ltd. | | | 130,458 | | | | 988,134 | |
| | Solar Industries India Ltd. | | | 103,839 | | | | 4,880,924 | |
* | | Solara Active Pharma Sciences Ltd. | | | 13,202 | | | | 63,713 | |
| | Somany Ceramics Ltd. | | | 13,279 | | | | 86,754 | |
| | Sonata Software Ltd. | | | 268,088 | | | | 1,690,737 | |
* | | South Indian Bank Ltd. | | | 4,837,745 | | | | 798,286 | |
| | SP Apparels Ltd. | | | 1,629 | | | | 7,132 | |
* | | Spandana Sphoorty Financial Ltd. | | | 33,936 | | | | 252,129 | |
| | SRF Ltd. | | | 60,124 | | | | 1,859,604 | |
* | | Star Cement Ltd. | | | 157,490 | | | | 202,744 | |
* | | Sterling & Wilson Renewable | | | 46,227 | | | | 160,904 | |
| | Sterlite Technologies Ltd. | | | 525,634 | | | | 1,050,842 | |
* | | Strides Pharma Science Ltd. | | | 208,324 | | | | 782,248 | |
* | | Subex Ltd. | | | 837,814 | | | | 304,699 | |
| | Subros Ltd. | | | 89,803 | | | | 356,268 | |
| | Sudarshan Chemical Industries Ltd. | | | 102,209 | | | | 508,968 | |
| | Sumitomo Chemical India Ltd. | | | 124,491 | | | | 737,142 | |
| | Sun TV Network Ltd. | | | 285,578 | | | | 1,802,625 | |
| | Sundaram Finance Holdings Ltd. | | | 80,225 | | | | 86,645 | |
| | Sundaram Finance Ltd. | | | 95,242 | | | | 2,675,088 | |
| | Sundaram-Clayton Ltd. | | | 10,340 | | | | 599,513 | |
THE EMERGING MARKETS SMALL CAP SERIES
CONTINUED
| | | | | | | | | | |
| | | | | Shares | | | Value» | |
INDIA — (Continued) | | | | | | | | |
| | Sundram Fasteners Ltd. | | | 316,668 | | | $ | 3,605,442 | |
* | | Sunflag Iron & Steel Co. Ltd. | | | 10,410 | | | | 10,286 | |
| | Sunteck Realty Ltd. | | | 185,188 | | | | 873,513 | |
| | Suprajit Engineering Ltd. | | | 222,652 | | | | 877,227 | |
| | Supreme Industries Ltd. | | | 209,572 | | | | 5,492,082 | |
| | Supreme Petrochem Ltd. | | | 148,926 | | | | 1,364,208 | |
| | Surya Roshni Ltd. | | | 29,526 | | | | 148,603 | |
| | Sutlej Textiles & Industries Ltd. | | | 193,970 | | | | 152,522 | |
| | Suven Pharmaceuticals Ltd. | | | 684,847 | | | | 3,303,530 | |
* | | Suzlon Energy Ltd. | | | 17,059,138 | | | | 1,660,282 | |
| | Swan Energy Ltd. | | | 76,621 | | | | 209,887 | |
| | Swaraj Engines Ltd. | | | 20,114 | | | | 386,232 | |
| | Symphony Ltd. | | | 60,208 | | | | 610,002 | |
W | | Syngene International Ltd. | | | 385,557 | | | | 2,939,484 | |
| | Tamil Nadu Newsprint & Papers Ltd. | | | 59,444 | | | | 192,704 | |
| | Tamilnadu Petroproducts Ltd. | | | 77,740 | | | | 89,860 | |
| | Tanla Platforms Ltd. | | | 78,560 | | | | 705,718 | |
* | | TARC Ltd. | | | 106,825 | | | | 57,784 | |
| | Tasty Bite Eatables Ltd. | | | 703 | | | | 101,746 | |
| | Tata Chemicals Ltd. | | | 350,094 | | | | 4,793,250 | |
| | Tata Coffee Ltd. | | | 83,686 | | | | 219,389 | |
| | Tata Elxsi Ltd. | | | 72,466 | | | | 6,148,163 | |
| | Tata Metaliks Ltd. | | | 56,536 | | | | 499,757 | |
| | Tata Steel Long Products Ltd. | | | 44,261 | | | | 329,252 | |
| | TCI Express Ltd. | | | 57,011 | | | | 1,307,373 | |
* W | | TCNS Clothing Co. Ltd. | | | 5,301 | | | | 39,331 | |
| | TD Power Systems Ltd. | | | 59,075 | | | | 88,565 | |
* | | TeamLease Services Ltd. | | | 831 | | | | 29,196 | |
| | Techno Electric & Engineering Co. Ltd. | | | 198,034 | | | | 672,101 | |
| | Texmaco Rail & Engineering Ltd. | | | 374,850 | | | | 220,774 | |
| | Thermax Ltd. | | | 117,107 | | | | 3,091,875 | |
| | Thirumalai Chemicals Ltd. | | | 96,103 | | | | 218,763 | |
* | | Thomas Cook India Ltd. | | | 304,312 | | | | 278,552 | |
W | | Thyrocare Technologies Ltd. | | | 65,124 | | | | 503,964 | |
| | Tide Water Oil Co. India Ltd. | | | 25,459 | | | | 312,842 | |
| | Tilaknagar Industries Ltd. | | | 113,055 | | | | 126,978 | |
| | Time Technoplast Ltd. | | | 390,193 | | | | 483,716 | |
| | Timken India Ltd. | | | 86,065 | | | | 3,115,192 | |
| | Tinplate Co. of India Ltd. | | | 109,549 | | | | 403,910 | |
* | | Titagarh Wagons Ltd. | | | 102,157 | | | | 196,977 | |
| | Torrent Power Ltd. | | | 546,086 | | | | 3,336,455 | |
| | Tourism Finance Corp. of India Ltd. | | | 64,002 | | | | 66,498 | |
| | Transport Corp. of India Ltd. | | | 99,134 | | | | 858,104 | |
| | Trident Ltd. | | | 4,143,289 | | | | 1,765,762 | |
| | Triveni Engineering & Industries Ltd. | | | 289,397 | | | | 883,697 | |
| | Triveni Turbine Ltd. | | | 131,091 | | | | 443,433 | |
| | TTK Prestige Ltd. | | | 146,619 | | | | 1,646,633 | |
| | Tube Investments of India Ltd. | | | 410,776 | | | | 13,507,760 | |
| | TV Today Network Ltd. | | | 89,678 | | | | 301,133 | |
* | | TV18 Broadcast Ltd. | | | 1,674,355 | | | | 708,162 | |
| | TVS Motor Co. Ltd. | | | 333,778 | | | | 4,622,507 | |
| | TVS Srichakra Ltd. | | | 13,220 | | | | 394,918 | |
| | Uflex Ltd. | | | 110,987 | | | | 938,816 | |
| | Ugar Sugar Works Ltd. | | | 35,034 | | | | 32,595 | |
* | | Ugro Capital Ltd. | | | 74,547 | | | | 160,691 | |
* | | Ujjivan Financial Services Ltd. | | | 197,452 | | | | 585,915 | |
* W | | Ujjivan Small Finance Bank Ltd. | | | 945,651 | | | | 287,948 | |
| | Unichem Laboratories Ltd. | | | 124,053 | | | | 615,077 | |
| | Union Bank of India Ltd. | | | 1,378,209 | | | | 896,347 | |
THE EMERGING MARKETS SMALL CAP SERIES
CONTINUED
| | | | | | | | | | |
| | | | | Shares | | | Value» | |
INDIA — (Continued) | | | | | | | | |
| | UNO Minda Ltd. | | | 463,085 | | | $ | 2,998,157 | |
| | Usha Martin Ltd. | | | 225,489 | | | | 386,324 | |
| | UTI Asset Management Co. Ltd. | | | 23,479 | | | | 199,023 | |
* | | VA Tech Wabag Ltd. | | | 94,341 | | | | 301,566 | |
| | Vaibhav Global Ltd. | | | 257,258 | | | | 1,099,663 | |
| | Vakrangee Ltd. | | | 1,058,449 | | | | 403,418 | |
W | | Valiant Organics Ltd. | | | 2,782 | | | | 22,449 | |
| | Vardhman Textiles Ltd. | | | 488,265 | | | | 1,987,261 | |
* W | | Varroc Engineering Ltd. | | | 80,384 | | | | 302,994 | |
| | Varun Beverages Ltd. | | | 294,430 | | | | 3,734,021 | |
| | Venky’s India Ltd. | | | 16,753 | | | | 393,704 | |
| | Vesuvius India Ltd. | | | 15,479 | | | | 281,978 | |
| | V-Guard Industries Ltd. | | | 555,007 | | | | 1,718,431 | |
| | Vimta Labs Ltd. | | | 12,331 | | | | 63,323 | |
| | Vinati Organics Ltd. | | | 93,732 | | | | 2,163,732 | |
| | Vindhya Telelinks Ltd. | | | 15,562 | | | | 250,959 | |
| | VIP Industries Ltd. | | | 34,437 | | | | 317,578 | |
| | Visaka Industries Ltd. | | | 14,832 | | | | 96,920 | |
| | V-Mart Retail Ltd. | | | 3,876 | | | | 140,233 | |
* | | Vodafone Idea Ltd. | | | 15,626,929 | | | | 1,626,423 | |
| | Voltamp Transformers Ltd. | | | 6,458 | | | | 212,711 | |
| | VRL Logistics Ltd. | | | 105,624 | | | | 775,331 | |
| | VST Industries Ltd. | | | 19,201 | | | | 814,199 | |
| | VST Tillers Tractors Ltd. | | | 13,719 | | | | 372,134 | |
| | Welspun Corp. Ltd. | | | 436,397 | | | | 1,173,924 | |
| | Welspun Enterprises Ltd. | | | 250,028 | | | | 387,072 | |
| | Welspun India Ltd. | | | 1,327,306 | | | | 1,254,128 | |
| | West Coast Paper Mills Ltd. | | | 119,976 | | | | 887,136 | |
* | | Westlife Development Ltd. | | | 67,436 | | | | 611,876 | |
| | Wheels India Ltd. | | | 10,888 | | | | 82,881 | |
| | Whirlpool of India Ltd. | | | 40,537 | | | | 769,483 | |
* | | Wockhardt Ltd. | | | 145,950 | | | | 410,474 | |
* | | Wonderla Holidays Ltd. | | | 21,675 | | | | 90,244 | |
* | | Yes Bank Ltd. | | | 237,637 | | | | 44,681 | |
| | Zee Entertainment Enterprises Ltd. | | | 2,035,315 | | | | 6,463,376 | |
* | | Zee Media Corp. Ltd. | | | 636,607 | | | | 120,831 | |
| | Zensar Technologies Ltd. | | | 343,925 | | | | 923,522 | |
| | Zydus Wellness Ltd. | | | 18,379 | | | | 391,031 | |
| | | | | | | | | | |
TOTAL INDIA | | | | 686,162,224 | |
| | | | | | | | | | |
INDONESIA — (2.4%) | | | | | | | | |
| | ABM Investama Tbk PT | | | 1,069,000 | | | | 269,937 | |
| | Ace Hardware Indonesia Tbk PT | | | 19,988,600 | | | | 723,537 | |
* | | Adhi Karya Persero Tbk PT | | | 5,523,788 | | | | 196,761 | |
* | | Adi Sarana Armada Tbk PT | | | 3,576,500 | | | | 273,917 | |
* | | Agung Semesta Sejahtera Tbk PT | | | 34,642,700 | | | | 111,036 | |
| | AKR Corporindo Tbk PT | | | 23,912,200 | | | | 2,393,768 | |
* | | Alam Sutera Realty Tbk PT | | | 35,031,400 | | | | 390,721 | |
| | Aneka Gas Industri Tbk PT | | | 1,269,300 | | | | 166,819 | |
| | Aneka Tambang Tbk PT | | | 2,638,100 | | | | 312,267 | |
* †† | | Armidian Karyatama Tbk PT | | | 844,800 | | | | 508 | |
| | Arwana Citramulia Tbk PT | | | 18,420,300 | | | | 1,080,712 | |
| | Ashmore Asset Management Indonesia Tbk PT | | | 88,400 | | | | 5,875 | |
| | Astra Agro Lestari Tbk PT | | | 1,572,300 | | | | 856,963 | |
| | Astra Otoparts Tbk PT | | | 2,355,600 | | | | 199,421 | |
* | | Asuransi Maximus Graha Persada Tbk PT | | | 8,900,400 | | | | 73,523 | |
* †† | | Bakrie Telecom Tbk PT | | | 49,756,298 | | | | 29,906 | |
| | Bali Bintang Sejahtera Tbk PT | | | 3,153,100 | | | | 51,006 | |
* | | Bank Amar Indonesia Tbk PT | | | 6,621,600 | | | | 132,724 | |
THE EMERGING MARKETS SMALL CAP SERIES
CONTINUED
| | | | | | | | | | |
| | | | | Shares | | | Value» | |
INDONESIA — (Continued) | | | | | | | | |
| | Bank BTPN Syariah Tbk PT | | | 5,204,000 | | | $ | 984,659 | |
* | | Bank Bukopin Tbk PT | | | 63,114,482 | | | | 548,169 | |
* | | Bank Capital Indonesia Tbk PT | | | 9,245,100 | | | | 84,219 | |
* | | Bank Ganesha Tbk PT | | | 7,884,200 | | | | 51,032 | |
* | | Bank Ina Perdana PT | | | 5,377,000 | | | | 1,352,513 | |
* | | Bank Mayapada International Tbk PT | | | 934,600 | | | | 41,007 | |
| | Bank Maybank Indonesia Tbk PT | | | 14,258,200 | | | | 232,329 | |
* | | Bank MNC Internasional Tbk PT | | | 32,986,100 | | | | 228,295 | |
* | | Bank Nationalnobu Tbk PT | | | 1,174,200 | | | | 41,997 | |
| | Bank OCBC Nisp Tbk PT | | | 1,841,100 | | | | 88,627 | |
| | Bank Pan Indonesia Tbk PT | | | 13,964,900 | | | | 2,151,436 | |
| | Bank Pembangunan Daerah Jawa Barat Dan Banten Tbk PT | | | 8,878,812 | | | | 782,669 | |
| | Bank Pembangunan Daerah Jawa Timur Tbk PT | | | 12,456,900 | | | | 563,016 | |
| | Bank Tabungan Negara Persero Tbk PT | | | 13,371,649 | | | | 1,326,125 | |
* | | Bekasi Fajar Industrial Estate Tbk PT | | | 15,027,700 | | | | 133,934 | |
| | BFI Finance Indonesia Tbk PT | | | 23,038,600 | | | | 1,635,115 | |
* | | Bintang Oto Global Tbk PT | | | 7,756,800 | | | | 674,052 | |
| | BISI International Tbk PT | | | 8,589,500 | | | | 814,260 | |
| | Blue Bird Tbk PT | | | 696,300 | | | | 68,618 | |
* | | Buana Lintas Lautan Tbk PT | | | 18,874,200 | | | | 186,319 | |
* | | Bumi Resources Minerals Tbk PT | | | 84,337,900 | | | | 978,572 | |
* | | Bumi Resources Tbk PT | | | 261,056,100 | | | | 3,166,487 | |
* | | Bumi Serpong Damai Tbk PT | | | 14,012,000 | | | | 835,596 | |
* | | Bumi Teknokultura Unggul Tbk PT | | | 65,924,600 | | | | 211,331 | |
* | | Capital Financial Indonesia Tbk PT | | | 1,258,200 | | | | 61,271 | |
| | Catur Sentosa Adiprana Tbk PT | | | 2,986,100 | | | | 155,950 | |
W | | Cikarang Listrindo Tbk PT | | | 4,462,100 | | | | 194,545 | |
| | Ciputra Development Tbk PT | | | 29,071,620 | | | | 1,751,703 | |
* | | Citra Marga Nusaphala Persada Tbk PT | | | 13,896,403 | | | | 1,729,527 | |
* | | City Retail Developments Tbk PT | | | 12,056,400 | | | | 108,195 | |
* | | Delta Dunia Makmur Tbk PT | | | 15,329,000 | | | | 384,688 | |
| | Dharma Satya Nusantara Tbk PT | | | 6,420,300 | | | | 228,580 | |
| | Elnusa Tbk PT | | | 10,521,900 | | | | 253,480 | |
| | Erajaya Swasembada Tbk PT | | | 27,567,400 | | | | 761,050 | |
* | | Gajah Tunggal Tbk PT | | | 4,584,000 | | | | 177,706 | |
| | Garudafood Putra Putri Jaya Tbk PT | | | 11,090,700 | | | | 369,737 | |
* | | Global Mediacom Tbk PT | | | 17,118,300 | | | | 328,980 | |
* †† | | Hanson International Tbk PT | | | 483,480,300 | | | | 0 | |
| | Harum Energy Tbk PT | | | 6,043,000 | | | | 623,089 | |
| | Hexindo Adiperkasa Tbk PT | | | 523,400 | | | | 196,403 | |
| | Impack Pratama Industri Tbk PT | | | 1,149,500 | | | | 252,161 | |
| | Indika Energy Tbk PT | | | 5,804,300 | | | | 1,210,022 | |
| | Indo Tambangraya Megah Tbk PT | | | 682,100 | | | | 1,964,897 | |
| | Indocement Tunggal Prakarsa Tbk PT | | | 1,308,100 | | | | 778,119 | |
| | Indomobil Sukses Internasional Tbk PT | | | 512,300 | | | | 29,919 | |
| | Indosat Tbk PT | | | 319,400 | | | | 138,612 | |
* | | Indosterling Technomedia Tbk PT | | | 482,900 | | | | 141,805 | |
| | Industri Jamu Dan Farmasi Sido Muncul Tbk PT | | | 22,446,246 | | | | 1,065,407 | |
* †† | | Inovisi Infracom Tbk PT | | | 1,806,467 | | | | 0 | |
| | Integra Indocabinet Tbk PT | | | 4,674,000 | | | | 129,480 | |
* †† | | Inti Agri Resources Tbk PT | | | 92,782,800 | | | | 55,768 | |
* | | Intiland Development Tbk PT | | | 4,610,132 | | | | 54,615 | |
| | Jaccs Mitra Pinasthika Mustika Tbk PT | | | 4,348,100 | | | | 285,531 | |
| | Japfa Comfeed Indonesia Tbk PT | | | 12,837,300 | | | | 1,140,625 | |
* | | Jasa Marga Persero Tbk PT | | | 5,160,800 | | | | 1,128,353 | |
| | Jaya Real Property Tbk PT | | | 10,463,000 | | | | 312,621 | |
* | | Kapuas Prima Coal Tbk PT | | | 37,878,000 | | | | 145,394 | |
* | | Kawasan Industri Jababeka Tbk PT | | | 108,474,057 | | | | 1,043,268 | |
| | KMI Wire & Cable Tbk PT | | | 5,778,100 | | | | 111,004 | |
THE EMERGING MARKETS SMALL CAP SERIES
CONTINUED
| | | | | | | | | | |
| | | | | Shares | | | Value» | |
INDONESIA — (Continued) | | | | | | | | |
* | | Krakatau Steel Persero Tbk PT | | | 13,163,002 | | | $ | 317,054 | |
* | | Kresna Graha Investama Tbk PT | | | 5,504,400 | | | | 17,617 | |
* | | Lippo Karawaci Tbk PT | | | 123,858,040 | | | | 794,050 | |
* | | M Cash Integrasi PT | | | 216,900 | | | | 151,510 | |
| | Mahkota Group Tbk PT | | | 374,000 | | | | 19,182 | |
* | | Malindo Feedmill Tbk PT | | | 3,163,300 | | | | 110,601 | |
* | | Map Aktif Adiperkasa PT | | | 751,600 | | | | 154,236 | |
| | Matahari Department Store Tbk PT | | | 2,197,200 | | | | 657,639 | |
* | | Matahari Putra Prima Tbk PT | | | 289,100 | | | | 2,516 | |
* | | MD Pictures Tbk PT | | | 538,400 | | | | 92,803 | |
| | Medco Energi Internasional Tbk PT | | | 19,378,707 | | | | 1,437,420 | |
| | Media Nusantara Citra Tbk PT | | | 17,933,800 | | | | 943,779 | |
| | Medikaloka Hermina Tbk PT | | | 14,906,100 | | | | 1,424,644 | |
* | | Mega Manunggal Property Tbk PT | | | 10,772,800 | | | | 327,465 | |
* | | Metro Healthcare Indonesia Tbk PT | | | 11,631,800 | | | | 380,272 | |
| | Metrodata Electronics Tbk PT | | | 15,657,100 | | | | 587,247 | |
| | Metropolitan Kentjana Tbk PT | | | 9,100 | | | | 13,171 | |
* | | Mitra Adiperkasa Tbk PT | | | 27,990,200 | | | | 2,164,540 | |
| | Mitra Keluarga Karyasehat Tbk PT | | | 4,883,100 | | | | 864,987 | |
* | | MNC Kapital Indonesia Tbk PT | | | 27,203,400 | | | | 181,527 | |
* | | MNC Land Tbk PT | | | 29,086,600 | | | | 154,740 | |
* | | MNC Vision Networks Tbk PT | | | 27,903,500 | | | | 147,984 | |
* | | Mulia Industrindo Tbk PT | | | 1,595,600 | | | | 58,309 | |
* | | Multipolar Tbk PT | | | 5,540,600 | | | | 46,854 | |
* | | NFC Indonesia Tbk PT | | | 86,200 | | | | 67,937 | |
| | Nippon Indosari Corpindo Tbk PT | | | 13,183,989 | | | | 1,060,760 | |
| | Pabrik Kertas Tjiwi Kimia Tbk PT | | | 3,377,600 | | | | 1,691,981 | |
* | | Pacific Strategic Financial Tbk PT | | | 20,982,800 | | | | 1,540,363 | |
| | Pakuwon Jati Tbk PT | | | 32,672,800 | | | | 917,989 | |
| | Panin Financial Tbk PT | | | 52,906,000 | | | | 2,154,866 | |
* | | Paninvest Tbk PT | | | 4,828,600 | | | | 579,469 | |
* | | Pelayaran Tamarin Samudra Tbk PT | | | 19,571,300 | | | | 6,274 | |
| | Perusahaan Gas Negara Tbk PT | | | 23,914,800 | | | | 3,030,235 | |
| | Perusahaan Perkebunan London Sumatra Indonesia Tbk PT | | | 10,211,400 | | | | 739,640 | |
* | | Pollux Properti Indonesia Tbk PT | | | 2,219,300 | | | | 42,788 | |
* †† | | Pool Advista Indonesia Tbk PT | | | 10,473,500 | | | | 6,295 | |
* | | PP Persero Tbk PT | | | 9,359,714 | | | | 528,180 | |
| | Prodia Widyahusada Tbk PT | | | 175,800 | | | | 59,770 | |
| | Puradelta Lestari Tbk PT | | | 33,039,000 | | | | 385,349 | |
| | Ramayana Lestari Sentosa Tbk PT | | | 8,938,400 | | | | 329,690 | |
| | Resource Alam Indonesia Tbk PT | | | 3,392,700 | | | | 137,844 | |
* †† | | Rimo International Lestari Tbk PT | | | 211,251,900 | | | | 126,975 | |
| | Rukun Raharja Tbk PT | | | 2,350,900 | | | | 146,505 | |
| | Salim Ivomas Pratama Tbk PT | | | 12,369,300 | | | | 336,538 | |
| | Samindo Resources Tbk PT | | | 106,600 | | | | 10,755 | |
| | Sampoerna Agro Tbk PT | | | 3,879,900 | | | | 537,595 | |
| | Samudera Indonesia Tbk PT | | | 3,249,500 | | | | 493,556 | |
* | | Sarana Meditama Metropolitan Tbk PT | | | 3,473,000 | | | | 64,539 | |
| | Sariguna Primatirta Tbk PT | | | 5,940,900 | | | | 274,224 | |
| | Sawit Sumbermas Sarana Tbk PT | | | 12,640,300 | | | | 1,126,158 | |
* †† | | Sekawan Intipratama Tbk PT | | | 9,367,900 | | | | 0 | |
| | Selamat Sempurna Tbk PT | | | 13,150,400 | | | | 1,264,215 | |
* | | Semen Baturaja Persero Tbk PT | | | 6,838,100 | | | | 187,641 | |
| | Semen Indonesia Persero Tbk PT | | | 588,300 | | | | 300,098 | |
| | Siloam International Hospitals Tbk PT | | | 11,618,000 | | | | 816,288 | |
| | Sinar Mas Agro Resources & Technology Tbk PT | | | 1,020,560 | | | | 302,813 | |
* †† | | Sri Rejeki Isman Tbk PT | | | 35,353,931 | | | | 62,049 | |
| | Steel Pipe Industry of Indonesia PT | | | 2,787,400 | | | | 49,329 | |
* †† | | Sugih Energy Tbk PT | | | 100,457,800 | | | | 0 | |
THE EMERGING MARKETS SMALL CAP SERIES
CONTINUED
| | | | | | | | | | |
| | | | | Shares | | | Value» | |
INDONESIA — (Continued) | | | | | | | | |
| | Summarecon Agung Tbk PT | | | 32,903,146 | | | $ | 1,248,782 | |
* †† | | Surabaya Agung Industri Pulp & Kertas Tbk PT | | | 64,500 | | | | 0 | |
| | Surya Citra Media Tbk PT | | | 62,152,600 | | | | 932,272 | |
| | Surya Esa Perkasa Tbk PT | | | 20,076,900 | | | | 1,371,271 | |
| | Surya Permata Andalan Tbk PT | | | 550,300 | | | | 17,573 | |
| | Surya Pertiwi Tbk PT | | | 1,435,000 | | | | 52,893 | |
* | | Surya Semesta Internusa Tbk PT | | | 16,561,000 | | | | 344,189 | |
* †† | | Suryainti Permata Tbk PT | | | 7,252,000 | | | | 0 | |
| | Temas Tbk PT | | | 1,050,300 | | | | 120,408 | |
| | Tempo Scan Pacific Tbk PT | | | 1,861,700 | | | | 162,419 | |
| | Timah Tbk PT | | | 8,208,514 | | | | 713,877 | |
* †† | | Trada Alam Minera Tbk PT | | | 180,020,800 | | | | 108,203 | |
| | Trias Sentosa Tbk PT | | | 32,818,400 | | | | 1,565,529 | |
* | | Trimegah Sekuritas IndonesiaTbk PT | | | 2,930,400 | | | | 56,341 | |
| | Triputra Agro Persada PT | | | 4,188,700 | | | | 186,871 | |
| | Tunas Baru Lampung Tbk PT | | | 11,437,500 | | | | 513,263 | |
| | Ultrajaya Milk Industry & Trading Co. Tbk PT | | | 15,164,100 | | | | 1,370,935 | |
| | Unggul Indah Cahaya Tbk PT | | | 48,239 | | | | 34,674 | |
* †† | | Waskita Beton Precast Tbk PT | | | 28,238,300 | | | | 64,497 | |
* | | Waskita Karya Persero Tbk PT | | | 31,956,666 | | | | 985,597 | |
| | Wijaya Karya Bangunan Gedung Tbk PT | | | 6,345,100 | | | | 68,291 | |
| | Wijaya Karya Beton Tbk PT | | | 8,423,800 | | | | 112,537 | |
* | | Wijaya Karya Persero Tbk PT | | | 9,818,007 | | | | 573,324 | |
| | XL Axiata Tbk PT | | | 9,989,700 | | | | 1,614,793 | |
| | | | | | | | | | |
TOTAL INDONESIA | | | | 84,409,677 | |
| | | | | | | | | | |
MALAYSIA — (1.6%) | | | | | | | | |
# | | 7-Eleven Malaysia Holdings Bhd, Class B | | | 2,072,285 | | | | 1,041,229 | |
| | Able Global Bhd | | | 232,200 | | | | 67,051 | |
| | Aeon Co. M Bhd | | | 1,014,100 | | | | 296,084 | |
| | AEON Credit Service M Bhd | | | 312,000 | | | | 856,935 | |
# | | AFFIN Bank Bhd | | | 1,323,695 | | | | 627,879 | |
| | Ajinomoto Malaysia Bhd | | | 67,800 | | | | 161,763 | |
| | Alliance Bank Malaysia Bhd | | | 2,568,000 | | | | 2,009,080 | |
| | Allianz Malaysia Bhd | | | 134,100 | | | | 377,296 | |
| | AME Elite Consortium Bhd | | | 83,800 | | | | 24,793 | |
* | | Ancom Nylex Bhd | | | 689,200 | | | | 135,626 | |
# | | Ann Joo Resources Bhd | | | 353,150 | | | | 73,534 | |
# | | Astro Malaysia Holdings Bhd | | | 1,643,500 | | | | 234,640 | |
# * | | Berjaya Assets Bhd | | | 1,888,400 | | | | 115,974 | |
* | | Berjaya Corp. Bhd | | | 6,779,128 | | | | 336,513 | |
| | Berjaya Food Bhd | | | 501,000 | | | | 99,514 | |
# * | | Berjaya Land Bhd | | | 3,154,600 | | | | 153,198 | |
# * | | Bermaz Auto Bhd | | | 694,900 | | | | 290,779 | |
| | Bintulu Port Holdings Bhd | | | 25,900 | | | | 27,317 | |
* | | Boustead Holdings Bhd | | | 1,445,328 | | | | 176,170 | |
# | | Boustead Plantations Bhd | | | 932,299 | | | | 137,004 | |
# | | British American Tobacco Malaysia Bhd | | | 360,600 | | | | 802,519 | |
* | | Bumi Armada Bhd | | | 4,938,200 | | | | 407,838 | |
| | Bursa Malaysia Bhd | | | 1,100,300 | | | | 1,501,101 | |
# | | Cahya Mata Sarawak Bhd | | | 1,296,800 | | | | 230,322 | |
| | Carlsberg Brewery Malaysia Bhd, Class B | | | 752,900 | | | | 3,547,052 | |
* †† | | Carotech Bhd | | | 230,650 | | | | 0 | |
# | | CB Industrial Product Holding Bhd | | | 867,240 | | | | 203,534 | |
# | | CSC Steel Holdings Bhd | | | 435,500 | | | | 108,846 | |
| | D&O Green Technologies Bhd | | | 706,600 | | | | 581,563 | |
# | | Dayang Enterprise Holdings Bhd | | | 1,165,375 | | | | 305,214 | |
| | DRB-Hicom Bhd | | | 2,600,800 | | | | 737,599 | |
# | | Dufu Technology Corp. Bhd | | | 506,600 | | | | 254,842 | |
THE EMERGING MARKETS SMALL CAP SERIES
CONTINUED
| | | | | | | | | | |
| | | | | Shares | | | Value» | |
MALAYSIA — (Continued) | | | | | | | | |
# | | Duopharma Biotech Bhd | | | 1,059,314 | | | $ | 309,358 | |
| | Dutch Lady Milk Industries Bhd | | | 79,100 | | | | 507,662 | |
| | Eco World Development Group Bhd | | | 2,120,900 | | | | 271,494 | |
# * | | Eco World International Bhd | | | 872,100 | | | | 48,773 | |
* | | Ecofirst Consolidated Bhd | | | 402,200 | | | | 29,792 | |
# * | | Ekovest Bhd | | | 3,871,950 | | | | 258,263 | |
| | Evergreen Fibreboard Bhd | | | 149,100 | | | | 12,316 | |
| | FAR East Holdings Bhd | | | 258,300 | | | | 205,283 | |
# | | Formosa Prosonic Industries Bhd | | | 187,500 | | | | 125,140 | |
| | Frontken Corp. Bhd | | | 1,989,150 | | | | 1,035,306 | |
| | Gadang Holdings Bhd | | | 1,444,200 | | | | 93,225 | |
# | | Gas Malaysia Bhd | | | 531,500 | | | | 379,044 | |
| | George Kent Malaysia Bhd | | | 963,000 | | | | 101,741 | |
| | Globetronics Technology Bhd | | | 1,161,072 | | | | 256,274 | |
* †† | | Golden Plus Holding Bhd | | | 216,000 | | | | 0 | |
# | | Guan Chong Bhd | | | 979,000 | | | | 435,640 | |
| | Hai-O Enterprise Bhd | | | 642,197 | | | | 194,412 | |
| | HAP Seng Consolidated Bhd | | | 348,540 | | | | 474,500 | |
| | Hap Seng Plantations Holdings Bhd | | | 204,100 | | | | 87,180 | |
| | Heineken Malaysia Bhd | | | 89,500 | | | | 436,690 | |
# | | Hengyuan Refining Co. Bhd | | | 322,900 | | | | 290,438 | |
| | HeveaBoard Bhd | | | 526,300 | | | | 39,995 | |
# | | Hextar Global Bhd | | | 102,700 | | | | 51,482 | |
# | | Hiap Teck Venture Bhd | | | 3,025,300 | | | | 147,348 | |
# | | Hibiscus Petroleum Bhd | | | 3,450,800 | | | | 708,034 | |
# | | Hong Leong Capital Bhd | | | 33,800 | | | | 45,421 | |
| | Hong Leong Industries Bhd | | | 350,400 | | | | 689,882 | |
| | Hup Seng Industries Bhd | | | 921,033 | | | | 130,566 | |
| | IGB Bhd | | | 666,254 | | | | 325,958 | |
| | IJM Corp. Bhd | | | 712,500 | | | | 245,479 | |
| | Insas Bhd | | | 245,581 | | | | 39,982 | |
| | IOI Properties Group Bhd | | | 132,600 | | | | 28,899 | |
* | | Iris Corp. Bhd | | | 401,400 | | | | 10,618 | |
* | | Iskandar Waterfront City Bhd | | | 1,196,100 | | | | 64,762 | |
# * | | JAKS Resources Bhd | | | 4,088,380 | | | | 216,207 | |
| | Jaya Tiasa Holdings Bhd | | | 1,265,327 | | | | 156,448 | |
# * | | JHM Consolidation Bhd | | | 860,400 | | | | 157,876 | |
| | Keck Seng Malaysia Bhd | | | 289,650 | | | | 211,204 | |
# | | Kelington Group Bhd | | | 600,700 | | | | 164,490 | |
| | Kenanga Investment Bank Bhd | | | 298,700 | | | | 55,321 | |
| | Kerjaya Prospek Group Bhd | | | 728,690 | | | | 181,742 | |
# | | Kim Loong Resources Bhd | | | 838,580 | | | | 298,782 | |
# * | | KNM Group Bhd | | | 6,978,580 | | | | 125,517 | |
# | | Kobay Technology Bhd | | | 263,800 | | | | 162,752 | |
| | Kossan Rubber Industries Bhd | | | 268,700 | | | | 71,152 | |
| | KPJ Healthcare Bhd | | | 4,788,700 | | | | 831,109 | |
# | | Kretam Holdings Bhd | | | 1,548,200 | | | | 187,995 | |
* | | Kronologi Asia Bhd | | | 791,100 | | | | 67,057 | |
# * | | KSL Holdings Bhd | | | 790,818 | | | | 123,956 | |
# | | Kumpulan Fima Bhd | | | 168,550 | | | | 72,165 | |
| | Land & General Bhd | | | 5,669,760 | | | | 109,070 | |
| | LBS Bina Group Bhd | | | 2,657,916 | | | | 227,704 | |
# * | | Leong Hup International Bhd | | | 525,600 | | | | 50,591 | |
# | | Lii Hen Industries Bhd | | | 951,000 | | | | 167,856 | |
# | | Lingkaran Trans Kota Holdings Bhd | | | 636,300 | | | | 673,077 | |
# W | | Lotte Chemical Titan Holding Bhd | | | 1,020,797 | | | | 283,095 | |
# | | LPI Capital Bhd | | | 373,224 | | | | 978,983 | |
| | Luxchem Corp. Bhd | | | 56,200 | | | | 6,300 | |
| | Magni-Tech Industries Bhd | | | 612,433 | | | | 220,090 | |
THE EMERGING MARKETS SMALL CAP SERIES
CONTINUED
| | | | | | | | | | |
| | | | | Shares | | | Value» | |
MALAYSIA — (Continued) | | | | | | | | |
# | | Magnum Bhd | | | 2,968,363 | | | $ | 986,969 | |
# | | Mah Sing Group Bhd | | | 3,290,287 | | | | 355,742 | |
# | | Malakoff Corp. Bhd | | | 4,685,100 | | | | 610,567 | |
# | | Malayan Flour Mills Bhd | | | 2,082,475 | | | | 240,244 | |
# | | Malaysia Building Society Bhd | | | 5,406,590 | | | | 674,498 | |
# | | Malaysia Smelting Corp. Bhd | | | 213,800 | | | | 63,348 | |
# | | Malaysian Resources Corp. Bhd | | | 4,929,166 | | | | 313,149 | |
| | Matrix Concepts Holdings Bhd | | | 3,248,937 | | | | 974,259 | |
| | MBM Resources Bhd | | | 483,896 | | | | 340,141 | |
| | Media Chinese International Ltd. | | | 1,200,400 | | | | 40,415 | |
| | Media Prima Bhd | | | 86,700 | | | | 7,784 | |
| | Mega First Corp. Bhd | | | 1,538,100 | | | | 1,067,444 | |
# | | MKH Bhd | | | 1,437,434 | | | | 352,989 | |
| | MNRB Holdings Bhd | | | 1,170,188 | | | | 212,762 | |
# | | MPHB Capital Bhd | | | 1,201,700 | | | | 240,967 | |
| | Muda Holdings Bhd | | | 348,000 | | | | 133,176 | |
* | | Muhibbah Engineering M Bhd | | | 1,522,025 | | | | 133,679 | |
* | | Mulpha International Bhd | | | 354,130 | | | | 171,095 | |
| | Nylex Malaysia Bhd | | | 4,205 | | | | 174 | |
# | | OCK Group Bhd | | | 1,345,100 | | | | 122,629 | |
| | Oriental Holdings Bhd | | | 679,900 | | | | 957,410 | |
# | | OSK Holdings Bhd | | | 5,459,555 | | | | 1,027,790 | |
| | PA Resources Bhd | | | 970,800 | | | | 51,364 | |
| | Padini Holdings Bhd | | | 1,331,800 | | | | 953,115 | |
| | Panasonic Manufacturing Malaysia Bhd | | | 25,084 | | | | 122,378 | |
| | Pantech Group Holdings Bhd | | | 1,007,619 | | | | 147,097 | |
# | | Paramount Corp. Bhd | | | 1,104,355 | | | | 170,649 | |
| | Perak Transit Bhd | | | 632,500 | | | | 131,803 | |
# | | Petron Malaysia Refining & Marketing Bhd | | | 256,100 | | | | 248,670 | |
# | | Pharmaniaga Bhd | | | 316,200 | | | | 37,449 | |
# | | PIE Industrial Bhd | | | 39,900 | | | | 21,483 | |
| | PMB Technology Bhd | | | 49,300 | | | | 42,118 | |
* | | Pos Malaysia Bhd | | | 108,000 | | | | 13,597 | |
# * | | Ranhill Utilities Bhd | | | 1,759,838 | | | | 143,250 | |
| | RCE Capital Bhd | | | 220,600 | | | | 73,694 | |
* | | Revenue Group Bhd | | | 294,700 | | | | 58,431 | |
| | Sam Engineering & Equipment M Bhd | | | 330,200 | | | | 371,530 | |
* | | Sapura Energy Bhd | | | 26,310,200 | | | | 194,405 | |
# | | Sarawak Oil Palms Bhd | | | 830,255 | | | | 451,483 | |
| | Scientex Bhd | | | 1,398,672 | | | | 964,494 | |
| | SEG International Bhd | | | 145,885 | | | | 19,445 | |
* | | Shangri-La Hotels Malaysia Bhd | | | 244,900 | | | | 177,979 | |
# | | Sime Darby Property Bhd | | | 5,517,400 | | | | 530,619 | |
# | | SKP Resources Bhd | | | 2,082,124 | | | | 701,319 | |
# | | SP Setia Bhd Group | | | 3,536,900 | | | | 358,324 | |
# | | Sports Toto Bhd | | | 2,350,050 | | | | 901,898 | |
†† | | Sumatec Resources Bhd | | | 6,536,100 | | | | 1,244 | |
# | | Sunway Construction Group Bhd | | | 346,636 | | | | 111,587 | |
| | Suria Capital Holdings Bhd | | | 269,560 | | | | 59,422 | |
# | | Syarikat Takaful Malaysia Keluarga Bhd | | | 731,957 | | | | 511,113 | |
# | | Ta Ann Holdings Bhd | | | 448,389 | | | | 374,662 | |
# | | Taliworks Corp. Bhd | | | 1,493,916 | | | | 285,650 | |
| | Tan Chong Motor Holdings Bhd | | | 211,500 | | | | 49,650 | |
# | | TASCO Bhd | | | 191,900 | | | | 35,312 | |
# | | Thong Guan Industries Bhd | | | 530,900 | | | | 304,542 | |
| | TMC Life Sciences Bhd | | | 948,400 | | | | 124,164 | |
# * | | Tropicana Corp. Bhd | | | 2,587,990 | | | | 722,024 | |
# | | TSH Resources Bhd | | | 1,381,600 | | | | 309,667 | |
* | | Tune Protect Group Bhd | | | 432,900 | | | | 24,748 | |
THE EMERGING MARKETS SMALL CAP SERIES
CONTINUED
| | | | | | | | | | |
| | | | | Shares | | | Value» | |
MALAYSIA — (Continued) | | | | | | | | |
# | | Uchi Technologies Bhd | | | 887,200 | | | $ | 634,462 | |
| | UEM Edgenta Bhd | | | 941,100 | | | | 214,918 | |
# * | | UEM Sunrise Bhd | | | 2,829,800 | | | | 122,781 | |
# | | UMW Holdings Bhd | | | 1,084,500 | | | | 770,476 | |
| | Unisem M Bhd | | | 278,300 | | | | 156,554 | |
| | United Malacca Bhd | | | 442,250 | | | | 503,280 | |
| | United Plantations Bhd | | | 62,500 | | | | 188,401 | |
# | | UOA Development Bhd | | | 4,413,299 | | | | 1,457,362 | |
| | UWC Bhd | | | 405,800 | | | | 318,869 | |
# * | | Velesto Energy Bhd | | | 12,270,108 | | | | 312,306 | |
# | | VS Industry Bhd | | | 2,829,900 | | | | 506,296 | |
* | | Wah Seong Corp. Bhd | | | 1 | | | | 0 | |
# | | WCT Holdings Bhd | | | 2,091,593 | | | | 161,480 | |
# | | Wellcall Holdings Bhd | | | 1,183,600 | | | | 283,118 | |
* | | Widad Group Bhd | | | 1,235,800 | | | | 109,854 | |
| | Yinson Holdings Bhd | | | 2,167,000 | | | | 971,870 | |
# * | | YNH Property Bhd | | | 2,935,116 | | | | 2,542,129 | |
| | YTL Power International Bhd | | | 1,385,743 | | | | 206,673 | |
| | | | | | | | | | |
TOTAL MALAYSIA | | | | | | | 58,092,744 | |
| | | | | | | | | | |
MEXICO — (3.1%) | | | | | | | | |
# * | | ALEATICA SAB de CV | | | 228,600 | | | | 376,769 | |
| | Alfa SAB de CV, Class A | | | 858,225 | | | | 570,042 | |
| | Alpek SAB de CV | | | 1,130,127 | | | | 1,585,703 | |
* | | Alsea SAB de CV | | | 1,253,320 | | | | 2,407,579 | |
* | | Axtel SAB de CV | | | 6,155,647 | | | | 431,855 | |
W | | Banco del Bajio SA | | | 2,573,919 | | | | 7,246,414 | |
| | Bolsa Mexicana de Valores SAB de CV | | | 1,254,686 | | | | 2,274,684 | |
| | Consorcio ARA SAB de CV | | | 5,594,857 | | | | 889,507 | |
# * | | Controladora Vuela Cia de Aviacion SAB de CV, Class A | | | 1,965,760 | | | | 1,663,847 | |
# | | Corp Actinver SAB de CV | | | 198,770 | | | | 124,401 | |
* | | Corp Interamericana de Entretenimiento SAB de CV, Class B | | | 960,372 | | | | 450,788 | |
| | Corp. Inmobiliaria Vesta SAB de CV | | | 1,611,339 | | | | 3,510,902 | |
| | Corp. Moctezuma SAB de CV | | | 838,557 | | | | 2,492,859 | |
| | Corporativo Fragua SAB de CV | | | 3 | | | | 47 | |
* | | Corpovael SA de CV | | | 73,341 | | | | 9,032 | |
| | Cydsa SAB de CV | | | 10,875 | | | | 7,135 | |
# * †† | | Empresas ICA SAB de CV | | | 3,768,186 | | | | 18,258 | |
* | | Financiera Independencia SAB de CV SOFOM ENR | | | 3,187 | | | | 1,287 | |
| | GCC SAB de CV | | | 555,674 | | | | 3,466,757 | |
# | | Genomma Lab Internacional SAB de CV, Class B | | | 2,030,927 | | | | 1,563,198 | |
| | Gentera SAB de CV | | | 2,941,632 | | | | 3,016,906 | |
| | Gruma SAB de CV, Class B | | | 26,146 | | | | 301,735 | |
# | | Grupo Aeroportuario del Centro Norte SAB de CV | | | 579,894 | | | | 4,624,401 | |
| | Grupo Comercial Chedraui SA de CV | | | 1,754,925 | | | | 7,093,925 | |
# | | Grupo Herdez SAB de CV | | | 1,428,625 | | | | 2,864,749 | |
* | | Grupo Hotelero Santa Fe SAB de CV | | | 618,935 | | | | 125,580 | |
| | Grupo Industrial Saltillo SAB de CV | | | 1,080,258 | | | | 1,684,206 | |
| | Grupo KUO SAB de CV, Class B | | | 714,554 | | | | 1,496,694 | |
* | | Grupo Pochteca SAB de CV | | | 336,841 | | | | 144,509 | |
* | | Grupo Posadas SAB de CV | | | 164,564 | | | | 213,959 | |
# | | Grupo Rotoplas SAB de CV | | | 786,579 | | | | 1,191,004 | |
* | | Grupo Sanborns SAB de CV | | | 905,924 | | | | 1,120,231 | |
* | | Grupo Simec SAB de CV, Class B | | | 954,497 | | | | 9,538,707 | |
#* W | | Grupo Traxion SAB de CV | | | 317,143 | | | | 371,198 | |
# * | | Hoteles City Express SAB de CV | | | 1,160,092 | | | | 319,109 | |
| | Industrias Bachoco SAB de CV, Class B | | | 1,126,567 | | | | 4,601,110 | |
* | | Industrias CH SAB de CV, Class B | | | 1,752,132 | | | | 19,365,158 | |
| | La Comer SAB de CV | | | 3,003,626 | | | | 5,518,194 | |
THE EMERGING MARKETS SMALL CAP SERIES
CONTINUED
| | | | | | | | | | |
| | | | | Shares | | | Value» | |
MEXICO — (Continued) | | | | | | | | |
| | Megacable Holdings SAB de CV | | | 2,030,295 | | | $ | 4,229,055 | |
# * | | Minera Frisco SAB de CV, Class A1 | | | 5,327,018 | | | | 639,898 | |
* W | | Nemak SAB de CV | | | 2,609,193 | | | | 705,864 | |
| | Operadora de Sites Mexicanos SA de CV, Class A | | | 2,337,869 | | | | 2,573,508 | |
| | Orbia Advance Corp. SAB de CV | | | 49,219 | | | | 82,798 | |
* | | Organizacion Cultiba SAB de CV | | | 1,103,096 | | | | 606,862 | |
| | Organizacion Soriana SAB de CV, Class B | | | 358,274 | | | | 547,004 | |
| | Promotora y Operadora de Infraestructura SAB de CV | | | 543,423 | | | | 4,087,809 | |
| | Promotora y Operadora de Infraestructura SAB de CV, Class L | | | 7,839 | | | | 36,439 | |
# | | Qualitas Controladora SAB de CV | | | 347,921 | | | | 1,365,309 | |
| | Regional SAB de CV | | | 520,708 | | | | 3,629,424 | |
* †† | | Sanluis Corp. SA | | | 4,642 | | | | 0 | |
* †† | | Sanluis Corp. SA | | | 4,642 | | | | 0 | |
* †† | | Sanluis Rassini | | | 3,300 | | | | 0 | |
* | | Unifin Financiera SAB de CV | | | 48,493 | | | | 4,014 | |
* | | Vista Energy SAB de CV, ADR | | | 2,874 | | | | 38,023 | |
* | | Vitro SAB de CV, Class A | | | 704,098 | | | | 630,785 | |
| | | | | | | | | | |
TOTAL MEXICO | | | | | | | 111,859,231 | |
| | | | | | | | | | |
PHILIPPINES — (1.0%) | | | | | | | | |
| | 8990 Holdings, Inc. | | | 3,671,200 | | | | 608,662 | |
| | A Soriano Corp. | | | 2,931,411 | | | | 450,036 | |
†† | | ACR Mining Corp. | | | 48,205 | | | | 2,792 | |
* | | AgriNurture, Inc. | | | 480,000 | | | | 56,912 | |
| | AllHome Corp. | | | 193,200 | | | | 9,224 | |
| | Alliance Global Group, Inc. | | | 7,091,400 | | | | 1,106,186 | |
| | Alsons Consolidated Resources, Inc. | | | 2,780,000 | | | | 38,970 | |
| | Apex Mining Co., Inc. | | | 5,852,000 | | | | 145,058 | |
* | | Apollo Global Capital, Inc. | | | 27,650,000 | | | | 13,373 | |
* | | AyalaLand Logistics Holdings Corp. | | | 4,021,100 | | | | 223,984 | |
* | | Belle Corp. | | | 13,307,400 | | | | 262,266 | |
* | | Bloomberry Resorts Corp. | | | 9,045,400 | | | | 1,099,836 | |
* | | Cebu Air, Inc. | | | 603,320 | | | | 377,556 | |
* | | Cebu Holdings, Inc. | | | 3,180,400 | | | | 265,902 | |
* W | | CEMEX Holdings Philippines, Inc. | | | 10,073,263 | | | | 116,955 | |
| | Century Pacific Food, Inc. | | | 2,790,500 | | | | 1,146,597 | |
| | Century Properties Group, Inc. | | | 4,391,151 | | | | 26,514 | |
| | China Banking Corp. | | | 6,526,914 | | | | 2,924,502 | |
| | COL Financial Group, Inc. | | | 922,000 | | | | 49,824 | |
| | Cosco Capital, Inc. | | | 11,229,900 | | | | 765,004 | |
| | D&L Industries, Inc. | | | 6,538,700 | | | | 888,275 | |
* | | DITO CME Holdings Corp. | | | 1,016,100 | | | | 51,803 | |
| | DMCI Holdings, Inc. | | | 7,609,100 | | | | 1,254,306 | |
| | DoubleDragon Corp. | | | 2,132,190 | | | | 207,115 | |
| | Eagle Cement Corp. | | | 574,500 | | | | 205,252 | |
| | East West Banking Corp. | | | 1,996,300 | | | | 202,062 | |
| | Filinvest Development Corp. | | | 3,356,422 | | | | 369,883 | |
| | Filinvest Land, Inc. | | | 53,722,577 | | | | 723,261 | |
| | First Gen Corp. | | | 235,300 | | | | 63,284 | |
| | First Philippine Holdings Corp. | | | 1,712,200 | | | | 1,807,578 | |
| | Global Ferronickel Holdings, Inc. | | | 4,072,911 | | | | 158,144 | |
* | | Global-Estate Resorts, Inc. | | | 2,410,000 | | | | 34,918 | |
| | GT Capital Holdings, Inc. | | | 152,490 | | | | 1,090,306 | |
* | | Holcim Philippines, Inc. | | | 2,182,300 | | | | 146,364 | |
* | | Integrated Micro-Electronics, Inc. | | | 2,685,414 | | | | 233,236 | |
| | LT Group, Inc. | | | 2,600,500 | | | | 363,523 | |
* | | MacroAsia Corp. | | | 1,945,032 | | | | 155,198 | |
| | Manila Water Co., Inc. | | | 7,255,700 | | | | 2,049,881 | |
* | | Max’s Group, Inc. | | | 832,200 | | | | 62,593 | |
THE EMERGING MARKETS SMALL CAP SERIES
CONTINUED
| | | | | | | | | | |
| | | | | Shares | | | Value» | |
PHILIPPINES — (Continued) | | | | | | | | |
* | | Megawide Construction Corp. | | | 2,375,208 | | | $ | 141,920 | |
| | Megaworld Corp. | | | 16,918,000 | | | | 610,337 | |
| | Metro Pacific Investments Corp. | | | 13,174,000 | | | | 833,526 | |
| | Nickel Asia Corp. | | | 10,067,100 | | | | 843,211 | |
* | | Petron Corp. | | | 9,686,800 | | | | 417,500 | |
* | | Philcomsat Holdings Corp. | | | 316,021 | | | | 1,738 | |
| | Philex Mining Corp. | | | 4,552,300 | | | | 181,583 | |
* | | Philippine National Bank | | | 1,895,726 | | | | 629,047 | |
* †† | | Philippine National Construction Corp. | | | 173,000 | | | | 2,744 | |
| | Philippine Savings Bank | | | 474,907 | | | | 464,257 | |
* | | Philippine Seven Corp. | | | 10,510 | | | | 12,123 | |
| | Philippine Stock Exchange, Inc. | | | 74,482 | | | | 212,188 | |
* †† | | Philtown Properties, Inc. | | | 430,294 | | | | 0 | |
* | | Phoenix Petroleum Philippines, Inc. | | | 929,580 | | | | 136,615 | |
| | Pilipinas Shell Petroleum Corp. | | | 1,365,390 | | | | 406,482 | |
| | Premium Leisure Corp. | | | 16,097,000 | | | | 122,100 | |
| | Puregold Price Club, Inc. | | | 1,996,790 | | | | 1,036,063 | |
* | | PXP Energy Corp. | | | 2,777,800 | | | | 282,238 | |
| | RFM Corp. | | | 7,485,068 | | | | 490,238 | |
| | Rizal Commercial Banking Corp. | | | 2,651,952 | | | | 1,039,744 | |
| | Robinsons Land Corp. | | | 8,402,151 | | | | 2,161,850 | |
| | Robinsons Retail Holdings, Inc. | | | 1,008,440 | | | | 935,782 | |
| | Security Bank Corp. | | | 494,790 | | | | 740,868 | |
| | Semirara Mining & Power Corp. | | | 224,900 | | | | 136,733 | |
| | Shakey’s Pizza Asia Ventures, Inc. | | | 274,900 | | | | 34,513 | |
* | | Top Frontier Investment Holdings, Inc. | | | 2,580 | | | | 4,651 | |
| | Union Bank of the Philippines | | | 2,090,564 | | | | 2,786,454 | |
| | Vista Land & Lifescapes, Inc. | | | 30,112,200 | | | | 898,446 | |
| | Vistamalls, Inc. | | | 589,600 | | | | 34,316 | |
| | Wilcon Depot, Inc. | | | 3,038,100 | | | | 1,544,060 | |
| | | | | | | | | | |
TOTAL PHILIPPINES | | | | | | | 36,898,462 | |
| | | | | | | | | | |
POLAND — (0.9%) | | | | | | | | |
* | | 11 bit studios SA | | | 4,289 | | | | 483,858 | |
| | AB SA | | | 2,202 | | | | 18,910 | |
* | | Agora SA | | | 118,444 | | | | 123,921 | |
* | | Alior Bank SA | | | 197,391 | | | | 1,213,555 | |
| | Alumetal SA | | | 7,000 | | | | 97,134 | |
# | | Amica SA | | | 13,231 | | | | 196,749 | |
* | | AmRest Holdings SE | | | 43,597 | | | | 167,581 | |
| | Apator SA | | | 59,870 | | | | 173,210 | |
# | | ASBISc Enterprises PLC | | | 51,262 | | | | 231,825 | |
| | Asseco Poland SA | | | 52,876 | | | | 760,777 | |
| | Auto Partner SA | | | 10,278 | | | | 24,947 | |
| | Bank Handlowy w Warszawie SA | | | 35,620 | | | | 461,022 | |
* | | Bank Millennium SA | | | 740,670 | | | | 674,689 | |
# * | | Bank Ochrony Srodowiska SA | | | 63,177 | | | | 101,554 | |
* | | Benefit Systems SA | | | 1,135 | | | | 147,011 | |
# * | | Bioton SA | | | 111,045 | | | | 82,204 | |
| | Boryszew SA | | | 130,974 | | | | 121,739 | |
| | Budimex SA | | | 56,826 | | | | 2,852,963 | |
| | Bumech SA | | | 642 | | | | 8,972 | |
# * | | CCC SA | | | 72,112 | | | | 555,845 | |
# | | Celon Pharma SA | | | 11,092 | | | | 31,349 | |
# * | | CI Games SA | | | 240,060 | | | | 135,732 | |
* | | Ciech SA | | | 76,136 | | | | 533,461 | |
| | Cognor Holding SA | | | 33,792 | | | | 26,098 | |
# | | ComArch SA | | | 12,137 | | | | 355,829 | |
# | | Develia SA | | | 1,491,512 | | | | 619,027 | |
THE EMERGING MARKETS SMALL CAP SERIES
CONTINUED
| | | | | | | | | | |
| | | | | Shares | | | Value» | |
POLAND — (Continued) | | | | | | | | |
| | Dom Development SA | | | 14,033 | | | $ | 248,012 | |
# | | Echo Investment SA | | | 22,550 | | | | 14,215 | |
* | | Enea SA | | | 713,481 | | | | 778,745 | |
* | | Eurocash SA | | | 187,631 | | | | 447,896 | |
| | Fabryki Mebli Forte SA | | | 74,704 | | | | 290,945 | |
# * | | Famur SA | | | 717,909 | | | | 462,381 | |
| | Firma Oponiarska Debica SA | | | 4,682 | | | | 49,450 | |
# | | Globe Trade Centre SA | | | 449,774 | | | | 572,979 | |
* | | Grupa Azoty SA | | | 119,312 | | | | 817,448 | |
| | Grupa Kety SA | | | 54,943 | | | | 5,668,090 | |
| | Inter Cars SA | | | 36,447 | | | | 2,746,139 | |
# * | | Jastrzebska Spolka Weglowa SA | | | 150,049 | | | | 1,301,314 | |
| | Kernel Holding SA | | | 90,829 | | | | 314,311 | |
| | KRUK SA | | | 67,950 | | | | 3,956,902 | |
| | LiveChat Software SA | | | 21,353 | | | | 496,251 | |
# * | | Lubawa SA | | | 30,768 | | | | 14,910 | |
# | | Lubelski Wegiel Bogdanka SA | | | 25,286 | | | | 176,924 | |
| | Mirbud SA | | | 32,611 | | | | 21,771 | |
| | Mo-BRUK SA | | | 585 | | | | 35,019 | |
| | Neuca SA | | | 1,203 | | | | 153,651 | |
| | NEWAG SA | | | 522 | | | | 1,485 | |
# * | | PKP Cargo SA | | | 62,771 | | | | 160,087 | |
# | | PlayWay SA | | | 2,915 | | | | 172,222 | |
* | | Polimex-Mostostal SA | | | 48,575 | | | | 34,679 | |
# | | Stalexport Autostrady SA | | | 350,306 | | | | 188,022 | |
* | | Tauron Polska Energia SA | | | 2,605,956 | | | | 1,057,334 | |
| | Tim SA | | | 15,749 | | | | 89,108 | |
| | VRG SA | | | 873,743 | | | | 625,349 | |
# | | Warsaw Stock Exchange | | | 48,075 | | | | 325,362 | |
# * | | Wawel SA | | | 365 | | | | 32,082 | |
| | Wirtualna Polska Holding SA | | | 2,954 | | | | 57,416 | |
W | | XTB SA | | | 31,923 | | | | 182,291 | |
# | | Zespol Elektrocieplowni Wroclawskich Kogeneracja SA | | | 672 | | | | 3,375 | |
# * | | Zespol Elektrowni Patnow Adamow Konin SA | | | 86,407 | | | | 494,789 | |
| | | | | | | | | | |
TOTAL POLAND | | | | | | | 32,190,916 | |
| | | | | | | | | | |
QATAR — (0.9%) | | | | | | | | |
| | Aamal Co. | | | 5,648,983 | | | | 1,744,847 | |
| | Al Khaleej Takaful Group QSC | | | 475,885 | | | | 345,497 | |
| | Al Meera Consumer Goods Co. QSC | | | 256,977 | | | | 1,235,657 | |
* | | Alijarah Holding Co. QPSC | | | 991,777 | | | | 245,969 | |
| | Baladna | | | 2,035,733 | | | | 925,050 | |
| | Barwa Real Estate Co. | | | 3,540,857 | | | | 3,304,029 | |
* | | Dlala Brokerage & Investments Holding Co. QSC | | | 354,306 | | | | 162,984 | |
| | Doha Bank QPSC | | | 3,560,833 | | | | 2,156,278 | |
| | Doha Insurance Co. QSC | | | 178,039 | | | | 100,524 | |
* | | Estithmar Holding QPSC | | | 3,254,754 | | | | 1,624,663 | |
* | | Gulf International Services QSC | | | 2,627,664 | | | | 1,311,649 | |
| | Gulf Warehousing Co. | | | 763,972 | | | | 896,244 | |
* | | Lesha Bank LLC | | | 3,432,187 | | | | 1,154,572 | |
| | Mannai Corp. QSC | | | 294,024 | | | | 613,312 | |
* | | Mazaya Real Estate Development QPSC | | | 2,272,872 | | | | 521,379 | |
| | Medicare Group | | | 504,405 | | | | 964,244 | |
| | Qatar Aluminum Manufacturing Co. | | | 5,693,630 | | | | 2,533,237 | |
| | Qatar Insurance Co. SAQ | | | 3,096,864 | | | | 1,835,854 | |
| | Qatar International Islamic Bank QSC | | | 291,121 | | | | 924,683 | |
| | Qatar Islamic Insurance Group | | | 13,547 | | | | 33,052 | |
| | Qatar National Cement Co. QSC | | | 600,194 | | | | 750,766 | |
| | Qatar Navigation QSC | | | 955,807 | | | | 2,691,732 | |
THE EMERGING MARKETS SMALL CAP SERIES
CONTINUED
| | | | | | | | | | |
| | | | | Shares | | | Value» | |
QATAR — (Continued) | | | | | | | | |
* | | Salam International Investment Ltd. QSC | | | 2,728,762 | | | $ | 580,971 | |
| | United Development Co. QSC | | | 5,503,272 | | | | 2,164,707 | |
| | Vodafone Qatar QSC | | | 5,189,123 | | | | 2,385,522 | |
* | | Widam Food Co. | | | 298,655 | | | | 228,388 | |
| | Zad Holding Co. | | | 7,517 | | | | 35,586 | |
| | | | | | | | | | |
TOTAL QATAR | | | | | | | 31,471,396 | |
| | | | | | | | | | |
RUSSIA — (0.0%) | | | | | | | | |
* †† | | Etalon Group PLC, GDR | | | 359,594 | | | | 0 | |
* †† | | Globaltrans Investment PLC, GDR | | | 168,485 | | | | 0 | |
* †† | | Magnitogorsk Iron & Steel Works PJSC, GDR | | | 32,799 | | | | 0 | |
* †† | | Mechel PJSC, Sponsored ADR | | | 123,618 | | | | 0 | |
* †† | | PhosAgro PJSC, GDR | | | 120,928 | | | | 0 | |
* †† | | PhosAgro PJSC | | | 779 | | | | 0 | |
* †† | | Ros Agro PLC, GDR | | | 44,970 | | | | 0 | |
* †† | | Rostelecom PJSC, Sponsored ADR | | | 171,891 | | | | 0 | |
* †† | | RusHydro PJSC, ADR | | | 952,144 | | | | 0 | |
* †† | | VK Co. Ltd., GDR | | | 126,978 | | | | 0 | |
* †† | | VTB Bank PJSC, GDR | | | 27,705 | | | | 0 | |
| | | | | | | | | | |
SAUDI ARABIA — (3.9%) | | | | | | | | |
* | | Abdul Mohsen Al-Hokair Tourism and Development Co. | | | 47,049 | | | | 226,691 | |
| | Abdullah Al Othaim Markets Co. | | | 70,915 | | | | 2,142,321 | |
| | Abdullah Saad Mohammed Abo Moati Stationaries Co. | | | 29,214 | | | | 248,534 | |
| | Advanced Petrochemical Co. | | | 314,249 | | | | 3,698,597 | |
* | | Al Alamiya for Cooperative Insurance Co. | | | 77,220 | | | | 310,681 | |
| | Al Babtain Power & Telecommunication Co. | | | 80,373 | | | | 481,451 | |
* | | Al Etihad Cooperative Insurance Co. | | | 94,568 | | | | 340,802 | |
* | | Al Gassim Investment Holding Co. | | | 33,599 | | | | 198,617 | |
| | Al Hammadi Holding | | | 252,667 | | | | 3,022,214 | |
* | | Al Hassan Ghazi Ibrahim Shaker Co. | | | 93,542 | | | | 558,628 | |
| | Al Jouf Agricultural Development Co. | | | 45,839 | | | | 526,158 | |
* | | Al Jouf Cement Co. | | | 201,449 | | | | 620,568 | |
* | | Al Khaleej Training & Education Co. | | | 190,689 | | | | 802,298 | |
| | Al Moammar Information Systems Co. | | | 66,233 | | | | 1,864,796 | |
* | | Al Rajhi Co. for Co-operative Insurance | | | 73,964 | | | | 2,015,062 | |
* | | Al Sagr Cooperative Insurance Co. | | | 22,496 | | | | 109,076 | |
| | Al Yamamah Steel Industries Co. | | | 84,219 | | | | 669,278 | |
* | | AlAbdullatif Industrial Investment Co. | | | 139,281 | | | | 657,972 | |
| | Alandalus Property Co. | | | 194,116 | | | | 820,088 | |
| | Alaseel Co. | | | 47,539 | | | | 539,604 | |
* | | Al-Baha Development & Investment Co. | | | 57,086 | | | | 214,780 | |
| | Aldrees Petroleum & Transport Services Co. | | | 127,998 | | | | 2,470,599 | |
* | | AlJazira Takaful Ta’awuni Co. | | | 89,751 | | | | 365,676 | |
* | | Allianz Saudi Fransi Cooperative Insurance Co. | | | 128,617 | | | | 464,647 | |
| | Al-Omran Industrial & Trading Co. | | | 8,854 | | | | 201,302 | |
| | Alujain Corp. | | | 82,243 | | | | 1,027,298 | |
* | | Arab Sea Information Systems Co. | | | 15,224 | | | | 336,745 | |
* | | Arabia Insurance Cooperative Co. | | | 47,353 | | | | 159,048 | |
| | Arabian Cement Co. | | | 185,419 | | | | 1,854,067 | |
| | Arabian Centres Co. Ltd. | | | 298,279 | | | | 1,549,812 | |
* | | Arabian Shield Cooperative Insurance Co. | | | 151,853 | | | | 710,920 | |
| | Arriyadh Development Co. | | | 350,650 | | | | 1,893,405 | |
| | Astra Industrial Group | | | 153,280 | | | | 2,244,182 | |
| | Ataa Educational Co. | | | 34,801 | | | | 490,651 | |
| | Baazeem Trading Co. | | | 15,303 | | | | 276,166 | |
* | | Basic Chemical Industries Ltd. | | | 42,491 | | | | 413,206 | |
* | | Batic Investments & Logistic Co. | | | 109,054 | | | | 686,632 | |
| | Bawan Co. | | | 95,676 | | | | 955,540 | |
THE EMERGING MARKETS SMALL CAP SERIES
CONTINUED
| | | | | | | | | | |
| | | | | Shares | | | Value» | |
SAUDI ARABIA — (Continued) | | | | | | | | |
* | | Buruj Cooperative Insurance Co. | | | 52,247 | | | $ | 224,487 | |
* | | Chubb Arabia Cooperative Insurance Co. | | | 44,551 | | | | 195,500 | |
| | City Cement Co. | | | 270,893 | | | | 1,464,016 | |
* | | Co. for Cooperative Insurance | | | 183,232 | | | | 4,129,417 | |
| | Dallah Healthcare Co. | | | 116,339 | | | | 4,959,732 | |
* | | Dar Al Arkan Real Estate Development Co. | | | 1,798,980 | | | | 6,436,392 | |
* | | Dur Hospitality Co. | | | 195,380 | | | | 1,107,211 | |
| | Eastern Province Cement Co. | | | 112,249 | | | | 1,321,606 | |
| | Electrical Industries Co. | | | 65,904 | | | | 471,082 | |
* | | Emaar Economic City | | | 1,261,768 | | | | 3,221,778 | |
* | | Fawaz Abdulaziz Al Hokair & Co. | | | 113,211 | | | | 521,102 | |
| | Fitaihi Holding Group | | | 58,130 | | | | 599,971 | |
* | | Gulf General Cooperative Insurance Co. | | | 27,302 | | | | 60,727 | |
| | Gulf Insurance Group | | | 76,953 | | | | 531,677 | |
| | Hail Cement Co. | | | 198,272 | | | | 671,905 | |
| | Halwani Brothers Co. | | | 73,696 | | | | 1,151,500 | |
* | | Herfy Food Services Co. | | | 63,460 | | | | 661,795 | |
* | | Jazan Energy & Development Co. | | | 97,806 | | | | 354,511 | |
| | L’Azurde Co. for Jewelry | | | 83,263 | | | | 319,176 | |
| | Leejam Sports Co. JSC | | | 77,737 | | | | 1,635,764 | |
| | Maharah Human Resources Co. | | | 84,550 | | | | 1,356,961 | |
* | | Malath Cooperative Insurance Co. | | | 94,457 | | | | 323,787 | |
* | | Mediterranean & Gulf Cooperative Insurance & Reinsurance Co. | | | 178,838 | | | | 460,414 | |
* | | Methanol Chemicals Co. | | | 131,270 | | | | 1,075,051 | |
* | | Middle East Healthcare Co. | | | 160,943 | | | | 1,384,264 | |
| | Middle East Paper Co. | | | 91,764 | | | | 1,271,046 | |
* | | Middle East Specialized Cables Co. | | | 32,002 | | | | 100,711 | |
* | | Mobile Telecommunications Co. Saudi Arabia | | | 1,338,969 | | | | 4,624,653 | |
| | Najran Cement Co. | | | 338,041 | | | | 1,142,081 | |
* | | Nama Chemicals Co. | | | 36,949 | | | | 443,870 | |
* | | National Agriculture Development Co. | | | 182,352 | | | | 1,265,413 | |
| | National Co. for Glass Industries | | | 63,808 | | | | 655,566 | |
| | National Co. for Learning & Education | | | 40,617 | | | | 641,456 | |
| | National Gas & Industrialization Co. | | | 129,343 | | | | 1,848,095 | |
| | National Gypsum | | | 62,155 | | | | 437,061 | |
* | | National Industrialization Co. | | | 885,659 | | | | 3,148,727 | |
| | National Medical Care Co. | | | 79,644 | | | | 1,482,606 | |
| | Northern Region Cement Co. | | | 394,791 | | | | 1,231,377 | |
| | Qassim Cement Co. | | | 136,489 | | | | 2,738,370 | |
* | | Raydan Food Co. | | | 21,364 | | | | 148,833 | |
* | | Saudi Airlines Catering Co. | | | 146,816 | | | | 3,023,350 | |
* | | Saudi Arabian Cooperative Insurance Co. | | | 56,673 | | | | 195,992 | |
| | Saudi Automotive Services Co. | | | 114,087 | | | | 960,090 | |
| | Saudi Cement Co. | | | 269,497 | | | | 3,822,372 | |
| | Saudi Ceramic Co. | | | 154,509 | | | | 1,702,165 | |
| | Saudi Chemical Co. Holding | | | 161,737 | | | | 1,263,125 | |
* | | Saudi Co. For Hardware CJSC | | | 69,700 | | | | 624,477 | |
* | | Saudi Ground Services Co. | | | 304,029 | | | | 2,105,001 | |
| | Saudi Industrial Services Co. | | | 145,826 | | | | 865,064 | |
* | | Saudi Marketing Co. | | | 85,805 | | | | 495,984 | |
* | | Saudi Paper Manufacturing Co. | | | 31,656 | | | | 236,435 | |
| | Saudi Pharmaceutical Industries & Medical Appliances Corp. | | | 136,212 | | | | 960,008 | |
* | | Saudi Printing & Packaging Co. | | | 81,990 | | | | 381,457 | |
* | | Saudi Public Transport Co. | | | 248,132 | | | | 1,116,356 | |
* | | Saudi Real Estate Co. | | | 623,638 | | | | 2,088,008 | |
* | | Saudi Reinsurance Co. | | | 192,614 | | | | 681,906 | |
* | | Saudi Research & Media Group | | | 39,943 | | | | 2,139,643 | |
* | | Saudi Steel Pipe Co. | | | 42,075 | | | | 230,007 | |
| | Saudia Dairy & Foodstuff Co. | | | 48,176 | | | | 3,011,719 | |
THE EMERGING MARKETS SMALL CAP SERIES
CONTINUED
| | | | | | | | | | |
| | | | | Shares | | | Value» | |
SAUDI ARABIA — (Continued) | | | | | | | | |
| | Savola Group | | | 7,824 | | | $ | 60,956 | |
* | | Seera Group Holding | | | 565,462 | | | | 2,870,101 | |
* | | Sinad Holding Co. | | | 240,983 | | | | 813,939 | |
| | Southern Province Cement Co. | | | 143,529 | | | | 2,091,937 | |
| | Tabuk Cement Co. | | | 183,346 | | | | 852,174 | |
* | | Takween Advanced Industries Co. | | | 131,028 | | | | 370,647 | |
| | Umm Al-Qura Cement Co. | | | 109,945 | | | | 543,246 | |
* | | United Co-operative Assurance Co. | | | 58,749 | | | | 127,733 | |
| | United Electronics Co. | | | 143,822 | | | | 2,925,837 | |
| | United International Transportation Co. | | | 124,963 | | | | 1,520,875 | |
| | United Wire Factories Co. | | | 63,308 | | | | 506,658 | |
* | | Wafrah for Industry and Development | | | 31,367 | | | | 290,732 | |
* | | Walaa Cooperative Insurance Co. | | | 135,005 | | | | 488,485 | |
* | | Wataniya Insurance Co. | | | 27,127 | | | | 107,454 | |
* | | Yamama Cement Co. | | | 382,705 | | | | 2,991,917 | |
| | Yanbu Cement Co. | | | 281,306 | | | | 3,120,329 | |
| | Zahrat Al Waha For Trading Co. | | | 41,562 | | | | 395,732 | |
* | | Zamil Industrial Investment Co. | | | 123,209 | | | | 586,238 | |
| | | | | | | | | | |
TOTAL SAUDI ARABIA | | | | | | | 138,555,952 | |
| | | | | | | | | | |
SOUTH AFRICA — (3.8%) | | | | | | | | |
| | Adcock Ingram Holdings Ltd. | | | 158,484 | | | | 411,898 | |
| | Advtech Ltd. | | | 2,588,777 | | | | 2,510,347 | |
| | AECI Ltd. | | | 485,126 | | | | 2,440,500 | |
| | African Rainbow Minerals Ltd. | | | 256,363 | | | | 3,610,133 | |
| | Afrimat Ltd. | | | 162,854 | | | | 425,500 | |
| | Alexander Forbes Group Holdings Ltd. | | | 2,051,912 | | | | 553,695 | |
| | Altron Ltd., Class A | | | 940,823 | | | | 449,096 | |
| | Alviva Holdings Ltd. | | | 411,231 | | | | 514,602 | |
| | Astral Foods Ltd. | | | 141,045 | | | | 1,354,261 | |
* | | Aveng Ltd. | | | 10,798 | | | | 9,223 | |
# | | AVI Ltd. | | | 1,073,577 | | | | 4,300,203 | |
| | Barloworld Ltd. | | | 811,474 | | | | 4,541,183 | |
* | | Blue Label Telecoms Ltd. | | | 1,427,968 | | | | 401,134 | |
# * | | Brait PLC | | | 3,522,364 | | | | 835,527 | |
# | | Cashbuild Ltd. | | | 69,167 | | | | 722,535 | |
| | Caxton & CTP Publishers & Printers Ltd. | | | 323,754 | | | | 167,338 | |
* | | City Lodge Hotels Ltd. | | | 1,183,037 | | | | 270,025 | |
| | Coronation Fund Managers Ltd. | | | 629,926 | | | | 1,124,498 | |
| | Curro Holdings Ltd. | | | 519,879 | | | | 239,009 | |
# | | DataTec Ltd. | | | 2,023,964 | | | | 4,551,150 | |
W | | Dis-Chem Pharmacies Ltd. | | | 989,847 | | | | 1,809,273 | |
* | | Distell Group Holdings Ltd. | | | 227,535 | | | | 2,149,913 | |
| | DRDGOLD Ltd. | | | 1,386,609 | | | | 715,728 | |
| | Exxaro Resources Ltd. | | | 98,848 | | | | 1,101,484 | |
| | Famous Brands Ltd. | | | 309,750 | | | | 950,466 | |
| | Foschini Group Ltd. | | | 907,837 | | | | 5,675,989 | |
| | Grand Parade Investments Ltd. | | | 1,258,031 | | | | 232,277 | |
| | Grindrod Ltd. | | | 1,987,164 | | | | 1,121,288 | |
| | Grindrod Shipping Holdings Ltd. | | | 38,439 | | | | 991,474 | |
# | | Harmony Gold Mining Co. Ltd., Sponsored ADR | | | 1,627,447 | | | | 4,556,852 | |
| | Hudaco Industries Ltd. | | | 116,059 | | | | 864,504 | |
| | Italtile Ltd. | | | 902,956 | | | | 675,886 | |
| | JSE Ltd. | | | 307,885 | | | | 1,701,196 | |
| | KAP Industrial Holdings Ltd. | | | 8,476,005 | | | | 2,131,524 | |
* | | Lesaka Technologies, Inc. | | | 776 | | | | 2,580 | |
| | Lewis Group Ltd. | | | 578,141 | | | | 1,515,560 | |
| | Life Healthcare Group Holdings Ltd. | | | 4,434,814 | | | | 4,765,656 | |
* | | Massmart Holdings Ltd. | | | 342,043 | | | | 1,139,144 | |
THE EMERGING MARKETS SMALL CAP SERIES
CONTINUED
| | | | | | | | | | |
| | | | | Shares | | | Value» | |
SOUTH AFRICA — (Continued) | | | | | | | | |
| | Merafe Resources Ltd. | | | 3,009,333 | | | $ | 203,293 | |
| | Metair Investments Ltd. | | | 778,116 | | | | 1,172,877 | |
| | MiX Telematics Ltd. | | | 37,895 | | | | 10,523 | |
| | MiX Telematics Ltd., Sponsored ADR | | | 27,358 | | | | 219,411 | |
| | Momentum Metropolitan Holdings | | | 3,353,713 | | | | 3,132,669 | |
| | Motus Holdings Ltd. | | | 459,916 | | | | 2,903,736 | |
| | Mpact Ltd. | | | 1,117,953 | | | | 1,703,267 | |
| | Mr Price Group Ltd. | | | 433,611 | | | | 4,173,404 | |
| | MultiChoice Group | | | 299,951 | | | | 1,960,422 | |
* | | Murray & Roberts Holdings Ltd. | | | 1,606,489 | | | | 415,619 | |
* | | Nampak Ltd. | | | 1,413,032 | | | | 144,839 | |
| | Netcare Ltd. | | | 3,207,467 | | | | 2,728,025 | |
| | Ninety One Ltd. | | | 72,524 | | | | 170,535 | |
* | | Northam Platinum Holdings Ltd. | | | 76,106 | | | | 711,981 | |
| | Oceana Group Ltd. | | | 285,133 | | | | 859,995 | |
| | Omnia Holdings Ltd. | | | 832,849 | | | | 3,267,550 | |
| | Pick n Pay Stores Ltd. | | | 1,054,001 | | | | 3,388,007 | |
* | | PPC Ltd. | | | 3,859,494 | | | | 468,430 | |
| | PSG Konsult Ltd. | | | 827,407 | | | | 494,199 | |
| | Raubex Group Ltd. | | | 952,268 | | | | 1,486,014 | |
| | RCL Foods Ltd. | | | 535,302 | | | | 319,659 | |
| | Reunert Ltd. | | | 625,305 | | | | 1,571,499 | |
| | RFG Holdings Ltd. | | | 423,587 | | | | 242,028 | |
| | Royal Bafokeng Platinum Ltd. | | | 539,585 | | | | 4,340,025 | |
| | Santam Ltd. | | | 139,757 | | | | 1,933,436 | |
* | | Sappi Ltd. | | | 1,465,415 | | | | 4,514,658 | |
* | | Southern Sun Ltd. | | | 92,144 | | | | 21,595 | |
| | SPAR Group Ltd. | | | 596,664 | | | | 5,057,843 | |
| | Spur Corp. Ltd. | | | 313,469 | | | | 354,942 | |
| | Sun International Ltd. | | | 1,072,783 | | | | 1,930,282 | |
| | Super Group Ltd. | | | 1,617,616 | | | | 2,289,646 | |
* | | Telkom SA SOC Ltd. | | | 1,012,159 | | | | 2,010,229 | |
# | | Tiger Brands Ltd. | | | 255,314 | | | | 2,583,336 | |
| | Transaction Capital Ltd. | | | 1,597,214 | | | | 3,570,410 | |
* | | Trencor Ltd. | | | 903,601 | | | | 292,703 | |
| | Truworths International Ltd. | | | 1,167,171 | | | | 3,321,605 | |
| | Tsogo Sun Gaming Ltd. | | | 1,735,276 | | | | 1,088,194 | |
* | | Wilson Bayly Holmes-Ovcon Ltd. | | | 274,413 | | | | 1,441,441 | |
| | Woolworths Holdings Ltd. | | | 2,234,195 | | | | 7,661,480 | |
| | | | | | | | | | |
TOTAL SOUTH AFRICA | | | | | | | 135,692,458 | |
| | | | | | | | | | |
SOUTH KOREA — (11.3%) | | | | | | | | |
# * | | 3S Korea Co. Ltd. | | | 179,036 | | | | 302,806 | |
| | ABco Electronics Co. Ltd. | | | 34,238 | | | | 252,738 | |
| | ABOV Semiconductor Co. Ltd. | | | 51,471 | | | | 363,937 | |
# * | | Abpro Bio Co. Ltd. | | | 630,240 | | | | 230,212 | |
* | | Actoz Soft Co. Ltd. | | | 15,291 | | | | 69,125 | |
| | ADTechnology Co. Ltd. | | | 4,814 | | | | 55,781 | |
# | | Advanced Nano Products Co. Ltd. | | | 28,035 | | | | 1,824,052 | |
# | | Advanced Process Systems Corp. | | | 42,216 | | | | 509,824 | |
| | Aekyung Chemical Co. Ltd. | | | 15,553 | | | | 101,209 | |
| | Aekyung Industrial Co. Ltd. | | | 18,948 | | | | 146,083 | |
* | | AeroSpace Technology of Korea, Inc. | | | 27,207 | | | | 80,307 | |
| | AfreecaTV Co. Ltd. | | | 27,213 | | | | 1,515,087 | |
* | | Agabang&Company | | | 62,474 | | | | 137,202 | |
| | Ahnlab, Inc. | | | 22,134 | | | | 966,928 | |
* | | Air Busan Co. Ltd. | | | 13,576 | | | | 18,562 | |
| | AJ Networks Co. Ltd. | | | 57,598 | | | | 237,180 | |
* | | Ajin Industrial Co. Ltd. | | | 102,112 | | | | 198,028 | |
THE EMERGING MARKETS SMALL CAP SERIES
CONTINUED
| | | | | | | | | | |
| | | | | Shares | | | Value» | |
SOUTH KOREA — (Continued) | | | | | | | | |
| | AJINEXTEK Co. Ltd. | | | 4,451 | | | $ | 27,074 | |
| | AK Holdings, Inc. | | | 13,911 | | | | 110,038 | |
* | | ALUKO Co. Ltd. | | | 176,811 | | | | 311,542 | |
* | | Amicogen, Inc. | | | 32,817 | | | | 436,802 | |
* | | Aminologics Co. Ltd. | | | 257,988 | | | | 345,792 | |
* | | Amo Greentech Co. Ltd. | | | 16,729 | | | | 178,024 | |
* | | Amotech Co. Ltd. | | | 28,871 | | | | 440,947 | |
* | | Anam Electronics Co. Ltd. | | | 194,257 | | | | 251,650 | |
# * | | Ananti, Inc. | | | 237,282 | | | | 878,994 | |
* | | Anapass, Inc. | | | 2,646 | | | | 46,323 | |
* | | Anterogen Co. Ltd. | | | 17,628 | | | | 176,450 | |
* | | Apact Co. Ltd. | | | 31,899 | | | | 110,432 | |
* | | APRO Co. Ltd. | | | 1,974 | | | | 22,396 | |
* | | Aprogen pharmaceuticals, Inc. | | | 861,356 | | | | 334,982 | |
* | | Aprogen, Inc. | | | 125,988 | | | | 92,148 | |
| | APS Holdings Corp. | | | 46,153 | | | | 388,089 | |
| | APTC Co. Ltd. | | | 26,444 | | | | 258,081 | |
* †† | | Arion Technology, Inc. | | | 51,658 | | | | 1,870 | |
* | | Aroot Co. Ltd. | | | 130,461 | | | | 46,703 | |
| | Asia Cement Co. Ltd. | | | 56,758 | | | | 368,586 | |
| | ASIA Holdings Co. Ltd. | | | 3,528 | | | | 269,635 | |
| | Asia Pacific Satellite, Inc. | | | 6,851 | | | | 43,207 | |
| | Asia Paper Manufacturing Co. Ltd. | | | 17,756 | | | | 455,779 | |
* | | Asiana Airlines, Inc. | | | 82,372 | | | | 597,409 | |
* | | ASTORY Co. Ltd. | | | 9,483 | | | | 136,966 | |
| | Atec Co. Ltd. | | | 16,045 | | | | 99,114 | |
* | | A-Tech Solution Co. Ltd. | | | 10,226 | | | | 68,708 | |
| | Atinum Investment Co. Ltd. | | | 131,075 | | | | 250,622 | |
* | | ATON, Inc. | | | 2,476 | | | | 44,412 | |
| | AUK Corp. | | | 95,994 | | | | 142,008 | |
| | Aurora World Corp. | | | 24,777 | | | | 132,860 | |
| | Austem Co. Ltd. | | | 36,276 | | | | 37,756 | |
# | | Autech Corp. | | | 46,360 | | | | 190,506 | |
| | Avaco Co. Ltd. | | | 36,513 | | | | 437,668 | |
* | | Avatec Co. Ltd. | | | 6,827 | | | | 83,850 | |
| | Baiksan Co. Ltd. | | | 54,335 | | | | 327,659 | |
* †† | | Barun Electronics Co. Ltd. | | | 1,089 | | | | 4,854 | |
* | | Barunson Entertainment & Arts Corp. | | | 89,960 | | | | 51,764 | |
| | Bcworld Pharm Co. Ltd. | | | 18,102 | | | | 87,068 | |
| | BGF Co. Ltd. | | | 119,024 | | | | 272,481 | |
# | | BH Co. Ltd. | | | 79,009 | | | | 1,333,283 | |
* | | Binex Co. Ltd. | | | 107,355 | | | | 837,602 | |
| | Binggrae Co. Ltd. | | | 21,800 | | | | 570,600 | |
# * | | Bioneer Corp. | | | 43,777 | | | | 816,309 | |
# * | | BioSmart Co. Ltd. | | | 66,962 | | | | 154,170 | |
* | | Biotoxtech Co. Ltd. | | | 46,948 | | | | 240,110 | |
| | BIT Computer Co. Ltd. | | | 62,006 | | | | 245,800 | |
| | Bixolon Co. Ltd. | | | 37,234 | | | | 202,638 | |
| | Bluecom Co. Ltd. | | | 17,420 | | | | 49,294 | |
# | | Boditech Med, Inc. | | | 87,808 | | | | 634,482 | |
* | | Bohae Brewery Co. Ltd. | | | 316,282 | | | | 139,309 | |
# | | BoKwang Industry Co. Ltd. | | | 66,131 | | | | 271,671 | |
| | Bolak Co. Ltd. | | | 110,078 | | | | 110,781 | |
| | Bookook Securities Co. Ltd. | | | 14,493 | | | | 183,631 | |
| | Boryung | | | 107,363 | | | | 790,304 | |
* | | Bosung Power Technology Co. Ltd. | | | 164,457 | | | | 458,886 | |
* | | Bridge Biotherapeutics, Inc. | | | 6,700 | | | | 44,921 | |
# | | Bukwang Pharmaceutical Co. Ltd. | | | 166,111 | | | | 878,823 | |
* | | Bumyang Construction Co. Ltd. | | | 1,797 | | | | 3,994 | |
THE EMERGING MARKETS SMALL CAP SERIES
CONTINUED
| | | | | | | | | | |
| | | | | Shares | | | Value» | |
SOUTH KOREA — (Continued) | | | | | | | | |
| | BusinessOn Communication Co. Ltd. | | | 3,824 | | | $ | 20,689 | |
| | BYC Co. Ltd. | | | 1,007 | | | | 259,711 | |
* | | BYON Co. Ltd. | | | 19,308 | | | | 11,875 | |
| | Byucksan Corp. | | | 165,999 | | | | 226,117 | |
* | | Caelum Co. Ltd. | | | 7,444 | | | | 15,648 | |
* | | Cafe24 Corp. | | | 35,287 | | | | 249,545 | |
* | | CammSys Corp. | | | 267,893 | | | | 392,196 | |
| | Camus Engineering & Construction, Inc. | | | 27,025 | | | | 32,180 | |
* | | Capro Corp. | | | 116,956 | | | | 180,765 | |
# | | Caregen Co. Ltd. | | | 13,593 | | | | 906,971 | |
* | | Carelabs Co. Ltd. | | | 17,016 | | | | 87,071 | |
| | Cell Biotech Co. Ltd. | | | 14,658 | | | | 115,100 | |
* | | Cellumed Co. Ltd. | | | 84,047 | | | | 255,337 | |
* | | Chabiotech Co. Ltd. | | | 127,163 | | | | 1,175,155 | |
| | Changhae Ethanol Co. Ltd. | | | 15,424 | | | | 120,619 | |
* | | Charm Engineering Co. Ltd. | | | 22,651 | | | | 13,750 | |
* | | Cheil Bio Co. Ltd. | | | 12,936 | | | | 12,060 | |
* | | Chemon, Inc. | | | 94,556 | | | | 146,388 | |
| | Chemtronics Co. Ltd. | | | 44,727 | | | | 493,483 | |
* | | Chemtros Co. Ltd. | | | 49,470 | | | | 301,485 | |
| | Cheryong Electric Co. Ltd. | | | 45,503 | | | | 301,716 | |
* | | ChinHung International, Inc. | | | 225,900 | | | | 194,616 | |
| | Chinyang Holdings Corp. | | | 86,435 | | | | 182,152 | |
| | Chips&Media, Inc. | | | 13,802 | | | | 154,078 | |
* | | Choa Pharmaceutical Co. | | | 85,589 | | | | 132,907 | |
* | | Choil Aluminum Co. Ltd. | | | 202,637 | | | | 332,198 | |
| | Chokwang Leather Co. Ltd. | | | 607 | | | | 20,874 | |
| | Chokwang Paint Ltd. | | | 16,613 | | | | 87,909 | |
# | | Chong Kun Dang Pharmaceutical Corp. | | | 19,342 | | | | 1,139,306 | |
| | Chongkundang Holdings Corp. | | | 11,961 | | | | 440,652 | |
| | Choong Ang Vaccine Laboratory | | | 28,743 | | | | 210,552 | |
* | | Chorokbaem Media Co. Ltd. | | | 48,420 | | | | 354,600 | |
| | Chosun Refractories Co. Ltd. | | | 6,616 | | | | 355,241 | |
* | | CJ Bioscience, Inc. | | | 471 | | | | 8,588 | |
| | CJ Freshway Corp. | | | 26,463 | | | | 592,603 | |
* | | CJ Seafood Corp. | | | 89,298 | | | | 166,264 | |
| | CKD Bio Corp. | | | 12,748 | | | | 194,827 | |
# | | Classys, Inc. | | | 49,967 | | | | 538,853 | |
| | Clean & Science Co. Ltd. | | | 14,112 | | | | 69,432 | |
| | CLIO Cosmetics Co. Ltd. | | | 10,125 | | | | 88,657 | |
* | | Cloud Air Co. Ltd. | | | 49,238 | | | | 32,259 | |
* | | CMG Pharmaceutical Co. Ltd. | | | 414,020 | | | | 616,210 | |
# * †† | | CNT85, Inc. | | | 1,452 | | | | 10,046 | |
* | | CoAsia Corp. | | | 22,488 | | | | 98,654 | |
* | | Com2uS Holdings Corp. | | | 16,335 | | | | 493,971 | |
| | Com2uSCorp. | | | 24,598 | | | | 1,223,929 | |
| | Commax Co. Ltd. | | | 8,272 | | | | 18,299 | |
* | | Comtec Systems Co. Ltd. | | | 55,335 | | | | 24,301 | |
* | | ContentreeJoongAng Corp. | | | 22,911 | | | | 353,208 | |
* | | Coreana Cosmetics Co. Ltd. | | | 102,112 | | | | 201,701 | |
* | | Corentec Co. Ltd. | | | 13,157 | | | | 83,730 | |
* | | COSMAX NBT, Inc. | | | 30,396 | | | | 82,040 | |
# | | Cosmax, Inc. | | | 32,365 | | | | 1,038,237 | |
* | | Cosmecca Korea Co. Ltd. | | | 5,765 | | | | 26,267 | |
* | | CosmoAM&T Co. Ltd. | | | 44,494 | | | | 2,089,210 | |
* | | Cosmochemical Co. Ltd. | | | 54,550 | | | | 961,588 | |
# | | Cowell Fashion Co. Ltd. | | | 106,695 | | | | 379,848 | |
| | Cowintech Co. Ltd. | | | 12,547 | | | | 222,899 | |
| | Creas F&C Co. Ltd. | | | 2,747 | | | | 38,288 | |
THE EMERGING MARKETS SMALL CAP SERIES
CONTINUED
| | | | | | | | | | |
| | | | | Shares | | | Value» | |
SOUTH KOREA — (Continued) | | | | | | | | |
# * | | Creative & Innovative System | | | 187,522 | | | $ | 1,712,919 | |
# | | Creverse, Inc. | | | 5,127 | | | | 74,405 | |
| | Crown Confectionery Co. Ltd. | | | 3,157 | | | | 18,024 | |
| | CROWNHAITAI Holdings Co. Ltd. | | | 23,850 | | | | 101,850 | |
* | | CrystalGenomics, Inc. | | | 185,334 | | | | 442,593 | |
* | | CS Bearing Co. Ltd. | | | 34,118 | | | | 177,268 | |
* | | CTC BIO, Inc. | | | 80,932 | | | | 384,219 | |
| | CTK Co. Ltd. | | | 2,437 | | | | 9,790 | |
* | | Cube Entertainment, Inc. | | | 12,798 | | | | 156,370 | |
| | Cuckoo Holdings Co. Ltd. | | | 31,442 | | | | 358,296 | |
| | Cuckoo Homesys Co. Ltd. | | | 26,647 | | | | 536,314 | |
* | | Curexo, Inc. | | | 43,440 | | | | 217,707 | |
# * | | Curo Co. Ltd. | | | 478,720 | | | | 109,492 | |
* | | CUROCOM Co. Ltd. | | | 73,660 | | | | 41,381 | |
| | Cymechs, Inc. | | | 25,921 | | | | 218,886 | |
| | D.I Corp. | | | 80,289 | | | | 247,296 | |
* | | DA Technology Co. Ltd. | | | 60,673 | | | | 151,493 | |
| | Dae Han Flour Mills Co. Ltd. | | | 4,392 | | | | 397,311 | |
| | Dae Hwa Pharmaceutical Co. Ltd. | | | 48,070 | | | | 341,930 | |
| | Dae Hyun Co. Ltd. | | | 102,719 | | | | 152,201 | |
* | | Dae Won Chemical Co. Ltd. | | | 80,068 | | | | 151,719 | |
| | Dae Won Kang Up Co. Ltd. | | | 151,346 | | | | 270,684 | |
* | | Dae Young Packaging Co. Ltd. | | | 248,153 | | | | 257,557 | |
# * | | Daea TI Co. Ltd. | | | 259,690 | | | | 518,214 | |
* | | Daebo Magnetic Co. Ltd. | | | 5,876 | | | | 248,856 | |
# | | Daebongls Co. Ltd. | | | 23,249 | | | | 124,391 | |
# | | Daechang Co. Ltd. | | | 221,469 | | | | 198,588 | |
| | Daedong Corp. | | | 59,572 | | | | 478,305 | |
| | Daeduck Electronics Co. Ltd. | | | 99,329 | | | | 1,709,775 | |
| | Daehan New Pharm Co. Ltd. | | | 38,400 | | | | 232,447 | |
| | Daehan Steel Co. Ltd. | | | 34,780 | | | | 298,461 | |
* | | Dae-Il Corp. | | | 40,268 | | | | 112,804 | |
# | | Daejoo Electronic Materials Co. Ltd. | | | 40,913 | | | | 2,573,380 | |
| | Daekyo Co. Ltd. | | | 53,089 | | | | 85,483 | |
| | Daelim B&Co Co. Ltd. | | | 36,970 | | | | 99,351 | |
* | | Daemyung Sonoseason Co. Ltd. | | | 230,575 | | | | 112,381 | |
| | Daeryuk Can Co. Ltd. | | | 12,389 | | | | 36,448 | |
# | | Daesang Corp. | | | 81,947 | | | | 1,203,920 | |
| | Daesang Holdings Co. Ltd. | | | 51,274 | | | | 254,554 | |
| | Daesung Energy Co. Ltd. | | | 35,012 | | | | 270,594 | |
| | Daesung Holdings Co. Ltd. | | | 12,873 | | | | 891,806 | |
* | | Daesung Industrial Co. Ltd. | | | 83,195 | | | | 238,639 | |
* | | Daesung Private Equity, Inc. | | | 34,984 | | | | 66,779 | |
* | | Daewon Cable Co. Ltd. | | | 206,186 | | | | 170,345 | |
* | | Daewon Media Co. Ltd. | | | 33,749 | | | | 279,975 | |
| | Daewon Pharmaceutical Co. Ltd. | | | 77,632 | | | | 916,830 | |
| | Daewon San Up Co. Ltd. | | | 55,250 | | | | 213,475 | |
# * | | Daewoo Electronic Components Co. Ltd. | | | 138,153 | | | | 148,249 | |
| | Daewoong Co. Ltd. | | | 58,330 | | | | 844,026 | |
| | Daewoong Pharmaceutical Co. Ltd. | | | 1,801 | | | | 203,896 | |
* | | Dahaam E-Tec Co. Ltd. | | | 2,100 | | | | 61,919 | |
| | Daihan Pharmaceutical Co. Ltd. | | | 19,913 | | | | 389,771 | |
| | Daishin Securities Co. Ltd. | | | 112,901 | | | | 1,104,662 | |
# * | | Danal Co. Ltd. | | | 202,555 | | | | 820,479 | |
* | | Danawa Co. Ltd. | | | 30,039 | | | | 360,066 | |
| | Daol Investment & Securities Co. Ltd. | | | 164,356 | | | | 356,538 | |
| | Daou Data Corp. | | | 60,778 | | | | 662,414 | |
| | Daou Technology, Inc. | | | 91,181 | | | | 1,157,149 | |
# * | | Dasan Networks, Inc. | | | 113,280 | | | | 319,976 | |
THE EMERGING MARKETS SMALL CAP SERIES
CONTINUED
| | | | | | | | | | |
| | | | | Shares | | | Value» | |
SOUTH KOREA — (Continued) | | | | | | | | |
# | | Dawonsys Co. Ltd. | | | 111,345 | | | $ | 1,333,324 | |
# * | | Dayou Automotive Seat Technology Co. Ltd. | | | 183,340 | | | | 85,676 | |
* | | Dayou Plus Co. Ltd. | | | 354,517 | | | | 204,374 | |
| | DB Financial Investment Co. Ltd. | | | 126,888 | | | | 358,112 | |
* | | DB, Inc. | | | 499,370 | | | | 263,956 | |
| | DCM Corp. | | | 18,701 | | | | 183,554 | |
* | | Dentis Co. Ltd. | | | 9,604 | | | | 49,043 | |
# | | Dentium Co. Ltd. | | | 26,896 | | | | 1,437,616 | |
| | Deutsch Motors, Inc. | | | 97,283 | | | | 426,180 | |
* | | Development Advance Solution Co. Ltd. | | | 39,144 | | | | 146,448 | |
| | Device ENG Co. Ltd. | | | 1,354 | | | | 14,746 | |
# | | Devsisters Co. Ltd. | | | 8,768 | | | | 299,432 | |
* | | Dexter Studios Co. Ltd. | | | 49,256 | | | | 318,266 | |
# | | DGB Financial Group, Inc. | | | 629,641 | | | | 2,998,224 | |
| | DI Dong Il Corp. | | | 52,974 | | | | 533,630 | |
| | Digital Chosun Co. Ltd. | | | 50,523 | | | | 81,951 | |
| | Digital Daesung Co. Ltd. | | | 66,620 | | | | 298,578 | |
* | | DIO Corp. | | | 45,722 | | | | 636,052 | |
| | Display Tech Co. Ltd. | | | 44,803 | | | | 153,176 | |
| | DL Construction Co. Ltd. | | | 26,871 | | | | 247,768 | |
# | | DL Holdings Co. Ltd. | | | 39,308 | | | | 1,693,898 | |
* †† | | DMOA Co. Ltd. | | | 414,534 | | | | 137,365 | |
| | DMS Co. Ltd. | | | 78,897 | | | | 259,484 | |
| | DN Automotive Corp. | | | 2,721 | | | | 110,602 | |
# | | DNF Co. Ltd. | | | 35,213 | | | | 324,978 | |
| | Dohwa Engineering Co. Ltd. | | | 60,443 | | | | 379,512 | |
| | Dong Ah Tire & Rubber Co. Ltd. | | | 38,282 | | | | 311,551 | |
| | Dong-A Hwasung Co. Ltd. | | | 14,590 | | | | 78,729 | |
| | Dong-A Socio Holdings Co. Ltd. | | | 14,514 | | | | 1,037,839 | |
| | Dong-A ST Co. Ltd. | | | 21,335 | | | | 815,498 | |
| | Dong-Ah Geological Engineering Co. Ltd. | | | 32,330 | | | | 298,884 | |
* | | Dongbang Transport Logistics Co. Ltd. | | | 94,680 | | | | 142,410 | |
| | Dongbu Corp. | | | 31,671 | | | | 151,197 | |
# | | Dongil Industries Co. Ltd. | | | 4,037 | | | | 505,969 | |
| | Dongjin Semichem Co. Ltd. | | | 65,470 | | | | 1,377,707 | |
| | Dongkoo Bio & Pharma Co. Ltd. | | | 21,999 | | | | 86,916 | |
| | DongKook Pharmaceutical Co. Ltd. | | | 95,048 | | | | 1,046,249 | |
| | Dongkuk Industries Co. Ltd. | | | 121,053 | | | | 398,837 | |
| | Dongkuk Steel Mill Co. Ltd. | | | 234,980 | | | | 1,882,828 | |
| | Dongkuk Structures & Construction Co. Ltd. | | | 120,350 | | | | 439,118 | |
| | Dongsung Chemical Co. Ltd. | | | 120,509 | | | | 373,252 | |
| | Dongsung Finetec Co. Ltd. | | | 71,914 | | | | 556,709 | |
* | | Dongwha Enterprise Co. Ltd. | | | 17,954 | | | | 825,418 | |
# | | Dongwha Pharm Co. Ltd. | | | 80,593 | | | | 510,107 | |
| | Dongwon Development Co. Ltd. | | | 153,298 | | | | 382,613 | |
| | Dongwon F&B Co. Ltd. | | | 4,936 | | | | 446,776 | |
| | Dongwon Industries Co. Ltd. | | | 4,704 | | | | 759,105 | |
# | | Dongwon Systems Corp. | | | 24,688 | | | | 794,618 | |
* | | Dongwoo Farm To Table Co. Ltd. | | | 32,913 | | | | 62,779 | |
| | Dongyang E&P, Inc. | | | 19,653 | | | | 173,539 | |
* | | Dongyang Steel Pipe Co. Ltd. | | | 396,748 | | | | 282,099 | |
# | | Doosan Co. Ltd. | | | 23,474 | | | | 1,271,791 | |
| | Doosan Tesna, Inc. | | | 20,410 | | | | 381,402 | |
# | | DoubleUGames Co. Ltd. | | | 36,271 | | | | 1,219,001 | |
| | Douzone Bizon Co. Ltd. | | | 29,827 | | | | 637,503 | |
* | | Dream Security Co. Ltd. | | | 44,221 | | | | 83,976 | |
| | Dreamtech Co. Ltd. | | | 7,465 | | | | 50,138 | |
* | | Dreamus Co. | | | 62,262 | | | | 115,283 | |
# * | | DRTECH Corp. | | | 88,665 | | | | 86,303 | |
THE EMERGING MARKETS SMALL CAP SERIES
CONTINUED
| | | | | | | | | | |
| | | | | Shares | | | Value» | |
SOUTH KOREA — (Continued) | | | | | | | | |
* | | DSC Investment, Inc. | | | 25,978 | | | $ | 75,178 | |
* | | DSK Co. Ltd. | | | 6,892 | | | | 27,939 | |
* | | Duck Yang Industry Co. Ltd. | | | 6,699 | | | | 13,767 | |
* | | Duckshin Housing Co. Ltd. | | | 41,004 | | | | 46,506 | |
# * | | Duk San Neolux Co. Ltd. | | | 41,465 | | | | 1,113,752 | |
* | | Duksan Hi-Metal Co. Ltd. | | | 6,584 | | | | 26,504 | |
* | | Duksan Techopia Co. Ltd. | | | 12,794 | | | | 156,226 | |
| | DY Corp. | | | 62,461 | | | | 237,851 | |
| | DY POWER Corp. | | | 34,233 | | | | 262,655 | |
| | DYPNF Co. Ltd. | | | 10,346 | | | | 296,436 | |
* | | E Investment&Development Co. Ltd. | | | 59,835 | | | | 41,926 | |
# * | | E& Corp. Co. Ltd. | | | 111,656 | | | | 205,153 | |
* | | E&D Co. Ltd. | | | 13,658 | | | | 279,403 | |
| | E1 Corp. | | | 13,432 | | | | 402,564 | |
| | Eagle Veterinary Technology Co. Ltd. | | | 7,061 | | | | 30,001 | |
| | Eagon Industrial Ltd. | | | 8,464 | | | | 44,371 | |
| | Easy Bio, Inc. | | | 87,948 | | | | 236,537 | |
# | | Easy Holdings Co. Ltd. | | | 176,052 | | | | 354,878 | |
| | eBEST Investment & Securities Co. Ltd. | | | 14,685 | | | | 52,025 | |
# | | Echo Marketing, Inc. | | | 47,640 | | | | 469,033 | |
| | Ecoplastic Corp. | | | 6,173 | | | | 13,127 | |
| | Ecopro HN Co. Ltd. | | | 13,855 | | | | 500,940 | |
| | e-Credible Co. Ltd. | | | 18,917 | | | | 226,896 | |
* | | Eehwa Construction Co. Ltd. | | | 55,076 | | | | 158,629 | |
# * | | EG Corp. | | | 19,573 | | | | 99,267 | |
* | | Ehwa Technologies Information Co. Ltd. | | | 455,538 | | | | 223,904 | |
| | Elentec Co. Ltd. | | | 49,808 | | | | 423,380 | |
* | | EMKOREA Co. Ltd. | | | 136,418 | | | | 269,643 | |
| | EM-Tech Co. Ltd. | | | 42,707 | | | | 817,961 | |
* | | Enex Co. Ltd. | | | 33,251 | | | | 20,496 | |
| | ENF Technology Co. Ltd. | | | 37,945 | | | | 608,091 | |
* | | Enplus Co. Ltd. | | | 92,834 | | | | 323,902 | |
* | | Enzychem Lifesciences Corp. | | | 57,121 | | | | 76,479 | |
# | | Eo Technics Co. Ltd. | | | 31,038 | | | | 1,416,878 | |
| | Estechpharma Co. Ltd. | | | 42,421 | | | | 217,734 | |
* | | ESTsoft Corp. | | | 27,672 | | | | 190,708 | |
* | | E-TRON Co. Ltd. | | | 1,491,477 | | | | 164,142 | |
* | | Eubiologics Co. Ltd. | | | 18,604 | | | | 135,365 | |
| | Eugene Corp. | | | 191,672 | | | | 457,377 | |
| | Eugene Investment & Securities Co. Ltd. | | | 263,075 | | | | 423,091 | |
| | Eugene Technology Co. Ltd. | | | 54,249 | | | | 818,429 | |
| | Eusu Holdings Co. Ltd. | | | 59,047 | | | | 285,886 | |
* | | Eutilex Co. Ltd. | | | 2,530 | | | | 12,930 | |
* | | EV Advanced Material Co. Ltd. | | | 44,834 | | | | 53,076 | |
* | | Ewon Comfortech Co. Ltd. | | | 14,501 | | | | 86,531 | |
* | | E-World | | | 79,853 | | | | 87,593 | |
* | | Exem Co. Ltd. | | | 92,152 | | | | 232,332 | |
* | | ezCaretech Co. Ltd. | | | 7,329 | | | | 91,837 | |
| | F&F Co. Ltd. | | | 35,705 | | | | 3,637,911 | |
| | Farmsco | | | 14,684 | | | | 37,864 | |
| | FarmStory Co. Ltd. | | | 168,511 | | | | 238,468 | |
| | Fila Holdings Corp. | | | 39,242 | | | | 898,750 | |
| | Fine M-Tec Co. Ltd. | | | 5,701 | | | | 30,295 | |
# | | Fine Semitech Corp. | | | 39,942 | | | | 377,440 | |
| | Fine Technix Co. Ltd. | | | 3,101 | | | | 5,129 | |
* | | Firstec Co. Ltd. | | | 116,567 | | | | 247,074 | |
* | | Flask Co. Ltd. | | | 9,575 | | | | 10,103 | |
* | | FNC Entertainment Co. Ltd. | | | 3,147 | | | | 10,193 | |
| | Foosung Co. Ltd. | | | 139,078 | | | | 1,206,417 | |
THE EMERGING MARKETS SMALL CAP SERIES
CONTINUED
| | | | | | | | | | |
| | | | | Shares | | | Value» | |
SOUTH KOREA — (Continued) | | | | | | | | |
| | Fursys, Inc. | | | 14,385 | | | $ | 276,599 | |
* | | FutureChem Co. Ltd. | | | 21,109 | | | | 142,196 | |
| | Gabia, Inc. | | | 43,120 | | | | 308,181 | |
# | | Galaxia Moneytree Co. Ltd. | | | 59,849 | | | | 211,779 | |
| | Gaon Cable Co. Ltd. | | | 6,271 | | | | 73,426 | |
* | | GemVax & Kael Co. Ltd. | | | 40,963 | | | | 355,827 | |
| | Gemvaxlink Co. Ltd. | | | 210,716 | | | | 152,895 | |
* | | Genematrix, Inc. | | | 12,082 | | | | 39,470 | |
# * | | Genexine, Inc. | | | 34,769 | | | | 545,123 | |
* | | Genie Music Corp. | | | 124,776 | | | | 330,248 | |
* | | GenNBio, Inc. | | | 2,619 | | | | 2,993 | |
| | GENOLUTION, Inc. | | | 6,482 | | | | 47,012 | |
* | | Genomictree, Inc. | | | 14,507 | | | | 91,516 | |
| | Genoray Co. Ltd. | | | 2,039 | | | | 11,434 | |
| | Geumhwa PSC Co. Ltd. | | | 6,842 | | | | 134,133 | |
* | | Gigalane Co. Ltd. | | | 63,904 | | | | 53,691 | |
| | Global Standard Technology Co. Ltd. | | | 14,039 | | | | 194,424 | |
| | GMB Korea Corp. | | | 24,445 | | | | 83,147 | |
* | | GNCO Co. Ltd. | | | 36,104 | | | | 11,067 | |
# | | Golfzon Co. Ltd. | | | 12,615 | | | | 1,019,269 | |
| | Golfzon Newdin Holdings Co. Ltd. | | | 84,626 | | | | 319,341 | |
# * †† | | Good People Co. Ltd. | | | 225,318 | | | | 31,290 | |
# | | Gradiant Corp. | | | 41,255 | | | | 394,686 | |
# * | | Grand Korea Leisure Co. Ltd. | | | 85,132 | | | | 847,248 | |
| | Green Chemical Co. Ltd. | | | 2,787 | | | | 19,237 | |
| | Green Cross Holdings Corp. | | | 80,040 | | | | 972,772 | |
* | | GS Global Corp. | | | 194,831 | | | | 368,185 | |
| | Gwangju Shinsegae Co. Ltd. | | | 13,770 | | | | 304,297 | |
| | Haatz, Inc. | | | 5,684 | | | | 20,642 | |
| | HAESUNG DS Co. Ltd. | | | 39,224 | | | | 1,042,997 | |
| | Haesung Industrial Co. Ltd. | | | 1,319 | | | | 9,526 | |
| | Haitai Confectionery & Foods Co. Ltd. | | | 37,409 | | | | 154,358 | |
# | | Han Kuk Carbon Co. Ltd. | | | 111,192 | | | | 864,307 | |
| | Hana Materials, Inc. | | | 13,726 | | | | 294,435 | |
# * | | Hana Micron, Inc. | | | 128,070 | | | | 837,599 | |
| | Hana Pharm Co. Ltd. | | | 859 | | | | 8,615 | |
# * | | Hanall Biopharma Co. Ltd. | | | 89,064 | | | | 885,143 | |
* | | Hancom, Inc. | | | 56,997 | | | | 522,743 | |
| | Handok, Inc. | | | 32,265 | | | | 366,623 | |
| | Handsome Co. Ltd. | | | 52,459 | | | | 922,636 | |
| | Hanil Cement Co. Ltd. | | | 32,697 | | | | 258,776 | |
| | Hanil Feed Co. Ltd. | | | 58,748 | | | | 253,219 | |
| | Hanil Holdings Co. Ltd. | | | 47,288 | | | | 334,932 | |
| | Hanil Hyundai Cement Co. Ltd. | | | 8,926 | | | | 113,852 | |
| | Hanjin Transportation Co. Ltd. | | | 33,634 | | | | 455,283 | |
* | | Hankook Cosmetics Co. Ltd. | | | 2,026 | | | | 8,548 | |
* | | Hankook Cosmetics Manufacturing Co. Ltd. | | | 4,096 | | | | 51,627 | |
| | Hankook Shell Oil Co. Ltd. | | | 2,629 | | | | 459,408 | |
| | Hanla IMS Co. Ltd. | | | 23,956 | | | | 83,971 | |
| | Hanmi Semiconductor Co. Ltd. | | | 165,467 | | | | 1,366,235 | |
| | HanmiGlobal Co. Ltd. | | | 31,164 | | | | 866,340 | |
| | Hannong Chemicals, Inc. | | | 3,988 | | | | 37,924 | |
* | | Hans Biomed Corp. | | | 29,685 | | | | 196,396 | |
| | Hansae Co. Ltd. | | | 72,287 | | | | 746,601 | |
| | Hansae Yes24 Holdings Co. Ltd. | | | 45,615 | | | | 147,744 | |
| | Hanshin Construction Co. Ltd. | | | 17,142 | | | | 105,894 | |
| | Hanshin Machinery Co. | | | 91,006 | | | | 438,632 | |
| | Hansol Holdings Co. Ltd. | | | 136,151 | | | | 301,798 | |
| | Hansol HomeDeco Co. Ltd. | | | 255,321 | | | | 188,698 | |
THE EMERGING MARKETS SMALL CAP SERIES
CONTINUED
| | | | | | | | | | |
| | | | | Shares | | | Value» | |
SOUTH KOREA — (Continued) | | | | | | | | |
# * | | Hansol IONES Co. Ltd. | | | 71,025 | | | $ | 328,493 | |
| | Hansol Paper Co. Ltd. | | | 64,542 | | | | 617,385 | |
* | | Hansol Technics Co. Ltd. | | | 102,841 | | | | 374,806 | |
# | | Hanssem Co. Ltd. | | | 14,050 | | | | 368,834 | |
* | | Hanwha General Insurance Co. Ltd. | | | 233,991 | | | | 603,859 | |
| | Hanwha Investment & Securities Co. Ltd. | | | 393,869 | | | | 678,184 | |
| | Hanyang Eng Co. Ltd. | | | 36,442 | | | | 347,259 | |
| | Hanyang Securities Co. Ltd. | | | 35,735 | | | | 217,453 | |
| | Harim Co. Ltd. | | | 194,038 | | | | 365,827 | |
| | Harim Holdings Co. Ltd. | | | 145,706 | | | | 718,946 | |
* | | HB SOLUTION Co. Ltd. | | | 28,101 | | | | 272,628 | |
| | HB Technology Co. Ltd. | | | 211,978 | | | | 271,847 | |
| | HDC Holdings Co. Ltd. | | | 37,315 | | | | 142,937 | |
| | HDC Hyundai Development Co. Engineering & Construction, Class E | | | 108,214 | | | | 758,450 | |
| | HDC Hyundai Engineering Plastics Co. Ltd. | | | 50,887 | | | | 138,609 | |
| | HDCLabs Co. Ltd. | | | 22,528 | | | | 117,733 | |
| | Hecto Financial Co. Ltd. | | | 7,655 | | | | 124,510 | |
| | Hecto Innovation Co. Ltd. | | | 34,635 | | | | 318,211 | |
* | | Helixmith Co. Ltd. | | | 68,999 | | | | 604,306 | |
* | | Heungkuk Fire & Marine Insurance Co. Ltd. | | | 188,691 | | | | 390,448 | |
* | | HFR, Inc. | | | 18,119 | | | | 384,617 | |
| | High Tech Pharm Co. Ltd. | | | 9,245 | | | | 59,172 | |
| | Hitejinro Holdings Co. Ltd. | | | 27,709 | | | | 196,267 | |
* | | HJ Magnolia Yongpyong Hotel & Resort Corp. | | | 109,445 | | | | 233,420 | |
* | | HJ Shipbuilding & Construction Co. Ltd. | | | 110,020 | | | | 270,639 | |
| | HL D&I Halla Corp. | | | 68,744 | | | | 137,038 | |
| | HL Holdings Corp. | | | 27,184 | | | | 600,430 | |
* | | HLB Global Co. Ltd. | | | 36,958 | | | | 206,386 | |
# * | | HLB Life Science Co. Ltd. | | | 228,090 | | | | 1,938,501 | |
* | | Hlb Pharma Ceutical Co. Ltd. | | | 5,001 | | | | 49,007 | |
* | | HLB Therapeutics Co. Ltd. | | | 59,545 | | | | 564,840 | |
| | HLscience Co. Ltd. | | | 3,143 | | | | 40,465 | |
* | | Home Center Holdings Co. Ltd. | | | 233,830 | | | | 177,797 | |
* | | Homecast Co. Ltd. | | | 116,798 | | | | 337,247 | |
| | HS Industries Co. Ltd. | | | 128,232 | | | | 337,962 | |
* | | HSD Engine Co. Ltd. | | | 128,636 | | | | 590,103 | |
* | | Hugel, Inc. | | | 12,995 | | | | 1,017,992 | |
* | | Humax Co. Ltd. | | | 65,528 | | | | 161,848 | |
| | Humedix Co. Ltd. | | | 21,560 | | | | 318,432 | |
* | | Huneed Technologies | | | 12,770 | | | | 55,773 | |
# | | Huons Co. Ltd. | | | 30,924 | | | | 677,808 | |
| | Huons Global Co. Ltd. | | | 26,394 | | | | 327,287 | |
| | Huvis Corp. | | | 52,644 | | | | 181,741 | |
| | Huvitz Co. Ltd. | | | 37,452 | | | | 289,817 | |
# | | Hwa Shin Co. Ltd. | | | 48,675 | | | | 303,829 | |
| | Hwacheon Machine Tool Co. Ltd. | | | 4,540 | | | | 99,875 | |
# * | | Hwail Pharm Co. Ltd. | | | 150,233 | | | | 229,449 | |
| | Hwangkum Steel & Technology Co. Ltd. | | | 33,205 | | | | 167,015 | |
| | Hwaseung Corp. Co. Ltd. | | | 11,150 | | | | 10,403 | |
| | Hwaseung Enterprise Co. Ltd. | | | 63,281 | | | | 390,964 | |
| | HwaSung Industrial Co. Ltd. | | | 37,257 | | | | 288,520 | |
| | Hy-Lok Corp. | | | 28,001 | | | | 405,291 | |
* | | Hyosung Chemical Corp. | | | 5,520 | | | | 392,046 | |
# | | Hyosung Corp. | | | 18,519 | | | | 889,702 | |
* | | Hyosung Heavy Industries Corp. | | | 9,479 | | | | 381,097 | |
| | Hyosung TNC Corp. | | | 4,054 | | | | 742,812 | |
| | HyosungITX Co. Ltd. | | | 13,955 | | | | 128,722 | |
| | Hyundai Bioland Co. Ltd. | | | 51,612 | | | | 437,941 | |
| | Hyundai BNG Steel Co. Ltd. | | | 36,935 | | | | 269,007 | |
THE EMERGING MARKETS SMALL CAP SERIES
CONTINUED
| | | | | | | | | | |
| | | | | Shares | | | Value» | |
SOUTH KOREA — (Continued) | | | | | | | | |
| | Hyundai Construction Equipment Co. Ltd. | | | 50,159 | | | $ | 1,510,494 | |
| | Hyundai Corp. | | | 30,105 | | | | 341,894 | |
| | Hyundai Corp. Holdings, Inc. | | | 19,173 | | | | 136,509 | |
# | | Hyundai Department Store Co. Ltd. | | | 46,770 | | | | 1,773,878 | |
# * | | Hyundai Doosan Infracore Co. Ltd. | | | 317,589 | | | | 1,234,672 | |
* | | Hyundai Electric & Energy System Co. Ltd. | | | 57,167 | | | | 1,376,203 | |
| | Hyundai Elevator Co. Ltd. | | | 72,251 | | | | 1,276,619 | |
* | | Hyundai Energy Solutions Co. Ltd. | | | 4,304 | | | | 177,534 | |
* | | HYUNDAI EVERDIGM Corp. | | | 4,006 | | | | 22,966 | |
| | Hyundai Ezwel Co. Ltd. | | | 76,198 | | | | 275,194 | |
| | Hyundai Futurenet Co. Ltd. | | | 138,333 | | | | 255,982 | |
# | | Hyundai Greenfood Co. Ltd. | | | 168,643 | | | | 769,873 | |
| | Hyundai Home Shopping Network Corp. | | | 23,796 | | | | 747,573 | |
| | Hyundai Livart Furniture Co. Ltd. | | | 47,892 | | | | 282,737 | |
| | Hyundai Motor Securities Co. Ltd. | | | 76,683 | | | | 495,521 | |
| | Hyundai Pharmaceutical Co. Ltd. | | | 91,807 | | | | 322,322 | |
| | Hyundai Wia Corp. | | | 43,714 | | | | 1,870,057 | |
| | Hyungkuk F&B Co. Ltd. | | | 13,023 | | | | 22,234 | |
# * †† | | Hyupjin Co. Ltd. | | | 97,584 | | | | 10,276 | |
# | | HyVision System, Inc. | | | 47,462 | | | | 506,625 | |
* | | I&C Technology Co. Ltd. | | | 639 | | | | 1,172 | |
| | i3system, Inc. | | | 18,619 | | | | 206,261 | |
* | | iA, Inc. | | | 1,086,695 | | | | 530,687 | |
| | ICD Co. Ltd. | | | 54,903 | | | | 325,776 | |
| | IDIS Holdings Co. Ltd. | | | 1,320 | | | | 10,143 | |
* | | IL Science Co. Ltd. | | | 7,360 | | | | 14,591 | |
| | Il Sung Construction Co. Ltd. | | | 1,197 | | | | 1,915 | |
| | Iljin Electric Co. Ltd. | | | 62,223 | | | | 190,686 | |
# | | Iljin Holdings Co. Ltd. | | | 80,297 | | | | 225,907 | |
| | Iljin Power Co. Ltd. | | | 26,588 | | | | 241,055 | |
| | Ilshin Spinning Co. Ltd. | | | 5,983 | | | | 436,436 | |
* | | Ilshin Stone Co. Ltd. | | | 206,774 | | | | 164,508 | |
†† | | ilShinbiobase Co. Ltd. | | | 122,045 | | | | 145,511 | |
| | Ilsung Pharmaceuticals Co. Ltd. | | | 4,137 | | | | 308,880 | |
| | Ilyang Pharmaceutical Co. Ltd. | | | 52,959 | | | | 660,123 | |
* | | iMarketKorea, Inc. | | | 69,527 | | | | 502,371 | |
| | InBody Co. Ltd. | | | 39,563 | | | | 569,344 | |
| | Incross Co. Ltd. | | | 29,001 | | | | 324,329 | |
# * | | Infinitt Healthcare Co. Ltd. | | | 34,801 | | | | 112,232 | |
| | InfoBank Corp. | | | 9,135 | | | | 77,597 | |
| | Innocean Worldwide, Inc. | | | 35,112 | | | | 988,992 | |
| | InnoWireless Co. Ltd. | | | 19,517 | | | | 375,859 | |
# | | Innox Advanced Materials Co. Ltd. | | | 49,189 | | | | 941,367 | |
* | | Innox Corp. | | | 928 | | | | 13,451 | |
* | | Inscobee, Inc. | | | 214,489 | | | | 230,154 | |
# * | | Insun ENT Co. Ltd. | | | 107,394 | | | | 675,083 | |
* | | Insung Information Co. Ltd. | | | 11,228 | | | | 16,054 | |
| | Intekplus Co. Ltd. | | | 19,343 | | | | 186,778 | |
| | Intellian Technologies, Inc. | | | 11,747 | | | | 513,625 | |
| | Intelligent Digital Integrated Security Co. Ltd. | | | 23,792 | | | | 358,847 | |
# * | | Interflex Co. Ltd. | | | 50,589 | | | | 363,138 | |
| | Interojo Co. Ltd. | | | 36,733 | | | | 626,645 | |
| | INTOPS Co. Ltd. | | | 38,974 | | | | 760,235 | |
# * | | iNtRON Biotechnology, Inc. | | | 83,532 | | | | 517,687 | |
| | Inzi Controls Co. Ltd. | | | 9,887 | | | | 55,457 | |
| | INZI Display Co. Ltd. | | | 13,375 | | | | 15,521 | |
# | | IS Dongseo Co. Ltd. | | | 52,102 | | | | 1,151,389 | |
| | ISC Co. Ltd. | | | 41,915 | | | | 890,488 | |
| | i-SENS, Inc. | | | 38,982 | | | | 945,515 | |
THE EMERGING MARKETS SMALL CAP SERIES
CONTINUED
| | | | | | | | | | |
| | | | | Shares | | | Value» | |
SOUTH KOREA — (Continued) | | | | | | | | |
* | | ISU Abxis Co. Ltd. | | | 7,306 | | | $ | 30,371 | |
| | ISU Chemical Co. Ltd. | | | 60,351 | | | | 1,064,119 | |
* | | IsuPetasys Co. Ltd. | | | 155,641 | | | | 641,398 | |
| | It’s Hanbul Co. Ltd. | | | 10,670 | | | | 106,818 | |
* | | Iwin Plus Co. Ltd. | | | 14,777 | | | | 5,291 | |
* | | Jahwa Electronics Co. Ltd. | | | 38,252 | | | | 499,198 | |
| | JASTECH Ltd. | | | 14,471 | | | | 67,214 | |
| | JB Financial Group Co. Ltd. | | | 439,857 | | | | 2,214,915 | |
| | JC Chemical Co. Ltd. | | | 22,661 | | | | 117,221 | |
| | JC Hyun System, Inc. | | | 47,592 | | | | 120,515 | |
| | Jeil Pharmaceutical Co. Ltd. | | | 7,973 | | | | 99,742 | |
* | | Jeju Semiconductor Corp. | | | 119,230 | | | | 319,078 | |
| | Jinro Distillers Co. Ltd. | | | 7,784 | | | | 117,421 | |
| | Jinsung T.E.C. | | | 36,955 | | | | 279,478 | |
| | JLS Co. Ltd. | | | 42,073 | | | | 219,394 | |
* | | JNK Heaters Co. Ltd. | | | 62,635 | | | | 234,884 | |
* | | JNTC Co. Ltd. | | | 9,150 | | | | 29,969 | |
* | | Jokwang ILI Co. Ltd. | | | 90,171 | | | | 87,854 | |
* | | JoyCity Corp. | | | 32,470 | | | | 95,291 | |
| | JS Corp. | | | 5,685 | | | | 56,350 | |
| | Jusung Engineering Co. Ltd. | | | 117,736 | | | | 942,798 | |
| | JVM Co. Ltd. | | | 20,022 | | | | 244,872 | |
| | JW Holdings Corp. | | | 180,363 | | | | 355,267 | |
| | JW Life Science Corp. | | | 29,965 | | | | 247,113 | |
| | JW Pharmaceutical Corp. | | | 50,256 | | | | 659,692 | |
* | | JW Shinyak Corp. | | | 68,072 | | | | 159,817 | |
| | Kangnam Jevisco Co. Ltd. | | | 14,797 | | | | 217,403 | |
* | | Kangstem Biotech Co. Ltd. | | | 87,134 | | | | 170,002 | |
| | KAON Media Co. Ltd. | | | 57,314 | | | | 236,396 | |
| | KC Co. Ltd. | | | 27,573 | | | | 299,457 | |
| | KC Green Holdings Co. Ltd. | | | 54,160 | | | | 94,521 | |
| | KC Tech Co. Ltd. | | | 37,495 | | | | 396,537 | |
| | KCC Engineering & Construction Co. Ltd. | | | 4,243 | | | | 17,342 | |
| | KCC Glass Corp. | | | 30,162 | | | | 818,130 | |
| | KCI Ltd. | | | 23,655 | | | | 139,296 | |
| | KCTC | | | 25,319 | | | | 71,849 | |
* | | KEC Corp. | | | 329,261 | | | | 592,441 | |
# | | KEPCO Plant Service & Engineering Co. Ltd. | | | 62,736 | | | | 1,402,997 | |
* | | Kespion Co. Ltd. | | | 40,499 | | | | 34,982 | |
* | | KEYEAST Co. Ltd. | | | 58,751 | | | | 236,209 | |
| | KG Chemical Corp. | | | 14,892 | | | | 240,068 | |
| | KG Dongbu Steel | | | 15,589 | | | | 84,866 | |
| | KG Eco Technology Service Co. Ltd. | | | 31,730 | | | | 211,555 | |
# | | Kginicis Co. Ltd. | | | 68,720 | | | | 618,667 | |
| | KGMobilians Co. Ltd. | | | 75,641 | | | | 301,104 | |
| | KH Vatec Co. Ltd. | | | 60,110 | | | | 511,120 | |
* | | KidariStudio, Inc. | | | 28,268 | | | | 123,714 | |
| | KINX, Inc. | | | 12,932 | | | | 466,337 | |
| | KISCO Corp. | | | 70,679 | | | | 288,528 | |
| | KISCO Holdings Co. Ltd. | | | 31,963 | | | | 289,063 | |
| | KISWIRE Ltd. | | | 39,433 | | | | 496,055 | |
| | KL-Net Corp. | | | 23,009 | | | | 41,450 | |
| | KM Corp. | | | 28,046 | | | | 109,404 | |
# * | | KMW Co. Ltd. | | | 41,816 | | | | 692,828 | |
| | Knotus Co. Ltd. | | | 19,251 | | | | 77,100 | |
* | | KoBioLabs, Inc. | | | 3,475 | | | | 27,000 | |
# | | Koentec Co. Ltd. | | | 82,232 | | | | 445,177 | |
# | | Koh Young Technology, Inc. | | | 210,636 | | | | 1,761,942 | |
# | | Kolmar BNH Co. Ltd. | | | 39,096 | | | | 590,098 | |
THE EMERGING MARKETS SMALL CAP SERIES
CONTINUED
| | | | | | | | | | |
| | | | | Shares | | | Value» | |
SOUTH KOREA — (Continued) | | | | | | | | |
# | | Kolmar Korea Co. Ltd. | | | 50,765 | | | $ | 1,218,109 | |
| | Kolmar Korea Holdings Co. Ltd. | | | 32,252 | | | | 311,923 | |
| | Kolon Corp. | | | 26,236 | | | | 415,371 | |
| | Kolon Global Corp. | | | 20,169 | | | | 189,480 | |
| | Kolon Industries, Inc. | | | 63,462 | | | | 1,932,511 | |
| | Kolon Plastic, Inc. | | | 49,059 | | | | 333,924 | |
| | Komelon Corp. | | | 21,175 | | | | 150,746 | |
# | | KoMiCo Ltd. | | | 23,135 | | | | 753,754 | |
* | | KONA I Co. Ltd. | | | 23,792 | | | | 258,336 | |
| | Kopla Co. Ltd. | | | 76,189 | | | | 260,839 | |
# | | Korea Alcohol Industrial Co. Ltd. | | | 47,508 | | | | 351,290 | |
| | Korea Arlico Pharm Co. Ltd. | | | 3,713 | | | | 13,619 | |
| | Korea Asset In Trust Co. Ltd. | | | 204,959 | | | | 417,014 | |
| | Korea Cast Iron Pipe Industries Co. Ltd. | | | 31,881 | | | | 152,688 | |
| | Korea Cement Co. Ltd. | | | 21,858 | | | | 40,509 | |
* | | Korea Circuit Co. Ltd. | | | 39,627 | | | | 397,739 | |
| | Korea District Heating Corp. | | | 10,363 | | | | 190,112 | |
| | Korea Electric Terminal Co. Ltd. | | | 21,069 | | | | 765,364 | |
| | Korea Electronic Certification Authority, Inc. | | | 55,043 | | | | 190,524 | |
| | Korea Electronic Power Industrial Development Co. Ltd. | | | 62,193 | | | | 348,894 | |
| | Korea Export Packaging Industrial Co. Ltd. | | | 5,621 | | | | 99,819 | |
| | Korea Flange Co. Ltd. | | | 70,591 | | | | 118,787 | |
* | | Korea Information & Communications Co. Ltd. | | | 24,722 | | | | 226,201 | |
* | | Korea Line Corp. | | | 577,450 | | | | 796,812 | |
* | | Korea Parts & Fasteners Co. Ltd. | | | 11,691 | | | | 48,415 | |
| | Korea Petrochemical Ind Co. Ltd. | | | 12,865 | | | | 1,066,820 | |
| | Korea Petroleum Industries Co. | | | 11,179 | | | | 84,487 | |
| | Korea Pharma Co. Ltd. | | | 10,327 | | | | 160,330 | |
| | Korea Real Estate Investment & Trust Co. Ltd. | | | 493,546 | | | | 472,387 | |
# | | Korea United Pharm, Inc. | | | 35,429 | | | | 590,601 | |
| | Korean Reinsurance Co. | | | 322,466 | | | | 1,662,641 | |
* | | Kortek Corp. | | | 38,389 | | | | 244,131 | |
# * | | KPM Tech Co. Ltd. | | | 258,546 | | | | 69,104 | |
* | | KPS Corp. | | | 8,173 | | | | 30,335 | |
| | KPX Chemical Co. Ltd. | | | 8,847 | | | | 296,431 | |
| | KSIGN Co. Ltd. | | | 205,671 | | | | 207,399 | |
| | KSS LINE Ltd. | | | 53,011 | | | | 334,339 | |
* | | KT Alpha Co. Ltd. | | | 62,034 | | | | 227,443 | |
| | KT Skylife Co. Ltd. | | | 84,493 | | | | 484,981 | |
# | | KT Submarine Co. Ltd. | | | 51,480 | | | | 196,633 | |
| | KTCS Corp. | | | 129,498 | | | | 196,169 | |
| | Ktis Corp. | | | 109,265 | | | | 187,769 | |
* | | Kuk Young G&M | | | 86,374 | | | | 75,704 | |
| | Kukbo Design Co. Ltd. | | | 11,235 | | | | 137,053 | |
| | Kukdo Chemical Co. Ltd. | | | 11,469 | | | | 348,006 | |
# | | Kukdong Oil & Chemicals Co. Ltd. | | | 71,029 | | | | 177,907 | |
# * | | Kuk-il Paper Manufacturing Co. Ltd. | | | 190,710 | | | | 334,649 | |
| | Kukjeon Pharmaceutical Co. Ltd. | | | 52,920 | | | | 283,517 | |
* | | Kum Yang Co. Ltd. | | | 95,714 | | | | 1,844,243 | |
* | | Kumho HT, Inc. | | | 218,810 | | | | 153,355 | |
# * | | Kumho Tire Co., Inc. | | | 339,665 | | | | 734,282 | |
| | KUMHOE&C Co. Ltd. | | | 75,262 | | | | 319,284 | |
| | Kumkang Kind Co. Ltd. | | | 62,740 | | | | 228,650 | |
| | Kwang Dong Pharmaceutical Co. Ltd. | | | 145,493 | | | | 603,064 | |
| | Kwang Myung Electric Co. Ltd. | | | 100,455 | | | | 148,075 | |
* | | KX Innovation Co. Ltd. | | | 69,335 | | | | 300,343 | |
| | Kyeong Nam Steel Co. Ltd. | | | 5,707 | | | | 12,206 | |
# | | Kyeryong Construction Industrial Co. Ltd. | | | 26,457 | | | | 316,808 | |
| | Kyobo Securities Co. Ltd. | | | 73,316 | | | | 268,451 | |
THE EMERGING MARKETS SMALL CAP SERIES
CONTINUED
| | | | | | | | | | |
| | | | | Shares | | | Value» | |
SOUTH KOREA — (Continued) | | | | | | | | |
| | Kyongbo Pharmaceutical Co. Ltd. | | | 42,025 | | | $ | 159,981 | |
| | Kyung Dong Navien Co. Ltd. | | | 24,470 | | | | 590,914 | |
| | Kyung Nong Corp. | | | 6,524 | | | | 42,030 | |
| | Kyungbang Co. Ltd. | | | 47,694 | | | | 366,309 | |
* | | Kyungchang Industrial Co. Ltd. | | | 18,649 | | | | 25,496 | |
| | KyungDong City Gas Co. Ltd. | | | 13,575 | | | | 222,941 | |
| | Kyungdong Pharm Co. Ltd. | | | 73,304 | | | | 378,322 | |
| | Kyung-In Synthetic Corp. | | | 131,581 | | | | 439,329 | |
# | | L&C Bio Co. Ltd. | | | 21,852 | | | | 343,698 | |
| | LabGenomics Co. Ltd. | | | 80,286 | | | | 405,473 | |
* | | Lake Materials Co. Ltd. | | | 103,591 | | | | 422,864 | |
# | | LB Semicon, Inc. | | | 119,129 | | | | 668,999 | |
| | LEADCORP, Inc. | | | 47,816 | | | | 253,766 | |
| | LF Corp. | | | 62,995 | | | | 655,680 | |
| | LG HelloVision Co. Ltd. | | | 116,618 | | | | 371,295 | |
| | LIG Nex1 Co. Ltd. | | | 20,826 | | | | 1,484,770 | |
# | | Lion Chemtech Co. Ltd. | | | 20,825 | | | | 133,369 | |
| | Lock & Lock Co. Ltd. | | | 64,031 | | | | 273,855 | |
* | | Longtu Korea, Inc. | | | 29,434 | | | | 58,881 | |
| | LOT Vacuum Co. Ltd. | | | 45,136 | | | | 320,856 | |
# | | Lotte Chilsung Beverage Co. Ltd. | | | 11,715 | | | | 1,153,622 | |
| | Lotte Confectionery Co. Ltd. | | | 8,416 | | | | 767,376 | |
* | | Lotte Data Communication Co. | | | 4,028 | | | | 65,936 | |
# | | LOTTE Fine Chemical Co. Ltd. | | | 56,329 | | | | 2,215,052 | |
| | LOTTE Himart Co. Ltd. | | | 34,338 | | | | 317,724 | |
* | | Lotte Non-Life Insurance Co. Ltd. | | | 155,474 | | | | 161,328 | |
# | | LS Cable & System Asia Ltd. | | | 35,473 | | | | 187,480 | |
| | LS Corp. | | | 11,569 | | | | 539,052 | |
# | | LS Electric Co. Ltd. | | | 34,059 | | | | 1,312,668 | |
| | Lutronic Corp. | | | 73,793 | | | | 936,809 | |
* | | LVMC Holdings | | | 207,836 | | | | 395,412 | |
| | LX Hausys Ltd. | | | 25,569 | | | | 576,821 | |
| | LX International Corp. | | | 102,861 | | | | 2,929,822 | |
# | | LX Semicon Co. Ltd. | | | 39,299 | | | | 2,280,114 | |
| | M.I.Tech Co. Ltd. | | | 17,788 | | | | 147,642 | |
* | | M2N Co. Ltd. | | | 20,327 | | | | 79,172 | |
| | Macrogen, Inc. | | | 3,933 | | | | 56,104 | |
| | Maeil Dairies Co. Ltd. | | | 4,652 | | | | 153,609 | |
| | Maeil Holdings Co. Ltd. | | | 22,787 | | | | 134,830 | |
| | MAKUS, Inc. | | | 2,286 | | | | 10,884 | |
| | Mcnex Co. Ltd. | | | 44,780 | | | | 860,659 | |
# * | | MDS Tech, Inc. | | | 58,702 | | | | 241,371 | |
* | | ME2ON Co. Ltd. | | | 93,947 | | | | 307,132 | |
| | Mediana Co. Ltd. | | | 24,894 | | | | 81,692 | |
* | | MEDICOX Co. Ltd. | | | 13,317 | | | | 80,758 | |
# * †† | | Medience Co. Ltd. | | | 53,361 | | | | 106,310 | |
* | | Medipost Co. Ltd. | | | 50,463 | | | | 508,883 | |
# | | Medy-Tox, Inc. | | | 15,791 | | | | 1,163,815 | |
# | | Meerecompany, Inc. | | | 18,983 | | | | 278,537 | |
# | | MegaStudy Co. Ltd. | | | 33,559 | | | | 258,899 | |
| | MegaStudyEdu Co. Ltd. | | | 27,677 | | | | 1,663,249 | |
| | MEKICS Co. Ltd. | | | 8,088 | | | | 23,100 | |
| | META BIOMED Co. Ltd. | | | 32,591 | | | | 49,896 | |
* | | Mgame Corp. | | | 59,295 | | | | 251,208 | |
| | Mi Chang Oil Industrial Co. Ltd. | | | 3,145 | | | | 164,254 | |
* | | MiCo BioMed Co. Ltd. | | | 14,873 | | | | 59,372 | |
| | MiCo Ltd. | | | 120,402 | | | | 783,858 | |
| | Mirae Asset Life Insurance Co. Ltd. | | | 239,457 | | | | 445,144 | |
| | Mirae Asset Venture Investment Co. Ltd. | | | 35,502 | | | | 106,702 | |
THE EMERGING MARKETS SMALL CAP SERIES
CONTINUED
| | | | | | | | | | |
| | | | | Shares | | | Value» | |
SOUTH KOREA — (Continued) | | | | | | | | |
| | Miwon Chemicals Co. Ltd. | | | 3,853 | | | $ | 163,047 | |
| | Miwon Commercial Co. Ltd. | | | 5,072 | | | | 603,823 | |
| | Miwon Specialty Chemical Co. Ltd. | | | 5,925 | | | | 696,631 | |
| | MK Electron Co. Ltd. | | | 55,102 | | | | 389,617 | |
| | MNTech Co. Ltd. | | | 63,871 | | | | 654,387 | |
* | | Mobile Appliance, Inc. | | | 98,324 | | | | 228,619 | |
* | | Monalisa Co. Ltd. | | | 73,193 | | | | 152,363 | |
| | MonAmi Co. Ltd. | | | 59,430 | | | | 131,015 | |
| | Moorim P&P Co. Ltd. | | | 82,322 | | | | 261,360 | |
| | Moorim Paper Co. Ltd. | | | 91,551 | | | | 156,020 | |
| | Motonic Corp. | | | 40,895 | | | | 218,582 | |
* | | Motrex Co. Ltd. | | | 36,574 | | | | 402,003 | |
* †† | | MPC plus, Inc. | | | 955 | | | | 207 | |
* | | mPlus Corp. | | | 15,452 | | | | 154,672 | |
* | | MS Autotech Co. Ltd. | | | 113,563 | | | | 319,739 | |
| | Muhak Co. Ltd. | | | 28,579 | | | | 96,543 | |
| | Multicampus Co. Ltd. | | | 10,150 | | | | 254,835 | |
* | | M-venture Investment, Inc. | | | 56,251 | | | | 50,912 | |
* | | MyungMoon Pharm Co. Ltd. | | | 94,962 | | | | 163,013 | |
| | Nam Hwa Construction Co. Ltd. | | | 25,880 | | | | 119,289 | |
# | | Namhae Chemical Corp. | | | 85,332 | | | | 545,935 | |
* | | Namsun Aluminum Co. Ltd. | | | 285,935 | | | | 416,848 | |
* | | Namuga Co. Ltd. | | | 36,468 | | | | 290,928 | |
| | Namyang Dairy Products Co. Ltd. | | | 1,212 | | | | 309,061 | |
* | | NanoenTek, Inc. | | | 81,092 | | | | 293,656 | |
| | Nasmedia Co. Ltd. | | | 18,911 | | | | 410,299 | |
# * | | Nature & Environment Co. Ltd. | | | 329,630 | | | | 244,765 | |
* | | NDFOS Co. Ltd. | | | 19,650 | | | | 71,599 | |
| | NeoPharm Co. Ltd. | | | 19,428 | | | | 235,016 | |
* | | Neowiz | | | 48,900 | | | | 1,235,694 | |
| | NEOWIZ HOLDINGS Corp. | | | 16,632 | | | | 282,284 | |
* | | Nepes Ark Corp. | | | 2,882 | | | | 46,824 | |
# * | | NEPES Corp. | | | 68,067 | | | | 869,737 | |
* | | Neptune Co. | | | 1,651 | | | | 14,570 | |
| | New Power Plasma Co. Ltd. | | | 7,229 | | | | 17,155 | |
| | Nexen Corp. | | | 108,320 | | | | 304,023 | |
| | Nexen Tire Corp. | | | 124,972 | | | | 676,257 | |
* | | Next Entertainment World Co. Ltd. | | | 71,002 | | | | 263,374 | |
| | NEXTIN, Inc. | | | 1,712 | | | | 62,121 | |
* | | NHN Corp. | | | 55,266 | | | | 888,721 | |
* | | NHN KCP Corp. | | | 84,992 | | | | 746,777 | |
| | NI Steel Co. Ltd. | | | 3,440 | | | | 9,292 | |
| | NICE Holdings Co. Ltd. | | | 71,741 | | | | 621,721 | |
| | Nice Information & Telecommunication, Inc. | | | 22,862 | | | | 424,736 | |
| | NICE Information Service Co. Ltd. | | | 131,225 | | | | 1,194,836 | |
| | NICE Total Cash Management Co. Ltd. | | | 54,101 | | | | 174,892 | |
* | | NK Co. Ltd. | | | 223,859 | | | | 139,755 | |
| | Nong Shim Holdings Co. Ltd. | | | 8,176 | | | | 351,561 | |
| | Nong Woo Bio Co. Ltd. | | | 9,704 | | | | 54,698 | |
| | NongShim Co. Ltd. | | | 8,049 | | | | 1,704,953 | |
| | NOROO Paint & Coatings Co. Ltd. | | | 37,026 | | | | 200,791 | |
| | NOVAREX Co. Ltd. | | | 11,444 | | | | 95,422 | |
| | NPC | | | 66,771 | | | | 316,522 | |
* | | NS Co. Ltd. | | | 1,771 | | | | 11,427 | |
* | | NSN Co. Ltd. | | | 42,271 | | | | 29,600 | |
* | | nTels Co. Ltd. | | | 16,474 | | | | 51,865 | |
* | | Nuintek Co. Ltd. | | | 43,573 | | | | 92,789 | |
* | | NUVOTEC Co. Ltd. | | | 153,125 | | | | 82,947 | |
| | Oceanbridge Co. Ltd. | | | 19,278 | | | | 171,571 | |
THE EMERGING MARKETS SMALL CAP SERIES
CONTINUED
| | | | | | | | | | |
| | | | | Shares | | | Value» | |
SOUTH KOREA — (Continued) | | | | | | | | |
* | | Omnisystem Co. Ltd. | | | 37,373 | | | $ | 38,623 | |
| | Openbase, Inc. | | | 68,350 | | | | 116,500 | |
* | | Optipharm Co. Ltd. | | | 1,575 | | | | 8,709 | |
| | Opto Device Technology Co. Ltd. | | | 2,933 | | | | 10,746 | |
| | OptoElectronics Solutions Co. Ltd. | | | 30,470 | | | | 338,405 | |
* | | OPTRON-TEC, Inc. | | | 54,673 | | | | 150,574 | |
| | OPTUS Pharmaceutical Co. Ltd. | | | 43,209 | | | | 187,814 | |
# * | | Orbitech Co. Ltd. | | | 93,260 | | | | 305,207 | |
* | | Orientbio, Inc. | | | 173,545 | | | | 74,867 | |
| | Orion Holdings Corp. | | | 88,035 | | | | 882,828 | |
# | | Osstem Implant Co. Ltd. | | | 43,402 | | | | 3,231,842 | |
# * †† | | Osung Advanced Materials Co. Ltd. | | | 223,449 | | | | 348,621 | |
| | Ottogi Corp. | | | 3,257 | | | | 1,008,863 | |
| | Paik Kwang Industrial Co. Ltd. | | | 98,951 | | | | 307,974 | |
* | | PANAGENE, Inc. | | | 24,893 | | | | 60,127 | |
| | Pang Rim Co. Ltd. | | | 89,464 | | | | 442,216 | |
* | | Pan-Pacific Co. Ltd. | | | 66,731 | | | | 56,117 | |
* | | Paradise Co. Ltd. | | | 125,164 | | | | 1,245,629 | |
| | Park Systems Corp. | | | 3,980 | | | | 305,758 | |
# | | Partron Co. Ltd. | | | 156,372 | | | | 898,763 | |
# | | Paseco Co. Ltd. | | | 14,642 | | | | 129,818 | |
# | | People & Technology, Inc. | | | 45,616 | | | | 1,473,572 | |
* | | Peptron, Inc. | | | 7,294 | | | | 40,631 | |
| | PHA Co. Ltd. | | | 25,290 | | | | 108,171 | |
* | | PharmAbcine | | | 13,657 | | | | 33,771 | |
# | | PharmaResearch Co. Ltd. | | | 20,129 | | | | 867,331 | |
* | | PharmGen Science, Inc. | | | 63,854 | | | | 337,367 | |
* | | Pharmicell Co. Ltd. | | | 161,353 | | | | 1,151,928 | |
* | | Philoptics Co. Ltd. | | | 8,562 | | | | 44,406 | |
* †† | | Philosys Healthcare Co. Ltd. | | | 94,841 | | | | 86,888 | |
# | | PI Advanced Materials Co. Ltd. | | | 53,171 | | | | 1,103,872 | |
| | Point Engineering Co. Ltd. | | | 24,538 | | | | 34,087 | |
# | | Poongsan Corp. | | | 67,915 | | | | 1,242,797 | |
| | Poongsan Holdings Corp. | | | 24,968 | | | | 446,483 | |
# | | Posco ICT Co. Ltd. | | | 179,741 | | | | 721,600 | |
| | Posco M-Tech Co. Ltd. | | | 72,480 | | | | 377,579 | |
| | POSCO Steeleon Co. Ltd. | | | 893 | | | | 16,900 | |
* | | Power Logics Co. Ltd. | | | 95,962 | | | | 360,869 | |
| | Protec Co. Ltd. | | | 19,624 | | | | 300,362 | |
| | PS TEC Co. Ltd. | | | 11,191 | | | | 26,509 | |
# | | PSK, Inc. | | | 71,508 | | | | 763,113 | |
| | Pulmuone Co. Ltd. | | | 38,753 | | | | 278,468 | |
| | Pungkuk Ethanol Co. Ltd. | | | 22,635 | | | | 208,752 | |
| | QSI Co. Ltd. | | | 10,628 | | | | 67,809 | |
* | | RaonSecure Co. Ltd. | | | 115,448 | | | | 189,452 | |
* | | Ray Co. Ltd/KR | | | 18,972 | | | | 249,123 | |
| | Rayence Co. Ltd. | | | 17,543 | | | | 118,050 | |
# | | Reyon Pharmaceutical Co. Ltd. | | | 27,505 | | | | 369,633 | |
# | | RFHIC Corp. | | | 68,876 | | | | 1,014,874 | |
* | | RFTech Co. Ltd. | | | 114,269 | | | | 351,387 | |
| | RN2 Technologies Co. Ltd. | | | 4,601 | | | | 31,184 | |
* | | Robostar Co. Ltd. | | | 28,003 | | | | 342,114 | |
* | | Robotis Co. Ltd. | | | 11,904 | | | | 196,620 | |
| | Rorze Systems Corp. | | | 12,806 | | | | 65,655 | |
# | | Rsupport Co. Ltd. | | | 59,819 | | | | 176,024 | |
| | S Net Systems, Inc. | | | 47,161 | | | | 152,160 | |
# | | S&S Tech Corp. | | | 54,626 | | | | 949,870 | |
* | | S.Y. Co. Ltd. | | | 129,076 | | | | 288,404 | |
| | Sajo Industries Co. Ltd. | | | 9,398 | | | | 274,895 | |
THE EMERGING MARKETS SMALL CAP SERIES
CONTINUED
| | | | | | | | | | |
| | | | | Shares | | | Value» | |
SOUTH KOREA — (Continued) | | | | | | | | |
| | Sajodaerim Corp. | | | 2,580 | | | $ | 42,936 | |
* | | Sajodongaone Co. Ltd. | | | 29,518 | | | | 21,635 | |
# * | | Sam Chun Dang Pharm Co. Ltd. | | | 36,463 | | | | 780,237 | |
* | | SAM KANG M&T Co. Ltd. | | | 84,478 | | | | 1,198,051 | |
| | Sam Young Electronics Co. Ltd. | | | 45,179 | | | | 310,618 | |
# | | Sam Yung Trading Co. Ltd. | | | 77,884 | | | | 708,061 | |
| | Sambo Corrugated Board Co. Ltd. | | | 7,239 | | | | 51,005 | |
| | Sambo Motors Co. Ltd. | | | 15,328 | | | | 63,031 | |
* | | Sambu Engineering & Construction Co. Ltd. | | | 297,390 | | | | 284,272 | |
| | Samchully Co. Ltd. | | | 6,711 | | | | 1,314,065 | |
| | Samchuly Bicycle Co. Ltd. | | | 15,529 | | | | 71,267 | |
# | | Samho Development Co. Ltd. | | | 64,421 | | | | 175,261 | |
| | SAMHWA Paints Industrial Co. Ltd. | | | 37,979 | | | | 165,650 | |
| | Samick Musical Instruments Co. Ltd. | | | 219,742 | | | | 181,727 | |
# | | Samick THK Co. Ltd. | | | 31,605 | | | | 255,795 | |
| | Samil Pharmaceutical Co. Ltd. | | | 25,472 | | | | 132,164 | |
| | Samji Electronics Co. Ltd. | | | 37,339 | | | | 212,996 | |
| | Samjin LND Co. Ltd. | | | 89,395 | | | | 179,347 | |
| | Samjin Pharmaceutical Co. Ltd. | | | 33,351 | | | | 589,542 | |
| | Samkee Corp. | | | 67,094 | | | | 200,196 | |
| | Sammok S-Form Co. Ltd. | | | 19,532 | | | | 229,156 | |
# | | SAMPYO Cement Co. Ltd. | | | 125,588 | | | | 309,783 | |
| | Samsung Climate Control Co. Ltd. | | | 1,221 | | | | 9,161 | |
* | | Samsung Pharmaceutical Co. Ltd. | | | 233,733 | | | | 445,741 | |
| | Samsung Publishing Co. Ltd. | | | 17,275 | | | | 300,912 | |
| | SAMT Co. Ltd. | | | 211,277 | | | | 382,132 | |
| | Samwha Capacitor Co. Ltd. | | | 30,126 | | | | 676,331 | |
| | Samwha Electric Co. Ltd. | | | 16,687 | | | | 180,696 | |
| | Samyang Corp. | | | 12,575 | | | | 327,205 | |
| | Samyang Foods Co. Ltd. | | | 13,290 | | | | 1,033,967 | |
# | | Samyang Holdings Corp. | | | 14,215 | | | | 616,923 | |
| | Samyang Packaging Corp. | | | 4,346 | | | | 48,474 | |
| | Samyang Tongsang Co. Ltd. | | | 5,256 | | | | 184,777 | |
* | | Samyoung Chemical Co. Ltd. | | | 36,545 | | | | 61,202 | |
# | | Sang-A Frontec Co. Ltd. | | | 35,732 | | | | 632,845 | |
* | | Sangbo Corp. | | | 112,085 | | | | 113,072 | |
# | | Sangsangin Co. Ltd. | | | 130,409 | | | | 592,057 | |
| | Sangsin Energy Display Precision Co. Ltd. | | | 38,495 | | | | 444,350 | |
| | SaraminHR Co. Ltd. | | | 26,768 | | | | 602,572 | |
| | Satrec Initiative Co. Ltd. | | | 22,788 | | | | 403,467 | |
| | SAVEZONE I&C Corp. | | | 64,559 | | | | 116,587 | |
* | | SBI Investment Korea Co. Ltd. | | | 350,632 | | | | 290,976 | |
* | | SBW | | | 881,230 | | | | 232,442 | |
* | | S-Connect Co. Ltd. | | | 208,292 | | | | 120,309 | |
# * | | SDN Co. Ltd. | | | 224,182 | | | | 311,850 | |
| | Seah Besteel Holdings Corp. | | | 51,280 | | | | 602,159 | |
| | SeAH Holdings Corp. | | | 3,283 | | | | 233,874 | |
# | | SeAH Steel Corp. | | | 3,893 | | | | 378,924 | |
| | SeAH Steel Holdings Corp. | | | 6,517 | | | | 618,310 | |
| | Sebang Co. Ltd. | | | 42,224 | | | | 487,080 | |
| | Sebang Global Battery Co. Ltd. | | | 22,923 | | | | 625,892 | |
| | Secuve Co. Ltd. | | | 76,608 | | | | 57,213 | |
| | Segyung Hitech Co. Ltd. | | | 5,861 | | | | 47,850 | |
| | Sejin Heavy Industries Co. Ltd. | | | 46,649 | | | | 187,276 | |
| | Sejong Industrial Co. Ltd. | | | 38,928 | | | | 126,126 | |
| | Sejong Telecom, Inc. | | | 758,673 | | | | 357,521 | |
* | | Sekonix Co. Ltd. | | | 25,593 | | | | 98,107 | |
* | | Selvas AI, Inc. | | | 61,638 | | | | 229,204 | |
| | Sempio Foods Co. | | | 9,478 | | | | 208,816 | |
THE EMERGING MARKETS SMALL CAP SERIES
CONTINUED
| | | | | | | | | | |
| | | | | Shares | | | Value» | |
SOUTH KOREA — (Continued) | | | | | | | | |
* | | S-Energy Co. Ltd. | | | 24,822 | | | $ | 62,522 | |
# | | Seobu T&D | | | 113,697 | | | | 534,828 | |
| | Seohan Co. Ltd. | | | 290,737 | | | | 207,806 | |
# | | Seojin System Co. Ltd. | | | 53,856 | | | | 554,406 | |
| | Seoul Auction Co. Ltd. | | | 41,464 | | | | 518,055 | |
| | Seoul City Gas Co. Ltd. | | | 1,738 | | | | 401,839 | |
* | | Seoul Food Industrial Co. Ltd. | | | 1,520,855 | | | | 233,649 | |
# | | Seoul Semiconductor Co. Ltd. | | | 161,292 | | | | 1,180,512 | |
# | | Seoul Viosys Co. Ltd. | | | 27,029 | | | | 99,956 | |
# | | Seoulin Bioscience Co. Ltd. | | | 24,822 | | | | 214,491 | |
| | Seowon Co. Ltd. | | | 106,245 | | | | 95,651 | |
| | SEOWONINTECH Co. Ltd. | | | 16,960 | | | | 67,339 | |
# | | Seoyon Co. Ltd. | | | 56,279 | | | | 205,776 | |
| | Seoyon E-Hwa Co. Ltd. | | | 37,029 | | | | 184,999 | |
* | | Sewon E&C Co. Ltd. | | | 518,090 | | | | 309,350 | |
†† | | Sewon Precision Industry Co. Ltd. | | | 25,563 | | | | 27,222 | |
| | Sewoon Medical Co. Ltd. | | | 90,686 | | | | 176,706 | |
# | | SFA Engineering Corp. | | | 66,414 | | | | 1,775,647 | |
# * | | SFA Semicon Co. Ltd. | | | 257,032 | | | | 776,385 | |
| | S-Fuelcell Co. Ltd. | | | 8,387 | | | | 117,791 | |
* | | SG Corp. | | | 525,085 | | | | 201,444 | |
| | SGC e Tec E&C Co. Ltd. | | | 6,274 | | | | 147,906 | |
| | SGC Energy Co. Ltd. | | | 9,993 | | | | 220,099 | |
| | SH Energy & Chemical Co. Ltd. | | | 339,049 | | | | 217,792 | |
| | Shin Heung Energy & Electronics Co. Ltd. | | | 8,995 | | | | 329,383 | |
* | | Shin Poong Pharmaceutical Co. Ltd. | | | 62,297 | | | | 943,478 | |
| | Shindaeyang Paper Co. Ltd. | | | 7,142 | | | | 414,992 | |
| | Shinil Electronics Co. Ltd. | | | 256,618 | | | | 317,498 | |
| | Shinsegae Engineering & Construction Co. Ltd. | | | 7,252 | | | | 82,869 | |
| | Shinsegae Food Co. Ltd. | | | 4,124 | | | | 138,562 | |
| | Shinsegae Information & Communication Co. Ltd. | | | 2,319 | | | | 20,153 | |
| | Shinsegae International, Inc. | | | 43,626 | | | | 719,509 | |
| | Shinsung Delta Tech Co. Ltd. | | | 44,703 | | | | 301,427 | |
* | | Shinsung E&G Co. Ltd. | | | 610,324 | | | | 808,344 | |
* | | Shinsung Tongsang Co. Ltd. | | | 122,206 | | | | 202,114 | |
* | | Shinwha Intertek Corp. | | | 107,691 | | | | 232,495 | |
| | Shinwon Corp. | | | 193,213 | | | | 208,557 | |
| | Shinyoung Securities Co. Ltd. | | | 17,134 | | | | 664,804 | |
* | | Showbox Corp. | | | 109,545 | | | | 254,285 | |
* | | Signetics Corp. | | | 215,282 | | | | 182,985 | |
| | SIGONG TECH Co. Ltd. | | | 35,400 | | | | 107,057 | |
# | | Silla Co. Ltd. | | | 28,011 | | | | 219,103 | |
# | | Simmtech Co. Ltd. | | | 66,827 | | | | 1,652,611 | |
| | SIMMTECH HOLDINGS Co. Ltd. | | | 19,511 | | | | 47,879 | |
| | SIMPAC, Inc. | | | 57,924 | | | | 253,842 | |
| | Sindoh Co. Ltd. | | | 16,601 | | | | 375,118 | |
| | Sinil Pharm Co. Ltd. | | | 3,891 | | | | 21,914 | |
* | | SinSin Pharmaceutical Co. Ltd. | | | 32,598 | | | | 114,605 | |
| | SJ Group Co. Ltd. | | | 8,579 | | | | 97,323 | |
| | SK D&D Co. Ltd. | | | 37,022 | | | | 534,973 | |
| | SK Discovery Co. Ltd. | | | 43,232 | | | | 900,263 | |
| | SK Gas Ltd. | | | 7,969 | | | | 637,193 | |
| | SK Networks Co. Ltd. | | | 513,086 | | | | 1,449,198 | |
* | | SK Rent A Car Co. Ltd. | | | 5,401 | | | | 24,655 | |
| | SK Securities Co. Ltd. | | | 1,416,650 | | | | 651,415 | |
# | | SL Corp. | | | 61,667 | | | | 1,327,023 | |
* | | SM Culture & Contents Co. Ltd. | | | 194,308 | | | | 423,729 | |
# | | SM Entertainment Co. Ltd. | | | 49,558 | | | | 2,468,483 | |
* | | SM Life Design Group Co. Ltd. | | | 104,568 | | | | 162,209 | |
THE EMERGING MARKETS SMALL CAP SERIES
CONTINUED
| | | | | | | | | | |
| | | | | Shares | | | Value» | |
SOUTH KOREA — (Continued) | | | | | | | | |
* †† | | S-MAC Co. Ltd. | | | 189,827 | | | $ | 235,667 | |
| | SMCore, Inc. | | | 53,702 | | | | 200,557 | |
| | SNT Dynamics Co. Ltd. | | | 43,348 | | | | 262,690 | |
| | SNT Energy Co. Ltd. | | | 1 | | | | 13 | |
| | SNT Holdings Co. Ltd. | | | 27,174 | | | | 272,523 | |
# | | SNT Motiv Co. Ltd. | | | 32,114 | | | | 993,867 | |
* | | SNU Precision Co. Ltd. | | | 77,902 | | | | 130,578 | |
* | | Solborn, Inc. | | | 54,990 | | | | 138,052 | |
* | | Solid, Inc. | | | 219,880 | | | | 651,848 | |
* | | SOLUM Co. Ltd. | | | 13,272 | | | | 160,357 | |
| | Songwon Industrial Co. Ltd. | | | 47,243 | | | | 570,550 | |
* | | Sonokong Co. Ltd. | | | 43,529 | | | | 55,447 | |
| | Soosan Heavy Industries Co. Ltd. | | | 50,388 | | | | 94,347 | |
| | Soulbrain Co. Ltd. | | | 10,916 | | | | 1,565,061 | |
| | Soulbrain Holdings Co. Ltd. | | | 19,846 | | | | 321,707 | |
| | SPC Samlip Co. Ltd. | | | 8,493 | | | | 419,987 | |
| | Speco Co. Ltd. | | | 10,580 | | | | 38,340 | |
# | | SPG Co. Ltd. | | | 47,728 | | | | 554,245 | |
# | | Spigen Korea Co. Ltd. | | | 13,602 | | | | 304,849 | |
* †† | | Ssangyong Motor Co. | | | 65,982 | | | | 231,605 | |
| | ST Pharm Co. Ltd. | | | 25,025 | | | | 1,460,245 | |
| | STIC Investments, Inc. | | | 127,660 | | | | 504,487 | |
* | | Straffic Co. Ltd. | | | 38,493 | | | | 110,916 | |
* | | STX Heavy Industries Co. Ltd. | | | 5,234 | | | | 13,860 | |
| | Suheung Co. Ltd. | | | 22,312 | | | | 524,949 | |
| | Sun Kwang Co. Ltd. | | | 16,326 | | | | 1,279,774 | |
| | Sung Kwang Bend Co. Ltd. | | | 51,596 | | | | 502,364 | |
* | | Sungchang Enterprise Holdings Ltd. | | | 214,939 | | | | 280,382 | |
| | Sungdo Engineering & Construction Co. Ltd. | | | 10,095 | | | | 32,550 | |
# | | Sungshin Cement Co. Ltd. | | | 59,213 | | | | 395,248 | |
# | | Sungwoo Hitech Co. Ltd. | | | 185,738 | | | | 673,661 | |
# | | Sunjin Co. Ltd. | | | 48,992 | | | | 273,078 | |
* | | Sunny Electronics Corp. | | | 114,566 | | | | 181,798 | |
* | | Suprema, Inc. | | | 18,844 | | | | 319,719 | |
| | SV Investment Corp. | | | 106,865 | | | | 163,481 | |
* | | Synergy Innovation Co. Ltd. | | | 105,399 | | | | 238,694 | |
* | | Synopex, Inc. | | | 253,251 | | | | 460,429 | |
| | Systems Technology, Inc. | | | 40,934 | | | | 392,539 | |
| | T&L Co. Ltd. | | | 4,142 | | | | 106,499 | |
| | Tae Kyung Industrial Co. Ltd. | | | 44,125 | | | | 199,489 | |
# | | Taekwang Industrial Co. Ltd. | | | 1,200 | | | | 591,822 | |
| | Taekyung BK Co. Ltd. | | | 21,499 | | | | 78,247 | |
* †† | | Taewoong Co. Ltd. | | | 56,071 | | | | 394,449 | |
| | Taeyoung Engineering & Construction Co. Ltd. | | | 85,762 | | | | 252,544 | |
# * | | Taihan Fiberoptics Co. Ltd. | | | 228,160 | | | | 410,886 | |
* | | Taihan Textile Co. Ltd. | | | 2,843 | | | | 101,625 | |
| | Tailim Packaging Co. Ltd. | | | 63,432 | | | | 112,380 | |
| | TCC Steel | | | 7,703 | | | | 50,007 | |
| | TechWing, Inc. | | | 104,027 | | | | 427,351 | |
* | | Tego Science, Inc. | | | 8,956 | | | | 100,764 | |
* | | Telcon RF Pharmaceutical, Inc. | | | 277,957 | | | | 206,498 | |
| | Telechips, Inc. | | | 36,782 | | | | 320,507 | |
* | | TERA SCIENCE Co. Ltd. | | | 76,064 | | | | 82,129 | |
# | | TES Co. Ltd. | | | 58,026 | | | | 645,944 | |
# * | | Theragen Etex Co. Ltd. | | | 111,294 | | | | 307,778 | |
# * | | Thinkware Systems Corp. | | | 26,213 | | | | 250,754 | |
# * | | TK Chemical Corp. | | | 47,613 | | | | 99,966 | |
| | TK Corp. | | | 53,989 | | | | 619,927 | |
* | | Tkg Aikang Co. Ltd. | | | 70,536 | | | | 71,154 | |
THE EMERGING MARKETS SMALL CAP SERIES
CONTINUED
| | | | | | | | | | |
| | | | | Shares | | | Value» | |
SOUTH KOREA — (Continued) | | | | | | | | |
# | | TKG Huchems Co. Ltd. | | | 69,624 | | | $ | 1,016,521 | |
# | | Tokai Carbon Korea Co. Ltd. | | | 20,425 | | | | 1,451,449 | |
| | Tongyang Life Insurance Co. Ltd. | | | 162,309 | | | | 582,659 | |
| | Tongyang, Inc. | | | 548,179 | | | | 380,975 | |
* | | Top Engineering Co. Ltd. | | | 52,518 | | | | 184,888 | |
* | | Toptec Co. Ltd. | | | 81,091 | | | | 384,060 | |
| | Tovis Co. Ltd. | | | 56,715 | | | | 345,755 | |
| | TS Corp. | | | 140,490 | | | | 250,391 | |
* | | TS Nexgen Co. Ltd. | | | 228,108 | | | | 158,712 | |
* | | Tuksu Construction Co. Ltd. | | | 31,513 | | | | 182,496 | |
* | | TY Holdings Co. Ltd. | | | 96,748 | | | | 715,613 | |
| | TYM Corp. | | | 421,296 | | | | 733,629 | |
| | UBCare Co. Ltd. | | | 91,237 | | | | 307,804 | |
| | Ubiquoss Holdings, Inc. | | | 32,753 | | | | 312,314 | |
| | Ubiquoss, Inc. | | | 26,517 | | | | 283,590 | |
| | Uju Electronics Co. Ltd. | | | 26,223 | | | | 295,557 | |
| | Uni-Chem Co. Ltd. | | | 155,749 | | | | 124,528 | |
* | | Unick Corp. | | | 53,999 | | | | 188,890 | |
| | Unid Co. Ltd. | | | 19,166 | | | | 1,036,036 | |
| | Union Materials Corp. | | | 28,259 | | | | 60,654 | |
| | Union Semiconductor Equipment & Materials Co. Ltd. | | | 89,463 | | | | 384,020 | |
| | Uniquest Corp. | | | 58,434 | | | | 342,648 | |
* | | Unison Co. Ltd. | | | 221,499 | | | | 288,573 | |
* | | UniTest, Inc. | | | 60,851 | | | | 543,287 | |
| | UTI, Inc. | | | 22,312 | | | | 296,119 | |
| | Value Added Technology Co. Ltd. | | | 29,655 | | | | 626,440 | |
* | | Very Good Tour Co. Ltd. | | | 15,639 | | | | 99,302 | |
| | Viatron Technologies, Inc. | | | 42,963 | | | | 252,185 | |
| | VICTEK Co. Ltd. | | | 91,039 | | | | 374,721 | |
# * | | Vidente Co. Ltd. | | | 57,951 | | | | 144,210 | |
| | Vieworks Co. Ltd. | | | 30,239 | | | | 734,089 | |
* | | Vina Tech Co. Ltd. | | | 9,178 | | | | 284,936 | |
| | Visang Education, Inc. | | | 16,820 | | | | 69,134 | |
| | Vitzro Tech Co. Ltd. | | | 13,726 | | | | 53,867 | |
| | Vitzrocell Co. Ltd. | | | 54,357 | | | | 455,215 | |
* | | Vivien Corp. | | | 13,190 | | | | 11,611 | |
* | | Vivozon Healthcare, Inc. | | | 147,360 | | | | 80,662 | |
* | | VT GMP Co. Ltd. | | | 42,957 | | | | 155,707 | |
| | Webcash Corp. | | | 13,826 | | | | 145,250 | |
* | | Webzen, Inc. | | | 56,800 | | | | 594,643 | |
| | Welcron Co. Ltd. | | | 109,997 | | | | 225,631 | |
* | | Wellbiotec Co. Ltd. | | | 99,963 | | | | 90,388 | |
* | | Wemade Play Co. Ltd. | | | 14,264 | | | | 176,187 | |
| | Whanin Pharmaceutical Co. Ltd. | | | 46,587 | | | | 562,292 | |
| | Wiable Corp. | | | 8,754 | | | | 13,802 | |
* | | WillBes & Co. | | | 178,256 | | | | 90,693 | |
# | | Winix, Inc. | | | 34,410 | | | | 234,293 | |
| | Wins Co. Ltd. | | | 26,610 | | | | 232,338 | |
| | WiSoL Co. Ltd. | | | 74,628 | | | | 331,186 | |
* | | WIZIT Co. Ltd. | | | 244,335 | | | | 123,450 | |
* | | WONIK CUBE Corp. | | | 58,473 | | | | 80,268 | |
* | | Wonik Holdings Co. Ltd. | | | 165,481 | | | | 386,127 | |
# | | WONIK IPS Co. Ltd. | | | 76,527 | | | | 1,473,297 | |
# | | Wonik Materials Co. Ltd. | | | 26,289 | | | | 545,589 | |
* | | Wonik Pne Co. Ltd. | | | 42,476 | | | | 624,879 | |
# | | Wonik QnC Corp. | | | 62,589 | | | | 1,066,341 | |
| | Woojin Plaimm Co. Ltd. | | | 3,881 | | | | 10,115 | |
| | Woojin, Inc. | | | 9,379 | | | | 55,207 | |
* | | Woongjin Co. Ltd. | | | 1 | | | | 1 | |
THE EMERGING MARKETS SMALL CAP SERIES
CONTINUED
| | | | | | | | | | |
| | | | | Shares | | | Value» | |
SOUTH KOREA — (Continued) | | | | | | | | |
| | Woongjin Thinkbig Co. Ltd. | | | 35,821 | | | $ | 57,212 | |
* | | Wooree Bio Co. Ltd. | | | 12,108 | | | | 28,835 | |
| | Woori Investment Bank Co. Ltd. | | | 1,534,136 | | | | 814,303 | |
# * | | Woori Technology, Inc. | | | 570,501 | | | | 521,263 | |
* †† | | Wooriro Co. Ltd. | | | 16,683 | | | | 12,160 | |
| | Woorison F&G Co. Ltd. | | | 116,049 | | | | 139,836 | |
| | Woory Industrial Co. Ltd. | | | 23,700 | | | | 226,109 | |
* | | Woosu AMS Co. Ltd. | | | 106,413 | | | | 191,335 | |
| | WooSung Co. Ltd. | | | 6,452 | | | | 92,131 | |
* | | Woowon Development Co. Ltd. | | | 3,040 | | | | 7,018 | |
| | Worldex Industry & Trading Co. Ltd. | | | 44,952 | | | | 600,078 | |
| | Y G-1 Co. Ltd. | | | 61,821 | | | | 250,416 | |
* | | Y2 Solution Co. Ltd. | | | 88,983 | | | | 37,744 | |
* | | Y-entec Co. Ltd. | | | 25,880 | | | | 150,744 | |
* | | Yest Co. Ltd. | | | 52,284 | | | | 296,412 | |
# | | YG Entertainment, Inc. | | | 42,279 | | | | 1,265,146 | |
* | | YG PLUS | | | 63,361 | | | | 177,593 | |
* | | YIK Corp. | | | 98,562 | | | | 227,162 | |
* | | YJM Games Co. Ltd. | | | 113,684 | | | | 107,049 | |
| | YMC Co. Ltd. | | | 54,027 | | | | 230,300 | |
| | YMT Co. Ltd. | | | 19,799 | | | | 202,610 | |
| | Yonwoo Co. Ltd. | | | 6,890 | | | | 60,618 | |
| | Yoosung Enterprise Co. Ltd. | | | 80,477 | | | | 149,343 | |
| | Youlchon Chemical Co. Ltd. | | | 35,492 | | | | 811,522 | |
# | | Young Poong Corp. | | | 795 | | | | 351,300 | |
| | Young Poong Precision Corp. | | | 37,751 | | | | 311,029 | |
| | Youngone Corp. | | | 20,354 | | | | 674,641 | |
| | Youngone Holdings Co. Ltd. | | | 21,971 | | | | 833,847 | |
* | | YoungWoo DSP Co. Ltd. | | | 15,059 | | | | 15,133 | |
| | YTN Co. Ltd. | | | 73,837 | | | | 311,440 | |
| | Yuanta Securities Korea Co. Ltd. | | | 340,341 | | | | 573,732 | |
| | YuHwa Securities Co. Ltd. | | | 96,255 | | | | 154,351 | |
* | | Yujin Robot Co. Ltd. | | | 9,092 | | | | 26,159 | |
* | | Yungjin Pharmaceutical Co. Ltd. | | | 229,011 | | | | 436,263 | |
| | Yuyu Pharma, Inc. | | | 8,551 | | | | 36,351 | |
| | Zeus Co. Ltd. | | | 28,507 | | | | 468,259 | |
| | Zinus, Inc. | | | 28,065 | | | | 615,777 | |
| | | | | | | | | | |
TOTAL SOUTH KOREA | | | | 402,710,105 | |
| | | | | | | | | | |
TAIWAN — (15.7%) | | | | | | | | |
| | 104 Corp. | | | 1,000 | | | | 5,894 | |
| | ABC Taiwan Electronics Corp. | | | 300,977 | | | | 204,604 | |
| | Abico Avy Co. Ltd. | | | 444,841 | | | | 260,538 | |
# | | Ability Enterprise Co. Ltd. | | | 851,293 | | | | 528,945 | |
# * | | Ability Opto-Electronics Technology Co. Ltd. | | | 262,776 | | | | 444,773 | |
# | | Abnova Corp. | | | 88,000 | | | | 94,055 | |
# | | AcBel Polytech, Inc. | | | 1,226,599 | | | | 1,045,904 | |
# | | ACES Electronic Co. Ltd. | | | 420,822 | | | | 393,218 | |
* | | Acon Holding, Inc. | | | 938,560 | | | | 310,585 | |
| | Acter Group Corp. Ltd. | | | 360,980 | | | | 1,052,409 | |
| | Action Electronics Co. Ltd. | | | 687,000 | | | | 268,069 | |
# | | ADATA Technology Co. Ltd. | | | 857,879 | | | | 1,431,255 | |
# | | Addcn Technology Co. Ltd. | | | 111,564 | | | | 622,777 | |
# | | Advanced Ceramic X Corp. | | | 163,000 | | | | 774,537 | |
# | | Advanced International Multitech Co. Ltd. | | | 422,000 | | | | 1,214,318 | |
# | | Advanced Optoelectronic Technology, Inc. | | | 457,000 | | | | 229,109 | |
# | | Advanced Power Electronics Corp. | | | 138,000 | | | | 403,943 | |
# | | Advanced Wireless Semiconductor Co. | | | 229,000 | | | | 437,744 | |
# | | Advancetek Enterprise Co. Ltd. | | | 1,099,519 | | | | 984,887 | |
THE EMERGING MARKETS SMALL CAP SERIES
CONTINUED
| | | | | | | | | | |
| | | | | Shares | | | Value» | |
TAIWAN — (Continued) | | | | | | | | |
| | AEON Motor Co. Ltd. | | | 33,359 | | | $ | 41,911 | |
| | Aerospace Industrial Development Corp. | | | 2,123,000 | | | | 2,061,869 | |
# | | AGV Products Corp. | | | 1,543,433 | | | | 442,596 | |
* | | Airmate Cayman International Co. Ltd. | | | 38,719 | | | | 19,593 | |
| | Alchip Technologies Ltd. | | | 22,000 | | | | 440,568 | |
# | | Alexander Marine Co. Ltd. | | | 46,000 | | | | 330,001 | |
# * | | ALI Corp. | | | 686,775 | | | | 380,514 | |
# | | All Ring Tech Co. Ltd. | | | 100,000 | | | | 176,034 | |
| | Allied Circuit Co. Ltd. | | | 113,000 | | | | 305,365 | |
# | | Allied Supreme Corp. | | | 46,000 | | | | 370,242 | |
# | | Allis Electric Co. Ltd. | | | 672,385 | | | | 520,201 | |
# | | Alltek Technology Corp. | | | 554,423 | | | | 522,851 | |
# | | Alltop Technology Co. Ltd. | | | 92,774 | | | | 327,236 | |
| | Alpha Networks, Inc. | | | 1,347,158 | | | | 1,117,389 | |
| | Altek Corp. | | | 925,945 | | | | 959,862 | |
| | Amazing Microelectronic Corp. | | | 315,085 | | | | 804,134 | |
* | | Ambassador Hotel | | | 1,135,000 | | | | 1,098,395 | |
# | | AMICCOM Electronics Corp. | | | 25,000 | | | | 18,479 | |
| | AMPACS Corp. | | | 12,000 | | | | 11,021 | |
| | Ampire Co. Ltd. | | | 317,000 | | | | 256,529 | |
# | | AMPOC Far-East Co. Ltd. | | | 346,444 | | | | 435,628 | |
| | AmTRAN Technology Co. Ltd. | | | 2,870,486 | | | | 823,393 | |
* | | Amulaire Thermal Technology, Inc. | | | 32,000 | | | | 29,358 | |
| | Anderson Industrial Corp. | | | 290,416 | | | | 80,450 | |
# | | Anpec Electronics Corp. | | | 224,007 | | | | 730,109 | |
# | | Apac Opto Electronics, Inc. | | | 147,000 | | | | 133,125 | |
# | | Apacer Technology, Inc. | | | 345,325 | | | | 427,298 | |
# | | APAQ Technology Co. Ltd. | | | 202,120 | | | | 252,345 | |
# | | APCB, Inc. | | | 485,000 | | | | 240,234 | |
| | Apex Biotechnology Corp. | | | 338,483 | | | | 244,522 | |
# | | Apex International Co. Ltd. | | | 556,470 | | | | 849,885 | |
# | | Apex Science & Engineering | | | 623,132 | | | | 190,264 | |
| | Arcadyan Technology Corp. | | | 533,055 | | | �� | 1,486,569 | |
| | Ardentec Corp. | | | 1,500,274 | | | | 1,943,163 | |
# | | Argosy Research, Inc. | | | 220,396 | | | | 414,674 | |
| | Asia Electronic Material Co. Ltd. | | | 331,000 | | | | 155,852 | |
# | | Asia Optical Co., Inc. | | | 851,000 | | | | 1,509,037 | |
* | | Asia Pacific Telecom Co. Ltd. | | | 6,978,999 | | | | 1,369,302 | |
* | | Asia Plastic Recycling Holding Ltd. | | | 405,182 | | | | 90,274 | |
| | Asia Polymer Corp. | | | 1,420,996 | | | | 1,093,404 | |
# | | Asia Tech Image, Inc. | | | 211,000 | | | | 353,898 | |
# | | Asia Vital Components Co. Ltd. | | | 887,058 | | | | 2,797,317 | |
# | | ASIX Electronics Corp. | | | 58,000 | | | | 164,054 | |
| | ASolid Technology Co. Ltd. | | | 27,000 | | | | 50,811 | |
# | | ASROCK, Inc. | | | 154,000 | | | | 466,099 | |
| | ATE Energy International Co. Ltd. | | | 10,274 | | | | 8,123 | |
| | Aten International Co. Ltd. | | | 350,479 | | | | 821,889 | |
# | | Audix Corp. | | | 279,600 | | | | 436,715 | |
| | AURAS Technology Co. Ltd. | | | 229,148 | | | | 850,716 | |
# | | Aurona Industries, Inc. | | | 246,000 | | | | 136,502 | |
| | Aurora Corp. | | | 262,349 | | | | 634,201 | |
# | | Avalue Technology, Inc. | | | 164,000 | | | | 286,702 | |
| | Aver Information, Inc. | | | 31,000 | | | | 37,656 | |
| | Awea Mechantronic Co. Ltd. | | | 132,210 | | | | 127,161 | |
# | | Axiomtek Co. Ltd. | | | 212,000 | | | | 348,066 | |
# * | | Azurewave Technologies, Inc. | | | 345,000 | | | | 196,365 | |
# | | Bafang Yunji International Co. Ltd. | | | 70,000 | | | | 380,564 | |
| | Bank of Kaohsiung Co. Ltd. | | | 2,515,334 | | | | 958,334 | |
| | Baolong International Co. Ltd. | | | 295,000 | | | | 141,260 | |
THE EMERGING MARKETS SMALL CAP SERIES
CONTINUED
| | | | | | | | | | |
| | | | | Shares | | | Value» | |
TAIWAN — (Continued) | | | | | | | | |
| | Basso Industry Corp. | | | 472,900 | | | $ | 565,875 | |
# | | BenQ Materials Corp. | | | 610,000 | | | | 549,255 | |
| | BES Engineering Corp. | | | 5,159,750 | | | | 1,277,471 | |
| | Bin Chuan Enterprise Co. Ltd. | | | 372,070 | | | | 249,515 | |
# | | Bionet Corp. | | | 140,000 | | | | 162,527 | |
| | Bionime Corp. | | | 133,000 | | | | 301,909 | |
# | | Biostar Microtech International Corp. | | | 631,975 | | | | 249,705 | |
| | Bioteque Corp. | | | 239,308 | | | | 793,790 | |
# | | Bizlink Holding, Inc. | | | 429,492 | | | | 3,275,239 | |
| | Bon Fame Co. Ltd. | | | 14,000 | | | | 20,870 | |
# | | Bora Pharmaceuticals Co. Ltd. | | | 62,724 | | | | 534,600 | |
| | Brave C&H Supply Co. Ltd. | | | 20,000 | | | | 39,954 | |
| | Bright Led Electronics Corp. | | | 375,520 | | | | 165,625 | |
# | | Brighton-Best International Taiwan, Inc. | | | 1,469,318 | | | | 1,525,692 | |
# | | Brillian Network & Automation Integrated System Co. Ltd. | | | 28,000 | | | | 71,585 | |
# | | Browave Corp. | | | 197,000 | | | | 278,354 | |
# | | C Sun Manufacturing Ltd. | | | 530,969 | | | | 720,085 | |
* | | Calin Technology Co. Ltd. | | | 11,000 | | | | 11,715 | |
* | | Cameo Communications, Inc. | | | 745,645 | | | | 214,114 | |
# | | Capital Futures Corp. | | | 335,895 | | | | 364,677 | |
# | | Capital Securities Corp. | | | 6,059,501 | | | | 1,877,151 | |
# * | | Career Technology MFG. Co. Ltd. | | | 1,580,459 | | | | 1,178,479 | |
# | | Carnival Industrial Corp. | | | 415,353 | | | | 137,701 | |
# | | Castles Technology Co. Ltd. | | | 58,866 | | | | 103,960 | |
| | Caswell, Inc. | | | 17,000 | | | | 42,016 | |
| | Cathay Chemical Works | | | 30,000 | | | | 22,288 | |
| | Cathay Real Estate Development Co. Ltd. | | | 2,062,700 | | | | 927,657 | |
# | | Cayman Engley Industrial Co. Ltd. | | | 152,099 | | | | 299,656 | |
# | | CCP Contact Probes Co. Ltd. | | | 159,844 | | | | 195,322 | |
# | | Celxpert Energy Corp. | | | 280,000 | | | | 256,802 | |
| | Center Laboratories, Inc. | | | 1,599,827 | | | | 2,159,906 | |
# | | Central Reinsurance Co. Ltd. | | | 504,380 | | | | 278,402 | |
# | | Century Iron & Steel Industrial Co. Ltd. | | | 459,000 | | | | 1,093,648 | |
| | Chain Chon Industrial Co. Ltd. | | | 651,484 | | | | 246,237 | |
* | | ChainQui Construction Development Co. Ltd. | | | 451,080 | | | | 199,435 | |
# | | Champion Building Materials Co. Ltd. | | | 903,851 | | | | 257,966 | |
| | Champion Microelectronic Corp. | | | 51,000 | | | | 58,704 | |
| | Chang Wah Electromaterials, Inc. | | | 1,362,350 | | | | 1,287,960 | |
| | Chang Wah Technology Co. Ltd. | | | 1,180,425 | | | | 1,059,884 | |
# | | Channel Well Technology Co. Ltd. | | | 680,000 | | | | 503,689 | |
| | Charoen Pokphand Enterprise | | | 698,483 | | | | 1,639,969 | |
| | CHC Healthcare Group | | | 367,000 | | | | 449,281 | |
# | | CHC Resources Corp. | | | 346,282 | | | | 479,645 | |
# | | Chen Full International Co. Ltd. | | | 342,000 | | | | 360,592 | |
# | | Chenbro Micom Co. Ltd. | | | 219,000 | | | | 448,524 | |
| | Cheng Loong Corp. | | | 2,760,383 | | | | 2,241,560 | |
| | Cheng Mei Materials Technology Corp. | | | 2,413,900 | | | | 690,579 | |
| | Cheng Uei Precision Industry Co. Ltd. | | | 1,321,331 | | | | 1,375,121 | |
# * | | Chenming Electronic Technology Corp. | | | 287,437 | | | | 120,617 | |
# | | Chia Chang Co. Ltd. | | | 378,000 | | | | 393,399 | |
# | | Chia Hsin Cement Corp. | | | 1,726,121 | | | | 847,742 | |
| | Chian Hsing Forging Industrial Co. Ltd. | | | 151,800 | | | | 148,164 | |
# | | Chicony Power Technology Co. Ltd. | | | 481,454 | | | | 1,043,143 | |
| | Chief Telecom, Inc. | | | 6,000 | | | | 51,731 | |
# | | Chieftek Precision Co. Ltd. | | | 248,847 | | | | 563,143 | |
| | Chien Kuo Construction Co. Ltd. | | | 658,249 | | | | 222,422 | |
| | Chien Shing Harbour Service Co. Ltd. | | | 16,000 | | | | 16,213 | |
# | | Chime Ball Technology Co. Ltd. | | | 106,840 | | | | 123,228 | |
| | China Bills Finance Corp. | | | 2,632,000 | | | | 1,159,694 | |
THE EMERGING MARKETS SMALL CAP SERIES
CONTINUED
| | | | | | | | | | |
| | | | | Shares | | | Value» | |
TAIWAN — (Continued) | | | | | | | | |
| | China Chemical & Pharmaceutical Co. Ltd. | | | 904,000 | | | $ | 566,045 | |
| | China Ecotek Corp. | | | 145,000 | | | | 182,379 | |
# | | China Electric Manufacturing Corp. | | | 798,959 | | | | 342,305 | |
| | China Fineblanking Technology Co. Ltd. | | | 159,242 | | | | 170,190 | |
# | | China General Plastics Corp. | | | 1,457,461 | | | | 891,860 | |
# | | China Glaze Co. Ltd. | | | 310,002 | | | | 115,688 | |
* | | China Man-Made Fiber Corp. | | | 4,555,390 | | | | 1,091,030 | |
| | China Metal Products | | | 1,069,603 | | | | 888,644 | |
| | China Motor Corp. | | | 800,600 | | | | 1,036,178 | |
# | | China Petrochemical Development Corp. | | | 13,546,553 | | | | 3,938,467 | |
| | China Steel Chemical Corp. | | | 576,554 | | | | 1,839,452 | |
# | | China Steel Structure Co. Ltd. | | | 282,000 | | | | 467,226 | |
# | | China Wire & Cable Co. Ltd. | | | 276,160 | | | | 214,645 | |
# | | Chinese Maritime Transport Ltd. | | | 287,594 | | | | 285,651 | |
| | Ching Feng Home Fashions Co. Ltd. | | | 544,409 | | | | 280,179 | |
| | Chin-Poon Industrial Co. Ltd. | | | 1,488,207 | | | | 1,267,085 | |
# | | Chipbond Technology Corp. | | | 2,353,000 | | | | 3,965,475 | |
| | ChipMOS Technologies, Inc. | | | 1,896,076 | | | | 1,862,109 | |
| | Chlitina Holding Ltd. | | | 190,000 | | | | 868,333 | |
| | Chong Hong Construction Co. Ltd. | | | 673,666 | | | | 1,486,171 | |
| | Chun YU Works & Co. Ltd. | | | 526,050 | | | | 360,233 | |
# | | Chun Yuan Steel Industry Co. Ltd. | | | 1,806,529 | | | | 830,471 | |
| | Chung Hsin Electric & Machinery Manufacturing Corp. | | | 1,402,375 | | | | 2,144,969 | |
# | | Chung Hung Steel Corp. | | | 2,332,979 | | | | 1,421,594 | |
| | Chung Hwa Food Industrial Co. Ltd. | | | 126,535 | | | | 388,202 | |
| | Chung Hwa Pulp Corp. | | | 1,434,405 | | | | 739,481 | |
| | Chunghwa Chemical Synthesis & Biotech Co. Ltd. | | | 139,000 | | | | 221,195 | |
# | | Chunghwa Precision Test Tech Co. Ltd. | | | 56,000 | | | | 658,336 | |
| | Chyang Sheng Dyeing & Finishing Co. Ltd. | | | 397,000 | | | | 169,921 | |
| | Cleanaway Co. Ltd. | | | 286,000 | | | | 1,480,617 | |
| | Clevo Co. | | | 1,624,200 | | | | 1,547,914 | |
| | CMC Magnetics Corp. | | | 3,954,108 | | | | 794,283 | |
| | C-Media Electronics, Inc. | | | 48,000 | | | | 58,837 | |
| | CoAsia Electronics Corp. | | | 452,412 | | | | 152,054 | |
| | Collins Co. Ltd. | | | 351,431 | | | | 156,240 | |
# | | Compeq Manufacturing Co. Ltd. | | | 1,085,000 | | | | 1,465,757 | |
# | | Compucase Enterprise | | | 278,000 | | | | 228,011 | |
| | Concord Securities Co. Ltd. | | | 1,728,796 | | | | 501,989 | |
| | Continental Holdings Corp. | | | 1,312,320 | | | | 1,134,383 | |
# | | Contrel Technology Co. Ltd. | | | 513,000 | | | | 220,885 | |
# | | Coremax Corp. | | | 258,065 | | | | 697,494 | |
| | Coretronic Corp. | | | 1,269,200 | | | | 1,963,907 | |
# | | Co-Tech Development Corp. | | | 795,533 | | | | 1,073,922 | |
| | Cowealth Medical Holding Co. Ltd. | | | 175,972 | | | | 129,207 | |
| | Coxon Precise Industrial Co. Ltd. | | | 43,000 | | | | 15,707 | |
# * | | CSBC Corp. Taiwan | | | 1,758,677 | | | | 801,371 | |
| | CTCI Corp. | | | 1,963,000 | | | | 2,854,593 | |
* | | C-Tech United Corp. | | | 162,878 | | | | 66,290 | |
| | Cub Elecparts, Inc. | | | 86,126 | | | | 370,514 | |
# | | CviLux Corp. | | | 266,040 | | | | 248,024 | |
| | Cyberlink Corp. | | | 91,697 | | | | 256,281 | |
# | | CyberPower Systems, Inc. | | | 235,000 | | | | 674,519 | |
# | | CyberTAN Technology, Inc. | | | 1,337,779 | | | | 902,961 | |
# | | Cypress Technology Co. Ltd. | | | 169,489 | | | | 266,256 | |
| | Cystech Electronics Corp. | | | 20,750 | | | | 36,296 | |
# | | DA CIN Construction Co. Ltd. | | | 1,101,711 | | | | 1,023,174 | |
| | Dadi Early-Childhood Education Group Ltd. | | | 21,357 | | | | 52,972 | |
| | Dafeng TV Ltd. | | | 304,870 | | | | 457,262 | |
# | | Da-Li Development Co. Ltd. | | | 1,413,747 | | | | 1,154,964 | |
THE EMERGING MARKETS SMALL CAP SERIES
CONTINUED
| | | | | | | | | | |
| | | | | Shares | | | Value» | |
TAIWAN — (Continued) | | | | | | | | |
* | | Danen Technology Corp. | | | 162,081 | | | $ | 51,945 | |
# | | Darfon Electronics Corp. | | | 783,550 | | | | 918,279 | |
# * | | Darwin Precisions Corp. | | | 1,385,635 | | | | 368,559 | |
# | | Davicom Semiconductor, Inc. | | | 44,888 | | | | 33,094 | |
# | | Daxin Materials Corp. | | | 236,200 | | | | 421,730 | |
| | De Licacy Industrial Co. Ltd. | | | 1,155,511 | | | | 497,648 | |
* | | Delpha Construction Co. Ltd. | | | 23,000 | | | | 13,052 | |
# | | Depo Auto Parts Ind Co. Ltd. | | | 358,000 | | | | 736,469 | |
* †† | | DER PAO Construction | | | 476,000 | | | | 0 | |
# | | Dimerco Data System Corp. | | | 220,612 | | | | 441,493 | |
# | | Dimerco Express Corp. | | | 440,880 | | | | 845,792 | |
# | | D-Link Corp. | | | 1,944,855 | | | | 875,250 | |
| | Donpon Precision, Inc. | | | 104,000 | | | | 64,284 | |
| | Dr Wu Skincare Co. Ltd. | | | 57,000 | | | | 150,678 | |
# | | Draytek Corp. | | | 247,000 | | | | 188,477 | |
# | | Dyaco International, Inc. | | | 142,813 | | | | 157,648 | |
| | DYNACOLOR, Inc. | | | 12,000 | | | | 12,765 | |
| | Dynamic Holding Co. Ltd. | | | 992,707 | | | | 499,088 | |
| | Dynapack International Technology Corp. | | | 492,000 | | | | 1,043,214 | |
| | E & R Engineering Corp. | | | 56,000 | | | | 88,465 | |
| | Eastern Media International Corp. | | | 1,100,011 | | | | 707,498 | |
# | | ECOVE Environment Corp. | | | 113,000 | | | | 853,564 | |
# * | | Edimax Technology Co. Ltd. | | | 624,108 | | | | 288,461 | |
| | Edison Opto Corp. | | | 262,749 | | | | 113,479 | |
# | | Edom Technology Co. Ltd. | | | 732,964 | | | | 617,597 | |
# | | eGalax_eMPIA Technology, Inc. | | | 199,777 | | | | 310,674 | |
# | | Egis Technology, Inc. | | | 203,000 | | | | 352,679 | |
| | Elan Microelectronics Corp. | | | 942,400 | | | | 2,365,750 | |
# * | | E-Lead Electronic Co. Ltd. | | | 197,873 | | | | 383,690 | |
# | | E-LIFE MALL Corp. | | | 295,000 | | | | 739,290 | |
| | Elite Advanced Laser Corp. | | | 531,226 | | | | 577,449 | |
# | | Elite Semiconductor Microelectronics Technology, Inc. | | | 919,200 | | | | 1,769,432 | |
# * | | Elitegroup Computer Systems Co. Ltd. | | | 1,259,254 | | | | 799,135 | |
# | | Emerging Display Technologies Corp. | | | 462,000 | | | | 281,347 | |
# | | Ennoconn Corp. | | | 244,938 | | | | 1,400,542 | |
| | Ennostar, Inc. | | | 2,037,462 | | | | 2,588,022 | |
# | | EnTie Commercial Bank Co. Ltd. | | | 2,292,603 | | | | 1,019,841 | |
# | | Episil Technologies, Inc. | | | 211,000 | | | | 567,028 | |
# | | Episil-Precision, Inc. | | | 223,000 | | | | 474,927 | |
# | | Eris Technology Corp. | | | 38,000 | | | | 195,488 | |
# | | Eson Precision Ind Co. Ltd. | | | 331,000 | | | | 603,205 | |
| | Eternal Materials Co. Ltd. | | | 3,021,985 | | | | 2,800,137 | |
# | | Etron Technology, Inc. | | | 630,979 | | | | 678,115 | |
| | Eurocharm Holdings Co. Ltd. | | | 102,000 | | | | 521,446 | |
* | | Everest Textile Co. Ltd. | | | 1,642,762 | | | | 388,709 | |
| | Evergreen International Storage & Transport Corp. | | | 1,928,000 | | | | 1,548,787 | |
# | | Evergreen Steel Corp. | | | 153,000 | | | | 228,529 | |
| | Everlight Chemical Industrial Corp. | | | 1,768,606 | | | | 949,657 | |
# | | Everlight Electronics Co. Ltd. | | | 1,457,000 | | | | 1,545,182 | |
| | Everspring Industry Co. Ltd. | | | 522,000 | | | | 179,008 | |
| | Excellence Opto, Inc. | | | 72,000 | | | | 45,537 | |
# | | Excelliance Mos Corp. | | | 77,000 | | | | 215,317 | |
# | | Excelsior Medical Co. Ltd. | | | 378,219 | | | | 723,576 | |
# | | EZconn Corp. | | | 159,800 | | | | 193,849 | |
| | Far Eastern Department Stores Ltd. | | | 3,516,000 | | | | 1,963,039 | |
# | | Far Eastern International Bank | | | 8,313,246 | | | | 2,730,708 | |
# | | Faraday Technology Corp. | | | 63,000 | | | | 275,901 | |
# | | Farglory F T Z Investment Holding Co. Ltd. | | | 386,957 | | | | 622,677 | |
| | Farglory Land Development Co. Ltd. | | | 878,000 | | | | 1,448,652 | |
THE EMERGING MARKETS SMALL CAP SERIES
CONTINUED
| | | | | | | | | | |
| | | | | Shares | | | Value» | |
TAIWAN — (Continued) | | | | | | | | |
* | | Federal Corp. | | | 1,212,238 | | | $ | 697,921 | |
# | | Feedback Technology Corp. | | | 119,200 | | | | 264,284 | |
| | Feng Hsin Steel Co. Ltd. | | | 1,672,100 | | | | 2,915,957 | |
# | | Firich Enterprises Co. Ltd. | | | 194,325 | | | | 151,046 | |
| | First Copper Technology Co. Ltd. | | | 99,000 | | | | 84,065 | |
# | | First Hi-Tec Enterprise Co. Ltd. | | | 256,580 | | | | 316,916 | |
| | First Hotel | | | 713,350 | | | | 306,335 | |
# | | First Insurance Co. Ltd. | | | 900,179 | | | | 392,227 | |
* | | First Steamship Co. Ltd. | | | 2,334,612 | | | | 578,664 | |
# | | FIT Holding Co. Ltd. | | | 485,456 | | | | 350,303 | |
| | Fitipower Integrated Technology, Inc. | | | 82,000 | | | | 263,126 | |
| | Fittech Co. Ltd. | | | 107,000 | | | | 261,244 | |
| | FLEXium Interconnect, Inc. | | | 1,189,087 | | | | 3,368,600 | |
| | Flytech Technology Co. Ltd. | | | 369,309 | | | | 724,433 | |
# | | FOCI Fiber Optic Communications, Inc. | | | 213,000 | | | | 143,863 | |
| | Force Mos Technology Ltd. | | | 26,000 | | | | 32,874 | |
| | Forcecon Tech Co. Ltd. | | | 62,000 | | | | 87,720 | |
# | | Forest Water Environment Engineering Co. Ltd. | | | 168,132 | | | | 146,961 | |
# | | Formosa Advanced Technologies Co. Ltd. | | | 589,000 | | | | 686,680 | |
# | | Formosa International Hotels Corp. | | | 223,329 | | | | 1,238,870 | |
# | | Formosa Laboratories, Inc. | | | 363,089 | | | | 531,654 | |
| | Formosa Oilseed Processing Co. Ltd. | | | 222,567 | | | | 375,373 | |
| | Formosa Optical Technology Co. Ltd. | | | 137,000 | | | | 240,088 | |
| | Formosa Taffeta Co. Ltd. | | | 1,042,000 | | | | 828,580 | |
| | Formosan Rubber Group, Inc. | | | 869,952 | | | | 533,967 | |
| | Formosan Union Chemical | | | 1,117,733 | | | | 703,434 | |
# | | Founding Construction & Development Co. Ltd. | | | 663,623 | | | | 353,678 | |
# | | Foxsemicon Integrated Technology, Inc. | | | 248,027 | | | | 1,279,999 | |
| | Franbo Lines Corp. | | | 48,481 | | | | 21,705 | |
| | Froch Enterprise Co. Ltd. | | | 581,189 | | | | 400,082 | |
| | FSP Technology, Inc. | | | 560,427 | | | | 641,770 | |
| | Fulgent Sun International Holding Co. Ltd. | | | 436,748 | | | | 1,845,538 | |
| | Fullerton Technology Co. Ltd. | | | 391,600 | | | | 217,315 | |
# | | Fulltech Fiber Glass Corp. | | | 1,335,997 | | | | 467,563 | |
| | Fusheng Precision Co. Ltd. | | | 111,000 | | | | 624,222 | |
# | | Fwusow Industry Co. Ltd. | | | 752,138 | | | | 455,419 | |
# | | G Shank Enterprise Co. Ltd. | | | 588,281 | | | | 797,797 | |
# | | Gallant Precision Machining Co. Ltd. | | | 111,000 | | | | 87,486 | |
# | | Gamania Digital Entertainment Co. Ltd. | | | 416,000 | | | | 692,454 | |
# * | | GCS Holdings, Inc. | | | 299,000 | | | | 323,008 | |
# | | GEM Services, Inc. | | | 213,570 | | | | 412,086 | |
# | | Gemtek Technology Corp. | | | 1,413,219 | | | | 1,143,064 | |
| | General Interface Solution Holding Ltd. | | | 857,000 | | | | 2,064,280 | |
| | General Plastic Industrial Co. Ltd. | | | 275,357 | | | | 236,115 | |
# | | Generalplus Technology, Inc. | | | 195,000 | | | | 269,760 | |
# | | GeneReach Biotechnology Corp. | | | 47,300 | | | | 74,497 | |
# | | Genesys Logic, Inc. | | | 290,000 | | | | 747,140 | |
| | Genius Electronic Optical Co. Ltd. | | | 219,917 | | | | 2,040,801 | |
# | | Genmont Biotech, Inc. | | | 220,000 | | | | 143,922 | |
| | Genovate Biotechnology Co. Ltd. | | | 15,000 | | | | 9,993 | |
# | | GeoVision, Inc. | | | 251,096 | | | | 258,249 | |
| | Getac Holdings Corp. | | | 1,489,360 | | | | 1,797,565 | |
# | | GFC Ltd. | | | 229,600 | | | | 459,458 | |
# * | | Giantplus Technology Co. Ltd. | | | 1,008,900 | | | | 344,996 | |
* | | Gigasolar Materials Corp. | | | 62,400 | | | | 185,476 | |
* | | Gigastorage Corp. | | | 71,965 | | | | 36,465 | |
# | | Global Brands Manufacture Ltd. | | | 957,730 | | | | 764,264 | |
| | Global Lighting Technologies, Inc. | | | 284,000 | | | | 482,725 | |
| | Global Mixed Mode Technology, Inc. | | | 222,000 | | | | 884,921 | |
THE EMERGING MARKETS SMALL CAP SERIES
CONTINUED
| | | | | | | | | | |
| | | | | Shares | | | Value» | |
TAIWAN — (Continued) | | | | | | | | |
# | | Global PMX Co. Ltd. | | | 179,000 | | | $ | 819,726 | |
* | | Globe Union Industrial Corp. | | | 889,914 | | | | 327,126 | |
| | Gloria Material Technology Corp. | | | 1,197,547 | | | | 1,053,509 | |
# | | Gold Circuit Electronics Ltd. | | | 1,158,104 | | | | 3,064,864 | |
| | Goldsun Building Materials Co. Ltd. | | | 3,254,587 | | | | 2,283,695 | |
# | | Good Will Instrument Co. Ltd. | | | 238,869 | | | | 188,810 | |
# | | Gordon Auto Body Parts | | | 391,000 | | | | 257,972 | |
| | Gourmet Master Co. Ltd. | | | 311,000 | | | | 944,072 | |
# | | Grand Fortune Securities Co. Ltd. | | | 1,025,629 | | | | 324,078 | |
| | Grand Ocean Retail Group Ltd. | | | 304,000 | | | | 125,367 | |
# | | Grand Pacific Petrochemical | | | 3,510,000 | | | | 1,892,120 | |
# | | Grand Process Technology Corp. | | | 81,000 | | | | 455,114 | |
# | | GrandTech CG Systems, Inc. | | | 204,799 | | | | 329,689 | |
| | Grape King Bio Ltd. | | | 415,000 | | | | 1,563,372 | |
| | Great China Metal Industry | | | 605,000 | | | | 454,107 | |
| | Great Taipei Gas Co. Ltd. | | | 1,444,000 | | | | 1,371,038 | |
# | | Great Tree Pharmacy Co. Ltd. | | | 97,044 | | | | 813,078 | |
| | Great Wall Enterprise Co. Ltd. | | | 2,406,001 | | | | 2,999,654 | |
# | | Greatek Electronics, Inc. | | | 1,027,000 | | | | 1,478,585 | |
* †† | | Green Energy Technology, Inc. | | | 1,570,850 | | | | 0 | |
# | | Green World FinTech Service Co. Ltd. | | | 14,700 | | | | 159,003 | |
# | | GTM Holdings Corp. | | | 431,150 | | | | 322,857 | |
# | | Hannstar Board Corp. | | | 1,379,954 | | | | 1,227,627 | |
| | HannStar Display Corp. | | | 3,885,505 | | | | 1,376,660 | |
| | HannsTouch Solution, Inc. | | | 1,930,782 | | | | 550,495 | |
# | | Hanpin Electron Co. Ltd. | | | 248,000 | | | | 215,498 | |
# | | Harvatek Corp. | | | 562,949 | | | | 269,973 | |
| | Heran Co. Ltd. | | | 6,000 | | | | 18,872 | |
| | Hey Song Corp. | | | 1,478,750 | | | | 1,496,037 | |
# | | Hi-Clearance, Inc. | | | 98,964 | | | | 423,805 | |
# | | Highlight Tech Corp. | | | 321,281 | | | | 445,476 | |
| | HIM International Music, Inc. | | | 60,710 | | | | 134,841 | |
| | Hiroca Holdings Ltd. | | | 211,448 | | | | 299,818 | |
# | | Hitron Technology, Inc. | | | 472,557 | | | | 361,820 | |
| | Hiyes International Co. Ltd. | | | 16,700 | | | | 29,858 | |
| | Ho Tung Chemical Corp. | | | 3,178,684 | | | | 791,055 | |
| | Hocheng Corp. | | | 851,734 | | | | 286,300 | |
# | | Hold-Key Electric Wire & Cable Co. Ltd. | | | 164,726 | | | | 72,434 | |
| | Holiday Entertainment Co. Ltd. | | | 234,430 | | | | 412,359 | |
# | | Holtek Semiconductor, Inc. | | | 659,000 | | | | 1,353,224 | |
| | Holy Stone Enterprise Co. Ltd. | | | 514,910 | | | | 1,392,652 | |
* | | Hong Pu Real Estate Development Co. Ltd. | | | 756,185 | | | | 515,919 | |
# | | Hong TAI Electric Industrial | | | 887,000 | | | | 399,476 | |
| | Hong YI Fiber Industry Co. | | | 440,652 | | | | 232,280 | |
# | | Horizon Securities Co. Ltd. | | | 1,136,320 | | | | 349,891 | |
| | Hota Industrial Manufacturing Co. Ltd. | | | 36,299 | | | | 83,957 | |
# | | Hotai Finance Co. Ltd. | | | 291,000 | | | | 848,565 | |
* | | Hotron Precision Electronic Industrial Co. Ltd. | | | 43,994 | | | | 46,305 | |
# | | Hsin Kuang Steel Co. Ltd. | | | 382,000 | | | | 404,186 | |
# | | Hsin Yung Chien Co. Ltd. | | | 157,255 | | | | 457,194 | |
| | Hsing TA Cement Co. | | | 488,162 | | | | 228,550 | |
# * | | HTC Corp. | | | 1,916,000 | | | | 2,988,428 | |
# | | Hu Lane Associate, Inc. | | | 276,737 | | | | 1,250,118 | |
# | | HUA ENG Wire & Cable Co. Ltd. | | | 1,201,565 | | | | 477,905 | |
| | Hua Yu Lien Development Co. Ltd. | | | 63,000 | | | | 104,471 | |
| | Huaku Development Co. Ltd. | | | 869,816 | | | | 2,323,321 | |
| | Huang Hsiang Construction Corp. | | | 205,800 | | | | 251,387 | |
# | | Hung Ching Development & Construction Co. Ltd. | | | 598,000 | | | | 383,459 | |
| | Hung Sheng Construction Ltd. | | | 1,304,251 | | | | 996,857 | |
THE EMERGING MARKETS SMALL CAP SERIES
CONTINUED
| | | | | | | | | | |
| | | | | Shares | | | Value» | |
TAIWAN — (Continued) | | | | | | | | |
| | Huxen Corp. | | | 119,244 | | | $ | 168,065 | |
# | | Hwa Fong Rubber Industrial Co. Ltd. | | | 823,812 | | | | 357,664 | |
| | Hwacom Systems, Inc. | | | 362,000 | | | | 157,151 | |
| | Hycon Technology Corp. | | | 16,000 | | | | 26,985 | |
| | Ibase Technology, Inc. | | | 213,206 | | | | 439,292 | |
# | | IBF Financial Holdings Co. Ltd. | | | 8,297,138 | | | | 2,854,886 | |
# | | IC Plus Corp. | | | 56,000 | | | | 95,933 | |
| | Ichia Technologies, Inc. | | | 869,000 | | | | 480,351 | |
# | | I-Chiun Precision Industry Co. Ltd. | | | 681,567 | | | | 352,470 | |
# | | IEI Integration Corp. | | | 466,832 | | | | 765,749 | |
| | Inergy Technology, Inc. | | | 11,000 | | | | 20,962 | |
| | Infortrend Technology, Inc. | | | 778,163 | | | | 415,478 | |
# | | Info-Tek Corp. | | | 236,000 | | | | 390,920 | |
# | | Ingentec Corp. | | | 48,410 | | | | 248,697 | |
# | | Innodisk Corp. | | | 263,447 | | | | 1,347,149 | |
# | | Inpaq Technology Co. Ltd. | | | 349,950 | | | | 436,940 | |
# | | Insyde Software Corp. | | | 97,000 | | | | 223,068 | |
# | | Intai Technology Corp. | | | 135,400 | | | | 382,215 | |
# * | | Integrated Service Technology, Inc. | | | 215,326 | | | | 523,770 | |
| | IntelliEPI, Inc. | | | 97,000 | | | | 172,650 | |
# | | International CSRC Investment Holdings Co. | | | 2,796,363 | | | | 1,637,466 | |
| | International Games System Co. Ltd. | | | 166,000 | | | | 1,807,326 | |
| | Iron Force Industrial Co. Ltd. | | | 155,393 | | | | 341,674 | |
# | | I-Sheng Electric Wire & Cable Co. Ltd. | | | 489,000 | | | | 615,274 | |
# | | ITE Technology, Inc. | | | 502,095 | | | | 923,957 | |
| | ITEQ Corp. | | | 839,040 | | | | 1,421,973 | |
* †† | | J Touch Corp. | | | 11,000 | | | | 0 | |
| | Jarllytec Co. Ltd. | | | 203,000 | | | | 332,481 | |
# | | Jentech Precision Industrial Co. Ltd. | | | 262,745 | | | | 2,848,374 | |
| | Jess-Link Products Co. Ltd. | | | 338,925 | | | | 368,953 | |
| | Jia Wei Lifestyle, Inc. | | | 30,000 | | | | 39,260 | |
# | | Jih Lin Technology Co. Ltd. | | | 213,000 | | | | 397,501 | |
| | Jiin Yeeh Ding Enterprise Co. Ltd. | | | 27,200 | | | | 26,902 | |
# | | Jinan Acetate Chemical Co. Ltd. | | | 64,564 | | | | 218,826 | |
* | | Jinli Group Holdings Ltd. | | | 258,681 | | | | 77,633 | |
| | Johnson Health Tech Co. Ltd. | | | 142,000 | | | | 317,764 | |
# | | Jourdeness Group Ltd. | | | 137,000 | | | | 307,412 | |
# | | K Laser Technology, Inc. | | | 586,000 | | | | 328,367 | |
| | Kaimei Electronic Corp. | | | 336,183 | | | | 539,078 | |
# | | Kaori Heat Treatment Co. Ltd. | | | 304,197 | | | | 1,101,590 | |
# | | Kaulin Manufacturing Co. Ltd. | | | 442,330 | | | | 178,131 | |
| | Keding Enterprises Co. Ltd. | | | 5,000 | | | | 20,776 | |
# | | KEE TAI Properties Co. Ltd. | | | 1,306,473 | | | | 441,340 | |
# | | Kenda Rubber Industrial Co. Ltd. | | | 1,785,845 | | | | 1,691,026 | |
# | | Kenmec Mechanical Engineering Co. Ltd. | | | 687,000 | | | | 513,197 | |
# | | Kerry TJ Logistics Co. Ltd. | | | 732,000 | | | | 792,429 | |
# * | | Key Ware Electronics Co. Ltd. | | | 302,194 | | | | 92,130 | |
# | | Keystone Microtech Corp. | | | 25,000 | | | | 116,390 | |
| | Kindom Development Co. Ltd. | | | 1,280,900 | | | | 956,356 | |
| | King Chou Marine Technology Co. Ltd. | | | 234,920 | | | | 247,711 | |
| | King Slide Works Co. Ltd. | | | 184,000 | | | | 2,387,486 | |
# | | King Yuan Electronics Co. Ltd. | | | 2,975,979 | | | | 3,010,998 | |
| | King’s Town Bank Co. Ltd. | | | 2,946,701 | | | | 2,804,492 | |
* | | King’s Town Construction Co. Ltd. | | | 333,074 | | | | 352,548 | |
# | | Kinik Co. | | | 318,000 | | | | 1,001,417 | |
# | | Kinko Optical Co. Ltd. | | | 541,103 | | | | 384,748 | |
| | Kinpo Electronics | | | 3,841,157 | | | | 1,680,404 | |
# | | Kinsus Interconnect Technology Corp. | | | 277,000 | | | | 892,569 | |
# | | KMC Kuei Meng International, Inc. | | | 205,253 | | | | 887,803 | |
THE EMERGING MARKETS SMALL CAP SERIES
CONTINUED
| | | | | | | | | | |
| | | | | Shares | | | Value» | |
TAIWAN — (Continued) | | | | | | | | |
# | | KNH Enterprise Co. Ltd. | | | 589,020 | | | $ | 277,651 | |
| | Ko Ja Cayman Co. Ltd. | | | 13,000 | | | | 20,438 | |
# | | KS Terminals, Inc. | | | 421,482 | | | | 895,357 | |
| | Kung Long Batteries Industrial Co. Ltd. | | | 254,000 | | | | 1,067,326 | |
# * | | Kung Sing Engineering Corp. | | | 1,616,290 | | | | 322,831 | |
| | Kuo Toong International Co. Ltd. | | | 751,648 | | | | 450,672 | |
| | Kuo Yang Construction Co. Ltd. | | | 729,899 | | | | 405,857 | |
# | | Kwong Fong Industries Corp. | | | 352,691 | | | | 109,330 | |
| | Kwong Lung Enterprise Co. Ltd. | | | 304,000 | | | | 567,045 | |
| | KYE Systems Corp. | | | 772,672 | | | | 228,578 | |
| | L&K Engineering Co. Ltd. | | | 635,048 | | | | 564,331 | |
# | | La Kaffa International Co. Ltd. | | | 80,701 | | | | 245,097 | |
| | LAN FA Textile | | | 805,933 | | | | 203,538 | |
| | Land Mark Optoelectronics Corp. | | | 293,300 | | | | 841,550 | |
# | | Lanner Electronics, Inc. | | | 278,916 | | | | 556,058 | |
# | | Laser Tek Taiwan Co. Ltd. | | | 267,504 | | | | 213,813 | |
# | | Laster Tech Corp. Ltd. | | | 83,091 | | | | 74,516 | |
* | | Leader Electronics, Inc. | | | 290,000 | | | | 83,305 | |
# | | Leadtrend Technology Corp. | | | 101,652 | | | | 177,635 | |
# | | Lealea Enterprise Co. Ltd. | | | 2,401,892 | | | | 773,782 | |
| | Ledlink Optics, Inc. | | | 141,300 | | | | 97,440 | |
# | | LEE CHI Enterprises Co. Ltd. | | | 648,000 | | | | 432,733 | |
# | | Lelon Electronics Corp. | | | 317,327 | | | | 475,746 | |
# | | Lemtech Holdings Co. Ltd. | | | 108,055 | | | | 240,395 | |
* | | Leofoo Development Co. Ltd. | | | 93,278 | | | | 45,699 | |
# * | | Li Cheng Enterprise Co. Ltd. | | | 306,108 | | | | 217,757 | |
* | | Li Peng Enterprise Co. Ltd. | | | 1,735,897 | | | | 416,695 | |
# | | Lian HWA Food Corp. | | | 303,993 | | | | 614,323 | |
| | Lida Holdings Ltd. | | | 257,400 | | | | 227,995 | |
| | Lien Hwa Industrial Holdings Corp. | | | 105,150 | | | | 151,616 | |
| | Lingsen Precision Industries Ltd. | | | 1,273,506 | | | | 507,502 | |
| | Lintes Technology Co. Ltd. | | | 7,000 | | | | 24,584 | |
| | Liton Technology Corp. | | | 89,000 | | | | 67,542 | |
# * | | Long Bon International Co. Ltd. | | | 694,274 | | | | 355,492 | |
# | | Longchen Paper & Packaging Co. Ltd. | | | 2,538,054 | | | | 1,167,091 | |
# | | Longwell Co. | | | 347,000 | | | | 560,884 | |
| | Lotes Co. Ltd. | | | 1 | | | | 24 | |
# | | Lotus Pharmaceutical Co. Ltd. | | | 334,000 | | | | 1,595,512 | |
# | | Lu Hai Holding Corp. | | | 196,102 | | | | 180,373 | |
# | | Lucky Cement Corp. | | | 540,000 | | | | 171,608 | |
| | Lumax International Corp. Ltd. | | | 303,832 | | | | 619,879 | |
| | Lung Yen Life Service Corp. | | | 564,000 | | | | 617,354 | |
| | Luxe Electric Co. Ltd. | | | 23,540 | | | | 11,946 | |
# | | M31 Technology Corp. | | | 58,000 | | | | 582,041 | |
# | | Macauto Industrial Co. Ltd. | | | 189,000 | | | | 335,128 | |
| | Machvision, Inc. | | | 146,398 | | | | 529,662 | |
# | | Macroblock, Inc. | | | 69,000 | | | | 195,757 | |
| | Makalot Industrial Co. Ltd. | | | 617,481 | | | | 3,823,632 | |
# | | Marketech International Corp. | | | 227,000 | | | | 685,610 | |
# | | Materials Analysis Technology, Inc. | | | 179,041 | | | | 761,817 | |
# | | Mayer Steel Pipe Corp. | | | 538,567 | | | | 360,180 | |
| | Maywufa Co. Ltd. | | | 69,322 | | | | 38,138 | |
# | | Mechema Chemicals International Corp. | | | 194,000 | | | | 570,061 | |
* | | Medigen Biotechnology Corp. | | | 85,000 | | | | 78,350 | |
* | | Medigen Vaccine Biologics Corp. | | | 538,257 | | | | 1,073,835 | |
# | | Meiloon Industrial Co. | | | 332,730 | | | | 171,088 | |
| | Mercuries & Associates Holding Ltd. | | | 1,446,486 | | | | 634,436 | |
# * | | Mercuries Life Insurance Co. Ltd. | | | 6,034,083 | | | | 1,025,031 | |
| | Merry Electronics Co. Ltd. | | | 301,914 | | | | 735,578 | |
THE EMERGING MARKETS SMALL CAP SERIES
CONTINUED
| | | | | | | | | | |
| | | | | Shares | | | Value» | |
TAIWAN — (Continued) | | | | | | | | |
| | Mildef Crete, Inc. | | | 193,000 | | | $ | 240,974 | |
# | | MIN AIK Technology Co. Ltd. | | | 491,452 | | | | 244,881 | |
# | | Mirle Automation Corp. | | | 602,098 | | | | 672,531 | |
| | Mitac Holdings Corp. | | | 3,232,918 | | | | 2,713,208 | |
# | | Mobiletron Electronics Co. Ltd. | | | 203,800 | | | | 297,985 | |
| | MOSA Industrial Corp. | | | 151,000 | | | | 109,522 | |
# | | MPI Corp. | | | 298,000 | | | | 780,781 | |
# | | Nak Sealing Technologies Corp. | | | 188,954 | | | | 614,327 | |
# | | Namchow Holdings Co. Ltd. | | | 581,000 | | | | 780,516 | |
# * | | Nan Kang Rubber Tire Co. Ltd. | | | 201,952 | | | | 213,720 | |
| | Nan Liu Enterprise Co. Ltd. | | | 123,000 | | | | 267,078 | |
| | Nan Pao Resins Chemical Co. Ltd. | | | 13,000 | | | | 51,757 | |
# * | | Nan Ren Lake Leisure Amusement Co. Ltd. | | | 576,317 | | | | 197,388 | |
# | | Nang Kuang Pharmaceutical Co. Ltd. | | | 226,000 | | | | 234,218 | |
| | Nantex Industry Co. Ltd. | | | 944,606 | | | | 991,281 | |
# * | | National Aerospace Fasteners Corp. | | | 89,000 | | | | 162,359 | |
# | | National Petroleum Co. Ltd. | | | 227,824 | | | | 355,573 | |
# | | Netronix, Inc. | | | 224,000 | | | | 387,128 | |
| | New Best Wire Industrial Co. Ltd. | | | 195,600 | | | | 218,258 | |
* | | New Era Electronics Co. Ltd. | | | 210,000 | | | | 96,684 | |
# * | | Newmax Technology Co. Ltd. | | | 148,000 | | | | 128,097 | |
# | | Nexcom International Co. Ltd. | | | 477,094 | | | | 382,134 | |
| | Nichidenbo Corp. | | | 656,417 | | | | 967,280 | |
| | Nidec Chaun-Choung Technology Corp. | | | 116,000 | | | | 361,226 | |
# | | Nien Hsing Textile Co. Ltd. | | | 458,345 | | | | 300,289 | |
# | | Niko Semiconductor Co. Ltd. | | | 190,000 | | | | 270,288 | |
# | | Nishoku Technology, Inc. | | | 132,400 | | | | 354,367 | |
| | Nova Technology Corp. | | | 84,000 | | | | 212,923 | |
| | O-Bank Co. Ltd. | | | 2,505,071 | | | | 616,110 | |
# | | Ocean Plastics Co. Ltd. | | | 764,200 | | | | 780,718 | |
| | OFCO Industrial Corp. | | | 38,000 | | | | 23,775 | |
| | OK Biotech Co. Ltd. | | | 182,527 | | | | 126,523 | |
| | Orient Europharma Co. Ltd. | | | 139,000 | | | | 151,177 | |
| | Orient Semiconductor Electronics Ltd. | | | 1,061,599 | | | | 531,956 | |
| | Oriental Union Chemical Corp. | | | 2,033,267 | | | | 1,063,546 | |
# | | O-TA Precision Industry Co. Ltd. | | | 222,227 | | | | 630,626 | |
| | Pacific Construction Co. | | | 1,300,921 | | | | 360,986 | |
# | | Pacific Hospital Supply Co. Ltd. | | | 255,209 | | | | 518,585 | |
# | | Paiho Shih Holdings Corp. | | | 458,365 | | | | 358,229 | |
# | | Pan Jit International, Inc. | | | 1,042,486 | | | | 1,772,860 | |
# | | Pan-International Industrial Corp. | | | 1,409,747 | | | | 1,387,968 | |
# | | Panion & BF Biotech, Inc. | | | 203,449 | | | | 947,404 | |
| | Paragon Technologies Co. Ltd. | | | 163,246 | | | | 100,197 | |
# | | Parpro Corp. | | | 208,000 | | | | 138,689 | |
| | PChome Online, Inc. | | | 366,000 | | | | 569,133 | |
# | | PCL Technologies, Inc. | | | 176,810 | | | | 485,177 | |
# | | P-Duke Technology Co. Ltd. | | | 214,633 | | | | 535,634 | |
# | | Pegavision Corp. | | | 104,000 | | | | 907,949 | |
* †† | | Pharmally International Holding Co. Ltd. | | | 441,605 | | | | 0 | |
* | | Phihong Technology Co. Ltd. | | | 1 | | | | 1 | |
# | | Phoenix Silicon International Corp. | | | 250,160 | | | | 384,749 | |
* | | Phytohealth Corp. | | | 161,000 | | | | 86,550 | |
# | | Pixart Imaging, Inc. | | | 517,150 | | | | 1,292,497 | |
| | Planet Technology Corp. | | | 160,000 | | | | 369,660 | |
# | | Plastron Precision Co. Ltd. | | | 523,460 | | | | 191,451 | |
| | Plotech Co. Ltd. | | | 343,800 | | | | 209,371 | |
# | | Polytronics Technology Corp. | | | 262,124 | | | | 428,018 | |
# | | Posiflex Technology, Inc. | | | 70,457 | | | | 250,476 | |
# | | Power Wind Health Industry, Inc. | | | 119,314 | | | | 430,766 | |
THE EMERGING MARKETS SMALL CAP SERIES
CONTINUED
| | | | | | | | | | |
| | | | | Shares | | | Value» | |
TAIWAN — (Continued) | | | | | | | | |
# | | Poya International Co. Ltd. | | | 151,409 | | | $ | 1,924,413 | |
| | President Securities Corp. | | | 2,818,193 | | | | 1,279,263 | |
| | Primax Electronics Ltd. | | | 1,312,000 | | | | 2,197,944 | |
# | | Prince Housing & Development Corp. | | | 3,787,644 | | | | 1,209,741 | |
# | | Pro Hawk Corp. | | | 87,000 | | | | 419,636 | |
* †† | | Prodisc Technology, Inc. | | | 1,707,199 | | | | 0 | |
# | | Promate Electronic Co. Ltd. | | | 622,000 | | | | 678,696 | |
# | | Prosperity Dielectrics Co. Ltd. | | | 366,559 | | | | 351,910 | |
| | Qisda Corp. | | | 3,422,900 | | | | 2,601,959 | |
| | QST International Corp. | | | 237,600 | | | | 423,389 | |
# | | Qualipoly Chemical Corp. | | | 308,048 | | | | 302,503 | |
# | | Quang Viet Enterprise Co. Ltd. | | | 154,000 | | | | 595,653 | |
# | | Quanta Storage, Inc. | | | 725,000 | | | | 848,919 | |
# | | Quintain Steel Co. Ltd. | | | 845,692 | | | | 315,485 | |
| | Radiant Opto-Electronics Corp. | | | 1,022,000 | | | | 3,113,899 | |
| | Radium Life Tech Co. Ltd. | | | 2,412,242 | | | | 678,507 | |
# | | Rafael Microelectronics, Inc. | | | 111,821 | | | | 407,687 | |
# * | | RDC Semiconductor Co. Ltd. | | | 138,000 | | | | 595,141 | |
| | Rechi Precision Co. Ltd. | | | 1,229,181 | | | | 603,663 | |
# | | Rexon Industrial Corp. Ltd. | | | 418,000 | | | | 365,142 | |
| | Rich Development Co. Ltd. | | | 2,360,036 | | | | 598,743 | |
* | | Ritek Corp. | | | 2,460,867 | | | | 534,266 | |
* | | Roo Hsing Co. Ltd. | | | 1,926,000 | | | | 174,534 | |
# | | Ruentex Engineering & Construction Co. | | | 206,540 | | | | 572,804 | |
| | Ruentex Industries Ltd. | | | 557,395 | | | | 952,178 | |
# | | Run Long Construction Co. Ltd. | | | 58,650 | | | | 115,202 | |
| | Sakura Development Co. Ltd. | | | 16,000 | | | | 15,619 | |
| | Sampo Corp. | | | 1,267,861 | | | | 923,719 | |
# | | San Fang Chemical Industry Co. Ltd. | | | 805,647 | | | | 499,736 | |
# | | San Far Property Ltd. | | | 626,510 | | | | 224,408 | |
# | | San Shing Fastech Corp. | | | 445,875 | | | | 730,237 | |
| | Sanitar Co. Ltd. | | | 212,000 | | | | 232,719 | |
| | Sanyang Motor Co. Ltd. | | | 1,623,628 | | | | 1,826,643 | |
| | Savior Lifetec Corp. | | | 183,000 | | | | 91,606 | |
# * | | SCI Pharmtech, Inc. | | | 186,474 | | | | 499,527 | |
# | | Scientech Corp. | | | 230,000 | | | | 444,923 | |
| | ScinoPharm Taiwan Ltd. | | | 262,000 | | | | 193,258 | |
# | | SDI Corp. | | | 427,000 | | | | 1,177,255 | |
| | Sea Sonic Electronics Co. Ltd. | | | 87,000 | | | | 123,744 | |
# | | Senao International Co. Ltd. | | | 335,541 | | | | 309,418 | |
# | | Senao Networks, Inc. | | | 106,000 | | | | 593,211 | |
# | | Sensortek Technology Corp. | | | 59,000 | | | | 359,738 | |
| | Sercomm Corp. | | | 818,000 | | | | 1,911,715 | |
# | | Sesoda Corp. | | | 616,803 | | | | 766,851 | |
| | Shane Global Holding, Inc. | | | 6,000 | | | | 12,767 | |
# | | Shan-Loong Transportation Co. Ltd. | | | 291,000 | | | | 294,293 | |
| | Sharehope Medicine Co. Ltd. | | | 294,572 | | | | 268,452 | |
# | | Sheng Yu Steel Co. Ltd. | | | 470,980 | | | | 339,741 | |
# | | ShenMao Technology, Inc. | | | 355,891 | | | | 410,707 | |
| | Shieh Yih Machinery Industry Co. Ltd. | | | 166,000 | | | | 52,762 | |
| | Shih Her Technologies, Inc. | | | 173,000 | | | | 271,170 | |
| | Shih Wei Navigation Co. Ltd. | | | 844,607 | | | | 598,555 | |
# | | Shihlin Electric & Engineering Corp. | | | 1,406,000 | | | | 2,382,492 | |
| | Shin Foong Specialty & Applied Materials Co. Ltd. | | | 28,000 | | | | 44,580 | |
| | Shin Hai Gas Corp. | | | 1,245 | | | | 1,988 | |
| | Shin Hsiung Natural Gas Co. Ltd. | | | 28,850 | | | | 57,808 | |
| | Shin Ruenn Development Co. Ltd. | | | 32,000 | | | | 26,004 | |
| | Shin Zu Shing Co. Ltd. | | | 618,943 | | | | 1,493,812 | |
| | Shinih Enterprise Co. Ltd. | | | 71,000 | | | | 44,940 | |
THE EMERGING MARKETS SMALL CAP SERIES
CONTINUED
| | | | | | | | | | |
| | | | | Shares | | | Value» | |
TAIWAN — (Continued) | | | | | | | | |
* | | Shining Building Business Co. Ltd. | | | 1,570,814 | | | $ | 441,751 | |
# | | Shinkong Insurance Co. Ltd. | | | 695,131 | | | | 949,749 | |
# | | Shinkong Synthetic Fibers Corp. | | | 4,285,395 | | | | 2,144,528 | |
| | Shinkong Textile Co. Ltd. | | | 788,542 | | | | 934,223 | |
# | | Shiny Chemical Industrial Co. Ltd. | | | 413,467 | | | | 1,286,291 | |
| | ShunSin Technology Holding Ltd. | | | 42,000 | | | | 103,034 | |
# * | | Shuttle, Inc. | | | 1,355,152 | | | | 475,695 | |
# | | Sigurd Microelectronics Corp. | | | 1,496,907 | | | | 2,154,652 | |
| | Silicon Optronics, Inc. | | | 18,000 | | | | 38,234 | |
| | Sinbon Electronics Co. Ltd. | | | 503,813 | | | | 3,912,409 | |
| | Sincere Navigation Corp. | | | 1,154,139 | | | | 630,006 | |
| | Singatron Enterprise Co. Ltd. | | | 55,000 | | | | 33,907 | |
| | Single Well Industrial Corp. | | | 79,224 | | | | 60,220 | |
# | | Sinher Technology, Inc. | | | 213,000 | | | | 234,106 | |
# | | Sinmag Equipment Corp. | | | 169,056 | | | | 432,043 | |
# | | Sinon Corp. | | | 1,362,510 | | | | 1,496,657 | |
# | | Sinopower Semiconductor, Inc. | | | 35,000 | | | | 103,309 | |
# | | Sinphar Pharmaceutical Co. Ltd. | | | 223,938 | | | | 193,761 | |
| | Sinyi Realty, Inc. | | | 854,660 | | | | 743,232 | |
| | Sirtec International Co. Ltd. | | | 325,600 | | | | 195,338 | |
# | | Sitronix Technology Corp. | | | 362,879 | | | | 1,856,686 | |
# | | Siward Crystal Technology Co. Ltd. | | | 530,000 | | | | 480,833 | |
| | Soft-World International Corp. | | | 262,000 | | | | 581,809 | |
# | | Solar Applied Materials Technology Corp. | | | 1,574,372 | | | | 1,350,114 | |
# | | Solomon Technology Corp. | | | 420,000 | | | | 291,564 | |
# | | Solteam, Inc. | | | 219,034 | | | | 273,283 | |
# | | Sonix Technology Co. Ltd. | | | 591,000 | | | | 840,275 | |
# | | Southeast Cement Co. Ltd. | | | 579,700 | | | | 318,969 | |
| | Speed Tech Corp. | | | 394,000 | | | | 611,661 | |
# | | Spirox Corp. | | | 298,824 | | | | 239,752 | |
| | Sporton International, Inc. | | | 252,601 | | | | 1,581,101 | |
| | Sports Gear Co. Ltd. | | | 46,000 | | | | 99,849 | |
| | St Shine Optical Co. Ltd. | | | 179,000 | | | | 1,170,542 | |
# | | Standard Chemical & Pharmaceutical Co. Ltd. | | | 353,571 | | | | 488,717 | |
| | Standard Foods Corp. | | | 485,000 | | | | 581,250 | |
# | | Stark Technology, Inc. | | | 377,688 | | | | 901,788 | |
| | Sun Race Sturmey-Archer, Inc. | | | 37,000 | | | | 50,687 | |
* | | Sun Yad Construction Co. Ltd. | | | 193,725 | | | | 74,028 | |
# | | Sunjuice Holdings Co. Ltd. | | | 16,000 | | | | 100,256 | |
* | | Sunko INK Co. Ltd. | | | 483,400 | | | | 197,284 | |
| | SunMax Biotechnology Co. Ltd. | | | 94,000 | | | | 398,268 | |
| | Sunny Friend Environmental Technology Co. Ltd. | | | 225,000 | | | | 938,536 | |
| | Sunonwealth Electric Machine Industry Co. Ltd. | | | 664,487 | | | | 826,857 | |
| | Sunplus Innovation Technology, Inc. | | | 19,000 | | | | 35,233 | |
# | | Sunplus Technology Co. Ltd. | | | 1,763,000 | | | | 1,226,546 | |
| | Sunrex Technology Corp. | | | 298,612 | | | | 333,350 | |
# | | Sunspring Metal Corp. | | | 391,069 | | | | 250,303 | |
# | | Supreme Electronics Co. Ltd. | | | 1,558,602 | | | | 1,599,721 | |
# | | Swancor Holding Co. Ltd. | | | 100,000 | | | | 276,046 | |
# | | Sweeten Real Estate Development Co. Ltd. | | | 687,465 | | | | 506,767 | |
# | | Symtek Automation Asia Co. Ltd. | | | 206,069 | | | | 482,771 | |
| | Syncmold Enterprise Corp. | | | 401,750 | | | | 735,271 | |
| | Syngen Biotech Co. Ltd. | | | 17,000 | | | | 72,157 | |
| | Synmosa Biopharma Corp. | | | 969,632 | | | | 978,232 | |
* | | Sysgration | | | 62,000 | | | | 69,830 | |
| | Systex Corp. | | | 556,388 | | | | 1,142,154 | |
| | T3EX Global Holdings Corp. | | | 31,000 | | | | 58,206 | |
| | TA Chen Stainless Pipe | | | 4,850,504 | | | | 5,667,713 | |
# | | Ta Liang Technology Co. Ltd. | | | 171,000 | | | | 215,642 | |
THE EMERGING MARKETS SMALL CAP SERIES
CONTINUED
| | | | | | | | | | |
| | | | | Shares | | | Value» | |
TAIWAN — (Continued) | | | | | | | | |
# | | Ta Ya Electric Wire & Cable | | | 2,617,007 | | | $ | 1,339,110 | |
# | | Ta Yih Industrial Co. Ltd. | | | 106,000 | | | | 112,477 | |
| | Tah Hsin Industrial Corp. | | | 221,092 | | | | 443,242 | |
| | TAI Roun Products Co. Ltd. | | | 201,000 | | | | 87,736 | |
# | | TA-I Technology Co. Ltd. | | | 397,788 | | | | 509,540 | |
# * | | Tai Tung Communication Co. Ltd. | | | 391,267 | | | | 166,396 | |
| | Taichung Commercial Bank Co. Ltd. | | | 15,973,893 | | | | 6,212,649 | |
# | | TaiDoc Technology Corp. | | | 192,470 | | | | 1,014,382 | |
# | | Taiflex Scientific Co. Ltd. | | | 667,340 | | | | 831,396 | |
# | | Taimide Tech, Inc. | | | 385,262 | | | | 363,073 | |
# | | Tainan Enterprises Co. Ltd. | | | 263,370 | | | | 148,968 | |
# | | Tainan Spinning Co. Ltd. | | | 4,077,044 | | | | 2,044,352 | |
# | | Tai-Saw Technology Co. Ltd. | | | 235,120 | | | | 173,863 | |
| | TaiSol Electronics Co. Ltd. | | | 75,000 | | | | 71,423 | |
# | | Taisun Enterprise Co. Ltd. | | | 714,648 | | | | 862,868 | |
# | | Taita Chemical Co. Ltd. | | | 948,828 | | | | 584,665 | |
| | TAI-TECH Advanced Electronics Co. Ltd. | | | 45,000 | | | | 102,586 | |
# | | Taiwan Chinsan Electronic Industrial Co. Ltd. | | | 427,113 | | | | 443,680 | |
| | Taiwan Cogeneration Corp. | | | 1,440,566 | | | | 1,307,062 | |
| | Taiwan FamilyMart Co. Ltd. | | | 16,000 | | | | 91,839 | |
| | Taiwan Fertilizer Co. Ltd. | | | 229,000 | | | | 371,278 | |
| | Taiwan Fire & Marine Insurance Co. Ltd. | | | 961,338 | | | | 590,479 | |
| | Taiwan FU Hsing Industrial Co. Ltd. | | | 620,000 | | | | 770,186 | |
| | Taiwan Glass Industry Corp. | | | 65,000 | | | | 41,057 | |
| | Taiwan Hon Chuan Enterprise Co. Ltd. | | | 885,468 | | | | 2,288,316 | |
# | | Taiwan Hopax Chemicals Manufacturing Co. Ltd. | | | 590,120 | | | | 632,313 | |
* †† | | Taiwan Kolin Co. Ltd. | | | 1,356,000 | | | | 0 | |
†† | | Taiwan Land Development Corp. | | | 2,845,991 | | | | 177,529 | |
# | | Taiwan Line Tek Electronic | | | 144,185 | | | | 108,982 | |
| | Taiwan Navigation Co. Ltd. | | | 730,777 | | | | 525,570 | |
| | Taiwan Paiho Ltd. | | | 930,287 | | | | 1,405,525 | |
| | Taiwan PCB Techvest Co. Ltd. | | | 995,238 | | | | 1,005,480 | |
| | Taiwan Sakura Corp. | | | 723,803 | | | | 1,314,305 | |
| | Taiwan Sanyo Electric Co. Ltd. | | | 417,400 | | | | 457,094 | |
| | Taiwan Secom Co. Ltd. | | | 248,000 | | | | 710,495 | |
# | | Taiwan Semiconductor Co. Ltd. | | | 816,000 | | | | 1,893,011 | |
# | | Taiwan Shin Kong Security Co. Ltd. | | | 1,307,577 | | | | 1,567,701 | |
| | Taiwan Steel Union Co. Ltd. | | | 18,000 | | | | 49,188 | |
# | | Taiwan Styrene Monomer | | | 1,843,209 | | | | 705,747 | |
| | Taiwan Surface Mounting Technology Corp. | | | 882,388 | | | | 2,231,415 | |
| | Taiwan Taxi Co. Ltd. | | | 81,888 | | | | 199,396 | |
# * | | Taiwan TEA Corp. | | | 1,930,897 | | | | 1,229,758 | |
# | | Taiwan Union Technology Corp. | | | 893,000 | | | | 1,212,407 | |
# | | Taiwan-Asia Semiconductor Corp. | | | 1,097,804 | | | | 1,073,802 | |
| | Taiyen Biotech Co. Ltd. | | | 383,883 | | | | 357,171 | |
| | TCI Co. Ltd. | | | 305,746 | | | | 1,018,356 | |
| | Te Chang Construction Co. Ltd. | | | 258,206 | | | | 238,319 | |
| | Team Group, Inc. | | | 162,400 | | | | 153,754 | |
# | | Tehmag Foods Corp. | | | 116,380 | | | | 880,582 | |
# | | Ten Ren Tea Co. Ltd. | | | 140,980 | | | | 140,307 | |
| | Tera Autotech Corp. | | | 91,885 | | | | 50,155 | |
| | Test Research, Inc. | | | 562,820 | | | | 1,048,477 | |
# | | Test Rite International Co. Ltd. | | | 1,117,495 | | | | 699,713 | |
| | Tex-Ray Industrial Co. Ltd. | | | 311,000 | | | | 110,012 | |
| | Thermaltake Technology Co. Ltd. | | | 35,000 | | | | 23,260 | |
# | | Thinking Electronic Industrial Co. Ltd. | | | 269,204 | | | | 979,107 | |
# | | Thye Ming Industrial Co. Ltd. | | | 391,135 | | | | 419,877 | |
# | | Ting Sin Co. Ltd. | | | 158,324 | | | | 67,389 | |
| | Ton Yi Industrial Corp. | | | 2,548,644 | | | | 1,310,026 | |
THE EMERGING MARKETS SMALL CAP SERIES
CONTINUED
| | | | | | | | | | |
| | | | | Shares | | | Value» | |
TAIWAN — (Continued) | | | | | | | | |
| | Tong Hsing Electronic Industries Ltd. | | | 332,976 | | | $ | 1,780,291 | |
| | Tong Yang Industry Co. Ltd. | | | 1,236,741 | | | | 1,730,611 | |
# | | Tong-Tai Machine & Tool Co. Ltd. | | | 769,892 | | | | 317,476 | |
| | Top Union Electronics Corp. | | | 68,000 | | | | 48,538 | |
* | | TOPBI International Holdings Ltd. | | | 289,096 | | | | 86,121 | |
| | Topco Scientific Co. Ltd. | | | 563,087 | | | | 2,605,688 | |
# | | Topco Technologies Corp. | | | 182,720 | | | | 396,719 | |
| | Topkey Corp. | | | 235,000 | | | | 1,255,433 | |
# | | Topoint Technology Co. Ltd. | | | 428,898 | | | | 377,127 | |
# | | Toung Loong Textile Manufacturing | | | 353,940 | | | | 290,705 | |
# | | TPK Holding Co. Ltd. | | | 1,347,000 | | | | 1,188,898 | |
# | | Trade-Van Information Services Co. | | | 255,000 | | | | 431,258 | |
| | Transart Graphics Co. Ltd. | | | 18,000 | | | | 30,756 | |
| | Transcend Information, Inc. | | | 731,000 | | | | 1,459,457 | |
| | Transcom, Inc. | | | 53,000 | | | | 204,667 | |
* | | TrueLight Corp. | | | 37,000 | | | | 24,113 | |
# | | Tsang Yow Industrial Co. Ltd. | | | 239,000 | | | | 167,839 | |
| | Tsann Kuen Enterprise Co. Ltd. | | | 206,059 | | | | 266,837 | |
| | TSC Auto ID Technology Co. Ltd. | | | 98,470 | | | | 570,815 | |
| | TSRC Corp. | | | 1,921,200 | | | | 1,574,160 | |
| | Ttet Union Corp. | | | 153,000 | | | | 688,025 | |
| | TTFB Co. Ltd. | | | 47,340 | | | | 272,272 | |
# | | TTY Biopharm Co. Ltd. | | | 815,979 | | | | 1,895,358 | |
# | | Tung Ho Steel Enterprise Corp. | | | 1,665,630 | | | | 2,548,962 | |
# | | Tung Thih Electronic Co. Ltd. | | | 232,000 | | | | 961,808 | |
| | Turvo International Co. Ltd. | | | 131,922 | | | | 370,382 | |
# | | TXC Corp. | | | 1,004,053 | | | | 2,369,719 | |
# | | TYC Brother Industrial Co. Ltd. | | | 848,980 | | | | 660,286 | |
* | | Tycoons Group Enterprise | | | 1,695,767 | | | | 420,069 | |
# | | Tyntek Corp. | | | 1,029,039 | | | | 483,822 | |
| | UDE Corp. | | | 251,000 | | | | 229,975 | |
| | U-Ming Marine Transport Corp. | | | 1,101,000 | | | | 1,199,224 | |
# | | Unictron Technologies Corp. | | | 23,000 | | | | 48,474 | |
# | | Union Bank Of Taiwan | | | 7,686,772 | | | | 3,607,709 | |
| | Unitech Computer Co. Ltd. | | | 341,804 | | | | 310,049 | |
* | | Unitech Printed Circuit Board Corp. | | | 2,033,648 | | | | 1,100,681 | |
| | United Integrated Services Co. Ltd. | | | 576,951 | | | | 2,589,286 | |
* | | United Orthopedic Corp. | | | 312,935 | | | | 300,838 | |
| | United Radiant Technology | | | 366,000 | | | | 179,801 | |
# | | United Recommend International Co. Ltd. | | | 56,350 | | | | 111,409 | |
* | | United Renewable Energy Co. Ltd. | | | 2,484,437 | | | | 1,614,924 | |
†† | | Unity Opto Technology Co. Ltd. | | | 2,760,500 | | | | 66,180 | |
| | Univacco Technology, Inc. | | | 32,000 | | | | 24,354 | |
| | Universal Cement Corp. | | | 1,620,433 | | | | 1,005,002 | |
# | | Universal Vision Biotechnology Co. Ltd. | | | 109,200 | | | | 835,198 | |
| | Unizyx Holding Corp. | | | 979,225 | | | | 777,883 | |
| | UPC Technology Corp. | | | 2,827,124 | | | | 1,068,323 | |
# | | Userjoy Technology Co. Ltd. | | | 195,587 | | | | 419,668 | |
| | USI Corp. | | | 2,894,156 | | | | 1,814,779 | |
* | | Usun Technology Co. Ltd. | | | 209,200 | | | | 162,853 | |
# | | Utechzone Co. Ltd. | | | 189,000 | | | | 444,590 | |
| | UVAT Technology Co. Ltd. | | | 55,000 | | | | 92,660 | |
| | Ve Wong Corp. | | | 556,696 | | | | 561,629 | |
# | | Ventec International Group Co. Ltd. | | | 223,000 | | | | 409,706 | |
# | | VIA Labs, Inc. | | | 50,000 | | | | 261,836 | |
* | | Victory New Materials Ltd. Co. | | | 327,832 | | | | 100,432 | |
| | Viking Tech Corp. | | | 118,000 | | | | 145,714 | |
| | Visual Photonics Epitaxy Co. Ltd. | | | 522,772 | | | | 933,345 | |
# | | Vivotek, Inc. | | | 136,704 | | | | 567,246 | |
THE EMERGING MARKETS SMALL CAP SERIES
CONTINUED
| | | | | | | | | | |
| | | | | Shares | | | Value» | |
TAIWAN — (Continued) | | | | | | | | |
| | Wafer Works Corp. | | | 1,548,251 | | | $ | 1,909,749 | |
# | | Waffer Technology Corp. | | | 319,513 | | | | 306,244 | |
| | Wah Hong Industrial Corp. | | | 144,021 | | | | 129,373 | |
| | Wah Lee Industrial Corp. | | | 603,300 | | | | 1,500,721 | |
| | Walsin Technology Corp. | | | 289,000 | | | | 705,406 | |
# | | Walton Advanced Engineering, Inc. | | | 1,110,197 | | | | 370,843 | |
| | WAN HWA Enterprise Co. | | | 401,238 | | | | 148,690 | |
| | We & Win Development Co. Ltd. | | | 161,000 | | | | 34,371 | |
| | We&Win Diversification Co. Ltd. | | | 95,000 | | | | 34,603 | |
| | WEI Chih Steel Industrial Co. Ltd. | | | 26,000 | | | | 17,564 | |
| | Wei Chuan Foods Corp. | | | 1,258,000 | | | | 711,737 | |
* †† | | Wei Mon Industry Co. Ltd. | | | 3,075,282 | | | | 0 | |
| | Weikeng Industrial Co. Ltd. | | | 1,320,459 | | | | 1,050,889 | |
| | Well Shin Technology Co. Ltd. | | | 319,000 | | | | 444,488 | |
# | | WELLELL, Inc. | | | 220,500 | | | | 158,547 | |
# * | | Wha Yu Industrial Co. Ltd. | | | 328,000 | | | | 154,042 | |
| | Wholetech System Hitech Ltd. | | | 207,000 | | | | 255,957 | |
| | Winmate, Inc. | | | 140,000 | | | | 349,141 | |
# | | Winstek Semiconductor Co. Ltd. | | | 234,000 | | | | 294,733 | |
†† | | Wintek Corp. | | | 5,447,000 | | | | 57,999 | |
# | | WinWay Technology Co. Ltd. | | | 48,000 | | | | 456,093 | |
| | Wisdom Marine Lines Co. Ltd. | | | 1,396,241 | | | | 2,258,206 | |
| | Wistron Information Technology & Services Corp. | | | 32,000 | | | | 76,197 | |
| | Wistron NeWeb Corp. | | | 960,155 | | | | 2,489,490 | |
# * | | Wowprime Corp. | | | 225,000 | | | | 870,866 | |
| | WT Microelectronics Co. Ltd. | | | 1,225,450 | | | | 2,213,380 | |
| | WUS Printed Circuit Co. Ltd. | | | 599,737 | | | | 421,397 | |
| | XAC Automation Corp. | | | 302,000 | | | | 195,505 | |
# | | XinTec, Inc. | | | 318,000 | | | | 941,478 | |
| | X-Legend Entertainment Co. Ltd. | | | 81,000 | | | | 102,437 | |
* †† | | XPEC Entertainment, Inc. | | | 192,135 | | | | 0 | |
# | | Xxentria Technology Materials Corp. | | | 487,207 | | | | 856,610 | |
| | Yankey Engineering Co. Ltd. | | | 2,000 | | | | 9,759 | |
# | | YC INOX Co. Ltd. | | | 1,267,609 | | | | 994,666 | |
| | YCC Parts Manufacturing Co. Ltd. | | | 79,000 | | | | 88,404 | |
# | | Yea Shin International Development Co. Ltd. | | | 675,103 | | | | 462,851 | |
# | | Yem Chio Co. Ltd. | | | 1,684,518 | | | | 675,912 | |
# | | Yeong Guan Energy Technology Group Co. Ltd. | | | 279,987 | | | | 430,925 | |
# | | YFC-Boneagle Electric Co. Ltd. | | | 374,687 | | | | 282,068 | |
# | | YFY, Inc. | | | 1,071,212 | | | | 847,897 | |
# | | Yi Jinn Industrial Co. Ltd. | | | 669,284 | | | | 377,591 | |
| | Yi Shin Textile Industrial Co. Ltd. | | | 28,000 | | | | 28,953 | |
# | | Yieh Phui Enterprise Co. Ltd. | | | 3,414,651 | | | | 1,509,700 | |
# | | Yonyu Plastics Co. Ltd. | | | 279,600 | | | | 286,927 | |
| | Young Fast Optoelectronics Co. Ltd. | | | 335,872 | | | | 265,165 | |
# | | Youngtek Electronics Corp. | | | 415,666 | | | | 727,479 | |
# | | Yuanta Futures Co. Ltd. | | | 342,827 | | | | 497,903 | |
| | Yuen Chang Stainless Steel Co. Ltd. | | | 60,000 | | | | 35,736 | |
| | Yuen Foong Yu Consumer Products Co. Ltd. | | | 140,000 | | | | 151,464 | |
| | Yulon Finance Corp. | | | 69,498 | | | | 293,620 | |
| | Yulon Motor Co. Ltd. | | | 1,697,056 | | | | 2,397,365 | |
| | Yung Chi Paint & Varnish Manufacturing Co. Ltd. | | | 250,869 | | | | 542,535 | |
# | | Yungshin Construction & Development Co. Ltd. | | | 377,000 | | | | 699,991 | |
| | YungShin Global Holding Corp. | | | 758,015 | | | | 914,467 | |
| | Yusin Holding Corp. | | | 25,721 | | | | 80,496 | |
| | Zeng Hsing Industrial Co. Ltd. | | | 210,107 | | | | 700,436 | |
# | | Zenitron Corp. | | | 654,000 | | | | 520,816 | |
# | | Zero One Technology Co. Ltd. | | | 522,226 | | | | 622,532 | |
* | | Zhong Yang Technology Co. Ltd. | | | 7,819 | | | | 8,601 | |
THE EMERGING MARKETS SMALL CAP SERIES
CONTINUED
| | | | | | | | | | |
| | | | | Shares | | | Value» | |
TAIWAN — (Continued) | | | | | | | | |
| | Zig Sheng Industrial Co. Ltd. | | | 1,265,732 | | | $ | 376,382 | |
| | ZillTek Technology Corp. | | | 19,000 | | | | 105,189 | |
# * | | Zinwell Corp. | | | 1,080,586 | | | | 553,795 | |
# | | Zippy Technology Corp. | | | 409,948 | | | | 481,479 | |
# | | ZongTai Real Estate Development Co. Ltd. | | | 594,686 | | | | 542,176 | |
| | | | | | | | | | |
TOTAL TAIWAN | | | | 560,730,507 | |
| | | | | | | | | | |
THAILAND — (2.6%) | | | | | | | | |
| | AAPICO Hitech PCL, NVDR | | | 44,370 | | | | 35,265 | |
| | AAPICO Hitech PCL | | | 827,632 | | | | 657,800 | |
| | Absolute Clean Energy PCL | | | 5,527,500 | | | | 397,934 | |
| | Advanced Information Technology PCL | | | 4,845,200 | | | | 789,286 | |
| | AEON Thana Sinsap Thailand PCL | | | 186,900 | | | | 802,894 | |
* | | After You PCL | | | 945,700 | | | | 278,293 | |
| | AgriPure Holdings PLC | | | 342,400 | | | | 45,431 | |
* | | AgriPure Holdings PLC | | | 26,750 | | | | 0 | |
| | AI Energy PCL | | | 150,750 | | | | 12,754 | |
| | AJ Plast PCL | | | 662,588 | | | | 215,872 | |
| | Allianz Ayudhya Capital PCL | | | 195,200 | | | | 217,972 | |
* | | Alpha Divisions PCL, Class F | | | 426,400 | | | | 16,917 | |
| | Alucon PCL | | | 2,200 | | | | 10,694 | |
| | Amanah Leasing PCL | | | 1,775,700 | | | | 192,220 | |
| | Amata Corp. PCL | | | 3,064,910 | | | | 1,570,303 | |
* | | Ananda Development PCL | | | 6,937,600 | | | | 260,661 | |
| | AP Thailand PCL | | | 9,322,416 | | | | 2,400,412 | |
* | | Aqua Corp. PCL | | | 1,423,200 | | | | 24,680 | |
| | Asia Plus Group Holdings PCL | | | 7,988,300 | | | | 629,661 | |
| | Asia Sermkij Leasing PCL, NVDR | | | 1,358,800 | | | | 1,160,300 | |
| | Asian Insulators PCL | | | 1,590,850 | | | | 261,240 | |
| | Asian Sea Corp. PCL, Class F | | | 740,500 | | | | 338,536 | |
| | Asiasoft Corp. PCL | | | 673,200 | | | | 293,618 | |
| | Bangchak Corp. PCL | | | 71,100 | | | | 56,977 | |
* | | Bangkok Airways PCL | | | 2,794,300 | | | | 991,147 | |
| | Bangkok Insurance PCL | | | 198,381 | | | | 1,438,601 | |
| | Bangkok Land PCL | | | 49,104,170 | | | | 1,303,080 | |
* | | Bangkok Ranch PCL | | | 1,634,700 | | | | 120,262 | |
* †† | | Bangkok Rubber Pub Co. | | | 14,600 | | | | 0 | |
| | BCPG PCL | | | 2,883,700 | | | | 723,577 | |
| | BEC World PCL | | | 2,062,348 | | | | 522,902 | |
* | | Better World Green PCL | | | 14,328,300 | | | | 271,056 | |
| | BG Container Glass PCL | | | 596,800 | | | | 155,237 | |
* | | Bound & Beyond PCL | | | 74,300 | | | | 23,621 | |
| | Business Online PCL | | | 436,400 | | | | 119,247 | |
| | Cal-Comp Electronics Thailand PCL, Class F | | | 12,497,033 | | | | 722,372 | |
| | CH Karnchang PCL | | | 3,802,500 | | | | 2,317,867 | |
| | Charoong Thai Wire & Cable PCL, Class F | | | 726,000 | | | | 113,116 | |
| | Chayo Group PCL | | | 122,200 | | | | 26,167 | |
| | Chularat Hospital PCL, Class F | | | 20,613,400 | | | | 1,917,274 | |
| | CIMB Thai Bank PCL | | | 7,467,800 | | | | 164,817 | |
| | CK Power PCL | | | 3,910,700 | | | | 507,590 | |
| | Communication & System Solution PCL | | | 1,235,900 | | | | 48,709 | |
* | | Country Group Development PCL | | | 14,802,500 | | | | 178,906 | |
* | | Country Group Holdings PCL, Class F | | | 3,458,000 | | | | 62,691 | |
| | Demco PCL | | | 607,800 | | | | 69,946 | |
| | Dhipaya Group Holdings PCL | | | 2,171,100 | | | | 3,094,645 | |
| | Diamond Building Products PCL | | | 166,700 | | | | 33,725 | |
| | Do Day Dream PCL | | | 340,400 | | | | 149,361 | |
| | Dynasty Ceramic PCL | | | 15,131,880 | | | | 1,073,465 | |
* | | E for L Aim PCL | | | 1,528,730 | | | | 17,673 | |
THE EMERGING MARKETS SMALL CAP SERIES
CONTINUED
| | | | | | | | | | |
| | | | | Shares | | | Value» | |
THAILAND — (Continued) | | | | | | | | |
* | | Earth Tech Environment PCL | | | 323,000 | | | $ | 27,497 | |
| | Eastern Polymer Group PCL, Class F | | | 3,322,300 | | | | 890,369 | |
| | Eastern Power Group PCL | | | 1,420,408 | | | | 161,223 | |
| | Eastern Water Resources Development & Management PCL, Class F | | | 2,421,400 | | | | 324,465 | |
| | Ekachai Medical Care PCL | | | 964,704 | | | | 196,439 | |
| | Esso Thailand PCL | | | 1,059,600 | | | | 403,684 | |
| | Exotic Food PCL, Class F | | | 382,700 | | | | 121,668 | |
| | Forth Corp. PCL | | | 603,600 | | | | 840,536 | |
| | Forth Smart Service PCL | | | 844,800 | | | | 426,173 | |
| | Fortune Parts Industry PCL, Class F | | | 230,000 | | | | 23,085 | |
| | GFPT PCL | | | 1,928,200 | | | | 744,733 | |
| | Global Green Chemicals PCL, Class F | | | 1,314,600 | | | | 490,471 | |
* †† | | Group Lease PCL, NVDR | | | 1,644,700 | | | | 5,268 | |
| | Haad Thip PCL | | | 285,700 | | | | 213,937 | |
| | Hana Microelectronics PCL | | | 1,320,100 | | | | 1,205,294 | |
| | Humanica PCL | | | 250,600 | | | | 72,428 | |
| | Hwa Fong Rubber Thailand PCL | | | 407,600 | | | | 69,611 | |
| | I&I Group PCL | | | 21,100 | | | | 24,116 | |
| | ICC International PCL | | | 204,600 | | | | 167,991 | |
| | Ichitan Group PCL | | | 1,493,100 | | | | 415,840 | |
| | Index Livingmall PCL | | | 395,300 | | | | 180,720 | |
| | Infraset PCL | | | 164,200 | | | | 15,704 | |
| | Interlink Communication PCL | | | 794,300 | | | | 161,740 | |
* | | Interlink Telecom PCL | | | 2,587,600 | | | | 270,590 | |
| | Internet Thailand PCL | | | 795,400 | | | | 114,942 | |
* | | Interpharma PCL | | | 20,800 | | | | 8,908 | |
| | IT City PCL | | | 152,900 | | | | 20,689 | |
* | | Italian-Thai Development PCL | | | 17,231,827 | | | | 873,816 | |
* †† | | ITV PLC | | | 2,785,600 | | | | 0 | |
| | JAS Asset PCL, Class F | | | 208,000 | | | | 21,969 | |
* | | Jasmine International PCL | | | 11,956,600 | | | | 760,246 | |
* | | JKN Global Media PCL | | | 638,200 | | | | 84,680 | |
| | Jubilee Enterprise PCL | | | 341,300 | | | | 260,055 | |
| | JWD Infologistics PCL | | | 1,363,500 | | | | 698,588 | |
| | Kang Yong Electric PCL | | | 6,000 | | | | 50,447 | |
| | Karmarts PCL | | | 1,756,900 | | | | 283,892 | |
| | KGI Securities Thailand PCL | | | 403,100 | | | | 51,261 | |
| | Khon Kaen Sugar Industry PCL | | | 6,254,237 | | | | 611,292 | |
| | Ladprao General Hospital PCL, Class F | | | 60,100 | | | | 9,080 | |
| | Lalin Property PCL | | | 495,500 | | | | 117,170 | |
| | Lam Soon Thailand PCL | | | 1,074,700 | | | | 141,185 | |
| | Lanna Resources PCL | | | 609,350 | | | | 296,190 | |
| | Lee Feed Mill PCL | | | 67,000 | | | | 4,260 | |
| | LH Financial Group PCL | | | 27,752,539 | | | | 802,096 | |
| | Loxley PCL | | | 6,581,976 | | | | 380,461 | |
| | LPN Development PCL | | | 4,234,002 | | | | 460,556 | |
* | | Master Ad PCL | | | 3,883,000 | | | | 54,072 | |
| | MBK PCL | | | 3,877,954 | | | | 1,915,542 | |
| | MC Group PCL | | | 783,000 | | | | 204,699 | |
* | | MCOT PCL | | | 658,800 | | | | 82,047 | |
| | MCS Steel PCL | | | 1,579,400 | | | | 385,928 | |
* | | MDX PCL | | | 108,900 | | | | 13,105 | |
| | Mega Lifesciences PCL | | | 618,200 | | | | 718,743 | |
| | Millcon Steel PCL | | | 5,433,354 | | | | 114,206 | |
| | Modernform Group PCL | | | 2,003,800 | | | | 176,899 | |
* | | Mono Next PCL | | | 1,413,700 | | | | 53,859 | |
| | Muang Thai Insurance PCL | | | 61,288 | | | | 202,093 | |
| | Namyong Terminal PCL | | | 1,737,000 | | | | 167,037 | |
| | Nava Nakorn PCL | | | 178,700 | | | | 9,672 | |
THE EMERGING MARKETS SMALL CAP SERIES
CONTINUED
| | | | | | | | | | |
| | | | | Shares | | | Value» | |
THAILAND — (Continued) | | | | | | | | |
* | | Nawarat Patanakarn PCL | | | 2,977,100 | | | $ | 61,013 | |
| | Netbay PCL | | | 393,700 | | | | 307,740 | |
| | Noble Development PCL | | | 2,319,300 | | | | 277,877 | |
| | Nonthavej Hospital PCL | | | 3,300 | | | | 3,316 | |
| | Northeast Rubber PCL | | | 3,149,300 | | | | 479,925 | |
| | NR Instant Produce PCL | | | 71,400 | | | | 12,100 | |
* | | Nusasiri PCL | | | 390,800 | | | | 10,473 | |
| | Origin Property PCL, Class F | | | 2,597,250 | | | | 696,058 | |
| | Pacific Pipe PCL | | | 192,400 | | | | 19,007 | |
| | PCS Machine Group Holding PCL | | | 1,196,800 | | | | 155,968 | |
* | | Plan B Media PCL, Class F | | | 7,247,656 | | | | 1,342,511 | |
* | | Platinum Group PCL, Class F | | | 3,236,300 | | | | 278,903 | |
| | Polyplex Thailand PCL | | | 1,023,050 | | | | 634,366 | |
* | | Power Solution Technologies PCL, Class F | | | 5,710,720 | | | | 256,577 | |
| | Praram 9 Hospital PCL | | | 91,700 | | | | 43,368 | |
| | Precious Shipping PCL | | | 2,314,600 | | | | 796,670 | |
| | Premier Marketing PCL | | | 1,413,900 | | | | 360,348 | |
| | Prima Marine PCL | | | 4,139,800 | | | | 701,569 | |
* | | Principal Capital PCL | | | 1,537,400 | | | | 246,404 | |
| | Property Perfect PCL | | | 30,025,746 | | | | 307,673 | |
| | Pruksa Holding PCL | | | 2,868,300 | | | | 904,351 | |
| | PTG Energy PCL | | | 3,087,900 | | | | 1,127,741 | |
| | Pylon PCL | | | 1,089,900 | | | | 121,991 | |
| | Quality Houses PCL | | | 28,415,326 | | | | 1,612,641 | |
| | R&B Food Supply PCL | | | 345,300 | | | | 99,798 | |
* | | Raimon Land PCL | | | 9,678,200 | | | | 180,544 | |
| | Rajthanee Hospital PCL | | | 519,100 | | | | 470,545 | |
| | Ratchaphruek Hospital PCL, Class F | | | 146,400 | | | | 23,464 | |
| | Ratchthani Leasing PCL | | | 7,384,755 | | | | 869,251 | |
| | Regional Container Lines PCL | | | 1,066,200 | | | | 742,362 | |
| | Rojana Industrial Park PCL | | | 3,049,854 | | | | 464,770 | |
| | RPCG Pcl | | | 1,542,900 | | | | 41,755 | |
| | RS PCL | | | 1,949,000 | | | | 803,975 | |
| | S 11 Group PCL | | | 1,380,900 | | | | 179,234 | |
* | | S Hotels & Resorts PCL | | | 3,052,300 | | | | 296,729 | |
| | S Kijchai Enterprise PCL, Class F | | | 168,900 | | | | 22,411 | |
| | Sabina PCL | | | 845,800 | | | | 555,570 | |
| | Saha Pathana Inter-Holding PCL | | | 699,100 | | | | 1,276,601 | |
| | Sahakol Equipment PCL | | | 2,553,800 | | | | 125,476 | |
| | Sahamitr Pressure Container PCL | | | 728,400 | | | | 283,245 | |
| | Saha-Union PCL | | | 753,300 | | | | 569,032 | |
* | | Samart Corp. PCL | | | 2,445,500 | | | | 366,247 | |
| | Samart Telcoms PCL | | | 721,200 | | | | 131,696 | |
| | Sansiri PCL | | | 47,003,710 | | | | 1,617,837 | |
| | Sappe PCL | | | 437,900 | | | | 465,973 | |
| | SC Asset Corp. PCL | | | 6,201,215 | | | | 612,627 | |
| | SCG Ceramics PCL | | | 2,696,100 | | | | 145,927 | |
* | | SEAFCO PCL | | | 2,160,702 | | | | 195,292 | |
* | | Seafresh Industry PCL | | | 227,200 | | | | 18,506 | |
| | Sena Development PCL | | | 2,107,633 | | | | 225,936 | |
* | | SENA J Property PCL | | | 835,300 | | | | 27,434 | |
| | Sermsang Power Corp. Co. Ltd. | | | 1,717,188 | | | | 446,667 | |
* | | Siam Wellness Group PCL, Class F | | | 80,500 | | | | 24,535 | |
| | Siamgas & Petrochemicals PCL | | | 2,078,300 | | | | 567,901 | |
| | Siamrajathanee PCL | | | 489,480 | | | | 124,749 | |
| | Sikarin PCL, Class F | | | 65,000 | | | | 24,422 | |
* | | Simat Technologies PCL | | | 1,166,200 | | | | 72,926 | |
* | | Singha Estate PCL | | | 11,739,354 | | | | 558,282 | |
| | Sino-Thai Engineering & Construction PCL | | | 3,693,013 | | | | 1,135,267 | |
THE EMERGING MARKETS SMALL CAP SERIES
CONTINUED
| | | | | | | | | | |
| | | | | Shares | | | Value» | |
THAILAND — (Continued) | | | | | | | | |
| | SiS Distribution Thailand PCL | | | 36,100 | | | $ | 24,661 | |
| | SISB PCL | | | 111,800 | | | | 56,399 | |
* | | SKY ICT PCL, Class F | | | 163,400 | | | | 43,362 | |
| | SNC Former PCL | | | 651,700 | | | | 280,817 | |
| | Somboon Advance Technology PCL | | | 935,137 | | | | 523,343 | |
| | Southern Concrete Pile PCL | | | 115,700 | | | | 15,656 | |
| | SPCG PCL | | | 1,937,400 | | | | 697,383 | |
| | Sri Trang Agro-Industry PCL | | | 2,624,200 | | | | 1,323,821 | |
| | Sri Trang Gloves Thailand PCL | | | 76,700 | | | | 22,369 | |
| | Sriracha Construction PCL | | | 59,800 | | | | 16,969 | |
| | Srisawad Capital 1969 PCL | | | 378,400 | | | | 258,497 | |
| | Srithai Superware PCL | | | 4,677,700 | | | | 202,790 | |
| | Srivichai Vejvivat PCL | | | 997,700 | | | | 237,236 | |
| | Starflex PCL | | | 849,700 | | | | 74,120 | |
| | Stars Microelectronics Thailand PCL | | | 1,023,800 | | | | 124,814 | |
* | | STP & I PCL | | | 4,616,764 | | | | 557,990 | |
| | Supalai PCL | | | 4,018,991 | | | | 2,217,520 | |
| | Super Energy Corp. PCL | | | 57,070,391 | | | | 1,049,639 | |
| | Susco PCL | | | 1,626,100 | | | | 196,533 | |
| | SVI PCL | | | 951,200 | | | | 202,436 | |
| | Synnex Thailand PCL | | | 681,540 | | | | 273,977 | |
| | Syntec Construction PCL | | | 4,670,200 | | | | 192,649 | |
| | TAC Consumer PCL, Class F | | | 1,430,100 | | | | 259,267 | |
| | Taokaenoi Food & Marketing PCL, Class F | | | 2,024,080 | | | | 372,269 | |
| | Tata Steel Thailand PCL | | | 1,198,700 | | | | 31,810 | |
| | Thai Nakarin Hospital PCL | | | 348,500 | | | | 334,216 | |
* | | Thai Reinsurance PCL | | | 8,213,800 | | | | 233,077 | |
| | Thai Rubber Latex Group PCL | | | 1,217,800 | | | | 69,113 | |
| | Thai Solar Energy PCL, Class F | | | 3,485,274 | | | | 194,135 | |
| | Thai Stanley Electric PCL, Class F | | | 141,000 | | | | 674,251 | |
| | Thai Vegetable Oil PCL | | | 1,901,982 | | | | 1,424,238 | |
| | Thai Wacoal PCL | | | 78,000 | | | | 69,679 | |
| | Thai Wah PCL, Class F | | | 1,671,200 | | | | 237,112 | |
| | Thaicom PCL | | | 1,633,800 | | | | 493,660 | |
| | Thaifoods Group PCL, Class F | | | 3,785,600 | | | | 556,998 | |
| | Thaire Life Assurance PCL, Class F | | | 1,525,800 | | | | 188,420 | |
| | Thaivivat Insurance PCL | | | 151,400 | | | | 68,818 | |
| | Thanachart Capital PCL | | | 892,800 | | | | 938,308 | |
| | Thitikorn PCL | | | 694,300 | | | | 163,268 | |
| | Thoresen Thai Agencies PCL | | | 4,069,454 | | | | 801,916 | |
| | Tipco Asphalt PCL | | | 2,277,200 | | | | 1,023,125 | |
| | TIPCO Foods PCL | | | 1,106,482 | | | | 255,834 | |
| | TKS Technologies PCL | | | 834,515 | | | | 236,804 | |
| | TMT Steel PCL | | | 964,000 | | | | 193,762 | |
| | Tong Hua Holding PCL | | | 216,000 | | | | 23,155 | |
| | TPC Power Holding PCL, Class F | | | 841,800 | | | | 168,095 | |
| | TPI Polene PCL | | | 23,075,800 | | | | 1,073,152 | |
| | TPI Polene Power PCL | | | 9,540,200 | | | | 842,225 | |
| | TQM Alpha PCL | | | 801,300 | | | | 789,510 | |
| | Triple i Logistics PCL | | | 83,300 | | | | 28,015 | |
* | | Triton Holding PCL | | | 8,152,600 | | | | 40,699 | |
* | | TTCL PCL | | | 824,440 | | | | 93,578 | |
| | TTW PCL | | | 2,977,700 | | | | 680,662 | |
* | | U City PLC, Class F | | | 12,358,389 | | | | 522,780 | |
| | Union Auction PCL | | | 825,400 | | | | 216,868 | |
* | | Unique Engineering & Construction PCL | | | 2,628,670 | | | | 309,418 | |
| | United Paper PCL | | | 1,036,800 | | | | 449,480 | |
* | | United Power of Asia PCL, Class F | | | 10,276,434 | | | | 62,101 | |
| | Univanich Palm Oil PCL | | | 2,156,800 | | | | 402,346 | |
THE EMERGING MARKETS SMALL CAP SERIES
CONTINUED
| | | | | | | | | | |
| | | | | Shares | | | Value» | |
THAILAND — (Continued) | | | | | | | | |
| | Univentures PCL | | | 1,488,000 | | | $ | 117,288 | |
| | Vanachai Group PCL | | | 1,592,659 | | | | 244,799 | |
| | Vinythai PCL | | | 12,200 | | | | 12,468 | |
| | WHA Utilities & Power PCL | | | 4,811,700 | | | | 515,810 | |
| | WICE Logistics PCL | | | 1,010,900 | | | | 294,824 | |
| | Workpoint Entertainment PCL | | | 799,040 | | | | 379,995 | |
| | YGGDRAZIL Group PCL | | | 49,500 | | | | 10,470 | |
* | | Ziga Innovation PCL | | | 797,100 | | | | 93,407 | |
| | | | | | | | | | |
TOTAL THAILAND | | | | 93,749,823 | |
| | | | | | | | | | |
TURKEY — (1.3%) | | | | | | | | |
| | Afyon Cimento Sanayi TAS | | | 570,356 | | | | 192,710 | |
| | Agesa Hayat ve Emeklilik AS | | | 119,451 | | | | 202,117 | |
| | Akcansa Cimento AS | | | 88,933 | | | | 210,227 | |
| | Aksa Akrilik Kimya Sanayii AS | | | 405,676 | | | | 1,518,267 | |
# | | Aksa Enerji Uretim AS | | | 820,184 | | | | 1,824,330 | |
| | Alarko Carrier Sanayii VE Ticaret AS | | | 898 | | | | 22,633 | |
# | | Alarko Holding AS | | | 456,636 | | | | 1,575,866 | |
* | | Albaraka Turk Katilim Bankasi AS | | | 3,650,381 | | | | 449,232 | |
# | | Alkim Alkali Kimya AS | | | 159,573 | | | | 334,670 | |
* | | Anadolu Anonim Turk Sigorta Sirketi | | | 656,269 | | | | 334,804 | |
| | Anadolu Hayat Emeklilik AS | | | 193,776 | | | | 156,596 | |
| | Aygaz AS | | | 201,864 | | | | 639,090 | |
* | | Bagfas Bandirma Gubre Fabrikalari AS | | | 24,948 | | | | 48,956 | |
* | | Baticim Bati Anadolu Cimento Sanayii AS | | | 4,453 | | | | 10,599 | |
# | | Bera Holding AS | | | 873,946 | | | | 1,076,360 | |
| | Bizim Toptan Satis Magazalari AS | | | 75,491 | | | | 110,566 | |
* | | Borusan Mannesmann Boru Sanayi ve Ticaret AS | | | 88,533 | | | | 252,651 | |
| | Borusan Yatirim ve Pazarlama AS | | | 4,035 | | | | 161,033 | |
| | Brisa Bridgestone Sabanci Sanayi ve Ticaret AS | | | 29,848 | | | | 75,637 | |
| | Cimsa Cimento Sanayi VE Ticaret AS | | | 166,702 | | | | 686,566 | |
| | Deva Holding AS | | | 73,348 | | | | 176,711 | |
| | Dogan Sirketler Grubu Holding AS | | | 1,366,655 | | | | 437,185 | |
* | | Doganlar Mobilya Grubu Imalat Sanayi ve Ticaret AS | | | 491,010 | | | | 133,227 | |
| | Dogus Otomotiv Servis ve Ticaret AS | | | 98,918 | | | | 651,756 | |
| | Eczacibasi Yatirim Holding Ortakligi AS | | | 2,502 | | | | 12,890 | |
# | | EGE Endustri VE Ticaret AS | | | 2,984 | | | | 529,351 | |
| | EGE Gubre Sanayii AS | | | 8,260 | | | | 34,553 | |
| | EIS Eczacibasi Ilac ve Sinai ve Finansal Yatirimlar Sanayi ve Ticaret AS | | | 488,985 | | | | 522,409 | |
| | Erbosan Erciyas Boru Sanayii ve Ticaret AS | | | 41,114 | | | | 364,526 | |
# * | | Fenerbahce Futbol AS | | | 90,646 | | | | 373,296 | |
* | | Global Yatirim Holding AS | | | 1,207,616 | | | | 440,093 | |
* †† | | Goldas Kuyumculuk Sanayi Ithalat Ve Bagli Ortakliklari | | | 8,540 | | | | 0 | |
| | Goltas Goller Bolgesi Cimento Sanayi ve Ticaret AS | | | 1 | | | | 6 | |
* | | Goodyear Lastikleri TAS | | | 243,750 | | | | 197,519 | |
* | | Gozde Girisim Sermayesi Yatirim Ortakligi AS | | | 647,008 | | | | 434,407 | |
| | GSD Holding AS | | | 515,175 | | | | 164,029 | |
* | | Hektas Ticaret TAS | | | 2,803,027 | | | | 4,309,757 | |
# * | | Ihlas Gayrimenkul Proje Gelistirme Ve Ticaret AS | | | 523,213 | | | | 27,556 | |
| | Indeks Bilgisayar Sistemleri Muhendislik Sanayi ve Ticaret AS | | | 357,271 | | | | 276,990 | |
# * | | Ipek Dogal Enerji Kaynaklari Arastirma Ve Uretim AS | | | 243,392 | | | | 357,649 | |
* | | Is Finansal Kiralama AS | | | 878,921 | | | | 401,447 | |
| | Is Yatirim Menkul Degerler AS, Class A | | | 394,002 | | | | 764,739 | |
* | | Izmir Demir Celik Sanayi AS | | | 1,216,377 | | | | 264,062 | |
| | Jantsa Jant Sanayi Ve Ticaret AS | | | 10,787 | | | | 57,248 | |
* | | Karel Elektronik Sanayi ve Ticaret AS | | | 45,535 | | | | 47,203 | |
# * | | Karsan Otomotiv Sanayii Ve Ticaret AS | | | 283,665 | | | | 136,866 | |
| | Kartonsan Karton Sanayi ve Ticaret AS | | | 29,121 | | | | 145,575 | |
* | | Katmerciler Arac Ustu Ekipman Sanayi ve Ticaret AS | | | 861,950 | | | | 101,782 | |
THE EMERGING MARKETS SMALL CAP SERIES
CONTINUED
| | | | | | | | | | |
| | | | | Shares | | | Value» | |
TURKEY — (Continued) | | | | | | | | |
* | | Kerevitas Gida Sanayi ve Ticaret AS | | | 480,207 | | | $ | 290,384 | |
* | | Konya Cimento Sanayii AS | | | 633 | | | | 81,862 | |
# | | Kordsa Teknik Tekstil AS | | | 175,250 | | | | 604,282 | |
# * | | Koza Anadolu Metal Madencilik Isletmeleri AS | | | 526,756 | | | | 901,826 | |
| | Logo Yazilim Sanayi Ve Ticaret AS | | | 211,326 | | | | 596,784 | |
W | | Mavi Giyim Sanayi Ve Ticaret AS, Class B | | | 248,822 | | | | 1,165,540 | |
* | | Migros Ticaret AS | | | 151,462 | | | | 984,900 | |
#* W | | MLP Saglik Hizmetleri AS | | | 311,376 | | | | 1,089,930 | |
* | | Mondi Tire Kutsan Kagit Ve Ambalaj Sanayii AS | | | 16,126 | | | | 19,813 | |
* | | NET Holding AS | | | 569,393 | | | | 444,252 | |
* | | Netas Telekomunikasyon AS | | | 110,964 | | | | 210,983 | |
| | Nuh Cimento Sanayi AS | | | 230,473 | | | | 1,083,895 | |
# * | | ODAS Elektrik Uretim ve Sanayi Ticaret AS | | | 1,185,849 | | | | 488,185 | |
| | Otokar Otomotiv Ve Savunma Sanayi AS | | | 5,944 | | | | 168,957 | |
* | | Oyak Cimento Fabrikalari AS | | | 97,755 | | | | 88,279 | |
* | | Pamukova Yenilenebilir Elektrik Uretim AS | | | 7,282 | | | | 58,003 | |
* | | Parsan Makina Parcalari Sanayii AS | | | 60,935 | | | | 184,269 | |
| | Polisan Holding AS | | | 443,358 | | | | 233,504 | |
* | | Reysas Tasimacilik ve Lojistik Ticaret AS | | | 712,126 | | | | 437,732 | |
| | Sarkuysan Elektrolitik Bakir Sanayi ve Ticaret AS | | | 1,310,249 | | | | 1,663,427 | |
# * | | Sasa Polyester Sanayi AS | | | 1,429,621 | | | | 9,207,695 | |
# * | | Sekerbank Turk AS | | | 3,368,091 | | | | 367,523 | |
| | Selcuk Ecza Deposu Ticaret ve Sanayi AS | | | 376,098 | | | | 466,350 | |
| | Tat Gida Sanayi AS | | | 237,110 | | | | 360,842 | |
# | | Tekfen Holding AS | | | 547,945 | | | | 971,642 | |
* | | Teknosa Ic Ve Dis Ticaret AS | | | 425,506 | | | | 426,280 | |
* | | Trabzonspor Sportif Yatirim ve Futbol Isletmeciligi TAS | | | 550,748 | | | | 134,564 | |
* | | Tukas Gida Sanayi ve Ticaret AS | | | 60,514 | | | | 60,944 | |
* | | Tumosan Motor ve Traktor Sanayi AS | | | 15,813 | | | | 63,009 | |
# * | | Turcas Petrol AS | | | 410,905 | | | | 526,013 | |
| | Turk Prysmian Kablo ve Sistemleri AS | | | 26,111 | | | | 43,685 | |
| | Turk Traktor ve Ziraat Makineleri AS | | | 7,712 | | | | 157,649 | |
| | Turkiye Sigorta AS | | | 77,586 | | | | 33,137 | |
* | | Turkiye Sinai Kalkinma Bankasi AS | | | 3,513,187 | | | | 568,387 | |
* | | Ulker Biskuvi Sanayi AS | | | 245,708 | | | | 347,210 | |
| | Vestel Beyaz Esya Sanayi ve Ticaret AS | | | 367,190 | | | | 185,048 | |
# | | Vestel Elektronik Sanayi ve Ticaret AS | | | 173,937 | | | | 431,067 | |
| | Yatas Yatak ve Yorgan Sanayi ve Ticaret AS | | | 341,276 | | | | 371,923 | |
* | | Zorlu Enerji Elektrik Uretim AS | | | 1,556,705 | | | | 395,409 | |
| | | | | | | | | | |
TOTAL TURKEY | | | | 47,160,926 | |
| | | | | | | | | | |
UNITED ARAB EMIRATES — (0.9%) | | | | | | | | |
| | Abu Dhabi Islamic Bank PJSC | | | 2,965,487 | | | | 7,672,903 | |
| | Abu Dhabi National Insurance Co. PSC | | | 100,246 | | | | 163,201 | |
| | Abu Dhabi Ship Building Co. PJSC | | | 215,465 | | | | 243,167 | |
| | Agthia Group PJSC | | | 786,927 | | | | 957,127 | |
| | Air Arabia PJSC | | | 6,000,755 | | | | 3,332,903 | |
* | | Ajman Bank PJSC | | | 2,477,816 | | | | 498,312 | |
| | Amanat Holdings PJSC | | | 2,892,817 | | | | 724,842 | |
* | | Amlak Finance PJSC | | | 1,757,460 | | | | 281,048 | |
* | | Apex Investment Co. PSC | | | 1,389,179 | | | | 1,450,804 | |
* †† | | Arabtec Holding PJSC | | | 2,783,626 | | | | 0 | |
| | Aramex PJSC | | | 2,367,697 | | | | 2,341,547 | |
* | | Arkan Building Materials Co. | | | 4,432,983 | | | | 1,858,950 | |
| | Dana Gas PJSC | | | 9,668,141 | | | | 2,475,095 | |
* | | Deyaar Development PJSC | | | 3,514,571 | | | | 469,866 | |
| | Dubai Financial Market PJSC | | | 4,059,981 | | | | 1,561,453 | |
| | Dubai Investments PJSC | | | 4,875,961 | | | | 2,893,592 | |
* | | Emaar Development PJSC | | | 2,262,348 | | | | 2,634,581 | |
THE EMERGING MARKETS SMALL CAP SERIES
CONTINUED
| | | | | | | | | | |
| | | | | Shares | | | Value» | |
UNITED ARAB EMIRATES — (Continued) | | | | | | | | |
| | Emirates Integrated Telecommunications Co. PJSC | | | 344,855 | | | $ | 537,970 | |
* | | Eshraq Investments PJSC | | | 4,117,235 | | | | 504,006 | |
* | | Gulf Navigation Holding PJSC | | | 1,692,804 | | | | 196,502 | |
* | | Gulf Pharmaceutical Industries PSC | | | 67,736 | | | | 22,482 | |
| | Islamic Arab Insurance Co. | | | 1,416,573 | | | | 199,851 | |
* | | Manazel PJSC | | | 3,465,676 | | | | 380,310 | |
| | National Central Cooling Co. PJSC | | | 58,643 | | | | 50,821 | |
* | | Palms Sports PrJSC | | | 50,999 | | | | 149,742 | |
* | | RAK Properties PJSC | | | 2,768,862 | | | | 557,481 | |
| | Ras Al Khaimah Ceramics | | | 661,361 | | | | 518,483 | |
* | | SHUAA Capital PSC | | | 2,423,689 | | | | 257,598 | |
* | | Union Properties PJSC | | | 4,498,526 | | | | 315,978 | |
| | | | | | | | | | |
TOTAL UNITED ARAB EMIRATES | | | | 33,250,615 | |
| | | | | | | | | | |
TOTAL COMMON STOCKS | | | | 3,479,423,022 | |
| | | | | | | | | | |
PREFERRED STOCKS — (0.9%) | | | | | | | | |
| | |
BRAZIL — (0.8%) | | | | | | | | |
| | Banco ABC Brasil SA | | | 321,270 | | | | 1,284,956 | |
W | | Banco BMG SASeries B | �� | | 199,949 | | | | 96,384 | |
| | Banco do Estado do Rio Grande do Sul SA Class B | | | 695,061 | | | | 1,570,296 | |
| | Banco Pan SA | | | 508,638 | | | | 761,160 | |
| | Centrais Eletricas Santa CatarinaSeries A | | | 59,700 | | | | 683,970 | |
| | Cia de Saneamento do ParanaSeries A | | | 4,294,927 | | | | 3,201,136 | |
| | Cia de Transmissao de Energia Eletrica Paulista | | | 627,378 | | | | 2,975,658 | |
| | Cia Energetica do Ceara Class A | | | 95,539 | | | | 787,912 | |
| | Cia Ferro Ligas da Bahia - FERBASA | | | 172,100 | | | | 1,747,487 | |
| | Cia Paranaense de Energia | | | 2,481,095 | | | | 3,554,371 | |
| | Eucatex SA Industria e Comercio | | | 196,878 | | | | 302,625 | |
| | Grazziotin SA | | | 12,400 | | | | 82,723 | |
| | Marcopolo SA | | | 1,801,511 | | | | 1,004,424 | |
| | Randon SA Implementos e Participacoes | | | 594,036 | | | | 1,143,107 | |
| | Schulz SA | | | 339,000 | | | | 321,576 | |
| | Taurus Armas SA | | | 172,874 | | | | 498,324 | |
| | Track & Field Co. SA | | | 123,600 | | | | 306,278 | |
| | Unipar Carbocloro SA Class B | | | 265,449 | | | | 5,487,809 | |
| | Usinas Siderurgicas de Minas Gerais SA Usiminas Class A | | | 1,020,521 | | | | 1,428,393 | |
| | | | | | | | | | |
TOTAL BRAZIL | | | | 27,238,589 | |
| | | | | | | | | | |
CHILE — (0.0%) | | | | | | | | |
| | Coca-Cola Embonor SA Class B | | | 598,934 | | | | 634,296 | |
| | Embotelladora Andina SA Class B | | | 41,652 | | | | 72,765 | |
| | | | | | | | | | |
TOTAL CHILE | | | | 707,061 | |
| | | | | | | | | | |
COLOMBIA — (0.0%) | | | | | | | | |
| | Grupo Aval Acciones y Valores SA | | | 472,331 | | | | 51,644 | |
| | | | | | | | | | |
PHILIPPINES — (0.0%) | | | | | | | | |
| | Cebu Air, Inc., 6.000% | | | 644,939 | | | | 400,488 | |
| | | | | | | | | | |
THAILAND — (0.1%) | | | | | | | | |
* | | U City PLC | | | 49,104,342 | | | | 1,341,790 | |
| | | | | | | | | | |
TOTAL PREFERRED STOCKS | | | | 29,739,572 | |
| | | | | | | | | | |
THE EMERGING MARKETS SMALL CAP SERIES
CONTINUED
| | | | | | | | | | |
| | | | | Shares | | | Value» | |
RIGHTS/WARRANTS — (0.0%) | | | | | | | | |
BRAZIL — (0.0%) | | | | | | | | |
* | | Fleury SA Rights 11/21/22 | | | 143,339 | | | $ | 36,074 | |
* | | Omega Energia SA Rights 11/07/22 | | | 70,508 | | | | 273 | |
| | | | | | | | | | |
TOTAL BRAZIL | | | | 36,347 | |
| | | | | | | | | | |
CHINA — (0.0%) | | | | | | | | |
* | | Zhong An Group Ltd. Rights 12/31/22 | | | 69,488 | | | | 0 | |
| | | | | | | | | | |
INDIA — (0.0%) | | | | | | | | |
* | | Suzlon Energy Ltd. Rights 10/20/22 | | | 4,061,699 | | | | 149,656 | |
| | | | | | | | | | |
INDONESIA — (0.0%) | | | | | | | | |
* | | Adhi Karya Persero Tbk PT Rights 11/08/22 | | | 10,927,837 | | | | 3,503 | |
| | | | | | | | | | |
MALAYSIA — (0.0%) | | | | | | | | |
* | | Yinson Holdings Bhd Warrants 06/21/25 | | | 286,285 | | | | 26,642 | |
| | | | | | | | | | |
SAUDI ARABIA — (0.0%) | | | | | | | | |
* | | Saudi Paper Manufacturing Co. Rights 11/02/22 | | | 23,907 | | | | 115,159 | |
| | | | | | | | | | |
SOUTH KOREA — (0.0%) | | | | | | | | |
* | | Icure Pharm, Inc. Rights 12/06/22 | | | 4,891 | | | | 1,889 | |
* | | Kolon Global Corp. Rights 12/02/22 | | | 573 | | | | 0 | |
| | | | | | | | | | |
TOTAL SOUTH KOREA | | | | 1,889 | |
| | | | | | | | | | |
TAIWAN — (0.0%) | | | | | | | | |
* | | Mercuries Life Insurance Co. Ltd. Rights 11/03/22 | | | 1,557,433 | | | | 13,534 | |
* | | Zeng Hsing Industrial Co. Ltd. 10/25/22 | | | 15,619 | | | | 8,482 | |
| | | | | | | | | | |
TOTAL TAIWAN | | | | 22,016 | |
| | | | | | | | | | |
THAILAND — (0.0%) | | | | | | | | |
* | | Aqua W3 Warrants 12/31/24 | | | 224,800 | | | | 591 | |
* | | Asian Sea Corp. PCL Rights 09/30/22 | | | 115,974 | | | | 0 | |
* | | Master Ad PCL Warrants 09/04/23 | | | 970,750 | | | | 0 | |
* | | Pstc W2 Warrants 10/28/23 | | | 1,903,573 | | | | 0 | |
| | | | | | | | | | |
TOTAL THAILAND | | | | 591 | |
| | | | | | | | | | |
TOTAL RIGHTS/WARRANTS | | | | 355,803 | |
| | | | | | | | | | |
TOTAL INVESTMENT SECURITIES
(Cost $3,641,873,380) | | | | 3,509,518,397 | |
| | | | | | | | | | |
| | | |
| | | | | | | | Value† | |
SECURITIES LENDING COLLATERAL — (1.8%) | | | | | | | | |
@ § | | The DFA Short Term Investment Fund | | | 5,706,428 | | | | 65,972,009 | |
| | | | | | | | | | |
TOTAL INVESTMENTS — (100.0%)
(Cost $3,707,870,867) | | | $ | 3,575,490,406 | |
| | | | | | | | | | |
| ADR | American Depositary Receipt |
| GDR | Global Depositary Receipt |
| » | Securities that have been fair value factored. See Note B to Financial Statements. |
| * | Non-Income Producing Securities. |
| # | Total or Partial Securities on Loan. |
| W | Rule 144A, Section 4(2), or other security that is restricted as to resale to institutional investors. This security has been deemed liquid based upon the Fund’s Liquidity Guidelines. The liquidity determination is unaudited. |
| †† | Security valued using significant unobservable inputs (Level 3). |
THE EMERGING MARKETS SMALL CAP SERIES
CONTINUED
| † | See Note B to Financial Statements. |
| @ | Security purchased with cash collateral received from Securities on Loan. |
As of October 31, 2022, The Emerging Markets Small Cap Series had entered into the following outstanding futures contracts:
| | | | | | | | | | | | | | | | | | | | |
Description | | Number of
Contracts | | | Expiration
Date | | | Notional
Value | | | Market
Value | | | Unrealized
Appreciation
(Depreciation) | |
Long Position Contracts: | | | | | | | | | | | | | | | | | | | | |
E-Mini MSCI Emerging Markets Index | | | 572 | | | | 12/16/22 | | | $ | 27,594,377 | | | $ | 24,412,960 | | | $ | (3,181,417 | ) |
| | | | | | | | | | | | | | | | | | | | |
Total Futures Contracts | | | | | | | | | | $ | 27,594,377 | | | $ | 24,412,960 | | | $ | (3,181,417 | ) |
| | | | | | | | | | | | | | | | | | | | |
Summary of the Series’ investments as of October 31, 2022, based on their valuation inputs, is as follows (see Security Valuation Note):
| | | | | | | | | | | | | | | | |
| | | Investments in Securities (Market Value) | |
| | | Level 1 | | | Level 2 | | | Level 3 | | | Total | |
Common Stocks | | | | | | | | | | | | | | | | |
Belgium | | | — | | | $ | 14,557 | | | | — | | | $ | 14,557 | |
Brazil | | $ | 200,556,578 | | | | 2,113,301 | | | | — | | | | 202,669,879 | |
Chile | | | 56,743 | | | | 22,523,667 | | | | — | | | | 22,580,410 | |
China | | | 30,708,728 | | | | 744,535,093 | | | $ | 7,629,809 | | | | 782,873,630 | |
Colombia | | | 2,857,262 | | | | 651,402 | | | | — | | | | 3,508,664 | |
Greece | | | 47,143 | | | | 12,823,190 | | | | — | | | | 12,870,333 | |
Hong Kong | | | — | | | | 603,989 | | | | — | | | | 603,989 | |
Hungary | | | — | | | | 1,366,524 | | | | — | | | | 1,366,524 | |
India | | | 328,042 | | | | 685,825,728 | | | | 8,454 | | | | 686,162,224 | |
Indonesia | | | 211,331 | | | | 83,744,145 | | | | 454,201 | | | | 84,409,677 | |
Malaysia | | | — | | | | 58,091,500 | | | | 1,244 | | | | 58,092,744 | |
Mexico | | | 105,709,485 | | | | 6,131,488 | | | | 18,258 | | | | 111,859,231 | |
Philippines | | | — | | | | 36,892,926 | | | | 5,536 | | | | 36,898,462 | |
Poland | | | — | | | | 32,190,916 | | | | — | | | | 32,190,916 | |
Qatar | | | — | | | | 31,471,396 | | | | — | | | | 31,471,396 | |
Saudi Arabia | | | 495,984 | | | | 138,059,968 | | | | — | | | | 138,555,952 | |
South Africa | | | 4,776,263 | | | | 130,916,195 | | | | — | | | | 135,692,458 | |
South Korea | | | 30,295 | | | | 400,895,469 | | | | 1,784,341 | | | | 402,710,105 | |
Taiwan | | | 499,088 | | | | 559,929,711 | | | | 301,708 | | | | 560,730,507 | |
Thailand | | | 91,364,773 | | | | 2,379,782 | | | | 5,268 | | | | 93,749,823 | |
Turkey | | | — | | | | 47,160,926 | | | | — | | | | 47,160,926 | |
United Arab Emirates | | | — | | | | 33,250,615 | | | | — | | | | 33,250,615 | |
Preferred Stocks | | | | | | | | | | | | | | | | |
Brazil | | | 27,142,205 | | | | 96,384 | | | | — | | | | 27,238,589 | |
Chile | | | — | | | | 707,061 | | | | — | | | | 707,061 | |
Colombia | | | 51,644 | | | | — | | | | — | | | | 51,644 | |
Philippines | | | — | | | | 400,488 | | | | — | | | | 400,488 | |
Thailand | | | 1,341,790 | | | | — | | | | — | | | | 1,341,790 | |
Rights/Warrants | | | | | | | | | | | | | | | | |
Brazil | | | — | | | | 36,347 | | | | — | | | | 36,347 | |
India | | | — | | | | 149,656 | | | | — | | | | 149,656 | |
Indonesia | | | — | | | | 3,503 | | | | — | | | | 3,503 | |
Malaysia | | | — | | | | 26,642 | | | | — | | | | 26,642 | |
Saudi Arabia | | | — | | | | 115,159 | | | | — | | | | 115,159 | |
South Korea | | | — | | | | 1,889 | | | | — | | | | 1,889 | |
Taiwan | | | — | | | | 22,016 | | | | — | | | | 22,016 | |
Thailand | | | — | | | | 591 | | | | — | | | | 591 | |
THE EMERGING MARKETS SMALL CAP SERIES
CONTINUED
| | | | | | | | | | | | | | | | |
| | | Investments in Securities (Market Value) | |
| | | Level 1 | | | Level 2 | | | Level 3 | | | Total | |
Securities Lending Collateral | | | — | | | $ | 65,972,009 | | | | — | | | $ | 65,972,009 | |
Futures Contracts** | | $ | (3,181,417 | ) | | | — | | | | — | | | | (3,181,417 | ) |
| | | | | | | | | | | | | | | | |
TOTAL | | $ | 462,995,937 | | | $ | 3,099,104,233 | | | $ | 10,208,819 | ^ | | $ | 3,572,308,989 | |
| | | | | | | | | | | | | | | | |
| ** | Valued at the unrealized appreciation/(depreciation) on the investment. |
| ^ | A reconciliation of Level 3 investments is presented when the Fund had a significant amount of Level 3 investments at the beginning and/or end of the reporting period in relation to net assets. |

Report of Independent Registered Public Accounting Firm
To the Board of Trustees of The DFA Investment Trust Company and Shareholders of The U.S. Large Cap Value Series, The DFA International Value Series, The Japanese Small Company Series, The Asia Pacific Small Company Series, The United Kingdom Small Company Series, The Continental Small Company Series, The Canadian Small Company Series, The Emerging Markets Series and The Emerging Markets Small Cap Series
Opinions on the Financial Statements
We have audited the accompanying statements of assets and liabilities, including the summary schedules of portfolio holdings, of The U.S. Large Cap Value Series, The DFA International Value Series, The Japanese Small Company Series, The Asia Pacific Small Company Series, The United Kingdom Small Company Series, The Continental Small Company Series, The Canadian Small Company Series, The Emerging Markets Series, and The Emerging Markets Small Cap Series (nine of the series constituting The DFA Investment Trust Company, hereafter collectively referred to as the “Series”) as of October 31, 2022, the related statements of operations for the year ended October 31, 2022, the statements of changes in net assets for each of the two years in the period ended October 31, 2022, including the related notes, and the financial highlights for each of the five years in the period ended October 31, 2022 (included in Item 1 of this Form N-CSR) and the schedules of investments (included in Item 6 of this Form N-CSR) as of October 31, 2022 (collectively referred to as the “financial statements”). In our opinion, the financial statements present fairly, in all material respects, the financial position of each of the Series as of October 31, 2022, the results of each of their operations for the year then ended, the changes in each of their net assets for each of the two years in the period ended October 31, 2022, and each of the financial highlights for each of the five years in the period ended October 31, 2022 in conformity with accounting principles generally accepted in the United States of America.
Basis for Opinions
These financial statements are the responsibility of the Series’ management. Our responsibility is to express an opinion on the Series’ financial statements based on our audits. We are a public accounting firm registered with the Public Company Accounting Oversight Board (United States) (PCAOB) and are required to be independent with respect to the Series in accordance with the U.S. federal securities laws and the applicable rules and regulations of the Securities and Exchange Commission and the PCAOB.
We conducted our audits of these financial statements in accordance with the standards of the PCAOB. Those standards require that we plan and perform the audit to obtain reasonable assurance about whether the financial statements are free of material misstatement, whether due to error or fraud.
|
PricewaterhouseCoopers LLP, Two Commerce Square, Suite 1800, 2001 Market Street, Philadelphia, PA 19103-7042
T: (267) 330-3000, F: (267) 330-3300, www.pwc.com/us |
Our audits included performing procedures to assess the risks of material misstatement of the financial statements, whether due to error or fraud, and performing procedures that respond to those risks. Such procedures included examining, on a test basis, evidence regarding the amounts and disclosures in the financial statements. Our audits also included evaluating the accounting principles used and significant estimates made by management, as well as evaluating the overall presentation of the financial statements. Our procedures included confirmation of securities owned as of October 31, 2022 by correspondence with the custodians, brokers and transfer agent of the investee fund; when replies were not received from brokers, we performed other auditing procedures. We believe that our audits provide a reasonable basis for our opinions.
/s/ PricewaterhouseCoopers LLP
Philadelphia, Pennsylvania
December 22, 2022
We have served as the auditor of one or more investment companies in Dimensional Fund Advisors L.P. investment company group since 1981.
|
PricewaterhouseCoopers LLP, Two Commerce Square, Suite 1800, 2001 Market Street, Philadelphia, PA 19103-7042
T: (267) 330-3000, F: (267) 330-3300, www.pwc.com/us |
| ITEM 7. | DISCLOSURE OF PROXY VOTING POLICIES AND PROCEDURES FOR CLOSED-END MANAGEMENT INVESTMENT COMPANIES. |
This item is not applicable to the Registrant, which is an open-end management investment company.
| ITEM 8. | PORTFOLIO MANAGERS OF CLOSED-END MANAGEMENT INVESTMENT COMPANIES. |
This item is not applicable to the Registrant, which is an open-end management investment company.
| ITEM 9. | PURCHASES OF EQUITY SECURITIES BY CLOSED-END MANAGEMENT INVESTMENT COMPANY AND AFFILIATED PURCHASERS. |
This item is not applicable to the Registrant, which is an open-end management investment company.
| ITEM 10. | SUBMISSION OF MATTERS TO A VOTE OF SECURITY HOLDERS. |
None.
| ITEM 11. | CONTROLS AND PROCEDURES. |
| | (a) | Based on their evaluation of the Registrant’s disclosure controls and procedures as of a date within 90 days of the filing date of this Form N-CSR (the “Report”), the Registrant’s Co-Principal Executive Officers and Principal Financial Officer believe that the disclosure controls and procedures (as defined in Rule 30a-3(c) under the Investment Company Act of 1940, as amended) are effectively designed to ensure that information required to be disclosed by the Registrant in the Report is recorded, |
| | processed, summarized and reported by the filing date, including ensuring that information required to be disclosed in the Report is accumulated and communicated to the Registrant’s officers that are making certifications in the Report, as appropriate, to allow timely decisions regarding required disclosure. The Registrant’s management, including the Co-Principal Executive Officers and the Principal Financial Officer, recognizes that any set of controls and procedures, no matter how well designed and operated, can provide only reasonable assurance of achieving the desired control objectives. |
| | (b) | There were no changes in the Registrant’s internal control over financial reporting (as defined in Rule 30a-3(d) under the Investment Company Act of 1940, as amended) that occurred during the period covered by this Report that have materially affected, or are reasonably likely to materially affect, the Registrant’s internal control over financial reporting. |
| ITEM 12. | DISCLOSURE OF SECURITIES LENDING ACTIVITIES FOR CLOSED-END MANAGEMENT INVESTMENT COMPANIES. |
This item is not applicable to the Registrant, which is an open-end management investment company.
SIGNATURES
Pursuant to the requirements of the Securities Exchange Act of 1934 and the Investment Company Act of 1940, the Registrant has duly caused this Report to be signed on its behalf by the undersigned, thereunto duly authorized.
The DFA Investment Trust Company
| | |
| By: | | /s/ David P. Butler |
| | David P. Butler |
| | Co-Chief Executive Officer |
|
| Date: January 4, 2023 |
| |
| By: | | /s/ Gerard K. O’Reilly |
| | Gerard K. O’Reilly |
| | Co-Chief Executive Officer and |
| | Chief Investment Officer |
|
| Date: January 4, 2023 |
Pursuant to the requirements of the Securities Exchange Act of 1934 and the Investment Company Act of 1940, this Report has been signed below by the following persons on behalf of the Registrant and in the capacities and on the dates indicated.
| | |
| By: | | /s/ David P. Butler |
| | David P. Butler |
| | Co-Principal Executive Officer |
| | The DFA Investment Trust Company |
|
| Date: January 4, 2023 |
| |
| By: | | /s/ Gerard K. O’Reilly |
| | Gerard K. O’Reilly |
| | Co-Principal Executive Officer |
| | The DFA Investment Trust Company |
|
| Date: January 4, 2023 |
| | |
| By: | | /s/ Jan Miller |
| | Jan Miller |
| | Principal Financial Officer |
| | The DFA Investment Trust Company |
Date: January 3, 2023