UNITED STATES
SECURITIES AND EXCHANGE COMMISSION
Washington, D.C. 20549
FORM N-CSR
CERTIFIED SHAREHOLDER REPORT OF REGISTERED
MANAGEMENT INVESTMENT COMPANIES
Investment Company Act file number | 811-7440 |
|
DIMENSIONAL EMERGING MARKETS VALUE FUND INC. |
(Exact name of registrant as specified in charter) |
|
1299 Ocean Avenue, Santa Monica, CA | | 90401 |
(Address of principal executive offices) | | (Zip code) |
|
Catherine L. Newell, Esquire, Vice President and Secretary Dimensional Emerging Markets Value Fund Inc., 1299 Ocean Avenue, Santa Monica, CA 90401 |
(Name and address of agent for service) |
|
Registrant’s telephone number, including area code: | 310-395-8005 | |
|
Date of fiscal year end: | November 30 | |
|
Date of reporting period: | December 1, 2005 - May 31, 2006 | |
| | | | | | | | | |
ITEM 1. REPORTS TO STOCKHOLDERS.
DFA INVESTMENT DIMENSIONS GROUP INC.
Emerging Markets Value Portfolio
DIMENSIONAL EMERGING MARKETS
VALUE FUND INC.
Semi-Annual Report
Six Months Ended May 31, 2006
(Unaudited)
[THIS PAGE INTENTIONALLY LEFT BLANK]
SEMI-ANNUAL REPORT
(Unaudited)
Table of Contents
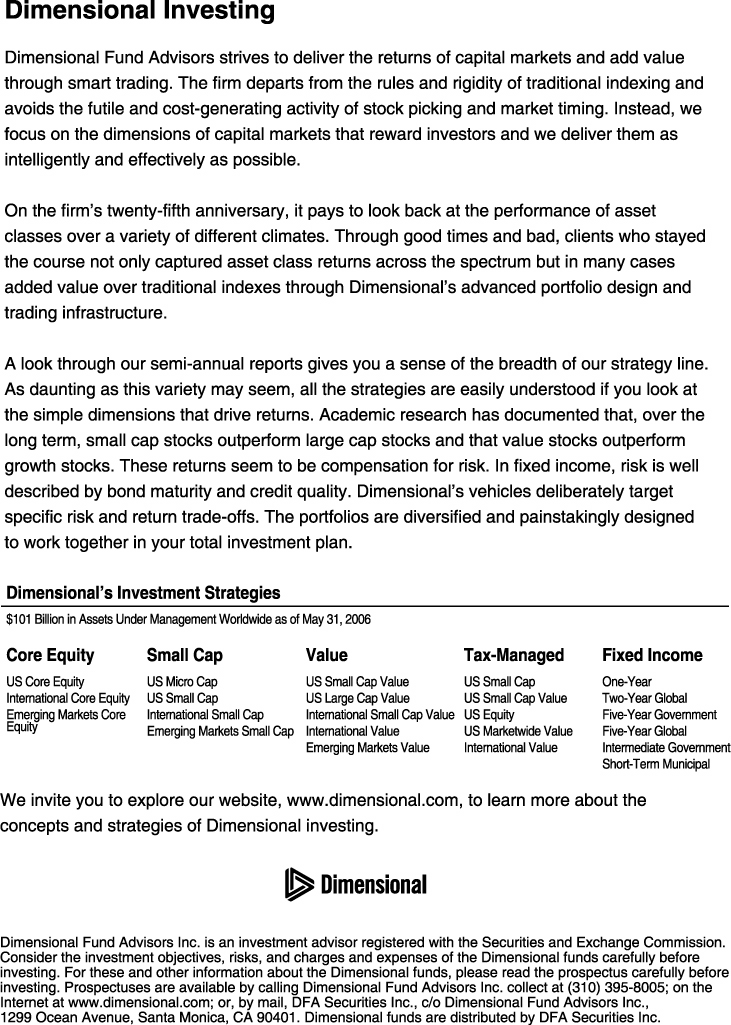
| Dimensional Investing | |
|
| | | Page | |
| DFA Investment Dimensions Group Inc. — Emerging Markets Value Portfolio | |
|
| Definitions of Abbreviations and Footnotes | | | 1 | | |
|
| Disclosure of Fund Expenses | | | 2 | | |
|
| Disclosure of Portfolio Holdings | | | 3 | | |
|
| Statement of Assets and Liabilities | | | 4 | | |
|
| Statement of Operations | | | 5 | | |
|
| Statements of Changes in Net Assets | | | 6 | | |
|
| Financial Highlights | | | 7 | | |
|
| Notes to Financial Statements | | | 8 | | |
|
| Dimensional Emerging Markets Value Fund Inc. | |
|
| Disclosure of Fund Expenses | | | 11 | | |
|
| Disclosure of Portfolio Holdings | | | 12 | | |
|
| Summary Schedule of Portfolio Holdings | | | 13 | | |
|
| Statement of Assets and Liabilities | | | 16 | | |
|
| Statement of Operations | | | 17 | | |
|
| Statements of Changes in Net Assets | | | 18 | | |
|
| Financial Highlights | | | 19 | | |
|
| Notes to Financial Statements | | | 20 | | |
|
| Voting Proxies on Fund Portfolio Securities | | | 25 | | |
|
| Board Approval of Investment Advisory Agreement | | | 26 | | |
|
This report is submitted for the information of the funds' shareholders. It is not authorized for distribution to prospective investors unless preceded or accompanied by an effective prospectus.
i
[THIS PAGE INTENTIONALLY LEFT BLANK]
DFA INVESTMENT DIMENSIONS GROUP INC.
DIMENSIONAL EMERGING MARKETS VALUE FUND INC.
DEFINITIONS OF ABBREVIATIONS AND FOOTNOTES
| Statement of Assets and Liabilities/Summary Schedules of Portfolio Holdings | |
| Investment Abbreviations | |
|
| ADR | | American Depositary Receipt | |
|
| FHLMC | | Federal Home Loan Mortgage Corporation | |
|
| Investment Footnotes | |
|
| † | | See Note B to Financial Statements. | |
|
| †† | | Securities have been fair valued. See Note B to Financial Statements | |
|
| ** | | Calculated as a percentage of total net assets. Percentages shown parenthetically next to the category headings have been calculated as a percentage of total investments. "Other Securities" are those securities that are not among the top 50 holdings of the fund or do not represent more than 1.0% of the net assets of the fund. Some of the individual securities within this category may be Non-Income Producing Securities. | |
|
| * | | Non-Income Producing Securities. | |
|
| Financial Highlights | |
| (A) | | Computed using average shares outstanding. | |
|
| (B) | | Annualized. | |
|
| (C) | | Non-Annualized. | |
|
| (D) | | Represents the combined ratios for the respective portfolio and its respective pro-rata share of its Master Fund Series. | |
|
| All Statements and Schedules | |
—
SEC | | Amounts are either zero or rounded to zero.
Securities and Exchange Commission. | |
|
1
DFA INVESTMENT DIMENSIONS GROUP INC.
EMERGING MARKETS VALUE PORTFOLIO
DISCLOSURE OF FUND EXPENSES
(Unaudited)
The following Expense Table is shown so that you can understand the impact of fees on your investment. All mutual funds have operating expenses. As a shareholder of the fund, you incur ongoing costs, which include costs for portfolio management, administrative services, and shareholder reports, among others. Operating expenses, legal and audit services, which are deducted from a fund's gross income, directly reduce the investment return of the fund. A fund's expenses are expressed as a percentage of its average net assets. This figure is known as the expense ratio. The following examples are intended to help you understand the ongoing costs, in dollars, of investing in the fund and to compare these costs with those of other mutual funds. The examples are based on an investment of $1,000 made at the beginning of the period shown and held for the entire period.
The Expense Table below illustrates your fund's costs in two ways.
Actual Fund Return
This section helps you to estimate the actual expenses after fee waivers that you paid over the period. The "Ending Account Value" shown is derived from the fund's actual return and "Expenses Paid During Period" reflect the dollar amount that would have been paid by an investor who started with $1,000 in the fund. You may use the information here, together with the amount you invested, to estimate the expenses that you paid over the period.
To do so, simply divide your account value by $1,000 (for example, a $7,500 account value divided by $1,000 = 7.5), then multiply the result by the number given for your fund under the heading "Expenses Paid During Period."
Hypothetical Example for Comparison Purposes
This section is intended to help you compare your fund's costs with those of other mutual funds. The hypothetical "Ending Account Value" and "Expenses Paid During the Period" are derived from the fund's actual expense ratio and an assumed 5% annual return before expenses. In this case, because the return used is not the fund's actual return, the results do not apply to your investment. The example is useful in making comparisons because the SEC requires all mutual funds to calculate expenses based on a 5% annual return. You can assess your fund's cost by comparing this hypothetical example with the hypothetical examples that appear in shareholder reports of other funds.
Please note that the expenses shown in the table are meant to highlight and help you compare ongoing costs only and do not reflect any transactional costs, if applicable. The "Annualized Expense Ratio" represents the actual expenses for the six-month period indicated.
Six Months Ended May 31, 2006
EXPENSE TABLE
| | | Beginning
Account
Value
12/01/05 | | Ending
Account
Value
05/31/06 | | Annualized
Expense
Ratio | | Expenses
Paid
During
Period* | |
| Actual Fund Return | | $ | 1,000.00 | | | $ | 1,170.60 | | | | 0.65 | % | | $ | 3.52 | | |
| Hypothetical 5% Annual Return | | $ | 1,000.00 | | | $ | 1,021.69 | | | | 0.65 | % | | $ | 3.28 | | |
*Expenses are equal to the fund's annualized expense ratio for the six-month period, multiplied by the average account value over the period, multiplied by the number of days in the most recent six-month period (182), then divided by the number of days in the year (365) to reflect the six-month period. The Portfolio is a Feeder Fund. The expenses shown reflect the direct expenses of the Feeder Fund and the indirect payment of the Feeder Fund's portion of the expenses of its Master Fund.
2
DFA INVESTMENT DIMENSIONS GROUP INC.
EMERGING MARKETS VALUE PORTFOLIO
DISCLOSURE OF PORTFOLIO HOLDINGS
(Unaudited)
The SEC has adopted the requirement that all funds file a complete Schedule of Investments with the SEC for their first and third fiscal quarters on Form N-Q for fiscal quarters starting after July 9, 2004. For DFA Investment Dimensions Group Inc., this would be for the fiscal quarters ending August 31 and February 28 (February 29 during leap year). The Form N-Q filing must be made within 60 days of the end of the quarter. DFA Investment Dimensions Group Inc. filed its most recent Form N-Q with the SEC on April 28, 2006. It is available upon request, without charge, by calling collect: (310) 395-8005 or by mailing a request to Dimensional Fund Advisors Inc., 1299 Ocean Avenue, Santa Monica, California 90401, or by visiting the SEC's website at http://www.sec.gov, or they may be reviewed and copied at the SEC's Public Reference Room in Washington, D.C. (call 1-800-732-0330 for information on the operation of the Public Reference Room).
PORTFOLIO HOLDINGS
The SEC adopted a requirement that all funds present their categories of portfolio holdings in a table, chart or graph format in their annual and semi-annual shareholder reports, whether or not a Schedule of Investments is utilized. The following table, which presents portfolio holdings as a percent of total investments before short-term investments and collateral for loaned securities, is provided in compliance with such requirement.
| Affiliated Investment Company | | | 100.0 | % | |
3
DFA INVESTMENT DIMENSIONS GROUP INC.
EMERGING MARKETS VALUE PORTFOLIO
STATEMENT OF ASSETS AND LIABILITIES
MAY 31, 2006
(Amounts in thousands, except share and per share amounts)
(Unaudited)
ASSETS:
Investment in Dimensional Emerging Markets Value Fund Inc. (Affiliated Investment Company)
(73,450,465 Shares, Cost $1,932,919) at Value† | | $ | 2,879,993 | | |
| Receivable for Fund Shares Sold | | | 13,077 | | |
| Prepaid Expenses and Other Assets | | | 27 | | |
| Total Assets | | | 2,893,097 | | |
| LIABILITIES: | |
| Payables: | |
| Investment Securities Purchased | | | 12,219 | | |
| Fund Shares Redeemed | | | 858 | | |
| Due to Advisor | | | 1,038 | | |
| Accrued Expenses and Other Liabilities | | | 107 | | |
| Total Liabilities | | | 14,222 | | |
| NET ASSETS | | $ | 2,878,875 | | |
SHARES OUTSTANDING, $0.01 PAR VALUE
(Authorized 200,000,000 Shares) | | | 109,736,486 | | |
| NET ASSET VALUE, OFFERING AND REDEMPTION PRICE PER SHARE | | $ | 26.23 | | |
See accompanying Notes to Financial Statements.
4
DFA INVESTMENT DIMENSIONS GROUP INC.
EMERGING MARKETS VALUE PORTFOLIO
STATEMENT OF OPERATIONS
FOR THE SIX MONTHS ENDED MAY 31, 2006
(Amounts in thousands)
(Unaudited)
| Investment Income | |
| Income Distributions Received from Affiliated Investment Company | | $ | 18,501 | | |
| Expenses | |
| Administrative Services Fees | | | 5,254 | | |
| Accounting & Transfer Agent Fees | | | 26 | | |
| Legal Fees | | | 7 | | |
| Audit Fees | | | 1 | | |
| Filing Fees | | | 44 | | |
| Shareholders' Reports | | | 29 | | |
| Directors'/Trustees' Fees & Expenses | | | 11 | | |
| Other | | | 3 | | |
| Total Expenses | | | 5,375 | | |
| Net Investment Income (Loss) | | | 13,126 | | |
| Realized and Unrealized Gain (Loss) | |
| Capital Gain Distributions Received from Affiliated Investment Company | | | 50,497 | | |
| Net Realized Gain (Loss) on Investment Securities Sold | | | (2,549 | ) | |
| Change in Unrealized Appreciation (Depreciation) of Investment Securities | | | 276,667 | | |
| Net Realized and Unrealized Gain (Loss) | | | 324,615 | | |
| Net Increase (Decrease) in Net Assets Resulting from Operations | | $ | 337,741 | | |
See accompanying Notes to Financial Statements.
5
DFA INVESTMENT DIMENSIONS GROUP INC.
EMERGING MARKETS VALUE PORTFOLIO
STATEMENTS OF CHANGES IN NET ASSETS
(Amounts in thousands)
| | | Six Months
Ended
May 31,
2006 | | Year
Ended
Nov. 30,
2005 | |
| | | (Unaudited) | | | |
| Increase (Decrease) in Net Assets | |
| Operations: | |
| Net Investment Income (Loss) | | $ | 13,126 | | | $ | 36,548 | | |
| Capital Gain Distributions Received from Affiliated Investment Company | | | 50,497 | | | | 19,856 | | |
| Net Realized Gain (Loss) on Investment Securities Sold | | | (2,549 | ) | | | (2,232 | ) | |
| Change in Unrealized Appreciation (Depreciation) of Investment Securities | | | 276,667 | | | | 344,565 | | |
| Net Increase (Decrease) in Net Assets Resulting from Operations | | | 337,741 | | | | 398,737 | | |
| Distributions From: | |
| Net Investment Income | | | (20,866 | ) | | | (31,728 | ) | |
| Net Short-Term Gains | | | (4,774 | ) | | | (1,064 | ) | |
| Net Long-Term Gains | | | (18,035 | ) | | | (3,733 | ) | |
| Total Distributions | | | (43,675 | ) | | | (36,525 | ) | |
| Capital Share Transactions (1): | |
| Shares Issued | | | 695,922 | | | | 1,008,916 | | |
| Shares Issued in Lieu of Cash Distributions | | | 33,956 | | | | 26,529 | | |
| Shares Redeemed | | | (222,549 | ) | | | (215,490 | ) | |
| Net Increase (Decrease) from Capital Share Transactions | | | 507,329 | | | | 819,955 | | |
| Total Increase (Decrease) in Net Assets | | | 801,395 | | | | 1,182,167 | | |
| Net Assets | |
| Beginning of Period | | | 2,077,480 | | | | 895,313 | | |
| End of Period | | $ | 2,878,875 | | | $ | 2,077,480 | | |
| (1) Shares Issued and Redeemed: | |
| Shares Issued | | | 25,960 | | | | 50,012 | | |
| Shares Issued in Lieu of Cash Distributions | | | 1,440 | | | | 1,352 | | |
| Shares Redeemed | | | (8,559 | ) | | | (10,411 | ) | |
| | | | 18,841 | | | | 40,953 | | |
| Accumulated Net Investment Income (Loss) | | $ | (2,928 | ) | | $ | 4,812 | | |
See accompanying Notes to Financial Statements.
6
DFA INVESTMENT DIMENSIONS GROUP INC.
EMERGING MARKETS VALUE PORTFOLIO
FINANCIAL HIGHLIGHTS
(for a share outstanding throughout each period)
| | | Six Months
Ended
May 31,
2006 | | Year
Ended
Nov. 30,
2005 | | Year
Ended
Nov. 30,
2004 | | Year
Ended
Nov. 30,
2003 | | Year
Ended
Nov. 30,
2002 | | Year
Ended
Nov. 30,
2001 | |
| | | (Unaudited) | | | | | | | | | | | |
| Net Asset Value, Beginning of Period | | $ | 22.86 | | | $ | 17.93 | | | $ | 12.53 | | | $ | 8.42 | | | $ | 8.43 | | | $ | 8.97 | | |
| Income from Investment Operations | |
| Net Investment Income (Loss) | | | 0.13 | (A) | | | 0.50 | | | | 0.21 | | | | 0.19 | | | | 0.18 | | | | 0.18 | | |
Net Gains (Losses) on Securities
(Realized and Unrealized) | | | 3.71 | | | | 4.96 | | | | 5.54 | | | | 4.13 | | | | 0.49 | | | | (0.58 | ) | |
| Total from Investment Operations | | | 3.84 | | | | 5.46 | | | | 5.75 | | | | 4.32 | | | | 0.67 | | | | (0.40 | ) | |
| Less Distributions | |
| Net Investment Income | | | (0.22 | ) | | | (0.44 | ) | | | (0.35 | ) | | | (0.14 | ) | | | (0.23 | ) | | | (0.09 | ) | |
| Net Realized Gains | | | (0.25 | ) | | | (0.09 | ) | | | — | | | | (0.07 | ) | | | (0.45 | ) | | | (0.05 | ) | |
| Total Distributions | | | (0.47 | ) | | | (0.53 | ) | | | (0.35 | ) | | | (0.21 | ) | | | (0.68 | ) | | | (0.14 | ) | |
| Net Asset Value, End of Period | | $ | 26.23 | | | $ | 22.86 | | | $ | 17.93 | | | $ | 12.53 | | | $ | 8.42 | | | $ | 8.43 | | |
| Total Return | | | 17.06 | %(C) | | | 31.06 | % | | | 46.76 | % | | | 52.59 | % | | | 8.29 | % | | | (4.60 | )% | |
Net Assets, End of Period
(thousands) | | $ | 2,878,875 | | | $ | 2,077,480 | | | $ | 895,313 | | | $ | 403,035 | | | $ | 118,516 | | | $ | 60,999 | | |
Ratio of Expenses to Average Net
Assets (D) | | | 0.65 | %(B) | | | 0.70 | % | | | 0.77 | % | | | 0.86 | % | | | 0.85 | % | | | 1.00 | % | |
Ratio of Net Investment Income to
Average Net Assets | | | 1.00 | %(B) | | | 2.45 | % | | | 1.37 | % | | | 2.41 | % | | | 2.10 | % | | | 2.34 | % | |
See accompanying Notes to Financial Statements.
7
DFA INVESTMENT DIMENSIONS GROUP INC.
EMERGING MARKETS VALUE PORTFOLIO
NOTES TO FINANCIAL STATEMENTS
(Unaudited)
A. Organization:
DFA Investment Dimensions Group Inc. (the "Group") is an open-end management investment company whose shares are offered, without a sales charge, generally to institutional investors and clients of registered investment advisors. The Group offers forty-one operational portfolios, one of which, the Emerging Markets Value Portfolio (the "Portfolio") is included in this report. The remaining forty portfolios are presented in separate reports.
The Portfolio invests all of its assets in the Dimensional Emerging Markets Value Fund Inc. (the "Fund"). At May 31, 2006, the Portfolio owned 88% of the outstanding shares of the Fund. The financial statements of the Fund are included elsewhere in this report and should be read in conjunction with the financial statements of the Portfolio.
B. Significant Accounting Policies:
The following significant accounting policies are in conformity with accounting principles generally accepted in the United States of America. Such policies are consistently followed by the Group in preparation of its financial statements. The preparation of financial statements in accordance with accounting principles generally accepted in the United States of America requires management to make estimates and assumptions that affect the reported amounts of assets and liabilities and disclosure of contingent assets and liabilities at the date of the financial statements and the reported amounts of increases and decreases in net assets from operations during the reporting period. Actual results could differ from those estimates and those differences could be material.
1. Security Valuation: The shares of the Fund held by the Portfolio are valued at its respective daily net asset value.
2. Deferred Compensation Plan: Each eligible Director of the Group may elect participation in the Deferred Compensation Plan (the "Plan"). Under the Plan, effective January 1, 2002, such Directors may defer payment of all or a portion of their total fees earned as a Director. These deferred amounts may be treated as though such amounts had been invested in shares of the following funds: U.S. Large Cap Value Portfolio, U.S. Core Equity 1 Portfolio, U.S. Core Equity 2 Portfolio, U.S. Vector Equity Portfolio, U.S. Micro Cap Portfolio, DFA International Value Portfolio, International Core Equity Portfolio, Emerging Markets Portfolio, Emerging Markets Core Equity Portfolio, and/or DFA Two-Year Global Fixed Income Portfolio. Contributions made under the Plan and the change in unrealized appreciation (depreciation) and income, are included in Directors'/Trustees' Fees and Expenses. At May 31, 2006, the total liability for deferred compensation to Directors is included in Accrued Expenses and Other Liabilities in the amount of $49 (in thousands).
Each Director has the option to receive their distribution of proceeds in one of the following methods upon one year's notice: lump sum, annual installments over a period of agreed upon years, or semi-annual installments over a period of agreed upon years. As of May 31, 2006, none of the Directors have requested distribution of proceeds.
3. Other: Security transactions are accounted for as of the trade date. Costs used in determining realized gains and losses on the sale of investment securities are on the basis of identified cost. Dividend income and distributions to shareholders are recorded on the ex-dividend date. Expenses directly attributable to the Portfolio are directly charged. Common expenses of the Group are allocated using methods approved by the Board of Directors/Trustees, generally based on average net assets.
8
C. Investment Advisor:
Dimensional Fund Advisors Inc. ("Dimensional" or the "Advisor") provides administrative services to the Portfolio, including supervision of services provided by others, providing information to the shareholders and the Board of Directors/Trustees, and other administrative services. The Advisor provides investment advisory services to the Fund. For the six months ended May 31, 2006, the Portfolio's administrative services fees were accrued daily and paid monthly to the Advisor based on an effective annual rate of 0.40% of average daily net assets.
Fees Paid to Officers and Directors/Trustees:
Certain Officers and Directors/Trustees of the Advisor are also Officers and Directors/Trustees of the Group; however, such Officers and Directors/Trustees (with the exception of the Chief Compliance Officer ("CCO")) receive no compensation from the Group. For the six months ended May 31, 2006, the total related amounts paid by the Group under this arrangement were $62 (in thousands). The total related amount paid by the Portfolio is included in Other Expenses on the Statement of Operations.
D. Federal Income Taxes:
The Portfolio has qualified and intends to continue to qualify as a regulated investment company under Subchapter M of the Internal Revenue Code for federal income tax purposes and to distribute substantially all of its taxable income and net capital gains to shareholders. Accordingly, no provision has been made for federal income taxes.
The tax character of dividends and distributions declared and paid during the years ended November 30, 2005 and November 30, 2004 were as follows (amounts in thousands):
| | | Net Investment
Income and
Short-Term
Capital Gains | | Long-Term
Capital Gains | | Total | |
| | 2005 | | | $ | 32,792 | | | $ | 3,733 | | | $ | 36,525 | | |
| | 2004 | | | | 12,625 | | | | 803 | | | | 13,428 | | |
At November 30, 2005, the components of distributable earnings/(accumulated losses) were as follows (amounts in thousands):
Undistributed
Net Investment
Income and
Short-Term
Capital Gains | | Undistributed
Long-Term
Capital Gains | | Total Net
Distributable
Earnings/
(Accumulated
Losses) | |
| $ | 5,093 | | | $ | 17,974 | | | $ | 23,067 | | |
For federal income tax purposes, the Portfolio measures its capital loss carryforwards annually at November 30, its fiscal year end. Capital loss carryforwards may be carried forward and applied against future capital gains. As of November 30, 2005, the Portfolio had no capital loss carryforwards available to offset future realized capital gains.
At May 31, 2006, the total cost and aggregate gross unrealized appreciation and (depreciation) of securities for federal income tax purposes were different from amounts reported for financial reporting purposes (amounts in thousands):
Federal
Tax Cost | | Unrealized
Appreciation | | Unrealized
(Depreciation) | | Net
Unrealized
Appreciation
(Depreciation) | |
| $ | 1,950,985 | | | $ | 947,074 | | | $ | (18,066 | ) | | $ | 929,008 | | |
9
E. Components of Net Assets
At May 31, 2006, net assets consisted of (amounts in thousands):
Paid-In
Capital | | Accumulated
Net
Investment
Income (Loss) | | Accumulated
Net Realized
Gain (Loss)
of Investment
Securities | | Unrealized
Appreciation
(Depreciation)
of Investment
Securities | | Total
Net Assets | |
| $ | 1,906,188 | | | $ | (2,928 | ) | | $ | 28,541 | | | $ | 947,074 | | | $ | 2,878,875 | | |
F. Line of Credit:
The Portfolio, together with other Dimensional-advised portfolios, has entered into a $50 million unsecured discretionary line of credit effective June 2005 with an affiliate of its domestic custodian bank. Each portfolio is permitted to borrow, subject to its investment limitations, up to a maximum of $50 million, as long as total borrowings under the line of credit do not exceed $50 million in the aggregate. Borrowings under the line of credit are charged interest at the then current Federal Funds Rate plus 1%. Each portfolio is individually, and not jointly, liable for its particular advances under the line of credit. There is no commitment fee on the unused portion of the line of credit. The agreement for the discretionary line of credit may be terminated by either party at any time. There were no borrowings by the Portfolio under the line of credit with the domestic custodian bank during the six months ended May 31, 2006. The line of cr edit was scheduled to expire on June 27, 2006. Effective June 28, 2006, the line of credit was extended and increased to $250 million in the aggregate. The line of credit is scheduled to expire on June 27, 2007.
The Portfolio, together with other Dimensional-advised portfolios, has also entered into an additional $500 million unsecured line of credit effective January 23, 2006 with its international custodian bank. Each portfolio is permitted to borrow, subject to its investment limitations, up to a maximum of $500 million, as long as total borrowings under the line of credit do not exceed $500 million in the aggregate. Each portfolio is individually, and not jointly, liable for its particular advances under the line of credit. Borrowings under the line of credit are charged interest at rates agreed to by the parties at the time of borrowing. There is no commitment fee on the unused portion of the line of credit. The agreement for the line of credit expires on January 22, 2007. There were no borrowings by the Portfolio under the line credit with the international custodian bank during the six months ended May 31, 2006.
G. Contractual Obligations:
In the normal course of business, the Group enters into contracts that contain a variety of representations and warranties which provide general indemnification. The Group's maximum exposure under these arrangements is unknown as this would involve future claims that may be made against the Group and/or its affiliates that have not yet occurred. However, based on experience, the Group expects the risk of loss to be remote.
H. Other:
On May 31, 2006, one shareholder held approximately 24% of the outstanding shares of the Portfolio. The shareholder may be an omnibus account, which typically holds shares for the benefit of several other underlying investors.
10
DIMENSIONAL EMERGING MARKETS VALUE FUND INC.
DISCLOSURE OF FUND EXPENSES
(Unaudited)
The following Expense Table is shown so that you can understand the impact of fees on your investment. All mutual funds have operating expenses. As a shareholder of the fund, you incur ongoing costs, which include costs for portfolio management, administrative services, and shareholder reports, among others. Operating expenses, legal and audit services, which are deducted from a fund's gross income, directly reduce the investment return of the fund. A fund's expenses are expressed as a percentage of its average net assets. This figure is known as the expense ratio. The following examples are intended to help you understand the ongoing costs, in dollars, of investing in the fund and to compare these costs with those of other mutual funds. The examples are based on an investment of $1,000 made at the beginning of the period shown and held for the entire period.
The Expense Table below illustrates your fund's costs in two ways.
Actual Fund Return
This section helps you to estimate the actual expenses after fee waivers that you paid over the period. The "Ending Account Value" shown is derived from the fund's actual return and "Expenses Paid During Period" reflect the dollar amount that would have been paid by an investor who started with $1,000 in the fund. You may use the information here, together with the amount you invested, to estimate the expenses that you paid over the period.
To do so, simply divide your account value by $1,000 (for example, a $7,500 account value divided by $1,000 = 7.5), then multiply the result by the number given for your fund under the heading "Expenses Paid During Period."
Hypothetical Example for Comparison Purposes
This section is intended to help you compare your fund's costs with those of other mutual funds. The hypothetical "Ending Account Value" and "Expenses Paid During the Period" are derived from the fund's actual expense ratio and an assumed 5% annual return before expenses. In this case, because the return used is not the fund's actual return, the results do not apply to your investment. The example is useful in making comparisons because the SEC requires all mutual funds to calculate expenses based on a 5% annual return. You can assess your fund's cost by comparing this hypothetical example with the hypothetical examples that appear in shareholder reports of other funds.
Please note that the expenses shown in the table are meant to highlight and help you compare ongoing costs only and do not reflect any transactional costs, if applicable. The "Annualized Expense Ratio" represents the actual expenses for the six-month period indicated.
Six Months Ended May 31, 2006
EXPENSE TABLE
| | | Beginning
Account
Value
12/01/05 | | Ending
Account
Value
05/31/06 | | Expenses
Annualized
Expense
Ratio | | Expenses
Paid
During
Period* | |
| Actual Fund Return | | $ | 1,000.00 | | | $ | 1,173.40 | | | | 0.23 | % | | $ | 1.25 | | |
| Hypothetical 5% Annual Return | | $ | 1,000.00 | | | $ | 1,023.78 | | | | 0.23 | % | | $ | 1.16 | | |
*Expenses are equal to the fund's annualized expense ratio for the six-month period, multiplied by the average account value over the period, multiplied by the number of days in the most recent six-month period (182), then divided by the number of days in the year (365) to reflect the six-month period.
11
DIMENSIONAL EMERGING MARKETS VALUE FUND INC.
DISCLOSURE OF PORTFOLIO HOLDINGS
(Unaudited)
The SEC has adopted the requirement that all funds file a complete Schedule of Investments with the SEC for their first and third fiscal quarters on Form N-Q for fiscal quarters starting after July 9, 2004. For Dimensional Emerging Markets Value Fund Inc., this would be for the fiscal quarters ending August 31 and February 28 (February 29 during leap year). The Form N-Q filing must be made within 60 days of the end of the quarter. Dimensional Emerging Markets Value Fund Inc. filed its most recent Form N-Q with the SEC on April 28, 2006. It is available upon request without charge, by calling collect: (310) 395-8005 or by mailing a request to Dimensional Fund Advisors Inc., 1299 Ocean Avenue, Santa Monica, California 90401, or by visiting the SEC's website at http://www.sec.gov, or they may be reviewed and copied at the SEC's Public Reference Room in Washington, D.C. (call 1-800-732-0330 for information on the operation of the Public Referenc e Room).
The SEC has also amended certain regulations to permit a fund to include in its reports to shareholders a "Summary Schedule of Portfolio Holdings" in lieu of a full Schedule of Investments. The Summary Schedule of Portfolio Holdings reports the fund's 50 largest holdings in unaffiliated issuers and any investments that exceed one percent of the fund's net assets at the end of the reporting period. The amendments also require that the Summary Schedule of Portfolio Holdings identify each category of investments that are held.
The fund is required to file a complete Schedule of Investments with the SEC on Form N-CSR within ten days after mailing the annual and semi-annual reports to shareholders. It will be available, upon request, without charge, by calling collect: (310) 395-8005 or by mailing a request to Dimensional Fund Advisors Inc., 1299 Ocean Avenue, Santa Monica, California 90401, or by visiting the SEC's website at http://www.sec.gov, or they may be reviewed and copied at the SEC's Public Reference Room in Washington, D.C. (call 1-800-732-0330 for information on the operation of the Public Reference Room).
PORTFOLIO HOLDINGS
The SEC adopted a requirement that all funds present their categories of portfolio holdings in a table, chart or graph format in their annual and semi-annual shareholder reports, whether or not a Schedule of Investments is utilized. The following table, which presents portfolio holdings as a percent of total investments before short-term investments and collateral for loaned securities, is provided in compliance with such requirement. The categories shown below represent broad industry sectors. Each industry sector consists of one or more specific industry classifications.
Consumer
Discretionary | | Consumer
Staples | | Energy | | Financials | | Health
Care | | Industrials | | Information
Technology | | Materials | | Telecommunication
Services | | Utilities | | Other | | Total | |
| | 9.3 | % | | | 6.1 | % | | | 10.2 | % | | | 21.1 | % | | | 1.4 | % | | | 14.9 | % | | | 5.5 | % | | | 22.3 | % | | | 3.8 | % | | | 4.2 | % | | | 1.2 | % | | | 100.0 | % | |
12
DIMENSIONAL EMERGING MARKETS VALUE FUND INC.
SUMMARY SCHEDULE OF PORTFOLIO HOLDINGS
May 31, 2006
(Unaudited)
| | | Shares | | Value†† | | Percentage
of Net Assets** | |
| ARGENTINA — (0.4%) | |
| COMMON STOCKS — (0.4%) | |
| Other Securities | | | | | | $ | 13,698,450 | | | | 0.4 | % | |
| BRAZIL — (7.3%) | |
| COMMON STOCKS — (1.7%) | |
| Arcelor Brasil SA | | | 1,751,487 | | | | 25,600,113 | | | | 0.8 | % | |
| Companhia Siderurgica Nacional SA | | | 931,400 | | | | 27,629,855 | | | | 0.8 | % | |
| Other Securities | | | | | | | 3,398,203 | | | | 0.1 | % | |
| TOTAL COMMON STOCKS | | | | | | | 56,628,171 | | | | 1.7 | % | |
| PREFERRED STOCKS — (5.6%) | |
| Gerdau SA | | | 1,222,542 | | | | 17,308,551 | | | | 0.5 | % | |
| Investimentos Itau SA | | | 5,388,166 | | | | 20,480,856 | | | | 0.6 | % | |
| Metalurgica Gerdau SA | | | 959,400 | | | | 16,429,077 | | | | 0.5 | % | |
| Usinas Siderurgicas de Minas Gerais SA Series A | | | 826,925 | | | | 26,733,368 | | | | 0.8 | % | |
| Other Securities | | | | | | | 101,156,371 | | | | 3.2 | % | |
| TOTAL PREFERRED STOCKS | | | | | | | 182,108,223 | | | | 5.6 | % | |
| TOTAL — BRAZIL | | | | | | | 238,736,394 | | | | 7.3 | % | |
| CHILE — (3.1%) | |
| COMMON STOCKS — (3.1%) | |
| Enersis SA ADR | | | 2,033,600 | | | | 23,711,776 | | | | 0.7 | % | |
| Other Securities | | | | | | | 75,853,728 | | | | 2.3 | % | |
| TOTAL — CHILE | | | | | | | 99,565,504 | | | | 3.0 | % | |
| CZECH REPUBLIC — (3.3%) | |
| COMMON STOCKS — (3.3%) | |
| * Cesky Telecom A.S. | | | 937,593 | | | | 19,466,396 | | | | 0.6 | % | |
| CEZ A.S. | | | 2,744,208 | | | | 86,787,776 | | | | 2.6 | % | |
| TOTAL — CZECH REPUBLIC | | | | | | | 106,254,172 | | | | 3.2 | % | |
| HUNGARY — (3.8%) | |
| COMMON STOCKS — (3.8%) | |
| Egis Nyrt. | | | 115,885 | | | | 15,526,739 | | | | 0.5 | % | |
| MOL Magyar Olaj- es Gazipari RT | | | 815,045 | | | | 83,480,476 | | | | 2.6 | % | |
| Other Securities | | | | | | | 25,837,373 | | | | 0.7 | % | |
| TOTAL — HUNGARY | | | | | | | 124,844,588 | | | | 3.8 | % | |
| INDIA — (12.7%) | |
| COMMON STOCKS — (12.7%) | |
| * Reliance Communication Ventures, Ltd. | | | 6,786,159 | | | | 39,232,367 | | | | 1.2 | % | |
| * Reliance Industries, Ltd. | | | 6,786,159 | | | | 139,698,377 | | | | 4.3 | % | |
| Sterlite Industries (India), Ltd. Series A | | | 1,319,280 | | | | 12,255,160 | | | | 0.4 | % | |
| Tata Steel, Ltd. | | | 1,899,526 | | | | 21,194,259 | | | | 0.7 | % | |
| Other Securities | | | | | | | 202,593,748 | | | | 6.1 | % | |
| TOTAL COMMON STOCKS | | | | | | | 414,973,911 | | | | 12.7 | % | |
| PREFERRED STOCKS — (0.0%) | |
| Other Securities | | | | | | | 80,293 | | | | 0.0 | % | |
| TOTAL — INDIA | | | | | | | 415,054,204 | | | | 12.7 | % | |
13
DIMENSIONAL EMERGING MARKETS VALUE FUND INC.
CONTINUED
| | | Shares | | Value†† | | Percentage
of Net Assets** | |
| INDONESIA — (3.1%) | |
| COMMON STOCKS — (3.1%) | |
| PT International Nickel Indonesia Tbk | | | 7,522,000 | | | $ | 16,101,700 | | | | 0.5 | % | |
| PT Medco Energi International Tbk | | | 31,249,000 | | | | 13,479,520 | | | | 0.4 | % | |
| PT Semen Gresik Tbk | | | 8,421,591 | | | | 20,177,081 | | | | 0.6 | % | |
| Other Securities | | | | | | | 49,908,743 | | | | 1.5 | % | |
| TOTAL — INDONESIA | | | | | | | 99,667,044 | | | | 3.0 | % | |
| ISRAEL — (4.4%) | |
| COMMON STOCKS — (4.4%) | |
| Bank Hapoalim B.M. | | | 8,089,710 | | | | 37,615,522 | | | | 1.2 | % | |
| Bank Leumi Le-Israel | | | 8,352,608 | | | | 31,334,021 | | | | 1.0 | % | |
| Other Securities | | | | | | | 74,855,737 | | | | 2.2 | % | |
| TOTAL — ISRAEL | | | | | | | 143,805,280 | | | | 4.4 | % | |
| MALAYSIA — (6.1%) | |
| COMMON STOCKS — (6.1%) | |
| Other Securities | | | | | | | 199,000,291 | | | | 6.1 | % | |
| PREFERRED STOCKS — (0.0%) | |
| Other Securities | | | | | | | 79,855 | | | | 0.0 | % | |
| RIGHTS/WARRANTS — (0.0%) | |
| Other Securities | | | | | | | 15,352 | | | | 0.0 | % | |
| TOTAL — MALAYSIA | | | | | | | 199,095,498 | | | | 6.1 | % | |
| MEXICO — (7.0%) | |
| COMMON STOCKS — (7.0%) | |
| Alfa S.A. de C.V. Series A | | | 5,405,364 | | | | 24,779,946 | | | | 0.8 | % | |
| Controladora Comercial Mexicana S.A. de C.V. Series B | | | 7,880,200 | | | | 12,331,266 | | | | 0.4 | % | |
| Grupo Carso S.A. de C.V. Series A-1 | | | 13,173,051 | | | | 27,639,832 | | | | 0.8 | % | |
| Nueva Grupo Mexico S.A. de C.V. Series B | | | 21,343,635 | | | | 60,589,354 | | | | 1.8 | % | |
| Organizacion Soriana S.A. de C.V. Series B | | | 5,249,700 | | | | 22,677,889 | | | | 0.7 | % | |
| Other Securities | | | | | | | 80,968,924 | | | | 2.5 | % | |
| TOTAL — MEXICO | | | | | | | 228,987,211 | | | | 7.0 | % | |
| PHILIPPINES — (1.3%) | |
| COMMON STOCKS — (1.3%) | |
| Other Securities | | | | | | | 43,374,321 | | | | 1.3 | % | |
| POLAND — (3.6%) | |
| COMMON STOCKS — (3.6%) | |
| Polski Koncern Naftowy Orlen SA | | | 3,223,851 | | | | 56,663,474 | | | | 1.7 | % | |
| Other Securities | | | | | | | 59,638,419 | | | | 1.8 | % | |
| TOTAL — POLAND | | | | | | | 116,301,893 | | | | 3.5 | % | |
| SOUTH AFRICA — (11.4%) | |
| COMMON STOCKS — (11.4%) | |
| ABSA Group, Ltd. | | | 898,244 | | | | 14,827,803 | | | | 0.5 | % | |
| Barloworld, Ltd. | | | 1,101,191 | | | | 18,688,652 | | | | 0.6 | % | |
| * Harmony Gold Mining Co., Ltd. | | | 1,528,002 | | | | 21,712,855 | | | | 0.7 | % | |
| Liberty Group, Ltd. | | | 1,494,978 | | | | 17,125,522 | | | | 0.5 | % | |
| Mittal Steel South Africa, Ltd. | | | 2,388,294 | | | | 22,335,659 | | | | 0.7 | % | |
| Nedbank Group, Ltd. | | | 2,021,460 | | | | 34,587,131 | | | | 1.1 | % | |
| Old Mutual PLC | | | 10,274,412 | | | | 31,941,146 | | | | 1.0 | % | |
| Sanlam, Ltd. | | | 10,756,714 | | | | 24,473,035 | | | | 0.8 | % | |
14
DIMENSIONAL EMERGING MARKETS VALUE FUND INC.
CONTINUED
| | | Shares | | Value†† | | Percentage
of Net Assets** | |
| Sappi, Ltd. | | | 1,124,613 | | | $ | 13,963,400 | | | | 0.4 | % | |
| Steinhoff International Holdings, Ltd. | | | 4,600,555 | | | | 14,672,577 | | | | 0.5 | % | |
| Telkom South Africa, Ltd. | | | 770,894 | | | | 16,392,966 | | | | 0.5 | % | |
| Other Securities | | | | | | | 142,400,415 | | | | 4.1 | % | |
| TOTAL — SOUTH AFRICA | | | | | | | 373,121,161 | | | | 11.4 | % | |
| SOUTH KOREA — (12.4%) | |
| COMMON STOCKS — (12.4%) | |
| Doosan Heavy Industries & Construction Co., Ltd. | | | 400,500 | | | | 12,321,974 | | | | 0.4 | % | |
| Hyundai Heavy Industries Co., Ltd. | | | 189,160 | | | | 19,233,901 | | | | 0.6 | % | |
| Hyundai Motor Co., Ltd. | | | 446,030 | | | | 34,460,404 | | | | 1.1 | % | |
| Kia Motors Corp. | | | 899,680 | | | | 15,321,959 | | | | 0.5 | % | |
| POSCO Sponsored ADR | | | 714,500 | | | | 45,942,350 | | | | 1.4 | % | |
| Other Securities | | | | | | | 275,892,654 | | | | 8.3 | % | |
| TOTAL COMMON STOCKS | | | | | | | 403,173,242 | | | | 12.3 | % | |
| RIGHTS/WARRANTS — (0.0%) | |
| Other Securities | | | | | | | 378,481 | | | | 0.0 | % | |
| TOTAL — SOUTH KOREA | | | | | | | 403,551,723 | | | | 12.3 | % | |
| TAIWAN — (13.0%) | |
| COMMON STOCKS — (13.0%) | |
| Chang Hwa Commercial Bank | | | 19,928,459 | | | | 12,973,308 | | | | 0.4 | % | |
| * China Development Financial Holding Corp. | | | 40,619,000 | | | | 15,216,097 | | | | 0.5 | % | |
| Far East Textile, Ltd. | | | 16,291,942 | | | | 12,524,955 | | | | 0.4 | % | |
| Mega Financial Holding Co., Ltd. | | | 18,530,000 | | | | 13,208,006 | | | | 0.4 | % | |
| United Microelectronics Corp. | | | 32,824,183 | | | | 20,521,780 | | | | 0.6 | % | |
| Other Securities | | | | | | | 351,081,627 | | | | 10.7 | % | |
| TOTAL — TAIWAN | | | | | | | 425,525,773 | | | | 13.0 | % | |
| THAILAND — (3.0%) | |
| COMMON STOCKS — (3.0%) | |
| Other Securities | | | | | | | 99,370,580 | | | | 3.0 | % | |
| RIGHTS/WARRANTS — (0.0%) | |
| Other Securities | | | | | | | 48,865 | | | | 0.0 | % | |
| TOTAL — THAILAND | | | | | | | 99,419,445 | | | | 3.0 | % | |
| TURKEY — (4.0%) | |
| COMMON STOCKS — (4.0%) | |
| Akbank T.A.S. | | | 3,293,434 | | | | 19,598,477 | | | | 0.6 | % | |
| Turkiye Garanti Bankasi A.S. | | | 4,833,512 | | | | 14,571,061 | | | | 0.5 | % | |
| Turkiye Is Bankasi A.S. | | | 2,232,528 | | | | 13,188,476 | | | | 0.4 | % | |
| Other Securities | | | | | | | 84,505,412 | | | | 2.5 | % | |
| TOTAL — TURKEY | | | | | | | 131,863,426 | | | | 4.0 | % | |
| | | Face
Amount | | Value† | | | |
| | | (000) | | | | | |
| TEMPORARY CASH INVESTMENTS — (0.1%) | |
Repurchase Agreement, PNC Capital Markets, Inc. 4.87%,
06/01/06 (Collateralized by $2,991,000 FHLMC Notes 4.00%,
09/22/09, valued at $3,394,785) to be repurchased at $3,344,452 | | $ | 3,344 | | | | 3,344,000 | | | | 0.1 | % | |
TOTAL INVESTMENTS — (100.0%)
(Cost $2,189,187,959) | | | | | | | $3,266,210,087 | | | | 99.5% | | |
| | | | | | | | | | | | | | |
See accompanying Notes to Financial Statements.
15
DIMENSIONAL EMERGING MARKETS VALUE FUND INC.
STATEMENT OF ASSETS AND LIABILITIES
MAY 31, 2006
(Amounts in thousands, except share and per share amounts)
(Unaudited)
| ASSETS: | |
| Investments at Value | | $ | 3,262,866 | | |
| Temporary Cash Investments at Value | | | 3,344 | | |
| Foreign Currencies at Value | | | 2,209 | | |
| Cash | | | 4 | | |
| Receivables: | |
| Investment Securities Sold | | | 54 | | |
| Dividends and Interest | | | 7,484 | | |
| Fund Shares Sold | | | 12,228 | | |
| Prepaid Expenses and Other Assets | | | 10 | | |
| Total Assets | | | 3,288,199 | | |
| LIABILITIES: | |
| Payables: | |
| Investment Securities Purchased | | | 3 | | |
| Due to Advisor | | | 296 | | |
| Deferred Thailand Capital Gains Tax | | | 5,395 | | |
| Deferred Chilean Repatriation Tax | | | 268 | | |
| Accrued Expenses and Other Liabilities | | | 462 | | |
| Total Liabilities | | | 6,424 | | |
| NET ASSETS | | $ | 3,281,775 | | |
SHARES OUTSTANDING, $0.01 PAR VALUE
(Unlimited Number of Shares Authorized) | | | 83,695,302 | | |
| NET ASSET VALUE, OFFERING AND REDEMPTION PRICE PER SHARE | | $ | 39.21 | | |
| Investments at Cost | | $ | 2,185,844 | | |
| Temporary Cash Investments at Cost | | $ | 3,344 | | |
| Foreign Currencies at Cost | | $ | 2,225 | | |
See accompanying Notes to Financial Statements.
16
DIMENSIONAL EMERGING MARKETS VALUE FUND INC.
STATEMENT OF OPERATIONS
FOR THE SIX MONTHS ENDED MAY 31, 2006
(Amounts in thousands)
(Unaudited)
| Investment Income | |
| Dividends (Net of Foreign Taxes Withheld of $3,819) | | $ | 44,487 | | |
| Interest | | | 909 | | |
| Total Investment Income | | | 45,396 | | |
| Expenses | |
| Investment Advisory Services Fees | | | 1,515 | | |
| Accounting & Transfer Agent Fees | | | 163 | | |
| Custodian Fees | | | 1,730 | | |
| Legal Fees | | | 12 | | |
| Audit Fees | | | 18 | | |
| Shareholders' Reports | | | 44 | | |
| Directors'/Trustees' Fees & Expenses | | | 12 | | |
| Other | | | 55 | | |
| Total Expenses | | | 3,549 | | |
| Net Investment Income (Loss) | | | 41,847 | | |
| Realized and Unrealized Gain (Loss) | |
| Net Realized Gain (Loss) on Investment Securities Sold | | | 97,230 | | |
| Net Realized Gain (Loss) on Foreign Currency Transactions | | | (978 | ) | |
| Change in Unrealized Appreciation (Depreciation) of: | |
| Investment Securities and Foreign Currency | | | 265,831 | | |
| Translation of Foreign Currency Denominated Amounts | | | (149 | ) | |
| Deferred Thailand Capital Gains Tax | | | (1,276 | ) | |
| Net Realized and Unrealized Gain (Loss) | | | 360,658 | | |
| Net Increase (Decrease) in Net Assets Resulting from Operations | | $ | 402,505 | | |
See accompanying Notes to Financial Statements.
17
DIMENSIONAL EMERGING MARKETS VALUE FUND INC.
STATEMENTS OF CHANGES IN NET ASSETS
(Amounts in thousands)
| | | Six Months
Ended
May 31,
2006 | | Year
Ended
Nov. 30,
2005 | |
| | | (Unaudited) | | | |
| Increase (Decrease) in Net Assets | |
| Operations: | |
| Net Investment Income (Loss) | | $ | 41,847 | | | $ | 58,055 | | |
| Net Realized Gain (Loss) on Investment Securities Sold | | | 97,230 | | | | 59,058 | | |
| Net Realized Gain (Loss) on Foreign Currency Transactions | | | (978 | ) | | | (3,127 | ) | |
| Change in Unrealized Appreciation (Depreciation) of: | |
| Investment Securities and Foreign Currency | | | 265,831 | | | | 375,233 | | |
| Translation of Foreign Currency Denominated Amounts | | | (149 | ) | | | 5 | | |
| Deferred Thailand Capital Gains Tax | | | (1,276 | ) | | | 249 | | |
| Net Increase (Decrease) in Net Assets Resulting from Operations | | | 402,505 | | | | 489,473 | | |
| Distributions From: | |
| Net Investment Income | | | (21,466 | ) | | | (51,518 | ) | |
| Net Short-Term Gains | | | (5,458 | ) | | | (1,386 | ) | |
| Net Long-Term Gains | | | (53,392 | ) | | | (24,479 | ) | |
| Total Distributions | | | (80,316 | ) | | | (77,383 | ) | |
| Capital Share Transactions (1): | |
| Shares Issued | | | 543,322 | | | | 847,065 | | |
| Shares Issued in Lieu of Cash Distributions | | | 70,680 | | | | 67,397 | | |
| Shares Redeemed | | | (71,480 | ) | | | (82,438 | ) | |
| Net Increase (Decrease) from Capital Share Transactions | | | 542,522 | | | | 832,024 | | |
| Total Increase (Decrease) in Net Assets | | | 864,711 | | | | 1,244,114 | | |
| Net Assets | |
| Beginning of Period | | | 2,417,064 | | | | 1,172,950 | | |
| End of Period | | $ | 3,281,775 | | | $ | 2,417,064 | | |
| (1) Shares Issued and Redeemed: | |
| Shares Issued | | | 13,504 | | | | 27,817 | | |
| Shares Issued in Lieu of Cash Distributions | | | 2,013 | | | | 2,289 | | |
| Shares Redeemed | | | (1,882 | ) | | | (2,587 | ) | |
| | | | 13,635 | | | | 27,519 | | |
| Accumulated Net Investment Income (Loss) | | $ | 25,706 | | | $ | 5,573 | | |
See accompanying Notes to Financial Statements.
18
DIMENSIONAL EMERGING MARKETS VALUE FUND INC.
FINANCIAL HIGHLIGHTS
(for a share outstanding throughout each period)
| | | Six Months
Ended
May 31,
2006 | | Year
Ended
Nov. 30,
2005 | | Year
Ended
Nov. 30,
2004 | | Year
Ended
Nov. 30,
2003 | | Year
Ended
Nov. 30,
2002 | | Year
Ended
Nov. 30,
2001 | |
| | | (Unaudited) | | | | | | | | | | | |
| Net Asset Value, Beginning of Period | | $ | 34.50 | | | $ | 27.57 | | | $ | 19.25 | | | $ | 12.81 | | | $ | 12.28 | | | $ | 14.14 | | |
| Income from Investment Operations | |
| Net Investment Income (Loss) | | | 0.55 | (A) | | | 0.99 | (A) | | | 0.52 | | | | 0.33 | | | | 0.23 | | | | 0.38 | | |
Net Gains (Losses) on Securities
(Realized and Unrealized) | | | 5.30 | | | | 7.42 | | | | 8.42 | | | | 6.45 | | | | 0.83 | | | | (0.92 | ) | |
| Total from Investment Operations | | | 5.85 | | | | 8.41 | | | | 8.94 | | | | 6.78 | | | | 1.06 | | | | (0.54 | ) | |
| Less Distributions | |
| Net Investment Income | | | (0.30 | ) | | | (0.88 | ) | | | (0.41 | ) | | | (0.34 | ) | | | (0.32 | ) | | | (0.33 | ) | |
| Net Realized Gains | | | (0.84 | ) | | | (0.60 | ) | | | (0.21 | ) | | | — | | | | (0.21 | ) | | | (0.99 | ) | |
| Total Distributions | | | (1.14 | ) | | | (1.48 | ) | | | (0.62 | ) | | | (0.34 | ) | | | (0.53 | ) | | | (1.32 | ) | |
| Net Asset Value, End of Period | | $ | 39.21 | | | $ | 34.50 | | | $ | 27.57 | | | $ | 19.25 | | | $ | 12.81 | | | $ | 12.28 | | |
| Total Investment Return | | | 17.34 | %(C) | | | 31.60 | % | | | 47.38 | % | | | 53.30 | % | | | 8.79 | % | | | (4.34 | )% | |
| Net Assets, End of Period (thousands) | | $ | 3,281,775 | | | $ | 2,417,064 | | | $ | 1,172,950 | | | $ | 617,723 | | | $ | 345,597 | | | $ | 279,096 | | |
| Ratio of Expenses to Average Net Assets | | | 0.23 | %(B) | | | 0.29 | % | | | 0.34 | % | | | 0.42 | % | | | 0.40 | % | | | 0.52 | % | |
| Ratio of Net Investment Income to Average Net Assets | | | 2.77 | %(B) | | | 3.23 | % | | | 2.33 | % | | | 2.39 | % | | | 1.67 | % | | | 3.16 | % | |
| Portfolio Turnover Rate | | | 5 | %(C) | | | 7 | % | | | 8 | % | | | 10 | % | | | 15 | % | | | 19 | % | |
See accompanying Notes to Financial Statements.
19
DIMENSIONAL EMERGING MARKETS VALUE FUND INC.
NOTES TO FINANCIAL STATEMENTS
(Unaudited)
A. Organization:
Dimensional Emerging Markets Value Fund Inc. (the "Fund") was organized as a closed-end management investment company registered under the Investment Company Act of 1940, as amended. Effective November 21, 1997, the Fund was reorganized as an open-end management investment company.
B. Significant Accounting Policies:
The following significant accounting policies are in conformity with accounting principles generally accepted in the United States of America. Such policies are consistently followed by the Fund in preparation of its financial statements. The preparation of financial statements in accordance with accounting principles generally accepted in the United States of America requires management to make estimates and assumptions that affect the reported amounts of assets and liabilities and disclosure of contingent assets and liabilities at the date of the financial statements and the reported amounts of increases and decreases in net assets from operations during the reporting period. Actual results could differ from those estimates and those differences could be material.
1. Security Valuation: Securities held by the Fund (including over-the-counter securities) are valued at the last quoted sale price of the day. Securities held by the Fund that are listed on NASDAQ are valued at the NASDAQ Official Closing Price ("NOCP"). If there is no last reported sale price or NOCP for the day, the Fund values the securities at the mean of the most recent quoted bid and asked prices. Price information on listed securities is taken from the exchange where the security is primarily traded.
Securities for which no market quotations are readily available (including restricted securities), or for which market quotations have become unreliable, are valued in good faith at fair value in accordance with procedures adopted by the Board of Directors/Trustees. Fair value pricing may also be used if events that have a significant effect on the value of an investment (as determined in the discretion of the Investment Committee of the Advisor) occur before the net asset value is calculated. When fair value pricing is used, the prices of securities used by the Fund may differ from the quoted or published prices for the same securities on their primary markets or exchanges.
The Fund will also fair value price in the circumstances described below. Generally, trading in foreign securities markets is completed each day at various times prior to the close of the New York Stock Exchange (NYSE). For example, trading in the Japanese securities markets is completed each day at the close of Tokyo Stock Exchange (normally 11:00 p.m. PT), which is fourteen hours prior to the close of the NYSE (normally 1:00 p.m. PT) and the time that the net asset value of the Fund is computed. Due to the time differences between the closings of the relevant foreign securities exchanges and the time the Fund prices its shares at the close of the NYSE, the Fund will fair value its foreign investments when it is determined that the market quotations for the foreign investments are either unreliable or not readily available. The fair value prices will attempt to reflect the impact of the U.S. financial markets' perceptions and trading activi ties on the Fund's foreign investments since the last closing prices of the foreign investments were calculated on their primary foreign securities markets or exchanges. For these purposes, the Board of Directors/Trustees of the Fund has determined that movements in relevant indices or other appropriate market indicators, after the close of the Tokyo Stock Exchange or the London Stock Exchange, demonstrate that market quotations may be unreliable, and may trigger fair value pricing. Consequently, fair valuation of portfolio securities may occur on a daily basis. The fair value pricing by the Fund utilizes data furnished by an independent pricing service (and that data draws upon, among other information, the market values of foreign investments). The fair value prices of portfolio securities generally will be used when it is determined that the use of such prices will have a material impact on the net asset value of the Fund. When the Fund uses fair value pricing, the values assigned to the Fund's foreign in vestments may not be the quoted or published prices of the investments on their primary markets or exchanges.
20
2. Foreign Currency Translation: Securities and other assets and liabilities of the Fund whose values are initially expressed in foreign currencies are translated to U.S. dollars using the mean between the most recently quoted bid and asked prices for the U.S. dollar as quoted by generally recognized reliable sources. Dividend and interest income and certain expenses are translated to U.S. dollars at the rate of exchange on their respective accrual dates. Receivables and payables denominated in foreign currencies are marked to market based on daily exchange rates and exchange gains or losses are realized upon ultimate receipt or disbursement.
The Fund does not isolate the effect of fluctuations in foreign exchange rates from the effect of fluctuations in the market prices of securities held whether realized or unrealized.
Realized gains or losses on foreign currency transactions represent net foreign exchange gains or losses from the disposition of foreign currencies, currency gains or losses realized between the trade and settlement dates on securities transactions, and the difference between amounts of interest, dividends and foreign withholding taxes recorded on the Fund's books and the U.S. dollar equivalent amounts actually received or paid.
3. Deferred Compensation Plan: Each eligible Director of the Fund may elect participation in the Deferred Compensation Plan (the "Plan"). Under the Plan, effective January 1, 2002, such Directors may defer payment of all or a portion of their total fees earned as a Director. These deferred amounts may be treated as though such amounts had been invested in shares of the following funds: U.S. Large Cap Value Portfolio, U.S. Core Equity 1 Portfolio, U.S. Core Equity 2 Portfolio, U.S. Vector Equity Portfolio, U.S. Micro Cap Portfolio, DFA International Value Portfolio, International Core Equity Portfolio, Emerging Markets Portfolio, Emerging Markets Core Equity Portfolio, and/or DFA Two-Year Global Fixed Income Portfolio. Contributions made under the Plan and the change in unrealized a ppreciation (depreciation) and income, are included in Directors'/Trustees' Fees and Expenses. At May 31, 2006, the total liability for deferred compensation to Directors is included in Accrued Expenses and Other Liabilities in the amount of $57 (in thousands).
Each Director has the option to receive their distribution of proceeds in one of the following methods upon one year's notice: lump sum, annual installments over a period of agreed upon years, or semi-annual installments over a period of agreed upon years. As of May 31, 2006, none of the Directors have requested distribution of proceeds.
4. Other: Security transactions are accounted for as of the trade date. Costs used in determining realized gains and losses on the sale of investment securities are on the basis of identified cost. Dividend income and distributions to shareholders are recorded on the ex-dividend date. Interest income is recorded on the accrual basis.
The Fund may be subject to taxes imposed by countries in which it invests, with respect to its investment in issuers existing or operating in such countries. Such taxes are generally based on income earned or repatriated and capital gains realized on the sale of such investments. The Fund accrues such taxes when the related income or capital gains are earned or throughout the holding period. Some countries require governmental approval for the repatriation of investment income, capital or the proceeds of sales earned by foreign investors. In addition, if there is a deterioration in a country's balance of payments or for other reasons, a country may impose temporary restrictions on foreign capital remittances abroad.
The Fund's investments in Chile are subject to governmental taxes on investment income. Such taxes are due when currencies are repatriated from the country. The Fund accrues for taxes on income as income is earned.
The Fund's investments in Thailand are subject to a 15% governmental capital gains tax. Such taxes are due upon sale of individual securities. The Fund accrues for taxes on the capital gains throughout the holding period of the underlying securities. The Fund is also subject to a 10% governmental capital gains tax on short-term capital gains for investments in India. Such taxes are due upon sale of individual securities. The taxes for the capital gains are accrued when the capital gains are earned.
C. Investment Advisor:
Dimensional Fund Advisors Inc. ("Dimensional" or the "Advisor") provides investment advisory services to the Fund. For the six months ended May 31, 2006, the Fund's advisory services fees were accrued daily and paid monthly to the Advisor based on an effective annual rate of 0.10% of average daily net assets.
21
Fees Paid to Officers and Directors/Trustees:
Certain Officers and Directors/Trustees of the Advisor are also Officers and Directors/Trustees of the Fund; however, such Officers and Directors/Trustees (with the exception of the Chief Compliance Officer ("CCO")) receive no compensation from the Fund. For the six months ended May 31, 2006, the total related amounts paid by the Fund under this arrangement were $3 (in thousands). The total related amounts paid by the Fund are included in Other Expenses on the Statement of Operations.
D. Purchases and Sales of Securities:
For the six months ended May 31, 2006, the Fund made the following purchases and sales of investment securities, other than short-term securities and U.S. government securities (amounts in thousands):
| Purchases | | $ | 642,043 | | |
| Sales | | | 159,432 | | |
E. Federal Income Taxes:
The Fund has qualified and intends to continue to qualify as a regulated investment company under Subchapter M of the Internal Revenue Code for federal income tax purposes and to distribute substantially all of its taxable income and net capital gains to shareholders. Accordingly, no provision has been made for federal income taxes.
Distributions from net investment income and net realized capital gains are determined in accordance with U.S. federal income tax regulations, which may differ from these amounts determined under accounting principles generally accepted in the United States of America. These book/tax differences are either temporary or permanent in nature. To the extent these differences are permanent, they are charged or credited to paid-in capital, undistributed net investment income or accumulated net realized gains, as appropriate, in the period that the differences arise. Accordingly, the following permanent differences as of November 30, 2005, primarily attributable to realized net foreign currency gains/losses and net realized gains on securities considered to be "passive foreign investment companies" were reclassified to the following accounts. These reclassifications had no effect on net assets or net asset value per share. (amounts in thousands):
Increase
(Decrease)
Undistributed
Net Investment
Income | | Increase
(Decrease)
Accumulated
Net Realized
Gains | | Increase
(Decrease)
Accumulated
Appreciation
(Depreciation) | |
| $ | (2,859 | ) | | $ | 3,108 | | | $ | (249 | ) | |
The tax character of dividends and distributions declared and paid during the years ended November 30, 2005 and November 30, 2004 were as follows (amounts in thousands):
| | | Net Investment
Income and
Short-Term
Gains | | Long-Term
Capital Gains | | Total | |
| | 2005 | | | $ | 52,904 | | | $ | 24,479 | | | $ | 77,383 | | |
| | 2004 | | | | 15,246 | | | | 6,727 | | | | 21,973 | | |
| At November 30, 2005, the components of distributable earnings/(accumulated losses) were as follows (amounts in thousands): | |
| | | Undistributed
Net Investment
Income and
Short-Term
Capital Gains | | Undistributed
Net Realized
Capital Gains | | Total Net
Distributable
Earnings/
(Accumulated
Losses) | |
| | | $ | 12,855 | | | $ | 53,152 | | | $ | 66,007 | | |
22
For federal income tax purposes, the Fund measures its capital loss carryforwards annually at November 30, its fiscal year end. Capital loss carryforwards may be carried forward and applied against future capital gains. As of November 30, 2005, the Fund had no capital loss carryforwards available to offset future realized capital gains.
Some of the Fund's investments are in securities considered to be "passive foreign investment companies", for which any unrealized appreciation (depreciation) (mark to market) and/or realized gains are required to be included in distributable net investment income for tax purposes. During the year ended November 30, 2005, the Fund had unrealized appreciation (depreciation) (mark to market) and realized gains on the sale of passive foreign investment companies (in thousands), of $1,867 and $2,725, respectively, which are included in distributable net investment income for federal income tax purposes, accordingly, such gains have been reclassified from accumulated net realized gains to accumulated net investment income.
At May 31, 2006, the total cost and aggregate gross unrealized appreciation and depreciation of securities for federal income tax purposes were different from amounts reported for financial reporting purposes (amounts in thousands):
Federal
Tax Cost | | Unrealized
Appreciation | | Unrealized
(Depreciation) | | Net
Unrealized
Appreciation
(Depreciation) | |
| $ | 2,190,073 | | | $ | 1,173,650 | | | $ | (97,513 | ) | | $ | 1,076,137 | | |
F. Components of Net Assets:
At May 31, 2006 net assets consisted of (amounts in thousands):
Paid-In
Capital | | Accumulated
Net
Investment
Income (Loss) | | Accumulated
Net Realized
Gain (Loss)
of Investment
Securities | | Accumulated
Net Realized
Foreign
Exchange
Gain (Loss) | | Deferred
Thailand
Capital
Gains Tax | | Unrealized
Appreciation
(Depreciation)
of Investment
Securities and
Foreign Currency | | Unrealized
Net
Foreign
Exchange
Gain (Loss) | | Total Net
Asset | |
| $ | 2,091,566 | | | $ | 25,706 | | | $ | 93,992 | | | $ | (978 | ) | | $ | (5,395 | ) | | $ | 1,077,006 | | | $ | (122 | ) | | $ | 3,281,775 | | |
G. Financial Instruments:
In accordance with the Fund's investment objectives and policies, the Fund may invest in certain financial instruments that have off-balance sheet risk in excess of the amounts recognized in the financial statements and concentrations of credit and market risk. These instruments and their significant corresponding risks are described below:
1. Repurchase Agreements: The Fund may purchase money market instruments from financial institutions, such as banks and non-bank dealers, subject to the counterparty's agreement to repurchase them at an agreed upon date and price. The counterparty will be required on a daily basis to maintain the value of the collateral subject to the agreement at not less than the repurchase price (including accrued interest). The agreements are conditioned upon the collateral being deposited under the Federal Reserve book-entry system or with the Fund's custodian or a third party sub-custodian. In the event of default or bankruptcy by the other party to the agreement, retention of the collateral may be subject to legal proceedings. All open repurchase agreements were entered into on May 31, 2006.
2. Foreign Market Risks: Investments in foreign markets may involve certain considerations and risks not typically associated with investments in the United States, including the possibility of future political and economic developments and the level of foreign governmental supervision and regulation of foreign securities markets. These markets are generally smaller, less liquid and more volatile than the major securities markets in the United States. Consequently, acquisition and disposition of securities by the Fund may be inhibited.
23
H. Line of Credit:
The Fund, together with other Dimensional-advised portfolios, has entered into a $50 million unsecured discretionary line of credit effective June 28, 2005 with an affiliate of its domestic custodian bank. Each portfolio is permitted to borrow, subject to its investment limitations, up to a maximum of $50 million, as long as total borrowings under the line of credit do not exceed $50 million in the aggregate. Borrowings under the line of credit are charged interest at the then current Federal Funds Rate plus 1%. Each portfolio is individually, and not jointly, liable for its particular advances under the line of credit. There is no commitment fee on the unused portion of the line of credit. The agreement for the discretionary line of credit may be terminated by either party at any time. For the six months ended May 31, 2006, borrowings by the Fund under this line of credit were as follows (amounts in thousands, except percentages and days):
Weighted
Average
Interest Rate | | Weighted
Average
Loan Balance | | Number of
Days
Outstanding | | Interest
Expense
Incurred | | Maximum Amount
Borrowed During
the Period | |
| | 5.26 | % | | $ | 4,104 | | | | 14 | | | $ | 8 | | | $ | 8,961 | | |
There were no outstanding borrowings by the Fund under this line of credit at May 31, 2006. The line of credit was scheduled to expire on June 27, 2006. Effective, June 28, 2006, the line of credit was extended and increased to $250 million in the aggregate. The line of credit is scheduled to expire on June 27, 2007.
The Fund, together with other Dimensional-advised portfolios, has also entered into an additional $500 million unsecured line of credit effective January 23, 2006 with its international custodian bank. Each portfolio is permitted to borrow, subject to its investment limitations, up to a maximum of $500 million, as long as total borrowings under the line of credit do not exceed $500 million in the aggregate. Each portfolio is individually, and not jointly, liable for its particular advances under the line of credit. Borrowings under the line of credit are charged interest at rates agreed to by the parties at the time of borrowing. There is no commitment fee on the unused portion of the line of credit. The agreement for the line of credit expires on January 22, 2007. There were no borrowings by the Fund under the line of credit with the international custodian bank during the six months ended May 31, 2006.
I. Contractual Obligations:
In the normal course of business, the Fund enters into contracts that contain a variety of representations and warranties which provide general indemnification. The Fund's maximum exposure under these arrangements is unknown as this would involve future claims that may be made against the Fund and/or its affiliates that have not yet occurred. However, based on experience, the Fund expects the risk of loss to be remote.
24
VOTING PROXIES ON FUND PORTFOLIO SECURITIES
A description of the policies and procedures that the Fund uses in voting proxies relating to securities held in the portfolio is available without charge, upon request, by calling collect: (310) 395-8005. Information regarding how the Advisor votes these proxies is available from the EDGAR database on the SEC's website at http://www.sec.gov and from the Advisor's website at http://www.dimensional.com and reflects the twelve-month period beginning July 1st and ending June 30th.
25
BOARD APPROVAL OF INVESTMENT ADVISORY AGREEMENT
At the Board meeting held on December 13, 2005 (the "Meeting"), the Board of Directors (the "Board") of Dimensional Emerging Markets Fund Inc. (the "Fund") considered the continuation of the Fund's investment management agreement (the "Advisory Agreement.").
Prior to the Meeting, independent counsel to the Independent Board Members sent to the Advisor a request for information, which identified the information that the Independent Board Members wished to receive in order to consider the continuation of the Advisory Agreement. The Portfolio Performance and Service Review Committee (the "Review Committee"), composed of Independent Board Members, met with their independent counsel in advance of the Meeting to discuss the materials provided by the Advisor, the independent reports prepared by Lipper Analytical Services, Inc. (the "Lipper Reports"), and issues related to the continuation of the Advisory Agreement. Also in advance of the Meeting, representatives of management met with the Review Committee to address and respond to questions that independent counsel posed after counsel's review and analysis of materials provided by the Advisor and the Lipper Reports.
At the Meeting, the Board considered a number of factors when considering the continuation of the Advisory Agreement for the Fund, including: (i) the nature, extent and quality of services provided by the Advisor to the Fund; (ii) the performance of the Fund and the Advisor; (iii) the fees and expenses borne by the Fund; (iv) the profitability realized by the Advisor from the relationship with the Fund; (v) whether economies of scale are realized by the Advisor with respect to the Fund as it grows larger, and the extent to which this is reflected in the level of the advisory fee charged; (vi) comparisons of the services to be rendered and the amounts to be paid under other advisory contracts; and (vii) any benefits to be derived by the Advisor from its relationship with the Fund.
When considering the nature and quality of the services provided by the Advisor to the Fund, the Board reviewed: (a) the scope and depth of the Advisor's organization; (b) the experience and expertise of its investment professionals currently providing management services to the Fund; and (c) the Advisor's investment advisory capabilities. The Board evaluated the Advisor's portfolio management process and discussed the unique features of the Advisor's investment approach. The Board also considered the nature and character of non-investment management services provided by the Advisor. After analyzing the caliber of services provided by the Advisor to the Fund, both quantitatively and qualitatively, including the impact of these services on investment performance, the Board concluded that the nature, extent and quality of services provided to the Fund were consistent with the operational requirements of the Fund and met the needs of the shareh olders of the Fund.
In considering the performance of the Fund, the Board analyzed the Lipper Reports, which compared the performance of the Fund with other funds in its respective peer group and peer universe, and noted that the performance of the Fund compared favorably with its peer group. The Board determined, among other things, that the performance of the Fund was acceptable as compared with relevant performance standards.
When considering the fees and expenses borne by the Fund, and considering the reasonableness of the management fees paid to the Advisor in light of the services provided to the Fund and any additional benefits received by the Advisor in connection with providing such services, the Board compared the fees charged by the Advisor to the Fund to the fees charged to the funds in its peer group for comparable services as provided in the Lipper Reports. The Board concluded that the advisory fees and total expenses of the Fund over various periods were favorable in relation to its peer funds, and that the advisory fees were fair, both on an absolute basis and in comparison with the fees of other funds identified in the peer groups and the industry at large. The Board also noted that, due to recent negotiations, the Fund was expected to experience a reduction in non-management fees charged by the Fund's administrator and transfer agent.
The Board considered the profitability of the Fund to the Advisor by reviewing the profitability analysis provided by the Advisor, including information about its fee revenues and income. The Board reviewed the overall profitability of the Advisor, and the compensation that it received for providing services to the Fund, including administrative fees paid by the feeder portfolio. The Board considered the profitability to the Advisor of managing the Fund and other "non-1940 Act registered" investment vehicles. Upon closely examining the Advisor's profitability, the Board concluded, among other things, that it was reasonable.
26
The Board also discussed whether economies of scale are realized by the Advisor with respect to the Fund as it grows larger, and the extent to which this is reflected in the level of advisory fees charged. For several reasons, the Board concluded that economies of scale and the reflection of such economies of scale in the level of advisory fees charged were inapplicable to the Fund at the present time, due to the current level of fees and expenses and the profitability of the Fund.
After full consideration of the factors discussed above, with no single factor identified as being of paramount importance, the Board, including the Independent Board Members, with the assistance of independent counsel, concluded that the continuation of the Advisory Agreement for the Fund was in the best interests of the Fund and its shareholders.
27
[THIS PAGE INTENTIONALLY LEFT BLANK]
DFA053106-005S
ITEM 2. CODE OF ETHICS.
Not applicable when filing a semi-annual report to shareholders.
ITEM 3. AUDIT COMMITTEE FINANCIAL EXPERT.
Not applicable when filing a semi-annual report to shareholders.
ITEM 4. PRINCIPAL ACCOUNTANT FEES AND SERVICES.
Not applicable when filing a semi-annual report to shareholders.
ITEM 5. AUDIT COMMITTEE OF LISTED REGISTRANTS.
This item is not applicable to the Registrant.
ITEM 6. SCHEDULE OF INVESTMENTS.
The Registrant’s schedule of investments is provided below.
DIMENSIONAL EMERGING MARKETS VALUE FUND INC.
DEFINITIONS OF ABBREVIATIONS AND FOOTNOTES
Schedule of Investments
Investment Abbreviations
ADR | | American Depositary Receipt |
FHLMC | | Federal Home Loan Mortgage Corporation |
Investment Footnotes
†† | | Securities have been fair valued. See Note B to Financial Statements |
* | | Non-Income Producing Securities. |
DIMENSIONAL EMERGING MARKETS VALUE FUND INC.
SCHEDULE OF INVESTMENTS
May 31, 2006
(Unaudited)
| | | | Shares | | Value†† | |
ARGENTINA — (0.4%) | | | | | |
COMMON STOCKS — (0.4%) | | | | | |
| | Acindar Industria Argentina de Aceros SA Series B | | 659,405 | | $ | 971,552 | |
* | | Alpargatas SAIC | | 6,363 | | 10,102 | |
* | | Banco Suquia SA | | 327,868 | | 51,535 | |
| | BBVA Banco Frances SA | | 130,508 | | 333,602 | |
* | | Capex SA Series A | | 131,575 | | 359,308 | |
* | | Celulosa Argentina SA Series B | | 14,412 | | 10,984 | |
* | | Central Puerto SA Series B | | 125,000 | | 86,926 | |
| | Cresud SA Comercial Industrial Financiera y Agropecuaria | | 461,252 | | 629,800 | |
| | DYCASA SA (Dragados y Construcciones Argentina) Series B | | 55,000 | | 54,140 | |
* | | Endesa Costanera SA Series B | | 261,000 | | 213,824 | |
* | | IRSA Inversiones y Representaciones SA | | 1,186,421 | | 1,393,915 | |
* | | Juan Minetti SA | | 769,693 | | 740,552 | |
| | Ledesma S.A.A.I. | | 885,405 | | 548,242 | |
* | | Metrogas SA Series B | | 176,000 | | 57,004 | |
* | | Molinos Rio de la Plata SA Series B | | 502,274 | | 564,598 | |
* | | Polledo SA Industrial y Constructora y Financiera | | 50,000 | | 6,589 | |
| | Siderar S.A.I.C. Series A | | 494,314 | | 3,625,856 | |
| | Solvay Indupa S.A.I.C. | | 1,229,322 | | 1,198,394 | |
| | Tenaris SA | | 140,000 | | 2,489,497 | |
* | | Transportadora de Gas del Sur SA Series B | | 364,679 | | 352,030 | |
| | | | | | | |
TOTAL — ARGENTINA | | | | 13,698,450 | |
| | | | | | | |
BRAZIL — (7.3%) | | | | | |
COMMON STOCKS — (1.7%) | | | | | |
| | Arcelor Brasil SA | | 1,751,487 | | 25,600,113 | |
* | | Avipal SA Avicultura e Agropecua | | 12,500,000 | | 39,946 | |
| | Brasil Telecom Participacoes SA | | 51,256,779 | | 554,127 | |
| | Companhia Siderurgica Nacional SA | | 931,400 | | 27,629,855 | |
* | | Embratel Participacoes SA | | 50,000,000 | | 127,568 | |
| | Eternit SA | | 111,900 | | 461,633 | |
* | | Tele Norte Celular Participacoes SA | | 50,064,513 | | 16,670 | |
| | Tele Norte Leste Participacoes SA | | 51,468 | | 1,435,540 | |
| | Telemig Celular Participacoes SA | | 51,793,284 | | 198,214 | |
* | | Telemig Celular Participacoes SA Subscription Receipts | | 553,152 | | 2,117 | |
| | Tim Participacoes SA | | 98,247,830 | | 312,269 | |
* | | Vivo Participacoes SA | | 56,706 | | 250,119 | |
TOTAL COMMON STOCKS | | | | 56,628,171 | |
| | | | | | | |
| | | | | | | |
PREFERRED STOCKS — (5.6%) | | | | | |
| | Acesita SA | | 413,076 | | 6,659,232 | |
| | Bradespar SA | | 5,702 | | 184,930 | |
| | | | | | | | |
1
| | Brasil Telecom Participacoes SA | | 1,984,088 | | $ | 12,012 | |
| | Braskem SA Preferred A | | 1,479,200 | | 9,031,915 | |
| | Centrais Electricas de Santa Catarina SA - CELESC Series B | | 4,620,000 | | 2,976,778 | |
| | Companhia Brasileira de Distribuicao Grupo Pao de Acucar | | 146,540,000 | | 4,879,386 | |
| | Companhia Brasileira de Distribuicao Grupo Pao de Acucar ADR | | 1,200 | | 39,660 | |
| | Companhia Brasileira de Petroleo Ipiranga SA | | 658,200 | | 4,938,279 | |
| | Companhia de Tecidos Norte de Minas | | 23,127,500 | | 1,780,192 | |
| | Confab Industrial SA | | 1,926,000 | | 3,606,305 | |
| | Distribuidora de Produtos de Petroleo Ipiranga SA | | 16,000 | | 167,784 | |
| | Duratex SA | | 805,100 | | 6,719,321 | |
| | Embratel Participacoes SA | | 1,389,166 | | 3,628 | |
| | Empresa Brasileira de Compressores SA - Embraco | | 458,400 | | 223,997 | |
| | Forjas Taurus SA | | 406,200 | | 549,797 | |
| | Gerdau SA | | 1,222,542 | | 17,308,551 | |
| | Globex Utilidades SA | | 34,076 | | 265,240 | |
| | Industrias Romi SA | | 9,200 | | 459,503 | |
* | | Inepar Industria e Construcoes SA | | 7,896 | | 40,906 | |
| | Investimentos Itau SA | | 5,388,166 | | 20,480,856 | |
| | Klabin SA | | 3,179,000 | | 6,804,778 | |
| | Magnesita SA Series A | | 140,483,000 | | 732,030 | |
| | Mahle-Metal Leve SA Industria e Comercio | | 4,000 | | 67,459 | |
| | Marcopolo SA | | 520,600 | | 1,573,619 | |
| | Metalurgica Gerdau SA | | 959,400 | | 16,429,077 | |
* | | Plascar Participacoes Industriais SA | | 6,900,000 | | 89,514 | |
| | Polialden Petroquimica SA | | 780,000 | | 141,496 | |
| | Refinaria de Petroleo Ipiranga SA | | 12,600 | | 168,908 | |
| | Ripasa SA Papel e Celulose | | 1,539,000 | | 3,267,671 | |
| | Sadia SA | | 3,082,282 | | 7,597,409 | |
| | Santista Textil SA | | 29,600 | | 229,440 | |
| | Sao Paulo Alpargatas SA | | 37,800 | | 1,618,249 | |
| | Suzano Bahia Sul Papel e Celullose SA | | 759,431 | | 4,367,755 | |
| | Suzano Petroquimica SA | | 545,905 | | 804,989 | |
| | Tele Norte Celular Participacoes SA | | 1,390,958 | | 283 | |
| | Tele Norte Leste Participacoes SA | | 7,538 | | 98,442 | |
| | Telemar Norte Leste SA | | 631,500 | | 12,083,838 | |
| | Telemig Celular Participacoes SA | | 1,422,616 | | 2,553 | |
* | | Telemig Celular Participacoes SA Subscription Receipts | | 15,193 | | 27 | |
| | Tim Participacoes SA | | 951,707,394 | | 2,312,906 | |
| | Ultrapar Participacoes SA | | 26,800 | | 395,191 | |
| | Uniao des Industrias Petroquimicas SA Series B | | 2,902,299 | | 1,957,875 | |
| | Unibanco-Uniao de Bancos Brasileiros SA ADR | | 77,600 | | 4,953,208 | |
| | Unibanco-Uniao de Bancos Brasileiros Units SA | | 135,500 | | 1,736,744 | |
| | Usinas Siderurgicas de Minas Gerais SA Series A | | 826,925 | | 26,733,368 | |
| | Vale do Rio Doce Series B | | 239,144 | | 0 | |
* | | Vivo Participacoes SA | | 890 | | 2,240 | |
| | Votorantim Celulose e Papel SA | | 533,500 | | 7,610,882 | |
TOTAL PREFERRED STOCKS | | | | 182,108,223 | |
| | | | | | | |
| | | | | | | |
RIGHTS/WARRANTS — (0.0%) | | | | | |
* | | Inepar Industria e Construcoes SA Preferred Rights 06/23/06 | | 1,156 | | 0 | |
* | | Vivo Participacoes SA Rights 06/06/06 | | 633 | | 0 | |
TOTAL RIGHTS/WARRANTS | | | | 0 | |
2
TOTAL — BRAZIL | | | | $ | 238,736,394 | |
| | | | | | | |
CHILE — (3.1%) | | | | | |
COMMON STOCKS — (3.1%) | | | | | |
| | Banco de Credito e Inversiones SA Series A | | 54,733 | | 1,524,353 | |
| | Banmedica SA | | 347,000 | | 296,108 | |
| | CAP SA (Compania de Aceros del Pacifico) | | 199,310 | | 2,766,492 | |
| | Cementos Bio-Bio SA | | 357,467 | | 931,881 | |
| | Compania Cervecerias Unidas SA | | 143,000 | | 666,725 | |
| | Compania de Consumidores de Gas | | 124,667 | | 638,299 | |
| | Compania de Telecomunicaciones de Chile SA Series A | | 2,486,405 | | 4,966,282 | |
| | Compania de Telecomunicaciones de Chile SA Series B | | 372,166 | | 656,107 | |
| | Compania SudAmericana de Vapores SA | | 3,263,055 | | 4,253,232 | |
| | Compania Telecomunicaciones de Chile SA Sponsored ADR | | 412,400 | | 3,319,820 | |
| | Corpbanca SA | | 479,508,603 | | 2,428,119 | |
| | Cristalerias de Chile SA | | 90,005 | | 886,208 | |
| | CTI SA (Cia Tecno Industrial) | | 4,900,000 | | 123,603 | |
| | Empresa Nacional de Electricidad SA | | 2,694,503 | | 2,435,766 | |
| | Empresa Nacional de Telecomunicaciones SA | | 116,880 | | 1,188,090 | |
| | Empresas CMPC SA | | 406,930 | | 10,684,584 | |
| | Empresas Copec SA | | 947,488 | | 8,458,445 | |
| | Empresas Iansa SA | | 23,583,062 | | 6,568,051 | |
| | Enersis SA | | 31,903,095 | | 7,374,449 | |
| | Enersis SA ADR | | 2,033,600 | | 23,711,776 | |
| | Industrias Forestales SA | | 2,580,202 | | 602,466 | |
* | | Inversiones Frimetal SA | | 4,900,000 | | 0 | |
| | Madeco Manufacturera de Cobre SA ADR | | 54,200 | | 504,060 | |
* | | Madeco SA | | 28,844,021 | | 2,623,659 | |
| | Masisa SA | | 3,620,083 | | 588,026 | |
| | Minera Valparaiso SA | | 7,500 | | 139,830 | |
| | Parque Arauco SA | | 782,020 | | 513,329 | |
| | Sociedad Quimica y Minera de Chile SA Series A | | 43,364 | | 461,942 | |
| | Sociedad Quimica y Minera de Chile SA Series B | | 945,090 | | 9,571,429 | |
| | Soquimic Comercial SA | | 150,000 | | 35,165 | |
| | Vina de Concha y Toro SA | | 350,000 | | 447,018 | |
* | | Vina San Pedro SA | | 13,979,895 | | 105,138 | |
| | Watt’s SA | | 163,489 | | 95,052 | |
| | | | | | | |
TOTAL — CHILE | | | | 99,565,504 | |
| | | | | | | |
CZECH REPUBLIC — (3.3%) | | | | | |
COMMON STOCKS — (3.3%) | | | | | |
* | | Cesky Telecom A.S. | | 937,593 | | 19,466,396 | |
| | CEZ A.S. | | 2,744,208 | | 86,787,776 | |
| | | | | | | |
TOTAL — CZECH REPUBLIC | | | | 106,254,172 | |
| | | | | | | |
HUNGARY — (3.8%) | | | | | |
COMMON STOCKS — (3.8%) | | | | | |
| | BorsodChem RT | | 655,406 | | 7,360,836 | |
* | | Danubius Hotel & Spa RT | | 138,417 | | 3,921,661 | |
| | Egis Nyrt. | | 115,885 | | 15,526,739 | |
* | | Fotex RT | | 971,495 | | 2,593,001 | |
| | Gedeon Richter RT | | 6,647 | | 1,298,090 | |
3
* | | Globus Konzervipari RT | | 180,413 | | $ | 391,059 | |
* | | Linamar Hungary Autoipari es G | | 100,770 | | 910,115 | |
| | MOL Magyar Olaj- es Gazipari RT | | 815,045 | | 83,480,476 | |
* | | Pannonplast RT | | 110,028 | | 1,556,523 | |
* | | RABA Automotive Holding P.L.C. | | 255,327 | | 910,900 | |
* | | Synergon Information Systems | | 134,656 | | 499,036 | |
* | | Tiszai Vegyi Kombinat RT | | 253,242 | | 6,373,882 | |
| | Zwack Unicum RT | | 387 | | 22,270 | |
| | | | | | | |
TOTAL — HUNGARY | | | | 124,844,588 | |
| | | | | | | |
INDIA — (12.7%) | | | | | |
COMMON STOCKS — (12.7%) | | | | | |
| | Aarti Industries, Ltd. | | 147,420 | | 215,044 | |
| | Adani Exports, Ltd. | | 1,287,587 | | 5,030,659 | |
| | Aditya Birla Nuvo, Ltd. | | 134,650 | | 2,183,822 | |
| | Aftek Infosys, Ltd. | | 564,418 | | 768,742 | |
* | | Agro Tech Foods, Ltd. | | 136,705 | | 316,435 | |
| | Alembic, Ltd. | | 60,143 | | 432,363 | |
| | Alok Industries, Ltd. | | 736,832 | | 1,236,461 | |
| | Amtek Auto, Ltd. | | 44,309 | | 271,653 | |
| | Apollo Tyres, Ltd. | | 175,197 | | 942,946 | |
* | | Aptech, Ltd. | | 20,996 | | 46,266 | |
| | Arvind Mills, Ltd. | | 1,185,419 | | 1,887,907 | |
| | Ashok Leyland, Ltd. | | 5,581,530 | | 4,714,497 | |
| | Aurobindo Pharma, Ltd. | | 215,126 | | 2,700,297 | |
| | Avaya Globalconnect, Ltd. | | 7,435 | | 51,928 | |
* | | Bajaj Auto Finance, Ltd. | | 37,588 | | 371,371 | |
| | Bajaj Auto, Ltd. | | 76,284 | | 4,521,788 | |
* | | Balaji Telefilms, Ltd. | | 10,796 | | 27,031 | |
| | Ballarpur Industries, Ltd. | | 886,062 | | 2,340,279 | |
| | Balmer Lawrie & Co., Ltd. | | 39,215 | | 363,549 | |
* | | Bank of Rajasthan, Ltd. | | 351,617 | | 275,603 | |
| | BASF India, Ltd. | | 84,085 | | 390,873 | |
| | BOC India, Ltd. | | 196,517 | | 695,395 | |
| | Bombay Dyeing & Manufacturing Co., Ltd. | | 56,026 | | 810,578 | |
* | | Ceat, Ltd. | | 67,553 | | 131,087 | |
* | | Century Enka, Ltd. | | 133,495 | | 487,466 | |
| | Century Textiles & Industries, Ltd. | | 277,738 | | 2,412,248 | |
| | Chambal Fertilizers & Chemicals, Ltd. | | 2,270,380 | | 1,825,241 | |
| | Cholamandalam DBS Finance, Ltd. | | 347 | | 1,192 | |
* | | City Union Bank, Ltd. | | 28,787 | | 62,791 | |
* | | Clariant Chemicals (India), Ltd. | | 2,398 | | 15,975 | |
| | Deepak Fertilizers & Petrochemicals Corp., Ltd. | | 353,125 | | 693,522 | |
* | | D-Link (India), Ltd. | | 66,109 | | 131,460 | |
| | Dr. Reddy’s Laboratories, Ltd. | | 333,699 | | 9,760,970 | |
| | E.I.D. - Parry (India), Ltd. | | 273,079 | | 1,665,750 | |
| | EIH, Ltd. | | 83,011 | | 1,226,960 | |
* | | Elder Pharmaceuticals, Ltd. | | 54,402 | | 375,829 | |
| | Electrosteel Casings, Ltd. | | 43,769 | | 342,818 | |
* | | Elgi Equipments, Ltd. | | 174,405 | | 270,172 | |
* | | Escorts, Ltd. | | 226,339 | | 392,567 | |
* | | Essar Steel, Ltd. | | 807,651 | | 720,910 | |
| | Essel Propack, Ltd. | | 77,366 | | 626,745 | |
4
* | | Eveready Industries (India), Ltd. | | 301,461 | | $ | 594,932 | |
* | | Everest Industries, Ltd. | | 23,275 | | 65,941 | |
| | Exide Industries, Ltd. | | 114,382 | | 636,858 | |
| | FDC, Ltd. | | 85,911 | | 82,045 | |
| | Federal Bank, Ltd. | | 308,952 | | 1,260,864 | |
| | Finolex Cables, Ltd. | | 104,411 | | 759,107 | |
| | Finolex Industries, Ltd. | | 695,629 | | 1,373,508 | |
* | | Geometric Software Solutions Co., Ltd. | | 27,253 | | 59,198 | |
| | GHCL, Ltd. | | 88,654 | | 312,099 | |
| | Godrej Industries, Ltd. | | 1,000 | | 13,426 | |
* | | Goetze (India), Ltd. | | 9,785 | | 61,544 | |
| | Great Eastern Shipping Co., Ltd. | | 1,032,054 | | 5,279,792 | |
| | GTL, Ltd. | | 544,800 | | 1,726,581 | |
| | Gujarat Alkalies & Chemicals, Ltd. | | 377,390 | | 1,577,859 | |
| | Gujarat Ambuja Cements, Ltd. | | 2,023,923 | | 4,055,180 | |
| | Gujarat Fluorochemicals, Ltd. | | 50,745 | | 499,140 | |
| | Gujarat Narmada Valley Fertilizers Co., Ltd. | | 601,145 | | 1,474,782 | |
| | Gujarat State Fertilizers & Chemicals, Ltd. | | 447,664 | | 2,054,392 | |
| | H.E.G., Ltd. | | 99,150 | | 367,978 | |
| | HCL Technologies, Ltd. | | 150,000 | | 1,624,152 | |
| | HDFC Bank, Ltd. | | 196,003 | | 3,146,157 | |
* | | Himachal Futuristic Communications, Ltd. | | 2,540,888 | | 1,644,648 | |
| | Himatsingka Seide, Ltd. | | 96,231 | | 236,003 | |
| | Hinduja TMT, Ltd. | | 93,601 | | 1,340,440 | |
* | | Hindustan Motors, Ltd. | | 296,702 | | 237,770 | |
* | | Hindustan Sanitaryware & Industries, Ltd. | | 24,608 | | 69,873 | |
| | Hotel Leelaventure, Ltd. | | 265,698 | | 2,005,383 | |
| | I.B.P. Co., Ltd. | | 7,999 | | 79,371 | |
| | ICI India, Ltd. | | 45,061 | | 338,654 | |
* | | ICICI Bank Sponsored ADR | | 5,100 | | 135,660 | |
* | | iGate Global Solutions, Ltd. | | 20,446 | | 93,019 | |
* | | India Cements, Ltd. | | 602,757 | | 2,091,569 | |
* | | India Glycols, Ltd. | | 110,588 | | 325,602 | |
| | Indian Hotels Co., Ltd. | | 294,289 | | 7,642,607 | |
| | Indian Petrochemicals Corp., Ltd. | | 1,306,558 | | 6,737,499 | |
| | Indo Rama Synthetics (India), Ltd. | | 202,314 | | 272,330 | |
| | IndusInd Bank, Ltd. | | 1,436,430 | | 1,429,894 | |
| | Industrial Development Bank of India, Ltd. | | 3,178,422 | | 4,819,799 | |
* | | Infotech Enterprises, Ltd. | | 11,561 | | 137,750 | |
| | IPCA Laboratories, Ltd. | | 49,978 | | 342,182 | |
* | | Ispat Industries, Ltd. Post Reconstruction | | 2,195,639 | | 827,425 | |
| | IVRCL Infrastructures & Projects, Ltd. | | 67,260 | | 345,656 | |
| | J.B. Chemicals & Pharmaceuticals, Ltd. | | 204,233 | | 435,413 | |
| | J.K. Industries, Ltd. | | 147,674 | | 281,273 | |
* | | Jammu & Kashmir Bank, Ltd. | | 190,012 | | 1,588,908 | |
* | | JBF Industries, Ltd. | | 35,983 | | 69,402 | |
| | Jindal Poly Films, Ltd. | | 21,594 | | 127,168 | |
| | Jindal Saw, Ltd. | | 60,558 | | 488,906 | |
* | | Jindal Stainless, Ltd. | | 614,306 | | 1,158,529 | |
| | Jindal Steel & Power, Ltd. | | 28,866 | | 1,134,700 | |
* | | JSW Steel, Ltd. | | 624,983 | | 3,916,857 | |
* | | Karnataka Bank, Ltd. | | 66,072 | | 140,722 | |
| | Kesoram Industries, Ltd. | | 136,927 | | 698,082 | |
| | Kirloskar Oil Engines, Ltd. | | 162,023 | | 870,432 | |
5
| | LIC Housing Finance, Ltd. | | 345,645 | | $ | 1,342,634 | |
* | | Maharashtra Scooters, Ltd. | | 13,612 | | 110,968 | |
| | Mahavir Spinning Mills, Ltd. | | 88,383 | | 678,600 | |
| | Mahindra & Mahindra, Ltd. | | 219,880 | | 2,895,388 | |
| | Maruti Udyog, Ltd. | | 182,830 | | 2,899,521 | |
| | Mastek, Ltd. | | 83,250 | | 714,863 | |
| | Merck, Ltd. | | 23,905 | | 277,779 | |
| | Monsanto India, Ltd. | | 1,217 | | 37,526 | |
| | Moser Baer (India), Ltd. | | 529,290 | | 2,425,804 | |
* | | Mphasis BFL, Ltd. | | 292,087 | | 1,203,404 | |
| | MRF, Ltd. | | 14,402 | | 870,474 | |
* | | Mukand, Ltd. | | 296,535 | | 635,336 | |
* | | Nagarjuna Fertilizers & Chemicals, Ltd. | | 1,476,016 | | 453,888 | |
| | Nahar Spinning Mills, Ltd. | | 31,075 | | 162,560 | |
* | | Natco Pharma, Ltd. | | 71,082 | | 169,086 | |
* | | National Organic Chemical Industries, Ltd. | | 598,288 | | 319,579 | |
| | Navneet Publications (India), Ltd. | | 23,748 | | 149,217 | |
* | | NIIT Technologies, Ltd. | | 23,227 | | 93,725 | |
| | NIIT, Ltd. | | 19,941 | | 156,983 | |
| | Nirma, Ltd. | | 140,496 | | 1,344,591 | |
* | | Omax Autos, Ltd. | | 20,202 | | 36,691 | |
| | Orchid Chemicals & Pharmaceuticals, Ltd. | | 199,488 | | 973,873 | |
| | Patni Computer Systems, Ltd. | | 204,200 | | 1,611,787 | |
* | | Pentamedia Graphics, Ltd. | | 658,344 | | 65,830 | |
* | | Petronet LNG, Ltd. | | 131,253 | | 137,862 | |
| | Polaris Software Lab, Ltd. | | 380,771 | | 706,281 | |
* | | Polyplex Corp., Ltd. | | 41,389 | | 120,637 | |
* | | Pricol, Ltd. | | 49,154 | | 41,315 | |
* | | Prism Cements, Ltd. | | 269,139 | | 181,909 | |
| | PSL, Ltd. | | 52,822 | | 270,243 | |
| | Punjab Tractors, Ltd. | | 284,281 | | 1,571,456 | |
* | | Rain Calcining, Ltd. | | 310,692 | | 258,632 | |
* | | Rajasthan Spinning & Weaving Mills, Ltd. | | 35,562 | | 89,946 | |
* | | Rama Newsprint & Papers, Ltd. | | 84,210 | | 20,332 | |
* | | Raymond, Ltd. | | 261,017 | | 2,758,283 | |
* | | Reliance Capital Ventures, Ltd. | | 6,786,159 | | 3,685,820 | |
* | | Reliance Communication Ventures, Ltd. | | 6,786,159 | | 39,232,367 | |
* | | Reliance Energy Ventures, Ltd. | | 6,786,159 | | 5,048,767 | |
* | | Reliance Industries, Ltd. | | 6,786,159 | | 139,698,377 | |
* | | Reliance Natural Resources, Ltd. | | 6,786,159 | | 3,788,408 | |
| | Rolta India, Ltd. | | 321,636 | | 1,370,472 | |
| | Ruchi Soya Industries, Ltd. | | 48,407 | | 328,830 | |
| | Samtel Colour, Ltd. | | 77,810 | | 84,167 | |
| | Sesa Goa, Ltd. | | 8,700 | | 228,838 | |
| | Shriram Transport Finance Co., Ltd. | | 50,855 | | 133,447 | |
* | | Sona Koyo Steering Systems, Ltd. | | 29,642 | | 53,601 | |
* | | Sonata Software, Ltd. | | 457,576 | | 267,227 | |
* | | South India Bank, Ltd. | | 76,352 | | 106,500 | |
* | | Srei Infrastructure Finance, Ltd. | | 94,741 | | 102,640 | |
| | SRF, Ltd. | | 132,296 | | 619,201 | |
| | Sterlite Industries (India), Ltd. Series A | | 1,319,280 | | 12,255,160 | |
* | | Sterlite Optical Technologies, Ltd. | | 140,600 | | 415,755 | |
* | | Subros, Ltd. | | 13,278 | | 60,098 | |
* | | Supreme Petrochem, Ltd. | | 69,306 | | 33,922 | |
6
| | Tata Chemicals, Ltd. | | 1,092,020 | | $ | 5,387,804 | |
* | | Tata Investment Corp., Ltd. | | 55,760 | | 507,061 | |
| | Tata Steel, Ltd. | | 1,899,526 | | 21,194,259 | |
| | Tata Tea, Ltd. | | 166,270 | | 2,578,783 | |
* | | Tele Data Informatics, Ltd. | | 87,903 | | 25,436 | |
| | Tube Investments of India, Ltd. | | 322,920 | | 825,345 | |
| | TVS Motor Co., Ltd. | | 269,922 | | 726,699 | |
| | Ucal Fuel Systems, Ltd. | | 4,360 | | 15,033 | |
| | Unichem Laboratories, Ltd. | | 20,832 | | 121,175 | |
* | | Usha Martin, Ltd. | | 139,597 | | 572,422 | |
| | UTI Bank, Ltd. | | 1,388,368 | | 8,557,676 | |
* | | Uttam Galva Steels | | 194,165 | | 149,055 | |
| | Varun Shipping Co. | | 469,669 | | 851,317 | |
| | Videocon Industries, Ltd. | | 35,767 | | 332,269 | |
| | Videsh Sanchar Nigam, Ltd. | | 929,481 | | 7,670,113 | |
| | Visualsoft Technologies, Ltd. | | 97,597 | | 198,058 | |
* | | Welspun India, Ltd. | | 24,452 | | 48,687 | |
* | | Welspun-Gujarat Stahl Rohren, Ltd. | | 76,557 | | 114,171 | |
| | Zee Telefilms, Ltd. Series B | | 2,095,477 | | 10,501,840 | |
* | | Zensar Technologies, Ltd. | | 21,303 | | 103,195 | |
* | | Zuari Industries, Ltd. | | 77,371 | | 364,662 | |
TOTAL COMMON STOCKS | | | | 414,973,911 | |
| | | | | | | |
| | | | | | | |
PREFERRED STOCKS — (0.0%) | | | | | |
* | | Ispat Industries, Ltd. Cumulative Preferred Shares | | 1,463,759 | | 80,293 | |
| | | | | | | |
TOTAL — INDIA | | | | 415,054,204 | |
| | | | | | | |
INDONESIA — (3.1%) | | | | | |
COMMON STOCKS — (3.1%) | | | | | |
* | | PT Apac Citra Centretex Tbk | | 774,000 | | 5,793 | |
| | PT Asahimas Flat Glass Tbk | | 5,333,500 | | 1,615,739 | |
* | | PT Astra Graphia Tbk | | 18,779,000 | | 641,922 | |
| | PT Astra International Tbk | | 4,235,500 | | 4,500,977 | |
* | | PT Bakrieland Development Tbk | | 18,329,500 | | 367,423 | |
| | PT Bank Pan Indonesia Tbk | | 113,482,661 | | 5,298,062 | |
| | PT Berlian Laju Tanker Tbk | | 54,456,800 | | 10,801,773 | |
| | PT Bhakti Investama Tbk | | 31,933,500 | | 467,060 | |
| | PT Branta Mulia Tbk | | 180,000 | | 23,339 | |
* | | PT Budi Acid Jaya Tbk | | 6,410,000 | | 79,774 | |
* | | PT Charoen Pokphand Indonesia Tbk | | 13,979,000 | | 545,431 | |
* | | PT Ciputra Surya Tbk | | 1,000,000 | | 71,671 | |
| | PT Clipan Finance Indonesia Tbk | | 12,461,000 | | 472,590 | |
* | | PT Davomas Adabi Tbk | | 71,017,500 | | 2,284,449 | |
* | | PT Delta Dunia Petronda Tbk | | 593,500 | | 5,767 | |
| | PT Dynaplast Tbk | | 3,040,000 | | 269,346 | |
* | | PT Ever Shine Textile Tbk | | 19,347,215 | | 177,689 | |
* | | PT Great River International Tbk | | 1,788,000 | | 88,869 | |
| | PT Gudang Garam Tbk | | 642,000 | | 665,091 | |
* | | PT Hero Supermarket Tbk | | 220,000 | | 140,248 | |
| | PT Indofood Sukses Makmur Tbk | | 25,723,500 | | 2,625,892 | |
| | PT Indo-Rama Synthetics Tbk | | 7,901,320 | | 385,865 | |
| | PT International Nickel Indonesia Tbk | | 7,522,000 | | 16,101,700 | |
7
| | PT Jaya Real Property Tbk | | 5,189,500 | | $ | 2,047,831 | |
* | | PT Karwell Indonesia Tbk | | 1,466,500 | | 26,145 | |
* | | PT Kawasan Industry Jababeka Tbk | | 59,170,000 | | 770,915 | |
| | PT Lautan Luas Tbk | | 7,721,000 | | 388,825 | |
| | PT Matahari Putra Prima Tbk | | 15,085,500 | | 1,177,594 | |
| | PT Mayorah Indah Tbk | | 8,497,572 | | 940,480 | |
| | PT Medco Energi International Tbk | | 31,249,000 | | 13,479,520 | |
| | PT Metrodata Electronics Tbk | | 18,582,000 | | 141,367 | |
* | | PT Modern Photo Tbk | | 1,266,500 | | 45,159 | |
* | | PT Mutlipolar Corporation Tbk | | 7,188,750 | | 97,297 | |
* | | PT Panasia Indosyntec Tbk | | 403,200 | | 17,971 | |
| | PT Panin Insurance Tbk | | 27,086,000 | | 886,951 | |
* | | PT Petrosea Tbk | | 76,000 | | 55,530 | |
* | | PT Polychem Indonesia Tbk | | 6,156,000 | | 144,012 | |
* | | PT Samudera Indonesia Tbk | | 415,500 | | 356,048 | |
| | PT Selamat Semp Tbk | | 10,624,000 | | 372,114 | |
| | PT Semen Gresik Tbk | | 8,421,591 | | 20,177,081 | |
* | | PT Sinar Mas Agro Resources & Technology Tbk | | 8,442,900 | | 2,621,284 | |
| | PT Summarecon Agung Tbk | | 2,250,000 | | 295,318 | |
* | | PT Sunson Textile Manufacturer Tbk | | 6,012,000 | | 149,948 | |
* | | PT Suparma Tbk | | 3,995,345 | | 86,605 | |
* | | PT Surya Dumai Industri Tbk | | 5,145,000 | | 200,130 | |
| | PT Surya Toto Indonesia Tbk | | 46,400 | | 30,081 | |
| | PT Tempo Scan Pacific Tbk | | 6,466,000 | | 3,998,578 | |
| | PT Tigaraksa Satria Tbk | | 684,000 | | 22,172 | |
| | PT Timah Tbk | | 5,855,000 | | 1,225,559 | |
| | PT Trias Sentosa Tbk | | 29,527,200 | | 417,085 | |
* | | PT Trimegah Sec Tbk | | 34,298,000 | | 519,889 | |
| | PT Tunas Ridean Tbk | | 10,810,000 | | 817,367 | |
* | | PT Ultrajaya Milk Industry & Trading Co. Tbk | | 13,717,500 | | 399,813 | |
| | PT Unggul Indah Cahaya Tbk | | 371,435 | | 121,905 | |
| | | | | | | |
TOTAL — INDONESIA | | | | 99,667,044 | |
| | | | | | | |
ISRAEL — (4.4%) | | | | | |
COMMON STOCKS — (4.4%) | | | | | |
* | | Afcon Industries, Ltd. | | 2,102 | | 10,940 | |
| | Albad Massuot Yitzhak, Ltd. | | 36,481 | | 354,275 | |
| | American Israeli Paper Mills, Ltd. | | 23,254 | | 1,081,320 | |
* | | Ashtrom Properties, Ltd. | | 171,400 | | 107,348 | |
| | Azorim Investment Development & Construction Co., Ltd. | | 299,403 | | 3,944,613 | |
| | Bank Hapoalim B.M. | | 8,089,710 | | 37,615,522 | |
| | Bank Leumi Le-Israel | | 8,352,608 | | 31,334,021 | |
| | Bank of Jerusalem, Ltd. | | 71,150 | | 105,368 | |
* | | Baran Group, Ltd. | | 94,200 | | 1,238,219 | |
* | | Blue Square Chain Stores Properties & Investments, Ltd. | | 33,400 | | 328,831 | |
| | Clal Industries, Ltd. | | 773,796 | | 3,988,803 | |
* | | Delta-Galil Industries, Ltd. | | 105,248 | | 741,918 | |
| | Discount Investment Corp. | | 167,655 | | 4,046,784 | |
* | | Discount Mortgage Bank, Ltd. | | 3,611 | | 448,689 | |
| | Elbit Medical Imaging, Ltd. | | 168,210 | | 4,188,276 | |
* | | Electra (Israel), Ltd. | | 13,319 | | 1,406,413 | |
* | | Electra Consumer Products | | 63,603 | | 420,105 | |
| | Elron Electronic Industries, Ltd. | | 202,296 | | 2,079,178 | |
8
* | | Feuchtwanger Investments 1984, Ltd. | | 10,500 | | $ | 28 | |
* | | First International Bank of Israel, Ltd. | | 550,597 | | 1,450,238 | |
* | | First International Bank of Israel, Ltd. Par Value $0.05 | | 294,660 | | 4,027,141 | |
* | | Formula Systems (1985), Ltd. | | 93,700 | | 1,110,319 | |
* | | Formula Vision Technologies, Ltd. | | 1,953 | | 1,387 | |
* | | Granite Hacarmel Investments, Ltd. | | 142,500 | | 207,444 | |
* | | GTC Real Estate NV | | 3,052 | | 18,886 | |
| | IDB Development Corp., Ltd. Series A | | 217,003 | | 7,166,050 | |
| | Industrial Building Corp., Ltd. | | 937,191 | | 1,604,172 | |
| | Israel Cold Storage & Supply Co., Ltd. | | 7,000 | | 50,885 | |
| | Israel Corp., Ltd. Series A | | 4,000 | | 1,567,379 | |
| | Israel Petrochemical Enterprises, Ltd. | | 238,177 | | 2,060,181 | |
* | | Israel Steel Mills, Ltd. | | 97,000 | | 836 | |
* | | J.O.E.L. Jerusalem Oil Exploration, Ltd. | | 27,096 | | 230,812 | |
* | | Kardan Israel, Ltd. | | 2,237 | | 7,431 | |
| | Knafaim Arkia Holdings, Ltd. | | 117,857 | | 1,277,684 | |
* | | Koor Industries, Ltd. | | 125,769 | | 7,274,968 | |
| | Leader Holding & Investments, Ltd. | | 166,882 | | 314,083 | |
* | | Liberty Properties, Ltd. | | 3,457 | | 29,461 | |
| | Makhteshim-Agan Industries, Ltd. | | 227,355 | | 1,311,978 | |
| | Merhav-Ceramic & Building Materials Center, Ltd. | | 36,232 | | 79,430 | |
* | | Metalink, Ltd. | | 21,794 | | 129,037 | |
* | | Middle East Tube Co., Ltd. | | 46,200 | | 61,939 | |
* | | Miloumor, Ltd. | | 67,325 | | 253,313 | |
* | | Minrav Holdings, Ltd. | | 2,000 | | 90,545 | |
* | | Naphtha Israel Petroleum Corp. | | 407,900 | | 114,389 | |
* | | OCIF Investments and Development, Ltd. | | 14,180 | | 318,980 | |
* | | Otzar Hashilton Hamekomi, Ltd. | | 1,050 | | 81,386 | |
| | Packer Plada, Ltd. | | 4,006 | | 234,436 | |
| | Polgat Industries, Ltd. Series A | | 87,600 | | 52,939 | |
| | Property and Building Corp., Ltd. | | 11,288 | | 1,424,975 | |
* | | Scailex Corp., Ltd. | | 365,565 | | 2,590,758 | |
| | Shrem Fudim Kelner & Co., Ltd. | | 101,645 | | 340,413 | |
| | Suny Electronic Inc., Ltd. | | 129,761 | | 509,016 | |
* | | Super-Sol, Ltd. Series B | | 793,301 | | 2,309,275 | |
* | | Team Computer & Systems, Ltd. | | 7,900 | | 118,399 | |
* | | The Israel Land Development Co., Ltd. | | 234,969 | | 923,644 | |
* | | Tower Semiconductor, Ltd. | | 578,773 | | 966,319 | |
* | | TTI Team Telecom International, Ltd. ADR | | 16,590 | | 82,618 | |
* | | Union Bank of Israel, Ltd. | | 373,011 | | 1,929,350 | |
* | | United Mizrahi Bank, Ltd. | | 1,263,799 | | 7,757,010 | |
| | Urdan Industries, Ltd. | | 183,950 | | 119,489 | |
* | | Ytong Industries, Ltd. | | 174,250 | | 165,634 | |
TOTAL COMMON STOCKS | | | | 143,805,280 | |
| | | | | | | |
| | | | | | | |
RIGHTS/WARRANTS — (0.0%) | | | | | |
* | | Global Trade Centre International Warrants 10/06/06 | | 91 | | 0 | |
| | | | | | | |
TOTAL — ISRAEL | | | | 143,805,280 | |
| | | | | | | |
MALAYSIA — (6.1%) | | | | | |
COMMON STOCKS — (6.1%) | | | | | |
* | | A&M Realty Berhad | | 213,550 | | 79,427 | |
9
| | ACP Industries Berhad | | 1,239,900 | | $ | 294,959 | |
* | | Advance Synergy Berhad | | 641,000 | | 34,610 | |
| | Advanced Synergy Capital Berhad | | 153,500 | | 13,724 | |
| | Affin Holdings Berhad | | 7,359,600 | | 3,448,053 | |
| | Aluminum Co. of Malaysia Berhad | | 250,000 | | 100,590 | |
* | | AMBD Berhad | | 1,990,900 | | 74,284 | |
| | AmInvestment Group Berhad | | 994,468 | | 460,445 | |
| | AMMB Holdings Berhad | | 14,093,744 | | 9,802,415 | |
* | | Ancom Berhad | | 393,750 | | 71,124 | |
| | Ann Joo Resources Berhad | | 1,235,100 | | 391,846 | |
* | | Antah Holding Berhad | | 306,000 | | 20,226 | |
| | APM Automotive Holdings Berhad | | 1,024,700 | | 759,535 | |
| | Apollo Food Holdings Berhad | | 198,400 | | 136,117 | |
* | | Arab Malaysia Corp. Berhad | | 2,000,000 | | 694,537 | |
* | | Asas Dunia Berhad | | 524,700 | | 101,379 | |
* | | Asia Pacific Land Berhad | | 5,644,300 | | 466,976 | |
| | Asiatic Development Berhad | | 3,959,500 | | 3,360,066 | |
| | Avenue Assets Berhad | | 4,158,800 | | 881,927 | |
| | Ayer Hitam Planting Syndicate Berhad | | 27,000 | | 18,595 | |
| | Bandar Raya Developments Berhad | | 2,886,500 | | 877,033 | |
| | Batu Kawan Berhad | | 1,212,300 | | 2,673,979 | |
* | | Berjaya Capital Berhad | | 614,136 | | 135,620 | |
* | | Berjaya Corp. Berhad | | 7,956,380 | | 273,905 | |
* | | Berjaya Corp. Berhad ICULS | | 34,838,582 | | 575,686 | |
* | | Berjaya Land Berhad | | 3,934,800 | | 552,455 | |
| | Bernas Padiberas Nasional Berhad | | 3,139,700 | | 1,323,023 | |
| | Bimb Holdings Berhad | | 1,029,800 | | 323,950 | |
| | Bina Darulaman Berhad | | 118,000 | | 27,815 | |
| | Binaik Equity Berhad | | 149,800 | | 28,017 | |
| | Bolton Properties Berhad | | 1,107,100 | | 229,104 | |
| | Boustead Holdings Berhad | | 3,078,700 | | 1,552,260 | |
| | Boustead Properties Berhad | | 343,700 | | 280,002 | |
| | Bumiputra-Commerce Asset Holdings Berhad | | 1,104,000 | | 1,674,444 | |
| | Cahya Mata Sarawak Berhad | | 1,169,500 | | 303,887 | |
| | Chemical Co. of Malaysia Berhad | | 311,000 | | 262,176 | |
| | Chin Teck Plantations Berhad | | 296,600 | | 433,494 | |
| | Choo Bee Metal Industries Berhad | | 235,700 | | 103,404 | |
* | | Compugates Holdings Berhad | | 5,000 | | 1,873 | |
* | | Cosway Corp. Berhad | | 854,100 | | 168,909 | |
* | | Country Heights Holdings Berhad | | 174,000 | | 31,167 | |
| | Courts Mammoth Berhad | | 1,280,000 | | 366,608 | |
| | Cycle & Carriage Bintang Berhad | | 249,800 | | 158,840 | |
* | | Damansara Realty Berhad | | 5,487,800 | | 197,414 | |
* | | Datuk Keramik Holdings Berhad | | 127,000 | | 1,574 | |
| | Dijaya Corp. Berhad | | 612,100 | | 133,913 | |
| | DNP Holdings Berhad | | 166,000 | | 27,479 | |
| | DRB-Hicom Berhad | | 6,126,600 | | 2,911,026 | |
* | | Dunham-Bush (Malaysia) Berhad | | 128,115 | | 53,160 | |
| | Eastern & Oriental Berhad | | 566,300 | | 208,239 | |
| | Eastern Pacific Industrial Corp. Berhad | | 414,400 | | 155,109 | |
* | | Ecofirst Consolidated Berhad | | 1,268,000 | | 43,620 | |
| | Edaran Otomobil Nasional Berhad | | 1,327,100 | | 976,394 | |
* | | Engtex Group Berhad | | 311,000 | | 93,487 | |
* | | EON Capital Berhad | | 1,058,307 | | 1,778,434 | |
10
| | Esso Malaysia Berhad | | 633,200 | | $ | 417,204 | |
* | | Faber Group Berhad | | 170,300 | | 29,576 | |
| | Far East Holdings Berhad | | 318,400 | | 303,464 | |
| | Focal Aims Holdings Berhad | | 424,000 | | 40,870 | |
* | | Fountain View Development Berhad | | 2,573,200 | | 188,651 | |
| | Gamuda Berhad | | 4,853,400 | | 4,606,730 | |
| | General Corp. Berhad | | 1,242,900 | | 202,001 | |
| | Glomac Berhad | | 1,096,800 | | 359,916 | |
| | Gold IS Berhad | | 1,287,600 | | 447,574 | |
| | Golden Hope Plantations Berhad | | 5,066,550 | | 6,143,804 | |
* | | Golden Plus Holdings Berhad | | 201,000 | | 24,430 | |
* | | Gopeng Berhad | | 273,900 | | 41,582 | |
* | | Grand United Holdings Berhad | | 451,100 | | 37,434 | |
* | | Gula Perak Berhad | | 3,605,350 | | 169,379 | |
| | GuocoLand (Malaysia) Berhad | | 4,944,641 | | 1,057,232 | |
| | Guthrie Ropel Berhad | | 191,700 | | 221,738 | |
| | Hap Seng Consolidated Berhad | | 1,499,200 | | 771,512 | |
| | Highlands and Lowlands Berhad | | 3,550,100 | | 4,050,211 | |
* | | HIL Industries Berhad | | 373,285 | | 34,033 | |
* | | Ho Hup Construction Co. Berhad | | 175,100 | | 29,267 | |
* | | Ho Wah Genting Berhad | | 369,000 | | 21,491 | |
| | Hong Leong Credit Berhad | | 1,191,937 | | 1,503,405 | |
| | Hong Leong Industries Berhad | | 904,400 | | 914,061 | |
| | Hume Industries (Malaysia) Berhad | | 389,967 | | 321,094 | |
| | Hwang-DBS (Malaysia) Berhad | | 775,000 | | 327,896 | |
| | IGB Corp. Berhad | | 9,267,800 | | 3,600,568 | |
| | IJM Corp. Berhad | | 3,810,000 | | 5,774,776 | |
* | | IJM Plantations Berhad | | 204,400 | | 80,021 | |
* | | Insas Berhad | | 2,012,100 | | 172,503 | |
| | Integrated Logistics Berhad | | 900,000 | | 485,503 | |
| | IOI Properties Berhad | | 13,600 | | 30,737 | |
| | Island & Peninsular Berhad | | 3,153,923 | | 1,164,144 | |
* | | Jaks Resources Berhad | | 2,292,000 | | 332,500 | |
| | Jaya Tiasa Holdings Berhad | | 1,128,700 | | 775,342 | |
| | Jerneh Asia Berhad | | 265,700 | | 147,724 | |
* | | Johan Holdings Berhad | | 228,000 | | 7,535 | |
| | Johor Land Berhad | | 247,940 | | 54,906 | |
* | | K & N Kenanga Holdings Berhad | | 1,454,300 | | 260,952 | |
| | Keck Seng (Malaysia) Berhad | | 1,174,800 | | 1,016,710 | |
* | | Kejora Harta Berhad | | 2,144,100 | | 277,747 | |
| | Kian Joo Can Factory Berhad | | 1,147,200 | | 932,703 | |
* | | KIG Glass Industrial Berhad | | 260,000 | | 2,148 | |
| | Kim Hin Industry Berhad | | 325,900 | | 125,014 | |
| | Kim Loong Resources Berhad | | 113,000 | | 42,038 | |
* | | KLCC Property Holdings Berhad | | 3,936,000 | | 2,277,424 | |
| | KPJ Healthcare Berhad | | 597,300 | | 260,141 | |
| | KrisAssets Holdings Berhad | | 368,377 | | 258,706 | |
| | Kuala Lumpur Kepong Berhad | | 3,820,500 | | 10,629,099 | |
* | | Kub Malaysia Berhad | | 4,595,400 | | 552,193 | |
| | Kulim Malaysia Berhad | | 1,295,725 | | 1,128,811 | |
* | | Kumpulan Europlus Berhad | | 3,428,300 | | 303,363 | |
| | Kwantas Corp. Berhad | | 123,000 | | 131,647 | |
* | | Land & General Berhad | | 7,131,600 | | 355,797 | |
| | Landmarks Berhad | | 2,886,300 | | 899,911 | |
11
* | | Leader Universal Holdings Berhad | | 4,214,433 | | $ | 460,381 | |
| | Leong Hup Holdings Berhad | | 1,469,800 | | 728,298 | |
* | | Lien Hoe Corp. Berhad | | 654,850 | | 46,024 | |
| | Lingui Development Berhad | | 2,774,700 | | 742,078 | |
| | Lion Diversified Holdings Berhad | | 2,683,300 | | 2,961,901 | |
| | Lion Industries Corp. Berhad | | 3,771,381 | | 1,272,628 | |
* | | London Biscuits Berhad | | 138,100 | | 66,594 | |
| | Malayan Cement Berhad | | 67,500 | | 14,034 | |
| | Malaysia Building Society Berhad | | 263,000 | | 49,214 | |
| | Malaysia Industrial Development Finance Berhad | | 5,266,200 | | 1,556,342 | |
| | Malaysian Airlines System Berhad | | 469,300 | | 380,102 | |
| | Malaysian Bulk Carriers Berhad | | 1,444,300 | | 818,934 | |
| | Malaysian Mosaics Berhad | | 1,968,000 | | 900,109 | |
| | Malaysian National Reinsurance Berhad | | 969,600 | | 1,026,068 | |
| | Malaysian Plantations Berhad | | 4,810,000 | | 2,794,401 | |
* | | Malaysian Resources Corp. Berhad | | 8,633,100 | | 1,704,811 | |
| | MBM Resources Berhad | | 416,233 | | 332,558 | |
* | | Meda, Inc. Berhad | | 650,100 | | 23,409 | |
| | Mega First Corp. Berhad | | 448,000 | | 123,457 | |
| | Melewar Industrial Group Berhad | | 768,000 | | 233,164 | |
| | Mentakab Rubber Co. (Malaya) Berhad | | 1,100 | | 489 | |
| | Merge Housing Berhad | | 58,952 | | 13,035 | |
| | Metro Kajang Holdings Berhad | | 535,333 | | 124,044 | |
* | | Metroplex Berhad | | 817,000 | | 12,375 | |
| | Mieco Chipboard Berhad | | 732,600 | | 207,960 | |
| | MK Land Holdings Berhad | | 3,938,100 | | 701,057 | |
| | MMC Corp. Berhad | | 6,727,400 | | 6,187,555 | |
| | MTD Infraperdana Berhad | | 5,891,300 | | 1,656,560 | |
| | Muda Holdings Berhad | | 706,000 | | 69,247 | |
| | Muhibbah Engineering Berhad | | 852,000 | | 328,655 | |
* | | MUI Properties Berhad | | 1,314,000 | | 101,511 | |
* | | Mulpha International Berhad | | 9,460,400 | | 3,051,865 | |
* | | Multi-Purpose Holdings Berhad | | 1,974,000 | | 465,569 | |
| | Mutiara Goodyear Development Berhad | | 247,900 | | 28,033 | |
| | MWE Holdings Berhad | | 458,000 | | 80,817 | |
| | Mycron Steel Berhad | | 119,750 | | 24,790 | |
| | Naluri Berhad | | 2,430,100 | | 354,896 | |
* | | Nam Fatt Berhad | | 286,100 | | 29,617 | |
| | Narra Industries Berhad | | 154,200 | | 55,286 | |
| | NCB Holdings Berhad | | 2,363,700 | | 1,726,140 | |
| | Negri Sembilan Oil Palms Berhad | | 167,600 | | 124,477 | |
| | New Straits Times Press (Malaysia) Berhad | | 1,185,400 | | 543,246 | |
| | Nylex (Malaysia) Berhad | | 307,250 | | 85,514 | |
| | Oriental Holdings Berhad | | 2,837,416 | | 3,047,572 | |
| | Oriental Interest Berhad | | 170,000 | | 62,395 | |
| | OSK Holdings Berhad | | 4,153,818 | | 1,406,581 | |
| | OSK Property Holdings Berhad | | 186,678 | | 64,005 | |
| | P.I.E. Industrial Berhad | | 254,300 | | 168,107 | |
| | Pacific & Orient Berhad | | 253,169 | | 124,115 | |
* | | Pacificmas Berhad | | 55,900 | | 93,722 | |
* | | Pan Malaysia Cement Works Berhad | | 1,271,800 | | 135,051 | |
| | Panasonic Manufacturing Malaysia Berhad | | 294,980 | | 768,420 | |
* | | Paracorp Berhad | | 252,000 | | 4,356 | |
| | Paramount Corp. Berhad | | 203,900 | | 120,194 | |
12
| | PBA Holdings Berhad | | 1,502,500 | | $ | 538,435 | |
| | Petaling Garden Berhad | | 871,000 | | 376,500 | |
| | Petronas Dagangan Berhad | | 332,800 | | 374,446 | |
* | | Pilecom Engineering Berhad | | 105,000 | | 2,458 | |
| | PJ Development Holdings Berhad | | 1,043,900 | | 120,979 | |
| | PK Resources Berhad | | 25,000 | | 3,646 | |
| | Pos Malaysia & Services Holdings Berhad | | 2,929,100 | | 3,470,270 | |
| | PPB Group Berhad | | 6,613,166 | | 7,541,927 | |
* | | Premium Nutrients Berhad | | 513,100 | | 29,876 | |
* | | Prime Utilities Berhad | | 46,000 | | 5,102 | |
* | | Promet Berhad | | 140,000 | | 0 | |
| | Proton Holdings Berhad | | 2,887,500 | | 4,613,687 | |
| | Pulai Springs Berhad | | 159,800 | | 59,882 | |
| | Ranhill Berhad | | 3,302,600 | | 1,223,001 | |
* | | RB Land Holdings Berhad | | 327,900 | | 50,716 | |
* | | RHB Capital Berhad | | 11,729,900 | | 8,118,208 | |
| | Road Builders (Malaysia) Holdings Berhad | | 4,667,400 | | 2,845,571 | |
* | | Salcon Berhad | | 287,000 | | 39,580 | |
| | Sapura Resources Berhad | | 286,800 | | 28,147 | |
| | Sapura Telecommunications Berhad | | 155,152 | | 35,135 | |
| | Sarawak Enterprise Corp. Berhad | | 4,271,000 | | 1,449,026 | |
| | Sarawak Oil Palms Berhad | | 139,500 | | 72,670 | |
| | Scientex, Inc. Berhad | | 116,000 | | 87,848 | |
| | Selangor Dredging Berhad | | 619,000 | | 65,843 | |
| | Shangri-La Hotels (Malaysia) Berhad | | 706,000 | | 286,152 | |
| | SHL Consolidated Berhad | | 943,700 | | 298,661 | |
* | | Silverstone Corp. Berhad | | 8,690 | | 383 | |
| | Sime Darby Berhad | | 355,980 | | 583,720 | |
* | | Sime Engineering Services Berhad | | 222,000 | | 72,293 | |
* | | South East Asia Lumber, Inc. Berhad | | 228,800 | | 20,179 | |
| | Southern Acids (Malaysia) Berhad | | 44,000 | | 20,225 | |
| | Southern Bank Berhad (Foreign) | | 1,854,950 | | 2,172,214 | |
| | Southern Steel Berhad | | 689,100 | | 188,288 | |
| | Store Corp. Berhad | | 124,630 | | 96,304 | |
| | Subur Tiasa Holdings Berhad | | 438,600 | | 387,104 | |
* | | Sumatec Resources Berhad | | 921,700 | | 198,370 | |
| | Sunrise Berhad | | 2,806,300 | | 1,276,572 | |
| | Sunway City Berhad | | 2,117,100 | | 1,051,785 | |
| | Sunway Holdings, Inc. Berhad | | 3,973,600 | | 515,575 | |
| | Suria Capital Holdings Berhad | | 1,181,600 | | 159,674 | |
| | TA Enterprise Berhad | | 8,319,300 | | 1,664,999 | |
* | | Talam Corp. Berhad | | 139,050 | | 7,506 | |
* | | Tamco Corp. Holdings Berhad | | 219,500 | | 16,627 | |
| | Tan Chong Motor Holdings Berhad | | 3,790,700 | | 1,555,493 | |
| | Tekala Corp. Berhad | | 337,700 | | 81,917 | |
| | TH Group Berhad | | 1,014,100 | | 156,794 | |
* | | Time Dotcom Berhad | | 8,911,700 | | 1,640,153 | |
| | Tiong Nam Transport Holdings Berhad | | 171,500 | | 29,887 | |
| | Tradewinds (Malaysia) Berhad | | 782,900 | | 550,526 | |
* | | Tradewinds Corp. Berhad | | 4,784,300 | | 928,427 | |
| | Tradewinds Plantation Berhad | | 464,000 | | 210,851 | |
* | | Trengganu Development & Management Berhad | | 534,400 | | 105,927 | |
| | Tronoh Mines Malaysia Berhad | | 508,500 | | 582,961 | |
| | UAC Berhad | | 49,800 | | 64,415 | |
13
| | UDA Holdings Berhad | | 1,642,300 | | $ | 963,844 | |
| | UEM World Berhad | | 5,673,800 | | 2,755,732 | |
| | UMW Holdings Berhad | | 3,008,943 | | 6,136,595 | |
| | Unico-Desa Plantations Berhad | | 4,007,420 | | 546,602 | |
| | Unisem (M) Berhad | | 2,969,100 | | 1,228,751 | |
| | United Malacca Rubber Estates Berhad | | 369,400 | | 456,177 | |
| | United Plantations Berhad | | 821,200 | | 1,719,450 | |
* | | Utama Banking Group Berhad | | 955,000 | | 170,587 | |
| | VS Industry Berhad | | 503,800 | | 201,230 | |
| | Warisan TC Holdings Berhad | | 109,850 | | 51,184 | |
| | Worldwide Holdings Berhad | | 515,700 | | 277,288 | |
| | WTK Holdings Berhad | | 820,300 | | 926,364 | |
| | Yeo Hiap Seng (Malaysia) Berhad | | 296,100 | | 163,086 | |
| | YTL Corp. Berhad | | 3,174,200 | | 4,371,191 | |
| | Yu Neh Huat Berhad | | 748,600 | | 259,959 | |
TOTAL COMMON STOCKS | | | | 199,000,291 | |
| | | | | | | |
| | | | | | | |
PREFERRED STOCKS — (0.0%) | | | | | |
* | | Malayan United Industries Berhad A1 08/03/13 | | 1,526,067 | | 42,029 | |
* | | Malayan United Industries Berhad A2 08/03/13 | | 1,526,067 | | 37,826 | |
TOTAL PREFERRED STOCKS | | | | 79,855 | |
| | | | | | | |
| | | | | | | |
RIGHTS/WARRANTS — (0.0%) | | | | | |
* | | Melewar Industrial Group Berhad Warrants 06/14/10 | | 95,800 | | 5,277 | |
* | | Mieco Chipboard Berhad Warrants 04/21/09 | | 76,000 | | 6,489 | |
* | | Sarawak Oil Palms Berhad Warrants 01/19/11 | | 23,250 | | 3,586 | |
TOTAL RIGHTS/WARRANTS | | | | 15,352 | |
| | | | | | | |
TOTAL — MALAYSIA | | | | 199,095,498 | |
| | | | | | | |
MEXICO — (7.0%) | | | | | |
COMMON STOCKS — (7.0%) | | | | | |
| | Alfa S.A. de C.V. Series A | | 5,405,364 | | 24,779,946 | |
* | | Cintra S.A. de C.V. | | 85,000 | | 26,377 | |
* | | Consorcio Hogar S.A. de C.V. Series B | | 540,200 | | 224,786 | |
| | Controladora Comercial Mexicana S.A. de C.V. Series B | | 7,880,200 | | 12,331,266 | |
* | | Corporacion Interamericana de Entramiento S.A. de C.V. Series B | | 1,671,586 | | 3,091,764 | |
| | Corporacion Mexicana de Restaurantes S.A. de C.V. Series B | | 3,689 | | 846 | |
| | Corporativo Fragua S.A. de C.V. Series B | | 70 | | 370 | |
* | | Desc S.A. de C.V. Series B | | 1,747,367 | | 1,647,544 | |
| | El Puerto de Liverpool S.A. de C.V. Series 1 | | 20,000 | | 44,080 | |
| | El Puerto de Liverpool S.A. de C.V. Series C1 | | 328,600 | | 724,235 | |
| | Embotelladora Arca S.A. de C.V., Mexico | | 458,003 | | 1,122,497 | |
* | | Empaques Ponderosa S.A. de C.V. Series B | | 90,000 | | 7,141 | |
* | | Empresas ICA S.A. de C.V | | 3,228,700 | | 10,389,452 | |
* | | Fomento Economico Mexicano S.A. de C.V. Series B & D | | 488,000 | | 4,187,344 | |
| | Gruma S.A. de C.V. Series B | | 3,347,050 | | 8,344,757 | |
| | Grupo Aeroporturio del Sureste S.A. de C.V. | | 92,600 | | 313,565 | |
| | Grupo Carso S.A. de C.V. Series A-1 | | 13,173,051 | | 27,639,832 | |
| | Grupo Cementos de Chihuahua S.A. de C.V. | | 2,692,992 | | 8,653,756 | |
| | Grupo Continental S.A. de C.V. | | 1,444,500 | | 2,349,557 | |
| | Grupo Corvi S.A. de C.V. Series L | | 284,000 | | 79,619 | |
14
| | Grupo Financiero Inbursa S.A. de C.V. Series O | | 6,727,615 | | $ | 9,667,647 | |
* | | Grupo Gigante S.A. de C.V. Series B | | 324,076 | | 174,566 | |
* | | Grupo Herdez S.A. de C.V. | | 319,000 | | 222,453 | |
| | Grupo Industrial Maseca S.A. de C.V. Series B | | 2,771,700 | | 1,527,208 | |
* | | Grupo Industrial Saltillo S.A. de C.V. | | 1,246,869 | | 1,198,173 | |
* | | Grupo Iusacell S.A. de C.V. | | 143,500 | | 506,039 | |
* | | Grupo Nutrisa S.A. de C.V. | | 428 | | 377 | |
| | Grupo Posadas S.A. de C.V. Series L | | 356,000 | | 272,893 | |
* | | Grupo Qumma S.A. de C.V. Series B | | 5,301 | | 84 | |
* | | Impulsora del Desarrollo Economico de America Latina S.A. de C.V. | | 6,727,615 | | 5,160,033 | |
| | Industrias Bachoco S.A. de C.V. (Certificate Representing Series B and Series L) | | 411,800 | | 1,365,043 | |
| | Industrias Penoles S.A. de C.V. | | 1,277,400 | | 8,671,410 | |
* | | Industrias S.A. de C.V. Series B | | 3,182,752 | | 8,030,535 | |
* | | Jugos del Valle S.A. de C.V. Series B | | 213,600 | | 442,528 | |
| | Nueva Grupo Mexico S.A. de C.V. Series B | | 21,343,635 | | 60,589,354 | |
| | Organizacion Soriana S.A. de C.V. Series B | | 5,249,700 | | 22,677,889 | |
* | | Promotora y Operadora de Infraestructura S.A. de C.V. | | 152,065 | | 118,644 | |
* | | Sanluis Corporacion S.A. de C.V. Series A | | 2,400 | | 952 | |
* | | Sanluis Corporacion S.A. de C.V. Series C & Series B | | 3,376 | | 1,515 | |
* | | Savia S.A. de C.V. | | 3,457,285 | | 243,836 | |
* | | US Commercial Corp. S.A. de C.V. | | 271,000 | | 63,312 | |
| | Vitro S.A. de C.V. | | 2,699,100 | | 2,093,986 | |
| | | | | | | |
TOTAL — MEXICO | | | | 228,987,211 | |
| | | | | | | |
PHILIPPINES — (1.3%) | | | | | |
COMMON STOCKS — (1.3%) | | | | | |
| | Aboitiz Equity Ventures, Inc. | | 5,782,000 | | 636,011 | |
| | Alaska Milk Corp. | | 7,953,000 | | 468,063 | |
* | | Alsons Consolidated Resources, Inc. | | 16,904,000 | | 171,214 | |
* | | Bacnotan Consolidated Industries, Inc. | | 1,696,970 | | 304,609 | |
* | | Belle Corp. | | 30,800,000 | | 681,853 | |
* | | Cebu Holdings, Inc. | | 7,763,250 | | 319,497 | |
* | | Digital Telecommunications (Philippines), Inc. | | 131,630,000 | | 3,194,911 | |
* | | DMCI Holdings, Inc. | | 1,226,000 | | 89,781 | |
* | | Equitable PCI Bank, Inc. | | 2,841,900 | | 3,920,797 | |
* | | Export & Industry Bank, Inc. | | 14,950 | | 116 | |
* | | Fil-Estate Land, Inc. | | 3,196,340 | | 31,753 | |
* | | Filinvest Development Corp. | | 5,283,500 | | 326,700 | |
* | | Filinvest Land, Inc. | | 189,880,125 | | 5,059,735 | |
* | | Filipina Water Bottling Corp. | | 5,471,786 | | 0 | |
| | First Philippines Holdings Corp. | | 887,600 | | 791,599 | |
* | | Kuok Philippine Properties, Inc. | | 4,300,000 | | 16,898 | |
| | Megaworld Properties & Holdings, Inc. | | 215,844,000 | | 6,384,840 | |
| | Metro Bank and Trust Co. | | 1,511,220 | | 1,032,576 | |
* | | Mondragon International Philippines, Inc. | | 2,464,000 | | 5,822 | |
| | Petron Corp. | | 15,160,000 | | 1,221,381 | |
* | | Philippine National Bank | | 3,619,900 | | 2,337,364 | |
* | | Philippine National Construction Corp. | | 398,900 | | 19,227 | |
* | | Philippine Realty & Holdings Corp. | | 20,930,000 | | 115,148 | |
| | Philippine Savings Bank | | 1,232,313 | | 923,326 | |
* | | Prime Media Holdings, Inc. | | 409,000 | | 8,040 | |
* | | Prime Orion Philippines, Inc. | | 14,400,000 | | 49,370 | |
* | | RFM Corp. | | 2,488,200 | | 32,641 | |
15
| | Robinson’s Land Corp. Series B | | 16,019,000 | | $ | 3,341,962 | |
| | Security Bank Corp. | | 2,713,200 | | 2,545,153 | |
| | SM Development Corp. | | 21,996,400 | | 686,197 | |
* | | Solid Group, Inc. | | 19,668,000 | | 205,176 | |
| | Soriano (A.) Corp. | | 20,195,000 | | 1,358,595 | |
| | Union Bank of the Philippines | | 547,400 | | 489,419 | |
| | Universal Robina Corp. | | 18,561,345 | | 6,604,547 | |
| | | | | | | |
TOTAL — PHILIPPINES | | | | 43,374,321 | |
| | | | | | | |
POLAND — (3.6%) | | | | | |
COMMON STOCKS — (3.6%) | | | | | |
| | Agora SA | | 253,557 | | 3,103,467 | |
* | | Amica Wronki SA | | 174,355 | | 1,181,307 | |
* | | Bank Millennium SA | | 6,521,691 | | 12,051,242 | |
| | Bank Przemyslowo Handlowy BPH SA | | 9,050 | | 2,030,321 | |
* | | Budimex SA | | 127,353 | | 2,110,709 | |
| | Debica SA | | 78,669 | | 1,506,700 | |
* | | Echo Investment SA | | 16,115 | | 1,272,317 | |
* | | Elektrobudowa SA | | 31,748 | | 532,235 | |
| | Fabryki Mebli Forte SA | | 63,159 | | 281,357 | |
| | Grupa Kety SA | | 45,647 | | 1,871,286 | |
* | | Huta Ferrum SA | | 4,233 | | 17,396 | |
| | Impexmetal SA | | 241,068 | | 10,123,219 | |
* | | Kredyt Bank SA | | 65,207 | | 318,353 | |
* | | Kroscienskie Huty Szkla Krosno SA | | 55,675 | | 123,443 | |
| | Lentex SA | | 79,285 | | 970,104 | |
* | | Mostostal Export SA | | 654,595 | | 479,274 | |
* | | Mostostal Warszawa SA | | 366,600 | | 2,024,285 | |
* | | Mostostal Zabrze Holding SA | | 140,376 | | 109,181 | |
| | Netia Holdings SA | | 3,117,643 | | 4,617,699 | |
| | Orbis SA | | 668,253 | | 9,386,590 | |
| | Polski Koncern Naftowy Orlen SA | | 3,223,851 | | 56,663,474 | |
| | Prokom Software SA | | 63,131 | | 2,586,275 | |
* | | Prosper SA | | 27,066 | | 144,578 | |
* | | Raciborska Fabryka Kotlow SA | | 291,972 | | 2,438,908 | |
* | | Stalexport SA | | 460,000 | | 358,173 | |
| | | | | | | |
TOTAL — POLAND | | | | 116,301,893 | |
| | | | | | | |
SOUTH AFRICA — (11.4%) | | | | | |
COMMON STOCKS — (11.4%) | | | | | |
| | ABSA Group, Ltd. | | 898,244 | | 14,827,803 | |
| | Advtech, Ltd. | | 620,958 | | 226,052 | |
| | Aeci, Ltd. | | 367,392 | | 3,187,435 | |
| | Afgri, Ltd. | | 1,376,115 | | 1,259,026 | |
* | | African Rainbow Minerals, Ltd. | | 1,038,945 | | 7,545,490 | |
| | AG Industries, Ltd. | | 600,361 | | 313,973 | |
| | Alexander Forbes, Ltd. | | 967,266 | | 2,016,912 | |
| | Allied Electronics Corp., Ltd. | | 401,440 | | 1,737,808 | |
| | Argent Industrial, Ltd. | | 224,277 | | 440,119 | |
* | | AST Group, Ltd. | | 740,636 | | 60,645 | |
| | Aveng, Ltd. | | 1,612,611 | | 5,282,907 | |
| | AVI, Ltd. | | 1,065,161 | | 2,445,807 | |
16
| | Barloworld, Ltd. | | 1,101,191 | | $ | 18,688,652 | |
* | | Bell Equipment, Ltd. | | 356,731 | | 619,947 | |
| | Business Connexion Group | | 465,381 | | 573,519 | |
| | Bytes Technology Group, Ltd. | | 314,654 | | 571,156 | |
| | Capitec Bank Holdings, Ltd. | | 171,133 | | 792,230 | |
| | Caxton & CTP Publishers & Printers, Ltd. | | 1,693,506 | | 3,640,039 | |
| | City Lodge Hotels, Ltd. | | 21,170 | | 163,535 | |
* | | Corpgro, Ltd. | | 579,166 | | 0 | |
| | Datacentrix Holdings, Ltd. | | 384,616 | | 174,199 | |
* | | Datatec, Ltd. | | 859,022 | | 3,827,583 | |
| | Delta Electrical Industries, Ltd. | | 185,990 | | 511,230 | |
* | | Dimension Data Holdings PLC | | 3,977,377 | | 3,133,375 | |
| | Distell Group, Ltd. | | 668,065 | | 3,525,745 | |
| | Dorbyl, Ltd. | | 105,718 | | 205,189 | |
| | Ellerine Holdings, Ltd. | | 605,945 | | 7,384,188 | |
| | Enviroserv Holdings, Ltd. | | 259,484 | | 238,379 | |
| | Gold Reef Casino Resorts, Ltd. | | 344,218 | | 752,792 | |
| | Group Five, Ltd. | | 258,794 | | 1,094,937 | |
* | | Harmony Gold Mining Co., Ltd. | | 1,528,002 | | 21,712,855 | |
| | Highveld Steel & Vanadilum Corp., Ltd. | | 268,788 | | 2,876,699 | |
| | Hudaco Industries, Ltd. | | 115,536 | | 755,926 | |
| | Iliad Africa, Ltd. | | 76,658 | | 136,768 | |
| | Illovo Sugar, Ltd. | | 1,015,749 | | 3,021,297 | |
| | Imperial Holdings, Ltd. | | 349,923 | | 7,483,135 | |
| | Investec, Ltd. | | 199,533 | | 10,193,019 | |
* | | JCI, Ltd. | | 4,289,448 | | 101,883 | |
| | JD Group, Ltd. | | 253,440 | | 2,976,869 | |
| | Johnic Communications, Ltd. | | 391,810 | | 3,372,701 | |
| | Liberty Group, Ltd. | | 1,494,978 | | 17,125,522 | |
* | | M Cubed Holdings, Ltd. | | 1,850,526 | | 101,616 | |
| | Medi-Clinic Corp., Ltd. | | 1,225,730 | | 3,550,566 | |
| | Metair Investment, Ltd. | | 25,609 | | 873,391 | |
* | | Metorex, Ltd. | | 610,501 | | 930,255 | |
| | Metropolitan Holdings, Ltd. | | 3,345,387 | | 6,246,432 | |
| | Mittal Steel South Africa, Ltd. | | 2,388,294 | | 22,335,659 | |
| | Murray & Roberts Holdings, Ltd. | | 1,024,849 | | 3,732,221 | |
| | Mvelaphanda Group, Ltd. | | 533,601 | | 670,224 | |
| | Nampak, Ltd. | | 2,316,402 | | 5,968,147 | |
| | Nedbank Group, Ltd. | | 2,021,460 | | 34,587,131 | |
| | New Clicks Holdings, Ltd. | | 1,571,547 | | 2,193,799 | |
* | | New Corpcapital, Ltd. | | 579,166 | | 18,886 | |
| | Northam Platinum, Ltd. | | 830,061 | | 4,526,117 | |
| | Nu-World Holdings, Ltd. | | 82,218 | | 427,426 | |
| | Oceana Group, Ltd. | | 407,669 | | 938,559 | |
| | Old Mutual PLC | | 10,274,412 | | 31,941,146 | |
| | Omnia Holdings, Ltd. | | 143,874 | | 951,071 | |
* | | Palabora Mining Co., Ltd. | | 69,265 | | 421,093 | |
| | Peregrine Holdings, Ltd. | | 770,533 | | 1,029,917 | |
| | Prism Holdings, Ltd. | | 458,100 | | 77,063 | |
| | PSG Group, Ltd. | | 278,342 | | 793,304 | |
| | Rainbow Chicken, Ltd. | | 1,113,475 | | 1,683,059 | |
* | | Randgold & Exploration Co., Ltd. | | 256,811 | | 339,301 | |
| | Redefine Income Fund, Ltd. | | 83,325 | | 71,724 | |
| | Sanlam, Ltd. | | 10,756,714 | | 24,473,035 | |
17
| | Santam, Ltd. | | 476,930 | | $ | 5,218,786 | |
| | Sappi, Ltd. | | 1,124,613 | | 13,963,400 | |
| | Steinhoff International Holdings, Ltd. | | 4,600,555 | | 14,672,577 | |
| | Sun International, Ltd. | | 190,655 | | 2,414,696 | |
| | Super Group, Ltd. | | 632,656 | | 1,023,725 | |
| | Telkom South Africa, Ltd. | | 770,894 | | 16,392,966 | |
| | Tiger Wheels, Ltd. | | 264,796 | | 869,079 | |
| | Tongaat-Hulett Group, Ltd. | | 538,741 | | 7,364,392 | |
| | Trans Hex Group, Ltd. | | 326,518 | | 512,079 | |
| | Trencor, Ltd. | | 666,282 | | 2,567,584 | |
| | UCS Group, Ltd. | | 887,793 | | 277,138 | |
| | Unitrans, Ltd. | | 165,695 | | 1,033,268 | |
| | Value Group, Ltd. | | 623,403 | | 296,672 | |
* | | Western Areas, Ltd. | | 424,500 | | 2,636,311 | |
| | | | | | | |
TOTAL — SOUTH AFRICA | | | | 373,121,161 | |
| | | | | | | |
SOUTH KOREA — (12.4%) | | | | | |
COMMON STOCKS — (12.4%) | | | | | |
| | Aekyung Petrochemical Co., Ltd. | | 10,140 | | 161,640 | |
* | | Anam Electronics Co., Ltd. | | 15,060 | | 45,487 | |
| | Asia Cement Manufacturing Co., Ltd. | | 10,728 | | 445,925 | |
* | | Asia Paper Manufacturing Co., Ltd. | | 11,450 | | 99,374 | |
| | AUK Corp. | | 40,090 | | 105,363 | |
| | Baiksan Co., Ltd. | | 41,550 | | 67,302 | |
* | | Bohae Brewery Co., Ltd. | | 4,010 | | 106,102 | |
* | | Bong Shin Co., Ltd. | | 37,790 | | 99,159 | |
| | Boo Kook Securities Co., Ltd. | | 17,385 | | 256,809 | |
* | | Boryung Pharmaceutical Co., Ltd. | | 6,010 | | 211,498 | |
| | BYC Co., Ltd. | | 810 | | 107,013 | |
* | | Byuck San Corp. | | 10,472 | | 149,451 | |
| | Byuck San Engineering and Construction Co., Ltd. | | 87,860 | | 675,046 | |
* | | Cambridge Members Co., Ltd. | | 5,780 | | 102,129 | |
| | Capro Corp. | | 82,410 | | 188,734 | |
| | Cheil Industrial, Inc. | | 95,804 | | 3,365,514 | |
* | | Cho Kwang Leather Co., Ltd. | | 13,660 | | 72,458 | |
* | | Cho Kwang Paint Co., Ltd. | | 24,260 | | 73,225 | |
| | Choil Aluminum Manufacturing Co., Ltd. | | 13,190 | | 109,154 | |
| | Chon Bang Co., Ltd. | | 2,520 | | 83,985 | |
| | Chosun Refractories Co., Ltd. | | 7,370 | | 386,068 | |
| | CJ Corp. | | 1,367 | | 157,871 | |
* | | CKD Bio Corp. | | 9,469 | | 49,525 | |
* | | Comtec Systems Co., Ltd. | | 75,460 | | 78,510 | |
* | | Cosmochemical Co., Ltd. | | 21,790 | | 84,430 | |
| | D.I Corp. | | 65,430 | | 128,044 | |
| | Dacom Corp. | | 63,060 | | 1,119,851 | |
| | Dae Chang Industrial Co. | | 6,170 | | 38,186 | |
| | Dae Dong Industrial Co., Ltd. | | 9,670 | | 110,054 | |
* | | Dae Hyun Co., Ltd. | | 95,610 | | 112,356 | |
* | | Dae Sang Corp. | | 52,594 | | 815,857 | |
| | Dae Won Kang Up Co., Ltd. | | 13,100 | | 258,305 | |
* | | Dae Young Packaging Co., Ltd. | | 356,210 | | 62,024 | |
* | | Dae Yu Co., Ltd. | | 25,070 | | 47,987 | |
| | Daeduck Electronics Co., Ltd. | | 58,160 | | 498,006 | |
18
| | Daeduck Industries Co., Ltd. | | 44,490 | | $ | 423,156 | |
| | Daegu Bank Co., Ltd. | | 193,922 | | 3,177,639 | |
| | Daehan Fire & Marine Insurance Co, Ltd. | | 63,050 | | 124,141 | |
| | Daehan Flour Mills Co., Ltd. | | 3,075 | | 426,985 | |
* | | Daehan Pulp Co., Ltd. | | 37,630 | | 166,601 | |
| | Daehan Synthetic Fiber Co., Ltd. | | 2,000 | | 174,389 | |
* | | Daekyung Machinery & Engineering Co., Ltd. | | 11,150 | | 133,071 | |
| | Daelim Industrial Co., Ltd. | | 70,240 | | 5,093,164 | |
| | Daelim Trading Co., Ltd. | | 42,312 | | 216,081 | |
* | | Daesang Farmsco | | 42,230 | | 94,644 | |
* | | Daesang Holdings Co., Ltd. | | 33,096 | | 171,692 | |
| | Daesung Industrial Co., Ltd. | | 9,730 | | 661,801 | |
* | | Daewon Pharmaceutical Co., Ltd. | | 12,880 | | 100,245 | |
* | | Daewoo Electronic Components Co., Ltd. | | 565 | | 29,932 | |
| | Daewoo Engineering & Construction Co., Ltd. | | 819,780 | | 11,918,650 | |
| | Daewoo Motor Sales Corp. | | 61,560 | | 1,417,633 | |
| | Daewoong Co., Ltd. | | 12,340 | | 224,362 | |
| | Dahaam E-Tec Co., Ltd. | | 5,985 | | 163,843 | |
| | Daishin Securities Co., Ltd. | | 103,481 | | 1,942,892 | |
| | Daiyang Metal Co., Ltd. | | 40,000 | | 51,412 | |
* | | Daou Technology, Inc. | | 93,660 | | 608,858 | |
| | DC Chemical Co., Ltd. | | 38,990 | | 1,455,773 | |
* | | Digital Power Communications Co., Ltd. | | 77,520 | | 88,790 | |
| | Dong Ah Tire Industrial Co., Ltd. | | 51,594 | | 314,772 | |
* | | Dong Hai Pulp Co., Ltd. | | 14,310 | | 36,089 | |
| | Dong IL Rubber Belt Co., Ltd. | | 24,560 | | 70,986 | |
| | Dong Wha Pharmaceutical Industries Co. | | 5,167 | | 148,567 | |
* | | Dong Won Co., Ltd. | | 5,520 | | 55,944 | |
| | Dong Yang Department Store Co., Ltd. | | 9,000 | | 158,057 | |
* | | Dongbang Agro Co., Ltd. | | 25,810 | | 99,213 | |
* | | Dongbang Transport Logistics Co., Ltd. | | 7,580 | | 129,160 | |
| | Dongbu Corp. | | 46,410 | | 938,928 | |
| | Dongbu Hannong Chemical Co., Ltd. | | 14,890 | | 346,226 | |
| | Dongbu Securities Co., Ltd. | | 23,142 | | 234,119 | |
| | Dongbu Steel Co., Ltd. | | 56,208 | | 464,023 | |
* | | DongbuElectronics Co., Ltd. | | 625,615 | | 1,311,893 | |
| | Dong-Il Corp. | | 4,310 | | 272,293 | |
| | Dongkook Industries Co., Ltd. | | 1,620 | | 11,153 | |
| | Dongkuk Steel Mill Co., Ltd. | | 155,862 | | 2,733,157 | |
| | Dongsu Industrial Co., Ltd. | | 16,170 | | 386,010 | |
| | Dongsung Chemical Co., Ltd. | | 9,530 | | 79,230 | |
* | | Dongsung Pharmaceutical Co., Ltd. | | 6,400 | | 49,672 | |
| | Dongwon F&B Co., Ltd. | | 6,666 | | 420,937 | |
| | Dongwon Industries Co., Ltd. | | 7,116 | | 211,016 | |
| | Dongyang Engineering & Construction Corp. | | 5,077 | | 231,550 | |
| | Dongyang Express Bus Corp. | | 1,522 | | 24,022 | |
| | Dongyang Mechatronics Corp. | | 35,960 | | 136,150 | |
* | | Doosan Corp. | | 47,020 | | 1,466,967 | |
| | Doosan Heavy Industries & Construction Co., Ltd. | | 400,500 | | 12,321,974 | |
* | | Doosan Industrial Development Co., Ltd. | | 193,240 | | 1,899,238 | |
| | DPI Co., Ltd. | | 41,490 | | 363,234 | |
| | Duck Yang Industry Co., Ltd. | | 4,000 | | 37,828 | |
* | | Ducsung Co., Ltd. | | 31,950 | | 149,515 | |
* | | Eagon Industrial Co., Ltd. | | 8,620 | | 142,637 | |
19
* | | Enex Co., Ltd. | | 5,960 | | $ 43,902 | |
| | F&F Co., Ltd. | | 32,520 | | 156,057 | |
* | | First Fire & Marine Insurance Co., Ltd. | | 56,480 | | 232,803 | |
| | Fursys, Inc. | | 24,120 | | 780,550 | |
| | Gaon Cable Co., Ltd. | | 7,950 | | 146,694 | |
| | Global & Yuasa Battery Co., Ltd. | | 11,600 | | 72,271 | |
| | Green Cross Corp. | | 10,540 | | 632,774 | |
| | GS Engineering & Construction Corp. | | 104,882 | | 7,360,243 | |
| | GS Holdings Corp. | | 157,000 | | 4,670,519 | |
* | | H.S. Industries Co., Ltd. | | 5,690 | | 49,540 | |
| | Hae In Co., Ltd. | | 23,550 | | 89,826 | |
| | Halla Engineering & Construction Corp. | | 18,270 | | 488,932 | |
| | Han Kuk Carbon Co., Ltd. | | 25,070 | | 138,862 | |
| | Han Wha Corp. | | 146,740 | | 3,915,375 | |
| | Han Yang Securities Co., Ltd. | | 24,940 | | 216,746 | |
| | Hana Securities Co., Ltd. | | 40,790 | | 576,193 | |
| | Handok Pharmaceuticals Co., Ltd. | | 18,150 | | 259,120 | |
| | Handsome Corp. | | 35,380 | | 632,072 | |
| | Hanil Cement Manufacturing Co., Ltd. | | 18,013 | | 1,281,829 | |
* | | Hanil Construction Co., Ltd. | | 15,060 | | 222,072 | |
| | Hanil E-Wha Co., Ltd. | | 79,730 | | 166,565 | |
| | Hanil Iron & Steel Co., Ltd. | | 1,815 | | 35,185 | |
| | Hanjin Heavy Industry Co., Ltd. | | 165,520 | | 4,441,605 | |
| | Hanjin Shipping Co., Ltd. | | 77,100 | | 1,865,363 | |
| | Hanjin Transportation Co., Ltd. | | 23,460 | | 682,129 | |
| | Hankook Cosmetics Co., Ltd. | | 30,000 | | 77,943 | |
| | Hankook Tire Manufacturing Co., Ltd. | | 150,550 | | 2,029,904 | |
| | Hankuk Electric Glass Co., Ltd. | | 23,010 | | 623,269 | |
| | Hankuk Glass Industries, Inc. | | 22,200 | | 757,226 | |
| | Hankuk Paper Manufacturing Co., Ltd. | | 9,800 | | 331,776 | |
* | | Hanmi Capital Co., Ltd. | | 33,570 | | 290,496 | |
| | Hansae Co., Ltd. | | 4,389 | | 82,718 | |
| | Hansol Chemical Co., Ltd. | | 21,407 | | 181,122 | |
| | Hansol Paper Co., Ltd. | | 102,044 | | 1,154,210 | |
| | Hanssem Co., Ltd. | | 49,690 | | 417,681 | |
* | | Hansung Enterprise Co., Ltd. | | 9,410 | | 51,032 | |
| | Hanwha Chemical Corp. | | 246,060 | | 2,571,703 | |
| | Hanwha Securities Co., Ltd. | | 78,810 | | 681,618 | |
| | Histeel Co., Ltd. | | 1,188 | | 16,879 | |
* | | Hi-Tron Systems, Inc. | | 11,660 | | 52,483 | |
| | Honam Petrochemical Corp. | | 25,470 | | 1,316,933 | |
| | Hotel Shilla, Ltd. | | 111,810 | | 1,816,668 | |
�� | | HS R&A Co., Ltd. | | 12,680 | | 178,384 | |
| | Huchems Fine Chemical Corp. | | 45,340 | | 370,788 | |
* | | Huneed Technologies Co., Ltd. | | 90,030 | | 83,340 | |
| | Husteel Co., Ltd. | | 14,260 | | 178,600 | |
| | Hwa Sung Industrial Co. | | 26,510 | | 356,768 | |
* | | Hwacheon Machinery Works Co., Ltd. | | 4,490 | | 73,198 | |
| | Hwashin Co., Ltd. | | 59,700 | | 169,569 | |
* | | Hyosung T & C Co., Ltd. | | 72,817 | | 1,247,428 | |
| | Hyundai Cement Co., Ltd. | | 15,435 | | 511,362 | |
| | Hyundai Department Store H & S Co., Ltd. | | 11,372 | | 792,023 | |
| | Hyundai Heavy Industries Co., Ltd. | | 189,160 | | 19,233,901 | |
| | Hyundai Hysco | | 170,820 | | 2,083,171 | |
20
| | Hyundai Merchant Marine Co., Ltd. | | 193,270 | | $ 3,926,530 | |
| | Hyundai Motor Co., Ltd. | | 446,030 | | 34,460,404 | |
| | Hyundai Pharmaceutical Ind. Co., Ltd. | | 4,200 | | 103,331 | |
| | Hyundai Securities Co., Ltd. | | 249,730 | | 3,076,584 | |
| | Hyundai Steel Co. | | 235,930 | | 8,474,484 | |
| | Il Dong Pharmaceutical Co., Ltd. | | 5,840 | | 230,418 | |
* | | Il Sung Construction Co., Ltd. | | 7,660 | | 62,044 | |
| | Iljin Diamond Co., Ltd. | | 11,368 | | 214,284 | |
* | | Iljin Display Co., Ltd. | | 5,361 | | 72,518 | |
| | Iljin Electric, Ltd. | | 75,110 | | 236,833 | |
| | Ilshin Spinning Co., Ltd. | | 5,070 | | 210,318 | |
| | Ilsung Pharmaceutical Co., Ltd. | | 3,990 | | 250,141 | |
| | ISU Chemical Co., Ltd. | | 14,350 | | 121,370 | |
| | Isupetasys Co., Ltd. | | 62,960 | | 121,134 | |
| | Jahwa Electronics Co., Ltd. | | 37,560 | | 278,659 | |
* | | Jeil Mutual Savings Bank | | 14,870 | | 109,165 | |
| | Jeil Pharmaceutical Co. | | 22,200 | | 129,888 | |
| | Jeonbuk Bank, Ltd. | | 71,281 | | 623,567 | |
* | | Jindo Corp. | | 30,230 | | 126,712 | |
* | | Jinro, Ltd. | | 407 | | 19,367 | |
| | Joongang Construction Co., Ltd. | | 12,490 | | 221,215 | |
| | K.C. Tech Co., Ltd. | | 15,390 | | 61,331 | |
| | KCC Corp. | | 29,050 | | 6,622,687 | |
| | Keang Nam Enterprises Co., Ltd. | | 27,222 | | 302,709 | |
| | KEC Corp. | | 155,000 | | 268,149 | |
| | Keyang Electric Machinery Co., Ltd. | | 71,760 | | 131,634 | |
| | KG Chemical Corp. | | 18,233 | | 123,283 | |
| | Kia Motors Corp. | | 899,680 | | 15,321,959 | |
| | KISWIRE, Ltd. | | 21,294 | | 541,323 | |
| | Kodenshi Korea Corp. | | 59,410 | | 131,200 | |
* | | KOJE Co., Ltd. | | 9,110 | | 66,860 | |
| | Kolon Chemical Co., Ltd. | | 20,220 | | 272,789 | |
* | | Kolon Industries, Inc. | | 35,969 | | 414,402 | |
* | | Korea Automotive Systems Co., Ltd. | | 10,160 | | 210,507 | |
| | Korea Cast Iron Pipe Co., Ltd. | | 44,688 | | 168,282 | |
| | Korea Circuit Co. | | 31,660 | | 163,118 | |
* | | Korea Cottrell Co., Ltd. | | 2,040 | | 93,798 | |
* | | Korea Data Systems Co., Ltd. | | 32,660 | | 43,350 | |
| | Korea Development Co., Ltd. | | 23,520 | | 639,989 | |
| | Korea Development Leasing Corp. | | 6,348 | | 332,071 | |
| | Korea Electric Terminal Co., Ltd. | | 19,740 | | 302,065 | |
* | | Korea Fine Chemical Co., Ltd. | | 10,620 | | 148,878 | |
| | Korea Flange Co., Ltd. | | 10,290 | | 128,718 | |
| | Korea Investment Holdings Co., Ltd. | | 116,926 | | 3,903,387 | |
| | Korea Iron & Steel Co., Ltd. | | 25,230 | | 980,446 | |
| | Korea Komho Petrochemical Co., Ltd. | | 61,750 | | 1,833,774 | |
| | Korea Line Corp. | | 20,600 | | 571,349 | |
| | Korea Mutual Savings Bank | | 14,910 | | 263,579 | |
| | Korea Petrochemical Industry Co., Ltd. | | 12,300 | | 325,561 | |
| | Korea Polyol Co., Ltd. | | 11,768 | | 486,313 | |
| | Korea Zinc Co., Ltd. | | 52,610 | | 4,675,695 | |
| | Korean Air Co., Ltd. | | 203,658 | | 7,348,194 | |
| | Korean Air Terminal Service Co., Ltd. | | 6,450 | | 165,720 | |
* | | Korean French Banking Corp. | | 130,960 | | 192,529 | |
21
* | | KP Chemical Corp. | | 201,976 | | $ | 976,651 | |
| | KT Freetel, Ltd. | | 81,000 | | 2,890,089 | |
* | | KTB Network, Ltd. | | 135,720 | | 695,308 | |
| | Kukdo Chemical Co., Ltd. | | 8,710 | | 149,319 | |
| | Kumho Industrial Co., Ltd. | | 99,300 | | 2,285,344 | |
* | | Kumkang Industrial Co., Ltd. | | 11,170 | | 87,783 | |
| | Kunsul Chemical Industrial Co., Ltd. | | 12,700 | | 173,129 | |
| | Kwang Dong Pharmaceutical Co., Ltd. | | 114,660 | | 395,716 | |
* | | Kwang Myung Electric Engineering Co., Ltd. | | 73,390 | | 60,779 | |
| | Kyeryong Construction Industrial Co., Ltd. | | 17,500 | | 678,397 | |
| | Kyobo Securities Co., Ltd. | | 76,680 | | 700,724 | |
| | Kyong Dong Boiler Co., Ltd. | | 3,450 | | 70,217 | |
* | | Kyungbang Co., Ltd. | | 1,856 | | 274,462 | |
* | | Leeku Industrial Co., Ltd. | | 4,040 | | 55,413 | |
| | LG Chemical, Ltd. | | 26,500 | | 1,071,835 | |
| | LG Corp. | | 129,850 | | 4,192,222 | |
| | LG International Corp. | | 117,374 | | 2,830,833 | |
| | LG Petrochemical Co., Ltd. | | 80,560 | | 1,636,768 | |
| | Lotte Chilsung Beverage Co., Ltd. | | 780 | | 979,721 | |
| | Lotte Confectionary Co., Ltd. | | 1,170 | | 1,420,034 | |
| | Lotte Sam Kang Co., Ltd. | | 2,460 | | 492,864 | |
| | LS Cable, Ltd. | | 81,160 | | 2,758,235 | |
| | Meritz Fire Marine Insurance | | 168,100 | | 1,015,400 | |
| | Meritz Securities Co., Ltd. | | 73,900 | | 462,577 | |
* | | Mi Chang Oil Industrial Co., Ltd. | | 3,650 | | 62,474 | |
| | Motonic Corp. | | 640 | | 24,767 | |
| | Namhae Chemical Corp. | | 105,810 | | 272,212 | |
* | | Namsun Aluminum Co., Ltd. | | 14,470 | | 46,255 | |
| | Namyang Dairy Products Co., Ltd. | | 1,600 | | 1,203,914 | |
* | | Nasan Co., Ltd. | | 9,560 | | 152,920 | |
* | | Nexen Corp. | | 5,680 | | 114,214 | |
| | NH Investment & Securities Co., Ltd. | | 54,071 | | 692,091 | |
| | Nong Shim Holdings Co., Ltd. | | 4,160 | | 391,663 | |
| | Ottogi Corp. | | 7,320 | | 893,000 | |
* | | Pacific Pharmaceutical Co., Ltd. | | 3,840 | | 129,747 | |
* | | Pang Rim Co., Ltd. | | 8,940 | | 154,794 | |
* | | Pantech & Curitel Communications, Inc. | | 85,030 | | 105,095 | |
* | | Pantech Co., Ltd. | | 40,270 | | 182,041 | |
| | PaperCorea, Inc. | | 19,552 | | 70,681 | |
| | Pohang Coated Steel Co., Ltd. | | 12,780 | | 214,821 | |
| | Poong Lim Industrial Co., Ltd. | | 40,780 | | 405,629 | |
| | Poong San Corp. | | 68,330 | | 1,397,996 | |
| | POSCO | | 420 | | 109,305 | |
| | POSCO Sponsored ADR | | 714,500 | | 45,942,350 | |
| | Pum Yang Construction Co., Ltd. | | 14,667 | | 173,078 | |
| | Pusan Bank | | 200,400 | | 2,571,731 | |
| | Pusan City Gas Co., Ltd. | | 23,820 | | 498,516 | |
* | | Pyung Hwa Holdings Co., Ltd. | | 42,576 | | 0 | |
| | Pyung Hwa Industrial Co., Ltd. | | 21,288 | | 108,213 | |
* | | Rocket Electric Co., Ltd. | | 3,460 | | 16,219 | |
| | S&T Corp. | | 6,130 | | 155,450 | |
| | S&T Dynamics Co., Ltd. | | 32,154 | | 244,665 | |
* | | Saehan Industries, Inc. | | 95,610 | | 323,828 | |
* | | Saehan Media Corp. | | 85,210 | | 167,957 | |
22
* | | Sajo Industries Co., Ltd. | | 9,090 | | $ | 52,800 | |
* | | Sam Kwang Glass Industrial Co., Ltd. | | 3,980 | | 55,939 | |
* | | Sam Whan Camus Co., Ltd. | | 9,400 | | 58,708 | |
| | Sam Yung Trading Co., Ltd. | | 13,840 | | 32,084 | |
| | Sambu Construction Co., Ltd. | | 14,358 | | 366,337 | |
| | Samhwa Crown and Closure Co., Ltd. | | 3,100 | | 44,693 | |
| | Samhwa Paints Industrial Co., Ltd. | | 48,610 | | 154,942 | |
| | Samsung Climate Control Co., Ltd. | | 11,990 | | 82,586 | |
| | Samsung Corp. | | 331,070 | | 9,016,931 | |
* | | Samsung Electro-Mechanics Co., Ltd. | | 57,260 | | 1,811,571 | |
| | Samsung Fine Chemicals Co., Ltd. | | 62,960 | | 1,652,721 | |
| | Samsung Heavy Industries Co., Ltd. | | 525,070 | | 11,006,547 | |
| | Samsung SDI Co., Ltd. | | 91,700 | | 7,700,406 | |
| | Samsung Securities Co., Ltd. | | 116,860 | | 6,268,609 | |
| | Samsung Techwin Co., Ltd. | | 130,710 | | 4,108,039 | |
| | Samwhan Corp. | | 22,410 | | 498,925 | |
| | Samyang Corp. | | 25,405 | | 1,503,918 | |
| | Samyang Genex Co., Ltd. | | 5,490 | | 544,625 | |
| | Samyang Tongsang Co., Ltd. | | 6,100 | | 124,951 | |
* | | Samyoung Chemical Co., Ltd. | | 2,820 | | 23,865 | |
| | Samyoung Electronics Co., Ltd. | | 44,570 | | 400,528 | |
| | Seah Holdings Corp. | | 7,339 | | 580,512 | |
| | Seah Steel Corp. | | 9,895 | | 257,274 | |
| | Sebang Co., Ltd. | | 18,120 | | 127,925 | |
| | Sejong Industrial Co., Ltd. | | 44,050 | | 207,406 | |
| | Sempio Foods Co. | | 8,080 | | 110,331 | |
| | Seondo Electric Co., Ltd. | | 35,800 | | 79,149 | |
| | Seoul Securities Co., Ltd. | | 546,100 | | 802,912 | |
* | | SGWICUS Corp. | | 20,530 | | 77,759 | |
* | | SH Chemical Co., Ltd. | | 13,920 | | 36,661 | |
* | | Shin Dong-Ah Fire & Marine Insurance Co. | | 32,653 | | 236,044 | |
| | Shin Heung Securities Co., Ltd. | | 22,703 | | 191,457 | |
* | | Shin Poong Paper Manufacturing Co., Ltd. | | 6,380 | | 57,779 | |
| | Shin Young Securities Co., Ltd. | | 18,390 | | 545,462 | |
| | Shin Young Wacoal, Inc. | | 273 | | 20,015 | |
| | Shinhan Financial Group Co., Ltd. | | 46,326 | | 2,121,866 | |
* | | Shin-Ho Paper Manufacturing Co., Ltd. | | 46,660 | | 294,721 | |
| | Shinmoorim Paper Manufacturing Co., Ltd. | | 34,120 | | 323,899 | |
| | Shinpoong Pharmaceutical Co., Ltd. | | 8,050 | | 181,453 | |
| | Shinsegae Engineering & Construction Co., Ltd. | | 3,980 | | 175,479 | |
| | Shinsung Engineering Co., Ltd. | | 17,040 | | 59,861 | |
* | | Shinsung Tongsang Co., Ltd. | | 34,250 | | 127,340 | |
| | Sindo Ricoh Co., Ltd. | | 18,480 | | 854,032 | |
* | | SJM Co., Ltd. | | 37,640 | | 160,303 | |
| | SK Chemicals Co., Ltd. | | 40,060 | | 1,407,515 | |
| | SK Corp., Ltd. | | 144,670 | | 9,728,030 | |
| | SK Gas Co., Ltd. | | 19,860 | | 785,196 | |
| | SKC Co., Ltd. | | 74,250 | | 1,617,721 | |
| | SL Corp. | | 33,210 | | 230,078 | |
| | Songwon Industrial Co., Ltd. | | 45,480 | | 162,207 | |
* | | Soosan Heavy Industries Co., Ltd. | | 95,600 | | 71,955 | |
* | | Ssangyong Cement Industry Co., Ltd. | | 88,776 | | 1,202,621 | |
* | | Ssangyong Fire & Marine Insurance Co. | | 13,190 | | 83,650 | |
* | | Ssangyong Motor Co. | | 247,830 | | 1,376,104 | |
23
* | | Starco Co., Ltd. | | 87,030 | | $ | 132,885 | |
| | Suheung Capsule Co., Ltd. | | 20,370 | | 146,043 | |
* | | Sung Bo Chemicals Co., Ltd. | | 4,130 | | 143,385 | |
| | Sung Chang Enterprise Co., Ltd. | | 12,230 | | 165,752 | |
| | Sung Shin Cement Co., Ltd. | | 45,580 | | 791,393 | |
* | | Sungwon Corp. | | 20,600 | | 101,594 | |
| | Sunjin Co., Ltd. | | 4,240 | | 173,924 | |
| | Sunkyong Securities Co., Ltd. | | 384,280 | | 459,828 | |
| | Tae Kwang Industrial Co., Ltd. | | 2,881 | | 1,805,476 | |
| | Tae Kyung Industrial Co., Ltd. | | 63,000 | | 171,337 | |
| | Tae Young Corp. | | 16,270 | | 1,202,519 | |
| | Taegu Department Store Co., Ltd. | | 19,941 | | 339,680 | |
| | Tai Han Electric Wire Co., Ltd. | | 95,477 | | 1,947,194 | |
| | Tai Lim Packaging Industries Co., Ltd. | | 13,420 | | 87,111 | |
* | | The Will-Bes & Co., Ltd. | | 27,760 | | 76,820 | |
* | | Tong Kook Corp. | | 607 | | 1,003 | |
* | | Tong Yang Major Corp. | | 24,960 | | 165,179 | |
| | Tong Yang Moolsan Co., Ltd. | | 12,890 | | 76,846 | |
* | | TRYBRANDS, Inc. | | 52,870 | | 316,619 | |
| | TS Corp. | | 3,881 | | 122,843 | |
* | | Unid Co., Ltd. | | 6,310 | | 128,766 | |
| | Union Steel Manufacturing Co., Ltd. | | 21,297 | | 524,455 | |
| | Wiscom Co., Ltd. | | 32,980 | | 140,365 | |
| | Woongjin.Com Co., Ltd. | | 78,940 | | 1,508,985 | |
| | Woori Investment & Securities Co., Ltd. | | 246,950 | | 5,191,552 | |
| | YESCO Co., Ltd. | | 12,780 | | 338,617 | |
| | Yoosung Enterprise Co., Ltd. | | 53,210 | | 193,797 | |
| | Youlchon Chemical Co., Ltd. | | 47,300 | | 491,801 | |
* | | Young Poong Mining & Construction Corp. | | 18,030 | | 1,049 | |
| | Youngbo Chemical Co., Ltd. | | 33,000 | | 74,782 | |
| | Youngone Corp. | | 108,650 | | 459,122 | |
| | Youngpoong Corp. | | 2,710 | | 592,286 | |
| | Yuhwa Securities Co., Ltd. | | 17,000 | | 248,115 | |
* | | Yuyang Telecom Co., Ltd. | | 6,460 | | 84,041 | |
* | | Zinus, Inc. | | 9,330 | | 7,399 | |
TOTAL COMMON STOCKS | | | | 403,173,242 | |
| | | | | | | |
RIGHTS/WARRANTS — (0.0%) | | | | | |
* | | Hyundai Merchant Marine Co., Ltd. Rights 06/14/06 | | 45,001 | | 247,446 | |
* | | Korea Data Systems Co., Ltd. Rights 06/30/06 | | 25,306 | | 9,901 | |
* | | NH Investment Securities Rights 06/30/06 | | 49,807 | | 121,134 | |
TOTAL RIGHTS/WARRANTS | | | | 378,481 | |
| | | | | | | |
TOTAL — SOUTH KOREA | | | | 403,551,723 | |
| | | | | | | |
TAIWAN — (13.0%) | | | | | |
COMMON STOCKS — (13.0%) | | | | | |
* | | A.G.V. Products Corp. | | 1,328,000 | | 279,615 | |
* | | Abit Computer Co., Ltd. | | 835,498 | | 17,213 | |
* | | Abocom Systems, Inc. | | 442,000 | | 127,384 | |
* | | Acbel Polytech, Inc. | | 1,852,000 | | 863,510 | |
* | | Accton Technology Corp. | | 1,621,000 | | 1,009,138 | |
| | Allis Electric Co., Ltd. | | 86,320 | | 18,310 | |
24
* | | Ampoc Far East Co., Ltd. | | 434,000 | | $ | 237,515 | |
| | Amtran Technology Co., Ltd. | | 1,669,385 | | 1,494,345 | |
* | | Apex Science & Engineering Corp. | | 103,000 | | 15,614 | |
* | | Arima Computer Corp. | | 4,196,000 | | 1,174,074 | |
| | Asia Cement Corp. | | 10,369,484 | | 7,806,488 | |
| | Asia Chemical Corp. | | 1,365,000 | | 440,245 | |
| | Asia Polymer Corp. | | 1,206,489 | | 489,558 | |
| | Asia Vital Components Co., Ltd. | | 1,133,322 | | 622,027 | |
| | Asustek Computer, Inc. | | 111,644 | | 262,356 | |
| | Aurora Corp. | | 448,650 | | 263,602 | |
| | Aurora Systems Corp. | | 157,000 | | 61,100 | |
| | Avision, Inc. | | 242,503 | | 211,842 | |
| | Bank of Kaohsiung Co., Ltd. | | 2,843,622 | | 1,296,070 | |
* | | Behavior Tech Computer Corp. | | 305,791 | | 171,792 | |
| | Bes Engineering Corp. | | 4,833,089 | | 691,664 | |
* | | Biostar Microtech International Corp. | | 432,000 | | 227,276 | |
* | | C Sun Manufacturing, Ltd. | | 157,000 | | 96,762 | |
* | | Carnival Industrial Corp. | | 2,092,000 | | 380,673 | |
| | Cathay Chemical Works, Inc. | | 532,000 | | 164,723 | |
* | | Cathay Real Estate Development Co., Ltd. | | 4,872,421 | | 3,444,580 | |
* | | Central Insurance Co., Ltd. | | 574,020 | | 295,428 | |
| | Central Reinsurance Co., Ltd. | | 1,041,614 | | 390,911 | |
* | | Chain Qui Development Co., Ltd. | | 260,000 | | 124,791 | |
* | | Champion Building Materials Co., Ltd. | | 1,195,000 | | 260,735 | |
| | Chang Hwa Commercial Bank | | 19,928,459 | | 12,973,308 | |
* | | Chang-Ho Fibre Corp. | | 192,000 | | 79,111 | |
* | | Charoen Pokphand Enterprises Co., Ltd. | | 96,000 | | 15,822 | |
| | Cheng Loong Corp. | | 4,472,480 | | 1,523,641 | |
* | | Chenming Mold Industrial Corp. | | 415,000 | | 163,510 | |
* | | Chia Her Industrial Co., Ltd. | | 1,837,340 | | 227,508 | |
* | | Chia Hsin Cement Corp. | | 2,967,000 | | 1,697,632 | |
* | | Chia Hsin Food & Synthetic Fiber Co., Ltd. | | 812,250 | | 49,012 | |
| | Chia-I Industrial Co., Ltd. | | 2,054,000 | | 404,303 | |
* | | Chien Shing Stainless Steel Co., Ltd. | | 1,472,000 | | 488,334 | |
* | | Chien Tai Cement Co., Ltd. | | 282,238 | | 8,829 | |
| | China Airlines | | 16,308,248 | | 7,649,580 | |
| | China Chemical & Pharmaceutical Co. | | 2,971,264 | | 1,087,359 | |
* | | China Development Financial Holding Corp. | | 40,619,000 | | 15,216,097 | |
| | China Electric Manufacturing Co., Ltd. | | 1,020,000 | | 632,188 | |
* | | China General Plastics Corp. | | 2,402,000 | | 575,841 | |
* | | China Glaze Co., Ltd. | | 54,000 | | 12,791 | |
* | | China Life Insurance Co., Ltd. | | 1,148,763 | | 527,835 | |
| | China Man-Made Fiber Co., Ltd. | | 4,685,813 | | 1,174,160 | |
| | China Metal Products Co., Ltd. | | 451,000 | | 659,612 | |
| | China Motor Co., Ltd. | | 5,986,570 | | 6,283,350 | |
* | | China Petrochemical Development Corp. | | 8,471,000 | | 2,099,920 | |
* | | China Rebar Co., Ltd. | | 828,658 | | 53,104 | |
| | China Steel Structure Co., Ltd. | | 318,219 | | 143,773 | |
| | China Synthetic Rubber Corp. | | 2,450,890 | | 2,027,398 | |
* | | China United Trust & Investment Corp. | | 2,398,289 | | 138,073 | |
* | | China Wire & Cable Co., Ltd. | | 379,000 | | 64,156 | |
| | Chinatrust Financial Holdings Co., Ltd. | | 289,901 | | 232,750 | |
* | | Ching Feng Home Fashions Industries Co., Ltd. | | 376,000 | | 106,578 | |
| | Chin-Poon Industrial Co., Ltd. | | 1,258,451 | | 915,564 | |
25
* | | Chun Yu Works & Co., Ltd. | | 1,800,000 | | $ | 508,710 | |
| | Chun Yuan Steel Industrial Co., Ltd. | | 1,910,655 | | 944,530 | |
| | Chung Hsin Electric & Machinery Co., Ltd. | | 858,000 | | 594,355 | |
| | Chung Hwa Pulp Corp. | | 1,685,419 | | 759,854 | |
* | | Chung Shing Textile Co., Ltd. | | 600 | | 4 | |
| | Chungwa Picture Tubes Co., Ltd. | | 29,367,045 | | 7,474,639 | |
| | Clevo Co. | | 2,350,990 | | 857,804 | |
* | | CMC Magnetics Corp. | | 12,998,000 | | 4,127,858 | |
| | Collins Co., Ltd. | | 1,119,319 | | 353,880 | |
| | Compal Electronics, Inc. | | 2,202,190 | | 2,243,267 | |
* | | Compeq Manufacturing Co., Ltd. | | 1,846,000 | | 855,161 | |
* | | Compex International Co. Ltd. | | 46,400 | | 290 | |
| | Continental Engineering Corp. | | 2,955,193 | | 1,652,128 | |
* | | Cosmos Bank Taiwan | | 7,259,000 | | 3,189,474 | |
| | CTCI Corp. | | 2,684,645 | | 1,423,163 | |
| | Cyntec Co., Ltd. | | 36,120 | | 39,195 | |
* | | Da-Cin Construction Co., Ltd. | | 621,190 | | 190,615 | |
* | | Delpha Construction Co., Ltd. | | 1,684,044 | | 281,981 | |
* | | Der Pao Construction Co., Ltd. | | 1,139,000 | | 63,195 | |
| | Diamond Flower Electric Instrument Co., Ltd. | | 65,280 | | 111,791 | |
* | | Eastern Media International | | 4,944,491 | | 1,641,446 | |
* | | Eclat Textile Co., Ltd. | | 219,144 | | 107,980 | |
| | Edom Technology Co., Ltd. | | 188,000 | | 108,179 | |
| | Elan Microelectronics Corp. | | 985,429 | | 568,298 | |
* | | Elite Material Co., Ltd. | | 97,650 | | 48,746 | |
| | Elite Semiconductor Memory Technology, Inc. | | 723,000 | | 712,257 | |
* | | Elitegroup Computer Systems Co., Ltd. | | 1,525,250 | | 969,762 | |
* | | Enlight Corp. | | 1,485,000 | | 527,161 | |
* | | EnTie Commercial Bank | | 5,347,474 | | 1,594,099 | |
| | Eten Information Systems, Ltd. | | 787,000 | | 823,914 | |
* | | Eternal Chemical Co., Ltd. | | 1,734,500 | | 2,725,662 | |
| | Eva Airways Corp. | | 16,403,783 | | 6,858,416 | |
* | | Ever Fortune Industrial Co., Ltd. | | 409,000 | | 4,213 | |
| | Everest Textile Co., Ltd. | | 1,918,820 | | 369,750 | |
| | Evergreen International Storage & Transport Corp. | | 3,637,000 | | 1,755,740 | |
| | Evergreen Marine Corp., Ltd. | | 7,857,502 | | 5,361,546 | |
| | Everlight Chemical Industrial Corp. | | 1,712,950 | | 643,447 | |
* | | Everspring Industry Co., Ltd. | | 1,095,180 | | 243,902 | |
* | | Excel Cell Electronics Co., Ltd. | | 87,000 | | 50,540 | |
| | Far East Textile, Ltd. | | 16,291,942 | | 12,524,955 | |
| | Far Eastern Department Stores, Ltd. | | 3,794,550 | | 1,960,681 | |
| | Far Eastern International Bank | | 4,319,752 | | 1,865,863 | |
| | Federal Corp. | | 1,805,650 | | 1,201,040 | |
| | Feng Hsin Iron & Steel Co., Ltd. | | 333,000 | | 321,891 | |
* | | FIC Global, Inc. | | 640,080 | | 53,484 | |
| | First Copper Technology Co., Ltd. | | 1,638,750 | | 608,350 | |
| | First Financial Holding Co., Ltd. | | 3,224,550 | | 2,369,864 | |
| | First Hotel | | 373,322 | | 366,454 | |
* | | First Steamship Co., Ltd. | | 728,000 | | 288,711 | |
| | Formosa Taffeta Co., Ltd. | | 6,346,580 | | 3,318,481 | |
| | Formosan Rubber Group, Inc. | | 1,348,000 | | 648,898 | |
* | | Formosan Union Chemical Corp. | | 206,961 | | 83,708 | |
* | | Fortune Electric Co., Ltd. | | 354,000 | | 109,810 | |
* | | Fu I Industrial Co., Ltd. | | 264,000 | | 74,084 | |
26
| | Fubon Financial Holding Co., Ltd. | | 3,021,000 | | $ | 2,657,170 | |
| | Fuh-Hwa Financial Holding Co., Ltd. | | 9,699,422 | | 4,057,773 | |
* | | Fwuson Industry Co., Ltd. | | 302,000 | | 49,508 | |
* | | G.T.M. Corp. | | 543,000 | | 308,040 | |
* | | Gem Terminal Industries Co., Ltd. | | 398,000 | | 214,456 | |
* | | Giga Storage Corp. | | 2,039,898 | | 423,152 | |
| | Giga-Byte Technology Co., Ltd. | | 3,037,287 | | 2,252,962 | |
| | Gold Circuit Electronics, Ltd. | | 1,421,805 | | 969,301 | |
* | | Goldsun Development & Construction Co., Ltd. | | 6,129,640 | | 2,620,737 | |
| | Good Will Instrument Co., Ltd. | | 95,000 | | 51,735 | |
* | | Gordon Auto Body Parts Co., Ltd. | | 623,000 | | 343,148 | |
* | | Grand Pacific Petrochemical Corp. | | 3,021,000 | | 739,297 | |
* | | Grape King, Inc. | | 854,000 | | 268,469 | |
| | Great China Metal Industry Co., Ltd. | | 1,106,000 | | 570,887 | |
| | Great Wall Enterprise Co., Ltd. | | 2,406,980 | | 947,222 | |
| | Hanpin Co., Ltd. | | 347,000 | | 155,014 | |
* | | Helix Technology, Inc. | | 158,211 | | 6,993 | |
| | Hey Song Corp. | | 944,000 | | 351,681 | |
* | | Hitron Technologies, Inc. | | 619,000 | | 221,396 | |
* | | Ho Tung Holding Corp. | | 2,160,628 | | 472,985 | |
* | | Hocheng Corp. | | 1,703,000 | | 415,243 | |
* | | Hold-Key Electric Wire & Cable Co., Ltd. | | 714,000 | | 162,632 | |
* | | Hong Ho Precision Textile Co., Ltd. | | 93,889 | | 9,726 | |
| | Hong Tai Electric Industrial Co., Ltd. | | 1,943,000 | | 879,795 | |
| | Hsin Kuang Steel Co., Ltd. | | 622,000 | | 422,697 | |
| | Hsinchu International Bank | | 7,646,417 | | 3,804,629 | |
| | Hsing Ta Cement Co., Ltd. | | 376,980 | | 128,285 | |
| | Hua Eng Wire & Cable Co., Ltd. | | 3,115,035 | | 673,013 | |
| | Hua Nan Financial Holding Co., Ltd. | | 86,428 | | 60,675 | |
* | | Hualon Corp. | | 257,040 | | 8,666 | |
* | | Hung Ching Development & Construction Co., Ltd. | | 303,468 | | 77,997 | |
| | Hung Poo Construction Corp. | | 1,648,000 | | 1,487,493 | |
* | | Hung Sheng Construction Co., Ltd. | | 2,520,000 | | 1,852,755 | |
| | Inventec Corp. | | 5,557,416 | | 3,762,089 | |
| | Jui Li Enterprise Co., Ltd. | | 355,000 | | 124,977 | |
| | Jung Shing Wire Co., Ltd. | | 123,000 | | 34,393 | |
* | | K Laser Technology, Inc. | | 680,000 | | 472,539 | |
| | Kang Na Hsiung Co., Ltd. | | 1,395,127 | | 636,032 | |
* | | Kao Hsing Chang Iron & Steel Corp. | | 1,658,000 | | 364,451 | |
| | Kaulin Manufacturing Co., Ltd. | | 247,000 | | 162,491 | |
* | | Kee Tai Properties Co., Ltd. | | 749,000 | | 286,209 | |
| | Kenda Rubber Industrial Co., Ltd. | | 1,663,000 | | 731,458 | |
| | King Yuan Electronics Co., Ltd. | | 1,603,394 | | 1,676,289 | |
* | | Kingdom Construction Co., Ltd. | | 2,469,000 | | 768,749 | |
| | Kinpo Electronics, Inc. | | 5,726,902 | | 2,284,581 | |
| | Knowledge-Yield-Excellence Systems Corp. | | 402,135 | | 369,162 | |
* | | Kung Long Batteries Industrial Co., Ltd. | | 173,000 | | 120,736 | |
* | | Kuoyang Construction Co., Ltd. | | 641,029 | | 269,413 | |
* | | Kwong Fong Industries Corp. | | 2,505,000 | | 379,001 | |
| | Lan Fa Textile Co., Ltd. | | 668,915 | | 117,173 | |
* | | Lead Data Co., Ltd. | | 1,971,140 | | 306,753 | |
* | | Leadtek Research, Inc. | | 1,009,493 | | 310,691 | |
* | | Lealea Enterprise Co., Ltd. | | 2,693,000 | | 320,537 | |
| | Lee Chang Yung Chemical Industry Corp. | | 857,501 | | 652,077 | |
27
* | | Lee Chi Enterprises Co., Ltd. | | 1,225,900 | | $ | 233,482 | |
* | | Lelon Co., Ltd. | | 919,118 | | 365,482 | |
* | | Leofoo Development Co., Ltd. | | 1,940,000 | | 1,321,285 | |
| | Les Enphants Co., Ltd. | | 153,146 | | 116,408 | |
* | | Li Peng Enterprise Co., Ltd. | | 2,737,000 | | 519,431 | |
| | Li Shin International Enterprise Corp. | | 224,496 | | 232,665 | |
* | | Lien Chang Electronic Enterprise Co., Ltd. | | 623,000 | | 203,201 | |
| | Lien Hwa Industrial Corp. | | 3,096,000 | | 1,323,480 | |
| | Lingsen Precision Industries, Ltd. | | 1,189,320 | | 406,319 | |
| | Long Bon Development Co., Ltd. | | 2,146,943 | | 1,137,430 | |
| | Long Chen Paper Co., Ltd. | | 2,357,000 | | 711,188 | |
| | Lucky Cement Corp. | | 1,504,000 | | 396,547 | |
* | | Lung Hwa Electronics Corp. | | 163,000 | | 34,050 | |
* | | Macronix International Co., Ltd. | | 15,368,009 | | 4,472,251 | |
| | Mayer Steel Pipe Corp. | | 662,000 | | 391,819 | |
* | | Maywufa Co., Ltd. | | 183,000 | | 57,885 | |
| | Mega Financial Holding Co., Ltd. | | 18,530,000 | | 13,208,006 | |
* | | Megamedia Corp. | | 782 | | 6 | |
| | Meiloon Co., Ltd. | | 35,000 | | 21,848 | |
| | Mercuries & Associates, Ltd. | | 967,980 | | 271,224 | |
* | | Mercuries Data Co., Ltd. | | 930,800 | | 206,098 | |
| | Merida Industry Co., Ltd. | | 181,260 | | 123,989 | |
* | | Microelectronics Technology, Inc. | | 1,937,000 | | 847,328 | |
| | Micro-Star International Co., Ltd. | | 3,303,542 | | 1,855,414 | |
* | | Microtek International, Inc. | | 429,062 | | 53,637 | |
| | Mitac Technology Corp. | | 1,285,000 | | 637,473 | |
| | Mobiletron Electronics Co., Ltd. | | 90,000 | | 71,047 | |
| | Mospec Seminconductor Corp. | | 404,000 | | 193,896 | |
* | | Mustek Systems, Inc. | | 988,514 | | 148,950 | |
* | | Namchow Chemical Industrial Co., Ltd. | | 164,057 | | 26,784 | |
* | | Nankang Rubber Tire Co., Ltd. | | 104,312 | | 189,127 | |
| | Nantex Industry Co., Ltd. | | 1,192,090 | | 532,009 | |
| | Nanya Technology Co., Ltd. | | 12,984,000 | | 8,294,438 | |
* | | New Asia Construction & Development Co., Ltd. | | 586,000 | | 59,729 | |
| | Nien Hsing Textile Co., Ltd. | | 2,071,000 | | 1,138,212 | |
| | Ocean Plastics Co., Ltd. | | 134,400 | | 75,102 | |
* | | Opto Tech Corp. | | 1,328,000 | | 697,470 | |
* | | Orient Semiconductor Electronics, Ltd. | | 648,713 | | 83,493 | |
* | | Pacific Construction Co., Ltd. | | 1,483,256 | | 180,842 | |
* | | Pacific Electric Wire & Cable Corp. | | 1,873,020 | | 30,403 | |
| | Pan Jit International, Inc. | | 1,138,893 | | 530,872 | |
* | | Phihong Technology Co., Ltd. | | 468,283 | | 309,805 | |
* | | Picvue Electronics, Ltd. | | 604,000 | | 29,503 | |
* | | Potrans Electrical Corp. | | 1,139,000 | | 155,019 | |
* | | Primax Electronics, Ltd. | | 1,377,744 | | 506,204 | |
* | | Prince Housing & Development Corp. | | 2,598,987 | | 1,084,240 | |
* | | Procomp Informatics, Ltd. | | 391,440 | | 0 | |
* | | Prodisc Technology, Inc. | | 4,992,157 | | 665,458 | |
* | | Promise Technology, Inc. | | 641,000 | | 283,131 | |
| | Quanta Display, Inc. | | 13,676,000 | | 5,262,792 | |
| | Radium Life Tech Corp. | | 564,376 | | 421,644 | |
| | Ralec Electronic Corp. | | 448,933 | | 248,070 | |
| | Realtek Semiconductor Corp. | | 1,432,200 | | 1,622,477 | |
* | | Rectron, Ltd. | | 78,300 | | 10,748 | |
28
| | Rexon Industrial Corp., Ltd. | | 218,820 | | $ | 53,312 | |
* | | Ritek Corp. | | 12,154,518 | | 3,628,991 | |
* | | Ruentex Development Co., Ltd. | | 2,897,000 | | 1,359,908 | |
* | | Ruentex Industries, Ltd. | | 2,485,000 | | 1,035,084 | |
* | | Sampo Corp. | | 6,919,850 | | 1,207,792 | |
| | San Fang Chemical Industry Co., Ltd. | | 207,280 | | 114,985 | |
| | Sanyang Industrial Co., Ltd. | | 3,466,000 | | 1,804,595 | |
| | Sanyo Electric Co., Ltd. | | 769,000 | | 547,165 | |
| | SDI Corp. | | 1,035,483 | | 717,610 | |
* | | Senao International Co., Ltd. | | 148,000 | | 72,816 | |
| | Sheng Yu Steel Co., Ltd. | | 1,250,000 | | 1,071,759 | |
| | Shihlin Electric & Engineering Corp. | | 1,643,000 | | 1,764,287 | |
* | | Shihlin Paper Corp. | | 524,000 | | 726,035 | |
| | Shinkong Co., Ltd. | | 1,567,809 | | 779,658 | |
* | | Shinkong Synthetic Fibers Co., Ltd. | | 5,766,000 | | 1,147,482 | |
| | Shuttle, Inc. | | 772,223 | | 309,960 | |
| | Sincere Navigation Corp. | | 382,052 | | 415,604 | |
* | | Sinkang Industries Co., Ltd. | | 419,000 | | 202,609 | |
* | | Sinkong Spinning Co., Ltd. | | 913,000 | | 655,559 | |
| | Sinon Corp. | | 1,366,700 | | 285,559 | |
| | SinoPac Holdings Co., Ltd. | | 13,190,809 | | 6,479,958 | |
| | Sintek Photronics Corp. | | 3,550,182 | | 908,653 | |
| | Siward Crystal Technology Co., Ltd. | | 489,868 | | 324,187 | |
* | | Solomon Technology Corp. | | 1,599,000 | | 558,326 | |
| | South East Soda Manufacturing Co., Ltd. | | 404,000 | | 150,970 | |
| | Southeast Cement Co., Ltd. | | 1,741,700 | | 395,018 | |
* | | Space Shuttle Hi-Tech Co., Ltd. | | 595,000 | | 66,597 | |
| | Standard Foods Taiwan, Ltd. | | 1,245,000 | | 600,002 | |
| | Stark Technology, Inc. | | 1,073,000 | | 487,142 | |
| | Sunonwealth Electric Machine Industry Co., Ltd. | | 1,089,460 | | 470,773 | |
* | | Systex Corp., Ltd. | | 2,772,341 | | 763,781 | |
* | | T JOIN Transportation Co. | | 1,537,000 | | 480,086 | |
| | Ta Chen Stainless Pipe Co., Ltd. | | 957,996 | | 716,212 | |
* | | Ta Chong Bank, Ltd. | | 11,180,906 | | 2,832,424 | |
| | Ta Ya Electric Wire & Cable Co., Ltd. | | 2,315,515 | | 684,329 | |
| | Tah Hsin Industrial Corp. | | 410,000 | | 241,096 | |
| | Ta-I Technology Co., Ltd. | | 674,272 | | 599,220 | |
* | | Taichung Commercial Bank | | 6,291,000 | | 1,262,115 | |
| | Tainan Business Bank | | 1,487,012 | | 467,194 | |
| | Tainan Spinning Co., Ltd. | | 6,757,000 | | 1,639,897 | |
| | Taishin Financial Holdings Co., Ltd. | | 14,294,000 | | 9,248,123 | |
* | | Taisun Enterprise Co., Ltd. | | 1,097,766 | | 204,044 | |
| | Taita Chemical Co., Ltd. | | 1,212,690 | | 281,786 | |
* | | Taitung Business Bank | | 163,395 | | 13,432 | |
* | | Taiwan Business Bank | | 18,032,412 | | 4,180,959 | |
| | Taiwan Cement Corp. | | 11,878,751 | | 10,061,416 | |
* | | Taiwan Cooperative Bank | | 8,950,668 | | 6,265,759 | |
| | Taiwan Fire & Marine Insurance Co., Ltd. | | 1,195,320 | | 718,369 | |
* | | Taiwan Flourescent Lamp Co., Ltd. | | 756,000 | | 243,508 | |
| | Taiwan Glass Ind. Corp. | | 3,721,485 | | 3,031,043 | |
| | Taiwan Hon Chuan Enterprise Co., Ltd. | | 778,070 | | 702,815 | |
* | | Taiwan Kolin Co., Ltd. | | 3,548,000 | | 1,056,694 | |
* | | Taiwan Line Tek Electronic Co., Ltd. | | 403,000 | | 189,601 | |
| | Taiwan Mask Corp. | | 1,367,000 | | 960,245 | |
29
| | Taiwan Navigation Co., Ltd. | | 631,825 | | $ | 410,988 | |
| | Taiwan Polypropylene Co., Ltd. | | 1,356,000 | | 870,963 | |
* | | Taiwan Pulp & Paper Corp. | | 847,000 | | 200,635 | |
* | | Taiwan Sakura Corp. | | 971,958 | | 174,470 | |
| | Taiwan Sogo Shinkong Security Co., Ltd. | | 586,414 | | 507,193 | |
| | Taiwan Styrene Monomer Corp. | | 2,715,000 | | 1,098,973 | |
* | | Taiwan Tea Corp. | | 3,668,381 | | 795,298 | |
* | | Taiyen Biotech Co., Ltd. | | 1,043,000 | | 680,886 | |
* | | Tatung Co., Ltd. | | 9,309,000 | | 4,068,209 | |
* | | Teapo Electronic Corp. | | 2,021,670 | | 457,692 | |
* | | Teco Electric & Machinery Co., Ltd. | | 8,440,834 | | 2,767,841 | |
| | Tecom, Ltd. | | 1,184,753 | | 533,046 | |
| | Test-Rite International Co., Ltd. | | 98,932 | | 73,565 | |
| | Tex-Ray Industrial Co., Ltd. | | 158,000 | | 58,384 | |
| | The Ambassador Hotel | | 605,000 | | 616,862 | |
* | | The Chinese Bank | | 8,296,000 | | 805,309 | |
| | The First Insurance Co., Ltd. | | 760,224 | | 286,831 | |
| | Thye Ming Industrial Co., Ltd. | | 164,000 | | 132,673 | |
| | Ton Yi Industrial Corp. | | 5,139,810 | | 1,124,696 | |
| | TSRC Corp. | | 1,760,000 | | 1,230,940 | |
| | Tung Ho Steel Enterprise Corp. | | 2,688,555 | | 2,297,074 | |
* | | Twinhead International Corp. | | 1,311,017 | | 157,377 | |
| | TYC Brother Industrial Co., Ltd. | | 462,320 | | 320,144 | |
| | Tycoons Group Enterprise Co., Ltd. | | 2,305,000 | | 407,333 | |
* | | Ulead Systems, Inc. | | 301,000 | | 223,994 | |
* | | Union Bank of Taiwan | | 6,645,577 | | 1,669,593 | |
* | | Union Insurance Co., Ltd. | | 1,794,575 | | 329,490 | |
| | Uni-President Enterprises Corp. | | 12,321,130 | | 9,012,055 | |
* | | Unitech Electronics Co., Ltd. | | 960,000 | | 377,104 | |
| | Unitech Printed Circuit Board Corp. | | 1,481,475 | | 613,690 | |
| | United Microelectronics Corp. | | 32,824,183 | | 20,521,780 | |
* | | Universal Cement Corp. | | 1,796,549 | | 626,154 | |
* | | Universal Microelectronics Co., Ltd. | | 304,010 | | 155,532 | |
| | Universal Scientific Industrial Co., Ltd. | | 2,863,392 | | 1,079,364 | |
* | | Universal, Inc. | | 622,000 | | 207,306 | |
| | UPC Technology Corp. | | 3,497,796 | | 1,124,277 | |
| | USI Corp. | | 3,514,000 | | 1,010,941 | |
| | U-TECH Media Corp. | | 1,068,799 | | 202,635 | |
* | | Ve Wong Corp. | | 725,000 | | 235,548 | |
* | | Via Technologies, Inc. | | 2,917,402 | | 2,839,019 | |
* | | Visual Photonics Epitacy Co., Ltd. | | 86,000 | | 111,928 | |
| | Walsin Lihwa Corp. | | 11,367,412 | | 4,859,771 | |
| | Walsin Technology Corp., Ltd. | | 833,126 | | 750,381 | |
| | Wan Hwa Enterprise Co., Ltd. | | 733,801 | | 419,746 | |
| | Waterland Financial Holdings | | 9,610,000 | | 3,112,516 | |
* | | Wei Chih Steel Industrial Co., Ltd. | | 1,615,898 | | 228,695 | |
* | | Wei Chuan Food Corp. | | 1,007,000 | | 372,514 | |
| | Weltrend Semiconductor, Inc. | | 1,086,000 | | 423,807 | |
* | | Winbond Electronics Corp. | | 16,875,000 | | 5,477,075 | |
* | | WPG Holdings Co., Ltd. | | 958,985 | | 302,377 | |
| | Wus Printed Circuit Co., Ltd. | | 2,434,928 | | 1,009,125 | |
* | | Yageo Corp. | | 10,993,840 | | 4,220,843 | |
| | Yang Ming Marine Transport Corp. | | 5,786,058 | | 3,602,161 | |
| | Yeung Cyang Industrial Co., Ltd. | | 319,000 | | 287,685 | |
30
* | | Yi Jinn Industrial Co., Ltd. | | 1,543,000 | | $ | 144,631 | |
| | Yieh Phui Enterprise Co., Ltd. | | 5,550,601 | | 2,065,690 | |
| | Yosun Industrial Corp. | | 910,997 | | 453,878 | |
| | Yuen Foong Yu Paper Manufacturing Co., Ltd. | | 6,213,461 | | 2,650,526 | |
| | Yulon Motor Co., Ltd. | | 5,933,271 | | 6,900,422 | |
| | Yung Chi Paint & Varnish Manufacturing Co., Ltd. | | 55,000 | | 70,607 | |
| | Yung Shin Pharmaceutical Industrial Co., Ltd. | | 281,400 | | 261,673 | |
| | Yung Tay Engineering Co., Ltd. | | 2,407,000 | | 1,385,157 | |
| | Zig Sheng Industrial Co., Ltd. | | 1,825,596 | | 353,707 | |
| | | | | | | |
TOTAL — TAIWAN | | | | 425,525,773 | |
| | | | | | | |
THAILAND — (3.0%) | | | | | |
COMMON STOCKS — (3.0%) | | | | | |
| | A.J. Plast Public Co., Ltd. (Foreign) | | 400,000 | | 31,467 | |
* | | Adkinson Securities Public Co., Ltd. (Foreign) | | 2,688,100 | | 549,815 | |
* | | Advance Agro Public Co., Ltd. (Foreign) | | 1,859,030 | | 1,218,716 | |
| | Aromatics (Thailand) Public Co., Ltd. (Foreign) | | 4,082,300 | | 2,569,167 | |
| | Bangkok Bank Public Co., Ltd. (Foreign) | | 229,700 | | 638,474 | |
| | Bangkok Expressway Public Co., Ltd. (Foreign) | | 5,353,500 | | 2,863,810 | |
| | Bangkok First Investment & Trust Public Co., Ltd. (Foreign) | | 1,229,100 | | 293,295 | |
| | Bangkok Insurance Public Co., Ltd. (Foreign) | | 78,780 | | 454,480 | |
* | | Bangkok Land Public Co., Ltd. (Foreign) | | 39,735,803 | | 677,285 | |
| | Bank of Ayudhya Public Co., Ltd. (Foreign) | | 16,377,100 | | 7,644,221 | |
| | Banpu Public Co., Ltd. (Foreign) | | 1,454,300 | | 5,338,980 | |
| | Big C Supercenter Public Co., Ltd. (Foreign) | | 1,274,800 | | 1,270,287 | |
| | Cal-Comp Electronics (Thailand) Public Co., Ltd. (Foreign) | | 10,961,500 | | 1,080,772 | |
| | Capital Nomura Securities Public Co., Ltd. (Foreign) | | 370,100 | | 395,479 | |
| | Central Plaza Hotel Public Co., Ltd. (Foreign) | | 723,000 | | 739,400 | |
| | Charoen Pokphand Foods Public Co., Ltd. (Foreign) | | 36,926,640 | | 5,470,972 | |
| | Charoong Thai Wire & Cable Public Co., Ltd. (Foreign) | | 646,900 | | 121,288 | |
| | Delta Electronics (Thailand) Public Co., Ltd. (Foreign) | | 3,889,700 | | 1,835,967 | |
| | Eastern Water Resources Development & Management Public Co., Ltd. (Foreign) | | 9,535,200 | | 1,245,189 | |
| | Erawan Group Public Co., Ltd. (Foreign) | | 2,859,300 | | 353,898 | |
| | Finansa Public Co., Ltd. (Foreign) | | 213,400 | | 95,130 | |
| | GFPT Public Co., Ltd. (Foreign) | | 498,600 | | 193,504 | |
* | | Golden Land Property Development Public Co., Ltd. (Foreign) | | 232,500 | | 40,239 | |
| | Hana Microelectronics Public Co., Ltd. (Foreign) | | 935,000 | | 625,213 | |
| | Hermraj Land & Development Public Co., Ltd. (Foreign) | | 17,522,900 | | 459,497 | |
| | ICC International Public Co., Ltd. (Foreign) | | 2,755,000 | | 2,961,977 | |
* | | Jasmine International Public Co., Ltd. (Foreign) | | 46,042,600 | | 531,238 | |
| | Kang Yong Electric Public Co., Ltd. (Foreign) | | 236,200 | | 365,433 | |
| | Kasikornbank Public Co., Ltd. (Foreign) | | 1,530,000 | | 2,567,720 | |
* | | KCE Electronics Public Co., Ltd. (Foreign) | | 1,743,300 | | 178,284 | |
* | | KGI Securities One Public Co., Ltd. (Foreign) | | 11,017,100 | | 624,018 | |
| | Kiatnakin Finance Public Co., Ltd. (Foreign) | | 1,727,800 | | 1,404,531 | |
| | Krung Thai Bank Public Co., Ltd. (Foreign) | | 29,431,100 | | 8,026,313 | |
| | Krungthai Card Public Co., Ltd. (Foreign) | | 612,600 | | 316,461 | |
* | | Laguna Resorts & Hotels Public Co., Ltd. (Foreign) | | 545,800 | | 1,331,045 | |
| | Lalin Property Public Co., Ltd. (Foreign) | | 476,900 | | 63,153 | |
* | | Loxley Public Co., Ltd. (Foreign) | | 11,055,600 | | 666,786 | |
| | MBK Development Public Co., Ltd. (Foreign) | | 442,600 | | 638,338 | |
* | | Millennium Steel Public Co., Ltd. (Foreign) | | 11,139,300 | | 300,865 | |
| | MK Real Estate Development Public Co., Ltd. (Foreign) | | 5,772,100 | | 351,154 | |
31
| | M-Link Asia Corp. Public Co., Ltd. (Foreign) | | 2,984,609 | | $ | 203,487 | |
| | Modernform Group Public Co., Ltd. (Foreign) | | 46,000 | | 45,234 | |
| | Muramoto Electronic (Thailand) Public Co., Ltd. (Foreign) | | 134,300 | | 760,687 | |
* | | Nakornthai Strip Mill Public Co., Ltd. (Foreign) | | 29,133,700 | | 328,504 | |
* | | Natural Park Public Co., Ltd. (Foreign) | | 39,695,000 | | 447,590 | |
* | | Pacific Assets Public Co., Ltd. (Foreign) | | 380,000 | | 39,261 | |
| | Padaeng Industry Public Co., Ltd. (Foreign) | | 1,600,800 | | 1,406,236 | |
* | | Picnic Gas & Engineering Public Co., Ltd. (Foreign) | | 8,305,900 | | 93,655 | |
| | Power Line Engineering Public Co., Ltd. (Foreign) | | 3,203,000 | | 671,929 | |
| | PTT Chemical Public Co., Ltd. (Foreign) | | 3,156,210 | | 6,786,659 | |
| | Quality Houses Public Co., Ltd. (Foreign) | | 31,100,900 | | 856,325 | |
| | Regional Container Lines Public Co., Ltd. (Foreign) | | 6,950,000 | | 3,389,799 | |
| | Rojana Industrial Park Public Co., Ltd. (Foreign) | | 222,600 | | 82,304 | |
| | Saha Pathana Inter-Holding Public Co., Ltd. (Foreign) | | 3,316,000 | | 1,678,217 | |
| | Saha Pathanapibul Public Co., Ltd. (Foreign) | | 1,367,000 | | 616,557 | |
| | Saha-Union Public Co., Ltd. (Foreign) | | 3,025,300 | | 1,864,286 | |
* | | Sahaviriya Steel Industries Public Co., Ltd. (Foreign) | | 53,641,100 | | 1,744,197 | |
| | Sansiri Public Co., Ltd. (Foreign) | | 6,528,500 | | 547,822 | |
| | Seamico Securities Public Co., Ltd. (Foreign) | | 4,588,600 | | 423,545 | |
* | | Shinawatra Satellite Public Co., Ltd. (Foreign) | | 4,788,600 | | 1,506,836 | |
| | Siam Commercial Bank Public Co., Ltd. (Foreign) | | 4,716,800 | | 7,235,684 | |
| | Siam Industrial Credit Public Co., Ltd. (Foreign) | | 4,478,950 | | 598,994 | |
| | Siam Makro Public Co., Ltd. (Foreign) | | 331,200 | | 607,945 | |
| | Sri Trang Agro Industry Public Co., Ltd. (Foreign) | | 828,331 | | 358,397 | |
| | Supalai Public Co., Ltd. (Foreign) | | 5,429,566 | | 373,029 | |
* | | Syntec Construction Public Co., Ltd. (Foreign) | | 4,637,300 | | 65,665 | |
| | Thai Plastic & Chemicals Public Co., Ltd. (Foreign) | | 1,569,600 | | 637,965 | |
| | Thai Rayon Public Co., Ltd. (Foreign) | | 165,000 | | 151,436 | |
| | Thai Rung Union Car Public Co., Ltd. (Foreign) | | 5,386,250 | | 686,434 | |
| | Thai Wacoal Public Co., Ltd. (Foreign) | | 93,300 | | 83,183 | |
* | | Thai-German Ceramic Industry Public Co., Ltd. (Foreign) | | 3,066,000 | | 167,229 | |
| | Thanachart Capital PCL, Ltd. (Foreign) | | 9,726,200 | | 3,978,726 | |
| | Tipco Asphalt Public Co., Ltd. (Foreign) | | 246,356 | | 119,512 | |
* | | TPI Polene Public Co., Ltd. (Foreign) | | 4,168,162 | | 1,464,622 | |
* | | Tuntex (Thailand) Public Co., Ltd. (Foreign) | | 1,987,600 | | 100,071 | |
| | Tycoons Worldwide Group Public Co., Ltd. (Foreign) | | 1,243,300 | | 236,369 | |
* | | United Communication Industry Public Co., Ltd. (Foreign) | | 864,400 | | 1,065,342 | |
| | Vanachai Group Public Co., Ltd. (Foreign) | | 2,439,900 | | 318,623 | |
| | Vinythai Public Co., Ltd. (Foreign) | | 4,881,117 | | 1,094,363 | |
TOTAL COMMON STOCKS | | | | 99,370,580 | |
| | | | | | | |
RIGHTS/WARRANTS — (0.0%) | | | | | |
* | | Bangkok Land Public Co., Ltd. (Foreign) Warrants 2006 | | 3,987,330 | | 0 | |
* | | Cal-Comp Electronics (Thailand) Public Co., Ltd. (Foreign) Warrants 04/18/09 | | 2,192,300 | | 48,865 | |
TOTAL RIGHTS/WARRANTS | | | | 48,865 | |
| | | | | | | |
TOTAL — THAILAND | | | | 99,419,445 | |
| | | | | | | |
TURKEY — (4.0%) | | | | | |
COMMON STOCKS — (4.0%) | | | | | |
| | Adana Cimento Sanayi Ticaret A.S. | | 299,788 | | 214,702 | |
| | Akbank T.A.S. | | 3,293,434 | | 19,598,477 | |
* | | Akenerji Elektrik Uretim A.S. | | 216,113 | | 542,433 | |
32
* | | Aksa Akrilik Kimya Sanayii A.S. | | 148,490 | | $ | 1,110,694 | |
| | Aksigorta A.S. | | 241,590 | | 833,837 | |
* | | Aksu Iplik Dokuma ve Boya Apre Fabrikalari A.S. | | 6,209 | | 17,077 | |
| | Alarko Carrier Sanayii ve Ticaret A.S. | | 40,047 | | 436,305 | |
| | Alkim Alkali Kimya A.S. | | 10,022 | | 41,000 | |
* | | Alternatifbank A.S. | | 1 | | 1 | |
* | | Altinyildiz mensucat ve Konfeksiyon Fabrikalari A.S. | | 87,865 | | 198,573 | |
| | Anadolu Anonim Turk Sigorta Sirketi A.S. | | 900,233 | | 1,401,046 | |
| | Anadolu Cam Sanayii A.S. | | 561,694 | | 1,772,405 | |
* | | Ayen Enerji A.S. | | 473,652 | | 742,995 | |
* | | Aygaz A.S. | | 142,149 | | 416,132 | |
| | Bagfas Bandirma Gubre Fabrikalari A.S. | | 11,130 | | 238,173 | |
| | Bati Anabolu Cimento A.S. | | 255,022 | | 1,179,469 | |
| | Bati Soeke Cimento Sanayi A.S. | | 21,090 | | 44,205 | |
| | Bolu Cimento Sanayii A.S. | | 557,470 | | 923,431 | |
| | Borusan Mannesmann Boru Sanayi ve Ticaret A.S. | | 98,343 | | 735,397 | |
| | Bossa Ticaret ve Sanayi Isletmeleri Ticaret A.S. | | 576,288 | | 382,501 | |
| | Brisa Bridgestone Sabanci Lastik San ve Ticaret A.S. | | 9,261 | | 429,769 | |
| | Cimsa Cimento Sanayi ve Ticaret A.S. | | 480,369 | | 2,861,957 | |
* | | Dardanel Onentas Gida Sanayii A.S. | | 16,183 | | 12,814 | |
* | | Dogan Sirketler Grubu Holding A.S. | | 3,007,361 | | 9,960,595 | |
| | Doktas Dokumculuk Ticaret ve Sanayi A.S. | | 63,360 | | 119,868 | |
* | | Eczacibasi Ilac Sanayi ve Ticaret A.S. | | 20,557 | | 47,630 | |
* | | Eczacibasi Yapi Gerecleri Sanayi ve Ticaret A.S. | | 362,756 | | 1,008,953 | |
| | Enka Insaat ve Sanayi A.S. | | 21,684 | | 143,653 | |
| | Eregli Demir ve Celik Fabrikalari Turk A.S. | | 1,995,394 | | 8,492,982 | |
* | | Finansbank A.S. | | 1,829,417 | | 8,836,060 | |
* | | Fortis Bank A.S. | | 2,104,055 | | 6,332,044 | |
* | | Gentas Clenel Metal Sanayi ve Ticaret A.S. | | 38,298 | | 39,204 | |
* | | Goldas Kuyumculuk Sanayi A.S. | | 327,200 | | 233,993 | |
* | | Goltas Goller Bolgesi Cimento Sanayi ve Ticaret A.S. | | 24,412 | | 1,166,411 | |
* | | Gubre Fabrikalari Ticaret A.S. | | 29,241 | | 68,537 | |
| | Gunes Sigorta A.S. | | 309,093 | | 510,025 | |
* | | Hektas Ticaret T.A.S. | | 49,107 | | 29,446 | |
* | | Ihlas Ev Aletleri Imalat Sanayi ve Ticaret A.S. | | 52,706 | | 31,991 | |
* | | Ihlas Holding A.S. | | 319,654 | | 148,084 | |
* | | Izmir Demir Celik Sanayii A.S. | | 230,946 | | 783,937 | |
| | Izocam Ticaret Ve Sanayi A.S. | | 27,299 | | 198,380 | |
| | Karton Sanayi ve Ticaret A.S. | | 1,000 | | 109,789 | |
* | | Klimasan Klima Sanayi ve Ticaret A.S. | | 5,565 | | 17,596 | |
* | | Koc Holding A.S. Series B | | 404,529 | | 1,577,763 | |
| | Kordsa Endustriyel Iplik Kord Bezi Sanayi ve Ticaret A.S. | | 414,951 | | 976,102 | |
* | | Kutahya Porselen Sanayii A.S. | | 7,076 | | 133,760 | |
| | Mardin Cimento Sanayii ve Ticaret A.S. | | 163,450 | | 802,053 | |
| | Marshall Boya ve Vernik Sanayii A.S. | | 17,490 | | 262,483 | |
* | | Medya Holdings A.S. | | 33,508 | | 146,937 | |
* | | Menderes Tekstil Sanayi ve Ticaret A.S. | | 347,650 | | 251,258 | |
* | | Net Turizm Ticaret ve Sanayi A.S. | | 185,098 | | 222,489 | |
| | Nortel Networks Netas Telekomuenikasyon A.S. | | 24,805 | | 601,971 | |
| | Otobus Karoseri Sanayi A.S. | | 98,162 | | 668,860 | |
| | Pinar Entegre et ve Un Sanayii A.S. | | 51,591 | | 85,349 | |
| | Pinar Sut Mamulleri Sanayii A.S. | | 58,424 | | 140,727 | |
* | | Raks Elektronik Sanayi ve Ticaret A.S. | | 5,859 | | 2,942 | |
* | | Sabah Yayincilik A.S. | | 31,938 | | 77,130 | |
33
| | Sarkuysan Elektrolitik Bakir Sanayi ve Ticaret A.S. | | 247,799 | | $ | 557,499 | |
* | | Sasa Dupont Sabanci Polyester Sanayi A.S. | | 1,346,358 | | 833,303 | |
* | | Tat Konserve Sanayii A.S. | | 175,295 | | 221,734 | |
* | | Tekstil Bankasi A.S. | | 1,226,983 | | 1,320,465 | |
| | Tire Kutsan Oluklu Mukavva Kutu ve Kagit Sanayii A.S. | | 156,597 | | 238,528 | |
| | Tofas Turk Otomobil Fabrikasi A.S. | | 605,547 | | 1,500,943 | |
| | Trakya Cam Sanayii A.S. | | 1,227,824 | | 3,752,311 | |
| | Tupras-Turkiye Petrol Rafinerileri A.S. | | 158,906 | | 2,700,925 | |
| | Turk Demir Dokum Fabrikalari A.S. | | 166,949 | | 1,159,326 | |
* | | Turk Prysmian Kablo ve Sistemleri A.S. | | 39,312 | | 95,006 | |
* | | Turk Sise ve Cam Fabrikalari A.S. | | 2,182,218 | | 6,472,634 | |
| | Turkiye Garanti Bankasi A.S. | | 4,833,512 | | 14,571,061 | |
| | Turkiye Is Bankasi A.S. | | 2,232,528 | | 13,188,476 | |
| | Ulker Gida Sanayi ve Ticaret A.S. | | 125,705 | | 332,657 | |
| | Unye Cimento Sanayi ve Ticaret A.S. | | 20,978 | | 59,617 | |
| | USAS Ucak Servisi A.S. | | 20,520 | | 72,886 | |
* | | Vestel Elektronik Sanayi ve Ticaret A.S. | | 223,134 | | 580,233 | |
* | | Yapi Kredi Finansal Kiralama A.S. | | 7,886 | | 16,099 | |
* | | Yapi ve Kredi Bankasi A.S. | | 3,543,654 | | 5,764,002 | |
* | | Yatas Yatak ve Yorgan Sanayi ve Ticaret A.S. | | 18,345 | | 63,326 | |
| | | | | | | |
TOTAL — TURKEY | | | | 131,863,426 | |
| | | | | | | |
| | | | Face
Amount | | Value† | |
| | | | (000) | | | |
TEMPORARY CASH INVESTMENTS — (0.1%) | | | | | |
| | Repurchase Agreement, PNC Capital Markets, Inc. 4.87%, 06/01/06 (Collateralized by $2,991,000 FHLMC Notes 4.00%, 09/22/09, valued at $3,394,785) to be repurchased at $3,344,452 | | $ | 3,344 | | 3,344,000 | |
| | | | | | | |
TOTAL INVESTMENTS — (100.0%) | | | | | |
(Cost $2,189,187,959) | | | | $ | 3,266,210,087 | |
| | | | | | | | | |
See accompanying Notes to Financial Statements.
34
ITEM 7. DISCLOSURE OF PROXY VOTING POLICIES AND PROCEDURES FOR CLOSED-END MANAGEMENT INVESTMENT COMPANIES.
This item is not applicable to the Registrant, which is an open-end management investment company.
ITEM 8. PORTFOLIO MANAGERS OF CLOSED-END MANAGEMENT INVESTMENT COMPANIES.
This item is not applicable to the Registrant, which is an open-end management investment company.
ITEM 9. PURCHASES OF EQUITY SECURITIES BY CLOSED-END MANAGEMENT INVESTMENT COMPANY AND AFFILIATED PURCHASERS.
This item is not applicable to the Registrant, which is an open-end management investment company.
ITEM 10. SUBMISSION OF MATTERS TO A VOTE OF SECURITY HOLDERS.
None.
ITEM 11. CONTROLS AND PROCEDURES.
(a) Based on their evaluation of the Registrant’s disclosure controls and procedures as of a date within 90 days of the filing date of this Form N-CSR (the “Report”), the Registrant’s Principal Executive Officer and Principal Financial Officer believe that the disclosure controls and procedures (as defined in Rule 30a-3(c) under the Investment Company Act of 1940, as amended) are effectively designed to ensure that information required to be disclosed by the Registrant in the Report is recorded, processed, summarized and reported by the filing date, including ensuring that information required to be disclosed in the Report is accumulated and communicated to the Registrant’s officers that are making certifications in the Report, as appropriate, to allow timely decisions regarding required disclosure. The Registrant’s management, including the Principal Executive Officer and the Principal Financial Officer, recognizes that any set of controls and procedures, no matter how well designed and operated, can provide only reasonable assurance of achieving the desired control objectives.
(b) There were no changes in the Registrant’s internal control over financial reporting (as defined in Rule 30a-3(d) under the 1940 Act) that occurred during the second fiscal quarter of the period covered by this Report that have materially affected, or are reasonably likely to materially affect, the Registrant’s internal control over financial reporting.
ITEM 12. EXHIBITS.
(a)(1) This item is not applicable.
(a)(2) Certifications pursuant to Section 302 of the Sarbanes-Oxley Act of 2002 are filed herewith.
(a)(3) This item is not applicable.
(b) Certifications pursuant to Section 906 of the Sarbanes-Oxley Act of 2002 are filed herewith.
SIGNATURES
Pursuant to the requirements of the Securities Exchange Act of 1934 and the Investment Company Act of 1940, the Registrant has duly caused this Report to be signed on its behalf by the undersigned, thereunto duly authorized.
Dimensional Emerging Markets Value Fund Inc.
By: | /s/David G. Booth | |
| David G. Booth |
| Chairman, Director, President, |
| Chief Executive Officer and Chief Investment Officer |
Date: August 3, 2006
Pursuant to the requirements of the Securities Exchange Act of 1934 and the Investment Company Act of 1940, this Report has been signed below by the following persons on behalf of the Registrant and in the capacities and on the dates indicated.
By: | /s/David G. Booth | |
| David G. Booth |
| Principal Executive Officer |
| Dimensional Emerging Markets Value Fund Inc. |
Date: August 3, 2006
By: | /s/Michael T. Scardina | |
| Michael T. Scardina |
| Principal Financial Officer |
| Dimensional Emerging Markets Value Fund Inc. |
Date: August 3, 2006